economic roundtable estimating the scope of services and cost to end homelessness prepared for bring...
TRANSCRIPT

Economic RoundtableEconomic Roundtable
Estimating the Scope of Services and Cost to End
Homelessness
Estimating the Scope of Services and Cost to End
Homelessness
Prepared for Bring LA Home!Prepared for Bring LA Home!

Economic RoundtableEconomic Roundtable 22
Questions to Answer in Estimating Cost
Questions to Answer in Estimating Cost1. How many people are homeless?
a. How big is the current homeless population?b. How many additional people become homeless each year?c. How many people escape homelessness each year?d. How many households are comprised by the homeless population?
2. What services are needed?a. How many people are in each needs-related category?b. What is the distribution of service needs within each category?c. How much does each type of service cost?
3. How much spendable resources do homeless people have?a. How many are enrolled in each public benefits program?b. What level of benefits is provided by each program?c. How many are employed?d. What is the earnings distribution among employed individuals?
4. How are housing needs met?a. What is the distribution of housing needs by size of housing unit?b. How much does each size of unit cost?c. How much of their spendable resources do households use for
housing?d. What subsidies are required after households pay what they are able
for housing?e. How long are subsidies provided?
1. How many people are homeless?a. How big is the current homeless population?b. How many additional people become homeless each year?c. How many people escape homelessness each year?d. How many households are comprised by the homeless population?
2. What services are needed?a. How many people are in each needs-related category?b. What is the distribution of service needs within each category?c. How much does each type of service cost?
3. How much spendable resources do homeless people have?a. How many are enrolled in each public benefits program?b. What level of benefits is provided by each program?c. How many are employed?d. What is the earnings distribution among employed individuals?
4. How are housing needs met?a. What is the distribution of housing needs by size of housing unit?b. How much does each size of unit cost?c. How much of their spendable resources do households use for
housing?d. What subsidies are required after households pay what they are able
for housing?e. How long are subsidies provided?

Economic RoundtableEconomic Roundtable
Population SizePopulation Size

Economic RoundtableEconomic Roundtable 44
Homeless Population EstimateHomeless Population Estimate Estimated point-in-
time population: 33,900 family
members 44,700 single
individuals Estimated annual
population: 119,100 family
members 135,000 single
individuals The size of the
homeless population is affected by: The length of time for
which individuals are homeless
The number of people who have repeat stints of homelessness.
Estimated point-in-time population: 33,900 family
members 44,700 single
individuals Estimated annual
population: 119,100 family
members 135,000 single
individuals The size of the
homeless population is affected by: The length of time for
which individuals are homeless
The number of people who have repeat stints of homelessness.
Table 8
Estimated Point-in-Time and Annual Homeless Population in Los Angeles County in 2002 by Family Status and Duration of Homelessness
Data from Los Angeles County Department of Public Social Services caseload in 2002, Winter Shelter Program residents in 2002, and National Survey of Homeless Assistance Providers and Clients in 1996
Family Members
Single Individuals Total
Homeless and Received CalWORKs or General Relief in 20021 101,681 70,585 172,266Estimated Ratio of Annual to Point-in-Time Homeless Population2 3.51 3.02Point-in-Time Recipients of CalWORKs or General Relief in 20023 28,969 23,385 52,354Estimated % of All Homeless Getting CalWORKs or GR in 20024 85% 52%Estimated Total Point-in-Time Homeless Population in 20025 33,921 44,678 78,600Estimated Total Annual Homeless Population in 20026 119,064 134,853 253,918
% Homeless 6 months or less7 86% 66%% Homeless 7-12 Months7 5% 11%% Homeless 12+ Months7 9% 22%Homeless 6 months or less8 29,314 29,689 59,003Homeless 7-12 Months8 1,544 5,041 6,585Homeless 12+ Months8 3,063 9,947 13,011Estimated Annual Turnover of Persons Homeless <6 months9 4.14 4.25Estimated Annual Turnover of Persons Homeless 7-12 Months9 1.33 1.33Estimated Annual Turnover of Persons Homeless 12+ Months9 1.00 1.00% Homeless <6 Months and Only Time in the Year10 92% 92%% Homeless 7-12 Months and Only Time in the Year10 77% 77%% Homeless 12+ Months and Only Time in the Year10 100% 100%% Homeless <6 months, and More than 1 Time in the Year10 8% 8%% Homeless 7-12 Months, and More than 1 Time in the Year10 23% 23%% Homeless 12+ Months, and More than 1 Time in the Year10 0% 0%Estimated Total Annual Homeless <6 Months in 200211 114,064 118,581 232,645Estimated Total Annual Homeless 7-12 Months in 200211 1,937 6,324 8,262Estimated Total Annual Homeless 12+ Months in 200211 3,063 9,947 13,011

Economic RoundtableEconomic Roundtable 55
Source Information for Estimating the
Size of Major Categories of
Homeless Residents
Source Information for Estimating the
Size of Major Categories of
Homeless Residents LAHSA’s estimates of the breakout of the homeless population in combination with Economic Roundtable estimates produce a detailed point-in-time estimate of homeless subpopulations.
This data is then used to produce an annual estimate of the size of the population categories used for producing cost estimates.
LAHSA’s estimates of the breakout of the homeless population in combination with Economic Roundtable estimates produce a detailed point-in-time estimate of homeless subpopulations.
This data is then used to produce an annual estimate of the size of the population categories used for producing cost estimates.
Table 9
Estimated Point-In-Time Homeless Subpopulations inLos Angeles County in 2002
Subpopulations within single individuals and within family membersoverlap and add up to more than 100 percent
Percent of Population
Estimated Point-in-Time Population
Single IndividualsTOTAL 100% 44,678Females2 30% 13,403Males2 70% 31,275Chronic Substance Abuse1 50% 22,339Seriously Mentally Ill1 25% 11,170Dually-Diagnosed1 16% 7,148Veterans3 22% 9,988Persons with HIV/AIDS1 3% 1,341Victims of Domestic Violence1 9% 4,021Youth/Emancipated Foster Youth1 8% 3,575Other-Employment Disability3 25% 11,032Other-Elderly1 12% 5,495Other-Multi-Diagnosed1 5% 2,234
Family MembersTOTAL 100% 33,921Female Parents2 31% 10,634Male Parents2 10% 3,362Female Children2 29% 9,948Male Children2 29% 9,977Chronic Substance Abuse1 32% 10,856Seriously Mentally Ill1 4% 1,356Dually-Diagnosed1 1% 340Veterans (among parents)3 13% 1,829Persons with HIV/AIDS1 3% 1,017Victims of Domestic Violence1 34% 11,533Other-Multi-Diagnosed1 1% 340Other-Employment Disability3 23% 3,184

Economic RoundtableEconomic Roundtable 66
Estimating Population by Major Category
The Number of New Entrants into Homelessness Sets the Size of All Groups
Estimating Population by Major Category
The Number of New Entrants into Homelessness Sets the Size of All Groups
Category Methodology
Esti-mated
Count of adults & children
Esti-mated
Count of Adults
Persons per
House-hold
Estimated ratio ofP-I-T to
annual pop.
Estimated Number of Persons in First Year
Estimated Number of
Households in First Year
Estimated % of Unduplicated New Persons Each Sub-sequent Yr.
Estimated Nmbr Undup-licated New Persons
Each Subsequent Yr.
Estimated Nmbr Unduplicated New Households Each Sub-sequent Yr.
Single men and women
44,678 shown in Table 8, minus: 3,575 homeless youth, 11,170 seriously mentally ill, 7,148 dually-diagnosed, 2,234 multi-diagnosed, and 1,341 with HIV/AIDS shown in Table 9
19,210
short-term (1-6 mth)
19,210 x .6645 plus 19,210 x .2227 x .25 (redistribution of population breakout shown in Table 4 to offset over-representation of long-term in mentally ill category)
16,451 16,451 1.00 4.25 69,916 69,916 92% 64,323 64,323
mid-term (7-11 mth)
19,210 x .1128 plus 19,210 x .2227 x .5 (redistribution of population breakout shown in Table 4 to offset over-representation of long-term in mentally ill category)
1,764 1,764 1.00 1.33 2,347 2,347 77% 1,807 1,807
long-term (12+ mth)
19,210 x .2227 x .25 (75% of long-term assumed to be in mentally-ill, dual- or multi-diagnosed category)
995 995 1.00 1.00 995 995 25% 249 249
Family Members
33,921 shown in Table 8 , minus: 1,356 seriously mentally ill, 340 dually-diagnosed, 340 multi-diagnosed, and 1,017 HIV/AIDS shown in Table 9
30,868
short-term (1-6 mth)
30,868 x ..8642 plus 3.,868 x .0903 x .25 (redistribution of population breakout shown in Table 8 to offset over-representation of long-term in mentally ill category)
28,133 11,660 2.69 4.14 116,469 43,297 92% 107,151 39,833
mid-term (7-11 mth)
30,868 x .0455 plus 30,868 x .0903 x .5 (redistribution of population breakout shown in Table 8 to offset over-representation of long-term in mentally ill category)
1,174 486 2.69 1.33 1,561 580 77% 1,202 447
long-term (12+ mth)
30,868 x .0903 x .25 (75% of long-term assumed to be in mentally-ill, dual- or multi-diagnosed category)
1,562 648 2.69 1.00 1,562 581 25% 391 145
Unaccom-panied Yth (thru 24 yr)
8% of single individuals shown in Table 9 3,575 3,575 1.00 3.22 11,516 11,516 65% 7,447 7,447
Seriously Mentally Ill, Dual- Multi-Diagnosed
11,170 single individuals and 1,356 family members estimated to be seriously mentally ill; 7,148 single individuals and 340 family members estimated to be dually-diagnosed; 2,234 single individuals and 340 family members estimated to be multi-diagnosed, as shown in Table 9
22,588 21,391 1.06 1.99 44,868 42,328 20% 8,974 8,466
HIV+/AIDS 1,341 single individuals and 1,017 family members shown in Table 9 2,358 1,705 1.37 1.99 4,684 3,419 20% 937 684
TOTAL 78,600 58,674 3.23 253,918 174,979 65% 192,480 123,401

Economic RoundtableEconomic Roundtable 77
Population SummaryPopulation Summary Annual population size is estimated for 9 categories of
homeless residents, each with it’s own profile of service needs and costs: Single men and women homeless 1-6 months Single men and women homeless 7-11 months Single men and women homeless 12+ months Family Members homeless 1-6 months Family Members homeless 7-11 months Family Members homeless 12+ months Unaccompanied Youth thru 24 years of age Seriously mentally ill, dual- multi-Diagnosed HIV+/AIDS
The number of individuals and households is estimated for each category.
The percent of the population accounted for by each category is assumed to remain the same regardless of population size.
The size of the homeless population is driven by the number of new entrants into homelessness each year.
Annual population size is estimated for 9 categories of homeless residents, each with it’s own profile of service needs and costs: Single men and women homeless 1-6 months Single men and women homeless 7-11 months Single men and women homeless 12+ months Family Members homeless 1-6 months Family Members homeless 7-11 months Family Members homeless 12+ months Unaccompanied Youth thru 24 years of age Seriously mentally ill, dual- multi-Diagnosed HIV+/AIDS
The number of individuals and households is estimated for each category.
The percent of the population accounted for by each category is assumed to remain the same regardless of population size.
The size of the homeless population is driven by the number of new entrants into homelessness each year.

Economic RoundtableEconomic Roundtable
Service Needs and CostsService Needs and Costs
Economic RoundtableEconomic Roundtable 99
Service Needs except Employment and Housing
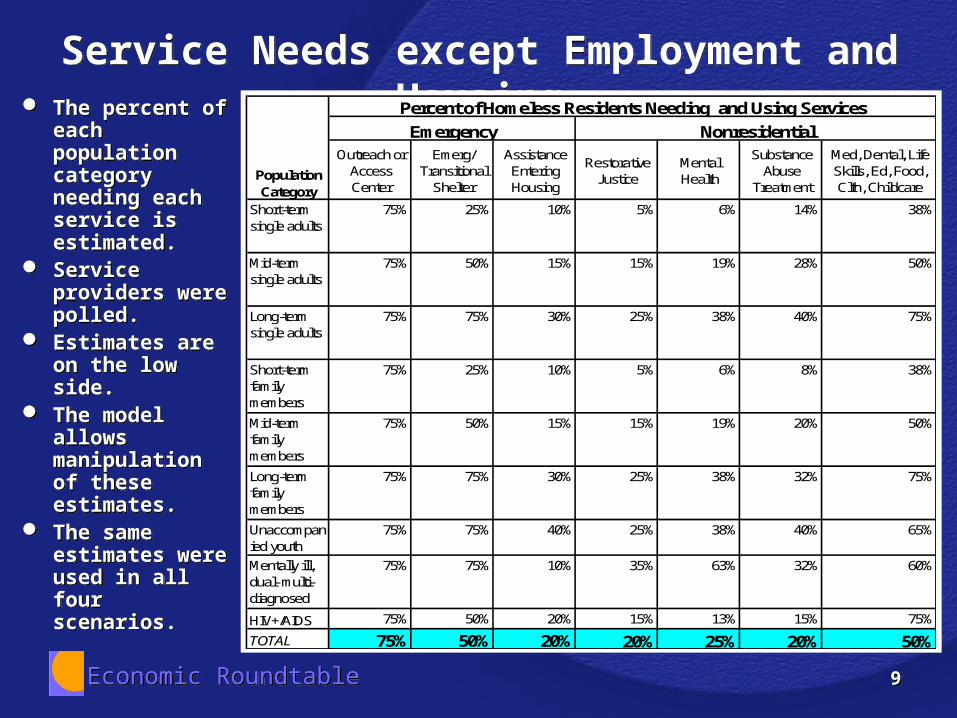
Service Needs except Employment and Housing The percent of
each population category needing each service is estimated.
Service providers were polled.
Estimates are on the low side.
The model allows manipulation of these estimates.
The same estimates were used in all four scenarios.
The percent of each population category needing each service is estimated.
Service providers were polled.
Estimates are on the low side.
The model allows manipulation of these estimates.
The same estimates were used in all four scenarios.
Short-term single adults
75% 25% 10% 5% 6% 14% 38%
Mid-term single adults
75% 50% 15% 15% 19% 28% 50%
Long-term single adults
75% 75% 30% 25% 38% 40% 75%
Short-term family members
75% 25% 10% 5% 6% 8% 38%
Mid-term family members
75% 50% 15% 15% 19% 20% 50%
Long-term family members
75% 75% 30% 25% 38% 32% 75%
Unaccompanied youth
75% 75% 40% 25% 38% 40% 65%
Mentally ill, dual- multi-diagnosed
75% 75% 10% 35% 63% 32% 60%
HIV+/AIDS 75% 50% 20% 15% 13% 15% 75%
TOTAL 75% 50% 20% 20% 25% 20% 50%
Substance Abuse
Treatment
Med, Dental, Life Skills, Ed, Food, Clth, Childcare
Percent of Homeless Residents Needing and Using Services
Emergency Nonresidential
Population Category
Restorative Justice
Mental Health
Outreach or Access Center
Emerg/ Transitional
Shelter
Assistance Entering Housing

Economic RoundtableEconomic Roundtable 1010
Three Factors Determine the Cost Differences in Scenarios 1-3 Differences in Housing Cost
Contributions Reduce Costs in Scenario 4
Three Factors Determine the Cost Differences in Scenarios 1-3 Differences in Housing Cost
Contributions Reduce Costs in Scenario 4
SCENARIOCautious Semi-
OptimisticOptimistic
Annual % Unduplicated New Homeless Persons Years 2-10 65% 65% 30%Percent of Adults in Labor Force After Services 50% 65% 65%Percent of Any-Time-Homeless-in-Year Population Receiving CalWORKs Benefits
30% 34% 34%
Percent of Any-Time-Homeless-in-Year Population Receiving SSI Benefits
20% 33% 33%
Percent of Any-Time-Homeless-in-Year Population Receiving General Relief Benefits
14% 21% 21%
FACTOR THAT VARY IN SCENARIOS
In Scenario 4, as in the other 3 scenarios, individuals begin by contributing 40% of their spendable income to pay housing costs. This amount increases by 5 percentage points each year for single adults with $7,000 to $11,999 and families with $10,000 to $15,999 in earnings.
In Scenario 4, as in the other 3 scenarios, individuals begin by contributing 40% of their spendable income to pay housing costs. This amount increases by 5 percentage points each year for single adults with $7,000 to $11,999 and families with $10,000 to $15,999 in earnings.

Economic RoundtableEconomic Roundtable 1111
Take-up and Cost of
Services
Take-up and Cost of
ServicesMost frequently needed services:Outreach, access
centers 75%Shelter and
linked services 50%
Nonresidential support services 50%
Job training/ placement 33%-43%
Most expensive services:Supportive
housing $10 - 12,700
Subsidized housing $5 – 7,700
Substance abuse treatment $5,200
Assisted housing entry $5,000
Most frequently needed services:Outreach, access
centers 75%Shelter and
linked services 50%
Nonresidential support services 50%
Job training/ placement 33%-43%
Most expensive services:Supportive
housing $10 - 12,700
Subsidized housing $5 – 7,700
Substance abuse treatment $5,200
Assisted housing entry $5,000
Table 12
Estimated Take-up Rate for Services and Local Costs to Pay for One Cycle of Service or Subsidize for One Year of Housing
Type of Assistance Local Cost per Household Percent of Homeless Population Receiving Each Type of Assistance
Outreach, Access Centers $250 75%
Shelter, & Linked Services $1,500 50%
Restorative Justice $1,500 20%
Mental Health $675 25%
Substance Abuse Treatment $5,250 20%
Medical, Dental, Life Skills, Education, Food, Clothing, Childcare, Other
Average of $1,500 50%
General Relief $1,667 per year average 14% to 21% depending on scenario
CalWORKs No local cost 30% to 34% depending on scenario
Supplemental Security Income (SSI) No local cost 20% to 33% depending on scenario
Training & Employment $1,917 per labor force entrant 1/3 of labor force entrants will use job search assistance, and another 1/3 vocational training
Assisted Entry into Housing $5,000 20%
Market Rate Family Housing No subsidy Families with $16,000 or more in annual spendable resources
Market Rate Individual Housing No subsidy Single adults with $12,000 or more in annual spendable resources
Affordable Family Housing $5,150 yearly after tenant rent contribution
Families with $10,000 to $15,999 in annual spendable resources
Affordable Individual Housing $3,155 yearly after tenant rent contribution
Single adults with $7,000 to $11,999 in annual spendable resources
Subsidized Family Housing $7,726 yearly after tenant rent contribution
1/2 of families with less than $10,000 in annual spendable resources
Subsidized Individual Housing $5,160 yearly after tenant rent contribution
1/2 of single adults with less than $7,000 in annual spendable resources
Supportive Family Housing $12,726 yearly after tenant rent contribution
1/2 of families with less than $10,000 in annual spendable resources
Supportive Individual Housing $10,160 yearly after tenant rent contribution
1/2 of single adults with less than $7,000 in annual spendable resources

Economic RoundtableEconomic Roundtable 1212
Employment Rate and Earnings Distribution for Each Population Category are Based on Estimates for How Employment and Earnings for Category
Differ from the Overall Homeless Population
Employment Rate and Earnings Distribution for Each Population Category are Based on Estimates for How Employment and Earnings for Category
Differ from the Overall Homeless PopulationTable 2 Table 3
Estimated Labor Force Participation within Categories of the Point-in-Time PopulationCAUTIOUS SCENARIO
Estimated Distribution of Earnings within Subgroups of the Point-in-Time Population
Estimated Ratio of Subgroup Members to Total Homeless Persons in Income Group
Category Basis for Estimating Percent in Labor Force After Receiving Services
P-I-T Partici-pants in Labor
Force After Services
Annual Partici-pants in Labor
Force After Services-1st Year
Annual Partici-pants in Labor
Force After Services-Years 2-
10
Estimated Ratio of Employment Rate
to Overall Homeless
Employment Rate
Percent of Adults in
Labor Force
$0 Annual
Earnings
$3K Annual
Earnings
$6K Annual
Earnings
$9K Annual
Earnings
$12K Annual Earnings
$15K+ Annual
Earnings
Short-term single adults
88% of 13,835 short-term single adults 11,872 50,455 46,418 1.44 72% 0.31 1.24 1.25 1.38 1.51 1.64
Mid-term single adults
75% of 4,306 mid-term single adults 1,085 1,443 1,111 1.23 62% 0.64 1.35 1.46 1.29 1.11 1.09
Long-term single adults
60% of 1,070 long-term single adults 489 489 122 0.98 49% 1.02 1.45 1.35 1.10 0.88 0.55
Short-term adult family members
88% of short-term adult family members (adults make up 41% of the 27,373 family members)
8,414 34,834 32,047 1.44 72% 0.31 1.24 1.25 1.38 1.51 1.64
Mid-term adult family members
75% of mid-term adult family members (adults make up 41% of the 2,798 family members)
299 398 306 1.23 62% 0.64 1.35 1.46 1.29 1.11 1.09
Long-term adult family members
60% of long-term adult family members (adults make up 41% of the 697 family members)
319 319 80 0.98 49% 1.02 1.45 1.35 1.10 0.88 0.55
Unaccompanied youth
70% of the 71% of 3,575 unaccompanied youth that PUMS shows to be non-disabled
2,052 6,611 4,275 1.15 57% 0.77 1.45 1.25 1.10 0.96 1.09
Mentally ill, dual- multi-diagnosed
25% of adults who are seriously mentally ill, dual-, and multi-diagnosed (adults make up 95% of the 22,588 persons in this population)
4,385 8,711 1,742 0.41 21% 1.92 0.52 0.52 0.46 0.40 0.27
HIV+/AIDS 50% of adult HIV+/AIDS (adults make un an estimated 72% of the homeless HIV+/AIDS population)
699 1,389 278 0.82 41% 1.28 1.04 1.04 0.92 0.80 0.55
TOTAL 29,615 104,648 86,380 1.00 50% 50% 8% 8% 9% 10% 15%

Economic RoundtableEconomic Roundtable 1313
The Number of People in Each Category in the Labor Force Varies with the Scenario, But the Percent Distribution of Earnings Outcomes
Remains Constant in all Four Scenarios
The Number of People in Each Category in the Labor Force Varies with the Scenario, But the Percent Distribution of Earnings Outcomes
Remains Constant in all Four Scenarios
“High” earners: Short-term
50% more likely than mid-term
Mid-term 50% more likely than long-term
Non-earners: Long-term
50% more likely than mid-term
Mid-term 50% more likely than short-term
“High” earners: Short-term
50% more likely than mid-term
Mid-term 50% more likely than long-term
Non-earners: Long-term
50% more likely than mid-term
Mid-term 50% more likely than short-term
Table 3-A
Estimated Annual Earned Income of Point-in-Time Homeless Adults, by Subgroup, After Receiving Services
Percent in Annual Income Group Number in Annual Income GroupCategory $0 $3K $6K $9K $12K $15K+ $0 $3K $6K $9K $12K $15K+ Total
Short-term single adult
28% 10% 10% 12% 16% 25% 4,579 1,619 1,619 2,024 2,563 4,047 16,451
Mid-term single adult
38% 11% 11% 11% 11% 16% 679 188 203 203 203 289 1,764
Long-term single adult
51% 11% 11% 10% 9% 8% 505 114 106 98 90 82 995
Short-term adult family members
28% 10% 10% 12% 16% 25% 3,245 1,147 1,147 1,434 1,817 2,868 11,660
Mid-term adult family members
38% 11% 11% 11% 11% 16% 187 52 56 56 56 80 486
Long-term adult family members
51% 11% 11% 10% 9% 8% 329 74 69 64 58 53 648
Unaccom-panied yth.
43% 11% 10% 10% 10% 16% 1,523 410 352 352 352 586 3,575
Mentally ill, dual- multi-diagnosed
79% 4% 4% 4% 4% 4% 17,005 877 877 877 877 877 21,391
HIV+/AIDS 59% 8% 8% 8% 8% 8% 1,006 140 140 140 140 140 1,705
TOTAL 50% 8% 8% 9% 10% 15% 29,059 4,622 4,568 5,247 6,155 9,023 58,674

Economic RoundtableEconomic Roundtable
For estimates of welfare benefits and total income see Tables 11-18 of the Population Services Matrix
For estimates of welfare benefits and total income see Tables 11-18 of the Population Services Matrix

Economic RoundtableEconomic Roundtable 1515
Services, Costs and Income SummaryServices, Costs and Income Summary
In all 4 scenarios the following thing remain the same: The percent of the overall population in each category The percent of each population category needing each
service The cost of each service The distribution of earnings within each population
category The following things changed in different scenarios:
The size of the homeless population The number of people who are employed and have
earnings The number of people who receive public benefits The amount of spendable resources that people
contribute to housing

Economic RoundtableEconomic Roundtable
Population-Services-Cost MatrixPopulation-Services-Cost Matrix

Economic RoundtableEconomic Roundtable 1717
Estimated Level of Services Needed and Used by Subgroups of Homeless Residents
in Cautious Scenario
Estimated Level of Services Needed and Used by Subgroups of Homeless Residents
in Cautious ScenarioEmploy-ment
Public Assist. Street, Shelter
Market Rate Housing Affordable Housing
Subsidized Housing
Subsidized Supportive
Other Nonresidential Support Services**
Major Categories within the Homeless
Population Tra
inin
g, S
earc
h,
Cre
atio
n, &
Ret
entio
n
Gen
eral
Rel
ief
Out
reac
h, A
cces
s C
ente
r
She
lter, &
link
ed s
ervi
ces
Fam
ily
Indi
vidu
al
Fam
ily
Indi
vidu
al
Fam
ily
Indi
vidu
al
Fam
ily
Indi
vidu
al
Res
tora
tive
Just
ice
Men
tal H
ealth
Sub
stan
ce A
buse
Tre
atm
ent
Med
ical
, Den
tal,
Life
Ski
lls, E
duca
tion,
Foo
d,
Clo
thin
g, C
hild
care
, O
ther
Single Men and Women Not: Seriously Mentally Ill, Dually-Diagnosed, Multi-Diagnosed, HIV/AIDS, or Unaccompanied Youth
Short-term 11,872 5,768 12,338 4,113 1,645 823 1,028 2,303 6,169
Mid-term 1,085 564 1,323 882 265 265 331 494 882
Long-term 489 287 746 746 298 249 373 398 746
Family Members Not: Seriously Mentally Ill, Dually-Diagnosed, Multi-Diagnosed, HIV/AIDS, or Unaccompanied Youth
Short-term 8,414 986 21,099 7,033 7,033 583 1,758 933 10,550
Mid-term 299 5 880 587 587 73 220 97 587
Long-term 319 0 1,172 1,172 1,172 162 586 207 1,172
Populations with Special Needs
Unaccomp. Yth. 2,052 988 2,681 2,681 1,430 894 1,341 1,430 2,324
Mnt. Ill Dual-Diag. 4,385 2,357 16,941 16,941 2,259 7,487 14,118 6,845 13,553
HIV+/AIDS 699 0 1,769 1,179 472 256 295 256 1,769
Estimated Total Point-in-Time, Annual and 10-Year Services that are needed and Will be Used by Homeless Residents
Total P-i-T persons 29,615 10,956 58,950 35,334 15,160 10,790 20,049 12,963 37,751
Annl hshld Yr 1 104,648 34,673 131,235 73,041 36,447 34,240 21,756 12,635 60,044 1,662 16,773 1,662 16,773 25,028 46,287 33,753 111,685
Ann hshld Yr 2-9 86,380 27,543 92,550 39,738 32,396 28,598 14,834 10,045 33,437 1,509 10,296 1,509 10,296 10,823 20,039 19,115 77,214
Tot hshld Yr1-10 882,071 282,559 964,189 430,683 328,010 291,618 155,263 103,040 360,979 15,242 109,432 15,242 109,432 122,432 226,641 205,784 806,613
Avg Ann. New Hshld
88,207 28,256 96,419 43,068 32,801 29,162 15,526 10,304 36,098 1,524 10,943 1,524 10,943 12,243 22,664 20,578 80,661
Avg Ann Cost/Hshld $1,917 $1,667 $250 $1,500 $0 $0 $5,000 $5,169 $3,177 $7,992 $5,350 $12,992 $10,350 $1,500 $675 $5,250 $1,500Avg Annual Cost $M $169 $47 $24 $65 $0 $0 $78 $299 $669 $68 $338 $110 $653 $18 $15 $108 $121Cum 10-Yr Cost $M $1,691 $471 $241 $646 $0 $0 $776 $2,990 $6,687 $675 $3,376 $1,098 $6,531 $184 $153 $1,080 $1,210
Ass
iste
d Ent
ry in
to H
ousi
ng-
Hou
seho
lds

Economic RoundtableEconomic Roundtable 1818
Annual Costs Under CAUTIOUS SCENARIO: Current Rate of New Homeless, Same Service Outcomes
$0
$500,000,000
$1,000,000,000
$1,500,000,000
$2,000,000,000
$2,500,000,000
$3,000,000,000
$3,500,000,000
$4,000,000,000
$4,500,000,000
1 2 3 4 5 6 7 8 9 10Year
Annual
Loca
l C
ost
s
Outreach, Access Cntr
Shelter, & Linked Srv
Health, Ed., Childcare
Employment Srv
General Relief
Restorative Justice
Mental Health Srv
Sub. Abuse Rehab
Asst. Entry into Hsng
Fam. Affordable Hsng
Indiv. Affordable Hsng
Fam. Subsidized Hsng
Indiv. Subsidized Hsng
Fam. Supportive Hsng
Indiv. Supportive Hsng
Housing
Services

Economic RoundtableEconomic Roundtable 1919
Annual Costs Under SEMI-OPTIMISTIC Scenario: Current Rate of New Homeless, Improved Service Outcomes
$0
$500,000,000
$1,000,000,000
$1,500,000,000
$2,000,000,000
$2,500,000,000
$3,000,000,000
$3,500,000,000
$4,000,000,000
$4,500,000,000
1 2 3 4 5 6 7 8 9 10Year
Annual Local C
osts
Outreach, Access Cntr
Shelter, & Linked Srv
Health, Ed., Childcare
Employment Srv
General Relief
Restorative Justice
Mental Health Srv
Sub. Abuse Rehab
Asst. Entry into Hsng
Fam. Affordable Hsng
Indiv. Affordable Hsng
Fam. Subsidized Hsng
Indiv. Subsidized Hsng
Fam. Supportive Hsng
Indiv. Supportive Hsng
Housing
Services

Economic RoundtableEconomic Roundtable 2020
Annual Costs Under OPTIMISTIC Scenario: Reduced Rate of New Homeless, Improved Service Outcomes
$0
$500,000,000
$1,000,000,000
$1,500,000,000
$2,000,000,000
$2,500,000,000
$3,000,000,000
$3,500,000,000
$4,000,000,000
$4,500,000,000
1 2 3 4 5 6 7 8 9 10Year
Annual Local C
ost
Outreach, Access Cntr
Shelter, & Linked Srv
Health, Ed., Childcare
Employment Srv
General Relief
Restorative Justice
Mental Health Srv
Sub. Abuse Rehab
Asst. Entry into Hsng
Fam. Affordable Hsng
Indiv. Affordable Hsng
Fam. Subsidized Hsng
Indiv. Subsidized Hsng
Fam. Supportive Hsng
Indiv. Supportive Hsng
Housing
Services

Economic RoundtableEconomic Roundtable 2121
Annual Costs Under MODIFIED OPTIMISTIC Scenario: Reduced New Homeless, Improved Outcomes, Some Housing Subsidies Decline
0
500,000,000
1,000,000,000
1,500,000,000
2,000,000,000
2,500,000,000
3,000,000,000
3,500,000,000
4,000,000,000
4,500,000,000
1 2 3 4 5 6 7 8 9 10Year
Annual Local C
ost
Outreach, Access Cntr
Shelter, & Linked Srv
Health, Ed., Childcare
Employment Srv
General Relief
Restorative Justice
Mental Health Srv
Sub. Abuse Rehab
Asst. Entry into Hsng
Fam. Affordable Hsng
Indiv. Affordable Hsng
Fam. Subsidized Hsng
Indiv. Subsidized Hsng
Fam. Supportive Hsng
Indiv. Supportive Hsng
Housing
Services

Economic RoundtableEconomic Roundtable 2222
Annual Cost to Subsidize Housing for Different Size Households with
Different Levels of Income
Annual Cost to Subsidize Housing for Different Size Households with
Different Levels of Income Subsidy levels in each
housing category are similar in all four scenarios
Subsidy levels in each housing category are similar in all four scenarios
Estimated Annual Cost to Subsidize HousingBased on Households Paying 40% of Spendable Resources (including Food Stamps) on Housing; Estimated Rent = $570 for Studio Units and $882 for 2-Bedroom Units
$0
$0
$5,169
$3,177
$7,991
$5,351
$12,991
$10,351
$0
$0
$5,135
$3,146
$7,593
$5,053
$12,593
$10,053
$0
$0
$5,145
$3,142
$7,593
$5,075
$12,593
$10,075
$0 $2,000 $4,000 $6,000 $8,000 $10,000 $12,000 $14,000
Family Market RateHousing
Individual MarketRate Housing
Family AffordableHousing
IndividualAffordable Housing
Family SubsidizedHousing
IndividualSubsidizedHousing
Family SubsidizedSupportive
IndividualSubsidizedSupportive
Typ
e of H
ousi
ng
Annual Subisidy
Optimistic
Semi-Optimistic
Cautious
SCENARIO

Economic RoundtableEconomic Roundtable 2323
Number of People Needing Different Levels of Housing
Subsidy in the Four Scenarios
Number of People Needing Different Levels of Housing
Subsidy in the Four Scenarios The four scenarios
produce vastly different profiles of housing need.
In the cautious scenario many more people are in subsidized housing, including very expensive supportive housing.
In the optimistic scenario many more people are in market rate housing and many fewer in supportive housing.
As increasing numbers of homeless people are housed, these different profiles result in multi-billion dollar differences in costs.
The four scenarios produce vastly different profiles of housing need.
In the cautious scenario many more people are in subsidized housing, including very expensive supportive housing.
In the optimistic scenario many more people are in market rate housing and many fewer in supportive housing.
As increasing numbers of homeless people are housed, these different profiles result in multi-billion dollar differences in costs.
Estimated Annual Housing Needs for Homeless Residents Under Three Different Scenarios
29,199
29,162
8,895
31,835
1,261
9,781
1,261
9,781
36,209
35,305
8,836
35,467
410
8,324
410
8,324
18,879
18,489
4,728
19,615
213
4,524
213
4,524
0 10,000 20,000 30,000 40,000
Family MarketRate Housing
Individual MarketRate Housing
Family AffordableHousing
IndividualAffordableHousing
FamilySubsidized
Housing
IndividualSubsidizedHousing
FamilySubsidizedSupportive
IndividualSubsidizedSupportive
Typ
e o
f H
ou
sin
g
Average Annual Number of Additional Housing Units
Optimistic
Semi-Optimistic
Cautious
SCENARIO

Economic RoundtableEconomic Roundtable 2424
SummarySummary1. More effective efforts to help homeless residents re-enter the
labor force and obtain public benefits will reduce costs by an estimated16 percent (cautious to semi-optimistic scenario).
2. Reducing the flow of people being cared for by major social institutions into homelessness will reduce costs by an estimated 47 percent (semi-optimistic to optimistic scenario).
3. Providing housing is by far the greatest cost in ending homelessness – accounting for two-thirds to three-quarters of total costs.
4. Requiring households with modest but still significant spendable resources (single adults with $7,000 to $11,999 and families with $10,000 to $15,999) to increase their contribution to rent costs by 5 percent each year will reduce costs by an estimated 37 percent (optimistic to modified-optimistic scenario).
5. The lowest cost scenario (modified optimistic) is estimated to cost roughly double what is currently being spent on homelessness.
1. More effective efforts to help homeless residents re-enter the labor force and obtain public benefits will reduce costs by an estimated16 percent (cautious to semi-optimistic scenario).
2. Reducing the flow of people being cared for by major social institutions into homelessness will reduce costs by an estimated 47 percent (semi-optimistic to optimistic scenario).
3. Providing housing is by far the greatest cost in ending homelessness – accounting for two-thirds to three-quarters of total costs.
4. Requiring households with modest but still significant spendable resources (single adults with $7,000 to $11,999 and families with $10,000 to $15,999) to increase their contribution to rent costs by 5 percent each year will reduce costs by an estimated 37 percent (optimistic to modified-optimistic scenario).
5. The lowest cost scenario (modified optimistic) is estimated to cost roughly double what is currently being spent on homelessness.