ecological concepts - assets
TRANSCRIPT

Tropical Ecosystems andEcological Concepts
Patrick L. OsborneInternational Center for Tropical EcologyUniversity of Missouri-St. Louis

published by the press syndic ate of the universit y of c ambridgeThe Pitt Building, Trumpington Street, Cambridge, United Kingdom
c ambridge universit y pressThe Edinburgh Building, Cambridge CB2 2RU, UK http://www.cup.cam.ac.uk40 West 20th Street, New York, NY 10011-4211, USA http://www.cup.org10 Stamford Road, Oakleigh, Melbourne 3166, AustraliaRuiz de Alarcón 13, 28014 Madrid, Spain
© P. L. Osborne 2000
This book is in copyright. Subject to statutory exceptionand to the provisions of relevant collective licensing agreements,no reproduction of any part may take place withoutthe written permission of Cambridge University Press.
First published 2000
Printed in the United Kingdom at the University Press, Cambridge
Typeface Swift Regular 9.5/12.25 pt. System QuarkXPress™ [se ]
A catalogue record for this book is available from the British Library
Library of Congress Cataloguing in Publication dataOsborne, Patrick L.
Tropical ecosystems and ecological concepts / Patrick L. Osborne.p. cm.
Includes bibliographical referencesISBN 0 521 64251 5 – ISBN 0 521 64523 9 (pbk.)1. Ecology–Tropics. I. Title.
QH84.5.O82 20005779.0913–dc21 99-047853
ISBN 0 521 64251 5 hardbackISBN 0 521 64523 9 paperback

Contents
Preface page xiii
Abbreviations and units xiv
Chapter 1 The tropical environment 1
1.1 The tropics 1
1.2 Climate in the tropics 1
1.3 Biogeographical regions 11
1.4 Chapter summary 17
Chapter 2 Hot deserts and environmental factors 18
2.1 The Sahara Desert and arid zones of northern Africa 18
2.2 The Namib Desert 22
2.3 Australian deserts 27
2.4 Environmental factors 31
2.5 Water 31
2.6 Limiting factors 34
2.7 Temperature 37
2.8 Salinity 38
2.9 Soils and nutrients 39
2.10 Environmental factors and plant and animal distributions 43
2.11 Desertification or land degradation? 46
2.12 Chapter summary 48
Chapter 3 Grasslands and primary production 50
3.1 Grass structure and biology 50
3.2 Neotropical grasslands 53
3.3 Light as an energy source 56
3.4 Carbon dioxide uptake by plants 56
3.5 Photosynthesis 57
3.6 Photorespiration 58
3.7 Photosynthetic strategies 60
3.8 Respiration 61
3.9 Environmental factors and photosynthesis 63
3.10 Primary production 64
3.11 Assessment of grassland primary production 64
3.12 Effects of grazing on grass growth 66
3.13 Seasonal variation in grassland primary production 67
3.14 Primary production rates in terrestrial biomes 68
3.15 Chapter summary 71
Chapter 4 Savanna and population dynamics 72
4.1 Fire and savanna vegetation 72

4.2 Savannas of the world 75
4.3 The Serengeti 78
4.4 Savanna plants and heterogeneity 80
4.5 Animal population dynamics in the Serengeti 81
4.6 Herbivores and herbivory 84
4.7 Principles of population growth 86
4.8 Factors determining population density 91
4.9 Density-dependent mortality factors 93
4.10 Competition theory and the competitive exclusionprinciple 99
4.11 Predation 100
4.12 Density-independent mortality factors 109
4.13 Reproductive strategies and population growth 109
4.14 Population age structure and life tables 110
4.15 Key factor analysis 117
4.16 Conservation of African wildlife 119
4.17 Ecosystem dynamics and ecological models 121
4.18 Chapter summary 126
Chapter 5 Lakes, energy flow and biogeochemical cycling 128
5.1 Thermal stratification 128
5.2 Pelagic zone production 143
5.3 Littoral zone producers and primary production 147
5.4 The catchment area concept 152
5.5 Aquatic consumers 154
5.6 The biota of tropical and temperate lakes: a comparison 158
5.7 Food chains and energy flow 159
5.8 Food chain energetics 159
5.9 Trophic levels 160
5.10 Limited length of food chains 163
5.11 Food chain efficiencies 165
5.12 Food web dynamics 166
5.13 Biogeochemical cycles 168
5.14 Quantitative aspects of nutrient supply and cycling 174
5.15 Eutrophication 177
5.16 Aquatic resource management 182
5.17 Chapter summary 184
Chapter 6 Rivers, floodplains and estuaries: the flood-pulseand river continuum concepts 186
6.1 Nile River 188
6.2 Purari River 195
6.3 Amazon River 199
6.4 Ecological concepts 208
6.5 Estuaries 216
6.6 Chapter summary 219
viii CONTENTS

Chapter 7 Wetlands and succession 221
7.1 What are wetlands? 221
7.2 Sudd communities of Lake Naivasha 222
7.3 Rooted emergent swamps of Lake Chilwa 223
7.4 Freshwater herbaceous wetlands: structure and function 225
7.5 Swamp forests 228
7.6 Wetland zonation 229
7.7 Wetland succession 231
7.8 Ecological succession 233
7.9 Community development and assembly 233
7.10 Wetland loss and conservation 234
7.11 Chapter summary 236
Chapter 8 Tropical rain forests and biodiversity 238
8.1 Biogeography of rain forests 239
8.2 Vegetation structure of tropical rain forests 242
8.3 Phenology and reproduction of tropical forest trees 245
8.4 Life-form concept of plants 247
8.5 Rain-forest animals 248
8.6 Convergent evolution 248
8.7 Plant–animal interactions 249
8.8 Co-evolution 253
8.9 Productivity and nutrient cycling in forests 254
8.10 Micro-climates and resource acquisition 256
8.11 Biological diversity 257
8.12 Why are rain forests so diverse? 262
8.13 Latitudinal gradients and species diversity 262
8.14 Gap theory 264
8.15 Patch dynamics 266
8.16 Tropical deciduous forests and ecotones 269
8.17 Low-diversity tropical rain forests 270
8.18 Deforestation and the loss of biodiversity 270
8.19 Rain-forest conservation 273
8.20 Chapter summary 278
Chapter 9 Mountains, zonation and community gradients 280
9.1 Tropical mountains 280
9.2 Zonation on tropical mountains 280
9.3 Vegetation zonation on Mount Wilhelm, Papua NewGuinea 281
9.4 Altitude zonation in Venezuela 287
9.5 Plant and animal ecophysiology: examples from MountKenya 289
9.6 Mountain zonation 294
9.7 Variation in plant and animal communities 296
9.8 Chapter summary 298
CONTENTS ix

Chapter 10 Mangroves, seagrasses and decomposition 299
10.1 Mangroves of Australia and New Guinea 301
10.2 Ecological adaptations of mangroves 302
10.3 Mangrove animals 306
10.4 Mangrove productivity 309
10.5 Seagrasses 310
10.6 Coastal vegetation and organic matter export 311
10.7 Decomposition 313
10.8 Decomposition rates and environmental factors 315
10.9 Detritus food chains 316
10.10 Decomposition in other tropical systems 317
10.11 Coastal zone management 318
10.12 Chapter summary 318
Chapter 11 Coral reefs and community ecology 320
11.1 Coral reef communities 320
11.2 Coral biology 322
11.3 Coral reefs 329
11.4 Coral reef algae 332
11.5 Coral reef herbivores 332
11.6 Coral reef biogeography and biodiversity 336
11.7 Community ecology 339
11.8 Coral reef management and conservation 344
11.9 Chapter summary 348
Chapter 12 Isolated habitats and biogeography: islands inthe sea, air and land 349
12.1 Island ecosystems 349
12.2 Krakatau 349
12.3 Dispersal 352
12.4 Colonisation and community assembly 356
12.5 Island biogeography 358
12.6 Speciation 363
12.7 Extinction 368
12.8 Exotic species on islands 370
12.9 Chapter summary 372
Chapter 13 Cities and human ecology 373
13.1 Jakarta, Indonesia 373
13.2 Evolution of human societies 375
13.3 World population growth 377
13.4 Food production 382
13.5 Industrialisation, natural resource use and pollution 388
13.6 Human population growth: consequences and solutions 391
13.7 Conclusions 395
13.8 Chapter summary 395
x CONTENTS

Chapter 14 Global ecology: biodiversity conservation,climate change and sustainable development 397
14.1 Temperate and tropical environments 397
14.2 Biodiversity loss 398
14.3 Biodiversity conservation 399
14.4 Global climate change 404
14.5 Sustainable development 409
14.6 Conclusions 410
14.7 Chapter summary 410
Glossary 411
References 425
Index 442
CONTENTS xi

1.1 The tropics
The tropics may be defined as that portion of theearth situated between the Tropics of Cancer (23°289N) and Capricorn (23° 289S). This area includesabout 50 million km2 of land, with almost half ofit in Africa. Other substantial portions lie inCentral and South America, southern Asia, north-ern Australia, with smaller areas in the PacificIslands. Plant and animal distributions, however,are not constrained by these lines on the globe butare determined by variations in climate, soil typeand other features of the environment. However, itis interesting that the distributions of tropical rainforests, mangroves and coral reefs do fall largelybetween these lines (Figures 8.2, 10.2 and 11.10).Therefore, it is appropriate to use the Tropics ofCancer and Capricorn as guides to the parts of theearth described in this book even though the dis-tribution of tropical plants and animals may not,in some places, extend as far as these lines or, inothers, extend north or south of them.
In 1855, Alphonse de Candolle proposed thatthe boundaries to major plant formations wereset by climate. He suggested that the limits todeserts and grasslands were set by moisture, butthat the latitudinal arrangement of the otherplant formations suggested that temperature wasthe dominant factor. Köppen (1884, 1931) devel-oped climate maps based on vegetation types. Inthis way, he was able to produce a climate map ofthe world even though he had very little climaticdata from many parts of it. He assigned to eachplant formation the climate that seemed appro-
priate to it. Since his climate map was based onthe global distribution of vegetation types, it isnot surprising that climate and vegetation mapswere similar.
It has subsequently been shown, using inde-pendent measures, that the distribution of theworld’s climatic regions are indeed closely relatedto vegetation and that Köppen’s vegetation-derived climate map has been verified through cli-matic measures. Figures 1.1 and 1.2 show therelationship between rainfall and vegetation inAfrica. Clearly climate plays a major role in deter-mining the global distribution of plants andanimals. An explanation of plant and animal dis-tributions also requires an understanding of thetheory of plate tectonics. In this chapter, wedescribe climate in the tropics and the theory ofplate tectonics and their role in determining theglobal distribution of plants and animals.
1.2 Climate in the tropics
Climatic variations are largely determined by lat-itude and altitude. In concentrating on tropicallatitudes, we have narrowed the latitudinal rangebut significant climatic shifts can still be relatedto geographical position. The major climaticfactors are temperature (daily and seasonal varia-tions) and rainfall (total rainfall and its seasonaldistribution).
1.2.1 TemperatureIn contrast to temperate regions of the earth, themost significant climatic feature of the tropics at
Chapter 1
The tropical environment

sea level is the absence of a cold season. The meanannual temperature at sea level usually exceeds18°C and seasonal fluctuations in temperatureand daily solar radiation are small (Table 1.1).Consequently, seasonality in temperature has lesseffect on biological activity in the tropics than ithas in temperate regions. At higher altitudes inthe tropics, diurnal temperature fluctuations canbe significant: high during the day and down to,or below, freezing at night (see chapter 9).
Temperatures on the earth’s surface follow
daily and seasonal cycles; daily because the earthrotates on its axis and seasonal because theearth’s axis of rotation is not at right angles to theline joining the earth and sun (Figure 1.3). If itwere at right angles, the sun would be overhead atthe equator every noon throughout the year.As the earth is tilted, the noon position of thesun moves progressively north after 21 March(equinox) and at noon on 21 June (summer sol-stice) it is directly overhead the Tropic of Cancer.The sun then appears to move south, crossing theequator on 23 September (equinox) to be directlyover the Tropic of Capricorn at noon on 22December (winter solstice). The solstices are
2 THE TROPICAL ENVIRONMENT
Figure 1.1. Distribution of total annual rainfall in Africa(after Pomeroy and Service 1986 reprinted by permission ofPearson Education Limited, Longman Group Limited).

named after the prevailing season in the northernhemisphere. After 21 December, the sun appearsto move north again and is directly over theequator at noon on 21 March.
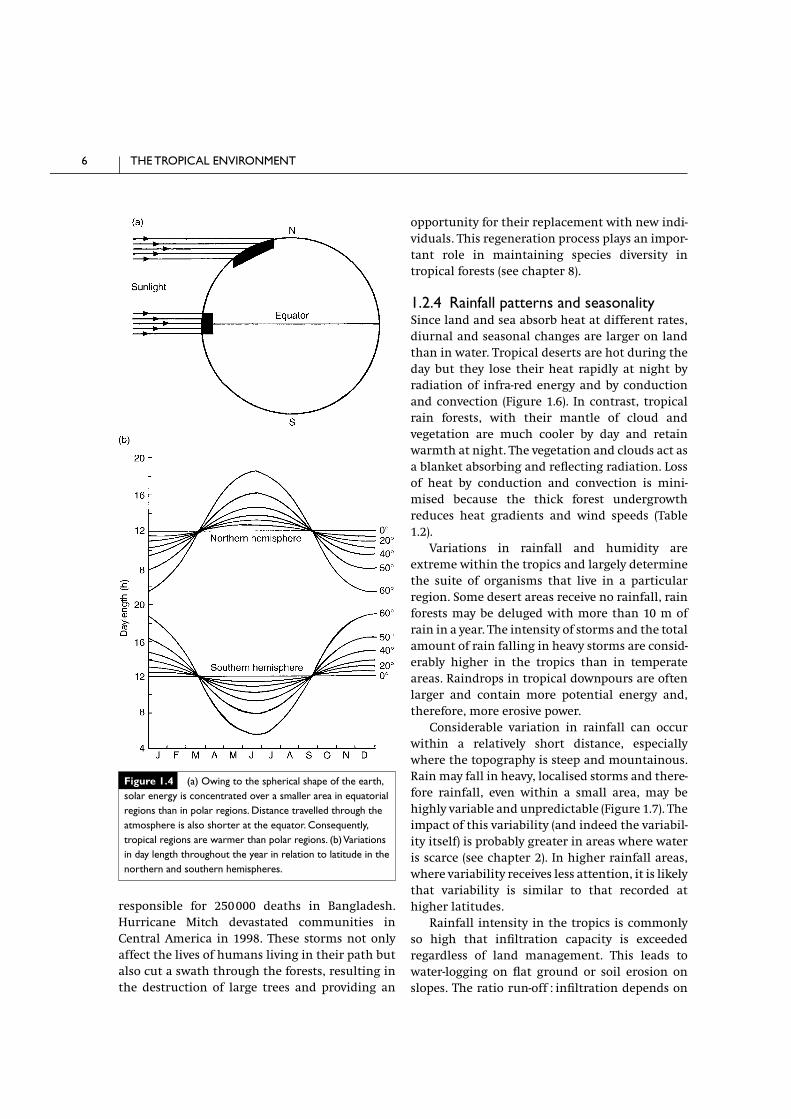
The tropics are hotter than temperate regionsbecause the sun’s rays strike almost at rightangles near the equator but at an increasinglyacute angle towards the poles. Therefore the sameamount of radiant heat is concentrated over asmaller area in the tropics than it is nearer the
poles (Figure 1.4a). Moreover, near the poles thesun’s rays have to pass through a deeper layer ofatmosphere and lose more energy by absorption,reflection and scattering. Day-length changes atlatitudes away from the equator partially com-pensate for the reduced heat input (Figure 1.4b),but total annual insolation is still lower at higherlatitudes.
As a result of the variations in energy supplywith latitude, lower latitudes have more heat,delivered at a more constant rate than higher lat-itudes. There is a mass transfer of heat away fromthe equator, towards the poles. This transferoccurs in both the oceans and the atmosphere.
CLIMATE IN THE TROPICS 3
Figure 1.2. Distribution of the main types of vegetation inAfrica. Note the relationship between the distribution ofrainfall (Figure 1.1) and vegetation type (after Ewer and Hall1978).

Oceanic heat transfer is significant since the heatcapacity of water (see Box 2.1) is high, but heattransfer through the atmosphere is more rapidand is mostly responsible for the climatic shiftswe observe on a daily basis.
1.2.2 The inter-tropical convergence zoneand rainfall
The concentration of radiant heat above theequator warms the air and it expands and rises. Asit rises, the air cools and, since cold air holds lessmoisture, rain falls. The air near the ground isreplaced by air from the north and south. Therising air spreads out and falls again at about30°N and S (see Figure 2.2). In this region, cool,dry air warms as it falls to earth and this explainswhy deserts are often found at these latitudes(chapter 2).
The rotation of the earth results in the deflec-tion of these northerly and southerly winds sothat they blow from the north-east (northernhemisphere) and south-east (southern hemi-sphere) respectively. This deflection is caused bythe Coriolis force. The earth rotates from west toeast. At the equator, the rate of rotation is fasterthan it is either to the north or south, since, at theequator, the earth’s surface is furthest from theaxis of rotation. This force causes oceanic andatmospheric currents to be deflected to the rightin the northern hemisphere and to the left in thesouthern hemisphere.
These winds (north-east (northern hemi-
sphere) and south-east (southern hemisphere)) areknown as trade winds (they powered the sailingships that plied the trade between the Orient andEurope) and are renowned for their consistentspeed and direction. These winds meet in an equa-torial low-pressure trough, warm air ascends andprecipitation results. This zone, the Inter-Tropical Convergence Zone (ITCZ), is wheremixing of trade winds from the northern andsouthern hemispheres often results in zones oflow atmospheric pressure (depressions) orcyclones.
The ITCZ is not a continuous feature in eithertime or space. The ITCZ moves north ofthe equator during the northern summer(June–August) bringing rain to the underlyingregions. At the end of the northern summer, theITCZ migrates south of the equator and theseregions have a wet season between November andJanuary. Equatorial regions exhibit a bimodalrainfall pattern, with peak rainfall occurring eachtime the ITCZ crosses the equator. In other words,there is a seasonal migration of a rain belt thatfollows the seasonal movement of the sun. At thehigher tropical latitudes, a single rainy seasonoccurs following the summer solstice in eachhemisphere. Two peaks in the mean annual rain-fall are recorded at sites near the equator inresponse to the passage of the overhead sun at theequinoxes. There are days when ITCZ-generatedcloud stretches in an almost unbroken bandaround the globe, but it is often broken into strips
4 THE TROPICAL ENVIRONMENT
Daily max Daily minLatitude J cm22 d21 J cm22 d21 Maximum/minimum [(Max2Min)3100]/Min
0° 3890 3430 1.13 13.410°N 3786 3180 1.19 19.123°N 4100 2552 1.61 60.750°N 4309 878 4.90 390.5
Notes: Note that, at the equator, the annual maximum solar radiation is only 13% higher than the minimum. This percentage
increases sharply outside the tropics and reaches almost 400% at 50°N and S.
Source: List 1971.
Table 1.1 Annual range of daily solar radiation at the top of the atmosphere at tropical and temperatelatitudes.

and may disappear entirely. The mean position ofthe ITCZ in January and July is shown in Figure1.5.
1.2.3 Monsoons, typhoons and tropicalstorms
To the north and south of the trade winds, beyond40 degrees, lie the westerlies. The equatorial west-erlies are responsible for the monsoons that occurover West Africa and the Indian subcontinent
(Figure 1.5). Land masses heat more rapidly duringsummer than do the adjacent oceans and, con-versely, the land cools more rapidly following theonset of winter. These differential rates of heatingand cooling cause seasonal switches in winds.From May to October, air rises over the warmAsian interior and draws in moisture-laden airfrom the Indian Ocean over the Indian sub-continent (south-west monsoon) and air drawnfrom the Pacific flows over Asia (south-eastmonsoon). From November to April, air sinks overthe cold Asian interior resulting in the north-eastmonsoons. Monsoons also occur in northernAustralia and West Africa.
Air converging upon a low-pressure cell(cyclone) rises, the air cools, clouds form and rainfalls. This contrasts with the warming and dryingthat occurs in a high-pressure cell (anticyclone).In the tropics, cyclones may form a rotating stormknown as a hurricane or typhoon. These stormscan be devastating, causing flooding in coastalareas through storm surges and torrential rains.High wind speeds wreak further havoc. In 1991,a typhoon struck the Bay of Bengal and was
CLIMATE IN THE TROPICS 5
Figure 1.3. Rotation of the earth around the sun.The axisof rotation is tilted at 23°28′ from the vertical. At thesummer solstice (northern hemisphere summer) the sun isoverhead at midday at the Tropic of Cancer. At this time ofthe year, above the Arctic circle, the sun does not set andbelow the Antarctic circle the sun does not rise. At thewinter solstice (northern hemisphere winter), the sun isoverhead at midday at the Tropic of Capricorn. At this timeof the year, above the Arctic circle, the sun does not rise andbelow the Antarctic circle the sun does not set. At theautumnal (23 September) and vernal (21 March) equinoxesthe sun is directly over the equator at midday (after Pomeroyand Service 1986 reprinted by permission of PearsonEducation Limited, Longman Group Limited).
responsible for 250000 deaths in Bangladesh.Hurricane Mitch devastated communities inCentral America in 1998. These storms not onlyaffect the lives of humans living in their path butalso cut a swath through the forests, resulting inthe destruction of large trees and providing an
opportunity for their replacement with new indi-viduals. This regeneration process plays an impor-tant role in maintaining species diversity intropical forests (see chapter 8).
1.2.4 Rainfall patterns and seasonalitySince land and sea absorb heat at different rates,diurnal and seasonal changes are larger on landthan in water. Tropical deserts are hot during theday but they lose their heat rapidly at night byradiation of infra-red energy and by conductionand convection (Figure 1.6). In contrast, tropicalrain forests, with their mantle of cloud andvegetation are much cooler by day and retainwarmth at night. The vegetation and clouds act asa blanket absorbing and reflecting radiation. Lossof heat by conduction and convection is mini-mised because the thick forest undergrowthreduces heat gradients and wind speeds (Table1.2).
Variations in rainfall and humidity areextreme within the tropics and largely determinethe suite of organisms that live in a particularregion. Some desert areas receive no rainfall, rainforests may be deluged with more than 10 m ofrain in a year. The intensity of storms and the totalamount of rain falling in heavy storms are consid-erably higher in the tropics than in temperateareas. Raindrops in tropical downpours are oftenlarger and contain more potential energy and,therefore, more erosive power.
Considerable variation in rainfall can occurwithin a relatively short distance, especiallywhere the topography is steep and mountainous.Rain may fall in heavy, localised storms and there-fore rainfall, even within a small area, may behighly variable and unpredictable (Figure 1.7). Theimpact of this variability (and indeed the variabil-ity itself) is probably greater in areas where wateris scarce (see chapter 2). In higher rainfall areas,where variability receives less attention, it is likelythat variability is similar to that recorded athigher latitudes.
Rainfall intensity in the tropics is commonlyso high that infiltration capacity is exceededregardless of land management. This leads towater-logging on flat ground or soil erosion onslopes. The ratio run-off : infiltration depends on
6 THE TROPICAL ENVIRONMENT
Figure 1.4. (a) Owing to the spherical shape of the earth,solar energy is concentrated over a smaller area in equatorialregions than in polar regions. Distance travelled through theatmosphere is also shorter at the equator. Consequently,tropical regions are warmer than polar regions. (b) Variationsin day length throughout the year in relation to latitude in thenorthern and southern hemispheres.

the rate of precipitation (drizzle or downpour),vegetation cover, soil porosity, litter cover andorganic matter content of the soil, soil moisturelevel and topography.
The decrease in mean annual rainfall atincreasing distances from the equator is accom-panied by increasing seasonality. The increase inseasonality is linked even more closely with the
magnitude of change in day length with increas-ing latitude (Figure 1.4b). In temperate regions,day length plays a key role in providing organismswith a biological clock. However, within thetropics, seasonality in rainfall has greater impacton the life of tropical organisms. Germination,flowering and fruiting in tropical plants andbreeding, feeding and life history strategies intropical animals are markedly affected by rainfall.
Seasonal movements of animals (migration)are often made in response to food supply which,in turn, fluctuates in abundance with rainfall. Theinfluence of environmental factors on organisms
CLIMATE IN THE TROPICS 7
Figure 1.5. Mean surface winds over the earth in (a)January and (b) July showing the approximate position of theInter-Tropical Convergence Zone (dashed line) (after Whiteet al. 1993 with kind permission from Kluwer AcademicPublishers).

8 THE TROPICAL ENVIRONMENT
Figure 1.6. Diurnal variations in air and soil surfacetemperature and humidity recorded in September at WadiHalfa, Sudan (after Cloudsley-Thompson and Chadwick1964).
Dry Wetseason season
Sampling height (m) 0.7 24.0 0.7 24.0Mean maximum (°C) 29.7 33.9 26.8 30.9Daily range 5.8 9.9 5.5 9.2
Source: Richards 1952.
Table 1.2 Mean maximum temperatures anddaily temperature range at two heightsabove the ground in tropical rainforest
Figure 1.7. Localised rainfall on the Chilwa Plain, Malawi(Photo: Patrick Osborne).

and their populations will be discussed in chap-ters 2, 3 and 4. An important general differencebetween tropical and temperate environments isthat the wet tropics have seasonal rainfall andnear constant temperatures, whereas, in temper-ate areas, rainfall varies less during the year buttemperature is markedly seasonal. Climate dia-grams provide a convenient way to display tem-perature and rainfall patterns, and constructionand interpretation of these diagrams is describedbelow.
1.2.5 Climate diagramsA good, comparative way of presenting climaticdata is through climate diagrams developed byWalter and Leith (1967). In these figures, seasonalvariations in temperature and rainfall are plottedon one diagram (Figure 1.8). The lower curveshows the mean monthly temperature (10°Cintervals on the y-axis); the upper curve presentsmean monthly rainfall (20 mm intervals on they-axis, except where rainfall exceeds 100mmwhen the scale is reduced by 10:1). The area underthis reduced scale is conventionally shaded blackto indicate very wet periods. The reduced scaleserves to keep the diagrams to a manageable size.Periods in which the curve for rainfall falls belowthat for temperature indicate arid months.
Another important convention in drawingthese diagrams is that data from the northernhemisphere are plotted from January toDecember, those from the southern hemisphereare plotted from July to June. This facilitates visualcomparison of diagrams from opposite sides ofthe equator (Figure 1.9). These diagrams are com-piled from mean values and therefore do notprovide information on interannual or diurnalvariations.
1.2.6 World distribution of tropicalclimates
Climate not only varies spatially and seasonallybut variations also occur from one year to thenext. We are gradually beginning to understandsome of these variations between years, andsignificant progress has been made in docu-menting and predicting the occurrence of oneprocess which has world-wide impact. In the
1920s, attention was drawn to an oscillation inatmospheric pressure between the east and westsides of the Pacific Ocean. This phenomenon wascalled the Southern Oscillation (SO). It has nowbeen shown that the SO is related to variations inrainfall and sea surface temperatures in the equa-torial eastern Pacific. The irregular occurrence ofwarmer than usual water off the Peruvian coasthas been known there a long time and is locallycalled El Niño. Under normal conditions, thewinds and ocean currents of the tropical Pacifictravel from east to west, producing a large reser-voir of warm water around Indonesia. El Niño is areversal of winds and ocean currents across thePacific that usually lasts for a year or two, andoccurs typically every four to five years. Recent El
CLIMATE IN THE TROPICS 9
Figure 1.8. Example of a climate diagram for Lomie inCameroon.The symbols and figures on the diagram have thefollowing meaning: (a) station name; (b) station altitude;(c) number of years of observations (first figure:temperature; second figure: rainfall); (d) mean annualtemperature; (e) mean annual rainfall mm; (f) mean dailyminimum of coldest month; (g) lowest temperature recorded;(h) mean daily maximum of warmest month; (i) maximumtemperature recorded; (j) mean daily temperature range; (k)graph of monthly mean temperatures (scale divisions are10°C); (l) graph of monthly mean rainfall (scale divisions are20 mm); (m) drought period; (n) humid period; (o) monthlyrainfall greater than 100 mm (scale 1/10 that of rainfall) (afterWalter 1971 with kind permission from Gustav FischerVerlag, Stuttgart 1991 © Spektrum Akademischer Verlag,Heidelberg, Berlin).

Niño Southern Oscillation (ENSO) events haveoccurred in 1972–73, 1976–77, 1982–83, 1992–93and 1997–98. The impact of these ENSO events isof global significance with common featuresincluding droughts in southern Africa, easternAustralia and Brazil, forest fires in Indonesia,storms and wet weather along the American coast
from Alaska to Peru and warmer winters in theAmerican mid-west.
The 1982–83 ENSO was one of the strongestthis century and regions as far apart as Australia,the Philippines, southern India and southernAfrica suffered severe droughts. In EastKalimantan, the impact of the drought was exac-erbated when some 3.5 million hectares of forestwere destroyed by fires. In both 1991–92 and1997–98, El Niño struck again with floods,famines and forest fires occurring in regions
10 THE TROPICAL ENVIRONMENT
Figure 1.9. Homoclimes of desert, savanna and rain forestregions in Africa, Australia, South-East Asia and SouthAmerica (after Walter and Leith 1967 with kind permissionfrom Urban and Fischer Verlag).