ecoevo 3rd by urabe
TRANSCRIPT

8/10/2019 EcoEvo 3rd by Urabe
http://slidepdf.com/reader/full/ecoevo-3rd-by-urabe 1/52
A little advanced Ecology
Ecological Stoichiometryand
Environmental Changes
6 Nov. 2012 Ecology and Evoliution3rd
8/10/2019 EcoEvo 3rd by Urabe
http://slidepdf.com/reader/full/ecoevo-3rd-by-urabe 2/52
Today’s outline
1. Ecological Stoichiometry
2. Light & Nutrient balance
Theory/lab & eld experiments
3. CO2 and herbivore growth
4. Function of algal diversity

8/10/2019 EcoEvo 3rd by Urabe
http://slidepdf.com/reader/full/ecoevo-3rd-by-urabe 3/52
6
Nutrients
Producers
Grazing food web
Detrital food web
Detritus
Light ! energy "
CO2
N, P
8/10/2019 EcoEvo 3rd by Urabe
http://slidepdf.com/reader/full/ecoevo-3rd-by-urabe 4/52
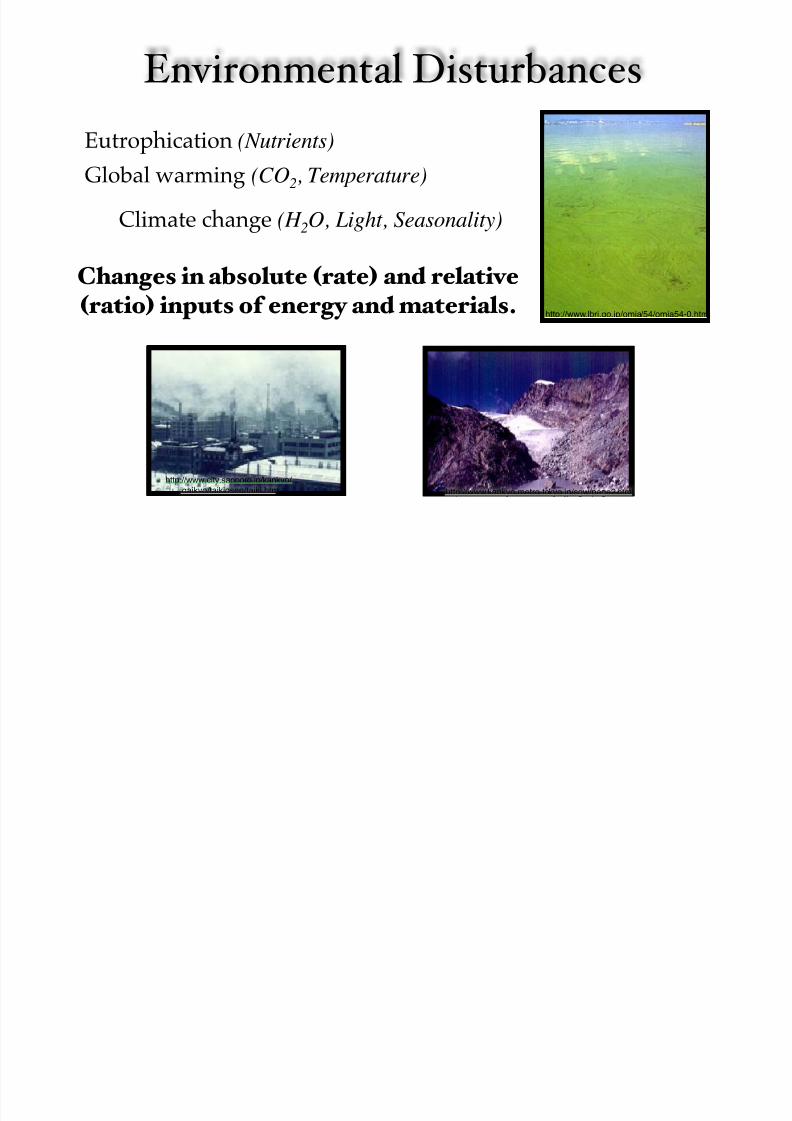
Environmental Disturbances
http://www.lbri.go.jp/omia/54/omia54-0.htm
http://www.city.sapporo.jp/kankyo/
gaikyo/taikiosen/taiki.htm
Changes in absolute ! rate " and relative
! ratio " inputs of energy and materials.
http://www.kankyo.metro.tokyo.jp/sgw/page2.html
Eutrophication (Nutrients)
Global warming (CO 2, Temperature)
Climate change (H 2O, Light, Seasonality)

8/10/2019 EcoEvo 3rd by Urabe
http://slidepdf.com/reader/full/ecoevo-3rd-by-urabe 5/52
Stoichiometry? Numerical relationship in elements between
substrates and products of chemical reactions
An example from chemistry:6CO 2 + 6H 2O→ C6H12 O6 + 6O 2
Each side has 6 Cs, 12 Hs and 18 Os
photosynthesis

8/10/2019 EcoEvo 3rd by Urabe
http://slidepdf.com/reader/full/ecoevo-3rd-by-urabe 6/52
Ecological
Stoichiometry?
Prey-predator interactions(CX,P Y)Predator + (C
A,P B)Prey
→ Q(C X,P
Y) Predator + (C a ,P b)Waste
Y+B=QY+b
It examines how balance of elements inorganisms shapes ecological processes
Sterner & Elser (202) Ecological Stoichiometry, Princeton Univ

8/10/2019 EcoEvo 3rd by Urabe
http://slidepdf.com/reader/full/ecoevo-3rd-by-urabe 7/52

8/10/2019 EcoEvo 3rd by Urabe
http://slidepdf.com/reader/full/ecoevo-3rd-by-urabe 8/52
https://reader010.{domain}/reader010/html5/0609/5b1b590f70281/5b1b591a

8/10/2019 EcoEvo 3rd by Urabe
http://slidepdf.com/reader/full/ecoevo-3rd-by-urabe 9/52
! Ribosome: organelles where Proteins are synthesized ! Cell with rich Ribosome high protein synthesis rate ! Thus, P-rich cells are high in activity for material production
! Heterotrophs with rich P is higher in their growth rate
http://www.hr-online.de/fs/schulfernsehen/genzeit.html

8/10/2019 EcoEvo 3rd by Urabe
http://slidepdf.com/reader/full/ecoevo-3rd-by-urabe 10/52
Comparison among various animals and bacteria
RNA and animal growth rate

8/10/2019 EcoEvo 3rd by Urabe
http://slidepdf.com/reader/full/ecoevo-3rd-by-urabe 11/52
Plant !Algae " Stoichiometry
C 6H 12O 6
6O2P, N
C 106N 16P 1
6CO2
6H2O C 6H 12O 6
6O2P, N
C 600N30P1
6CO2
6H2O C6H12O6
6O2 P, N
C 106N16P 1
Favorable
Nutrientdecient
Lightdecient
6CO2
6H2O
Redeld ratio
Redeld ratio
C-rich cells
8/10/2019 EcoEvo 3rd by Urabe
http://slidepdf.com/reader/full/ecoevo-3rd-by-urabe 12/52

8/10/2019 EcoEvo 3rd by Urabe
http://slidepdf.com/reader/full/ecoevo-3rd-by-urabe 13/52
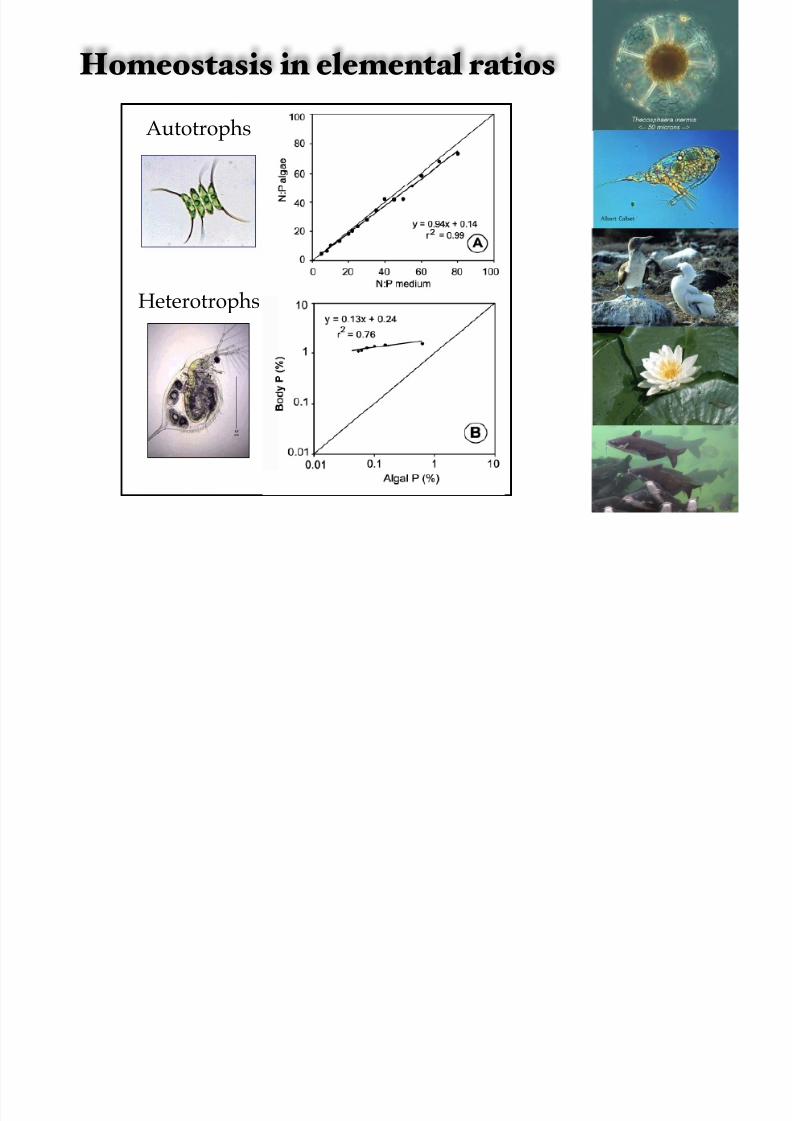
Autotrophs
Heterotrophs
Homeostasis in elemental ratios

8/10/2019 EcoEvo 3rd by Urabe
http://slidepdf.com/reader/full/ecoevo-3rd-by-urabe 14/52
Homeostasis 100
10
1 1 10 100 0.0001 0.001 0.01 0.1 1
1
0.1
0.01
0.001
0.0001
0.01 0.1 1 10
10
1
0.1
0.01 1 10
10
1
N : P a l g a e
N:P medium
C:N substrate
C : N b a c t e r i a
N:C medium
N : C
F u n g u s
D a p h n
i a P %
Algal P%
8/10/2019 EcoEvo 3rd by Urabe
http://slidepdf.com/reader/full/ecoevo-3rd-by-urabe 15/52
Algae Herbivorous [ Daphnia ]
CP
C P P
PC
CP
Variable P:C organisms High P:C organisms
Algae !Herbivore Stoichiometry
29
C

8/10/2019 EcoEvo 3rd by Urabe
http://slidepdf.com/reader/full/ecoevo-3rd-by-urabe 16/52
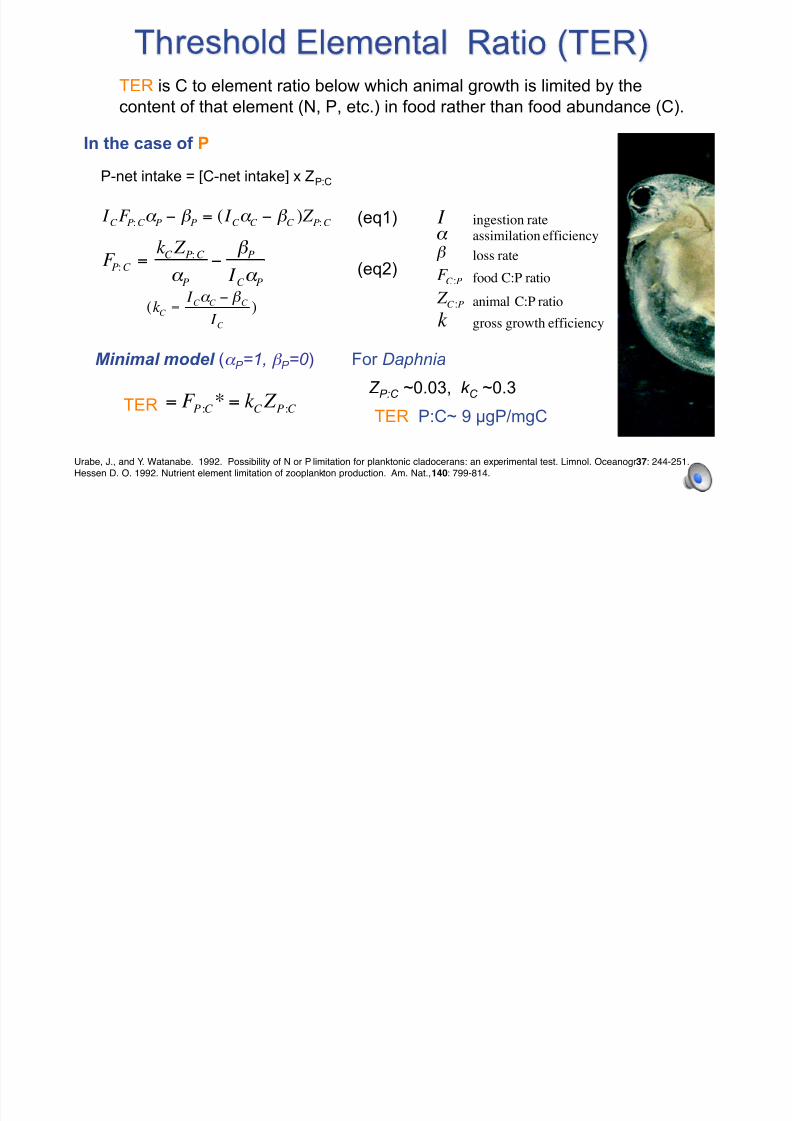
TER is C to element ratio below which animal growth is limited by thecontent of that element (N, P, etc.) in food rather than food abundance (C).
P-net intake = [C-net intake] x Z P:C
In the case of P
I ingestion rate
" assimilation efficiency
# loss rate F
C : P food C:P ratio
Z
C : P animal C:P ratio
k gross growth efficiency
Minimal model (! P =1, " P =0 )
= F P :C
* = k C
Z P :C TER
For Daphnia
Z P:C ~0.03, k C ~0.3TER P:C~ 9 ! gP/mgC
Urabe, J., and Y. Watanabe. 1992. Possibility of N or P limitation for planktonic cladocerans: an experimental test. Limnol. Oceanogr 37 : 244-251. Hessen D. O. 1992. Nutrient element limitation of zooplankton production. Am. Nat., 140 : 799-814.
F P : C =
k C
Z P : C
" P
# $ P I C " P
( k C
=
I C " C
# $ C
I C
)
I C
F P : C " P
# $ P = ( I C " C # $ C ) Z
P : C (eq1)
(eq2)

8/10/2019 EcoEvo 3rd by Urabe
http://slidepdf.com/reader/full/ecoevo-3rd-by-urabe 17/52
Urabe and Watanabe (1992) Limnology and Oceanography, 37 : 244-251
Threshold elemental ratio (TER) below which animal growth is limited by nutrientcontent (P, N) in food rather than food abundance (C)
For Daphnia TER P:C ~ 8.6 µg P/mgC or C:P ~300 atomic ratio
TER = Body P:C ratiox Gross Growth Efciency for C
Threshold Elemental Ratio
30
In the case of P Minimum model (! P =1, b P =0 )

8/10/2019 EcoEvo 3rd by Urabe
http://slidepdf.com/reader/full/ecoevo-3rd-by-urabe 18/52
Light!Nutrient Balance andHerbivore growth

8/10/2019 EcoEvo 3rd by Urabe
http://slidepdf.com/reader/full/ecoevo-3rd-by-urabe 19/52
Light intensity received each ask
PP
A theory
A l g a l A b u n d a n c e
( m g C / L )
Al g al P
: Cr a t i o
I n g e s t i o n r a t e
( C a r b o n / d a y )
Gr o w
t h r a t e
P
Light intensity received each ask
8/10/2019 EcoEvo 3rd by Urabe
http://slidepdf.com/reader/full/ecoevo-3rd-by-urabe 20/52
P
P
10 µM (high nutrient)
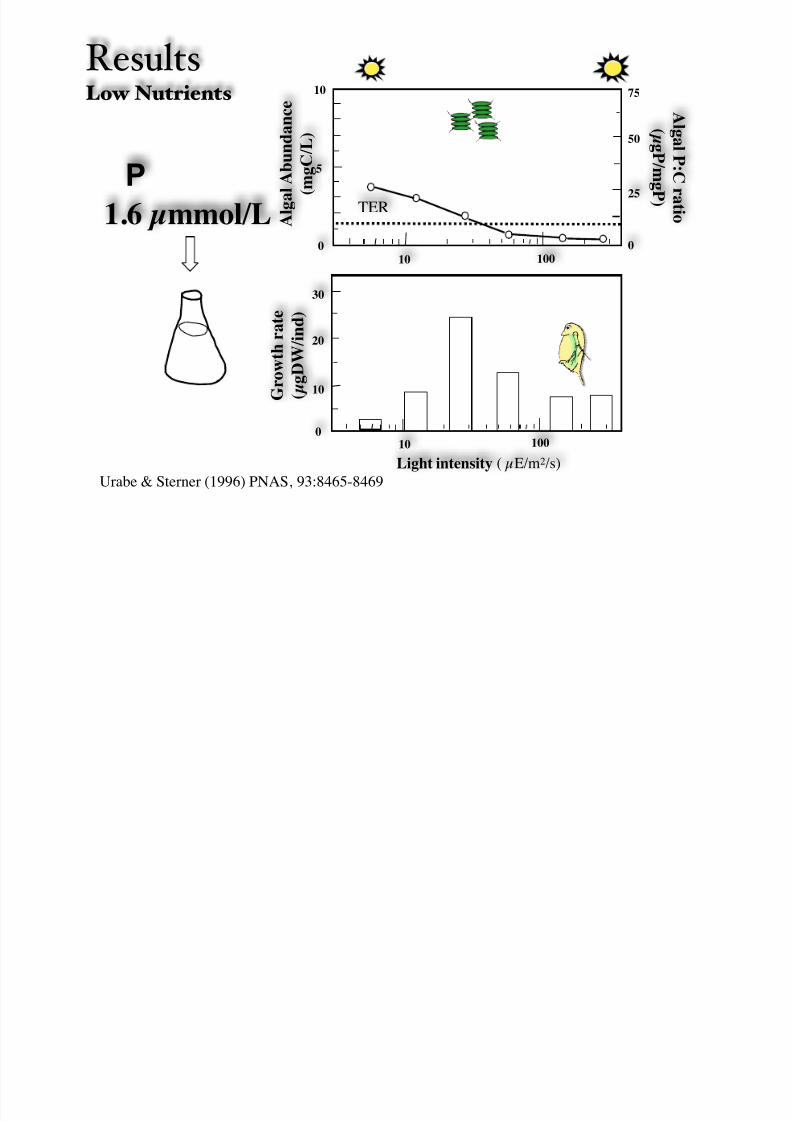
1.6 µM (low nutrient)
Low light High light
Low light High light
Experiment

8/10/2019 EcoEvo 3rd by Urabe
http://slidepdf.com/reader/full/ecoevo-3rd-by-urabe 21/52
0
5
10
0
25
50
75
20
30
10
0
P10 µmmol/L
10 100
10 100
Light intensity ( µE/m 2/s)
A l g a l A b u n d a n c e
( m g C / L )
Al g al P
: Cr a t i o
( µ gP / m gP )
G r o w t h r a t e
( µ g D W / i n d )
Results High Nutrients
TER
Urabe & Sterner (1996) PNAS, 93:8465-8469

8/10/2019 EcoEvo 3rd by Urabe
http://slidepdf.com/reader/full/ecoevo-3rd-by-urabe 22/52
0
5
10
0
25
50
75
20
30
10
0
10 100
10 100
Light intensity ( µE/m 2/s)
A l g a l A b u n d a n c e
( m g C / L )
Al g al P
: Cr a t i o
( µ gP / m gP )
G r o w t h r a t e
( µ g D W / i n d )
TER
Results Low Nutrients
Urabe & Sterner (1996) PNAS, 93:8465-8469
P
1.6 µmmol/L
8/10/2019 EcoEvo 3rd by Urabe
http://slidepdf.com/reader/full/ecoevo-3rd-by-urabe 23/52
In general…….Stephen Elser

8/10/2019 EcoEvo 3rd by Urabe
http://slidepdf.com/reader/full/ecoevo-3rd-by-urabe 24/52
I like ne weather, but if this makes my
food bad….

8/10/2019 EcoEvo 3rd by Urabe
http://slidepdf.com/reader/full/ecoevo-3rd-by-urabe 25/52
Background
The atmospheric CO 2 level is
expected to double or treble
by 2100 years.(IPCC 4th assessment report, 2007)

8/10/2019 EcoEvo 3rd by Urabe
http://slidepdf.com/reader/full/ecoevo-3rd-by-urabe 26/52
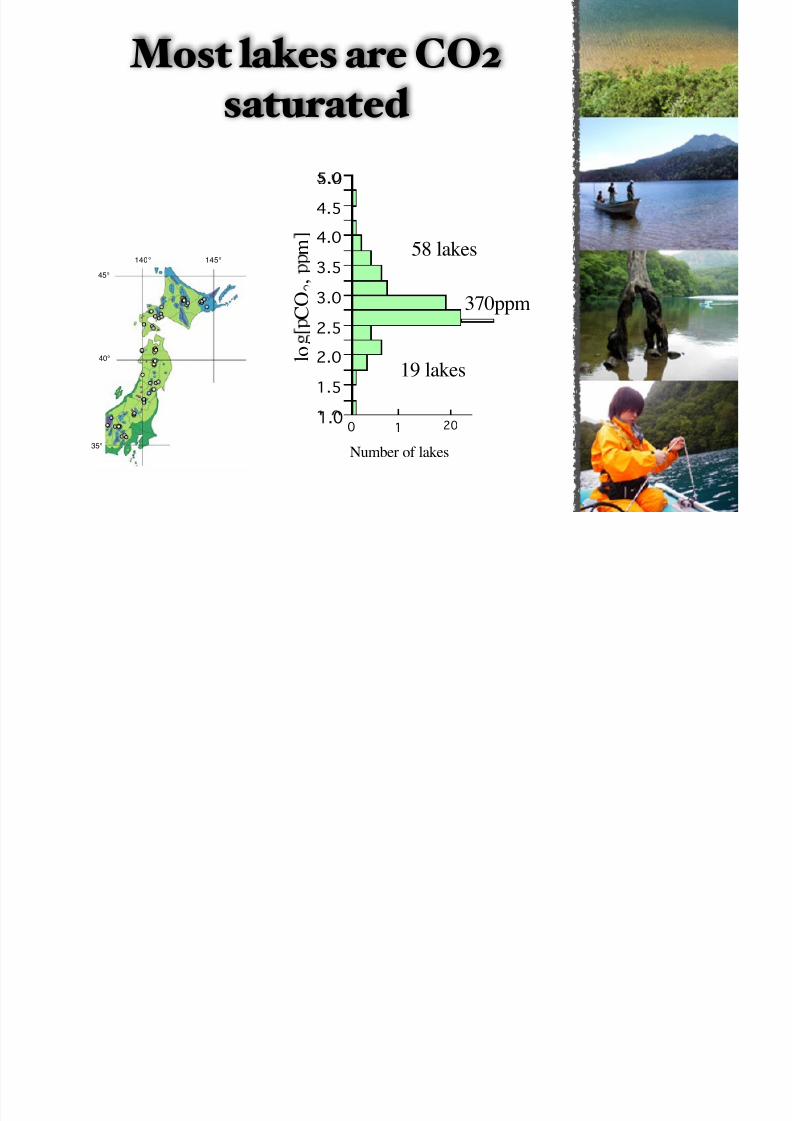
1.5
2.0
2.5
3.0
3.5
4.0
4.5
.5.0
1.0
370ppm
0 1 20
Number of lakes
19 lakes
58 lakes
l o
C O
,
m140° 145°
45°
40°
35°
Most lakes are CO2saturated
8/10/2019 EcoEvo 3rd by Urabe
http://slidepdf.com/reader/full/ecoevo-3rd-by-urabe 27/52
CO 2
DOC
DOC
CO 2
CO 2
Elevation of atmospheric CO2likely rises pCO2 in aquatics
much more via terrestrial input

8/10/2019 EcoEvo 3rd by Urabe
http://slidepdf.com/reader/full/ecoevo-3rd-by-urabe 28/52
Stoichiometric impactsof rising pCO2 on aplankton herbivore

8/10/2019 EcoEvo 3rd by Urabe
http://slidepdf.com/reader/full/ecoevo-3rd-by-urabe 29/52
A b u n d a n c e
days
Steady statebiomass
Exponentialgrowth rate
Daphnia growthex eriment
Body mass changes for 5 days
pCO 2; 360 ppm or 2000 ppmSemi-continuous culture (30% dilution per 2 days: 20°C) Nutrients: 1.5 µM P, N:P=80; Light: 150 µmoles m -2 s-1
Algae Scenedesmus (green algae)
Cyclotella (diatom)Synechococcus ( cyanobacteria)
Algal culture experiments

8/10/2019 EcoEvo 3rd by Urabe
http://slidepdf.com/reader/full/ecoevo-3rd-by-urabe 30/52
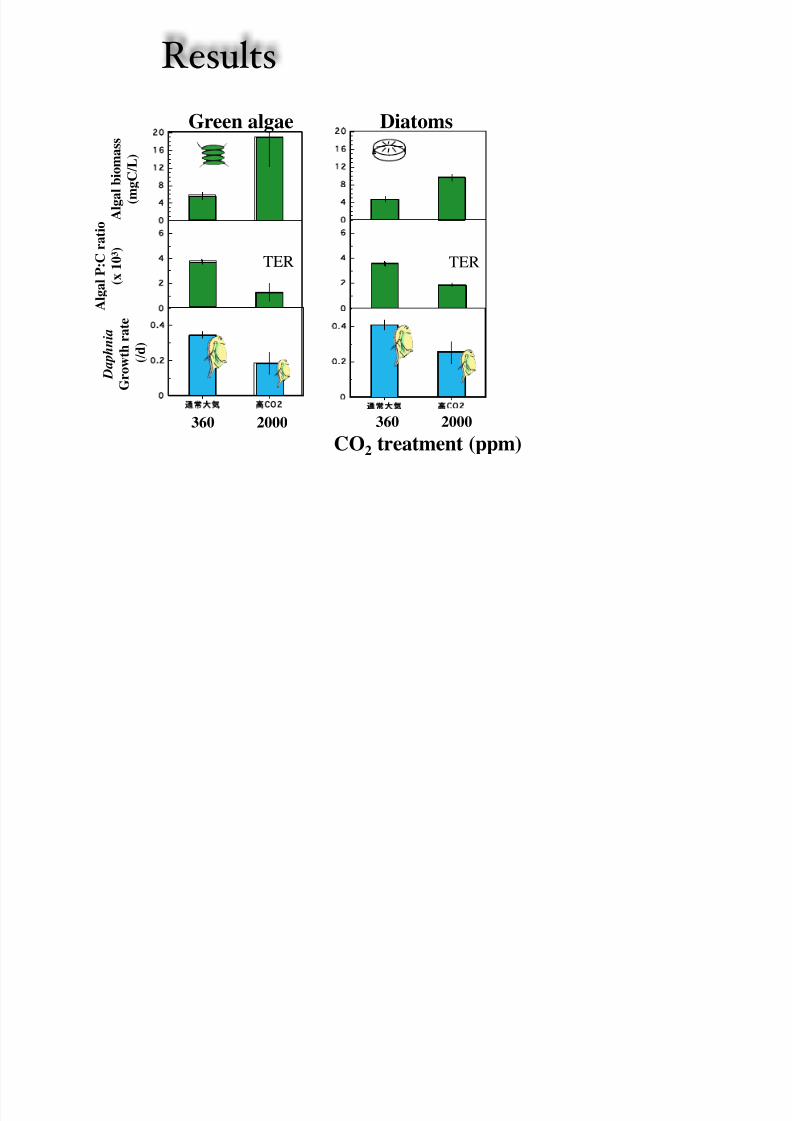
Results
Green algae Diatoms
4
8
2
6
2
CO2
2
4
6
CO2
2
4
CO2
4
8
2
6
2
CO2
2
4
6
CO2
2
4
CO2
A l g a l b i o m a s s
( m g C / L )
A l g a l P : C r a t i o
( x 1 0 3 )
D a p h n
i a
G r o w t h r a t e
( / d )
CO 2 treatment (ppm)360 2000 360 2000
TER TER
8/10/2019 EcoEvo 3rd by Urabe
http://slidepdf.com/reader/full/ecoevo-3rd-by-urabe 31/52
Results
Cyanobacteria
4
8
2
6
2
CO2
2
4
6
CO2
2
4
CO2
4
8
2
6
2
CO2
2
4
6
CO2
2
4
CO2
4
8
2
6
2
CO2
2
4
6
CO2
2
4
CO2
2/6 0/6n.s
n.s
n.s
A l g a l b i o m a s s
( m g C / L )
A l g a l P : C r a t i o
( x 1 0 3 )
D a p h n
i a
G r o w t h r a t e
( / d )
CO 2 treatment (ppm)360 2000 360 2000 360 2000
TER TER TER
Urabe et al (2003) GCB 9:818-825, Urabe & Waki (2009) GCB 15:523-531
Green algae Diatoms
8/10/2019 EcoEvo 3rd by Urabe
http://slidepdf.com/reader/full/ecoevo-3rd-by-urabe 32/52
A pitfall
Various algal species co-occur in nature.
Herbivore’s response may differ betweenfeeding on single algal species and
feeding on multiple algal species.
8/10/2019 EcoEvo 3rd by Urabe
http://slidepdf.com/reader/full/ecoevo-3rd-by-urabe 33/52
A b u n d a n c e
days
Steady statebiomass
Exponentialgrowth rate
Daphnia growthexperiment
Body mass changes for 5 days
pCO2; 360 ppm or 2000 ppm
Semi-continuous culture (30% dilution per 2 days: 20°C) Nutrients: 1.5 µM P, N:P=80; Light: 150 µmoles m -2 s-1
Algae Scenedesmus (green algae)
Cyclotella (diatom)Synechococcus ( cyanobacteria)
Mixed culture experiments
Mixed culture
48
8/10/2019 EcoEvo 3rd by Urabe
http://slidepdf.com/reader/full/ecoevo-3rd-by-urabe 34/52
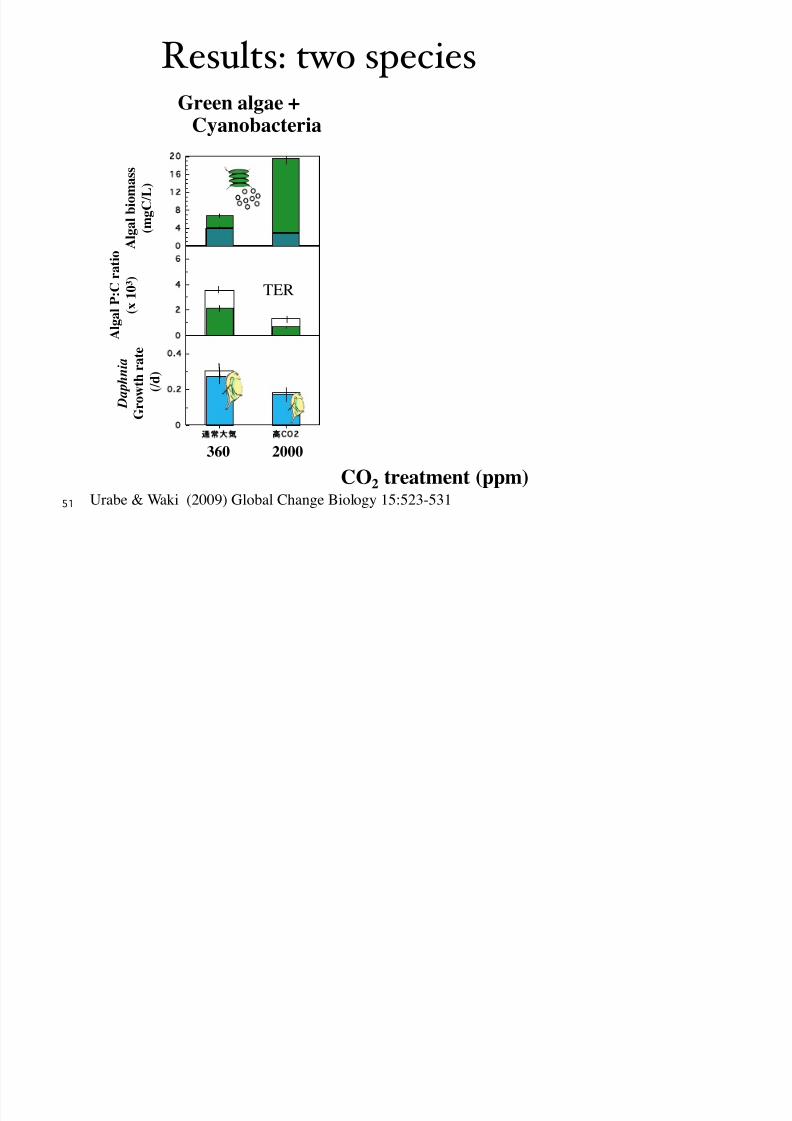
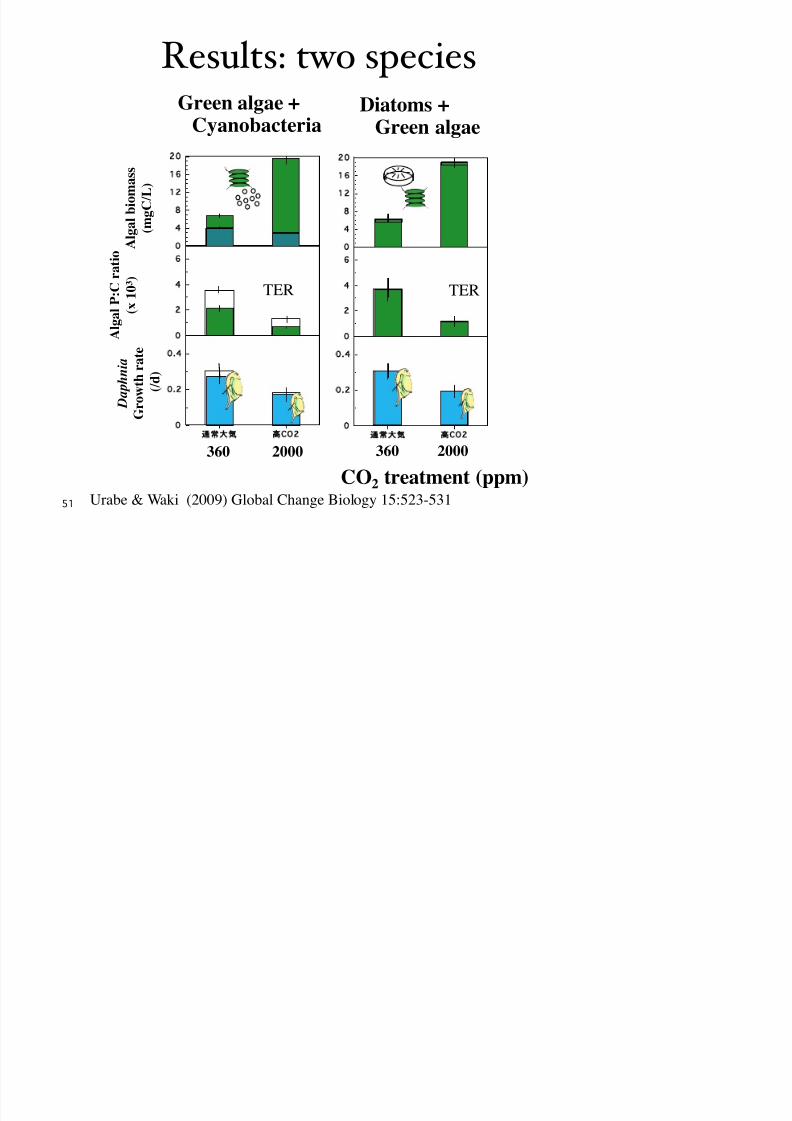
Results: two species
51
CO 2 treatment (ppm)
4
8
12
16
2
CO2
2
4
6
CO2
2
4
CO2
Green algae +
Cyanobacteria
A l g a l b i o m a s s
( m g C / L )
A l g a l P : C r a t i o
( x 1 0 3 )
D a p
h n
i a
G r o w t h r a t e
( / d )
360 2000
TER
Urabe & Waki (2009) Global Change Biology 15:523-531
8/10/2019 EcoEvo 3rd by Urabe
http://slidepdf.com/reader/full/ecoevo-3rd-by-urabe 35/52
Results: two species
51
CO 2 treatment (ppm)
4
8
12
16
2
CO2
2
4
6
CO2
2
4
CO2
A l g a l b i o m a s s
( m g C / L )
A l g a l P : C r a t i o
( x 1 0 3 )
D a p
h n
i a
G r o w t h r a t e
( / d )
360 2000
TER
4
8
12
16
2
CO2
2
4
6
CO2
2
4
CO2
Diatoms +
Green algae
360 2000
TER
Urabe & Waki (2009) Global Change Biology 15:523-531
Green algae +
Cyanobacteria
8/10/2019 EcoEvo 3rd by Urabe
http://slidepdf.com/reader/full/ecoevo-3rd-by-urabe 36/52
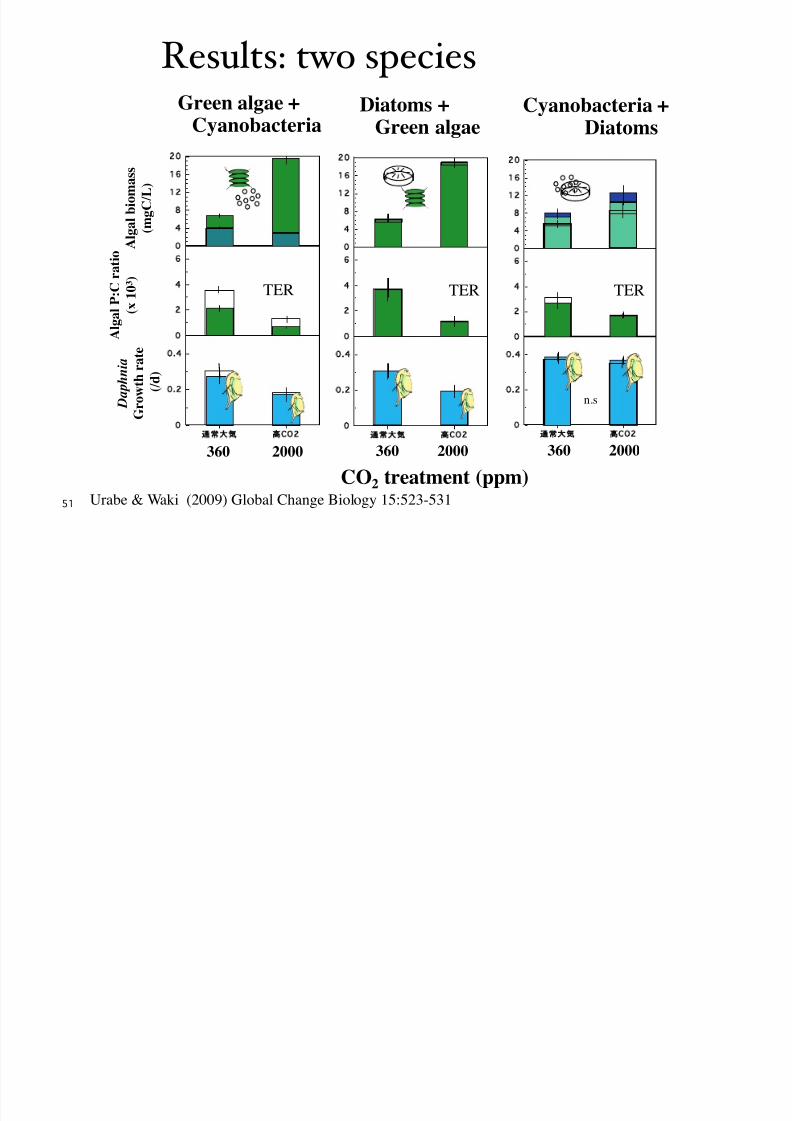
Results: two species
51
CO 2 treatment (ppm)
4
8
12
16
2
CO2
2
4
6
CO2
2
4
CO2
A l g a l b i o m a s s
( m g C / L )
A l g a l P : C r a t i o
( x 1 0 3 )
D a p
h n
i a
G r o w t h r a t e
( / d )
360 2000
TER
4
8
12
16
2
CO2
2
4
6
CO2
2
4
CO2
360 2000
TER
4
8
12
16
2
CO2
2
4
6
CO2
2
4
CO2
Cyanobacteria +
Diatoms
n.s
360 2000
TER
Urabe & Waki (2009) Global Change Biology 15:523-531
Green algae +
Cyanobacteria
Diatoms +
Green algae

8/10/2019 EcoEvo 3rd by Urabe
http://slidepdf.com/reader/full/ecoevo-3rd-by-urabe 37/52
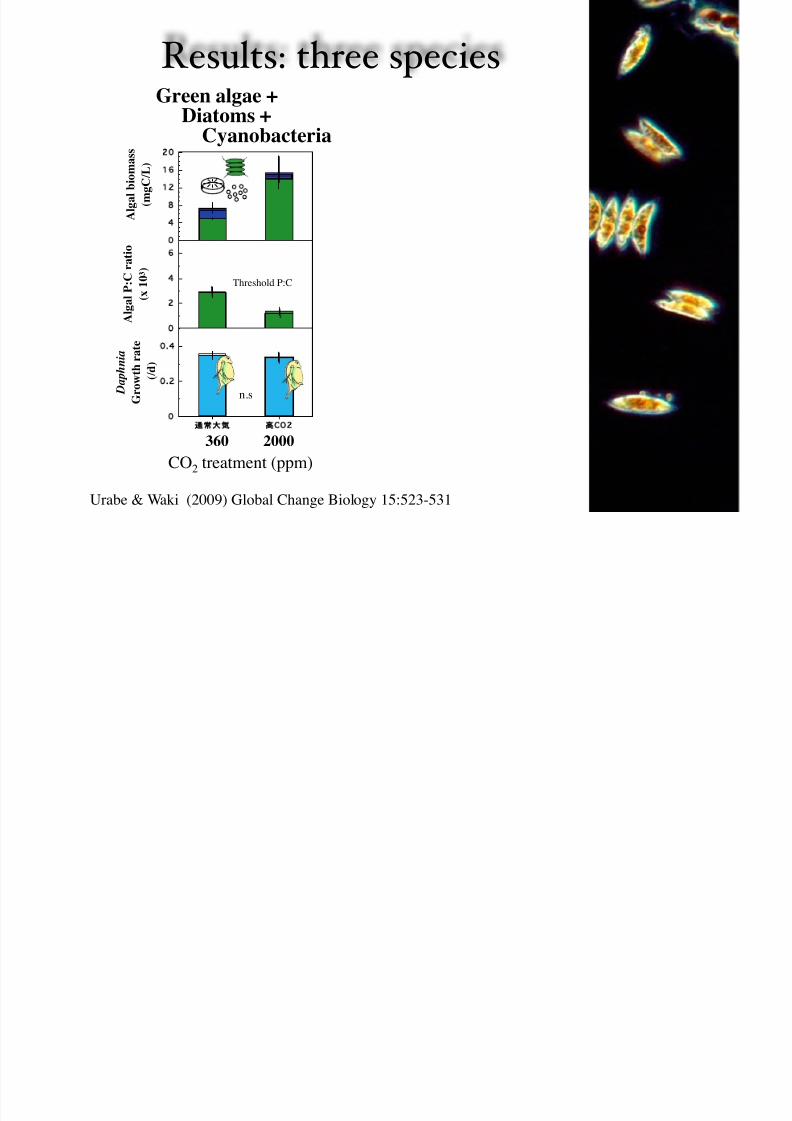
Results: three species
CO 2 treatment (ppm)
4
8
12
16
2
CO2
2
4
6
CO2
2
4
CO2
A l g a l b i o m a s s
( m g C / L )
A l g a l P : C r a t i o
( x 1 0 3 )
D a p h n
i a
G r o w t h r a t e
( / d )
360 2000
Green algae + Diatoms +
Cyanobacteria
Threshold P:C
n.s
Urabe & Waki (2009) Global Change Biology 15:523-531

8/10/2019 EcoEvo 3rd by Urabe
http://slidepdf.com/reader/full/ecoevo-3rd-by-urabe 38/52
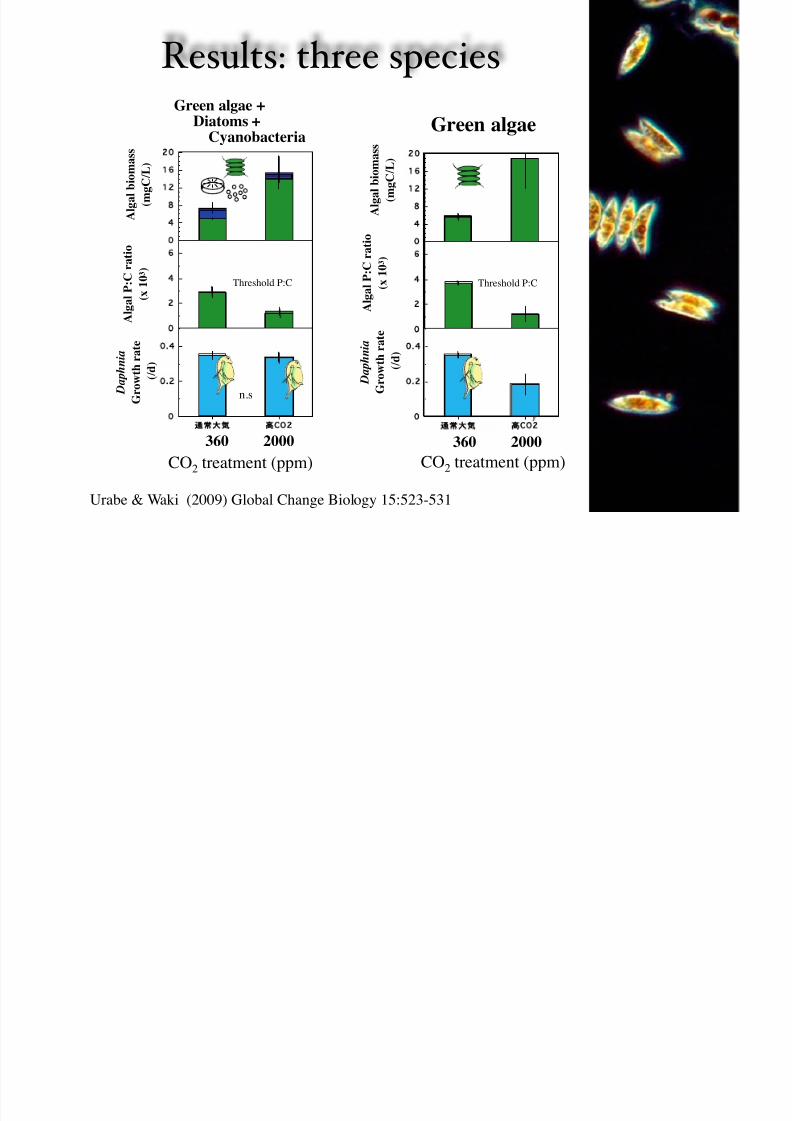
Results: three species
CO 2 treatment (ppm)
4
8
12
16
2
CO2
2
4
6
CO2
2
4
CO2
A l g a l b i o m a s s
( m g C / L )
A l g a l P : C r a t i o
( x 1 0 3 )
D a p h n
i a
G r o w t h r a t e
( / d )
360 2000
Green algae + Diatoms +
Cyanobacteria
Threshold P:C
n.s
Green algae
4
8
2
6
2
CO2
2
4
6
CO2
2
4
CO2
A l g a l b i o m a s s
( m g C / L )
A l g a l P : C r a t i o
( x 1 0 3 )
D a p
h n
i a
G r o w t h r a t e
( / d )
Threshold P:C
360 2000CO 2 treatment (ppm)
Urabe & Waki (2009) Global Change Biology 15:523-531
8/10/2019 EcoEvo 3rd by Urabe
http://slidepdf.com/reader/full/ecoevo-3rd-by-urabe 39/52
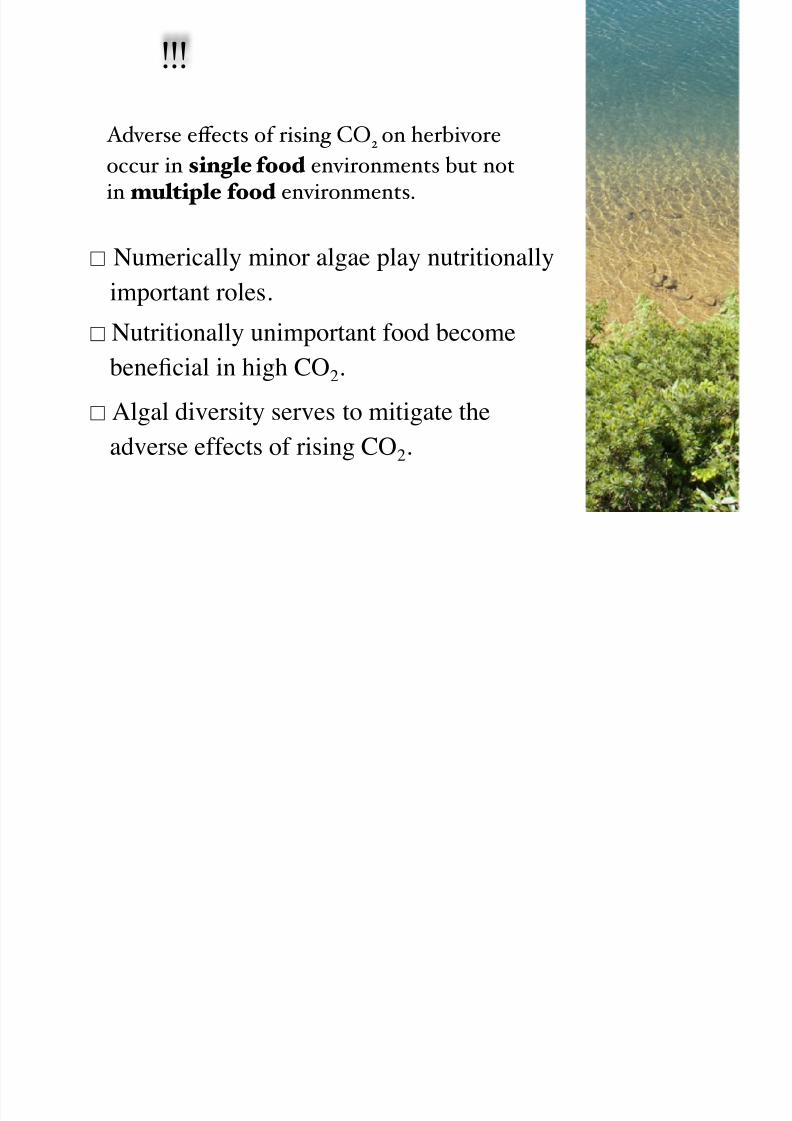
!!!
□ Numerically minor algae play nutritionallyimportant roles.
□ Nutritionally unimportant food becomebenecial in high CO 2.
□ Algal diversity serves to mitigate theadverse effects of rising CO 2.
Adverse e # ects of rising CO 2 on herbivoreoccur in single food environments but notin multiple food environments.

8/10/2019 EcoEvo 3rd by Urabe
http://slidepdf.com/reader/full/ecoevo-3rd-by-urabe 40/52
Why does this occur?
4
8
12
16
2
CO2
2
4
6
CO2
2
4
CO2
A l g a l b i o m a s s
( m g C / L )
A l g a l P : C r a t i o
( x 1 0 3 )
D a p
h n
i a
G r o w t h r a t e
( / d )
360 2000
CO 2 treatment (ppm)
Green algae +
Diatoms +Cyanobacteria
Threshold P:C
n.s
Green algae
4
8
2
6
2
CO2
2
4
6
CO2
2
4
CO2
A l g a l b i o m a s s
( m g C / L )
A l g a l P : C r a t i o
( x 1 0 3 )
D a p h n
i a
G r o w t h r a t e
( / d )
Threshold P:C
360 2000
CO 2 treatment (ppm)
8/10/2019 EcoEvo 3rd by Urabe
http://slidepdf.com/reader/full/ecoevo-3rd-by-urabe 41/52
Feedingcompensation
Stimulate feedingactivities
Assimilationenhancement
Functionally increaseassimilation efciency
Why high growth is maintained at high CO2 when fed multple algae?
Nutritionalcomplementarity
Complement decient nutrientseach other, orameliorate someharmful substances.
54
Possible mechanisms
Urabe & Waki (2009) Global Change Biology 15:523-531

8/10/2019 EcoEvo 3rd by Urabe
http://slidepdf.com/reader/full/ecoevo-3rd-by-urabe 42/52
Lab Experimentagain

8/10/2019 EcoEvo 3rd by Urabe
http://slidepdf.com/reader/full/ecoevo-3rd-by-urabe 43/52
G rowth rate
Ingestion rate ( 32P)
Assimilation rate ( 32P)
Measurements forG.I.A. rates
Low CO 2
2-3 speciestreatment
1 speciestreatment
High CO 2
2-3 speciestreatment
1 speciestreatment
Food abundance 1mgC/L Food abundance 1mgC/L
360ppm 2000 ppm

8/10/2019 EcoEvo 3rd by Urabe
http://slidepdf.com/reader/full/ecoevo-3rd-by-urabe 44/52
0
0.1
0.2
0.3
0.4
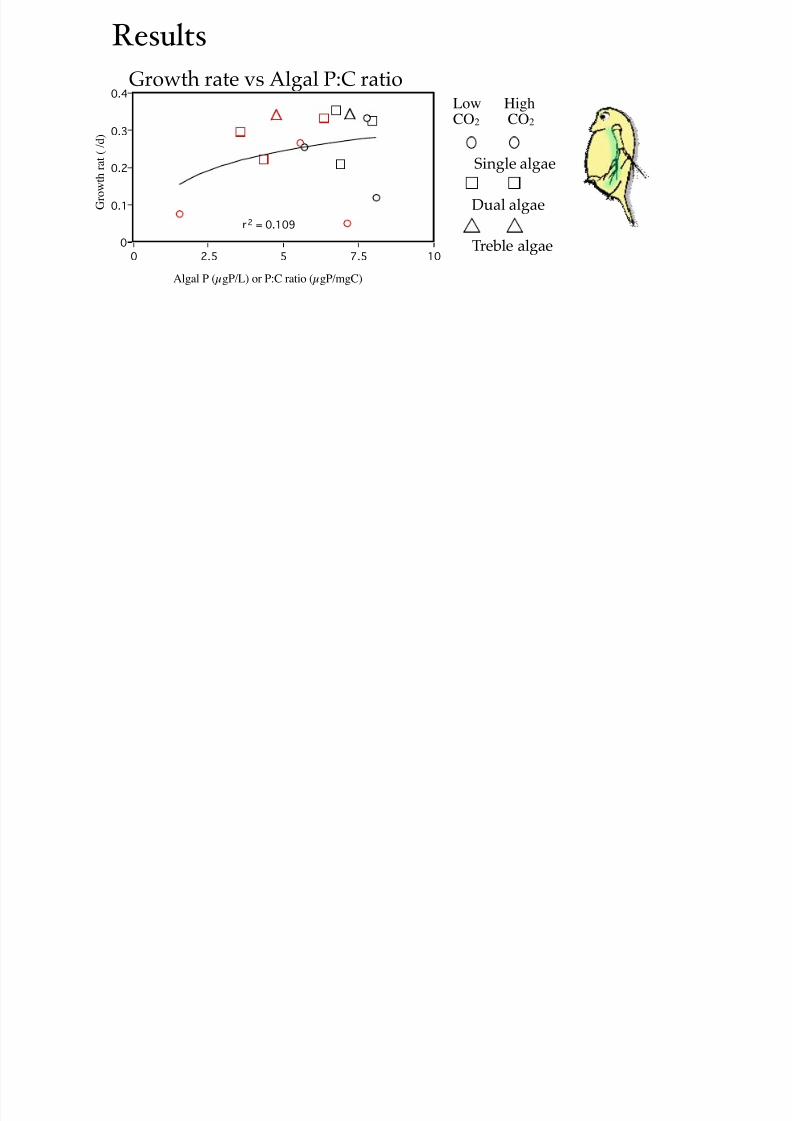
G r o w
t h r a t
( / d )
0 2.5 5 7.5 10
Algal P (µgP/L) or P:C ratio (µgP/mgC)
r 2 = 0.109
Single algae
Dual algae
Treble algae
Growth rate vs Algal P:C ratioLow High CO 2 CO 2
Results

8/10/2019 EcoEvo 3rd by Urabe
http://slidepdf.com/reader/full/ecoevo-3rd-by-urabe 45/52
0
0.1
0.2
0.3
0.4
G r o w
t h r a t
( / d )
0 2.5 5 7.5 10
Algal P (µgP/L) or P:C ratio (µgP/mgC)
r 2 = 0.109
Single algae
Dual algae
Treble algae
Growth rate vs Algal P:C ratio
0
0.1
0.2
0.3
0.4
G r o w
t h r a t e
( / d )
0 5 10 15 20
Ingestion for P (ngP/h/ind)
r 2 = 0.444
Growth rate vs Ingested P
Low High CO 2 CO 2
Results
l l d d f d f
8/10/2019 EcoEvo 3rd by Urabe
http://slidepdf.com/reader/full/ecoevo-3rd-by-urabe 46/52
0.0
0.5
1.0
1.5
2.0
2-3
F e e d
i n g r a t e
( m l /
h / i n d
)
Algal diversity and feeding performance
l

8/10/2019 EcoEvo 3rd by Urabe
http://slidepdf.com/reader/full/ecoevo-3rd-by-urabe 47/52
Single algae
Dual algae
Treble algae
Low High CO 2 CO 2
Results
0
0.1
0.2
0.3
0.4
G r o w
t h r a t e
( / d )
0 5 10 15 20
Ingestion for P (ngP/h/ind)
r 2 = 0.444
Growth rate vs Ingested P
R l
8/10/2019 EcoEvo 3rd by Urabe
http://slidepdf.com/reader/full/ecoevo-3rd-by-urabe 48/52
Single algae
Dual algae
Treble algae
Low High CO 2 CO 2
Results
0
0.1
0.2
0.3
0.4
G r o w
t h r a t e
( / d )
0 3 6 9 12
Assimilation rate for P (ngP/h/ind)
r 2 = 0.726
Growth rate vs Assimilated P
0
0.1
0.2
0.3
0.4
G r o w
t h r a t e
( / d )
0 5 10 15 20
Ingestion for P (ngP/h/ind)
r 2 = 0.444
Growth rate vs Ingested P
Al l di i d di i f

8/10/2019 EcoEvo 3rd by Urabe
http://slidepdf.com/reader/full/ecoevo-3rd-by-urabe 49/52
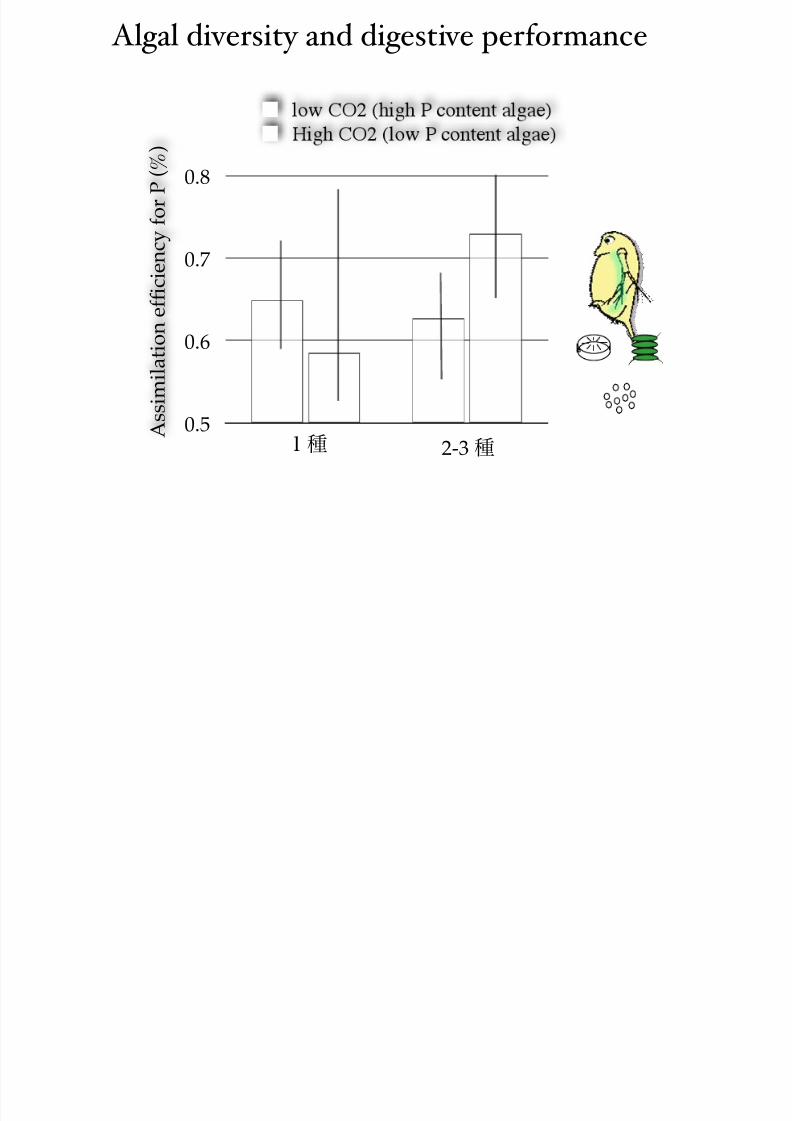
0.5
0.6
0.7
0.8
2-3 A s s i m
i l a t i o n e f c i e n
c y f o r P
( % )
Algal diversity and digestive performance

8/10/2019 EcoEvo 3rd by Urabe
http://slidepdf.com/reader/full/ecoevo-3rd-by-urabe 50/52
Feedingcompensation
Stimulate feedingactivities
Assimilationenhancement
Functionally increaseassimilation efciency
Why high growth is maintained at high CO2 when fed multiple algae?
Nutritionalcomplementarity
Complement decient nutrientseach other, orameliorate someharmful substances.
54
Possible mechanisms

8/10/2019 EcoEvo 3rd by Urabe
http://slidepdf.com/reader/full/ecoevo-3rd-by-urabe 51/52
Summary $ I %
■ Ecological Stoichiometry (ES) examines thebalance of elements in ecological interactions.
■ It is useful to understand the responses ofecosystems to environmental changes (light/CO 2/
nutrients) via quantity and quality of plants.
□ Putative increase in pCO 2 likely increase plant
(algal) abundance but reduce the nutrient contents.
□ Thus, algal species beneficial at present may notbe beneficial for herbivore in future (high CO 2 world).

8/10/2019 EcoEvo 3rd by Urabe
http://slidepdf.com/reader/full/ecoevo-3rd-by-urabe 52/52
Summary $ II %
□ However, adverse effects of rising CO 2 onherbivores can be mitigated by algal diversity
□ Algal diversity is certainly important for
sustaining herbivores especially at high CO2environment in future.
□ Finally, we need to study more on assimilationactivities of herbivores to understand theirresponse to changes in food condition.