downstream purification of surfactin produced by bacillus ... · petroleum-eter en n-heksaan....
TRANSCRIPT

Page i of 173
Downstream purification of surfactin produced by Bacillus subtilis ATCC 21332
by
Bagcinele Dlamini
Thesis presented in partial fulfilment
of the requirements for the Degree
of
MASTER OF ENGINEERING
(CHEMICAL ENGINEERING)
in the Faculty of Engineering
at Stellenbosch University
The financial assistance of the National Research Foundation (NRF) towards this research is hereby
acknowledged. Opinions expressed and conclusions arrived at, are those of the author and are not
necessarily attributed to the NRF.
Supervisor
Prof K. G. Clarke
Co-Supervisor
Dr R. W. M. Pott
December 2017

Page i of 173
Declaration
I By submitting this thesis electronically, I declare that the entirety of the work contained therein is my
own, original work, that I am the sole author thereof (save to the extent explicitly otherwise stated), that
reproduction and publication thereof by Stellenbosch University will not infringe any third party rights and
that I have not previously in its entirety or in part submitted it for obtaining any qualification.
Date: December 2017
Copyright © 2017 Stellenbosch University
All rights reserved
Stellenbosch University https://scholar.sun.ac.za
Page ii of 173
Abstract
Tuberculosis (TB), caused by Mycobacterium tuberculosis, is the most fatal disease from a single
infectious agent. In 2014, 9.6 million people fell ill with TB and 1.5 million died from the disease.
Surfactin offers a promise as an alternative antimicrobial agent against the organisms causing TB, as it
possesses the ability to lyse cell membranes as well as the ability to alter membrane permeability. The
use of surfactin as a medical drug is limited by its haemolytic activity, thus it can be used in other
applications in the fight against TB such as hand sanitizers or in equipment and surface sterilisers. The
antimicrobial activity of surfactin is limited in environments with high protein and lipid impurities thus it
is necessary to purify surfactin from the medium in which it is produced. The aim of this study is
therefore to propose a suitable strategy with operating conditions for surfactin purification. Since the
study of surfactin purification is dependent on the analysis of surfactin concentration, an additional aim
of this study is to develop and validate an analytical technique for surfactin concentration.
The proposed unit operations for surfactin purification were acid precipitation, solvent extraction and
adsorption. Prior to optimisation of these unit operations, surfactin was produced batch-wise from
Bacillus subtilis ATCC 21332 with a maximum surfactin concentration of 1109 mg/L and selectivity
(surfactin to antifungal ratio) of 5.5 gs/ga. Thin layer chromatography (TLC) was developed for
quantifying surfactin concentration, and . was further validated using the linearity and working range,
limit of detection, limit of quantification, instrument limit of detection, accuracy, precision, specificity,
selectivity and robustness under diverse solvent and sampling conditions.
After surfactin production and development of the TLC analytical technique, surfactin was isolated from
cell-free supernatants of B. subtilis into a precipitate by acid precipitation. Acid precipitation was carried
out by adding hydrochloric acid to cell-free supernatants to lower the pH, and recovering surfactin with
the precipitate by centrifugation. Acid precipitation was optimised by studying the effect of the
operating pH on surfactin purity, surfactin recovery, surfactin selectivity and relative concentrations of
protein and lipid impurities. The recommended operating pH for acid precipitation was pH 4, where the
surfactin purity, recovery and selectivity were 97%, 43% and 5.7 gs/ga respectively.
The precipitate from acid precipitation was further purified by solvent extraction. Solvent extraction was
carried out by selectively dissolving surfactin in dry acid precipitates using various organic solvents of
differing polarity. These solvents, in order of decreasing polarity, were: methanol, i-propanol,
chloroform:methanol (1:1 v/v), acetonitrile, chloroform:methanol (2:1 v/v), acetone, chloroform, ethyl
Stellenbosch University https://scholar.sun.ac.za

Page iii of 173
acetate, methyl tert-butyl ether (MTBE), petroleum ether and n-hexane. Solvent extraction was
optimised by studying the effect of solvent polarity on surfactin purity, surfactin recovery and relative
concentration of protein and lipid impurities in solvents after extraction. Polar solvents had better
surfactin recoveries and purities in comparison to non-polar solvents. MTBE gave both the highest
recovery (100%) and highest purity (80%), thus was the best solvent for extraction. This recovery and
purity was also higher than the recoveries and purities achieved by adsorption and acid precipitation,
thus solvent extraction was the best purification technique in this study.
The precipitate from acid precipitation was also purified by adsorption. Adsorption was carried out using
HP-20 non-polar resins on adsorption liquids formed by solubilising the precipitates in alkaline water.
The solubilised precipitates were further mixed with water or methanol to form the adsorption liquid.
Adsorption was optimised by studying the effect of initial pH, operating temperature, resin
concentration to surfactin concentration (RC/SC) ratio and methanol concentration on the percentage of
surfactin in the adsorption liquid adsorbed onto resins (% SA) and the factor by which surfactin
selectivity improved after the adsorption (IS) using surface designs. The study of surfactin adsorption
using surface designs or using methanol based adsorption liquid were new experimental approaches,
not having being previously reported.
% SA improved with initial pH, operating temperature, RC/SC ratio and methanol concentration. IS
independent of operating temperature, decreased with increase in RC/SC ratio and increased with pH
and methanol concentration. The recommended initial pH, operating temperature, RC/SC ratio and
methanol concentration was 11.5, 45 °C, 5 gr/gs and 30 % (v/v) respectively. The surfactin recovery and
purity after purification by adsorption at the selected operating conditions were found to be 91% and
58% respectively. The presence of methanol in adsorption liquid was seen to improve surfactin
adsorption rates. Equilibrium was reached 5 times faster in adsorption liquids with methanol compared
to adsorption liquids without methanol. Surfactin adsorption can be defined as multilayer adsorption as
it fitted the Freundlich model.
Acid precipitation, solvent extraction and adsorption were successful in purifying surfactin from B.
subtilis cultures. This is of major significance as surfactin can be used in the fight against TB, which is the
major cause of death from a single infectious agent globally.
Stellenbosch University https://scholar.sun.ac.za

Page iv of 173
Abstract (Afrikaans)
Onder siektes wat deur 'n aansteeklike agense veroorsaak word, is tuberkulose (TB), wat deur
Mycobacterium tuberculosis veroorsaak word, die dodelikste. In 2014 het 9.6 miljoen mense siek
geword van TB en 1.5 miljoen het van die siekte gesterf. Surfactin blyk 'n belowende alternatiewe
antimikrobiese agens te wees teen organismes wat TB veroorsaak, soos dit die vermoë het om
selmembrane te vernietig, asook om membrane se deurlaatbaarheid te verander; dus is dit in staat om
M. tuberculosis te denatureer. Die gebruik van surfactin as mediese middel is beperk deur sy
hemolitiese aktiwiteit. Dit kan dus gebruik word in ander toepassings in die stryd teen TB, soos
handverzorgers of in toerusting en oppervlaksterilisators. Die antimikrobiese werking van surfactin is
beperk in omgewings met hoë proteïen- en lipoïedonsuiwerhede, en dus is dit nodig om surfactin te
suiwer van die medium waarin dit vervaardig word. Die doel van hierdie studie is dus om 'n gepaste
strategie vir die suiwering van surfactin voor te stel, met bedryfstoestande. Aangesien die studie van
surfactinsuiwering is afhanklik van die analise van surfactinkonsentrasie; is 'n verdere doel van hierdie
studie om 'n tegniek te ontwikkel en te valideer vir die analise van surfactinkonsentrasie.
Die voorgestelde stappe vir surfactinsuiwering was suurpresipitasie, oplosmiddelonttrekking en
adsorpsie. Voor optimalisering van hierdie stappe, is surfactin bondelgewys uit Bacillus subtilis ATCC
21332, met 'n maksiumum surfactinkonsentrasie van 1109 mg/L en selektiwiteit (verhouding surfactin
tot antifungale middel) van 5.5 gs/ga, vervaardig .Dunlaag-chromatografie (DLC) is ontwikkel vir surfactin
konsentrasie analise, was verder gevalideer deur na lineariteit en werksomvang, perke van opsporing,
perke van kwantifisering, instrumentperke van opsporing, akkuraatheid, presisie, spesifisiteit, en
selektiwiteit en robuustheid onder verskillende oplosmiddel- en monsternemingstoestande te verwys.
Na die surfactin produksie en ontwikkeling van die DLC analitiese tegniek, is surfactin deur
suurpresipitasie tot 'n presipitaat geïsoleer van selvrye supernatante van B. subtilis. Suurpresipitasie is
uitgevoer deur chloorwaterstof by selvrye supernatante te voeg om die pH, en verhaal surfactin in die
presipitaat deur sentrifugasie. Suurpresipitasie is geoptimaliseer deur die effek van die werkende pH op
suiwerheid, herstel, en selektiwiteit van surfactin, en relatiewe konsentrasies van proteïen- en
lipoïedonsuiwerhede te ondersoek. Die aanbevole werkende pH vir suurpresipitasie was pH 4, en die
suiwerheid, herstel, en selektiwiteit van surfactin was onderskeidelik 97%, 43% en 5.7 gs/ga.
Die presipitaat van die suurpresipitasie is verder gesuiwer deur oplosmiddelekstraksie.
Oplosmiddelekstraksie is uitgevoer deur surfactin selektief in die presipitaat op te los deur verskeie
Stellenbosch University https://scholar.sun.ac.za

Page v of 173
organiese oplosmiddels met verskillende polariteite te gebruik. Hierdie oplosmiddels, in volgorde van
afnemende polariteit, was metanol, i-propanol, chloroform:metanol (1:1 v/v), asetonitriel,
chloroform:metanol (2:1 v/v), asetoon, chloroform, etielasetaat, metiel tert-butieleter(MTBE),
petroleum-eter en n-heksaan. Oplosmiddelekstraksie is geoptimaliseer deur ondersoek in te stel na die
uitwerking van die polariteit van die oplosmiddel op suiwerheid, herstel, en selektiwiteit van surfactin,
en relatiewe konsentrasies van proteïen- en lipoïedonsuiwerhede in oplosmiddels na ekstraksie. Daar is
bevind dat polêre oplosmiddels beter surfactinherstel en surfactinsuiwerheid toon in vergelyking met
nie-polêre oplosmiddels. MTBE het die hoogste surfactinsuiwerheid (80%) en surfactinherstel (100%)
gelewer, en was dus die beste oplosmiddel vir surfactinsuiwering deur ekstraksie van oplosmiddels.
Hierdie herstel en suiwerheid was ook hoër as die herwinnings en suiwerhede wat deur adsorpsie en
suur neerslag verkry is, dus was oplosmiddelwinning die beste suiweringstegniek in hierdie studie.
Die presipitaat van suurpresipitasie is ook deur adsorpsie gesuiwer. Adsorpsie is uitgevoer deur die
gebruik van HP-20 nie-polêre hars op adsorpsievloeistowwe wat gevorm is deur die presipitate in
alkaliese water meer oplosbaar te maak. Die meer oplosbare presipitaat is, verder, met water of
metanol gemeng om die adsorpsievloeistof te vorm. Adsorpsie is geoptimaliseer deur ondersoek in te
stel na die effek van aanvanklike pH, bedryfstemperatuur, die verhouding van harskonsentrasie tot
surfactinkonsentrasie (HK/SK) op die persentasie surfactin in die adsorpsievloeistof wat deur die hars
geadsorbeer is (%SA), en die faktor waarteen die surfactinselektiwiteit verbeter het na die adsorpsie
(VS) deur aanwending van oppervlakontwerpe. Die bestudering van surfactinadsorbsie deur
oppervlakontwerpe is 'n nuwe eksperimentele benadering, nie voorheen geraporteer nie.
% SA verbeter met aanvanklike pH, bedryfstemperatuur, HK/SK-verhouding en metanol konsentrasie..
VS was onafhanklik van bedryfstemperatuur, het afgeneem met toenames in HK/SK-verhouding en
verhoog met pH en metanol konsentrasie. Die aanbevole aanvanklike pH, bedryfstemperatuur, HK/SK-
verhouding en metanol konsentrasie was onderskeidelik 11.5, 45°C, 31 gr/gs en 30% (v/v). Die surfactin
herstel en suiwerheid na suiwering deur adsorpsie by die geselekteerde bedryfsomstandighede was
onderskeidelik 91% en 58%. Die waarneming was dat die teenwoordigheid van metanol in die
adsorpsievloeistof die koers waarteen surfactin geabsorbeer is, verbeter het. Ekwilibrium is vyf keer
vinniger bereik in adsorpsievloeistowwe met metanol as in dié sonder metanol. Adsorpsie van surfactin
kan gedefinieer word as multilaagadsorpsie met die feit dat dit geskik was vir die Freundlich-model.
Stellenbosch University https://scholar.sun.ac.za

Page vi of 173
Ekstraksie en adsorpsie was suksesvol in die versywering van surfactin B.subtillis cultures. Dit is van
groot relevansie siendat surfactin gebruik kan word in die geveg teen TB, wat die grootste oorsaak van
sterftes van ‘n enkele agent global is.
Stellenbosch University https://scholar.sun.ac.za
Page vii of 173
Journal paper
B Dlamini, V Rangarajan and K G Clarke (under review) Thin layer chromatography for the quantification
of the surfactin lipopeptide – a manual approach, J Analytical Chemistry
Stellenbosch University https://scholar.sun.ac.za

Page viii of 173
Acknowledgements
I would like to express my sincere thanks to the following people and organizations for making this
research possible:
Prof K. G. Clarke and Dr R. W. Pott for supervising my project
Dr V. Rangarajan for supervising the early stages of my project
Mrs. L. Simmers and Mr. J. Van Rooyen for assistance with lipopeptide and nitrate analysis
Dr A. Chimpango and Prof J. Gorgens for allowing me to use the freeze-drying equipment
Family and friends for the support and motivation
My fellow students
The National Research Foundation (NRF) of South Africa (Grant Number 98935) and
Stellenbosch University for research funding and the NRF for a postgraduate bursary.
Stellenbosch University https://scholar.sun.ac.za
Page ix of 173
Contents
Declaration ..................................................................................................................................................... i
Abstract ......................................................................................................................................................... ii
Abstract (Afrikaans) ..................................................................................................................................... iv
Journal paper .............................................................................................................................................. vii
Acknowledgements .................................................................................................................................... viii
List of figures ............................................................................................................................................... xiv
List of tables ................................................................................................................................................. xx
Glossary and nomenclature ....................................................................................................................... xxii
1 Introduction .......................................................................................................................................... 1
2 Literature review ................................................................................................................................... 4
2.1 Antibacterial activity of surfactin .................................................................................................. 4
2.2 Surfactin production ..................................................................................................................... 6
2.2.1 Assessment of surfactin production by different bacterial species ...................................... 9
2.2.2 Effect of nutrient media on surfactin production ................................................................. 9
2.2.3 Effect of environmental conditions on surfactin production ............................................. 10
2.2.4 Effect of mode of operation on surfactin production ......................................................... 12
2.3 Surfactin purification from Bacillus cultures ............................................................................... 12
2.3.1 Phase separation ................................................................................................................. 13
2.3.2 Precipitation ........................................................................................................................ 14
2.3.3 Foam fractionation .............................................................................................................. 16
2.3.4 Solvent extraction ............................................................................................................... 17
2.3.5 Ultrafiltration and nanofiltration ........................................................................................ 26
2.3.6 Chromatography ................................................................................................................. 30
2.3.7 Adsorption and ion-exchange ............................................................................................. 33
Stellenbosch University https://scholar.sun.ac.za
Page x of 173
2.4 Surfactin analytical strategies ..................................................................................................... 39
3 Hypotheses and objectives ................................................................................................................. 42
3.1 Hypotheses ................................................................................................................................. 42
3.1.1 Surfactin analyses by TLC .................................................................................................... 42
3.1.2 Surfactin purification .......................................................................................................... 42
3.2 Objectives.................................................................................................................................... 43
3.2.1 Surfactin production ........................................................................................................... 43
3.2.2 Surfactin analyses by TLC .................................................................................................... 43
3.2.3 Surfactin purification .......................................................................................................... 43
4 Methodology ....................................................................................................................................... 45
4.1 Surfactin production ................................................................................................................... 46
4.1.1 Microorganisms and culture maintenance ......................................................................... 46
4.1.2 Growth media ..................................................................................................................... 46
4.1.3 Surfactin production experiments ...................................................................................... 47
4.2 Development of the TLC analytical technique ............................................................................ 47
4.2.1 Chemicals and materials ..................................................................................................... 47
4.2.2 TLC procedure for determining surfactin concentrations and component Rf values ......... 49
4.2.3 TLC procedure for identifying impurities ............................................................................ 50
4.3 Surfactin purification by acid precipitation ................................................................................ 50
4.3.1 Procedure for surfactin purification by acid precipitation ................................................. 50
4.3.2 Calculation of surfactin recovery, purity and selectivity after acid precipitation ............... 51
4.4 Surfactin purification by solvent extraction ................................................................................ 52
4.4.1 Procedure for surfactin purification by solvent extraction ................................................. 52
4.4.2 Calculation of surfactin recovery and purity after solvent extraction ................................ 53
4.5 Surfactin purification by adsorption ........................................................................................... 54
4.5.1 Procedure for surfactin purification by adsorption ............................................................ 54
Stellenbosch University https://scholar.sun.ac.za

Page xi of 173
4.5.2 Calculation of surfactin purity and recovery after adsorption ........................................... 55
4.5.3 Optimisation of the surfactin adsorption purification technique ....................................... 56
4.5.4 Batch adsorption kinetics .................................................................................................... 60
4.5.5 Batch adsorption isotherms ................................................................................................ 60
4.6 Analytical methods ..................................................................................................................... 61
4.6.1 Cell concentration ............................................................................................................... 61
4.6.2 Glucose concentration ........................................................................................................ 62
4.6.3 Surfactin, iturin and fengycin concentration ...................................................................... 63
4.6.4 Ammonium concentration .................................................................................................. 66
4.6.5 Nitrate concentration ......................................................................................................... 66
5 Results and discussion ........................................................................................................................ 68
5.1 Surfactin production ................................................................................................................... 68
5.2 TLC development and validation ................................................................................................ 71
5.2.1 TLC development ................................................................................................................ 72
5.2.2 Validation of the TLC analytical technique for surfactin quantification ............................. 72
5.2.3 Impurity assays and extension of the TLC technique to lipopeptide analysis .................... 82
5.2.4 Problems encountered and recommendations for carrying out successful surfactin
analysis by TLC .................................................................................................................................... 85
5.2.5 Comparison of TLC and HPLC analytical techniques for surfactin analysis ......................... 85
5.3 Surfactin purification by acid precipitation ................................................................................ 86
5.3.1 Optimisation of acid precipitation based on surfactin recovery and purity ....................... 87
5.3.2 Optimisation of acid precipitation based on improvement in surfactin selectivity ........... 88
5.3.3 Optimisation of acid precipitation based on impurity assays ............................................. 89
5.4 Surfactin purification by solvent extraction ................................................................................ 91
5.4.1 Optimisation of solvent extraction based on surfactin recovery and purity ...................... 91
5.4.2 Optimisation of solvent extraction based on impurity assays ............................................ 94
Stellenbosch University https://scholar.sun.ac.za

Page xii of 173
5.5 Adsorption .................................................................................................................................. 98
5.5.1 Optimisation of surfactin adsorption based on % SA ....................................................... 100
5.5.2 Optimisation of surfactin adsorption based on improvement in selectivity (IS) .............. 115
5.5.3 Surfactin purity and recovery after purification by adsorption process ........................... 126
5.5.4 Batch adsorption kinetics .................................................................................................. 127
5.5.5 Batch adsorption isotherms .............................................................................................. 130
5.6 Repeatability ............................................................................................................................. 134
6 Conclusions and recommendations .................................................................................................. 139
6.1 Conclusions ............................................................................................................................... 139
6.2 Recommendations .................................................................................................................... 143
6.2.1 Further studies should be studied to determine the optimum pH in the range between 4
and 6 during surfactin purification by acid precipitation ................................................................. 143
6.2.2 A two-stage extraction should be considered for purification by solvent extraction ...... 143
6.2.3 Multi-fold extraction should be considered to improve surfactin recovery when non-polar
solvents are used as solvents in solvent extraction studies ............................................................. 143
6.2.4 Optimisation of initial temperature and optimisation using temperatures greater than 45
°C should be considered in surfactin adsorption studies.................................................................. 144
6.2.5 Methanol concentration higher 30% (v/v) should be considered in surfactin adsorption
studies 144
6.2.6 Resin washing should be considered to improve surfactin purities after surfactin
purification by adsorption................................................................................................................. 144
6.2.7 Column studies should be considered to improve the surfactin adsorption efficiency ... 144
6.2.8 Carrying out solvent extraction and adsorption purification steps sequentially should be
considered to improve surfactin purity, without affecting the surfactin recovery .......................... 145
6.2.9 A quantitative technique should be used for efficacy studies of surfactin after purification
145
7 References ........................................................................................................................................ 146
Stellenbosch University https://scholar.sun.ac.za
Page xiii of 173
8 Appendix ........................................................................................................................................... 159
8.1 Lipopeptide analysis .................................................................................................................. 159
8.2 Solvent extraction ..................................................................................................................... 160
8.3 Adsorption ................................................................................................................................ 161
8.3.1 Effect of methanol addition on pH measurement and volume of adsorption liquid ....... 161
8.3.2 Surfactin adsorption preliminary studies .......................................................................... 163
8.3.3 Equilibrium pH, % SA and IS surface after adsorption ...................................................... 165
Stellenbosch University https://scholar.sun.ac.za

Page xiv of 173
List of figures
Figure 1-1: Example of a surfactin structure (redrawn from Kosaric & Sukan (2014))................................. 2
Figure 2-1: Rotating disc contactor used for pertraction ........................................................................... 25
Figure 4-1: Block flow diagram for the proposed surfactin recovery ......................................................... 45
Figure 4-2: TLC plate after it was prepared for sample spotting ................................................................ 48
Figure 4-3: Cell dry weigh (CDW) standard curve ....................................................................................... 62
Figure 4-4: Standard curve for glucose quantification by DNS analysis ..................................................... 63
Figure 4-5: Standard curve for surfactin quantification by HPLC analysis .................................................. 65
Figure 4-6: Standard curve for fengycin quantification by HPLC analysis .................................................. 65
Figure 4-7: Standard curve for Iturin analysis by HPLC analysis ................................................................. 66
Figure 4-8: Nitrate standard curve .............................................................................................................. 67
Figure 5-1: Product concentrations in B. subtilis cultures during surfactin production ............................. 70
Figure 5-2: Nutrient concentrations in B. subtilis cultures during surfactin production ............................ 70
Figure 5-3: Surfactin selectivity in B. subtilis cultures during surfactin production ................................... 71
Figure 5-4: Standard curve for surfactin quantification by TLC .................................................................. 72
Figure 5-5: Specificity of TLC analysis for the measurement of surfactin concentrations ......................... 76
Figure 5-6: Comparison of actual and measured surfactin concentrations determined when surfactin was
dissolved in different solvents. ................................................................................................................... 78
Figure 5-7: Comparison of actual and measured surfactin concentrations for 10 times, 5 times and non-
diluted simulated supernatant which were spotted 10 times, 5 times and once on the same spot on the
TLC plate respectively. ................................................................................................................................ 80
Figure 5-8: Comparison of the measured and calculated surfactin concentrations when surfactin was
analysed in different days ........................................................................................................................... 81
Figure 5-9: Developed plates for concentrated B. subtilis cultures (after purification by acid precipitation)
with (a) primuline and (b) ninhydrin reagent ............................................................................................. 83
Figure 5-10: Comparison of the Rf values of surfactin, iturin and fengycin, when they were spotted on
the same spot and when the lipopeptide standards were spotted on different spots .............................. 84
Figure 5-11: Comparison of purities from acid precipitation step determined by HPLC and TLC analysis 86
Figure 5-12: Surfactin, antifungal and total lipopeptide recoveries after surfactin purification by acid
precipitation ................................................................................................................................................ 87
Figure 5-13: Surfactin and total lipopeptide purities after acid precipitation at different pH ................... 88
Stellenbosch University https://scholar.sun.ac.za
Page xv of 173
Figure 5-14: Surfactin selectivity and improvement in selectivity (IS) after surfactin purification by acid
precipitation ................................................................................................................................................ 89
Figure 5-15: (a) lipid and (b) protein impurities before and after surfactin purification by acid
precipitation ................................................................................................................................................ 90
Figure 5-16: Surfactin recoveries after surfactin purification by solvent extraction .................................. 92
Figure 5-17: Surfactin purities after surfactin purification by solvent extraction ...................................... 93
Figure 5-18: Lipid impurities at different solvent polarities after surfactin purification by solvent
extraction. ................................................................................................................................................... 95
Figure 5-19: Protein impurities after surfactin purification by solvent extraction ..................................... 96
Figure 5-20: Flow diagram showing how surfactin precipitates can be purified by a two-stage solvent
extraction process ....................................................................................................................................... 97
Figure 5-21: Linear (L) and quadratic (Q) effects of initial pH (1), operating temperature (2), resin
concentration to surfactin concentration (RC/SC) (3) ratio and interactions of these independent
variables on % Surfactin adsorption (% SA) at 95% confidence ............................................................... 100
Figure 5-22: % Surfactin adsorption (% SA) obtained after surfactin adsorption in the absence of
methanol at an initial pH of pH 6.5 ........................................................................................................... 102
Figure 5-23: % Surfactin adsorption (% SA) obtained after surfactin adsorption in the absence of
methanol at an initial pH of pH 9 .............................................................................................................. 103
Figure 5-24: % surfactin adsorption (% SA) obtained after surfactin adsorption in the absence of
methanol at an initial pH of pH 11.5 ......................................................................................................... 103
Figure 5-25: Effects of methanol concentration (4)as well as effects of interactions between methanol
concentration and initial pH (1), operating temperature (2) and resin concentration to surfactin
concentration (RC/SC) ratio (3) on % surfactin adsorption (% SA) at 95% confidence ............................ 107
Figure 5-26: % Surfactin adsorption (% SA) adsorption obtained after surfactin adsorption in the
presence of methanol at an initial pH and RC/SC ratio of 6.5 and 4 gr/gs respectively ............................ 109
Figure 5-27: % Surfactin adsorption (% SA) obtained after surfactin adsorption in the presence of
methanol at an initial pH and RC/SC ratio of 9 and 4 gr/gs respectively ................................................... 109
Figure 5-28: % Surfactin adsorption (% SA) obtained after surfactin adsorption in the presence of
methanol at an initial pH and RC/SC ratio of 11.5 and 4 gr/gs respectively .............................................. 110
Figure 5-29: % Surfactin adsorption (% SA) obtained after surfactin adsorption in the presence of
methanol at an initial pH and RC/SC ratio of 6.5 and 22 gr/gs respectively .............................................. 110
Stellenbosch University https://scholar.sun.ac.za

Page xvi of 173
Figure 5-30: % surfactin adsorption (% SA) obtained after surfactin adsorption in the presence of
methanol at an initial pH and RC/SC ratio of 9 and 22 gr/gs respectively ................................................. 111
Figure 5-31: % SA obtained after surfactin adsorption in the presence of methanol at an initial pH and
RC/SC ratio of 11.5 and 22 gr/gs respectively ............................................................................................ 111
Figure 5-32: % Surfactin adsorption (% SA) obtained after surfactin adsorption in the presence of
methanol at an initial pH and RC/SC ratio of 6.5 and 40 gr/gs respectively .............................................. 112
Figure 5-33: % Surfactin adsorption (% SA) obtained after surfactin adsorption in the presence of
methanol at an initial pH and RC/SC ratio of 9 and 40 gr/gs respectively ................................................. 112
Figure 5-34: % Surfactin adsorption (% SA) obtained after surfactin adsorption in the presence of
methanol at an initial pH and RC/SC ratio of 11.5 and 40 gr/gs respectively ............................................ 113
Figure 5-35: % Surfactin adsorption (% SA) obtained after surfactin adsorption at an initial pH and
methanol concentration of 11.5 and 30 % (v/v) respectively................................................................... 115
Figure 5-36: Linear (L) and quadratic (Q) effects of initial pH (1), operating temperature (2), resin
concentration to surfactin concentration (RC/SC) (3) ratio and interactions of these independent
variables on improvement in selectivity (IS) at 95% confidence .............................................................. 116
Figure 5-37: Improvement in selectivity (IS) obtained after surfactin adsorption in the absence of
methanol at an operating temperature of 25 °C ...................................................................................... 118
Figure 5-38: Improvement in selectivity (IS) obtained after surfactin adsorption in the absence of
methanol at an operating temperature of 35 °C ...................................................................................... 119
Figure 5-39: Improvement in selectivity (IS) obtained after surfactin adsorption in the absence of
methanol at an operating temperature of 45 °C ...................................................................................... 119
Figure 5-40: Linear (L) and quadratic (Q) effects of methanol concentration (4) as well as effects of
interactions of methanol concentration with initial pH (1), operating temperature (2) and resin
concentration to surfactin concentration (RC/SC) ratio (3) on improvement in selectivity (IS) at 95%
confidence ................................................................................................................................................. 120
Figure 5-41: IS obtained after surfactin adsorption in the presence of methanol at an operating
temperature and initial pH of 25 °C and 6.5 respectively ......................................................................... 121
Figure 5-42: Improvement in selectivity (IS) obtained after surfactin adsorption in the presence of
methanol at an operating temperature and initial pH of 25 °C and 9 respectively ................................. 122
Figure 5-43: Improvement in selectivity (IS) obtained after surfactin adsorption in the presence of
methanol at an operating temperature and initial pH of 25 °C and 11.5 respectively ............................ 122
Stellenbosch University https://scholar.sun.ac.za

Page xvii of 173
Figure 5-44: Improvement in selectivity (IS) obtained after surfactin adsorption in the presence of
methanol at an operating temperature and initial pH of 35 °C and 6.5 respectively .............................. 122
Figure 5-45: Improvement in selectivity (IS) obtained after surfactin adsorption in the presence of
methanol at an operating temperature and initial pH of 35 °C and 9 respectively ................................. 123
Figure 5-46: Improvement in selectivity (IS) obtained after surfactin adsorption in the presence of
methanol at an operating temperature and initial pH of 35 °C and 11.5 respectively ............................ 123
Figure 5-47: Improvement in selectivity (IS) obtained after surfactin adsorption in the presence of
methanol at an operating temperature and initial pH of 45 °C and 6.5 respectively .............................. 124
Figure 5-48: Improvement in selectivity (IS) obtained after surfactin adsorption in the presence of
methanol at an operating temperature and initial pH of 45 °C and 9 respectively ................................. 124
Figure 5-49: Improvement in selectivity (IS) obtained after surfactin adsorption in the presence of
methanol at an operating temperature and initial pH of 45 °C and 11.5 respectively ............................ 125
Figure 5-50: Surfactin adsorption kinetics at an initial pH, operating temperature and RC/SC ratio of 11.5,
45 °C and 27 gr/gs respectively .................................................................................................................. 128
Figure 5-51: Modelling of adsorption kinetics using (a) the pseudo first-order and (b) the pseudo second-
order models at an initial pH, operating temperature and RC/SC ratio of 11.5, 45 °C and 27 gr/gs
respectively. .............................................................................................................................................. 129
Figure 5-52: % SA and qe obtained at an initial pH, operating temperature, resin concentration and
methanol concentration of 11.5, 45 °C, 4 gr/L and 30% (v/v) respectively .............................................. 131
Figure 5-53: Modelling adsorption isotherms using the Langmuir model (a) and the Freundlich model (b)
for adsorption carried out at an initial pH, operating temperature, methanol concentration and resin
concentration of 11.5, 45 °C, 30% (v/v) and 4 gr/L respectively ............................................................... 133
Figure 5-54: Repeatability of experiments for analysis of concentrations of products and selectivity
during surfactin production ...................................................................................................................... 135
Figure 5-55: Repeatability of experiments for analysis of concentrations of nutrients during surfactin
production................................................................................................................................................. 135
Figure 5-56: Repeatability of experiments for determining recoveries, purities, selectivity and IS after
surfactin purification by acid precipitation ............................................................................................... 136
Figure 5-57: Repeatability of experiments for determining surfactin recovery and purity after surfactin
purification by solvent extraction ............................................................................................................. 137
Figure 5-58: Repeatability of experiments for determining % SA, qe, IS as well as surfactin purity and
recovery .................................................................................................................................................... 138
Stellenbosch University https://scholar.sun.ac.za

Page xviii of 173
Figure 8-1: Surfactin HPLC chromatogram ............................................................................................... 159
Figure 8-2: Fengycin HPLC chromatogram ................................................................................................ 159
Figure 8-3: Iturin HPLC chromatogram ..................................................................................................... 160
Figure 8-4: Difference between pH measured in water and pH measured in methanol-water solutions
resulting from methanol addition in water .............................................................................................. 162
Figure 8-5: Volume contraction due to addition of methanol in water ................................................... 163
Figure 8-6: Change in % SA during adsorption .......................................................................................... 164
Figure 8-7: Plot to show that surfactin concentration is dependent on RC/SC ratio rather than surfactin
concentration and resin concentration independently, by comparing the % SA at different resin
concentrations at an RC/SC ratio of 40 gr/gs ............................................................................................. 164
Figure 8-8: Equilibrium pH obtained after surfactin adsorption in the absence of methanol at an initial
pH of 6.5 .................................................................................................................................................... 165
Figure 8-9: Equilibrium pH obtained after surfactin adsorption in the absence of methanol at an initial
pH of 9 ....................................................................................................................................................... 165
Figure 8-10: Equilibrium pH obtained after surfactin adsorption in the absence of methanol at an initial
pH of 11.5 .................................................................................................................................................. 166
Figure 8-11: Equilibrium pH obtained after surfactin adsorption in the presence of methanol at an
operating temperature and initial pH of 35 °C and 6.5 respectively ........................................................ 166
Figure 8-12: Equilibrium pH obtained after surfactin adsorption in the presence of methanol at an
operating temperature and initial pH of 35 °C and 9 respectively ........................................................... 167
Figure 8-13: Equilibrium pH obtained after surfactin adsorption in the presence of methanol at an
operating temperature and initial pH of 35 °C and 11.5 respectively ...................................................... 167
Figure 8-14: % SA obtained after surfactin adsorption in the absence of methanol at an RC/SC ratio of 4
gr/gs ........................................................................................................................................................... 168
Figure 8-15: % SA obtained after surfactin adsorption in the absence of methanol at an RC/SC ratio of 22
gr/gs ........................................................................................................................................................... 168
Figure 8-16: % SA obtained after surfactin adsorption in the absence of methanol at an RC/SC ratio of 40
gr/gs ........................................................................................................................................................... 169
Figure 8-17: % SA obtained after surfactin adsorption in the absence of methanol at an operating
temperature of 25 °C ................................................................................................................................ 169
Figure 8-18: % SA obtained after surfactin adsorption in the absence of methanol at an operating
temperature of 35 °C ................................................................................................................................ 170
Stellenbosch University https://scholar.sun.ac.za
Page xix of 173
Figure 8-19: % SA obtained after surfactin adsorption in the absence of methanol at an operating
temperature of 45 °C ................................................................................................................................ 170
Figure 8-20: IS obtained after surfactin adsorption in the absence of methanol at an RC/SC ratio of 4 gr/gs
.................................................................................................................................................................. 171
Figure 8-21: IS obtained after surfactin adsorption in the absence of methanol at an RC/SC ratio of 22
gr/gs ........................................................................................................................................................... 171
Figure 8-22: IS obtained after surfactin adsorption in the absence of methanol at an RC/SC ratio of 40
gr/gs ........................................................................................................................................................... 172
Figure 8-23: IS obtained after surfactin adsorption in the absence of methanol at an initial pH of 6.5 .. 172
Figure 8-24: IS obtained after surfactin adsorption in the absence of methanol at an initial pH of 9 ..... 173
Figure 8-25: IS obtained after surfactin adsorption in the absence of methanol at an initial pH of 11.5 173
Stellenbosch University https://scholar.sun.ac.za

Page xx of 173
List of tables
Table 2-1: Summary of surfactin production studies in literature ............................................................... 7
Table 2-2: Summary of studies on surfactin recovery by acid precipitation in literature .......................... 15
Table 2-3: Summary of studies on surfactin recovery by solvent extraction in literature ......................... 20
Table 2-4: Summary of studies on surfactin recovery by ultrafilatratioin and nanofiltration in literature 27
Table 2-5: Summary of studies on surfactin recovery by adsorption in literature ..................................... 34
Table 4-1: Growth medium for Surfactin production from B. Subtilis (adapted from Pretorius et al.
(2015)) ......................................................................................................................................................... 46
Table 4-2: HP-20 resin properties specified by the manufacturer ............................................................. 54
Table 4-3: Range at which independent variables were optimised in surfactin adsorption studies .......... 57
Table 4-4: Face centred central composite design for studying the effects of temperature, pH and RC/SC
ratio on surfactin adsorption ...................................................................................................................... 58
Table 4-5: face centred central composite design for studying the effects of methanol concentration on
surfactin adsorption .................................................................................................................................... 59
Table 4-6: Mobile phase information for HPLC analysis ............................................................................. 64
Table 4-7: Ion chromatography specifications for nitrate analysis ............................................................ 67
Table 5-1:Standard curve slope and validation parameters of the TLC analytial technique ..................... 73
Table 5-2: Accuracy and precision determined across the linear range ..................................................... 74
Table 5-3: Solvents used to study the suitability of the TLC analytical technique for surfactin analysis in
various solvents and the concentration of spiked surfactin in the different solvents ............................... 77
Table 5-4: Accuracy and precision of the TLC technique when used for surfactin analysis in various
solvents ....................................................................................................................................................... 78
Table 5-5: Surfactin concentration in media used for studying the multiple spotting error...................... 79
Table 5-6: Accuracy and precision obtained when surfactin was spotted by multiple spotting ................ 80
Table 5-7: Accuracy and precision obtained when surfactin concentration was analysed on different days
using the TLC analytical technique ............................................................................................................. 81
Table 5-8: ANOVA table showing the linear (L) and quadratic (Q) effects of initial pH (1), operating
temperature (2), resin concentration to surfactin concentration (RC/SC) ratio (3) and interactions of
these independent variables on % SA at 95% confidence ........................................................................ 101
Table 5-9: ANOVA table showing the effects of methanol concentration (4) as well as effects of
interactions between methanol concentration and initial pH (1), operating temperature (2) and resin
Stellenbosch University https://scholar.sun.ac.za

Page xxi of 173
concentration to surfactin concentration (RC/SC) (3) ratio on % surfactin adsorption (% SA) at a 95%
confidence ................................................................................................................................................. 108
Table 5-10: ANOVA table showing the linear (L) and quadratic (Q) effects of initial pH (1), operating
temperature (2), resin concentration to surfactin concentration (RC/SC) (3) ratio and interactions of
these independent variables on improvement in selectivity (IS) at 95% confidence .............................. 117
Table 5-11: ANOVA table showing the linear (L) and quadratic (Q) effects of methanol concentration (4)
as well as effects of interactions of methanol concentration with initial pH (1), operating temperature (2)
and resin concentration to surfactin concentration (RC/SC) ratio (3) on improvement in selectivity (IS) at
95% confidence ......................................................................................................................................... 120
Table 5-12: K and R2 values obtained from modelling the experimental data using the pseudo first-order
and pseudo-second order mode ............................................................................................................... 130
Table 5-13: Model parameters and R2 values obtained from modelling the experimental data using the
Langmuir and Freundlich models.. ............................................................................................................ 134
Table 8-1: Boiling points of solvents used in solvent extraction studies .................................................. 161
Stellenbosch University https://scholar.sun.ac.za
Page xxii of 173
Glossary and nomenclature
Acronyms
ATCC 21332 Strain of Bacillus subtilis
C/M (1:1) Mixture of chloroform and methanol in the volume ratio 1:1
C/M (2:1) mixture of chloroform and methanol in the volume ratio 2:1
CCC Circumscribed central composite design
CDW Cell dry weight
CMC Critical micelle concentration
FCC Face-centred central composite design
h/d ratio Column height to diameter ratio
HPLC High performance liquid chromatography
HPTLC High performance thin layer chromatography
ICC Inscribed central composite design
ILOD Instrument limit of detection
LOD Limit of detection
LOQ Limit of Quantification
MTBE Methyl tert-butyl ether
MWCO Molecular weight cut-off
PVDF Polyvinylidene fluoride
RC/SC ratio Resin concentration to surfactin concentration ratio
RP-HPLC Reversed phase- high performance liquid chromatography
TB Tuberculosis
Stellenbosch University https://scholar.sun.ac.za

Page xxiii of 173
Units
% (m/m) Mass percentage
% (v/v) or vol% Volume percentage
% (w/v) Percentage weight per unit volume
°C Degrees Celsius
g Gram
ga Grams of antifungals
gr Grams of resins
gs Grams of surfactin
gtl Grams of total lipopeptides
h Hours
KDa Kilodaltons
L Litre
mg Milligrams
mm Millimetres
mm2/g/L Square millimetres per grams per litre
nm Nanometres
rpm Revolutions per minute
Stellenbosch University https://scholar.sun.ac.za

Page xxiv of 173
Symbols
% Aantifungals Percentage of antifungals adsorbed during surfactin adsorption
% SA Percentage of surfactin adsorbed during surfactin adsorption
µ True values of measured surfactin concentrations (gs/L)
1/n Empirical constant
c Intraparticle diffusion constant (gs/gr)
Ca,e Equilibrium antifungals concentration after adsorption (gs/L)
Ca,i Antifungals concentration in adsorption liquid (ga/L)
CAi Antifungals concentration in supernatants (ga/L)
Cd Surfactin concentration in desorption liquid (gs/L)
Ce Equilibrium surfactin concentration after adsorption (gs/L)
Ci Surfactin concentration in adsorption liquid (gs/L)
CSi Surfactin concentration in supernatants (gs/L)
Ct Surfactin concentration at a particular time during adsorption (gs/L)
IS Factor by which surfactin selectivity over antifungals improved after
acid precipitation and adsorption
k1 First order kinetics model rate constant (1/h)
k2 Second order kinetics model rate constant [(gs/gr)2/h]
KF Freundlich constant [(gs/gr)(L/gs)1/n]
ki Intraparticle diffusion rate constant [(gs/gr)(1/h0.5)]
KL Langmuir constant (L/gs)
m First order kinetics model constant
M Mass of residue after adsorption (g)
Stellenbosch University https://scholar.sun.ac.za

Page xxv of 173
MAi Mass of antifungals in supernatants (ga)
MAp Mass of antifungals in precipitate after acid precipitation (ga)
MDS Mass of total solids extracted into solvents during solvent extraction (g)
MP Mass of dry precipitate after acid precipitation (g)
MS Mass of surfactin extracted into solvents during solvent extraction (gs)
MSi Mass of surfactin in supernatants (gs)
MSP Mass of surfactin in precipitate (gs)
PS Surfactin purity
qe ` Surfactin adsorption capacity at equilibrium (gs/gr)
qm Theoretical maximum surfactin adsorption capacity (gs/gr)
qt surfactin adsorption capacity at a particular time during adsorption
(gs/gr)
R2 Regression coefficient
RA Antifungals recovery
Rb Detergent to-lipid ratio in biological membrane
RS Surfactin recovery
S TLC standard curve slope (mm2/g/L)
SS Surfactin selectivity (gs/ga)
t Time (h)
Vd Volume of desorption liquid (L)
Vi Volume of adsorption liquid (L)
W Resin mass (g)
α Accuracy
Stellenbosch University https://scholar.sun.ac.za

Page xxvi of 173
β Precision
χ Average values of measured surfactin concentrations (gs/L)
Glossary
Integrated bioreactor Bioreactor with in situ recovery
Multiple spotting Adding a sample more than once on a particular spot on a TLC plate
with intermediate drying
Simulated supernatant Imitation of the media with used for surfactin production spiked with
bovine serum albumin and surfactin.
Surfactin selectivity Ratio of surfactin concentration to antifungals concentration in a
sample
Stellenbosch University https://scholar.sun.ac.za

Page 1 of 173
1 Introduction
This thesis provides detail on the purification of surfactin, produced by Bacillus subtilis ATCC 21332,
which can be used in the fight against tuberculosis (TB). TB, caused by Mycobacterium tuberculosis, is an
airborne disease that most often affects the lungs. According to World Health Organisation (WHO) data
reviewed in March 2016, TB is a major infectious killer disease globally. In 2014, TB resulted in 9 million
infections and 1.5 million deaths. TB is a global disease, but over 95% of cases and deaths are in
developing countries. The TB mortality in South Africa is 44 per one hundred thousand people in the
year 2014. Approximately a third of the world population has latent TB, and people with immune
systems compromised by factors such as HIV, malnutrition or diabetes and tobacco use have a much
higher risk of falling ill. HIV positive people are 20 to 30 times more likely to develop active TB disease,
and approximately 0.4 million people died of HIV-associated TB in 2014, while a third of HIV deaths in
2015 were due to TB (WHO, 2016).
TB is preventable and curable using standard anti-TB drugs, which have been around for decades,
provided these drugs are available and taken appropriately. However, some bacterial strains causing TB
have developed resistance to standard anti-TB drugs. TB caused by bacteria which is resistant to
isoniazid and rifampicin, which are the two most powerful standard anti-TB drugs, is called multidrug-
resistant tuberculosis (MDR-TB). The rise and proliferation of MDR-TB is primarily caused by
inappropriate use of anti-TB drugs, or use of poor quality medicines. There was a threefold increase new
cases of MDR-TB between 2009 and 2013, and approximately 480 000 new cases were reported in 2013.
MDR-TB can be treated with second-line drugs. Second-line treatment is however unreliable as it may
have limited treatment options and limited access to recommended medication (WHO, 2016).
Surfactin offers promise as an alternative antimicrobial agent against the organisms causing TB, with
potential effectiveness against MDR-TB (Das, et al., 2008). According to Heerklotz et al. (2004), surfactin
possesses the ability to lyse cell membranes as well as the ability to alter membrane permeability. This
can result in denaturing of M. tuberculosis, which causes TB. The use of surfactin as a drug is, however,
limited by its haemolytic activity. Surfactin can therefore be used for functions such as surface and
equipment sterilisation or in hand sanitizers. In this case, surfactin would be used to denature TB in
phlegm in order to reduce the TB causing bacteria released to the air. The use of surfactin in anti-
bacterial soaps can also be investigated as surfactin activity against cells is selective, and surfactin has a
low toxicity for mammalian cells thus may not be harmful to the skin (Vollenbroich, et al., 1997). In
Stellenbosch University https://scholar.sun.ac.za

Page 2 of 173
addition to antibacterial properties, surfactin has other properties such as antiviral (Vollenbroich, et al.,
1997) and antitumor properties (Kameda, et al., 1974).
Surfactin is a biosurfactant, and biosurfactants have both lipophilic and hydrophilic moieties. The
lipophilic group consists of a hydrocarbon chain of a fatty acid or sterol ring. The hydrophilic part
contains a carboxyl group (composed of fatty acids or amino acids), a phosphoryl group (composed of
phospholipids), and a hydroxyl group (composed of saccharides and peptides) (Kim, et al., 2004).
Surfactin is classified as a lipopeptide biosurfactant, and is the most powerful biosurfactant synthesized
by a linear, non-ribosomal peptide synthase to form a mixture of hepapeptides with a fatty acid chain
consisting of 13-16 carbon atoms (Jauregi, et al., 2013). The hepapeptide (L-Glu-L-Leu-D-Leu-L-Val-L-Asp-
D-Leu-L-Leu) part of surfactin has variable amino acids at positions 2, 4, and 7, where Glu is glutamic
acid, Leu is leucine, Val is valine, and Asp is aspartic acid (Yang, et al., 2015). Surfactin therefore has
numerous homologues. A typical structure of surfactin is shown in Figure 1-1.
Figure 1-1: Example of a surfactin structure (redrawn from Kosaric & Sukan (2014))
To use surfactin in its potential applications in the fight against TB, a cost-effective purification
technique for surfactin purification from B. subtilis cultures needs to be developed. The optimization of
surfactin purification techniques is highly dependent on surfactin concentration analysis. Reversed
phase-high performance liquid chromatography (RP-HPLC) has proven to be effective for surfactin
analysis, but it is not readily available due to its expensive nature. A cheaper but accurate method for
surfactin quantification is therefore needed. The first aim of this study was therefore to develop and
O
O Leu
H
H D-Leu N
H
O
NH
O O HN
Val
H O
H Leu
HN O
D-Leu N
H
O
N H
H
COO-
COO-
Glu
O H
H Asp
Stellenbosch University https://scholar.sun.ac.za
Page 3 of 173
validate an analytical technique for analysis of surfactin concentration. This would allow the second,
more significant aim, to be pursed. The second aim of this study was to propose a surfactin purification
strategy with operating conditions. The operating conditions would be obtained through optimization of
the proposed purification strategy.
This thesis first presents a literature review (chapter 2). The literature review consists of four parts. The
first and second parts provide a review on surfactin antibacterial properties and production strategies.
Production strategies were evaluated to determine an efficient strategy to produce surfactin for later
use in surfactin purification and analysis studies. The literature review then provides and evaluates
surfactin purification strategies, which was done in order to propose a suitable strategy for surfactin
purification. Since it was realized that the analysis of surfactin concentration is of high importance in
surfactin purification studies, the last part of the literature review provides an evaluation of strategies
for analysis of surfactin concentration in order to develop an appropriate method for surfactin analysis.
The hypotheses and specific objectives of this study are then presented in chapter 3, based on the
literature review. Methodologies for testing the hypotheses and carrying out the specific objectives are
then presented in chapter 4. The methodology section begins by detailing how surfactin was produced,
and how parameters for determining if surfactin production was efficient were obtained. The
methodology section then details how a thin layer chromatography (TLC) was developed for surfactin
concentration analysis. The methodology section then provides procedures for carrying out and
optimising the various proposed surfactin purification techniques (acid precipitation, solvent extraction
and adsorption) in order to recommend operating conditions for theses purification techniques. Lastly,
the methodology section provides procedures for analysis of various parameters (such as glucose
concentration and nitrate concentration).
The results as well as a discussion of the results obtained from the methodology section are then
provided in chapter 5. Finally, conclusions and recommendations based on the results and discussion are
provided in chapter 6. The conclusions evaluate whether the specific objectives were met and where the
hypotheses were validated. Recommendations provide suggestions on improvements that can be done
in future experiments in order to extend this study.
Stellenbosch University https://scholar.sun.ac.za

Page 4 of 173
2 Literature review
2.1 Antibacterial activity of surfactin
Surfactin has biological properties such as antiviral (Vollenbroich, et al., 1997), antibacterial (Heerklotz &
Seelig, 2007) and antitumor properties (Kameda, et al., 1974). Additionally, lipopeptide biosurfactants
with surfactin characteristics have antibacterial activity against multidrug-resistant bacteria (Das, et al.,
2008). Bence (2011) showed that surfactin has potential effectiveness against M. tuberculosis, where
Mycobacterium aurum was used as a surrogate of M. tuberculosis. The biological properties of surfactin
therefore hold promise for effectiveness against TB and MDR-TB causing organisms
Surfactin has a potential use in medical applications as it has selective antibacterial activity. Eeman et al.
(2006) suggested that surfactin activity is selective depending on the composition of the lipid matrix of
the target cell. Grau et al. (1999) found that surfactin perturbation was stronger in membranes which
have phospholipids with a shorter chain length. Snook et al. (2009) stated that surfactin is mainly
effective against Gram-negative bacteria although it is also effective against some Gram-positive
bacteria. A drawback against the use of surfactin in medical applications is that it has haemolytic activity
(Dufour, et al., 2005).
Various authors (Shen, et al., 2010; Deleu, et al., 2003; and Eeman, et al., 2006) have suggested that
surfactin biological activities were likely due to the ability of surfactin to interact with biological
membranes. According to Shen et al. (2010), surfactin was able to strongly interact with membranes due
to its high amphiphilic character. Surfactin (in solution) has peptide ring which has a horse-saddle
structure and a fatty acyl chain on the opposite end (Bonmatin, et al., 1992). The fatty acyl chain is
capable of extending into lipid bilayers resulting in interaction of surfactin with biological membranes
through hydrophobic interactions (Heerklotz & Seelig, 2001 and Maget-Dana & Ptak, 1995). Homologues
containing long chain fatty acid were seen to have stronger antimicrobial activities in comparison to
those with shorter chains (Dhanarajan, et al., 2016). Additionally, conic molecules with large head
groups have relatively higher constraints in the lipid packing thus more potent compared to rod like
molecules (Dufour, et al., 2005). Surfactin structure and hydrophobicity thus affect the antibacterial
activity of surfactin, hence different surfactin isoforms could have different antibacterial activities.
The interaction of surfactin with biological membranes results in membrane permeability changes
and/or membrane disruption (Heerklotz, et al., 2004). The molecular mechanism of surfactin activity
Stellenbosch University https://scholar.sun.ac.za

Page 5 of 173
against biological membranes is not fully understood, but numerous suggestions have been made. One
suggestion was that surfactin results in permeability changes in lipid bilayers in membranes by inducing
cationic pores in the membranes (Sheppard, et al., 1991), which results from the ability of surfactin to
bind with monovalent and divalent cations (Eeman, et al., 2006). The channel-forming activity can be
increased by the membrane dipole potential, which results in an increase in both the number of open
channels and their conductance (Ostroumova, et al., 2010). Surfactin membrane activity therefore partly
depends on presence of monovalent and divalent ions. It has also been suggested that the denaturing of
membranes by formation of ion-conducting pores is prominent at moderate surfactin concentrations,
while the detergent effect prevails at high concentrations (Bonmatin, et al., 2003).
It has been suggested that surfactin results in permeability changes and/or membrane disruption
through the detergent effect. Surfactin inserts into membranes, but has a preference for micelle
formation over membrane insertion (Heerklotz & Seelig, 2001). Surfactin thus forms micelles in the
membranes which result in pore formation in the membranes as well as leakages of the target cell
membranes (Heerklotz & Seelig, 2007 and Shen, et al., 2010). It was also proposed that surfactin
interacts with membranes by binding with the outer monolayer, before slowly moving to the inner
monolayer. The binding of surfactin with the outer monolayer therefore results in an asymmetric
increase in lateral pressure on the membrane. This causes the bilayer to bend, and may lead to
membrane disruption at a certain surfactin threshold concentration (Heerklotz & Seelig, 2001 and
Heerklotz & Seelig, 2007).
The solubilisation of target cell membranes by the detergent effect is induced by the detergent to-lipid
ratio in the membrane (Rb). Membrane leakage begins when Rb is approximately 0.05 and membrane
lysis or solubilisation begins when Rb is 0.22 and is completed when Rb is 0.43 (Heerklotz & Seelig, 2007).
The aqueous surfactin concentration thus determines the antibacterial activity of surfactin.
In addition to dependence on surfactin concentration, the antibacterial activity of surfactin is also
dependent on surfactin purity. Snook et al. (2009) noted that the antimicrobial activity of surfactin is
limited in environments with high protein and lipid concentrations. Mukherjee et al. (2009) found that
purified surfactin had a higher antimicrobial activity compared to impure surfactin at the same
concentration.
Stellenbosch University https://scholar.sun.ac.za
Page 6 of 173
2.2 Surfactin production
To take advantage of the uses and potential uses of surfactin, surfactin can be produced batch wise, fed-
batch wise or continuously in submerged bioreactor systems (Isa, et al., 2008). An ideal production
process is one that results in high surfactin quantity and selectivity. High surfactin selectivity is necessary
as it significantly reduces the cost and complexity of the downstream purification process (Rangarajan &
Clarke, 2016). Surfactin selectivity is the ratio of surfactin concentration to antifungals concentration in
supernatants of B. subtilis. B. subtilis produces two other lipopeptides (iturin and fengycin) in addition to
surfactin, which are also known as antifungals. These antifungals result in complexity of downstream
purification as they have an amphiphilic nature like surfactin thus present difficulty in separating from
surfactin (Dhanarajan, et al., 2015).
Studies of surfactin production from various Bacillus spp. (Bacillus amyloliquefaciens, Bacillus
licheniformis, Bacillus subtilis and Bacillus spizizenii) in literature are summarised in Table 2-1. The
studies in Table 2-1 were compared to determine optimal conditions for surfactin production. Ideal
production is one with relatively high final surfactin concentration in cultures after production and a
relatively low harvesting time. The maximum amount of surfactin was obtained in the study by Wei et
al. (2007) at some 3340 mg/L, although the harvesting time was not specified. The study by Chen et al.
(2006) produced surfactin in the shortest amount of time (24 h).
Stellenbosch University https://scholar.sun.ac.za

Page 7 of 173
Table 2-1: Summary of surfactin production studies in literature
Bacteria species Carbon and
nitrogen source
(g/L)
Trace elements and other elements
(g/L)
Reactor
type
Surfactin
(mg/L)
Production
duration
(h)
Source
B. subtilis BS5 Molasses: 160
(mL/L), NaNO3:
5
ZnSO4·7H2O: 0.16, FeCl3·6H2O: 0.27,
MnSO4·H2O: 0.017
Shake
flasks
1120 72 Abdel-Mawgoud,
et al., (2008b)
B. subtilis BBK006 0.2% C6H12O6,
NH4Cl: 1
NaCl: 5, MgSO4: 0.12, CaCl2: 0.11 Integrated
bioreactor
136 Chen, et al.,
(2006)
B. subtilis BBK006 0.2% C6H12O6,
NH4Cl: 1
NaCl: 5, MgSO4: 0.12, CaCl2: 0.11 Shake
flasks
92 24 Chen, et al.,
(2006)
B. subtilis ATCC 21332 C6H12O6: 40,
NH4NO3: 4
MgSO4: 0.096, CaCl2: 0.00078, FeSO4:
0.00061, Na2EDTA: 0.0015
Bioreactor 800 Cooper, et al.,
(1981)
B. subtilis ATCC 21332 C6H12O6: 10 - 40,
NH4NO3- 4
Not specified Bioreactor 439 48 Davis, et al.,
(1999)
B. subtilis LSFM-05 Glycerol: 50,
NaNO3: 3
NaCl: 0.1, MgSO4.7H2O: 0.5, Vitamin
stock solution
Bioreactor 930 60 De Faria, et al.,
(2011)
B. subtilis ATCC 21332 C6H12O6: 40,
NH4NO3: 4
CaCl2: 0.7, Na2EDTA: 0.0015 Shake
flasks
1500 72 Huang, et al.,
(2015)
B. amyloliquefaciens
MB199
Sucrose: 21,
NH4NO3: 2.5
MgSO4.7H2O: 0.2, MnCl2.4H2O:
0.002, yeast extract: 0.2
Shake
flasks
134 48 Liu, et al., (2012)
Stellenbosch University https://scholar.sun.ac.za
Stellenbosch University https://scholar.sun.ac.za

Page 8 of 173
B. amyloliquefaciens
DSM 23117
C6H12O6: 40;
NH4NO3: 4
MgSO4.H2O: 0.332, MnSO4.H2O:
0.0017, FeSO4.7H2O: 0.002,
CaCl2.4H2O: 0.001, yeast extract: 0.5
Bioreactor 249 32 Pretorius, et al.,
(2015)
B. licheniformis DSM
13
C6H12O6: 40;
NH4NO3-: 4
MgSO4.H2O: 0.332, MnSO4.H2O:
0.0017, FeSO4.7H2O: 0.002,
CaCl2.4H2O: 0.001, yeast extract: 0.5
Bioreactor 0 Pretorius, et al.,
(2015)
B. subtilis ATCC 21332 C6H12O6: 40;
NH4NO3-: 4
MgSO4.H2O: 0.332, MnSO4.H2O:
0.0017, FeSO4.7H2O: 0.002,
CaCl2.4H2O: 0.001, yeast extract: 0.5
Bioreactor 882 Pretorius, et al.,
(2015)
B. subtilis subs.
spizizenii
C6H12O6: 40;
NH4NO3: 4
MgSO4.H2O: 0.332, MnSO4.H2O:
0.0017, FeSO4.7H2O: 0.002,
CaCl2.4H2O: 0.001, yeast extract: 0.5
Bioreactor 36.5 Pretorius, et al.,
(2015)
B. subtilis ATCC 21332 C6H12O6: 40
NH4NO3: 4
CaCl2- 0.00078; FeSO4- 0.00061;
Na2EDTA- 0.0015 MnSO4- 0.0015
Shake
flasks
2600 120 Wei & Chu,
(2002)
B. subtilis ATCC 21332 C6H12O6: 40;
NH4NO3: 4
CaCl2-0.00078 FeSO4-0.61 Na2EDTA-
0.0015 MnSO4- 0.0015
Shake
flasks
3000 Wei, et al., (2004)
B. subtilis ATCC 21332 C6H12O6: 40;
NH4NO3: 4
CaCl2- 0.00078 Na2EDTA- 0.0015
MgSO4.7H2O- 0.2 FeSO4.7H2O- 0.083
MnSO4.H2O- 0.034
Shake
flasks
3340 Wei, et al., (2007)
Stellenbosch University https://scholar.sun.ac.za
Stellenbosch University https://scholar.sun.ac.za
Page 9 of 173
The quantity of and selectivity to surfactin achieved during production as well as the maximum
production time depends on various factors, such as the bacteria species used for production, nutrient
media, environmental conditions in which the bacteria species is grown and production mode. These
factors are discussed in section 2.2.1 to section 2.2.4.
2.2.1 Assessment of surfactin production by different bacterial species
Surfactin is produced biologically by several Bacillus spp. under certain types of media and process
conditions (Kosaric & Sukan, 2014), discussed in section 2.2.2 and 2.2.3. In a study by Pretorius et al.
(2015), the surfactin production efficiency of four Bacillus spp. (B. amyloliquefaciens DSM 23117, B.
licheniformis DSM 13, B. subtilis ATCC 21332 and B. subtilis subs. spizizenii) was determined by
comparing the surfactin quantity, yield and productivity by these different Bacillus spp. B. subtilis ATCC
21332 excelled in surfactin production efficiency as it gave better surfactin quantity and selectivity. B.
subtilis ATCC 21332 produced approximately 3.5 times more surfactin than B. amyloliquefaciens, while it
produced approximately 24 times more surfactin than B. licheniformis and B. subtilis subs. spizizenii did
not produce surfactin at all (Table 2-1). B. subtilis also produced the least antifungal concentration
among these species, hence relatively higher surfactin selectivity. B. subtilis produced approximately 5
times, 2 times and 1.5 times less antifungals compared to B. amyloliquefaciens, B. licheniformis and B.
spizizenii respectively (Pretorius, et al., 2015). B. subtilis ATCC 21332 is also commonly used for surfactin
production in literature (Table 2-1).
2.2.2 Effect of nutrient media on surfactin production
Surfactin production is also influenced by the nutrient composition of the production medium. Surfactin
can be produced from complex media, including those of agro-industrial wastes. Abdel-Mawgoud et al.
(2008a) produced surfactin at concentrations of 1.12 g/L using molasses as a carbon source (Table 2-1).
Complex media are relatively cheap, but may have high impurity loads. To avoid these high impurity
loads, chemically defined media are used. The use of chemically defined media allows effective process
modification, product consistency, ease of scale-up, lower impurity concentrations and better
adaptability of the system to different types and modes of bioreactor operation (Rangarajan & Clarke,
2016).
Chemically defined media mainly consist of a carbon source, nitrogen source and trace metals. Surfactin
is mainly produced from glucose and ammonium nitrate at concentrations of 40 g/L and 4 g/L as a
carbon and nitrogen sources respectively. Sucrose and glycerol have also been used as carbon sources in
Stellenbosch University https://scholar.sun.ac.za

Page 10 of 173
surfactin production (Table 2-1). The concentration of carbon and nitrogen sources affects surfactin
production. For example, an excess initial glucose concentration in the nutrient media can lead to
production of undesirable fermentative by-products such as acetates, lactates and 2,3-butanediol
(Rangarajan & Clarke, 2016).
The concentration of trace elements in nutrient media has a significant influence on surfactin
production. Metal cations (manganese (II), iron (II), magnesium and potassium ions) enhance surfactin
production. Manganese (II) ions promote the synthesis of nitrate reductase, hence the channelling of
more nitrate ions towards anaerobic metabolism during the oxygen-depleted product formation phase.
Iron (II) ions are growth stimulants and a cofactor for various enzymes involved in the formation of
lipopeptides. Addition of trace elements also has some drawbacks. The addition of iron (II) ions results in
the induction of the acid metabolite phthalic anhydride, which reduces the lipopeptide yield. Some
metal ions, such as zinc (II) ions, supress the growth of B. subtilis, while other metal ions (copper (II),
cobalt (II), nickel (II) and aluminium ions) can hinder B. subtilis growth. Metal ions of heavy metals are
likely to result in growth inhibition due to their toxic properties (Rangarajan & Clarke, 2016).
Surfactin production has been carried out using different media (Table 2-1). However, there is likely to
be an optimal medium specifically for surfactin production. There is currently more research being done
on the optimisation of nutrient media for surfactin production.
2.2.3 Effect of environmental conditions on surfactin production
Surfactin production is also affected by environmental conditions. These include temperature, pH,
agitation, dissolved oxygen concentration and the presence of particles (activated carbon and polymers)
in cultures during production (Ohno, et al., 1995; Makkar & Cameotra, 1997; Yeh, et al., 2006; Davis, et
al., 1999; Kim, et al., 1997; Chtioui, et al., 2010; Gancel, et al., 2009; Chen, et al., 2006 and Davis, et al.,
2001. Temperature affects the selectivity of the lipopeptide produced (Ohno, et al., 1995), and possibly
the rate at which surfactin is produced as an increase in temperature improves bacteria growth
(Ratkowsky, et al., 1982). B. subtilis strains produce more than one lipopeptide and Ohno et al. (1995)
found that iturin A was optimally produced at 25 °C while surfactin was optimally produced at 37 °C.
Although the optimum temperature for surfactin production is 37 °C, most studies on surfactin
production were carried out at 30°C (including Cooper, et al., 1981; Davis, et al., 1999 and Pretorius, et
al., 2015).
Stellenbosch University https://scholar.sun.ac.za

Page 11 of 173
For surfactin production using B. subtilis ATCC 21332, the pH of the cultures should be maintained
between 6 and 8.5. Surfactin precipitates at pH lower than 6, while no fermentation occurs at pH
greater than 8.5 (Liu, et al., 2007). Makkar & Cameotra (1997) found that the optimum pH for surfactin
production was pH 7, while Abushady et al. (2005) found that pH between 6.5 and 7 are optimum for
surfactin production. Abushady et al. (2005) also found that surfactin production continuously declined
when pH was decreased below 6.5 or increased above 7. The pH is expected to drop during production,
partly because of acidification resulting from the addition of iron (II) ions (Wei, et al., 2004). Most
studies use disodium hydrogen phosphate and potassium dihydrogen phosphate as buffers for
controlling pH during production, but sodium hydroxide has also been used. Cooper et al. (1981)
proposed 30mM KH2PO4, 40mM Na2HPO4, for controlling pH during surfactin production.
Agitation is necessary to ensure mixing during production. Additionally, an increase in agitation speed
results in an increase in the overall volumetric oxygen transfer coefficient, hence improveing surfactin
production (Yeh, et al., 2006). However, high agitation speeds result in increased shear on the
organisms, and may increase foam formation (Yeh, et al., 2006). According to Abushady et al. (2005), the
optimum agitation speed for surfactin production in shake flasks is 150 rpm.
The quantity of dissolved oxygen influences the selectivity of surfactin production. High oxygen transfer
conditions favour surfactin production while low to medium oxygen transfer conditions favour fengycin
production (Rangarajan & Clarke, 2016). Davis et al. (1999) and Kim et al. (1997) found that surfactin
was favoured in oxygen limited conditions. On the other hand, Pretorius et al. (2015) found that an
increase in dissolved oxygen enhanced surfactin production.
Particles such as activated carbon and polymers were found to improve lipopeptide production (Chtioui,
et al., 2010; Gancel, et al., 2009; and Yeh, et al., 2006). Yeh et al. (2006) reported an enhanced yield (36-
fold) of surfactin using B. subtilis through the incorporation of activated carbon in the growth medium
as activated carbon improved cell dry weight (CDW), hence surfactin yield. Chen et al. (2006) found that
the addition of activated carbon into B. subtilis cultures during production improved surfactin
production by in situ recovery (surfactin recovery during production). According to Drouin & Cooper
(1991), surfactin inhibits its own production by B. subtilis, resulting in poor yield. In situ recovery has
also been done by solvent extraction (Chtioui, et al., 2010) and foam fractionation (Chen, et al., 2006),
and these studies have also shown that in situ recovery improves surfactin production.
Stellenbosch University https://scholar.sun.ac.za

Page 12 of 173
Environmental factors (such as aeration, agitation and addition of particles in cultures during
production) also indirectly affect surfactin production as they can determine foam formation during
production. Foam formation negatively affects surfactin production (Chen, et al., 2006 and Davis, et al.,
2001). Foaming can result in undesirable stripping of product, nutrients, and cells into the foam.
Foaming may result in the need for antifoams or mechanical foam breakers, which would increase the
overall cost of the process. Chemical antifoams also reduce the oxygen transfer rate, affect cell
physiology and are potential impurities that may have to be removed in downstream separation (Davis,
et al., 2001).
2.2.4 Effect of mode of operation on surfactin production
Lipopeptide production can be carried out both in submerged and solid-state bioreactor systems. The
choice of a suitable strategy is influenced by numerous factors such as substrate availability, process
economics and the desired end application of the product. Submerged production systems have a
comparatively higher yield, easier to scale up and allow easier monitoring and control of process
parameters (Rangarajan & Clarke, 2016). Submerged cultivation can be carried out in batch, fed-batch
and continuous systems (Kosaric & Sukan, 2014).
Surfactin production studies are commonly carried out batch-wise in shake flasks or bioreactors (Table
2-1), where a bioreactor is defined as a controlled stirred fermenter. Bioreactors are more effective for
surfactin production in comparison to shake flasks as they produce more surfactin under similar
conditions. In a study by Chen et al. (2006), surfactin production was improved by approximately 1.5-
fold through the use of a bioreactor compared to using shake flasks (Table 2-1). Shake flasks, however,
have a major advantage in that they are relatively easier and cheaper to operate than bioreactors. Batch
production also has an advantage over fed-batch and continuous processes as they are relatively easy to
setup as there are no additional considerations such as feeding rates. Batch cultivation in shake-flasks is
therefore suitable for laboratory testing of production methodologies.
2.3 Surfactin purification from Bacillus cultures
During production, surfactin is secreted into the culture medium by the ubiquitous gram-positive rod-
shaped Bacillus spp. (Kosaric & Sukan, 2014). The fact that surfactin is an extracellular product is critical
in determining the concentration and purification techniques of surfactin. The concentration and
purification of surfactin from Bacillus cultures may be necessary depending on the intended surfactin
application. For example, applications such as treatment of heavy metals wastewater do not require a
Stellenbosch University https://scholar.sun.ac.za

Page 13 of 173
high biosurfactant purity (Das, et al., 2009) while applications such as medical and cosmetic industries
require high surfactin purity and conformity requirements are higher (Dhanarajan, et al., 2015).
Surfactin recovery can be achieved through downstream purification, and a single downstream
processing unit operation is often not sufficient for bio-product recovery with a high purity. A sequence
of downstream unit operations may therefore be required (Chen, et al., 2008c).
The mechanism of downstream separation techniques depends on surfactin properties such as ionic
charge, solubility in water, hydrophilicity, size, micelle forming ability, foam forming ability, polarity,
molecular weight, and molecular shape (Kosaric & Sukan, 2014; Chen & Juang, 2008b and Wang, et al.,
2010). These properties mainly arise due to the amphiphilic nature of surfactin. Surfactin is an
amphiphilic molecule as it consists of two parts, which are a polar (hydrophilic) group and a non-polar
(hydrophobic) group (Kuyukina & Ivshina, 2010).
The mechanism of downstream techniques also depends on the type and concentration of impurities in
cultures after production. During surfactin production from B. subtilis, it has been reported that
supernatants (before acid precipitation) contain macromolecules (surfactin micelles, polysaccharides,
peptides, and proteins), midmolecules and small molecules (mineral salts medium, alcohols, phthalic
acid, amino acids, glycine, serine, threonine, and alanine) (Chen & Juang, 2008a). B. subtilis also
produces iturin and fengycin, which present a difficulty in surfactin purification as they have an
amphiphilic nature like surfactin (Dhanarajan, et al., 2015).
Downstream purification techniques for lipopeptide purification include phase separation, extraction,
foam fractionation, precipitation, adsorption, chromatography as well as ultrafiltration and
nanofiltration (Chen, et al., 2008c). The method or combination of methods for surfactin recovery must
be cautiously selected as they constitute a significant portion (approximately 60%) of the economics of
the whole process of biosurfactant production (Chen & Juang, 2008b). Lastly, the applicability to large
scale recovery should be considered in selection of downstream processes (Chen & Juang, 2008b). It
may be necessary to use a combination of downstream separation techniques for surfactin purification.
More separation steps, however, could mean more equipment hence high capital and production costs
and reduced surfactin recovery.
2.3.1 Phase separation
The first step in the downstream purification of a bioproduct excreted into the growth medium is usually
the removal of insoluble impurities such as cells from cultures. Phase separation in bioprocess cultures
Stellenbosch University https://scholar.sun.ac.za

Page 14 of 173
depends on liquid viscosity, density differences as well as cell size and shape. Bioprocess cultures may
have properties which may render phase separation difficult, such as high viscosities, gelatinous
materials, compressible filter cakes, low density differences compared to water and a high degree of
initial dispersion and diluteness of particulate suspension. Pre-treatment may be necessary prior to
solid-liquid phase separation. Such pre-treatment may include aging, which acts to cluster cells in later
stationary phase where their density increases relative to water, heat treatment, pH treatments and the
addition of chemicals which aid flocculation (Dutta, 2008). Palme et al. (2010) showed that ultrasonic
waves can be used to agglomerate cells, such that they can be recovered by sedimentation. Phase
separation can also be, and is most commonly, carried out by centrifugation and filtration.
Filtration separates solid particles from cultures by forcing the fluid through a filtering medium which
allows the liquid to pass while solids are retained (Dutta, 2008). Filtration can be divided into cross-flow
and dead-end filtration. Cross-flow filtration is recommended in bioprocesses as the tangential flow
along the filter medium minimizes and controls filter cake formation, which can limit liquid flux when
such small particles as cells are being filtered out. The efficiency of filtration depends on cell shape and
size as well as the fluid viscosity (Kosaric & Sukan, 2014). Filtration in bioprocessing is however affected
by the presence of proteins in solution. Although filter pores can be an order of magnitude larger than
the solubilised proteins, severe pore plugging by proteins often still occurs during filtration (Marshall &
Munro, 1993).
Centrifugation can be used in situations where filtration is ineffective, such as in the case of small
particles. Centrifugation however requires more expensive equipment and greater operating costs than
filtration and typically cannot be scaled up to achieve the capacity of filtration equipment.
Centrifugation separates solids by enhancing settling velocities of particles by centrifugal forces, and
depends on density differences of the phases being separated (Dutta, 2008). Centrifugation is commonly
used for removal of biomass after surfactin production, and is affected by rotation speed. A
centrifugation speed of 10000 rpm is commonly used for biomass removal (Chen & Juang, 2008b and
Mubarak, et al., 2014) in B. subtilis ATCC 21332 cultures. Centrifugation is also affected by temperature.
Low temperatures cause cells to agglomerate, hence more easily removed by centrifugation (Kosaric &
Sukan, 2014).
2.3.2 Precipitation
The solubility of organic solutes depends on the solution properties such as temperature, pH,
composition, ionic strength and dielectric constant. Any alteration of these properties may result in
Stellenbosch University https://scholar.sun.ac.za
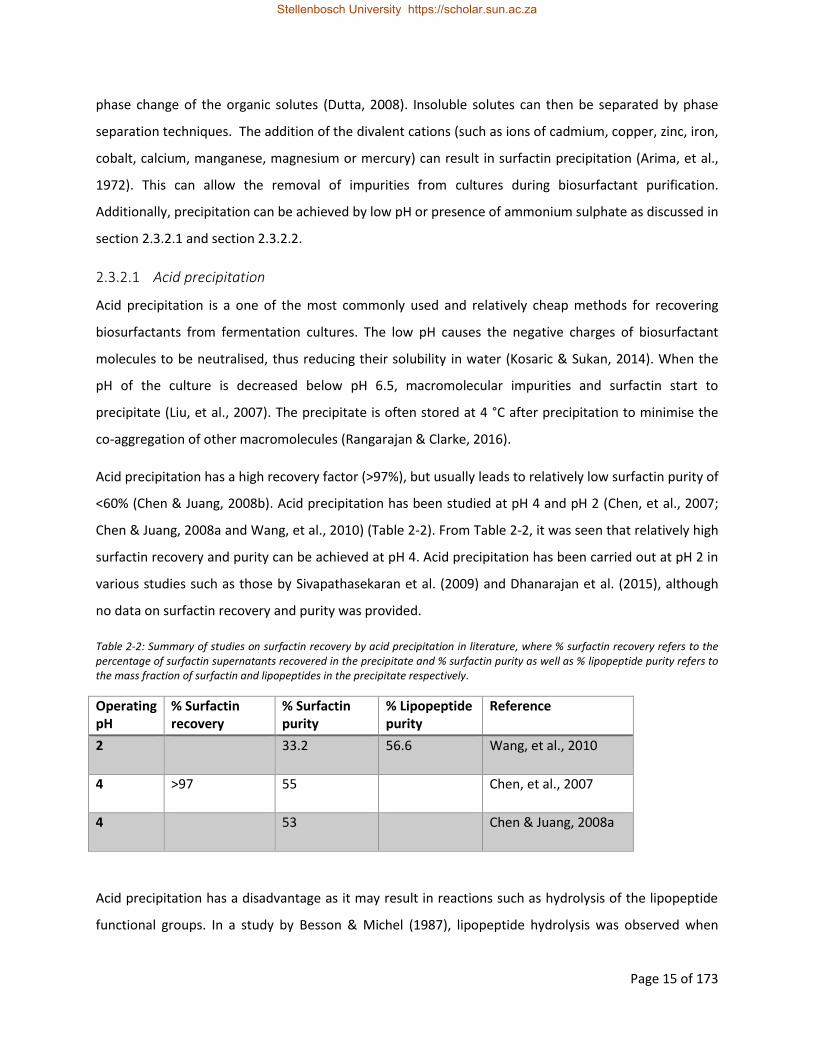
Page 15 of 173
phase change of the organic solutes (Dutta, 2008). Insoluble solutes can then be separated by phase
separation techniques. The addition of the divalent cations (such as ions of cadmium, copper, zinc, iron,
cobalt, calcium, manganese, magnesium or mercury) can result in surfactin precipitation (Arima, et al.,
1972). This can allow the removal of impurities from cultures during biosurfactant purification.
Additionally, precipitation can be achieved by low pH or presence of ammonium sulphate as discussed in
section 2.3.2.1 and section 2.3.2.2.
Acid precipitation 2.3.2.1
Acid precipitation is a one of the most commonly used and relatively cheap methods for recovering
biosurfactants from fermentation cultures. The low pH causes the negative charges of biosurfactant
molecules to be neutralised, thus reducing their solubility in water (Kosaric & Sukan, 2014). When the
pH of the culture is decreased below pH 6.5, macromolecular impurities and surfactin start to
precipitate (Liu, et al., 2007). The precipitate is often stored at 4 °C after precipitation to minimise the
co-aggregation of other macromolecules (Rangarajan & Clarke, 2016).
Acid precipitation has a high recovery factor (>97%), but usually leads to relatively low surfactin purity of
<60% (Chen & Juang, 2008b). Acid precipitation has been studied at pH 4 and pH 2 (Chen, et al., 2007;
Chen & Juang, 2008a and Wang, et al., 2010) (Table 2-2). From Table 2-2, it was seen that relatively high
surfactin recovery and purity can be achieved at pH 4. Acid precipitation has been carried out at pH 2 in
various studies such as those by Sivapathasekaran et al. (2009) and Dhanarajan et al. (2015), although
no data on surfactin recovery and purity was provided.
Table 2-2: Summary of studies on surfactin recovery by acid precipitation in literature, where % surfactin recovery refers to the percentage of surfactin supernatants recovered in the precipitate and % surfactin purity as well as % lipopeptide purity refers to the mass fraction of surfactin and lipopeptides in the precipitate respectively.
Operating pH
% Surfactin recovery
% Surfactin purity
% Lipopeptide purity
Reference
2 33.2 56.6 Wang, et al., 2010
4 >97 55 Chen, et al., 2007
4 53 Chen & Juang, 2008a
Acid precipitation has a disadvantage as it may result in reactions such as hydrolysis of the lipopeptide
functional groups. In a study by Besson & Michel (1987), lipopeptide hydrolysis was observed when
Stellenbosch University https://scholar.sun.ac.za

Page 16 of 173
lipopeptides were exposed to HCl at temperatures greater than 105 °C. There is therefore a possibility
that no hydrolysis occurs acid precipitation is carried out at room temperature. Acid precipitation can
also result in esterification of lipopeptides (Desjardine, et al., 2007).
Salting out 2.3.2.2
Ammonium sulphate salting out is mainly used for protein purification, but has also been used for
surfactin purification. The addition of ammonium sulphate to bioprocess cultures causes water
molecules to bind to sulphate ions. This reduces the amount of water molecules available to bind with
protein molecules, resulting in precipitation of the proteins which are not hydrated by binding to water
molecules. Ammonium sulphate is a common salt for salting out since it is highly soluble in water,
relatively cheap, and does not denature proteins (Chen, et al., 2008b). A disadvantage of salting out is
that the salts added act as an impurity in the surfactin produced. Subsequent purification may therefore
be required after salting out to remove the salts resulting in increased overall purification costs.
Additionally, is not attractive as it results in co-precipitation of proteins (Rangarajan & Clarke, 2016).
Chen et al. (2008b) studied surfactin recovery from a B. subtilis culture by ammonium sulphate salting
out. The surfactin was co-precipitated with protein molecules in the bioprocess cultures, and a
maximum purity and recovery of 61% and 80% were obtained respectively. Chen et al. (2008b) also
studied ammonium sulphate salting out after destabilising surfactin micelles using ethanol at a
concentration of 33% (v/v). This method improved the purity and recovery to 69% and 92% respectively.
The optimum ammonium sulphate concentration was 23% w/v.
2.3.3 Foam fractionation
The foam foaming ability of surfactin can be useful for surfactin recovery by foam fractionation. Foaming
occurs more readily at surfactin concentrations exceeding the critical micelle concentration (CMC)
(Chen, et al. 2006), When gas bubbles are passed through bioprocess cultures, surfactin binds to the
surface of the gas bubbles due to its surface activity. The bubbles are then removed from the system as
foam to recover the surfactin (Stevenson & Li, 2014). Foaming is particularly attractive as it is most
efficient when dilute solutions are used, cheap to operate and can be used in the presence of biomass
thus does not need an extra centrifugation step for biomass removal (Davis, et al., 2001). Since surfactin
can be recovered in the presence of biomass, foam fractionation can be used to recover surfactin during
production (in situ recovery). Surfactin can also be recovered after production (ex situ recovery).
Stellenbosch University https://scholar.sun.ac.za

Page 17 of 173
In situ recovery of surfactin by foam fractionation is capable of achieving high recoveries (≥90%) (Chen,
et al., 2006 and Noah, et al., 2002). However, no data on purity has been provided for surfactin recovery
by foam fractionation. Chen et al. (2006) found that in-situ foam fractionation has a surfactin
enrichment (the ratio of surfactin concentration in the foam to the surfactin concentration in the
remaining liquid after foam fractionation) of approximately 50.
Davis et al. (2001) studied ex-situ recovery of surfactin from Bacillus cultures by foam fractionation, and
high recoveries (up to 95%) were obtained. In the study by Davis et al. (2001), it was noticed that the
presence of cells in the cultures increased surfactin recovery since cells improved the foam forming
ability of the solution, thus more liquid was carried up into the foam. Maximum surfactin enrichments of
8.4 and 51.6 were obtained from cell-free and cell containing systems respectively.
A disadvantage of foam fractionation is that it is not possible to simultaneously attain the maximum
surfactin recovery and maximum surfactin enrichment. Davis et al. (2001) found that the maximum
surfactin enrichment was obtained in the latter stages of foaming, where a low volume of liquid was
collected in the foam per unit time hence the recovery was relatively low. At the initial stages of foam
fractionation, a high surfactin recovery was attained. The high surfactin recovery was, however,
accompanied by relatively high impurity content in the foam resulting in low surfactin enrichment
(Davis, et al., 2001). According to Chen & Juang (2008b), the major problem of this separation technique
is that it leads to relatively low biosurfactant purity.
2.3.4 Solvent extraction
Solvent extraction purifies surfactin by selectively extracting surfactin in impure mixtures into solvents,
and then recovering the purified surfactin from solvents. The selectivity of the extraction solvent toward
surfactin and impurities is therefore critical for purification by solvent extraction. Surfactin can dissolve
in organic solvents as it has a hydrophobic end (Chen & Juang, 2008b). Organic solvents have selective
extraction of surfactin from culture supernatants or acid precipitates as they improve the purity of
surfactin after extraction. Selective extraction is due to different solubilities of surfactin and impurities
in different organic solvents. (Chen & Juang, 2008a; Chen & Juang, 2008b and Juang, et al., 2012).
Surfactin recovery by solvent extraction has been carried out by various strategies (solid-liquid
extraction, liquid-liquid extraction, chemical assisted extraction, pertraction and non-dispersive
extraction) (Table 2-3). Solid-liquid extraction refers to mixing impure surfactin in solid form with an
organic solvent to dissolve the surfactin, while dissolving relatively fewer impurities (Chen & Juang,
Stellenbosch University https://scholar.sun.ac.za
Page 18 of 173
2008b). Liquid-liquid extraction refers to mixing impure surfactin in aqueous form with organic solvents.
The surfactin is then extracted into the organic solvents while impurities are left in the aqueous phase.
The organic solvent is usually insoluble in water to allow easy separation of the organic and aqueous
phases. If an organic solvent soluble in water is used, it is then separated from the aqueous phase by
centrifugation (Geisslera, et al., 2017 and Chen & Juang, 2008a).
Liquid-liquid extraction has been improved by addition of chemicals in the aqueous phase to assist
extraction of surfactin into the organic solvents (Chen & Juang, 2008b and Juang, et al., 2012). This is
referred to as chemical assisted extraction. Liquid-liquid extraction can also be carried out by
pertraction, where surfactin is extracted from the aqueous surfactin mixture into an organic solvent
before being transferred to a receiving aqueous phase (section 2.3.4.4). Lastly, liquid-liquid extraction
can be done by non-dispersive extraction, where extraction is carried out in microporous membrane
(section 2.3.4.5).
Solvent extraction has some draw backs. This process may result in excessive usage and waste of
solvents resulting in increased operating costs, and organic solvents have environmental impacts which
need to be considered. Additional equipment is usually needed for solvent regeneration, and high
temperature recovery may be necessary which consumes energy (Kosaric & Sukan, 2014). Solvent
extractions are slow processes as a low agitation speed (<250 rpm) may be required during extraction to
avoid excessive foam formation (Chen & Juang, 2008a). Additionally, solvent extraction can result in
esterification of lipopeptide functional groups (Besson & Michel, 1987). According to Zhao et al. (2013),
surfactin is spontaneously esterified in methanol solutions with acids due to the presence of carboxyl
groups in the surfactin structure. Desjardine et al. (2007) studied the efficacy of a lipopeptide
(tauramamide) after estirification. They found that estirification does not affect the minimum inhibitory
concentration of the lipopeptide, but the potency of the lipopeptide was reduced.
Solvent extraction has advantages as it is relatively less complex compared to ultrafiltration and
adsorption. Solvent extraction does not require high pressure operation and is not affected by plugging
of filter membranes like ultrafiltration. Additionally, it is relatively cheaper than chromatography
techniques (Kosaric & Sukan, 2014).
Surfactin recovery by solvent extraction has been studied extensively in literature (Table 2-3). The ideal
process and solvents for solvent extraction are those that simultaneously achieve a high surfactin
recovery and purity. From Table 2-3, it can be seen that chemical assisted extraction using n-hexane as a
Stellenbosch University https://scholar.sun.ac.za

Page 19 of 173
solvent is the best process for solvent extraction as it achieved the highest surfactin purity (91%), while
the recovery it achieved (>96%) is comparable to the maximum recovery in solvent studies in literature
(99.6%). The surfactin purity and recovery achieved by solvent extraction is influenced by various factors
(e.g. solvent type, chemical assistance), which are discussed in section 2.3.4.1 to section 2.3.4.5.
Stellenbosch University https://scholar.sun.ac.za

Page 20 of 173
Table 2-3: Summary of studies on surfactin recovery by solvent extraction in literature, where % purity refers to the mass percentage of surfactin in the purified surfactin while % recovery refers to the percenage of surfactin recovered into solvents during extraction
Solvent Extraction type Solvent Pre-purification
stages
% Purity % Recovery Reference
Non-dispersive solvent extraction n-hexane Acid precipitation 78 60 Chen & Juang, 2008a
Liquid-liquid extraction Chloroform:methanol
(2:1, v/v)
None 99.6 Geisslera, et al., 2017
Liquid-liquid extraction Ethyl acetate Acid precipitation 58-60 99 Chen
& Juang, 2008b
Liquid-liquid extraction n-hexane Acid precipitation 58-60 21 Chen & Juang, 2008b
Solid-liquid extraction Ethyl acetate Acid precipitation 84 78 Chen & Juang, 2008b
Solid-liquid extraction n-hexane Acid precipitation 60 62 Chen & Juang, 2008b
Chemical assisted extraction n-hexane Acid precipitation 70 95 Chen & Juang, 2008b and
Juang, et al., 2012
Chemical assisted extraction n-hexane Acid precipitation 70 98 Chen & Juang, 2008b and
Juang, et al., 2012
Pertraction n-heptane 97 Dimitrov, et al., 2008
Chemical assisted extraction
(TOA)
n-hexane Acid precipitation 85 >96 Juang, et al., 2012
Chemical assisted extraction
(TOA, NaCl)
n-hexane Acid precipitation 91 >96 Juang, et al., 2012
Stellenbosch University https://scholar.sun.ac.za
Stellenbosch University https://scholar.sun.ac.za
Page 21 of 173
Effect of solvent and surfactin polarity on solvent extraction 2.3.4.1
Surfactin purification by solvent extraction is dependent on solvent and surfactin polarity. Surfactin is an
amphiphilic molecule, and the polar and non-polar groups of the molecule interact very differently with
polar solvents and non-polar solvents (Alexandridis & Lindman, 2000). The non-polar lipid part
contributes to high solubility in organic solvents (Yang, et al., 2015). The polarity of surfactin is
dependent on pH. According to Liu et al. (2015), the micropolarity of surfacitn increases with a decrease
in pH.
Surfactin is mainly soluble in polar solvents, but it is partially soluble in some non-polar solvents.
Surfactin is soluble in alkaline water, acetone, methanol, ethanol, n-propanol, i-propanol, n-butanol, i-
butanol, t-butanol, ethyl acetate, chloroform, methylene chloride, dioxane, benzene, tetrahydrofuran,
dimethylformamide and glacial acetic acid (Arima, et al., 1972). Surfactin is insoluble or sparingly soluble
in carbon tetrachloride, petroleum ether, ligroin, petroleum benzene, hexane and cyclohexane.
Surfactin is also soluble in ether but gradually precipitates, sometimes becoming a gel (Arima, et al.,
1972).
Organic solvents such as methanol, ethanol, butanol, diethyl ether, n-pentane, n-hexane, ethyl acetate,
acetone, acetic acid, chloroform, and dichloromethane have been used, either single or in combination
for biosurfactant purification by solvent extraction. The most effective solvent for surfactin extraction
would be the mixture of chloroform and methanol in various ratios, which allows the polarity of the
extraction to be varied to target the extractable material (Kosaric & Sukan, 2014). Due to environmental
and safety considerations, chloroform is not attractive due to its high toxicity (Chen & Juang, 2008b).
Ethyl acetate and methyl tert-butyl ether (MTBE) are better alternatives for chloroform as polar solvents
and n-heptane may be safer than n-hexane as a nonpolar solvent (Kosaric & Sukan, 2014).
Chen & Juang (2008b) studied liquid-liquid extraction of surfactin from cultures pre-treated by acid
precipitation using equal volumes of the organic solutions n-hexane and ethyl acetate (Table 2-3). It
should be noted that n-hexane is non-polar, while ethyl acetate is polar. From this study, the solvent
polarity had a significant effect on surfactin recovery as the recovery was higher when ethyl acetate was
used as a solvent (≥95%) compared to when n-hexane was used (21%). Polar solvents therefore recover
more surfactin than non-polar solvents. Solvent polarity did not have a significant effect on surfactin
purity after solvent extraction, as the final purity was approximately 60% when either ethyl acetate or n-
hexane was used as a solvent. The similar purities mean that polar solvents recover more surfactin and
Stellenbosch University https://scholar.sun.ac.za
Page 22 of 173
more impurities, while non-polar solvents recover less surfactin and less impurities. Polar solvents are
therefore preferable for solvent extraction due to their high recoveries.
The low recovery in non-polar solvents can be improved by replacing the organic solvent used for
extraction with a fresh one during extraction. This is referred to as repeated extraction. Chen & Juang
(2008b) did repeated extraction to improve the surfactin recovery from n-hexane by solid liquid
extraction, and the surfactn recovery improved from 59% and a purity of 62%. Repeated extraction,
however, did not improve surfactin recovery when ethyl acetate was used as a solvent (Geisslera, et al.,
2017). The actual values of the recovery were, however, not reported in the study by Geisslera et al.
(2017).
Effect of the nature of mixture being purified on solvent extraction 2.3.4.2
‘Nature of mixture being purified’ refers to the surfactin and impurity composition in the mixture,
whether the mixture is in solid or liquid state, as well as the presence of bacterial cells in the mixture
being purified. The surfactin and impurity composition can depend on the bacteria species and strain
used for production and the pre-purification the mixture has already undergone. Geisslera et al. (2017)
studied surfactin recovery from cultures of B. amyloliquefaciens and B. methylotrophicus by solvent
extraction using chloroform:methanol (2:1, v/v) as a solvent. The recovery when surfactin was produced
from B. amyloliquefaciens (96.5%) was different to that obtained when surfactin was produced from B.
methylotrophicus (99.6%), although it cannot be determined if these values are significantly different at
a 95% confidence interval based on the given data.
Solvent extraction can be used to recover surfactin from a solid (precipitate) or liquid (solubilised
precipitate and cell-free supernatants after production). Purification of surfactin in liquid mixtures by
solvent extraction is referred to as liquid-liquid extraction, and solid-liquid extraction if surfactin is in
solid mixtures. Solid-liquid extraction has an advantage over liquid-liquid extraction as it does not result
in foam formation, which results in an emulsion after liquid-liquid extraction (Chen & Juang, 2008b).
Geisslera et al. (2017) found, through preliminary studies, that higher overall surfactin recoveries are
achievable when extraction is done directly on cell-free supernatant rather than after acid precipitation.
Chen & Juang (2008b) studied both liquid-liquid extraction and solid-liquid extraction under the same
conditions, using n-hexane and ethyl acetate as solvents (Table 2-3). When ethyl acetate was used as a
solvent, a higher surfactin recovery was achieved in liquid-liquid extraction (99%) than in solid-liquid
extraction (78%). A lower purity (60%) was achieved for liquid-liquid extraction compared to that
Stellenbosch University https://scholar.sun.ac.za

Page 23 of 173
achieved by solid-liquid extraction (84%). When n-hexane was used as a solvent, the maximum recovery
achieved in liquid-liquid extraction (21%) was lower than that in solid-liquid extraction (62%), while the
purities were comparable at approximately 60% (Table 2-3). Solid-liquid extraction is therefore more
efficient in terms of recovery for polar solvents, while liquid-liquid extraction is more efficient for non-
polar solvents (Chen & Juang, 2008b).
Liquid-liquid extraction can be used for surfactin recovery in the presence of cells in the aqueous phase.
Liquid-liquid extraction can thus be used to recover surfactin during surfactin production. Drouin &
Cooper (1991) attempted to extract surfactin during batch production using an aqueous two-phase
system based on polyethylene-glycol (PEG) and dextran in the presence of sodium phosphate. The cells
were seen to partition to the lower dextran rich-phase while surfactin dissolved in preferably in the
upper PEG-rich phase during cultivation. The presence of sodium phosphate causes surfactants to
distribute according to charge, thus the anionic surfactin was partitioned to the top phase. The study by
Drouin & Cooper (1991) improved surfactin production, but no data on purity and recovery of the
recovered surfactin was provided.
Effect of ultrasound and chemical assistance on solvent extraction 2.3.4.3
Lipopeptide extraction can also be assisted using ultrasonic waves (Yuan, et al., 2012), but this has not
yet been studied for surfactin purification. Surfactin extraction can also be assisted by the addition of
the chemicals (tri-n-octylmethylammonium chloride (Aliquat 336) and tri-n-octylamine (TOA)) in the
aqueous phase. This is known as chemical assisted extraction or reverse miceller extraction as the added
chemicals cause surfactin to form reverse micelles in the aqueous phase. Chemical assisted extraction
consists of an extraction step (where surfactin is extracted from supernatants into an organic phase) and
a stripping step (where surfactin is stripped from the organic phase into water).
Chen & Juang (2008b) and Juang et al. (2012) studied surfactin purification by chemical assisted
extraction using n-hexane as the solvent. Chemical assisted extraction achieved surfactin recoveries of
approximately 95% and 98% when Aliquat 336 and TOA were used respectively (Chen & Juang, 2008b).
This is greater than the extraction achieved when hexane was used as a solvent in conventional liquid-
liquid extraction (21%) (Table 2-3). The extraction step was seen to be positively influenced by the
presence of methanol (which results in disruption of micelles) and the increase in pH in the aqueous
phase (which affects surfactin charge). The presence of 10% (v/v) methanol in the aqueous phase
improved surfactin recoveries improved from 73% to 95%, while an increase in pH from 7 to 10
increased recoveries from 87% to 92% (Chen & Juang, 2008b).
Stellenbosch University https://scholar.sun.ac.za
Page 24 of 173
The stripping step recovers surfactin from the organic phase, and can be promoted by the presence of
alcohols (as they disrupt micelles) and salts (as increased ionic strength results in thinner double-electric
layers and smaller inner diameters of the reverse micelles) in the stripping solution. The surfactin purity
after purification by chemical assisted extraction can reach up to about 70% (Chen & Juang, 2008b and
Juang, et al., 2012). This is greater than that obtained through acid precipitation (53%) and conventional
solvent extraction with n-hexane and ethyl acetate (58–60%). In studies by Chen & Juang (2008b) and
Juang et al. (2012) sodium chloride and ammonium sulphate salts were studied for surfactin stripping in
the presence of methanol, and ammonium sulphate had similar surfactin stripping (88%) compared to
sodium chloride (approximately 90%).
Although chemical assistance improves surfactin recovery and purity, it has two major drawbacks.
Firstly, the additional step of extracting surfactin from the organic solvent results in increased
equipment and operating costs. Secondly, the chemicals added may be toxic, and they may not be fully
removed from the surfactin after the stripping step (Chen & Juang, 2008b and Dimitrov, et al., 2008). To
avoid these drawbacks, extraction can be carried out in liquid membrane extraction which combines
both extraction and stripping steps and does not require chemical assistance.
Effect of liquid membranes on solvent extraction 2.3.4.4
Liquid membrane extraction (also known as pertraction) consists of two aqueous phases separated by
an organic phase which is insoluble in both aqueous phases (Figure 2-1). Surfactin is extracted from the
aqueous feed solution into the organic phase. This results in a surfactin concentration gradient between
the organic phase and the receiving solution, hence surfactin is stripped from the organic phase into the
receiving aqueous phase.
Dimitrov et al. (2008) studied surfactin recovery by pertraction using n-heptane as the organic phase,
and found a surfactin recovery of 97%. This is higher than recoveries obtained in conventional liquid-
liquid extraction or solid liquid extraction when a non-polar solvent was used, hence pertraction
improved surfactin recovery. In addition to improving surfactin recovery, pertraction allows continuous
regeneration of the organic solvent thus less use of organic solvents (Dimitrov, et al., 2008).
Unlike the study by Chen et al. (2008b), the study by Dimitrov et al. (2008) showed that an increase in
pH reduced surfactin recovery. The recovery improved from 83% to 97% when the pH was reduced from
6.05 to 5.65. The low pH in the feed solution favours the formation of β-sheet micelles, which allow
surfactin transfer and accumulation into the organic phase (Dimitrov, et al., 2008).
Stellenbosch University https://scholar.sun.ac.za
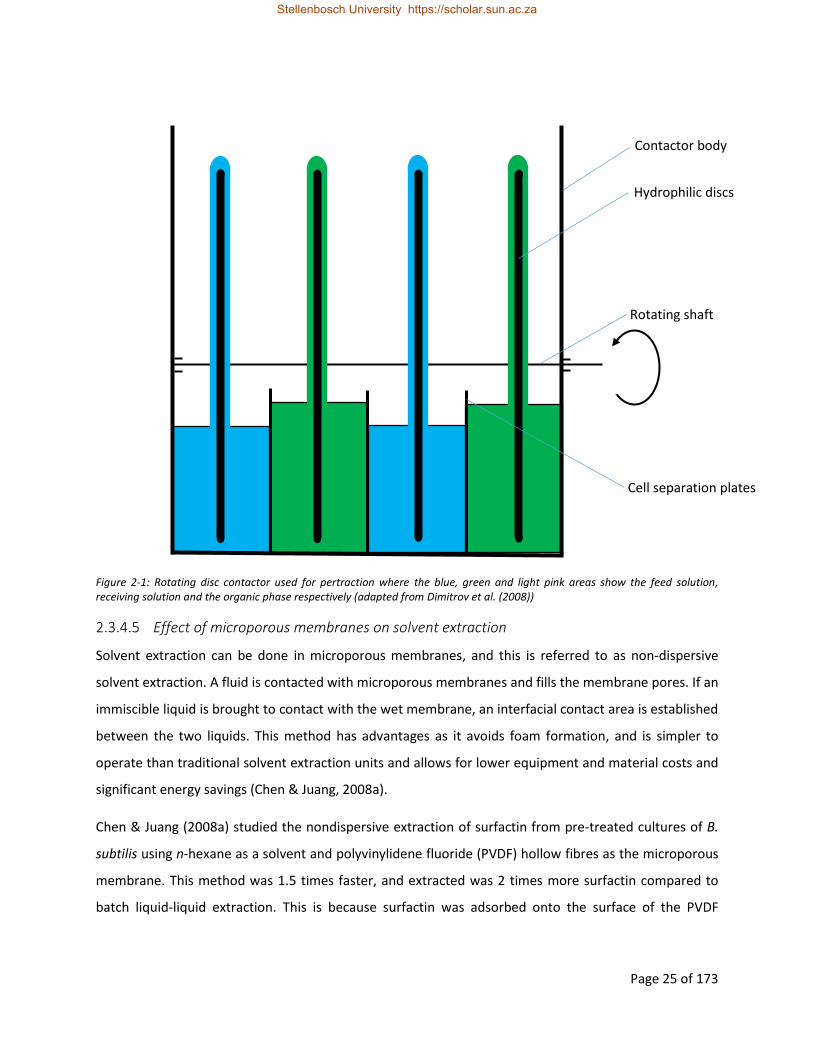
Page 25 of 173
Figure 2-1: Rotating disc contactor used for pertraction where the blue, green and light pink areas show the feed solution, receiving solution and the organic phase respectively (adapted from Dimitrov et al. (2008))
Effect of microporous membranes on solvent extraction 2.3.4.5
Solvent extraction can be done in microporous membranes, and this is referred to as non-dispersive
solvent extraction. A fluid is contacted with microporous membranes and fills the membrane pores. If an
immiscible liquid is brought to contact with the wet membrane, an interfacial contact area is established
between the two liquids. This method has advantages as it avoids foam formation, and is simpler to
operate than traditional solvent extraction units and allows for lower equipment and material costs and
significant energy savings (Chen & Juang, 2008a).
Chen & Juang (2008a) studied the nondispersive extraction of surfactin from pre-treated cultures of B.
subtilis using n-hexane as a solvent and polyvinylidene fluoride (PVDF) hollow fibres as the microporous
membrane. This method was 1.5 times faster, and extracted was 2 times more surfactin compared to
batch liquid-liquid extraction. This is because surfactin was adsorbed onto the surface of the PVDF
Cell separation plates
Contactor body
Hydrophilic discs
Rotating shaft
Stellenbosch University https://scholar.sun.ac.za

Page 26 of 173
hollow fibres, and then transferred to the organic phase. This process achieved a surfactin purity and
recovery of 78% and 60% respectively (Table 2-3).
2.3.5 Ultrafiltration and nanofiltration
Ultrafiltration has various advantages over other surfactin purification techniques. Ultrafiltration has
lower mass transfer limitations, does not require the use of large volumes of organic solvents which may
be toxic, and can be easily scaled up. Ultrafiltration minimizes denaturation and physical damage of
biomolecules from shear effects. Ultrafiltration does not have problems of solute re-solubilisation as
solutes are retained in the solution phase (Chen, et al., 2007). Lastly, ultrafiltration is a very simple
process which requires no phase change. However, it has a major drawback as it requires high pressure
operation which result in increased equipment and operation costs (Sen & Swaminathan, 2005).
Surfactin recovery by ultrafiltration and nanofiltration has been studied in literature (Table 2-4).
Ultrafiltration works by permeation of relatively small molecules through a membrane under pressure
while larger molecules are retained (Clarke, 2013). Surfactin recovery has been studied by ultrafiltration
carried out using polyethersulfone (PES), cellulose ester (CE), hydrosart (HT) and regenerated cellulose
(RC and YM) membranes with various molecular weight cut-offs (MWCO). The MWCO is shown is shown
in the membrane name e.g. cellulose ester membranes with MWCO of 50 KDa are named as CE 50.
Ultrafiltration and nanofilltration were compared to determine a process which simultaneously achieves
high recoveries and purities. The study by Isa et al. (2007), where a two-stage ultrafiltration was used, is
the only study that was able to achieve surfactin purity greater than 90% by ultrafiltration. This study
achieved the highest surfactin recovery (96±5%) in comparison to other studies in literature. Purification
by ultrafiltration is affected by various factors (e.g. membrane properties and filter cake formation), and
these are discussed in sections 2.3.5.1 and 2.3.5.2.
Stellenbosch University https://scholar.sun.ac.za

Page 27 of 173
Table 2-4: Summary of studies on surfactin recovery by ultrafilatratioin and nanofiltration in literature, where % purity refers to the mass percentage of surfactin in the purified surfactin while % recovery refers to the percenage of surfactin recovered into the final surfactin product after membrane filtration
Filtration process Membrane
material
Pre-purification stages % Recovery % Purity Reference
two stage ultrafiltration PES100 Acid precipitation 87 85 Chen, et al., 2007
two stage ultrafiltration PES100, YM1 acid precipitation 79 86 Chen, et al., 2007
One stage cross-flow filtration PES 100 Acid precipitation 83 79 Chen, et al., 2008a
Two stage Dead end ultrafiltration PES100 Acid precipitation 85 75 Chen, et al., 2008a
One stage ultrafiltration PES100 Acid precipitation 68 83 Chen, et al., 2008b
One stage ultrafiltration PES100 Salting out 81 78 Chen, et al., 2008b
One stage nanofiltration YM1 Salting out 81 79 Chen, et al., 2008b
Two stage ultrafiltration (centrifugal
device)
RC 10 None 91±7 94±1 Isa, et al., 2007
Two stage ultrafiltration (stirred cell) RC 10 None 96±5 93±1 Isa, et al., 2007
Two stage ultrafiltration PES 10 None 96±5 94±2 Isa, et al., 2007
Two stage ultrafiltration CE 30 None 95 Lin & Jiang, 1997
One stage crossflow filtration PES10 None 94.4 87.2 Mubarak, et al., 2014
One stage crossflow filtration HT10 None 96.3 88.2 Mubarak, et al., 2014
One stage dead end filtration Amicon XM-50
Foam fractionation 98.5 70 Sen & Swaminathan,
2005
Stellenbosch University https://scholar.sun.ac.za
Stellenbosch University https://scholar.sun.ac.za

Page 28 of 173
Effect of surfactin and membrane properties on ultrafiltration and nanofiltration 2.3.5.1
Ultrafiltration and nanofiltration are capable of separating dissolved and suspended molecular species
through a filter membrane under pressure based on size differences between surfactin and impurities.
Surfactin forms micelles of about 50-100 molecules at the CMC with nominal diameters ranging from
two to three orders of magnitude larger than the single surfactin molecules (Sen & Swaminathan, 2005).
Lin & Jiang (1997) found that the size of surfactin micelles range between 30 KDa to 50 KDa, while Chen
et al. (2007) reported that they range between 50 KDa and 100 KDa.
Surfactin micelles in culture supernatants can therefore be separated from smaller molecules such as
salts, glucose and amino acids through ultrafiltration using membranes with pore diameters of
approximately 30 KDa. To separate surfactin from macromolecules such as proteins, pore diameters of
approximately 100 KDa would be appropriate as these would allow surfactin micelles to pass through
while inhibiting the passage of protein macromolecules. Chen et al. (2008b) studied surfactin recovery
by single stage ultrafiltration using PES 100 membranes. In this study, a surfactin recovery and purity of
63% and 83% was achieved (Table 2-4).
Surfactin can also be purified by ultrafiltration and nanofiltration in monomer form, by dispersing the
micelles using low molecular weight alcohols. This allows surfactin to pass through membranes below 30
KDa, hence separate surfactin from macromolecules. This property has been used by Lin & Jiang (1997)
and Chen et al. (2007) who studied surfactin recovery from B. subtilis cultures by two stage
ultrafiltration using CE 30 and PES 100 membranes respectively. Surfactin micelles were retained in the
first ultrafiltration stage. The retained micelles were then dispersed by using methanol and collected in
the permeate of the second ultrafiltration stage. Lin & Jiang (1997) and Chen et al. (2007) obtained
recoveries of 95% and 87% respectively, while Chen et al. (2007) further got purities of 87%. In a study
by (Chen, et al., 2008c), a surfactin purity of 76% was obtained from two-stage ultrafiltration (Table 2-4).
Surfactin monomers can be further purified from relatively smaller molecules such as salts by using
membranes with smaller pores in nanofiltration. Chen et al. (2008b) studied nanofiltration using YM 1
membranes. Surfactin recoveries and purities of 79% and 81% were obtained. Chen et al. (2007) used
nanofiltration after a single stage ultrafiltration step using YM 1 membranes, and achieved a recovery
and purity of 79% and 86% respectively (Table 2-4). However, the relatively low flux of the nanofiltration
process makes this process unattractive (Chen, et al., 2008b and Chen et al. 2007).
Stellenbosch University https://scholar.sun.ac.za

Page 29 of 173
Membrane material is expected to affect surfactin recovery by ultrafiltration. Surfactin monomers
adsorb stronger on more hydrophobic membranes reducing the pore radius, and this results in a flux
decline (Chen, et al., 2008a). Less negatively charged membranes also allow surfactin to easily pass
through as surfactin has an overall negative charge (Isa, et al., 2007). Although it was expected that
membrane material affects surfactin recovery by ultrafiltration, Isa et al. (2007) found that this is not
always true. Isa et al. (2007) studied surfactin recovery by ultrafiltration using different membranes with
similar MWCO (RC 10 and PES 10) and found that surfactin recoveries and purities of approximately 95%
(Table 2-4) for both membranes.
Effect of filter cake formation on ultrafiltration and nanofiltration 2.3.5.2
During ultrafiltration and nanofiltration, contaminants deposit onto the filter membrane to form a filter
cake. The presence of protein contaminants in filter cakes results in an establishment of a concentration
polarization layer, which block membrane pores hence reduce the efficiency of ultrafiltration and
nanofiltration. Concentration polarization can be avoided by using stirred cell devices in dead end
filtration, which cause turbulence near the membrane surface. Isa et al. (2007) studied surfactin
recovery by a two stage membrane filtration processes using centrifugal and stirred cell devices using 30
and 10 KDa MWCO regenerated cellulose membranes. A similar recovery and purity of approximately
95% was obtained in both studies (Table 2-4). Sen & Swaminathan (2005) studied surfactin recovery by a
single-step ultrafiltration process in a magnetically stirred cell system using Amicon XM-50 filtration
membranes. A surfactin purity and recovery of about 70% and 98.5% respectively was obtained in this
study (Table 2-4).
Cake formation can also be reduced using cross cross-flow filtration. In cross-flow filtration, the
retentate flows parallel to the membrane surface unlike dead-end filtration where the retentate flows
perpendicular to the membrane surface (Chen, et al., 2008a). Mubarak et al. (2014) studied surfactin
recovery from B. subtilis cultures by one-step cross-flow ultrafiltration using HT10 and PES10
membranes. Recoveries of 94.4% and 96.3% were achieved for the PES10 and HT10 membranes
respectively, while purities of 87.2% and 88.9% were achieved respectively (Table 2-4). The flux was
seen to increase with increasing cross-flow velocity, but decrease with increasing the initial surfactin
concentration and TMP. A higher cross-flow velocity removes cake formed on membrane resulting in
slow formation of the concentration polarization layer.
In addition to cross-flow ultrafiltration, fouling can also be reduced by membrane cleaning. Chen et al.
(2008a) studied surfactin recovery from pre-treated B. subtilis cultures by cross-flow ultrafiltration with
Stellenbosch University https://scholar.sun.ac.za

Page 30 of 173
in situ cleaning. The cleaning solutions were deionized water, NaOH solution (pH 11 and 13) and 1 wt%
Terg-a-zyme solution, and PES 100 membranes were used. A surfactin recovery and purity of 83% and
79% were obtained respectively. This was higher compared to the recovery and purity of 85% and 75%
obtained through two-stage dead end filtration under similar conditions (Chen, et al., 2008a) (Table 2-4).
Fouling can also be reduced by pre-purification of B. subtilis cultures prior to ultrafiltration. Chen et al.
(2008b) studied surfactin recovery from B. subtilis cultures by pre-treating the culture through
ammonium sulphate salting-out using PES 100 and YM 1 membranes. Purities of 78% and 79% were
obtained for the PES 100 and YM 1 membranes respectively, while recoveries were 81% in both cases
(Table 2-4). Fouling can also be reduced by changing the hydrophilicity of the membrane and periodic
flushing or back-flushing. Back-flushing allows ultrafiltration to be carried out for longer before it is
stopped for intensive physical or chemical cleaning (Chen, et al., 2008a).
2.3.6 Chromatography
Chromatography purifies surfactin based on its degree of interaction with stationary and mobile phases.
Chromatography depends on factors such as hydrophobicity, molecular size and molecular charge
(Kosaric & Sukan, 2014). Chromatography consists of a solid adsorbent (stationary phase) and a solvent
containing the solutes to be separated (mobile phase) in a column. The solutes travel through the
stationary phase at different rates in the column depending on their specific equilibrium characteristics.
The least adsorbed solute moves more rapidly through the column than more adsorbed solutes. The
rate at which solutes move through the column can be modelled using adsorption isotherms which
relate the solute concentration on the adsorbent’s surface (Clarke, 2013).
Chromatography has some drawbacks. It is prone to clogging in the presence of solid particles. These
processes may require the usage of solvents and buffers for equilibration, which may lead to increased
operating costs as well as generation and release of hazardous waste. Additionally, costs may arise from
washing, elution, and regeneration of the resins. Due to the high operating costs, chromatography may
only be suitable for analytical purposes or purification of valuable pharmaceuticals or cosmetics
products on a small scale (Kosaric & Sukan, 2014). These methods include TLC, RP- and the cheaper
alternatives: ion-exchange chromatography, adsorption chromatography and size exclusion
chromatography (SEC). Purification by ion-exchange chromatography as well as adsorption
chromatography will be discussed in section 2.3.7. RP-HPLC, SEC and TLC are discussed in section 2.3.6.1
to section 2.3.6.3.
Stellenbosch University https://scholar.sun.ac.za

Page 31 of 173
Purification by RP-HPLC 2.3.6.1
RP-HPLC is widely used for high quality purification for research in the fields of cosmetics and medicine
(Yang, et al., 2015). RP-HPLC relies on pumps to pass the sample mixture being purified through a
column filled with adsorbent material. The different components of the sample mixture pass through
the column at different flow rates as they interact differently with the adsorbent material resulting in
separation of the components as they flow out of the column (Yang, et al., 2015).
RP-HPLC purifies molecules based on their hydrophilicity, and is thus capable of separating surfactin
homologues. Homologues may differ in composition by only a single amino acid and/or the fatty acid
residue. These different amino acids have diverse hydrophilic characteristics and thus interact
differently with the mobile phase (methanol or acetonitrile), and the fraction with higher hydrophilicity
in the peptide ring is easily eluted in a C18 column. The fraction containing the longer fatty acid, on the
other hand, is harder to elute since the hydrophobic fatty acid chains combine with the modified filler of
the C18 column. The fraction containing the longer fatty acid therefore requires a relatively higher
proportion of methanol/acetonitrile (Yang, et al., 2015).
Razafindralambo et al. (1993) studied purification of antifungal lipopeptides from B. subtilis cultures by
adsorption into C18 gel followed by RP-HPLC. This method was effective for isolating and fractionating
iturin A and surfactin, which were co-produced by B. subtilis. The biocompatibility of this method allows
maintenance of the structure and function of lipopeptides during purification (Razafindralambo, et al.,
1993). Kim et al. (2004), Sivapathasekaran et al. (2009 ), Chen et al. (2008d) and Liu et al. (2008) also
used RP-HPLC for the purification of surfactin and other biosurfactants.
Dhanarajan et al. (2016) studied purification of three lipopeptide families (surfactin, fengycin and iturin)
produced by Bacillus megaterium by analytical HPLC, before HPLC was scaled up to semipreparative
HPLC. Lipopeptides were pre-purified by in situ foam fractionation and filtration to remove solid
particles before injection into the HPLC system. This method purified surfactin to a purity of 97% with a
recovery of 96%. Although further scale-up to larger columns may lead to higher lipopeptide
throughput, it would also lead to a higher column particle size. This would result in difficulty in
separating the lipopeptide homologues.
Stellenbosch University https://scholar.sun.ac.za
Page 32 of 173
Surfactin purification by SEC 2.3.6.2
Size exclusion, or gel, chromatography separates solutes based on their size differences. A sample
solution is passed through porous gel beads with controlled pore sizes. Smaller molecules are allowed to
pass through the bead pores, while most large molecules cannot penetrate the pores. The larger
molecules therefore move more rapidly than smaller molecules, since the smaller molecules have a
longer effective path length. This creates a time dependant size distribution in the eluent (Clarke, 2013).
A study by Mukherjee et al. (2009) showed that size exclusion chromatography can be used to purify
biosurfactants after acid precipitation. In the study by Mukherjee et al. (2009), a lipopeptide
biosurfactant produced by B. circulans was purified by gel filtration chromatography with a Sephadex G-
50 matrix. UV–visible spectroscopy and TLC analysis of the biosurfactants before and after purification
was used to show that the biosurfactant was significantly purified.
According to (Mukherjee, et al., 2009), the micelle forming ability of biosurfactants is the major property
of biosurfactants affecting their purification by SEC. Vanittanakom et al. (1986) used Sephadex LH-20 for
biosurfactant purification. No data on purity and recovery was, however, given in this study.
Surfactin purification by TLC 2.3.6.3
Lipopeptide purification by thin layer chromatography depends on lipopeptide polarity. Standard TLC
uses a highly polar stationary phase, and a mobile phase. The distance components in the mixture being
separated travel depend on polarity of the components (Geisslera, et al., 2017). Lipopeptide purification
by TLC also depends on the polarity of the mobile phase. Geisslera et al. (2017) found that polar solvents
such as methanol have a high affinity to lipopeptides, thus polar solvents result in greater migration of
lipopeptides on TLC plates compared to non-polar solvents.
Mukherjee et al. (2008) used high performance thin layer chromatography (HPTLC) to purify lipopeptide
biosurfactants produced by B. subtilis. In their study, a chloroform:methanol:water mixture in the ratio
65:25:4 was used to as a mobile phase. UV light was used for lipopeptide detection, and the detected
lipopeptides were scraped off from the plates. The lipopeptide fractions in the scraped silica were
dissolved in a mixture of chloroform and methanol in the ratio of 65:35, and the silica was removed by
centrifugation. The solvent was then vaporised to recover the pure lipopeptide.
Sivapathasekaran et al. (2010) used TLC for surfactin purification after pre-treatment by acid
precipitation and methanol extraction. Korenblum et al. (2012) purified a surfactin-like molecule in a
silica gel 60 column after pre-treatment by acid precipitation and solvent extraction using chloroform-
Stellenbosch University https://scholar.sun.ac.za
Page 33 of 173
methanol (2:1 v/v). The lipopeptides were then eluted with chloroform-methanol (9:1 v/v) and
methanol. It should be noted that surfactin purification by TLC can only be used in analytical scale.
Mukherjee et al. (2008) and Sivapathasekaran et al. (2010) purified surfactin for small scale analysis such
as FTIR analysis
2.3.7 Adsorption and ion-exchange
Adsorption and ion-exchange have been used to purify surfactin in B. subtilis cultures by either
adsorption of surfactin from cultures or adsorption of impurities from cultures (Wang, et al., 2010;
Dhanarajan, et al., 2015; Liu, et al., 2007; Montastruc, et al., 2008 and Chen, et al., 2008c). According to
Dhanarajan et al. (2015), surfactin adsorption can become the most superior method for lipopeptide
concentration for correctly selected resins and optimal working conditions.
Surfactin purification by adsorption has several advantages. The resins can be regenerated and reused.
Adsorption is capable of achieving purities and separating different lipopeptide families present
(Dhanarajan, et al., 2015). Moreover, adsorption is capable of recovering lipopeptides from dilute
aqueous solutions, has low toxicity and can be easily scaled up (Chen, et al., 2008c).
Few studies (Table 2-5) have attempted to purify surfactin by adsorption. These studies were compared
to determine in which study surfactin purification was done optimally. Optimal adsorption can be
defined as one where a high surfactin recovery and purity are simultaneously achieved. Based on these
studies, the study by Dhanarajan et al. (2015) had the highest purity (91.6%), while studies by Chen et al.
(2008c) gave the highest recoveries (95%). Factors affecting adsorption (e.g. resin properties) are
discussed in section 2.3.7.1 to section 2.3.7.4.
Stellenbosch University https://scholar.sun.ac.za

Page 34 of 173
Table 2-5: Summary of studies on surfactin recovery by adsorption in literature, where % purity is the mass fraction of surfactin in the product after purification while % recovery is the fraction of surfactin in adsorption liquid recovered into the surfactin product after purification by adsorption
Purification strategy Pre-purification
stage
Resin
type
% Recovery % Purity Reference
Surfactin adsorption None X-5 resin 78.4 48.3 Wang, et al., 2010
Surfactin adsorption Acid
precipitation
HP-20 88 91.6 Dhanarajan, et al.,
2015
Ion exchange Pure surfactin Activated
carbon
Liu, et al., 2007
Ion exchange None Activated
carbon
Montastruc, et al.,
2008
Adsorption (removal of
impurities)
Two-stage
ultrafiltration
XAD-7 95 88 Chen, et al., 2008c
Ion exchange (removal
of impurities)
Two-stage
ultrafiltration
AG1-X4 94 80 Chen, et al., 2008c
Optimal surfactin purification by adsorption depends on various factors, which include properties of
adsorption resins, resin concentration and surfactin concentration, properties of liquid being purified
and mode of operation (static or dynamic).
Effect of resin properties on surfactin adsorption 2.3.7.1
Resins can be screened by comparing the adsorption capacities, desorption capacities, percentage of
surfactin adsorbed into resins during adsorption (% SA), percentage of surfactin desorbed from resins
during desorption as well as surfactin adsorption rate (Jia & Lu, 2008; Jin, et al., 2008; Zhang, et al.,
2008; Wang, et al., 2010 and Dhanarajan, et al., 2015). Resin properties include pore diameters, particle
size and polarity. High pore diameters improve desorption capacities, but reduce adsorption capacities
(Jia & Lu, 2008).
Smaller resin particle sizes or higher resin surface areas improve the surfactin adsorption capacity and
adsorption rates as it increases the surface available for surfactin adsorption on the resins at a constant
resin mass. This observation is only expected in a well agitated system, where the external limitations to
mass transfer have been reduced and internal transport of surfactin onto the adsorption surface is the
Stellenbosch University https://scholar.sun.ac.za
Page 35 of 173
rate limiting step. Liu et al. (2007) studied the effect of particle size on surfactin adsorption and found
that initial adsorption rates increased from approximately 4 to 24 mg/L/h when adsorbent particle size
was decreased from 1.4 to 0.4 g/L. A drawback with smaller particle sizes is however the difficulty in
collecting the resins (Liu, et al., 2007).
Surfactin adsorption is also dependent on resin polarity. Adsorption resins can be classified as non-polar,
neutral or polar. Wang et al. (2010) and Dhanarajan et al. (2015) studied surfactin adsorption by twelve
resins of different polarity, and found that non-polar resins gave high surfactin adsorption
(approximately 95%). Non-polar resins are therefore more suitable for surfactin adsorption in
comparison to polar and neutral resins. Polar and neutral resins are therefore more suitable for surfactin
purification by adsorptive removal of impurities. Neutral resins (XAD-7) have been used for surfactin
purification in pre-treated B. subtilis cultures by adsorptive removal of impurities in a study by Chen et
al. (2008c). In addition to neutral resins, Chen et al. (2008c) also used charged ion-exchange resins (AG1-
X4). These resins adsorbed impurities in B. subtilis cultures more quickly and preferably than surfactin. A
recovery and purity of 95% and 88% was achieved using XAD-resins, while a recovery and purity of 94%
and 80% was achieved by the AG1-X4 resins (Table 2-5).
Effect of resin concentration and initial surfactin concentration on surfactin adsorption 2.3.7.2
An increase in resin concentration increases the surface area available to adsorb surfactin hence % SA
increases until approximately all of the surfactin is adsorbed. Thereafter, an increase in resin
concentration results in a decrease in adsorption capacity since the resin mass increases while there is
no more surfactin to adsorb (Dhanarajan, et al., 2015 and Wang, et al., 2010). Dhanarajan et al. (2015)
and Wang et al. (2010) studied the effect of increase in resin concentration while keeping total
lipopeptide concentration constant at 1 g/L and 0.372 g/L respectively. In the study by Dhanarajan et al.
(2015), the adsorption ratio increased with increasing resin concentration until 10 g/L, after which the
amount adsorbed then stayed constant. In the study by Wang et al. (2010) the adsorption ratio of
surfactin increased rapidly with increase in resin concentration from 0 g/L t o10 g/L, before increasing
slowly to saturation at 25 g/L.
An increase in surfactin concentration, at a constant resin concentration, increases the surfactin
adsorption capacity until the resin becomes saturated. This increase is due to an increase in driving force
to overcome mass transfer limitations between aqueous and solid phases, hence improving surfactin
diffusion through the liquid film surrounding the adsorbent (Dhanarajan, et al., 2015). Wang et al.
(2010), however, found that the kinetics of adsorption or ion exchange are not dependent on surfactin
Stellenbosch University https://scholar.sun.ac.za
Page 36 of 173
concentration as larger micelles exist at higher surfactin concentrations. Large micelles make pore or
intraparticle diffusion and internal adsorption within the resin particles difficult, causing surfactin to
primarily adsorb on outer surfaces of the resin (Wang, et al., 2010). After resin saturation, an increase in
surfactin concentration would result in reduced recoveries of the surfactin.
Dhanarajan et al. (2015) and Chen et al. (2008c) studied the effect of initial surfactin concentration on
adsorption capacity. In the study by Dhanarajan et al. (2015), where HP-20 non-polar resins were used,
an increase in initial surfactin concentratioin improved surfacitn adsorption capacity, and an optimum
surfactin concentration of 3 g/L was obtained at a resin concentration of 10 g/L. Chen et al. (2008c)
found that an increase in surfactin concentration improved surfactin adsorption, when neutral XAD-7
resins were used, and equilibrium is attained more quickly at low initial surfactin concentration (<500
mg/L). This behaviour is likely due to the fact that surfactin forms large micelles (size 108–142 nm) at
high concentrations, resulting in poor intra-particle diffusion and internal adsorption within the resins.
Unlike the study by Dhanarajan et al. (2015) and the study by Chen et al. (2008c) when XAD-7 resins
were used, Chen et al. (2008c) found that the surfactin adsorption capacity decreases with increasing
initial surfactin concentration when AG1-X4 ion exchange resins were used. This was possibly due to the
increase in surfactin micelle size and impurity concentration with increase in initial surfactin
concentration. Increase in impurities result in competition for adsorption sites on resins (Chen, et al.,
2008c).
Liu et al. (2007) suggested that surfactin adsorption is actually dependent on the surfactin concentration
to resin concentration ratio (RC/SC ratio) rather than resin concentration and surfactin concentration
independently. Liu et al. (2007) studied the effect of the increase in surfactin concentration and resin
concentration on surfactin adsorption while maintaining the RC/SC ratio (7.6 gr/gs). It was seen that the
% SA at equilibrium and the overall rate of adsorption was similar despite the different the different
initial surfactin concentration, which ranged from 8.5 gs/L to 38 gs/L, and resin concentration if the
RC/SC ratio is constant. Equilibrium was achieved after approximately 33 h of adsorption at different
resin concentrations when the RC/SC ratio was held constant.
Effect of environmental factors on surfactin adsorption 2.3.7.3
The effect of temperature on surfactin adsorption is unclear. Liu et al. (2007) found that an increase in
temperature negatively affects surfactin adsorption (surfactin adsorption capacity decreased by
approximately two times when the temperature was increased from 20 °C and 40 °C). This suggests that
Stellenbosch University https://scholar.sun.ac.za
Page 37 of 173
surfactin adsorption is an exothermic process. Dhanarajan et al. (2015), on the other hand, found that
high temperatures enhance surfactin adsorption (an increase in temperature from 25 °C to 45 °C
resulted in an increase in the adsorption ratio form approximately 78% to approximately 97%). This
suggests that surfactin adsorption is an endothermic process. The study by Liu et al. (2007) is expected
to be more accurate as pure surfactin was used, while the study by Dhanarajan et al. (2015) is more
relevant as surfactin was purified from culture supernatants.
Although the effect of operating temperature on surfactin adsorption capacities was unclear, it was
found that an increase in tempeature increases surfactin adsorption rates. This is because higher
temperatures increase molecular movement during adsorption (Dhanarajan, et al., 2015). In a study by
Liu et al. (2007), the adsorption rate was up to three times faster when the temperature was increased
from 20 °C to 40 °C.
Surfactin adsorption is also affected by the pH of cultures being purified. As noted by Wiczling & Kaliszan
(2010), an acidic group, such as those found in surfactin, is generally ionized (deprotonated) at a pH
above its pKa, while a basic group is ionized (protonated) at a pH below its pKa. A change in pH can thus
result in ionization of the side chains of amino acids present in the peptide moiety of lipopeptides thus
varying their adsorption properties (Dhanarajan, et al., 2015). A change in pH also affects adsorption by
influencing the charge of surfactin. Surfactin micelles have a negative charge, and they have a more
negative charge at the pH extremes (pH 6 and pH 11). In addition to the increased negative charge at the
pH 6 and pH 11, surfactin also forms smaller micelles (108 and 142 nm respectively) at these pHs. This
could be another factor causing increased adsorption at higher pH extremes (Chen, et al., 2008c).
Liu et al. (2007), however, found that pH does not affect surfactin adsorption. This is possibly because a
small pH range (6.5 to 8.5) was used to study the effect of pH on surfactin adsorption. The acidic groups
in surfactin were not ionized. Wang et al. (2010) proposed that pH 7 is suitable for surfactin adsorption
studies as surfactin and fengycin have the best stability at this pH. Chen et al. (2008c) found that
increased surfactin adsorption occurs at extremes of the pH range studied (6 and 11). In the study by
Chen et al. (2008c), there was an interaction between surfactin concentration and pH. Surfactin
concentration and pH were both seen to influence the zeta potential of surfactin, and the zeta potential
decreased with increasing surfactin concentration. Chen et al. (2008c) found that the pH changes during
adsorption, but the effect of the change in pH is unknown. Chen et al. (2008c) suggested that a buffer be
used for surfactin adsorption studies, but surfactin was seen not to affect adsorption in the presence of
buffers in the study by Liu et al. (2007).
Stellenbosch University https://scholar.sun.ac.za

Page 38 of 173
Surfactin adsorption is also affected by ionic strength. Liu et al. (2007) studied the effect of ionic
strength on surfactin adsorption by using K2SO4 to vary the ionic strength. It was seen that an increase in
ionic strength reduces the % SA as well as the surfactin adsorption rate (an increase in K2SO4
concentration from 0.05 g/L to 0.1 g/L reduced % SA by approximately two-fold). Buffer addition may
increase the ionic strength (Breuer & Jeffrey, 2004), thus may potentially reduce the efficiency of
surfactin adsorption.
The quantity of impurities also affect surfactin adsorpton. Liu et al. (2007) and Montastruc et al. (2008)
studied surfactin adsorption onto activated carbon from pure surfactin and B. subtilis cultures
respectively. A lower adsorption capacity (26% lower) was obtained in study by Montastruc et al. (2008)
compared to that by Liu et al. (2007) under similar conditions. This was probably due to adsorption of
other impurities, such as proteins, in the study by Montastruc et al. (2008).
Impurities can be reduced by resin washing after adsorption. After adsorption, the resins are wet with
adsorption liquid which has impurities. The adsorption liquid together with some water-soluble
impurities can be washed off with deionized water (Wang, et al., 2010 and Dhanarajan, et al., 2015).
Razafindralambo et al. (1993) found that methanol solutions of up to 50% methanol can be used for
washing resins, while achieving a 100% surfactin recovery. Wang et al. (2010) studied surfactin
purification in B. subtilis supernatants by adsorption using X-5 resins, and washed the resins using
deionized water. A surfactin adsorption and desorption ratio of 90% and 94% were obtained
respectively. The surfactin purity was improved from 24.5% to 48.3% (Table 2-5)
It can also be postulated that surfactin adsorption can be affected by methanol addition in B. subtilis
cultures. Methanol increases the negative charge of surfactin molecules (Isa, et al., 2007) and disrupts
surfactin micelles in adsorption solutions (Chen, et al., 2008b). Surfactin exists as micelles in dynamic
equilibrium with monomers in aqueous solution, and only surfactin monomers, rather than micelles, are
adsorbed during adsorption. The surfactin micelles then release more monomers to restore dynamic
equilibrium between monomers and micelles (Danov, et al., 1996). The addition of methanol is thus
expected to improve surfactin adoption rate as it disrupts micelles to form monomers. The presence of
methanol in the adsorption liquid also affects the polarity of the solution. It is expected that for less
polar solvents, more surfactin will be adsorbed compared to other lipopeptides and impurities
(Dhanarajan, et al., 2015). The addition of methanol is therefore also expected to improve the surfactin
selectiity.
Stellenbosch University https://scholar.sun.ac.za

Page 39 of 173
Liu et al. (2007), however, studied surfactin adsorption rates at surfactin concentrations above CMC
(where surfactin exists as micelles) and concentrations below CMC (where surfactin does not exist as
micelles) at a constant resin concentration. Although higher adsorption rates were expected at surfactin
concentrations below CMC, the adsorption rates were found to be similar. This observation was possibly
due to the fact that low surfactin concentrations have a low driving force for adsorption (Liu, et al.,
2007), hence low adsorption rates at concentrations below CMC.
Effect of static and dynamic modes on surfactin adsorption 2.3.7.4
Surfactin adsorption is also dependent on whether adsorption is carried in a static mode (in shake flasks)
or dynamic mode (in columns). Static adsorption studies are commonly used for optimising factors
affecting adsorption (e.g. temperature) due to its simplicity, while actual surfactin adsorption is
commonly done by dynamic adsorption (Liu, et al., 2007; Wang, et al., 2010 and Dhanarajan, et al.,
2015). Dynamic surfactin adsorption improves the adsorption efficiency compared to static adsorption.
Wang et al. (2010) tested the surfactin adsorption using different resins (DM130, X-5, HPD-300 and
D101) by both static and dynamic adsorption. For the X-5 resin, the % SA was 86.1% and 95% in static
mode and dynamic mode respectively. Chen et al. (2008c) found that the surfactin adsorption capacities
achieved in static and dynamic mode under similar conditions were 0.16 gs/gr and 0.26 gs/gr respectively.
Static adsorption is affected by agitation rates, while dynamic adsorption is affected by the height to
diameter (h/d) ratio of columns. Agitation is necessary to ensure external transport is not rate limiting.
Liu et al. (2007) studied the effect of agitation rate between 80 and 180 rpm, and that the residual
surfactin was constant at approximately 10.7 mg/L at the different agitation rates. Agitation speed
therefore does not improve surfactin adsorption at agitation speed greater than 80 rpm (Liu, et al.,
2007). Column studies are affected by the height/diameter (h/d) ratio. A high h/d ratio may lead to
insufficient use of the bed, while a low h/d ratio could result in short retention time of solute and reduce
the mass transfer rate (Dhanarajan, et al., 2015).
2.4 Surfactin analytical strategies
The analysis of surfactin concentration is crucial for surfactin purification studies. Surfactin
concentration has been analysed by direct and indirect methods. Indirect methods determine surfactin
concentration based on physical properties of surfactin (ability to alter surface tension, ability to cause
haemolysis and antibacterial activity) (Bence, 2011; Moran, et al., 2002 and Sen & Swaminathan, 2005).
Indirect methods have an advantage in that they require less expensive equipment and reagents (Heyd,
Stellenbosch University https://scholar.sun.ac.za

Page 40 of 173
et al., 2008 and Moran, et al., 2002). The major disadvantage of indirect methods is that they are
susceptible to the presence of other surface-active compounds (such as iturin and fengycin) in the
solution (Heyd, et al., 2008).
Direct methods quantify surfactin based on its absolute concentration in cultures. These include the dry
weights method, RP-HPLC and HPTLC. In the dry weights method, surfactin is purified from cultures and
the dry weight of the purified surfactin per unit volume of culture is defined as the surfactin
concentration. Biosurfactant purification for quantification by dry weights has been done by solvent
extraction, ultrafiltration and TLC (Moran, et al., 2002 and Das, et al., 2014). The major disadvantage of
this method is that it is affected by losses of some surfactin during the series of purification steps
(Moran, et al., 2002).
RP-HPLC, which is able to separate surfactin into its isoforms when the gradient method is used, is the
most commonly used direct quantification of surfactin concentration (Dhanarajan, et al., 2015; Chen, et
al., 2008c; Wang, et al., 2010; Juang, et al., 2012 and Chen & Juang, 2008). This technique, however, has
limitations. Firstly, it is limited by the unavailability of individual standards of surfactin isoforms. The
surfactin standards currently available in the market contain more than one isoform with and overall
surfactin purity of less than 98%, may result in poor estimations of individual isoform concentrations,
hence poor accuracies of the HPLC technique. To prevent the poor accuracies which may arise for
availability of isoforms, the isocratic method can be used in RP-HPLC. In the isocratic mode, surfactin is
quantified as a lipopeptide family rather than individual isoforms. This method is however still limited by
high equipment costs and high analysis time (Geisslera, et al., 2017). Deng et al. (2017) developed a
method for surfactin analysis, liquid chromatography-tandem mass spectrometry, which reduces the
analysis time compared to RP-HPLC. This method is, however, also limited by high equipment costs.
A method has been recently developed for surfactin analysis by high performance thin layer
chromatography (HPTLC) (Geisslera, et al., 2017). This method has a poor resolution compared to high
performance liquid chromatography (HPLC), but it is suitable for general quantification of lipopeptide
families. HPTLC, unlike HPLC, has no peak interference in between the three lipopeptide groups. HPTLC
also reduces the chances of cross-contaminations since a new plate is used for each analysis. This
method also allows for the use of surfactin analysis when surfactin is dissolved in a wide range of
solvents (Geisslera, et al., 2017). This method has also been used for quantification of a biosurfactant
lipopeptide by Mukherjee et al. (2008) and Sivapathasekaran et al. (2010). Although HPTLC is cheaper
than HPLC, it still has high equipment costs.
Stellenbosch University https://scholar.sun.ac.za

Page 41 of 173
A cheaper surfactin analysis technique would be TLC. TLC would be relatively cheaper than HPTLC as it is
not automated (e.g. it does not require an automatic spotter or a densiometric scanner). Like HPLTC,
TLC would quantify surfactin concentration by relating the area of bands formed by surfactin on TLC
plates after development to the surfactin concentration of the sample spotted on the plate. It is
expected that there is a linear relationship between the area of bands formed by surfactin on TLC plates
and the surfactin concentration on the sample spotted on the TLC plates for a particular concentration
range (Geisslera, et al., 2017).
TLC is has not been used for quantification of surfactin concentration in literature, but this method has
been used for identifying lipopeptides as well as other impurities in a culture samples. To identify
lipopeptides by TLC, retardation factors (Rf) of lipopeptides from culture supernatants are compared
those of the pure lipopeptides. In addition to Rf values, the spots can be tested to see if they are
lipopeptide spots by testing for the lipid moiety (using a detector such as UV, iodine vapours or
primuline) as well as the peptide moiety (using ninhydrin) (Sivapathasekaran, et al., 2010 and
Mukherjee, et al., 2008).
To identify impurities by TLC, lipopeptides are identified using Rf values. Any components on the TLC
plates which do not have Rf values similar to those of lipopeptides can be referred to as impurities.
These impurities can be identified if they are lipids or protein impurities depending on the detector (e.g.
ninhydrin or primuline) they respond to. Mukherjee et al. (2009) used impurity assays for determining
the degree of biosurfactant purification after purification by gel filtration chromatography. In this study
the relative quantity of impurities was identified based on smearing caused by impurities on TLC plates
after development, identified by UV light. Mukherjee et al. (2008) used primuline and ninhydrin to
identify lipopeptides in developed TLC plates. Although the methodology in the study by Mukherjee et
al. (2008) was not used to identify impurities, impurities with lipid parts and protein parts were seen on
the TLC plates. Razafindralambo et al. (1993) identified an unknown compund in B. subtilis cultures after
TLC development, which can be defined as an impurity.
Stellenbosch University https://scholar.sun.ac.za
Page 42 of 173
3 Hypotheses and objectives
The hypotheses of this study, which were drawn from critical analysis of the literature, are presented in
section 3.1, while the specific objectives required to achieve these hypotheses are given in section 3.2.
3.1 Hypotheses
3.1.1 Surfactin analyses by TLC
TLC analysis is capable of quantifying surfactin concentration
TLC analysis can be used to qualitatively analyse impurities with peptide and lipid parts in B.
subtilis cultures
3.1.2 Surfactin purification
Acid precipitation 3.1.2.1
surfactin can be recovered from cell-free supernatants of B. subtilis cultures by acid
precipitation to a high recovery and purity
maximum surfactin recovery and purity achieved after surfactin purification by acid
precipitation can be obtained when precipitation is carried out in the range between pH 2 and
pH 4
surfactin purification by acid precipitation does not influence the selectivity of surfactin in the
final product
Solvent extraction 3.1.2.2
precipitates obtained after surfactin purification by acid precipitation can be further purified by
solvent extraction to a high purity and recovery
polar solvents are capable of producing higher recoveries compared to non-polar solvents when
used for surfactin purification by solvent extraction
non-polar solvents are capable of producing higher surfactin purities compared to polar solvents
when used for surfactin purification by solvent extraction
Surfactin adsorption 3.1.2.3
precipitates obtained after surfactin purification by acid precipitation can be further purified by
adsorption to a high purity and recovery
Stellenbosch University https://scholar.sun.ac.za

Page 43 of 173
surfactin purification by adsorption is capable of improving the selectivity of surfactin in the final
product
the fraction of surfactin absorbed as well as the factor by which the selectivity improves during
surfactin purification by adsorption is influenced by the temperature at which adsorption is
carried out as well as the initial pH, RC/SC ratio and methanol concentration in the adsorption
liquid
Surfactin adsorption can be modelled by the Langmuir or Freundlich model
3.2 Objectives
The main objective of this study was to propose a suitable surfactin purification procedure or
procedures, and to provide optimal operating conditions for the proposed purification procedure(s).
However, it was also necessary to produce surfactin and develop an analytical technique for surfactin
concentration for use in the surfactin purification studies so these became further objectives. Specific
objectives are listed below.
3.2.1 Surfactin production
produce surfactin using B. subtilis ATCC 21332
3.2.2 Surfactin analyses by TLC
develop a methodology for the analysis of surfactin concentration by TLC, and further validate
this methodology
investigate if the TLC analytical technique can be used for qualitatively determining the
impurities in B. subtilis cultures
3.2.3 Surfactin purification
Acid precipitation 3.2.3.1
investigate the effect of operating pH on surfactin purification by acid precipitation, and
recommend an operating pH for acid precipitation
Solvent extraction 3.2.3.2
investigate the effect of solvent polarity on surfactin purification by solvent extraction, and
recommend the best solvent for solvent extraction
Stellenbosch University https://scholar.sun.ac.za

Page 44 of 173
Adsorption 3.2.3.3
Use a surface design to investigate the effect of the operating temperature as well as the effect
of the initial pH, RC/SC ratio and methanol concentration in the adsorption liquid on surfactin
purification by adsorption
provide suitable operating conditions for surfactin purification by adsorption
propose a suitable for model for modelling surfactin adsorption
Stellenbosch University https://scholar.sun.ac.za

Page 45 of 173
4 Methodology
This section outlines how the objectives of this study (discussed in section 3.2) were achieved. Surfactin
production and purification were carried out according to the flow diagram shown in Figure 4-1. The
black line in Figure 4-1 shows surfactin production and pre-purification by acid precipitation, while the
red and blue lines show surfactin purification by solvent extraction and adsorption respectively. In
addition to surfactin production and purification, this section provides detail on the TLC analytical
technique was developed for surfactin analysis.
Surfactin production
Biomass removal
Acid precipitation
Freeze-drying
Solvent extraction
Surfactin adsorption using
HP20 resins
Culture Biomass
Spent supernatant
Precipitate
Supernatant
Dry precipitate
Hydrochloricacid
Water
Organic solvents
Methanol
Impurities
Nutrientmedia
Bacilus subtilis
Impurities
Purified surfactinOrganic solvents
Resolubilising in sodium
hydroxide
Sodium hydroxide
Precipitate
Purified surfactin
Re-solubilised precipitate
Figure 4-1: Block flow diagram for the proposed surfactin recovery method where the black line show surfactin production and pre-purification by acid precipitation, while the red and blue lines show surfactin purification by solvent extraction and adsorption respectively
Stellenbosch University https://scholar.sun.ac.za
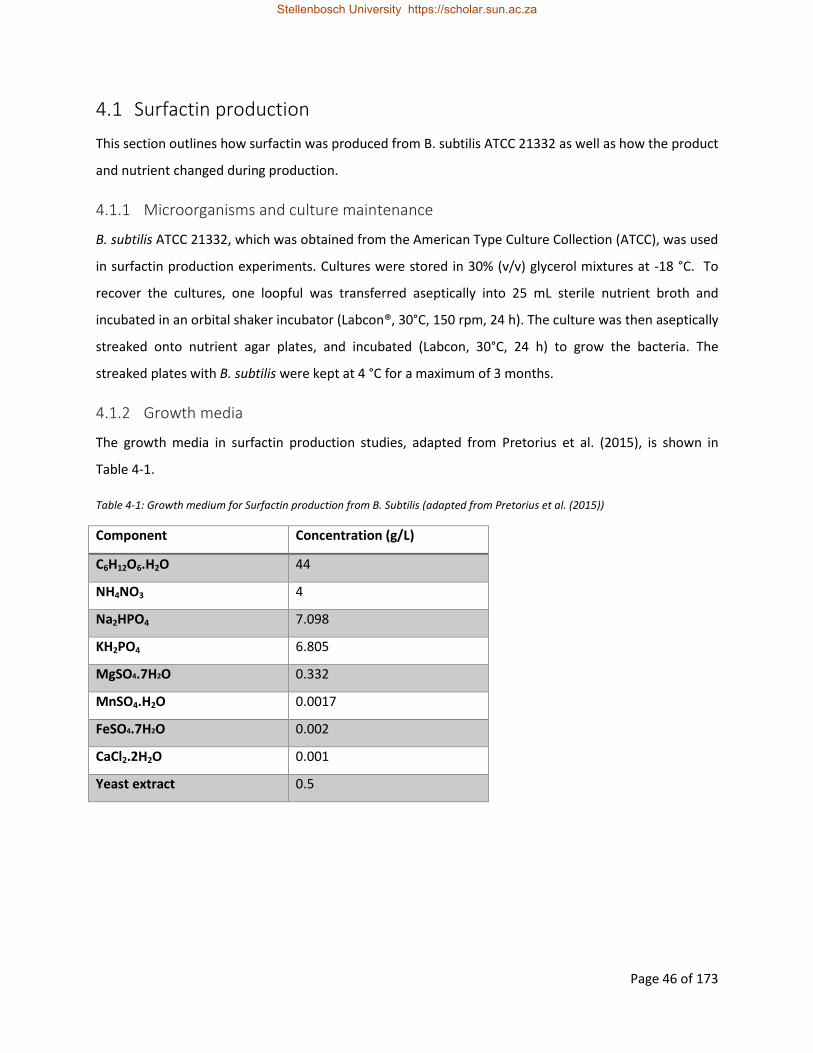
Page 46 of 173
4.1 Surfactin production
This section outlines how surfactin was produced from B. subtilis ATCC 21332 as well as how the product
and nutrient changed during production.
4.1.1 Microorganisms and culture maintenance
B. subtilis ATCC 21332, which was obtained from the American Type Culture Collection (ATCC), was used
in surfactin production experiments. Cultures were stored in 30% (v/v) glycerol mixtures at -18 °C. To
recover the cultures, one loopful was transferred aseptically into 25 mL sterile nutrient broth and
incubated in an orbital shaker incubator (Labcon®, 30°C, 150 rpm, 24 h). The culture was then aseptically
streaked onto nutrient agar plates, and incubated (Labcon, 30°C, 24 h) to grow the bacteria. The
streaked plates with B. subtilis were kept at 4 °C for a maximum of 3 months.
4.1.2 Growth media
The growth media in surfactin production studies, adapted from Pretorius et al. (2015), is shown in
Table 4-1.
Table 4-1: Growth medium for Surfactin production from B. Subtilis (adapted from Pretorius et al. (2015))
Component Concentration (g/L)
C6H12O6.H2O 44
NH4NO3 4
Na2HPO4 7.098
KH2PO4 6.805
MgSO4.7H2O 0.332
MnSO4.H2O 0.0017
FeSO4.7H2O 0.002
CaCl2.2H2O 0.001
Yeast extract 0.5
Stellenbosch University https://scholar.sun.ac.za

Page 47 of 173
4.1.3 Surfactin production experiments
Inoculum development 4.1.3.1
Prior to bacterial growth, a two-stage inoculation procedure was followed. In the first inoculation stage,
two loops of B. subtilis were aseptically transferred from nutrient agar plates, which were prepared as
discussed in section 4.1.1, to 100 mL of sterile growth media and incubated (Labcon, 30 °C, 150 rpm, 18
h). After incubation, 10 mL of the first inoculum was aseptically transferred to 90 mL growth media in
500 mL baffled shake flasks. The second inoculum was incubated (Labcon, 30 °C, 150 rpm, 18 h).
Surfactin production procedure 4.1.3.2
To grow bacteria and produce surfactin, 15 mL culture from the second inoculum was transferred to 135
mL of sterile growth media in 500 mL baffled shake flasks. The shake flasks were then incubated
(Labcon, 30 °C, 150 rpm, 60 h).
For analysis of products and depletion of nutrients during surfactin production, experiments were
performed in duplicate. 2 mL samples were taken at approximately 12 h intervals during surfactin
production for 72 h. These samples were analysed for cell dry weight (CDW), glucose concentration,
ammonium concentration, nitrate concentration as well as surfactin and antifungal (fengycin and iturin)
concentrations using analytical techniques discussed in section 4.6. The surfactin selectivity (SS) was
defined as the ratio between the surfactin concentration (CS) and antifungal concentration (CA) in a
particular sample as shown in Equation 4-1.
𝑆𝑆 =𝐶𝑆
𝐶𝐴 Equation 4-1
4.2 Development of the TLC analytical technique
Prior to surfactin purification studies, the TLC analytical technique was developed. This section discusses
the development of the TLC analytical technique. The validation of the TLC analytical technique is
discussed in section 5.2, but the chemicals and materials used for both the development and validation
are given in section 4.2.1.
4.2.1 Chemicals and materials
Surfactin (≥ 98%) (Sigma-Aldrich) was used in the preparation of the calibration curve; this surfactin was
assumed to be 100% pure in the calculations. Iturin (≥95%) and fengycin (≥90%), also purchased from
Sigma-Aldrich, were used in selectivity studies. Commercial surfactin (≥90%) kindly provided by Kaneka
Corporation (Japan), was used in validation studies. Where commercial surfactin was used, the
Stellenbosch University https://scholar.sun.ac.za

Page 48 of 173
concentrations were converted to pure surfactin by multiplying by 92% and the corresponding pure
surfactin concentration was reported in the text. 92% was chosen as a multiplier as it is close to the
lower rage of the commercial surfactin purity (≥90%).
The TLC chamber used in this study was a Latch-lid chromatotank fitted with a Teflon coated TLC plate
rack which hold six 100 mm by 100 mm TLC plates. Silica gel 60 F254 TLC plates (Merck Millipore) were
used as the stationary phase. The TLC plates and TLC chamber were both obtained from Sigma-Aldrich.
The TLC plates come in square shape of 200 mm length. Each TLC plate was cut into square TLC plates of
100 mm length. The spots where samples were to be spotted on the plates were marked in pencil 15
mm from the lower edge and 10 mm from the left edge and right edges. The distance between these
spots was 10 mm, hence the plate has a capacity of 9 samples (Figure 4-2).
Figure 4-2: TLC plate after it was prepared for sample spotting
TLC plates were square
shaped with a length of
100 mm
points where samples
were added were 10
mm apart
one of the
points where
samples were
can be
spotted
95 mm distance
allowed for
movement of
solvent front
Samples were
added 15 mm
above the lower
edge of the plate
Stellenbosch University https://scholar.sun.ac.za

Page 49 of 173
Analytical grade methanol and chloroform (Sigma-Aldrich) were used for preparation of the mobile
phase. A mixture of chloroform, methanol and water in the volume ratio of 65:25:4 was used as the
mobile phase. Other solvents (ethanol and i-propanol) used for validation were also obtained from
Sigma-Aldrich. For specificity and selectivity studies, a simulated supernatant of B. subtilis was prepared
by adding 2 g/L bovine serum albumin (Sigma-Aldrich) and 2 g/L surfactin to the medium used in
surfactin production (Table 4-1). This simulated supernatant was also used to assess the sensitivity of
the technique to multiple spotting (discussed in section 5.2.2.4.2). To study impurity assays, the
concentrated supernatant containing 2.48 g/L surfactin, prepared as discussed in section 4.5.1 was used.
Primuline and ninhydrin, used for identifying lipid and protein components on the TLC plates after
development were obtained from Sigma-Aldrich. Solid primuline was dissolved in 80% (v/v) acetone in
water to form the liquid primuline reagent of 0.005% w/v.
4.2.2 TLC procedure for determining surfactin concentrations and component Rf values
The TLC chamber was initially equilibrated by adding 60 mL of the mobile phase into the chamber and
sealing it for 30 minutes. Samples (or standards) were spotted onto TLC plates using a 5 µL Wheaton
capillary tube, into which a 1 µL sample had been transferred. The spotted TLC plate was placed into the
mobile phase in the equilibrated TLC chamber, ensuring no splashing and that the solvent forms a
straight front. This was done to ensure symmetric bands with no peak tailing. A freshly prepared solvent
was used after development of every plate to ensure a constant polarity of the mobile phase. After the
mobile phase had migrated a distance of 95 mm up the TLC plate, the plates were taken out of the
chamber and dried in a fume cupboard. The TLC plates were then sprayed with primuline reagent,
ensuring the entire plate is uniformly soaked with primuline, to show the area of the bands formed by
surfactin present on the TLC plates. The TLC plates were then scanned (minimum 600 dpi, Canon
Canoscan LIDE 220).
Image J (open source image processing and analysis in Java (https://imagej.nih.gov)), was used to
calculate the area of surfactin bands on the scanned TLC plates as well as the distance travelled by the
surfactin or other components on the TLC plate. The retardation factor (Rf) of surfactin or other
components showing on the TLC plates was determined by dividing the distance travelled by surfactin or
a particular component by the distance travelled by the solvent front. Surfactin concentration was
determined by converting the area obtained by Image J into concentration through a standard curve.
Stellenbosch University https://scholar.sun.ac.za

Page 50 of 173
The standard curve was prepared using surfactin (≥98%) from Sigma-Aldrich. A standard surfactin
solution of 4 g/L was made in methanol. This standard solution was diluted to form 3, 2, 1 and 0.5 g/L
samples. These standards were used to spot samples of 0.5 g/L to 4.5 g/L (with increments 0.5 g/L) on
TLC plates. To spot the 4.5 g/L standard, the 4 g/L standard was spotted and dried, before the 0.5 g/L
standard was spotted. This was repeated for spotting the 3.5, 2.5 and 1.5 g/L standards. The spotted
plates were then developed, and the areas of the standards were determined by image J. The areas
obtained were plotted against the concentration spotted at each point to determine the standard curve.
The standard curve is shown in Figure 5-4. Experiments for standard curve development were repeated
eight times.
4.2.3 TLC procedure for identifying impurities
To identify co-existing impurities, samples were spotted on the TLC, and the plate was developed and
dried as discussed in section 4.2.2. For assay of lipid impurities, the developed TLC plates were sprayed
with primuline to identify any lipid components on the TLC plate. Components with lipid components
are visible as white bands on the TLC plate.
To identify proteins or components with peptide parts, the ninhydrin was applied on the developed TLC
plate by means of a cotton wool. The cotton wool was dampened with ninhydrin, and the damp cotton
wool was used to gently apply ninhydrin across the developed TLC plate. After ninhydrin was applied,
the plate was then dried the plates with a domestic hairdryer until the purple spots became visible on
the places where peptide parts were present.
4.3 Surfactin purification by acid precipitation
This section details how surfactin was recovered from cell free supernatants by acid precipitation, as
well as the quantification of recovery, purity and selectivity after acid precipitation.
4.3.1 Procedure for surfactin purification by acid precipitation
Acid precipitation was used to purify cell-free supernatants of B. subtilis. Cell-free supernatants were
prepared by removing biomass from B. subtilis cultures prepared as discussed in section 4.1.3.2.
Biomass was removed by slow centrifugation (Eppendorf 5702 R, 2900×g, 30 minutes) followed by fast
centrifugation (Eppendorf Minispin, 14000×g, 5 minutes). The supernatant was decanted into beakers
while the biomass was removed from the Falcon tubes and autoclaved (121 °C, 15 minutes) before being
discarded. 16% (m/m) HCl was used for acid precipitation of surfactin from the cell free supernatant,
Stellenbosch University https://scholar.sun.ac.za
Page 51 of 173
while 2.5 M NaOH was used to control the pH of the cell free supernatants to the desired pH. The
precipitate was then placed at 4 °C for a minimum of 2 h, before removal of the spent supernatant by
centrifugation (Eppendorf 5702 R, 2900×g, 10 minutes).
4.3.2 Calculation of surfactin recovery, purity and selectivity after acid precipitation
Acid precipitation was optimised by comparing the surfactin purity (PS), surfactin recovery (RS) and
improvement in surfactin selectivity (IS) at pH 2, pH 3 and pH 4. PS was calculated by dividing the mass of
surfactin in the precipitate after acid precipitation (MSP) by the mass of the dry precipitate (Mp) as
shown in Equation 4-2. RS was calculated by dividing MSP by the mass of surfactin in the cell-free
supernatant (Msi) as shown in Equation 4-3.
𝑃𝑆 = 100𝑀𝑆𝑃
𝑀𝑃 Equation 4-2
𝑅𝑆 = 100𝑀𝑆𝑓
𝑀𝑆𝑖 Equation 4-3
IS was determined by dividing RS by the antifungals recovery (RA) as shown in Equation 4-4. The
antifungals recovery was calculated by dividing the mass of antifungals in the dry precipitate after acid
precipitation (MAP) by the mass of antifungals in the cell free supernatant (MAi) as shown in Equation 4-5.
The selectivity of surfactin in the precipitate was also determined by dividing the surfactin concentration
in the dry precipitate by the antifungals concentration in the dry precipitate according to Equation 4-1.
𝐼𝑆 =𝑅𝑆
𝑅𝐴 Equation 4-4
𝑅𝐴 = 100𝑀𝐴𝑃
𝑀𝐴𝑖 Equation 4-5
To determine MSi and MAi experiments were done using 30 mL cell free supernatant (Vsupernatant) in 50 mL
Falcon tubes. The surfactin and antifungals concentration in the cell free supernatant (CSi and CAi) was
determined by HPLC analysis as discussed in section 4.6.3. MSi and MAi were then determined by
multiplying the Vsupernatant by CSi and CAi respectively.
To determine MP, acid precipitation was carried out at pH 2, pH 3 and pH 4 as discussed in section 4.3.1
in pre-weighed Falcon tubes. The Falcon tubes were pre-weighed by initially drying (Memmert, 60 °C, 2
h) and cooling in a desiccator before weighing to four decimal places (Sauter AR 100) to determine the
initial Falcon tube mass (mti). The precipitate after acid precipitation was dried (Memmert, 37 °C, 48 h)
and cooled in a desiccator. The mass of the Falcon tube with the dry precipitate (mtf) was measured
(Sauter AR 100) to four decimal places, and Mp was then obtained by subtracting mti from mtf.
Stellenbosch University https://scholar.sun.ac.za

Page 52 of 173
To determine MSf and MAf, the dry precipitate in the Falcon tubes was crushed using a spatula. 25 mL
deionized water was added into the dry precipitate. 1.25 M NaOH was added into the precipitate water
mixture to solubilise the dry precipitate. NaOH was added at time intervals during solubilisation to
ensure that the pH of the precipitate-water mixture was always greater than 7. The sum of the volume
of deionized water and the volume of the total NaOH added (Vf) was noted. Solubilisation was done in
an orbital shaker (25 °C, 90 rpm, 24 h). The surfactin and antifungals concentration in the solubilised
precipitate (CSf and CAf respectively) was determined by HPLC analysis as discussed in section 4.6.3. MSf
and MAf were then determined by multiplying CSf and CAf by Vf respectively.
4.4 Surfactin purification by solvent extraction
This section details how surfactin purification by solvent extraction was carried out and the
quantification of the recovery and purity after extraction.
4.4.1 Procedure for surfactin purification by solvent extraction
Solvent extraction was used to purify dry precipitates after surfactin purification by acid precipitation.
Dry surfactin precipitates were prepared by first producing surfactin as discussed in section 4.1.3.2, and
recovering the supernatant by centrifugation (Eppendorf 5702 R, 2900×g, 30 minutes). Surfactin was
recovered from the supernatant by acid precipitation at pH 2 as discussed in section 4.3.1, and the
precipitate was frozen at -18 °C before freeze drying (VirTis sentry 2.0, -40 °C, 100 Torr, 48 h). The
precipitate was further dried (Memmert, 37 °C, 24 h) and stored in a desiccator.
Organic solvents of differing polarity were then used to selectively extract surfactin from the dry
precipitates in an incubator (Labcon, 30 °C, 150 rpm, 24 h). The organic solvents used, in order of
decreasing polarity, were methanol, i-propanol, chloroform:methanol mixture in the volume ratio 1:1
(C/M 1:1), acetonitrile, chloroform:methanol mixture in the volume ratio 2:1 (C/M 2:1), acetone,
chloroform, ethyl acetate, MTBE, petroleum ether and n-hexane.
Extraction was carried out in 100 mL Erlenmeyer flasks, which were sealed by covering with aluminium
foil, and wrapping with Sellotape. During extraction, a fraction of the dry precipitate is dissolved in the
organic solvents, while the other fraction remained undissolved. The undissolved fraction is referred to
as the undissolved precipitate. After extraction, the undissolved precipitate is separated from organic
solvents through centrifugation (Eppendorf 5702R, 2900×g, 10 minutes). Prior to centrifugation, the
solvents with undissolved precipitate were poured from the 100 mL Erlenmeyer flasks (in which
extraction was carried out) into 50 mL Falcon tubes. The flasks were then rinsed with 5 mL of the solvent
Stellenbosch University https://scholar.sun.ac.za

Page 53 of 173
used for extraction, and this rinsing solvent was poured into the 50 mL Falcon tubes with solvents and
undissolved precipitate before centrifugation.
4.4.2 Calculation of surfactin recovery and purity after solvent extraction
Solvent extraction was optimised by comparing the surfactin recovery (RS) and purity (PS) achieved by
each solvent after extraction of surfactin from the dry precipitate. RS was calculated by dividing the mass
of surfactin extracted into the solvents (MS) by the mass of surfactin in the dry precipitate (MSP) as
shown in Equation 4-6. PS was calculated by dividing MS by the total mass of solids in the dry precipitate
which were dissolved in the solvents during extraction (MDS) as shown in Equation 4-7.
𝑅𝑆 = 100𝑀𝑆
𝑀𝑆𝑃 Equation 4-6
𝑃𝑆 = 100𝑀𝑆
𝑀𝐷𝑆 Equation 4-7
To determine MSP, 30 mL alkaline water (Vw) was added to 0.1 g of the dry precipitate in a 100 mL
Erlenmeyer flasks. The tube was sealed and agitated (Labcon, 150 rpm, 30 °C, 48 h) to solubilise the dry
precipitate. The surfactin concentration in alkaline water (Cs,w) water was determined by the TLC
analytical technique discussed in section 4.2.2. MSP was then determined by multiplying Vw by Cs,w.
To determine MS, solvent extraction was carried out using 0.1 g of the dry precipitate and 30 mL solvent
as discussed in section 4.4.1. Surfactin concentration in the solvents after extraction (CS) was
determined by TLC analysis as discussed in section 4.2.2. The mass of surfactin extracted into the
solvents was then determined by multiplying CS by the sum of the solvent used for extraction and that
used for rinsing the flasks after extraction.
MDS was determined by subtracting the sum of the mass of the undissolved precipitate during solvent
extraction (MUS) and the mass of the undissolved precipitate during solubilisation of the precipitate in
alkaline water (MUW) from the mass of the dry precipitate before extraction (MP), as shown in Equation
4-8.
𝑀𝐷𝑆 = 𝑀𝑝 − (𝑀𝑈𝑆 +𝑀𝑈𝑊) Equation 4-8
To determine MUS and MUW, 0.1 g of dry precipitate (MP) was used for solvent extraction and
solubilisation in alkaline water in pre-weighed falcon tubes respectively. The Falcon tubes were pre-
weighed by drying (Memmert, 60 °C, 2 h) and cooing in a desiccator before being weighed (Sauter AR
100) to four decimal places. The undissolved precipitate after extraction and solubilisation was then
recovered in by centrifugation (Eppendorf 5702 R, 2900×g, 10 min), before drying in a water bath in a
Stellenbosch University https://scholar.sun.ac.za

Page 54 of 173
fume cupboard and further drying in an oven (Memmert, 37 °C, 36 h). The Falcon tubes with dry
undissolved precipitates were then cooled in a desiccator and weighed (Sauter AR 100) to four decimal
places. MUS and MUW were then obtained by subtracting the mass of Falcon tubes with dry undissolved
precipitate from the mass of the empty Falcon tube. MUW was assumed to be the mass of biomass, since
there were no undissolved solids when the dry precipitate was resolubilised in acid precipitation studies,
where centrifugation was done at 14000×g.
4.5 Surfactin purification by adsorption
This section details how surfactin purification by adsorption was carried and the quantification of the
recovery, purity and selectivity after adsorption. Additionally, this section provides detail on how
surfactin purification was optimised as well as how adsorption kinetics and isotherms were studied. HP-
20 non-polar resins were used to purify resolubilised surfactin precipitates from the acid precipitation
purification step. The resin properties, according to manufacturer’s specifications, are shown in Table
4-2.
Table 4-2: HP-20 resin properties specified by the manufacturer
Uniformity coefficient 1.5
Water content 59.40%
Particle size distribution through 250 micrometres 2.70%
Effective size 0.35 mm
4.5.1 Procedure for surfactin purification by adsorption
The resins were prepared for adsorption by pre-treatment with 95% (v/v) ethanol in an incubator
(Labcon, 30 °C, 150 rpm, 24) to remove any impurities (monomers and porogenic agents) trapped inside
the pores during the synthesis process. After pre-treatment, the resins were recovered using a Buchner
vacuum filter (Millipore) lined with a 0.2 μm paper disk (Anatech) and washed with deionized water
before drying (Memmert, 40 °C, 48 h). The adsorption resins were stored at room temperature, which
falls within the recommended temperature range (4 °C to 38 °C) for resin storage, and exposure of the
resins to direct sunlight was avoided.
The solubilised surfactin precipitates from the acid precipitation were prepared by initially producing
surfactin as discussed in section 4.1.3.2, and recovering the supernatant by slow centrifugation
Stellenbosch University https://scholar.sun.ac.za
Page 55 of 173
(Eppendorf 5702 R, 2900×g, 30 minutes). Surfactin was recovered from the supernatants by acid
precipitation at pH 2 as discussed in section 4.3.1, and the precipitate was dissolved in alkaline water to
form a stock solution at pH 8, with a surfactin and antifungal concentration of 2.48 g/L and 1.05 g/L
respectively (determined by HPLC analysis). The stock solution was further centrifuged by fast
centrifugation (Eppendorf Minispin, 14000×g, 5 min) to remove any biomass as slow centrifugation was
used before acid precipitation. The stock solution was then kept in 50 mL Falcon tubes and stored at -18
°C.
The stock solution was sterilised by filtration through a syringe filter (Anatech, 0.22 µm) before
adsorption studies to avoid the growth of bacteria during adsorption experiments. The stock solution
was diluted 5 times using sterile deionized water or deionized water with methanol (where indicated in
text) to form the adsorption liquid. The pH of the adsorption liquid was adjusted using 4% (m/m) HCl
and/or 2.5 M NaOH to the desired pH. A Metrohm 744 pH meter was used for pH measurements, and
the supplier of the pH meter confirmed that it is suitable for use in solutions with less than 30% (v/v)
methanol. According to Canals et al. (2001), a pH meter is suitable for measuring the pH even in the
presence of methanol provided a correction factor is considered, which was found to be insignificant in
this study (section 8.3.1).
25 mL of the adsorption liquid was mixed with a desired resin mass (determined by a Sauter AR 100
balance to four decimal places) in sterile 100 mL baffled shake flasks. Adsorption was then carried out in
in an incubator (Labcon, 150 rpm, 24 h) at the desired temperature. Preliminary tests showed that
equilibrium was reached after 24 h (section 8.3.2).
4.5.2 Calculation of surfactin purity and recovery after adsorption
The surfactin purity (PS) and recovery (RS) after purification by adsorption was determined according to
Equation 4-9 and Equation 4-10 respectively. In these equations, Vd, Cd and M are the volume of
desorption liquid, surfactin concentration in the desorption liquid and mass of residue left when the
desorption liquid was evaporated after surfactin desorption, respectively.
𝑅𝑆 =𝑉𝑖𝐶𝑖−𝑉𝑑𝐶𝑑
𝑉𝑖𝐶𝑖 Equation 4-9
𝑃𝑆 =𝑉𝑑𝐶𝑑
𝑀 Equation 4-10
To determine Cd, adsorption was carried out as discussed in section 4.5.1 at an initial pH, operating
temperature, RC/SC ratio and methanol concentration of 11.5, 45 °C, 5 gr/gs and 30% (v/v). After
Stellenbosch University https://scholar.sun.ac.za
Page 56 of 173
adsorption, the resins were recovered by filtration using 150 mm diameter filter papers in filter funnels
under gravity to ensure all resins are recovered. Filtration was carried out overnight, and the resins were
put into 100 mL baffled shake flasks. 25 mL of methanol (Vd) was added into the shake flasks, and the
flasks were sealed and agitated (Labcon, 150 rpm, 30 °C, 24 h). The surfactin concentration in the
desorption liquid was then determined by TLC analysis as discussed in section 4.2.2.
To determine M, 20 mL of the methanol with desorbed surfactin was put in pre-weighed Falcon tubes.
The methanol was then evaporated in a water bath to recover the solid residue. The residue was further
dried (Memmert, 37 °C, 24 h). The mass of the Falcon tube with dry solid residue was determined to
four decimal places using a Sauter AR 100 balance. M was then determined by subtracting the initial
mass of the falcon tubes from the mass of the Falcon tubes with dry residue. Purity and recovery
experiments were repeated four times.
4.5.3 Optimisation of the surfactin adsorption purification technique
Surfactin adsorption was optimised based on the percentage of surfactin adsorbed onto resins during
adsorption (% SA) and the improvement in surfactin selectivity (IS). % SA and IS were determined
according to Equation 4-11 and Equation 4-12.
%𝑆𝐴 = 100 (𝐶𝑖−𝐶𝑒
𝐶𝑖) Equation 4-11
𝐼𝑆 =𝑃𝑆𝐴
%𝐴𝑎𝑛𝑡𝑖𝑓𝑢𝑛𝑔𝑎𝑙𝑠 Equation 4-12
In Equation 4-11, Ci and Ce are the initial and equilibrium surfactin concentrations in the adsorption
liquid respectively. In Equation 4-12, % Aantifungals is the percentage of antifungals adsorbed (calculated
according to Equation 4-13, where Ca,i and Ca,e are the initial and equilibrium antifungal concentrations).
%𝐴𝑎𝑛𝑡𝑖𝑓𝑢𝑛𝑔𝑎𝑙𝑠 =𝐶𝑎,𝑖−𝐶𝑎,𝑒
𝐶𝑎,𝑖 Equation 4-13
Surfactin adsorption was optimised by determining the effect of operating temperature, initial pH,
RC/SC ratio as well as the methanol concentration on % SA and IS in the ranges shown in Table 4-3. The
RC/SC ratio was optimised by keeping the surfactin concentration constant (0.5 g/L) while varying the
resin concentration between 2 g/L and 20 g/L.
Stellenbosch University https://scholar.sun.ac.za

Page 57 of 173
Table 4-3: Range at which independent variables were optimised in surfactin adsorption studies
Independent variable Minimum value maximum value
Operating temperature (°C) 25 45
Initial pH 6.5 11.5
RC/SC ratio (gr/gs) 4 40
Methanol concentration [%(v/v)] 0 30
A face centred factorial design (Table 4-4) was used to study the effect of operating temperature, initial
pH and RC/SC ratio. The effect of methanol on the adsorption was then determined, also using a face
centred factorial design (Table 4-5). All experimental runs were done in duplicate.
To determine % SA and IS, adsorption was carried out as discussed in section 4.5.1 for all experimental
runs in Table 4-4 and Table 4-5, and Ce as well as Ca,e were determined by HPLC analysis as discussed in
section 4.6.3. Ci and Ca,i were determined from dilutions made on the stock solution (prepared in section
4.5.1) and were used together with the determined Ce and Ca,e to determine % SA and IS according to
Equation 4-11 and Equation 4-12.
Stellenbosch University https://scholar.sun.ac.za
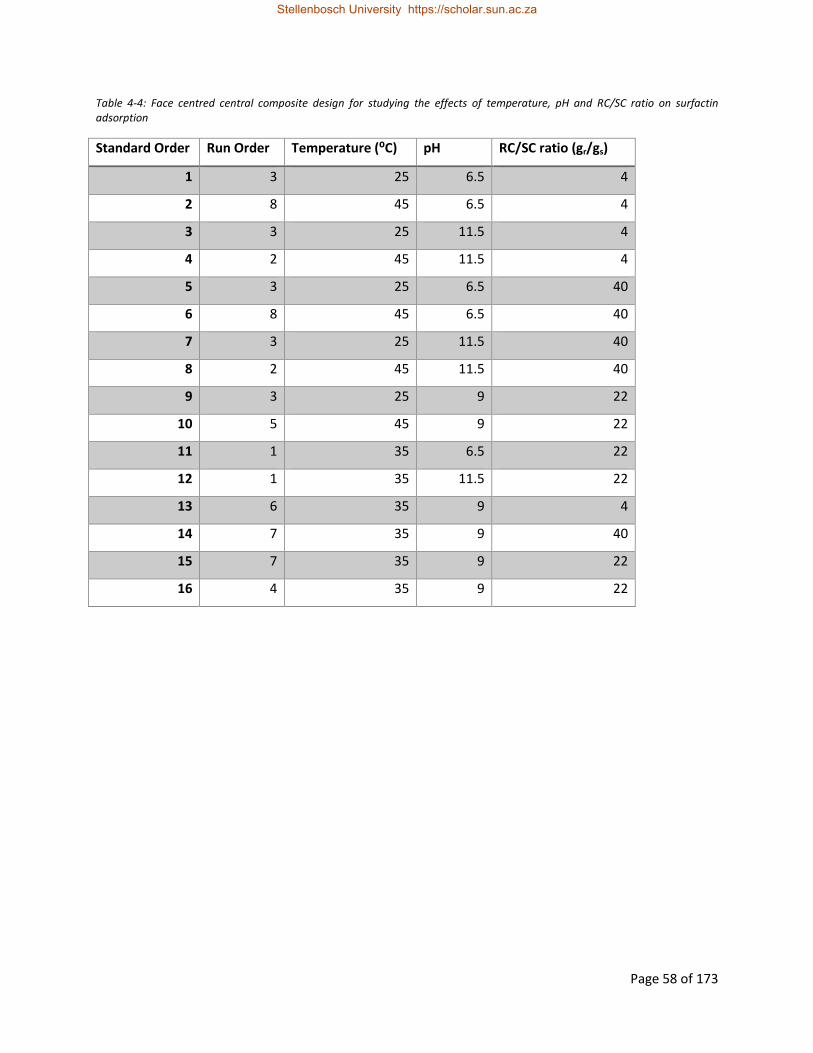
Page 58 of 173
Table 4-4: Face centred central composite design for studying the effects of temperature, pH and RC/SC ratio on surfactin adsorption
Standard Order Run Order Temperature (⁰C) pH RC/SC ratio (gr/gs)
1 3 25 6.5 4
2 8 45 6.5 4
3 3 25 11.5 4
4 2 45 11.5 4
5 3 25 6.5 40
6 8 45 6.5 40
7 3 25 11.5 40
8 2 45 11.5 40
9 3 25 9 22
10 5 45 9 22
11 1 35 6.5 22
12 1 35 11.5 22
13 6 35 9 4
14 7 35 9 40
15 7 35 9 22
16 4 35 9 22
Stellenbosch University https://scholar.sun.ac.za
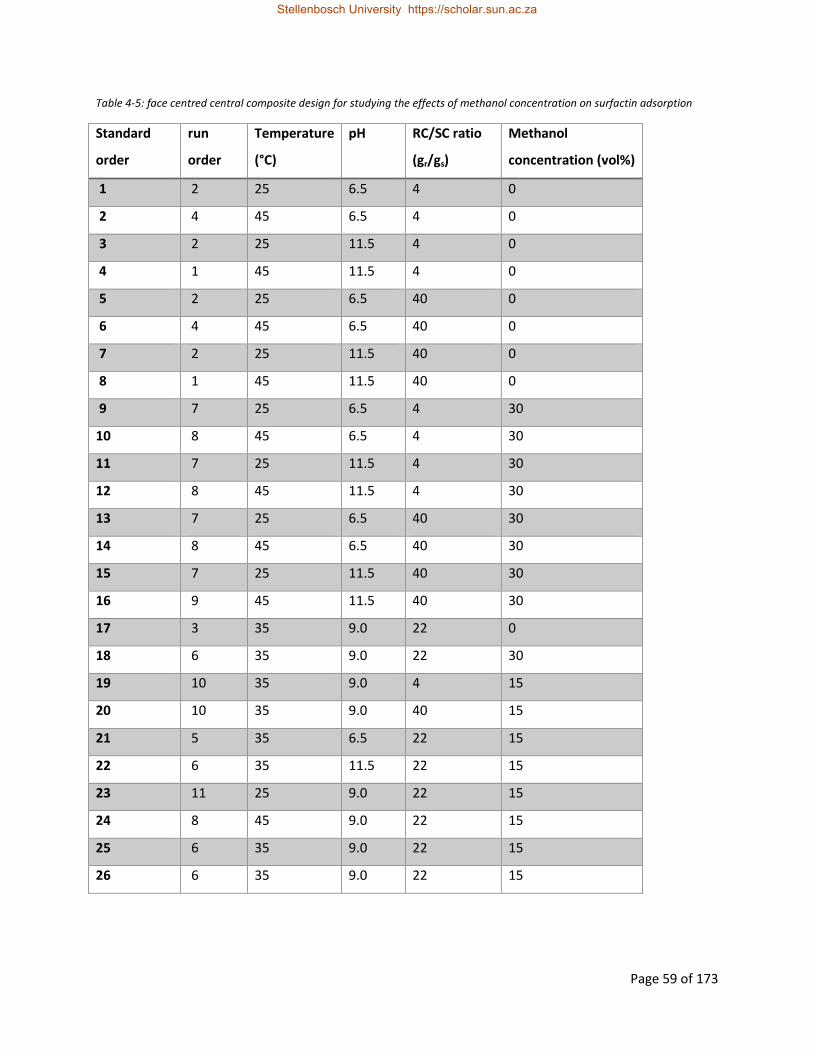
Page 59 of 173
Table 4-5: face centred central composite design for studying the effects of methanol concentration on surfactin adsorption
Standard
order
run
order
Temperature
(°C)
pH RC/SC ratio
(gr/gs)
Methanol
concentration (vol%)
1 2 25 6.5 4 0
2 4 45 6.5 4 0
3 2 25 11.5 4 0
4 1 45 11.5 4 0
5 2 25 6.5 40 0
6 4 45 6.5 40 0
7 2 25 11.5 40 0
8 1 45 11.5 40 0
9 7 25 6.5 4 30
10 8 45 6.5 4 30
11 7 25 11.5 4 30
12 8 45 11.5 4 30
13 7 25 6.5 40 30
14 8 45 6.5 40 30
15 7 25 11.5 40 30
16 9 45 11.5 40 30
17 3 35 9.0 22 0
18 6 35 9.0 22 30
19 10 35 9.0 4 15
20 10 35 9.0 40 15
21 5 35 6.5 22 15
22 6 35 11.5 22 15
23 11 25 9.0 22 15
24 8 45 9.0 22 15
25 6 35 9.0 22 15
26 6 35 9.0 22 15
Stellenbosch University https://scholar.sun.ac.za

Page 60 of 173
4.5.4 Batch adsorption kinetics
Batch kinetics were studied by determining adsorption capacity (qt) at different time intervals during
adsorption as well as the time taken to reach equilibrium (teq). The qt was determined according to
Equation 4-14, where V, Ci, Ct and W are the volume of adsorption liquid, initial surfactin concentration,
surfactin concentration at different time intervals during adsorption and resin mass respectively.
𝑞𝑡 =𝑉(𝐶𝑖−𝐶𝑡)
𝑊 Equation 4-14
To determine qt and teq batch kinetics were studied by carrying out adsorption as discussed in section
4.5.1 at 45 °C, pH 11.5, adsorption liquid of 30 mL, RC/SC ratio 22 gr/gs (hence resin mass of 0.33 gr) and
at methanol concentrations of 0% (v/v) and 30% (v/v). 400 µL samples were taken at time intervals
during adsorption for 30 h. The surfactin concentration (Ct) at the different time intervals was
determined by HPLC analysis as discussed in section 4.6.3. Adsorption runs in batch kinetic studies were
done in duplicate.
Batch kinetics were also modelled using the pseudo first-order model (Equation 4-15) as well as the
pseudo second-order model (Equation 4-16) to determine the best model for surfactin adsorption
kinetics. This was done in order to determine surfactin adsorption rates. In these models, m is a
constant, t is the time at which sample was taken during adsorption, qe is the adsorption capacity at
equilibrium while k1 and k2 rate constants for the pseudo fist-order equation and pseudo second-order
rate equation respectively. Symbolic regression using the Microsoft Excel R2 as a model selector was
used to determine which model best fits the kinetics data in this study. Since qe is integrated in the y-
axis of the pseudo first-order model, qe and k1 in this model were determined by regression using solver
in Microsoft Excel. For the pseudo second-order model, qe and k2 were determined by plotting 1/qt
against 1/t. qe and k2 were then determined using the y-intercept and slope of this plot respectively.
𝑙𝑛 (𝑞𝑒
𝑞𝑒−𝑞𝑡) = 𝑘1𝑡 + 𝑚 Equation 4-15
1
𝑞𝑡=
1
𝑡𝑘2𝑞𝑒2 +
1
𝑞𝑒 Equation 4-16
4.5.5 Batch adsorption isotherms
Batch isotherms were studied to determine a suitable model for modelling surfactin adsorption based
on equilibrium adsorption capacity (qe). The qe was determined according to Equation 4-17, where Ci, Ce,
Vi and W are the initial surfactin concentration, equilibrium surfactin concentration, volume of
adsorption liquid and resin mass respectively.
Stellenbosch University https://scholar.sun.ac.za

Page 61 of 173
𝑞𝑒 =𝑉𝑖(𝐶𝑖−𝐶𝑒)
𝑊 Equation 4-17
The Langmuir model (Equation 4-18) and the Freundlich model (Equation 4-19) were tested in this study.
Symbolic regression using the Microsoft Excel function R2 as a model selector was used to determine
which model best fits the experimental data in this study. In Equation 4-18, KL is the adsorption
equilibrium constant and qm is the theoretical maximum adsorption capacity. In Equation 4-19, KF is the
Freundlich constant and 1/n is an empirical constant.
𝐶𝑒
𝑞𝑒=
𝐶𝑒
𝑞𝑚+
1
𝐾𝐿𝑞𝑚 Equation 4-18
𝑙𝑛𝑞𝑒 = 𝑙𝑛𝐾𝐹 +1
𝑛𝑙𝑛𝐶𝑒 Equation 4-19
To determine qe, adsorption isotherms were studied by carrying out adsorption as discussed in section
4.5.1, at a methanol concentration of 0% (v/v) and 30% (v/v) in the adsorption liquid. The resin mass (W)
was held constant at 0.1 gr, while the surfactin concentration was varied between 1.92 and 0.32 gs/L.
The initial pH, operating temperature and methanol concentration in the adsorption liquid were held
constant at 11.5, 45 °C and 30% (v/v) respectively. Ce was determined by HPLC analysis as discussed in
section 4.6.3. Adsorption runs for batch isotherms studies were done in duplicate.
4.6 Analytical methods
4.6.1 Cell concentration
Cell concentration in B. subtilis cultures was determined by obtaining absorbance readings of suitably
diluted culture samples and subsequently converting these absorbance readings into CDW through the
use of a standard curve. 1 mL culture samples were collected during surfactin production, and their
absorbance was determined through a spectrophotometer (Varian, 620 nm) using distilled water as a
blank. Culture samples with an optical density greater than 0.8 were diluted with deionized water to get
an optical density less than 0.8. The absorbance readings were then calibrated using with a CDW
standard curve (Figure 4-3) to obtain cell concentrations.
To obtain the CDW standard curve, B. subtilis was grown for 24 h as discussed in section 4.1.3.2. The
culture was then diluted to dilutions ranging from ×200 to ×25, each dilution with a volume of 16 mL,
using 0.85% w/v NaCl solution. 1 mL of each dilution analysed for absorbance (Varian, 620 nm). The
remaining 15 mL of each dilution was filtered using a Buchner vacuum filter (Millipore) lined with a 0.2
μm filter pre-weighed paper disk (Anatech). The filter papers were pre-weighed by drying (Memmert,
Stellenbosch University https://scholar.sun.ac.za
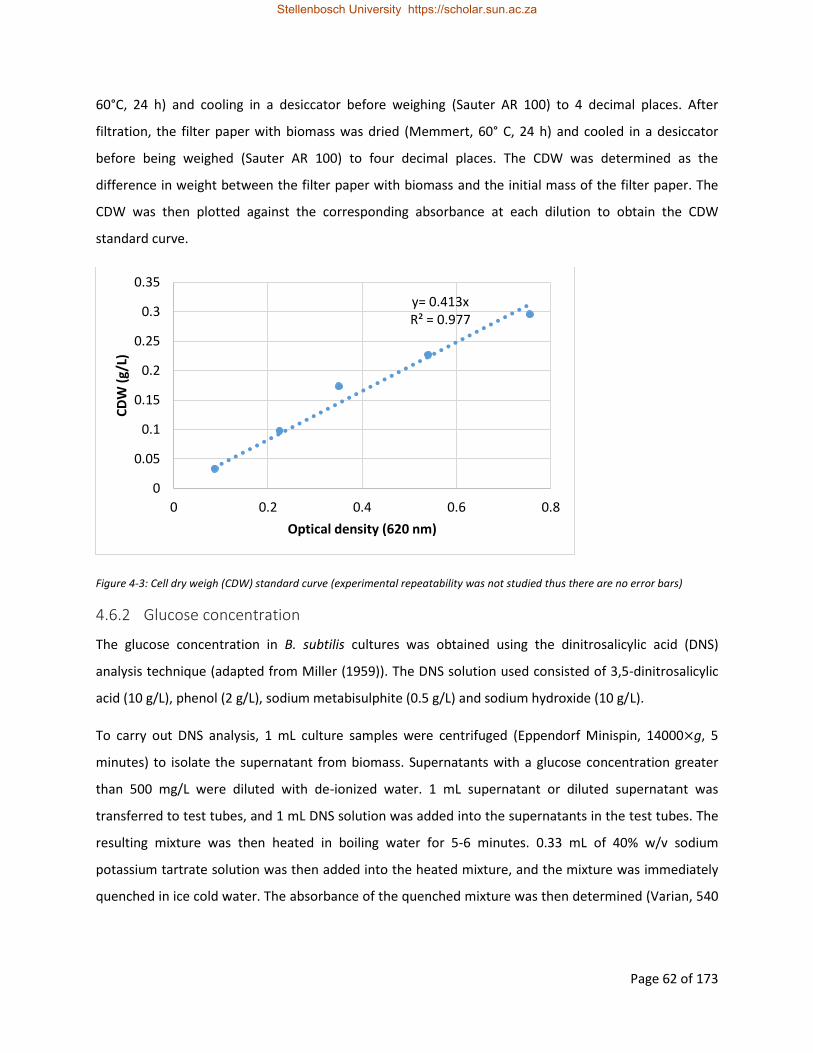
Page 62 of 173
60°C, 24 h) and cooling in a desiccator before weighing (Sauter AR 100) to 4 decimal places. After
filtration, the filter paper with biomass was dried (Memmert, 60° C, 24 h) and cooled in a desiccator
before being weighed (Sauter AR 100) to four decimal places. The CDW was determined as the
difference in weight between the filter paper with biomass and the initial mass of the filter paper. The
CDW was then plotted against the corresponding absorbance at each dilution to obtain the CDW
standard curve.
Figure 4-3: Cell dry weigh (CDW) standard curve (experimental repeatability was not studied thus there are no error bars)
4.6.2 Glucose concentration
The glucose concentration in B. subtilis cultures was obtained using the dinitrosalicylic acid (DNS)
analysis technique (adapted from Miller (1959)). The DNS solution used consisted of 3,5-dinitrosalicylic
acid (10 g/L), phenol (2 g/L), sodium metabisulphite (0.5 g/L) and sodium hydroxide (10 g/L).
To carry out DNS analysis, 1 mL culture samples were centrifuged (Eppendorf Minispin, 14000×g, 5
minutes) to isolate the supernatant from biomass. Supernatants with a glucose concentration greater
than 500 mg/L were diluted with de-ionized water. 1 mL supernatant or diluted supernatant was
transferred to test tubes, and 1 mL DNS solution was added into the supernatants in the test tubes. The
resulting mixture was then heated in boiling water for 5-6 minutes. 0.33 mL of 40% w/v sodium
potassium tartrate solution was then added into the heated mixture, and the mixture was immediately
quenched in ice cold water. The absorbance of the quenched mixture was then determined (Varian, 540
y= 0.413x R² = 0.977
0
0.05
0.1
0.15
0.2
0.25
0.3
0.35
0 0.2 0.4 0.6 0.8
CD
W (
g/L)
Optical density (620 nm)
Stellenbosch University https://scholar.sun.ac.za

Page 63 of 173
nm). The absorbance reading was then calibrated with a glucose standard curve (Figure 4-4) to obtain
the glucose concentration in g/L.
To prepare the standard curve, glucose standards with concentrations ranging between 0.05 and 0.5 g/L
were prepared. The absorbance readings of the standards were determined in an analogous manner to
that of the sample supernatant. These absorbance readings were then related to the glucose
concentration of the corresponding standard to obtain the glucose standard curve.
Figure 4-4: Standard curve for glucose quantification by DNS analysis, where the error bars indicate the standard deviation of four replicates
4.6.3 Surfactin, iturin and fengycin concentration
Surfactin concentration in this study was analysed by TLC analysis and HPLC analysis. Surfactin analysis
by TLC is detailed in section 4.2.2. This section outlines how the analysis of surfactin and antifungal
(iturin and fengycin) concentration determination was carried out by HPLC analysis. Surfactin analysis by
HPLC was done for samples from production, acid precipitation and adsorption studies. Samples with a
methanol concentration greater than 30% (v/v) were diluted to a methanol concentration ≤30% (v/v)
prior to analysis as high methanol concentrations distorts surfactin peak shape and increases elution
time.
1 mL samples were centrifuged (Eppendorf Minispin, 14000×g, 5 minutes), and 500 µL of the
centrifuged samples were then mixed with 500 µL acetonitrile containing 0.05% (v/v) trifluoroacetic
acid. This mixture was then filtered using a 0.22 µm syringe filter (Anatech) before injection into the
y = 0.0027x R² = 0.997
0
0.2
0.4
0.6
0.8
1
1.2
1.4
1.6
0 100 200 300 400 500 600
Op
tica
l den
sity
(5
40
nm
)
Glucose concentration (mg/L)
Stellenbosch University https://scholar.sun.ac.za

Page 64 of 173
HPLC column. If the mixture had to be stored to await HPLC analysis, it was stored at -18 ⁰C and only
filtered (0.22 µm) prior to analysis.
50 µL of the mixture was injected in the HPLC column, a Phenomenex Luna 3μm C18 column (250 x 4.6
mm) using a Dionex Ultimate 3000 Diode-array detector. The mobile phase solvent, gradient and flow
rate used during analysis are shown in Table 4-6. The eluent of the HPLC column was monitored at 210
nm to obtain sample adsorption peaks. The peak areas obtained were calibrated with the surfactin and
antifungal standard curves (Figure 4-5 to Figure 4-7) to obtain the surfactin and antifungal
concentrations in g/L, and the corresponding chromatograms are shown in Figure 8-1 to Figure 8-3.
Table 4-6: Mobile phase information for HPLC analysis
Mobile
phase A
0.05% (v/v) Trifluoroacetic acid (Fluka®) in water
Mobile
phase B
0.05% (v/v) Trifluoroacetic acid in acetonitrile (High purity UV grade, Burdick & Jackson)
Mobile
phase
gradient
Start at 35% B, increase to 40% B during the next 2 minutes, isocratic at 40% B for the next
5 minutes, increase to 63% B during the next 43 minutes, increase to 80% B during the next
10 minutes, increase to 87% B during the next 35 minutes, return to 35% B during the next
10 minutes and isocratic stabilisation at 35% B for the next 5 minutes.
Flow
rate
0.9 mL/min
The surfactin standard curves were prepared using surfactin standards with surfactin concentrations
ranging from 0.2 g/L to 2.5 g/L in water, using surfactin (≥98%) (Sigma-Aldrich). The surfactin standards
were prepared for HPLC by mixing with acetonitrile and run through the HPLC column, and area of each
homologue was determined. The homologue areas were then used to determine the fraction of each
homologue in the standard. The concentration of each homologue in the standards was determined by
multiplying the surfactin concentration in the standards by the fraction of a particular homologue in the
standard. The standard curves for the different homologues was then determined by plotting the
homologue area against the homologue concentration. The overall surfactin standard curve is shown in
Figure 4-5.
Stellenbosch University https://scholar.sun.ac.za

Page 65 of 173
Figure 4-5: Standard curve for surfactin quantification by HPLC analysis (experimental repeatability was not studied thus there are no error bars)
The antifungal standard curves were prepared using fengycin and iturin standards with fengycin and
iturin concentrations of 0.1 to 0.5 g/L and 0.05 to 0.2 g/L respectively in methanol. The antifungal
standards were prepared using (≥90%) fengycin and (≥95%) iturin, both from Sigma-Aldrich. The
standards were run through the HPLC column, and the areas obtained were related to the standard
concentrations to obtain the antifungal standard curves shown in Figure 4-6 and Figure 4-7.
Figure 4-6: Standard curve for fengycin quantification by HPLC analysis (experimental repeatability was not studied thus there are no error bars)
y = 1303,7x R² = 0,996
0
200
400
600
800
1000
0 0.1 0.2 0.3 0.4 0.5 0.6 0.7
Are
a (m
AU
*min
)
Surfactin concenration (g/L)
y = 0,749x R² = 0,999
0
50
100
150
200
250
300
350
400
0 100 200 300 400 500 600
Are
a(m
AU
.min
)
Fengycin concentration(mg/L)
Stellenbosch University https://scholar.sun.ac.za

Page 66 of 173
Figure 4-7: Standard curve for Iturin analysis by HPLC analysis (experimental repeatability was not studied thus there are no error bars)
4.6.4 Ammonium concentration
The ammonium concentration in B. subtilis cultures was analysed using ammonium test strips (Merck). 1
mL culture samples were centrifuged (Eppendorf Minispin, 14000×g, 5 minutes) to isolate the
supernatant from biomass. 2 drops of NH4-1 solution were added to 1 mL of the supernatant. The
reaction zone of the test strip was immersed in the supernatant-NaOH mixture for 3 seconds, and
suspended in air for 10 seconds. The colour of the reaction zone was then compared to the colour field
relating the colour of the reaction zone to the on the ammonium concentration in mg/L.
4.6.5 Nitrate concentration
The nitrate concentration was quantified by ion chromatography. 1 mL culture samples were
centrifuged (Eppendorf Minispin, 14000×g, 5 minutes) to isolate the supernatant from biomass. 500 µL
of the supernatant was mixed with 500 µL of buffer (5 mM sodium carbonate). The supernatant-buffer
mixture was then diluted 50 times in deionized water and filtered using a 0.22 µm syringe filter
(Anatech).
50 µL of the prepared samples were then injected into the column with specifications described in Table
4-7 to obtain sample peaks. The peak areas were converted into nitrate concentration by means of a
standard curve (Figure 4-8). The standard curve was determined by injecting nitrate standards (ranging
from 10 to 100 mg/L) into the column and eluted with the mobile phase. Nitrate concentrations were
then plotted against the corresponding peak areas to obtain the nitrate standard curve.
y = 1.0254x R² = 0.999
0
50
100
150
200
250
0 50 100 150 200 250
Are
a (m
AU
.min
)
Iturin concentration (mg/L)
Stellenbosch University https://scholar.sun.ac.za

Page 67 of 173
Table 4-7: Ion chromatography specifications for nitrate analysis
Separator column IonPac AS4A-SC 4mm Mobile
Mobile phase 1.8 mM Na2CO3/1.7 mM NaHCO3
Flow rate 1 mL/min
Regenerant 25 mM H2SO4
Figure 4-8: Nitrate standard curve (experimental repeatability was not studied thus there are no error bars)
y = 4E+06x R² = 0,997
0
100
200
300
400
500
600
700
800
900
0 50 100 150 200 250
Are
a (µ
S*m
in)
Mill
ion
s
Nitrate concentratin (g/L)
Stellenbosch University https://scholar.sun.ac.za
Page 68 of 173
5 Results and discussion
This section presents the results and discussion of the experiments done in order to achieve the specific
objectives of this is study. The main aim of this study is to propose surfactin purification techniques with
operating conditions. To study surfactin purification, however, the surfactin had to be produced and a
surfactin analytical technique had to be developed. This section therefore begins by providing results
and discussion of surfactin production studies followed by studies on the development and validation of
the TLC analytical technique. Thereafter, this section presents the results and discussion of optimisation
experiments on acid precipitation, solvent extraction and adsorption to determine operating conditions
of these purification techniques. This section then provides a repeatability analysis of the experiments
carried out in this study.
5.1 Surfactin production
To achieve the main aim of this study, surfactin was produced for use in purification studies. It should be
noted that the main focus of this study is not on surfactin production. Surfactin was produced from B.
subtilis ATCC 21332, batch wise in shake flasks. B. subtilis was chosen for surfactin production due to its
high selectivity towards surfactin production. Additionally, B. subtilis is not a human pathogen thus safe
to work with (Kosaric & Sukan, 2014). Production was carried out in shake flasks due to the simplicity of
shake flasks compared to bioreactors.
During surfactin production, the maximum surfactin concentration in B. subtilis cultures was 1109 mg/L.
The maximum surfactin concentration in B. subtilis cultures during production in literature ranges from
439 mg/L and 3340 mg/L where glucose and ammonium nitrate were used as a carbon and nitrogen
respectively (Table 2-1). The maximum surfactin concentration in this study is thus lower than that in
literature. This is possibly due to the fact that the nutrient media used in this study was optimised for
fengycin production by B. amyloliquefaciens DSM23117 (Pretorius, et al., 2015) and not for surfactin
production.
The maximum surfactin concentration obtained in this study is greater than that obtained in the study
by Pretorius et al. (2015) (882 mg/L), where the same nutrient media and bacteria species were used for
surfactin production. Surfactin production in the study by Pretorius et al. (2015) was carried out in a
bioreactor rather than shake flasks, thus a relatively higher surfactin concentration was expected (Chen,
et al., 2006).
Stellenbosch University https://scholar.sun.ac.za

Page 69 of 173
The change in surfactin with time during production is shown in Figure 5-1. Surfactin was seen to
increase with time during production, until it reached a maximum (1109 mg/L) at approximately 53 h.
According to Figure 5-1, surfactin production in this study was produced in both the exponential phase
and stationary phase as in the study by Pretorius et al. (2015). This is in contrast with surfactin
production in the study by Davis et al. (1999), although the same bacteria species was used for surfactin
production. In the study by Davis et al. (1999), surfactin was mainly produced at the beginning of the
stationary phase. This variation is possibly due to the fact that different nutrient media was used in the
study by Davis et al. (1999), as Bence (2011) showed that the trend at which surfactin is produced could
be influenced by the growth medium.
The suitable harvesting time ranged between 53 and 66 h. After the maximum surfactin concentration
had been reached after 53 h, the surfactin concentration remained consistent between 53 h and 66 h.
The suitable harvesting time was considered to be the time when surfactin concentration is at its
maximum during production. The harvesting time in this study lies within the literature indicated range
of harvesting times for surfactin production from B. subtilis ATCC 21332 (48- 120 h), shown in Table 2-1.
The surfactin concentration is expected to decrease with time if cultivation was continued further than
66 h. Surfactin concentration is expected to decrease as surfactin may inhibit cell growth above a certain
concentration and surfactin may be consumed due to substrate scarcity in the growth medium
(Mukherjee, et al., 2009 and Wei & Chu, 2002).
The maximum surfactin concentration was seen to coincide with the beginning of the death phase of B.
subtilis cells during production (Figure 5-1). The cessation in the increase of surfactin concentration
might therefore be due to the decrease in metabolising B. subtilis cells. Additionally, when comparing
Figure 5-1 and Figure 5-2, it can be seen that the death phase coincides with the onset of glucose
depletion.
Cell growth was seen to be influenced by ammonium concentration. The exponential phase ended at
approximately 29 h (Figure 5-1). From Figure 5-1 and Figure 5-2, it can also be seen that the stationary
phase begun just after ammonium has been consumed, even though nitrate was not fully consumed
during surfactin production. This is in accordance the study by Davis et al. (1999), who reported that
although ammonium nitrate is a dual nitrogen source, the ammonium is consumed prior to nitrate
consumption. Since the exponential phase ended before glucose and nitrate were fully consumed,
ammonium ions are the overall growth limiting nutrient.
Stellenbosch University https://scholar.sun.ac.za
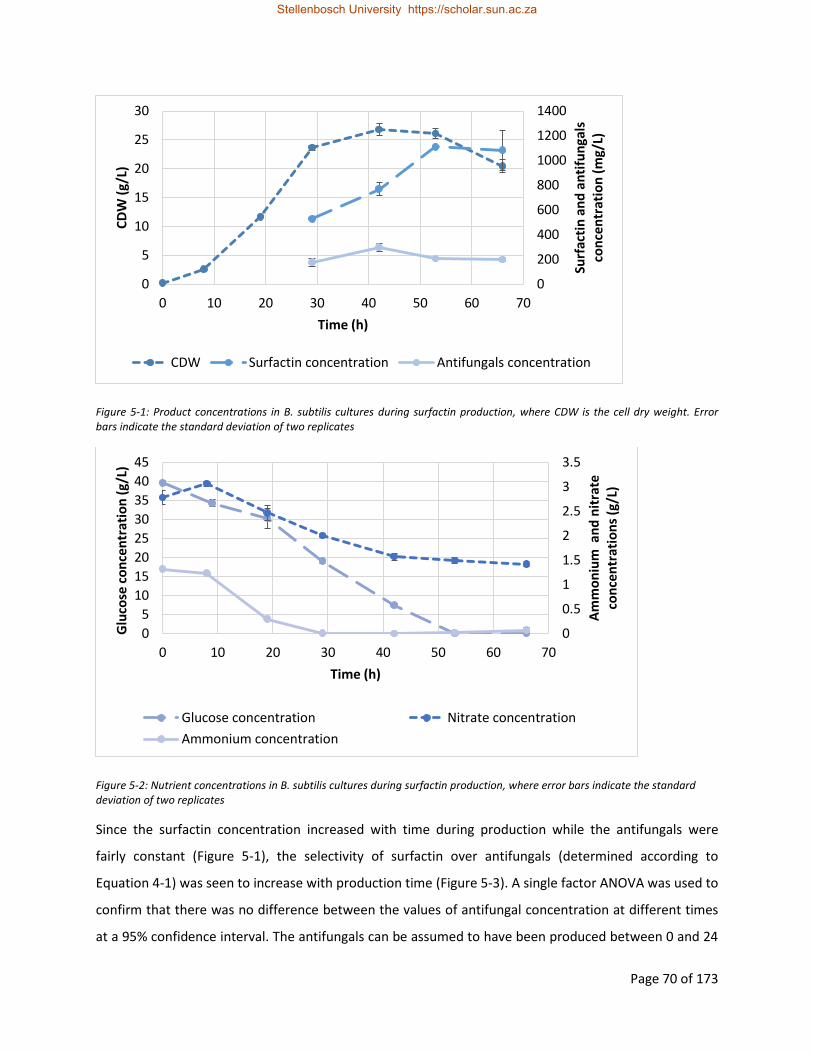
Page 70 of 173
Figure 5-1: Product concentrations in B. subtilis cultures during surfactin production, where CDW is the cell dry weight. Error bars indicate the standard deviation of two replicates
Figure 5-2: Nutrient concentrations in B. subtilis cultures during surfactin production, where error bars indicate the standard deviation of two replicates
Since the surfactin concentration increased with time during production while the antifungals were
fairly constant (Figure 5-1), the selectivity of surfactin over antifungals (determined according to
Equation 4-1) was seen to increase with production time (Figure 5-3). A single factor ANOVA was used to
confirm that there was no difference between the values of antifungal concentration at different times
at a 95% confidence interval. The antifungals can be assumed to have been produced between 0 and 24
0
200
400
600
800
1000
1200
1400
0
5
10
15
20
25
30
0 10 20 30 40 50 60 70
Surf
acti
n a
nd
an
tifu
nga
ls
con
cen
trat
ion
(m
g/L)
CD
W (
g/L)
Time (h)
CDW Surfactin concentration Antifungals concentration
0
0.5
1
1.5
2
2.5
3
3.5
0
5
10
15
20
25
30
35
40
45
0 10 20 30 40 50 60 70
Am
mo
niu
m a
nd
nit
rate
co
nce
ntr
atio
ns
(g/L
)
Glu
cose
co
nce
ntr
atio
n (
g/L)
Time (h)
Glucose concentration Nitrate concentration
Ammonium concentration
Stellenbosch University https://scholar.sun.ac.za
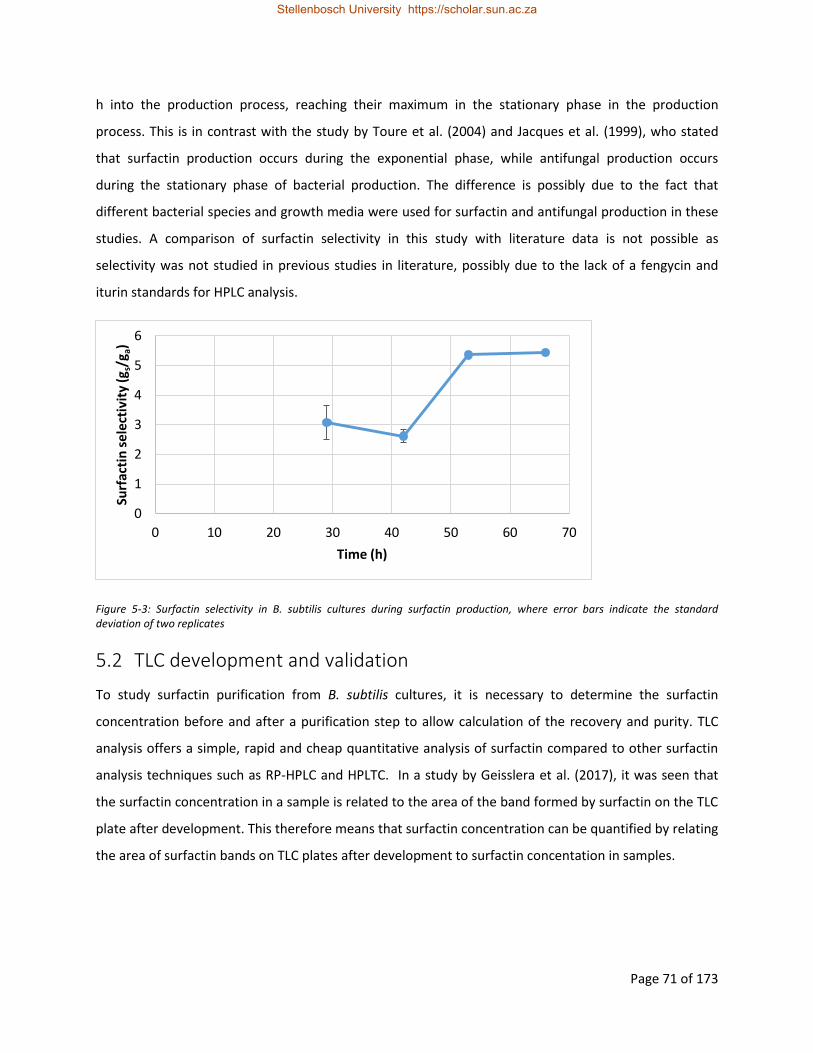
Page 71 of 173
h into the production process, reaching their maximum in the stationary phase in the production
process. This is in contrast with the study by Toure et al. (2004) and Jacques et al. (1999), who stated
that surfactin production occurs during the exponential phase, while antifungal production occurs
during the stationary phase of bacterial production. The difference is possibly due to the fact that
different bacterial species and growth media were used for surfactin and antifungal production in these
studies. A comparison of surfactin selectivity in this study with literature data is not possible as
selectivity was not studied in previous studies in literature, possibly due to the lack of a fengycin and
iturin standards for HPLC analysis.
Figure 5-3: Surfactin selectivity in B. subtilis cultures during surfactin production, where error bars indicate the standard deviation of two replicates
5.2 TLC development and validation
To study surfactin purification from B. subtilis cultures, it is necessary to determine the surfactin
concentration before and after a purification step to allow calculation of the recovery and purity. TLC
analysis offers a simple, rapid and cheap quantitative analysis of surfactin compared to other surfactin
analysis techniques such as RP-HPLC and HPLTC. In a study by Geisslera et al. (2017), it was seen that
the surfactin concentration in a sample is related to the area of the band formed by surfactin on the TLC
plate after development. This therefore means that surfactin concentration can be quantified by relating
the area of surfactin bands on TLC plates after development to surfactin concentation in samples.
0
1
2
3
4
5
6
0 10 20 30 40 50 60 70
Surf
acti
n s
ele
ctiv
ity
(gs/
g a)
Time (h)
Stellenbosch University https://scholar.sun.ac.za
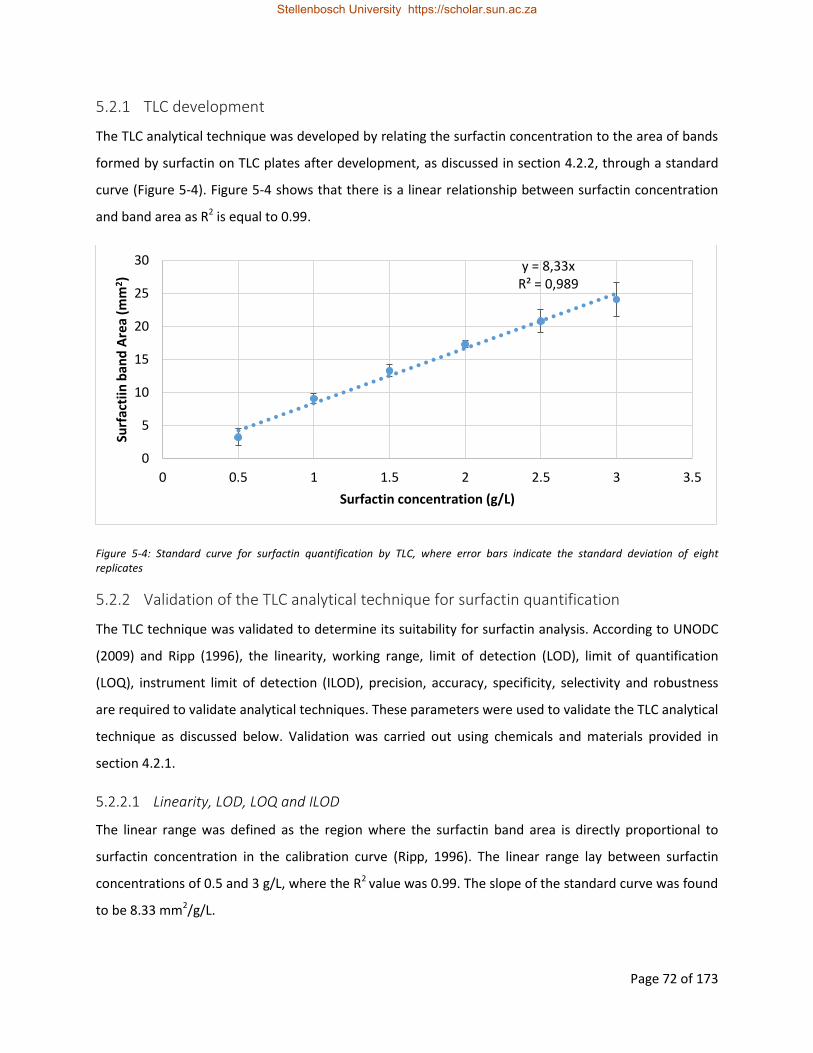
Page 72 of 173
5.2.1 TLC development
The TLC analytical technique was developed by relating the surfactin concentration to the area of bands
formed by surfactin on TLC plates after development, as discussed in section 4.2.2, through a standard
curve (Figure 5-4). Figure 5-4 shows that there is a linear relationship between surfactin concentration
and band area as R2 is equal to 0.99.
Figure 5-4: Standard curve for surfactin quantification by TLC, where error bars indicate the standard deviation of eight replicates
5.2.2 Validation of the TLC analytical technique for surfactin quantification
The TLC technique was validated to determine its suitability for surfactin analysis. According to UNODC
(2009) and Ripp (1996), the linearity, working range, limit of detection (LOD), limit of quantification
(LOQ), instrument limit of detection (ILOD), precision, accuracy, specificity, selectivity and robustness
are required to validate analytical techniques. These parameters were used to validate the TLC analytical
technique as discussed below. Validation was carried out using chemicals and materials provided in
section 4.2.1.
Linearity, LOD, LOQ and ILOD 5.2.2.1
The linear range was defined as the region where the surfactin band area is directly proportional to
surfactin concentration in the calibration curve (Ripp, 1996). The linear range lay between surfactin
concentrations of 0.5 and 3 g/L, where the R2 value was 0.99. The slope of the standard curve was found
to be 8.33 mm2/g/L.
y = 8,33x R² = 0,989
0
5
10
15
20
25
30
0 0.5 1 1.5 2 2.5 3 3.5
Surf
acti
in b
and
Are
a (m
m2)
Surfactin concentration (g/L)
Stellenbosch University https://scholar.sun.ac.za

Page 73 of 173
The standard curve was also validated by LOD, LOQ and ILOD. LOD was defined as the lowest surfactin
concentration that can be detected and identified with a degree of certainty, and was calculated
according to Equation 5-1. The LOQ was defined as the lowest surfactin concentration that can be
determined with a good degree of precision and accuracy (Ripp, 1996), and was calculated according to
Equation 5-2. In Equation 5-1 and Equation 5-2, 𝜎 and S are the standard deviation of the areas of the
surfactin bands at the low-level surfactin concentration in the standard curve and the slope of the
standard curve respectively. The LOD and LOQ were found to be 0.5 g/L and 1.6 g/L respectively.
𝐿𝑂𝐷 =3.3𝜎
𝑆 Equation 5-1
𝐿𝑂𝑄 =10𝜎
𝑆 Equation 5-2
The ILOD was defined as the lowest surfactin concentration that can be detected by the TLC analytical
technique (Ripp, 1996). To determine the ILOD, the simulated supernatant (prepared as discussed in
section 4.2.1), was diluted to a surfactin concentration of 0.05 g/L. This was used to spot samples
ranging from 0.05 g/L to 0.4 g/L (with increments of 0.05 g/L) on a TLC plate by multiple spotting. The
plate was developed and primuline reagent was used to detect surfactin. The concentration at which the
bands start appearing on the TLC plate was visually determined as the ILOD, and was found to be 0.25
g/L. The linear range, slope, LOD, LOQ and ILOD are summarised in Table 5-1.
Table 5-1:Standard curve slope and validation parameters of the TLC analytial technique
Parameter Value
linear range 0.5-3 g/L
R2 0.99
Slope 8.33 mm2/g/L
LOD 0.5 g/L
LOQ 1.6 g/L
ILOD 0.25 g/L
Stellenbosch University https://scholar.sun.ac.za

Page 74 of 173
Accuracy and precision 5.2.2.2
The TLC technique was also validated by accuracy (a measure of how close the measured surfactin
concentration is to the actual concentration) and precision (a measure of random errors in the
measured surfactin concentrations under repeatable or reproducible conditions) (Ripp, 1996). Since the
accuracy and precision are concentration dependent, they were both analysed at a high concentration
(2.27 g/L), medium concentration (1.70 g/L) and low concentration (0.85 g/L) along the linear range of
the calibration curve, using samples of commercial surfactin dissolved in methanol (prepared as
discussed in section 4.2.1).
The accuracy (α) and precision (β) were calculated according to Equation 5-3 and Equation 5-4
respectively, where µ and χ are the true values and average values of the measured surfactin
concentrations respectively. Experiments for accuracy and precision studies were repeated 8 times.
𝛼 = 100 (1 −|𝜇−𝜒|
µ) Equation 5-3
𝛽 = 100(1 −𝜎
µ) Equation 5-4
The accuracy and precision, along the linear range of the calibration curve, are shown in Table 5-2. The
precision ranged from 82% to 94%, while the accuracy ranged from 90% to 98%. According to UNODC
(2009), a valid analytical technique should have an accuracy greater than 80% at lower concentrations
on the calibration, and better than 85% for the other concentrations levels. Additionally, the analytical
technique must have a minimum precision of 80% at lower concentrations on the calibration curve. The
accuracy and precision determined at various concentrations along the linear range are therefore
acceptable. Since the precision could be as low as 82%, this analytical technique can be defined as a
semi-quantitative analysis.
Table 5-2: Accuracy and precision determined across the linear range
Surfactin concentration (g/L) Accuracy Precision
2.27 93% 94%
1.70 98% 84%
0.85 90% 82%
Stellenbosch University https://scholar.sun.ac.za

Page 75 of 173
When considering the concentration of 0.85 g/L, it was seen than high accuracy (90%) can be
determined for concentrations lower than LOQ (1.6 g/L). This contradiction is possibly due to the fact
that the LOD and LOQ are not robust parameters and can be affected by minor changes in the analytical
system such as purity of reagents. According to Ripp (1996), the LOQ depends on the analytical
technique, type of analyte as well as the general physical-chemical makeup of the sample. These
parameters should therefore always be verified by laboratories adopting previously validated methods
(Ripp, 2009).
Specificity 5.2.2.3
This study was done to determine if the surfactin concentration can be estimated in samples with
impurities at a high accuracy and precision. This is necessary as surfactin samples are likely to contain
some degree of impurities, especially in B. subtilis cultures. Specificity was studied using 2 g/L surfactin
in simulated supernatant (prepared as discussed in section 4.2.1) and in water. The simulated
supernatant and water with surfactin was spotted onto TLC plates, and the surfactin concentration was
measured by TLC analysis as discussed in section 4.2.2 and compared to the actual surfactin
concentration (Figure 5-5).
Figure 5-5 shows that there was no significant difference between the measured concentration and the
actual concentration, in both water and simulated supernatant, since the actual concentrations lie
within the error bars of the calculated concentrations. The measured concentration in water was also
similar to that in the simulated supernatant, indicating that the presence of impurities in the simulated
supernatant does not affect surfactin analysis. A single factor ANOVA was used to confirm this
observation at a 95% confidence interval. TLC is therefore specific for surfactin analysis.
Stellenbosch University https://scholar.sun.ac.za

Page 76 of 173
Figure 5-5: Specificity of TLC analysis for the measurement of surfactin concentrations, where error bars indicate the standard deviation of five replicates
To further confirm the specificity of the TLC analysis for measurement of surfactin concentration, the
accuracy and precision of the measured concentrations was also determined according to Equation 5-3
and Equation 5-4 respectively. The accuracy in water and simulated supernatant was found to be 98%
and 97% respectively, while the precision was found to be 95% and 94% respectively. The high
accuracies and precisions (>90%) in the simulated supernatant as well as the similar accuracies and
precisions between water and simulated supernatant confirmed that the TLC analytical technique is
specific for surfactin analysis in the presence of impurities.
Geisslera et al. (2017), on the other hand, found that surfactin analysis by HPTLC can be affected by the
presence of impurities as impurities tend to overlap with the substances of interest. This could cause the
TLC technique to give measured surfactin concentrations which are lower than the actual
concentrations. Although this was not the case in this study, it may be necessary to be pre-treat samples
prior to quantification should overlapping occur.
Robustness 5.2.2.4
According to guidelines from the ICH Harmonized Tripartite (2005), robustness is the measure of the
capacity of the TLC analytical procedure to remain unaffected by variations in method parameters. The
variations which may be encountered in the TLC technique may arise due to analysis of surfactin in
different solvents, having to analyse samples on different days as well as having to spot samples more
than once on the TLC plate. An analytical technique is described as robust if results are not sensitive to
0.0
0.5
1.0
1.5
2.0
2.5
Simulated supernatant Water
Surf
acti
n c
on
cen
trat
ioin
(g/
L)
Solvent
Actual concentration Measured concentration
Stellenbosch University https://scholar.sun.ac.za

Page 77 of 173
variations in the experimental conditions (ICH, 2005). Sensitivity to different solvents as well as
sensitivity to multiple spotting were used to test the robustness of the TLC analytical technique in this
study as discussed in section 5.2.2.4.1 and section 5.2.2.4.2.
5.2.2.4.1 Sensitivity to different solvents
This study was done to determine if the TLC analytical technique was suitable for surfactin analysis when
surfactin was dissolved in different solvents. Sensitivity to different solvents was tested by comparing
the actual and measured surfactin concentrations in different solvents (Table 5-3), and the results are
displayed in Figure 5-6. Experiments for sensitivity to different solvents were repeated five times. The
actual concentration was seen to lie within error of the measured concentration. A single factor ANOVA
was used to confirm this observation at a 95% confidence interval. The TLC analytical technique was
therefore found to be suitable for measurement of surfactin concentration when surfactin was dissolved
in different solvents.
Table 5-3: Solvents used to study the suitability of the TLC analytical technique for surfactin analysis in various solvents and the concentration of spiked surfactin in the different solvents
Solvent Surfactin concentration (g/L)
Methanol 1.70
Ethanol 2.10
Isopropanol 1.95
Water 2.00
Stellenbosch University https://scholar.sun.ac.za
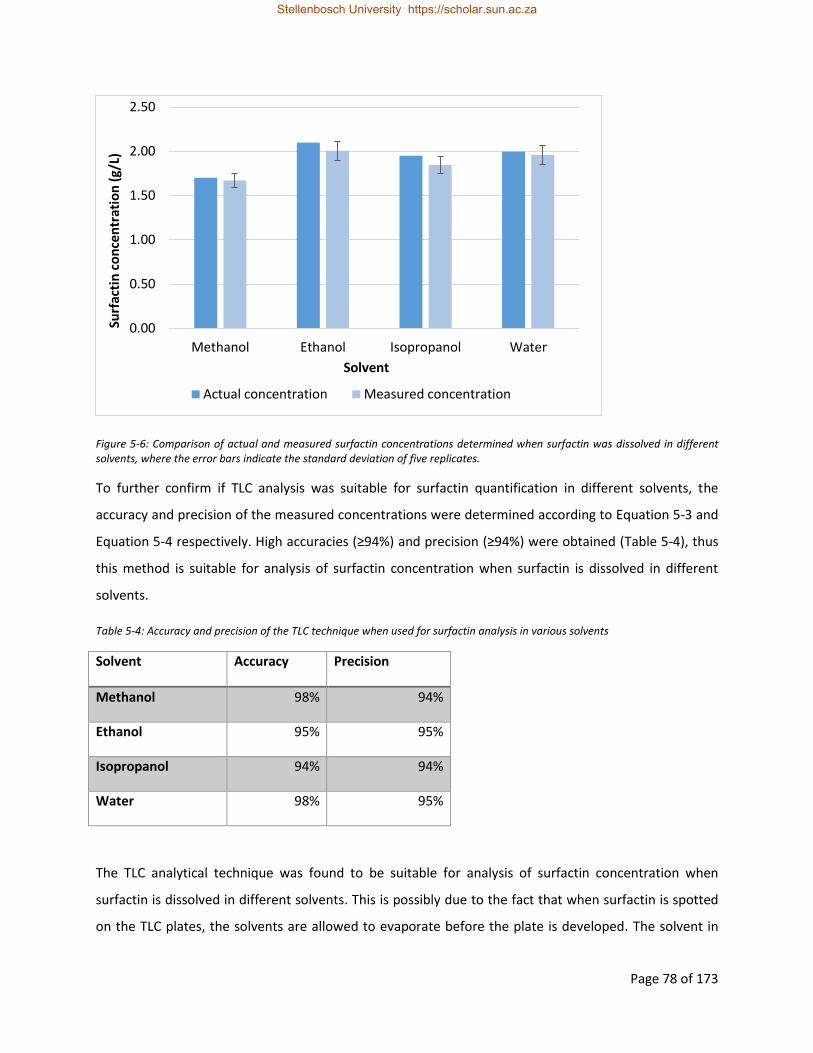
Page 78 of 173
Figure 5-6: Comparison of actual and measured surfactin concentrations determined when surfactin was dissolved in different solvents, where the error bars indicate the standard deviation of five replicates.
To further confirm if TLC analysis was suitable for surfactin quantification in different solvents, the
accuracy and precision of the measured concentrations were determined according to Equation 5-3 and
Equation 5-4 respectively. High accuracies (≥94%) and precision (≥94%) were obtained (Table 5-4), thus
this method is suitable for analysis of surfactin concentration when surfactin is dissolved in different
solvents.
Table 5-4: Accuracy and precision of the TLC technique when used for surfactin analysis in various solvents
Solvent Accuracy Precision
Methanol 98% 94%
Ethanol 95% 95%
Isopropanol 94% 94%
Water 98% 95%
The TLC analytical technique was found to be suitable for analysis of surfactin concentration when
surfactin is dissolved in different solvents. This is possibly due to the fact that when surfactin is spotted
on the TLC plates, the solvents are allowed to evaporate before the plate is developed. The solvent in
0.00
0.50
1.00
1.50
2.00
2.50
Methanol Ethanol Isopropanol Water
Surf
acti
n c
on
cen
trat
ion
(g/
L)
Solvent
Actual concentration Measured concentration
Stellenbosch University https://scholar.sun.ac.za
Page 79 of 173
which surfactin was dissolved therefore does not affect the polarity during analysis hence the migration
of surfactin during the development of the plate. This is significant as this procedure can be used for
analysis of surfactin during solvent extraction. In solvent extraction studies, surfactin concentration in
various solvents used for extraction may be required, while analytical techniques such as HPLC are not
capable of quantifying surfactin concentration when surfactin is dissolved in solvents.
5.2.2.4.2 Sensitivity to multiple spotting
Multiple spotting refers to spotting samples more than once on the TLC plate with intermediate drying.
This is used to increase the amount of surfactin on a single spot on a TLC plate, which is necessary if the
surfactin concentration in the samples being analysed is lower than the LOD (0.5 g/L). Multiple spotting
was studied using simulated supernatant with 1 g/L surfactin (prepared by diluting the simulated
supernatant prepared as discussed in 4.2.1 in water). The supernatants were then diluted 5 times and
10 times to form concentrations shown in Table 5-5. Experiments to determine the sensitivity of TLC
analysis to multiple spotting were repeated 6 times.
Table 5-5: Surfactin concentration in media used for studying the multiple spotting error
Dilution Surfactin concentration (g/L)
No dilution 1
5 times dilution 0.2
10 times dilution 0.1
The undiluted supernatant, 5 times diluted supernatant and 10 times diluted supernatant were spotted
once, 5 times and 10 times respectively on the TLC plate with intermediate drying. Surfactin
concentration of the three supernatants was then measured by TLC analysis and compared to the actual
surfactin concentration (Figure 5-7). There was no significant difference between the measured and
actual concentrations, since the actual concentrations lie within the error bars of the calculated
concentrations. A single factor ANOVA was used to confirm this observation at a 95% confidence
interval. The TLC analytical technique was therefore not sensitive to multiple spotting.
Stellenbosch University https://scholar.sun.ac.za
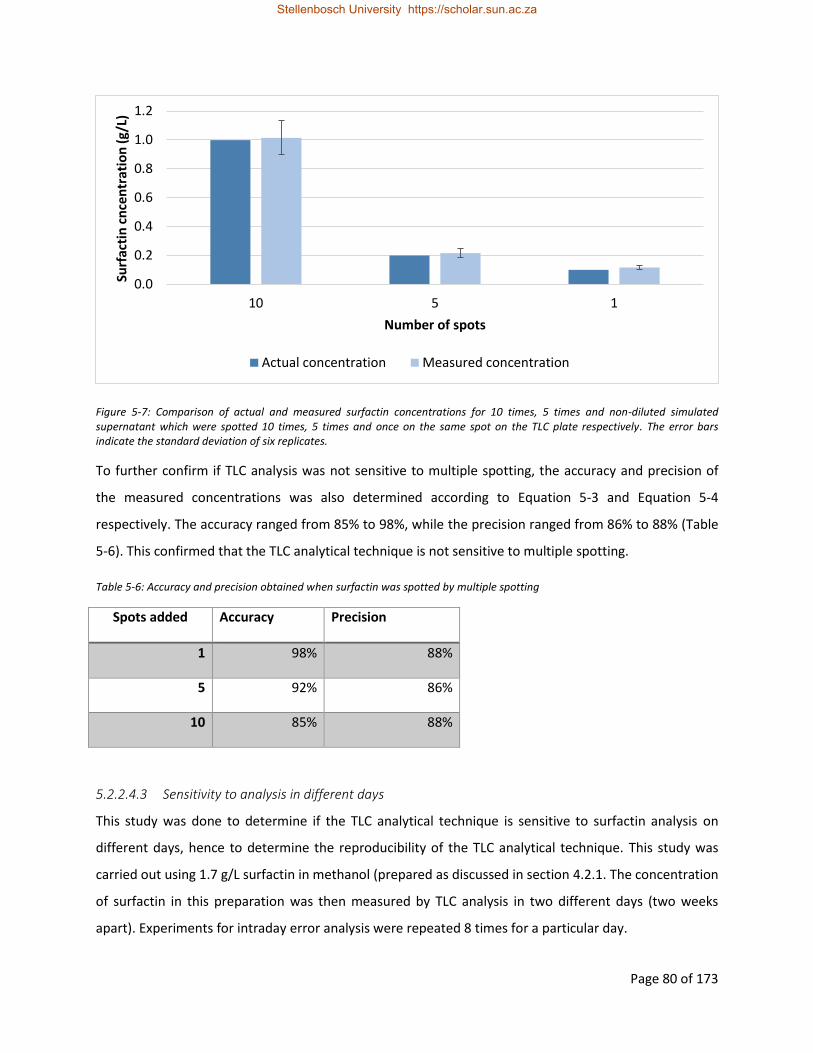
Page 80 of 173
Figure 5-7: Comparison of actual and measured surfactin concentrations for 10 times, 5 times and non-diluted simulated supernatant which were spotted 10 times, 5 times and once on the same spot on the TLC plate respectively. The error bars indicate the standard deviation of six replicates.
To further confirm if TLC analysis was not sensitive to multiple spotting, the accuracy and precision of
the measured concentrations was also determined according to Equation 5-3 and Equation 5-4
respectively. The accuracy ranged from 85% to 98%, while the precision ranged from 86% to 88% (Table
5-6). This confirmed that the TLC analytical technique is not sensitive to multiple spotting.
Table 5-6: Accuracy and precision obtained when surfactin was spotted by multiple spotting
Spots added Accuracy Precision
1 98% 88%
5 92% 86%
10 85% 88%
5.2.2.4.3 Sensitivity to analysis in different days
This study was done to determine if the TLC analytical technique is sensitive to surfactin analysis on
different days, hence to determine the reproducibility of the TLC analytical technique. This study was
carried out using 1.7 g/L surfactin in methanol (prepared as discussed in section 4.2.1. The concentration
of surfactin in this preparation was then measured by TLC analysis in two different days (two weeks
apart). Experiments for intraday error analysis were repeated 8 times for a particular day.
0.0
0.2
0.4
0.6
0.8
1.0
1.2
10 5 1
Surf
acti
n c
nce
ntr
atio
n (
g/L)
Number of spots
Actual concentration Measured concentration
Stellenbosch University https://scholar.sun.ac.za
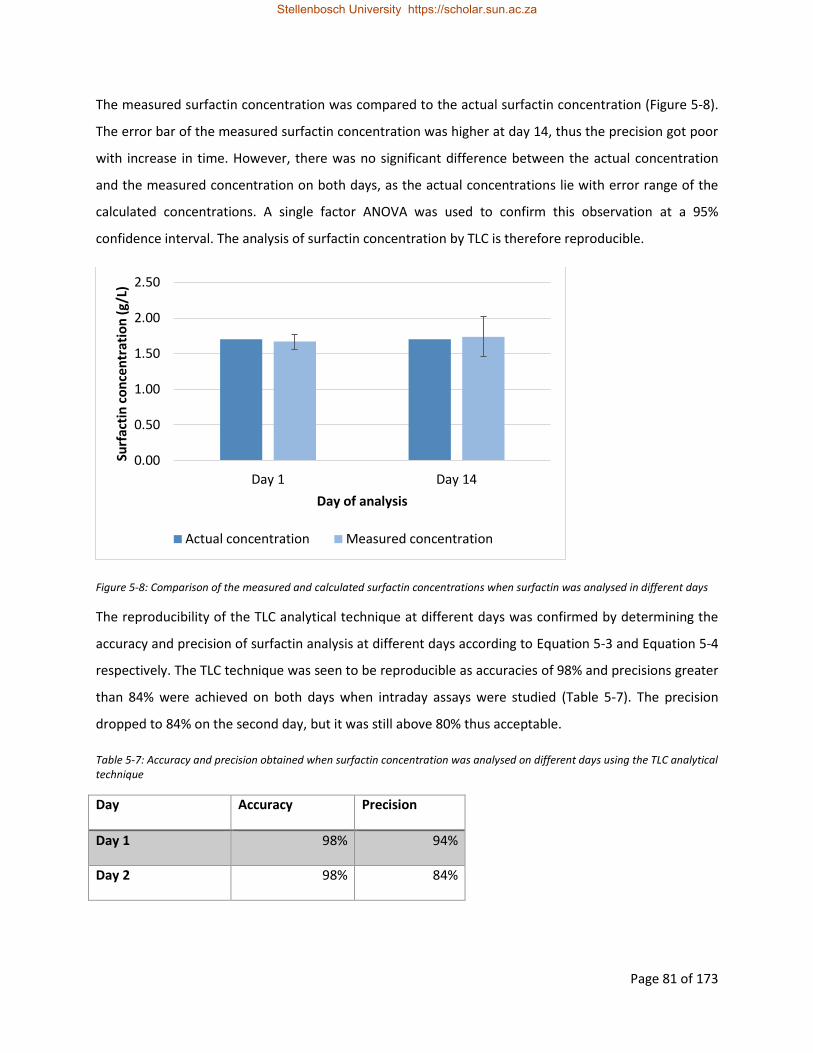
Page 81 of 173
The measured surfactin concentration was compared to the actual surfactin concentration (Figure 5-8).
The error bar of the measured surfactin concentration was higher at day 14, thus the precision got poor
with increase in time. However, there was no significant difference between the actual concentration
and the measured concentration on both days, as the actual concentrations lie with error range of the
calculated concentrations. A single factor ANOVA was used to confirm this observation at a 95%
confidence interval. The analysis of surfactin concentration by TLC is therefore reproducible.
Figure 5-8: Comparison of the measured and calculated surfactin concentrations when surfactin was analysed in different days
The reproducibility of the TLC analytical technique at different days was confirmed by determining the
accuracy and precision of surfactin analysis at different days according to Equation 5-3 and Equation 5-4
respectively. The TLC technique was seen to be reproducible as accuracies of 98% and precisions greater
than 84% were achieved on both days when intraday assays were studied (Table 5-7). The precision
dropped to 84% on the second day, but it was still above 80% thus acceptable.
Table 5-7: Accuracy and precision obtained when surfactin concentration was analysed on different days using the TLC analytical technique
Day Accuracy Precision
Day 1 98% 94%
Day 2 98% 84%
0.00
0.50
1.00
1.50
2.00
2.50
Day 1 Day 14
Surf
acti
n c
on
cen
trat
ion
(g/
L)
Day of analysis
Actual concentration Measured concentration
Stellenbosch University https://scholar.sun.ac.za

Page 82 of 173
5.2.3 Impurity assays and extension of the TLC technique to lipopeptide analysis
Surfactin with different degrees of purities is obtained during initial recovery by acid precipitation or
other purification procedures (Rangarajan and Clarke, 2016). Impurity assessments would suggest the
course of purification procedures to be followed to get rid of the impurities in surfactin purification
studies. The TLC analytical technique can be used to determine the level of impurities present in the
surfactin sample using the primuline reagent (which would reveal the presence of lipid impurities) and
ninhydrin reagent (which would reveal the presence of peptide/protein impurities).
To demonstrate the suitability of TLC analysis for detection and quantification of impurities, impurity
assays were done on resolubilised acid precipitates of B. subtilis with a surfactin concentration of 2.48
g/L. The resolubilised precipitates were spotted 5 times on TLC plates and developed in the TLC
chamber. Multiple spotting was used for better visualisation of the impurities.
Figure 5-9 shows the developed plates when primuline (Figure 5-9a) and ninhydrin (Figure 5-9b) were
used as detection agents. Lipid impurities show as white spots and peptide/protein impurities show as
dark spots on the TLC plates. Components with lipid parts were seen to move up the TLC plate while
those with peptide parts did not move up the TLC plate. Impurity assays provide a qualitative analysis of
impurities and proteins in B. subtilis cultures. A high concentration of protein impurities is noted by
darker regions on the developed TLC plates, while higher lipid concentrations are noted by wider bands
on the TLC plate.
Figure 5-9a shows that surfactin, fengycin and iturin can be detected using the primuline reagent.
Surfactin and iturin, however cannot be detected using the ninhydrin detector. According to the
certificate of analysis of surfactin (from Kaneka, Japan), surfactin does not respond to the ninhydrin
detector. There was little or no iturin the B. subtilis cultures as it was not seen on the TLC plates.
Figure 5-9b shows that developing plates with a ninhydrin showed the presence of protein impurities in
the same place where samples were originally spotted as dark spots on the TLC plates. The proteins in B.
subtilis cultures therefore possibly have a poor solubility in the mobile phase
(chloroform:methanol:water mixture in the volume ratio 65:25:4). According to Bele & Khale (2011),
compounds which are insoluble in the mobile phase do not move up the TLC plate during development.
The dark regions in the Rf range of fengycin in Figure 5-9b were assumed to be fengycin.
Stellenbosch University https://scholar.sun.ac.za

Page 83 of 173
Figure 5-9: Developed plates for concentrated B. subtilis cultures (after purification by acid precipitation) with (a) primuline and (b) ninhydrin reagent
To determine if TLC analysis can be extended for analysis of other lipopeptides, selectivity studies were
carried out based on Rf values of surfactin, iturin and fengycin. Selectivity studies were carried out using
surfactin, iturin and fengycin (all from Sigma-Aldrich), prepared in methanol. The lipopeptide standards
were spotted on different spots as well as on the same spot (with intermediate drying) on TLC plates,
and the Rf values were determined as discussed in section 4.2.2 and compared (Figure 5-10).
Figure 5-10 shows that the migration of surfactin, iturin and fengycin on TLC plates is similar, whether
these lipopeptides are spotted on the same spot or on different spots on the TLC plates as the error bars
overlap. This observation was confirmed statistically using a single way ANOVA, which showed that
there was no significant difference between the Rf values at a 95% confidence interval. The TLC method
is therefore selective for surfactin, iturin and fengycin.
fengycin
standard
Concentrated
culture
Iturin
standard
Concentrated
culture
Surfactin
standard
Fengycin
standard Concentrated
culture
Iturin
standard Concentrated
culture
Surfactin
standard
a b
Surfactin
Iturin
Fengycin
Protein
Stellenbosch University https://scholar.sun.ac.za
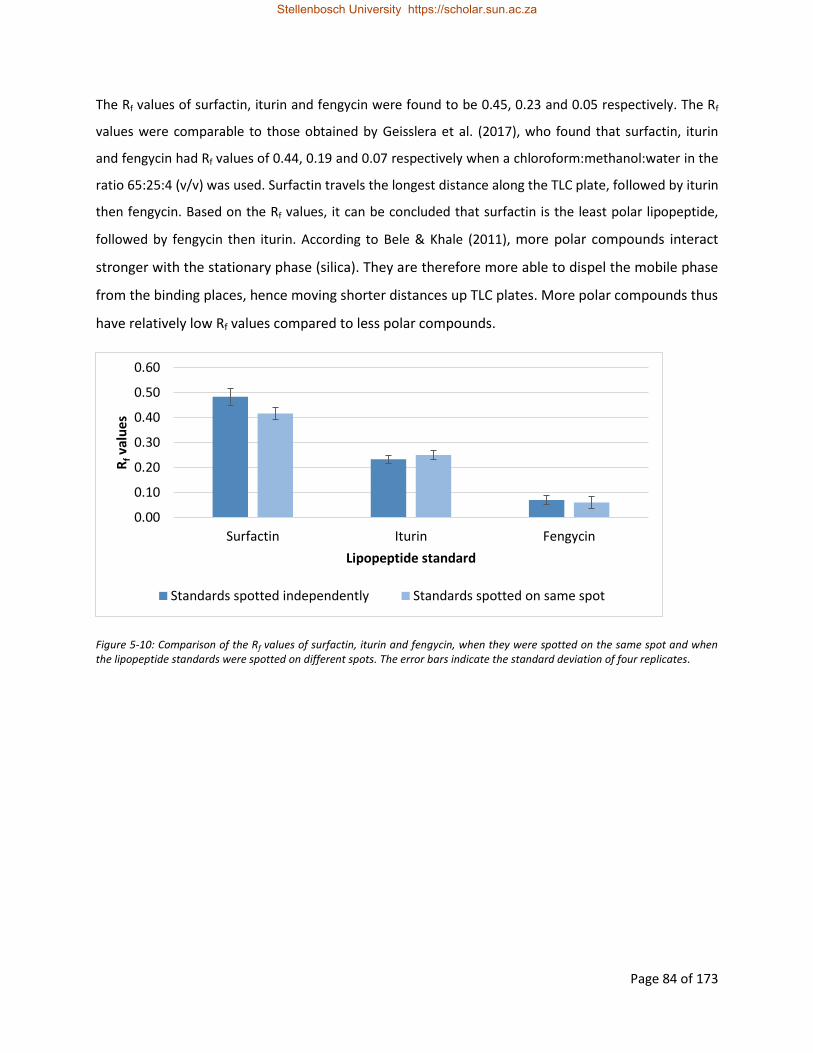
Page 84 of 173
The Rf values of surfactin, iturin and fengycin were found to be 0.45, 0.23 and 0.05 respectively. The Rf
values were comparable to those obtained by Geisslera et al. (2017), who found that surfactin, iturin
and fengycin had Rf values of 0.44, 0.19 and 0.07 respectively when a chloroform:methanol:water in the
ratio 65:25:4 (v/v) was used. Surfactin travels the longest distance along the TLC plate, followed by iturin
then fengycin. Based on the Rf values, it can be concluded that surfactin is the least polar lipopeptide,
followed by fengycin then iturin. According to Bele & Khale (2011), more polar compounds interact
stronger with the stationary phase (silica). They are therefore more able to dispel the mobile phase
from the binding places, hence moving shorter distances up TLC plates. More polar compounds thus
have relatively low Rf values compared to less polar compounds.
Figure 5-10: Comparison of the Rf values of surfactin, iturin and fengycin, when they were spotted on the same spot and when the lipopeptide standards were spotted on different spots. The error bars indicate the standard deviation of four replicates.
0.00
0.10
0.20
0.30
0.40
0.50
0.60
Surfactin Iturin Fengycin
Rf v
alu
es
Lipopeptide standard
Standards spotted independently Standards spotted on same spot
Stellenbosch University https://scholar.sun.ac.za

Page 85 of 173
5.2.4 Problems encountered and recommendations for carrying out successful surfactin
analysis by TLC
TLC analysis needs to be meticulously done as careless procedures (such as not ensuring proper
saturation of TLC chamber prior to analysis) may affect the accuracy of the analysis. One problem
encountered during TLC analysis is ensuring the mobile phase forms a straight front as it rises up the TLC
plate. This problem may arise when the TLC plate is not parallel to the mobile phase when inserted in
the TLC chamber. Surfactin will migrate a higher distance on the end where the solvent moves higher up
the TLC plate, and the bands will be of poor quality as they will not be circular.
Another problem may arise when TLC is carried out in a chamber that is not properly saturated. This
may arise due to loss of saturating vapour when spotted TLC plates are placed in the chamber as the
chamber must be opened. This can be avoided by inserting spotted TLC plates in the chamber as quickly
as possible, while making sure of a straight solvent front. Improper tank saturation may also arise when
insufficient time was allowed for tank saturation prior to analysis. Analysis in an unsaturated tank causes
surfactin to migrate higher up the plate (Geisslera, et al., 2017).
Another problem may arise when surfactin is analysed in solvents other than water. Solvents with
dissolved surfactin should be stored at -18 °C before analysis, and spotting should be carried out while
the temperature of the solvents is below 0 °C to minimise volatilisation during spotting.
Surfactin analysis may be affected by unclean TLC plates and the presence of impurities in samples.
Impurities may overlap with the substances of interest. Samples of cell-free supernatants may need to
be pre-treated prior to quantification should overlapping occur. Pre-treatment can be achieved by
solvent extraction using chloroform:methanol (2:1, v/v) (Geisslera, et al., 2017). TLC plates must be
clean and dust-free. Pre-washing of the TLC plates with methanol and storage in a dust-free
environment after drying can be considered.
5.2.5 Comparison of TLC and HPLC analytical techniques for surfactin analysis
To compare surfactin analysis by TLC and HPLC, the surfactin purity in the precipitate (obtained as
discussed in section 4.5.3) was determined based on concentrations determined by HPLC and TLC
analysis (Figure 5-11). Figure 5-11 shows that the TLC purities are lower than the HPLC purities. The TLC
results show greater error bars compared to the HPLC results, thus HPLC is more precise analytical
technique. The error bars overlap thus there is no significant difference between the results determined
by HPLC and TLC.
Stellenbosch University https://scholar.sun.ac.za

Page 86 of 173
Figure 5-11: Comparison of purities from acid precipitation step determined by HPLC and TLC analysis, where the error bars indicate the standard deviation of four replicates
5.3 Surfactin purification by acid precipitation
Acid precipitation was used to isolate surfactin from supernatants of B. subtilis cultures, to obtain the
partially purified product in solid form. Low pH causes the charges of amino acids in surfactin to
neutralise, hence surfactin loses its solubility in water and precipitates (Kosaric & Sukan, 2014). Acid
precipitation was chosen as it is capable of achieving high recoveries (>97%) and is a relatively cheap
method compared to other techniques such as salting out (Chen & Juang, 2008b and Chen, et al.,
2008c). Additionally, acid precipitation is capable of simultaneously achieving maximums of both
recovery and purity, unlike foam fractionation where maximum surfactin recoveries cannot be obtained
at maximum purities (Davis, et al. 2001).
Surfactin recovery by acid precipitation has been studied at pH 4 and pH 2 in literature (Table 2-2). No
study was, however, carried out to optimise the operating pH between these two pH (pH 2 and pH 4) in
literature, thus the influence of pH on acid precipitation was investigated in this study. Acid precipitation
was optimised based on surfactin recovery and purity (section 5.3.1), improvement in selectivity (section
5.3.2) as well as impurity assays (sections 5.3.3). These recoveries, purities and improvement in
selectivities were obtained based on surfactin and antifungal concentrations determined by HPLC
analysis. HPLC analysis was used for analysis at it has a higher precision in comparison to TLC analysis.
0
10
20
30
40
50
60
2 3 4
% P
uri
ty
pH
Purities determined by HPLC Purities determined by TLC
Stellenbosch University https://scholar.sun.ac.za

Page 87 of 173
5.3.1 Optimisation of acid precipitation based on surfactin recovery and purity
The surfactin and antifungal recoveries (determined according to Equation 4-3 and Equation 4-5) as well
as total lipopeptide recoveries obtained from acid precipitation at different pHs are shown in Figure
5-12, and were found to be approximately 97% at the different pHs. A single factor ANOVA analysis was
used to show that there was no significant difference between the surfactin, antifungal and total
lipopeptide recoveries at the different pH at a 95% confidence interval. The high recoveries attained are
in accordance with the study by Chen et al. (2007), who found that total lipopeptide recoveries greater
than 97% are obtaned at pH 4. The optimum pH can therefore not be obtained based on recoveries.
Figure 5-12: Surfactin, antifungal and total lipopeptide recoveries after surfactin purification by acid precipitation, where the error bars indicate the standard deviation of four replicates
The surfactin purities (determined according to Equation 4-2) and total lipopeptide purities (determined
similarly to surfactin purities) at the different pHs are shown in Figure 5-13. The surfactin purities at the
different pHs were similar, at approximately 43%, while the total lipopeptide purities were
approximately 50%. The difference between the total lipopeptide purities and surfactin purities at the
different pHs are a result of the antifungal purities. This difference is also similar at the different pHs.
The surfactin purity after the acid precipitation step was not affected by pH at pH below pH 4. The
optimum pH can therefore not be obtained based on surfactin or total lipopeptide purities.
The surfactin purities are greater than those obtained in the study by Wang et al. (2010) where the
surfactin purity of 33.2% was obtained at pH 4. The total lipopeptide purities are however aproximately
similar to those in the studies by Wang et al. (2010), Chen et al. (2007) and Chen & Juang (2008b) who
found total lipopeptide purities of 56.6%, 55% and 53% respectively.
0
20
40
60
80
100
120
2 3 4
Re
cove
ry
pH
Surfactin recovery Antifungals recovery Total lipopeptide recovery
Stellenbosch University https://scholar.sun.ac.za

Page 88 of 173
Figure 5-13: Surfactin and total lipopeptide purities after acid precipitation at different pH, where the error bars indicate the standard deviation of four two replicates
5.3.2 Optimisation of acid precipitation based on improvement in surfactin selectivity
This section compares the surfactin selectivity (determined according to Equation 4-1) as well as
improvement in selectivity (IS, determined according to Equation 4-4) after acid precipitation at the
different pHs (Figure 5-14). Like surfactin purity and recovery, the selectivity and IS were not affected by
pHs in the studied range. The surfactin selectivity at the different pHs was constant at approximately
5.7. This is approximately similar to the selectivity in the supernatant before acid precipitation (5.5).
Acid precipitation was not expected to improve surfactin selectivity as high recoveries (>97%) were
expected for both surfactin and antifungals.
The improvement in selectivity at the different pHs, was therefore approximately 1 which means that
acid precipitation did not improve the selectivity. This is due to the fact that approximately the same
surfactin and antifungal recoveries were achieved during the acid precipitation step. No other studies
have reported surfactin selectivity after acid precipitation so far, possibly due to the lack of fengycin and
iturin standards for HPLC analysis. The optimum pH can therefore not be obtained based on surfactin
selectivity and improvement in selectivity.
0
10
20
30
40
50
60
2 3 4
% P
uri
ty
pH
Surfactin purity Total lipopeptide purity
Stellenbosch University https://scholar.sun.ac.za

Page 89 of 173
Figure 5-14: Surfactin selectivity and improvement in selectivity (IS) after surfactin purification by acid precipitation, where the error bars indicate the standard deviation of two replicates
5.3.3 Optimisation of acid precipitation based on impurity assays
Impurity assays were also used for optimisation of surfactin purification by acid precipitation. Samples of
cell-free supernatant and resolubilised precipitates after acid precipitation at the different pHs
(obtained as discussed in section 4.3.2) were spotted 10 times on TLC plates by multiple spotting. The
plates were then developed as discussed in section 4.2.2, before primuline and ninhydrin were used to
visualise the components with lipid and peptide moieties as discussed in section 4.2.3. The relative
quantity of impurities with lipid and peptide parts in cell-free supernatants and resolubilised precipitates
from acid precipitation at different pHs was then compared (Figure 5-15).
Figure 5-15a shows lipids or other components with lipid parts as white bands on the TLC plate. In Figure
5-15a, a component with lipid parts which is neither surfactin nor fengycin was seen near the top of the
plate. It is unknown what type of lipid or biosurfactant this is, and so the area of its band cannot be
related to its concentration. However, a bigger area would likely result from a higher concentration. The
areas of these lipids were similar at the different pHs, thus it can be assumed that they are in similar
concentrations in the precipitates obtained through acid precipitation at the different pHs. The lipid
assays can therefore not be used to determine the optimum pH.
Figure 5-15b shows protein or other components with peptide parts as dark regions on the TLC plates.
The proteins only showed on the lower parts of the TLC plate. Protein showed on the places where
samples were originally spotted. Dark regions also showed in the Rf range of fengycin, and these were
due to presence of fengycin in the cell-free supernatants and resolubilised acid precipitates. Darker
0
1
2
3
4
5
6
7
8
2 3 4
Sele
ctiv
ity
(gs/
g a)
IS
pH
Surfactin selectivity IS
Stellenbosch University https://scholar.sun.ac.za

Page 90 of 173
pH 3
precipitate
regions in (Figure 5-15b) are due to higher protein concetrations. Since the supernatant showed a
darker and broader shading compared to the resolubilised precipitates obtained after acid precipitation
at different pHs, the crude supernatant contains more protein in comparison to the resolubilised
precipitates. The shading of the different resolubilised precipitates on the TLC plates (Figure 5-15b) are
similar, hence the precipitates obtained by acid precipitation at different pHs can be assumed to have
similar protein quantities. The analysis of protien impurities could therefore not be used to determine
the optimum pH.
Figure 5-15: (a) lipid and (b) protein impurities before and after surfactin purification by acid precipitation
The optimum pH could not be determined in terms of recovery, purity, selectivity as well as impurity
assays. The maximum surfactin recovery, purity and selectivity had already been reached at the highest
pH used in this study. Further studies on pH optimisation are therefore recommended, and a suitable pH
range for these studies would be between pH 4 and pH 6. pH 6 would be suitable as the highest pH as
surfactin starts precipitating at pH below 6 (Liu, et al., 2007). Based on this study, pH 4 was
Supernatant
pH 2
precipitate pH 4
precipitate
Standards
Supernatant
pH 2
precipitate pH 3
precipitate
pH 4
precipitate
a b
Standards
Lipid impurities
Fengycin
Protein impurities
Surfactin
Stellenbosch University https://scholar.sun.ac.za

Page 91 of 173
recommended for acid precipitation as it can be attained using less hydrochloric acid. This is
advantageous as it is cost effective since less acid is used and the HCl is also impurity in our product.
Additionally, less sodium hydroxide is required for solubilising dry precipitates at pH 4.
5.4 Surfactin purification by solvent extraction
Solvent extraction purifies surfactin from the acid precipitation by selective extraction of surfactin into
organic solvents. Solvent extraction was chosen because of its simplicity compared to other purification
techniques such as ultrafiltration and chromatographic techniques. Unlike ultrafiltration, it does not
require high pressure operation equipment and there are fewer operational complications such as
plugging of filter membranes. Unlike chromatographic techniques, solvent extraction is relatively
inexpensive (Kosaric & Sukan, 2014).
This section presents results for optimisation of the solvent extraction process. Solvents of differing
polarity were used in this study. These solvents, in order of decreasing polarity, were methanol, i-
propanol, (C/M 1:1), acetonitrile, (C/M 2:1), acetone, chloroform, ethyl acetate, methyl tert-butyl ether
(MTBE), petroleum ether and n-hexane. To determine the optimum solvent, the surfactin recovery and
purity achieved after solvent extraction using the different solvents was compared (section 5.4.1). The
surfactin recovery and purity were calculated based on surfactin based on surfactin concentrations
determined by TLC analysis. TLC was used for surfactin analysis as it is capable of measuring surfactin
concentrations when surfactin is dissolved in all of the organic solvents used in this study, unlike HPLC.
Optimisation was also done base on impurity assays (section 5.4.2).
5.4.1 Optimisation of solvent extraction based on surfactin recovery and purity
The change in surfactin recovery (determined according to Equation 4-6) with solvent polarity is shown
in Figure 5-16.. 100% recoveries were achievable when methanol, MTBE and acetone were used as
solvents, while isopropanol, C/M (1:1), C/M (2:1) and ethyl acetate were also capable for achieving
100% recoveries. These solvents were therefore the best for extraction, based on surfactin recoveries.
According to a statistical single factor ANOVA and a post-hoc analysis by least significant difference
(LSD), there is no significant difference between the surfactin recoveries by methanol, isopropanol, C/M
(1:1), C/M (2:1), acetone, ethyl acetate and MTBE. Surfactin recoveries by acetonitrile and chloroform
are significantly lower than those of methanol and MTBE. Surfactin is partially soluble in n-hexane and
petroleum ether, and soluble in the rest of the solvents used (Arima, et al., 1972). The partial extraction
in isopropanol, C/M (1:1), acetonitrile, C/M (2:1), acetone, chloroform and ethyl acetate is therefore
Stellenbosch University https://scholar.sun.ac.za

Page 92 of 173
possibly due to some surfactin molecules not being exposed to the solvents due to interference of the
impurities, hence they were not extracted. Surfactin recovery by ethyl acetate was found to be 84%,
which is comparable to that in the study by Chen & Juang (2008b) (78%).
N-hexane and petroleum ether, which are the least polar solvents among the solvents studied, showed
the lowest surfactin recoveries (15% and 7% respectively). This was in line with the hypothesis that less
polar solvents give low surfactin recoveries. According Chen & Juang (2008b), up to 60% of the surfactin
can be recovered by solvent extraction using the solid-liquid extraction technique when hexane is used
as a solvent. In the study by Chen & Juang (2008b), repeated extraction was used to improve the
surfactin recovery when hexane was used as the solvent. This is possible as surfactin is partially soluble
in hexane (Arima, et al., 1972), thus repeated extraction using a fresh solvent is expected to improve
total surfactin extraction.
Besides repeated extraction, another factor to consider for improving recovery is liquid-liquid extraction
for extraction using polar solvents. Geisslera et al. (2017) found that solvent extraction on supernatants
gave higher overall recoveries compared to acid precipitation followed by solvent extraction.
Additionally, solvent extraction directly on supernatants is also less time consuming compared to acid
precipitation followed by solvent extraction. Chen & Juang (2008b) found that extraction by ethyl
acetate improved from 84% to 99% when liquid-liquid extraction was used rather than solid-liquid
extraction, while the extraction by hexane decreased from 62% to 21%.
Figure 5-16: Surfactin recoveries after surfactin purification by solvent extraction, where the error bars indicate the standard deviation of two replicates. The solvent polarity index shows relative polarities of solvents on the scale of water=100. C/M (1:1)
0
20
40
60
80
100
120
0
20
40
60
80
100
120
Solv
ent
po
lart
y in
de
x
% R
eco
very
Organic solvents
Recovery Solvent polarity index
Stellenbosch University https://scholar.sun.ac.za
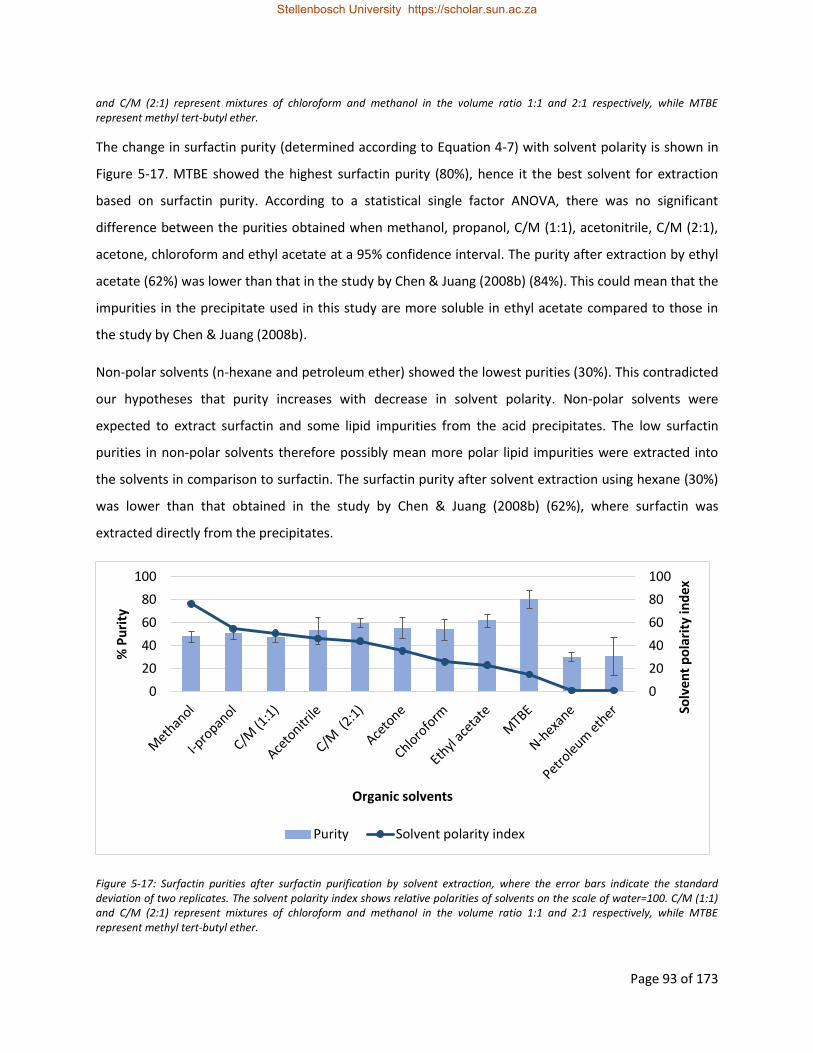
Page 93 of 173
and C/M (2:1) represent mixtures of chloroform and methanol in the volume ratio 1:1 and 2:1 respectively, while MTBE represent methyl tert-butyl ether.
The change in surfactin purity (determined according to Equation 4-7) with solvent polarity is shown in
Figure 5-17. MTBE showed the highest surfactin purity (80%), hence it the best solvent for extraction
based on surfactin purity. According to a statistical single factor ANOVA, there was no significant
difference between the purities obtained when methanol, propanol, C/M (1:1), acetonitrile, C/M (2:1),
acetone, chloroform and ethyl acetate at a 95% confidence interval. The purity after extraction by ethyl
acetate (62%) was lower than that in the study by Chen & Juang (2008b) (84%). This could mean that the
impurities in the precipitate used in this study are more soluble in ethyl acetate compared to those in
the study by Chen & Juang (2008b).
Non-polar solvents (n-hexane and petroleum ether) showed the lowest purities (30%). This contradicted
our hypotheses that purity increases with decrease in solvent polarity. Non-polar solvents were
expected to extract surfactin and some lipid impurities from the acid precipitates. The low surfactin
purities in non-polar solvents therefore possibly mean more polar lipid impurities were extracted into
the solvents in comparison to surfactin. The surfactin purity after solvent extraction using hexane (30%)
was lower than that obtained in the study by Chen & Juang (2008b) (62%), where surfactin was
extracted directly from the precipitates.
Figure 5-17: Surfactin purities after surfactin purification by solvent extraction, where the error bars indicate the standard deviation of two replicates. The solvent polarity index shows relative polarities of solvents on the scale of water=100. C/M (1:1) and C/M (2:1) represent mixtures of chloroform and methanol in the volume ratio 1:1 and 2:1 respectively, while MTBE represent methyl tert-butyl ether.
0
20
40
60
80
100
0
20
40
60
80
100
Solv
ent
po
lari
ty in
de
x
% P
uri
ty
Organic solvents
Purity Solvent polarity index
Stellenbosch University https://scholar.sun.ac.za

Page 94 of 173
5.4.2 Optimisation of solvent extraction based on impurity assays
Impurity assays were also used for optimisation of surfactin purification by solvent extraction. Samples
of solvents after extraction (as discussed in section 4.4.1) were spotted 10 times on TLC plates by
multiple spotting. The plates were then developed as discussed in section 4.2.2, before primuline and
ninhydrin were used to visualise the components with lipid and peptide moieties as discussed in section
4.2.3.
The relative quantity of impurities with lipid and peptide parts in the solvents after extraction was then
compared (Figure 5-18 and Figure 5-19). It should be noted that alkaline water was used for
resolubilisation, rather than purification of acid precipitates. This was done for comparison of impurity
compositions as water was assumed completely resolubilise the acid precipitates (recovering 100%
surfactin and impurities). Figure 5-18 shows the change of lipid impurities with solvent polarity, while
Figure 5-19 shows the change in protein impurities with solvent polarity. The lipid impurity layer is
shown by the white bands near the top of the TLC plate in Figure 5-18. The chloroform used in this study
seemed to had vaporized during storage, thus could be showing a higher lipid concentration than the
actual concentration.
The lipid layer was seen to be more prominent with decrease in polarity, except for chloroform (Figure
5-18). According to Breil et al. (2017) non-polar solvents dissolve lipids better than polar solvents.
Methanol, i-propanol, and acetonitrile, which are among the most polar solvents, hardly showed lipid
bands. Polar solvents were therefore more effective for surfactin recovery while eliminating lipid
impurities. Although the lipid band was not seen in Figure 5-18, alkaline water is capable of solubilising
lipid impurities. This was observed in acid precipitation studies (Figure 5-15b).
Stellenbosch University https://scholar.sun.ac.za

Page 95 of 173
Figure 5-18: Lipid impurities at different solvent polarities after surfactin purification by solvent extraction. C/M (1:1) and C/M (2:1) represent mixtures of chloroform and methanol in the volume ratio 1:1 and 2:1 respectively, while MTBE represent methyl tert-butyl ether.
The change in protein impurities with solvent polarity after solvent extraction is shown in Figure 5-19.
Protein impurities in solvents after extraction decreased with solvent polarity. This is accordance with
findings of Breil et al. (2017), which state that polar solvents are better at dissolving proteins than non-
polar solvents. Non-polar solvents are therefore more suitable for removal of protein impurities. MTBE,
ethyl acetate and acetonitrile were seen to recover surfactin, while recovering low protein impurities.
I-propanol
Methanol C/M (1:1) C/M (2:1)
Alkaline
water
Acetone
Chloroform
Ethyl acetate N-hexane
MTBE
Acetonitrile
Petroleum ether
Solvent polarity
Lipid impurities
Surfactin
Stellenbosch University https://scholar.sun.ac.za
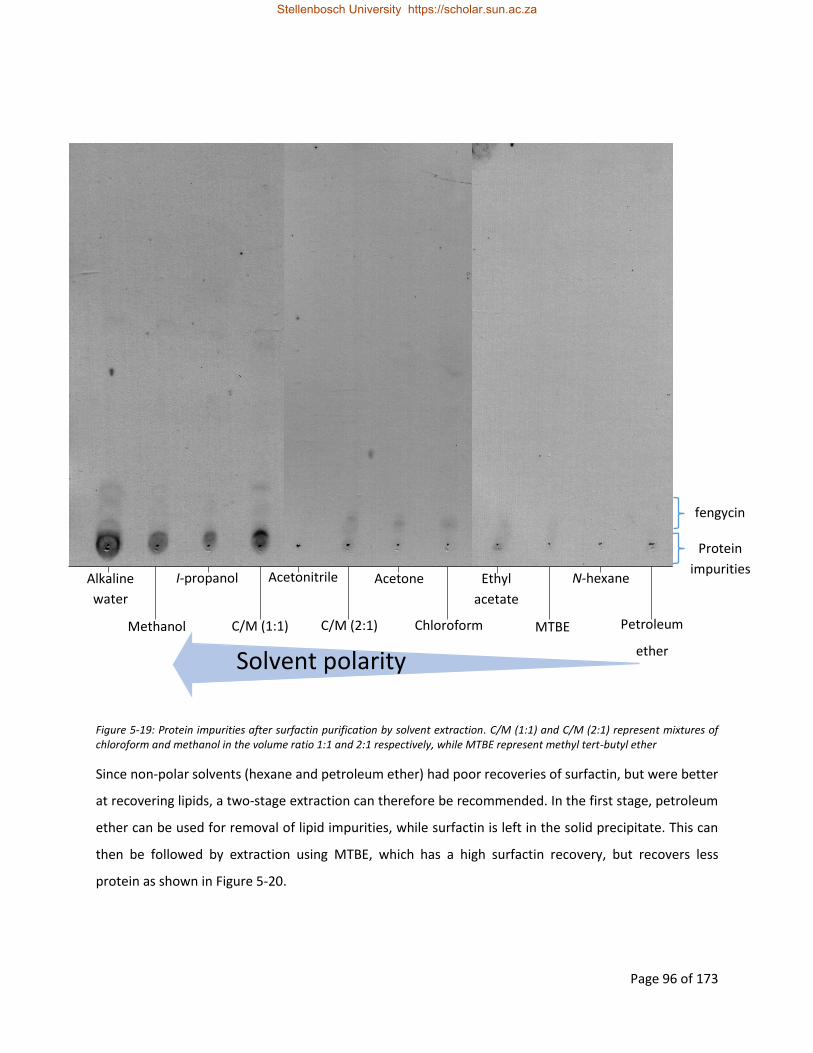
Page 96 of 173
Figure 5-19: Protein impurities after surfactin purification by solvent extraction. C/M (1:1) and C/M (2:1) represent mixtures of chloroform and methanol in the volume ratio 1:1 and 2:1 respectively, while MTBE represent methyl tert-butyl ether
Since non-polar solvents (hexane and petroleum ether) had poor recoveries of surfactin, but were better
at recovering lipids, a two-stage extraction can therefore be recommended. In the first stage, petroleum
ether can be used for removal of lipid impurities, while surfactin is left in the solid precipitate. This can
then be followed by extraction using MTBE, which has a high surfactin recovery, but recovers less
protein as shown in Figure 5-20.
Solvent polarity
Alkaline
water
I-propanol Acetonitrile Acetone Ethyl
acetate
N-hexane
Methanol Chloroform MTBE Petroleum
ether
C/M (1:1) C/M (2:1)
Protein
impurities
fengycin
Stellenbosch University https://scholar.sun.ac.za

Page 97 of 173
Figure 5-20: Flow diagram showing how surfactin precipitates can be purified by a two-stage solvent extraction process
Dry acid
precipitate
Lipid
impurities
Protein
impurities
Purified
surfactin
Extraction using
MTBE or acetonitrile
Extraction using
hexane or
petroleum ether
Stellenbosch University https://scholar.sun.ac.za

Page 98 of 173
5.5 Adsorption
Adsorption was also considered for surfactin purification in this study. Surfactin adsorption was chosen
as it does not require high operating pressures and is not affected by concentration polarization like
membrane filtration. Additionally, this method is capable of achieving the highest recoveries compared
to solvent extraction and ultrafiltration, and it is capable of separating the different lipopeptide families.
Lastly, surfactin purification by adsorption is relatively cheaper than other methods capable of
recovering surfactin at high purities (i.e. chromatographic techniques). Surfactin purification by
adsorption, however, has limitations as it is affected mass transfer limitations, requires an additional
elution step, requires the use of organic solvents which may be toxic and has additional costs due to
regeneration of the resins (Kosaric & Sukan, 2014).
From the literature survey, it was seen that surfactin adsorption is affected by the operating
temperature, initial pH and resin concentration to surfactin concentration ratio (RC/SC ratio). Based on
an understanding of the surfactin adsorption mechanism, it was also proposed that the presence of
methanol in the adsorption liquid could improve adsorption. No studies have however been done to
determine how methanol addition to adsorption liquids affect surfactin concentration. In this study, the
effect of the initial pH was determined in the range 6.5 to 11.5, while the effect of the operating
temperature was determined between 25 °C and 45 °C. The minimum initial pH and operating
temperature were chosen as surfactin precipitates at pH below 6 (Liu, et al., 2007), and 25 °C is
approximately room temperature.
The maximum initial pH and operating temperature ranges (11.5 and 45 °C respectively) were chosen in
consideration of the antimicrobial properties of surfactin. It was believed that high temperatures and pH
reduce the antimicrobial activity of surfactin. No studies have been done to determine if the exposure of
surfactin to high pH and temperatures affect its efficacy against M. tuberculosis. Geetha & Manonmani
(2010), however, studied the larvicidal efficacy of surfactin after exposure to high pH and temperatres. It
was seen that surfactin produced by B. subtilis had maximum larvicidal efficacy between pH 3 and pH
10, while the surfactin was stable at temperatures between 25 °C and 42 °C.
The effect of the RC/SC ratio was determined between 4 gr/gs and 40 gr/gs. This range was chosen as it
was assumed that surfactin reaches saturation somewhere in this range based on studies by Dhanarajan
et al. (2015). The maximum methanol concentration was chosen as 30% (v/v) as this concentration is
sufficient to disperse approximately all surfactin micelles in solution (Chen, et al., 2008b). The effect of
Stellenbosch University https://scholar.sun.ac.za

Page 99 of 173
methanol concentration on surfactin adsorption is a new technique, investigated here for the first time,
but the effect of operating temperature, initial pH and RC/SC ratio have been studied in literature (Chen,
et al., 2008c; Dhanarajan, et al., 2015, Liu, et al., 2007, Montastruc, et al., 2008 and Wang, et al., 2010)
using one factor at a time (OFAT) experiments. In this study, however, the effect of these parameters on
surfactin adsorption was instead studied using a surface design.
A response surface design was chosen over OFAT design since OFAT designs are not effective if there are
interactions within the system (Czitrom, 1999). The face-centred central factorial design (FCC design)
was chosen over the circumscribed central factorial design (CCC design) since the CCC design requires
points outside the design space which are not possible to achieve (e.g. temperatures below 25 ⁰C are
not achievable in an orbital shaker without a cooling system). The FCC was chosen over the inscribed
central composite design (ICC design) since the FCC provides high quality predictions over the entire
design space (Verseput, 2001). Lastly, a FCC design allows fewer runs for a comparison study between
adsorption in the presence of methanol or in the absence of methanol compared to the CCC and ICC
designs.
A FCC design has a drawback as it gives poor precision for estimating pure quadratic coefficients for the
quadratic models used to model surface designs (Verseput, 2001). Verseput (2001), however, found
that there is insufficient reduction in prediction error or difference in effects estimation resulting from
using FCC designs rather than CCC or ICC designs. Additionally, for a reasonable overall experimental
error (e.g. 5% relative standard deviation), a FCC design is preferable as it does not have the added
complexity of running each variable at five levels. In FCC designs, each variable is only run at three
levels, thus FCC designs are the simplest variety of CCD to carry and they are least vulnerable to
experimental error associated with setup and operation (Verseput, 2001).
This study begins by providing the results and discussion of optimisation of surfactin adsorption based
on the percentage of surfactin adsorbed onto resins when independent variables were altered. This is
followed by the results and discussion of optimisation of surfactin adsorption based on improvement in
surfactin selectivity when independent variables were altered. This section then provides the purity and
recovery of the surfactin product after purification adsorption Lastly, batch kinetics and isotherms are
then presented to determine the adsorption characteristics.
Stellenbosch University https://scholar.sun.ac.za

Page 100 of 173
5.5.1 Optimisation of surfactin adsorption based on % SA
Surfactin adsorption was optimised based on the percentage of surfactin in adsorption liquids which is
adsorbed onto resins during adsorption (% SA). The % SA was calculated based on Equation 4-11, using
surfactin concentrations determined by HPLC analysis. HPLC analysis was used as it is has a higher
precision than TLC analysis and it is capable of quantifying surfactin at low concentrations. The effects
and interactions of the initial pH, operating temperature and RC/SC ratio on % SA are summarised in a
Pareto chart (Figure 5-21) and their ANOVA is summarised in Table 5-8. It should be noted that the
effect of methanol concentration was studied separately in section 5.5.1.4.
Figure 5-21: Linear (L) and quadratic (Q) effects of initial pH (1), operating temperature (2), resin concentration to surfactin concentration (RC/SC) (3) ratio and interactions of these independent variables on % Surfactin adsorption (% SA) at 95% confidence
Stellenbosch University https://scholar.sun.ac.za

Page 101 of 173
Table 5-8: ANOVA table showing the linear (L) and quadratic (Q) effects of initial pH (1), operating temperature (2), resin concentration to surfactin concentration (RC/SC) ratio (3) and interactions of these independent variables on % SA at 95% confidence. The values written in red show parameters that had an effect on % surfactin adsorption (% SA) at a 95% confidence interval
Source of variation Sum of
squares
Degrees of
freedom
Mean
square
p
(1) pH (L) 2.33 1 2.33 0.690967
pH (Q) 1.43 1 1.43 0.755054
(2) Temperature (L) 578.03 1 578.03 0.000002
Temperature (Q) 6.78 1 6.78 0.499237
(3) RC/SC ratio (L) 18966.02 1 18966.02 0.000000
RC/SC ratio (Q) 4286.28 1 4286.28 0.000000
1L by 2L 9.46 1 9.46 0.425805
1L by 3L 40.90 1 40.90 0.104973
2L by 3L 177.96 1 177.96 0.001777
Error 345.74 24 14.41
Total SS 26331.97 33
Effect of initial pH on surfactin adsorption 5.5.1.1
The initial pH had no significant effect on adsorption. Additionally, the pH did not have any interactions
with either temperature or RC/SC ratio (Figure 5-21 and Table 5-8). The surface plots of % SA against
RC/SC ratio and temperature at different pH levels (Figure 5-22 to Figure 5-24) are identical which
indicates pH has no effect or interaction with temperature or RC/SC ratio. The absence of initial pH-
RC/SC ratio interactions can also be seen on surface plots of % SA against RC/SC ratio and pH at different
operating temperature levels (Figure 8-14 to Figure 8-16) in the appendix (section 8.3.3.2). Additionally,
the absence of initial pH- operating temperature interactions can be seen on surface plots of % SA
against initial pH and operating temperature at different levels of the RC/SC ratio (Figure 8-17 to Figure
Stellenbosch University https://scholar.sun.ac.za
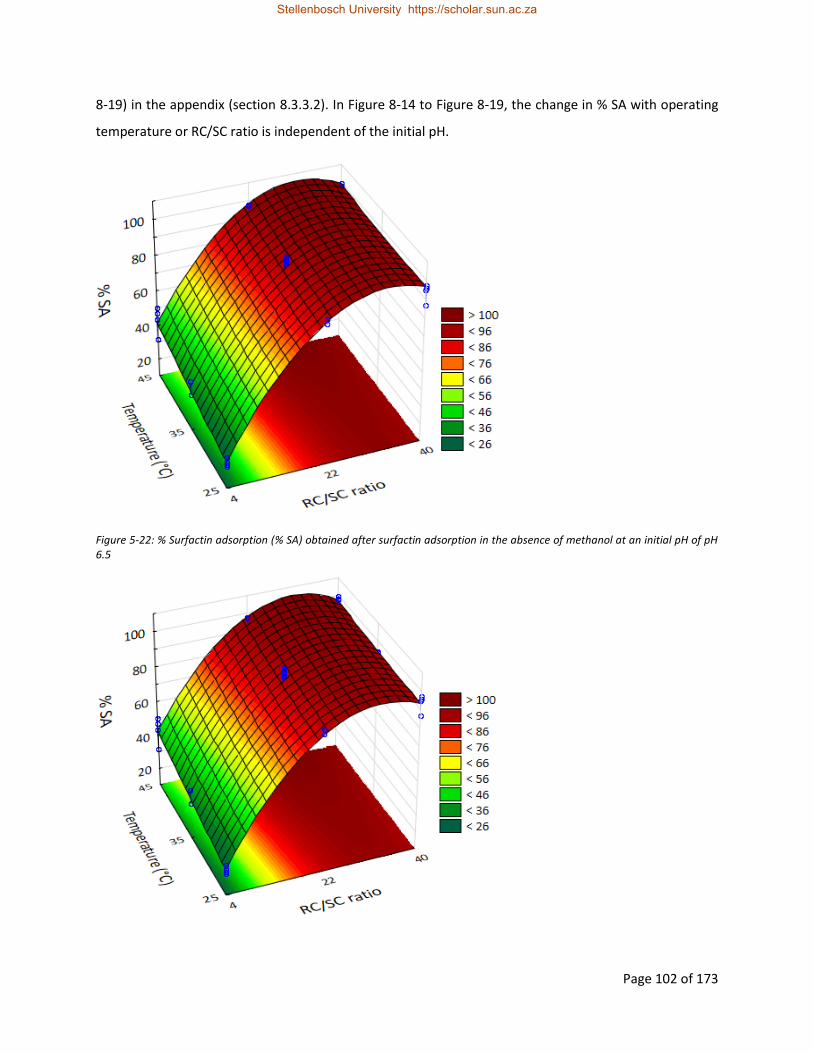
Page 102 of 173
8-19) in the appendix (section 8.3.3.2). In Figure 8-14 to Figure 8-19, the change in % SA with operating
temperature or RC/SC ratio is independent of the initial pH.
Figure 5-22: % Surfactin adsorption (% SA) obtained after surfactin adsorption in the absence of methanol at an initial pH of pH 6.5
Stellenbosch University https://scholar.sun.ac.za
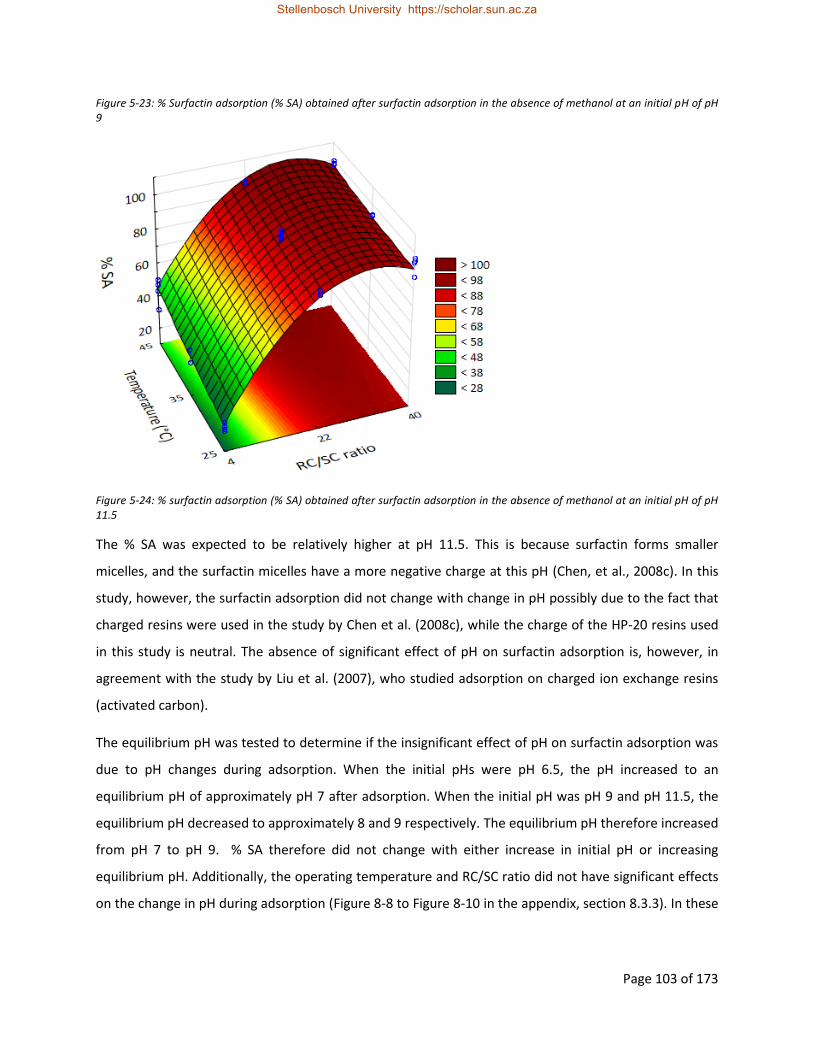
Page 103 of 173
Figure 5-23: % Surfactin adsorption (% SA) obtained after surfactin adsorption in the absence of methanol at an initial pH of pH 9
Figure 5-24: % surfactin adsorption (% SA) obtained after surfactin adsorption in the absence of methanol at an initial pH of pH 11.5
The % SA was expected to be relatively higher at pH 11.5. This is because surfactin forms smaller
micelles, and the surfactin micelles have a more negative charge at this pH (Chen, et al., 2008c). In this
study, however, the surfactin adsorption did not change with change in pH possibly due to the fact that
charged resins were used in the study by Chen et al. (2008c), while the charge of the HP-20 resins used
in this study is neutral. The absence of significant effect of pH on surfactin adsorption is, however, in
agreement with the study by Liu et al. (2007), who studied adsorption on charged ion exchange resins
(activated carbon).
The equilibrium pH was tested to determine if the insignificant effect of pH on surfactin adsorption was
due to pH changes during adsorption. When the initial pHs were pH 6.5, the pH increased to an
equilibrium pH of approximately pH 7 after adsorption. When the initial pH was pH 9 and pH 11.5, the
equilibrium pH decreased to approximately 8 and 9 respectively. The equilibrium pH therefore increased
from pH 7 to pH 9. % SA therefore did not change with either increase in initial pH or increasing
equilibrium pH. Additionally, the operating temperature and RC/SC ratio did not have significant effects
on the change in pH during adsorption (Figure 8-8 to Figure 8-10 in the appendix, section 8.3.3). In these
Stellenbosch University https://scholar.sun.ac.za

Page 104 of 173
figures, the equilibrium pH does not change with either operating temperature or RC/SC ratio. The
change in pH during adsorption was in agreement with the study by Chen et al. (2008c).
Due to the pH change during adsorption, the control of pH by the use of buffers seems to be a better
option for studying the effect of pH on adsorption. Liu et al. (2007) studied the effect of pH on surfactin
adsorption with pH between 6.5 and 8.5 while controlling the pH using buffer solutions. The pH was still
seen not to affect surfactin adsorption even in the presence of buffers. The addition of buffers may also
increase the ionic strength in the adsorption liquid (Breuer & Jeffrey, 2004). Liu et al. (2007) found that
an increase in ionic strength in adsorption liquid reduces surfactin adsorption capacity as well as the
surfactin adsorption rate.
Since the pH did not affect adsorption in the absence of methanol, an initial pH of pH 11.5 was selected.
This was selected since pH 11.5 is not so extreme as to affect surfactin antibacterial activity, while it is
too alkaline to prevent the growth of cells in the adsorption liquid, hence no sterilisation of the liquid
before adsorption is required.
Effect of RC/SC ratio on surfactin adsorption 5.5.1.2
The RC/SC ratio was seen to have the most significant effect on surfactin adsorption (Figure 5-21 and
Table 5-8). The effect of RC/SC ratio can also be seen from Figure 5-22 to Figure 5-24, which show that %
SA increased from a minimum of approximately 25% at an RC/SC ratio of 4 gr/gs to 100% at an RC/SC
ratio of 22 gr/gs. The % SA increased with RC/SC ratio until it reached a peak of approximately 105% at
an RC/SC ratio of approximately 31 gs/gr, before lowering again (Figure 5-22 to Figure 5-24).
The increase in % SA with RC/SC ratio was due to the fact that an increase in RC/SC ratio results in an
increase in amount of resin available to adsorb surfactin in the medium. An increase in RC/SC ratio is
therefore expected to improve surfactin adsorption until approximately 100% of the surfactin has been
adsorbed. The % SA is then expected to be constant with increase in RC/SC ratio (Dhanarajan, et al.,
2015). This decrease in % SA adsorption after a % SA of 100% was achieved was due to the fact that a
quadratic function was used to model the experimental data, since a quadratic function must have
turning point thus is bound to show a decrease at some point. The quadratic model is therefore not
suitable for modelling the change in % SA with RC/SC ratio
In this study, the RC/SC ratio was used as a single factor affecting adsorption since it was expected that
an optimum RC/SC ratio exists, rather than an optimum resin concentration or optimum initial surfactin
concentration independently. This was expected as a continuous increase in resin concentration, at a
Stellenbosch University https://scholar.sun.ac.za
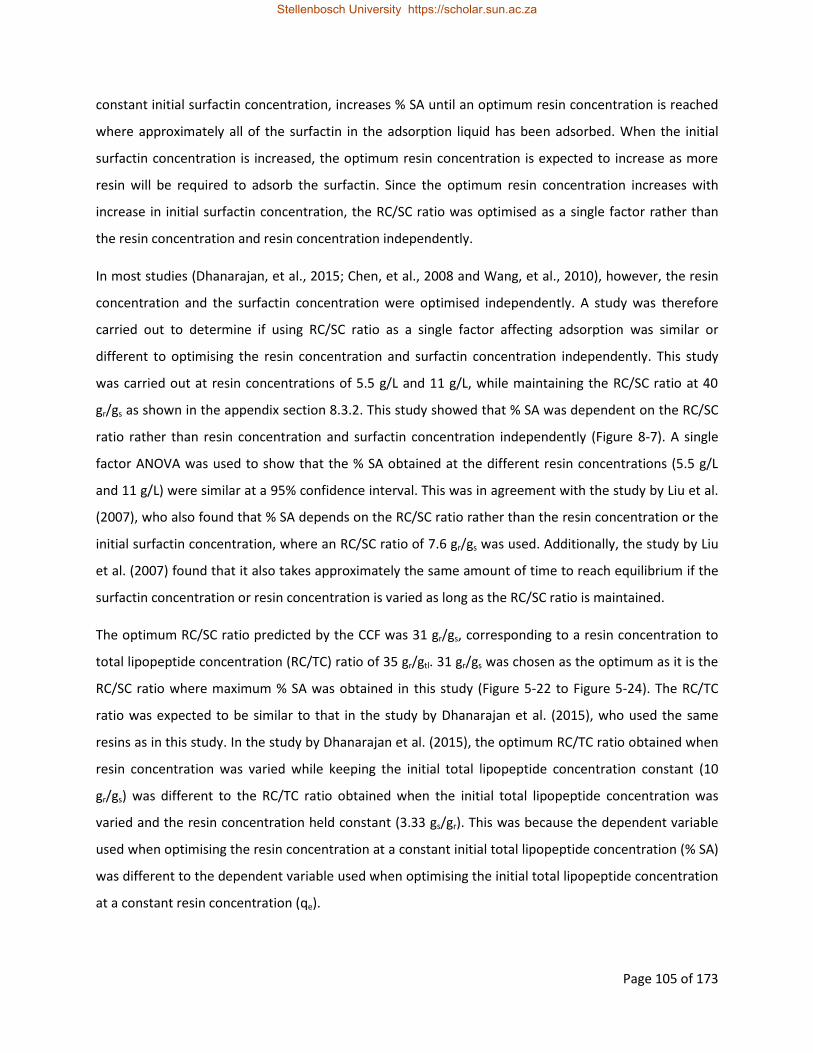
Page 105 of 173
constant initial surfactin concentration, increases % SA until an optimum resin concentration is reached
where approximately all of the surfactin in the adsorption liquid has been adsorbed. When the initial
surfactin concentration is increased, the optimum resin concentration is expected to increase as more
resin will be required to adsorb the surfactin. Since the optimum resin concentration increases with
increase in initial surfactin concentration, the RC/SC ratio was optimised as a single factor rather than
the resin concentration and resin concentration independently.
In most studies (Dhanarajan, et al., 2015; Chen, et al., 2008 and Wang, et al., 2010), however, the resin
concentration and the surfactin concentration were optimised independently. A study was therefore
carried out to determine if using RC/SC ratio as a single factor affecting adsorption was similar or
different to optimising the resin concentration and surfactin concentration independently. This study
was carried out at resin concentrations of 5.5 g/L and 11 g/L, while maintaining the RC/SC ratio at 40
gr/gs as shown in the appendix section 8.3.2. This study showed that % SA was dependent on the RC/SC
ratio rather than resin concentration and surfactin concentration independently (Figure 8-7). A single
factor ANOVA was used to show that the % SA obtained at the different resin concentrations (5.5 g/L
and 11 g/L) were similar at a 95% confidence interval. This was in agreement with the study by Liu et al.
(2007), who also found that % SA depends on the RC/SC ratio rather than the resin concentration or the
initial surfactin concentration, where an RC/SC ratio of 7.6 gr/gs was used. Additionally, the study by Liu
et al. (2007) found that it also takes approximately the same amount of time to reach equilibrium if the
surfactin concentration or resin concentration is varied as long as the RC/SC ratio is maintained.
The optimum RC/SC ratio predicted by the CCF was 31 gr/gs, corresponding to a resin concentration to
total lipopeptide concentration (RC/TC) ratio of 35 gr/gtl. 31 gr/gs was chosen as the optimum as it is the
RC/SC ratio where maximum % SA was obtained in this study (Figure 5-22 to Figure 5-24). The RC/TC
ratio was expected to be similar to that in the study by Dhanarajan et al. (2015), who used the same
resins as in this study. In the study by Dhanarajan et al. (2015), the optimum RC/TC ratio obtained when
resin concentration was varied while keeping the initial total lipopeptide concentration constant (10
gr/gs) was different to the RC/TC ratio obtained when the initial total lipopeptide concentration was
varied and the resin concentration held constant (3.33 gs/gr). This was because the dependent variable
used when optimising the resin concentration at a constant initial total lipopeptide concentration (% SA)
was different to the dependent variable used when optimising the initial total lipopeptide concentration
at a constant resin concentration (qe).
Stellenbosch University https://scholar.sun.ac.za
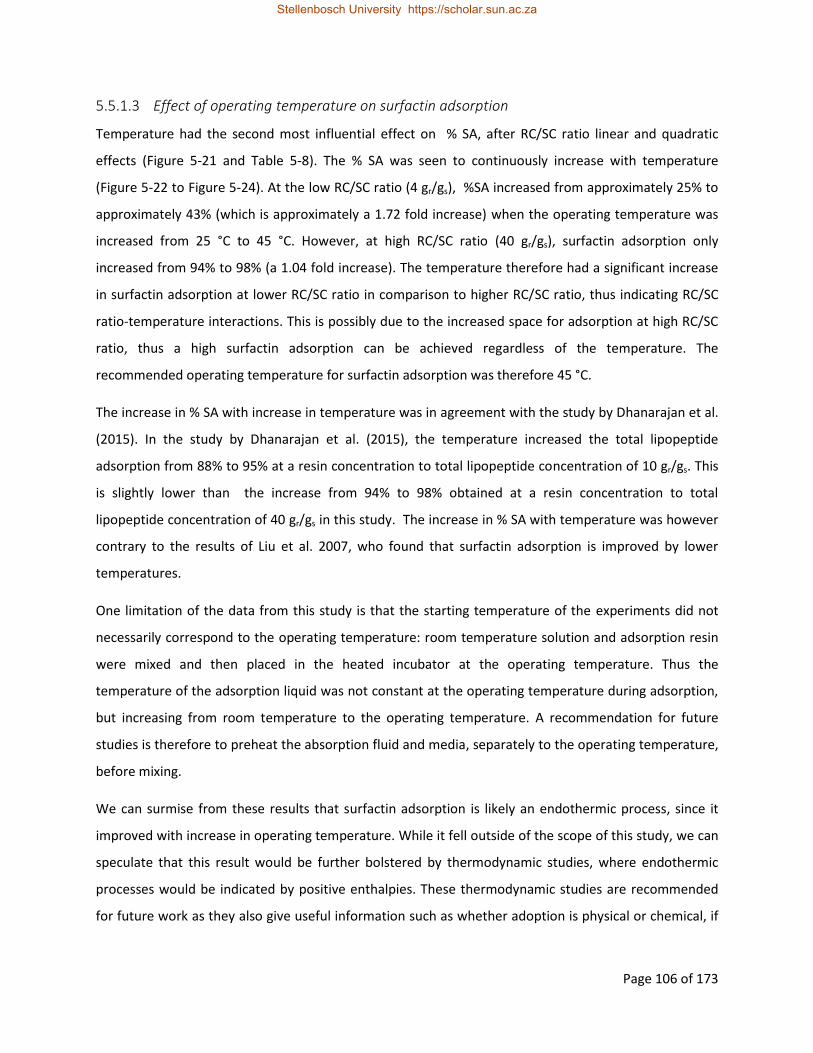
Page 106 of 173
Effect of operating temperature on surfactin adsorption 5.5.1.3
Temperature had the second most influential effect on % SA, after RC/SC ratio linear and quadratic
effects (Figure 5-21 and Table 5-8). The % SA was seen to continuously increase with temperature
(Figure 5-22 to Figure 5-24). At the low RC/SC ratio (4 gr/gs), %SA increased from approximately 25% to
approximately 43% (which is approximately a 1.72 fold increase) when the operating temperature was
increased from 25 °C to 45 °C. However, at high RC/SC ratio (40 gr/gs), surfactin adsorption only
increased from 94% to 98% (a 1.04 fold increase). The temperature therefore had a significant increase
in surfactin adsorption at lower RC/SC ratio in comparison to higher RC/SC ratio, thus indicating RC/SC
ratio-temperature interactions. This is possibly due to the increased space for adsorption at high RC/SC
ratio, thus a high surfactin adsorption can be achieved regardless of the temperature. The
recommended operating temperature for surfactin adsorption was therefore 45 °C.
The increase in % SA with increase in temperature was in agreement with the study by Dhanarajan et al.
(2015). In the study by Dhanarajan et al. (2015), the temperature increased the total lipopeptide
adsorption from 88% to 95% at a resin concentration to total lipopeptide concentration of 10 gr/gs. This
is slightly lower than the increase from 94% to 98% obtained at a resin concentration to total
lipopeptide concentration of 40 gr/gs in this study. The increase in % SA with temperature was however
contrary to the results of Liu et al. 2007, who found that surfactin adsorption is improved by lower
temperatures.
One limitation of the data from this study is that the starting temperature of the experiments did not
necessarily correspond to the operating temperature: room temperature solution and adsorption resin
were mixed and then placed in the heated incubator at the operating temperature. Thus the
temperature of the adsorption liquid was not constant at the operating temperature during adsorption,
but increasing from room temperature to the operating temperature. A recommendation for future
studies is therefore to preheat the absorption fluid and media, separately to the operating temperature,
before mixing.
We can surmise from these results that surfactin adsorption is likely an endothermic process, since it
improved with increase in operating temperature. While it fell outside of the scope of this study, we can
speculate that this result would be further bolstered by thermodynamic studies, where endothermic
processes would be indicated by positive enthalpies. These thermodynamic studies are recommended
for future work as they also give useful information such as whether adoption is physical or chemical, if
Stellenbosch University https://scholar.sun.ac.za

Page 107 of 173
adsorption is spontaneous or not, and whether the adsorption system becomes more ordered or not
during adsorption (Du, et al., 2008 and Ming, et al., 2006).
Effect of methanol concentration on surfactin adsorption 5.5.1.4
The CCF design used for studying the effect of pH, RC/SC ratio and temperature on % SA was extended
to study the effect of methanol on % SA. This allowed the effects of methanol as well as the effects of
interactions of methanol with pH, RC/SC ratio and temperature on % SA to be quantified. The effect of
methanol as well as the interactions of methanol with and methanol interactions with pH, RC/SC ratio
and temperature on % SA are shown in Figure 5-25 and Table 5-9. The effect of interactions between
methanol concentration with either operating temperature or RC/SC ratio did not have significant
effects on % SA. The effect of the interaction between initial pH and methanol concentration, however,
did have a significant effect on % SA.
Figure 5-25: Effects of methanol concentration (4)as well as effects of interactions between methanol concentration and initial pH (1), operating temperature (2) and resin concentration to surfactin concentration (RC/SC) ratio (3) on % surfactin adsorption (% SA) at 95% confidence
Stellenbosch University https://scholar.sun.ac.za

Page 108 of 173
Table 5-9: ANOVA table showing the effects of methanol concentration (4) as well as effects of interactions between methanol concentration and initial pH (1), operating temperature (2) and resin concentration to surfactin concentration (RC/SC) (3) ratio on % surfactin adsorption (% SA) at a 95% confidence. The values in red indicate parameters which had a significant effect on % SA at 95% confidence interval.
Sum of Squares
Degrees of freedom
Mean Square
p
Methanol concentration (Q) 4764.77 1 4764.773 0.001604
Methanol concentration (L) 2010.77 1 2010.772 0.034526
1L by 2L 209.62 1 209.618 0.485352
1L by 3L 463.29 1 463.289 0.301156
1L by 4L 3569.55 1 3569.555 0.005664
Error 19488.65 46 423.666
Total SS 30506.66 51
The relationship between methanol concentration and % SA was shown through surface plots. These
surface plots (Figure 5-26 to Figure 5-34) show % SA against methanol concentration and temperature at
each of the pHs 6.5, 9 and 11.5 with RC/SC ratios of 4 gr/gs (Figure 5-26 to Figure 5-28), 22 gr/gs (Figure
5-29 to Figure 5-31) and 40 gr/gs (Figure 5-32 to Figure 5-34).
Stellenbosch University https://scholar.sun.ac.za

Page 109 of 173
Figure 5-26: % Surfactin adsorption (% SA) adsorption obtained after surfactin adsorption in the presence of methanol at an initial pH and RC/SC ratio of 6.5 and 4 gr/gs respectively
Figure 5-27: % Surfactin adsorption (% SA) obtained after surfactin adsorption in the presence of methanol at an initial pH and RC/SC ratio of 9 and 4 gr/gs respectively
Stellenbosch University https://scholar.sun.ac.za
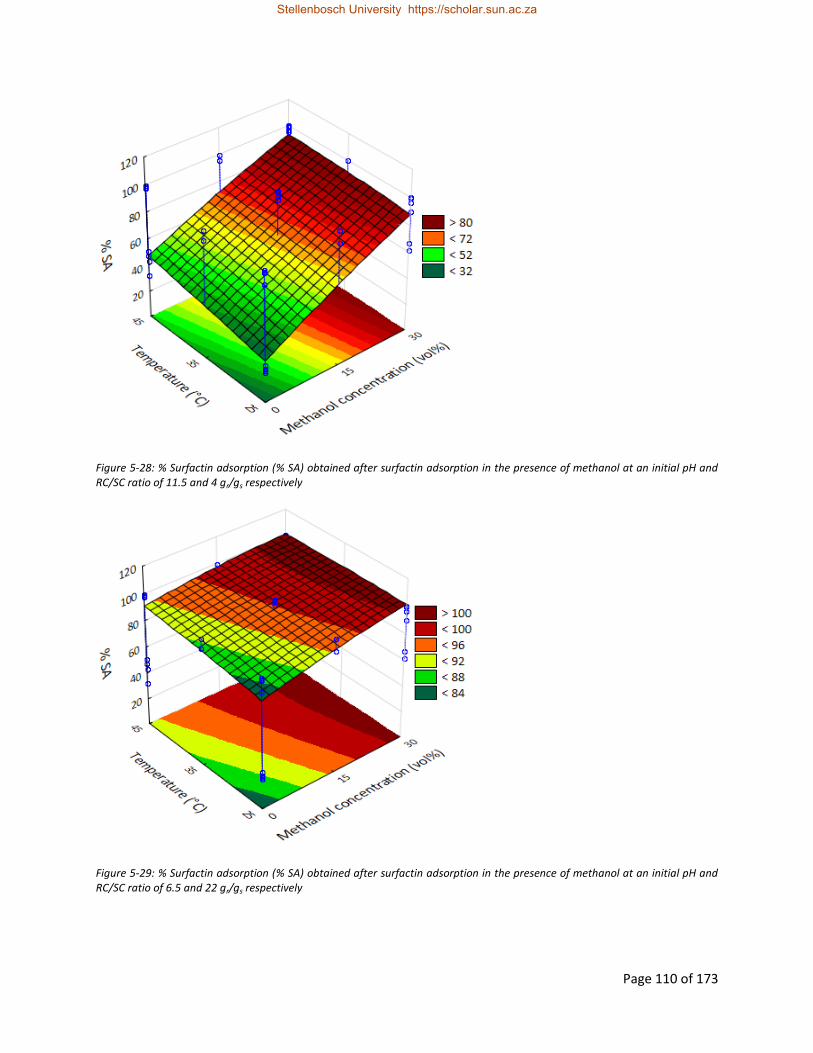
Page 110 of 173
Figure 5-28: % Surfactin adsorption (% SA) obtained after surfactin adsorption in the presence of methanol at an initial pH and RC/SC ratio of 11.5 and 4 gr/gs respectively
Figure 5-29: % Surfactin adsorption (% SA) obtained after surfactin adsorption in the presence of methanol at an initial pH and RC/SC ratio of 6.5 and 22 gr/gs respectively
Stellenbosch University https://scholar.sun.ac.za
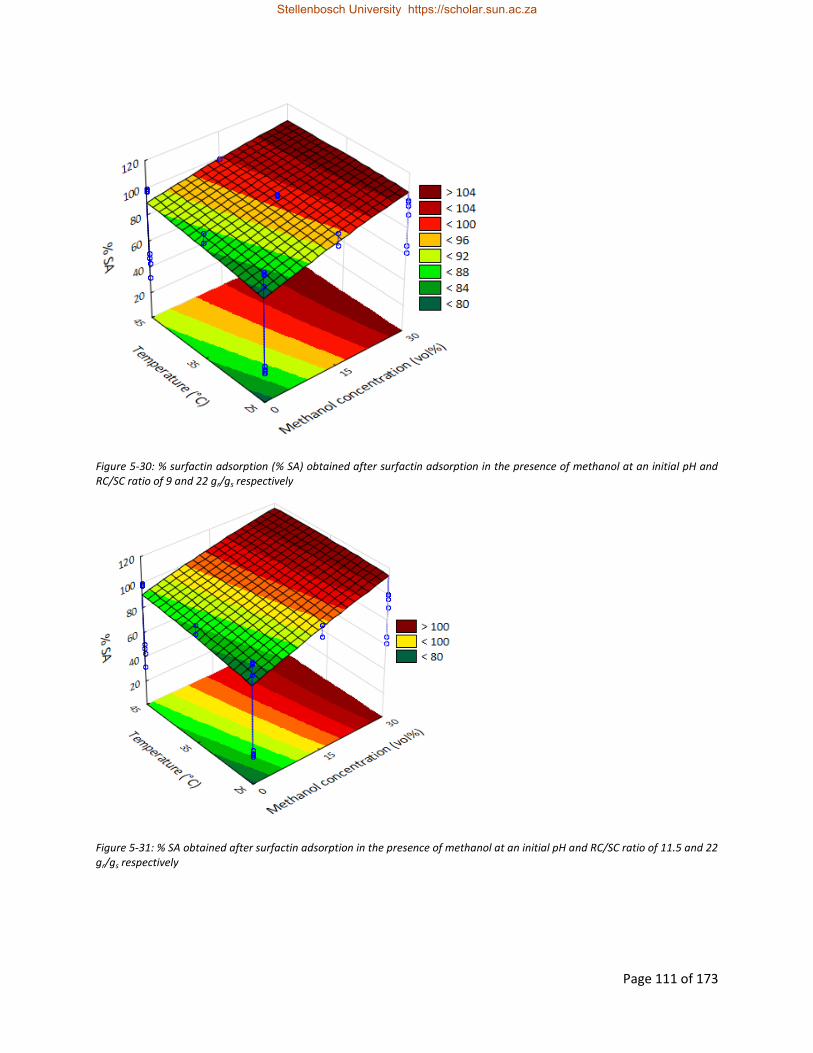
Page 111 of 173
Figure 5-30: % surfactin adsorption (% SA) obtained after surfactin adsorption in the presence of methanol at an initial pH and RC/SC ratio of 9 and 22 gr/gs respectively
Figure 5-31: % SA obtained after surfactin adsorption in the presence of methanol at an initial pH and RC/SC ratio of 11.5 and 22 gr/gs respectively
Stellenbosch University https://scholar.sun.ac.za

Page 112 of 173
Figure 5-32: % Surfactin adsorption (% SA) obtained after surfactin adsorption in the presence of methanol at an initial pH and RC/SC ratio of 6.5 and 40 gr/gs respectively
Figure 5-33: % Surfactin adsorption (% SA) obtained after surfactin adsorption in the presence of methanol at an initial pH and RC/SC ratio of 9 and 40 gr/gs respectively
Stellenbosch University https://scholar.sun.ac.za

Page 113 of 173
Figure 5-34: % Surfactin adsorption (% SA) obtained after surfactin adsorption in the presence of methanol at an initial pH and RC/SC ratio of 11.5 and 40 gr/gs respectively
An increase in methanol concentration was seen to improve the % SA. This effect is seen predominantly
at the lowest RC/SC ratio of 4 gr/gs (Figure 5-26 to Figure 5-28). Here, an increase in methanol
concentration from 0% (v/v) to 30% (v/v) was seen to increase % SA from approximately 25% to 95%. At
RC/SC ratios of 22 gr/gs (Figure 5-29 to Figure 5-31) and 40 gr/gs, (Figure 5-32 to Figure 5-34), however,
the % SA was close to 100% at all methanol concentrations.
An increase in pH resulted in an increase in % SA in the presence of methanol. This is particularly evident
when comparing Figure 5-26, Figure 5-27 and Figure 5-28, where pH was increased stepwise while the
RC/SC ratio was kept constant at 4 gr/gs and Figure 5-29, Figure 5-30 and Figure 5-31 where the pH
increased stepwise while the RC/SC ratio is kept constant at 22 gr/gs. An increase in pH was seen to
improve surfactin in the presence of methanol in the adsorption liquid, while it had not effect on
surfactin adsorption in when there was no methanol in the adsorption liquid. Additionally, the pH did
not change during adsorption in the presence of methanol in the adsorption liquid. Figure 8-11 to Figure
8-13 in the appendix (section 8.3.3) show that the equilibrium pH was similar to the initial pH during
adsorption at 30% (v/v) methanol. Since surfactin adsorption continuously increased with increase in
initial pH, the recommended initial pH for surfactin adsorption in the presence of methanol is 11.5.
Stellenbosch University https://scholar.sun.ac.za
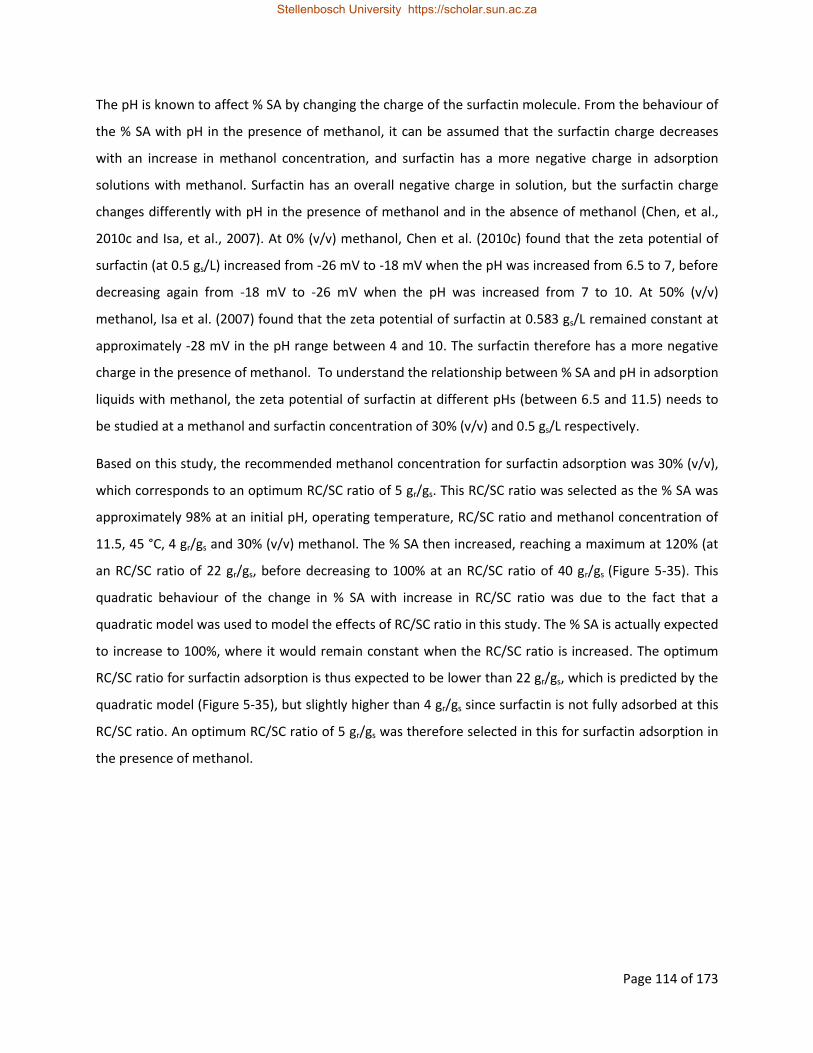
Page 114 of 173
The pH is known to affect % SA by changing the charge of the surfactin molecule. From the behaviour of
the % SA with pH in the presence of methanol, it can be assumed that the surfactin charge decreases
with an increase in methanol concentration, and surfactin has a more negative charge in adsorption
solutions with methanol. Surfactin has an overall negative charge in solution, but the surfactin charge
changes differently with pH in the presence of methanol and in the absence of methanol (Chen, et al.,
2010c and Isa, et al., 2007). At 0% (v/v) methanol, Chen et al. (2010c) found that the zeta potential of
surfactin (at 0.5 gs/L) increased from -26 mV to -18 mV when the pH was increased from 6.5 to 7, before
decreasing again from -18 mV to -26 mV when the pH was increased from 7 to 10. At 50% (v/v)
methanol, Isa et al. (2007) found that the zeta potential of surfactin at 0.583 gs/L remained constant at
approximately -28 mV in the pH range between 4 and 10. The surfactin therefore has a more negative
charge in the presence of methanol. To understand the relationship between % SA and pH in adsorption
liquids with methanol, the zeta potential of surfactin at different pHs (between 6.5 and 11.5) needs to
be studied at a methanol and surfactin concentration of 30% (v/v) and 0.5 gs/L respectively.
Based on this study, the recommended methanol concentration for surfactin adsorption was 30% (v/v),
which corresponds to an optimum RC/SC ratio of 5 gr/gs. This RC/SC ratio was selected as the % SA was
approximately 98% at an initial pH, operating temperature, RC/SC ratio and methanol concentration of
11.5, 45 °C, 4 gr/gs and 30% (v/v) methanol. The % SA then increased, reaching a maximum at 120% (at
an RC/SC ratio of 22 gr/gs, before decreasing to 100% at an RC/SC ratio of 40 gr/gs (Figure 5-35). This
quadratic behaviour of the change in % SA with increase in RC/SC ratio was due to the fact that a
quadratic model was used to model the effects of RC/SC ratio in this study. The % SA is actually expected
to increase to 100%, where it would remain constant when the RC/SC ratio is increased. The optimum
RC/SC ratio for surfactin adsorption is thus expected to be lower than 22 gr/gs, which is predicted by the
quadratic model (Figure 5-35), but slightly higher than 4 gr/gs since surfactin is not fully adsorbed at this
RC/SC ratio. An optimum RC/SC ratio of 5 gr/gs was therefore selected in this for surfactin adsorption in
the presence of methanol.
Stellenbosch University https://scholar.sun.ac.za
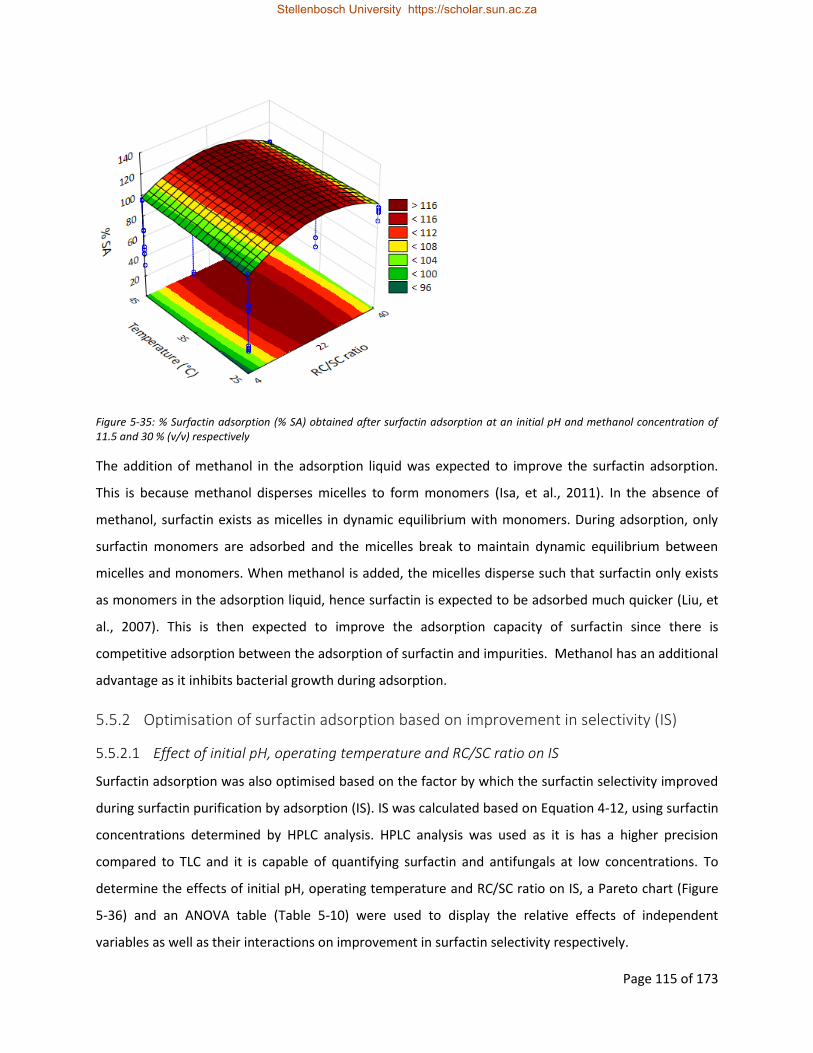
Page 115 of 173
Figure 5-35: % Surfactin adsorption (% SA) obtained after surfactin adsorption at an initial pH and methanol concentration of 11.5 and 30 % (v/v) respectively
The addition of methanol in the adsorption liquid was expected to improve the surfactin adsorption.
This is because methanol disperses micelles to form monomers (Isa, et al., 2011). In the absence of
methanol, surfactin exists as micelles in dynamic equilibrium with monomers. During adsorption, only
surfactin monomers are adsorbed and the micelles break to maintain dynamic equilibrium between
micelles and monomers. When methanol is added, the micelles disperse such that surfactin only exists
as monomers in the adsorption liquid, hence surfactin is expected to be adsorbed much quicker (Liu, et
al., 2007). This is then expected to improve the adsorption capacity of surfactin since there is
competitive adsorption between the adsorption of surfactin and impurities. Methanol has an additional
advantage as it inhibits bacterial growth during adsorption.
5.5.2 Optimisation of surfactin adsorption based on improvement in selectivity (IS)
Effect of initial pH, operating temperature and RC/SC ratio on IS 5.5.2.1
Surfactin adsorption was also optimised based on the factor by which the surfactin selectivity improved
during surfactin purification by adsorption (IS). IS was calculated based on Equation 4-12, using surfactin
concentrations determined by HPLC analysis. HPLC analysis was used as it is has a higher precision
compared to TLC and it is capable of quantifying surfactin and antifungals at low concentrations. To
determine the effects of initial pH, operating temperature and RC/SC ratio on IS, a Pareto chart (Figure
5-36) and an ANOVA table (Table 5-10) were used to display the relative effects of independent
variables as well as their interactions on improvement in surfactin selectivity respectively.
Stellenbosch University https://scholar.sun.ac.za

Page 116 of 173
Figure 5-36: Linear (L) and quadratic (Q) effects of initial pH (1), operating temperature (2), resin concentration to surfactin concentration (RC/SC) (3) ratio and interactions of these independent variables on improvement in selectivity (IS) at 95% confidence
Stellenbosch University https://scholar.sun.ac.za

Page 117 of 173
Table 5-10: ANOVA table showing the linear (L) and quadratic (Q) effects of initial pH (1), operating temperature (2), resin concentration to surfactin concentration (RC/SC) (3) ratio and interactions of these independent variables on improvement in selectivity (IS) at 95% confidence. The values in red indicate parameters which had a significant effect on IS at a 95% confidence interval
Source of variation Sum of
squares
Degrees of
freedom
Mean
square
p
(1) pH (L) 0.340605 1 0.340605 0.051607
pH (Q) 0.004032 1 0.004032 0.825529
(2) Temperature (L) 0.109520 1 0.109520 0.256836
Temperature (Q) 0.004845 1 0.004845 0.809061
(3 ) RC/SC ratio (L) 0.420500 1 0.420500 0.032056
RC/SC ratio(Q) 0.019245 1 0.019245 0.630732
1L by 2L 0.110556 1 0.110556 0.254657
1L by 3L 0.162006 1 0.162006 0.170570
2L by 3L 0.223256 1 0.223256 0.110245
Error 1.948137 24 0.081172
Total SS 3.349474 33
The change in IS during adsorption was seen to be independent of the operating temperature (Figure
5-36 and Table 5-10). The change in IS during adsorption was also independent of operating
temperature- RC/SC ratio and operating temperature- initial pH interactions. This can be supplemented
by surface plots of IS against operating temperature and pH at RC/SC ratio levels (Figure 8-20 to Figure
8-22) as well as surface plots of IS against operating temperature and pH at different RC/SC ratio levels
(Figure 8-23 to Figure 8-25) shown in the appendix (section 8.3.3.3).
The IS was seen to be dependent only on the RC/SC ratio (Figure 5-36 and Table 5-10) at a 95%
confidence interval. The IS was seen to improve with a decrease in RC/SC ratio (Figure 5-37 and Figure
5-38). At an operating temperature of 25 °C and initial pH 11.5, the IS was seen to increase from a
minimum of approximately 1 to a maximum of approximately 1.8 (Figure 5-37). This behaviour was
Stellenbosch University https://scholar.sun.ac.za

Page 118 of 173
possibly due to the ease of adsorption of surfactin compared to antifungals. Surfactin is the least polar
lipopeptide in comparison to other antifungals. It is therefore expected that it is more easily adsorbed
onto non-polar resins compared to antifungals. Therefore, at low RC/SC ratio, the surfactin is adsorbed
to fill the adsorption sites before antifungals are adsorbed, hence the higher IS. At high RC/SC ratio,
however, there are enough adsorption sites for adsorption of surfactin and antifungals hence both
surfactin and antifungals are adsorbed.
Figure 5-37: Improvement in selectivity (IS) obtained after surfactin adsorption in the absence of methanol at an operating temperature of 25 °C
Stellenbosch University https://scholar.sun.ac.za

Page 119 of 173
Figure 5-38: Improvement in selectivity (IS) obtained after surfactin adsorption in the absence of methanol at an operating temperature of 35 °C
Figure 5-39: Improvement in selectivity (IS) obtained after surfactin adsorption in the absence of methanol at an operating temperature of 45 °C
The IS was seen to be slightly affected by the change in pH. An increase in pH was seen to slightly
improve the surfactin selectivity. This behaviour is possibly due to ionization of surfactin and antifungals
with increase in pH. According to Wiczling & Kaliszan (2010), an acidic group is generally ionized
(deprotonated) at a pH above its pKa, while a basic group is ionized (protonated) at a pH below its pKa.
A change in pH can thus result in ionization of the side chains of amino acids present in the peptide
moiety of lipopeptides thus varying their adsorption properties. Since surfactin has different amino acid
composition to antifungals, variation in pH may affect the IS. The operating temperature was not seen
to have any effect on IS at a 95% confidence interval.
Effect of methanol concentration on IS 5.5.2.2
To determine the effects of methanol concentration on IS during adsorption, a Pareto chart (Figure 5-40)
and an ANOVA table (Table 5-11) were used to display the relative effects of independent variables as
well as their interactions on improvement in surfactin selectivity respectively.
Stellenbosch University https://scholar.sun.ac.za

Page 120 of 173
Figure 5-40: Linear (L) and quadratic (Q) effects of methanol concentration (4) as well as effects of interactions of methanol concentration with initial pH (1), operating temperature (2) and resin concentration to surfactin concentration (RC/SC) ratio (3) on improvement in selectivity (IS) at 95% confidence
Table 5-11: ANOVA table showing the linear (L) and quadratic (Q) effects of methanol concentration (4) as well as effects of interactions of methanol concentration with initial pH (1), operating temperature (2) and resin concentration to surfactin concentration (RC/SC) ratio (3) on improvement in selectivity (IS) at 95% confidence. The values in red indicate parameters which had a significant effect on IS at a 95% confidence interval
Sum of squares
Degrees of freedom
Mean square
p
Methanol concentration (L)
2.49114 1 2.491136 0.046710
Methanol concentration (Q)
1.95419 1 1.954190 0.076812
1L by 4L 1.70155 1 1.701551 0.097990
2L by 4L 2.29998 1 2.299976 0.055604
3L by 4L 3.43548 1 3.435476 0.020465
Error 28.05893 47 0.596998
Total SS 39.94126 52
Stellenbosch University https://scholar.sun.ac.za

Page 121 of 173
Surface plots of a change in IS with change RC/SC ratio and methanol concentration at different
operation temperatures are shown in Figure 5-41 to Figure 5-49.
Figure 5-41: IS obtained after surfactin adsorption in the presence of methanol at an operating temperature and initial pH of 25 °C and 6.5 respectively
Stellenbosch University https://scholar.sun.ac.za
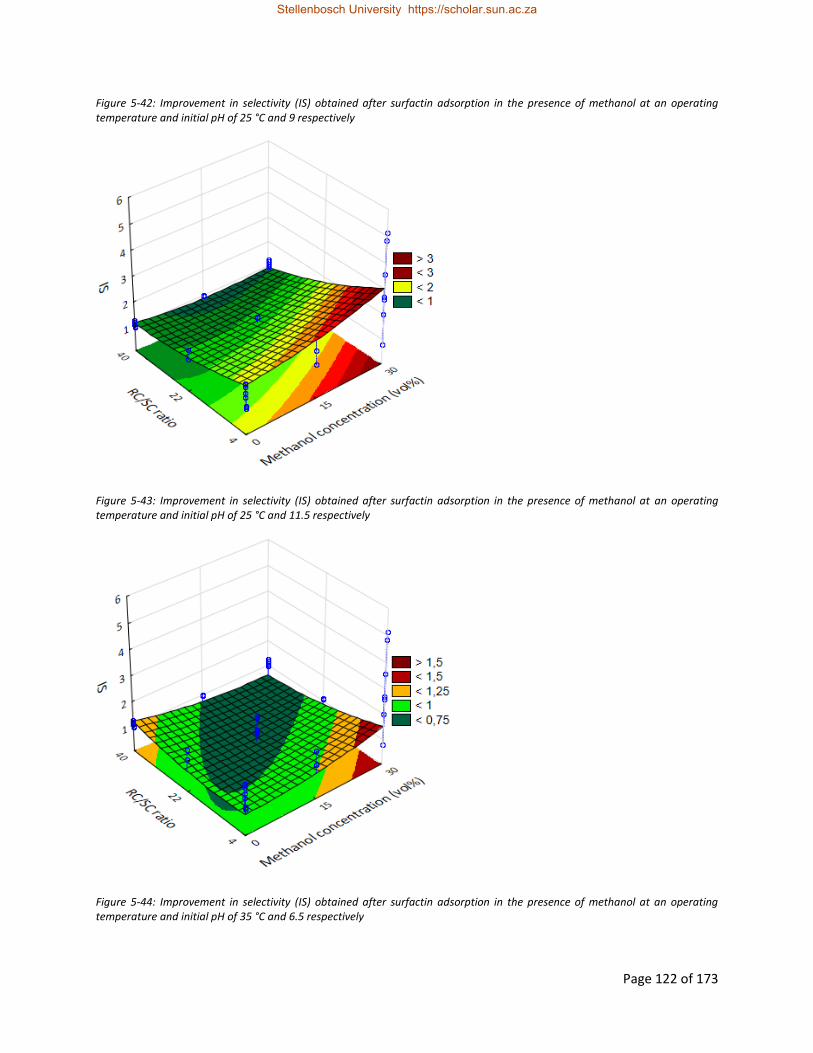
Page 122 of 173
Figure 5-42: Improvement in selectivity (IS) obtained after surfactin adsorption in the presence of methanol at an operating temperature and initial pH of 25 °C and 9 respectively
Figure 5-43: Improvement in selectivity (IS) obtained after surfactin adsorption in the presence of methanol at an operating temperature and initial pH of 25 °C and 11.5 respectively
Figure 5-44: Improvement in selectivity (IS) obtained after surfactin adsorption in the presence of methanol at an operating temperature and initial pH of 35 °C and 6.5 respectively
Stellenbosch University https://scholar.sun.ac.za
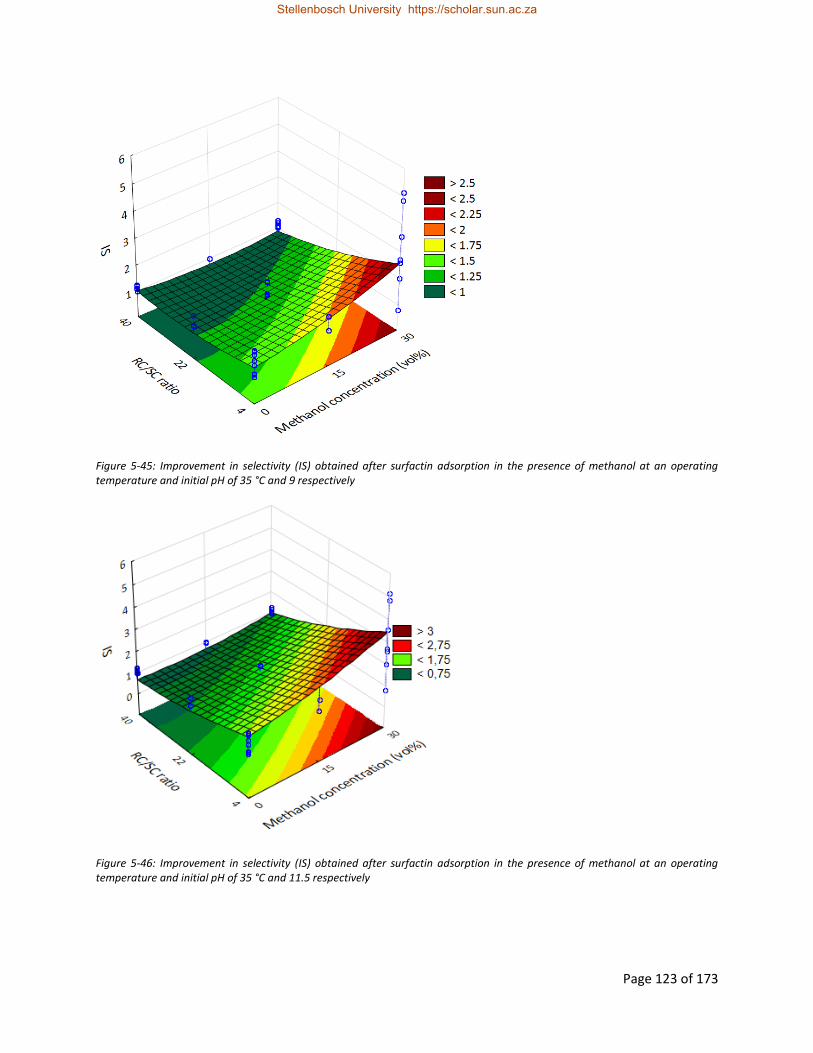
Page 123 of 173
Figure 5-45: Improvement in selectivity (IS) obtained after surfactin adsorption in the presence of methanol at an operating temperature and initial pH of 35 °C and 9 respectively
Figure 5-46: Improvement in selectivity (IS) obtained after surfactin adsorption in the presence of methanol at an operating temperature and initial pH of 35 °C and 11.5 respectively
Stellenbosch University https://scholar.sun.ac.za

Page 124 of 173
Figure 5-47: Improvement in selectivity (IS) obtained after surfactin adsorption in the presence of methanol at an operating temperature and initial pH of 45 °C and 6.5 respectively
Figure 5-48: Improvement in selectivity (IS) obtained after surfactin adsorption in the presence of methanol at an operating temperature and initial pH of 45 °C and 9 respectively
Stellenbosch University https://scholar.sun.ac.za
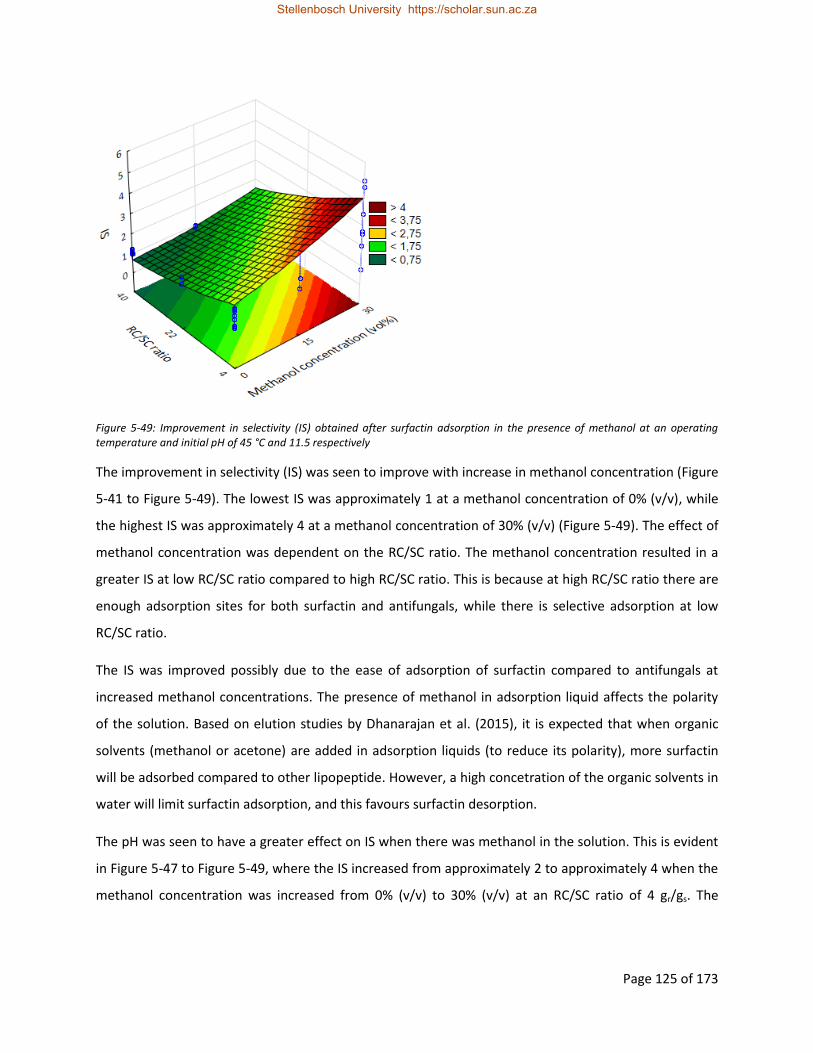
Page 125 of 173
Figure 5-49: Improvement in selectivity (IS) obtained after surfactin adsorption in the presence of methanol at an operating temperature and initial pH of 45 °C and 11.5 respectively
The improvement in selectivity (IS) was seen to improve with increase in methanol concentration (Figure
5-41 to Figure 5-49). The lowest IS was approximately 1 at a methanol concentration of 0% (v/v), while
the highest IS was approximately 4 at a methanol concentration of 30% (v/v) (Figure 5-49). The effect of
methanol concentration was dependent on the RC/SC ratio. The methanol concentration resulted in a
greater IS at low RC/SC ratio compared to high RC/SC ratio. This is because at high RC/SC ratio there are
enough adsorption sites for both surfactin and antifungals, while there is selective adsorption at low
RC/SC ratio.
The IS was improved possibly due to the ease of adsorption of surfactin compared to antifungals at
increased methanol concentrations. The presence of methanol in adsorption liquid affects the polarity
of the solution. Based on elution studies by Dhanarajan et al. (2015), it is expected that when organic
solvents (methanol or acetone) are added in adsorption liquids (to reduce its polarity), more surfactin
will be adsorbed compared to other lipopeptide. However, a high concetration of the organic solvents in
water will limit surfactin adsorption, and this favours surfactin desorption.
The pH was seen to have a greater effect on IS when there was methanol in the solution. This is evident
in Figure 5-47 to Figure 5-49, where the IS increased from approximately 2 to approximately 4 when the
methanol concentration was increased from 0% (v/v) to 30% (v/v) at an RC/SC ratio of 4 gr/gs. The
Stellenbosch University https://scholar.sun.ac.za

Page 126 of 173
improved effects of pH in the presence of methanol are possibly to similar ionizaion effects disussed in
section 5.5.2.1. The ionization however would have a greater effect in IS in the presence of methanol.
5.5.3 Surfactin purity and recovery after purification by adsorption process
To study surfactin purity and recovery after adsorption, surfactin was first adsorbed onto resins as
discussed in section 4.5.1. Surfactin adsorption was carried out at the recommended adsorption
operating conditions, which were an initial pH, operating temperature, RC/SC ratio and methanol
concentration of 11.5, 45 °C, 5 gr/gs and a methanol concentration of 30% (v/v) in the adsorption liquid.
After adsorption, surfactin was then recovered from the resins by desorption using absolute methanol
(section 4.5.2). Like adsorption, desorption was carried out for 24 hours. Desorption was seen to occur
as soon as the resins were contacted with the desorption liquid (methanol). In a study by Wang et al.
(2010), desorption was carried out for 6 minutes, and up to 100% desorption from resins was achieved.
In this study, desorption was carried out for 24 hours to assure surfactin desorption was complete as
desorption was carried in columns in the study by Wang et al. (2010) while it was carried out in shake
flasks in this study.
The surfactin recovery was calculated using Equation 4-9, while the surfactin purity was calculated using
Equation 4-10. The surfactin purity and recovery were calculated using surfactin concentrations
determined by TLC analysis. TLC analysis was used due to its simplicity and quickness in comparison to
HPLC analysis. The surfactin recovery and purity after surfactin purification by adsorption were 91±8%
and 58±6% respectively. The surfactin recovery was greater than that in the study by Dhanarajan et al.
(2015) (89.4%), while the surfactin purity was lower than that in the study by Dhanarajan et al. (2015)
(91.6%). The purity after adsorption was lower than the maximum purity achieved by solvent extraction
(80%).
The purity could be improved by resin washing, using dynamic rather than static adsorption, gradient
elution and carrying out the solvent extraction and adsorption purification steps sequentially. Resins can
be washed using deionised water after adsorption. Some of the adsorption liquid, which contains
impurities, may be trapped in the resins when the resins are recovered before surfactin desorption.
Since surfactin is harder to elute than other impurities, methanol can also be added to the deionised
water used for resin washing without affecting surfactin recovery. The methanol concentration would,
however, have to be optimised to see the best concentration for resin washing. A suitable range for
optimisation of methanol in the adsorption liquid would be between 0% and 80% (v/v).
Stellenbosch University https://scholar.sun.ac.za

Page 127 of 173
Adsorption can also be improved by carrying out the adsorption and desorption steps in a column
(dynamic adsorption) rather than in shake flasks (static adsorption). Wang et al. (2010) has shown that
dynamic adsorption improves % SA compared to static adsorption. Gradient elution, which is used to
separate lipopeptide families, can also be done to elute the adsorbed surfactin in column operation.
Gradient elution can be carried out using organic solvents (such as methanol and acetone) in water.
Organic solvents can be tested to determine which solvent is best for elution, and their concentration in
water would have to be optimised. A recommended organic solvent concentration range in water would
be between 0% (v/v) and 90% (v/v). Another factor which would need to be optimised for elution
studies would be the pH of the liquid used for elution.
Lastly, the purity can be improved by combining the adsorption with the solvent extraction step. In this
case, the precipitate from the acid precipitation step would be purified by methanol extraction. Instead
of evaporating the methanol to recover the surfactin product, the methanol-surfactin mixture would be
diluted with water to a methanol concentration of 30% (v/v), with a pH of 11.5. This mixture would then
be purified by surfactin adsorption at optimum operating temperature and RC/SC ratio.
5.5.4 Batch adsorption kinetics
Batch kinetics were studied to determine if the addition of methanol in the adsorption liquid improves
the surfactin adsorption rate. This was done by comparing the time it takes to reach equilibrium when
adsorption was carried out with 0% (v/v) methanol and 30% (v/v) methanol in the adsorption liquid.
Adsorption rates were also determined using the pseudo first-order and pseudo second-order models
(shown in Equation 4-15 and Equation 4-16 respectively). Lastly, batch kinetics were studied to
determine if the intraparticle diffusion was rate limiting.
To determine the time it takes to reach equilibrium, batch kinetics were studied by observing the
change in surfactin adsorption capacity at different time intervals during adsorption (qt) (determined
according to Equation 4-14) with time during adsorption (Figure 5-50). Surfactin adsorption capacity was
initially increased rapidly, before increasing slower and slower until equilibrium was reached, where the
adsorption capacity did not increase with time (Figure 5-50). This was possibly due to the presence of
more vacant surface sites available for adsorption during the initial stage, and the vacant sites decrease
as more surfactin is adsorbed making further adsorption more difficult. Additionally, surface sites could
be more difficult to occupy in later stages should there be repulsive forces between the adsorbed
surfactin molecules with the molecules on the bulk phase.
Stellenbosch University https://scholar.sun.ac.za
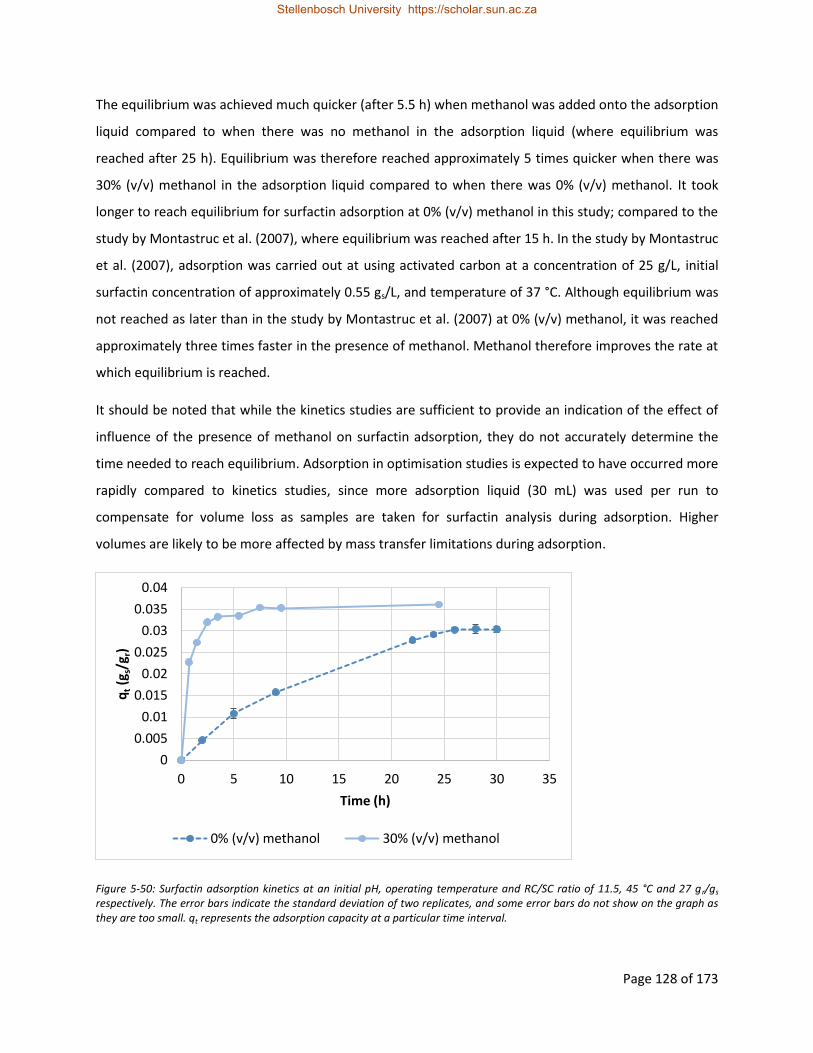
Page 128 of 173
The equilibrium was achieved much quicker (after 5.5 h) when methanol was added onto the adsorption
liquid compared to when there was no methanol in the adsorption liquid (where equilibrium was
reached after 25 h). Equilibrium was therefore reached approximately 5 times quicker when there was
30% (v/v) methanol in the adsorption liquid compared to when there was 0% (v/v) methanol. It took
longer to reach equilibrium for surfactin adsorption at 0% (v/v) methanol in this study; compared to the
study by Montastruc et al. (2007), where equilibrium was reached after 15 h. In the study by Montastruc
et al. (2007), adsorption was carried out at using activated carbon at a concentration of 25 g/L, initial
surfactin concentration of approximately 0.55 gs/L, and temperature of 37 °C. Although equilibrium was
not reached as later than in the study by Montastruc et al. (2007) at 0% (v/v) methanol, it was reached
approximately three times faster in the presence of methanol. Methanol therefore improves the rate at
which equilibrium is reached.
It should be noted that while the kinetics studies are sufficient to provide an indication of the effect of
influence of the presence of methanol on surfactin adsorption, they do not accurately determine the
time needed to reach equilibrium. Adsorption in optimisation studies is expected to have occurred more
rapidly compared to kinetics studies, since more adsorption liquid (30 mL) was used per run to
compensate for volume loss as samples are taken for surfactin analysis during adsorption. Higher
volumes are likely to be more affected by mass transfer limitations during adsorption.
Figure 5-50: Surfactin adsorption kinetics at an initial pH, operating temperature and RC/SC ratio of 11.5, 45 °C and 27 gr/gs respectively. The error bars indicate the standard deviation of two replicates, and some error bars do not show on the graph as they are too small. qt represents the adsorption capacity at a particular time interval.
0
0.005
0.01
0.015
0.02
0.025
0.03
0.035
0.04
0 5 10 15 20 25 30 35
qt (
g s/g
r)
Time (h)
0% (v/v) methanol 30% (v/v) methanol
Stellenbosch University https://scholar.sun.ac.za
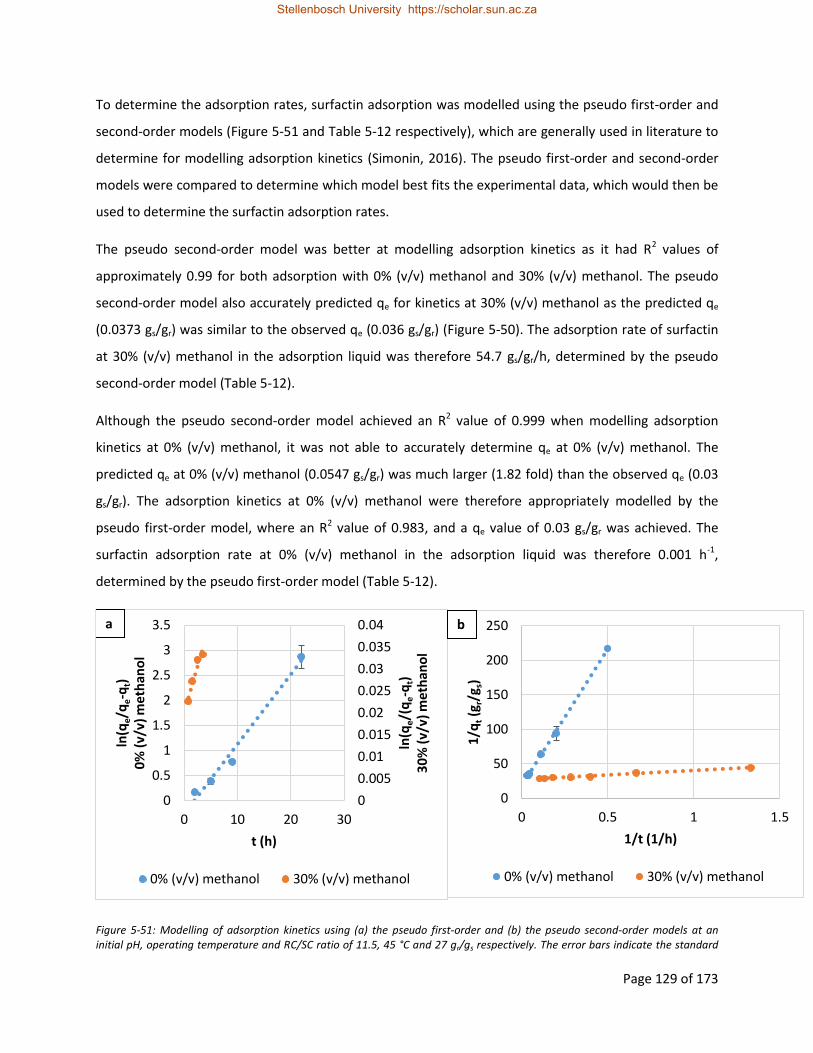
Page 129 of 173
To determine the adsorption rates, surfactin adsorption was modelled using the pseudo first-order and
second-order models (Figure 5-51 and Table 5-12 respectively), which are generally used in literature to
determine for modelling adsorption kinetics (Simonin, 2016). The pseudo first-order and second-order
models were compared to determine which model best fits the experimental data, which would then be
used to determine the surfactin adsorption rates.
The pseudo second-order model was better at modelling adsorption kinetics as it had R2 values of
approximately 0.99 for both adsorption with 0% (v/v) methanol and 30% (v/v) methanol. The pseudo
second-order model also accurately predicted qe for kinetics at 30% (v/v) methanol as the predicted qe
(0.0373 gs/gr) was similar to the observed qe (0.036 gs/gr) (Figure 5-50). The adsorption rate of surfactin
at 30% (v/v) methanol in the adsorption liquid was therefore 54.7 gs/gr/h, determined by the pseudo
second-order model (Table 5-12).
Although the pseudo second-order model achieved an R2 value of 0.999 when modelling adsorption
kinetics at 0% (v/v) methanol, it was not able to accurately determine qe at 0% (v/v) methanol. The
predicted qe at 0% (v/v) methanol (0.0547 gs/gr) was much larger (1.82 fold) than the observed qe (0.03
gs/gr). The adsorption kinetics at 0% (v/v) methanol were therefore appropriately modelled by the
pseudo first-order model, where an R2 value of 0.983, and a qe value of 0.03 gs/gr was achieved. The
surfactin adsorption rate at 0% (v/v) methanol in the adsorption liquid was therefore 0.001 h-1,
determined by the pseudo first-order model (Table 5-12).
Figure 5-51: Modelling of adsorption kinetics using (a) the pseudo first-order and (b) the pseudo second-order models at an initial pH, operating temperature and RC/SC ratio of 11.5, 45 °C and 27 gr/gs respectively. The error bars indicate the standard
0
0.005
0.01
0.015
0.02
0.025
0.03
0.035
0.04
0
0.5
1
1.5
2
2.5
3
3.5
0 10 20 30
ln(q
e/(
qe-q
t)
30
% (
v/v)
me
than
ol
ln(q
e/q
e-q
t)
0%
(v/
v) m
eth
ano
l
t (h)
0% (v/v) methanol 30% (v/v) methanol
a
0
50
100
150
200
250
0 0.5 1 1.5
1/q
t (g r
/gs)
1/t (1/h)
0% (v/v) methanol 30% (v/v) methanol
b
Stellenbosch University https://scholar.sun.ac.za

Page 130 of 173
deviation of two replicates, and some error bars do not show on the graph as they are too small. qe and qt represent the adsorption capacity at equilibrium as well as at different time intervals during adsorption respectively, while t represents time.
Table 5-12: K and R2 values obtained from modelling the experimental data using the pseudo first-order and pseudo-second
order mode, where qe represent the predicted equilibrium adsorption capacity while k1 and k2 represent the rate constants of the pseudo first-order model and pseudo second-order model respectively.
Methanol concentration 0% methanol 30% methanol
Pseudo first-order model
k1 (1/h) 0.001 0.021
qe 0.0300 1.01
R2 0.983 0.928
Pseudo second order-model
k2 [gs/gr/h] 0.844 54.7
qe 0.0547 0.0373
R2 0.999 0.986
The pseudo first-order and second-order models were used assuming that adsorption is controlled by
the direct adsorption surfactin onto resins. The theoretical of the pseudo second-order ground is
actually based on fundamental theories of surface reactions (Plazinski, et al., 2013). However,
adsorption depends on other mechanisms (transport in the bulk solution, diffusion across the film
surrounding the adsorbent particles and diffusion in the pores of the sorbent) in addition to direct
adsorption on the solid surface (Fierro, et al., 2008). Intraparticle diffusion can be studied using the
intra-particle diffusion model. The intraparticle diffusion model also gives useful information on the
relative thickness of the boundary later, hence information of boundary layer diffusion (Fierro, et al.,
2008).
5.5.5 Batch adsorption isotherms
Batch Isotherms were done to compare the effect of a change in the initial surfactin concentration on qe
(determined according to Equation 4-17) and % SA (determined according to Equation 4-11). Batch
optimisation studies were carried out using % SA as the dependent variable, rather than qe. This is
Stellenbosch University https://scholar.sun.ac.za

Page 131 of 173
because high qe can be associated with low recoveries. Figure 5-52 shows that qe continues increasing
while % SA, which is the percentage of surfactin in the adsorption liquid adsorbed onto resins,
decreases. This means that qe increased with decrease in surfactin recovery, thus qe was not suitable for
optimisation studies as maximum recoveries were desirable in this study. The adsorption capacity
increases with increase in initial surfactin concentration before reaching a saturation plateau, after
which the adsorption remains constant with increase in initial surfactin concentration as in the study by
Dhanarajan et al. (2015).
Figure 5-52: % SA and qe obtained at an initial pH, operating temperature, resin concentration and methanol concentration of 11.5, 45 °C, 4 gr/L and 30% (v/v) respectively. The error bars indicate the standard deviation of two replicates, and some error bars do not show on the graph as they are too small. Ci is the initial surfactin concentration.
Batch isotherms were also carried out to determine a suitable model for surfactin adsorption. The
Langmuir model (which describes monolayer adsorption) and the Freundlich model (which describes
both monolayer and multilayer adsorption) were tested. The Langmuir and Freundlich model are shown
in Equation 4-18 and Equation 4-19 respectively, and they were used to model the surfactin adsorption
isotherms as shown in Figure 5-53a and Figure 5-53b respectively. The model parameters and
correlation factors are shown in Table 5-13. The Freundlich model (R2> 0.99 for both adsorption at 0%
methanol and 30% methanol) was better at modelling surfactin adsorption isotherms in comparison to
the Langmuir model (R2< 0.99 for both adsorption at 0% methanol and 30% methanol). The Langmuir
model can also be used to model surfactin adsorption as the R2 is approximately 0.98 for both, which is
close to 0.99.
0
0.05
0.1
0.15
0.2
0.25
0.3
0
20
40
60
80
100
120
0 0.5 1 1.5 2 2.5
qe (
g s/g
r)
% S
A
Ci (gs/L)
% SA qe
Stellenbosch University https://scholar.sun.ac.za
Page 132 of 173
Since the Freundlich model was the best for surfactin adsorption, surfactin adsorption is likely a
multilayer adsorption. The Freundlich constant (KF) and the theoretical maximum surfactin adsorption
capacity (qm), which indicate the adsorption capacity, were higher at 30% (v/v) methanol in comparison
to 0% (v/v) methanol in the adsorption liquid. The presence of methanol in adsorption liquids thus
improves the surfactin adsorption capacities. The addition of methanol was therefore seen to improve
the adsorption capacity. The Langmuir constant (KL) was also higher in the presence of methanol
indicating that an increase in the affinity of binding sites for surfactin (Wu, 2007), hence a higher
stability of the combination between surfactin and resins (Zhang, et al., 2008).
The driving force of surfactin adsorption is described by 1/n, where the magnitude of the driving force is
inversely proportional to 1/n (Ming, et al., 2006). There was therefore a lower driving force for
adsorption at 30% (v/v) methanol in the adsorption liquid (1/n=0.573) compared to when there was no
methanol in the adsorption liquid (1/n=0.404). Since methanol disperses surfactin micelles, it was
expected that this would allow surfactin molecules to more easily adsorb with HP-20 resin active sites
resulting in a relatively higher driving force for adsorption at 30% (v/v) methanol in the adsorption
liquid. However, since high methanol concentration favours surfactin desorption, it is not surprising that
the presence of methanol in the adsorption liquid resulted in reduced driving force for adsorption.
According to Jiang et al. (2002), if the 1/n is greater than 10, adsorption can be defined as chemical, and
physical if 1/n is below 10. Surfactin adsorption was therefore physical in this study. Thermodynamic
analyses would, however, be more appropriate to determine if surfactin adsorption was a physisorption
or a chemisorption process. These were however not done as they were beyond the scope of this study,
but they are recommended for future studies.
No study on surfactin adsorption isotherms has been carried out in literature. There is, however, a study
on lipopeptide adsorption isotherms by Dhanarajan et al. (2015). In the study by Dhanarajan et al.
(2015), total lipopeptide adsorption of surfactin, iturin and fengycin from solubilised acid precipitates of
B. megaterium cultures was studied using HP-20 resinis at 0% (v/v) methanol in adsorption liquids.
Dhanarajan et al. (2015) found that the Redlich–Peterson model was best for modelling surfactin
adsorption isotherms (R2=0.998) followed by the Langmuir model (R2=0.987). Unlike the finding of this
study, Dhanarajan et al. (2015) found that the Freundlich model was poor of modelling surfactin
adsorption isotherms (R2=0.948).
Stellenbosch University https://scholar.sun.ac.za

Page 133 of 173
KF and qm, which were 0.257 gs/gr(L/gs)1/n and 0.25 gs/gr respectively, were higher in the study by
Dhanarajan et al. (2015) than those in this study, indicating higher adsorption capacities. This is possibly
due to that only surfactin was considered in this study, thus less mass is adsorbed per unit of resin
compared to when total lipopeptide mass is considered. KL (11.72 L/g) was higher while 1/n (0.33) was
lower in the study by Dhanarajan et al. (2015) compared to this study, indicating a higher affinity of
binding sites for lipopeptides and a better driving force for adsorption in the study by Dhanarajan et al.
(2015).
Figure 5-53: Modelling adsorption isotherms using the Langmuir model (a) and the Freundlich model (b) for adsorption carried out at an initial pH, operating temperature, methanol concentration and resin concentration of 11.5, 45 °C, 30% (v/v) and 4 gr/L respectively. The error bars indicate the standard deviation of two replicates, and some error bars do not show on the graph as they are too small. qe represents the equilibrium adsorption capacity, while Ce represent the equilibrium surfactin concentration.
0
5
10
15
20
0 10 20 30 40 50
1/q
e (
g r/g
s)
1/Ce (L/gs)
0% (v/v) methanol 30% (v/v) methanol
a
-3
-2.5
-2
-1.5
-1
-4 -3 -2 -1 0 1
lnq
e (
ln(g
s/g r
))
ln(Ce) (ln(gs/L))
0% (v/v) methanol 30% (v/v) methanol
b
Stellenbosch University https://scholar.sun.ac.za

Page 134 of 173
Table 5-13: Model parameters and R2 values obtained from modelling the experimental data using the Langmuir and Freundlich
models. KL and KF are the Langmuir and Freundlich constants respectively, qm is the theoretical maximum surfactin adsorption capacity and 1/n is an empirical constant.
Langmuir model
Methanol concentration
0% (v/v) 30% (v/v)
KL (L/gs) 6.85 11.3
qm (gs/gr) 0.195 0.306
R2 0.978 0.983
Freundlich model
Methanol concentration
0% (v/v) 30% (v/v)
KF [(gs/gr)(L/gs)1/n] 0.183 0.564
1/n 0.4035 0.573
R2 0.998 0.996
5.6 Repeatability
This section discusses the repeatability of the experiments done in this study. The reproducibility was
calculated according to Equation 5-5, where σ and χ are the standard deviation and average values
obtained from experimental runs.
𝑅𝑒𝑝𝑒𝑎𝑡𝑖𝑏𝑖𝑙𝑖𝑡𝑦 = 100(1 −𝜎
𝜒) Equation 5-5
The repeatability of experiments for analysis of concentrations of products and selectivity from surfactin
production was determined according to Equation 5-5 (Figure 5-54). The repeatability in surfactin
production experiments was tested between 29 and 66 hours during surfactin production. The
experiments had a high repeatability (≥80%), hence they were repeatable.
Stellenbosch University https://scholar.sun.ac.za

Page 135 of 173
Figure 5-54: Repeatability of experiments for analysis of concentrations of products and selectivity during surfactin production
The repeatability of experiments for analysis of concentrations of nutrients (glucose, ammonium and
nitrate) during surfactin production was also determined according to Equation 5-5 (Figure 5-55). The
repeatability was tested between 0 and 29 during surfactin production. The experiments had a high
repeatability (≥80%), hence they were repeatable.
Figure 5-55: Repeatability of experiments for analysis of concentrations of nutrients during surfactin production
50
60
70
80
90
100
29 42 66
% R
epea
tib
ility
Time (h)
CDW Surfactin concentration
Antifungals concentration Selectivity
0
20
40
60
80
100
0 9 29
% R
epea
tib
ility
Time (h)
Glucose concentration Ammonium concentration Nitrate concentration
Stellenbosch University https://scholar.sun.ac.za

Page 136 of 173
The repeatability of the experiments in development of the analytical technique was not discussed in
this section, as the reproducibility of TLC analysis was discussed during validation of the TLC analytical
technique (section 5.2.2.4.1). This reproducibility was determined through intraday error analysis, and
TLC analysis was found to give reproducible results as it gave high accuracy and precision (98% and ≥84%
respectively) when analysis was carried out in different days.
The repeatability of experiments for determining recoveries, purities, selectivity and improvement in
selectivity was determined according to Equation 5-5 (Figure 5-56). The repeatability of these
experiments was tested at pH 2 and pH 4, and a high repeatability (>85%) was obtained. Acid
precipitation experiments were therefore repeatable.
Figure 5-56: Repeatability of experiments for determining recoveries, purities, selectivity and IS after surfactin purification by acid precipitation
The repeatability of experiments for determining surfactin recovery and purity after surfactin
purification by solvent extraction was determined according to Equation 5-5 (Figure 5-57) for all solvents
used in the extraction experiments. A high repeatability (>80%) was obtained for extraction using
methanol, i-propanol, C/M (1:1), C/M (2:1), acetone, chloroform, ethyl acetate and MTBE as solvents.
The experiments for determining the purity and recovery of extraction using acetonitrile were 78%
(which is close to 80%). Purity experiments for extraction using n-hexane showed a high repeatability
(87%), while recoveries showed a repeatability of 75%. Extraction experiments using petroleum ether
showed a low repeatability (up to 45%). This low repeatability could be due to low surfactin
50
60
70
80
90
100
2 4
% R
epea
tib
ility
pH
Surfactin recovery Antifungals recovery Total lipopeptide recovery
Surfactin purity Total lipopeptide purity Selectivity
IS
Stellenbosch University https://scholar.sun.ac.za

Page 137 of 173
concentrations in the solvents after extraction and due to the high volatility of hexane and petroleum
ether. Petroleum ether has the lowest boiling point (36 °C) among the solvents used in this study (Table
8-1 in the appendix section).
Figure 5-57: Repeatability of experiments for determining surfactin recovery and purity after surfactin purification by solvent extraction
The repeatability of experiments conducted in surfactin adsorption studies was determined according to
Equation 5-5 (Figure 5-58). The repeatability of experiments for determining % SA, qe and IS were tested
at an initial pH, operating temperature, RC/SC ratio and methanol concentration of 6.5, 35 °C, 11 gr/gs
and 30% (v/v) respectively. The repeatability of experiments for determining surfactin purity and
recovery was tested at an initial pH, operating temperature, RC/SC ratio and methanol concentration of
11.5, 45 °C, 5 gr/gs and 30% (v/v) respectively. The repeatability of the experiments for determining %
SA, qe and IS were approximately 98%, while the repeatability of the experiments for determining
recovery and purity were approximately 90%. Adsorption experiments were therefore repeatable.
40
50
60
70
80
90
100
Rep
eati
bili
ty
Organic solvents
Recovery Purity
Stellenbosch University https://scholar.sun.ac.za

Page 138 of 173
Figure 5-58: Repeatability of experiments for determining % SA, qe, IS as well as surfactin purity and recovery. Repeatability of experiments for determining % SA, qe and IS were tested at an initial pH, operating temperature, RC/SC ratio and methanol concentration of 6.5, 35 °C, 11 gr/gs and 30% (v/v) respectively, while the repeatability of experiments for determining surfactin purity and recovery was tested at an initial pH, operating temperature, RC/SC ratio and methanol concentration of 11.5, 45 °C, 5 gr/gs and 30% (v/v) respectively.
0
10
20
30
40
50
60
70
80
90
100
% SA qe IS Purity Recovery
% R
epea
tab
ility
Parameters being determined
Stellenbosch University https://scholar.sun.ac.za

Page 139 of 173
6 Conclusions and recommendations
This section provides the conclusions of this study as well as recommendations for future studies based
on the results and discussion (chapter 5).
6.1 Conclusions
The production and purification of surfactin is necessary due to the potential effectiveness of surfactin
against organisms causing TB. The acid precipitation, solvent extraction and adsorption purification
techniques were proposed for surfactin purification from B. subtilis cultures. Prior to surfactin
purification studies, surfactin was produced and a technique for quantification of surfactin
concentration was developed. Surfactin was successfully produced batch-wise using B. subtilis to a
concentration of 1109 mg/L.
The TLC analytical technique was successfully developed and validated for the quantification of surfactin
concentration. A linear relationship was observed between surfactin concentration and the area formed
by surfactin bands on TLC plates after analysis between surfactin concentrations of 0.5 g/L and 3 g/L.
The TLC analytical technique was suitable for surfactin analysis when surfactin was dissolved in different
solvents and when surfactin was spotted by multiple spotting on TLC plates to an accuracy and precision
of up to 98% and 95% respectively. Based on intraday error analysis, surfactin gave reproducible results
as a high accuracy and precision (98% and ≥84% respectively) were obtained when analysis was carried
out in different days (two weeks apart). TLC analysis was also found to be specific for surfactin analysis,
and selective for surfactin analysis in the presence of other lipopeptides (fengycin and iturin).
TLC analysis also allowed the qualitative analysis of impurities with lipid and peptide parts in B. subtilis
cultures, which are the major impurities in these cultures. Impurities with lipid parts were determined
using primuline as a detector while impurities with peptide parts could be determined using ninhydrin as
a detector.
After surfactin production and development of the TLC analytical technique, surfactin was successfully
recovered from cell-free supernatants by acid precipitation, with a purity and recovery of 43% and 97%
respectively. Based on literature, surfactin recoveries greater than 97% were expected, with a total
lipopeptide purity of approximately 55%. The surfactin recoveries in this study (97%) were therefore
comparable to the literature values, while the total lipopeptide purity (50%) was marginally lower. This
Stellenbosch University https://scholar.sun.ac.za

Page 140 of 173
is possibly due to a higher than expected concentration of impurities precipitating with surfactin during
acid precipitation.
The surfactin purity and recovery obtained after surfactin purification by acid precipitation were seen to
be independent of operating pH for operating pHs lower than 4. Surfactin recovery by acid precipitation
reported in literature has been carried out at pH 4 and pH 2. However, no study has been done to
optimise the operating pH between these two pH (pH 2 and pH 4). In this study, surfactin recovery by
acid precipitation was therefore examined in the range between pH 2 and pH 4, and the surfactin
recovery and purity were as consistent with pH (at 97% and 43% respectively) in this range. An operating
pH of 4 was recommended as the operating pH as it requires less acid to achieve the precipitation, and
the precipitates formed require less sodium hydroxide to re-solubilise.
Like the purity and recovery, the surfactin selectivity was found to be independent of operating pH for
operating pHs below 4 during surfactin purification by acid precipitation. Surfactin selectivity after acid
precipitation was found to be 5.7 gs/ga, which was comparable to the surfactin selectivity in
supernatants after production (5.5 gs/ga). This was in line with the hypothesis which stated that surfactin
selectivity does not alter after surfactin purification by acid precipitation
The precipitates obtained after surfactin purification by acid precipitation were further purified by
solvent extraction. Solvent extraction successfully purified surfactin in acid precipitates, and a maximum
surfactin recovery and purity of 100% and 80% respectively was obtained. The highest surfactin recovery
and purity was achieved when MTBE was used as a solvent. MTBE was thus the best solvent for solvent
extraction as it gave the highest surfactin recovery and purity. The high surfactin purity is due the high
selectivity of MTBE for surfactin extraction in the presence of impurities. In comparison to surfactin
purification by adsorption, surfactin purification by solvent extraction is superior as it gave a higher
surfactin recovery and purity.
Maximum surfactin recoveries were obtained when polar solvents were used for solvent extraction. The
most polar solvent (methanol) achieved a 100% surfactin recovery. The non-polar solvents n-hexane and
petroleum ether achieved the lowest surfactin recoveries (16% and 8% respectively). This was in line
with our hypothesis which stated that polar solvents recover more surfactin in comparison to non-polar
solvents.
In addition to high recoveries, maximum surfactin purities were also obtained when polar solvents were
used for surfactin purification by solvent extraction. The least polar solvents, n-hexane and petroleum
Stellenbosch University https://scholar.sun.ac.za

Page 141 of 173
ether, achieved the lowest surfactin purities (30%). This was not in line with our hypothesis as it was
expected that non-polar solvents would give the highest surfactin purities. The major impurity in non-
polar solvents after solvent extraction was expected to be lipids. The low purity in non-polar solvents
was possibly due to a higher recovery of lipid impurities into the solvents during solvent extraction in
comparison to surfactin.
Besides purification by solvent extraction, the precipitates from acid precipitation were also further
purified by adsorption. Surfactin was successfully purified by adsorption, with a recovery and purity of
91% and 58% respectively. Based on literature, it was expected that surfactin precipitates from acid
precipitation could be purified by adsorption with a recovery and purity of 90% and 80% respectively.
The low purities in surfactin adsorption means that more impurities were adsorbed than expected. This
is possibly because static rather than dynamic adsorption was used in this study. Additionally, resin
washing and gradient elution were not done in this study.
During surfactin purification adsorption, the surfactin selectivity was improved, which was in line with
the hypothesis of this study. The highest improvement in selectivity was 4. The improvement in
selectivity improved with an increase in methanol concentration and initial pH, while it decreased with
an increase in RC/SC ratio. The highest improvement in selectivity was observed at a methanol
concentration, initial pH and RC/SC ratio of 30% (v/v), 11.5 and 4 gr/gs.
Since it was hypothesised that surfactin adsorption is dependent on the operating temperature as well
as the initial pH, RC/SC ratio and methanol concentration in the adsorption liquid, the effect and
interactions of these independent variables was determined using a face-centred central factorial
design. The factorial design was successful in determining the effects and interactions of the
independent variables on surfactin adsorption. The surface design, however, had a limitation in
quantifying the effects of RC/SC ratio on surfactin adsorption as it uses a quadratic model to model the
change in surfactin adsorption with RC/SC ratio, while this change would be appropriately modelled
using the Langmuir of Freundlich models. Surfactin adsorption isotherms studies showed that the
Freundlich model was best for modelling surfactin adsorption.
Since the methanol bases adsorption liquids has never been studied before, adsorption was optimised
separately in adsorption liquids with methanol and adsorption liquids without methanol for comparison.
In the absence of methanol, an increase in operating temperature was seen to improve surfactin
adsorption. At low RC/SC ratios (4 gr/gs), an increase in temperature from 25 °C to 45 °C improved
Stellenbosch University https://scholar.sun.ac.za

Page 142 of 173
surfactin adsorption from approximately 25% to 43%. This was expected as some studies in literature
stated that surfactin adsorption is an endothermic process. The recommended operating temperature
for surfactin adsorption was 45 °C.
The initial pH did not affect surfactin adsorption in the absence of methanol. Additionally the effects of
interactions between initial pH with operating temperature or RC/SC ratio also had no effect surfactin
adsorption at a 95% confidence interval. The initial pH was, however, expected to improve surfactin
adsorption as it affects surfactin charge. The selected pH for surfactin adsorption in the absence of
methanol was 11.5, based on the fact that bacterial growth in the adsorption liquid during adsorption is
likely to be negligible, compared to that at the lower pHs.
The RC/SC ratio was had the most significant effect on surfactin adsorption in the absence of methanol.
An increase in RC/SC ratio was expected to improve the surfactin concentration until a 100% adsorption
is reached, where the % adsorption would then remain constant. In this study, the % SA increased from
25% (when RC/SC ratio was 4 gr/gs) to a turning point at 105% (when the ratio was 31 gr/gs) before
decreasing again to approximately 100% (when the RC/SC ratio was 40 gr/gs). The quadratic behaviour is
due to the fact that a quadratic model was used to experimental data on % SA optimisation in this study.
The optimum RC/SC ratio obtained for studies in the absence of methanol was 31 gr/gs.
The factorial design used for studying the effect of operating temperature, initial pH and RC/SC ratio was
then extended to study the effect of methanol concentration on surfactin adsorption as well as the
effects of the interteractions of methanol concentration with operating temperature, initial pH and
RC/SC ratio on adsorption. Surfactin adsorption improved with increase in methanol concentration in
the adsorption liquid. The addition of methanol in the adsorption was studied as methanol disperses
surfactin micelles and was thus expected to improve adsorption. The addition of methanol was seen to
improve surfactin adsorption rates, and adsorption kinetics studies showed that adsorption equilibrium
could be achieved 5 times faster when methanol was added into the adsorption liquid. The change in
initial pH was seen to have a more significant on % adsorption as well as IS surfactin adsorption when
adsorption was carried out in the presence of methanol. IS of up to 4 times was achieved when
adsorption was carried out in the presence of methanol. Methanol addition also improved adsorption
capacities, and the optimum RC/SC ratio was 5 gr/gs in the presence of methanol. The optimum initial pH
remained 11.5, as an increase in pH was seen to improve both % adsorption and surfactin selectivity.
Stellenbosch University https://scholar.sun.ac.za

Page 143 of 173
The proposed surfactin purification techniques in this study, which were acid precipitation, solvent
extraction and adsorption were successful in purifying surfactin from B. subtilis cultures. The best
method for purifying surfactin from cell-free supernatants of B. subtilis cultures in this study is to pre-
purify the surfactin by acid precipitation and dry the precipitate. Thereafter, purify the dry precipitate by
solvent extraction using MTBE as a solvent. This is of major significance as surfactin can be used in the
fight against TB, which is among the top five major causes of death globally.
6.2 Recommendations
Based on the results and discussion (Chapter 5), the following recommendations were made:
6.2.1 Further studies should be studied to determine the optimum pH in the range
between 4 and 6 during surfactin purification by acid precipitation
The surfactin purity, recovery and selectivity were consistent for pH below pH 4. The actual optimum pH
for acid precipitation could therefore be higher pH 4, thus it is recommended that more acid
precipitation studies be done between pH 4 and pH 6 to determine the optimum pH. Acid precipitation
studies between pH 4 and pH 6 are recommended since surfactin starts precipitating at pH below 6
according to literature.
6.2.2 A two-stage extraction should be considered for purification by solvent extraction
The surfactin purity after solvent extraction can be improved by a two-stage extraction. Since non-polar
solvents (hexane and petroleum ether) had poor recoveries of surfactin, but were better at recovering
lipids, these solvents can be used for removal of lipid impurities in the first extraction stage (leaving
surfactin in the solid precipitate). The second extraction stage would be extraction using MTBE, which
mostly recovers surfactin in comparison to protein.
6.2.3 Multi-fold extraction should be considered to improve surfactin recovery when
non-polar solvents are used as solvents in solvent extraction studies
A low recovery was attained by solvent extraction using hexane and petroleum ether. Surfactin is known
to be partially soluble in hexane and petroleum ether. Therefore, there is a possibility that the solvents
were saturated with surfactin after solvent extraction. Fresh solvent can therefore be used to further
extract surfactin in the surfactin in the remaining precipitate after extraction to improve the recovery.
Stellenbosch University https://scholar.sun.ac.za
Page 144 of 173
6.2.4 Optimisation of initial temperature and optimisation using temperatures greater
than 45 °C should be considered in surfactin adsorption studies
Adsorption studies were optimised by varying the operating temperature, while the initial temperature
was room temperature. Since % SA studies increased with operating temperature, there is a possibility
that a high initial temperature will improve the % SA. Maximum surfactin adsorption was obtained at 45
°C. This was the upper range at which temperature was studied, chosen as high temperatures could
negatively affect the efficacy of surfactin. Higher temperatures should be considered for future
adsorption studies, while the efficacy of surfactin is tested to ensure that optimisation is done without
negatively affecting the efficacy.
6.2.5 Methanol concentration higher 30% (v/v) should be considered in surfactin
adsorption studies
An increase in methanol concentration was seen to improve surfactin adsorption. The maximum
methanol concentration that was studied in this study was 30% (v/v), since this concentration is best for
micelle destabilisation based on literature. Future studies can be studied for methanol concentrations
greater than 30% (v/v) in the adsorption liquid. This would particularly important as high methanol
concentrations are likely to improve surfactin selectivity.
6.2.6 Resin washing should be considered to improve surfactin purities after surfactin
purification by adsorption
After adsorption or prior to desorption, some of the adsorption liquid (which contains impurities) may
be trapped in the resins when the resins are recovered. This liquid can be washed off using deionised
water. Surfactin is also harder to elute than other impurities, thus methanol can also be added to the
deionised water used for resin washing without affecting surfactin recovery. This could be used to wash
off some adsorbed impurities.
6.2.7 Column studies should be considered to improve the surfactin adsorption
efficiency
In static adsorption, surfactin resins need to be recovered after adsorption in order to desorb the
surfactin. The resins are recovered by filtration. Dynamic adsorption in columns is however more
efficient as it allows easy desorption since resins do not have to be filtered out prior to desorption.
Dynamic adsorption also improves adsorption capacities compared to static adsorption.
Stellenbosch University https://scholar.sun.ac.za

Page 145 of 173
6.2.8 Carrying out solvent extraction and adsorption purification steps sequentially
should be considered to improve surfactin purity, without affecting the surfactin recovery
In this technique, surfactin would be extracted from dry precipitates using methanol. This would
improve the surfactin purity, while 100% of the surfactin is recovered. The methanol with surfactin can
then be mixed with alkaline water to form an adsorption liquid with a methanol concentration of 30%
(v/v) at a pH of 11.5. This adsorption liquid can then be purified by adsorption with an RC/SC ratio and
operating temperature of 45 °C and 5 gr/gs respectively to further improve the purity. Higher adsorption
capacities and purities are expected as there are less there would be less impurities in this adsorption
liquid.
6.2.9 A quantitative technique should be used for efficacy studies of surfactin after
purification
Since the surfactin produced in this study is for use in the fight against TB, antimicrobial tests of the
purified surfactin against M. tuberculosis are necessary. Purified surfactin is expected to improve the
antibacterial activity of surfactin (Snook, et al., 2009 and Mukherjee, et al., 2009). Razafindralambo et al.
(1993), on the other hand, stated that acid precipitation and exposure of surfactin to organic solvents
may result in hydrolysis or esterification of lipopeptide functional groups, and this may reduce the
antibacterial activity of surfactin. Surfactin efficacy studies should therefore be quantitatively done to
test the efficacy after surfactin purification by acid precipitation, solvent extraction and adsorption.
These tests can be done using M. aurum, a surrogate of M. tuberculosis, which is much safer to work
with. A suitable test might be the agar well diffusion test on Mueller-Hinton agar medium, which was
used by Mukherjee et al. (2009) to show that antibacterial activity of surfactin is improved by surfactin
purification.
Stellenbosch University https://scholar.sun.ac.za

Page 146 of 173
7 References
Abdel-Mawgoud, A. M., Aboulwafa, M. M. & Hassouna, N. A. H., 2008a. Characterization of Surfactin
Produced by Bacillus subtilis Isolate BS5. Appl Biochem Biotechnol, 150(3), pp. 289-303.
Abdel-Mawgoud, M. A., Aboulwafa, M. M. & Hassouna, A. H. N., 2008b. Optimization of Surfactin
Production by Bacillus subtilis Isolate BS5. Appl Biochem Biotechnol, 150(3), pp. 305-325.
Abushady, H. M., Bashandy, A. S., Aziz, N. H. & Ibrahim, H. M. M., 2005. Molecular Characterization of
Bacillus subtilis Surfactin Producing Strain and the Factors Affecting its Production. International journal
of agricultrure and biology, 3(7), pp. 337-344.
Alexandridis, P. & Lindman, B., 2000. Amphiphilic Block Copolymers: Self-assembly and applications.
Elsevier.
Arima, K., Tamura, G. & Kakinuma, A., 1972. Surfactin. United States of America, Patent No. 3,687,926.
Bence, K., 2011. Bacterial production of antimicrobial biosurfactants by Bacillus subtilis (Doctoral
dissertation, Stellenbosch: Stellenbosch University)
Bele, A.A. and Khale, A., 2011. An overview on thin layer chromatography. International Journal of
Pharmaceutical Sciences and Research, 2(2), p. 256.
Besson, F. & Michel, G., 1987. Isolation and characterization of new iturins: iturin D and iturin E. The
Journal of antibiotics, 40(4), pp.437-442.
Bonmatin, J. M., Laprevote, O. & Peypoux, F., 2003. Diversity Among Microbial Cyclic Lipopeptides:
Iturins and Surfactins. Activity-Structure Relationships to Design New Bioactive Agents. Combinatorial
Chemistry & High Throughput Screening, 6(6), pp. 541-556.
Bonmatin, J. M., Genest, M., Petit, M. C., Gincel, E., Simorre, J. P., Cornet, B., Gallet, X., Caille, A., Labbe,
H., Vovelle, F. & Ptak, M., 1992. Progress in multidimensional NMR investigations of peptide and protein
3-D structures in solution. From structure to functional aspects. Biochimie, 74(9-10), pp. 825-836.
Bosch, E. B. & Roses, M., 1992. Relationships between ET Polarity and Composition in Binary Solvent
Mixtures. Journal of chemical society, Faraday Transactions, 88(24), pp. 3541-3546.
Breil, C. B., Abert Vian, M., Zemb, T., Kunz, W. & Chemat, F., 2017. “Bligh and Dyer” and Folch Methods
for Solid–Liquid–Liquid Extraction of Lipids from Microorganisms. Comprehension of Solvatation
Stellenbosch University https://scholar.sun.ac.za

Page 147 of 173
Mechanisms and towards Substitution with Alternative Solvents. International Journal of molecular
sciences, 18(4), pp.708.
Breuer, P. L. & Jeffrey, M. I., 2004. The effect of ionic strength and buffer choice on the decomposition
of tetrathionate in alkaline solutions. Hydrometallurgy, 72(3), p. 335 – 338.
Canals, I., Oumada, F. Z., Roses, M. & Bosch, E., 2001. Retention of ionizable compounds on HPLC. 6. pH
measurements with the glass electrode in methanol–water mixtures. Journal of Chromatography A,
911(2), pp. 191–202.
Chen, C.-Y., Baker, S. C. & Darton, R., 2006. Batch production of biosurfactant with foam fractionation.
Journal of Chemical Technology and Biotechnology, 81(12), pp. 1923-1931.
Chen, H.-L., Chen, Y.-S. & Juang, R.-S., 2007. Separation of surfactin from fermentation broths by acid
precipitation and two-stage dead-end ultrafiltration processes. Journal of Membrane Science, 299(1) pp.
114-121.
Chen, H.-L., Chen, Y.-S. & Juang, R.-S., 2008a. Flux decline and membrane cleaning in cross-flow
ultrafiltration of treated fermentation broths for surfactin recovery. Separation and Purification
Technology, 62(1), pp. 47-55.
Chen, H.-L., Chen, Y.-S. & Juang, R.-S., 2008b. Recovery of surfactin from fermentation broths by a hybrid
salting-out and membrane filtration process. Separation and Purification Technology, 59(3), pp. 244-252.
Chen, H.-L. & Juang, R.-S., 2008a. Extraction of surfactin from fermentation broth with n-hexane in
microporous PVDF hollow fibers: Significance of membrane adsorption. Journal of membrane science,
325(2), pp. 599-604.
Chen, H.-L. & Juang, R.-S., 2008b. Recovery and separation of surfactin from pretreated fermentation
broths by physical and chemical extraction. Biochemical Engineering Journal, 38(1), pp. 39-46.
Chen, H.-L., Lee, Y.-S., Wei, Y.-H. & Juang, R.-S., 2008c. Purification of surfactin in pretreated
fermentation broths by adsorptive removal of impurities. Biochemical Engineering Journal, 40(3), pp.
452-459.
Chen, H., Wang, L., Su, C. X., Gong, G. H., Wang, P. & Yu, Z. L., 2008d. Isolation and characterization of
lipopeptide antibiotics produced by Bacillus subtilis. Letters in Applied Microbiology, 47(3), pp. 180-186.
Stellenbosch University https://scholar.sun.ac.za

Page 148 of 173
Chtioui, O., Dimitrov, K., Gancel, F. & Nikov, 2010. Biosurfactants production by immobilized cells of
Bacillus subtilis ATCC 21332 and their recovery by pertraction. Process Biochemistry, 45(11), p. 1795–
1799.
Clarke, K. G., 2013. Bioprocess Engineering: An Introductory Engineering and Life Science Approach. UK
and USA: Woodhead Publishing Limited.
Cooper, D. G., Macdonald, C. R., Duff, S. J. & Kosaric, N., 1981. Enhanced Production of Surfactin from
Bacillus subtilis by Continuous Product Removal and Metal Cation Additions. Applied and environmental
microbiology, 42(3), pp. 408-412.
Czitrom, V., 1999. One-Factor-at-a-Time Versus Designed Experiments. The American Statistician, 53(2),
pp. 126-131.
Danov, K. D., Vlahovska, P.M., Horozov, T., Dushkin, C. D., Kralchevsky, P. A., Mehreteab, A. & Broze, G.,
1996. Adsorption from Micellar Surfactant Solutions: Nonlinear Theory and Experiment. Journal of
colloid and interface science, 183(1), pp. 223-235.
Das, P., Mukherjee, S. & Sen, R., 2008. Antimicrobial potential of a lipopeptide biosurfactant derived
from a marine Bacillus circulans. Journal of Applied Microbiology, 104(6), pp. 1675-1684.
Das, P., Mukherjee, S. & Sen, R., 2009. Biosurfactant of marine origin exhibiting heavy metal remediation
properties. Bioresource technology, 100(20), pp. 4887-4890.
Das, P., Yang, X.-P. & Ma, L. Z., 2014. Analysis of biosurfactants from industrially viable Pseudomonas
strain isolated from crude oil suggests how rhamnolipids congeners affect emulsification property and
antimicrobial activity. Frontiers in microbiology, 696(5), pp. 1-8.
Davis, D. A., Lynch, H. C. & Varley, J., 2001. The application of foaming for the recovery of Surfactin from
B. subtilis ATCC 21332 cultures. Enzyme and Microbial Technology, 28(4), pp. 346-354.
Davis, D. A., Lynch, L. C. & Varley, J., 1999. The production of Surfactin in batch culture by Bacillus
subtilis ATCC 21332 is strongly influenced by the conditions of nitrogen metabolism. Enzyme and
Microbial Technology , 25(3), p. 322–329.
de Faria, F. A., Stefani, D., Vaz, B. G., Silva, I. S., Garcia, J. S., Eberlin, M. N., Grossman, M. J., Alves, O. L. &
Durrant, L. R., 2011. Purification and structural characterization of fengycin homologues produced by
Bacillus subtilis LSFM-05 grown on raw glycerol. J Ind Microbiol Biotechnol, 38(7), pp. 863-871.
Stellenbosch University https://scholar.sun.ac.za
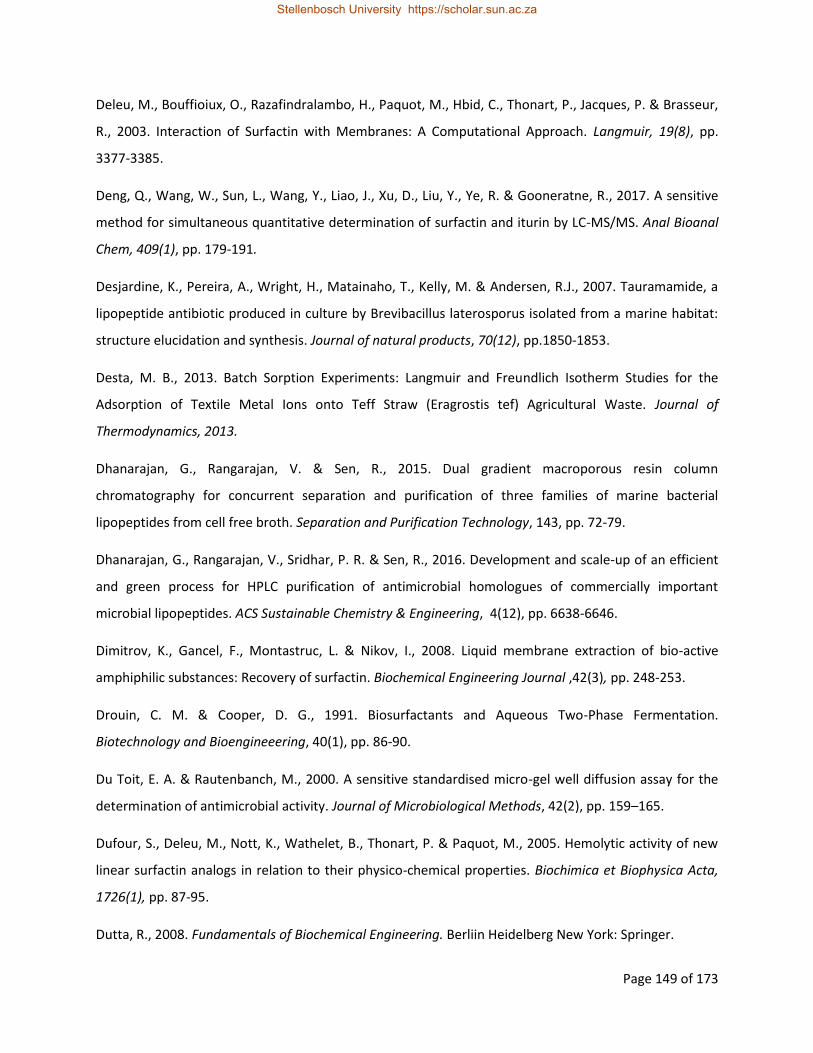
Page 149 of 173
Deleu, M., Bouffioiux, O., Razafindralambo, H., Paquot, M., Hbid, C., Thonart, P., Jacques, P. & Brasseur,
R., 2003. Interaction of Surfactin with Membranes: A Computational Approach. Langmuir, 19(8), pp.
3377-3385.
Deng, Q., Wang, W., Sun, L., Wang, Y., Liao, J., Xu, D., Liu, Y., Ye, R. & Gooneratne, R., 2017. A sensitive
method for simultaneous quantitative determination of surfactin and iturin by LC-MS/MS. Anal Bioanal
Chem, 409(1), pp. 179-191.
Desjardine, K., Pereira, A., Wright, H., Matainaho, T., Kelly, M. & Andersen, R.J., 2007. Tauramamide, a
lipopeptide antibiotic produced in culture by Brevibacillus laterosporus isolated from a marine habitat:
structure elucidation and synthesis. Journal of natural products, 70(12), pp.1850-1853.
Desta, M. B., 2013. Batch Sorption Experiments: Langmuir and Freundlich Isotherm Studies for the
Adsorption of Textile Metal Ions onto Teff Straw (Eragrostis tef) Agricultural Waste. Journal of
Thermodynamics, 2013.
Dhanarajan, G., Rangarajan, V. & Sen, R., 2015. Dual gradient macroporous resin column
chromatography for concurrent separation and purification of three families of marine bacterial
lipopeptides from cell free broth. Separation and Purification Technology, 143, pp. 72-79.
Dhanarajan, G., Rangarajan, V., Sridhar, P. R. & Sen, R., 2016. Development and scale-up of an efficient
and green process for HPLC purification of antimicrobial homologues of commercially important
microbial lipopeptides. ACS Sustainable Chemistry & Engineering, 4(12), pp. 6638-6646.
Dimitrov, K., Gancel, F., Montastruc, L. & Nikov, I., 2008. Liquid membrane extraction of bio-active
amphiphilic substances: Recovery of surfactin. Biochemical Engineering Journal ,42(3), pp. 248-253.
Drouin, C. M. & Cooper, D. G., 1991. Biosurfactants and Aqueous Two-Phase Fermentation.
Biotechnology and Bioengineeering, 40(1), pp. 86-90.
Du Toit, E. A. & Rautenbanch, M., 2000. A sensitive standardised micro-gel well diffusion assay for the
determination of antimicrobial activity. Journal of Microbiological Methods, 42(2), pp. 159–165.
Dufour, S., Deleu, M., Nott, K., Wathelet, B., Thonart, P. & Paquot, M., 2005. Hemolytic activity of new
linear surfactin analogs in relation to their physico-chemical properties. Biochimica et Biophysica Acta,
1726(1), pp. 87-95.
Dutta, R., 2008. Fundamentals of Biochemical Engineering. Berliin Heidelberg New York: Springer.
Stellenbosch University https://scholar.sun.ac.za
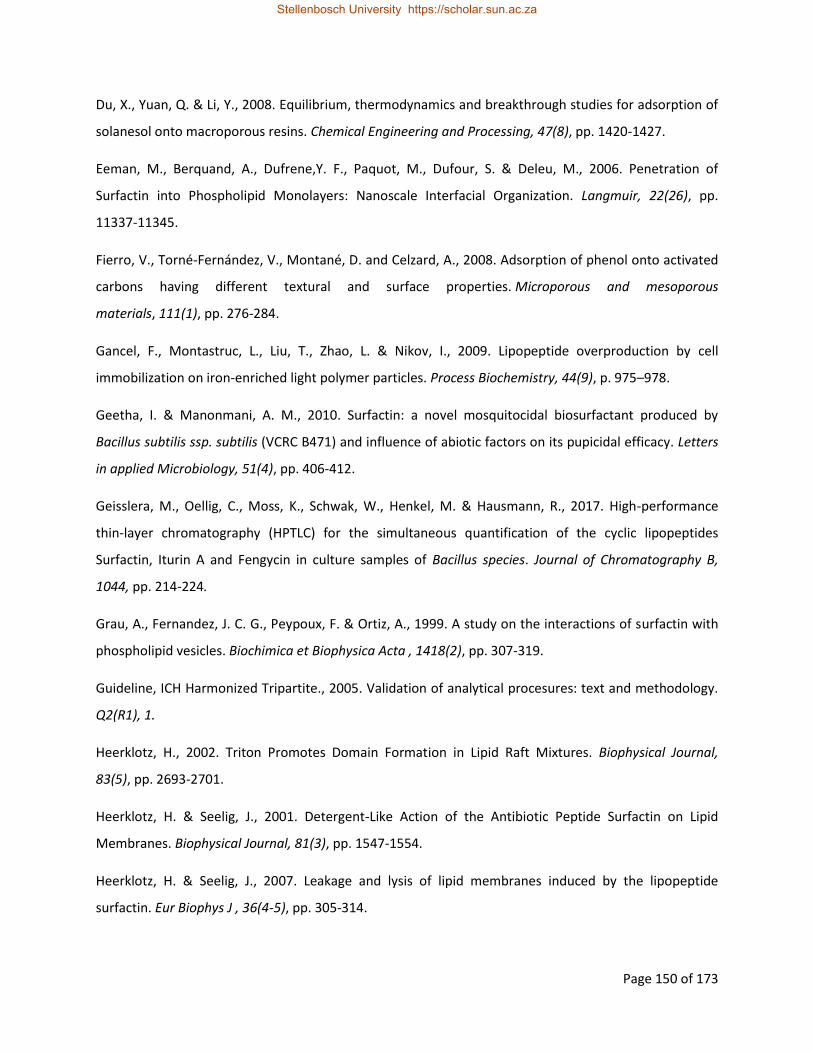
Page 150 of 173
Du, X., Yuan, Q. & Li, Y., 2008. Equilibrium, thermodynamics and breakthrough studies for adsorption of
solanesol onto macroporous resins. Chemical Engineering and Processing, 47(8), pp. 1420-1427.
Eeman, M., Berquand, A., Dufrene,Y. F., Paquot, M., Dufour, S. & Deleu, M., 2006. Penetration of
Surfactin into Phospholipid Monolayers: Nanoscale Interfacial Organization. Langmuir, 22(26), pp.
11337-11345.
Fierro, V., Torné-Fernández, V., Montané, D. and Celzard, A., 2008. Adsorption of phenol onto activated
carbons having different textural and surface properties. Microporous and mesoporous
materials, 111(1), pp. 276-284.
Gancel, F., Montastruc, L., Liu, T., Zhao, L. & Nikov, I., 2009. Lipopeptide overproduction by cell
immobilization on iron-enriched light polymer particles. Process Biochemistry, 44(9), p. 975–978.
Geetha, I. & Manonmani, A. M., 2010. Surfactin: a novel mosquitocidal biosurfactant produced by
Bacillus subtilis ssp. subtilis (VCRC B471) and influence of abiotic factors on its pupicidal efficacy. Letters
in applied Microbiology, 51(4), pp. 406-412.
Geisslera, M., Oellig, C., Moss, K., Schwak, W., Henkel, M. & Hausmann, R., 2017. High-performance
thin-layer chromatography (HPTLC) for the simultaneous quantification of the cyclic lipopeptides
Surfactin, Iturin A and Fengycin in culture samples of Bacillus species. Journal of Chromatography B,
1044, pp. 214-224.
Grau, A., Fernandez, J. C. G., Peypoux, F. & Ortiz, A., 1999. A study on the interactions of surfactin with
phospholipid vesicles. Biochimica et Biophysica Acta , 1418(2), pp. 307-319.
Guideline, ICH Harmonized Tripartite., 2005. Validation of analytical procesures: text and methodology.
Q2(R1), 1.
Heerklotz, H., 2002. Triton Promotes Domain Formation in Lipid Raft Mixtures. Biophysical Journal,
83(5), pp. 2693-2701.
Heerklotz, H. & Seelig, J., 2001. Detergent-Like Action of the Antibiotic Peptide Surfactin on Lipid
Membranes. Biophysical Journal, 81(3), pp. 1547-1554.
Heerklotz, H. & Seelig, J., 2007. Leakage and lysis of lipid membranes induced by the lipopeptide
surfactin. Eur Biophys J , 36(4-5), pp. 305-314.
Stellenbosch University https://scholar.sun.ac.za

Page 151 of 173
Heerklotz, H., Wieprecht, T. & Seelig, J., 2004. Membrane Perturbation by the Lipopeptide Surfactin and
Detergents as Studied by Deuterium NMR. Journal of Physical Chemistry, 108(15), pp. 4909-4915.
Heyd, M., Kohnert, T. H., Nusser, M., Kirschhofer, F., Brenner-Weiss, G., Franzreb, M. & Berensmeier, Sl.,
2008. Development and trends of biosurfactant analysis and purification using rhamnolipids as an
example. Anaytical and bioanaytical Chemistry, 391(5), p. 1579–1590.
Huang, X., Liu, J. N., Wang, Y., Liu, J. & Lu, L., 2015. The positive effects of Mn2+ on nitrogen use and
surfactin production by Bacillus subtilis ATCC 21332. Biotechnology & Biotechnological Equipment, 29(2),
pp. 381-389.
Isa, M. H. M., Coraglia, D. E., Frazier, R. A. & Jauregi, P., 2007. Recovery and purification of surfactin from
fermentation broth by a two-step ultrafiltration process. Journal of Membrane Science, 296(1), pp. 51–
57.
Isa, M. H. M., Frazier, R. A. & Jauregi, P., 2008. A further study of the recovery and purification of
surfactin from fermentation. Separation and Purification Technology, 64(2), pp. 176-182.
Isa, M. H. M., Frazier, R. & Jauregi, P., 2011. Surface Activity of Surfactin Recovered and Purified from
Fermentation Broth Using a Two-Step Ultrafiltration (Uf) Process. Sains Malaysiana, 40(9), pp. 1043–
1048.
Jacques, P., Hbid, C., Destain, J., Razafindralambo, H., Paquot, M., De Pauw, E. & Thonart, P., 1999.
Optimization of Biosurfactant Lipopeptide Production from Bacillus subtilis S499 by Plackett-Burman
Design. Applied Biochemistry and Biotechnology, 77(1-3), pp. 223-233.
Jauregi, P., Coutte, F., Catiau, L., Lecouturier, D. & Jacques, P., 2013. Micelle size characterization of
lipopeptides produced by B. subtilis and their recovery by the two-step ultrafiltration process.
Separation and purification technology, 104, pp. 175-182.
Jia, G. & Lu, X., 2008. Enrichment and purification of madecassoside and asiaticoside from Centella
asiatica extracts with macroporous resins. Journal of Chromatography A, 1193(1), pp. 136-141.
Jiang, J.Q., Cooper, C. and Ouki, S., 2002. Comparison of modified montmorillonite adsorbents: part I:
preparation, characterization and phenol adsorption. Chemosphere, 47(7), pp. 711-716.
Stellenbosch University https://scholar.sun.ac.za

Page 152 of 173
Jin, Q., Yue, J., Shan, L., Tao, G., Wang, X. & Qui, A., 2008. Process research of macroporous resin
chromotography for separation of N-(p-coumaroyl)serotonin and N-feruloylserotonin from Chinese
safflower seed extracts. Separation and Purification Technology, 62(2), pp. 370-375.
Juang, R. S., Chen, H. L. & Tsao, S. C., 2012. Recovery and separation of surfactin from pretreated
Bacillus subtilis broth by reverse micellar extraction. Biochemical Engineering Journal, 61, pp. 78-83.
Kameda, Y., Ouhira, S., Matsui, K., Kanatomo, S., Hase, T. & Atsusaka, T., 1974. Antitumour Activity of
Bacillus natto. V.1) Isolation and characterization of Surfactin in the Culture Medium of Bacillus natto
KMD 23112). Chem. Pharm. Bull, 4(22), pp. 938-944.
Kim, H. S., Yoon, B. D., Lee, C. H., Suh, H. H., Oh, H. M., Katsuragi, T. & Tani, Y., 1997. Production and
Properties of a Lipopeptide Biosurfactant from Bacillus subtilis C9. Journal of fermentation and
Bioengineering, 84(1), pp. 41-46.
Kim, P., Bai, H., Bai, D., Chae, H., Chung, S., Kim, Y., Park, R. & Chi, Y. T., 2004. Purification and
characterization of a lipopeptide produced by Bacillus thuringiensis CMB26. Journal of Applied
Microbiology, 97(5), pp. 942–949.
Korenblum, E., de Araujo, L. V., Guimaraes, C.R., De Souza, L. M., Sassaki, G., Abreu, F., Nitschke, M.,
Lins, U., Freire, D. M. G., Barreto-Bergter, E. & Seldin, L., 2012. Purification and characterization of a
surfactin-like molecule produced by Bacillus sp. H2O-1 and its antagonistic effect against sulfate
reducing bacteria. BMC Microbiology, 12(1), p. 252.
Kosaric, N. & Sukan, F.V. eds., 2014. Biosurfactants; Production and Utilization Processes, Technologies,
and Economics (Vol 159). CRC Press.
Kuyukina, M. S. & Ivshina, I. B., 2010. Rhodococcus Biosurfactants: Biosynthesis, Properties, and
Potential Applications. In Biology of Rhodococcus (pp. 291-313). Springer Berlin Heidelberg.
Liu, J.F., Mbadinga, S.M., Yang, S.Z., Gu, J.D. & Mu, B.Z., 2015. Chemical structure, property and
potential applications of biosurfactants produced by Bacillus subtilis in petroleum recovery and spill
mitigation. International journal of molecular sciences, 16(3), pp. 4814-4837
Lin, S. C. & Jiang, H. J., 1997. Recovery and purification of the lipopeptide biosurfactant of Bacillus
subtilis by ultrafiltration. Biotechnology Techniques, 11(6), pp. 413-416.
Stellenbosch University https://scholar.sun.ac.za

Page 153 of 173
Liu, T., Monstastruc, L., Gancel, F., Zhao, L., & Nikov, I., 2007. Integrated process for production of
surfactin Part 1: Adsorption rate of pure surfactin onto activated carbon. Biochemical Engineering
Journal, 35(3), pp. 333-340.
Liu, X., Ren, B., Gao, H., Liu, M., Dai, H., Song, F., Yu, Z., Wang, S., Hu, J., Kokare, C. R. & Zhang, L., 2012.
Optimization for the Production of Surfactin with a New Synergistic Antifungal Activity. PloS one, 7(5),
p.e34430.
Liu, X. Y., Yang, S. Z. & Mu, B.-Z., 2008. Isolation and characterization of a C12-lipopeptide produced by
Bacillus subtilis HSO 121. Journal of Peptide Science, 14(7), pp. 856-875.
Liu, Y. and Shen, L., 2008. From Langmuir kinetics to first-and second-order rate equations for
adsorption. Langmuir, 24(20), pp. 11625-11630.
Maget-Dana, R. & Ptak, M., 1995. Interactions of Surfactin with Membrane Models. Biophysical Journal,
68(5), pp. 1937-1943.
Makkar, R. S. & Cameotra, S. S., 1997. Biosurfactant production by a thermophilic Bacillus subtilis strain.
Journal of Industrial Microbiology & Biotechnology, 18(1), pp. 37–42.
Marshall, A. D. & Munro, P. A. T. G., 1993. The effect of protein fouling in microfiltration and
ultrafiltration on permeate flux, protein retention and selectivity : A literature review. Desalination,
91(1), pp. 65-108.
Miller, G. L., 1959. Use of Dinitrosalicylic Acid Reagent for Determination of Reducing Sugar. Anal. Chem,
31(3), pp. 426-428.
Ming, Z. W., Long, C. J., Cai, P. B., Xing, Z. Q. & Zhang, B., 2006. Synergistic adsorption of phenol from
aqueous solution onto polymeric adsorbents. Journal of Hazardous Materials B, 128(2), pp. 123–129.
Montastruc, L., Liu, T., Gancel, F., Zhao, L. & Nikov, I., 2008. Integrated process for production of
surfactin Part 2. Equilibrium and kinetic study of surfactin adsorption onto activated carbon. Biochemical
Engineering Journal, 38(3), pp. 349-354.
Moran, A. C., Martınez, A. M. & Siñeriz, F., 2002. Quantification of surfactin in culture supernatants by
hemolytic activity. Biotechnology Letters, 24(3), pp. 177–180.
Stellenbosch University https://scholar.sun.ac.za

Page 154 of 173
Mubarak, M. Q. E., Isa, M. H. M. & Hassan, A. R., 2014. Single-step Cross-flow Ultrafiltration for Recovery
and Purification of Surfactin Produced by Bacillus subtilis ATCC 21332. International Conference on
Chemical, Environment & Biological Sciences, pp. 44-49.
Mukherjee, S. D. ,. P., Sivapathasekaran, C. & Sen, R., 2008. Enhanced production of biosurfactant by a
marine bacterium on statistical screening of nutritional parameters. Biochemical Engineering Journal ,
42(3), p. 254–260.
Mukherjee, S., Das, P., Sivapathasekaran, C. & Sen, R., 2009. Antimicrobial biosurfactants from marine
Bacillus circulans: extracellular synthesis and purification. Letters in Applied Microbiology, 48(3), pp. 281-
288.
Nazari, M., Kurdi, M. & Heerklotz, H., 2012. Classifying Surfactants with Respect to Their Effect on Lipid
Membrane Order. Biophysical Journal Volume, 102(3), pp. 498-506.
Noah, K. S., Fox, S. L., Bruhn, D. F., Thompson, D. N. & Bala, G. A., 2002. Development of Continuous
Surfactin Production from Potato Process Effluent by Bacillus subtilis in an Airlift Reactor. In
Biotechnology for Fuels and Chemicals (pp. 803-818). Humana Press.
Ohno, A., Ano, T. & Shoda, M., 1995. Effect of Temperature on Production of Lipopeptide Antibiotics,
Iturin A and Surfactin by a Dual Producer, Bacillus subtilis RB14, in Solid-State Fermentation. Journal of
fermentation and bioengineering, 80(5), pp. 517-519.
Ostroumova, O. S., Malev, V. V., Llin, M. G. & Schagina, L. V., 2010. Surfactin Activity Depends on the
Membrane Dipole Potential. Langmuir, 26(19), pp. 15092–15097.
Pretorius, D., Van Rooyen, J. & Clarke, K. G., 2015. Enhanced production of antifungal lipopeptides by
Bacillus amyloliquefaciens for biocontrol of postharvest disease. New Biotechnology, 32(2), pp. 243-252.
Plazinski, W., Dziuba, J. & Rudzinski, W., 2013. Modeling of sorption kinetics: the pseudo-second order
equation and the sorbate intraparticle diffusivity. Adsorption, 19(5), pp. 1055-1064.
Rangarajan, V. & Clarke, K. G., 2016. Process development and intensification for enhanced production
of Bacillus lipopeptides. Biotechnology and Genetic Engineering Reviews, 31(1-2), pp. 46-68.
Rangarajan, V. & Clarke, K. G., 2016. Towards bacterial lipopeptide products for specific applications- a
review of appropriate downstream processing schemes. Process Biochemistry, 51(12), pp. 2176-2185.
Stellenbosch University https://scholar.sun.ac.za
Page 155 of 173
Ratkowsky, D. A., Olley, J., McMeekin, T. A. & Ball, A., 1982. Relationship Between Temperature and
Growth Rate of Bacterial Cultures. Journal of Bacteriology, 149(1), pp. 1-5.
Razafindralambo, H., Paquot, M., Hbid, C., Jacques, P., Destain, J., 1993. Purification of antifungal
lipopeptides by reversed-phase high-performance liquid chromatography. Journal of Chromatography,
639(1), pp. 81-85.
Ripp, J., 1996. Analytical detection limit guidance & Laboratory Guide for Determining Method Detection
Limits. Wisconsin Department of Natural Resources (p. 24). PUBL-TS-056-96 Laboratory Certification
Program.
Sandoval, N., Grau, S., Sorli, L., Montero, M., Esteve, E., & Horcajada, J. P., 2015. Clinical experience with
the use of daptomycin in a tertiary care teaching hospital in Barcelona, Spain. Future microbiology,
10(7), pp. 1145-1154
Sang-Cheol, L., Kim, S. H., Park, I. H., Chung, S. Y., Chandra, M. S., & Yong-Lark, C., 2010. Isolation,
Purification, and Characterization of Novel Fengycin S from Bacillus amyloliquefaciens LSC04 Degrading-
Crude Oil. Biotechnology and Bioprocess Engineering, 15(2), pp. 246-253.
Sen, R. & Swaminathan, T., 2005. Characterization of concentration and purification parameters and
operating conditions for the small-scale recovery of surfactin. Process Biochemistry, 40(9), pp. 2593-
2598.
Shen, H. H., Thomas, R. K., Penfold, J. & Fragneto, G., 2010. Destruction and Solubilization of Supported
Phospholipid Bilayers on Silica by the Biosurfactant Surfactin. Langmuir, 26(10), pp. 7334-7342.
Shen, H.-H., Thomas, R. K. & Taylor, P., 2010. The Location of the Biosurfactant Surfactin in Phospholipid
Bilayers Supported on Silica Using Neutron Reflectometry. Langmuir, 26(1), pp. 320-327.
Sheppard, J. D., Jumarie, C., Cooper, D. G. & Laprade, R., 1991. Ionic channels induced by surfactin in
planar lipid bilayer membranes. Biochimica et Biophysica Acta, 1064(1), pp. 13-23.
Simonin, J.P., 2016. On the comparison of pseudo-first order and pseudo-second order rate laws in the
modeling of adsorption kinetics. Chemical Engineering Journal, 300, pp.254-263.
Sivapathasekaran, C., Das, P., Mukherjee, S., Saravanakumar, J., Mandal, M. & Sen, R., 2010. Marine
Bacterium Derived Lipopeptides: Characterization and Cytotoxic Activity Against Cancer Cell Lines.
International Journal of Peptide Research and Therapeutics, 16(4), pp. 215–222.
Stellenbosch University https://scholar.sun.ac.za

Page 156 of 173
Sivapathasekaran, C., Mukherjee, S., Samanta, R. & Sen, R., 2009. High-performance liquid
chromatography purification of biosurfactant isoforms produced by a marine bacterium. Analytical and
Bioanalytical Chemistry , 395(3), p. 845–854.
Smallwood, I. M., 2012. Handbook of organic solvent properties. Butterworth-Heinemann.
Snook, M. E., Mitchell, T., Hinton, D. M. & Bacon, C. W., 2009. Isolation and Characterization of Leu7-
Surfactin from the Endophytic Bacterium Bacillus mojavensis RRC 101, a Biocontrol Agent for Fusarium
verticillioides. Journal of agricultural and food chemistry., 57(10), p. 4287–4292.
Stevenson, P. & Li, X., 2014. Foam Fractionation: Principles and Process Design. CRC press.
Toure, Y., Ongena, M. A. R. C., Jacques, P., Guiro, A. & Thonart, P., 2004. Role of lipopeptides produced
by Bacillus subtilis GA1 in the reduction of grey mould disease caused by Botrytis cinerea on apple.
Journal of Applied Microbiology , 96(5), pp. 1151–1160.
Tsukagoshi, N., Tamura, G. & Arima, K., 1970. A novel protoplast-bursting factor (surfactin) obtained
from Bacillus subtilis IAM 1213: II. The interaction of surfactin with bacterial membranes and lipids.
BIioichimica et Biophysica Acta (BBA)-Biomembranes, 196(2), pp. 211-214.
United Nations Office on Drugs, Crime. Laboratory, and Scientific Section, 2009. Guidance for the
Validation of Analytical Methodology and Calibration of Equipment used for Testing Illicit Drugs Siezed
Materials and Biological Specimens: A Commitment to Quality and Continuous Improvement. United
Nations Publications
Vanittanakom, N., Loeffler, W., Koch, U. & Jung, G., 1986. Fengycin- A novel antifungal lipopeptide
antibiotic produced by Bacillus subtilis F-29-3. Journal of antibiotics, 39(7), pp. 888-901.
Verseput, R., 2001. Digging into DOE: Selecting the right central composite design for response surface
methodology applications. Quality Digest, 21(6), pp. 33-36.
Vollenbroich, D., Ozel, M., Vater, J., Kamp, R. M. & Pauli, G., 1997. Mechanism of Inactivation of
Enveloped Viruses by the Biosurfactant Surfactin from Bacillus subtilis. Biologicals, 25(3), pp. 289–297.
Vollenbroich, D., Pauli, G., Ozel, M. & Vater, J., 1997. Antimycoplasma Properties and Application in Cell
Culture of Surfactin, a Lipopeptide Antibiotic from Bacillus subtilis. Applied and environmental
microbiology, 63(1), pp. 44-49.
Walsh, G., 2014. Proteins: Biochemistry and Biotechnology. Johh Wiley & Sons.
Stellenbosch University https://scholar.sun.ac.za

Page 157 of 173
Wang, S., Jin, X., Bu, Q., Zhou, X. & Wu, F., 2006. Effects of particle size, organic matter and ionic
strength on the phosphate sorption in different trophic lake sediments. Journal of Hazardous Materials ,
128(2), pp. 95–105.
Wang, Y., Lu, Z. & Bie, X., 2010. Separation and extraction of antimicrobial lipopeptides produced by
Bacillus amyloliquefaciens ES-2 with macroporous resin. European Food Research Technology, (231), pp.
189-196.
Wei, Y. H. & Chu, I.-M., 2002. Mn2+ improves surfactin production by Bacillus subtilis. Biotechnology
Letters, 24(6), pp. 479-482.
Wei, Y. H., Lai, C.-C. & Chang, J.-S., 2007. Using Taguchi experimental design methods to optimize trace
element composition for enhanced surfactin production by Bacillus subtilis ATCC 21332. Process
Biochemistry, 42(1), pp. 40-45.
Wei, Y. H., Wang, L.-F. & Chang, J.-S., 2004. Optimizing Iron Supplement Strategies for Enhanced
Surfactin Production with Bacillus subtilis. Biotechnology Progress, 20(3), pp. 979-983.
Wiczling, P. & Kaliszan, R., 2010. pH Gradient as a Tool for the Separation of Ionizable Analytes in
Reversed-Phase High-Performance Chromatography. Analytical Chemistry, 82(2), pp. 3692–3698.
World Health Organization, 2016. Global tuberculosis report 2016
Wu, C.H., 2007. Adsorption of reactive dye onto carbon nanotubes: equilibrium, kinetics and
thermodynamics. Journal of hazardous materials, 144(1), pp. 93-100.
Yang, H., Li, X., Huimin, X. L. & Shen, Z., 2015. Identification of lipopeptide isoforms by MALDI-TOF-
MS/MS based on the simultaneous purification of iturin, fengycin,and surfactin by RP-HPLC. Analytical
and Bioanalytical Chemistry, 407(9), pp. 2529–2542.
Yeh, M. S., Wei, Y. H. & Chang, J. S., 2006. Bioreactor design for enhanced carrier-assisted surfactin
production with Bacillus subtilis. Process Biochemistry, 41(8), pp. 1799–1805.
Yuan, J., Raza, W., Huang, Q. & Shen, Q., 2012. The ultrasound-assisted extraction and identification of
antifungal substances from B. amyloliquefaciens strain NJN-6 suppressing Fusarium oxysporum. Journal
of Basic Microbiology, 52(6), pp. 721-730.
Zhang, B., Yang, R., Zhao, Y. & Liu, C. Z., 2008. Separation of chlorogenic acid from honeysuckle crude
extracts by macroporous resins. Journal of Chromatography B, 867(2), pp. 253-258.
Stellenbosch University https://scholar.sun.ac.za

Page 158 of 173
Zhao, Y., Yang, S.Z. and Mu, B.Z., 2013. Kinetic modeling of esterification reaction of surfactin-C15 in
methanol solution. Applied biochemistry and biotechnology, 169(1), pp.327-337.
Stellenbosch University https://scholar.sun.ac.za
Page 159 of 173
8 Appendix
8.1 Lipopeptide analysis
This section provides HPLC chromatograms for surfactin, iturin and fengycin. These are shown in Figure
8-1 to Figure 8-3.
Figure 8-1: Surfactin HPLC chromatogram
Figure 8-2: Fengycin HPLC chromatogram
48.0 55.0 60.0 65.0 70.0 75.0 80.0 85.0 90.0 98.0-70.0
-40.0
-20.0
10.0 Bagcinele 07_032016 #12 [modified by jvanrooyen]STD 0.05g/L SurfactinsmAU
min
2 - 68.9133 - Surfactin 1 - 69.843
4 - Surfactin 2 - 73.807
5 - Surfactin 3 - 79.823
6 - Surfactin 4 - 81.307
7 - Surfactin 5 & 6 - 86.995
WVL:210 nm
Stellenbosch University https://scholar.sun.ac.za

Page 160 of 173
Figure 8-3: Iturin HPLC chromatogram
8.2 Solvent extraction
This section details how solvent polarities were determined in the solvent extractions study as well as
boiling points of solvents used in solvent extraction studies. The solvent polarities were obtained from
Bosch & Roses (1992) and Smallwood (2012), which use the ET polarity scale. The polarity of solvent
mixtures was determined using Equation 8-1, where PISM is the polarity index of the solvent mixture. xSA,
xSB, PISA and PISB the compositions and polarities of the solvents being mixed respectively, denoted as
solvent A and solvent B.
𝑃𝐼𝑆𝑀 = 𝑥𝑆𝐴𝑃𝐼𝑆𝐴 + 𝑥𝑆𝐵𝑃𝐼𝑆𝐵 Equation 8-1
The boiling points of solvents used in solvent extraction studies are shown in Table 8-1.
Stellenbosch University https://scholar.sun.ac.za

Page 161 of 173
Table 8-1: Boiling points of solvents used in solvent extraction studies
Solvents Boiling points (°C)
methanol 64
I-propanol 82
chloroform: methanol (1:1) 54
Acetonitrile 81.6
chloroform: methanol (2:1) 53.5
Acetone 56
Chloroform 61
Ethyl acetate 77
MTBE 55
N-Hexane 69
Petroleum ether 36
8.3 Adsorption
8.3.1 Effect of methanol addition on pH measurement and volume of adsorption liquid
The pH can be measured in water as well as in water-methanol solutions. The presence of methanol in
aqueous solutions is different from the pH of aqueous solutions without methanol. The difference
between the pH obtained from water and methanol-water solutions can be defined as delta (δ). δ
changes with the methanol concentration in water according to Equation 8-2 and Figure 8-4. In this
equation, υ is the methanol volume fraction in methanol-water solutions. From Figure 8-4, it can be
seen that the δ is insignificant for methanol concentrations below 30%.
𝛿 =0.09𝜐−0.11𝜐2
1−3.15𝜐+3.51𝜐2−1.35𝜐3 Equation 8-2
Stellenbosch University https://scholar.sun.ac.za

Page 162 of 173
Figure 8-4: Difference between pH measured in water and pH measured in methanol-water solutions resulting from methanol addition in water
When methanol is added to aqueous mixtures, the sum of the volumes of methanol and aqueous
solution is less than the final volume of the aqueous-methanol mixture. The difference is known as the
volume contraction. The relationship between the volume contraction and the final methanol
concentration in the aqueous phase is shown in Figure 8-5. At 30% (v/v) methanol, the volume
contraction is approximately 2.4%. The surfactin and resin concentrations are therefore expected to be
slightly higher than the actual concentrations in solutions with methanol compared to solutions without
methanol. However, the volume contraction was not taken into account as surfactin is dependent on
the resin concentration to surfactin concentration ratio is maintained despite the volume contraction.
Additionally, a volume contraction of 2.4% will result in a negligible error in the concentrations.
-2.5
-2
-1.5
-1
-0.5
0
0.5
0 0.2 0.4 0.6 0.8 1 1.2
δ
Methanol volume fraction
Stellenbosch University https://scholar.sun.ac.za

Page 163 of 173
Figure 8-5: Volume contraction due to addition of methanol in water
8.3.2 Surfactin adsorption preliminary studies
Preliminary tests were carried out to determine if equilibrium was reached after 24 h during adsorption.
The adsorption was carried out for 24 h. This was based on the study by Dhanarajan et al. (2015), who
found that HP-20 resins were saturated with lipopeptides after 8 h during adsorption. Prior to
adsorption studies, it was tested if equilibrium will be reached within 24 h. This was done by carrying
out adsorption at a resin concentration and surfactin concentration of 0.4 gr/L and 20 gs/L. The
temperature and pH were 45 °C and 11 respectively. This study was done in an incubator (labcon, 150
rpm, 48 h) using 100 mL non-baffled shake flasks and 25 mL of the adsorption liquid. The results (Figure
8-6) showed that equilibrium was reached after 24 h.
y = -14.142x3 + 6.9516x2 + 7.1936x + 0.0041
0
0.5
1
1.5
2
2.5
3
3.5
4
0.0 0.1 0.2 0.3 0.4 0.5 0.6 0.7 0.8 0.9 1.0
% C
on
trac
tio
n o
f vo
lum
e
Methanol volume fraction
Stellenbosch University https://scholar.sun.ac.za

Page 164 of 173
Figure 8-6: Change in % SA during adsorption (error bars are not shown as experimental repeatability was not studied)
Preliminary studies were also done to determine if surfactin adsorption is dependent on RC/SC ratio or
on resin concentration and surfactin concentration independently. These studies were done at resin
concentrations of 5.5 g/L and 11 g/L, while maintaining the RC/SC ratio at 40 gr/gs. The initial pH and
operating temperature were held constant at 11.5 and 45 °C respectively, and the experiments wer
carried out in an incubator (Labcon, 150 rpm, 24 h). The results are shown in Figure 8-7. The two means
in Figure 8-7 were compared using a single factor ANOVA, which showed that they were similar at a 95%
confidence interval.
Figure 8-7: Plot to show that surfactin concentration is dependent on RC/SC ratio rather than surfactin concentration and resin concentration independently, by comparing the % SA at different resin concentrations at an RC/SC ratio of 40 gr/gs. The error bars indicate the standard deviation of two replicates
0
10
20
30
40
50
60
70
80
90
100
0 10 20 30 40 50
% S
A
Time (h)
0
20
40
60
80
100
120
5.5 11
% S
A
Resin concenration (g/L)
Stellenbosch University https://scholar.sun.ac.za

Page 165 of 173
8.3.3 Equilibrium pH, % SA and IS surface after adsorption
Equilibrium pH surface plots 8.3.3.1
This section shows the change in equilibrium pH obtained after adsorption experimental runs. The
equilibrium pH for studies at 0% (v/v) methanol is shown in Figure 8-8 to Figure 8-10, while equilibrium
pH for studies in the presence of methanol is shown in Figure 8-11 to Figure 8-13
Figure 8-8: Equilibrium pH obtained after surfactin adsorption in the absence of methanol at an initial pH of 6.5
Figure 8-9: Equilibrium pH obtained after surfactin adsorption in the absence of methanol at an initial pH of 9
Stellenbosch University https://scholar.sun.ac.za
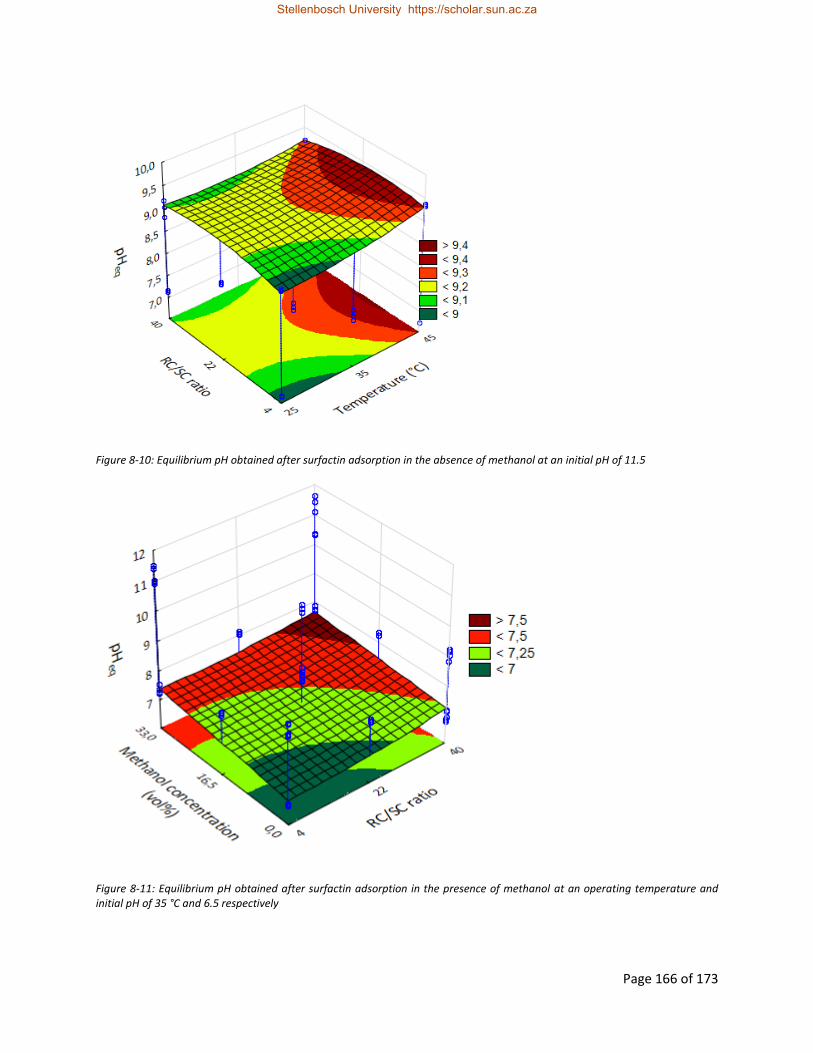
Page 166 of 173
Figure 8-10: Equilibrium pH obtained after surfactin adsorption in the absence of methanol at an initial pH of 11.5
Figure 8-11: Equilibrium pH obtained after surfactin adsorption in the presence of methanol at an operating temperature and initial pH of 35 °C and 6.5 respectively
Stellenbosch University https://scholar.sun.ac.za

Page 167 of 173
Figure 8-12: Equilibrium pH obtained after surfactin adsorption in the presence of methanol at an operating temperature and initial pH of 35 °C and 9 respectively
Figure 8-13: Equilibrium pH obtained after surfactin adsorption in the presence of methanol at an operating temperature and initial pH of 35 °C and 11.5 respectively
% SA surface plots 8.3.3.2
This section shows the change in % SA obtained after adsorption experimental runs. These are shown
through surface plots (Figure 8-14 to Figure 8-19)
Stellenbosch University https://scholar.sun.ac.za

Page 168 of 173
Figure 8-14: % SA obtained after surfactin adsorption in the absence of methanol at an RC/SC ratio of 4 gr/gs
Figure 8-15: % SA obtained after surfactin adsorption in the absence of methanol at an RC/SC ratio of 22 gr/gs
Stellenbosch University https://scholar.sun.ac.za

Page 169 of 173
Figure 8-16: % SA obtained after surfactin adsorption in the absence of methanol at an RC/SC ratio of 40 gr/gs
Figure 8-17: % SA obtained after surfactin adsorption in the absence of methanol at an operating temperature of 25 °C
Stellenbosch University https://scholar.sun.ac.za

Page 170 of 173
Figure 8-18: % SA obtained after surfactin adsorption in the absence of methanol at an operating temperature of 35 °C
Figure 8-19: % SA obtained after surfactin adsorption in the absence of methanol at an operating temperature of 45 °C
Stellenbosch University https://scholar.sun.ac.za

Page 171 of 173
Improvement in selectivity surface plots 8.3.3.3
This section shows the change in IS obtained after adsorption experimental runs. These are shown
through surface plots (Figure 8-20 to Figure 8-25)
Figure 8-20: IS obtained after surfactin adsorption in the absence of methanol at an RC/SC ratio of 4 gr/gs
Figure 8-21: IS obtained after surfactin adsorption in the absence of methanol at an RC/SC ratio of 22 gr/gs
Stellenbosch University https://scholar.sun.ac.za

Page 172 of 173
Figure 8-22: IS obtained after surfactin adsorption in the absence of methanol at an RC/SC ratio of 40 gr/gs
Figure 8-23: IS obtained after surfactin adsorption in the absence of methanol at an initial pH of 6.5
Stellenbosch University https://scholar.sun.ac.za

Page 173 of 173
Figure 8-24: IS obtained after surfactin adsorption in the absence of methanol at an initial pH of 9
Figure 8-25: IS obtained after surfactin adsorption in the absence of methanol at an initial pH of 11.5
Stellenbosch University https://scholar.sun.ac.za