dot/faa/ar-96/10 the role of fretting fatigue the role of fretting fatigue on aircraft rivet hole...
TRANSCRIPT
DOT/FAA/AR-96/10
Office of Aviation Research Washington, D.C. 20591
The Role of Fretting Fatigue on Aircraft Rivet Hole Cracking
DETCI October 1996
Final Report
^ttomD*
This document is available to the U.S. public through the National Technical Information Service, Springfield, Virginia 22161.
19961230 042
© U.S. Department of Transportation Federal Aviation Administration
NOTICE
This document is disseminated under the sponsorship of the U.S. Department of Transportation in the interest of information exchange. The United States Government assumes no liability for the contents or use thereof. The United States Government does not endorse products or manufacturers. Trade or manufacturer's names appear herein solely because they are considered essential to the objective of this report.
Technical Report Documentation Page
1. Report No.
DOT/FAA/AR-96/10
2. Government Accession No.
4. Title and Subtitle
THE ROLE OF FRETTING FATIGUE ON AIRCRAFT RIVET HOLE CRACKING
7. Author(s)
David W. Heoppner, P.E., Ph.D., Charles B. Elliot III, P.E., Ph.D., and Mark W. Moesser, Ph.D.
9. Performing Organization Name and Address
Quality and Integrity Design Engineering Center (QEDEC) Department of Mechanical Engineering University of Utah 3209 Merrill Engineering Center Salt Lake City, UT 84112
12. Sponsoring Agency Name and Address
U.S. Department of Transportation Federal Aviation Administration Office of Aviation Research Washington, DC 20591
3. Recipient's Catalog No.
5. Report Date
October 1996 6. Performing Organization Code
8. Performing Organization Report No.
10. Work Unit No. (TR AIS)
11. Contract or Grant No.
93-G-068
13. Type of Report and Period Covered
Final Report
14. Sponsoring Agency Code
AAR-430
15. Supplementary Notes
The FAA William J. Hughes Technical Center COTR is Thomas Flournoy, AAR-430.
16. Abstract
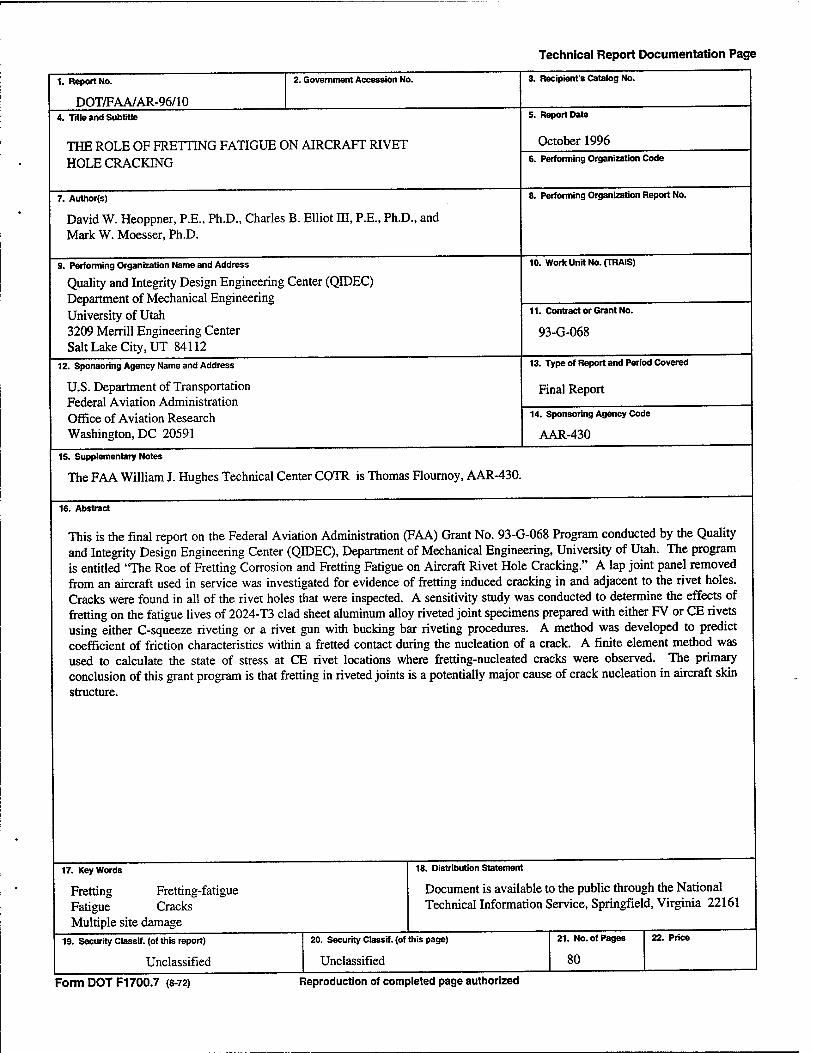
This is the final report on the Federal Aviation Administration (FAA) Grant No. 93-G-068 Program conducted by the Quality and Integrity Design Engineering Center (QIDEC), Department of Mechanical Engineering, University of Utah. The program is entitled "The Roe of Fretting Corrosion and Fretting Fatigue on Aircraft Rivet Hole Cracking." A lap joint panel removed from an aircraft used in service was investigated for evidence of fretting induced cracking in and adjacent to the rivet holes. Cracks were found in all of the rivet holes that were inspected. A sensitivity study was conducted to determine the effects of fretting on the fatigue lives of 2024-T3 clad sheet aluminum alloy riveted joint specimens prepared with either FV or CE rivets using either C-squeeze riveting or a rivet gun with bucking bar riveting procedures. A method was developed to predict coefficient of friction characteristics within a fretted contact during the nucleation of a crack. A finite element method was used to calculate the state of stress at CE rivet locations where fretting-nucleated cracks were observed. The primary conclusion of this grant program is that fretting in riveted joints is a potentially major cause of crack nucleation in aircraft skin structure.
17. Keywords
Fretting Fretting-fatigue Fatigue Cracks Multiple site damage
19. Security Classrf. (of this report)
Unclassified
18. Distribution Statement
Document is available to the public through the National Technical Information Service, Springfield, Virginia 22161
20. Security Classif. (of this page)
Unclassified
21. No. of Pages
80
22. Price
Form DOT F1700.7 (8-72) Reproduction of completed page authorized
ACKNOWLEDGMENTS
The authors express their gratitude to the Federal Aviation Administration for funding this work and especially to Dr. Thomas Flournoy for the excellent manner in which it was monitored.
The authors also are thankful for the efforts of Boeing Defense and Space Group, which provided the panel from a service aircraft which was inspected during this program.
The authors wish to acknowledge the considerable support provided by personnel from the Aviation Department of the Salt Lake Community College, especially Mr. Steve Mendiola. The Aviation Department teaches an aircraft maintenance program that leads to FAA airframe and power plant licensing. In preparation for the program QIDEC personnel were trained in riveting procedures by Mr. Mendiola. Additionally, Aviation Department equipment was used for all riveting. This support was provided gratis by the Aviation Department in the spirit of cooperation between Utah State agencies which have a sincere desire to help the FAA in its difficult job of ensuring the structural integrity of the aging aircraft fleet.
iii/iv

TABLE OF CONTENTS
Page
EXECUTIVE SUMMARY ix
1 INTRODUCTION 1
2 PROCEDURES 1
2.1 Inspection of a Lap Joint Panel From a Service Aircraft 1 2.2 Sensitivity Study 3 2.3 Prediction of Coefficient of Friction During Fretting 6 2.4 Riveted Joint Computer Simulation 11
3 RESULTS 15
3.1 Inspection of a Lap Joint Panel From a Service Aircraft 15 3.2 Sensitivity Study 19 3.3 Prediction of Coefficient of Friction During Fretting 27 3.4 Riveted Joint Computer Simulation 32
4 DISCUSSION 34
4.1 Inspection of a Lap Joint Panel From a Service Aircraft 34 4.2 Sensitivity Study 34 4.3 Prediction of Coefficient of Friction During Fretting 35 4.4 Riveted Joint Computer Simulation 35
5 CONCLUSIONS 36
5.1 Inspection of a Lap Joint Panel From a Service Aircraft 36 5.2 Sensitivity Study 36 5.3 Prediction of Coefficient of Friction During Fretting 36 5.4 Riveted Joint Computer Simulation 36
6 REFERENCES 37
APPENDICES
A—Plan for Fabrication, Fatigue Testing, and Examination of Riveted Joint Specimens (March 20,1995)
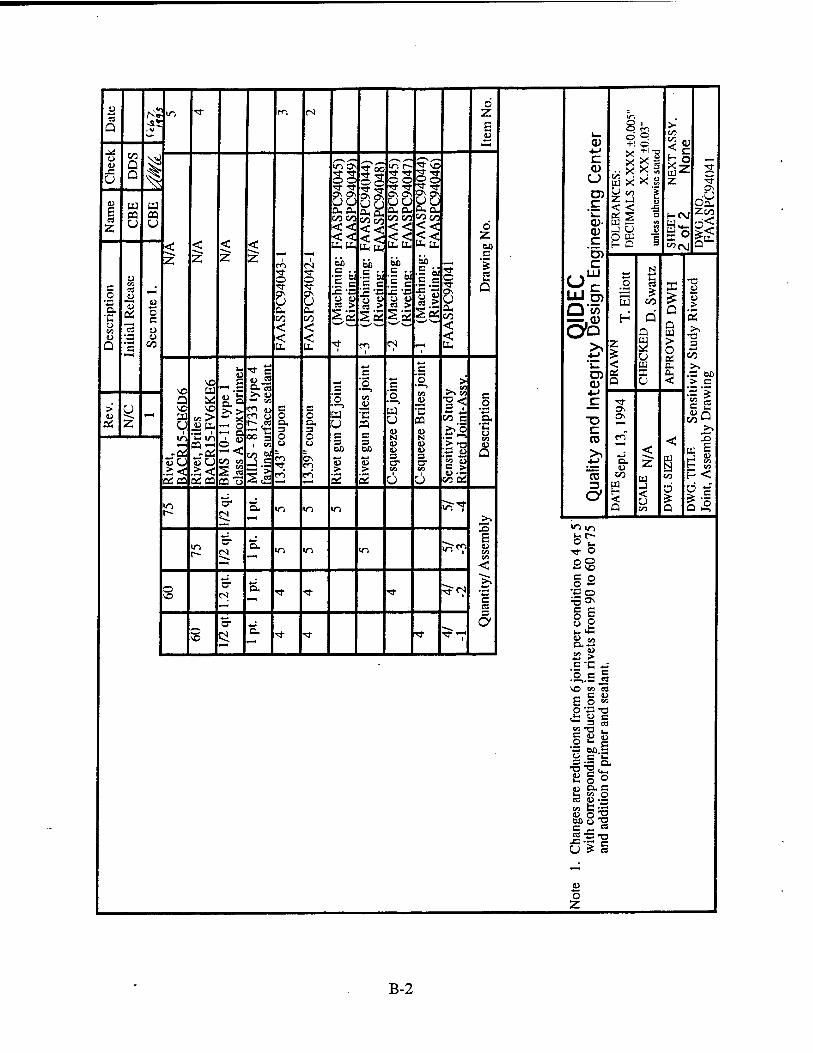
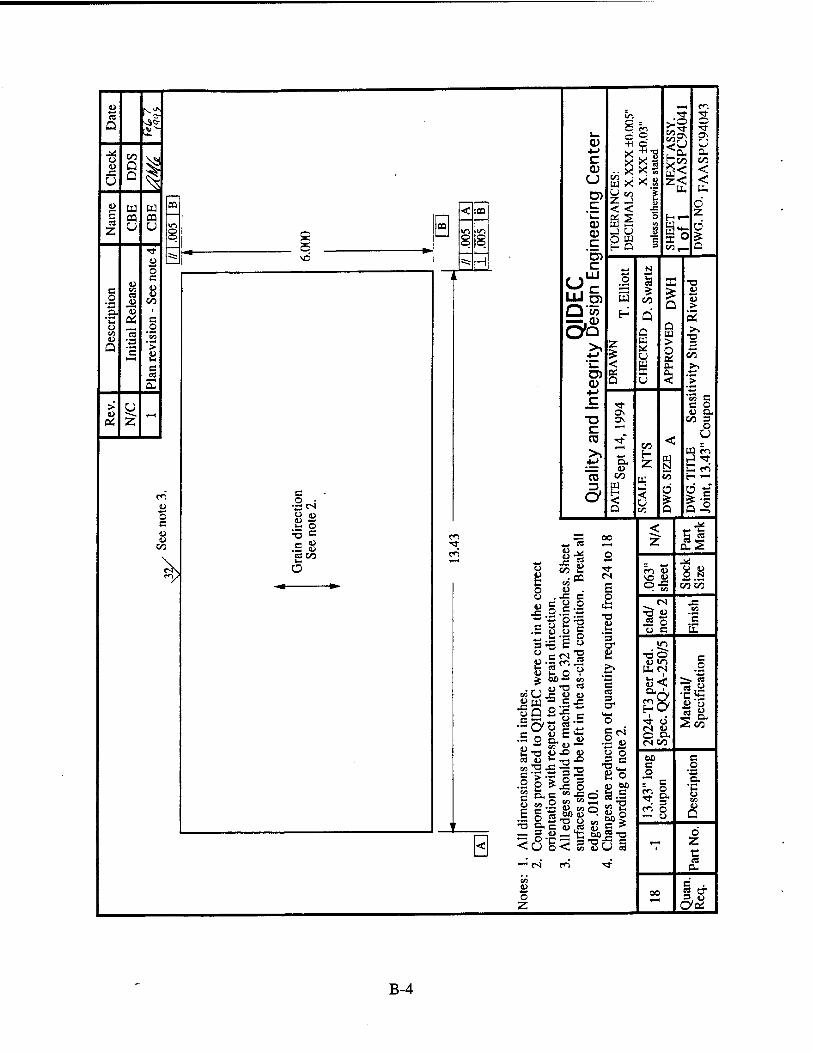
B—Fabrication Drawings for Sensitivity Study Specimens
C—Drawings of Antibending System
D—Plan for Fabrication, Fatigue Testing, and Examination of Riveted Joint Specimens (August 4,1995)
E—Data for Fabrication, Fatigue Testing, and Examination of Riveted Joint Specimens
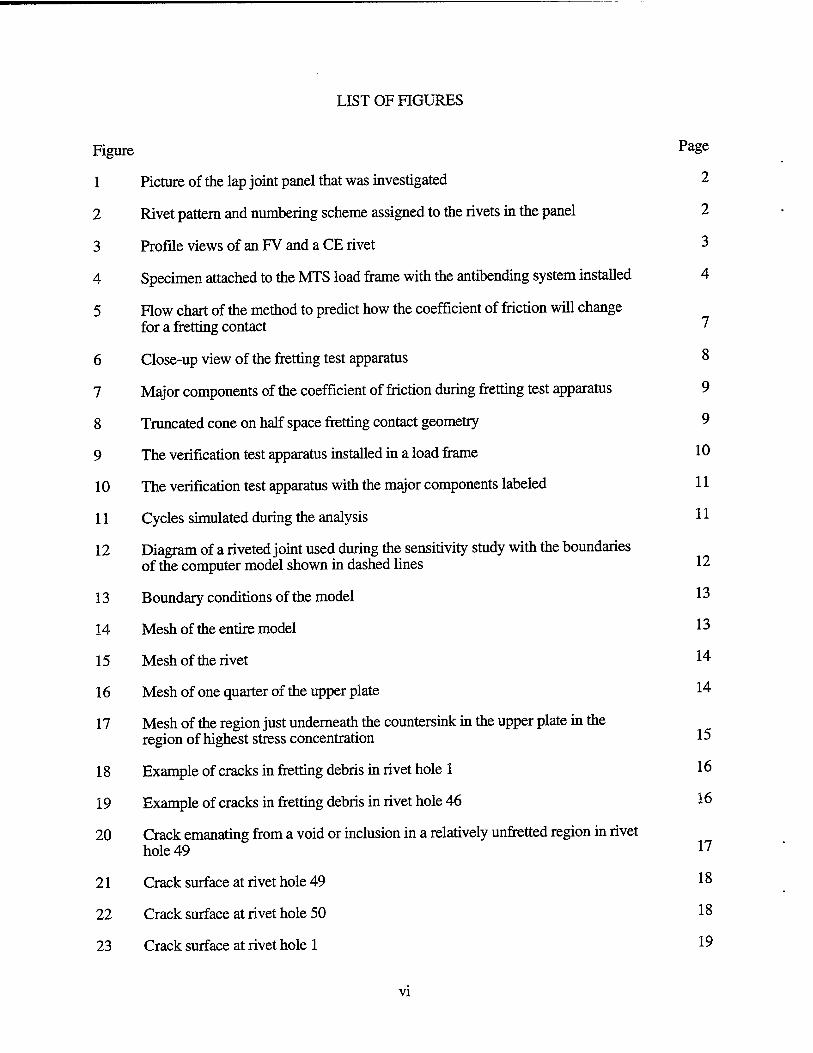
LIST OF FIGURES
Figure PaSe
1 Picture of the lap joint panel that was investigated 2
2 Rivet pattern and numbering scheme assigned to the rivets in the panel 2
3 Profile views of an FV and a CE rivet 3
4 Specimen attached to the MTS load frame with the antibending system installed 4
5 Row chart of the method to predict how the coefficient of friction will change for a fretting contact 7
6 Close-up view of the fretting test apparatus 8
7 Major components of the coefficient of friction during fretting test apparatus 9
8 Truncated cone on half space fretting contact geometry 9
9 The verification test apparatus installed in a load frame 10
10 The verification test apparatus with the major components labeled 11
11 Cycles simulated during the analysis 11
12 Diagram of a riveted joint used during the sensitivity study with the boundaries of the computer model shown in dashed lines 12
13 Boundary conditions of the model 13
14 Mesh of the entire model 13
15 Mesh of the rivet 14
16 Mesh of one quarter of the upper plate 14
17 Mesh of the region just underneath the countersink in the upper plate in the region of highest stress concentration 15
18 Example of cracks in fretting debris in rivet hole 1 16
19 Example of cracks in fretting debris in rivet hole 46 16
20 Crack emanating from a void or inclusion in a relatively unfretted region in rivet hole 49 n
21 Crack surface at rivet hole 49 18
22 Crack surface at rivet hole 50 18
23 Crack surface at rivet hole 1 19
VI
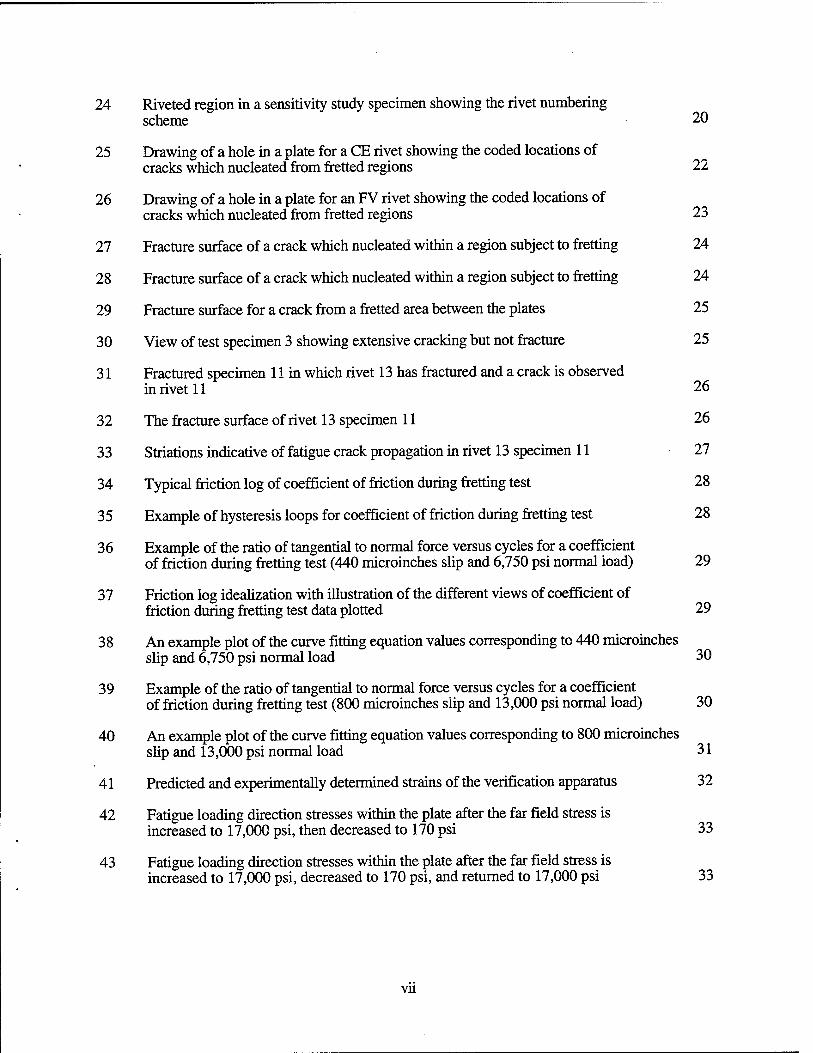
24 Riveted region in a sensitivity study specimen showing the rivet numbering scheme 20
25 Drawing of a hole in a plate for a CE rivet showing the coded locations of cracks which nucleated from fretted regions 22
26 Drawing of a hole in a plate for an FV rivet showing the coded locations of cracks which nucleated from fretted regions 23
27 Fracture surface of a crack which nucleated within a region subject to fretting 24
28 Fracture surface of a crack which nucleated within a region subject to fretting 24
29 Fracture surface for a crack from a fretted area between the plates 25
30 View of test specimen 3 showing extensive cracking but not fracture 25
31 Fractured specimen 11 in which rivet 13 has fractured and a crack is observed in rivet 11 26
32 The fracture surface of rivet 13 specimen 11 26
33 Striations indicative of fatigue crack propagation in rivet 13 specimen 11 27
34 Typical friction log of coefficient of friction during fretting test 28
35 Example of hysteresis loops for coefficient of friction during fretting test 28
36 Example of the ratio of tangential to normal force versus cycles for a coefficient of friction during fretting test (440 microinches slip and 6,750 psi normal load) 29
37 Friction log idealization with illustration of the different views of coefficient of friction during fretting test data plotted 29
38 An example plot of the curve fitting equation values corresponding to 440 microinches slip and 6,750 psi normal load 30
39 Example of the ratio of tangential to normal force versus cycles for a coefficient of friction during fretting test (800 microinches slip and 13,000 psi normal load) 30
40 An example plot of the curve fitting equation values corresponding to 800 microinches slip and 13,000 psi normal load 31
41 Predicted and experimentally determined strains of the verification apparatus 32
42 Fatigue loading direction stresses within the plate after the far field stress is increased to 17,000 psi, then decreased to 170 psi 33
43 Fatigue loading direction stresses within the plate after the far field stress is increased to 17,000 psi, decreased to 170 psi, and returned to 17,000 psi 33
vu
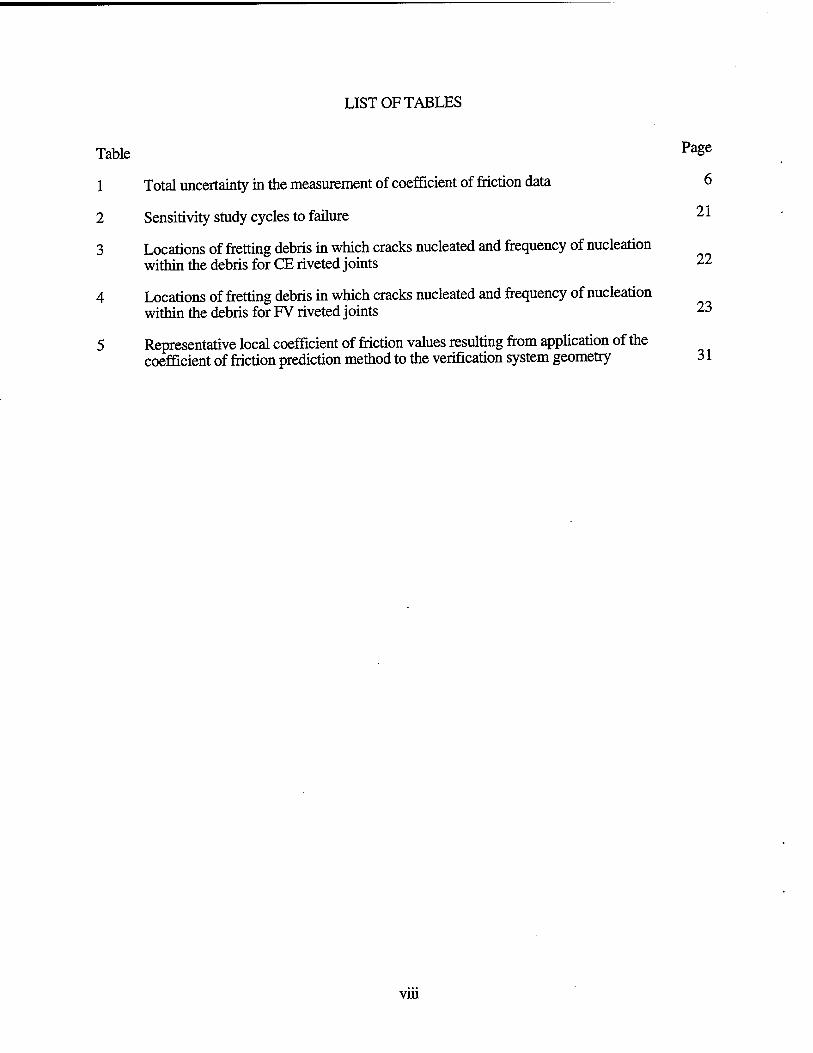
LIST OF TABLES
Table Pa§e
1 Total uncertainty in the measurement of coefficient of friction data 6
2 Sensitivity study cycles to failure 21
3 Locations of fretting debris in which cracks nucleated and frequency of nucleation within the debris for CE riveted joints 22
4 Locations of fretting debris in which cracks nucleated and frequency of nucleation within the debris for FV riveted joints 23
5 Representative local coefficient of friction values resulting from application of the coefficient of friction prediction method to the verification system geometry 31
viu
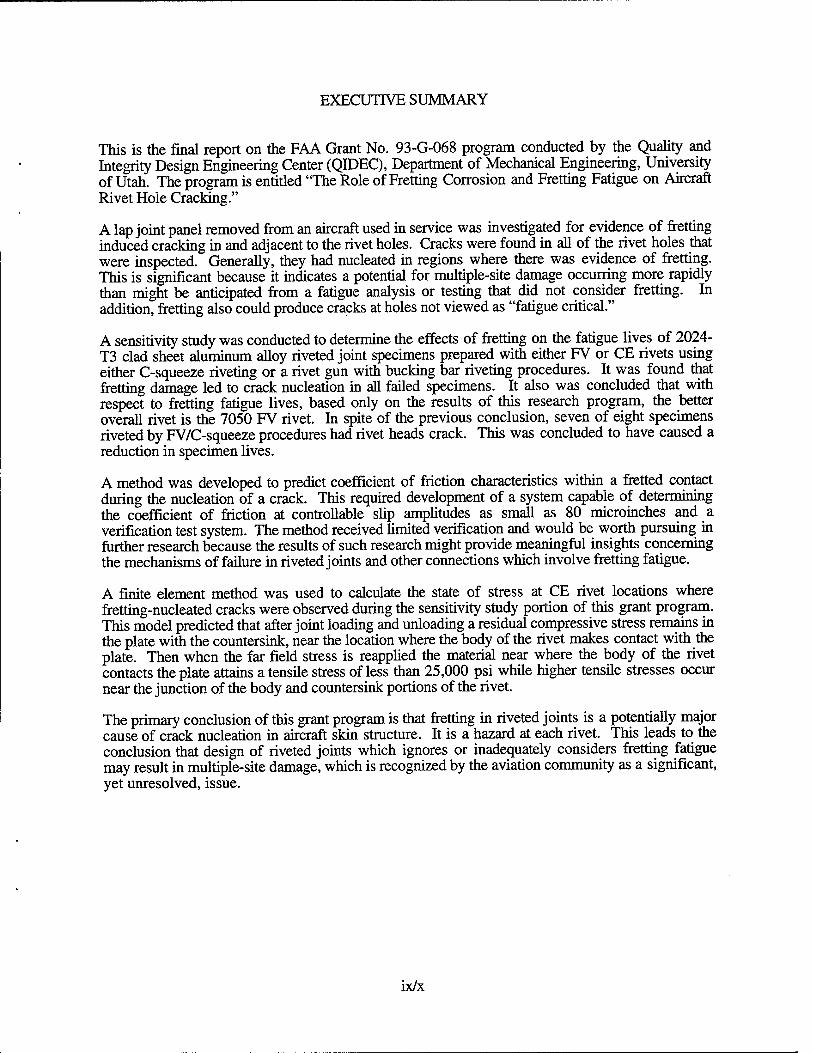
EXECUTIVE SUMMARY
This is the final report on the FAA Grant No. 93-G-068 program conducted by the Quality and Integrity Design Engineering Center (QIDEC), Department of Mechanical Engineering, University of Utah. The program is entitled "The Role of Fretting Corrosion and Fretting Fatigue on Aircraft Rivet Hole Cracking."
A lap joint panel removed from an aircraft used in service was investigated for evidence of fretting induced cracking in and adjacent to the rivet holes. Cracks were found in all of the rivet holes that were inspected. Generally, they had nucleated in regions where there was evidence of fretting. This is significant because it indicates a potential for multiple-site damage occurring more rapidly than might be anticipated from a fatigue analysis or testing that did not consider fretting. In addition, fretting also could produce cracks at holes not viewed as "fatigue critical."
A sensitivity study was conducted to determine the effects of fretting on the fatigue lives of 2024- T3 clad sheet aluminum alloy riveted joint specimens prepared with either FV or CE rivets using either C-squeeze riveting or a rivet gun with bucking bar riveting procedures. It was found that fretting damage led to crack nucleation in all failed specimens. It also was concluded that with respect to fretting fatigue lives, based only on the results of this research program, the better overall rivet is the 7050 FV rivet. In spite of the previous conclusion, seven of eight specimens riveted by FV/C-squeeze procedures had rivet heads crack. This was concluded to have caused a reduction in specimen lives.
A method was developed to predict coefficient of friction characteristics within a fretted contact during the nucleation of a crack. This required development of a system capable of determining the coefficient of friction at controllable slip amplitudes as small as 80 microinches and a verification test system. The method received limited verification and would be worth pursuing in further research because the results of such research might provide meaningful insights concerning the mechanisms of failure in riveted joints and other connections which involve fretting fatigue.
A finite element method was used to calculate the state of stress at CE rivet locations where fretting-nucleated cracks were observed during the sensitivity study portion of this grant program. This model predicted that after joint loading and unloading a residual compressive stress remains in the plate with the countersink, near the location where the body of the rivet makes contact with the plate. Then when the far field stress is reapplied the material near where the body of the rivet contacts the plate attains a tensile stress of less than 25,000 psi while higher tensile stresses occur near the junction of the body and countersink portions of the rivet.
The primary conclusion of this grant program is that fretting in riveted joints is a potentially major cause of crack nucleation in aircraft skin structure. It is a hazard at each rivet. This leads to the conclusion that design of riveted joints which ignores or inadequately considers fretting fatigue may result in multiple-site damage, which is recognized by the aviation community as a significant, yet unresolved, issue.
ix/x
1 INTRODUCTION.
This report is submitted in accordance with the requirements of Department of Transportation, Federal Aviation Administration Regulation 9550.7, Research Grants Program. It covers the two year grant no. 93-G-068 program entitled "The Role of Fretting Corrosion and Fretting Fatigue on Aircraft Rivet Hole Cracking." The program was conducted by the Quality and Integrity Design Engineering Center (QIDEC), Department of Mechanical Engineering, University of Utah.
The American Society for Testing and Materials defines fretting as "a wear phenomenon occurring between two surfaces having oscillatory relative motion of small amplitude" and fretting corrosion as "a form of fretting wear in which corrosion plays a significant role" [1]. Fretting and fretting corrosion can be present in any area of an aircraft structure (e.g., engines, aircraft primary and secondary structure, and landing gear components) in which small amplitude cyclic slip between adjacent contacting materials is possible. When at least one of the fretted components also experiences fatigue loading, the process is called fretting fatigue. The effects are synergistic with the component life possibly being reduced by an order of magnitude or more as a result of fretting fatigue when compared to fatigue without fretting. The main effect of the fretting is an accelerated nucleation of cracks which then may propagate due primarily to the fatigue loading [2]. Rivets and mechanically fastened joints in general are particularly susceptible to fretting fatigue which can result in multiple-site damage because the damage can occur at many rivet holes. The damage can link up in aircraft structures and if not detected during inspection could create catastrophic results. Thus, it is imperative to understand the role of fretting fatigue in producing multiple-site damage in riveted aircraft joints.
The work performed under this grant was organized into four subprograms as explained in the procedures section which follows. The work was interrelated, with the performance of each subprogram enhanced by the results and experience obtained during the performance of the others.
2 PROCEDURES.
2.1 INSPECTION OF A LAP JOINT PANEL FROM A SERVICE AIRCRAFT.
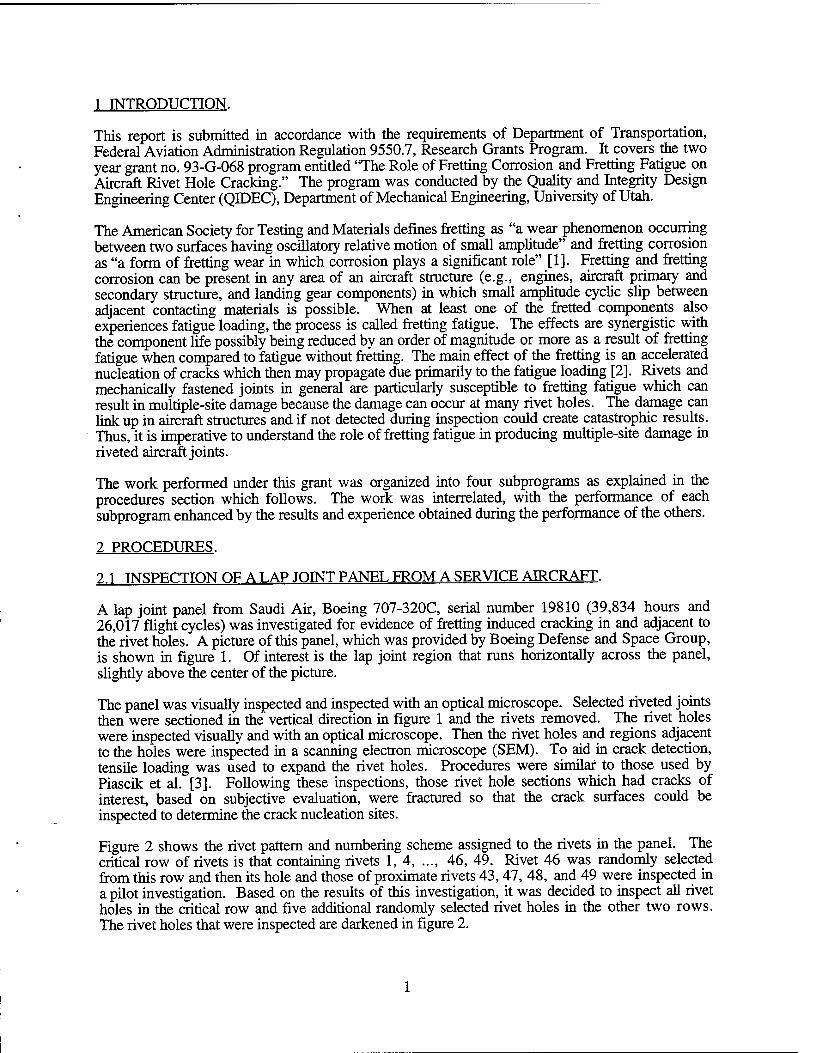
A lap joint panel from Saudi Air, Boeing 707-320C, serial number 19810 (39,834 hours and 26,017 flight cycles) was investigated for evidence of fretting induced cracking in and adjacent to the rivet holes. A picture of this panel, which was provided by Boeing Defense and Space Group, is shown in figure 1. Of interest is the lap joint region that runs horizontally across the panel, slightly above the center of the picture.
The panel was visually inspected and inspected with an optical microscope. Selected riveted joints then were sectioned in the vertical direction in figure 1 and the rivets removed. The rivet holes were inspected visually and with an optical microscope. Then the rivet holes and regions adjacent to the holes were inspected in a scanning electron microscope (SEM). To aid in crack detection, tensile loading was used to expand the rivet holes. Procedures were similar to those used by Piascik et al. [3]. Following these inspections, those rivet hole sections which had cracks of interest, based on subjective evaluation, were fractured so that the crack surfaces could be inspected to determine the crack nucleation sites.
Figure 2 shows the rivet pattern and numbering scheme assigned to the rivets in the panel. The critical row of rivets is that containing rivets 1, 4, ..., 46, 49. Rivet 46 was randomly selected from this row and then its hole and those of proximate rivets 43,47, 48, and 49 were inspected in a pilot investigation. Based on the results of this investigation, it was decided to inspect all rivet holes in the critical row and five additional randomly selected rivet holes in the other two rows. The rivet holes that were inspected are darkened in figure 2.
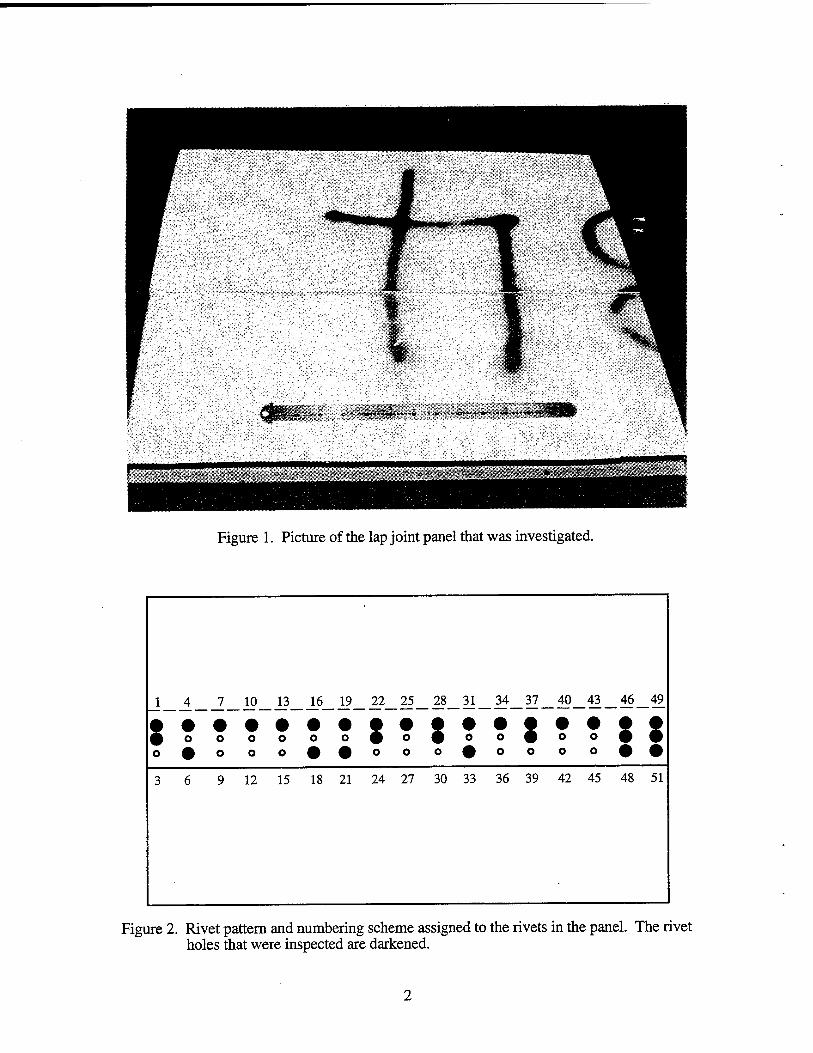
Figure 1. Picture of the lap joint panel that was investigated.
14 7 10 13 16 19 22 25 28 31 34 37 40 43 46 49
: ?: o o oo o 09090 09° ° o # o o o # # o o 0900 o o
::
12 15 18 21 24 27 30 33 36 39 42 45 48 51
Figure 2. Rivet pattern and numbering scheme assigned to the rivets in the panel. The rivet holes that were inspected are darkened.
2.2 SENSITIVITY STUDY.
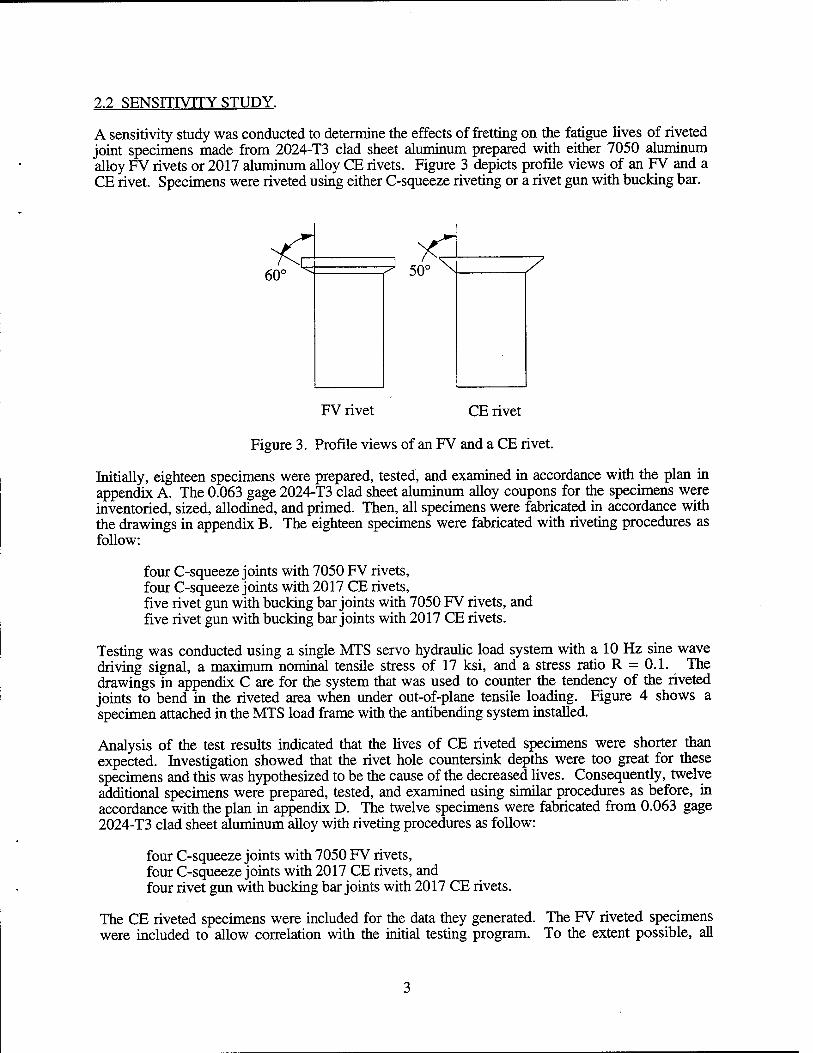
A sensitivity study was conducted to determine the effects of fretting on the fatigue lives of riveted joint specimens made from 2024-T3 clad sheet aluminum prepared with either 7050 aluminum alloy FV rivets or 2017 aluminum alloy CE rivets. Figure 3 depicts profile views of an FV and a CE rivet. Specimens were riveted using either C-squeeze riveting or a rivet gun with bucking bar.
<3 60°
>C 50°
FV rivet CE rivet
Figure 3. Profile views of an FV and a CE rivet.
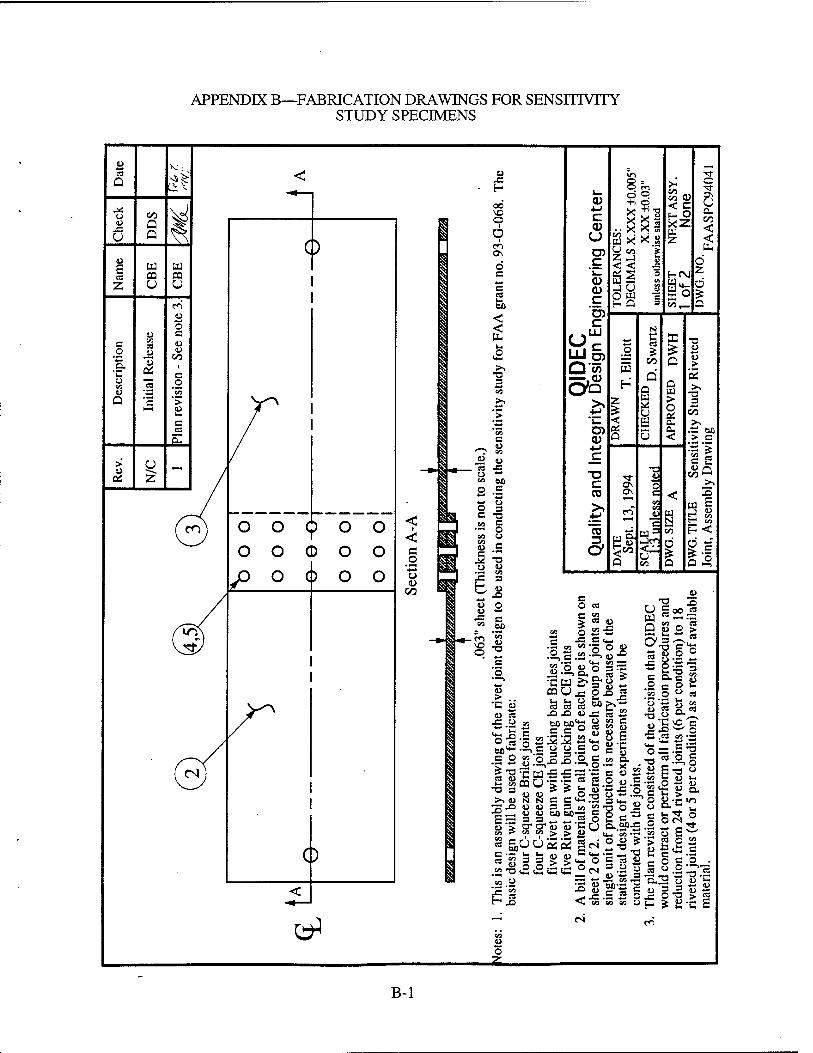
Initially, eighteen specimens were prepared, tested, and examined in accordance with the plan in appendix A. The 0.063 gage 2024-T3 clad sheet aluminum alloy coupons for the specimens were inventoried, sized, allodined, and primed. Then, all specimens were fabricated in accordance with the drawings in appendix B. The eighteen specimens were fabricated with riveting procedures as follow:
four C-squeeze joints with 7050 FV rivets, four C-squeeze joints with 2017 CE rivets, five rivet gun with bucking bar joints with 7050 FV rivets, and five rivet gun with bucking bar joints with 2017 CE rivets.
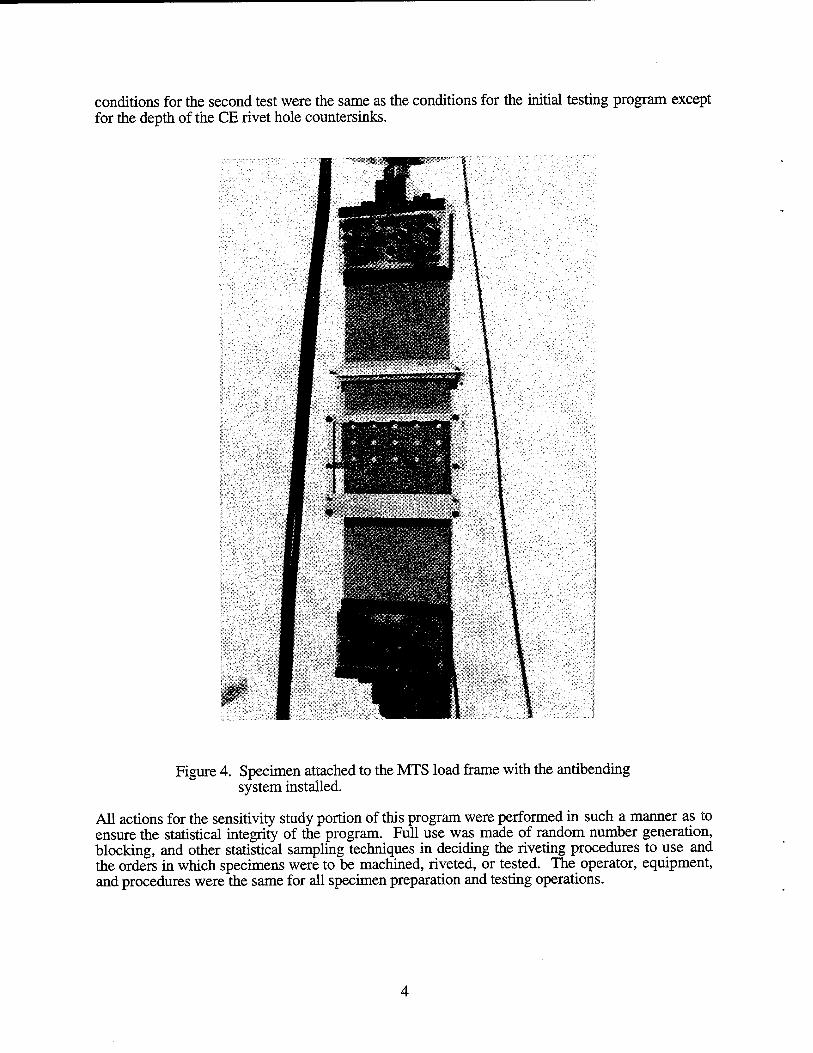
Testing was conducted using a single MTS servo hydraulic load system with a 10 Hz sine wave driving signal, a maximum nominal tensile stress of 17 ksi, and a stress ratio R = 0.1. The drawings in appendix C are for the system that was used to counter the tendency of the riveted joints to bend in the riveted area when under out-of-plane tensile loading. Figure 4 shows a specimen attached in the MTS load frame with the antibending system installed.
Analysis of the test results indicated that the lives of CE riveted specimens were shorter than expected. Investigation showed that the rivet hole countersink depths were too great for these specimens and this was hypothesized to be the cause of the decreased lives. Consequently, twelve additional specimens were prepared, tested, and examined using similar procedures as before, in accordance with the plan in appendix D. The twelve specimens were fabricated from 0.063 gage 2024-T3 clad sheet aluminum alloy with riveting procedures as follow:
four C-squeeze joints with 7050 FV rivets, four C-squeeze joints with 2017 CE rivets, and four rivet gun with bucking bar joints with 2017 CE rivets.
The CE riveted specimens were included for the data they generated. The FV riveted specimens were included to allow correlation with the initial testing program. To the extent possible, all
conditions for the second test were the same as the conditions for the initial testing program except for the depth of the CE rivet hole countersinks.
I** x m * «
•> » «► « * '
« • • » •
Figure 4. Specimen attached to the MTS load frame with the antibending system installed.
All actions for the sensitivity study portion of this program were performed in such a manner as to ensure the statistical integrity of the program. Full use was made of random number generation, blocking, and other statistical sampling techniques in deciding the riveting procedures to use and the orders in which specimens were to be machined, riveted, or tested. The operator, equipment, and procedures were the same for all specimen preparation and testing operations.
During data reduction, statistical comparisons of the fatigue lives of specimens within a sample* and between samples were made by standard cumulative normal distribution function hypothesis testing methods [4]. In these procedures, a hypothesis is stated concerning whether the values to be compared are from the same population. The level of confidence desired in the results of the analysis is also assumed. A standard table is entered with a "Z" value that is a measure of the number of standard deviations between the values to be compared. This provides a measure of the confidence that the values are not from the same population which is compared to the desired level of confidence. Alternately, given a desired confidence level, the corresponding "Z" value can be determined. Then the hypothesis is accepted or rejected based on the confidence or "Z" value determined. Acceptance of the hypothesis means that you can be confident (at the level of confidence chosen) that the values are not from the same population. This provides statistical justification for considering one population superior to the other based on the conditions of the experimental program and the confidence level chosen. For example, for this program the sample with the "statistically" longer mean life is considered to be from a population with better fretting fatigue life characteristics than the sample with the shorter mean life. Rejection of the hypothesis means that there is no statistical basis for considering one population superior to the other based on the conditions of the experimental program and the confidence level chosen.
For this program 99 percent confidence ("Z" value of 2.326) was used for comparison in all cases except one where 95 percent confidence ("Z" value of 1.645) was used. In comparing specimens within a sample, the specimen being considered was assumed not to be from the same population. Therefore, the difference between the sample mean (without the value of the specimen being considered) and the value for that specimen was determined. This difference was divided by the sample standard deviation (computed without the value of that specimen) to determine the "Z' value. For comparisons between samples, the two samples were assumed to be from the same population. A combined standard deviation (standard error of the difference) for the two samples was computed by the equation:
SD = [a1/(n1)i/2]+ [G2/(n2)i/2]
where: SD is the standard error of the difference Gi is the standard deviation for the first sample ni is the number of values in the first sample
Ü2 is the standard deviation for the second sample ti2 is the number of values in the second sample
Then the difference in the sample means was divided by this "SD" value to determine the "Z" value which was compared to the "Z" value of 2.326 or 1.645.
Following testing, the fracture surfaces of the failed specimens were investigated in order to gain insights into the factors that resulted in failure, especially the influence of fretting on the fatigue process.
* Except as justified in the discussion, a sample is considered to be all specimens from the same test program produced with the same type rivets and riveting procedures.
2.3 PREDICTION OF COEFFICIENT OF FRTCTION DT IRTNG FRETTING.
Traditionally for many materials the metal dry friction between contacting surfaces has been characterized by a ratio of the friction force which impedes relative motion between the surfaces to the normal force which holds the surfaces together. There are two such ratios: the coefficient of static friction (us) as motion is impending and the lower-value coefficient of kinetic friction (uk) while there is relative motion or slip between the surfaces. These values are global in that they and slip amplitude are considered constant within the contact region. Also, they are not considered to be functions of wear (cycles), contact area, geometry, and surface roughness.
In fretting fatigue portions of the fretted interface may experience relative slip while other portions may stick (not slip) and the boundary of the stick-slip region experiences high-stress concentrations that can result in crack nucleation. Additionally, the friction characteristics within a fretted interface change with cycling due to wear. Therefore, to better understand the fretting fatigue process it is necessary to understand friction at the local level and how it changes with cycling. In this program where a finite element model was used local is defined as the element size of 0.00048 in2.
A method was developed to predict coefficient of friction characteristics within a fretted contact during the nucleation of a crack. The method consists of an iterative procedure that compares computed local frictional values from a three-dimensional (3D) linear ADINA finite element model with predicted frictional values and updates the predictions as necessary until agreement is reached at each model node. Starting with the first cycle, the method steps forward in cycles at a rate that ensures convergence until the required number of cycles has been considered. A flow chart of the protocol that ensures convergence is shown in figure 5.
The method uses coefficient of friction data determined using the system shown mounted in an MTS load frame in figure 6. A drawing of this system is shown in figure 7, and a drawing of the contact area is shown in figure 8. This system is capable of determining coefficient of friction values at slip amplitudes as low as 80 microinches (2 micrometers) with uncertainly as shown in table 1.
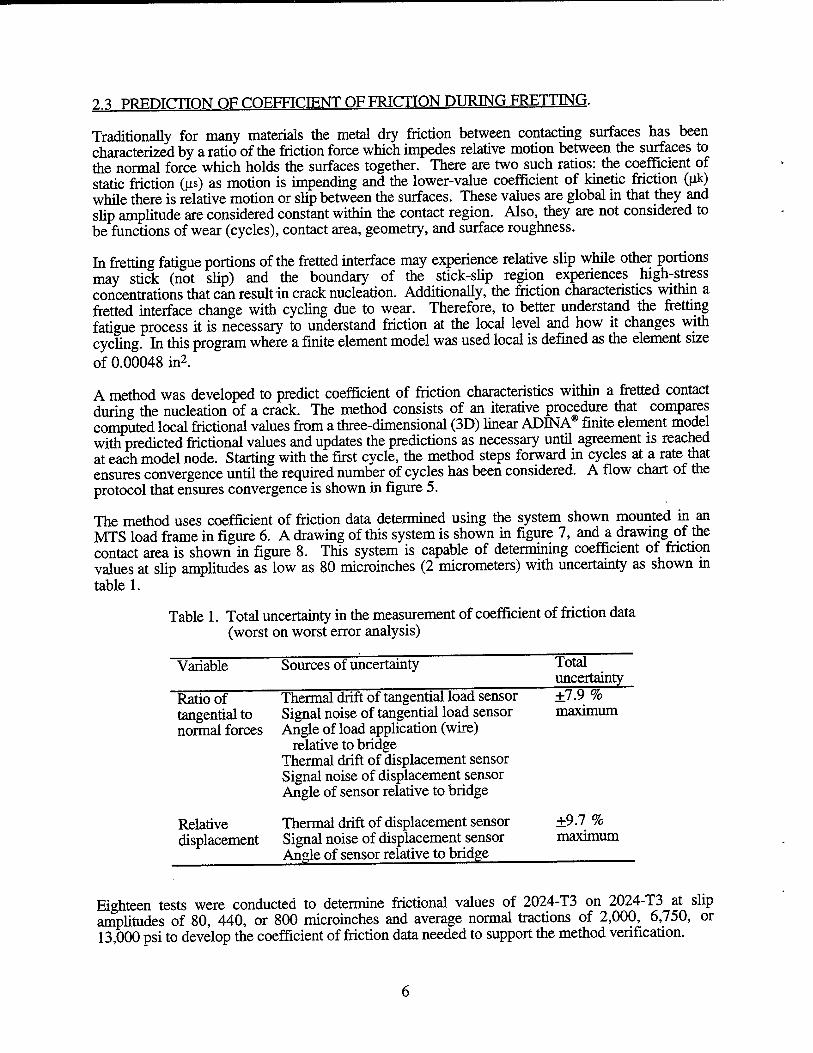
Table 1. Total uncertainty in the measurement of coefficient of friction data (worst on worst error analysis)
Variable Sources of uncertainty
Ratio of Thermal drift of tangential load sensor tangential to Signal noise of tangential load sensor normal forces Angle of load application (wire)
relative to bridge Thermal drift of displacement sensor Signal noise of displacement sensor Angle of sensor relative to bridge
Relative Thermal drift of displacement sensor displacement Signal noise of displacement sensor Angle of sensor relative to bridge
Total uncertainty ±7.9 % maximum
±9.7 % maximum
Eighteen tests were conducted to determine frictional values of 2024-T3 on 2024-T3 at slip amplitudes of 80, 440, or 800 microinches and average normal tractions of 2,000, 6,750, or 13,000 psi to develop the coefficient of friction data needed to support the method verification.
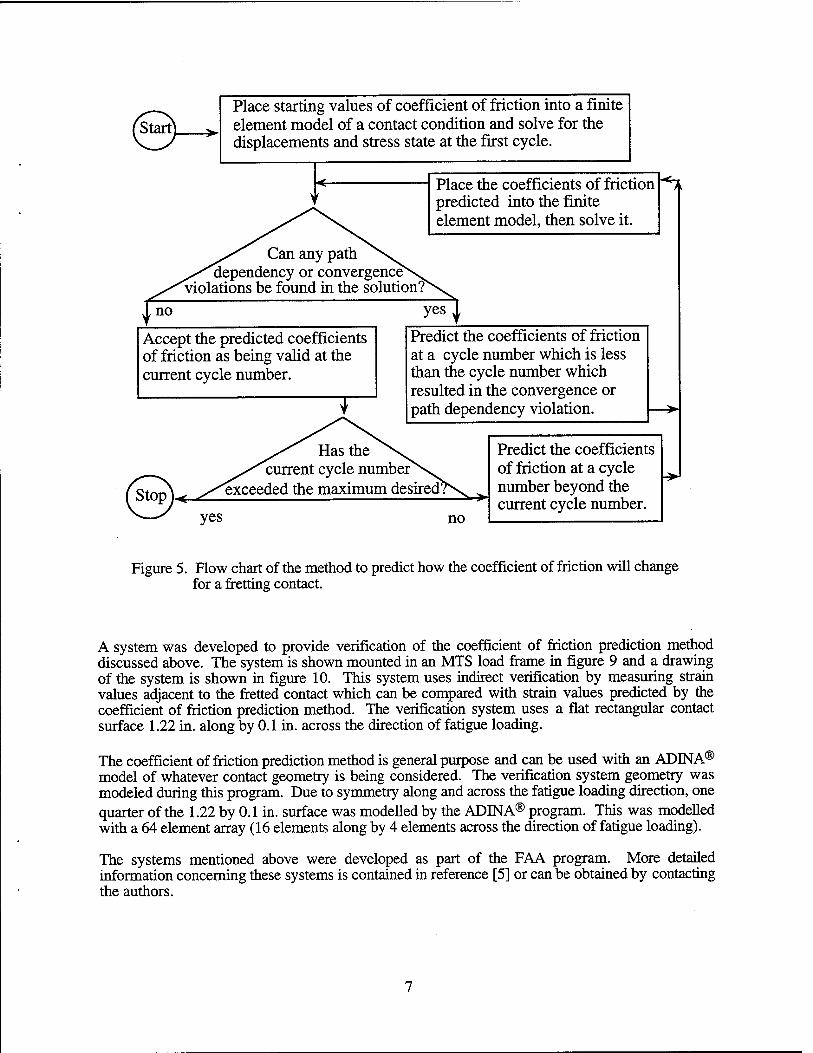
Start! Place starting values of coefficient of friction into a finite element model of a contact condition and solve for the displacements and stress state at the first cycle.
Place the coefficients of friction predicted into the finite element model, then solve it.
^h
Can any path "dependency or convergence"
'violations be found in the solution?^ no yes
Accept the predicted coefficients of friction as being valid at the current cycle number.
Predict the coefficients of friction at a cycle number which is less than the cycle number which resulted in the convergence or path dependency violation.
Has the 'current cycle number^
^exceeded the maximum desired^
no
Predict the coefficients of friction at a cycle number beyond the current cycle number.
Figure 5. Flow chart of the method to predict how the coefficient of friction will change for a fretting contact.
A system was developed to provide verification of the coefficient of friction prediction method discussed above. The system is shown mounted in an MTS load frame in figure 9 and a drawing of the system is shown in figure 10. This system uses indirect verification by measuring strain values adjacent to the fretted contact which can be compared with strain values predicted by the coefficient of friction prediction method. The verification system uses a flat rectangular contact surface 1.22 in. along by 0.1 in. across the direction of fatigue loading.
The coefficient of friction prediction method is general purpose and can be used with an ADINA® model of whatever contact geometry is being considered. The verification system geometry was modeled during this program. Due to symmetry along and across the fatigue loading direction, one quarter of the 1.22 by 0.1 in. surface was modelled by the ADINA® program. This was modelled with a 64 element array (16 elements along by 4 elements across the direction of fatigue loading).
The systems mentioned above were developed as part of the FAA program. More detailed information concerning these systems is contained in reference [5] or can be obtained by contacting the authors.
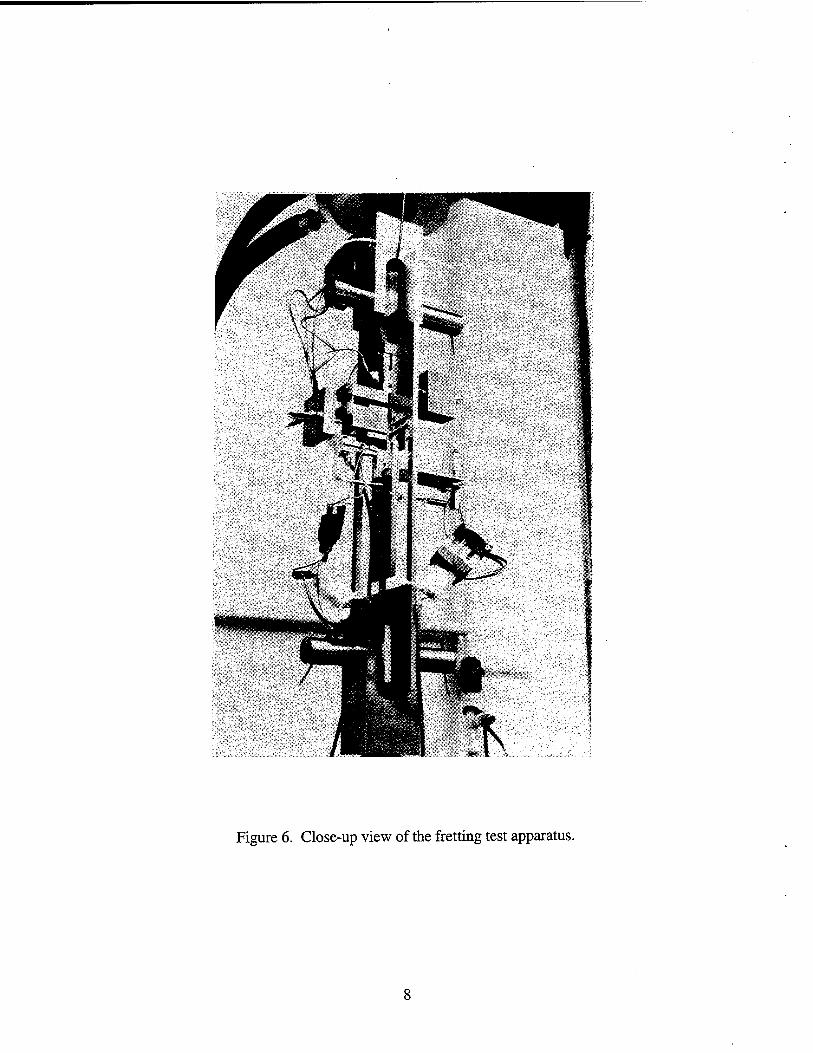
Figure 6. Close-up view of the fretting test apparatus.
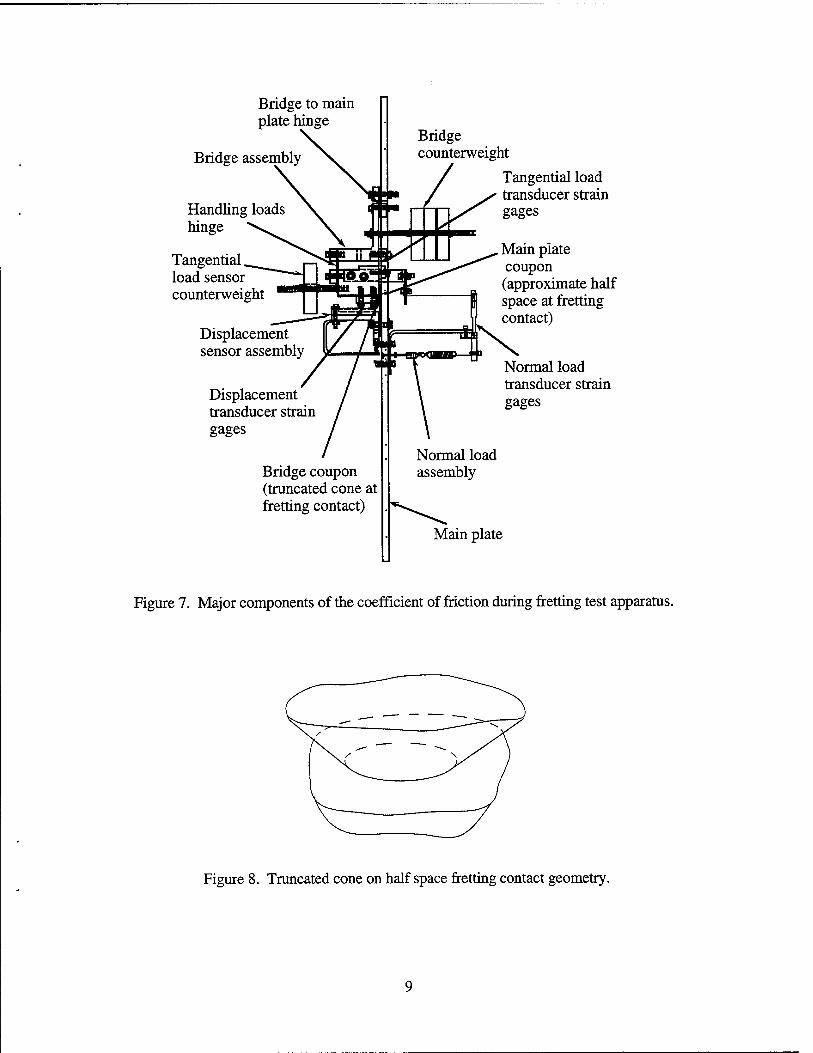
Bridge to main plate hinge
Bridge assembly
Handling loads hinge
Tangential load sensor counterweight
Displacement sensor assembly
Displacement transducer strain gages
Bridge counterweight
Tangential load transducer strain gages
Main plate coupon (approximate half space at fretting contact)
Normal load transducer strain gages
Bridge coupon (truncated cone at fretting contact)
Main plate
Figure 7. Major components of the coefficient of friction during fretting test apparatus.
Figure 8. Truncated cone on half space fretting contact geometry.
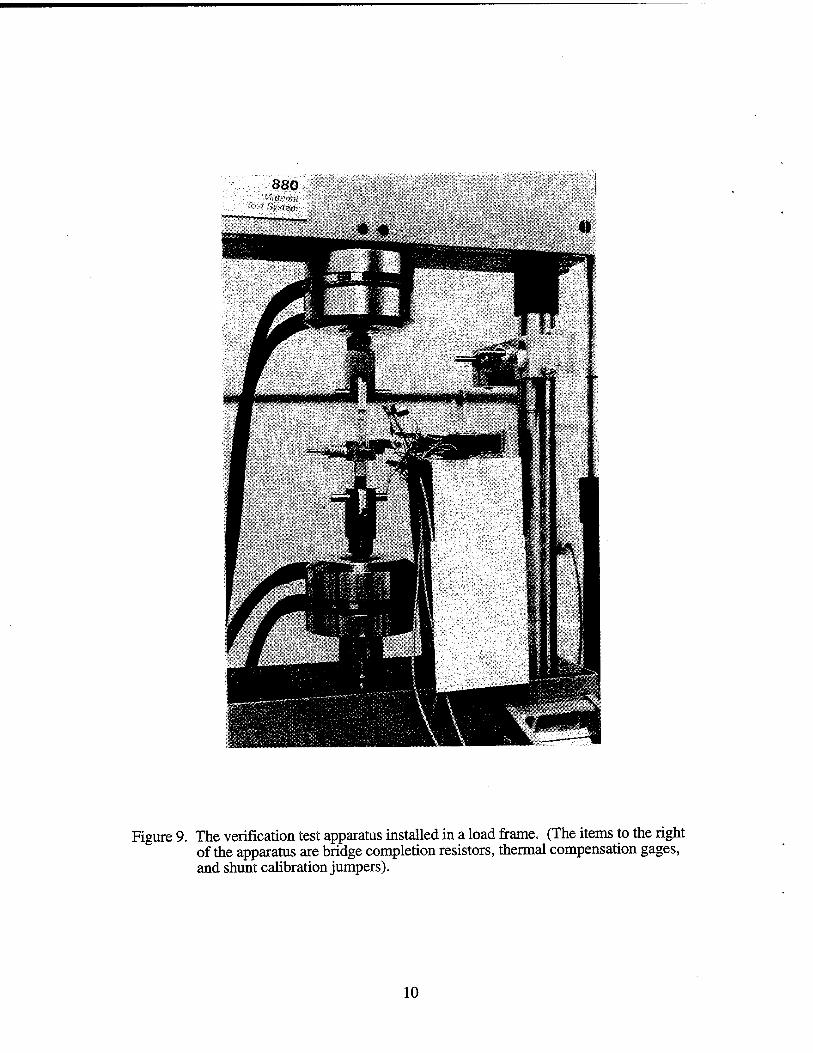
880 "■l.ttVtKti
" System
Figure 9. The verification test apparatus installed in a load frame. (The items to the right of the apparatus are bridge completion resistors, thermal compensation gages, and shunt calibration jumpers).
10
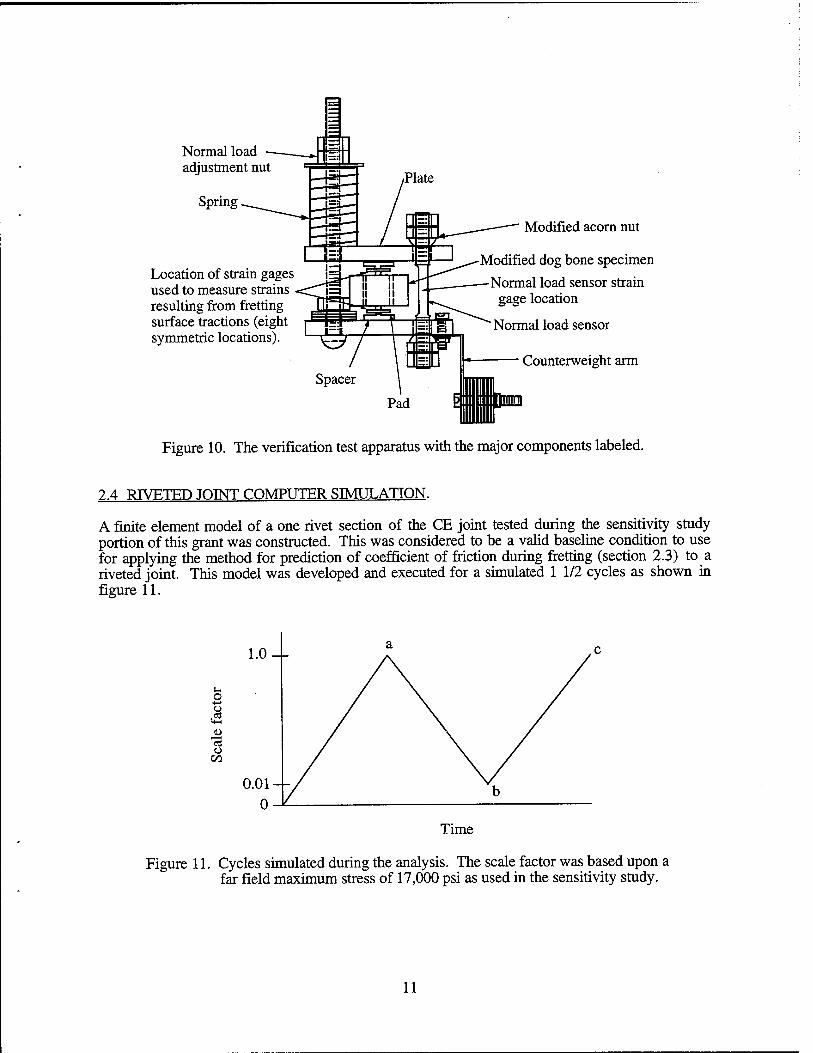
Normal load adjustment nut
Spring
Location of strain gages used to measure strains resulting from fretting surface tractions (eight symmetric locations).
Modified acorn nut
Modified dog bone specimen
Normal load sensor strain gage location
Normal load sensor
Counterweight arm
Figure 10. The verification test apparatus with the major components labeled.
2.4 RIVETED JOINT COMPUTER SIMULATION.
A finite element model of a one rivet section of the CE joint tested during the sensitivity study portion of this grant was constructed. This was considered to be a valid baseline condition to use for applying the method for prediction of coefficient of friction during fretting (section 2.3) to a riveted joint. This model was developed and executed for a simulated 1 1/2 cycles as shown in figure 11.
O
IM
"a o
Time
Figure 11. Cycles simulated during the analysis. The scale factor was based upon a far field maximum stress of 17,000 psi as used in the sensitivity study.
11
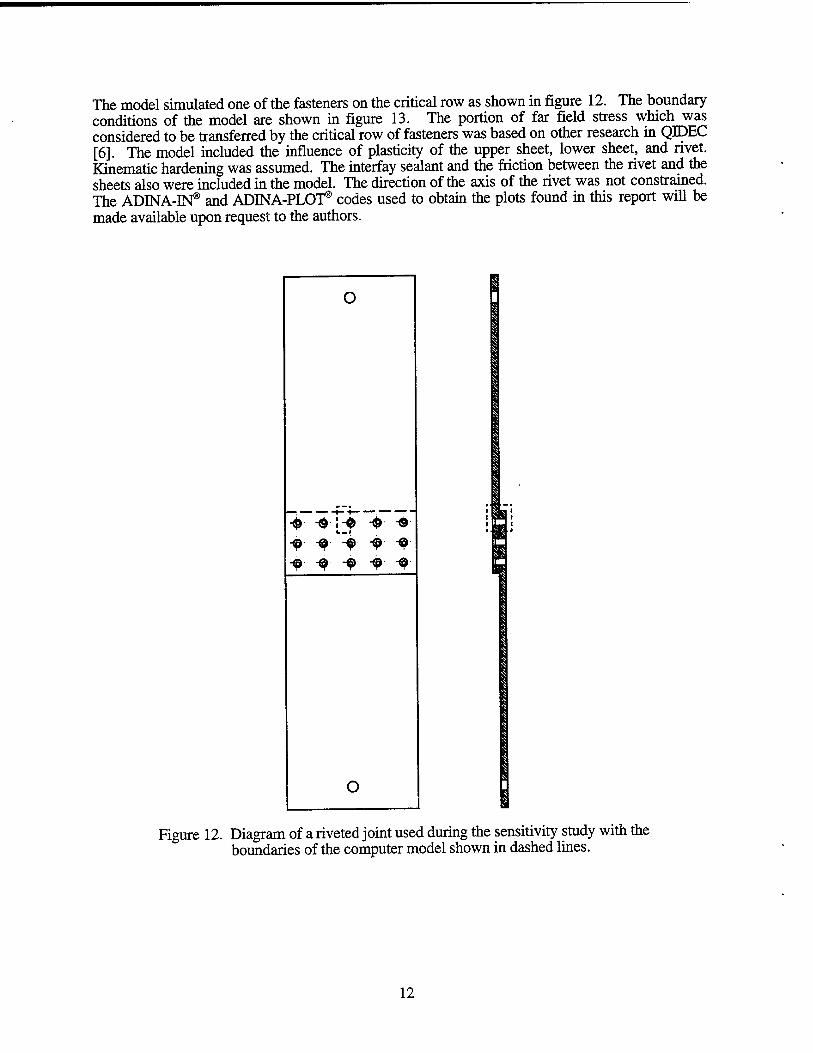
The model simulated one of the fasteners on the critical row as shown in figure 12. The boundary conditions of the model are shown in figure 13. The portion of far field stress which was considered to be transferred by the critical row of fasteners was based on other research in QIDEC [6]. The model included the influence of plasticity of the upper sheet, lower sheet, and rivet. Kinematic hardening was assumed. The interfay sealant and the friction between the rivet and the sheets also were included in the model. The direction of the axis of the rivet was not constrained. The ADINA-IN® and ADINA-PLOT® codes used to obtain the plots found in this report will be made available upon request to the authors.
O
■© -© ~© "® "^
-© ■© ~Q "<B ~^
Figure 12. Diagram of a riveted joint used during the sensitivity study with the boundaries of the computer model shown in dashed lines.
12
Symmetry a = applied stress (17,000 psi max.)
No stress
Symmetry
0.37 a 0.63 a
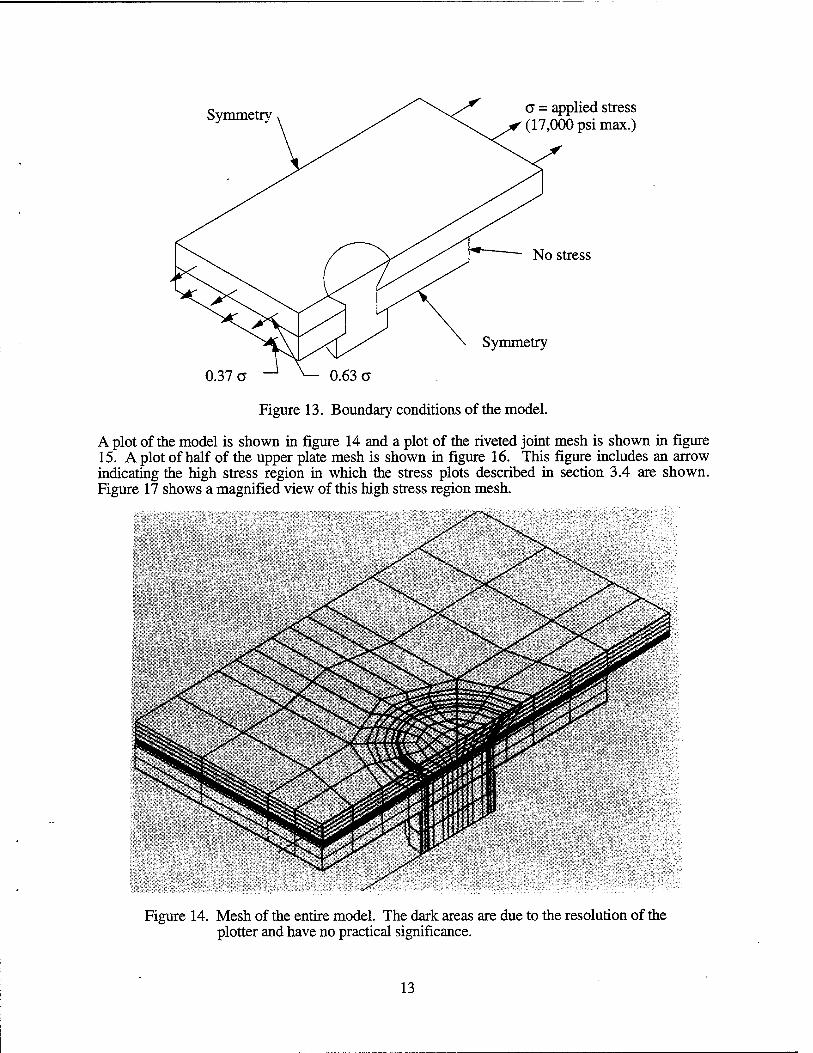
Figure 13. Boundary conditions of the model.
A plot of the model is shown in figure 14 and a plot of the riveted joint mesh is shown in figure 15. A plot of half of the upper plate mesh is shown in figure 16. This figure includes an arrow indicating the high stress region in which the stress plots described in section 3.4 are shown. Figure 17 shows a magnified view of this high stress region mesh.
Figure 14. Mesh of the entire model. The dark areas are due to the resolution of the plotter and have no practical significance.
13

- J>
Figure 15. Mesh of the rivet.
Figure 16. Mesh of one quarter of the upper plate. An arrow marks the high stress region for which the stress plots in section 3.4 are shown. The stress direction for the plots is the direction of fatigue loading which is from upper right to lower left in this figure.
14
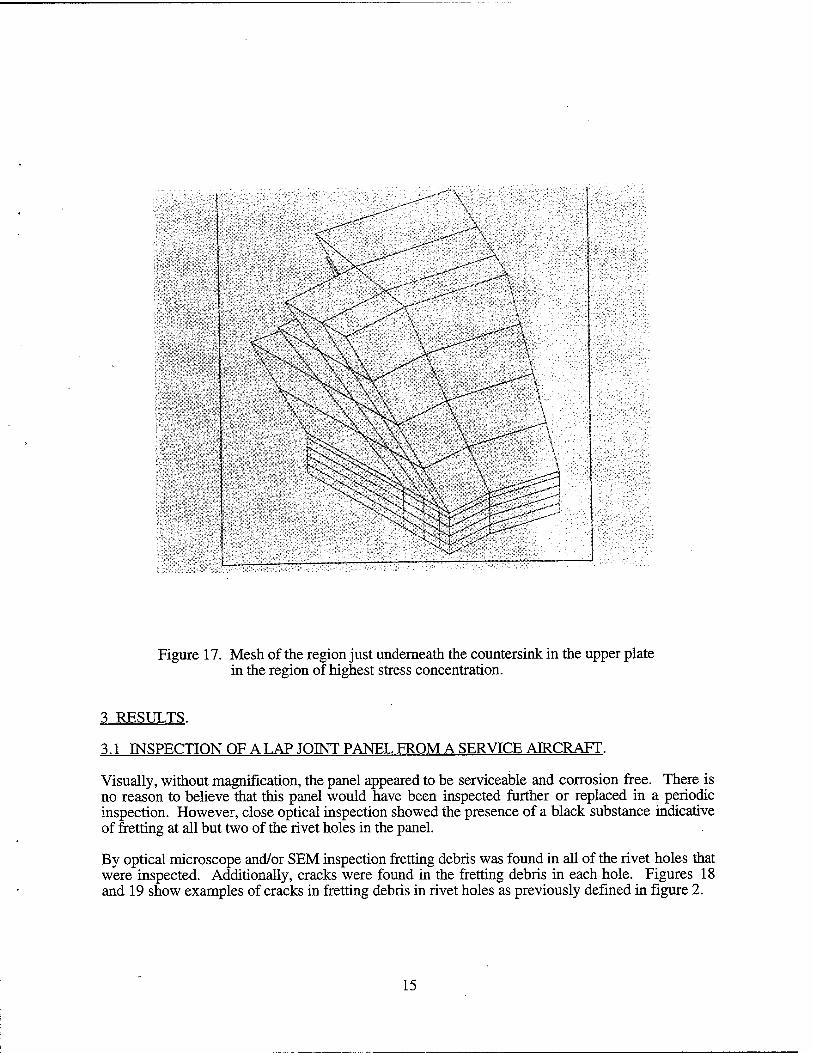
Figure 17. Mesh of the region just underneath the countersink in the upper plate in the region of highest stress concentration.
3 RESULTS.
3.1 INSPECTION OF A LAP JOINT PANEL FROM A SERVICE AIRCRAFT.
Visually, without magnification, the panel appeared to be serviceable and corrosion free. There is no reason to believe that this panel would have been inspected further or replaced in a periodic inspection. However, close optical inspection showed the presence of a black substance indicative of fretting at all but two of the rivet holes in the panel.
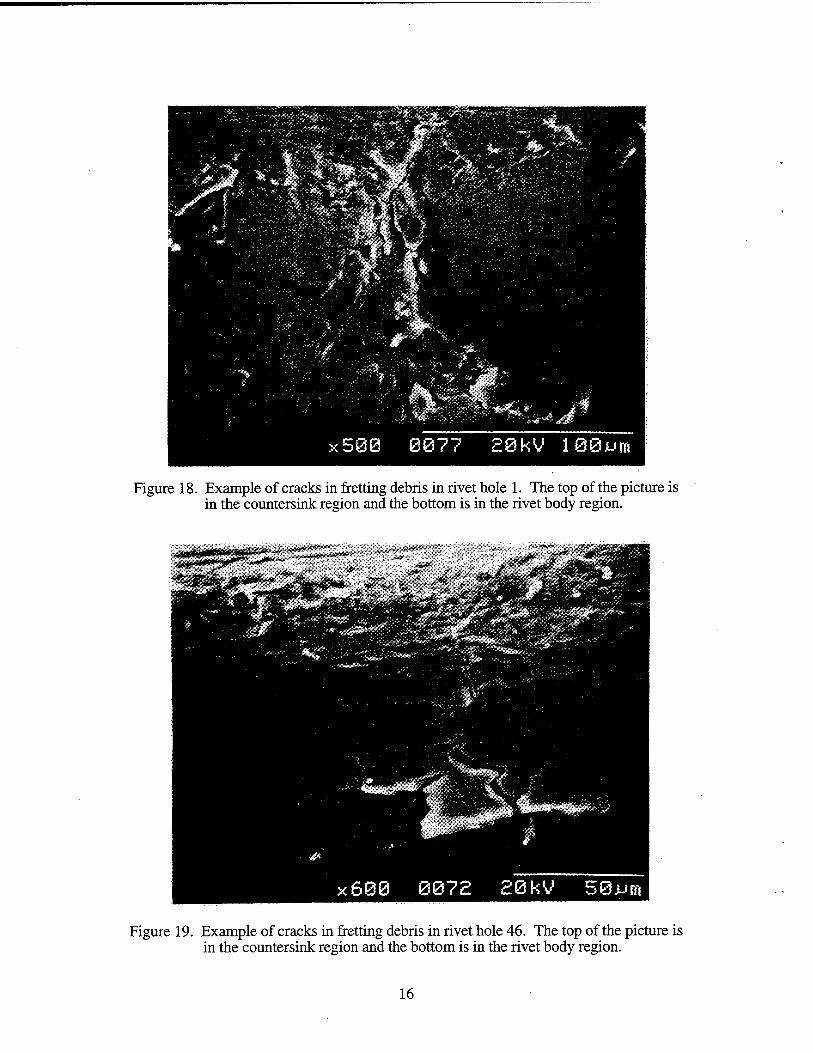
By optical microscope and/or SEM inspection fretting debris was found in all of the rivet holes that were inspected. Additionally, cracks were found in the fretting debris in each hole. Figures 18 and 19 show examples of cracks in fretting debris in rivet holes as previously defined in figure 2.
15
■■-■'- ■■'■* "':'" 5 -f - *
■'' ■ - *v :" *. i fe %
£'••*'. : J^^B
x500 007? 28kV 180jjm
Figure 18. Example of cracks in fretting debris in rivet hole 1. The top of the picture is in the countersink region and the bottom is in the rivet body region.
Figure 19. Example of cracks in fretting debris in rivet hole 46. The top of the picture is in the countersink region and the bottom is in the rivet body region.
16
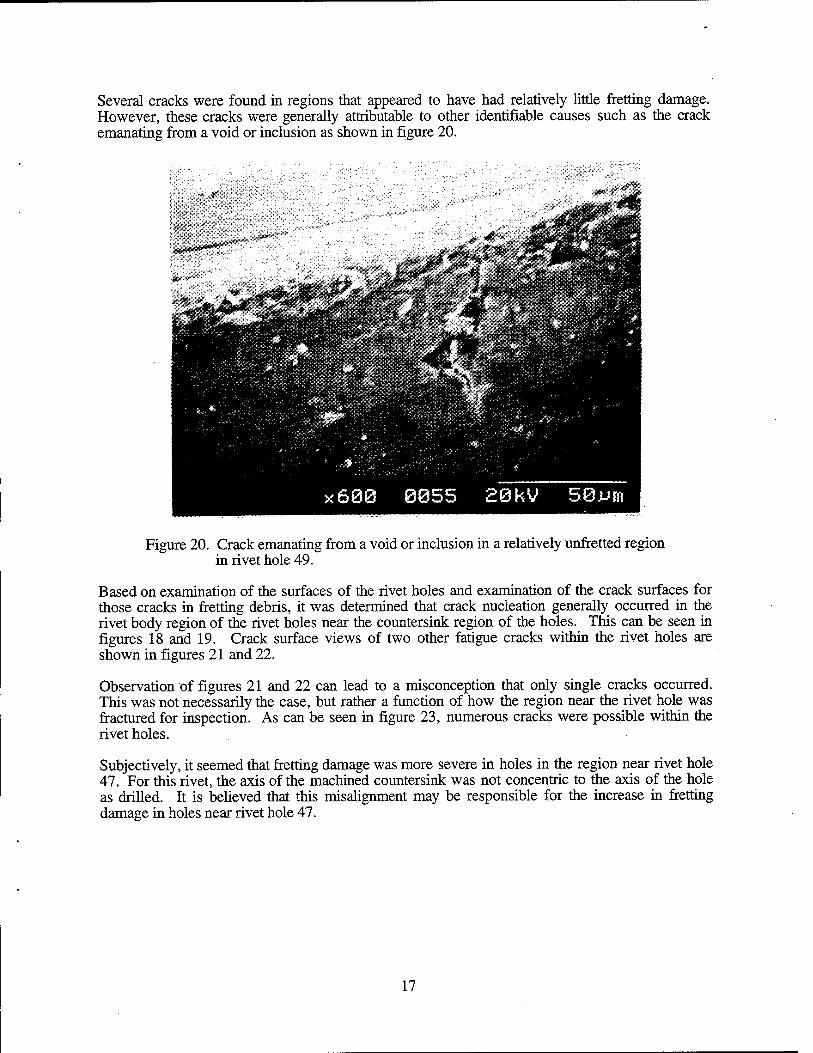
Several cracks were found in regions that appeared to have had relatively little fretting damage. However, these cracks were generally attributable to other identifiable causes such as the crack emanating from a void or inclusion as shown in figure 20.
Figure 20. Crack emanating from a void or inclusion in a relatively unfretted region in rivet hole 49.
Based on examination of the surfaces of the rivet holes and examination of the crack surfaces for those cracks in fretting debris, it was determined that crack nucleation generally occurred in the rivet body region of the rivet holes near the countersink region of the holes. This can be seen in figures 18 and 19. Crack surface views of two other fatigue cracks within the rivet holes are shown in figures 21 and 22.
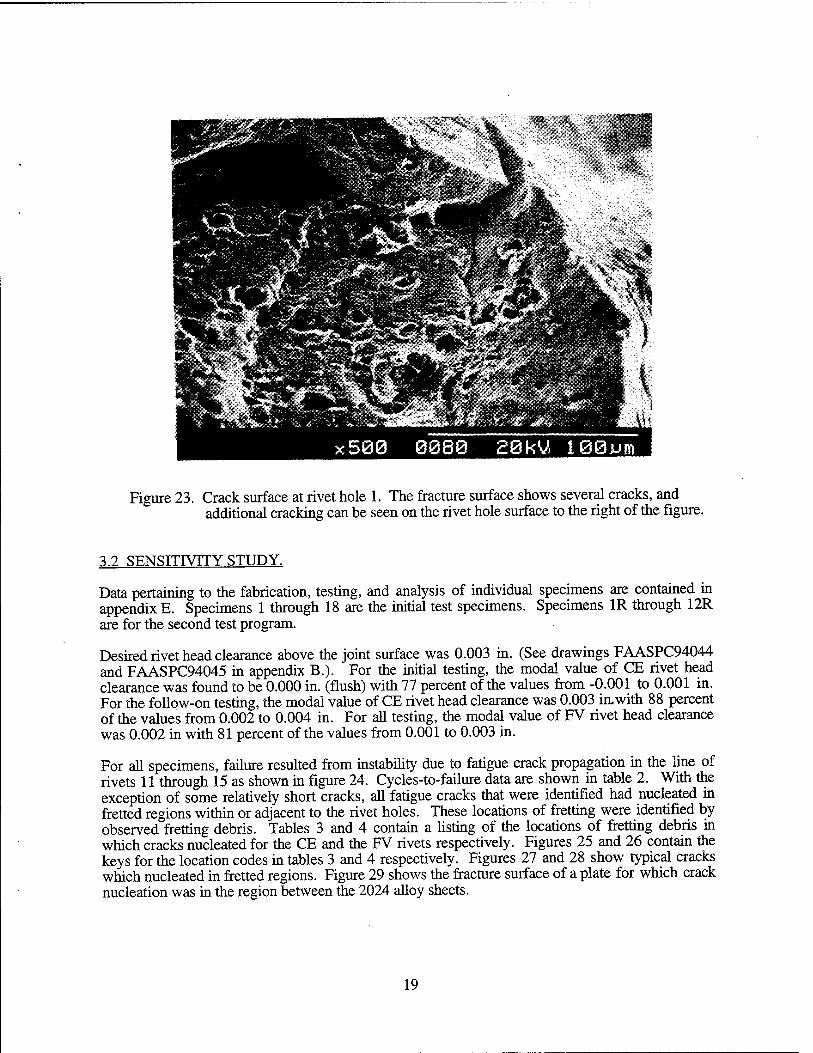
Observation of figures 21 and 22 can lead to a misconception that only single cracks occurred. This was not necessarily the case, but rather a function of how the region near the rivet hole was fractured for inspection. As can be seen in figure 23, numerous cracks were possible within the rivet holes.
Subjectively, it seemed that fretting damage was more severe in holes in the region near rivet hole 47. For this rivet, the axis of the machined countersink was not concentric to the axis of the hole as drilled. It is believed that this misalignment may be responsible for the increase in fretting damage in holes near rivet hole 47.
17
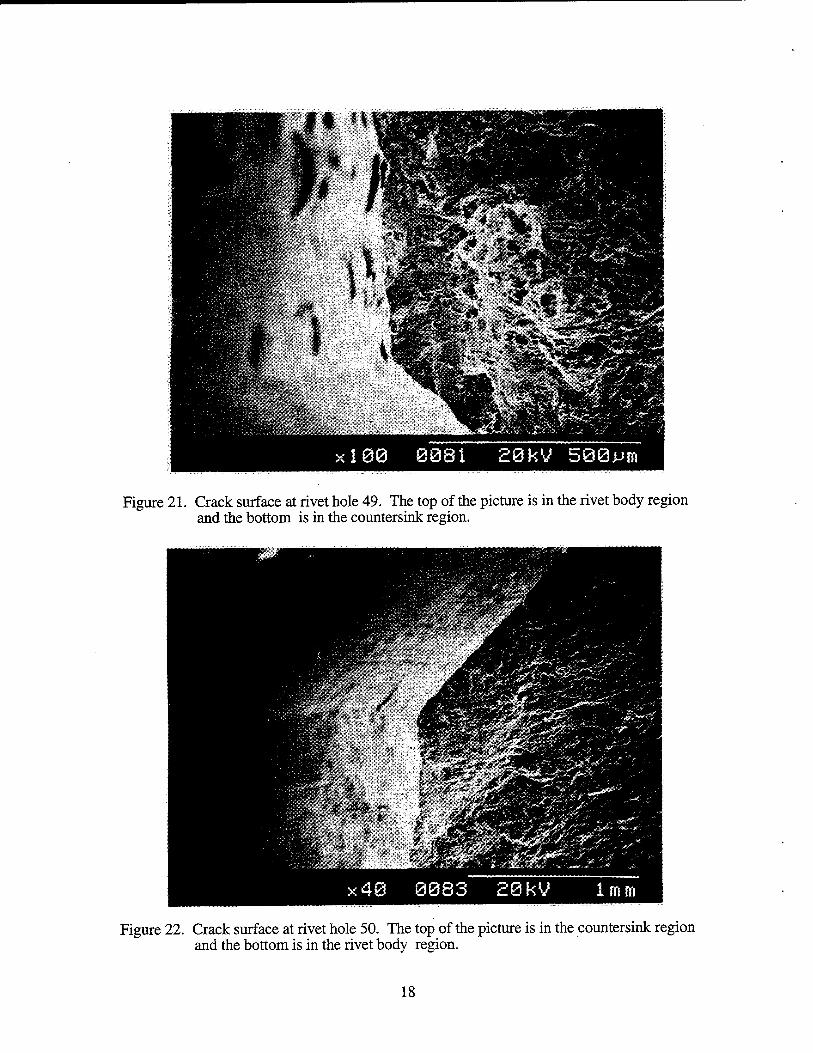
Figure 21. Crack surface at rivet hole 49. The top of the picture is in the rivet body region and the bottom is in the countersink region.
Figure 22. Crack surface at rivet hole 50. The top of the picture is in the countersink region and the bottom is in the rivet body region.
18
life»
n^»^ W'S&'i
^^^,|^^
Figure 23. Crack surface at rivet hole 1. The fracture surface shows several cracks, and additional cracking can be seen on the rivet hole surface to the right of the figure.
3.2 SENSITIVITY STUDY.
Data pertaining to the fabrication, testing, and analysis of individual specimens are contained in appendix E. Specimens 1 through 18 are the initial test specimens. Specimens 1R through 12R are for the second test program.
Desired rivet head clearance above the joint surface was 0.003 in. (See drawings FAASPC94044 and FAASPC94045 in appendix B.). For the initial testing, the modal value of CE rivet head clearance was found to be 0.000 in. (flush) with 77 percent of the values from -0.001 to 0.001 in. For the follow-on testing, the modal value of CE rivet head clearance was 0.003 in.with 88 percent of the values from 0.002 to 0.004 in. For all testing, the modal value of FV rivet head clearance was 0.002 in with 81 percent of the values from 0.001 to 0.003 in.
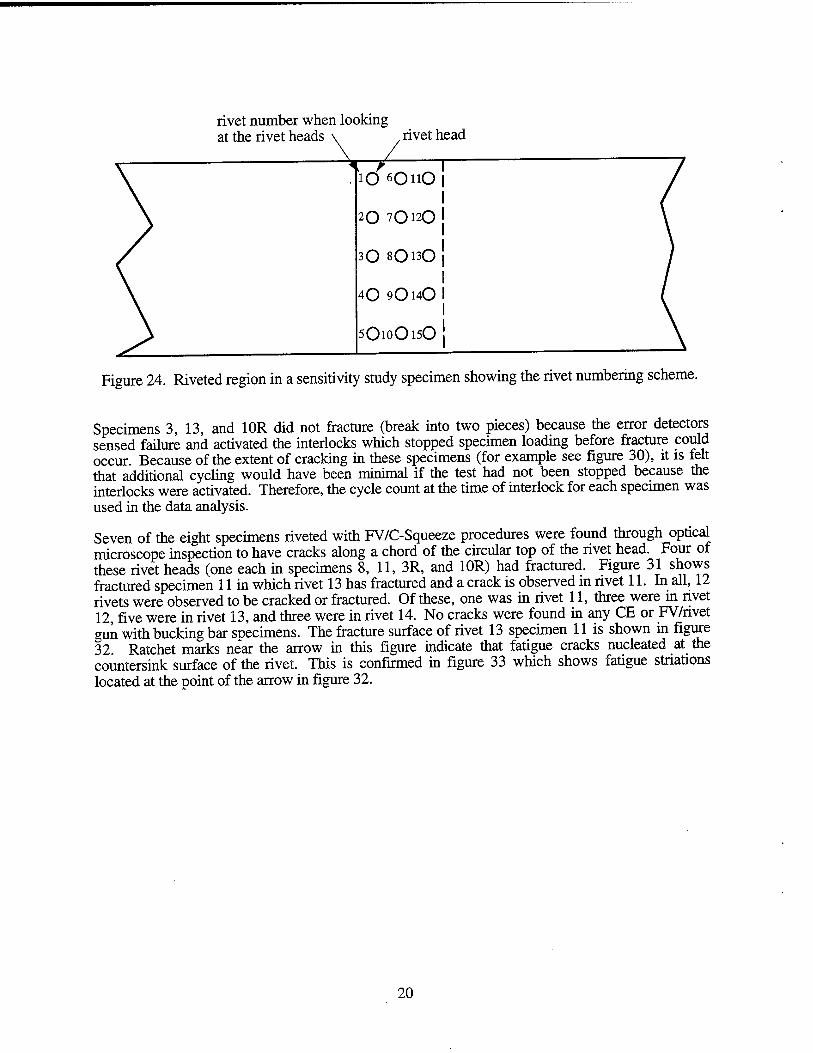
For all specimens, failure resulted from instability due to fatigue crack propagation in the line of rivets 11 through 15 as shown in figure 24. Cycles-to-failure data are shown in table 2. With the exception of some relatively short cracks, all fatigue cracks that were identified had nucleated in fretted regions within or adjacent to the rivet holes. These locations of fretting were identified by observed fretting debris. Tables 3 and 4 contain a listing of the locations of fretting debris in which cracks nucleated for the CE and the FV rivets respectively. Figures 25 and 26 contain the keys for the location codes in tables 3 and 4 respectively. Figures 27 and 28 show typical cracks which nucleated in fretted regions. Figure 29 shows the fracture surface of a plate for which crack nucleation was in the region between the 2024 alloy sheets.
19
rivet number when looking at the rivet heads \ rivet head
iQ 6OnO
20 70120
30 80130
40 90l40
5O10O15O
Figure 24. Riveted region in a sensitivity study specimen showing the rivet numbering scheme.
Specimens 3, 13, and 10R did not fracture (break into two pieces) because the error detectors sensed failure and activated the interlocks which stopped specimen loading before fracture could occur. Because of the extent of cracking in these specimens (for example see figure 30), it is felt that additional cycling would have been minimal if the test had not been stopped because the interlocks were activated. Therefore, the cycle count at the time of interlock for each specimen was used in the data analysis.
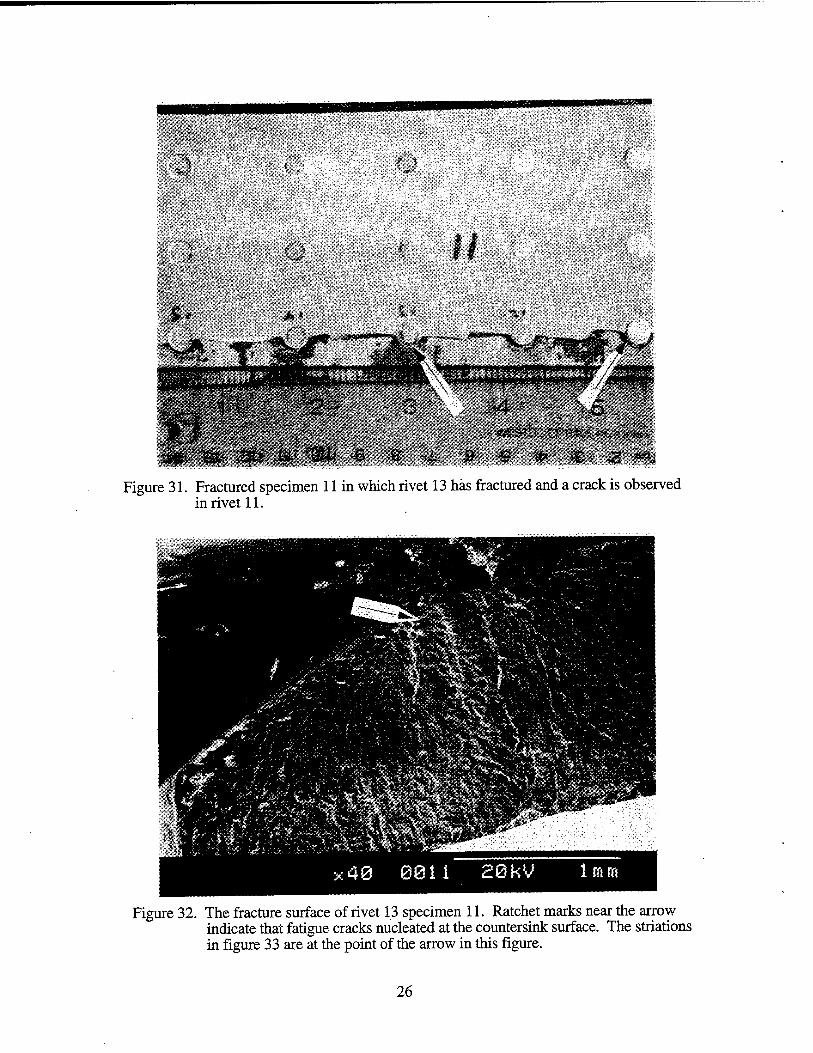
Seven of the eight specimens riveted with FV/C-Squeeze procedures were found through optical microscope inspection to have cracks along a chord of the circular top of the rivet head. Four of these rivet heads (one each in specimens 8, 11, 3R, and 10R) had fractured. Figure 31 shows fractured specimen 11 in which rivet 13 has fractured and a crack is observed in rivet 11. In all, 12 rivets were observed to be cracked or fractured. Of these, one was in rivet 11, three were in rivet 12, five were in rivet 13, and three were in rivet 14. No cracks were found in any CE or FV/rivet gun with bucking bar specimens. The fracture surface of rivet 13 specimen 11 is shown in figure 32. Ratchet marks near the arrow in this figure indicate that fatigue cracks nucleated at the countersink surface of the rivet. This is confirmed in figure 33 which shows fatigue striations located at the point of the arrow in figure 32.
20
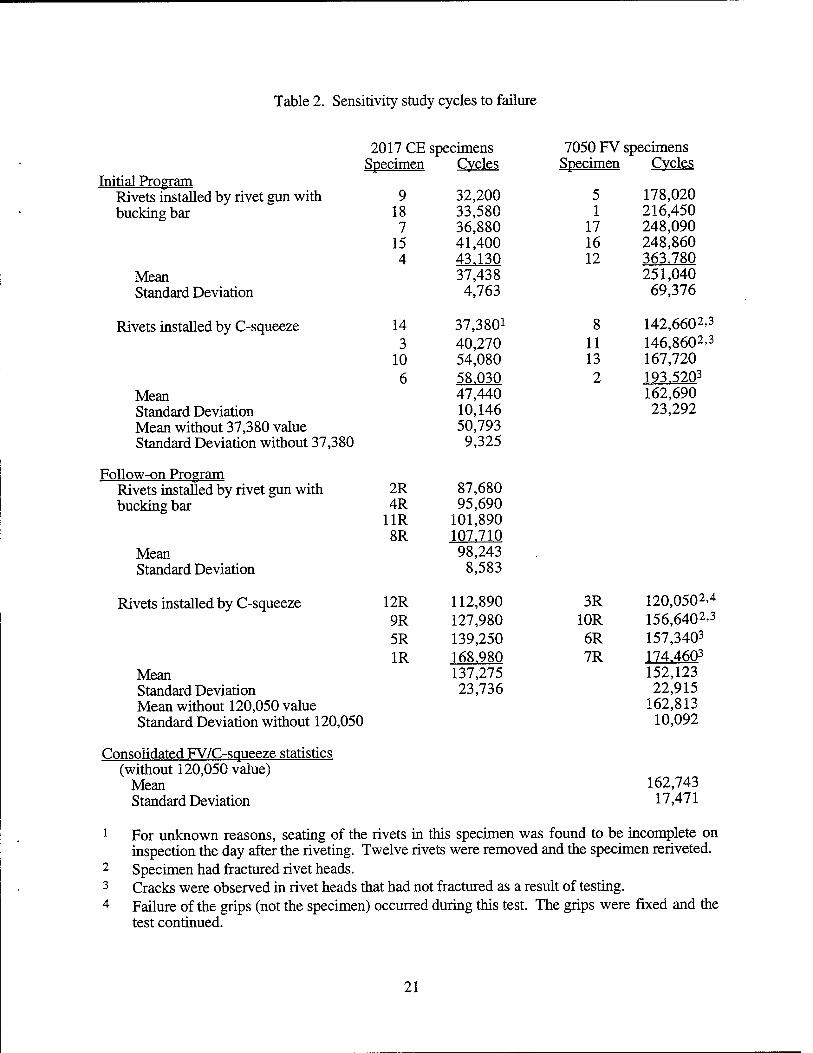
Table 2. Sensitivity study cycles to failure
2017 CE specimens Specimen Cycles
9 32,200 18 33,580 7 36,880 15 41,400 4 43.130
37,438 4,763
14 37,380* 3 40,270 10 54,080
6 58.030 47,440 10,146 50,793 9,325
2R 87,680 4R 95,690 11R 101,890 8R 107.710
98,243 8,583
12R 112,890 9R 127,980 5R 139,250 1R 168.980
137,275 23,736
7050 FV specimens Cycles
5 178,020 1 216,450
17 248,090 16 248,860 12 363.780
251,040 69,376
8 142,6602>3
11 146,8602>3
13 167,720
2 193.5203 162,690 23,292
Initial Program Rivets installed by rivet gun with bucking bar
Mean Standard Deviation
Rivets installed by C-squeeze
Mean Standard Deviation Mean without 37,380 value Standard Deviation without 37,380
Follow-on Program Rivets installed by rivet gun with bucking bar
Mean Standard Deviation
Rivets installed by C-squeeze 12R 112,890 3R 120,0502>4
10R 156,6402>3
6R 157,3403
7R 174.4603
Mean 137,275 152,123 Standard Deviation 23,736 22,915 Mean without 120,050 value 162,813 Standard Deviation without 120,050 10,092
Consolidated FV/C-squeeze statistics (without 120,050 value)
Mean 162,743 Standard Deviation 17,471
1 For unknown reasons, seating of the rivets in this specimen was found to be incomplete on inspection the day after the riveting. Twelve rivets were removed and the specimen reriveted. Specimen had fractured rivet heads.
3 Cracks were observed in rivet heads that had not fractured as a result of testing. 4 Failure of the grips (not the specimen) occurred during this test. The grips were fixed and the
test continued.
2
21
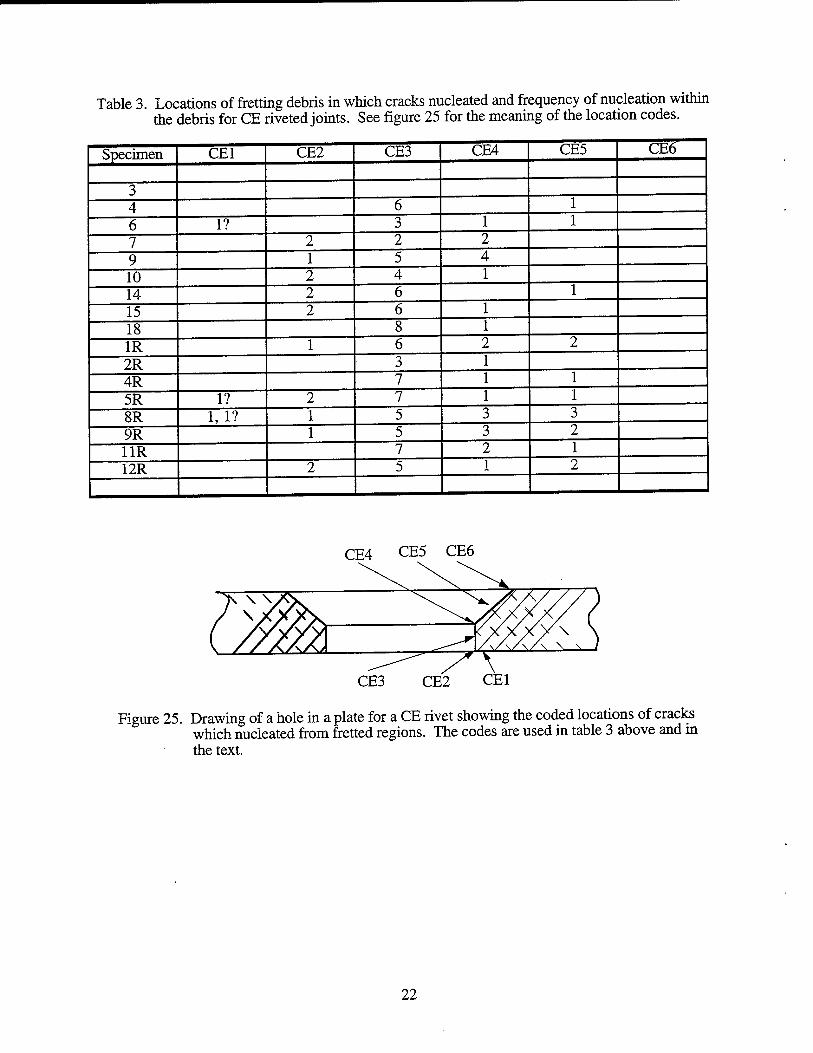
Table 3. Locations of fretting debris in which cracks nucleated and frequency of nucleation within the debris for CE riveted joints. See figure 25 for the meaning of the location codes.
Specimen CE1 CE2 CE3 CE4 CE5 CE6
3 4 6 1
6 1? 3 1 1 7 2 2 2 9 1 5 4 10 2 4 1 14 2 6 1 15 2 6 1 18 8 1 1R 1 6 2 2
2R 3 1 4R 7 1 1
5R 1? 2 7 1 1
8R 1,1? 1 5 3 3
9R 1 5 3 2 11R 7 2 1 12R 2 5 1 2
CE4 CE5 CE6
CE3 CE2 CE1
Figure 25. Drawing of a hole in a plate for a CE rivet showing the coded locations of cracks which nucleated from fretted regions. The codes are used in table 3 above and in the text.
22
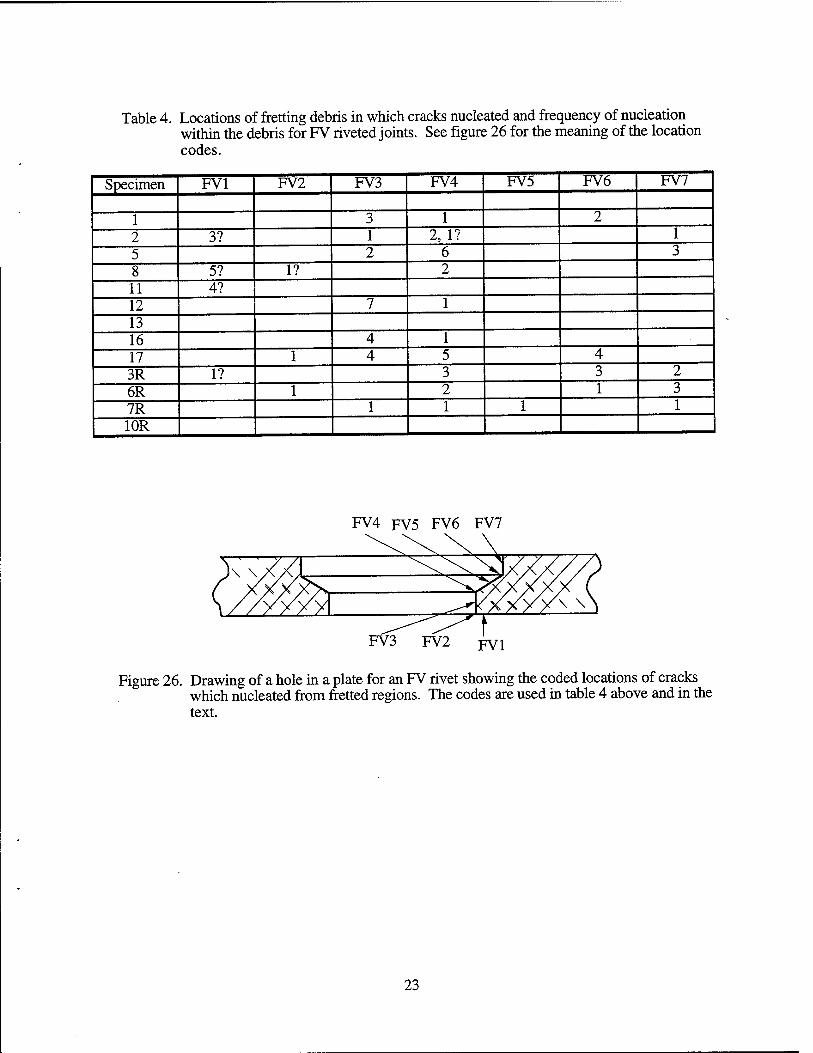
Table 4. Locations of fretting debris in which cracks nucleated and frequency of nucleation within the debris for FV riveted joints. See figure 26 for the meaning of the location codes.
Specimen FV1 FV2 FV3 FV4 FV5 FV6 FV7
1 3 1 2 2 3? 1 2, 1? 1 5 2 6 3 8 5? 1? 2
11 4? 12 7 1 13 16 4 1 17 1 4 5 4 3R 1? 3 3 2 6R 1 2 1 3 7R 1 1 1 1 10R
FV4 FV5 FV6 FV7
Figure 26. Drawing of a hole in a plate for an FV rivet showing the coded locations of cracks which nucleated from fretted regions. The codes are used in table 4 above and in the text.
23
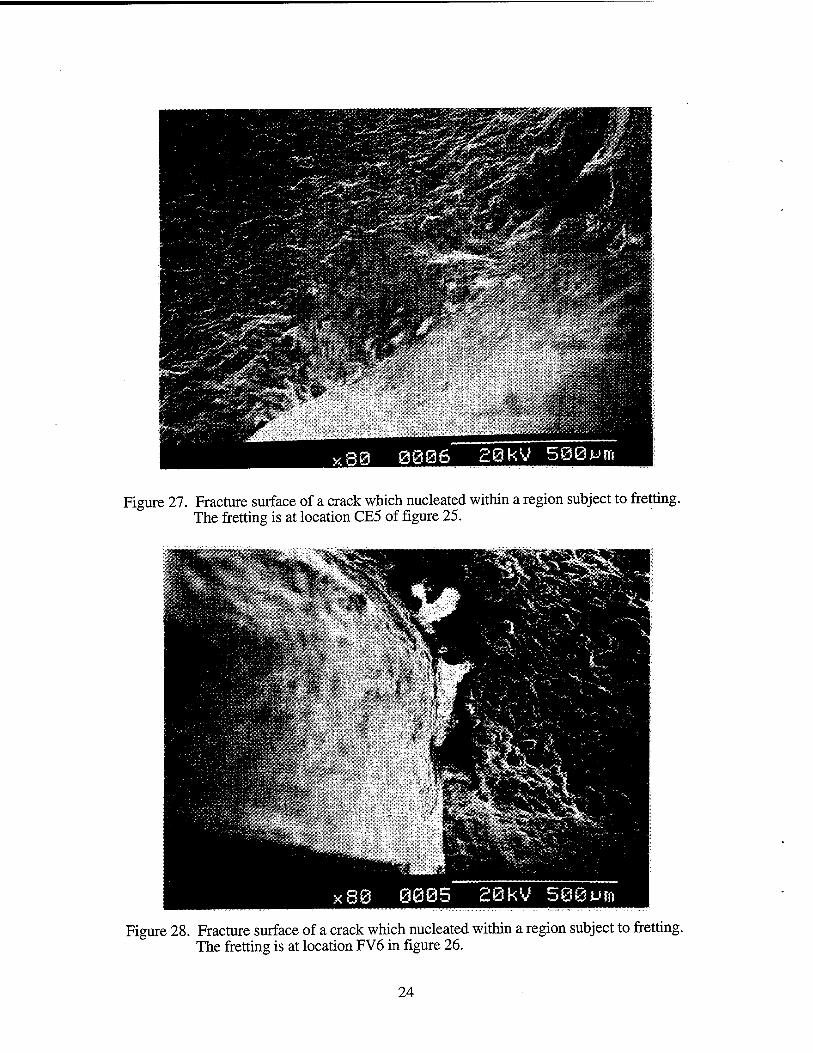
Figure 27. Fracture surface of a crack which nucleated within a region subject to fretting. The fretting is at location CE5 of figure 25.
Figure 28. Fracture surface of a crack which nucleated within a region subject to fretting. The fretting is at location FV6 in figure 26.
24
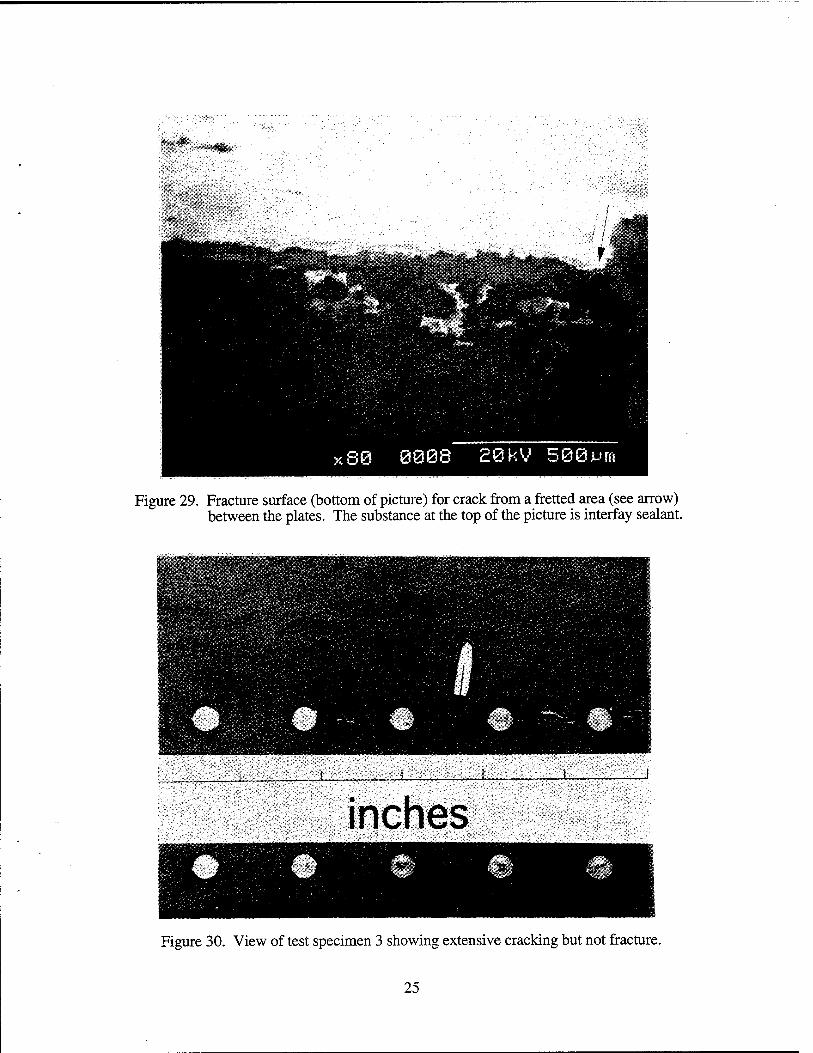
Figure 29. Fracture surface (bottom of picture) for crack from a fretted area (see arrow) between the plates. The substance at the top of the picture is interfay sealant.
inches
Figure 30. View of test specimen 3 showing extensive cracking but not fracture.
25
f \ (\ ItH
~fe:' Ä. &fc£ ':.BF ;'iQfc ' -6l Figure 31. Fractured specimen 11 in which rivet 13 has fractured and a crack is observed
in rivet 11.
x40 0811 28kV 1mm
Figure 32. The fracture surface of rivet 13 specimen 11. Ratchet marks near the arrow indicate that fatigue cracks nucleated at the countersink surface. The striations in figure 33 are at the point of the arrow in this figure.
26
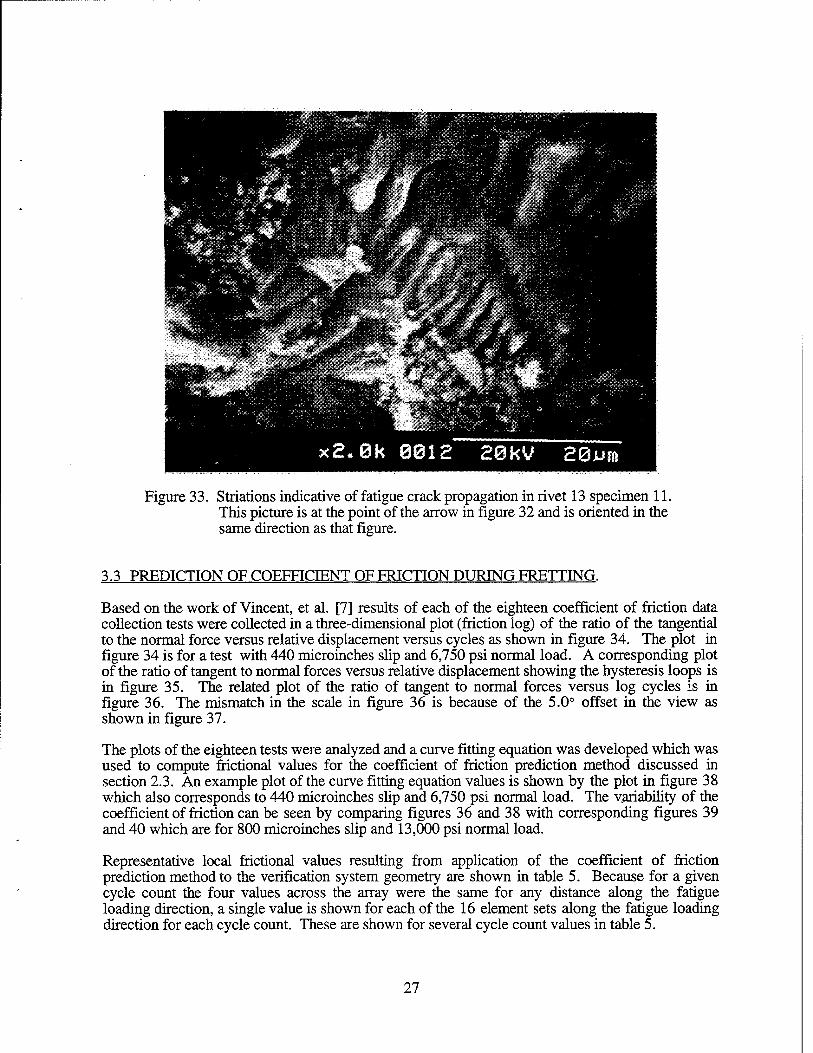
Figure 33. Striations indicative of fatigue crack propagation in rivet 13 specimen 11. This picture is at the point of the arrow in figure 32 and is oriented in the same direction as that figure.
3.3 PREDICTION OF COEFFICIENT OF FRICTION DURING FRETTING.
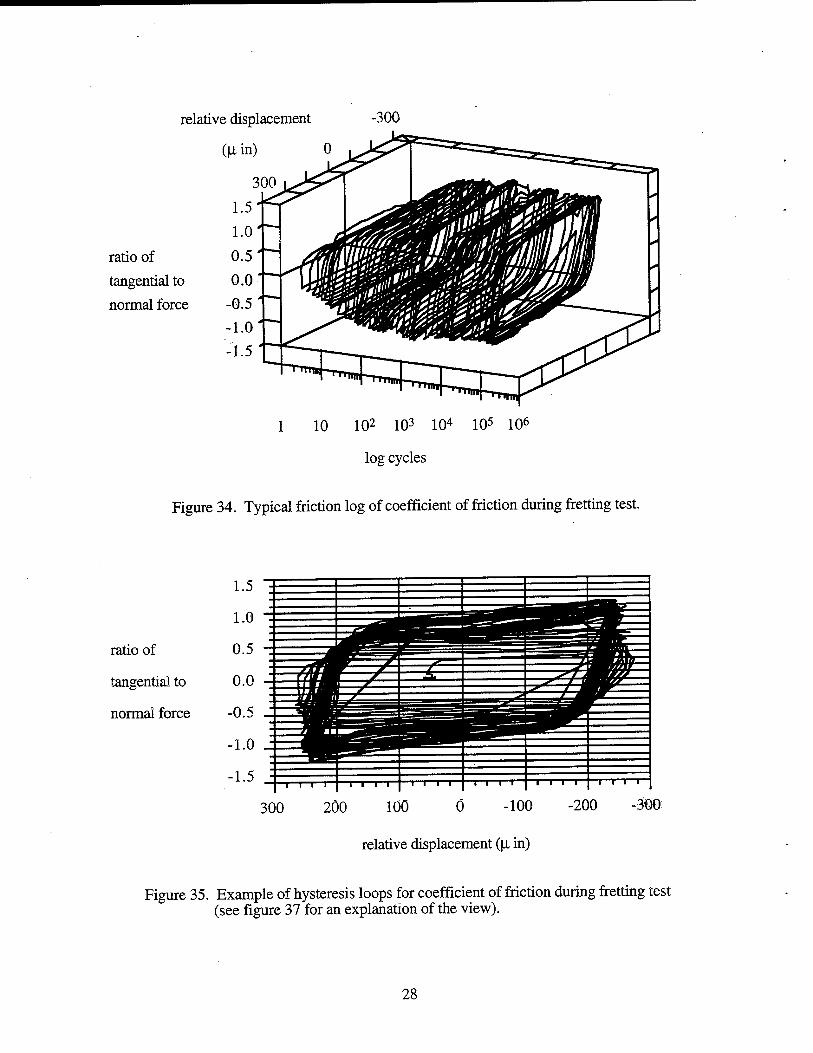
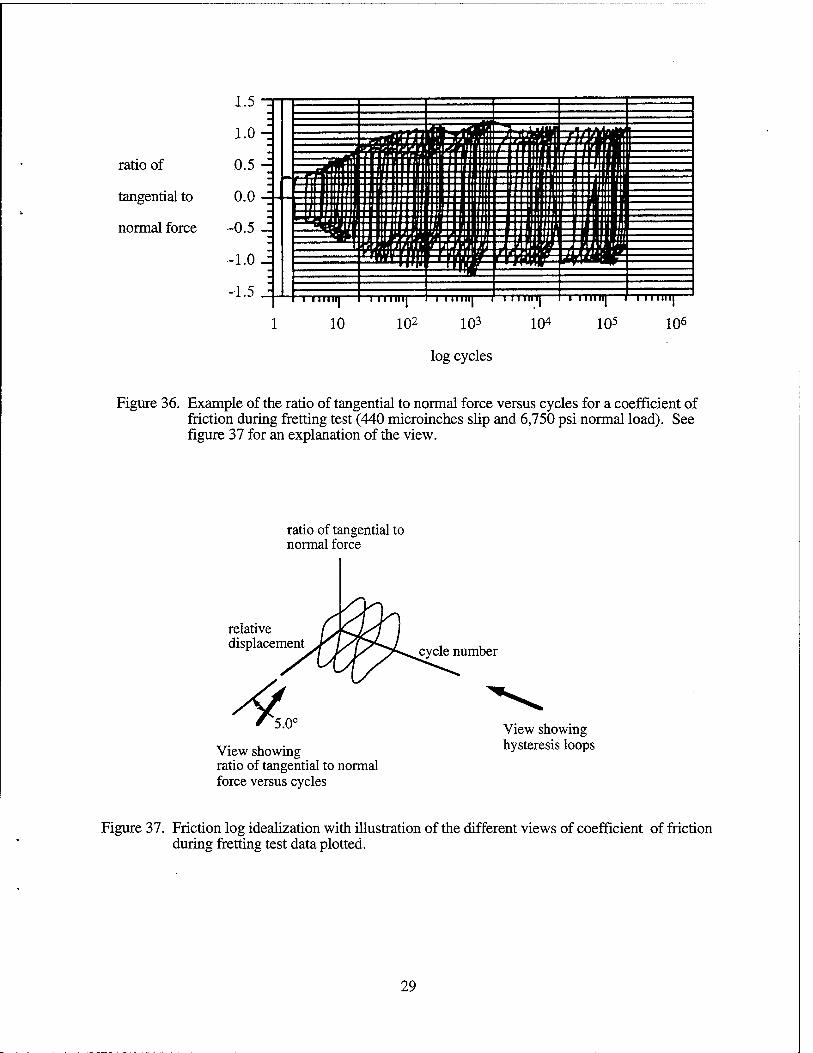
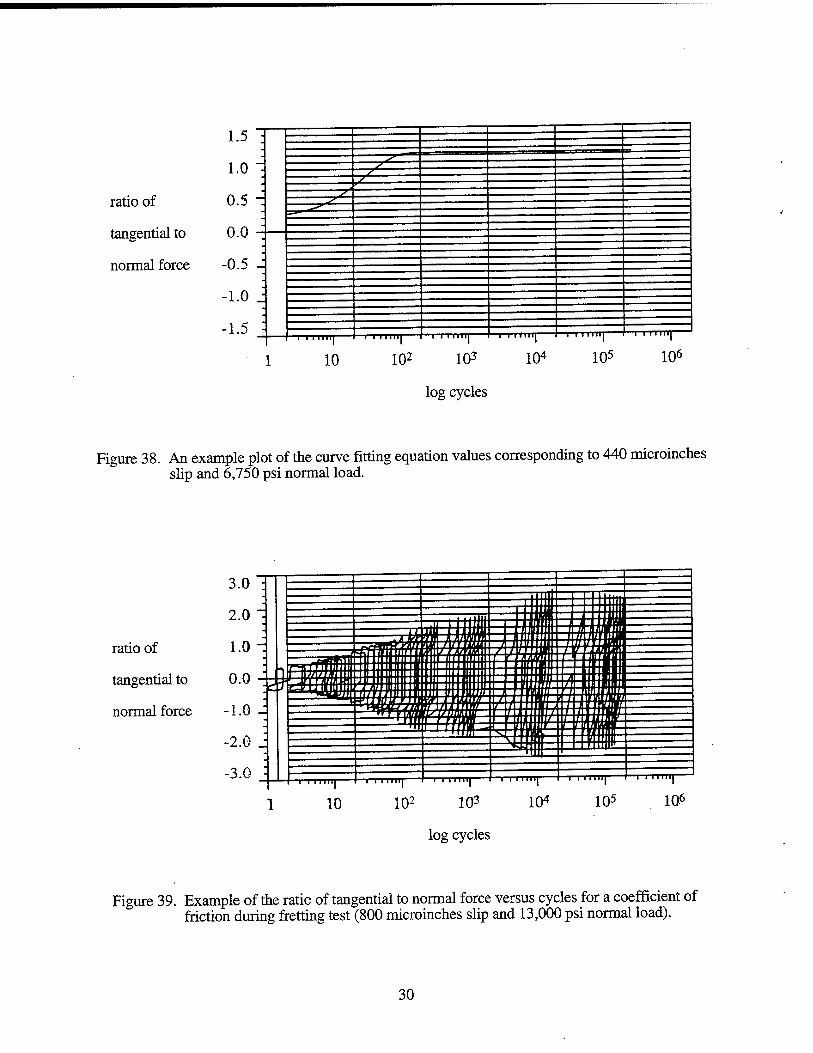
Based on the work of Vincent, et al. [7] results of each of the eighteen coefficient of friction data collection tests were collected in a three-dimensional plot (friction log) of the ratio of the tangential to the normal force versus relative displacement versus cycles as shown in figure 34. The plot in figure 34 is for a test with 440 microinches slip and 6,750 psi normal load. A corresponding plot of the ratio of tangent to normal forces versus relative displacement showing the hysteresis loops is in figure 35. The related plot of the ratio of tangent to normal forces versus log cycles is in figure 36. The mismatch in the scale in figure 36 is because of the 5.0° offset in the view as shown in figure 37.
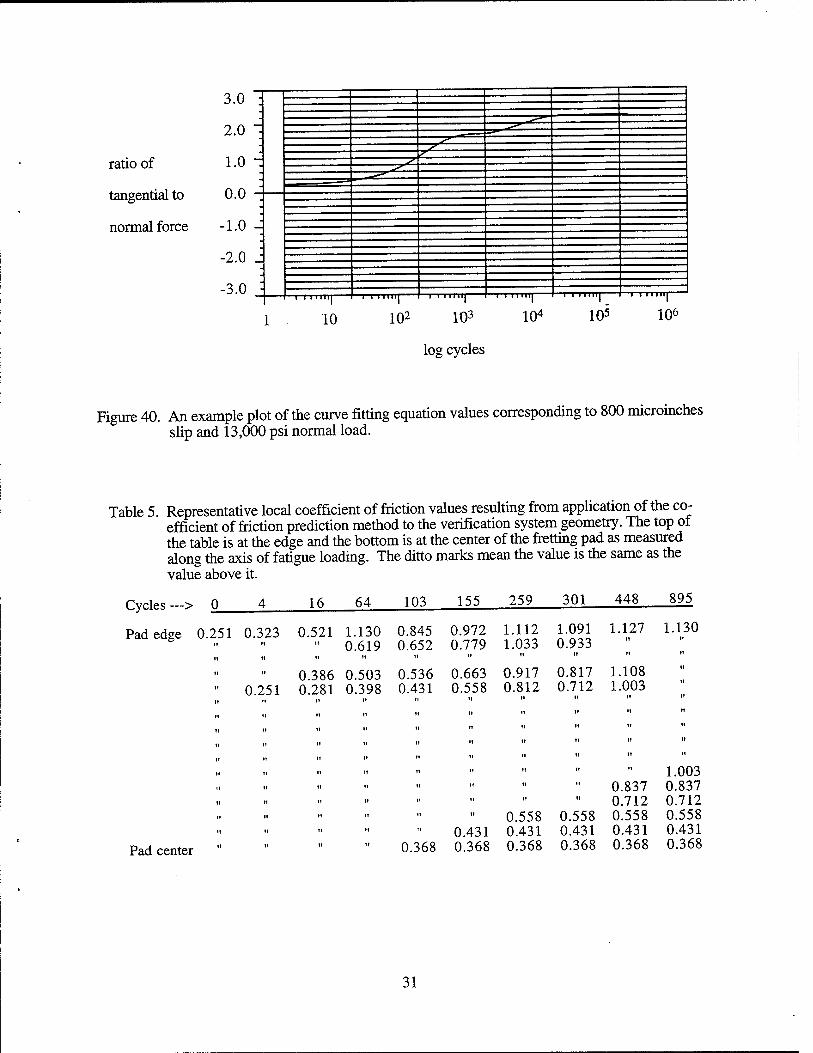
The plots of the eighteen tests were analyzed and a curve fitting equation was developed which was used to compute frictional values for the coefficient of friction prediction method discussed in section 2.3. An example plot of the curve fitting equation values is shown by the plot in figure 38 which also corresponds to 440 microinches slip and 6,750 psi normal load. The variability of the coefficient of friction can be seen by comparing figures 36 and 38 with corresponding figures 39 and 40 which are for 800 microinches slip and 13,000 psi normal load.
Representative local frictional values resulting from application of the coefficient of friction prediction method to the verification system geometry are shown in table 5. Because for a given cycle count the four values across the array were the same for any distance along the fatigue loading direction, a single value is shown for each of the 16 element sets along the fatigue loading direction for each cycle count. These are shown for several cycle count values in table 5.
27
-300
ratio of
tangential to
normal force
1 10 102 103 104 105 106
log cycles
Figure 34. Typical friction log of coefficient of friction during fretting test.
1.5
1.0
ratio of 0.5
tangential to 0.0
normal force -0.5
-1.0
-1.5
T* / J
—i—n—r~ —T—i—t—r-\ —n—r-r— i i i i i i i—r- —l—i—i—i—
300 2Ö0 10Ö 0 -100 -200 -3$0
relative displacement (|i in)
Figure 35. Example of hysteresis loops for coefficient of friction during fretting test (see figure 37 for an explanation of the view).
28
ratio of
tangential to
normal force
1.5
1.0-
0.5 -
0.0
-0.5
-1.0 J
•1.5 ^
II X.KKTS Jill ItltirjH ■■ « (!'!'■ .,*• »I..I« .i. .-•■ .ran ii nun«« ■■«in i ■!■■■■■■ n i II
- .HI ■■■(!• <■■ »nil til ■■■III IIIIIIBBI ■■■III;! •■■•■■■■Ill I i II jl.illl ■ ■■llllllllllllll ■■■III IIIHIaMlMI 'IIHIMIa» ■■■Jill llll
^»IB in IM aaiiiaiiasiiniii •■■ iiniiiiaaHaaini utiiiHaiBaamiiiit' <■■■■ IIIIIIII ■■ maiiaa iinm ■■■ imiiii aanaaani u in ■Mia ilium ■■ ■*■■■■■■ in in ■■■ IIIIIIIIaaiiiiiiii II in IIIIIIII BBil .■■■■■■III III ■■■ IIIIIIII
■ ■null ■■■■ iianaa ill in aaa Iimiit ■mi IIIIIIIIII ■imiiaiti IIIIIIII inn ■■■■■'i mi uaaiaii MI II ■anaiai inn aa ■ ■■■■•■ a in • •naaaiii miiaai ■■■ i.im i aaiBin mi n ^i'.llii'lli ill II ail a ani m ■■■ill iimaai ■■■ IIIIIIII I aa ■•■• nil • l
i.'iN iiaaiiaiiiiiiif.iaiiii niiiaiaii'iiiiii'HBii in tit ■. i ■•■■ II»'-nu" var in i iii.«a» ■iiiiiiiiiaaa • in isn '^IIVIBIII *mr s —r.r.*,..,9iftnr
i HIHI
Timfwr ■ immif 'llll mttwt, t.it.ia
•IHII.V
I II mil i HI mi—f i 11 mil
■II f llll «PIT •'•
mm—r i n imi
10 102 103
log cycles
104 105 106
Figure 36. Example of the ratio of tangential to normal force versus cycles for a coefficient of friction during fretting test (440 microinches slip and 6,750 psi normal load). See figure 37 for an explanation of the view.
ratio of tangential to normal force
relative displacement
4 cycle number
5.0°
View showing ratio of tangential to normal force versus cycles
View showing hysteresis loops
Figure 37. Friction log idealization with illustration of the different views of coefficient of friction during fretting test data plotted.
29
ratio of
tangential to
normal force
102 10*
log cycles
Figure 38. An example plot of the curve fitting equation values corresponding to 440 microinches slip and 6,750 psi normal load.
ratio of
tangential to
normal force
i iuui| I i iniiij 1 i IIMII| 1 ■ i mm 1 ' "iiiij ' • • |
10 102 103
log cycles
104 105 1Q6
Figure 39. Example of the ratio of tangential to normal force versus cycles for a coefficient of friction during fretting test (800 microinches slip and 13,000 psi normal load).
30
ratio of
tangential to
normal force
3.0
2.0
1.0 i
0.0
-1.0 -_
-2.0 1
-3.0
1
i 11 inn—
10
z. -z. ■ZL
102 103 104 105
log cycles
i i i mil—
106
Figure 40. An example plot of the curve fitting equation values corresponding to 800 microinches slip and 13,000 psi normal load.
Table 5. Representative local coefficient of friction values resulting from application of the co- efficient of friction prediction method to the verification system geometry. The top of the table is at the edge and the bottom is at the center of the fretting pad as measured along the axis of fatigue loading. The ditto marks mean the value is the same as the value above it.
Cycles —> 0_ 16 64 103 155 259 301 448 895
Pad edge 0.251 0.323 0.521 1.130 0.845 0.972 1.112 1.091 1.127 1.130 8 0.619 0.652 0.779 1.033 0.933
0.251 0.386 0.503 0.536 0.663 0.917 0.817 1.108 0.281 0.398 0.431 0.558 0.812 0.712 1.003
Pad center 0.368 0.431 0.368
0.558 0.431 0.368
0.558 0.431 0.368
0.837 0.712 0.558 0.431 0.368
1.003 0.837 0.712 0.558 0.431 0.368
31
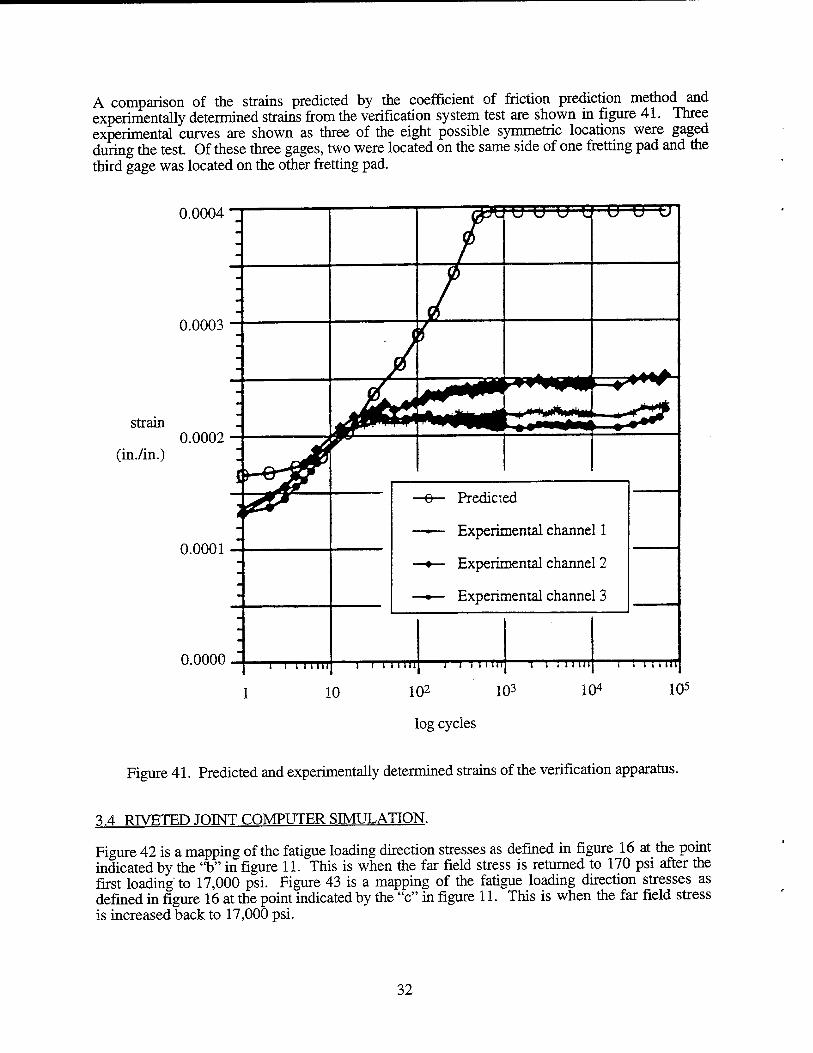
A comparison of the strains predicted by the coefficient of friction prediction method and experimentally determined strains from the verification system test are shown in figure 41. Three experimental curves are shown as three of the eight possible symmetric locations were gaged during the test. Of these three gages, two were located on the same side of one fretting pad and the third gage was located on the other fretting pad.
0.0004
0.0003
strain
(in./in.) 0.0002
0.0001
0.0000 i i i inn
Predicted
Experimental channel 1
Experimental channel 2
Experimental channel 3
i i i inn 1 I 1 I I Ml I I - Ulli
10 102 103
log cycles
104
i 11 mi
105
Figure 41. Predicted and experimentally determined strains of the verification apparatus.
3.4 PJVETED JOINT COMPUTER SIMULATION.
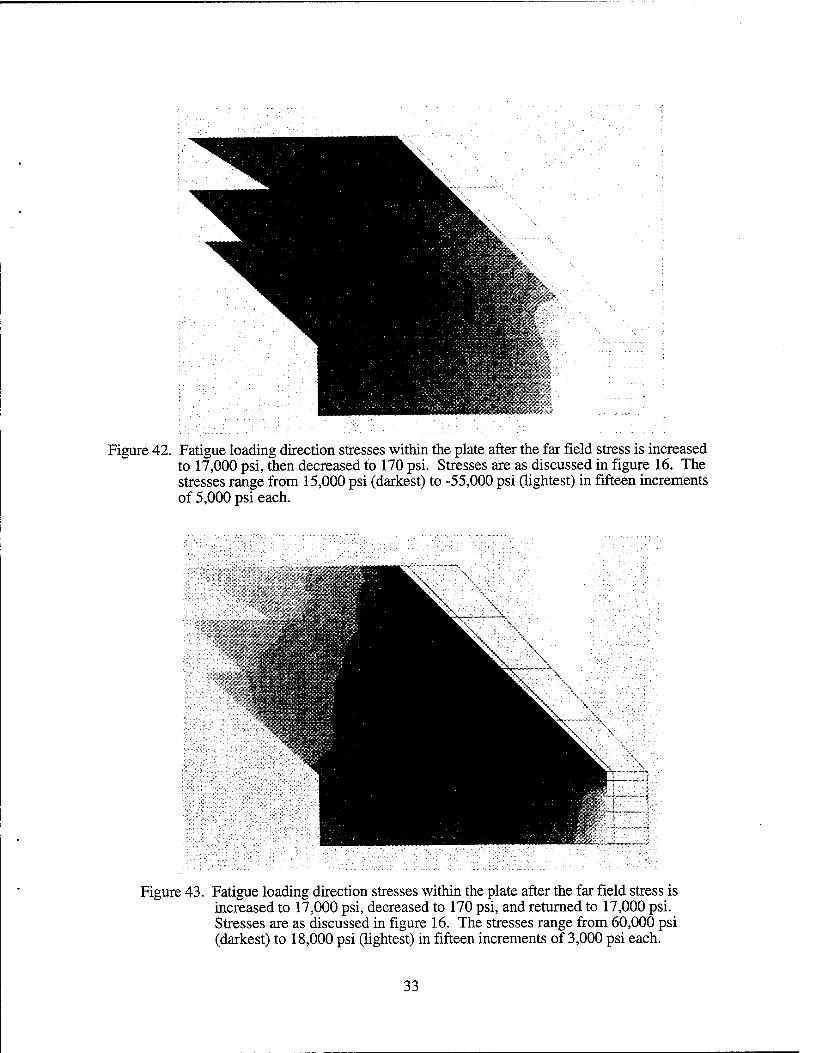
Figure 42 is a mapping of the fatigue loading direction stresses as defined in figure 16 at the point indicated by the "b" in figure 11. This is when the far field stress is returned to 170 psi after the first loading to 17,000 psi. Figure 43 is a mapping of the fatigue loading direction stresses as defined in figure 16 at the point indicated by the "c" in figure 11. This is when the far field stress is increased back to 17,000 psi.
32
U-.W&>i
Figure 42. Fatigue loading direction stresses within the plate after the far field stress is increased to 17,000 psi, then decreased to 170 psi. Stresses are as discussed in figure 16. The stresses range from 15,000 psi (darkest) to -55,000 psi (lightest) in fifteen increments of 5,000 psi each.
Figure 43. Fatigue loading direction stresses within the plate after the far field stress is increased to 17,000 psi, decreased to 170 psi, and returned to 17,000 psi. Stresses are as discussed in figure 16. The stresses range from 60,000 psi (darkest) to 18,000 psi (lightest) in fifteen increments of 3,000 psi each.
33
4 DTSCUSSION.
4.1 TNSPECTTON OF A LAP JOINT PANF.T, FROM A SFR VTCE AIRCRAFT.
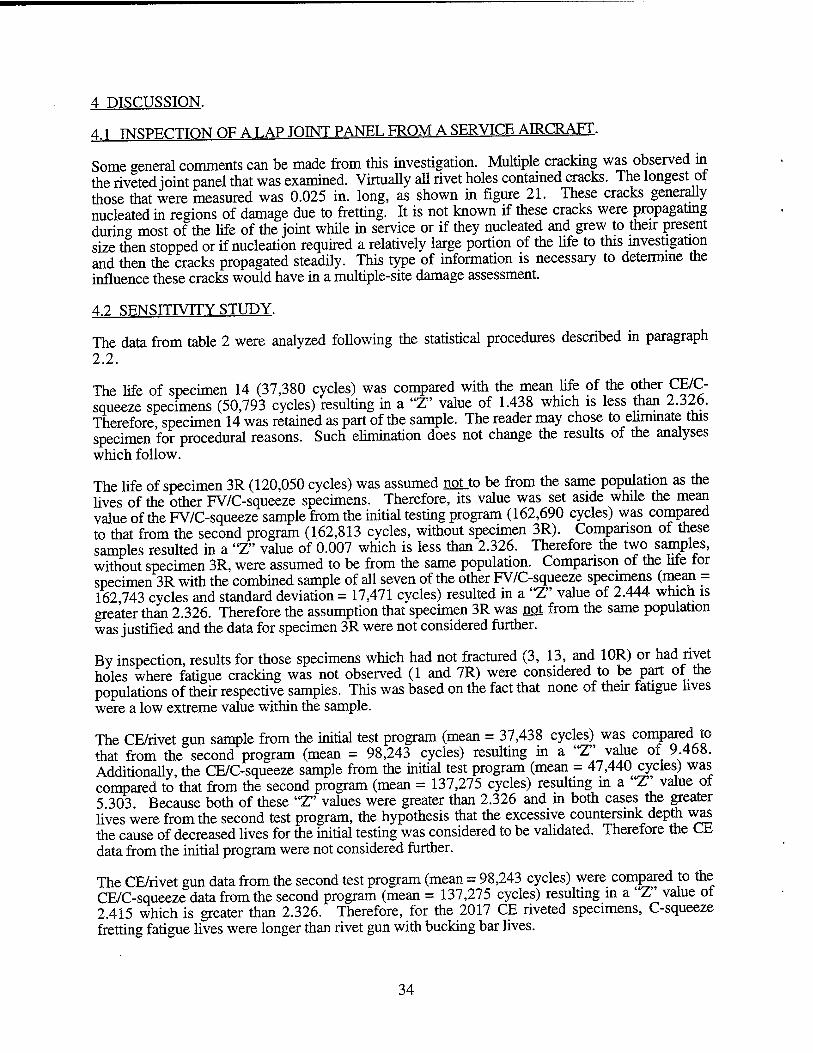
Some general comments can be made from this investigation. Multiple cracking was observed in the riveted joint panel that was examined. Virtually all rivet holes contained cracks. The longest of those that were measured was 0.025 in. long, as shown in figure 21. These cracks generally nucleated in regions of damage due to fretting. It is not known if these cracks were propagating during most of the life of the joint while in service or if they nucleated and grew to their present size then stopped or if nucleation required a relatively large portion of the life to this investigation and then the cracks propagated steadily. This type of information is necessary to determine the influence these cracks would have in a multiple-site damage assessment.
4.2 SENSmVTTY STUDY.
The data from table 2 were analyzed following the statistical procedures described in paragraph 2.2.
The life of specimen 14 (37,380 cycles) was compared with the mean life of the other CE/C- squeeze specimens (50,793 cycles) resulting in a "Z" value of 1.438 which is less than 2.326. Therefore, specimen 14 was retained as part of the sample. The reader may chose to eliminate this specimen for procedural reasons. Such elimination does not change the results of the analyses which follow.
The life of specimen 3R (120,050 cycles) was assumed noLto be from the same population as the lives of the other FV/C-squeeze specimens. Therefore, its value was set aside while the mean value of the FV/C-squeeze sample from the initial testing program (162,690 cycles) was compared to that from the second program (162,813 cycles, without specimen 3R). Comparison of these samples resulted in a "Z" value of 0.007 which is less than 2.326. Therefore the two samples, without specimen 3R, were assumed to be from the same population. Comparison of the life for specimen 3R with the combined sample of all seven of the other FV/C-squeeze specimens (mean = 162 743 cycles and standard deviation = 17,471 cycles) resulted in a "Z" value of 2.444 which is greater than 2.326. Therefore the assumption that specimen 3R was not from the same population was justified and the data for specimen 3R were not considered further.
By inspection, results for those specimens which had not fractured (3, 13, and 1 OR) or had rivet holes where fatigue cracking was not observed (1 and 7R) were considered to be part of the populations of their respective samples. This was based on the fact that none of their fatigue lives were a low extreme value within the sample.
The CE/rivet gun sample from the initial test program (mean = 37,438 cycles) was compared to that from the second program (mean = 98,243 cycles) resulting in a "Z" value of 9 468. Additionally, the CE/C-squeeze sample from the initial test program (mean = 47,440 cycles) was compared to that from the second program (mean = 137,275 cycles) resulting in a "Z'value of 5.303. Because both of these "Z" values were greater than 2.326 and in both cases the greater lives were from the second test program, the hypothesis that the excessive countersink depth was the cause of decreased lives for the initial testing was considered to be validated. Therefore the CE data from the initial program were not considered further.
The CE/rivet gun data from the second test program (mean = 98,243 cycles) were compared to the CE/C-squeeze data from the second program (mean = 137,275 cycles) resulting in a "Z" value of 2.415 which is greater than 2.326. Therefore, for the 2017 CE riveted specimens, C-squeeze fretting fatigue lives were longer than rivet gun with bucking bar lives.
34
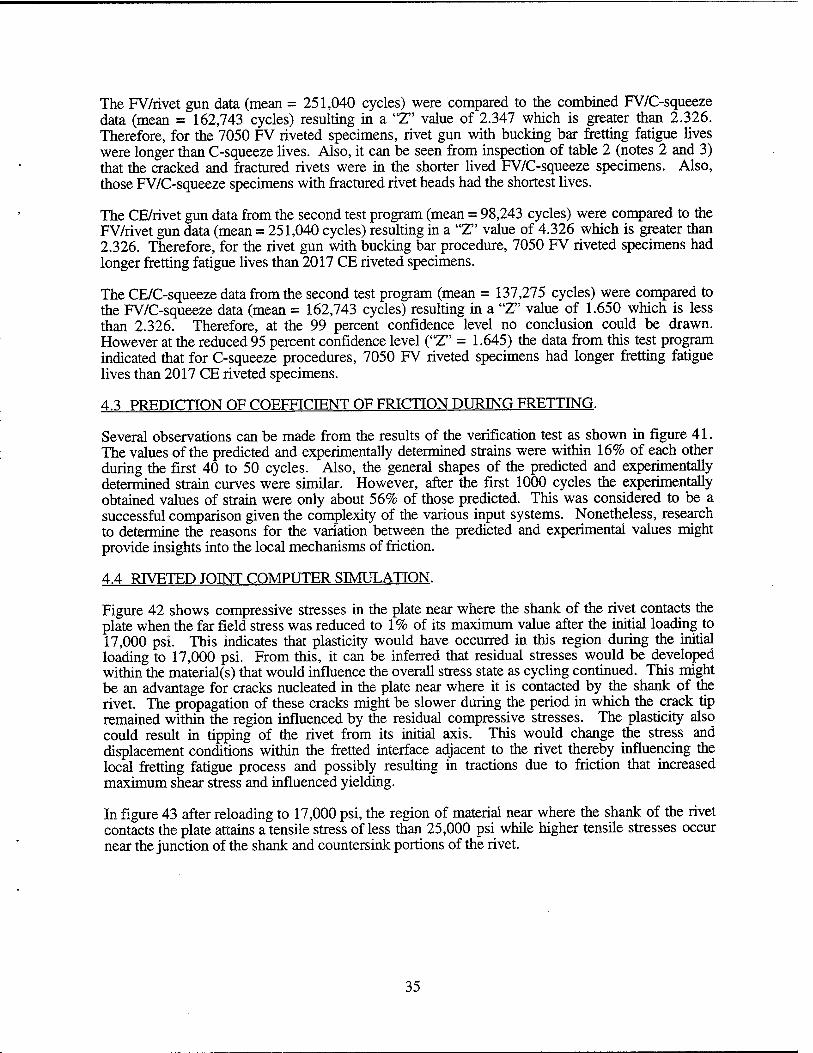
The FV/rivet gun data (mean = 251,040 cycles) were compared to the combined FV/C-squeeze data (mean = 162,743 cycles) resulting in a "Z" value of 2.347 which is greater than 2.326. Therefore, for the 7050 FV riveted specimens, rivet gun with bucking bar fretting fatigue lives were longer than C-squeeze lives. Also, it can be seen from inspection of table 2 (notes 2 and 3) that the cracked and fractured rivets were in the shorter lived FV/C-squeeze specimens. Also, those FV/C-squeeze specimens with fractured rivet heads had the shortest lives.
The CE/rivet gun data from the second test program (mean = 98,243 cycles) were compared to the FV/rivet gun data (mean = 251,040 cycles) resulting in a "Z" value of 4.326 which is greater than 2.326. Therefore, for the rivet gun with bucking bar procedure, 7050 FV riveted specimens had longer fretting fatigue lives than 2017 CE riveted specimens.
The CE/C-squeeze data from the second test program (mean = 137,275 cycles) were compared to the FV/C-squeeze data (mean = 162,743 cycles) resulting in a "Z" value of 1.650 which is less than 2.326. Therefore, at the 99 percent confidence level no conclusion could be drawn. However at the reduced 95 percent confidence level ("Z" = 1.645) the data from this test program indicated that for C-squeeze procedures, 7050 FV riveted specimens had longer fretting fatigue lives than 2017 CE riveted specimens.
4.3 PREDICTION OF COEFFICIENT OF FRICTION DURING FRETTING.
Several observations can be made from the results of the verification test as shown in figure 41. The values of the predicted and experimentally determined strains were within 16% of each other during the first 40 to 50 cycles. Also, the general shapes of the predicted and experimentally determined strain curves were similar. However, after the first 1000 cycles the experimentally obtained values of strain were only about 56% of those predicted. This was considered to be a successful comparison given the complexity of the various input systems. Nonetheless, research to determine the reasons for the variation between the predicted and experimental values might provide insights into the local mechanisms of friction.
4.4 RIVETED JOINT COMPUTER SIMULATION.
Figure 42 shows compressive stresses in the plate near where the shank of the rivet contacts the plate when the far field stress was reduced to 1% of its maximum value after the initial loading to 17,000 psi. This indicates that plasticity would have occurred in this region during the initial loading to 17,000 psi. From this, it can be inferred that residual stresses would be developed within the material(s) that would influence the overall stress state as cycling continued. This might be an advantage for cracks nucleated in the plate near where it is contacted by the shank of the rivet. The propagation of these cracks might be slower during the period in which the crack tip remained within the region influenced by the residual compressive stresses. The plasticity also could result in tipping of the rivet from its initial axis. This would change the stress and displacement conditions within the fretted interface adjacent to the rivet thereby influencing the local fretting fatigue process and possibly resulting in tractions due to friction that increased maximum shear stress and influenced yielding.
In figure 43 after reloading to 17,000 psi, the region of material near where the shank of the rivet contacts the plate attains a tensile stress of less than 25,000 psi while higher tensile stresses occur near the junction of the shank and countersink portions of the rivet.
35
5 CONCLUSIONS.
5.1 INSPECTION OF A LAP JOINT PANEL FROM A SERVICE AIRCRAFT.
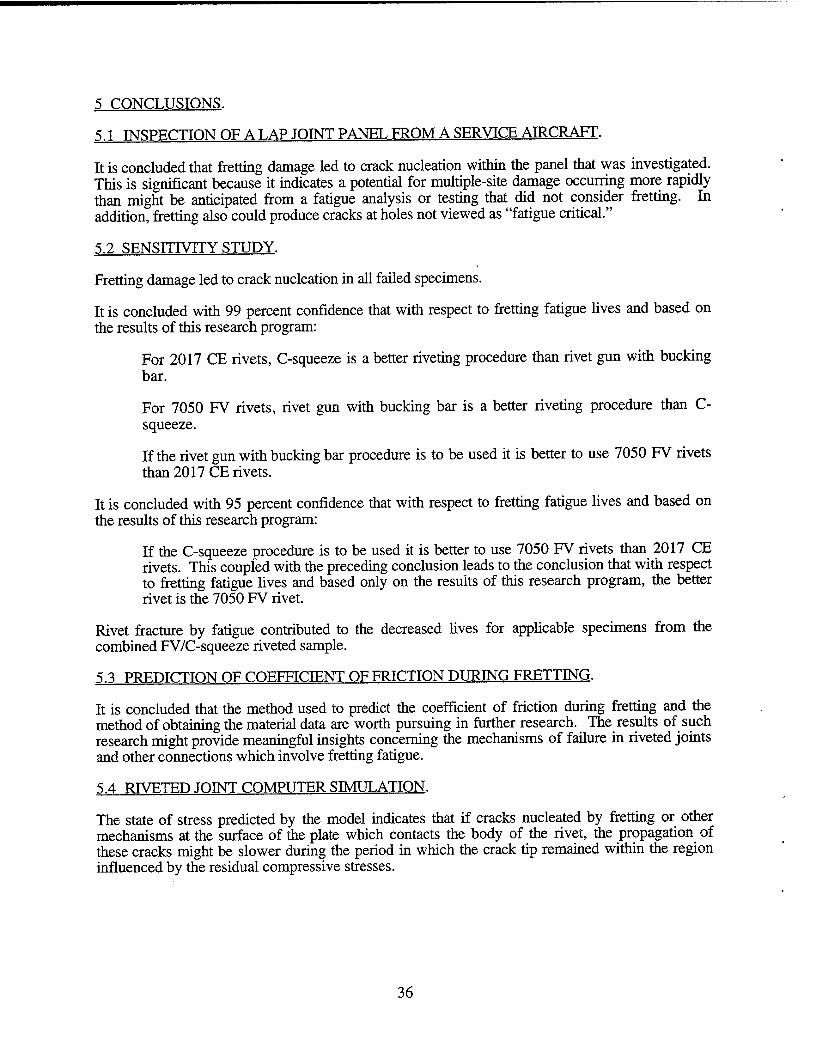
It is concluded that fretting damage led to crack nucleation within the panel that was investigated. This is significant because it indicates a potential for multiple-site damage occurring more rapidly than might be anticipated from a fatigue analysis or testing that did not consider fretting. In addition, fretting also could produce cracks at holes not viewed as "fatigue critical."
5.2 SENSITIVITY STUDY.
Fretting damage led to crack nucleation in all failed specimens.
It is concluded with 99 percent confidence that with respect to fretting fatigue lives and based on the results of this research program:
For 2017 CE rivets, C-squeeze is a better riveting procedure than rivet gun with bucking bar.
For 7050 FV rivets, rivet gun with bucking bar is a better riveting procedure than C- squeeze.
If the rivet gun with bucking bar procedure is to be used it is better to use 7050 FV rivets than 2017 CE rivets.
It is concluded with 95 percent confidence that with respect to fretting fatigue lives and based on the results of this research program:
If the C-squeeze procedure is to be used it is better to use 7050 FV rivets than 2017 CE rivets. This coupled with the preceding conclusion leads to the conclusion that with respect to fretting fatigue lives and based only on the results of this research program, the better rivet is the 7050 FV rivet.
Rivet fracture by fatigue contributed to the decreased lives for applicable specimens from the combined FV/C-squeeze riveted sample.
5.3 PREDICTION OF COEFFICIENT OF FRICTION DI IRTNG FRETTING.
It is concluded that the method used to predict the coefficient of friction during fretting and the method of obtaining the material data are worth pursuing in further research. The results of such research might provide meaningful insights concerning the mechanisms of failure in riveted joints and other connections which involve fretting fatigue.
5.4 RIVETED JOINT COMPUTER SIMULATION.
The state of stress predicted by the model indicates that if cracks nucleated by fretting or other mechanisms at the surface of the plate which contacts the body of the rivet, the propagation of these cracks might be slower during the period in which the crack tip remained within the region influenced by the residual compressive stresses.
36
6 REFERENCES.
1. Compilation ofASTM Standard Definitions, 6th Edition, 1986.
2. Hoeppner, D. W. and Goss, G. L., "A Fretting-Fatigue Damage Threshold Concept," Wear, Vol. 27, 1974, pp. 61-70.
3. Piascik, R. S., Willard, S. A., and Miller, M., "The Characterization of Widespread Fatigue Damage in Fuselage Structure," NASA Conference Publication 3274,1994.
4. O'Connor, Patrick D. T., Practical Reliability Engineering, John Wiley & Son, 1991.
5. Moesser, M. W., Toward Prediction of Coefficient of Friction During Fretting, Ph.D. dissertation, University of Utah, 1996.
6. Kinyon, S. E., A Finite Element Analysis of a Riveted Joint, masters thesis, University of Utah, 1994.
7. Vincent, L., Berthier, Y., and Godet, M., "Testing Methods in Fretting Fatigue: A Critical Appraisal," Standardization of Fretting Fatigue Test Methods and Equipment, M. H. Attia and R. B. Waterhouse (eds.), ASTM, 1992, pp. 33-48.
37/38
APPENDIX A—PLAN FOR FABRICATION, FATIGUE TESTING, AND EXAMINATION OF RIVETED JOINT SPECIMENS (MARCH 20,1995)
1. Overview
1.1. The Quality and Integrity Design Engineering Center (QIDEC) of the University of Utah is in the process of fabricating 18 riveted joint specimens to be used in fatigue testing. QIDEC is either contracting or performing all fabrication procedures as described in paragraph 2. This is a revision from the previous plan which assumed that QIDEC would contract with Macnab Manufacturing which would fabricate the specimens. QIDEC will perform all testing and examination of failed specimens in accordance with paragraph 3.
1.2. The 18 specimens will be fabricated from 0.063 gage 2024-T3 clad sheet aluminum alloy with riveting procedures as follow:
four C-squeeze joints with 7050 Briles rivets, four C-squeeze joints with 2017 CE rivets, five rivet gun with bucking bar joints with 7050 Briles rivets, and five rivet gun with bucking bar joints with 2017 CE rivets.
1.3. In the paragraphs that follow, reference is continually made to table Al which shows the specimen preparation and testing protocol to be followed. Two sets of QIDEC drawings are also attached. The first gives the specific procedures to be followed in those cases where the specimen preparation work is not contracted outside of QJDEC. The second shows the system to be used during the fatigue testing to counter the tendency of the riveted joints to bend in the riveted area when under tensile loading.
2. Joint Fabrication Procedures
2.1. QIDEC obtained 36 6-in.-wide coupons of 2024-T3 clad sheet aluminum, a bag of CE rivets and a bag of Briles rivets.
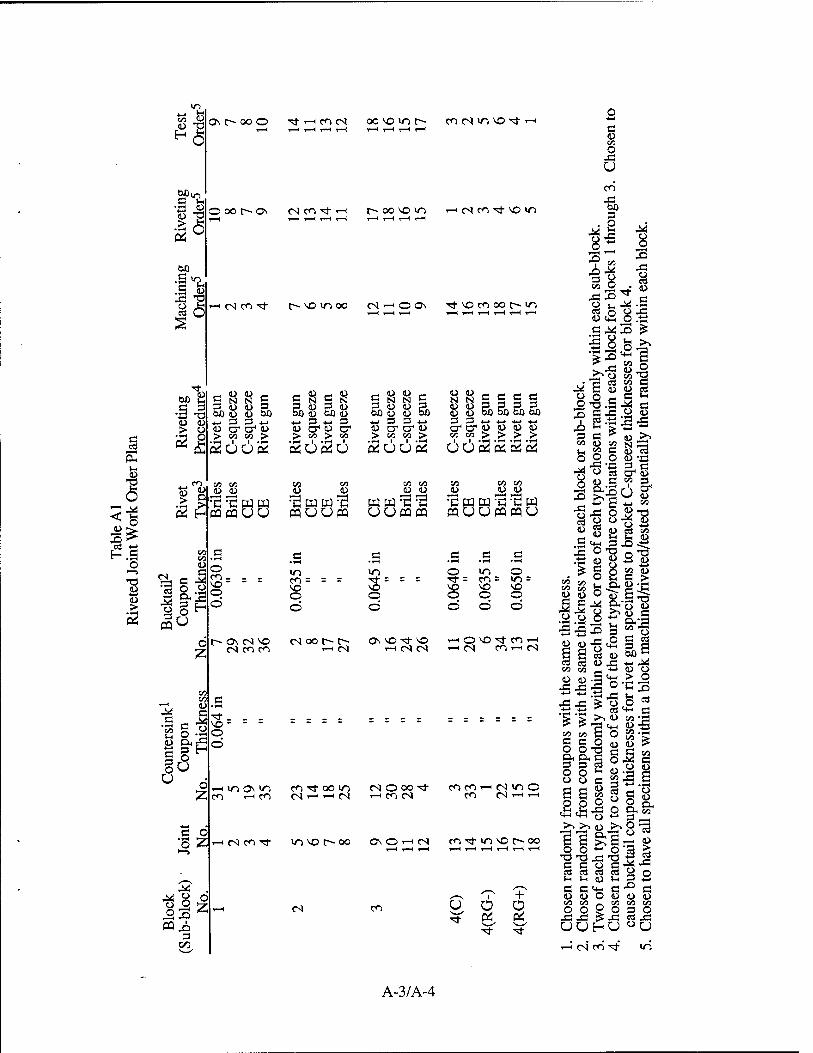
2.1.1. The coupons were numbered consecutively as unpacked and the thickness of each end of each coupon was measured twice with a digital micrometer and recorded. Based on these measurements, the coupons were paired for manufacturing into sets such that the coupon thickness in the coupon where the rivet heads are to be located was the same for all joints, and the coupon thicknesses adjacent to the bucktails were conducive to experimental blocking. Otherwise, random number generation was used to match coupons and, within each experimental block, to determine rivet type, riveting procedure, the order of machining, and the order of riveting. The results of this sorting procedure are shown in table Al.
2.1.2. Rivets from the bags of rivets were measured until sufficient rivets of each type with identical measurements were available for all joints to be manufactured. These dimensions were 0.1875 in. diameter by 0.3475 in. length (including head) for the Briles rivets and 0.188 in. diameter by 0.346 in. length (including head) for the CE rivets.
2.2. The 36 coupons were allodined in a single batch in accordance with MIL-C-5541 class 1A.
2.3. The 36 coupons were coated in a single batch with BMS 10-11 type 1 class A adhesive primer.
2.4. Each coupon will be machined to size in accordance with QIDEC drawings FAASPC94042 and FAASPC94043.
A-l
2.5. Each set of coupons will be clamped together in a machining fixture and not separated until all of the machining in the rivet area is completed.
2.6. All sets will be machined and marked in accordance with QIDEC drawings FAASPC94044 and FAASPC94045 using one milling machine. The order of machining will be as shown in table Al. Initially, pilot holes will be drilled with a centering drill to ensure alignment. Number 10 double margin drills ground to 0.192 in. diameter will be used to drill all rivet holes. Countersink stops will be used to drill all countersinks in order to ensure consistent countersink depth. These stops were set based on inspection of holes drilled and countersunk during pilot machining work sessions. The settings will not be changed during the specimen machining program. The specific drill and countersink used to machine each hole will be identified and documented.
2.7. Rivet hole diameters will be measured using a Meyer C-10 gage set and recorded for all rivet holes in each coupon where the rivet heads are to be located.
2.8. Joints will be riveted in accordance with QIDEC drawings FAASPC94046, FAASPC94047, FAASPC94048, and FAASPC94049. The order of riveting will be as shown in table Al. All specimens within a block will be riveted during the same riveting session. Procedures for each block and between blocks will be as consistent as possible and documented for each rivet, specimen, and block. Specifically, the same person will perform the same tasks using the same equipment and procedures during riveting of all specimens to the extent feasible and appropriate. The diameter of each bucktail will be determined to be within specifications by use of go/no-go gages. Environmental (temperature and relative humidity) and lighting conditions will be as consistent as possible. Temperature and relative humidity will be recorded at the time that the riveting of each specimen is begun.
2.9. Rivet head clearances will be computed and recorded for all rivets in each specimen based upon measurements using a machinists microscope.
3. Joint Fatigue Testing and Examination Procedures
3.1. All testing will be conducted on the same calibrated MTS servo hydraulic tension testing load system. Prior to testing, the load system will be aligned by direct alignment of the grips. Additionally, alignment will be verified prior to and following testing of each block of specimens (see table Al) using an alignment specimen to be produced by QIDEC.
3.2. Testing will be conducted sequentially within four test blocks. The order of testing, based on random number generation within each block, will be as shown in table Al. Fatigue loading will be with a 10 Hz sine wave driving signal, a maximum nominal tensile stress of 17 ksi, and a stress ratio of R = 0.1. The system shown in the attached drawings will be used during the fatigue testing to counter the tendency of the riveted joints to bend in the riveted area when under tensile loading. Temperature and relative humidity will be recorded at the time that the testing of each specimen is begun. Total cycles to fracture will be determined for each specimen.
3.3. Following testing, failed joints will be stored in a desiccant chamber when they are not being examined.
3.4. The joints will be examined optically with little or no magnification and using an optical microscope to identify probable locations and causes of crack nucleation. Then, metallographic and fractographic investigations will be performed to confirm the causes of crack nucleation and identify the mechanisms involved in the process. Photographs will be taken as appropriate.
A-2
Tes
t O
rder
ON r^ 00 0 Tl" T-H CO CN oo*om> co cN m vo rf TH 0 4-J
1—i 1-H 7—1 1—1 T—1 1-H 1-H 1-H T-H c 00
0 J3 u
c^ CO
J3
Riv
eti
Ord
e OOOXJi CN CO "3" 1—1 M»vom TH M cn ■* vo 10
bloc
k.
5 1
thro
ug
bloc
k. 1—1 1-H 1—1 1—1 I—1 1 1 T-H T-H T-H
bfl .S v-> p >-<
h su
b-
bloc
k;
:4.
riea
ch
86 H(S(*l^t t~- VO «O 00 CN 1-1 O ON ■n- vo co 00 c-~ <n O «H -* -S
T-H 1 1 T-H 1-H T-H y—i T-H 1-H 1-H
3^3 £
?>ü COT;
*3 *o gun
eeze
ee
ze
gun
gun
eeze
gu
n ee
ze
gun
eeze
ee
ze
gun t^ fg 3 3 3 3
u 8 & oß 6ß 6fl bloc
k,
ndom
l hi
n ea
ic
knes
en
ran
0) 1> +-* 3 3 ■*-» 4-. 3 *.. 3 *.. 3 3 +-» 3 3 ■!-»■*-» 4-» 4-» i 5"25 5- o (D CT1 O-1 4> <u CJI (u cy <u er1 cr £> CT1 CT1 4> 4> 1> D £> u > *3 3 C -** ü >>
.21 *& > 00 00 > > 00 > oo > op op > 5« M > > > >
Sous 2 U 2 U 2 U U 2 u u 2 2 2 2 w ü » N3 TH SO C O> « S 5 Q 0 0 -Ö
=3
SS.
ss w
ithin
eac
h bl
ock
»r on
e of
eac
h ty
pe c
h 'p
roce
dure
com
bina
ti le
ns to
bra
cket
C-s
qu
rive
ted/
test
ed s
eque
n
1 2 H
00 00
c
00 00 00 00
•"Sa m^ 00 00 00 00 00
Tab
le A
l Jo
int W
ork WfflUU
0
«ÜÜW
in
UUWffl
_3
«n
«UUWfflU
.s .s .s 0 <n 0
T3 4>
Buc
ktai
l2
Cou
pon
Thi
ck co - - -
vo - - " CO = = = vo
Tj- r = z VO
Tfr = CO = >n = VO vo vo
A3 ID > 2
0 Ö
0 Ö
O Ö
OOO Ö Ö Ö
thic
kne
thic
kne;
bl
ocke
ur
type
/ sp
eckt
ch
ined
/ o r~ ON CN vo CN 00 i> r- ON VOrl- VO T-H O VO "* CO T-H
£ g 5 o> ao« Z CN CO CO T-H CN 1—1 CN CN 1-H CN CO 1—1 cN
cö co <U J3 *-> M 00 00 — ■>-> D O
00 00
Is r< -^ 55 o a
3 • 1—(
•* _ . - vo- - - 0
= = = = — - - 5 z z - = - -
coup
ons
with
the
coup
ons
with
the
n ra
ndom
ly w
ithir
is
e on
e of
eac
h of
hi
ckne
sses
for
riv
men
s w
ithin
a b
io
Cou
nt©
C
oup
i.
T
h Ö
o rninavi co -<* 00 m MOOC* co co 1-H cN «n O S6 8 1 So O O 2 " O Q^
Z co T-H co CN T-H 1—1 cN T-H CO CN CO CN 1-H T-H
il-gS %™ *2 -; ff&fll S ° "o Z r—j
i—l CN CO Tfr vi^Ot^oo ON O t-H CN co "3- m vo c-» 00 T-H T-H T—1 1-H T-H T-H T-H T-H 1-H 0 0 ~ 0 a >;
-0 Ti 43 T3 -H S 3 BO S-^43
ea 3 cö 3 0 0 -^ i_ »_ m in 3 *H
^ ^—^ /*""*^ C Cö C* fi -*! °. c ,-s 1 + U U O U U t) O O 17
'—I CN CO U Ü 0 ^ & &
00 00 _ 00 00 00
O O 2 O 3 O J2XI £-3 cö J3
^f ^ UÜHU°U on ^H cN co -^- in
A-3/A-4
APPENDIX B- -FABRICATION DRAWINGS FOR SENSITIVITY STUDY SPECIMENS
c3 a s5>
o JS U
to Q Q
u £ cs
Z OQ U
CD en
e _o n.
•C u CO
Q
CS
"5
o o c u a)
I
c o
*CO
"> K c CO
> as z
C)
00900 00000
y° ° 000
o
&
u j=
a> 4-1 c o D)
_C 'i_ (D (D C
c III
UJo> Q'w
as
-o c (0
3
© fn 0 q -H ©
^2 1 < < -s Si 2 J u s Og s
>- So < c
F-C\J
o-l CO
U
a o
a
<~ u on
©
u a. 00 < <
•a 3
do >> .ä 00 > C
"si co u
JD E
c of co 'S
■CM CQO S3 53
00 60 c c
s a a .OxiXJ
W-S-S
0 N s e u 3 3 U 00 00 5- «-• «-» o" u u «p > > u55
c 0 e0 C CO 1 C8 u o «■£ w «-» *^
co-- 0 u .a •»>»-°
T3 3 U goo «
7> co es D u o >
13 « P °
« * ** 2 u IS
J-J =« <U W —
u. O »a C 03 co u
<Z u B o s-n
es CO
es
. O o
o o .g
u
eS
"3ggc£
= CS 2 3 U u
_ — « 'tt! 3
£ U r S c
"^ CO CO CO O
ItN
O
C "O
o - o £ £ o ° J
o = -S -S
ä E-a « S Ü *-»
a w B > 2 8 - •"■ c — 'S c o S.2,_- a " .2 ^^ "H.2 o u 'jf?
R üt E
m
o
B-l
«. m
o u
Ö
oo Q
es
Z
tu 03 U
w oa u
c o
Ü
03
05 o c u 1)
CO
> eg
05 Z
< Z
Q
ID U
-OS
>< os oa
o
< Z
00
cr
cr (N
cr
cr
<s
C/3
c eg es 4> to
4) U
t: 3 CO
6/ c
O 0>
< < u.
o a. 3 o u
en
O ■«• ON u a. oo < < a.
e o Q. 3 O u ö\ m
60 C . , = 61 .5 c .s -c es £ 2.2
c o
u c 3 00
u >
3; °o
2° oo ■3--St
°" °- a, a. ooooooS <C <. << U.U.
<< << u-u.
60 .5 04 c =
■E'C SS Si2
> c5
"SI
Si o o " ON
_ U a. cu oo oo << << U.U.
60 •-* HI
.S c JZ -a u u es >
CN
c 5 *—>
tu u u N U Ü 3 cr en
i u
'S" vo ■^•^
a. a. oo 00 << << UHU:
60 E BJl S.E u « eB >
S2
•n 03 u N U U 3 cr CO
u
o T ON
U ON
oo < <
> >-> en
S<
oo c
£S .2-a 2 CO co a^
oo OS
^
o Z
E
o Z 60 c $ eo
a, ■C o
CO eu Q
2
< "5.
CO 3
■u C QJ
C 'L_ a>-
c
c UJ U
Wo) —,CL)
■D c CO
CO
CD*
o +1 X X X x" so
<
X -
a
I* X w
tu z
Hf\i
iä cotvj
U
o\ 0\
u oo
Tf O o o
S o o ** •so
c c sl a > ;s,.s § SO co d _ e u So" o — -a
O <- e •S BO.g "eg
ö§0 ^ c« o
gs " oS 60 o^ C __ eo M-S-O u1§
i
z u < u CO
-3- O
Oof Zoo a i< 1^ u.
T3
> 5 •o 3
00 >>
.■a 60 > B
i'l oo
tu E
55
o Z
B-2

u
Q In 25 en Y
. 40
41
4042
4-1 c CD
o q 2u U JCU CL. nco co g< < o a
Q ^ ^
+1 ©
U ^ ca Z J g
< < 5
z< < tt. u.
Ö
co,_ Q
u E CO
Z
w w < ca CQ CQ u 8 s H in
8 8
1_
cu a) c
"TO c
LU
LUo> Q'co — <u
U S ■» J U 8 O tu -5 PQ 3
c .0
'C
u CO BS
'S 06
Tf o o c u
1
e
co
Q Q >
(5
j k
"öS .o ÖÜ Q ä T5 a 'E >
C 03
ßü CO
z < a
U s u
o g <
3
CO >> '?
u C TI- In C C O
T—* CS u n. öS 2 "O
c CO
ON
co
Z
<
CO 3 o U
£ a. s ca co tu co H —
c 5 < Q
_1
< u 1 > .5
s o •5 = .5 u en
o ü . S
< z
CO
o c
Ü *—»
rn «5 OX!
. CO
O _N co'co
u CO
J§=-2 *
3-a E " er
-S o en
"E iZ
«n ° e<N"2 H
«> H o i .s
en U j= U U 5 Jg w „ .S 5 §•
u — 5s a — -a 2 c -o px> e y o O U UTJÜ a c "»12-S'S tJ "E1*-
■rip c B-tN
(S w o o. «s co
.2
"C t*-1
u '5 e3 « Sco
60 B C o
"il m g" rn o
o •a o,
•c
i 1
1£§2-2*1
1 = § .g S3 ^ M J ■§
o cc CU Q
i
6 Z
I a.
E '-, <N en ^t
e« 00 ra Q" O r—l 3 u
Z ac^:
B-3
N£ Q ■-iö-
£-
o u U
CO Q a $
^ u E tu a
CQ CQ
2 u u -a- u o c
s o CO (3 U CO
n. U öS a
o , , o V3 CO
•n C/3
U "c > H^ U
c to
> o OJ
05 2
CD
c
(J D)
a) a> c
'o> c
LÜ
O'cö
as
CD
■D C CO
CO
5
© q +1 ©
< s o f-
V00
z<
X ° co,—
w
a, u co
CO H 2
ffl < u
O o u
a IS • pa en "
U
n-2 .2 5.5-3
■s'Sil
«So? > 00~ co
«U.g « « «2 tu ~ cc
•~ O o 2 ~
Tl- tS
E p
•a p 3 a"
c CO 3 cr
til *"* C3 5? ~* a i) •"* T-i -o «"H-S-^-o § S; s o s .a P > x: o
- 3 ciJ£ <Q 5< 3
3 C
fio
ö sa.s 3 «'S
oo S; c« rr * M 2-a
13 u § '«N
O 2
< 2
tN
.2 o
•a o a.fs
PS rr o o »< tN CO
oo s r™ i
en i
TJ- C ON U 0. CO < <
■a 3
CO
55 5 c o u a, CO 3
o U
H —
11" S cs
coK
c
c .o
« ^ 2 CO
c o
•X5
Q
o 2
s D-
2 o" 3 U go;
B-4
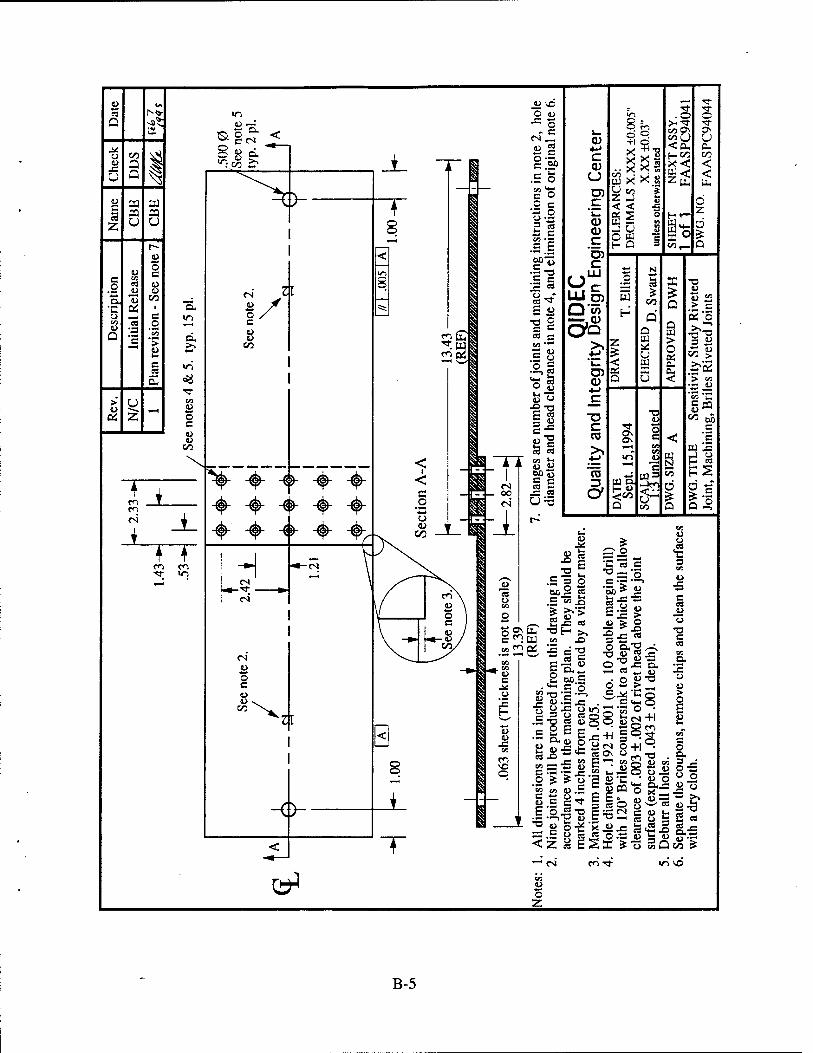
B-5
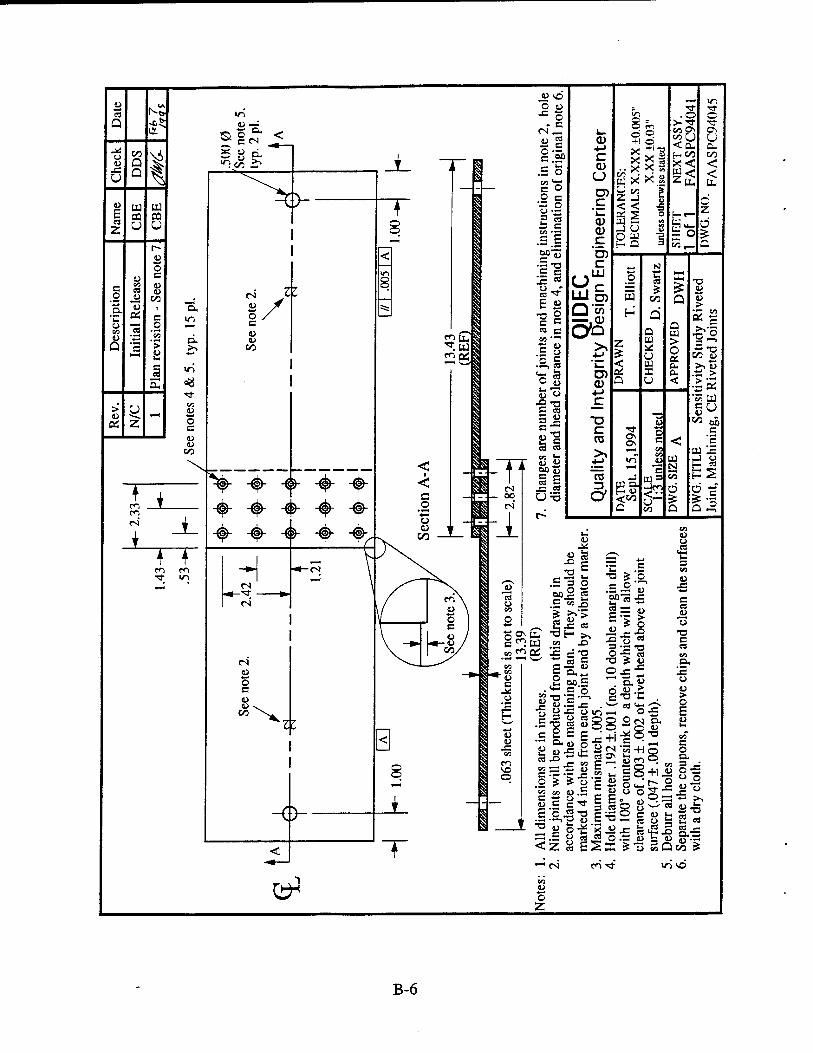
B-6

c
-H
J "es
eg
u U
3 CA
60 c
(4M
U © r- oo "«
CD 4-> C CD U
c CD CD c 'o> c III
LÜO) Q'tö
SS
CD
T3 c CO
CO
5
4 tu X y co
< <
-J u o u
©
+i-q
coo COJJ <CL HCO X<
H-
a = o to.-
5; rr s> U 0. CO
< <
Ö z b
BJ
en
is _o
<*-1> en es oo
JBtC 8 si! el 8 K
.So O m
o 8
S eo e.S «|
£•
' (N CO VD
co
Z id
u co
Q
<
u
5 ö >*» VI
•a D 3r to 05 & a> > O
•a «j 'I §• cou
c tu -s P.S:
g.i
O 2.
u c
3 K
Off)
00 .cr>
(S —<
O _N
co co
c E
c _o
Ǥco
c o
•E a. •C o U
O Z. c '5
e es er 3 u am!
B-7
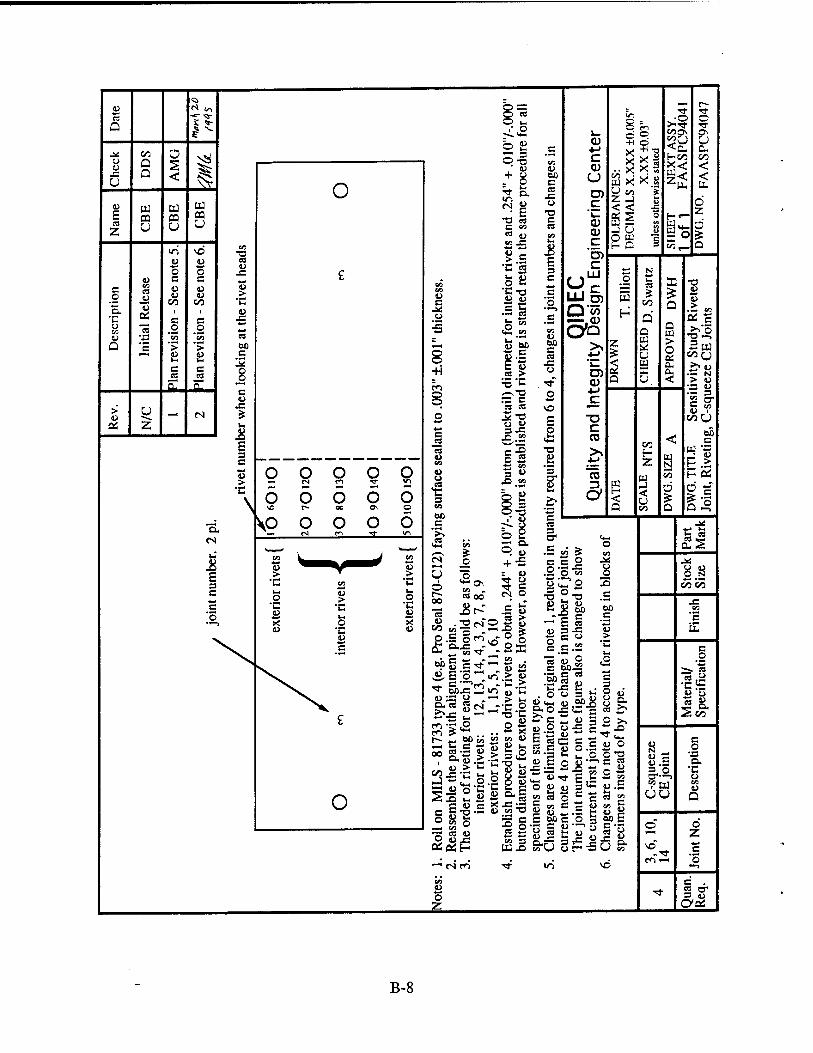
u 00 c es x: o
•o c ca
w x: ?! U - X>
u 60 c ca x: u rr o
E
■a
'3 a* u
T3 C CO
CO
5 s C8 3 cr .£ ™ £ e e © .2o» 3 O •o r,-o £||
c c.2
1aJ '5bS rt
"C H £ ^ . o o = h 5><*- u £PJ£
£>e r u ° o -
o +i X X X x"
Si -1 u O UJ
«1 X s
u
o
<CL. HO0 x<
00
Z a < u CO
s
S.2 H-S C 4-* U
g.| B 2 J2.5S.8 OPij » do r K C e « —
00 e C SJ « fc 6 3
u u
3 **- C *-*
•sg •2.1 £ o
X) _c 00 c u >
■c
e 3
co i>
I- ^ «4-, u o
o2 U.S
U s eo e «'§
L*' en
<u .5
UU
CO •—i
o
u 1/2 < < U.
Ö z a Q
.> « OS c
^> —> 2w O0(J
.— N > U
'I a" i> i oou
oo c
tu *s J «
H0Ä
g.S
ÜI u N
oo co
c
c
5s- «
« « Soo
o •o a. •c u en U Q
o Z c
"o
c 3 U Qai
B-8
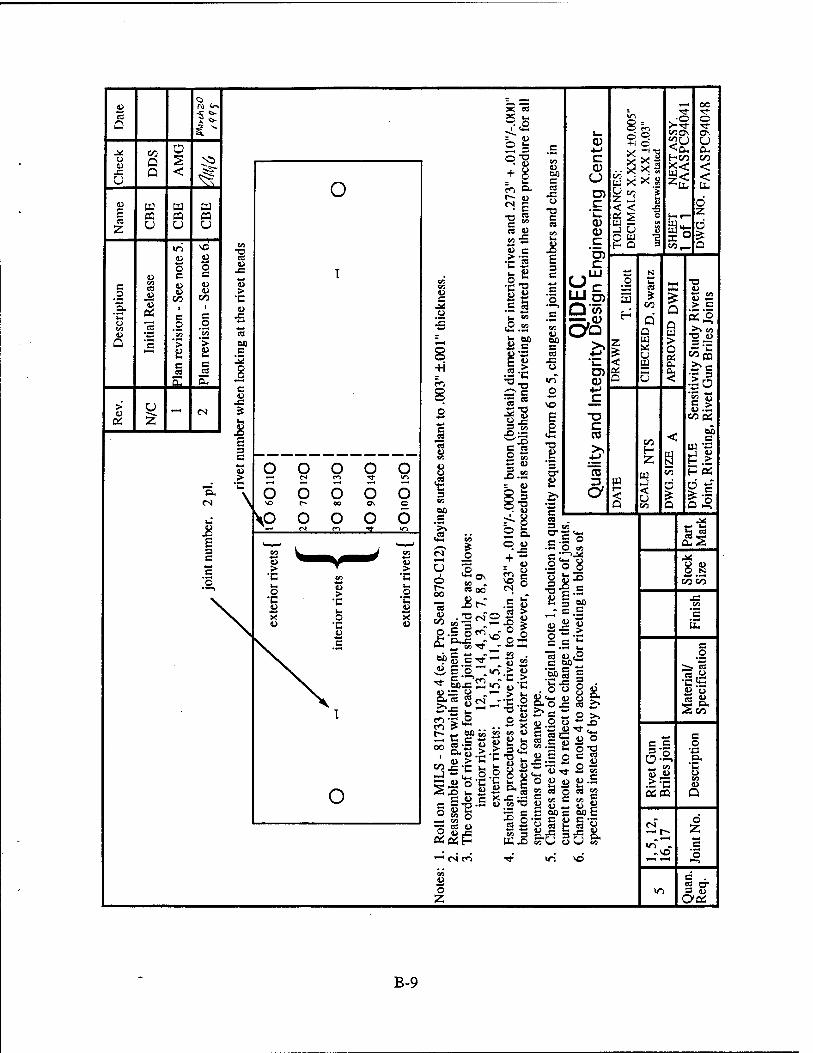
Q o ™ «« a
.* CO O o u n
is <
U ^
E u a w CQ m 03
Z u u U
»ri VO u u es o o u
JE o B
c ca
"3 06
u CO
u u CO
> •c
_a. 1
E 1
B x: o ~^ o o
4-1
o •a en Cn CS Q B > > M
t> £ B
B es
B es 8
Pi 0- E U
>' 4) u »-H (N
CSS Z
E 3 B *^ U > ^ •c
C* \ CS \
tJI
Ja E 3 B *■* E o
E
u
+1 CO
eg en
U u
3
.«
s 1
oS e8o°
^ ocx: ;U »n
CO ? *■' .. ..
3^s:cfeo
en u M E CS
J= ej
•O E es
E 3 C
E "5
u M E cs u
>n o
3 cr u
0) c u
'v. CU CD c 'o> c
LU
O'tö
(D ■*->
-D c (0
co
3 B «S . 3 en
B-S o
Jo 8 I £s -op- el ^-" c .E
ez> C5 +1 X ^ s $* in
UJ X X a U CO =t Z -1 fc* < < ■«7
UJ 2 O
J u 8 O H Q 1
HCO X<
"2,
KÜ
bo
.2-^ co
EU E X
— en w
Ö SS.S
- "es U c2
1 ?l§ E • s« 8 8 •§•§ £ = •£ ~^
£ fe « = u S ° 3c2 "'S " ©'S
S E O U U JJ .S
l«J BO
C« W w ^
53 E E MC 0'5 -= w r< C S E
en 3
1 tN t^i w-i \o
CS
CO
d Q UJ m u
co
Z UJ
< u CO
<
s
o Z
E B
*J eo o ea .STB CtJCQ
oc
O U 0- co < <
0 z d
Q
■o u u S > E 5*5 >» en
3 n; 5« i>E
11 coos
DO B
tü •= -J «>
H a:
i-E
a. S
COCO
E
E _o
« « S CO
E o •a o. •c u en u Q
o Z E
"S
B eS B" 3 ej a«:
B-9
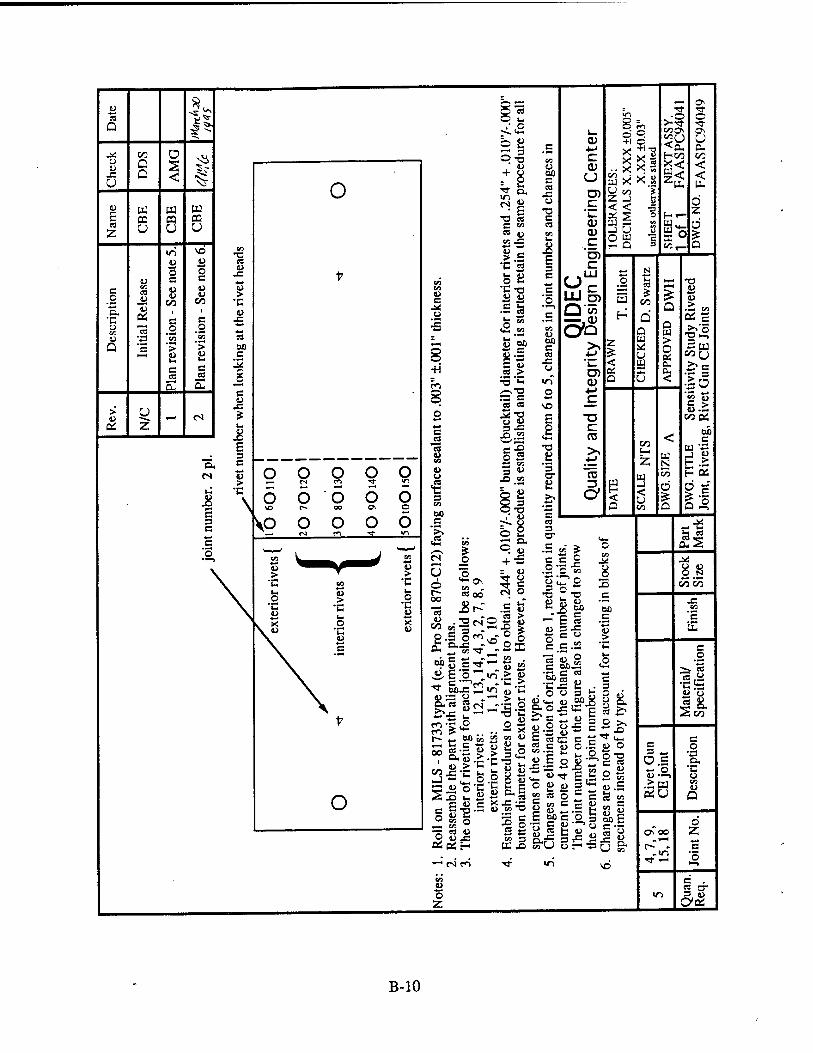
u ^ -s £ es 1^ a
CO a NÜ •*;.-
Ü o < ^
E W W w a CQ «
Z u u u «n \o 4)
o o « c c
c o
V3 es u
1) CO
u u
a. •c öS
1
c c u C8 o o u •a e« Q c > >
1—( B B c e ea es
F4 CL
> u u ^^ <N as z
>".o
u QO E es x: u
T3 E es
U _ .25
u
c es
J= o
o
e '3 er u
0) +-> c <v u
_C
o> (!) C
"o> c
LLi
LUD) Q'cö
Co
D) CU
T3 C ro
CO
3
©
Si x' a
H«-
CO H Z
3 < U
a
cr .S «' £ e c o .So» 3 O
- Ej = .= •- 81)2 c oo—
£§ B . . o o a h £*- « £f>_25
3
8 is e oo
> •c
^c ■^ s- «-» w 3
_ esc: c c
O P 4> 3 "*" »«of c Si iD ~ .5 H E oo c o 3 •- c ID —' o 8.2 5Ü S - £*u 3 P « 5
c 3
es C1
£ >»
u o
u.S sa en
»I 60 t
V3
v£>
O Z
c 3 <-, o.s — 'o
.aw oSU
ON OO
r-^ -
ON 2; rf ON u CL.
co < < li
Ö z d
T3
OS '
^ i—>
EW cO(j
lo 11 coo;
00 c
[Ü 'S
P .>: H öS
rl
O N CO CO
c
c o
•nha 1> o
^:co
c o
•B
•c u en U Q
o Z c '5
c es cr 3 CJ
B-10
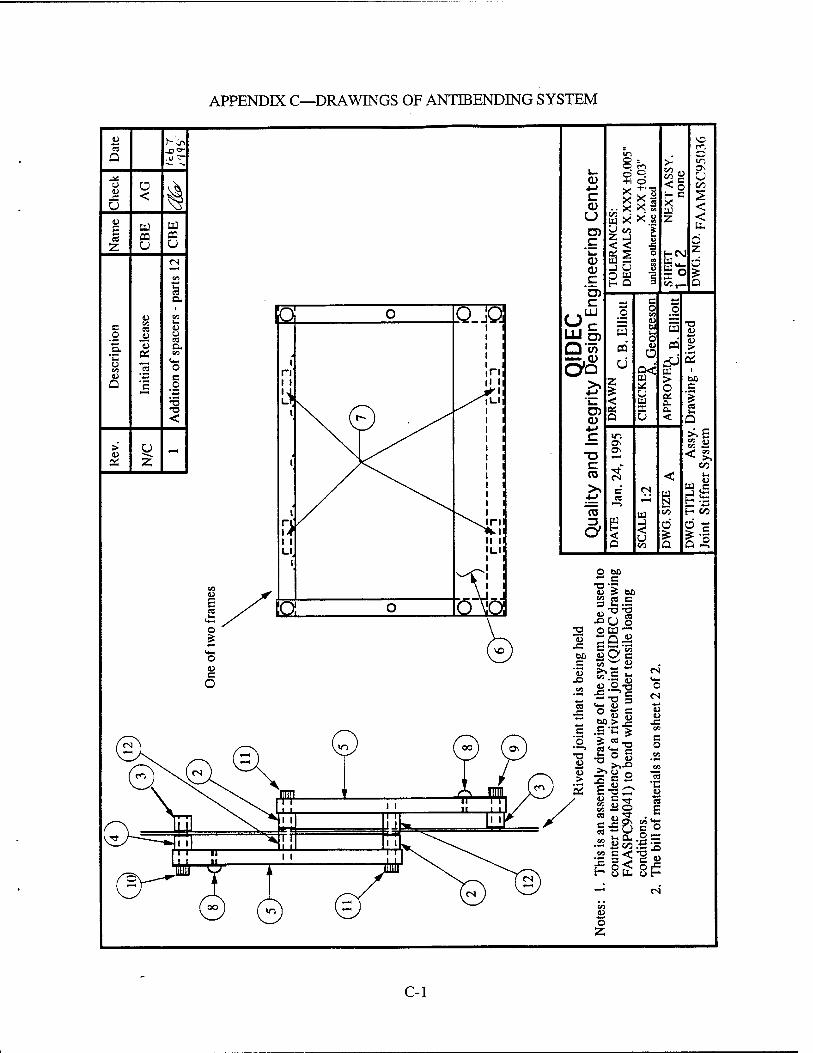
APPENDIX C—DRAWINGS OF ANTIBENDING SYSTEM
u es
Q
o u
U ü <
cd z
tu aa u
c _o D.
*c o « u Q
C3
"3
> u 5J
z
<N
E S3
ja 0 0 a 4
1 n i i
i
i i
rii
i
4
l
\(< ?^ i-'i
4
! rii
i i ■ i
i
\o o 0\Q
CD *-> c 0) u
_c CD CD c
'o> c
LÜ
O'tö
as CD
C CO
CO
5
ö <= +i p
^2 < < i 5
O iü
>-
<o S- c X tu z
HC\J
E ° C2r-
m ü
B o U 01 s o
EP *: u u u
«s
tu m
CÜ > O OS EU
3
VC r<-,
O* U
< < u. d z d D
** E T3-r
OCÜ' '
T3
>
be c
«3
SS < &
)-)
gig
Is
C-l
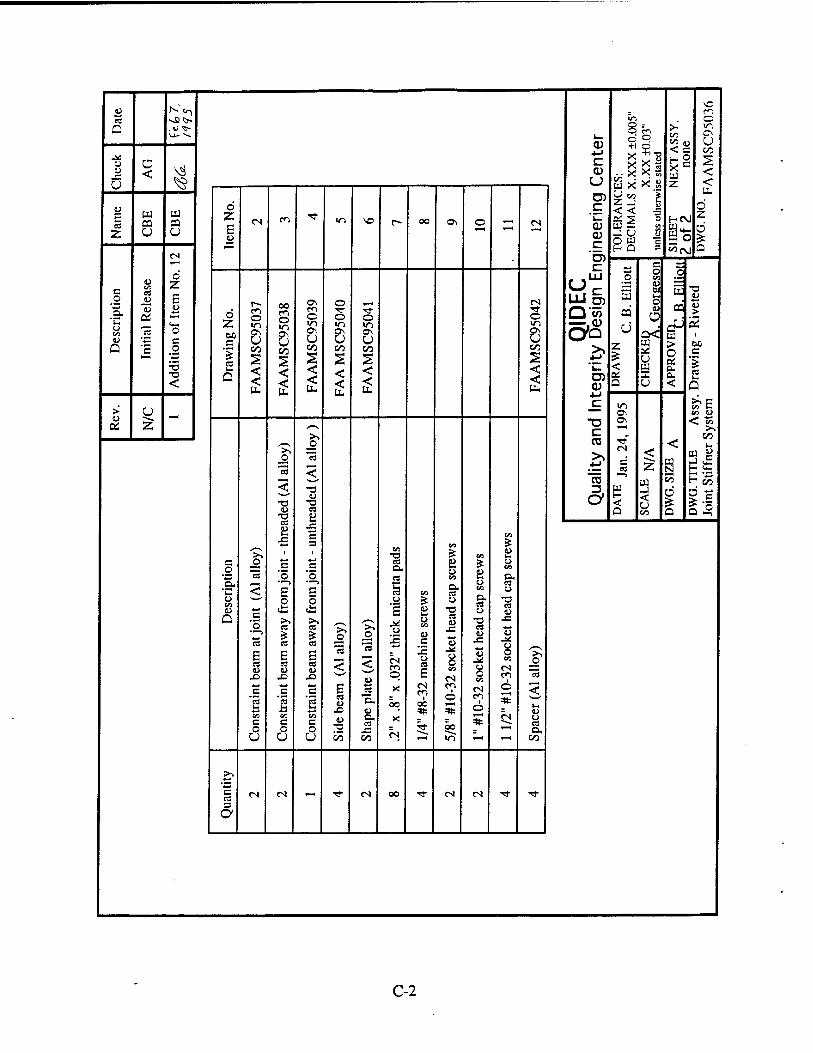
re Q
u <
N 0-)
a CQ
c o
u Q
re u
"3
> u 0*
u z
CQ u
o z £ ID
d Z
E Ü2
CN CO TT in \c r- 00 Os o »-H CN
d Z 60 C
re
Q
m o >n
u co
S < < a.
00
O m
<
CO o Vt o\ U
s < < ft
O
o >n
e < < ft
*—t
o in ON U co
< < ft
CN TT O IT)
8 co
< < ft,
e _o
a, ■c o CO
Q
"re <
c \o
re
E re u
Xl
c
1 CO C o U
"re <
U •a re x
c jo
¥ re re E re u
Xl +-» c
1 CO c o U
>>
"re < T3
<U •D re 8 X c 3 i
4^ C
°o •*—t
E o
<*- re re E re <L> X
c
'1 en C o
"re <
E re i> X o
12 co
o
■«
<
«-» _re "o, u a. re X co
CQ ■o re O.
s S3
_o X
CN en © X
00
X
CN
CO
8 u CO
U c X u re E
CN ro
■ oo
CO
8 o CO
a. re o
•a re <u X
i
o
%
00 «n
CO
=s 8 o CO
CX re o
T3 re a> X
CO
CN en Ö
& 8 u CO
a. re u
"O re X
u
CO
CN
6
?►, _o
"3
<
u u re a,
co
>>
e re 3 a
CN CN - Tt CN 00 T CN CN ■* Tf
*-> c: CD u
_C 'i_ Q> CD C
'o c 111
ÜJö) Q'175 —,aj
0)
C CO
CO
&
o +l X X X
x'
<
Ü u a
o
x c
z
HtNJ
a" to CM
CQ
ON ON
c o CO D .
u CQ
cP u > o
a. <
< z
< U
s
u CO
< < ft,
Ö z d a
c
re
CO I CO U
^ CO
co u
U « H ' H <
P'co
C-2
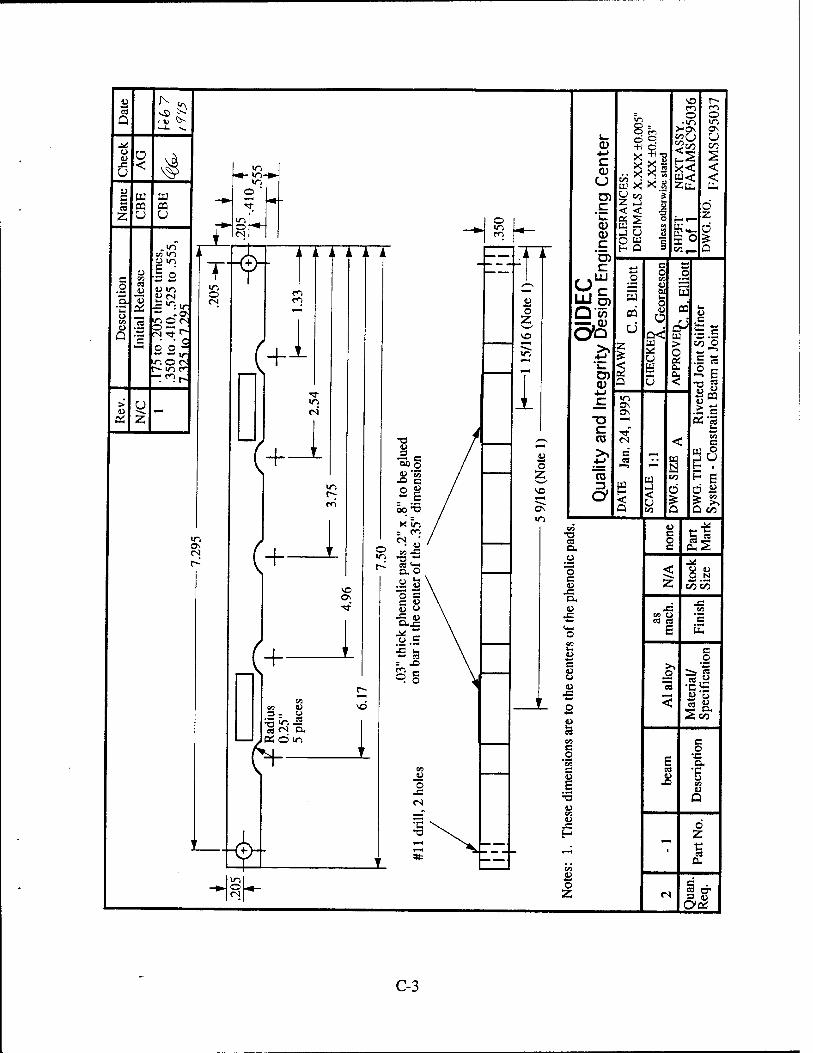
C-3
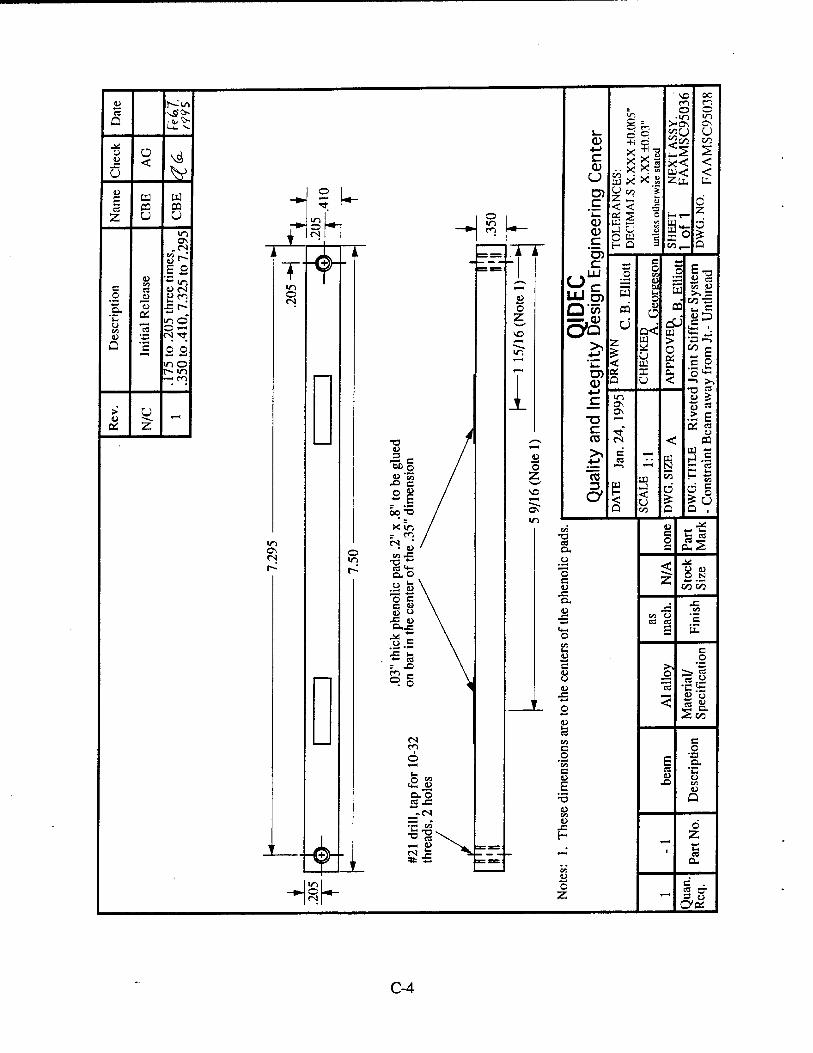
• vo oc
re Q
4-» c CD
AN
CE
S:
AL
S X
.XX
X ±
0.00
5"
X.X
X ±
0.03
" th
erw
ise
stat
ed
rn c-, o o
V3(J U
><< < u< < Zu« u.
Ö
o u X U
< V
E re CO -^
o *- £_
z u u <N i
•
° i 'i_ £ 2 ° Hi
r s 1*- 0)
c
c 111
UJo)
OBJ s ill i/->
V o
1 i A ii
c en re ES *- in
£s<n
, -0"
,
===" "I .2 53
c o u u O
.2 §T5 — Ü re
_• c/3 ■£
'C u
Ü
OS
'c
■5 r" <n © O -*
o 2
o Z
1—H
O'co CQ
Ü z
<
O
W
U HI
ffl ö_5
> — ->
£ si r- >n —i ro — T as
Q U s —» >> "T5 re
> u u 1 4->
_£_
73
ON ü re
•S E as z
"o T C CO <
OS «
CQ 4> /
"5b § / o 5^ •__■
C re *-H 1 P "re
ä'"5 / Z ~cö <
C/3 i- t5 X) c / o # / VO 3 <
OO "O /
x in /
c r\ Q on a Q ,
en u S re E CO / •a c
o s OS r , ^-si7 a.
"o 1 a. o z O N c •- S \ u <J5 C«
"o e \
•5 « \
x Q.
X X!
en U re re
X en 'c
a.x \ •* e \
(41 O E IE
° 5 \ C/2
. «S \ c o
r XI \ c >* *M
P 8 \ u _o 5» ?5
"S re w
'C l*-
x: ^^ t) "o 1 r « 2 <
g «S en c m C o © .2 'in g a.
«is ja
c
E x> •c o en CO
n,"o cB X! ^ D
__.ro <o VI
1 li\ X H
d Z
1 itTiu sj X ==_ __; 1
Cu ^r *- ===" en
| VI o Z
c
-H -H re a- 5, " 1 eyas
C-4
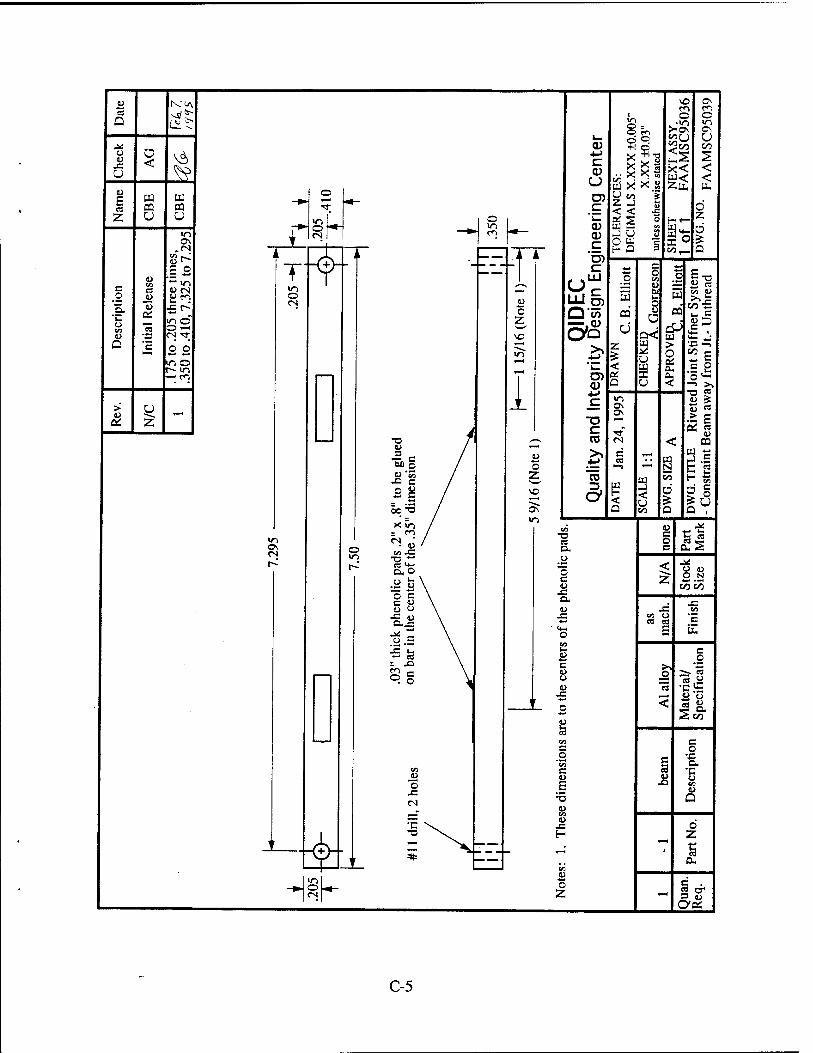
B N."o\ 0 C1
Q In O • in in
1-4- V.
I— ON U
u x: U
0 < VÄ
V 4-> c CD
+1 0
x< zS
CO
< < u.
E re CQ
0 Z j g < < •£ at* 5 0
0 Z u U <n 0
in a> c
'CO c:
z
Os
E 2
+ « rn "*~ JU 8 0 w "a
Ü
-L. i ii i
u r _o c 0 CO 0 ETS
c co C3 >n
1 >—\ UJ§) Q'ü5 as
= Ü re co D
.9* so
OS
"e3
■S •""■ >no 0 -*
O
0 Z
E a Ü
u 0 u 0
JJ c „• Q 'c O O
m 0 r» <n
in
T CO CD
z < öS Q S 5i
•a—»
.5 S 0"-
> as z -
1 X5
in O Os
tN
aj cö
Oi C3
T3 / CD /
CO < 03
"eb § / 0 0
C CS "1
< i
B3 "
K'"5 / •° c / :2l /
Z "cö
5 <
PS g §
Ö0*O / oT D co Q 0 , x >h / x ) -£
m - ^ / T3 cd
c c
ON
»n T5 ■"
a. O
a.
"0
c
t- < ? ON
0 h \ s 2 H *-* .— "5 c \ c u \
4> x: a.
t/3 CZl
JB u 0 \ t> X : c«
-s u \ x: CO t i := O.XS \ *-* ca ct
■Ss \ O £ : u.
is \ CO 1- U c
#o r XI \ C > S •*-
^ r- \ O O \
1
0 0 u
x: ** - 2
u S3
< ' s 8, Sen
co
"O
en C
_o "co e u 6
■3 u
i c 0 •v CM
i 0
ZZi CO a>
1 3\ 0 z 1 A V- ^J ^^ . ^-<
6 a. *!' * —"
CO
H§ U 4>4 O z *■■
c « a" 3 {j Coi
C-5
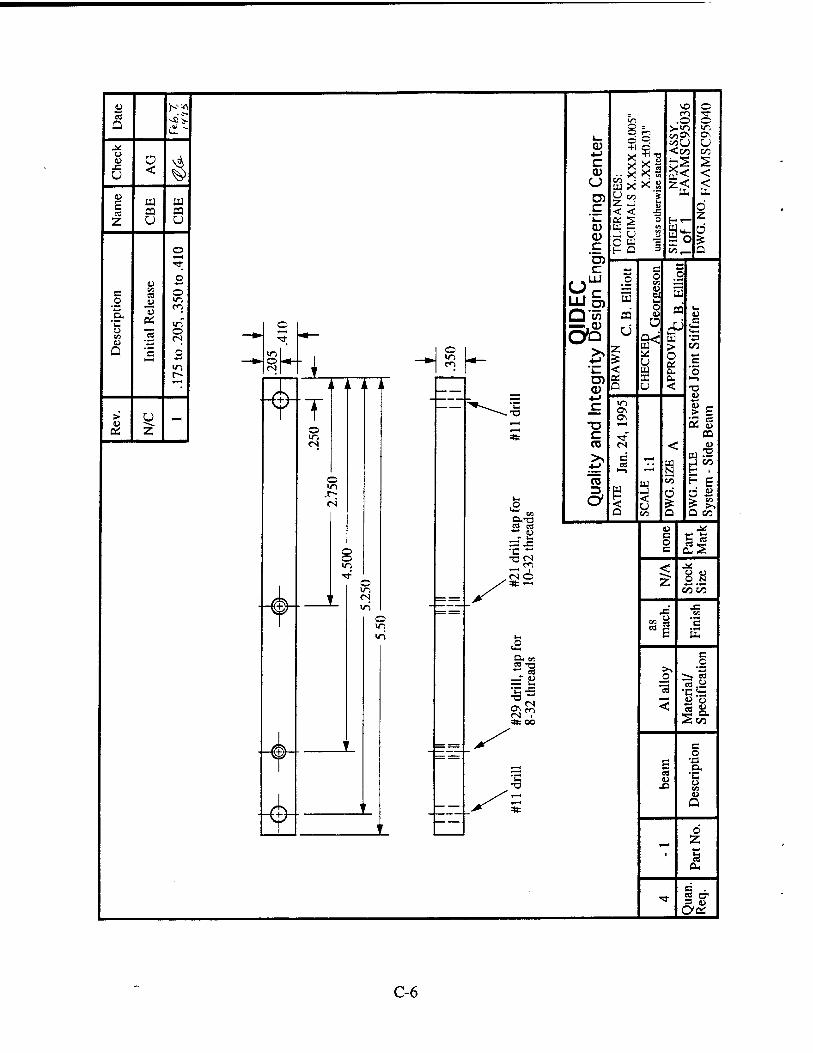
s K*'^ SD O re Q
• >- _ m rr ^S- Ün .o c £-
CD
c
XX
X ±
0.00
X
X ±
0.03
" st
ated
EXT
ASS
Y
AM
SC95
AM
SC95
o O VÄ <
^ CD (J
AN
CE
S A
LS
X. X
Iher
wis
c z< < tt, t
d u E re 03 CQ 2 u u 'l_ <* s ° Hi
CD CD C O w s
S- Q 3 o TT
o o c o _c
s u S3 o <->C
C/3
01 E
Q. es "re
°E
en ÜJö) tu
CQ o o
u
a
o
Q
o CN
o
c
o
2 ?
■j H« h
Qi
:egn
ty D
e Ü 2
< as Q
w > O a: 0- a. <
1= •a
c '5
i i i L J 1 i L
> U *—H T T —~ ^^^^-T3
*-> ON > E
*Tv re u z o St
■D C CO rs
C re i—i
~ <
1
0£ t> pa
o .T- t*
5
CO
5 <
u < d
P E d S >• ">
"- en a on a Q tV2 0<T3 re re t> ^
s 5 T3CN J^ en
c O c e3 w
■■a-' <: O N o /*e~ Z
j u-i »5K
-a- 1 r in — ^Z. -* j£ T o "s
«n 1- iZ *s (4M
G- en c «3 *U *"* CO >»
o
<
re w "C **"
re «
' r — Z?Z.
2 tn
-i »- E
c o -a
^M a.
1 re u •c o
1 ^/ ^^ u
-4 < r Q
V' , T 1 r 6
• 1 a.
B ■>3- re a"
3 t>
C-6
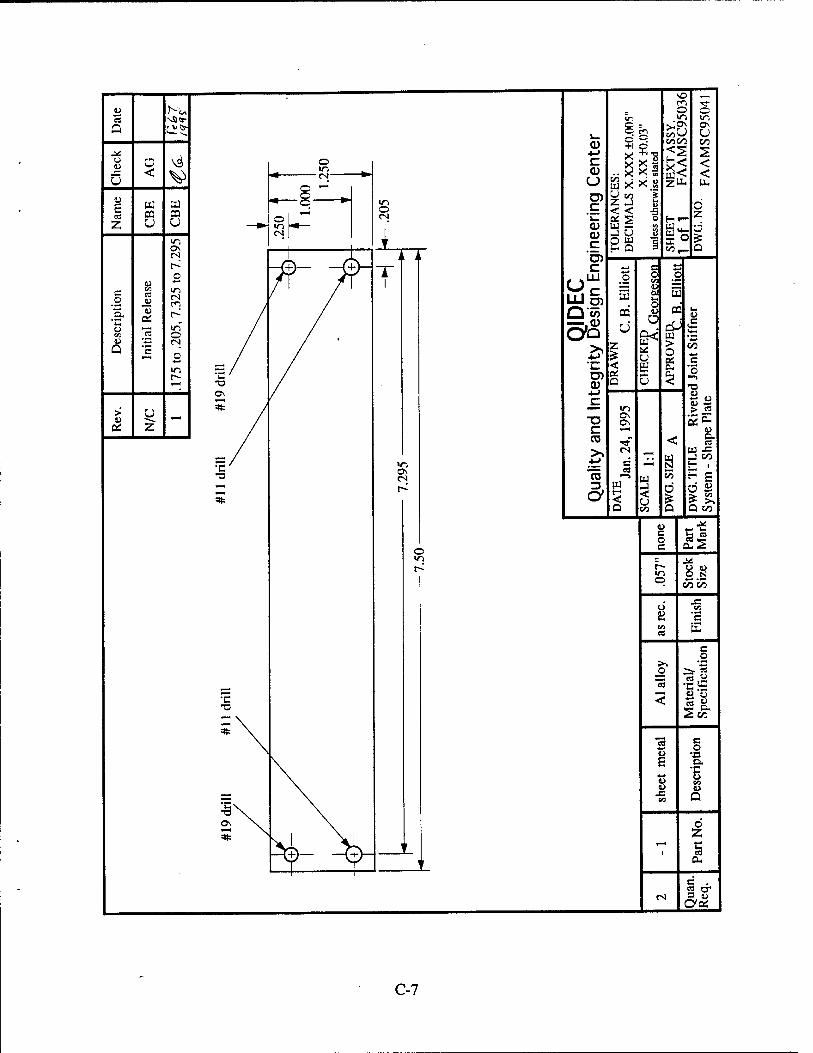
o u <
E CS
Z ca u
c o
Q
"3
> u y
z
vd V
VO — m TT .. o © >n ir,
*->
•jo c>
C b< < w< < O u x'x.S ztu tu
Z J s < < TS
ö _ z L- Q£ S ° Hr
QJ
C
c:
J u 3 O W e PQ 3
go*
«>>■ c ö LU
LU5) 53
o u
QID
D
esi
CQ
Ü o
u
CQ "-1
tu -S
2? z o
OS
C/3
c i_ < UJ CL, o
*—>
"8 4->
öS a u 5I c w S
I^H >n > « ■o OJCM
c *-H <D
TO Tf < C CQ
C C8
4H' S (0 i-^ [II to H £
5 S < r,'
d ä 5: >> O CO a Q c/3
c o e Cu2
s ^ r- O N p 00 C/3
J= o en fi C en es tu
c o >. *s
O =* « "3 —* U o < 3 w
<5 CO
"3 C o u •o
£ a.
'5 &> 4>
CO D
ö Z
1 CM
C . 2 a*
rJ 5, u O>oi
C-7
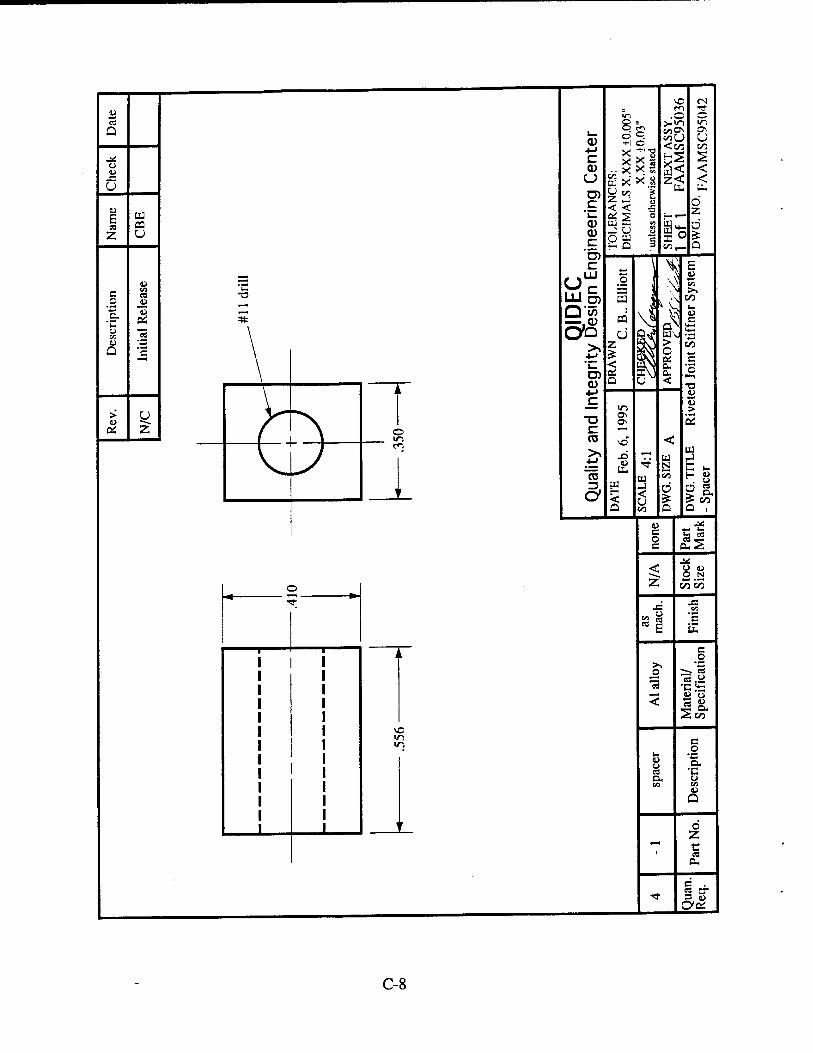
a
o u U
03 z
> u
OS
CO u
E ea o u a.
"C u a:
o CS u •c Q B
z
•c
(D
c u D> C
'i_ CD CD C
'o> C
111
LÜO) Q'co
CD
T3 C CO
to
3
© m d <=• +i o
o3 X' X S ^2 i
< 5
m .©
<co
2£
C-4
in o\ U co
< <
f3i
o 2 d a
s m ü
in os ON
u
E
CO u u
CO
> 'c2
u B o s
< Z~
o
g s. a
5.
O _N co co
x: s
o
in >n
u u cs
B
i,a "C it-
« « Seo
B O •a a. •c o
a
o Z
s . es tT 3 CJ get:
C-8
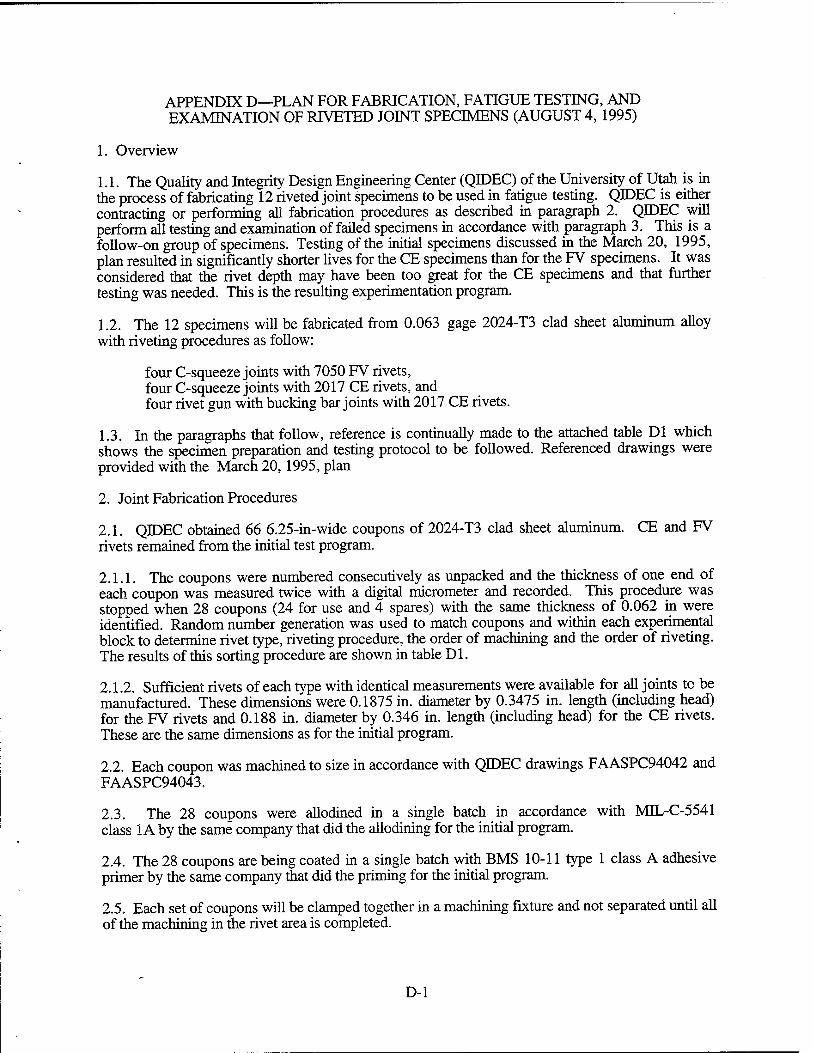
APPENDIX D—PLAN FOR FABRICATION, FATIGUE TESTING, AND EXAMINATION OF RIVETED JOINT SPECIMENS (AUGUST 4, 1995)
1. Overview
1.1. The Quality and Integrity Design Engineering Center (QIDEC) of the University of Utah is in the process of fabricating 12 riveted joint specimens to be used in fatigue testing. QIDEC is either contracting or performing all fabrication procedures as described in paragraph 2. QIDEC will perform all testing and examination of failed specimens in accordance with paragraph 3. This is a follow-on group of specimens. Testing of the initial specimens discussed in the March 20, 1995, plan resulted in significantly shorter lives for the CE specimens than for the FV specimens. It was considered that the rivet depth may have been too great for the CE specimens and that further testing was needed. This is the resulting experimentation program.
1.2. The 12 specimens will be fabricated from 0.063 gage 2024-T3 clad sheet aluminum alloy with riveting procedures as follow:
four C-squeeze joints with 7050 FV rivets, four C-squeeze joints with 2017 CE rivets, and four rivet gun with bucking bar joints with 2017 CE rivets.
1.3. In the paragraphs that follow, reference is continually made to the attached table Dl which shows the specimen preparation and testing protocol to be followed. Referenced drawings were provided with the March 20,1995, plan
2. Joint Fabrication Procedures
2.1. QIDEC obtained 66 6.25-in-wide coupons of 2024-T3 clad sheet aluminum. CE and FV rivets remained from the initial test program.
2.1.1. The coupons were numbered consecutively as unpacked and the thickness of one end of each coupon was measured twice with a digital micrometer and recorded. This procedure was stopped when 28 coupons (24 for use and 4 spares) with the same thickness of 0.062 in were identified. Random number generation was used to match coupons and within each experimental block to determine rivet type, riveting procedure, the order of machining and the order of riveting. The results of this sorting procedure are shown in table Dl.
2.1.2. Sufficient rivets of each type with identical measurements were available for all joints to be manufactured. These dimensions were 0.1875 in. diameter by 0.3475 in. length (including head) for the FV rivets and 0.188 in. diameter by 0.346 in. length (including head) for the CE rivets. These are the same dimensions as for the initial program.
2.2. Each coupon was machined to size in accordance with QIDEC drawings FAASPC94042 and FAASPC94043.
2.3. The 28 coupons were allodined in a single batch in accordance with MIL-C-5541 class 1A by the same company that did the allodining for the initial program.
2.4. The 28 coupons are being coated in a single batch with BMS 10-11 type 1 class A adhesive primer by the same company mat did the priming for the initial program.
2.5. Each set of coupons will be clamped together in a machining fixture and not separated until all of the machining in the rivet area is completed.
D-l
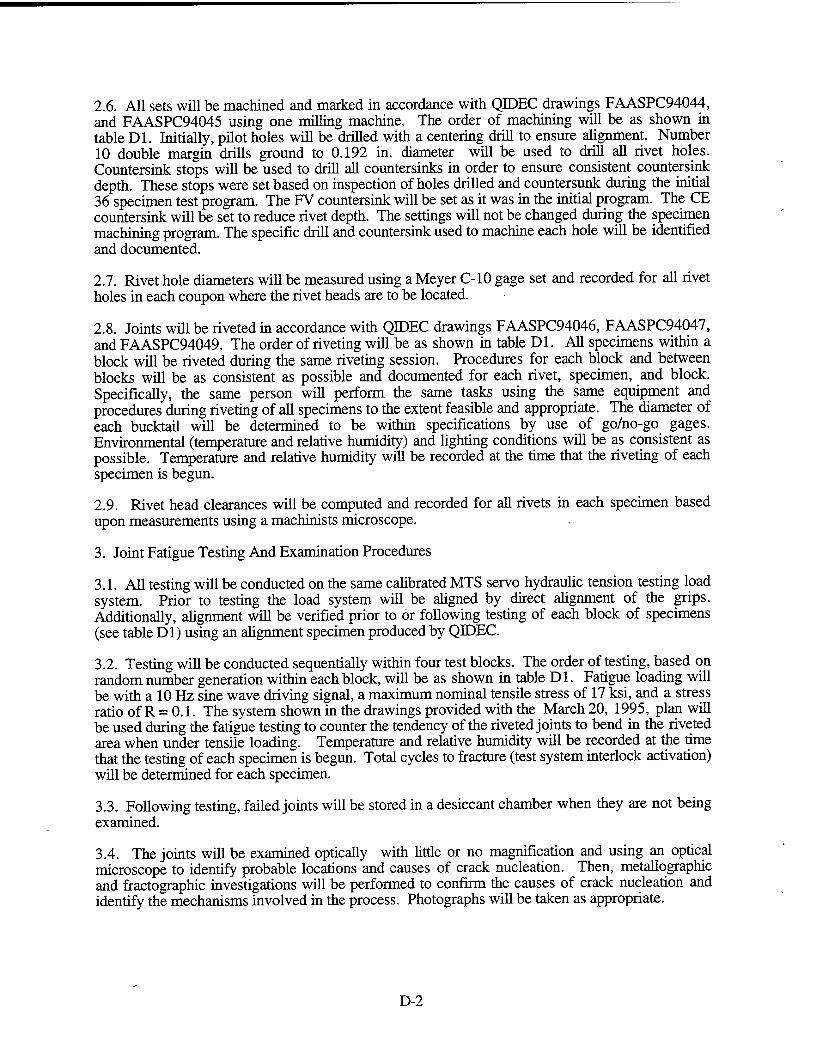
2.6. All sets will be machined and marked in accordance with QIDEC drawings FAASPC94044, and FAASPC94045 using one milling machine. The order of machining will be as shown in table Dl. Initially, pilot holes will be drilled with a centering drill to ensure alignment. Number 10 double margin drills ground to 0.192 in. diameter will be used to drill all rivet holes. Countersink stops will be used to drill all countersinks in order to ensure consistent countersink depth. These stops were set based on inspection of holes drilled and countersunk during the initial 36 specimen test program. The FV countersink will be set as it was in the initial program. The CE countersink will be set to reduce rivet depth. The settings will not be changed during the specimen machining program. The specific drill and countersink used to machine each hole will be identified and documented.
2.7. Rivet hole diameters will be measured using a Meyer C-10 gage set and recorded for all rivet holes in each coupon where the rivet heads are to be located.
2.8. Joints will be riveted in accordance with QIDEC drawings FAASPC94046, FAASPC94047, and FAASPC94049. The order of riveting will be as shown in table Dl. All specimens within a block will be riveted during the same riveting session. Procedures for each block and between blocks will be as consistent as possible and documented for each rivet, specimen, and block. Specifically, the same person will perform the same tasks using the same equipment and procedures during riveting of all specimens to the extent feasible and appropriate. The diameter of each bucktail will be determined to be within specifications by use of go/no-go gages. Environmental (temperature and relative humidity) and lighting conditions will be as consistent as possible. Temperature and relative humidity will be recorded at the time that the riveting of each specimen is begun.
2.9. Rivet head clearances will be computed and recorded for all rivets in each specimen based upon measurements using a machinists microscope.
3. Joint Fatigue Testing And Examination Procedures
3.1. All testing will be conducted on the same calibrated MTS servo hydraulic tension testing load system. Prior to testing the load system will be aligned by direct alignment of the grips. Additionally, alignment will be verified prior to or following testing of each block of specimens (see table Dl) using an alignment specimen produced by QJDEC.
3.2. Testing will be conducted sequentially within four test blocks. The order of testing, based on random number generation within each block, will be as shown in table Dl. Fatigue loading will be with a 10 Hz sine wave driving signal, a maximum nominal tensile stress of 17 ksi, and a stress ratio of R = 0.1. The system shown in the drawings provided with the March 20, 1995, plan will be used during the fatigue testing to counter the tendency of the riveted joints to bend in the riveted area when under tensile loading. Temperature and relative humidity will be recorded at the time that the testing of each specimen is begun. Total cycles to fracture (test system interlock activation) will be determined for each specimen.
3.3. Following testing, failed joints will be stored in a desiccant chamber when they are not being examined.
3.4. The joints will be examined optically with little or no magnification and using an optical microscope to identify probable locations and causes of crack nucleation. Then, metallographic and fractographic investigations will be performed to confirm the causes of crack nucleation and identify the mechanisms involved in the process. Photographs will be taken as appropriate.
D-2
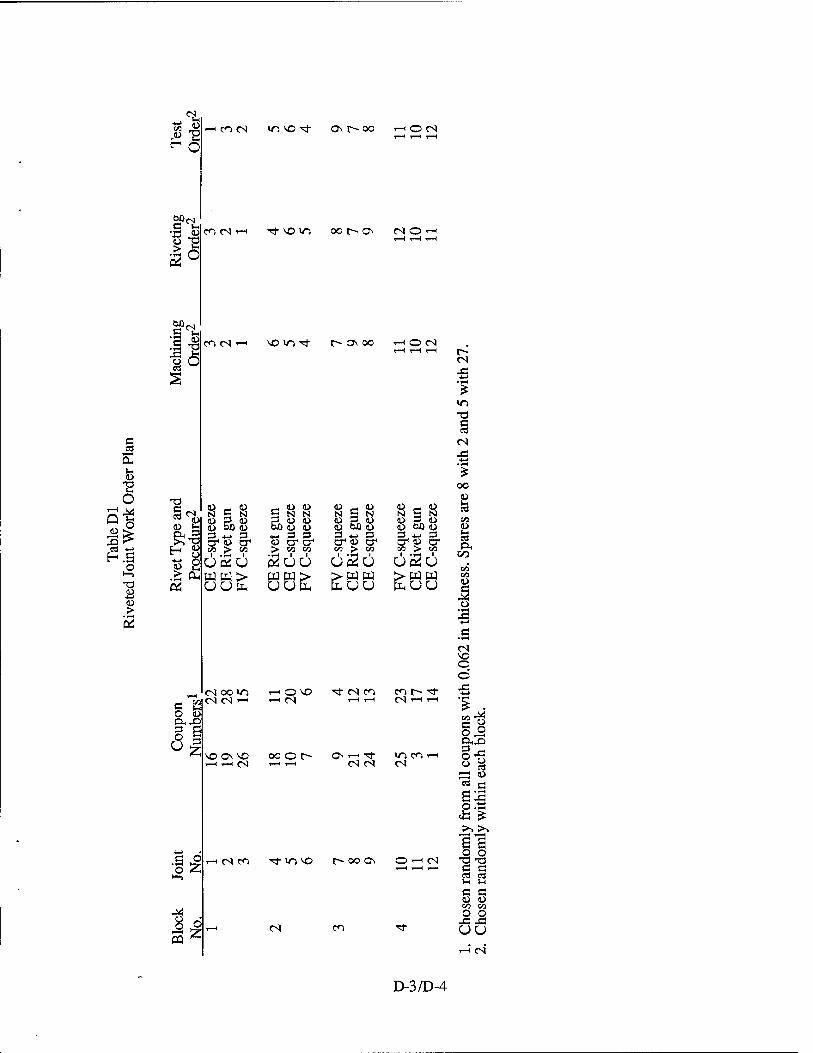
E2.S o
ä
•I«
H(fiM m vo ^ o\ r~-oo ' OcS
00 C
CO CS TJ-VOU-) oot-^ON <NOr-<
g
e Co <D
I
co tN vom-* r~ o\ oo o es
e 3
o
i
N S N <D 3 ü
0> 00 <U 3 *-> 3
uesu
S N N 3 Ü <D bß (D U ♦-.3 3 <o cr cr > C/3 CO
uut
a> <u N S N D 3 <D m ho <u cr P cr1 GO > tt>
U0S*U
o - 3
CO &0 3 « W >
<u N
<D
& en
O (D
öl
.3 & o Ä
3 ^
cs oo in es CS i-i es
oo o r-
TI- es en
o ^H ^r es es
CS 1-H i—I
in co ^H eS
(Sen Ttin^O t^ oo ON o ^* (S
<S en
es
«n -a c cö
es
00
I &0
PH CO
o •*-4
XI
o Ö X
a " o o £H.O
«fa £
o o -a -a a a e s c c <*> 00 O O X X UU
^ <s'
D-3/D-4
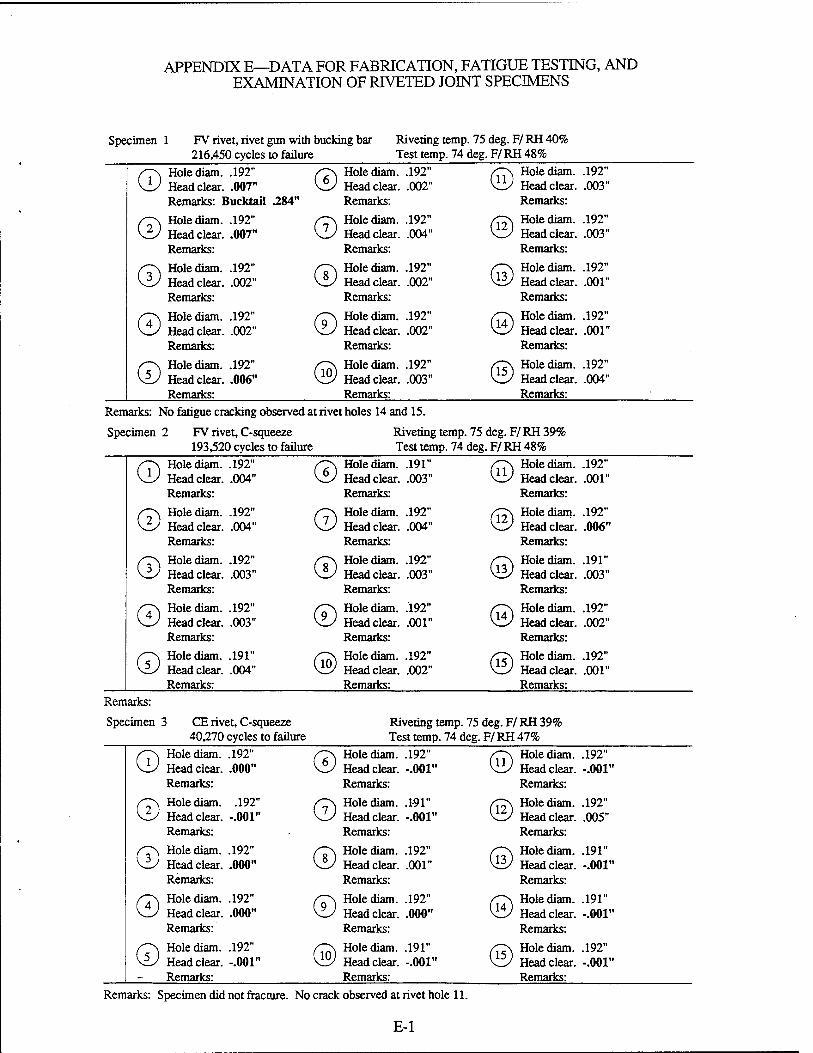
APPENDIX E—DATA FOR FABRICATION, FATIGUE TESTING, AND EXAMINATION OF RIVETED JOINT SPECIMENS
Specimen 1 FV rivet, rivet gun with bucking bar 216,450 cycles to failure
Riveting temp. 75 deg. F/ RH 40% Test temp. 74 deg. F/ RH 48%
s~\ Hole diam. .192" \U Head clear. .007"
Remarks: Bucktail .284" © Hole diam.
Head clear. Remarks:
.192" .002" © Hole diam.
Head clear. Remarks:
.192" .003"
/T\ Hole diam. \zJ Head clear.
Remarks:
.192"
.007" © Hole diam. Head clear. Remarks:
.192" .004" © Hole diam.
Head clear. Remarks:
.192" .003"
/TN Hole diam. V_/ Head clear.
Remarks:
.192" .002" © Hole diam.
Head clear. Remarks:
.192" .002" © Hole diam.
Head clear. Remarks:
.192" .001"
/~\ Hole diam. K^J Head clear.
Remarks:
.192" .002" © Hole diam.
Head clear. Remarks:
.192" .002" © Hole diam.
Head clear. Remarks:
.192" .001"
/"~\ Hole diam. Viz Head clear.
Remarks:
.192" .006" © Hole diam.
Head clear. Remarks:
.192" .003" © Hole diam.
Head clear. Remarks:
.192" .004"
Remarks: No fatigue cracking observed at rivet holes 14 and 15.
Specimen 2 FV rivet, C-squeeze 193,520 cycles to failure
Riveting temp. 75 deg. F/RH 39% Test temp. 74 deg. F/ RH 48%
fT\ Hole diam. W Head clear.
.192" © Hole diam. .191" © Hole diam. .192" .004" Head clear. .003" Head clear. .001"
Remarks: Remarks: Remarks:
/TN Hole diam. \lJ Head clear.
.192" © Hole diam. .192" © Hole diam. .192" .004" Head clear. .004" Head clear. .006"
Remarks: Remarks: Remarks:
/T\ Hole diam. \2J Head clear.
.192" © Hole diam. .192" © Hole diam. .191" .003" Head clear. .003" Head clear. .003"
Remarks: Remarks: Remarks:
/T\ Hole diam. V ' Head clear.
.192" © Hole diam. .192" © Hole diam. .192" .003" Head clear. .001" Head clear. .002"
Remarks: Remarks: Remarks: /~\ Hole diam. W Head clear.
.191" © Hole diam. .192" © Hole diam. .192" .004" Head clear. .002" Head clear. .001"
Remarks: Remarks: Remarks: Remarks:
Specimen 3 CE rivet, C-squeeze 40,270 cycles to failure
Riveting temp. 75 deg. F/ RH 39% Test temp. 74 deg. F/ RH 47%
Hole diam. .192" Head clear. .000" Remarks:
Hole diam. .192" Head clear. -.001" Remarks:
Hole diam. .192" Head clear. .000" Remarks:
Hole diam. .192" Head clear. .000" Remarks:
Hole diam. .192" V Head clear. -.001"
Remarks:
©
©
©
©
©
©
©
©
Hole diam. .192" Head clear. -.001" Remarks:
Hole diam. .191" Head clear. -.001" Remarks:
Hole diam. .192" Head clear. .001" Remarks:
Hole diam. .192" Head clear. .000" Remarks:
Hole diam. .191" Head clear. -.001" Remarks:
© Hole diam. .192" Head clear. -.001" Remarks:
Hole diam. Head clear. Remarks:
Hole diam. Head clear. Remarks:
Hole diam. Head clear. Remarks:
Hole diam. Head clear. Remarks:
.192"
.005"
.191" -.001"
.191" -.001"
.192" -.001"
Remarks: Specimen did not fracture. No crack observed at rivet hole 11.
E-l
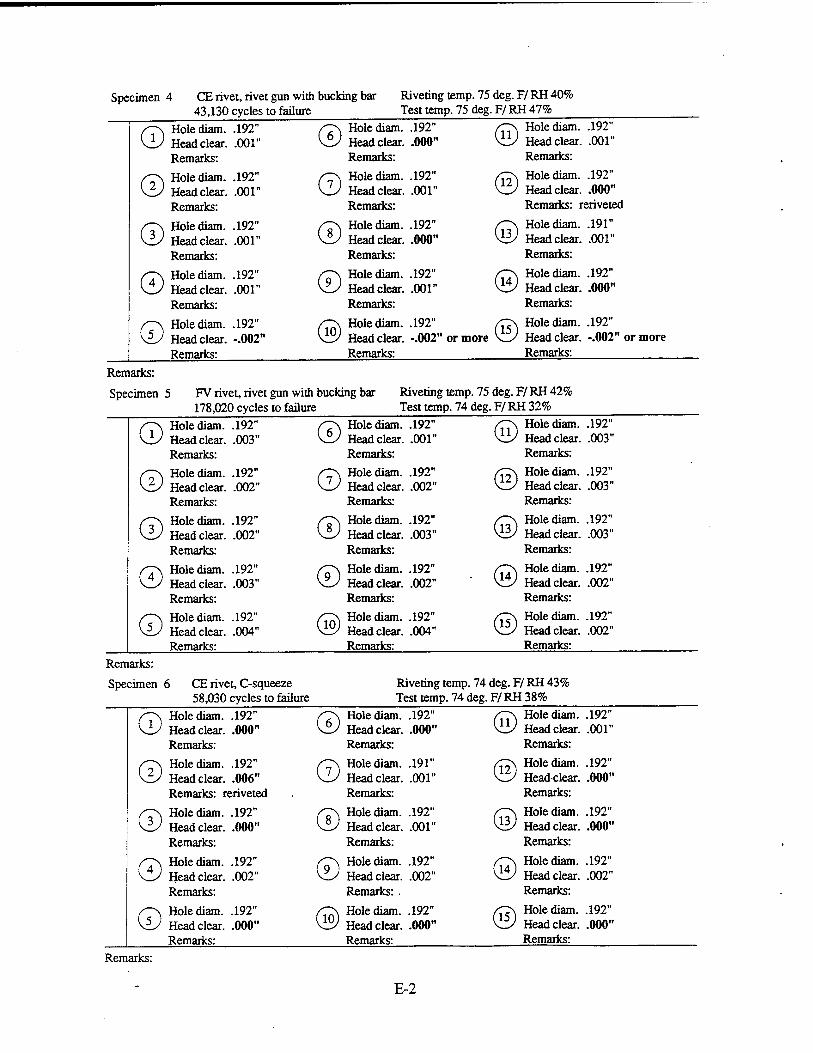
Specimen 4 CE rivet, rivet gun with bucking bar Riveting temp. 75 deg. F/RH 40% 43,130 cycles to failure Test temp. 75 deg. F/ RH 47%
s~~\ Hole diam. \_y Head clear.
Remarks:
.192" .001" ® Hole diam.
Head clear. Remarks:
.192" .000" © Hole diam.
Head clear. Remarks:
.192" .001"
/"~\ Hole diam. V_y Head clear.
Remarks:
.192" .001" © Hole diam.
Head clear. Remarks:
.192" .001" © Hole diam. .192"
Head clear. .000" Remarks: reriveted
/TN Hole diam. \U Head clear.
Remarks:
.192" .001" © Hole diam.
Head clear. Remarks:
.192" .000" © Hole diam.
Head clear. Remarks:
.191" .001"
/~\ Hole diam. ^—J Head clear.
Remarks:
.192" .001" © Hole diam.
Head clear. Remarks:
.192" .001" © Hole diam.
Head clear. Remarks:
.192" .000"
/~\ Hole diam. \zJ Head clear.
Remarks:
.192" -.002" ® Hole diam.
Head clear. Remarks:
.192" -.002" © or more V_/
Hole diam. Head clear. Remarks:
.192" -.002" or more
Remarks:
Specimen 5 FV rivet, rivet gun with bucking bar Riveting temp. 75 deg. F/ RH 42% 178,020 cycles to failure Test temp. 74 deg. F/ RH 32%
/T\ Hole diam. viy Head clear.
Remarks:
.192" .003" ® Hole diam.
Head clear. Remarks:
.192" .001" © Hole diam.
Head clear. Remarks:
.192" .003"
/~\ Hole diam. \_/ Head clear.
Remarks:
.192" .002" © Hole diam.
Head clear. Remarks:
.192" .002" © Hole diam.
Head clear. Remarks:
.192" .003"
/TN Hole diam. ^—J Head clear.
Remarks:
.192" .002" © Hole diam.
Head clear. Remarks:
.192" .003" © Hole diam.
Head clear. Remarks:
.192" .003"
/T\ Hole diam. ^—/ Head clear.
Remarks:
.192" .003" © Hole diam.
Head clear. Remarks:
.192" .002" ■ © Hole diam.
Head clear. Remarks:
.192" .002"
/~*\ Hole diam. V£y Head clear.
Remarks:
.192" .004" ® Hole diam.
Head clear. Remarks:
.192" .004" © Hole diam.
Head clear. Remarks:
.192" .002"
Remarks:
Specimen 6 CE rivet, C-squeeze 58,030 cycles to failure
Riveting temp. 74 deg. F/ RH 43% Test temp. 74 deg. F/ RH 38%
/T\ Hole diam. v_y Head clear.
Remarks:
.192"
.000" © Hole diam. Head clear. Remarks:
.192" .000" © Hole diam.
Head clear. Remarks:
.192" .001"
/~\ Hole diam. .192" W Head clear. .006"
Remarks: reriveted © Hole diam.
Head clear. Remarks:
.191" .001" © Hole diam.
Headclear. Remarks:
.192" .000"
/T\ Hole diam. W Head clear.
Remarks:
.192" .000" © Hole diam.
Head clear. Remarks:
.192" .001" © Hole diam.
Head clear. Remarks:
.192"
.000"
/"TN Hole diam. ^—/ Head clear.
Remarks:
.192" .002" © Hole diam.
Head clear. Remarks: .
.192" .002" © Hole diam.
Head clear. Remarks:
.192" .002"
/~\ Hole diam. Viz Head clear.
Remarks:
.192" .000" © Hole diam.
Head clear. Remarks:
.192"
.000" © Hole diam. Head clear. Remarks:
.192" .000"
Remarks:
E-2
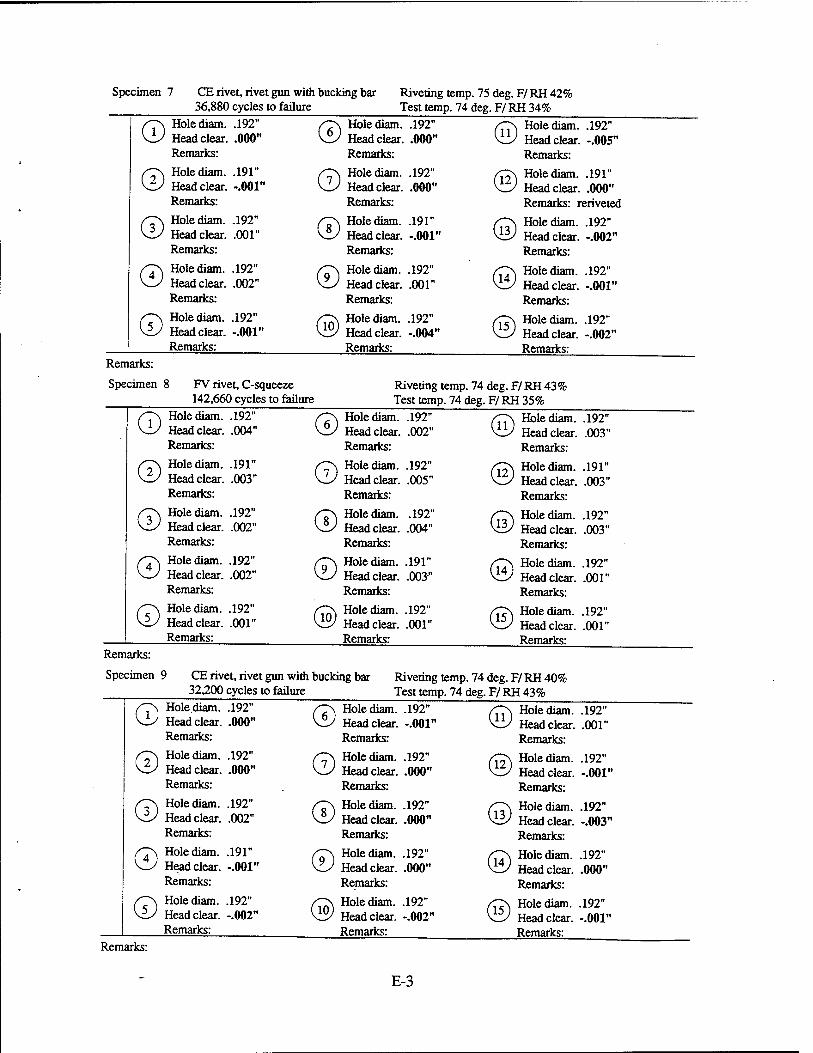
Sp scimen 7 CE rivet, rivet gun with bucking bar Riveting temp. 75 deg. F/ RH 42% 36,880 cycles to failure Test temp. 74 deg. F/ RH 34%
/~\ Hole diam. .192" W Head clear. .000"
Remarks:
■Os Holediam. .192" \zJ Head clear. .000"
Remarks:
/J~J\ Holediam. V—' Head clear
Remarks:
.192" -.005"
/T\ Hole diam. .191" \zJ Head clear. -.001"
Remarks:
/O, Holediam. .192" KU Head clear. .000"
Remarks:
/T>\ Holediam. v_y Head clear
Remarks: i
.191" .000"
■eriveted /T\ Hole diam. .192" \V Head clear. .001"
Remarks:
/T\ Holediam. .191" W Head clear. -.001"
Remarks:
S~\ Holediam. Vi£y Head clear.
Remarks:
.192" -.002"
/T\ Hole diam. .192" V_y Head clear. .002"
Remarks:
/T\ Holediam. .192" Viy Head clear. .001"
Remarks:
/^\ Holediam. \-J Head clear.
Remarks:
.192" -.001"
f~\ Hole diam. .192" W Head clear. -.001"
Remarks:
/^N Holediam. .192" KZ/ Head clear. -.004"
Remarks:
/T>, Holediam. v_/ Head clear.
Remarks:
.192" -.002"
Remarks:
Specimen 8 FV rivet, C-squeeze Riveting temp. 142,660 cycles to failure Test temp. 74 c
74deg.F/RH43% leg.F/RH35%
/T7\ Holediam. K-J Head clear.
Remarks:
/~\ Hole diam. .192" W Head clear. .004"
Remarks:
/T\ Holediam. .192" Vl/ Head clear. .002"
Remarks:
.192" .003"
/T\ Hole diam. .191" \i) Head clear. .003"
Remarks:
/T\ Holediam. .192" W Head clear. .005"
Remarks:
/O Holediam. W Head clear.
Remarks:
.191" .003"
/T\ Hole diam. .192" W Head clear. .002"
Remarks:
/TN Holediam. .192" W Head clear. .004"
Remarks:
/jT\ Holediam. ^EJ Head clear.
Remarks:
.192" .003"
/T\ Hole diam. .192" V_y Head clear. .002"
Remarks:
/T\ Holediam. .191" \i-/ Head clear. .003"
Remarks:
/T7\ Holediam. \—S Head clear.
Remarks:
.192" .001"
/~\ Hole diam. .192" W Head clear. .001"
Remarks:
/T>, Holediam. .192" ^y Head clear. .001"
Remarks:
/0\ Holediam. v_y Head clear.
Remarks:
.192" .001"
Remarks:
Specimen 9 CE rivet, rivet gun with bucking bar Riveting temp. 74 deg.F/RH 40% 32200 cycles to failure Test temp. 74 deg. F/ RH 43%
/T\ Holediam. .192" W Head clear. .000"
Remarks:
/O) Holediam. .192" W Head clear. -.001"
Remarks:
/TT\ Holediam. V_y Head clear.
Remarks:
.192" .001"
/T\ Holediam. .192" \zJ Head clear. .000"
Remarks:
/C\ Holediam. .192" W Head clear. .000"
Remarks:
|ON Holediam. v_y Head clear.
Remarks:
.192" -.001"
/T\ Holediam. .192" \V Head clear. .002"
Remarks:
/TN Holediam. .192" \U Head clear. .000"
Remarks:
/7T\ Holediam. vi£/ Head clear.
Remarks:
.192" -.003"
/"7\ Holediam. .191" W Head clear. -.001"
Remarks:
/T\ Holediam. .192" W Head clear. .000"
Remarks:
/TTN Holediam. ^^ Head clear.
Remarks:
.192"
.000"
S~\ Holediam. .192" \& Head clear. -.002"
Remarks:
s~\ Holediam. .192" \™J Head clear. -.002"
Remarks:
/T>\ Holediam. v. ' Head clear.
Remarks:
192" -.001"
Remarks:
E-3
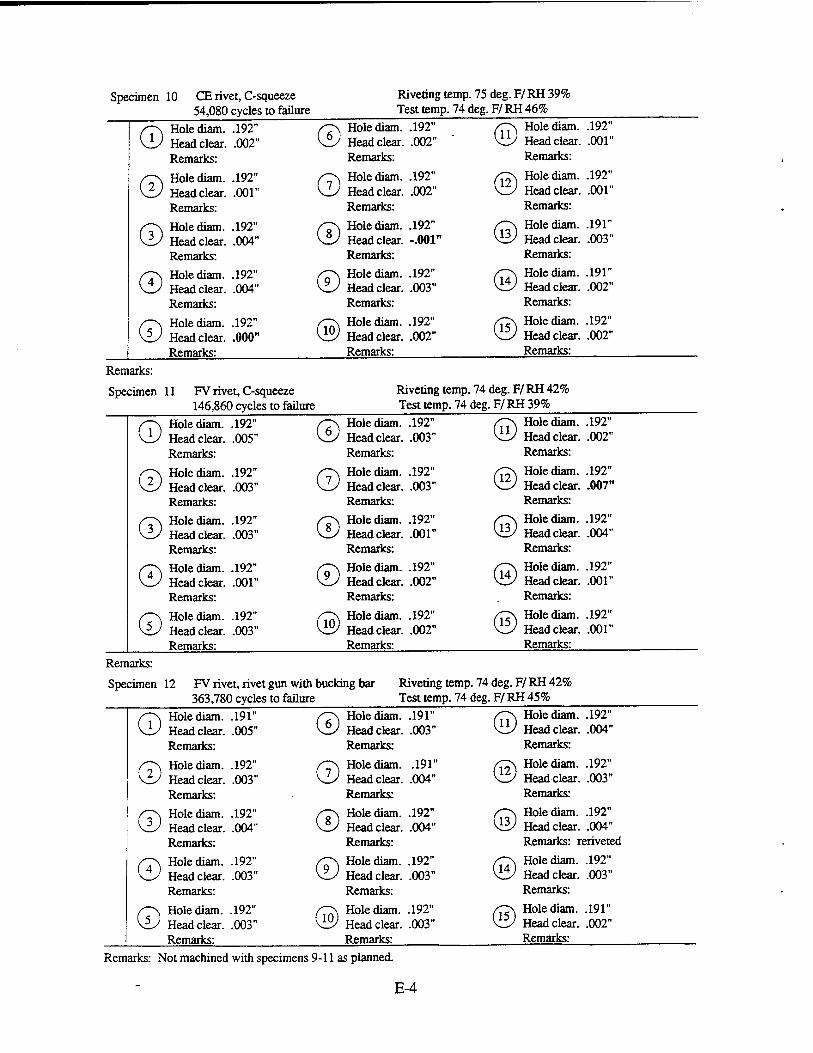
Specimen 10 CE rivet, C-squeeze 54,080 cycles to failure
Riveting temp Test temp. 74
75deg.F/RH39% äeg.F/RH46%
/7\ Hole diam. viz Head clear.
Remarks:
.192" .002" © Hole diam.
Head clear. Remarks:
.192" .002" © Hole diam.
Head clear. Remarks:
.192" .001"
/~\ Hole diam. KzJ Head clear.
Remarks:
.192" .001" © Hole diam.
Head clear. Remarks:
.192" .002" © Hole diam.
Head clear. Remarks:
.192" .001"
/T\ Hole diam. VL/ Head clear.
Remarks:
.192" .004" © Hole diam.
Head clear. Remarks:
.192" -.001" © Hole diam.
Head clear. Remarks:
.191" .003"
S7\ Hole diam. V_y Head clear.
Remarks:
.192" .004" © Hole diam.
Head clear. Remarks:
.192" .003" ® Hole diam.
Head clear. Remarks:
.191" .002"
^~-\ Hole diam. \U Head clear.
Remarks:
.192" .000" ® Hole diam.
Head clear. Remarks:
.192" .002" © Hole diam.
Head clear. Remarks:
.192" .002"
Remarks:
Specimen 11 FV rivet, C-squeeze 146,860 cycles to failure
Riveting temp Test temp. 74
74deg.F/RH42% deg.F/RH39%
/T\ Hole diam. \-J Head clear.
Remarks:
.192" .005" © Hole diam.
Head clear. Remarks:
.192" .003" © Hole diam.
Head clear. Remarks:
.192" .002"
/T\ Hole diam. v_y Head clear.
Remarks:
.192" .003" © Hole diam.
Head clear. Remarks:
.192" .003" © Hole diam.
Head clear. Remarks:
.192" .007"
/T\ Hole diam. \U Head clear.
Remarks:
.192" .003" © Hole diam.
Head clear. Remarks:
.192" .001" © Hole diam.
Head clear. Remarks:
.192" .004"
/"7\ Hole diam. V_y Head clear.
Remarks:
.192" .001" © Hole diam.
Head clear. Remarks:
.192" .002" © Hole diam.
Head clear. Remarks:
.192" .001"
/~~\ Hole diam. vi/ Head clear.
Remarks:
.192" .003" ® Hole diam.
Head clear. Remarks:
.192" .002" © Hole diam.
Head clear. Remarks:
.192" .001"
Remarks:
Specimen 12 FV rivet, rivet gun with bucking bar Riveting temp 363,780 cycles to failure Test temp. 74
.74deg.F/RH42% deg.F/RH45%
/~\ Hole diam. vi/ Head clear.
Remarks:
.191" .005" © Hole diam.
Head clear. Remarks:
.191" .003" © Hole diam.
Head clear. Remarks:
.192" .004"
/~\ Hole diam. v_y Head clear.
Remarks:
.192" .003" © Hole diam.
Head clear. Remarks:
.191" .004" © Hole diam.
Head clear. Remarks:
.192" .003"
/TN Hole diam. \—S Head clear.
Remarks:
.192" .004" © Hole diam.
Head clear. Remarks:
.192" .004" © Hole diam. .192"
Head clear. .004" Remarks: reriveted
/^p\ Hole diam. v^y Head clear.
Remarks:
.192" .003" © Hole diam.
Head clear. Remarks:
.192" .003" © Hole diam.
Head clear. Remarks:
.192" .003"
/~\ Hole diam. v£y Head clear.
Remarks:
.192" .003" ® Hole diam.
Head clear. Remarks:
.192" .003" © Hole diam.
Head clear. Remarks:
.191"
.002"
Remarks: Not machined with specimens 9-11 as planned.
E-4
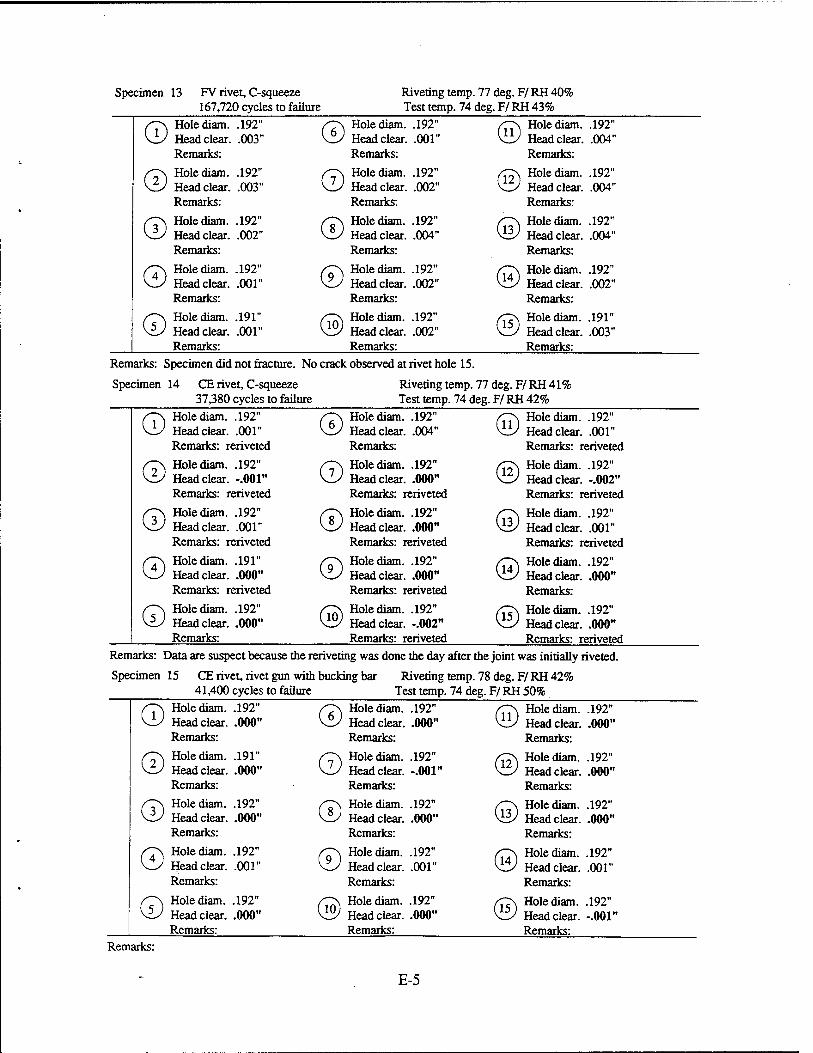
Specimen 13 FV rivet, C-squeeze 167,720 cycles to failure
Riveting temp Test temp. 74
77deg.F/RH40% deg.F/RH 43%
ST\ Hole diam. .192" W Head clear. .003"
Remarks: © Hole diam. .192"
Head clear. .001" Remarks:
© Hole diam. Head clear. Remarks:
.192" .004"
/T\ Hole diam. .192" W Head clear. .003"
Remarks: © Hole diam. .192"
Head clear. .002" Remarks:
© Hole diam. Head clear. Remarks:
.192" .004"
/T\ Hole diam. .192" vl/ Head clear. .002"
Remarks: © Hole diam. .192"
Head clear. .004" Remarks:
© Hole diam. Head clear. Remarks:
.192" .004"
/-TN Hole diam. .192" \ZJ Head clear. .001"
Remarks: © Hole diam. .192"
Head clear. .002" Remarks:
© Hole diam. Head clear. Remarks:
.192" .002"
/~\ Hole diam. .191" \U Head clear. .001"
Remarks: ® Hole diam. .192"
Head clear. .002" Remarks:
© Hole diam. Head clear. Remarks:
.191" .003"
Remarks: Specimen did not fracture. No crack observed at rivet hole 15.
Specimen 14 CE rivet, C-squeeze Riveting temp. 77 deg.F/RH 41% 37,380 cycles to failure Test temp. 74 deg. F/ RH 42%
©
©
©
©
©
Hole diam. .192" Head clear. .001" Remarks: reriveted
Hole diam. .192" Head clear. -.001" Remarks: reriveted
Hole diam. .192" Head clear. .001" Remarks: reriveted
Hole diam. .191" Head clear. .000" Remarks: reriveted
Hole diam. .192" Head clear. .000" Remarks:
© ©
©
Hole diam. .192" Head clear. .004" Remarks: Hole diam. .192" Head clear. .000" Remarks: reriveted
Hole diam. .192" Head clear. .000" Remarks: reriveted
Hole diam. .192" Head clear. .000" Remarks: reriveted
Hole diam. .192" Head clear. -.002" Remarks: reriveted
© Hole diam. .192" Head clear. .001" Remarks: reriveted
Hole diam. .192" Head clear. -.002" Remarks: reriveted
Hole diam. .192" Head clear. .001" Remarks: reriveted
Hole diam. .192" Head clear. .000" Remarks:
Hole diam. .192" Head clear. .000" Remarks: reriveted
Remarks: Data are suspect because the reriveting was done the day
Specimen 15 CE rivet, rivet gun with bucking bar Riveting 41,400 cycles to failure Test temp.
after the joint was initially riveted.
temp. 78 deg.F/RH 42% 74 deg.F/RH 50%
/T\ Hole diam. W Head clear.
.192" /~T\ Hole diam. \zJ Head clear.
.192" /Tj\ Hole diam. .192" .000" .000" W Head clear. .000"
Remarks: Remarks: Remarks: /T\ Hole diam. V_y Head clear.
.191" /T\ Hole diam. W Head clear.
.192" /TZ\ Hole diam. V_y Head clear.
.192" .000" -.001" .000"
Remarks: Remarks: Remarks: /T\ Hole diam. W Head clear.
.192" .000"
fT\ Hole diam. \ZS Head clear.
.192" .000"
/^\ Hole diam. Vi^ Head clear.
.192"
.000" Remarks: Remarks: Remarks:
/T\ Hole diam. v_y Head clear.
.192" /~\ Hole diam. v_y Head clear.
.192" /~\ Hole diam. VC/ Head clear.
.192" .001" .001" .001"
Remarks: Remarks: Remarks: f~*\ Hole diam. W Head clear.
.192" /~N Hole diam. Viiy Head clear.
.192" |0| Hole diam. v_> Head clear.
.192" .000" .000" -.001"
Remarks: Remarks: Remarks: Remarks:
E-5
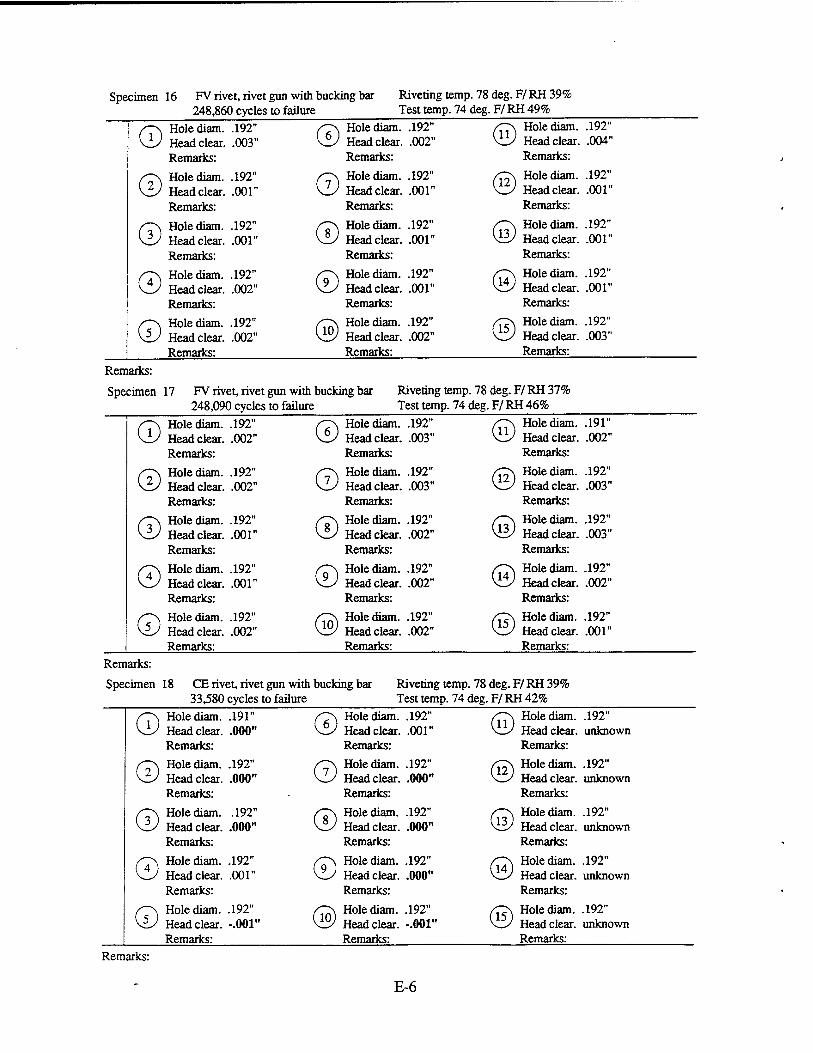
Specimen 16 FV rivet, rivet 248,860 cycles
gun with bucking bar to failure
Riveting temp. 78 Test temp. 74 deg
deg.F/RH39% F/RH49%
/TN Holediam. V_y Head clear.
.192" © Hole diam. .192" © Hole diam. .192"
.003" Head clear. .002" Head clear. .004" Remarks: Remarks: Remarks:
/TN Holediam. \_y Head clear.
.192" .001" © Hole diam.
Head clear. .192" .001" © Hole diam.
Head clear. .192" .001"
Remarks: Remarks: Remarks:
/T\ Holediam. V ' Head clear.
.192" © Hole diam. .192" © Hole diam. .192" .001" Head clear. .001" Head clear. .001"
Remarks: Remarks: Remarks:
S~\ Holediam. K.S Head clear.
.192" © Hole diam. .192" © Hole diam. .192" .002" Head clear. .001" Head clear. .001"
Remarks: Remarks: Remarks:
/"""\ Holediam. \zJ Head clear.
.192" © Hole diam. .192" © Hole diam. .192" .002" Head clear. .002" Head clear. .003"
Remarks: Remarks: Remarks:
Remarks:
Specimen 17 FV rivet, rivet gun with bucking bar 248,090 cycles to failure
Riveting temp. 78 Test temp. 74 deg.
deg.F/RH37% F/RH46%
© ©
©
©
©
Holediam. .192" Head clear. .002" Remarks:
Holediam. .192" Head clear. .002" Remarks:
Holediam. .192" Head clear. .001" Remarks:
Holediam. .192" Head clear. .001" Remarks:
Holediam. .192" Head clear. .002" Remarks:
©
©
©
Holediam. .192" Head clear. .003" Remarks:
Holediam. .192" Head clear. .003" Remarks:
Holediam. .192" Head clear. .002" Remarks:
Holediam. .192" Head clear. .002" Remarks:
Holediam. .192" Head clear. .002" Remarks:
© Hole diam. Head clear. Remarks:
Hole diam. Head clear. Remarks:
Hole diam. Head clear. Remarks:
Hole diam. Head clear. Remarks:
Hole diam. Head clear. Remarks:
.191" .002"
.192" .003"
.192" .003"
.192" .002"
.192" .001"
Remarks:
Specimen 18 CE rivet, rivet gun with bucking bar 33,580 cycles to failure
Riveting temp. 78 deg. F/RH 39% Test temp. 74 deg. F/ RH 42%
Holediam. .191" Head clear. .000" Remarks:
Holediam. .192" Head clear. .000" Remarks:
Holediam. .192" Head clear. .000" Remarks:
Holediam. .192" Head clear. .001" Remarks:
Holediam. .192" U Head clear. -.001"
Remarks:
© ©
©
©
©
© ©
©
Holediam. .192" Head clear. .001" Remarks: Holediam. .192" Head clear. .000" Remarks:
Holediam. .192" Head clear. .000" Remarks:
Holediam. .192" Head clear. .000" Remarks:
©
, Holediam. .192" 10J Head clear. -.001"
Remarks:
Holediam. .192" Head clear, unknown Remarks: Holediam. .192" Head clear, unknown Remarks:
Holediam. .192" zzJ Head clear, unknown
Remarks:
Holediam. .192" Head clear, unknown Remarks:
Holediam. .192" Head clear, unknown Remarks:
Remarks:
E-6
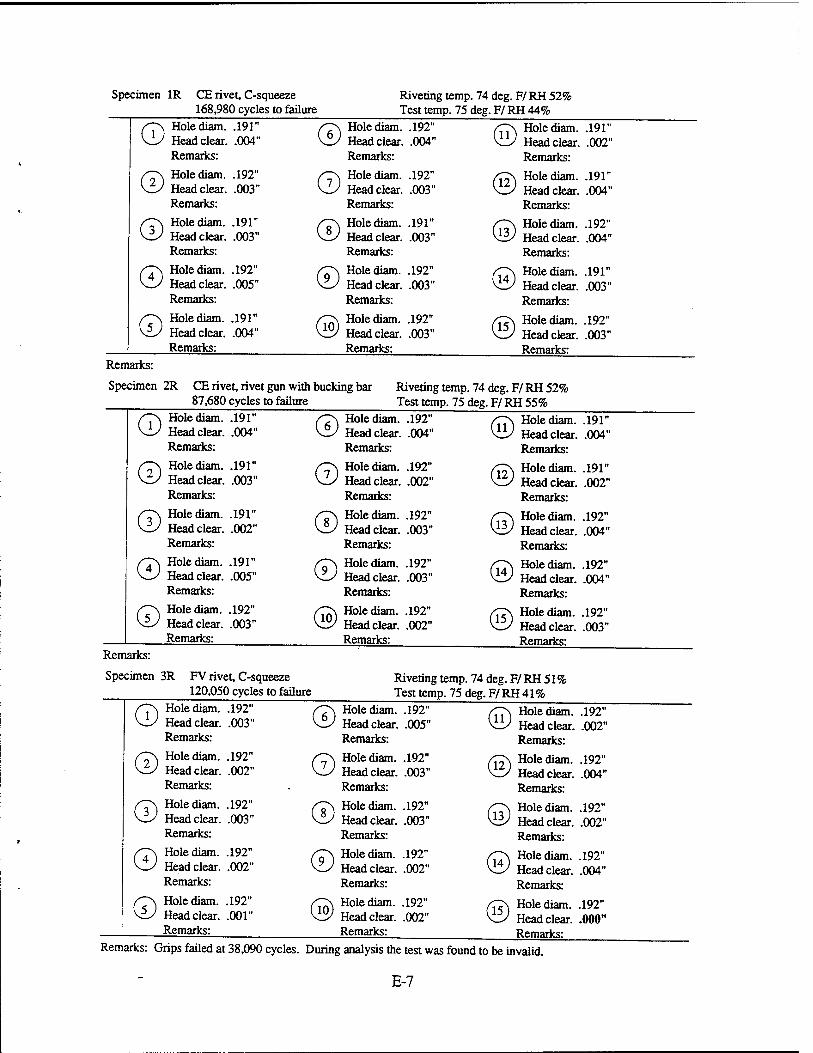
Specimen 1R CE rivet, C-squeeze Riveting temp. 74 deg. F/RH 52% 168,980 cycles to failure Test temp. 75 deg. F/ RH 44%
/T\ Hole diam. .191" \±J Head clear. .004"
Remarks:
/"T\ Hole diam. .192" \zJ Head clear. .004"
Remarks:
/C7\ Hole diam. v_y Head clear
Remarks:
.191" .002"
rr\ Hole diam. .192" \lJ Head clear. .003"
Remarks:
/T\ Hole diam. .192" \U Head clear. .003"
Remarks:
/T£\ Hole diam. \—s Head clear.
Remarks:
.191" .004"
/T\ Hole diam. .191" \U Head clear. .003"
Remarks:
/T\ Hole diam. .191" W Head clear. .003"
Remarks:
/TT\ Hole diam. vi£/ Head clear.
Remarks:
.192" .004"
/7\ Hole diam. .192" V_y Head clear. .005"
Remarks:
/T\ Hole diam. .192" Viy Head clear. .003"
Remarks:
/C7\ Hole diam. v_-z Head clear.
Remarks:
.191" .003"
s~\ Hole diam. .191" \V Head clear. .004"
Remarks:
(C^\ Hole diam. .192" V^y Head clear. .003"
Remarks:
zO\ Hole diam. V^ Head clear.
Remarks:
.192" .003"
Remarks:
Specimen 2R CE rivet, rivet gun with bucking bar Riveting temp. 74 deg. F/ RH 52% 87,680 cycles to failure Test temp. 75 deg. F/ RH 55%
f~\ Hole diam. .191" W Head clear. .004"
Remarks:
|0 Hole diam. .192" vü/ Head clear. .004"
Remarks:
/~\ Hole diam. KU Head clear.
Remarks:
.191" .004"
/T\ Hole diam. .191" \zJ Head clear. .003"
Remarks:
/T\ Hole diam. .192" \U Head clear. .002"
Remarks:
/^T\ Hole diam. ^—J Head clear.
Remarks:
.191" .002"
/T\ Hole diam. .191" \U Head clear. .002"
Remarks:
/T\ Hole diam. .192" W Head clear. .003"
Remarks:
/~T\ Hole diam. \£s Head clear.
Remarks:
.192" .004"
/"7\ Hole diam. .191" \U Head clear. .005"
Remarks:
/T\ Hole diam. .192" \U Head clear. .003"
Remarks:
/J^\ Hole diam. V—' Head clear.
Remarks:
.192" .004"
f~\ Hole diam. .192" W Head clear. .003"
Remarks:
/C\ Hole diam. .192" V31 Head clear. .002"
Remarks:
|ON Hole diam. \^ Head clear.
Remarks:
.192" .003"
Remarks:
Specimen 3R FV rivet, C-squeeze Riveting temp. 74 deg. F/RH 51% 120,050 cycles to failure Test temp. 75 deg. F/ RH 41 %
/"T\ Hole diam. .192" W Head clear. .003"
Remarks:
/7\ Hole diam. .192" \zJ Head clear. .005"
Remarks:
/j~J\ Hole diam. K-S Head clear.
Remarks:
.192" .002"
/7\ Hole diam. .192" \zJ Head clear. .002"
Remarks:
/T\ Hole diam. .192" W Head clear. .003"
Remarks:
(C\ Hole diam. ^—J Head clear.
Remarks:
.192" .004"
/T\ Hole diam. .192" Vi/ Head clear. .003"
Remarks:
/T\ Hole diam. .192" W Head clear. .003"
Remarks:
/~\ Hole diam. ^& Head clear.
Remarks:
.192"
.002"
fTs Hole diam. .192" \-J Head clear. .002"
Remarks:
/T\ Hole diam. .192" W Head clear. .002"
Remarks:
/T~\ Hole diam. K<Z) Head clear.
Remarks:
.192" .004"
S~\ Hole diam. .192" W Head clear. .001"
Remarks:
f~\ Hole diam. .192" ^y Head clear. .002"
Remarks:
/ON Hole diam. \-J Head clear.
Remarks:
192" .000"
Remarks: Grips failed at 38,090 cycles. During analysis the test was found to be invalid.
E-7
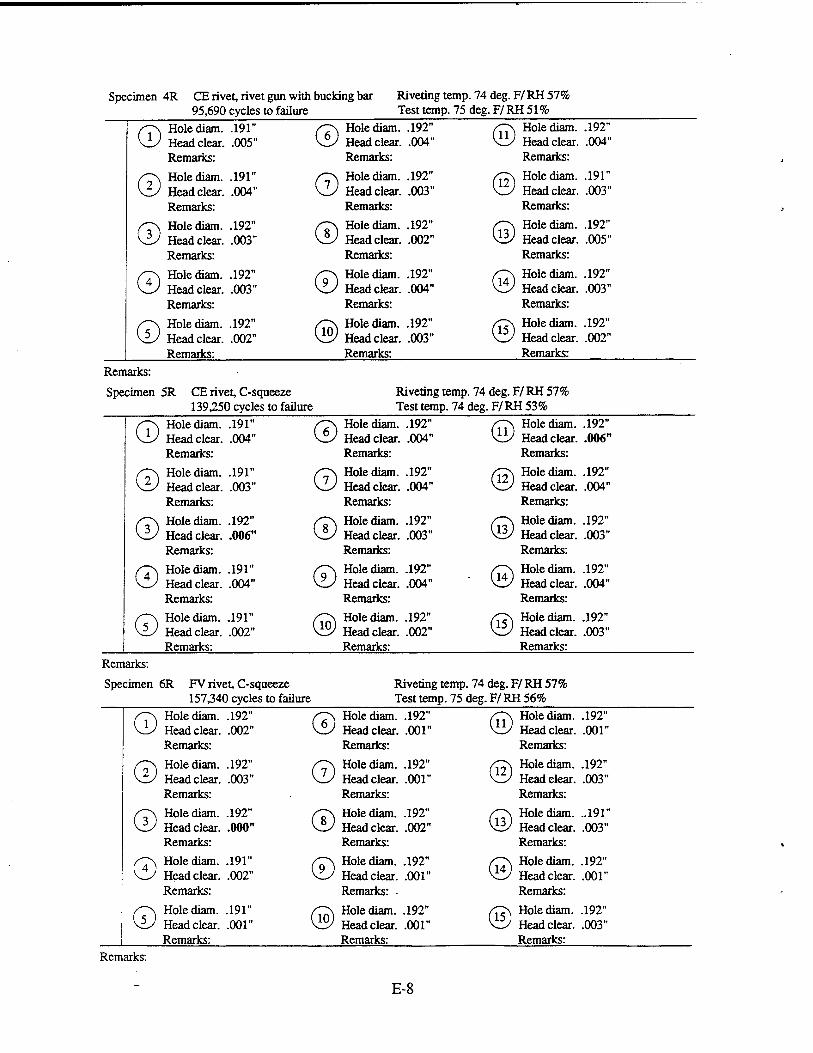
Specimen 4R CE rivet, rivet gun with bucking bar 95,690 cycles to failure
Riveting temp. 74 Test temp. 75 deg,
deg.F/RH57% F/RH51%
© Hole diam. .191" Head clear. .005" Remarks:
/-7\ Hole diam. .192" \ZJ Head clear. .004"
Remarks: © Hole diam.
Head clear. Remarks:
.192" .004"
© Hole diam. .191" Head clear. .004" Remarks:
/T\ Hole diam. .192" W Head clear. .003"
Remarks: ® Hole diam.
Head clear. Remarks:
.191" .003"
© Hole diam. .192" Head clear. .003" Remarks:
ST\ Hole diam. .192" W Head clear. .002"
Remarks: © Hole diam.
Head clear. Remarks:
.192" .005"
© Hole diam. .192" Head clear. .003" Remarks:
/~\ Hole diam. .192" \L/ Head clear. .004"
Remarks: © Hole diam.
Head clear. Remarks:
.192" .003"
© Hole diam. .192" Head clear. .002" Remarks:
/~\ Hole diam. .192" Viy Head clear. .003"
Remarks: ® Hole diam.
Head clear. Remarks:
.192" .002"
Remarks:
Specimen 5R CE rivet, C-squeeze Riveting temp. 74 deg. F/ RH 57% 139^50 cycles to failure Test temp. 74 deg. F/ RH 53%
© Hole diam. .191" Head clear. .004" Remarks:
/7\ Hole diam. .192" ViV Head clear. .004"
Remarks: © Hole diam.
Head clear. Remarks:
.192" .006"
© Hole diam. .191" Head clear. .003" Remarks:
/Z\ Hole diam. .192" \U Head clear. .004"
Remarks:
© Hole diam. Head clear. Remarks:
.192" .004"
© Hole diam. .192" Head clear. .006" Remarks:
/T\ Hole diam. .192" W Head clear. .003"
Remarks: © Hole diam.
Head clear. Remarks:
.192" .003"
© Hole diam. .191" Head clear. .004" Remarks:
/~\ Hole diam. .192" \ZJ Head clear. .004"
Remarks: - © Hole diam.
Head clear. Remarks:
.192" .004"
© Hole diam. .191" Head clear. .002" Remarks:
/CN Hole diam. .192" \^J Head clear. .002"
Remarks: © Hole diam.
Head clear. Remarks:
.192" .003"
Remarks:
Specimen ( 5R FV rivet, C-squeeze Riveting temp. 74 deg. F/ RH 57% 157,340 cycles to failure Test temp. 75 deg. F/ RH 56%
© Hole diam. .192" Head clear. .002" Remarks:
S~\ Hole diam. .192" \zJ Head clear. .001"
Remarks: © Hole diam.
Head clear. Remarks:
.192" .001"
© Hole diam. .192" Head clear. .003" Remarks:
/T\ Hole diam. .192" \U Head clear. .001"
Remarks: © Hole diam.
Head clear. Remarks:
.192" .003"
© Hole diam. .192" Head clear. .000" Remarks:
/T\ Hole diam. .192" Vfy Head clear. .002"
Remarks: © Hole diam.
Head clear. Remarks:
..191" .003"
© Hole diam. .191" Head clear. .002" Remarks:
/T\ Hole diam. .192" V-/ Head clear. .001"
Remarks: © Hole diam.
Head clear. Remarks:
.192" .001"
© Hole diam. .191" Head clear. .001" Remarks:
S~\ Hole diam. .192" vi^y Head clear. .001"
Remarks: © Hole diam.
Head clear. Remarks:
.192" .003"
Remarks:
E-8

Specimen 7R FV rivet, C-squeeze 174,460 cycles to failure
Riveting temp. 74 Test temp. 74 deg.
deg.F/RH58% F/RH43%
/"~\ Holediam. \^J Head clear.
.192" © Hole diam. .192" ® Hole diam. .192" .001" Head clear. .003" Head clear. .002"
Remarks: Remarks: Remarks:
s~T\ Holediam. V_/ Head clear.
.192" © Hole diam. .192" © Hole diam. .192" .002" Head clear. .002" Head clear. .003"
Remarks: Remarks: Remarks:
fis Holediam. W Head clear.
.192" © Hole diam. .192" © Hole diam. .192" .002" Head clear. .002" Head clear. .004"
Remarks: Remarks: Remarks:
/~\ Holediam. v_/ Head clear.
.192" © Hole diam. .192" © Hole diam. .192" .002" Head clear. .003" Head clear. .003"
Remarks: Remarks: Remarks:
/^~\ Holediam. vL/ Head clear.
.192" ® Hole diam. .192" © Hole diam. .192" .002" Head clear. .001" Head clear. .001"
Remarks: Remarks: Remarks: Remarks: No fatigue cracking observed at rivet holes 12 and 15.
Specimen 8R CE rivet, rivet gun with bucking bar Riveting temp. 75 107,710 cycles to failure
deg.F/RH58% Test temp. 75 deg. F/ RH 50%
© Hole diam. .192" © Hole diam. .192" © Hole diam. .192" Head clear. .004" Head clear. .003" Head clear. .004" Remarks: Remarks: Remarks:
© Hole diam. .192" © Hole diam. .192" ® Hole diam. .192" Head clear. .004" Head clear. .003" Head clear. .003" Remarks: Remarks: Remarks:
© Hole diam. .192" © Hole diam. .192" © Hole diam. .192" Head clear. .004" Head clear. .003" Head clear. .003" Remarks: Remarks: Remarks:
© Hole diam. .192" © Hole diam. .192" © Hole diam. .192" Head clear. .004" Head clear. .003" Head clear. .003" Remarks: Remarks: Remarks:
© Hole diam. .192" ® Hole diam. .192" © Hole diam. .192" Head clear. .003" Head clear. .002" Head clear. .003" Remarks: Remarks: Remarks:
Remarks:
Spe cimen ?R CE rivet, C-squeeze Riveting temp. 75 deg. F/ RH 58% 127,980 cycles to failure Test temp. 75deg.F/RH50%
© Hole diam. .192" © Hole diam. .192" © Hole diam. .192" Head clear. .004" Head clear. .003" Head clear. .007" Remarks: Remarks: Remarks:
© Hole diam. .192" © Hole diam. .192" © Hole diam. .192" Head clear. .007" Head clear. .014" Head clear. .003" Remarks: Remarks: Remarks:
© Hole diam. .192" © Hole diam. .192" © Hole diam. .192" Head clear. .002" Head clear. .005" Head clear. .005" Remarks: Remarks: Remarks:
© Hole diam. .191" © Hole diam. .192" © Hole diam. .192" Head clear. .005" Head clear. .003" Head clear. .004" Remarks: Remarks: Remarks:
© Hole diam. .192" ® Hole diam. .192" © Hole diam. .192" Head clear. .002" Head clear. .002" Head clear. .002" Remarks: Remarks: Remarks:
Remarks:
E-9
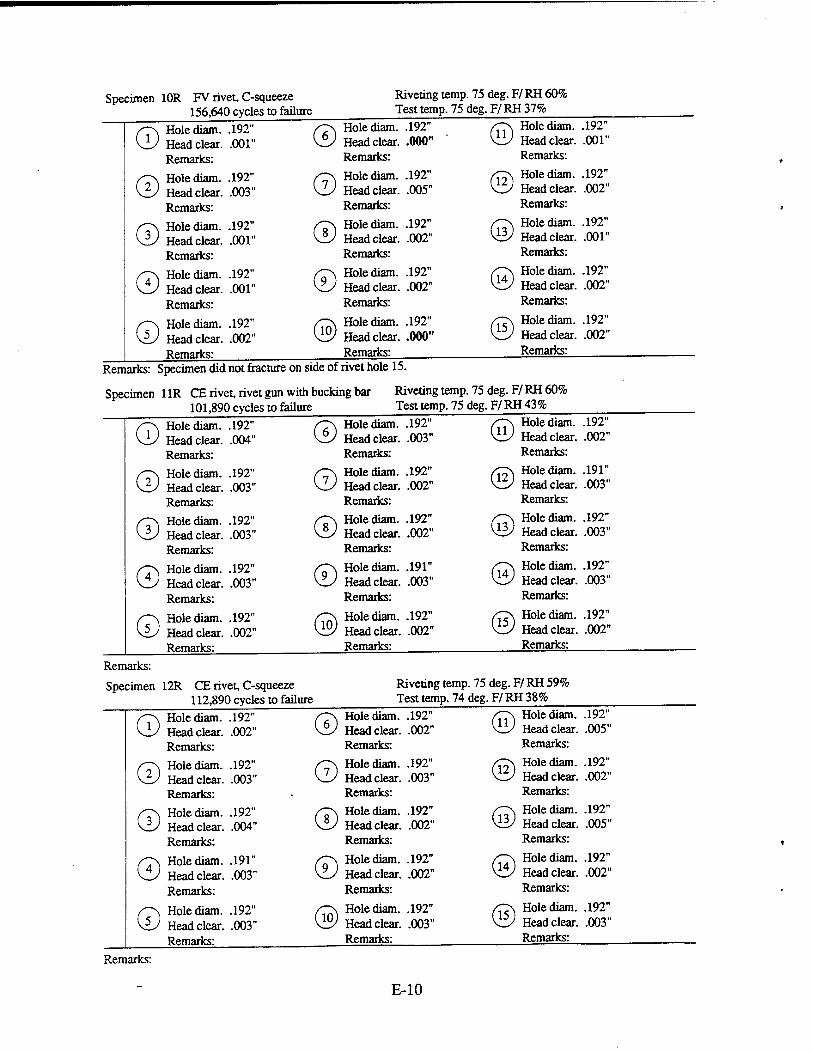
Specimen lOR FV rivet, C-squeeze 156,640 cycles to failure
Riveting temp. 75 Test temp. 75 deg
deg.F/RH60% ,F/RH37%
©
© ©
©
©
Hole diam. .192" Head clear. .001" Remarks:
Hole diam. .192" Head clear. .003" Remarks:
Hole diam. .192" Head clear. .001" Remarks:
Hole diam. .192" Head clear. .001" Remarks:
Hole diam. .192" Head clear. .002" Remarks:
©
©
©
Hole diam. .192" Head clear. .000" Remarks:
Hole diam. .192" Head clear. .005" Remarks:
Hole diam. .192" Head clear. .002" Remarks:
Hole diam. .192" Head clear. .002" Remarks:
Hole diam. .192" Head clear. .000" Remarks:
Hole diam. Head clear. Remarks:
©Hole diam. Head clear. Remarks:
Hole diam. Head clear. Remarks:
Hole diam. Head clear. Remarks:
Hole diam. Head clear. Remarks:
.192" .001"
.192" .002"
.192" .001"
.192" .002"
.192" .002"
Remarks: Specimen did not fracture on side of rivet hole 15.
Specimen 11R CE rivet, rivet gun with bucking bar 101,890 cycles to failure
Riveting temp. 75 Test temp. 75 deg
deg.F/RH60% ,F/RH43%
© © ©
©
©
Hole diam. .192" Head clear. .004" Remarks: Hole diam. .192" Head clear. .003" Remarks: Hole diam. .192" Head clear. .003" Remarks:
Hole diam. .192" Head clear. .003" Remarks:
Hole diam. .192" Head clear. .002" Remarks:
© ©
©
Hole diam. .192" Head clear. .003" Remarks: Hole diam. .192" Head clear. .002" Remarks: Hole diam. .192" Head clear. .002" Remarks:
Hole diam. .191" Head clear. .003" Remarks:
Hole diam. .192" Head clear. .002" Remarks;
© Hole diam. .192" Head clear. .002" Remarks: Hole diam. .191" Head clear. .003" Remarks:
Hole diam. .192" Head clear. .003" Remarks:
Hole diam. .192" Head clear. .003" Remarks:
Hole diam. .192" Head clear. .002" Remarks:
Remarks:
Specimen 12R CE rivet, C-squeeze 112,890 cycles to failure
Riveting temp. 75 Test temp. 74 deg
deg.F/RH59% .F/RH38%
©
© ©
©
©
Hole diam. .192" Head clear. .002" Remarks: Hole diam. .192" Head clear. .003" Remarks: Hole diam. .192" Head clear. .004" Remarks:
Hole diam. .191" Head clear. .003" Remarks:
Hole diam. .192" Head clear. .003" Remarks:
© Hole diam. .192" © Hole diam. .192" Head clear. .002" Head clear. .005" Remarks: Remarks:
© Hole diam. .192" © Hole diam. .192" Head clear. .003" Head clear. .002" Remarks: Remarks:
© Hole diam. Head clear. Remarks:
.192" .002" © Hole diam.
Head clear. Remarks:
.192" .005"
© Hole diam. .192" © Hole diam. .192" Head clear. .002" Head clear. .002" Remarks: Remarks:
® Hole diam. Head clear. Remarks:
.192" .003" © Hole diam.
Head clear. Remarks:
.192" .003"
Remarks:
E-10