finite element analysis of fretting fatigue … · international journal of fracture fatigue and...
TRANSCRIPT

International Journal of Fracture Fatigue and Wear, Volume 3
135
Proceedings of the 4th International Conference on Fracture Fatigue and Wear, pp. 135-142, 2015
FINITE ELEMENT ANALYSIS OF FRETTING FATIGUE OF FRETTED
WIRES
D.G. Wang a, b, c e, *, M. Abdel Wahabc, L.L Wangd, X.W. Lia, Z.C. Zhua, D.K. Zhanga, X.B. Maoe
aSchool of Mechatronic Engineering, China University of Mining and Technology, Xuzhou 221116, China bState Key Laboratory of Solid Lubrication, Lanzhou Institute of Chemical Physics, Chinese Academy of
Sciences, Lanzhou 730000, China cFaculty of Engineering and Architecture, Soete Laboratory, Ghent University, B-9052 Zwijnaarde, Belgium
dLow Carbon Energy Institute, China University of Mining and Technology, Xuzhou 221116, China eState Key Laboratory of Geomechanics & Deep Underground Engineering, China University of Mining and
Technology, Xuzhou 221116, China
Abstract: Finite element analysis of fretting fatigue of fretted wires is presented in thist study. Effects of fretting wear depth and contact load on stress distributions and crack initiation characteristics on fretting conact surfaces of fretted wires are analyzed using the finite element method, which was validated by fretting fatigue tests. The results show that increasing wear depth and contact load induces distinct stress distributions and accelerates crack initiation on fretting surfaces.
Keywords: Finite element analysis; fretting fatigue; fretted wires
1 INTRODUCTION
In mine hoisting systems, hoisting ropes connecting the mine hoist and the conveyance have played a vital role because their endurance strength and fatigue life have great effect on the mine production and the safety of miners [1-3]. During mine production, the hoisting rope winding around the friction wheel lifts and releases the hoisting container cyclically, and is always subject to axial tensile load and bending load. Those loads lead to microscopic motion of individual wires relative to their neighbouring wires in the rope and tangential force (induced by contact load). The interaction between contact load, relative displacement and cyclic load causes fretting fatigue of steel wires, which accelerates the rope failure [4-7]. During the fretting fatigue process, contacting wires present different wear depths of wear sars at distinct fatigue cycles. Therefore, it is significant to explore the fretting fatigue failure of wires during bending fatigue of the rope and fretting fatigue behaviors of fretted wires.
Over the last years, several advances have been made in the understanding of the fretting fatigue damage of steel wires. Hobbs and Raoof [8] explored different fretting fatigue mechanisms of steel wire ropes under different cyclic loading modes. Zhang et al. [9] investigated fatigue fracture behaviors of fretted wires. Dieng et al. [10] revealed the impact of lubrication and zinc coating on the fretting fatigue behavior of high strength steel wires. Périera et al. [11,12] studied the impact of water and sodium chloride on fretting fatigue behaviors of bridge cable wires and pointed out the lubrication effect of water and corrosive effect of sodium chloride in fretting fatigue. Wang et al. [13, 14] conducted fretting fatigue tests of steel wires in low cycle fatigue and explored crack initiation characteristics of steel wires in Hertz contact during the initial fretting-fatigue. From literature studies mentioned above, it is found that previous efforts have been focused on fretting fatigue behaviors under distinct fretting parameters and different environments, and crack initiations of wires in Hertz contact. Unlike previous studies, stress distributions and crack initiation properties of fretted wires during fretting fatigue employing finite element analyses are explored in this study.
International Journal of Fracture Fatigue and Wear, Volume 3
136
The objective of the present study is to conduct finite element analyses of fretted wires under the action of fretting fatigue loading conditions. Section 2 presented the finite element model of fretting fatigue of fretted wires to explore the roles of fretting wear depth and contact load on stress distributions and crack initiation characteristics on fretting contact surfaces. In Section 3, in order to validate the finite element model, fretting fatigue tests of steel wires at different fatigue cycles (distinct fretting wear depths) to examine crack initiation characteristics on contacting surfaces of fretted wires are presented.
2 FINITE ELEMENT ANALYSIS OF FRETTING-FATIGUE OF FRETTED WIRES
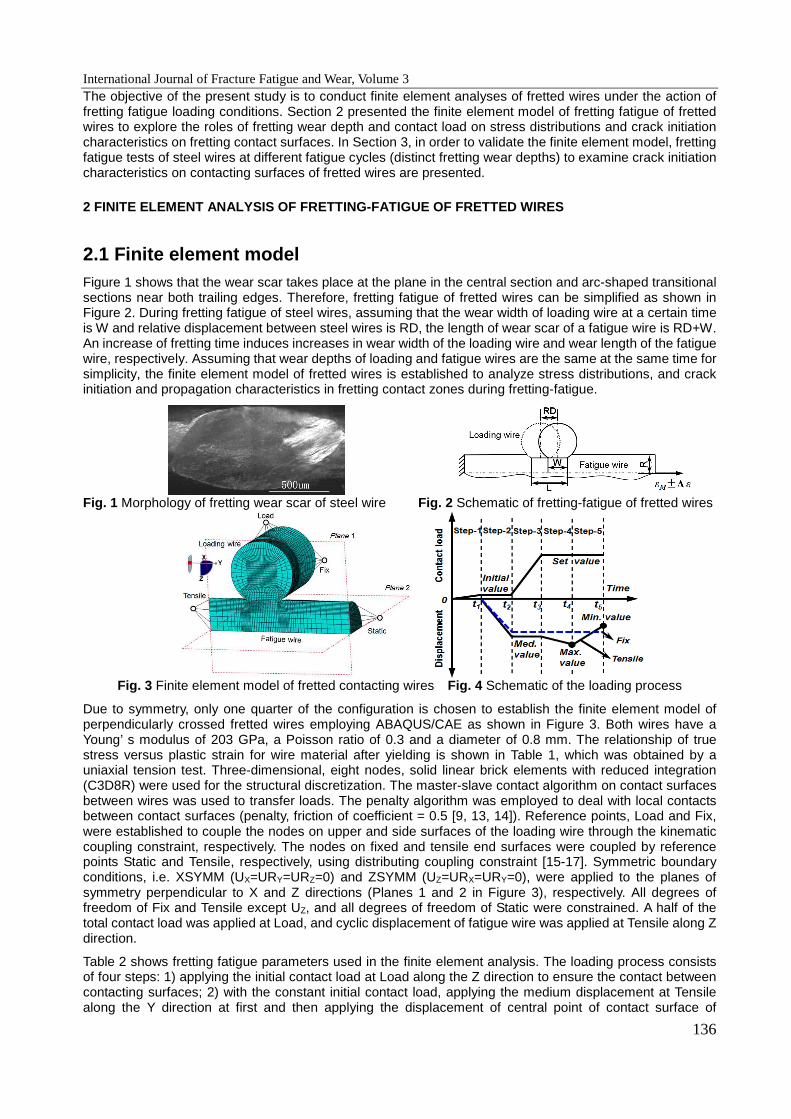
2.1 Finite element model Figure 1 shows that the wear scar takes place at the plane in the central section and arc-shaped transitional sections near both trailing edges. Therefore, fretting fatigue of fretted wires can be simplified as shown in Figure 2. During fretting fatigue of steel wires, assuming that the wear width of loading wire at a certain time is W and relative displacement between steel wires is RD, the length of wear scar of a fatigue wire is RD+W. An increase of fretting time induces increases in wear width of the loading wire and wear length of the fatigue wire, respectively. Assuming that wear depths of loading and fatigue wires are the same at the same time for simplicity, the finite element model of fretted wires is established to analyze stress distributions, and crack initiation and propagation characteristics in fretting contact zones during fretting-fatigue.
Fig. 1 Morphology of fretting wear scar of steel wire Fig. 2 Schematic of fretting-fatigue of fretted wires
Fig. 3 Finite element model of fretted contacting wires Fig. 4 Schematic of the loading process
Due to symmetry, only one quarter of the configuration is chosen to establish the finite element model of perpendicularly crossed fretted wires employing ABAQUS/CAE as shown in Figure 3. Both wires have a Young’ s modulus of 203 GPa, a Poisson ratio of 0.3 and a diameter of 0.8 mm. The relationship of true stress versus plastic strain for wire material after yielding is shown in Table 1, which was obtained by a uniaxial tension test. Three-dimensional, eight nodes, solid linear brick elements with reduced integration (C3D8R) were used for the structural discretization. The master-slave contact algorithm on contact surfaces between wires was used to transfer loads. The penalty algorithm was employed to deal with local contacts between contact surfaces (penalty, friction of coefficient = 0.5 [9, 13, 14]). Reference points, Load and Fix, were established to couple the nodes on upper and side surfaces of the loading wire through the kinematic coupling constraint, respectively. The nodes on fixed and tensile end surfaces were coupled by reference points Static and Tensile, respectively, using distributing coupling constraint [15-17]. Symmetric boundary conditions, i.e. XSYMM (UX=URY=URZ=0) and ZSYMM (UZ=URX=URY=0), were applied to the planes of symmetry perpendicular to X and Z directions (Planes 1 and 2 in Figure 3), respectively. All degrees of freedom of Fix and Tensile except UZ, and all degrees of freedom of Static were constrained. A half of the total contact load was applied at Load, and cyclic displacement of fatigue wire was applied at Tensile along Z direction.
Table 2 shows fretting fatigue parameters used in the finite element analysis. The loading process consists of four steps: 1) applying the initial contact load at Load along the Z direction to ensure the contact between contacting surfaces; 2) with the constant initial contact load, applying the medium displacement at Tensile along the Y direction at first and then applying the displacement of central point of contact surface of
International Journal of Fracture Fatigue and Wear, Volume 3
137
stretched fatigue wire at Fix; 3) increasing the contact load at Load to the preset value with constant displacements of points, Tensile and Fix and 4) applying maximum and minimum displacements at Tensile with a constant contact load and displacement of point Fix. The loading diagram is shown in Figure 4.
Table 1 Data for wire material after yielding
True stress (MPa) 1450 1498.61 1570.51 1634.2 1657.56 1680.94 1690.94 1696.52
Plastic strain 0 0.000107 0.000739 0.00158 0.00228 0.00290 0.00359 0.00429
Table 2. Fretting fatigue parameters in finite element analysis
Wear depth (µm) Contact load (N) Fretting amplitude (µm) Cyclic strain range (×10-3)
20-60 10-40 60 4-5
2.2 Stress distributions of the wire contact zone under the typical
condition
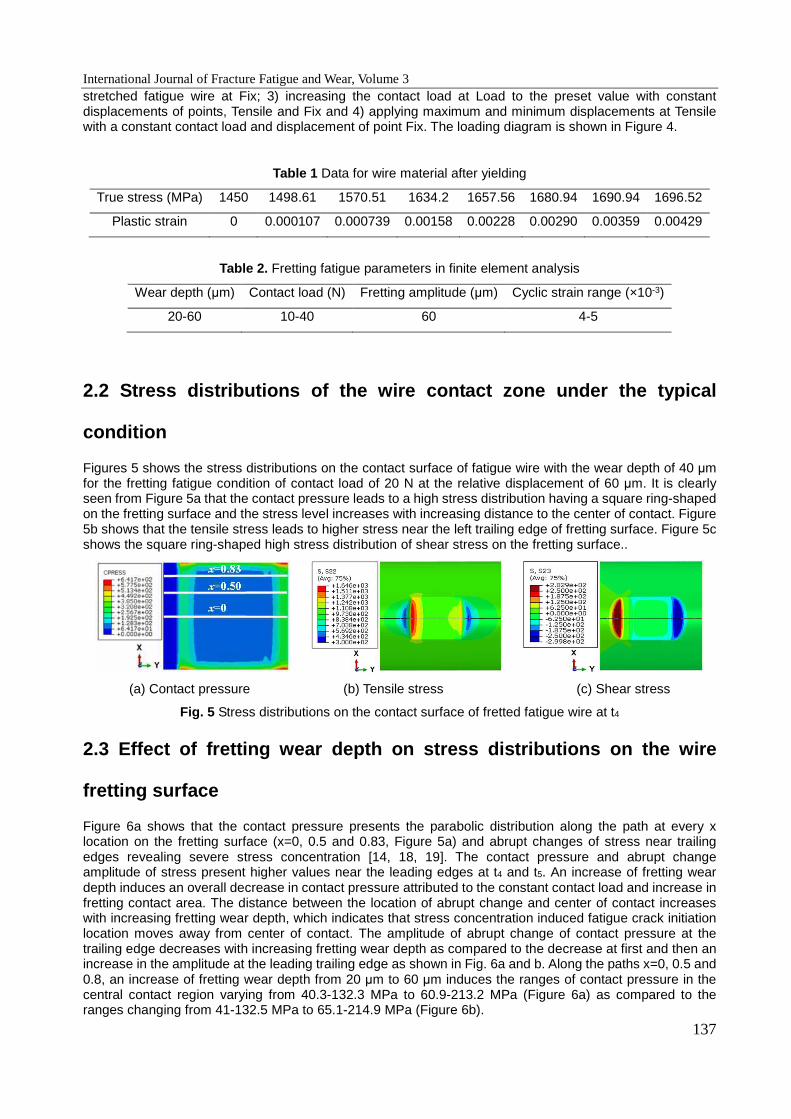
Figures 5 shows the stress distributions on the contact surface of fatigue wire with the wear depth of 40 µm for the fretting fatigue condition of contact load of 20 N at the relative displacement of 60 µm. It is clearly seen from Figure 5a that the contact pressure leads to a high stress distribution having a square ring-shaped on the fretting surface and the stress level increases with increasing distance to the center of contact. Figure 5b shows that the tensile stress leads to higher stress near the left trailing edge of fretting surface. Figure 5c shows the square ring-shaped high stress distribution of shear stress on the fretting surface..
(a) Contact pressure (b) Tensile stress (c) Shear stress
Fig. 5 Stress distributions on the contact surface of fretted fatigue wire at t4
2.3 Effect of fretting wear depth on stress distributions on the wire
fretting surface
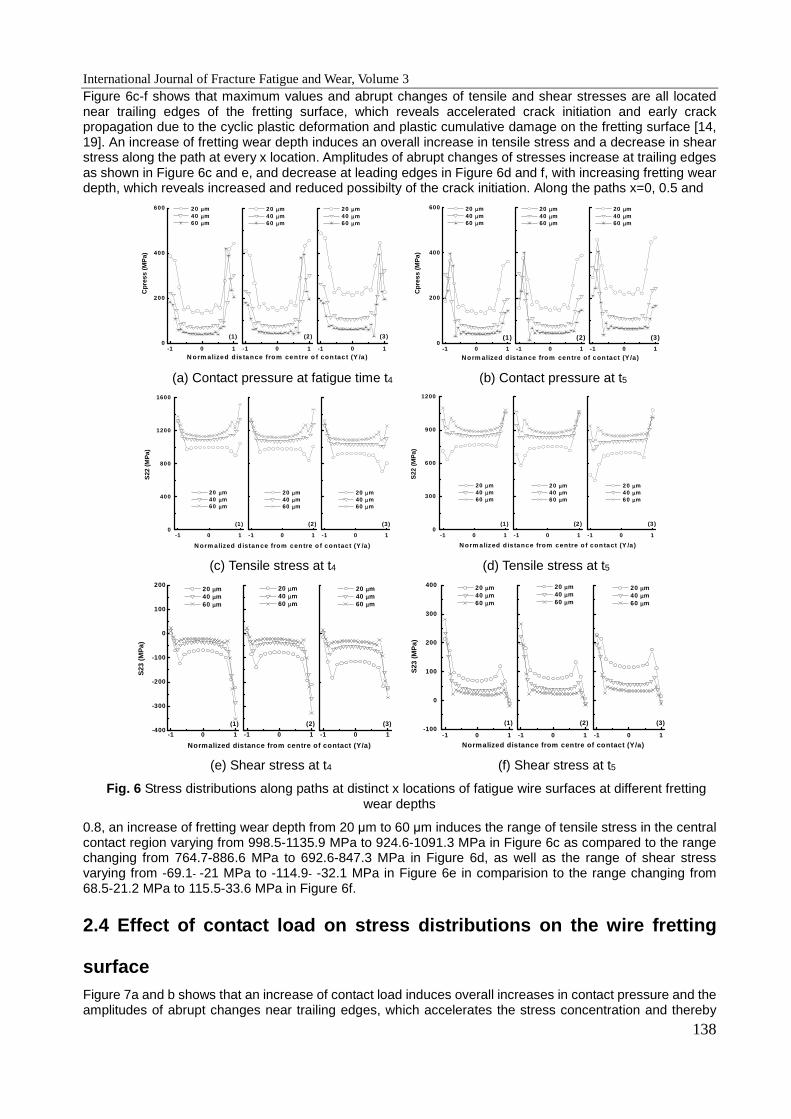
Figure 6a shows that the contact pressure presents the parabolic distribution along the path at every x location on the fretting surface (x=0, 0.5 and 0.83, Figure 5a) and abrupt changes of stress near trailing edges revealing severe stress concentration [14, 18, 19]. The contact pressure and abrupt change amplitude of stress present higher values near the leading edges at t4 and t5. An increase of fretting wear depth induces an overall decrease in contact pressure attributed to the constant contact load and increase in fretting contact area. The distance between the location of abrupt change and center of contact increases with increasing fretting wear depth, which indicates that stress concentration induced fatigue crack initiation location moves away from center of contact. The amplitude of abrupt change of contact pressure at the trailing edge decreases with increasing fretting wear depth as compared to the decrease at first and then an increase in the amplitude at the leading trailing edge as shown in Fig. 6a and b. Along the paths x=0, 0.5 and 0.8, an increase of fretting wear depth from 20 µm to 60 µm induces the ranges of contact pressure in the central contact region varying from 40.3-132.3 MPa to 60.9-213.2 MPa (Figure 6a) as compared to the ranges changing from 41-132.5 MPa to 65.1-214.9 MPa (Figure 6b).
International Journal of Fracture Fatigue and Wear, Volume 3
138
Figure 6c-f shows that maximum values and abrupt changes of tensile and shear stresses are all located near trailing edges of the fretting surface, which reveals accelerated crack initiation and early crack propagation due to the cyclic plastic deformation and plastic cumulative damage on the fretting surface [14, 19]. An increase of fretting wear depth induces an overall increase in tensile stress and a decrease in shear stress along the path at every x location. Amplitudes of abrupt changes of stresses increase at trailing edges as shown in Figure 6c and e, and decrease at leading edges in Figure 6d and f, with increasing fretting wear depth, which reveals increased and reduced possibilty of the crack initiation. Along the paths x=0, 0.5 and
-1 0 10
200
400
600
Cpr
ess
(MP
a)
20 µm 40 µm 60 µm
(1) (2) (3)
-1 0 1
N orm alized d is tance from centre o f con tac t (Y /a )
20 µm 40 µm 60 µm
-1 0 1
20 µm 40 µm 60 µm
-1 0 1
0
200
400
600
Cp
ress
(M
Pa)
20 µm 40 µm 60 µm
(1)
-1 0 1
Norm alized d istance from centre of contact (Y /a )
20 µm 40 µm 60 µm
(2)
-1 0 1
20 µm 40 µm 60 µm
(3)
(a) Contact pressure at fatigue time t4 (b) Contact pressure at t5
-1 0 10
400
800
1200
1600
S22
(M
Pa)
20 µm 40 µm 60 µm
(1) (2) (3)
-1 0 1
N orm alized d istan ce from cen tre o f contact (Y /a )
20 µm 40 µm 60 µm
-1 0 1
20 µm 40 µm 60 µm
-1 0 1
0
300
600
900
1200
S22
(M
Pa)
20 µm 40 µm 60 µm
(1 ) (2 ) (3 )
-1 0 1
N orm alized d istance from centre o f con tact (Y /a )
20 µm 40 µm 60 µm
-1 0 1
20 µm 40 µm 60 µm
(c) Tensile stress at t4 (d) Tensile stress at t5
-1 0 1-400
-300
-200
-100
0
100
200
S23
(M
Pa)
20 µm 40 µm 60 µm
(1) (2) (3)
-1 0 1
Normalized distance from centre of contact (Y/a)
20 µm 40 µm 60 µm
-1 0 1
20 µm 40 µm 60 µm
-1 0 1
-100
0
100
200
300
400
S23
(M
Pa)
20 µm 40 µm 60 µm
-1 0 1
Normalized distance from centre of contact (Y /a)
20 µm 40 µm 60 µm
-1 0 1
20 µm 40 µm 60 µm
(1) (2) (3)
(e) Shear stress at t4 (f) Shear stress at t5
Fig. 6 Stress distributions along paths at distinct x locations of fatigue wire surfaces at different fretting wear depths
0.8, an increase of fretting wear depth from 20 µm to 60 µm induces the range of tensile stress in the central contact region varying from 998.5-1135.9 MPa to 924.6-1091.3 MPa in Figure 6c as compared to the range changing from 764.7-886.6 MPa to 692.6-847.3 MPa in Figure 6d, as well as the range of shear stress varying from -69.1- -21 MPa to -114.9- -32.1 MPa in Figure 6e in comparision to the range changing from 68.5-21.2 MPa to 115.5-33.6 MPa in Figure 6f.
2.4 Effect of contact load on stress distributions on the wire fretting
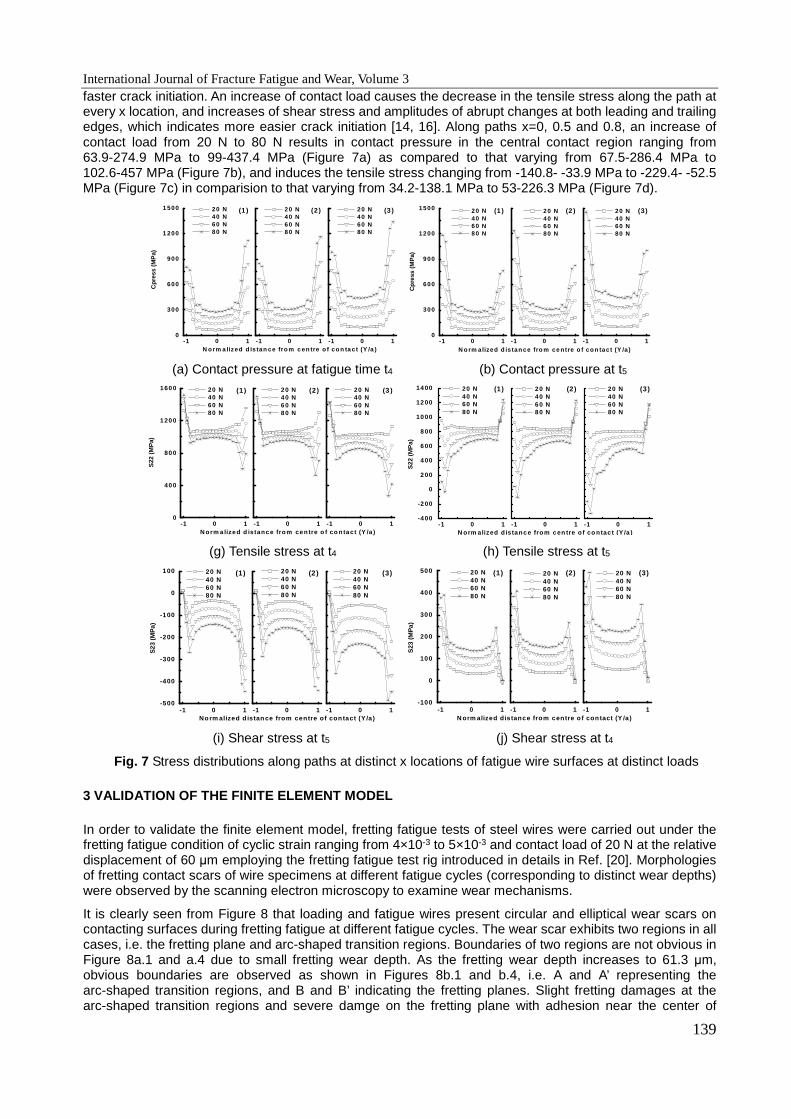
surface Figure 7a and b shows that an increase of contact load induces overall increases in contact pressure and the amplitudes of abrupt changes near trailing edges, which accelerates the stress concentration and thereby
International Journal of Fracture Fatigue and Wear, Volume 3
139
faster crack initiation. An increase of contact load causes the decrease in the tensile stress along the path at every x location, and increases of shear stress and amplitudes of abrupt changes at both leading and trailing edges, which indicates more easier crack initiation [14, 16]. Along paths x=0, 0.5 and 0.8, an increase of contact load from 20 N to 80 N results in contact pressure in the central contact region ranging from 63.9-274.9 MPa to 99-437.4 MPa (Figure 7a) as compared to that varying from 67.5-286.4 MPa to 102.6-457 MPa (Figure 7b), and induces the tensile stress changing from -140.8- -33.9 MPa to -229.4- -52.5 MPa (Figure 7c) in comparision to that varying from 34.2-138.1 MPa to 53-226.3 MPa (Figure 7d).
-1 0 10
300
600
900
1 200
1 500
Cp
ress
(M
Pa)
20 N 40 N 60 N 80 N
(1 ) (2 ) (3 )
-1 0 1
N o rm a lized d is tan ce fro m c en tre o f co n ta ct (Y /a )
20 N 40 N 60 N 80 N
-1 0 1
20 N 40 N 60 N 80 N
-1 0 1
0
300
600
900
1200
1500
Cp
ress
(M
Pa)
20 N 40 N 60 N 80 N
-1 0 1
N o rm alized d is tan ce fro m ce ntre o f co n tact (Y /a )
20 N 40 N 60 N 80 N
-1 0 1
20 N 40 N 60 N 80 N
(1 ) (2 ) (3)
(a) Contact pressure at fatigue time t4 (b) Contact pressure at t5
-1 0 10
400
800
1200
1600
S22
(M
Pa)
20 N 40 N 60 N 80 N
(1) (2) (3 )
-1 0 1
N orm a lized d istance from centre o f co ntact (Y /a )
20 N 40 N 60 N 80 N
-1 0 1
20 N 40 N 60 N 80 N
-1 0 1
-400
-200
0
200
400
600
800
1000
1200
1400
S22
(M
Pa)
20 N 40 N 60 N 80 N
(1) (2) (3)
-1 0 1N orm alized d istance from cen tre o f co ntac t (Y /a )
20 N 40 N 60 N 80 N
-1 0 1
20 N 40 N 60 N 80 N
(g) Tensile stress at t4 (h) Tensile stress at t5
-1 0 1-500
-400
-300
-200
-100
0
100
S23
(M
Pa)
20 N 40 N 60 N 80 N
(1) (2) (3)
-1 0 1
Norm alized d istance from centre of con tact (Y /a )
20 N 40 N 60 N 80 N
-1 0 1
20 N 40 N 60 N 80 N
-1 0 1
-100
0
100
200
300
400
500
S23
(M
Pa)
20 N 40 N 60 N 80 N
(1) (2) (3)
-1 0 1
N orm alized distance from centre o f con tact (Y /a )
20 N 40 N 60 N 80 N
-1 0 1
20 N 40 N 60 N 80 N
(i) Shear stress at t5 (j) Shear stress at t4
Fig. 7 Stress distributions along paths at distinct x locations of fatigue wire surfaces at distinct loads
3 VALIDATION OF THE FINITE ELEMENT MODEL
In order to validate the finite element model, fretting fatigue tests of steel wires were carried out under the fretting fatigue condition of cyclic strain ranging from 4×10⁻³ to 5×10⁻³ and contact load of 20 N at the relative displacement of 60 µm employing the fretting fatigue test rig introduced in details in Ref. [20]. Morphologies of fretting contact scars of wire specimens at different fatigue cycles (corresponding to distinct wear depths) were observed by the scanning electron microscopy to examine wear mechanisms.
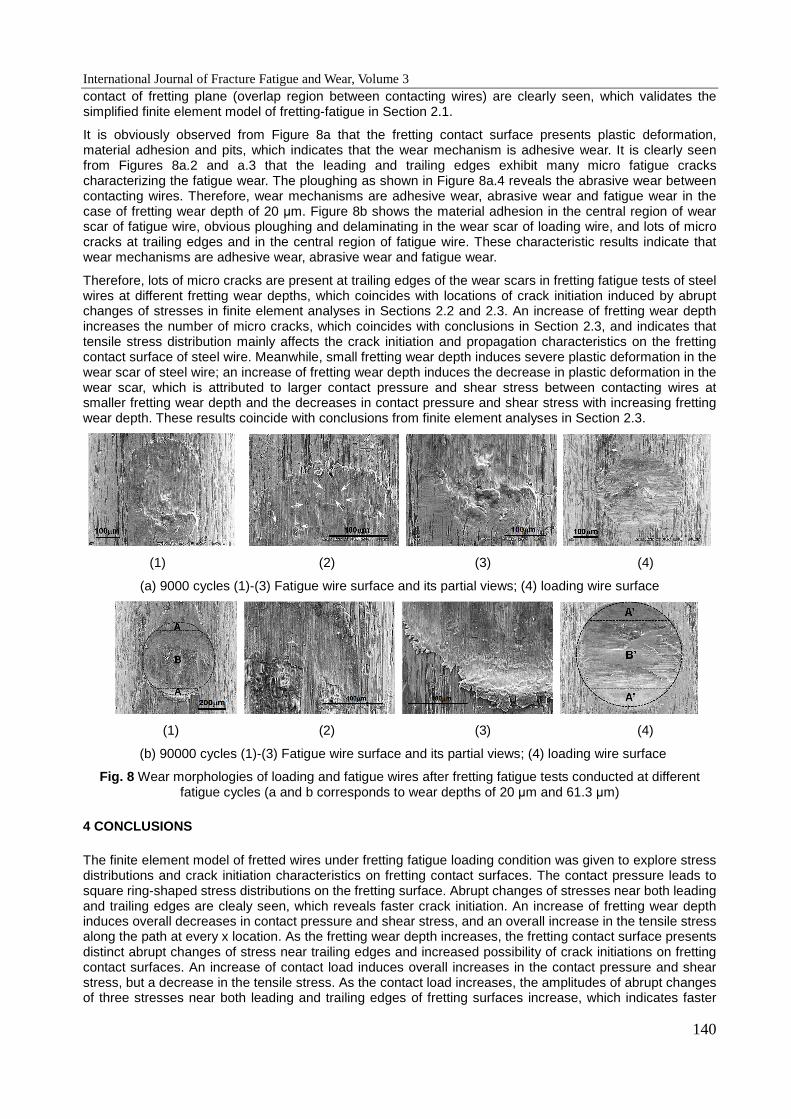
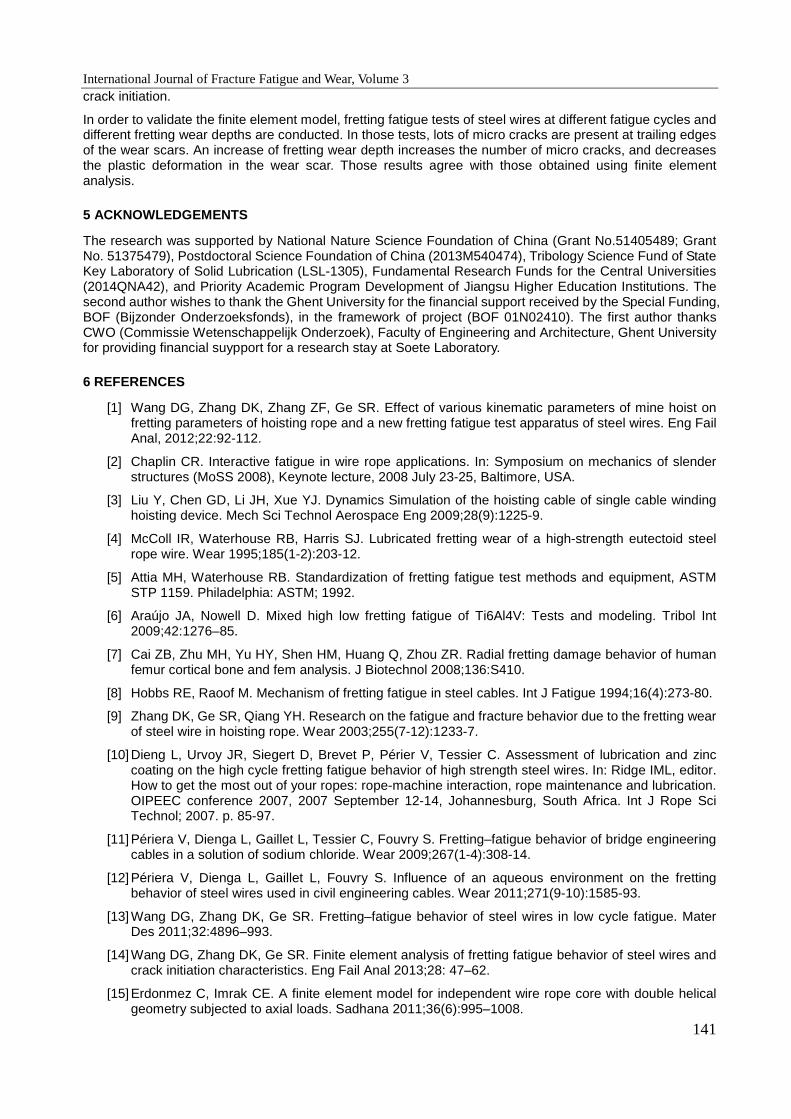
It is clearly seen from Figure 8 that loading and fatigue wires present circular and elliptical wear scars on contacting surfaces during fretting fatigue at different fatigue cycles. The wear scar exhibits two regions in all cases, i.e. the fretting plane and arc-shaped transition regions. Boundaries of two regions are not obvious in Figure 8a.1 and a.4 due to small fretting wear depth. As the fretting wear depth increases to 61.3 µm, obvious boundaries are observed as shown in Figures 8b.1 and b.4, i.e. A and A’ representing the arc-shaped transition regions, and B and B’ indicating the fretting planes. Slight fretting damages at the arc-shaped transition regions and severe damge on the fretting plane with adhesion near the center of
International Journal of Fracture Fatigue and Wear, Volume 3
140
contact of fretting plane (overlap region between contacting wires) are clearly seen, which validates the simplified finite element model of fretting-fatigue in Section 2.1.
It is obviously observed from Figure 8a that the fretting contact surface presents plastic deformation, material adhesion and pits, which indicates that the wear mechanism is adhesive wear. It is clearly seen from Figures 8a.2 and a.3 that the leading and trailing edges exhibit many micro fatigue cracks characterizing the fatigue wear. The ploughing as shown in Figure 8a.4 reveals the abrasive wear between contacting wires. Therefore, wear mechanisms are adhesive wear, abrasive wear and fatigue wear in the case of fretting wear depth of 20 µm. Figure 8b shows the material adhesion in the central region of wear scar of fatigue wire, obvious ploughing and delaminating in the wear scar of loading wire, and lots of micro cracks at trailing edges and in the central region of fatigue wire. These characteristic results indicate that wear mechanisms are adhesive wear, abrasive wear and fatigue wear.
Therefore, lots of micro cracks are present at trailing edges of the wear scars in fretting fatigue tests of steel wires at different fretting wear depths, which coincides with locations of crack initiation induced by abrupt changes of stresses in finite element analyses in Sections 2.2 and 2.3. An increase of fretting wear depth increases the number of micro cracks, which coincides with conclusions in Section 2.3, and indicates that tensile stress distribution mainly affects the crack initiation and propagation characteristics on the fretting contact surface of steel wire. Meanwhile, small fretting wear depth induces severe plastic deformation in the wear scar of steel wire; an increase of fretting wear depth induces the decrease in plastic deformation in the wear scar, which is attributed to larger contact pressure and shear stress between contacting wires at smaller fretting wear depth and the decreases in contact pressure and shear stress with increasing fretting wear depth. These results coincide with conclusions from finite element analyses in Section 2.3.
(1) (2) (3) (4)
(a) 9000 cycles (1)-(3) Fatigue wire surface and its partial views; (4) loading wire surface
(1) (2) (3) (4)
(b) 90000 cycles (1)-(3) Fatigue wire surface and its partial views; (4) loading wire surface
Fig. 8 Wear morphologies of loading and fatigue wires after fretting fatigue tests conducted at different fatigue cycles (a and b corresponds to wear depths of 20 µm and 61.3 µm)
4 CONCLUSIONS
The finite element model of fretted wires under fretting fatigue loading condition was given to explore stress distributions and crack initiation characteristics on fretting contact surfaces. The contact pressure leads to square ring-shaped stress distributions on the fretting surface. Abrupt changes of stresses near both leading and trailing edges are clealy seen, which reveals faster crack initiation. An increase of fretting wear depth induces overall decreases in contact pressure and shear stress, and an overall increase in the tensile stress along the path at every x location. As the fretting wear depth increases, the fretting contact surface presents distinct abrupt changes of stress near trailing edges and increased possibility of crack initiations on fretting contact surfaces. An increase of contact load induces overall increases in the contact pressure and shear stress, but a decrease in the tensile stress. As the contact load increases, the amplitudes of abrupt changes of three stresses near both leading and trailing edges of fretting surfaces increase, which indicates faster
International Journal of Fracture Fatigue and Wear, Volume 3
141
crack initiation.
In order to validate the finite element model, fretting fatigue tests of steel wires at different fatigue cycles and different fretting wear depths are conducted. In those tests, lots of micro cracks are present at trailing edges of the wear scars. An increase of fretting wear depth increases the number of micro cracks, and decreases the plastic deformation in the wear scar. Those results agree with those obtained using finite element analysis.
5 ACKNOWLEDGEMENTS
The research was supported by National Nature Science Foundation of China (Grant No.51405489; Grant No. 51375479), Postdoctoral Science Foundation of China (2013M540474), Tribology Science Fund of State Key Laboratory of Solid Lubrication (LSL-1305), Fundamental Research Funds for the Central Universities (2014QNA42), and Priority Academic Program Development of Jiangsu Higher Education Institutions. The second author wishes to thank the Ghent University for the financial support received by the Special Funding, BOF (Bijzonder Onderzoeksfonds), in the framework of project (BOF 01N02410). The first author thanks CWO (Commissie Wetenschappelijk Onderzoek), Faculty of Engineering and Architecture, Ghent University for providing financial suypport for a research stay at Soete Laboratory.
6 REFERENCES
[1] Wang DG, Zhang DK, Zhang ZF, Ge SR. Effect of various kinematic parameters of mine hoist on fretting parameters of hoisting rope and a new fretting fatigue test apparatus of steel wires. Eng Fail Anal, 2012;22:92-112.
[2] Chaplin CR. Interactive fatigue in wire rope applications. In: Symposium on mechanics of slender structures (MoSS 2008), Keynote lecture, 2008 July 23-25, Baltimore, USA.
[3] Liu Y, Chen GD, Li JH, Xue YJ. Dynamics Simulation of the hoisting cable of single cable winding hoisting device. Mech Sci Technol Aerospace Eng 2009;28(9):1225-9.
[4] McColl IR, Waterhouse RB, Harris SJ. Lubricated fretting wear of a high-strength eutectoid steel rope wire. Wear 1995;185(1-2):203-12.
[5] Attia MH, Waterhouse RB. Standardization of fretting fatigue test methods and equipment, ASTM STP 1159. Philadelphia: ASTM; 1992.
[6] Araújo JA, Nowell D. Mixed high low fretting fatigue of Ti6Al4V: Tests and modeling. Tribol Int 2009;42:1276–85.
[7] Cai ZB, Zhu MH, Yu HY, Shen HM, Huang Q, Zhou ZR. Radial fretting damage behavior of human femur cortical bone and fem analysis. J Biotechnol 2008;136:S410.
[8] Hobbs RE, Raoof M. Mechanism of fretting fatigue in steel cables. Int J Fatigue 1994;16(4):273-80.
[9] Zhang DK, Ge SR, Qiang YH. Research on the fatigue and fracture behavior due to the fretting wear of steel wire in hoisting rope. Wear 2003;255(7-12):1233-7.
[10] Dieng L, Urvoy JR, Siegert D, Brevet P, Périer V, Tessier C. Assessment of lubrication and zinc coating on the high cycle fretting fatigue behavior of high strength steel wires. In: Ridge IML, editor. How to get the most out of your ropes: rope-machine interaction, rope maintenance and lubrication. OIPEEC conference 2007, 2007 September 12-14, Johannesburg, South Africa. Int J Rope Sci Technol; 2007. p. 85-97.
[11] Périera V, Dienga L, Gaillet L, Tessier C, Fouvry S. Fretting–fatigue behavior of bridge engineering cables in a solution of sodium chloride. Wear 2009;267(1-4):308-14.
[12] Périera V, Dienga L, Gaillet L, Fouvry S. Influence of an aqueous environment on the fretting behavior of steel wires used in civil engineering cables. Wear 2011;271(9-10):1585-93.
[13] Wang DG, Zhang DK, Ge SR. Fretting–fatigue behavior of steel wires in low cycle fatigue. Mater Des 2011;32:4896–993.
[14] Wang DG, Zhang DK, Ge SR. Finite element analysis of fretting fatigue behavior of steel wires and crack initiation characteristics. Eng Fail Anal 2013;28: 47–62.
[15] Erdonmez C, Imrak CE. A finite element model for independent wire rope core with double helical geometry subjected to axial loads. Sadhana 2011;36(6):995–1008.

International Journal of Fracture Fatigue and Wear, Volume 3
142
[16] Shi YP, Zhou YR. Examples of ABAQUS finite element analysis. Beijing: Mechanical Industrial Press; 2006.
[17] Shibu G, Mohankumar KV, Devendiran S. Analysis of a three layered straight wire rope strand using finite element method. In: proceedings of the world congress on engineering (WCE 2011), 2011 July 6–8, London, UK.
[18] Xu YJ, Yuan H. Computational analysis and characterization of fretting stress fields. Comp Mater Sci 2009; 45:674-9.
[19] Talemi HR, Wahab AM, Baets DP. Numerical investigation into effect of contact geometry on fretting fatigue crack propagation lifetime. Tribol T 2012;55(3):365–75.
[20] Wang DG, Zhang DK, Wang SQ, Ge SR. Finite element analysis of hoisting rope and fretting wear evolution and fatigue life estimation of steel wires. Eng Fail Anal 2013;27:173–93.