x~ cdfa - agricultural marketing service
TRANSCRIPT
~,|/ , , ~ I ~ rM
--v ~ x~ CDFA California Department of Food and Agriculture
C A L I F O R N I A
!
+
k f
S T A T I S T I C S
÷ ÷ ÷
STATE OF CAUFORNIA
" 1t) ~ - , ' = - - CDFA
California Department of Food & Agriculture William (Bill) J Lyons, Jr, Secretary Dairy Marketing Branch 1220 N Street, Sacramento, CA 95814 (916) 654-1456/Fax (916) 654-0867
GRAY DAVIS, Governo~
:~'~
,4. h~
This publication was prepared in the Dairy Marketing Branch, Division of Marketing Services by."
Dairy Statistics Service Candace Gates, Research Manager
Karen Dapper, Research Analyst Tami Cuccia, Sr. Account Clerk
Special thanks to: Eric Erba, Sr. Agricultural Economist
Tom Gossard, Sr. Agricultural Economist
In Cooperation With:
Manufactur ing Cost Unit Ed Hunter, Supervisor
Production Cost Unit Greg Lawley, Supervisor
Milk Pooling Branch Don Shippelhoute, Research Program Specialist
Joleen Rodriguez, Staff Analyst
And
U S. Department of Agriculture Washington, D C
Ann Venneman, Secretary
National Agricultural Statistics Service Ron Bosecker, Administrator
James Tippett, California Statistician
J
Recorded Milk Prices: ~ _ ~ ~ ,.~.. i~,:~ ,~. (800) 503-3490 within California; (916) 442-MILK outside California and Sacramento i ~ i~ ~ :
Retail Price Information- 1 (888) 930-MILK/Retai l Website" w w w cdfa ca gov/da i~ Dairy Market ing Branch Phone: I916) 654-1456 : ~ i ::i!:.
Homepage Website: w w w cdfa ca Clov/dair~ E-mail Address dairv@cdfa ca now ~ , ~
I THE CALIFORNIA DAIRY INDUSTRY IN 2 0 0 0
The "2000 California Dairy Statistics" annual reflects that it was a mixed year for the California dairy industry. Milk production and milk cow numbers both increased. Processing of most dairy products also increased. However, the annual average price paid to producers declined, as did the number of dairy farms.
The decline in farm numbers follows a long-term trend. However, the decline in milk prices represents a unique combination of factors. Feed prices were low relative to milk prices in 1998-99. (Feed costs represent approximately 50 percent of the total cost of producing milk.) Consequently, national milk production increased faster in 1999-2000 than in prior years. The excess milk resulted in depressed prices in 2000.
Even with lower prices, California continues to lead the nation in total milk production, with Wisconsin ranking second, and New York third. In addition, California is first in the total number of milk cows, averaging 696 cows per farm.
In 2000, Kings County replaced Riverside County in the ranking of California's five leading counties in terms of milk production: Tulare (24 percent), Merced ( 13 percent), San Bernardino ( 11 percent), Stanislaus ( 10 percent), and Kings (8 percent).
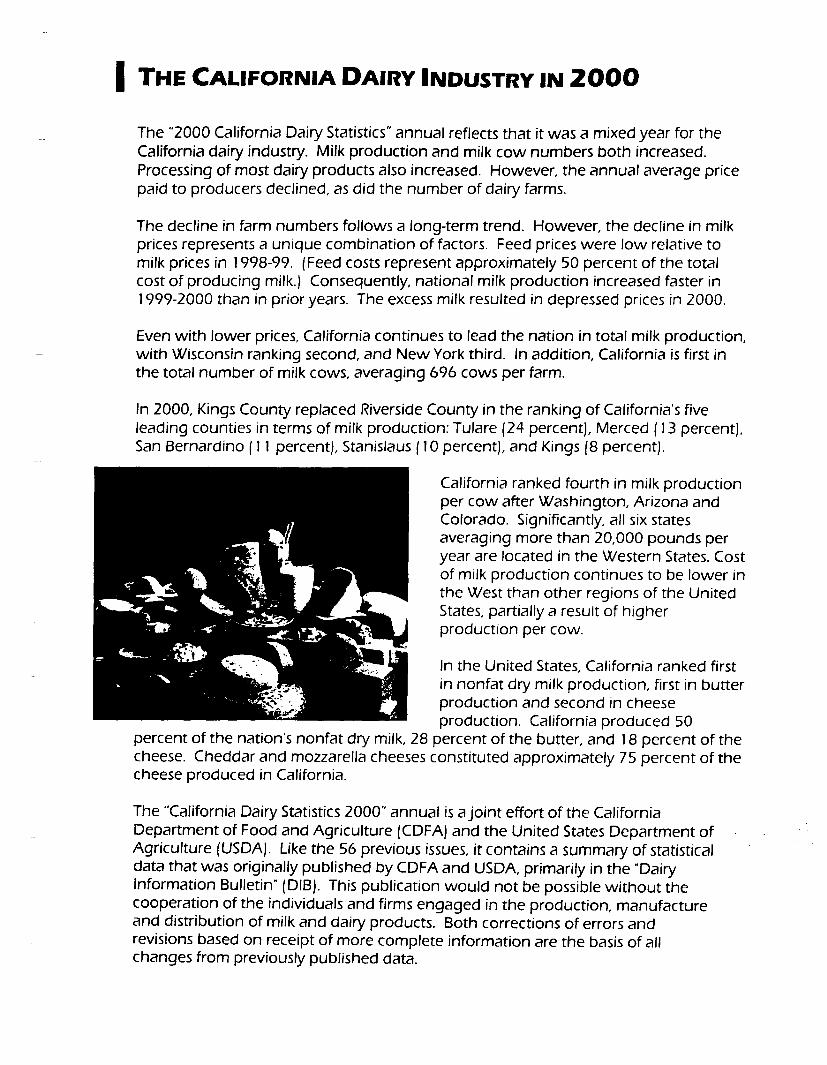
California ranked fourth in milk production per cow after Washington, Arizona and Colorado. Significantly, all six states averaging more than 20,000 pounds per year are located in the Western States. Cost of milk production continues to be lower in the West than other regions of the United States, partially a result of higher production per cow.
In the United States, California ranked first in nonfat dry milk production, first in butter production and second in cheese production. California produced 50
percent of the nation's nonfat dry milk, 28 percent of the butter, and 18 percent of the cheese. Cheddar and mozzarella cheeses constituted approximately 75 percent of the cheese produced in California.
The "California Dairy Statistics 2000" annual is a joint effort of the California Department of Food and Agriculture (CDFA) and the United States Department of Agriculture (USDA). Like the 56 previous issues, it contains a summary of statistical data that was originally published by CDFA and USDA, primarily in the "Dairy Information Bulletin" (DIB). This publication would not be possible without the cooperation of the individuals and firms engaged in the production, manufacture and distribution of milk and dairy products. Both corrections of errors and revisions based on receipt of more complete information are the basis of all changes from previously published data.
I TABLE OF CONTENTS Page
Dairy Industry 2 0 0 0
2000 California County Highlights . . . . . . . . . . . . . . . . . . . . . . . . . . . . . . . . . . . . . . . . . . . . . . . . . . . . . . . . . . . . . . . . . . . . . . . . . . . . . . . . . . . . . . . . . . . . . . . . . . . . . . . . . . . . . . . . . . . I
Table 1. 2000 California - Cows, Production, Receipts (as reported by USDA/NASS) ..................... 2
Table 2. 2000 United States - Cows, Production, Receipts (as reported by USDA/NASS) .............. 3
Table 3. Cows, Production, Receipts - by State (as reported by USDA/NASS) .................................... 4
Table 4. California Counties; Cows, Dairies and Cows per Dairy ............................................................ 5
Commercial Mi lk Production 2 0 0 0
Commercial Milk Production in 2000, Chart I . . . . . . . . . . . . . . . . . . . . . . . . . . . . . . . . . . . . . . . . . . . . . . . . . . . . . . . . . . . . . . . . . . . . . . . . . . . . . . . . . . . . . . . . . . . . . . 6
Table 5. California Milk Production . . . . . . . . . . . . . . . . . . . . . . . . . . . . . . . . . . . . . . . . . . . . . . . . . . . . . . . . . . . . . . . . . . . . . . . . . . . . . . . . . . . . . . . . . . . . . . . . . . . . . . . . . . . . . . . . . . . 7
Table 6. California Milk Production, by County ............................................................................................. 8
Table 7. California Milk Production, by County, by Month ....................................................................... 9- I 0
Table 8. California Market Milk Production, by County, by Month ........................................................ ! 1- ! 2
Table 9. California Manufactur ing Milk Production, by County, by Month ......................................... 13-14
Pooled Mi lk Uti l izat ion 2 0 0 0
Pooled Milk Utilization and Quota Transfers in 2000, Chart 2 ................................................................ 15
Table I 0. Utilization of Pooled Milk Fat, in California ................................................................................... 16 Table I I. Utilization of Pooled Milk Solids-not-Fat, in California, Chart 3 ............................................. ! 6
Sales of Class 1 Marke t Milk Products 2 0 0 0
California Sales of Market Milk Products in 2000, Chart 4 . . . . . . . . . . . . . . . . . . . . . . . . . . . . . . . . . . . . . . . . . . . . . . . . . . . . . . . . . . . . . . . . . . . . . . . . . ! 7
Table 12. Class I Sales, in California . . . . . . . . . . . . . . . . . . . . . . . . . . . . . . . . . . . . . . . . . . . . . . . . . . . . . . . . . . . . . . . . . . . . . . . . . . . . . . . . . . . . . . . . . . . . . . . . . . . . . . . . . . . . . . . . . . . ! 8
Table 13. Class I Sales, in California, by Marketing Area ............................................................................ 19
Manufacture of Dairy Products 2 0 0 0
Manufacture of Dairy Products in California for 2000 ............................................................................... 20
Table 14. Production of Soft Dairy Products (Class 2) in California, Chart 5 ........................................ 21-22
Table 15. Production of Frozen Dairy Products (Class 3) in California ................................................... 23
Table 16. Production of Butter and Dry Milk Products (Class 4a) in California, Chart 6 ................... 24
Table i 7. Production of Hard Cheeses (Class 4b) in California ................................................................. 25
Cont inued
Page
Pricing
Pricing in 2000, Average Commodity Prices . . . . . . . . . . . . . . . . . . . . . . . . . . . . . . . . . . . . . . . . . . . . . . . . . . . . . . . . . . . . . . . . . . . . . . . . . . . . . . . . . . . . . . . . . . . . . . . . . . . 26
Table 18. Average Prices Paid Producers in California for All Bulk Milk ................................................. 27 Table 19. Average Prices Paid Producers in California for Market Milk .................................................. 27 Table 20. Average Prices Paid Producers in California for Manufactur ing Milk .................................. 27
Table 2 I. Minimum Class I Prices . . . . . . . . . . . . . . . . . . . . . . . . . . . . . . . . . . . . . . . . . . . . . . . . . . . . . . . . . . . . . . . . . . . . . . . . . . . . . . . . . . . . . . . . . . . . . . . . . . . . . . . . . . . . . . . . . . . . . . . 28
Table 22. Minimum Class 2 Prices ....................................................................................................................... 29
Table 23. Minimum Class 3 Prices . . . . . . . . . . . . . . . . . . . . . . . . . . . . . . . . . . . . . . . . . . . . . . . . . . . . . . . . . . . . . . . . . . . . . . . . . . . . . . . . . . . . . . . . . . . . . . . . . . . . . . . . . . . . . . . . . . . . . . . 30
Table 24. Minimum Class 4a and 4b Prices ..................................................................................................... 3 I
Table 25. Quota, Base, and Overbase Prices .................................................................................................. 32
2001-2002 Price Announcement Schedule .................................................................................................... 33
Cost of Production Summary 2000
Cost of Production in 2000, Chart 7 . . . . . . . . . . . . . . . . . . . . . . . . . . . . . . . . . . . . . . . . . . . . . . . . . . . . . . . . . . . . . . . . . . . . . . . . . . . . . . . . . . . . . . . . . . . . . . . . . . . . . . . . . . . . . . . . . . 34
Manufacturing Costs Summary 2000
Manufacturing Costs in 2000, Weighted Averages Table . . . . . . . . . . . . . . . . . . . . . . . . . . . . . . . . . . . . . . . . . . . . . . . . . . . . . . . . . . . . . . . . . . . . . . . . . 35
California Milk Processing Plants
California Milk Processing Plants 2000, Chart 8 ............................................................................................. 36
Other Information
Classification of Dairy Products . . . . . . . . . . . . . . . . . . . . . . . . . . . . . . . . . . . . . . . . . . . . . . . . . . . . . . . . . . . . . . . . . . . . . . . . . . . . . . . . . . . . . . . . . . . . . . . . . . . . . . . . . . . . . . . . . . . . . . . . . . . 37-38
California Dairy Industry Historic Timeline ...................................................................................................... 40-4 I
Key Contacts for Department Dairy Services .................................................................................................. 42-43
Charts
Chart I. California Milk Production 1996-2000 .............................................................................................. 6
Chart 2. Utilization of Milk in California by Class, 2000 ............................................................................... 15
Chart 3. Use of Total Pool Milk Solids in California, by Class, 1990-2000 .............................................. • ! 6
Chart 4. Sales of Class I Market Milk Products in California, 1990-2000 ............................................... 17
Chart 5. Class 2 Products Comparison, 2000 .................................................................................................. 22
Chart 6. California Cheese Production, by Type of Cheese, 1993-2000 ................................................ 24
Chart 7. Milk Production Cost Summary 1999-2000 .................................................................................... 34
Chart 8. California Milk Processing Plants 1987-2000 ................................................................................. 36
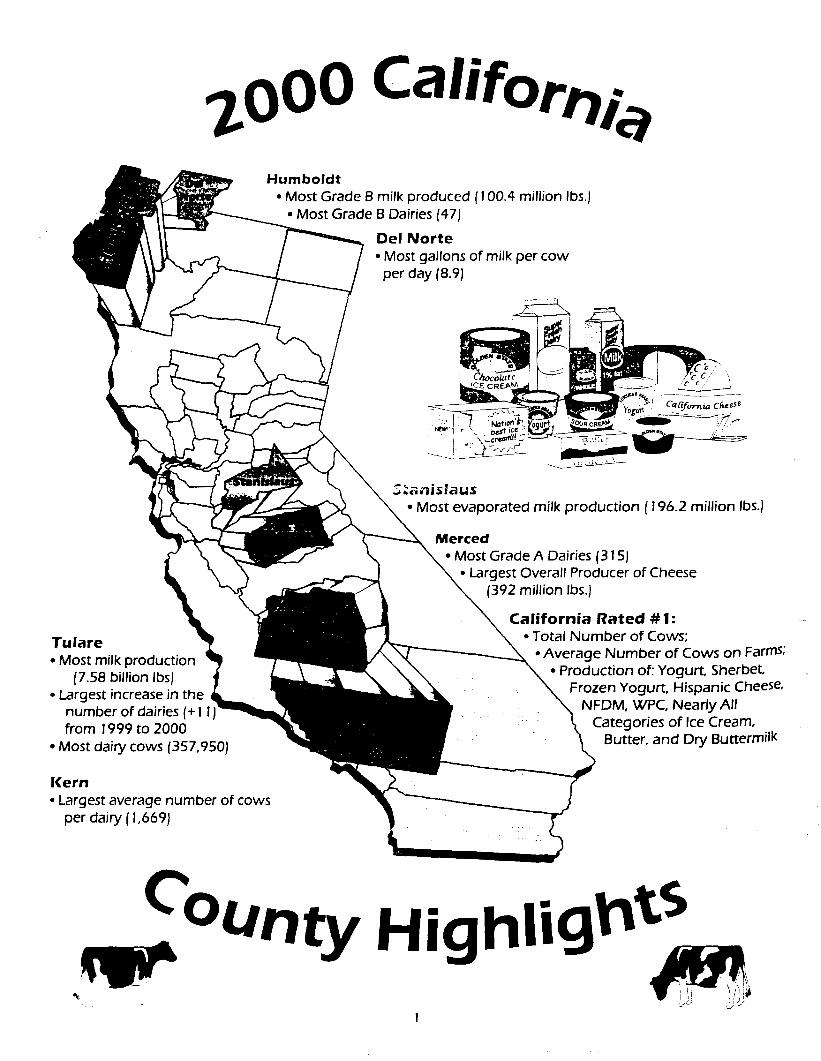
lO00 California H u m b o l d t
• Most Grade B milk produced ( 100.4 million Ibs.) • Most Grade B Dairies (47)
Del N o r t e • Most gallons of milk per cow
per day (8.9)
T u l a r e • Most milk production
(7.58 billion Ibs) • Largest increase in the
number of dairies (+ ! from 1999 to 2000
• Most dairy cows (357,950)
K e r n • Largest average number of cows
per dairy (1,669)
ee$ ~
; : ~ n i s l a u s • • Most evaporated milk product ion ( 196.2 mill ion Ibs.)
Mereed • • Most Grade A Dairies (315) ~ • Largest Overall Producer of Cheese \ (392 million Ibs.)
C a l i f o r n i a R a t e d # 1: • Total Number of Cows;
Average Number of Cows on FarmS; • Product ion of: Yogurt, Sherbet,
Frozen Yogurt Hispanic CheeSe, i ~ • " ~ NFDM, WPCiNear lyA l l
: :: " \ Categories of Ice Cream, Butter, and Dry Buttermilk
i "
Co unty Highlights
I 2000 CALIFORNIA: Cows, Production, Receipts
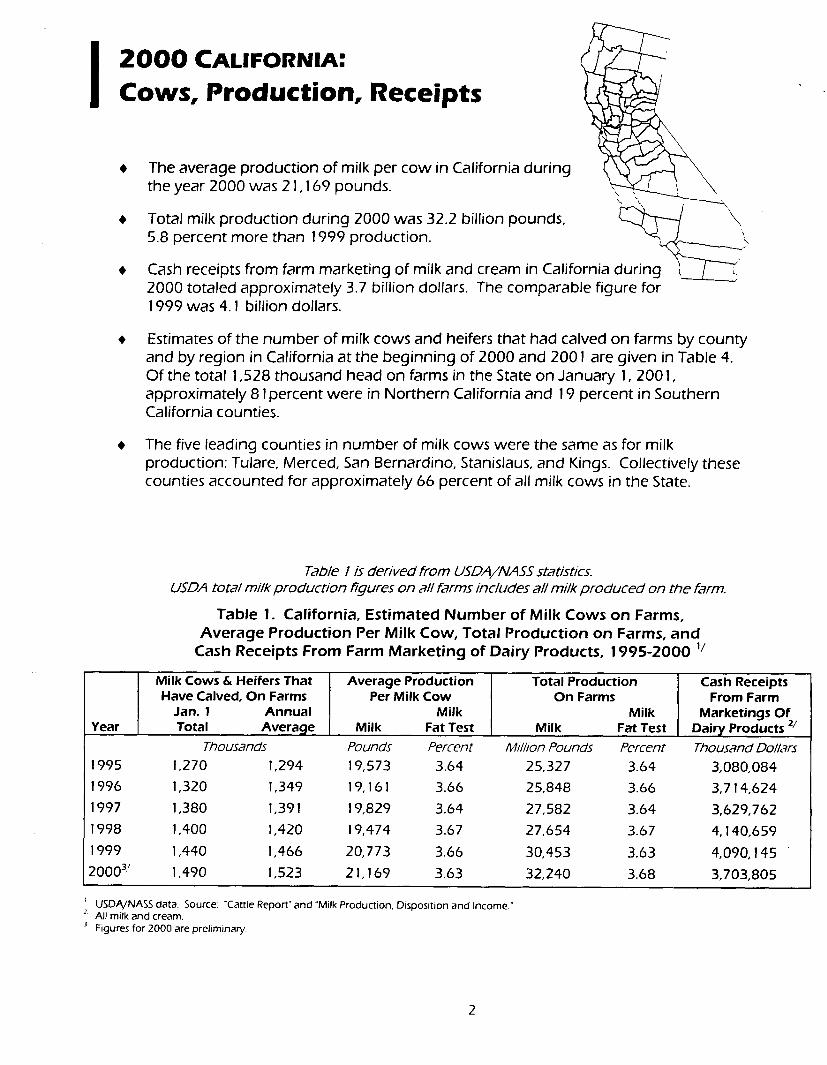
• The average production of milk per cow in California during the year 2000 was 21,169 pounds.
• Total milk production during 2000 was 32.2 billion pounds, ~ ~ ~ ~ 5.8 percent more than 1999 production.
• Cash receipts from farm marketing of milk and cream in California during ~ / -~ 2000 totaled approximately 3.7 billion dollars. The comparable figure for 1999 was 4.1 billion dollars.
Estimates of the number of milk cows and heifers that had calved on farms by county and by region in California at the beginning of 2000 and 2001 are given in Table 4. Of the total 1,528 thousand head on farms in the State on January 1,2001, approximately 81 percent were in Northern California and 19 percent in Southern California counties.
The five leading counties in number of milk cows were the same as for milk production: Tulare, Merced, San Bernard/no, Stanislaus, and Kings. Collectively these counties accounted for approximately 66 percent of all milk cows in the State.
Table I is derived f rom USDA/NASS statistics. USDA total milk product ion ,qgures on all farms includes all milk p roduced on the farm.
Table 1. Cali fornia, Est imated N u m b e r of Milk Cows on Farms, A v e r a g e Product ion Per Milk Cow, Total Product ion on Farms, a n d
Cash Receipts From Farm M a r k e t i n g of Dai ry Products, 1 9 9 5 - 2 0 0 0 11
M i l k C o w s & Heifers That Average Production Have Calved, On Farms Per Milk Cow
Jan. 1 Annual Milk Year Total Average Milk Fat Test
Thousands Pounds Percent 1995 1,270 1,294 19,573 3.64 1996 1,320 1,349 19,161 3.66 1997 1,380 1,391 19,829 3.64 1998 1,400 1,420 19,474 3.67
1999 1,440 1,466 20,773 3.66 2000 ~ 1,490 1,523 21,169 3.63
Total Production On Farms
Milk Milk Fat Test
Mill~on Pounds Percent
25,327 3.64 25,848 3.66 27,582 3.64 27,654 3.67
30,453 3.63 32,240 3.68
Cash Receipts From Farm
Marketings Of Dain/Products 2/ Thousand Dollars
3,080,084 3,714,624
3,629,762 4, 140,659
4,090, 145 3,703,805
USDA/NASS data. Source: "Cattle Report" and "Milk Production, Disposition and Income." 2 All milk and cream. 3 Figures for 2000 are preliminary.
2000 UNITED STATES: Cows, Production, Receipts
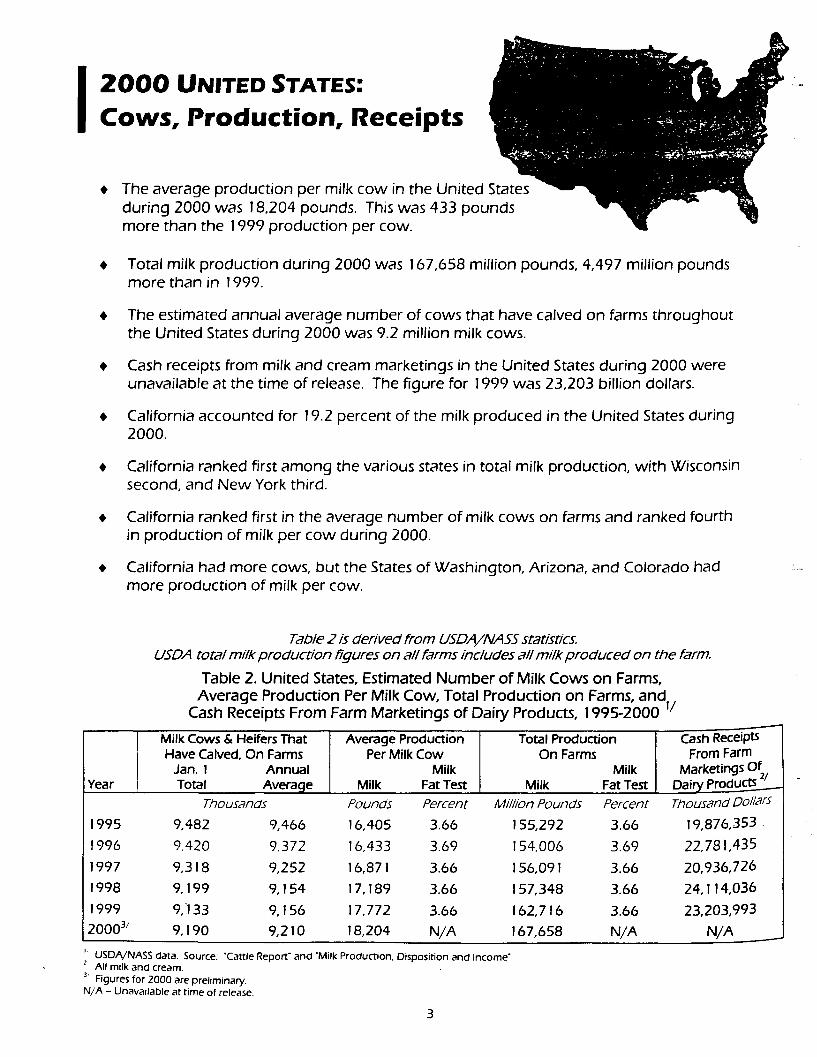
The average production per milk cow in the United during 2000 was 18,204 pounds. This was 433 pou more than the 1999 production per cow.
Total milk production during 2000 was 167,658 million pounds, 4,497 million pounds more than in 1999.
The estimated annual average number of cows that have calved on farms throughout the United States during 2000 was 9.2 million milk cows.
Cash receipts from milk and cream marketings in the United States during 2000 were unavailable at the time of release. The figure for 1999 was 23,203 billion dollars.
California accounted for 19.2 percent of the milk produced in the United States during 2000.
California ranked first among the various states in total milk production, wi th Wisconsin second, and New York third.
California ranked first in the average number of milk cows on farms and ranked fourth in production of milk per cow during 2000.
California had more cows, but the States of Washington, Arizona, and Colorado had more production of milk per cow.
. . . . . .
i Year i
Table 2 is derived from USDA/NASS statistics. USDA total milk production Egures on all farms includes all milk produced on the farm.
Table 2. United States, Estimated Number of Milk Cows on Farms, Average Production Per Milk Cow, Total Production on Farms, and
Cash Receipts From Farm Marketings of Dairy Products, 1995-2000 11
1995 9,482 9,466
1996 9,420 9.372
1997 9,318 9,252
1998 9,199 9,154
1999 9,'133 9,156 20003/ 9,190 9,210
J
Milk Cows & Heifers That Average Production Have Calved, On Farms Per Milk Cow
Jan, ! Annual Milk Total Average Milk Fat Test
Thousands Pounds Percent
16,405 3.66
16,433 3.69
16,871 3.66
17, 189 3.66
17,772 3.66 18,204 N/A
Total Production On Farms
Milk Milk Fat Test
Million Pounds Percent
155,292 3.66
154,006 3.69
! 56,091 3.66
! 57,348 3.66
! 62,716 3.66 167,658 N/A
Cash Receipts From Farm
Marketings Of Dairy ProduCts z/ Thousand Dollars
19,876,353 -
22,781,435
20,936,726
24, 114,036
23,203,993
N/A _---
USDA/NASS data. Source: "Cattle Report" and "Milk Production, Disposition and Income', All milk and cream.
3, Figures for 2000 are preliminary. N/A - Unavailable at time of release.
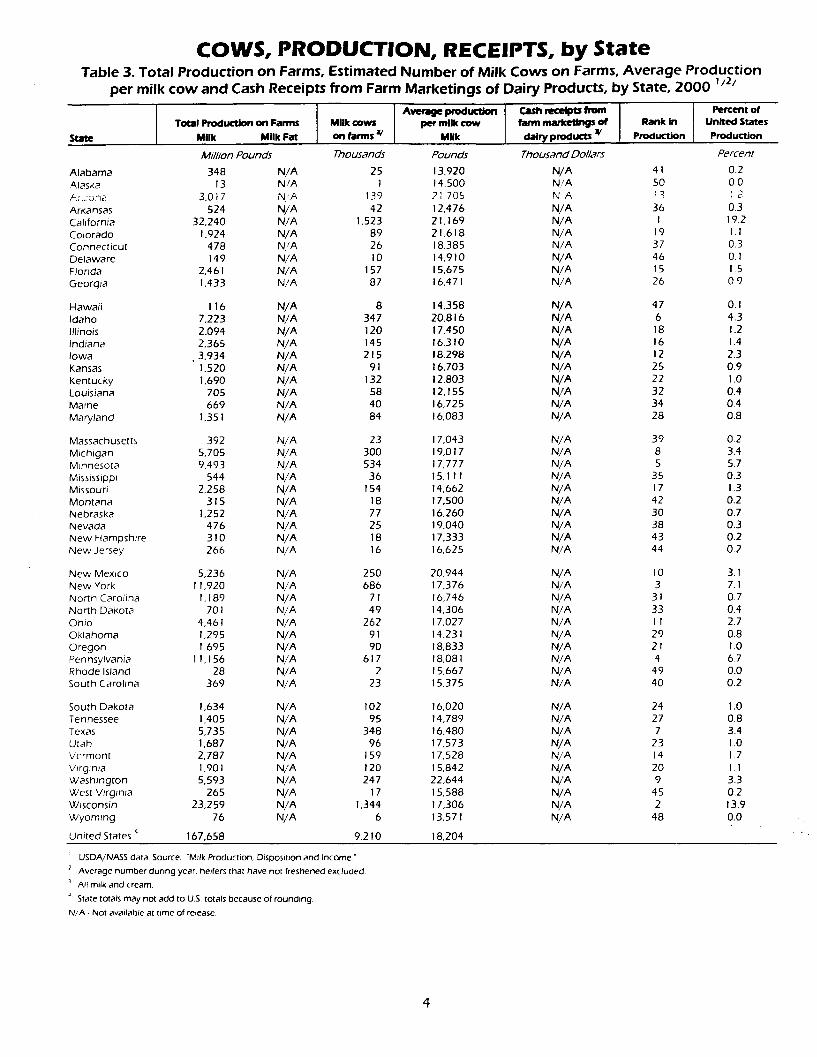
COWS, PRODUCTION, RECEIPTS, by State Table 3. Total Production on Farms, Estimated Number of Milk Cows on Farms, Average Production
per milk cow and Cash Receipts from Farm Marketings of Dairy Products, by State, 2 0 0 0 1/2/
State
Alabama Alaska A:izona ArKansas California Colorado Connecticut Delaware Florida Georgia
Hawaii Idaho Illinois Indiana Iowa Kansas Kentucky Louisiana Maine Maryland
Massachusetts Michigan Minnesota Mississippi Missouri Montana Nebraska Nevada New Hampshire New Jersey
New Mexico New York North Carolina North DaKota Ohio Oklahoma Oregon Pennsylvania Rhode Island South Carolina
South Dakota Tennessee Texas Utah Vermont Virginia Washington West Virginia W~sconsin Wyoming
United States 4
Total ProduclJon on Farms Milk cows per milk cow Milk Milk Fat on farms 2,, Milk
Million Pounds
348 N/A 13 N/A
3,017 N A 524 N/A
32,240 N/A 1,924 N/A
478 N,/A 149 N/A
2,461 N/A 1.433 NIA
116 N/A 7,223 N/A 2,094 N/A 2,365 N/A
• 3,934 N/A 1,520 N/A 1.690 N/A
705 N/A 669 N/A
1,351 N/A
392 N/A 5,705 1~ IA 9,493 1'~ fA
544 N/A 2,258 N/A
315 N/A 1,252 N/A
476 N/A 310 N/A 266 N/A
5,236 N/A 11,920 N/A
1,189 N/A 701 NfA
4,461 N/A 1,295 N/A 1,695 N/A
11,156 N/A 28 N/A
369 N/A
1,634 N/A 1,405 N/A 5,735 N/A 1,687 N/A 2,787 N/A 1,901 N/A 5,593 N/A
265 N/A 23,259 N/A
76 N/A
167,658
Cash m:e~s from farm marketlmg; of Rank in
dairy products s/ Production
Percent of United States
Production
Thousands Pounds Thousand Dollars Percent
25 13,920 N/A 41 0.2 1 14.500 N/A 50 0.0
139 21,705 N A 73 7 ~: 42 12,476 N/A 36 0.3
1,523 21,169 N/A I 19.2 89 21,618 N/A 19 I.I 26 18,385 N/A 37 0.3 10 14,910 N/A 46 0. I
157 15,675 N/A 15 15 87 16.471 N/A 26 0 9
8 14,358 N/A 47 0. I 347 20,816 N/A 6 4.3 120 17,450 N/A 18 1.2 145 16,310 N/A 16 1.4 215 18,298 N/A 12 2.3
91 16,703 N/A 25 0.9 132 12,803 N/A 22 1.0 58 12,155 N/A 32 0.4 40 16,725 N/A 34 0.4 84 16,083 N/A 28 0.8
23 17,043 N/A 39 0.2 300 19,017 N/A 8 3.4 534 17,777 N/A 5 5.7 36 15,111 N/A 35 0.3
154 14,662 N/A 17 1.3 18 17,500 N/A 42 0.2 77 16,260 N/A 30 0.7 25 19,040 N/A 38 0.3 18 17,333 N/A 43 0.2 16 16,625 N/A 44 0.2
250 20,944 N/A 10 3.1 686 17,376 N/A 3 7. I
71 16,746 N/A 31 0.7 49 14,306 N/A 33 0.4
262 17,027 N/A 11 2.7 91 14,231 N/A 29 0.8 90 18,833 N/A 21 1.0
617 18,081 N/A 4 6.7 2 15,667 N/A 49 0.0
23 15,375 N/A 40 0.2
102 16,020 N/A 24 1.0 95 14,789 N/A 27 0.8
348 16,480 N/A 7 3.4 96 17,573 N/A 23 1.0
159 17,528 N/A 14 1.7 120 15,842 N/A 20 I. I 247 22,644 N/A 9 3.3
17 15,588 N/A 45 0.2 1,344 17,306 N/A 2 13.9
6 13,571 N/A 48 0.0
9,210 18,204
USDA/NASS data. Source: "Milk Production, Disposition and Income" 2 Average number during year, heifers that have not freshened excluded 3 All milk and cream. ~' State totals may not add to U.S. totals because or rounding N/A - Not available at time of release.
4
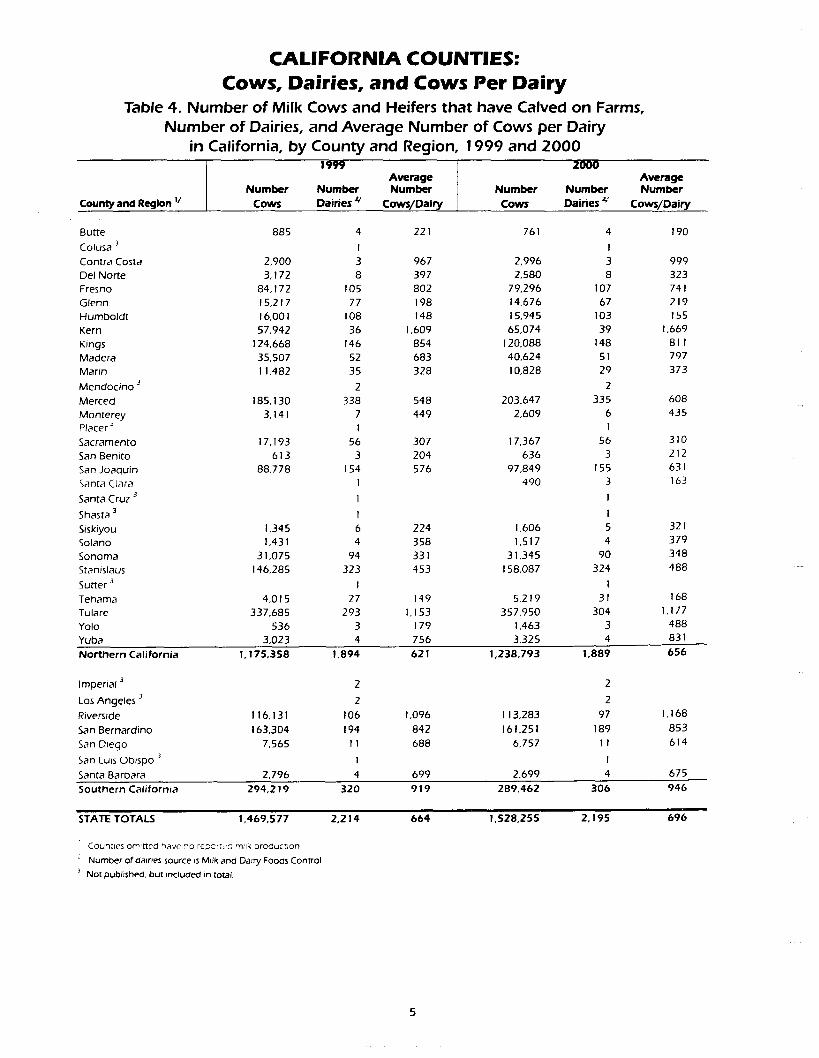
CALIFORNIA COUNTIES: Cows, Dairies, and Cows Per Dairy
Table 4, Number of Milk Cows and Heifers that have Calved on Farms, Number of Dairies, and Average Number of Cows per Dairy
in California, by County and Region, 1999 and 2000
County and Region v
! 999 2000 Average Average
Number Number Number Number Number Number Cows Dairies ~ Cows/Dairy Cows Daines ~' Cows/Dairy
Butte 885 4 221 761 4 190
Colusa 3 1 I
Contra Costa 2,900 3 967 2,996 3 999 Del Norte 3,172 8 397 2,580 8 323 Fresno 84,172 105 802 79,296 107 74 I Glenn 15,217 77 198 14,676 67 219 Humboldt 16,001 108 148 15,945 103 155 Kern 57,942 36 1,609 65,074 39 1,669 Kings 124,668 146 854 120,088 148 81 I Madera 35,507 52 683 40,624 51 797 Marin I 1,482 35 328 10,828 29 373
Mendoc ino 3 2 2 Merced 185, 130 338 548 203,647 335 608 Monterey 3,141 7 449 2,609 6 435 Placer ~ I I Sacramento 17,193 56 307 17,367 56 310 San Benito 613 3 204 636 3 212 San Joaquin 88,778 154 576 97,849 155 631 Santa Clara 1 490 3 163
Santa Cruz 3 1 I
Shasta 3 1 I
Siskiyou 1,345 6 224 1,606 5 32 I Solano 1,431 4 358 1,517 4 379 Sonoma 31,075 94 331 31,345 90 348 Stanislaus 146,285 323 453 158,087 324 488
Sutter 3 I 1
Tehama 4,015 27 149 5,219 31 168 Tulare 337,685 293 1,153 357,950 304 1.177 Yolo 536 3 179 1,463 3 488 Yuba 3,023 4 756 3,325 4 831
Northern California I, 175,358 ! ,894 621 1,238,793 1,889 656
Imperial 3 2 2
Los Angeles ~ 2 2
Riverside 116,131 106 1,096 I 13,283 97 I, 168
San Bernardino 163.304 194 842 161.251 189 853 San Diego 7,565 11 688 6,757 1 I 614
San Luls Obispo ~ 1 I
Santa Barbara 2,796 4 699 2,699 4 675
Southern California 294,219 320 919 289,462 306 946
STATE TOTALS 1,469,577 2,214 664 ! ,528,255 2,195 696
Counties omF~ed have no report,'c, milk Droductlort
: Number of dairies source is Milk and Dairy Foods Control 3 Not published, but included in total.
I COMMERCIAL MILK PRODUCTION IN 2 0 0 0
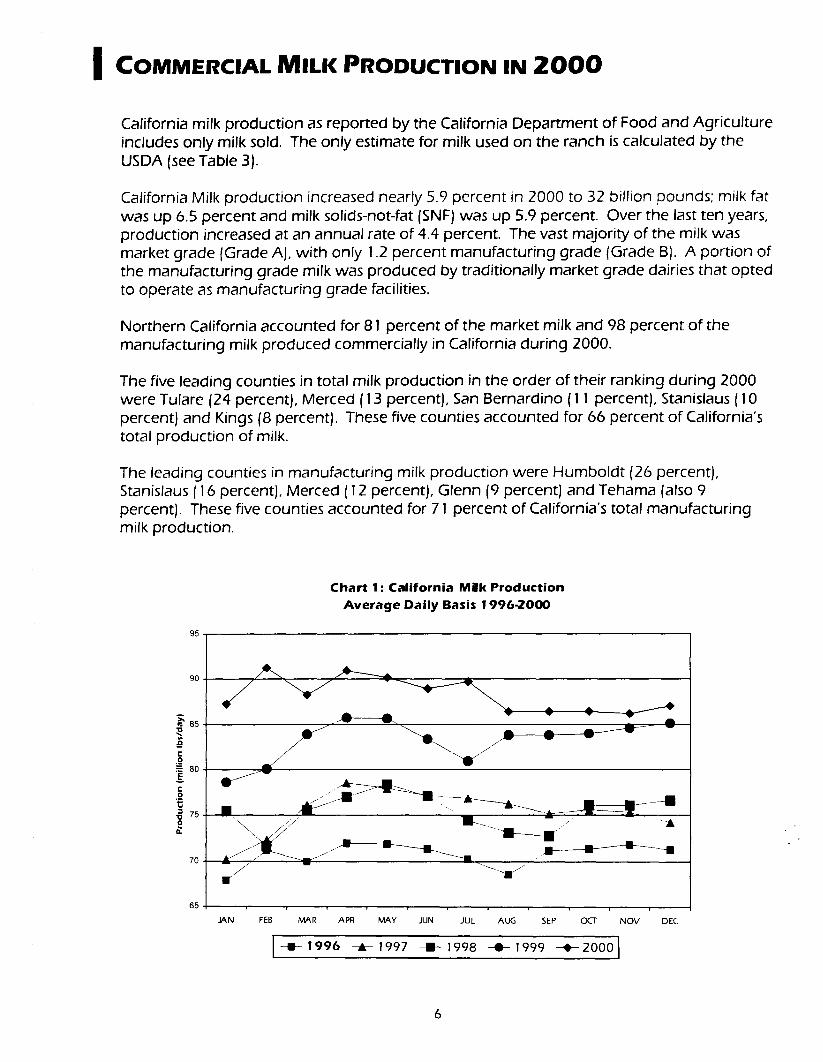
California milk production as reported by the California Department of Food and Agriculture includes only milk sold. The only estimate for milk used on the ranch is calculated by the USDA (see Table 3).
California Milk production increased nearly 5.9 percent in 2000 to 32 billion pounds; milk fat was up 6.5 percent and milk solids-not-fat (SNF) was up 5.9 percent. Over the last ten years, production increased at an annual rate of 4.4 percent. The vast majority of the milk was market grade (Grade A), with only 1.2 percent manufacturing grade (Grade B). A portion of the manufacturing grade milk was produced by traditionally market grade dairies that opted to operate as manufacturing grade facilities.
Northern California accounted for 81 percent of the market milk and 98 percent of the manufacturing milk produced commercially in California during 2000.
The five leading counties in total milk production in the order of their ranking during 2000 were Tulare (24 percent), Merced ( 13 percent), San Bernardino ( 11 percent), Stanislaus ( 10 percent) and Kings (8 percent). These five counties accounted for 66 percent of California's total production of milk.
The leading counties in manufacturing milk production were Humboldt (26 percent), Stanislaus (16 percent), Merced ( 12 percent), Glenn (9 percent) and Tehama (also 9 percent). These five counties accounted for 71 percent of California's total manufacturing milk production.
Chart 1: California Milk Production Average Dai ly Basis 1 9 9 6 2 0 0 0
95
7~ •
?0 A/f ~ / ' ~ . i
65
JAN FEB MAR APR MAY JUN JUL AUG SEP OCT NOV DE(:
I - 1 - - 1 9 9 6 - A - 1 9 9 7 - 1 ~ 1 9 9 8 - O - 1 9 9 9 - ~ - 2 0 0 0 I
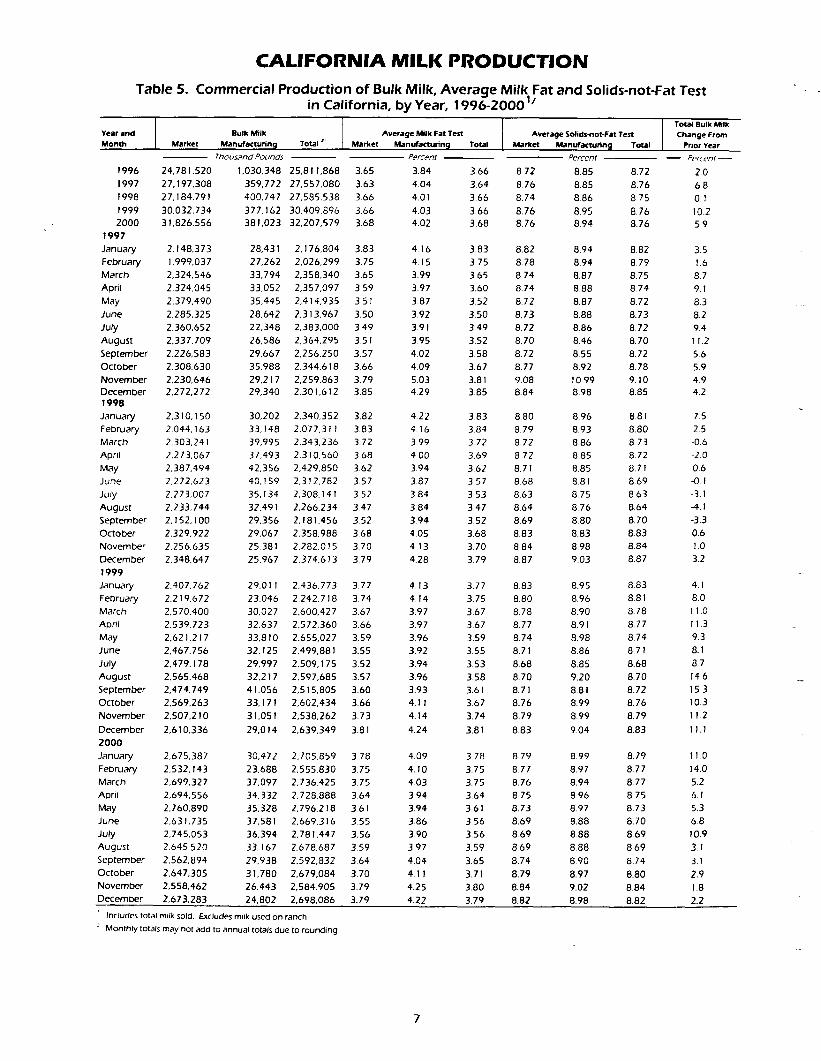
C A L I F O R N I A M I L K P R O D U C T I O N
Table 5, Commercial Production of Bulk Milk, Average Milk Fat and Solids-not-Fat Test in California, by Year, 1996-20001/
1996 1997 1998 1999 2 0 0 0
1 9 9 7
January February March April May June July August September October November December 1 9 9 8
January February March April May June July August September October November December 1 9 9 9
January February March April May June July August September October November
December 2 0 0 0
January February March April May June July August September October November December
Year and Month
Total Bulk Milk Bulk Milk Average Milk Fat Test Average Solids~ot-Fat Test Change From
Market Manufacturin~l Total z Market Manufacturin~l Total Market Manufacturincj Total Phor Year
- - Thousand P o u n ~ Percent - - Percent P ~ r c e n t - -
24,781,520 1,030.348 25,811,868 3.65 3.84 3.66 8.72 8.85 8.72 2.0 27,197,308 359.772 27.557,080 3.63 4.04 3.64 8.76 8.85 8.76 6.8 27.184.791 400,747 27.585,538 3.66 4.01 3.66 8.74 8.86 875 0.1 30,032.734 377.162 30.409,896 3,66 4.03 3.66 8.76 8,95 8.76 10.2 31,826,556 381,023 32,207,579 3.68 4.02 3,68 8.76 8.94 8.76 5.9
2,148.373 28,431 2,176,804 3.83 4 16 3.83 8.82 8.94 8.82 3.5 1,999.037 27,262 2,026,299 3.75 4.15 3.75 8.78 8.94 8.79 1.6 2,324.546 33,794 2,358,340 3.65 3.99 3.65 8.74 8.87 8.75 8.7 2,324,045 33,052 2,357,097 3.59 3.97 3.60 8.74 8.88 8.74 9. I 2.379,490 35,445 2,414,935 3.51 3.87 3.52 8.72 8.87 8.72 8.3 2,285,325 28,642 2,313,967 3.50 3.92 3.50 8.73 888 8.73 8.2 2,360,652 22,348 2,383,000 3.49 3.91 3.49 8.72 8.86 8.72 9.4 2,337,709 26,586 2,364,295 3.51 3.95 3.52 8.70 8.46 8.70 I 1.2 2,226,583 29,667 2,256,250 3.57 4.02 3.58 8.72 8.55 8,72 5.6 2,308.630 35,988 2,344,618 3.66 4.09 3.67 8.77 8.92 8.78 5.9 2,230.646 29,217 2,259,863 3.79 5.03 3.81 9.08 10.99 9.10 4.9 2,272,272 29,340 2,301,612 3.85 4.29 3.85 8.84 8.98 8.85 4.2
2.310.150 30,202 2,340,352 3.82 4.22 3.83 8.80 8.96 8.81 7.5 2.044,163 33,148 2,077.311 3.83 4.16 3.84 8.79 8.93 8.80 2.5 2.303,241 39,995 2,343.236 3.72 3.99 3.72 8.72 8.86 8.73 -0.6 2,273,067 37,493 2,310,560 3.68 4.00 3.69 8.72 8.85 8,72 -2.0 2,387,494 42,356 2,429.850 3.62 3.94 3.62 8.71 8.85 8.71 0.6 2.272,623 40.159 2,312.782 3.57 3.87 357 8.68 8.81 8.69 ~).I 2,273,007 35,134 2,308,141 3.52 3.84 3.53 8.63 8.75 8.63 -3. I 2.233,744 32,491 2,266,234 3.47 3.84 3.47 8.64 8.76 8.64 -4. I 2,152,100 29,356 2,181.456 3.52 3.94 3.52 8.69 8.80 8.70 -3.3 2,329,922 29,067 2,358,988 3.68 4.05 3.68 8.83 8.83 8.83 0.6 2,256,635 25.381 2,282,015 3.70 4.13 3.70 8.84 8,98 8.84 1.0 2.348,647 25,967 2,374,613 3.79 4.28 3.79 8.87 9.03 8.87 3.2
2.407,762 29,011 2,436,773 3.77 4.13 3,77 8.83 8.95 8.83 4.1 2,219.672 23,046 2,242,718 3.74 4,14 3.75 8,80 8.96 8.81 8.0 2.570,400 30,027 2,600,427 3.67 3.97 3.67 8.78 8.90 8.78 I I .0 2.539,723 32.637 2,572,360 3.66 3,97 3.67 8.77 8.91 8.77 11.3 2,621,217 33,810 2,655,027 3.59 3.96 3.59 8.74 8.98 8.74 9.3 2,467,756 32.125 2,499,881 3.55 3.92 3.55 8.71 8.86 8.71 8.1 2.479,178 29.997 2,509,175 3.52 3.94 3.53 8.68 8.85 8.68 8.7 2,565,468 32.217 2,597,685 3.57 3.96 3.58 8.70 9.20 8.70 14.6 2,474,749 41.056 2,515,805 3.60 3.93 3.6 I 8.71 8.81 8.72 15.3 2,569,263 33.171 2,602,434 3.66 4.1 I 3.67 8.76 8.99 8.76 10.3 2,507,210 31.051 2,538.262 3.73 4.14 3.74 8.79 8.99 8.79 11.2
2,610,336 29.014 2,639,349 3.81 4.24 3.81 8.83 9.04 8.83 11.1
2,675,387 30,472 2,705,859 3.78 4.09 3.78 8.79 8.99 8.79 11.0 2.532.143 23,688 2.555,830 3.75 4.10 3.75 8.77 8.97 8.77 14.0 2,699,327 37.097 2,736,425 3.75 4.03 3.75 8.76 8.94 8.77 5.2 2,694.556 34,332 2.728,888 3.64 3.94 3.64 8.75 8.96 8.75 6. I 2.760.890 35,328 2,796,218 3.61 3.94 3.61 8.73 8.97 8.73 5.3 2.631,735 37,581 2,669,316 3.55 3.86 3.56 8.69 8.88 8.70 6.8 2,745,053 36.394 2,781,447 3.56 3.90 3.56 8.69 8.88 8.69 10.9 2.645,520 33, 167 2,678,687 3.59 397 3.59 8.69 8.88 8.69 3. I 2,562.894 29.938 2,592,832 3.64 4.04 3.65 8.74 8.90 8.74 3.1 2,647.305 31,780 2,679,084 3.70 4.11 3.71 8.79 8.97 8.80 2.9 2,558,462 26,443 2,584,905 3.79 4.25 3.80 8.84 9.02 8.84 1.8 2,673,283 24,802 2,698,086 3.79 4.22 3.79 8.82 8.98 8.82 2.2
Includes total milk sold Excludes milk used on ranch Monthly totals may not add to annual Iotals due to rounding.
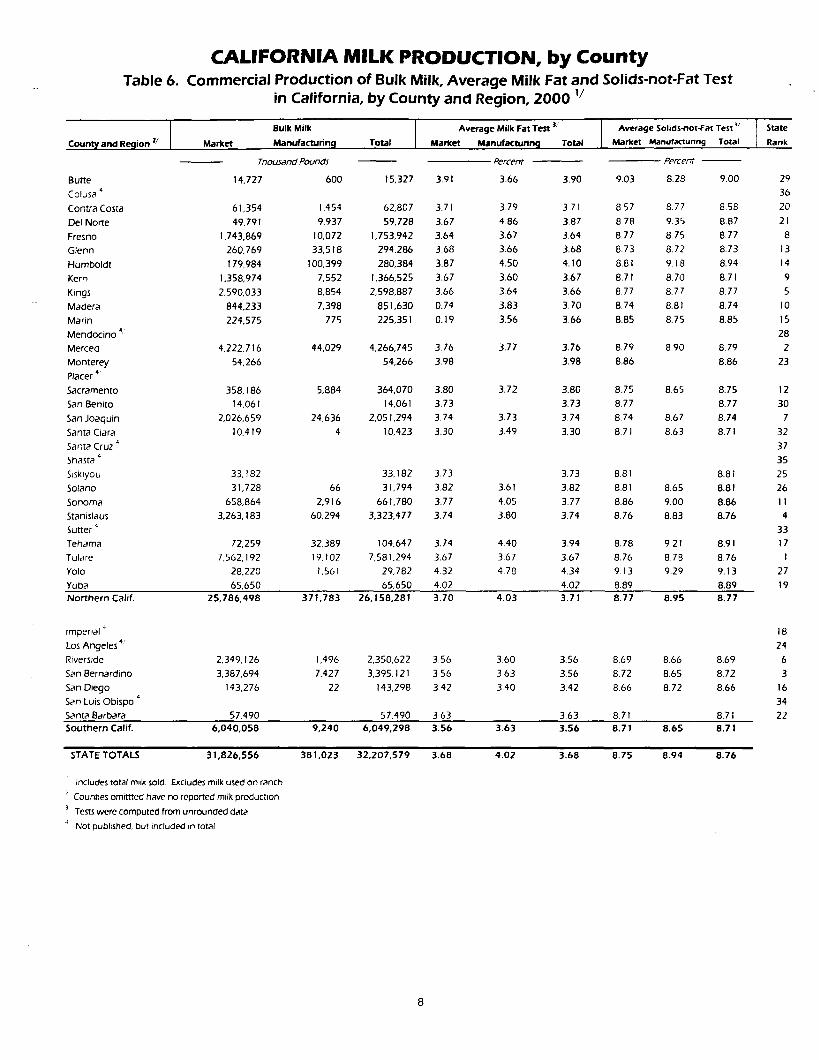
Table 6.
CALIFORNIA MILK PRODUCTION, by County Commercial Production of Bulk Milk, Average Milk Fat and Solids-not-Fat Test
in California, by County and Region, 2000 1/
Count)r and Recjion z/
Bulk Milk Average Milk Fat Test 3,, Average Solids-riot-Fat Test 3, State
Market Manufacturing Total Market Manufacturin(j Total Market Manufactunng Total Rank
T h o u s a n d P o u n d s P e r c e n t - - P e r c e n t - -
Butte 14,727 600 15,327 3,91 3.66 3.90 9.03 8.28 9.00 29 Colusa 4 36
Contra Costa 61,354 1,454 62,807 3.71 3.79 3.71 857 8.77 8.58 20
Del Norte 49,791 9,937 59,728 3.67 4.86 3.87 8.78 9.35 8.87 21
Fresno 1,743,869 10,072 1,753,942 3.64 3.67 3.64 8.77 8.75 8.77 8 Glenn 260,769 33,518 294,286 3.68 3.66 3.68 8.73 8.72 8.73 13
Humboldt 179,984 100,399 280,384 3.87 4.50 4.10 8.81 9.18 8.94 14
Kern 1,358,974 7 ,552 1,366,525 3.67 3.60 3.67 8.71 8.70 8.71 9
Kings 2,590,033 8 ,854 2,598,887 3.66 3.64 3.66 8.77 8.77 8.77 5
Madera 844,233 7,398 851,630 0.74 3.83 3.70 8.74 8.81 8.74 10
Matin 224,575 775 225,351 0.19 3.56 3.66 8.85 8.75 8.85 15
Mendocino 4., 28 Merced 4,222,716 44,029 4,266,745 3.76 3.77 3.76 8.79 8.90 8.79 2
Monterey 54,266 54,266 3.98 3.98 8.86 8.86 23 Placer 4
Sacramento 358,186 5,884 364.070 380 3.72 3.80 8.75 8.65 8.75 12 San Benito 14,061 14,061 3.73 3.73 8.77 8.77 30
San Joaquin 2,026,659 24,636 2,051,294 3.74 3.73 3.74 8.74 8.67 8.74 7
Santa Clara 10.419 4 10,423 3.30 3.49 3.30 8.71 8.63 8.71 32
Santa Cruz 4 37
Shasta ~ 35 Sisklyou 33,182 33,182 3.73 3.73 8.81 8.81 25
Solano 31,728 66 31,794 3.82 3.61 3.82 8.81 8.65 8.81 26
Sonoma 658,864 2,916 661,780 3.77 4.05 3.77 8.86 9.00 8.86 11
Stanislaus 3,263,183 60,294 3,323,477 3.74 3.80 3.74 8.76 8.83 8.76 4 Sutter 4 33
Tehama 72,259 32,389 104,647 3.74 4.40 3.94 8.78 9.21 8.91 17
Tulare 7,562,192 19,102 7,581,294 3.67 3.67 3.67 8.76 8.78 8.76 1 Yolo 28,220 1,561 29,782 4.32 4.78 4.34 9.13 9.29 9.13 27
Yuba 65,650 65,650 4.02 4.02 8.89 8.89 19 Northern Calif. 25,786,498 371,783 26,158,281 3.70 4.03 3.71 8.77 8.95 8.77
Imperial ~ I 8 Los Angeles 4 24
Riverside 2,349,126 t,496 2,350,622 3.56 3.60 3.56 8.69 8.66 8.69 6
San Bernardino 3,387,694 7,427 3,395,121 3.56 3.63 3.56 8.72 8.65 8.72 3
San Diego 143,276 22 143,298 3.42 3.40 3.42 8.66 8.72 8.66 16 San Luis Obispo 4 34
Santa Barbara 57,490 57,490 3.63 3.63 8.71 8.71 22 Southern Calif. 6,040,058 9,240 6,049,298 3.56 3.63 3.56 8.71 8.65 8.71
STATE TOTALS 31,826,556 381,023 32,207,579 3.68 4.02 3.68 8.75 8.94 8.76
T
Includes total milk sold Excludes milk used on ranch
2 Counties omittted have no reported milk production
Tests were computed from unrounded data
Not published, but included in total
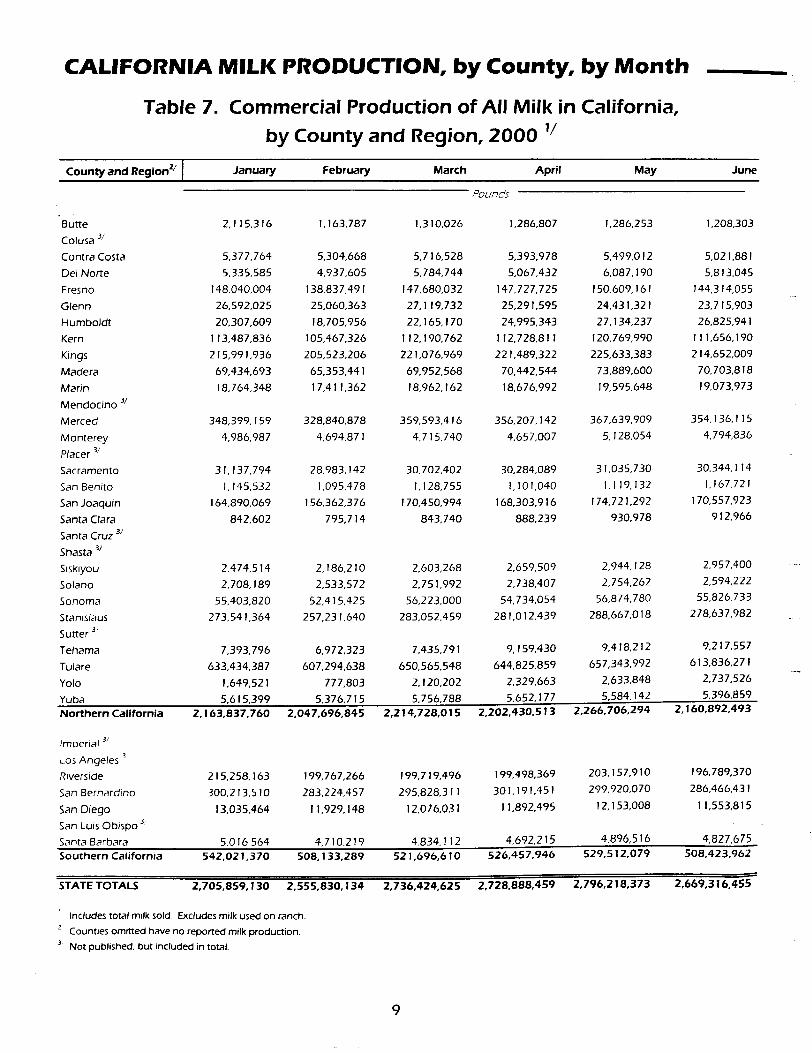
C A L I F O R N I A M I L K P R O D U C T I O N , by County , by M o n t h
Table 7. Commercial Production of All Milk in California, by County and Region, 2000 11
!
County and Region z/ I January February March April May June
Pounds
"Butte 2, 115,316 I, 163,787 1,310,026 1,286,807 1,286,253 1,208,303 Colusa 3/
Contra Costa 5,377,764 5,304,668 5,716,528 5,393,978 5,499,012 5,021,881
Del Norte 5,335,585 4,937,605 5,784,744 5,067,432 6,087,190 5,813,045
Fresno 148.040,004 138.837,491 147,680,032 147,727,725 150,609,161 144,314,055
Glenn 26,592,025 25,060,363 27,119,732 25,291,595 24,431,321 23,715,903
Humboldt 20,307,609 18,705,956 22, 165, 170 24,995,343 27,134,237 26,825,941
Kern I 13,487,836 105,467,326 112,190,762 112,728,811 120,769,990 1 I 1,656,190
Kings 215,991,936 205,523,206 221,076,969 221,489,322 225,633,383 214,652,009
Madera 69,434,693 65,353,441 69,952,568 70,442,544 73,889,600 70,703,818
Matin 18,764,348 17,411,362 18,962,162 18,676,992 19,595,648 19.073,973
Mendocino 3/ Merced 348,399, 159 328,840,878 359,593,416 356,207,142 367,639,909 354,136,115
Monterey 4,986,987 4,694,871 4,715,740 4,657,007 5, 128,054 4,794,836
Placer 3,'
Sacramento 3 I, 137,794 28,983, 142 30,702,402 30,284,089 31,035,730 30.344,114
San Benito 1,145,532 1,095.478 1,128,755 I, 101,040 1,119,132 I, 167,721
San Joaquin 164,890,069 156,362,376 170,450,994 168,303,916 174,721,292 170,557,923
Santa Clara 842,602 795,714 843,740 888,239 930,978 912,966
Santa Cruz 3/ Shasta 31
Siskiyou 2.474,514 2,186,210 2,603,268 2,659,509 2,944,128 2,957,400
Solano 2,708,189 2,533,572 2,751,992 2,738,407 2,754,262 2,594,222
Sonoma 55,403,820 52,415,425 56,223.000 54,734,054 56,874,780 55,826,733
Stanislaus 273,541,364 257,231,640 283,052,459 281,012,439 288,667,018 278,637,982
Sutter 31 Tehama 7,393,796 6,972,323 7,435, 791 9, 159,430 9,418,212 9,217,557
Tulare 633,434,387 607,294,638 650,565,548 644,825,859 657,343,992 613,836,271
Yolo 1,649,521 777,803 2, 120,202 2,329,663 2,633,848 2,737,526
Yuba 5,615.399 5,376,715 5,756,788 5,652,177 5,584,142 5,396.859 Northern California 2,163,837,760 2,047,696,845 2,214,728,015 2,202,430,513 2,266,706,294 2,160,892,493
Imperial 3,'
Los Angeles ~ Riverside 215,258, 163 199,767,266 199,719,496 199,498,369 203, 157,9 I0 196,789,370
San Bernardino 300,213,510 283,224,457 295,828,311 301,191,451 299,920,070 286,466,43 I
San Diego 13,035,464 I 1,929,148 12,076,031 11,892,495 12,153,008 11,553,815 3 San Luis Obispo
Santa Barbara 5.016 564 4,710,219 4,834, 112 4,692,215 4,896,516 4,827,675 Southern California 542,02 I, 370 508, 133,289 521,696,610
STATE TOTALS 2,705,859,130 2,555,830,134
Includes total milk sold. Excludes milk used on ranch. 2 Counties omitted have no reported milk production. s Not published, but included in total.
2,736,424,625
526,457,946 529,512,079 508,423,962
2,728,888,459 2,796,218,373 2,669,316,455
9
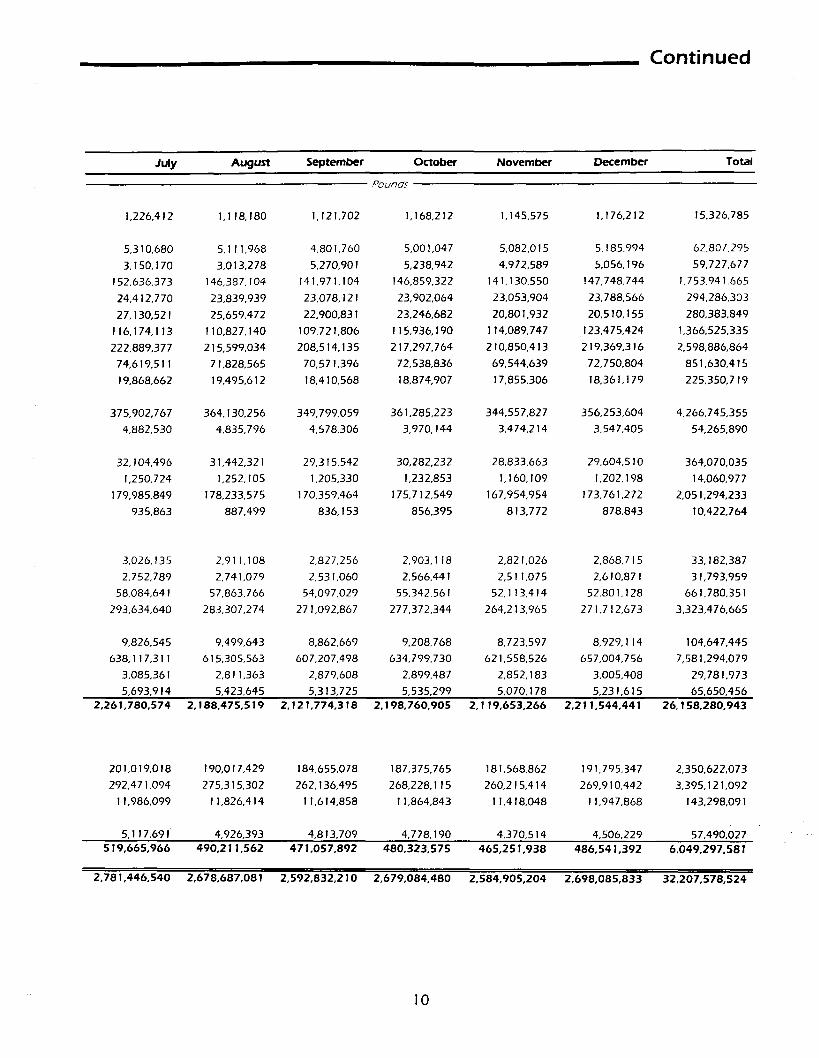
Cont inued
July August September October November December Total
,Pound5
1,226,412 1,118,180 1,121,702 1,168,212 1,145,575 1,176,212 15,326.785
5,310,680 5,111.968 4,801,760 5,001,047 5,082,015 5,185,994 62,807,295 3,150,170 3,013,278 5 , 2 7 0 , 9 0 1 5,238,942 4.972,589 5,056,196 59,727.677
152.636,373 146,387.104 141,971,104 146,859,322 141,130.550 147,748,744 1,753,941,665
24,412,770 23,839,939 23,078,121 23,902,064 23,053,904 23,788,566 294,286.303 27,130,521 25,659,472 22,900,831 23,246,682 20,801,932 20,510,155 280,383,849
116,174,113 110,827,140 109,721,806 115,936,190 114,089,747 123,475,424 1.366,525,335 222,889,377 215,599.034 208,514,135 217,297,764 210,850,413 219,369,316 2,598,886,864
74,619,511 71,828.565 70,571,396 72,538,836 69.544,639 72,750,804 851,630,415 19,868,662 1 9 , 4 9 5 , 6 1 2 1 8 , 4 1 0 , 5 6 8 1 8 , 8 7 4 , 9 0 7 17.855,306 18,361,179 225,350,719
375,902,767 364,130,256 349,799,059 361,285,223 344,557,827 356,253,604 4,266,745,355 4,882,530 4,835,796 4,578,306 3,970,144 3,474,214 3,547,405 54,265,890
32,104,496 31,442,321 29,315,542 30,282,232 28,833,663 29,604,510 364,070,035 1,250,724 1,252,105 1,205,330 1,232,853 1,160,109 1,202,198 14,060,977
179,985,849 178,233,575 170,359,464 175,712,549 167,954,954 173,761,272 2,051,294,233 935,863 887,499 836,153 856,395 813,772 878,843 10,422,764
3,026,135 2,911,108 2,827.256 2,903,118 2,821,026 2,868,715 33.182.387 2,752,789 2,741,079 2,531,060 2.566,441 2,511,075 2,610.871 31,793,959
58,084,641 57,863,766 54,097.029 55,342,561 52,113,414 52,801,128 661,780,351 293,634,640 283,307,274 271,092,867 277,372,344 264,213,965 271,712,673 3,323,476,665
9,826,545 9,499,643 8,862,669 9,208.768 8,723,597 8,929,114 104,647,445 638,117,311 615,305,563 607,207,498 634,799.730 621,558,526 657,004,756 17,581,294,079
3,085,361 2,811,363 2,879,608 2,899,487 2,852,183 3,005,408 29,781,973 5,693,914 5,423.645 5,313,725 5,535,299 5,070,178 5,231,615 65,650,456
2,261,780,574 2,188,475,519 2,121,774,318 2,198,760,905 2,119,653,266 2,211,544,441 26,158,280,943
201,019,018 190,017,429 184,655,078 187,375,765 181,568,862 191,795,347 2,350,622,073 292,471,094 275,315,302 262,136,495 268,228,115 260,215.414 269,910,442 3,395,121,092
11,986,099 11,826,414 1 1 , 6 1 4 , 8 5 8 11,864,843 11,418,048 11,947,868 143,298,091
5,117,691 4,926,393 4,813,709 4,778,190 4,370,514 4,506,229 57,490,027 519,665,966 490,211,562 471,057,892 480,323,575 465,251,938 486,541,392 6,049,297,58 !
2,781,446,540 2,678,687,081 2,592,832,210 2,679,084,480 2,584,905,204 2,698,085,833 32,207,578,524
10
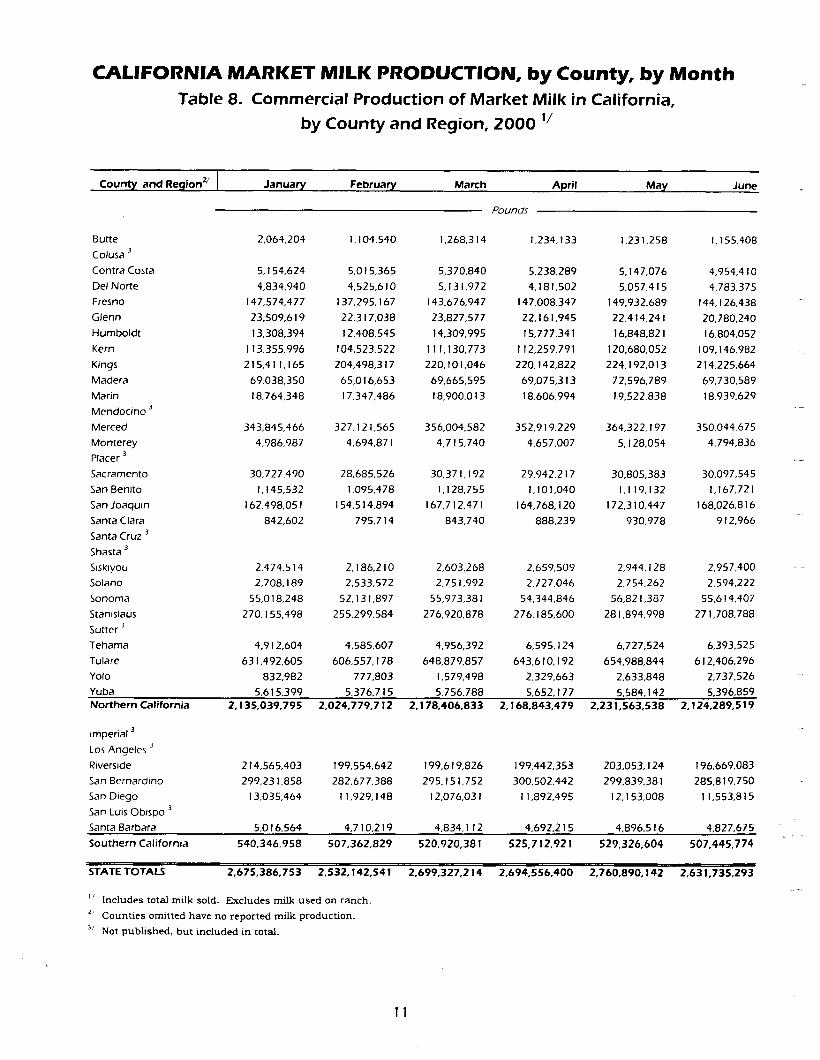
CALIFORNIA MARKET MILK PRODUCTION, by County, by Month Table 8. Commercial Production of Market Milk in California,
by County and Region, 2000 1/
County and Region z/ J Januan 1 February March April May June
Pounds
Butte 2,064,204 1,104,540 1,268,314 1,234,133 1,231,258 I, 155,408 Colusa 3
Contra Costa 5,154,624 5,015,365 5,370,840 5,238,289 5,147,076 4,954,4 I0 Del Norte 4,834,940 4,525,610 5,131,972 4,181,502 5,057,415 4,783,375 Fresno 147,574,477 137,295, 167 143,676,947 147,008,347 149,932.689 144,126,438
Glenn 23,509,619 22,317,038 23,827,577 22,161,945 22,414,241 20,780,240 Humboldt 13,308,394 12,408,545 14,309,995 15,777,341 16,848,821 16,804,052
Kern 113,355,996 104,523,522 111,130,773 112,259,791 120,680,052 109,146,982 Kings 215,411,165 204,498,317 220, 101,046 220,142,822 224,192,013 214,225,664 Madera 69,038,350 65,016,653 69,665,595 69,075,313 72,596,789 69,730,589 Marin 18,764,348 17,347,486 18,900,013 18,606,994 19,522,838 18,939,629 Mendocino 3
Merced 343,845,466 327,121,565 356,004,582 352,919,229 364,322, 197 350,044.675 Monterey 4,986,987 4,694,871 4,715,740 4,657,007 5, 128,054 4,794,836 Placer 3
Sacramento 30,727,490 28,685,526 30,37 I, 192 29,942,217 30,805,383 30,097,545 San Benito I, 145,532 1,095,478 I, 128,755 I, I 01,040 I, 119,132 I, 167,721 San Joaquin 162,498,051 154,514,894 167,712,471 164,768,120 172,310,447 168,026,816 Santa Clara 842,602 795,714 843,740 888.239 930,978 912,966 Santa Cruz 3 Shasta 3
Siskiyou 2,474,514 2, 186,210 2,603,268 2,659,509 2,944, 128 2,957,400 Solano 2,708,189 2.533,572 2,751,992 2,727,046 2,754,262 2,594,222 Sonoma 55,018,248 52,131,897 55,973,381 54,344.846 56,821,387 55,614,407 Stanislaus 270,155,498 255,299,584 276,920,878 276.185,600 281,894,998 271,708,788 Sutter 3
Tehama 4,912,604 4,585,607 4,956,392 6,595, 124 6,727,524 6,393,525 Tulare 631,492,605 606,557,178 648,879,857 643,610,192 654,988,844 612,406,296 Yolo 832,982 777,803 1,579,498 2,329,663 2,633,848 2,737,526 Yuba 5,615,399 5,376,715 5,756,788 5,652,177 5,584,142 5,396,859 Northern California 2,135,039,795 2,024,779,712 2,178,406,833 2,168,843,479 2,231,563,538 2,124,289,519
Imperial 3
Los Angeles ~
Riverside 214,565,403 199,554,642 199,619,826 199,442,353 203,053, 124 196,669,083 San Bernardino 299,231,858 282,677,388 295,151,752 300,502,442 299,839,381 285,819,750 San Diego 13,035,464 11,929,148 12,076,031 11,892,495 12,153,008 11,553,815 San Luis Ob~spo 3
Santa Barbara 5,016.564 4,710,219 4,834,112 4,692,215 4,896,516 4,827,675
Southern California 540.346.958 507,362.829
STATE TOTALS 2,675,386,753 2,532,142,541
I/ I n c l u d e s t o t a l m i l k so ld . E x c l u d e s m i l k u s e d o n r a n c h .
2: C o u n t i e s o m i t t e d h a v e n o r e p o r t e d m i l k p r o d u c t i o n .
3/ Not p u b l i s h e d , b u t i n c l u d e d i n t o t a l .
520.920,381 525,712,921 529,326,604 507,445,774
2,699,327,214 2,694,556,400 2,760,890,142 2,63 !,735,293
11
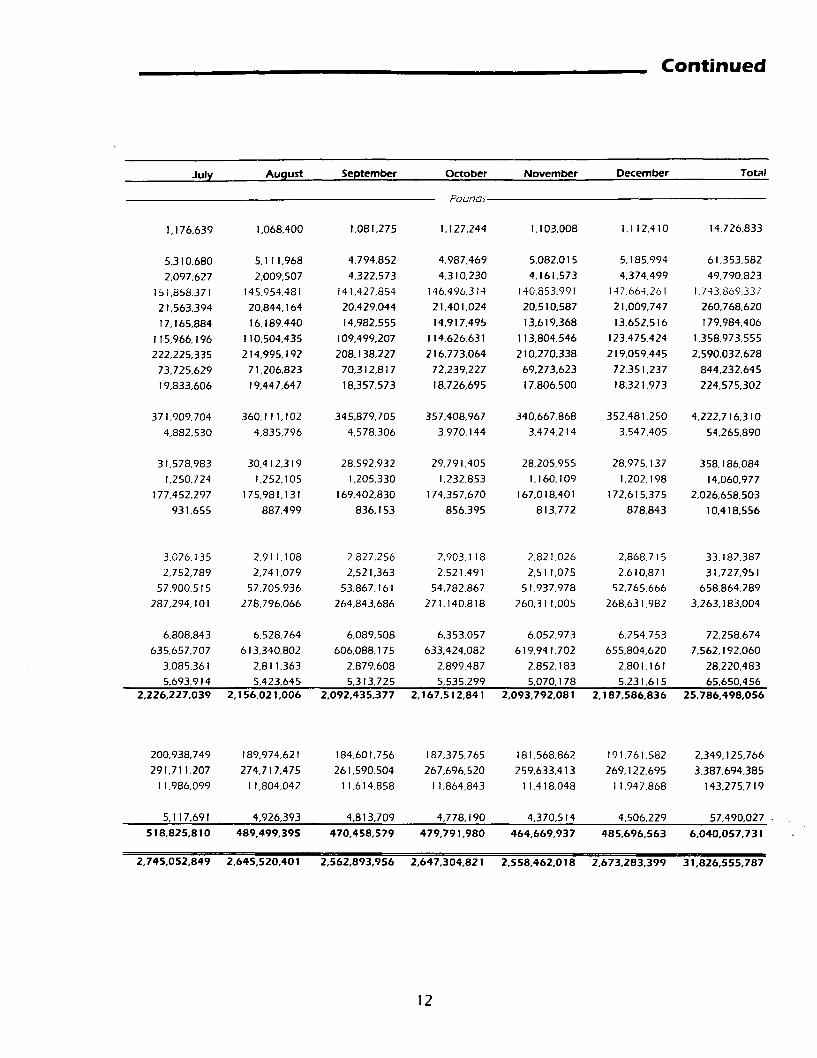
Cont inued
July August September October November December Total
Pouno3
1,176,639 1,068,400 1,081,275 1 , 1 2 7 . 2 4 4 1 , 1 0 3 , 0 0 8 1 , 1 1 2 , 4 1 0 14,726,833
5,310,680 5 , 1 1 1 , 9 6 8 4 , 7 9 4 , 8 5 2 4,987,469 5 , 0 8 2 , 0 1 5 5 , 1 8 5 , 9 9 4 61,353,582 2,097,627 2,009,507 4,322,573 4.310,230 4 , 1 6 1 , 5 7 3 4,374.499 49.790,823
151,858,371 145,954,481 141,427,854 146,496,314 140,853,991 147,664.261 1,743,869,337 21,563,394 2 0 , 8 4 4 , 1 6 4 2 0 , 4 2 9 , 0 4 4 2 1 , 4 0 1 , 0 2 4 2 0 , 5 1 0 , 5 8 7 21.009,747 260,768,620
17,165,884 1 6 , 1 8 9 , 4 4 0 1 4 , 9 8 2 , 5 5 5 1 4 , 9 1 7 , 4 9 5 1 3 , 6 1 9 , 3 6 8 1 3 , 6 5 2 . 5 1 6 179,984,406 115,966,196 110,504,435 109,499,207 114,626,631 113,804,546 123,475,424 1,358,973,555
222,225,335 214,995,192 208,138,227 216,773,064 210,270,338 219,059,445 2,590,032,628 73,725,629 7 1 , 2 0 6 , 8 2 3 7 0 , 3 1 2 , 8 1 7 7 2 . 2 3 9 , 2 2 7 69,273,623 7 2 . 3 5 1 , 2 3 7 844,232.645 19,833,606 1 9 , 4 4 7 , 6 4 7 1 8 , 3 5 7 , 5 7 3 1 8 , 7 2 6 , 6 9 5 1 7 , 8 0 6 , 5 0 0 18 ,321 ,973 224.575,302
371,909,704 360,111,102 345,879,705 357,408,967 340,667,868 352,481.250 4,222,716,310 4,882,530 4,835,796 4 , 5 7 8 , 3 0 6 3 , 9 7 0 , 1 4 4 3 , 4 7 4 , 2 1 4 3,547.405 54,265,890
31,578,983 3 0 , 4 1 2 , 3 1 9 2 8 , 5 9 2 , 9 3 2 2 9 , 7 9 1 . 4 0 5 2 8 , 2 0 5 , 9 5 5 2 8 , 9 7 5 . 1 3 7 358,186,084 1,250,724 1,252,105 1,205,330 1 , 2 3 2 , 8 5 3 1 , 1 6 0 , 1 0 9 1 , 2 0 2 , 1 9 8 14,060,977
177,452,297 175,981,131 169,402,830 174,357,670 167,018,401 172,615,375 2,026,658,503 931,655 887,499 836,153 856.395 813,772 878.843 10,418,556
3,026,135 2 , 9 1 1 , 1 0 8 2 , 8 2 7 , 2 5 6 2 , 9 0 3 , 1 1 8 2 , 8 2 1 , 0 2 6 2 , 8 6 8 , 7 1 5 33,182.387 2,752,789 2,741.079 2 , 5 2 1 , 3 6 3 2 . 5 2 1 . 4 9 1 2 , 5 1 1 , 0 7 5 2 . 6 1 0 . 8 7 1 31.727,951
57,900,515 5 7 , 7 0 5 , 9 3 6 5 3 , 8 6 7 , 1 6 1 5 4 , 7 8 2 , 8 6 7 51,937,978 5 2 , 7 6 5 , 6 6 6 658,864,289 287,294,101 278 ,796 ,066 264,843,686 271.140,818 260,311,005 268,631.982 3,263,183,004
6.808,843 6 . 5 2 8 . 7 6 4 6,089,508 6 . 3 5 3 , 0 5 7 6 , 0 5 2 , 9 7 3 6 , 2 5 4 , 7 5 3 72,258,674 635,657,707 613,340,802 606,088,175 633,424,082 619,941,702 655,804,620 7,562,192,060
3,085.361 2,811,363 2,879,608 2 , 8 9 9 , 4 8 7 2 , 8 5 2 , 1 8 3 2 , 8 0 1 , 1 6 1 28,220,483 5.693,914 5,423,645 5,313,725 5 , 5 3 5 , 2 9 9 5 , 0 7 0 , 1 7 8 5 , 2 3 1 , 6 1 5 65.650.456
2,226,227,039 2,156,02 !,006 2,092,435,377 2,167,512,841 2,093,792,081 2,187,586,836 25,786,498,056
200,938,749 189,974,621 184,601.756 187,375,765 181,568.862 191,761,582 2,349,125,766 291,711,207 274 ,717 ,475 261,590,504 267,696,520 259,633,413 269,122,695 3,387,694,385
11,986,099 1 1 , 8 0 4 , 0 4 2 1 1 , 6 1 4 , 8 5 8 1 1 , 8 6 4 , 8 4 3 1 1 , 4 1 8 , 0 4 8 1 1 , 9 4 7 , 8 6 8 143.275,719
5, I 17,691 4 , 9 2 6 , 3 9 3 4 , 8 1 3 , 7 0 9 4,778,190 4 , 3 7 0 , 5 1 4 4,506,229 57,490,027 - 518,825,810 489,499,395 470,458,579 479,791,980 464,669,937 485,696,563 6,040,057,731
2,745,052,849 2,645,520,401 2,562,893,956 2,647,304,821 2,558,462,018 2,673,283,399 31,826,555,787
12
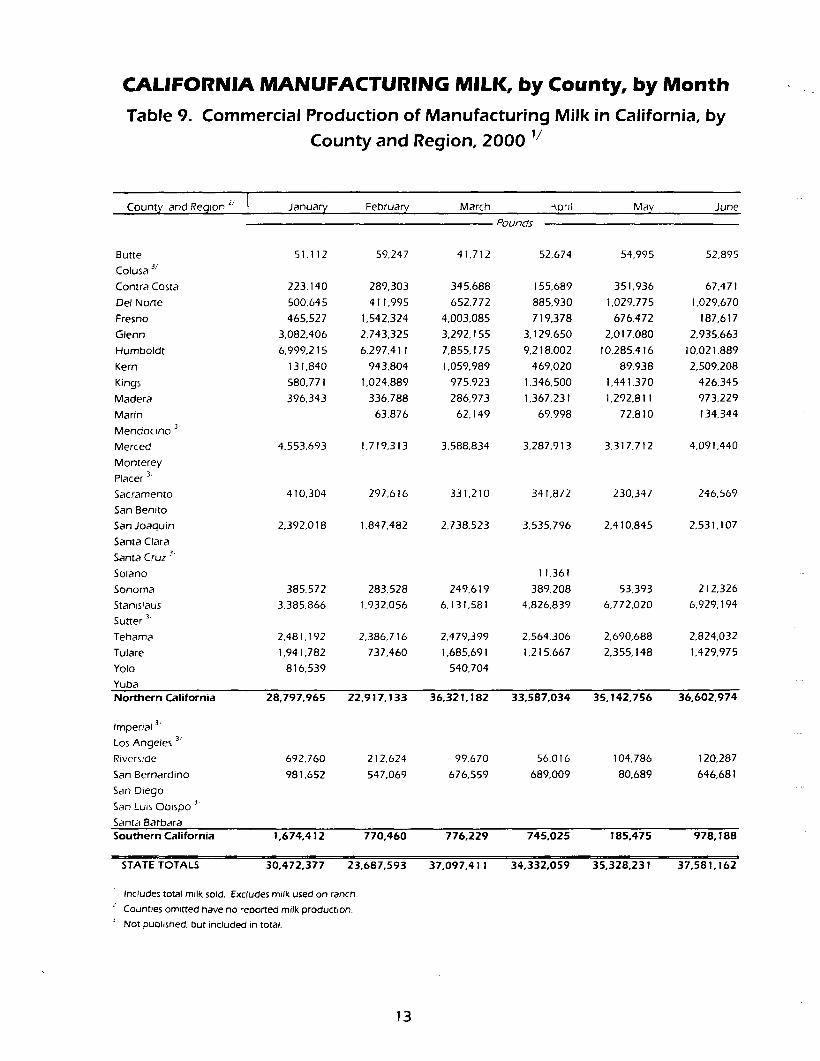
CALIFORNIA MANUFACTURING MILK, by County, by Month Table 9. Commercial Production of Manufacturing Milk in California, by
County and Region, 2000 11
County and Reqion 2, t January February March ~,pril May June
Butte
Colusa ~'
Contra Costa
Del Notre
Fresno
Glenn
Humboldt
Kern
Kings
Madera
Marin
Mendocino 3
Merced
Monterey Placer 3,
Sacramento
San Benito
San Joaquin
Santa Clara Santa Cruz 3,
Solano
Sonoma
Stanislaus Sutter 3,
Tehama
Tulare
Yolo
Yuba
Pounds
51,112 59.247 41,712 52,674 54,995 52,895
223,140 289,303 345,688 155,689 351,936 67,471
500.645 411,995 652,772 885,930 1,029,775 1,029,670
465,527 1,542,324 4,003,085 719,378 676,472 187,617
3,082,406 2,743,325 3,292,155 3,129,650 2,017,080 2,935,663
6,999,215 6,297,411 7,855,175 9,218,002 10,285,416 10,021,889
131,840 943,804 1,059,989 469,020 89.938 2,509,208
580,771 1,024,889 975,923 1,346,500 1,441,370 426,345
396,343 336,788 286,973 1,367,231 1,292,811 973,229
63,876 62,149 69,998 72,810 134,344
4,553,693 1,719,313 3,588,834 3,287,913 3,317,712 4,091,440
410,304 297,616 331,210 341,872 230.347 246,569
2,392,018 1,847.482 2,738,523 3,535,796 2,410,845 2,531,107
11,361
385,572 283,528 249,619 389,208 53.393 212,326
3,385,866 1,932,056 6,131,581 4,826,839 6,772.020 6,929,194
2,481,192 2,386,716 2,479,399 2,564,306 2,690,688 2,824,032
1,941,782 737,460 1,6B5,691 1,215,667 2,355,148 1,429,975
816,539 540,704
Northern California 28, 797,965 22,9 ! 7,133 36,321,182 33,587,034 35,142,756 36,602,974
Imperial 3,
Los Angeles 3,
Riversicle
San Bernardino
San Diego
San Luis Obispo 3,
Santa Barbara
692.760 212.624 99,670 56,016 104,786 120,287
981.652 547,069 676,559 689,009 80,689 646,681
Southern California 1,674,412 770,460 776,229 745,025 185,475 978,188
STATE TOTALS 30,472,377 23,687,593
: Includes total milk sold. Excludes milk used on rancl~.
: Counties omitted have no reported milk production. 3 Not published, but included in total.
37,097,411 34,332,059 35,328.231 37,581,162
13
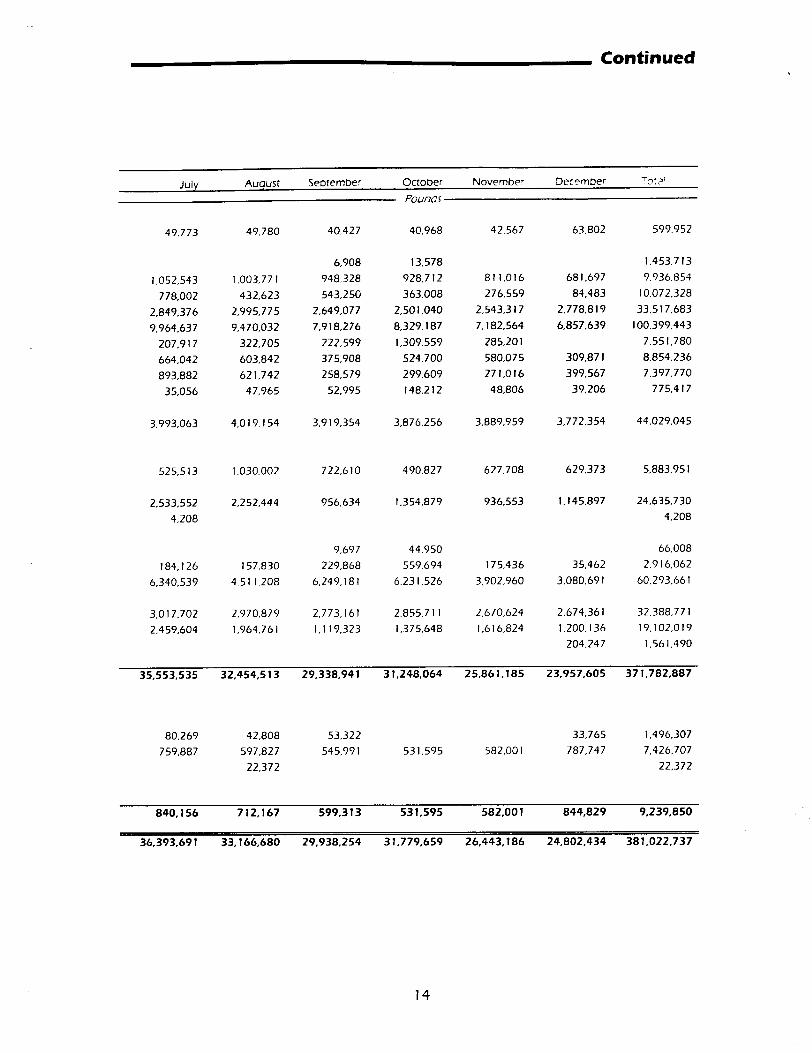
Continued
JuhJ Aunust Seotember October November December "r .
POUrTGS
49,773 49,780 40,427 40,968 42.567 63,802 599,952
6,908 13,578 1.453,713
1,052,543 1,003,771 948,328 928,712 811.016 681,697 9,936.854
778,002 432,623 543,250 363,008 276,559 84,483 10,072,328
2,849,376 2 , 9 9 5 , 7 7 5 2 , 6 4 9 , 0 7 7 2,501,040 2,543,317 2,778,819 33,517.683
9,964,637 9 , 4 7 0 , 0 3 2 7 , 9 1 8 , 2 7 6 8,329,187 7 , 1 8 2 , 5 6 4 6,857.639 100,399,443
207,917 322,705 222,599 1,309,559 285,201 7,551.780 664,042 603,842 375,908 524,700 580,075 309,871 8,854,236
893,882 621,742 258,579 299,609 271,016 399.567 7,397,770
35,056 47,965 52,995 148,212 48,806 39,206 775,417
3,993,063 4 , 0 1 9 , 1 5 4 3 , 9 1 9 , 3 5 4 3,876,256 3,889,959 3,772,354 44,029,045
525,513 1,030,002 722,610 490,827 627,708 629.373 5,883,951
2,533,552 2,252,444 956,634 1,354,879 936,553 1 ,145 ,897 24,635,730
4,208 4,208
9,697 44,950 66,008
184,126 157,830 229,868 559,694 175,436 35.462 2,916,062
6,340,539 4,511,208 6 , 2 4 9 , 1 8 1 6 , 2 3 1 , 5 2 6 3,902,960 3 , 0 8 0 . 6 9 1 60,293,661
3,017,702 2 , 9 7 0 , 8 7 9 2 , 7 7 3 , 1 6 1 2 , 8 5 5 , 7 1 1 2 , 6 7 0 , 6 2 4 2 . 6 7 4 , 3 6 1 32,388,771 2,459,604 1 ,964 ,761 1 , 1 1 9 , 3 2 3 1 , 3 7 5 , 6 4 8 1 , 6 1 6 , 8 2 4 1 . 2 0 0 , 1 3 6 19,102.019
204,247 1.561.490
35,553,535 32,454,513 29,338,941 31,248,064 25,861,185 23,957,605 371,782,887
80,269 42,808 53,322 33,765 1.496.307 759,887 597,827 545,991 531.595 582,001 787,747 7.426,707
22,372 22,.372
840,156 712,167 599,313 531,595 582,001 844,829 9,239,850
36,393,691 33,166,680 29,938,254 31,779,659 26,443,186 24,802,434 381,022,737
14
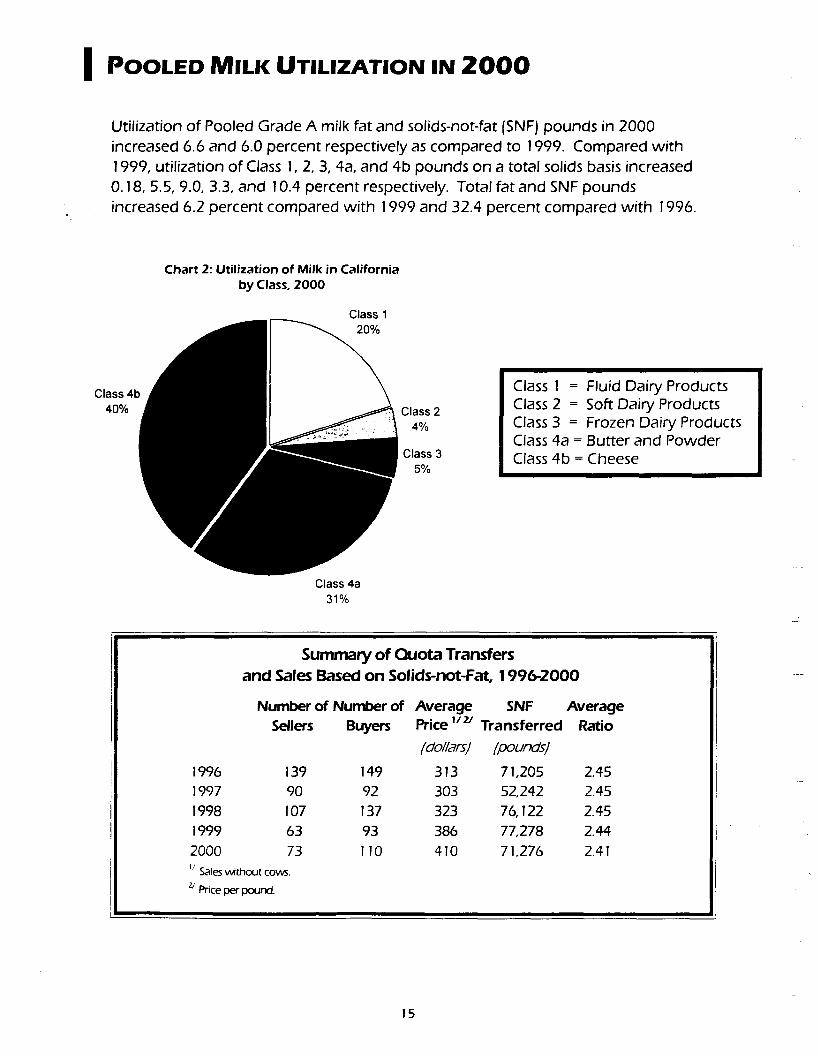
I POOLED MILK UTILIZATION IN 2 0 0 0
Utilization of Pooled Grade A milk fat and solids-not-fat (SNF) pounds in 2000 increased 6.6 and 6.0 percent respectively as compared to 1999. Compared with 1999, utilization of Class 1, 2, 3, 4a, and 4b pounds on a total solids basis increased 0.18, 5.5, 9.0, 3.3, and 10.4 percent respectively. Total fat and SNF pounds increased 6.2 percent compared with 1999 and 32.4 percent compared with 1996.
Chart 2: Utilization of Milk in California by Class, 2000
Class 1
Class 4t 40% Class 2
4%
Class 3 5%
Class I = Fluid Dairy Products Class 2 = Soft Dairy Products Class 3 = Frozen Dairy Products Class 4a = Butter and Powder Class 4b = Cheese
Class 4a 31%
Summary of Quota Transfers and Sales Based on Solids-not-Fat, 1996-2000
Number of Number of Average SNF Average
Sellers Buyers Price lz z~ Transfer red Ratio
(dollars) (pounds) 1996 139 149 313 71,205
1997 90 92 303 52,242
1998 107 137 323 76, 122
1999 63 93 386 77,278
2000 73 1 I0 410 71,276
~J Sales without cows. z/Price per pound.
2.45
2.45
2.45
2.44
2.41
15
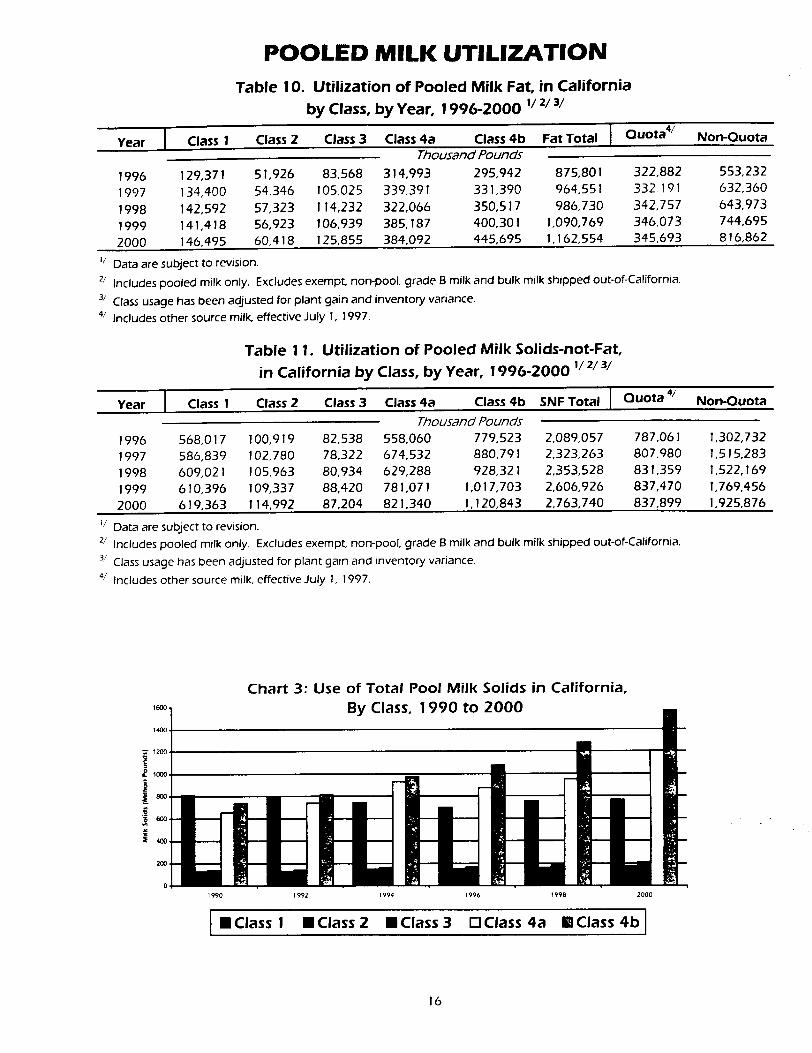
POOLED MILK UT IL IZAT ION Table I 0, Utilization of Pooled Milk Fat, in California
by Class, by Year, 1996-2000 w/2/3/
Year I Class 1 Class 2 Class 3 Class 4a Class 4b Fat Total I Quota ~ Non-Quota ThousandPounds
1996 129,371 51,926 83,568 314,993 295,942 875,801 322,882 553,232 1997 134,400 54,346 105,025 339,391 331,390 964,551 332191 632,360 1998 142,592 57,323 i14,232 322,066 350,517 986,730 342,757 643,973 1999 141,418 56,923 106,939 385,187 400,301 1,090,769 346,073 744,695 2000 146,495 60,418 125,855 384,092 445,695 1,162,554 345,693 816,862
~t Data are subject to revision. zj Includes pooled milk only. Excludes exempt, non-pool, grade B milk and bulk milk shipped out-of-California.
3/ Class usage has been adjusted for plant gain and inventory variance. 41 Includes other source milk, effective July I, 1997.
Table 11. Ut i l izat ion of Pooled Mi lk Solids-not-Fat, in Cal i fornia by Class, by Year, 1 9 9 6 - 2 0 0 0 i /2/3/
Year I Class 1 Class 2 Class 3 Class 4a Class 4b SNF Total I Quota 4/ Non-Quota ThousandPounds
1996 568,017 100,919 82,538 558,060 779,523 2,089,057 787,061 1,302,732 1997 586,839 102,780 78,322 674,532 880,791 2,323,263 807,980 1,515,283 1998 609,021 105,963 80,934 629,288 928,321 2,353,528 831,359 1,522,169 1999 610,396 109,337 88,420 781,071 1,017,703 2,606,926 837,470 1,769,456 2000 619,363 114,992 87,204 821,340 1,120,843 2,763,740 837,899 1,925,876
~/ Data are subject to revision. 2j Includes pooled milk only. Excludes exempt, non-pool, grade B milk and bulk 3. Class usage has been adjusted for plant gain and inventory variance.
4/ Includes other source milk, effective July I, 1997.
milk shipped out-of-California.
1600
Chart 3: Use of Total Pool Mi lk Solids in California, By Class, 1 9 9 0 to 2 0 0 0
O 1000 1 • __ - -
i -
~ ° - -
1990 1992 T994 1996 1998 2000
I • C l a s s l • C l a s s 2 • C l a s s 3 I-I C l a s s 4 a I g C l a s s 4 b l
16
I SALES OF CLASS 1 MARKET MILK PRODUCTS IN 2 0 0 0
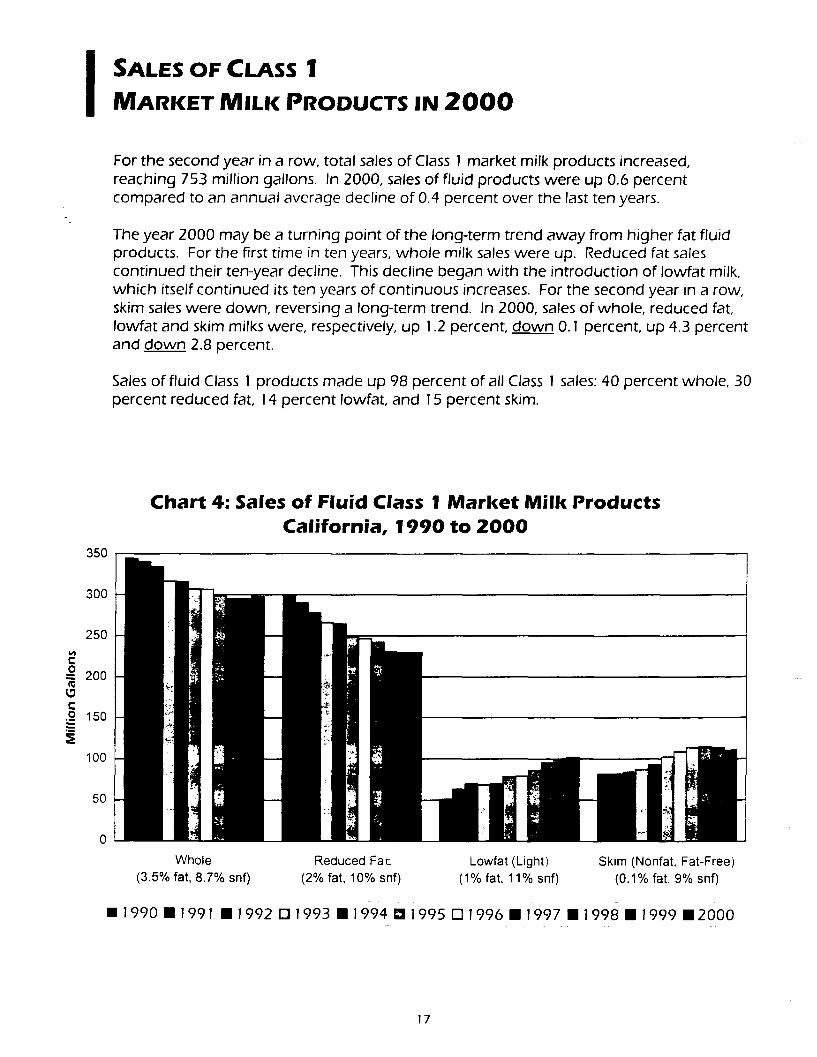
For the second year in a row, total sales of Class I market milk products increased, reaching 753 million gallons. In 2000, sales of fluid products were up 0.6 percent compared to an annual average decline of 0.4 percent over the last ten years.
The year 2000 may be a turning point of the long-term trend away from higher fat fluid products. For the first time in ten years, whole milk sales were up. Reduced fat sales continued their ten-year decline. This decline began with the introduction of Iowfat milk, which itself continued its ten years of continuous increases. For the second year in a row, skim sales were down, reversing a long-term trend. In 2000, sales of whole, reduced fat, Iowfat and skim milks were, respectively, up !.2 percent, down O. I percent, up 4.3 percent and down 2.8 percent.
Sales of fluid Class 1 products made up 98 percent of all Class I sales: 40 percent whole, 30 percent reduced fat, 14 percent Iowfat, and 15 percent skim.
350
Chart 4: Sales of Fluid Class 1 Market Milk Products California, 1990 to 2000
_o
.9
300
250
200
150
100
50
Whole (3.5% fat, 8.7% snf)
Reduced Fac (2% fat, 10% snf)
Lowfat (Light) (1% fat, 11% snf)
Skim (Nonfat, Fat-Free) (0.1% fat, 9% snf)
• 1990 • 1991 • 1992 [] 1993 • 1994 [] 1995 [] 1996 • 1997 • 1998 • 1999 • 2 0 0 0
17
Year Whole
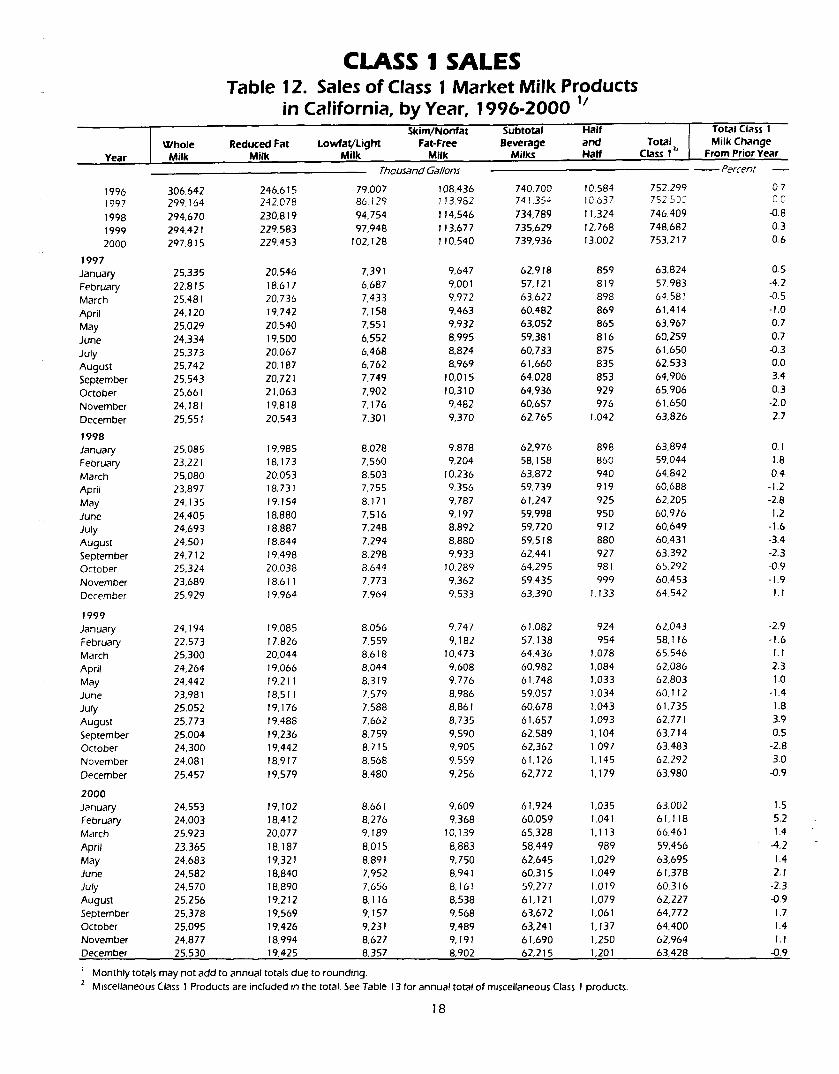
Table CLASS 1 SALES
12, Sales of Class 1 Market Milk Products in California, by Year, 1996-2000
Reduced Fat Lowfat/Light Fat-Free Skim/Nonfat Subtotal Half 1
Beverage and Total2 ' t Milk Milks Haft C~ss Milk Milk Milk
Total Class 1 Milk Change
From Prior Year
1996 306,642 246.615 1997 299,164 242.078 1998 294,670 230.819 1999 294,421 229,583 2000 297,815 229.453
1997 January 25,335 20, 546 February 22,815 18.617 March 25,481 20,736 April 24,120 19.742 May 25,029 20.540 June 24,334 19.500 July 25,373 20.067 August 25,742 20.187 September 25,543 20,721 October 25,661 21,063 November 24,181 19.818 December 25,551 20.543
1998 January 25,085 19,985 February 23,221 18,173 March 25,080 20,053 April 23,897 18,731 May 24,135 19.154 June 24,405 18,880 July 24,693 18.887 August 24,501 18.844 September 24,712 19.498 October 25,324 20.038 November 23,689 18.611 December 25,929 19,964
1999 January 24,194 19,085 February 22,573 17,826 March 25,300 20,044 April 24,264 19.066 May 24,442 19.211 June 23.981 18.511 July 25,052 19,176 August 25,773 19,488 September 25,004 19.236 October 24,300 19,442 November 24.081 18,917 December 25,457 19,579
2000 January 24,553 19.102 February 24,003 18.412 March 25,923 20.077 April 23,365 18,187 May 24,683 19.321 June 24,582 18,840 July 24,570 18,890 August 25,256 19,212 September 25,378 19,569 October 25,095 19,426 November 24,877 18,994 December 25,530 19.425
ThousandGallons
79,007 108,436 740.700 10,584 752,299 86,129 113,982 741.354 !0.637 752 5 ~ 94,754 114,546 734,789 11,324 746,409 97,948 113,677 735,629 12,768 748.682
102,128 110.540 739,936 13,002 753,217
7,391 9,647 62,918 859 63.824 6,687 9,001 57,121 819 57,983 7,433 9,972 63,622 898 64,581 7,158 9.463 60,482 869 61,414 7,551 9,932 63,052 865 63,967 6,552 8,995 59,381 816 60,259 6,468 8,824 60,733 875 61,650 6,762 8,969 61,660 835 62,533 7,749 10,015 64,028 853 64,906 7,902 10,310 64,936 929 65,906 7,176 9,482 60,657 976 61.650 7,301 9,370 62,765 1,042 63,826
8,028 9,878 62,976 898 63,894 7,560 9,204 58,158 860 59,044 8,503 10,236 63,872 940 64,842 7,755 9,356 59,739 919 60,688 8,171 9,787 61,247 925 62,205 7,516 9,197 59,998 950 60,976 7,248 8,892 59,720 912 60.649 7,294 8,880 59,518 880 60,431 8,298 9,933 62,441 927 63,392 8,644 10,289 64,295 981 65,292 7,773 9.362 59,435 999 60,453 7,964 9,533 63,390 1,133 64,542
8,056 9,747 61,082 924 62,043 7,559 9,182 57,138 954 58,116 8.618 10,473 64,436 1,078 65,546 8,044 9,608 60,982 1,084 62,086 8,319 9,776 61,748 1,033 62,803 7,579 8,986 59,057 1,034 60,112 7,588 8,861 60,678 1,043 61,735 7,662 8,735 61,657 1,093 62,771 8,759 9,590 62,589 1,104 63,714 8,715 9,905 62,362 1,097 63,483 8,568 9,559 61,126 1,145 62,292 8,480 9,256 62,772 1,179 63,980
8,661 9,609 61,924 1,035 63.002 8,276 9,368 60,059 1,041 61,118 9,189 10,139 65,328 1,113 66,461 8,015 8,883 58,449 989 59,456 8,891 9,750 62,645 1,029 63,695 7,952 8,941 60,315 1,049 61,378 7,656 8,161 59,277 1,019 60,316 8,116 8,538 61,121 1,079 62,227 9,157 9,568 63,672 1,061 64,772 9,231 9,489 63,241 1,137 64,400 8,627 9,191 61,690 1,250 62,964 8,357 8,902 62,215 1,201 63,428
- - P e r c e n t
07 0O
-0.8 0.3 0.6
0.5 -4.2 -0.5 -I.0 0.7 0.7
-0.3 0.0 3.4 0.3
-2.0 2.7
0.1 1.8 0.4
-1.2 -2.8 1.2
-1.6 -3.4 -2.3 -0.9 -1.9 1.1
-2.9 -1.6 1.1 2.3 1.0
-I.4 1.8 3.9 0.5 -2.8 3.0
-0.9
1.5 5.2 1.4
-4.2 1.4 2,1
-2.3 -0.9 1.7 1.4 1.1
-0.9
Monthly totals may not add to annual totals due to rounding. 2, Miscellaneous Class 1 Products are included in the total. See Table 13 for annual total of miscellaneous Class 1 products,
18
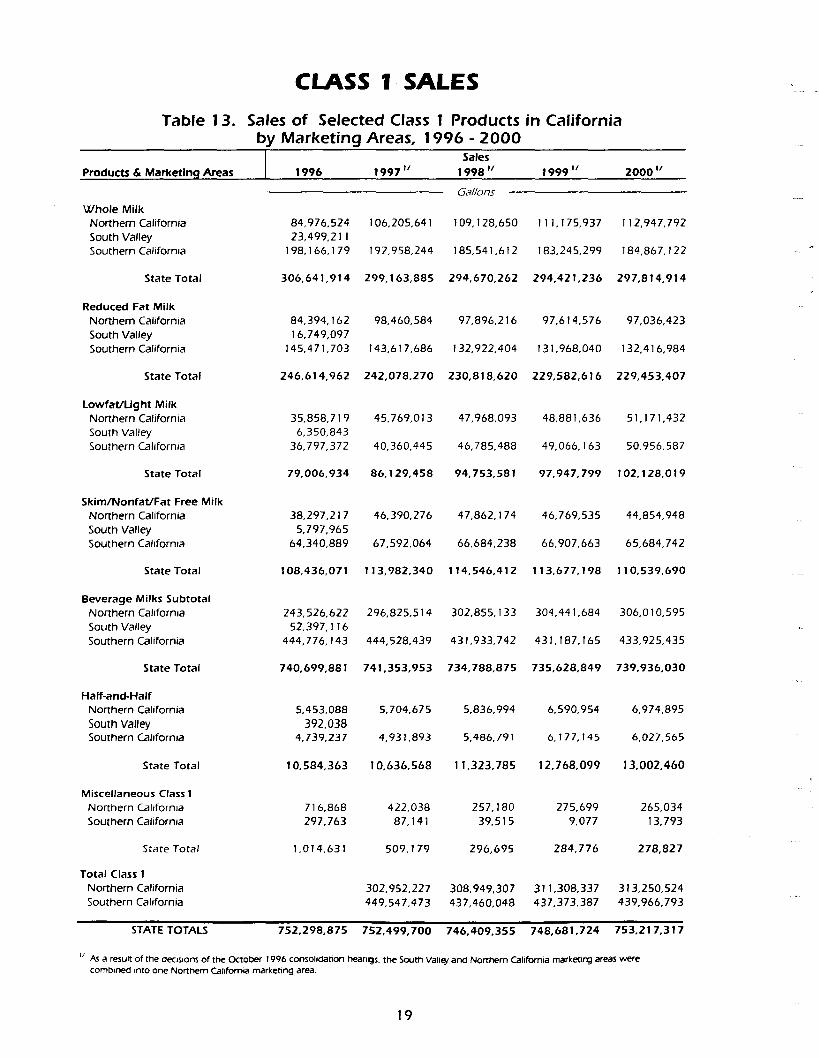
Table 13,
Products & Marketing Areas
Whole Milk Northern California South Valley Southern California
State Total
Reduced Fat Milk Northern California South Valley Southern California
State Total
Lowfat/Light Milk Northern California South Valley Southern California
State Total
Skim/Nonfat/Fat Free Milk Northern California South Valley Southern California
State Total
Beverage Milks Subtotal Northern California South Valley Southern California
State Total
C L A S S 11. S A L E S
Sales of Selected Class 1 Products in Cal i fornia by M a r k e t i n g Areas, 1 9 9 6 - 2 0 0 0
Sales 1996 19971/ 1998 I/ 19991/ 2000 I/
Gallons
84.976,524 106,205,641 109,128,650 111,175,937 112,947.792 23.499,211
198.166,179 192,958,244 185.541,612 183,245,299 184,867.122
306,641,914 299,163,885 294,670,262 294,421,236 297,814,914
84,394,162 98,460,584 97,896,216 97,614,576 97,036,423 16,749,097
145,471,703 143,617,686 132,922,404 131,968,040 132,416,984
246,614,962 242,078,270 230,818,620 229,582,616 229,453.407
35,858,719 45.769,013 47,968,093 48,881,636 51,171,432 6,350,843
36,797,372 40,360,445 46,785,488 49,066.163 50,956,587
79,006,934 86,129,458 94,753,581 97,947,799 I02 ,128 ,019
38,297,217 46,390,276 47,862.174 46,769,535 44,854,948 5,797,965
64,340,889 67,592.064 66,684.238 66,907,663 65,684,742
108,436,071 113,982,340 114,546,412 113,677,198 110,539,690
243.526.622 296,825,514 302,855,133 304,441,684 306,010,595 52.397.116
444,776,143 444,528,439 431,933,742 431,187,165 433,925,435
740,699,881 741,353,953 734,788,875 735,628,849 739,936,030
Half-and-Half Northern California 5.453.088 5,704,675 5,836,994 6,590,954 6,974,895 SOUth Valley 392,038 Southern California 4,739,237 4.931.893 5.486, 791 6, 177, 145 6.027.565
State Total 10,584.363 10,636,568 i 1,323,785 12,768,099 13,002,460
Miscellaneous Class 1 Northern California 716,868 422,038 257, 180 275,699 265,034 Southern California 297,763 87, 141 39,515 9,077 13,793
State Total 1.014, 631 509, 1 79 296,695 284,776 278,827
Total Class 1 Northern California 302,952,227 308,949.307 311,308.337 313.250,524 Southern California 449,547,473 437,460.048 437,373.387 439,966.793
STATE TOTALS 752,298,875 752,499,700 746,409,355 748,681,724 753,217,317
:~ As a result of the clecJsions of the October 1996 consolidation hearigs, the South Valley and Northern California marketing areas were combined into one Northern California marketing area.
19
MANUFACTURE OF DAIRY PRODUCTS IN 2 0 0 0
California leads the nation in milk production. It also leads the nation in the production of many manufactured dairy products: yogurt, nearly all categories of ice cream, sherbet, frozen yogurt, Hispanic cheese, butter, nonfat dry milk (NFDM), dry butter milk, and whey protein concentrate (WPC). California is second or third in the production of most other manufactured products: cottage cheese, ice cream mixes, dry skim whey and total cheese, as well as American and Italian cheeses.
Class 2 (Soft Dairy Products)
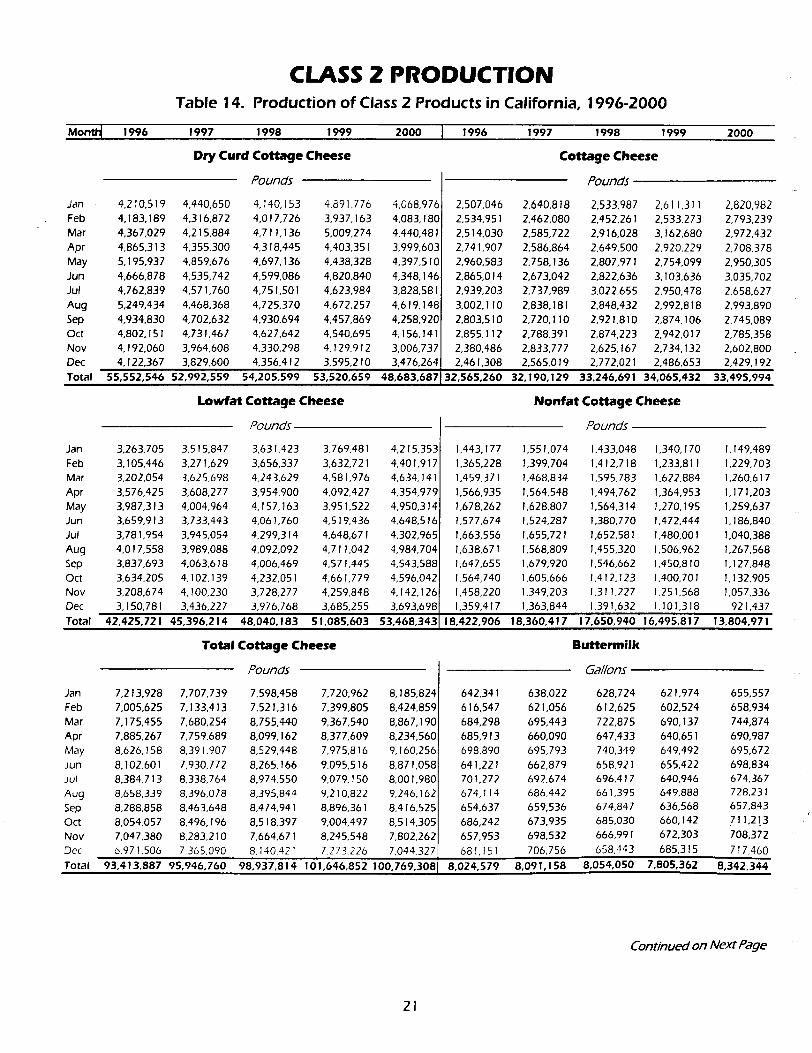
During 2000, total cottage cheese production declined to I 01 million pounds. Production was down 0.9 percent compared to an annual average decline of 0.7 percent over the last ten years. Production of cottage cheese curd, creamed cottage cheese, Iowfat and nonfat cottage cheese were, respectively, down 9.0 percent, down 1.7 percent, u_~ 4.7 percent and down 16.3 percent.
During 2000, yogurt production increased to 29 million gallons. Production was up 8.0 percent compared to an annual average increase of 0.6 percent over the last ten years. Sour cream and sour cream dressing also showed an increase in production, reaching 19 million gallons. Production was up 5.6 percent compared to a ten-year annual average increase of 3.6 percent. Similarly, buttermilk production increased to 8.3 million gallons. Production was up 6.9 percent compared to a ten-year annual average decrease of 1.7 percent.
Class 3 (Frozen Dairy Products)
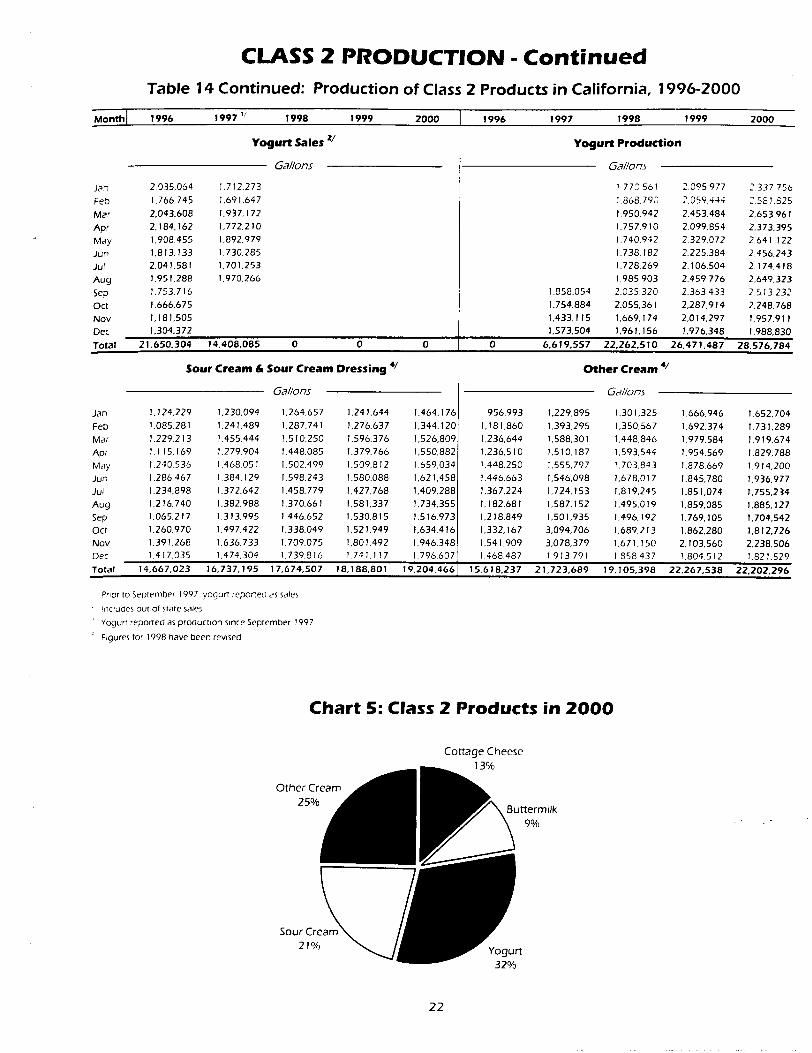
During 2000, total frozen product production declined to 163 million gallons. Production was down 1.0 percent compared to an annual average decline of 0.5 percent over the last ten years. Production of ice cream, ice milk, sherbet and frozen yogurt were, respectively, down 0.8 percent, down 0.8 percent, down 9.7 percent, and up 5.0 percent.
The shares of total frozen product production were 73 percent ice cream, 19 percent ice milk, 4 percent sherbet, and 4 percent frozen yogurt.
Class 4a (Butter and Nonfat Dry Milk)
Continuing their steady advance, both butter and nonfat dry milk (NFDM) production were up in 2000. Butter production rose 4.8 percent to 343 million pounds; the annual average increase over the last ten years was 2.5 percent. NFDM production rose 6.3 percent to 693 million pounds; the annual average increase over the last ten years was 7.9 percent.
Class 4b (Cheese and Whey Byproducts)
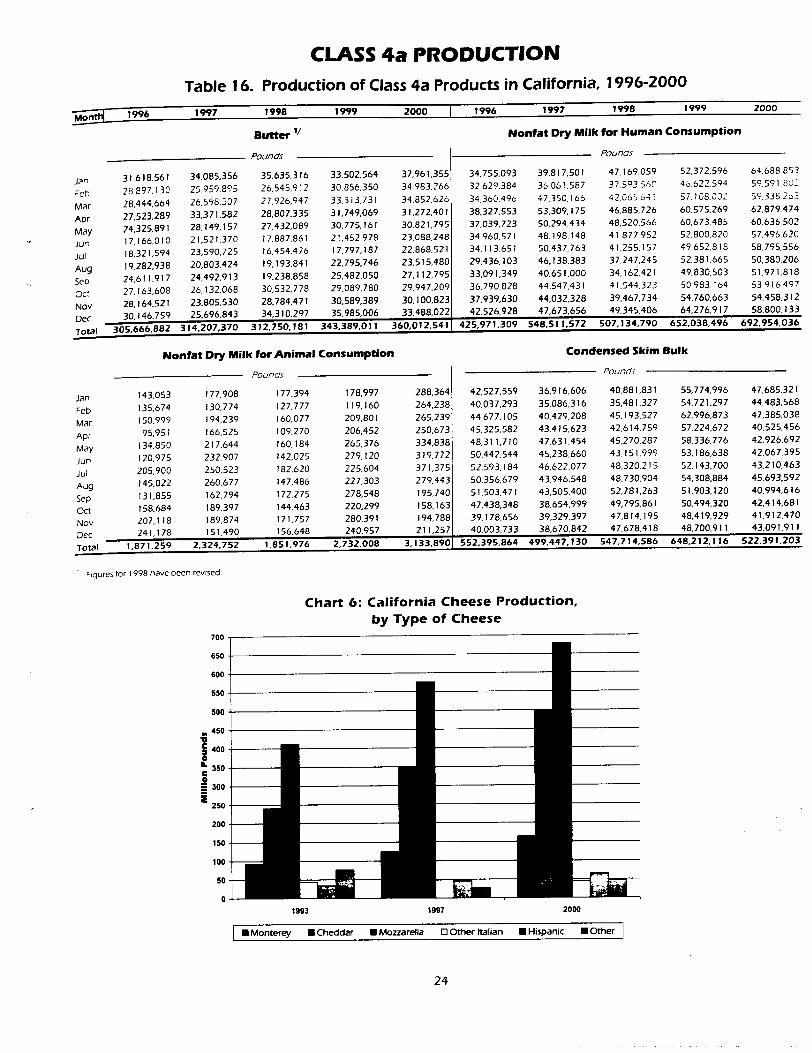
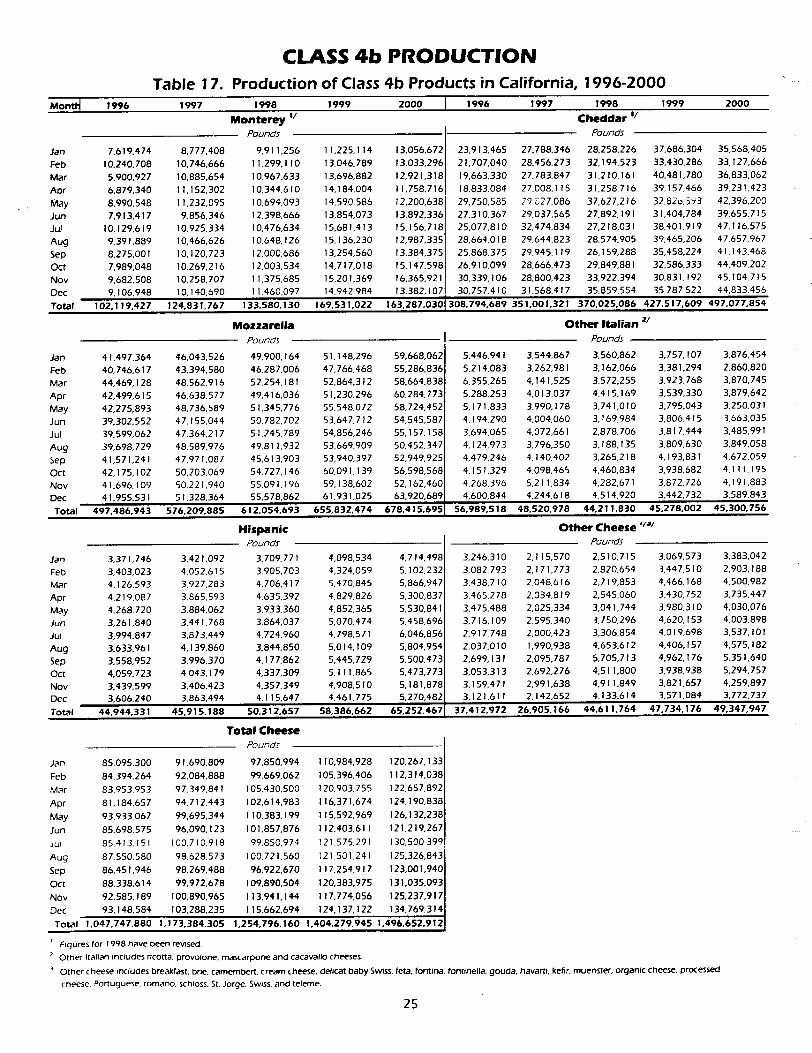
Class 4b utilization has been growing faster than the other four classes. The year 2000 was no exception. Total cheese production increased to 1.49 billion pounds. Production was up 6.6 percent compared to an annual average increase of 7.9 percent over the last ten years. Production percentage breakdowns were as follows: Mozzarella (up 3.4 percent), Cheddar (up 16.3 percent), Monterey (down 3.7 percent), Hispanic (up 11.8 percent), other Italian (up 0.1 percent), and all other cheese (up 3.4 percent). The shares of total cheese production were 45 percent mozzarella, 33 percent Cheddar, 11 percent Monterey, 4 percent Hispanic, 3 percent other Italian, and 3 percent all other.
20
CLASS 2 P R O D U C T I O N Table 14. Product ion of Class 2 Products in California, 1 9 9 6 - 2 0 0 0
Montl~ 1996 1997 1998 1999 2000 I 1996 1997 1998 1999 2000
Dry Curd Cottage Cheese
Pounds
Jan 4,210,519 4,440,650 4,140,153 4,891.776 4,068,976 Feb 4,183,189 4,316,872 4.017,726 3,937,163 4,083,180 Mar 4,367,029 4,215,884 4,711,136 5,009,274 4,440,481 Apr 4,865,313 4,355,300 4,318,445 4,403,351 3,999.603 May 5,195,937 4,859.676 4.697,136 4,438,328 4,397.510 Jun 4,666,878 4,535,742 4,599,086 4,820,840 4,348,146 Jul 4 ,762,839 4,571,760 4,751,501 4,623,984 3,828,581 Aug 5,249,434 4,468,368 4,725,370 4,672,257 4,619,148 Sep 4,934,830 4.702,632 4,930,694 4,457,869 4.258,920 Oct 4,802,151 4,731,467 4,627,642 4,540,695 4,156,141 Nov 4,192.060 3,964,608 4,330,298 4,129,912 3,006,737 Dec 4.122,367 3,829,600 4,356,412 3,595,210 3,476,264 Total
Cottage Cheese
Pounds
2,507,046 2,640.818 2,533.987 2,611,311 2,820,982 2,534,951 2,462,080 2,452,261 2,533,273 2,793,239 2,514.030 2,585,722 2,916,028 3,162.680 2,972,432 2,741,907 2,586,864 2,649,500 2,920,229 2,708,378 2,960,583 2,758,136 2,807,971 2.754,099 2,950.305 2,865,014 2,673,042 2,822,636 3,103,636 3,035,702 2,939,203 2,737,989 3,022,655 2,950,478 2,658.627 3.002,110 2,838,181 2,848,432 2,992,818 2,993,890 2,803,510 2,720,110 2,921,810 2,874,106 2.745,089 2,855,112 2,788,391 2,874,223 2,942.017 2,785,358 2,380,486 2,833.777 2,625,167 2,734,132 2,602,800 2,461,308 2,565,019 2,772,021 2,486.653 2,429,192
55,552,546 52,992,559 54,205,599 53,520,659 48,683,687 32,565,260 32,190,129 33,246,691 34,065,432 33,495,994
Lowfat Cottage Cheese
Pounds
Jan 3,263,705 3,515,847 3,631,423 3,769,481 4,215,353 Feb 3,105,446 3.271,629 3,656.337 3,632,721 4,401,917 Mar 3,202,054 3,625,698 4,243,629 4,581,976 4,634,14 Apr 3,576,425 3,608,277 3,954.900 4,092,427 4,354,979 May 3.987,313 4,004,964 4,157,163 3,951,522 4,950,314 Jun 3.659,913 3,733,443 4,061,760 4,519,436 4,648.516 Jul 3 ,781,954 3,945,054 4,299,314 4,648,671 4,302,965: Aug 4,017,558 3,989,088 4,092,092 4,711,042 4,984,704 Sep 3,837,693 4,063,618 4,006,469 4.571,445 4,543.588 Oct 3,634,205 4,102,139 4,232,051 4,661,779 4,596,042 Nov 3.208,674 4,100,230 3,728,277 4,259,848 4,142,126 Dec 3,150,781 3,436,227 3,976,768 3,685,255 3.693,698
Nonfat Cottage Cheese
Pounds
1,443,177 1,551,074 1,433,048 1,340,170 1,149,489 1.365,228 1.399,704 1,412,718 1.233,811 1,229,703 1,459,371 1,468,834 1,595,783 1,622,884 1.260,617 1,566,935 1,564.548 1,494,762 1,364,953 1,171,203 1,678,262 1,628.807 1,564,314 1,270,195 1,259,637 1,577,674 1,524,287 1,380,770 1,472.444 1,186,840 1,663,556 1,655,721 1,652,581 1,480,001 1,040,388 1,638.671 1,568,809 1,455,320 1,506.962 1,267,568 1,647.655 1,679,920 1,546,662 1,450,810 1,127.848 1,564,740 1,605,666 1,412.123 1.400,701 1,132,905 1,458,220 1.349,203 1,311,227 1.251,568 1,057,336 1.359,417 1,363,844 1,391,632 1,101,318 921,437
Total 42,425,721 45,396,214 48,040,183 51,085,603 53,468,343 18,422,906 18,360,417 17,650,940 16,495,817 13,804,971
Tota l Co t tage Cheese
Pounds
Jan 7,213,928 7,707.739 7,598,458 7.720,962 8,185,824 Feb 7,005,625 7,133,413 7.521,316 7.399,805 8,424,859 Mar 7,175,455 7,680.254 8,755,440 9.367,540 8,867,190 Apr 7,885,267 7,759.689 8,099,162 8.377,609 8,234,560 May 8,626,158 8,391.907 8,529,448 7.975,816 9,160,256 Jun 8,102.601 7,930,772 8,265,166 9,095,516 8.871,058 Jul 8 ,384,713 8,338,764 8,974,550 9,079,150 8.001,980 Aug 8,658,339 8.396,078 8,395,844 9,210,822 9.246,162 Sep 8,288,858 8,463,648 8,474,941 8,896,361 8,416,525 Oct 8,054,057 8.496,196 8,518,397 9,004,497 8,514,305 Nov 7,047,380 8.283,210 7,664,671 8,245,548 7,802,262 Dec 6.971,506 7.365,090 8,140.421 7,273.226 7,044.327 Total
Buttermilk
Gallons
642,341 6 3 8 , 0 2 2 628,724 6 2 1 , 9 7 4 655,557 616,547 6 2 1 , 0 5 6 612,625 602,524 658,934 684,298 6 9 5 , 4 4 3 7 2 2 , 8 7 5 6 9 0 , 1 3 7 744,874 685,913 660,090 6 4 7 , 4 3 3 640 ,651 690,987 698.890 6 9 5 , 7 9 3 7 4 0 , 3 4 9 6 4 9 . 4 9 2 695,672 641,221 662,879 658 .921 6 5 5 . 4 2 2 698,834 701,272 6 9 2 , 6 7 4 6 9 6 . 4 1 7 6 4 0 , 9 4 6 674,367 674,114 6 8 6 , 4 4 2 6 6 1 , 3 9 5 6 4 9 , 8 8 8 728,231 654,637 6 5 9 , 5 3 6 6 7 4 , 8 4 7 6 3 6 , 5 6 8 657,843 686,242 6 7 3 , 9 3 5 6 8 5 , 0 3 0 6 6 0 , 1 4 2 711,2!3 657,953 6 9 8 , 5 3 2 666 ,991 672,303 708,372 681,151 7 0 6 , 7 5 6 6 5 8 , 4 4 3 6 8 5 , 3 1 5 717,460
93,413,887 95,946,760 98,937,814 101,646,852 100,769,308 8,024,579 8,091,158 8,054,050 7,805,362 8,342,344
Continued on Next Page
21
CLASS 2 P R O D U C T I O N - C o n t i n u e d Table 14 Continued: Production of Class 2 Products in California, 1996-2000
Month] 1996 ! 997 '" 1998 ! 999 2000 I 1996 1997 1998 ! 999 2000
Yogurt Sales z/
Gallons
Jan 2035,064 1.712273 Fe~ 1.766,745 1.691,647 Mar 2 , 0 4 3 , 6 0 8 1.937,172 Apr 2,184,162 1,772.210 May 1 , 9 0 8 . 4 5 5 1,892.979 Jun 1,813,133 1.730.285 Jul 2,041,581 1,701.253 Aug 1 , 9 5 1 , 2 8 8 1,970,266 5eo 1,753,716 Oct 1.666,675 Nov I, 181.505 Dec 1.304,372
Total
Yogurt Product ion
Gallons
1 779561 2.095977 2337756 1,868,790 2.059.444 2,581.825 1,950.942 2 ,453 ,484 2.653,961 1,757,910 2,099,854 2.373.395 1.740,942 2,329,072 2.641.122 1.738,182 2 .225 .384 2,456.243 1,728,269 2,106,504 2.174.418 1,985,903 2.459.776 2.649.323
1.858,054 2,035.320 2.363,433 2513.232 1,754,884 2 ,055,361 2,287,914 2.248,768 1,433,115 1,669,174 2 ,014 ,297 1.957.911 1,573,504 1 ,961.156 1 ,976,348 1,988,830
21,650,304 14.408,085 0 0 0 0 6,619,557 22,262,510 26.471.487 28.576,784
Sour Cream & Sour Cream Dressing 41
Gallons
Jan 1,124,229 1 ,230,094 1,264,657 1,241,644 1,464,176 Feb 1,085,281 1 ,241.489 1,287,741 1 ,276,637 1,344,120 Mar 1,229.213 1,455.444 1,510,250 1 ,596.376 1,526,809 Apr 1,115,169 1,279,904 t,448,085 1 ,379,766 1,550,882 May 1 . 2 4 0 , 5 3 6 1,468,051 1,502,499 1.509,812 1,659,034 Jun 1,286,467 1,384, 129 1,598,243 1,580,088 1,621,458 Jul 1,234,898 1,372,642 1,458,779 1,427,768 1,409,288 Aug 1 , 2 1 6 . 7 4 0 1,382,988 1,370,661 1 ,581,337 1,734.355 Sep 1,065,217 1 ,313,995 1,446,652 1,530,815 1,516,973 Oct 1,260,970 1 ,497.422 1,338,049 1 ,521.949 1,634,416 Nov 1 . 3 9 1 , 2 6 8 1.636,733 1.709,075 1,801,492 1.946.348 Dec 1.417,035 1,474,304 T.739,816 1,741,117 1.796.607
O t h e r C r e a m 41
Gallons
956,993 1 ,229,895 1 .301,325 1 ,666,946 1,652,704 1,181,860 1 ,393,295 1 ,350.567 1.692,374 1.731,289 1.236,644 1,588.301 1 ,448 .846 1 .979.584 1,919,674 1,236,510 1 ,510,187 1 .593,544 1 .954,569 1,829,788 1.448,250 T,555,797 1 ,703,843 1 ,878.669 1,914,200 1,446,663 1 .546.098 1 ,678,017 1 ,845,780 1,936,977 1,367,224 1 .724.153 1 ,819.245 1.851,074 1,755.234 1,182,681 1 ,587 ,152 1 ,495,019 1,859,085 1,885,127 1,218,849 1 ,501,935 1 ,496.192 1 ,769.105 1.704.542 1,332.167 3,094,706 1,689,213 1 ,862,280 1,812,726 1,541.909 3,078,379 1 .671,150 2,103,560 2,238.506 1.468,487 I 913,791 1858437 lr804,512 1.82t,529
Total 14,667,023 16,737,195 17,674,507 18,188,801 19,204.466 15.618,237 21,723,689 19.105,398 22,267.538 22,202.296
Pnor to September 1997 yogu~ repon'ecl as sales
)ncludes oul ol-slate sales Yogur~ reposed as production since September T 997
Figures for 1998 have been revised
C h a r t 5: Class 2 P r o d u c t s in 2 0 0 0
Otl-
Cottage Cheese I ~01~
ettermilk
9%
Sol
t JL-I~
22
CLASS 3 P R O D U C T I O N
Table 15. Production of Class 3 Products in California, 1996-2000
MonmJ ! 996 1997 1998 1999 2000 1996 i 997 ! 998 1999 2000
Ice C r e a m
Gallons
Jan 7,237,872 7,213,305 6,550,412 6,699,006 Fe~ 7,870,710 7,750,700 8,167,784 8.274,693 Mar 8,961,585 9,800,628 10,439,699 10,110,694 Apr 9,102,822 10,083,395 10,220,092 10,812,213 May 10,535,138 11,112,408 10,024,147 11,548,117 Jun 11,610,718 12,128,916 11,237,205 14,208,437 Jul 11,576,419 11,340,875 11,388,020 13,265,859 Aug 11,782,936 10,674,421 11,245,395 12,027.289 Sep 9,013,366 9,065,192 10,721,316 9,603,135 O~ 7,550,119 7,410,188 7,671,561 8,448.320 Nov 5,858,321 6,667,610 6.512,674 8.037,029 Dec 6,335,814 6,424,870 6,386.618 6,573.065 Total
6.256,583 9,181,476
10,735,985 0,882,246 1,988,851 2,851,834 1,817,934 1,844,433 0,718,609 8,947,819 7,246,704 6,222,445
Ice M i l k ~ /~
Gallons
2,000,350 2,223,688 1,981,943 1947,467 1,940,035 2,024,664 2,228,164 2,214,796 2,024,195 2,119,082 2,552,789 2,608,242 2,678,914 2,667,290 2,660,509 2,475,930 2,775,402 2,923,329 2,600,226 2,823,492 2,925,049 2,636,844 2,840,564 2,874.893 3,049,063 3.078,100 3,206,953 4,062.686 3,498,290 3,393,441 2,902,167 2,850,081 3.607.295 3,322,150 3,007.784 3,102,792 3,415,208 3.728,629 2,733,620 3,178,474 2,522,506 2,757,163 2,767,433 2,770,217 2,474,820 2,510,566 2,641,281 2,017.676 2,425,654 2.382,419 1,980,900 2,067,522 2,042,523 2,012,498 1,856.411 1,846,170 2,038,106 1,985,860 2,167,657 1,908,634
107,435,819 109,672.508 110,564,922 119,607,855 i18.694,919 29,921,985 31,448,656 32,851,648 31,044,159 30,794,164
Sherbet Frozen Yogurt z/3/
Gallons
Jan 542,557 365,187 492,690 504,542 479,942 Feb 524,229 471,529 471,150 623,477 619,643 Mar 628,412 603,604 690,515 799,381 856,00 I Apr 527,905 649,955 668,502 731,192 685,648 May 647,057 752,784 642,492 845,916 713,405 Jun 655,070 764,171 789,828 941,591 825,459 Jul 642,884 632,924 825,198 854,176 708,622 Aug 722,343 565,791 848,705 888,934 818,519 Sep 499,137 485,736 660,494 594,940 615,229 Oct 465,335 472,210 530,283 573,191 466,649 Nov 311.422 360,945 426,066 521,157 262,407 Dec 310,364 266,367 331,384 217,086 260,865 Total 8,095,583 7.312,389
Gallon5
1,066,994 723,598 600,008 496,880 291,251 968,496 863,938 666,069 425,114 402.664
1,216,126 943,173 860,648 639,014 623,598 1,211,046 910,818 791,187 670,550 540,792 1,157,528 1,034,533 706,134 646,488 796,499 1,088,362 1.080.328 776,150 728,422 700,918 1,318,966 942,352 849,714 696,238 679,730 1,045,066 790,205 913,826 548,134 755,168 1,133,254 1,032,592 789,022 424,858 611,174
753,085 756,923 603,901 412,142 476,509 639.899 560.707 505,981 355,104 438,154 509,144 537,870 389,906 307,080 353,094
6,476,715 6,391,203 7,377,387 12,107.966 10,177,037 8,452,546 6.350,026 6,669,552
T o t a l F r o z e n P r o d u c t s
Gallons
Jan 10,847,773 10,525,779 9,625,052 9,647,895 8,967,812 Feb I 1,388,099 I 1,314,331 I 1,519,799 11,347,479 12,322,865 Mar 13,358,912 13,955,647 14,669,777 14,216,379 14,876,093 Apr 13.317,703 14,419.570 14,603, 190 14,814,182 14,932,177 May 15,264,772 15,536,569 14,213,337 15,915.414 16,547,819 Jun 16,432,250 17,180,368 16,865,869 19,376,740 17,771,653 Jul 16,440,437 15,766,232 16,670,227 18,138,423 16,214,070 Aug 16,653,136 15,445,625 16,736,554 16,197,978 16,596,595: Sep 13,168,264 13,340,684 14,938,265 13,393,149 14,419,832 Oc~ 11,279,105 I 1,280,603 10,823,421 11,859,308 12,273,396 Nov 8,790,543 9,656,783 9,487,245 10,925,788 9,803,675 Dec 9,001,492 9,267,214 9.093,768 9.264,888 8,745,039 i Total 155.942.486 157,689,404 159,246.503 165,097,622 163.471,0241
Includes Light Dairy Dessert and Nonfat Ice Cream. Figures for 1998 have been rewsed.
3 Includes nonfat and reduced fat yogurts.
23
CLASS 4a PRODUCTION Production of Class 4a Products in California, 1996-2000
1 9 9 6 1 9 9 7 1998 ! 9 9 ~ 2 0 0 0 1996 1 9 9 7 1 9 9 8 1999 2 0 0 0
Table 16.
Butter v
Pounds
Jan 31,618,561 34,085,356 35,635,316 33,502,564 37,961,355 ~eb 28897,130 25.959,895 26,545,912 30.856.350 34 983,266 Mar 28.444,664 26,595,507 27,926,947 33,313,731 34.852,626 Apr 27,523,289 33,371,582 28,807,335 31,749,069 31.272,401 May 24.325,891 28,149,157 27,432,089 30,775,161 30,821,795 Jun 17,166,010 21,521,370 17,887,861 21,452,978 23,088,248 Jul 18,321,594 23,590,725 16,454,476 17,797,187 22,868,521 Aug 19,282,938 20,803,424 19,193,841 22,795,746 23,515,480 Sep 24.611,917 24,492,913 19,238,858 25,482,050 27,112,795 Oc: 27,163,608 26,132,068 30,532,778 29,089,780 29,947,209 Nov 28,164,521 23,805,530 28,784,471 30,589,389 30,100,823 Dec 30.146,759 25,696,843 34,310,297 35,985,006 33,488,022 Total 3 0 5 , 6 6 6 , 8 8 2 3 1 4 , 2 0 7 , 3 7 0 3 1 2 , 7 5 0 , 1 8 1 3 4 3 , 3 8 9 , 0 1 1 3 6 0 , 0 1 2 , 5 4 1 4 2 5 , 9 7 1 , 3 0 9 548 ,51 ! , 5 7 2 5 0 7 , 1 3 4 , 7 9 0 6 5 2 , 0 3 8 , 4 9 6
Nonfat Dry Milk for Animal Consumption Condensed Skim Bulk
Pounds
143,053 177,908 177,394 178,997 288,364 135,674 130,774 127,777 119,160 264,238 150,999 194,239 160,077 209,801 265,239 95,951 166,525 109,270 206,452 250,673
134,850 217,644 160,184 265,376 334,838 120.975 232,907 142,025 279,120 319,772 205,900 250,523 182,620 225,604 371,375 145,022 260,677 147,486 227,303 279,443 131,855 162,794 172,275 278,548 195,740 158,684 189,397 144,463 220,299 158,163 207,118 189,874 171,757 280,391 194,788 241,178 151,490 156,648 240,957 211,257
Nonfat Dry Milk for Human Consumption
PounG3
34,755,093 39.817,501 47.169.059 52.372,596 64.688853 32.629,384 36 061.587 37593 56~ 46 622.594 59.591802 34,360,496 47,350,166 42,065.041 57,108.002 59.338 2~3
38,327,553 53.309,175 46,885,726 60.575,269 62.879,474 37,039,723 50,294,434 48,520.566 60,673,485 60.636,502 34.960.571 48,198,148 41877.952 52.800820 57.496,620 34.113,651 50,437,763 41,255,157 49,652,818 58.795,556 29,436,103 46,138,383 37,247,245 52,381,665 50,380,206 33,091,349 40,651.000 34,162,421 49.830,503 51,971,818 36,790,828 44.547,431 41.544,323 50.983.164 53916 497 37,939,630 44,032,328 39,467,734 54,760,663 54,458,312 42,526,928 47,673,656 49,345,406 64,276,917 58,800,133
6 9 2 , 9 5 4 , 0 3 ~
Jan Feb Mar Apr May Jun Jul Aug Sep Oct Nov Dec Total 1 , 8 7 1 , 2 5 9 2 , 3 2 4 , 7 5 2 1 , 8 5 1 , 9 7 6 2 , 7 3 2 . 0 0 8 3 , 1 3 3 , 8 9 0 5 5 2 , 3 9 5 , 8 6 4 4 9 9 . 4 4 7 , 1 3 0 5 4 7 , 7 1 4 , 5 8 6 6 4 8 , 2 1 2 . 1 1 6
Pounds
42,527,559 36,916,606 40,881,831 55,774,996 47,685,321 40,037,293 35,086,316 35,481,327 54,721,297 44,483,568 44,677,105 40,429,208 45,193.527 62,996,873 47,385,038 45,325,582 43,415,623 42,614,759 57,224,672 40,525,456 48,311,710 47,631,454 45,270,287 58,336,776 42,926.692 50,442,544 45,238,660 43,151,999 53,186,638 42,067,395 52,593,184 46,622,077 48,320,215 52,143,700 43,210,463 50,356,679 43,946,548 48,730,904 54,308,884 45,693,592 51,503,471 43,505,400 52,781,263 51,903,120 40,994,616 47,438,348 38,654,999 49,795,861 50,494.320 42,414,681 39,178,656 39,329,397 47,814,195 48,419.929 41,912,470 40,003,733 38,670,842 47,678,418 48,700,911 43,091,911
5 2 2 , 3 9 1 , 2 0 3
Fngures for 1998 have been revised
70O
650
60O
550
5O0
m 450 'ID : 4 0 0
~ 3 5 0 S: 0
300
250 •
200 .
150 -
100 •
50'
I,
C h a r t 6: C a l i f o r n i a C h e e s e P r o d u c t i o n , by T y p e o f Cheese
1~3 1~7 2 0 ~
I • Monterey • Cheddar • Mozzarella [] Other Italian • Hispanic • Other I
24
CLASS 4b P R O D U C T I O N Table 17, Production of Class 4b Products in California, 1996-2000
Mont~ 1996 1997 1998 1999 2000 I 1996 ! 997 1998 1999 2000
M o n t e r e y ~/ Pounds
Jan 7,619,474 8,777.408 9,911,256 11,225,114 13,056,672 Feb 10,240,708 10.746,666 11,299,110 13,046,789 13,033,296 Mar 5,900,927 10,885,654 10,967,633 13,696,882 12,921,318 Aor 6,879,340 11,152,302 10,344,610 14,184,004 11,758,716 May 8,990,548 11,232,095 10,694,093 14,590,586 12,200,638 Jun 7.913,417 9,856,346 12,398,666 13,854,073 13,892,336 Jul 10,129,619 10.925.334 10,476,634 15,681,413 15,156,718 Aug 9,391,889 10,466,626 10,648,126 15,136,230 12,987,335 Sep 8,275.001 10,120,723 12.000,686 13,254,560 13,384,375 O~ 7,989,048 10,269,216 12,003,534 14,717,018 15,147,598 Nov 9.682,508 10,258,707 11,375,685 15,201,369 16,365,921 Dec 9.106.948 10,140,690 11,460,097 14,942.984 13,382,107
Total
C h e d d a r ~/ Pounds
23,913.465 27.788,346 28.258,226 37,686,304 35,568,405 21,707,040 28.456.273 32.194.523 33,430.286 33,127,666 19,663,330 27,783.847 31.210,161 40.481,780 36,833.062 18.833,084 27.008,115 31.258.716 39,157,466 39,231,423 29.750,585 2~$27.086 37,627,216 32.82~,593 42,396,200 27,310,367 29,037,565 27.892,191 31,404,784 39.655,715 25,077,810 32.474.834 27,218~031 38,401,919 47,116,575 28,664,018 29.644.823 28.574.905 39,465,206 47.657,967 25,868,375 29.945.119 26,159,288 35,458,224 41,143,468 26.910,099 28,666.473 29,849,881 32,586,333 44,409.202 30,339,106 28.800,423 33,922.394 30,831,192 45,104.715 30,757410 31.568.417 35,859.554 35.787.522 44,833,456
102,119,427 124,831,767 133,580,130 169,531,022 163,287,030 308,794,689 351,001,321 370,025,086 427,517,609 497,077,854
M o z z a r e l l a Pounds
Jan 41,497,364 46,043,526 49,900,164 51,148.296 59,668,062 Feb 40,746,617 43,394.580 46,287,006 47,766.468 55,286.836 Mar 44,469,128 48.562,916 52,254,181 52.864,312 58,664,838 Apt 42,499,615 46.638.577 49,416,036 51,230,296 60,284,773 May 42,275,893 48.736.589 51,345,776 55,548.072 58,724,452 Jun 39,302,552 47.155,044 50,782,702 53,647.712 54,545.587 Jul 39.599,062 47,364.217 51,245,789 54,856,246 55,157.158 Aug 39,698,729 48.589,976 49,811,932 53,669,909 50,452.347 Sep 41,571,241 47.971,087 45,613,903 53,940,397 52,949.925 Oct 42,175,102 50,203.069 54,727,146 60,091,139 56,598,568 Nov 41,696,109 50,221.940 55,091,196 59,138,602 52,162,460 Dec 41,955,531 5h328.364 55,578,862 61,931,025 63,920.689
Total
O t h e r I t a l i an z/ Pounds
5,446,941 3,544,867 3,560,862 3,757,107 3.876.454 5,214,083 3,262,981 3,162,066 3,381,294 2,860,820 6,355,265 4,141,525 3,572,255 3,923,768 3,870,745 5,288,253 4,013,037 4,415,169 3,539,330 3,879,642 5,171,833 3.990,178 3.741,010 3,795,043 3,250.031 4,194,290 4.004,060 3,169,984 3,806,415 3.663.035 3,694,065 4,072,661 2,878,706 3,817,444 3.485.991 4,124,973 3,796,350 3,188,135 3,809,630 3.849.058 4,479,246 4,140.402 3,265,218 4,193,831 4.672.059 4,151,329 4,098,465 4,460,834 3,938,682 4.111,195 4,268,396 5,211,834 4,282,671 3,872,726 4.191.883 4,600,844 4,244,618 4,514,920 3,442,732 3.589.843
497,486,943 576,209,885 612.054,693 655,832,474 678.415,695 56,989.518 48,520,978 44,211,830 45,278,002 45,300.756
H i s p a n i c Pounds
Jan 3,371,746 3,421.092 3,709,771 4,098,534 4,714,498 Feb 3,403,023 4,052.615 3,905,703 4,324,059 5,102,232 Mar 4,126,593 3.927,283 4,706,417 5.470.845 5,866,947 Apr 4,219,087 3.865.593 4,635,392 4.829,826 5,300,837 May 4,268,720 3,884.062 3,933,360 4,852,365 5,530,841 Jun 3,261,840 3.441.768 3,864,037 5,070.474 5,458,696 Jul 3,994,847 3,873.449 4,724,960 4,798.571 6,046,856 Aug 3,633,961 4,139.860 3,844,850 5.014.109 5,804,954 Sep 3,558,952 3.996.370 4,177,862 5.445.729 5,500.473 Oct 4,059,723 4.043,179 4,337,309 5,111.865 5,473.773 Nov 3,439.599 3,406.423 4,357,349 4.908,510 5,181,878 Dec 3,606,240 3.863.494 4,115,647 4.461.775 5,270,482 Total 50,312,657 58,386,662 65,252,467
O t h e r Cheese ':~: Pounds
3,246,310 2,115,570 2,510,715 3,069,573 3.383,042 3,082.793 2,171,773 2,820,654 3,447,510 2.903,188 3,438,710 2.048,616 2,719,853 4,466,168 4,500.982 3,465,278 2,034,819 2,545,060 3,430,752 3,735,447 3,475,488 2,025,334 3,041,744 3,980,310 4,030,076 3,716,109 2.595,340 3,750,296 4,620,153 4,003,898 2,917,748 2,000,423 3,306,854 4,019,698 3,537,101 2,037,010 1,990,938 4,653,612 4,406,157 4,575,182 2,699,131 2,095,787 5,705,713 4,962,176 5,351,640 3,053,313 2,692,276 4,511,800 3,938,938 5,294,757 3,159,471 2,991,638 4,911,849 3,821,657 4,259,897 3,121,611 2,142,652 4,133,614 3,571,084 3,772,737
44,944,331 45,915,188 37,412,972 26,905,166 44,611,764 47.734,176 49,347,947
To ta l Cheese Pounds
Jan 85,095,300 91,690.809 97,850,994 I 10,984.928 120,267,133 Feb 84,394,264 92,084,888 99,669,062 105,396.406 112.314,038 Mar 83,953,953 97,349.841 105,430,500 120.903,755 122,657,892 Apr 81,184,657 94,712.443 102,614,983 116.371,674 124,190,838 May 93,933,067 99,695,344 110,383,199 115,592.969 126,132,238 Jun 85,698,575 96,090,123 101,857,876 112.403,61 I 121,219,267 Jut 85.413.151 100,710,918 99,850,974 121.575.291 130.500 39q Aug 87,550.580 98.628,573 100,721,560 121,501.241 125,326,843 Sep 86,451,946 98,269,488 96,922,670 I 17,254,917 123,001,940 Oct 88,338.614 99.972.678 109,890,504 120.383.975 131,035,093 Nov 92,585,189 100,890,965 113,941,144 117,774.056 125,237,917 Dec 93.148,584 103,288,235 115,662,694 124,137,122 134,769,314 Total 1,047.747,880 1,173,384,305 1,254,796,160 !,404,279,945 1,496,652,912
Figures for 1998 I')ave been revised. 7 Other italian includes ncotta, provolone, mascarpone and cacavallo cheeses. 3 Other cheese ~nclucles breakfast, brie, camembert, cream cheese, clelicat baby Swwss, feta. rontina, fontinella, gouda. Mavarti, kelir, muenster, organic cheese, processecl
cheese, Portuguese. romano, schloss. St. Jorge. SwJss, and teleme.
25
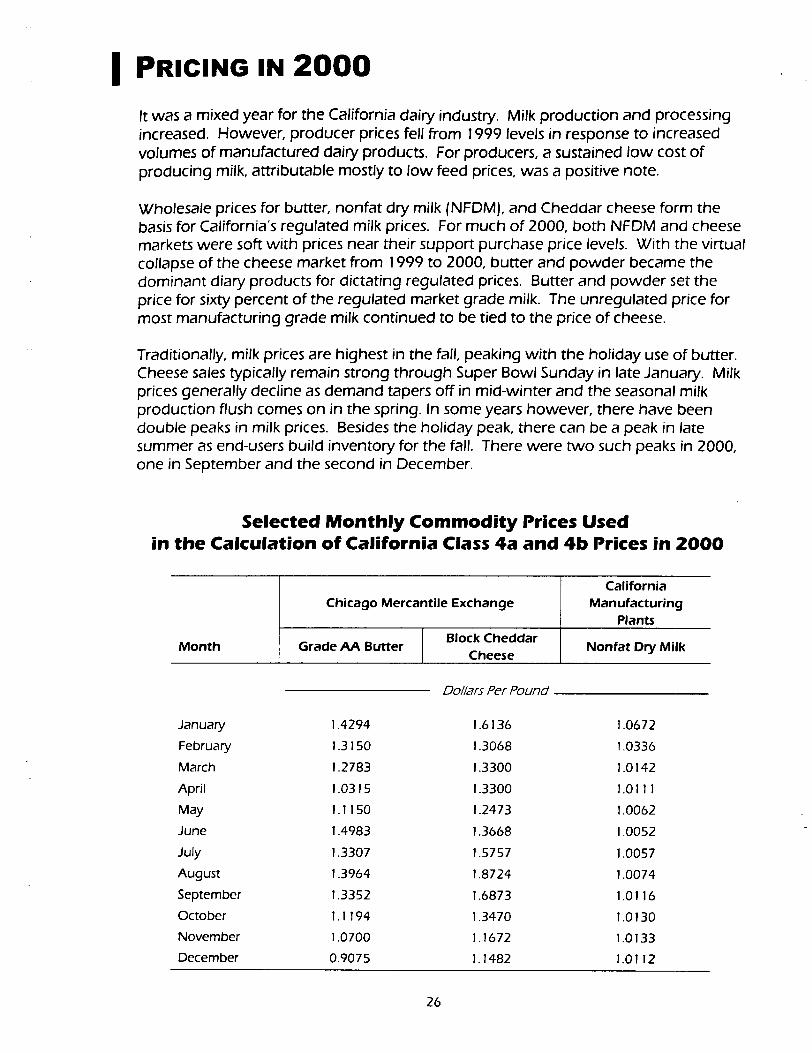
I PRiCINO IN 2 0 0 0 It was a mixed year for the California dairy industry. Milk production and processing increased. However, producer prices fell from 1999 levels in response to increased volumes of manufactured dairy products. For producers, a sustained low cost of producing milk, attributable mostly to low feed prices, was a positive note.
Wholesale prices for butter, nonfat dry milk (NFDM), and Cheddar cheese form the basis for California's regulated milk prices. For much of 2000, both NFDM and cheese markets were soft wi th prices near their support purchase price levels. With the virtual collapse of the cheese market from 1999 to 2000, butter and powder became the dominant diary products for dictating regulated prices. Butter and powder set the price for sixty percent of the regulated market grade milk. The unregulated price for most manufacturing grade milk continued to be tied to the price of cheese.
Traditionally, milk prices are highest in the fall, peaking with the holiday use of butter. Cheese sales typically remain strong through Super Bowl Sunday in late January. Milk prices generally decline as demand tapers off in mid-winter and the seasonal milk production flush comes on in the spring. In some years however, there have been double peaks in milk prices. Besides the holiday peak, there can be a peak in late summer as end-users build inventory for the fall. There were two such peaks in 2000, one in September and the second in December.
Selected Month ly Commodi ty Prices Used in the Calculation of California Class 4a and 4b Prices in 2 0 0 0
California Chicago Mercantile Exchange Manufacturing
Plants Block Cheddar
Month Grade AA Butter Cheese Nonfat Dry Milk
Dollars Per Pound
January 1.4294 ! .6 ! 36
February 1.3150 1.3068
March 1.2783 1.3300
April !.0315 1.3300
May 1.1150 1.2473
June 1.4983 1.3668
July 1.3307 1.5757
August 1.3964 1.8724
September 1.3352 1.6873
October I. 1194 1.3470 November 1.0700 I. 1672
December 0.9075 I. 1482
.0672
.0336
.0142
.0111
.0062
.0052
.0057
!.0074
1.0116
1.0130
1.0133 1.0112
26
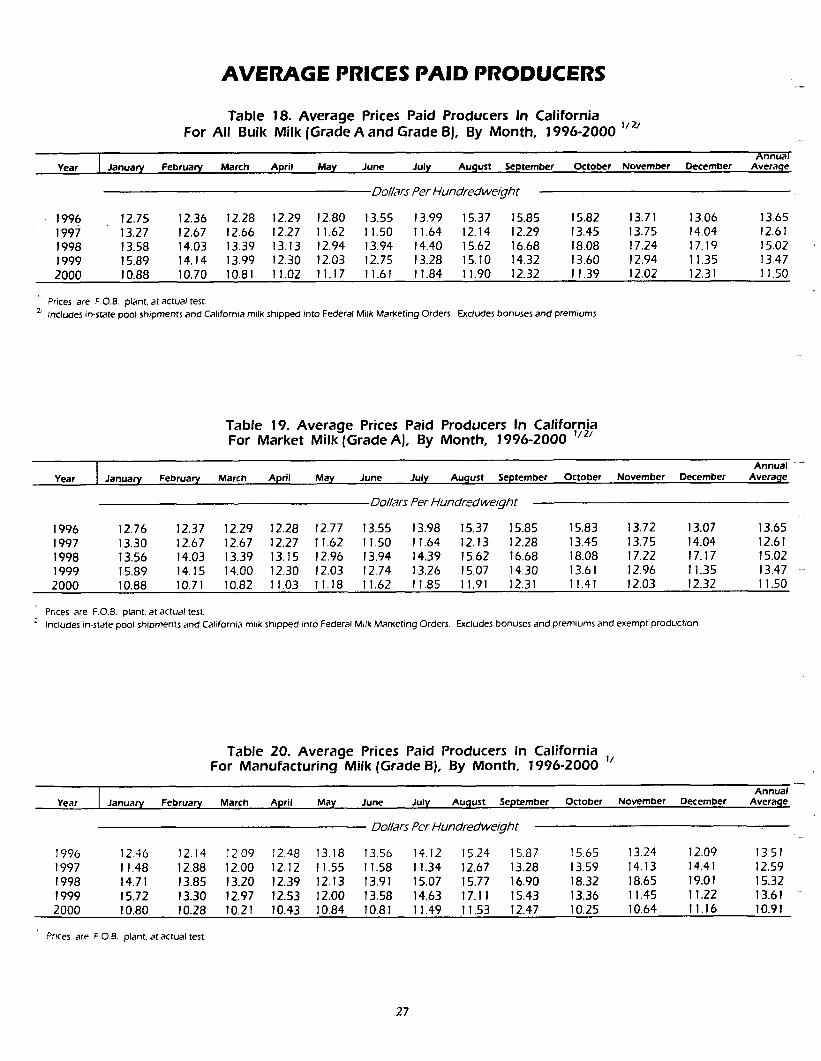
A V E R A G E PRICES PAID PRODUCERS
Table 18. Average Prices Paid Producers In California For All Bulk Milk (GradeA and Grade B), By Month, 1996-2000 i/2/
Year I January February March April May June July Annual
Auqust September October November December Average
.Dollars Per Hundredwe/~Tht
1996 12.75 1997 13.27 1998 13.58 1999 15.89 2000 10.88
12.36 12.28 12.29 12.80 13.55 12,67 12.66 12,27 11.62 11.50 14,03 13.39 13.13 12.94 13.94 14.14 13,99 12,30 12.03 12.75 10.70 10.81 11.02 11.17 11.61
13,99 15.37 15.85 15.82 13.71 13.06 11.64 12.14 12.29 13.45 13.75 14.04 14,40 15.62 16.68 18.08 17.24 17,19 13.28 15.10 14.32 13.60 12.94 11.35 11.84 11.90 12.32 11.39 12.02 12.31
13.65 12.61 15.02 13,47 11.50
Prices are F.O.B. plant, at actual test. Includes in-state pool shipments and California milk shipped into Federal Milk Marketing Orders. Excludes bonuses and premiums.
Table 19. Average Prices Paid Producers In California For Market Milk (GradeA), By Month, 1996-2000 T/2/
Year I January February March
1996 12.76 1997 13.30 1998 13.56 1999 15.89 2000 10.88
April May June July August September October November December
Dollars Per Hundredweight
12.37 12.29 12.28 12.77 13 .55 13.98 15.37 15.85 15.83 13.72 13.07 12.67 12.67 12.27 11.62 11 .50 11 .64 12.13 12.28 13.45 13.75 14.04 14.03 13.39 13.15 12.96 13 ,94 14 .39 15 .62 16.68 18.08 17.22 17.17 14,15 14.00 12.30 12,03 12 .74 13.26 15.07 14.30 13.61 12.96 11.35 10.71 10.82 11.03 11,18 11 ,62 11.85 11,91 12.31 11.41 12.03 12.32
Annual - - Average
13.65 12.61 15.02 13.47 .... 11.50
Prices are F.O.B. plant, at actual test. 2 Includes in-state pool shipments and California milk shipped into Federal Milk Marketing Orders. Excludes bonuses and premiums and exempt production.
Table 20. Average Prices Paid Producers In California For Manufacturing Milk (Grade B), By Month, 1996-2000 1/
Annual Year January February March April May June July Aucjust September October November December
Dollars Per Hundredwe/ght
I996 12.46 12,14 12.09 12.48 13.18 13 .56 14.12 15,24 15.87 15.65 13.24 12.09 1997 11.48 12.88 12.00 12.12 11.55 11 .58 11.34 12.67 13.28 13.59 14.13 14.41 1998 14.71 13.85 13.20 12.39 12.13 13.91 15 .07 15.77 16.90 18.32 18.65 19.01 1999 15.72 13.30 12.97 12.53 12.00 13.58 14.63 17.11 15.43 13.36 11.45 11.22 2000 10.80 10.28 10.21 10.43 10.84 10.81 11 .49 11.53 12.47 10.25 10.64 11.16
Average
13.51 12.59 15.32 13.61 " 10.91
Prices are F O.B. plant, at actual test.
27
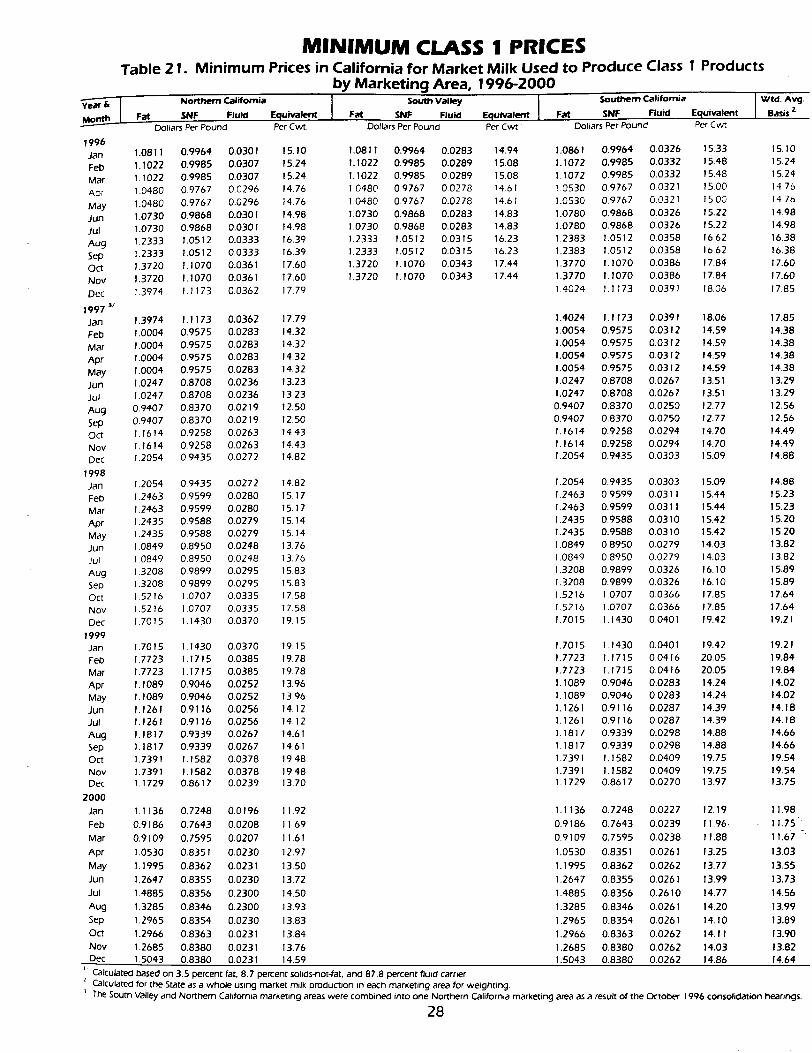
M I N I M U M CLASS 1 PRICES Table 21. Min imum Prices in California for Market Milk Used to Produce Class 1 Products
by Marketing Area, 1996-2000
1996 Jan Feb Mar ~Dr
May Jun Jul Aug Sep Oct Nov Dec
1997 3/ Jan Feb Mar Apr May Jun Jul Aug Sep Oct Nov Dec
1998 Jan Feb Mar Apr May Jun Jul Aug Sep Oct Nov Dec
1999 Jan Feb Mar Apr May Jun Jul Aug Sep Oct Nov Dec
2000 Jan Feb Mar Apr May Jun Jul Aug Sep Oct Nov Dec
Northern Califomia I South Valley
Fat SNF Fluid Equivalent I Fat SNF Fluid Equivalent Fat Dollars Per Pound Per Cwt Dollars Per Pound Per Cwt
Southern California Wtd. Avg. $NF Fluid Equivalent Basis ~
Dollars Per Pound Per Cw~
1.0811 0.9964 0.0301 15.10 1.0811 0.9964 0.0283 14.94 1.0861 0,9964 0.0326 15.33 1.1022 0.9985 0,0307 15.24 1.1022 0,9985 0.0289 15.08 1.1072 0,9985 0.0332 15.48 1.1022 0.9985 0.0307 15.24 1.1022 0.9985 0.0289 15.08 1.1072 0.9985 0.0332 15.48 1.0480 09767 0.0296 14.76 1.0480 0.9767 0.0278 14.61 1.0530 0.9767 0.0321 15.00 1.0480 0.9767 0.0296 14.76 1,0480 0.9767 0.0278 14.61 1.0530 0,9767 0.0321 15.00 1.0730 0.9868 0.0301 14.98 1.0730 0,9868 0.0283 14.83 1.0780 0.9868 0.0326 15.22 1.0730 0.9868 0.0301 14.98 1,0730 0.9868 0.0283 14.83 1.0780 0.9868 0,0326 15.22 1.2333 1 .0512 0.0333 16.39 1,2333 1.0512 0.0315 16.23 1.2383 1 ,0512 0.0358 16.62 1.2333 1 .0512 0.0333 16.39 1.2333 1.0512 0.0315 16.23 1.2383 1 ,0512 0.0358 16.62 1.3720 1 .1070 0.0361 17.60 1.3720 1 .1070 0.0343 17.44 1.3770 1 .1070 0.0386 17,84 1.3720 1 ,1070 0.0361 17.60 1.3720 1 .1070 0.0343 17.44 1.3770 1 .1070 0.0386 17,84 1,3974 1 .1173 0,0362 17.79 1.4024 1 .1173 0,0391 18.06
15.10 15,24 15.24 1476 14 7b 14,98 14.98 16.38 16.38 17.60 17.60 17.85
1.3974 1 .1173 0.0362 17.79 1.4024 1.1173 0.0391 18.06 1.0004 0.9575 0.0283 14.32 1.0054 0,9575 0.0312 14.59 1.0004 0.9575 0.0283 14.32 1.0054 0.9575 0.0312 14.59 1,0004 0,9575 0.0283 14.32 1.0054 0.9575 0.0312 14.59 1.0004 0.9575 0.0283 14.32 1.0054 0.9575 0.0312 14.59 1.0247 0,8708 0.0236 13.23 1.0247 0.8708 0.0267 13.51 1.0247 0.8708 0.0236 13.23 1.0247 0.8708 0.0267 13.51 0.9407 0.8370 0.0219 12.50 0.9407 0.8370 0.0250 12.77 0.9407 0.8370 0.0219 12.50 0.9407 0.8370 0.0250 12.77 1.1614 0.9258 0.0263 14.43 1.1614 0.9258 0.0294 14.70 1.1614 0.9258 0.0263 14.43 1.1614 0.9258 0.0294 14.70 1.2054 0.9435 0.0272 14.82 1.2054 0.9435 0.030,3 15.09
17.85 14.38 14.38 14.38 14.38 13.29 13.29 12.56 12.56 14.49 14.49 14.88
1.2054 0.9435 0.0272 14.82 1.2054 0.9435 0.030.3 15.09 1.2463 0.9599 0,0280 15,17 1.2463 0,9599 0.0311 15.44 1.2463 0.9599 0.0280 15.17 1,2463 0.9599 0.0311 15.44 1.2435 0.9588 0.0279 15.14 1.2435 0.9588 0.0310 15.42 1.2435 0.9588 0.0279 15.14 1.2435 0.9588 0.0310 15.42 1.0849 0.8950 0.0248 13.76 1.0849 0.8950 0.0279 14.03 1.0849 0.8950 0,0248 13.76 1,0849 0,8950 0.0279 14,03 1.3208 0.9899 0.0295 15.83 1.3208 0.9899 0.0326 16.10 1.3208 0.9899 0.0295 15.83 1.3208 0.9899 0.0326 16,10 1.5216 1 .0707 0.0335 17.58 1.5216 1 .0707 0.0366 17.85 1.5216 1 .0707 0.0335 17.58 1.5216 1 .0707 0.0366 17.85 1.7015 1 .1430 0.0370 19.15 1.7015 1 .1430 0,0401 19.42
14.88 15.23 15.23 15.20 15,20 13.82 13.82 15.89 15.89 17.64 17.64 19.21
1.7015 1 .1430 0.0370 19.15 1.7015 1 .1430 0.0401 19,42 1.7723 1 .1715 0.0385 19.78 1.7723 1 .1715 0,0416 20.05 1.7723 1 .1715 0.0385 19.78 1.7723 1 .1715 0.0416 20.05 1.1089 0.9046 0.0252 13.96 1.1089 0.9046 0.0283 14.24 1.1089 0.9046 0.0252 13.96 1.1089 0.9046 0.0283 14.24 1.1261 0.9116 0.0256 14.12 1.1261 0.9116 0.0287 14.39 1.1261 0.9116 0.0256 14.12 1.1261 0.9116 0,0287 14.39 1.1817 0.9339 0.0267 14.61 1,1817 0.9339 0.0298 14.88 1.1817 0.9339 0.0267 14.61 1.1817 0.9339 0.0298 14.88 1.7391 1 .1582 0.0378 19.48 1.7391 1 .1582 0.0409 19.75 1.7391 1 .1582 0.0378 19.48 1.7391 1 .1582 0.0409 19.75 1.1729 0.8617 0.0239 13.70 1.1729 0,8617 0.0270 13.97
19.21 19,84 19.84 14,02 14.02 14.18 14.18 14.66 14.66 19.54 19.54 13.75
1.1136 0.7248 0.0196 11.92 1.1136 0.7248 0.0227 12.19 0.9186 0.7643 0.0208 11.69 0.9186 0.7643 0.0239 11.96- 0.9109 0.7595 0.0207 11.61 0.9109 0.7595 0.0238 11.88
1.0530 0 .8351 0.0230 12.97 1.0530 0 .8351 0.0261 13.25 1.1995 0.8362 0.0231 13.50 1.1995 0.8362 0.0262 13.77 1.2647 0.8355 0.0230 13.72 1.2647 0.8355 0.0261 13.99 1.4885 0.8356 0.2300 14.50 1.4885 0.8356 0.2610 14.77 1.3285 0.8346 0,2300 13.93 1.3285 0.8346 0.0261 14.20 1.2965 0.8354 0.0230 13.83 1.2965 0.8354 0.0261 14.10 1.2966 0.8363 0.0231 13.84 1.2966 0.8363 0.0262 14.11 1.2685 0.8380 0.0231 13.76 1.2685 0.8380 0.0262 14.03 1.5043 0.8380 0.0231 14.59 1.5043 0.8380 0.0262 14.86
11.98 11.75" 11.67 - 13.03 13.55 13.73 14.56 13,99 13,89 13.90 13.82 14.64
r Calculated based on 3.5 percent fat, 8.7 percent solids-not-fat, and 87.8 percent fluid carrie~ • Calculated for the State as a whole using market milk production in each marketing area for weighting. 3 The South Valley and Northern California marketing areas were combined into one Nortt'~ern California marketing area as
2 8
a result of the October 1996 consolidation hearings.
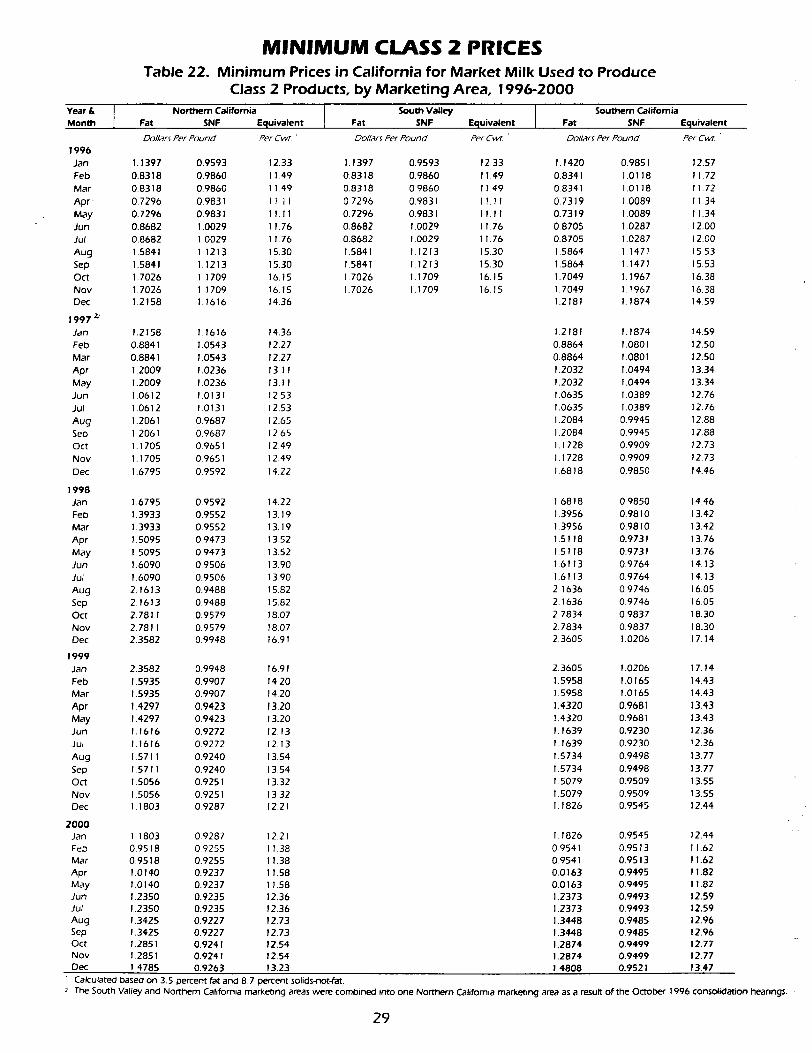
Year & Month
M I N I M U M CLASS 2 PRICES Table 22. Min imum Prices in California for Market Milk Used to Produce
Class 2 Products, by Market ing Area, 1996-2000 Northern California South Valley Southern California
Fat SNF Equivalent Fat SNF Equivalent Fat SNF Equivalent
Dol lars Per P o u n d Per C w t " Dol lar~ Per P o u n d Per CvvT ' Dol lars Per P o u n d Per C w t "
1996 Jan 1.1397 0.9593 12.33 Feb 0.8318 0.9860 11.49 Mar 0.8318 0.9860 11.49 Apr- 0.7296 0.9831 I1 11 May 0.7296 0,9831 11.11 Jun 0.8682 1.0029 11.76 Jul 0.8682 1.0029 11.76 Aug 1.5841 1.1213 15.30 Sep 1.5841 1.1213 15.30 Oct 1.7026 1.1709 16,15 Nov 1.7026 1.1709 16.15 Dec 1.2158 1.1616 14,36
1997 ~ Jan 1.2158 1.1616 14.36 Feb 0.8841 1.0543 12.27 Mar 0.8841 1.0543 12.27 Apr 12009 1.0236 13.11 May 1.2009 1.0236 13.11 Jun 1.0612 1.0131 12.53 Jul 1.0612 1.0131 12.53 Aug 1.2061 0.9687 12.65 Sep 1.2061 0.9687 12.65 Oct 1.1705 0.9651 12.49 Nov 1.1705 0.9651 12.49
Dec 1.6795 0.9592 14.22
1998 Jan 1.6795 0.9592 14.22 Feb 1.3933 0.9552 13.19 Mar 1.3933 0.9552 13.19 Apr 1,5095 0.9473 13.52 May 1.5095 0.9473 13.52 Jun 1.6090 0.9506 13.90 Jul 1.6090 0.9506 13.90 Aug 2.1613 0.9488 15,82 Sep 2.1613 0.9488 15,82 Oct 2.7811 0.9579 18.07 Nov 2.7811 0.9579 18.07 Dec 2.3582 0.9948 16.91
1999 Jan 2.3582 0.9948 16.91 Feb 1.5935 0.9907 14.20 Mar 1.5935 0.9907 14.20 Apr 1.4297 0.9423 13,20 May 1.4297 0.9423 13.20 Jun 1.1616 0.9272 12,13 Jul 1.1616 0,9272 12.13 Aug 1.5711 0.9240 13.54 Sep 1.5711 0.9240 13.54 Oct 1.5056 0.9251 13.32 Nov 1,5056 0.9251 1332 Dec 1.1803 0.9287 12.21
2000 Jan 11803 0.9287 12.21 Feb 0.9518 09255 1138 Mar 0.9518 0.9255 11.38 Apr 1.0140 0.9237 11.58 May 1,0140 0.9237 11.58 Jun 1.2350 0.9235 12.36 Jul 1.2350 0.9235 12,36 Aug 1.3425 0.9227 12,73 Sep 1.3425 0.9227 12.73 Oct 1.2851 0.9241 12.54 Nov 1.2851 0.9241 12.54 Dec 1.4785 0,9263 13.23
1.1397 0.9593 12.33 1.1420 0.9851 12.57 0.8318 0.9860 11.49 0.8341 1.0118 11.72 0.8318 0 9860 11.49 08341 1.0118 11.72 07296 0.9831 11.11 0.7319 1.0089 11.34 0.7296 0.9831 I1.11 0.7319 1.0089 11.34 0.8682 1,0029 11.76 0.8705 1.0287 12.00 0.8682 1.0029 11.76 0.8705 1.0287 12.00 1.5841 1,1213 15.30 1.5864 1.1471 15.53 1,5841 1.1213 15.30 1.5864 1.1471 15.53 1.7026 1.1709 16.15 1.7049 1.1967 16.38 1.7026 1.1709 16.15 1.7049 1.1967 16.38
1.2181 1.1874 14.59
1.2181 1.1874 14.59 0,8864 1.0801 12.50 0.8864 1.0801 12.50 1.2032 1.0494 13.34 1.2032 1.0494 13.34 1.0635 1.0389 12.76 1.0635 1.0389 12.76 1.2084 0.9945 12.88 1.2084 0.9945 12.88 1.1728 0.9909 12.73 1.1728 0.9909 12.73
16818 0.9850 14.46
1.6818 0.9850 14.46 1.3956 0.9810 13.42 1.3956 0.9810 13.42 1.5118 0.9731 13.76 1.5118 0.9731 13.76 1.6113 0,9764 14.13 1.6113 0,9764 14.13 2.1636 0.9746 16.05 2.1636 0,9746 16.05 2.7834 0.9837 18.30 2,7834 0.9837 18.30 2.3605 1.0206 17.14
2.3605 1.0206 17.14 1.5958 1.0165 14.43 1.5958 1.0165 14.43 1.4320 0.9681 13.43 1.4320 0.9681 13.43 1.1639 0.9230 12.36 1.1639 0.9230 12.36 1.5734 0.9498 13.77 1.5734 0.9498 13.77 1.5079 0.9509 13.55 1.5079 0.9509 13.55 1.1826 0.9545 12.44
1.1826 0.9545 12.44 0.9541 0.9513 11.62 0.9541 0.9513 11.62 0.0163 0.9495 11.82 0.0163 0.9495 11.82 1.2373 0.9493 12.59 1.2373 0.9493 12.59 1.3448 0.9485 12.96 1.3448 0.9485 12.96 1.2874 0.9499 12,77 1.2874 0.9499 12.77 1.4808 0.9521 13,47
' Calculate0 based on 35 percent fat and 8.7 percent solids-not-fat. 2 The South Valley and Nortt~em Cahfornia marketing areas were combined into one Northern California markeOng area as a result of the October 1996
29
consolidation hearings. ~
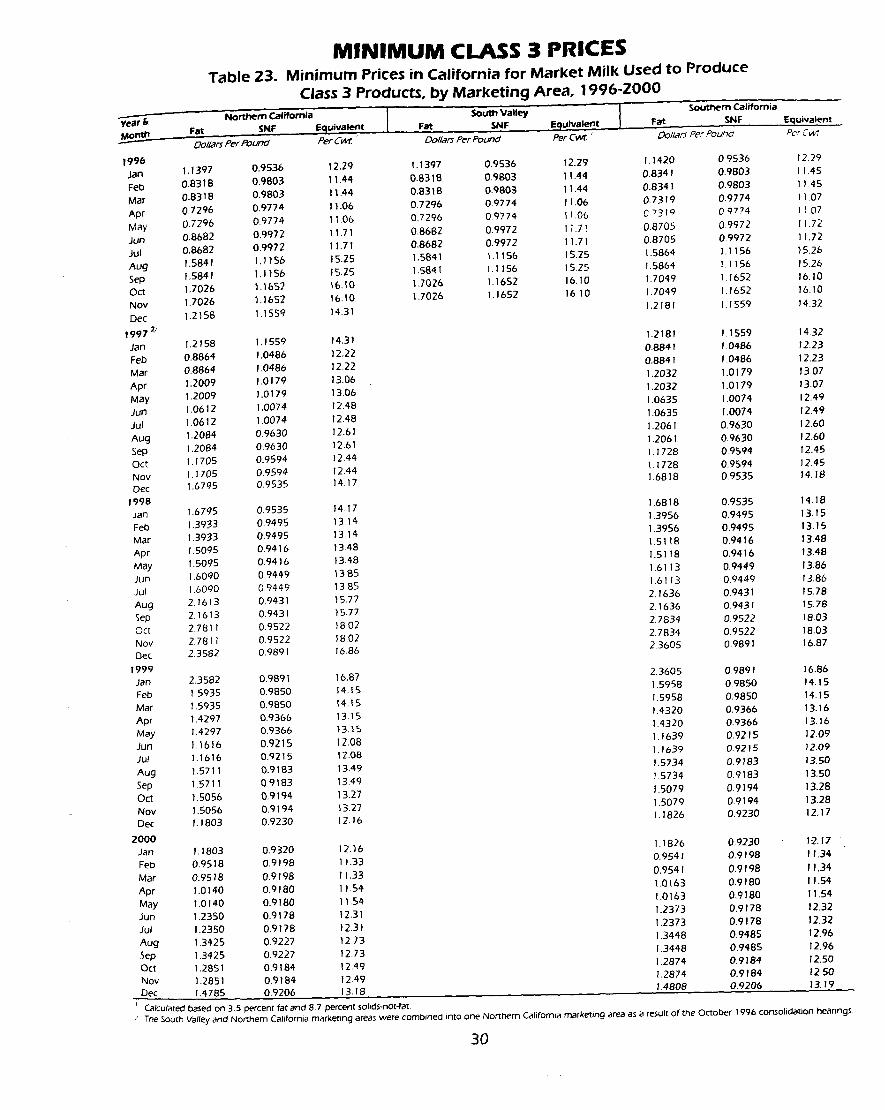
" ~ &
1996 Jan Feb Mar Apr May Jun Jul Aug Sep Oct Nov Dec
1997 2/ Jan Feb Mar Apr May Jun Jul Aug Sep Oct Nov Dec
1998 ./an Feb Mar Apr May Jun Jul Aug Sep Oct Nov Dec
1999 Jan Feb Mar Apr May Jun Jul Aug Sep Oct Nov Dec
2000 Jan Feb Mar Apr May Jun Jul Aug Sep Oct Nov Dec
Table 23,
M I N I M U M CLASS 3 PRICES Minimum Prices in California for Market Milk Used to Produce
Class 3 Products, by Marketing Area, 1996-2000 Northern California ] ' -" S°ut~ V~'l='~ I .~outl"tem California
Fat SNF Equivaleflt Fat ,,, $NF Equivalent Fat $NF ,, Equiva!ent .,. OO/latS Per Pour~ Per Cw£ ' Dollars Per Pound Per C~" ' r ~ l l a l ~ Per Pound Per C Wt
1.1397 0.9536 12.29 1.1397 0,9536 12.29 1.1420 0.9536 12,29 0.8318 0.9803 11.44 0.8318 0.9803 11.44 0.8341 0.9803 11,45 0.8318 0.9803 11.44 0,8318 0.9803 11.44 0.8341 0.9803 11.45 0.7296 0.9774 11.06 0.7296 0.9774 11.06 0.7319 0,9774 11.07 0.7296 0.9774 11.06 0.7296 0.9774 11.06 0731Q 0 9774 I ! 07 0.8682 0.9972 11.71 0.8682 0.9972 11.71 0.8705 09972 11.72 0.8682 0.9972 11.71 0.8682 0.9972 11.71 0.8705 0.9972 11,72 1.5841 1.1156 15.25 1.5841 1,1156 15.25 1.5864 1,1156 15.26 1,5841 1.1156 I5.25 1,5841 1.1156 15.25 1.5864 1.1156 15.26 1,7026 1.1652 16.I0 1,7026 1.1652 16.10 1.7049 1.1652 16. I0 1.7026 1.1652 16.10 1,7026 1.1652 16.10 1.7049 1.1652 16.10 1.2156 1.1559 14.31 1.2181 1.1559 14.32
1.2158 1.1559 14.31 1.2181 1.1559 14.32 P.8864 1.0486 12.22 0.8841 1.0486 12.23 L8864 1.0486 12.22 0.8841 1.0486 12.23 .2009 1.0179 13.06 1.2032 1.0179 13.07 .2009 1.0179 13.06 1.2032 1.0179 13.07 .0612 1.0074 12.48 1.0635 1.0074 12.49 .0612 1.0074 12.48 1.0635 1.0074 12.49 .2084 0.9630 12.61 1,2061 0.9630 12.60 .2064 0.9630 12.61 1.2061 0.9630 12.60 .1705 0.9594 12.44 1.1728 0.9594 12.45 .1705 0.9594 12.44 1.1728 0.9594 12.45 .6795 0.9535 14.17 1.6818 0.9535 14.18
1.6795 0.9535 14.17 1,6818 0.9535 14.18 1.3933 0.9495 13.14 1,3956 0.9495 13.15 1.3933 0.9495 13.14 1.3956 0.9495 13.15 1,5095 0.9416 13.48 1.5118 0.9416 13.48 1,5095 0.9416 13.48 1.5118 0.9416 13.48 1.6090 0.9449 13.85 1.6113 0,9449 13.86 1.6090 0.9449 13.85 1.6113 0,9449 13.86 2.1613 0.9431 15.77 2,1636 0.9431 15.78 2.1613 0.9431 15.77 2.1636 0.9431 15.78 2.7811 0.9522 18.02 2.7834 0.9522 18.03 2.7811 0.9522 I8.02 2.7834 0.9522 18.03 2.3552 0.9891 16.86 2.3605 0.9891 16.87
2.3582 0.9891 16.87 2.3605 0.9891 16.86 1.5935 0.9850 14.15 1.5958 0.9850 14.15 1.5935 0.9850 14.15 1.5958 0.9850 14.15 1.4297 0.9366 13.15 1.4320 0.9366 13.16 1.4297 0.9366 13.15 1.4320 0.9366 13.16 1.1616 0.9215 12.08 1.1639 0.9215 12,09 1.1616 0.9215 12.08 1.1639 0.9215 12,09 1.5711 0.9183 13.49 1.5734 0.9183 13,50 1.5711 0,9183 13.49 1.5734 0.9183 13,50 1.5056 0.9194 13.27 1.5079 0.9194 13.28 1.5056 0,9194 13.27 1.5079 0.9194 13,28 1.1803 0,9230 12.16 1.1826 0.9230 12.17
1.1803 0.9320 12.16 1.1826 0,9230 12.17 0.9518 0,9198 11.33 0.9541 0.9198 11,34
0.9518 0.9198 11.33 0.9541 0.9198 11.34 1.0140 0.9180 11.54 1.0163 0.9180 11.54 1.0140 0.9180 11.54 1,0163 0,9180 11.54 1.2350 0.9178 12.31 1.2373 0.9178 12.32 1.2350 0.9178 12.31 1.2373 0.9178 12.32 1.3425 0.9227 12.73 1.3448 0.9485 12.96 1.3425 0.9227 12.73 1.3448 0.9485 12,96 1.2851 0.9184 12.49 1,2874 0.9184 12.50 1.2851 0.9184 12.49 1,2874 0.9184 12.50
1.4808 0.9206 13.19 1.4785 0.9206 13.18
Calculated based on 3.5 percen~ fat anti 8.7 percent solids-not-fat. 2 Tile South Valley and Northern California marketing areas were combined into one Northern California marketing area as a result of the October 1996 consolidation hearings.
30
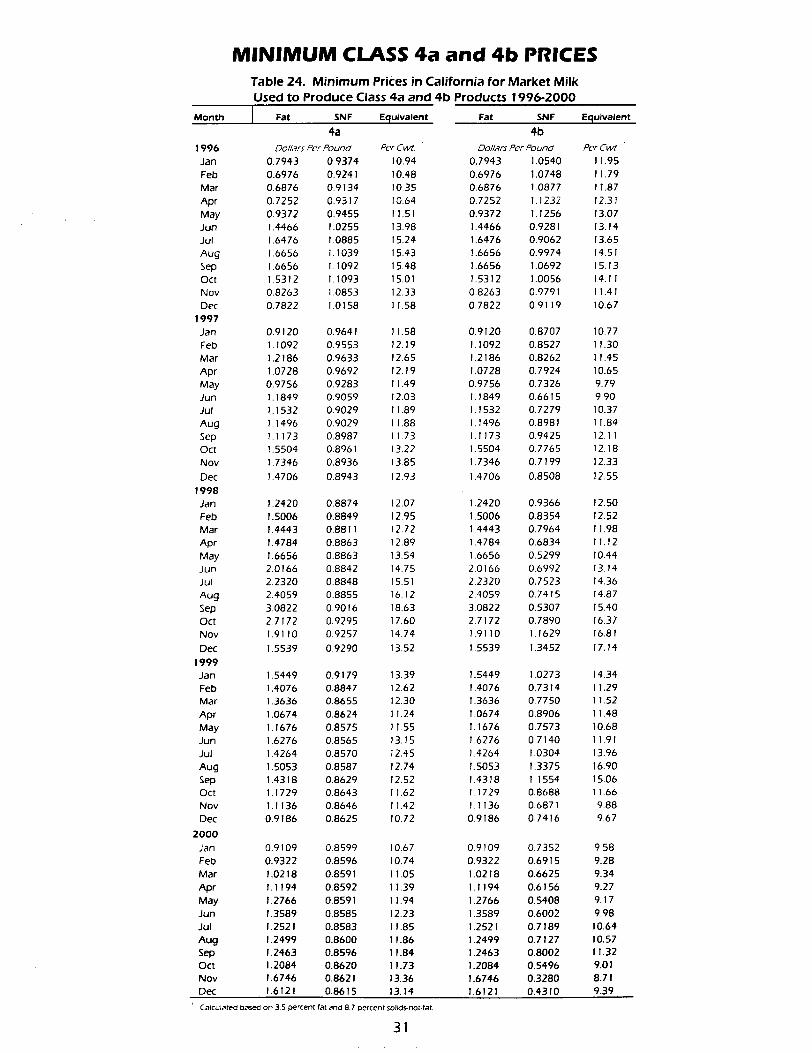
M I N I M U M CLASS 4a a n d 4b PRICES Table 24. Minimum Prices in California for Market Milk Used to Produce Class 4a a n d 4 b Products 1 9 9 6 - 2 0 0 0
Month I Fat SNF Equivalent Fat SNF Equivalent
1996 Jan 0.7943 0,9374 10.94 Feb 0.6976 0.9241 10.48 Mar 0.6876 0.9134 10.35 Apr 0.7252 0.9317 10.64 May 0.9372 0.9455 11.51 Jun 1.4466 1.0255 13,98 Jul 1,6476 1.0885 15.24 Aug 1,6656 1.1039 15.43 Sep 1.6656 1.1092 15,48 Oct 1,5312 1.1093 15.01 Nov 0.8263 1,0853 12,33 Dec 0.7822 1.0158 11.58
1997 Jan 0.9120 0.9641 11.58 Feb 1.1092 0.9553 12.19 Mar 1.2186 0.9633 12.65 Apr 1.0728 0.9692 12.19 May 0.9756 0.9283 11.49 Jun 1.1849 0.9059 12.03 Jul 1.1532 0.9029 11,89 Aug 1.1496 0.9029 11.88 Sep 1.1173 0.8987 t l .73 Oct 1.5504 0.8961 13.22 Nov 1.7346 0.8936 13.85
Dec 1.4706 0.8943 12.93 1998 Jan 1.2420 0.8874 12.07 Feb 1.5006 0.8849 12.95 Mar 1.4443 0.8811 12.72 Apr 1.4784 0.8863 12.89 May 1.6656 0.8863 13.54 Jun 2.0166 0.8842 14.75 Jul 2.2320 0.8848 IS.51 Aug 2,4059 0.8855 16.12 Sep 3.0822 0.9016 18.63 Oct 2,7172 0.9295 17.60 Nov 1.9110 0,9257 14.74
Dec 1.5539 0,9290 13,52 1999 Jan 1.5449 0.9179 13,39 Feb 1,4076 0.8847 12.62 Mar 1.3636 0.8655 12.30 Apr 1.0674 0.8624 11.24 May 1.1676 0.8575 11.55 Jun 1.6276 0.8565 13.15 Jul 1.4264 0.8570 12.45 Aug 1.5053 0.8587 12.74 Sep 1.4318 0.8629 12.52 Oct 1.1729 0.8643 11.62 Nov 1.1136 0.8646 11.42 Dec 0.9186 0.8625 10.72
2000 Jan 0.9109 0.8599 10.67 Feb 0.9322 0.8596 10.74 Mar 1.0218 0.8591 11.05 Apr 1.1194 0.8592 11.39 May 1.2766 0.8591 11.94 Jun 1.3589 0.8585 12.23 Jul 1.2521 0.8583 11.85 Aug 1.2499 0.8600 11.86 Sep 1.2463 0.8596 11.84 O ~ 1.2084 0.8620 11.73 Nov 1.6746 0.8621 13.36 Dec 1.6121 0,8615 13,14
4a 4b DollarsPerPound PerCw~ DollarsPerPound Per Cv~
0.7943 1.0540 11,95 0.6976 1.0748 11.79 0.6876 1.0877 11.87 0.7252 1.1232 12.31 0.9372 1.1256 13.07 1,4466 0.9281 13.14 1.6476 0.9062 13.65 1.6656 0.9974 14.51 1.6656 1.0692 15.13 1.5312 1.0056 14,11 0.8263 0.9791 11.41 0,7822 0.9119 10.67
0.9120 1.1092 1.2186 1.0728 0,9756
.1849
.1532
.1496
.1173
.5504
.7346
.4706
0.8707 10.77 0.8527 11.30 0.8262 11.45 0.7924 10.65 0.7326 9.79 0.6615 9.90 0.7279 10.37 0,8981 11.84 0.9425 12,11 0.7765 12.18 0.7199 12.33
0.8508 12.55
1.2420 0,9366 12.50 1.5006 0.8354 12.52 1.4443 0.7964 11.98 1.4784 0.6834 11.12 1,6656 0.5299 10.44 2.0166 0.6992 13.14 2.2320 0.7523 14.36 2.4059 0.7415 14.87 3,0822 0.5307 15.40 2.7172 0.7890 16.37 1.9110 1.1629 16.81
1.5539 1.3452 17.14
1.5449 1.0273 14.34 1.4076 0.7314 11.29 1.3636 0,7750 11.52 1.0674 0.8906 11.48 1.1676 0.7573 10.68 1.6276 0.7140 11.91 1.4264 1,0304 13.96 1.5053 1.3375 16.90 1.4318 1.1554 15.06 1,1729 0.8688 11.66 1,1136 0,6871 9.88 0.9186 0.7416 9.67
0.9109 0.7352 9.58 0,9322 0.6915 9,28 1.0218 0.6625 9.34 1.1194 0,6156 9.27 1.2766 0.5408 9.17 1.3589 0.6002 9.98 1.2521 0.7189 10.64 1.2499 0.7127 10,57 1.2463 0.8002 11.32 1.2084 0.5496 9.01 1.6746 0.3280 8.71 1.6121 0.4310 9.39
Calculated based on 3.5 percent fat anti 8.7 percent sohds-not-fa[
31
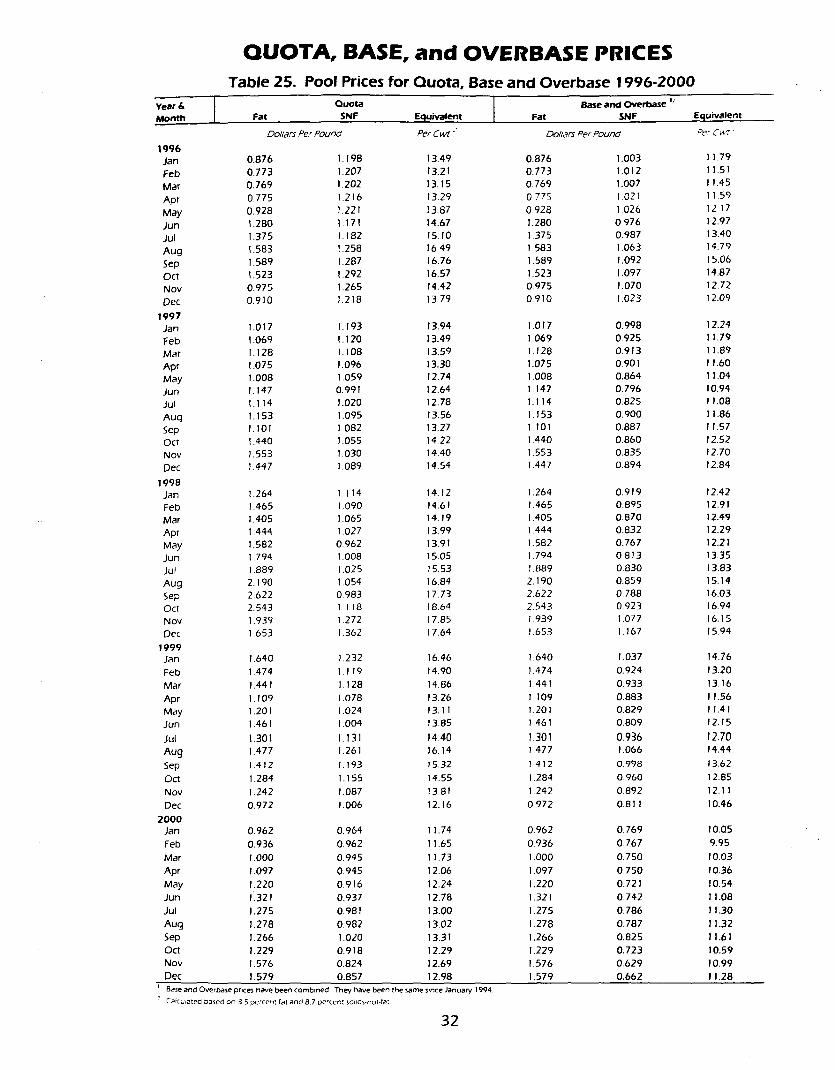
- I Year & Month
QUOTA, BASE, and OVERBASE PRICES Table 25. Pool Prices for Quota, Base and Overbase 1996-2000
Quota l Base and Overbase ~/ Fat SNF Equivalent / Fat SNF Equivalent
Dollars Per Pound Per Cwt " Dollars Per Poun~ ~c" C ~ "
1996 Jan 0.876 I. 198 13.49 0.876 1.003 I 1.79 Feb 0.773 1.207 13.21 0.773 1.012 11.51 Mar 0.769 1.202 13.15 0.769 1.007 11.45 Apr 0.775 1.216 I3.29 0.775 1.021 11.59 May 0.928 1.221 t 3.87 0928 1.026 12 17 Jun 1.280 1.171 14.67 1.280 0976 12.97 Jul 1.375 1.182 15.10 1.375 0.987 13.40 Aug 1.583 1.258 16.49 1.583 1.063 14.79 Sep 1.589 1.287 16.76 1.589 1.092 15.06 Oct 1.523 1,292 16.57 1.523 1.097 14.87 Nov 0.975 1.265 14.42 0.975 1.070 12.72 Dec 0.910 1.218 13.79 0.9 I0 1.023 12.09
1997 Jan 1.017 I. 193 13.94 1.017 0.998 12.24 Feb 1.069 I. 120 13.49 1,069 0.925 1 1.79 Mar I. 128 I, 108 13.59 1,128 0.913 11.89 Apt 1.075 1096 13.30 1.075 0.901 I 1.60 May 1.008 1.059 12.74 1.008 0.864 11.04 Jun 1.147 0.991 12.64 1.147 0.796 10.94 Jul 1.114 1.020 12.78 1. I 14 0.825 11.08 Aug I. 153 1.095 13.56 1.153 0.900 I 1.86 Sep I. 101 1.082 13.27 1. I01 0.887 11.57 Oct 1.440 1.055 14.22 1.440 0860 12,52 Nov 1.553 1.030 14.40 1.553 0.835 12.70 Dec 1.447 1.089 14,54 1.447 0.894 12.84
1998 Jan 1,264 I, 114 14.12 1.264 0.919 12.42 Feb 1,465 1.090 14.61 1,465 0.895 12.91 Mar 1.405 1.065 14.19 1.405 0.870 12.49 Apt 1.444 1,027 13.99 1.444 0.832 12.29 May 1.582 0.962 13.91 I. 582 0.767 12.21 Jun 1,794 1.008 15.05 1,794 0.813 13.35 Jul 1.889 1.025 15.53 1.889 0.830 13.83 Aug 2,190 1.054 16.84 2,190 0.859 15.14 Sep 2.622 0.983 17.73 2.622 0.788 16.03 Oct 2.543 I. 118 18.64 2.543 0.923 16.94 Nov 1.939 1.272 17.85 1939 1.077 16.15 Dec 1.653 1.362 17.64 1.653 1.167 15,94
1999 Jan 1.640 1.232 16.46 1.640 1.037 14.76 Feb 1.474 1. 119 14.90 1.474 0.924 13.20 Mar 1.441 1,128 14.86 1.441 0,933 13.16 Apr 1.109 1.078 13.26 1.109 0.883 11.56 May 1.201 1.024 13.11 1.201 0.829 I 1.4 I Jun 1.461 1.004 13.85 1.461 0.809 12.15
Jul 1.301 1.131 14.40 1.301 0.936 12.70 Aug 1.477 1.261 16.14 1,477 1.066 14.44
Sep 1.412 1.193 15.32 1,412 0.998 13.62 Oct 1,284 I. 155 14.55 1.284 0.960 12,85 Nov 1.242 1.087 13.81 1.242 0892 12.11 Dec 0.972 1,006 12.16 0.972 0.811 10.46
2000 Jan 0.962 0.964 11.74 0.962 0.769 10,05 Feb 0.936 0.962 11.65 0.936 0.767 9.95 Mar 1.000 0,945 11.73 1.000 0.750 10.03 Apr 1.097 0.945 12.06 1.097 0.750 10.36 May 1.220 0.916 12.24 1.220 0.721 10.54 Jun 1.321 0.937 12.78 1,321 0.742 11.08 Jul 1.275 0.981 13.00 1.275 0.786 11.30 Aug 1,278 0.982 13.02 1.278 0.787 11.32 Sep 1,266 1.020 13.31 1.266 0.825 11.61 Oct 1.229 0.918 12.29 1.229 0.723 10.59 Nov 1.576 0.824 12.69 1.576 0.629 10.99 Dec 1.579 0.857 12.98 1.579 0.662 I 1.28
~' Base and Overbase prices inave been to,breed They have been the same since January 1994 2 Calculated based on 35 perce'~t fat and 87 percen~ solids not fat
32
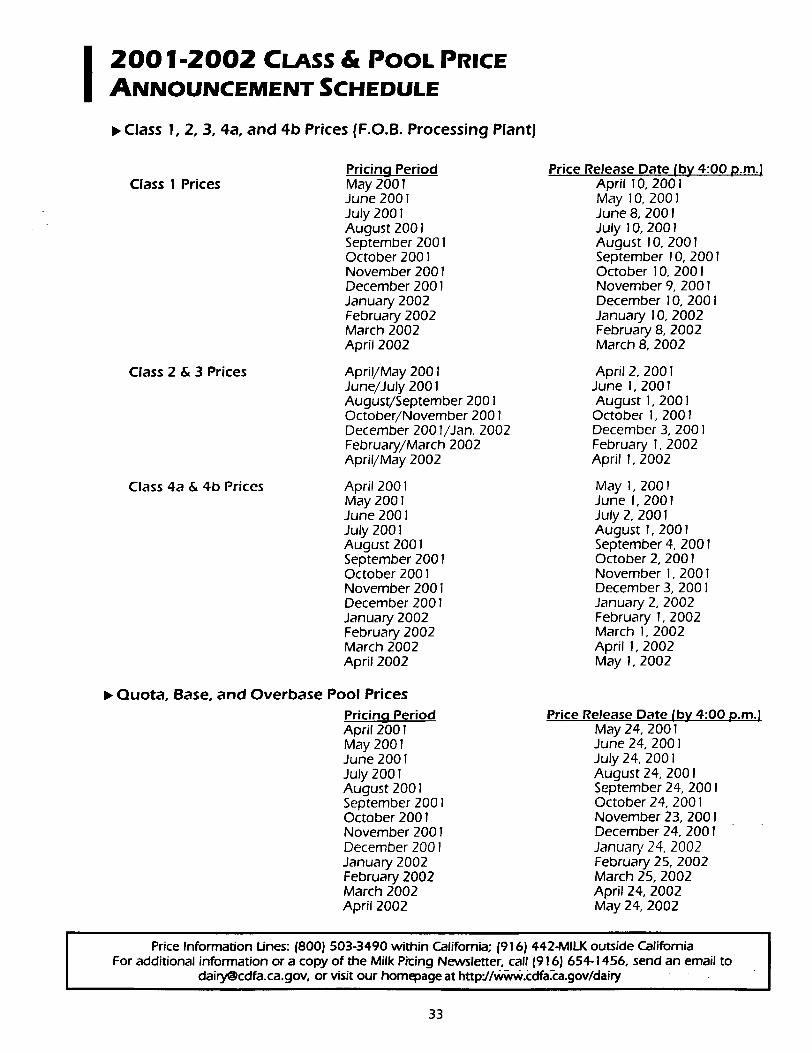
I 2001-2002 CLASS & POOL PRICE ANNOUNCEMENT SCHEDULE
I~ Class I , 2, 3, 4a , a n d 4 b Prices (F.O.B. Process ing Plant )
Class 1 Prices
Class 2 & 3 Prices
Class 4a & 4b Prices
Pricing Period May 2001 June 2001 July 2001 August 2001 September 2001 October 2001 November 2001 December 200 ! January 2002 February 2002 March 2002 April 2002
April/May 2001 June/July 200 i August/September 2001 October/November 2001 December 200 I/Jan. 2002 February/March 2002 April/May 2002
April 2001 May 2001 June 2001 July 2001 August 2001 September 2001 October 2001 November 2001 December 2001 January 2002 February 2002 March 2002 April 2002
I~ Q u o t a , Base, a n d O v e r b a s e Pool Prices
Pricing Period April 2001 May 2001 June 2001 July 2001 August 2001 September 2001 October 2001 November 2001 December 2001 January 2002 February 2002 March 2002 April 2002
Price Release Date (by 4:00 p.m.) April I0, 2001 May I 0, 2001 June 8, 2001 July 10, 2001 August I0, 2001 September I0, 2001 October 10, 200 ! November 9, 2001 December 10, 2001 January ! 0, 2002 February 8, 2002 March 8, 2002
April 2, 2001 June I, 2001 August 1,2001 October 1,2001 December 3, 2001 February I, 2002 April 1, 2002
May 1,2001 June !, 2001 July 2, 2001 August I, 2001 September 4, 2001 October 2, 2001 November I, 2001 December 3, 2001 January 2, 2002 February I, 2002 March 1, 2002 April 1, 2002 May I, 2002
Price Release Date (by 4:00 p.m. I May 24, 2001 June 24, 2001 July 24, 2001 August 24, 2001 September 24, 2001 October 24, 2001 November 23, 2001 December 24, 2001 January 24, 2002 February 25, 2002 March 25, 2002 April 24, 2002 May 24, 2002
Price Information Lines: (800) 503-3490 within California; (916) 442-MILK outside California For additional information or a copy of the Milk P~ing Newsletter, call (916) 654-1456, send an email to
dairyOcdfa.ca.gov, or visit our homepage at http'.//WTalW.~=clfa_ca.gov/dairy
33
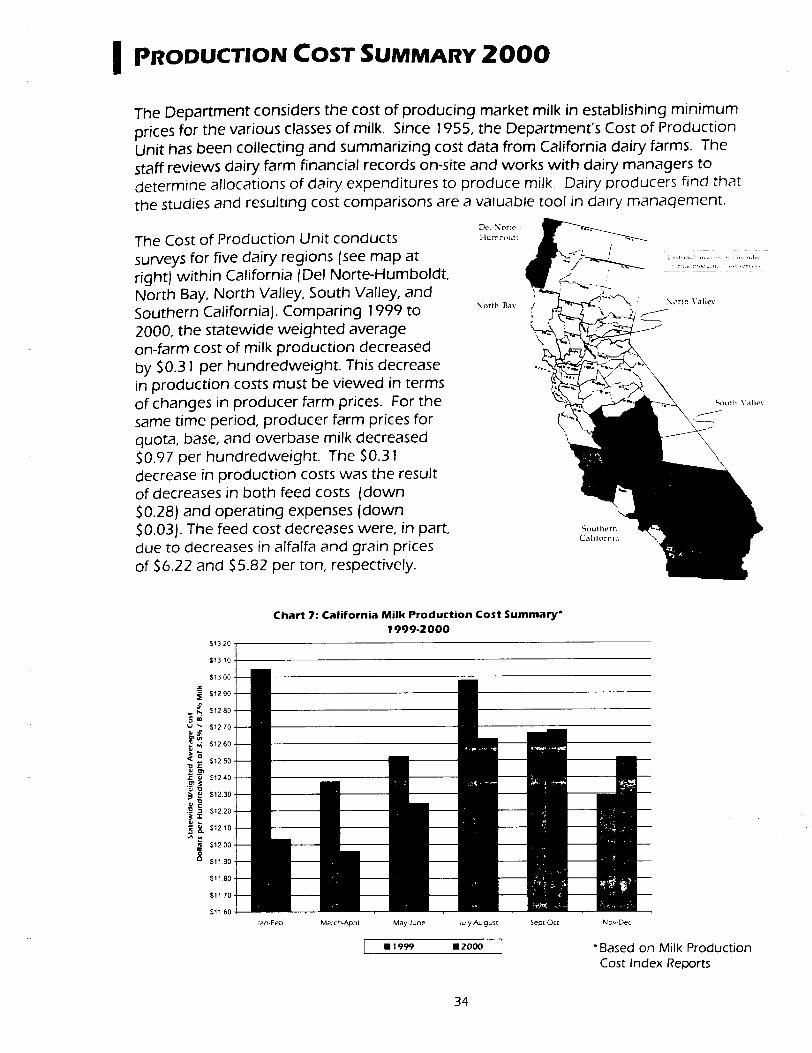
I P R O D U C T I O N COST S U M M A R Y 2 0 0 0
The Department considers the cost of producing market milk in establishing minimum prices for the various classes of milk. Since 1955, the Department's Cost of Production Unit has been collecting and summarizing cost data from California dairy farms. The staff reviews dairy farm financial records on-site and works with dairy managers to determine allocations of dairy expenditures to produce milk. Dairy producers find that the studies and resulting cost comparisons are a valuable tool in dairy manaqement.
The Cost of Production Unit conducts surveys for five dairy regions (see map at right) within California (Del Norte-Humboldt, North Bay, North Valley, South Valley, and Southern California). Comparing 1999 to 2000, the statewide weighted average on-farm cost of milk production decreased by $0.31 per hundredweight. This decrease in production costs must be viewed in terms of changes in producer farm prices. For the same time period, producer farm prices for quota, base, and overbase milk decreased $0.97 per hundredweight. The $0.31 decrease in production costs was the result of decreases in both feed costs (down $0.28) and operating expenses (down $0.03). The feed cost decreases were, in part, due to decreases in alfalfa and grain prices of $6.22 and $5.82 per ton, respectively.
Del Xotte- ~ !~" ~ Hum~oidt
North Bay
$13 20
$~3 10
Cha~ 7:California Milk Product ionCostSumma~" 1999-2000
Jan-FeD March-April May-June J uly-Au gust Sep[Ocl
[ . , , , , .2o ] Nov-Dec
*Based on Milk P roduc t ion Cost Index Reports
34
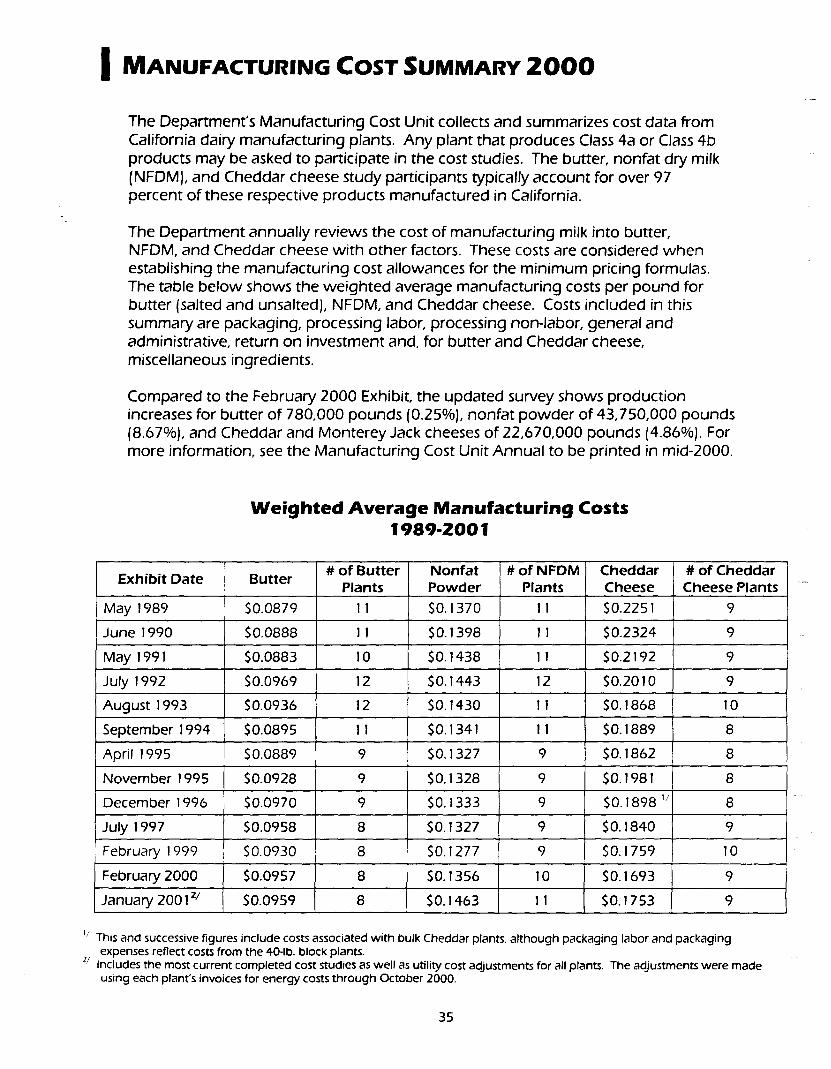
- °
I MANUFACTURING COST SUMMARY 2 0 0 0
The Department's Manufacturing Cost Unit collects and summarizes cost data from California dairy manufacturing plants. Any plant that produces Class 4a or Class 4b products may be asked to participate in the cost studies. The butter, nonfat dry milk (NFDM), and Cheddar cheese study participants typically account for over 97 percent of these respective products manufactured in California.
The Department annually reviews the cost of manufacturing milk into butter, NFDM, and Cheddar cheese with other factors. These costs are considered when establishing the manufacturing cost allowances for the minimum pricing formulas. The table below shows the weighted average manufacturing costs per pound for butter (salted and unsalted), NFDM, and Cheddar cheese. Costs included in this summary are packaging, processing labor, processing non-labor, general and administrative, return on investment and, for butter and Cheddar cheese, miscellaneous ingredients.
Compared to the February 2000 Exhibit, the updated survey shows production increases for butter of 780,000 pounds (0.25%), nonfat powder of 43,750,000 pounds (8.67%), and Cheddar and Monterey Jack cheeses of 22,670,000 pounds (4.86%). For more information, see the Manufacturing Cost Unit Annual to be printed in mid-2000.
Weighted Average Manufacturing Costs 1989-2001
# of Butter Nonfat # of NFDM Cheddar # of Cheddar Exhibit Date Butter
Plants Powder Plants Cheese Cheese Plants
May 1989 k $0.0879 11 $0.1370 I1 $0.2251 9
June 1990 $0.0888 I I $0.1398 11 $0,2324 9
May 1991 $0.0883 10 $0.1438 11 $0.2192 9
$0.0969 12 $0.1443 12 $0.2010 9 July 1992
August 1993 $0.0936 12 $0.1430 11
September 1994 $0.0895 11 $0.1341 ! I
April ! 995 $0.0889 9 $0.1327 9
November 1995 $0.0928 9 $0.1328 9
December 1996 $0.0970 9 $0. i 333 9
July 1997 $0.0958 8 $0.1327 9
9 $0.0930 $0.1277
$0.1868 10
$0.1889 8
$0.1862 8
$0.1981 8
$0.1898 lj 8
$0.1840 9
$0.1759 February 1999 8
February 2000 $0.0957 8 $0.1356 10 $0. i 693 9
January 2001 ax $0.0959 8 $0.1463 ! 1 $0.1753 9
i
10
~J This and successive figures include costs associated with bulk Cheddar plants, although packaging labor and packaging expenses reflect costs from the 40-lb. block plants.
2s Includes the most current completed cost studies as well as utility cost adjustments for all plants. The adjustments were made using each plant's invoices for energy costs through October 2000.
35
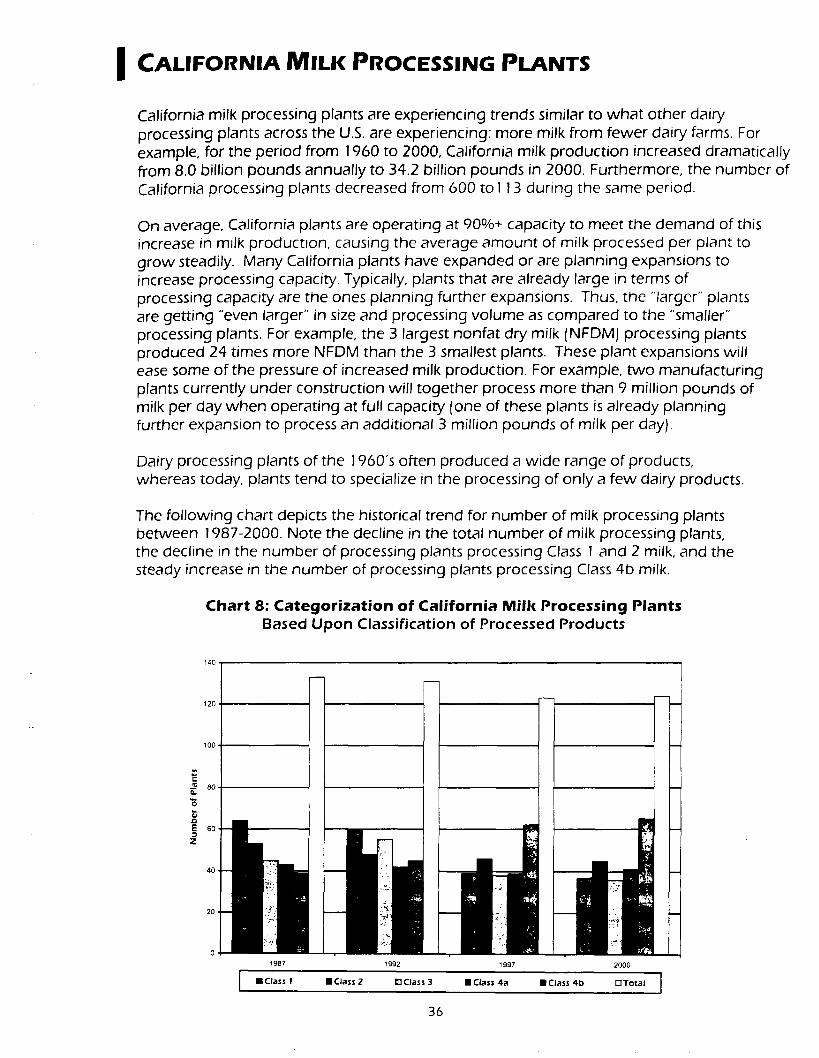
I CALIFORNIA MILK PROCESSING PLANTS
California milk processing plants are experiencing trends similar to what other dairy processing plants across the U.S. are experiencing: more milk from fewer dairy farms. For example, for the period from 1960 to 2000, California milk production increased dramatically from 8.0 billion pounds annually to 34.2 billion pounds in 2000. Furthermore, the number of California processing plants decreased from 600 to 113 during the same period.
On average, California plants are operating at 90%+ capacity to meet the demand of this increase in milk production, causing the average amount of milk processed per plant to grow steadily. Many California plants have expanded or are planning expansions to increase processing capacity. Typically, plants that are already large in terms of processing capacity are the ones planning further expansions. Thus, the "'larger" plants are getting "even larger" in size and processing volume as compared to the "smaller" processing plants. For example, the 3 largest nonfat dry milk (NFDM) processing plants produced 24 times more NFDM than the 3 smallest plants. These plant expansions will ease some of the pressure of increased milk production. For example, two manufacturing plants currently under construction will together process more than 9 million pounds of milk per day when operating at full capacity (one of these plants is already planning further expansion to process an additional 3 million pounds of milk per day).
Dairy processing plants of the ! 960"s often produced a wide range of products, whereas today, plants tend to specialize in the processing of only a few dairy products.
The following chart depicts the historical trend for number of milk processing plants between 1987-2000. Note the decline in the total number of milk processing plants, the decline in the number of processing plants processing Class I and 2 milk, and the steady increase in the number of processing plants processing Class 4b milk.
Chart 8: Categorizat ion of California Mill( Processing Plants Based Upon Classification of Processed Products
140
120
100
m 80
,o E 60
Z
40,
m
1987
F mClass 1
n
m
1- 1992 1997 2000
• Class 2 [ ] Class 3 • Class 4a • Class 4b [ ] Total
36
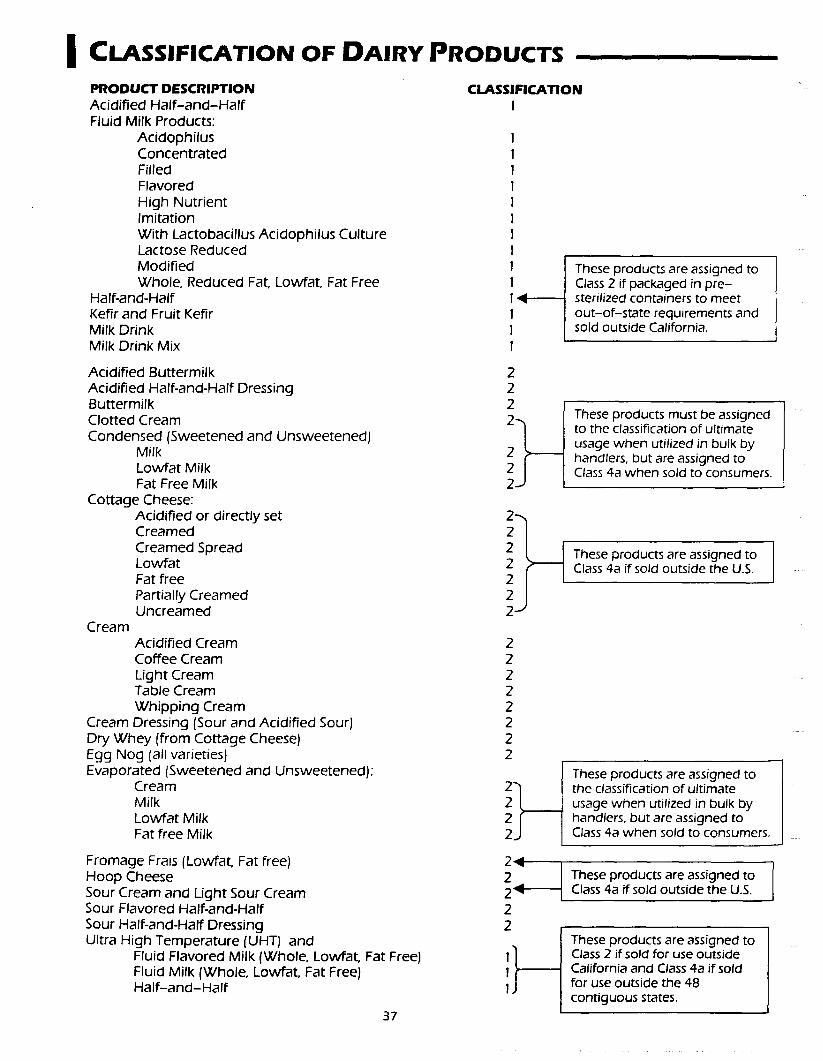
CLASSIFICATION OF DAIRY PRODUCTS P R O D U C T DESCRIPT ION Acidified Hal f -and-Hal f Fluid Milk Products:
Acidophilus Concentrated Filled Flavored High Nutrient Imitation With Lactobacillus Acidophilus Culture Lactose Reduced Modified Whole, Reduced Fat, Lowfat, Fat Free
Half-and-Half Kefir and Fruit Kefir Milk Drink Milk Drink Mix
C L A S S I F I C A T I O N 1
These products are assigned to Class 2 if packaged in pre- sterilized containers to meet out-of-state requirements and sold outside California.
Acidified Buttermilk Acidified Half-and-Half Dressing Buttermilk Clotted Cream Condensed (Sweetened and Unsweetened)
Milk Lowfat Milk Fat Free Milk
Cottage Cheese: Acidified or directly set Creamed Creamed Spread Lowfat Fat free Partially Creamed Uncreamed
Cream Acidified Cream Coffee Cream Light Cream Table Cream Whipping Cream
Cream Dressing (Sour and Acidified Sour) Dry Whey (from Cottage Cheese) Egg Nog (all varieties) Evaporated (Sweetened and Unsweetened):
Cream Milk Lowfat Milk Fat free Milk
2 2 2 2
;1 2 j
2 2 2 2 2 2 2 2
!1
These products must be assigned to the classification of ultimate usage when utilized in bulk by handlers, but are assigned to Class 4a when sold to consumers.
These products are assigned to Class 4a if sold outside the U.S.
These products are assigned to the classification of ultimate usage when utilized in bulk by handlers, but are assigned to Class 4a when sold to consumers.
Fromage Frais (Lowfat, Fat free) Hoop Cheese Sour Cream and Light Sour Cream Sour Flavored Half-and-Half Sour Half-and-Half Dressing Ultra High Temperature (UHT) and
Fluid Flavored Milk (Whole, Lowfat, Fat Free) Fluid Milk (Whole, Lowfat, Fat Free) Hal f -and-Hal f
37
2 2
!}-
These products are assigned to Class 4a if sold outside the U.S.
These products are assigned to Class 2 if sold for use outside California and Class 4a if sold for use outside the 48 contiguous states.
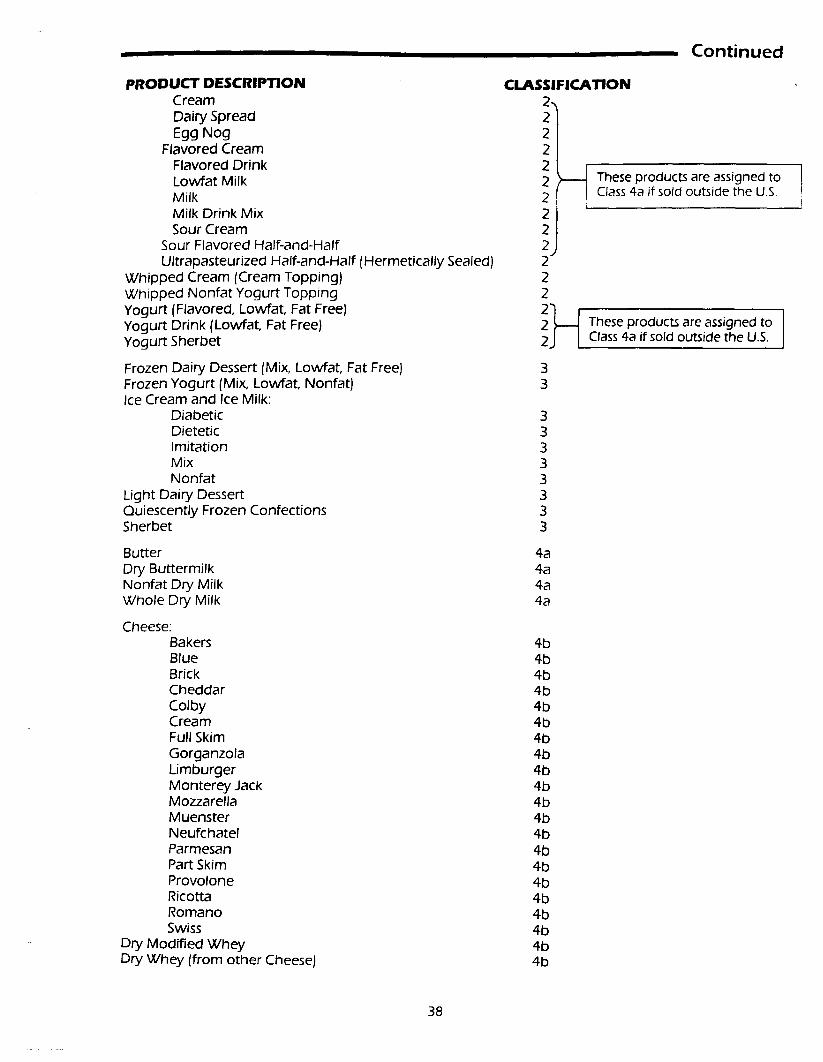
_ C o n t i n u e d
PRODUCT DESCRIPTION CLASSIFICATION Cream 2 Dairy Spread i l Egg Nog
Flavored Cream Flavored Drink ! ~ Lowfat Milk 22 Milk 2 i Milk Drink Mix Sour Cream
Sour Flavored Half-and-Half Ultrapasteurized Half-and-Half (Hermetically Sealed) 2 - -
Whipped Cream (Cream Topping) 2 Whipped Nonfat Yogurt Topping 2 Yogurt (Flavored, Lowfat, Fat Free) i }---~ Yogurt Drink (Lowfat, Fat Free) Yogurt Sherbet
Frozen Dairy Dessert (Mix, Lowfat, Fat Free) 3 Frozen Yogurt (Mix, Lowfat, Nonfat) 3 Ice Cream and Ice Milk:
Diabetic 3 Dietetic 3 Imitation 3 Mix 3 Nonfat 3
Light Dairy Dessert 3 Quiescently Frozen Confections 3 Sherbet 3
Butter 4a Dry Buttermilk 4a Nonfat Dry Milk 4a Whole Dry Milk 4a
Cheese: Bakers 4b Blue 4b Brick 4b Cheddar 4b Colby 4b Cream 4b Full Skim 4b Gorganzola 4b Limburger 4b Monterey Jack 4b Mozzarella 4b Muenster 4b Neufchatel 4b Parmesan 4b Part Skim 4b Provolone 4b Ricotta 4b Romano 4b Swiss 4b
Dry Modified Whey 4b Dry Whey (from other Cheese) 4b
These products are assigned to I Class 4a if sold outside tl3e U.S.
These products are assigned to Class 4a if sold outside the U.S.
38
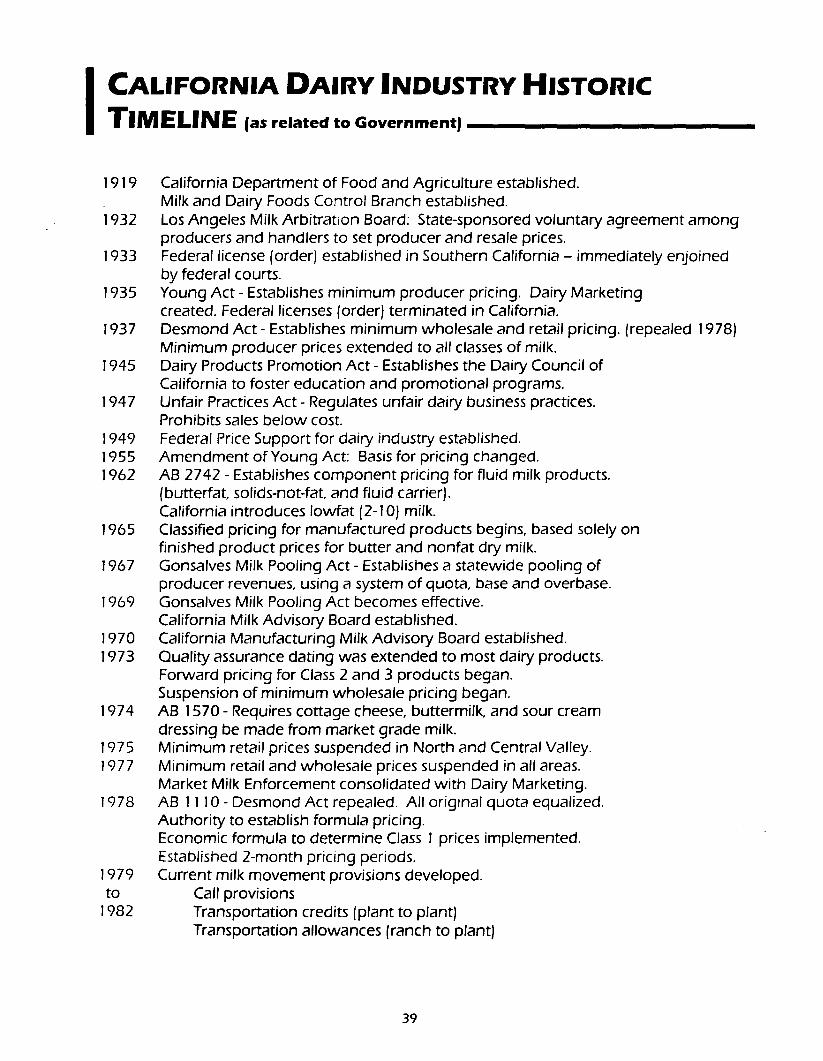
I CALIFORNIA DAIRY INDUSTRY HISTORIC TIMELINE (as related to Government)
1919
1932
1933
1935
1937
1945
1947
1949 1955 1962
1965
1967
1969
1970 1973
1974
1975 1977
1978
1979 to
1982
California Department of Food and Agriculture established. Milk and Dairy Foods Control Branch established. Los Angeles Milk Arbitration Board: State-sponsored voluntary agreement among producers and handlers to set producer and resale prices. Federal license (order) established in Southern California - immediately enjoined by federal courts. Young Act - Establishes minimum producer pricing. Dairy Marketing created. Federal licenses (order) terminated in California. Desmond Act - Establishes minimum wholesale and retail pricing. (repealed 1978) Minimum producer prices extended to all classes of milk, Dairy Products Promotion Act - Establishes the Dairy Council of California to foster education and promotional programs. Unfair Practices Act - Regulates unfair dairy business practices. Prohibits sales below cost. Federal Price Support for dairy industry established. Amendment of Young Act: Basis for pricing changed. AB 2742 - Establishes component pricing for fluid milk products. (butterfat, solids-not-fat, and fluid carrier). California introduces Iowfat (2-10) milk. Classified pricing for manufactured products begins, based solely on finished product prices for butter and nonfat dry milk. Gonsalves Milk Pooling Act - Establishes a statewide pooling of producer revenues, using a system of quota, base and overbase. Gonsalves Milk Pooling Act becomes effective. California Milk Advisory Board established. California Manufacturing Milk Advisory Board established. Quality assurance dating was extended to most dairy products. Forward pricing for Class 2 and 3 products began. Suspension of minimum wholesale pricing began. AB 1570 - Requires cottage cheese, buttermilk, and sour cream dressing be made from market grade milk. Minimum retail prices suspended in North and Central Valley. Minimum retail and wholesale prices suspended in all areas. Market Milk Enforcement consolidated with Dairy Marketing. AB 1110 - Desmond Act repealed. All original quota equalized. Authority to establish formula pricing. Economic formula to determine Class I prices implemented. Established 2-month pricing periods. Current milk movement provisions developed.
Call provisions Transportation credits (plant to plant) Transportation allowances (ranch to plant)
39
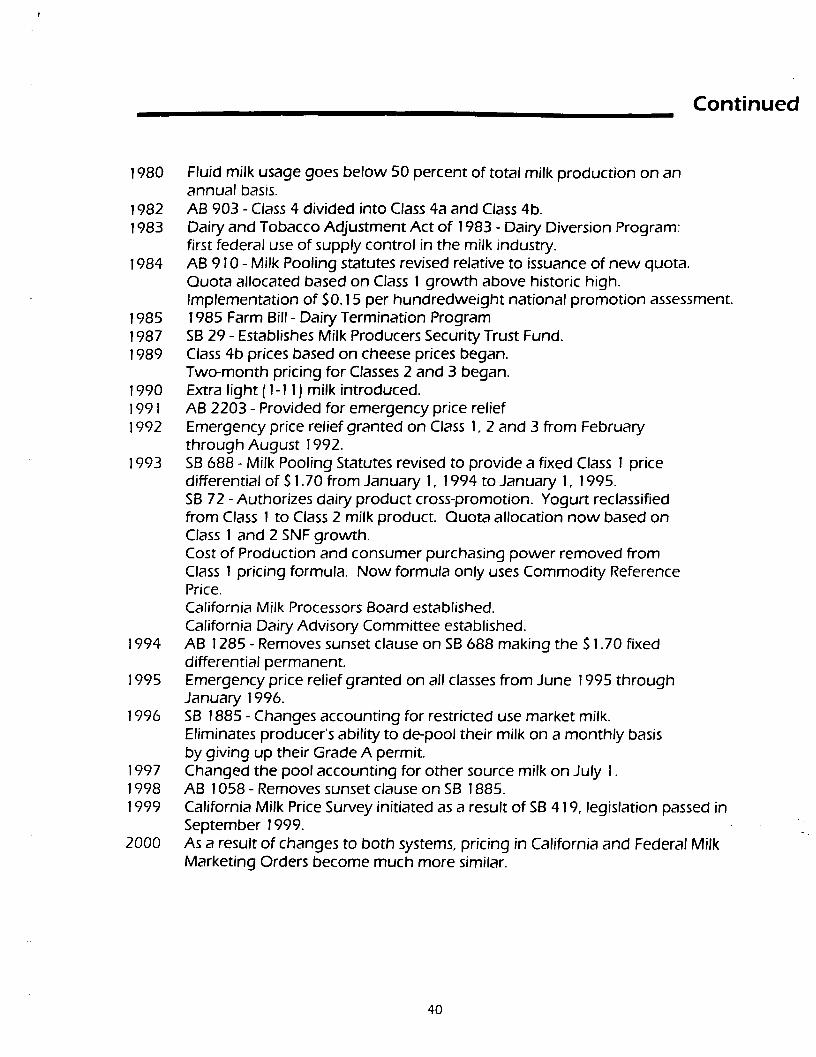
Cont inued
1980
1982 1983
1984
1985 1987 1989
1990 1991 1992
1993
1994
1995
1996
1997 1998 1999
2000
Fluid milk usage goes below 50 percent of total milk production on an annual basis. AB 903 - Class 4 divided into Class 4a and Class 4b. Dairy and Tobacco Adjustment Act of 1983 - Dairy Diversion Program:: first federal use of supply control in the milk industry. AB 910 - Milk Pooling statutes revised relative to issuance of new quota. Quota allocated based on Class I growth above historic high. Implementation of $0.15 per hundredweight national promotion assessment. 1985 Farm Bill - Dairy Termination Program SB 29 - Establishes Milk Producers Security Trust Fund. Class 4b prices based on cheese prices began. Two-month pricing for Classes 2 and 3 began. Extra light ( 1-11 ) milk introduced. AB 2203 - Provided for emergency price relief Emergency price relief granted on Class 1, 2 and 3 from February through August 1992. SB 688 - Milk Pooling Statutes revised to provide a fixed Class I price differential of $1.70 from January 1, 1994 to January 1, 1995. SB 72 - Authorizes dairy product cross-promotion. Yogurt reclassified from Class 1 to Class 2 milk product. Quota allocation now based on Class 1 and 2 SNF growth. Cost of Production and consumer purchasing power removed from Class 1 pricing formula. Now formula only uses Commodity Reference Price. California Milk Processors Board established. California Dairy Advisory Commit-tee established. AB 1285 - Removes sunset clause on SB 688 making the $1.70 fixed differential permanent. Emergency price relief granted on all classes from June 1995 through January 1996. SB 1885 - Changes accounting for restricted use market milk. Eliminates producer's ability to de-pool their milk on a monthly basis by giving up their Grade A permit. Changed the pool accounting for other source milk on July I. AB 1058 - Removes sunset clause on SB 1885. California Milk Price Survey initiated as a result of SB 419, legislation passed in September 1999. As a result of changes to both systems, pricing in California and Federal Milk Marketing Orders become much more similar.
40
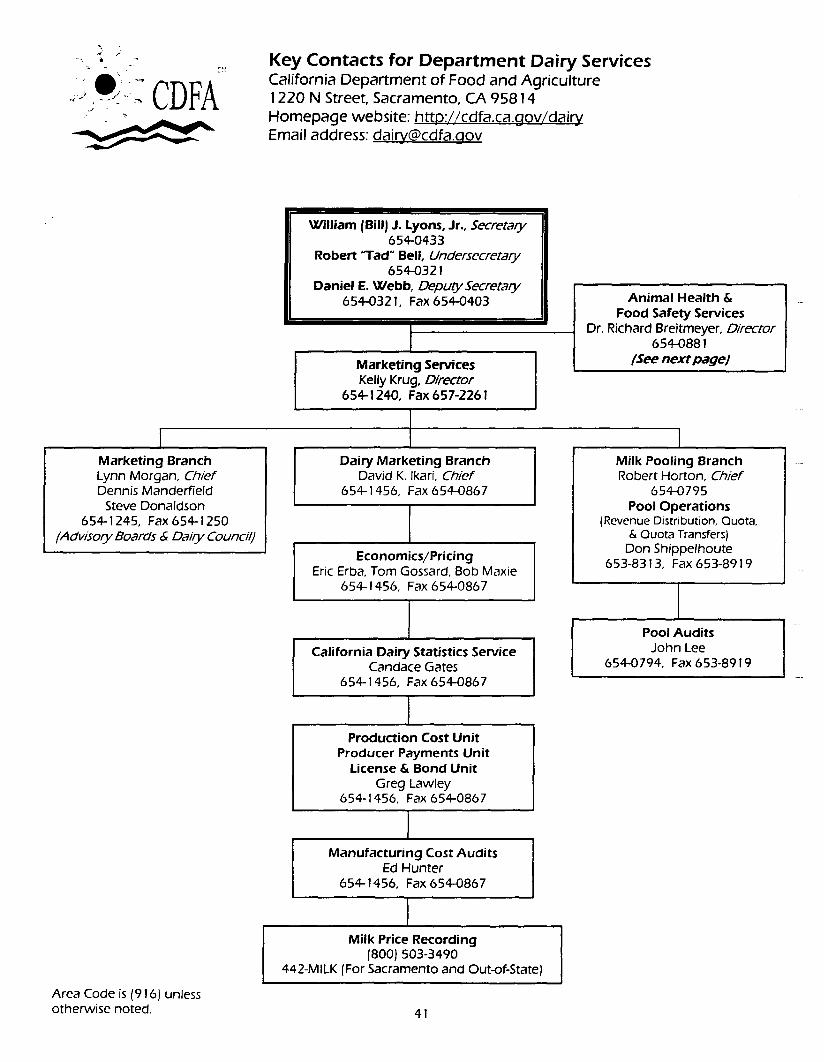
. . . . . - - CDFA J
Key Contacts for Department Dairy Services California Department of Food and Agriculture 1220 N Street, Sacramento, CA 95814 Homepage website: http://cdfa.ca.gov/dairy Email address: [email protected]
Marketing Branch Lynn Morgan, Chief Dennis Manderfield
Steve Donaldson 654-1245, Fax 654-1250
(Advisory Boards & Dairy Council)
William (Bill) J. Lyons, Jr., Secretary 654-0433
Robert " lad" Bell, Undersecretary 654-0321
Daniel E. Webb, Deputy Secretary 654-032 I, Fax 654-0403
Marketing Services Kelly Krug, Director
654-1240, Fax 657-2261
Dairy Marketing Branch David K. Ikari, Chief
654-I 456, Fax 654-0867
Economics/Pricing Eric Erba, Tom Gossard, Bob Maxie
654-1456, Fax 654-0867
California Dairy Statistics Service Candace Gates
654-1456, Fax 654-0867
I Production Cost Unit
Producer Payments Unit License & Bond Unit
Greg Lawley 654-1456, Fax 654-0867
I Manufacturing Cost Audits
Ed Hunter 654-1456, Fax 654-0867
Animal Health & Food Safety Services
Dr. Richard Breitmeyer, Director 654-0881
/See next page)
I Milk Pooling Branch Robert Horton, Chief
654-0795 Pool Operations
(Revenue Distribution, Quota, & Quota Transfers)
Don Shippelhoute 653-8313, Fax 653-8919
Pool Audits John Lee
654-0794, Fax 653-8919
Milk Price Recording (800) 503-3490
442-MILK (For Sacramento and Out-of-State)
Area Code is (916) unless otherwise noted. 41
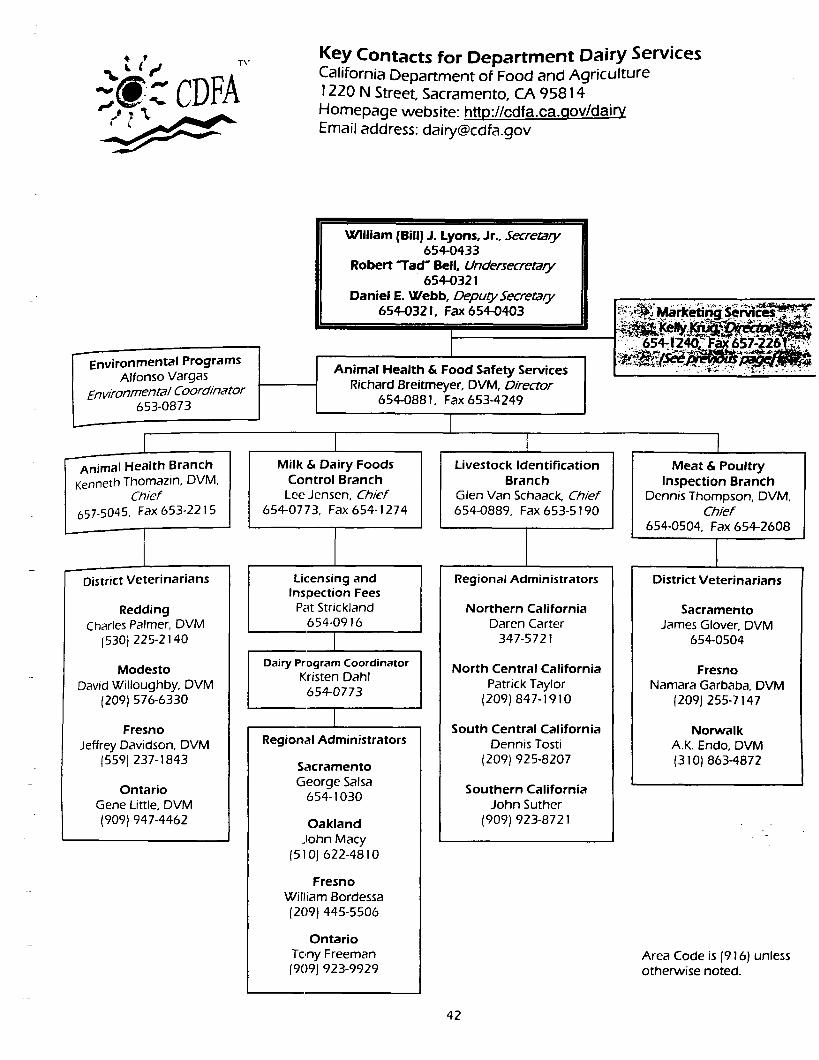
f TM
cDFA Key Contacts for Depar tment Dairy Services California Department of Food and Agriculture 1 220 N Street, Sacramento, CA 95814 Homepage website: http://cdfa.ca.qov/dairy Email address: [email protected]
Environmental Programs Alfonso Vargas
Environmental Coordinator 653-0873
I mal Health Branch eth Thomazin, DVM,
Chief 5045, Fax 653-2215
William (Bill) J, Lyons, Jr., Secretary 654-0433
Robert "Tad" Bell, Undersecretary 654-0321
Daniel E. Webb, Deputy Secretary 654-032 I, Fax 654-0403
Animal Health & Food Safety Services Richard Breitmeyer, DVM, Director
654-0881, Fax 653-4249
/ - - " i i 6 5 ~ 1 2 ~ i~- ~ ' ~ , ~ . ' - ~ , ~ * ~ ~ ~ w ~ .~tm~i
I I I I
Livestock Identification Branch
Glen Van Schaack, Chief 654-0889, Fax 653-5190
Milk & Dairy Foods Control Branch
Lee Jensen, Chief 654-0773, Fax 654-1274
Meat & Poultry Inspection Branch
Dennis Thompson, DVM, Chief
654-0504, Fax 654-2608
District Veterinarians
Redding Charles Palmer, DVM
(530) 225-2140
Modesto David Willoughby, DVM
(209) 576-6330
Fresno Jeffrey Davidson, DVM
15591 237-1843
Ontario Gene Little, DVM (909) 947-4462
Licensing and Inspection Fees
Pat Strickland 654-0916
1 Dairy Program Coordinator
Kristen Dahl 654-0773
Regional Administrators
Sacramento George Salsa
654-1030
Oakland John Macy
(510) 622-4810
Fresno William Bordessa (209) 445-5506
Ontario Tony Freeman (909) 923-9929
Regional Administrators
Northern California Daren Carter
347-5721
North Central California Patrick Taylor
(209) 847-1910
South Central California Dennis Tosti
(209) 925-8207
Southern California John Suther
(909) 923-8721
42
District Veterinarians
Sacramento James Glover, DVM
654-0504
Fresno Namara Garbaba, DVM
(209) 255-7147
Norwalk A.K. Endo, DVM (310) 863-4872
Area Code is (916) unless otherwise noted.