wsns clustering based on semantic neighborhood relationships
TRANSCRIPT
Computer Networks 56 (2012) 1627–1645
Contents lists available at SciVerse ScienceDirect
Computer Networks
journal homepage: www.elsevier .com/ locate/comnet
WSNs clustering based on semantic neighborhood relationships
Atslands R. Rocha a,⇑, Luci Pirmez b, Flávia C. Delicato b, Érico Lemos b, Igor Santos b,Danielo G. Gomes a, José Neuman de Souza a
a Group of Computer Networks, Software Engineering and Systems (GREat), Federal University of Ceará, Campus do Pici, Bloco 942-A,CEP: 60455-760 Fortaleza, Brazilb Federal University of Rio de Janeiro, Caixa Postal 2324, Rio de Janeiro, Brazil
a r t i c l e i n f o
Article history:Received 19 March 2011Received in revised form 19 September 2011Accepted 17 January 2012Available online 31 January 2012
Keywords:Wireless sensor networksSemantic clusteringSemantic neighborhood relationshipsFuzzy logic system
1389-1286/$ - see front matter � 2012 Elsevier B.Vdoi:10.1016/j.comnet.2012.01.014
⇑ Corresponding author. Tel./fax: +55 85 3366979E-mail addresses: [email protected] (A.R. Roc
(L. Pirmez), [email protected] (F.C. Delicato)(É. Lemos), [email protected] (I. Santos),Gomes), [email protected] (J.N. Gomes), [email protected]
a b s t r a c t
We propose a semantic clustering model based on a fuzzy inference system to find out thesemantic neighborhood relationships in wireless sensor networks in order to both reduceenergy consumption and improve the data accuracy. As a case study we describe a struc-tural health monitoring application which was used to illustrate and assess the proposedmodel. We conduct experiments in order to evaluate the proposal in two different scenar-ios of damage with different data aggregation methods. We also compared our proposal,using the same data set, with a deterministic clustering method and with the LEACH algo-rithm. The results indicate that our approach is an energy-efficient clustering method forWSNs, outperforming both the deterministic clustering and LEACH algorithms in about70% and 47% of energy savings respectively. The energy saving comes from the fact thatwe have a more efficient in-network data aggregation process since by exploiting thesemantic relation between sensor nodes we can potentially aggregate more similar dataand consequently, decrease the data redundancy (thus minimizing transmissions). Nodesthat are semantically unrelated can operate in low-duty cycle, further reducing the energyconsumption. Moreover, our proposal has the potential to improve the data accuracy pro-vided for the application where accuracy is a QoS requirement in typical WSN applications.
� 2012 Elsevier B.V. All rights reserved.
1. Introduction
Wireless sensor networks (WSNs) are examples ofresource-constrained networks in which processingresources, storage and energy are limited. In spite of thefact that cost and size considerations imply that theresources available to individual nodes are severely lim-ited, recent advances on technology and research in thisfield lead us to believe that limited processor and memoryare temporary constraints in WSNs that tend to disappearwith fast developing fabrication techniques [1]. The energyconstraint, on the other hand, remains as a critical issue
. All rights reserved.
7.ha), [email protected], [email protected]@ufc.br (D.G.r (J.N. de Souza).
that needs to be tackled so that WSNs can be widely em-ployed. There is a wide range of applications that can ben-efit from the use of WSNs, with different features and QoSrequirements. Typical QoS requirements in WSN environ-ments are coverage, data accuracy and packet delay. Onthe one hand, it is important to adopt strategies and proto-cols that assure a given level of QoS for client applicationsso that the WSN can meet its design goals. On the otherhand, while meeting QoS requirements the resource con-sumption of the WSN nodes must be managed in an effi-cient way in order to extend the network operationallifetime. Since the energy is the most critical resource insuch networks, the tradeoff between energy saving andQoS provision is a major concern.
Clustering has been used both in ad hoc networks as inWSNs as an effective technique for extending the networklifetime, and supporting network scalability [2,3]. The
1628 A.R. Rocha et al. / Computer Networks 56 (2012) 1627–1645
general idea is to perform the cluster formation based onthe received signal strength indicator (RSSI) and to use lo-cal cluster heads (CHs) as routers of data gathered by thesensors in their clusters towards the sink node. Since thedistance among cluster members and the respective clus-ter-head is, in general, smaller than the distance betweenthese sensors and the sink, sensors in a cluster save trans-mission energy. Clustering can also be beneficial for pur-poses of energy saving because it favors data fusionprocedures. Cluster members can collaborate about recentdata measurements and determine how much informationshould be transmitted to the sink node. By averaging datavalues collected within the cluster, the algorithm can tradedata resolution for transmission power.
Some advantages of network clustering can be identi-fied as [4] (i) size reducing of the routing tables stored ateach individual sensor node, (ii) saving the communicationbandwidth, since it limits the scope of the inter-clusterinteractions to CHs and avoids redundant exchange ofmessages among sensor nodes, (iii) stabilizing the networktopology at the level of sensors and thus cuts on topologymaintenance overhead and (iv) the use of optimized man-agement strategies to prolong the battery life of the indi-vidual sensors.
Several works using clustering for WSNs have beendeveloped [4,5,2,6]. However, although in some of theseworks the authors use information from sensor nodes tomake decisions about the network organization, thesemantic of collected data to group sensor nodes into clus-ters is not frequently exploited [7,8]. In this work we pro-pose a semantic clustering for WSNs in order to minimizethe communication resource usage and energy cost. Thekey feature of our proposal is a computation of semanticneighborhood relationships based on collected data fromsensor nodes. We define as semantic neighbors the set ofsensors that are semantically related. In traditional cluster-ing approaches, when the concept of neighborhood relatesto the geographical distance between nodes, sometimesneighboring nodes cover areas which are not related atall, or neighboring nodes provide measurements that arenot semantically related. For example, in the airport secu-rity applications [9], sensor nodes both do video and audioprocessing and communicate with their neighboring nodesin order to share a global view of the monitored environ-ment. However, sensors nodes fixed on opposite sides ofa same wall will cover different areas of this airport envi-ronment that are not related at all.
It is also worth emphasizing that a semantic clusteringmethod favors applying fusion/aggregation algorithmsonly in semantically related data within the network. Forexample, in an airport security application, if a cluster con-sists of nodes fixed on opposite sides of the same wall, theCH will not be able to eliminate any redundancy (one ofthe goals of fusion/aggregation data techniques) beforesending messages to the sink, since the data sent fromindividual sensors are not related to the same monitoredenvironment. Thus, the semantic clustering proposalbrings advantages compared to the clusters generated onlyby taking into account the distance between the sensornodes. Moreover, in case of applications based on events,it is interesting that clusters encompass only nodes
(semantic neighbors) that detect the event of interest,while the unrelated nodes can remain working at a lowerduty cycle in order to save energy.
In our work, the set of semantic neighbors is groupedinto semantic clusters. The semantic clustering is a serviceprovided by a semantic middleware for WSNs described inour previous work [7]. A fuzzy system is responsible toestablish the relationships of the semantic neighborhood.Fuzzy inference systems match two of the most challeng-ing requirements [10] of WSNs: (i) they are simple andcan be executed on limited hardware and (ii) they can dealwith imprecise data. Several WSNs applications use crispvalues to specify the numerical variables that characterizea monitored event. For example, in a fire detection applica-tion, the WSN might classify an event when the tempera-ture is above 50 �C. However, sensor readings are notalways accurate and the sensor nodes, even if they areneighbors, often measure different values. In that example,if a sensor report 49.9 �C, a wrong decision will be made.Therefore, the ability of handling imprecise data is desir-able since individual data from sensor nodes often areinaccurate due to calibration problems, environmentalnoise, wireless transmission loss, faulty sensors, amongother items. Thus, fuzzy logic can handle the fluctuatingof sensor readings in a proper way.
Our clustering method can minimize the computationalresources usage because (i) involves only the relevantnodes to the event monitored by the network; (ii) thesemantic neighbors can be grouped into a semantic clusterthat provides the use of techniques of local collaboration asdata aggregation; and (iii) nodes semantically unrelatedcan operate in low duty cycle. Moreover, by using thesemantic clustering, we have the potential to improvethe data accuracy provided for the application, where accu-racy is a typical QoS requirement in WSN applications.
In this work, our proposal is applied in the structuralhealth monitoring (SHM) domain. Some experiments wereperformed in order to evaluate the impact of our proposalin the network. First, we evaluate the proposal in two dif-ferent scenarios of damage in the WSN. Second, we evalu-ate the impact of different aggregation method in theproposal related to energy saving. Third, our proposalwas compared, using the same data set, with two algo-rithms: a deterministic clustering and the well-knownLEACH (low-energy adaptive clustering hierarchy) [11].This comparison includes the evaluating of the data accu-racy and the energy consumed by the clustering phase. Itis shown that our approach is an energy-efficient cluster-ing method for WSNs, where it outperforms both thedeterministic clustering and LEACH methods in about70% and 47% of energy save respectively.
2. Related work
Bouhafs et al. [5] propose a semantic clustering algo-rithm for energy-efficient routing in WSNs that allows alayered data aggregation whose the main feature is togroup sensors according to semantic information andnodes connectivity properties. The sink node broadcasts auser’s query (e.g., temperature > 50 �C) throughout the
1 Here in this paper cluster head is related to the physical clustering.Likewise, whenever we refer to the grouping of sensors in cluster based onsemantics, we use the semantic cluster term. In the other references toclusters, we are referring to the initial physical clustering.
A.R. Rocha et al. / Computer Networks 56 (2012) 1627–1645 1629
network. When the collected data from a node match thequery, this node both elects itself as a CH and sends anadvertisement message containing the user’s query to itsneighbors. Similar to [5], our proposal also considers thesemantic information of the nodes in order to form theclusters, but we use a fuzzy system to determine relevantsensors in a given period. Thus, we both accommodateproperly the inaccuracy of the collected data from sensorsand specify accurately the number of relevant sensors.Moreover, our aggregation method is one-layer. We justaggregate sensing data in CH(s) in order to not generate asignificant latency in data delivery.
Bruckner et al. [9] show how a network of smart sensornodes can be established by using high-level semanticknowledge that is gathered by loopy belief propagation be-tween sensors with overlapping sensing areas. The seman-tic knowledge is obtained by fusing information frommonomodal sensors (audio and video) into multimodal ob-jects by using a semantic multilevel framework. Thesemantic neighborhood relationships are inferred by smartnodes using statistical analysis of the shared environmentsince the events have a temporal correlation. Our work issimilar to [9] because both approaches use the concept ofsemantic neighborhood. Nevertheless, we use a distributedfuzzy system to specify the semantic relationships, whichsupport inaccurate data and reduce development and con-vergence time of the algorithm, since it does not requiremassive amount of data as statistical analysis. In [9], theauthors do not use clusterization at all.
Perianu et al. [2] present a method for spontaneousclustering of mobile wireless sensor nodes based on a com-mon context, namely Tandem, which allows reclustering incase of topological or contextual changes. Our work is sim-ilar to [2] because both use clusterization methods. How-ever, we use semantic clusters that are created in orderto save energy by placing the clusters whose sensors arenot detecting any event in low duty cycle.
Hussain et al. [12] present the design of agent-basedsensor networks for petroleum offshore monitoring. Theauthors propose a routing agent that uses genetic algo-rithms to create clusters by using network information(such as available nodes and their initial energies) obtainedfrom the knowledge base repository. Our proposal and [12]are both applied in SHM domain and use a clusteringmethod to save energy. However, in [12] the clusters areestablished according to the amount of sensors energywhereas we present clusters that are established accordingto the sensors that are semantic neighbors. The benefit ofcreating semantic clusters instead of clusters formedaccording to the nodes energy is that only the sensorsrelated to the monitored event are in activity. In [12], thesensor nodes involved in the monitored event are in activ-ity, but the remainder nodes also forward packets that arenot relevant to the application at that time.
Tashtoush and Okour [6] also present a method basedon fuzzy system for uniform clustering of distributedWSNs. Each sensor node uses parameters as energy level,local density within its sensing range, besides time infor-mation as input data for the fuzzy system to perform aclustering of the sensor nodes. The similarity with our pro-posal is that both works use a clustering method based on
fuzzy logic. The difference between them is that in [6] thesemantic of the collected data from sensor nodes are nottaken into account for clusterization method.
All these related works build their solutions oversemantic clustering techniques or fuzzy logic or SHM do-mains. To the best of our knowledge, we are the first toaddress semantic clustering techniques and structuralmonitoring issues in conjunction. In [8], we presented anearly version of this work where we proposed a semanticclustering model based on fuzzy inference system to findout the semantic neighborhood relationships in WSNs. Inthis paper, we go one step forward and provide a detailedexperimental evaluation using Crossbow’s MicaZ motes[13].
3. Clustering proposal overview
We propose a two-phase clustering method: a physicaland a semantic clustering. First, at the network start upprocess, a physical clustering is done. The physical organi-zation is hierarchical and consists of two levels. The upperlevel encompasses CHs that do not perform sensing tasks,but perform processing of data received by sensors and in-ter-cluster communication. The lower level consists of sen-sors that are responsible for collecting the environmentaldata and are subordinated to one of the CHs. For the phys-ical clustering phase, algorithms that use RSSI or distanceparameters can be used, e.g., LEACH, PEACH (Power-Effi-cient and Adaptive Clustering Hierarchy Protocol) [14],among other existent protocols [4].
The semantic organization1 is also hierarchical and con-sists of two levels. The upper level is composed of semanticcollectors. We define a semantic collector as a sensor nodethat is responsible for making a report containing the datareceived by the semantic neighbors and send the report tothe sink node. The semantic collectors perform processingon the received data before sending them to the sink node.This processing can be done through techniques of aggrega-tion or data fusion [15]. The lower level consists of semanticneighbors that are subordinated to one of the semanticcollectors.
The UML activity diagram (Fig. 1) describes the steps toperform the semantic clustering phase. Our proposedmethod is applied in three steps: (i) creating Low LevelSymbols (LLSs) for each sensor input; (ii) performing fuzzysystem to calculate the semantic neighborhood relation-ships of the network; and (iii) (re) grouping in semanticclusters the set of sensor nodes which are semantically re-lated to each others. Step 1 is processed locally in each sen-sor node, while steps 2–3 are processed locally in each CH.
In the first step, each sensor node creates low level sym-bols (LLS) to represent monomodal symbols. Each inputvariable of a sensor, such as temperature, pressure, light,is considered a monomodal symbol. Thus, the LLSs specifythe variables which can be analyzed in the environment tosupport a decision-making process. For example, in a SHM

Creates LLSsinput
Sensor Cluster Head
Establishes semantic neighborhood
Starts individual fuzzy inference
Starts distributed fuzzy inference
Communicateswith others CH
Starts semantic clustering
Sends dataTo CH
Fig. 1. UML diagram.
1630 A.R. Rocha et al. / Computer Networks 56 (2012) 1627–1645
domain, a semantic relationship between LLSs such asacceleration, temperature and humidity can be performed,in order to detect possible damages in the engineeringstructure. In the next step, a fuzzy system is responsiblefor establishing semantic neighborhoods relationships be-tween sensor nodes. The fuzzy inference system operatesin two phases: in a first phase, an individual fuzzy infer-ence process is performed in each CH considering onlythe sensor nodes that belong to its own cluster; afterwards,a distributed fuzzy inference process is performed in eachCH considering the neighbors CHs ‘‘opinion’’ about theirsensor nodes relationship.
The ‘‘opinion’’ of the CHs is gathered when they com-municate with each other in order to obtain an accuratedecision. In the last step, the semantic neighbors are (re)-grouped into semantic clusters, although those sensornodes can be either on the same physical cluster or not.It is important mentioning that for many applications, ini-tially our semantic clustering is implicitly based on the dis-tance between the sensor nodes for clustering the nodes.Actually, the focus of our proposal is mainly applicationsthat provides base for this feature. The main reason is thatthe transmission distance is a key feature in order to saveenergy and the it must be considered even we emphasizethe semantic data in the clustering process.
In a given neighborhood, the CH having the largestnumber of semantic neighbors as a whole is elected as asemantic collector. The semantic collector may send anadvertisement message via broadcast to the semanticneighbors join the semantic cluster. In case of tie, i.e, twoor more CHs have the same number of semantic neighbors,the semantic collector chosen is the CH who firstly sendsthe advertisement message (also received by the CHs viabroadcast).
The semantic collector is responsible for sending the re-ports to the sink nodes. The reports may contain the aggre-gated data of the semantic neighbors. Whenever the fuzzyinference system does not detect relevant semantic rela-tionship to some adjacent sensor nodes, none informationis shared between them and their operation is switched tolow duty-cycle. The transmission intervals of unrelatednodes are extended in order to produce low duty-cycleoperation thus saving energy, since they are not directlyinvolved with the monitored event at a given period.
4. Semantic neighborhood process
As it was previously mentioned, in our work a fuzzysystem is responsible to establish the relationships of thesemantic neighborhood. Any system based on fuzzy logicstarts with and builds on a set of user-supplied human lan-guage rules. The fuzzy systems convert these rules to theirmathematical equivalents. Such approach results in muchmore accurate representations of the way systems behavein the real world [16]. Fuzzy logic models, called fuzzyinference systems, consist of a number of conditional ‘‘if-then’’ rules. For the designer who understands the system,these rules are easy to write, and as many rules as neces-sary can be supplied to properly describe the system(although typically only a moderate number of rules areneeded). In our case, a domain expert is responsible to pro-vide the rules. Since WSN can be applied in a wide range ofapplication domains, the rules need to be tailored to eachspecific domain so that the fuzzy system better reflectsthe real world environment being modeled. It is an intrin-sic feature of the fuzzy logic technique that the most accu-rate and representative of the real world the defined rulesare, the better the fuzzy system will perform. In fuzzy logic,unlike standard conditional logic, the truth of any state-ment is a matter of degree. Fuzzy inference systems relyon membership functions to explain to the computerhow to calculate the correct value between 0 and 1. Thedegree to which any fuzzy statement is true is denotedby a value between 0 and 1. Not only do the rule-based ap-proach and flexible membership function scheme makefuzzy systems straightforward to create, but they also sim-plify the design of systems and ensure that the system canbe easily updated and maintained over time. Therefore, inspite of the behavior and performance of a fuzzy system isclearly dependent on domain specific rules and functions,such systems were designed to be flexible and easy toadapt to different domains.
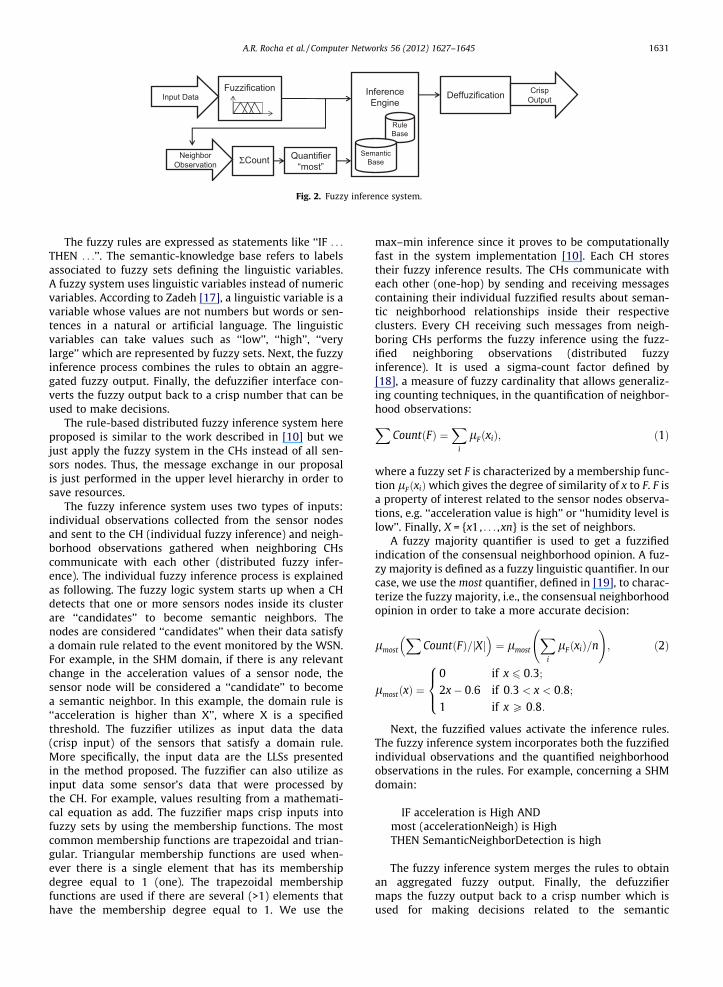
We use a rule-based distributed fuzzy inference system(Fig. 2) for WSN. Briefly, a fuzzy logic system is composedof five basic components: fuzzifier interface, inference pro-cess, defuzzifier interface, semantic-knowledge base andrule base. The fuzzifier converts crisp inputs into fuzzy setsby using the membership functions. A membership func-tion gives the similarity degree of a crisp input to the fuzzyset. Next, the fuzzified values activate the rules of knowl-edge base that are provided by experts or extracted fromnumerical data. The fuzzy rules summarize how the rela-tionship between the fuzzy sets is reflected in the outputvariable behavior.
FuzzificationInput Data Inference
EngineDeffuzification Crisp
Output
ΣCount Quantifier“most”
NeighborObservation
Rule Base
Semantic Base
Fig. 2. Fuzzy inference system.
A.R. Rocha et al. / Computer Networks 56 (2012) 1627–1645 1631
The fuzzy rules are expressed as statements like ‘‘IF . . .
THEN . . .’’. The semantic-knowledge base refers to labelsassociated to fuzzy sets defining the linguistic variables.A fuzzy system uses linguistic variables instead of numericvariables. According to Zadeh [17], a linguistic variable is avariable whose values are not numbers but words or sen-tences in a natural or artificial language. The linguisticvariables can take values such as ‘‘low’’, ‘‘high’’, ‘‘verylarge’’ which are represented by fuzzy sets. Next, the fuzzyinference process combines the rules to obtain an aggre-gated fuzzy output. Finally, the defuzzifier interface con-verts the fuzzy output back to a crisp number that can beused to make decisions.
The rule-based distributed fuzzy inference system hereproposed is similar to the work described in [10] but wejust apply the fuzzy system in the CHs instead of all sen-sors nodes. Thus, the message exchange in our proposalis just performed in the upper level hierarchy in order tosave resources.
The fuzzy inference system uses two types of inputs:individual observations collected from the sensor nodesand sent to the CH (individual fuzzy inference) and neigh-borhood observations gathered when neighboring CHscommunicate with each other (distributed fuzzy infer-ence). The individual fuzzy inference process is explainedas following. The fuzzy logic system starts up when a CHdetects that one or more sensors nodes inside its clusterare ‘‘candidates’’ to become semantic neighbors. Thenodes are considered ‘‘candidates’’ when their data satisfya domain rule related to the event monitored by the WSN.For example, in the SHM domain, if there is any relevantchange in the acceleration values of a sensor node, thesensor node will be considered a ‘‘candidate’’ to becomea semantic neighbor. In this example, the domain rule is‘‘acceleration is higher than X’’, where X is a specifiedthreshold. The fuzzifier utilizes as input data the data(crisp input) of the sensors that satisfy a domain rule.More specifically, the input data are the LLSs presentedin the method proposed. The fuzzifier can also utilize asinput data some sensor’s data that were processed bythe CH. For example, values resulting from a mathemati-cal equation as add. The fuzzifier maps crisp inputs intofuzzy sets by using the membership functions. The mostcommon membership functions are trapezoidal and trian-gular. Triangular membership functions are used when-ever there is a single element that has its membershipdegree equal to 1 (one). The trapezoidal membershipfunctions are used if there are several (>1) elements thathave the membership degree equal to 1. We use the
max–min inference since it proves to be computationallyfast in the system implementation [10]. Each CH storestheir fuzzy inference results. The CHs communicate witheach other (one-hop) by sending and receiving messagescontaining their individual fuzzified results about seman-tic neighborhood relationships inside their respectiveclusters. Every CH receiving such messages from neigh-boring CHs performs the fuzzy inference using the fuzz-ified neighboring observations (distributed fuzzyinference). It is used a sigma-count factor defined by[18], a measure of fuzzy cardinality that allows generaliz-ing counting techniques, in the quantification of neighbor-hood observations:X
CountðFÞ ¼X
i
lFðxiÞ; ð1Þ
where a fuzzy set F is characterized by a membership func-tion lFðxiÞwhich gives the degree of similarity of x to F. F isa property of interest related to the sensor nodes observa-tions, e.g. ‘‘acceleration value is high’’ or ‘‘humidity level islow’’. Finally, X = {x1, . . . ,xn} is the set of neighbors.
A fuzzy majority quantifier is used to get a fuzzifiedindication of the consensual neighborhood opinion. A fuz-zy majority is defined as a fuzzy linguistic quantifier. In ourcase, we use the most quantifier, defined in [19], to charac-terize the fuzzy majority, i.e., the consensual neighborhoodopinion in order to take a more accurate decision:
lmost
XCountðFÞ=jXj
� �¼ lmost
Xi
lFðxiÞ=n
!; ð2Þ
lmostðxÞ ¼0 if x 6 0:3;
2x� 0:6 if 0:3 < x < 0:8;
1 if x P 0:8:
8><>:
Next, the fuzzified values activate the inference rules.The fuzzy inference system incorporates both the fuzzifiedindividual observations and the quantified neighborhoodobservations in the rules. For example, concerning a SHMdomain:
IF acceleration is High ANDmost (accelerationNeigh) is HighTHEN SemanticNeighborDetection is high
The fuzzy inference system merges the rules to obtainan aggregated fuzzy output. Finally, the defuzzifiermaps the fuzzy output back to a crisp number which isused for making decisions related to the semantic

1632 A.R. Rocha et al. / Computer Networks 56 (2012) 1627–1645
neighborhood. We use a simple defuzzification strategydenoted as center of gravity (COG) method in order to pro-duce a crisp output.
2 Semantic clustering is not used in the original Sensor-SHM algorithm.
5. Methodology for building the fuzzy knowledge base
Pirmez et al. [20] present a methodology for buildingfuzzy knowledge bases to aid the design of WSN applica-tions but also generic enough to be applied in other do-mains. This methodology encompasses five stages: (i)bibliographical research on selected domain; (ii) selectionof parameters to be used in the knowledge base; (iii) plan-ning and execution of simulations/measurements andanalysis of results; (iv) definition of linguistic variablesand (v) definition of fuzzy inference rules.
The first stage of methodology presented in [20] con-sists of an extensive literature review on selected domainin order to choose a set of parameters to be consideredfor the system fuzzy design.
The second stage consists of selecting the parameters tobe monitored in that domain. The parameters can be vari-ables to be monitored according to the application require-ments, such as temperature, and pressure. Moreover, theparameters can be WSN physical characteristics, such asnetwork density, or QoS parameters, such as minimum de-lay or data accuracy.
The third stage consists of performing simulations and/or measurements with use of a proper methodology toanalyze the behavior of the WSN in the selected domain.A set of scenarios should be planned to evaluate the behav-ior of the WSN while varying each monitored parameter. Inthis work, we use a database [21] to build the inferencerules (see Section 7.4 for details).
The fourth stage is responsible for building the semanticbase, i.e., for populating the fuzzy knowledge base for thefuzzy system. The base is built from the data obtained inthe simulations/measurements performed during the thirdstage. It is necessary the definition of all the linguistic vari-ables of fuzzy system for building the semantic base. Weassumed that the linguistic variables are defined througha quintuple (X, L, U, G, M) [22], where X is the variablesymbolic name; L is the set of labels assumed by X; U isthe universe of discourse that contains all possible valuesassumed by X; G is the syntactic rule, usually defined inthe form of a grammar; and M are the semantic rules thatdefine the meaning of each label L (also known as member-ship function). To simplify the G grammars definition weadopted the approach based on the use of an ordered struc-ture of linguistic terms, presented in [22]. Therefore,according to such approach, we supply directly the setsof primary terms (also known as fuzzy sets or sets of la-bels), distributed over a scale on which a complete (total)order is established.
The fifth stage in generating the knowledge base con-sists of building the inference rules that relate the linguis-tic values of the fuzzy variables. Once the fuzzy variablesare defined, the inference rules for each fuzzy set are builttaking into account the relation between the fuzzy sets andthe behaviors of the WSN according to the specifiedscenarios.
6. Case study: structural damage detection, location andextent estimation
Nowadays WSNs are widely used for SHM systems[23,24] mainly because such networks have low cost ofdeployment and maintenance and a high degree of flexibil-ity and reconfigurability of the installed nodes. SHM sys-tems aim to detect and localize damages in engineeringstructures such as buildings, bridges, mines and offshoreplatforms. In general, SHM applications rely on measuringthe structural response to natural stimuli or forced excita-tion. Natural stimuli can be caused by earthquakes or otherevents and forced stimuli can be produced by hydraulic orpiezoelectric shakers. A variety of sensors, such as acceler-ometers, stress/strain gauges, corrosion, crack, delamina-tion and humidity, can be used to measure structuralresponses.
SHM systems perform a high density sensing of themonitored environment. Thus, it is interesting to applymethods that save energy and help extend the networklifetime. In this section we describe our proposed semanticclustering method applied to the SHM domain and wepresent it based on the Sensor-SHM algorithm [25]. Sen-sor-SHM is a distributed algorithm for WSNs which per-forms damage detection, localization and extentdetermination in engineering structures, making use ofthe shifts in the structure’s modal frequencies.
In this work, we use only the function of damage detec-tion of Sensor-SHM algorithm and then we apply oursemantic clustering method to save energy and to improvethe data accuracy. Below, we explain the steps performedby the Sensor-SHM for damage detection in engineeringstructures. Further details on the process of structural loca-tion and extent estimation performed by Sensor-SHM canbe found in [25].
It is important mentioning that in our proposal, we as-sume that the damage occurs gradually. Our semantic clus-tering algorithm starts whenever the Sensor-SHM detectsthe first relevant changes in the modal frequency valuesof the structure. Catastrophic events or sudden damagesare out of the scope of this work.
6.1. Sensor-SHM: structural damage detection
In the Sensor-SHM algorithm, a hierarchical networktopology comprised of two layers is assumed. The lowerlayer contains sensor nodes organized in clusters2 andthe higher layer contains CHs. Sensor nodes perform onlysensing tasks and communicate with their correspondingcluster head. CHs do not perform sensing tasks and areresponsible for coordinating the communication and pro-cessing inside their respective clusters. Each CH is awareof its CH neighbors.
The presence of damage in a engineering structure cancause changes in all modal frequencies in a given positionof the sensor node [26]. Therefore, the perceived changedepends on the position of the sensor node, e.g. if it is
A.R. Rocha et al. / Computer Networks 56 (2012) 1627–1645 1633
located near the damage. The part of Sensor-SHM algo-rithm for damage detection is explained as follows.
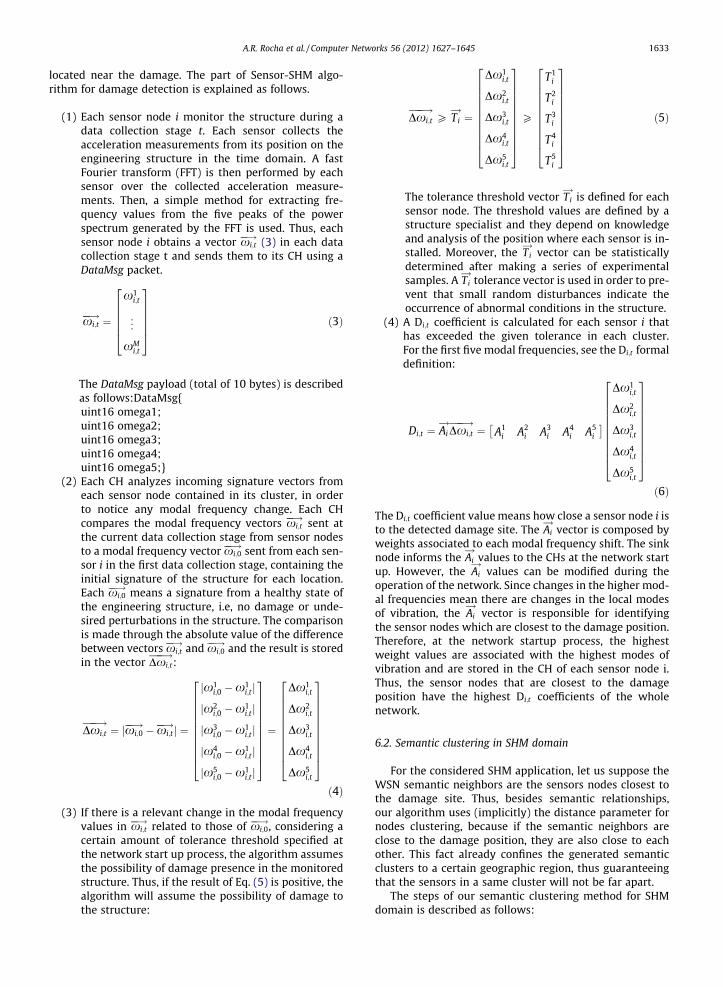
(1) Each sensor node i monitor the structure during adata collection stage t. Each sensor collects theacceleration measurements from its position on theengineering structure in the time domain. A fastFourier transform (FFT) is then performed by eachsensor over the collected acceleration measure-ments. Then, a simple method for extracting fre-quency values from the five peaks of the powerspectrum generated by the FFT is used. Thus, eachsensor node i obtains a vector xi;t
��! (3) in each datacollection stage t and sends them to its CH using aDataMsg packet.
xi;t��! ¼
x1i;t
..
.
xMi;t
266664
377775 ð3Þ
The DataMsg payload (total of 10 bytes) is describedas follows:DataMsg{uint16 omega1;uint16 omega2;uint16 omega3;uint16 omega4;uint16 omega5;}
(2) Each CH analyzes incoming signature vectors fromeach sensor node contained in its cluster, in orderto notice any modal frequency change. Each CHcompares the modal frequency vectors xi;t
��! sent atthe current data collection stage from sensor nodesto a modal frequency vector xi;0
��! sent from each sen-sor i in the first data collection stage, containing theinitial signature of the structure for each location.Each xi;0
��! means a signature from a healthy state ofthe engineering structure, i.e, no damage or unde-sired perturbations in the structure. The comparisonis made through the absolute value of the differencebetween vectors xi;t
��! and xi;0��! and the result is stored
in the vector Dxi;t���!
:
Dxi;t���! ¼ jxi;0
��!�xi;t��!j ¼
jx1i;0 �x1
i;tj
jx2i;0 �x1
i;tj
jx3i;0 �x1
i;tj
jx4i;0 �x1
i;tj
jx5i;0 �x1
i;tj
26666666664
37777777775¼
Dx1i;t
Dx2i;t
Dx3i;t
Dx4i;t
Dx5i;t
26666666664
37777777775ð4Þ
(3) If there is a relevant change in the modal frequencyvalues in xi;t
��! related to those of xi;0��!, considering a
certain amount of tolerance threshold specified atthe network start up process, the algorithm assumesthe possibility of damage presence in the monitoredstructure. Thus, if the result of Eq. (5) is positive, thealgorithm will assume the possibility of damage tothe structure:
Dxi;t���!
P Ti!¼
Dx1i;t
Dx2i;t
Dx3i;t
Dx4i;t
Dx5i;t
26666666664
37777777775
P
T1i
T2i
T3i
T4i
T5i
26666666664
37777777775
ð5Þ
!
The tolerance threshold vector Ti is defined for eachsensor node. The threshold values are defined by astructure specialist and they depend on knowledgeand analysis of the position where each sensor is in-stalled. Moreover, the Ti!vector can be statistically
determined after making a series of experimentalsamples. A Ti
!tolerance vector is used in order to pre-
vent that small random disturbances indicate theoccurrence of abnormal conditions in the structure.
(4) A Di;t coefficient is calculated for each sensor i thathas exceeded the given tolerance in each cluster.For the first five modal frequencies, see the Di;t formaldefinition:
Di;t ¼ Ai!
Dxi;t���! ¼ A1
i A2i A3
i A4i A5
i
� �Dx1
i;t
Dx2i;t
Dx3i;t
Dx4i;t
Dx5i;t
26666666664
37777777775ð6Þ
The Di;t coefficient value means how close a sensor node i isto the detected damage site. The Ai
!vector is composed by
weights associated to each modal frequency shift. The sinknode informs the Ai
!values to the CHs at the network start
up. However, the Ai!
values can be modified during theoperation of the network. Since changes in the higher mod-al frequencies mean there are changes in the local modesof vibration, the Ai
!vector is responsible for identifying
the sensor nodes which are closest to the damage position.Therefore, at the network startup process, the highestweight values are associated with the highest modes ofvibration and are stored in the CH of each sensor node i.Thus, the sensor nodes that are closest to the damageposition have the highest Di;t coefficients of the wholenetwork.
6.2. Semantic clustering in SHM domain
For the considered SHM application, let us suppose theWSN semantic neighbors are the sensors nodes closest tothe damage site. Thus, besides semantic relationships,our algorithm uses (implicitly) the distance parameter fornodes clustering, because if the semantic neighbors areclose to the damage position, they are also close to eachother. This fact already confines the generated semanticclusters to a certain geographic region, thus guaranteeingthat the sensors in a same cluster will not be far apart.
The steps of our semantic clustering method for SHMdomain is described as follows:
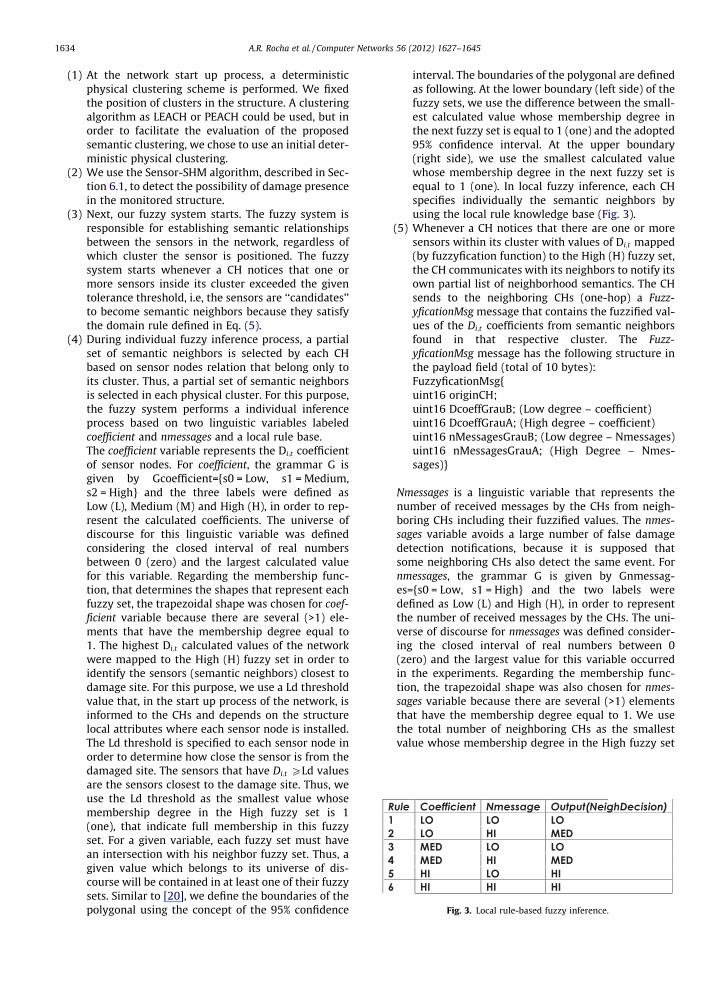
Fig. 3. Local rule-based fuzzy inference.
1634 A.R. Rocha et al. / Computer Networks 56 (2012) 1627–1645
(1) At the network start up process, a deterministicphysical clustering scheme is performed. We fixedthe position of clusters in the structure. A clusteringalgorithm as LEACH or PEACH could be used, but inorder to facilitate the evaluation of the proposedsemantic clustering, we chose to use an initial deter-ministic physical clustering.
(2) We use the Sensor-SHM algorithm, described in Sec-tion 6.1, to detect the possibility of damage presencein the monitored structure.
(3) Next, our fuzzy system starts. The fuzzy system isresponsible for establishing semantic relationshipsbetween the sensors in the network, regardless ofwhich cluster the sensor is positioned. The fuzzysystem starts whenever a CH notices that one ormore sensors inside its cluster exceeded the giventolerance threshold, i.e, the sensors are ‘‘candidates’’to become semantic neighbors because they satisfythe domain rule defined in Eq. (5).
(4) During individual fuzzy inference process, a partialset of semantic neighbors is selected by each CHbased on sensor nodes relation that belong only toits cluster. Thus, a partial set of semantic neighborsis selected in each physical cluster. For this purpose,the fuzzy system performs a individual inferenceprocess based on two linguistic variables labeledcoefficient and nmessages and a local rule base.The coefficient variable represents the Di;t coefficientof sensor nodes. For coefficient, the grammar G isgiven by Gcoefficient={s0 = Low, s1 = Medium,s2 = High} and the three labels were defined asLow (L), Medium (M) and High (H), in order to rep-resent the calculated coefficients. The universe ofdiscourse for this linguistic variable was definedconsidering the closed interval of real numbersbetween 0 (zero) and the largest calculated valuefor this variable. Regarding the membership func-tion, that determines the shapes that represent eachfuzzy set, the trapezoidal shape was chosen for coef-ficient variable because there are several (>1) ele-ments that have the membership degree equal to1. The highest Di;t calculated values of the networkwere mapped to the High (H) fuzzy set in order toidentify the sensors (semantic neighbors) closest todamage site. For this purpose, we use a Ld thresholdvalue that, in the start up process of the network, isinformed to the CHs and depends on the structurelocal attributes where each sensor node is installed.The Ld threshold is specified to each sensor node inorder to determine how close the sensor is from thedamaged site. The sensors that have Di;t PLd valuesare the sensors closest to the damage site. Thus, weuse the Ld threshold as the smallest value whosemembership degree in the High fuzzy set is 1(one), that indicate full membership in this fuzzyset. For a given variable, each fuzzy set must havean intersection with his neighbor fuzzy set. Thus, agiven value which belongs to its universe of dis-course will be contained in at least one of their fuzzysets. Similar to [20], we define the boundaries of thepolygonal using the concept of the 95% confidence
interval. The boundaries of the polygonal are definedas following. At the lower boundary (left side) of thefuzzy sets, we use the difference between the small-est calculated value whose membership degree inthe next fuzzy set is equal to 1 (one) and the adopted95% confidence interval. At the upper boundary(right side), we use the smallest calculated valuewhose membership degree in the next fuzzy set isequal to 1 (one). In local fuzzy inference, each CHspecifies individually the semantic neighbors byusing the local rule knowledge base (Fig. 3).
(5) Whenever a CH notices that there are one or moresensors within its cluster with values of Di;t mapped(by fuzzyfication function) to the High (H) fuzzy set,the CH communicates with its neighbors to notify itsown partial list of neighborhood semantics. The CHsends to the neighboring CHs (one-hop) a Fuzz-yficationMsg message that contains the fuzzified val-ues of the Di;t coefficients from semantic neighborsfound in that respective cluster. The Fuzz-yficationMsg message has the following structure inthe payload field (total of 10 bytes):
FuzzyficationMsg{uint16 originCH;uint16 DcoeffGrauB; (Low degree – coefficient)uint16 DcoeffGrauA; (High degree – coefficient)uint16 nMessagesGrauB; (Low degree – Nmessages)uint16 nMessagesGrauA; (High Degree – Nmes-sages)}Nmessages is a linguistic variable that represents thenumber of received messages by the CHs from neigh-boring CHs including their fuzzified values. The nmes-sages variable avoids a large number of false damagedetection notifications, because it is supposed thatsome neighboring CHs also detect the same event. Fornmessages, the grammar G is given by Gnmessag-es={s0 = Low, s1 = High} and the two labels weredefined as Low (L) and High (H), in order to representthe number of received messages by the CHs. The uni-verse of discourse for nmessages was defined consider-ing the closed interval of real numbers between 0(zero) and the largest value for this variable occurredin the experiments. Regarding the membership func-tion, the trapezoidal shape was also chosen for nmes-sages variable because there are several (>1) elementsthat have the membership degree equal to 1. We usethe total number of neighboring CHs as the smallestvalue whose membership degree in the High fuzzy set
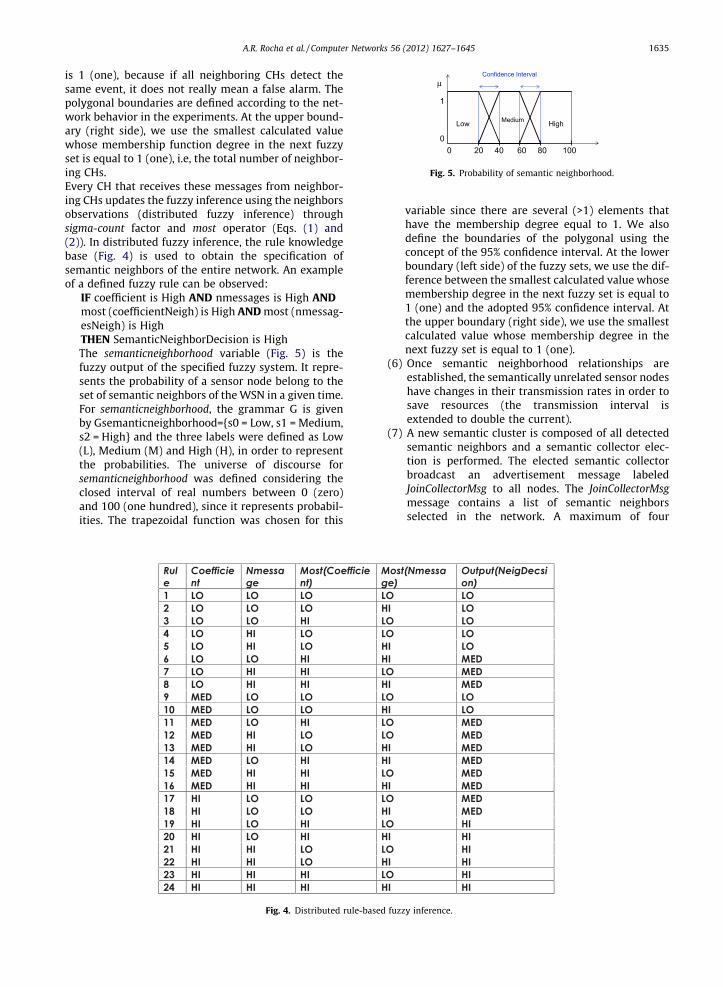
0 20 40 60 80 100
Confidence Interval
0
1
μ
Low Medium High
Fig. 5. Probability of semantic neighborhood.
A.R. Rocha et al. / Computer Networks 56 (2012) 1627–1645 1635
is 1 (one), because if all neighboring CHs detect thesame event, it does not really mean a false alarm. Thepolygonal boundaries are defined according to the net-work behavior in the experiments. At the upper bound-ary (right side), we use the smallest calculated valuewhose membership function degree in the next fuzzyset is equal to 1 (one), i.e, the total number of neighbor-ing CHs.Every CH that receives these messages from neighbor-ing CHs updates the fuzzy inference using the neighborsobservations (distributed fuzzy inference) throughsigma-count factor and most operator (Eqs. (1) and(2)). In distributed fuzzy inference, the rule knowledgebase (Fig. 4) is used to obtain the specification ofsemantic neighbors of the entire network. An exampleof a defined fuzzy rule can be observed:
IF coefficient is High AND nmessages is High ANDmost (coefficientNeigh) is High AND most (nmessag-esNeigh) is HighTHEN SemanticNeighborDecision is HighThe semanticneighborhood variable (Fig. 5) is thefuzzy output of the specified fuzzy system. It repre-sents the probability of a sensor node belong to theset of semantic neighbors of the WSN in a given time.For semanticneighborhood, the grammar G is givenby Gsemanticneighborhood={s0 = Low, s1 = Medium,s2 = High} and the three labels were defined as Low(L), Medium (M) and High (H), in order to representthe probabilities. The universe of discourse forsemanticneighborhood was defined considering theclosed interval of real numbers between 0 (zero)and 100 (one hundred), since it represents probabil-ities. The trapezoidal function was chosen for this
Fig. 4. Distributed rule-based fuzz
variable since there are several (>1) elements thathave the membership degree equal to 1. We alsodefine the boundaries of the polygonal using theconcept of the 95% confidence interval. At the lowerboundary (left side) of the fuzzy sets, we use the dif-ference between the smallest calculated value whosemembership degree in the next fuzzy set is equal to1 (one) and the adopted 95% confidence interval. Atthe upper boundary (right side), we use the smallestcalculated value whose membership degree in thenext fuzzy set is equal to 1 (one).
(6) Once semantic neighborhood relationships areestablished, the semantically unrelated sensor nodeshave changes in their transmission rates in order tosave resources (the transmission interval isextended to double the current).
(7) A new semantic cluster is composed of all detectedsemantic neighbors and a semantic collector elec-tion is performed. The elected semantic collectorbroadcast an advertisement message labeledJoinCollectorMsg to all nodes. The JoinCollectorMsgmessage contains a list of semantic neighborsselected in the network. A maximum of four
y inference.
1636 A.R. Rocha et al. / Computer Networks 56 (2012) 1627–1645
semantic neighbors is advertised per message due toTinyOS message size. Whenever there are moresemantic neighbors, the approach will send multipleJoinCollectorMsg messages including the differentidentifiers. Each semantic neighbor that receive thecluster-head advertisement message might compareits identifier to the list of semantic neighbors identi-fier and decide if join or not to the semantic cluster.A JoinCollectorMsg has the following structure in thepayload field (total of 10 bytes):
JoinCollectorMsg{uint16 idSemanticCollector;uint16 sneighbors[4]; (Four IDs per message)}The semantic collector is responsible for sending a(ReportMsg) message containing the reports to the sinknodes. The ReportMsg message contains the value of Di;t
coefficient resulting from an aggregation methodperformed on the semantic collector. The actual aggre-gation method is the mean of the values Di;t received bysemantic neighbors. The aggregation degree is definedas the number of packets aggregated into a singlepacket transmission. In this case, the aggregationdegree is equivalent to the number of semanticneighbors of the network. A ReportMsg has the follow-ing structure in the field of data (content of total sixbytes):
ReportMsg{uint16 DcoeffAggr; (aggregation method output)uint16 pertinency; (fuzzy output)uint16 sneighbors; (number of semantic neighbors)}
(8) Whenever a new damage is detected, both a newelection of the semantic neighbors and a newsemantic clustering are performed.
In cases of multiple damages or large damages, it is pos-sible the occurrence of multiple semantic collectors thatcan send to the sink node multiple reports from the differ-ent positions in the structure.
7. Experimental evaluation
7.1. Goals
Four sets of experiments were performed in order toevaluate the impact of our proposal in the network, con-sidering the following metrics: overhead of messagesgenerated in the network, total of bytes sent, energy con-sumption and memory usage. Experiments I and II aim toevaluate the proposal in two scenarios of damage. Experi-ment III aims to assess the impact over the energy savingof the selected aggregation method in our proposal. Final-ly, experiment IV aims at comparing our proposed seman-tic clustering algorithm to a deterministic clusteringmethod and the LEACH algorithm. In this experiment,besides the number of sent messages, total of bytes sent,energy consumption and memory usage, we also evaluatethe data accuracy and the energy used to establish theclusters.
7.2. Environment
We used Crossbow Technology’s [13] Micaz wirelesssensors with the following specification: ATMEGA128Lmicroprocessor, CC2420 radio (2.4 Hz), 128 kB program-mable flash memory, 512 kB external serial flash, 4 kB EE-PROM. The MIB520 is used to access data from the sinknode (or a sniffer that captures network traffic to posterioranalysis) through its USB interface.
NesC [27] and TinyOs (version 1.x) [28], a component-oriented operating system, have been used in the systemimplementation. Two modules were implemented: Sens-orNodeModule and ClusterHeadModule. The SensorNode-Module runs only at the sensor nodes, which send thevalues of the five modal frequencies for the CHs. The pack-et transmission rates of each sensor were set with differentvalues. These values were chosen in the range [500,1300](ms) to avoid a high rate of packet collisions. The Cluster-HeadModule runs only at the CHs which perform the func-tions described in the previous section. After the executionof ClusterHeadModule, all the CHs which received fuzzifi-cation messages from neighbors converge to an identicalsemantic neighborhood table. Every sensor node was con-figured in a low power mode (low energy), regardless theyare CHs or sensors.
The Xmesh [29] routing protocol developed by Cross-bow Technology was selected for use in our experiments.In order to evaluate the data sent over the network, weuse the Xniffer [29] development tool, which is includedin the sensors kit from Crossbow.
7.3. Energy model
We used the energy model [30] defined for Micaz sen-sors to assess the energy consumption in transmissions:
Et ¼ Psent � Plength � TB� It � V ð7Þ
where:
� Psent = number of sent packets.
� Plength = length of a packet in bytes.� TB = byte transmission time (32 ls).� It = transmit mode current = 17.4 mA.� V = supply voltage (3 V).
The values used for TB, It and V parameters were foundin the Crossbow Micaz Datasheet [31], which are also equalto the values presented in [30].
The variable Plength depends on the type of the packetsent. For each algorithm, there are different packet typesand sizes. The sections which describe our experiments in-clude the specific values of packet types and sizes used toassess the energy consumption.
In addition to the packets exchanged by our application,we also evaluated the packets related to the Xmesh routingprotocol. Every node in the network periodically sendsHealth and Rte messages. The Rte messages are used toupdate the routing table. The Health messages are sent tothe sink node and comprise information such as theremaining energy of the node and number of packets sent
A.R. Rocha et al. / Computer Networks 56 (2012) 1627–1645 1637
and received. The packet sizes (including their headersizes) are given below:
� Rte = 27 or 12 bytes.� Health = 25 or 29 bytes.� AckDwn = 10 bytes.
7.4. Database
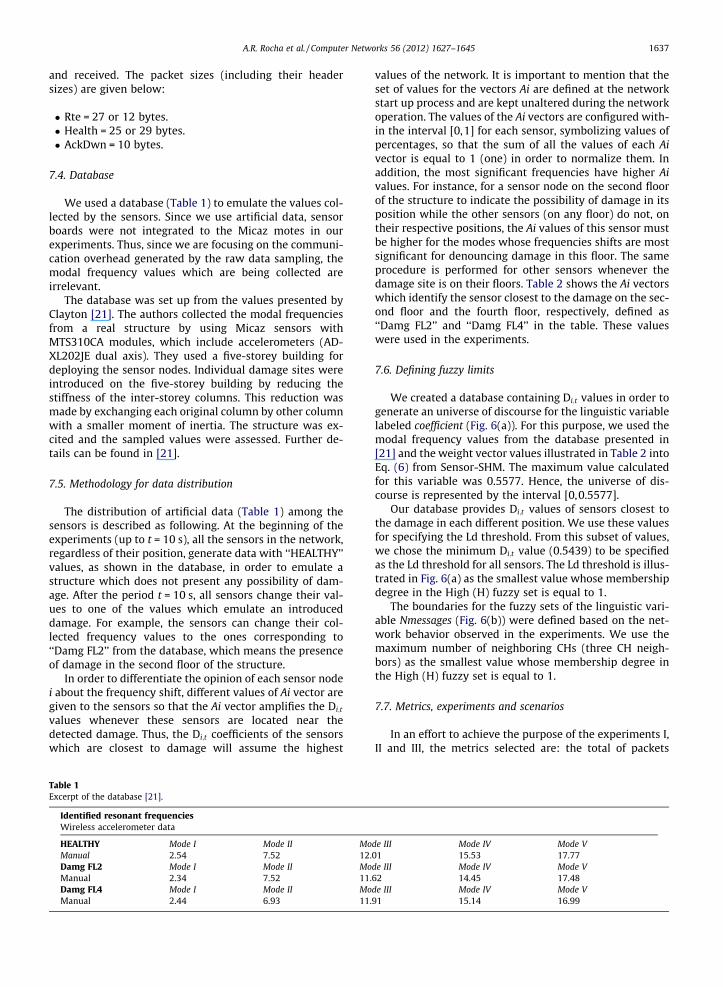
We used a database (Table 1) to emulate the values col-lected by the sensors. Since we use artificial data, sensorboards were not integrated to the Micaz motes in ourexperiments. Thus, since we are focusing on the communi-cation overhead generated by the raw data sampling, themodal frequency values which are being collected areirrelevant.
The database was set up from the values presented byClayton [21]. The authors collected the modal frequenciesfrom a real structure by using Micaz sensors withMTS310CA modules, which include accelerometers (AD-XL202JE dual axis). They used a five-storey building fordeploying the sensor nodes. Individual damage sites wereintroduced on the five-storey building by reducing thestiffness of the inter-storey columns. This reduction wasmade by exchanging each original column by other columnwith a smaller moment of inertia. The structure was ex-cited and the sampled values were assessed. Further de-tails can be found in [21].
7.5. Methodology for data distribution
The distribution of artificial data (Table 1) among thesensors is described as following. At the beginning of theexperiments (up to t = 10 s), all the sensors in the network,regardless of their position, generate data with ‘‘HEALTHY’’values, as shown in the database, in order to emulate astructure which does not present any possibility of dam-age. After the period t = 10 s, all sensors change their val-ues to one of the values which emulate an introduceddamage. For example, the sensors can change their col-lected frequency values to the ones corresponding to‘‘Damg FL2’’ from the database, which means the presenceof damage in the second floor of the structure.
In order to differentiate the opinion of each sensor nodei about the frequency shift, different values of Ai vector aregiven to the sensors so that the Ai vector amplifies the Di;t
values whenever these sensors are located near thedetected damage. Thus, the Di;t coefficients of the sensorswhich are closest to damage will assume the highest
Table 1Excerpt of the database [21].
Identified resonant frequenciesWireless accelerometer data
HEALTHY Mode I Mode II MoManual 2.54 7.52 12.Damg FL2 Mode I Mode II MoManual 2.34 7.52 11.Damg FL4 Mode I Mode II MoManual 2.44 6.93 11.
values of the network. It is important to mention that theset of values for the vectors Ai are defined at the networkstart up process and are kept unaltered during the networkoperation. The values of the Ai vectors are configured with-in the interval [0,1] for each sensor, symbolizing values ofpercentages, so that the sum of all the values of each Aivector is equal to 1 (one) in order to normalize them. Inaddition, the most significant frequencies have higher Aivalues. For instance, for a sensor node on the second floorof the structure to indicate the possibility of damage in itsposition while the other sensors (on any floor) do not, ontheir respective positions, the Ai values of this sensor mustbe higher for the modes whose frequencies shifts are mostsignificant for denouncing damage in this floor. The sameprocedure is performed for other sensors whenever thedamage site is on their floors. Table 2 shows the Ai vectorswhich identify the sensor closest to the damage on the sec-ond floor and the fourth floor, respectively, defined as‘‘Damg FL2’’ and ‘‘Damg FL4’’ in the table. These valueswere used in the experiments.
7.6. Defining fuzzy limits
We created a database containing Di;t values in order togenerate an universe of discourse for the linguistic variablelabeled coefficient (Fig. 6(a)). For this purpose, we used themodal frequency values from the database presented in[21] and the weight vector values illustrated in Table 2 intoEq. (6) from Sensor-SHM. The maximum value calculatedfor this variable was 0.5577. Hence, the universe of dis-course is represented by the interval [0,0.5577].
Our database provides Di;t values of sensors closest tothe damage in each different position. We use these valuesfor specifying the Ld threshold. From this subset of values,we chose the minimum Di;t value (0.5439) to be specifiedas the Ld threshold for all sensors. The Ld threshold is illus-trated in Fig. 6(a) as the smallest value whose membershipdegree in the High (H) fuzzy set is equal to 1.
The boundaries for the fuzzy sets of the linguistic vari-able Nmessages (Fig. 6(b)) were defined based on the net-work behavior observed in the experiments. We use themaximum number of neighboring CHs (three CH neigh-bors) as the smallest value whose membership degree inthe High (H) fuzzy set is equal to 1.
7.7. Metrics, experiments and scenarios
In an effort to achieve the purpose of the experiments I,II and III, the metrics selected are: the total of packets
de III Mode IV Mode V01 15.53 17.77de III Mode IV Mode V62 14.45 17.48de III Mode IV Mode V91 15.14 16.99
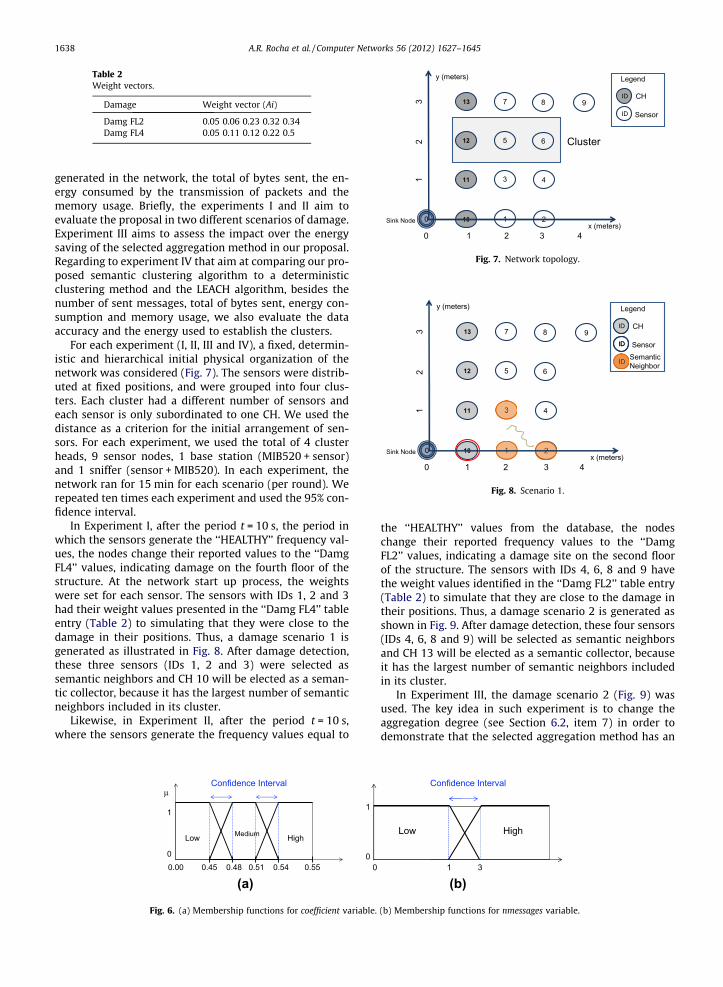
Table 2Weight vectors.
Damage Weight vector (Ai)
Damg FL2 0.05 0.06 0.23 0.32 0.34Damg FL4 0.05 0.11 0.12 0.22 0.5
01
2
3
11
12
Sink Node
13
0
0 1 2 3 4
3
5
7
4
6
8 9Sensor
CH
Legend
x (meters)
y (meters)
Cluster
10 1 2
ID
ID
Fig. 7. Network topology.
01
2
3
10
11
12
Sink Node
13
0
0 1 2 3 4
5
7
4
6
8 9
x (meters)
y (meters)
Sensor
CH
Legend
ID
ID
SemanticNeighbor
ID
ID
Fig. 8. Scenario 1.
1638 A.R. Rocha et al. / Computer Networks 56 (2012) 1627–1645
generated in the network, the total of bytes sent, the en-ergy consumed by the transmission of packets and thememory usage. Briefly, the experiments I and II aim toevaluate the proposal in two different scenarios of damage.Experiment III aims to assess the impact over the energysaving of the selected aggregation method in our proposal.Regarding to experiment IV that aim at comparing our pro-posed semantic clustering algorithm to a deterministicclustering method and the LEACH algorithm, besides thenumber of sent messages, total of bytes sent, energy con-sumption and memory usage, we also evaluate the dataaccuracy and the energy used to establish the clusters.
For each experiment (I, II, III and IV), a fixed, determin-istic and hierarchical initial physical organization of thenetwork was considered (Fig. 7). The sensors were distrib-uted at fixed positions, and were grouped into four clus-ters. Each cluster had a different number of sensors andeach sensor is only subordinated to one CH. We used thedistance as a criterion for the initial arrangement of sen-sors. For each experiment, we used the total of 4 clusterheads, 9 sensor nodes, 1 base station (MIB520 + sensor)and 1 sniffer (sensor + MIB520). In each experiment, thenetwork ran for 15 min for each scenario (per round). Werepeated ten times each experiment and used the 95% con-fidence interval.
In Experiment I, after the period t = 10 s, the period inwhich the sensors generate the ‘‘HEALTHY’’ frequency val-ues, the nodes change their reported values to the ‘‘DamgFL4’’ values, indicating damage on the fourth floor of thestructure. At the network start up process, the weightswere set for each sensor. The sensors with IDs 1, 2 and 3had their weight values presented in the ‘‘Damg FL4’’ tableentry (Table 2) to simulating that they were close to thedamage in their positions. Thus, a damage scenario 1 isgenerated as illustrated in Fig. 8. After damage detection,these three sensors (IDs 1, 2 and 3) were selected assemantic neighbors and CH 10 will be elected as a seman-tic collector, because it has the largest number of semanticneighbors included in its cluster.
Likewise, in Experiment II, after the period t = 10 s,where the sensors generate the frequency values equal to
0.00 0.45 0.48 0.51 0.54 0.55
Confidence Interval
0
1
μ
Low Medium High
00
1
(a)
Fig. 6. (a) Membership functions for coefficient variable.
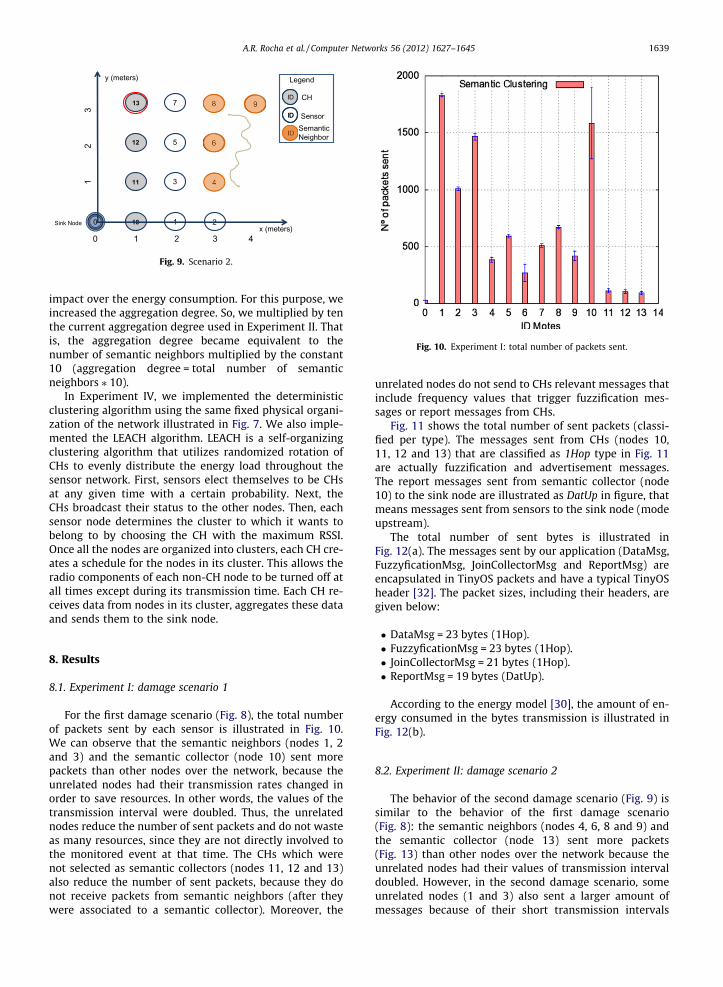
the ‘‘HEALTHY’’ values from the database, the nodeschange their reported frequency values to the ‘‘DamgFL2’’ values, indicating a damage site on the second floorof the structure. The sensors with IDs 4, 6, 8 and 9 havethe weight values identified in the ‘‘Damg FL2’’ table entry(Table 2) to simulate that they are close to the damage intheir positions. Thus, a damage scenario 2 is generated asshown in Fig. 9. After damage detection, these four sensors(IDs 4, 6, 8 and 9) will be selected as semantic neighborsand CH 13 will be elected as a semantic collector, becauseit has the largest number of semantic neighbors includedin its cluster.
In Experiment III, the damage scenario 2 (Fig. 9) wasused. The key idea in such experiment is to change theaggregation degree (see Section 6.2, item 7) in order todemonstrate that the selected aggregation method has an
1 3
Confidence Interval
Low High
(b)
(b) Membership functions for nmessages variable.
01
2
3
10
11
12
Sink Node
13
0
0 1 2 3 4
1
3
5
7
2x (meters)
y (meters)
Sensor
CH
Legend
ID
ID
SemanticNeighbor
ID
ID
Fig. 9. Scenario 2.
Fig. 10. Experiment I: total number of packets sent.
A.R. Rocha et al. / Computer Networks 56 (2012) 1627–1645 1639
impact over the energy consumption. For this purpose, weincreased the aggregation degree. So, we multiplied by tenthe current aggregation degree used in Experiment II. Thatis, the aggregation degree became equivalent to thenumber of semantic neighbors multiplied by the constant10 (aggregation degree = total number of semanticneighbors ⁄ 10).
In Experiment IV, we implemented the deterministicclustering algorithm using the same fixed physical organi-zation of the network illustrated in Fig. 7. We also imple-mented the LEACH algorithm. LEACH is a self-organizingclustering algorithm that utilizes randomized rotation ofCHs to evenly distribute the energy load throughout thesensor network. First, sensors elect themselves to be CHsat any given time with a certain probability. Next, theCHs broadcast their status to the other nodes. Then, eachsensor node determines the cluster to which it wants tobelong to by choosing the CH with the maximum RSSI.Once all the nodes are organized into clusters, each CH cre-ates a schedule for the nodes in its cluster. This allows theradio components of each non-CH node to be turned off atall times except during its transmission time. Each CH re-ceives data from nodes in its cluster, aggregates these dataand sends them to the sink node.
8. Results
8.1. Experiment I: damage scenario 1
For the first damage scenario (Fig. 8), the total numberof packets sent by each sensor is illustrated in Fig. 10.We can observe that the semantic neighbors (nodes 1, 2and 3) and the semantic collector (node 10) sent morepackets than other nodes over the network, because theunrelated nodes had their transmission rates changed inorder to save resources. In other words, the values of thetransmission interval were doubled. Thus, the unrelatednodes reduce the number of sent packets and do not wasteas many resources, since they are not directly involved tothe monitored event at that time. The CHs which werenot selected as semantic collectors (nodes 11, 12 and 13)also reduce the number of sent packets, because they donot receive packets from semantic neighbors (after theywere associated to a semantic collector). Moreover, the
unrelated nodes do not send to CHs relevant messages thatinclude frequency values that trigger fuzzification mes-sages or report messages from CHs.
Fig. 11 shows the total number of sent packets (classi-fied per type). The messages sent from CHs (nodes 10,11, 12 and 13) that are classified as 1Hop type in Fig. 11are actually fuzzification and advertisement messages.The report messages sent from semantic collector (node10) to the sink node are illustrated as DatUp in figure, thatmeans messages sent from sensors to the sink node (modeupstream).
The total number of sent bytes is illustrated inFig. 12(a). The messages sent by our application (DataMsg,FuzzyficationMsg, JoinCollectorMsg and ReportMsg) areencapsulated in TinyOS packets and have a typical TinyOSheader [32]. The packet sizes, including their headers, aregiven below:
� DataMsg = 23 bytes (1Hop).� FuzzyficationMsg = 23 bytes (1Hop).� JoinCollectorMsg = 21 bytes (1Hop).� ReportMsg = 19 bytes (DatUp).
According to the energy model [30], the amount of en-ergy consumed in the bytes transmission is illustrated inFig. 12(b).
8.2. Experiment II: damage scenario 2
The behavior of the second damage scenario (Fig. 9) issimilar to the behavior of the first damage scenario(Fig. 8): the semantic neighbors (nodes 4, 6, 8 and 9) andthe semantic collector (node 13) sent more packets(Fig. 13) than other nodes over the network because theunrelated nodes had their values of transmission intervaldoubled. However, in the second damage scenario, someunrelated nodes (1 and 3) also sent a larger amount ofmessages because of their short transmission intervals

Fig. 11. Experiment I: total number of packets sent (per type).
Fig. 12. Experiment I: (a) Total number of bytes sent and (b) energy consumption.
Fig. 13. Experiment II: total number of packets sent.
1640 A.R. Rocha et al. / Computer Networks 56 (2012) 1627–1645
initially configured. The CHs which were not selected assemantic collectors (nodes 10, 11 and 12) faced a reductionin the number of sent packets, because they do not receivepackets from semantic neighbors (after they were associ-ated to a semantic collector) and the unrelated nodes donot send relevant packets to CHs. The metrics are calcu-lated and presented in figures as following: packets fromeach type sent by each sensor (Fig. 14), total number of by-tes sent (Fig. 15(a)) and energy consumption (Fig. 15(b)).
8.3. Experiment III: changing aggregation degree
In Experiment III, we multiplied the current aggregationdegree used in experiment II by 10, i.e, the aggregation de-gree became equivalent to the number of semantic neigh-bors multiplied by the constant 10. Thus, we increased thenumber of data packets aggregated into a single reportpacket. Fig. 16 shows that the number of report messages(DatUp type) sent to the sink node decreased in compari-son to the Experiment II. The assessed energy saving was
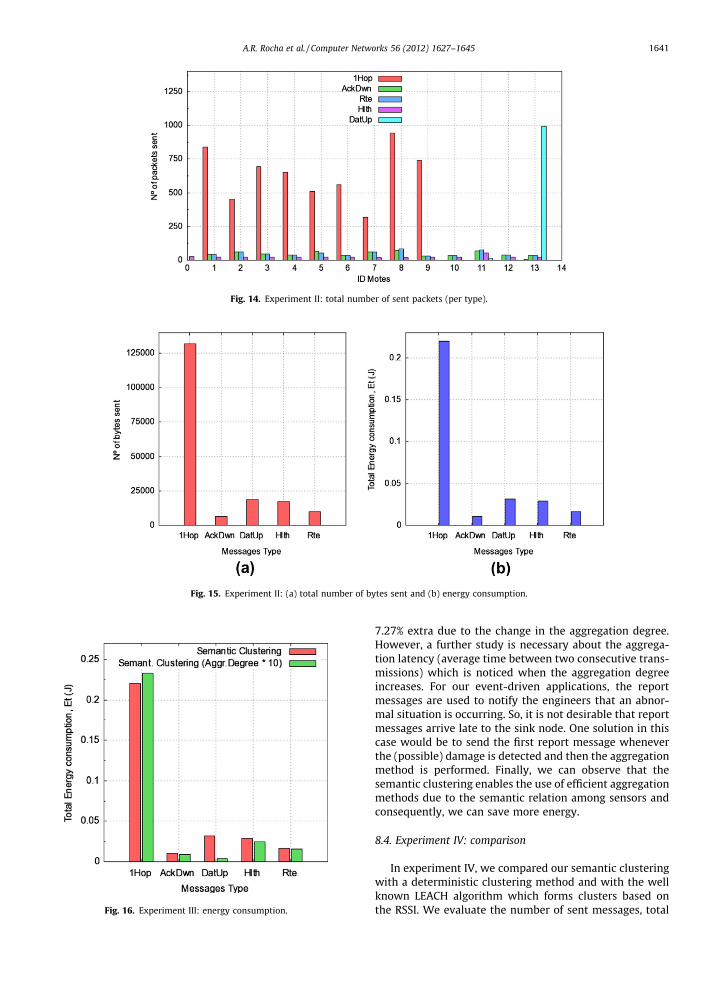
Fig. 14. Experiment II: total number of sent packets (per type).
Fig. 15. Experiment II: (a) total number of bytes sent and (b) energy consumption.
Fig. 16. Experiment III: energy consumption.
A.R. Rocha et al. / Computer Networks 56 (2012) 1627–1645 1641
7.27% extra due to the change in the aggregation degree.However, a further study is necessary about the aggrega-tion latency (average time between two consecutive trans-missions) which is noticed when the aggregation degreeincreases. For our event-driven applications, the reportmessages are used to notify the engineers that an abnor-mal situation is occurring. So, it is not desirable that reportmessages arrive late to the sink node. One solution in thiscase would be to send the first report message wheneverthe (possible) damage is detected and then the aggregationmethod is performed. Finally, we can observe that thesemantic clustering enables the use of efficient aggregationmethods due to the semantic relation among sensors andconsequently, we can save more energy.
8.4. Experiment IV: comparison
In experiment IV, we compared our semantic clusteringwith a deterministic clustering method and with the wellknown LEACH algorithm which forms clusters based onthe RSSI. We evaluate the number of sent messages, total

Table 3Memory usage.
Semanticclustering(memory inbytes)
Deterministicclustering(memory inbytes)
LEACH(memoryin bytes)
CHModule 50,484 ROM 41,864 ROM 44,4862567 RAM 2386 RAM 2577 RAM
SensorModule 40,760 ROM 40,532 ROM 44,4862291 RAM 2284 RAM 2284 RAM
1642 A.R. Rocha et al. / Computer Networks 56 (2012) 1627–1645
of sent bytes, energy consumption, memory usage, dataaccuracy and the overhead during the setup phase. Somebenchmarks are given below. Regarding memory usage(Table 3), the proposed semantic clustering uses morememory of the nodes than deterministic clustering algo-rithm, because the code is more complex, since it includesthe fuzzy system described earlier. Our code occupies 17%extra ROM memory and 7% extra RAM for ClusterHead-Module. For SensorNodeModule, the increase was 0.56%of ROM and 0.31% of RAM. When compared to the LEACHalgorithm, our code occupies 11.9% extra ROM memoryand save 0.39% of memory RAM for ClusterHeadModule.In contrast, for SensorNodeModule, we save 9.15% ofROM memory and 12.5% of RAM memory.
Anyway, our proposal still follows the documentation[29] of Crossbow Technology, which recommends thatthe maximum of RAM should not exceed 3750 bytes forthe processor ATMEGA128L (Micaz motes). It is importantthat a WSN application does not consume a lot of RAMmemory, or it will not have enough space for the programexecution.
With regard to the overhead of messages generated inthe network, the network behavior is similar to scenarios1 and 2 (Figs. 8 and 9), then, in summary, we will repro-duce only the results from scenario 1 (experiment I). Asshown in Fig. 17, our proposal obtained a reduction of69.11% and 54.71% of the total number of sent packets
Fig. 17. Experiment IV: total number of packets sent.
when compared to the deterministic and LEACH clusteringmethods respectively. This result is a consequence of thefact that, at the both deterministic and LEACH clusteringalgorithms, the sensors that do not have values ofDi;t PLd (i.e, they are not close to the damage site andare not relevant to the monitored event at that time) alsotransmit a considerable amount of packets, wasting re-sources. Thus, the deterministic and LEACH clusteringalgorithms are energy-intensive because of the amount ofreport messages and communication originated by unre-lated sensors. Moreover, our proposal exploits the seman-tic relation between sensor nodes thus potentiallyproviding a more efficient aggregation method, decreasingthe number of report messages and improving the dataaccuracy. The results (Fig. 18(a)) also show that we faceda reduction of 56.68% and 43.98% in the bytes sent respec-tively when compared to the deterministic and LEACHclustering methods. Consequently, we save 70.25% of en-ergy (Fig. 18(b)) in comparison to the deterministic clus-tering and 47.75% of energy in comparison to the LEACHalgorithms.
Regarding data accuracy, we consider that (i) theaggregation method consists in computing the mean ofthe Di;t values sent from sensor nodes and (ii) the sensorsthat have Di;t PLd values are the sensors closest to thedamage site. Table 4 illustrates the mean value of the re-sults contained in the report messages sent to the sinkfor each algorithm. We use the Di;t PLd expression as aparameter of comparison whose Ld value is equal to0.5439 (see Section 7.6). The semantic clustering is moreaccurate than the others algorithms. This is due to thefact that in our proposal the set of semantic neighborsis grouped into semantic clusters. Thus, only the valuesoriginated by semantic neighbors are considered in theaggregation method performed on the collector semantic.Consequently, the semantic collector aggregates moresimilar data. In contrast, the others two algorithmsaggregate data from both relevant and non-relevantsensors.
Concerning the energy used to establish the clusters, weevaluate the messages sent over the network during thesetup phase. Table 5 shows the energy consumption dueto the messages transmissions during the clustering setupphase for both the semantic clustering and LEACH algo-rithms. Since the deterministic clustering is a static pro-posal without any changes in the positions of clusters itis irrelevant for the comparison. The semantic clusteringused 0.6 mJ (i.e. 0.18% of the total energy consumed)whereas the LEACH algorithm used 241.20 mJ (i.e. 50.23%of the total energy consumed). This is due to the fact thatLEACH algorithm is divided into rounds and each one be-gins with a setup phase. Unlike LEACH algorithm, oursemantic clustering is an event-driven proposal, i.e, thereis no clustering rounds. Whenever a new damage is de-tected, both a new election of the semantic neighborsand a new semantic clustering phase are performed. Thatis why we also evaluate the average energy consumptionrelated to the setup phase per round. Even in this case,the semantic clustering outperforms the LEACHalgorithm.

Fig. 18. Experiment IV: (a) total number of bytes sent and (b) energy consumption.
Table 4Data accuracy (aggregation method).
Ldvalue
Semantic clustering(mean of the values)
Deterministicclustering (mean ofthe values)
LEACH (meanof the values)
0.54 0.55 0.49 0.52
Table 5Set-up phase (average energy consumption).
Semanticclustering
LEACH algorithm
Total(mJ)
Total(%)
Per round(mJ)
Per round(%)
Total(mJ)
Total(%)
0.60 0.18 0.94 0.20 241.20 50.23
A.R. Rocha et al. / Computer Networks 56 (2012) 1627–1645 1643
9. Conclusions and further work
In this paper, we have studied WSNs clustering basedon semantic neighborhood relationships. To this aim, wehave proposed a semantic clustering model based on a fuz-zy inference system in order to both reduce the energyconsumption and improve the accuracy of the data.
Our proposal obtained a reduction of 69.11% and 54.71%of the total number of sent packets when compared to thedeterministic and LEACH clustering algorithms respec-tively. Besides, the assessed energy saving was 7.27% extradue to changing the aggregation degree. Concerning dataaccuracy, our proposal aggregated more similar data thanLEACH and deterministic algorithms. In overall, the pro-posed semantic clustering achieved pretty good resultsand outcomes.
Finally, we will extend our work to consider the optimalclustering solution related to the number of semantic col-lectors, overhead and energy saving. Whenever a semanticcluster is large, there is an overhead in the CH to handle the
messages sent from sensors. Otherwise, if there are severalsmall semantic clusters, there are more semantic collectorsand the overhead in this case refers to the control and re-port messages. Hence, there is a tradeoff we intend toinvestigate to possibly find out the most suitable clustersize.
Acknowledgements
This work is partly supported by the National Councilfor Research and Development (CNPq) through processes4781174/2010-1 and 309270/2009-0 for Luci Pirmez;311363/2011-3, 470586/2011-7 and 201090/2009-0 forFlavia Delicato; 481638/2007-5 for José Neuman de Souza;by Research and Projects Financing(FINEP) through pro-cesses 01.10.0549.00 and 01.10.0064.00 for Luci Pirmez;and by Carlos Chagas Filho Foundation for Research Sup-port in the State of Rio de Janeiro (FAPERJ) through pro-cesses E26/101.360/2010 for Luci Pirmez.
References
[1] T. He, S. Krishnamurthy, J.A. Stankovic, T. Abdelzaher, L. Luo, R.Stoleru, T. Yan, L. Gu, Energy-efficient surveillance system usingwireless sensor networks, International Conference on MobileSystems, Applications, and Services, ACM Press, Boston, MA, 2004,pp. 270–283.
[2] R.S. Marin-Perianu, C. Lombriser, P.J.M. Havinga, J. Scholten, G.Troster, Tandem: a context-aware method for spontaneousclustering of dynamic wireless sensor nodes, The Internet ofThings, vol. 4952, Springer, Berlin/Heidelberg, 2008, pp. 341–359.
[3] X.Y.S. Ghiasi, A. Srivastava, M. Sarrafzadeh, Optimal energyaware clustering in sensor networks, Sensors Journal 2 (7) (2002)258–269.
[4] A.A. Abbasi, M. Younis, A survey on clustering algorithms for wirelesssensor networks, Computer Communications 30 (14–15) (2007)2826–2841.
[5] F. Bouhafs, M. Merabti, H. Mokhtar, A semantic clustering routingprotocol for wireless sensor networks, in: ConsumerCommunications and Networking Conference, IEEE ComputerSociety, 2006, pp. 351–355.
[6] Y.M. Tashtoush, M.A. Okour, Fuzzy self-clustering for wireless sensornetworks, in: IEEE/IFIP International Conference on Embedded andUbiquitous Computing, 2008, pp. 223–229.
1644 A.R. Rocha et al. / Computer Networks 56 (2012) 1627–1645
[7] A.R. Rocha, F. Delicato, J.N. de Souza, D.G. Gomes, L. Pirmez, Asemantic middleware for autonomic wireless sensor networks,Workshop on Middleware for Ubiquitous and Pervasive Systems,vol. 389, ACM, Dublin, Irlanda, 2009, pp. 19–25.
[8] A.R. Rocha, I. Santos, L. Pirmez, F.C. Delicato, D.G. Gomes, J.N. deSouza, Semantic clustering in wireless sensor networks, in:Communications: Wireless in Developing Countries and Networksof the Future, IFIP Advances in Information and CommunicationTechnology, vol. 327, Springer, Boston, 2010, pp. 3–14.
[9] D. Bruckner, G. Zucker, J. Simo, W. Herzner, S. Mahlknecht, Semanticneighborhood sensor network for smart surveillance applications,in: International Conference from Scientific Computing toComputational Engineering, 2008.
[10] M. Marin-Perianu, P.J.M. Havinga, D-fler: a distributed fuzzy logicengine for rule-based wireless sensor networks, in: InternationalSymposium on Ubiquitous Computing Systems, Springer Verlag,Germany, 2007, pp. 86–101.
[11] W. Heinzelman, A. Chandrakasan, H. Balakrishnan, An application-specific protocol architecture for wireless microsensor networks,IEEE Transactions on Wireless Communications 1 (4) (2002) 660–670.
[12] S. Hussain, M.R. Islam, E. Shakshuki, M.S. Zaman, Agent-basedpetroleum offshore monitoring using sensor networks, in:International Workshop on Database and Expert SystemsApplications, 2006, pp. 103–107.
[13] Crossbow Technology. http://www.xbox.com/.(Accessed 16.03.11).[14] S. Yi, J. Heo, Y. Cho, J. Hong, Peach: power-efficient and adaptive
clustering hierarchy protocol for wireless sensor networks,Computer Communications 30 (14–15) (2007) 2842–2852.
[15] E.F. Nakamura, A.A.F. Loureiro, A.C. Frery, Information fusion forwireless sensor networks: methods, models, and classifications,Journal ACM Computing Surveys 39 (3) (2007) 1–55.
[16] L.A. Zadeh, Making computer think like people, IEEE Spectrum 8(1984) 26–32.
[17] L.A. Zadeh, Outline of a new approach to the analysis of complexsystems and decision processes, IEEE Transactions on Systems, Man,and Cybernetics SMC-3 (1) (1973) 28–44.
[18] L.A. Zadeh, A computational approach to fuzzy quantifiers in naturallanguages, Computers and Mathematics with Applications 9 (1)(1983) 149–184.
[19] J. Kacprzyk, Group decision making with a fuzzy linguistic majority,Fuzzy Sets and Systems 18 (2) (1986) 105–118.
[20] L. Pirmez, F.C. Delicato, P.F. Pires, A.L. Mostardinha, N.S. de Rezende,Applying fuzzy logic for decision-making on wireless sensornetworks, in: Fuzzy Systems Conference, FUZZ-IEEE, 2007, pp. 1–6.
[21] E.H. Clayton, Y. Qian, O. Orjih, S.J. Dyke, A. Mita, C. Lu, Off-the-shelfmodal analysis: Structural health monitoring with motes, in:International Modal Analysis Conference, 2006.
[22] F. Herrera, E. Herrera-Viedma, Linguistic decision analysis: steps forsolving decision problems under linguistic information, Information,Fuzzy Sets and Systems 115 (1998) 67–82.
[23] K. Chintalapudi, T. Fu, J. Paek, N. Kothari, S. Rangwala, J. Caffrey, R.Govindan, E. Johnson, S. Masri, Monitoring civil structures with awireless sensor network, IEEE Internet Computing 10 (2) (2006) 26–34.
[24] G. Hackmann, F. Sun, N. Castaneda, C. Lu, S. Dyke, A holistic approachto decentralized structural damage localization using wirelesssensor networks, in: Real-Time Systems Symposium, 2008, pp. 35–46.
[25] I. Santos, L. Pirmez, E. Lemos, L. Vaz, F. Delicato, J.N. Souza, Resourceconsumption analysis for a structural health monitoring algorithmusing wireless sensor networks, in: Brazilian Symposium onComputer Networks and Distributed Systems, 2010.
[26] S. Kim, S. Pakzad, D. Culler, J. Demmel, G. Fenves, S. Glaser, M. Turon,Health monitoring of civil infrastructures using wireless sensornetworks, in: International Conference on Information Processing inSensor Networks, 2007, pp. 254–263.
[27] D. Gay, P. Levis, R. von Behren, M. Welsh, E. Brewer, D. Culler, Thenesc language: a holistic approach to networked embedded systems,in: ACM SIGPLAN 2003 Conference on Programming LanguageDesign and Implementation, vol. 38, 2003.
[28] P. Levis, S. Madden, J. Polastre, R. Szewczyk, K. Whitehouse, A. Woo,D. Gay, J. Hill, M. Welsh, E. Brewer, D. Culler. TinyOS: An operatingsystem for wireless sensor networks, In: Ambient Intelligence,Springer-Verlag, 2005.
[29] Xmesh users manual, revision d, pN: 7430-0108-01, 2007.
[30] R. Jurdak, A.G. Ruzzelli, G. O’Hare, Adaptive radio modes in sensornetworks: How deep to sleep? in: IEEE Communications SocietyConference on Ad Hoc and Sensor Networks, 2008.
[31] Datasheet micaz: Wireless measurement system, document PartNumber: 6020-0060-04 Rev A.
[32] Xserve users manual, revision d, pN: 7430-0111-01, 2007.
Atslands R. Rocha is a Ph.D. student at theDepartment of Teleinformatics Engineering ofthe Federal University of Ceará (UFC), Brazil.Her recent research focuses on wirelesssensor networks, semantic middleware, com-putacional intelligence and clustering algo-rithms for sensor networks. She is currentlypart of the research team of the Group ofComputer Networks, Software Engineeringand Systems (GREat/UFC) which performsresearch and development projects in part-nership with other educational institutions
and businesses. She is an Assistant Professor of the Federal University ofCeará, where she teaches for undergraduate course.
Luci Pirmez is a professor at the Institute ofInformatics of the Federal University of Rio deJaneiro (UFRJ), Brazil. She received her M.Sc.and Ph.D. degree, both in computer sciencefrom the Federal University of Rio de Janeiro,Brazil in 1986 and 1996, respectively. She is amember of research staff of the ComputerCenter of Federal University of Rio de Janeiro.Her research interests include wireless net-works, wireless sensor networks, networkmanagement and security. She is one of 300researchers in computer science from all over
Brazil selected to be CNPq researchers. She is currently involved in anumber of research projects with funding from Brazilian governmentagencies, in the areas of wireless networks, wireless sensor networks,
network management and security.Flávia C. Delicato is an Associate Professor ofthe Federal University of Rio de Janeiro, Brazil,where she teaches for undergraduate and post-graduate courses and works as a researcher. In2009 she was a Visitor Researcher at the Mál-aga University, Spain. In 2010 she was a visit-ing academic at the University of Sydney,Australia. She participates in several researchprojects with funding from International andBrazilian government agencies. Her researchinterests are middleware, wireless sensornetworks and Software Engineering tech-
niques applied to ubiquitous systems. She is a Researcher Fellow of theNational Council for Scientific and Technological Development.
Érico Lemos is a master student in the Com-puter Science course of the Federal Universityof Rio de Janeiro (UFRJ), Brazil. Currently he ispart of the research team of the laboratoryLabNet in UFRJ, which develops researches inthe area of sensor networks in UFRJ. Hisresearch interests are wireless sensor net-works, computer network and distributedcomputing.
A.R. Rocha et al. / Computer Networks 56 (2012) 1627–1645 1645
Igor Leão dos Santos is a student in the Pro-duction Engineering course of the FederalUniversity of Rio de Janeiro (UFRJ), Brazil.Currently he is part of the research team ofthe laboratory called LabNet, which developsresearches in the area of sensor networks inUFRJ. His research interests are wireless sen-sor networks, structural health monitoringand statistical process control.
Danielo G. Gomes is an assistant professor atthe Teleinformatics Engineering Departmentof the Federal University of Ceará (UFC), Bra-zil. He received his Ph.D. degree in Réseaux etTélécoms from the University of Evry, France,in 2004. Currently, his research interestsinclude mainly the fields of computer systemsperformance evaluation, cloud computing andWSNs. He has served as a referee for someimportant journals in the area of computernetworks, such as Computer Networks (1389-1286), Computer Communications (0140-
3664), Ad Hoc Networks (1570-8705), Journal of Network and ComputerApplications (1084-8045) and Journal of Network and Systems Manage-ment (1064-7570).
José Neuman de Souza holds a Ph.D. degreeat Paris VI University, France, from 1994.Nowadays he is a CNPq researcher and pro-fessor at the Federal University of Ceará, Bra-zil, developing research activities and givinglectures at the Computer Science Department.He is Area Editor for the following scientificElsevier journals: Computer Networks, Com-puter Communications and Journal of Net-works and Computer Applications. He is theBrazilian representative at the IFIP TC6(communication systems) since 1999.