working party on agricultural policies and markets drivers of
TRANSCRIPT
Organisation for Economic Co-operation and Development
TAD/CA/APM/WP(2020)2/PART2/FINAL
Unclassified English - Or. English
28 May 2020
TRADE AND AGRICULTURE DIRECTORATE
COMMITTEE FOR AGRICULTURE
Working Party on Agricultural Policies and Markets
Drivers of Farm Performance – Part 2
Empirical Country Case Studies
Contact: Catherine Moreddu ([email protected])
JT03462277
This document, as well as any data and map included herein, are without prejudice to the status of or sovereignty over any territory, to the
delimitation of international frontiers and boundaries and to the name of any territory, city or area.

2 TAD/CA/APM/WP(2020)2/PART2/FINAL
DRIVERS OF FARM PERFORMANCE Unclassified
Note by the Secretariat
This analysis of drivers of farm performance, mandated under Expected Output
Result 2.1.2.3 of the 2017-18 Programme of Work and Budget of the Committee for
Agriculture aims at empirically identifying the main conditions for, and obstacles to,
productivity and environmental sustainability of different types of farms in selected OECD
countries.
This study has been conducted by Professor Johannes Sauer (Technical University of
Munich) in collaboration with the OECD Farm-Level Analysis Network, and under the
responsibility of Catherine Moreddu.
The findings of the analysis are reported in three documents:
The Part 1 document contains a short description of the methodological framework
and data, an overview of findings by farm type, and conclusions
[TAD/CA/APM/WP(2020)2/PART1/FINAL]. It also includes three annexes.
Annex A contains the detailed methodology framework applied; Annex B contains
a review of the literature, and Annex C contains tables supporting the overview of
findings.
The Part 2 document contains the results of individual farm cases
[TAD/CA/APM/WP(2020)2/PART2/FINAL].
An annex document contains a series of background tables for each case study,
including descriptive statistics and estimation results (Annex D)
[TAD/CA/APM/WP(2020)2/ANN/FINAL].
This document contains Part 2 of the report.
These three documents were declassified by the Working Party on Agricultural Policies
and Markets on 17-18 March 2020.

TAD/CA/APM/WP(2020)2/PART2/FINAL 3
DRIVERS OF FARM PERFORMANCE Unclassified
Table of contents
Part 2. Discussion of results by country .............................................................................................. 8
1. Australia ............................................................................................................................................. 8
1.1. Australian dairy farms................................................................................................................... 8 1.2. Australian crop farms .................................................................................................................. 13 1.3. Australian mixed crop and livestock farms................................................................................. 16 1.4. Australian beef and sheep farms ................................................................................................. 20 1.5. Australian beef farms .................................................................................................................. 24 1.6. Australian sheep meat farms ....................................................................................................... 28 1.7. Australian wool farms ................................................................................................................. 32
2. Chile .................................................................................................................................................. 36
2.1. Chilean small-scale fruit farms ................................................................................................... 36
3. Czech Republic ................................................................................................................................ 41
3.1. Czech dairy farms ....................................................................................................................... 41
4. Denmark ........................................................................................................................................... 46
4.1. Dairy farms ................................................................................................................................. 46 4.2. Pig farms ..................................................................................................................................... 50
5. Estonia .............................................................................................................................................. 59
5.1. Estonian dairy farms ................................................................................................................... 59
6. France ............................................................................................................................................... 64
6.1. French dairy farms ...................................................................................................................... 64 6.2. French crop farms ....................................................................................................................... 68
7. Hungary ............................................................................................................................................ 74
7.1. Hungarian crop farms ................................................................................................................. 74
8. Ireland .............................................................................................................................................. 78
8.1. Irish dairy farms .......................................................................................................................... 79 8.2. Irish crop farms ........................................................................................................................... 83 8.3. Irish cattle farms ......................................................................................................................... 87 8.4. Irish sheep farms ......................................................................................................................... 97
9. Italy ................................................................................................................................................. 101
9.1. Italian crop farms ...................................................................................................................... 101
10. Korea ............................................................................................................................................ 107
10.1. Korean rice farms .................................................................................................................... 107
11. Norway ......................................................................................................................................... 112
11.1. Norwegian dairy farms ........................................................................................................... 112 11.2. Norwegian crop farms............................................................................................................. 117
4 TAD/CA/APM/WP(2020)2/PART2/FINAL
DRIVERS OF FARM PERFORMANCE Unclassified
11.3. Norwegian cattle farms ........................................................................................................... 121
12. Sweden .......................................................................................................................................... 126
12.1. Swedish dairy farms ................................................................................................................ 126 12.2. Swedish crop farms ................................................................................................................. 130
13. United Kingdom .......................................................................................................................... 135
13.1. UK dairy farms ....................................................................................................................... 135 13.2. UK cereal farms ...................................................................................................................... 139 13.3. UK mixed crop and livestock farms ....................................................................................... 144 13.4. UK pig farms .......................................................................................................................... 148 13.5. UK poultry farms .................................................................................................................... 153
Tables
Table 1.1. Productivity characteristics of Australian dairy farms, by class .......................................... 10 Table 1.2. Multiple characteristics of Australian dairy farms, by class ................................................ 12 Table 1.3. Productivity characteristics of Australian crop farms, by class ............................................ 14 Table 1.4. Multiple characteristics of Australian crop farms, by class .................................................. 15 Table 1.5. Productivity characteristics of Australian crop and livestock farms, by class ..................... 17 Table 1.6. Multiple characteristics of Australian crop and livestock farms, by class ........................... 19 Table 1.7. Productivity characteristics of Australian sheep and beef farms, by class ........................... 22 Table 1.8. Multiple characteristics of Australian beef and sheep farms, by class ................................. 23 Table 1.9. Productivity characteristics of Australian beef farms, by class ............................................ 25 Table 1.10. Multiple characteristics of Australian beef farms, by class ................................................ 27 Table 1.11. Productivity characteristics of Australian sheep meat farms, by class ............................... 30 Table 1.12. Multiple characteristics of Australian sheep meat farms, by class ..................................... 31 Table 1.13. Productivity characteristics of Australian wool farms, by class ......................................... 34 Table 1.14. Multiple characteristics of Australian wool farms, by class ............................................... 35 Table 2.1. Productivity characteristics of Chilean small-scale fruit farms, by class ............................. 38 Table 2.2. Multiple characteristics of Chilean small-scale fruit farms, by class ................................... 40 Table 3.1. Productivity characteristics of Czech dairy farms, by class ................................................. 43 Table 3.2. Multiple characteristics of Czech dairy farms, by class ....................................................... 45 Table 4.1. Productivity characteristics of Danish dairy farms, by class ................................................ 47 Table 4.2. Multiple characteristics of Danish dairy farms, by class ...................................................... 50 Table 4.3. Productivity characteristics of Danish rearing and fattening pig farms, by type and class .. 52 Table 4.4. Multiple characteristics of Danish rearing and fattening pig farms, by class ....................... 55 Table 4.5. Productivity characteristics of Danish specialised fattening pig farms, by type and class ... 57 Table 4.6. Multiple characteristics of Danish specialised fattening pig farms, by class ....................... 59 Table 5.1. Productivity characteristics of Estonian dairy farms by class .............................................. 61 Table 5.2. Multiple characteristics of Estonian dairy farms, by class ................................................... 63 Table 6.1. Productivity characteristics of French dairy farms, by class ................................................ 65 Table 6.2. Multiple characteristics of French dairy farms, by class ...................................................... 67 Table 6.3. Productivity characteristics of French crop farms, by class ................................................. 70 Table 6.4. Multiple characteristics of French crop farms, by class ....................................................... 72 Table 7.1. Productivity characteristics of Hungarian crop farms, by class ........................................... 75 Table 7.2. Multiple characteristics of Hungarian crop farms, by class ................................................. 77 Table 8.1. Productivity characteristics of Irish dairy farms, by class .................................................... 80 Table 8.2. Multiple characteristics of Irish dairy farms, by class .......................................................... 82
TAD/CA/APM/WP(2020)2/PART2/FINAL 5
DRIVERS OF FARM PERFORMANCE Unclassified
Table 8.3. Productivity characteristics of Irish crop farms, by class ..................................................... 84 Table 8.4. Multiple characteristics of Irish crop farms, by class ........................................................... 86 Table 8.5. Productivity characteristics of Irish cattle rearing farms, by class ....................................... 89 Table 8.6. Multiple characteristics of Irish cattle rearing farms, by class ............................................. 91 Table 8.7. Productivity characteristics of Irish “cattle other” farms, by class ....................................... 94 Table 8.8. Multiple characteristics of Irish “cattle other” farms, by class ............................................. 95 Table 8.9. Productivity characteristics of Irish sheep farms, by class ................................................... 98 Table 8.10. Multiple characteristics of Irish sheep farms, by class ..................................................... 100 Table 9.1. Productivity characteristics of Italian crop farms, by class ................................................ 104 Table 9.2. Multiple characteristics of Italian crop farms, by class ...................................................... 106 Table 10.1. Productivity characteristics of Korean rice farms, by class .............................................. 108 Table 10.2. Multiple characteristics of Korean rice farms, by class.................................................... 111 Table 11.1. Productivity characteristics of Norwegian dairy farms, by class ..................................... 114 Table 11.2. Multiple characteristics of Norwegian dairy farms, by class ........................................... 116 Table 11.3. Productivity characteristics of Norwegian crop farms, by class ...................................... 118 Table 11.4. Multiple characteristics of Norwegian crop farms, by class ............................................ 121 Table 11.5. Productivity characteristics of Norwegian cattle farms, by class ..................................... 123 Table 11.6. Multiple characteristics of Norwegian cattle farms, by class ........................................... 125 Table 12.1. Productivity characteristics of Swedish dairy farms, by class.......................................... 127 Table 12.2. Multiple characteristics of Swedish dairy farms, by class ................................................ 129 Table 12.3. Productivity characteristics of Swedish crop farms, by class ........................................... 132 Table 12.4. Multiple characteristics of Swedish crop farms, by class ................................................. 133 Table 13.1. Productivity characteristics of UK dairy farms, by class ................................................. 136 Table 13.2. Multiple characteristics of UK dairy farms, by class ....................................................... 138 Table 13.3. Productivity characteristics of UK cereal farms, by class ................................................ 141 Table 13.4. Multiple characteristics of UK cereal farms, by class ...................................................... 142 Table 13.5. Productivity characteristics of UK mixed crop and livestock farms, by class ................. 145 Table 13.6. Multiple characteristics of UK mixed crop and livestock farms, by class ....................... 147 Table 13.7. Productivity characteristics of UK pig farms, by class .................................................... 150 Table 13.8. Multiple characteristics of UK pig farms, by class .......................................................... 151 Table 13.9. Productivity characteristics of UK poultry farms, by class .............................................. 154 Table 13.10. Multiple characteristics of UK poultry farms, by class .................................................. 156
Figures
Figure 1.1. Productivity and technical change for Australian dairy farms, by class, 1989 to 2018 ........ 9 Figure 1.2. Multi-dimensional indices for Australian dairy farms ........................................................ 11 Figure 1.3. Productivity and technical change for Australian crop farms, by class, 1989 to 2018 ....... 13 Figure 1.4. Multi-dimensional indices for Australian crop farms ......................................................... 15 Figure 1.5. Productivity and technical change for Australian crop and livestock farms, by class,
1989 to 2018 .................................................................................................................................. 17 Figure 1.6. Multi-dimensional indices for Australian crop and livestock farms ................................... 19 Figure 1.7. Productivity and technical change for Australian beef and sheep farms, by class, 1989
to 2018 ........................................................................................................................................... 21 Figure 1.8. Multi-dimensional indices for Australian sheep and beef farms ......................................... 23 Figure 1.9. Productivity and technical change for Australian beef farms, by class, 1989 to 2018........ 25 Figure 1.10. Multi-dimensional indices for Australian beef farms ....................................................... 27 Figure 1.11. Productivity and technical change for Australian sheep meat farms, by class, 1989 to
2018 ............................................................................................................................................... 29 Figure 1.12. Multi-dimensional indices for Australian sheep meat farms ............................................ 31
6 TAD/CA/APM/WP(2020)2/PART2/FINAL
DRIVERS OF FARM PERFORMANCE Unclassified
Figure 1.13. Productivity and technical change for Australian wool farms, by class, 1989 to 2018 .... 33 Figure 1.14. Multi-dimensional indices for Australian wool farms ...................................................... 35 Figure 2.1. Productivity for Chilean small-scale fruit farms, by class, 2015 ........................................ 37 Figure 2.2. Multi-dimensional indices for Chilean small-scale fruit farms ........................................... 40 Figure 3.1. Productivity and technical change for Czech dairy farms, by class, 2005 to 2015 ............. 42 Figure 3.2. Multi-dimensional indices for Czech dairy farms ............................................................... 44 Figure 4.1. Productivity and technical change for Danish dairy farms, by class, 2010 to 2016 ........... 47 Figure 4.2. Multi-dimensional indices for Danish dairy farms ............................................................. 49 Figure 4.3. Productivity and technical change for Danish rearing and fattening pig farms, by type
and class, 2006 to 2016 ................................................................................................................. 52 Figure 4.4. Multi-dimensional indices for Danish rearing and fattening pig farms, by type ................ 54 Figure 4.5. Productivity and technical change for Danish specialised fattening pig farms, by type
and class, 2006 to 2016 ................................................................................................................. 56 Figure 4.6. Multi-dimensional indices for Danish specialised fattening pig farms, by type ................. 58 Figure 5.1. Productivity and technical change for Estonian dairy farms, by class, 2000 to 2015 ......... 61 Figure 5.2. Multi-dimensional indices for Estonian dairy farms ........................................................... 63 Figure 6.1. Productivity and technical change for French dairy farms, by class, 1990 to 2013 ............ 65 Figure 6.2. Multi-dimensional indices for French dairy farms .............................................................. 66 Figure 6.3. Productivity and technical change for French crop farms, by class, 1989 to 2016 ............. 69 Figure 6.4. Multi-dimensional indices for French crop farms ............................................................... 71 Figure 7.1. Productivity and technical change for Hungarian crop farms, by class, 2001 to 2014 ....... 75 Figure 7.2. Indices for Hungarian crop farms ....................................................................................... 76 Figure 8.1. Productivity and technical change for Irish dairy farms, by class, 2010 to 2018 ............... 80 Figure 8.2. Multi-dimensional indices for Irish dairy farms ................................................................. 81 Figure 8.3. Productivity and technical change for Irish crop farms, by class, 2010 to 2018 ................. 84 Figure 8.4. Multi-dimensional indices for Irish crop farms .................................................................. 86 Figure 8.5. Productivity and technical change for Irish cattle rearing farms, by class, 2010 to 2018 ... 89 Figure 8.6. Multi-dimensional indices for Irish cattle rearing farms ..................................................... 91 Figure 8.7. Productivity and technical change for Irish “cattle other” farms, by class, 2010 to 2018 .. 93 Figure 8.8. Multi-dimensional indices for Irish “cattle other” farms .................................................... 95 Figure 8.9. Productivity and technical change for Irish sheep farms, by class, 2010 to 2018 ............... 98 Figure 8.10. Multi-dimensional indices for Irish sheep farms ............................................................ 100 Figure 9.1. Productivity and technical change for Italian crop farms, by class, 2008 to 2015 ............ 103 Figure 9.2. Multi-dimensional indices for Italian crop farms .............................................................. 105 Figure 10.1. Productivity and technical change for Korean rice farms, by class, 2003 to 2015 ......... 108 Figure 10.2. Multi-dimensional indices for Korean rice farms ........................................................... 110 Figure 11.1. Productivity and technical change for Norwegian dairy farms, by class, 2005 to 2016 . 113 Figure 11.2. Multi-dimensional indices for Norwegian dairy farms ................................................... 115 Figure 11.3. Productivity and technical change for Norwegian crop farms, by class, 2005 to 2016 .. 117 Figure 11.4. Multi-dimensional indices for Norwegian crop farms .................................................... 119 Figure 11.5. Productivity and technical change for Norwegian cattle farms, by class, 2005 to 2016 . 122 Figure 11.6. Multi-dimensional indices for Norwegian cattle farms ................................................... 124 Figure 12.1. Productivity and technical change for Swedish dairy farms, by class, 1997 to 2017 ..... 127 Figure 12.2. Multi-dimensional indices for Swedish dairy farms ....................................................... 128 Figure 12.3. Productivity and technical change for Swedish crop farms, by class, 1997 to 2017 ...... 131 Figure 12.4. Multi-dimensional indices for Swedish crop farms ........................................................ 132 Figure 13.1. Productivity and technical change for UK dairy farms, by class, 1995 to 2017 ............. 136 Figure 13.2. Multi-dimensional indices for UK dairy farms ............................................................... 137 Figure 13.3. Productivity and technical change for UK cereal farms, by class, 1995 to 2017 ............ 140 Figure 13.4. Multi-dimensional indices for UK cereal farms .............................................................. 142
TAD/CA/APM/WP(2020)2/PART2/FINAL 7
DRIVERS OF FARM PERFORMANCE Unclassified
Figure 13.5. Productivity and technical change for UK mixed crop and livestock farms, by class,
1995 to 2017 ................................................................................................................................ 144 Figure 13.6. Multi-dimensional indices for UK mixed crop and livestock farms ............................... 146 Figure 13.7. Productivity and technical change for UK pig farms, by class, 1995 to 2017 ................ 149 Figure 13.8. Multi-dimensional indices for UK pig farms .................................................................. 150 Figure 13.9. Productivity and technical change for UK poultry farms, by class, 1995 to 2017 .......... 154 Figure 13.10. Multi-dimensional indices for UK poultry farms .......................................................... 155
8 TAD/CA/APM/WP(2020)2/PART2/FINAL
DRIVERS OF FARM PERFORMANCE Unclassified
Part 2. Discussion of results by country
For each country case study in Table 1.1 of Part 1
[TAD/CA/APM/WP(2020)2/PART1/FINAL], Part 2 presents the estimation results of a
latent class estimation of a translog production function applied to the various panel
datasets described in Annex D [TAD/CA/APM/WP(2020)2/ANN/FINAL].1 Annex D also
contains additional tables showing the detailed estimated results by country and farm type.
At a later stage, the country sections of Annex D could be directly attached to the country
sections in this Part 2.
1. Australia
1. For Australia, the analysis applies to a sample of broadacre farms (crop, livestock,
sheep meat, wool sheep, mixed crop and livestock, mixed sheep and beef) and to a sample
of dairy farms, all covering the period 1989 to 2018.
2. Australian agriculture accounts for 58% of Australian land use (446 million ha) and
59% of water extractions. It contributes a significant share to the country’s goods and
services exported (about 14%). The mix of Australian agricultural activity is determined
by climate, water availability, soil type and proximity to markets. Livestock grazing is
widespread, occurring in most areas of Australia, while cropping is generally concentrated
in coastal areas (ABARES, 2018).
1.1. Australian dairy farms
3. According to Table A D.1.1, which contains descriptive statistical measures for the
sample, the average milk output per farm is around AUD 1.5 million (total farm output of
about AUD 1.6 million in 2018. The variable cost items increased over the period 1989 to
2018, and the share of hired labour significantly increased for the average Australian dairy
farm. The stocking density has been around 1.8 livestock units (LU) per ha in 2018 with an
average herd size of about 740 cows per farm (an increase from about 1.2 LU per ha and
230 cows in 1989).
4. In the model used to estimate the technology and the Class identification
components for the Australian dairy production the output variable is total output per farm
and year and input variables are cows, land, capital, materials, fodder, fuel and labour. The
Class identification component is based on the indices related to structure, environmental
sustainability, innovation, technology, diversity, individual, location, household and
financial aspects (Table A D.1.2).
5. For Australian dairy farms, three distinct technology classes emerge from the model
estimates (Table A D.1.2). The individual farms are distributed very unevenly across the
three technology classes (Table 1.1), as Class 3 includes about three-quarters of all farms.
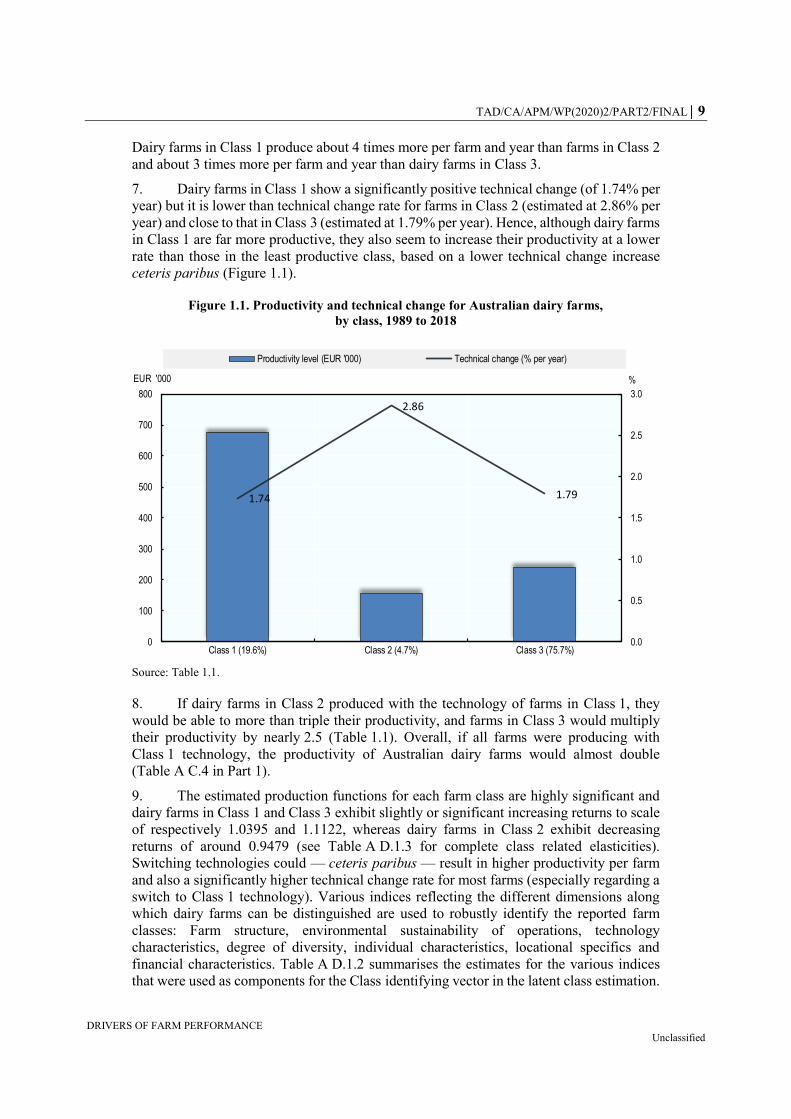
6. Farms in Class 1 show a significantly higher productivity performance
— measured as the potential output levels that could be achieved with a given input bundle,
in value per year — than their milk-producing counterparts in classes 2 and 3 (Figure 1.1).
1 The routine offered by the econometric software LIMDEP (version 11) is used for the estimation.
TAD/CA/APM/WP(2020)2/PART2/FINAL 9
DRIVERS OF FARM PERFORMANCE Unclassified
Dairy farms in Class 1 produce about 4 times more per farm and year than farms in Class 2
and about 3 times more per farm and year than dairy farms in Class 3.
7. Dairy farms in Class 1 show a significantly positive technical change (of 1.74% per
year) but it is lower than technical change rate for farms in Class 2 (estimated at 2.86% per
year) and close to that in Class 3 (estimated at 1.79% per year). Hence, although dairy farms
in Class 1 are far more productive, they also seem to increase their productivity at a lower
rate than those in the least productive class, based on a lower technical change increase
ceteris paribus (Figure 1.1).
Figure 1.1. Productivity and technical change for Australian dairy farms,
by class, 1989 to 2018
Source: Table 1.1.
8. If dairy farms in Class 2 produced with the technology of farms in Class 1, they
would be able to more than triple their productivity, and farms in Class 3 would multiply
their productivity by nearly 2.5 (Table 1.1). Overall, if all farms were producing with
Class 1 technology, the productivity of Australian dairy farms would almost double
(Table A C.4 in Part 1).
9. The estimated production functions for each farm class are highly significant and
dairy farms in Class 1 and Class 3 exhibit slightly or significant increasing returns to scale
of respectively 1.0395 and 1.1122, whereas dairy farms in Class 2 exhibit decreasing
returns of around 0.9479 (see Table A D.1.3 for complete class related elasticities).
Switching technologies could — ceteris paribus — result in higher productivity per farm
and also a significantly higher technical change rate for most farms (especially regarding a
switch to Class 1 technology). Various indices reflecting the different dimensions along
which dairy farms can be distinguished are used to robustly identify the reported farm
classes: Farm structure, environmental sustainability of operations, technology
characteristics, degree of diversity, individual characteristics, locational specifics and
financial characteristics. Table A D.1.2 summarises the estimates for the various indices
that were used as components for the Class identifying vector in the latent class estimation.
1.74
2.86
1.79
0.0
0.5
1.0
1.5
2.0
2.5
3.0
0
100
200
300
400
500
600
700
800
Class 1 (19.6%) Class 2 (4.7%) Class 3 (75.7%)
%EUR '000
Productivity level (EUR '000) Technical change (% per year)
10 TAD/CA/APM/WP(2020)2/PART2/FINAL
DRIVERS OF FARM PERFORMANCE Unclassified
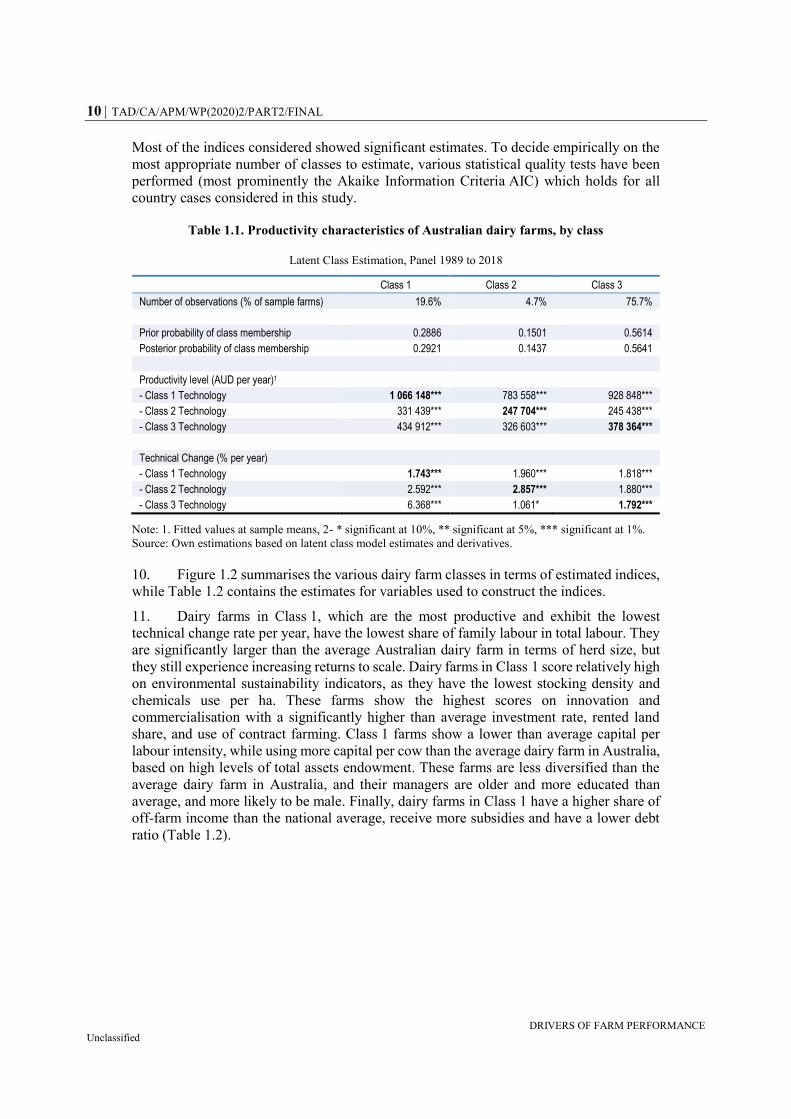
Most of the indices considered showed significant estimates. To decide empirically on the
most appropriate number of classes to estimate, various statistical quality tests have been
performed (most prominently the Akaike Information Criteria AIC) which holds for all
country cases considered in this study.
Table 1.1. Productivity characteristics of Australian dairy farms, by class
Latent Class Estimation, Panel 1989 to 2018
Class 1 Class 2 Class 3
Number of observations (% of sample farms) 19.6% 4.7% 75.7%
Prior probability of class membership 0.2886 0.1501 0.5614
Posterior probability of class membership 0.2921 0.1437 0.5641
Productivity level (AUD per year)1
- Class 1 Technology 1 066 148*** 783 558*** 928 848***
- Class 2 Technology 331 439*** 247 704*** 245 438***
- Class 3 Technology 434 912*** 326 603*** 378 364***
Technical Change (% per year)
- Class 1 Technology 1.743*** 1.960*** 1.818***
- Class 2 Technology 2.592*** 2.857*** 1.880***
- Class 3 Technology 6.368*** 1.061* 1.792***
Note: 1. Fitted values at sample means, 2- * significant at 10%, ** significant at 5%, *** significant at 1%.
Source: Own estimations based on latent class model estimates and derivatives.
10. Figure 1.2 summarises the various dairy farm classes in terms of estimated indices,
while Table 1.2 contains the estimates for variables used to construct the indices.
11. Dairy farms in Class 1, which are the most productive and exhibit the lowest
technical change rate per year, have the lowest share of family labour in total labour. They
are significantly larger than the average Australian dairy farm in terms of herd size, but
they still experience increasing returns to scale. Dairy farms in Class 1 score relatively high
on environmental sustainability indicators, as they have the lowest stocking density and
chemicals use per ha. These farms show the highest scores on innovation and
commercialisation with a significantly higher than average investment rate, rented land
share, and use of contract farming. Class 1 farms show a lower than average capital per
labour intensity, while using more capital per cow than the average dairy farm in Australia,
based on high levels of total assets endowment. These farms are less diversified than the
average dairy farm in Australia, and their managers are older and more educated than
average, and more likely to be male. Finally, dairy farms in Class 1 have a higher share of
off-farm income than the national average, receive more subsidies and have a lower debt
ratio (Table 1.2).
TAD/CA/APM/WP(2020)2/PART2/FINAL 11
DRIVERS OF FARM PERFORMANCE Unclassified
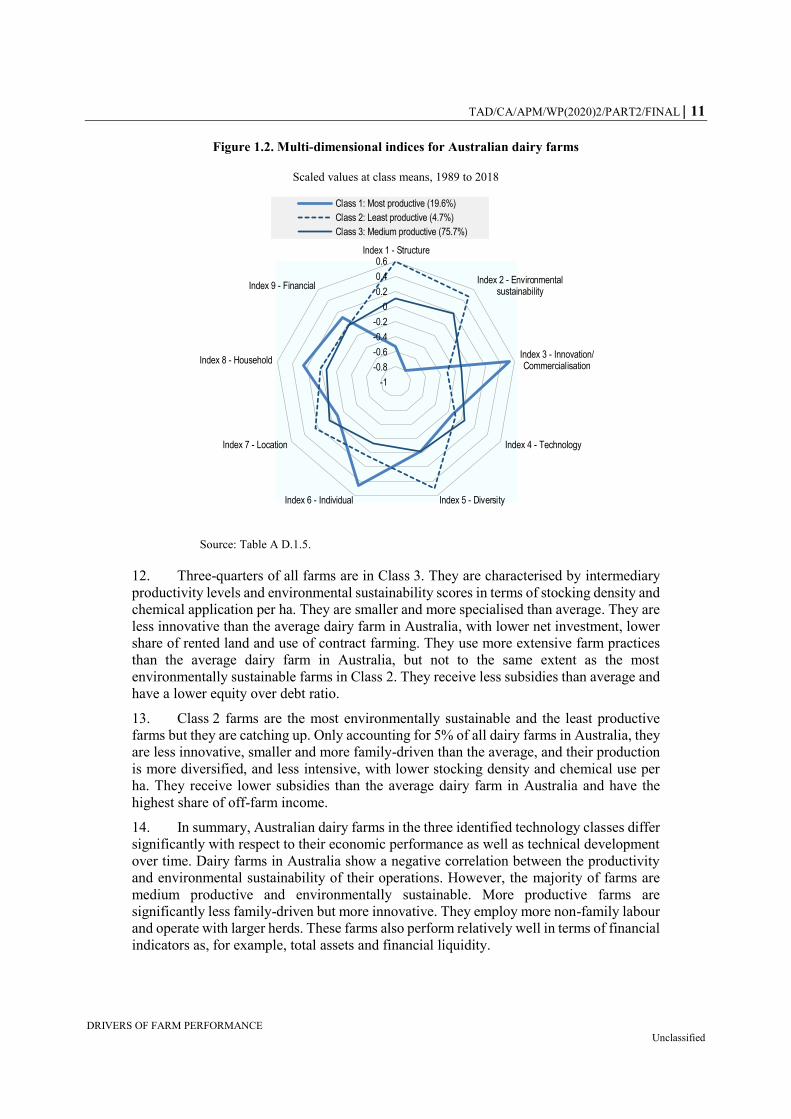
Figure 1.2. Multi-dimensional indices for Australian dairy farms
Scaled values at class means, 1989 to 2018
Source: Table A D.1.5.
12. Three-quarters of all farms are in Class 3. They are characterised by intermediary
productivity levels and environmental sustainability scores in terms of stocking density and
chemical application per ha. They are smaller and more specialised than average. They are
less innovative than the average dairy farm in Australia, with lower net investment, lower
share of rented land and use of contract farming. They use more extensive farm practices
than the average dairy farm in Australia, but not to the same extent as the most
environmentally sustainable farms in Class 2. They receive less subsidies than average and
have a lower equity over debt ratio.
13. Class 2 farms are the most environmentally sustainable and the least productive
farms but they are catching up. Only accounting for 5% of all dairy farms in Australia, they
are less innovative, smaller and more family-driven than the average, and their production
is more diversified, and less intensive, with lower stocking density and chemical use per
ha. They receive lower subsidies than the average dairy farm in Australia and have the
highest share of off-farm income.
14. In summary, Australian dairy farms in the three identified technology classes differ
significantly with respect to their economic performance as well as technical development
over time. Dairy farms in Australia show a negative correlation between the productivity
and environmental sustainability of their operations. However, the majority of farms are
medium productive and environmentally sustainable. More productive farms are
significantly less family-driven but more innovative. They employ more non-family labour
and operate with larger herds. These farms also perform relatively well in terms of financial
indicators as, for example, total assets and financial liquidity.
-1
-0.8
-0.6
-0.4
-0.2
0
0.2
0.4
0.6Index 1 - Structure
Index 2 - Environmentalsustainability
Index 3 - Innovation/Commercialisation
Index 4 - Technology
Index 5 - DiversityIndex 6 - Individual
Index 7 - Location
Index 8 - Household
Index 9 - Financial
Class 1: Most productive (19.6%)
Class 2: Least productive (4.7%)
Class 3: Medium productive (75.7%)

12 TAD/CA/APM/WP(2020)2/PART2/FINAL
DRIVERS OF FARM PERFORMANCE Unclassified
Table 1.2. Multiple characteristics of Australian dairy farms, by class Deviations from sample means1, 1989 to 2018
Class 1: Most productive (19.6%)
Class 2: Least productive (4.7%)
Class 3: Medium productive (75.7%)
Farm structure
Family/hired labour ratio -0.0714 0.2993 0.0001
Herd size (LU) 0.7647 -0.4171 -0.1729
Form of ownership (1=company, 2=partnership/trust, 3=sole trader)
0.0273 0.3165 -0.0265
Environmental sustainability
Stocking density (LU per ha) 0.4044 -0.4010 -0.0803
Chemicals use (AUD per ha) 0.7304 -0.2839 -0.1721
Innovation-commercialisation
Net investment ratio (per total assets) 0.4010 -0.1398 -0.0955
Contract farming (1=yes, 0=no) 0.2434 -0.3093 -0.0442
Share land rented 0.2496 -0.1307 -0.0567
Technology
Capital / labour ratio (AUD per AWU) -0.0202 -0.0629 0.0091
Capital per cow (AUD per LU) 0.0326 0.3640 -0.0308
Fodder per cow (AUD per LU) 0.5861 -0.0725 -0.1477
Labour per cow (AWU per LU) -0.0441 -0.0879 0.0169
Herdtest (1=yes, 0=no) 0.5593 -0.3087 -0.1262
Diversity
Herfindahl Index (sqrt[Σ(yi/Y)2]) 0.0937 -0.3725 -0.0014
Production diversity (yc/ΣY) -0.0563 -0.3339 0.0351
Individual
Age (years)15 0.0796 0.0697 -0.0249
Education (various levels) 0.3553 -0.1373 -0.0838
Gender (1=male, 2=female) 0.3050 0.1654 -0.0893
Location
Region subtropical Dairy NSW -0.0205 -0.0433 0.0080
Region Dairy NSW 0.0947 -0.2229 -0.0109
Region NSW Murray dairy 0.0582 -0.1062 -0.0086
Region West Victoria dairy -0.0764 0.0573 0.0163
Region Vic Murray dairy -0.0497 -0.1329 0.0211
Region Vic Gippsland dairy -0.0171 0.1254 -0.0033
Region subtropical dairy Qld -0.0244 0.0169 0.0053
Region Dairy SA -0.0721 0.0576 0.0152
Region Dairy WA 0.0508 -0.0045 -0.0129
Region Dairy Tas 0.0577 0.2506 -0.0304
(all: 1=yes, 0=no)
Household
Off-farm income share -0.2005 0.6522 0.0120
Age spouse (years) 0.0599 0.0347 -0.0177
Education spouse (various levels) 0.1653 -0.1135 -0.0359
Gender spouse (1=male, 2=female) 0.2229 0.0392 -0.0603
Financial
Total assets (AUD) 0.8336 -0.2611 -0.2003
Total subsidies (AUD) 0.6784 -0.1329 -0.1679
Equity/debt ratio 0.0925 -0.0240 -0.0225
Note: LU: Livestock Unit. AWU: Annual Work Unit. NSW: New-South-Wales; Vic: Victoria; SA: South
Australia; WA: Western Australia; Tas: Tasmania; Qld: Queensland.
1. Deviations from sample means (=0), z-scores based, scaled values.
Source: Estimations.
TAD/CA/APM/WP(2020)2/PART2/FINAL 13
DRIVERS OF FARM PERFORMANCE Unclassified
1.2. Australian crop farms
15. According to Table A D.1.6, which contains descriptive statistical measures for the
sample, the average crop output per farm is around AUD 1.77 million (total farm output of
about AUD 2.08 million in 2018). The variable cost items increased over time and the share
of hired labour significantly increases for the average Australian crop farm. The average
cropping farm cultivated about 4 060 ha of land in 2018 (compared to about 1 610 ha in
1989).
16. In the model used to estimate the technology and the Class identification
components for the Australian crop production the output variable is total output per farm
and year and input variables are land, capital, chemicals, labour, fuel and materials. The
Class identification component is based on the indices related to structure, environmental
sustainability, innovation, technology, diversity, individual, location, household and
financial aspects (Table A D.1.7).
17. For Australian crop farms, two distinct technology classes emerge from the model
estimates (Table A D.1.7). The individual farms are distributed very unevenly across the
three technology classes (Table 1.3), as Class 1 includes over 85% of all farms.
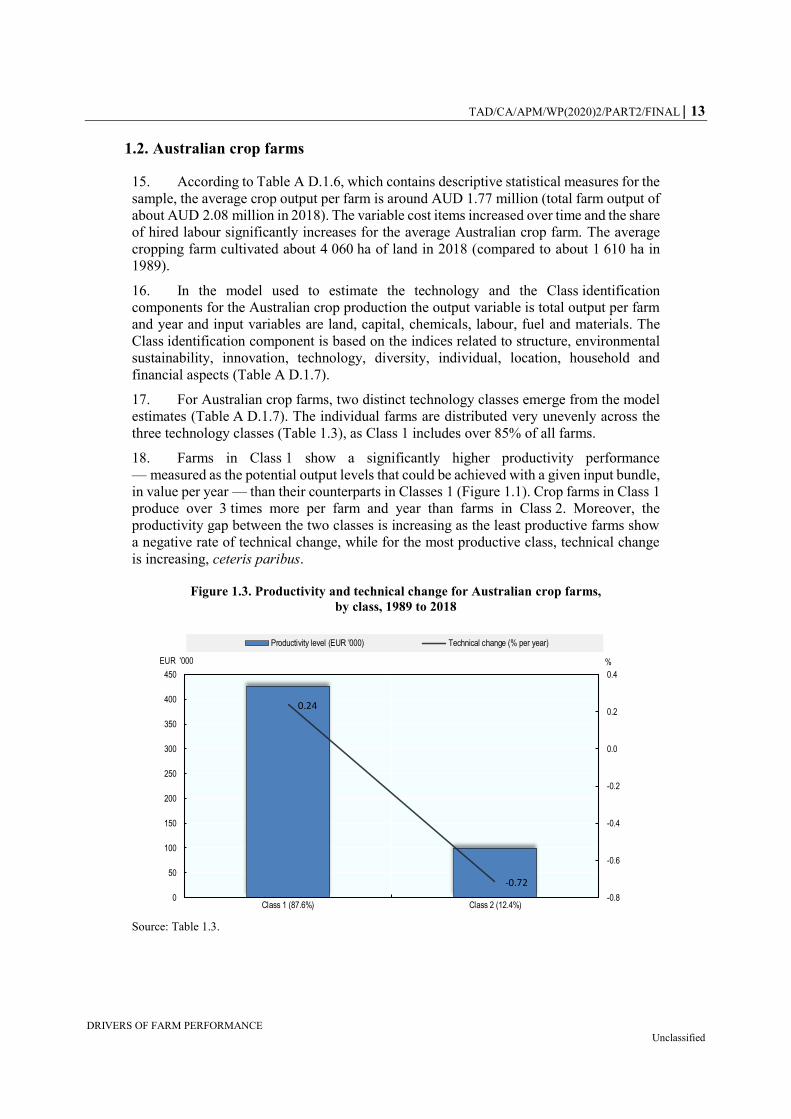
18. Farms in Class 1 show a significantly higher productivity performance
— measured as the potential output levels that could be achieved with a given input bundle,
in value per year — than their counterparts in Classes 1 (Figure 1.1). Crop farms in Class 1
produce over 3 times more per farm and year than farms in Class 2. Moreover, the
productivity gap between the two classes is increasing as the least productive farms show
a negative rate of technical change, while for the most productive class, technical change
is increasing, ceteris paribus.
Figure 1.3. Productivity and technical change for Australian crop farms,
by class, 1989 to 2018
Source: Table 1.3.
0.24
-0.72
-0.8
-0.6
-0.4
-0.2
0.0
0.2
0.4
0
50
100
150
200
250
300
350
400
450
Class 1 (87.6%) Class 2 (12.4%)
%EUR '000
Productivity level (EUR '000) Technical change (% per year)
14 TAD/CA/APM/WP(2020)2/PART2/FINAL
DRIVERS OF FARM PERFORMANCE Unclassified
19. If crop farms in Class 2 produced with the technology of farms in Class 1, they
would be able to double their productivity (Table 1.3). Given the small share of Class 2
farms in the total, the overall productivity of Australian crop farms would increase by about
20% (Table A C5 in Part 1).
Table 1.3. Productivity characteristics of Australian crop farms, by class
Latent Class Estimation, Panel 1989 to 2018
Class 1 Class 2
Number of observations (% of sample farms) 87.6 12.4
Prior probability of class membership 0.8938 0.1062
Posterior probability of class membership 0.8228 0.1772
Productivity level (AUD per year)1
- Class 1 Technology 641 715*** 409 094***
- Class 2 Technology 307 644*** 196 596***
Technical Change (% per year)
- Class 1 Technology 0.236*** -0.935***
- Class 2 Technology 0.580*** -0.716*
Note: * significant at 10%, ** significant at 5%, *** significant at 1%. 1. Fitted values at sample means.
Source: Own estimations based on latent class model estimates and derivatives.
20. The estimated production functions for each farm class are highly significant. Crop
farms in Class 2 exhibit increasing returns to scale of about 1.0903 whereas farms in
Class 1 show slightly decreasing returns to scale of about 0.9521 (Table A D.1.9).
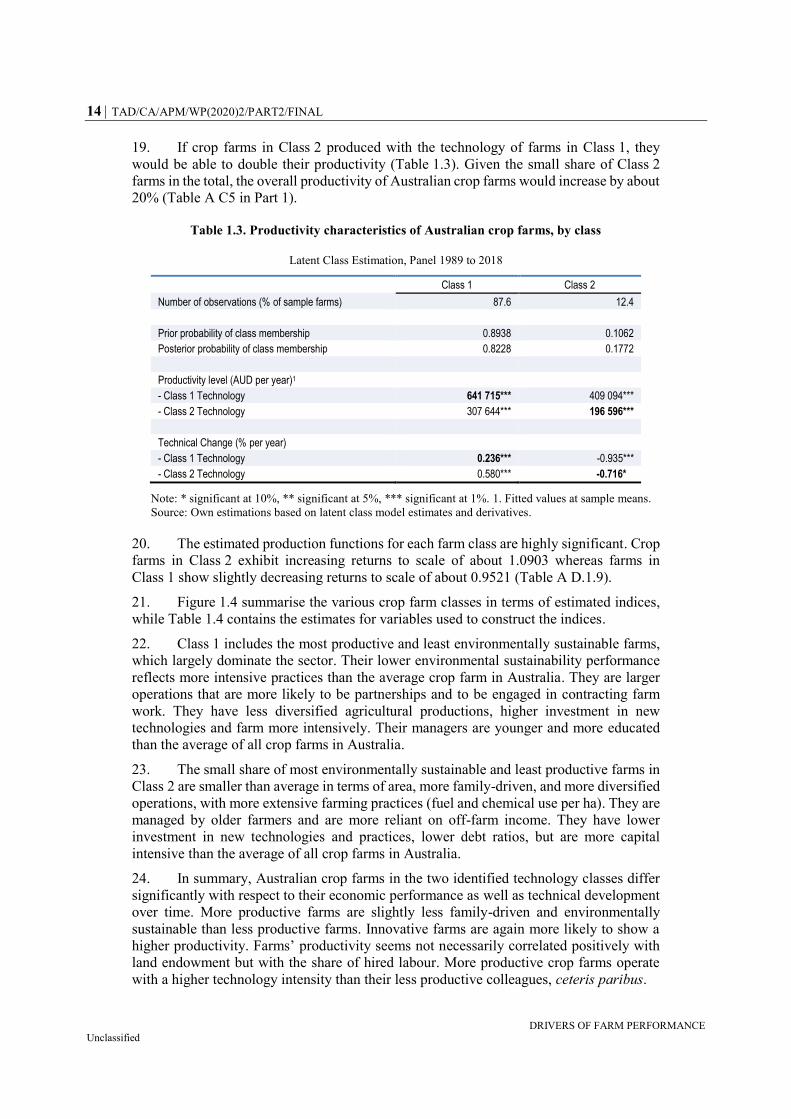
21. Figure 1.4 summarise the various crop farm classes in terms of estimated indices,
while Table 1.4 contains the estimates for variables used to construct the indices.
22. Class 1 includes the most productive and least environmentally sustainable farms,
which largely dominate the sector. Their lower environmental sustainability performance
reflects more intensive practices than the average crop farm in Australia. They are larger
operations that are more likely to be partnerships and to be engaged in contracting farm
work. They have less diversified agricultural productions, higher investment in new
technologies and farm more intensively. Their managers are younger and more educated
than the average of all crop farms in Australia.
23. The small share of most environmentally sustainable and least productive farms in
Class 2 are smaller than average in terms of area, more family-driven, and more diversified
operations, with more extensive farming practices (fuel and chemical use per ha). They are
managed by older farmers and are more reliant on off-farm income. They have lower
investment in new technologies and practices, lower debt ratios, but are more capital
intensive than the average of all crop farms in Australia.
24. In summary, Australian crop farms in the two identified technology classes differ
significantly with respect to their economic performance as well as technical development
over time. More productive farms are slightly less family-driven and environmentally
sustainable than less productive farms. Innovative farms are again more likely to show a
higher productivity. Farms’ productivity seems not necessarily correlated positively with
land endowment but with the share of hired labour. More productive crop farms operate
with a higher technology intensity than their less productive colleagues, ceteris paribus.
TAD/CA/APM/WP(2020)2/PART2/FINAL 15
DRIVERS OF FARM PERFORMANCE Unclassified
Figure 1.4. Multi-dimensional indices for Australian crop farms
Scaled values at class means, 1989 to 2018
Source: Table A D.1.10.
Table 1.4. Multiple characteristics of Australian crop farms, by class
Deviations from sample means1, 1989 to 2018
Class 1: Most productive (87.6%)
Class 2: Least productive (12.4%)
Farm structure
Family/hired labour ratio -0.0063 0.0446
Land (ha) -0.0020 0.0141
Form of ownership (1=company, 2=partnership/trust, 3=sole trader)
-0.0290 0.2047
Environmental sustainability
Fuel per ha (AUD per ha) 0.0278 -0.1959
Chemicals use (AUD per ha) 0.0656 -0.4632
Innovation-commercialisation
Net investment ratio (per total assets) 0.0274 -0.1934
Contract farming (1=yes, 0=no) 0.0783 -0.5527
Share land rented 0.0341 -0.2405
Technology
Capital / labour ratio (AUSD per AWU) 0.0021 -0.0149
Capital per ha (AUD per ha) -0.0105 0.0074
Seed per ha (AUD per ha) 0.0160 -0.1132
Diversity
Herfindahl Index (sqrt[Σ(yi/Y)2]) 0.1884 -1.3297
Production diversity (yc/ΣY) 0.1884 -1.3237
Individual
Age (years) -0.0151 0.1065
Education (various levels) 0.0362 -0.2554
Gender (1=male, 2=female) 0.0049 -0.1135
Location
Region pastoral zone -0.0218 0.1537
Region wheat-sheep zone 0.0404 -0.2851
Region high-rainfall zone -0.0271 0.1910
(all: 1=yes, 0=no)
Household
-2
-1
0
1
2Index 1 - Structure
Index 2 - Environmentalsustainability
Index 3 - Innovation/Commercialisation
Index 4 - Technology
Index 5 - DiversityIndex 6 - Individual
Index 7 - Location
Index 8 - Household
Index 9 - Financial
Class 1: Most productive (87.6%)
Class 2: Least productive (12.4%)
16 TAD/CA/APM/WP(2020)2/PART2/FINAL
DRIVERS OF FARM PERFORMANCE Unclassified
Off-farm income share -0.0393 0.2776
Age spouse (years) 0.0058 -0.0411
Education spouse (various levels) 0.0354 -0.2500
Gender spouse (1=male, 2=female) 0.0248 -0.1749
Financial
Total assets (AUS$) 0.0430 -0.3039
Total subsidies (AUS$) -0.0105 0.0739
Equity/debt ratio -0.0117 0.0827
Note: AWU: Annual Work Unit. 1. Deviations from sample means (=0), z-scores based, scaled values.
Source: Estimations.
1.3. Australian mixed crop and livestock farms
25. According to Table A D.1.11, which contains descriptive statistical measures for
the sample, the average crop and livestock output per farm in 2018 has been about
AUD 1.4 million. The variable cost items increased over time and the share of hired labour
significantly increases for the average Australian crop and livestock farm. In 2018, the
stocking density was about 1.65 LU per ha, and the average farm had a land endowment of
about 7 180 ha (compared with about 1.74 LU per ha and 2 850 ha in 1989).
26. In the model used to estimate the technology and the Class identification
components for the Australian crop and livestock production the output variable is total
output per farm and year and input variables are land, capital, labour, livestock units and
other materials. The Class identification component is based on the indices related to
structure, environmental sustainability, innovation, technology, diversity, individual,
location, household and financial aspects (Table A D.1.12).
27. For Australian crop and livestock farms, three distinct technology classes emerge
from the model estimates (Table A D.1.12). The individual farms are distributed very
unevenly across the three technology classes (Table 1.5), as Class 1 includes 86% of all
crop and livestock farms.
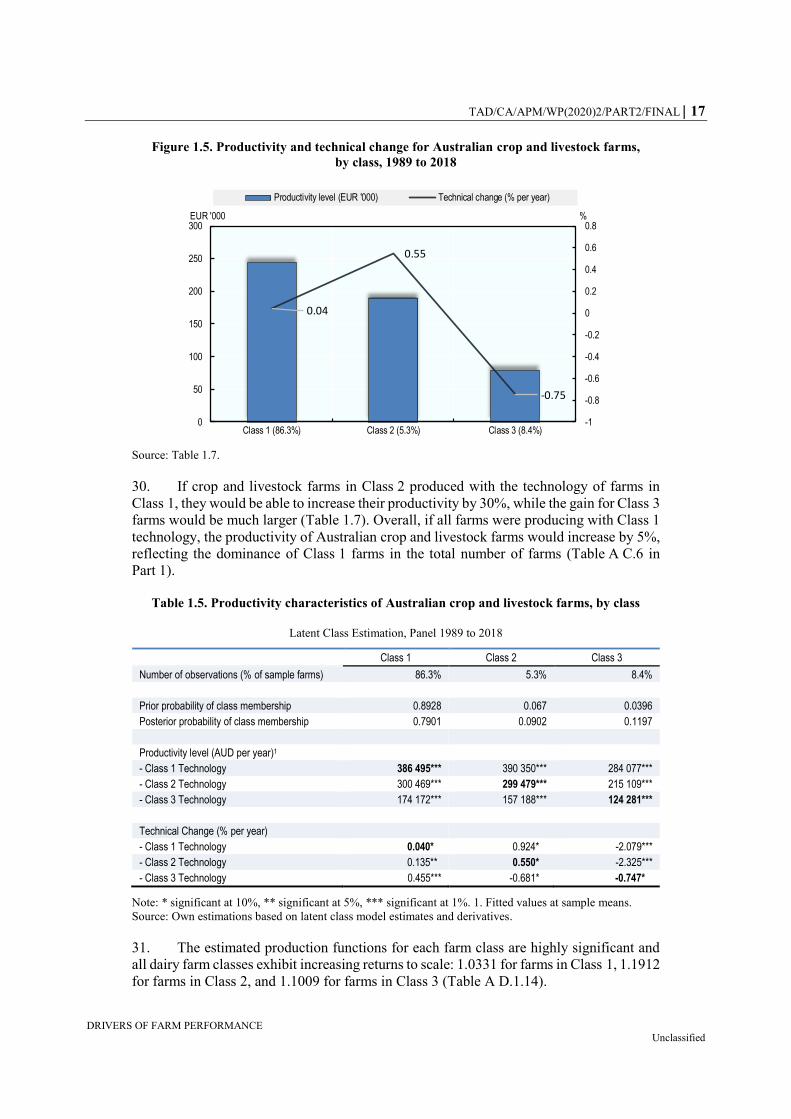
28. Farms in Class 1 achieve a higher productivity performance — measured as the
potential output levels that could be achieved with a given input bundle, in value per year
— than their counterparts in classes 2 and 3 (Figure 1.5). Farms in Class 1 produce about
3 times more than farms in Class 3, but the productivity level of farms in Class 2 is only
23% lower than that of the highest performers in Class 1.
29. Crop and livestock farms in Class 2 show a significantly positive technical change,
which is much higher than that for farms in Class 1, indicating that the productivity
difference between the two classes is narrowing. But the performance gap between farms
in Class 3 and other crop and livestock farms in Australia is increasing as the former
experience a negative technical change, ceteris paribus (Figure 1.5).
TAD/CA/APM/WP(2020)2/PART2/FINAL 17
DRIVERS OF FARM PERFORMANCE Unclassified
Figure 1.5. Productivity and technical change for Australian crop and livestock farms,
by class, 1989 to 2018
Source: Table 1.7.
30. If crop and livestock farms in Class 2 produced with the technology of farms in
Class 1, they would be able to increase their productivity by 30%, while the gain for Class 3
farms would be much larger (Table 1.7). Overall, if all farms were producing with Class 1
technology, the productivity of Australian crop and livestock farms would increase by 5%,
reflecting the dominance of Class 1 farms in the total number of farms (Table A C.6 in
Part 1).
Table 1.5. Productivity characteristics of Australian crop and livestock farms, by class
Latent Class Estimation, Panel 1989 to 2018
Class 1 Class 2 Class 3
Number of observations (% of sample farms) 86.3% 5.3% 8.4%
Prior probability of class membership 0.8928 0.067 0.0396
Posterior probability of class membership 0.7901 0.0902 0.1197
Productivity level (AUD per year)1
- Class 1 Technology 386 495*** 390 350*** 284 077***
- Class 2 Technology 300 469*** 299 479*** 215 109***
- Class 3 Technology 174 172*** 157 188*** 124 281***
Technical Change (% per year)
- Class 1 Technology 0.040* 0.924* -2.079***
- Class 2 Technology 0.135** 0.550* -2.325***
- Class 3 Technology 0.455*** -0.681* -0.747*
Note: * significant at 10%, ** significant at 5%, *** significant at 1%. 1. Fitted values at sample means.
Source: Own estimations based on latent class model estimates and derivatives.
31. The estimated production functions for each farm class are highly significant and
all dairy farm classes exhibit increasing returns to scale: 1.0331 for farms in Class 1, 1.1912
for farms in Class 2, and 1.1009 for farms in Class 3 (Table A D.1.14).
0.04
0.55
-0.75
-1
-0.8
-0.6
-0.4
-0.2
0
0.2
0.4
0.6
0.8
0
50
100
150
200
250
300
Class 1 (86.3%) Class 2 (5.3%) Class 3 (8.4%)
%EUR '000
Productivity level (EUR '000) Technical change (% per year)
18 TAD/CA/APM/WP(2020)2/PART2/FINAL
DRIVERS OF FARM PERFORMANCE Unclassified
32. Figure 1.6 summarises the various crop and livestock farm classes in terms of
estimated indices, while Table 1.6 contains the estimates for variables used to construct the
indices.
33. Class 1 groups over 85% of all crop and livestock farms in Australia: The most
productive and least environmentally sustainable. There are more specialised farms, with
an average area, but larger herds, and thus higher stocking density. They are more capital
intensive and likely to be engaged in contract farming. They are operated by younger
farmers, and have lower off-farm income.
34. Class 2 farms (about 5% of all farms) achieve medium productivity and above
average environmental sustainability. They are larger, and more family driven operations,
more likely to be partnerships. They are more diversified and more extensive operations.
They invest more in new technologies, and are less likely to be engaged in contract farming.
They receive more subsidies than average and have lower debt ratios.
35. Class 3 groups the most environmentally sustainable farms, which are the least
productive and account for the remaining 8% of all farms. They are smaller operations with
higher stocking density but lower use of chemicals. They are the most specialised farms.
They are more capital intensive per ha, but invest less in new technologies than average.
Operators are older and more likely to be men. They have the highest share of off-farm
income.
36. In summary, Australian crop and livestock farms in the three identified technology
classes differ with respect to their economic performance as well as technical development
over time. The large majority of these farms (about 86%) produce with a high productivity
and only a slightly lower than average environmental sustainability. These farms are based
on an average family labour share that operate large herd sizes and relatively large land
endowments. The least productive mixed crop-livestock farms in the sector use more than
average hired labour input but produce with significantly less than average land endowment
and livestock units. Those farms are least innovative and score relatively low on financial
stability and liquidity indicators.

TAD/CA/APM/WP(2020)2/PART2/FINAL 19
DRIVERS OF FARM PERFORMANCE Unclassified
Figure 1.6. Multi-dimensional indices for Australian crop and livestock farms
Scaled values at class means, 1989 to 2018
Source: Table A D.1.15.
Table 1.6. Multiple characteristics of Australian crop and livestock farms, by class
Deviations from sample means1, 1989 to 2018
Class 1: Most productive (86.3%)
Class 2: Medium productive (5.3%)
Class 3: Least productive (8.4%)
Farm structure
Family/hired labour ratio -0.0126 0.1948 0.0057
Herd size (LU) 1.1223 0.1841 -1.3063
Land (ha) 0.0097 0.0564 -0.1360
Form of ownership (1=company, 2=partnership/trust, 3=sole trader)
-0.0187 0.3006 0.0012
Environmental sustainability
Stocking density (LU per ha) 0.1981 -1.3117 1.1136
Chemicals use (AUD per ha) 0.0484 -0.0888 -0.4430
Fuel per ha (AUD per ha) 0.0144 -0.0034 -0.0513
Innovation-commercialisation
Net investment ratio (per total assets) -0.0141 0.3817 -0.0639
Contract farming (1=yes, 0=no) 0.0476 -0.2218 -0.1869
Share land rented 0.0094 0.0143 -0.0640
Genetics veterinary expenses (AUD per LU) 0.0080 0.0111 -0.0385
Insurance expenses (AUD per LU) -0.0079 0.0046 0.0259
Technology
Capital / labour ratio (AUD per AWU) 0.0067 -0.0003 -0.0691
Veterinary expenses (wo genetics) (AUD per LU) -0.0021 0.0236 0.0260
Share crop land 0.0111 -0.0177 -0.0279
LU per labour (LU per AWU) 0.0631 -0.2860 -0.4687
Capital per LU (AUD per LU) -0.0136 0.2636 -0.0278
Capital per ha (AUD per LU) -0.0338 0.0973 0.2864
Seed per ha (AUD per ha) -0.0218 0.0517 0.0420
-5
-4
-3
-2
-1
0
1
2
3
4Index 1 - Structure
Index 2 - Environmentalsustainability
Index 3 - Innovation/Commercialisation
Index 4 - Technology
Index 5 - DiversityIndex 6 - Individual
Index 7 - Location
Index 8 - Household
Index 9 - Financial
Class 1: Most productive (86.3%)
Class 2: Medium productive (5.3%)
Class 3: Least productive (8.4%)
20 TAD/CA/APM/WP(2020)2/PART2/FINAL
DRIVERS OF FARM PERFORMANCE Unclassified
Herdtest (1=yes, 0=no) -0.0540 1.0124 -0.0887
Diversity
Herfindahl Index (sqrt[Σ(yi/Y)2]) 0.1344 -0.3422 -1.1682
Production diversity (yc/ΣY) 0.1343 -0.3422 -1.1837
Individual
Age (years) -0.0296 0.0408 0.2789
Education (various levels) 0.0028 0.0482 -0.0595
Gender (1=male, 2=female) -0.0370 0.1720 0.2724
Location
Region pastoral zone -0.0034 0.0479 0.0046
Region wheat-sheep zone 0.0066 -0.2597 0.0975
Region high-rainfall zone (all: 1=yes, 0=no) -0.0152 0.2518 -0.0036
Household
Off-farm income share -0.0829 0.3627 0.6237
Age spouse (years) -0.0019 -0.2598 0.1853
Education spouse (various levels) 0.0188 -0.2798 -0.0156
Gender spouse (1=male, 2=female) -0.0060 -0.2447 0.2180
Financial
Total assets (AUD) 0.0291 0.0724 -0.3460
Total subsidies (AUD) -0.0042 0.1854 -0.0744
Equity/debt ratio 0.0019 0.3627 -0.0145
Note: LU: Livestock Unit. AWU: Annual Work Unit.
1. Deviations from sample means (=0), z-scores based, scaled values.
Source: Estimations.
1.4. Australian beef and sheep farms
37. According to Table A D.1.16, which contains descriptive statistical measures for
the sample, the average beef and sheep output per farm was about AUD 1.2 million in 2018
(an increase from about AUD 320 000 in 1989). The variable cost items increased over
time and the share of hired labour significantly increases for the average Australian sheep
and beef farm. The average farm had about 13 700 LU in 2018 resulting in an average
stocking density of about 2.4 LU per ha (compared to about 27 000 LU and about 3 LU per
ha in 1989).
38. In the model used to estimate the technology and the Class identification
components for the Australian beef and sheep meat production the output variable is total
output per farm and year and input variables are land, capital, labour, livestock units, and
fodder. The Class identification component is based on the indices related to structure,
environmental sustainability, innovation, technology, diversity, individual, location,
household and financial aspects (Table A D.1.17).
39. For Australian beef and sheep farms, three distinct technology classes emerge from
the model estimates (Table A D.1.17). The individual farms are distributed very unevenly
across the three technology classes (Table 1.7), as Class 3 includes about three-quarters of
all farms.
40. Beef and sheep farms in Class 2 show a significantly higher productivity
performance — measured as the potential output levels that could be achieved with a given
input bundle, in value per year — than their counterparts in classes 1 and 3 (Figure 1.7).
Dairy farms in Class 1 produce only 15% of the output level obtained by farms in Class 2,
while beef and sheep farms in Class 3 reach 40% of Class 2 achievements.
TAD/CA/APM/WP(2020)2/PART2/FINAL 21
DRIVERS OF FARM PERFORMANCE Unclassified
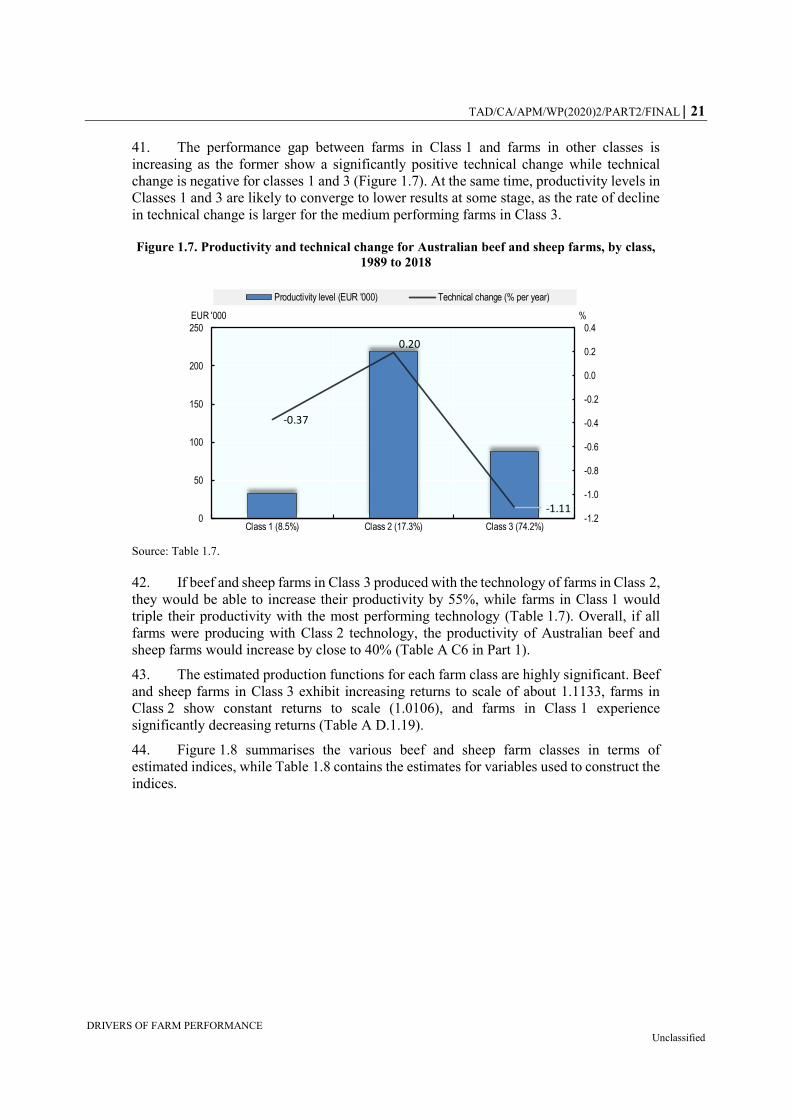
41. The performance gap between farms in Class 1 and farms in other classes is
increasing as the former show a significantly positive technical change while technical
change is negative for classes 1 and 3 (Figure 1.7). At the same time, productivity levels in
Classes 1 and 3 are likely to converge to lower results at some stage, as the rate of decline
in technical change is larger for the medium performing farms in Class 3.
Figure 1.7. Productivity and technical change for Australian beef and sheep farms, by class,
1989 to 2018
Source: Table 1.7.
42. If beef and sheep farms in Class 3 produced with the technology of farms in Class 2,
they would be able to increase their productivity by 55%, while farms in Class 1 would
triple their productivity with the most performing technology (Table 1.7). Overall, if all
farms were producing with Class 2 technology, the productivity of Australian beef and
sheep farms would increase by close to 40% (Table A C6 in Part 1).
43. The estimated production functions for each farm class are highly significant. Beef
and sheep farms in Class 3 exhibit increasing returns to scale of about 1.1133, farms in
Class 2 show constant returns to scale (1.0106), and farms in Class 1 experience
significantly decreasing returns (Table A D.1.19).
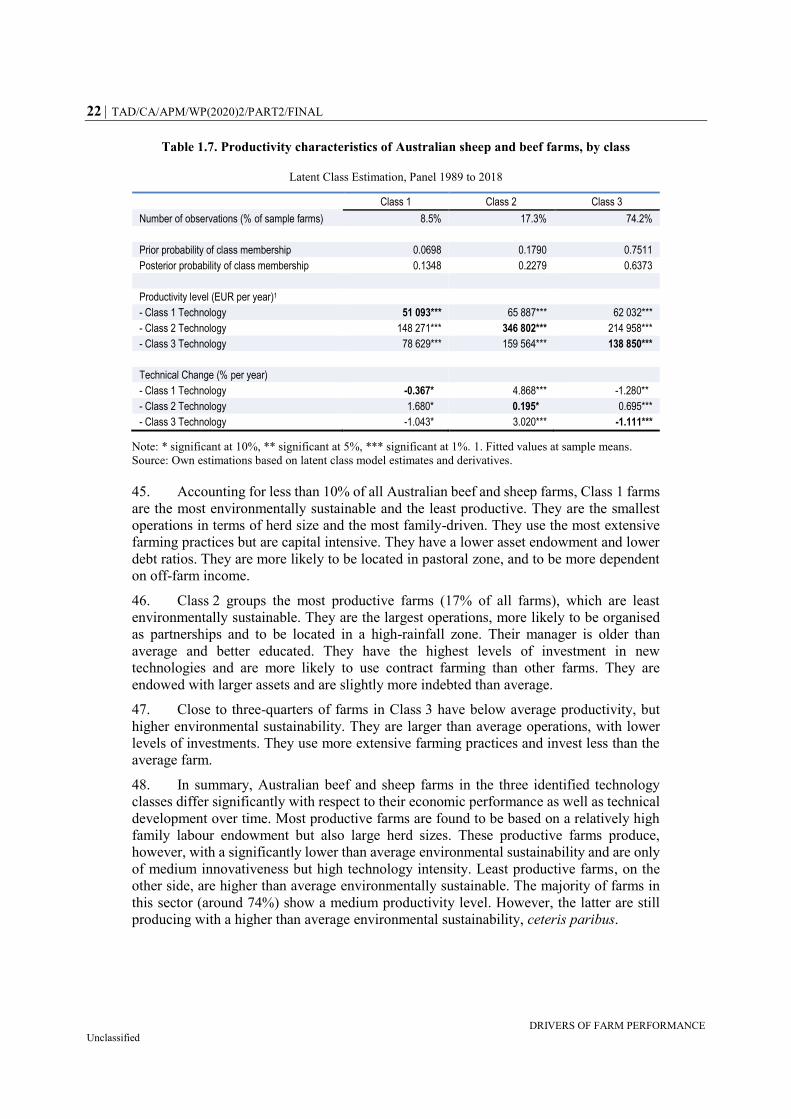
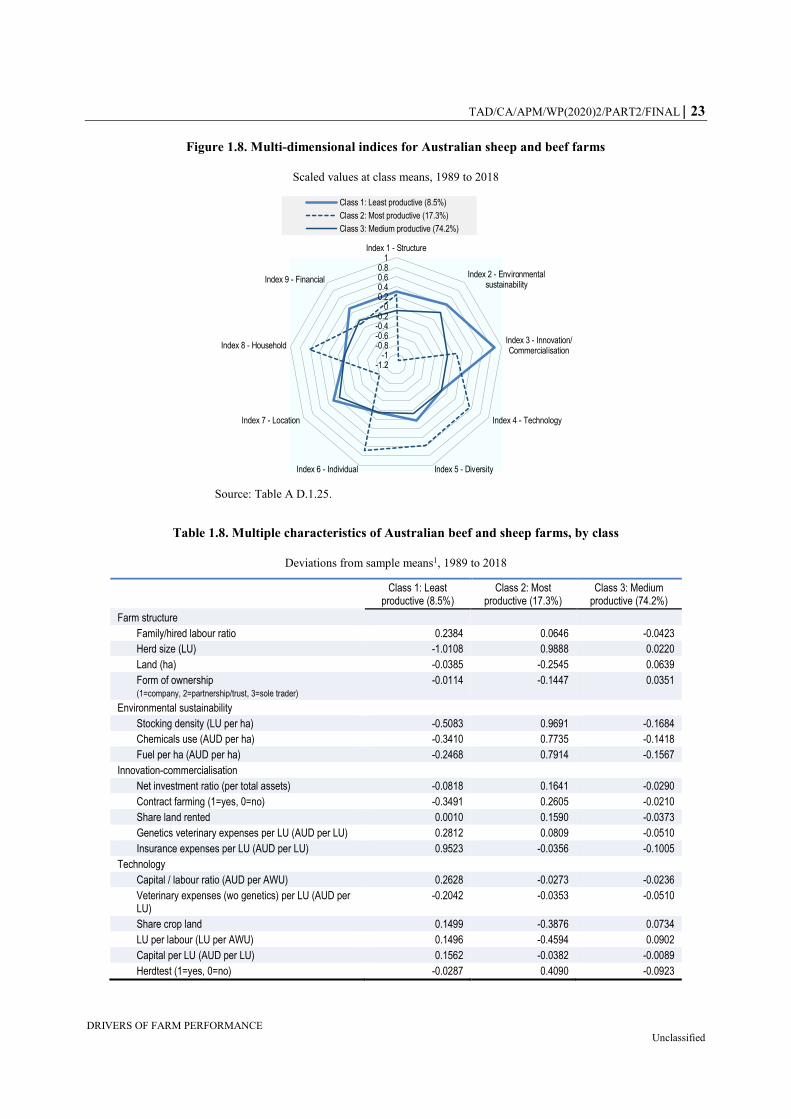
44. Figure 1.8 summarises the various beef and sheep farm classes in terms of
estimated indices, while Table 1.8 contains the estimates for variables used to construct the
indices.
-0.37
0.20
-1.11-1.2
-1.0
-0.8
-0.6
-0.4
-0.2
0.0
0.2
0.4
0
50
100
150
200
250
Class 1 (8.5%) Class 2 (17.3%) Class 3 (74.2%)
%EUR '000
Productivity level (EUR '000) Technical change (% per year)
22 TAD/CA/APM/WP(2020)2/PART2/FINAL
DRIVERS OF FARM PERFORMANCE Unclassified
Table 1.7. Productivity characteristics of Australian sheep and beef farms, by class
Latent Class Estimation, Panel 1989 to 2018
Class 1 Class 2 Class 3
Number of observations (% of sample farms) 8.5% 17.3% 74.2%
Prior probability of class membership 0.0698 0.1790 0.7511
Posterior probability of class membership 0.1348 0.2279 0.6373
Productivity level (EUR per year)1
- Class 1 Technology 51 093*** 65 887*** 62 032***
- Class 2 Technology 148 271*** 346 802*** 214 958***
- Class 3 Technology 78 629*** 159 564*** 138 850***
Technical Change (% per year)
- Class 1 Technology -0.367* 4.868*** -1.280**
- Class 2 Technology 1.680* 0.195* 0.695***
- Class 3 Technology -1.043* 3.020*** -1.111***
Note: * significant at 10%, ** significant at 5%, *** significant at 1%. 1. Fitted values at sample means.
Source: Own estimations based on latent class model estimates and derivatives.
45. Accounting for less than 10% of all Australian beef and sheep farms, Class 1 farms
are the most environmentally sustainable and the least productive. They are the smallest
operations in terms of herd size and the most family-driven. They use the most extensive
farming practices but are capital intensive. They have a lower asset endowment and lower
debt ratios. They are more likely to be located in pastoral zone, and to be more dependent
on off-farm income.
46. Class 2 groups the most productive farms (17% of all farms), which are least
environmentally sustainable. They are the largest operations, more likely to be organised
as partnerships and to be located in a high-rainfall zone. Their manager is older than
average and better educated. They have the highest levels of investment in new
technologies and are more likely to use contract farming than other farms. They are
endowed with larger assets and are slightly more indebted than average.
47. Close to three-quarters of farms in Class 3 have below average productivity, but
higher environmental sustainability. They are larger than average operations, with lower
levels of investments. They use more extensive farming practices and invest less than the
average farm.
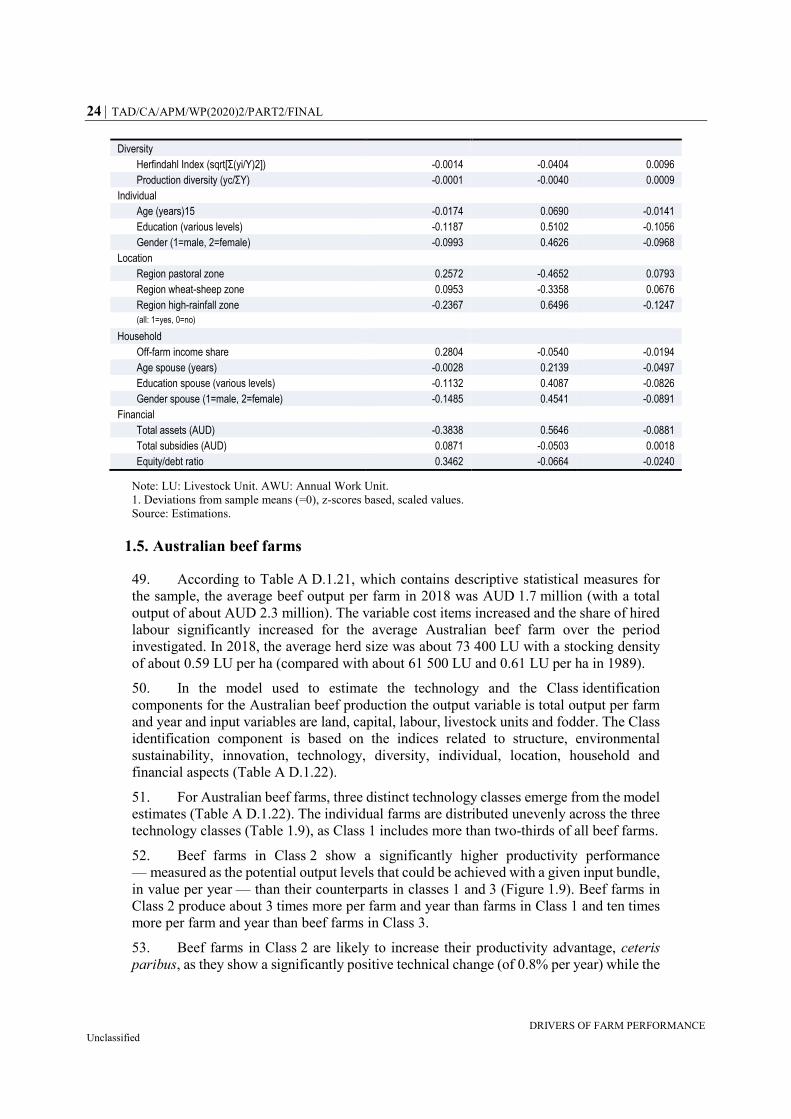
48. In summary, Australian beef and sheep farms in the three identified technology
classes differ significantly with respect to their economic performance as well as technical
development over time. Most productive farms are found to be based on a relatively high
family labour endowment but also large herd sizes. These productive farms produce,
however, with a significantly lower than average environmental sustainability and are only
of medium innovativeness but high technology intensity. Least productive farms, on the
other side, are higher than average environmentally sustainable. The majority of farms in
this sector (around 74%) show a medium productivity level. However, the latter are still
producing with a higher than average environmental sustainability, ceteris paribus.
TAD/CA/APM/WP(2020)2/PART2/FINAL 23
DRIVERS OF FARM PERFORMANCE Unclassified
Figure 1.8. Multi-dimensional indices for Australian sheep and beef farms
Scaled values at class means, 1989 to 2018
Source: Table A D.1.25.
Table 1.8. Multiple characteristics of Australian beef and sheep farms, by class
Deviations from sample means1, 1989 to 2018
Class 1: Least productive (8.5%)
Class 2: Most productive (17.3%)
Class 3: Medium productive (74.2%)
Farm structure
Family/hired labour ratio 0.2384 0.0646 -0.0423
Herd size (LU) -1.0108 0.9888 0.0220
Land (ha) -0.0385 -0.2545 0.0639
Form of ownership (1=company, 2=partnership/trust, 3=sole trader)
-0.0114 -0.1447 0.0351
Environmental sustainability
Stocking density (LU per ha) -0.5083 0.9691 -0.1684
Chemicals use (AUD per ha) -0.3410 0.7735 -0.1418
Fuel per ha (AUD per ha) -0.2468 0.7914 -0.1567
Innovation-commercialisation
Net investment ratio (per total assets) -0.0818 0.1641 -0.0290
Contract farming (1=yes, 0=no) -0.3491 0.2605 -0.0210
Share land rented 0.0010 0.1590 -0.0373
Genetics veterinary expenses per LU (AUD per LU) 0.2812 0.0809 -0.0510
Insurance expenses per LU (AUD per LU) 0.9523 -0.0356 -0.1005
Technology
Capital / labour ratio (AUD per AWU) 0.2628 -0.0273 -0.0236
Veterinary expenses (wo genetics) per LU (AUD per LU)
-0.2042 -0.0353 -0.0510
Share crop land 0.1499 -0.3876 0.0734
LU per labour (LU per AWU) 0.1496 -0.4594 0.0902
Capital per LU (AUD per LU) 0.1562 -0.0382 -0.0089
Herdtest (1=yes, 0=no) -0.0287 0.4090 -0.0923
-1.2-1
-0.8-0.6-0.4-0.2
00.20.40.60.8
1Index 1 - Structure
Index 2 - Environmentalsustainability
Index 3 - Innovation/Commercialisation
Index 4 - Technology
Index 5 - DiversityIndex 6 - Individual
Index 7 - Location
Index 8 - Household
Index 9 - Financial
Class 1: Least productive (8.5%)
Class 2: Most productive (17.3%)
Class 3: Medium productive (74.2%)
24 TAD/CA/APM/WP(2020)2/PART2/FINAL
DRIVERS OF FARM PERFORMANCE Unclassified
Diversity
Herfindahl Index (sqrt[Σ(yi/Y)2]) -0.0014 -0.0404 0.0096
Production diversity (yc/ΣY) -0.0001 -0.0040 0.0009
Individual
Age (years)15 -0.0174 0.0690 -0.0141
Education (various levels) -0.1187 0.5102 -0.1056
Gender (1=male, 2=female) -0.0993 0.4626 -0.0968
Location
Region pastoral zone 0.2572 -0.4652 0.0793
Region wheat-sheep zone 0.0953 -0.3358 0.0676
Region high-rainfall zone -0.2367 0.6496 -0.1247
(all: 1=yes, 0=no)
Household
Off-farm income share 0.2804 -0.0540 -0.0194
Age spouse (years) -0.0028 0.2139 -0.0497
Education spouse (various levels) -0.1132 0.4087 -0.0826
Gender spouse (1=male, 2=female) -0.1485 0.4541 -0.0891
Financial
Total assets (AUD) -0.3838 0.5646 -0.0881
Total subsidies (AUD) 0.0871 -0.0503 0.0018
Equity/debt ratio 0.3462 -0.0664 -0.0240
Note: LU: Livestock Unit. AWU: Annual Work Unit.
1. Deviations from sample means (=0), z-scores based, scaled values.
Source: Estimations.
1.5. Australian beef farms
49. According to Table A D.1.21, which contains descriptive statistical measures for
the sample, the average beef output per farm in 2018 was AUD 1.7 million (with a total
output of about AUD 2.3 million). The variable cost items increased and the share of hired
labour significantly increased for the average Australian beef farm over the period
investigated. In 2018, the average herd size was about 73 400 LU with a stocking density
of about 0.59 LU per ha (compared with about 61 500 LU and 0.61 LU per ha in 1989).
50. In the model used to estimate the technology and the Class identification
components for the Australian beef production the output variable is total output per farm
and year and input variables are land, capital, labour, livestock units and fodder. The Class
identification component is based on the indices related to structure, environmental
sustainability, innovation, technology, diversity, individual, location, household and
financial aspects (Table A D.1.22).
51. For Australian beef farms, three distinct technology classes emerge from the model
estimates (Table A D.1.22). The individual farms are distributed unevenly across the three
technology classes (Table 1.9), as Class 1 includes more than two-thirds of all beef farms.
52. Beef farms in Class 2 show a significantly higher productivity performance
— measured as the potential output levels that could be achieved with a given input bundle,
in value per year — than their counterparts in classes 1 and 3 (Figure 1.9). Beef farms in
Class 2 produce about 3 times more per farm and year than farms in Class 1 and ten times
more per farm and year than beef farms in Class 3.
53. Beef farms in Class 2 are likely to increase their productivity advantage, ceteris
paribus, as they show a significantly positive technical change (of 0.8% per year) while the
TAD/CA/APM/WP(2020)2/PART2/FINAL 25
DRIVERS OF FARM PERFORMANCE Unclassified
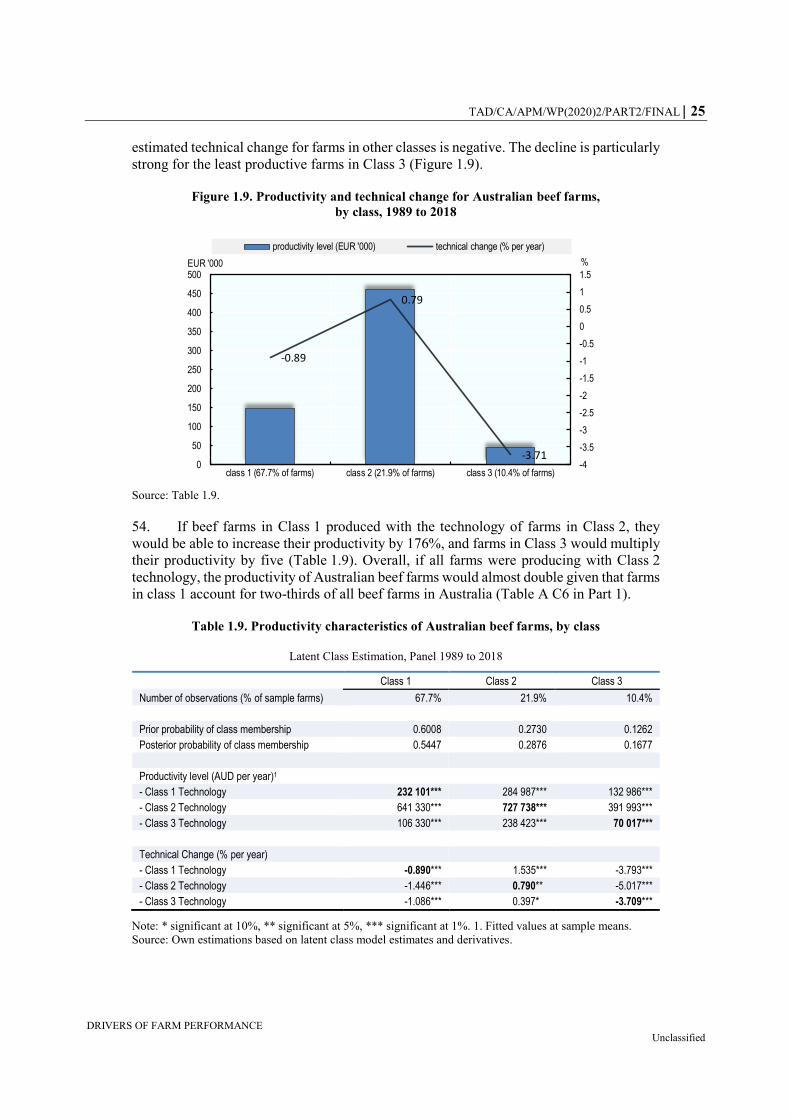
estimated technical change for farms in other classes is negative. The decline is particularly
strong for the least productive farms in Class 3 (Figure 1.9).
Figure 1.9. Productivity and technical change for Australian beef farms,
by class, 1989 to 2018
Source: Table 1.9.
54. If beef farms in Class 1 produced with the technology of farms in Class 2, they
would be able to increase their productivity by 176%, and farms in Class 3 would multiply
their productivity by five (Table 1.9). Overall, if all farms were producing with Class 2
technology, the productivity of Australian beef farms would almost double given that farms
in class 1 account for two-thirds of all beef farms in Australia (Table A C6 in Part 1).
Table 1.9. Productivity characteristics of Australian beef farms, by class
Latent Class Estimation, Panel 1989 to 2018
Class 1 Class 2 Class 3
Number of observations (% of sample farms) 67.7% 21.9% 10.4%
Prior probability of class membership 0.6008 0.2730 0.1262
Posterior probability of class membership 0.5447 0.2876 0.1677
Productivity level (AUD per year)1
- Class 1 Technology 232 101*** 284 987*** 132 986***
- Class 2 Technology 641 330*** 727 738*** 391 993***
- Class 3 Technology 106 330*** 238 423*** 70 017***
Technical Change (% per year)
- Class 1 Technology -0.890*** 1.535*** -3.793***
- Class 2 Technology -1.446*** 0.790** -5.017***
- Class 3 Technology -1.086*** 0.397* -3.709***
Note: * significant at 10%, ** significant at 5%, *** significant at 1%. 1. Fitted values at sample means.
Source: Own estimations based on latent class model estimates and derivatives.
-0.89
0.79
-3.71-4
-3.5
-3
-2.5
-2
-1.5
-1
-0.5
0
0.5
1
1.5
0
50
100
150
200
250
300
350
400
450
500
class 1 (67.7% of farms) class 2 (21.9% of farms) class 3 (10.4% of farms)
%EUR '000
productivity level (EUR '000) technical change (% per year)

26 TAD/CA/APM/WP(2020)2/PART2/FINAL
DRIVERS OF FARM PERFORMANCE Unclassified
55. The estimated production functions for each farm class are highly significant and
all beef farm classes exhibit nearly constant or slightly increasing returns to scale: 1.0423
for Class 1, 1.0076 for Class 2, and finally 1.0158 for Class 3 (Table A D.1.24).
56. Figure 1.10 summarise the various beef farm classes in terms of estimated indices,
while Table 1.10 contains the estimates for variables used to construct the indices.
57. Class 1 groups over two-thirds of Australian beef farms, which have average
environmental sustainability, and a below average productivity. They are larger than
average operations in terms of area and herd size. They are close to the average for most
indicators of technology and practices, but their manager is older and more educated than
average and more likely to be a woman. Their asset endowment is below average.
58. Class 2 farms are the most productive and the least environmentally sustainable, as
they have more intensive farming practices. They are smaller, more diversified operations,
but have assets well above average. They investment slightly more in new technologies and
activities than average, and higher debt ratios than average. Their manager is younger and
less educated than average.
59. Class 3 farms are the most environmentally sustainable and the least productive.
They are the largest, most diverse operations. They use the most extensive farming
practices. They are less capital intensive than average and are less likely to use contract
farming. They generate a higher share of off-farm income, and lower debt ratios, but
smaller asset endowment.
60. In summary, Australian beef farms in the three identified technology classes differ
significantly with respect to their economic performance as well as technical development
over time. Beef farming in Australia is characterised by a strong positive link between farm
structure (i.e. larger herd size and land endowment as well as less family labour oriented)
and productivity. Least productive farms in this sector operate with a lower than average
technology intensity and financial viability. Most productive beef farms are, however, less
environmentally sustainable than the average beef farm in Australia. These farms are very
innovative but do not necessarily operate with a higher capital and input intensity compared
to medium productive beef farms.

TAD/CA/APM/WP(2020)2/PART2/FINAL 27
DRIVERS OF FARM PERFORMANCE Unclassified
Figure 1.10. Multi-dimensional indices for Australian beef farms
Scaled values at class means, 1989 to 2018
Source: Table A D.1.20.
Table 1.10. Multiple characteristics of Australian beef farms, by class
Deviations from sample means1, 1989 to 2018
Class 1: Medium productive (67.7%)
Class 2: Most productive (21.9%)
Class 3: Least productive (10.4%)
Farm structure
Family/hired labour ratio 0.0067 -0.0222 0.0032
Herd size (LU) 0.4576 -1.1469 0.6893
Land (ha) 0.2352 -0.8602 0.2796
Form of ownership (1=company, 2=partnership/trust, 3=sole trader)
0.1696 -0.5897 0.1368
Environmental sustainability
Stocking density (LU per ha) -0.0305 0.1516 -0.1209
Chemicals use (AUD per ha) -0.0399 0.1858 -0.1320
Fuel per ha (AUD per ha) -0.0502 0.2051 -0.1051
Innovation-commercialisation
Net investment ratio (per total assets) -0.0065 0.0632 -0.0910
Contract farming (1=yes, 0=no) 0.0084 0.0896 -0.2445
Share land rented -0.0160 0.0414 0.0169
Genetics veterinary expenses per LU (AUD per LU)
-0.0210 0.0802 -0.0324
Insurance expenses per LU (AUD per LU) -0.0368 0.1242 -0.0216
Technology
Capital / labour ratio (AUD per AWU) 0.0333 -0.0497 -0.1124
Veterinary expenses (wo genetics) per LU (AUD per LU)
0.0043 -0.0123 -0.0023
Share crop land 0.0017 -0.0310 0.0544
-2
-1.5
-1
-0.5
0
0.5
1
1.5Index 1 - Structure
Index 2 - Environmentalsustainability
Index 3 - Innovation/Commercialisation
Index 4 - Technology
Index 5 - DiversityIndex 6 - Individual
Index 7 - Location
Index 8 - Household
Index 9 - Financial
Class 1: Medium productive (67.7%)
Class 2: Most productive (21.9%)
Class 3: Least productive (10.4%)

28 TAD/CA/APM/WP(2020)2/PART2/FINAL
DRIVERS OF FARM PERFORMANCE Unclassified
LU per labour (LU per AWU) -0.0127 0.0908 -0.1090
Capital per LU (AUD per LU) -0.0104 -0.0042 0.0766
Herdtest (1=yes, 0=no) -0.0412 0.1648 -0.0788
Diversity
Herfindahl Index (sqrt[Σ(yi/Y)2]) -0.0561 -0.1690 0.7235
Production diversity (yc/ΣY) -0.0055 -0.0166 0.0712
Individual
Age (years) 0.1545 -0.5061 0.0591
Education (various levels) 0.2421 -0.7749 0.0545
Gender (1=male, 2=female) 0.2226 -0.6978 0.0191
Location
Region pastoral zone -0.1569 0.4999 -0.0305
Region wheat-sheep zone 0.0674 -0.2053 -0.0067
Region high-rainfall zone 0.0942 -0.3166 0.0530
(all: 1=yes, 0=no)
Household
Off-farm income share -0.0242 -0.0830 0.3334
Age spouse (years) 0.1928 -0.6027 0.0131
Education spouse (various levels) 0.1875 -0.5480 -0.0681
Gender spouse (1=male, 2=female) 0.1818 -0.5204 -0.0893
Financial
Total assets (AUD) -0.1504 0.6294 -0.3460
Total subsidies (AUD) -0.0128 0.0308 0.0188
Equity/debt ratio -0.0053 -0.0830 0.3334
Note: LU: Livestock Unit. AWU: Annual Work Unit.
1. Deviations from sample means (=0), z-scores based, scaled values.
Source: Estimations.
1.6. Australian sheep meat farms
61. According to Table A D.1.26, which contains descriptive statistical measures for
the sample, the average sheep meat output per farm was about AUD 787 500 in 2018 (with
a total output of about AUD 850 000). The variable cost items increased over time and the
share of hired labour significantly increases for the average Australian meat sheep farm.
The average herd size was about 6 200 LU in 2018 and the average land acreage about
12 600 ha which results in a stocking density of about 3.5 LU per ha (compared with about
10 100 LU and about 25 250 ha in 1989).
62. In the model used to estimate the technology and the Class identification
components for the Australian sheep meat production the output variable is total output per
farm and year and input variables are land, capital, labour, livestock units, and materials.
The Class identification component is based on the indices related to structure,
environmental sustainability, innovation, technology, diversity, individual, location,
household and financial aspects (Table A D.1.27).
63. For Australian sheep meat farms, three technology classes with relatively close
productivity performance emerge from the model estimates (Table A D.1.27). The
individual farms are distributed very unevenly across the three technology classes
(Table 1.11), as Class 1 includes nearly three-quarters of all farms.
64. Sheep meat farms in Class 1 show a significantly higher productivity performance
— measured as the potential output levels that could be achieved with a given input bundle,
in value per year — than their counterparts in classes 2 and 3 (Figure 1.11). Farms in
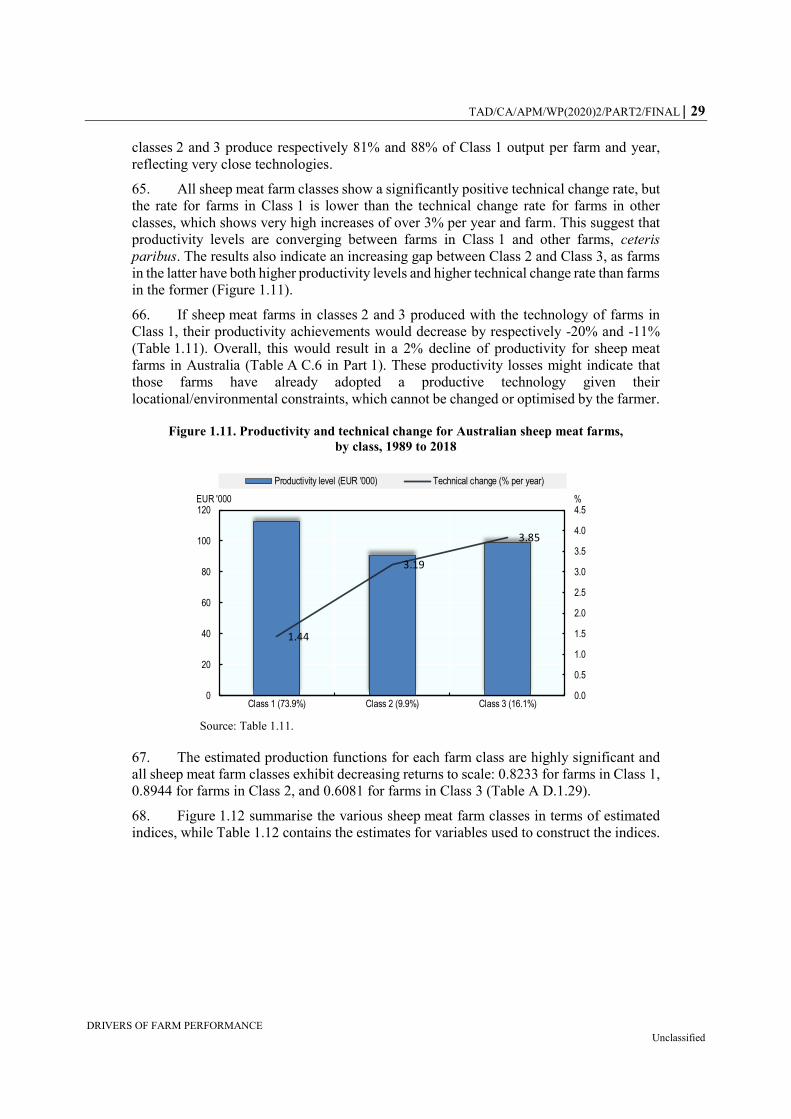
TAD/CA/APM/WP(2020)2/PART2/FINAL 29
DRIVERS OF FARM PERFORMANCE Unclassified
classes 2 and 3 produce respectively 81% and 88% of Class 1 output per farm and year,
reflecting very close technologies.
65. All sheep meat farm classes show a significantly positive technical change rate, but
the rate for farms in Class 1 is lower than the technical change rate for farms in other
classes, which shows very high increases of over 3% per year and farm. This suggest that
productivity levels are converging between farms in Class 1 and other farms, ceteris
paribus. The results also indicate an increasing gap between Class 2 and Class 3, as farms
in the latter have both higher productivity levels and higher technical change rate than farms
in the former (Figure 1.11).
66. If sheep meat farms in classes 2 and 3 produced with the technology of farms in
Class 1, their productivity achievements would decrease by respectively -20% and -11%
(Table 1.11). Overall, this would result in a 2% decline of productivity for sheep meat
farms in Australia (Table A C.6 in Part 1). These productivity losses might indicate that
those farms have already adopted a productive technology given their
locational/environmental constraints, which cannot be changed or optimised by the farmer.
Figure 1.11. Productivity and technical change for Australian sheep meat farms,
by class, 1989 to 2018
Source: Table 1.11.
67. The estimated production functions for each farm class are highly significant and
all sheep meat farm classes exhibit decreasing returns to scale: 0.8233 for farms in Class 1,
0.8944 for farms in Class 2, and 0.6081 for farms in Class 3 (Table A D.1.29).
68. Figure 1.12 summarise the various sheep meat farm classes in terms of estimated
indices, while Table 1.12 contains the estimates for variables used to construct the indices.
1.44
3.19
3.85
0.0
0.5
1.0
1.5
2.0
2.5
3.0
3.5
4.0
4.5
0
20
40
60
80
100
120
Class 1 (73.9%) Class 2 (9.9%) Class 3 (16.1%)
%EUR '000
Productivity level (EUR '000) Technical change (% per year)

30 TAD/CA/APM/WP(2020)2/PART2/FINAL
DRIVERS OF FARM PERFORMANCE Unclassified
Table 1.11. Productivity characteristics of Australian sheep meat farms, by class
Latent Class Estimation, Panel 1989 to 2018
Class 1 Class 2 Class 3
Number of observations (% of sample farms) 73.9% 10.0% 16.1%
Prior probability of class membership 0.7201 0.0000 0.2799
Posterior probability of class membership 0.6441 0.1011 0.2548
Productivity level (AUD per year)1
- Class 1 Technology 177 594*** 114 028*** 138 746***
- Class 2 Technology 261 764*** 143 272*** 191 434***
- Class 3 Technology 302 580*** 138 013*** 156 232***
Technical Change (% per year)
- Class 1 Technology 1.443*** 4.655*** 3.400***
- Class 2 Technology 1.374*** 3.191*** 4.319***
- Class 3 Technology 1.121*** 3.705*** 3.847***
Note: * significant at 10%, ** significant at 5%, *** significant at 1%. 1. Fitted values at sample means.
Source: Own estimations based on latent class model estimates and derivatives.
69. Class 1 includes close to three-quarters of all farms, which are the most productive
and also the most environmentally sustainable of all sheep meat farms in Australia. They
are more diverse operations, with the largest herds, but only above average in terms of land.
As a result, they have the highest stocking density, but otherwise use less chemicals and
fuel per ha. Their capital intensity and investment in new technologies is below average.
70. Class 2 farms are the least productive and have a lower than average environmental
sustainability score, due to lower stocking density. They are smaller in terms of herd size
and land, and most specialised operations, with high capital intensity. They are managed
by older and more educated farmers, more likely to be women. They have the highest share
of off-farm income, receive the highest amount of subsidies and have lower debt ratios.
71. Class 3 groups the least environmentally sustainable farms, which have a
productivity slightly higher the lowest one. They are the largest and most innovative farms
and are more capital intensive than average. They are less diversified than average, their
manager is younger, but better educated than average. They receive the lowest amount of
subsidies and obtain the lowest share of off-farm income.
72. In summary, Australian sheep meat farms in the three identified technology classes
differ slightly with respect to their economic performance, but more significantly with
respect to their technical development over time. Productive sheep meat farms in Australia
are also found more environmentally sustainable than other farms in the sector. They use
less family labour but produce with an average farm size. The least productive farms in the
sector operate with a lower than average environmental sustainability. These farms are,
however, very capital intensive and least diverse. Generally, productivity differences
between farms in the sector are relatively low, ceteris paribus.
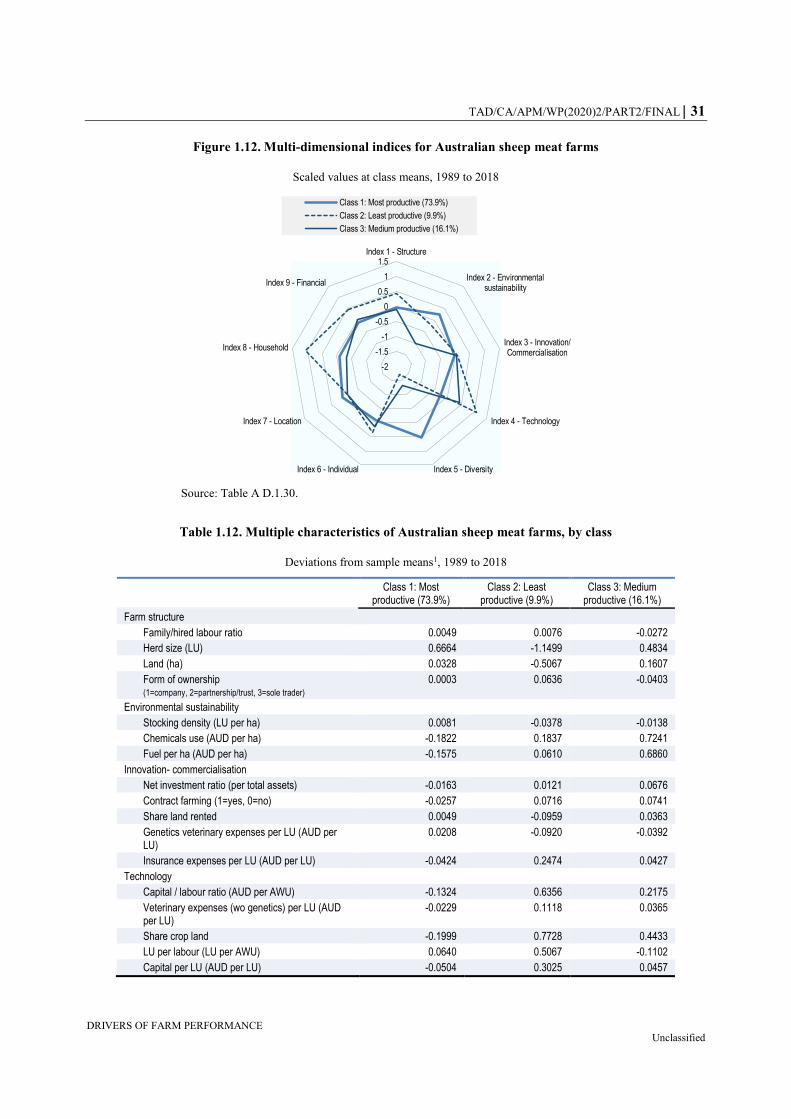
TAD/CA/APM/WP(2020)2/PART2/FINAL 31
DRIVERS OF FARM PERFORMANCE Unclassified
Figure 1.12. Multi-dimensional indices for Australian sheep meat farms
Scaled values at class means, 1989 to 2018
Source: Table A D.1.30.
Table 1.12. Multiple characteristics of Australian sheep meat farms, by class
Deviations from sample means1, 1989 to 2018
Class 1: Most productive (73.9%)
Class 2: Least productive (9.9%)
Class 3: Medium productive (16.1%)
Farm structure
Family/hired labour ratio 0.0049 0.0076 -0.0272
Herd size (LU) 0.6664 -1.1499 0.4834
Land (ha) 0.0328 -0.5067 0.1607
Form of ownership (1=company, 2=partnership/trust, 3=sole trader)
0.0003 0.0636 -0.0403
Environmental sustainability
Stocking density (LU per ha) 0.0081 -0.0378 -0.0138
Chemicals use (AUD per ha) -0.1822 0.1837 0.7241
Fuel per ha (AUD per ha) -0.1575 0.0610 0.6860
Innovation- commercialisation
Net investment ratio (per total assets) -0.0163 0.0121 0.0676
Contract farming (1=yes, 0=no) -0.0257 0.0716 0.0741
Share land rented 0.0049 -0.0959 0.0363
Genetics veterinary expenses per LU (AUD per LU)
0.0208 -0.0920 -0.0392
Insurance expenses per LU (AUD per LU) -0.0424 0.2474 0.0427
Technology
Capital / labour ratio (AUD per AWU) -0.1324 0.6356 0.2175
Veterinary expenses (wo genetics) per LU (AUD per LU)
-0.0229 0.1118 0.0365
Share crop land -0.1999 0.7728 0.4433
LU per labour (LU per AWU) 0.0640 0.5067 -0.1102
Capital per LU (AUD per LU) -0.0504 0.3025 0.0457
-2
-1.5
-1
-0.5
0
0.5
1
1.5Index 1 - Structure
Index 2 - Environmentalsustainability
Index 3 - Innovation/Commercialisation
Index 4 - Technology
Index 5 - DiversityIndex 6 - Individual
Index 7 - Location
Index 8 - Household
Index 9 - Financial
Class 1: Most productive (73.9%)
Class 2: Least productive (9.9%)
Class 3: Medium productive (16.1%)
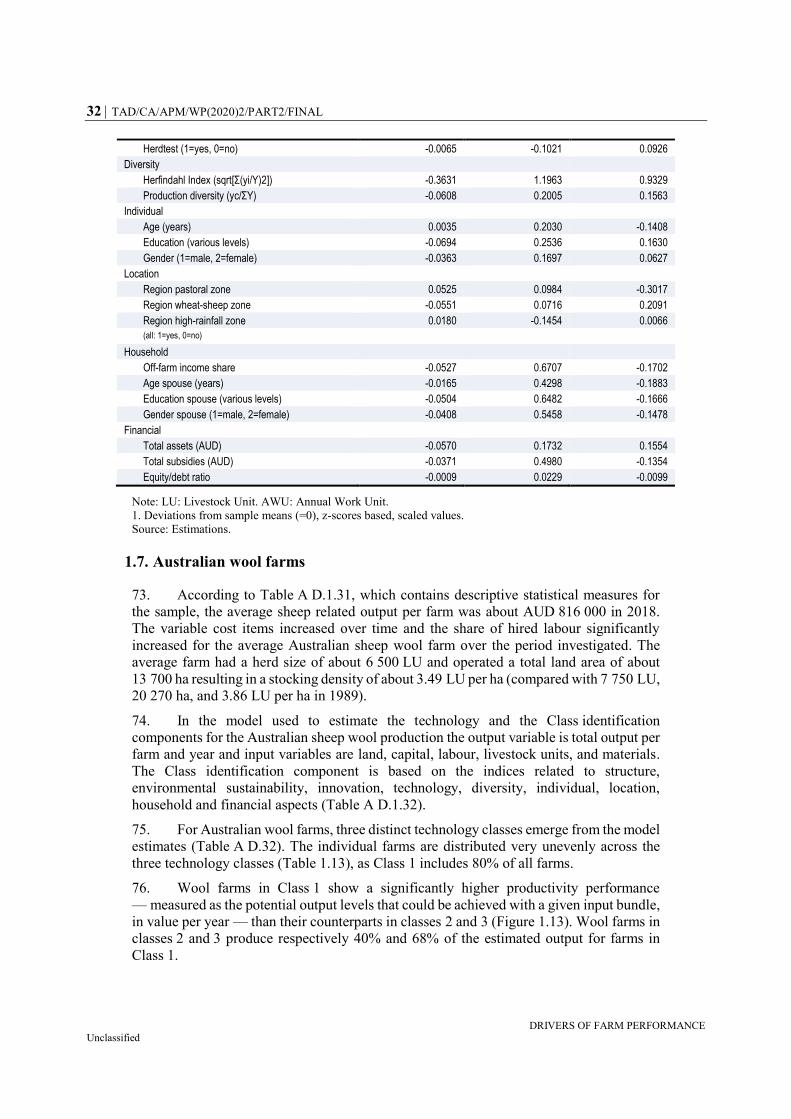
32 TAD/CA/APM/WP(2020)2/PART2/FINAL
DRIVERS OF FARM PERFORMANCE Unclassified
Herdtest (1=yes, 0=no) -0.0065 -0.1021 0.0926
Diversity
Herfindahl Index (sqrt[Σ(yi/Y)2]) -0.3631 1.1963 0.9329
Production diversity (yc/ΣY) -0.0608 0.2005 0.1563
Individual
Age (years) 0.0035 0.2030 -0.1408
Education (various levels) -0.0694 0.2536 0.1630
Gender (1=male, 2=female) -0.0363 0.1697 0.0627
Location
Region pastoral zone 0.0525 0.0984 -0.3017
Region wheat-sheep zone -0.0551 0.0716 0.2091
Region high-rainfall zone 0.0180 -0.1454 0.0066
(all: 1=yes, 0=no)
Household
Off-farm income share -0.0527 0.6707 -0.1702
Age spouse (years) -0.0165 0.4298 -0.1883
Education spouse (various levels) -0.0504 0.6482 -0.1666
Gender spouse (1=male, 2=female) -0.0408 0.5458 -0.1478
Financial
Total assets (AUD) -0.0570 0.1732 0.1554
Total subsidies (AUD) -0.0371 0.4980 -0.1354
Equity/debt ratio -0.0009 0.0229 -0.0099
Note: LU: Livestock Unit. AWU: Annual Work Unit.
1. Deviations from sample means (=0), z-scores based, scaled values.
Source: Estimations.
1.7. Australian wool farms
73. According to Table A D.1.31, which contains descriptive statistical measures for
the sample, the average sheep related output per farm was about AUD 816 000 in 2018.
The variable cost items increased over time and the share of hired labour significantly
increased for the average Australian sheep wool farm over the period investigated. The
average farm had a herd size of about 6 500 LU and operated a total land area of about
13 700 ha resulting in a stocking density of about 3.49 LU per ha (compared with 7 750 LU,
20 270 ha, and 3.86 LU per ha in 1989).
74. In the model used to estimate the technology and the Class identification
components for the Australian sheep wool production the output variable is total output per
farm and year and input variables are land, capital, labour, livestock units, and materials.
The Class identification component is based on the indices related to structure,
environmental sustainability, innovation, technology, diversity, individual, location,
household and financial aspects (Table A D.1.32).
75. For Australian wool farms, three distinct technology classes emerge from the model
estimates (Table A D.32). The individual farms are distributed very unevenly across the
three technology classes (Table 1.13), as Class 1 includes 80% of all farms.
76. Wool farms in Class 1 show a significantly higher productivity performance
— measured as the potential output levels that could be achieved with a given input bundle,
in value per year — than their counterparts in classes 2 and 3 (Figure 1.13). Wool farms in
classes 2 and 3 produce respectively 40% and 68% of the estimated output for farms in
Class 1.
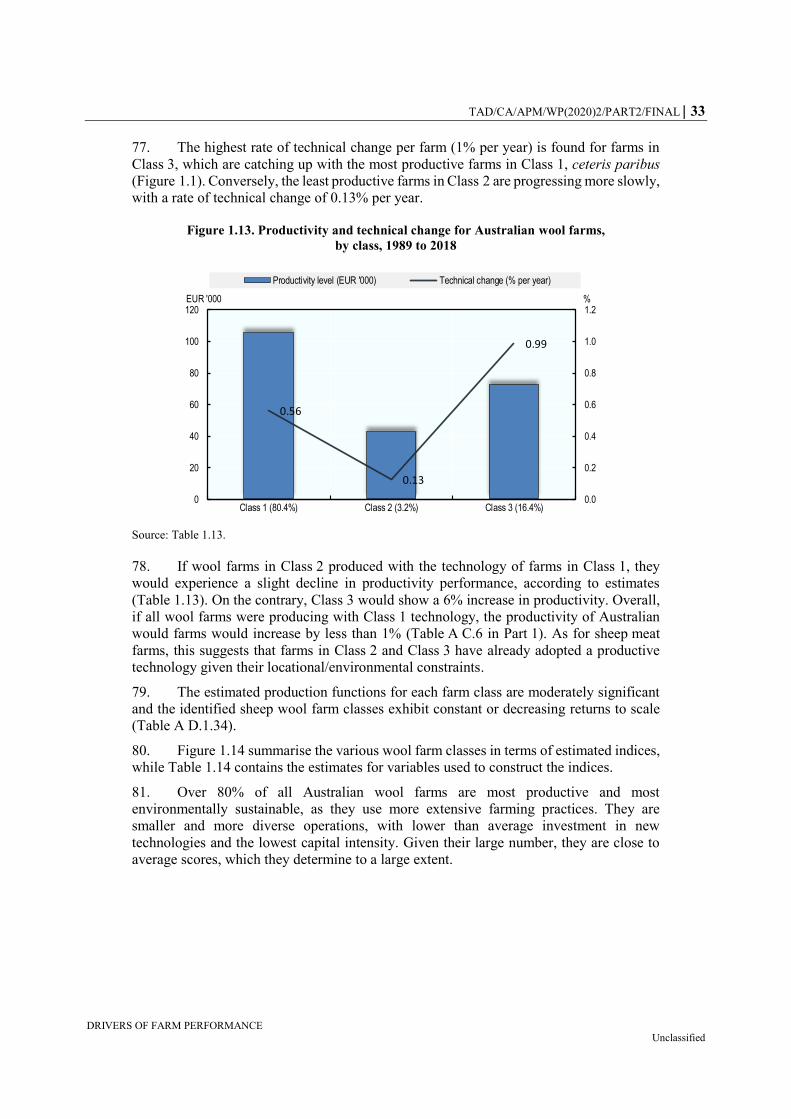
TAD/CA/APM/WP(2020)2/PART2/FINAL 33
DRIVERS OF FARM PERFORMANCE Unclassified
77. The highest rate of technical change per farm (1% per year) is found for farms in
Class 3, which are catching up with the most productive farms in Class 1, ceteris paribus
(Figure 1.1). Conversely, the least productive farms in Class 2 are progressing more slowly,
with a rate of technical change of 0.13% per year.
Figure 1.13. Productivity and technical change for Australian wool farms,
by class, 1989 to 2018
Source: Table 1.13.
78. If wool farms in Class 2 produced with the technology of farms in Class 1, they
would experience a slight decline in productivity performance, according to estimates
(Table 1.13). On the contrary, Class 3 would show a 6% increase in productivity. Overall,
if all wool farms were producing with Class 1 technology, the productivity of Australian
would farms would increase by less than 1% (Table A C.6 in Part 1). As for sheep meat
farms, this suggests that farms in Class 2 and Class 3 have already adopted a productive
technology given their locational/environmental constraints.
79. The estimated production functions for each farm class are moderately significant
and the identified sheep wool farm classes exhibit constant or decreasing returns to scale
(Table A D.1.34).
80. Figure 1.14 summarise the various wool farm classes in terms of estimated indices,
while Table 1.14 contains the estimates for variables used to construct the indices.
81. Over 80% of all Australian wool farms are most productive and most
environmentally sustainable, as they use more extensive farming practices. They are
smaller and more diverse operations, with lower than average investment in new
technologies and the lowest capital intensity. Given their large number, they are close to
average scores, which they determine to a large extent.
0.56
0.13
0.99
0.0
0.2
0.4
0.6
0.8
1.0
1.2
0
20
40
60
80
100
120
Class 1 (80.4%) Class 2 (3.2%) Class 3 (16.4%)
%EUR '000
Productivity level (EUR '000) Technical change (% per year)

34 TAD/CA/APM/WP(2020)2/PART2/FINAL
DRIVERS OF FARM PERFORMANCE Unclassified
Table 1.13. Productivity characteristics of Australian wool farms, by class
Latent Class Estimation, Panel 1989 to 2018
Class 1 Class 2 Class 3
Number of observations (% of sample farms) 80.4% 3.2% 16.4%
Prior probability of class membership 0.7864 0.0004 0.2132
Posterior probability of class membership 0.7237 0.0433 0.2330
Productivity level (AUD per year)1
- Class 1 Technology 167 360*** 67 474*** 121 686***
- Class 2 Technology 115 844*** 67 745*** 77 018***
- Class 3 Technology 188 339*** 77 972*** 114 611***
Technical Change (% per year)
- Class 1 Technology 0.563*** -1.460** 1.265***
- Class 2 Technology 3.300*** 0.127* 1.439***
- Class 3 Technology 0.543*** -2.846*** 0.988***
Note: * significant at 10%, ** significant at 5%, *** significant at 1%. 1. Fitted values at sample means. Source:
Own estimations based on latent class model estimates and derivatives.
82. This groups the 3% least productive farms, with a below average environmental
sustainability driven by their high stocking density. They are the largest, most diverse
operations, with older and more educated than average managers, more likely to be women.
They have the highest share of off-farm income, receive less subsidies and have lower debt
ratios.
83. Least environmentally sustainable farms achieve medium productivity (16% of all
farms). They are larger than average, more specialised operations, with most intensive
farming practices. They have the highest levels of investment in new technologies and
practices and the highest capital intensity. They are managed by younger farmers and their
households are less dependent on off-farm income. They have the largest asset endowment,
receive the highest subsidies and their debt/equity ratio is slightly below average.
84. In summary, Australian wool farms in the three identified technology classes differ
significantly with respect to their economic performance as well as technical development
over time. The most productive sheep farms are again more environmentally sustainable.
Contrary to the meat producing sheep sector, however, more productive wool producing
sheep farms are based on an average family labour endowment that operate significantly
larger than average herds. A small group of least productive farms produce with a
significantly lower than average environmental sustainability using a significantly higher
than average amount of hired labour linked to a relatively high technology intensity.
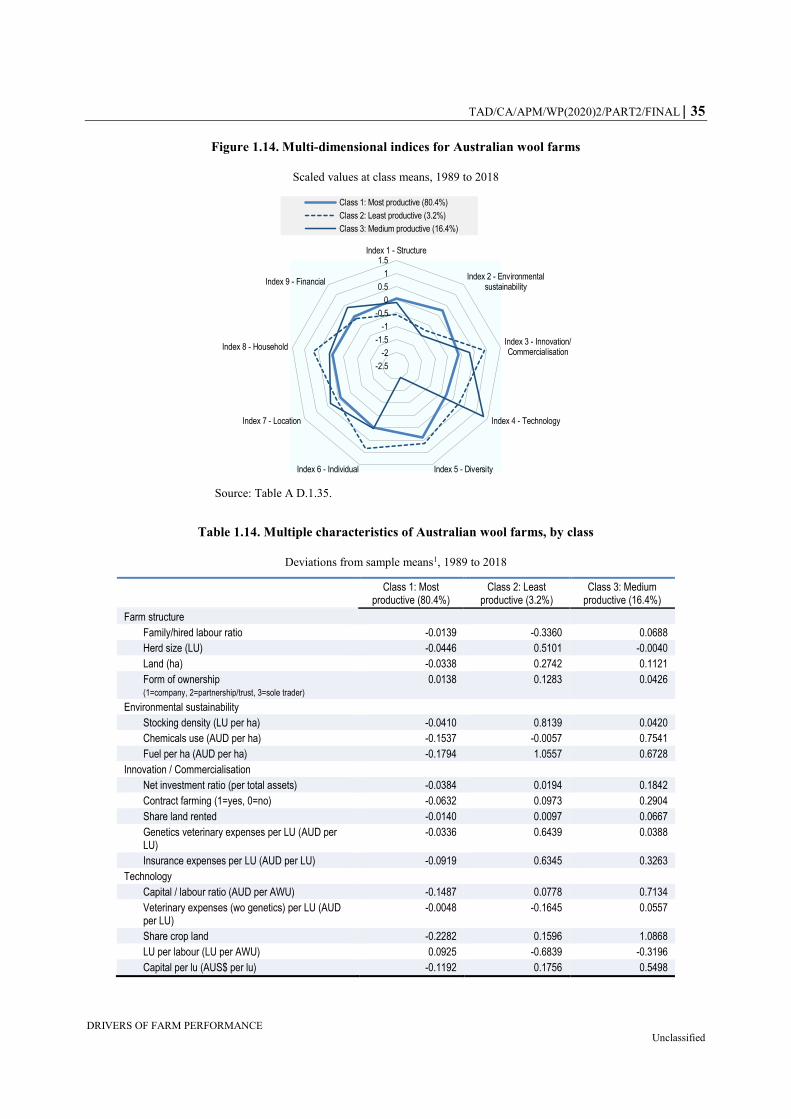
TAD/CA/APM/WP(2020)2/PART2/FINAL 35
DRIVERS OF FARM PERFORMANCE Unclassified
Figure 1.14. Multi-dimensional indices for Australian wool farms
Scaled values at class means, 1989 to 2018
Source: Table A D.1.35.
Table 1.14. Multiple characteristics of Australian wool farms, by class
Deviations from sample means1, 1989 to 2018
Class 1: Most productive (80.4%)
Class 2: Least productive (3.2%)
Class 3: Medium productive (16.4%)
Farm structure
Family/hired labour ratio -0.0139 -0.3360 0.0688
Herd size (LU) -0.0446 0.5101 -0.0040
Land (ha) -0.0338 0.2742 0.1121
Form of ownership (1=company, 2=partnership/trust, 3=sole trader)
0.0138 0.1283 0.0426
Environmental sustainability
Stocking density (LU per ha) -0.0410 0.8139 0.0420
Chemicals use (AUD per ha) -0.1537 -0.0057 0.7541
Fuel per ha (AUD per ha) -0.1794 1.0557 0.6728
Innovation / Commercialisation
Net investment ratio (per total assets) -0.0384 0.0194 0.1842
Contract farming (1=yes, 0=no) -0.0632 0.0973 0.2904
Share land rented -0.0140 0.0097 0.0667
Genetics veterinary expenses per LU (AUD per LU)
-0.0336 0.6439 0.0388
Insurance expenses per LU (AUD per LU) -0.0919 0.6345 0.3263
Technology
Capital / labour ratio (AUD per AWU) -0.1487 0.0778 0.7134
Veterinary expenses (wo genetics) per LU (AUD per LU)
-0.0048 -0.1645 0.0557
Share crop land -0.2282 0.1596 1.0868
LU per labour (LU per AWU) 0.0925 -0.6839 -0.3196
Capital per lu (AUS$ per lu) -0.1192 0.1756 0.5498
-2.5
-2
-1.5
-1
-0.5
0
0.5
1
1.5Index 1 - Structure
Index 2 - Environmentalsustainability
Index 3 - Innovation/Commercialisation
Index 4 - Technology
Index 5 - DiversityIndex 6 - Individual
Index 7 - Location
Index 8 - Household
Index 9 - Financial
Class 1: Most productive (80.4%)
Class 2: Least productive (3.2%)
Class 3: Medium productive (16.4%)
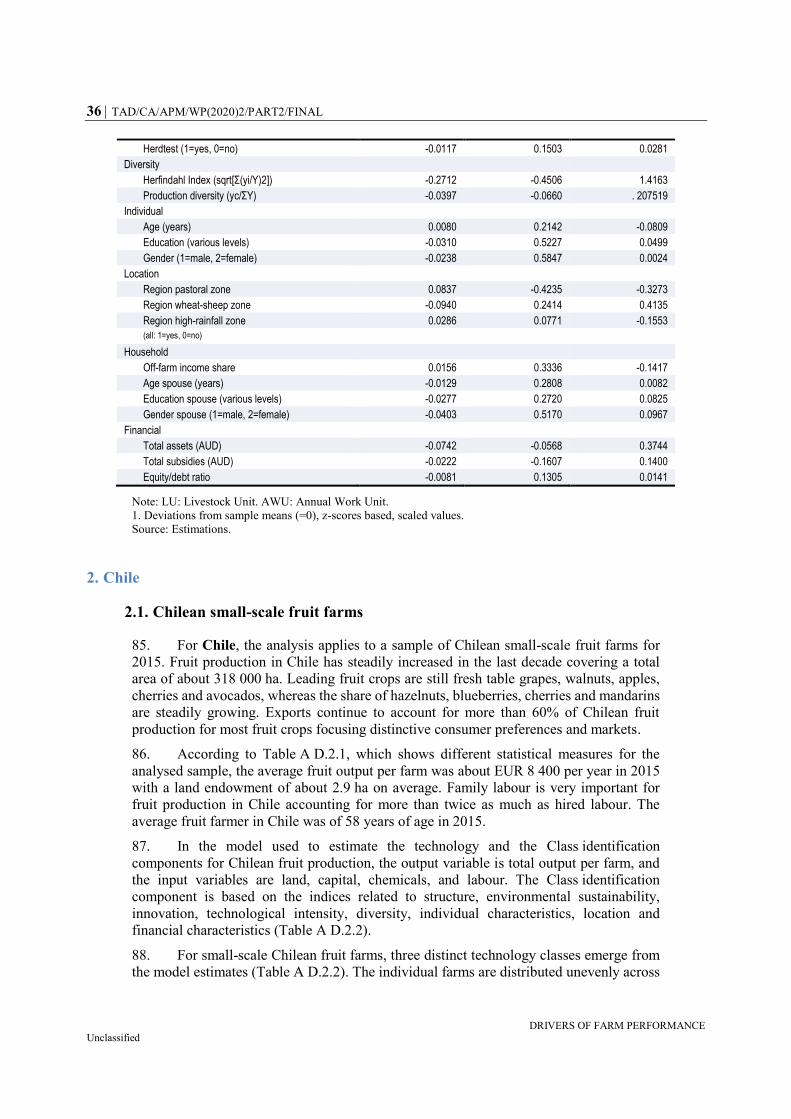
36 TAD/CA/APM/WP(2020)2/PART2/FINAL
DRIVERS OF FARM PERFORMANCE Unclassified
Herdtest (1=yes, 0=no) -0.0117 0.1503 0.0281
Diversity
Herfindahl Index (sqrt[Σ(yi/Y)2]) -0.2712 -0.4506 1.4163
Production diversity (yc/ΣY) -0.0397 -0.0660 . 207519
Individual
Age (years) 0.0080 0.2142 -0.0809
Education (various levels) -0.0310 0.5227 0.0499
Gender (1=male, 2=female) -0.0238 0.5847 0.0024
Location
Region pastoral zone 0.0837 -0.4235 -0.3273
Region wheat-sheep zone -0.0940 0.2414 0.4135
Region high-rainfall zone 0.0286 0.0771 -0.1553
(all: 1=yes, 0=no)
Household
Off-farm income share 0.0156 0.3336 -0.1417
Age spouse (years) -0.0129 0.2808 0.0082
Education spouse (various levels) -0.0277 0.2720 0.0825
Gender spouse (1=male, 2=female) -0.0403 0.5170 0.0967
Financial
Total assets (AUD) -0.0742 -0.0568 0.3744
Total subsidies (AUD) -0.0222 -0.1607 0.1400
Equity/debt ratio -0.0081 0.1305 0.0141
Note: LU: Livestock Unit. AWU: Annual Work Unit.
1. Deviations from sample means (=0), z-scores based, scaled values.
Source: Estimations.
2. Chile
2.1. Chilean small-scale fruit farms
85. For Chile, the analysis applies to a sample of Chilean small-scale fruit farms for
2015. Fruit production in Chile has steadily increased in the last decade covering a total
area of about 318 000 ha. Leading fruit crops are still fresh table grapes, walnuts, apples,
cherries and avocados, whereas the share of hazelnuts, blueberries, cherries and mandarins
are steadily growing. Exports continue to account for more than 60% of Chilean fruit
production for most fruit crops focusing distinctive consumer preferences and markets.
86. According to Table A D.2.1, which shows different statistical measures for the
analysed sample, the average fruit output per farm was about EUR 8 400 per year in 2015
with a land endowment of about 2.9 ha on average. Family labour is very important for
fruit production in Chile accounting for more than twice as much as hired labour. The
average fruit farmer in Chile was of 58 years of age in 2015.
87. In the model used to estimate the technology and the Class identification
components for Chilean fruit production, the output variable is total output per farm, and
the input variables are land, capital, chemicals, and labour. The Class identification
component is based on the indices related to structure, environmental sustainability,
innovation, technological intensity, diversity, individual characteristics, location and
financial characteristics (Table A D.2.2).
88. For small-scale Chilean fruit farms, three distinct technology classes emerge from
the model estimates (Table A D.2.2). The individual farms are distributed unevenly across
TAD/CA/APM/WP(2020)2/PART2/FINAL 37
DRIVERS OF FARM PERFORMANCE Unclassified
the three technology classes (Table 2.1). Class 1 covers about 45% of all fruit farms,
Class 2 about 36% and Class 3, which is based on only 86 observations, about 19%.
89. Farms in Class 1 show a significantly higher productivity performance — measured
as the potential output levels that could be achieved with a given input bundle, in EUR per
year — than their fruit-producing counterparts in classes 2 and 3 (Figure 2.1). They
produce much more per farm and year than farms in Class 3, and even almost 15 times
more than fruit farms in Class 2.
Figure 2.1. Productivity for Chilean small-scale fruit farms, by class, 2015
Source: Table 2.1
90. If fruit farms in Class 2 produced with the technology of farms in Class 1, they
would be close to tripling their productivity. Hence, a large part of small-scale fruit farms
in Chile was highly productive in 2015. However, more than 50% of all fruit farms could
significantly increase their productivity level by switching to a more productive technology
(Class 1 technology), ceteris paribus (Table 2.1). Overall, if all farms adopted the
technology of the most productive farms in Class 1, the productivity of small-scale fruit
farms in Chile would increase on average by about 45% (Table A C.5 in Part 1).
0
1 000
2 000
3 000
4 000
5 000
6 000
7 000
8 000
9 000
Class 1 (44.6%) Class 2 (36.2%) Class 3 (19.2%)
EUR
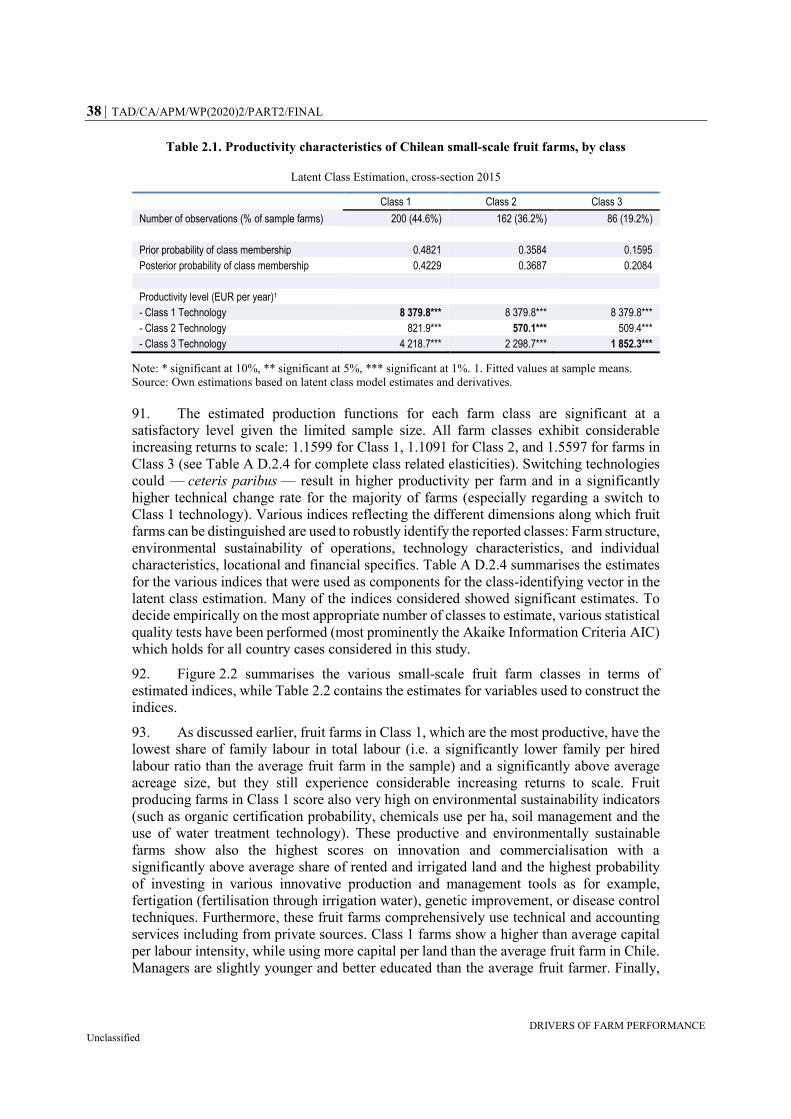
38 TAD/CA/APM/WP(2020)2/PART2/FINAL
DRIVERS OF FARM PERFORMANCE Unclassified
Table 2.1. Productivity characteristics of Chilean small-scale fruit farms, by class
Latent Class Estimation, cross-section 2015
Class 1 Class 2 Class 3
Number of observations (% of sample farms) 200 (44.6%) 162 (36.2%) 86 (19.2%)
Prior probability of class membership 0.4821 0.3584 0.1595
Posterior probability of class membership 0.4229 0.3687 0.2084
Productivity level (EUR per year)1
- Class 1 Technology 8 379.8*** 8 379.8*** 8 379.8***
- Class 2 Technology 821.9*** 570.1*** 509.4***
- Class 3 Technology 4 218.7*** 2 298.7*** 1 852.3***
Note: * significant at 10%, ** significant at 5%, *** significant at 1%. 1. Fitted values at sample means.
Source: Own estimations based on latent class model estimates and derivatives.
91. The estimated production functions for each farm class are significant at a
satisfactory level given the limited sample size. All farm classes exhibit considerable
increasing returns to scale: 1.1599 for Class 1, 1.1091 for Class 2, and 1.5597 for farms in
Class 3 (see Table A D.2.4 for complete class related elasticities). Switching technologies
could — ceteris paribus — result in higher productivity per farm and in a significantly
higher technical change rate for the majority of farms (especially regarding a switch to
Class 1 technology). Various indices reflecting the different dimensions along which fruit
farms can be distinguished are used to robustly identify the reported classes: Farm structure,
environmental sustainability of operations, technology characteristics, and individual
characteristics, locational and financial specifics. Table A D.2.4 summarises the estimates
for the various indices that were used as components for the class-identifying vector in the
latent class estimation. Many of the indices considered showed significant estimates. To
decide empirically on the most appropriate number of classes to estimate, various statistical
quality tests have been performed (most prominently the Akaike Information Criteria AIC)
which holds for all country cases considered in this study.
92. Figure 2.2 summarises the various small-scale fruit farm classes in terms of
estimated indices, while Table 2.2 contains the estimates for variables used to construct the
indices.
93. As discussed earlier, fruit farms in Class 1, which are the most productive, have the
lowest share of family labour in total labour (i.e. a significantly lower family per hired
labour ratio than the average fruit farm in the sample) and a significantly above average
acreage size, but they still experience considerable increasing returns to scale. Fruit
producing farms in Class 1 score also very high on environmental sustainability indicators
(such as organic certification probability, chemicals use per ha, soil management and the
use of water treatment technology). These productive and environmentally sustainable
farms show also the highest scores on innovation and commercialisation with a
significantly above average share of rented and irrigated land and the highest probability
of investing in various innovative production and management tools as for example,
fertigation (fertilisation through irrigation water), genetic improvement, or disease control
techniques. Furthermore, these fruit farms comprehensively use technical and accounting
services including from private sources. Class 1 farms show a higher than average capital
per labour intensity, while using more capital per land than the average fruit farm in Chile.
Managers are slightly younger and better educated than the average fruit farmer. Finally,
TAD/CA/APM/WP(2020)2/PART2/FINAL 39
DRIVERS OF FARM PERFORMANCE Unclassified
farms in Class 1 are most likely located in proximity to urban centres and they receive some
public support (Table 2.2).
94. Fruit farms in Class 3 exhibit a significantly lower than average productivity level.
Family labour is of low importance for those farms, which are larger than the average fruit
farm in Chile in terms of land endowment. Given the measured returns to scale
(Table A D.1.4), fruit farms in Class 3 should significantly increase the size of their
production operations to take advantage of economies of scale. However, the
environmental sustainability of these farms is found to be below average based on the
various indicators used. Farms in Class 3 show also a lower than average score on
innovation and commercialisation with a below average share of rented and irrigated land
and a rather low probability of investing in various innovative production and management
tools. Furthermore these fruit farms use technical and accounting services including from
private sources with a lower than average probability compared to the average fruit farm in
Chile in 2015. Their capital intensity is well below average and they employ the least
capital per land of all farm classes. Finally, fruit farms in Class 3 receive low levels of
public support (Table 2.3).
95. Class 2 farms are the least productive in the cross-sectional sample considered.
Family labour is most important for those fruit farms, which are considerably smaller than
the average fruit farm in Chile in terms of land endowment. Fruit farms in Class 2 should
increase the size of their production operations to become more profitable given the
measured positive economies of scale. These farms are found to be among the least
environmentally sustainable fruit producers based on various indicators used (here
especially the lowest probability of using water treatment technology and organic
certification). Farms in this class also have the lowest scores on innovation and
commercialisation with a significantly below average share of rented land and very low
probabilities for investing in various innovative production and management tools as, for
example fertigation, genetic or disease control techniques. Furthermore, these fruit farms
mostly do not use technical and accounting services nor private advisory services. They
have an average capital intensity with a slightly above average capital usage per land unit.
These fruit farms are located further away from urban centres (Table 2.3).
96. In summary, Chilean small-scale fruit farms in the three identified technology
classes differ significantly with respect to their economic performance. Family farms and
comparatively smaller farms show a lower environmental sustainability based on the
measures used in the empirical analysis. Highly environmentally sustainable fruit farms
also have a high probability to be very innovative in terms of investing in state-of-the-art
productive and environmentally sustainable technologies. These farms are located close to
urban centres with a higher than average capital intensity. Farms’ capital intensity is not
necessarily correlated with land endowment, while farms’ productivity shows to be
correlated with acreage size and a higher share of hired labour in total farm labour. Finally,
with more dynamic structural change in the sector, there would be a large scope for
improving productivity and environmental sustainability by having more fruit farms
switching to a more productive and environmentally sustainable fruit production
technology.

40 TAD/CA/APM/WP(2020)2/PART2/FINAL
DRIVERS OF FARM PERFORMANCE Unclassified
Figure 2.2. Multi-dimensional indices for Chilean small-scale fruit farms
Scaled values at class means, 2015
Source: Table A D.2.5.
Table 2.2. Multiple characteristics of Chilean small-scale fruit farms, by class
Deviations from sample means1, 2015
Class 1: Most productive (44.6%)
Class 2: Least productive (36.2%)
Class 3: Medium productive (19.2%)
Farm structure
Family/hired labour ratio -0.2145 0.2186 0.0871
Land (ha) 0.1062 -0.2754 0.2717
Environmental sustainability
Organic (probability) 0.1119 -0.0878 -0.0949
Chemicals use (EUR per ha) 0.0581 0.0091 -0.1522
Soil management ratio -0.0397 0.1227 -0.1387
Water treatment technology (prob) 0.1186 -0.1069 -0.0744
Innovation-commercialisation
Share land rented 0.1556 -0.1498 -0.0797
Irrigation ratio 0.1983 0.0213 -0.5014
Internet use (prob) 0.1812 -0.1352 -0.1668
Computer use (prob) 0.2169 -0.1778 -0.1696
Fertigation technology (prob) 0.3138 -0.2072 -0.3394
Genetic technology (prob) 0.3321 -0.2737 -0.2565
Input technology (prob) 0.2229 -0.2397 -0.0669
Disease technology (prob) 0.2909 -0.2932 -0.1244
Fair trade (prob) 0.1158 -0.1258 -0.0322
Technical advisory (prob) 0.3309 -0.3125 -0.1811
-0.6
-0.4
-0.2
0
0.2
0.4
0.6
0.8Index 1 - Structure
Index 2 - Environmentalsustainability
Index 3 - Innovation/Commercialisation
Index 4 - Technology
Index 6 - Individual
Index 7 - Location
Index 8 - Household
Index 9 - Financial
Class 1: Most productive (44.6%)
Class 2: Least productive (36.2%)
Class 3: Medium productive (19.2%)

TAD/CA/APM/WP(2020)2/PART2/FINAL 41
DRIVERS OF FARM PERFORMANCE Unclassified
Accounting advice (prob) 0.4642 -0.4681 -0.1979
Private advisory (prob) 0.2516 -0.2156 -0.1790
Technology
Capital / labour ratio (EUR per AWU) 0.1295 -0.0901 -0.1313
Capital per land (EUR per ha) 0.0588 0.0095 -0.1548
Individual
Age (years) -0.0762 -0.1491 0.4579
Gender (1-male, 0-female) 0.2052 -0.3724 0.2243
Education (years) 0.0903 0.1114 -0.4198
Experience (years) 0.0682 0.0891 -0.3265
Civil association membership (1-yes, 0-no) -0.0297 -0.0061 0.0804
Location
Distance to urban centre (h) -0.1069 0.1385 -0.0123
Household
Household size (n) 0.0472 -0.2237 0.3117
Ethnic (1-yes, 0-no) -0.1267 0.1771 -0.0391
Financial
Public support (1-yes, 0-no) 0.0713 -0.0212 -0.1258
Note: AWU: Annual Work Unit. 1. Deviations from sample means (=0), z-scores based, scaled values.
Source: Estimations.
3. Czech Republic
3.1. Czech dairy farms
97. For the Czech Republic, the analysis applies to a sample of dairy farms covering
the period 2005 to 2015. The Czech dairy sector is highly consolidated having undergone
a severe transformation process that followed the former planned economy approach by the
Socialist regime. The number of dairy farms has declined by about 60% in the last 20 years
with about 1 100 milk producing farms in 2016 delivering nearly 3 000 million litres milk
per year based on more than 373 000 dairy cows (EDF, 2017; Czech Statistical Office,
2017).
98. The total livestock production in the Czech Republic increased over the last
10 years to about 6 836 LUs in total whereas about 72% relate to cattle production. The
density of cattle related livestock production also increased over this period to about
40 units of livestock per 100 ha (Czech Statistical Office, 2017). The average milk yield
per cow significantly increased from about 6 900 litres per cow and year to more than
8 000 litres per cow and year. The average herd size was about 314 cows per farm and the
total milk output in current prices has been reported as about CZK 21 250 million for 2016.
99. The economic situation of milk production in the Czech Republic has been
characterised by low output prices but relatively low production costs compared to other
EU member countries (European Dairy Farmers - EDF, 2017). Specialised dairy farms
account for 9.7% of the total agricultural production and 28.3% for the total milk
production in the Czech Republic. According to the results of the current Farm Structure
Survey (FSS 2016), this type of farming cultivates 8.4% of the total area of agricultural
land in the Czech Republic and accounts for 6.7% of the total number of agricultural
holdings. Nevertheless, the largest volume of milk production from all production areas
monitored is produced by mixed-production type holdings (66.7%) (FADN CZ, 2017).

42 TAD/CA/APM/WP(2020)2/PART2/FINAL
DRIVERS OF FARM PERFORMANCE Unclassified
100. According to Table A D.3.1, which contains descriptive statistical measures for the
sample, the average milk output per farm increased over the period 2005 to 2015 due to a
significant increase in herd size. The variable cost items increased over time and the share
of hired labour significantly increases for the average Czech dairy farm. The stocking
density remained more or less at the same level, as did the probability of being engaged in
organic dairy production.
101. In the model used to estimate the technology and the Class identification
components for the Czech dairy production the output variable is total output per farm and
year and input variables are cows, capital, materials, fodder, fuel and labour. The Class
identification component is based on the indices related to structure, environmental
sustainability, innovation, diversity and location (Table A D.3.2). The individual farms are
distributed very evenly across the three technology classes (Table 3.1). Class 1 covers
about 34% of all dairy farms, Class 2 about 32.5%, and Class 3 about 33.5%.
102. Farms in Class 1 show a significantly higher productivity performance
— measured as the potential output levels that could be achieved with a given input bundle,
in EUR per year — than their milk-producing counterparts in Classes 2 and 3 (Figure 3.1).
Dairy farms in Class 1 produce about 6 times more per farm and year than farms in Class 2
and about 12 times more per farm and year than dairy farms in Class 3.
103. Dairy farms in Class 1 show a significantly positive technical change (of 2.06% per
year) compared to a modest positive technical change rate for farms in Class 3 (estimated
at 0.97% per year) and in Class 2 (estimated at 0.37% per year). Hence, although dairy
farms in Class 1 are already far more productive, they also seem to increase their
productivity at a higher rate based on a significant positive technical change development
ceteris paribus.
Figure 3.1. Productivity and technical change for Czech dairy farms, by class, 2005 to 2015
Source: Table 3.1.
104. If dairy farms in Class 2 produced with the technology of farms in Class 1, they
would be able to increase their productivity significantly by about 167%, and farms in
Class 3 would increase their productivity 171%. (Table 3.1). If all Czech dairy farms
adopted the technology of most productive farms in Class 1, their average productivity
would increase by 32% (Table A C.4 in Part 1).
2.06
0.37
0.97
0.0
0.5
1.0
1.5
2.0
2.5
0
100
200
300
400
500
600
700
800
Class 1 (33.9%) Class 2 (32.5%) Class 3 (33.6%)
%EUR '000
Productivity (EUR '000 per year) Technical change (% per year)
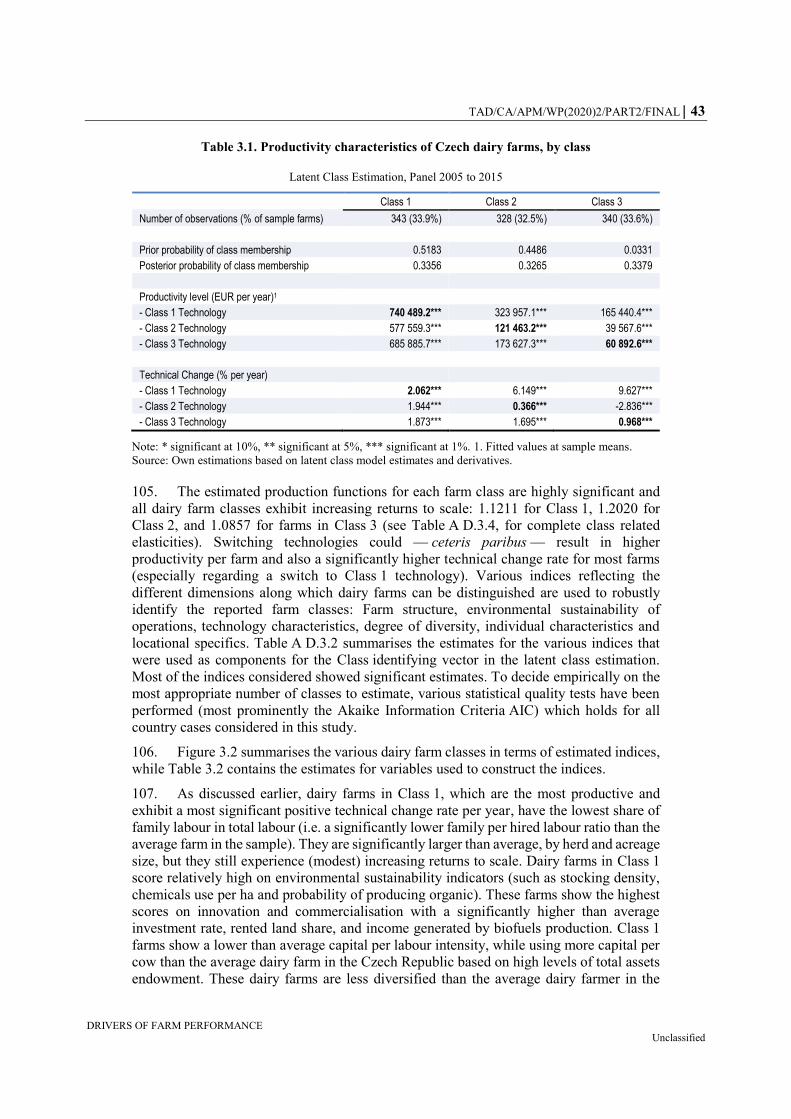
TAD/CA/APM/WP(2020)2/PART2/FINAL 43
DRIVERS OF FARM PERFORMANCE Unclassified
Table 3.1. Productivity characteristics of Czech dairy farms, by class
Latent Class Estimation, Panel 2005 to 2015
Class 1 Class 2 Class 3
Number of observations (% of sample farms) 343 (33.9%) 328 (32.5%) 340 (33.6%)
Prior probability of class membership 0.5183 0.4486 0.0331
Posterior probability of class membership 0.3356 0.3265 0.3379
Productivity level (EUR per year)1
- Class 1 Technology 740 489.2*** 323 957.1*** 165 440.4***
- Class 2 Technology 577 559.3*** 121 463.2*** 39 567.6***
- Class 3 Technology 685 885.7*** 173 627.3*** 60 892.6***
Technical Change (% per year)
- Class 1 Technology 2.062*** 6.149*** 9.627***
- Class 2 Technology 1.944*** 0.366*** -2.836***
- Class 3 Technology 1.873*** 1.695*** 0.968***
Note: * significant at 10%, ** significant at 5%, *** significant at 1%. 1. Fitted values at sample means.
Source: Own estimations based on latent class model estimates and derivatives.
105. The estimated production functions for each farm class are highly significant and
all dairy farm classes exhibit increasing returns to scale: 1.1211 for Class 1, 1.2020 for
Class 2, and 1.0857 for farms in Class 3 (see Table A D.3.4, for complete class related
elasticities). Switching technologies could — ceteris paribus — result in higher
productivity per farm and also a significantly higher technical change rate for most farms
(especially regarding a switch to Class 1 technology). Various indices reflecting the
different dimensions along which dairy farms can be distinguished are used to robustly
identify the reported farm classes: Farm structure, environmental sustainability of
operations, technology characteristics, degree of diversity, individual characteristics and
locational specifics. Table A D.3.2 summarises the estimates for the various indices that
were used as components for the Class identifying vector in the latent class estimation.
Most of the indices considered showed significant estimates. To decide empirically on the
most appropriate number of classes to estimate, various statistical quality tests have been
performed (most prominently the Akaike Information Criteria AIC) which holds for all
country cases considered in this study.
106. Figure 3.2 summarises the various dairy farm classes in terms of estimated indices,
while Table 3.2 contains the estimates for variables used to construct the indices.
107. As discussed earlier, dairy farms in Class 1, which are the most productive and
exhibit a most significant positive technical change rate per year, have the lowest share of
family labour in total labour (i.e. a significantly lower family per hired labour ratio than the
average farm in the sample). They are significantly larger than average, by herd and acreage
size, but they still experience (modest) increasing returns to scale. Dairy farms in Class 1
score relatively high on environmental sustainability indicators (such as stocking density,
chemicals use per ha and probability of producing organic). These farms show the highest
scores on innovation and commercialisation with a significantly higher than average
investment rate, rented land share, and income generated by biofuels production. Class 1
farms show a lower than average capital per labour intensity, while using more capital per
cow than the average dairy farm in the Czech Republic based on high levels of total assets
endowment. These dairy farms are less diversified than the average dairy farmer in the

44 TAD/CA/APM/WP(2020)2/PART2/FINAL
DRIVERS OF FARM PERFORMANCE Unclassified
Czech Republic, and their managers are older than average. Finally, dairy farms in Class 1
are most likely located in less-favoured areas (Table 3.2).
108. Dairy farms in Class 2 show a medium productivity, but a lower than average
technical change per year. They are smaller than the average dairy farm in the Czech
Republic in terms of herd size and land endowment. Hired labour is important and a single
ownership is likely for these farms. Dairy farms in Class 2 should significantly increase the
size of their production operations given the measured economies of scale. They are found
to be the most environmentally sustainable based on various indicators used (such as
stocking density, chemicals use per ha and probability of producing organic). However,
dairy farms in Class 2 invest less than the average dairy farm in the Czech Republic and
generate less income by biofuel production. Their capital intensity is the lowest of all dairy
farms, and they employ the most labour per cow. These dairy farms are the least specialised
of the three classes and their farm managers are of average age. Finally, dairy farms in
Class 2 are likely located in less-favoured areas or areas of higher altitude (Table 3.2).
Figure 3.2. Multi-dimensional indices for Czech dairy farms
Scaled values at class means, 2005 to 2015
Source: Table A D.3.5.
109. Class 3 farms are the least productive but show a significant average technical
change rate per year. Family labour is most important for those dairy farms, which are
considerably smaller than the average dairy farm in the Czech Republic in terms of herd
size and land endowment. Single ownership is most probable for these farms. Dairy farms
in Class 3 should increase the size of their production operations to become more profitable
given the identified positive economies of scale. These farms are found to be the least
environmentally sustainable based on various indicators used (such as stocking density,
chemicals use per ha and probability of producing organic). Dairy farms in Class 3 invest
far less than the average dairy farm in the Czech Republic and generate least income from
biofuel production. Their capital intensity is, however, the highest of all dairy farms and
consistent with this notion is the finding that farms in Class 3 employ the lowest quantity
of labour per cow. These farms are least diversified and their farm managers are of lower
than average age. Finally, dairy farms in Class 3 are less likely located in less-favoured
areas or areas of higher altitude (Table 3.3).
-2
-1.5
-1
-0.5
0
0.5
1
1.5Index 1 - Structure
Index 2 - Environmentalsustainability
Index 3 - Innovation/Cooperation/
Commercialisation
Index 4 - Technology
Index 5 - Diversity
Index 7 - Location
Class 1: Most productive (33.9%)
Class 2: Medium productive (32.5%)
Class 3: Least productive (33.6%)
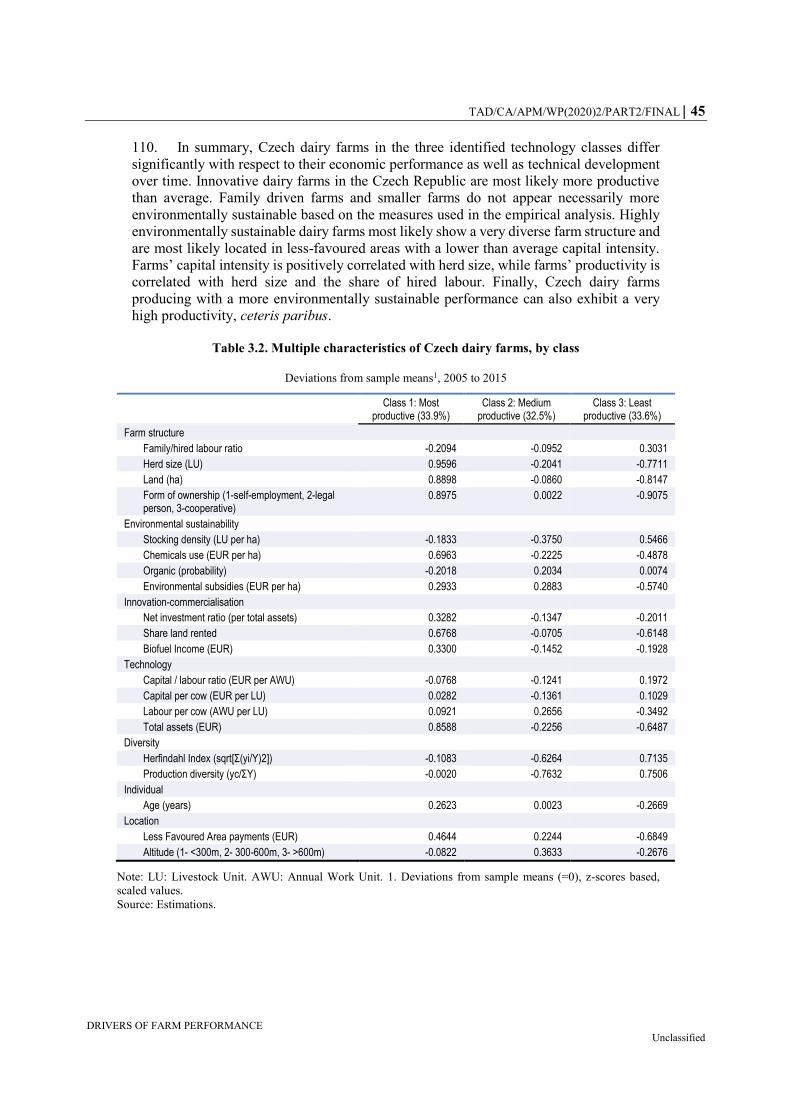
TAD/CA/APM/WP(2020)2/PART2/FINAL 45
DRIVERS OF FARM PERFORMANCE Unclassified
110. In summary, Czech dairy farms in the three identified technology classes differ
significantly with respect to their economic performance as well as technical development
over time. Innovative dairy farms in the Czech Republic are most likely more productive
than average. Family driven farms and smaller farms do not appear necessarily more
environmentally sustainable based on the measures used in the empirical analysis. Highly
environmentally sustainable dairy farms most likely show a very diverse farm structure and
are most likely located in less-favoured areas with a lower than average capital intensity.
Farms’ capital intensity is positively correlated with herd size, while farms’ productivity is
correlated with herd size and the share of hired labour. Finally, Czech dairy farms
producing with a more environmentally sustainable performance can also exhibit a very
high productivity, ceteris paribus.
Table 3.2. Multiple characteristics of Czech dairy farms, by class
Deviations from sample means1, 2005 to 2015
Class 1: Most productive (33.9%)
Class 2: Medium productive (32.5%)
Class 3: Least productive (33.6%)
Farm structure
Family/hired labour ratio -0.2094 -0.0952 0.3031
Herd size (LU) 0.9596 -0.2041 -0.7711
Land (ha) 0.8898 -0.0860 -0.8147
Form of ownership (1-self-employment, 2-legal person, 3-cooperative)
0.8975 0.0022 -0.9075
Environmental sustainability
Stocking density (LU per ha) -0.1833 -0.3750 0.5466
Chemicals use (EUR per ha) 0.6963 -0.2225 -0.4878
Organic (probability) -0.2018 0.2034 0.0074
Environmental subsidies (EUR per ha) 0.2933 0.2883 -0.5740
Innovation-commercialisation
Net investment ratio (per total assets) 0.3282 -0.1347 -0.2011
Share land rented 0.6768 -0.0705 -0.6148
Biofuel Income (EUR) 0.3300 -0.1452 -0.1928
Technology
Capital / labour ratio (EUR per AWU) -0.0768 -0.1241 0.1972
Capital per cow (EUR per LU) 0.0282 -0.1361 0.1029
Labour per cow (AWU per LU) 0.0921 0.2656 -0.3492
Total assets (EUR) 0.8588 -0.2256 -0.6487
Diversity
Herfindahl Index (sqrt[Σ(yi/Y)2]) -0.1083 -0.6264 0.7135
Production diversity (yc/ΣY) -0.0020 -0.7632 0.7506
Individual
Age (years) 0.2623 0.0023 -0.2669
Location
Less Favoured Area payments (EUR) 0.4644 0.2244 -0.6849
Altitude (1- <300m, 2- 300-600m, 3- >600m) -0.0822 0.3633 -0.2676
Note: LU: Livestock Unit. AWU: Annual Work Unit. 1. Deviations from sample means (=0), z-scores based,
scaled values.
Source: Estimations.

46 TAD/CA/APM/WP(2020)2/PART2/FINAL
DRIVERS OF FARM PERFORMANCE Unclassified
4. Denmark
111. For Denmark, the analysis applies to a sample of dairy farms covering the period
2010 to 2016 and to a sample of pig farms covering the period 2006 to 2016. In Denmark,
field crops dominate agricultural land use, but are mostly used for animal feed. Livestock
related production mainly relates to pigs, cattle, chicken and mink. The total food
production in Denmark largely exceeds the food demand of its own population, hence, most
products are exported. The average farm size is about 70 ha, more than 20% of the farms
cultivate more than 100 ha land (Danish Agriculture & Food Council, 2016; Vidø and
Schou, 2017).
4.1. Dairy farms
112. Dairy production in Denmark is characterised by relatively large-scale production
units with an average herd size of about 172 cows per farm and high milk yields per cow
of about 9 500 kg/head in 2016. The total number of dairy farms has been steadily
decreasing to about 3 300 dairy farms in 2016 and an average of about 1 600 tonnes of milk
delivered per farm. The number of farms delivering more than 5 000 tonnes per farm and
year has been significantly increasing in the last ten years (from 6 farms in 2006 to
106 farms in 2016) (Landbrug & Foedevarer, 2017).
113. According to Table A D.4.1, which summarises descriptive statistical measures for
the sample of Danish dairy farms, the average milk output per farm significantly increased
between 2010 and 2016 due to a significant increase in herd size. The variable cost items
also increased over the period, as well as the share of hired labour in the average farm
labour, which outperformed the share of family labour in 2016. The average stocking
density per farm increased slightly over the period investigated, while the probability of
being engaged in organic dairy production slightly declined.
114. In the model used to estimate the technology and the Class identification
components for the Danish dairy, the output variable is total output per farm and year. The
input variables are cows, land, capital, materials. The Class identification component is
based on the indices related to structure, environmental sustainability, innovation,
technology, diversity, individual and household characteristics, location and financial
aspects (Table A D.4.2).
115. For Danish dairy farms, three distinct technology classes emerge from the model
estimates (Table A D.4.2). The individual farms are distributed unevenly across the three
technology classes (Table 4.1). Class 1 covers about 67% of all dairy farms, Class 2 about
16% and Class 3 about 17%.
116. Dairy farms in Class 1 show a higher productivity performance — measured as the
potential output levels that could be achieved with a given input bundle, in EUR per year —
than their milk-producing counterparts in Classes 2 and 3 (Figure 4.1). They produce about
10% more per farm and year than farms in Class 2 and about 90% more per farm and year
than dairy farms in Class 3 (Figure 4.1).
117. Dairy farms in Class 1 show a positive technical change (of 1.78% per year)
compared to a significant positive technical change rate for farms in Class 2 (estimated at
2.97% per year) and in Class 3 (estimated at 2.02% per year). Hence, although dairy farms
in Class 1 are more productive, productivity seems to grow at a higher rate in slightly less
productive farms in Class 2 and significantly less productive farms in Class 3, due to
significant increases in technical change ceteris paribus (Table 4.1). Switching to Class 2

TAD/CA/APM/WP(2020)2/PART2/FINAL 47
DRIVERS OF FARM PERFORMANCE Unclassified
technology could also lead to a higher positive technical change rate for Class 1 farms (of
up to 3.9% per year compared to the current 1.78% estimated rate).
Figure 4.1. Productivity and technical change for Danish dairy farms, by class, 2010 to 2016
Source: Table 4.1.
118. If dairy farms in Class 3 produced with the technology of farms in Class 1, they
would be able to increase their productivity by about 25%. Moreover, the most productive
farms in Class 1 could even further increase their productivity by switching to Class 2
technology (by 6%) implying that Class 1 and Class 2 farms produce with a quite similar
technology (Table 4.1).
Table 4.1. Productivity characteristics of Danish dairy farms, by class
Latent Class Estimation, Panel 2010 to 2016
Class 1 Class 2 Class 3
Number of observations (% of sample farms) 11 461 (66.9%) 2 736 (15.9%) 2 924 (17.2%)
Prior probability of class membership 0.9579 0.0211 0.0211
Posterior probability of class membership 0.6363 0.1785 0.1852
Productivity level (EUR per year)1
- Class 1 Technology 695 809*** 578 348*** 463 438***
- Class 2 Technology 729 219*** 655 091*** 453 626***
- Class 3 Technology 579 215*** 495 999*** 367 261***
Technical Change (% per year)
- Class 1 Technology 1.780*** 1.573*** 0.429***
- Class 2 Technology 3.917*** 2.969*** 2.040***
- Class 3 Technology 2.190*** 1.990*** 2.020***
Note: * significant at 10%, ** significant at 5%, *** significant at 1%. 1. Fitted values at sample means.
Source: Own estimations based on latent class model estimates and derivatives.
1.78
2.97
2.02
0
0.5
1
1.5
2
2.5
3
3.5
0
100
200
300
400
500
600
700
800
Class 1 (66.9%) Class 2 (15.9%) Class 3 (17.2%)
% '000 EUR
Productivity ('000 EUR per year) Technical change (% per year)
48 TAD/CA/APM/WP(2020)2/PART2/FINAL
DRIVERS OF FARM PERFORMANCE Unclassified
119. The estimated production functions are highly significant and all dairy farm classes
exhibit (slight to significant) increasing returns to scale: 1.0291 for Class 1, 1.0838 for
Class 2, and 1.1008 for farms in Class 3 (see Table A.B.4.4 for complete class related
elasticities). Switching technologies could — ceteris paribus — result in higher
productivity per dairy farm and in a significantly higher technical change rate for most
farms (especially regarding a switch to Class 2 technology). Various indices, reflecting the
different dimensions along which dairy farms can be distinguished, are used to identify
robustly the reported farm classes: Farm structure, environmental sustainability of
operations, innovation and technology related characteristics, degree of diversity,
individual and household characteristics as well as locational specifics. Table A.B.4.4
summarises the estimates for the various indices used as components for the class-
identifying vector in the latent class estimation. Most of the indices considered showed
significant estimates. To decide on the empirically most appropriate number of classes to
be estimated, various statistical quality tests have been performed (most prominently the
Akaike Information Criteria AIC) which holds for all country cases considered in this
study.
120. Figure 4.2 summarise the various dairy farm classes in terms of estimated indices,
while Table 4.2 contains the estimates for variables used to construct the indices.
121. As discussed earlier, dairy farms in Class 1 are slightly more productive and exhibit
a positive technical change rate per year. They have the lowest share of family labour (i.e.
a significantly lower family per hired labour share than the average farm in the sample) and
a significantly above average herd and acreage size but still experience (modest) increasing
returns to scale. Dairy farms in Class 1 score relatively low on environmental sustainability
indicators (such as stocking density, chemicals use per ha and probability of producing
organic). On the other hand, these farms show a slightly higher than average score on
innovation and commercialisation with a higher than average rented land share and higher
than average probability of being engaged in contracting. Class 1 farms show a slightly
lower than average capital per labour intensity and capital per cow intensity than the
average dairy farm in Denmark linked to an average level of assets endowment. They are
less diversified than the average dairy farm, and their managers are slightly younger than
the average Danish dairy farmer. Finally, dairy farms in Class 1 generate lower than
average off-farm income compared to the average Danish dairy farm (Table 4.2).
122. Dairy farms in Class 2 are slightly less productive than their counterparts in Class
1 but show a higher than average technical change per year. Hired labour is more important
for those farms, which are smaller than the average dairy farm in Denmark in terms of herd
size but larger in terms of land endowment. Dairy farms in Class 2 should significantly
increase the size of their production operations given the measured economies of scale (of
about 1.0838). These farms are found to be the most environmentally sustainable based on
the various indicators used (such as stocking density, chemicals use per ha and probability
of producing organic). Furthermore, dairy farms in Class 2 invest significantly more than
the average dairy farm in Denmark and their capital intensity is the highest of all dairy
farms, employing most capital and fodder per cow. Most likely, these dairy farms operate
with innovative milking technologies, e.g. automatic milk systems or milking parlours.
These dairy farms are diversified and their farm managers are of average age. Finally, dairy
farms in Class 2 generate higher than the average off-farm income per farm and operate
with a significantly higher than average level of assets endowment (Table 4.3).

TAD/CA/APM/WP(2020)2/PART2/FINAL 49
DRIVERS OF FARM PERFORMANCE Unclassified
Figure 4.2. Multi-dimensional indices for Danish dairy farms
Scaled Values at Class Means, 2010 to 2016
Source: Table A D.4.5.
123. Finally, Class 3 dairy farms are the least productive but show a significant technical
change rate per year. Family labour is most important for those farms, which are
considerably smaller than the average dairy farm in Denmark in terms of herd size and land
endowment. Dairy farms in Class 3 should increase the size of their production operations
to become more profitable given the identified positive economies of scale (of about
1.1008). These farms are found as environmentally sustainable as the average based on the
various indicators used (such as stocking density, chemicals use per ha and probability of
producing organic). Dairy farms in Class 3 invest far less than the average dairy farm in
Denmark and most likely operate with less innovative milking technologies as, for example
pipeline systems or milking carousels. Their capital intensity is the lowest of all dairy farms
and consistently with this notion is the finding that farms in Class 3 employ lowest levels
of capital per cow. These dairy farms are the most diversified and their farm managers are
of higher than average age. Finally, dairy farms in Class 3 generate the lowest off-farm
income of the three classes and show the lowest level of assets endowment (Table 4.3).
124. In summary, Danish dairy farms in the three identified technology classes differ
significantly with respect to their economic performance as well as technical development
over time. Innovative farms are most likely productive compared to their peer group and
show the highest technical change rates over time. Family driven farms and comparatively
smaller farms not necessarily show a higher environmental sustainability based on the
measures used in the empirical analysis. Highly environmentally sustainable dairy farms
most likely show a diverse Farm structure and most likely employ an innovative milking
technology. Farms’ capital intensity is not necessarily correlated with herd size, while
farms’ productivity is correlated with the share of hired labour. Finally, more
environmentally sustainable farms exhibit higher than average levels of productivity,
ceteris paribus.
-2.5
-2
-1.5
-1
-0.5
0
0.5
1
1.5Index 1 - Structure
Index 2 - Environmental sustainability
Index 3 - Innovation/Cooperation/Commercialisation
Index 4 - Technology
Index 5 - DiversityIndex 6 - Individual
Index 7 - Location
Index 8 - Household
Index 9 - Financial
Class 1: Most productive (66.9%) Class 2: Medium productive (15.9%)
Class 3: Least productive (17.2%)
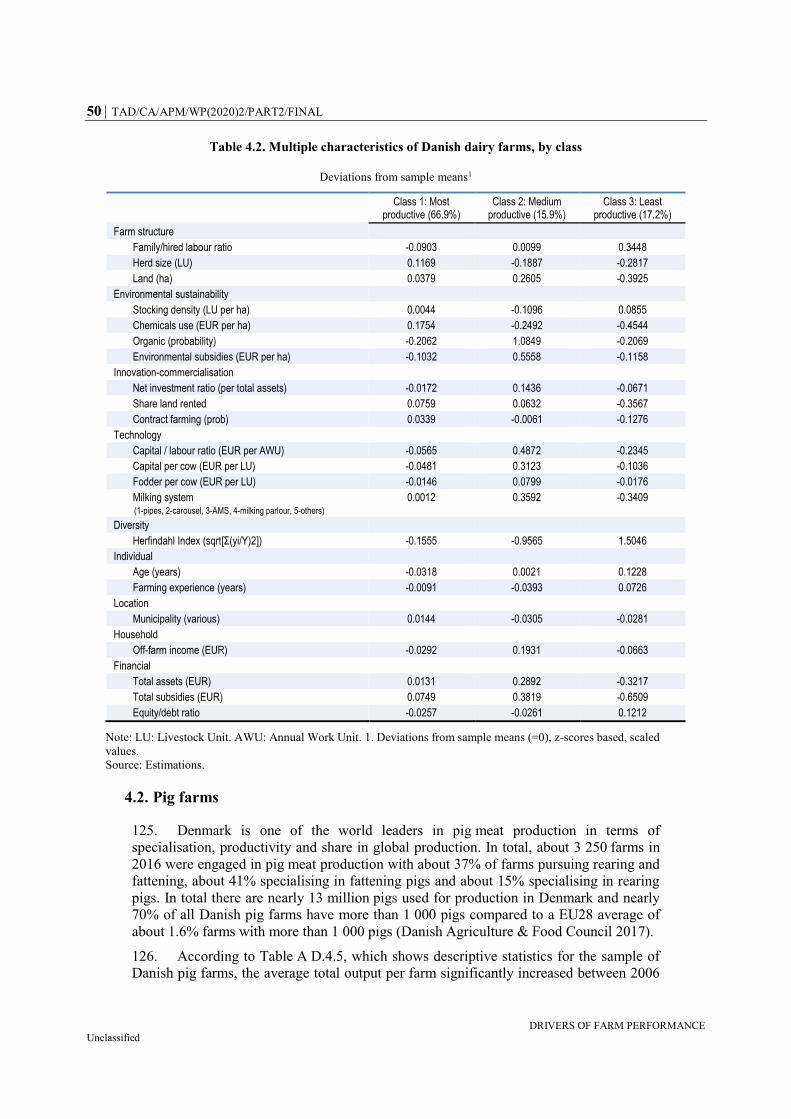
50 TAD/CA/APM/WP(2020)2/PART2/FINAL
DRIVERS OF FARM PERFORMANCE Unclassified
Table 4.2. Multiple characteristics of Danish dairy farms, by class
Deviations from sample means1
Class 1: Most productive (66.9%)
Class 2: Medium productive (15.9%)
Class 3: Least productive (17.2%)
Farm structure
Family/hired labour ratio -0.0903 0.0099 0.3448
Herd size (LU) 0.1169 -0.1887 -0.2817
Land (ha) 0.0379 0.2605 -0.3925
Environmental sustainability
Stocking density (LU per ha) 0.0044 -0.1096 0.0855
Chemicals use (EUR per ha) 0.1754 -0.2492 -0.4544
Organic (probability) -0.2062 1.0849 -0.2069
Environmental subsidies (EUR per ha) -0.1032 0.5558 -0.1158
Innovation-commercialisation
Net investment ratio (per total assets) -0.0172 0.1436 -0.0671
Share land rented 0.0759 0.0632 -0.3567
Contract farming (prob) 0.0339 -0.0061 -0.1276
Technology
Capital / labour ratio (EUR per AWU) -0.0565 0.4872 -0.2345
Capital per cow (EUR per LU) -0.0481 0.3123 -0.1036
Fodder per cow (EUR per LU) -0.0146 0.0799 -0.0176
Milking system (1-pipes, 2-carousel, 3-AMS, 4-milking parlour, 5-others)
0.0012 0.3592 -0.3409
Diversity
Herfindahl Index (sqrt[Σ(yi/Y)2]) -0.1555 -0.9565 1.5046
Individual
Age (years) -0.0318 0.0021 0.1228
Farming experience (years) -0.0091 -0.0393 0.0726
Location
Municipality (various) 0.0144 -0.0305 -0.0281
Household
Off-farm income (EUR) -0.0292 0.1931 -0.0663
Financial
Total assets (EUR) 0.0131 0.2892 -0.3217
Total subsidies (EUR) 0.0749 0.3819 -0.6509
Equity/debt ratio -0.0257 -0.0261 0.1212
Note: LU: Livestock Unit. AWU: Annual Work Unit. 1. Deviations from sample means (=0), z-scores based, scaled
values.
Source: Estimations.
4.2. Pig farms
125. Denmark is one of the world leaders in pig meat production in terms of
specialisation, productivity and share in global production. In total, about 3 250 farms in
2016 were engaged in pig meat production with about 37% of farms pursuing rearing and
fattening, about 41% specialising in fattening pigs and about 15% specialising in rearing
pigs. In total there are nearly 13 million pigs used for production in Denmark and nearly
70% of all Danish pig farms have more than 1 000 pigs compared to a EU28 average of
about 1.6% farms with more than 1 000 pigs (Danish Agriculture & Food Council 2017).
126. According to Table A D.4.5, which shows descriptive statistics for the sample of
Danish pig farms, the average total output per farm significantly increased between 2006

TAD/CA/APM/WP(2020)2/PART2/FINAL 51
DRIVERS OF FARM PERFORMANCE Unclassified
and 2016 due to a significant increase in the livestock herd value. In addition, the variable
cost items of pig farms increased over the period and the share of hired labour outmatched
the share of family labour in 2016. The livestock value per ha increased over the period
investigated and the share of organic production significantly decreased. In 2016 about
22% of all pig farms were engaged in rearing and fattening, 36% were specialised in pig
rearing and about 42% were specialised in fattening.
127. In the model used to estimate the technology and the Class identification
components for the pig meat production, the output variable is total output per farm and
year. The input variables are labour and livestock, land, capital, fodder, intermediates and
labour. The Class identification component is based on the indices related to structure,
environmental sustainability, innovation, technology, diversity, individual and household
characteristics, location and financial aspects (Table A D.4.6 and Table A D.4.7.).
128. With respect to specialised rearing pig farms, the empirical analysis did not allow
the identification of significantly different technologies for separate classes of farms. This
suggests that pig rearing production technologies in Denmark are highly mature and merely
differ between farms, hence, the subsequent empirical analyses focuses on the other types
of pig farms in Denmark for which significantly heterogeneous technologies could be
identified.
4.2.1. Danish rearing and fattening pig farms
129. For rearing and fattening pig farms in Denmark, three distinct technology classes
emerge from the model estimates (Table A D.4.6). The individual farms are distributed
unevenly across the three technology classes with Class 1 and Class 3 of almost equal size
including the majority of farms (Table 4.4). Class 1 covers about 48% of all dairy farms,
Class 2 about 9%, and Class 3 about 43%.
130. Farms in Class 3 show a significantly higher productivity performance
— measured as the potential output levels that could be achieved with a given input bundle,
in EUR per year — than their pig rearing and fattening counterparts in classes 1 and 2
(Figure 4.4). The average output value per farm and per year of pig farms in Class 3 is
twice as high as that of farms in Class 1, and nearly 4 times higher than that of pig farms
in Class 2. Nevertheless, switching technologies could result in higher productivity growth
over time: pig farms in Class 3 show a significantly positive technical change (estimated at
1.86% per year) compared to a still considerable positive technical change rate for farms
in Class 1 (estimated at 1.33% per year) and a modest rate in Class 2 (estimated at 0.63%
per year). Hence, although pig farms in Class 3 are already far more productive, they also
seem to increase their productivity at a higher rate based on a significant positive technical
change development ceteris paribus (Table 4.4).
131. If rearing and fattening farms in Class 2 produced with the technology of farms in
Class 1, they would be able to slightly increase their productivity. However, the results
suggest that the different class technologies are very close to the optimal technological
choice for the farms in each individual class. By switching technologies, only slight
performance improvements seem possible at the individual farm level.

52 TAD/CA/APM/WP(2020)2/PART2/FINAL
DRIVERS OF FARM PERFORMANCE Unclassified
Figure 4.3. Productivity and technical change for Danish rearing and fattening pig farms,
by type and class, 2006 to 2016
Source: Table 4.3.
Table 4.3. Productivity characteristics of Danish rearing and fattening pig farms, by type
and class
Latent Class Estimations, Panel 2006 to 2016
Class 1 Class 2 Class 3
Number of observations (% of sample farms) 2 369 (48.0%) 433 (8.8%) 2 132 (43.2%)
Prior probability of class membership 0.5555 0.0272 0.4173
Posterior probability of class membership 0.4491 0.1238 0.4271
Productivity level (EUR per year)1
- Class 1 Technology 626 704*** 355 908*** 1 265 6910***
- Class 2 Technology 551 352*** 352 156*** 1 149 950***
- Class 3 Technology 614 048*** 347 329*** 1 360 862***
Technical Change (% per year)
- Class 1 Technology 1.327*** 1.905*** 2.397***
- Class 2 Technology 1.154*** 0.631*** 0.785***
- Class 3 Technology 2.136*** 2.661*** 1.865***
Note: * significant at 10%, ** significant at 5%, *** significant at 1%. 1. Fitted values at sample means.
Source: Own estimations based on latent class model estimates and derivatives.
132. The estimated production functions are highly significant and all rearing and
fattening pig farm classes exhibit increasing returns to scale: 1.0473 for Class 1, 1.0703 for
Class 2, and 1.0729 for farms in Class 3 (see Table A D.4.11 for complete class related
elasticities). Switching technologies could — ceteris paribus — result in slightly higher
productivity per farm for a minority of farms, and a significantly higher technical change
rate for most farms (especially for a switch to Class 3 technology). Various indices,
reflecting the different dimensions along which rearing and fattening pig farms can be
distinguished, are used to robustly identify the reported farm classes: farm structure,
environmental sustainability of operations, technology characteristics, degree of diversity,
1.33
0.63
1.87
0.0
0.2
0.4
0.6
0.8
1.0
1.2
1.4
1.6
1.8
2.0
0
200
400
600
800
1 000
1 200
1 400
1 600
Class 1 (48.0%) Class 2 (8.8%) Class 3 (43.2%)
%'000 EUR
Productivity ('000 EUR per year) Technical change (% per year)

TAD/CA/APM/WP(2020)2/PART2/FINAL 53
DRIVERS OF FARM PERFORMANCE Unclassified
individual and household characteristics and locational as well as financial specifics.
Table A D.4.7 summarises the estimates for the various indices that were used as
components for the class-identifying vector in the latent class estimation. Most of the
indices considered showed significant estimates. To decide on the empirically most
appropriate number of classes to be estimated, various statistical quality tests have been
performed (most prominently the Akaike Information Criteria AIC) which holds for all
country cases considered in this study.
133. Figure 4.4 summarises the various rearing and fattening pig farm classes in terms
of estimated indices, while Table 4.4 contains the estimates for variables used to construct
the indices.
134. As discussed earlier, pig farms in Class 3 are the most productive and exhibit the
most significant positive technical change rate per year. They have the lowest share of
family labour in total labour (i.e. a significantly lower family per hired labour ratio than the
average farm in the sample) and an average herd and acreage size significantly above the
average of all farms in the sample, but they still experience (considerable) increasing
returns to scale. Pig farms in Class 3 score relatively low on environmental sustainability
indicators (such as stocking density, chemicals use per ha and probability of producing
organic). These farms, however, show the highest scores on innovation and
commercialisation with a significantly higher than average investment rate, rented land
share, and income generated by biofuels production. Class 3 farms show a higher than
average capital per labour intensity, while using less capital per livestock unit than the
average rearing and fattening pig farm in Denmark, based on high levels of total assets
endowment. These pig farms are less diversified and their managers are younger than the
average pig farmer in Denmark (Table 4.6).
135. The productivity of pig farms in Class 1 is medium and their technical change per
year is average. Family labour is more important than hired labour for those farms, which
are smaller than the average rearing and fattening pig farm in Denmark in terms of herd
size and land endowment. A single ownership is very likely for these pig farms. Rearing
and fattening pig farms in Class 1 should significantly increase the size of their production
operations given the measured economies of scale. The environmental sustainability of
these farms is found to be medium based on various indicators used (such as stocking
density, chemicals use per ha and probability of producing organic). Pig farms in Class 1
invest slightly less than the average pig farm in Denmark, but generate more than average
income by biofuel production. These pig farms are least specialised and their farm
managers are older than the average rearing and fattening pig farmer. Finally, pig farms in
Class 1 generate about average off-farm income and operate with a lower than average
assets endowment (Table 4.4).

54 TAD/CA/APM/WP(2020)2/PART2/FINAL
DRIVERS OF FARM PERFORMANCE Unclassified
Figure 4.4. Multi-dimensional indices for Danish rearing and fattening pig farms, by type
Scaled Values at Class Means, 2006 to 2016
Source: Table A D.4.13.
136. Class 2 farms are the least productive but show a significant average technical
change rate per year. Family labour is most important for those rearing and fattening pig
farms, which are considerably smaller than the average pig farm in Denmark in terms of
herd size and land endowment. Pig farms in Class 2 should increase the size of their
production operations to become more profitable given the estimated positive economies
of scale. These farms, however, are found to be the most environmentally sustainable based
on various indicators used (mainly due to their significantly lower chemicals use per ha and
the high probability of producing organic). Pig farms in Class 2 are least innovative and
invest far less than the average rearing and fattening pig farm in Denmark. They generate
the lowest income from biofuel production. Their capital intensity is rather low and they
have the lowest share of hired labour in total labour among the three classes. These pig
farms are the least diversified and their farm managers are of higher than average age.
Finally, rearing and fattening pig farms in Class 2 operate with a significantly lower than
average asset endowment (Table 4.4).
137. In summary, Danish rearing and fattening pig farms in the three identified
technology classes significantly vary with respect to their economic performance as well
as technical development over time. Innovative pig farms in Denmark are most likely more
productive than their peer group. Family driven farms and comparatively smaller farms
show a higher environmental sustainability based on the measures used in the empirical
analysis. Highly environmentally sustainable pig farms not necessarily show a diverse farm
structure and are not per se less capital intensive. Farms’ productivity is, however,
positively correlated with herd size and the share of hired labour, ceteris paribus.
-1.5
-1
-0.5
0
0.5
1
1.5Index 1 – Structure
Index 2 - Environmentalsustainability
Index 3- Innovation/Cooperation/Commercialisation
Index 4 – Technology
Index 5 – DiversityIndex 6 – Individual
Index 7 – Location
Index 8 – Household
Index 9 – Financial
Class 1: Medium productive (48.0%)
Class 2: Least productive (8.8%)
Class 3: Most productive (43.2%)

TAD/CA/APM/WP(2020)2/PART2/FINAL 55
DRIVERS OF FARM PERFORMANCE Unclassified
Table 4.4. Multiple characteristics of Danish rearing and fattening pig farms, by class
Deviations from sample means1
Class 1: Medium productive (48.0%)
Class 2: Least productive (8.8%)
Class 3: Most productive (43.2%)
Farm structure
Family/hired labour ratio 0.4152 0.6094 -0.5852
Livestock value (EUR) -0.4617 -0.5201 0.6187
Land (ha) -0.2553 -0.8797 0.4623
Legal form (1- sole owner, 2- partnership, assets owned, 3- partnership, assets rented, 4- legal corporation, 5- other special arrangement)
-0.1869 -0.0171 0.2112
Family succession (0- no, 1- yes) 0.0685 -0.2896 -0.0173
Environmental sustainability
Livestock value per ha (EUR per ha) -0.0169 0.1463 -0.0109
Chemicals use (EUR per ha) -0.1989 -0.8738 0.3986
Organic (probability) -0.0745 0.7744 -0.0746
Environmental subsidies (EUR per ha) -0.0185 0.4659 -0.0741
Innovation-commercialisation
Net investment ratio (per total assets) -0.0911 -0.2445 0.1509
Share land rented -0.0281 -0.5591 0.1447
Contract farming (prob) 0.0869 -0.4789 0.0007
Biofuel income (EUR) 0.0115 -0.1266 0.0129
Technology
Capital / labour ratio (EUR per AWU) -0.0019 -0.1972 0.0422
Capital per livestock value 0.0406 -0.0329 -0.0385
Fodder per livestock value 0.0815 -0.0402 -0.0824
Diversity
Herfindahl Index (sqrt[Σ(yi/Y)2]) -0.3808 0.6879 0.2834
Production diversity (yc/ΣY) -0.4296 0.6482 0.3467
Individual
Age (years) 0.1414 0.1054 -0.1786
Location
Municipality (various) 0.0362 0.2415 -0.0893
Household
Off-farm income (EUR) 0.0135 -0.0008 -0.0149
Financial
Total assets (EUR) -0.2376 -0.7444 0.4152
Total subsidies (EUR) -0.2063 -0.7541 0.3823
Equity/debt ratio 0.0144 -0.0326 -0.0093
Note: AWU: Annual Work Unit. 1. Deviations from sample means (=0), z-scores based, scaled values.
Source: Estimations.
4.2.2. Danish specialised fattening pig farms
138. With respect to specialised fattening type pig farming, three distinct technology
classes emerge from the model estimates (Table A D.4.8). The individual farms are
distributed unevenly across the three technology classes (Table 4.5). Class 1 covers about
19% of all pig fattening farms, Class 2 about 60%, and Class 3 about 21%.
139. Farms in Class 1 show a significantly higher productivity performance
— measured as the potential output levels that could be achieved with a given input bundle,
in EUR per year — than their fattening pig producing counterparts in Classes 2 and 3

56 TAD/CA/APM/WP(2020)2/PART2/FINAL
DRIVERS OF FARM PERFORMANCE Unclassified
(Figure 4.5). Pig farms in Class 1 produce about 2 times more per farm and year than farms
in Class 2 and nearly 3.5 times more per farm and year than pig farms in Class 3.
140. Pig farms in Class 1 also show a significantly positive technical change (of about
2.08% per year) compared to a modest positive technical change rate for farms in Class 2
(of about 1.84% per year) and in Class 3 (of about 1.61% per year). Hence, although pig
farms in Class 1 are already far more productive, they also seem to increase their
productivity at a higher rate given the significantly positive technical change development
ceteris paribus (Figure 4.5).
141. If pig farms in Class 2 produced with the technology of farms in Class 1, they would
be able to increase their productivity by 17%, and farms in Class 3 would increase their
productivity by about 31%, ceteris paribus (Table 4.5). Overall, if all farms adopted the
technology of most productive farms in Class 1, their productivity would increase on
average by 13% (Table A C.6 in Part 1).
Figure 4.5. Productivity and technical change for Danish specialised fattening pig farms,
by type and class, 2006 to 2016
Source: Table 4.5.
142. The estimated production functions are highly significant and all fattening pig farm
classes exhibit modest to significant increasing returns to scale: 1.0747 for Class 1, 1.2494
for Class 2, and 1.0199 for farms in Class 3 (see Table A D.4.12 for complete class related
elasticities). Switching technologies could — ceteris paribus — result in higher
productivity per farm and a significantly higher technical change rate for most farms
(especially regarding a switch to Class 1 technology). Various indices, reflecting the
different dimensions along which dairy farms can be distinguished, are used to robustly
identify the reported farm classes: Farm structure, environmental sustainability of
operations, technology characteristics, degree of diversity, individual characteristics and
locational specifics. Table A D.4.8 summarises the estimates for the various indices that
were used as components for the class-identifying vector in the latent class estimation. Most
of the indices considered showed significant estimates. To decide on the empirically most
appropriate number of classes to be estimated, various statistical quality tests have been
performed (most prominently the Akaike Information Criteria AIC) which holds for all
country cases considered in this study.
2.08
1.84
1.61
0.00
0.50
1.00
1.50
2.00
2.50
0
200
400
600
800
1000
1200
Class 1 (19.4%) Class 2 (59.5%) Class 3 (21.1%)
% '000 EUR
Type specialist fattening
Productivity ('000 EUR per year) Technical change (% per year)

TAD/CA/APM/WP(2020)2/PART2/FINAL 57
DRIVERS OF FARM PERFORMANCE Unclassified
Table 4.5. Productivity characteristics of Danish specialised fattening pig farms, by type and
class
Latent Class Estimations, Panel 2006 to 2016
Class 1 Class 2 Class 3
Number of observations (% of sample farms) 1 852 (19.4%) 5 670 (59.5%) 2 002 (21.1%)
Prior probability of class membership 0.1496 0.7335 0.1169
Posterior probability of class membership 0.2268 0.5182 0.2549
Productivity level (EUR per year)1
- Class 1 Technology 972 406*** 566 951*** 381 715***
- Class 2 Technology 854 292*** 484 711*** 302 800***
- Class 3 Technology 777 259*** 457 361*** 291 073***
Technical Change (% per year)
- Class 1 Technology 2.081*** 2.451*** 3.556***
- Class 2 Technology 1.834*** 1.841*** 2.479***
- Class 3 Technology 1.621*** 1.543*** 1.613***
Note: * significant at 10%, ** significant at 5%, *** significant at 1%. 1. Fitted values at sample means.
Source: Own estimations based on latent class model estimates and derivatives.
143. Figure 4.6 summarises the various specialist fattening pig farm classes in terms of
estimated indices, while Table 4.6 contains the estimates for variables used to construct the
indices.
144. As discussed earlier, pig farms in Class 1 are the most productive and exhibit the
most significantly positive technical change rate per year. They have the lowest share of
family labour in total labour (i.e. a significantly lower family per hired labour ratio than the
average farm in the sample) and a significantly above average herd and acreage size, but
they still experience (considerable) increasing returns to scale. Pig farms in Class 1 score
relatively low on environmental sustainability indicators (especially chemicals use per ha
and probability of producing organic). These farms, however, show the highest scores on
innovation and commercialisation with a significantly higher than average investment rate,
rented land share, and income generated by biofuels production.
145. Class 1 farms show a higher than average capital per labour intensity, while using
more capital per livestock unit than the average fattening pig farm in Denmark based on
high levels of total assets endowment. These pig farms are diversified, they operate with a
larger than average asset endowment and their managers are younger than the average
fattening pig farmer in Denmark (Table 4.6).
146. Specialised fattening pig farms in Class 2 are of medium productivity, but still show
a considerably positive technical change per year. Hired labour is less important for those
farms, which are smaller than the average pig farm in Denmark in terms of herd size and
land endowment. A single ownership is very likely for these farms. Pig farms in Class 2
should significantly increase the size of their production operations given the measured
economies of scale (of about 1.2494). These farms are found to be of average
environmental sustainability based on various indicators (such as stocking density,
chemicals use per ha and probability of producing organic). However, pig farms in Class 2
invest slightly less than the average fattening pig farm in Denmark and generate less income
by biofuel production. Their capital intensity is about average, and they employ more

58 TAD/CA/APM/WP(2020)2/PART2/FINAL
DRIVERS OF FARM PERFORMANCE Unclassified
labour per capital than their counterparts in Class 1. Diversification of activities in these
pig farms is medium and their farm managers are of average age (Table 4.6).
Figure 4.6. Multi-dimensional indices for Danish specialised fattening pig farms, by type
Scaled Values at Class Means, 2006 to 2016
Source: Table A D 4.14.
147. Class 3 farms are the least productive but show a significant average technical
change rate per year. Family labour is most important for those fattening pig farms, which
are significantly smaller than the average specialised fattening pig farm in Denmark in
terms of herd size and land endowment. Single ownership is most probable for these farms.
Pig farms in Class 3 operate close to the optimum scale and only experience slightly
positive economies of scale. These farms are found to be the most environmentally
sustainable based on various indicators used (such as stocking density, chemicals use per
ha and probability of producing organic). Pig farms in Class 3 invest far less than the
average pig farm in Denmark, have the lowest share of rented land and generate least
income from biofuel production. Their capital intensity is the lowest of all fattening pig
farms and consistently with this notion is the finding that farms in Class 3 employ the
highest amount of labour per capital unit. These pig farms are the least diversified and their
farm managers are of higher than average age. Finally, pig farms in Class 3 operate with
the lowest level of asset endowment (Table 4.6).
148. In summary, Danish specialised fattening pig farms in the individual technology
classes significantly vary with respect to their economic performance as well as technical
development over time. Innovative fattening pig farms in Denmark are most likely more
productive compared to their peer group. Family driven farms and comparatively smaller
farms show a higher environmental sustainability performance based on the measures used
in the empirical analysis. Highly environmentally sustainable pig farms are not necessarily
more diversified but operate with a lower than average capital intensity. Farms’ capital
intensity is positively correlated with herd size, while farms’ productivity is correlated with
herd size and the share of hired labour. Finally, Danish fattening pig farms producing more
environmentally sustainably can also exhibit a relatively high productivity, ceteris paribus.
-1.5
-1
-0.5
0
0.5
1Index 1 – Structure
Index 2 - Environmentalsustainability
Index 3 - Innovation/Cooperation/Commercialisation
Index 4 – Technology
Index 5 – DiversityIndex 6 – Individual
Index 7 – Location
Index 8 – Household
Index 9 – Financial
Class 1: Most productive (19.4%)
Class 2: Medium productive (59.5%)
Class 3: Least productive (21.1%)
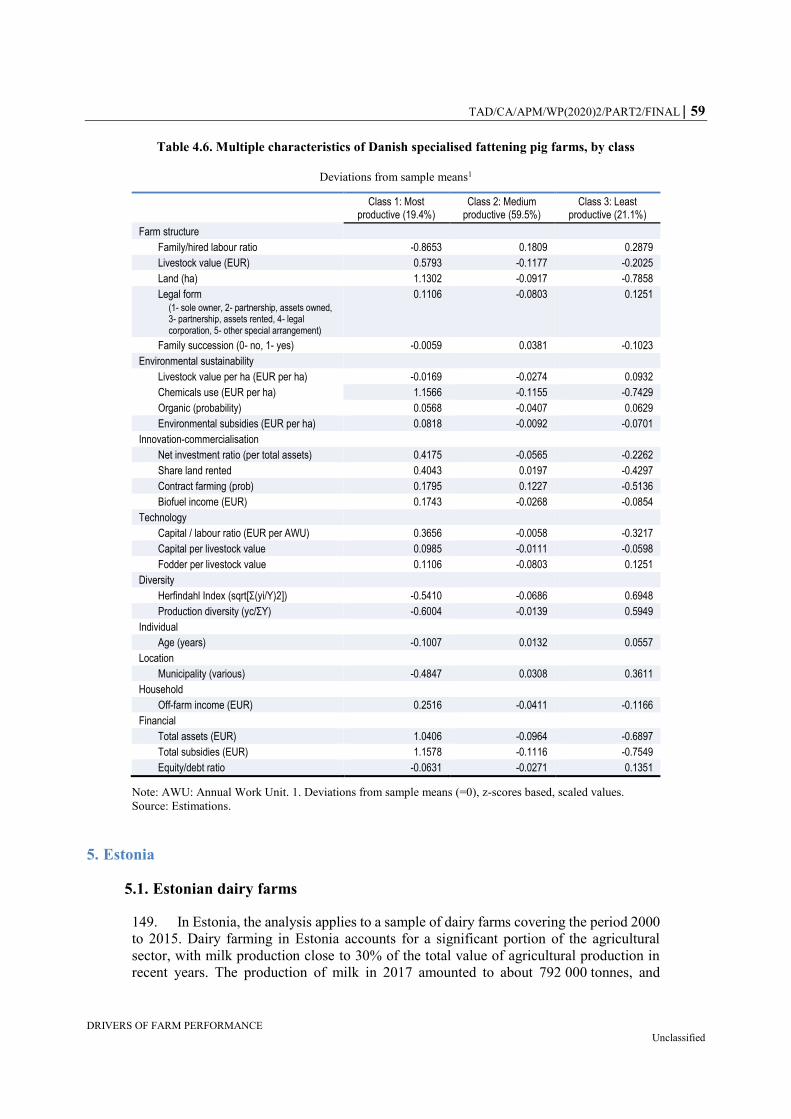
TAD/CA/APM/WP(2020)2/PART2/FINAL 59
DRIVERS OF FARM PERFORMANCE Unclassified
Table 4.6. Multiple characteristics of Danish specialised fattening pig farms, by class
Deviations from sample means1
Class 1: Most productive (19.4%)
Class 2: Medium productive (59.5%)
Class 3: Least productive (21.1%)
Farm structure
Family/hired labour ratio -0.8653 0.1809 0.2879
Livestock value (EUR) 0.5793 -0.1177 -0.2025
Land (ha) 1.1302 -0.0917 -0.7858
Legal form (1- sole owner, 2- partnership, assets owned, 3- partnership, assets rented, 4- legal corporation, 5- other special arrangement)
0.1106 -0.0803 0.1251
Family succession (0- no, 1- yes) -0.0059 0.0381 -0.1023
Environmental sustainability
Livestock value per ha (EUR per ha) -0.0169 -0.0274 0.0932
Chemicals use (EUR per ha) 1.1566 -0.1155 -0.7429
Organic (probability) 0.0568 -0.0407 0.0629
Environmental subsidies (EUR per ha) 0.0818 -0.0092 -0.0701
Innovation-commercialisation
Net investment ratio (per total assets) 0.4175 -0.0565 -0.2262
Share land rented 0.4043 0.0197 -0.4297
Contract farming (prob) 0.1795 0.1227 -0.5136
Biofuel income (EUR) 0.1743 -0.0268 -0.0854
Technology
Capital / labour ratio (EUR per AWU) 0.3656 -0.0058 -0.3217
Capital per livestock value 0.0985 -0.0111 -0.0598
Fodder per livestock value 0.1106 -0.0803 0.1251
Diversity
Herfindahl Index (sqrt[Σ(yi/Y)2]) -0.5410 -0.0686 0.6948
Production diversity (yc/ΣY) -0.6004 -0.0139 0.5949
Individual
Age (years) -0.1007 0.0132 0.0557
Location
Municipality (various) -0.4847 0.0308 0.3611
Household
Off-farm income (EUR) 0.2516 -0.0411 -0.1166
Financial
Total assets (EUR) 1.0406 -0.0964 -0.6897
Total subsidies (EUR) 1.1578 -0.1116 -0.7549
Equity/debt ratio -0.0631 -0.0271 0.1351
Note: AWU: Annual Work Unit. 1. Deviations from sample means (=0), z-scores based, scaled values.
Source: Estimations.
5. Estonia
5.1. Estonian dairy farms
149. In Estonia, the analysis applies to a sample of dairy farms covering the period 2000
to 2015. Dairy farming in Estonia accounts for a significant portion of the agricultural
sector, with milk production close to 30% of the total value of agricultural production in
recent years. The production of milk in 2017 amounted to about 792 000 tonnes, and

60 TAD/CA/APM/WP(2020)2/PART2/FINAL
DRIVERS OF FARM PERFORMANCE Unclassified
increased by 1% compared to 2016. This was due to both a slight increase in the number
of dairy cows (to 88 400 cows) and higher annual milk produced per cow (Statistics
Estonia, 2018).
150. According to Table A D.5.1, which summarises the descriptive statistical measures
for the Estonian sample, Estonian dairy farms significantly increased milk output between
2000 and 2015, following a significant increase in herd size. As can be expected of a
transition economy, all cost items increased over the period as did the labour use by the
average dairy farm whereas the share of family labour relatively decreased. Stocking
density slightly increased, while the probability of being engaged in organic dairy
production more or less remained at the same level.
151. In the model used to estimate the technology and the Class identification
components for the Estonian dairy production, the output variable is total output per farm
and year and input variables are dairy cows, capital, materials, fodder, fuel and other costs
(Box 1). The Class identification component is based on the indices related to structure,
environmental sustainability, innovation, diversity, individual and location
(Table A D.5.2).
152. For Estonian dairy farms, two distinct technology classes emerge from the model
estimates (Table A.B.5.2). Class 1 covers more than 80% of all dairy farms in the sample
and Class 2 the remaining 17%.
153. Farms in Class 1 show a significantly lower productivity performance — measured
as the potential output levels that could be achieved with a given input bundle, in EUR per
year — than their counterparts in Class 2 (Figure 5.1). The latter produce about thirteen
times more per farm and year than the former.
154. Farms in Class 1 show a significantly positive technical change (estimated at 2.16%
per year) compared to a modest positive technical change rate for farms in Class 2
(estimated at 0.346% per year) Hence, although dairy farms in Class 1 are far less
productive, they seem to catch up given the significant positive technical change
development (Figure 5.1).
155. If dairy farms in Class 1 would produce with the technology of farms in Class 2,
they would be able to significantly increase their productivity by about 4 times (Table 5.1).
Overall, this would result in an average productivity increase of about 85% for all dairy
farms in Estonia (Table A C.4).

TAD/CA/APM/WP(2020)2/PART2/FINAL 61
DRIVERS OF FARM PERFORMANCE Unclassified
Figure 5.1. Productivity and technical change for Estonian dairy farms,
by class, 2000 to 2015
Source: Table 5.1.
Table 5.1. Productivity characteristics of Estonian dairy farms by class
Latent Class Estimation, Panel 2000 to 2015
Class 1 Class 2
Number of observations (% of sample farms) 2 431 (83%) 504 (17%)
Prior probability of class membership 0.4922 0.5008
Posterior probability of class membership 0.8252 0.1748
Productivity level (EUR per year) 1
- Class 1 Technology 30 056*** 301 131***
- Class 2 Technology 126 033*** 403 406***
Technical Change (% per year)
- Class 1 Technology 2.16*** 0.699***
- Class 2 Technology 0.271*** 0.346***
Note: * significant at 10%, ** significant at 5%, *** significant at 1%.1. Fitted values at sample means.
Source: Own estimations based on latent class model estimates and derivatives.
156. The estimated production functions are highly significant and both dairy farm
classes exhibit increasing returns to scale, which are slightly lower for farms in Class 2
(1.1799) than for farms in Class 1 (1.1896) (see Table A D.5.4 for complete class related
elasticities). Switching technologies between classes could — ceteris paribus — result in
higher productivity per farm but lower technical change for most farms (and vice versa).
Various indices, reflecting the different dimensions along which farms can be
distinguished, are used to robustly identify the reported farm classes: Farm structure,
environmental sustainability of operations, technology characteristics, degree of diversity,
individual characteristics and locational specifics. Table A D.5.4 summarises the estimates
for the various indices that were used as elements of the Class identifying vector in the
2.16
0.346
0
0.5
1
1.5
2
2.5
0
50
100
150
200
250
300
350
400
450
Class 1 (83%) Class 2 (17%)
%EUR '000
Productivity (EUR '000 per year) Technical change (% per year)
62 TAD/CA/APM/WP(2020)2/PART2/FINAL
DRIVERS OF FARM PERFORMANCE Unclassified
latent class estimation. Beside the index for locational specifics, all other indices showed
significant estimates.
157. Figure 5.2 summarise the two dairy farm classes in terms of estimated indices,
while Table 5.2 contains the estimates for variables used to construct the indices.
158. Dairy farms in Class 1 are less productive but show most significant positive
technical change per year. They have a relatively high share of family labour (i.e. a
significantly lower share of hired versus family labour than the average farm in the sample)
and a below average herd and area size, which is consistent with the estimated increasing
returns to scale for those farms. Dairy farms in Class 1 score high on environmental
sustainability characteristics (for example stocking density, chemicals use per ha and
probability of producing organic) but show a lower than average investment rate and
willingness to co-operate. Farms in Class 1 show a low capital intensity, but produce with
more fodder per cow. These dairy farms are more diversified, and their managers are a bit
older than the average Estonian dairy farmer. Finally, dairy farms in Class 1 are more likely
located in less-favoured areas and Natura 2000 regions compared to the average dairy farm
in Estonia (Table 5.2).
159. Dairy farms in Class 2 are highly productive, but show a lower than average
technical change per year. Hired labour is essential for those farms, the hired to family
labour ratio being significantly larger than in Class 1. Farms in Class 2 have a significantly
above average herd and area size, but should increase further their production to take
advantage of economies of scale. These farms score lower than average on various
indicators used (stocking density, chemicals use per ha and probability of producing
organic) but invest significantly more than the average dairy farm in Estonia. They are also
highly likely to cooperate with other farms. Their capital intensity is significantly higher
than the average sector capital intensity, however, farms in Class 2 employ more labour per
cow. These dairy farms are more specialised and their farm managers are younger than the
average dairy farmer in Estonia. Finally, dairy farms in Class 2 are less likely located in
less-favoured areas and Natura 2000 regions compared to farms in Class 1 and the average
dairy farm in Estonia (Table 5.2).
160. In summary, Estonian dairy farms in the two identified technology classes differ
significantly with respect to their economic performance and technical development over
time. Innovative dairy farms are likely to be more productive. Family driven farms and
comparatively smaller farms show a higher environmental sustainability based on the
indicators used. Highly environmentally sustainable dairy farms are most likely located in
less-favoured areas. Farms’ capital intensity and the degree of specialisation are positively
correlated with herd size, farms’ productivity is correlated with herd size and the share of
hired labour. Finally, dairy farms producing more environmentally sustainably in Estonia
appear to be less productive ceteris paribus.

TAD/CA/APM/WP(2020)2/PART2/FINAL 63
DRIVERS OF FARM PERFORMANCE Unclassified
Figure 5.2. Multi-dimensional indices for Estonian dairy farms
Scaled values at class means, 2000 to 2015
Source: Table A D.5.5.
Table 5.2. Multiple characteristics of Estonian dairy farms, by class
Deviations from sample means1
Class 1: Least productive (83%)
Class 2: Most productive (17%)
Farm structure
Hired / family labour ratio -0.2177 1.0501
Herd size (livestock units) -64.2584 309.9446
Land (ha) -201.4147 971.506
Environmental sustainability
Stocking density (livestock units per ha) -0.0514 0.2478
Chemicals use (EUR per ha) -302.4744 33.2247
Organic (probability) 0.0224 -0.1082
Innovation-commercialisation
Net investment ratio (per total assets) -0.7852 0.1603
Cooperation (probability) -0.1332 0.6424
Technology
Capital / labour ratio (EUR per hour) -1.9849 9.5742
Capital / cow ratio (EUR per cow) -169.043 815.3643
Diversity
Herfindahl Index (sqrt[Σ(yi/Y)2]) -0.0017 0.0084
Fodder / cow ratio (EUR per cow) 0.0292 -0.1406
Labour per cow ratio (hour per livestock unit) -0.0533 0.2569
Individual
Age (years) 0.3362 -1.6217
Location
Less Favoured Area (probability) 0.0074 -0.0356
Natura 2000 (probability) 0.0001 -0.0006
Note: 1. Deviations from sample means (= 0), scaled values.
Source: Estimations.
-20
-15
-10
-5
0
5
10
15Index 1 - Structure
Index 2 - Environmentalsustainability
Index 3 -Innovation/Cooperation/
Commercialisation
Index 4 - TechnologyIndex 5 - Diversity
Index 6 - Individual
Index 7 - Location
Class 1: Least productive (83%)
Class 2: Most productive (17%)
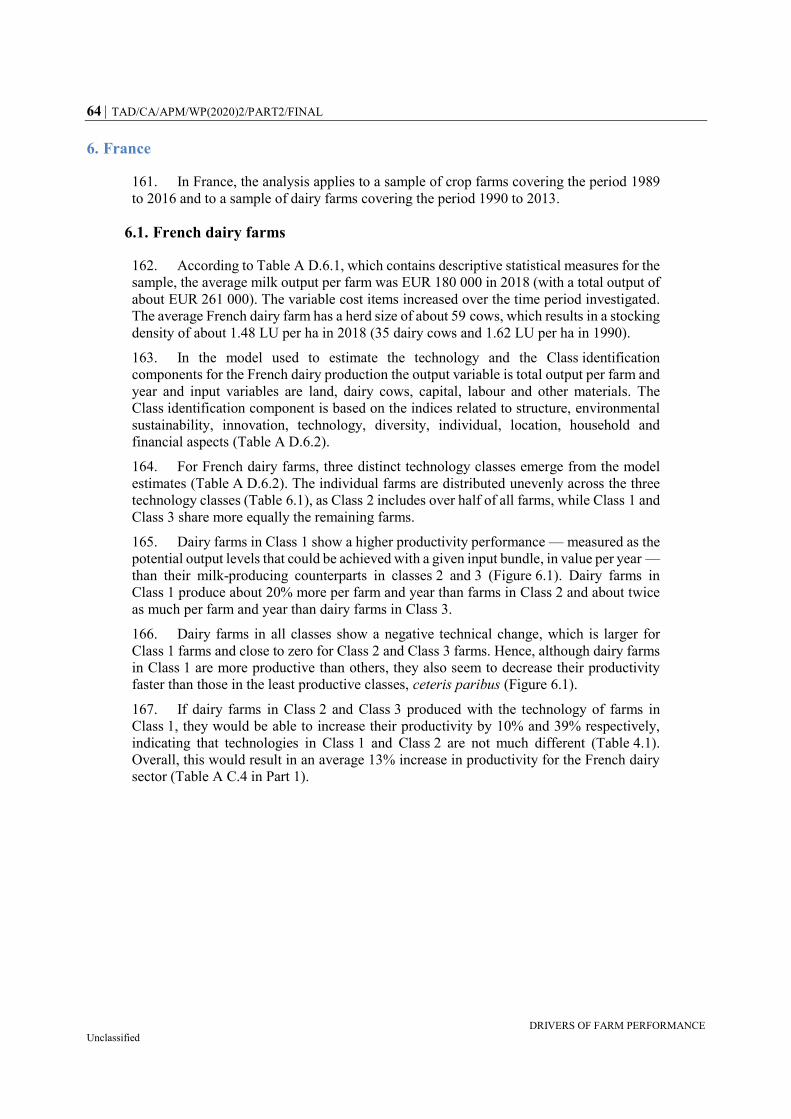
64 TAD/CA/APM/WP(2020)2/PART2/FINAL
DRIVERS OF FARM PERFORMANCE Unclassified
6. France
161. In France, the analysis applies to a sample of crop farms covering the period 1989
to 2016 and to a sample of dairy farms covering the period 1990 to 2013.
6.1. French dairy farms
162. According to Table A D.6.1, which contains descriptive statistical measures for the
sample, the average milk output per farm was EUR 180 000 in 2018 (with a total output of
about EUR 261 000). The variable cost items increased over the time period investigated.
The average French dairy farm has a herd size of about 59 cows, which results in a stocking
density of about 1.48 LU per ha in 2018 (35 dairy cows and 1.62 LU per ha in 1990).
163. In the model used to estimate the technology and the Class identification
components for the French dairy production the output variable is total output per farm and
year and input variables are land, dairy cows, capital, labour and other materials. The
Class identification component is based on the indices related to structure, environmental
sustainability, innovation, technology, diversity, individual, location, household and
financial aspects (Table A D.6.2).
164. For French dairy farms, three distinct technology classes emerge from the model
estimates (Table A D.6.2). The individual farms are distributed unevenly across the three
technology classes (Table 6.1), as Class 2 includes over half of all farms, while Class 1 and
Class 3 share more equally the remaining farms.
165. Dairy farms in Class 1 show a higher productivity performance — measured as the
potential output levels that could be achieved with a given input bundle, in value per year —
than their milk-producing counterparts in classes 2 and 3 (Figure 6.1). Dairy farms in
Class 1 produce about 20% more per farm and year than farms in Class 2 and about twice
as much per farm and year than dairy farms in Class 3.
166. Dairy farms in all classes show a negative technical change, which is larger for
Class 1 farms and close to zero for Class 2 and Class 3 farms. Hence, although dairy farms
in Class 1 are more productive than others, they also seem to decrease their productivity
faster than those in the least productive classes, ceteris paribus (Figure 6.1).
167. If dairy farms in Class 2 and Class 3 produced with the technology of farms in
Class 1, they would be able to increase their productivity by 10% and 39% respectively,
indicating that technologies in Class 1 and Class 2 are not much different (Table 4.1).
Overall, this would result in an average 13% increase in productivity for the French dairy
sector (Table A C.4 in Part 1).

TAD/CA/APM/WP(2020)2/PART2/FINAL 65
DRIVERS OF FARM PERFORMANCE Unclassified
Figure 6.1. Productivity and technical change for French dairy farms, by class, 1990 to 2013
Source: Table 6.1.
Table 6.1. Productivity characteristics of French dairy farms, by class
Latent Class Estimation, Panel 1990 to 2013
Class 1 Class 2 Class 3
Number of observations (% of sample farms) 21% 51.6% 27.4%
Prior probability of class membership 0.0602 0.8279 0.1119
Posterior probability of class membership 0.2303 0.4803 0.2895
Productivity level (EUR per year)1
- Class 1 Technology 169 437*** 149 851*** 126 792***
- Class 2 Technology 163 227*** 135 990*** 117 595***
- Class 3 Technology 126 450*** 106 372*** 91 133***
Technical Change (% per year)
- Class 1 Technology -0.560*** -0.932*** -0.788***
- Class 2 Technology -0.133*** -0.051* -0.041*
- Class 3 Technology -0.549*** -0.193*** -0.091**
Note: * significant at 10%, ** significant at 5%, *** significant at 1%.1. Fitted values at sample means.
Source: Own estimations based on latent class model estimates and derivatives.
168. The estimated production functions for each farm class are highly significant and
all dairy farm classes exhibit increasing returns to scale: 1.0367 for farms in Class 1, 1.0646
for farms in Class 2 and 1.1484 for farms in Class 3 (Table A D.6.4). This suggests that an
increase in herd size would result in additional revenue for the dairy farms (ceteris paribus).
169. Figure 6.2 summarises the various dairy farm classes in terms of estimated indices,
while Table 6.2 contains the estimates for variables used to construct the indices.
-0.56
-0.051
-0.091
-0.6
-0.5
-0.4
-0.3
-0.2
-0.1
0.0
0
20
40
60
80
100
120
140
160
180
Class 1 (21.0%) Class 2 (51.6%) Class 3 (27.4%)
%EUR '000 EUR
Productivity level (EUR '000) Technical change (% per year)

66 TAD/CA/APM/WP(2020)2/PART2/FINAL
DRIVERS OF FARM PERFORMANCE Unclassified
170. Class 1 farms are the most productive farms with slightly below average
environmental sustainability account for over a quarter of all farms. They are more
specialised, larger operations, with higher assets, more likely to be partnerships and include
older farmers. Investment in innovative technologies and activities is above average. They
are more likely to use more extensive practices, including organic production.
171. Class 2 groups over half of all farms that are in the least environmentally
sustainable and achieve productivity levels close to the highest. They are more diversified
than others, use more intensive practices and are more likely to be in plains. They have
scores close to the average of all farms for most other indices.
172. Class 3 farms are the most environmentally sustainable, least productive farms.
They are smaller than average in terms of herd size, and more specialised. They use more
extensive technologies and practices and have lower capital intensity. They are more likely
to be located in mountainous areas and have lower debts than average.
173. In summary, French dairy farms in the three identified technology classes differ
significantly with respect to their economic performance as well as technical development
over time. Most productive farms are less family driven and comparatively larger in terms
of herd size and land endowment. These farms show an average environmental
sustainability based on the measures used in the empirical analysis. Highly environmentally
sustainable dairy farms are nevertheless most likely family driven with a lower than
average herd size and lower than average productivity level. The capital intensity of farms
seems positively correlated with herd size, while their productivity seems correlated with
herd size and the share of hired labour, ceteris paribus.
Figure 6.2. Multi-dimensional indices for French dairy farms
Scaled values at class means, 1990 to 2013
Source: Table A D.1.5.
-1.5
-1
-0.5
0
0.5
1
1.5Index 1 - Structure
Index 2 - Environmentalsustainability
Index 3 - Innovation/commercialisation
Index 4 - Technology
Index 5 - DiversityIndex 6 - Individual
Index 7 - Location
Index 8 - Household
Index 9 - Financial
Class 1: Most productive (21.0%)
Class 2: Medium productive (51.6%)
Class 3: Least productive (27.4%)

TAD/CA/APM/WP(2020)2/PART2/FINAL 67
DRIVERS OF FARM PERFORMANCE Unclassified
Table 6.2. Multiple characteristics of French dairy farms, by class
Deviations from sample means1, 1990 to 2013
Class 1: Most productive (21%)
Class 2: Medium productive (51.6%)
Class 3: Least productive (27.4%)
Farm structure
Family/hired labour ratio -0.0063 -0.0257 0.0533
Herd size (LU) 0.2318 -0.0122 -0.1549
Form of ownership (1-family farms, 2-partnerships, 3-other)
0.5141 -0.1553 -0.1016
Environmental sustainability
Stocking density (LU per ha) -0.0264 0.0365 -0.0486
Chemicals use (EUR per ha) -0.0419 0.2100 -0.3639
Organic production (1=yes, 0=no) 0.1688 -0.0531 -0.0294
Fuel per ha (EUR per ha) 0.5062 -0.0332 -0.3259
Environmental subsidies per ha (EUR per ha) 0.6383 -0.2416 -0.0342
Tillage area (ha) 0.3351 0.0778 -0.4039
Innovation-commercialisation
Net investment ratio (per total assets) 0.3824 -0.0370 -0.2235
Share contract farming 0.3086 0.0611 -0.3519
Share land rented 0.2249 0.0507 -0.2681
Biofuel income (EUR) 0.1721 -0.0255 -0.0839
Miscellaneous income (EUR) 0.0180 0.0119 -0.0362
Insurance expenses (EUR) 0.4782 -0.0850 -0.2066
Technology
Capital / labour ratio (EUR per AWU) 0.2733 -0.0397 -0.1349
Capital per cow (EUR per LU) 0.4331 -0.0766 -0.1879
Cow per labour (LU per AWU) -0.0914 0.0195 0.0333
Fodder per cow (EUR per LU) 0.1691 -0.0515 -0.0326
Materials per cow (EUR per LU) 0.0454 0.0405 -0.1111
Diversity
Herfindahl Index (sqrt[Σ(yi/Y)2]) -0.7128 -0.1273 0.7868
Production diversity (yc/ΣY) -0.8321 -0.0574 0.7466
Forest area (ha) -0.0496 -0.0692 0.1686
Individual
Age (years) 0.3333 -0.1518 0.0305

68 TAD/CA/APM/WP(2020)2/PART2/FINAL
DRIVERS OF FARM PERFORMANCE Unclassified
Location
Subregion 1 nuts 2 FR10 0.0230 -0.0046 -0.0091
Subregion 2 nuts 2 FR21 0.0909 0.0178 -0.1033
Subregion 3 nuts 2 FR22 0.0203 0.0249 -0.0626
Subregion 4 nuts 2 FR23 0.1321 0.0095 -0.1193
Subregion 5 nuts 2 FR24 -0.0435 -0.0001 0.0336
Subregion 6 nuts 2 FR25 -0.1120 0.1088 -0.1192
Subregion 7 nuts 2 FR26 0.0063 0.0044 -0.0132
Subregion 8 nuts 2 FR30 0.0966 0.0219 -0.1155
Subregion 9 nuts 2 FR41 0.0677 -0.0045 -0.0434
Subregion 10 nuts 2 FR42 0.0964 -0.0037 -0.0671
Subregion 11 nuts 2 FR43 0.1361 -0.0761 0.0390
Subregion 12 nuts 2 FR51 0.1017 -0.0478 0.0121
Subregion 13 nuts 2 FR52 -0.0128 -0.0231 0.0534
Subregion 14 nuts 2 FR53 0.0215 -0.0452 0.0687
Subregion 15 nuts 2 FR61 0.0161 0.1132 -0.2257
Subregion 16 nuts 2 FR62 -0.0963 0.2041 -0.3108
Subregion 17 nuts 2 FR63 0.0019 -0.0239 0.0435
Subregion 18 nuts 2 FR71 -0.0929 -0.0631 0.1901
Subregion 19 nuts 2 FR72 -0.1137 -0.0807 0.2393
Subregion 20 nuts 2 FR81 -0.0564 -0.0878 0.2087
Subregion 21 nuts 2 FR82 0.0048 -0.0968 0.1788
Subregion 22 nuts 2 FR94 -0.0032 -0.2203 0.4177
(all: 1=yes, 0=no)
Altitude (1- <300m, 2- 300-600m, 3- >600m) 0.0421 -0.3461 0.6202
Less favoured area payments (EUR) 0.0391 -0.3772 0.6810
Household
Off-farm income share 0.1217 -0.0299 0.0638
Rural support (EUR) 0.8113 -0.2736 -0.1066
Financial
Total assets (EUR) 0.4840 -0.0489 -0.2791
Total subsidies (EUR) 0.8543 -0.1792 -0.3176
Equity/debt ratio -0.0465 -0.0149 0.0638
Notes: LU: Livestock Unit. AWU: Annual Work Unit.
1. Deviations from sample means (=0), z-scores based, scaled values.
Source: Estimations.
6.2. French crop farms
174. According to Table A D.6.6, which contains descriptive statistical measures for the
sample, the average crop output per farm was about EUR 167 000 in 2016 (with a total
output of about EUR 193 000). The variable cost items significantly increased over the
period analysed. The average crop farm cultivated about 136 ha of land in 2016 (a
significant increase considering the average area operated was about 77 ha in 1989).
175. In the model used to estimate the technology and the Class identification
components for the French crop production the output variable is total output per farm and
year and input variables are land, capital, labour and materials. The Class identification
component is based on the indices related to structure, environmental sustainability,
innovation, technology, diversity, individual, location, household and financial aspects
(Table A D.6.7).

TAD/CA/APM/WP(2020)2/PART2/FINAL 69
DRIVERS OF FARM PERFORMANCE Unclassified
176. For French crop farms, four technology classes emerge from the model estimates
(Table A D.6.7). The individual farms are distributed unevenly across the three technology
classes (Table 6.3), as Class 1 includes over half of all farms, while Class 3 and Class 4
group less around 10% of all farms.
177. Farms in Class 1 show a productivity performance — measured as the potential
output levels that could be achieved with a given input bundle, in value per year — around
10% higher than their counterparts in classes 1 and 3 (Figure 6.3). Crop farms in Class 2
are significantly less productive than other farms, and produce about a third of farms in
Class 4.
178. The highest rate of technical change per year and per farm is found in for farms in
Class 1, suggesting they will quickly catch up with farms in Class 4, which show a fast
decline rate of technical change, ceteris paribus (Figure 6.3). Farms in Class 3 will also
achieve higher productivity as they have a positive rate of technical change, but more
slowly than farms in Class 1. Farms in Class 2, which account for a quarter of all farms,
are likely to see their productivity deteriorate as they show a strong negative rate of
technical change, and their productivity gap with farms in classes 1 and 3 increase.
Figure 6.3. Productivity and technical change for French crop farms, by class, 1989 to 2016
Source: Table 6.3.
179. If crop farms in Class 2 produced with the technology of farms in Class 4, they
would be able to increase their productivity by 40% (Table 6.3). For farms in classes 1
and 3, this would result in a deterioration of their productivity performance of -14% and
58% respectively (Table A C.5 in Part 1). The highest productivity gains for all farms
would occur if they adopted the technology of farms in Class 3, but that would require the
adoption of most intensive and less environmentally sustainable farming practices
(Table 6.4).
1.24
-2.39
0.77
-2.43
-3.0
-2.5
-2.0
-1.5
-1.0
-0.5
0.0
0.5
1.0
1.5
0
20
40
60
80
100
120
140
160
180
Class 1 (55.4%) Class 2 (24.6%) Class 3 (8.5%) Class 4 (11.6%)
%EUR '000
Productivity level (EUR '000) Technical change (% per year)
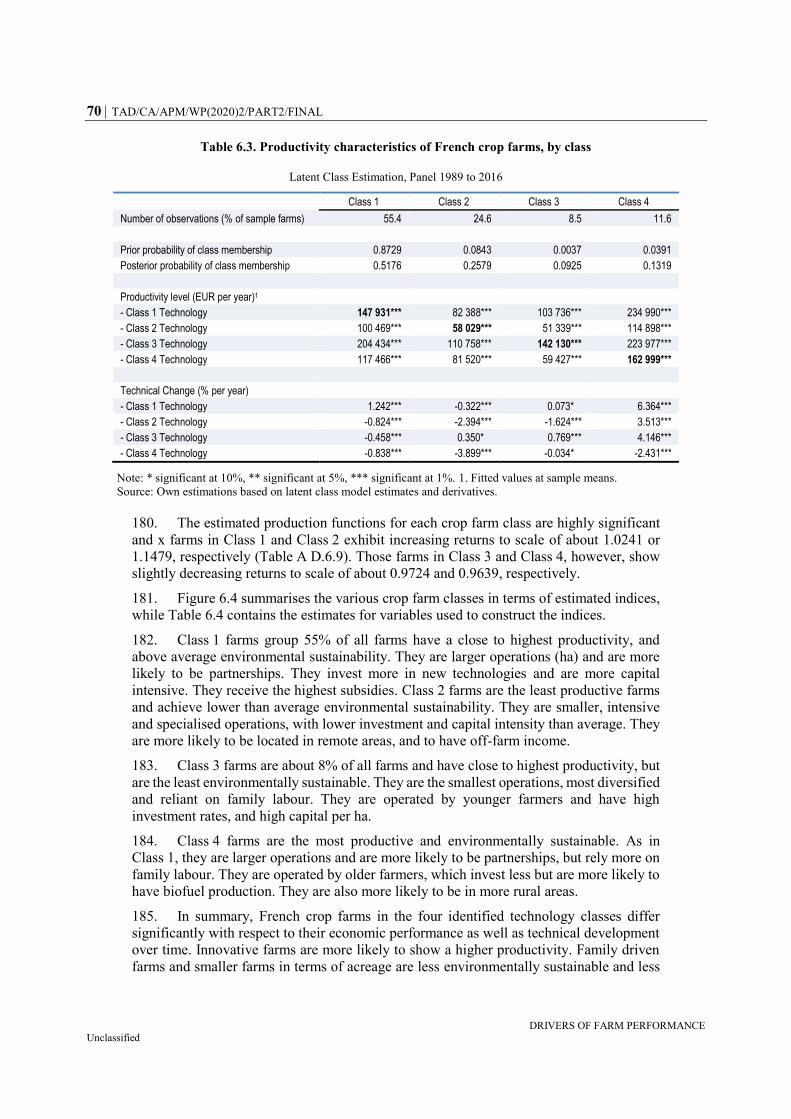
70 TAD/CA/APM/WP(2020)2/PART2/FINAL
DRIVERS OF FARM PERFORMANCE Unclassified
Table 6.3. Productivity characteristics of French crop farms, by class
Latent Class Estimation, Panel 1989 to 2016
Class 1 Class 2 Class 3 Class 4
Number of observations (% of sample farms) 55.4 24.6 8.5 11.6
Prior probability of class membership 0.8729 0.0843 0.0037 0.0391
Posterior probability of class membership 0.5176 0.2579 0.0925 0.1319
Productivity level (EUR per year)1
- Class 1 Technology 147 931*** 82 388*** 103 736*** 234 990***
- Class 2 Technology 100 469*** 58 029*** 51 339*** 114 898***
- Class 3 Technology 204 434*** 110 758*** 142 130*** 223 977***
- Class 4 Technology 117 466*** 81 520*** 59 427*** 162 999***
Technical Change (% per year)
- Class 1 Technology 1.242*** -0.322*** 0.073* 6.364***
- Class 2 Technology -0.824*** -2.394*** -1.624*** 3.513***
- Class 3 Technology -0.458*** 0.350* 0.769*** 4.146***
- Class 4 Technology -0.838*** -3.899*** -0.034* -2.431***
Note: * significant at 10%, ** significant at 5%, *** significant at 1%. 1. Fitted values at sample means.
Source: Own estimations based on latent class model estimates and derivatives.
180. The estimated production functions for each crop farm class are highly significant
and x farms in Class 1 and Class 2 exhibit increasing returns to scale of about 1.0241 or
1.1479, respectively (Table A D.6.9). Those farms in Class 3 and Class 4, however, show
slightly decreasing returns to scale of about 0.9724 and 0.9639, respectively.
181. Figure 6.4 summarises the various crop farm classes in terms of estimated indices,
while Table 6.4 contains the estimates for variables used to construct the indices.
182. Class 1 farms group 55% of all farms have a close to highest productivity, and
above average environmental sustainability. They are larger operations (ha) and are more
likely to be partnerships. They invest more in new technologies and are more capital
intensive. They receive the highest subsidies. Class 2 farms are the least productive farms
and achieve lower than average environmental sustainability. They are smaller, intensive
and specialised operations, with lower investment and capital intensity than average. They
are more likely to be located in remote areas, and to have off-farm income.
183. Class 3 farms are about 8% of all farms and have close to highest productivity, but
are the least environmentally sustainable. They are the smallest operations, most diversified
and reliant on family labour. They are operated by younger farmers and have high
investment rates, and high capital per ha.
184. Class 4 farms are the most productive and environmentally sustainable. As in
Class 1, they are larger operations and are more likely to be partnerships, but rely more on
family labour. They are operated by older farmers, which invest less but are more likely to
have biofuel production. They are also more likely to be in more rural areas.
185. In summary, French crop farms in the four identified technology classes differ
significantly with respect to their economic performance as well as technical development
over time. Innovative farms are more likely to show a higher productivity. Family driven
farms and smaller farms in terms of acreage are less environmentally sustainable and less

TAD/CA/APM/WP(2020)2/PART2/FINAL 71
DRIVERS OF FARM PERFORMANCE Unclassified
productive, ceteris paribus. Capital intensiveness of production is negatively correlated
with the environmental sustainability of operations, whereas diverse farms are not
operating with at a higher environmental sustainability level. The productivity of crop
farms is linked to the farms’ structure. Finally, the empirical results at unweighted class
level suggest that environmentally sustainable crop farming is positively correlated with a
higher economic productivity, ceteris paribus.
Figure 6.4. Multi-dimensional indices for French crop farms
Scaled values at class means, 1989 to 2016
Source: Table A D.6.10.
-2
-1.5
-1
-0.5
0
0.5
1
1.5
2Index 1 - Structure
Index 2 - Environmental sustainability
Index 3 - Innovation/commercialisation
Index 4 - Technology
Index 5 - DiversityIndex 6 - Individual
Index 7 - Location
Index 8 - Household
Index 9 - Financial
Class 1: Medium productive (55.4%) Class 2: Least productive (24.6%)
Class 3: Medium productive (8.5%) Class 4: Most productive (11.6%)
72 TAD/CA/APM/WP(2020)2/PART2/FINAL
DRIVERS OF FARM PERFORMANCE Unclassified
Table 6.4. Multiple characteristics of French crop farms, by class
Deviations from sample means1, 1989 to 2016
Class 1: Medium productive (55.4%)
Class 2: Least productive (24.6%)
Class 3: Medium productive (8.5%)
Class 4: Most productive (11.5%)
Farm structure
Family/hired labour ratio -0.0047 -0.0827 0.0383 0.1699
Land endowment (ha) 0.1826 -0.5038 -0.7904 0.7770
Form of ownership (1-family farms, 2-partnerships, 3-other)
0.1103 -0.2677 -0.1640 0.1612
Environmental sustainability
Chemicals use (EUR per ha) -0.0228 -0.2038 0.5971 0.1028
Organic production (1=yes, 0=no) 0.0268 -0.0446 -0.1012 0.0410
Fuel per ha (EUR per ha) -0.0125 -0.0123 0.0662 0.0375
Environmental subsidies per ha (EUR per ha)
0.0247 -0.0605 -0.1450 0.1167
Tillage area (ha) 0.1875 -0.5019 -0.7912 0.7503
Innovation-commercialisation
Net investment ratio (per total assets) 0.2318 -0.4760 0.1959 -0.2424
Share contract farming -0.0079 -0.0237 0.1339 -0.0103
Share land rented 0.1712 -0.5292 -0.0575 0.3467
Biofuel income (EUR) 0.0443 -0.1490 -0.1462 0.2119
Miscellaneous income (EUR) 0.0986 -0.3756 0.1861 0.1890
Insurance expenses (EUR) 0.1493 -0.6287 -0.1779 0.7515
Technology
Capital / labour ratio (EUR per AWU) 0.2974 -0.3969 -0.2432 -0.4015
Labour per ha (AWU per ha) -0.1336 -0.0912 1.3781 -0.1803
Capital per ha (EUR per ha) -0.0016 -0.2067 1.0677 -0.3383
Materials per ha (EUR per ha) -0.0475 -0.0551 0.5476 -0.0585
Diversity
Herfindahl Index (sqrt[Σ(yi/Y)2]) -0.0307 0.2773 -0.5353 -0.0483
Production diversity (yc/ΣY) -0.0605 -0.1606 1.0496 -0.1411
Forest area (ha) -0.0368 0.1136 -0.0241 -0.0474
Individual
Age (years) -0.1584 -0.2213 -0.3049 1.4519

TAD/CA/APM/WP(2020)2/PART2/FINAL 73
DRIVERS OF FARM PERFORMANCE Unclassified
Location
Subregion 1 nuts 2 FR10 0.0932 -0.1557 -0.2150 0.0427
Subregion 2 nuts 2 FR21 0.0643 -0.0372 -0.2874 -0.0172
Subregion 3 nuts 2 FR22 0.1198 -0.1824 -0.1114 -0.1040
Subregion 4 nuts 2 FR23 0.0466 -0.0884 0.0324 -0.0589
Subregion 5 nuts 2 FR24 -0.0184 0.0939 -0.2630 0.0821
Subregion 6 nuts 2 FR25 0.0353 -0.0434 -0.0615 -0.0315
Subregion 7 nuts 2 FR26 -0.0446 0.0870 -0.2188 0.1898
Subregion 8 nuts 2 FR30 0.0604 -0.1789 0.3712 -0.1822
Subregion 9 nuts 2 FR41 0.0168 -0.0607 -0.1689 0.1726
Subregion 10 nuts 2 FR42 0.0423 -0.1013 0.1812 -0.1205
Subregion 11 nuts 2 FR43 -0.0157 0.0311 -0.0323 0.0331
Subregion 12 nuts 2 FR51 -0.0433 0.0486 0.0839 0.0422
Subregion 13 nuts 2 FR52 -0.0085 -0.0270 0.1703 -0.0270
Subregion 14 nuts 2 FR53 -0.0413 0.0897 -0.0982 0.0791
Subregion 15 nuts 2 FR61 -0.0317 0.0447 0.1251 -0.0353
Subregion 16 nuts 2 FR62 -0.0762 -0.0979 0.9295 -0.1109
Subregion 17 nuts 2 FR63 -0.0634 0.1725 -0.1549 0.0509
Subregion 18 nuts 2 FR71 -0.0662 -0.0241 0.6240 -0.0911
Subregion 19 nuts 2 FR72 -0.1219 0.3321 -0.2070 0.0301
Subregion 20 nuts 2 FR81 -0.0208 0.0447 0.0126 -0.0045
Subregion 21 nuts 2 FR82 -0.0378 0.0825 0.0122 -0.0032
Subregion 22 nuts 2 FR83 -0.0159 0.0510 -0.1238 0.0588
Subregion 23 nuts 2 FR91 -0.0071 0.0026 0.0775 -0.0284
Subregion 24 nuts 2 FR92 -0.0303 -0.0349 0.1392 -0.0388
Subregion 25 nuts 2 FR94 0.0038 -0.0281 0.1008 -0.0329
Subregion 26 nuts 2 FRA1 -0.0278 -0.0067 0.0160 0.1356
Subregion 27 nuts 2 FRA2 -0.0164 -0.0199 0.0990 0.0479
Subregion 28 nuts 2 FRA3 -0.0133 -0.0446 0.1087 0.0787
(all: 1=yes, 0=no)
Altitude (1- <300m, 2- 300-600m, 3- >600m) -0.1004 0.1846 -0.0999 0.1620
Less favoured area payments (EUR) -0.0531 0.3697 -0.0637 -0.4843
Household
Off-farm income share -0.0673 0.1919 -0.0687 -0.0352
Rural support (EUR) -0.0154 -0.1141 -0.1432 0.4211
Financial
Total assets (EUR) 0.2226 -0.5737 -0.0665 0.2023
Total subsidies (EUR) 0.2120 -0.1623 -0.0942 -0.6007
Equity/debt ratio -0.0082 -0.0048 -0.0083 0.0556
Notes: AWU: Annual Work Unit. 1. Deviations from sample means (=0), z-scores based, scaled values.
Source: Estimations.

74 TAD/CA/APM/WP(2020)2/PART2/FINAL
DRIVERS OF FARM PERFORMANCE Unclassified
7. Hungary
7.1. Hungarian crop farms
186. In Hungary, the analysis applies to a sample of crop farms covering the period
2001 to 2014. Crop production in Hungary is very diverse, and dominated by cereals,
oilseeds and industrial crops. The major share of agricultural area is used for wheat and
maize production, followed by sunflower, barley and rapeseed production. Alfalfa, oat,
potatoes and sugar beet are also produced in Hungary.
187. The average utilised agricultural area per farm has been about 44 ha in 2016 with
an average employment rate of about 1.5 persons per farm (Hungarian Chamber of
Commerce, 2017). Private farms cultivated about 54% of the agricultural area, while about
36% belonged to enterprises and about 10% to holdings. Enterprises had the highest share
of arable land and grassland in total area. Structural change in Hungarian agriculture
remains high: whereas the number of farms with less than 4 ha of land decreased in the
period 2013 to 2016, those cultivating more than 4 ha increased. The number of farms
holding between 50 and 200 ha most significantly expanded, but those cultivating between
300 and 1 000 ha also increased. The average size of agricultural enterprises fell from 310
to 253 ha between 2013 and 2016, the average size of private farms increased to about
7.6 ha.
188. According to Table A D.7.1, which contains descriptive statistical measures for the
Hungarian crop farm sample, the crop output of the average Hungarian crop farm increased
between 2001 and 2014, mainly due to productivity improvements as for example, the
acreage per farm more or less remained the same over the 15 years considered. The variable
input costs increased as expected, the labour structure changed only slightly and finally the
probability of being engaged in organic production did not increase dramatically.
189. In the model used to estimate the technology and the Class identification
components for the Hungarian crop production the output variable is the total output per
farm and year and the inputs variable are land, capital, chemicals, materials and labour. The
Class identification vector consists of all seven indices as outlined in Table A D.7.2.
190. For Hungarian crop farms, three distinct technology classes emerge from the model
estimates (Table A D.7.2). Class 3 comprises half of the crop farms in the sample, while
the other half is distributed relatively evenly across the first two classes (about 28% in
Class 1 and about 22% in Class 2) (Table 7.1).
191. Farms in Class 1 show the highest productivity performance — measured as the
potential output levels that could be achieved with a given input bundle, in EUR per year —
followed by crop farms in Class 3 and Class 2. The first class produces on average about
two times more per farm and year than farms in Class 2 (Figure 7.1).
192. Farms in Class 1 show a significantly positive technical change per year (of about
5% per year). However, crop farms in the other two classes also experience considerable
technical change (of about 4% per year for Class 3 farms and about 2% for Class 2 farms).
Hence, despite crops farms in Class 2 being far less productive than their counterparts in
the other two classes, they also seem to catch up in their performance based on a significant
positive technical change development (Figure 7.1). Finally, significant scale effects are
found for all classes: about 1.1366 for farms in Class 1, about 1.1758 for farms in Class 3,
and about 1.1212 for farms in Class 3 (Table A D.7.4).

TAD/CA/APM/WP(2020)2/PART2/FINAL 75
DRIVERS OF FARM PERFORMANCE Unclassified
193. If crop farms in Class 2 produced with the technology of farms in Class 1, they
would be able to significantly increase their productivity by about 1.5 times, while those in
Class 3 would increase their productivity by about 1.3 times (Table 7.1). Overall, this
would result in a 20% average increase in productivity for crop farms in Hungary
(Table A C.5).
Figure 7.1. Productivity and technical change for Hungarian crop farms,
by class, 2001 to 2014
Source: Table 7.1.
Table 7.1. Productivity characteristics of Hungarian crop farms, by class
Latent Class Estimation, Panel 2001 to 2014
Class 1 Class 2 Class 3
Number of observations (% of sample farms) 3 933 (28%) 3 057 (22%) 7 138 (50%)
Prior probability of class membership 0.2672 0.2592 0.4736
Posterior probability of class membership 0.2978 0.2379 0.4643
Productivity level (EUR per year) 1
- Class I Technology 123 355*** 86 131*** 145 702***
- Class II Technology 83 118*** 57 234*** 101 146***
- Class III Technology 94 459*** 64 814*** 116 021***
Technical Change (% per year)
- Class I Technology 5.003*** 4.987*** 5.157***
- Class II Technology 2.246*** 2.007*** 2.284***
- Class III Technology 4.212*** 4.048*** 3.994***
Note: * significant at 10%, ** significant at 5%, *** significant at 1%.1. Fitted values at sample means.
Source: Own estimations based on latent class model estimates and derivatives.
194. Figure 7.2 summarises the three crop farm classes with respect to the various
indices used to identify the class membership of individual crop farms, while Table 4.7
contains the estimates for variables used to construct the indices. All dimensions considered
to distinguish crop farms are found statistically significant (Table A D.7.4).
5.00
2.01
3.99
0
1
2
3
4
5
6
0
20
40
60
80
100
120
140
Class 1 (28%) Class 2 (22%) Class 3 (50%)
%EUR '000
Productivity (EUR '000 per year) Technical change (% per year)

76 TAD/CA/APM/WP(2020)2/PART2/FINAL
DRIVERS OF FARM PERFORMANCE Unclassified
195. Farms in Class 1 are the most productive operations with the highest annual
technical change rate. These crop farms have the highest share of family labour in the
sample but operate with a below average farms size with increasing returns to scale. Farms
in Class 1 have most probably a single owner. They score relatively low on sustainability
(depending on the selected indicators: chemicals used, organic production, and
environmental subsidies received). These farms show the lowest share of rented land but a
higher than average probability of being engaged in biofuel production. They have a
medium to high input intensity, are rather specialised and generated only a small amount
of income from non-crop agricultural production. The farm managers are younger than
average, and off-farm income is of average importance. Finally, these crop farms are least
likely located in less-favoured areas but likely in nitrate vulnerable zones (Table 7.2).
Figure 7.2. Indices for Hungarian crop farms
Scaled values at class means, 2001 to 2014
Source: Table A D.7.5.
196. Farms in Class 2 are about 24% of the total sample and are the least productive with
the lowest but still positive technical change per year (of about 2%). They have a below
average share of family labour, but are also relatively small exhibiting significantly
increasing returns to scale (of about 1.1757). Crop farms in this class have most likely a
single owner and score high on sustainability (depending on the selected indicators:
chemicals used, organic production, and environmental subsidies received). Those farms
show a very high input intensity and a high probability of biofuel production. They have
an average degree of diversity but show a significant probability of additional off-farm
income. The farm manager is slightly older than average and the farm is very likely located
in less-favoured areas of Hungary (Table 7.2).
197. Class 3 farms are nearly as productive as farms in Class 1 and show a positive rate
of technical change of about 4% per year. For those crop farms family labour is of least
importance and most likely more than one owner is registered for those farms. They are
significantly larger than the average crop farm size in Hungary, however, still exhibit
-3
-2
-1
0
1
2Index 1 - Structure
Index 2 - Environmental sustainability
Index 3 - Innovation/Cooperation/Commercialisation
Index 4 - TechnologyIndex 5 - Diversity
Index 6 - Individual
Index 7 - Location
Class 1: Most productive (28%) Class 2: Least productive (22%)
Class 3: Medium productive (50%)

TAD/CA/APM/WP(2020)2/PART2/FINAL 77
DRIVERS OF FARM PERFORMANCE Unclassified
positive scale effects (of about 1.1212). Those farms also operate with a relatively high
sustainability (depending on the selected indicators used: chemicals used, organic
production, and environmental subsidies received). They have the highest share of rented
land and are most capital intensive and least labour intensive. However, farms in Class 3
are more diversified than the average crop farm in Hungary and are least relying on off-
farm income, and invest more than the average crop farm.
198. In summary, Hungarian crop farms in the three identified technology classes differ
significantly with respect to economic performance and technical development over time.
Innovative farms are more likely to be productive, while family driven farms and smaller
farms in terms of acreage can be innovative. Highly sustainable crop farms are most likely
located in less-favoured areas. Capital intensity and a low level of labour use are positively
correlated with farm size. The productivity of crop farms is not linked to economic size, to
family labour share in total labour or the type of ownership. Finally, the results suggest that
more sustainable crop farms in Hungary are most likely less productive.
Table 7.2. Multiple characteristics of Hungarian crop farms, by class
Deviations from sample means1
Class 1: Most productive (28%)
Class 2: Least productive (22%)
Class 3: Medium productive (50%)
Farm structure
Family labour (hour per year) 282.906 -1.678 -155.161
Land (ha) -48.471 -66.682 55.265
Sole ownership (probability) 0.023 0.063 -0.039
Sustainability
Chemicals use (EUR per ha) 10.128 -4.833 -3.512
Organic (probability) -3.14E-03 2.26E-03 7.63E-04
Environmental subsidies (EUR per ha) -67.563 -96.512 60.561
Innovation-commercialisation
Net investment ratio (per total assets) 9.06E-03 1.36E-03 7.31E-03
Share Land Rented -0.012 -7.16E-03 9.46E-03
Biofuel production (probability) 3.26E-03 4.12E-03 -3.56E-03
Technology
Labour / capital ratio (hour per EUR) 2.183 2.408 -2.234
Materials per ha (EUR per ha) 10.297 30.685 -18.815
Labour per ha (hour per ha) 2.218 23.773 -11.403
Diversity
Herfindahl Index (sqrt[Σ(yi/Y)2]) 0.013 1.43E-03 -7.43E-03
Livestock production (probability) -0.043 -0.028 0.036
Other output (probability) -0.035 -0.053 0.042
Individual
Age (years) -1.101 2.179 -0.327
Off-Farm work (probability) -0.01 0.015 -6.82E-04
Location
Less Favoured Area (probability) -0.011 5.18E-03 3.91E-03
Nitrate Vulnerable Zone (probability) 0.022 -0.021 -3.21E-03
Note: 1. Deviations from sample means (=0), scaled values.
Source: Estimations.

78 TAD/CA/APM/WP(2020)2/PART2/FINAL
DRIVERS OF FARM PERFORMANCE Unclassified
8. Ireland
199. In Ireland, the analysis applies to the following farm samples: dairy farms, crop
farms, cattle rearing farms, cattle other farms and sheep farms, all covering the period 2010
to 2018.
200. The analysis presented in this section is based on data from the Teagasc, National
Farm Survey, and provider of data to the Farm Accountancy Data Network (FADN). The
same dataset is used on an annual basis by Teagasc researchers to examine the economic,
environmental and social sustainability of for a range of farm types in Ireland. Given that
the sustainability metrics used in the Teagasc report differ from those employed in the
current study (and reported on below) are based on the same dataset it is important to
1) outline how the metrics differ and 2) how the results differ. Box 8.1 below outlines the
metrics and results from the most recent Teagasc report (Buckley et al., 2019).
Box 8.1. Main findings on farm performance in the Teagasc Sustainability Report
Using data compiled through the Teagasc National Farm Survey (NFS), Buckley et al.
(2019) track the performance of Irish farms in terms of economic, environmental and social
sustainability. While the primary focus of the Teagasc NFS is measurement of economic
performance, in recent years the scope of the survey has been expanded to include a
growing range of environmental metrics, including farm level greenhouse gas emissions.
The 2019 edition of the report also includes metrics for farm level ammonia emissions for
the first time.
Economic sustainability is measured by the following variables: economic return to land,
profitability, productivity of labour, economic viability, market orientation.
Environmental sustainability is measured by the following variables: agriculture
Greenhouse Gas (GHG) emissions per farm, per hectare, and per kg of output, energy GHG
emissions per farm and per kg of output, ammonia emissions per farm, per hectare and per
kg of output, Nitrogen (N) balance, N use efficiency, N surplus per kg of output,
Phosphorous (P) balance and P use efficiency.
Social sustainability is measured by the following variables: household vulnerability,
agricultural education, isolation risk, age profile and work life balance.
Innovation indictors: A range of sector specific innovation indicators are also included in
the report.
Main findings, relevant for comparison purposes
The report illustrates the income gap between dairy farms and other farm types in Ireland,
which has accelerated with the growth in Irish milk production in recent years. However,
the report also highlights that within each farm type there is a wide range in income levels
across the farm population. This fact tends to be overlooked when attention is focused only
on the average level of income for particular farm types.
The report illustrates that farm level emissions efficiency is improving, with a trend towards
fewer emissions of greenhouse gases and ammonia per unit of product produced. However,
the report also shows that emissions of GHG and ammonia over time are increasing on
farms that are growing in size.
TAD/CA/APM/WP(2020)2/PART2/FINAL 79
DRIVERS OF FARM PERFORMANCE Unclassified
The report also demonstrates the positive relationship between economic profitability and
emissions efficiency, with the highest levels of emissions efficiency tending to be found on
the most profitable farms.
This suggests that improvement in economic sustainability can be achieved side by side
with improvements in emissions efficiency.
Source: Buckley, C. T. Donnellan, E. Dillon, K. Hanrahan, B. Moran and M. Ryan (2019), Teagasc National
Farm Survey 2017 Sustainability Report, Agricultural Economics and Farm Surveys Department,
Rural Economy and Development Programme, Teagasc, Athenry, Co. Galway, 26 March,
www.teagasc.ie/media/website/publications/2019/2017-sustainability-report-250319.pdf
8.1. Irish dairy farms
201. According to Table A D.8.1, which contains descriptive statistical measures for the
sample, the average milk output per farm in 2018 was about EUR 231 000 (with a total
output of about EUR 251 000). The variable cost items increased over time and the share
of hired labour significantly increases for the average Irish dairy farm in the period
investigated. The average dairy farm in the sample operated in 2018 with a herd size of
about 84 cows (about 65 cows in 2010) and a related stocking density of about 1.96 LU per
ha (about 1.72 LU per ha in 2010).
202. In the model used to estimate the technology and the Class identification
components for Irish milk production, the output variable is total output per farm and year
and input variables are land, capital, dairy cows, labour and materials. The
Class identification component is based on the indices related to structure, environmental
sustainability, innovation, technology, diversity, individual, location, household and
financial aspects (Table A D.8.2).
203. For Irish dairy farms, three distinct technology classes emerge from the model
estimates (Table A D.8.2). The individual farms are distributed very unevenly across the
three technology classes (Table 8.1), as Class 1 includes more than half of all farms and
Class 2 less than 8%.
204. Dairy farms in Class 1 show a higher productivity performance — measured as the
potential output levels that could be achieved with a given input bundle, in value per year —
than their milk-producing counterparts in classes 2 and 3 (Figure 8.1). Dairy farms in
Class 1 produce per farm and year about twice the output of farms in class 2 and 3, which
show similar levels of productivity. However, while farms in Class 2 show a significant
positive technical change, which is larger for Class 1 farms, technical change is negative
for farms in Class 3. As a result, farms in Class 2 are reducing their productivity gap with
farms in Class 1, while farms in Class 3 are increasing their productivity gap with both
Class 1 and Class 2 farms, ceteris paribus (Figure 8.1).
205. If dairy farms in Class 2 and Class 3 produced with the technology of farms in
Class 1, they would be able to increase their productivity by 36% and 19% respectively,
suggesting that technologies in Class 1 and Class 3 are relatively close (Table 8.1). Overall,
the adoption of Class 1 technologies by all farms would result in an average 7% increase
in productivity for Irish dairy farms (Table A C.4 in Part 1). In practice, however, natural
and human resource constraints may limit the adoption of the best technology by other
classes.

80 TAD/CA/APM/WP(2020)2/PART2/FINAL
DRIVERS OF FARM PERFORMANCE Unclassified
Figure 8.1. Productivity and technical change for Irish dairy farms,
by class, 2010 to 2018
Source: Table 8.1.
Table 8.1. Productivity characteristics of Irish dairy farms, by class
Latent Class Estimation, Panel 2010 to 2018
Class 1 Class 2 Class 3
Number of observations (% of sample farms) 51.2 7.9 40.9
Prior probability of class membership 0.5517 0.0009 0.4474
Posterior probability of class membership 0.5052 0.0868 0.4081
Productivity level (EUR per year)1
- Class 1 Technology 245 134*** 150 678*** 142 729***
- Class 2 Technology 190 441*** 110 494*** 101 397***
- Class 3 Technology 227 453*** 129 819*** 120 351***
Technical Change (% per year)
- Class 1 Technology 0.277* 0.135* 0.302*
- Class 2 Technology 1.243* 0.562* 1.223*
- Class 3 Technology -0.731** -0.343* -0.385*
Note: * significant at 10%, ** significant at 5%, *** significant at 1%. 1. Fitted values at sample means.
Source: Own estimations based on latent class model estimates and derivatives.
206. The estimated production functions for each farm class are moderately significant
and all dairy farm classes exhibit slightly significantly increasing returns to scale: 1.0244
for farms in Class 1, 1.1393 for farms in Class 2, and 1.0591 for farms in Class 3
(Table A D.8.4).
207. Figure 8.2 summarises the various dairy farm classes in terms of estimated indices,
while Table 8.2 contains the estimates for variables used to construct the indices.
0.28
0.56
-0.39
-0.6
-0.4
-0.2
0.0
0.2
0.4
0.6
0.8
0
50
100
150
200
250
300
Class 1 (51.2%) Class 2 (7.9%) Class 3 (40.9%)
%'000 EUR
Productivity level (EUR '000) Technical change (% per year)

TAD/CA/APM/WP(2020)2/PART2/FINAL 81
DRIVERS OF FARM PERFORMANCE Unclassified
208. Class 1 farms are the most productive and least environmentally sustainable and
achieve small but positive technical change. They are much larger than average in terms of
herd size and have more diversified operations. They invest much more in new technologies
and activities than average and are more capital intensive, based on larger assets
endowment than average. Their operators are younger and more likely to be women.
209. Class 2 farms are the least productive, with negative technical change and below
average environmental sustainability. They are have fewer animals than average, but are
more diversified. They have lower than average levels of investment and capital intensity.
Their operators are more likely to be older and male. They are more likely to be in less
favoured areas, have lower assets and receive lower levels of subsidies.
210. Class 3 farms are the most sustainable in environmental terms, with close to lowest
productivity and negative technical change accounts for about 40% of all farms. They are
smaller operations, relying mainly on family labour, and their operators are older than
average. They have lower than average levels of investment. They are more likely to be in
less favoured areas, and have lower assets.
211. In summary, Irish dairy farms in the three identified technology classes differ
significantly with respect to their economic performance as well as technical development
over time. Innovative farms are most likely more productive. Family driven and smaller
farms are operating with a slightly higher environmental sustainability relative to the
average sector level. Dairy farms with lower environmental sustainability most likely show
a diverse structure with an average capital intensity. The productivity of farms is correlated
with herd size, ceteris paribus. Around half of the Irish dairy sector exhibits high
productivity and innovativeness, however, less than average environmental sustainability.
Figure 8.2. Multi-dimensional indices for Irish dairy farms
Scaled values at class means, 2010 to 2018
Source: Table A D.8.5.
-1-0.8-0.6-0.4-0.2
00.20.40.60.8
1Index 1 - Structure
Index 2 - Environmentalsustainability
Index 3 - Innovation/commercialisation
Index 4 - Technology
Index 5 - DiversityIndex 6 - Individual
Index 7 - Location
Index 8 - Household
Index 9 - Financial
Class 1: Most productive (51.2%)
Class 2: Least productive (7.9%)
Class 3: Medium productive (40.9%)

82 TAD/CA/APM/WP(2020)2/PART2/FINAL
DRIVERS OF FARM PERFORMANCE Unclassified
Table 8.2. Multiple characteristics of Irish dairy farms, by class
Deviations from sample means1, 2010 to 2018
Class 1: Most productive (51.2%)
Class 2: Least productive (7.9%)
Class 3: Medium productive (40.9%)
Farm structure
Family/hired labour ratio -0.0462 -0.4093 0.1366
Herd size (LU) 0.4647 -0.1100 -0.5598
Environmental sustainability
Stocking density (LU PER ha) 0.1929 -0.1377 -0.2147
Chemicals use (EUR per ha) 0.1760 -0.3904 -0.1449
Organic production (1=yes, 0=no) -0.0656 0.0783 0.0670
Fuel per ha (EUR per ha) -0.0586 -0.0302 0.0791
Environmental subsidies per ha (EUR per ha) 0.0971 -0.1653 -0.0896
Tillage area (ha) 0.1925 -0.1352 -0.2146
REPS participation (1=yes, 0=no) 0.1221 -0.1803 -0.1179
Water charges (EUR) -0.0676 0.2277 0.0407
Nitrate derogation (1=yes, 0=no) 0.1427 -0.0200 -0.1745
Innovation -commercialisation
Net investment ratio (per total assets) 0.4242 -0.3899 -0.4553
Share contract farming 0.4232 -0.5152 -0.4300
Share land rented 0.1192 -0.0384 -0.1417
Energy crops area (ha) 0.0199 -0.0567 -0.0140
Miscellaneous income (EUR) 0.1124 0.0085 -0.1422
Insurance expenses (EUR) 0.3962 -0.4121 -0.4161
E-Profit monitoring (1=yes, 0=no) 0.3794 -0.5964 -0.3595
Professional/Advisory expenses (EUR) 0.4027 -0.4411 -0.4185
Technology
Capital / labour ratio (EUR per AWU) 0.2423 -0.4666 -0.2132
Capital per cow (EUR per LU) 0.0091 -0.3645 0.0588
Cow per labour (LU PER AW) 0.3487 -0.0900 -0.4186
Fodder per cow (EUR per LU) -0.0354 -0.3331 0.1084
Materials per cow (EUR per LU) 0.0067 -0.3275 0.0547
Diversity
Herfindahl Index (sqrt[Σ(yi/Y)2]) 0.1337 -0.7730 -0.0184
Production diversity (yc/ΣY) 0.1393 -0.8407 -0.0124
Forest area (ha) 0.0549 0.0250 -0.0734
Individual
Age (years) -0.1709 0.1798 0.1791
Agricultural education operator (1 = Full-Time 3rd Level Agri Course, 2 = Farm Apprenticeship Scheme, 3= Certificate in Farming, 4= 1 yr Ag College, 5 = Course > 60 hours, 6= Course < 60 hours, 7 = Other)
0.1939 -0.4263 -0.1603
Gender operator (1-male, 0-female) -0.1091 0.2320 0.0918
Marital status (1-married, 0-other) -0.0209 0.1287 0.0014
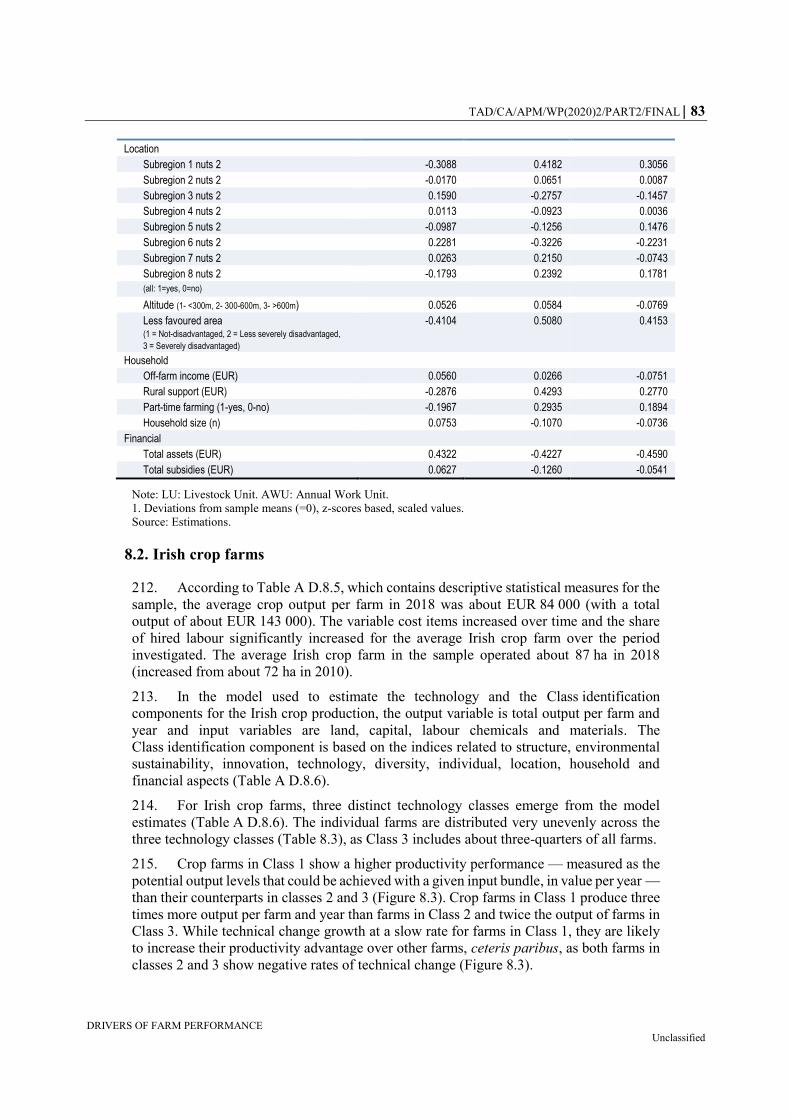
TAD/CA/APM/WP(2020)2/PART2/FINAL 83
DRIVERS OF FARM PERFORMANCE Unclassified
Location
Subregion 1 nuts 2 -0.3088 0.4182 0.3056
Subregion 2 nuts 2 -0.0170 0.0651 0.0087
Subregion 3 nuts 2 0.1590 -0.2757 -0.1457
Subregion 4 nuts 2 0.0113 -0.0923 0.0036
Subregion 5 nuts 2 -0.0987 -0.1256 0.1476
Subregion 6 nuts 2 0.2281 -0.3226 -0.2231
Subregion 7 nuts 2 0.0263 0.2150 -0.0743
Subregion 8 nuts 2 -0.1793 0.2392 0.1781
(all: 1=yes, 0=no)
Altitude (1- <300m, 2- 300-600m, 3- >600m) 0.0526 0.0584 -0.0769
Less favoured area (1 = Not-disadvantaged, 2 = Less severely disadvantaged,
3 = Severely disadvantaged)
-0.4104 0.5080 0.4153
Household
Off-farm income (EUR) 0.0560 0.0266 -0.0751
Rural support (EUR) -0.2876 0.4293 0.2770
Part-time farming (1-yes, 0-no) -0.1967 0.2935 0.1894
Household size (n) 0.0753 -0.1070 -0.0736
Financial
Total assets (EUR) 0.4322 -0.4227 -0.4590
Total subsidies (EUR) 0.0627 -0.1260 -0.0541
Note: LU: Livestock Unit. AWU: Annual Work Unit.
1. Deviations from sample means (=0), z-scores based, scaled values.
Source: Estimations.
8.2. Irish crop farms
212. According to Table A D.8.5, which contains descriptive statistical measures for the
sample, the average crop output per farm in 2018 was about EUR 84 000 (with a total
output of about EUR 143 000). The variable cost items increased over time and the share
of hired labour significantly increased for the average Irish crop farm over the period
investigated. The average Irish crop farm in the sample operated about 87 ha in 2018
(increased from about 72 ha in 2010).
213. In the model used to estimate the technology and the Class identification
components for the Irish crop production, the output variable is total output per farm and
year and input variables are land, capital, labour chemicals and materials. The
Class identification component is based on the indices related to structure, environmental
sustainability, innovation, technology, diversity, individual, location, household and
financial aspects (Table A D.8.6).
214. For Irish crop farms, three distinct technology classes emerge from the model
estimates (Table A D.8.6). The individual farms are distributed very unevenly across the
three technology classes (Table 8.3), as Class 3 includes about three-quarters of all farms.
215. Crop farms in Class 1 show a higher productivity performance — measured as the
potential output levels that could be achieved with a given input bundle, in value per year —
than their counterparts in classes 2 and 3 (Figure 8.3). Crop farms in Class 1 produce three
times more output per farm and year than farms in Class 2 and twice the output of farms in
Class 3. While technical change growth at a slow rate for farms in Class 1, they are likely
to increase their productivity advantage over other farms, ceteris paribus, as both farms in
classes 2 and 3 show negative rates of technical change (Figure 8.3).

84 TAD/CA/APM/WP(2020)2/PART2/FINAL
DRIVERS OF FARM PERFORMANCE Unclassified
Figure 8.3. Productivity and technical change for Irish crop farms,
by class, 2010 to 2018
Source: Table 8.3.
216. If crop farms in Class 2 produced with the technology of farms in Class 1, they
would be able to more than triple their productivity, while the gain would be 22% for farms
in Class 3 (Table 8.3). Overall, the productivity of Irish crop farms would increase on
average by 45% (Table A C.5 in Part 1). In practice, however, natural and human resource
constraints may limit the adoption of the best technology by other classes.
Table 8.3. Productivity characteristics of Irish crop farms, by class
Latent Class Estimation, Panel 2010 to 2018
Class 1 Class 2 Class 3
Number of observations (% of sample farms) 33.2% 34.1% 32.7%
Prior probability of class membership 0.3129 0.0986 0.5885
Posterior probability of class membership 0.3395 0.3395 0.3210
Productivity level (EUR per year)1
- Class 1 Technology 195 166*** 190 175*** 124 517***
- Class 2 Technology 139 302*** 56 982*** 74 832***
- Class 3 Technology 173 217*** 72 135*** 102 317***
Technical Change (% per year)
- Class 1 Technology 0.101* 2.352* 0.700*
- Class 2 Technology -1.229* -1.222** -1.574**
- Class 3 Technology -1.947*** 1.217* -0.915**
Note: 1. Fitted values at sample means, 2- * significant at 10%, ** significant at 5%, *** significant at 1%.
Source: Own estimations based on latent class model estimates and derivatives.
0.10
-1.22
-0.92
-1.4
-1.2
-1.0
-0.8
-0.6
-0.4
-0.2
0.0
0.2
0
50
100
150
200
250
Class 1 (33.2%) Class 2 (34.1%) Class 3 (32.7%)
%'000 EUR
Productivity level (EUR '000) Technical change (% per year)

TAD/CA/APM/WP(2020)2/PART2/FINAL 85
DRIVERS OF FARM PERFORMANCE Unclassified
217. The estimated production functions for each farm class are moderately significant
and crop farms in Class 1 and Class 3 exhibit significantly increasing returns to scale of
about 1.6294 and 1.4023 (Table A D.8.9). However, crop farms in Class 2 operate with
nearly constant returns to scale (1.0056).
218. Figure 8.4 summarises the various crop farm classes in terms of estimated indices,
while Table 8.4 contains the estimates for variables used to construct the indices.
219. Class 1 groups the most productive farms, with lower than average environmental
sustainability and accounts for a third of all farms. They are larger (ha) family-driven
operations. They use variable inputs and capital more intensively than average. They invest
much more than other farms in new technologies. They receive more subsidies per ha and
have much higher assets than average. Their operator is more likely to be a woman, to have
lower agricultural training and to be younger than average.
220. Class 2 farms are the least productive farms and also the least environmentally
sustainable of all crop farms in Ireland. They are smaller, more specialised operations, with
lower investment in technologies. They are more likely to be engaged in contract farming
and to cultivate energy crops. Their operators are older and hold more agricultural training.
They are more likely to be part-time and have a higher share of off-farm income.
221. Class 3 groups the most environmentally sustainable farms achieving productivity
levels close to the highest. They are smaller, more diversified operations than average, and
are more likely to be engaged in agri-environmental schemes. They have low capital
intensity and are more likely to be in less-favoured areas. Overall, they receive less
subsidies per ha than average.
222. In summary, Irish crop farms in the three identified technology classes differ
significantly with respect to their economic performance as well as technical development
over time. For crop farming in Ireland, a strong positive correlation between the level of
innovativeness and the productivity of farming operations is also found. Those most
productive crop farms are less family driven and cultivate a larger area. However, these
farms are also less environmentally sustainable than the average crop farm in Ireland.
About a third of all crop farms show a low productivity and also very low environmental
sustainability scores based on the measures used in the empirical analysis. Those farms are
mainly family-driven and smaller than average, and they are the less innovative in the crop
sector.
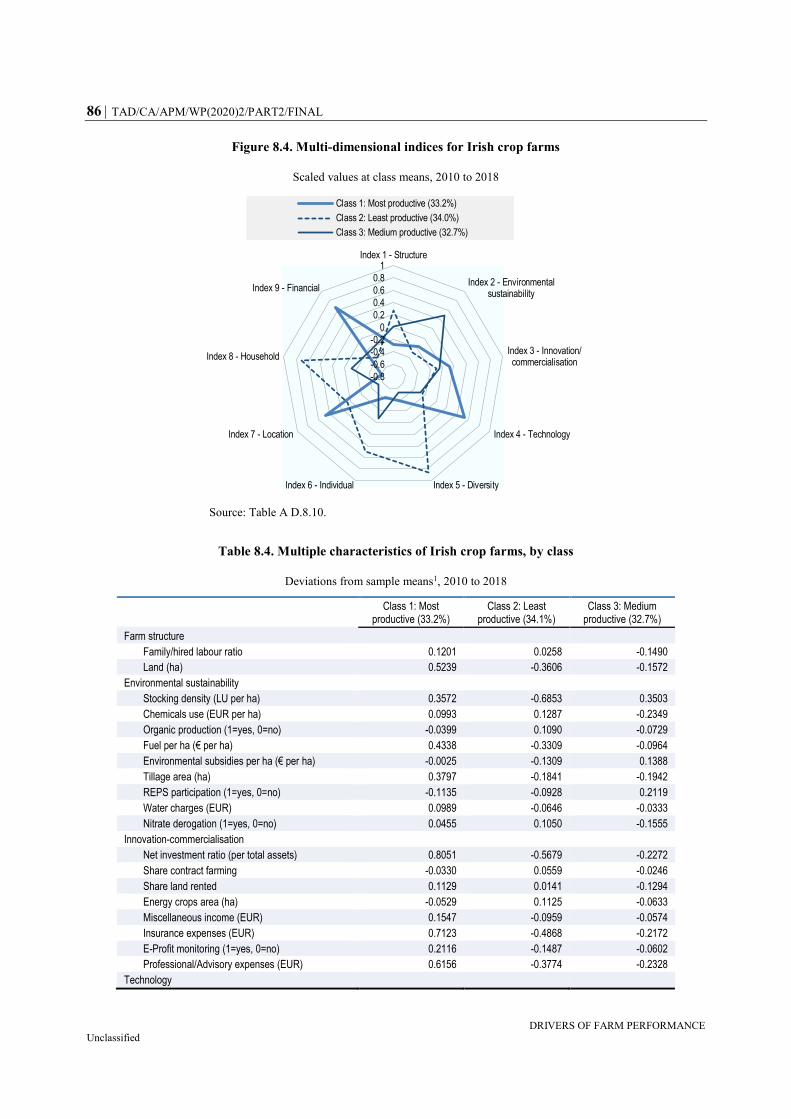
86 TAD/CA/APM/WP(2020)2/PART2/FINAL
DRIVERS OF FARM PERFORMANCE Unclassified
Figure 8.4. Multi-dimensional indices for Irish crop farms
Scaled values at class means, 2010 to 2018
Source: Table A D.8.10.
Table 8.4. Multiple characteristics of Irish crop farms, by class
Deviations from sample means1, 2010 to 2018
Class 1: Most productive (33.2%)
Class 2: Least productive (34.1%)
Class 3: Medium productive (32.7%)
Farm structure
Family/hired labour ratio 0.1201 0.0258 -0.1490
Land (ha) 0.5239 -0.3606 -0.1572
Environmental sustainability
Stocking density (LU per ha) 0.3572 -0.6853 0.3503
Chemicals use (EUR per ha) 0.0993 0.1287 -0.2349
Organic production (1=yes, 0=no) -0.0399 0.1090 -0.0729
Fuel per ha (€ per ha) 0.4338 -0.3309 -0.0964
Environmental subsidies per ha (€ per ha) -0.0025 -0.1309 0.1388
Tillage area (ha) 0.3797 -0.1841 -0.1942
REPS participation (1=yes, 0=no) -0.1135 -0.0928 0.2119
Water charges (EUR) 0.0989 -0.0646 -0.0333
Nitrate derogation (1=yes, 0=no) 0.0455 0.1050 -0.1555
Innovation-commercialisation
Net investment ratio (per total assets) 0.8051 -0.5679 -0.2272
Share contract farming -0.0330 0.0559 -0.0246
Share land rented 0.1129 0.0141 -0.1294
Energy crops area (ha) -0.0529 0.1125 -0.0633
Miscellaneous income (EUR) 0.1547 -0.0959 -0.0574
Insurance expenses (EUR) 0.7123 -0.4868 -0.2172
E-Profit monitoring (1=yes, 0=no) 0.2116 -0.1487 -0.0602
Professional/Advisory expenses (EUR) 0.6156 -0.3774 -0.2328
Technology
-0.8
-0.6
-0.4
-0.2
0
0.2
0.4
0.6
0.8
1Index 1 - Structure
Index 2 - Environmentalsustainability
Index 3 - Innovation/commercialisation
Index 4 - Technology
Index 5 - DiversityIndex 6 - Individual
Index 7 - Location
Index 8 - Household
Index 9 - Financial
Class 1: Most productive (33.2%)
Class 2: Least productive (34.0%)
Class 3: Medium productive (32.7%)
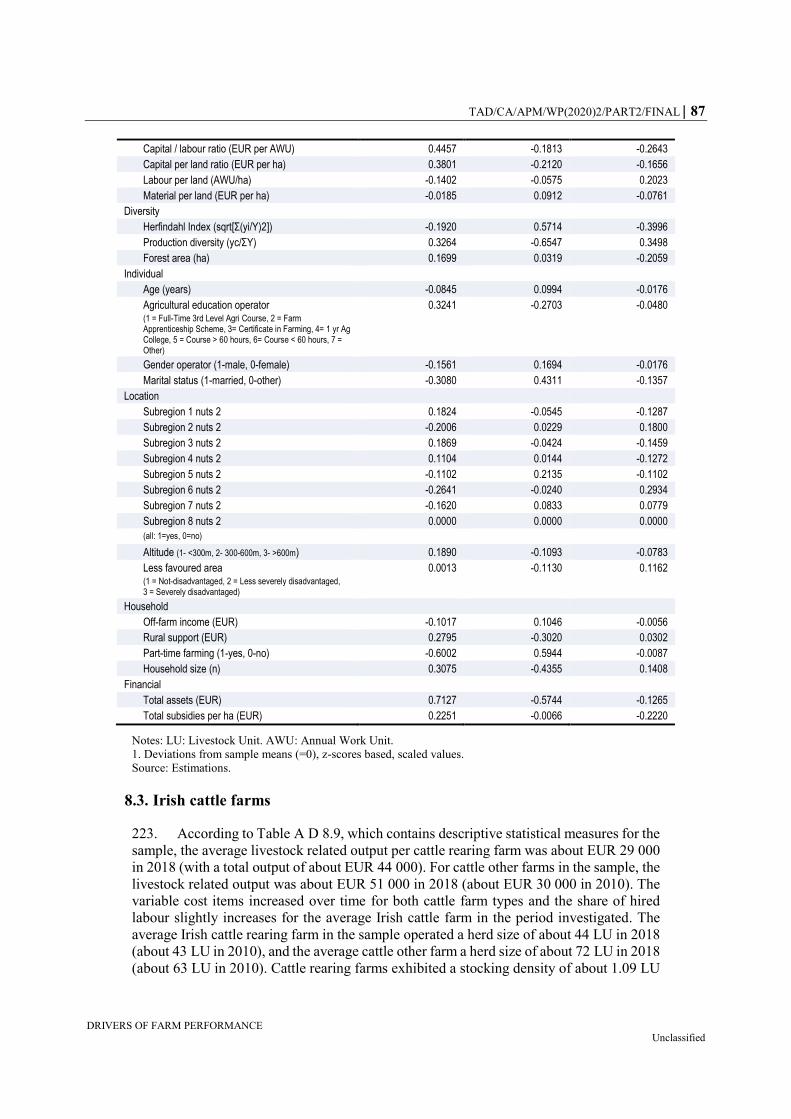
TAD/CA/APM/WP(2020)2/PART2/FINAL 87
DRIVERS OF FARM PERFORMANCE Unclassified
Capital / labour ratio (EUR per AWU) 0.4457 -0.1813 -0.2643
Capital per land ratio (EUR per ha) 0.3801 -0.2120 -0.1656
Labour per land (AWU/ha) -0.1402 -0.0575 0.2023
Material per land (EUR per ha) -0.0185 0.0912 -0.0761
Diversity
Herfindahl Index (sqrt[Σ(yi/Y)2]) -0.1920 0.5714 -0.3996
Production diversity (yc/ΣY) 0.3264 -0.6547 0.3498
Forest area (ha) 0.1699 0.0319 -0.2059
Individual
Age (years) -0.0845 0.0994 -0.0176
Agricultural education operator (1 = Full-Time 3rd Level Agri Course, 2 = Farm Apprenticeship Scheme, 3= Certificate in Farming, 4= 1 yr Ag College, 5 = Course > 60 hours, 6= Course < 60 hours, 7 = Other)
0.3241 -0.2703 -0.0480
Gender operator (1-male, 0-female) -0.1561 0.1694 -0.0176
Marital status (1-married, 0-other) -0.3080 0.4311 -0.1357
Location
Subregion 1 nuts 2 0.1824 -0.0545 -0.1287
Subregion 2 nuts 2 -0.2006 0.0229 0.1800
Subregion 3 nuts 2 0.1869 -0.0424 -0.1459
Subregion 4 nuts 2 0.1104 0.0144 -0.1272
Subregion 5 nuts 2 -0.1102 0.2135 -0.1102
Subregion 6 nuts 2 -0.2641 -0.0240 0.2934
Subregion 7 nuts 2 -0.1620 0.0833 0.0779
Subregion 8 nuts 2 0.0000 0.0000 0.0000
(all: 1=yes, 0=no)
Altitude (1- <300m, 2- 300-600m, 3- >600m) 0.1890 -0.1093 -0.0783
Less favoured area (1 = Not-disadvantaged, 2 = Less severely disadvantaged, 3 = Severely disadvantaged)
0.0013 -0.1130 0.1162
Household
Off-farm income (EUR) -0.1017 0.1046 -0.0056
Rural support (EUR) 0.2795 -0.3020 0.0302
Part-time farming (1-yes, 0-no) -0.6002 0.5944 -0.0087
Household size (n) 0.3075 -0.4355 0.1408
Financial
Total assets (EUR) 0.7127 -0.5744 -0.1265
Total subsidies per ha (EUR) 0.2251 -0.0066 -0.2220
Notes: LU: Livestock Unit. AWU: Annual Work Unit.
1. Deviations from sample means (=0), z-scores based, scaled values.
Source: Estimations.
8.3. Irish cattle farms
223. According to Table A D 8.9, which contains descriptive statistical measures for the
sample, the average livestock related output per cattle rearing farm was about EUR 29 000
in 2018 (with a total output of about EUR 44 000). For cattle other farms in the sample, the
livestock related output was about EUR 51 000 in 2018 (about EUR 30 000 in 2010). The
variable cost items increased over time for both cattle farm types and the share of hired
labour slightly increases for the average Irish cattle farm in the period investigated. The
average Irish cattle rearing farm in the sample operated a herd size of about 44 LU in 2018
(about 43 LU in 2010), and the average cattle other farm a herd size of about 72 LU in 2018
(about 63 LU in 2010). Cattle rearing farms exhibited a stocking density of about 1.09 LU

88 TAD/CA/APM/WP(2020)2/PART2/FINAL
DRIVERS OF FARM PERFORMANCE Unclassified
per ha in 2018 (about 0.97 LU per ha in 2010), and cattle other farms about 1.89 LU per ha
in 2018 (about 3.08 LU per ha in 2010).
224. In the model used to estimate the technology and the Class identification
components for the Irish beef production, the output variable is total output per farm and
year and input variables are land, livestock units, capital, labour and materials. The
Class identification component is based on the indices related to structure, environmental
sustainability, innovation, technology, diversity, individual, location, household and
financial aspects (Table A D.8.10).
8.3.1. Irish cattle rearing farms
225. For Irish cattle rearing farms, three distinct technology classes emerge from the
model estimates (Table A D.8.10). The individual farms are distributed very unevenly
across the three technology classes (Table 8.5), as Class 3 includes close to two-thirds of
all farms.
226. Cattle rearing farms in Class 1 show a higher productivity performance
— measured as the potential output levels that could be achieved with a given input bundle,
in value per year — than their counterparts in classes 2 and 3 (Figure 8.5). Farms in Class 1
produce 25% more output per farm and year than farms in class 2 and 40% more output
than farms in Class 3. All three classes show positive rates of technical change, but it is
significantly higher for farms in Class 3, which are catching up with farms in the two other
classes, ceteris paribus. However, as farms in Class 2 have a slightly lower rate of technical
change than farms in Class 1, their productivity gap is expected to increase, ceteris paribus
(Figure 8.5).
227. If farms in Class 2 and Class 3 produced with the technology of farms in Class 1,
they would be able to increase their productivity by respectively 41% and 30% (Table 8.5).
Overall, this would result in an average 20% increase in productivity for all cattle rearing
farms (Table A C.5 in Part 1). In practice, however, natural and human resource constraints
may limit the adoption of the best technology by other classes.

TAD/CA/APM/WP(2020)2/PART2/FINAL 89
DRIVERS OF FARM PERFORMANCE Unclassified
Figure 8.5. Productivity and technical change for Irish cattle rearing farms,
by class, 2010 to 2018
Source: Table 8.5.
Table 8.5. Productivity characteristics of Irish cattle rearing farms, by class
Latent Class Estimation, Panel 2010 to 2018
Class 1 Class 2 Class 3
Number of observations (% of sample farms) 26.7% 9.2% 64.1%
Prior probability of class membership 0.128250 0.031390 0.840360
Posterior probability of class membership 0.270714 0.110823 0.618463
Productivity level (EUR per year)1
51 103 54 650*** 40 123*** 51 103***
45 022 38 789*** 33 024*** 45 022***
39 431 40 280*** 30 897*** 39 431***
Technical Change (% per year)
- Class 1 Technology 1.066** 1.044* 0.777*
- Class 2 Technology 6.123** 0.804* 0.380*
- Class 3 Technology 2.677*** 1.949*** 2.154***
Note: * significant at 10%, ** significant at 5%, *** significant at 1%. 1. Fitted values at sample means.
Source: Own estimations based on latent class model estimates and derivatives.
228. The estimated production functions for each farm class are moderately significant
and cattle rearing farms in Class 1 exhibit decreasing returns to scale (of about 0.9541). For
farms in Class 2 significantly increasing returns to scale (of about 1.2108) are found, and
for farms in Class 3 close to constant returns to scale (of about 1.0105) (Table A D.8.14).
1.07
0.80
2.15
0.0
0.5
1.0
1.5
2.0
2.5
0
10
20
30
40
50
60
Class 1 (26.7%) Class 2 (9.2%) Class 3 (64.1%)
%'000 EUR
Productivity level (EUR '000) Technical change (% per year)

90 TAD/CA/APM/WP(2020)2/PART2/FINAL
DRIVERS OF FARM PERFORMANCE Unclassified
229. Figure 8.6 summarises the various cattle rearing farm classes in terms of estimated
indices, while Table 8.6 contains the estimates for variables used to construct the indices.
230. Grouped in Class 1, the most productive farms are also the most environmentally
sustainable and account for over a quarter of all farms. They are the largest operations in
terms of herd size and have the most diversified production. They have a higher share of
hired labour than average and are more likely to be managed by younger farmers. They
have higher levels of investment in new technologies and activities and higher capital
intensity than average. They receive more rural support but generate less off-farm income
than average.
231. Class 2 farms are the least environmentally sustainable and medium productivity.
They account for less than 10% of all farms. They are the largest operations in terms of
herd size, with higher stocking density, lower capital intensity but higher investment in new
technologies than average. They are less likely to be located in less favoured areas. They
are likely to be managed by older men that have higher levels of off-farm income, and
higher assets and they receive more subsidies than average.
232. Class 3 is the largest class with close to two-thirds of all farms. Class 3 farms are
the least productive and achieve average levels of environmental sustainability. They are
smaller, more specialised operations, with lower investment in new technologies than
average, and have lower assets and receive fewer subsidies than average. They have close
to average scores on most other variables.
233. In summary, Irish cattle rearing farms in the three identified technology classes
differ significantly with respect to their economic performance as well as technical
development over time. Most productive farms are comparatively larger in terms of herd
size and land endowment. These farms show a high environmental sustainability of their
production activities based on the measures used in the empirical analysis. These farms are
also highly innovative. The production intensity of cattle rearing in Ireland seems positively
correlated with herd size, ceteris paribus. The rest of the cattle rearing farms score
significantly lower on environmental sustainability and also lower on productivity.
Medium productive farms in the sector (nearly 10%) show significant innovation activities
and financial stability. However, those farms score poorly on environmental sustainability
indicators.

TAD/CA/APM/WP(2020)2/PART2/FINAL 91
DRIVERS OF FARM PERFORMANCE Unclassified
Figure 8.6. Multi-dimensional indices for Irish cattle rearing farms
Scaled values at class means, 2010 to 2018
Source: Table A D.8.15.
Table 8.6. Multiple characteristics of Irish cattle rearing farms, by class
Deviations from sample means1, 2010 to 2018
Class 1: Most productive (26.7%)
Class 2: Medium productive (9.2%)
Class 3: Least productive (64.1%)
Farm structure
Family/hired labour ratio -0.2247 -0.0583 0.0850
Herd size (LU) 0.3171 0.3831 -0.1866
Environmental sustainability
Stocking density (LU per ha) -0.2425 0.2732 0.0616
Chemicals use EUR per ha) -0.3181 0.1703 0.1078
Organic production (1=yes, 0=no) -0.3159 0.1224 0.1137
Fuel per ha (EUR per ha) 0.1140 0.2292 -0.0803
Environmental subsidies per ha (€ per ha) 0.9537 -0.4207 -0.3361
Tillage area (ha) -0.0360 0.6593 -0.0796
REPS participation (1=yes, 0=no) 0.9957 -0.4337 -0.3517
Water charges (EUR) 0.0350 -0.0441 -0.0082
Nitrate derogation (1=yes, 0=no) -0.0466 -0.0545 0.0272
Innovation-commercialisation
Net investment ratio (per total assets) 0.3441 0.1956 -0.1711
Share contract farming 0.1716 0.1988 -0.0998
Share land rented 0.0167 -0.3860 0.0484
Energy crops area (ha) 0.0476 -0.0497 -0.0127
Miscellaneous income (EUR) 0.1347 0.1090 -0.0717
Insurance expenses (EUR) 0.3415 0.2210 -0.1737
E-Profit monitoring (1=yes, 0=no) 0.2315 -0.0431 -0.0901
Professional/Advisory expenses (EUR) 0.4549 0.0305 -0.1935
Technology
-0.6
-0.4
-0.2
0
0.2
0.4
0.6
0.8Index 1 - Structure
Index 2 - Environmentalsustainability
Index 3 - Innovation/commercialisation
Index 4 - Technology
Index 5 - DiversityIndex 6 - Individual
Index 7 - Location
Index 8 - Household
Index 9 - Financial
Class 1: Most productive (26.7%)
Class 2: Medium productive (9.2%)
Class 3: Least productive (64.1%)
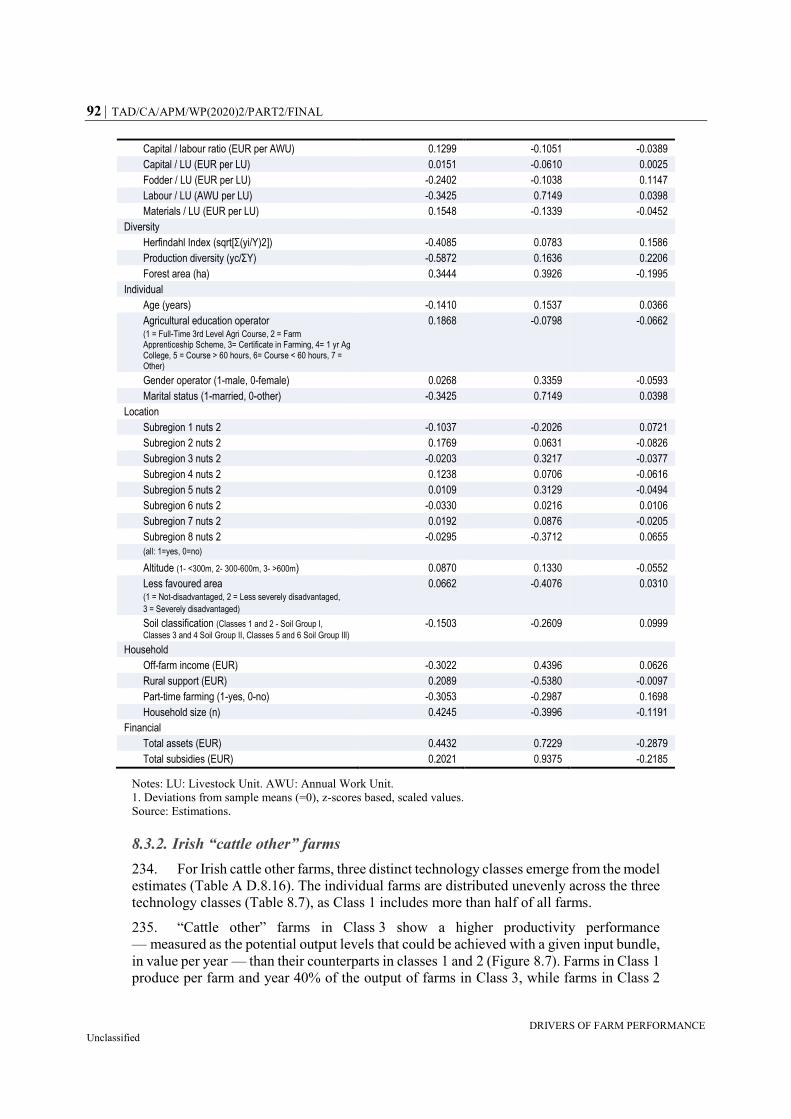
92 TAD/CA/APM/WP(2020)2/PART2/FINAL
DRIVERS OF FARM PERFORMANCE Unclassified
Capital / labour ratio (EUR per AWU) 0.1299 -0.1051 -0.0389
Capital / LU (EUR per LU) 0.0151 -0.0610 0.0025
Fodder / LU (EUR per LU) -0.2402 -0.1038 0.1147
Labour / LU (AWU per LU) -0.3425 0.7149 0.0398
Materials / LU (EUR per LU) 0.1548 -0.1339 -0.0452
Diversity
Herfindahl Index (sqrt[Σ(yi/Y)2]) -0.4085 0.0783 0.1586
Production diversity (yc/ΣY) -0.5872 0.1636 0.2206
Forest area (ha) 0.3444 0.3926 -0.1995
Individual
Age (years) -0.1410 0.1537 0.0366
Agricultural education operator (1 = Full-Time 3rd Level Agri Course, 2 = Farm Apprenticeship Scheme, 3= Certificate in Farming, 4= 1 yr Ag College, 5 = Course > 60 hours, 6= Course < 60 hours, 7 = Other)
0.1868 -0.0798 -0.0662
Gender operator (1-male, 0-female) 0.0268 0.3359 -0.0593
Marital status (1-married, 0-other) -0.3425 0.7149 0.0398
Location
Subregion 1 nuts 2 -0.1037 -0.2026 0.0721
Subregion 2 nuts 2 0.1769 0.0631 -0.0826
Subregion 3 nuts 2 -0.0203 0.3217 -0.0377
Subregion 4 nuts 2 0.1238 0.0706 -0.0616
Subregion 5 nuts 2 0.0109 0.3129 -0.0494
Subregion 6 nuts 2 -0.0330 0.0216 0.0106
Subregion 7 nuts 2 0.0192 0.0876 -0.0205
Subregion 8 nuts 2 -0.0295 -0.3712 0.0655
(all: 1=yes, 0=no)
Altitude (1- <300m, 2- 300-600m, 3- >600m) 0.0870 0.1330 -0.0552
Less favoured area (1 = Not-disadvantaged, 2 = Less severely disadvantaged,
3 = Severely disadvantaged)
0.0662 -0.4076 0.0310
Soil classification (Classes 1 and 2 - Soil Group I,
Classes 3 and 4 Soil Group II, Classes 5 and 6 Soil Group Ill) -0.1503 -0.2609 0.0999
Household
Off-farm income (EUR) -0.3022 0.4396 0.0626
Rural support (EUR) 0.2089 -0.5380 -0.0097
Part-time farming (1-yes, 0-no) -0.3053 -0.2987 0.1698
Household size (n) 0.4245 -0.3996 -0.1191
Financial
Total assets (EUR) 0.4432 0.7229 -0.2879
Total subsidies (EUR) 0.2021 0.9375 -0.2185
Notes: LU: Livestock Unit. AWU: Annual Work Unit.
1. Deviations from sample means (=0), z-scores based, scaled values.
Source: Estimations.
8.3.2. Irish “cattle other” farms
234. For Irish cattle other farms, three distinct technology classes emerge from the model
estimates (Table A D.8.16). The individual farms are distributed unevenly across the three
technology classes (Table 8.7), as Class 1 includes more than half of all farms.
235. “Cattle other” farms in Class 3 show a higher productivity performance
— measured as the potential output levels that could be achieved with a given input bundle,
in value per year — than their counterparts in classes 1 and 2 (Figure 8.7). Farms in Class 1
produce per farm and year 40% of the output of farms in Class 3, while farms in Class 2
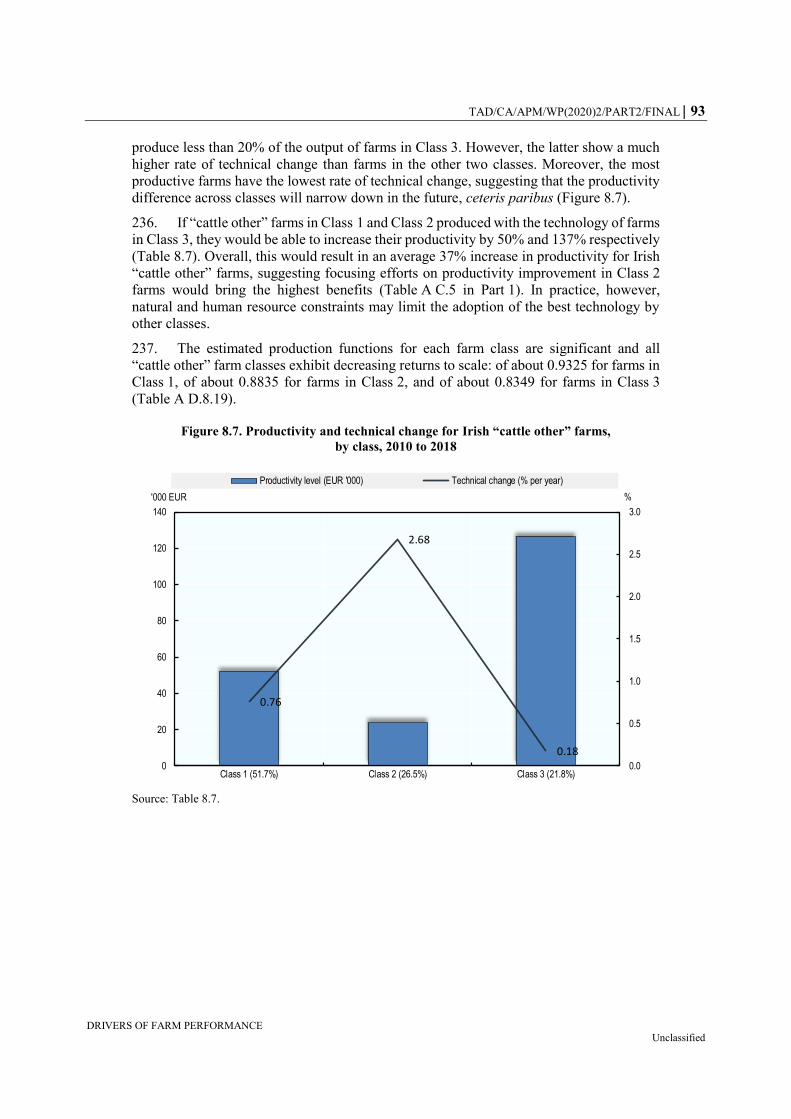
TAD/CA/APM/WP(2020)2/PART2/FINAL 93
DRIVERS OF FARM PERFORMANCE Unclassified
produce less than 20% of the output of farms in Class 3. However, the latter show a much
higher rate of technical change than farms in the other two classes. Moreover, the most
productive farms have the lowest rate of technical change, suggesting that the productivity
difference across classes will narrow down in the future, ceteris paribus (Figure 8.7).
236. If “cattle other” farms in Class 1 and Class 2 produced with the technology of farms
in Class 3, they would be able to increase their productivity by 50% and 137% respectively
(Table 8.7). Overall, this would result in an average 37% increase in productivity for Irish
“cattle other” farms, suggesting focusing efforts on productivity improvement in Class 2
farms would bring the highest benefits (Table A C.5 in Part 1). In practice, however,
natural and human resource constraints may limit the adoption of the best technology by
other classes.
237. The estimated production functions for each farm class are significant and all
“cattle other” farm classes exhibit decreasing returns to scale: of about 0.9325 for farms in
Class 1, of about 0.8835 for farms in Class 2, and of about 0.8349 for farms in Class 3
(Table A D.8.19).
Figure 8.7. Productivity and technical change for Irish “cattle other” farms,
by class, 2010 to 2018
Source: Table 8.7.
0.76
2.68
0.180.0
0.5
1.0
1.5
2.0
2.5
3.0
0
20
40
60
80
100
120
140
Class 1 (51.7%) Class 2 (26.5%) Class 3 (21.8%)
%'000 EUR
Productivity level (EUR '000) Technical change (% per year)
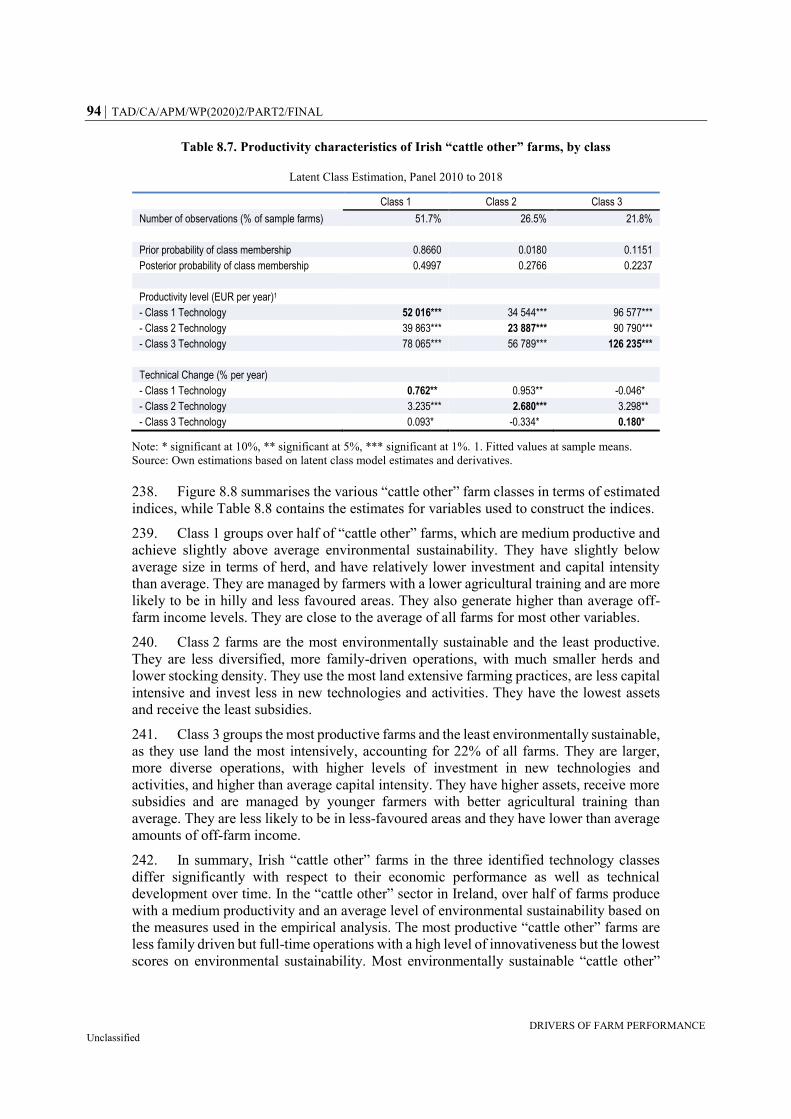
94 TAD/CA/APM/WP(2020)2/PART2/FINAL
DRIVERS OF FARM PERFORMANCE Unclassified
Table 8.7. Productivity characteristics of Irish “cattle other” farms, by class
Latent Class Estimation, Panel 2010 to 2018
Class 1 Class 2 Class 3
Number of observations (% of sample farms) 51.7% 26.5% 21.8%
Prior probability of class membership 0.8660 0.0180 0.1151
Posterior probability of class membership 0.4997 0.2766 0.2237
Productivity level (EUR per year)1
- Class 1 Technology 52 016*** 34 544*** 96 577***
- Class 2 Technology 39 863*** 23 887*** 90 790***
- Class 3 Technology 78 065*** 56 789*** 126 235***
Technical Change (% per year)
- Class 1 Technology 0.762** 0.953** -0.046*
- Class 2 Technology 3.235*** 2.680*** 3.298**
- Class 3 Technology 0.093* -0.334* 0.180*
Note: * significant at 10%, ** significant at 5%, *** significant at 1%. 1. Fitted values at sample means.
Source: Own estimations based on latent class model estimates and derivatives.
238. Figure 8.8 summarises the various “cattle other” farm classes in terms of estimated
indices, while Table 8.8 contains the estimates for variables used to construct the indices.
239. Class 1 groups over half of “cattle other” farms, which are medium productive and
achieve slightly above average environmental sustainability. They have slightly below
average size in terms of herd, and have relatively lower investment and capital intensity
than average. They are managed by farmers with a lower agricultural training and are more
likely to be in hilly and less favoured areas. They also generate higher than average off-
farm income levels. They are close to the average of all farms for most other variables.
240. Class 2 farms are the most environmentally sustainable and the least productive.
They are less diversified, more family-driven operations, with much smaller herds and
lower stocking density. They use the most land extensive farming practices, are less capital
intensive and invest less in new technologies and activities. They have the lowest assets
and receive the least subsidies.
241. Class 3 groups the most productive farms and the least environmentally sustainable,
as they use land the most intensively, accounting for 22% of all farms. They are larger,
more diverse operations, with higher levels of investment in new technologies and
activities, and higher than average capital intensity. They have higher assets, receive more
subsidies and are managed by younger farmers with better agricultural training than
average. They are less likely to be in less-favoured areas and they have lower than average
amounts of off-farm income.
242. In summary, Irish “cattle other” farms in the three identified technology classes
differ significantly with respect to their economic performance as well as technical
development over time. In the “cattle other” sector in Ireland, over half of farms produce
with a medium productivity and an average level of environmental sustainability based on
the measures used in the empirical analysis. The most productive “cattle other” farms are
less family driven but full-time operations with a high level of innovativeness but the lowest
scores on environmental sustainability. Most environmentally sustainable “cattle other”

TAD/CA/APM/WP(2020)2/PART2/FINAL 95
DRIVERS OF FARM PERFORMANCE Unclassified
farms in Ireland show a low productivity with a strong family driven focus but low levels
of intensity and financial stability.
Figure 8.8. Multi-dimensional indices for Irish “cattle other” farms
Scaled values at class means, 2010 to 2018
Source: Table A D.8.20.
Table 8.8. Multiple characteristics of Irish “cattle other” farms, by class
Deviations from sample means1, 2010 to 2018
Class 1: Medium productive (51.7%)
Class 2: Least productive (26.5%)
Class 3: Most productive (21.8%)
Farm structure
Family/hired labour ratio 0.0275 0.1768 -0.1498
Herd size (LU) -0.1081 -0.6010 0.9871
Environmental sustainability
Stocking density (LU per ha) -0.0037 -0.5512 0.6790
Chemicals use (EUR per ha) -0.0814 -0.5341 0.8422
Organic production (1=yes, 0=no) 0.0897 0.0329 -0.2528
Fuel per ha (EUR per ha) 0.0077 -0.1364 0.1476
Environmental subsidies per ha (€ per ha) 0.0888 -0.3197 0.1782
Tillage area (ha) -0.1954 -0.3128 0.8437
REPS participation (1=yes, 0=no) 0.0880 -0.2573 0.1041
Water charges (EUR) 0.0308 -0.1577 0.1188
Nitrate derogation (1=yes, 0=no) -0.0595 0.0106 0.1282
Innovation-commercialisation
Net investment ratio (per total assets) -0.1453 -0.5776 1.0467
Share contract farming -0.1480 -0.4465 0.8939
Share land rented 0.0217 -0.2320 0.2306
Energy crops area (ha) -0.0144 -0.0389 0.0815
Miscellaneous income (EUR) -0.0336 -0.1304 0.2383
-1.5
-1
-0.5
0
0.5
1Index 1 - Structure
Index 2 - Environmentalsustainability
Index 3 - Innovation/commercialisation
Index 4 - Technology
Index 5 - DiversityIndex 6 - Individual
Index 7 - Location
Index 8 - Household
Index 9 - Financial
Class 1: Medium productive (51.7%)
Class 2: Least productive (26.5%)
Class 3: Most productive (21.8%)

96 TAD/CA/APM/WP(2020)2/PART2/FINAL
DRIVERS OF FARM PERFORMANCE Unclassified
Insurance expenses (EUR) -0.1178 -0.6025 1.0119
E-Profit monitoring (1=yes, 0=no) -0.0796 -0.2497 0.4924
Professional/Advisory expenses (EUR) -0.0519 -0.5752 0.8223
Technology
Capital / labour ratio (EUR per AWU) -0.1047 -0.3534 0.6779
Capital / LU (EUR per LU) -0.0218 -0.1204 0.1981
Fodder / LU (EUR per LU) -0.0178 -0.1380 0.2100
Labour / LU (AWU per LU) 0.0229 0.1377 -0.5334
Materials / LU (EUR per LU) 0.0245 -0.0755 0.0338
Diversity
Herfindahl Index (sqrt[Σ(yi/Y)2]) -0.0777 0.2860 -0.1636
Production diversity (yc/ΣY) -0.0652 -0.0345 0.0067
Forest area (ha) -0.0296 -0.2089 0.3241
Individual
Age (years) 0.0939 -0.0345 -0.1808
Agricultural education operator (1 = Full-Time 3rd Level Agri Course, 2 = Farm Apprenticeship Scheme, 3= Certificate in Farming, 4= 1 yr Ag College, 5 = Course > 60 hours, 6= Course < 60 hours, 7 = Other)
0.1925 -0.2467 -0.1566
Gender operator (1-male, 0-female) -0.0542 -0.0453 0.1835
Marital status (1-married, 0-other) 0.0229 0.1377 -0.2217
Location
Subregion 1 nuts 2 0.0563 0.0954 -0.2494
Subregion 2 nuts 2 -0.0385 0.0458 0.0358
Subregion 3 nuts 2 -0.0709 0.0961 0.0513
Subregion 4 nuts 2 -0.0280 -0.1259 0.2193
Subregion 5 nuts 2 -0.0115 -0.0810 0.1257
Subregion 6 nuts 2 -0.0880 -0.1647 0.4090
Subregion 7 nuts 2 0.1010 -0.0236 -0.2108
Subregion 8 nuts 2 0.0503 0.2223 -0.3896
(all: 1=yes, 0=no)
Altitude (1- <300m, 2- 300-600m, 3- >600m) 0.1409 -0.2520 -0.0278
Less favoured area (1 = Not-disadvantaged, 2 = Less severely disadvantaged,
3 = Severely disadvantaged)
0.1542 -0.0838 -0.2638
Soil classification (Classes 1 and 2 - Soil Group I,
Classes 3 and 4 Soil Group II, Classes 5 and 6 Soil Group Ill) 0.0353 0.2152 -0.3454
Household
Off-farm income (EUR) 0.1564 -0.1202 -0.2248
Rural support (EUR) 0.1510 -0.2330 -0.0748
Part-time farming (1-yes, 0-no) 0.0667 0.5877 -0.8726
Household size (n) -0.1057 -0.2354 0.5368
Financial
Total assets (EUR) -0.1219 -0.6657 1.0985
Total subsidies (EUR) -0.0694 -0.2800 0.5049
Notes: LU: Livestock Unit. AWU: Annual Work Unit.
1. Deviations from sample means (=0), z-scores based, scaled values.
Source: Estimations.

TAD/CA/APM/WP(2020)2/PART2/FINAL 97
DRIVERS OF FARM PERFORMANCE Unclassified
8.4. Irish sheep farms
243. According to Table A D.8.21, which contains descriptive statistical measures for
the sample, the average livestock related output per farm in 2018 was about EUR 37 000
(with a total output of about EUR 61 000). The variable cost items increased over time and
the share of hired labour significantly increases for the average Irish sheep farm over the
period investigated. The average sheep farm in the sample operated with a herd size of
about 66 LU in 2018 (of about 63 LU in 2010) and a land area of about 71 ha (compared
to about 72 ha in 2010). This results in a stocking density of about 1.23 LU per ha for 2018
(compared to a density of about 1.18 LU per ha in 2010).
244. In the model used to estimate the technology and the Class identification
components for the Irish sheep production, the output variable is total output per farm and
year and input variables are land, livestock units, capital, labour and materials. The
Class identification component is based on the indices related to structure, environmental
sustainability, innovation, technology, diversity, individual, location, household and
financial aspects (Table A D.8.22).
245. For Irish sheep farms, three distinct technology classes emerge from the model
estimates (Table A D.8.22). The individual farms are distributed relatively evenly across
the three technology classes (Table 8.9).
246. Sheep farms in Class 1 show a higher productivity performance — measured as the
potential output levels that could be achieved with a given input bundle, in value per year —
than their counterparts in classes 2 and 3 (Figure 8.9). Sheep farms in Class 1 produce per
farm and year about twice the output of farms in class 2 and 3, which are similar levels of
productivity. However, while farms in Class 2 show a significant positive technical change,
technical change is negative for farms in both Class 1 and Class 3. As a result, farms in
Class 2 are reducing their productivity gap with farms in Class 1, while farms in Class 3
are increasing their productivity gap with both Class 1 and Class 2 farms, ceteris paribus
(Figure 8.9).
247. If sheep farms in Class 2 and Class 3 produced with the technology of farms in
Class 1, they would be able to increase their productivity by about 45% each, indicating
that technologies in Class 2 and Class 3 are relatively close (Table 8.9). Overall, this would
result in an average 26% increase in productivity for the Irish sheep farms (Table A C.5 in
Part 1). In practice, however, natural and human resource constraints may limit the
adoption of the best technology by other classes.

98 TAD/CA/APM/WP(2020)2/PART2/FINAL
DRIVERS OF FARM PERFORMANCE Unclassified
Figure 8.9. Productivity and technical change for Irish sheep farms,
by class, 2010 to 2018
Source: Table 8.9.
Table 8.9. Productivity characteristics of Irish sheep farms, by class
Latent Class Estimation, Panel 2010 to 2018
Class 1 Class 2 Class 3
Number of observations (% of sample farms) 24.9% 37.8% 37.7%
Prior probability of class membership 0.0185 0.4959 0.4857
Posterior probability of class membership 0.2494 0.3803 0.3703
Productivity level (EUR per year)1
- Class 1 Technology 79 913*** 52 172*** 58 151***
- Class 2 Technology 65 310*** 36 392*** 43 626***
- Class 3 Technology 67 494*** 34 091*** 40 175***
Technical Change (% per year)
- Class 1 Technology -0.807* -0.753* -0.273*
- Class 2 Technology 1.216* 0.257* -0.027*
- Class 3 Technology 1.085* -1.113* -1.058**
Note: * significant at 10%, ** significant at 5%, *** significant at 1%. 1. Fitted values at sample means.
Source: Own estimations based on latent class model estimates and derivatives.
248. The estimated production functions for each farm class are significant and sheep
farms in Class 1 and Class 2 exhibit decreasing returns to scale of about 0.9426 and 0.9424,
respectively. Sheep farms in Class 3, however, show significantly increasing returns to
scale of about 1.2231 (Table A D.8.24).
249. Figure 8.10 summarises the various sheep farm classes in terms of estimated
indices, while Table 8.10 contains the estimates for variables used to construct the indices.
-0.81
0.26
-1.06
-1.2
-1.0
-0.8
-0.6
-0.4
-0.2
0.0
0.2
0.4
0
10
20
30
40
50
60
70
80
90
Class 1 (24.9%) Class 2 (37.8%) Class 3 (37.3%)
%'000 EUR
Productivity level (EUR '000) Technical change (% per year)
TAD/CA/APM/WP(2020)2/PART2/FINAL 99
DRIVERS OF FARM PERFORMANCE Unclassified
250. Class 1 farms are the most productive farms (about a quarter of all farms) and the
least environmentally sustainable, based on the variety of indicators used to derive the
environmental sustainability score. They are the largest operations in terms of herd size and
most diversified. They have the highest investment in new technologies and activities than
and are the most capital intensive farms. They are managed by younger farmers, with a
higher education in farming, and are the least likely to be located in less-favoured or hilly
areas. They have higher asset levels, receive more subsidies and generate less off-farm
income than average.
251. Class 2 groups the least productive farms that are more environmentally sustainable
than average and account for 38% of all farms. They are the most likely to be located in
less favoured areas and are endowed with the lowest levels of asset and subsidies, but
receive more rural support. They are more likely to be managed by a man, to be part-time
farms, and to generate high levels of off-farm income.
252. Class 3 groups the most environmentally sustainable farms, which account for 27%
of all farms, and achieve productivity levels that are slightly higher than the lowest. They
are smaller, more specialised and family-driven operations. They are less capital intensive
than average and have lower investment in new technologies and activities than average.
They are the least capital and labour intensive of all farms. Their levels of assets and
subsidies is close to the lowest in Class 2.
253. In summary, Irish sheep farms in the three identified technology classes differ
significantly with respect to their economic performance as well as technical development
over time. Most productive farms are mainly full-time operations, which are non-family
driven and highly innovative. These farms produce with a lower environmental
sustainability than the sample average and a relatively high capital intensity. They score
high on financial stability and liquidity. More than half of the farms in the Irish sheep sector
produce with lower productivity but score significantly higher on environmental
sustainability based on the measures used in the empirical analysis. About 13% of all farms
were found to operate with a very low productivity and innovativeness. However, these
farms, which are mainly part-time with lower input intensity, score highest on
environmental sustainability measures.
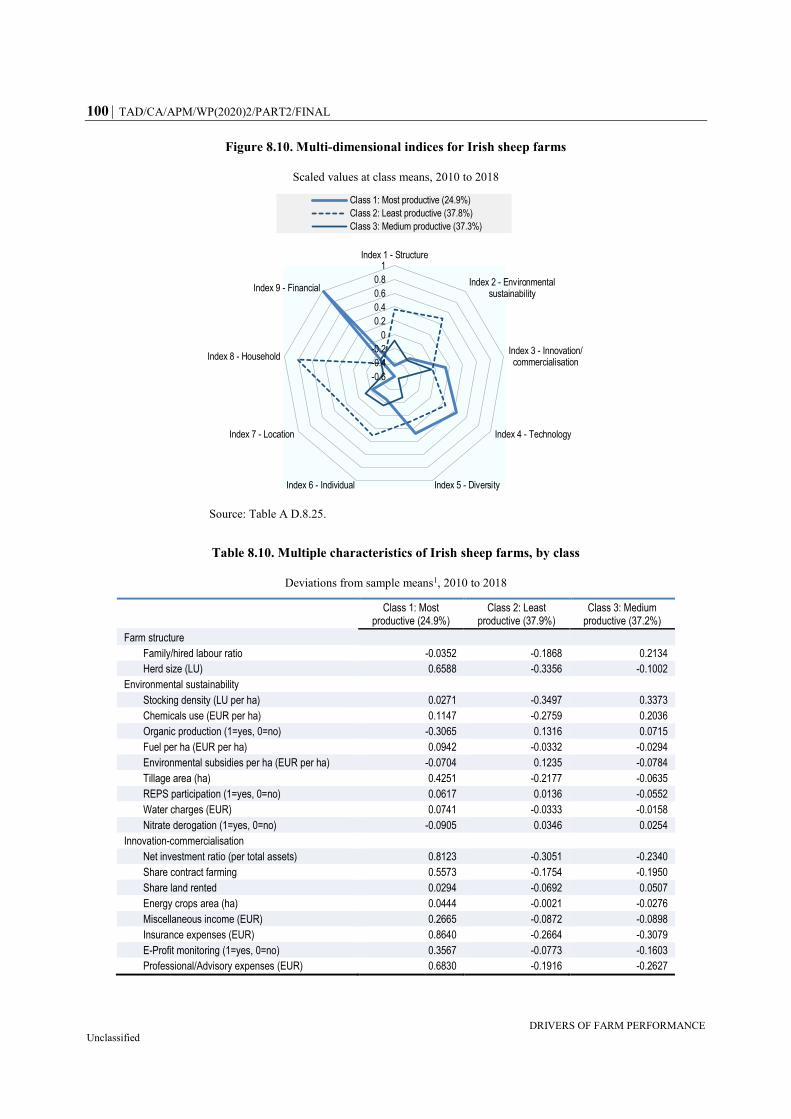
100 TAD/CA/APM/WP(2020)2/PART2/FINAL
DRIVERS OF FARM PERFORMANCE Unclassified
Figure 8.10. Multi-dimensional indices for Irish sheep farms
Scaled values at class means, 2010 to 2018
Source: Table A D.8.25.
Table 8.10. Multiple characteristics of Irish sheep farms, by class
Deviations from sample means1, 2010 to 2018
Class 1: Most productive (24.9%)
Class 2: Least productive (37.9%)
Class 3: Medium productive (37.2%)
Farm structure
Family/hired labour ratio -0.0352 -0.1868 0.2134
Herd size (LU) 0.6588 -0.3356 -0.1002
Environmental sustainability
Stocking density (LU per ha) 0.0271 -0.3497 0.3373
Chemicals use (EUR per ha) 0.1147 -0.2759 0.2036
Organic production (1=yes, 0=no) -0.3065 0.1316 0.0715
Fuel per ha (EUR per ha) 0.0942 -0.0332 -0.0294
Environmental subsidies per ha (EUR per ha) -0.0704 0.1235 -0.0784
Tillage area (ha) 0.4251 -0.2177 -0.0635
REPS participation (1=yes, 0=no) 0.0617 0.0136 -0.0552
Water charges (EUR) 0.0741 -0.0333 -0.0158
Nitrate derogation (1=yes, 0=no) -0.0905 0.0346 0.0254
Innovation-commercialisation
Net investment ratio (per total assets) 0.8123 -0.3051 -0.2340
Share contract farming 0.5573 -0.1754 -0.1950
Share land rented 0.0294 -0.0692 0.0507
Energy crops area (ha) 0.0444 -0.0021 -0.0276
Miscellaneous income (EUR) 0.2665 -0.0872 -0.0898
Insurance expenses (EUR) 0.8640 -0.2664 -0.3079
E-Profit monitoring (1=yes, 0=no) 0.3567 -0.0773 -0.1603
Professional/Advisory expenses (EUR) 0.6830 -0.1916 -0.2627
-0.6
-0.4
-0.2
0
0.2
0.4
0.6
0.8
1Index 1 - Structure
Index 2 - Environmentalsustainability
Index 3 - Innovation/commercialisation
Index 4 - Technology
Index 5 - DiversityIndex 6 - Individual
Index 7 - Location
Index 8 - Household
Index 9 - Financial
Class 1: Most productive (24.9%)
Class 2: Least productive (37.8%)
Class 3: Medium productive (37.3%)
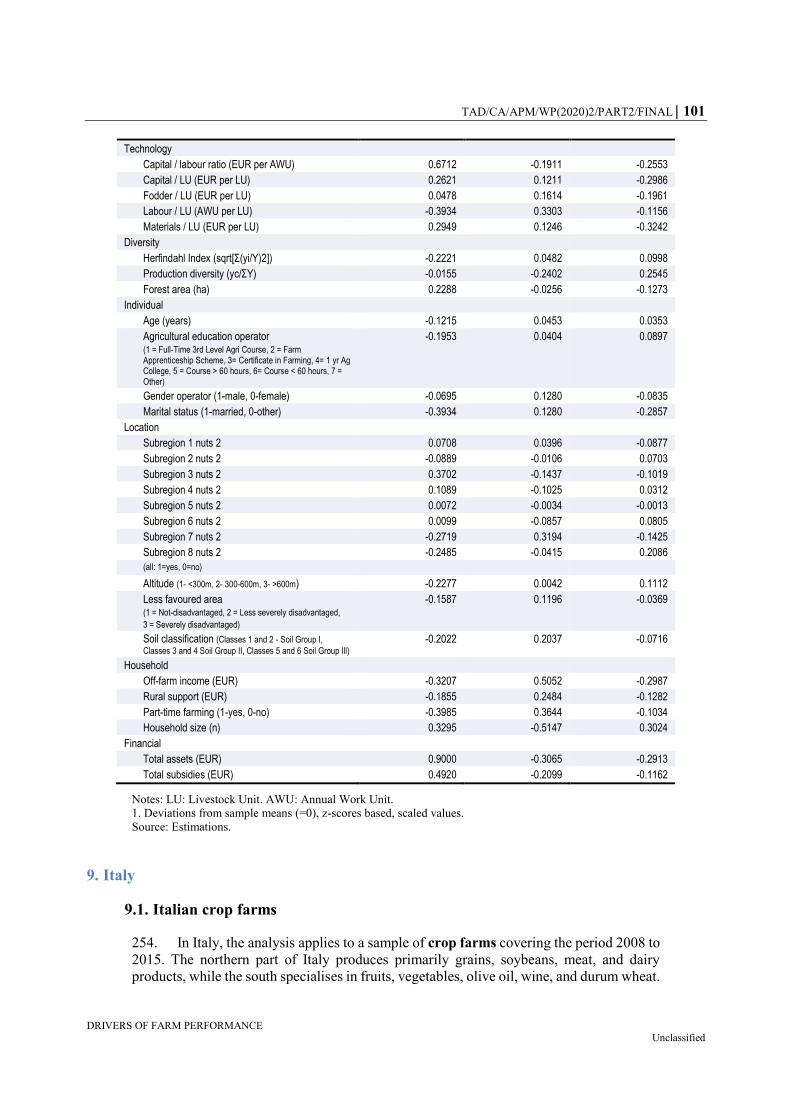
TAD/CA/APM/WP(2020)2/PART2/FINAL 101
DRIVERS OF FARM PERFORMANCE Unclassified
Technology
Capital / labour ratio (EUR per AWU) 0.6712 -0.1911 -0.2553
Capital / LU (EUR per LU) 0.2621 0.1211 -0.2986
Fodder / LU (EUR per LU) 0.0478 0.1614 -0.1961
Labour / LU (AWU per LU) -0.3934 0.3303 -0.1156
Materials / LU (EUR per LU) 0.2949 0.1246 -0.3242
Diversity
Herfindahl Index (sqrt[Σ(yi/Y)2]) -0.2221 0.0482 0.0998
Production diversity (yc/ΣY) -0.0155 -0.2402 0.2545
Forest area (ha) 0.2288 -0.0256 -0.1273
Individual
Age (years) -0.1215 0.0453 0.0353
Agricultural education operator (1 = Full-Time 3rd Level Agri Course, 2 = Farm Apprenticeship Scheme, 3= Certificate in Farming, 4= 1 yr Ag College, 5 = Course > 60 hours, 6= Course < 60 hours, 7 = Other)
-0.1953 0.0404 0.0897
Gender operator (1-male, 0-female) -0.0695 0.1280 -0.0835
Marital status (1-married, 0-other) -0.3934 0.1280 -0.2857
Location
Subregion 1 nuts 2 0.0708 0.0396 -0.0877
Subregion 2 nuts 2 -0.0889 -0.0106 0.0703
Subregion 3 nuts 2 0.3702 -0.1437 -0.1019
Subregion 4 nuts 2 0.1089 -0.1025 0.0312
Subregion 5 nuts 2 0.0072 -0.0034 -0.0013
Subregion 6 nuts 2 0.0099 -0.0857 0.0805
Subregion 7 nuts 2 -0.2719 0.3194 -0.1425
Subregion 8 nuts 2 -0.2485 -0.0415 0.2086
(all: 1=yes, 0=no)
Altitude (1- <300m, 2- 300-600m, 3- >600m) -0.2277 0.0042 0.1112
Less favoured area (1 = Not-disadvantaged, 2 = Less severely disadvantaged,
3 = Severely disadvantaged)
-0.1587 0.1196 -0.0369
Soil classification (Classes 1 and 2 - Soil Group I,
Classes 3 and 4 Soil Group II, Classes 5 and 6 Soil Group Ill) -0.2022 0.2037 -0.0716
Household
Off-farm income (EUR) -0.3207 0.5052 -0.2987
Rural support (EUR) -0.1855 0.2484 -0.1282
Part-time farming (1-yes, 0-no) -0.3985 0.3644 -0.1034
Household size (n) 0.3295 -0.5147 0.3024
Financial
Total assets (EUR) 0.9000 -0.3065 -0.2913
Total subsidies (EUR) 0.4920 -0.2099 -0.1162
Notes: LU: Livestock Unit. AWU: Annual Work Unit.
1. Deviations from sample means (=0), z-scores based, scaled values.
Source: Estimations.
9. Italy
9.1. Italian crop farms
254. In Italy, the analysis applies to a sample of crop farms covering the period 2008 to
2015. The northern part of Italy produces primarily grains, soybeans, meat, and dairy
products, while the south specialises in fruits, vegetables, olive oil, wine, and durum wheat.
102 TAD/CA/APM/WP(2020)2/PART2/FINAL
DRIVERS OF FARM PERFORMANCE Unclassified
255. Italian agriculture is characterised by small-sized farms where more than 50% of
the agricultural holdings have less than 5 ha with an average farm size of about 12 ha (EU28
average of about 16 ha). Farms are managed by relatively old farmers with only about 5%
below 35 years of age (European Commission, 2014). Italy’s agricultural production is very
diversified, the majority of output stemming from vegetables and horticultural products,
fruits and wine, milk and cereals. Other important products relate to cattle and pig
production, poultry and forage plants. In 2015 the major share of agricultural utilised area
devoted to crops was used for the production of forage, wheat and olive trees (in total about
5.2 million ha), followed by maize, grapevine, citrus and fruit trees, oil seeds and
vegetables production. In addition, minor shares of land are used to grow barley, oats,
potatoes, and legumes. Wheat and maize production are the strongest in the North of Italy
whereas citrus and fruit trees as well as olive trees and tomato production dominate in the
South and the Islands.
256. According to Table A.B.9.1, which summarises descriptive statistical measures for
the Italian sample of crop farms, the average crop output per farm did not significantly
increase over the period 2008-15. The average farm size in terms of land endowment did
not change significantly and the variable input costs only slightly increased. The labour
structure with about 30-35% hired labour remained more or less stable throughout the
period, however, an increase in the share of family labour is observed in the last years.
Finally, the probability for organic crop farming has been constant throughout the eight
years considered.
257. In the model used to estimate the technology and the Class identification
components for the Italian crop production, the output variable is the total output per farm
and year and the inputs variables are land, capital, labour, chemicals, and materials. The
Class identification vector for the Italian case study consists of all seven indices as outlined
in Table A.B.9.2).
258. Crop farms are distributed unevenly across the three classes, with Class 1
comprising over half the farms in the sample (about 51.5%), Class 2 about 7% of farms and
Class 3 about 41.5% of all farms (Figure 9.1).
259. Farms in Class 1 show the highest productivity performance — measured as the
potential output levels that could be achieved with a given input bundle, in EUR per year —
followed by crop farms in Class 3 and Class 2. The first class produces nearly three times
more per farm and year than those farms in Class 2 (Figure 9.1).
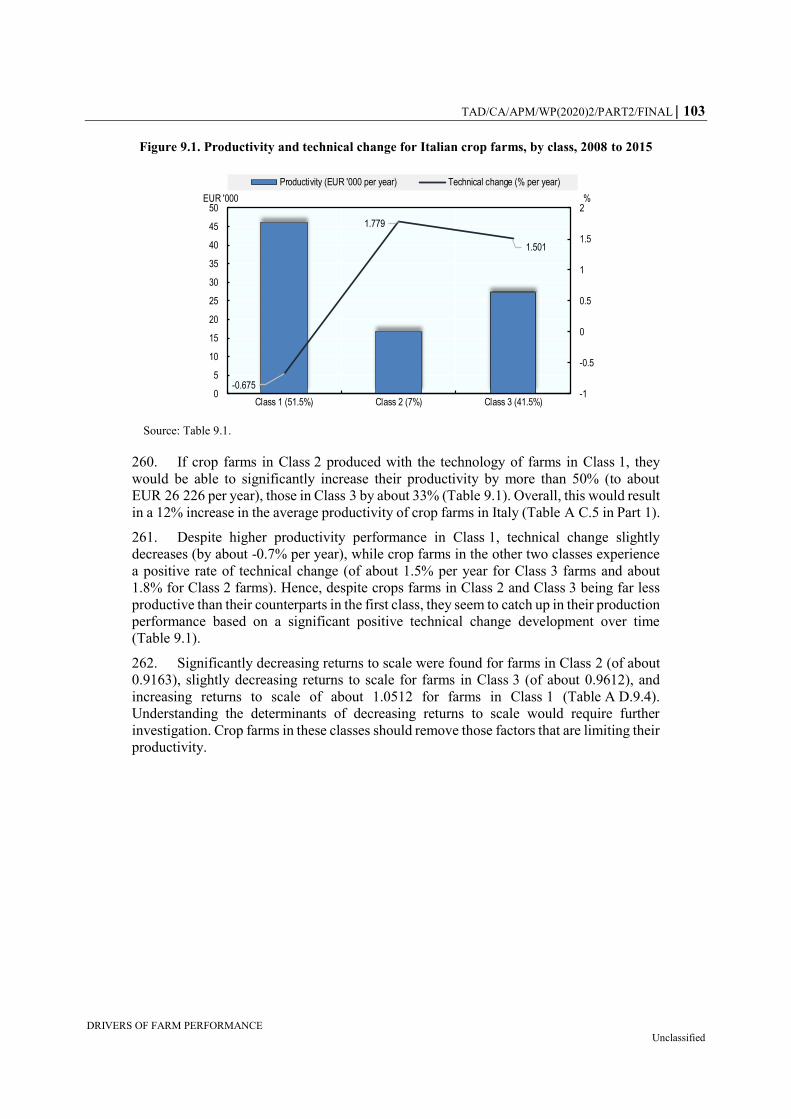
TAD/CA/APM/WP(2020)2/PART2/FINAL 103
DRIVERS OF FARM PERFORMANCE Unclassified
Figure 9.1. Productivity and technical change for Italian crop farms, by class, 2008 to 2015
Source: Table 9.1.
260. If crop farms in Class 2 produced with the technology of farms in Class 1, they
would be able to significantly increase their productivity by more than 50% (to about
EUR 26 226 per year), those in Class 3 by about 33% (Table 9.1). Overall, this would result
in a 12% increase in the average productivity of crop farms in Italy (Table A C.5 in Part 1).
261. Despite higher productivity performance in Class 1, technical change slightly
decreases (by about -0.7% per year), while crop farms in the other two classes experience
a positive rate of technical change (of about 1.5% per year for Class 3 farms and about
1.8% for Class 2 farms). Hence, despite crops farms in Class 2 and Class 3 being far less
productive than their counterparts in the first class, they seem to catch up in their production
performance based on a significant positive technical change development over time
(Table 9.1).
262. Significantly decreasing returns to scale were found for farms in Class 2 (of about
0.9163), slightly decreasing returns to scale for farms in Class 3 (of about 0.9612), and
increasing returns to scale of about 1.0512 for farms in Class 1 (Table A D.9.4).
Understanding the determinants of decreasing returns to scale would require further
investigation. Crop farms in these classes should remove those factors that are limiting their
productivity.
-0.675
1.779
1.501
-1
-0.5
0
0.5
1
1.5
2
0
5
10
15
20
25
30
35
40
45
50
Class 1 (51.5%) Class 2 (7%) Class 3 (41.5%)
%EUR '000
Productivity (EUR '000 per year) Technical change (% per year)
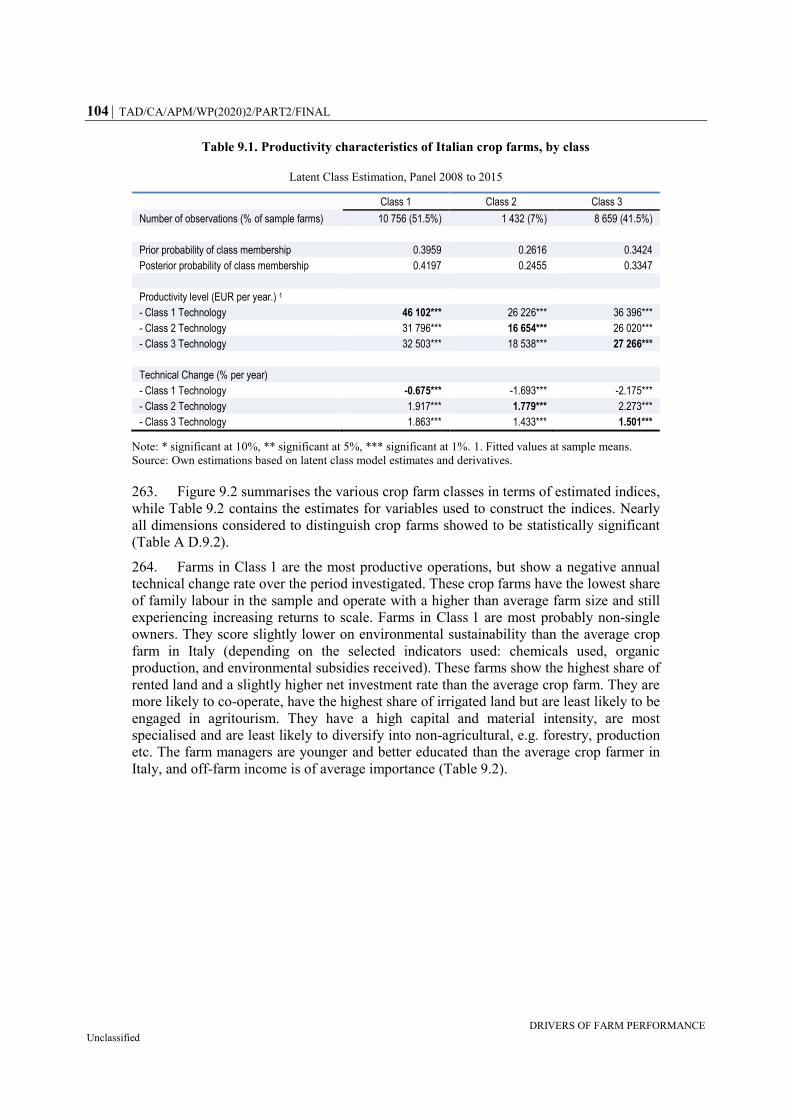
104 TAD/CA/APM/WP(2020)2/PART2/FINAL
DRIVERS OF FARM PERFORMANCE Unclassified
Table 9.1. Productivity characteristics of Italian crop farms, by class
Latent Class Estimation, Panel 2008 to 2015
Class 1 Class 2 Class 3
Number of observations (% of sample farms) 10 756 (51.5%) 1 432 (7%) 8 659 (41.5%)
Prior probability of class membership 0.3959 0.2616 0.3424
Posterior probability of class membership 0.4197 0.2455 0.3347
Productivity level (EUR per year.) 1
- Class 1 Technology 46 102*** 26 226*** 36 396***
- Class 2 Technology 31 796*** 16 654*** 26 020***
- Class 3 Technology 32 503*** 18 538*** 27 266***
Technical Change (% per year)
- Class 1 Technology -0.675*** -1.693*** -2.175***
- Class 2 Technology 1.917*** 1.779*** 2.273***
- Class 3 Technology 1.863*** 1.433*** 1.501***
Note: * significant at 10%, ** significant at 5%, *** significant at 1%. 1. Fitted values at sample means.
Source: Own estimations based on latent class model estimates and derivatives.
263. Figure 9.2 summarises the various crop farm classes in terms of estimated indices,
while Table 9.2 contains the estimates for variables used to construct the indices. Nearly
all dimensions considered to distinguish crop farms showed to be statistically significant
(Table A D.9.2).
264. Farms in Class 1 are the most productive operations, but show a negative annual
technical change rate over the period investigated. These crop farms have the lowest share
of family labour in the sample and operate with a higher than average farm size and still
experiencing increasing returns to scale. Farms in Class 1 are most probably non-single
owners. They score slightly lower on environmental sustainability than the average crop
farm in Italy (depending on the selected indicators used: chemicals used, organic
production, and environmental subsidies received). These farms show the highest share of
rented land and a slightly higher net investment rate than the average crop farm. They are
more likely to co-operate, have the highest share of irrigated land but are least likely to be
engaged in agritourism. They have a high capital and material intensity, are most
specialised and are least likely to diversify into non-agricultural, e.g. forestry, production
etc. The farm managers are younger and better educated than the average crop farmer in
Italy, and off-farm income is of average importance (Table 9.2).

TAD/CA/APM/WP(2020)2/PART2/FINAL 105
DRIVERS OF FARM PERFORMANCE Unclassified
Figure 9.2. Multi-dimensional indices for Italian crop farms
Scaled values at class means, 2008 to 2015
Source: Table A D.9.5.
265. Crop farms in Class 2 represent about 7% of the total sample and are the least
productive with the lowest but a considerable positive technical change (of about 1.8% per
year). They have the highest share of family labour across all crop farms but are also the
smallest in terms of land size exhibiting significantly decreasing returns to scale (of about
0.9163). Crop farms in this class have most likely a single owner and score lowest on
environmental sustainability (depending on the selected indicators used: chemicals used,
organic production, and environmental subsidies received). Those farms show a high input
intensity but are also most likely and significantly diversified in their production and have
a high probability of being engaged in forestry production. The farm manager is slightly
older than average and the farm is most likely located in less-favoured and high altitude
areas of Italy (Table 9.3).
266. Class 3 farms (about 41.5% of all crop farms) are nearly half as productive as farms
in Class 1 and show a positive rate of technical change of about 1.5% per year. For those
crop farms family labour is important and likely, a single person or family owns the farm.
Farms in this class are slightly less endowed with land than the average crop farm in Italy
and interestingly also exhibit negative scale effects (of about 0.9612). Nevertheless, those
farms operate with the highest environmental sustainability of all farms in the sample
(depending on the selected indicators used: chemicals used, organic production, and
environmental subsidies received). They have a lower than average share of rented land
and are least input intensive. However, farms in Class 3 are less diversified than the average
crop farm in Italy, their farm managers are significantly older, and these farms are less
likely to be located in less favoured areas and areas of high altitude.
267. In summary, Italian crop farms in the three identified technology classes differ
significantly with respect to their economic performance and their technical development
-1.5
-1
-0.5
0
0.5
1
1.5Index 1 - Structure
Index 2 - Environmentalsustainability
Index 3 - Innovation/Cooperation/Commercialisation
Index 4 - TechnologyIndex 5 - Diversity
Index 6 - Individual
Index 7 - Location
Class 1: Most productive (51.5%)
Class 2: Least productive (7%)
Class 3: Medium productive (41.5%)
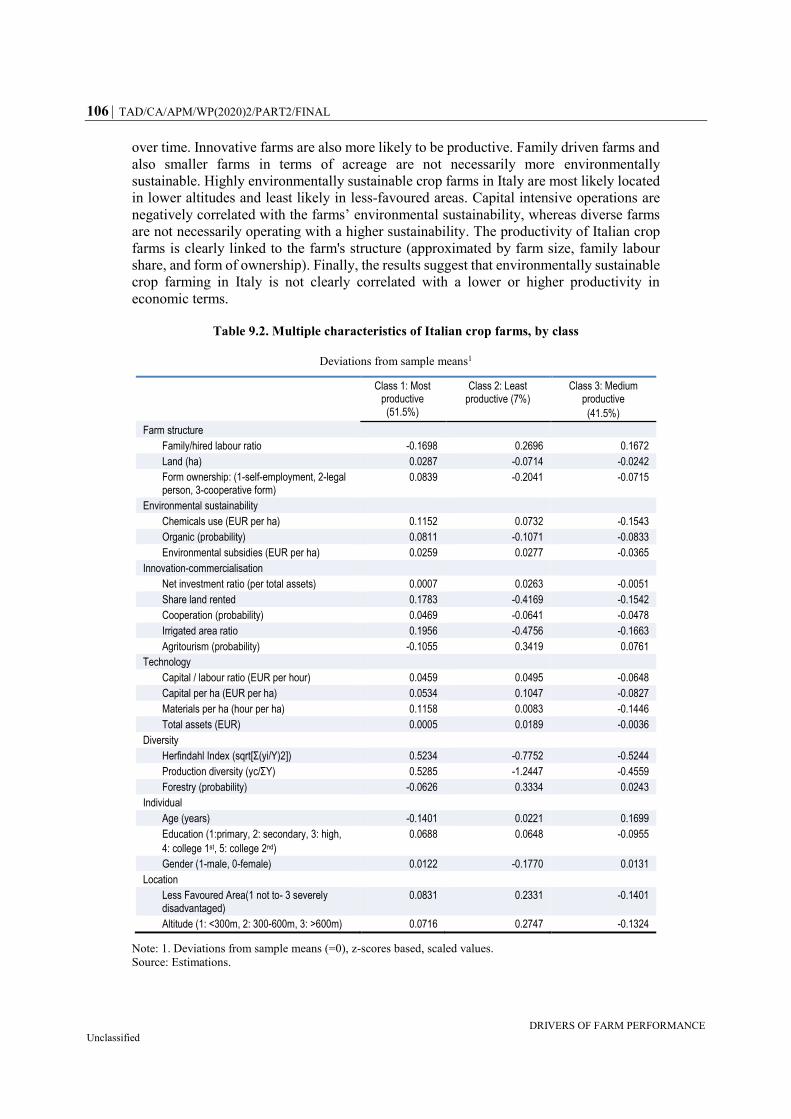
106 TAD/CA/APM/WP(2020)2/PART2/FINAL
DRIVERS OF FARM PERFORMANCE Unclassified
over time. Innovative farms are also more likely to be productive. Family driven farms and
also smaller farms in terms of acreage are not necessarily more environmentally
sustainable. Highly environmentally sustainable crop farms in Italy are most likely located
in lower altitudes and least likely in less-favoured areas. Capital intensive operations are
negatively correlated with the farms’ environmental sustainability, whereas diverse farms
are not necessarily operating with a higher sustainability. The productivity of Italian crop
farms is clearly linked to the farm's structure (approximated by farm size, family labour
share, and form of ownership). Finally, the results suggest that environmentally sustainable
crop farming in Italy is not clearly correlated with a lower or higher productivity in
economic terms.
Table 9.2. Multiple characteristics of Italian crop farms, by class
Deviations from sample means1
Class 1: Most productive (51.5%)
Class 2: Least productive (7%)
Class 3: Medium productive
(41.5%)
Farm structure
Family/hired labour ratio -0.1698 0.2696 0.1672
Land (ha) 0.0287 -0.0714 -0.0242
Form ownership: (1-self-employment, 2-legal person, 3-cooperative form)
0.0839 -0.2041 -0.0715
Environmental sustainability
Chemicals use (EUR per ha) 0.1152 0.0732 -0.1543
Organic (probability) 0.0811 -0.1071 -0.0833
Environmental subsidies (EUR per ha) 0.0259 0.0277 -0.0365
Innovation-commercialisation
Net investment ratio (per total assets) 0.0007 0.0263 -0.0051
Share land rented 0.1783 -0.4169 -0.1542
Cooperation (probability) 0.0469 -0.0641 -0.0478
Irrigated area ratio 0.1956 -0.4756 -0.1663
Agritourism (probability) -0.1055 0.3419 0.0761
Technology
Capital / labour ratio (EUR per hour) 0.0459 0.0495 -0.0648
Capital per ha (EUR per ha) 0.0534 0.1047 -0.0827
Materials per ha (hour per ha) 0.1158 0.0083 -0.1446
Total assets (EUR) 0.0005 0.0189 -0.0036
Diversity
Herfindahl Index (sqrt[Σ(yi/Y)2]) 0.5234 -0.7752 -0.5244
Production diversity (yc/ΣY) 0.5285 -1.2447 -0.4559
Forestry (probability) -0.0626 0.3334 0.0243
Individual
Age (years) -0.1401 0.0221 0.1699
Education (1:primary, 2: secondary, 3: high,
4: college 1st, 5: college 2nd)
0.0688 0.0648 -0.0955
Gender (1-male, 0-female) 0.0122 -0.1770 0.0131
Location
Less Favoured Area(1 not to- 3 severely disadvantaged)
0.0831 0.2331 -0.1401
Altitude (1: <300m, 2: 300-600m, 3: >600m) 0.0716 0.2747 -0.1324
Note: 1. Deviations from sample means (=0), z-scores based, scaled values.
Source: Estimations.
TAD/CA/APM/WP(2020)2/PART2/FINAL 107
DRIVERS OF FARM PERFORMANCE Unclassified
10. Korea
10.1. Korean rice farms
268. In Korea, the analysis applies to a sample of rice farms covering the period 2003 to
2015. The structure of agricultural production in Korea has significantly changed during
the last decades with the production of rice still accounting for approximately half of
Korea’s cultivated land area. With the development and distribution of new rice varieties,
rice production per ha increased from about 4.5 tonnes in 1995 to 5.4 tonnes in 2015. About
60% of the 1.09 million farms in Korea are engaged in rice production with the average
rice farm cultivating about 1.25 ha in 2015.
269. According to Table A D.10.1, which summarises various statistical measures for
the sample of Korean rice farms, the average rice output per farm increased between 2003
and 2015, by about 50% also due to a significant increase in land endowment per farm. The
variable cost items also increased over the period, however, the share of hired labour
decreased for the average rice farm in Korea. Total assets per farm significantly increased
and finally the probability of being engaged in part-time rice farming increased in the
period considered.
270. In the model used to estimate the technology and the Class identification
components for the Korean rice production, the output variable is total output per farm and
year whereas the input variables are land, capital, chemicals, materials, and labour. The
Class identification component is based on the indices related to structure, environmental
sustainability, innovation, diversity and location (Table A D.10.2). The individual farms
are unevenly distributed over the three identified technology classes (Figure 10.1). Class 1
covers about 58% of all rice farms, Class 2 about 33% and Class 3 about 9%.
271. Farms in Class 2, however, show a significantly higher productivity performance
— measured as the potential output levels that could be achieved with a given input bundle,
in EUR per year — than their rice-producing counterparts in Classes 1 and 3. Rice farms
in Class 2 produce about 20% more per farm and year than farms in Class 1, and about
116% more per farm and year than rice farms in Class 3. If rice farms in Class 1 produced
with the technology of farms in Class 2, they would be able to increase their productivity
by about 2% (Table 10.1). However, if farms in Class 3 adopted this technology, their
productivity would decrease by -4%.
272. Rice farms in Class 2 also show a significantly positive technical change (estimated
at 1.74% per year) compared to a modest positive technical change rate for farms in Class 1
(estimated at 1.44% per year) and a negative rate in Class 3 (estimated at -1.37% per year).
Hence, although rice farms in Class 2 are already far more productive, they also seem to
increase their productivity at a higher rate based on a significant positive technical change
development, ceteris paribus (Table 10.1).

108 TAD/CA/APM/WP(2020)2/PART2/FINAL
DRIVERS OF FARM PERFORMANCE Unclassified
Figure 10.1. Productivity and technical change for Korean rice farms, by class, 2003 to 2015
Source: Table 10.1.
Table 10.1. Productivity characteristics of Korean rice farms, by class
Latent Class Estimation, Panel 2003 to 2015
Class 1 Class 2 Class 3
Number of observations (% of sample farms) 9 548 (57.9%) 5 472 (33.3%) 1 452 (8.8%)
Prior probability of class membership 0.4105 0.3217 0.2677
Posterior probability of class membership 0.4534 0.3405 0.2061
Productivity level (EUR per year)1
- Class 1 Technology 4 978*** 5 670*** 1 971***
- Class 2 Technology 5 082*** 5 985*** 2 658***
- Class 3 Technology 4 228*** 5 449*** 2 759***
Technical Change (% per year)
- Class 1 Technology 1.438*** -0.278*** 0.406***
- Class 2 Technology 1.099*** 1.740*** 2.600***
- Class 3 Technology -2.845*** -5.552*** -1.367***
Note: * significant at 10%, ** significant at 5%, *** significant at 1%. 1. Fitted values at sample means.
Source: Estimations.
273. The estimated production functions are highly significant and all rice farm classes
exhibit increasing returns to scale: 1.2104 for Class 1, 1.0522 for Class 2, and 1.5505 for
farms in Class 3 (see Table A D.10.4 for complete class related elasticities). Switching
technologies could — ceteris paribus — result in higher productivity per rice farm and a
significantly higher technical change rate for most farms (especially regarding a switch to
Class 2 technology). Various indices, reflecting the different dimensions along which rice
farms can be distinguished, to robustly identify the reported farm classes: Farm structure,
environmental sustainability of operations, technology characteristics, degree of diversity,
individual characteristics and locational specifics. Table A D.10.2 summarises the
estimates for the various indices that were used as components for the class identifying
1.44 1.74
-1.37
-2.0
-1.5
-1.0
-0.5
0.0
0.5
1.0
1.5
2.0
0
1 000
2 000
3 000
4 000
5 000
6 000
7 000
Class 1 (57.9%) Class 2 (33.3%) Class 3 (8.8%)
%EURProductivity (EUR per year) Technical change (% per year)

TAD/CA/APM/WP(2020)2/PART2/FINAL 109
DRIVERS OF FARM PERFORMANCE Unclassified
vector in the latent class estimation. Most of the indices considered showed significant
estimates. To decide on the empirically most appropriate number of classes to be estimated,
various statistical quality tests have been performed (most prominently the Akaike
Information Criteria AIC) which holds for all country cases considered in this study.
274. Figure 10.2 summarises the various rice farm classes in terms of estimated indices,
while Table 10.2 contains the estimates for variables used to construct the indices.
275. As discussed earlier, rice farms in Class 2 are the most productive and exhibit the
highest positive technical change rate per year. These farms have the lowest share of family
labour (i.e. a significantly lower family per hired labour share than the average rice farm in
the sample) and a significantly above average acreage size, with slightly increasing returns
to scale. Rice producing farms in Class 2, however, score relatively low on environmental
sustainability indicators (such as fertiliser and chemicals use). On the other hand, these
farms show the highest scores on innovation and commercialisation with a significantly
above average investment rate and rented land share. Class 2 farms show a higher than
average capital per labour intensity, while using more capital per land than the average rice
farm in Korea based on high levels of total assets endowment. These rice farms are less
diversified, and their managers are younger than the average rice farmer in Korea. Finally,
rice farms in Class 2 are most likely located in more environmentally beneficial areas and
off-farm income is important for those farms (Table 10.2).
276. Rice farms in Class 1 are nearly as productive as Class 2 rice farms, but show a
lower, positive technical change per year. Family labour is important for Class 1 farms,
which are smaller than the average rice farm in Korea in terms of land endowment. Rice
farms in Class 1 should significantly increase the size of their production operations due to
measured economies of scale. These farms are found to have above average environmental
sustainability performance based on the various indicators used (such as chemical use per
ha). However, rice farms in Class 1 invest slightly less than the average rice farm in Korea
and show a lower than average rented land share. Their capital intensity is still above
average, and they employ most capital per land. These rice farms are, however, the least
specialised and their farm managers are older than average. Finally, rice farms in Class 1
are likely located in less-favoured areas and show the lowest off-farm income of all rice
farms in Korea (Table 10.2).
277. Class 3 farms are the least productive and show a significant negative average
technical change rate per year. Family labour is most important for those rice farms, which
are considerably smaller than the average rice farm in Korea in terms of land endowment.
Rice farms in Class 3 should increase the size of their production operations to become
more profitable due to identified positive economies of scale (of around 1.55). However,
these farms are found to be among the most environmentally sustainable rice producers
based on various indicators used (such as fertiliser and chemicals use per ha). Rice farms
in Class 3 invest far less than the average rice farm in Korea and rely less on rented land.
Their capital intensity is the lowest of all rice farms and consistently with this notion is the
finding that farms in Class 3 employ least capital per land. The diversification of activities
in these rice farms is about average and their farm managers are of average age. Finally,
rice farms in Class 3 can be located in environmentally less-favoured detrimental areas but
also more favourable areas (Table 10.2).
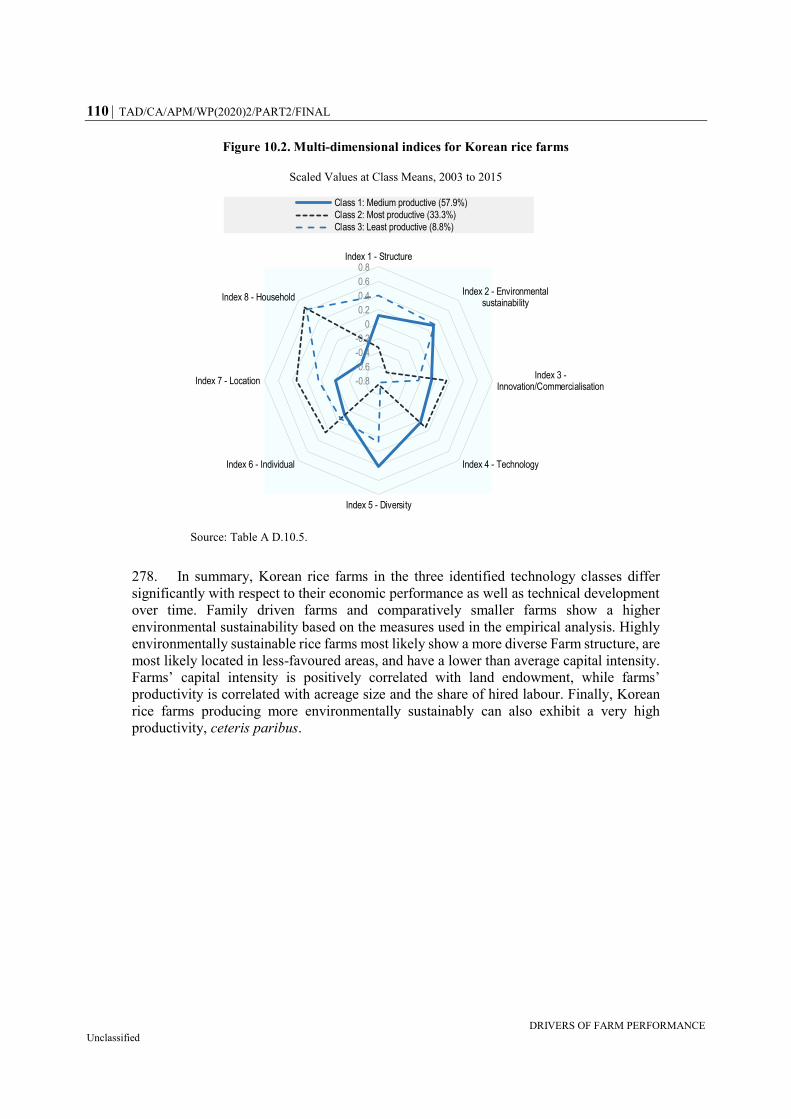
110 TAD/CA/APM/WP(2020)2/PART2/FINAL
DRIVERS OF FARM PERFORMANCE Unclassified
Figure 10.2. Multi-dimensional indices for Korean rice farms
Scaled Values at Class Means, 2003 to 2015
Source: Table A D.10.5.
278. In summary, Korean rice farms in the three identified technology classes differ
significantly with respect to their economic performance as well as technical development
over time. Family driven farms and comparatively smaller farms show a higher
environmental sustainability based on the measures used in the empirical analysis. Highly
environmentally sustainable rice farms most likely show a more diverse Farm structure, are
most likely located in less-favoured areas, and have a lower than average capital intensity.
Farms’ capital intensity is positively correlated with land endowment, while farms’
productivity is correlated with acreage size and the share of hired labour. Finally, Korean
rice farms producing more environmentally sustainably can also exhibit a very high
productivity, ceteris paribus.
-0.8
-0.6
-0.4
-0.2
0
0.2
0.4
0.6
0.8Index 1 - Structure
Index 2 - Environmentalsustainability
Index 3 -Innovation/Commercialisation
Index 4 - Technology
Index 5 - Diversity
Index 6 - Individual
Index 7 - Location
Index 8 - Household
Class 1: Medium productive (57.9%)
Class 2: Most productive (33.3%)
Class 3: Least productive (8.8%)
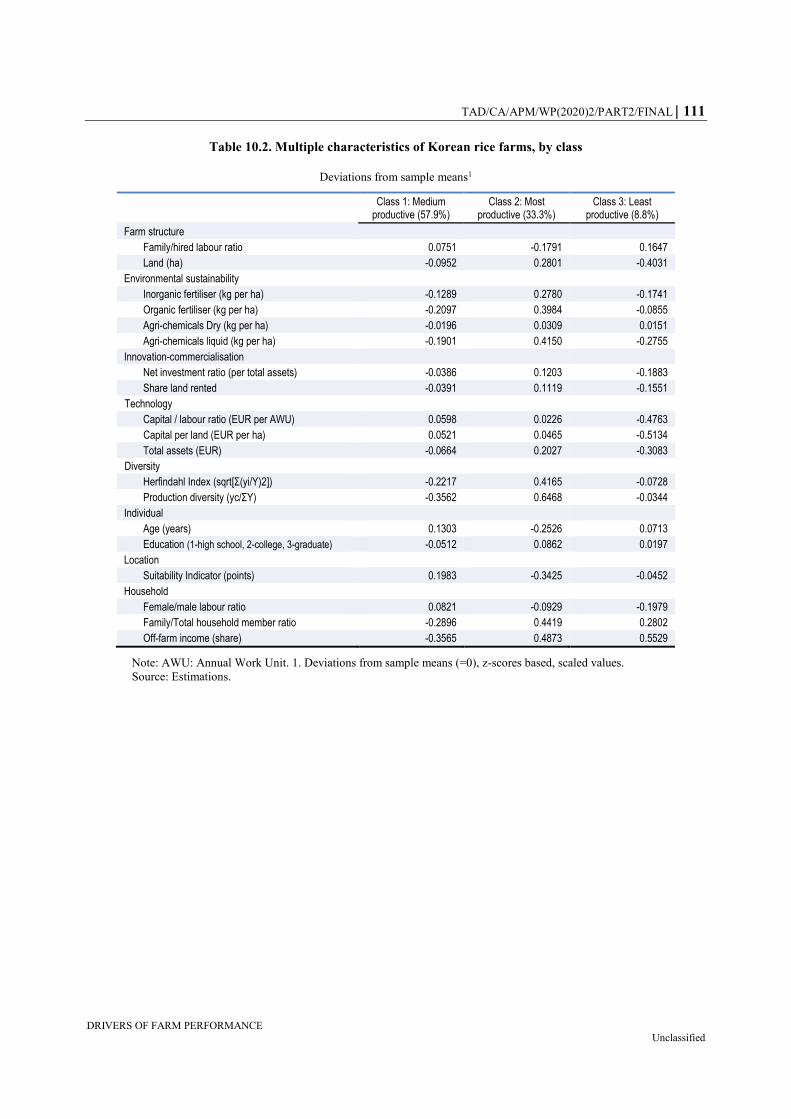
TAD/CA/APM/WP(2020)2/PART2/FINAL 111
DRIVERS OF FARM PERFORMANCE Unclassified
Table 10.2. Multiple characteristics of Korean rice farms, by class
Deviations from sample means1
Class 1: Medium productive (57.9%)
Class 2: Most productive (33.3%)
Class 3: Least productive (8.8%)
Farm structure
Family/hired labour ratio 0.0751 -0.1791 0.1647
Land (ha) -0.0952 0.2801 -0.4031
Environmental sustainability
Inorganic fertiliser (kg per ha) -0.1289 0.2780 -0.1741
Organic fertiliser (kg per ha) -0.2097 0.3984 -0.0855
Agri-chemicals Dry (kg per ha) -0.0196 0.0309 0.0151
Agri-chemicals liquid (kg per ha) -0.1901 0.4150 -0.2755
Innovation-commercialisation
Net investment ratio (per total assets) -0.0386 0.1203 -0.1883
Share land rented -0.0391 0.1119 -0.1551
Technology
Capital / labour ratio (EUR per AWU) 0.0598 0.0226 -0.4763
Capital per land (EUR per ha) 0.0521 0.0465 -0.5134
Total assets (EUR) -0.0664 0.2027 -0.3083
Diversity
Herfindahl Index (sqrt[Σ(yi/Y)2]) -0.2217 0.4165 -0.0728
Production diversity (yc/ΣY) -0.3562 0.6468 -0.0344
Individual
Age (years) 0.1303 -0.2526 0.0713
Education (1-high school, 2-college, 3-graduate) -0.0512 0.0862 0.0197
Location
Suitability Indicator (points) 0.1983 -0.3425 -0.0452
Household
Female/male labour ratio 0.0821 -0.0929 -0.1979
Family/Total household member ratio -0.2896 0.4419 0.2802
Off-farm income (share) -0.3565 0.4873 0.5529
Note: AWU: Annual Work Unit. 1. Deviations from sample means (=0), z-scores based, scaled values.
Source: Estimations.

112 TAD/CA/APM/WP(2020)2/PART2/FINAL
DRIVERS OF FARM PERFORMANCE Unclassified
11. Norway
279. In Norway, the analysis applies to a sample of dairy farms, a sample of crop farms
and a sample of livestock farms, all covering the period 2005 to 2016. Agricultural
production in Norway is characterised by its unique environmental and climatic conditions.
A relatively long winter season as well as much lower yields linked to a small-scale
structure and generally high level of production cost (Norwegian Ministry of Agriculture
and Food, 2017). Only 3% of the total land area is used for agricultural production with
livestock farming mainly in the Western and Northern parts of the country and crop related
production activities mainly in the south-eastern parts of the country. In 2017 there were
about 40 000 farms in Norway cultivating nearly 1 million ha. The average land
endowment per farm has been about 24 ha (Hemmings 2016, Norwegian Ministry of
Agriculture and Food 2017).
280. The main agricultural income activities in Norway relate to dairy, crops and
livestock production whereas the majority of farms is engaged in a mix of activities. In
2017, about 26% of all farms in Norway were cultivating around 10 to 20 ha per farm,
about 17% around 5 to 10 ha, and also about 17% around 20 to 30 ha of land. Only about
11% of all farms in Norway use more than 50 ha for production. About 60% of all farms
are engaged in some kind of livestock production, about 35% in crop related activities and
about 15% in dairy production. 30% of all farms active in milk production in 2017 have
30 or more cows, around 26% 20-29 cows, and around 20% of these farms produce with a
dairy herd size of about 15-19 cows. Around 30% of all livestock farms use around 20-
49 sheep units per herd, 28% use 50-99 sheep units per herd, and around 15% more than
150 sheep units per herd. Finally, in 2017, 24% of all farms engaged in pig production had
up to 19 sows for breeding, 17% around 40-59 units and about 23% more than 100 sows.
In terms of land use, main crops cultivated in Norway in 2017 are wheat, oats, and barley
as well as potatoes and vegetables (Statistics Norway 2018).
11.1. Norwegian dairy farms
281. According to Table A D.11.1, which gives descriptive statistical measures for the
sample of Norwegian dairy farms, the average milk output per farm increased over the
period 2005-16, partly due to a significant increase in herd size. The variable cost items
increased over the period, as did the share of hired labour for the average Norwegian dairy
farm. The stocking density remained more or less at the same level whereas the probability
of being engaged in organic dairy production slightly increased.
282. In the model used to estimate the technology and the Class identification
components for the Norwegian dairy production, the output variable is total output per farm
and year, and the input variables are land, cows, capital, materials, and labour. The
Class identification component in each estimation is based on the indices related to
structure, environmental sustainability, innovation, technology, diversity, individual and
household characteristics, location and financial aspects (Table A D.11.2).
283. For Norwegian dairy farms, three distinct technology classes emerge from the
model estimates (Table A D.11.2). The individual farms are distributed unevenly across
the three identified technology classes (Table 11.1). Class 1 covers about 64.5% of all dairy
farms, Class 2 about 16.3%, and Class 3 about 19.2%.
284. Farms in Class 1 show a higher productivity performance — measured as the
potential output levels that could be achieved with a given input bundle, in EUR per year —

TAD/CA/APM/WP(2020)2/PART2/FINAL 113
DRIVERS OF FARM PERFORMANCE Unclassified
than their milk-producing counterparts in Classes 2 and 3 (Figure 11.1). Dairy farms in
Class 1 produce about 100% more per farm and year than farms in Class 2 but only about
5% more per farm and year than dairy farms in Class 3.
Figure 11.1. Productivity and technical change for Norwegian dairy farms,
by class, 2005 to 2016
Source: Table 11.1.
285. If dairy farms in Class 2 produced with the technology of farms in Class 1, they
would be able to increase significantly their productivity by about 30%, but if they did the
same, farms in Class 3 would experience a slight decline in productivity (Table A C.4 in
Part 1).
286. Dairy farms in Class 1 also show a significantly positive technical change
(estimated at 2.52% per year) compared to a modest positive technical change rate for farms
in Class 3 (estimated at 0.49% per year) and a negative rate in Class 2 (estimated at -0.41%
per year). Hence, although dairy farms in Class 1 are already far more productive, they also
seem to increase their productivity at a higher rate given the significant positive technical
change development ceteris paribus (Table 11.1).
287. The estimated production functions are highly significant and all dairy farm classes
exhibit significantly increasing returns to scale: 1.0918 for Class 1, 1.2371 for Class 2, and
1.1413 for farms in Class 3 (see Table A D.11.4 for complete class related elasticities).
Switching technologies could — ceteris paribus — result in higher productivity per farm
and also a significantly higher technical change rate for some farms (especially regarding
a switch to Class 1 technology). Various indices, reflecting the different dimensions along
which dairy farms can be distinguished, are used to robustly identify the reported farm
classes: Farm structure, environmental sustainability of operations, technology
characteristics, degree of diversity, individual and household characteristics and locational
as well as financial specifics. Table A D.11.3 summarises the estimates for the various
indices that were used as components for the class-identifying vector in the latent class
estimation. Most of the indices considered showed significant estimates. To decide on the
empirically most appropriate number of classes to be estimated, various statistical quality
tests have been performed (most prominently the Akaike Information Criteria AIC) which
holds for all country cases considered in this study.
2.52
-0.41
0.49
-1.0
-0.5
0.0
0.5
1.0
1.5
2.0
2.5
3.0
0
10
20
30
40
50
60
70
80
90
Class 1 (64.6%) Class 2 (16.2%) Class 3 (19.2%)
%EUR '000
Productivity (EUR '000 per year) Technical change (% per year)
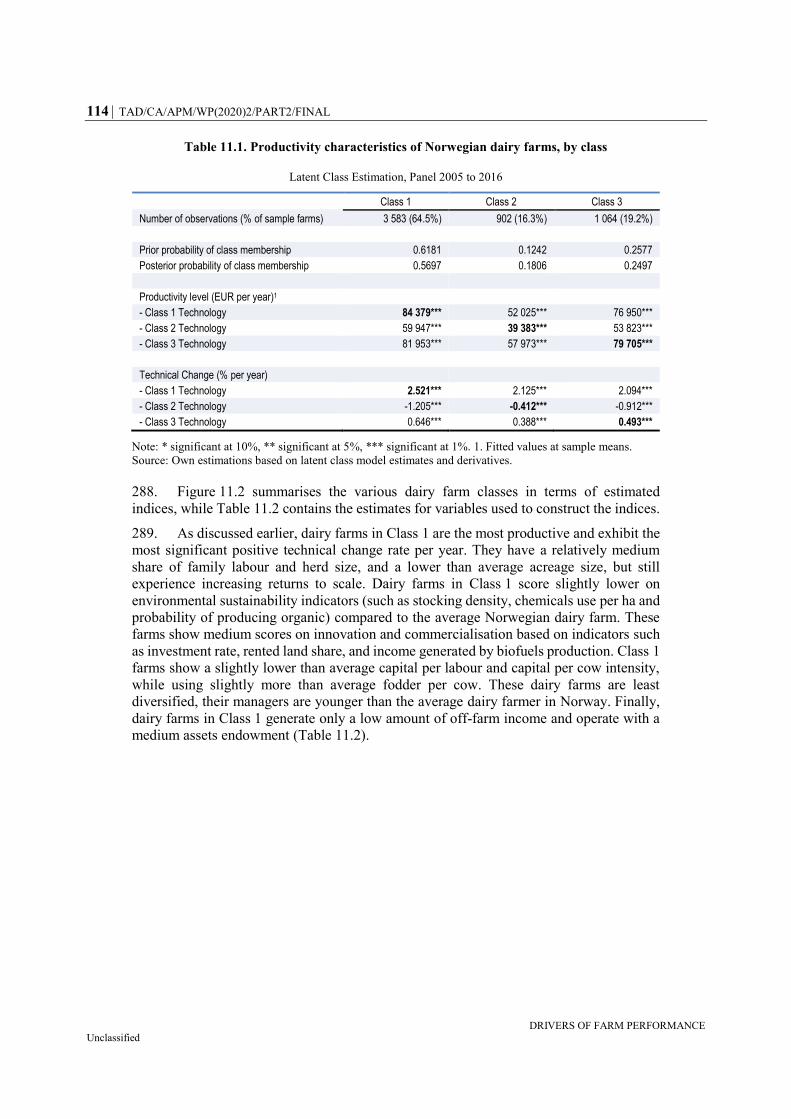
114 TAD/CA/APM/WP(2020)2/PART2/FINAL
DRIVERS OF FARM PERFORMANCE Unclassified
Table 11.1. Productivity characteristics of Norwegian dairy farms, by class
Latent Class Estimation, Panel 2005 to 2016
Class 1 Class 2 Class 3
Number of observations (% of sample farms) 3 583 (64.5%) 902 (16.3%) 1 064 (19.2%)
Prior probability of class membership 0.6181 0.1242 0.2577
Posterior probability of class membership 0.5697 0.1806 0.2497
Productivity level (EUR per year)1
- Class 1 Technology 84 379*** 52 025*** 76 950***
- Class 2 Technology 59 947*** 39 383*** 53 823***
- Class 3 Technology 81 953*** 57 973*** 79 705***
Technical Change (% per year)
- Class 1 Technology 2.521*** 2.125*** 2.094***
- Class 2 Technology -1.205*** -0.412*** -0.912***
- Class 3 Technology 0.646*** 0.388*** 0.493***
Note: * significant at 10%, ** significant at 5%, *** significant at 1%. 1. Fitted values at sample means.
Source: Own estimations based on latent class model estimates and derivatives.
288. Figure 11.2 summarises the various dairy farm classes in terms of estimated
indices, while Table 11.2 contains the estimates for variables used to construct the indices.
289. As discussed earlier, dairy farms in Class 1 are the most productive and exhibit the
most significant positive technical change rate per year. They have a relatively medium
share of family labour and herd size, and a lower than average acreage size, but still
experience increasing returns to scale. Dairy farms in Class 1 score slightly lower on
environmental sustainability indicators (such as stocking density, chemicals use per ha and
probability of producing organic) compared to the average Norwegian dairy farm. These
farms show medium scores on innovation and commercialisation based on indicators such
as investment rate, rented land share, and income generated by biofuels production. Class 1
farms show a slightly lower than average capital per labour and capital per cow intensity,
while using slightly more than average fodder per cow. These dairy farms are least
diversified, their managers are younger than the average dairy farmer in Norway. Finally,
dairy farms in Class 1 generate only a low amount of off-farm income and operate with a
medium assets endowment (Table 11.2).
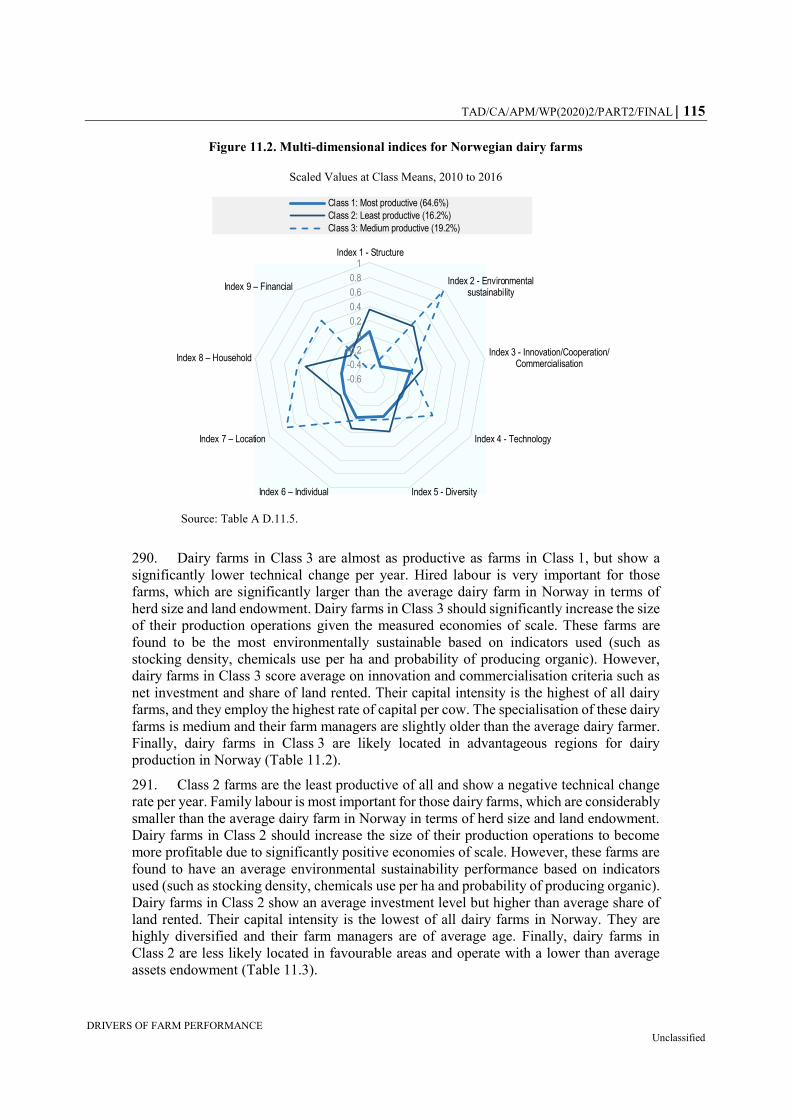
TAD/CA/APM/WP(2020)2/PART2/FINAL 115
DRIVERS OF FARM PERFORMANCE Unclassified
Figure 11.2. Multi-dimensional indices for Norwegian dairy farms
Scaled Values at Class Means, 2010 to 2016
Source: Table A D.11.5.
290. Dairy farms in Class 3 are almost as productive as farms in Class 1, but show a
significantly lower technical change per year. Hired labour is very important for those
farms, which are significantly larger than the average dairy farm in Norway in terms of
herd size and land endowment. Dairy farms in Class 3 should significantly increase the size
of their production operations given the measured economies of scale. These farms are
found to be the most environmentally sustainable based on indicators used (such as
stocking density, chemicals use per ha and probability of producing organic). However,
dairy farms in Class 3 score average on innovation and commercialisation criteria such as
net investment and share of land rented. Their capital intensity is the highest of all dairy
farms, and they employ the highest rate of capital per cow. The specialisation of these dairy
farms is medium and their farm managers are slightly older than the average dairy farmer.
Finally, dairy farms in Class 3 are likely located in advantageous regions for dairy
production in Norway (Table 11.2).
291. Class 2 farms are the least productive of all and show a negative technical change
rate per year. Family labour is most important for those dairy farms, which are considerably
smaller than the average dairy farm in Norway in terms of herd size and land endowment.
Dairy farms in Class 2 should increase the size of their production operations to become
more profitable due to significantly positive economies of scale. However, these farms are
found to have an average environmental sustainability performance based on indicators
used (such as stocking density, chemicals use per ha and probability of producing organic).
Dairy farms in Class 2 show an average investment level but higher than average share of
land rented. Their capital intensity is the lowest of all dairy farms in Norway. They are
highly diversified and their farm managers are of average age. Finally, dairy farms in
Class 2 are less likely located in favourable areas and operate with a lower than average
assets endowment (Table 11.3).
-0.6
-0.4
-0.2
0
0.2
0.4
0.6
0.8
1Index 1 - Structure
Index 2 - Environmentalsustainability
Index 3 - Innovation/Cooperation/Commercialisation
Index 4 - Technology
Index 5 - DiversityIndex 6 – Individual
Index 7 – Location
Index 8 – Household
Index 9 – Financial
Class 1: Most productive (64.6%)
Class 2: Least productive (16.2%)
Class 3: Medium productive (19.2%)
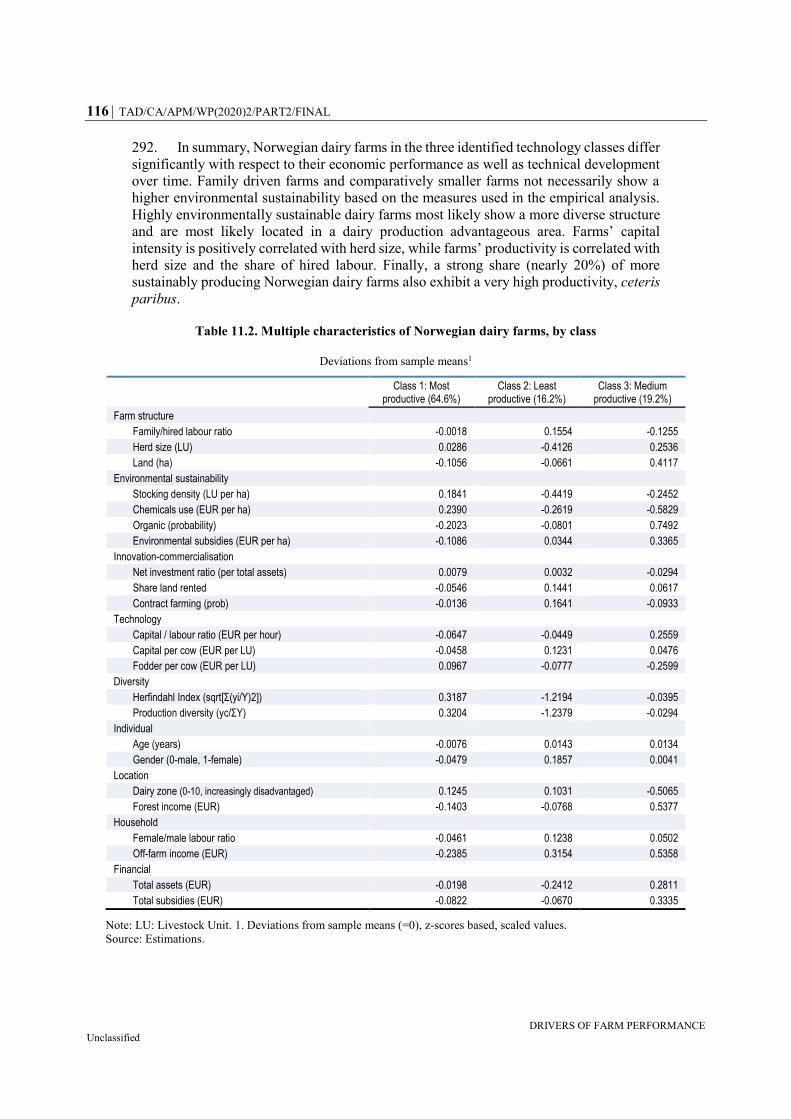
116 TAD/CA/APM/WP(2020)2/PART2/FINAL
DRIVERS OF FARM PERFORMANCE Unclassified
292. In summary, Norwegian dairy farms in the three identified technology classes differ
significantly with respect to their economic performance as well as technical development
over time. Family driven farms and comparatively smaller farms not necessarily show a
higher environmental sustainability based on the measures used in the empirical analysis.
Highly environmentally sustainable dairy farms most likely show a more diverse structure
and are most likely located in a dairy production advantageous area. Farms’ capital
intensity is positively correlated with herd size, while farms’ productivity is correlated with
herd size and the share of hired labour. Finally, a strong share (nearly 20%) of more
sustainably producing Norwegian dairy farms also exhibit a very high productivity, ceteris
paribus.
Table 11.2. Multiple characteristics of Norwegian dairy farms, by class
Deviations from sample means1
Class 1: Most productive (64.6%)
Class 2: Least productive (16.2%)
Class 3: Medium productive (19.2%)
Farm structure
Family/hired labour ratio -0.0018 0.1554 -0.1255
Herd size (LU) 0.0286 -0.4126 0.2536
Land (ha) -0.1056 -0.0661 0.4117
Environmental sustainability
Stocking density (LU per ha) 0.1841 -0.4419 -0.2452
Chemicals use (EUR per ha) 0.2390 -0.2619 -0.5829
Organic (probability) -0.2023 -0.0801 0.7492
Environmental subsidies (EUR per ha) -0.1086 0.0344 0.3365
Innovation-commercialisation
Net investment ratio (per total assets) 0.0079 0.0032 -0.0294
Share land rented -0.0546 0.1441 0.0617
Contract farming (prob) -0.0136 0.1641 -0.0933
Technology
Capital / labour ratio (EUR per hour) -0.0647 -0.0449 0.2559
Capital per cow (EUR per LU) -0.0458 0.1231 0.0476
Fodder per cow (EUR per LU) 0.0967 -0.0777 -0.2599
Diversity
Herfindahl Index (sqrt[Σ(yi/Y)2]) 0.3187 -1.2194 -0.0395
Production diversity (yc/ΣY) 0.3204 -1.2379 -0.0294
Individual
Age (years) -0.0076 0.0143 0.0134
Gender (0-male, 1-female) -0.0479 0.1857 0.0041
Location
Dairy zone (0-10, increasingly disadvantaged) 0.1245 0.1031 -0.5065
Forest income (EUR) -0.1403 -0.0768 0.5377
Household
Female/male labour ratio -0.0461 0.1238 0.0502
Off-farm income (EUR) -0.2385 0.3154 0.5358
Financial
Total assets (EUR) -0.0198 -0.2412 0.2811
Total subsidies (EUR) -0.0822 -0.0670 0.3335
Note: LU: Livestock Unit. 1. Deviations from sample means (=0), z-scores based, scaled values.
Source: Estimations.

TAD/CA/APM/WP(2020)2/PART2/FINAL 117
DRIVERS OF FARM PERFORMANCE Unclassified
11.2. Norwegian crop farms
293. According to Table A D.11.6, which summarises descriptive statistical measures
for the sample of Norwegian crop farms , the crop output of the average Norwegian crop
farm increased over the period investigated 2005 to 2016, mainly due to productivity
improvements as, for example, the acreage per farm only slightly increased over the
11 years considered. The variable input costs also increased, and the labour structure
changed to some extent with the share of hired labour higher on average per farm than the
share of family labour in 2016. Finally, the probability of being engaged in organic
production slightly increased.
294. In the model used to estimate the technology and the Class identification
components for the Norwegian crop production, the output variable is total output per farm
and year per farm and year and the input variables are land, capital, chemicals, materials.
The Class identification component in each estimation is based on the indices related to
structure, environmental sustainability, innovation, technology, diversity, individual and
household characteristics, location and financial aspects (Table A D.11.7).
295. For Norwegian crop farms, three distinct farm classes of crop farms emerge from
the model estimates (Table A D.11.7). The individual farms are distributed relatively
unevenly across the three identified technology classes (Table 11.3). Class 1 covers about
42% of all crop farms, Class 2 about 45%, and Class 3 about 14%.
296. Farms in Class 1 show a significantly higher productivity performance
— measured as the potential output levels that could be achieved with a given input bundle,
in EUR per year — than their crop-producing counterparts in Classes 2 and 3 (Figure 11.3).
Crop farms in Class 1 produce about 1.6 times more per farm and year than farms in Class 2
and about 1.5 times more per farm and year than crop farms in Class 3.
Figure 11.3. Productivity and technical change for Norwegian crop farms,
by class, 2005 to 2016
Source: Table 11.3.
297. Assuming that crop farms in Class 2 produced with the technology of farms in
Class 1, they would be able to significantly increase their productivity by nearly 10%, and
farms in Class 3 would increase their productivity even by nearly 50% (Table 11.3). If all
2.28
1.47
0.93
0.0
0.5
1.0
1.5
2.0
2.5
0
10
20
30
40
50
60
Class 1 (41.8%) Class 2 (44.6%) Class 3 (13.6%)
%EUR '000
Productivity (EUR '000 per year) Technical change (% per year)
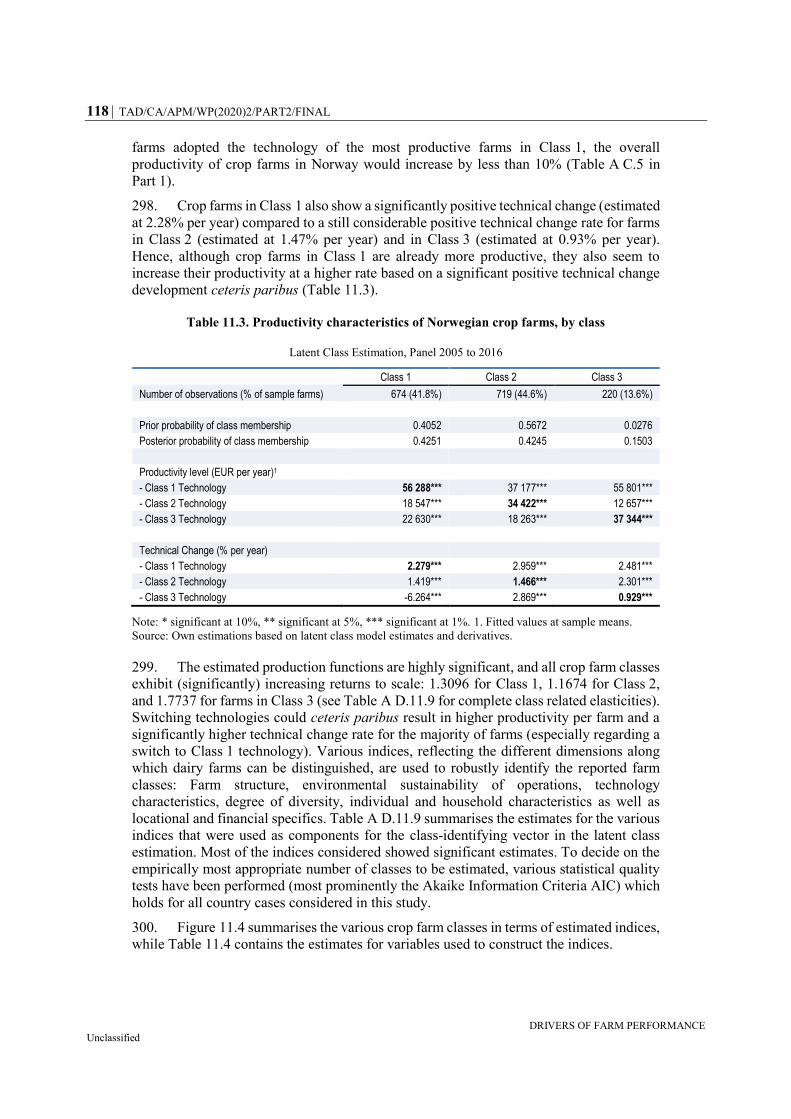
118 TAD/CA/APM/WP(2020)2/PART2/FINAL
DRIVERS OF FARM PERFORMANCE Unclassified
farms adopted the technology of the most productive farms in Class 1, the overall
productivity of crop farms in Norway would increase by less than 10% (Table A C.5 in
Part 1).
298. Crop farms in Class 1 also show a significantly positive technical change (estimated
at 2.28% per year) compared to a still considerable positive technical change rate for farms
in Class 2 (estimated at 1.47% per year) and in Class 3 (estimated at 0.93% per year).
Hence, although crop farms in Class 1 are already more productive, they also seem to
increase their productivity at a higher rate based on a significant positive technical change
development ceteris paribus (Table 11.3).
Table 11.3. Productivity characteristics of Norwegian crop farms, by class
Latent Class Estimation, Panel 2005 to 2016
Class 1 Class 2 Class 3
Number of observations (% of sample farms) 674 (41.8%) 719 (44.6%) 220 (13.6%)
Prior probability of class membership 0.4052 0.5672 0.0276
Posterior probability of class membership 0.4251 0.4245 0.1503
Productivity level (EUR per year)1
- Class 1 Technology 56 288*** 37 177*** 55 801***
- Class 2 Technology 18 547*** 34 422*** 12 657***
- Class 3 Technology 22 630*** 18 263*** 37 344***
Technical Change (% per year)
- Class 1 Technology 2.279*** 2.959*** 2.481***
- Class 2 Technology 1.419*** 1.466*** 2.301***
- Class 3 Technology -6.264*** 2.869*** 0.929***
Note: * significant at 10%, ** significant at 5%, *** significant at 1%. 1. Fitted values at sample means.
Source: Own estimations based on latent class model estimates and derivatives.
299. The estimated production functions are highly significant, and all crop farm classes
exhibit (significantly) increasing returns to scale: 1.3096 for Class 1, 1.1674 for Class 2,
and 1.7737 for farms in Class 3 (see Table A D.11.9 for complete class related elasticities).
Switching technologies could ceteris paribus result in higher productivity per farm and a
significantly higher technical change rate for the majority of farms (especially regarding a
switch to Class 1 technology). Various indices, reflecting the different dimensions along
which dairy farms can be distinguished, are used to robustly identify the reported farm
classes: Farm structure, environmental sustainability of operations, technology
characteristics, degree of diversity, individual and household characteristics as well as
locational and financial specifics. Table A D.11.9 summarises the estimates for the various
indices that were used as components for the class-identifying vector in the latent class
estimation. Most of the indices considered showed significant estimates. To decide on the
empirically most appropriate number of classes to be estimated, various statistical quality
tests have been performed (most prominently the Akaike Information Criteria AIC) which
holds for all country cases considered in this study.
300. Figure 11.4 summarises the various crop farm classes in terms of estimated indices,
while Table 11.4 contains the estimates for variables used to construct the indices.
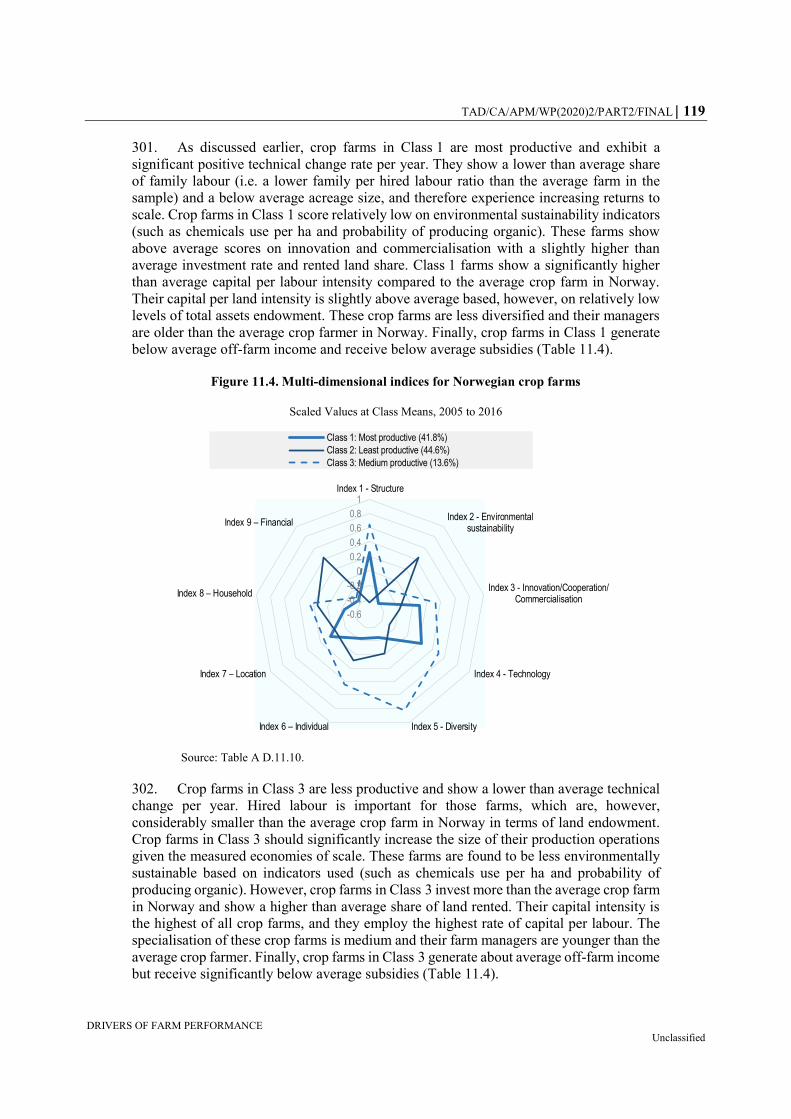
TAD/CA/APM/WP(2020)2/PART2/FINAL 119
DRIVERS OF FARM PERFORMANCE Unclassified
301. As discussed earlier, crop farms in Class 1 are most productive and exhibit a
significant positive technical change rate per year. They show a lower than average share
of family labour (i.e. a lower family per hired labour ratio than the average farm in the
sample) and a below average acreage size, and therefore experience increasing returns to
scale. Crop farms in Class 1 score relatively low on environmental sustainability indicators
(such as chemicals use per ha and probability of producing organic). These farms show
above average scores on innovation and commercialisation with a slightly higher than
average investment rate and rented land share. Class 1 farms show a significantly higher
than average capital per labour intensity compared to the average crop farm in Norway.
Their capital per land intensity is slightly above average based, however, on relatively low
levels of total assets endowment. These crop farms are less diversified and their managers
are older than the average crop farmer in Norway. Finally, crop farms in Class 1 generate
below average off-farm income and receive below average subsidies (Table 11.4).
Figure 11.4. Multi-dimensional indices for Norwegian crop farms
Scaled Values at Class Means, 2005 to 2016
Source: Table A D.11.10.
302. Crop farms in Class 3 are less productive and show a lower than average technical
change per year. Hired labour is important for those farms, which are, however,
considerably smaller than the average crop farm in Norway in terms of land endowment.
Crop farms in Class 3 should significantly increase the size of their production operations
given the measured economies of scale. These farms are found to be less environmentally
sustainable based on indicators used (such as chemicals use per ha and probability of
producing organic). However, crop farms in Class 3 invest more than the average crop farm
in Norway and show a higher than average share of land rented. Their capital intensity is
the highest of all crop farms, and they employ the highest rate of capital per labour. The
specialisation of these crop farms is medium and their farm managers are younger than the
average crop farmer. Finally, crop farms in Class 3 generate about average off-farm income
but receive significantly below average subsidies (Table 11.4).
-0.6
-0.4
-0.2
0
0.2
0.4
0.6
0.8
1Index 1 - Structure
Index 2 - Environmentalsustainability
Index 3 - Innovation/Cooperation/Commercialisation
Index 4 - Technology
Index 5 - DiversityIndex 6 – Individual
Index 7 – Location
Index 8 – Household
Index 9 – Financial
Class 1: Most productive (41.8%)
Class 2: Least productive (44.6%)
Class 3: Medium productive (13.6%)
120 TAD/CA/APM/WP(2020)2/PART2/FINAL
DRIVERS OF FARM PERFORMANCE Unclassified
303. Class 2 farms are the least productive but only slightly less productive than their
counterparts in Class 3. They show, however, a considerable positive technical change rate
per year. Family labour is very important for those crop farms, which are considerably
larger than the average crop farm in Norway in terms of land endowment. Crop farms in
Class 2 should increase the size of their production operations to become more profitable
given the estimated positive economies of scale (which are, however, considerably smaller
than for their counterparts in other classes). These farms are found to be below average
environmentally sustainable based on indicators used (such as chemicals use per ha and
probability of producing organic). Crop farms in Class 2 invest less than the average crop
farm in Norway and show a lower than average share of land rented. Their capital intensity
is relatively low and consistently with this notion is the finding that farms in Class 2 employ
the lowest rate of capital per labour. These crop farms are medium diversified and finally
crop farms in Class 2 generate well above average levels of off-farm income and receive
significantly above average levels of subsidies (Table 11.4).
304. In summary, Norwegian crop farms in the three identified technology classes differ
significantly with respect to their economic performance as well as technical development
over time. Innovative crop farms in Norway can be expected to be also more productive
than the average of their peer group. Family driven farms and comparatively smaller farms
show a lower environmental sustainability based on the measures used in the empirical
analysis. Highly environmentally sustainable crop farms do not necessarily show a more
diverse structure but likely a lower than average capital intensity. Farms’ productivity is
obviously not per se positively correlated with land endowment but with the share of hired
labour. Finally, Norwegian crop farms producing more environmentally sustainably show
a (relatively) lower productivity, ceteris paribus.

TAD/CA/APM/WP(2020)2/PART2/FINAL 121
DRIVERS OF FARM PERFORMANCE Unclassified
Table 11.4. Multiple characteristics of Norwegian crop farms, by class
Deviations from sample means1
Class 1: Most productive (41.8%)
Class 2: Least productive (44.6%)
Class 3: Medium productive (13.6%)
Farm structure
Family/hired labour ratio -0.1312 0.2135 -0.2961
Land (ha) -0.2253 0.4031 -0.6271
Environmental sustainability
Chemicals use (EUR per ha) 0.1806 -0.1552 -0.0463
Organic (probability) -0.1518 0.1674 -0.0820
Environmental subsidies (EUR per ha) -0.3641 0.4020 -0.1986
Innovation-commercialisation
Net investment ratio (per total assets) 0.0179 -0.0889 0.2357
Share land rented 0.1061 -0.1467 0.1544
Contract farming (prob) 0.0261 -0.0901 0.2148
Technology
Capital / labour ratio (EUR per hour) 0.3527 -0.4153 0.2766
Capital per land (EUR per ha) 0.0801 -0.0371 -0.1239
Diversity
Herfindahl Index (sqrt[Σ(yi/Y)2]) 0.1838 0.0083 -0.5902
Production diversity (yc/ΣY) 0.1781 0.0103 -0.5793
Individual
Age (years) 0.2145 -0.1006 -0.3282
Gender (0-male, 1-female) -0.1175 0.0185 0.2996
Location
Dairy zone (0-10, increasingly disadvantaged) 0.2071 -0.4639 0.8815
Meat zone (0-5, increasingly disadvantaged) 0.2206 -0.4887 0.9213
Forest income (EUR) -0.0549 0.0266 0.0813
Household
Female/male labour ratio -0.0255 -0.0864 0.3604
Off-farm income (EUR) -0.3025 0.2835 0.0002
Financial
Total assets (EUR) -0.2546 0.2838 -0.1708
Total subsidies (EUR) -0.2431 0.3052 -0.2527
Note: 1. Deviations from sample means (=0), z-scores based, scaled values.
Source: Estimations.
11.3. Norwegian cattle farms
305. According to Table A D.11.11, which shows descriptive statistical measures for the
sample of Norwegian cattle farms, the average livestock output of these farms significantly
increased over the period 2005 to 2016, partly due to an increase in livestock herd size. The
variable cost items increased over the period, as well as the share of hired labour for the
average Norwegian cattle farm, whereas the share of family labour remained more or less
constant. The stocking density increased, and the probability of being engaged in organic
production slightly decreased.
306. In the model used to estimate the technology and the Class identification
components for the Norwegian beef production, the output variable is total output per farm
and year and the input variables are land, capital, livestock units, fodder, materials, fuel,
and labour. The Class identification component in each estimation is based on the indices

122 TAD/CA/APM/WP(2020)2/PART2/FINAL
DRIVERS OF FARM PERFORMANCE Unclassified
related to structure, environmental sustainability, innovation, technology, diversity,
individual and household characteristics, location and financial aspects (Table A D.11.12).
307. For Norwegian specialised cattle farms, two distinct technology classes emerge
from the model estimates (Table A D.11.12). The individual farms are distributed very
unevenly across the two identified technology classes (Table 11.5). Class 1 covers about
81% of all livestock farms while Class 2 contains the remaining 19%.
308. Cattle farms in Class 2 show a slightly higher productivity performance
— measured as the potential output levels that could be achieved with a given input bundle,
in EUR per year — than their milk-producing counterparts in Class 1 (Figure 11.5). They
produce about 13% more per farm and year than farms in Class 1.
Figure 11.5. Productivity and technical change for Norwegian cattle farms,
by class, 2005 to 2016
Source: Table 11.5.
309. The empirical findings paradoxically suggest that only farms in the slightly more
productive Class 2 could increase their productivity further, assuming they would switch
to Class 1 technology. This might be due to the unique production environment for some
cattle farms in Norway and the minor difference being found between class related
productivity levels. However, if livestock farms in Class 2 produced with the technology
of farms in Class 1, they would be able to further increase their productivity by about 24%.
310. Cattle farms in Class 1 show a positive technical change (of about 1.566% per year)
compared to a negative technical change rate for farms in Class 2 (of about -1.19% per
year). Hence, farms in Class 1 are slightly less productive, they nevertheless seem to
increase their productivity at a higher rate given the significant positive technical change
development ceteris paribus (Table 11.5).
1.56
-1.20
-1.5
-1.0
-0.5
0.0
0.5
1.0
1.5
2.0
28
29
30
31
32
33
34
35
36
Class 1 (81%) Class 2 (19%)
%EUR '000
Productivity (EUR '000 per year) Technical change (% per year)

TAD/CA/APM/WP(2020)2/PART2/FINAL 123
DRIVERS OF FARM PERFORMANCE Unclassified
Table 11.5. Productivity characteristics of Norwegian cattle farms, by class
Latent Class Estimation, Panel 2005 to 2016
Class 1 Class 2
Number of observations (% of sample farms) 1 340 (80.9%) 315 (19.1%)
Prior probability of class membership 0.8553 0.1447
Posterior probability of class membership 0.7609 0.2391
Productivity level (EUR per year)1
- Class 1 Technology 30 823*** 43 104***
- Class 2 Technology 18 823*** 34 887***
Technical Change (% per year)
- Class 1 Technology 1.558*** 1.192***
- Class 2 Technology -2.821*** -1.197***
Note: * significant at 10%, ** significant at 5%, *** significant at 1%.
1. Fitted values at sample means.
Source: Own estimations based on latent class model estimates and derivatives.
311. The estimated production functions are highly significant and both livestock farm
classes exhibit increasing returns to scale: 1.0777 for Class 1, and 2.0563 for farms in
Class 2 (see Table A D.11.14 for complete class related elasticities). Switching
technologies could — ceteris paribus — result in higher productivity per farm and also a
significantly higher technical change rate a minority of farms only (especially regarding a
switch to Class 1 technology). Various indices, reflecting the different dimensions along
which cattle farms can be distinguished, are used to robustly identify the reported farm
classes: Farm structure, environmental sustainability of operations, technology
characteristics, degree of diversity, individual and household characteristics and locational
as well as financial characteristics. Table A D.11.14 summarises the estimates for the
various indices that were used as components for the class-identifying vector in the latent
class estimation. Most of the indices considered showed significant estimates. To decide
on the empirically most appropriate number of classes to be estimated, again various
statistical quality tests have been performed (most prominently the Akaike Information
Criteria AIC) which holds for all country cases considered in this study.
312. Figure 11.6 summarises the various cattle farm classes in terms of estimated
indices, while Table 11.6 contains the estimates for variables used to construct the indices.
313. As discussed earlier, cattle farms in Class 2 are slightly more productive but exhibit
a negative technical change rate per year. They have the lowest share of family labour (i.e.
a significantly lower family per hired labour ratio than the average farm in the sample) and
a significantly above average herd and acreage size, but still experience (modest) increasing
returns to scale. Cattle farms in Class 2 score relatively high on environmental
sustainability indicators (such as stocking density, chemicals use per ha and probability of
producing organic). These farms show lower than average scores on innovation and
commercialisation with a lower than average investment rate and rented land share. Class 2
farms show a higher than average capital per labour intensity, while using more capital per
livestock unit than the average cattle farm in Norway based on high levels of total assets
endowment. These farms are, however, more diversified, and their managers are younger
than the average cattle farmer in Norway. Finally, cattle farms in Class 2 generate slightly

124 TAD/CA/APM/WP(2020)2/PART2/FINAL
DRIVERS OF FARM PERFORMANCE Unclassified
more off-farm income and receive a significantly higher level of subsidies than the average
cattle farm (Table 11.6).
Figure 11.6. Multi-dimensional indices for Norwegian cattle farms
Scaled Values at Class Means, 2005 to 2016
Source: Table A D.11.15.
314. Cattle farms in Class 1 are slightly less productive but show a positive technical
change per year. Family labour is more important for those farms, which are smaller than
the average cattle farm in Norway in terms of herd size and land endowment. Livestock
farms in Class 1 should still increase the size of their production operations given the
measured economies of scale. These farms are found to be less environmentally sustainable
based on indicators used (such as stocking density, chemicals use per ha and probability of
producing organic). However, cattle farms in Class 1 invest more than the average cattle
farm in Norway and use more rented land for production. Their capital intensity is lower
than average, and they employ the highest rate of labour per capital and livestock unit.
These cattle farms are less diversified than average and their farm managers are slightly
older than the average cattle farmer in Norway. Finally, cattle farms in Class 1 generate
slightly less off-farm income and receive a lower level of subsidies than the average cattle
farm in Norway (Table 11.6).
315. In summary, Norwegian cattle farms in the two identified technology classes differ
significantly with respect to their economic performance as well as technical development
over time. Innovative farms are not per se more productive compared to their peer group.
Family driven farms and comparatively smaller farms show a lower environmental
sustainability based on the measures used in the empirical analysis. Highly environmentally
sustainable cattle farms most likely show a very diverse farm structure and most likely
receive a higher amount of subsidies. Farms’ capital intensity is positively correlated with
herd size, while farms’ productivity is only slightly correlated with herd size and the share
-1.2-1
-0.8-0.6-0.4-0.2
00.20.40.60.8
1Index 1 - Structure
Index 2 - Environmentalsustainability
Index 3 - Innovation/Cooperation/Commercialisation
Index 4 - Technology
Index 5 - DiversityIndex 6 – Individual
Index 7 – Location
Index 8 – Household
Index 9 – Financial
Class 1: Least productive (81%) Class 2: Most productive (19%)

TAD/CA/APM/WP(2020)2/PART2/FINAL 125
DRIVERS OF FARM PERFORMANCE Unclassified
of hired labour. Finally, Norwegian cattle farms producing more environmentally
sustainably can also exhibit a very high productivity, ceteris paribus.
Table 11.6. Multiple characteristics of Norwegian cattle farms, by class
Deviations from sample means1
Class 1: Least productive (81%)
Class 2: Most productive (19%)
Farm structure
Family/hired labour ratio 0.0634 -0.2697
Herd size (LU) -0.1414 0.6017
Land (ha) -0.1943 0.8266
Environmental sustainability
Stocking density (LU per ha) -0.0109 0.0461
Chemicals use (EUR per ha) 0.0336 -0.1430
Organic (probability) -0.1044 0.4442
Environmental subsidies (EUR per ha) -0.0831 0.3524
Innovation-commercialisation
Net investment ratio (per total assets) 0.0129 -0.0549
Share land rented 0.1045 -0.4446
Contract farming (prob) 0.0332 -0.1412
Technology
Capital / labour ratio (EUR per h) -0.0291 0.1236
Capital per livestock unit (EUR per LU) -0.0043 0.0187
Fodder per livestock unit (EUR per LU) 0.0068 -0.0289
Diversity
Herfindahl Index (sqrt[Σ(yi/Y)2]) 0.1529 -0.6507
Production diversity (yc/ΣY) 0.1571 -0.6683
Individual
Age (years) 0.0245 -0.1041
Gender (0-male, 1-female) 0.0623 -0.2649
Location
Dairy zone (0-10, increasingly disadvantaged) 0.1005 -0.4342
Meat zone (0-5, increasingly disadvantaged) 0.0957 -0.4071
Forest income (EUR) -0.0864 0.3675
Household
Female/male labour ratio 0.0317 -0.1347
Off-farm income (EUR) -0.0118 0.0503
Financial
Total assets (EUR) -0.0688 0.3028
Total subsidies (EUR) -0.1401 0.5961
Note: LU: Livestock Unit. 1. Deviations from sample means (=0), z-scores based, scaled values.
Source: Estimations.

126 TAD/CA/APM/WP(2020)2/PART2/FINAL
DRIVERS OF FARM PERFORMANCE Unclassified
12. Sweden
316. For Sweden, the analysis applies to a sample of crop farms and dairy farms
covering the period 1997 to 2017.
12.1. Swedish dairy farms
317. According to Table A D.12.1, which contains descriptive statistical measures for
the sample, the average milk output per farm was about EUR 230 000 in 2017 (with a total
output of about EUR 405 000). The variable cost items increased over time and the share
of hired labour significantly increases for the average Swedish dairy farm. The average
Swedish dairy farm in the sample in 2017 operated with a herd size of about 118 dairy cows
and an average stocking density of about 0.69 LU per ha.
318. In the model used to estimate the technology and the Class identification
components for the Swedish dairy production the output variable is total output per farm
and year and input variables are capital, materials, fuel and labour. The Class identification
component is based on the indices related to structure, environmental sustainability,
innovation, technology, diversity, individual, location, household and financial aspects
(Table A D.12.2).
319. For Swedish dairy farms, three distinct technology classes emerge from the model
estimates (Table A D.12.2). The individual farms are distributed unevenly across the three
technology classes (Table 12.1), with Class 2 including close to half of all farms.
320. Dairy farms in Class 2 show a higher productivity performance — measured as the
potential output levels that could be achieved with a given input bundle, in value per year —
than their milk-producing counterparts in classes 1 and 3 (Figure 12.1). Dairy farms in
classes 1 and 3, which have similar levels of productivity, produce per farm and year about
a third of the output for farms in Class 2.
321. All three farm classes show significant positive technical change, but the growth
rate for the most productive farms in Class 2 is lower than that for other classes, suggesting
that they will lose some of their productivity advantage over time, ceteris paribus.
Productivity developments between Class 1 and Class 3 farms will differ significantly as
Class 3 farms show a rate of technical change per farm and per year much higher than that
for farms in Class 1 (Figure 12.1).
322. If dairy farms in Class 1 and Class 3 produced with the technology of farms in
Class 2, they would be able to increase their productivity by 180% and 112% respectively.
As with developments in technical change, this suggests that technologies in Class 1 and
Class 3 differ significantly, although current productivity levels are close (Table 12.1).
Overall, the adoption of Class 2 technologies by all farms would result in an average 45%
increase in productivity for Swedish dairy farms (Table A C.4 in Part 1).
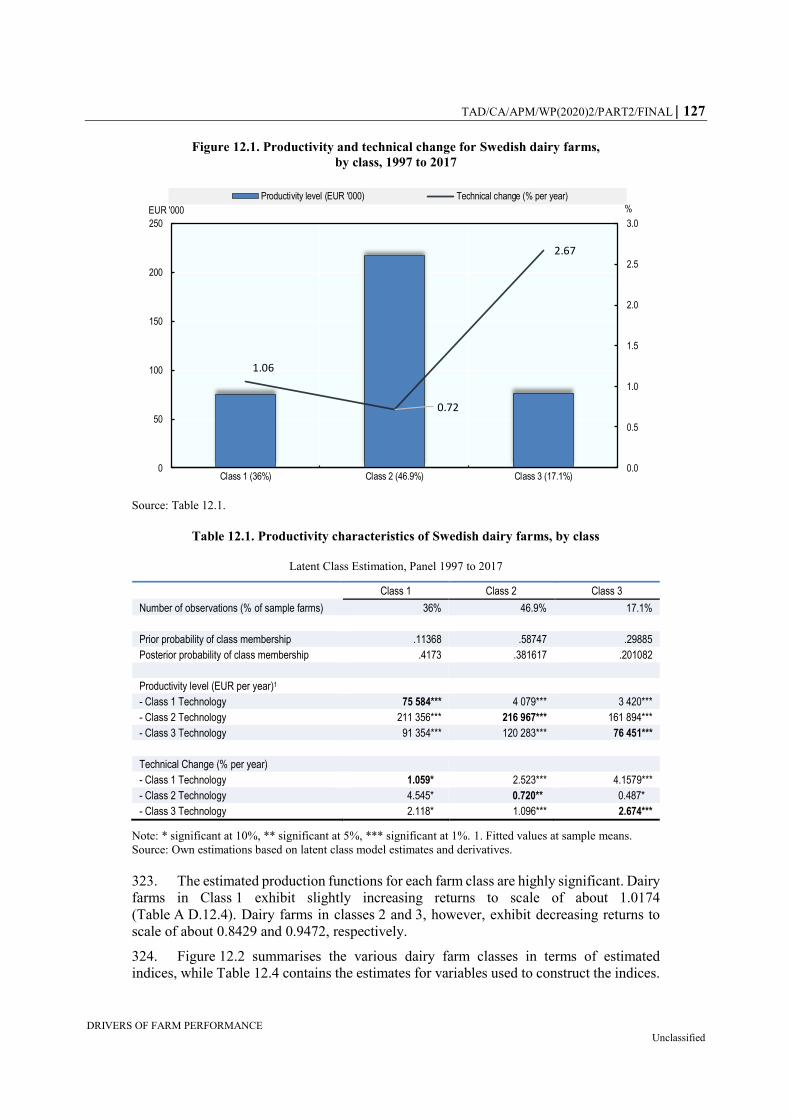
TAD/CA/APM/WP(2020)2/PART2/FINAL 127
DRIVERS OF FARM PERFORMANCE Unclassified
Figure 12.1. Productivity and technical change for Swedish dairy farms,
by class, 1997 to 2017
Source: Table 12.1.
Table 12.1. Productivity characteristics of Swedish dairy farms, by class
Latent Class Estimation, Panel 1997 to 2017
Class 1 Class 2 Class 3
Number of observations (% of sample farms) 36% 46.9% 17.1%
Prior probability of class membership .11368 .58747 .29885
Posterior probability of class membership .4173 .381617 .201082
Productivity level (EUR per year)1
- Class 1 Technology 75 584*** 4 079*** 3 420***
- Class 2 Technology 211 356*** 216 967*** 161 894***
- Class 3 Technology 91 354*** 120 283*** 76 451***
Technical Change (% per year)
- Class 1 Technology 1.059* 2.523*** 4.1579***
- Class 2 Technology 4.545* 0.720** 0.487*
- Class 3 Technology 2.118* 1.096*** 2.674***
Note: * significant at 10%, ** significant at 5%, *** significant at 1%. 1. Fitted values at sample means.
Source: Own estimations based on latent class model estimates and derivatives.
323. The estimated production functions for each farm class are highly significant. Dairy
farms in Class 1 exhibit slightly increasing returns to scale of about 1.0174
(Table A D.12.4). Dairy farms in classes 2 and 3, however, exhibit decreasing returns to
scale of about 0.8429 and 0.9472, respectively.
324. Figure 12.2 summarises the various dairy farm classes in terms of estimated
indices, while Table 12.4 contains the estimates for variables used to construct the indices.
1.06
0.72
2.67
0.0
0.5
1.0
1.5
2.0
2.5
3.0
0
50
100
150
200
250
Class 1 (36%) Class 2 (46.9%) Class 3 (17.1%)
%EUR '000
Productivity level (EUR '000) Technical change (% per year)

128 TAD/CA/APM/WP(2020)2/PART2/FINAL
DRIVERS OF FARM PERFORMANCE Unclassified
Figure 12.2. Multi-dimensional indices for Swedish dairy farms
Scaled values at class means, 1997 to 2017
Source: Table A D.12.5.
325. Farms in Class 1 are the least productive and most environmentally sustainable of
all dairy farms in Sweden. They are smaller operations, more specialised, with lower
investments in new technologies and lower capital intensity. They are more likely to be
operated by older men with lower education levels. They receive fewer subsidies than
average and are more reliant on off-farm income than average.
326. Class 2 groups more productive, least environmentally sustainable farms in Class 2,
which account for close to half of all dairy farms. They are larger farms, with larger assets,
which invest in new technologies and are capital intensive. They are relatively diversified
and receive higher levels of subsidies. They are more likely to be operated by women, with
higher education levels than average.
327. Class 3 includes farms that achieve a productivity level barely above the lowest
performers, and their environmental sustainability score is slightly below average. They
are smaller, more diversified operations, with lower investment than average. They are
more likely to be in less-favoured areas and to have a female operator, with higher
education levels than average.
328. In summary, Swedish dairy farms in the three identified technology classes differ
significantly with respect to their economic performance as well as technical development
over time. Comparatively smaller farms achieve a higher environmental sustainability
based on the variables used in the empirical analysis. However, these dairy farms are
significantly less productive than other farms in the sector. Highly environmentally
sustainable dairy farms most likely produce with a lower intensity but are not necessarily
are more diverse. The capital intensity of farms seems positively correlated with herd size,
while their productivity seems correlated with herd size but not with the share of hired
labour, ceteris paribus. Almost half of Swedish dairy farms show a higher productivity
linked to higher innovativeness. However, around 17% of all dairy farms are less
-1
-0.5
0
0.5
1
1.5Index 1 - Structure
Index 2 - Environmentalsustainability
Index 3 -Innovation/commercialisation
Index 4 - Technology
Index 5 - DiversityIndex 6 - Individual
Index 7 - Location
Index 8 - Household
Index 9 - Financial
Class 1: Least productive (36%)
Class 2: Most productive (46.9%)
Class 3: Medium productive (17.1%)
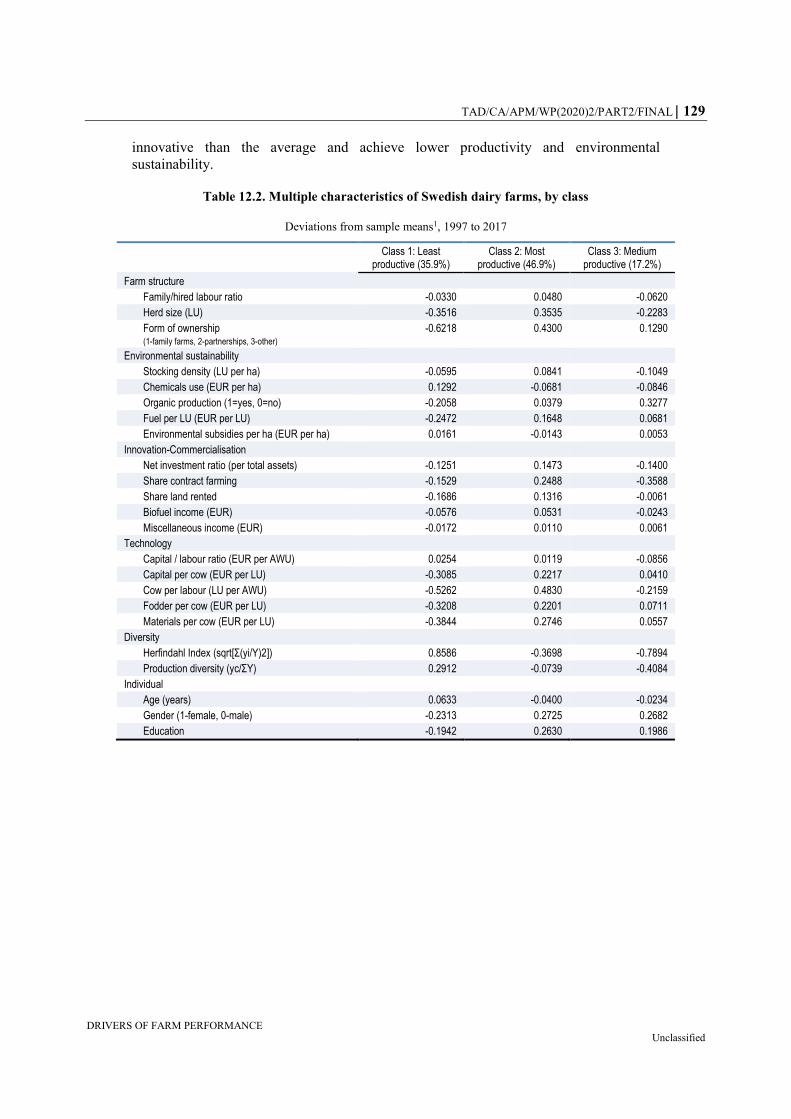
TAD/CA/APM/WP(2020)2/PART2/FINAL 129
DRIVERS OF FARM PERFORMANCE Unclassified
innovative than the average and achieve lower productivity and environmental
sustainability.
Table 12.2. Multiple characteristics of Swedish dairy farms, by class
Deviations from sample means1, 1997 to 2017
Class 1: Least productive (35.9%)
Class 2: Most productive (46.9%)
Class 3: Medium productive (17.2%)
Farm structure
Family/hired labour ratio -0.0330 0.0480 -0.0620
Herd size (LU) -0.3516 0.3535 -0.2283
Form of ownership (1-family farms, 2-partnerships, 3-other)
-0.6218 0.4300 0.1290
Environmental sustainability
Stocking density (LU per ha) -0.0595 0.0841 -0.1049
Chemicals use (EUR per ha) 0.1292 -0.0681 -0.0846
Organic production (1=yes, 0=no) -0.2058 0.0379 0.3277
Fuel per LU (EUR per LU) -0.2472 0.1648 0.0681
Environmental subsidies per ha (EUR per ha) 0.0161 -0.0143 0.0053
Innovation-Commercialisation
Net investment ratio (per total assets) -0.1251 0.1473 -0.1400
Share contract farming -0.1529 0.2488 -0.3588
Share land rented -0.1686 0.1316 -0.0061
Biofuel income (EUR) -0.0576 0.0531 -0.0243
Miscellaneous income (EUR) -0.0172 0.0110 0.0061
Technology
Capital / labour ratio (EUR per AWU) 0.0254 0.0119 -0.0856
Capital per cow (EUR per LU) -0.3085 0.2217 0.0410
Cow per labour (LU per AWU) -0.5262 0.4830 -0.2159
Fodder per cow (EUR per LU) -0.3208 0.2201 0.0711
Materials per cow (EUR per LU) -0.3844 0.2746 0.0557
Diversity
Herfindahl Index (sqrt[Σ(yi/Y)2]) 0.8586 -0.3698 -0.7894
Production diversity (yc/ΣY) 0.2912 -0.0739 -0.4084
Individual
Age (years) 0.0633 -0.0400 -0.0234
Gender (1-female, 0-male) -0.2313 0.2725 0.2682
Education -0.1942 0.2630 0.1986
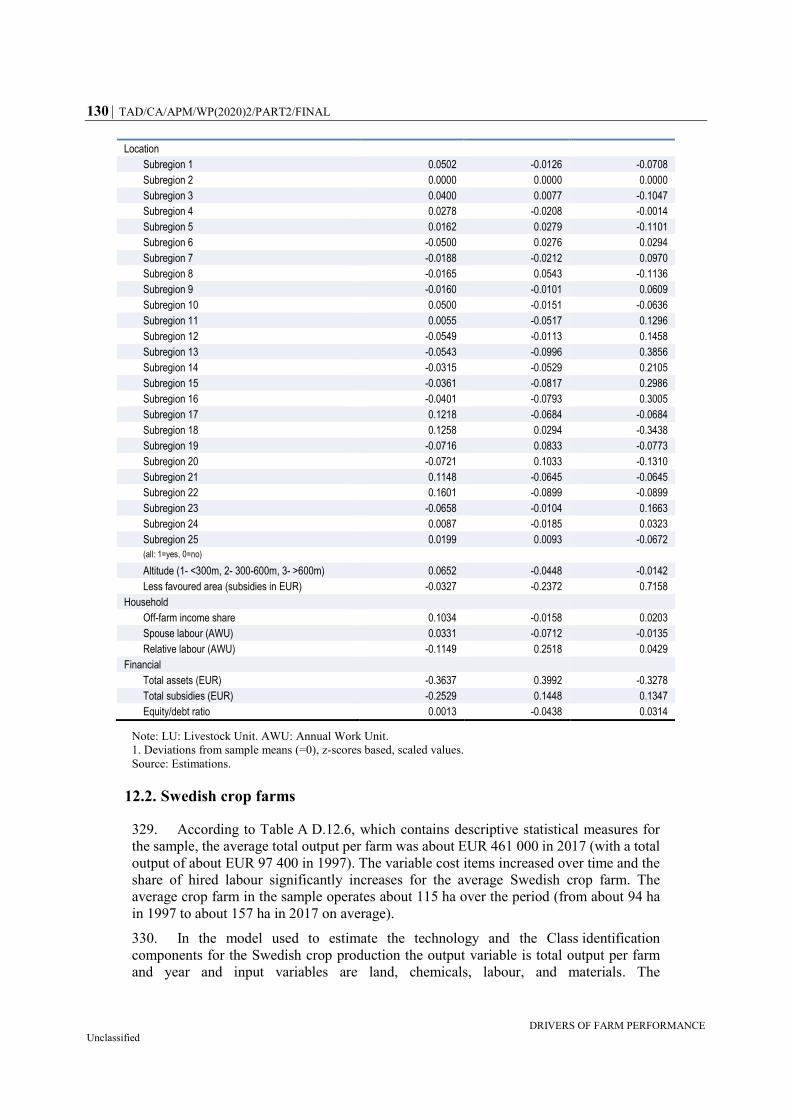
130 TAD/CA/APM/WP(2020)2/PART2/FINAL
DRIVERS OF FARM PERFORMANCE Unclassified
Location
Subregion 1 0.0502 -0.0126 -0.0708
Subregion 2 0.0000 0.0000 0.0000
Subregion 3 0.0400 0.0077 -0.1047
Subregion 4 0.0278 -0.0208 -0.0014
Subregion 5 0.0162 0.0279 -0.1101
Subregion 6 -0.0500 0.0276 0.0294
Subregion 7 -0.0188 -0.0212 0.0970
Subregion 8 -0.0165 0.0543 -0.1136
Subregion 9 -0.0160 -0.0101 0.0609
Subregion 10 0.0500 -0.0151 -0.0636
Subregion 11 0.0055 -0.0517 0.1296
Subregion 12 -0.0549 -0.0113 0.1458
Subregion 13 -0.0543 -0.0996 0.3856
Subregion 14 -0.0315 -0.0529 0.2105
Subregion 15 -0.0361 -0.0817 0.2986
Subregion 16 -0.0401 -0.0793 0.3005
Subregion 17 0.1218 -0.0684 -0.0684
Subregion 18 0.1258 0.0294 -0.3438
Subregion 19 -0.0716 0.0833 -0.0773
Subregion 20 -0.0721 0.1033 -0.1310
Subregion 21 0.1148 -0.0645 -0.0645
Subregion 22 0.1601 -0.0899 -0.0899
Subregion 23 -0.0658 -0.0104 0.1663
Subregion 24 0.0087 -0.0185 0.0323
Subregion 25 0.0199 0.0093 -0.0672
(all: 1=yes, 0=no)
Altitude (1- <300m, 2- 300-600m, 3- >600m) 0.0652 -0.0448 -0.0142
Less favoured area (subsidies in EUR) -0.0327 -0.2372 0.7158
Household
Off-farm income share 0.1034 -0.0158 0.0203
Spouse labour (AWU) 0.0331 -0.0712 -0.0135
Relative labour (AWU) -0.1149 0.2518 0.0429
Financial
Total assets (EUR) -0.3637 0.3992 -0.3278
Total subsidies (EUR) -0.2529 0.1448 0.1347
Equity/debt ratio 0.0013 -0.0438 0.0314
Note: LU: Livestock Unit. AWU: Annual Work Unit.
1. Deviations from sample means (=0), z-scores based, scaled values.
Source: Estimations.
12.2. Swedish crop farms
329. According to Table A D.12.6, which contains descriptive statistical measures for
the sample, the average total output per farm was about EUR 461 000 in 2017 (with a total
output of about EUR 97 400 in 1997). The variable cost items increased over time and the
share of hired labour significantly increases for the average Swedish crop farm. The
average crop farm in the sample operates about 115 ha over the period (from about 94 ha
in 1997 to about 157 ha in 2017 on average).
330. In the model used to estimate the technology and the Class identification
components for the Swedish crop production the output variable is total output per farm
and year and input variables are land, chemicals, labour, and materials. The

TAD/CA/APM/WP(2020)2/PART2/FINAL 131
DRIVERS OF FARM PERFORMANCE Unclassified
Class identification component is based on the indices related to structure, environmental
sustainability, innovation, technology, diversity, individual, location, household and
financial aspects (Table A D.12.7).
331. For Swedish crop farms, three distinct technology classes emerge from the model
estimates (Table A D.12.7). The individual farms are distributed relatively evenly across
the three technology classes (Table 12.3).
332. Crop farms in Class 2 show a higher productivity performance — measured as the
potential output levels that could be achieved with a given input bundle, in value per year —
than their counterparts in classes 1 and 3 (Figure 12.3). Crop farms in Class 1 produce
three-quarters of the output per farm and year produced by farms in Class 2, while farms
in Class 3 produce only a quarter of Class 2 output.
333. The three classes of Swedish crops farms show strong, positive rates of technical
change. The highest growth rate (about 5%) is estimated for the most productive farms in
Class 2, and the lowest for the least productive farms in Class 3. This suggests that
differences in productivity between classes will further increase, ceteris paribus
(Figure 12.3).
Figure 12.3. Productivity and technical change for Swedish crop farms,
by class, 1997 to 2017
Source: Table 12.3.
334. If crop farms in Class 3 produced with the technology of farms in Class 2, they
would be able to almost double their productivity (Table 12.3). However, if farms in
Class 1 adopted the technology of the most productive farms in Class 2, their productivity
would decrease by 34%, suggesting that they already produce with a technology which is
best adapted to their conditions. Overall, the productivity of Swedish crop farms would
increase by 4% (Table A C.5 in Part 1). The highest productivity gains would be obtained
if all farms adopted the technology of farms in Class 1, which is based on higher capital
intensity and more intensive farming practices than the average of all Swedish crop farms
(Table 12.4).
3.2
4.9
2.1
0
1
2
3
4
5
6
0
50
100
150
200
250
class 1 (25.1% of farms) class 2 (34.3% of farms) class 3 (40.6% of farms)
%EUR '000
Productivity level (EUR '000) Technical change (% per year)
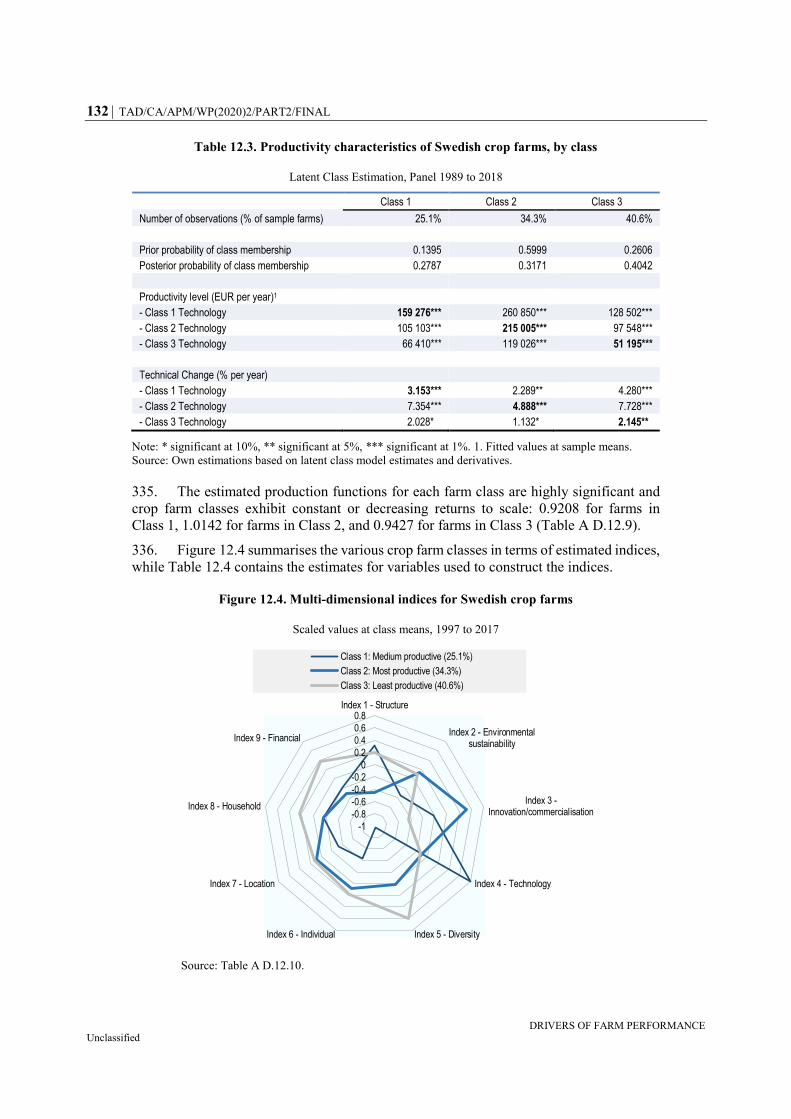
132 TAD/CA/APM/WP(2020)2/PART2/FINAL
DRIVERS OF FARM PERFORMANCE Unclassified
Table 12.3. Productivity characteristics of Swedish crop farms, by class
Latent Class Estimation, Panel 1989 to 2018
Class 1 Class 2 Class 3
Number of observations (% of sample farms) 25.1% 34.3% 40.6%
Prior probability of class membership 0.1395 0.5999 0.2606
Posterior probability of class membership 0.2787 0.3171 0.4042
Productivity level (EUR per year)1
- Class 1 Technology 159 276*** 260 850*** 128 502***
- Class 2 Technology 105 103*** 215 005*** 97 548***
- Class 3 Technology 66 410*** 119 026*** 51 195***
Technical Change (% per year)
- Class 1 Technology 3.153*** 2.289** 4.280***
- Class 2 Technology 7.354*** 4.888*** 7.728***
- Class 3 Technology 2.028* 1.132* 2.145**
Note: * significant at 10%, ** significant at 5%, *** significant at 1%. 1. Fitted values at sample means.
Source: Own estimations based on latent class model estimates and derivatives.
335. The estimated production functions for each farm class are highly significant and
crop farm classes exhibit constant or decreasing returns to scale: 0.9208 for farms in
Class 1, 1.0142 for farms in Class 2, and 0.9427 for farms in Class 3 (Table A D.12.9).
336. Figure 12.4 summarises the various crop farm classes in terms of estimated indices,
while Table 12.4 contains the estimates for variables used to construct the indices.
Figure 12.4. Multi-dimensional indices for Swedish crop farms
Scaled values at class means, 1997 to 2017
Source: Table A D.12.10.
-1
-0.8
-0.6
-0.4
-0.2
0
0.2
0.4
0.6
0.8Index 1 - Structure
Index 2 - Environmentalsustainability
Index 3 -Innovation/commercialisation
Index 4 - Technology
Index 5 - DiversityIndex 6 - Individual
Index 7 - Location
Index 8 - Household
Index 9 - Financial
Class 1: Medium productive (25.1%)
Class 2: Most productive (34.3%)
Class 3: Least productive (40.6%)

TAD/CA/APM/WP(2020)2/PART2/FINAL 133
DRIVERS OF FARM PERFORMANCE Unclassified
337. Class 1 farms achieve productivity levels slightly higher than least performers, but
are the least environmentally sustainable, as they use more intensive farm practices than
average. They are of average size and more specialised operations than the average Swedish
crop farm. They are more capital intensive but invest less in new technologies and
activities. They generate below average off-farm income and have higher debt ratios.
338. Class 2 groups the most productive farms, accounting for 44% of all farms, which
are also the most environmentally sustainable. They are larger operations, more likely to
be partnerships. The have more diversified productions, with higher investment in new
technologies and activities. They have larger assets than average but higher debt ratios.
339. Class 3 farms are least productive and achieve average environmental
sustainability, as measured by the intensity of farming practices. They are smaller and more
diverse operations than average. They are more likely operated by women and to generate
a higher share of off-farm income. They are less capital intensive than average, invest less
in new technologies, and have lower debt ratios.
340. In summary, Swedish crop farms in the three identified technology classes differ
significantly with respect to their economic performance as well as technical development
over time. Innovative farms are also more likely to be more productive and more
environmentally sustainable than average. Comparatively, smaller farms and to a certain
extent family driven farms show a lower environmental sustainability. Productivity is
correlated positively with land endowment but not significantly with the share of hired
labour. For crop farms in Sweden, crop farms producing more environmentally sustainably
are also found to exhibit higher productivity, ceteris paribus.
Table 12.4. Multiple characteristics of Swedish crop farms, by class
Deviations from sample means1, 1997 to 2017
Class 1: Medium productive (25.1%)
Class 2: Most productive (34.3%)
Class 3: Least productive (40.6%)
Farm structure
Family/hired labour ratio 0.0239 0.0644 -0.0692
Land (ha) -0.0422 0.3636 -0.2812
Form of ownership (1-family farms, 2-partnerships, 3-other)
-0.5021 0.2682 0.0831
Environmental sustainability
Chemicals use (EUR per ha) 0.2099 -0.0683 -0.0717
Organic production (1=yes, 0=no) -0.2943 0.1798 0.0296
Fuel per ha (EUR per ha) 0.1900 -0.0623 -0.0645
Environmental subsidies per ha (EUR per ha) -0.2111 0.1610 -0.0058
Innovation-commercialisation
Net investment ratio (per total assets) -0.0202 0.1896 -0.1477
Share contract farming 0.0790 0.2899 -0.2937
Share land rented -0.1087 0.4138 -0.2826
Biofuel income (EUR) -0.0743 0.1265 -0.0611
Miscellaneous income (EUR) 0.0425 -0.0158 -0.0129
Technology
Capital / labour ratio (EUR per AWU) 0.1756 0.1569 -0.2409
Capital per land (EUR per ha) 0.2449 -0.0652 -0.0960
Labour per land (AWU per ha) 0.2171 -0.0766 -0.0692
Materials per land (EUR per ha) 0.3925 0.0813 -0.1910
Diversity

134 TAD/CA/APM/WP(2020)2/PART2/FINAL
DRIVERS OF FARM PERFORMANCE Unclassified
Herfindahl Index (sqrt[Σ(yi/Y)2]) 0.8154 -0.1732 -0.3566
Production diversity (yc/ΣY) 0.5689 0.1600 -0.4862
Individual
Age (years) 0.0278 0.0143 -0.0293
Gender (1-female, 0-male) -0.3183 0.0508 0.1534
Education -0.2936 0.0715 0.1207
Location
Subregion 1 -0.0410 0.0055 0.0206
Subregion 2 0.0000 0.0000 0.0000
Subregion 3 -0.0155 -0.0050 0.0138
Subregion 4 0.0446 -0.0218 -0.0091
Subregion 5 0.0004 0.0058 -0.0051
Subregion 6 -0.0364 0.1172 -0.0766
Subregion 7 -0.0352 -0.0151 0.0345
Subregion 8 -0.0190 0.0992 -0.0722
Subregion 9 -0.1243 0.0821 0.0073
Subregion 10 0.0679 -0.0078 -0.0353
Subregion 11 0.0260 -0.0309 0.0101
Subregion 12 -0.0624 -0.0314 0.0650
Subregion 13 -0.1108 0.0049 0.0642
Subregion 14 -0.0900 -0.0185 0.0712
Subregion 15 -0.0187 0.0035 0.0086
Subregion 16 -0.0900 0.0182 0.0402
Subregion 17 0.0905 -0.0357 -0.0256
Subregion 18 0.2195 -0.0677 -0.0782
Subregion 19 0.1396 0.0040 -0.0895
Subregion 20 -0.1122 -0.0275 0.0925
Subregion 21 0.0623 -0.0389 -0.0055
Subregion 22 0.1337 -0.0284 -0.0585
Subregion 23 -0.0089 -0.0376 0.0372
Subregion 24 -0.0404 0.0101 0.0164
Subregion 25 -0.0468 -0.0639 0.0829
(all: 1=yes, 0=no)
Altitude (1- <300m, 2- 300-600m, 3- >600m) 0.1179 -0.0259 -0.0509
Less favoured area payments (EUR) -0.1839 0.0719 0.0527
Household
Off-farm income share -0.1935 -0.2426 0.3244
Spouse labour (AWU -0.0961 0.0388 0.0265
Relative labour (AWU) 0.0118 0.0775 -0.0727
Financial
Total assets (EUR) 0.1133 0.3191 -0.3396
Total subsidies (EUR) -0.1593 0.0477 0.0579
Equity/debt ratio -0.1142 -0.1147 0.1674
Note: AWU: Annual Work Unit. 1. Deviations from sample means (=0), z-scores based, scaled values.
Source: Estimations.

TAD/CA/APM/WP(2020)2/PART2/FINAL 135
DRIVERS OF FARM PERFORMANCE Unclassified
13. United Kingdom
341. For the United Kingdom, the analysis applies to a sample of crop farms, dairy
farms, pig farms and mixed farms, all covering the period 1995 to 2017.
13.1. UK dairy farms
342. According to Table A D.13.1, which contains descriptive statistical measures for
the sample, the average milk output per farm in 2017 was about GBP 374 000 (with a total
output of about GBP 496 000). The variable cost items increased over time and the share
of hired labour significantly increases for the average UK dairy farm in the period
investigated. The average herd size was about 170 dairy cows in 2017, against about
96 cows in 1995. The average stocking density decreased from 1.24 LU per ha in 1995 to
1.41 LU per ha in 2017.
343. In the model used to estimate the technology and the Class identification
components for the UK dairy production the output variable is total output per farm and
year and input variables are land, dairy cows, capital, labour and materials. The
Class identification component is based on the indices related to structure, environmental
sustainability, innovation, technology, diversity, individual, location, household and
financial aspects (Table A D.13.2).
344. For UK dairy farms, three distinct technology classes emerge from the model
estimates (Table A D.13.2). The individual farms are distributed unevenly across the three
technology classes (Table 13.1), with Class 2 including over half of all farms.
345. Dairy farms in Class 2 show a higher productivity performance — measured as the
potential output levels that could be achieved with a given input bundle, in value per year —
than their milk-producing counterparts in classes 1 and 3 (Figure 13.1). Dairy farms in
Class 2 produce per farm and year broadly twice the output of farms in classes 1 and 3,
although farms in Class 3 have a slightly higher productivity than farms in Class 1.
346. All three farm classes show significant positive technical change, but the growth
rate for the least productive farms in Class 1 is higher than that for other classes, suggesting
that they will catch up over time with both farms in Class 2 and farms in Class 3, ceteris
paribus. At the same time, farms in Class 3 will see their productivity deteriorating against
that in other farm classes, as they have the lowest rate of technical change (Figure 12.1).
347. If dairy farms in Class 1 and Class 3 produced with the technology of farms in
Class 2, they would be able to increase their productivity by 127% and 76% respectively.
As with developments in technical change, this suggests that technologies in Class 1 and
Class 3 differ significantly, although current productivity levels are close (Table 13.1).
Overall, the adoption of Class 2 technologies by all farms would result in an average 30%
increase in productivity for UK dairy farms (Table A C.4 in Part 1).

136 TAD/CA/APM/WP(2020)2/PART2/FINAL
DRIVERS OF FARM PERFORMANCE Unclassified
Figure 13.1. Productivity and technical change for UK dairy farms,
by class, 1995 to 2017
Source: Own estimations based on latent class model estimates and derivatives.
Table 13.1. Productivity characteristics of UK dairy farms, by class
Latent Class Estimation, Panel 1995 to 2017
Class 1 Class 2 Class 3
Number of observations (% of sample farms) 27.6% 54.9% 17.5%
Prior probability of class membership 0.2480 0.4210 0.3310
Posterior probability of class membership 0.3657 0.4039 0.2305
Productivity level (EUR per year)1
- Class 1 Technology 117 966*** 77 034*** 57 331***
- Class 2 Technology 268 069*** 256 577*** 252 382***
- Class 3 Technology 133 372*** 140 730*** 143 315***
Technical Change (% per year)
- Class 1 Technology 2.310*** 3.067*** 3.038***
- Class 2 Technology 1.500*** 1.956*** 1.794***
- Class 3 Technology 0.199*** 2.670*** 0.317*
Note: 1. Fitted values at sample means, 2- * significant at 10%, ** significant at 5%, *** significant at 1%.
Source: Estimations.
348. The estimated production functions for each farm class are highly significant and
dairy farms in classes 2 and 3 exhibit increasing returns to scale of 1.0856 and 1.0345
respectively. However, dairy farms in Class 1 show significantly decreasing returns to scale
of 0.7602 (Table A D.13.4).
349. Figure 13.2 summarises the various dairy farm classes in terms of estimated
indices, while Table 13.2 contains the estimates for variables used to construct the indices.
350. Class 1 farms are the most environmentally sustainable and least productive ones.
They are smaller, more family-oriented and specialised farms, which are more likely to
adopt agri-environmental practices and have land in less favoured areas. They are less
2.31
1.96
0.32
0
0.5
1
1.5
2
2.5
0
50
100
150
200
250
300
350
Class 1 (27.6%) Class 2 (54.9%) Class 3 (17.5%)
%EUR '000
Productivity level (EUR '000) Technical change (% per year)
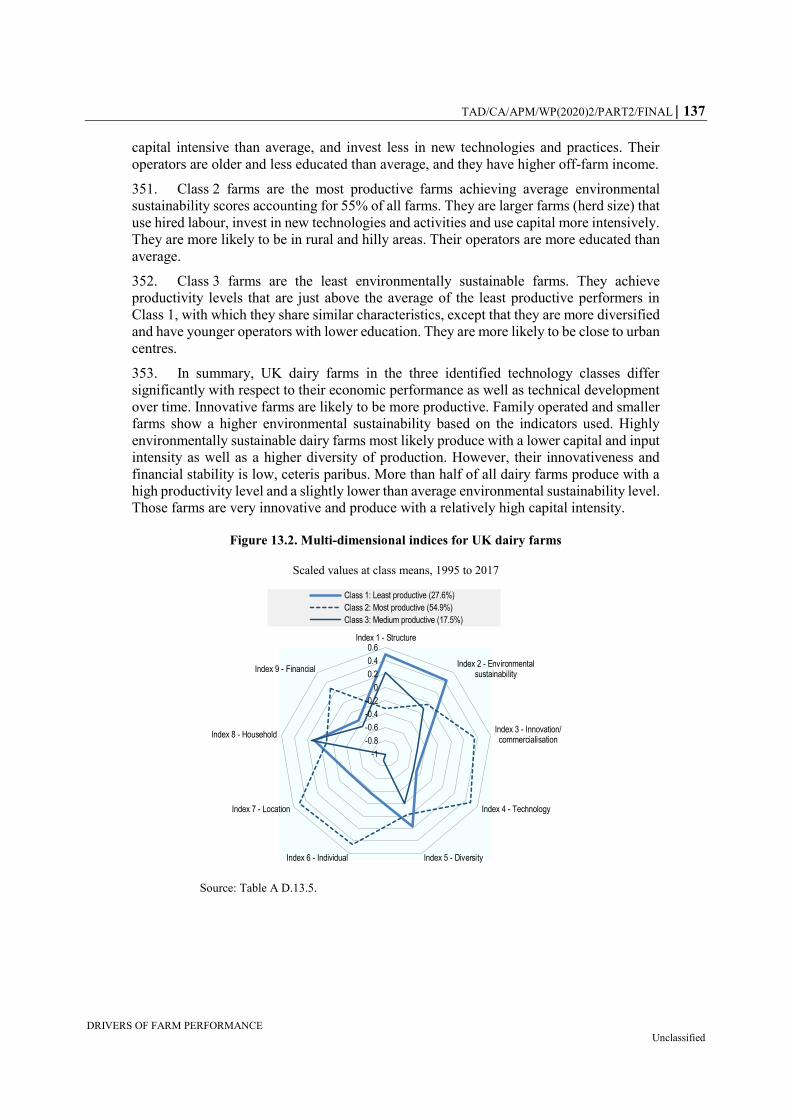
TAD/CA/APM/WP(2020)2/PART2/FINAL 137
DRIVERS OF FARM PERFORMANCE Unclassified
capital intensive than average, and invest less in new technologies and practices. Their
operators are older and less educated than average, and they have higher off-farm income.
351. Class 2 farms are the most productive farms achieving average environmental
sustainability scores accounting for 55% of all farms. They are larger farms (herd size) that
use hired labour, invest in new technologies and activities and use capital more intensively.
They are more likely to be in rural and hilly areas. Their operators are more educated than
average.
352. Class 3 farms are the least environmentally sustainable farms. They achieve
productivity levels that are just above the average of the least productive performers in
Class 1, with which they share similar characteristics, except that they are more diversified
and have younger operators with lower education. They are more likely to be close to urban
centres.
353. In summary, UK dairy farms in the three identified technology classes differ
significantly with respect to their economic performance as well as technical development
over time. Innovative farms are likely to be more productive. Family operated and smaller
farms show a higher environmental sustainability based on the indicators used. Highly
environmentally sustainable dairy farms most likely produce with a lower capital and input
intensity as well as a higher diversity of production. However, their innovativeness and
financial stability is low, ceteris paribus. More than half of all dairy farms produce with a
high productivity level and a slightly lower than average environmental sustainability level.
Those farms are very innovative and produce with a relatively high capital intensity.
Figure 13.2. Multi-dimensional indices for UK dairy farms
Scaled values at class means, 1995 to 2017
Source: Table A D.13.5.
-1
-0.8
-0.6
-0.4
-0.2
0
0.2
0.4
0.6Index 1 - Structure
Index 2 - Environmentalsustainability
Index 3 - Innovation/commercialisation
Index 4 - Technology
Index 5 - DiversityIndex 6 - Individual
Index 7 - Location
Index 8 - Household
Index 9 - Financial
Class 1: Least productive (27.6%)
Class 2: Most productive (54.9%)
Class 3: Medium productive (17.5%)

138 TAD/CA/APM/WP(2020)2/PART2/FINAL
DRIVERS OF FARM PERFORMANCE Unclassified
Table 13.2. Multiple characteristics of UK dairy farms, by class
Deviations from sample means1, 1995 to 2017
Class 1: Least productive (27.6%)
Class 2: Most productive (54.9%)
Class 3: Medium productive (17.5%)
Farm structure
Family/hired labour ratio 0.2165 -0.1148 0.0188
Number of holdings (1 Sole trader (incl. farmer & spouse partnership) 2 Partnership (other family only) 3 Partnership (other) 4 Farming company 5 Farm company subsidiary)
-0.0123 0.0099 -0.0117
Herd size (LU) -0.4388 0.2871 -0.2085
Form of ownership (1 Sole trader (including farmer and spouse partnership) 2 Partnership (other family only) 3 Partnership (other) 4 Farming company 5 Farm company subsidiary)
-0.1595 0.1194 -0.1230
Environmental sustainability
Stocking density (LU per ha) -0.1507 0.0743 -0.0143
Chemicals use (GBP per ha) 0.1163 -0.0099 -0.0421
Organic production share -0.0106 0.0567 -0.1609
Fuel per LU (GBP per LU) -0.0641 0.0919 -0.1875
Environmental subsidies per ha (GBP per ha) 0.0276 0.0021 -0.0501
Innovation-commercialisation
Net investment ratio (per total assets) -0.1350 0.1026 -0.1090
Share contract farming -0.0191 0.0145 -0.0170
Share land rented -0.0059 -0.0101 0.0412
Biofuel income (GBP) 0.0215 0.0000 -0.0339
Miscellaneous income (GBP) -0.1079 0.1602 -0.3323
Insurance expenses (GBP) -0.3194 0.2657 -0.3296
Professional fees (GBP) -0.2702 0.2023 -0.2084
Technology
Capital / labour ratio (GBP per AWU) -0.1713 0.1821 -0.3011
Capital per cow (GBP per LU) -0.1462 0.1320 -0.1835
Cow per labour (GBP per AWU) -0.1667 0.1105 -0.0839
Fodder per cow (GBP per LU) -0.3105 0.3129 -0.3315
Materials per cow (GBP per LU) -0.2344 0.1984 -0.2528
Diversity
Herfindahl Index (sqrt[Σ(yi/Y)2]) -0.0855 -0.0001 0.1352
Production diversity (yc/ΣY) -0.1677 0.0414 0.1344
Woodland area (ha) -0.0060 0.0016 0.0044
Individual
Age (years) 0.0242 -0.0081 -0.0127
Gender (1-female, 2-male) -0.2613 0.3659 -0.7356
Education (0 School only 1 GCSE or equivalent 2 A level or equivalent 3 College / National Diploma/ certificate 4 Degree 5 Postgraduate qualification 6 Apprenticeship 9 Other)
-0.2525 0.2933 -0.5217

TAD/CA/APM/WP(2020)2/PART2/FINAL 139
DRIVERS OF FARM PERFORMANCE Unclassified
Location
Subregion 1 -0.0070 0.0254 -0.0686
Subregion 2 -0.0159 0.0411 -0.1038
Subregion 3 -0.0435 0.0361 -0.0448
Subregion 4 -0.1208 0.0821 -0.0671
Subregion 5 -0.0791 0.0655 -0.0806
Subregion 6 -0.0581 0.0650 -0.1121
Subregion 7 0.0000 0.0000 0.0000
Subregion 8 -0.1162 0.0379 0.0645
Subregion 9 -0.1196 0.0890 -0.0907
Subregion 10 0.1485 -0.0710 -0.0115
(all: 1=yes, 0=no)
Altitude (1 Most of holding below 300m 2 Most of holding at 300m to 600m 3 Most of holding at 600m or over 4 Data not available)
-0.2307 0.3273 -0.6628
Less favoured area (1 All land outside LFA 2 All land inside SDA 3 All land inside DA 4 50% + in LFA of which 50% + in SDA 5 50% + in LFA of which 50% + in DA 6 <50% in LFA of which 50% + in SDA 7 <50% in LFA of which 50% + in DA)
0.2180 -0.0972 -0.0388
Rural-urban classification (1 Urban > 10k – sparse 2 Town and fringe – sparse 3 Village - sparse 4 Hamlet & isolated dwellings - sparse 5 Urban > 10k – less sparse 6 Town & fringe – less sparse 7 Village – less sparse 8 Hamlet & isolated dwellings – less sparse)
-0.2934 0.3711 -0.7013
Household
Off-farm income share 0.1494 -0.0990 0.0751
Labour spouse (AWU) 0.0273 0.0244 -0.1196
Financial
Total assets (GBP) -0.3441 0.2736 -0.3154
Total subsidies (GBP) 0.1648 -0.1728 0.2821
Equity/debt ratio -0.0002 -0.0026 0.0100
Note: LU: Livestock Unit. AWU: Annual Work Unit.
1. Deviations from sample means (=0), z-scores based, scaled values.
Source: Estimations.
13.2. UK cereal farms
354. According to Table A.B.13.6, which contains descriptive statistical measures for
the sample, the average crop output per farm was about GBP 356 000 in 2017 (with a total
output of about GBP 506 000). The variable cost items increased over time and the share
of hired labour significantly increases for the average UK crop farm. The average farm
operated about 283 ha in 2017 (an increase from an average of about 208 ha in 1995).
355. In the model used to estimate the technology and the Class identification
components for the UK cereal production the output variable is total output per farm and
year and input variables are land, capital, labour, chemicals, and materials. The
Class identification component is based on the indices related to structure, environmental
sustainability, innovation, technology, diversity, individual, location, household and
financial aspects (Table A D.13.2).
356. For UK cereal farms, three distinct technology classes emerge from the model
estimates (Table A D.13.2). The individual farms are distributed unevenly across the three
technology classes (Table 13.3), with Class 2 including only 8% of all farms, while the
remaining farms are shared evenly between Class 1 and Class 3.
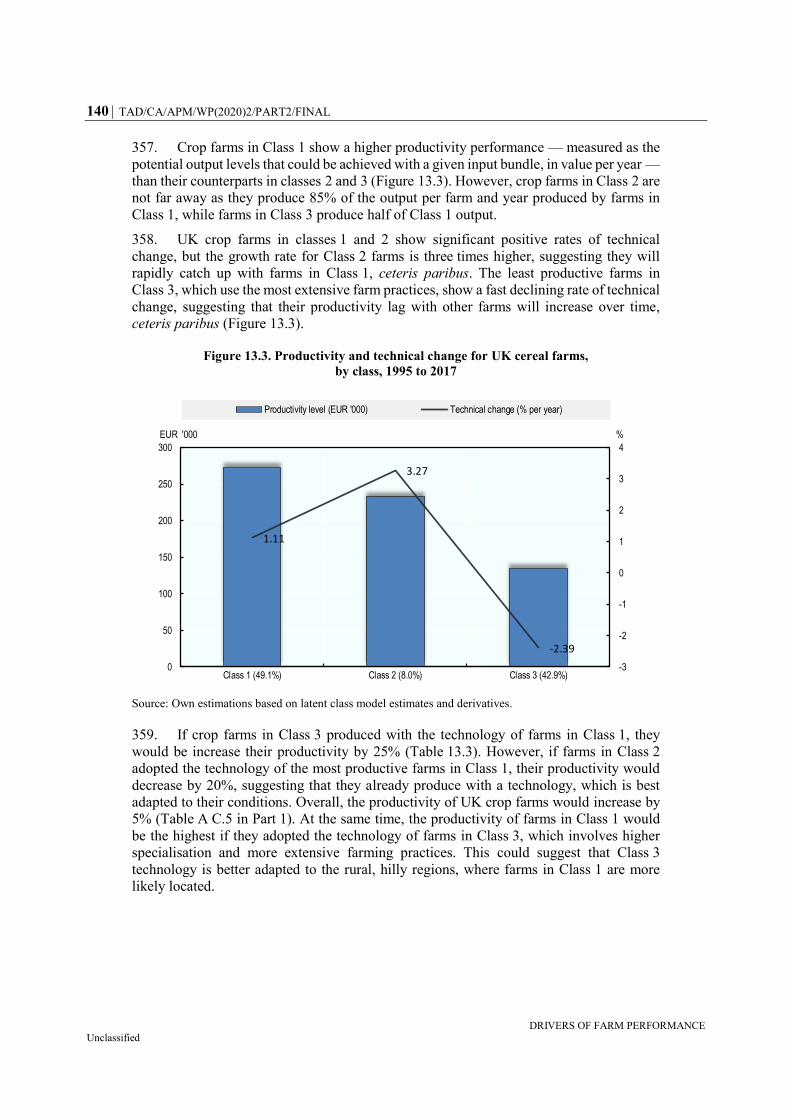
140 TAD/CA/APM/WP(2020)2/PART2/FINAL
DRIVERS OF FARM PERFORMANCE Unclassified
357. Crop farms in Class 1 show a higher productivity performance — measured as the
potential output levels that could be achieved with a given input bundle, in value per year —
than their counterparts in classes 2 and 3 (Figure 13.3). However, crop farms in Class 2 are
not far away as they produce 85% of the output per farm and year produced by farms in
Class 1, while farms in Class 3 produce half of Class 1 output.
358. UK crop farms in classes 1 and 2 show significant positive rates of technical
change, but the growth rate for Class 2 farms is three times higher, suggesting they will
rapidly catch up with farms in Class 1, ceteris paribus. The least productive farms in
Class 3, which use the most extensive farm practices, show a fast declining rate of technical
change, suggesting that their productivity lag with other farms will increase over time,
ceteris paribus (Figure 13.3).
Figure 13.3. Productivity and technical change for UK cereal farms,
by class, 1995 to 2017
Source: Own estimations based on latent class model estimates and derivatives.
359. If crop farms in Class 3 produced with the technology of farms in Class 1, they
would be increase their productivity by 25% (Table 13.3). However, if farms in Class 2
adopted the technology of the most productive farms in Class 1, their productivity would
decrease by 20%, suggesting that they already produce with a technology, which is best
adapted to their conditions. Overall, the productivity of UK crop farms would increase by
5% (Table A C.5 in Part 1). At the same time, the productivity of farms in Class 1 would
be the highest if they adopted the technology of farms in Class 3, which involves higher
specialisation and more extensive farming practices. This could suggest that Class 3
technology is better adapted to the rural, hilly regions, where farms in Class 1 are more
likely located.
1.11
3.27
-2.39
-3
-2
-1
0
1
2
3
4
0
50
100
150
200
250
300
Class 1 (49.1%) Class 2 (8.0%) Class 3 (42.9%)
%EUR '000
Productivity level (EUR '000) Technical change (% per year)
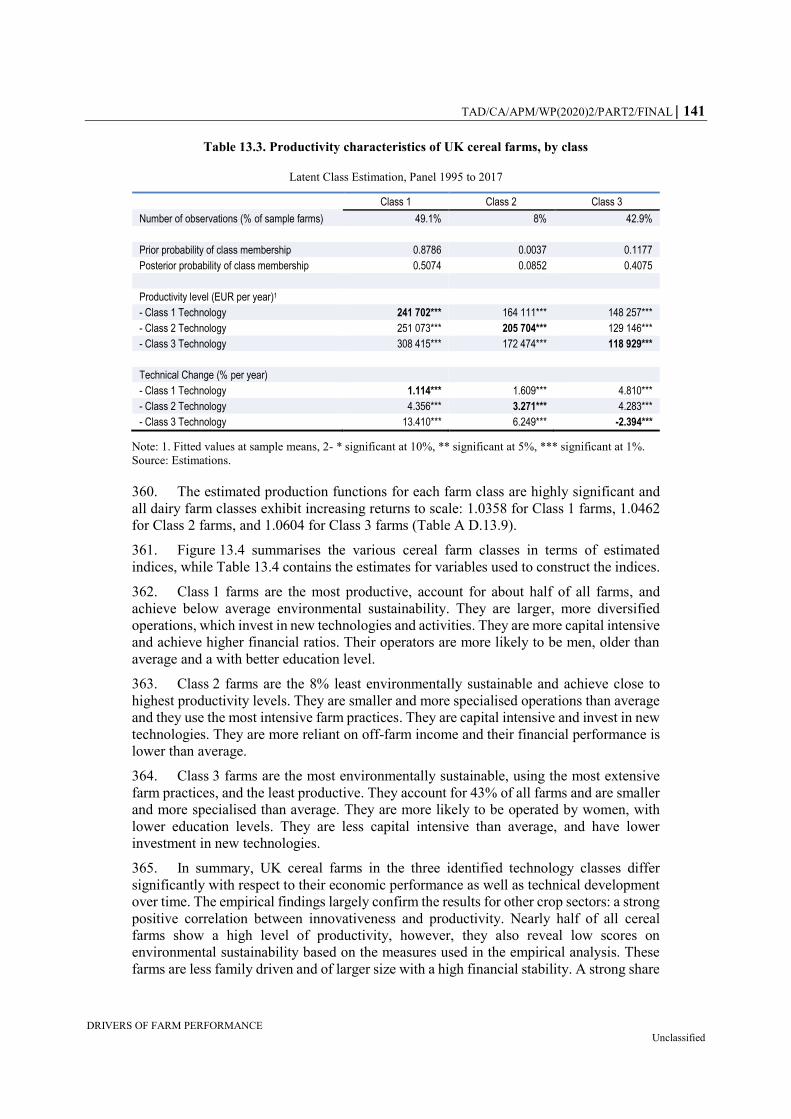
TAD/CA/APM/WP(2020)2/PART2/FINAL 141
DRIVERS OF FARM PERFORMANCE Unclassified
Table 13.3. Productivity characteristics of UK cereal farms, by class
Latent Class Estimation, Panel 1995 to 2017
Class 1 Class 2 Class 3
Number of observations (% of sample farms) 49.1% 8% 42.9%
Prior probability of class membership 0.8786 0.0037 0.1177
Posterior probability of class membership 0.5074 0.0852 0.4075
Productivity level (EUR per year)1
- Class 1 Technology 241 702*** 164 111*** 148 257***
- Class 2 Technology 251 073*** 205 704*** 129 146***
- Class 3 Technology 308 415*** 172 474*** 118 929***
Technical Change (% per year)
- Class 1 Technology 1.114*** 1.609*** 4.810***
- Class 2 Technology 4.356*** 3.271*** 4.283***
- Class 3 Technology 13.410*** 6.249*** -2.394***
Note: 1. Fitted values at sample means, 2- * significant at 10%, ** significant at 5%, *** significant at 1%.
Source: Estimations.
360. The estimated production functions for each farm class are highly significant and
all dairy farm classes exhibit increasing returns to scale: 1.0358 for Class 1 farms, 1.0462
for Class 2 farms, and 1.0604 for Class 3 farms (Table A D.13.9).
361. Figure 13.4 summarises the various cereal farm classes in terms of estimated
indices, while Table 13.4 contains the estimates for variables used to construct the indices.
362. Class 1 farms are the most productive, account for about half of all farms, and
achieve below average environmental sustainability. They are larger, more diversified
operations, which invest in new technologies and activities. They are more capital intensive
and achieve higher financial ratios. Their operators are more likely to be men, older than
average and a with better education level.
363. Class 2 farms are the 8% least environmentally sustainable and achieve close to
highest productivity levels. They are smaller and more specialised operations than average
and they use the most intensive farm practices. They are capital intensive and invest in new
technologies. They are more reliant on off-farm income and their financial performance is
lower than average.
364. Class 3 farms are the most environmentally sustainable, using the most extensive
farm practices, and the least productive. They account for 43% of all farms and are smaller
and more specialised than average. They are more likely to be operated by women, with
lower education levels. They are less capital intensive than average, and have lower
investment in new technologies.
365. In summary, UK cereal farms in the three identified technology classes differ
significantly with respect to their economic performance as well as technical development
over time. The empirical findings largely confirm the results for other crop sectors: a strong
positive correlation between innovativeness and productivity. Nearly half of all cereal
farms show a high level of productivity, however, they also reveal low scores on
environmental sustainability based on the measures used in the empirical analysis. These
farms are less family driven and of larger size with a high financial stability. A strong share
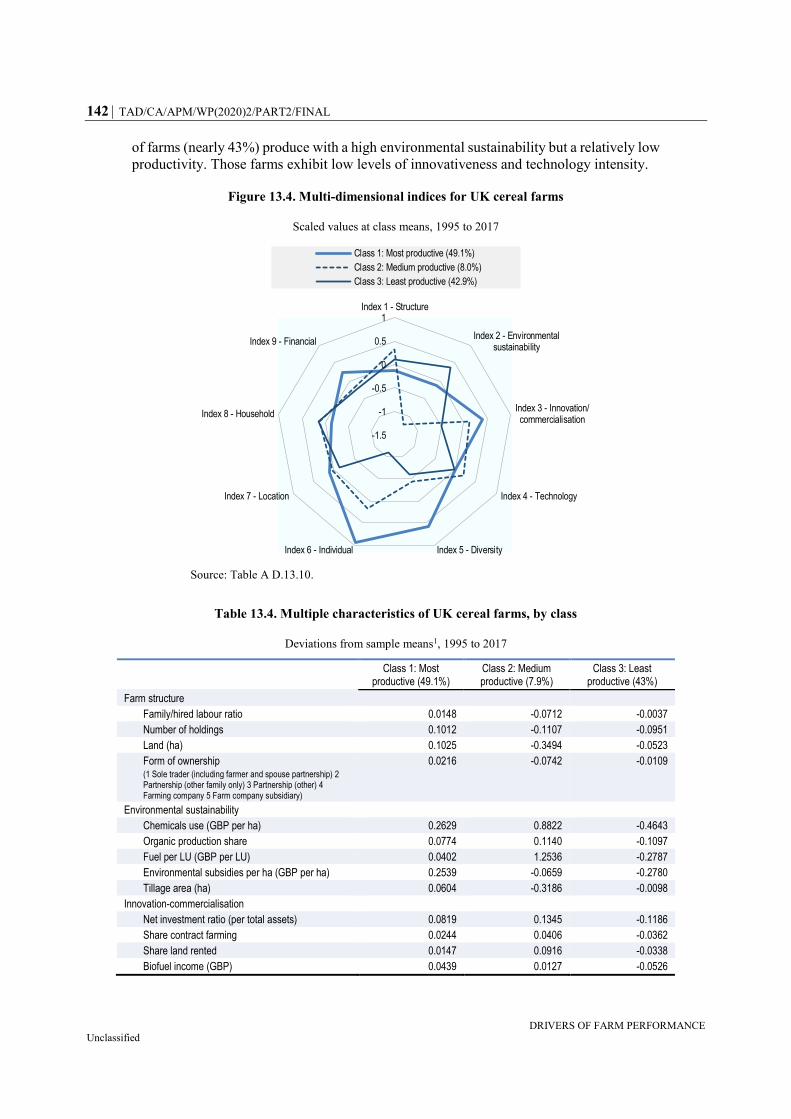
142 TAD/CA/APM/WP(2020)2/PART2/FINAL
DRIVERS OF FARM PERFORMANCE Unclassified
of farms (nearly 43%) produce with a high environmental sustainability but a relatively low
productivity. Those farms exhibit low levels of innovativeness and technology intensity.
Figure 13.4. Multi-dimensional indices for UK cereal farms
Scaled values at class means, 1995 to 2017
Source: Table A D.13.10.
Table 13.4. Multiple characteristics of UK cereal farms, by class
Deviations from sample means1, 1995 to 2017
Class 1: Most productive (49.1%)
Class 2: Medium productive (7.9%)
Class 3: Least productive (43%)
Farm structure
Family/hired labour ratio 0.0148 -0.0712 -0.0037
Number of holdings 0.1012 -0.1107 -0.0951
Land (ha) 0.1025 -0.3494 -0.0523
Form of ownership (1 Sole trader (including farmer and spouse partnership) 2 Partnership (other family only) 3 Partnership (other) 4 Farming company 5 Farm company subsidiary)
0.0216 -0.0742 -0.0109
Environmental sustainability
Chemicals use (GBP per ha) 0.2629 0.8822 -0.4643
Organic production share 0.0774 0.1140 -0.1097
Fuel per LU (GBP per LU) 0.0402 1.2536 -0.2787
Environmental subsidies per ha (GBP per ha) 0.2539 -0.0659 -0.2780
Tillage area (ha) 0.0604 -0.3186 -0.0098
Innovation-commercialisation
Net investment ratio (per total assets) 0.0819 0.1345 -0.1186
Share contract farming 0.0244 0.0406 -0.0362
Share land rented 0.0147 0.0916 -0.0338
Biofuel income (GBP) 0.0439 0.0127 -0.0526
-1.5
-1
-0.5
0
0.5
1Index 1 - Structure
Index 2 - Environmentalsustainability
Index 3 - Innovation/commercialisation
Index 4 - Technology
Index 5 - DiversityIndex 6 - Individual
Index 7 - Location
Index 8 - Household
Index 9 - Financial
Class 1: Most productive (49.1%)
Class 2: Medium productive (8.0%)
Class 3: Least productive (42.9%)
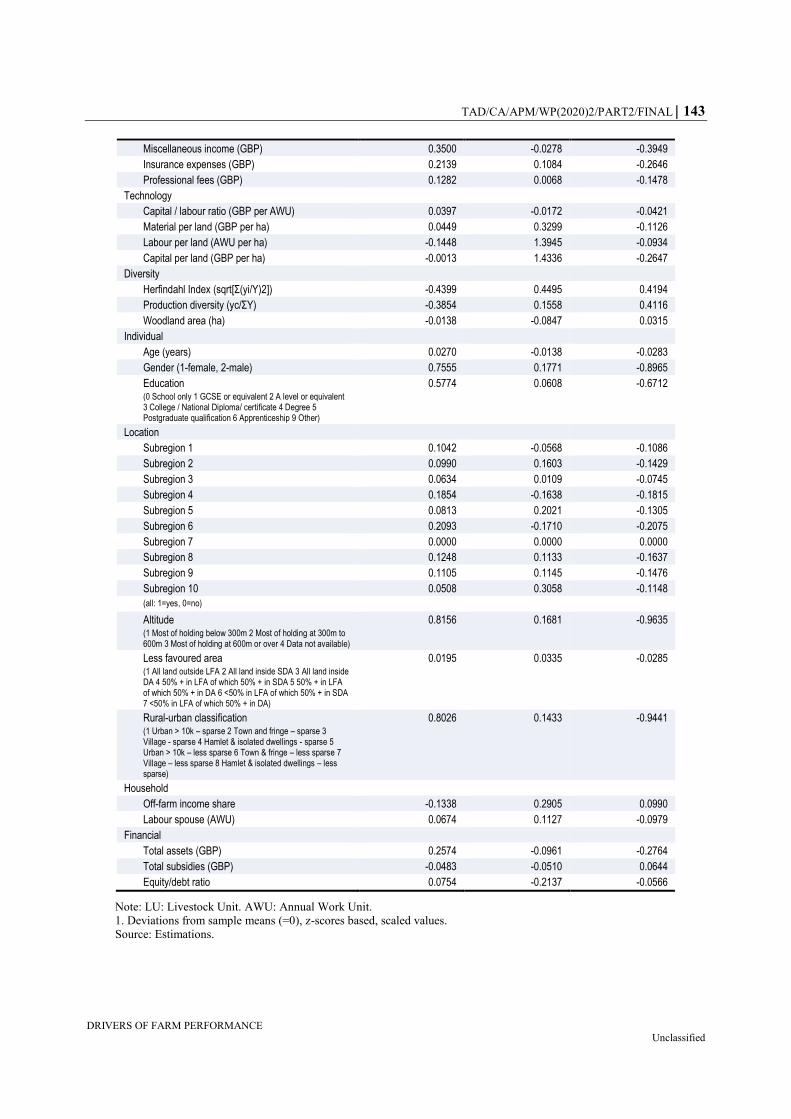
TAD/CA/APM/WP(2020)2/PART2/FINAL 143
DRIVERS OF FARM PERFORMANCE Unclassified
Miscellaneous income (GBP) 0.3500 -0.0278 -0.3949
Insurance expenses (GBP) 0.2139 0.1084 -0.2646
Professional fees (GBP) 0.1282 0.0068 -0.1478
Technology
Capital / labour ratio (GBP per AWU) 0.0397 -0.0172 -0.0421
Material per land (GBP per ha) 0.0449 0.3299 -0.1126
Labour per land (AWU per ha) -0.1448 1.3945 -0.0934
Capital per land (GBP per ha) -0.0013 1.4336 -0.2647
Diversity
Herfindahl Index (sqrt[Σ(yi/Y)2]) -0.4399 0.4495 0.4194
Production diversity (yc/ΣY) -0.3854 0.1558 0.4116
Woodland area (ha) -0.0138 -0.0847 0.0315
Individual
Age (years) 0.0270 -0.0138 -0.0283
Gender (1-female, 2-male) 0.7555 0.1771 -0.8965
Education (0 School only 1 GCSE or equivalent 2 A level or equivalent 3 College / National Diploma/ certificate 4 Degree 5 Postgraduate qualification 6 Apprenticeship 9 Other)
0.5774 0.0608 -0.6712
Location
Subregion 1 0.1042 -0.0568 -0.1086
Subregion 2 0.0990 0.1603 -0.1429
Subregion 3 0.0634 0.0109 -0.0745
Subregion 4 0.1854 -0.1638 -0.1815
Subregion 5 0.0813 0.2021 -0.1305
Subregion 6 0.2093 -0.1710 -0.2075
Subregion 7 0.0000 0.0000 0.0000
Subregion 8 0.1248 0.1133 -0.1637
Subregion 9 0.1105 0.1145 -0.1476
Subregion 10 0.0508 0.3058 -0.1148
(all: 1=yes, 0=no)
Altitude (1 Most of holding below 300m 2 Most of holding at 300m to 600m 3 Most of holding at 600m or over 4 Data not available)
0.8156 0.1681 -0.9635
Less favoured area (1 All land outside LFA 2 All land inside SDA 3 All land inside DA 4 50% + in LFA of which 50% + in SDA 5 50% + in LFA of which 50% + in DA 6 <50% in LFA of which 50% + in SDA 7 <50% in LFA of which 50% + in DA)
0.0195 0.0335 -0.0285
Rural-urban classification (1 Urban > 10k – sparse 2 Town and fringe – sparse 3 Village - sparse 4 Hamlet & isolated dwellings - sparse 5 Urban > 10k – less sparse 6 Town & fringe – less sparse 7 Village – less sparse 8 Hamlet & isolated dwellings – less sparse)
0.8026 0.1433 -0.9441
Household
Off-farm income share -0.1338 0.2905 0.0990
Labour spouse (AWU) 0.0674 0.1127 -0.0979
Financial
Total assets (GBP) 0.2574 -0.0961 -0.2764
Total subsidies (GBP) -0.0483 -0.0510 0.0644
Equity/debt ratio 0.0754 -0.2137 -0.0566
Note: LU: Livestock Unit. AWU: Annual Work Unit.
1. Deviations from sample means (=0), z-scores based, scaled values.
Source: Estimations.

144 TAD/CA/APM/WP(2020)2/PART2/FINAL
DRIVERS OF FARM PERFORMANCE Unclassified
13.3. UK mixed crop and livestock farms
366. According to Table A D.13.11, which contains descriptive statistical measures for
the sample, the average total output per farm was about GBP 357 000 in 2017 (about
GBP 223 000 in 1995). The variable cost items increased over time and the share of hired
labour increases for the average UK mixed farm over the period investigated. The average
mixed farm cultivated about 198 ha in 2017 and operated a total herd size of about 149 LU
(against 156 ha and 184 LU in 1995).
367. In the model used to estimate the technology and the Class identification
components for the UK crop and meat production the output variable is total output per
farm and year and input variables are land, capital, labour, and livestock units. The
Class identification component is based on the indices related to structure, environmental
sustainability, innovation, technology, diversity, individual, location, household and
financial aspects (Table A D.13.12).
368. For UK mixed crop and livestock farms, three distinct technology classes emerge
from the model estimates (Table A D.13.12). The individual farms are distributed relatively
evenly across the three technology classes (Table 13.5), although Class 3 is larger than the
other two classes.
369. Crop and livestock farms in Class 1 achieve a higher productivity performance —
measured as the potential output levels that could be achieved with a given input bundle,
in value per year — than their counterparts in classes 2 and 3 (Figure 13.5). Farms in
Class 1 produce about 3 times more than farms in Class 2, and twice as much as farms in
Class 3.
370. Farms in Class 3 show a significantly positive technical change, which growth
twice as fast as that for farms in Class 1, suggesting that the productivity difference between
the two classes will narrow over time. But the performance gap between farms in Class 2
and other crop and livestock farms in the UK is increasing as the former experience a
significant, negative technical change, ceteris paribus (Figure 13.5).
Figure 13.5. Productivity and technical change for UK mixed crop and livestock farms,
by class, 1995 to 2017
Source: Own estimations based on latent class model estimates and derivatives.
0.94
-1.96
2.10
-2.5
-2
-1.5
-1
-0.5
0
0.5
1
1.5
2
2.5
0
50
100
150
200
250
300
350
400
Class 1 (28.3% of farms) Class 2 (29.2% of farms) Class 3 (42.5% of farms)
%EUR '000
Productivity level (EUR '000) Technical change (% per year)
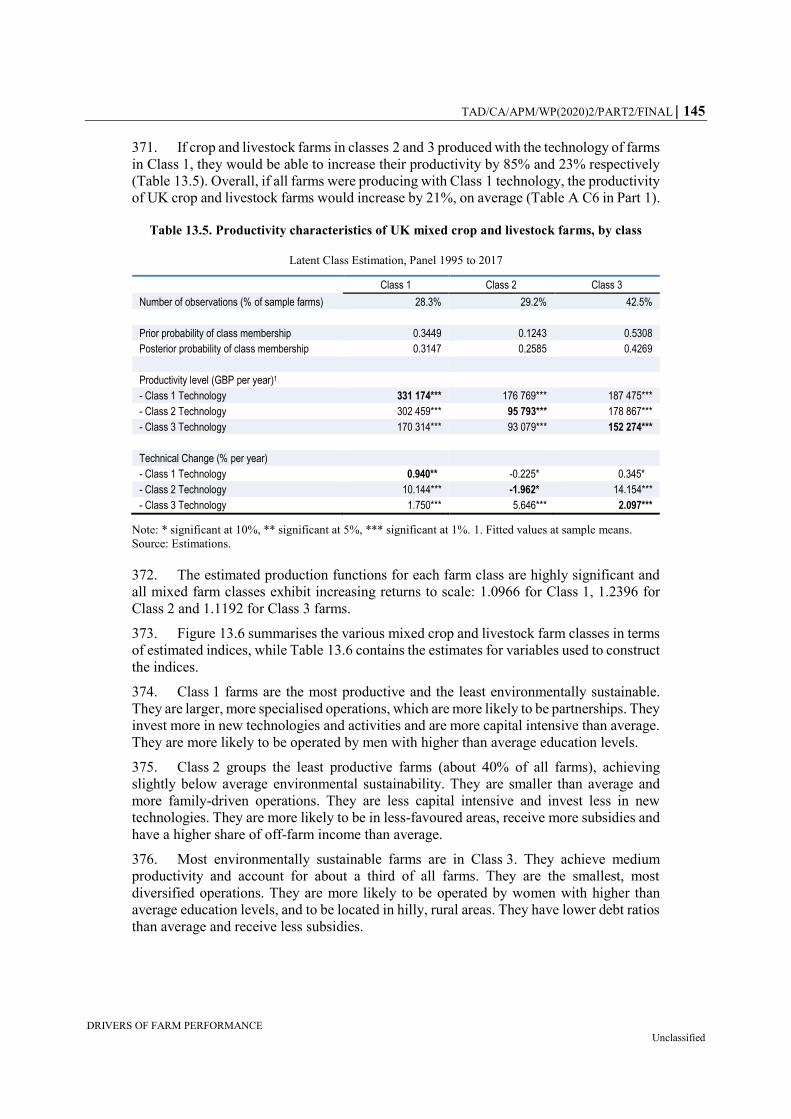
TAD/CA/APM/WP(2020)2/PART2/FINAL 145
DRIVERS OF FARM PERFORMANCE Unclassified
371. If crop and livestock farms in classes 2 and 3 produced with the technology of farms
in Class 1, they would be able to increase their productivity by 85% and 23% respectively
(Table 13.5). Overall, if all farms were producing with Class 1 technology, the productivity
of UK crop and livestock farms would increase by 21%, on average (Table A C6 in Part 1).
Table 13.5. Productivity characteristics of UK mixed crop and livestock farms, by class
Latent Class Estimation, Panel 1995 to 2017
Class 1 Class 2 Class 3
Number of observations (% of sample farms) 28.3% 29.2% 42.5%
Prior probability of class membership 0.3449 0.1243 0.5308
Posterior probability of class membership 0.3147 0.2585 0.4269
Productivity level (GBP per year)1
- Class 1 Technology 331 174*** 176 769*** 187 475***
- Class 2 Technology 302 459*** 95 793*** 178 867***
- Class 3 Technology 170 314*** 93 079*** 152 274***
Technical Change (% per year)
- Class 1 Technology 0.940** -0.225* 0.345*
- Class 2 Technology 10.144*** -1.962* 14.154***
- Class 3 Technology 1.750*** 5.646*** 2.097***
Note: * significant at 10%, ** significant at 5%, *** significant at 1%. 1. Fitted values at sample means.
Source: Estimations.
372. The estimated production functions for each farm class are highly significant and
all mixed farm classes exhibit increasing returns to scale: 1.0966 for Class 1, 1.2396 for
Class 2 and 1.1192 for Class 3 farms.
373. Figure 13.6 summarises the various mixed crop and livestock farm classes in terms
of estimated indices, while Table 13.6 contains the estimates for variables used to construct
the indices.
374. Class 1 farms are the most productive and the least environmentally sustainable.
They are larger, more specialised operations, which are more likely to be partnerships. They
invest more in new technologies and activities and are more capital intensive than average.
They are more likely to be operated by men with higher than average education levels.
375. Class 2 groups the least productive farms (about 40% of all farms), achieving
slightly below average environmental sustainability. They are smaller than average and
more family-driven operations. They are less capital intensive and invest less in new
technologies. They are more likely to be in less-favoured areas, receive more subsidies and
have a higher share of off-farm income than average.
376. Most environmentally sustainable farms are in Class 3. They achieve medium
productivity and account for about a third of all farms. They are the smallest, most
diversified operations. They are more likely to be operated by women with higher than
average education levels, and to be located in hilly, rural areas. They have lower debt ratios
than average and receive less subsidies.
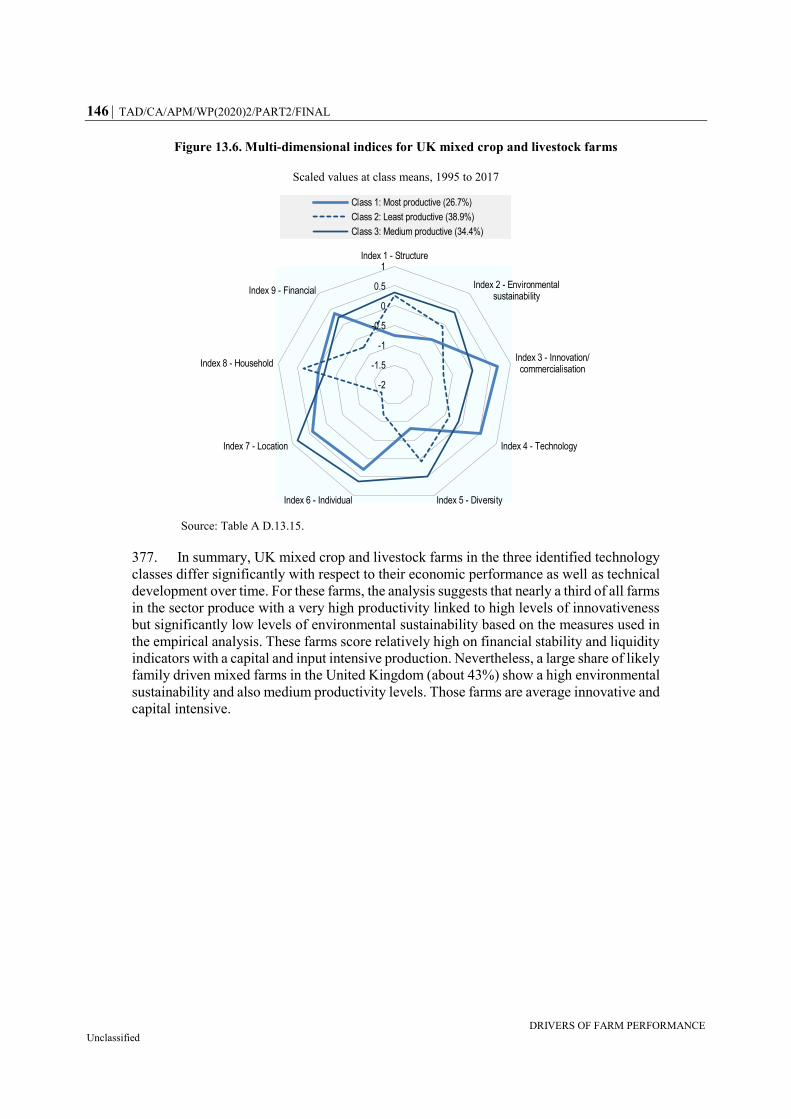
146 TAD/CA/APM/WP(2020)2/PART2/FINAL
DRIVERS OF FARM PERFORMANCE Unclassified
Figure 13.6. Multi-dimensional indices for UK mixed crop and livestock farms
Scaled values at class means, 1995 to 2017
Source: Table A D.13.15.
377. In summary, UK mixed crop and livestock farms in the three identified technology
classes differ significantly with respect to their economic performance as well as technical
development over time. For these farms, the analysis suggests that nearly a third of all farms
in the sector produce with a very high productivity linked to high levels of innovativeness
but significantly low levels of environmental sustainability based on the measures used in
the empirical analysis. These farms score relatively high on financial stability and liquidity
indicators with a capital and input intensive production. Nevertheless, a large share of likely
family driven mixed farms in the United Kingdom (about 43%) show a high environmental
sustainability and also medium productivity levels. Those farms are average innovative and
capital intensive.
-2
-1.5
-1
-0.5
0
0.5
1Index 1 - Structure
Index 2 - Environmentalsustainability
Index 3 - Innovation/commercialisation
Index 4 - Technology
Index 5 - DiversityIndex 6 - Individual
Index 7 - Location
Index 8 - Household
Index 9 - Financial
Class 1: Most productive (26.7%)
Class 2: Least productive (38.9%)
Class 3: Medium productive (34.4%)
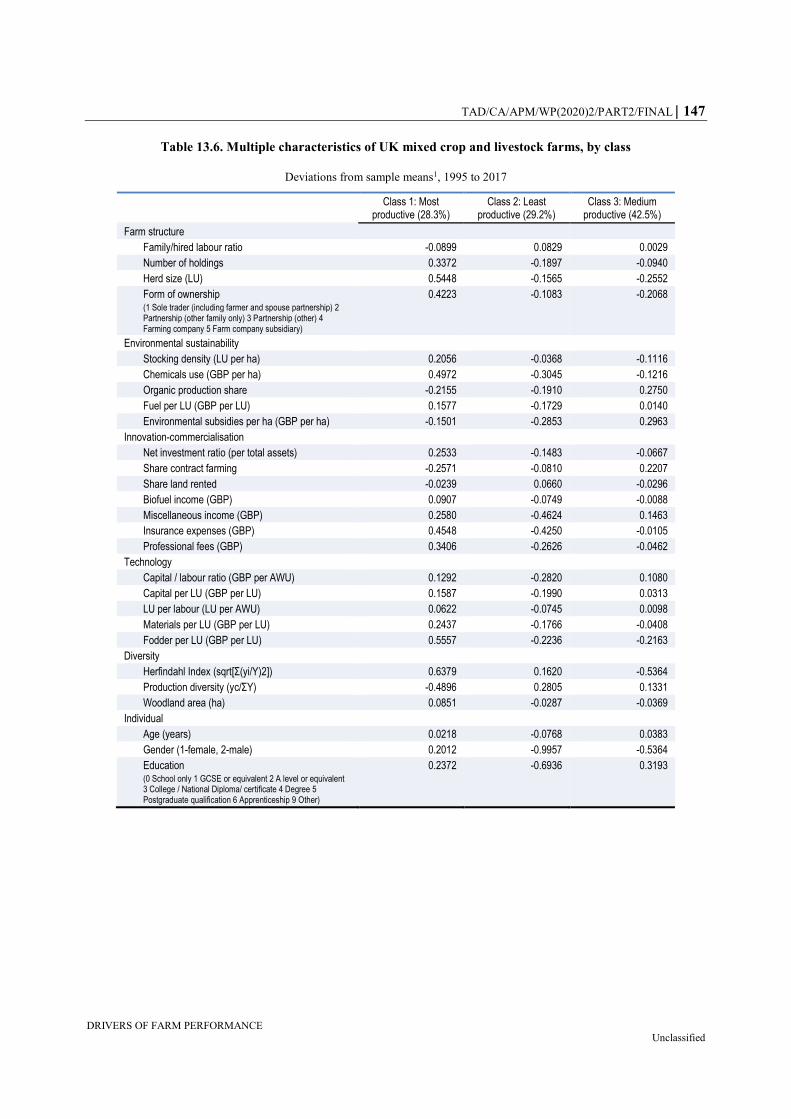
TAD/CA/APM/WP(2020)2/PART2/FINAL 147
DRIVERS OF FARM PERFORMANCE Unclassified
Table 13.6. Multiple characteristics of UK mixed crop and livestock farms, by class
Deviations from sample means1, 1995 to 2017
Class 1: Most productive (28.3%)
Class 2: Least productive (29.2%)
Class 3: Medium productive (42.5%)
Farm structure
Family/hired labour ratio -0.0899 0.0829 0.0029
Number of holdings 0.3372 -0.1897 -0.0940
Herd size (LU) 0.5448 -0.1565 -0.2552
Form of ownership (1 Sole trader (including farmer and spouse partnership) 2 Partnership (other family only) 3 Partnership (other) 4 Farming company 5 Farm company subsidiary)
0.4223 -0.1083 -0.2068
Environmental sustainability
Stocking density (LU per ha) 0.2056 -0.0368 -0.1116
Chemicals use (GBP per ha) 0.4972 -0.3045 -0.1216
Organic production share -0.2155 -0.1910 0.2750
Fuel per LU (GBP per LU) 0.1577 -0.1729 0.0140
Environmental subsidies per ha (GBP per ha) -0.1501 -0.2853 0.2963
Innovation-commercialisation
Net investment ratio (per total assets) 0.2533 -0.1483 -0.0667
Share contract farming -0.2571 -0.0810 0.2207
Share land rented -0.0239 0.0660 -0.0296
Biofuel income (GBP) 0.0907 -0.0749 -0.0088
Miscellaneous income (GBP) 0.2580 -0.4624 0.1463
Insurance expenses (GBP) 0.4548 -0.4250 -0.0105
Professional fees (GBP) 0.3406 -0.2626 -0.0462
Technology
Capital / labour ratio (GBP per AWU) 0.1292 -0.2820 0.1080
Capital per LU (GBP per LU) 0.1587 -0.1990 0.0313
LU per labour (LU per AWU) 0.0622 -0.0745 0.0098
Materials per LU (GBP per LU) 0.2437 -0.1766 -0.0408
Fodder per LU (GBP per LU) 0.5557 -0.2236 -0.2163
Diversity
Herfindahl Index (sqrt[Σ(yi/Y)2]) 0.6379 0.1620 -0.5364
Production diversity (yc/ΣY) -0.4896 0.2805 0.1331
Woodland area (ha) 0.0851 -0.0287 -0.0369
Individual
Age (years) 0.0218 -0.0768 0.0383
Gender (1-female, 2-male) 0.2012 -0.9957 -0.5364
Education (0 School only 1 GCSE or equivalent 2 A level or equivalent 3 College / National Diploma/ certificate 4 Degree 5 Postgraduate qualification 6 Apprenticeship 9 Other)
0.2372 -0.6936 0.3193
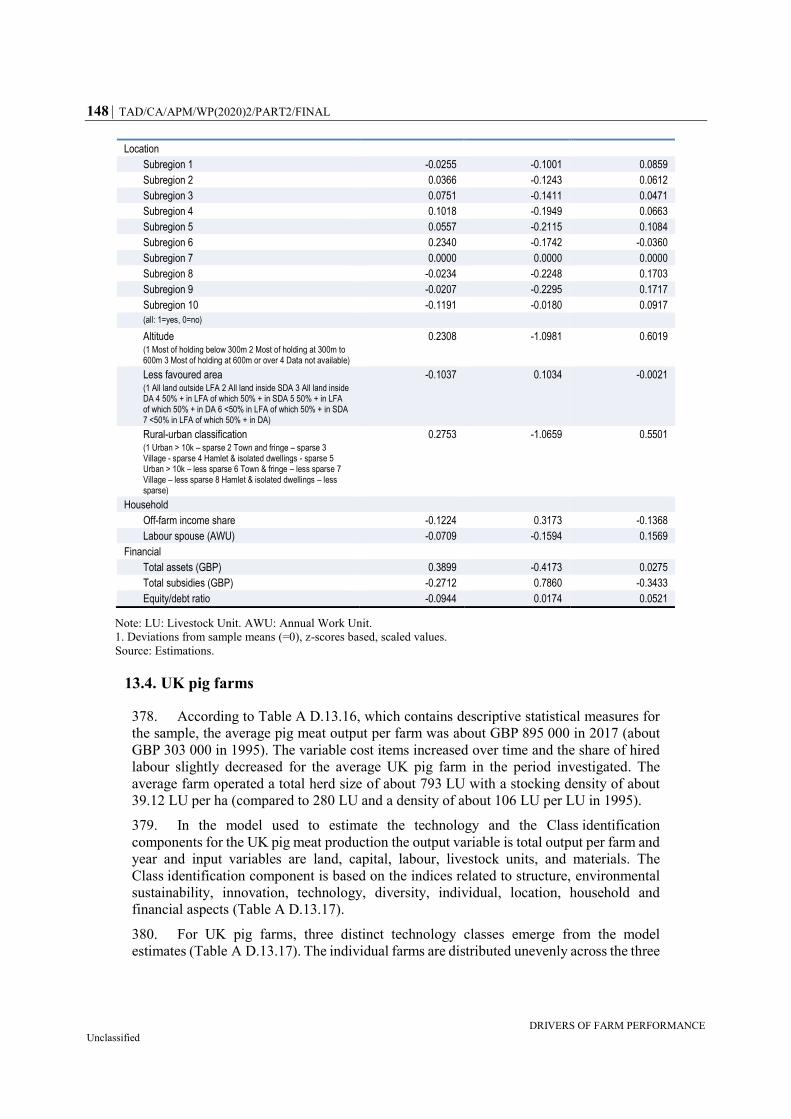
148 TAD/CA/APM/WP(2020)2/PART2/FINAL
DRIVERS OF FARM PERFORMANCE Unclassified
Location
Subregion 1 -0.0255 -0.1001 0.0859
Subregion 2 0.0366 -0.1243 0.0612
Subregion 3 0.0751 -0.1411 0.0471
Subregion 4 0.1018 -0.1949 0.0663
Subregion 5 0.0557 -0.2115 0.1084
Subregion 6 0.2340 -0.1742 -0.0360
Subregion 7 0.0000 0.0000 0.0000
Subregion 8 -0.0234 -0.2248 0.1703
Subregion 9 -0.0207 -0.2295 0.1717
Subregion 10 -0.1191 -0.0180 0.0917
(all: 1=yes, 0=no)
Altitude (1 Most of holding below 300m 2 Most of holding at 300m to 600m 3 Most of holding at 600m or over 4 Data not available)
0.2308 -1.0981 0.6019
Less favoured area (1 All land outside LFA 2 All land inside SDA 3 All land inside DA 4 50% + in LFA of which 50% + in SDA 5 50% + in LFA of which 50% + in DA 6 <50% in LFA of which 50% + in SDA 7 <50% in LFA of which 50% + in DA)
-0.1037 0.1034 -0.0021
Rural-urban classification (1 Urban > 10k – sparse 2 Town and fringe – sparse 3 Village - sparse 4 Hamlet & isolated dwellings - sparse 5 Urban > 10k – less sparse 6 Town & fringe – less sparse 7 Village – less sparse 8 Hamlet & isolated dwellings – less sparse)
0.2753 -1.0659 0.5501
Household
Off-farm income share -0.1224 0.3173 -0.1368
Labour spouse (AWU) -0.0709 -0.1594 0.1569
Financial
Total assets (GBP) 0.3899 -0.4173 0.0275
Total subsidies (GBP) -0.2712 0.7860 -0.3433
Equity/debt ratio -0.0944 0.0174 0.0521
Note: LU: Livestock Unit. AWU: Annual Work Unit.
1. Deviations from sample means (=0), z-scores based, scaled values.
Source: Estimations.
13.4. UK pig farms
378. According to Table A D.13.16, which contains descriptive statistical measures for
the sample, the average pig meat output per farm was about GBP 895 000 in 2017 (about
GBP 303 000 in 1995). The variable cost items increased over time and the share of hired
labour slightly decreased for the average UK pig farm in the period investigated. The
average farm operated a total herd size of about 793 LU with a stocking density of about
39.12 LU per ha (compared to 280 LU and a density of about 106 LU per LU in 1995).
379. In the model used to estimate the technology and the Class identification
components for the UK pig meat production the output variable is total output per farm and
year and input variables are land, capital, labour, livestock units, and materials. The
Class identification component is based on the indices related to structure, environmental
sustainability, innovation, technology, diversity, individual, location, household and
financial aspects (Table A D.13.17).
380. For UK pig farms, three distinct technology classes emerge from the model
estimates (Table A D.13.17). The individual farms are distributed unevenly across the three

TAD/CA/APM/WP(2020)2/PART2/FINAL 149
DRIVERS OF FARM PERFORMANCE Unclassified
technology classes (Table 13.7), with Class 2 including close to two-thirds of all farms,
while Class 3 only contains 7% of all farms.
381. Pig farms in Class 1 achieve a higher productivity performance — measured as the
potential output levels that could be achieved with a given input bundle, in value per year
— than their counterparts in classes 2 and 3 (Figure 13.7). Farms in classes 2 and 3 produce
respectively about 75% and 22% of the output of farms in Class 1.
382. All farm classes show a positive rate of technical change, with large differences
across classes. The highest rate is found for the least productive farms in Class 3 but the
most productive farms in Class 1 also show a strong growth in technical change. The
convergence is thus likely to be slow. The performance gap between farms in Class 2 and
farms in Class 1 is likely to increase, ceteris paribus, as the former have a much lower rate
of technical change (0.5% against 3.2%) (Figure 13.7).
383. If pig farms in Class 3 produced with the technology of farms in Class 1, they would
be able to increase their productivity by 51% (Table 13.7). But the technology of farms in
Class 2 seems well adapted to their conditions as switching technology would result for
them in a slight decline in productivity, and would probably deteriorate their environmental
sustainability performance as they have more extensive farming practices than farms in
Class 1. Overall, if all farms were producing with Class 1 technology, the productivity of
UK pig farms would increase by less than 1% (Table A C6 in Part 1).
Figure 13.7. Productivity and technical change for UK pig farms,
by class, 1995 to 2017
Source: Own estimations based on latent class model estimates and derivatives.
3.17
0.45
3.56
0.0
0.5
1.0
1.5
2.0
2.5
3.0
3.5
4.0
0
50
100
150
200
250
300
350
400
Class 1 (28.3%) Class 2 (64.8%) Class 3 (6.9%)
%EUR '000
Productivity level (EUR '000) Technical change (% per year)
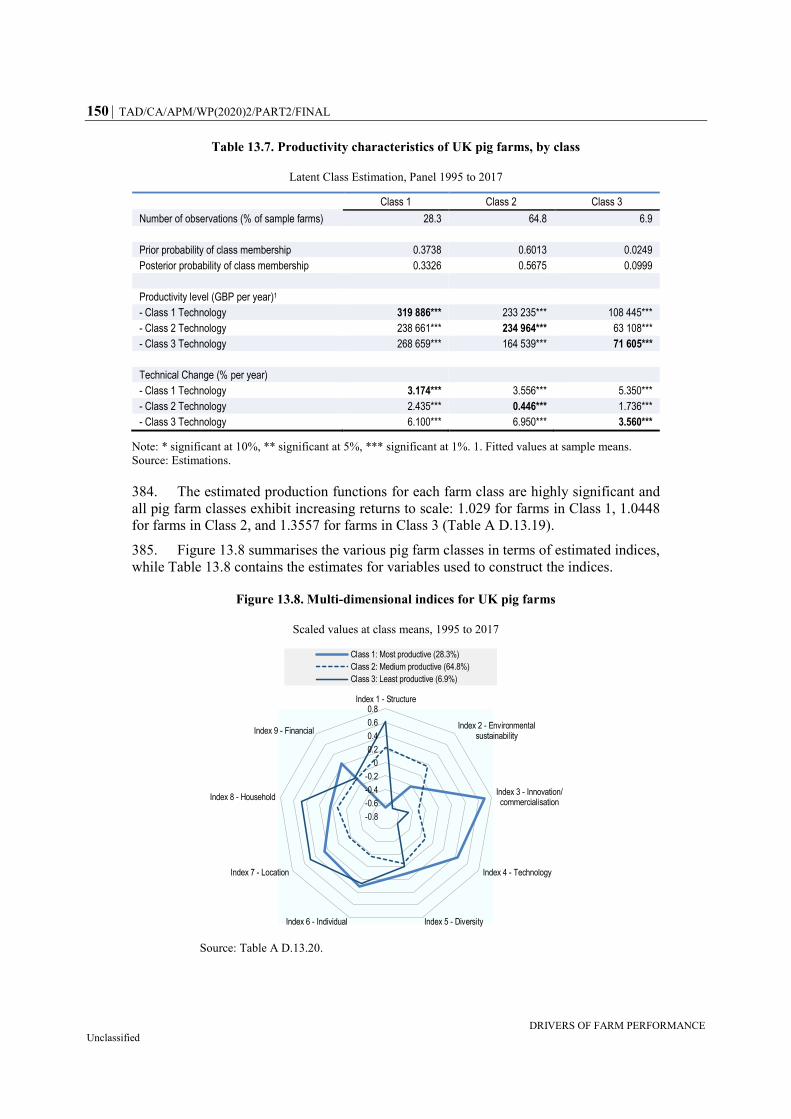
150 TAD/CA/APM/WP(2020)2/PART2/FINAL
DRIVERS OF FARM PERFORMANCE Unclassified
Table 13.7. Productivity characteristics of UK pig farms, by class
Latent Class Estimation, Panel 1995 to 2017
Class 1 Class 2 Class 3
Number of observations (% of sample farms) 28.3 64.8 6.9
Prior probability of class membership 0.3738 0.6013 0.0249
Posterior probability of class membership 0.3326 0.5675 0.0999
Productivity level (GBP per year)1
- Class 1 Technology 319 886*** 233 235*** 108 445***
- Class 2 Technology 238 661*** 234 964*** 63 108***
- Class 3 Technology 268 659*** 164 539*** 71 605***
Technical Change (% per year)
- Class 1 Technology 3.174*** 3.556*** 5.350***
- Class 2 Technology 2.435*** 0.446*** 1.736***
- Class 3 Technology 6.100*** 6.950*** 3.560***
Note: * significant at 10%, ** significant at 5%, *** significant at 1%. 1. Fitted values at sample means.
Source: Estimations.
384. The estimated production functions for each farm class are highly significant and
all pig farm classes exhibit increasing returns to scale: 1.029 for farms in Class 1, 1.0448
for farms in Class 2, and 1.3557 for farms in Class 3 (Table A D.13.19).
385. Figure 13.8 summarises the various pig farm classes in terms of estimated indices,
while Table 13.8 contains the estimates for variables used to construct the indices.
Figure 13.8. Multi-dimensional indices for UK pig farms
Scaled values at class means, 1995 to 2017
Source: Table A D.13.20.
-0.8
-0.6
-0.4
-0.2
0
0.2
0.4
0.6
0.8Index 1 - Structure
Index 2 - Environmentalsustainability
Index 3 - Innovation/commercialisation
Index 4 - Technology
Index 5 - DiversityIndex 6 - Individual
Index 7 - Location
Index 8 - Household
Index 9 - Financial
Class 1: Most productive (28.3%)
Class 2: Medium productive (64.8%)
Class 3: Least productive (6.9%)

TAD/CA/APM/WP(2020)2/PART2/FINAL 151
DRIVERS OF FARM PERFORMANCE Unclassified
386. Class 1 farms are the most productive farms, with below average environmental
sustainability. They are the largest, most diversified operations, and the most likely to be
partnerships, with managers having better education. They have the highest capital
intensity and investments in new technologies, building on large assets. They are more
likely to be located in a less-favoured and rural area. They receive the highest level of
subsidies and have lower debt ratios.
387. Class 2 groups the most environmentally sustainable farms (close to two-thirds of
all farms), which achieve below average productivity. They are smaller and more
specialised operations than average, with lower investment in new technologies and capital
intensity. Their managers are more likely to be younger, female, and with lower education
levels than average. They are below average in terms of asset endowment, subsidy received
and equity/debt ratio.
388. Class 3 group the 7% of farms that are the least environmentally sustainable and
least productive. They are the smallest operations, least capital intensive operations, which
invest the least in new technologies. Their managers are more likely to be older and male.
They are more likely to be located in hilly, rural areas, but not less favoured areas. They
have the lowest asset endowment and are the most reliant on off-farm income.
389. In summary, UK pig farms in the three identified technology classes differ
significantly with respect to their economic performance as well as technical development
over time. More innovative farms are most likely more productive compared to their peer
group, and family driven and smaller farms generally show a higher environmental
sustainability, ceteris paribus. However, a small share of the farms in pig farming sector
(about 7%) are largely dependent on family labour. The analysis revealed very low scores
on environmental sustainability based on the measures used in the empirical analysis.
Those farms also show very low levels of productivity and a low intensity of production.
Table 13.8. Multiple characteristics of UK pig farms, by class
Deviations from sample means1, 1995 to 2017
Class 1: Most productive (28.3%)
Class 2: Medium productive (64.8%)
Class 3: Least productive (6.9%)
Farm structure
Family/hired labour ratio -0.0438 -0.0080 0.2541
Number of holdings 0.3433 -0.1302 -0.1825
Herd size (LU) 0.4101 -0.1444 -0.3235
Form of ownership (1 Sole trader (including farmer and spouse partnership) 2 Partnership (other family only) 3 Partnership (other) 4 Farming company 5 Farm company subsidiary)
0.3872 -0.1167 -0.4889
Environmental sustainability
Stocking density (LU per ha) -0.1006 0.0564 -0.1180
Chemicals use (GBP per ha) 0.1537 -0.1120 0.4218
Organic production share -0.0056 0.0076 -0.0482
Fuel per LU (GBP per LU) 0.1264 -0.1108 0.5228
Environmental subsidies per ha (GBP per ha) -0.0221 -0.0052 0.1390
Innovation-commercialisation
Net investment ratio (per total assets) 0.2501 -0.0948 -0.1337
Share contract farming 0.1303 -0.0672 0.0923
Share land rented -0.0105 0.0047 -0.0012
Biofuel income (GBP) -0.0263 -0.0228 0.3217
Miscellaneous income (GBP) 0.3500 -0.1515 -0.0098

152 TAD/CA/APM/WP(2020)2/PART2/FINAL
DRIVERS OF FARM PERFORMANCE Unclassified
Insurance expenses (GBP) 0.4539 -0.1523 -0.4281
Professional fees (GBP) 0.4491 -0.1562 -0.3718
Technology
Capital / labour ratio (GBP per AWU) 0.3585 -0.1019 -0.5108
Capital per LU (GBP per LU) 0.3613 -0.1335 -0.2258
LU per labour (GBP per AWU) 0.2566 -0.0749 -0.3469
Fodder per LU (GBP per LU) -0.2034 0.1230 -0.3219
Materials per LU (GBP per LU) -0.0540 -0.0164 0.3749
Diversity
Herfindahl Index (sqrt[Σ(yi/Y)2]) -0.7777 0.3513 -0.1148
Production diversity (yc/ΣY) 0.7411 -0.3130 -0.0952
Woodland area 0.3914 -0.1490 -0.2035
Individual
Age (years) 0.0505 -0.0318 0.0918
Gender (1-female, 2-male) 0.1612 -0.1003 0.2817
Education (0 School only 1 GCSE or equivalent 2 A level or equivalent 3 College / National Diploma/ certificate 4 Degree 5 Postgraduate qualification 6 Apprenticeship 9 Other)
0.2769 -0.1283 0.0712
Location
Subregion 1 -0.0344 0.0239 -0.0837
Subregion 2 -0.0701 0.0503 -0.1849
Subregion 3 0.2103 -0.0873 -0.0414
Subregion 4 -0.1002 0.0391 0.0432
Subregion 5 -0.0553 0.0332 -0.0852
Subregion 6 0.0652 -0.0968 0.6416
Subregion 7 0.0000 0.0000 0.0000
Subregion 8 0.1084 -0.0341 -0.1236
Subregion 9 -0.0412 0.0447 -0.2504
Subregion 10 0.0000 0.0000 0.0000
(all: 1=yes, 0=no)
Altitude (1 Most of holding below 300m 2 Most of holding at 300m to 600m 3 Most of holding at 600m or over 4 Data not available)
0.1770 -0.1005 0.2191
Less favoured area (1 All land outside LFA 2 All land inside SDA 3 All land inside DA 4 50% + in LFA of which 50% + in SDA 5 50% + in LFA of which 50% + in DA 6 <50% in LFA of which 50% + in SDA 7 <50% in LFA of which 50% + in DA)
0.0957 -0.0260 -0.1473
Rural-urban classification (1 Urban > 10k – sparse 2 Town and fringe – sparse 3 Village - sparse 4 Hamlet & isolated dwellings - sparse 5 Urban > 10k – less sparse 6 Town & fringe – less sparse 7 Village – less sparse 8 Hamlet & isolated dwellings – less sparse)
0.1674 -0.1063 0.3122
Household
Off-farm income share -0.0632 -0.0459 0.6894
Labour spouse (AWU) -0.1177 0.0486 0.0251
Financial
Total assets (GBP) 0.5043 -0.1850 -0.3274
Total subsidies (GBP) 0.1984 -0.0796 -0.0905
Equity/debt ratio 0.0553 -0.0190 -0.0534
Note: LU: Livestock Unit. AWU: Annual Work Unit.
1. Deviations from sample means (=0), z-scores based, scaled values.
Source: Estimations.

TAD/CA/APM/WP(2020)2/PART2/FINAL 153
DRIVERS OF FARM PERFORMANCE Unclassified
13.5. UK poultry farms
390. According to Table A D 13.21, which contains descriptive statistical measures for
the sample, the average livestock related output per farm was about GBP 872 000 in 2017
(with a total of about GBP 965 000 per farm). The variable cost items increased over time
and the share of hired labour significantly increases for the average UK poultry farm over
the period investigated. The average farm operated a total herd size of about 406 LU in
2017 (compared to a total herd size of 495 LU in 1995). Hence, the stocking density
decreased from about 39.4 LU per ha in 1995 to about 28.4 LU per ha in 2017.
391. In the model used to estimate the technology and the Class identification
components for the UK poultry meat production, the output variable is total output per farm
and year and input variables are land, capital, labour, livestock units, and materials. The
Class identification component is based on the indices related to structure, environmental
sustainability, innovation, technology, diversity, individual, location, household and
financial aspects (Table A D.13.22).
392. For UK poultry farms, three distinct technology classes emerge from the model
estimates (Table A D.13.22). The individual farms are distributed very unevenly across the
three technology classes (Table 13.9), as Class 3 includes about three-quarters of all UK
poultry farms.
393. Poultry farms in Class 1 achieve a higher productivity performance — measured as
the potential output levels that could be achieved with a given input bundle, in value per
year — than their counterparts in classes 2 and 3 (Figure 13.9). Farms in classes 2 and 3
produce respectively about 19% and 64% of the output of farms in Class 1.
394. All poultry farm classes show a positive rate of technical change, which is
particularly strong (over 5%) for the least productive farms in Class 2. Though lower, the
rate of technical change of farms in Class 1 is also high (3.3%). The lowest rate is found
for farms in Class 3, suggesting that the productivity gap with Class 1 farms is increasing,
ceteris paribus. Differences in technical rate rates also suggest the convergence between
farms in Class 3 and Class 2 will be faster, than that between Class 2 and Class 1
(Figure 13.9).
395. If poultry farms in Class 2 produced with the technology of farms in Class 1, they
would be able to increase their productivity by 63% (Table 13.9). But the technology of
farms in Class 3 seems well adapted to their conditions and relatively close to that used by
Class 1 farms, as switching technology would not have a significant effect on productivity.
Overall, if all farms were producing with Class 1 technology, the productivity of UK
poultry farms would increase by less than 1% (Table A C6 in Part 1).
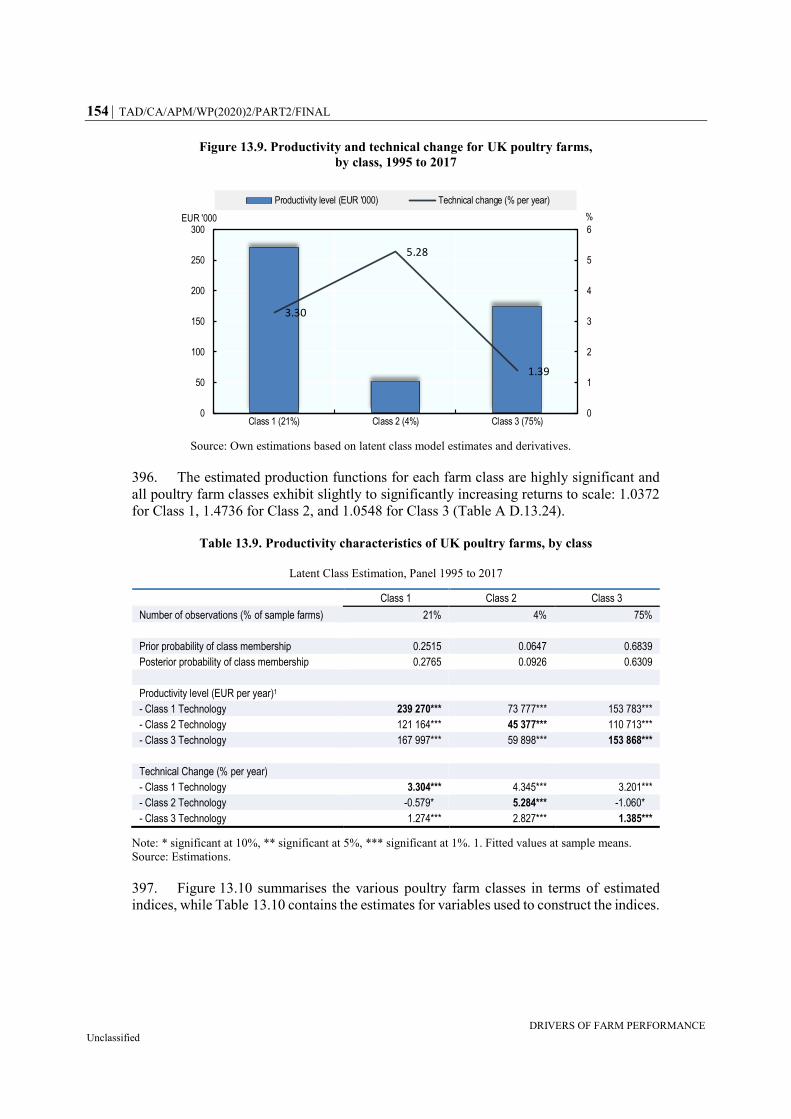
154 TAD/CA/APM/WP(2020)2/PART2/FINAL
DRIVERS OF FARM PERFORMANCE Unclassified
Figure 13.9. Productivity and technical change for UK poultry farms,
by class, 1995 to 2017
Source: Own estimations based on latent class model estimates and derivatives.
396. The estimated production functions for each farm class are highly significant and
all poultry farm classes exhibit slightly to significantly increasing returns to scale: 1.0372
for Class 1, 1.4736 for Class 2, and 1.0548 for Class 3 (Table A D.13.24).
Table 13.9. Productivity characteristics of UK poultry farms, by class
Latent Class Estimation, Panel 1995 to 2017
Class 1 Class 2 Class 3
Number of observations (% of sample farms) 21% 4% 75%
Prior probability of class membership 0.2515 0.0647 0.6839
Posterior probability of class membership 0.2765 0.0926 0.6309
Productivity level (EUR per year)1
- Class 1 Technology 239 270*** 73 777*** 153 783***
- Class 2 Technology 121 164*** 45 377*** 110 713***
- Class 3 Technology 167 997*** 59 898*** 153 868***
Technical Change (% per year)
- Class 1 Technology 3.304*** 4.345*** 3.201***
- Class 2 Technology -0.579* 5.284*** -1.060*
- Class 3 Technology 1.274*** 2.827*** 1.385***
Note: * significant at 10%, ** significant at 5%, *** significant at 1%. 1. Fitted values at sample means.
Source: Estimations.
397. Figure 13.10 summarises the various poultry farm classes in terms of estimated
indices, while Table 13.10 contains the estimates for variables used to construct the indices.
3.30
5.28
1.39
0
1
2
3
4
5
6
0
50
100
150
200
250
300
Class 1 (21%) Class 2 (4%) Class 3 (75%)
%EUR '000
Productivity level (EUR '000) Technical change (% per year)

TAD/CA/APM/WP(2020)2/PART2/FINAL 155
DRIVERS OF FARM PERFORMANCE Unclassified
Figure 13.10. Multi-dimensional indices for UK poultry farms
Scaled values at class means, 1995 to 2017
Source: Table A D.13.25.
398. Class 1 groups the most productive farms, which are below average in terms of
environmental sustainability. They are the largest, most diversified operations, and the most
likely to be partnerships, with managers having better education. They have the highest
capital intensity and investments in new technologies, building on large assets. They are
more likely to be located in a less-favoured and a rural area. They receive the highest level
of subsidies and have lower debt ratios.
399. Most environmentally sustainable farms achieving below average productivity are
in Class 2, which accounts for close to two-thirds of all farms. They are smaller and more
specialised operations than average, with lower investment in new technologies and capital
intensity. Their managers are more likely to be younger, women, and with lower education
levels than average. They are below average in terms of asset endowment, subsidy received
and equity/debt ratio.
400. Class 3 farms (7% of all farms) are the least environmentally sustainable and least
productive. They are the smallest operations, least capital intensive operations, which
invest the least in new technologies. Their manager is more likely to be older and male.
They are more likely to be located in hilly, rural areas, but not less favoured areas. They
have the lowest asset endowment and are the most reliant on off-farm income.
401. In summary, UK poultry farms in the three identified technology classes differ
significantly with respect to their economic performance as well as technical development
over time. The analysis revealed that most of these farms (around 75%) produce with a
medium level of productivity and are relatively environmentally sustainable based on the
measures used in the empirical analysis. These poultry farms are more family driven with
a medium capital and input intensity. The most productive farms in the sector, however,
score lower than average on environmental sustainability but show high levels of
innovativeness. Those farms are less likely family driven farms and operate large flocks of
poultry.
-1-0.8-0.6-0.4-0.2
00.20.40.60.8
11.2
Index 1 - Structure
Index 2 - Environmentalsustainability
Index 3 - Innovation/commercialisation
Index 4 - Technology
Index 5 - DiversityIndex 6 - Individual
Index 7 - Location
Index 8 - Household
Index 9 - Financial
Class 1: Most productive (21%)
Class 2: Least productive (4%)
Class 3: Medium productive (75%)
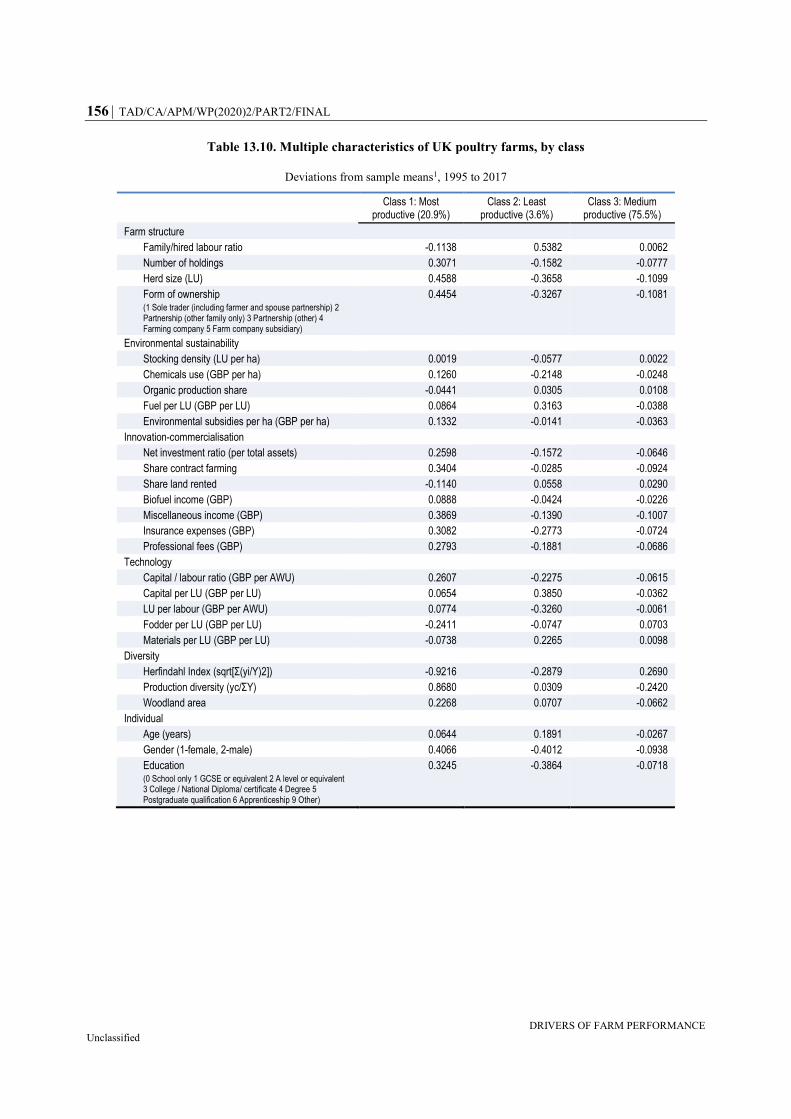
156 TAD/CA/APM/WP(2020)2/PART2/FINAL
DRIVERS OF FARM PERFORMANCE Unclassified
Table 13.10. Multiple characteristics of UK poultry farms, by class
Deviations from sample means1, 1995 to 2017
Class 1: Most productive (20.9%)
Class 2: Least productive (3.6%)
Class 3: Medium productive (75.5%)
Farm structure
Family/hired labour ratio -0.1138 0.5382 0.0062
Number of holdings 0.3071 -0.1582 -0.0777
Herd size (LU) 0.4588 -0.3658 -0.1099
Form of ownership (1 Sole trader (including farmer and spouse partnership) 2 Partnership (other family only) 3 Partnership (other) 4 Farming company 5 Farm company subsidiary)
0.4454 -0.3267 -0.1081
Environmental sustainability
Stocking density (LU per ha) 0.0019 -0.0577 0.0022
Chemicals use (GBP per ha) 0.1260 -0.2148 -0.0248
Organic production share -0.0441 0.0305 0.0108
Fuel per LU (GBP per LU) 0.0864 0.3163 -0.0388
Environmental subsidies per ha (GBP per ha) 0.1332 -0.0141 -0.0363
Innovation-commercialisation
Net investment ratio (per total assets) 0.2598 -0.1572 -0.0646
Share contract farming 0.3404 -0.0285 -0.0924
Share land rented -0.1140 0.0558 0.0290
Biofuel income (GBP) 0.0888 -0.0424 -0.0226
Miscellaneous income (GBP) 0.3869 -0.1390 -0.1007
Insurance expenses (GBP) 0.3082 -0.2773 -0.0724
Professional fees (GBP) 0.2793 -0.1881 -0.0686
Technology
Capital / labour ratio (GBP per AWU) 0.2607 -0.2275 -0.0615
Capital per LU (GBP per LU) 0.0654 0.3850 -0.0362
LU per labour (GBP per AWU) 0.0774 -0.3260 -0.0061
Fodder per LU (GBP per LU) -0.2411 -0.0747 0.0703
Materials per LU (GBP per LU) -0.0738 0.2265 0.0098
Diversity
Herfindahl Index (sqrt[Σ(yi/Y)2]) -0.9216 -0.2879 0.2690
Production diversity (yc/ΣY) 0.8680 0.0309 -0.2420
Woodland area 0.2268 0.0707 -0.0662
Individual
Age (years) 0.0644 0.1891 -0.0267
Gender (1-female, 2-male) 0.4066 -0.4012 -0.0938
Education (0 School only 1 GCSE or equivalent 2 A level or equivalent 3 College / National Diploma/ certificate 4 Degree 5 Postgraduate qualification 6 Apprenticeship 9 Other)
0.3245 -0.3864 -0.0718
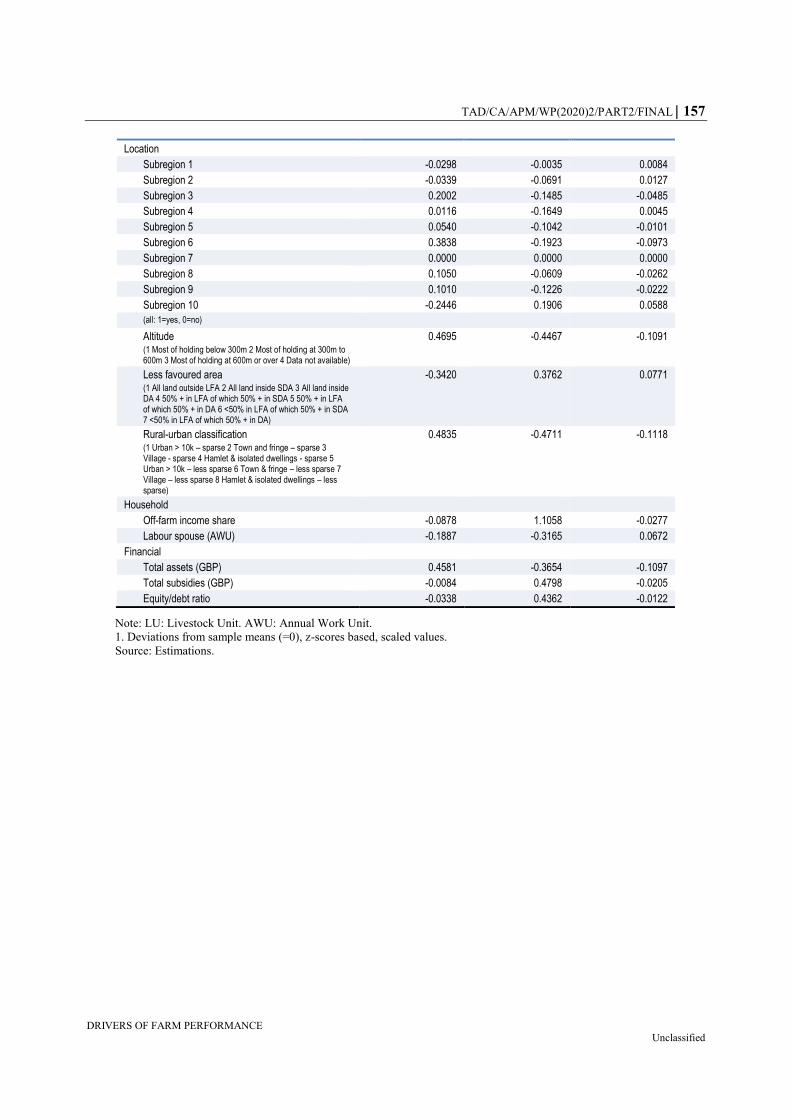
TAD/CA/APM/WP(2020)2/PART2/FINAL 157
DRIVERS OF FARM PERFORMANCE Unclassified
Location
Subregion 1 -0.0298 -0.0035 0.0084
Subregion 2 -0.0339 -0.0691 0.0127
Subregion 3 0.2002 -0.1485 -0.0485
Subregion 4 0.0116 -0.1649 0.0045
Subregion 5 0.0540 -0.1042 -0.0101
Subregion 6 0.3838 -0.1923 -0.0973
Subregion 7 0.0000 0.0000 0.0000
Subregion 8 0.1050 -0.0609 -0.0262
Subregion 9 0.1010 -0.1226 -0.0222
Subregion 10 -0.2446 0.1906 0.0588
(all: 1=yes, 0=no)
Altitude (1 Most of holding below 300m 2 Most of holding at 300m to 600m 3 Most of holding at 600m or over 4 Data not available)
0.4695 -0.4467 -0.1091
Less favoured area (1 All land outside LFA 2 All land inside SDA 3 All land inside DA 4 50% + in LFA of which 50% + in SDA 5 50% + in LFA of which 50% + in DA 6 <50% in LFA of which 50% + in SDA 7 <50% in LFA of which 50% + in DA)
-0.3420 0.3762 0.0771
Rural-urban classification (1 Urban > 10k – sparse 2 Town and fringe – sparse 3 Village - sparse 4 Hamlet & isolated dwellings - sparse 5 Urban > 10k – less sparse 6 Town & fringe – less sparse 7 Village – less sparse 8 Hamlet & isolated dwellings – less sparse)
0.4835 -0.4711 -0.1118
Household
Off-farm income share -0.0878 1.1058 -0.0277
Labour spouse (AWU) -0.1887 -0.3165 0.0672
Financial
Total assets (GBP) 0.4581 -0.3654 -0.1097
Total subsidies (GBP) -0.0084 0.4798 -0.0205
Equity/debt ratio -0.0338 0.4362 -0.0122
Note: LU: Livestock Unit. AWU: Annual Work Unit.
1. Deviations from sample means (=0), z-scores based, scaled values.
Source: Estimations.