drivers of brand extensions
TRANSCRIPT
Tor zur Welt der Wissenschaft
Franziska VölcknerHenrik Sattler
Drivers of brand extensionsuccess: A structural equationmodeling approach
Research Papers on Marketing and RetailingUniversity of Hamburg
No. 018April 2004

U n i ve r s i t ä t H a m b u r g • T o r z u r W e l t d e r W i s s e n s c h a f t
V o n - M e l l e - P a r k 5 • 2 0 1 4 6 H a m b u r g • www. h e n r i k s a t t l e r . d e
Fachbere ich Wi r t scha f t sw issenscha f ten
Ins t i t u t f ü r Hande l und Marke t ing
Geschä f t s füh render D i rek to rPro f . D r . Henr i k Sa t t l e r
Nr. 018
Franziska Völckner* – Henrik Sattler**
Drivers of brand extension success: A structural
equation modeling approach
April 2004
ISSN 1618-8985
*) Assistant Professor of Marketing and Management Science, University of Hamburg, Institute of Marketing, Retailing and Management Science, Von-Melle-Park 5, 20146 Hamburg, Germany, Phone: +49 40 42838-3695, Fax: +49 40 42838-3650, E-mail: [email protected]
**) Professor of Marketing and Management Science, University of Hamburg, Institute of Marketing, Retailing and Management Science, Von-Melle-Park 5, 20146 Hamburg, Germany, Phone: +49 40 42838-6401, Fax: +49 40 42838-3650, E-mail: [email protected]
Drivers of brand extension success Page 1
Drivers of brand extension success: A structural equation modeling approach
ABSTRACT
Using a comprehensive data set containing over 6600 cases of a national consumer survey the
authors undertake a structural equation analysis of the key drivers of brand extension success.
The study builds on four key aspects missing in extant research: (1) prior work only analyzes a
small fraction of all relevant drivers of extension success, i.e. previous studies are restricted to
a partial analysis of the determinants of extension success and thus cannot determine the
relative importance of the success drivers, (2) dependence relationships between the
determinants of extension success are ignored, (3) measurement error is ignored, i.e.
measurement error is not an explicit component of the developed and tested models, and (4)
using hypothetical brand extensions, such as Heineken popcorn, previous studies may be
distorted by a hypothetical bias. On the basis of a simultaneous analysis of a broad variety of
possible drivers of extension success the authors uncover five variables with a substantial
impact on extension success. The measured effects can be generalized across different
extension product categories. In addition the authors find several important dependence
relationships between the investigated success drivers and demonstrate that an analysis that
fails to account for these dependence relationships results in a misinterpretation of the
significance and relative importance of the drivers of extension success. The results also
suggest that prior work is not distorted by a substantial hypothetical bias with respect to the
impact of the two variables quality of the parent brand and fit on extension success.
Particularly in the recent past the existence of such hypothetical bias has been presumed
repeatedly by researchers.
Drivers of brand extension success Page 2
INTRODUCTION
Brand names are among a company’s most valuable assets (Klink and Smith 2001;
Rangaswamy, Burke and Oliva 1993). Brand values are reflected, among others, in customer
loyalty, unique and positive associations, the ability to attract new customers and charge
surplus prices, the ease of new market entrance and the blocking of the entrance of new outside
competitors (Keller 2003). A major part of a brand’s value stems from its contribution to
launching new products. Brand extensions, i.e. the use of established brand names to launch
new products (e. g. Mr. Clean for a new detergent), are one of the most frequently employed
branding strategies. For fast moving consumer goods (fmcg) often more than 85 % of new
product introductions are brand extensions (Ernst & Young and Nielsen 1999; Rangaswamy,
Burke and Oliva 1993; Kirmani, Sood and Bridges 1999). Brand extensions are considered
profitable because brands that are already known and recognized are generally assumed to
require lower new-product introduction expenses such as advertising, trade deals or price
promotions (Tauber 1988; Collins-Dodd and Louviere 1999). These benefits are mainly due to
the transfer of the parent brand’s awareness and associations toward the new product (e.g.
Keller 2003). However, the success of brand extensions is very uncertain. In many fmcg
product categories failure rates of brand extensions are around 80 % (Ernst&Young and
Nielsen 1999; Marketing 2003). Often US-Dollar 50 million or more are spent for the
introduction of these extensions (Aaker 1990; Mortimer 2003). Moreover, unsuccessful
extensions can harm the parent brand which can result in substantial losses of brand equity
(Gürhan-Canli and Maheswaran 1998; Keller and Sood 2003; Swaminathan, Fox and Reddy
2001).This shows that, though the introduction of brand extensions has become prevalent, such
a practice does not necessarily guarantee success (Reddy, Holak and Bhat 1994; Nijssen 1999).
Drivers of brand extension success Page 3
Accordingly, understanding the drivers of brand extension success is of considerable
importance.
The success of a brand extension is largely determined by how the consumers evaluate
the extension (Klink and Smith 2001). Over the last 15 years research on consumer behavior
toward brand extension has been the subject of substantial interest. More than 50 empirical
studies worldwide have investigated empirically potential determinants of brand extension
success (i.e. success factors of brand extensions).
Research Motivations
In the past, researchers have relied primarily on studies conducted in lab settings in
which respondents are typically provided with descriptions of hypothetical brand extensions
and are asked to provide their instantaneous reactions (e.g. Aaker and Keller 1990;
Broniarczyk and Alba 1994; Dacin and Smith 1994). The success factors identified (e.g. fit
between a parent brand and its extension, quality of the parent brand or history of previous
extensions of the parent brand) can be quite useful in launching a brand extension.
Nevertheless there are several major limitations to these studies:
First, little is known about the relative importance of the success factors in explaining
brand extension success because each study to date investigates the main and interaction
effects of only a small fraction of all relevant success factors. For example Aaker and Keller
(1990) as well as various replications of this study (see Bottomley and Holden 2001) only
investigate the factors fit between the parent brand and the extension product, quality of the
parent brand, and the degree of difficulty in designing and making a product in the extension
category (as well as the interaction of quality with the fit variable). Since there may be many
Drivers of brand extension success Page 4
other significant determinants of brand extension success, e.g. number of previous brand
extensions (Dacin and Smith 1994), advertising support (Reddy, Holak and Bhat 1994), or
retailer acceptance (Nijssen 1999), the generalization of past studies to contexts where a broad
variety of success factors is involved is debatable (Czellar 2003, p. 98).
Second, previous studies only test the direct relationship between brand extension
success (dependent variable) and potential success factors (independent variables). They do not
take into account that some success factors may be dependent variables in other dependence
relationships, i.e. previous studies do not examine a series of dependence relationships. The
failure to account for potential dependence relationships between success factors may lead to
misinterpretation of significance and relative importance of the investigated success factors.
Take for instance the number of previous brand extensions of the parent brand. Past studies
mostly found a non-significant effect for this variable (Smith and Park 1992; Nijssen 1999).
However, the conclusion that this factor is only of minor relevance for the success of a new
brand extension may be false since it ignores the potential effect of this variable on other
success factors. It is, for example, widely recognized that a strong parent brand (that already
has successfully introduced several extension products) positively influences retailers’
probability of listing a new brand extension (e.g. Collins-Dodd and Louviere 1999). Retailer
acceptance of an extension product in turn positively impacts brand extension success (Nijssen
1999). Hence, when examining the determinants of extension success, it is necessary to
develop and test comprehensive models that include the direct effects of the success factors on
the extension success as well as the dependence relationships between the success factors.
Third, previous studies do not take measurement error into account. Measurement error
is an especially serious concern in brand extension research since the constructs of interest
Drivers of brand extension success Page 5
(such as perceived fit between parent brand and extension product) have many facets and
cannot be directly observed. They can only be measured through observed measures that vary
in their degree of observational meaningfulness and validity. Observed measures of the
underlying theoretical constructs are invariably contaminated by measurement error, i.e. most
measures used in brand extension research reflect not only the construct that they are intended
to represent, but also random and systematic measurement error. Both random and systematic
measurement errors are threats to the validity of research findings (MacKenzie 2001). The
biasing effect of measurement error can increase or decrease the observed relationships of the
investigated success factors, thus leading to both type I and type II errors. Since measurement
error is inevitable, the correspondence between constructs and their measures has to be an
explicit component of marketing models (Steenkamp and Baumgartner 2000, p. 196). Previous
models of extension success fail to account for measurement error. However, in theory
development and model testing as well as in deriving empirical generalizations it is crucial to
consider explicitly the interplay between constructs and measures (Steenkamp and
Baumgartner 2000, p. 196).
Fourth, almost all previous studies use hypothetical brand extensions (e.g. Aaker and
Keller 1990; Barone, Miniard and Rome 2000; Bottomley and Doyle 1996; Bottomley and
Holden 2001; Boush and Loken 1991; Broniarczyk and Alba 1994; Dacin and Smith 1994;
Keller and Aaker 1992; Klink and Smith 2001; Lane 2000; Park, McCarthy and Milberg 1993;
Park, Milberg and Lawson 1991), such as Heineken popcorn, Crest shaving cream or Timex
bicycles. A major difference between real and hypothetical brand extensions concerns the basis
for consumer evaluations of the extension products. With real brand extensions, the evaluation
process is based predominantly on information gathered from personal experience, i.e. self-
Drivers of brand extension success Page 6
generated information. Whereas using hypothetical brand extensions, consumer evaluations are
based on abstract descriptions provided by the researcher. Particularly in the recent past,
researchers have presumed repeatedly that the overwhelming impact of the quality of the
parent brand and the fit between the parent and extension categories (see Bottomley and
Holden 2001) is a result of the use of hypothetical brand extensions (e.g. Klink and Smith
2001; McCarthy, Heath and Milberg 2001). Using hypothetical brand extensions, prior work
considerably restricted the amount of extension attribute information available to the subjects.
If subjects only have limited knowledge of an extension, they have to make inferences about a
proposed extension. In particular they will rely on available diagnostic cues such as brand
name and perceived fit between parent and extension product categories (e.g. Klink and Smith
2001; Ford and Smith 1987; Wernerfelt 1988). Conversely, consumers acting in the
marketplace have access to considerably more information about an extension, e.g. through
marketing communications and word of mouth (Czellar 2003, p. 99; Klink and Smith 2001,
p. 327). Moreover, it is unclear how concrete experience with the extension product impacts
extension attitude. Thus, although the internal validity of the studies that use hypothetical
extension products seems high, their generalization to real-life consumption contexts is
debatable (e.g. Czellar 2003, p. 98). Take for instance the fit between parent brand and
extension category. Results from previous research suggest that brands should not be extended
to perceptually distant product categories (Barone, Miniard and Romeo 2000). However, in
real marketplace conditions there are many examples of successful extensions that were not
perceptually close to the parent brand (e.g. Dannon spring water, Camel footwear). Thus, most
of the past brand extension research findings might be distorted by a hypothetical bias (see in
general Harrison and Rutström 2002).
Drivers of brand extension success Page 7
Fifth, most of the past studies used either students as respondents (e.g. Aaker and Keller
1990; Klink and Smith 2001; Lane 2000; Barone, Miniard and Rome 2000; Bottomley and
Doyle 1996; Broniarczyk and Alba 1994 (study 1 and 2); Dacin and Smith 1994 (study 1);
Boush and Loken 1991; Park, McCarthy, and Milberg 1993; Park, Milberg and Lawson 1991)
or a convenience sample (e.g. Broniarczyk and Alba 1994 (study 3); Dacin and Smith 1994
(study 2); Keller and Aaker 1992). The sample characteristics of previous brand extension
research may limit the generalizability of findings.
Against this background this article seeks to make several important contributions to
brand extension research by offering a large-scale empirical study that overcomes the
discussed limitations of past research at least partly. The basic contributions of this article are
as follows:
We address the issue of significance and relative importance of the determinants of
extension success by investigating simultaneously a broad variety of success factors. Thus,
while past research analyzed just a limited number of variables in one study (usually three to
four factors) we investigate simultaneously 10 factors.
To our knowledge this is the first study testing a conceptual model of the determinants
of extension success that considers not only the direct relations between the success factors and
the extension success but also the dependence relationships between the investigated factors,
i.e. in contrast to the partial models of previous studies we examine simultaneously a whole
system of conceptual relationships including dependence relations between the success factors
as well as the direct effects of the success factors on the extension success. When considering
the relationships between complex constructs, the parameters of interest should be the
structural parameters linking the theoretical constructs (success factors and extension success)
Drivers of brand extension success Page 8
rather than any regression coefficients relating observed Ys to observed Xs (e.g. Alwin and
Tessler 1974; Bagozzi 1980). Thus, the hypothesized relationships are translated into a
structural equation model with its measurement and structural components estimated using
AMOS 4.0. Structural equation modeling makes a clear distinction between unobserved,
theoretical constructs and erroneous, empirical measures. The correspondence between
theoretical constructs and their multiple measures is an explicit component of a structural
equation model. Hence, in structural equation modeling measurement error is explicitly taken
into account.
To avoid the problems linked to hypothetical brand extensions, we investigate the
success of real brand extensions. The existence of a hypothetical bias in past studies using
hypothetical extensions (e.g. Heineken popcorn) is assessed by comparing the results across
two consumer segments that differ in the level of extension product knowledge. To make sure
that our findings can be generalized to a broad set of circumstances we include 22 parent
brands with a total of 66 brand extensions. The main sample consists of 2426 respondents
drawn according to a quota sampling procedure with a representative structure for Germany.
Having outlined the motivation of this paper, section 2 identifies the major
determinants of extensions success and their dependence relationships. Section 3 describes the
research design and discusses some methodological issues. The results are presented in section
4. Finally, conclusions and implications for the management of brand extensions as well as
opportunities for further research are presented.

Drivers of brand extension success Page 9
BACKGROUND LITERATURE AND MODEL DEVELOPMENT
The success of a brand extension is proposed to be affected by parent brand, extension,
brand-extension-relationship, and extension’s product category characteristics. The primary
purpose of this study is to determine empirically (1) the system of relationships between these
characteristics and (2) the extent to which these characteristics affect the success of brand
extensions. The following section provides a rationale for research hypotheses pertaining to
each of these five categories.
Direct Effects of the Success Factors
As described above a first objective of this study is to investigate simultaneously the
direct effects of a broad variety of success factors on extension success. In the last 15 years an
important body of empirical studies on consumer evaluation of brand extensions has been
published in leading academic journals. Based on a systematic literature review in the
following journals between 1985 and 2001 (the year of data collection) we identified the
drivers of extension success which had already been analyzed by past research1: International
Journal of Research in Marketing, Journal of Consumer Research, Journal of Marketing,
Journal of Marketing Research, Management Science, Marketing Letters, and Marketing
Science. Articles frequently cited in these journals were additionally included in the review.
We limited our review to empirical studies investigating the effect of certain success factors
(e.g. quality of the parent brand) on some kind of extension success measure (typically
customer evaluations of brand extensions such as the perceived quality of the extension). Most
of the studies identified are based on consumer surveys using hypothetical brand extensions
1 The effect of ingredient branding strategies which has been investigated by recent empirical studies (e.g. Desai and Keller 2002) is not considered in our research.
Drivers of brand extension success Page 10
(i.e. extensions not introduced in the market) where the respondents are asked to rate the
independent (i.e. success factors) and dependent variables (i.e. success of the extension, e.g.
perceived quality of the extension) on simple rating scales. A typical example is the
fundamental study by Aaker and Keller (1990). Only very few studies use market data as
dependent variables, e.g. market share or stock market value (Lane and Jacobson 1995; Reddy,
Holak and Bhat 1994; Smith and Park 1992).
As a result we identified 15 drivers of extension success which had been proven to be
of significant (p < 0.10) relevance in at least one empirical study. However, we restrict our
analysis to ten success factors in order to keep the evaluation task manageable for the
respondents. We excluded three factors for which past research only found a minor influence
on brand extension success: Difficulty of producing a product of the extension’s product class
(e.g. Sunde and Brodie 1993; Bottomley and Doyle 1996; Nijssen and Bucklin 1998;
Bottomley and Holden 2001), consumers’ knowledge of the extension’s product class (e.g.
Smith and Park 1992), and company size (Reddy, Holak and Bhat 1994). Furthermore, we
excluded the order and direction of previous brand extensions (Dawar and Anderson 1994) as
well as consumers’ mood since the measurement of these two factors is extremely complex
within a consumer survey.
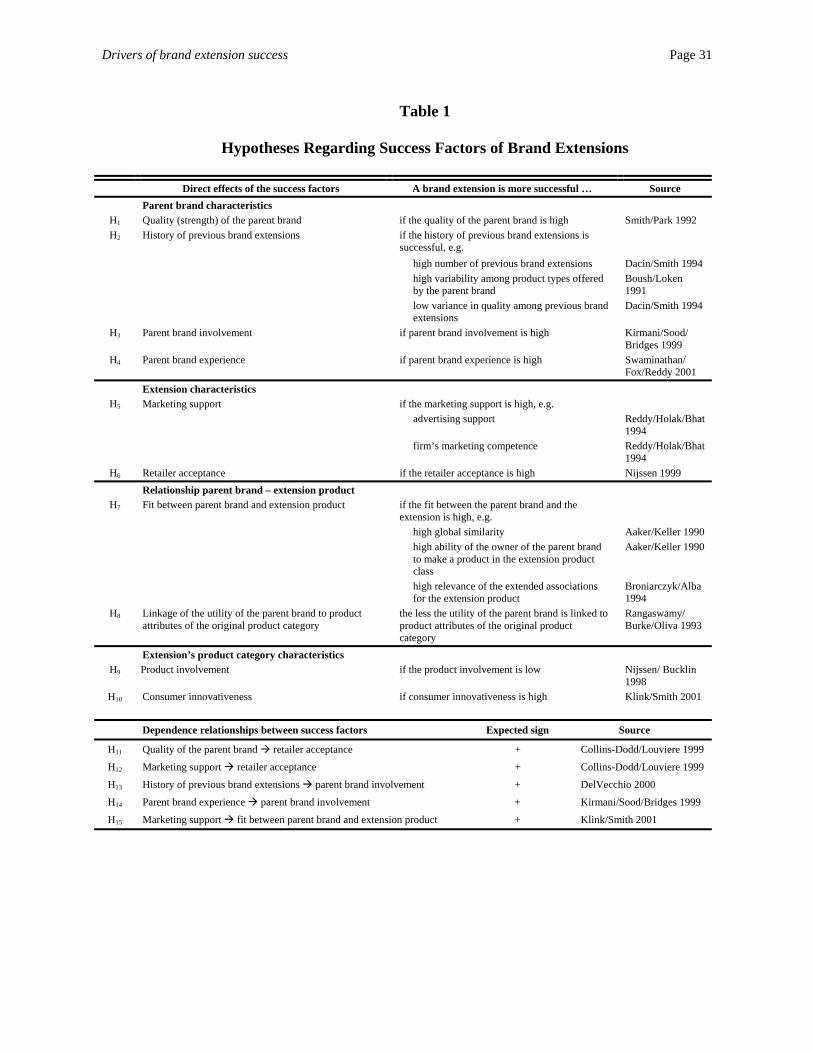
The ten hypotheses which will be investigated in this article are shown in Table 1.
Because of limited space the original wordings of the hypotheses have been shortened. Also,
multiple-measures of the same factor (e.g. fit or history of previous extensions) are treated as
one determinant of extension success. Moreover, just one source per hypothesis is shown in
Table 1. A theoretical foundation for the postulated hypothesis is provided in the sources listed
in Table 1. Therefore a detailed discussion of the research hypotheses is set aside.
Drivers of brand extension success Page 11
Insert Table 1 about here
Based on the findings of past research it is unclear whether the success factors shown in
Table 1 have a significant impact on extension success or not. There are many examples of
inconclusive results concerning a particular factor (e.g. the studies by Dacin and Smith 1994 as
well as Reddy, Holak and Bhat 1994 with respect to the number of previous brand extensions).
Moreover, it remains unclear which of the factors have the strongest impact on brand extension
success because past studies have only investigated a very limited number of factors in one
study (see above). In order to overcome these problems we analyze the factors respectively
hypotheses shown in Table 1 simultaneously. As is more fully described subsequently, model 1
(M1) includes only the direct effects of the 10 success factors shown in Table 1 and serves as a
baseline model. By using chi-square difference tests we will compare the performance of M1
with two other models which include dependence relationships between the success factors.
Dependence Relationships between the Success Factors
Literature on brand extensions: Past research has clearly focused on the relationship
between extension success and its potential determinants. However, based on the literature
review described above we identified five studies (see Table 1) that investigate the impact of a
certain success factor (independent variable) on another success factor (dependent variable).
Nevertheless it remains unclear whether respectively how the dependence relationships
between the success factors impact extensions success since none of these studies considered
extension success as a component of the estimated model. The identified dependence
relationships between certain success factors are taken up in M1 resulting in M2.

Drivers of brand extension success Page 12
Expert judgments: There is an important tradition in marketing research of
incorporating judgmentally derived information into marketing models (Leeflang and Wittink
2000), in particular managerially estimated parameter values (e.g. Sandor and Wedel 2001).
Hence, in addition to the literature based approach we consider an alternative path for model
development using judgmentally derived information on the structural relationships in our
model M1 (e.g. Czellar 2003; Steenkamp and Baumgartner 2000). We propose to elicit
information on relevant dependence relationships between the determinants of extension
success from brand managers and marketing scientists specialized in the area of branding by
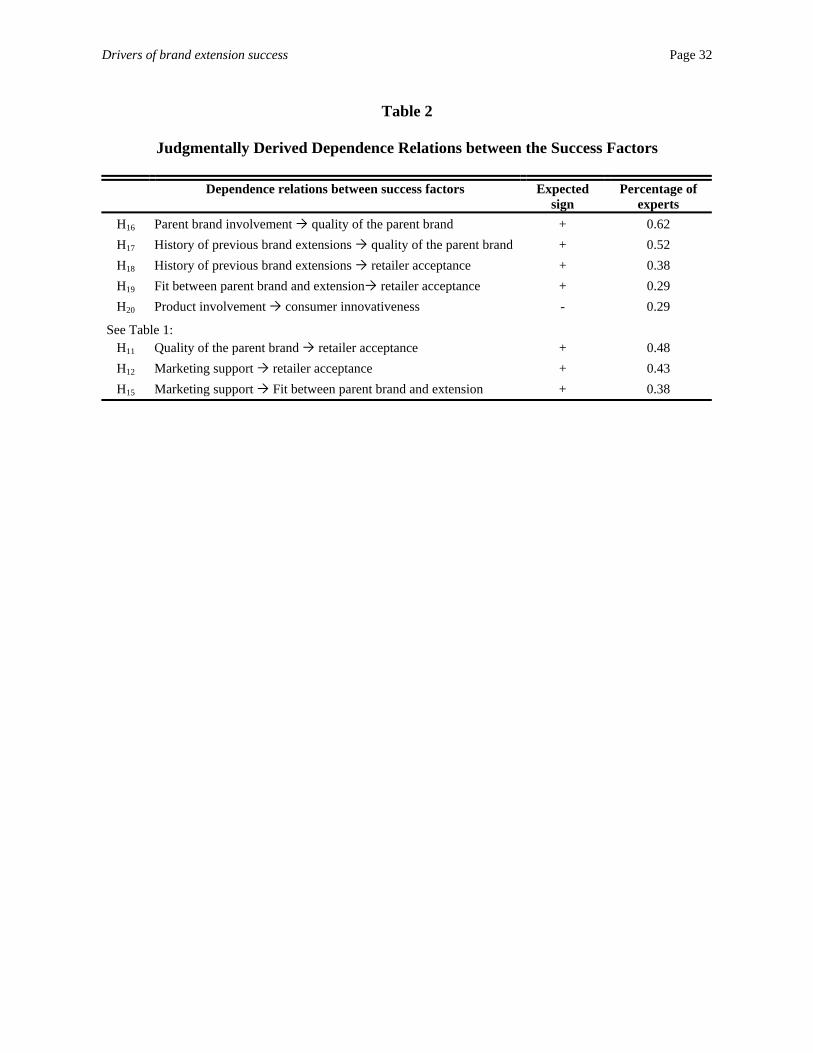
using semi-structured interviews. 21 brand managers and researchers agreed to participate. In
the task we provided the participants with a description of the 10 success factors of M1 and
asked them to point out possible dependence relationships between the 10 factors as well as to
give a rationale for each of these relationships. In total, eight dependence relationships were
specified by at least 25 % of the participants (see Table 2) and are taken up in M1 resulting in
M3.
Insert Table 2 about here
To summarize, three different models will be tested empirically. M1 considers only the
direct effects of the success factors on extension success, whereas M2 includes additionally
five dependence relationships between the determinants of extension success. For both models
an explicit theoretical foundation has been provided by past research. Likewise M2 the third
model (M3) includes dependence relationships between the success factors. However, we
Drivers of brand extension success Page 13
propose a new path for model development by using expert judgments (see also Czellar 2003,
p. 113; Steenkamp and Baumgartner 2000, p. 197).
The developing and testing of alternative models is in agreement with
recommendations made in previous research (e.g. Bentler and Bonett 1980; Rust and
Schmittlein 1985; Brown and Cudeck 1993; Tanaka 1993; Baumgartner and Homburg 1996).
As argued by Cudeck and Browne (1983), structural equation modeling should be conducted in
the form of comparisons among different plausible models that are nested in each other and can
be justified theoretically. Instead of developing and testing one single model the aim of the
analysis is to find a model from among a set of alternatives which best approximates reality.
The comparison of different models also guards against the mistaken notion that a theoretical
model which attains an acceptable fit has somehow been shown to be the most plausible
representation of the data (e.g. Baumgartner and Homburg 1996; Stelzl 1986; Breckler 1990).
THE RESEARCH DESIGN
The stated hypotheses were tested using real extensions of real brands in the fast
moving consumer goods industry. Two pretests were conducted to identify the brands and
extension products. The starting point was a set of 50 brands taken from a list of the 100 brands
with the highest revenues in the German fmcg market. In a first pretest respondents (n = 40)
were asked to rate their familiarity with these brands. Based on the pretest results, the 25
brands with the highest awareness ratings were chosen. In our study we concentrate on well-
known brands, because in the marketplace brand extensions are particularly popular for well-
established brands (e.g. Tauber 1988; Swaminathan, Fox and Reddy 2001).
Drivers of brand extension success Page 14
For each of the 25 brands 5 real brand extensions introduced in the time period 1998–
2001 were selected randomly from the German “LPV New Products Database” (a database that
contained at the time of the design of this study all new product introductions in Germany
since January 1996). To make sure that the brand extensions finally used in our study varied
with respect to both awareness and (perceived) extension success a second pretest with 171
subjects was conducted. Pretest participants answered a series of questions regarding their
familiarity with the extension product and the perceived quality of the extension. Based on the
pretest results 22 parent brands with three extensions each were selected, resulting in 66 brand
extensions for the main study.
Multiple-item measures were employed for both the extension success as well as the
success factors. A questionnaire was developed using variables and rating scales that follow
closely those of previous studies (see Table 1). Extension success was construed as perceived
extension quality (e.g. Aaker and Keller 1990; Broniarczyk and Alba 1994; Bottomley and
Doyle 1996; Klink and Smith 2001) and was measured with three questions ascertaining (1)
the perceived overall quality of the extension (1 = very low and 7 = very high), (2) the market
position of the extension product (extent to which subjects agreed/disagreed to the statement
“product XY belongs to the top 3 products in the market”, 1 = strongly disagree and 7 =
strongly agree) and (3) the perceived overall quality relatively to competing products in the
market (1 = below average, 7 = above average).
Measures of the success factors were adapted from those used in typical previous
studies (see Table 1). For example the perceived fit was measured by asking the participants to
rate (1) the overall similarity of the brand extension to the parent brand (1 = very low, 7 = very
high), (2) the perceived ability of the company to make a product in the extension product class
Drivers of brand extension success Page 15
(1 = very high, 7 = very low) and (3) the relevance of the brand-specific associations in the
extension product category (Broniarczyk and Alba 1994).
Data were collected from 2426 respondents drawn according to a quota sampling
procedure with a representative structure for Germany concerning age, gender and number of
household members. In addition, a constraint was that the brands in the questionnaire were
known by the consumers. Since each questionnaire had scales for three of the 66 brand
extensions 2426 * 3 = 7278 cases were obtained. The exclusion of respondents for whom the
extension categories were not relevant reduced the number of cases to 6668 cases. Because of
0.2 % missing values we used a combination of listwise deletion and informative imputation
procedure (Ford 1976).
The models were analyzed with AMOS 4.0 (Arbuckle and Wothke 1999)2 using
maximum likelihood estimation, which assumes multivariate normal data and a reasonable
sample size. Simulation research has shown that with a good model and multivariate normal
data the ratio of sample size to number of free parameters should be 10:1 or higher to get
trustworthy parameter estimates and to obtain appropriate significance tests (Baumgartner and
Homburg 1996). Thus, with 6668 cases and a maximum of 70 free parameters our sample is
sufficiently large. Approximate normality of the data is crucial for maximum likelihood
estimation because model estimation and testing are based on the validity of this assumption.
Hence, prior to model estimation and testing multivariate tests of normality based on skewness
and kurtosis of the observed variables were performed. The tests indicated that the data were
approximately normal (e.g. Bollen 1989). In addition, we performed outlier analysis and
excluded influential outliers before estimating each of the three alternative structural equation
2 Covariance matrices are available from the authors.

Drivers of brand extension success Page 16
models (e.g. Baumgartner and Homburg 1996, p. 148; Mullen, Milne and Doney 1995; Bollen
1989).
Furthermore, our sufficiently large sample allows us to randomly split the data into two
parts, thereby making it possible to cross-validate the findings (Byrne 2001). As such, sample I
serves as the calibration sample on which the hypothesized models are tested. The replicability
of each model is then tested based on sample II (the validation sample).
RESULTS
The presentation of the results is organized in five sections. First, we briefly describe
the results of the assessment of the employed multiple-item measures. Second, we analyze the
baseline model described in section 2.1, i.e. we simultaneously test the 10 hypotheses with
regard to the direct effects of the determinants of extension success. Third, we test the whole
system of relationships between the success factors and the extensions success, i.e. we analyze
simultaneously the hypotheses postulated in section 2. The remaining two sections investigate
moderating effects of extension categories and consumers’ direct experience with the extension
product.
Assessment of the Measurement Model
As a first step of the analysis, we examined the reliability and validity of the measures
employed. First, Cronbach’s Alpha is computed for all scales. The alphas vary from 0.80 to
0.92. Second, the items are subject to exploratory and confirmatory factor analyses. The quality
of the construct measurement was ascertained by looking at the sign, size, and the significance
of the estimated factor loadings and the magnitude of measurement error. All of the factor
Drivers of brand extension success Page 17
loadings are significant (t-values higher than 30.54) and are highly related to their respective
constructs in support of convergent validity. Explained variance varies between 52.9 % and
84.9 %. To ascertain how well the constructs are measured by their indicators we computed
two indices of reliability (e.g. Steenkamp and van Trijp 1991; Fornell and Larcker 1981;
Bagozzi and Yi 1988), one at the individual item level (individual-item reliability) and one for
all measures of a given construct simultaneously (composite reliability). All constructs display
satisfactory levels of reliability as indicated by individual-item reliabilities exceeding 0.70 and
composite reliabilities ranging from 0.62 to 0.85. These figures are comparable to those
obtained in many marketing studies. Finally, a test for construct discriminant validity was
conducted. The shared variance estimate for each success factor was calculated and compared
to the square of the phi-coefficient representing the correlation between pairs of success factors
(Fornell and Larcker 1981). Each of the shared variance estimates exceeded the square of the
corresponding phi-coefficient which provides evidence of discriminant validity among all
success factors. They represent distinct constructs in the two models.
To summarize, the measures provide a good fit to the date and thus were used in the
following estimation and testing of the three models described above.
Baseline Model
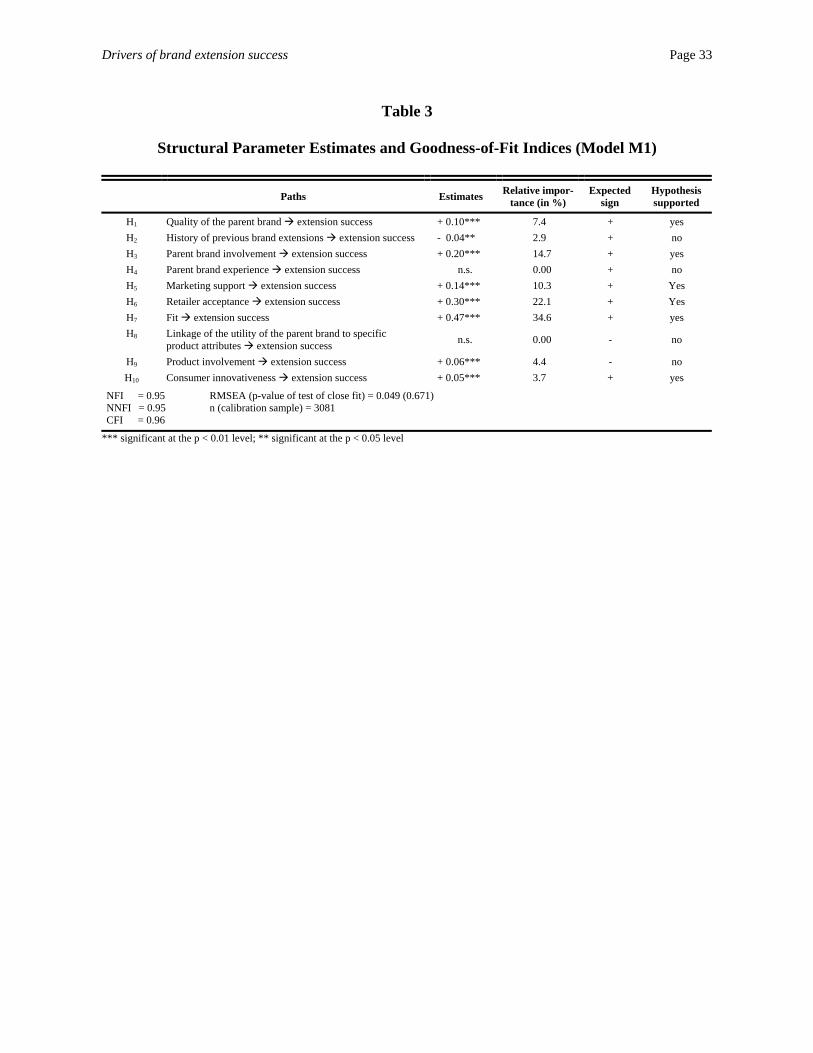
Turning to the structural model itself, Table 3 reports the parameter estimates and
goodness-of-fit indicators of the structural equation system that comprises of the direct effects
of the success factors on extension success, i.e. there are no dependence relationships between
the success factors involved. Overall fit indices are used to assess the fit of the model to the
data (e.g. Hu and Bentler 1995). In particular we look at an incremental fit index (normed fit
Drivers of brand extension success Page 18
index [NFI] = 0.95) that compares the target model to a model in which all observed measures
are assumed to be uncorrelated, two incremental fit indices based on non-centrality (non-
normed fit index [NNFI] = 0.95, comparative fit index [CFI] = 0.96) and a stand-alone fit
index based on non-centrality (root mean squared error of approximation which estimates how
well the fitted model approximates the population covariance matrix per degree of freedom
[RMSEA] = 0.049).3 All fit indices are clearly within a satisfactory range and show that a
substantial amount of variance is accounted for by the model.
Insert Table 3 about here
Significance and relative importance of success factors: In Table 3, it can be seen that
eight success factors have a significant direct influence on extension success. The by far most
important factor turns out to be the fit between the parent and extension category (sign as
expected). While the significance of this factor is not unexpected (given the results of prior
research, e. g. Bottomley and Holden 2001), the overwhelming impact of this factor relative to
other brand extension success factors is a notable and interesting result, in particular since we
used real brand extensions. In the recent past researchers have repeatedly presumed that the
overwhelming impact of the fit can be attributed to the use of hypothetical brand extensions
(e.g. Klink and Smith 2001). However, the results of the present study show that even with the
exclusive use of real brand extensions the fit is still proven to be the most important success
factor.
3 The chi-square-statistic for model fit is problematic as its power varies with the sample size. With large samples the statistical test will almost certainly be significant, even if the model actually describes the data very well (Bagozzi and Yi 1988; Bentler 1990). Given the sensitivity of the chi-square-statistic for sample size we set it aside.
Drivers of brand extension success Page 19
Other relevant success factors turn out to be retailer acceptance, parent brand
involvement, quality of the parent brand and marketing support (signs as expected). All other
factors are either of minor relevance (history of previous brand extensions, product
involvement, and innovativeness) or even of non-significant relevance (experience with the
parent brand, linkage of the utility of the parent brand to specific product attributes).
For the relationship between the product involvement and extension success the
coefficient estimate is significant and positive, which does not support H9. However, a positive
effect might be plausible since high product involvement promotes a person’s perception of the
riskiness of buying an average product in the product class (e.g. Nijssen, Uijl and Bucklin
1995, p. 868). Consumers may rely on a well-known brand in order to reduce this perceived
risk (e.g. Keller 2003). That is, under certain conditions high product involvement may have a
positive effect on brand extension success.
Furthermore, the influence of the history of previous brand extensions on extension
success is significant but negative. Thus, H2 is not supported. The negative influence might be
attributed to some kind of parent brand dilution effect since a history of brand extensions may
cause an increasing incongruity in the parent brand’s product range. In fact, looking at the data
the respondents assess almost one half of the selected parent brands as having only a
moderately clear brand image (7-point rating scale, the means for 10 brands are ranging from
3.0 to 4.5).
To assess the robustness of the postulated model we cross-validate our findings by
comparing the estimates across the calibration and the validation sample. The test involves
constraining the path coefficients and factor loadings as well as the variance/covariance of the
constructs to be equal across the two samples and then evaluating whether the resulting change
Drivers of brand extension success Page 20
in chi-square is significant (p < 0.01) with the appropriate number of degrees of freedom. No
statistically significant difference is observed (χ2d = 70.44, n.s.).
Dependence Relationships between the Success Factors
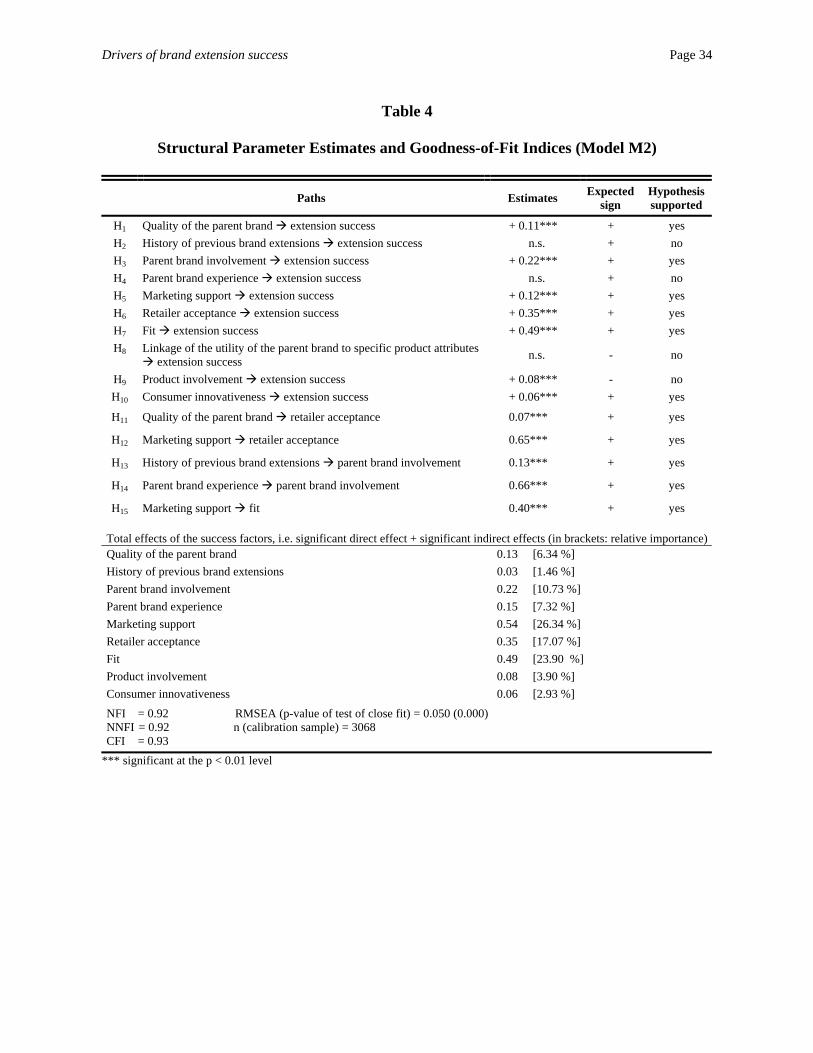
Estimating and testing of M2: Table 4 reports the structural parameter estimates and
goodness-of-fit indices for M2. Although the various fit indices are lower than for M1, they
suggest that the model represents an acceptable fit to the data. As is shown in Table 4, all
coefficients are significant (p < 0.01) and positive, with the exception of the impact of the
history of previous brand extensions (H2), the parent brand experience (H4) and the linkage of
the utility of the parent brand to specific product attributes (H8) on extension success. Thus, the
hypotheses H1, H3, H5 – H7 and H9 – H15 are supported. For the history of previous brand
extensions no significant direct effect on extension success is found. Nevertheless, there is a
strong and highly significant relationship between the history of previous extensions and the
parent brand involvement (standardized path estimate = 0.13, p < 0.01) which in turn has a
significant and positive impact on extension success (standardized path estimate = 0.22, p <
0.01). Hence, the history of past extensions has a significant and positive impact on extension
success (0.13 * 0.22 = 0.03) through its positive effect on parent brand involvement, in support
of H13 and H2. Similar, parent brand experience has no direct effect on extension success, but
through its significant and positive impact on parent brand involvement this variable has a
significant and positive influence on extension success.
Insert Table 4 about here
Drivers of brand extension success Page 21
In summary, the results of the literature based model M2 already show several
significant and substantial dependence relations between the success factors. Past brand
extension research has fully ignored such dependence relationships when studying the key
drivers of extension success. As is explicitly shown subsequently, the failure to account for
dependence relationships between the success factors leads to misinterpretation of the
significance and relative importance of the determinants of extension success. This is a serious
problem since it has been one of the key issues in past research to determine the factors that
influence extension success respectively consumer evaluations of brand extensions.
Similar to the previous run, we cross-validated model M2 by estimating the model on
the calibration as well as the validation sample. The chi-square difference test comparing the
calibration sample estimates with the validation sample estimates was not significant (χ2d =
61.86, n.s.) which indicates that our model is robust with other samples.
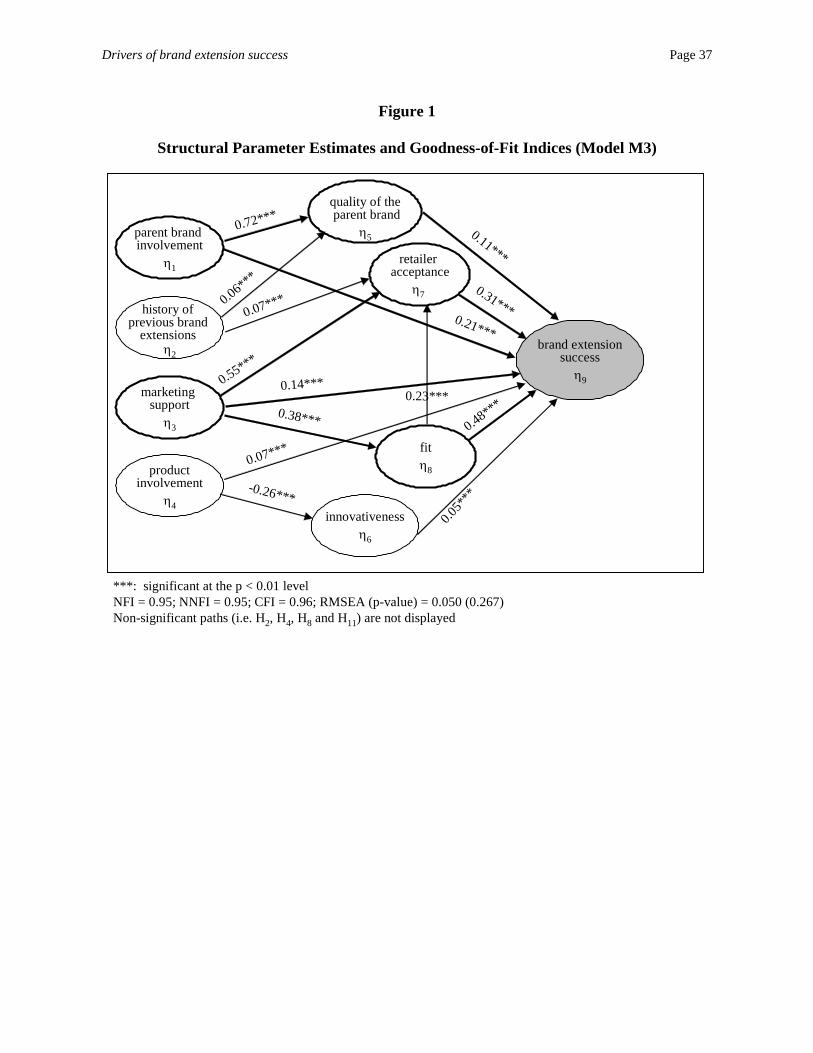
Estimating and testing of M3: Turning to model M3, Figure 1 reports the parameter
estimates of the direct effects as well as the estimates of the judgmentally derived relationships
between the success factors. The various fit indicators show, once again, that a substantial
amount of variance is accounted for by the model. Furthermore, the cross-validation of model
M3 results in a non-significant chi-square difference (χ2d = 43.90, n.s.).
Insert Figure 1 about here
With the exception of three direct effects (H2, H4 and H8) and the influence of the
parent brand quality on retailer acceptance (H11) of the extension product, all relationships
between the constructs in the model turn out to be significant at the p < 0.01 level. Looking at

Drivers of brand extension success Page 22
the direct effects only, the fit between the parent brand and the extension product turns out to
be the factor with the strongest impact on extension success. Other factors with a substantial
direct effect on extension success are retailer acceptance (β97 = 0.31), parent brand
involvement (β91 = 0.21), marketing support (β93 = 0.14) and quality of the parent brand (β95 =
0.11). Comparing the direct effects in model M1 with those in M3, there are almost no
differences, which indicates that the estimates are quite robust.
Similar to model M2 there is no direct effect of the history of previous brand extensions
on extension success. However, the results show that this variable has a significant and positive
impact on both the quality of the parent brand and the retailer acceptance of the extension
product, as hypothesized in H17 and H18. Hence, even if there is no significant direct
relationship between the history of previous brand extensions and extension success, there are
two indirect relationships through (a) the quality of the parent brand and (b) the retailer
acceptance.
Turning to the other success factors, there are several other indirect relationships. For
example the marketing support has both a direct impact on extension success (β93 = 0.14) as
well as three indirect effects on extensions success through the following paths:
(1) Marketing support fit extension success [β83 * β98 = 0.38 * 0.48 = 0.18]
(2) Marketing support fit retailer acceptance extension success [β83 * β78 * β97
= 0.38 * 0.23 * 0.31 = 0.03]
(3) Marketing support retailer acceptance extension success [β73 * β97 = 0.55 *
0.31 = 0.17]
Hence, the variable marketing support has a substantial total effect of 0.52 = 0.14 + 0.18 + 0.03
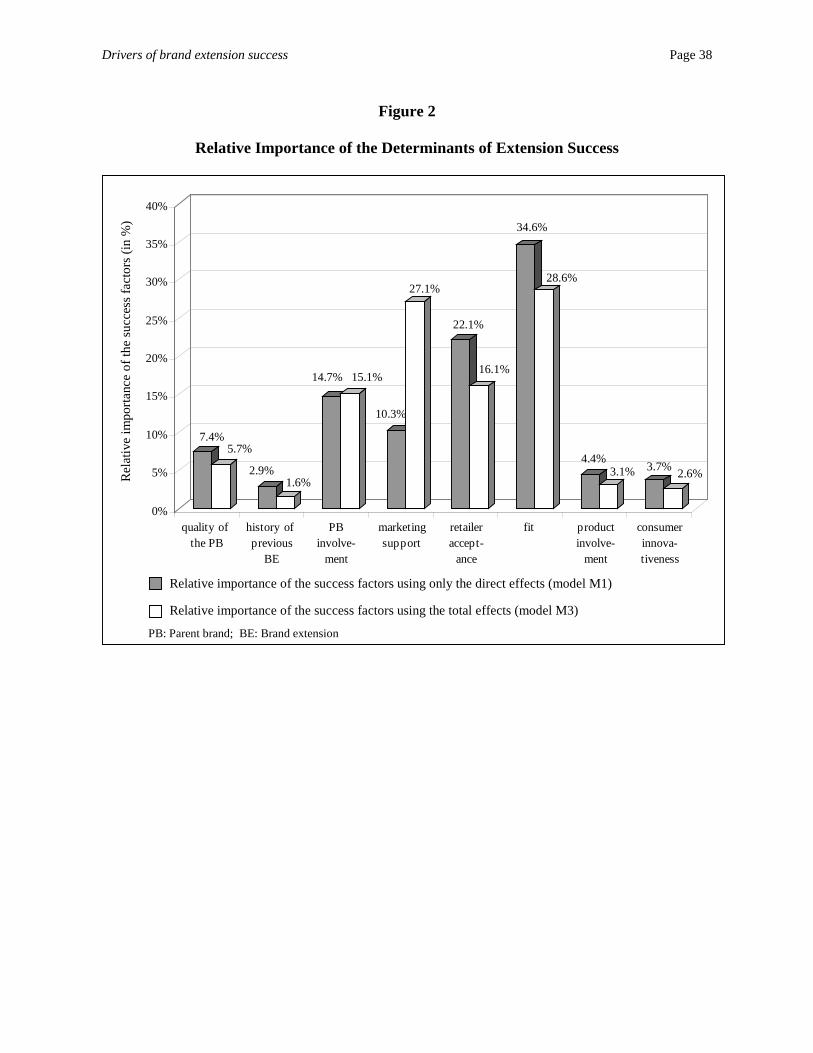
+ 0.17 on the success of a brand extension. In general, the total effect of a variable X1 on a
Drivers of brand extension success Page 23
variable X2 represents the comprehensive impact of X1 on X2 considering the whole system of
dependence relationships between the variables investigated. Similar to the total effect of the
variable marketing support the total effects of all other success factors can be computed in
order to determine their relative importance for the success of a brand extension. Figure 2
reports the relative importance of each success factor for model M1 as well as for model M3.
Most striking, looking at the results for model M3, there is a considerable change in the
relative influence of the investigated success factors compared to model M1 that ignores
dependence relations between the success factors. For example the relative importance of the
marketing support for the success of a brand extension increases from 10.3 % (M1) to 27.1 %
(M3), and the relative importance of the fit between parent brand and extension product
decreases from 34.6 % to 28.6 % (but the fit is still proven to be the most important success
factor).
Insert Figure 2 about here
Model comparison: In order to compare the performance of the three models and to
identify the “best-fitting” model we use nested and non-nested model comparisons (Leeflang,
Wittink, Wedel and Naert 2000) on the basis of the results of the cross-validation. Model M3
clearly turns out to be the “best” model: The chi-square difference for M3 is clearly lower than
for M1 respectively M2, i.e. turning to the constrained model (constrained path coefficients,
factor loadings and variance/covariance of the constructs) clearly has the smallest negative
effect for model M3. Furthermore, the chi-square difference divided through the difference in
the degrees of freedom is clearly lower for M3 than for the other two models. Hence, having

Drivers of brand extension success Page 24
identified M3 as the “best-fitting” model, the following analyses will concentrate on this
model.
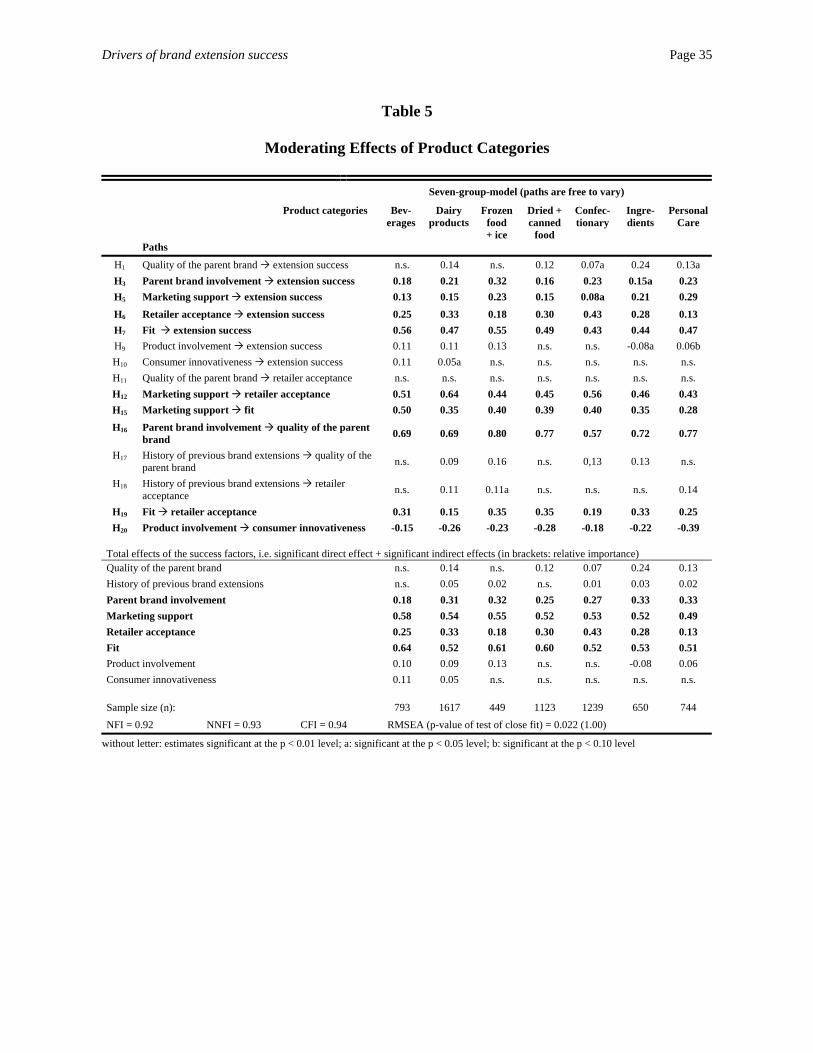
Moderating Effects of Extension Categories
To assess the generalizability of our “best fitting” model further, we compare the
performance of M3 across product categories. Since our data set covers a broad variety of
extension categories we are able to split our sample into several sub-samples according to the
widely used classification of food- and non-food-product-classes by A.C. Nielsen (2002).
To investigate the generalizability of M3 across product categories, a seven-group-
baseline model was developed in which the estimates of all hypothesized paths of M3 were
free to vary (see Table 5, seven-group-model). Then the same model was run whereby the path
coefficients within the structural model were constrained to be equal across the seven groups
and it was evaluated if the resulting change in chi-square is significant with the appropriate
number of degrees of freedom. Table 5 reports the coefficient estimates as well as the
goodness-of-fit indices for the seven-group-comparison. The various fit indices suggest that the
model represents an acceptable fit to the data.
Insert Table 5 about here
While there is some variation with respect to the significance and relative importance of
the success factors across the seven sub-groups, the general pattern is very similar: For every
sub-group of product categories there is a significant and positive direct effect of the four
variables parent brand involvement, marketing support, retailer acceptance, and fit on
Drivers of brand extension success Page 25
extension success, in support of H3, H5, H6 and H7. In addition five dependence relations
between the success factors turn out to be significant and positive for all seven sub-groups,
supporting H12, H15, H16, H19 and H20 (see Table 5 in bold type).4 Moreover, the total effects
reported in Table 5 show that in every sub-group the variables marketing support and fit turn
out to have the strongest impact on extension success. Furthermore, similar to the aggregate
analysis retailer acceptance and parent brand involvement have a significant and substantial
impact on extension success.
However, there are also some differences between the product classes. First, Table 5
shows that we cannot find an exact replication of the aggregate results in any of the seven
product classes. Second, to some extent there are considerable differences in the relative
importance of the success factors between the seven product categories. For example relative
importance of the quality of the parent brand is three times higher for ingredients than for
confectionary. The chi-square difference test comparing the seven-group-baseline model
(hypothesized paths are free to vary) and the constrained seven-group-model (path coefficients
were constrained to be equal across the seven groups, see above) is statistically significant (χ2d
= 295.48, p < 0.01). As already outlined, statistical tests are problematic as their power varies
with the sample size, i.e. since our analysis is based on a very large sample, the statistical test
will almost certainly be significant.
To summarize, the results of the seven-group analysis indicate that the main findings of
the aggregate analysis can be generalized across product categories. However, the statistically
significant chi-square-difference suggests that both the relations between the success factors
4 In agreement with the recommendation of spare modeling (e.g. Lambert and Brittan 1970; Quine 1960) we excluded those paths which turned out to be of non-significant relevance in all seven product categories (i.e. H2, H4 and H8) and estimated the modified model again.

Drivers of brand extension success Page 26
and the relations between the success factors and the extension success are to some extent
sensitive to the extension’s product category.
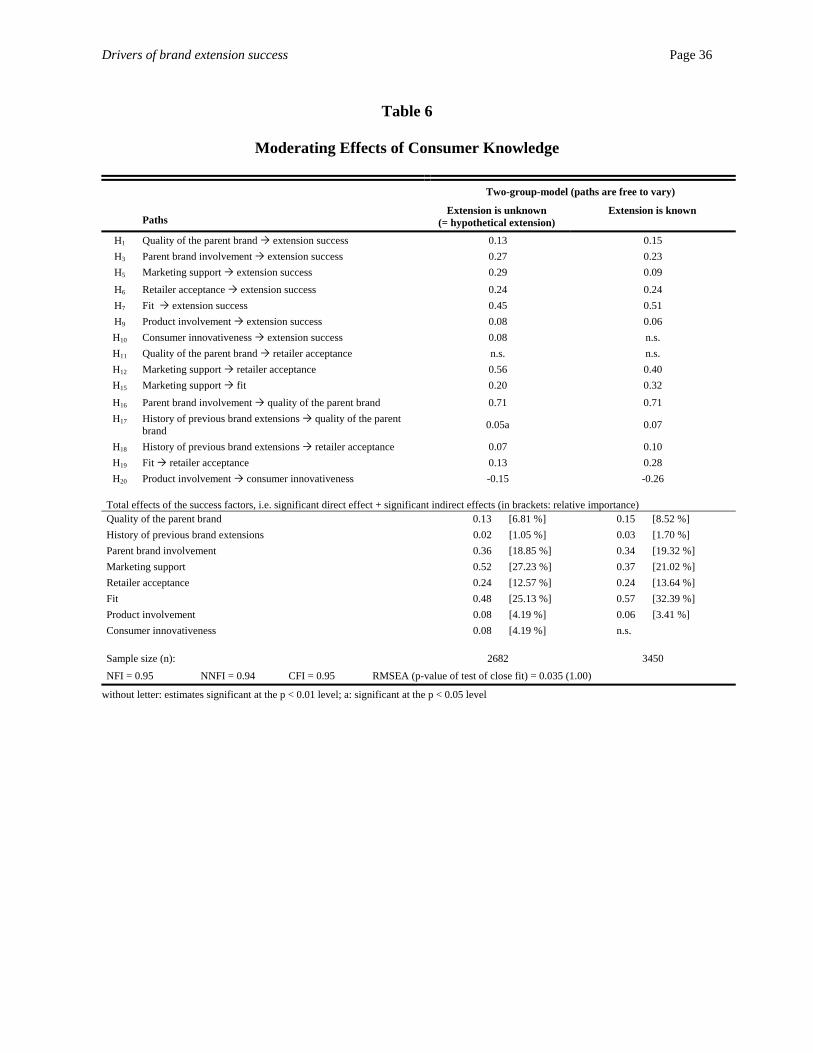
Moderating Effects of Consumers’ Experience with the Extension
Our final analysis pertained to consumers’ levels of brand knowledge and familiarity.
Particularly in the recent past researchers have presumed repeatedly that the dominance of the
two factors quality of the parent brand and fit between the parent brand and the extension
product results from the use of hypothetical brand extensions. Compared with the evaluation of
real brand extensions, there is only limited information available for hypothetical extensions
(Klink and Smith 2001). Typically, previous studies provide the single cue of a brand name
and extension product category as stimulus to be evaluated. When subjects have limited
information, they make inferences about a proposed extension product by relying on the cues
available such as perceived quality of the parent brand or the perceived fit between the parent
and extension categories. Conversely, the impact of these cues might diminish as other relevant
cues which are available in the marketplace for real brand extensions become available (Klink
and Smith 2001). Hence, past research might be distorted by a hypothetical bias.
Since our large sample consists of consumers that know the extension products (i.e. for
these subjects the stimuli are real brand extensions) as well as consumers that have not been
aware of the products until our survey (i.e. the products represent hypothetical brand
extensions to them) we are able to test whether past research is distorted by a hypothetical bias.
To develop a two-group comparison, we divided the total sample into two groups on
the basis of consumers’ recognition of the extension products. We test for a hypothetical bias
by comparing the path coefficients across two groups: one in which subjects know the
Drivers of brand extension success Page 27
extension product versus one in which the extension products are unknown. A baseline model
in which all hypothesized paths were free to vary was estimated. Table 6 shows the coefficient
estimates as well as the goodness-of-fit indices for the two-group comparison. Then, the same
model was run in which the paths were constrained to be equal. The chi-square difference test
is statistically significant (χ2d = 295.48, p < 0.01), which indicates that there are at least some
differences between real and hypothetical extension products that might have biased the
findings of past research.
Insert Table 6 about here
However, even though there is some variation with respect to the significance and the
relative importance of the success factors across the two groups, the general pattern is pretty
similar: Looking at the total effects, there is a strong impact of the factors fit, marketing
support, parent brand involvement, and retailer acceptance in both groups. Moreover, in both
groups the variables history of previous brand extensions, product involvement and consumer
innovativeness are only of minor relevance for the success of a brand extension. But beside
these similarities there is also a remarkable difference between the two groups with respect to
the marketing support of the extension product. For the group of subjects that know the
extension products (group 2) it turns out that this factor is of only minor relevance. This result
is plausible since for instance repeated exposure to advertisements should not be as important
in group 2 as in group 1.
To assess the existence of a hypothetical bias further, we performed additional two-
group comparisons on the basis of the respondents’ familiarity respectively experience with the
Drivers of brand extension success Page 28
extension products. We divided our sample into high and low familiarity groups (i.e. heavy and
light user) based on median split as well as percentile analysis. The results of both two-group
comparisons are very similar and provide further support for the results reported in Table 6
(two-group comparison based on consumers’ recognition): Again, we find a strong impact of
the factors fit, marketing support, parent brand involvement, and retailer acceptance across the
two groups regardless of the mode of splitting the sample (median split or percentile analysis).
In particular it is remarkable that the fit between parent brand and extension product turns out
to be the most important driver of success in all groups. This implies that consumers’ level of
experience with the extension product does not moderate the influence of the investigated
factors on extension success. However, we observe a statistically significant chi-square
difference between the two groups. Given our very large sample, this is not surprising.
To summarize, we performed two-group model comparisons in which we divided our
sample into two groups by using three different approaches. In all three model comparisons we
found very similar patterns across the groups with respect to the significance and relative
importance of the success factors. Hence, the results of the three alternative two-group model
comparisons seem to imply that there is no substantial hypothetical bias with respect to the
significance and relative importance of the drivers of extension success.
DISCUSSION AND CONCLUSIONS
This research investigates the significance and relative importance of a variety of factors
affecting consumer evaluations of brand extensions. Our research differs from past research in
four major aspects. First, the hypothesized relationships between success factors and extension
success are set up as a structural equation model. Second, rather than testing single
Drivers of brand extension success Page 29
relationships between one dependent variable (brand extension success) and several
independent variables (success factors) we examine a series of dependence relationships
simultaneously. Third, by using a structural equation modelling approach we take measurement
errors into account. Fourth, rather than investigating hypothetical brand extensions in lab
settings, we utilize existent brand extensions. Our main findings can be summarized as follows:
• The measures of the constructs demonstrate high reliability and validity.
• The fit between the parent brand and the extension product, the involvement in the
parent brand, the marketing support for the extension product and its distribution turn
out to be by far the most important success factors.
• We find several important indirect effects of the investigated success factors.
Compared with model M1 which ignores dependence relations between the success
factors there is a considerable change in the relative influence of the investigated
success factors. For example the relative importance of the marketing support for the
success of a brand extension increases from 10.3 % (M1) to 27.1 % (M3).
• The main findings of the aggregate analysis can be generalized across product
categories. However, the statistically significant chi-square-difference suggests that
the relations between the success factors as well as the relations between the success
factors and the extension success are to some extent sensitive to the extension’s
product category.
• We found no substantial hypothetical bias with respect to the significance and relative
importance of the drivers of extension success.

Drivers of brand extension success Page 30
Some potential areas of limitation for this research could be the following. First, we
chose to analyze only fast moving consumer goods. It would be interesting to investigate to
which extent our findings can be generalized to other fields such as consumer durables or
services. Second, the success of a brand extension can be seen from different perspectives. This
study concentrates on consumer-specific indicators of extension success, i. e. the perceived
quality of the extension product. Other indicators of an extension’s success are for example its
profitability, sales volume, revenue or market share. In future work the question could be
addressed to which extent our findings can be replicated with some economic indicators of
brand extensions success.
A further discussion and managerial implications will be added.
Drivers of brand extension success Page 31
Table 1
Hypotheses Regarding Success Factors of Brand Extensions
Direct effects of the success factors A brand extension is more successful … Source Parent brand characteristics
H1 Quality (strength) of the parent brand if the quality of the parent brand is high Smith/Park 1992 H2 History of previous brand extensions
if the history of previous brand extensions is successful, e.g.
high number of previous brand extensions Dacin/Smith 1994 high variability among product types offered
by the parent brand Boush/Loken 1991
low variance in quality among previous brand extensions
Dacin/Smith 1994
H3 Parent brand involvement if parent brand involvement is high Kirmani/Sood/ Bridges 1999
H4 Parent brand experience if parent brand experience is high Swaminathan/ Fox/Reddy 2001
Extension characteristics H5 Marketing support if the marketing support is high, e.g.
advertising support Reddy/Holak/Bhat 1994
firm’s marketing competence Reddy/Holak/Bhat 1994
H6 Retailer acceptance if the retailer acceptance is high Nijssen 1999 Relationship parent brand – extension product
H7 Fit between parent brand and extension product if the fit between the parent brand and the extension is high, e.g.
high global similarity Aaker/Keller 1990 high ability of the owner of the parent brand
to make a product in the extension product class
Aaker/Keller 1990
high relevance of the extended associations for the extension product
Broniarczyk/Alba 1994
H8 Linkage of the utility of the parent brand to product attributes of the original product category
the less the utility of the parent brand is linked to product attributes of the original product category
Rangaswamy/ Burke/Oliva 1993
Extension’s product category characteristics H9 Product involvement if the product involvement is low Nijssen/ Bucklin
1998 H10 Consumer innovativeness if consumer innovativeness is high Klink/Smith 2001
Dependence relationships between success factors Expected sign Source
H11 Quality of the parent brand retailer acceptance + Collins-Dodd/Louviere 1999
H12 Marketing support retailer acceptance + Collins-Dodd/Louviere 1999
H13 History of previous brand extensions parent brand involvement + DelVecchio 2000
H14 Parent brand experience parent brand involvement + Kirmani/Sood/Bridges 1999
H15 Marketing support fit between parent brand and extension product + Klink/Smith 2001
Drivers of brand extension success Page 32
Table 2
Judgmentally Derived Dependence Relations between the Success Factors
Dependence relations between success factors Expected sign
Percentage of experts
H16 Parent brand involvement quality of the parent brand + 0.62 H17 History of previous brand extensions quality of the parent brand + 0.52 H18 History of previous brand extensions retailer acceptance + 0.38 H19 Fit between parent brand and extension retailer acceptance + 0.29 H20 Product involvement consumer innovativeness - 0.29
See Table 1: H11 Quality of the parent brand retailer acceptance + 0.48 H12 Marketing support retailer acceptance + 0.43 H15 Marketing support Fit between parent brand and extension + 0.38
Drivers of brand extension success Page 33
Table 3
Structural Parameter Estimates and Goodness-of-Fit Indices (Model M1)
Paths Estimates Relative impor-tance (in %)
Expected sign
Hypothesis supported
H1 Quality of the parent brand extension success + 0.10*** 7.4 + yes H2 History of previous brand extensions extension success - 0.04** 2.9 + no H3 Parent brand involvement extension success + 0.20*** 14.7 + yes H4 Parent brand experience extension success n.s. 0.00 + no H5 Marketing support extension success + 0.14*** 10.3 + Yes H6 Retailer acceptance extension success + 0.30*** 22.1 + Yes H7 Fit extension success + 0.47*** 34.6 + yes H8 Linkage of the utility of the parent brand to specific
product attributes extension success n.s. 0.00 - no
H9 Product involvement extension success + 0.06*** 4.4 - no H10 Consumer innovativeness extension success + 0.05*** 3.7 + yes
NFI = 0.95 RMSEA (p-value of test of close fit) = 0.049 (0.671) NNFI = 0.95 n (calibration sample) = 3081 CFI = 0.96
*** significant at the p < 0.01 level; ** significant at the p < 0.05 level
Drivers of brand extension success Page 34
Table 4
Structural Parameter Estimates and Goodness-of-Fit Indices (Model M2)
Paths Estimates Expected sign
Hypothesis supported
H1 Quality of the parent brand extension success + 0.11*** + yes H2 History of previous brand extensions extension success n.s. + no H3 Parent brand involvement extension success + 0.22*** + yes H4 Parent brand experience extension success n.s. + no H5 Marketing support extension success + 0.12*** + yes H6 Retailer acceptance extension success + 0.35*** + yes H7 Fit extension success + 0.49*** + yes H8 Linkage of the utility of the parent brand to specific product attributes
extension success n.s. - no
H9 Product involvement extension success + 0.08*** - no H10 Consumer innovativeness extension success + 0.06*** + yes
H11 Quality of the parent brand retailer acceptance 0.07*** + yes
H12 Marketing support retailer acceptance 0.65*** + yes
H13 History of previous brand extensions parent brand involvement 0.13*** + yes
H14 Parent brand experience parent brand involvement 0.66*** + yes
H15 Marketing support fit 0.40*** + yes
Total effects of the success factors, i.e. significant direct effect + significant indirect effects (in brackets: relative importance)Quality of the parent brand 0.13 [6.34 %] History of previous brand extensions 0.03 [1.46 %] Parent brand involvement 0.22 [10.73 %] Parent brand experience 0.15 [7.32 %] Marketing support 0.54 [26.34 %] Retailer acceptance 0.35 [17.07 %] Fit 0.49 [23.90 %] Product involvement 0.08 [3.90 %] Consumer innovativeness 0.06 [2.93 %] NFI = 0.92 RMSEA (p-value of test of close fit) = 0.050 (0.000) NNFI = 0.92 n (calibration sample) = 3068 CFI = 0.93
*** significant at the p < 0.01 level
Drivers of brand extension success Page 35
Table 5
Moderating Effects of Product Categories
Seven-group-model (paths are free to vary)
Product categories Paths
Bev- erages
Dairy products
Frozen food + ice
Dried + canned
food
Confec-tionary
Ingre-dients
Personal Care
H1 Quality of the parent brand extension success n.s. 0.14 n.s. 0.12 0.07a 0.24 0.13a H3 Parent brand involvement extension success 0.18 0.21 0.32 0.16 0.23 0.15a 0.23 H5 Marketing support extension success 0.13 0.15 0.23 0.15 0.08a 0.21 0.29 H6 Retailer acceptance extension success 0.25 0.33 0.18 0.30 0.43 0.28 0.13 H7 Fit extension success 0.56 0.47 0.55 0.49 0.43 0.44 0.47 H9 Product involvement extension success 0.11 0.11 0.13 n.s. n.s. -0.08a 0.06b H10 Consumer innovativeness extension success 0.11 0.05a n.s. n.s. n.s. n.s. n.s. H11 Quality of the parent brand retailer acceptance n.s. n.s. n.s. n.s. n.s. n.s. n.s. H12 Marketing support retailer acceptance 0.51 0.64 0.44 0.45 0.56 0.46 0.43 H15 Marketing support fit 0.50 0.35 0.40 0.39 0.40 0.35 0.28 H16 Parent brand involvement quality of the parent
brand 0.69 0.69 0.80 0.77 0.57 0.72 0.77
H17 History of previous brand extensions quality of the parent brand n.s. 0.09 0.16 n.s. 0,13 0.13 n.s.
H18 History of previous brand extensions retailer acceptance n.s. 0.11 0.11a n.s. n.s. n.s. 0.14
H19 Fit retailer acceptance 0.31 0.15 0.35 0.35 0.19 0.33 0.25 H20 Product involvement consumer innovativeness -0.15 -0.26 -0.23 -0.28 -0.18 -0.22 -0.39
Total effects of the success factors, i.e. significant direct effect + significant indirect effects (in brackets: relative importance) Quality of the parent brand n.s. 0.14 n.s. 0.12 0.07 0.24 0.13 History of previous brand extensions n.s. 0.05 0.02 n.s. 0.01 0.03 0.02 Parent brand involvement 0.18 0.31 0.32 0.25 0.27 0.33 0.33 Marketing support 0.58 0.54 0.55 0.52 0.53 0.52 0.49 Retailer acceptance 0.25 0.33 0.18 0.30 0.43 0.28 0.13 Fit 0.64 0.52 0.61 0.60 0.52 0.53 0.51 Product involvement 0.10 0.09 0.13 n.s. n.s. -0.08 0.06 Consumer innovativeness 0.11 0.05 n.s. n.s. n.s. n.s. n.s.
Sample size (n): 793 1617 449 1123 1239 650 744 NFI = 0.92 NNFI = 0.93 CFI = 0.94 RMSEA (p-value of test of close fit) = 0.022 (1.00)
without letter: estimates significant at the p < 0.01 level; a: significant at the p < 0.05 level; b: significant at the p < 0.10 level
Drivers of brand extension success Page 36
Table 6
Moderating Effects of Consumer Knowledge
Two-group-model (paths are free to vary)
Paths
Extension is unknown (= hypothetical extension)
Extension is known
H1 Quality of the parent brand extension success 0.13 0.15 H3 Parent brand involvement extension success 0.27 0.23 H5 Marketing support extension success 0.29 0.09 H6 Retailer acceptance extension success 0.24 0.24 H7 Fit extension success 0.45 0.51 H9 Product involvement extension success 0.08 0.06 H10 Consumer innovativeness extension success 0.08 n.s. H11 Quality of the parent brand retailer acceptance n.s. n.s. H12 Marketing support retailer acceptance 0.56 0.40 H15 Marketing support fit 0.20 0.32 H16 Parent brand involvement quality of the parent brand 0.71 0.71 H17 History of previous brand extensions quality of the parent
brand 0.05a 0.07
H18 History of previous brand extensions retailer acceptance 0.07 0.10 H19 Fit retailer acceptance 0.13 0.28 H20 Product involvement consumer innovativeness -0.15 -0.26
Total effects of the success factors, i.e. significant direct effect + significant indirect effects (in brackets: relative importance) Quality of the parent brand 0.13 [6.81 %] 0.15 [8.52 %] History of previous brand extensions 0.02 [1.05 %] 0.03 [1.70 %] Parent brand involvement 0.36 [18.85 %] 0.34 [19.32 %] Marketing support 0.52 [27.23 %] 0.37 [21.02 %] Retailer acceptance 0.24 [12.57 %] 0.24 [13.64 %] Fit 0.48 [25.13 %] 0.57 [32.39 %] Product involvement 0.08 [4.19 %] 0.06 [3.41 %] Consumer innovativeness 0.08 [4.19 %] n.s.
Sample size (n): 2682 3450 NFI = 0.95 NNFI = 0.94 CFI = 0.95 RMSEA (p-value of test of close fit) = 0.035 (1.00)
without letter: estimates significant at the p < 0.01 level; a: significant at the p < 0.05 level
Drivers of brand extension success Page 37
Figure 1
Structural Parameter Estimates and Goodness-of-Fit Indices (Model M3)
brand extensionsuccess
η9
innovativenessη6
marketingsupport
η3
parent brand involvement
η1
productinvolvement
η4
history of previous brand
extensionsη2
fitη8
quality of theparent brand
η5
retaileracceptance
η7
0.11***
0.23***
0.07***0.06***
0.72***
0.05*
**
0.21***
0.07***0.48***
0.14***
0.31***
0.55***
***: significant at the p < 0.01 levelNFI = 0.95; NNFI = 0.95; CFI = 0.96; RMSEA (p-value) = 0.050 (0.267)Non-significant paths (i.e. H2, H4, H8 and H11) are not displayed
-0.26***
0.38***
Drivers of brand extension success Page 38
Figure 2
Relative Importance of the Determinants of Extension Success
7.4%5.7%
2.9%1.6%
14.7% 15.1%
10.3%
27.1%
22.1%
16.1%
34.6%
28.6%
4.4%3.1% 3.7% 2.6%
0%
5%
10%
15%
20%
25%
30%
35%
40%
quality of the PB
history of previous
BE
PBinvolve-
ment
marketingsupport
retaileraccept-
ance
fit productinvolve-
ment
consumerinnova-tiveness
Relative importance of the success factors using only the direct effects (model M1)
Relative importance of the success factors using the total effects (model M3)
PB: Parent brand; BE: Brand extension
Rel
ativ
e im
porta
nce
of th
esu
cces
sfac
tors
(in %
)
Drivers of brand extension success Page 39
References
Aaker, D.A. (1990): Brand Extensions: The Good, the Bad, and the Ugly, Sloan Management
Review, 31 (Summer), 47-56.
Aaker, D.A. and K.L. Keller (1990): Consumer Evaluations of Brand Extensions, Journal of
Marketing, 54 (January), 27-41.
A.C. Nielsen (2002): Universen 2002.
Alwin, D.F. and R.C. Tessler (1974): Causal Models, Unobserved Variables, and Experimental
Data, American Journal of Sociology, 80 (1), 58-86.
Arbuckle, J. L. and W. Wothke (1999): Amos 4.0 User´s Guide, Chicago.
Bagozzi, R.P. (1980): Causal Models in Marketing, New York: Wiley.
Bagozzi, R.P. and Y. Yi (1988): On the Evaluation of Structural Equation Models, Journal of
the Academy of Marketing Science, 16 (1), 74-94.
Barone, M.J., P.W. Miniard and J.B. Romeo (2000): The Influence of Positive Mood on Brand
Extension Evaluation, Journal of Consumer Research, 26 (March), 386-400.
Baumgartner, H. and C. Homburg (1996): Applications of Structural Equation Modeling in
Marketing and Consumer Research: A Review, International Journal of Research in
Marketing, 13, 139-161.
Bentler, P.M. (1990): Comparative Fit Indexes in Structural Models, Psychological Bulletin,
107, 238-246.
Bentler, P.M. and D. Bonett (1980): Significance Tests and Goodness of Fit in the Analysis of
Covariance Structures, Psychological Bulletin, 88, 588-606.
Bollen, K.A. (1989): Structural Equations With Latent Variables, New York et al.
Drivers of brand extension success Page 40
Bottomley, P.A. and J.R. Doyle (1996): The Formation of Attitudes towards Brand Extensions:
Testing and Generalising Aaker and Keller's Model, International Journal of Research in
Marketing, 13 (4), 365-377.
Bottomley, P.A. and S.J.S. Holden (2001): Do We Really Know How Consumers Evaluate
Brand Extensions? Empirical Generalizations Based on Secondary Analysis of Eight
Studies, Journal of Marketing Research, 38, 494-500.
Boush, D.M. and B. Loken (1991): A Process-Tracing Study of Brand Extension Evaluation,
Journal of Marketing Research, 28 (February), 16-28.
Breckler, S.J. (1990): Applications of Covariance Structure Modeling in Psychology: Cause for
Concern?, Psychological Bulletin, 107, 260-273.
Broniarczyk, S.M. and J.W. Alba (1994): The Importance of the Brand in Brand Extension,
Journal of Marketing Research, 31 (May), 214-228.
Brown, M.W. and R. Cudeck (1993): Alternative Ways of Assessing Model Fit, in: Testing
Structural Equation Models, Bollen, K.A. and J.S. Long (eds.) Newbury Park, S. 136-162.
Byrne, B.M. (2001): Structural Equation Modeling With AMOS: Basic Concepts,
Applications, and Programming, Mahwah, New Jersey.
Collins-Dodd, C. and J.J. Louviere (1999): Brand Equity and Retailer Acceptance of Brand
Extensions, Journal of Retailing and Consumer Services, 6, 1-13.
Cudeck, R. and M.W. Browne (1983): Cross-Validation of Covariance Structures, in:
Multivariate Behavioral Research, 18, 147-167.
Czellar, S. (2003): Consumer Attitude toward Brand Extensions: An Integrative Model and
Research Propositions, International Journal of Research in Marketing, 20, 97-115.
Drivers of brand extension success Page 41
Dacin, A.P. and D.C. Smith (1994): The Effect of Brand Portfolio Characteristics on Consumer
Evaluations of Brand Extension, Journal of Marketing Research, 31 (May), 229-242.
Dawar, N. and P.F. Anderson (1994): The Effects of Order and Direction on Multiple Brand
Extensions, Journal of Business Research, 30, 119-129.
DelVecchio, D. (2000): Moving Beyond Fit: The Role of Brand Portfolio Characteristics in
Consumer Evaluations of Brand Reliability, Journal of Product & Brand Management, 9
(7), 457-471.
Desai, K.K. and K.L. Keller (2002): The Effects of Ingredient Branding Strategies on Host
Brand Extendibility, Journal of Marketing, 66 (January), 73-93.
Ernst & Young and Nielsen (1999): New Product Introduction: Successful Innovation/Failure:
A Fragile Boundary.
Ford, B. L. (1976): Missing Data Procedures: A Comparative Study, ASA Proceedings of the
Social Statistics Section, Annual American Statistical Association, 324-329.
Ford, G.T. and R.A. Smith (1987): Inferential Belief in Consumer Evaluations: An Assessment
of Alternative Processing Strategies, Journal of Consumer Research, 14 (December), 363-
371.
Fornell, C. and D.F. Larcker (1981): Evaluating Structural Equation Models with
Unobservable Variables and Measurement Error, Journal of Marketing Research, 18
(February), 39-50.
Gürhan-Canli, Z. and D. Maheswaran (1998): The Effects of Extensions on Brand Name
Dilution and Enhancement, Journal of Marketing Research, 35 (Nov.), 464-473.
Drivers of brand extension success Page 42
Harrison, G.W. and E.E. Rutström (2004), Experimental Evidence on the Existence of
Hypothetical Bias in Value Elicitation Methods, in Handbook of Experimental Economics
Results, Plott, C. R. and V.L. Smith (eds.): New York: Elsevier Press.
Hu, L.-T. and P.M. Bentler (1995): Evaluating Model Fit, in: Structural Equation Modeling:
Concepts, Issues, and Applications, R.H. Hoyle (ed.) Thousand Oaks et al., 76-99.
Keller, K.L. (2003): Strategic Brand Management. Building, Measuring, and Managing Brand
Equity, 2. Ed., Upper Saddle River.
Keller, K.L. and S. Sood (2003): Brand Equity Dilution, Sloan Management Review, 45 (1),
12-15.
Keller, K.L. and D.A. Aaker (1992): The Effects of Corporate Images and Branding Strategies
on New Product Evaluations, in: Working Paper No. 1216 Stanford University.
Kim, B.-D. and M.W. Sullivan (1998): The Effect of Parent Brand Experience on Line
Extension Trial and Repeat Purchase, in: Marketing Letters, 9 (2), 181-193.
Kirmani, A., S. Sood and S. Bridges (1999): The Ownership Effect in Consumer Responses to
Brand Line Stretches, Journal of Marketing, 63 (January), 88-101.
Klink, R.R. and D.C. Smith (2001): Threats to the External Validity of Brand Extension
Research, Journal of Marketing Research, 38 (August), 326-335.
Lambert, K. and G. Brittan (1970): An Introduction to the Philosophy of Science, New Jersey.
Lane, V.R. (2000): The Impact of Ad Repetition and Ad Content on Consumer Perceptions of
Incongruent Extensions, Journal of Marketing, 64 (April), 80-91.
Lane, V. and R. Jacobson (1995): Stock Market Reactions to Brand Extension
Announcements: The Effects of Brand Attitude and Familiarity, Journal of Marketing, 59
(January), 63-77.
Drivers of brand extension success Page 43
Leeflang, P.S.H. and D.R. Wittink (2000): Building Models for Marketing Decisions: Past,
Present, and Future, International Journal of Research in Marketing, 17, 105-126.
Leeflang, P.S.H., D.R. Wittink, M. Wedel and P.A. Naert (2000): Building Models for
Marketing Decisions, Boston et al.
MacKenzie, S.B. (2001): Opportunities for Improving Consumer Research through Latent
Variable Structural Equation Modeling, Journal of Consumer Research, 28 (June), 159-
166.
Marketing (UK) (2003): Premium extensions are proving to be the most promising FMCG
launches, as manufacturers look to counteract retailers' price cuts, 28. August 2003, 25.
McCarthy, M.S., T.B. Heath and S.J. Milberg (2001): New Brands Versus Brand Extensions,
Attitudes Versus Choice: Experimental Evidence for Theory and Practice, Marketing
Letters, 12 (1), 75-90.
Mortimer, Ruth (2003): Fool's gold for marketers?, Brand Strategy, Issue 168 (February), 20-
22.
Mullen, M.R., G.R. Milne and P.M. Doney (1995): An International Marketing Application of
Outlier Analysis for Structural Equations: A Methodological Note, Journal of International
Marketing, 3 (1), 45-62.
Nielsen (1999): Die Nielsen Top 100 Marken, Lebensmittelzeitung, No. 26, June 27, 1999, 54.
Nijssen, E.J. (1999): Success Factors of Line Extensions of Fast-Moving Consumer Goods,
European Journal of Marketing, 33 (5/6), 450-469.
Nijssen, E.J. and L.P. Bucklin (1998): The Effect of Involvement upon Brand Extension, in:
Working Paper, University of Nijmegen/California.
Drivers of brand extension success Page 44
Nijssen, E., R. Uijl and L.P. Bucklin (1995): The Effect of Involvement on Brand Extensions,
Proceedings of the 24th Annual EMAC Conference, ESSEC, Paris, France, 867-870.
Park, C.W., M.S. McCarthy and S.J. Milberg (1993): The Effects of Direct and Associative
Brand Extension Strategies on Consumer Response to Brand Extensions, Advances in
Consumer Research, McAllister, M. and M.L. Rothschild (eds.) 20, Provo, UT:
Association for Consumer Research, S. 28-33.
Park, C.W., S.J. Milberg and R. Lawson (1991): Evaluation of Brand Extensions: The Role of
Product Feature Similarity and Brand Concept Consistency, Journal of Consumer
Research, 18 (September), S. 185-193.
Quine, W.V. (1960): On Simple Theories of a Complex World, London.
Rangaswamy, A., R.R. Burke and T.A. Oliva (1993): Brand Equity and the Extendibility of
Brand Names, International Journal of Research in Marketing, 10, 61-75.
Reddy, S.K., S.L. Holak and S. Bhat (1994): To Extend or Not to Extend: Success
Determinants of Line Extensions, Journal of Marketing Research, 31 (May), 243-262.
Rust, R.T. and D.C. Schmittlein (1985): A Bayesian Cross-Validated Likelihood Method for
Comparing Alternative Specifications of Quantitative Models, Marketing Science, 4 (1),
20-40.
Sandor, Z. and M. Wedel (2001): Designing Conjoint Choice Experiments Using Managers’
Prior Beliefs, Journal of Marketing Research, 38 (4), 430-443.
Smith, D.C. and C.W. Park (1992): The Effects of Brand Extensions on Market Share and
Advertising Efficiency, Journal of Marketing Research, 29 (August), 296-313.
Sunde, L. and R.J. Brodie (1993): Consumer Evaluations of Brand Extensions: Further
Empirical Results, International Journal of Research in Marketing, 10 (1), 47-53.
Drivers of brand extension success Page 45
Steenkamp, J.-B.E.M. and H. Baumgartner (2000): On the Use of Structural Equation Models
for Marketing Modeling, International Journal of Research in Marketing, 17, 195-202.
Steenkamp, J.-B.E.M. and H.C.M. van Trijp (1991): The Use of LISREL in Validating
Marketing Constructs, International Journal of Research in Marketing, 8, 283-299.
Stelzl, I. (1986): Changing a Causal Hypothesis Without Changing the Fit: Some Rules for
Generating Equivalent Path Models, Multivariate Behavioral Research, 21, 309-331.
Swaminathan, V., R.J. Fox and S.K. Reddy (2001): The Impact of Brand Extension
Introduction on Choice, Journal of Marketing, 65 (October), 1-15.
Tauber, E.M. (1988): Brand Leverage: Strategy for Growth in a Cost-Control World, Journal
of Advertising Research, 28 (August/September), 26-30.
Wernerfelt, B. (1988): Umbrella Branding as a Signal of New Product Quality: An Example of
Signalling by Posting a Bond, Rand Journal of Economics, 19 (Autumn), 458-466.

Research Papers on Marketing and Retailing - University of Hamburg Im Zentrum der Reihe Research Papers on Marketing and Retailing (Hrsg.: Prof. Dr. Henrik Sattler) steht ein marktgerichtetes, wertorientiertes Management, z. B. zu folgenden Fragestellungen:
• Mit welchen Methoden kann ein monetärer Markenwert gemessen werden?
• Wie können Markenstrategien im Handel bewertet werden?
• Wie soll der Handel gewinnoptimale Preise setzen?
• Wie können Konsumentenpräfe-renzen gemessen und in ein wert-orientiertes Management integriert werden?
• Wie kann der Erfolg von Neupro-dukten bestimmt werden?
• Welche Erlösmodelle sollen im eCommerce verfolgt werden?
The Research Papers on Marketing and Retailing (Ed.: Prof. Henrik Sattler) focus on market-orientated, value-based management, e.g.:
• Which methods to be applied as a means of measuring brand equity
• How to evaluate brand strategies in retailing
• How to set optimum-profit prices • How to measure consumer
preferences and integrate them into a value-based management
• How to determine the success of new products
• How to follow up revenue models in e-commerce.
Bisher erschienen:
Published so far:
001 Sattler, H., T. Nitschke, „Ein empirischer Vergleich von Instrumenten zur Erhebung von Zahlungsbereitschaften“, October 2001.
002 Sattler, H., F. Völckner, G. Zatloukal, „Erfolgsfaktoren von Markentransfers“, March 2002.
003 Sattler, H., “Appropriability of Product Innovations: An Empirical Analysis for Germany”, May 2002.
004 Hartmann, A., H. Sattler, „Wie robust sind Methoden zur Präferenzmessung?“, May 2002.
005 Sattler, H., S. Schrader, C. Lüthje, “Informal Cooperation in the US and Germany: Cooperative Managerial Capitalism vs. Competitive Managerial Capitalism in Interfirm Information Trading”, June 2002.
006 Hartmann, A., H. Sattler, “Commercial Use of Conjoint Analysis in Germany, Austria, and Switzerland“, August 2002.
007 Sattler, H., S. Högl, O. Hupp, “Evaluation of the Financial Value of Brands“, August 2002.
008 Sattler, H., K. Schirm, “Credibility of Product-Preannouncements: An International Empirical Comparison”, September 2002.
009 Sattler, H., “Methods for Measuring Consumers’ Willingness to Pay”, Sept. 2002.
010 Sattler, H., F. Völckner, G. Zatloukal, “Factors Affecting Consumer Evaluations of Brand Extensions”, September 2002.
011 Sattler, H., F. Völckner, „Bestimmungsfaktoren des Markentransfererfolges. Eine Replikation der Studie von Zatloukal (2002)“, September 2002.
012 Sattler, H., „Markentransferstrategien“, March 2003. 013 Sattler, H., A. Hartmann, S. Kröger, “Number of Tasks in Choice-Based
Conjoint Analysis“, December 2003. 014 Völckner, F., „Wahrnehmung und Beurteilung von Markentransfers bei
kurzlebigen Konsumgütern: Eine kausalanalytische Betrachtung“, Januar 2004.
015 Hartmann, A, A. Steffens, “Qualitative Marketingforschung. Überblick und Anbieterverzeichnis“, Februar 2004.
016 Sattler, H., F. Völckner, “Empirical Generalizability of Consumer Evaluations of Brand Extensions”, März 2004.
017 Völckner, F., H. Sattler, “Markentransfererfolgsanalysen bei kurzlebigen Konsumgütern unter Berücksichtigung von Konsumentenheterogenität”, April 2004.
018 Völckner, F., H. Sattler, „Drivers of brand extension success: A structural equation modeling approach“, April 2004.
Die Research Papers und weitere Publikationen des Instituts für Handel und Marketing I (Prof. Dr. Henrik Sattler) an der Universität Hamburg können Sie von unserer Homepage herunterladen:
You may download the research papers and other publications from the Institute of Marketing, Retailing, and Management Science (Prof. Dr. Henrik Sattler) at the University of Hamburg from our homepage:
www.henriksattler.de