wood and bamboo pp composites: fungal and termite resistance, water absorption and ftir analysis
TRANSCRIPT
PEER-REVIEWED ARTICLE bioresources.com
Kartal et al. (2013). “Fungal & termite resistance,” BioResources 8(1), 1222-1244. 1222
Wood and Bamboo-PP Composites: Fungal and Termite Resistance, Water Absorption, and FT-IR Analyses
S. Nami Kartal,a,* Sema Aysal,
a Evren Terzi,
a Nural Yılgör,
a Tsuyoshi Yoshimura,
b
and Kunio Tsunoda b,†
This study evaluated biological resistance of composites produced from polypropylene and either wood or bamboo by using two different levels of particle content and three different particle sizes. Composite specimens containing higher particle content and smaller particle size resulted in increased mass losses in decay resistance tests against Tyromyces palustris, a standardized test fungus, Schizophyllum commune, and Pycnoporus coccineus. As particle content increased, mass losses in laboratory termite resistance tests increased; however, decreased particle size caused slightly decreased mass losses. Higher mass losses in bamboo-composites were obtained compared to mass losses in wood-composites in biological resistance tests. There is no significant effect of particle size on water absorption and thickness swell. The IR spectrums of composite specimens showed that significant changes were seen in the wood components following the application of heat during the manufacturing process. While the IR spectrum of WPC specimens with 70% wood was similar to the wood, the composite specimen with 50% wood displayed similarities to polypropylene.
Keywords: Wood plastic composites; Biological resistance; Schizophyllum commune;
Pycnoporus coccineus; Coptotermes formosanus
Contact information: a: Forestry Faculty, Istanbul University, P. O. Box 34473, Istanbul, Turkey;
b: RISH, Kyoto University, P.O. 611-0011; *Corresponding author: [email protected]
† Deceased on September 5
th, 2011
INTRODUCTION
Biological performance of wood-plastic composites (WPCs) in field and labora-
tory tests has become a major interest as the demand for WPCs increases and they are
increasingly used as alternative materials to treated and untreated wood. Even though
WPCs are generally considered to be more resistant to biodegradation than wood due to
encapsulation of wood by the plastic, decay rates in general are much slower than those
in solid wood (Schmidt 1993; Naghipour 1996; Clemons 2002; Wang and Morrell 2004;
Lomelí-Ramírez et al. 2009; Fabiyi et al. 2011), and the wood in WPCs still remains
susceptible to decay (Morris and Cooper 1998; Mankowski and Morrell 2000; Verhey et
al. 2001, 2002; Ibach and Clemons 2002; Pendleton et al. 2002; Silva et al. 2002;
Simonsen et al. 2002; Ibach et al. 2003; Clemons and Ibach 2004). Since there are
currently no standards for assessing the biological performance of WPC’s in either
laboratory tests or in field exposure, the durability of WPCs had been long assessed by
standard tests such as soil block tests or agar tests developed for solid wood. American
Wood Protection Association (AWPA), however, has recently suggested water
immersion at either room temperature or 70ºC before decay testing of WPCs in the
PEER-REVIEWED ARTICLE bioresources.com
Kartal et al. (2013). “Fungal & termite resistance,” BioResources 8(1), 1222-1244. 1223
standard test AWPA E10-12 to increase the moisture content of the specimens (AWPA
2012). High moisture levels are generally needed by microorganisms to attack WPCs;
however, test methods without water immersion of WPC specimens do not produce
enough mass loss on specimens due to the slow rate of water absorption.
Various characteristics such as density of the material, particle size of wood
fibers, moisture content, biocides, and additives are important for biological durability of
WPCs (Chow et al. 2002; Verhey and Laks 2002; Silva Guzman 2003; Klyosov 2007;
McDonald et al. 2009; Morrell et al. 2010). Silva Guzman (2003) has reported that since
the plastic is basically resistant to fungi, wood/plastic ratio in WPCs affects the decay
resistance of WPCs. High wood content in WPCs generally results in faster water
absorption since more hydrophilic material is present (Clemons 2002; Verhey et al.
2002). On the other hand, in general, WPCs produced with smaller wood particles show
increased water resistance (Tatakani 2000) since such particles generally improve the
interface between the wood fibers and the plastic and reduce voids in the interface area as
pathways for moisture flow and colonization by fungi (Stark and Berger 1997;
Mankowski and Morrell 2000; Verhey et al. 2002).
Mankowski et al. (2005) showed that WPCs in aboveground applications could
also be susceptible to decay by fungi. Morris and Cooper (1998) observed the brown rot
fungus Gloeophyllum striatum and the white rot fungus Pycnoporus sanguineus growing
on WPC deck boards after 4 years in Florida. Mankowski et al. (2005) and Manning et
al. (2006) also reported the presence of Schizophyllum commune and Pycnoporus
sanguineus fruiting bodies on the surface of WPCs exposed for 18 and 30 months,
respectively, in Hawaii. In the recent study, we have modified the Japanese standard test
method JIS K 1571 (JIS 2004) to evaluate biological performance of the WPCs
manufactured using soil substrate instead of quartz sand and adding wood chips as feeder
in order to increase water absorption of the specimens during incubation and thus,
increase mass losses in the specimens. In addition to the standardized brown rot fungus,
Tyromyces palustris, three different strains of Schizophyllum commune and one strain of
Pycnoporus coccineus that was observed on WPCs in previous studies stated above were
used. Termite and mold resistance of the WPC specimens were also evaluated in
laboratory tests. Water absorption and thickness swell tests were performed to observe
the effects of particle content and size on water uptake of WPC specimens. FT-IR
analyses were also run on some WPC specimens before and after decay tests.
EXPERIMENTAL
Production of Wood- and Bamboo-Polypropylene Composites Composite samples were manufactured by MISAWA Homes Co. Ltd., Japan. The
samples were prepared from either wood (hardwood/softwood mixture) or bamboo flour
using two different levels of particle content (50 and 70%), three different particle sizes
(30, 60, and 100 meshes), and commercialized polypropylene (PP) as a thermoplastic
resin. Bamboo particles were selected as a natural fiber source which is abundant in Asia
and South America. The PP was commercial homo-polymer (E-200GP) with a melting
point of 160°C and a melt flow rate (MFR) of 2.0 g 10 min-1
. A blend of wood or bamboo
flour with PP was compounded in a closed mixing blender for 10 min at a constant
temperature of 180°C with a constant blender revolution of 30 rpm. Test samples were
made using a 100 by 100 by 5 mm mold. The mold containing wood or bamboo flour,
PEER-REVIEWED ARTICLE bioresources.com
Kartal et al. (2013). “Fungal & termite resistance,” BioResources 8(1), 1222-1244. 1224
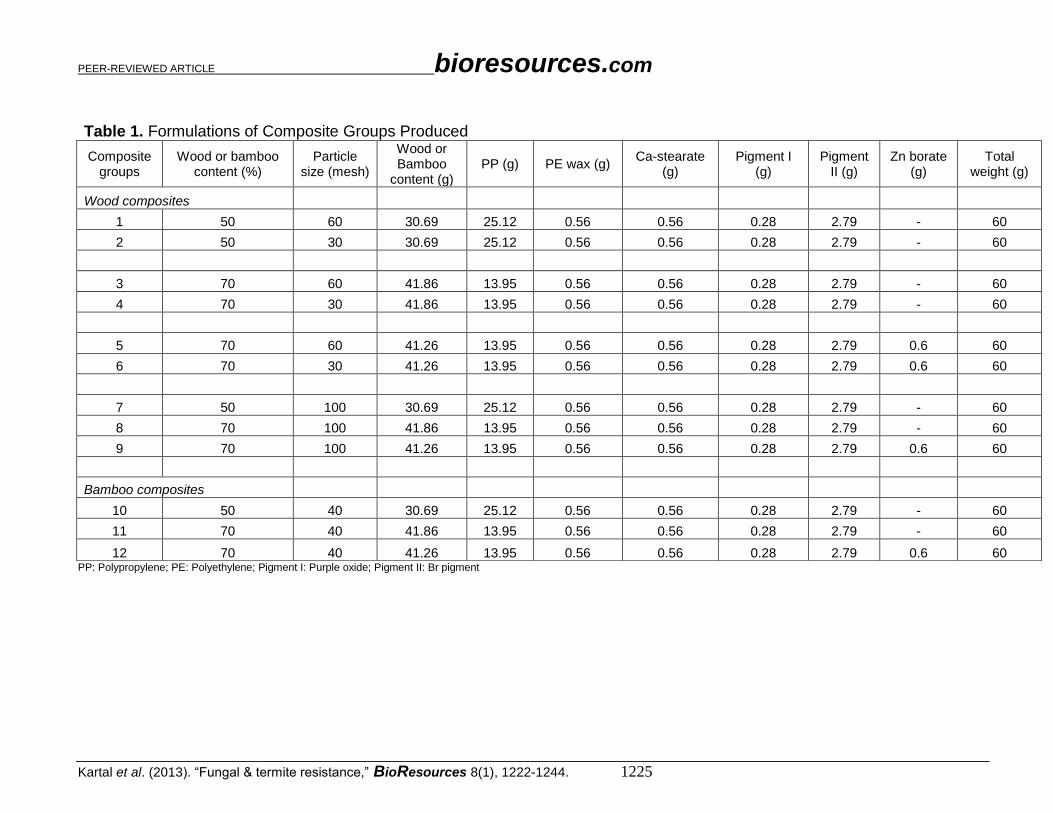
PP, zinc borate (Zn borate) (1% by weight), and other additives stated in Table 1 as a
footnote was heated to 180°C and pressed 45 sec at 2 MPa, then cooled at room
temperature. The resulting WPC samples were cut to 20 by 20 by 5 mm specimens. WPC
sample groups are shown in Table 1 along with the amounts of wood and bamboo flour
and additives.
Decay Resistance Tests A monoculture decay test was conducted according to the Japanese Industrial
Standards JIS K 1571 (JIS 2004) with some modifications using the brown rot fungus,
Tyromyces (Fomitopsis) palustris (Berkeley et Curtis) Murrill (FFPRI 0507), three
different strains of Schizophyllum commune Fries (NBRC 4929, NBRC 30749, and
NBRC 6504), and one strain of Pycnoporus coccineus (NBRC 9768) (Fries) Bondartzev
& Singer (Syn: Polystictus sanguineus, Trametes sanguinea). The modifications were
usage of screened garden soil instead of white sea sand in decay tests and thinner
specimen size for both decay and termite tests (in the JIS standard, the specimen size is
20 x 20 x 10 mm; however, the test specimens were used in their original board thickness
which is 5 mm due to fabrication process). The culture of T. palustris was obtained from
RISH, Kyoto University, Kyoto, Japan, whilst the cultures of S. commune and P.
coccineus were purchased from Biological Resource Center (NBRC), National Institute
of Technology and Evaluation, Chiba, Japan. All cultures were maintained on dextrose-
potato-agar medium at 27 ± 2ºC.
Liquid fungal cultures were prepared by inoculating 1000 mL of liquid medium,
which contained 40 g glucose, 3 g peptone, 15 g malt extract, and 1000 mL distilled
water with the fungi. The medium was shaken at 26 ± 2ºC for 10 days at 100 rpm.
Glass test bottles were filled with screened garden soil (8 to 20 mesh) and wetted
with distilled water to bring the moisture content of the soil to 130% water holding
capacity (WHC), as suggested by the American Wood Protection Association (AWPA)
AWPA E10-12 standard method (AWPA 2010).
The soil was obtained from Takii & Co. Ltd. Japan and had the following
properties: N: 330 mg/L; P: 570 mg/L; K: 480 mg/L; Cd: 0.004 mg/L; Hg: 0.0005 mg/L;
As: 0.005 mg/L; Cr+6
: 0.02 mg/L; pH: weak acidic; water holding capacity (WHC):
200%. Five to six wooden sticks (2 to 3 cm in length and 2 to 3 mm in thickness) were
placed on the top of the soil as feeders. The jars were then steam-sterilized at 103.4 kPa
(15 psig) for 30 minutes and then inoculated with 3 mL of individual liquid fungal
cultures and incubated at 27 ± 2ºC and 70 ± 2% relative humidity (RH) until the fungi
completely colonized the feeders and topsoil.
After the oven-dried weights at 60ºC were determined, the test specimens (20 by
20 by 5 mm) were sterilized with gaseous ethylene oxide. Three specimens per composite
group were placed in a pre-inoculated decay test jar on the surface of soil. Nine replicates
were tested for each decay fungus. The test jars were then incubated at 27 ± 2ºC and 70 ±
2% RH for 12 weeks.
Following incubation, surface mycelium was brushed from each specimen before
the specimens were oven-dried at 60ºC for 3 days. The extent of the fungal attack was
expressed as the percentage of mass loss. In addition, moisture content of the WPC
specimens was measured following incubation for 12 weeks.
PEER-REVIEWED ARTICLE bioresources.com
Kartal et al. (2013). “Fungal & termite resistance,” BioResources 8(1), 1222-1244. 1225
PP: Polypropylene; PE: Polyethylene; Pigment I: Purple oxide; Pigment II: Br pigment
Table 1. Formulations of Composite Groups Produced
Composite groups
Wood or bamboo content (%)
Particle size (mesh)
Wood or Bamboo
content (g) PP (g) PE wax (g)
Ca-stearate (g)
Pigment I (g)
Pigment II (g)
Zn borate (g)
Total weight (g)
Wood composites 1 50 60 30.69 25.12 0.56 0.56 0.28 2.79 - 60
2 50 30 30.69 25.12 0.56 0.56 0.28 2.79 - 60
3 70 60 41.86 13.95 0.56 0.56 0.28 2.79 - 60
4 70 30 41.86 13.95 0.56 0.56 0.28 2.79 - 60
5 70 60 41.26 13.95 0.56 0.56 0.28 2.79 0.6 60
6 70 30 41.26 13.95 0.56 0.56 0.28 2.79 0.6 60
7 50 100 30.69 25.12 0.56 0.56 0.28 2.79 - 60
8 70 100 41.86 13.95 0.56 0.56 0.28 2.79 - 60
9 70 100 41.26 13.95 0.56 0.56 0.28 2.79 0.6 60
Bamboo composites 10 50 40 30.69 25.12 0.56 0.56 0.28 2.79 - 60
11 70 40 41.86 13.95 0.56 0.56 0.28 2.79 - 60
12 70 40 41.26 13.95 0.56 0.56 0.28 2.79 0.6 60
PEER-REVIEWED ARTICLE bioresources.com
Kartal et al. (2013). “Fungal & termite resistance,” BioResources 8(1), 1222-1244. 1226
Termite Resistance Tests Test specimens (20 by 20 by 5 mm) were exposed to the subterranean termites,
Coptotermes formosanus Shiraki, according to the JIS K 1571 standard method (JIS
2004). An acrylic cylinder (80 mm in diameter, 60 mm in height) whose lower end was
sealed with a 5 mm thick hard plaster (GC New Plastone, Dental Stone, GC Dental
Industrial Corp., Tokyo, Japan) was used as a container. A test specimen was placed at
the center of the plaster bottom of the test container. A total of 150 worker termites
collected from a laboratory colony of Research Institute for Sustainable Humanosphere
(RISH), Kyoto University, Japan were introduced into each test container together with
15 termite soldiers. Three specimens per composite group were assayed against the
termites. The assembled containers were set on damp cotton pads to supply water to the
specimens and kept at 28 ± 2°C and >85 ± 2% RH in darkness for three weeks. The mass
losses of the specimens due to termite attack were calculated based on the differences in
the initial and final oven-dry (60°C, 3 days) weights of the specimens. Termite mortality
and material consumption rates were also determined.
Mold Resistance Tests The specimens (10 by 5 by 100 mm long) were evaluated for resistance to mold
fungi according to the American Society for Testing and Material (ASTM) D4445-10
(ASTM 2010). Three mold fungi, Aspergillus niger 2.242, Penicillium chrysogenum
PH02, and Trichoderma viride ATCC 20476 were grown and maintained on 2% malt
agar (Difco, Detroit, MI, USA) at 27 ± 2C, and 80% RH. A mixed spore suspension of
the three test fungi was prepared by washing the surface of individual 2-week-old Petri
plate cultures with 10 to 15 mL of sterile DI water. Washings were combined in a spray
bottle and diluted to approximately 100 mL with DI water to yield approximately 3x10⁷
spores mL-1
. The spray bottle was adjusted to deliver 1 mL inoculum per spray.
Specimens (five specimens per composite group) were sprayed with 1 mL of mixed mold
spore suspension and incubated at 27 ± 2C and 80% RH for 4 weeks. Following
incubation, specimens were visually rated on a scale of 0 to 5 with 0 indicating that the
specimen was completely free of mold growth and 5 indicating that the specimen was
completely covered with mold growth.
Water Absorption and Thickness Swell Tests Water absorption (WA) and thickness swell (TS) tests were determined by using
five replicate specimens (20 by 20 by 5 mm) from each composite group, immersing
them in water at 23°C for 30 days, and weighing them periodically. Weight gain and
thickness swell were measured on a total composite basis for determination of WA and
TS, respectively.
Water absorption (WA) was calculated according to the following formula,
WA (%) = (Mc – Mo) / Mo x 100, (1)
where Mc is the mass of the specimen after immersion (g); Mo is the mass of the specimen
before immersion (g).
Thickness swelling (TS) was calculated as follows,
TS (%) = (tc – to) / to x 100, (2)
PEER-REVIEWED ARTICLE bioresources.com
Kartal et al. (2013). “Fungal & termite resistance,” BioResources 8(1), 1222-1244. 1227
where tc is the thickness of the specimen after immersion (mm), and to is the thickness of
the specimen before immersion (mm).
FT-IR Analyses The FTIR absorption data were obtained using a Perkin Elmer 100 FT-IR
Spectrometer combined with an ATR unit (Universal ATR Diamond Zn/Se) at a
resolution of 4 cm-1
for 32 scans in the spectral range 600 to 4000 cm-1
. Measurements at
three randomly chosen spots on the specimen surfaces were taken. IR spectra were also
obtained directly from dried and milled wood powder used in WPC production. The
spectra were baseline corrected and normalized to the highest peak. The analyses were
performed on undecayed WPC specimens (50% wood / 50% PP and 70% wood / 30% PP
with 60 mesh particle size only) and the same blend specimens exposed to S. commune
(NBRC4929) and T. palustris.
Statistical Analysis Statistical analysis was conducted using the SPSS program in conjunction with
analysis of variance (ANOVA). Duncan’s multiple range test (DMRT) was used to test
statistical significance at = 0.05 level.
RESULTS AND DISCUSSION
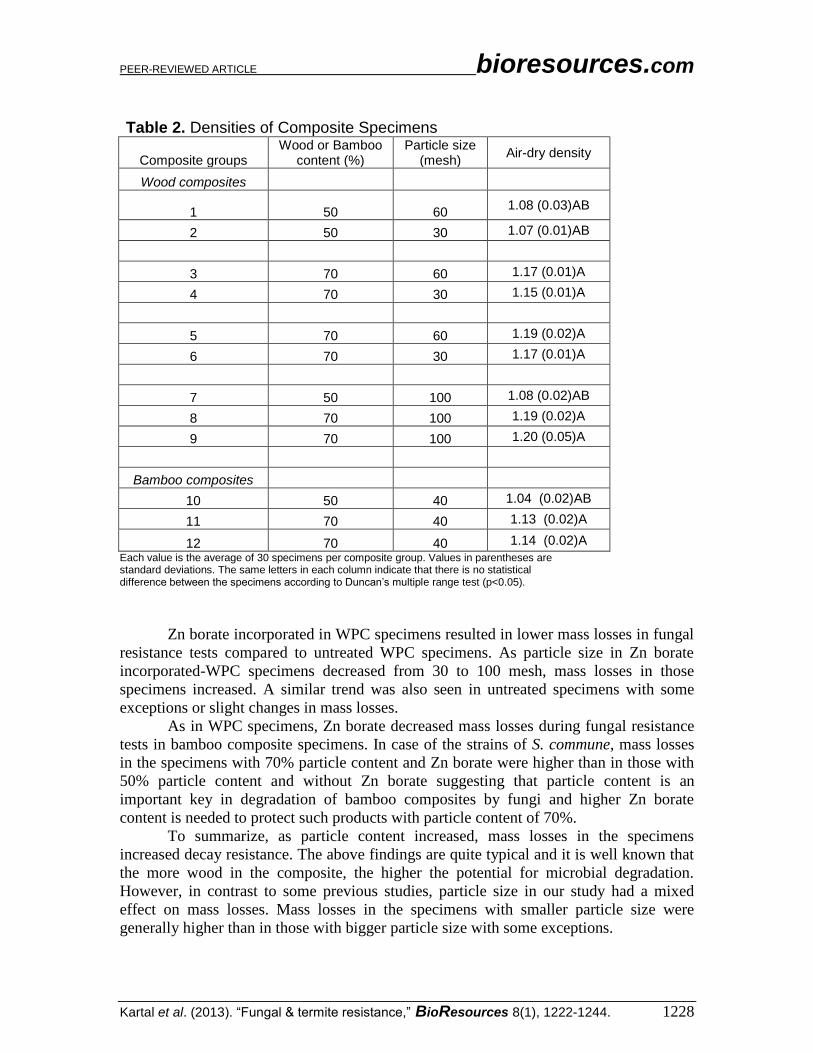
Density As particle content in WPC specimens increased, air-dry density values increased;
however, particle size had slight influences on air-dry densities (Table 2). As particle size
decreased from 30 to 100 meshes, slight increases were seen in air-dry density values.
The same trend was also observed in bamboo composite specimens when particle content
was considered. In the study, air-dry densities in both WPC and bamboo composite
specimens with Zn borate were slightly higher than those without Zn borate.
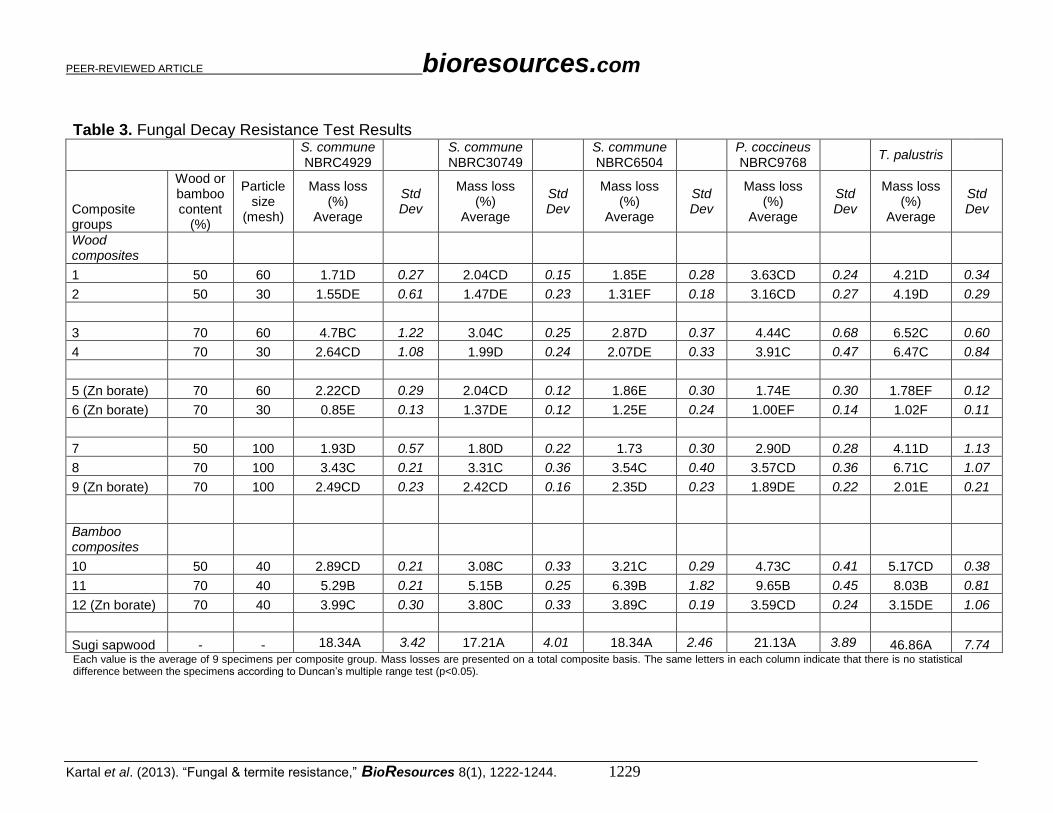
Decay Resistance Mass losses in WPCs, bamboo composites, and sugi solid wood specimens in
fungal decay resistance tests are summarized in Table 3. In general, the strains of S.
commune resulted in similar mass losses in the specimens. As particle content increased
from 50 to 70% in the specimens, mass losses increased. Particle size, however, had a
mixed effect on the mass losses. Mass losses in the specimens with smaller particle size
were generally higher than in those with bigger particle size with some exceptions. In
general, the fungus P. coccineus caused more mass losses in WPC specimens compared
to the strains of S. commune.
Particle content in the test specimens exposed to P. coccineus had a slight effect
on mass loss. A mixed effect of particle size was also observed when P. coccineus was
employed. The brown rot fungus, T. palustris, accounted for the highest mass losses in
the WPC specimens. In the test specimens exposed to T. palustris, the effect of particle
content was more distinct than those exposed to the other fungi tested; however, particle
size had no significant effect on mass losses in the specimens.
PEER-REVIEWED ARTICLE bioresources.com
Kartal et al. (2013). “Fungal & termite resistance,” BioResources 8(1), 1222-1244. 1228
Table 2. Densities of Composite Specimens
Composite groups Wood or Bamboo
content (%) Particle size
(mesh) Air-dry density
Wood composites
1 50 60 1.08 (0.03)AB
2 50 30 1.07 (0.01)AB
3 70 60 1.17 (0.01)A
4 70 30 1.15 (0.01)A
5 70 60 1.19 (0.02)A
6 70 30 1.17 (0.01)A
7 50 100 1.08 (0.02)AB
8 70 100 1.19 (0.02)A
9 70 100 1.20 (0.05)A
Bamboo composites 10 50 40 1.04 (0.02)AB
11 70 40 1.13 (0.02)A
12 70 40 1.14 (0.02)A
Each value is the average of 30 specimens per composite group. Values in parentheses are standard deviations. The same letters in each column indicate that there is no statistical difference between the specimens according to Duncan’s multiple range test (p<0.05).
Zn borate incorporated in WPC specimens resulted in lower mass losses in fungal
resistance tests compared to untreated WPC specimens. As particle size in Zn borate
incorporated-WPC specimens decreased from 30 to 100 mesh, mass losses in those
specimens increased. A similar trend was also seen in untreated specimens with some
exceptions or slight changes in mass losses.
As in WPC specimens, Zn borate decreased mass losses during fungal resistance
tests in bamboo composite specimens. In case of the strains of S. commune, mass losses
in the specimens with 70% particle content and Zn borate were higher than in those with
50% particle content and without Zn borate suggesting that particle content is an
important key in degradation of bamboo composites by fungi and higher Zn borate
content is needed to protect such products with particle content of 70%.
To summarize, as particle content increased, mass losses in the specimens
increased decay resistance. The above findings are quite typical and it is well known that
the more wood in the composite, the higher the potential for microbial degradation.
However, in contrast to some previous studies, particle size in our study had a mixed
effect on mass losses. Mass losses in the specimens with smaller particle size were
generally higher than in those with bigger particle size with some exceptions.
PEER-REVIEWED ARTICLE bioresources.com
Kartal et al. (2013). “Fungal & termite resistance,” BioResources 8(1), 1222-1244. 1229
Table 3. Fungal Decay Resistance Test Results
S. commune NBRC4929
S. commune NBRC30749
S. commune NBRC6504
P. coccineus NBRC9768
T. palustris
Composite groups
Wood or bamboo content
(%)
Particle size
(mesh)
Mass loss (%)
Average
Std Dev
Mass loss (%)
Average
Std Dev
Mass loss (%)
Average
Std Dev
Mass loss (%)
Average
Std Dev
Mass loss (%)
Average
Std Dev
Wood composites
1 50 60 1.71D 0.27 2.04CD 0.15 1.85E 0.28 3.63CD 0.24 4.21D 0.34
2 50 30 1.55DE 0.61 1.47DE 0.23 1.31EF 0.18 3.16CD 0.27 4.19D 0.29
3 70 60 4.7BC 1.22 3.04C 0.25 2.87D 0.37 4.44C 0.68 6.52C 0.60
4 70 30 2.64CD 1.08 1.99D 0.24 2.07DE 0.33 3.91C 0.47 6.47C 0.84
5 (Zn borate) 70 60 2.22CD 0.29 2.04CD 0.12 1.86E 0.30 1.74E 0.30 1.78EF 0.12
6 (Zn borate) 70 30 0.85E 0.13 1.37DE 0.12 1.25E 0.24 1.00EF 0.14 1.02F 0.11
7 50 100 1.93D 0.57 1.80D 0.22 1.73 0.30 2.90D 0.28 4.11D 1.13
8 70 100 3.43C 0.21 3.31C 0.36 3.54C 0.40 3.57CD 0.36 6.71C 1.07
9 (Zn borate) 70 100 2.49CD 0.23 2.42CD 0.16 2.35D 0.23 1.89DE 0.22 2.01E 0.21
Bamboo composites
10 50 40 2.89CD 0.21 3.08C 0.33 3.21C 0.29 4.73C 0.41 5.17CD 0.38
11 70 40 5.29B 0.21 5.15B 0.25 6.39B 1.82 9.65B 0.45 8.03B 0.81
12 (Zn borate) 70 40 3.99C 0.30 3.80C 0.33 3.89C 0.19 3.59CD 0.24 3.15DE 1.06
Sugi sapwood - - 18.34A 3.42 17.21A 4.01 18.34A 2.46 21.13A 3.89 46.86A 7.74 Each value is the average of 9 specimens per composite group. Mass losses are presented on a total composite basis. The same letters in each column indicate that there is no statistical difference between the specimens according to Duncan’s multiple range test (p<0.05).
PEER-REVIEWED ARTICLE bioresources.com
Kartal et al. (2013). “Fungal & termite resistance,” BioResources 8(1), 1222-1244. 1230
Mankowski and Morrell (2000) found considerably more mass losses in
pine/polyethylene composites with wood particle content of 70% when compared to
composite specimens with wood content of 50%. Verhey et al. (2001) showed that the
composites with higher wood content generally had more mass loss in decay tests. Stark
and Berger (1997) and Pendleton et al. (2002) state that wood content rather than particle
size may have a greater effect on the decay resistance of WPCs. Verhey et al. (2002) and
(Verhey and Laks 2002) also show that WPCs with large particles are more susceptible to
decay. This effect is attributed to better encapsulation of smaller wood particles by the
plastic matrix and a uniform distribution in the matrix (Lomelí-Ramírez et al. 2009). Moisture Content in Specimens after Decay Resistance Tests
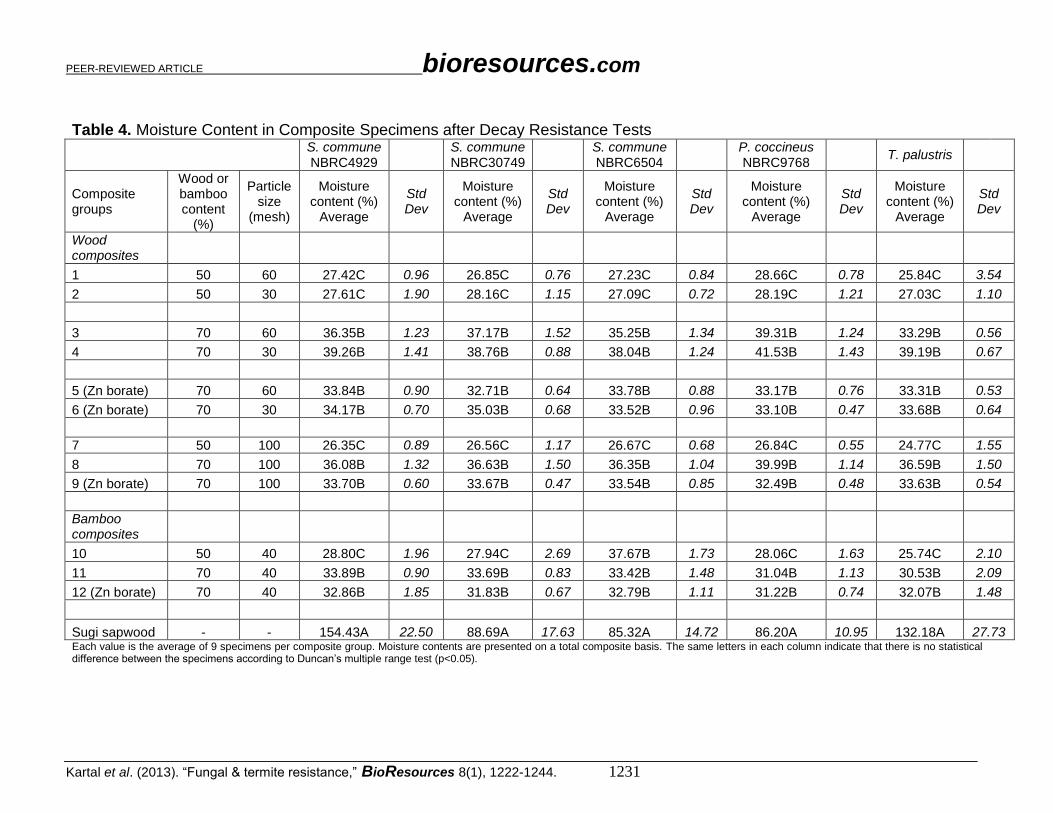
Table 4 shows moisture content achieved by the specimens exposed to the fungi
tested during 12 weeks of incubation in soil-block tests. Moisture content in solid wood
specimens prepared from sugi sapwood varied from 85 to 154% during the decay
process. The composite specimens, however, showed less moisture absorption changing
from 25 to 42%. As expected, the specimens with higher particle content showed higher
water absorption than those with lower particle content. Particle size, on the other hand,
had an insignificant effect on moisture content in the specimens. Degree of fungal attack
is closely related to moisture content of test specimen and increased mass losses are in
general accompanied by increases in moisture content since water is crucial for coloniza-
tion and decay of lignocellulosics by fungi (Lomelí-Ramírez et al. 2009; Silva Guzman
2003). Lomelí-Ramírez et al. (2009) states that proper moisture content to start decay by
fungi is about 20%, and ideally this value is 30%; however, Silva Guzman (2003)
suggests moisture levels need to be higher than 30%. Zabel and Morrell (1992) also state
wood moisture content of 25 to 30% for fungal decay. Even though the plastic in WPCs
encapsulates particles, the wood component generally reaches moisture levels that are
proper for fungal decay due to un-encapsulated fibers near the surface (Silva Guzman
2003; Wang and Morrell 2004). Thus, it is highly possible to observe severe fungal attack
near the surfaces of WPCs. Wang and Morrell (2004) and Silva et al. (2001) state that
degradation by fungi is likely to be limited to the surfaces of WPCs, and the inner parts of
the composites remain generally unaffected until sufficient moisture levels are achieved.
Lomelí-Ramírez et al. (2009) also explains that the source of increased water content in
specimens during decay process can be achieved by fungal respiration, which
metabolizes wood components and produces water. Additionally, hyphae transport water
from high humidity media into drier specimens (Ammer 1964; Muller et al. 2001).
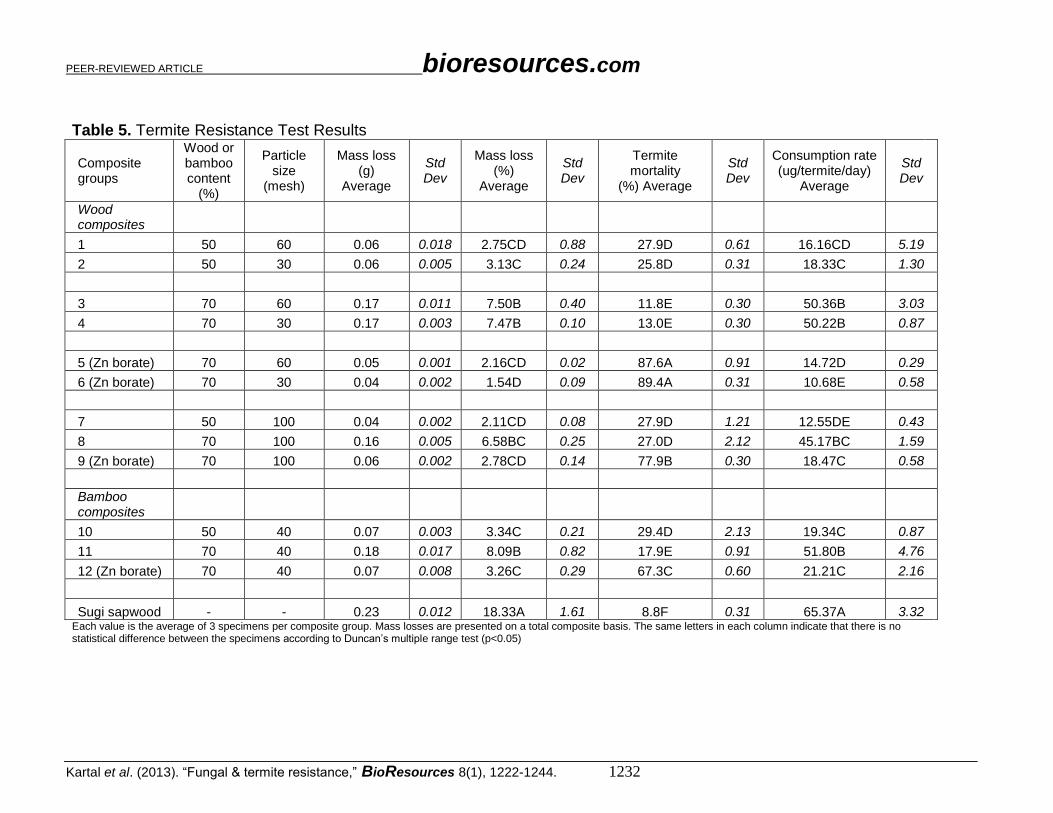
Termite Resistance Table 5 shows mass losses in the composite specimens following laboratory
termite resistance tests with sugi (Cryptomeria japonica) solid wood specimens as
controls. Termite mortalities and daily consumptions of the specimens by the termites
during the 3-week-exposure are also shown in Table 5. As observed in decay resistance
tests, mass losses increased when higher wood content (70%) was employed in the
specimens. However, in termite resistance tests, as particle size decreased from 30 to 100
mesh, mass losses generally decreased. Termite mortalities in WPC specimens without
Zn borate were higher than those in solid wood specimens. More particle content (70%)
decreased termite mortalities when compared to particle content of 50% except for the
specimens with a particle size of 100 meshes.
PEER-REVIEWED ARTICLE bioresources.com
Kartal et al. (2013). “Fungal & termite resistance,” BioResources 8(1), 1222-1244. 1231
Table 4. Moisture Content in Composite Specimens after Decay Resistance Tests
S. commune NBRC4929
S. commune NBRC30749
S. commune NBRC6504
P. coccineus NBRC9768
T. palustris
Composite groups
Wood or bamboo content
(%)
Particle size
(mesh)
Moisture content (%)
Average
Std Dev
Moisture content (%)
Average
Std Dev
Moisture content (%)
Average
Std Dev
Moisture content (%)
Average
Std Dev
Moisture content (%)
Average
Std Dev
Wood composites
1 50 60 27.42C 0.96 26.85C 0.76 27.23C 0.84 28.66C 0.78 25.84C 3.54
2 50 30 27.61C 1.90 28.16C 1.15 27.09C 0.72 28.19C 1.21 27.03C 1.10
3 70 60 36.35B 1.23 37.17B 1.52 35.25B 1.34 39.31B 1.24 33.29B 0.56
4 70 30 39.26B 1.41 38.76B 0.88 38.04B 1.24 41.53B 1.43 39.19B 0.67
5 (Zn borate) 70 60 33.84B 0.90 32.71B 0.64 33.78B 0.88 33.17B 0.76 33.31B 0.53
6 (Zn borate) 70 30 34.17B 0.70 35.03B 0.68 33.52B 0.96 33.10B 0.47 33.68B 0.64
7 50 100 26.35C 0.89 26.56C 1.17 26.67C 0.68 26.84C 0.55 24.77C 1.55
8 70 100 36.08B 1.32 36.63B 1.50 36.35B 1.04 39.99B 1.14 36.59B 1.50
9 (Zn borate) 70 100 33.70B 0.60 33.67B 0.47 33.54B 0.85 32.49B 0.48 33.63B 0.54
Bamboo composites
10 50 40 28.80C 1.96 27.94C 2.69 37.67B 1.73 28.06C 1.63 25.74C 2.10
11 70 40 33.89B 0.90 33.69B 0.83 33.42B 1.48 31.04B 1.13 30.53B 2.09
12 (Zn borate) 70 40 32.86B 1.85 31.83B 0.67 32.79B 1.11 31.22B 0.74 32.07B 1.48
Sugi sapwood - - 154.43A 22.50 88.69A 17.63 85.32A 14.72 86.20A 10.95 132.18A 27.73 Each value is the average of 9 specimens per composite group. Moisture contents are presented on a total composite basis. The same letters in each column indicate that there is no statistical difference between the specimens according to Duncan’s multiple range test (p<0.05).
PEER-REVIEWED ARTICLE bioresources.com
Kartal et al. (2013). “Fungal & termite resistance,” BioResources 8(1), 1222-1244. 1232
Table 5. Termite Resistance Test Results
Composite groups
Wood or bamboo content
(%)
Particle size
(mesh)
Mass loss (g)
Average
Std Dev
Mass loss (%)
Average
Std Dev
Termite mortality
(%) Average
Std Dev
Consumption rate (ug/termite/day)
Average
Std Dev
Wood composites
1 50 60 0.06 0.018 2.75CD 0.88 27.9D 0.61 16.16CD 5.19
2 50 30 0.06 0.005 3.13C 0.24 25.8D 0.31 18.33C 1.30
3 70 60 0.17 0.011 7.50B 0.40 11.8E 0.30 50.36B 3.03
4 70 30 0.17 0.003 7.47B 0.10 13.0E 0.30 50.22B 0.87
5 (Zn borate) 70 60 0.05 0.001 2.16CD 0.02 87.6A 0.91 14.72D 0.29
6 (Zn borate) 70 30 0.04 0.002 1.54D 0.09 89.4A 0.31 10.68E 0.58
7 50 100 0.04 0.002 2.11CD 0.08 27.9D 1.21 12.55DE 0.43
8 70 100 0.16 0.005 6.58BC 0.25 27.0D 2.12 45.17BC 1.59
9 (Zn borate) 70 100 0.06 0.002 2.78CD 0.14 77.9B 0.30 18.47C 0.58
Bamboo composites
10 50 40 0.07 0.003 3.34C 0.21 29.4D 2.13 19.34C 0.87
11 70 40 0.18 0.017 8.09B 0.82 17.9E 0.91 51.80B 4.76
12 (Zn borate) 70 40 0.07 0.008 3.26C 0.29 67.3C 0.60 21.21C 2.16
Sugi sapwood - - 0.23 0.012 18.33A 1.61 8.8F 0.31 65.37A 3.32 Each value is the average of 3 specimens per composite group. Mass losses are presented on a total composite basis. The same letters in each column indicate that there is no statistical difference between the specimens according to Duncan’s multiple range test (p<0.05)
PEER-REVIEWED ARTICLE bioresources.com
Kartal et al. (2013). “Fungal & termite resistance,” BioResources 8(1), 1222-1244. 1233
Bamboo composites also showed the same trends in termite mortalities as seen in
WPC specimens. Zn borate incorporated-WPC specimens had considerably lower mass
losses than untreated specimens, as expected, and termite mortalities were considerably
higher in those specimens when compared to untreated specimens. As particle size
decreased from 30 to 100 mesh, mass losses increased and termite mortalities decreased
gradually in Zn borate incorporated-WPC specimens. In general, the mass losses in the
specimens were compatible with the termite mortalities in the tests.
As particle content increased from 50 to 70%, mass losses in the specimens
increased. Even though incorporation on Zn borate into specimens with particle size of
70% decreased mass losses, mass losses in those specimens were as high as in the
specimens with particle size of 50% and without Zn borate, suggesting that particle
content is an important factor in degradation of such composites by termites.
Kylosov (2007) states that WPC materials are commonly resistant to termites.
Termites cannot get into the plastic matrix easily and can only slightly trim wood fibers
at the surface of WPCs. This was also shown in our study, and as particle content
increased from 50 to 70% in WPC specimens, mass losses due to termite attack generally
increased by more than twice. Mold Resistance
Mold resistance test results revealed that all WPC specimens and specimens
produced by bamboo particles were covered completely by the three common mold fungi
tested. Specimens were rated after just a 4-week-incubation, since complete fungal
coverage was reached and rating of the specimens was discontinued. Control wood
specimens from southern pine were also covered by mold growth at week 4. No
inhibitory effect for added Zn borate was seen for any of the specimens. Since all
specimens were rated 5 (100% coverage by the mold fungi), no relation between mold
resistance and particle content/particle size was established in the study.
Laks et al. (2005) found that an increase in wood content in WPC specimens
increased mold growth. Klyosov (2007) stated that Zn borate in amounts of 0.5, 1, and
2% in the WPCs practically stopped the microbial degradation in the latter in the AWPA
laboratory soil block tests. However, the use of Zn borate did not completely control
surface mold on the WPC decks exposed in outdoor field tests. One percent of Zn borate
practically did not affect mold development on a 60-mesh-maple wood (particle content
of 70%)-filled polyethylene, and only 3 and 5% of Zn borate were effective. Schirp et al.
(2008) reported that mold and staining fungi may develop more rapidly on the WPC
surfaces, and fungi belonging to such genera as Aureobasidium, Aspergillus, and
Penicillium are important to evaluate organisms for both plastic and wood.
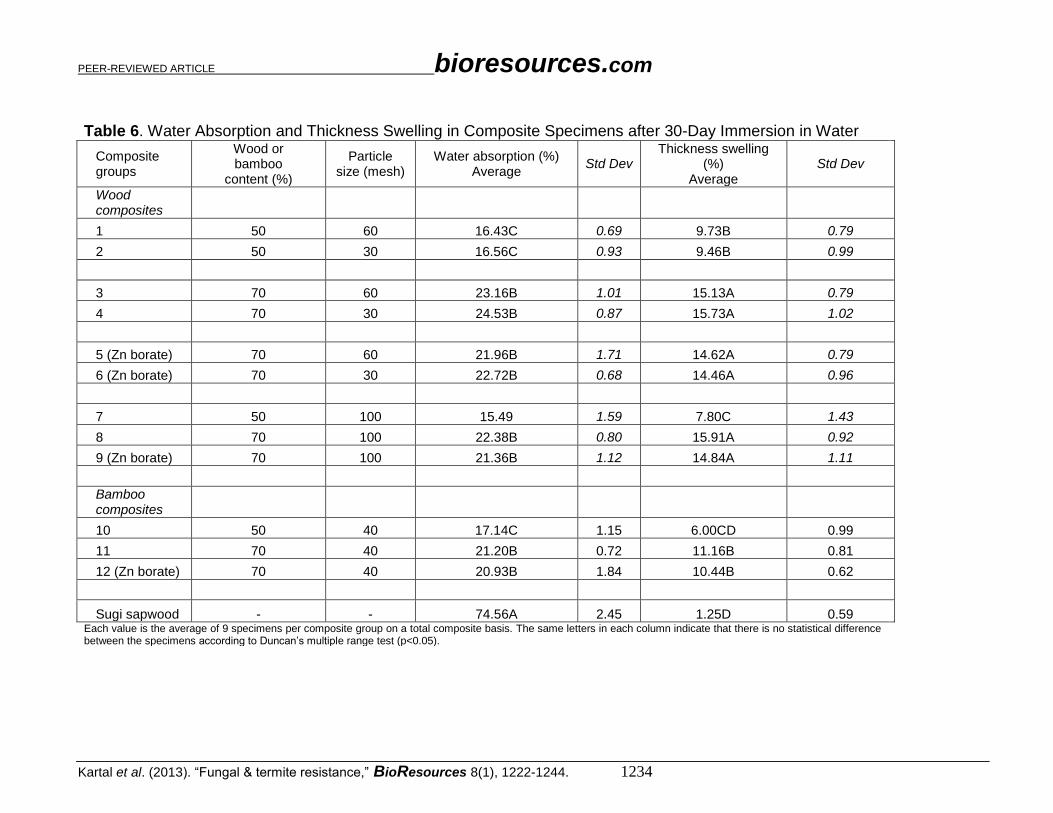
Water Absorption and Thickness Swell after 30-Day-Immersion Water absorption of all composite specimens tended to be much lower than that of
sugi solid wood specimens; however, thickness swellings in the composites were
considerably higher than solid wood specimens, which is typical of composites (Table 6).
Overall moisture content of the composite specimens varied from 16 to 25% during a 30-
day-immersion period; however, sugi solid wood specimens had a moisture content of
75%, which is considerably higher when compared to the composite specimens. In
WPCs, in general, smaller particles are more likely to be evenly encapsulated by the
plastic material presenting a less continuous pathway for water uptake (Wang and
Morrell 2004).
PEER-REVIEWED ARTICLE bioresources.com
Kartal et al. (2013). “Fungal & termite resistance,” BioResources 8(1), 1222-1244. 1234
Table 6. Water Absorption and Thickness Swelling in Composite Specimens after 30-Day Immersion in Water
Composite groups
Wood or bamboo
content (%)
Particle size (mesh)
Water absorption (%) Average
Std Dev
Thickness swelling (%)
Average
Std Dev
Wood composites
1 50 60 16.43C 0.69 9.73B 0.79
2 50 30 16.56C 0.93 9.46B 0.99
3 70 60 23.16B 1.01 15.13A 0.79
4 70 30 24.53B 0.87 15.73A 1.02
5 (Zn borate) 70 60 21.96B 1.71 14.62A 0.79
6 (Zn borate) 70 30 22.72B 0.68 14.46A 0.96
7 50 100 15.49 1.59 7.80C 1.43
8 70 100 22.38B 0.80 15.91A 0.92
9 (Zn borate) 70 100 21.36B 1.12 14.84A 1.11
Bamboo composites
10 50 40 17.14C 1.15 6.00CD 0.99
11 70 40 21.20B 0.72 11.16B 0.81
12 (Zn borate) 70 40 20.93B 1.84 10.44B 0.62
Sugi sapwood - - 74.56A 2.45 1.25D 0.59
Each value is the average of 9 specimens per composite group on a total composite basis. The same letters in each column indicate that there is no statistical difference between the specimens according to Duncan’s multiple range test (p<0.05).
PEER-REVIEWED ARTICLE bioresources.com
Kartal et al. (2013). “Fungal & termite resistance,” BioResources 8(1), 1222-1244. 1235
0
5
10
15
20
25
0 90 180 270 360 450 540 630 720
%
Time (h)
Water absorption, 100-mesh Wood-PP composite
50% 70%
0
5
10
15
20
25
0 90 180 270 360 450 540 630 720
%
Time (h)
Thickness swelling, 100-mesh Wood-PP composite
50% 70%
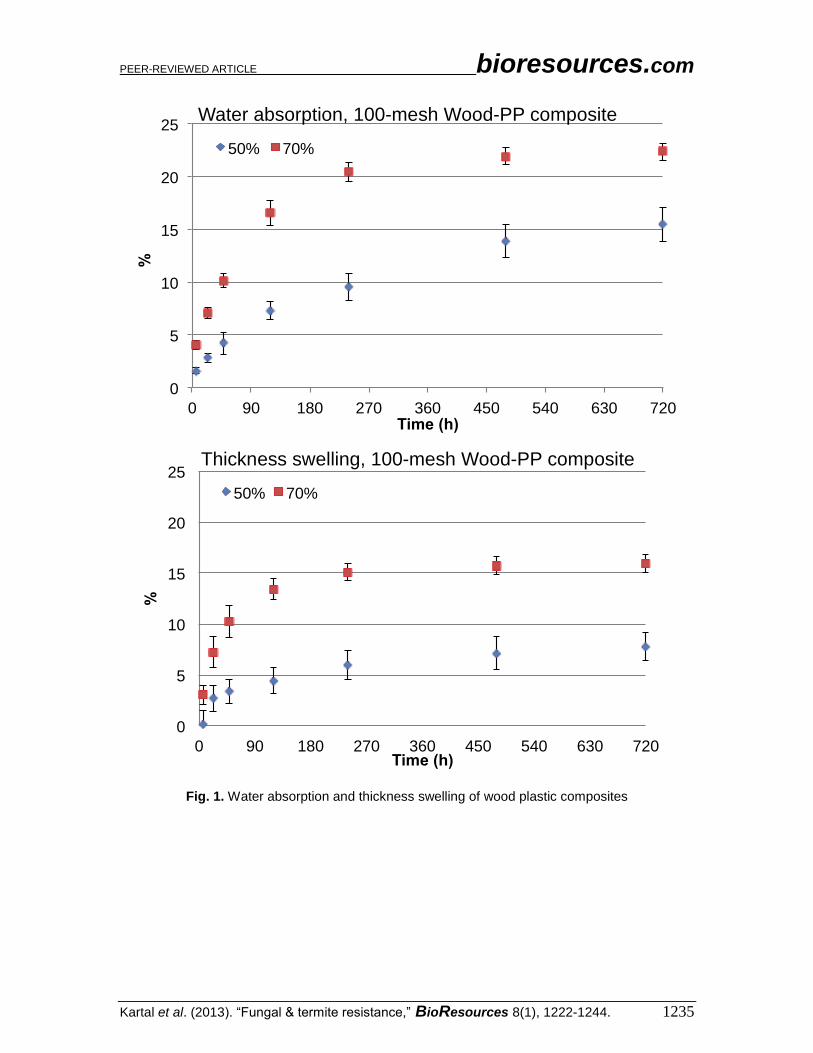
Fig. 1. Water absorption and thickness swelling of wood plastic composites
PEER-REVIEWED ARTICLE bioresources.com
Kartal et al. (2013). “Fungal & termite resistance,” BioResources 8(1), 1222-1244. 1236
0
5
10
15
20
25
0 90 180 270 360 450 540 630 720
%
Time (h)
Water absorption, 40 Mesh Bamboo-PP composite
%70 Bamboo-PP
%50 Bamboo-PP
%70 Bamboo-PP-ZnBorate
0
5
10
15
20
25
0 90 180 270 360 450 540 630 720
%
Time (h)
Thickness swelling, 40-mesh Bamboo-PP composite
%70 bamboo-PP %50 bamboo-PP %70 bamboo-PP Zn Borate
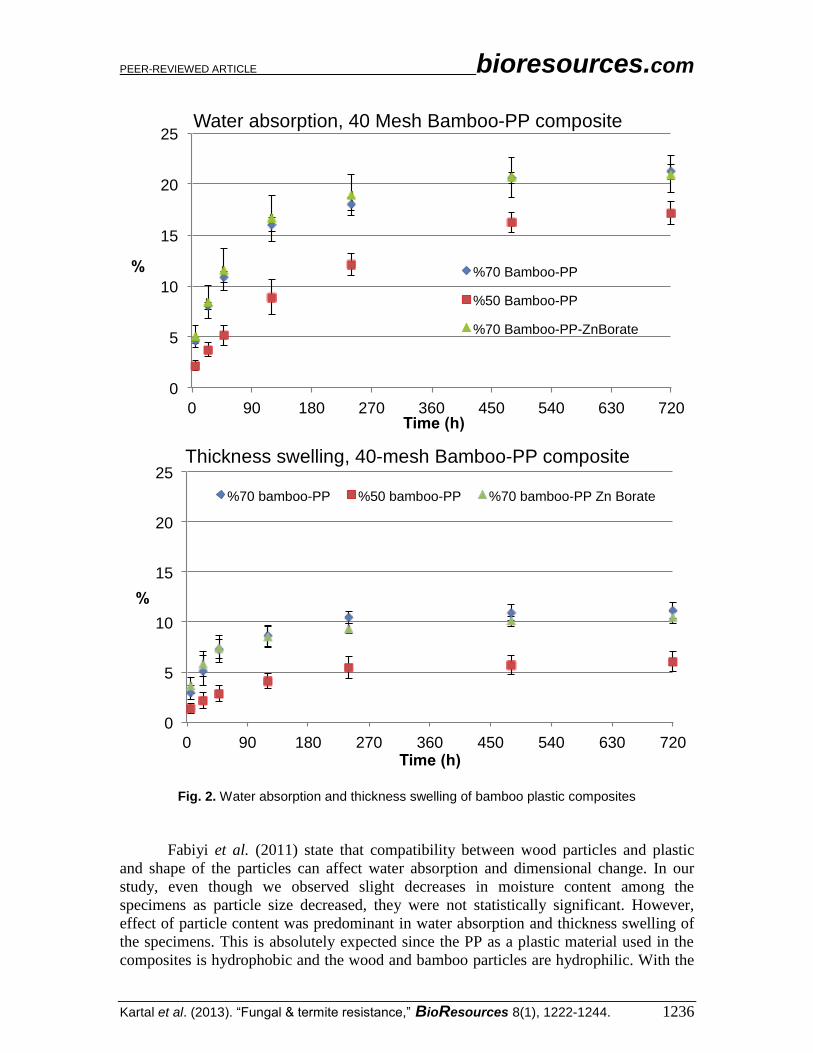
Fig. 2. Water absorption and thickness swelling of bamboo plastic composites
Fabiyi et al. (2011) state that compatibility between wood particles and plastic
and shape of the particles can affect water absorption and dimensional change. In our
study, even though we observed slight decreases in moisture content among the
specimens as particle size decreased, they were not statistically significant. However,
effect of particle content was predominant in water absorption and thickness swelling of
the specimens. This is absolutely expected since the PP as a plastic material used in the
composites is hydrophobic and the wood and bamboo particles are hydrophilic. With the
PEER-REVIEWED ARTICLE bioresources.com
Kartal et al. (2013). “Fungal & termite resistance,” BioResources 8(1), 1222-1244. 1237
increase of the amount of wood and bamboo particles in the composites, their polar
character increases, resulting in higher water content. Plotting water absorption versus
time showed that water absorption curves increased linearly until reaching a pseudo-
equilibrium level (Figs. 1 and 2). The time taken to reach this equilibrium level was
identical for both wood and bamboo plastic composites tested.
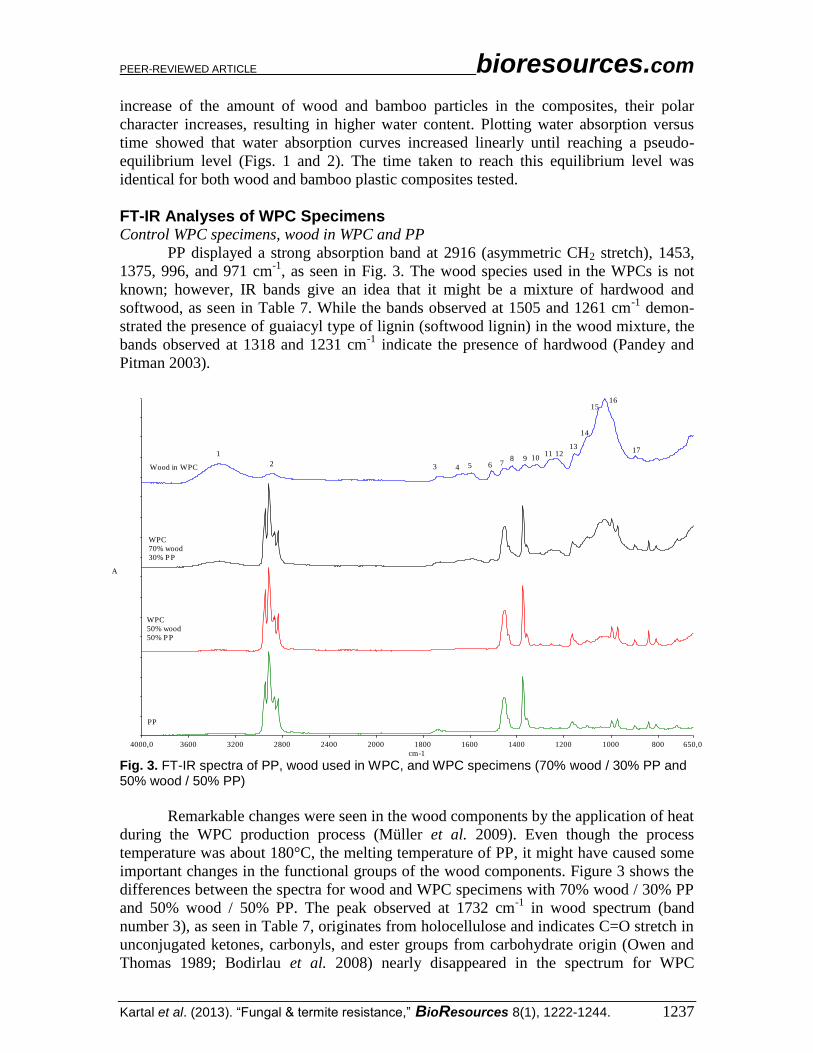
FT-IR Analyses of WPC Specimens Control WPC specimens, wood in WPC and PP
PP displayed a strong absorption band at 2916 (asymmetric CH2 stretch), 1453,
1375, 996, and 971 cm-1
, as seen in Fig. 3. The wood species used in the WPCs is not
known; however, IR bands give an idea that it might be a mixture of hardwood and
softwood, as seen in Table 7. While the bands observed at 1505 and 1261 cm-1
demon-
strated the presence of guaiacyl type of lignin (softwood lignin) in the wood mixture, the
bands observed at 1318 and 1231 cm-1
indicate the presence of hardwood (Pandey and
Pitman 2003).
4000,0 3600 3200 2800 2400 2000 1800 1600 1400 1200 1000 800 650,0
cm-1
A
Wood in WPC
WPC
70% wood
30% P P
WPC
50% wood
50% P P
PP
1
2 3 4 5 6 78 9 10
11 1213
14
1516
17
Fig. 3. FT-IR spectra of PP, wood used in WPC, and WPC specimens (70% wood / 30% PP and 50% wood / 50% PP)
Remarkable changes were seen in the wood components by the application of heat
during the WPC production process (Müller et al. 2009). Even though the process
temperature was about 180°C, the melting temperature of PP, it might have caused some
important changes in the functional groups of the wood components. Figure 3 shows the
differences between the spectra for wood and WPC specimens with 70% wood / 30% PP
and 50% wood / 50% PP. The peak observed at 1732 cm-1
in wood spectrum (band
number 3), as seen in Table 7, originates from holocellulose and indicates C=O stretch in
unconjugated ketones, carbonyls, and ester groups from carbohydrate origin (Owen and
Thomas 1989; Bodirlau et al. 2008) nearly disappeared in the spectrum for WPC
PEER-REVIEWED ARTICLE bioresources.com
Kartal et al. (2013). “Fungal & termite resistance,” BioResources 8(1), 1222-1244. 1238
specimen with 50% wood / 50% PP. The band detected for wood at 3336 cm-1
(band
number 1) indicated the intensity of O-H absorption. While the intensity of this band
decreased in WPC, the specimen with 70% wood, it disappeared nearly in the WPC
specimen with 50% wood. The hydroxyl group contents in wood are thought to be
affected by heat treatment and showed a decrease due to the increased amount of wood
content in the WPC specimen. The bands originating from holocellulose and cellulose at
1103, 1046, and 897 cm-1
were also absorption bands observed in both WPC specimens
and the wood sample. While some of the bands in WPC specimens were shifted to lower
bands, some of the bands shifted to higher bands compared to the wood sample due to the
effect of high temperature and addition of PP and the other additives. Some of the
spectral bands present in wood sample such as band numbers 2, 7, 8, and 9 (Table 7),
were dominated in WPC specimens by the spectral bands in PP.
WPC specimen with 70% wood was more similar to the wood sample used to
produce the WPCs compared to the other WPC specimen with 50% wood as seen in Fig.
3. As expected, WPC specimens with more PP (50%) displayed similar spectra to PP
used in the manufacturing of the WPCs.
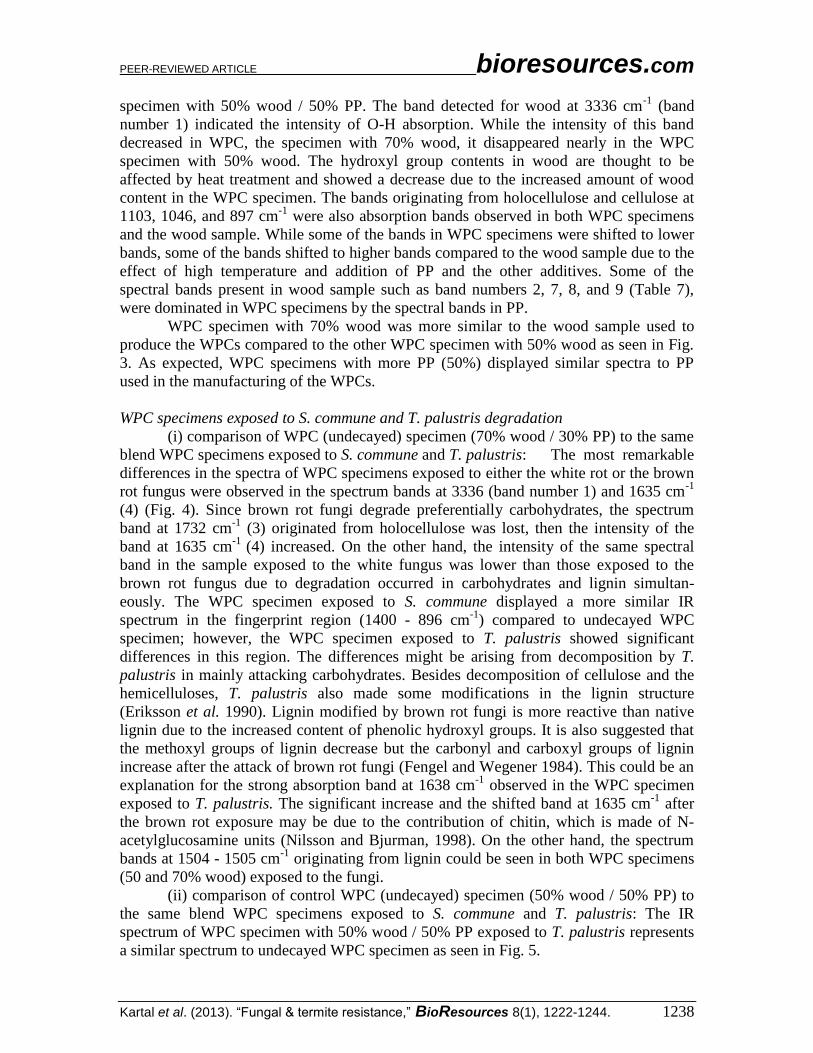
WPC specimens exposed to S. commune and T. palustris degradation
(i) comparison of WPC (undecayed) specimen (70% wood / 30% PP) to the same
blend WPC specimens exposed to S. commune and T. palustris: The most remarkable
differences in the spectra of WPC specimens exposed to either the white rot or the brown
rot fungus were observed in the spectrum bands at 3336 (band number 1) and 1635 cm-1
(4) (Fig. 4). Since brown rot fungi degrade preferentially carbohydrates, the spectrum
band at 1732 cm-1
(3) originated from holocellulose was lost, then the intensity of the
band at 1635 cm-1
(4) increased. On the other hand, the intensity of the same spectral
band in the sample exposed to the white fungus was lower than those exposed to the
brown rot fungus due to degradation occurred in carbohydrates and lignin simultan-
eously. The WPC specimen exposed to S. commune displayed a more similar IR
spectrum in the fingerprint region (1400 - 896 cm-1
) compared to undecayed WPC
specimen; however, the WPC specimen exposed to T. palustris showed significant
differences in this region. The differences might be arising from decomposition by T.
palustris in mainly attacking carbohydrates. Besides decomposition of cellulose and the
hemicelluloses, T. palustris also made some modifications in the lignin structure
(Eriksson et al. 1990). Lignin modified by brown rot fungi is more reactive than native
lignin due to the increased content of phenolic hydroxyl groups. It is also suggested that
the methoxyl groups of lignin decrease but the carbonyl and carboxyl groups of lignin
increase after the attack of brown rot fungi (Fengel and Wegener 1984). This could be an
explanation for the strong absorption band at 1638 cm-1
observed in the WPC specimen
exposed to T. palustris. The significant increase and the shifted band at 1635 cm-1
after
the brown rot exposure may be due to the contribution of chitin, which is made of N-
acetylglucosamine units (Nilsson and Bjurman, 1998). On the other hand, the spectrum
bands at 1504 - 1505 cm-1
originating from lignin could be seen in both WPC specimens
(50 and 70% wood) exposed to the fungi.
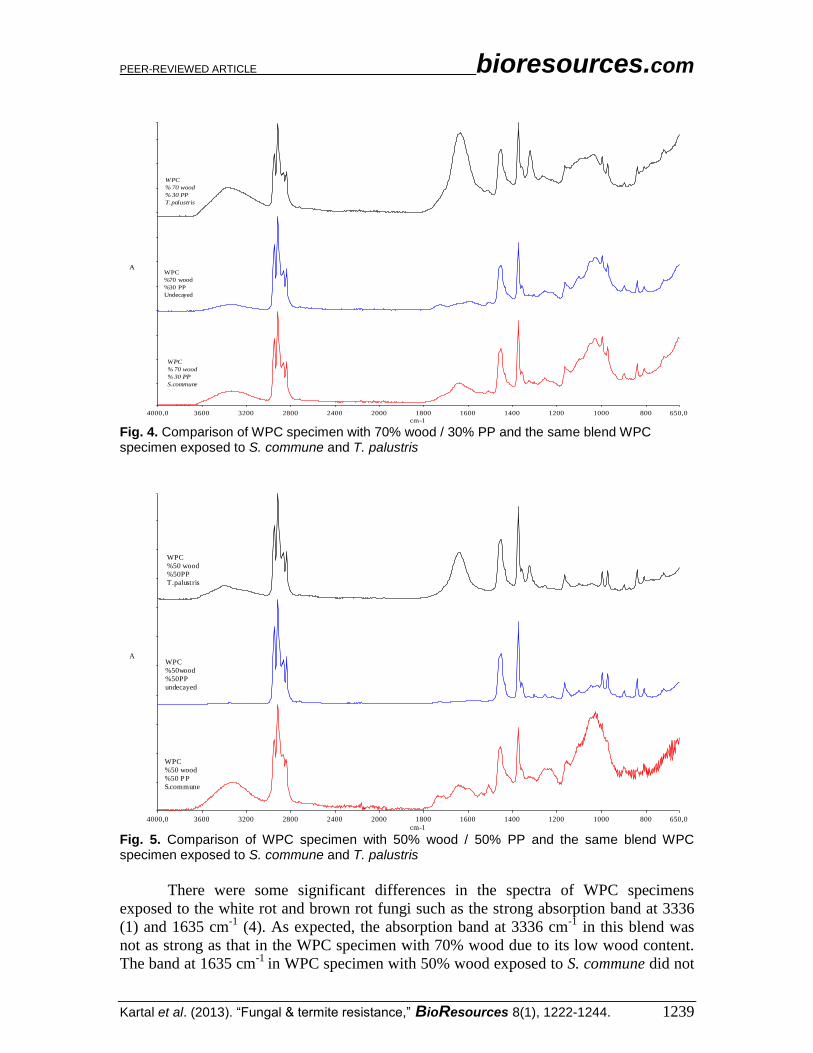
(ii) comparison of control WPC (undecayed) specimen (50% wood / 50% PP) to
the same blend WPC specimens exposed to S. commune and T. palustris: The IR
spectrum of WPC specimen with 50% wood / 50% PP exposed to T. palustris represents
a similar spectrum to undecayed WPC specimen as seen in Fig. 5.
PEER-REVIEWED ARTICLE bioresources.com
Kartal et al. (2013). “Fungal & termite resistance,” BioResources 8(1), 1222-1244. 1239
4000,0 3600 3200 2800 2400 2000 1800 1600 1400 1200 1000 800 650,0
cm-1
A
WPC
% 70 wood
% 30 PP
S.commune
WPC
%70 wood
%30 PP
Undecayed
WPC
% 70 wood
% 30 PP
T.palustris
Fig. 4. Comparison of WPC specimen with 70% wood / 30% PP and the same blend WPC specimen exposed to S. commune and T. palustris
4000,0 3600 3200 2800 2400 2000 1800 1600 1400 1200 1000 800 650,0
cm-1
A
WPC
%50 wood
%50 P P
S.commune
WPC
%50wood
%50PP
undecayed
WPC
%50 wood
%50PP
T.palust ris
Fig. 5. Comparison of WPC specimen with 50% wood / 50% PP and the same blend WPC specimen exposed to S. commune and T. palustris
There were some significant differences in the spectra of WPC specimens
exposed to the white rot and brown rot fungi such as the strong absorption band at 3336
(1) and 1635 cm-1
(4). As expected, the absorption band at 3336 cm-1
in this blend was
not as strong as that in the WPC specimen with 70% wood due to its low wood content.
The band at 1635 cm-1
in WPC specimen with 50% wood exposed to S. commune did not
PEER-REVIEWED ARTICLE bioresources.com
Kartal et al. (2013). “Fungal & termite resistance,” BioResources 8(1), 1222-1244. 1240
display a strong intensity as well as the same blend WPC exposed to T. palustris, which
is probably due to different decay processes of these two fungi. While most white rot
fungi decompose lignin selectively depending on the extent of the exposure period, some
brown rot fungi decompose carbohydrates and lignin simultaneously and they modify
lignin structure (Fengel and Wegener 1984; Eriksson 1990). On the contrary, the IR
spectrum of WPC specimen exposed to S. commune displayed more differences than the
IR spectrum of WPC specimen exposed to T. palustris when compared to undecayed
WPC specimen.
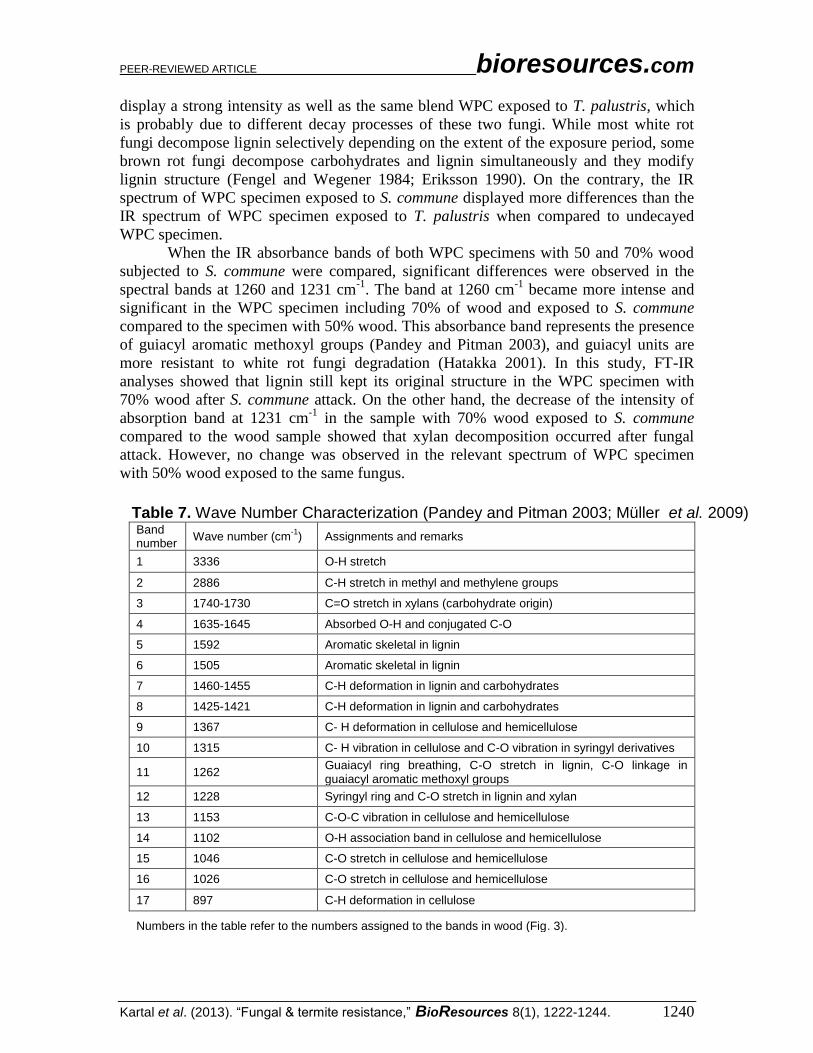
When the IR absorbance bands of both WPC specimens with 50 and 70% wood
subjected to S. commune were compared, significant differences were observed in the
spectral bands at 1260 and 1231 cm-1
. The band at 1260 cm-1
became more intense and
significant in the WPC specimen including 70% of wood and exposed to S. commune
compared to the specimen with 50% wood. This absorbance band represents the presence
of guiacyl aromatic methoxyl groups (Pandey and Pitman 2003), and guiacyl units are
more resistant to white rot fungi degradation (Hatakka 2001). In this study, FT-IR
analyses showed that lignin still kept its original structure in the WPC specimen with
70% wood after S. commune attack. On the other hand, the decrease of the intensity of
absorption band at 1231 cm-1
in the sample with 70% wood exposed to S. commune
compared to the wood sample showed that xylan decomposition occurred after fungal
attack. However, no change was observed in the relevant spectrum of WPC specimen
with 50% wood exposed to the same fungus.
Table 7. Wave Number Characterization (Pandey and Pitman 2003; Müller et al. 2009) Band number
Wave number (cm-1
) Assignments and remarks
1 3336 O-H stretch
2 2886 C-H stretch in methyl and methylene groups
3 1740-1730 C=O stretch in xylans (carbohydrate origin)
4 1635-1645 Absorbed O-H and conjugated C-O
5 1592 Aromatic skeletal in lignin
6 1505 Aromatic skeletal in lignin
7 1460-1455 C-H deformation in lignin and carbohydrates
8 1425-1421 C-H deformation in lignin and carbohydrates
9 1367 C- H deformation in cellulose and hemicellulose
10 1315 C- H vibration in cellulose and C-O vibration in syringyl derivatives
11 1262 Guaiacyl ring breathing, C-O stretch in lignin, C-O linkage in guaiacyl aromatic methoxyl groups
12 1228 Syringyl ring and C-O stretch in lignin and xylan
13 1153 C-O-C vibration in cellulose and hemicellulose
14 1102 O-H association band in cellulose and hemicellulose
15 1046 C-O stretch in cellulose and hemicellulose
16 1026 C-O stretch in cellulose and hemicellulose
17 897 C-H deformation in cellulose
Numbers in the table refer to the numbers assigned to the bands in wood (Fig. 3).
PEER-REVIEWED ARTICLE bioresources.com
Kartal et al. (2013). “Fungal & termite resistance,” BioResources 8(1), 1222-1244. 1241
CONCLUSIONS
1. The composite specimens produced with higher particle content and smaller
particle size experienced increased mass losses in decay resistance tests in most
cases. Even though mass losses in the specimens in termite resistance tests
increased as particle content increased, decreased particle size caused slightly
decreased mass losses.
2. All composite specimens were colonized by the mold fungi in a short period of 4
weeks. In order to increase biological resistance of the specimens, higher loadings
of Zn borate might be beneficial for providing more resistance against decay fungi
and preventing mold growth in WPCs. The modified soil-block decay test can be
used to specify WPCs that may be resistant or non-resistant to decay by fungi.
Results of this study show a clear difference in mass losses of the composites with
higher wood content without Zn borate preservative compared to the specimens
with lower wood content amended with Zn borate.
3. As expected, the IR spectrum of WPC specimen including 70% wood is more
similar to the wood sample than those of the specimen with 50% wood. The
changes that occurred in the specimen with 70% wood exposed to the brown rot
fungus are more significant than the same blended specimen exposed to the white
rot fungus.
4. It was observed that lignin kept its original structure in WPC specimen with 70%
wood and exposed to S. commune. Agar plate and soil block tests using either air-
dried, water-soaked, or aged WPC specimens are in progress to evaluate the effect
of initial moisture content of the specimens on susceptibility to decay fungi to
compare the AWPA E10-12 standard method updated for decay tests for WPCs.
ACKNOWLEDGMENTS
The late Kunio Tsunoda, Associate Professor of RISH, Kyoto University, who
passed away on October 5th, 2011 during this project, is sincerely commemorated. The
first author acknowledges the support from RISH, Kyoto University under the Visiting
Professor Program in summer 2011. The authors wish to thank Mr. Akio Adachi,
laboratory staff, and graduate students at the laboratory of Innovative Humano-
habitability of RISH, Kyoto University for technical assistance in decay testing. Financial
support (UDP 22620) by the Coordination Unit for Scientific Research Projects of
Istanbul University is gratefully appreciated. MISAWA Homes Co. Ltd., Japan is
acknowledged for composite production. We would like to thank Carol A. Clausen of
USDA Forest Service Forest Products Laboratory, Madison, WI, USA for providing a
critical scientific review of the paper.
REFERENCES CITED
American Society for Testing Materials (ASTM) (2010). Annual Book of ASTM
Standards, Vol. 04.10. ASTM, West Conshohocken, Pennsylvania USA.
PEER-REVIEWED ARTICLE bioresources.com
Kartal et al. (2013). “Fungal & termite resistance,” BioResources 8(1), 1222-1244. 1242
American Wood Protection Association (AWPA) (2012). Annual Book of AWPA
Standards. AWPA, Birmingham, Alabama, USA.
Ammer, V. (1964). “On the connection between moisture content and fungal decay in
wood,” Holz. Roh. Werkst. 22, 47-51.
Bodirlău, R., Teacă, C. A., Spiridon, I. (2008). “Chemical modification of beech
wood:Effect on thermal stability,” BioResources 3, 789-800.
Chow, P., Nakayama, F. S., Youngquist, J. A., Muehl, J. H., and Krzysik, A. M. (2002).
“Durability of wood/plastic composites made from Parthenium species,” IRG/WP/02-
40225. The International Research Group on Wood Preservation, Stockholm,
Sweden.
Clemons, C. (2002). “Wood-plastic composites in the United States: The interfacing of
two industries,” Forest Prod. J. 52, 10-18.
Clemons, C., and Ibach, R. E. (2004). “Effects of processing method and moisture history
on laboratory fungal resistance of wood-HDPE composites,” Forest Prod. J. 54, 50-
57.
Eriksson, K. E., Blanchette, R. A., and Ander, P. (1990). Microbial and Enzymatic
Degradation of Wood and Wood Components, Springer, Berlin Heidelberg New
York.
Fabiyi, J. S., McDonald, A. G., Morrell, J. J., and Freitag, C. (2011). “Effects of wood
species on durability and chemical changes of fungal decayed wood plastic
composites,” Compos. Part A-Appl. S. 42, 501-510.
Fengel, D., and Wegener, G. (1984). Wood: Chemistry, Ultrastructure, Reactions, Walter
De Gruyter Inc., Berlin, Germany.
Guzman, J. A. (2003). “Development of an accelerated method for assessing decay of
wood plastic composites (WPCs),” PhD thesis, Oregon State University, USA.
Hatakka, A. (2001). “Biodegradation of lignin,” In: Steinbüchel A. (ed.), Biopolymers,
Vol 1: Hofrichter M., Steinbüchel A. (eds.), Lignin, Humic Substances and Coal,
Wiley- VCH, Germany, pp. 129-180.
Ibach, R. E., and Clemons, C. M. (2002). “Biological resistance of polyethylene
composites made with chemically modified fiber or flour,” In: Proceedings of Sixth
Pacific-Rim Bio-Based Composites Symposium, Portland, Oregon, pp. 574-583.
Ibach, R. E., Clemons, C., and Stark, N. (2003). “Combined ultraviolet and water
exposure as a preconditioning method in laboratory fungal durability testing,” In:
Proceedings of The Seventh International Conference on Woodfiber-Plastic
Composites, Forest Products Society, Madison, Wisconsin, pp. 61-67.
Japanese Industrial Standards (JIS) (2004). Japanese Standard Association, Tokyo, Japan
(in Japanese).
Klyosov, A. A., (2007). Wood-Plastic Composites, John Wiley & Sons, New Jersey.
Laks, V. K., Verhey, S., and Richter, D. (2005). “Effect of manufacturing variables on
mold susceptibility of wood-plastic composites,” In: Proceedings of The Eighth
International Conference on Woodfiber- Plastic Composites, Madison, Wisconsin,
265-270.
Lomelí-Ramírez, M. G., Ochoa-Ruiz, H. G., Fuentes-Talavera, F. J., and Garcia-
Enriquez, S., (2009). “Evaluation of accelerated decay of wood plastic composites by
Xylophagus fungi,” Int Biodeter. Biodegr. 63, 1030-1035.
Mankowski, M., and Morrell, J. J. (2000). “Patterns of fungal attack in wood-plastic
composites following exposure in a soil block test,” Wood Fiber Sci. 32, 340-345.
PEER-REVIEWED ARTICLE bioresources.com
Kartal et al. (2013). “Fungal & termite resistance,” BioResources 8(1), 1222-1244. 1243
Mankowski, M. E., Ascherl, F. M., and Manning, M. J. (2005). “Durability of wood
plastic composites relative to natural weathering and preservative treatment with zinc
borate,” IRG/WP 05-40316. The International Research Group on Wood
Preservation, Bangalore, India.
Manning, M. J., Ascher, F. M., and Mankowski, M. E. (2006). “Wood-plastic composites
and the durability dilemma: Observations from the field,” IRG/WP 06-40351. The
International Research Group on Wood Preservation, Tromsø, Norway.
McDonald, A. G., Fabiyi, J. S., Morrell, J., and Freitag, C. (2009). “Effect of wood
species on the weathering and soil performance of wood plastic composites,” In:
Proceeding of the 10th International Conference on Wood and Biofiber-Plastic
Composites, Madison, Wisconsin, pp. 84-89.
Morrell, J. J., Stark, N. M., Pendleton, D. E., and McDonald, A. G. (2010). “Durability of
wood-plastic composites,” Tenth International Conference on Wood & Biofiber
Plastic Composites and Cellulose Nanocomposites Symposium, Forest Products
Society, Madison, Wisconsin, ISBN 978-1- 892529-55-8.
Morris, P. I., and Cooper, P. (1998). “Recycled plastic/wood composite lumber attacked
by fungi,” Forest Prod. J. 48, 86-88.
Muller, U., Bammer, R., Halmschlager, E., Stollberger, R., and Wimmer, R. (2001).
“Detection of fungal wood decay using magnetic resonance imaging,” Holz Roh
Werkst. 59, 190-194.
Müller, G., Schöpper, C., Vos, H., Kharazipour, A., and Polle, A. (2009). “FTIR-ATR
spectroscopic analyses of changes in wood properties during particle and fibreboard
production of hard and softwood trees,” BioResources 4, 49-71.
Naghipour, B. (1996). “Effects of extreme environmental conditions and fungus exposure
on the properties of wood-plastic composites,” M.S. Thesis, University of Toronto,
Toronto, Canada.
Nilsson, K., and Bjurman J. (1998). “Chitin as an indicator of the biomass of two wood-
decay fungi in relation to temperature, incubation time and media composition,” Can.
J. Microbiol. 44, 575-581.
Owen, N.L., and Thomas, D. W. (1989). “Infrared studies of hard and soft woods,” Appl.
Spectrosc. 43, 451-455.
Pandey, K. K., and Pitman, A. J. (2003). “FTIR studies of the changes in wood chemistry
following decay by brown-rot and white-rot fungi,” Int. Biodeter. Biodegr. 52, 151-
160.
Pendleton, D. E., Hoffard, T. A., Adcock, T., Woodward, B., and Wolcott, M. P. (2002).
“Durability of an Extruded HDPE/Wood Composite,” Forest Prod. J. 52, 21-27.
Schirp, A., Ibach, R. E., Pendleton, D. E., and Wolcott, M. P. (2008). “Biological
degradation of wood-plastic composites (WPC) and strategies for improving the
resistance of WPC against bio-logical decay,” In: T.P. Schultz et al. (ed.)
Development of Commercial Wood Preservatives. ACS Symposium Series 982,
American Chemical Society, Washington, D.C., pp. 480-507.
Schmidt, E. L. (1993). “Decay testing and moisture changes for a plastic-wood
composite,” In: Proceedings AWPA 89, 108-109.
Silva, A., Freitag, C., Morrell, J. J., and Gartner, B. L. (2002). “Effect of fungal attack on
creep behavior and strength of wood plastic composites,” The Sixth International
Conference on Wood fiber-Plastic Composites, Proceedings, The Forest Products
Society, Madison, Wisconsin, pp. 69-72.
PEER-REVIEWED ARTICLE bioresources.com
Kartal et al. (2013). “Fungal & termite resistance,” BioResources 8(1), 1222-1244. 1244
Silva, A., Freitag, C., Morrell, J. J., and Gartner, B. (2001). “Effect of fungal attack on
creep behavior and strength of wood plastic composite,” In: Proc. of the Sixth
International Conference on Wood fiber-Plastic Composites, Forest Products Society,
Madison, WI, pp. 73-77.
Silva Guzman, J. A. (2003). “Development of an accelerated method for assessing decay
of wood plastic composites (WPCs),” PhD thesis, Oregon State University, USA.
Silva, A., Gartner, B. L., and Morrell J.J. (2007). “Towards the development of
accelerated methods for assessing the durability of wood plastic composites,” J. Test
Eval. 35, 203-210.
Simonsen, J., Freitag, C. M., and Morrell, J. J. (2002). “The effect of wood-plastic ratio
on the performance of borate biocides against brown-rot fungi,” The Sixth
International Conference on Wood fiber-plastic Composites, The Forest Products
Society. Madison, Wisconsin, pp. 69-72.
Stark, N., and Berger, M. J. (1997). “Effect of species and particle size on properties of
wood-flour-filled polypropylene composites,” Proceedings: Functional Fillers for
Thermoplastics & Thermosets, USDA Forest Service, Forest Products Laboratory,
Madison, Wisconsin, pp 1-16.
Takatani, M., Ito, H., Ohsugi, S., Kitayama, T., Saegusa, M., Kawai, S., and Okamoto, T.
(2000). “Effect of lignocellulosic materials on the properties of thermoplastic
polymer/wood composites,” Holzforshung 54, 197-200.
Verhey, S., Laks, P., and Richter, D. (2001). “Laboratory decay resistance of wood fiber/
thermoplastic composites,” Forest Prod. J. 51, 44-49.
Verhey, S. A., Lacks, P. E., and Richter, D. L. (2002). “The effect of composition on the
decay resistance of model wood fiber-thermoplastic composites,” The Sixth
International Conference on Wood fiber-plastic Composites, The Forest Products
Society, Madison, Wisconsin, pp. 79-86.
Verhey, S. A., and Laks, P. E. (2002). “Wood particle size affects the decay resistance of
wood fiber/thermoplastic composites,” Forest Prod. J. 52, 78-81.
Wang, W., and Morrell, J. J. (2004). “Water sorption characteristics of two wood-plastic
composites,” Forest Prod. J. 54, 209-212.
Zabel, R. A., and Morrell, J. J. (1992). Wood Microbiology, Academic Press, San Diego,
CA. 474 pp.
Article submitted: December 4, 2012; Peer review completed: January 17, 2013; Revised
version received and accepted: January 21, 2013; Published: January 22, 2013.