termite mound emissions of ch 4 and co 2 are primarily determined by seasonal changes in termite...
TRANSCRIPT
ECOSYSTEM ECOLOGY - ORIGINAL PAPER
Termite mound emissions of CH4 and CO2 are primarilydetermined by seasonal changes in termite biomass and behaviour
Hizbullah Jamali • Stephen J. Livesley •
Tracy Z. Dawes • Lindsay B. Hutley •
Stefan K. Arndt
Received: 18 January 2011 / Accepted: 21 March 2011 / Published online: 12 May 2011
� Springer-Verlag 2011
Abstract Termites are a highly uncertain component in
the global source budgets of CH4 and CO2. Large seasonal
variations in termite mound fluxes of CH4 and CO2 have
been reported in tropical savannas but the reason for this is
largely unknown. This paper investigated the processes that
govern these seasonal variations in CH4 and CO2 fluxes
from the mounds of Microcerotermes nervosus Hill (Ter-
mitidae), a common termite species in Australian tropical
savannas. Fluxes of CH4 and CO2 of termite mounds were
3.5-fold greater in the wet season as compared to the dry
season and were a direct function of termite biomass.
Termite biomass in mound samples was tenfold greater
in the wet season compared to the dry season. When
expressed per unit termite biomass, termite fluxes were
only 1.2 (CH4) and 1.4 (CO2)-fold greater in the wet season
as compared to the dry season and could not explain the
large seasonal variations in mound fluxes of CH4 and CO2.
Seasonal variation in both gas diffusivity through mound
walls and CH4 oxidation by mound material was negligi-
ble. These results highlight for the first time that seasonal
termite population dynamics are the main driver for the
observed seasonal differences in mound fluxes of CH4 and
CO2. These findings highlight the need to combine mea-
surements of gas fluxes from termite mounds with detailed
studies of termite population dynamics to reduce the
uncertainty in quantifying seasonal variations in termite
mound fluxes of CH4 and CO2.
Keywords Carbon dioxide � Methane � Microcerotermes
nervosus � Mounds � Termite biomass
Introduction
Tropical savanna ecosystems have been identified as a
major source of greenhouse gas emissions; however,
uncertainty in the magnitude of these emissions is con-
siderable (Bousquet et al. 2006; Grace et al. 2006). The
exchange of carbon dioxide (CO2), methane (CH4) and
nitrous oxide (N2O) in natural savanna ecosystems is pre-
dominantly a function of: (1) gross primary production
(CO2), (2) plant and soil respiration (CO2), (3) termite
activity (CH4), (4) periods of wetland inundation and water
level (CH4, N2O), (5) soil CH4 oxidation (CH4), (6) soil
nitrification and denitrification (N2O), and (7) fire events
(CO2, CH4, N2O) (Livesley et al. 2011). Termites are one
of the most uncertain contributors to the global budgets of
CH4 and CO2 (Bignell et al. 1997; Brummer et al. 2009;
Khalil et al. 1990). Termite mounds have also been
reported as a significant point source of N2O; however,
such N2O fluxes were negligible from termite mounds in
Communicated by Jerome Casas.
H. Jamali (&) � S. K. Arndt
Department of Forest and Ecosystem Science,
The University of Melbourne, 500 Yarra Boulevard,
Richmond, VIC 3121, Australia
e-mail: [email protected]
S. J. Livesley
Department of Resource Management and Geography,
The University of Melbourne, 500 Yarra Boulevard,
Richmond, VIC 3121, Australia
T. Z. Dawes
CSIRO Ecosystem Sciences, PMB 44,
Winnellie, NT 0822, Australia
L. B. Hutley
Research Institute for the Environment and Livelihoods,
Charles Darwin University, Darwin, NT 0909, Australia
123
Oecologia (2011) 167:525–534
DOI 10.1007/s00442-011-1991-3
this study (unpublished data) as similarly found by Khalil
et al. (1990). The uncertainty in termite-related fluxes is
mainly associated with scaling-up factors, such as global
estimates of termite biomass, the number of nests (Khalil
et al. 1990), and the lack of process-based understanding of
CH4 and CO2 exchange between termites and the atmo-
sphere. Most previous studies used laboratory-based ter-
mite fluxes in scaling-up which ignored the fact that termite
behaviour can be affected in artificial conditions (Bignell
et al. 1997) and that not all CH4 produced by termites is
emitted to the atmosphere because of mound wall diffu-
sivity and CH4 oxidation by methanotrophs in the mound
material (Sugimoto et al. 1998). The laboratory-based
studies scale-up the emission rates using regional and
global termite biomass estimates which are still lacking for
many regions (Bignell et al. 1997; Sanderson 1996). Field-
based studies, though more realistic, mostly ignore the
contribution of termites that do not construct mounds.
Also, such field-based studies are few and do not cover all
biogeographical regions where termites occur.
An important factor for consideration in scaling is the
large seasonal variations in termite mound fluxes of CH4
and CO2. Termite densities tend to be highest in savanna
ecosystems that occur in highly seasonal climate zones
(Hutley and Setterfield 2008). CH4 fluxes from a mound
of Coptotermes lacteus (Rhinotermitidae) in summer were
greater than rest of the three seasons combined in sub-
tropical Australia, with large seasonal variations in mound
CO2 fluxes observed (Khalil et al. 1990). In the tropical
savannas of northern Australia, CH4 fluxes from the
mounds of four termite species were 5- to 26-fold greater
in the wet season as compared to the dry season (Jamali
et al. 2011). In an Australian tropical semi-arid woodland,
Holt (1987) reported almost fourfold greater CO2 fluxes
in the wet season as compared to the dry season from the
mounds of Amitermes laurensis (Termitidae). The sea-
sonal variations in mound gas fluxes have mainly been
correlated with temperature in the sub-tropics (Khalil
et al. 1990), and with moisture in the tropical savannas, as
there is limited seasonal variation in temperature (Holt
1987; Jamali et al. 2011). While the effect of temperature
on termite fluxes of CH4 and CO2 have been reported
(Jamali et al. 2011; Shelton and Appel 2000; Zimmerman
and Greenberg 1983), the effect of moisture is still largely
unknown. To our knowledge, no process-based study has
been conducted which assesses the factors causing these
seasonal variations in mound fluxes of CH4 and CO2 in
the tropical savannas. Given that the savanna biome
occupies 15% of the global land surface, understanding
these processes is required for accurate predictions of
global greenhouse gas budgets.
The observed seasonality in mound fluxes of CH4 and
CO2 can be caused by a number of different factors. First,
the observed seasonal variation in mound fluxes could be
caused by a seasonal change in emissions per unit termite
biomass. Environmental factors, such as temperature,
moisture, or food quantity and quality can change the rates
of metabolism and respiration in termites. Second, seasonal
variation in fluxes can be caused by a change in the number
of termites inside mound. For example, certain termite
species can lose up to 50% of their colony biomass as a
result of swarming (Wood and Sands 1978). Also, termite
population in mounds can increase as part of the repro-
ductive life cycle. Third, seasonal variation in termite
activity, such as foraging outside mounds, can result in
seasonal variation in mound-based flux measurements.
This can impact termite flux estimates based on termite
mounds alone, as only a fraction of the termites in the
colony will be present in the mound whilst the remainder of
the termites will be emitting CH4 and CO2 elsewhere in the
ecosystem. Fourth, termite mound walls are mainly com-
posed of soil and can oxidize a fraction of CH4 produced
by termites inside mounds as a result of methanotrophic
activity (Sugimoto et al. 1998). Variable mound water
contents across seasons can cause variable CH4 oxidation
rates (and thus variable mound CH4 fluxes) as oxidation
rates can be influenced by moisture. Seasonal CO2 varia-
tion can also be partly due to the effect of moisture and
temperature on the respiration of microbial biomass in the
mound walls (Holt 1987). Fifth, seasonal variation in gas
diffusivity through mound wall due to changing mound
water content can also cause seasonal variation in net
mound fluxes.
This study was aimed to investigate for the first time the
factors causing seasonal variations in termite mound fluxes
of CH4 and CO2 in Australian tropical savannas. All the
experiments were conducted on Microcerotermes nervosus,
one of the most common mound-building termite species in
northern Australia (Watson and Abbey 1993). The objec-
tives were to investigate the seasonality in: (1) CH4 and
CO2 emissions per unit termite biomass; (2) termite bio-
mass dynamics in mounds; (3) gas diffusivity of mound
material and fluxes of mound material as a result of
microbial activity; and (4) short term effect of temperature
and moisture on CH4 and CO2 fluxes from termites (not
mounds).
Materials and methods
Site
Field work was conducted in a savanna woodland at the
CSIRO Tropical Ecosystems Research Center (TERC
12�240S, 130�550E), near Darwin in northern Australia. The
vegetation is dominated by Eucalyptus tetrodonta F. Muell
526 Oecologia (2011) 167:525–534
123
and E. miniata Cunn. ex Schauer over a ground layer of
annual and perennial C4 grasses, and a thick litter layer
(Dawes-Gromadzki and Spain 2003). This is widespread
savanna type across northern Australia at annual rainfall
above 900 mm (Fox et al. 2001).
Field-based flux measurements
Five mounds of Microcerotermes nervosus were repeat-
measured for CH4 and CO2 fluxes between February and
December 2009 at intervals of 4–6 weeks. Mounds with
easy access for measurements were selected. Fluxes were
measured using static manual chambers of volume
0.02 m3, constructed from polyvinylchloride. A collar was
permanently installed around the mounds to a soil depth of
3 cm. A chamber of equal circumference to the collar was
placed over the mound and connected to the collar using a
ribbon of closed cell foam and several tension spring-
clamps. This chamber was then connected to a Los Gatos
Research (LGRTM) Fast Greenhouse Gas Analyzer
(FGGA) through a pair of gas tubes and SwagelokTM push-
fittings. LCD screen was attached to the FGGA which
displayed the CH4 and CO2 concentrations measured at a
frequency of 1 Hz (i.e. one sample per second) for a period
of 5 min per chamber. The operation of the FGGA is based
on an off-axis integrated cavity output spectroscopy com-
bined with a highly specific narrow band laser for the
detection of CH4 and CO2 and strongly reflective mirrors to
obtain a laser path length of 2–20 9 103 m. Further tech-
nical details on FGGA operation can be found in Hendriks
et al. (2008). Flux was calculated from the linear change in
concentration of CH4 and CO2 in the chamber headspace
by multiplying the slope (ppmv h-1) with the chamber
volume (L) and dividing by the mound basal area (m2).
Flux was then corrected for temperature and pressure based
on the ideal gas law.
Auxiliary environmental measurements
Mound temperature (Tmound) was measured immediately
after the mound flux measurement by horizontally inserting
a hand held Cole-Palmer� stainless steel temperature probe
6 cm into the mound. Mound water content was not
directly measured to avoid destruction of the mounds
required for repeat measurements. Instead, soil water
content (%) was measured gravimetrically by collecting
five soil core samples from the top 6 cm next to each
mound using a brass soil sampling ring. These were
weighed, oven-dried at 105�C and reweighed. Monthly
rainfall (mm) data were obtained from the Darwin Airport
meteorological station of the Bureau of Meteorology,
Australia which is located less than 2 km from the TERC
site.
Flux and termite biomass measurements
in the laboratory
Samples (n = 22) from M. nervosus mounds were col-
lected in 3-L glass jars and equilibrated at 25�C for 5 h in a
temperature-controlled room at Charles Darwin University,
Darwin, prior to measurement of CH4 and CO2 fluxes.
Fluxes were measured by connecting the glass jars to the
FGGA and observing a linear change in the headspace
concentration of CH4 and CO2 at a frequency of 1 Hz for a
period of 10 min. Fresh biomass of termites was deter-
mined immediately afterwards by breaking down the
mound samples and collecting individual termites using
forceps. Workers and soldiers were weighed separately to
an accuracy of 10-4 g. The mean biomass of an individual
termite within a caste (i.e. workers, soldiers and alates) was
determined by weighing 10 individuals from each caste
from most of the mound samples. The volume of mound
samples was measured, before breaking and removing the
termites, by cling-wrapping the sample in a thin plastic
sheet and placing it in a partially water-filled calibrated
container. The volume of displaced water was subtracted
from the chamber volume to calculate the net headspace
volume. A maximum of only two mound samples were
collected and measured each day. This experiment was
conducted in both the wet (n = 22) and the dry (n = 22)
seasons and was completed within a 2-week period for both
seasons.
Fluxes were also measured from the mound material
following termite removal from mound samples. Mound
material samples were incubated for 30 min using the same
protocols described above for incubating mound samples
containing termites but using 1-L glass jars. Seasonal dif-
ference in fluxes from mound material would explain the
contribution of CH4 oxidation and microbial respiration to
seasonal variations in mound fluxes of CH4 and CO2. These
mound material fluxes were subtracted from the gross
fluxes of mound samples, measured before removing the
termites, for calculating the net CH4 and CO2 from termites
only.
Gas diffusivity measurements of mounds
Seasonal difference in gas diffusivity of mound walls was
measured using two methods.
Indirect method
Seasonal difference in mound diffusivity was estimated
indirectly by using the ratio of internal mound CH4 con-
centration and mound CH4 flux. Eleven mounds of M.
nervosus were repeat-measured for mound CH4 flux and
internal mound CH4 concentration in the wet and the dry
Oecologia (2011) 167:525–534 527
123
seasons. Internal mound CH4 concentration was measured
immediately after the mound flux measurements by col-
lecting 20-mL gas samples from mounds using a syringe
and tube. These gas samples were immediately transferred
to pre-evacuated glass vials (Labco Exetainer) which were
then analysed for CH4 concentration (ppm) using an auto-
injected gas chromatograph (GC, ShimadzuTM, GC17a) at
the Creswick laboratories of The University of Melbourne.
Seasonal variation in the ratio of CH4 flux to internal
mound CH4 concentration, and the consistency of rela-
tionship between mound CH4 flux and internal mound CH4
concentration across seasons would help explain if there is
a seasonal difference in mound wall diffusivity.
Direct method
Gas diffusivity through mound wall was repeat measured in
the wet and the dry seasons directly according to von Fischer
et al. (2009) from the decrease in concentration of sulphur
hexa fluoride (SF6) that was injected into the chamber
headspace through a rubber septum using a syringe and
needle. In this experiment, the M. nervosus mounds (n = 5)
and chambers used were the same that were also being repeat
measured for seasonal fluxes of CH4 and CO2 as described in
‘‘Field-based flux measurements’’ above. A small fan was
fitted inside each chamber to maintain good mixing of SF6
within the chamber headspace. After chamber closure, 20-mL
gas samples were collected from the chamber headspace at 2,
12, 22, 32 min using a syringe and a one-way stopcock. These
gas samples were immediately transferred to pre-evacuated
exetainers and analysed for SF6 and CH4 concentration using
a GC. Mound water content was measured by collecting
samples from adjacent M. nervosus mounds (n = 5) and
weighing at 105�C for 48 h. These mound samples were
collected in a way that they largely included a portion of
mound wall. Bulk density (g cm-3) of these mound samples
was calculated by measuring their volume as described under
‘‘Flux and termite biomass measurements in the laboratory’’
above (data not shown). Diffusion coefficients (cm2 min-1)
for CH4 were determined from that of SF6 using their
respective molecular weights as explained in von Fischer
et al. (2009).
Effect of temperature and moisture on laboratory
termite fluxes
The short-term effect of temperature on termite fluxes was
measured in the laboratory, using mound samples (n = 5)
of M. nervosus that contained termites. These were kept in
3-L glass jars and housed in a temperature-controlled room
at the Charles Darwin University, Darwin, Australia.
Fluxes were measured at three temperatures, 25, 35 and
15�C, after equilibrating for 6 h at each temperature.
The effect of moisture on termite fluxes was investigated
by measuring fluxes before and after placing wet calico
cloth pieces in the jars at a constant temperature of 25�C
using the same protocols described for the temperature
effect. Fluxes from the wet calico were also measured and
subtracted from the total fluxes.
Statistical analysis
SPSS (v.16.0, SPS, Chicago, IL, USA) was used for the sta-
tistical analyses of data. Statistical significance was defined at
p B 0.05, unless otherwise stated. Note that original data were
used in all the figures and transformed data were used for
statistical tests where necessary as stated.
A simple linear regression (n = 30) was used for testing
the relationship of mean mound fluxes (CH4 and CO2),
measured in field, with mean mound temperature and mean
soil water content.
A simple linear regression (n = 22) was used for testing
the relationship between mound CH4 flux (lg CH4-C
m-2 h-1) and internal mound CH4 concentration (ppm). A
paired Student’s t test (n = 11) was used to compare the
mound CH4 flux to internal mound CH4 concentration
(ppm) ratio between the wet and the dry seasons. Paired
Student’s t test was also used to compare the water content
and gas diffusivity coefficients (log10 transformed) of
mounds between the wet and the dry seasons.
For the fluxes measured from mound samples in the lab-
oratory, a simple linear regression analysis was used for
testing the relationship between termite biomass and flux
(CH4 and CO2) separately for the wet (n = 22) and the dry
(n = 22) seasons. An independent sample Student’s t test
(n = 22) was used for analysing the significance of differ-
ence in flux per unit termite biomass between the wet and the
dry seasons; data was transformed using ln(flux). An inde-
pendent sample Student’s t test (n = 22) was also used for
testing the significance of difference in termite biomass per
unit mound sample mass between the wet and the dry sea-
sons; data were transformed using the log10(termite biomass).
For analysing the effect of temperature on fluxes, a Q10
temperature coefficient, which is a measure of the rate of
change of a biological or chemical system (in this case CH4
and CO2 flux) as a consequence of increasing the temper-
ature by 10�C, was calculated as follows:
Q10 ¼F2
F1
� � 10
T2�T1ð Þð1Þ
where F1,2 are fluxes at two different temperatures, and T is
corresponding room temperature (�C). Q10 was calculated
for a temperature range of 15–25 and 25–35�C.
Paired sample Student’s t test was used for analysing the
effect of moisture on CH4 and CO2 fluxes from the mound
samples (n = 5); data were transformed using log10(flux).
528 Oecologia (2011) 167:525–534
123
Results
Seasonal fluxes measured in field
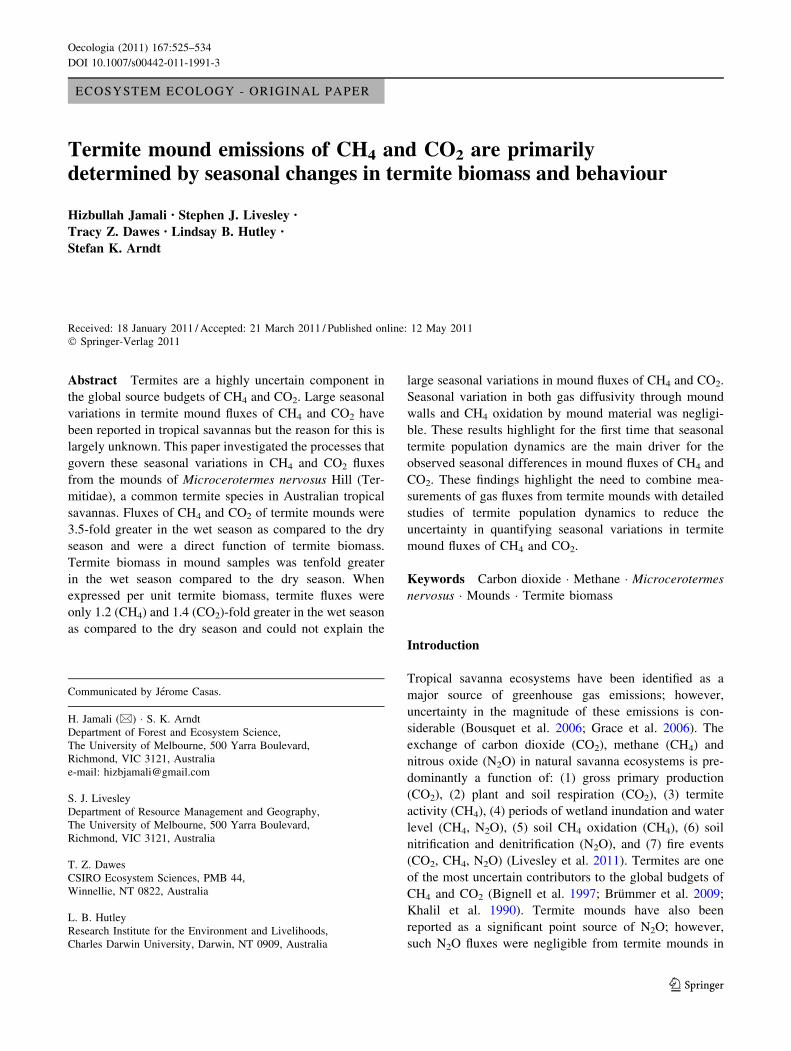
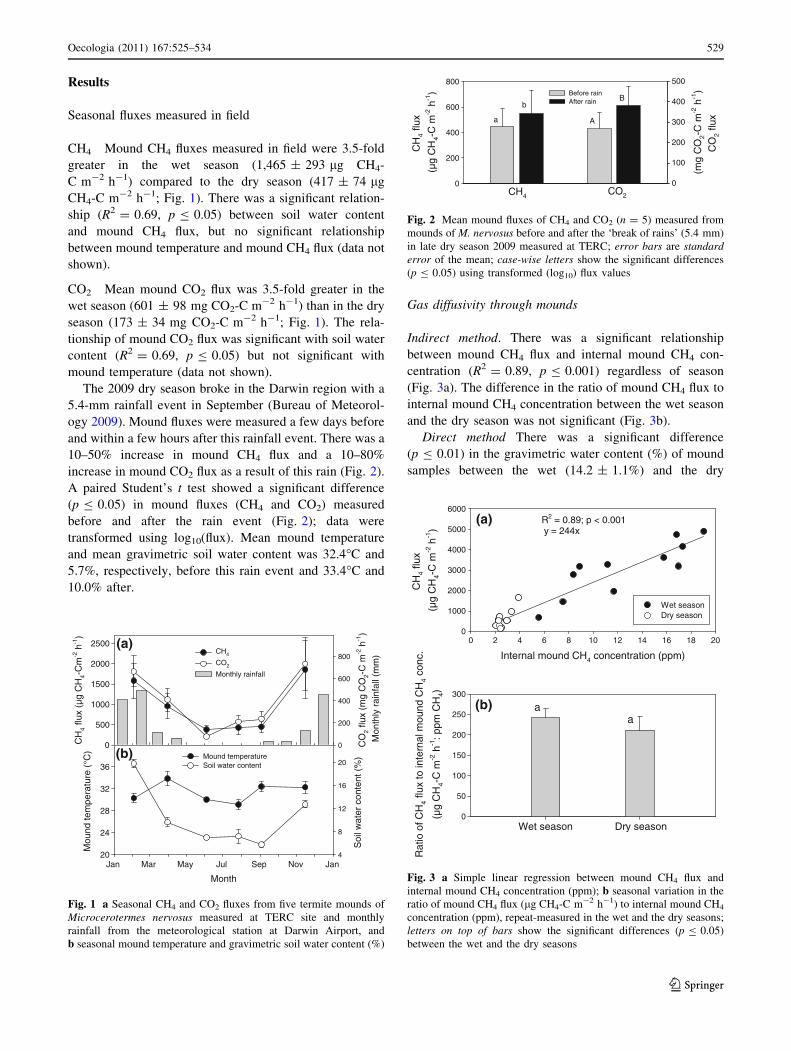
CH4 Mound CH4 fluxes measured in field were 3.5-fold
greater in the wet season (1,465 ± 293 lg CH4-
C m-2 h-1) compared to the dry season (417 ± 74 lg
CH4-C m-2 h-1; Fig. 1). There was a significant relation-
ship (R2 = 0.69, p B 0.05) between soil water content
and mound CH4 flux, but no significant relationship
between mound temperature and mound CH4 flux (data not
shown).
CO2 Mean mound CO2 flux was 3.5-fold greater in the
wet season (601 ± 98 mg CO2-C m-2 h-1) than in the dry
season (173 ± 34 mg CO2-C m-2 h-1; Fig. 1). The rela-
tionship of mound CO2 flux was significant with soil water
content (R2 = 0.69, p B 0.05) but not significant with
mound temperature (data not shown).
The 2009 dry season broke in the Darwin region with a
5.4-mm rainfall event in September (Bureau of Meteorol-
ogy 2009). Mound fluxes were measured a few days before
and within a few hours after this rainfall event. There was a
10–50% increase in mound CH4 flux and a 10–80%
increase in mound CO2 flux as a result of this rain (Fig. 2).
A paired Student’s t test showed a significant difference
(p B 0.05) in mound fluxes (CH4 and CO2) measured
before and after the rain event (Fig. 2); data were
transformed using log10(flux). Mean mound temperature
and mean gravimetric soil water content was 32.4�C and
5.7%, respectively, before this rain event and 33.4�C and
10.0% after.
Gas diffusivity through mounds
Indirect method. There was a significant relationship
between mound CH4 flux and internal mound CH4 con-
centration (R2 = 0.89, p B 0.001) regardless of season
(Fig. 3a). The difference in the ratio of mound CH4 flux to
internal mound CH4 concentration between the wet season
and the dry season was not significant (Fig. 3b).
Direct method There was a significant difference
(p B 0.01) in the gravimetric water content (%) of mound
samples between the wet (14.2 ± 1.1%) and the dry
(a)
CH
4 flu
x (µ
g C
H4-
Cm
-2 h
-1)
0
500
1000
1500
2000
2500
CO
2 flu
x (m
g C
O2-
C m
-2 h
-1)
Mon
thly
rai
nfal
l (m
m)
0
200
400
600
800CH4
CO2
Monthly rainfall
(b)
Month
Jan Mar May Jul Sep Nov Jan
Mou
nd te
mpe
ratu
re (
°C)
20
24
28
32
36
Soi
l wat
er c
onte
nt (
%)
4
8
12
16
20Mound temperatureSoil water content
Fig. 1 a Seasonal CH4 and CO2 fluxes from five termite mounds of
Microcerotermes nervosus measured at TERC site and monthly
rainfall from the meteorological station at Darwin Airport, and
b seasonal mound temperature and gravimetric soil water content (%)
CH4 CO2
CH
4 flu
x
(µg
CH
4-C
m-2
h-1
)
0
200
400
600
800
(mg
CO
2-C
m-2
h-1
)C
O2
flux
0
100
200
300
400
500Before rainAfter rain
a
b
A
B
Fig. 2 Mean mound fluxes of CH4 and CO2 (n = 5) measured from
mounds of M. nervosus before and after the ‘break of rains’ (5.4 mm)
in late dry season 2009 measured at TERC; error bars are standarderror of the mean; case-wise letters show the significant differences
(p B 0.05) using transformed (log10) flux values
(b) a a
Wet season Dry season
Rat
io o
f CH
4 flu
x to
inte
rnal
mou
nd C
H4
conc
.
(µg
CH
4-C
m-2
h-1
: ppm
CH
4)
0
50
100
150
200
250
300
(a) R2 = 0.89; p < 0.001 y = 244x
Internal mound CH4 concentration (ppm)
0 2 4 6 8 10 12 14 16 18 20
CH
4 flu
x
(µg
CH
4-C
m-2
h-1
)
0
1000
2000
3000
4000
5000
6000
Wet seasonDry season
Fig. 3 a Simple linear regression between mound CH4 flux and
internal mound CH4 concentration (ppm); b seasonal variation in the
ratio of mound CH4 flux (lg CH4-C m-2 h-1) to internal mound CH4
concentration (ppm), repeat-measured in the wet and the dry seasons;
letters on top of bars show the significant differences (p B 0.05)
between the wet and the dry seasons
Oecologia (2011) 167:525–534 529
123
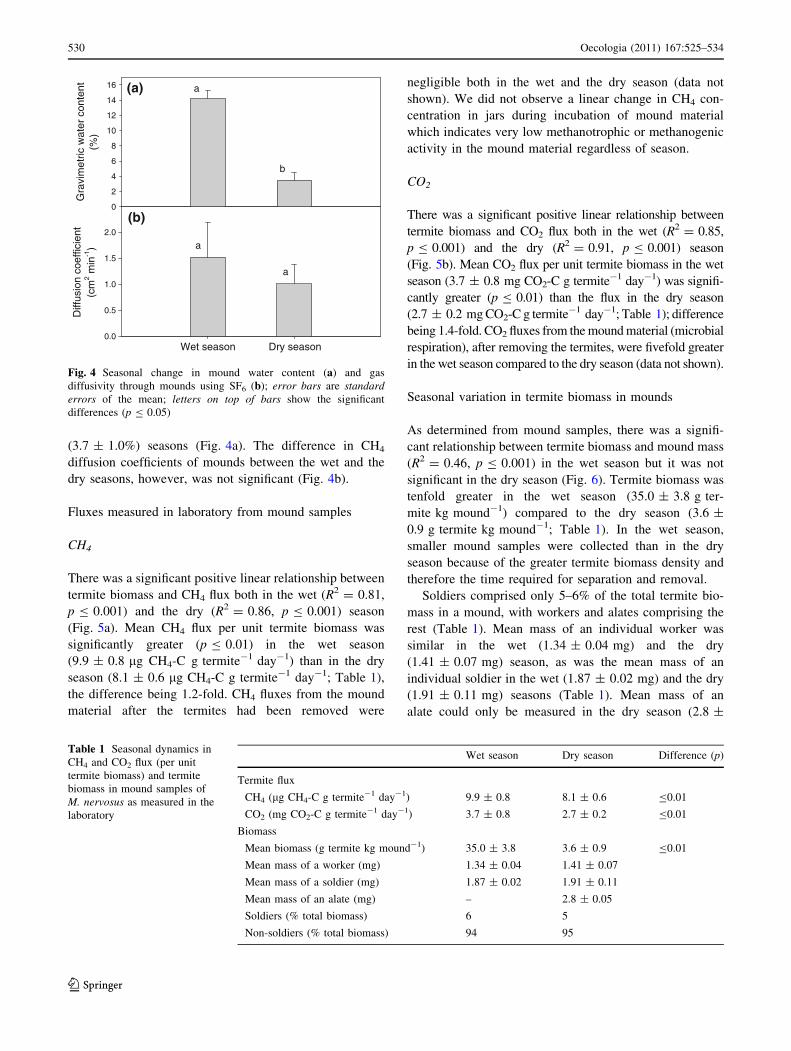
(3.7 ± 1.0%) seasons (Fig. 4a). The difference in CH4
diffusion coefficients of mounds between the wet and the
dry seasons, however, was not significant (Fig. 4b).
Fluxes measured in laboratory from mound samples
CH4
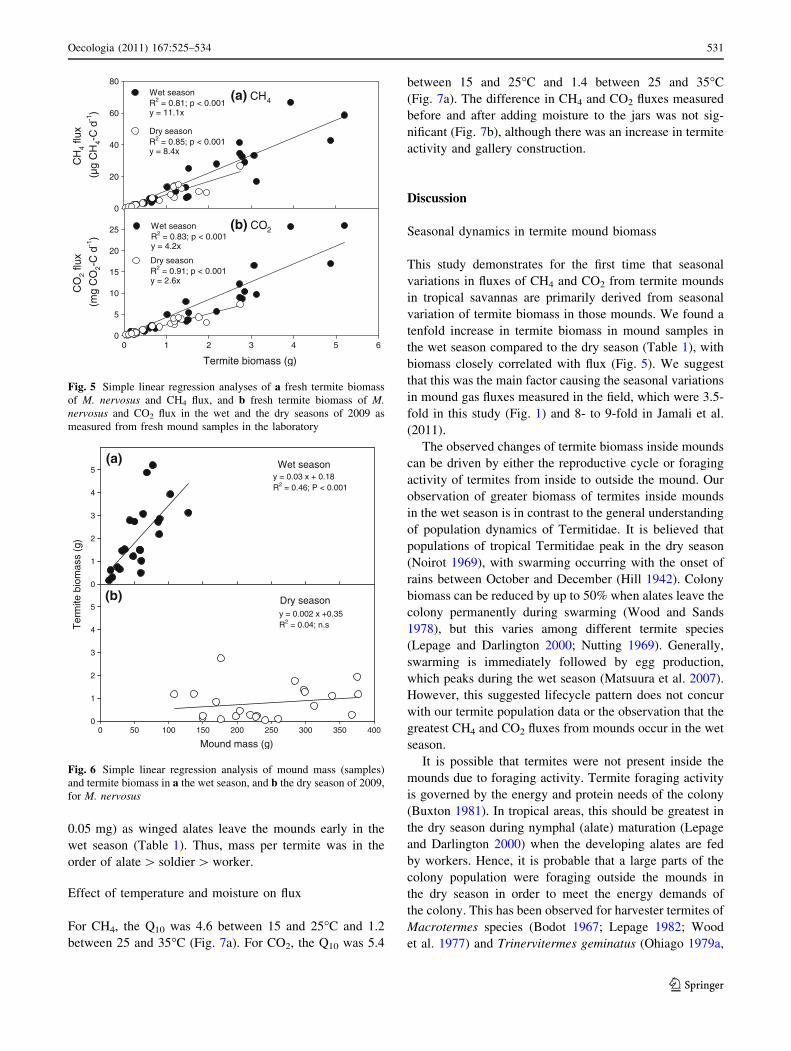
There was a significant positive linear relationship between
termite biomass and CH4 flux both in the wet (R2 = 0.81,
p B 0.001) and the dry (R2 = 0.86, p B 0.001) season
(Fig. 5a). Mean CH4 flux per unit termite biomass was
significantly greater (p B 0.01) in the wet season
(9.9 ± 0.8 lg CH4-C g termite-1 day-1) than in the dry
season (8.1 ± 0.6 lg CH4-C g termite-1 day-1; Table 1),
the difference being 1.2-fold. CH4 fluxes from the mound
material after the termites had been removed were
negligible both in the wet and the dry season (data not
shown). We did not observe a linear change in CH4 con-
centration in jars during incubation of mound material
which indicates very low methanotrophic or methanogenic
activity in the mound material regardless of season.
CO2
There was a significant positive linear relationship between
termite biomass and CO2 flux both in the wet (R2 = 0.85,
p B 0.001) and the dry (R2 = 0.91, p B 0.001) season
(Fig. 5b). Mean CO2 flux per unit termite biomass in the wet
season (3.7 ± 0.8 mg CO2-C g termite-1 day-1) was signifi-
cantly greater (p B 0.01) than the flux in the dry season
(2.7 ± 0.2 mg CO2-C g termite-1 day-1; Table 1); difference
being 1.4-fold. CO2 fluxes from the mound material (microbial
respiration), after removing the termites, were fivefold greater
in the wet season compared to the dry season (data not shown).
Seasonal variation in termite biomass in mounds
As determined from mound samples, there was a signifi-
cant relationship between termite biomass and mound mass
(R2 = 0.46, p B 0.001) in the wet season but it was not
significant in the dry season (Fig. 6). Termite biomass was
tenfold greater in the wet season (35.0 ± 3.8 g ter-
mite kg mound-1) compared to the dry season (3.6 ±
0.9 g termite kg mound-1; Table 1). In the wet season,
smaller mound samples were collected than in the dry
season because of the greater termite biomass density and
therefore the time required for separation and removal.
Soldiers comprised only 5–6% of the total termite bio-
mass in a mound, with workers and alates comprising the
rest (Table 1). Mean mass of an individual worker was
similar in the wet (1.34 ± 0.04 mg) and the dry
(1.41 ± 0.07 mg) season, as was the mean mass of an
individual soldier in the wet (1.87 ± 0.02 mg) and the dry
(1.91 ± 0.11 mg) seasons (Table 1). Mean mass of an
alate could only be measured in the dry season (2.8 ±
a
a
Wet season Dry season
Diff
usio
n co
effic
ient
(cm
2 min
-1)
0.0
0.5
1.0
1.5
2.0
a
b
Gra
vim
etric
wat
er c
onte
nt(%
)
0
2
4
6
8
10
12
14
16 (a)
(b)
Fig. 4 Seasonal change in mound water content (a) and gas
diffusivity through mounds using SF6 (b); error bars are standarderrors of the mean; letters on top of bars show the significant
differences (p B 0.05)
Table 1 Seasonal dynamics in
CH4 and CO2 flux (per unit
termite biomass) and termite
biomass in mound samples of
M. nervosus as measured in the
laboratory
Wet season Dry season Difference (p)
Termite flux
CH4 (lg CH4-C g termite-1 day-1) 9.9 ± 0.8 8.1 ± 0.6 B0.01
CO2 (mg CO2-C g termite-1 day-1) 3.7 ± 0.8 2.7 ± 0.2 B0.01
Biomass
Mean biomass (g termite kg mound-1) 35.0 ± 3.8 3.6 ± 0.9 B0.01
Mean mass of a worker (mg) 1.34 ± 0.04 1.41 ± 0.07
Mean mass of a soldier (mg) 1.87 ± 0.02 1.91 ± 0.11
Mean mass of an alate (mg) – 2.8 ± 0.05
Soldiers (% total biomass) 6 5
Non-soldiers (% total biomass) 94 95
530 Oecologia (2011) 167:525–534
123
0.05 mg) as winged alates leave the mounds early in the
wet season (Table 1). Thus, mass per termite was in the
order of alate [ soldier [ worker.
Effect of temperature and moisture on flux
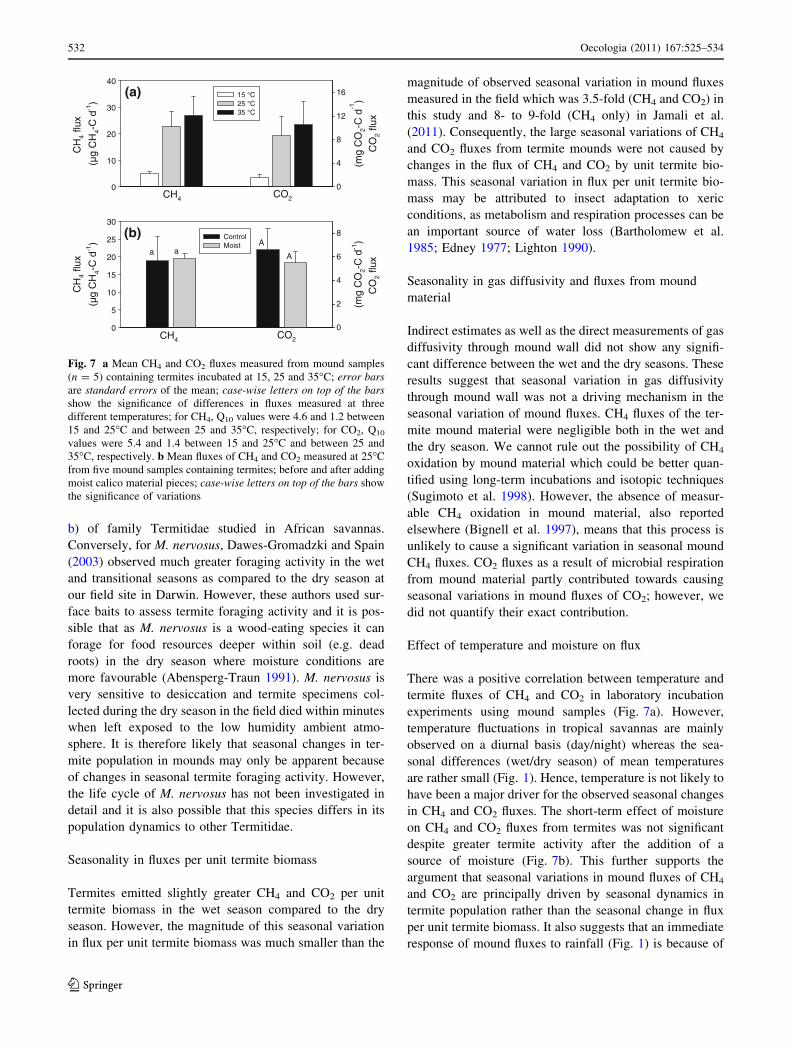
For CH4, the Q10 was 4.6 between 15 and 25�C and 1.2
between 25 and 35�C (Fig. 7a). For CO2, the Q10 was 5.4
between 15 and 25�C and 1.4 between 25 and 35�C
(Fig. 7a). The difference in CH4 and CO2 fluxes measured
before and after adding moisture to the jars was not sig-
nificant (Fig. 7b), although there was an increase in termite
activity and gallery construction.
Discussion
Seasonal dynamics in termite mound biomass
This study demonstrates for the first time that seasonal
variations in fluxes of CH4 and CO2 from termite mounds
in tropical savannas are primarily derived from seasonal
variation of termite biomass in those mounds. We found a
tenfold increase in termite biomass in mound samples in
the wet season compared to the dry season (Table 1), with
biomass closely correlated with flux (Fig. 5). We suggest
that this was the main factor causing the seasonal variations
in mound gas fluxes measured in the field, which were 3.5-
fold in this study (Fig. 1) and 8- to 9-fold in Jamali et al.
(2011).
The observed changes of termite biomass inside mounds
can be driven by either the reproductive cycle or foraging
activity of termites from inside to outside the mound. Our
observation of greater biomass of termites inside mounds
in the wet season is in contrast to the general understanding
of population dynamics of Termitidae. It is believed that
populations of tropical Termitidae peak in the dry season
(Noirot 1969), with swarming occurring with the onset of
rains between October and December (Hill 1942). Colony
biomass can be reduced by up to 50% when alates leave the
colony permanently during swarming (Wood and Sands
1978), but this varies among different termite species
(Lepage and Darlington 2000; Nutting 1969). Generally,
swarming is immediately followed by egg production,
which peaks during the wet season (Matsuura et al. 2007).
However, this suggested lifecycle pattern does not concur
with our termite population data or the observation that the
greatest CH4 and CO2 fluxes from mounds occur in the wet
season.
It is possible that termites were not present inside the
mounds due to foraging activity. Termite foraging activity
is governed by the energy and protein needs of the colony
(Buxton 1981). In tropical areas, this should be greatest in
the dry season during nymphal (alate) maturation (Lepage
and Darlington 2000) when the developing alates are fed
by workers. Hence, it is probable that a large parts of the
colony population were foraging outside the mounds in
the dry season in order to meet the energy demands of
the colony. This has been observed for harvester termites of
Macrotermes species (Bodot 1967; Lepage 1982; Wood
et al. 1977) and Trinervitermes geminatus (Ohiago 1979a,
(a) CH4
CH
4 flu
x
(µg
CH
4-C
d-1
)
0
20
40
60
80Wet seasonR2 = 0.81; p < 0.001y = 11.1x
Dry seasonR2 = 0.85; p < 0.001y = 8.4x
(b) CO2
Termite biomass (g)
0 1 2 3 4 5 6
CO
2 flu
x
(mg
CO
2-C
d-1
)
0
5
10
15
20
25 Wet seasonR2 = 0.83; p < 0.001y = 4.2x
Dry seasonR2 = 0.91; p < 0.001y = 2.6x
Fig. 5 Simple linear regression analyses of a fresh termite biomass
of M. nervosus and CH4 flux, and b fresh termite biomass of M.nervosus and CO2 flux in the wet and the dry seasons of 2009 as
measured from fresh mound samples in the laboratory
Wet seasony = 0.03 x + 0.18R2 = 0.46; P < 0.001
Ter
mite
bio
mas
s (g
)
0
1
2
3
4
5(a)
Dry seasony = 0.002 x +0.35R2 = 0.04; n.s
Mound mass (g)0 50 100 150 200 250 300 350 400
0
1
2
3
4
5(b)
Fig. 6 Simple linear regression analysis of mound mass (samples)
and termite biomass in a the wet season, and b the dry season of 2009,
for M. nervosus
Oecologia (2011) 167:525–534 531
123
b) of family Termitidae studied in African savannas.
Conversely, for M. nervosus, Dawes-Gromadzki and Spain
(2003) observed much greater foraging activity in the wet
and transitional seasons as compared to the dry season at
our field site in Darwin. However, these authors used sur-
face baits to assess termite foraging activity and it is pos-
sible that as M. nervosus is a wood-eating species it can
forage for food resources deeper within soil (e.g. dead
roots) in the dry season where moisture conditions are
more favourable (Abensperg-Traun 1991). M. nervosus is
very sensitive to desiccation and termite specimens col-
lected during the dry season in the field died within minutes
when left exposed to the low humidity ambient atmo-
sphere. It is therefore likely that seasonal changes in ter-
mite population in mounds may only be apparent because
of changes in seasonal termite foraging activity. However,
the life cycle of M. nervosus has not been investigated in
detail and it is also possible that this species differs in its
population dynamics to other Termitidae.
Seasonality in fluxes per unit termite biomass
Termites emitted slightly greater CH4 and CO2 per unit
termite biomass in the wet season compared to the dry
season. However, the magnitude of this seasonal variation
in flux per unit termite biomass was much smaller than the
magnitude of observed seasonal variation in mound fluxes
measured in the field which was 3.5-fold (CH4 and CO2) in
this study and 8- to 9-fold (CH4 only) in Jamali et al.
(2011). Consequently, the large seasonal variations of CH4
and CO2 fluxes from termite mounds were not caused by
changes in the flux of CH4 and CO2 by unit termite bio-
mass. This seasonal variation in flux per unit termite bio-
mass may be attributed to insect adaptation to xeric
conditions, as metabolism and respiration processes can be
an important source of water loss (Bartholomew et al.
1985; Edney 1977; Lighton 1990).
Seasonality in gas diffusivity and fluxes from mound
material
Indirect estimates as well as the direct measurements of gas
diffusivity through mound wall did not show any signifi-
cant difference between the wet and the dry seasons. These
results suggest that seasonal variation in gas diffusivity
through mound wall was not a driving mechanism in the
seasonal variation of mound fluxes. CH4 fluxes of the ter-
mite mound material were negligible both in the wet and
the dry season. We cannot rule out the possibility of CH4
oxidation by mound material which could be better quan-
tified using long-term incubations and isotopic techniques
(Sugimoto et al. 1998). However, the absence of measur-
able CH4 oxidation in mound material, also reported
elsewhere (Bignell et al. 1997), means that this process is
unlikely to cause a significant variation in seasonal mound
CH4 fluxes. CO2 fluxes as a result of microbial respiration
from mound material partly contributed towards causing
seasonal variations in mound fluxes of CO2; however, we
did not quantify their exact contribution.
Effect of temperature and moisture on flux
There was a positive correlation between temperature and
termite fluxes of CH4 and CO2 in laboratory incubation
experiments using mound samples (Fig. 7a). However,
temperature fluctuations in tropical savannas are mainly
observed on a diurnal basis (day/night) whereas the sea-
sonal differences (wet/dry season) of mean temperatures
are rather small (Fig. 1). Hence, temperature is not likely to
have been a major driver for the observed seasonal changes
in CH4 and CO2 fluxes. The short-term effect of moisture
on CH4 and CO2 fluxes from termites was not significant
despite greater termite activity after the addition of a
source of moisture (Fig. 7b). This further supports the
argument that seasonal variations in mound fluxes of CH4
and CO2 are principally driven by seasonal dynamics in
termite population rather than the seasonal change in flux
per unit termite biomass. It also suggests that an immediate
response of mound fluxes to rainfall (Fig. 1) is because of
(a)
CH4
CH
4 flu
x
(µg
CH
4-C
d-1
)
0
10
20
30
40
(mg
CO
2-C
d-1
)C
O2
flux
0
4
8
12
1615 °C25 °C35 °C
CO2
a
CH
4 flu
x
(µg
CH
4-C
d-1
)
0
5
10
15
20
25
30
(mg
CO
2-C
d-1
)C
O2
flux
0
2
4
6
8ControlMoist
CH4 CO2
aA
A
(b)
Fig. 7 a Mean CH4 and CO2 fluxes measured from mound samples
(n = 5) containing termites incubated at 15, 25 and 35�C; error barsare standard errors of the mean; case-wise letters on top of the barsshow the significance of differences in fluxes measured at three
different temperatures; for CH4, Q10 values were 4.6 and 1.2 between
15 and 25�C and between 25 and 35�C, respectively; for CO2, Q10
values were 5.4 and 1.4 between 15 and 25�C and between 25 and
35�C, respectively. b Mean fluxes of CH4 and CO2 measured at 25�C
from five mound samples containing termites; before and after adding
moist calico material pieces; case-wise letters on top of the bars show
the significance of variations
532 Oecologia (2011) 167:525–534
123
termites being restricted to mounds and not because of any
effect on their gut biology, metabolism or physiology.
Conclusions
This study is the first to investigate the processes responsible
for large seasonal variations in CH4 and CO2 from termite
mounds. The key finding of this paper is that these seasonal
variations in mound fluxes of CH4 and CO2 in the tropical
savannas of Australia are primarily derived from seasonal
variation of termite biomass in mounds. Termites emit slightly
greater CH4 and CO2 per unit termite biomass in the wet
season as compared to the dry season, but this does not account
for the large seasonal differences observed in mound fluxes of
CH4 and CO2. Our results highlight the need to integrate future
studies of termite gas fluxes with detailed studies of termite
population dynamics and behaviour for realistic estimates of
greenhouse gas emissions from termites.
Acknowledgments This research was supported by the Australian
Research Council, Linkage Grant LP0774812. Jamali was supported
by an AusAID postgraduate scholarship. The authors would like to
thank Gus Wanganeen from CSIRO Ecosystem Sciences, Darwin for
identifying the termite species, and Benedikt Fest from The Univer-
sity of Melbourne for his technical support in measuring the gas
diffusivity using SF6. We are also grateful to Claire Petit and other
students at CSIRO Ecosystem Sciences, Darwin for their help in
termite sorting. All experiments conducted in this study comply with
the current laws of Australia.
References
Abensperg-Traun M (1991) Seasonal changes in activity of subter-
ranean termite species (Isoptera) in Western Australian wheat-
belt habitats. Aust J Ecol 16:331–336
Bartholomew GA, Lighton JRB, Louw GN (1985) Energetics of
locomotion and patterns of respiration in tenebrionid beetles
from the Namib desert. J Comp Physiol B 155:155–162
Bignell DE, Eggleton P, Nunes L, Thomas KL (1997) Termites as
mediators of forest carbon fluxes in tropical forests: budgets for
carbon dioxide and methane emissions. In: Watt AD, Stork NE,
Hunter MD (eds) Forests and insects. Chapman and Hall,
London, pp 109–134
Bodot P (1967) Cycles saisonniers d’activite’ collective des termites
des savanes de Basse Cote d’Ivoire. Insectes Soc 16:39–54
Bousquet P et al (2006) Contribution of anthropogenic and natural
sources to atmospheric methane variability. Nature 443:439–443
Brummer C, Papen H, Wassmann R, Bruggemann N (2009) Fluxes of
CH4 and CO2 from soil and termite mounds in south Sudanian
savanna of Burkina Faso (West Africa). Glob Biogeochem Cycles
23:GB1001
Bureau of Meteorology (2009) Government of Australia, vol 2008.
www.bom.gov.au
Buxton RD (1981) Changes in the composition and activities of
termite communities in relation to changing rainfall. Oecologia
51:371–378
Dawes-Gromadzki T, Spain A (2003) Seasonal patterns in the activity
and richness of surface-foraging termites (Isoptera) at paper baits
in a tropical Australian savanna. J Trop Ecol 19:449–456
Edney EB (1977) Water balance in land arthropods. Springer, Berlin
Fox ID, Neldner VJ, Wilson GW, Bannink PJ (2001) The vegetation
of the Australian tropical savannas. Environmental Protection
Agency, Queensland Government, Brisbane
Grace J, San Jose J, Meir P, Miranda HS, Montes RA (2006)
Productivity and carbon fluxes of tropical savannas. J Biogeogr
33:387–400
Hendriks DMD, Dolman AJ, van der Molen MK, van Huissteden J
(2008) A compact and stable eddy covariance set-up for methane
measurements using off-axis integrated cavity output spectros-
copy. Atmos Chem Phys 8:431–443
Hill GF (1942) Termites (Isoptera) from the Australian region.
CSIRO, Melbourne
Holt JA (1987) Carbon mineralization in semi-arid northeastern
Australia: the role of termites. J Trop Ecol 3:255–263
Hutley LB, Setterfield SA (2008) Savannas. In: Jørgensen SE (ed)
Encyclopedia of ecology. Elsevier, Amsterdam
Jamali H, Livesley SJ, Dawes TZ, Cook GD, Hutley LB, Arndt SK
(2011) Diurnal and seasonal variations in CH4 flux from termite
mounds in tropical savannas of the Northern Territory, Australia.
Agric For Meteorol (in press)
Khalil MAK, Rasmussen RA, French JRJ, Holt JA (1990) The
influence of termites on atmospheric trace gases—CH4, CO2,
CHCL3, N2O, CO, H2, and light—hydrocarbons. J Geophys Res-
Atmos 95:3619–3634
Lepage M (1982) Foraging of Macrotermes spp. (Isoptera: Macrot-
ermitinae) in the tropics. In: Jaisson P (ed) Social insects.
Universite’ de Paris-Norad, Paris, pp 206–218
Lepage M, Darlington JPEC (2000) Population dynamics of ter-
mites. In: Abe T, Bignell DE, Higashi M (eds) Termites:
evolution, sociality, symbiosis, ecology. Kluwer, Dordrech,
pp 333–361
Lighton JRB (1990) Slow discontinuous ventilation in the namib
dube-sea ant Camponotus-detritus (Hymenoptera, Formicidae).
J Exp Biol 151:71–82
Livesley SJ et al (2011) Seasonal variation and fire effects on CH4,
N2O and CO2 exchange in savanna soils of northern Australia.
Agric For Meteorol (in press)
Matsuura K, Kobayashi N, Yashiro T (2007) Seasonal patterns of egg
production in field colonies of the termite Reticulitermessperatus (Isoptera: Rhinotermitidae). Popul Ecol 49:179–183
Noirot C (1969) Formation of castes in the higher termites. In:
Krishna K, Weesner FM (eds) Biology of termites, vol 1.
Academic, New York, pp 311–350
Nutting WL (1969) Flight and colony foundation. In: Krishna K,
Weesner FM (eds) Biology of termites, vol 1. Academic, New
York, pp 233–282
Ohiago CE (1979a) Nest and soil populations of Trinervitermes spp.
with particular reference to T. geminatus (Wasmann), (Isoptera)
in South Guinea Savanna near Mokwa, Nigeria. Oecologia
40:167–178
Ohiago CE (1979b) A quantitative study of seasonal foraging by the
grass harvesting termite, Trinervitermes geminatus (Wasmann),
(Isoptera, Nasutitermitinae) in Southern Guinea Savanna, Mo-
kwa, Nigeria. Oecologia 40:179–188
Sanderson MG (1996) Biomass of termites and their emissions of
methane and carbon dioxide: a global database. Glob Biogeo-
chem Cycles 10:543–557
Shelton TG, Appel AG (2000) Cyclic carbon dioxide release in the
dampwood termite, Zootermopsis nevadensis (Hagen). Comp
Biochem Physiol A 126:539–545
Sugimoto A, Inoue T, Kirtibutr N, Abe T (1998) Methane oxidation
by termite mounds estimated by the carbon isotopic composition
of methane. Glob Biogeochem Cycles 12:595–605
von Fischer JC, Butters G, Duchateau PC, Thelwell RJ, Siller R
(2009) In situ measures of methanotroph activity in upland soils:
Oecologia (2011) 167:525–534 533
123

a reaction-diffusion model and field observation of water stress.
J Geophys Res-Biogeosci 114:G01015
Watson JAL, Abbey HM (1993) Atlas of Australian termites. CSIRO,
Australia
Wood TG, Sands WA (1978) The role of termites in ecosystems. In:
Brian MV (ed) Production ecology of ants and termites.
Cambridge University Press, Cambridge, pp 245–292
Wood TG, Johnson RA, Ohiago CE, Collins NM, Longhurst C (1977)
Ecology and importance of termites in crops and pastures in
Northern Nigeria. Centre for Overseas Pest Research, London,
pp 1973–1977
Zimmerman PR, Greenberg JP (1983) Termites and methane. Nature
302:354–355
534 Oecologia (2011) 167:525–534
123