applications of fourier transform infrared (ftir) imaging
TRANSCRIPT
1179
31Applications of Fourier Transform Infrared (FTIR) ImagingAl de Leon, Brylee Tiu, Joey Mangadlao, Katrina Pangilinan, Pengfei Cao, andRigoberto Advincula
31.1Introduction
Fourier transform infrared (FTIR) spectroscopy is a common method used toascertain the molecular identity and composition of a sample. The technique relieson the absorption in the 2–15 μm−1 regions of the electromagnetic spectrumresulting to excitation of vibrational, rotational, and bending modes of constituentchemical moieties. The general selection rule for IR spectroscopy is the change indipole moment during vibration. Although FTIR by itself offers a number of utilitiesin chemical characterization, coupling it with a microscope allows the elucidationof a chemical structure in a specific spatial region. This technique is called FTIRmicrospectroscopy or simply FTIR microscopy. In principle, the combination of spatialspecificity and information on chemical makeup allows the construction of an FTIRmap or FTIR image (a chemical map) providing information on the distribution ofchemical species, morphological assemblies, diffusion profiles, and concentrationgradients.
It is important to delineate the difference between FTIR mapping and FTIRimaging. FTIR mapping, also called point mapping, is a point-by-point measurementacross the sample to obtain spatially resolved information [1]. In detail, an IRspectrum is collected at a particular point, and then the sample is moved tocollect the spectrum of another location. The process is repeated within the area ofinterest. The spectra are then correlated by a computer to a specific and reproduciblyobtainable sample position [2]. While a very good signal-to-noise ratio for very smallsingle-point sample areas can be obtained, the method suffers from a number oflimitations: firstly, low-spatial resolution at sample areas is restricted to squares>15 × 15 μm2 [1, 2]. Secondly, diffraction effects and stray light compromiseaccuracy of the data.
Finally, as the technique is essentially a sequential mapping process, carryingout the analysis takes a long time and requiring very precise X–Y positioning andimage reconstruction. In effect, studying dynamic processes with FTIR mappingis extremely challenging.
Handbook of Spectroscopy, Second Edition. Edited by Gunter Gauglitz and David S. Moore.© 2014 Wiley-VCH Verlag GmbH & Co. KGaA. Published 2014 by Wiley-VCH Verlag GmbH & Co. KGaA.
1180 31 Applications of Fourier Transform Infrared (FTIR) Imaging
FTIR imaging, on the other hand, was primarily developed to overcome thelimitations of FTIR mapping. The use of focal plane array (FPA) detectors in FTIRimaging affords simultaneous collection of spectra at a single experiment thus, a‘‘chemical snapshot’’ is obtained [1]. FPA detectors consist of a large number ofsmall detectors laid out in a grid pattern. The spectrum, simultaneously acquiredby each detector, is represented as a single pixel in the resulting FTIR image. As agiven field of view is imaged in a single collection, the sample does not need to bemoved and the use of aperture is not required to limit the sample area, and hence,the occurrence of stray light, which compromise spatial distribution, is eliminated[3]. In addition, in FTIR imaging, the collection time is decreased by a factor of n2,where n is the number of spatial resolution elements in one direction of a squaresample area imaged [3]. Koenig et al. [3] illustrated that a 500 × 500 μm sample areawill take 10 h if it were analyzed by FTIR mapping, while it will only take less thana minute for FTIR imaging with the same image quality and spectral resolution.In addition, the use of mosaicking or assembly of several FTIR images enablessampling over a wider area. Thus, spatially and temporally resolved chemicalinformation can be obtained. In combination with chemometrics or time-resolvedstudies, it makes a very powerful analytical technique.
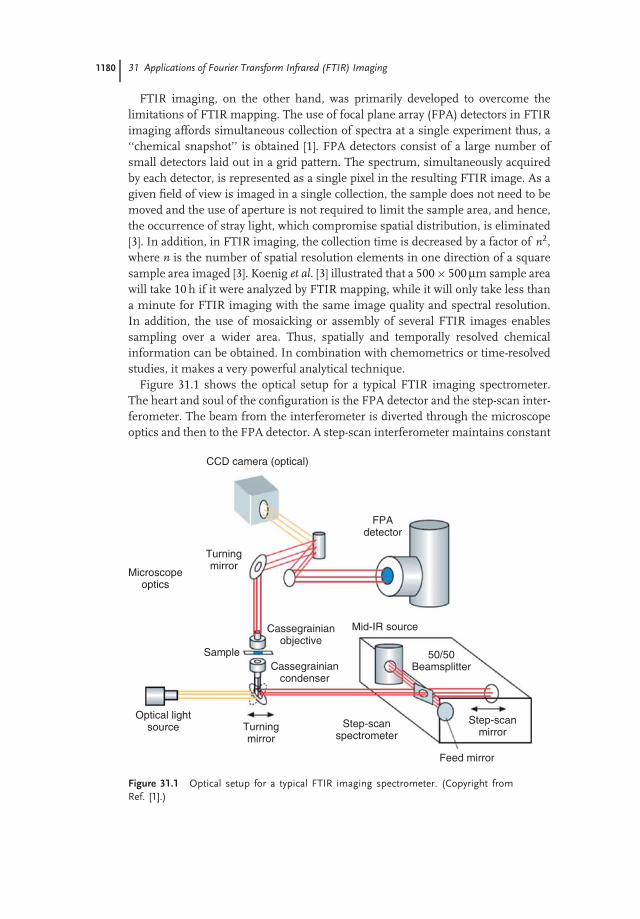
Figure 31.1 shows the optical setup for a typical FTIR imaging spectrometer.The heart and soul of the configuration is the FPA detector and the step-scan inter-ferometer. The beam from the interferometer is diverted through the microscopeoptics and then to the FPA detector. A step-scan interferometer maintains constant
Optical light source Turning
mirror
Feed mirror
Step-scan spectrometer
Step-scan mirror
Mid-IR source
Sample
Microscope optics
Turning mirror
FPA detector
CCD camera (optical)
Cassegrainian condenser
Cassegrainian objective
50/50 Beamsplitter
Figure 31.1 Optical setup for a typical FTIR imaging spectrometer. (Copyright fromRef. [1].)
31.2 FTIR Imaging Applied to Polymeric Systems 1181
optical retardation for an arbitrarily large time while the FPA coadds collectedframes at each optical retardation point in order to improve signal-to-noise ratio. ACassegraninan condenser and objective are also added to focus the radiation to theplane of the sample [1, 3]. This configuration allows for the imaging of a wide fieldof view in a single collection.
The speed of image acquisition and improved signal-to-noise ratio in FTIRimaging offer the advantage of real-time monitoring of dynamic phenomena andchemical processes in both biological and nonbiological systems. For example,FTIR imaging is essential in studying both static and dynamic phenomena inpolymeric systems. It has been used to investigate single and mixed solventdiffusions in polymer films, polymer blends, polymer–liquid crystal systems, andcomposites [4–6]. The characterization of structure and morphology, as well asthe determination of homogeneity in polymer systems, can also be analyzed bythe technique [7, 8]. While much potential has to be exploited in the area ofmaterial, FTIR imaging has been widely used in biological arena where it hasbecome useful in the characterization of biological samples, diagnosis, reactiondynamics of pharmaceuticals, and drug delivery [9, 10]. With FTIR imaging,chemical processes can be investigated, and specific molecules inside the cell canbe mapped out in real time, because staining and labeling are not required forvisualization. More recently, FTIR imaging has also been found useful in forensicscience, microfluidics, and biofuels [11–13].
31.2FTIR Imaging Applied to Polymeric Systems
The chemical nature of single polymer particles and polymer films has beeneffectively studied using FTIR imaging. While not exhaustive, the applicationsof the technique of various polymer materials will be described in the followingsections.
31.2.1Polymer Ultrathin Film Characterization
Our group has used FTIR imaging to confirm the successful polymerization ofblock copolymers from polyelectrolyte atom transfer radical polymerization (ATRP)macroinitiators. The macroinitiators were assembled via layer-by-layer (LbL) de-position onto an aminopropyltrimethoxysilane (APS)-functionalized silicon wafer[14]. Successful polymerization of poly(styrene-b-2,2,2-trifluoroethyl methacrylate)(p(St-b-TFEMA) was confirmed by comparing the chemical maps before and afterpolymerization of trifluoromethyl methacrylate (TFEMA) from the polystyrene (pSt)brush, which was polymerized via surface-initiated ATRP. Specifically, FTIR imag-ing for pSt homopolymer shows no absorbance at 1730 cm−1, which correspondsto carbonyl region. After the polymerization of TFEMA, the carbonyl peak becomesapparent on some regions. The chemical heterogeneity is brought about by the fact
1182 31 Applications of Fourier Transform Infrared (FTIR) Imaging
that each layer in the LbL film acted as an initiating site. This resulted in varyingheights of grafted pSt brush and unequal grafting of the pTFEMA block brushes.
We also utilized FTIR imaging to verify the successful grafting and the spatialdistribution of binary mixed brush. Mixed brushes of poly(N-isopropylacrylamide)(pNIPAM) and pST were grown from LbL assembly of polyelectrolyte ATRPmacroinitiators and 4-4′-azobis(4-cyanovaleric acid) free radical polymerizationinitiator [7]. IR images focused at 1650 cm−1 (–C=O), 2900 cm−1 (–CH), and3300 cm−1 –NH) of (pNIPAM) and pNIPAM-pSt mixed brush were compared.The significant decrease in the maximum absorbance in the three regions forthe pNIPAM-pST mixed brush relative to that for pNIPAM homopolymer brushconfirms the successful grafting of both pSt and pNIPAM. In addition, by lookingat the functional distribution, it was concluded that the surface was saturatedwith pNIPAM. This was also confirmed by ellipsometry studies, which revealedthat the brush thickness of pNIPAM and pSt is 159 and 2 nm, respectively,for 20 layers of macroinitiators. This result was expected because with morelayers of macroinitiators deposited on the surface, the initiator density increasesaccordingly, and thicker pNIPAM brush is polymerized. Thick pNIPAM brushlimits the availability of the underlying free radical initiator for polymerization ofstyrene. In addition, the statistical distribution of the pNIPAM-pSt mixed brushesmeant that the surface functionalities were randomly configured on the surface.
In another study performed by our group, we used FTIR imaging to estimate thedegree of coverage of pNIPAM brush on ATRP-initiator-modified LbL assembly ofchitosan and alginate [8]. Image focused at 1650 cm−1 (amide I carbonyl backbonestretch) shows that majority of the area is covered by pNIPAM. Comparison withthe image focused at 1600 cm−1 (carboxylated region), led the author to concludethat about 85% surface was covered by pNIPAM and that its growth was favoredon the amine regions derived from chitosan.
31.2.2Polymer Nanostructures and Surface Patterning
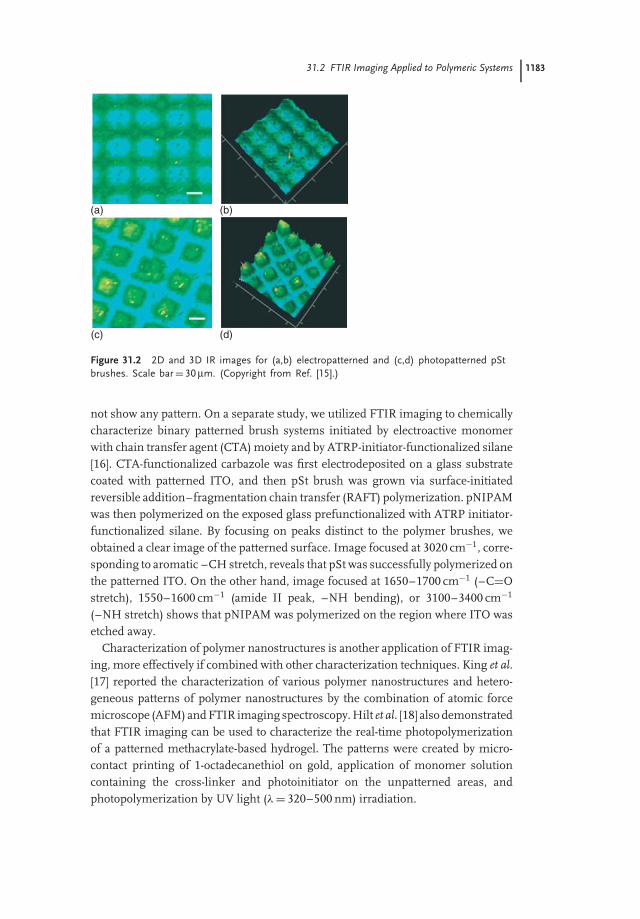
Chemical composition of the patterned surface can also be mapped using FTIRimaging as exemplified by our group [15]. We presented a simple yet versatileroute for patterning polymer brushes. This was made possible by using a moleculebearing an electroactive (carbazole) group and a photoactive (benzophenone) group.Two patterning routes available are (i) electrodeposition on patterned indium tinoxide (ITO) surface and then photografting of the spin-coated polystyrene (PS) film(Figure 31.2a,b) and (ii) electrodeposition on ITO and patterned photografting ofspin-coated film using a photomask (Figure 31.2c,d).
FTIR imaging was conducted to gain information about the chemical com-position of the patterns produced. All images are focused at 3034 cm−1, whichcorresponds to aromatic –CH stretch of polystyrene. Green areas represent highconcentration of pSt, while the blue areas represent either the glass substrate or theelectrodeposited benzophenone. These patterns were only visible at this wave num-ber, that is, images focused at different wave numbers (e.g., 1680–1800 cm−1) do
31.2 FTIR Imaging Applied to Polymeric Systems 1183
(a) (b)
(c) (d)
Figure 31.2 2D and 3D IR images for (a,b) electropatterned and (c,d) photopatterned pStbrushes. Scale bar = 30 μm. (Copyright from Ref. [15].)
not show any pattern. On a separate study, we utilized FTIR imaging to chemicallycharacterize binary patterned brush systems initiated by electroactive monomerwith chain transfer agent (CTA) moiety and by ATRP-initiator-functionalized silane[16]. CTA-functionalized carbazole was first electrodeposited on a glass substratecoated with patterned ITO, and then pSt brush was grown via surface-initiatedreversible addition–fragmentation chain transfer (RAFT) polymerization. pNIPAMwas then polymerized on the exposed glass prefunctionalized with ATRP initiator-functionalized silane. By focusing on peaks distinct to the polymer brushes, weobtained a clear image of the patterned surface. Image focused at 3020 cm−1, corre-sponding to aromatic –CH stretch, reveals that pSt was successfully polymerized onthe patterned ITO. On the other hand, image focused at 1650–1700 cm−1 (–C=Ostretch), 1550–1600 cm−1 (amide II peak, –NH bending), or 3100–3400 cm−1
(–NH stretch) shows that pNIPAM was polymerized on the region where ITO wasetched away.
Characterization of polymer nanostructures is another application of FTIR imag-ing, more effectively if combined with other characterization techniques. King et al.[17] reported the characterization of various polymer nanostructures and hetero-geneous patterns of polymer nanostructures by the combination of atomic forcemicroscope (AFM) and FTIR imaging spectroscopy. Hilt et al. [18] also demonstratedthat FTIR imaging can be used to characterize the real-time photopolymerizationof a patterned methacrylate-based hydrogel. The patterns were created by micro-contact printing of 1-octadecanethiol on gold, application of monomer solutioncontaining the cross-linker and photoinitiator on the unpatterned areas, andphotopolymerization by UV light (λ = 320–500 nm) irradiation.
1184 31 Applications of Fourier Transform Infrared (FTIR) Imaging
31.2.3Diffusion and Dissolution of Polymer Films
Koenig et al. [4] are among the first to employ FTIR imaging to study the physicalprocesses in polymeric systems, such as diffusion and dissolution processes.Their main objective is to spatially resolve the chemical functionalities to monitorthe diffusion process involved in polymer–dispersed liquid crystal system. Theymonitored the diffusion of a low-molecular-weight liquid crystal into a solid polymerfilm in real time [19], and mapped the multiphase domains. They also studied thediffusion process for both cured and uncured blends of polybutadiene and diallylphthalate by monitoring the domain compositions, sizes, shapes, and interfaces. Inanother study, they used FTIR imaging to characterize and calculate the dissolutionrate of poly(α-methylstyrene) and poly(styrene-b-methyl methacrylate) as a functionof solvent and temperature [20, 21].
31.2.4Phase Separation
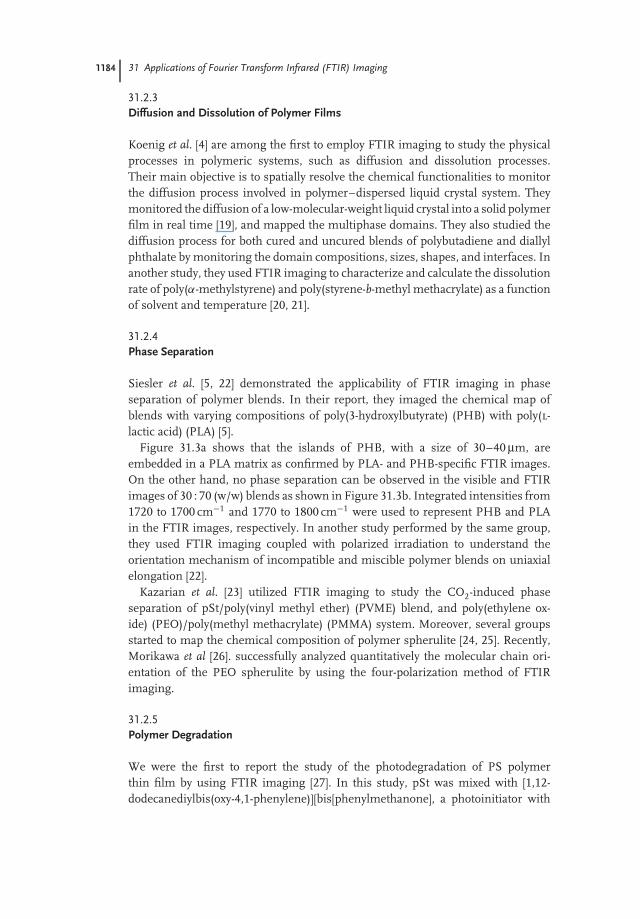
Siesler et al. [5, 22] demonstrated the applicability of FTIR imaging in phaseseparation of polymer blends. In their report, they imaged the chemical map ofblends with varying compositions of poly(3-hydroxylbutyrate) (PHB) with poly(l-lactic acid) (PLA) [5].
Figure 31.3a shows that the islands of PHB, with a size of 30–40 μm, areembedded in a PLA matrix as confirmed by PLA- and PHB-specific FTIR images.On the other hand, no phase separation can be observed in the visible and FTIRimages of 30 : 70 (w/w) blends as shown in Figure 31.3b. Integrated intensities from1720 to 1700 cm−1 and 1770 to 1800 cm−1 were used to represent PHB and PLAin the FTIR images, respectively. In another study performed by the same group,they used FTIR imaging coupled with polarized irradiation to understand theorientation mechanism of incompatible and miscible polymer blends on uniaxialelongation [22].
Kazarian et al. [23] utilized FTIR imaging to study the CO2-induced phaseseparation of pSt/poly(vinyl methyl ether) (PVME) blend, and poly(ethylene ox-ide) (PEO)/poly(methyl methacrylate) (PMMA) system. Moreover, several groupsstarted to map the chemical composition of polymer spherulite [24, 25]. Recently,Morikawa et al [26]. successfully analyzed quantitatively the molecular chain ori-entation of the PEO spherulite by using the four-polarization method of FTIRimaging.
31.2.5Polymer Degradation
We were the first to report the study of the photodegradation of PS polymerthin film by using FTIR imaging [27]. In this study, pSt was mixed with [1,12-dodecanediylbis(oxy-4,1-phenylene)][bis[phenylmethanone], a photoinitiator with
31.3 Biomedical Applications of FTIR Imaging 1185
VIS PLA PHB
VIS PLA PHB
10
10
8
6
4
14
18
18
16
14
12
8
12
16
(a)
(b)
Figure 31.3 Visual image (left), PLA-specific FTIR image (center), and PHB-specific FTIRimage (right) of a PHB/PLA (50 : 50% (w/w)) blend (a) and a PHB/PLA (30 : 70 (w/w))blend (b). (Copyright from Ref. [5].)
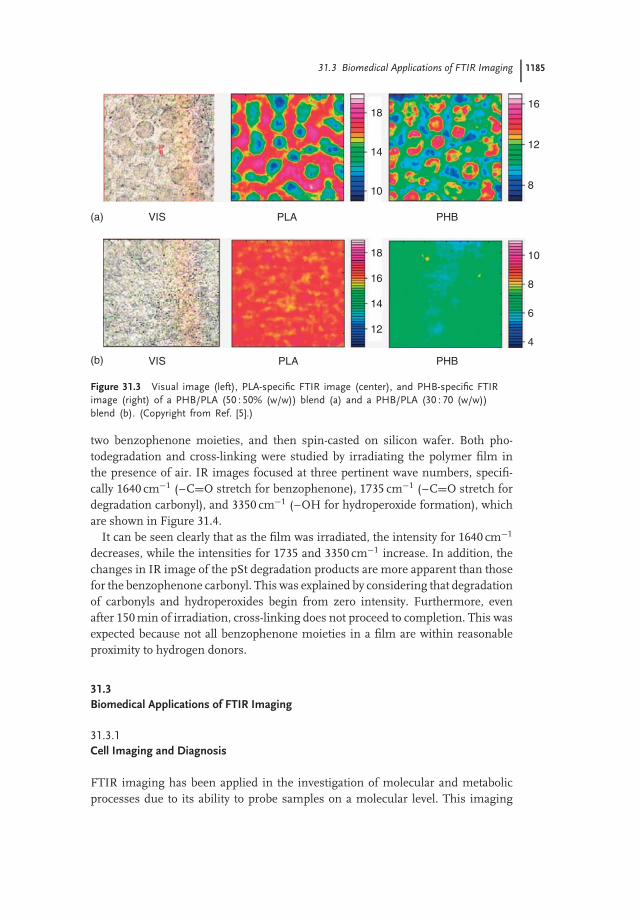
two benzophenone moieties, and then spin-casted on silicon wafer. Both pho-todegradation and cross-linking were studied by irradiating the polymer film inthe presence of air. IR images focused at three pertinent wave numbers, specifi-cally 1640 cm−1 (–C=O stretch for benzophenone), 1735 cm−1 (–C=O stretch fordegradation carbonyl), and 3350 cm−1 (–OH for hydroperoxide formation), whichare shown in Figure 31.4.
It can be seen clearly that as the film was irradiated, the intensity for 1640 cm−1
decreases, while the intensities for 1735 and 3350 cm−1 increase. In addition, thechanges in IR image of the pSt degradation products are more apparent than thosefor the benzophenone carbonyl. This was explained by considering that degradationof carbonyls and hydroperoxides begin from zero intensity. Furthermore, evenafter 150 min of irradiation, cross-linking does not proceed to completion. This wasexpected because not all benzophenone moieties in a film are within reasonableproximity to hydrogen donors.
31.3Biomedical Applications of FTIR Imaging
31.3.1Cell Imaging and Diagnosis
FTIR imaging has been applied in the investigation of molecular and metabolicprocesses due to its ability to probe samples on a molecular level. This imaging
1186 31 Applications of Fourier Transform Infrared (FTIR) Imaging
0.3480 1640 cm−1
0.2273 1735 cm−1
0.4027 3350 cm−1
0.000 0 60 120 150
0.000 0 30 60 120
0.000 0 30 60 120
(a)
(b)
(c)
Figure 31.4 (a–c) 2D FTIR images focused at 1640, 1735, and 3350 cm−1 as a function ofirradiation time in 30 min increment. Area = 176 × 176 μm2. (Copyright from Ref. [27].)
technique offers a rapid, high-resolution, and nondestructive molecular analysisthat requires neither staining nor labeling, an advantage. Subtle changes in thecharacteristic infrared signatures of biomolecules such as proteins, lipids, andnucleic acids have been used to characterize tissue specimens for diagnoses (e.g.,early development of cancer cells) [28–32].
Cancer is probably one of the most important diseases that are needed tobe diagnosed early. Traditionally, cancer is detected after it has already causedsignificant morphological changes in tissues. Breast cancer is the most commoncancer among women, affecting one in eight women in the United States [33].
31.3 Biomedical Applications of FTIR Imaging 1187
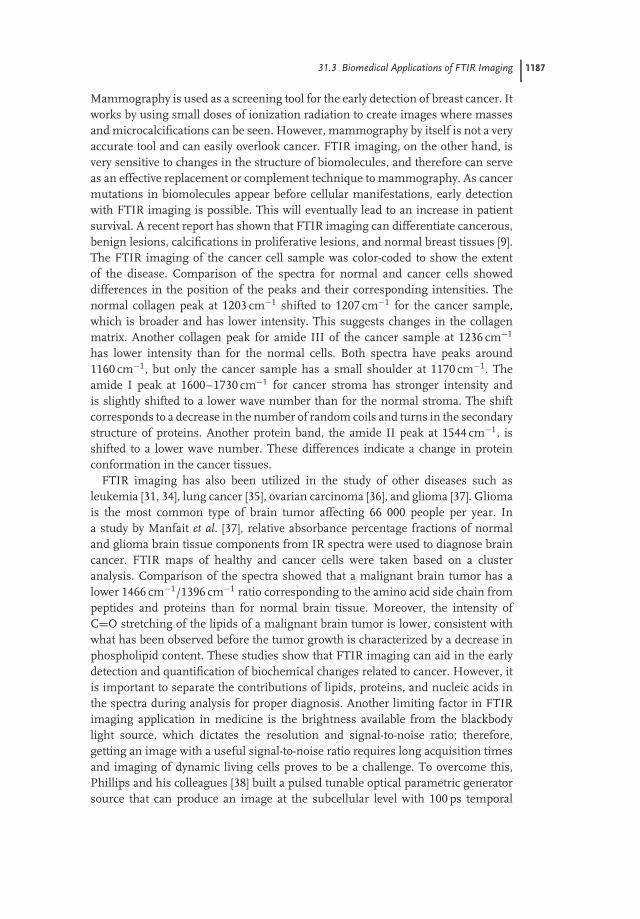
Mammography is used as a screening tool for the early detection of breast cancer. Itworks by using small doses of ionization radiation to create images where massesand microcalcifications can be seen. However, mammography by itself is not a veryaccurate tool and can easily overlook cancer. FTIR imaging, on the other hand, isvery sensitive to changes in the structure of biomolecules, and therefore can serveas an effective replacement or complement technique to mammography. As cancermutations in biomolecules appear before cellular manifestations, early detectionwith FTIR imaging is possible. This will eventually lead to an increase in patientsurvival. A recent report has shown that FTIR imaging can differentiate cancerous,benign lesions, calcifications in proliferative lesions, and normal breast tissues [9].The FTIR imaging of the cancer cell sample was color-coded to show the extentof the disease. Comparison of the spectra for normal and cancer cells showeddifferences in the position of the peaks and their corresponding intensities. Thenormal collagen peak at 1203 cm−1 shifted to 1207 cm−1 for the cancer sample,which is broader and has lower intensity. This suggests changes in the collagenmatrix. Another collagen peak for amide III of the cancer sample at 1236 cm−1
has lower intensity than for the normal cells. Both spectra have peaks around1160 cm−1, but only the cancer sample has a small shoulder at 1170 cm−1. Theamide I peak at 1600–1730 cm−1 for cancer stroma has stronger intensity andis slightly shifted to a lower wave number than for the normal stroma. The shiftcorresponds to a decrease in the number of random coils and turns in the secondarystructure of proteins. Another protein band, the amide II peak at 1544 cm−1, isshifted to a lower wave number. These differences indicate a change in proteinconformation in the cancer tissues.
FTIR imaging has also been utilized in the study of other diseases such asleukemia [31, 34], lung cancer [35], ovarian carcinoma [36], and glioma [37]. Gliomais the most common type of brain tumor affecting 66 000 people per year. Ina study by Manfait et al. [37], relative absorbance percentage fractions of normaland glioma brain tissue components from IR spectra were used to diagnose braincancer. FTIR maps of healthy and cancer cells were taken based on a clusteranalysis. Comparison of the spectra showed that a malignant brain tumor has alower 1466 cm−1/1396 cm−1 ratio corresponding to the amino acid side chain frompeptides and proteins than for normal brain tissue. Moreover, the intensity ofC=O stretching of the lipids of a malignant brain tumor is lower, consistent withwhat has been observed before the tumor growth is characterized by a decrease inphospholipid content. These studies show that FTIR imaging can aid in the earlydetection and quantification of biochemical changes related to cancer. However, itis important to separate the contributions of lipids, proteins, and nucleic acids inthe spectra during analysis for proper diagnosis. Another limiting factor in FTIRimaging application in medicine is the brightness available from the blackbodylight source, which dictates the resolution and signal-to-noise ratio; therefore,getting an image with a useful signal-to-noise ratio requires long acquisition timesand imaging of dynamic living cells proves to be a challenge. To overcome this,Phillips and his colleagues [38] built a pulsed tunable optical parametric generatorsource that can produce an image at the subcellular level with 100 ps temporal
1188 31 Applications of Fourier Transform Infrared (FTIR) Imaging
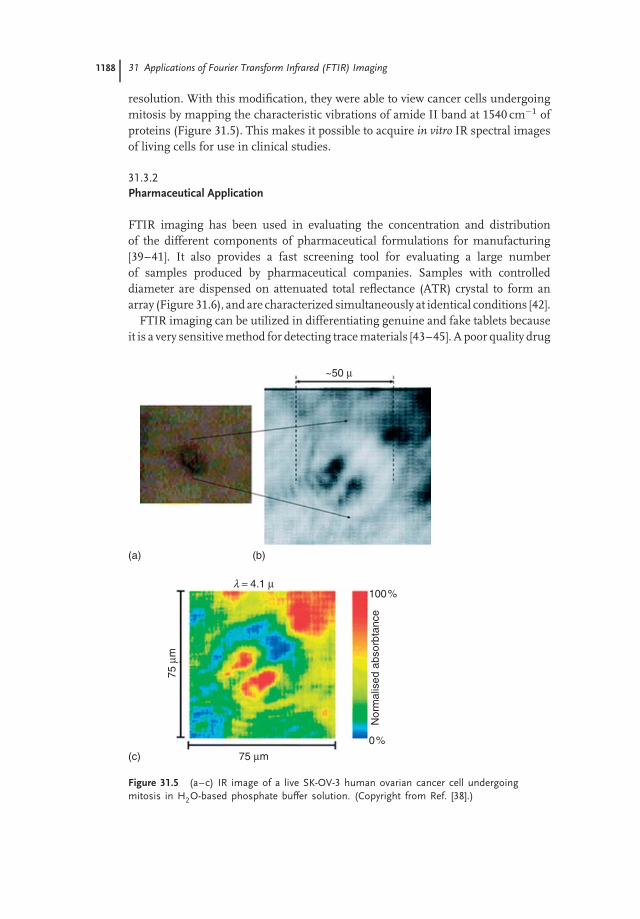
resolution. With this modification, they were able to view cancer cells undergoingmitosis by mapping the characteristic vibrations of amide II band at 1540 cm−1 ofproteins (Figure 31.5). This makes it possible to acquire in vitro IR spectral imagesof living cells for use in clinical studies.
31.3.2Pharmaceutical Application
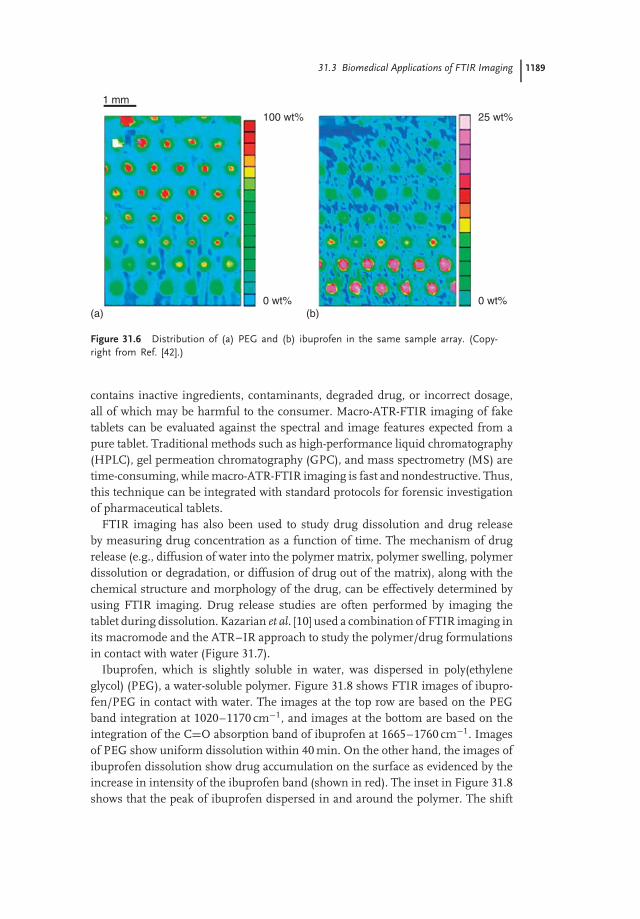
FTIR imaging has been used in evaluating the concentration and distributionof the different components of pharmaceutical formulations for manufacturing[39–41]. It also provides a fast screening tool for evaluating a large numberof samples produced by pharmaceutical companies. Samples with controlleddiameter are dispensed on attenuated total reflectance (ATR) crystal to form anarray (Figure 31.6), and are characterized simultaneously at identical conditions [42].
FTIR imaging can be utilized in differentiating genuine and fake tablets becauseit is a very sensitive method for detecting trace materials [43–45]. A poor quality drug
~50 μ
(a)
(c)
(b)
75 μ
m
75 μm
λ = 4.1 μ100%
0%
Nor
mal
ised
abs
orbt
ance
Figure 31.5 (a–c) IR image of a live SK-OV-3 human ovarian cancer cell undergoingmitosis in H2O-based phosphate buffer solution. (Copyright from Ref. [38].)
31.3 Biomedical Applications of FTIR Imaging 1189
1 mm
0 wt%
100 wt%
(a)0 wt%
25 wt%
(b)
Figure 31.6 Distribution of (a) PEG and (b) ibuprofen in the same sample array. (Copy-right from Ref. [42].)
contains inactive ingredients, contaminants, degraded drug, or incorrect dosage,all of which may be harmful to the consumer. Macro-ATR-FTIR imaging of faketablets can be evaluated against the spectral and image features expected from apure tablet. Traditional methods such as high-performance liquid chromatography(HPLC), gel permeation chromatography (GPC), and mass spectrometry (MS) aretime-consuming, while macro-ATR-FTIR imaging is fast and nondestructive. Thus,this technique can be integrated with standard protocols for forensic investigationof pharmaceutical tablets.
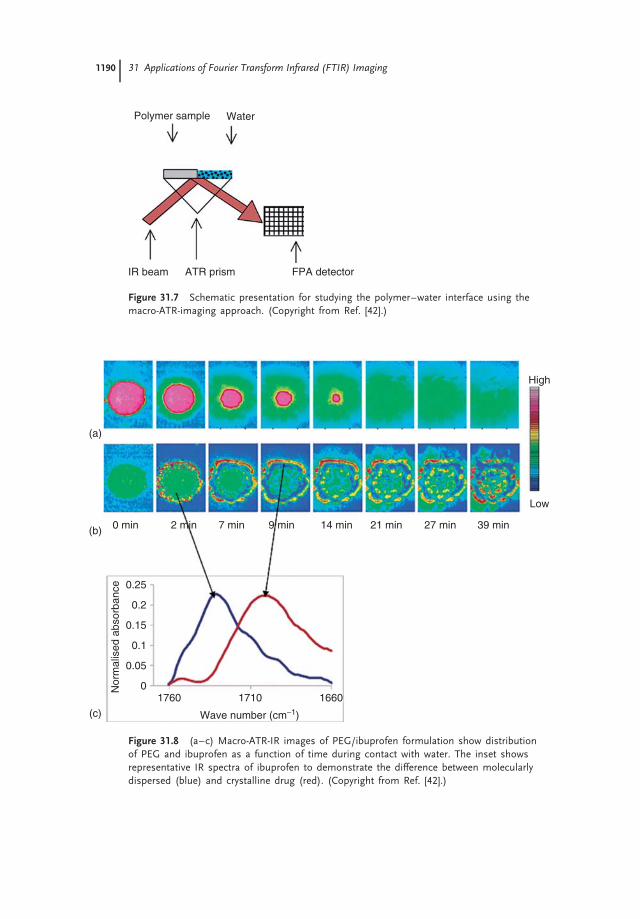
FTIR imaging has also been used to study drug dissolution and drug releaseby measuring drug concentration as a function of time. The mechanism of drugrelease (e.g., diffusion of water into the polymer matrix, polymer swelling, polymerdissolution or degradation, or diffusion of drug out of the matrix), along with thechemical structure and morphology of the drug, can be effectively determined byusing FTIR imaging. Drug release studies are often performed by imaging thetablet during dissolution. Kazarian et al. [10] used a combination of FTIR imaging inits macromode and the ATR–IR approach to study the polymer/drug formulationsin contact with water (Figure 31.7).
Ibuprofen, which is slightly soluble in water, was dispersed in poly(ethyleneglycol) (PEG), a water-soluble polymer. Figure 31.8 shows FTIR images of ibupro-fen/PEG in contact with water. The images at the top row are based on the PEGband integration at 1020–1170 cm−1, and images at the bottom are based on theintegration of the C=O absorption band of ibuprofen at 1665–1760 cm−1. Imagesof PEG show uniform dissolution within 40 min. On the other hand, the images ofibuprofen dissolution show drug accumulation on the surface as evidenced by theincrease in intensity of the ibuprofen band (shown in red). The inset in Figure 31.8shows that the peak of ibuprofen dispersed in and around the polymer. The shift
1190 31 Applications of Fourier Transform Infrared (FTIR) Imaging
Polymer sample Water
IR beam ATR prism FPA detector
Figure 31.7 Schematic presentation for studying the polymer–water interface using themacro-ATR-imaging approach. (Copyright from Ref. [42].)
0 min 2 min 7 min 9 min 14 min 21 min 27 min 39 min
High
Low
0
0.05
0.1
0.15
0.2
0.25
Nor
mal
ised
abs
orba
nce
1760 1710 1660
Wave number (cm−1)
(a)
(b)
(c)
Figure 31.8 (a–c) Macro-ATR-IR images of PEG/ibuprofen formulation show distributionof PEG and ibuprofen as a function of time during contact with water. The inset showsrepresentative IR spectra of ibuprofen to demonstrate the difference between molecularlydispersed (blue) and crystalline drug (red). (Copyright from Ref. [42].)
31.4 Other Applications of FTIR Imaging 1191
(blue to red) can be interpreted as crystallization of the drug as it is released inwater. When the polymer matrix is dissolved, the initial layer becomes saturatedwith water-insoluble drug, which leads to its precipitation. In addition, the polymerchains at the interface decreased the rate of dissolution of the drug. As ibuprofenhas a carboxylic group, the addition of pH modifiers can affect the dissolution andthe rate of release of the drug [46]. The same group studied the drug release ofother compounds such as niferidipine [47] and buflomedyl pyridoxal phosphate[48]. Koenig et al. [49] investigated the release of testosterone in PEO. From theIR image, the drug release mechanism was identified. It was determined that thehomogeneity of the polymer/drug matrix, the drug particle size, the drug concen-tration, and the molecular weight, morphology, and dissolution of the polymerdictates the rate and uniformity of drug release. The information provided bydissolution studies are the basis for the design and optimization of the formulationfor controlled drug delivery.
31.4Other Applications of FTIR Imaging
31.4.1Forensic Science
Owing to label-free and noninvasive sample collection and increased chemical in-formation, spectroscopic methods have gained attention in the forensic communityfor fingermark and trace investigations [11, 46]. As compared to other spectroscopictechniques, the ability of FTIR imaging to analyze a wide sampling area and toidentify small amounts of randomly distributed trace materials makes it one of themost promising tools in forensic science. Usually, significant information gainedby detecting small particles of prohibited drugs, gunpowder, explosives, and otherpotential evidences present at localized regions throughout the sample is difficultto record using ‘‘mapping-type’’ spectroscopy methods, but an imaging approachenables fast access to this data in a single measurement [46].
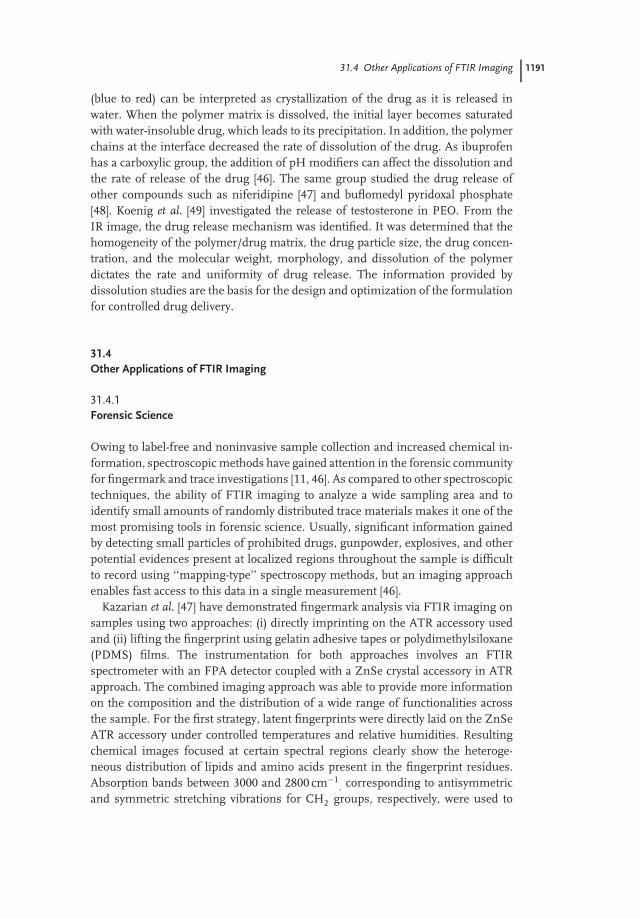
Kazarian et al. [47] have demonstrated fingermark analysis via FTIR imaging onsamples using two approaches: (i) directly imprinting on the ATR accessory usedand (ii) lifting the fingerprint using gelatin adhesive tapes or polydimethylsiloxane(PDMS) films. The instrumentation for both approaches involves an FTIRspectrometer with an FPA detector coupled with a ZnSe crystal accessory in ATRapproach. The combined imaging approach was able to provide more informationon the composition and the distribution of a wide range of functionalities acrossthe sample. For the first strategy, latent fingerprints were directly laid on the ZnSeATR accessory under controlled temperatures and relative humidities. Resultingchemical images focused at certain spectral regions clearly show the heteroge-neous distribution of lipids and amino acids present in the fingerprint residues.Absorption bands between 3000 and 2800 cm−1
, corresponding to antisymmetricand symmetric stretching vibrations for CH2 groups, respectively, were used to
1192 31 Applications of Fourier Transform Infrared (FTIR) Imaging
confirm the presence of several types of lipids. Peaks at 1745 cm−1 and shoulder at1712 cm−1 reveal the presence of triglycerides and/or phospholipids and fatty acids,respectively. Traces of amino acids and protein substances are identified usingthe absorption bands at 1654 cm−1 (–C=O), 1551 cm−1 (–NH in-plane bend),and around 3080–3100 cm−1 (weak –NH stretching vibrations corresponding toamide B).
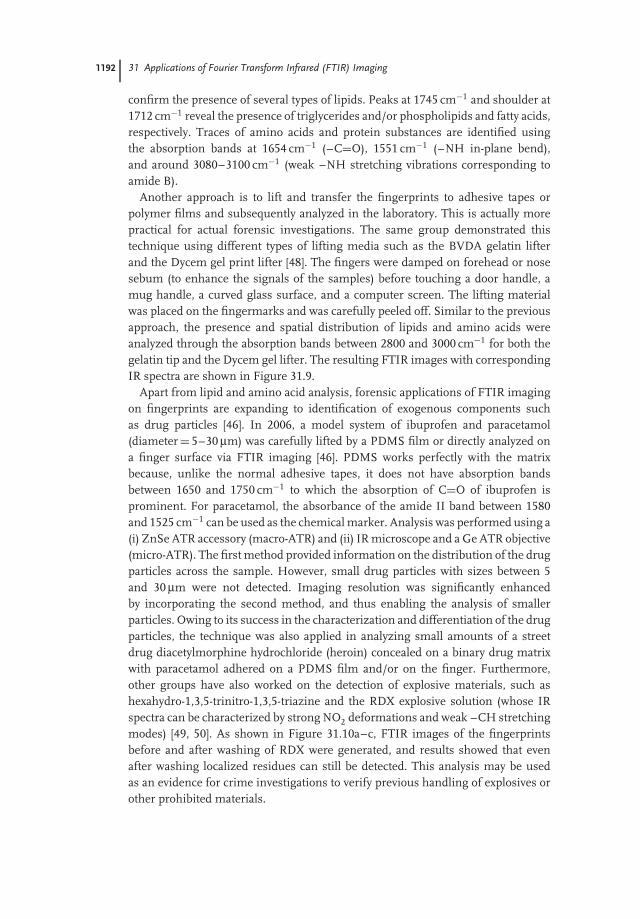
Another approach is to lift and transfer the fingerprints to adhesive tapes orpolymer films and subsequently analyzed in the laboratory. This is actually morepractical for actual forensic investigations. The same group demonstrated thistechnique using different types of lifting media such as the BVDA gelatin lifterand the Dycem gel print lifter [48]. The fingers were damped on forehead or nosesebum (to enhance the signals of the samples) before touching a door handle, amug handle, a curved glass surface, and a computer screen. The lifting materialwas placed on the fingermarks and was carefully peeled off. Similar to the previousapproach, the presence and spatial distribution of lipids and amino acids wereanalyzed through the absorption bands between 2800 and 3000 cm−1 for both thegelatin tip and the Dycem gel lifter. The resulting FTIR images with correspondingIR spectra are shown in Figure 31.9.
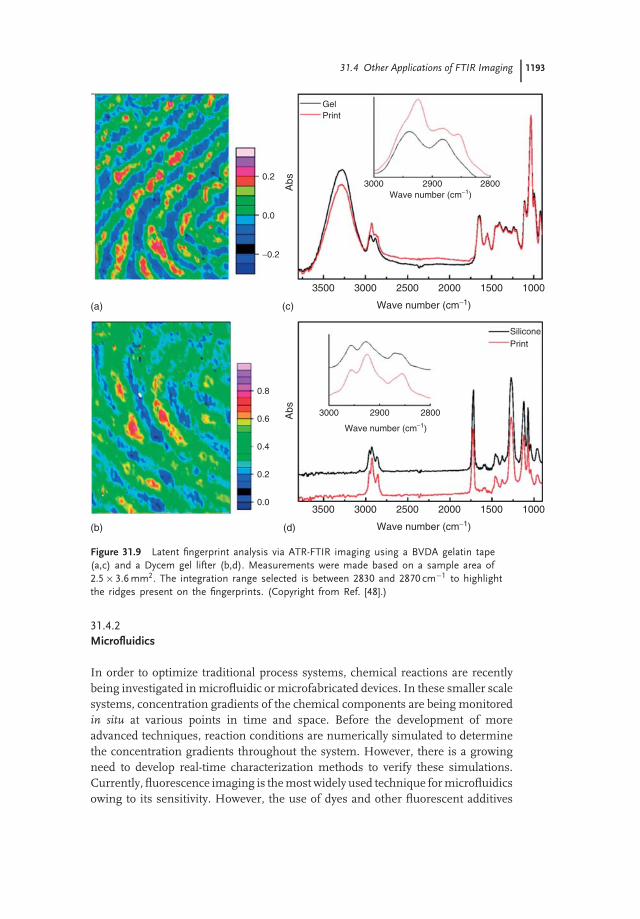
Apart from lipid and amino acid analysis, forensic applications of FTIR imagingon fingerprints are expanding to identification of exogenous components suchas drug particles [46]. In 2006, a model system of ibuprofen and paracetamol(diameter = 5–30 μm) was carefully lifted by a PDMS film or directly analyzed ona finger surface via FTIR imaging [46]. PDMS works perfectly with the matrixbecause, unlike the normal adhesive tapes, it does not have absorption bandsbetween 1650 and 1750 cm−1 to which the absorption of C=O of ibuprofen isprominent. For paracetamol, the absorbance of the amide II band between 1580and 1525 cm−1 can be used as the chemical marker. Analysis was performed using a(i) ZnSe ATR accessory (macro-ATR) and (ii) IR microscope and a Ge ATR objective(micro-ATR). The first method provided information on the distribution of the drugparticles across the sample. However, small drug particles with sizes between 5and 30 μm were not detected. Imaging resolution was significantly enhancedby incorporating the second method, and thus enabling the analysis of smallerparticles. Owing to its success in the characterization and differentiation of the drugparticles, the technique was also applied in analyzing small amounts of a streetdrug diacetylmorphine hydrochloride (heroin) concealed on a binary drug matrixwith paracetamol adhered on a PDMS film and/or on the finger. Furthermore,other groups have also worked on the detection of explosive materials, such ashexahydro-1,3,5-trinitro-1,3,5-triazine and the RDX explosive solution (whose IRspectra can be characterized by strong NO2 deformations and weak –CH stretchingmodes) [49, 50]. As shown in Figure 31.10a–c, FTIR images of the fingerprintsbefore and after washing of RDX were generated, and results showed that evenafter washing localized residues can still be detected. This analysis may be usedas an evidence for crime investigations to verify previous handling of explosives orother prohibited materials.
31.4 Other Applications of FTIR Imaging 1193
0.2
0.8
0.6
0.4
0.2
0.0
0.0
−0.2
3000 2900 2800
3500 3000 2500 2000 1500 1000
Wave number (cm−1)
3500 3000 2500 2000 1500 1000
Wave number (cm−1)
Wave number (cm−1)
3000 2900 2800
Wave number (cm−1)
GelPrint
PrintSilicone
Abs
Abs
(a)
(b)
(c)
(d)
Figure 31.9 Latent fingerprint analysis via ATR-FTIR imaging using a BVDA gelatin tape(a,c) and a Dycem gel lifter (b,d). Measurements were made based on a sample area of2.5 × 3.6 mm2. The integration range selected is between 2830 and 2870 cm−1 to highlightthe ridges present on the fingerprints. (Copyright from Ref. [48].)
31.4.2Microfluidics
In order to optimize traditional process systems, chemical reactions are recentlybeing investigated in microfluidic or microfabricated devices. In these smaller scalesystems, concentration gradients of the chemical components are being monitoredin situ at various points in time and space. Before the development of moreadvanced techniques, reaction conditions are numerically simulated to determinethe concentration gradients throughout the system. However, there is a growingneed to develop real-time characterization methods to verify these simulations.Currently, fluorescence imaging is the most widely used technique for microfluidicsowing to its sensitivity. However, the use of dyes and other fluorescent additives
1194 31 Applications of Fourier Transform Infrared (FTIR) Imaging
(a)
(b)
(c)
RDX : 3072 cm−1
Protein 3240 cm−1
Oils: 2920 cm−1
0.00
1000 1500 2000 2500 3000 3500 4000
0.01
0.02
0.03
0.04
0.05
0.06
Figure 31.10 FTIR imaging for explosivematerial detection. These reconstructed im-ages present distributions of oil secretions,proteins, and the RDX solution present
across the sample. (a) Fingerprint, (b)Zoomed in region, (c) IR spectra differenti-ation. (Copyright from Ref. [50])
may cause disturbance and introduce contaminants to the systems. Furthermore,it does not necessarily give exact compositional and functional group information.As a result of which label-free spectroscopic techniques such as FTIR imaginghave been gaining attention in these studies. Each pixel in an FTIR image containsspatially resolved infrared spectrum of the chemical components of the system;hence, absorption bands of various functional groups can accurately monitor themovement, emergence, or disappearance of any chemical component in a processsystem.
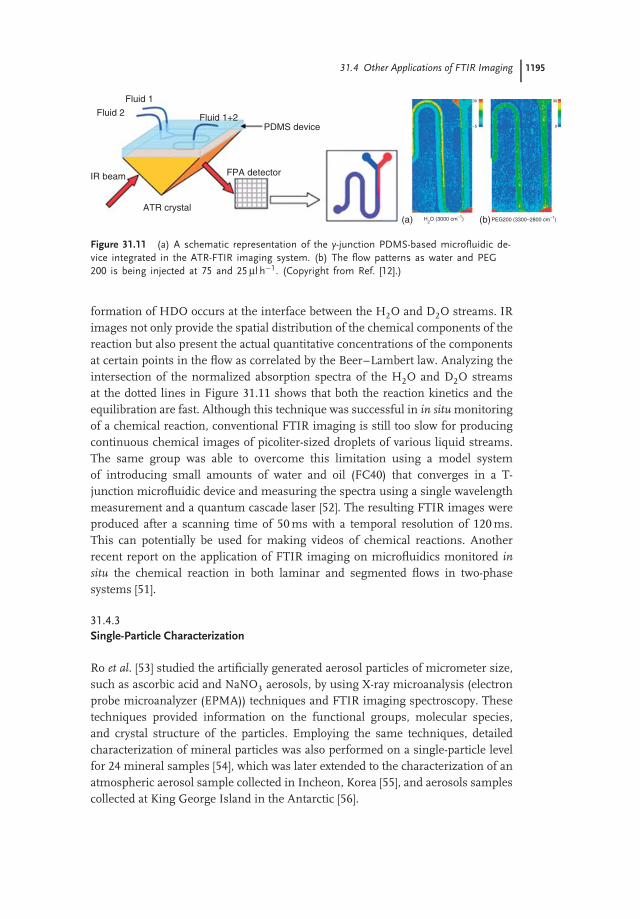
In 2009, the mixing behavior of deionized water and PEG in a y-junction PDMSmicrofluidic device, as depicted in Figure 31.11, was studied by using FTIR imaging[12, 51]. Both liquids were injected at steady state and the system was equilibratedbefore imaging. The IR images focused at 2800–3000 cm−1 and at 3100–3700 cm−1,for the –CH absorption band of PEG and for the –OH absorption band of water,respectively, were captured. In reference to Figure 31.11, the red colors representhigh concentration of the component, while the darker regions correspond to zeroconcentration. On the basis of the images, it can be concluded that PEG occupiesmost areas and water slowly diffuses from the left side.
In the same report, FTIR imaging was also used in in situ monitoring of theH/D isotope exchange between H2O and D2O to produce HDO [12]. As signifiedby the emergence of two additional peaks at around 1451 and 2500 cm−1, the
31.4 Other Applications of FTIR Imaging 1195
Fluid 1
Fluid 2
IR beam
ATR crystal
FPA detector
PDMS deviceFluid 1+2
(a) (b)H2O (3000 cm−1) PEG200 (3300–2800 cm−1)
30
–5
30
0
Figure 31.11 (a) A schematic representation of the y-junction PDMS-based microfluidic de-vice integrated in the ATR-FTIR imaging system. (b) The flow patterns as water and PEG200 is being injected at 75 and 25 μl h−1. (Copyright from Ref. [12].)
formation of HDO occurs at the interface between the H2O and D2O streams. IRimages not only provide the spatial distribution of the chemical components of thereaction but also present the actual quantitative concentrations of the componentsat certain points in the flow as correlated by the Beer–Lambert law. Analyzing theintersection of the normalized absorption spectra of the H2O and D2O streamsat the dotted lines in Figure 31.11 shows that both the reaction kinetics and theequilibration are fast. Although this technique was successful in in situ monitoringof a chemical reaction, conventional FTIR imaging is still too slow for producingcontinuous chemical images of picoliter-sized droplets of various liquid streams.The same group was able to overcome this limitation using a model systemof introducing small amounts of water and oil (FC40) that converges in a T-junction microfluidic device and measuring the spectra using a single wavelengthmeasurement and a quantum cascade laser [52]. The resulting FTIR images wereproduced after a scanning time of 50 ms with a temporal resolution of 120 ms.This can potentially be used for making videos of chemical reactions. Anotherrecent report on the application of FTIR imaging on microfluidics monitored insitu the chemical reaction in both laminar and segmented flows in two-phasesystems [51].
31.4.3Single-Particle Characterization
Ro et al. [53] studied the artificially generated aerosol particles of micrometer size,such as ascorbic acid and NaNO3 aerosols, by using X-ray microanalysis (electronprobe microanalyzer (EPMA)) techniques and FTIR imaging spectroscopy. Thesetechniques provided information on the functional groups, molecular species,and crystal structure of the particles. Employing the same techniques, detailedcharacterization of mineral particles was also performed on a single-particle levelfor 24 mineral samples [54], which was later extended to the characterization of anatmospheric aerosol sample collected in Incheon, Korea [55], and aerosols samplescollected at King George Island in the Antarctic [56].
1196 31 Applications of Fourier Transform Infrared (FTIR) Imaging
Before After
Pixels
LowHigh LowHigh
Pix
els
10 20 30 40 50 60 Pixels10 20 30 40 50 60
100
μm
100
μm
10
V VV
V
V
V
F
F
R
2030
4050
600.
0
0.2
0.4
0.6
0.8
1000
1600
1500
2000
2500
3000
350 0
Pix
els
1020
3040
5060
Wav
e nu
mbe
r (c
m−1
)
Absorbance 0.0
0.2
0.4
0.6
0.8
1000
1600
1500
2000
2500
3000
3500
Wav
e nu
mbe
r (c
m−1
)Absorbance
(a)
(b)
(c)
Figu
re31
.12
Cro
ssse
ctio
nof
popl
arw
ood
befo
rean
daf
ter
pyro
lysi
s.(a
)V
isib
lelig
htim
ages
,(b
)FT
IRim
ages
,an
d(c
)IR
spec
tra
high
light
ing
the
arom
atic
C=C
atth
ere
gion
indi
cate
dby
the
blue
box.
For
the
FTIR
imag
es,
F=
fiber
,R
=ra
yce
lls,
V=
vess
els,
and
*=
empt
ysp
aces
.(C
opyr
ight
from
Ref
.[1
3].)
References 1197
31.4.4Biofuels
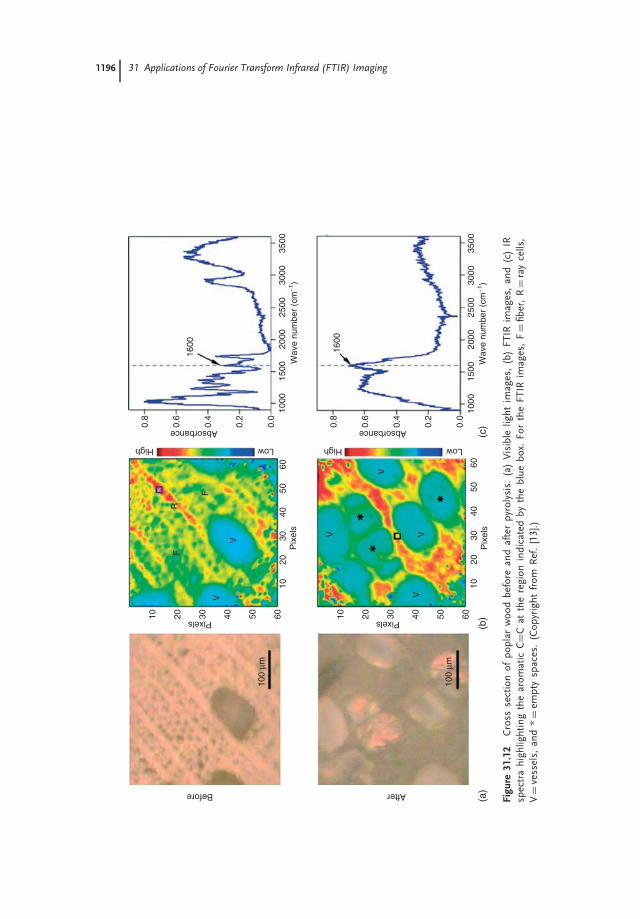
In the search for more cost-efficient and environment-friendly energy sources,thermochemical conversion of organic material or biomass through pyrolysis orgasification is continuously being developed as promising substitutes for crude oil.Pyrolysis, which is generally driven by phenomenological changes in chemical andphysical properties, is the thermochemical decomposition of organic materials inthe absence of oxygen. One of its main uses is to produce a lighter synthetic fuelfrom crops, agricultural residues, or other biological wastes. Recently, Nimlos et al.[13] investigated the changes in the structural and chemical compositions of poplarwood (biomass) after thermal decomposition using FTIR imaging coupled withvarious multivariate techniques. The FTIR images were analyzed at 1600 cm−1
to monitor the presence of C=C functional groups. Before pyrolysis, the C=Cabsorption band represents the distribution of lignin; however, the emergence ofpolyaromatic compounds produced after the pyrolysis causes a broadening of theabsorption band centered at 1600 cm−1 ranging from ∼1550 to 1650 cm−1. Theresulting FTIR images are presented in Figure 31.12, which highlight the increasein empty spaces in the wood and the changes in aromatic C=C absorption band.Apart from lignin, other components of wood such as cellulose and hemicellulosewere also analyzed by adding multivariate techniques.
31.5Conclusion
In summary, FTIR imaging is a very powerful technique for the chemical mappingof surfaces, and for obtaining spatially and temporally resolved chemical infor-mation. It also enables the identification of chemical functionalities distributedfrom a corresponding diffraction-limited optical image, and it distinguishes thepresence of overlapping species within the same location. The technique has foundutility in studying polymer systems, in biomedical applications, forensic science,and biofuels. More powerful applications can be further developed if we harnessthe advantages and sampling methods that cannot be carried out by any othermicrospectroscopic method in a similar resolution or timescale. Furthermore,multivariate methods, chemometrics, and time-resolved spectroscopy enhance itsutility in analytical chemistry.
References
1. Bhargava, R., Wang, S.Q., and Koenig, J.(2001) Anal. Chem., 73, 361A.
2. Bhargava, R., Wall, B., and Koenig, J.(2000) Appl. Spectrosc., 54, 470.
3. Bhargava, R., Wang, S.Q., and Koenig, J.(2003) Adv. Polym. Sci., 163, 137.
4. Challa, S.R., Wang, S.Q., and Koenig, J.(1997) Appl. Spectrosc., 51, 10.
5. Vogel, C., Wessel, E., and Siesler, H.W.(2008) Biomacromolecules, 9, 523.
6. Gupper, A., Chan, K.L.A., and Kazarian,S.G. (2004) Macromolecules, 37, 6498.
1198 31 Applications of Fourier Transform Infrared (FTIR) Imaging
7. Estillore, N. and Advincula, R. (2011)Langmuir, 27, 5997.
8. Fujie, T., Park, J., Murata, A., Estillore,N., Tria, M., Takeoka, S., and Advincula,R. (2009) ACS Appl. Mater. Interfaces, 1,1404.
9. Ooi, G.J., Fox, J., Siu, K., Lewis, R.,Bambery, K.R., McNaughton, D., andWood, B.R. (2008) Med. Phys., 35, 2151.
10. Chan, K.L.A. and Kazarian, S.G. (2003)Macromolecules, 36, 9866.
11. Hazarika, P. and Russell, D.A. (2012)Angew. Chem. Int. Ed., 51, 3524.
12. Chan, K.L.A., Gulati, S., Edel, J.B.,de Mello, A.J., and Kazarian, S.G. (2009)Lab Chip, 9, 2909.
13. Bahng, M.K., Donohoe, B.S., andNimlos, M.R. (2010) Energy Fuels, 25,370.
14. Estillore, N. and Advincula, R. (2011)Macromol. Chem. Phys., 15, 1552.
15. Tria, M., Park, J., and Advincula, R.(2011) Chem. Commun., 47, 2393.
16. Tria, M. and Advincula, R. (2011) Macro-mol. Rapid Commun., 32, 966.
17. Felts, J.R., Kjoller, K., Lo, M., Prater,C.B., and King, W.P. (2012) ACS Nano,6, 8015.
18. Biswal, D. and Hilt, J.Z. (2009) Macro-molecules, 42, 973.
19. Snively, C.M. and Koenig, J.L. (1998)Macromolecules, 31, 3753.
20. Koenig, J. (2002) Adv. Mater., 14, 457.21. Miller-Chou, B.A. and Koenig, J.L.
(2003) Macromolecules, 36, 4851.22. Vogel, C., Wessel, E., and Siesler, H.W.
(2008) Macromolecules, 41, 2975.23. Kazarian, S.G. and Chan, K.L.A. (2004)
Macromolecules, 37, 579.24. Merten, C., Kowalik, T., Aßhoff, S.J.,
and Hartwig, A. (2010) Macromol. Chem.Phys., 211, 1627.
25. Cong, Y., Hong, Z., Qi, Z., Zhou, W.,Li, H., Liu, H., Chen, W., Wang, X., andLi, L. (2010) Macromolecules, 43, 9859.
26. Hikima, Y., Morikawa, J., andHashimoto, T. (2012) Macromolecules,45, 8356.
27. Millan, M., Locklin, J., Fulghum, T.,Baba, A., and Advincula, R. (2005)Polymer, 46, 5556.
28. Ellis, D.I. and Goodacre, R. (2006)Analyst, 131, 875.
29. Vahlsing, T., Damm, U., Kondepati,V.R., Leonhardt, S., Brendel, M.D.,Wood, B.R., and Michael Heise, H.(2010) J. Biophotonics, 3, 567.
30. Kim, D.H., Jarvis, R.M., Xu, Y., Oliver,A.W., Allwood, J.W., Hampson, L.,Hampson, I.N., and Goodacre, R. (2010)Analyst, 135, 1235.
31. Babrah, J., McCarthy, K., Lush, R.J., Rye,A.D., Bessant, C., and Stone, N. (2009)Analyst, 134, 763.
32. Lamberti, A., Sanges, C., and Arcari, P.(2010) Spectroscopy, 24, 535.
33. American Cancer Society (2012)October 31-November 26 2012,http://www.cancer.org (accessed 25 March2013).
34. Babrah, J., McCarthy, K.P., Lush, R.,Rye, A.D., Bessant, C., and Stone, N.(2007) Diagnostic optical spectroscopyin biomedicine IV. Proc. SPIE, 6628,66280R.
35. Krafft, C., Codrich, D., Pelizzo, G., andSergo, V. (2008) Vib. Spectro., 46, 141.
36. Kuimova, M.K., Chan, K.L., andKazarian, S.G. (2009) Appl. Spectrosc.,63, 164.
37. Beljebbar, A., Amharref, N., Leveques,A., Dukic, S., Venteo, L., Schneider, L.,Pluot, M., and Manfait, M. (2008) Anal.Chem., 80, 8406.
38. Amrania, H., McCrow, A.P., Matthews,M.R., Kazarian, S.G., Kuimovac, M.K.,and Phillips, C.C. (2011) Chem. Sci., 2,107.
39. Chan, K.L.A., Hammond, S.V., andKazarian, S.G. (2003) Anal. Chem., 75,2140.
40. Kolomiets, O., Hoffmann, U., Geladi, P.,and Siesler, H.W. (2008) Appl. Spectrosc.,62, 1200.
41. Awotwe-Otoo, D., Zidan, A.S., Rahman,Z., and Habib, M.J. (2012) AAPS Pharm-SciTech, 13, 611.
42. Chan, K.L.A. and Kazarian, S.G. (2005)J. Comb. Chem., 7, 185.
43. Ricci, C., Nyadong, L., Fernandez, F.M.,Newton, P.N., and Kazarian, S.G. (2007)Anal. Bioanal. Chem., 387, 551.
44. Ricci, C., Eliasson, C., Macleod, N.A.,Newton, P.N., Matousek, P., andKazarian, S.G. (2007) Anal. Bioanal.Chem., 389, 1525.

References 1199
45. Lanzarotta, A., Lakes, K., Marcott, C.A.,Witkowski, M.R., and Sommer, A.J.(2011) Anal. Chem., 83, 5972.
46. Ricci, C., Chan, K.L.A., and Kazarian,S.G. (2006) Appl. Spectrosc., 60,1013.
47. Ricci, C., Phiriyavityopas, P., Curum,N., Chan, K.L.A., Jickells, S., andKazarian, S.G. (2007) Appl. Spectrosc., 61,514.
48. Ricci, C., Bleay, S., and Kazarian, S.G.(2007) Anal. Chem., 79, 5771.
49. Chen, T., Schultz, Z.D., and Levin, I.W.(2009) Analyst, 134, 1902.
50. Bhargava, R., Schwartz Perlman, R.,Fernandez, D., Levin, I., and Bartick,E. (2009) Anal. Bioanal. Chem., 394,2069.
51. Chan, K.L.A. and Kazarian, S.G. (2012)Anal. Chem., 84, 4052.
52. Chan, K.L.A., Niu, X., deMello, A.J., andKazarian, S.G. (2011) Anal. Chem., 83,3606.
53. Ryu, J.Y. and Ro, C.U. (2009) Anal.Chem., 81, 6695.
54. Jung, H.J., Malek, M.A., Ryu, J.Y.,Kim, B.W., Song, Y.C., Kim, H.K.,and Ro, C.U. (2010) Anal. Chem., 82,6193.
55. Song, Y.C., Ryu, J.Y., Malek, M.A., Jung,H.J., and Ro, C.U. (2010) Anal. Chem.,82, 7987.
56. Maskey, S., Geng, H., Song, Y.C.,Hwang, H.J., Yoon, Y.J., Ahn, K.H., andRo, C.U. (2011) Environ. Sci. Technol.,45, 6275.