an in-situ fourier transform infrared study of co2 electroreduction
TRANSCRIPT
ELSEVIER Journal of Electroanalytical Chemistry 395 (1995) 195-209
JOURNAL Of
An in-situ Fourier transform infrared study of C O 2 electroreduction catalysed by Ni(0)-4,4'-dimethyl 2,2'-bipyridine
and Ni(0)-1,10-phenanthroline complexes
Paul A. Christensen a,*, Andrew Hamnett a, Simon J. Higgins b, John A. Timney c a Department of Chemistry, Bedson Building, The University, Newcastle upon Tyne, NE1 7RU, UK
b Department of Chemistry, The Donnan Laboratory, University of Liverpool, PO Box 14Z Liverpool L69 3BX. UK c Science Section, Newcastle College, Newcastle upon Tyne, UK
Received 20 January 1995; in revised form 28 April 1995
Abstract
The electrochemical reduction of CO 2 by electrogenerated LNi(0) and (L'-)Ni(0) (L=4,4'-dimethyl-2,2'-bipyridine, 1,10- phenanthroline) complexes has been studied using in-situ Fourier transform IR spectroscopy. Electrogenerated [L2Ni] reacts slowly with CO 2 to produce [Ni(L)(CO)2]; no intermediates could be detected in this reaction. However, the dicarbonyls with both L = Phen and L = 4,4'-dimethyl-2,2'-bipyridine (Me2Bipy) react with trace water to give [Ni2( ~-HXCO)6]-, providing a route that is operative at relatively high potentials. At more negative potentials (below - 1 . 6 V vs. the saturated calomel electrode (SCE)), where a catalytic current due to CO 2 reduction is seen, spectroscopic evidence for the transient formation of [Ni(Me2Bipy " XCO) 2] has been found. It appears that [Ni(Me2Bipy "-)(CO) 2] reacts sufficiently fast that its steady state concentration in the thin layer is very low. In contrast, [Ni(Phen'-)(CO)2] is more stable. For both complexes, electrogenerated CO, which cannot escape from the thin layer, attacks the radical dicarbonyl species to form [Ni(CO)4], which is then ultimately reduced to nickel carbonyl cluster anions. [Ni(Phen)(CO)2] also reacts to produce a metalloformate species, not observed with the Me2Bipy analogue. The OC-Ni-CO angle was calculated for each of the four [Ni(LXCO) 2 ] and [Ni(L"-XCO)2] species and was found to be 104 ° +_ 2 °, in agreement with the expected tetrahedral geometry of a Ni(0) complex.
Keywords: Fourier transform, IR spectroscopy, Electroreduction, Ni complexes, Electrocatalysis
1. Introduct ion
Carbon dioxide is potentially an abundant and cheap carbon source. At present, it has little value as the end- product of fossil fuel combustion and is discharged into the atmosphere, despite the possible environmental conse- quences [1]. Therefore methods for reducing CO 2 cheaply, and thereby increasing its value as either a fine chemicals feedstock or a fuel, are of considerable interest. Moreover, reduction of CO 2 to species with C - H bonds does not require an exceptionally negative thermodynamic potential. In fact, the reduction potential for the reaction
CO 2 + 6e- + 6H + ~ CH3OH + H 2 0 (1)
* Corresponding author.
0022-0728/95/$09.50 © 1995 Elsevier Science S.A. All rights reserved SSDI 0022-0728(95)04133-8
at pH 7 is - 0 . 3 8 V, which is quite close to the value for H 2 evolution at this pH.
To date, attempts to reduce CO 2 electrochemically have required substantial overpotentials owing to the kinetic barrier afforded by the large H O M O - L U M O gap in the molecule. In the absence of any catalyst, the first reduction product, CO 2 -, is highly unstable and the E ° value for the process
C O 2 Jr- e - , , CO~ (2)
is approx. - 2 . 2 V vs. the saturated calomel electrode (SEE) [2].
Therefore electrocatalysis is required to avoid the CO 2 - species if the overpotential for CO 2 reduction is to be lowered. Interest in the use of metal complexes for this purpose is growing and has been the subject of many reviews (for example [2-4]). Two families of complexes
196 P.A. Christensen et al. /Journal of Electroanalytical Chemistry 395 (1995) 195-209
have received most attention so far: macrocyclic N-donor complexes and 2,2'-bipyridine (Bipy) complexes. In the latter, the role of the ligand appears to be to act as an electron reservoir, and the active catalyst is a complex of the reduced ligand (Bipy ' - ) .
The variety of nickel complexes which have been exam- ined as electrocatalysts for CO 2 reduction is noteworthy. The most successful of the macrocyclic N-donor com- plexes to date is probably [Ni(cyclam)] 2+ (cyclam= 1,4,8,11-tetraazacyclotetradecane), which at Hg electrodes and potentials below - 0 . 7 V /SCE catalyses the reduction of CO 2 to CO with more than 99% current efficiency in aqueous solution [5]. In this case adsorption of the active species (Ni(I)) at the electrode surface is necessary for optimum activity [6], and an important role of the macro- cyclic ligand is undoubtedly to stabilize the unusual Ni(I) oxidation state.
Another low oxidation state Ni complex, the cluster [Ni3(/x3-I)(/x3-CNMe)(/x2-dppm)3], has been found to electrocatalyse the reductive disproportionation of CO 2 to CO and CO 2- (in " w e t " solvents HCO 2 is formed) [7]. Further, the related cluster [Ni3(/z3-I)2(/z2-dppm) 3] is a photocatalyst for the reductive disproportionation and is the first example of a catalyst for a photoinduced C-C coupling reaction involving CO z, which takes place with cyclohexene to give cyclohexane-l,2-dicarboxylic acid [8,9].
The complex [Ni(Bipy)3] 2÷ electrocatalyses CO 2 re- duction (to CO and CO32-) in aprotic media [10,11]. In similar electrocatalytic reactions in the presence of alkynes, insertion of CO 2 occurs to give ot,13-unsaturated car- boxylic acids [12], and in the presence of alkyl halides ketones are produced [13]. One question of interest with this system is whether the active catalyst is merely a low-valent nickel complex, or whether further reduction to give a (Bipy "-) complex is necessary.
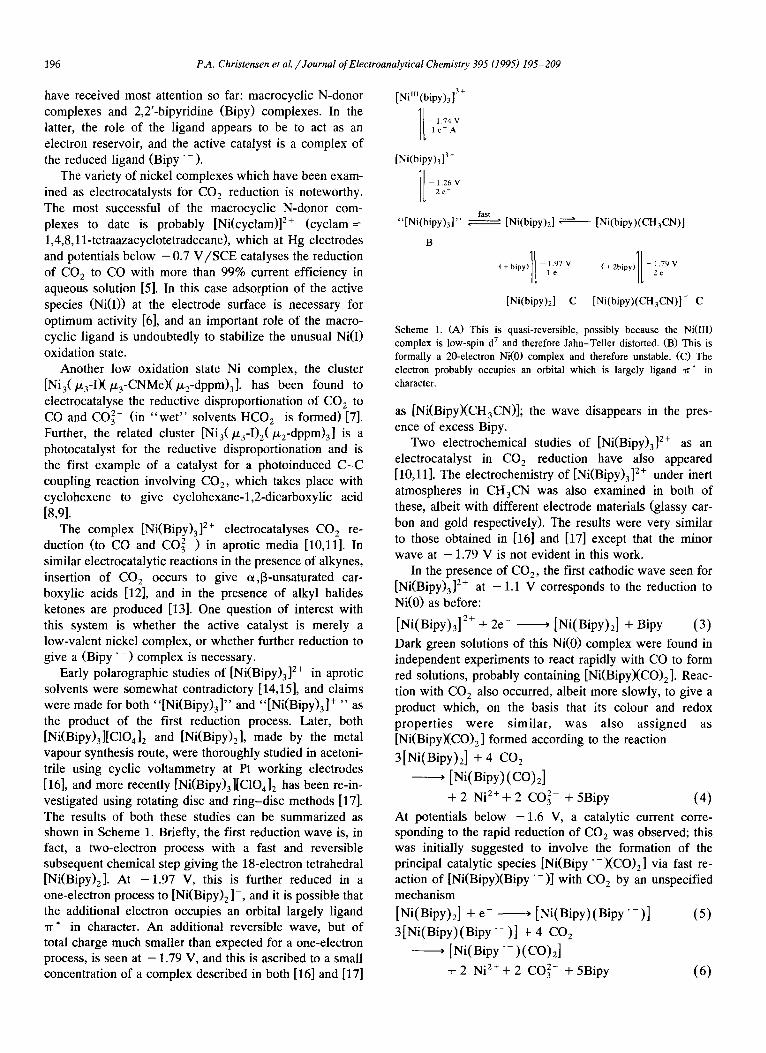
Early polarographic studies of [Ni(Bipy)3] 2÷ in aprotic solvents were somewhat contradictory [14,15], and claims were made for both "[Ni(Bipy)3]" and "[Ni(Bipy)3] ÷ " as the product of the first reduction process. Later, both [Ni(Bipy)3][C104] 2 and [Ni(Bipy)2], made by the metal vapour synthesis route, were thoroughly studied in acetoni- trile using cyclic voltammetry at Pt working electrodes [16], and more recently [Ni(Bipy)3][C104] z has been re-in- vestigated using rotating disc and ring-disc methods [17]. The results of both these studies can be summarized as shown in Scheme 1. Briefly, the first reduction wave is, in fact, a two-electron process with a fast and reversible subsequent chemical step giving the 18-electron tetrahedral [Ni(Bipy)2]. At - 1 . 97 V, this is further reduced in a one-electron process to [Ni(Bipy) 2 ]-, and it is possible that the additional electron occupies an orbital largely ligand "rr * in character. An additional reversible wave, but of total charge much smaller than expected for a one-electron process, is seen at - 1.79 V, and this is ascribed to a small concentration of a complex described in both [16] and [17]
[Nim (bipy)3] 3 +
1[ -l'74Vle A
[Ni(bipy)3] 3÷
][-1.26 v 2e-
fast "[Ni(bipy)3]" , • [Ni(bipy)2]
B
[Ni(bipy)2] C
[Ni(bipy)(CH3CN)]
[Ni(bipy)(CH3CN)] - C
Scheme 1. (A) This is quasi-reversible, possibly because the Ni(lll) complex is low-spin d 7 and therefore Jahn-Teller distorted. (B) This is formally a 20-electron Ni(0) complex and therefore unstable. (C) The electron probably occupies an orbital which is largely ligand ,rr * in character.
as [Ni(Bipy)(CH3CN)]; the wave disappears in the pres- ence of excess Bipy.
Two electrochemical studies of [Ni(Bipy)3] 2÷ as an electrocatalyst in CO 2 reduction have also appeared [10,11]. The electrochemistry of [Ni(Bipy)3] 2+ under inert atmospheres in CH3CN was also examined in both of these, albeit with different electrode materials (glassy car- bon and gold respectively). The results were very similar to those obtained in [16] and [17] except that the minor wave at -1 .79 V is not evident in this work.
In the presence of CO z, the first cathodic wave seen for [Ni(Bipy)3] 2÷ at - 1 . 1 V corresponds to the reduction to Ni(0) as before:
[Ni(Bipy)3] 2+ + 2e- , [Ni(Bipy)2] + Bipy (3)
Dark green solutions of this Ni(0) complex were found in independent experiments to react rapidly with CO to form red solutions, probably containing [Ni(Bipy)(CO) 2 ]. Reac- tion with CO 2 also occurred, albeit more slowly, to give a product which, on the basis that its colour and redox properties were similar, was also assigned as [Ni(Bipy)(CO) 2 ] formed according to the reaction
3[Ni(Bipy)2] + 4 CO 2
, [Ni(Bipy) (CO)2 ]
+ 2 Ni 2÷ + 2 CO32- + 5Bipy (4)
At potentials below - 1 . 6 V, a catalytic current corre- sponding to the rapid reduction of CO 2 was observed; this was initially suggested to involve the formation of the principal catalytic species [Ni(Bipy "-)(CO) 2] via fast re- action of [Ni(Bipy)(Bipy "-)] with CO 2 by an unspecified mechanism
[Ni(Bipy)2 ] + e- , [Ni(Bipy)(Bipy ' - ) ] (5)
3[Ni(Bipy)(Bipy ' - ) ] + 4 CO 2
, [Ni(Bipy "- )(CO)2]
+ 2 Ni 2+ + 2 CO32- + 5Bipy (6)
P.A. Christensen et al. /Journal of Electroanalytical Chemistr)' 3q5 (1995) 195-209 197
or by the reduction of the dicarbonyl at - 1.6 V / S C E [13]
[Ni(Bipy)(CO)2 ] + e - > [ N i ( B i p y ' - ) ( C O ) a ] (7)
[Ni(Bipy "- )(CO)2 ] + CO 2
, [Ni(Bipy)(CO)2] + CO~- (8)
Eq. (8) is clearly incorrect as written, as the redox poten- tial for the CO2/CO 2 couple is known to be less than - 2.0 V/SCE.
The formation of insoluble NiCO 3 via reactions (4) and (6) results in eventual catalyst loss. This can be overcome by carrying out the reaction in a single-compartment cell with a sacrificial Mg anode, thus generating MgCO 3.
To date, the involvement of intermediates in the above electrocatalytic cycle has been inferred from structure-ac- tivity correlations and from electrochemical I -V- t experi- ments. Direct spectroscopic observation of intermediates has not yet been reported. Many of the likely intermediates one might postulate on the basis of known CO 2 coordina- tion chemistry, for example M-(r/~-OCO), M('r /2-OCO), M(01-CO(), should be amenable to the range of in-situ Fourier transform IR (FTIR) techniques developed in re- cent years [18-21)] for monitoring electrochemical reac- tions. In addition, the involvement of M - C O complexes (as intermediates or products) would provide exceptional chromophores. We have employed one such technique, single potential alteration IR spectroscopy (SPAIRS), in a detailed study of the electrochemistry of fac-[Re(Bipy)- (CO)3C1] in acetonitrile, in both the presence and absence of CO 2 [21]. The combination of spectroscopic and elec- trochemical data and calculations employing the energy- factored force constants approach allowed us to eliminate some otherwise plausible mechanisms and to assign the spectra of (long-lived) intermediates. We have studied CO 2 reduction catalysed by both macrocycle complexes (Co(II)-phthalocyanines [22], Ni(II)-tetraazamacrocycle complexes [23]), and by [Ni(Bipy)3] 2+ and related com- plexes, using the SPAIRS technique. We report the results of the [Ni(Bipy)d 2+ study here.
2. Experimental
2.1. Details of FTIR experimental set-up
The F-FIR spectrometers employed were a Digilab FTS- 40 and a Digilab Qualimatic which were controlled by an Oxsys Micros electrochemical interface, which also con- trolled the electrochemistry in the spectroelectrochemical cell, as described in detail elsewhere [24]. The cell was a standard three-electrode thin-layer design and employed a CaF 2 plate window, a platinum loop counter-electrode and an SCE as the reference electrode. The working electrode was either a platinum disc pressed into a " top hat" shape or a glassy carbon disc, both of which exposed approx. 0.4 cm 2 to the electrolyte and the IR beam. The electrode
body was Teflon, and the connection to the rear of the Pt electrode was made via a spring and push-rod arrange- ment. Nitrogen- or CO2-saturated electrolyte was delivered to the cell from an external reservoir via PTFE tubing. The reference electrode was separated from the spectroelectro- chemical cell by a salt bridge filled with 0.2 M tetraethyl ammonium tetrafluoroborate (TEAT) or tetrabutylammo- nium tetrafluoroborate (TBAT) + CH3CN to minimize wa- ter contamination.
The spectra reported in this paper are presented as either D R / R vs. r, or Abs. vs. u, where
D R / R = (S n - Sr)/S r
and
Abs = loge(Sn//Sr)
S~ is the reference spectrum and S, is any spectrum collected at a different potential E~. The spectra shown below were all collected at 8 cm 1 resolution, and con- sisted of 100 co-added and averaged scans (FTS-40 spec- trometer) or 69 co-added and averaged scans (Qualimatic spectrometer). Both data manipulations result in difference spectra, where peaks pointing up, to + D R / R or +Abs, are due to a decrease in absorption at the wavenumber and potential with respect to the spectrum collected at the reference potential, and peaks pointing down, to - D R / R or - A b s , are due to a gain in absorption at that wavenum- bet and potential.
2.2. Materials and chemicals
Ni(C104) 2 • 6H,O (Aldrich), 1,10-phenanthroline (phen) (Aldrich), 4,4'-dimethyl-2,2'-bipyridine (MezBipy) (Al- drich), methanol (Fluka, reagent grade) and triethyl ortho- formate (Aldrich) were used without further purification. TEAT and TBAT (Lancaster) were recrystallized twice from hot ethanol and dried at 60°C in a vacuum prior to use. Acetonitrile (Fluka, HPLC grade) was refluxed over Call 2 (Aldrich) for at least 4 h and then distilled under nitrogen prior to electrochemical experiments. All elec- trolyte solutions were prepared using standard Schlenk procedures and were transferred to the SPAIRS cell under positive nitrogen pressure through PTFE tubing.
2.3. Preparation of complexes
[Ni(Me2Bipy)k~][Cl04] 2 (the same general method was used to prepare the phenanthroline perchlorate salt). To [Ni(H20)6][C104] 2 (2.26 g, 6.19 mmol) in methanol (100 cm 3) was added the ligand (3.00 g, 19.2 mmol) in methanol (100 cm3). The mixture was warmed, and acetonitrile was added until dissolution occurred at reflux. Triethyl ortho- formate (5 cm 3) was added, and the mixture was refluxed for 10 min and then set aside to cool to room temperature. The light pink-brown crystalline product was filtered off and dried in a vacuum: 3.17 g, 73%. Immediately prior to
198 P~A. Christensen et aL /Journal of Electroanalytical Chemistry 395 (1995) 195-209
electrolyte preparations employing this complex, and the other perchlorate salts, small quantities (approx. 0.2 g) were dried in a vacuum at 70°C for 4 h.
[Ni(Me2Bipy)3][ClO4]2.1.5H20. Light fawn crystals; 77%. Found: C, 51.55; H, 4.42; N, 10.03. Calculated for C36H39C12N6NiO9.5: C, 51.64; H, 4.70; N, 10.04.
[Ni(Phen)3][Cl04] 2. Pink crystals; 94%. Found: C, 53.90; H, 2.99; N, 10.50. Calculated for C36H24 -
CI2N6NiO8: C, 54.17; H, 3.03; N, 10.53.
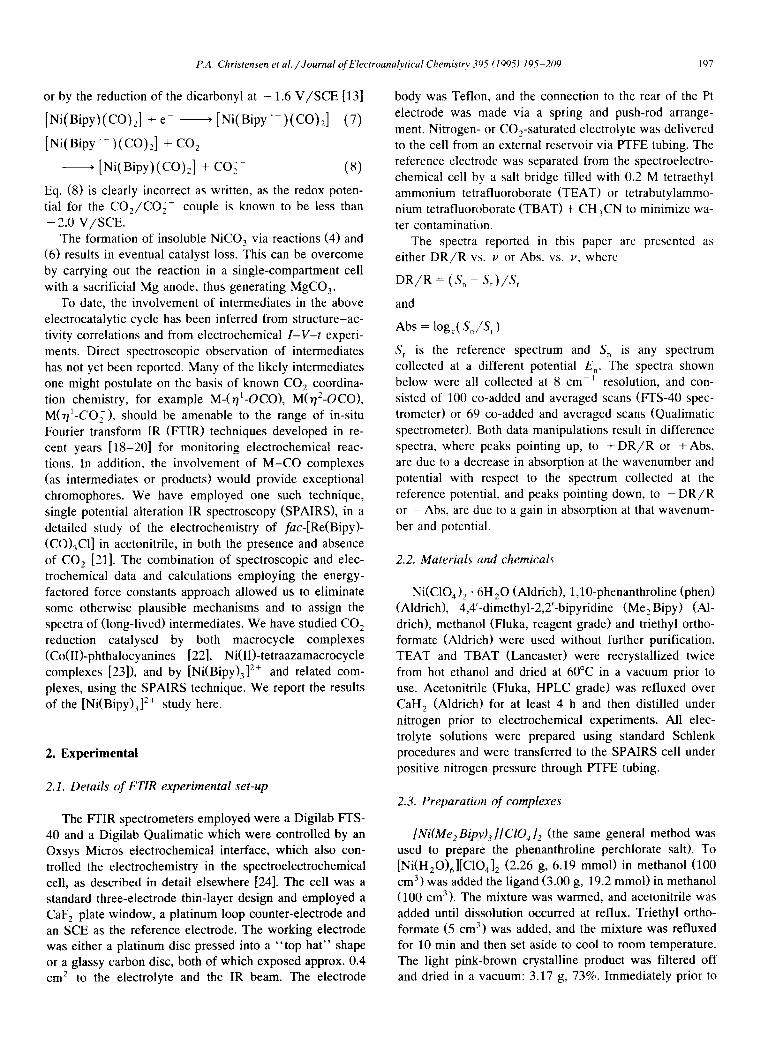
2.4. Preparation of Nafion®-coated edge carbon elec- trodes with entrapped nickel complexes (Fig. 3(d))
The Nation ® was deposited by dropping 5 /~1 of a 2% Nafion® + ethanol solution onto the electrode (0.4 cm 2) and allowing the solvent to evaporate. The coated elec- trode was then immersed in a 1 mM aqueous solution of nickel complex I, I I or I I I for 20-25 min, after which it was rinsed thoroughly with water.
2+ H ~ H / - - N N--~
- - N Ni N - X--- N N__/ H ~ H
!
2+ H ~ H
Ni
N N H ~ H
I | I (nickel cyclam) 2+
I!
2.5. Energy-factored force constants
The carbonyl stretching frequencies of the complexes formed electrochemically were analysed using the Timney approach employing energy-factored force constants. The method is reviewed in detail elsewhere [21]. It is accurate for neutral mononuclear carbonyl complexes (rms error, approx. 5 cm-a) , but rather less so for charged complexes in polar solvents (rms error, 8 cm-1).
spacers, and using the empty cell as reference. The ab- sorbances obtained in this way were then compared with those determined by a straightforward Beer-Lambert cal- culation from the single-beam spectrum of the filled cell. In each case, the two values were within 3% of each other. On this basis the extinction coefficient for the 2625 cm- band was calculated as 1 .01+0.07 M -1 cm - t (95%), which compares very favourably with the literature value, calculated from transmittance measurements [25], of 1.018 M-1 cm-1. Given an extinction coefficient of 1200 M-1 cm -1 for the 2340 cm-1 band of CO e [26] and the extinction coefficient of the 2625 cm-1 acetonitrile band, it was relatively straightforward to calculate the extinction coefficient of the 1642 cm -1 CO 2- band in the following manner. If no electroreduction catalyst for CO e is present, stepping the potential of a platinum electrode to succes- sively more negative potentials results simply in the con- version of CO e to CO3 z- [27], provided that very small amounts of water are present. If the layer of electrolyte trapped between the platinum electrode and the window of the spectroelectrochemical cell is sufficiently thin, then all the CO 2 in the thin layer is converted to CO 2-. This procedure gave an extinction coefficient of approx. 3085 M - ~ c m 1.
3. Results and discussion
3.1. [Ni(Me 2 Bipy)31(C104) 2
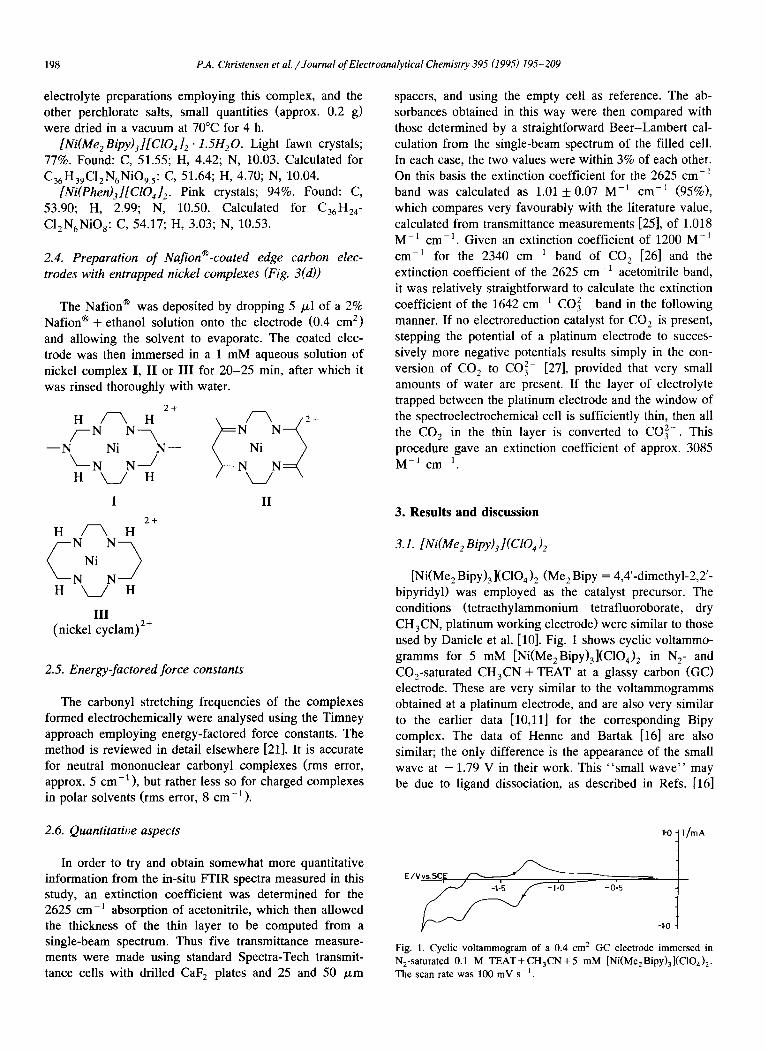
[Ni(Me2 BipY)3 ](CIO4)2 (Me2 Bipy = 4,4'-dimethyl-2,2'- bipyridyl) was employed as the catalyst precursor. The conditions (tetraethylammonium tetrafluoroborate, dry CH3CN , platinum working electrode) were similar to those used by Daniele et al. [10]. Fig. 1 shows cyclic voltammo- gramms for 5 mM [Ni(Me2Bipy)3](C104) 2 in N 2- and CO2-saturated CH3CN + TEAT at a glassy carbon (GC) electrode. These are very similar to the voltammogramms obtained at a platinum electrode, and are also very similar to the earlier data [10,11] for the corresponding Bipy complex. The data of Henne and Bartak [16] are also similar; the only difference is the appearance of the small wave at - 1.79 V in their work. This "small wave" may be due to ligand dissociation, as described in Refs. [16]
2.6. Quantitative aspects
In order to try and obtain somewhat more quantitative information from the in-situ FTIR spectra measured in this study, an extinction coefficient was determined for the 2625 cm-1 absorption of acetonitrile, which then allowed the thickness of the thin layer to be computed from a single-beam spectrum. Thus five transmittance measure- ments were made using standard Spectra-Tech transmit- tance cells with drilled CaF z plates and 25 and 50 /zm
1.o I x/~A
EIVvs, SC F ~
Fig. 1. Cyclic voltammogram of a 0.4 cm 2 GC electrode immersed in N a-saturated 0.1 M TEAT + CH3CN + 5 mM [Ni(Me2 BipY)3 ](CIO 4)2. The scan rate was 100 mV s - l .
P.A. Christensen et al. / Journal of Electroanalyticul Chemist~ 395 (1995) 195-209 190
and [17], and is likely to be very dependent on scan rate and other variables.
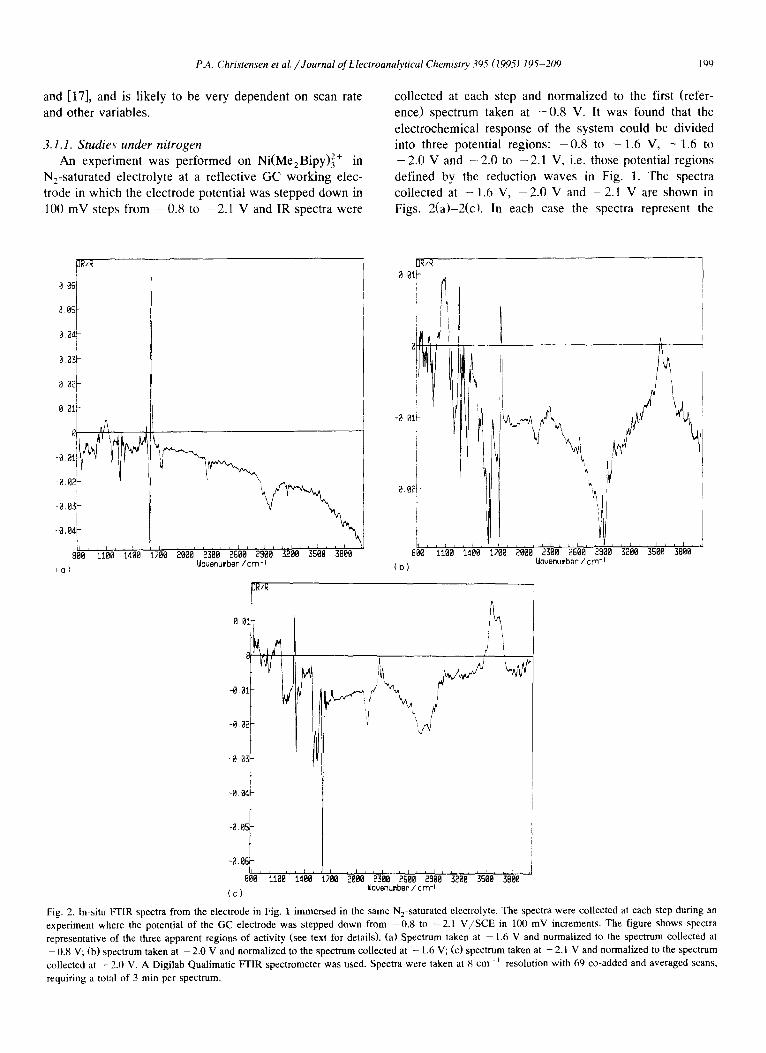
3.1.1. Studies under nitrogen An experiment was performed on Ni(MezBipy) 2+ in
N2-saturated electrolyte at a reflective GC working elec- trode in which the electrode potential was stepped down in 100 mV steps from - 0 . 8 to - 2 . 1 V and IR spectra were
collected at each step and normalized to the first (refer- ence) spectrum taken at - 0 . 8 V. It was found that the electrochemical response of the system could be divided into three potential regions: - 0 . 8 to - 1 . 6 V, - 1 . 6 to
- 2.0 V and -- 2.0 to - 2.1 V, i.e. those potential regions defined by the reduction waves in Fig. 1. The spectra collected at - 1.6 V, - 2 . 0 V and - 2 . 1 V are shown in Figs. 2(a)-2(cL In each case the spectra represent the
pR/R
agG I
i ~o3~
a021
001 i I
- 0 02;
-003
-0,84
i r I i ~ I L
880 11o0 14fl0 (o)
1708 2888 2380 2500 2900 3200 3500 38fl8 Wouenumber / c m - i
I R/R
881k
-0.8
DR/R o, 8~.P
L
-0.021 i
i t
r
(b) 880
ii i
~1o0 lao8 a I L n ~ , ' I , J I ,
I;00' 2800 2380 '2560' 2900' 3280 3508 3800 Wauenumbsr / cm-
-0.8,'
-0,8~
-8.8E I a I i i I i i i i I , i I i J J i I t [ i i r i i ~ L
800 i108 idOO i200 2800 2100 2500 2900 3208 3500 3808 Wouenum~er / e r , 7 - 1
(c)
Fig. 2. In-situ FTIR spectra from the electrode in Fig. 1 immersed in the same N2-saturated electrolyte. The spectra were collected at each step during an experiment where the potential of the GC electrode was stepped down from -0 .8 to -2 .1 V/SCE in 100 mV increments. The figure shows spectra representative of the three apparent regions of activity (see text for details). (a) Spectrum taken at - 1.6 V and normalized to the spectrum collected at - 0 . 8 V; (b) spectrum taken at - 2 . 0 V and normalized to the spectrum collected at - 1.6 V; (c) spectrum taken at -2 .1 V and normalized to the spectrum collected at - 2.0 V. A Digilab Qualimatic FFIR spectrometer was used. Spectra were taken at 8 cm- i resolution with 69 co-added and averaged scans,
requiring a total of 3 rain per spectrum.
200 P.A. Christensen et al. / Journal of Electroanalytical Chemistry 395 (1995) 195-209
82
BFd
L
002
H20
0 M°28tPYF 1 X~cm CO TBF~
Wovenumbor/cm-I (0)
liiIiii
I
[v] [ . . . . ! . . . . 1200 1880 1908 2880 Wovsnumher/cm-I
(b)
~bs, x10808
-d
5
5
7
-9
°12 ~
1280 1800 1008 (c)
i 2800 2188
Wouenumber/cm-I
-0 ,5
-I
-15
-2
-2.5
- 3 2400 2300 2000 2100 2000 1 9 ~
nvel~umbm./cm-I
-0 • OJ
-00~
(e)
Abs,
. . . . I . . . . I , 1208 1800 1900 I . . . . I , , 2000 2100 Wauenumber Icm-i
(f) 10 2000 Wov~number/cm-i
~.8~ 1838 1850 t69B 19~.e 1 S ~ 1980 20t0 ~ 4 0 2070 W ~ / c m ' l (g)
P.A. Christensen et al. /Journal of Electroanalytical Chemistry 395 (1995) 195-209 201
equilibrium state at the specified potential, as lateral diffu- sion of [Ni(MezBipy)3] 2+ into the thin layer is slow. In order to ensure that the changes taking place in previous regions did not mask any absorption resulting from poten- tial changes in the region under study, the spectra are normalized to different reference spectra: the spectrum collected at - 1.6 V is normalized to that taken at - 0 . 8 V, the spectrum collected at - 2 . 0 V is normalized to that taken at - 1 . 6 V and the spectrum taken at - 2 . 1 V is normalized to that collected at - 2 . 0 V.
The bipolar band in Fig. 2(a) centred near 1600 cm-1 appears at - 0 . 9 V and continues to increase in intensity until - 1.6 V, after which it remains more or less constant. As a result of the data manipulation and the fact that this band does not change in intensity at lower potentials, it is not observed as a bipolar band in Figs. 2(b) and 2(c). However, in Fig. 2(c) the positive lobe of this bipolar band appears to be shifted from ca. 1615 cm-~ to 1595 cm ~, and starts to increase in intensity at potentials below - 1.9 V. The negative lobe of the bipolar feature in Fig. 2(a) near 1610 cm ~ can be attributed to the C = C + C = N vibration of the bipyridine ligand [28,29]. This feature has been shown to shift to lower frequencies on decreasing the oxidation state of the metal ion in a range of Bipy com- plexes [28].
Significantly, there is no evidence for any metal-coordi- nated acetonitrile bands in our spectra at any potential above - 2.2 V. Peaks due to the loss of free CH3CN and the gain of peaks due to the gain of coordinated CH3CN would have been expected if any significant concentration of species such as [Ni(BipyXr/I-NCCH3)] - [16] had been formed. The possibility of the formation of significant amounts of other 1 : 1 Ni(0):Bipy complexes which might be more likely candidates, such as [Ni(Bipy)(~2-N-=C-C - C H 3 ) ] (analogous to [Ni(diphosphine)(r/2-RC=CR)] [30]) can also be excluded 1
3.1.2. B e h m , iour unde r CO~
- 1.0 to - 1 .7 V / S C E .
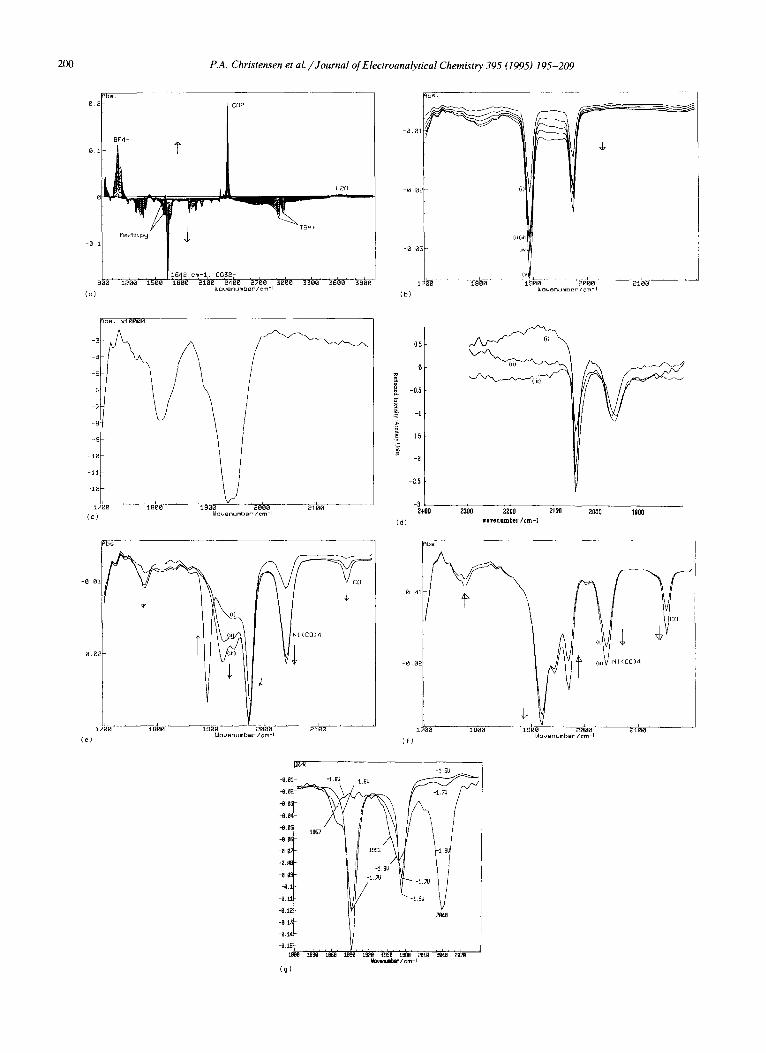
A similar series of experiments to those discussed above were then performed using a platinum electrode immersed in CO:satura ted electrolyte containing 6 mM [Ni- (Me2Bipy)3](CIO4) 2, and the results are shown in Fig. 3. 2 The reference spectrum was collected at - 0 . 5 V / S C E , after which the potential of the platinum electrode was stepped down in 100 mV increments and spectra were taken at each step and normalized to the reference spec- trum. The concentration of CO 2 in the thin layer at the start of the experiment (calculated from the single-beam spectrum at - 1 . 0 V; optical path length through the electrolyte, 17 /zm) was 0.21 M, and that at the end was 0.10 M. This agrees well with the loss of CO~ calculated from the intensity of the 2340 cm t band in the spectrum collected at - 2 . 2 V in Fig. 3(a), corresponding to a concentration of 110 mM.
Fig. 3(a) is dominated by a strong feature near 1642 cm 1, which can be unambiguously assigned to the ,3 band of CO~ [27], and the CO~ loss feature near 2340 cm 1. However, it is clear that the CO~ loss is not simply dissolution to CO~ [27] because of the presence of a rich variety of absorptions in the carbonyl region of Fig. 3(a) and the calculated CO 2 loss of 110 mM for a correspond- ing CO~- gain of only 35 mM. Plots of the intensities of these features as a function of potential are shown in Figs. 4(a) and 4(b). The bipolar Me2Bipy band is also clearly seen in Fig. 3(a).
Fig. 3(b) shows the carbonyl absorption region of the spectra in Fig. 3(a) collected at potentials between - 1.3 and - 1 . 7 V, still using the spectrum taken at - 0 . 5 V / S C E as the reference. It can be seen from the figure that, at potentials between - 1.3 and 1.7 V, two features
i Side-on coordinated nitriles are rare, but not unknown. For example the complex [{Ni(PPh3)(bt, '02-NCCH3)(/x, "oCNCCH3)} 4] has been characterized crystallographically [31].
2 The results on GC and platinum were identical, but the increased reflectivity of platinum made alignment easier. In addition, it was found that the carbon electrodes were prone to potential-dependent reflectivity changes, giving rise to non-zero baselines.
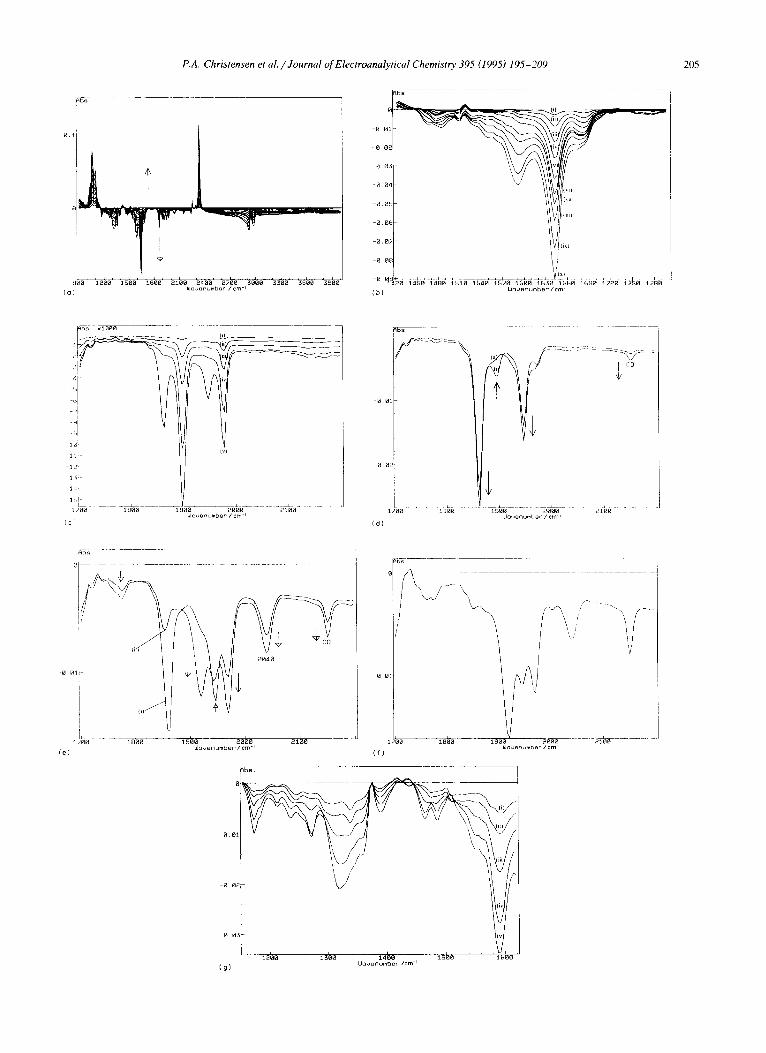
Fig. 3. ln-situ FTIR spectra (8 c m - i resolution, 100 scans, 60 s per scan using a BioRad FFS-40 spectrometer) of a 0.4 cm 2 platinum electrode immersed in CO2-saturated 0.1 M T E A T + CH3CN + 5 mM [Ni(Me2Bipy)3](CIO4) 2. The reference spectrum was collected at - 0 . 5 V / S C E , after which the potential of the reflective platinum electrode was stepped down in 100 mV increments and spectra were taken at each potential and normalized to the reference. (a) Full spectral range, - 1.0 to - 2 . 2 V in 100 mV steps. All the observed features, both loss and gain, are steadily growing in intensity on each side of the zero absorbance baseline. (b) The spectra in (a) collected at (i) - 1.3 V to (v) - 1.7 V, showing just the carbonyl absorption region. (c) The spectrum collected at - 1.4 V in (b) subtracted from that taken at - 1.5 V. (d) ln-situ FTIR spectra from a Nation ~-coated edge carbon electrode (0.4 cm 2) immersed in CO2-saturated 0.1 M KH2PO 4 + NaOH (pH 7). The Nafion®-contained entrapped nickel complexes (see text for details): (i) I, (ii) 111 and (iii) II. The spectra (8 c m - l resolution, 69 scans, 3 min per scan) were collected at - 1.5 V and normalized to the relevant reference spectrum taken at - 1.1 V. (e) The spectra in (a) taken at (i) - 1.8 V, (ii) - 1.9 V and (iii) - 2 . 0 V, showing only the carbonyl absorption region. (f) The spectra in (a) taken
at (i) - 2 . 1 V and (ii) - 2 . 2 V, showing only the carbonyl absorption region. (g) In-situ F'FIR spectra (8 cm 1, 69 scans, 3 min per scan) from the GC electrode in Fig. 1 immersed in the same (CO2-saturated) solution. The spectra were collected a! (i) - 1.6 V, (ii) - 1.7 V and (iii) - 1.8 V normalized to the reference spectrum taken - 0 . 8 V.
202 P.A. Christensen et al. /Journal of Electroanalytical Chemistry 395 (1995) 195-209
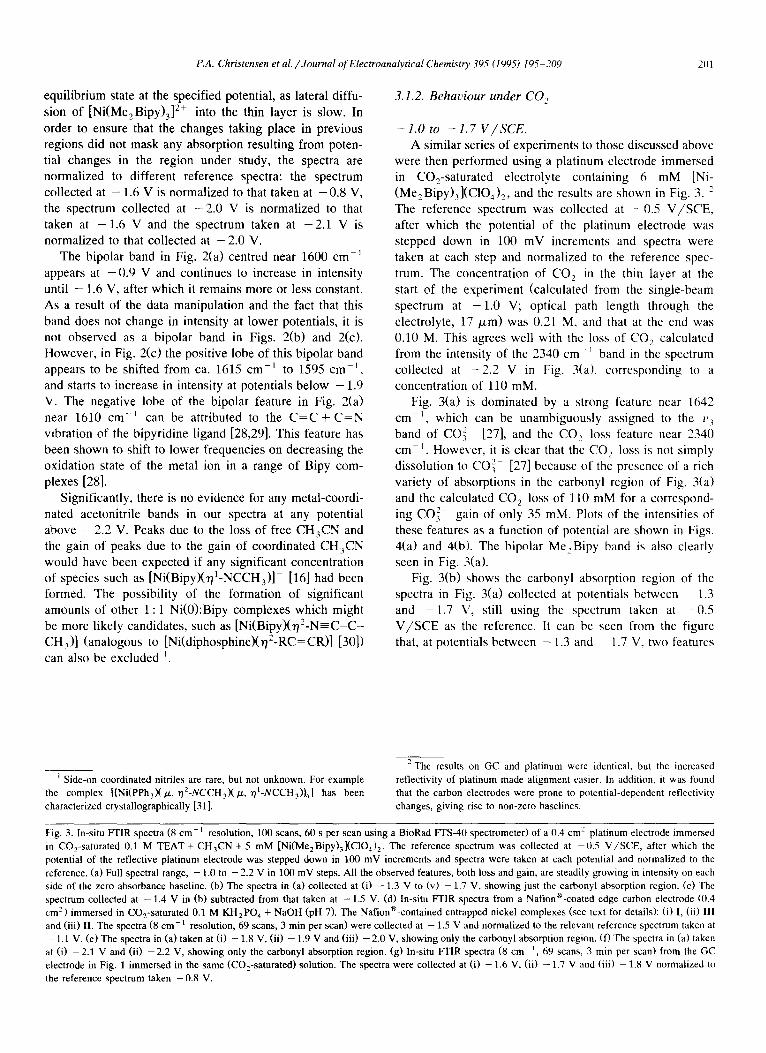
grow in at 1973 and 1893 cm -] whose intensities track each other as a function of potential (Fig. 4(a)), suggesting that they are due to the same species. The formation of this species is accompanied by the formation of CO32- . Our
energy-factored force constant calculations [21] predict IR carbonyl absorptions at 1965 and 1895 cm -] for the complex [Ni(Me 2 Bipy)(CO) 2 ]. Additional evidence for this assignment arises from the fact that the carbonyl stretching
CO2 Loss ~J
, l + - _ _ ~
~ ~ " " ~ ~ 0.1
0 +
0.06
1893 cm-1 x " " ~ 0.04
1973 cm-1 " \~ ~ ~ < Ni(CO)4gain \ ~., / + ~ " ~ , + ~ _
1~ -~" c + - ~ ~ . _ . ~ . , ~ . 0.02
I ~:+ - - O . . . . . - ~ + - 7 X ' ' - ~ - ' ~ - ~ + ' " . . . . . . . 4,- - , s - - . . . . 4, . . . . . . ~ ,~ - ~ -2.3 -2.1 -1.9 -1.7 -1.5 -1.3
( 0 ) E / V vs.SCE
/1920 cm-1
1943 cm-1
,1968 cm-1 / 1973 cm-1
/
/
/ /
/
/
Absorbance 0.12
-1.1
Absorbance 0.025
0.02
0.015
' / ~ O.Ol 1940 cm-1
\\ 1777 cm-1 ", / / , , /
I;' o.oos . , \ \ \ / / -
-2J3 -2.1 -1.9 -1.7 -1.5 -1.3 -1.1
(b ) E / V v$.SCE
Fig. 4. P]ots of the intensities of the various features observed in Figs. 3(a)-(c), 3(c) and 3(f) as a function of the potential of the reflective working electrode. The CO 2 and CO~- intensities in (a) have been scaled down by a factor of 2 for clarity.
P.A. Christensen et al. / Journal of E lectroanalytical Chemistry 395 (1995) 195-209 203
bands for solid [Ni(Bipy)(CO) 2] (KBr disc) have been reported [32] as 1970 and 1890 cm -1. Since this species appears at potentials negative of the Ni( I I ) /Ni (0) wave but positive of the other reduction waves, this confirms [11] that [Ni(0)(Me2Bipy) 2] reacts with CO 2 to form [Ni(MeBipy)(CO) 2] and C O 3 - . It is interesting that no intermediates were observed in the transformation. This could be due to one (or both) of the following: first, the intermediates may be extremely labile and therefore only present at equilibrium concentrations beyond the detection limit of our technique; second, the characteristic peaks due to the intermediates may be obscured by other bands. For example a species such as [Ni(Me2Bipy)(~12-OCO)], by analogy with known N i - C O 2 complexes such as [Ni(P{cyclohexyl}3)2(r/2-OCO)] [33], would be expected to show two bands due to the r/2-CO2 moiety at approx. 1650 and 1635 cm-~ which would be obscured by the strong features due to CO 2 .
It is clear from Fig. 3(b) that a feature is growing in near 1810 c m - 1 in the potential range from - 1.3 to - 1.7 V. In addition, there appears to be an absorption increasing in intensity at more negative potentials between the dicar- bonyl bands at 1893 and 1973 cm -1. As can be seen from Figs. 3(b) and 4(a), the dicarbonyl features show no in- crease in intensity between - 1.4 and - 1.5 V, suggesting that subtracting the spectrum collected at - 1 . 4 V from that taken at - 1.5 V should remove the dicarbonyl absorp- tions and bring out the weaker underlying features. The resulting difference spectrum is shown in Fig. 3(c); two very broad features can clearly be seen near 1809 cm-1 and 1940 cm -I We were unable to assign the former band, but the latter feature has been observed by us more clearly in the following two related experiments.
(i) If the above experiment is performed in the presence of ca. 1 mM water, the (Me2Bipy)Ni(CO) 2 species is still the initial product at potentials below - 1 . 2 V. However, at potentials below - 1 . 6 V, the absorptions due to this species decrease and are replaced by a broad band at 1940 cm-1 and a feature at 2043 cm -~ both of which then steadily increase in intensity as the potential is stepped down. The 2043 cm i feature can be attributed to Ni(CO) 4 [34-37].
(ii) If Ni complexes I - I I I are trapped in a Nafion* film deposited as a thin layer on a polished Pt electrode and immersed in CO2-saturated phosphate buffer (pH 7) [23], two bands at similar frequencies are observed in the spectra of each of the complexes studied (Fig. 3(d)). The first band, at 2043 cm l in all three spectra, can be unambiguously assigned to the F 2 vibration of Ni(CO)~ [34-38], and the second broad band, which differed only slightly in frequency with the nature of the ligand, gener-
1 ally appears near 1950 cm These experiments suggest that the various ligands play
little or no role in influencing the position of the 1950 cm-~ feature, and this in turn suggests that a common species is formed in the reduction of complexes I - I I I and
(MezBipy)3Ni 2+. There are two possible identities for the species responsible for this feature:
(i) it may be assigned to CO adsorbed at electrode- posited nickel;
(ii) it may be attributable to a second nickel carbonyl species, most probably a species initially formulated as [Ni(CO)3H]- but now known to be [Ni2(/x-HXCO)6]- (Vco = 1950 cm-l [s ] , 2005 cm l[m] [39]).
Although CO adsorbed at bridge sites on nickel metal under UHV conditions is reported to absorb in the region 1860-1950 cm-~ [40], it has been reported more recently that CO adsorbed at such sites in solution absorbs near 1890 cm 1 [41,42] and the linear form absorbs near 2015 cm ~ [42]. Therefore it is unlikely that the 1940 cm band is due to CO adsorbed on nickel, and we tentatively assign this feature to [Ni2(/x-H)(CO) 6] . The conditions which favour the formation of such nickel clusters are discussed in more detail below.
It should be emphasized that our in-situ FTIR experi- ments exploit a thin layer of electrolyte trapped between the IR-transparent window and the working electrode sur- face. The resulting restriction on free diffusion to and from the electrode means that differences are sometimes ob- served between our experiments and conventional electro- chemical experiments. This is clearly the case in the two experiments discussed above; CO is apparently produced in both cases, but is trapped in the thin layer a n d / o r the Nation*. This trapped CO is then free to attack the nickel catalytic species, replacing the ligands and resulting in Ni(CO) 4 .
Returning to the experiment in Fig. 3, it appears from the above discussion that the [Ni~(/~-H)(CO) 6] cluster is formed at reasonably positive potentials of - 1 . 3 V, or less. There is no evidence in Fig, 3(b) for CO formation, either free as CO in solution or in the form of Ni(CO) 4. Consequently, the cluster must be produced as a result of the instability of [Ni(Me2Bipy)(CO) 2] and it is likely that the reaction involves trace water as the most probable source of protons. This clearly represents an undesirable mechanism by which the nickel complex may be lost to the catalytic cycle. In contrast with the two experiments discussed above and the reduction process at lower poten- tials discussed below, this loss mechanism does not appear to involve trapped CO and so is not a consequence of the experimental conditions chosen.
- 1 . 7 to - 2 . 2 V / S C E .
Significant changes occur at potentials between - 1 . 8 and - 2 . 2 V (Figs. 3(e) and 3(f)), The intensities of the peaks due to [Ni(Me2Bipy)(CO) 2] fall, the peak at 1893 cm 1 clearly vanishes altogether at - 1 . 9 V and the peak at 1973 cm-~ broadens and moves to lower energy (1968 c m - 1 ) at the same potential. Therefore the latter peak must be due to a new species whose identity is discussed below. Two new features also appear at 1920 cm -1 and 1943 cm-~ (Fig. 4(b)). The most probable reduction product of
204 P.A. Christensen et al. /Journal of Electroanalytical Chemistry 395 (1995) 195-209
[Ni(Me2Bipy)(CO) 2] is [Ni(Me2Bipy ' - X C O ) 2 ] , but en- ergy-factored force constant calculations for this species suggest that the carbonyl stretches should be at 1946 and 1870 cm-1 , both very different from the peaks observed in the simple step experiments described above. This was surprising, particularly in view of the fact that the analo- gous [N i (Phen ' - ) (CO) 2] species could be easily detected as described below, and a series of experiments over a longer time were designed to see if the [Ni(MezBipy " - ) - (CO) z] species could be detected as a transient. In such experiments, when the data collection time was increased to approx. 3 min, two other features developed, a shoulder at 1955 cm-~ and a weak peak at 1867 cm-1 (Fig. 3(g)). These are transient, being most prominent at - 1 . 7 V and disappearing again at - 1.9 V. Their appearance coincides with a rapid increase in the amount of CO 2 generated and CO 2 lost. Therefore we tentatively assign the bands at 1955 and 1867 c m - 1 to [Ni(Me 2 B i p y ' - XCO)2 ], the com- plex suggested earlier [11] as the major catalytic species. However, it is clear from Fig. 4(b) that the catalytic cycle is not complete: there is a steady loss of the [Ni- (Me2Bipy)(CO) 2] but no concomitant formation of [Ni-
(Me 2 Bipy" - )(CO) 2 ]. Returning to the features at 1968, 1920 and 1943 cm -1,
the atypical conditions imposed upon the electrochemistry by the presence of the thin layer were discussed above. The effect of the thin layer is also evident here; the major changes in the spectra beginning at - 1 . 7 V (Figs. 3 ( d ) - 3(g)) coincide with a rapid increase in the CO 2 generated and CO 2 lost, and with the catalytic current for CO 2 reduction observed in conventional electrochemical experi- ments owing to generat ion of the catalyt ic [Ni- (Me2bipy "- ) (CO) 2] species. Once [Ni (MezBipy" ) (CO) 2] is present, the catalytic cycle quickly produces excess CO (urea x = 2150 cm 1 [27]) which cannot readily diffuse away and reacts with the N i (0 ) -MezBipy com- plexes present to give Ni(CO) 4.
At this stage of the experiments, we have reducing conditions (reasonably negative potentials), carbonyl-rich Ni(0) complexes and potential bases (CO~- and free MezBipy). These conditions are known to produce nickel carbonyl cluster anions. In support of this possibility, it can be seen from Figs. 3(d) and 3(e) that, at potentials below - 1 . 8 V, features grow in that are consistent with the formation of species having bridging carbonyls, e.g. near 1777 cm -1 with a shoulder near 1764 cm -~.
The chemistry of the carbony nickelates is complex and
• " l ~ l N I C P ' I ' I B n ~ 3 2 +
0
- t
i , - , , . 1
E / V u s SCE
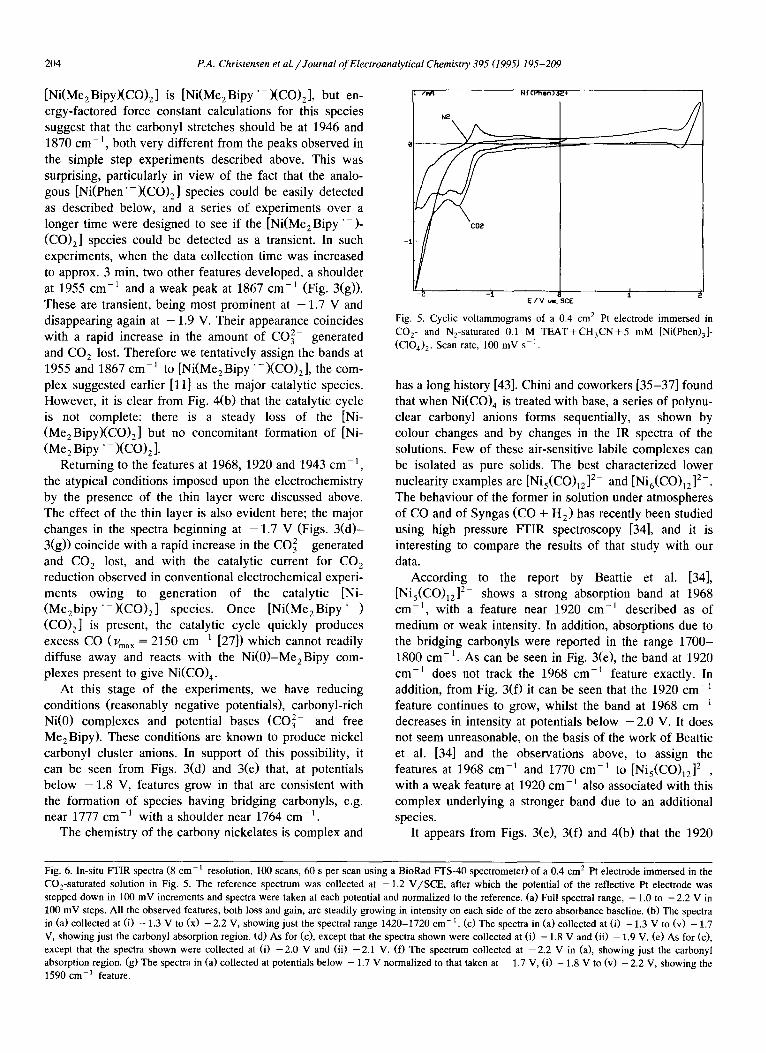
Fig. 5. Cyclic voltammograms of a 0.4 cm 2 Pt electrode immersed in CO 2- and N2-saturated 0.1 M TEAT+CH3CN+5 mM [Ni(Phen)3]- (CIO4) 2. Scan rate, 100 mV s -1 .
has a long history [43]. Chini and coworkers [35-37] found that when Ni(CO) 4 is treated with base, a series of polynu- clear carbonyl anions forms sequentially, as shown by colour changes and by changes in the IR spectra of the solutions. Few of these air-sensitive labile complexes can be isolated as pure solids. The best characterized lower nuclearity examples are [Nis(CO)12] 2- and [Ni6(CO)1212-. The behaviour of the former in solution under atmospheres of CO and of Syngas (CO + H 2) has recently been studied using high pressure FFIR spectroscopy [34], and it is interesting to compare the results of that study with our data.
According to the report by Beattie et al. [34], [Nis(CO)12] 2- shows a strong absorption band at 1968 cm -1, with a feature near 1920 cm -1 described as of medium or weak intensity. In addition, absorptions due to the bridging carbonyls were reported in the range 1700- 1800 cm -1. As can be seen in Fig. 3(e), the band at 1920 cm -1 does not track the 1968 cm 1 feature exactly. In addition, from Fig. 3 (0 it can be seen that the 1920 c m - feature continues to grow, whilst the band at 1968 cm decreases in intensity at potentials below - 2 . 0 V. It does not seem unreasonable, on the basis of the work of Beattie et al. [34] and the observations above, to assign the features at 1968 cm 1 and 1770 cm -1 to [Ni5(CO)12] 2 , with a weak feature at 1920 cm-1 also associated with this complex underlying a stronger band due to an additional species.
It appears from Figs. 3(e), 3(f) and 4(b) that the 1920
Fig. 6. ln-situ FTIR spectra (8 cm- 1 resolution, 100 scans, 60 s per scan using a BioRad FTS-40 spectrometer) of a 0.4 cm 2 Pt electrode immersed in the CO2-saturated solution in Fig. 5. The reference spectrum was collected at - 1.2 V/SCE, after which the potential of the reflective Pt electrode was stepped down in 100 mV increments and spectra were taken at each potential and normalized to the reference. (a) Full spectral range, - 1.0 to - 2.2 V in 100 mV steps. All the observed features, both loss and gain, are steadily growing in intensity on each side of the zero absorbance baseline. (b) The spectra in (a) collected at (i) - 1.3 V to (x) -2.2 V, showing just the spectral range 1420-1720 cm-1. (c) The spectra in (a) collected at (i) - 1.3 V to (v) - 1.7 V, showing just the carbonyl absorption region. (d) As for (c), except that the spectra shown were collected at (i) - 1.8 V and (ii) - 1.9 V. (e) As for (c), except that the spectra shown were collected at (i) -2.0 V and (ii) -2.1 V. (f) The spectrum collected at -2.2 V in (a), showing just the carbonyl absorption region. (g) The spectra in (a) collected at potentials below - 1.7 V normalized to that taken at - 1.7 V, (i) - 1.8 V to (v) - 2.2 V, showing the 1590 cm-1 feature.
v
r i
t
m~
, i
J ~L
]
IL I
~!
i
7 ff
//
.,...,
t~
®t ~E
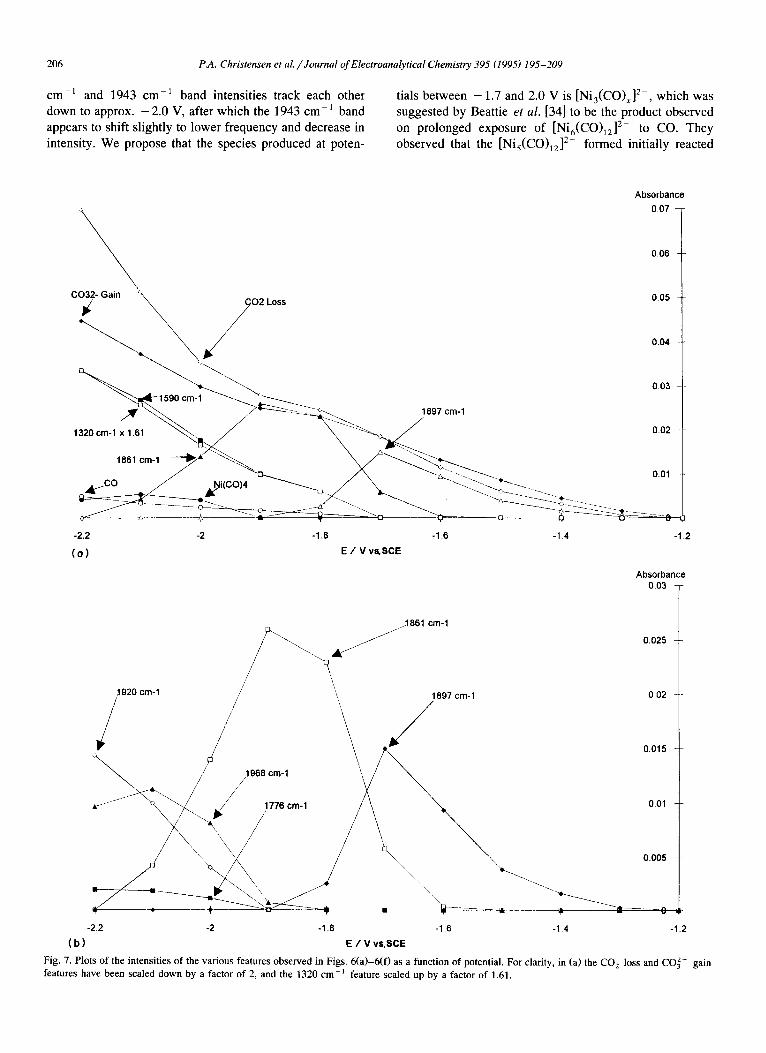
206 P.A. Christensen et al. /Journal of Electroanalytical Chemistry 395 (1995) 195-209
cm - t and 1943 cm -1 band intensities track each other down to approx. - 2.0 V, after which the 1943 c m - 1 band appears to shift slightly to lower frequency and decrease in intensity. We propose that the species produced at poten-
tials between - 1.7 and 2.0 V is [Ni3(CO)x] 2-, which was suggested by Beattie et al. [34] to be the product observed on prolonged exposure of [Ni6(CO)12] 2- to CO. They observed that the [Nis(CO)12] 2- formed initially reacted
Absorbance 0.07
L 0.06
C " " ~ 0.05
320 cm. 1 x ~ 1 . 6 1 ~ / ~ - ~ - ~ ~ . ~ ~ ~1897 cm'l
-2.2 -2 -1.8 -1.6 -1.4 -1.2
( o ) E / V v~SCE
Absorbance 0.03
3861 cm-1
/ 0.015
/196811~11cm 1 0.01
J " . o.o05
-22 -2 -1.8 -1.6 -1.4 -1.2 ( b ) E / V vs.SCE
Fig. 7. Plots of the intensities of the various features observed in Figs. 6(a)-6(f) as a function of potential. For clarity, in (a) the CO 2 loss and CO~- gain features have been scaled down by a factor of 2, and the 1320 cm -1 feature scaled up by a factor of 1.61.
P.A. Christensen et aL /Journal of Electroanalytical Chemistry 395 (1995) 195-209 2(17
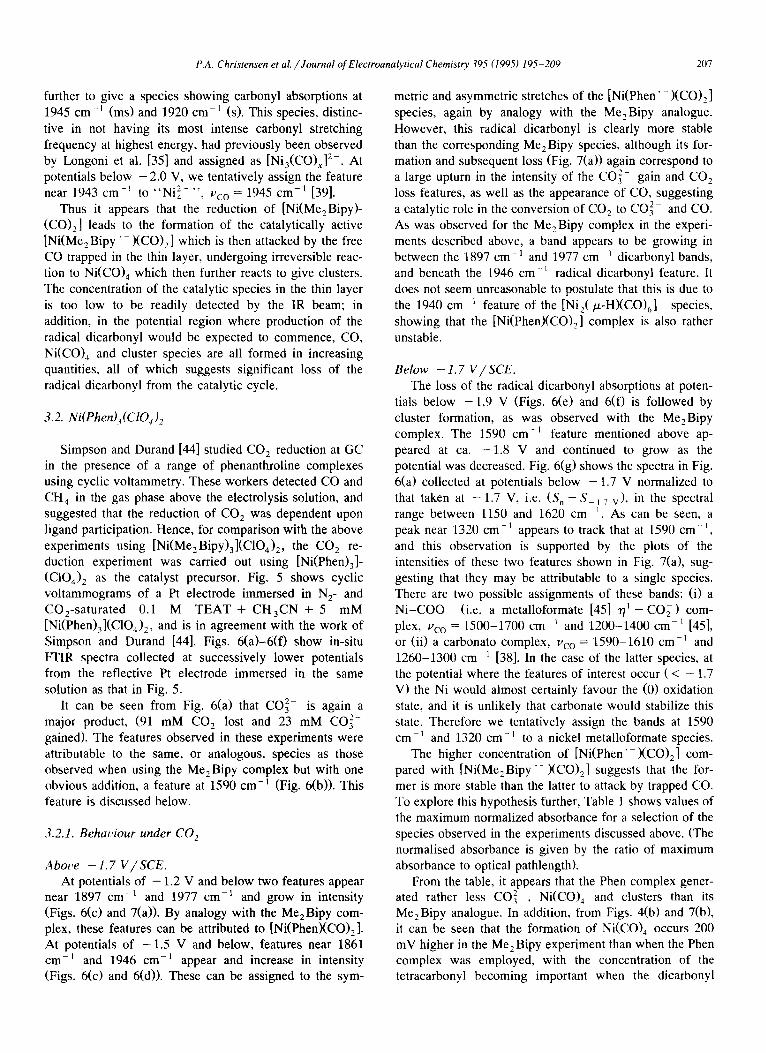
further to give a species showing carbonyl absorptions at 1945 cm- l (ms) and 1920 c m - l (s). This species, distinc- tive in not having its most intense carbonyl stretching frequency at highest energy, had previously been observed by Longoni et al. [35] and assigned as [Ni3(CO)x] 2-. At potentials below - 2 . 0 V, we tentatively assign the feature near 1943 cm -1 to "Ni 2- " , Uco = 1945 cm -1 [39].
Thus it appears that the reduction of [Ni(Me2Bipy)- ((20) 2 ] leads to the formation of the catalytically active [Ni(Me2Bipy " )(CO) e] which is then attacked by the free CO trapped in the thin layer, undergoing irreversible reac- tion to Ni(CO) 4 which then further reacts to give clusters. The concentration of the catalytic species in the thin layer is too low to be readily detected by the IR beam; in addition, in the potential region where production of the radical dicarbonyl would be expected to commence, CO, Ni(CO)4 and cluster species are all formed in increasing quantities, all of which suggests significant loss of the radical dicarbonyl from the catalytic cycle.
3.2. Ni(Phen)~(Cl04) 2
Simpson and Durand [44] studied CO 2 reduction at GC in the presence of a range of phenanthroline complexes using cyclic voltammetry. These workers detected CO and CH 4 in the gas phase above the electrolysis solution, and suggested that the reduction of CO 2 was dependent upon ligand participation. Hence, fbr comparison with the above experiments using [Ni(MezBipy)3](CIO4)2, the CO 2 re- duction experiment was carried out using [Ni(Phen)3]- (CIO4) e as the catalyst precursor. Fig. 5 shows cyclic voltammograms of a Pt electrode immersed in N 2- and COz-saturated 0.1 M TEAT + CH3CN + 5 mM [Ni(Phen)3](C104) 2, and is in agreement with the work of Simpson and Durand [44]. Figs. 6(a)-6(f) show in-situ FFIR spectra collected at successively lower potentials from the reflective Pt electrode immersed in the same solution as that in Fig. 5.
It can be seen from Fig. 6(a) that CO32- is again a major product, (91 mM CO 2 lost and 23 mM CO z- gained). The features observed in these experiments were attributable to the same, or analogous, species as those observed when using the Me2Bipy complex but with one obvious addition, a feature at 1590 cm-1 (Fig. 6(b)). This feature is discussed below.
3.2.1. Behat~iour under CO 2
Above - 1.7 V / S C E .
At potentials of - 1.2 V and below two features appear near 1897 cm -1 and 1977 cm -1 and grow in intensity (Figs. 6(c) and 7(a)). By analogy with the MezBipy com- plex, these features can be attributed to [Ni(Phen)(CO)2]. At potentials of - 1 . 5 V and below, features near 1861 cm -1 and 1946 cm -~ appear and increase in intensity (Figs. 6(c) and 6(d)). These can be assigned to the sym-
metric and asymmetric stretches of the [Ni(Phen" - )(CO), ] species, again by analogy with the Me2Bipy analogue. However, this radical dicarbonyl is clearly more stable than the corresponding Me 2Bipy species, although its for- mation and subsequent loss (Fig. 7(a)) again correspond to a large upturn in the intensity of the CO 3- gain and CO, loss features, as well as the appearance of CO, suggesting a catalytic role in the conversion of CO 2 to CO 2 and CO. As was observed for the Me2Bipy complex in the experi- ments described above, a band appears to be growing in between the 1897 cm-~ and 1977 cm ~ dicarbonyl bands, and beneath the 1946 cm-~ radical dicarbonyl feature. It does not seem unreasonable to postulate that this is due to the 1940 cm 1 feature of the [Ni2(/.~-H)(CO)6] - species, showing that the [Ni(Phen)(CO) 2] complex is also rather unstable.
Below - 1 . 7 V / S C E .
The loss of the radical dicarbonyl absorptions at poten- tials below - 1 . 9 V (Figs. 6(e) and 6(f) is followed by cluster formation, as was observed with the MezBipy complex. The 1590 cm -1 feature mentioned above ap- peared at ca. - 1 . 8 V and continued to grow as the potential was decreased. Fig. 6(g) shows the spectra in Fig. 6(a) collected at potentials below - 1 . 7 V normalized to that taken at - 1 . 7 V, i.e. (S n - S 17 v), in the spectral range between 1150 and 1620 cm ~. As can be seen, a peak near 1320 cm-~ appears to track that at 1590 cm -~, and this observation is supported by the plots of the intensities of these two features shown in Fig. 7(a), sug- gesting that they may be attributable to a single species. There are two possible assignments of these bands: (i) a Ni -COO (i.e. a metalloformate [45] r / ~ - CO 2) com- plex, Uco = 1500-1700 cm ~ and 1200-1400 cm i [45], or (ii) a carbonato complex, Uco = 1590-1610 cm 1 and 1260-1300 cm -1 [38]. In the case of the latter species, at the potential where the features of interest occur ( < - 1.7 V) the Ni would almost certainly favour the (0) oxidation state, and it is unlikely that carbonate would stabilize this state. Therefore we tentatively assign the bands at 1590 cm-~ and 1320 cm-1 to a nickel metalloformate species.
The higher concentration of [Ni(Phen'-)(CO) 2] com- pared with [Ni(Me2Bipy ' -XCO):] suggests that the for- mer is more stable than the latter to attack by trapped CO. To explore this hypothesis further, Table l shows values of the maximum normalized absorbance for a selection of the species observed in the experiments discussed above. (The normalised absorbance is given by the ratio of maximum absorbance to optical pathlength).
From the table, it appears that the Phen complex gener- ated rather less CO 2 , Ni(CO) 4 and clusters than its MezBipy analogue. In addition, from Figs. 4(b) and 7(b), it can be seen that the formation of Ni(CO) 4 occurs 200 mV higher in the Me2Bipy experiment than when the Phen complex was employed, with the concentration of the tetracarbonyl becoming important when the dicarbonyl
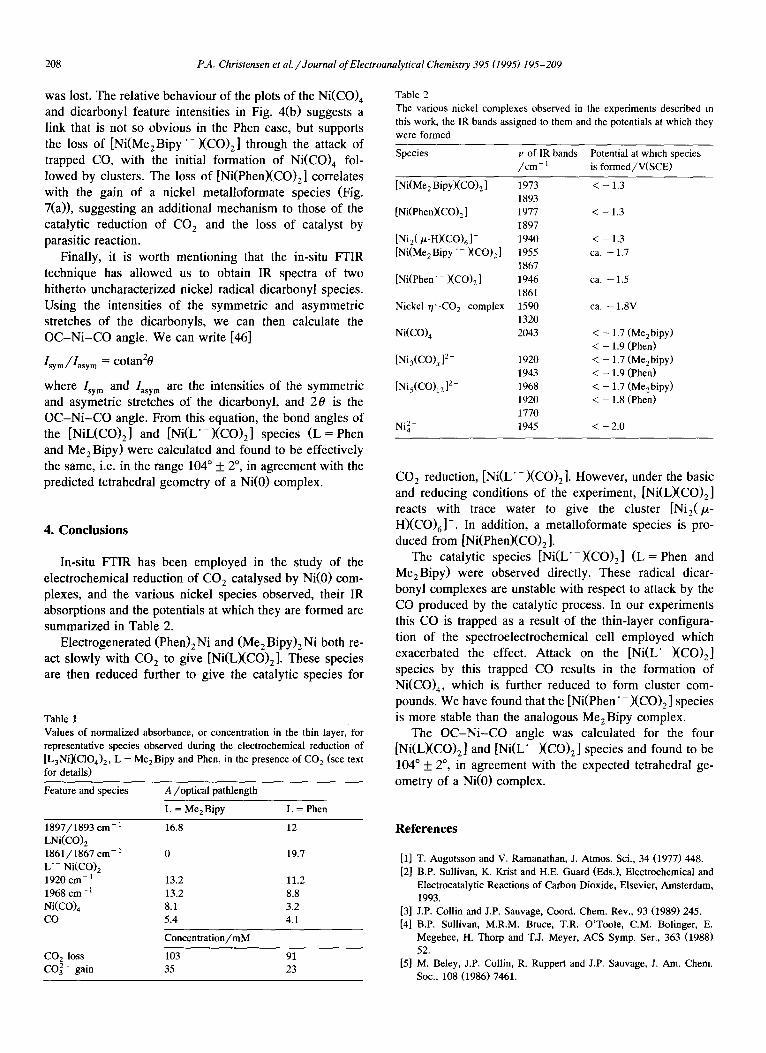
208 P.A. Christensen et al. /Journal of Electroanalytical Chemistry 395 (1995) 195-209
was lost. The relative behaviour of the plots of the Ni(CO)n and dicarbonyl feature intensities in Fig. 4(b) suggests a link that is not so obvious in the Phen case, but supports the loss of [Ni(MeEBipy '-)(CO) 2] through the attack of trapped CO, with the initial formation of Ni(CO) 4 fol- lowed by clusters. The loss of [Ni(Phen)(CO) z] correlates with the gain of a nickel metalloformate species (Fig. 7(a)), suggesting an additional mechanism to those of the catalytic reduction of CO 2 and the loss of catalyst by parasitic reaction.
Finally, it is worth mentioning that the in-situ FTIR technique has allowed us to obtain IR spectra of two hitherto uncharacterized nickel radical dicarbonyl species. Using the intensities of the symmetric and asymmetric stretches of the dicarbonyls, we can then calculate the OC-Ni-CO angle. We can write [46]
Isym//Iasym = cotanE0
where lsym and Iasym are the intensities of the symmetric and asymetric stretches of the dicarbonyl, and 2 0 is the O C - N i - C O angle. From this equation, the bond angles of the [NiL(CO) E ] and [Ni(L'-)(CO) 2 ] species (L- -Phen and Me 2 Bipy) were calculated and found to be effectively the same, i.e. in the range 104 ° _+ 2 °, in agreement with the predicted tetrahedral geometry of a Ni(0) complex.
4. Conclusions
In-situ FTIR has been employed in the study of the electrochemical reduction of CO 2 catalysed by Ni(0) com- plexes, and the various nickel species observed, their IR absorptions and the potentials at which they are formed are summarized in Table 2.
Electrogenerated (Phen) E Ni and (Me 2 Bipy) 2 Ni both re- act slowly with CO 2 to give [Ni(L)(CO)2]. These species are then reduced further to give the catalytic species for
Table 1 Values of normalized absorbance, or concentration in the thin layer, for representative species observed during the electrochemical reduction of [LaNi](C104) 2, L = MeEBipy and Phen, in the presence of CO 2 (see text for details)
Feature and species A/optical pathlength
L = Me 2 Bipy L = Phen
1897/1893 cm- 1 16.8 LNi(CO) 2 1861/1867 cm- 1 0
L ' - Ni(CO) 2 1920 cm- 1 13.2 1968 cm- 1 13.2 Ni(CO)4 8.1 CO 5.4
CO 2 loss CO~- gain
Concentration/mM
103 35
12
19.7
11.2 8.8 3.2 4.1
91 23
Table 2 The various nickel complexes observed in the experiments described in this work, the IR bands assigned to them and the potentials at which they were formed
Species v of IR bands Potential at which species / c m - 1 is formed/V(SCE)
[Ni(Me2 BipyXCO)2] 1973 < - 1.3 1893
[Ni(Phen)(CO): ] 1977 < - 1.3 1897
[Ni 2( P--HXCO)6 ]- 1940 < - 1.3 [Ni(Me 2 Bipy ' - )(CO) 2 ] 1955 ca. - 1.7
1867 [Ni(Phen" - )(CO) 2 ] 1946 ca. - 1.5
1861 Nickel ~1-CO2 complex 1590 ca. - 1.8V
1320 Ni(CO) 4 2043 < - 1.7 (MeEbipy)
< - 1.9 (Phen) [Ni3(CO)x] 2- 1920 < - 1.7 (MeEbipy)
1943 < - 1.9 (Phen) [Ni5(CO)12] 2- 1968 < - 1.7 (MeEbipy)
1920 < - 1.8 (Phen) 1770
Ni~- 1945 < - 2.0
CO e reduction, [Ni(L'-)(CO)2]. However, under the basic and reducing conditions of the experiment, [Ni(L)(CO) e] reacts with trace water to give the cluster [NiE(/z- H X C O ) 6 ] - . In addition, a metalloformate species is pro- duced from [Ni(Phen)(CO) 2 ].
The catalytic species [Ni(L'-)(CO) 2] ( L = Phen and MeeBipy) were observed directly. These radical dicar- bonyl complexes are unstable with respect to attack by the CO produced by the catalytic process. In our experiments this CO is trapped as a result of the thin-layer configura- tion of the spectroelectrochemical cell employed which exacerbated the effect. Attack on the [Ni(L'-)(CO) 2] species by this trapped CO results in the formation of Ni(CO)4, which is further reduced to form cluster com- pounds. We have found that the [Ni(Phen'-)(CO)2 ] species is more stable than the analogous Me 2 Bipy complex.
The OC-Ni-CO angle was calculated for the four [Ni(L)(CO)2] and [Ni(L" )(CO)E] species and found to be 104°_+ 2 °, in agreement with the expected tetrahedral ge- ometry of a Ni(0) complex.
References
[1] T. Augutsson and V. Ramanathan, J. Atmos. Sci., 34 (1977) 448. [2] B.P. Sullivan, K. Krist and H.E. Guard (Eds.), Electrochemical and
Electrocatalytic Reactions of Carbon Dioxide, Elsevier, Amsterdam, 1993.
[3] J.P. Collin and J.P. Sauvage, Coord. Chem. Rev., 93 (1989) 245. [4] B.P. Sullivan, M.R.M. Bruce, T.R. O'Toole, C.M. Bolinger, E.
Megehee, H. Thorp and T.J. Meyer, ACS Symp. Ser., 363 (1988) 52.
[5] M. Beley, J.P. Collin, R. Ruppert and J.P. Sauvage, J. Am. Chem. Soc., 108 (1986) 7461.
P.A. Christensen et al. /Journal of Electroanalytieal Chemist~ ~95 (1995) 195-209 2119
[6] G.B. Balazs and F.C. Anson, J. Electroanal. Chem., 322 (1992) 325. [7] K.S. Ratliff, R.E. Lentz and C.P. Kubiak, Organometallics, 11
(1992) 1986. [8] D.A. Morgenstern, R.W. Wittrig, P.E. Fanwick and C.P. Kubiak, J.
Am. Chem. Soc., 115 (1993) 6470. [9] W. Leitner, Angew. Chem. Int. Edn. Engl., 33 (1994) 173.
[10] S. Daniele, P. Ugo, G. Bontempelli and M. Fiorani, J. Electroanal. Chem., 219 (1987) 219 259.
[11] L. Garnier, Y. Rollin and J. P6richon, Nouv. J. Chim., 13 (1989) 53. [12] S. D6rien, E. Dufiach and J. P6richon, J. Am. Chem. Soc., 113
(1991) 8447. [13] L. Garnicr, Y. Rollin and J. P6richon, J. Organometl. Chem., 367
(1989) 347. [14] N. Tanaka and Y. Sato, Inorg. Nucl. Chem. Lett., 4 (1968) 487. [15] R. Prasad and D.B. Scaife, J. Electroanal. Chem., 84 (1977) 373. [16] B.J. Henne and D.E. Bartak, Inorg. Chem., 23 (1984) 369. [1 '7] P.N. Bartlett and V. Eastwick-Field, Electrochim. Acta, 38 (1993)
2515. [18] A. Bewick and S. Pons in R.J.H. Clark and R.E. Hester (Eds.),
Advances in Infrared and Raman Spectroscopy, Vol. 12, Wiley- Heyden, London, 1985, p. 1.
[19] P.A. Christensen and A. Hamnett, Compr. Chem. Kinet., 29 (1988) 1.
[20] J.K. Foley, C. Korzeniewski, J.L. Daschbach and S. Pons, in A.J. Bard (Ed.), Electroalaalytical Chemistry: A Series of Advances, Dekker, New York, 1986, p. 309.
[2l] P. Christensen, A. Hamnett, A.V.G. Muir and J. Timney, J. Chem. Soc., Dalton Trans., (1992) 1455, and references cited therein.
[22] P.A. Christensen, A. Hamnett and A.V.G. Muir, J. Electroanal. Chem., 241 (1988) 361.
[2.3] P.A. Christensen, A. Hamnett, S.J. Higgins and A.V.G. Muir, to be submitted.
[24] P.A. Christensen and A. Hamnett, Electrochim. Acta, 36 (1991) 1263.
[25] T.G. Goplen, D.G. Cameron and R.N. Jones, Appl. Spectrosc., 34 (1980) 657.
[26] M.B. Mizen and M.S. Wrighton, J. Electrochem. Soc., 136 (1989) 941.
[27] P.A. Christensen, A. Hamnett, A,V.G. Muir and N.A. Freeman, J. Electroanal. Chem., 288 (1990) 197.
[28] Y. Saito, J. Takemoto, B. Hutchinson and K. Nakamoto, Inorg. Chem., 11 (1972) 2003.
[29] P.K. Mallick, G.D. Danzer, D.P. Strommen and J.R. Kincaid, J. Phys. Chem., 92 (1988) 5628.
[30] G. Wilkinson, F.G.A. Stone and E.A. Abel (Eds.), Comprehensive Organometallic Chemistry, Pergaman, Oxford.
[31] I.W. Bassi, C. Benedicenti, M. Calcaterra, R. lntrito, G. Rucci and C. Santini, J. Organomet. Chem., 144 (1978) 225.
[32] T. Kohara, S. Komiya, T. Yamamoto and A. Yamamoto, Chem. Lett., (1979) 1513.
[33] M. Aresta and C.F. Nobile, J. Chem. Soc. Dalton Trans., (1977) 708.
[34] J.K. Beattie, T.W, Hambley, A.F. Masters and J.T. Meyer, lnorg. Chim. Acta, 213 (1993) 49.
[35] G. Lcmgoni. P. Chini and A. Cavalieri, lnorg. (?hem., 15 (t976) 3025.
[36] G. Longoni and P. Chini, Inorg. Chem., 15 (19761 3029. [37] A. Ceriotti, P. Chini, R. Della Pergola and G. Longini, lnorg.
Chem., 22 (1983) 1595. [38] K. Nakamoto, Infrared and Raman Spectra of Inorganic and Coordi-
nation Compounds (4th edn.), Wiley, New York, 1986, p. 252. [39] G. Longoni, M. Manassero and M. Sansoni, J. Organomet. Chem.,
174 (1979) (141. [40] C.W. Garland, R,C. Lord and P.F. Troiano. J. Phys. Chem., 69
(1965) 1195 [41] M. Zhao, K Wang and D.A. Scherson, J. Phys. Chem., 97 (1993)
4488, [42] S. Taguchi, A. Aramata and M. Enyo, J. Electroanal. Chem., 372
(1994) 161. [43] W. Hieber, J. Ellerman and E, Zahn, Z. Naturforsch. B, 18 (1963)
589. [44] T.C. Simpson and R.R. Durand Jr., Electrochim. Acta, 33 (1988)
581. [45] C. Creutz, in B.P. Sullivan, K. Krist and H.E. Guard (Eds.),
Electrochemical and Electrocatalytic Reactions of Carbon Dioxide, Elsevier, Amsterdam, 1993, p. 39.
[46] F.A. Cotton and G. Wilkinson, Advanced Inorganic Chemistry, Wiley, New York, 1988, p. 1036.