what's in a diagram that a computer should understand?
TRANSCRIPT
CAAD futures Digital Proceedings 1995 469 469
What's In a Diagram That a Computer ShouldUnders tand?
Ellen Yi-Luen Do
College of Architecture,Georgia Institute of TechnologyAtlanta, GA 30332USA
This paper reports on an experiment to test the feasibility of using a diagramming tool toaccess an architectural knowledge base. Our hypothesis is that designers only use a small seto conventional elements to make diagrams of architect concepts. If this true, then a schemefor retrieving information from computer knowledge bases using diagrams would work.Therefore we asked designers to make diagrams from texts, to interpret'. diagrams into texts,to pair diagrams and texts, and to comment on existing pars from the case base. We foundfrom the experiment that common features are shared between different designers'diagrams and texts.
Keywords: architectural diagrams, graphic interface, knowledge bases
1 Motivation - why study diagrams?
1.1 Diagrams are important in architectural education and the design professionsAll designers make diagrams. Diagrams express complex real world architectural problems
and solutions concisely and abstractly [1,2] and therefore designers often draw diagrams when theyare concerned with general architectural concepts and issues. Diagrams also play an important rolein the education of architects. Many instructors use diagrams to critique students and to showprinciples of circulation, adjacency, lighting, and visual field. Perhaps reflecting their important rolesin design, diagrams are also employed in books to illustrate architectural concepts. For example, "TheImage of the City" [3] "Problem Seeking" [4] and "Design Thinking" [5] all depend on diagrams tocommunicate basic concepts of architectural design'. In addition to common use of diagrams inarchitectural education, diagrams are also used in professional practice. Designers in architecturefirms often work by making or copying diagrams from their design team colleagues for furtherdevelopment. We also find diagrams throughout the sketch books of famous designers such as LouisI. Kahn [6], Le Corbusier [7, 8], and Peter Eisenman [9].
1.2 Diagram-based indexing for architectural knowledge basesTo support design decision making, various architectural knowledge bases have been built,
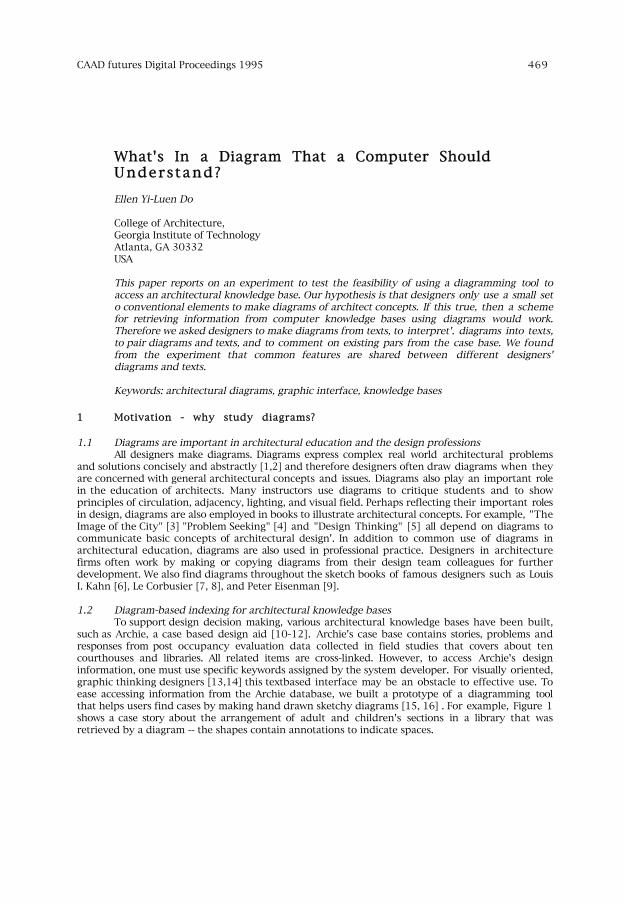
such as Archie, a case based design aid [10-12]. Archie's case base contains stories, problems andresponses from post occupancy evaluation data collected in field studies that covers about tencourthouses and libraries. All related items are cross-linked. However, to access Archie's designinformation, one must use specific keywords assigned by the system developer. For visually oriented,graphic thinking designers [13,14] this textbased interface may be an obstacle to effective use. Toease accessing information from the Archie database, we built a prototype of a diagramming toolthat helps users find cases by making hand drawn sketchy diagrams [15, 16] . For example, Figure 1shows a case story about the arrangement of adult and children's sections in a library that wasretrieved by a diagram -- the shapes contain annotations to indicate spaces.
CAAD futures Digital Proceedings 1995 470 470
Figure1I A case (jell) about the arrangement of adult and children's sections in alibrary, retrieved by a diagram (right). (A for adult and C for children).
1.3. Diagrams, sketches, and their roles in design processSeveral recent books discuss the distinction between different kinds of architectural
drawings and their uses in design. For example, Fraser and Henmi's "Envisioning Architecture" [18]looks at how techniques used to make different drawing types influence the making of architecture.Herbert's "Architectural Study Drawings" [17] examines the graphical media and design processesof six practicing architects. He argues that drawings are more than just a convenient strategy forsolving design problems and that they are in fact "the designer's principal means of thinking."Robbin's "Why Architects Draw" [19], like Herbert's book, examines the work of well-knownprofessional architects and includes architects' own descriptions of their personal design processes.Ervin's "The Structure and Function of Diagrams in Environmental Design" characterized diagramsas "abstract," "topological," and "propositional" that deal with organizing principles and relationsbetween physical elements [20]
1.4 In this study we focus on diagrams that explain design issues of environmental forces,building components, and human responsesBy "diagram" we mean a drawing that uses geometric elements to abstractly represent
natural and artificial phenomena such as sound, light, wind, and rain; building components such aswalls, windows, doors and furniture; and human behavior such as sight lines, perception of privacyand circulation, as well as territorial boundaries of space or rooms.
A diagram differs from a sketch in that it contains symbols. For example, a diagram mighthave an arrow indicating directional "force", which is unlikely to appear in a sketch. A diagram alsorepresents abstractly without giving detailed descriptions of scale or realistic pictorialrepresentations. It can be spatial, for example, showing relative positions and approximate sizes ofrooms, or it can be non-spatial, for example, showing the sequence of building construction. Adiagram indicates spatial relationships only approximately with indefinite' shapes. For example, abubble diagram represents functional spaces in a floor plan with rough sizes, adjacencies,containment, and connections. In contrast, a sketch does not use symbols or abstractions and it ismainly about spatial form. For example, a perspective sketch provides three dimensional informationabout a scene, indicating physical elements and their spatial relationships. A plan or elevation sketchmay be concerned with the proportions of a building or its components. A schematic drawing hasfeatures of both a diagram and a sketch. It uses conventional symbols to represent buildingcomponents and it has the spatial feel of a sketch. It is more complex, and more precise than adiagram, and is drawn to scale. However, there are no clear cut distinctions between diagrams,sketches and schematic drawings.
The rest of the paper is organized as follows: Section 2 describes experiments we conductedusing material from a case based design aid Archie. Section 3 presents the four major findings of theexperiments. Finally, in Section 4, we discuss the results and their implications.
2 The experiment -- how do diagrams convey ideas?
The goal of the experiment was to find out what in diagrams can be read, what symbols,designers use most, and how they use them. The aim is to find whether different designers drawdiagrams similarly. If so, in what ways? If not, can they at least interpret
CAAD futures Digital Proceedings 1995 471 471
other designers diagrams? Therefore, we performed experiments with task variations to explore=there are common features among diagrams drawn by different designers. The test materialsincluded four tasks, each consisting of six questions. In each task, the first three questions wereconcerned with architecturally problematic situations, and the second three questions with possibledesign responses to repair an architectural problem. Participants were asked to spend no more thanten minutes on each task, but this timing restriction was not enforced. The time spent byparticipants ranged from thirty minutes to one hour. Sixty-two undergraduate design studentsparticipated in the actual test. There were nineteen (31%) female students and forty-three (69%)male students ages from twenty to thirty-three. Participants for the experiments were studentsenrolled in Design Theory and Method core course offered by Environmental Design Department ofthe University of Colorado at Boulder.
The first Task (1) asked participants to illustrate given text describing either architecturalproblems or responses. For example, here is the text from Question 1.
MAPS IN POSSIBLE SPECIAL COLLECTIONA separated special map room allows control over access to valuable material but if out of
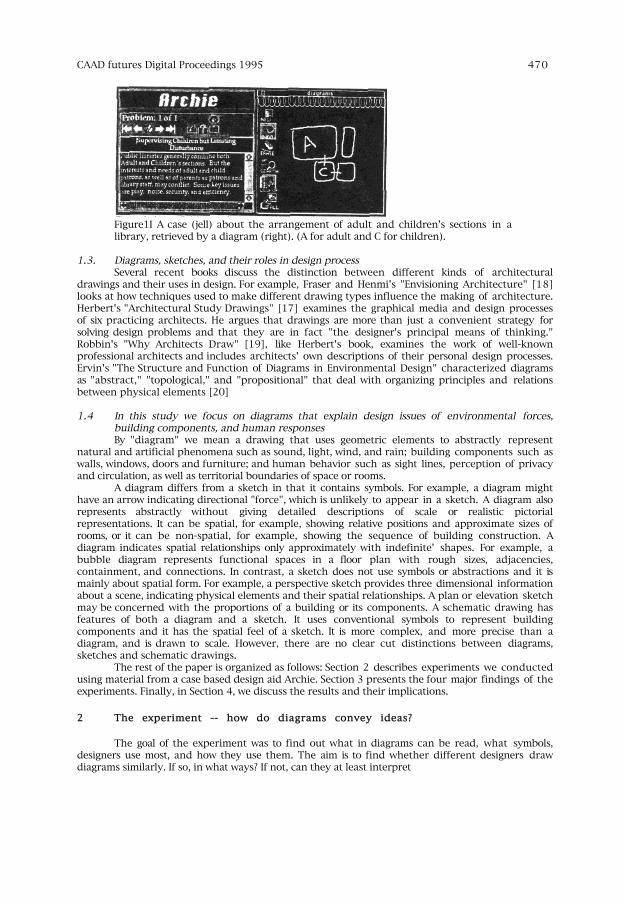
sight of normal staff areas may require an additional staff member to supervise.The second Task (2) asked participants to write a brief text description for a given
architectural diagram. They were given brief guidelines for writing text descriptions with examples.Figure 2 below shows the diagram from the first question in this task with its title.
Figure 2 Material for Task 2, Questions 1, a diagram with title.
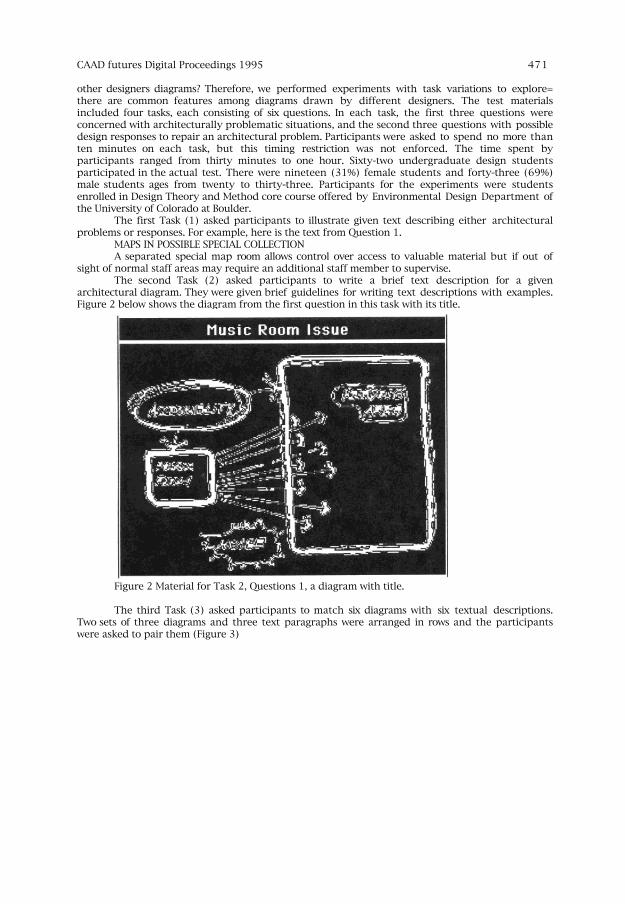
The third Task (3) asked participants to match six diagrams with six textual descriptions.Two sets of three diagrams and three text paragraphs were arranged in rows and the participantswere asked to pair them (Figure 3)
CAAD futures Digital Proceedings 1995 472 472
Figure . Example page for pairing test, Task 3, diagrams on top row, and texts onbottom row with different sequence.
The fourth and final Task (4) asked participants to comment on six given diagramtext pairs,taken from the Archie case base. For example, Figure 4 shows the actual Question 6 from this task.
3 Experiment results -- what's in a diagram that can be read?
In this section we describe our findings, with emphasis on Task 1, because it is adiagram-making experiment. Task 2 - 4 were all designed as supplementary tasks. The results oftasks 2 - 4 supported the findings of Task 1 and confirmed that designers can read others' diagrams.
We found the experiment results support. our hypotheses about diagram making. First,participants used only a small set of basic geometric shapes such as ovals and rectangles, lines andhatch marks. Second, a small set of symbols is used in conventional ways to represent sun, lighting,sight lines, noise, furniture, walls and windows, doors, and people. Third, participants interpret otherdesigners' diagrams or texts about architectural concepts in a similar way. Fourth, participantsrevealed a preference for drawing either a sectional or a plan view to illustrate different concepts.These observations suggest that a computer based diagramming tool would only need to providelimited pattern recognition facilities.
3.1 Task 1 reveals drawing elements and viewing preferences in diagram-making.The six questions in Task 1 asked participants to draw a diagram from a given text
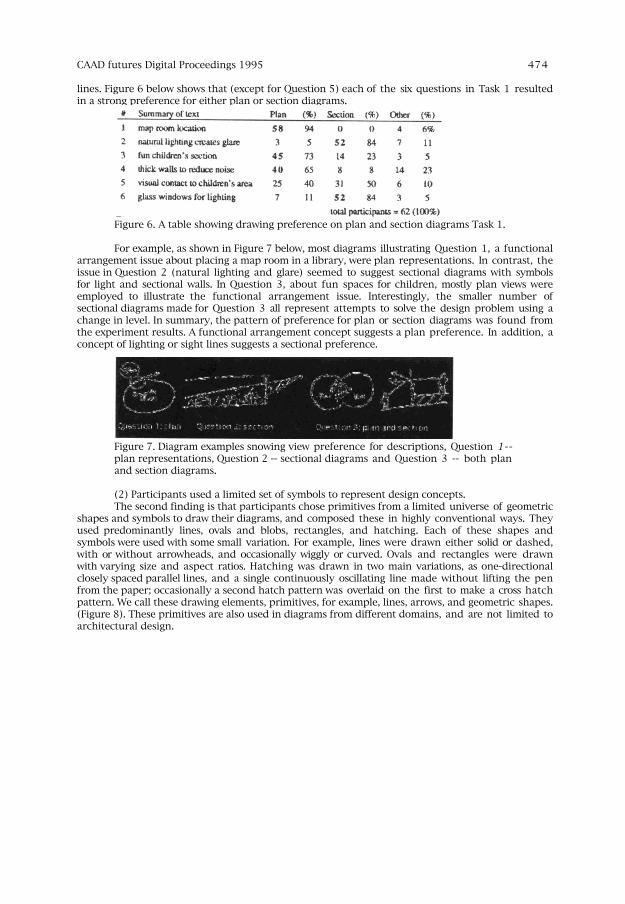
description. There was wide variation in the level of completeness, detail, and drawing competenceamong the sixty-two sets of diagrams made for Task 1. For example, as shown in Figure 5, whenasked to illustrate a text about using thick walls to reduce sound transmission between courtroomsand public areas, several participants simply drew a rectangle to indicate a thick wall. At the otherend of the spectrum, some participants interpreted the task as a design task, and produced highlydetailed configurations to solve the problem. Some even introduced concepts that were not givenexplicitly, such as putting restrooms beside the courtroom.
CAAD futures Digital Proceedings 1995 473 473
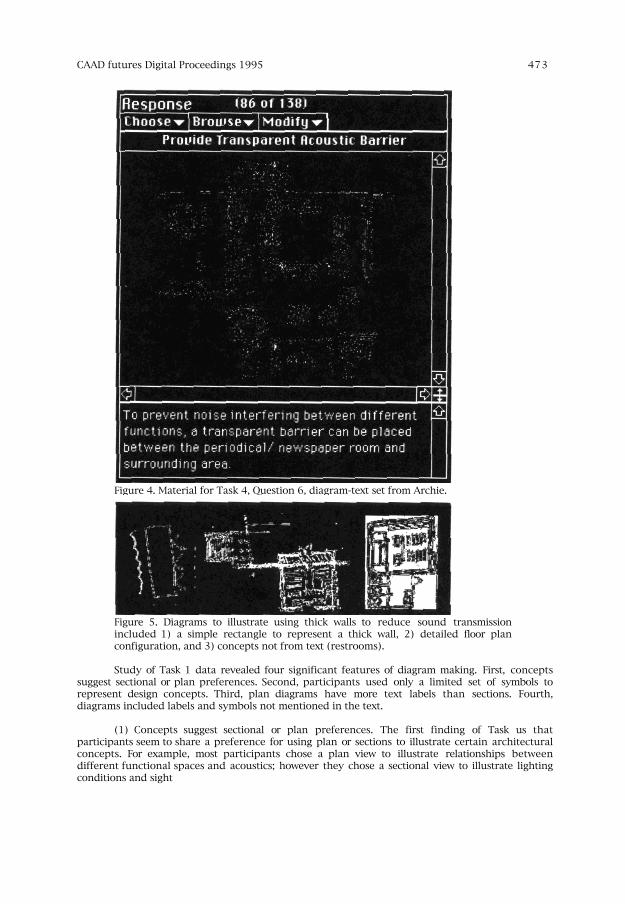
Figure 4. Material for Task 4, Question 6, diagram-text set from Archie.
Figure 5. Diagrams to illustrate using thick walls to reduce sound transmissionincluded 1) a simple rectangle to represent a thick wall, 2) detailed floor planconfiguration, and 3) concepts not from text (restrooms).
Study of Task 1 data revealed four significant features of diagram making. First, conceptssuggest sectional or plan preferences. Second, participants used only a limited set of symbols torepresent design concepts. Third, plan diagrams have more text labels than sections. Fourth,diagrams included labels and symbols not mentioned in the text.
(1) Concepts suggest sectional or plan preferences. The first finding of Task us thatparticipants seem to share a preference for using plan or sections to illustrate certain architecturalconcepts. For example, most participants chose a plan view to illustrate relationships betweendifferent functional spaces and acoustics; however they chose a sectional view to illustrate lightingconditions and sight
CAAD futures Digital Proceedings 1995 474 474
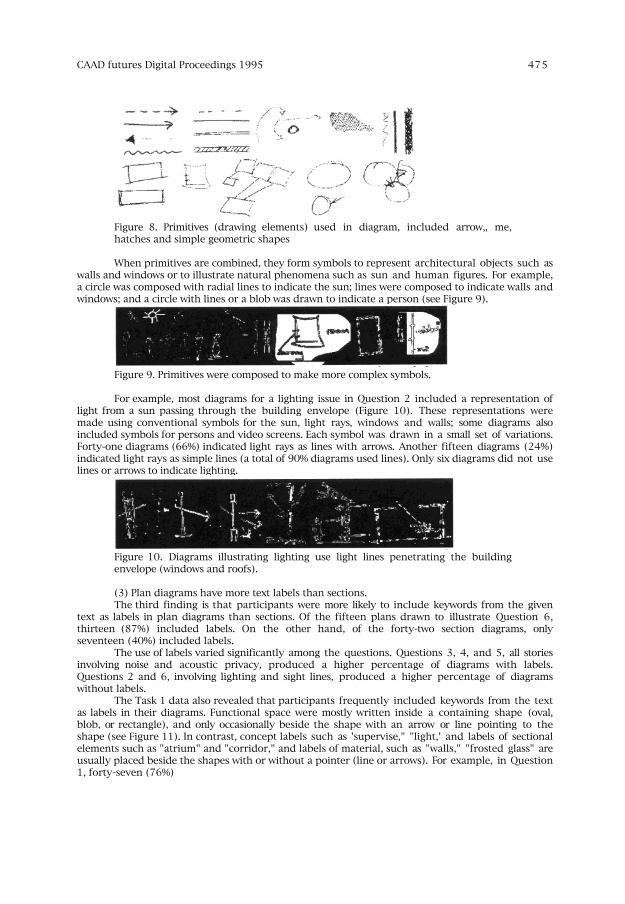
lines. Figure 6 below shows that (except for Question 5) each of the six questions in Task 1 resultedin a strong preference for either plan or section diagrams.
Figure 6. A table showing drawing preference on plan and section diagrams Task 1.
For example, as shown in Figure 7 below, most diagrams illustrating Question 1, a functionalarrangement issue about placing a map room in a library, were plan representations. In contrast, theissue in Question 2 (natural lighting and glare) seemed to suggest sectional diagrams with symbolsfor light and sectional walls. In Question 3, about fun spaces for children, mostly plan views wereemployed to illustrate the functional arrangement issue. Interestingly, the smaller number ofsectional diagrams made for Question 3 all represent attempts to solve the design problem using achange in level. In summary, the pattern of preference for plan or section diagrams was found fromthe experiment results. A functional arrangement concept suggests a plan preference. In addition, aconcept of lighting or sight lines suggests a sectional preference.
Figure 7. Diagram examples snowing view preference for descriptions, Question 1--plan representations, Question 2 -- sectional diagrams and Question 3 -- both planand section diagrams.
(2) Participants used a limited set of symbols to represent design concepts.The second finding is that participants chose primitives from a limited universe of geometric
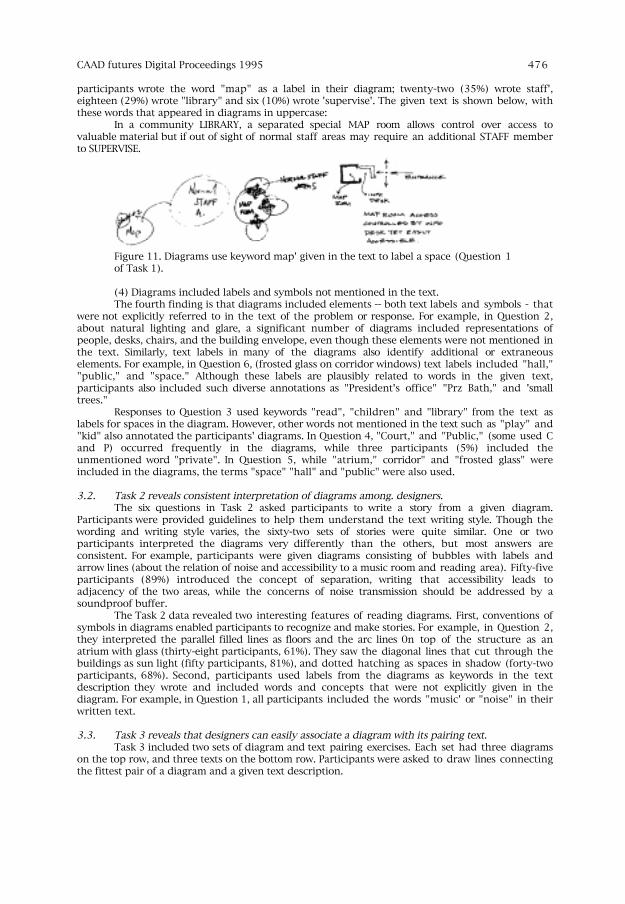
shapes and symbols to draw their diagrams, and composed these in highly conventional ways. Theyused predominantly lines, ovals and blobs, rectangles, and hatching. Each of these shapes andsymbols were used with some small variation. For example, lines were drawn either solid or dashed,with or without arrowheads, and occasionally wiggly or curved. Ovals and rectangles were drawnwith varying size and aspect ratios. Hatching was drawn in two main variations, as one-directionalclosely spaced parallel lines, and a single continuously oscillating line made without lifting the penfrom the paper; occasionally a second hatch pattern was overlaid on the first to make a cross hatchpattern. We call these drawing elements, primitives, for example, lines, arrows, and geometric shapes.(Figure 8). These primitives are also used in diagrams from different domains, and are not limited toarchitectural design.
CAAD futures Digital Proceedings 1995 475 475
Figure 8. Primitives (drawing elements) used in diagram, included arrow,, me,hatches and simple geometric shapes
When primitives are combined, they form symbols to represent architectural objects such aswalls and windows or to illustrate natural phenomena such as sun and human figures. For example,a circle was composed with radial lines to indicate the sun; lines were composed to indicate walls andwindows; and a circle with lines or a blob was drawn to indicate a person (see Figure 9).
Figure 9. Primitives were composed to make more complex symbols.
For example, most diagrams for a lighting issue in Question 2 included a representation oflight from a sun passing through the building envelope (Figure 10). These representations weremade using conventional symbols for the sun, light rays, windows and walls; some diagrams alsoincluded symbols for persons and video screens. Each symbol was drawn in a small set of variations.Forty-one diagrams (66%) indicated light rays as lines with arrows. Another fifteen diagrams (24%)indicated light rays as simple lines (a total of 90% diagrams used lines). Only six diagrams did not uselines or arrows to indicate lighting.
Figure 10. Diagrams illustrating lighting use light lines penetrating the buildingenvelope (windows and roofs).
(3) Plan diagrams have more text labels than sections.The third finding is that participants were more likely to include keywords from the given
text as labels in plan diagrams than sections. Of the fifteen plans drawn to illustrate Question 6,thirteen (87%) included labels. On the other hand, of the forty-two section diagrams, onlyseventeen (40%) included labels.
The use of labels varied significantly among the questions. Questions 3, 4, and 5, all storiesinvolving noise and acoustic privacy, produced a higher percentage of diagrams with labels.Questions 2 and 6, involving lighting and sight lines, produced a higher percentage of diagramswithout labels.
The Task 1 data also revealed that participants frequently included keywords from the textas labels in their diagrams. Functional space were mostly written inside a containing shape (oval,blob, or rectangle), and only occasionally beside the shape with an arrow or line pointing to theshape (see Figure 11). In contrast, concept labels such as 'supervise," "light,' and labels of sectionalelements such as "atrium" and "corridor," and labels of material, such as "walls," "frosted glass" areusually placed beside the shapes with or without a pointer (line or arrows). For example, in Question1, forty-seven (76%)
CAAD futures Digital Proceedings 1995 476 476
participants wrote the word "map" as a label in their diagram; twenty-two (35%) wrote staff',eighteen (29%) wrote "library" and six (10%) wrote 'supervise'. The given text is shown below, withthese words that appeared in diagrams in uppercase:
In a community LIBRARY, a separated special MAP room allows control over access tovaluable material but if out of sight of normal staff areas may require an additional STAFF memberto SUPERVISE.
Figure 11. Diagrams use keyword map' given in the text to label a space (Question 1of Task 1).
(4) Diagrams included labels and symbols not mentioned in the text.The fourth finding is that diagrams included elements -- both text labels and symbols - that
were not explicitly referred to in the text of the problem or response. For example, in Question 2,about natural lighting and glare, a significant number of diagrams included representations ofpeople, desks, chairs, and the building envelope, even though these elements were not mentioned inthe text. Similarly, text labels in many of the diagrams also identify additional or extraneouselements. For example, in Question 6, (frosted glass on corridor windows) text labels included "hall,""public," and "space." Although these labels are plausibly related to words in the given text,participants also included such diverse annotations as "President's office" "Prz Bath," and 'smalltrees."
Responses to Question 3 used keywords "read", "children" and "library" from the text aslabels for spaces in the diagram. However, other words not mentioned in the text such as "play" and"kid" also annotated the participants' diagrams. In Question 4, "Court," and "Public," (some used Cand P) occurred frequently in the diagrams, while three participants (5%) included theunmentioned word "private". In Question 5, while "atrium," corridor" and "frosted glass" wereincluded in the diagrams, the terms "space" "hall" and "public" were also used.
3.2. Task 2 reveals consistent interpretation of diagrams among. designers.The six questions in Task 2 asked participants to write a story from a given diagram.
Participants were provided guidelines to help them understand the text writing style. Though thewording and writing style varies, the sixty-two sets of stories were quite similar. One or twoparticipants interpreted the diagrams very differently than the others, but most answers areconsistent. For example, participants were given diagrams consisting of bubbles with labels andarrow lines (about the relation of noise and accessibility to a music room and reading area). Fifty-fiveparticipants (89%) introduced the concept of separation, writing that accessibility leads toadjacency of the two areas, while the concerns of noise transmission should be addressed by asoundproof buffer.
The Task 2 data revealed two interesting features of reading diagrams. First, conventions ofsymbols in diagrams enabled participants to recognize and make stories. For example, in Question 2,they interpreted the parallel filled lines as floors and the arc lines 0n top of the structure as anatrium with glass (thirty-eight participants, 61%). They saw the diagonal lines that cut through thebuildings as sun light (fifty participants, 81%), and dotted hatching as spaces in shadow (forty-twoparticipants, 68%). Second, participants used labels from the diagrams as keywords in the textdescription they wrote and included words and concepts that were not explicitly given in thediagram. For example, in Question 1, all participants included the words "music' or "noise" in theirwritten text.
3.3. Task 3 reveals that designers can easily associate a diagram with its pairing text.Task 3 included two sets of diagram and text pairing exercises. Each set had three diagrams
on the top row, and three texts on the bottom row. Participants were asked to draw lines connectingthe fittest pair of a diagram and a given text description.
CAAD futures Digital Proceedings 1995 477 477
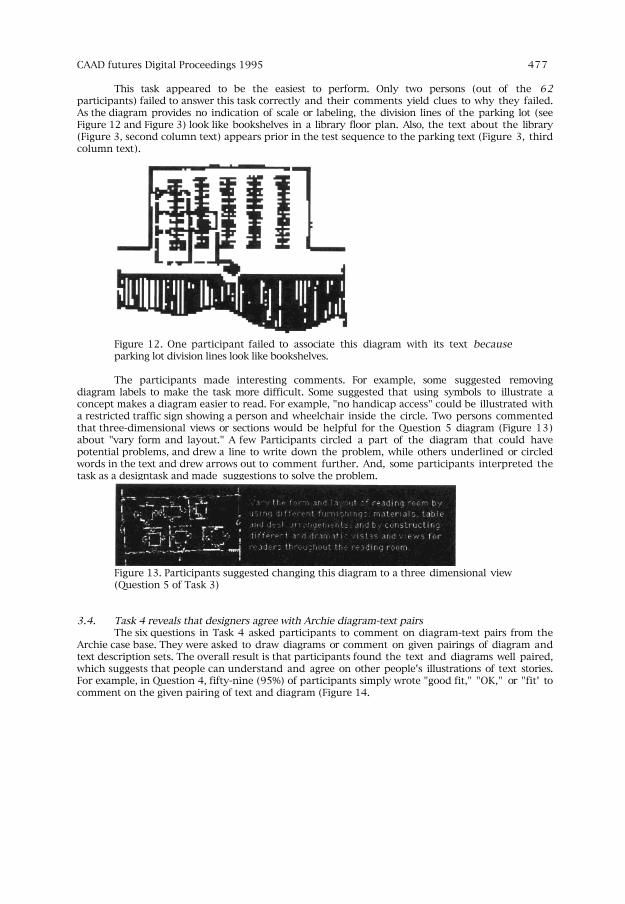
This task appeared to be the easiest to perform. Only two persons (out of the 62participants) failed to answer this task correctly and their comments yield clues to why they failed.As the diagram provides no indication of scale or labeling, the division lines of the parking lot (seeFigure 12 and Figure 3) look like bookshelves in a library floor plan. Also, the text about the library(Figure 3, second column text) appears prior in the test sequence to the parking text (Figure 3, thirdcolumn text).
Figure 12. One participant failed to associate this diagram with its text becauseparking lot division lines look like bookshelves.
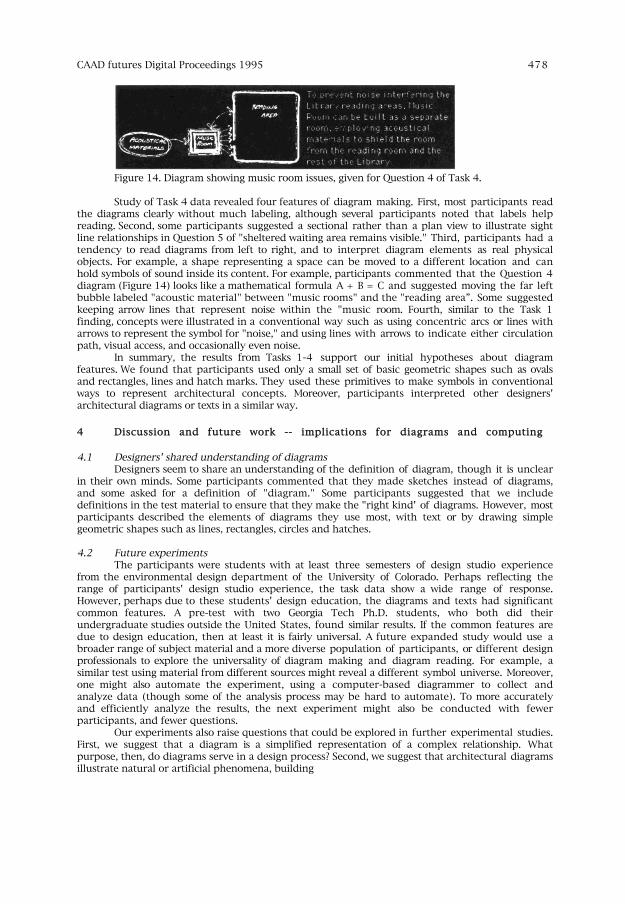
The participants made interesting comments. For example, some suggested removingdiagram labels to make the task more difficult. Some suggested that using symbols to illustrate aconcept makes a diagram easier to read. For example, "no handicap access" could be illustrated witha restricted traffic sign showing a person and wheelchair inside the circle. Two persons commentedthat three-dimensional views or sections would be helpful for the Question 5 diagram (Figure 13)about "vary form and layout." A few Participants circled a part of the diagram that could havepotential problems, and drew a line to write down the problem, while others underlined or circledwords in the text and drew arrows out to comment further. And, some participants interpreted thetask as a designtask and made suggestions to solve the problem.
Figure 13. Participants suggested changing this diagram to a three dimensional view(Question 5 of Task 3)
3.4. Task 4 reveals that designers agree with Archie diagram-text pairsThe six questions in Task 4 asked participants to comment on diagram-text pairs from the
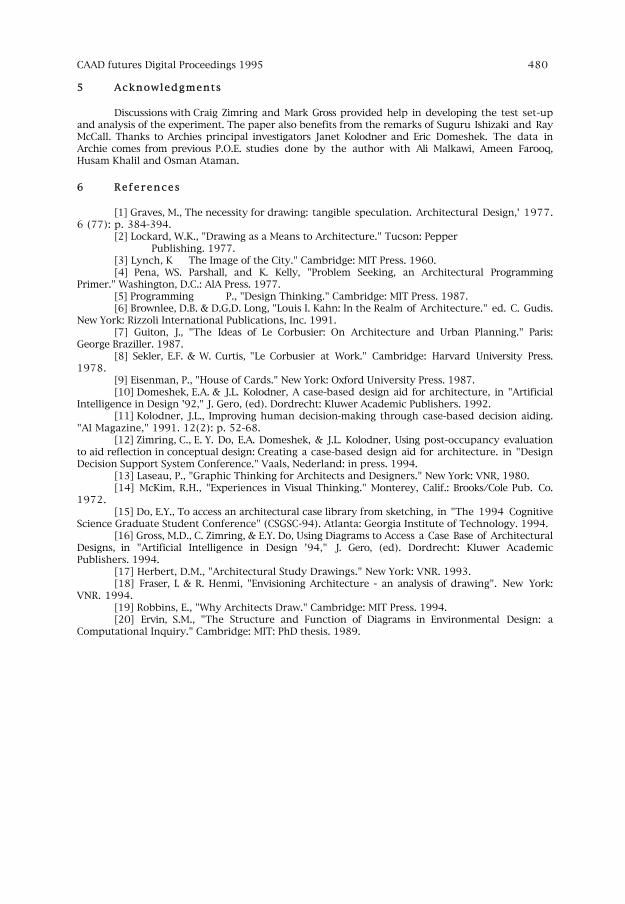
Archie case base. They were asked to draw diagrams or comment on given pairings of diagram andtext description sets. The overall result is that participants found the text and diagrams well paired,which suggests that people can understand and agree on other people's illustrations of text stories.For example, in Question 4, fifty-nine (95%) of participants simply wrote "good fit," "OK," or "fit' tocomment on the given pairing of text and diagram (Figure 14.
CAAD futures Digital Proceedings 1995 478 478
Figure 14. Diagram showing music room issues, given for Question 4 of Task 4.
Study of Task 4 data revealed four features of diagram making. First, most participants readthe diagrams clearly without much labeling, although several participants noted that labels helpreading. Second, some participants suggested a sectional rather than a plan view to illustrate sightline relationships in Question 5 of "sheltered waiting area remains visible." Third, participants had atendency to read diagrams from left to right, and to interpret diagram elements as real physicalobjects. For example, a shape representing a space can be moved to a different location and canhold symbols of sound inside its content. For example, participants commented that the Question 4diagram (Figure 14) looks like a mathematical formula A + B = C and suggested moving the far leftbubble labeled "acoustic material" between "music rooms" and the "reading area”. Some suggestedkeeping arrow lines that represent noise within the "music room. Fourth, similar to the Task 1finding, concepts were illustrated in a conventional way such as using concentric arcs or lines witharrows to represent the symbol for "noise," and using lines with arrows to indicate either circulationpath, visual access, and occasionally even noise.
In summary, the results from Tasks 1-4 support our initial hypotheses about diagramfeatures. We found that participants used only a small set of basic geometric shapes such as ovalsand rectangles, lines and hatch marks. They used these primitives to make symbols in conventionalways to represent architectural concepts. Moreover, participants interpreted other designers'architectural diagrams or texts in a similar way.
4 Discussion and future work -- implications for diagrams and computing
4.1 Designers' shared understanding of diagramsDesigners seem to share an understanding of the definition of diagram, though it is unclear
in their own minds. Some participants commented that they made sketches instead of diagrams,and some asked for a definition of "diagram." Some participants suggested that we includedefinitions in the test material to ensure that they make the "right kind' of diagrams. However, mostparticipants described the elements of diagrams they use most, with text or by drawing simplegeometric shapes such as lines, rectangles, circles and hatches.
4.2 Future experimentsThe participants were students with at least three semesters of design studio experience
from the environmental design department of the University of Colorado. Perhaps reflecting therange of participants' design studio experience, the task data show a wide range of response.However, perhaps due to these students' design education, the diagrams and texts had significantcommon features. A pre-test with two Georgia Tech Ph.D. students, who both did theirundergraduate studies outside the United States, found similar results. If the common features aredue to design education, then at least it is fairly universal. A future expanded study would use abroader range of subject material and a more diverse population of participants, or different designprofessionals to explore the universality of diagram making and diagram reading. For example, asimilar test using material from different sources might reveal a different symbol universe. Moreover,one might also automate the experiment, using a computer-based diagrammer to collect andanalyze data (though some of the analysis process may be hard to automate). To more accuratelyand efficiently analyze the results, the next experiment might also be conducted with fewerparticipants, and fewer questions.
Our experiments also raise questions that could be explored in further experimental studies.First, we suggest that a diagram is a simplified representation of a complex relationship. Whatpurpose, then, do diagrams serve in a design process? Second, we suggest that architectural diagramsillustrate natural or artificial phenomena, building

CAAD futures Digital Proceedings 1995 479 479
components and human behavior. Are diagrams limited to these concepts? Third, what is thestructure of a diagram? Is there a grammatical rule and syntax for diagrams? Fourth, doesdiagramming reflect specific theoretical positions in design? For instance, do diagrams reflectparticular education, training, or style for arranging layouts and form? Fifth, to what extent isdiagramming a matter of individual style and preference?
4.3 Future work - diagrams as an index to design information systems.We began this study of designers' diagrams to explore the feasibility of using diagrams to
access a design information system. We found that diagrams are use conventionally among designers,which supports the feasibility of computer support for visual note taking, and for indexing adatabase of design information. Our study shows that designers can read other designer's diagramsand that they often use symbols to illustrate their ideas. In our experiment many participants agreedthat diagrams are useful and that existing Draw and CAD programs should provide the ability todiagram. This suggests that a computational environment that supports and recognizes hand drawndiagrams would be useful.
We have built Archies Napkin, a prototype system linking a diagramming tool to Archie [15,16] . It recognizes a small set of diagrams that serve as symbols indexing Archie's case base. Forexample, a designer concerned about connecting two functional spaces by a path might draw twocircles or shapes connected by a line. Archie uses the diagram to find stories about how corridorsconnect two rooms in the background while designers remain in design drawing activities. Althoughwe have illustrated the idea of diagram indexing with a case based system, we could also usediagrams to access other design information knowledge bases.
We currently have several items on our agenda to augment our prototype. First, to expandArchie's Napkin diagrammer with more diagramming abilities such as indexing, note-taking andcases-accessing, we need to further study the features of diagrams. We would examine how speedand the drawing pressure reflects the thinking involved during the design activities. The questionsof how diagrams are transformed to sketches an schematic drawing and construction drafting stillremains for exploration. To understand more about the role of drawing in design, we need to lookalso at sketches and other types of drawing, not only at diagrams. We would also explore automatingthe diagram indexing process.
Second, we would develop a more structured organization of diagram primitives. Forexample, the recognized features of diagrams could include spatial relationships such as adjacencies,proximity, relative size, and alignment constraints. A structural engineering diagram could includedifferent symbols for material, joints and mounting; an urban design diagram could include symbolsfor landmarks, axis and edges. We would define more useful
Primitive objects found in design folios and office tracing papers and build a larger symbollibrary.
Third, we would perform usability tests for our retrieval by diagram scheme. We woulddevelop experiments to find how a diagramming interface can help designers find relevant issuesfrom Archie. An architectural story can be accessed in different ways, each of which has differentvirtues. For example, a keyword search is powerful when the designers know exactly what the designproblems are. A diagram might support different reading based on context and shape information.Designers might be reminded of a case story by recognizing simple geometric shapes and spatialrelationships before they find the correct text specification.
To sum up, our goal is an "intelligent" user interface that recognizes design diagrams andprovides selection of retrieval choices. We are currently exploring how to weigh similarity betweendifferent diagram primitives, and finding efficient ways to parse a diagram. We believe thediagramming tool should be integrated with the design information system. To further supportdesigning, designers should be able to find relevant stories from the case base, copy diagrams intothe sketch environment, and enhance and develop diagrams into more precise drawings. In thebackground, a design knowledge base would watch, find, and display examples of relevant designstories.
CAAD futures Digital Proceedings 1995 480 480
5 Acknowledgments
Discussions with Craig Zimring and Mark Gross provided help in developing the test set-upand analysis of the experiment. The paper also benefits from the remarks of Suguru Ishizaki and RayMcCall. Thanks to Archies principal investigators Janet Kolodner and Eric Domeshek. The data inArchie comes from previous P.O.E. studies done by the author with Ali Malkawi, Ameen Farooq,Husam Khalil and Osman Ataman.
6 Re fe rences
[1] Graves, M., The necessity for drawing: tangible speculation. Architectural Design,' 1977.6 (77): p. 384-394.
[2] Lockard, W.K., "Drawing as a Means to Architecture." Tucson: PepperPublishing. 1977.
[3] Lynch, K The Image of the City." Cambridge: MIT Press. 1960.[4] Pena, WS. Parshall, and K. Kelly, "Problem Seeking, an Architectural Programming
Primer." Washington, D.C.: AlA Press. 1977.[5] Programming P., "Design Thinking." Cambridge: MIT Press. 1987.[6] Brownlee, D.B. & D.G.D. Long, "Louis I. Kahn: In the Realm of Architecture." ed. C. Gudis.
New York: Rizzoli International Publications, Inc. 1991.[7] Guiton, J., "The Ideas of Le Corbusier: On Architecture and Urban Planning." Paris:
George Braziller. 1987.[8] Sekler, E.F. & W. Curtis, "Le Corbusier at Work." Cambridge: Harvard University Press.
1978.[9] Eisenman, P., "House of Cards." New York: Oxford University Press. 1987.[10] Domeshek, E.A. & J.L. Kolodner, A case-based design aid for architecture, in "Artificial
Intelligence in Design '92," J. Gero, (ed). Dordrecht: Kluwer Academic Publishers. 1992.[11] Kolodner, J.L., Improving human decision-making through case-based decision aiding.
"Al Magazine," 1991. 12(2): p. 52-68.[12] Zimring, C., E. Y. Do, E.A. Domeshek, & J.L. Kolodner, Using post-occupancy evaluation
to aid reflection in conceptual design: Creating a case-based design aid for architecture. in "DesignDecision Support System Conference." Vaals, Nederland: in press. 1994.
[13] Laseau, P., "Graphic Thinking for Architects and Designers." New York: VNR, 1980.[14] McKim, R.H., "Experiences in Visual Thinking." Monterey, Calif.: Brooks/Cole Pub. Co.
1972.[15] Do, E.Y., To access an architectural case library from sketching, in "The 1994 Cognitive
Science Graduate Student Conference" (CSGSC-94). Atlanta: Georgia Institute of Technology. 1994.[16] Gross, M.D., C. Zimring, & E.Y. Do, Using Diagrams to Access a Case Base of Architectural
Designs, in "Artificial Intelligence in Design '94," J. Gero, (ed). Dordrecht: Kluwer AcademicPublishers. 1994.
[17] Herbert, D.M., "Architectural Study Drawings." New York: VNR. 1993.[18] Fraser, I. & R. Henmi, "Envisioning Architecture - an analysis of drawing". New York:
VNR. 1994.[19] Robbins, E., "Why Architects Draw." Cambridge: MIT Press. 1994.[20] Ervin, S.M., "The Structure and Function of Diagrams in Environmental Design: a
Computational Inquiry." Cambridge: MIT: PhD thesis. 1989.