wednesday • january 19, 2022 mumbai - ongc
TRANSCRIPT
................BM-BMECMYK
WEDNESDAY • JANUARY 19, 2022
MUMBAI
₹�10 • Pages 12 • Volume 29 • Number 18 Bengaluru Chennai Coimbatore Hubballi Hyderabad Kochi Kolkata Madurai Malappuram Mangaluru Mumbai Noida Thiruvananthapuram Tiruchirapalli Tirupati Vijayawada Visakhapatnam Regd. TN/ARD/14/09-11, RNI No. 55320/94

................BM-BMECMYK
MUMBAI
BusinessLineJ2 WEDNESDAY • JANUARY 19 • 2022
SHISHIR SINHA
New Delhi, January 18
Armed with the SupremeCourt ruling in the Devas case, the government is considering invoking provisions ofthe Companies Act to seizethe personal assets of individuals associated with thecompany and those involvedin the decision to seal thedeal between it and Antrix,the commercial arm of ISRO.
A day after the apex courtupheld a National CompanyLaw Tribunal decision towind up Devas (Digitally Enhanced Video and Audio Services, Finance MinisterNirmala Sitharamanlaunched a blistering attackon the Congress for handingover airwaves used by the Defence Ministry to a privatefi�rm.
“After 1011 years ofstruggle, the Supreme Courthas come out with a decisionon the case. This indicateshow the Congress misusedits position when in power,”
the Finance Minister said.
Key spectrum handed overShe said Antrix entered intoan agreement with Devas forproviding multimedia services to mobile users forwhich it was given the Sbandsatellite spectrum withoutthe knowledge of the UnionCabinet. She said the Congress took six years to cancelthe deal and the then government did not initiate steps tofi�ght the arbitration proceedings the private company
had initiated against the cancellation. “It is a fraud of Congress, by Congress (and) forCongress,” Sitharaman said,as she read out from the Supreme Court decision.
Arbitration proceedingsDevas had initiated arbitration against the annulmentat the International Chambers of Commerce (ICC).Sitharaman said the commercial terminal award wasfor a total of $1 billion, while$93.3 million plus cost and in
terest was awarded againstIndia in the arbitrationbrought under the IndiaGermany BIT. Besides, $111.2 million plus cost and interestwas awarded in the arbitration under IndiaMauritiusBIT.
Devas shareholders arepursuing Indian governmentassets abroad to recover theawards and have got a Frenchcourt order for freezing properties in Paris and got partialrights over funds maintainedby Air India in Canada. TheSupreme Court has given acomprehensive verdict upholding the liquidation ofDevas ordered by NCLT,Sitharaman said, adding thatthis would be cited in the international courts to challenge the enforcement actions of the private fi�rm.
Winding up process onGovernment offi�cials said thewinding up process of Devas,which will entail seizure ofassets, including fi�xed deposits, has already begun withan authorisation given onTuesday and a liquidatoralready in place. “Legal opinion for using Section 339 ofthe Companies Act will besought. This provision prescribes seizure of the personal assets of people engaged in decision making,”said an offi�cial.
Section 339 of the Companies Act 2013 deals with the ‘Liability for Fraudulent Conduct of Business’.
Govt looking to attach personalassets of Devas managers: FM
WX“It is a fraud of Congress,
by Congress (and) for
Congress,” Nirmala
Sitharaman said, as she
read out paragraphs
from the Supreme
Court’s verdict
Mulling invoking
Section 339 of the
Companies Act
BusinessLine was the first newspaper to break the story on the
scandalous Antrix-Devas deal on May 31, 2010
................BM-BMECMYK
Bengaluru Chennai Coimbatore Hubballi Hyderabad Kochi Kolkata Madurai Malappuram Mangaluru Mumbai Noida Thiruvananthapuram Tiruchirapalli Tirupati Vijayawada Visakhapatnam
WEDNESDAY • JANUARY 19, 2022
MUMBAI
₹�10 • Pages 12 • Volume 29 • Number 18
COSTLY RAW MATERIALS
Tata Motors, India’s third largest
carmaker, is the latest to announce a
price hike of passenger vehicles p2
BOND YIELDS ON A HIGH
The weighted average cutoff yield of
10year State Development Loans hardened
by 9 basis points to 7.24% at the auction p3
ALL CHARGED UP
India’s power demand is expected
to grow at an annual rate of 6.5%
between 2022 and 2024, says IEA p9
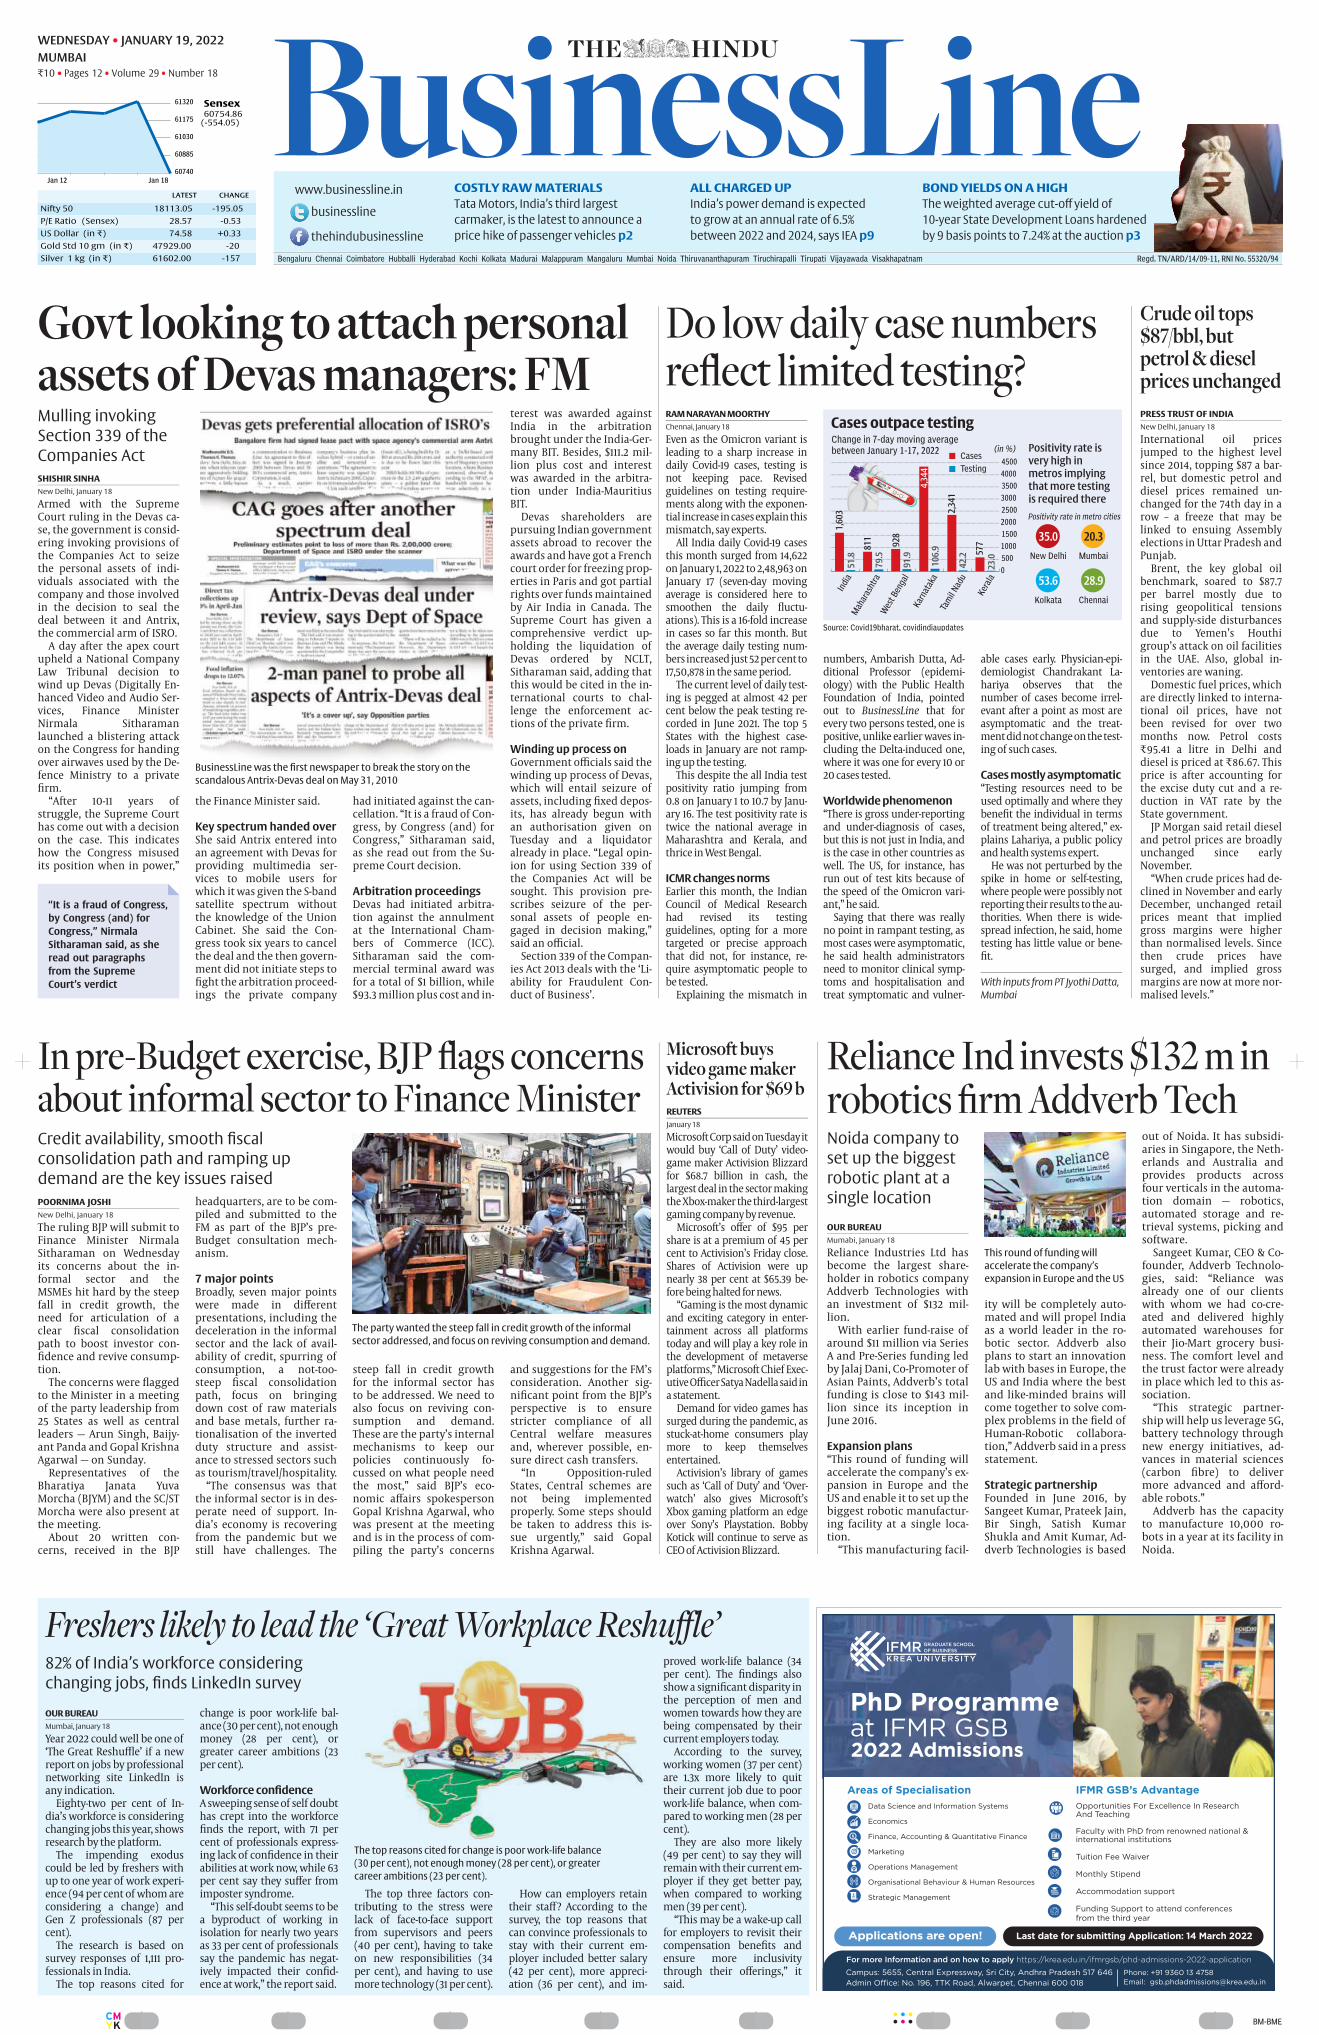
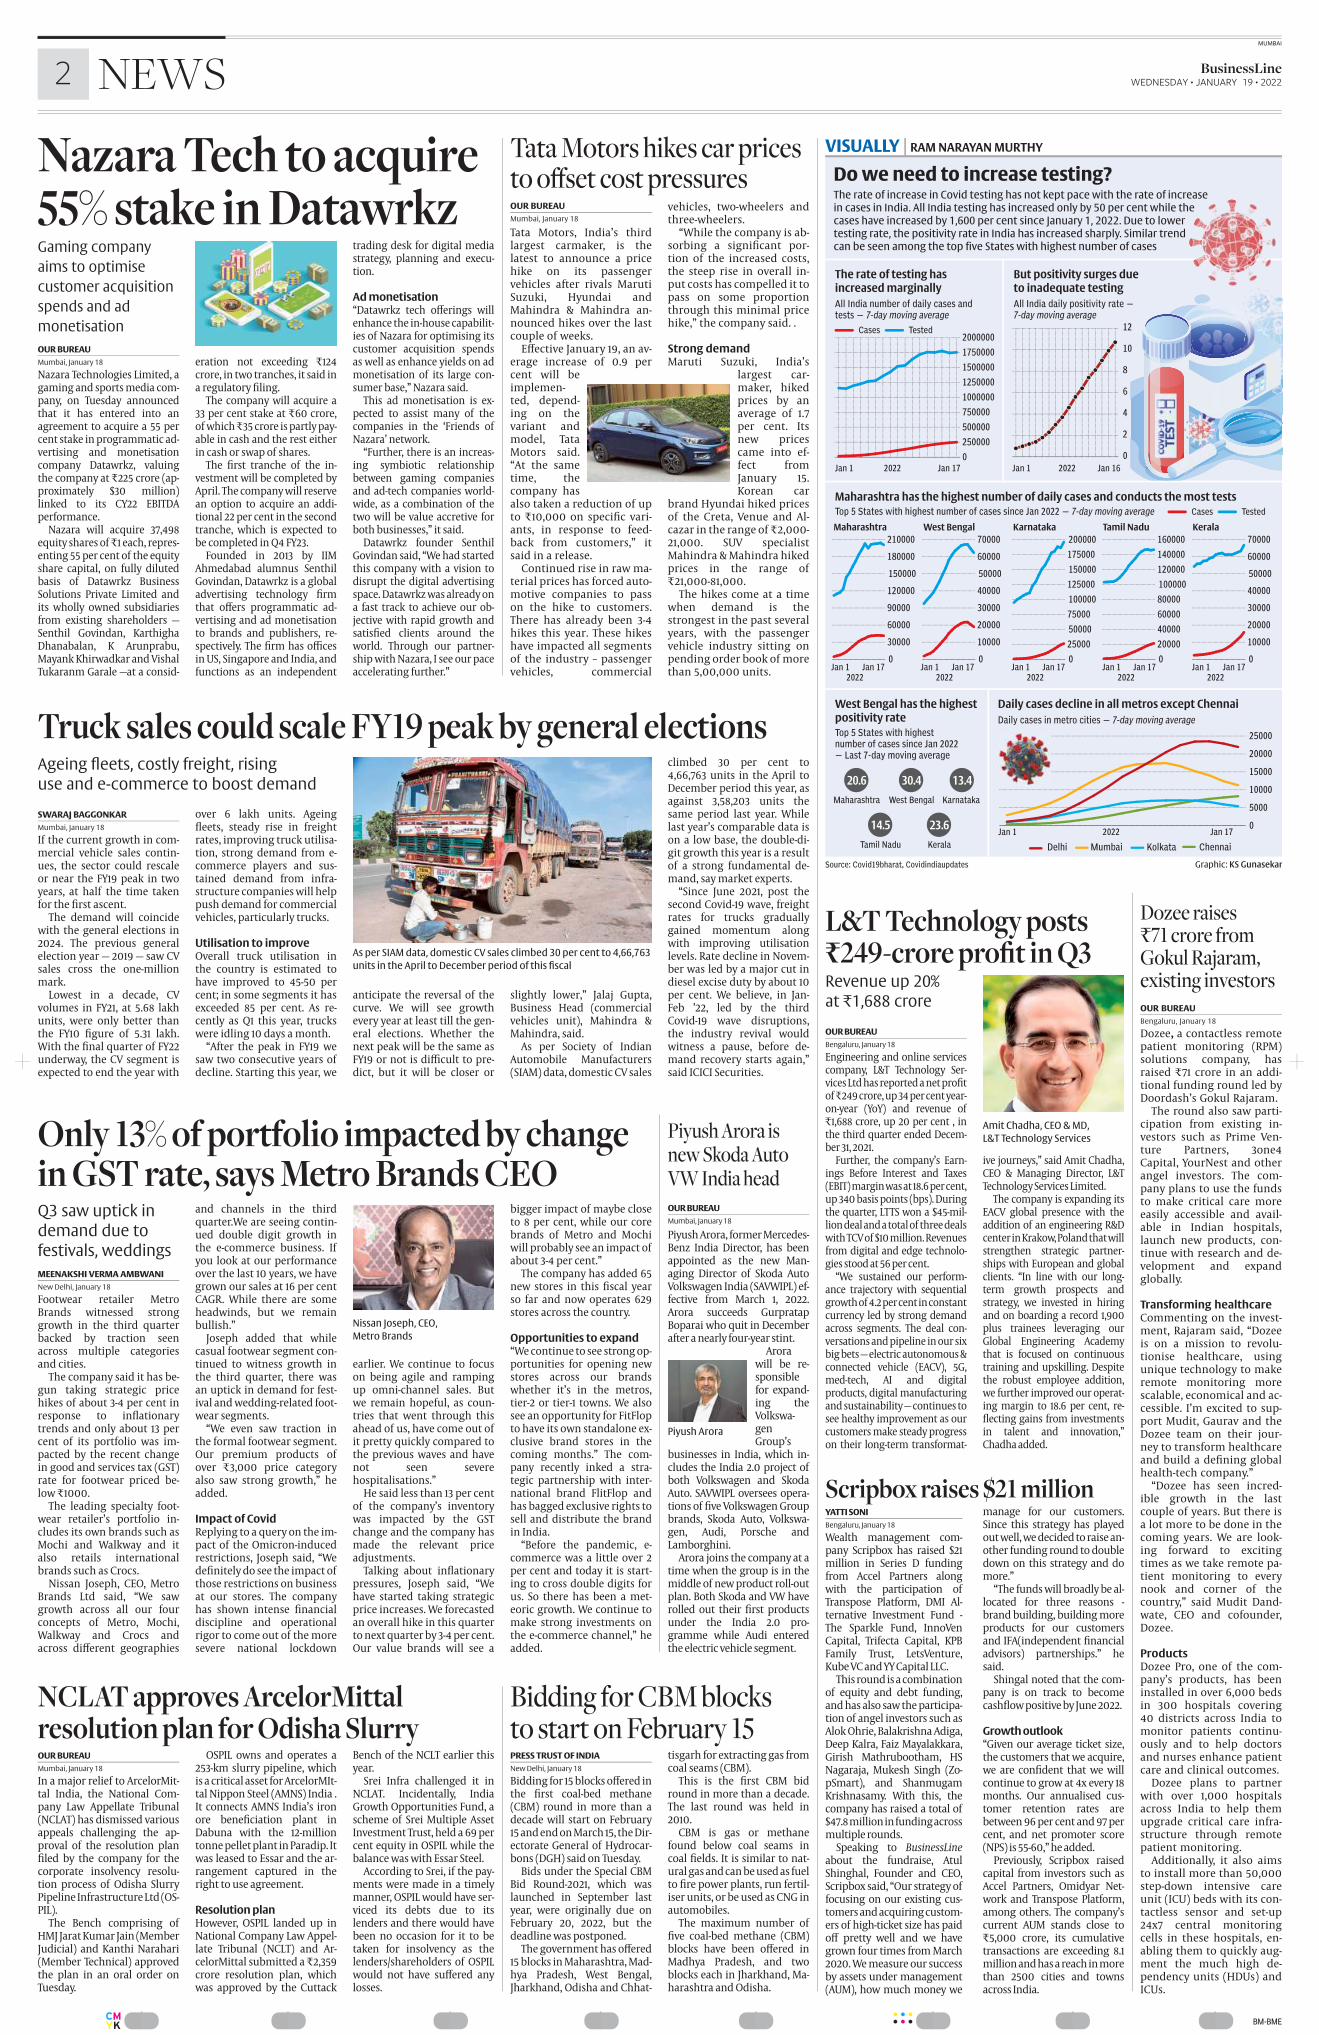
RAM NARAYAN MOORTHY
Chennai, January 18
Even as the Omicron variant isleading to a sharp increase indaily Covid19 cases, testing isnot keeping pace. Revisedguidelines on testing requirements along with the exponential increase in cases explain thismismatch, say experts.
All India daily Covid19 casesthis month surged from 14,622on January 1, 2022 to 2,48,963 onJanuary 17 (sevenday movingaverage is considered here tosmoothen the daily fl�uctuations). This is a 16fold increasein cases so far this month. Butthe average daily testing numbers increased just 52 per cent to17,50,878 in the same period.
The current level of daily testing is pegged at almost 42 percent below the peak testing recorded in June 2021. The top 5States with the highest caseloads in January are not ramping up the testing.
This despite the all India testpositivity ratio jumping from0.8 on January 1 to 10.7 by January 16. The test positivity rate istwice the national average inMaharashtra and Kerala, andthrice in West Bengal.
ICMR changes normsEarlier this month, the IndianCouncil of Medical Researchhad revised its testingguidelines, opting for a moretargeted or precise approachthat did not, for instance, require asymptomatic people tobe tested.
Explaining the mismatch in
numbers, Ambarish Dutta, Additional Professor (epidemiology) with the Public HealthFoundation of India, pointedout to BusinessLine that forevery two persons tested, one ispositive, unlike earlier waves including the Deltainduced one,where it was one for every 10 or20 cases tested.
Worldwide phenomenon“There is gross underreportingand underdiagnosis of cases,but this is not just in India, andis the case in other countries aswell. The US, for instance, hasrun out of test kits because ofthe speed of the Omicron variant,” he said.
Saying that there was reallyno point in rampant testing, asmost cases were asymptomatic,he said health administratorsneed to monitor clinical symptoms and hospitalisation andtreat symptomatic and vulner
able cases early. Physicianepidemiologist Chandrakant Lahariya observes that thenumber of cases become irrelevant after a point as most areasymptomatic and the treatment did not change on the testing of such cases.
Cases mostly asymptomatic“Testing resources need to beused optimally and where theybenefi�t the individual in termsof treatment being altered,” explains Lahariya, a public policyand health systems expert.
He was not perturbed by thespike in home or selftesting,where people were possibly notreporting their results to the authorities. When there is widespread infection, he said, hometesting has little value or benefi�t.
With inputs from PT Jyothi Datta,
Mumbai
Do low daily case numbersreflect limited testing?
OUR BUREAU
Mumbai, January 18
Year 2022 could well be one of‘The Great Reshuffl�e’ if a newreport on jobs by professionalnetworking site LinkedIn isany indication.
Eightytwo per cent of India’s workforce is consideringchanging jobs this year, showsresearch by the platform.
The impending exoduscould be led by freshers withup to one year of work experience (94 per cent of whom areconsidering a change) andGen Z professionals (87 percent).
The research is based onsurvey responses of 1,111 professionals in India.
The top reasons cited for
change is poor worklife balance (30 per cent), not enoughmoney (28 per cent), orgreater career ambitions (23per cent).
Workforce confidenceA sweeping sense of self doubthas crept into the workforcefi�nds the report, with 71 percent of professionals expressing lack of confi�dence in theirabilities at work now, while 63per cent say they suff�er fromimposter syndrome.
“This selfdoubt seems to bea byproduct of working inisolation for nearly two yearsas 33 per cent of professionalssay the pandemic has negatively impacted their confi�dence at work,” the report said.
The top three factors contributing to the stress werelack of facetoface supportfrom supervisors and peers(40 per cent), having to takeon new responsibilities (34per cent), and having to usemore technology (31 per cent).
How can employers retaintheir staff�? According to thesurvey, the top reasons thatcan convince professionals tostay with their current employer included better salary(42 per cent), more appreciation (36 per cent), and im
proved worklife balance (34per cent). The fi�ndings alsoshow a signifi�cant disparity inthe perception of men andwomen towards how they arebeing compensated by theircurrent employers today.
According to the survey,working women (37 per cent)are 1.3x more likely to quittheir current job due to poorworklife balance, when compared to working men (28 percent).
They are also more likely(49 per cent) to say they willremain with their current employer if they get better pay,when compared to workingmen (39 per cent).
“This may be a wakeup callfor employers to revisit theircompensation benefi�ts andensure more inclusivitythrough their off�erings,” itsaid.
Freshers likely to lead the ‘Great Workplace Reshuffle’
The top reasons cited for change is poor work-life balance
(30 per cent), not enough money (28 per cent), or greater
career ambitions (23 per cent).
82% of India’s workforce considering
changing jobs, fi�nds LinkedIn survey
OUR BUREAU
Mumabi, January 18
Reliance Industries Ltd hasbecome the largest shareholder in robotics companyAddverb Technologies withan investment of $132 million.
With earlier fundraise ofaround $11 million via SeriesA and PreSeries funding ledby Jalaj Dani, CoPromoter ofAsian Paints, Addverb’s totalfunding is close to $143 million since its inception inJune 2016.
Expansion plans“This round of funding willaccelerate the company’s expansion in Europe and theUS and enable it to set up thebiggest robotic manufacturing facility at a single location.
“This manufacturing facil
ity will be completely automated and will propel Indiaas a world leader in the robotic sector. Addverb alsoplans to start an innovationlab with bases in Europe, theUS and India where the bestand likeminded brains willcome together to solve complex problems in the fi�eld ofHumanRobotic collaboration,” Addverb said in a pressstatement.
Strategic partnershipFounded in June 2016, bySangeet Kumar, Prateek Jain,Bir Singh, Satish KumarShukla and Amit Kumar, Addverb Technologies is based
out of Noida. It has subsidiaries in Singapore, the Netherlands and Australia andprovides products acrossfour verticals in the automation domain — robotics,automated storage and retrieval systems, picking andsoftware.
Sangeet Kumar, CEO & Cofounder, Addverb Technologies, said: “Reliance wasalready one of our clientswith whom we had cocreated and delivered highlyautomated warehouses fortheir JioMart grocery business. The comfort level andthe trust factor were alreadyin place which led to this association.
“This strategic partnership will help us leverage 5G,battery technology throughnew energy initiatives, advances in material sciences(carbon fi�bre) to delivermore advanced and aff�ordable robots.”
Addverb has the capacityto manufacture 10,000 robots in a year at its facility inNoida.
Reliance Ind invests $132 m inrobotics firm Addverb TechNoida company to
set up the biggest
robotic plant at a
single location
This round of funding will
accelerate the company’s
expansion in Europe and the US
PRESS TRUST OF INDIA
New Delhi, January 18
International oil pricesjumped to the highest levelsince 2014, topping $87 a barrel, but domestic petrol anddiesel prices remained unchanged for the 74th day in arow – a freeze that may belinked to ensuing Assemblyelections in Uttar Pradesh andPunjab.
Brent, the key global oilbenchmark, soared to $87.7per barrel mostly due torising geopolitical tensionsand supplyside disturbancesdue to Yemen’s Houthigroup’s attack on oil facilitiesin the UAE. Also, global inventories are waning.
Domestic fuel prices, whichare directly linked to international oil prices, have notbeen revised for over twomonths now. Petrol costs₹95.41 a litre in Delhi anddiesel is priced at ₹86.67. Thisprice is after accounting forthe excise duty cut and a reduction in VAT rate by theState government.
JP Morgan said retail dieseland petrol prices are broadlyunchanged since earlyNovember.
“When crude prices had declined in November and earlyDecember, unchanged retailprices meant that impliedgross margins were higherthan normalised levels. Sincethen crude prices havesurged, and implied grossmargins are now at more normalised levels.”
Crude oil tops$87/bbl, butpetrol & dieselprices unchanged
REUTERS
January 18
Microsoft Corp said on Tuesday itwould buy ‘Call of Duty’ videogame maker Activision Blizzardfor $68.7 billion in cash, thelargest deal in the sector makingthe Xboxmaker the thirdlargestgaming company by revenue.
Microsoft’s off�er of $95 pershare is at a premium of 45 percent to Activision’s Friday close.Shares of Activision were upnearly 38 per cent at $65.39 before being halted for news.
“Gaming is the most dynamicand exciting category in entertainment across all platformstoday and will play a key role inthe development of metaverseplatforms,” Microsoft Chief Executive Offi�cer Satya Nadella said ina statement.
Demand for video games hassurged during the pandemic, asstuckathome consumers playmore to keep themselvesentertained.
Activision’s library of gamessuch as ‘Call of Duty’ and ‘Overwatch’ also gives Microsoft’sXbox gaming platform an edgeover Sony’s Playstation. BobbyKotick will continue to serve asCEO of Activision Blizzard.
Microsoft buysvideo game makerActivision for $69 b
POORNIMA JOSHI
New Delhi, January 18
The ruling BJP will submit toFinance Minister NirmalaSitharaman on Wednesdayits concerns about the informal sector and theMSMEs hit hard by the steepfall in credit growth, theneed for articulation of aclear fi�scal consolidationpath to boost investor confi�dence and revive consumption.
The concerns were fl�aggedto the Minister in a meetingof the party leadership from25 States as well as centralleaders — Arun Singh, Baijyant Panda and Gopal KrishnaAgarwal — on Sunday.
Representatives of theBharatiya Janata YuvaMorcha (BJYM) and the SC/STMorcha were also present atthe meeting.
About 20 written concerns, received in the BJP
headquarters, are to be compiled and submitted to theFM as part of the BJP’s preBudget consultation mechanism.
7 major pointsBroadly, seven major pointswere made in diff�erentpresentations, including thedeceleration in the informalsector and the lack of availability of credit, spurring ofconsumption, a nottoosteep fi�scal consolidationpath, focus on bringingdown cost of raw materialsand base metals, further rationalisation of the invertedduty structure and assistance to stressed sectors suchas tourism/travel/hospitality.
“The consensus was thatthe informal sector is in desperate need of support. India’s economy is recoveringfrom the pandemic but westill have challenges. The
steep fall in credit growthfor the informal sector hasto be addressed. We need toalso focus on reviving consumption and demand.These are the party’s internalmechanisms to keep ourpolicies continuously focussed on what people needthe most,” said BJP’s economic aff�airs spokespersonGopal Krishna Agarwal, whowas present at the meetingand is in the process of compiling the party’s concerns
and suggestions for the FM’sconsideration. Another signifi�cant point from the BJP’sperspective is to ensurestricter compliance of allCentral welfare measuresand, wherever possible, ensure direct cash transfers.
“In OppositionruledStates, Central schemes arenot being implementedproperly. Some steps shouldbe taken to address this issue urgently,” said GopalKrishna Agarwal.
In pre-Budget exercise, BJP flags concernsabout informal sector to Finance Minister
The party wanted the steep fall in credit growth of the informal
sector addressed, and focus on reviving consumption and demand.
Credit availability, smooth fi�scal
consolidation path and ramping up
demand are the key issues raised
Regd. TN/ARD/14/09-11, RNI No. 55320/94
................BM-BMECMYK
MUMBAI
2 BusinessLine WEDNESDAY • JANUARY 19 • 2022NEWS
OUR BUREAU
Mumbai, January 18
Tata Motors, India’s thirdlargest carmaker, is thelatest to announce a pricehike on its passengervehicles after rivals MarutiSuzuki, Hyundai andMahindra & Mahindra announced hikes over the lastcouple of weeks.
Eff�ective January 19, an average increase of 0.9 percent will beimplemented, depending on thevariant andmodel, TataMotors said.“At the sametime, thecompany hasalso taken a reduction of upto ₹�10,000 on specifi�c variants, in response to feedback from customers,” itsaid in a release.
Continued rise in raw material prices has forced automotive companies to passon the hike to customers.There has already been 34hikes this year. These hikeshave impacted all segmentsof the industry – passengervehicles, commercial
vehicles, twowheelers andthreewheelers.
“While the company is absorbing a signifi�cant portion of the increased costs,the steep rise in overall input costs has compelled it topass on some proportionthrough this minimal pricehike,” the company said. .
Strong demandMaruti Suzuki, India’s
largest carmaker, hikedprices by anaverage of 1.7per cent. Itsnew pricescame into effect fromJanuary 15.Korean car
brand Hyundai hiked pricesof the Creta, Venue and Alcazar in the range of ₹�2,00021,000. SUV specialistMahindra & Mahindra hikedprices in the range of₹�21,00081,000.
The hikes come at a timewhen demand is thestrongest in the past severalyears, with the passengervehicle industry sitting onpending order book of morethan 5,00,000 units.
Tata Motors hikes car pricesto offset cost pressures
SWARAJ BAGGONKAR
Mumbai, January 18
If the current growth in commercial vehicle sales continues, the sector could rescaleor near the FY19 peak in twoyears, at half the time takenfor the fi�rst ascent.
The demand will coincidewith the general elections in2024. The previous generalelection year — 2019 — saw CVsales cross the onemillionmark.
Lowest in a decade, CVvolumes in FY21, at 5.68 lakhunits, were only better thanthe FY10 fi�gure of 5.31 lakh.With the fi�nal quarter of FY22underway, the CV segment isexpected to end the year with
over 6 lakh units. Ageingfl�eets, steady rise in freightrates, improving truck utilisation, strong demand from ecommerce players and sustained demand from infrastructure companies will helppush demand for commercialvehicles, particularly trucks.
Utilisation to improveOverall truck utilisation inthe country is estimated tohave improved to 4550 percent; in some segments it hasexceeded 85 per cent. As recently as Q1 this year, truckswere idling 10 days a month.
“After the peak in FY19 wesaw two consecutive years ofdecline. Starting this year, we
anticipate the reversal of thecurve. We will see growthevery year at least till the general elections. Whether thenext peak will be the same asFY19 or not is diffi�cult to predict, but it will be closer or
slightly lower,” Jalaj Gupta,Business Head (commercialvehicles unit), Mahindra &Mahindra, said.
As per Society of IndianAutomobile Manufacturers(SIAM) data, domestic CV sales
climbed 30 per cent to4,66,763 units in the April toDecember period this year, asagainst 3,58,203 units thesame period last year. Whilelast year’s comparable data ison a low base, the doubledigit growth this year is a resultof a strong fundamental demand, say market experts.
“Since June 2021, post thesecond Covid19 wave, freightrates for trucks graduallygained momentum alongwith improving utilisationlevels. Rate decline in November was led by a major cut indiesel excise duty by about 10per cent. We believe, in JanFeb ’22, led by the thirdCovid19 wave disruptions,the industry revival wouldwitness a pause, before demand recovery starts again,”said ICICI Securities.
Ageing fl�eets, costly freight, rising
use and ecommerce to boost demand
Truck sales could scale FY19 peak by general elections
As per SIAM data, domestic CV sales climbed 30 per cent to 4,66,763
units in the April to December period of this fiscal
OUR BUREAU
Mumbai, January 18
Piyush Arora, former MercedesBenz India Director, has beenappointed as the new Managing Director of Skoda AutoVolkswagen India (SAVWIPL) effective from March 1, 2022.Arora succeeds GurpratapBoparai who quit in Decemberafter a nearly fouryear stint.
Arorawill be responsiblefor expanding theVolkswagenGroup’s
businesses in India, which includes the India 2.0 project ofboth Volkswagen and SkodaAuto. SAVWIPL oversees operations of fi�ve Volkswagen Groupbrands, Skoda Auto, Volkswagen, Audi, Porsche andLamborghini.
Arora joins the company at atime when the group is in themiddle of new product rolloutplan. Both Skoda and VW haverolled out their fi�rst productsunder the India 2.0 programme while Audi enteredthe electric vehicle segment.
Piyush Arora is new Skoda AutoVW India head
Piyush Arora
OUR BUREAU
Mumbai, January 18
Nazara Technologies Limited, agaming and sports media company, on Tuesday announcedthat it has entered into anagreement to acquire a 55 percent stake in programmatic advertising and monetisationcompany Datawrkz, valuingthe company at ₹�225 crore (approximately $30 million)linked to its CY22 EBITDAperformance.
Nazara will acquire 37,498equity shares of ₹�1 each, representing 55 per cent of the equityshare capital, on fully dilutedbasis of Datawrkz BusinessSolutions Private Limited andits wholly owned subsidiariesfrom existing shareholders —Senthil Govindan, KarthighaDhanabalan, K Arunprabu,Mayank Khirwadkar and VishalTukaranm Garale —at a consid
eration not exceeding ₹�124crore, in two tranches, it said ina regulatory fi�ling.
The company will acquire a33 per cent stake at ₹�60 crore,of which ₹�35 crore is partly payable in cash and the rest eitherin cash or swap of shares.
The fi�rst tranche of the investment will be completed byApril. The company will reservean option to acquire an additional 22 per cent in the secondtranche, which is expected tobe completed in Q4 FY23.
Founded in 2013 by IIMAhmedabad alumnus SenthilGovindan, Datawrkz is a globaladvertising technology fi�rmthat off�ers programmatic advertising and ad monetisationto brands and publishers, respectively. The fi�rm has offi�cesin US, Singapore and India, andfunctions as an independent
trading desk for digital mediastrategy, planning and execution.
Ad monetisation“Datawrkz tech off�erings willenhance the inhouse capabilities of Nazara for optimising itscustomer acquisition spendsas well as enhance yields on admonetisation of its large consumer base,” Nazara said.
This ad monetisation is expected to assist many of thecompanies in the ‘Friends ofNazara’ network.
“Further, there is an increasing symbiotic relationshipbetween gaming companiesand adtech companies worldwide, as a combination of thetwo will be value accretive forboth businesses,” it said.
Datawrkz founder SenthilGovindan said, “We had startedthis company with a vision todisrupt the digital advertisingspace. Datawrkz was already ona fast track to achieve our objective with rapid growth andsatisfi�ed clients around theworld. Through our partnership with Nazara, I see our paceaccelerating further.”
Nazara Tech to acquire 55% stake in DatawrkzGaming company
aims to optimise
customer acquisition
spends and ad
monetisation
MEENAKSHI VERMA AMBWANI
New Delhi, January 18
Footwear retailer MetroBrands witnessed stronggrowth in the third quarterbacked by traction seenacross multiple categoriesand cities.
The company said it has begun taking strategic pricehikes of about 34 per cent inresponse to infl�ationarytrends and only about 13 percent of its portfolio was impacted by the recent changein good and services tax (GST)rate for footwear priced below ₹�1000.
The leading specialty footwear retailer’s portfolio includes its own brands such asMochi and Walkway and italso retails internationalbrands such as Crocs.
Nissan Joseph, CEO, MetroBrands Ltd said, “We sawgrowth across all our fourconcepts of Metro, Mochi,Walkway and Crocs andacross diff�erent geographies
and channels in the thirdquarter.We are seeing continued double digit growth inthe ecommerce business. Ifyou look at our performanceover the last 10 years, we havegrown our sales at 16 per centCAGR. While there are someheadwinds, but we remainbullish.”
Joseph added that whilecasual footwear segment continued to witness growth inthe third quarter, there wasan uptick in demand for festival and weddingrelated footwear segments.
“We even saw traction inthe formal footwear segment.Our premium products ofover ₹�3,000 price categoryalso saw strong growth,” headded.
Impact of CovidReplying to a query on the impact of the Omicroninducedrestrictions, Joseph said, “Wedefi�nitely do see the impact ofthose restrictions on businessat our stores. The companyhas shown intense fi�nancialdiscipline and operationalrigor to come out of the moresevere national lockdown
earlier. We continue to focuson being agile and rampingup omnichannel sales. Butwe remain hopeful, as countries that went through thisahead of us, have come out ofit pretty quickly compared tothe previous waves and havenot seen severehospitalisations.”
He said less than 13 per centof the company’s inventorywas impacted by the GSTchange and the company hasmade the relevant priceadjustments.
Talking about infl�ationarypressures, Joseph said, “Wehave started taking strategicprice increases. We forecastedan overall hike in this quarterto next quarter by 34 per cent.Our value brands will see a
bigger impact of maybe closeto 8 per cent, while our corebrands of Metro and Mochiwill probably see an impact ofabout 34 per cent.”
The company has added 65new stores in this fi�scal yearso far and now operates 629stores across the country.
Opportunities to expand“We continue to see strong opportunities for opening newstores across our brandswhether it’s in the metros,tier2 or tier1 towns. We alsosee an opportunity for FitFlopto have its own standalone exclusive brand stores in thecoming months.” The company recently inked a strategic partnership with international brand FlitFlop andhas bagged exclusive rights tosell and distribute the brandin India.
“Before the pandemic, ecommerce was a little over 2per cent and today it is starting to cross double digits forus. So there has been a meteoric growth. We continue tomake strong investments onthe ecommerce channel,” headded.
Q3 saw uptick in
demand due to
festivals, weddings
Nissan Joseph, CEO,
Metro Brands
Only 13% of portfolio impacted by changein GST rate, says Metro Brands CEO
OUR BUREAU
Mumbai, January 18
In a major relief to ArcelorMittal India, the National Company Law Appellate Tribunal(NCLAT) has dismissed variousappeals challenging the approval of the resolution planfi�led by the company for thecorporate insolvency resolution process of Odisha SlurryPipeline Infrastructure Ltd (OSPIL).
The Bench comprising ofHMJ Jarat Kumar Jain (MemberJudicial) and Kanthi Narahari(Member Technical) approvedthe plan in an oral order onTuesday.
OSPIL owns and operates a253km slurry pipeline, whichis a critical asset for ArcelorMIttal Nippon Steel (AMNS) India .It connects AMNS India’s ironore benefi�ciation plant inDabuna with the 12milliontonne pellet plant in Paradip. Itwas leased to Essar and the arrangement captured in theright to use agreement.
Resolution planHowever, OSPIL landed up inNational Company Law Appellate Tribunal (NCLT) and ArcelorMittal submitted a ₹�2,359crore resolution plan, whichwas approved by the Cuttack
Bench of the NCLT earlier thisyear.
Srei Infra challenged it inNCLAT. Incidentally, IndiaGrowth Opportunities Fund, ascheme of Srei Multiple AssetInvestment Trust, held a 69 percent equity in OSPIL while thebalance was with Essar Steel.
According to Srei, if the payments were made in a timelymanner, OSPIL would have serviced its debts due to itslenders and there would havebeen no occasion for it to betaken for insolvency as thelenders/shareholders of OSPILwould not have suff�ered anylosses.
NCLAT approves ArcelorMittal resolution plan for Odisha Slurry
OUR BUREAU
Bengaluru, January 18
Engineering and online servicescompany, L&T Technology Services Ltd has reported a net profi�tof ₹�249 crore, up 34 per cent yearonyear (YoY) and revenue of₹�1,688 crore, up 20 per cent , inthe third quarter ended December 31, 2021.
Further, the company’s Earnings Before Interest and Taxes(EBIT) margin was at 18.6 per cent,up 340 basis points (bps). Duringthe quarter, LTTS won a $45million deal and a total of three dealswith TCV of $10 million. Revenuesfrom digital and edge technologies stood at 56 per cent.
“We sustained our performance trajectory with sequentialgrowth of 4.2 per cent in constantcurrency led by strong demandacross segments. The deal conversations and pipeline in our sixbig bets — electric autonomous &connected vehicle (EACV), 5G,medtech, AI and digitalproducts, digital manufacturingand sustainability — continues tosee healthy improvement as ourcustomers make steady progresson their longterm transformat
ive journeys,” said Amit Chadha,CEO & Managing Director, L&TTechnology Services Limited.
The company is expanding itsEACV global presence with theaddition of an engineering R&Dcenter in Krakow, Poland that willstrengthen strategic partnerships with European and globalclients. “In line with our longterm growth prospects andstrategy, we invested in hiringand on boarding a record 1,900plus trainees leveraging ourGlobal Engineering Academythat is focused on continuoustraining and upskilling. Despitethe robust employee addition,we further improved our operating margin to 18.6 per cent, refl�ecting gains from investmentsin talent and innovation,”Chadha added.
Revenue up 20%
at ₹�1,688 crore
L&T Technology posts ₹�249crore profi�t in Q3
Amit Chadha, CEO & MD,
L&T Technology Services
OUR BUREAU
Bengaluru, January 18
Dozee, a contactless remotepatient monitoring (RPM)solutions company, hasraised ₹�71 crore in an additional funding round led byDoordash’s Gokul Rajaram.
The round also saw participation from existing investors such as Prime Venture Partners, 3one4Capital, YourNest and otherangel investors. The company plans to use the fundsto make critical care moreeasily accessible and available in Indian hospitals,launch new products, continue with research and development and expandglobally.
Transforming healthcareCommenting on the investment, Rajaram said, “Dozeeis on a mission to revolutionise healthcare, usingunique technology to makeremote monitoring morescalable, economical and accessible. I’m excited to support Mudit, Gaurav and theDozee team on their journey to transform healthcareand build a defi�ning globalhealthtech company.”
“Dozee has seen incredible growth in the lastcouple of years. But there isa lot more to be done in thecoming years. We are looking forward to excitingtimes as we take remote patient monitoring to everynook and corner of thecountry,” said Mudit Dandwate, CEO and cofounder,Dozee.
ProductsDozee Pro, one of the company’s products, has beeninstalled in over 6,000 bedsin 300 hospitals covering40 districts across India tomonitor patients continuously and to help doctorsand nurses enhance patientcare and clinical outcomes.
Dozee plans to partnerwith over 1,000 hospitalsacross India to help themupgrade critical care infrastructure through remotepatient monitoring.
Additionally, it also aimsto install more than 50,000stepdown intensive careunit (ICU) beds with its contactless sensor and setup24x7 central monitoringcells in these hospitals, enabling them to quickly augment the much high dependency units (HDUs) andICUs.
Dozee raises ₹�71 crore fromGokul Rajaram,existing investors
PRESS TRUST OF INDIA
New Delhi, January 18
Bidding for 15 blocks off�ered inthe fi�rst coalbed methane(CBM) round in more than adecade will start on February15 and end on March 15, the Directorate General of Hydrocarbons (DGH) said on Tuesday.
Bids under the Special CBMBid Round2021, which waslaunched in September lastyear, were originally due onFebruary 20, 2022, but thedeadline was postponed.
The government has off�ered15 blocks in Maharashtra, Madhya Pradesh, West Bengal,Jharkhand, Odisha and Chhat
tisgarh for extracting gas fromcoal seams (CBM).
This is the fi�rst CBM bidround in more than a decade.The last round was held in2010.
CBM is gas or methanefound below coal seams incoal fi�elds. It is similar to natural gas and can be used as fuelto fi�re power plants, run fertiliser units, or be used as CNG inautomobiles.
The maximum number offi�ve coalbed methane (CBM)blocks have been off�ered inMadhya Pradesh, and twoblocks each in Jharkhand, Maharashtra and Odisha.
Bidding for CBM blocks to start on February 15
YATTI SONI
Bengaluru, January 18
Wealth management company Scripbox has raised $21million in Series D fundingfrom Accel Partners alongwith the participation ofTranspose Platform, DMI Alternative Investment Fund The Sparkle Fund, InnoVenCapital, Trifecta Capital, KPBFamily Trust, LetsVenture,Kube VC and YY Capital LLC.
This round is a combinationof equity and debt funding,and has also saw the participation of angel investors such asAlok Ohrie, Balakrishna Adiga,Deep Kalra, Faiz Mayalakkara,Girish Mathrubootham, HSNagaraja, Mukesh Singh (ZopSmart), and ShanmugamKrishnasamy. With this, thecompany has raised a total of$47.8 million in funding acrossmultiple rounds.
Speaking to BusinessLine
about the fundraise, AtulShinghal, Founder and CEO,Scripbox said, “Our strategy offocusing on our existing customers and acquiring customers of highticket size has paidoff� pretty well and we havegrown four times from March2020. We measure our successby assets under management(AUM), how much money we
manage for our customers.Since this strategy has playedout well, we decided to raise another funding round to doubledown on this strategy and domore.”
“The funds will broadly be allocated for three reasons brand building, building moreproducts for our customersand IFA(independent fi�nancialadvisors) partnerships.” hesaid.
Shingal noted that the company is on track to becomecashfl�ow positive by June 2022.
Growth outlook“Given our average ticket size,the customers that we acquire,we are confi�dent that we willcontinue to grow at 4x every 18months. Our annualised customer retention rates arebetween 96 per cent and 97 percent, and net promoter score(NPS) is 5560,” he added.
Previously, Scripbox raisedcapital from investors such asAccel Partners, Omidyar Network and Transpose Platform,among others. The company’scurrent AUM stands close to₹�5,000 crore, its cumulativetransactions are exceeding 8.1million and has a reach in morethan 2500 cities and townsacross India.
Scripbox raises $21 million
................BM-BMECMYK
MUMBAI
BusinessLineWEDNESDAY • JANUARY 19 • 2022 3NEWS
BusinessLineDisclaimer: Readers are requested to verify& make appropriate enquiries to satisfythemselves about the veracity of anadvertisement before responding to anypublished in this newspaper. THGPUBLISHING PVT LTD., the Publisher &Owner of this newspaper, does not vouchfor the authenticity of any advertisementor advertiser or for any of the advertiser’sproducts and/or services. In no event canthe Owner, Publisher, Printer, Editor,Director/s, Employees of thisnewspaper/company be heldresponsible/liable in any mannerwhatsoever for any claims and/or damagesfor advertisements in this newspaper.
OUR BUREAU
Mumbai, January 18
The weighted average cutoff�yield of 10year State Development Loans (SDLs)hardened by 9 basis points(bps) to 7.24 per cent at theauction on Tuesday from 7.15per cent in the last auctionon concerns around infl�ation and uncertainty as tohow much the governmentwill borrow in FY23.
The spread between theweighted average 10yearSDL and old 10year Gsec(coupon rate: 6.10 per cent)yield was 61 bps on Tuesday(58 bps last Tuesday) andthat with the new 10year G
sec (6.54 per cent) wasmildly higher at 62 bps, according to ICRA.
“In line with global trends,domestic yields havehardened since last week, refl�ecting the imminent ratehikes by the US Fed, increasein global oil prices, fi�rmingof the domestic CPI infl�ation, as well as the magnitude of supply expected inFY2023,” the rating agencysaid in a report.
10-year G-Sec yield upICRA noted that the oldbenchmark 10year GSecyield rose by 6 bps to 6.63 percent from 6.57 per cent lastTuesday.
Moreover, the new 10yearpaper, which was issued lastFriday at a cutoff� of 6.54 percent (6.54 GS 2032), was par
tially devolved by the Reserve Bank of India to theprimary dealers, indicatingweak demand for Gsec atthe prevailing yields. Itsyield had risen to 6.61 percent on Tuesday.
Twelve State governmentsraised ₹�21,200 crore throughSDLs on Tuesday, about 6 percent higher than the₹�20,000 crore that was indicated for this week in therevised Q4 FY2022 auctioncalendar.
“Six States borrowed
₹�6,700 crore today, despitenot having indicated theirparticipation in the auctioncalendar; UP borrowed ₹�900crore more than indicated,”ICRA said.
The weighted average SDLcutoff� increased by 4 bps to7.11 per cent from 7.07 percent in the last auction, withan increase in tenor to 12years from 11 years.
Madan Sabnavis, ChiefEconomist, Bank of Baroda,said: “Bond yields are spiking upwards on concerns ofinfl�ation (oil prices going upcontributing to this) as wellas budgetary concerns. Theborrowing programme fornext year is under focus andwith redemptions beingaround ₹�4lakh crore, therewill once again be a largeborrowing programme.”
12 States raise
₹�21,200 crore
through SDLs
Cut-off yields on 10-year Stateborrowings harden 9 bps
NARAYANAN V
Chennai, January 18
Indian corporates are on a borrowing spree overseas. Just twoweeks into the current calendar year, India Inc has raisedover $6 billion through off�shore bond issuance, aided bysurplus liquidity, low interestrates and the growing tractionfor ‘environmental, social andcorporate governance’ or ESGbond issues in global markets.
On January 4, Reliance Industries announced a fundraise of $4 billion through amultitranche longtenure dollar jumbo bond issuance.
The largest ever foreign currency bond issue from India, it
was in three tranches of $1.5 billion, $1.75 billion and $750 million spread over a tenure of 10,30 and 40 years, respectively.
Besides RIL, several more Indian corporates issued off�shore bonds, especially ESGlabelled green and sustainabilitybonds.
On January 7, NasdaqlistedReNew Energy Global Plcraised $400 million by issuingcertifi�ed green bonds throughits Mauritiusbased subsidiary,India Clean Energy Holdings.
Indian Railway Finance Corporation (IRFC), the marketborrowing arm of Indian Railways, launched its $500million bonds under the $7billion
‘global mediumterm note’(GMTN) programme rated atpar with the sovereign. IRFCwas the fi�rst central public sector enterprise (CPSE) to exclusively list its green off�shorebonds at Indian stock ex
changes INX and NSEIFSC atGIFT City in Gujarat.
“Availability of funds atlower costs is the only reasonso many corporates are borrowing from the internationalmarkets. Some of these issues
are also ESGbased becausethat particular market is morevibrant overseas, as comparedto India, so you get fi�ne rates ofborrowing,” said Madan Sabnavis, Chief Economist at Bankof Baroda.
Last week, JSW Infrastructure raised $400 millionthrough sustainabilitylinkedbond issue for a sevenyear tenure.
The fund raise marked thecompany’s debut bond issue aswell as the fi�rst sustainabilitylinked bond (SLB) from an Indian ports company.
Prior to that, Shriram Transport Finance Company raised$475 million through socialbonds overseas. A recent report by S&P Global Market Intelligence said India’s greenbond issuance is set for a new
record in 2022, following an exceptionally strong 2021.
Green bondsAccording to the UKbasedgreen bond tracking agencyClimate Bonds Initiative, Indiaissued $6.11 billion in greenbonds during 2021 — the mostsince 2015, when green bondswere fi�rst issued from thecountry. The fi�rst two weeks ofthe current calendar year alsosaw the country’s largestlender, State Bank of India, raising $300 million through itsLondon branch, while AdaniEnterprises subsidiary Mumbai International Airport Limited received board approval toraise up to $1.25 billion in oneor more tranches through issuance of dollardenominated secured fi�xed rate bonds.
India Inc on an overseas borrowing binge Corporates raise $6billion plus through
offshore bonds in opening fortnight of 2022
On borrowing spree
■ RIL announced a fundraise of
$4 billion through a jumbo bond
issuance
■ ReNew Energy Global Plc raised
$400 million by issuing certified
green bonds
■ IRFC launched its $500-million
bonds under the ‘global medium-term note’ programme
■ JSW Infrastructure raised $400 million through
sustainability-linked bond issue
■ Shriram Transport Finance Company raised $475 million via
social bonds overseas
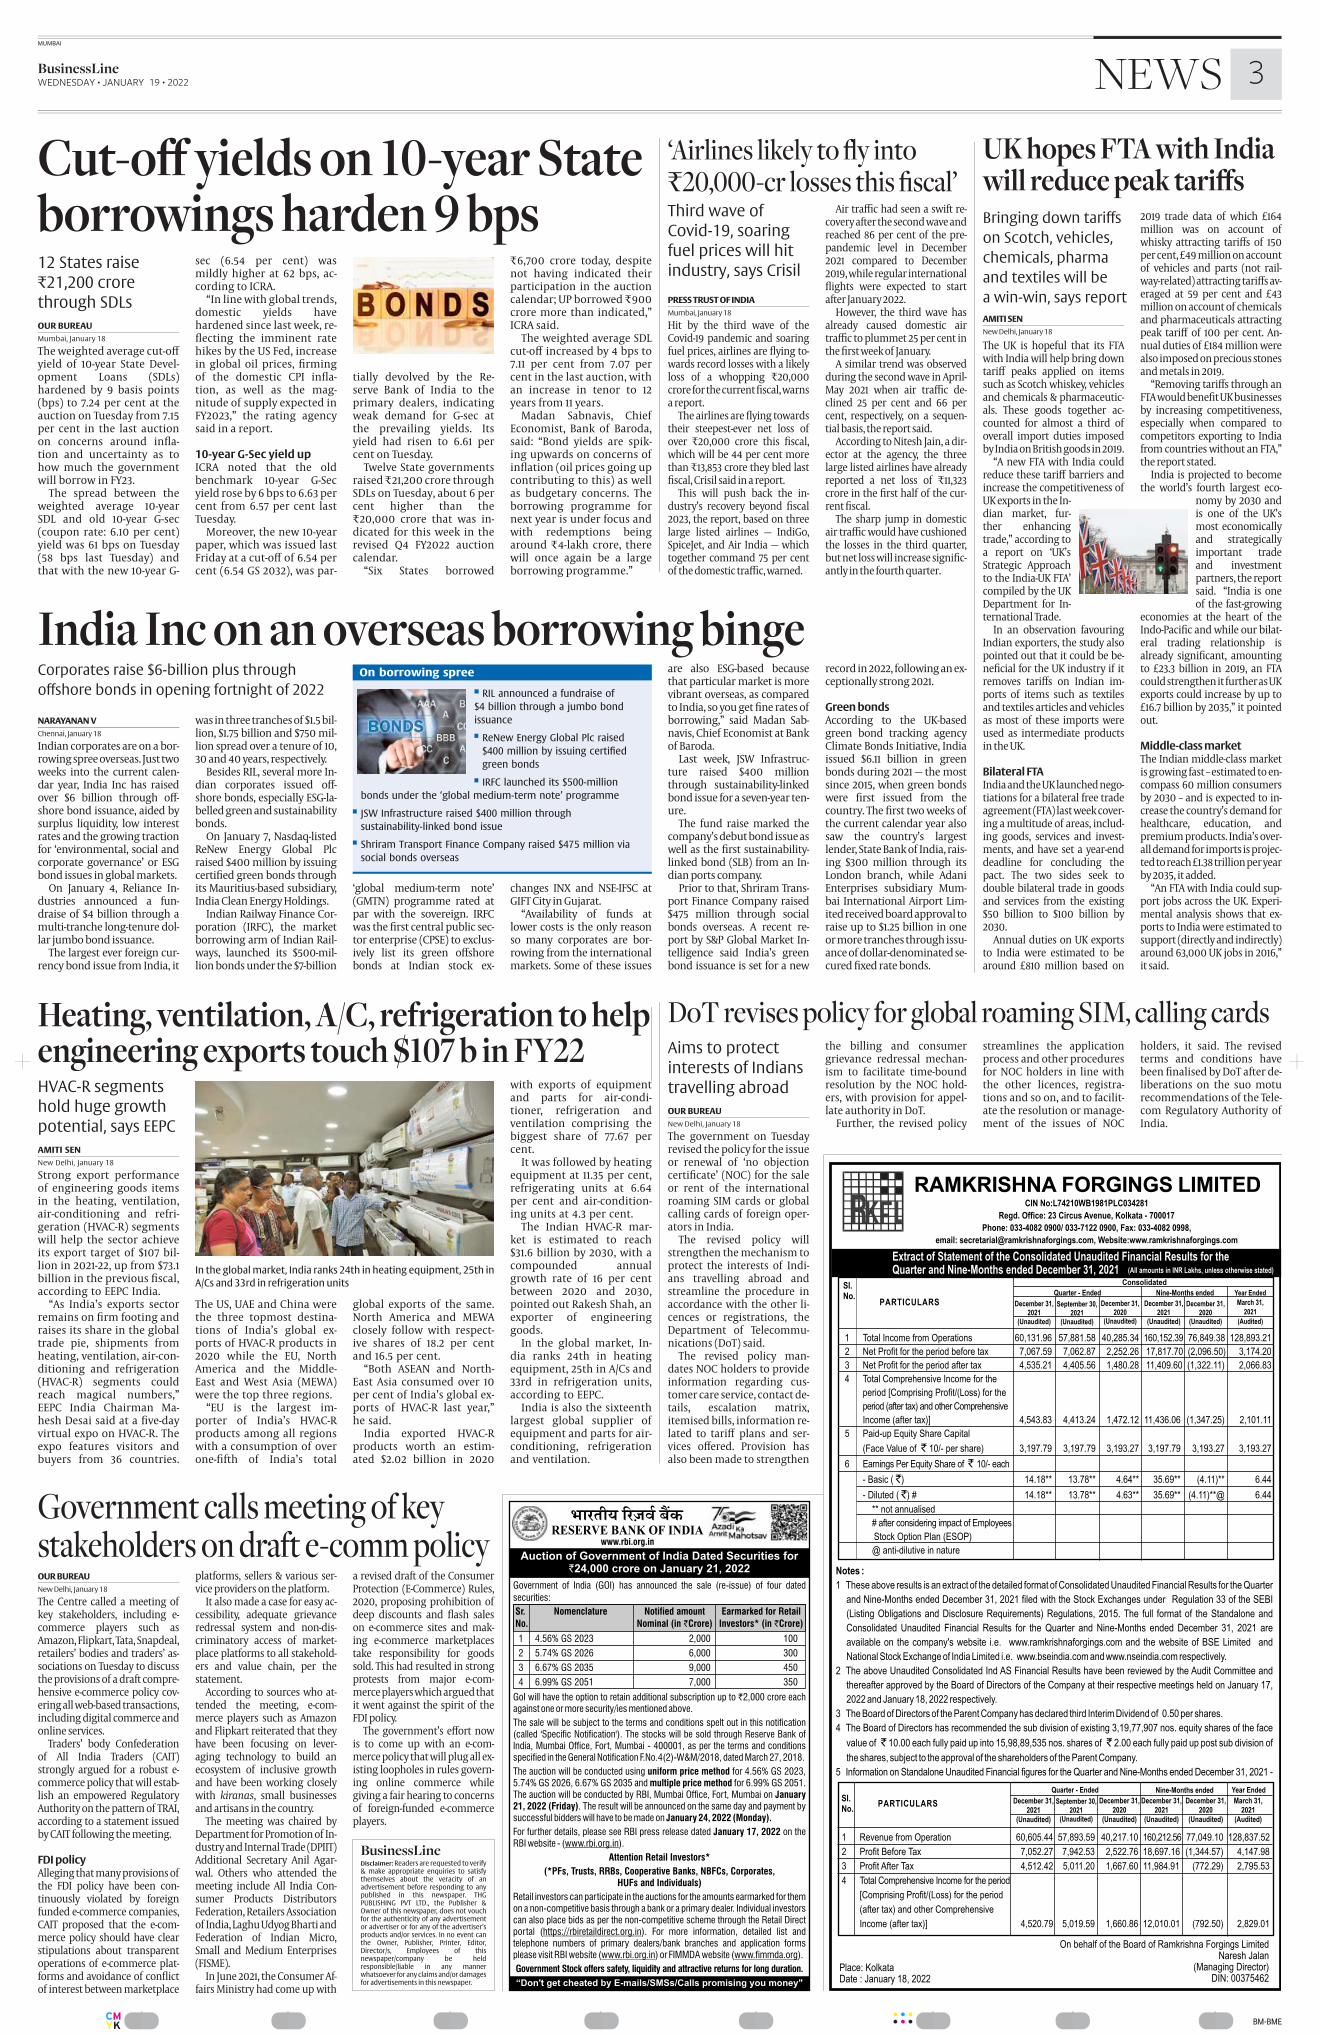
AMITI SEN
New Delhi, January 18
Strong export performanceof engineering goods itemsin the heating, ventilation,airconditioning and refrigeration (HVACR) segmentswill help the sector achieveits export target of $107 billion in 202122, up from $73.1billion in the previous fi�scal,according to EEPC India.
“As India’s exports sectorremains on fi�rm footing andraises its share in the globaltrade pie, shipments fromheating, ventilation, airconditioning and refrigeration(HVACR) segments couldreach magical numbers,”EEPC India Chairman Mahesh Desai said at a fi�vedayvirtual expo on HVACR. Theexpo features visitors andbuyers from 36 countries.
The US, UAE and China werethe three topmost destinations of India’s global exports of HVACR products in2020 while the EU, NorthAmerica and the MiddleEast and West Asia (MEWA)were the top three regions.
“EU is the largest importer of India’s HVACRproducts among all regionswith a consumption of overonefi�fth of India’s total
global exports of the same.North America and MEWAclosely follow with respective shares of 18.2 per centand 16.5 per cent.
“Both ASEAN and NorthEast Asia consumed over 10per cent of India’s global exports of HVACR last year,”he said.
India exported HVACRproducts worth an estimated $2.02 billion in 2020
with exports of equipmentand parts for airconditioner, refrigeration andventilation comprising thebiggest share of 77.67 percent.
It was followed by heatingequipment at 11.35 per cent,refrigerating units at 6.64per cent and airconditioning units at 4.3 per cent.
The Indian HVACR market is estimated to reach$31.6 billion by 2030, with acompounded annualgrowth rate of 16 per centbetween 2020 and 2030,pointed out Rakesh Shah, anexporter of engineeringgoods.
In the global market, India ranks 24th in heatingequipment, 25th in A/Cs and33rd in refrigeration units,according to EEPC.
India is also the sixteenthlargest global supplier ofequipment and parts for airconditioning, refrigerationand ventilation.
HVACR segments
hold huge growth
potential, says EEPC
Heating, ventilation, A/C, refrigeration to helpengineering exports touch $107 b in FY22
In the global market, India ranks 24th in heating equipment, 25th in
A/Cs and 33rd in refrigeration units
OUR BUREAU
New Delhi, January 18
The government on Tuesdayrevised the policy for the issueor renewal of ‘no objectioncertifi�cate’ (NOC) for the saleor rent of the internationalroaming SIM cards or globalcalling cards of foreign operators in India.
The revised policy willstrengthen the mechanism toprotect the interests of Indians travelling abroad andstreamline the procedure inaccordance with the other licences or registrations, theDepartment of Telecommunications (DoT) said.
The revised policy mandates NOC holders to provideinformation regarding customer care service, contact details, escalation matrix,itemised bills, information related to tariff� plans and services off�ered. Provision hasalso been made to strengthen
the billing and consumergrievance redressal mechanism to facilitate timeboundresolution by the NOC holders, with provision for appellate authority in DoT.
Further, the revised policy
streamlines the applicationprocess and other proceduresfor NOC holders in line withthe other licences, registrations and so on, and to facilitate the resolution or management of the issues of NOC
holders, it said. The revisedterms and conditions havebeen fi�nalised by DoT after deliberations on the suo moturecommendations of the Telecom Regulatory Authority ofIndia.
Aims to protect
interests of Indians
travelling abroad
DoT revises policy for global roaming SIM, calling cards
OUR BUREAU
New Delhi, January 18
The Centre called a meeting ofkey stakeholders, including ecommerce players such asAmazon, Flipkart, Tata, Snapdeal,retailers’ bodies and traders’ associations on Tuesday to discussthe provisions of a draft comprehensive ecommerce policy covering all webbased transactions,including digital commerce andonline services.
Traders’ body Confederationof All India Traders (CAIT)strongly argued for a robust ecommerce policy that will establish an empowered RegulatoryAuthority on the pattern of TRAI,according to a statement issuedby CAIT following the meeting.
FDI policyAlleging that many provisions ofthe FDI policy have been continuously violated by foreignfunded ecommerce companies,CAIT proposed that the ecommerce policy should have clearstipulations about transparentoperations of ecommerce platforms and avoidance of confl�ictof interest between marketplace
platforms, sellers & various service providers on the platform.
It also made a case for easy accessibility, adequate grievanceredressal system and nondiscriminatory access of marketplace platforms to all stakeholders and value chain, per thestatement.
According to sources who attended the meeting, ecommerce players such as Amazonand Flipkart reiterated that theyhave been focusing on leveraging technology to build anecosystem of inclusive growthand have been working closelywith kiranas, small businessesand artisans in the country.
The meeting was chaired byDepartment for Promotion of Industry and Internal Trade (DPIIT)Additional Secretary Anil Agarwal. Others who attended themeeting include All India Consumer Products DistributorsFederation, Retailers Associationof India, Laghu Udyog Bharti andFederation of Indian Micro,Small and Medium Enterprises(FISME).
In June 2021, the Consumer Affairs Ministry had come up with
a revised draft of the ConsumerProtection (ECommerce) Rules,2020, proposing prohibition ofdeep discounts and fl�ash saleson ecommerce sites and making ecommerce marketplacestake responsibility for goodssold. This had resulted in strongprotests from major ecommerce players which argued thatit went against the spirit of theFDI policy.
The government’s eff�ort nowis to come up with an ecommerce policy that will plug all existing loopholes in rules governing online commerce whilegiving a fair hearing to concernsof foreignfunded ecommerceplayers.
Government calls meeting of key stakeholders on draft ecomm policy
AMITI SEN
New Delhi, January 18
The UK is hopeful that its FTAwith India will help bring downtariff� peaks applied on itemssuch as Scotch whiskey, vehiclesand chemicals & pharmaceuticals. These goods together accounted for almost a third ofoverall import duties imposedby India on British goods in 2019.
“A new FTA with India couldreduce these tariff� barriers andincrease the competitiveness ofUK exports in the Indian market, further enhancingtrade,” according toa report on ‘UK’sStrategic Approachto the IndiaUK FTA’compiled by the UKDepartment for International Trade.
In an observation favouringIndian exporters, the study alsopointed out that it could be benefi�cial for the UK industry if itremoves tariff�s on Indian imports of items such as textilesand textiles articles and vehiclesas most of these imports wereused as intermediate productsin the UK.
Bilateral FTAIndia and the UK launched negotiations for a bilateral free tradeagreement (FTA) last week covering a multitude of areas, including goods, services and investments, and have set a yearenddeadline for concluding thepact. The two sides seek todouble bilateral trade in goodsand services from the existing$50 billion to $100 billion by2030.
Annual duties on UK exportsto India were estimated to bearound £810 million based on
2019 trade data of which £164million was on account ofwhisky attracting tariff�s of 150per cent, £49 million on accountof vehicles and parts (not railwayrelated) attracting tariff�s averaged at 59 per cent and £43million on account of chemicalsand pharmaceuticals attractingpeak tariff� of 100 per cent. Annual duties of £184 million werealso imposed on precious stonesand metals in 2019.
“Removing tariff�s through anFTA would benefi�t UK businessesby increasing competitiveness,especially when compared tocompetitors exporting to Indiafrom countries without an FTA,”the report stated.
India is projected to becomethe world’s fourth largest eco
nomy by 2030 andis one of the UK’smost economicallyand strategicallyimportant tradeand investmentpartners, the reportsaid. “India is oneof the fastgrowing
economies at the heart of theIndoPacifi�c and while our bilateral trading relationship isalready signifi�cant, amountingto £23.3 billion in 2019, an FTAcould strengthen it further as UKexports could increase by up to£16.7 billion by 2035,” it pointedout.
Middle-class marketThe Indian middleclass marketis growing fast – estimated to encompass 60 million consumersby 2030 – and is expected to increase the country’s demand forhealthcare, education, andpremium products. India’s overall demand for imports is projected to reach £1.38 trillion per yearby 2035, it added.
“An FTA with India could support jobs across the UK. Experimental analysis shows that exports to India were estimated tosupport (directly and indirectly)around 63,000 UK jobs in 2016,”it said.
UK hopes FTA with Indiawill reduce peak tariffsBringing down tariffs
on Scotch, vehicles,
chemicals, pharma
and textiles will be
a winwin, says report PRESS TRUST OF INDIA
Mumbai, January 18
Hit by the third wave of theCovid19 pandemic and soaringfuel prices, airlines are fl�ying towards record losses with a likelyloss of a whopping ₹�20,000crore for the current fi�scal, warnsa report.
The airlines are fl�ying towardstheir steepestever net loss ofover ₹�20,000 crore this fi�scal,which will be 44 per cent morethan ₹�13,853 crore they bled lastfi�scal, Crisil said in a report.
This will push back the industry’s recovery beyond fi�scal2023, the report, based on threelarge listed airlines — IndiGo,SpiceJet, and Air India — whichtogether command 75 per centof the domestic traffi�c, warned.
Air traffi�c had seen a swift recovery after the second wave andreached 86 per cent of the prepandemic level in December2021 compared to December2019, while regular internationalfl�ights were expected to startafter January 2022.
However, the third wave hasalready caused domestic airtraffi�c to plummet 25 per cent inthe fi�rst week of January.
A similar trend was observedduring the second wave in AprilMay 2021 when air traffi�c declined 25 per cent and 66 percent, respectively, on a sequential basis, the report said.
According to Nitesh Jain, a director at the agency, the threelarge listed airlines have alreadyreported a net loss of ₹�11,323crore in the fi�rst half of the current fi�scal.
The sharp jump in domesticair traffi�c would have cushionedthe losses in the third quarter,but net loss will increase signifi�cantly in the fourth quarter.
Third wave of
Covid19, soaring
fuel prices will hit
industry, says Crisil
‘Airlines likely to fl�y into₹�20,000cr losses this fi�scal’
Published by N. Ravi at Kasturi Buildings, 859 & 860, Anna Salai, Chennai-600002 and Printed by N. Vaidyanathan at Dangat Media Pvt Ltd, No. 22, Dighe MIDC, Vishnu Nagar, TTC Industrial Area, Dighe, Navi Mumbai-400701 on behalf of THG PUBLISHING PVT LTD., Chennai-600002. Editor: Raghuvir Srinivasan (Editor responsible for selection of news under the PRB Act). ISSN 0971 - 7528
................BM-BMECMYK
LET TERS TO THE EDITOR Send your letters by email to [email protected] or by post to ‘Letters to the Editor’, The Hindu Business Line, Kasturi Buildings, 859-860, Anna Salai, Chennai 600002.
THINKMUMBAI
4 BusinessLine WEDNESDAY • JANUARY 19 • 2022
The Reserve Bank of India’s (RBI) latest assessment of the state of the economy(January 2022 Bulletin) confi�rms someof our apprehensions – that Omicron
may be “more a fl�ash fl�ood than a wave” but its impact on the economy and contactintensive sectors in particular cannot be wished away. While India, according to the World Bank, is expected togrow 8.7 per cent in 2022, the latest mobility indicators (January fi�rst week) point to a disquietingscenario – of contact intensive sectors being in thered even in the event of a recovery. The RBI observes that poor international and domestic passenger traffi�c, as well as tourist arrivals, persistedthrough the latter half of 2021, even as the economy was in recovery mode. The defi�cit visavisprepandemic levels narrowed between Augustand November, but remained substantial at 17.6per cent in the case of domestic air passengertraffi�c in November 2021 (over November 2019),against 43.8 per cent in August 2021. In the case ofinternational passenger traffi�c, this gap was even
larger at 58.6 per cent inNovember, against 77.5 percent in August. This has impacted the airlines, hotels,tourism and restaurantssectors.
The OctoberMarch period,when weddings and leisure
travel peak, accounts for a big chunk of the annual$30 billion revenues of the sector. Although thesecond and third quarters of FY22 did see encouraging growth in RevPAR (revenue per availableroom in hotels), it is back to the doldrums nowafter Omicron. According to a study by NationalRestaurant Association of India, 25 per cent of restaurants in India closed down permanently inFY21.
These contactintensive sectors need fi�scal support – over and above the Emergency Credit LineGuarantee Scheme (ECLGS). Under ECLGS 3.0 announced in March 2021 for hotels, hospitality andtourism sectors, they can avail themselves ofloans up to 40 per cent of credit outstanding subject to a cap of ₹�200 crore. However, the deadlineof March 2022 for ECLGS must be extended forthese sectors by at least another six months. Atstake are the jobs of over 40 million people. Thebiggest problem that the hospitality industry willface is on the cash fl�ow front as they will continueto bear fi�xed costs such as electricity bills, salariesand rent even as revenues turn pale. The hospitality industry contributes 9 per cent to India's GDP.The ECLGS has made a bigger diff�erence to the fortunes of the midsized businesses. The May 2020proposal of the Centre to foot the PF bill of employees will boost the sector as a whole, besidesformalising their existence. To ensure that airlineoperators survive this phase, the Centre can consider reducing taxes on aviation turbine fuel as atemporary, shortterm measure, without seriously compromising its revenues. Airport landingand parking charges can be pared as well. TheCentre and States should work in tandem on reliefmeasures for hotels and restaurants, such as licence fees and electricity rates. Any Budget stimulus that leaves out employmentintensive sectorswill not be a broadbased one.
Room for support The battered tourism, hospitality and aviation
industry could do with a Budget stimulus
0x y z
wednesday, january 19, 2022
RAHUL MAZUMDAR
With the Indian economy doing well inthe fi�rst three quarters of FY22, when
compared to FY21, and the government’s determination to carry thismomentum to the next fi�nancialyear, the expectations from theBudget FY23 remains reasonablyhigh.
Five broad areas that could cement this would be in terms of domestic growth, facilitating exportinfrastructure, access to healthcare,increasing savings to help consumption, while also supportinggeoeconomic preparedness.
Widening PLITrade has been the driving force forthe prosperity of most economiesacross the globe A lot of hope is onthe PLI scheme, which advocates incremental productionbased incentive, and has the potential totake India’s exports to a new high,while also diversifying the exportbasket.
In this context the governmentcan consider enhancing the exposure under the PLI schemeand have more upcomingindustries identifi�ed. Forexample, industries likeaerospace, warehouse robotics, waste management, including maintenance, repair, and overhaul(MRO), amongst others,could be bought under the ambit ofPLI schemes.
Hopefully, the Budget will widenthe PLI scheme while consideringupcoming potential industries, especially while targeting exports of$1 trillion by 2025.
Port infrastructureIndia’s coastline is almost 10 timesthat of Vietnam which has four major ports. Encouraging PPP withsome of the world’s largest portplayers of Singapore, Hong Kong,Busan, and Rotterdam can change
the course of India’s trade. Alongwith it, the government needs toopen the dredging market to increase and maintain draft depth atports allowing larger vessels. Manyof the existing ports in India also requires to be modernised, and connectivity enhanced.
In fact, many of these portsacross the coastline can evolve asbig manufacturing and exporthubs, while also reducing the costof transshipment.
Further, should there be any taxexemptions for foreign fl�ag ships atthese ports, India can become aAsian hub.
The Budget could identify a fewports with time bound incentivestowards completing them. It maybe noted that while Budget FY22 announced ₹�1,702 crore for the Ministry of Ports, for development ofports, there was nothing for existing major ports; the allocation forminor ports has declined by 54 percent in the last two years.
Healthcare infraWhile hopefully the upcoming
Budget will provide rebates onmedical insurance premiums, and
further inducements forR&D spend to boostpharma companies, it isimportant to strengthenthe healthcare infrastructure in Tier 2 and 3 cities.This lack of infrastructure was tragically exposed during the
Covid19 second wave.According to the National Health
Profi�le 2018, the number of districthospital stands at 1,003, government hospitals in rural areas at19,810, Railway hospitals 136, andemployee state insurance facities at151. If these hospitals arestrengthened on a publicprivatemode by extending attractive incentives, including exploring a taxholiday, the population of the country will be healthier.
In fact, even if 5 per cent of these21,000 odd hospitals get the atten
tion for timebound upgradation,the pressure on Tier1 cities will bemuch reduced.
Increasing tax exemptionSection 80C of the Income Tax Actallows a maximum deduction of₹�1.5 lakh every year from the taxpayers’ total income. Over and abovethis, the NPS gives an additional deduction of ₹�50,000 under Section80CCD (1b). While the income ofpeople has increased, interest rateshave continued to fall as opposed tocost of living. Further, the pandemic has caused many job lossesand exposed people’s fi�nancial vulnerabilities especially when itcomes to secured savinginstruments.
Hence, it will help the salariedclass if the Budget considers doubling the yearly contribution underSection 80C and Section 80CCD (1b).Enhancing the ceiling will not onlyboost India’s domestic savings, butwill also contribute to governmentfi�nancing its defi�cits.
At the same time, investmentsthrough NPS would allow more investors to participate in the capitalmarket through the various op
tions available in it. The pandemicexposed the issues related tohealthcare. The upcoming Budgetcan expand the scope of Section80D to allow a deduction for expenditure incurred on any pandemic related treatment for all, irrespective of age.
Another segment that wouldhave a multiplier eff�ect on the various other sectors of the economy isresidential housing — its contribution to GDP is around 5 per cent andis a large employment generator.The Budget could raise the deduction limit for interest on homeloans under Section 24(B) above thepermissible ₹�2 lakh to boost theoverall economic sentiment.
Strategic institutionsExports not just have a multipliereff�ect like creating jobs, boostingmanufacturing, and earning foreign exchange, today they play acritical role in the everchanginggeoeconomics scenario.
As India aspires to move into producing EVs, mobile phone, solarpanels, aerospace equipment, etc. itis also important to acknowledgethat there are many inputs like lith
ium that go into these but are notavailable in abundance in the country. So, India will be looking at a newform of dependence on imports.This revives the need to secure certain assets overseas.
In this context Budget FY23 couldexplore the idea of dedicated fi�nancial institutions like Exim Bankwhich can cater to such overseasstrategic needs with governmentbacking, something akin toChinese government banks and institutions. Benefi�ciaries of such asupport could be Indian PSUs andquasisovereign institutions.
It may be mentioned that the US,at the onset of the pandemic inDecember 2019, operationalised anew ‘Development Finance Corporation (DFC) to pursue its strategicinterests. This initiative is considered as an eff�ort towards meeting its needs, countering China’s infl�uence on global trade andbusiness, and furthering the US foreign policy goals whilst supportingdirect investments abroad.
The writer is an Economist with India
Exim Bank. Views expressed are
personal
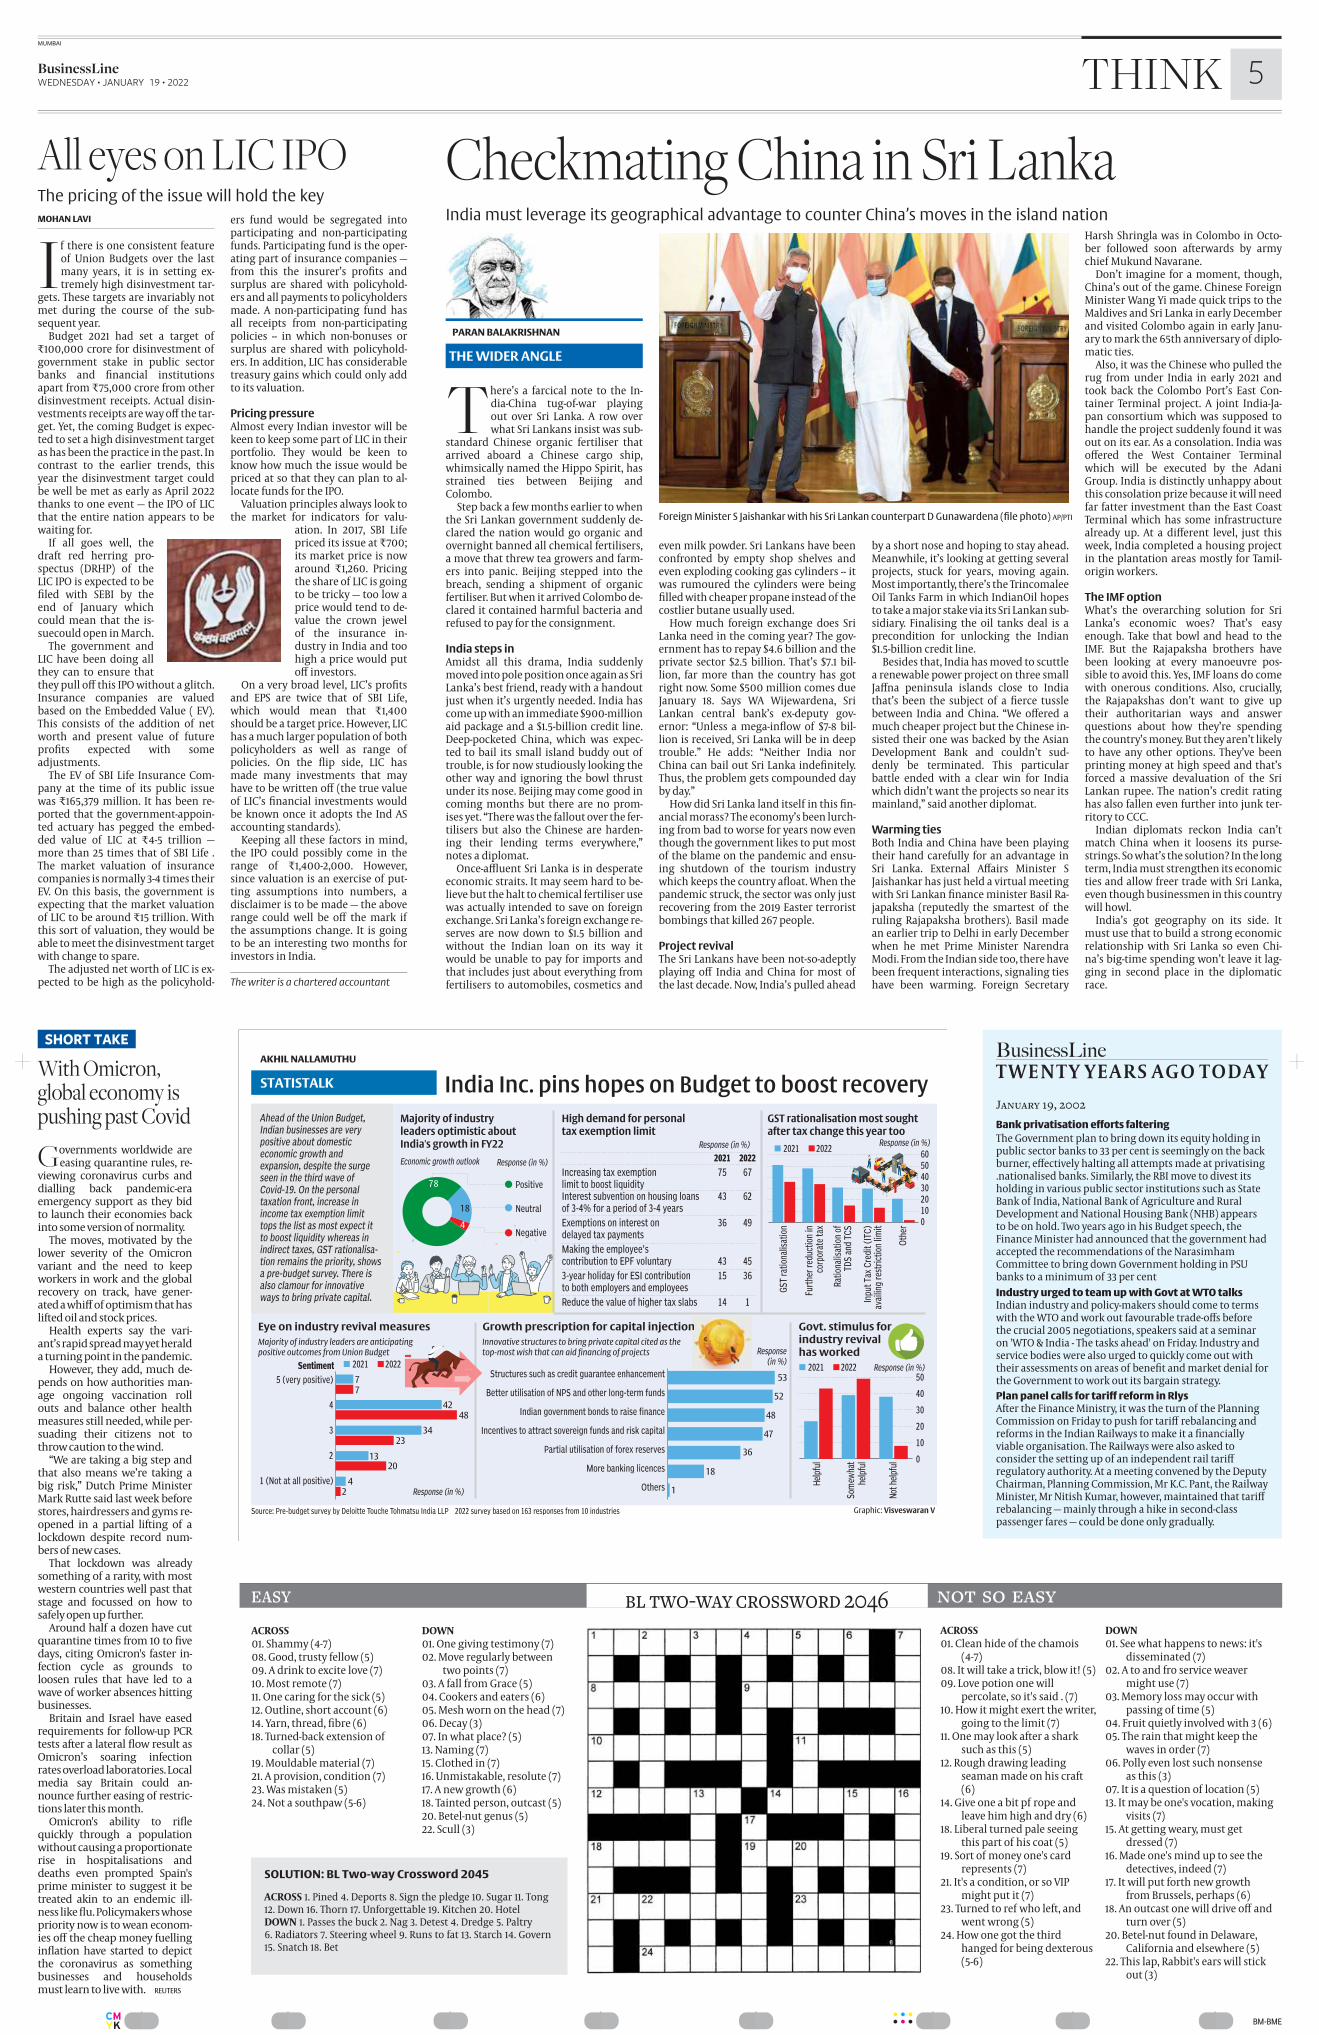
Widening the PLI scheme, improving healthcare and port infra, tax sops for individuals can be some of the priority areas
Growth pangs Finance Minister Nirmala Sitharaman’s Budget initiatives must maintain the growth momentum REUTERS
How the Budget can cement growth
G CHANDASHEKHAR/DEBOJYOTI DEY
Energy fuels economicgrowth and electricity is acritical component ofevery nation’s energy mix.
India is no exception. Currentlyranked third largest in the world,electricity generation in India hasgrown remarkable, particularly inthe last 10 years with overall installed generation capacity increasing at an average annual rate of 8.8per cent from 2010 to 2020, reaching 370 GW in March 2020.
The national peak demand hasgrown at an average rate of 4.4 percent to reach 184 GW during thesame period, according to the Central Electricity Authority. The rate ofnational access increased from 43per cent in 2000 to about 95 percent in 2019, according to International Energy Agency’s ‘India 2020Energy Policy Review’.
Reform measuresTo be sure, India’s electricity markethas undergone signifi�cant restructuring and reforms during the pastthree decades. The twin objectivewas to scale up generation and distribution as well as make the market transparent, competitive andeffi�cient.
Experiences in India, and inmany countries, suggest that as reforms progress and competitiveness increases with restructuringand unbundling of the sector, costsof procurement of electricity reduces while the quality and stability of power availability improves.
One nation, one gridThe electricity market in the country, however, remains fragmentedboth at the retail level and in wholesale trading. One of the importantsteps taken to overcome this problem was synchronisation of regional grids into one national gridat one frequency. India has indeedachieved this by pursuing a ‘one nation one grid’ policy, making thecountry the world’s largest national synchronous grid.
Simultaneously, a slew of policyreforms oriented towards creatingan effi�cient and transparent electricity trading system across the country has been in the works. The reform process began in the 1990s,with unbundling and liberalisationof the sector. A landmark reformwas the enactment of the ElectricityAct, 2003 that removed licensingfor generation and introducedopen access for transmission anddistribution.
Integration of the marketThis development fostered competition and paved the way for integration of the electricity market acrossthe country. An off�shoot of open access transmission was the introduction of power trading on spot exchanges, which facilitatedtransparent price discovery in electricity markets.
Electricity trading on spot exchanges has picked up momentumquickly and the volume traded onpower exchanges increased at anaverage annual growth rate ofabout 25 per cent while that transacted through bilateral transactions increased at an annualgrowth rate of about 7 per centfrom 200910 to 201819, accordingto the Central Electricity RegulatoryCommission.
With gradual opening up, thepower markets have become in
creasingly competitive and transparent.
At the same time, the market haswitnessed an increase in the volatility in electricity prices, exposingstakeholders to price risks.
Reducing volatilityThe average annualised volatility inelectricity prices was about 41 percent the last fi�ve years, enough toadversely aff�ect the margins andeconomic viability of users and producers. Indeed, electricity prices areinherently volatile due to theirunique physical attributes manifested in the free market in thiscommodity.
As such, key stakeholders, including generation companies, distributors, load serving companies andmyriad user industries that seekcertainty in their costs and revenues from the use/sale of electricity,need eff�ective hedging mechanisms for effi�cient price risk management.
Under the circumstances, creation of, and access to, risk management instruments for hedging electricity prices becomes essential.
As seen in many developed electricity markets around the world,risk management using Futuresand Options is one of the most ef
fective and popular ways to managethis risk. Further, given the transparency of wellregulated exchangetraded derivatives market,it is important to use hedging instruments traded on exchangemarkets. This will facilitate and further advance a transparent andcompetitive electricity market inthe country while reducing uncertainties and costs.
Transparent derivatives marketsare also known for providing effi�cient platforms for price discovery,which is one more reason for usingexchangetraded electricity derivatives market for the development ofthis sector.
With the recent legal resolutionof the regulatory jurisdictional issues connected to trading of electricity derivatives in India, it is hopedthat the Indian securities marketwill soon see the launch of fi�nancialderivatives on electricity.
This is sure to meet a longpending demand for a product thataddresses risk management associated with electricity.
Chandrashekhar is a policy
commentator and commodities
market specialist and Dey is Assistant
Vice-President, MCX India. Views
expressed are personal
Time to introduce electricity derivativesAn effective hedging mechanism will reduce volatility and help in price discovery in the power market
Power plans SUSHIL KUMAR VERMA
Punjab polls and farmers
In the present clutch of State elections, Punjab stands out on twocounts. Elsewhere the " Us vs Them"script has completely eclipsed discourse on a plethora of vital issuesthat, however, found energetic relevance only in Punjab. Though thiscould be attributed to the yearlongfarmer agitation, it must be saidthat the State has largely been freefrom stoking social divisiveness.
An abrupt foray into the Statepolitics by the farmers, post theiryear long crusade, has caught otherparties off� guard.
Each one is fi�ghting against timeto woo them into their fold. Nowonder all were united in seeking adeferment of elections from the EC.The farmers could be credited forhelping restore some gravity, longabsent in our elections. R Narayanan Navi Mumbai
Empowering women
Apropos 'Can the FM relieve women of this burden' ? (January 18),it is good to note that rural womenof Maharashtra and Gujarat havebeen provided with water wheelsdeveloped by Wello, an Americansocial enterprise.
While women have been relieved of the physical hardships offetching drinking water walkingmiles away, it is not the fi�nal remedy or the panacea but just oneamong the other alternatives available in addressing the issues ofrural women folk.
The point of providing cleandrinking water to every householdused to be the 'mantra' of everyother political party while comingto power.
Water, being the essentialsource of livelihood, the government identify the hamlets and villages which are water defi�cit and
provide them water by diggingdeep borewells and overheadtanks powered through solar.
With the available technologies,providing water should not be diffi�cult for village heads .
Similar to the ambitious plansof electrifying all villages and making smokefree villages, theagenda of providing clean drinking water should get on the top ofbureaucrats' list.
Thrust and liberal funds canmake this happen enabling therural womenfolk in fi�ndingenough time in sharpening theirskills and get empowered in realsense. RV BaskaranChennai
Banking fraud
This is with reference to the article‘Banking frauds will increase overnext 2 years’ (January 18), it is really
shocking to note that bankingfrauds will increase in spite of themany innovations that are beingadopted by various banks in capturing maximum share of business through them.
Cyber crimes are increasing bythe day.
Most importantly the fraudsmay crop up from diff�erentcorners of the world eitherthrough fake accounts or fake billswhich the banks may not be awareof until a certain point of time. It istherefore essential that banks’audit systems undertake multiplechecks on all highvalue transactions from diff�erent angles at different stages of the transaction beit a lending or a business deal.
Banking frauds should beseverely dealt with by the vigilancedepartments.Katuru Durga Prasad RaoHyderabad
Corporate compulsions
This refers to the article “Enhancingthe lifespan of organisations” (January 18).
Since measures for the long survival of an organisation require human resources to implement them,their sustained quality to adopt thenew changes and keep innovating toface new challenges becomes a crucial factor.
If we look at the history of organisations like Ford company and Tatagroup, we can a see thoughtful succession planning at the top to maintain a pool of talent.
A dynamic organisation culturemakes the application of technologyand innovative practices possible.Also, proactive customerservice,competitive pricing with product/service quality and continuous innovation (kaizen) contribute a lot. YG ChoukseyPune
Scan & ShareScan & Share
POCKET RAVIKANTH
................BM-BMECMYK
THINKMUMBAI
BusinessLineWEDNESDAY • JANUARY 19 • 2022 5
ACROSS
01. Shammy (47) 08. Good, trusty fellow (5) 09. A drink to excite love (7) 10. Most remote (7) 11. One caring for the sick (5) 12. Outline, short account (6) 14. Yarn, thread, fi�bre (6) 18. Turnedback extension of
collar (5) 19. Mouldable material (7) 21. A provision, condition (7) 23. Was mistaken (5) 24. Not a southpaw (56)
DOWN
01. One giving testimony (7) 02. Move regularly between
two points (7) 03. A fall from Grace (5) 04. Cookers and eaters (6) 05. Mesh worn on the head (7) 06. Decay (3) 07. In what place? (5) 13. Naming (7) 15. Clothed in (7) 16. Unmistakable, resolute (7) 17. A new growth (6) 18. Tainted person, outcast (5) 20. Betelnut genus (5) 22. Scull (3)
ACROSS
01. Clean hide of the chamois(47)
08. It will take a trick, blow it! (5) 09. Love potion one will
percolate, so it's said . (7) 10. How it might exert the writer,
going to the limit (7) 11. One may look after a shark
such as this (5) 12. Rough drawing leading
seaman made on his craft(6)
14. Give one a bit pf rope andleave him high and dry (6)
18. Liberal turned pale seeingthis part of his coat (5)
19. Sort of money one's cardrepresents (7)
21. It's a condition, or so VIPmight put it (7)
23. Turned to ref who left, andwent wrong (5)
24. How one got the thirdhanged for being dexterous(56)
DOWN
01. See what happens to news: it'sdisseminated (7)
02. A to and fro service weavermight use (7)
03. Memory loss may occur withpassing of time (5)
04. Fruit quietly involved with 3 (6) 05. The rain that might keep the
waves in order (7) 06. Polly even lost such nonsense
as this (3) 07. It is a question of location (5) 13. It may be one's vocation, making
visits (7) 15. At getting weary, must get
dressed (7) 16. Made one's mind up to see the
detectives, indeed (7) 17. It will put forth new growth
from Brussels, perhaps (6) 18. An outcast one will drive off� and
turn over (5) 20. Betelnut found in Delaware,
California and elsewhere (5) 22. This lap, Rabbit's ears will stick
out (3)
easy not so easy
ACROSS 1. Pined 4. Deports 8. Sign the pledge 10. Sugar 11. Tong 12. Down 16. Thorn 17. Unforgettable 19. Kitchen 20. Hotel DOWN 1. Passes the buck 2. Nag 3. Detest 4. Dredge 5. Paltry 6. Radiators 7. Steering wheel 9. Runs to fat 13. Starch 14. Govern 15. Snatch 18. Bet
bl two-way crossword 2046
SOLUTION: BL Two-way Crossword 2045
MOHAN LAVI
If there is one consistent featureof Union Budgets over the lastmany years, it is in setting extremely high disinvestment tar
gets. These targets are invariably notmet during the course of the subsequent year.
Budget 2021 had set a target of₹�100,000 crore for disinvestment ofgovernment stake in public sectorbanks and fi�nancial institutionsapart from ₹�75,000 crore from otherdisinvestment receipts. Actual disinvestments receipts are way off� the target. Yet, the coming Budget is expected to set a high disinvestment targetas has been the practice in the past. Incontrast to the earlier trends, thisyear the disinvestment target couldbe well be met as early as April 2022thanks to one event — the IPO of LICthat the entire nation appears to bewaiting for.
If all goes well, thedraft red herring prospectus (DRHP) of theLIC IPO is expected to befi�led with SEBI by theend of January whichcould mean that the issuecould open in March.
The government andLIC have been doing allthey can to ensure thatthey pull off� this IPO without a glitch.Insurance companies are valuedbased on the Embedded Value ( EV).This consists of the addition of networth and present value of futureprofi�ts expected with someadjustments.
The EV of SBI Life Insurance Company at the time of its public issuewas ₹�165,379 million. It has been reported that the governmentappointed actuary has pegged the embedded value of LIC at ₹�45 trillion —more than 25 times that of SBI Life .The market valuation of insurancecompanies is normally 34 times theirEV. On this basis, the government isexpecting that the market valuationof LIC to be around ₹�15 trillion. Withthis sort of valuation, they would beable to meet the disinvestment targetwith change to spare.
The adjusted net worth of LIC is expected to be high as the policyhold
ers fund would be segregated intoparticipating and nonparticipatingfunds. Participating fund is the operating part of insurance companies —from this the insurer’s profi�ts andsurplus are shared with policyholders and all payments to policyholdersmade. A nonparticipating fund hasall receipts from nonparticipatingpolicies in which nonbonuses orsurplus are shared with policyholders. In addition, LIC has considerabletreasury gains which could only addto its valuation.
Pricing pressureAlmost every Indian investor will bekeen to keep some part of LIC in theirportfolio. They would be keen toknow how much the issue would bepriced at so that they can plan to allocate funds for the IPO.
Valuation principles always look tothe market for indicators for valu
ation. In 2017, SBI Lifepriced its issue at ₹�700;its market price is nowaround ₹�1,260. Pricingthe share of LIC is goingto be tricky — too low aprice would tend to devalue the crown jewelof the insurance industry in India and toohigh a price would putoff� investors.
On a very broad level, LIC’s profi�tsand EPS are twice that of SBI Life,which would mean that ₹�1,400should be a target price. However, LIChas a much larger population of bothpolicyholders as well as range ofpolicies. On the fl�ip side, LIC hasmade many investments that mayhave to be written off� (the true valueof LIC’s fi�nancial investments wouldbe known once it adopts the Ind ASaccounting standards).
Keeping all these factors in mind,the IPO could possibly come in therange of ₹�1,4002,000. However,since valuation is an exercise of putting assumptions into numbers, adisclaimer is to be made — the aboverange could well be off� the mark ifthe assumptions change. It is goingto be an interesting two months forinvestors in India.
The writer is a chartered accountant
All eyes on LIC IPO The pricing of the issue will hold the key
There’s a farcical note to the IndiaChina tugofwar playingout over Sri Lanka. A row overwhat Sri Lankans insist was sub
standard Chinese organic fertiliser thatarrived aboard a Chinese cargo ship,whimsically named the Hippo Spirit, hasstrained ties between Beijing andColombo.
Step back a few months earlier to whenthe Sri Lankan government suddenly declared the nation would go organic andovernight banned all chemical fertilisers,a move that threw tea growers and farmers into panic. Beijing stepped into thebreach, sending a shipment of organicfertiliser. But when it arrived Colombo declared it contained harmful bacteria andrefused to pay for the consignment.
India steps inAmidst all this drama, India suddenlymoved into pole position once again as SriLanka’s best friend, ready with a handoutjust when it’s urgently needed. India hascome up with an immediate $900millionaid package and a $1.5billion credit line.Deeppocketed China, which was expected to bail its small island buddy out oftrouble, is for now studiously looking theother way and ignoring the bowl thrustunder its nose. Beijing may come good incoming months but there are no promises yet. “There was the fallout over the fertilisers but also the Chinese are hardening their lending terms everywhere,”notes a diplomat.
Onceaffl�uent Sri Lanka is in desperateeconomic straits. It may seem hard to believe but the halt to chemical fertiliser usewas actually intended to save on foreignexchange. Sri Lanka’s foreign exchange reserves are now down to $1.5 billion andwithout the Indian loan on its way itwould be unable to pay for imports andthat includes just about everything fromfertilisers to automobiles, cosmetics and
even milk powder. Sri Lankans have beenconfronted by empty shop shelves andeven exploding cooking gas cylinders itwas rumoured the cylinders were beingfi�lled with cheaper propane instead of thecostlier butane usually used.
How much foreign exchange does SriLanka need in the coming year? The government has to repay $4.6 billion and theprivate sector $2.5 billion. That’s $7.1 billion, far more than the country has gotright now. Some $500 million comes dueJanuary 18. Says WA Wijewardena, SriLankan central bank’s exdeputy governor: “Unless a megainfl�ow of $78 billion is received, Sri Lanka will be in deeptrouble.” He adds: “Neither India norChina can bail out Sri Lanka indefi�nitely.Thus, the problem gets compounded dayby day.”
How did Sri Lanka land itself in this fi�nancial morass? The economy’s been lurching from bad to worse for years now eventhough the government likes to put mostof the blame on the pandemic and ensuing shutdown of the tourism industrywhich keeps the country afl�oat. When thepandemic struck, the sector was only justrecovering from the 2019 Easter terroristbombings that killed 267 people.
Project revivalThe Sri Lankans have been notsoadeptlyplaying off� India and China for most ofthe last decade. Now, India’s pulled ahead
by a short nose and hoping to stay ahead.Meanwhile, it’s looking at getting severalprojects, stuck for years, moving again.Most importantly, there’s the TrincomaleeOil Tanks Farm in which IndianOil hopesto take a major stake via its Sri Lankan subsidiary. Finalising the oil tanks deal is aprecondition for unlocking the Indian$1.5billion credit line.
Besides that, India has moved to scuttlea renewable power project on three smallJaff�na peninsula islands close to Indiathat’s been the subject of a fi�erce tusslebetween India and China. “We off�ered amuch cheaper project but the Chinese insisted their one was backed by the AsianDevelopment Bank and couldn’t suddenly be terminated. This particularbattle ended with a clear win for Indiawhich didn’t want the projects so near itsmainland,” said another diplomat.
Warming tiesBoth India and China have been playingtheir hand carefully for an advantage inSri Lanka. External Aff�airs Minister SJaishankar has just held a virtual meetingwith Sri Lankan fi�nance minister Basil Rajapaksha (reputedly the smartest of theruling Rajapaksha brothers). Basil madean earlier trip to Delhi in early Decemberwhen he met Prime Minister NarendraModi. From the Indian side too, there havebeen frequent interactions, signaling tieshave been warming. Foreign Secretary
Harsh Shringla was in Colombo in October followed soon afterwards by armychief Mukund Navarane.
Don’t imagine for a moment, though,China’s out of the game. Chinese ForeignMinister Wang Yi made quick trips to theMaldives and Sri Lanka in early Decemberand visited Colombo again in early January to mark the 65th anniversary of diplomatic ties.
Also, it was the Chinese who pulled therug from under India in early 2021 andtook back the Colombo Port’s East Container Terminal project. A joint IndiaJapan consortium which was supposed tohandle the project suddenly found it wasout on its ear. As a consolation. India wasoff�ered the West Container Terminalwhich will be executed by the AdaniGroup. India is distinctly unhappy aboutthis consolation prize because it will needfar fatter investment than the East CoastTerminal which has some infrastructurealready up. At a diff�erent level, just thisweek, India completed a housing projectin the plantation areas mostly for Tamilorigin workers.
The IMF optionWhat’s the overarching solution for SriLanka’s economic woes? That’s easyenough. Take that bowl and head to theIMF. But the Rajapaksha brothers havebeen looking at every manoeuvre possible to avoid this. Yes, IMF loans do comewith onerous conditions. Also, crucially,the Rajapakshas don’t want to give uptheir authoritarian ways and answerquestions about how they’re spendingthe country’s money. But they aren’t likelyto have any other options. They’ve beenprinting money at high speed and that’sforced a massive devaluation of the SriLankan rupee. The nation’s credit ratinghas also fallen even further into junk territory to CCC.
Indian diplomats reckon India can’tmatch China when it loosens its pursestrings. So what’s the solution? In the longterm, India must strengthen its economicties and allow freer trade with Sri Lanka,even though businessmen in this countrywill howl.
India’s got geography on its side. Itmust use that to build a strong economicrelationship with Sri Lanka so even China’s bigtime spending won’t leave it lagging in second place in the diplomaticrace.
Checkmating China in Sri Lanka India must leverage its geographical advantage to counter China’s moves in the island nation
Foreign Minister S Jaishankar with his Sri Lankan counterpart D Gunawardena (file photo) AP/PTI
PARAN BALAKRISHNAN
THE WIDER ANGLE
January 19, 2002
Bank privatisation efforts faltering
The Government plan to bring down its equity holding inpublic sector banks to 33 per cent is seemingly on the backburner, eff�ectively halting all attempts made at privatising.nationalised banks. Similarly, the RBI move to divest itsholding in various public sector institutions such as StateBank of India, National Bank of Agriculture and RuralDevelopment and National Housing Bank (NHB) appearsto be on hold. Two years ago in his Budget speech, theFinance Minister had announced that the government hadaccepted the recommendations of the NarasimhamCommittee to bring down Government holding in PSUbanks to a minimum of 33 per cent
Industry urged to team up with Govt at WTO talksIndian industry and policymakers should come to termswith the WTO and work out favourable tradeoff�s beforethe crucial 2005 negotiations, speakers said at a seminaron 'WTO & India The tasks ahead' on Friday. Industry andservice bodies were also urged to quickly come out withtheir assessments on areas of benefi�t and market denial forthe Government to work out its bargain strategy.
Plan panel calls for tariff reform in Rlys After the Finance Ministry, it was the turn of the PlanningCommission on Friday to push for tariff� rebalancing andreforms in the Indian Railways to make it a fi�nanciallyviable organisation. The Railways were also asked toconsider the setting up of an independent rail tariff�regulatory authority. At a meeting convened by the DeputyChairman, Planning Commission, Mr K.C. Pant, the RailwayMinister, Mr Nitish Kumar, however, maintained that tariff�rebalancing — mainly through a hike in secondclasspassenger fares — could be done only gradually.
TWENTY YEARS AGO TODAY
BusinessLine
Governments worldwide areeasing quarantine rules, re
viewing coronavirus curbs anddialling back pandemiceraemergency support as they bidto launch their economies backinto some version of normality.
The moves, motivated by thelower severity of the Omicronvariant and the need to keepworkers in work and the globalrecovery on track, have generated a whiff� of optimism that haslifted oil and stock prices.
Health experts say the variant’s rapid spread may yet heralda turning point in the pandemic.
However, they add, much depends on how authorities manage ongoing vaccination rollouts and balance other healthmeasures still needed, while persuading their citizens not tothrow caution to the wind.
“We are taking a big step andthat also means we’re taking abig risk,” Dutch Prime MinisterMark Rutte said last week beforestores, hairdressers and gyms reopened in a partial lifting of alockdown despite record numbers of new cases.
That lockdown was alreadysomething of a rarity, with mostwestern countries well past thatstage and focussed on how tosafely open up further.
Around half a dozen have cutquarantine times from 10 to fi�vedays, citing Omicron's faster infection cycle as grounds toloosen rules that have led to awave of worker absences hittingbusinesses.
Britain and Israel have easedrequirements for followup PCRtests after a lateral fl�ow result asOmicron’s soaring infectionrates overload laboratories. Localmedia say Britain could announce further easing of restrictions later this month.
Omicron's ability to rifl�equickly through a populationwithout causing a proportionaterise in hospitalisations anddeaths even prompted Spain'sprime minister to suggest it betreated akin to an endemic illness like fl�u. Policymakers whosepriority now is to wean economies off� the cheap money fuellinginfl�ation have started to depictthe coronavirus as somethingbusinesses and householdsmust learn to live with. REUTERS
With Omicron,global economy ispushing past Covid
SHORT TAKE
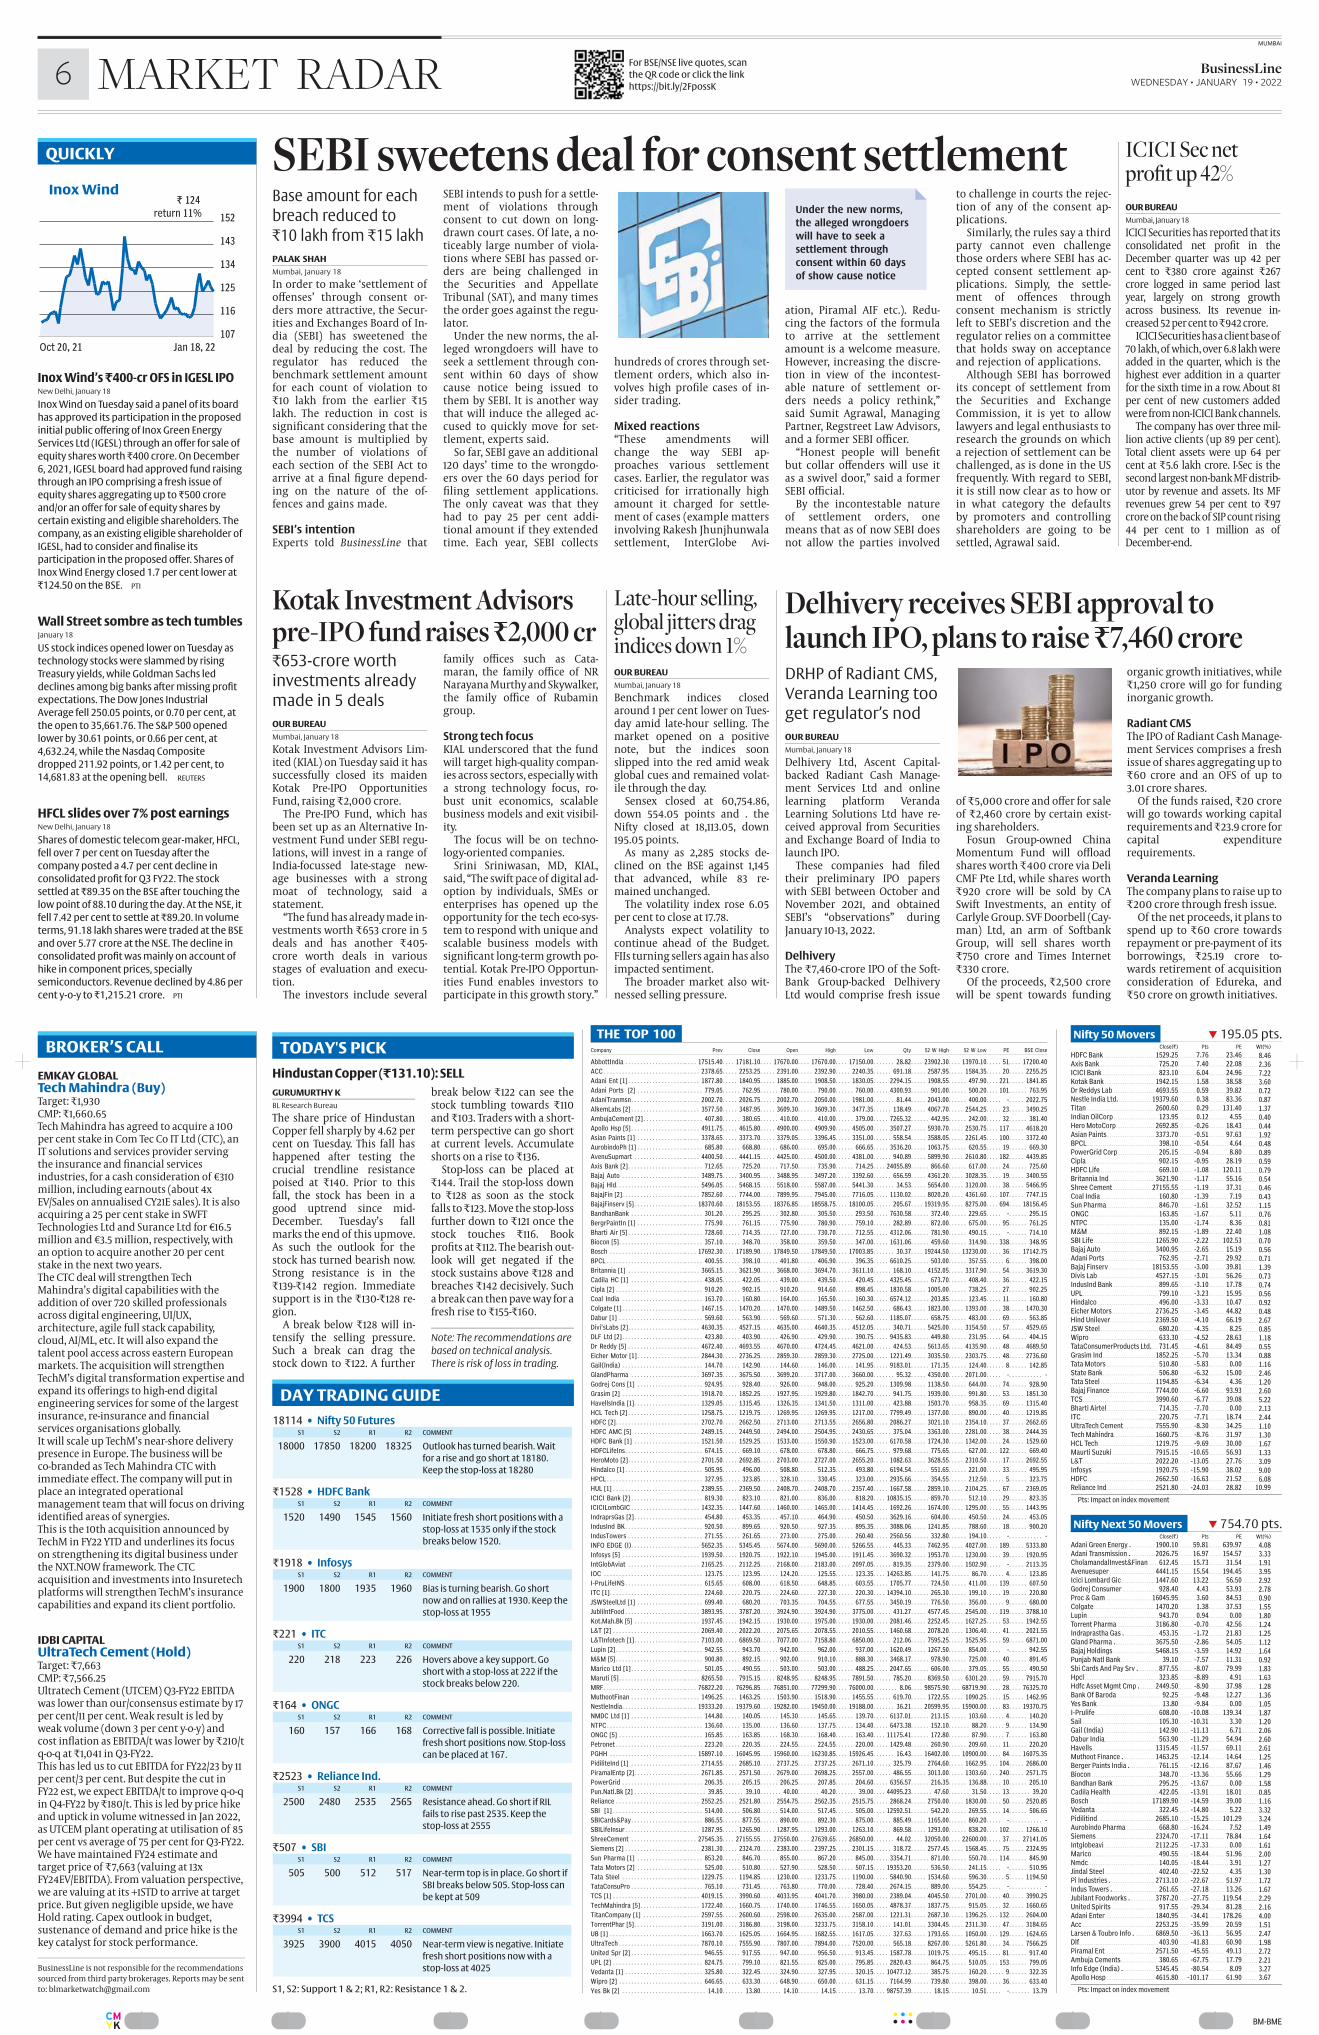
................BMBMECMYK
MUMBAI
6 BusinessLine WEDNESDAY • JANUARY 19 • 2022MARKET RADAR
For BSE/NSE live quotes, scan
the QR code or click the link
https://bit.ly/2FpossK
Inox Wind’s ₹�400cr OFS in IGESL IPONew Delhi, January 18
Inox Wind on Tuesday said a panel of its board
has approved its participation in the proposed
initial public offering of Inox Green Energy
Services Ltd (IGESL) through an offer for sale of
equity shares worth ₹�400 crore. On December
6, 2021, IGESL board had approved fund raising
through an IPO comprising a fresh issue of
equity shares aggregating up to ₹�500 crore
and/or an offer for sale of equity shares by
certain existing and eligible shareholders. The
company, as an existing eligible shareholder of
IGESL, had to consider and fi�nalise its
participation in the proposed offer. Shares of
Inox Wind Energy closed 1.7 per cent lower at
₹�124.50 on the BSE. PTI
Wall Street sombre as tech tumblesJanuary 18
US stock indices opened lower on Tuesday as
technology stocks were slammed by rising
Treasury yields, while Goldman Sachs led
declines among big banks after missing profi�t
expectations. The Dow Jones Industrial
Average fell 250.05 points, or 0.70 per cent, at
the open to 35,661.76. The S&P 500 opened
lower by 30.61 points, or 0.66 per cent, at
4,632.24, while the Nasdaq Composite
dropped 211.92 points, or 1.42 per cent, to
14,681.83 at the opening bell. REUTERS
HFCL slides over 7% post earningsNew Delhi, January 18
Shares of domestic telecom gearmaker, HFCL,
fell over 7 per cent on Tuesday after the
company posted a 4.7 per cent decline in
consolidated profi�t for Q3 FY22. The stock
settled at ₹�89.35 on the BSE after touching the
low point of 88.10 during the day. At the NSE, it
fell 7.42 per cent to settle at ₹�89.20. In volume
terms, 91.18 lakh shares were traded at the BSE
and over 5.77 crore at the NSE. The decline in
consolidated profi�t was mainly on account of
hike in component prices, specially
semiconductors. Revenue declined by 4.86 per
cent yoy to ₹�1,215.21 crore. PTI
QUICKLY
THE TOP 100Company Prev Close Open High Low Qty 52 W High 52 W Low PE BSE Close
AbbottIndia . . . . . . . . . . . . . . . . . . . .. . . . 17515.40. . . . 17181.10. . . . 17670.00. . . . 17670.00. . . . 17150.00. . . . . . . 28.82. . . . 23902.30. . . . 13970.10. . . . . 51 . . . . 17200.40
ACC . . . . . . . . . . . . . . . . . . . . . . . . . . .. . . . . 2378.65. . . . . 2253.25. . . . . 2391.00. . . . . 2392.90. . . . . 2240.35. . . . . . 691.18. . . . . 2587.95. . . . . 1584.35. . . . . 20 . . . . . 2255.25
Adani Ent [1] . . . . . . . . . . . . . . . . . . .. . . . . 1877.80. . . . . 1840.95. . . . . 1885.00. . . . . 1908.50. . . . . 1830.05. . . . . 2294.15. . . . . 1908.55. . . . . . 497.90. . . . 221 . . . . . 1841.85
Adani Ports [2] . . . . . . . . . . . . . . . .. . . . . . 779.05. . . . . . 762.95. . . . . . 780.00. . . . . . 790.00. . . . . . 760.00. . . . . 4300.93. . . . . . 901.00. . . . . . 500.20. . . . 101 . . . . . . 763.95
AdaniTranmsn. . . . . . . . . . . . . . . . . .. . . . . 2002.70. . . . . 2026.75. . . . . 2002.70. . . . . 2050.00. . . . . 1981.00. . . . . . . 81.44. . . . . 2043.00. . . . . . 400.00. . . . . . . . . . 2022.75
AlkemLabs [2] . . . . . . . . . . . . . . . . . .. . . . . 3577.50. . . . . 3487.95. . . . . 3609.30. . . . . 3609.30. . . . . 3477.35. . . . . . 138.49. . . . . 4067.70. . . . . 2544.25. . . . . 23 . . . . . 3490.25
AmbujaCement [2]. . . . . . . . . . . . . .. . . . . . 407.80. . . . . . 380.65. . . . . . 410.00. . . . . . 410.00. . . . . . 379.00. . . . . 7265.32. . . . . . 442.95. . . . . . 242.00. . . . . 32 . . . . . . 381.40
Apollo Hsp [5]. . . . . . . . . . . . . . . . . .. . . . . 4911.75. . . . . 4615.80. . . . . 4900.00. . . . . 4909.90. . . . . 4505.00. . . . . 3507.27. . . . . 5930.70. . . . . 2530.75. . . . 117 . . . . . 4618.20
Asian Paints [1] . . . . . . . . . . . . . . . .. . . . . 3378.65. . . . . 3373.70. . . . . 3379.05. . . . . 3396.45. . . . . 3351.00. . . . . . 558.54. . . . . 3588.05. . . . . 2261.45. . . . 100 . . . . . 3372.40
AurobindoPh [1] . . . . . . . . . . . . . . . .. . . . . . 685.80. . . . . . 668.80. . . . . . 686.00. . . . . . 695.00. . . . . . 666.65. . . . . 3536.20. . . . . 1063.75. . . . . . 620.55. . . . . 19 . . . . . . 669.30
AvenuSupmart . . . . . . . . . . . . . . . . .. . . . . 4400.50. . . . . 4441.15. . . . . 4425.00. . . . . 4500.00. . . . . 4381.00. . . . . . 940.89. . . . . 5899.90. . . . . 2610.80. . . . 182 . . . . . 4439.85
Axis Bank [2]. . . . . . . . . . . . . . . . . . .. . . . . . 712.65. . . . . . 725.20. . . . . . 717.50. . . . . . 735.90. . . . . . 714.25. . . . 24055.89. . . . . . 866.60. . . . . . 617.00. . . . . 24 . . . . . . 725.60
Bajaj Auto . . . . . . . . . . . . . . . . . . . . .. . . . . 3489.75. . . . . 3400.95. . . . . 3488.95. . . . . 3497.20. . . . . 3392.60. . . . . . 656.59. . . . . 4361.20. . . . . 3028.35. . . . . 19 . . . . . 3400.55
Bajaj Hld. . . . . . . . . . . . . . . . . . . . . . .. . . . . 5496.05. . . . . 5468.15. . . . . 5518.00. . . . . 5587.00. . . . . 5441.30. . . . . . . 34.53. . . . . 5654.00. . . . . 3120.00. . . . . 38 . . . . . 5466.95
BajajFin [2]. . . . . . . . . . . . . . . . . . . . .. . . . . 7852.60. . . . . 7744.00. . . . . 7899.95. . . . . 7945.00. . . . . 7716.05. . . . . 1130.02. . . . . 8020.20. . . . . 4361.60. . . . 107 . . . . . 7747.15
BajajFinserv [5]. . . . . . . . . . . . . . . . .. . . . 18370.60. . . . 18153.55. . . . 18376.85. . . . 18558.75. . . . 18100.05. . . . . . 205.67. . . . 19319.95. . . . . 8275.00. . . . 694 . . . . 18156.45
BandhanBank . . . . . . . . . . . . . . . . . .. . . . . . 301.20. . . . . . 295.25. . . . . . 302.80. . . . . . 305.50. . . . . . 293.50. . . . . 7630.58. . . . . . 372.40. . . . . . 229.65. . . . . . . . . . . 295.15
BergrPaintIn [1] . . . . . . . . . . . . . . . .. . . . . . 775.90. . . . . . 761.15. . . . . . 775.90. . . . . . 780.90. . . . . . 759.10. . . . . . 282.89. . . . . . 872.00. . . . . . 675.00. . . . . 95 . . . . . . 761.25
Bharti Air [5] . . . . . . . . . . . . . . . . . . .. . . . . . 728.60. . . . . . 714.35. . . . . . 727.00. . . . . . 730.70. . . . . . 712.55. . . . . 4312.06. . . . . . 781.90. . . . . . 490.15. . . . . . . . . . . 714.10
Biocon [5]. . . . . . . . . . . . . . . . . . . . . .. . . . . . 357.10. . . . . . 348.70. . . . . . 358.00. . . . . . 359.50. . . . . . 347.00. . . . . 1631.06. . . . . . 459.60. . . . . . 314.90. . . . 338 . . . . . . 348.95
Bosch . . . . . . . . . . . . . . . . . . . . . . . . .. . . . 17692.30. . . . 17189.90. . . . 17849.50. . . . 17849.50. . . . 17003.85. . . . . . . 30.37. . . . 19244.50. . . . 13230.00. . . . . 36 . . . . 17142.75
BPCL . . . . . . . . . . . . . . . . . . . . . . . . . .. . . . . . 400.55. . . . . . 398.10. . . . . . 401.80. . . . . . 406.90. . . . . . 396.35. . . . . 6610.25. . . . . . 503.00. . . . . . 357.55. . . . . . 6 . . . . . . 398.00
Britannia [1] . . . . . . . . . . . . . . . . . . .. . . . . 3665.15. . . . . 3621.90. . . . . 3668.00. . . . . 3694.70. . . . . 3611.10. . . . . . 168.10. . . . . 4152.05. . . . . 3317.90. . . . . 54 . . . . . 3619.30
Cadila HC [1] . . . . . . . . . . . . . . . . . .. . . . . . 438.05. . . . . . 422.05. . . . . . 439.00. . . . . . 439.50. . . . . . 420.45. . . . . 4325.45. . . . . . 673.70. . . . . . 408.40. . . . . 36 . . . . . . 422.15
Cipla [2] . . . . . . . . . . . . . . . . . . . . . . .. . . . . . 910.20. . . . . . 902.15. . . . . . 910.20. . . . . . 914.60. . . . . . 898.45. . . . . 1830.58. . . . . 1005.00. . . . . . 738.25. . . . . 27 . . . . . . 902.25
Coal India . . . . . . . . . . . . . . . . . . . . .. . . . . . 163.70. . . . . . 160.80. . . . . . 164.00. . . . . . 165.50. . . . . . 160.30. . . . . 6574.12. . . . . . 203.85. . . . . . 123.45. . . . . 11 . . . . . . 160.80
Colgate [1]. . . . . . . . . . . . . . . . . . . . .. . . . . 1467.15. . . . . 1470.20. . . . . 1470.00. . . . . 1489.50. . . . . 1462.50. . . . . . 686.43. . . . . 1823.00. . . . . 1393.00. . . . . 38 . . . . . 1470.30
Dabur [1] . . . . . . . . . . . . . . . . . . . . . .. . . . . . 569.60. . . . . . 563.90. . . . . . 569.60. . . . . . 571.30. . . . . . 562.60. . . . . 1185.07. . . . . . 658.75. . . . . . 483.00. . . . . 69 . . . . . . 563.85
Divi'sLabs [2]. . . . . . . . . . . . . . . . . . .. . . . . 4630.35. . . . . 4527.15. . . . . 4635.00. . . . . 4640.35. . . . . 4512.05. . . . . . 340.71. . . . . 5425.00. . . . . 3154.50. . . . . 57 . . . . . 4529.65
DLF Ltd [2]. . . . . . . . . . . . . . . . . . . . .. . . . . . 423.80. . . . . . 403.90. . . . . . 426.90. . . . . . 429.90. . . . . . 390.75. . . . . 9435.83. . . . . . 449.80. . . . . . 231.95. . . . . 64 . . . . . . 404.15
Dr Reddy [5] . . . . . . . . . . . . . . . . . . .. . . . . 4672.40. . . . . 4693.55. . . . . 4670.00. . . . . 4724.45. . . . . 4621.00. . . . . . 424.53. . . . . 5613.65. . . . . 4135.90. . . . . 48 . . . . . 4689.50
Eicher Motor [1]. . . . . . . . . . . . . . . .. . . . . 2844.30. . . . . 2736.25. . . . . 2859.30. . . . . 2859.30. . . . . 2725.00. . . . . 1221.49. . . . . 3035.50. . . . . 2303.75. . . . . 48 . . . . . 2736.60
Gail(India) . . . . . . . . . . . . . . . . . . . . .. . . . . . 144.70. . . . . . 142.90. . . . . . 144.60. . . . . . 146.00. . . . . . 141.95. . . . . 9183.01. . . . . . 171.35. . . . . . 124.40. . . . . . 8 . . . . . . 142.85
GlandPharma . . . . . . . . . . . . . . . . . .. . . . . 3697.35. . . . . 3675.50. . . . . 3699.20. . . . . 3717.00. . . . . 3660.00. . . . . . . 95.32. . . . . 4350.00. . . . . 2071.00. . . . . . . . . . . . . . . .
Godrej Cons [1] . . . . . . . . . . . . . . . .. . . . . . 924.95. . . . . . 928.40. . . . . . 926.00. . . . . . 948.00. . . . . . 925.20. . . . . 1309.98. . . . . 1138.50. . . . . . 644.00. . . . . 74 . . . . . . 928.90
Grasim [2] . . . . . . . . . . . . . . . . . . . . .. . . . . 1918.70. . . . . 1852.25. . . . . 1927.95. . . . . 1929.80. . . . . 1842.70. . . . . . 941.75. . . . . 1939.00. . . . . . 991.80. . . . . 53 . . . . . 1851.30
HavellsIndia [1]. . . . . . . . . . . . . . . . .. . . . . 1329.05. . . . . 1315.45. . . . . 1326.35. . . . . 1341.50. . . . . 1311.00. . . . . . 423.88. . . . . 1503.70. . . . . . 958.35. . . . . 69 . . . . . 1315.40
HCL Tech [2] . . . . . . . . . . . . . . . . . . .. . . . . 1258.75. . . . . 1219.75. . . . . 1269.95. . . . . 1269.95. . . . . 1217.00. . . . . 7799.49. . . . . 1377.00. . . . . . 890.00. . . . . 40 . . . . . 1219.85
HDFC [2]. . . . . . . . . . . . . . . . . . . . . . .. . . . . 2702.70. . . . . 2662.50. . . . . 2713.00. . . . . 2713.55. . . . . 2656.80. . . . . 2086.27. . . . . 3021.10. . . . . 2354.10. . . . . 37 . . . . . 2662.65
HDFC AMC [5] . . . . . . . . . . . . . . . . .. . . . . 2489.15. . . . . 2449.50. . . . . 2494.00. . . . . 2504.95. . . . . 2430.65. . . . . . 375.04. . . . . 3363.00. . . . . 2281.00. . . . . 38 . . . . . 2444.35
HDFC Bank [1] . . . . . . . . . . . . . . . . .. . . . . 1521.50. . . . . 1529.25. . . . . 1533.00. . . . . 1550.90. . . . . 1523.00. . . . . 6170.58. . . . . 1724.30. . . . . 1342.00. . . . . 24 . . . . . 1529.60
HDFCLifeIns. . . . . . . . . . . . . . . . . . . .. . . . . . 674.15. . . . . . 669.10. . . . . . 678.00. . . . . . 678.80. . . . . . 666.75. . . . . . 979.68. . . . . . 775.65. . . . . . 627.00. . . . 122 . . . . . . 669.40
HeroMoto [2]. . . . . . . . . . . . . . . . . . .. . . . . 2701.50. . . . . 2692.85. . . . . 2703.00. . . . . 2727.00. . . . . 2655.20. . . . . 1082.63. . . . . 3628.55. . . . . 2310.50. . . . . 17 . . . . . 2692.55
Hindalco [1] . . . . . . . . . . . . . . . . . . . .. . . . . . 505.95. . . . . . 496.00. . . . . . 508.80. . . . . . 512.35. . . . . . 493.80. . . . . 6194.54. . . . . . 551.65. . . . . . 221.00. . . . . 33 . . . . . . 495.95
HPCL . . . . . . . . . . . . . . . . . . . . . . . . . .. . . . . . 327.95. . . . . . 323.85. . . . . . 328.10. . . . . . 330.45. . . . . . 323.00. . . . . 2935.66. . . . . . 354.55. . . . . . 212.50. . . . . . 5 . . . . . . 323.75
HUL [1] . . . . . . . . . . . . . . . . . . . . . . . .. . . . . 2389.55. . . . . 2369.50. . . . . 2408.70. . . . . 2408.70. . . . . 2357.40. . . . . 1667.58. . . . . 2859.10. . . . . 2104.25. . . . . 67 . . . . . 2369.05
ICICI Bank [2] . . . . . . . . . . . . . . . . . .. . . . . . 819.30. . . . . . 823.10. . . . . . 821.00. . . . . . 836.00. . . . . . 818.20. . . . 10835.15. . . . . . 859.70. . . . . . 512.10. . . . . 29 . . . . . . 823.35
ICICILombGIC . . . . . . . . . . . . . . . . . .. . . . . 1432.35. . . . . 1447.60. . . . . 1460.00. . . . . 1465.00. . . . . 1414.45. . . . . 1692.26. . . . . 1674.00. . . . . 1295.00. . . . . 55 . . . . . 1443.95
IndraprsGas [2]. . . . . . . . . . . . . . . . .. . . . . . 454.80. . . . . . 453.35. . . . . . 457.10. . . . . . 464.90. . . . . . 450.50. . . . . 3629.16. . . . . . 604.00. . . . . . 450.50. . . . . 24 . . . . . . 453.05
IndusInd BK. . . . . . . . . . . . . . . . . . . .. . . . . . 920.50. . . . . . 899.65. . . . . . 920.50. . . . . . 927.35. . . . . . 895.35. . . . . 3088.06. . . . . 1241.85. . . . . . 788.60. . . . . 18 . . . . . . 900.20
IndusTowers . . . . . . . . . . . . . . . . . . .. . . . . . 271.55. . . . . . 261.65. . . . . . 273.00. . . . . . 275.00. . . . . . 260.40. . . . . 2560.56. . . . . . 332.80. . . . . . 194.10. . . . . . . . . . . . . . . .
INFO EDGE (I). . . . . . . . . . . . . . . . . .. . . . . 5652.35. . . . . 5345.45. . . . . 5674.00. . . . . 5690.00. . . . . 5266.55. . . . . . 445.33. . . . . 7462.95. . . . . 4027.00. . . . 189 . . . . . 5333.80
Infosys [5] . . . . . . . . . . . . . . . . . . . . .. . . . . 1939.50. . . . . 1920.75. . . . . 1922.10. . . . . 1945.00. . . . . 1911.45. . . . . 3690.32. . . . . 1953.70. . . . . 1230.00. . . . . 39 . . . . . 1920.95
IntGlobAviat . . . . . . . . . . . . . . . . . . .. . . . . 2165.25. . . . . 2112.25. . . . . 2168.00. . . . . 2183.00. . . . . 2097.05. . . . . . 819.35. . . . . 2379.00. . . . . 1502.90. . . . . . . . . . 2113.35
IOC . . . . . . . . . . . . . . . . . . . . . . . . . . .. . . . . . 123.75. . . . . . 123.95. . . . . . 124.20. . . . . . 125.55. . . . . . 123.35. . . . 14263.85. . . . . . 141.75. . . . . . . 86.70. . . . . . 4 . . . . . . 123.85
IPruLifeINS. . . . . . . . . . . . . . . . . . . .. . . . . . 615.65. . . . . . 608.00. . . . . . 618.50. . . . . . 648.85. . . . . . 603.55. . . . . 1705.77. . . . . . 724.50. . . . . . 411.00. . . . 139 . . . . . . 607.50
ITC [1]. . . . . . . . . . . . . . . . . . . . . . . . .. . . . . . 224.60. . . . . . 220.75. . . . . . 224.60. . . . . . 227.30. . . . . . 220.30. . . . 14394.10. . . . . . 265.30. . . . . . 199.10. . . . . 19 . . . . . . 220.80
JSWSteelLtd [1] . . . . . . . . . . . . . . . .. . . . . . 699.40. . . . . . 680.20. . . . . . 703.35. . . . . . 704.55. . . . . . 677.55. . . . . 3450.19. . . . . . 776.50. . . . . . 356.00. . . . . . 9 . . . . . . 680.00
JublilntFood . . . . . . . . . . . . . . . . . . . .. . . . . 3893.95. . . . . 3787.20. . . . . 3924.90. . . . . 3924.90. . . . . 3775.00. . . . . . 431.27. . . . . 4577.45. . . . . 2545.00. . . . 119 . . . . . 3788.10
Kot.Mah.Bk [5] . . . . . . . . . . . . . . . . .. . . . . 1937.45. . . . . 1942.15. . . . . 1930.00. . . . . 1975.00. . . . . 1930.00. . . . . 2081.46. . . . . 2252.45. . . . . 1627.25. . . . . 53 . . . . . 1942.55
L&T [2] . . . . . . . . . . . . . . . . . . . . . . . .. . . . . 2069.40. . . . . 2022.20. . . . . 2075.65. . . . . 2078.55. . . . . 2010.55. . . . . 1460.68. . . . . 2078.20. . . . . 1306.40. . . . . 41 . . . . . 2021.55
L&TInfotech [1]. . . . . . . . . . . . . . . . .. . . . . 7103.00. . . . . 6869.50. . . . . 7077.00. . . . . 7158.80. . . . . 6850.00. . . . . . 212.06. . . . . 7595.25. . . . . 3525.95. . . . . 59 . . . . . 6871.00
Lupin [2] . . . . . . . . . . . . . . . . . . . . . . .. . . . . . 942.55. . . . . . 943.70. . . . . . 942.00. . . . . . 962.00. . . . . . 937.00. . . . . 1620.49. . . . . 1267.50. . . . . . 854.00. . . . . . . . . . . 942.55
M&M [5] . . . . . . . . . . . . . . . . . . . . . . .. . . . . . 900.80. . . . . . 892.15. . . . . . 902.00. . . . . . 910.10. . . . . . 888.30. . . . . 3468.17. . . . . . 978.90. . . . . . 725.00. . . . . 40 . . . . . . 891.45
Marico Ltd [1]. . . . . . . . . . . . . . . . . .. . . . . . 501.05. . . . . . 490.55. . . . . . 503.00. . . . . . 503.00. . . . . . 488.25. . . . . 2047.65. . . . . . 606.00. . . . . . 379.05. . . . . 55 . . . . . . 490.50
Maruti [5]. . . . . . . . . . . . . . . . . . . . . .. . . . . 8265.50. . . . . 7915.15. . . . . 8248.95. . . . . 8248.95. . . . . 7891.50. . . . . . 785.20. . . . . 8369.50. . . . . 6301.20. . . . . 59 . . . . . 7915.70
MRF . . . . . . . . . . . . . . . . . . . . . . . . . . .. . . . 76822.20. . . . 76296.85. . . . 76851.00. . . . 77299.90. . . . 76000.00. . . . . . . . 8.06. . . . 98575.90. . . . 68719.90. . . . . 28 . . . . 76325.70
MuthootFinan . . . . . . . . . . . . . . . . . .. . . . . 1496.25. . . . . 1463.25. . . . . 1503.90. . . . . 1518.90. . . . . 1455.55. . . . . . 619.70. . . . . 1722.55. . . . . 1090.25. . . . . 15 . . . . . 1462.95
NestleIndia. . . . . . . . . . . . . . . . . . . . .. . . . 19333.20. . . . 19379.60. . . . 19282.00. . . . 19450.00. . . . 19188.00. . . . . . . 36.21. . . . 20599.95. . . . 15900.00. . . . . 83 . . . . 19370.75
NMDC Ltd [1] . . . . . . . . . . . . . . . . . .. . . . . . 144.80. . . . . . 140.05. . . . . . 145.30. . . . . . 145.65. . . . . . 139.70. . . . . 6137.01. . . . . . 213.15. . . . . . 103.60. . . . . . 4 . . . . . . 140.20
NTPC. . . . . . . . . . . . . . . . . . . . . . . . . .. . . . . . 136.60. . . . . . 135.00. . . . . . 136.60. . . . . . 137.75. . . . . . 134.40. . . . . 6473.38. . . . . . 152.10. . . . . . . 88.20. . . . . . 9 . . . . . . 134.90
ONGC [5] . . . . . . . . . . . . . . . . . . . . . .. . . . . . 165.85. . . . . . 163.85. . . . . . 168.30. . . . . . 168.40. . . . . . 163.40. . . . 11175.41. . . . . . 172.80. . . . . . . 87.90. . . . . . 7 . . . . . . 163.80
Petronet . . . . . . . . . . . . . . . . . . . . . . .. . . . . . 223.20. . . . . . 220.35. . . . . . 224.55. . . . . . 224.55. . . . . . 220.00. . . . . 1429.48. . . . . . 260.90. . . . . . 209.60. . . . . 11 . . . . . . 220.20
PGHH . . . . . . . . . . . . . . . . . . . . . . . . .. . . . 15897.10. . . . 16045.95. . . . 15960.00. . . . 16230.85. . . . 15926.45. . . . . . . 16.43. . . . 16402.00. . . . 10900.00. . . . . 84 . . . . 16075.35
PidiliteInd [1] . . . . . . . . . . . . . . . . . .. . . . . 2714.55. . . . . 2685.10. . . . . 2737.25. . . . . 2737.25. . . . . 2671.10. . . . . . 325.79. . . . . 2764.60. . . . . 1662.95. . . . 104 . . . . . 2686.00
PiramalEntp [2]. . . . . . . . . . . . . . . . .. . . . . 2671.85. . . . . 2571.50. . . . . 2679.00. . . . . 2698.25. . . . . 2557.00. . . . . . 486.55. . . . . 3013.00. . . . . 1303.60. . . . 240 . . . . . 2571.75
PowerGrid . . . . . . . . . . . . . . . . . . . . .. . . . . . 206.35. . . . . . 205.15. . . . . . 206.25. . . . . . 207.85. . . . . . 204.60. . . . . 6356.57. . . . . . 216.35. . . . . . 136.88. . . . . 10 . . . . . . 205.10
Pun.Natl.Bk [2] . . . . . . . . . . . . . . . . .. . . . . . . 39.85. . . . . . . 39.10. . . . . . . 40.00. . . . . . . 40.20. . . . . . . 39.00. . . . 44095.23. . . . . . . 47.60. . . . . . . 31.50. . . . . 13 . . . . . . . 39.20
Reliance . . . . . . . . . . . . . . . . . . . . . . .. . . . . 2552.25. . . . . 2521.80. . . . . 2554.75. . . . . 2562.35. . . . . 2515.75. . . . . 2868.24. . . . . 2750.00. . . . . 1830.00. . . . . 50 . . . . . 2520.85
SBI [1] . . . . . . . . . . . . . . . . . . . . . . . .. . . . . . 514.00. . . . . . 506.80. . . . . . 514.00. . . . . . 517.45. . . . . . 505.00. . . . 12592.51. . . . . . 542.20. . . . . . 269.55. . . . . 14 . . . . . . 506.65
SBICards&Pay. . . . . . . . . . . . . . . . . .. . . . . . 886.55. . . . . . 877.55. . . . . . 890.00. . . . . . 892.30. . . . . . 875.00. . . . . . 885.49. . . . . 1165.00. . . . . . 860.20. . . . . . . . . . . . . . . .
SBILifeInsur . . . . . . . . . . . . . . . . . . . .. . . . . 1287.95. . . . . 1265.90. . . . . 1287.95. . . . . 1293.00. . . . . 1263.10. . . . . . 869.58. . . . . 1293.00. . . . . . 838.20. . . . 102 . . . . . 1266.10
ShreeCement . . . . . . . . . . . . . . . . . .. . . . 27545.35. . . . 27155.55. . . . 27550.00. . . . 27639.65. . . . 26850.00. . . . . . . 44.02. . . . 32050.00. . . . 22600.00. . . . . 37 . . . . 27141.05
Siemens [2] . . . . . . . . . . . . . . . . . . . .. . . . . 2381.30. . . . . 2324.70. . . . . 2383.00. . . . . 2397.25. . . . . 2301.15. . . . . . 318.72. . . . . 2577.45. . . . . 1568.45. . . . . 75 . . . . . 2324.95
Sun Pharma [1] . . . . . . . . . . . . . . . .. . . . . . 853.20. . . . . . 846.70. . . . . . 855.00. . . . . . 867.20. . . . . . 845.00. . . . . 3354.71. . . . . . 871.00. . . . . . 550.70. . . . 114 . . . . . . 845.90
Tata Motors [2] . . . . . . . . . . . . . . . .. . . . . . 525.00. . . . . . 510.80. . . . . . 527.90. . . . . . 528.50. . . . . . 507.15. . . . 19353.20. . . . . . 536.50. . . . . . 241.15. . . . . . . . . . . 510.95
Tata Steel . . . . . . . . . . . . . . . . . . . . .. . . . . 1229.75. . . . . 1194.85. . . . . 1230.00. . . . . 1233.75. . . . . 1190.00. . . . . 5840.90. . . . . 1534.60. . . . . . 596.30. . . . . . 5 . . . . . 1194.50
TataConsuPro . . . . . . . . . . . . . . . . . .. . . . . . 765.10. . . . . . 731.45. . . . . . 763.80. . . . . . 770.00. . . . . . 728.40. . . . . 2674.15. . . . . . 889.00. . . . . . 554.25. . . . . . . . . . . . . . . .
TCS [1] . . . . . . . . . . . . . . . . . . . . . . . .. . . . . 4019.15. . . . . 3990.60. . . . . 4033.95. . . . . 4041.70. . . . . 3980.00. . . . . 2389.04. . . . . 4045.50. . . . . 2701.00. . . . . 40 . . . . . 3990.25
TechMahindra [5]. . . . . . . . . . . . . . .. . . . . 1722.40. . . . . 1660.75. . . . . 1740.00. . . . . 1746.55. . . . . 1650.05. . . . . 4878.37. . . . . 1837.75. . . . . . 915.05. . . . . 32 . . . . . 1660.65
TitanCompany [1] . . . . . . . . . . . . . .. . . . . 2597.55. . . . . 2600.60. . . . . 2598.00. . . . . 2635.00. . . . . 2587.00. . . . . 1221.31. . . . . 2687.30. . . . . 1396.25. . . . 132 . . . . . 2604.00
TorrentPhar [5]. . . . . . . . . . . . . . . . .. . . . . 3191.00. . . . . 3186.80. . . . . 3198.00. . . . . 3233.75. . . . . 3158.10. . . . . . 141.01. . . . . 3304.45. . . . . 2311.30. . . . . 47 . . . . . 3184.65
UB [1] . . . . . . . . . . . . . . . . . . . . . . . . .. . . . . 1663.70. . . . . 1625.05. . . . . 1664.95. . . . . 1682.55. . . . . 1617.05. . . . . . 327.63. . . . . 1793.65. . . . . 1050.00. . . . 129 . . . . . 1624.65
UltraTech . . . . . . . . . . . . . . . . . . . . . .. . . . . 7870.10. . . . . 7555.90. . . . . 7807.00. . . . . 7894.00. . . . . 7520.00. . . . . . 565.18. . . . . 8267.00. . . . . 5261.80. . . . . 34 . . . . . 7566.25
United Spr [2] . . . . . . . . . . . . . . . . . .. . . . . . 946.55. . . . . . 917.55. . . . . . 947.00. . . . . . 956.50. . . . . . 913.45. . . . . 1587.78. . . . . 1019.75. . . . . . 495.15. . . . . 81 . . . . . . 917.40
UPL [2] . . . . . . . . . . . . . . . . . . . . . . . .. . . . . . 824.75. . . . . . 799.10. . . . . . 821.55. . . . . . 825.00. . . . . . 795.85. . . . . 2820.43. . . . . . 864.75. . . . . . 510.05. . . . 153 . . . . . . 799.05
Vedanta [1] . . . . . . . . . . . . . . . . . . . .. . . . . . 325.80. . . . . . 322.45. . . . . . 324.90. . . . . . 327.95. . . . . . 320.15. . . . 10477.12. . . . . . 385.75. . . . . . 160.20. . . . . . 9 . . . . . . 322.35
Wipro [2] . . . . . . . . . . . . . . . . . . . . . .. . . . . . 646.65. . . . . . 633.30. . . . . . 648.90. . . . . . 650.00. . . . . . 631.15. . . . . 7164.99. . . . . . 739.80. . . . . . 398.00. . . . . 36 . . . . . . 633.40
Yes Bk [2] . . . . . . . . . . . . . . . . . . . . .. . . . . . . 14.10. . . . . . . 13.80. . . . . . . 14.10. . . . . . . 14.15. . . . . . . 13.70. . . . 98757.39. . . . . . . 18.15. . . . . . . 10.51. . . . . . . . . . . . 13.79
BusinessLine is not responsible for the recommendations
sourced from third party brokerages. Reports may be sent
EMKAY GLOBAL Tech Mahindra (Buy)Target: ₹�1,930CMP: ₹�1,660.65Tech Mahindra has agreed to acquire a 100per cent stake in Com Tec Co IT Ltd (CTC), anIT solutions and services provider servingthe insurance and fi�nancial servicesindustries, for a cash consideration of €310million, including earnouts (about 4xEV/Sales on annualised CY21E sales). It is alsoacquiring a 25 per cent stake in SWFTTechnologies Ltd and Surance Ltd for €16.5million and €3.5 million, respectively, withan option to acquire another 20 per centstake in the next two years.The CTC deal will strengthen TechMahindra’s digital capabilities with theaddition of over 720 skilled professionalsacross digital engineering, UI/UX,architecture, agile full stack capability,cloud, AI/ML, etc. It will also expand thetalent pool access across eastern Europeanmarkets. The acquisition will strengthenTechM’s digital transformation expertise andexpand its off�erings to highend digitalengineering services for some of the largestinsurance, reinsurance and fi�nancialservices organisations globally.It will scale up TechM’s nearshore deliverypresence in Europe. The business will becobranded as Tech Mahindra CTC withimmediate eff�ect. The company will put inplace an integrated operationalmanagement team that will focus on drivingidentifi�ed areas of synergies.This is the 10th acquisition announced byTechM in FY22 YTD and underlines its focuson strengthening its digital business underthe NXT.NOW framework. The CTCacquisition and investments into Insuretechplatforms will strengthen TechM’s insurancecapabilities and expand its client portfolio.
BROKER’S CALL
IDBI CAPITAL UltraTech Cement (Hold)Target: ₹�7,663CMP: ₹�7,566.25Ultratech Cement (UTCEM) Q3FY22 EBITDAwas lower than our/consensus estimate by 17per cent/11 per cent. Weak result is led byweak volume (down 3 per cent yoy) andcost infl�ation as EBITDA/t was lower by ₹�210/tqoq at ₹�1,041 in Q3FY22. This has led us to cut EBITDA for FY22/23 by 11per cent/3 per cent. But despite the cut inFY22 est, we expect EBITDA/t to improve qoqin Q4FY22 by ₹�180/t. This is led by price hikeand uptick in volume witnessed in Jan 2022,as UTCEM plant operating at utilisation of 85per cent vs average of 75 per cent for Q3FY22.We have maintained FY24 estimate andtarget price of ₹�7,663 (valuing at 13xFY24EV/EBITDA). From valuation perspective,we are valuing at its +1STD to arrive at targetprice. But given negligible upside, we haveHold rating. Capex outlook in budget,sustenance of demand and price hike is thekey catalyst for stock performance.
PALAK SHAH
Mumbai, January 18
In order to make ‘settlement ofoff�enses’ through consent orders more attractive, the Securities and Exchanges Board of India (SEBI) has sweetened thedeal by reducing the cost. Theregulator has reduced thebenchmark settlement amountfor each count of violation to₹�10 lakh from the earlier ₹�15lakh. The reduction in cost issignifi�cant considering that thebase amount is multiplied bythe number of violations ofeach section of the SEBI Act toarrive at a fi�nal fi�gure depending on the nature of the offences and gains made.
SEBI’s intentionExperts told BusinessLine that
SEBI intends to push for a settlement of violations throughconsent to cut down on longdrawn court cases. Of late, a noticeably large number of violations where SEBI has passed orders are being challenged inthe Securities and AppellateTribunal (SAT), and many timesthe order goes against the regulator.
Under the new norms, the alleged wrongdoers will have toseek a settlement through consent within 60 days of showcause notice being issued tothem by SEBI. It is another waythat will induce the alleged accused to quickly move for settlement, experts said.
So far, SEBI gave an additional120 days’ time to the wrongdoers over the 60 days period forfi�ling settlement applications.The only caveat was that theyhad to pay 25 per cent additional amount if they extendedtime. Each year, SEBI collects
hundreds of crores through settlement orders, which also involves high profi�le cases of insider trading.
Mixed reactions“These amendments willchange the way SEBI approaches various settlementcases. Earlier, the regulator wascriticised for irrationally highamount it charged for settlement of cases (example mattersinvolving Rakesh Jhunjhunwalasettlement, InterGlobe Avi
ation, Piramal AIF etc.). Reducing the factors of the formulato arrive at the settlementamount is a welcome measure.However, increasing the discretion in view of the incontestable nature of settlement orders needs a policy rethink,”said Sumit Agrawal, ManagingPartner, Regstreet Law Advisors,and a former SEBI offi�cer.
“Honest people will benefi�tbut collar off�enders will use itas a swivel door,” said a formerSEBI offi�cial.
By the incontestable natureof settlement orders, onemeans that as of now SEBI doesnot allow the parties involved
to challenge in courts the rejection of any of the consent applications.
Similarly, the rules say a thirdparty cannot even challengethose orders where SEBI has accepted consent settlement applications. Simply, the settlement of off�ences throughconsent mechanism is strictlyleft to SEBI’s discretion and theregulator relies on a committeethat holds sway on acceptanceand rejection of applications.
Although SEBI has borrowedits concept of settlement fromthe Securities and ExchangeCommission, it is yet to allowlawyers and legal enthusiasts toresearch the grounds on whicha rejection of settlement can bechallenged, as is done in the USfrequently. With regard to SEBI,it is still now clear as to how orin what category the defaultsby promoters and controllingshareholders are going to besettled, Agrawal said.
Base amount for each
breach reduced to
₹�10 lakh from ₹�15 lakh
SEBI sweetens deal for consent settlement WX
Under the new norms,
the alleged wrongdoers
will have to seek a
settlement through
consent within 60 days
of show cause notice
OUR BUREAU
Mumbai, January 18
ICICI Securities has reported that itsconsolidated net profi�t in theDecember quarter was up 42 percent to ₹�380 crore against ₹�267crore logged in same period lastyear, largely on strong growthacross business. Its revenue increased 52 per cent to ₹�942 crore.
ICICI Securities has a client base of70 lakh, of which, over 6.8 lakh wereadded in the quarter, which is thehighest ever addition in a quarterfor the sixth time in a row. About 81per cent of new customers addedwere from nonICICI Bank channels.
The company has over three million active clients (up 89 per cent).Total client assets were up 64 percent at ₹�5.6 lakh crore. ISec is thesecond largest nonbank MF distributor by revenue and assets. Its MFrevenues grew 54 per cent to ₹�97crore on the back of SIP count rising44 per cent to 1 million as ofDecemberend.
ICICI Sec netprofit up 42%
OUR BUREAU
Mumbai, January 18
Delhivery Ltd, Ascent Capitalbacked Radiant Cash Management Services Ltd and onlinelearning platform VerandaLearning Solutions Ltd have received approval from Securitiesand Exchange Board of India tolaunch IPO.
These companies had fi�ledtheir preliminary IPO paperswith SEBI between October andNovember 2021, and obtainedSEBI’s “observations” duringJanuary 1013, 2022.
DelhiveryThe ₹�7,460crore IPO of the SoftBank Groupbacked DelhiveryLtd would comprise fresh issue
of ₹�5,000 crore and off�er for saleof ₹�2,460 crore by certain existing shareholders.
Fosun Groupowned ChinaMomentum Fund will offloadshares worth ₹�400 crore via DeliCMF Pte Ltd, while shares worth₹�920 crore will be sold by CASwift Investments, an entity ofCarlyle Group. SVF Doorbell (Cayman) Ltd, an arm of SoftbankGroup, will sell shares worth₹�750 crore and Times Internet₹�330 crore.
Of the proceeds, ₹�2,500 crorewill be spent towards funding
organic growth initiatives, while₹�1,250 crore will go for fundinginorganic growth.
Radiant CMSThe IPO of Radiant Cash Management Services comprises a freshissue of shares aggregating up to₹�60 crore and an OFS of up to3.01 crore shares.
Of the funds raised, ₹�20 crorewill go towards working capitalrequirements and ₹�23.9 crore forcapital expenditurerequirements.
Veranda LearningThe company plans to raise up to₹�200 crore through fresh issue.
Of the net proceeds, it plans tospend up to ₹�60 crore towardsrepayment or prepayment of itsborrowings, ₹�25.19 crore towards retirement of acquisitionconsideration of Edureka, and₹�50 crore on growth initiatives.
DRHP of Radiant CMS,
Veranda Learning too
get regulator’s nod
Delhivery receives SEBI approval tolaunch IPO, plans to raise ₹�7,460 crore
GURUMURTHY K
BL Research Bureau
The share price of HindustanCopper fell sharply by 4.62 percent on Tuesday. This fall hashappened after testing thecrucial trendline resistancepoised at ₹�140. Prior to thisfall, the stock has been in agood uptrend since midDecember. Tuesday’s fallmarks the end of this upmove.As such the outlook for thestock has turned bearish now.Strong resistance is in the₹�139₹�142 region. Immediatesupport is in the ₹�130₹�128 region.
A break below ₹�128 will intensify the selling pressure.Such a break can drag thestock down to ₹�122. A further
break below ₹�122 can see thestock tumbling towards ₹�110and ₹�103. Traders with a shortterm perspective can go shortat current levels. Accumulateshorts on a rise to ₹�136.
Stoploss can be placed at₹�144. Trail the stoploss downto ₹�128 as soon as the stockfalls to ₹�123. Move the stoplossfurther down to ₹�121 once thestock touches ₹�116. Bookprofi�ts at ₹�112. The bearish outlook will get negated if thestock sustains above ₹�128 andbreaches ₹�142 decisively. Sucha break can then pave way for afresh rise to ₹�155₹�160.
Note: The recommendations are
based on technical analysis.
There is risk of loss in trading.
TODAY'S PICK
Hindustan Copper (₹�131.10): SELL
18114 • Nifty 50 FuturesS1 S2 R1 R2 COMMENT
18000 17850 18200 18325 Outlook has turned bearish. Wait
for a rise and go short at 18180.
Keep the stoploss at 18280
S1, S2: Support 1 & 2; R1, R2: Resistance 1 & 2.
₹�1528 • HDFC BankS1 S2 R1 R2 COMMENT
1520 1490 1545 1560 Initiate fresh short positions with a
stoploss at 1535 only if the stock
breaks below 1520.
₹�1918 • InfosysS1 S2 R1 R2 COMMENT
1900 1800 1935 1960 Bias is turning bearish. Go short
now and on rallies at 1930. Keep the
stoploss at 1955
₹�221 • ITCS1 S2 R1 R2 COMMENT
220 218 223 226 Hovers above a key support. Go
short with a stoploss at 222 if the
stock breaks below 220.
₹�164 • ONGCS1 S2 R1 R2 COMMENT
160 157 166 168 Corrective fall is possible. Initiate
fresh short positions now. Stoploss
can be placed at 167.
₹�2523 • Reliance Ind. S1 S2 R1 R2 COMMENT
2500 2480 2535 2565 Resistance ahead. Go short if RIL
fails to rise past 2535. Keep the
stoploss at 2555
₹�507 • SBIS1 S2 R1 R2 COMMENT
505 500 512 517 Nearterm top is in place. Go short if
SBI breaks below 505. Stoploss can
be kept at 509
₹�3994 • TCSS1 S2 R1 R2 COMMENT
3925 3900 4015 4050 Nearterm view is negative. Initiate
fresh short positions now with a
stoploss at 4025
DAY TRADING GUIDE
Nifty 50 Movers H 195.05 pts.Close(₹�) Pts PE Wt(%)
HDFC Bank . . . . . . . . . . . . . . . . . . . . . . . . . .. . 1529.25. . . . . . . . . . 7.76. . . . . . . . . 23.46 . . . . . . . . 8.46Axis Bank. . . . . . . . . . . . . . . . . . . . . . . . . . . . .. . . . 725.20. . . . . . . . . . 7.40. . . . . . . . . 22.08 . . . . . . . . 2.36ICICI Bank . . . . . . . . . . . . . . . . . . . . . . . . . . .. . . . 823.10. . . . . . . . . . 6.04. . . . . . . . . 24.96 . . . . . . . . 7.22Kotak Bank . . . . . . . . . . . . . . . . . . . . . . . . . .. . 1942.15. . . . . . . . . . 1.58. . . . . . . . . 38.58 . . . . . . . . 3.60Dr Reddys Lab . . . . . . . . . . . . . . . . . . . . .. . 4693.55. . . . . . . . . . 0.59. . . . . . . . . 39.82 . . . . . . . . 0.72Nestle India Ltd. . . . . . . . . . . . . . . . . . .19379.60. . . . . . . . . . 0.38. . . . . . . . . 83.36 . . . . . . . . 0.87Titan . . . . . . . . . . . . . . . . . . . . . . . . . . . . . . . . . . . .. . 2600.60. . . . . . . . . . 0.29. . . . . . . 131.40 . . . . . . . . 1.37Indian OilCorp . . . . . . . . . . . . . . . . . . . . .. . . . 123.95. . . . . . . . . . 0.12. . . . . . . . . . . 4.55 . . . . . . . . 0.40Hero MotoCorp. . . . . . . . . . . . . . . . . . . .. . 2692.85. . . . . . . . 0.26. . . . . . . . . 18.43 . . . . . . . . 0.44Asian Paints. . . . . . . . . . . . . . . . . . . . . . . . .. . 3373.70. . . . . . . . 0.51. . . . . . . . . 97.63 . . . . . . . . 1.92BPCL. . . . . . . . . . . . . . . . . . . . . . . . . . . . . . . . . . . .. . . . 398.10. . . . . . . . 0.54. . . . . . . . . . . 4.64 . . . . . . . . 0.48PowerGrid Corp . . . . . . . . . . . . . . . . . . .. . . . 205.15. . . . . . . . 0.94. . . . . . . . . . . 8.80 . . . . . . . . 0.89Cipla . . . . . . . . . . . . . . . . . . . . . . . . . . . . . . . . . . . .. . . . 902.15. . . . . . . . 0.95. . . . . . . . . 28.19 . . . . . . . . 0.59HDFC Life . . . . . . . . . . . . . . . . . . . . . . . . . . . .. . . . 669.10. . . . . . . . 1.08. . . . . . . 120.11 . . . . . . . . 0.79Britannia Ind. . . . . . . . . . . . . . . . . . . . . . . .. . 3621.90. . . . . . . . 1.17. . . . . . . . . 55.16 . . . . . . . . 0.54Shree Cement. . . . . . . . . . . . . . . . . . . . . .27155.55. . . . . . . . 1.19. . . . . . . . . 37.31 . . . . . . . . 0.46Coal India . . . . . . . . . . . . . . . . . . . . . . . . . . . .. . . . 160.80. . . . . . . . 1.39. . . . . . . . . . . 7.19 . . . . . . . . 0.43Sun Pharma . . . . . . . . . . . . . . . . . . . . . . . . .. . . . 846.70. . . . . . . . 1.61. . . . . . . . . 32.52 . . . . . . . . 1.15ONGC . . . . . . . . . . . . . . . . . . . . . . . . . . . . . . . . . .. . . . 163.85. . . . . . . . 1.67. . . . . . . . . . . 5.11 . . . . . . . . 0.76NTPC . . . . . . . . . . . . . . . . . . . . . . . . . . . . . . . . . . .. . . . 135.00. . . . . . . . 1.74. . . . . . . . . . . 8.36 . . . . . . . . 0.81M&M . . . . . . . . . . . . . . . . . . . . . . . . . . . . . . . . . . .. . . . 892.15. . . . . . . . 1.89. . . . . . . . . 22.40 . . . . . . . . 1.08SBI Life . . . . . . . . . . . . . . . . . . . . . . . . . . . . . . . .. . 1265.90. . . . . . . . 2.22. . . . . . . 102.53 . . . . . . . . 0.70Bajaj Auto . . . . . . . . . . . . . . . . . . . . . . . . . . . .. . 3400.95. . . . . . . . 2.65. . . . . . . . . 15.19 . . . . . . . . 0.56Adani Ports . . . . . . . . . . . . . . . . . . . . . . . . . .. . . . 762.95. . . . . . . . 2.71. . . . . . . . . 29.92 . . . . . . . . 0.71Bajaj Finserv . . . . . . . . . . . . . . . . . . . . . . . .18153.55. . . . . . . . 3.00. . . . . . . . . 39.81 . . . . . . . . 1.39Divis Lab . . . . . . . . . . . . . . . . . . . . . . . . . . . . . .. . 4527.15. . . . . . . . 3.01. . . . . . . . . 56.26 . . . . . . . . 0.73IndusInd Bank . . . . . . . . . . . . . . . . . . . . .. . . . 899.65. . . . . . . . 3.10. . . . . . . . . 17.78 . . . . . . . . 0.74UPL . . . . . . . . . . . . . . . . . . . . . . . . . . . . . . . . . . . . . .. . . . 799.10. . . . . . . . 3.23. . . . . . . . . 15.95 . . . . . . . . 0.56Hindalco . . . . . . . . . . . . . . . . . . . . . . . . . . . . . .. . . . 496.00. . . . . . . . 3.33. . . . . . . . . 10.47 . . . . . . . . 0.92Eicher Motors . . . . . . . . . . . . . . . . . . . . . .. . 2736.25. . . . . . . . 3.45. . . . . . . . . 44.82 . . . . . . . . 0.48Hind Unilever. . . . . . . . . . . . . . . . . . . . . . .. . 2369.50. . . . . . . . 4.10. . . . . . . . . 66.19 . . . . . . . . 2.67JSW Steel . . . . . . . . . . . . . . . . . . . . . . . . . . . .. . . . 680.20. . . . . . . . 4.35. . . . . . . . . . . 8.25 . . . . . . . . 0.85Wipro . . . . . . . . . . . . . . . . . . . . . . . . . . . . . . . . . .. . . . 633.30. . . . . . . . 4.52. . . . . . . . . 28.63 . . . . . . . . 1.18TataConsumerProducts Ltd.. . . . 731.45. . . . . . . . 4.61. . . . . . . . . 84.49 . . . . . . . . 0.55Grasim Ind . . . . . . . . . . . . . . . . . . . . . . . . . . .. . 1852.25. . . . . . . . 5.70. . . . . . . . . 13.34 . . . . . . . . 0.88Tata Motors . . . . . . . . . . . . . . . . . . . . . . . . .. . . . 510.80. . . . . . . . 5.83. . . . . . . . . . . 0.00 . . . . . . . . 1.16State Bank . . . . . . . . . . . . . . . . . . . . . . . . . . .. . . . 506.80. . . . . . . . 6.32. . . . . . . . . 15.00 . . . . . . . . 2.46Tata Steel . . . . . . . . . . . . . . . . . . . . . . . . . . . .. . 1194.85. . . . . . . . 6.34. . . . . . . . . . . 4.36 . . . . . . . . 1.20Bajaj Finance . . . . . . . . . . . . . . . . . . . . . . .. . 7744.00. . . . . . . . 6.60. . . . . . . . . 93.93 . . . . . . . . 2.60TCS . . . . . . . . . . . . . . . . . . . . . . . . . . . . . . . . . . . . . .. . 3990.60. . . . . . . . 6.77. . . . . . . . . 39.08 . . . . . . . . 5.22Bharti Airtel. . . . . . . . . . . . . . . . . . . . . . . . .. . . . 714.35. . . . . . . . 7.70. . . . . . . . . . . 0.00 . . . . . . . . 2.13ITC . . . . . . . . . . . . . . . . . . . . . . . . . . . . . . . . . . . . . . .. . . . 220.75. . . . . . . . 7.71. . . . . . . . . 18.74 . . . . . . . . 2.44UltraTech Cement. . . . . . . . . . . . . . . .. . 7555.90. . . . . . . . 8.30. . . . . . . . . 34.25 . . . . . . . . 1.10Tech Mahindra. . . . . . . . . . . . . . . . . . . . .. . 1660.75. . . . . . . . 8.76. . . . . . . . . 31.97 . . . . . . . . 1.30HCL Tech . . . . . . . . . . . . . . . . . . . . . . . . . . . . .. . 1219.75. . . . . . . . 9.69. . . . . . . . . 30.00 . . . . . . . . 1.67Maurti Suzuki . . . . . . . . . . . . . . . . . . . . . .. . 7915.15. . . . . . 10.65. . . . . . . . . 56.93 . . . . . . . . 1.33L&T . . . . . . . . . . . . . . . . . . . . . . . . . . . . . . . . . . . . . .. . 2022.20. . . . . . 13.05. . . . . . . . . 27.76 . . . . . . . . 3.09Infosys . . . . . . . . . . . . . . . . . . . . . . . . . . . . . . . . .. . 1920.75. . . . . . 15.90. . . . . . . . . 38.02 . . . . . . . . 9.00HDFC . . . . . . . . . . . . . . . . . . . . . . . . . . . . . . . . . . .. . 2662.50. . . . . . 16.63. . . . . . . . . 21.52 . . . . . . . . 6.08Reliance Ind. . . . . . . . . . . . . . . . . . . . . . . . .. . 2521.80. . . . . . 24.03. . . . . . . . . 28.82 . . . . . . 10.99
Pts: Impact on index movement
Nifty Next 50 Movers H 754.70 pts.Close(₹�) Pts PE Wt(%)
Adani Green Energy . . . . . . . . . . . .. . 1900.10. . . . . . . . 59.81. . . . . . . 639.97 . . . . . . . . 4.08Adani Transmission .. . . . . . . . . . . .. . 2026.75. . . . . . . . 16.97. . . . . . . 154.57 . . . . . . . . 3.33CholamandalInvest&Finan . .. . . . 612.45. . . . . . . . 15.73. . . . . . . . . 31.54 . . . . . . . . 1.91Avenuesuper . . . . . . . . . . . . . . . . . . . . . . .. . 4441.15. . . . . . . . 15.54. . . . . . . 194.45 . . . . . . . . 3.95Icici Lombard Gic . . . . . . . . . . . . . . . . .. . 1447.60. . . . . . . . 13.22. . . . . . . . . 56.50 . . . . . . . . 2.92Godrej Consumer . . . . . . . . . . . . . . . .. . . . 928.40. . . . . . . . . . 4.43. . . . . . . . . 53.93 . . . . . . . . 2.78Proc & Gam . . . . . . . . . . . . . . . . . . . . . . . . .16045.95. . . . . . . . . . 3.60. . . . . . . . . 84.53 . . . . . . . . 0.90Colgate . . . . . . . . . . . . . . . . . . . . . . . . . . . . . . . .. . 1470.20. . . . . . . . . . 1.38. . . . . . . . . 37.53 . . . . . . . . 1.55Lupin . . . . . . . . . . . . . . . . . . . . . . . . . . . . . . . . . . .. . . . 943.70. . . . . . . . . . 0.94. . . . . . . . . . . 0.00 . . . . . . . . 1.80Torrent Pharma . . . . . . . . . . . . . . . . . . .. . 3186.80. . . . . . . . 0.70. . . . . . . . . 42.56 . . . . . . . . 1.24Indraprastha Gas . . . . . . . . . . . . . . . .. . . . 453.35. . . . . . . . 1.72. . . . . . . . . 21.83 . . . . . . . . 1.25Gland Pharma . . . . . . . . . . . . . . . . . . . . .. . 3675.50. . . . . . . . 2.86. . . . . . . . . 54.05 . . . . . . . . 1.12Bajaj Holdings . . . . . . . . . . . . . . . . . . . . .. . 5468.15. . . . . . . . 3.59. . . . . . . . . 14.92 . . . . . . . . 1.64Punjab Natl Bank . . . . . . . . . . . . . . . . .. . . . . 39.10. . . . . . . . 7.57. . . . . . . . . 11.31 . . . . . . . . 0.92Sbi Cards And Pay Srv . . . . . . . .. . . . 877.55. . . . . . . . 8.07. . . . . . . . . 79.99 . . . . . . . . 1.83Hpcl . . . . . . . . . . . . . . . . . . . . . . . . . . . . . . . . . . . . .. . . . 323.85. . . . . . . . 8.89. . . . . . . . . . . 4.91 . . . . . . . . 1.63Hdfc Asset Mgmt Cmp .. . . . . . .. . 2449.50. . . . . . . . 8.90. . . . . . . . . 37.98 . . . . . . . . 1.28Bank Of Baroda . . . . . . . . . . . . . . . . . . .. . . . . 92.25. . . . . . . . 9.48. . . . . . . . . 12.27 . . . . . . . . 1.36Yes Bank . . . . . . . . . . . . . . . . . . . . . . . . . . . . . .. . . . . 13.80. . . . . . . . 9.84. . . . . . . . . . . 0.00 . . . . . . . . 1.05IPrulife . . . . . . . . . . . . . . . . . . . . . . . . . . . . . . .. . . . 608.00. . . . . . 10.08. . . . . . . 139.34 . . . . . . . . 1.87Sail . . . . . . . . . . . . . . . . . . . . . . . . . . . . . . . . . . . . . .. . . . 105.30. . . . . . 10.31. . . . . . . . . . . 3.30 . . . . . . . . 1.20Gail (India) . . . . . . . . . . . . . . . . . . . . . . . . . .. . . . 142.90. . . . . . 11.13. . . . . . . . . . . 6.71 . . . . . . . . 2.06Dabur India. . . . . . . . . . . . . . . . . . . . . . . . . .. . . . 563.90. . . . . . 11.29. . . . . . . . . 54.94 . . . . . . . . 2.60Havells. . . . . . . . . . . . . . . . . . . . . . . . . . . . . . . . .. . 1315.45. . . . . . 11.57. . . . . . . . . 69.11 . . . . . . . . 2.61Muthoot Finance . . . . . . . . . . . . . . . .. . 1463.25. . . . . . 12.14. . . . . . . . . 14.64 . . . . . . . . 1.25Berger Paints India . . . . . . . . . . . . .. . . . 761.15. . . . . . 12.16. . . . . . . . . 87.67 . . . . . . . . 1.46Biocon . . . . . . . . . . . . . . . . . . . . . . . . . . . . . . . . .. . . . 348.70. . . . . . 13.36. . . . . . . . . 55.66 . . . . . . . . 1.29Bandhan Bank . . . . . . . . . . . . . . . . . . . . .. . . . 295.25. . . . . . 13.67. . . . . . . . . . . 0.00 . . . . . . . . 1.58Cadila Health. . . . . . . . . . . . . . . . . . . . . . .. . . . 422.05. . . . . . 13.91. . . . . . . . . 18.01 . . . . . . . . 0.85Bosch . . . . . . . . . . . . . . . . . . . . . . . . . . . . . . . . . .17189.90. . . . . . 14.59. . . . . . . . . 39.00 . . . . . . . . 1.16Vedanta . . . . . . . . . . . . . . . . . . . . . . . . . . . . . . .. . . . 322.45. . . . . . 14.80. . . . . . . . . . . 5.22 . . . . . . . . 3.32Pidilitind . . . . . . . . . . . . . . . . . . . . . . . . . . . . . .. . 2685.10. . . . . . 15.25. . . . . . . 101.29 . . . . . . . . 3.24Aurobindo Pharma . . . . . . . . . . . . . .. . . . 668.80. . . . . . 16.24. . . . . . . . . . . 7.52 . . . . . . . . 1.49Siemens. . . . . . . . . . . . . . . . . . . . . . . . . . . . . . .. . 2324.70. . . . . . 17.11. . . . . . . . . 78.84 . . . . . . . . 1.64Intglobeavi . . . . . . . . . . . . . . . . . . . . . . . . . .. . 2112.25. . . . . . 17.33. . . . . . . . . . . 0.00 . . . . . . . . 1.61Marico . . . . . . . . . . . . . . . . . . . . . . . . . . . . . . . . .. . . . 490.55. . . . . . 18.44. . . . . . . . . 51.96 . . . . . . . . 2.00Nmdc . . . . . . . . . . . . . . . . . . . . . . . . . . . . . . . . . . .. . . . 140.05. . . . . . 18.44. . . . . . . . . . . 3.91 . . . . . . . . 1.27Jindal Steel . . . . . . . . . . . . . . . . . . . . . . . . . .. . . . 402.40. . . . . . 22.52. . . . . . . . . . . 4.35 . . . . . . . . 1.30Pi Industries . . . . . . . . . . . . . . . . . . . . . . .. . 2713.10. . . . . . 22.67. . . . . . . . . 51.97 . . . . . . . . 1.72Indus Towers .. . . . . . . . . . . . . . . . . . . . . .. . . . 261.65. . . . . . 27.18. . . . . . . . . 13.26 . . . . . . . . 1.67Jubilant Foodworks . . . . . . . . . . . . .. . 3787.20. . . . . . 27.75. . . . . . . 119.54 . . . . . . . . 2.29United Spirits . . . . . . . . . . . . . . . . . . . . . .. . . . 917.55. . . . . . 29.34. . . . . . . . . 81.28 . . . . . . . . 2.16Adani Enter. . . . . . . . . . . . . . . . . . . . . . . . . .. . 1840.95. . . . . . 34.41. . . . . . . 178.26 . . . . . . . . 4.00Acc . . . . . . . . . . . . . . . . . . . . . . . . . . . . . . . . . . . . . .. . 2253.25. . . . . . 35.99. . . . . . . . . 20.59 . . . . . . . . 1.51Larsen & Toubro Info . . . . . . . . . .. . 6869.50. . . . . . 36.13. . . . . . . . . 56.95 . . . . . . . . 2.47Dlf. . . . . . . . . . . . . . . . . . . . . . . . . . . . . . . . . . . . . . . .. . . . 403.90. . . . . . 41.83. . . . . . . . . 60.90 . . . . . . . . 1.98Piramal Ent. . . . . . . . . . . . . . . . . . . . . . . . . .. . 2571.50. . . . . . 45.55. . . . . . . . . 49.13 . . . . . . . . 2.72Ambuja Cements . . . . . . . . . . . . . . . . .. . . . 380.65. . . . . . 67.75. . . . . . . . . 17.79 . . . . . . . . 2.21Info Edge (India) .. . . . . . . . . . . . . . . .. . 5345.45. . . . . . 80.54. . . . . . . . . . . 8.09 . . . . . . . . 3.27Apollo Hosp . . . . . . . . . . . . . . . . . . . . . . . . .. . 4615.80. . . . 101.17. . . . . . . . . 61.90 . . . . . . . . 3.67
Pts: Impact on index movement
OUR BUREAU
Mumbai, January 18
Kotak Investment Advisors Limited (KIAL) on Tuesday said it hassuccessfully closed its maidenKotak PreIPO OpportunitiesFund, raising ₹�2,000 crore.
The PreIPO Fund, which hasbeen set up as an Alternative Investment Fund under SEBI regulations, will invest in a range ofIndiafocussed latestage newage businesses with a strongmoat of technology, said astatement.
“The fund has already made investments worth ₹�653 crore in 5deals and has another ₹�405crore worth deals in variousstages of evaluation and execution.
The investors include several
family offi�ces such as Catamaran, the family offi�ce of NRNarayana Murthy and Skywalker,the family offi�ce of Rubamingroup.
Strong tech focusKIAL underscored that the fundwill target highquality companies across sectors, especially witha strong technology focus, robust unit economics, scalablebusiness models and exit visibility.
The focus will be on technologyoriented companies.
Srini Sriniwasan, MD, KIAL,said, “The swift pace of digital adoption by individuals, SMEs orenterprises has opened up theopportunity for the tech ecosystem to respond with unique andscalable business models withsignifi�cant longterm growth potential. Kotak PreIPO Opportunities Fund enables investors toparticipate in this growth story.”
Kotak Investment AdvisorspreIPO fund raises ₹�2,000 cr ₹�653crore worthinvestments alreadymade in 5 deals
OUR BUREAU
Mumbai, January 18
Benchmark indices closedaround 1 per cent lower on Tuesday amid latehour selling. Themarket opened on a positivenote, but the indices soonslipped into the red amid weakglobal cues and remained volatile through the day.
Sensex closed at 60,754.86,down 554.05 points and . theNifty closed at 18,113.05, down195.05 points.
As many as 2,285 stocks declined on the BSE against 1,145that advanced, while 83 remained unchanged.
The volatility index rose 6.05per cent to close at 17.78.
Analysts expect volatility tocontinue ahead of the Budget.FIIs turning sellers again has alsoimpacted sentiment.
The broader market also witnessed selling pressure.
Late-hour selling,global jitters dragindices down 1%
................BM-BMECMYK
MUMBAI
BusinessLineWEDNESDAY • JANUARY 19 • 2022 7NEWS
YATTI SONI
Bengaluru, January 18
The number of resellers on
internet commerce start-up
Meesho has grown by 2.5x in
2021, bringing the total
number of resellers or
entrepreneurs on the platform
to 15 million. The
marketplace
provides small
businesses which
includes SMBs,
MSMEs and
individual entrepreneurs,
access to customers, a
selection of over 700
categories, pan-India logistics,
payment services and
customer support capabilities.
BusinessLine spoke to Utkrishta
Kumar, Vice President and GM -
Business, at Meesho about the
company’s reseller ecosystem.
Excerpts:
How many resellers are
currently associated with
Meesho? What are the
average monthly earnings
for the resellers on the
platform?
Around 700 odd millionusers are active on the internet in India, but there areonly around 200 millionusers who are transacting online.
We have seen the socialcommerce industry grow signifi�cantly in the last fewyears and various researchreports have projected thatthere is a potential for this tooutgrow any other industryright now, with an expected
CAGR of close to 55 per centto 60 per cent over the nextfew years.
Now, coming to the specifi�c problems that we aretrying to solve. Our entrepreneurs provide access tousers who are online but are
not transacting online. In 2021, the entrepreneurs onMeesho grew by 2.5x.
We have close to 15million microentre
preneurs on Meesho as ofnow. This is a testament tohow we have gone ahead andhelped this ecosystem growby providing a destinationfor entrepreneurs to solveproblems that online activeconsumers today are facing.
With multiple platforms
eyeing the social commerce
space, how do you ensure
that the resellers on
Meesho are loyal to the
brand?
Let’s zoomin on the problemstatements and what an entrepreneur needs from theplatform. In terms of selection, we are the biggest online destination for all unbranded goods in lifestylecategories. So, we are provid
ing them everything thattheir users need, and our pricing is very competitive. Infact, our pricing is not justlower than other online destinations, but it is also lowerthan all the offl�ine destinations out there.
In addition to this, we havebeen trying to come up withnew initiatives. During theonset of Covid19, when theeconomy had come to somesort of a halt, we had our microcredit strategy to ensureentrepreneurs had a minimal income.
Further, when it comes tosolving for core challenges,wherever we fi�nd a use casethat could help entrepreneurs succeed, we go aheadand implement them. Thishas led to broader retentionand loyalty on the platform.
What is the general
demographic of resellers
associated with
Meesho?
We have entrepreneurs fromthe smaller cities to thebiggest towns.They are largelybetween the 18
45 age range and a majorityof our entrepreneurs are women who are either homemakers, students, teachers,or small business owners.
Overall, 70 per cent of theentrepreneurs come fromTier 2 markets like Dimapur,Faizabad, and Haldwani. Cities with a higher share of entrepreneurs are Lucknow, Visakhapatnam andAhmedabad.
Why are the advantages of
reseller-led commerce over
consumer-led commerce?
Our broader mission statement is to democratise internet commerce for everyone.We have seen consumer demand on Meesho growingexponentially, but this hadno impact on the entrepreneurled demand. The entrepreneurs, at the end of theday, are solving a very diff�erent use case. They are targeting users who are active on
line but are not transactingonline.
By bridging that gap,we have seen exponential growth on bothfronts. We have seengrowth in what we call resellerled commerce, andcustomerled commerce.
And our vision isto build thatecosystemwhere allsellers, entrepreneurs andconsumerscan coexist.
‘Meesho seeks to democratise ecommerce’
ZYWherever we find a use-case
that could help entrepreneurs
on Meesho succeed, we go
ahead and implement it.
UTKRISHTA KUMARVice President and GM — Business,Meesho
YZ
O
AKHIL NALLAMUTHU
BL Research Bureau
As the dollar has been recovering, the rupee, which was on astrong rally, started to descendlast Thursday. It remained sothis week as the profi�tbookingseems to continue. On Tuesday,INR lost nearly half a per cent asit closed at 74.58 against thegreenback.
Another key factor that contributed to the rupee’s weakness is that while fl�ows werebuilding up in a healthy way —primarily due to infl�ows in theequity segment — foreign portfolio investors (FPIs) pulled outconsiderable amount ofmoney. According to the latestNSDL (National Securities Depository Limited) data, the netFPI investments so far thismonth is at $300 million. Comparatively, it was at $464 mil
lion a week ago. Net fl�ows haveturned negative in equities segment i.e., the net outfl�ow is at$132 million for January, compared to a net infl�ow of $477million a week.
Therefore, there was a netoutfl�ow of $609 million overthe past week. This is despitethe equity markets doing well.
ChartsThe rupee rally, which began inmidDecember, faced its fi�rstmajor hurdle in the form of theresistance band of 73.90 – 73.75last week. On the back of this,the local currency started to depreciate and has now fallen below the supports at 74.25 and74.50.
The nearest support fromTuesday’s close of 74.58 is at 75with subsequent support at75.25. On the other hand, the
resistance levels can be seen at74.50, 74.25 and 74. The dollarindex, which was movingwithin the price range of 95.75and 96.90 since November lastyear, fell below the support at95.75 last week. After marking atwomonth low of 94.63 last Friday, the index has recoveredand is now trading around95.40. Nevertheless, it can tradewith a bearish bias so long as itremains below 95.75. This canhelp INR gain ground againstUSD.
OutlookThe close below the support74.50 on Tuesday at 74.58 cancontinue to keep the rupee under pressure. Therefore, thedownswing is likely to extendin the forthcoming sessionswherein the domestic currencymight decline to 75.
From trading perspective,one can sell INR at current leveland on a rise to 74.25 with stoploss at 74. Exit when it falls to 75.
Traders can maintain bearish bias, sell
at current level and on a rise to 74.25
Rupee can weaken further WEEKLY RUPEE REVIEW
OUR BUREAU
Mumbai, January 18
Small Industries DevelopmentBank of India (SIDBI) has sanctioned funds aggregating₹�650 crore to two small fi�nance banks (SFBs) — AU SFB andJana SFB — so that they can support smallsized nonbankingfi�nancial companies (NBFCs)and micro fi�nance institutions(MFIs) which, in turn, canprovide fi�nancial assistance tosmall businesses and microentrepreneurs.
SIDBI, in a statement, said ithas already released ₹�530crore to the aforementionedSFBs. Referring to the doubleintermediation measure,
Sivasubramanian Ramann,Chairman & Managing Director, SIDBI, said, “The move isexpected to benefi�t more than40 smallsized NBFCs / MFIswhich will help in mitigatingthe hardships they face in garnering resources.”
The assistance has been extended out of the special liquidity facility of ₹�16,000crore sanctioned by the Reserve Bank of India to SIDBI tomeet the challenges beingfaced by MSMEs due to the prevailing Covid19 pandemic.
Informal sectorSIDBI that the relatively smaller NBFCs and MFIs normallycater to the informal MSMEsector — especially new tocredit businesses, small retailtrade, micro credit and othersmall household businesses —
in the hinterland due to theirunique advantage of ‘nextdoor’ presence and accumulated knowledge about theirclientele over a period of time(as compared to banks and larger NBFCs).
It observed that the Covid19pandemic has adversely impacted the businesses ofMSMEs, leading to a slowdownin the income generation activities of these small businessesand micro enterprises. This hasfurther adversely aff�ected thecollections and liquidity position of the NBFCs and MFIs.
Smaller NBFCs / MFIs, in particular, have always faced challenges in accessing adequateinstitutional funding and generally source their funds support from other larger andwellestablished nonbankingcompanies / SFBs.
SIDBI extends ₹�650crorefund line to AU SFB, Jana SFBMove will benefi�t
over 40 smallsized
NBFCs and MFIs
KR SRIVATS
New Delhi, January 18
The Indian Banks’ Association(IBA) has urged the governmentto extend the ₹�4.5lakh croreEmergency Credit Line Guarantee Scheme (ECLGS) — an MSMEsupport initiative — by one moreyear beyond March 31, the announced end date for thescheme.
This is needed given that thepandemic’s eff�ect on economicactivity is still continuing, andmore so when the expected revival of the economy has not materialised and MSMEs are struggling to come out of theirfi�nancial difficulties, IBA said.
Mitigating Covid impactIBA has conveyed, in a letter tothe Department of Financial Services in the Finance Ministry, that
support needs to be extended tillthe economy regains itsstrength, sources in the IBA said.
It maybe recalled that ECLGSwas launched with the objectiveof providing additional liquidityto MSMEs to help them cope withthe crisis arising out of Covid19.
Under this scheme, loans extended to MSMEs by banks andNBFCs would be 100 per centguaranteed by the NationalCredit Guarantee Trustee Company (NCGTC).
The loan will be extended inthe form of additional workingcapital term loan facility in caseof banks and additional termloan in case of NBFCs to MSMEsand interested Pradhan MantriMudra Yojana borrowers.
In September 2021, the government had extended the validityof ECLGS till March 31, 2022, or till
guarantees for an amount of₹�4.5lakh crore are issued underthe scheme, whichever is earlier.The last date of disbursement under the scheme was also extended to June 30, 2022.
Additional credit supportMeanwhile, IBA has also made acase for additional funding of 10per cent of eligible fi�nance for allborrowers continuing to be affected by the extended disruptions. With the continuing ef
fects of the pandemic, theassumed cash fl�ows have not materialised fully. In addition tothis, the existing malaise ofdelayed payments of MSME duesby large corporates has exacerbated due to their own constricted cash fl�ows. Thus, there is aneed for an incremental dose offunding to these MSMEs to helpthem tide over the current situation, IBA has said.
Sources added that IBA hasalso recommended that the
cover under ECLGS scheme be extended to all MSMEs irrespectiveof sector and size so that a broadbased recovery will be possible,and those units found viable andnow classifi�ed as Special Mention Accounts (SMA) 2 be madeeligible for additional fundingunder the Guarantee Cover ofECLGS.
‘Extend cover to SMA 2’SMA 2 is a category where theamount is overdue for tenurebetween 61 days to less than 90days. Under the current framework, eligibility for additionalfunding is restricted to SMA 0and SMA 1 accounts and SMA 2 accounts are kept out of the ambitof the ECLGS. IBA is understoodto have highlighted that SMA 2accounts also deserve a chance tosurvive the harsh postCovid environment and that if no assistance is extended, there is a realdanger of these accounts slipping into NPAs.
IBA says the facility needs to be continued
till the economy gets back on the rails
Under ECLGS, loans extended to MSMEs would be 100 per cent
guaranteed by the National Credit Guarantee Trustee Company
ECLGS: Banks’ body seeks 1-yr extension
OUR BUREAU
Mumbai, January 18
Bajaj Finance Ltd (BFL) reported a 84 per cent yearonyear(yoy) jump in third quarterstandalone net profi�t on theback of healthy growth in netinterest income, fees andcommission income andother operating income.
A 20 per cent decline inloan loss provisions also boos
ted the bottom line. Standalone net profi�t rose to₹�1,934 crore from ₹�1,049crore. Net interest incomerose 41 per cent yoy to ₹�4,363crore (from ₹�3,103 crore).
Loan loss provisions were20 per cent lower at ₹�995crore (₹�1,245 crore).
AUM increased 21 per cent yoy to ₹�1,32,913 crore by 2021end (from ₹�1,09,598 crore).
Bajaj Finance Q3 net up 84%
OUR BUREAU
Bengaluru, January 18
Fintech startup INDmoney hasraised $75 million as part of itsongoing Series D round fromglobal investors such as Steadview Capital, Tiger Global andDragoneer Investment Group.
After this round of fi�nancing,INDmoney’s total capital raisestands at $133 million with balance capital available of nearly$120 million, besides additionalcapital from other investors. INDmoney’s value proposition is
enabling customers to save,plan and invest on one platform. The platform allowsusers to track all investmentsand liabilities, including mutual funds, fi�xed deposits, EPF,crypto, credit cards, insurancesand other things. The platformcan also be used to invest in USStocks, mutual funds, fi�xed deposits etc.
Launched in 2019, INDmoney recently touched a milestone of 3.5 million registeredusers tracking more than $15billion of their investments.The company claims that thenumber of users is growing at20 per cent month on month.
Total capital raise
now at $133 million
INDmoney raises $75 m
OUR BUREAU
Mumbai, January 18
Evenfl�ow Brands, a marketplace aggregator of thirdparty sellers on ecommerceplatforms, on Tuesday announced that it has acquiredfour consumer brands inIndia.
The acquisition includestwo sports and fi�tnessbrands Vifi�tkit and Yogarise,kitchen label Frenchware,and gardening brandCingaro, all with an annualrun rate in the $0.5–2 million
range. As part of the deal,Evenfl�ow will bring onboardthe founders of Frenchwareand Cinagro as consultants.
“We are looking to triplethe growth for each of thesebrands in the next sixmonths,” said Utsav Agarwal,Cofounder & CEO, EvenFlow.
“At present, all fourbrands are Amazononly butwe are in the process of onboarding them on othermarketplaces including Flipkart, Meesho and Jiomart,”he added.
Evenfl�ow Brands closesfour new acquisitions
MEENAKSHI VERMA AMBWANI
Chennai, January 18
Consumer electronics brandboAt’s parent company Imagine Marketing has enteredinto a 50:50 joint venturewith Dixon Technologies tomanufacture wireless audioproducts in India. The twoplayers expect the JV entity toachieve revenues of ₹�1,000crore by the end of fouryears.
Leveraging supply chain Vivek Gambhir, CEO, boAt,told BusinessLine, “In a shortspan of time, we have established a clear leadership inthe personal audio segment.This joint venture with Dixonis an important milestone forus to establish a strong manufacturing ecosystem in India. It will help us to becomemore agile, launch more in
novative products and alsobring down the cost ofproducts.”
The joint venture will helpboAt establish a manufacturing base in India and deriskits supply chain by leveraging on the high qualityand lowcost structure ofDixon Technologies.
Saurabh Gupta, CFO, DixonTechnologies, told Business-Line, “We feel confi�dent thatby the end of the fourth year,the JV will achieve revenuesof about ₹�1,000 crore. Thetotal capex over the period offour years will be to the tuneof ₹�40 crore. Out of this,
about ₹�15 crore will be the investment made by both thepartners as equity contribution and the balance ₹�25crore will be funded throughstrong cashfl�ow generationby the JV entity.”
IP development expertiseThe joint venture will initially focus on manufacturing Bluetoothenabled wireless audio devices and, at alater stage, will also exploreopportunities to make otherlifestyleoriented products.Gambhir added that it will gobeyond manufacturing andalso focus on building expertise in IP developmentand strengthen inhousedesign capabilities.
“The headroom for growth,in the categories that we arepresent in, is tremendous.We will strive to develop innovative products throughthis JV not only for the Indianconsumers but also for international markets,” he said.
Aims for revenue of
₹�1,000 cr in 4 years
The JV will manufacture
wireless audio products in India
boAt forms JV with Dixon Tech
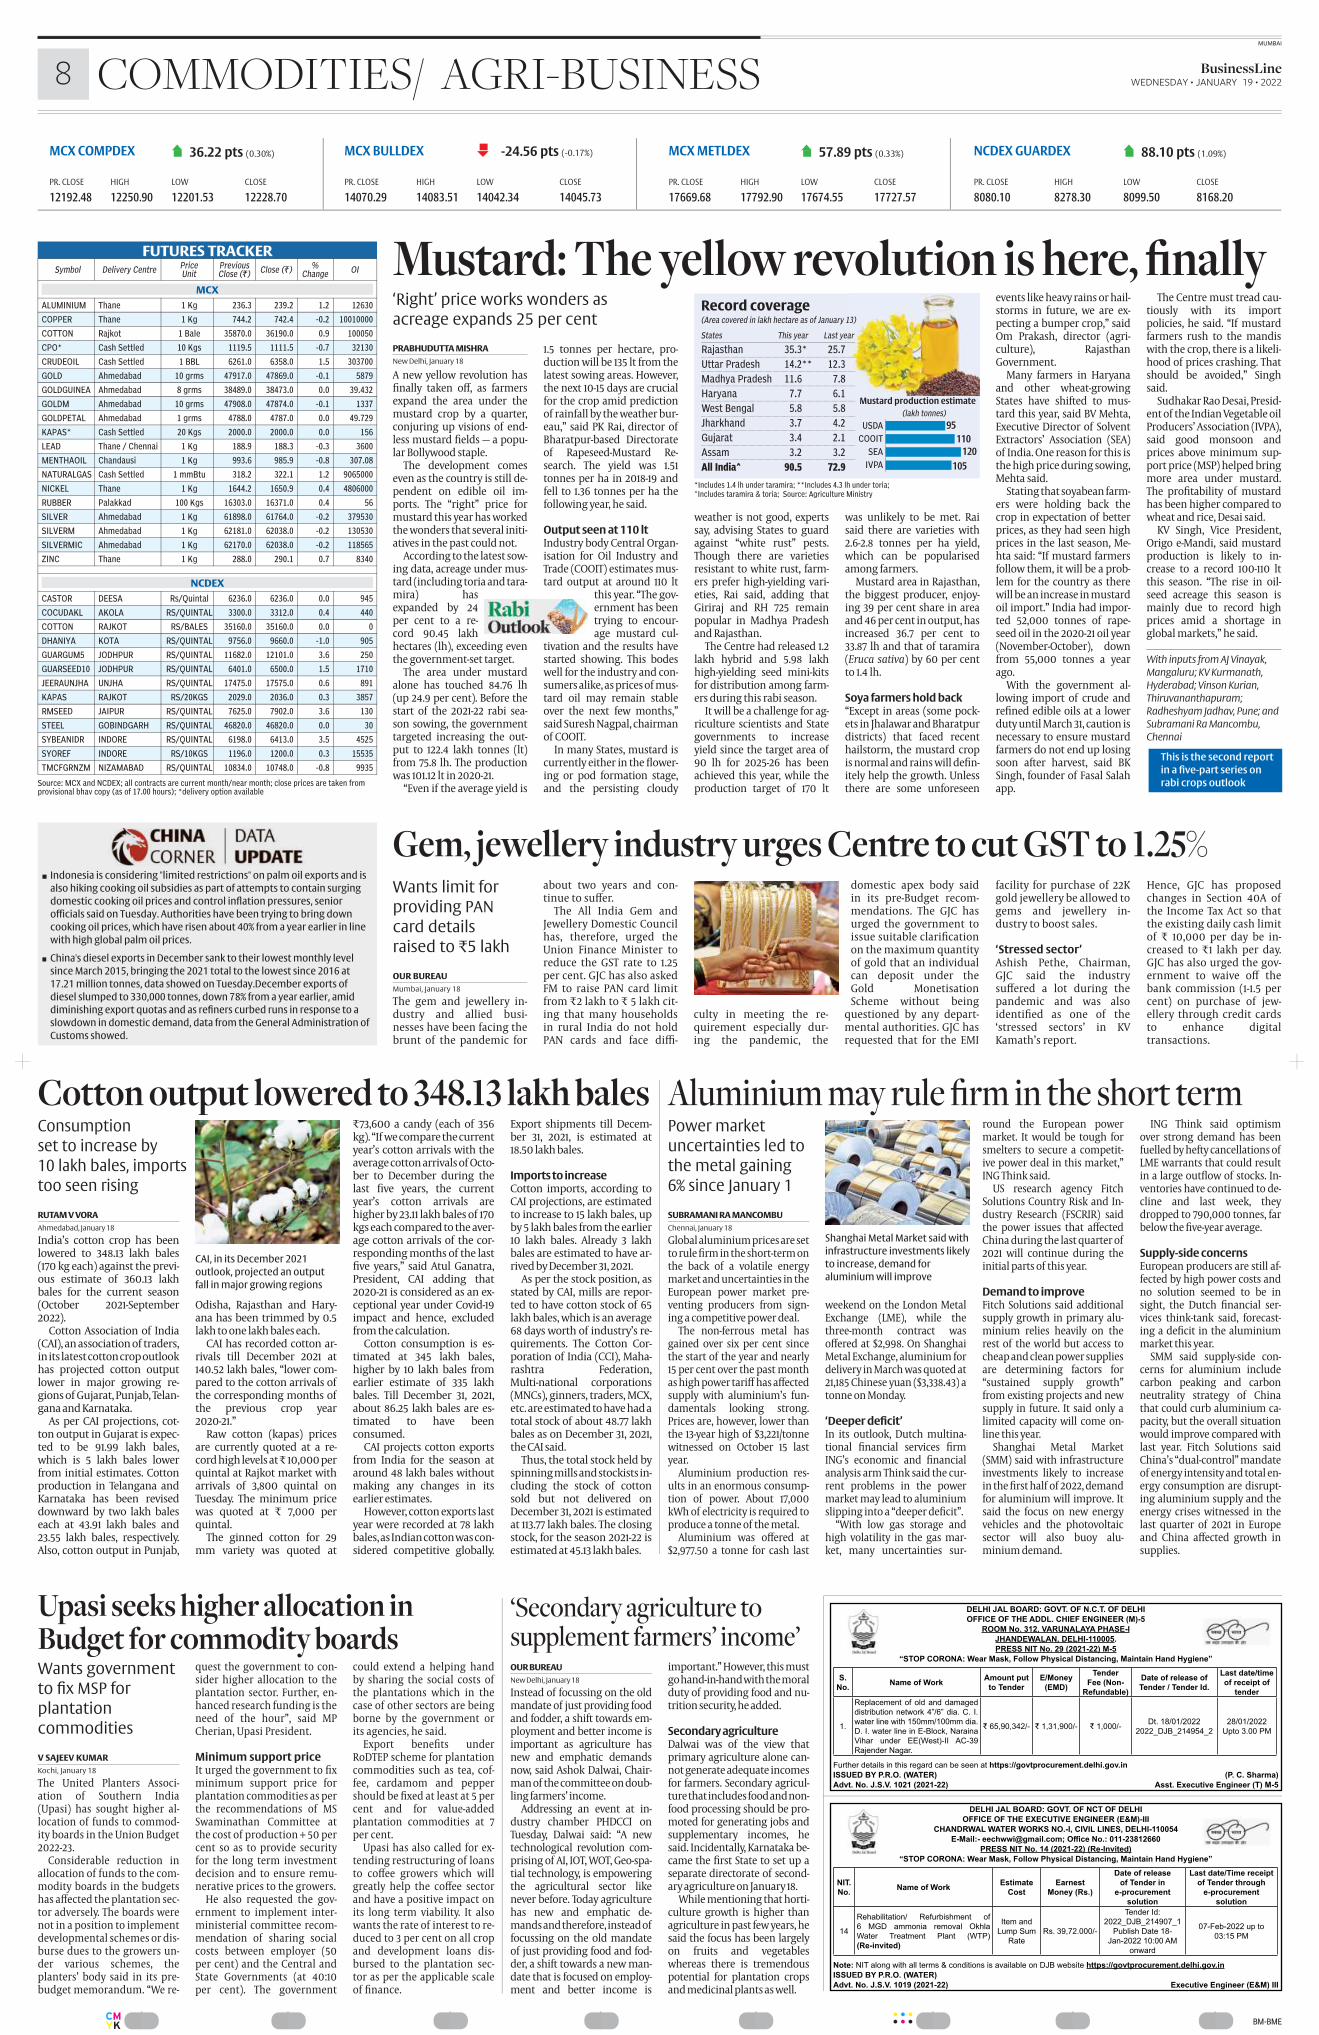
................BM-BMECMYK
MUMBAI
8 BusinessLine WEDNESDAY • JANUARY 19 • 2022COMMODITIES/ AGRI-BUSINESS
PRABHUDUTTA MISHRA
New Delhi, January 18
A new yellow revolution hasfi�nally taken off�, as farmersexpand the area under themustard crop by a quarter,conjuring up visions of endless mustard fi�elds — a popular Bollywood staple.
The development comeseven as the country is still dependent on edible oil imports. The “right” price formustard this year has workedthe wonders that several initiatives in the past could not.
According to the latest sowing data, acreage under mustard (including toria and taramira) hasexpanded by 24per cent to a record 90.45 lakhhectares (lh), exceeding eventhe governmentset target.
The area under mustardalone has touched 84.76 lh(up 24.9 per cent). Before thestart of the 202122 rabi season sowing, the governmenttargeted increasing the output to 122.4 lakh tonnes (lt)from 75.8 lh. The productionwas 101.12 lt in 202021.
“Even if the average yield is
1.5 tonnes per hectare, production will be 135 lt from thelatest sowing areas. However,the next 1015 days are crucialfor the crop amid predictionof rainfall by the weather bureau,” said PK Rai, director ofBharatpurbased Directorateof RapeseedMustard Research. The yield was 1.51tonnes per ha in 201819 andfell to 1.36 tonnes per ha thefollowing year, he said.
Output seen at 110 ltIndustry body Central Organisation for Oil Industry andTrade (COOIT) estimates mustard output at around 110 lt
this year. “The government has beentrying to encourage mustard cul
tivation and the results havestarted showing. This bodeswell for the industry and consumers alike, as prices of mustard oil may remain stableover the next few months,”said Suresh Nagpal, chairmanof COOIT.
In many States, mustard iscurrently either in the fl�owering or pod formation stage,and the persisting cloudy
weather is not good, expertssay, advising States to guardagainst “white rust” pests.Though there are varietiesresistant to white rust, farmers prefer highyielding varieties, Rai said, adding thatGiriraj and RH 725 remainpopular in Madhya Pradeshand Rajasthan.
The Centre had released 1.2lakh hybrid and 5.98 lakhhighyielding seed minikitsfor distribution among farmers during this rabi season.
It will be a challenge for agriculture scientists and Stategovernments to increaseyield since the target area of90 lh for 202526 has beenachieved this year, while theproduction target of 170 lt
was unlikely to be met. Raisaid there are varieties with2.62.8 tonnes per ha yield,which can be popularisedamong farmers.
Mustard area in Rajasthan,the biggest producer, enjoying 39 per cent share in areaand 46 per cent in output, hasincreased 36.7 per cent to33.87 lh and that of taramira(Eruca sativa) by 60 per centto 1.4 lh.
Soya farmers hold back“Except in areas (some pockets in Jhalawar and Bharatpurdistricts) that faced recenthailstorm, the mustard cropis normal and rains will defi�nitely help the growth. Unlessthere are some unforeseen
events like heavy rains or hailstorms in future, we are expecting a bumper crop,” saidOm Prakash, director (agriculture), RajasthanGovernment.
Many farmers in Haryanaand other wheatgrowingStates have shifted to mustard this year, said BV Mehta,Executive Director of SolventExtractors’ Association (SEA)of India. One reason for this isthe high price during sowing,Mehta said.
Stating that soyabean farmers were holding back thecrop in expectation of betterprices, as they had seen highprices in the last season, Mehta said: “If mustard farmersfollow them, it will be a problem for the country as therewill be an increase in mustardoil import.” India had imported 52,000 tonnes of rapeseed oil in the 202021 oil year(NovemberOctober), downfrom 55,000 tonnes a yearago.
With the government allowing import of crude andrefi�ned edible oils at a lowerduty until March 31, caution isnecessary to ensure mustardfarmers do not end up losingsoon after harvest, said BKSingh, founder of Fasal Salahapp.
The Centre must tread cautiously with its importpolicies, he said. “If mustardfarmers rush to the mandiswith the crop, there is a likelihood of prices crashing. Thatshould be avoided,” Singhsaid.
Sudhakar Rao Desai, President of the Indian Vegetable oilProducers’ Association (IVPA),said good monsoon andprices above minimum support price (MSP) helped bringmore area under mustard.The profi�tability of mustardhas been higher compared towheat and rice, Desai said.
KV Singh, Vice President,Origo eMandi, said mustardproduction is likely to increase to a record 100110 ltthis season. “The rise in oilseed acreage this season ismainly due to record highprices amid a shortage inglobal markets,” he said.
With inputs from AJ Vinayak,
Mangaluru; KV Kurmanath,
Hyderabad; Vinson Kurian,
Thiruvananthapuram;
Radheshyam Jadhav, Pune; and
Subramani Ra Mancombu,
Chennai
‘Right’ price works wonders as
acreage expands 25 per cent
Mustard: The yellow revolution is here, finally FUTURES TRACKERSymbol Delivery Centre
PriceUnit
PreviousClose (₹�)
Close (₹�)%
ChangeOI
MCX
ALUMINIUM Thane 1 Kg 236.3 239.2 1.2 12630
COPPER Thane 1 Kg 744.2 742.4 -0.2 10010000
COTTON Rajkot 1 Bale 35870.0 36190.0 0.9 100050
CPO* Cash Settled 10 Kgs 1119.5 1111.5 -0.7 32130
CRUDEOIL Cash Settled 1 BBL 6261.0 6358.0 1.5 303700
GOLD Ahmedabad 10 grms 47917.0 47869.0 -0.1 5879
GOLDGUINEA Ahmedabad 8 grms 38489.0 38473.0 0.0 39.432
GOLDM Ahmedabad 10 grms 47908.0 47874.0 -0.1 1337
GOLDPETAL Ahmedabad 1 grms 4788.0 4787.0 0.0 49.729
KAPAS* Cash Settled 20 Kgs 2000.0 2000.0 0.0 156
LEAD Thane / Chennai 1 Kg 188.9 188.3 -0.3 3600
MENTHAOIL Chandausi 1 Kg 993.6 985.9 -0.8 307.08
NATURALGAS Cash Settled 1 mmBtu 318.2 322.1 1.2 9065000
NICKEL Thane 1 Kg 1644.2 1650.9 0.4 4806000
RUBBER Palakkad 100 Kgs 16303.0 16371.0 0.4 56
SILVER Ahmedabad 1 Kg 61898.0 61764.0 -0.2 379530
SILVERM Ahmedabad 1 Kg 62181.0 62038.0 -0.2 130530
SILVERMIC Ahmedabad 1 Kg 62170.0 62038.0 -0.2 118565
ZINC Thane 1 Kg 288.0 290.1 0.7 8340
NCDEX
CASTOR DEESA Rs/Quintal 6236.0 6236.0 0.0 945
COCUDAKL AKOLA RS/QUINTAL 3300.0 3312.0 0.4 440
COTTON RAJKOT RS/BALES 35160.0 35160.0 0.0 0
DHANIYA KOTA RS/QUINTAL 9756.0 9660.0 -1.0 905
GUARGUM5 JODHPUR RS/QUINTAL 11682.0 12101.0 3.6 250
GUARSEED10 JODHPUR RS/QUINTAL 6401.0 6500.0 1.5 1710
JEERAUNJHA UNJHA RS/QUINTAL 17475.0 17575.0 0.6 891
KAPAS RAJKOT RS/20KGS 2029.0 2036.0 0.3 3857
RMSEED JAIPUR RS/QUINTAL 7625.0 7902.0 3.6 130
STEEL GOBINDGARH RS/QUINTAL 46820.0 46820.0 0.0 30
SYBEANIDR INDORE RS/QUINTAL 6198.0 6413.0 3.5 4525
SYOREF INDORE RS/10KGS 1196.0 1200.0 0.3 15535
TMCFGRNZM NIZAMABAD RS/QUINTAL 10834.0 10748.0 -0.8 9935
Source: MCX and NCDEX; all contracts are current month/near month; close prices are taken fromprovisional bhav copy (as of 17.00 hours); *delivery option available
■ Indonesia is considering "limited restrictions" on palm oil exports and is
also hiking cooking oil subsidies as part of attempts to contain surging
domestic cooking oil prices and control inflation pressures, senior
officials said on Tuesday. Authorities have been trying to bring down
cooking oil prices, which have risen about 40% from a year earlier in line
with high global palm oil prices.
■ China's diesel exports in December sank to their lowest monthly level
since March 2015, bringing the 2021 total to the lowest since 2016 at
17.21 million tonnes, data showed on Tuesday.December exports of
diesel slumped to 330,000 tonnes, down 78% from a year earlier, amid
diminishing export quotas and as refiners curbed runs in response to a
slowdown in domestic demand, data from the General Administration of
Customs showed.
MCX COMPDEX C 36.22 pts (0.30%) MCX BULLDEX D -24.56 pts (-0.17%) MCX METLDEX C 57.89 pts (0.33%) NCDEX GUARDEX C 88.10 pts (1.09%)
PR. CLOSE HIGH LOW CLOSE PR. CLOSE HIGH LOW CLOSE PR. CLOSE HIGH LOW CLOSE PR. CLOSE HIGH LOW CLOSE
12192.48 12250.90 12201.53 12228.70 14070.29 14083.51 14042.34 14045.73 17669.68 17792.90 17674.55 17727.57 8080.10 8278.30 8099.50 8168.20
OUR BUREAU
Mumbai, January 18
The gem and jewellery industry and allied businesses have been facing thebrunt of the pandemic for
about two years and continue to suff�er.
The All India Gem andJewellery Domestic Councilhas, therefore, urged theUnion Finance Minister toreduce the GST rate to 1.25per cent. GJC has also askedFM to raise PAN card limitfrom ₹�2 lakh to ₹� 5 lakh citing that many householdsin rural India do not holdPAN cards and face diffi�
culty in meeting the requirement especially during the pandemic, the
domestic apex body saidin its preBudget recommendations. The GJC hasurged the government toissue suitable clarifi�cationon the maximum quantityof gold that an individualcan deposit under theGold MonetisationScheme without being
questioned by any departmental authorities. GJC hasrequested that for the EMI
facility for purchase of 22Kgold jewellery be allowed togems and jewellery industry to boost sales.
‘Stressed sector’Ashish Pethe, Chairman,GJC said the industrysuff�ered a lot during thepandemic and was alsoidentifi�ed as one of the‘stressed sectors’ in KVKamath’s report.
Hence, GJC has proposedchanges in Section 40A ofthe Income Tax Act so thatthe existing daily cash limitof ₹� 10,000 per day be increased to ₹�1 lakh per day.GJC has also urged the government to waive off� thebank commission (11.5 percent) on purchase of jewellery through credit cardsto enhance digitaltransactions.
Wants limit forproviding PANcard details raised to ₹5 lakh
Gem, jewellery industry urges Centre to cut GST to 1.25%
RUTAM V VORA
Ahmedabad, January 18
India’s cotton crop has beenlowered to 348.13 lakh bales(170 kg each) against the previous estimate of 360.13 lakhbales for the current season(October 2021September2022).
Cotton Association of India(CAI), an association of traders,in its latest cotton crop outlookhas projected cotton outputlower in major growing regions of Gujarat, Punjab, Telangana and Karnataka.
As per CAI projections, cotton output in Gujarat is expected to be 91.99 lakh bales,which is 5 lakh bales lowerfrom initial estimates. Cottonproduction in Telangana andKarnataka has been reviseddownward by two lakh baleseach at 43.91 lakh bales and23.55 lakh bales, respectively.Also, cotton output in Punjab,
Odisha, Rajasthan and Haryana has been trimmed by 0.5lakh to one lakh bales each.
CAI has recorded cotton arrivals till December 2021 at140.52 lakh bales, “lower compared to the cotton arrivals ofthe corresponding months ofthe previous crop year202021.”
Raw cotton (kapas) pricesare currently quoted at a record high levels at ₹� 10,000 perquintal at Rajkot market witharrivals of 3,800 quintal onTuesday. The minimum pricewas quoted at ₹� 7,000 perquintal.
The ginned cotton for 29mm variety was quoted at
₹�73,600 a candy (each of 356kg). “If we compare the currentyear’s cotton arrivals with theaverage cotton arrivals of October to December during thelast fi�ve years, the currentyear’s cotton arrivals arehigher by 23.11 lakh bales of 170kgs each compared to the average cotton arrivals of the corresponding months of the lastfi�ve years,” said Atul Ganatra,President, CAI adding that202021 is considered as an exceptional year under Covid19impact and hence, excludedfrom the calculation.
Cotton consumption is estimated at 345 lakh bales,higher by 10 lakh bales fromearlier estimate of 335 lakhbales. Till December 31, 2021,about 86.25 lakh bales are estimated to have beenconsumed.
CAI projects cotton exportsfrom India for the season ataround 48 lakh bales withoutmaking any changes in itsearlier estimates.
However, cotton exports lastyear were recorded at 78 lakhbales, as Indian cotton was considered competitive globally.
Export shipments till December 31, 2021, is estimated at18.50 lakh bales.
Imports to increaseCotton imports, according toCAI projections, are estimatedto increase to 15 lakh bales, upby 5 lakh bales from the earlier10 lakh bales. Already 3 lakhbales are estimated to have arrived by December 31, 2021.
As per the stock position, asstated by CAI, mills are reported to have cotton stock of 65lakh bales, which is an average68 days worth of industry’s requirements. The Cotton Corporation of India (CCI), Maharashtra Federation,Multinational corporations(MNCs), ginners, traders, MCX,etc. are estimated to have had atotal stock of about 48.77 lakhbales as on December 31, 2021,the CAI said.
Thus, the total stock held byspinning mills and stockists including the stock of cottonsold but not delivered onDecember 31, 2021 is estimatedat 113.77 lakh bales. The closingstock, for the season 202122 isestimated at 45.13 lakh bales.
Consumption set to increase by 10 lakh bales, importstoo seen rising
Cotton output lowered to 348.13 lakh bales
CAI, in its December 2021
outlook, projected an output
fall in major growing regions
SUBRAMANI RA MANCOMBU
Chennai, January 18
Global aluminium prices are setto rule fi�rm in the shortterm onthe back of a volatile energymarket and uncertainties in theEuropean power market preventing producers from signing a competitive power deal.
The nonferrous metal hasgained over six per cent sincethe start of the year and nearly15 per cent over the past monthas high power tariff� has aff�ectedsupply with aluminium’s fundamentals looking strong.Prices are, however, lower thanthe 13year high of $3,221/tonnewitnessed on October 15 lastyear.
Aluminium production results in an enormous consumption of power. About 17,000kWh of electricity is required toproduce a tonne of the metal.
Aluminium was off�ered at$2,977.50 a tonne for cash last
weekend on the London MetalExchange (LME), while thethreemonth contract wasoff�ered at $2,998. On ShanghaiMetal Exchange, aluminium fordelivery in March was quoted at21,185 Chinese yuan ($3,338.43) atonne on Monday.
‘Deeper deficit’In its outlook, Dutch multinational fi�nancial services fi�rmING’s economic and fi�nancialanalysis arm Think said the current problems in the powermarket may lead to aluminiumslipping into a “deeper defi�cit”.
“With low gas storage andhigh volatility in the gas market, many uncertainties sur
round the European powermarket. It would be tough forsmelters to secure a competitive power deal in this market,”ING Think said.
US research agency FitchSolutions Country Risk and Industry Research (FSCRIR) saidthe power issues that aff�ectedChina during the last quarter of2021 will continue during theinitial parts of this year.
Demand to improveFitch Solutions said additionalsupply growth in primary aluminium relies heavily on therest of the world but access tocheap and clean power suppliesare determining factors for“sustained supply growth”from existing projects and newsupply in future. It said only alimited capacity will come online this year.
Shanghai Metal Market(SMM) said with infrastructureinvestments likely to increasein the fi�rst half of 2022, demandfor aluminium will improve. Itsaid the focus on new energyvehicles and the photovoltaicsector will also buoy aluminium demand.
ING Think said optimismover strong demand has beenfuelled by hefty cancellations ofLME warrants that could resultin a large outfl�ow of stocks. Inventories have continued to decline and last week, theydropped to 790,000 tonnes, farbelow the fi�veyear average.
Supply-side concernsEuropean producers are still affected by high power costs andno solution seemed to be insight, the Dutch fi�nancial services thinktank said, forecasting a defi�cit in the aluminiummarket this year.
SMM said supplyside concerns for aluminium includecarbon peaking and carbonneutrality strategy of Chinathat could curb aluminium capacity, but the overall situationwould improve compared withlast year. Fitch Solutions saidChina’s “dualcontrol” mandateof energy intensity and total energy consumption are disrupting aluminium supply and theenergy crises witnessed in thelast quarter of 2021 in Europeand China aff�ected growth insupplies.
Power marketuncertainties led tothe metal gaining6% since January 1
Aluminium may rule firm in the short term
Shanghai Metal Market said with
infrastructure investments likely
to increase, demand for
aluminium will improve
V SAJEEV KUMAR
Kochi, January 18
The United Planters Association of Southern India(Upasi) has sought higher allocation of funds to commodity boards in the Union Budget202223.
Considerable reduction inallocation of funds to the commodity boards in the budgetshas aff�ected the plantation sector adversely. The boards werenot in a position to implementdevelopmental schemes or disburse dues to the growers under various schemes, theplanters’ body said in its prebudget memorandum. “We re
quest the government to consider higher allocation to theplantation sector. Further, enhanced research funding is theneed of the hour”, said MPCherian, Upasi President.
Minimum support priceIt urged the government to fi�xminimum support price forplantation commodities as perthe recommendations of MSSwaminathan Committee atthe cost of production + 50 percent so as to provide securityfor the long term investmentdecision and to ensure remunerative prices to the growers.
He also requested the government to implement interministerial committee recommendation of sharing socialcosts between employer (50per cent) and the Central andState Governments (at 40:10per cent). The government
could extend a helping handby sharing the social costs ofthe plantations which in thecase of other sectors are beingborne by the government orits agencies, he said.
Export benefi�ts underRoDTEP scheme for plantationcommodities such as tea, coffee, cardamom and peppershould be fi�xed at least at 5 percent and for valueaddedplantation commodities at 7per cent.
Upasi has also called for extending restructuring of loansto coff�ee growers which willgreatly help the coff�ee sectorand have a positive impact onits long term viability. It alsowants the rate of interest to reduced to 3 per cent on all cropand development loans disbursed to the plantation sector as per the applicable scaleof fi�nance.
Wants governmentto fix MSP forplantationcommodities
Upasi seeks higher allocation inBudget for commodity boards
OUR BUREAU
New Delhi, January 18
Instead of focussing on the oldmandate of just providing foodand fodder, a shift towards employment and better income isimportant as agriculture hasnew and emphatic demandsnow, said Ashok Dalwai, Chairman of the committee on doubling farmers’ income.
Addressing an event at industry chamber PHDCCI onTuesday, Dalwai said: “A newtechnological revolution comprising of AI, IOT, WOT, Geospatial technology, is empoweringthe agricultural sector likenever before. Today agriculturehas new and emphatic demands and therefore, instead offocussing on the old mandateof just providing food and fodder, a shift towards a new mandate that is focused on employment and better income is
important.” However, this mustgo handinhand with the moralduty of providing food and nutrition security, he added.
Secondary agricultureDalwai was of the view thatprimary agriculture alone cannot generate adequate incomesfor farmers. Secondary agriculture that includes food and nonfood processing should be promoted for generating jobs andsupplementary incomes, hesaid. Incidentally, Karnataka became the fi�rst State to set up aseparate directorate of secondary agriculture on January 18.
While mentioning that horticulture growth is higher thanagriculture in past few years, hesaid the focus has been largelyon fruits and vegetableswhereas there is tremendouspotential for plantation cropsand medicinal plants as well.
‘Secondary agriculture tosupplement farmers’ income’
This is the second report
in a five-part series on
rabi crops outlook
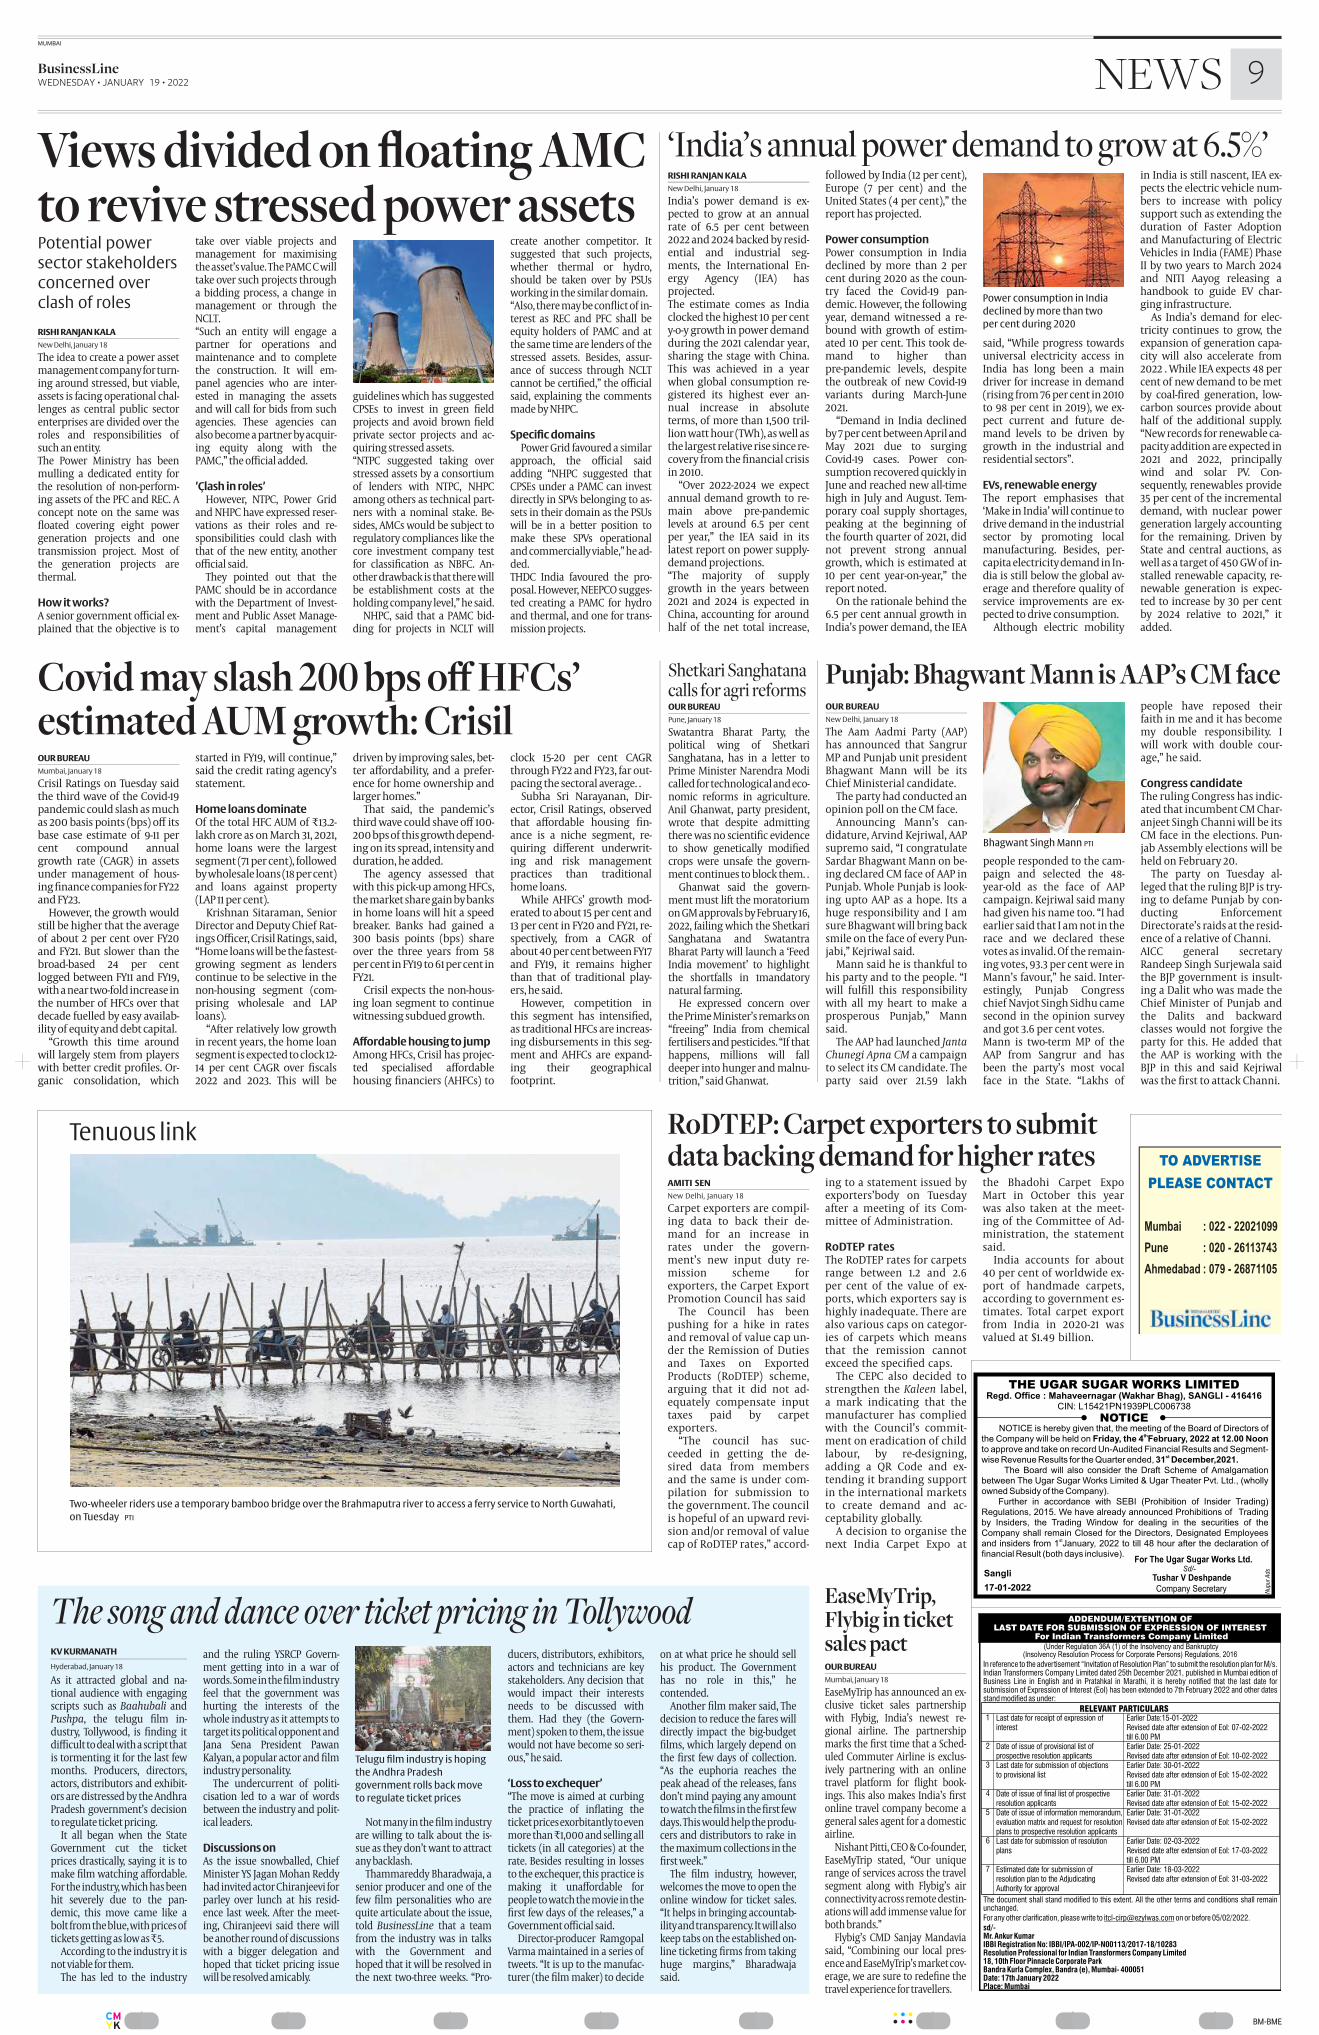
................BM-BMECMYK
AMITI SEN
New Delhi, January 18
Carpet exporters are compiling data to back their demand for an increase inrates under the government’s new input duty remission scheme forexporters, the Carpet ExportPromotion Council has said
The Council has beenpushing for a hike in ratesand removal of value cap under the Remission of Dutiesand Taxes on ExportedProducts (RoDTEP) scheme,arguing that it did not adequately compensate inputtaxes paid by carpetexporters.
“The council has succeeded in getting the desired data from membersand the same is under compilation for submission tothe government. The councilis hopeful of an upward revision and/or removal of valuecap of RoDTEP rates,” accord
ing to a statement issued byexporters’body on Tuesdayafter a meeting of its Committee of Administration.
RoDTEP ratesThe RoDTEP rates for carpetsrange between 1.2 and 2.6per cent of the value of exports, which exporters say ishighly inadequate. There arealso various caps on categories of carpets which meansthat the remission cannotexceed the specifi�ed caps.
The CEPC also decided tostrengthen the Kaleen label,a mark indicating that themanufacturer has compliedwith the Council’s commitment on eradication of childlabour, by redesigning,adding a QR Code and extending it branding supportin the international marketsto create demand and acceptability globally.
A decision to organise thenext India Carpet Expo at
the Bhadohi Carpet ExpoMart in October this yearwas also taken at the meeting of the Committee of Administration, the statementsaid.
India accounts for about40 per cent of worldwide export of handmade carpets,according to government estimates. Total carpet exportfrom India in 202021 wasvalued at $1.49 billion.
RoDTEP: Carpet exporters to submitdata backing demand for higher rates
RISHI RANJAN KALA
New Delhi, January 18
India’s power demand is expected to grow at an annualrate of 6.5 per cent between2022 and 2024 backed by residential and industrial segments, the International Energy Agency (IEA) hasprojected.The estimate comes as Indiaclocked the highest 10 per centyoy growth in power demandduring the 2021 calendar year,sharing the stage with China.This was achieved in a yearwhen global consumption registered its highest ever annual increase in absoluteterms, of more than 1,500 trillion watt hour (TWh), as well asthe largest relative rise since recovery from the fi�nancial crisisin 2010.
“Over 20222024 we expectannual demand growth to remain above prepandemiclevels at around 6.5 per centper year,” the IEA said in itslatest report on power supplydemand projections.“The majority of supplygrowth in the years between2021 and 2024 is expected inChina, accounting for aroundhalf of the net total increase,
followed by India (12 per cent),Europe (7 per cent) and theUnited States (4 per cent),” thereport has projected.
Power consumptionPower consumption in Indiadeclined by more than 2 percent during 2020 as the country faced the Covid19 pandemic. However, the followingyear, demand witnessed a rebound with growth of estimated 10 per cent. This took demand to higher thanprepandemic levels, despitethe outbreak of new Covid19variants during MarchJune2021.
“Demand in India declinedby 7 per cent between April andMay 2021 due to surgingCovid19 cases. Power consumption recovered quickly inJune and reached new alltimehigh in July and August. Temporary coal supply shortages,peaking at the beginning ofthe fourth quarter of 2021, didnot prevent strong annualgrowth, which is estimated at10 per cent yearonyear,” thereport noted.
On the rationale behind the6.5 per cent annual growth inIndia’s power demand, the IEA
in India is still nascent, IEA expects the electric vehicle numbers to increase with policysupport such as extending theduration of Faster Adoptionand Manufacturing of ElectricVehicles in India (FAME) PhaseII by two years to March 2024and NITI Aayog releasing ahandbook to guide EV charging infrastructure.
As India’s demand for electricity continues to grow, theexpansion of generation capacity will also accelerate from2022 . While IEA expects 48 percent of new demand to be metby coalfi�red generation, lowcarbon sources provide abouthalf of the additional supply.“New records for renewable capacity addition are expected in2021 and 2022, principallywind and solar PV. Consequently, renewables provide35 per cent of the incrementaldemand, with nuclear powergeneration largely accountingfor the remaining. Driven byState and central auctions, aswell as a target of 450 GW of installed renewable capacity, renewable generation is expected to increase by 30 per centby 2024 relative to 2021,” itadded.
said, “While progress towardsuniversal electricity access inIndia has long been a maindriver for increase in demand(rising from 76 per cent in 2010to 98 per cent in 2019), we expect current and future demand levels to be driven bygrowth in the industrial andresidential sectors”.
EVs, renewable energyThe report emphasises that‘Make in India’ will continue todrive demand in the industrialsector by promoting localmanufacturing. Besides, percapita electricity demand in India is still below the global average and therefore quality ofservice improvements are expected to drive consumption.
Although electric mobility
‘India’s annual power demand to grow at 6.5%’
Power consumption in India
declined by more than two
per cent during 2020
Tenuous link
Two-wheeler riders use a temporary bamboo bridge over the Brahmaputra river to access a ferry service to North Guwahati,
on Tuesday PTI
KV KURMANATH
Hyderabad, January 18
As it attracted global and national audience with engagingscripts such as Baahubali andPushpa, the telugu fi�lm industry, Tollywood, is fi�nding itdiffi�cult to deal with a script thatis tormenting it for the last fewmonths. Producers, directors,actors, distributors and exhibitors are distressed by the AndhraPradesh government’s decisionto regulate ticket pricing.
It all began when the StateGovernment cut the ticketprices drastically, saying it is tomake fi�lm watching aff�ordable.For the industry, which has beenhit severely due to the pandemic, this move came like abolt from the blue, with prices oftickets getting as low as ₹�5.
According to the industry it isnot viable for them.
The has led to the industry
and the ruling YSRCP Government getting into in a war ofwords. Some in the fi�lm industryfeel that the government washurting the interests of thewhole industry as it attempts totarget its political opponent andJana Sena President PawanKalyan, a popular actor and fi�lmindustry personality.
The undercurrent of politicisation led to a war of wordsbetween the industry and political leaders.
Discussions onAs the issue snowballed, ChiefMinister YS Jagan Mohan Reddyhad invited actor Chiranjeevi forparley over lunch at his residence last week. After the meeting, Chiranjeevi said there willbe another round of discussionswith a bigger delegation andhoped that ticket pricing issuewill be resolved amicably.
Not many in the fi�lm industryare willing to talk about the issue as they don’t want to attractany backlash.
Thammareddy Bharadwaja, asenior producer and one of thefew fi�lm personalities who arequite articulate about the issue,told BusinessLine that a teamfrom the industry was in talkswith the Government andhoped that it will be resolved inthe next twothree weeks. “Pro
ducers, distributors, exhibitors,actors and technicians are keystakeholders. Any decision thatwould impact their interestsneeds to be discussed withthem. Had they (the Government) spoken to them, the issuewould not have become so serious,” he said.
‘Loss to exchequer’“The move is aimed at curbingthe practice of infl�ating theticket prices exorbitantly to evenmore than ₹�1,000 and selling alltickets (in all categories) at therate. Besides resulting in lossesto the exchequer, this practice ismaking it unaff�ordable forpeople to watch the movie in thefi�rst few days of the releases,” aGovernment offi�cial said.
Directorproducer RamgopalVarma maintained in a series oftweets. “It is up to the manufacturer (the fi�lm maker) to decide
on at what price he should sellhis product. The Governmenthas no role in this,” hecontended.
Another fi�lm maker said, Thedecision to reduce the fares willdirectly impact the bigbudgetfi�lms, which largely depend onthe fi�rst few days of collection.“As the euphoria reaches thepeak ahead of the releases, fansdon’t mind paying any amountto watch the fi�lms in the fi�rst fewdays. This would help the producers and distributors to rake inthe maximum collections in thefi�rst week.”
The fi�lm industry, however,welcomes the move to open theonline window for ticket sales.“It helps in bringing accountability and transparency. It will alsokeep tabs on the established online ticketing fi�rms from takinghuge margins,” Bharadwajasaid.
The song and dance over ticket pricing in Tollywood
Telugu film industry is hoping
the Andhra Pradesh
government rolls back move
to regulate ticket prices
OUR BUREAU
Mumbai, January 18
EaseMyTrip has announced an exclusive ticket sales partnershipwith Flybig, India’s newest regional airline. The partnershipmarks the fi�rst time that a Scheduled Commuter Airline is exclusively partnering with an onlinetravel platform for fl�ight bookings. This also makes India’s fi�rstonline travel company become ageneral sales agent for a domesticairline.
Nishant Pitti, CEO & Cofounder,EaseMyTrip stated, “Our uniquerange of services across the travelsegment along with Flybig’s airconnectivity across remote destinations will add immense value forboth brands.”
Flybig’s CMD Sanjay Mandaviasaid, “Combining our local presence and EaseMyTrip’s market coverage, we are sure to redefi�ne thetravel experience for travellers.
EaseMyTrip,Flybig in ticketsales pact
RISHI RANJAN KALA
New Delhi, January 18
The idea to create a power assetmanagement company for turning around stressed, but viable,assets is facing operational challenges as central public sectorenterprises are divided over theroles and responsibilities ofsuch an entity.The Power Ministry has beenmulling a dedicated entity forthe resolution of nonperforming assets of the PFC and REC. Aconcept note on the same wasfl�oated covering eight powergeneration projects and onetransmission project. Most ofthe generation projects arethermal.
How it works?A senior government offi�cial explained that the objective is to
take over viable projects andmanagement for maximisingthe asset’s value. The PAMC C willtake over such projects througha bidding process, a change inmanagement or through theNCLT.“Such an entity will engage apartner for operations andmaintenance and to completethe construction. It will empanel agencies who are interested in managing the assetsand will call for bids from suchagencies. These agencies canalso become a partner by acquiring equity along with thePAMC,” the offi�cial added.
’Çlash in roles’However, NTPC, Power Grid
and NHPC have expressed reservations as their roles and responsibilities could clash withthat of the new entity, anotheroffi�cial said.
They pointed out that thePAMC should be in accordancewith the Department of Investment and Public Asset Management’s capital management
guidelines which has suggestedCPSEs to invest in green fi�eldprojects and avoid brown fi�eldprivate sector projects and acquiring stressed assets. “NTPC suggested taking overstressed assets by a consortiumof lenders with NTPC, NHPCamong others as technical partners with a nominal stake. Besides, AMCs would be subject toregulatory compliances like thecore investment company testfor classifi�cation as NBFC. Another drawback is that there willbe establishment costs at theholding company level,” he said.
NHPC, said that a PAMC bidding for projects in NCLT will
create another competitor. Itsuggested that such projects,whether thermal or hydro,should be taken over by PSUsworking in the similar domain.“Also, there may be confl�ict of interest as REC and PFC shall beequity holders of PAMC and atthe same time are lenders of thestressed assets. Besides, assurance of success through NCLTcannot be certifi�ed,” the offi�cialsaid, explaining the commentsmade by NHPC.
Specific domainsPower Grid favoured a similar
approach, the offi�cial saidadding “NHPC suggested thatCPSEs under a PAMC can investdirectly in SPVs belonging to assets in their domain as the PSUswill be in a better position tomake these SPVs operationaland commercially viable,” he added.THDC India favoured the proposal. However, NEEPCO suggested creating a PAMC for hydroand thermal, and one for transmission projects.
Potential power
sector stakeholders
concerned over
clash of roles
Views divided on floating AMCto revive stressed power assets
MUMBAI
BusinessLineWEDNESDAY • JANUARY 19 • 2022 9NEWS
OUR BUREAU
Pune, January 18
Swatantra Bharat Party, thepolitical wing of ShetkariSanghatana, has in a letter toPrime Minister Narendra Modicalled for technological and economic reforms in agriculture.Anil Ghanwat, party president,wrote that despite admittingthere was no scientifi�c evidenceto show genetically modifi�edcrops were unsafe the government continues to block them. .
Ghanwat said the government must lift the moratoriumon GM approvals by February 16,2022, failing which the ShetkariSanghatana and SwatantraBharat Party will launch a ‘FeedIndia movement’ to highlightthe shortfalls in 1mandatorynatural farming.
He expressed concern overthe Prime Minister’s remarks on“freeing” India from chemicalfertilisers and pesticides. “If thathappens, millions will falldeeper into hunger and malnutrition,” said Ghanwat.
Shetkari Sanghatanacalls for agri reforms
OUR BUREAU
Mumbai, January 18
Crisil Ratings on Tuesday saidthe third wave of the Covid19pandemic could slash as muchas 200 basis points (bps) off� itsbase case estimate of 911 percent compound annualgrowth rate (CAGR) in assetsunder management of housing fi�nance companies for FY22and FY23.
However, the growth wouldstill be higher that the averageof about 2 per cent over FY20and FY21. But slower than thebroadbased 24 per centlogged between FY11 and FY19,with a near twofold increase inthe number of HFCs over thatdecade fuelled by easy availability of equity and debt capital.
“Growth this time aroundwill largely stem from playerswith better credit profi�les. Organic consolidation, which
started in FY19, will continue,”said the credit rating agency’sstatement.
Home loans dominateOf the total HFC AUM of ₹�13.2lakh crore as on March 31, 2021,home loans were the largestsegment (71 per cent), followedby wholesale loans (18 per cent)and loans against property(LAP 11 per cent).
Krishnan Sitaraman, SeniorDirector and Deputy Chief Ratings Offi�cer, Crisil Ratings, said,“Home loans will be the fastestgrowing segment as lenderscontinue to be selective in thenonhousing segment (comprising wholesale and LAPloans).
“After relatively low growthin recent years, the home loansegment is expected to clock 1214 per cent CAGR over fi�scals2022 and 2023. This will be
driven by improving sales, better aff�ordability, and a preference for home ownership andlarger homes.”
That said, the pandemic’sthird wave could shave off� 100200 bps of this growth depending on its spread, intensity andduration, he added.
The agency assessed thatwith this pickup among HFCs,the market share gain by banksin home loans will hit a speedbreaker. Banks had gained a300 basis points (bps) shareover the three years from 58per cent in FY19 to 61 per cent inFY21.
Crisil expects the nonhousing loan segment to continuewitnessing subdued growth.
Affordable housing to jumpAmong HFCs, Crisil has projected specialised aff�ordablehousing fi�nanciers (AHFCs) to
clock 1520 per cent CAGRthrough FY22 and FY23, far outpacing the sectoral average. .
Subha Sri Narayanan, Director, Crisil Ratings, observedthat aff�ordable housing fi�nance is a niche segment, requiring diff�erent underwriting and risk managementpractices than traditionalhome loans.
While AHFCs’ growth moderated to about 15 per cent and13 per cent in FY20 and FY21, respectively, from a CAGR ofabout 40 per cent between FY17and FY19, it remains higherthan that of traditional players, he said.
However, competition inthis segment has intensifi�ed,as traditional HFCs are increasing disbursements in this segment and AHFCs are expanding their geographicalfootprint.
Covid may slash 200 bps off HFCs’estimated AUM growth: Crisil
OUR BUREAU
New Delhi, January 18
The Aam Aadmi Party (AAP)has announced that SangrurMP and Punjab unit presidentBhagwant Mann will be itsChief Ministerial candidate.
The party had conducted anopinion poll on the CM face.
Announcing Mann’s candidature, Arvind Kejriwal, AAPsupremo said, “I congratulateSardar Bhagwant Mann on being declared CM face of AAP inPunjab. Whole Punjab is looking upto AAP as a hope. Its ahuge responsibility and I amsure Bhagwant will bring backsmile on the face of every Punjabi,” Kejriwal said.
Mann said he is thankful tohis party and to the people. “Iwill fulfi�ll this responsibilitywith all my heart to make aprosperous Punjab,” Mannsaid.
The AAP had launched JantaChunegi Apna CM a campaignto select its CM candidate. Theparty said over 21.59 lakh
people responded to the campaign and selected the 48yearold as the face of AAPcampaign. Kejriwal said manyhad given his name too. “I hadearlier said that I am not in therace and we declared thesevotes as invalid. Of the remaining votes, 93.3 per cent were inMann’s favour,” he said. Interestingly, Punjab Congresschief Navjot Singh Sidhu camesecond in the opinion surveyand got 3.6 per cent votes.Mann is twoterm MP of theAAP from Sangrur and hasbeen the party’s most vocalface in the State. “Lakhs of
people have reposed theirfaith in me and it has becomemy double responsibility. Iwill work with double courage,” he said.
Congress candidateThe ruling Congress has indicated that incumbent CM Charanjeet Singh Channi will be itsCM face in the elections. Punjab Assembly elections will beheld on February 20.
The party on Tuesday alleged that the ruling BJP is trying to defame Punjab by conducting EnforcementDirectorate’s raids at the residence of a relative of Channi. AICC general secretaryRandeep Singh Surjewala saidthe BJP government is insulting a Dalit who was made theChief Minister of Punjab andthe Dalits and backwardclasses would not forgive theparty for this. He added thatthe AAP is working with theBJP in this and said Kejriwalwas the fi�rst to attack Channi.
Punjab: Bhagwant Mann is AAP’s CM face
Bhagwant Singh Mann PTI
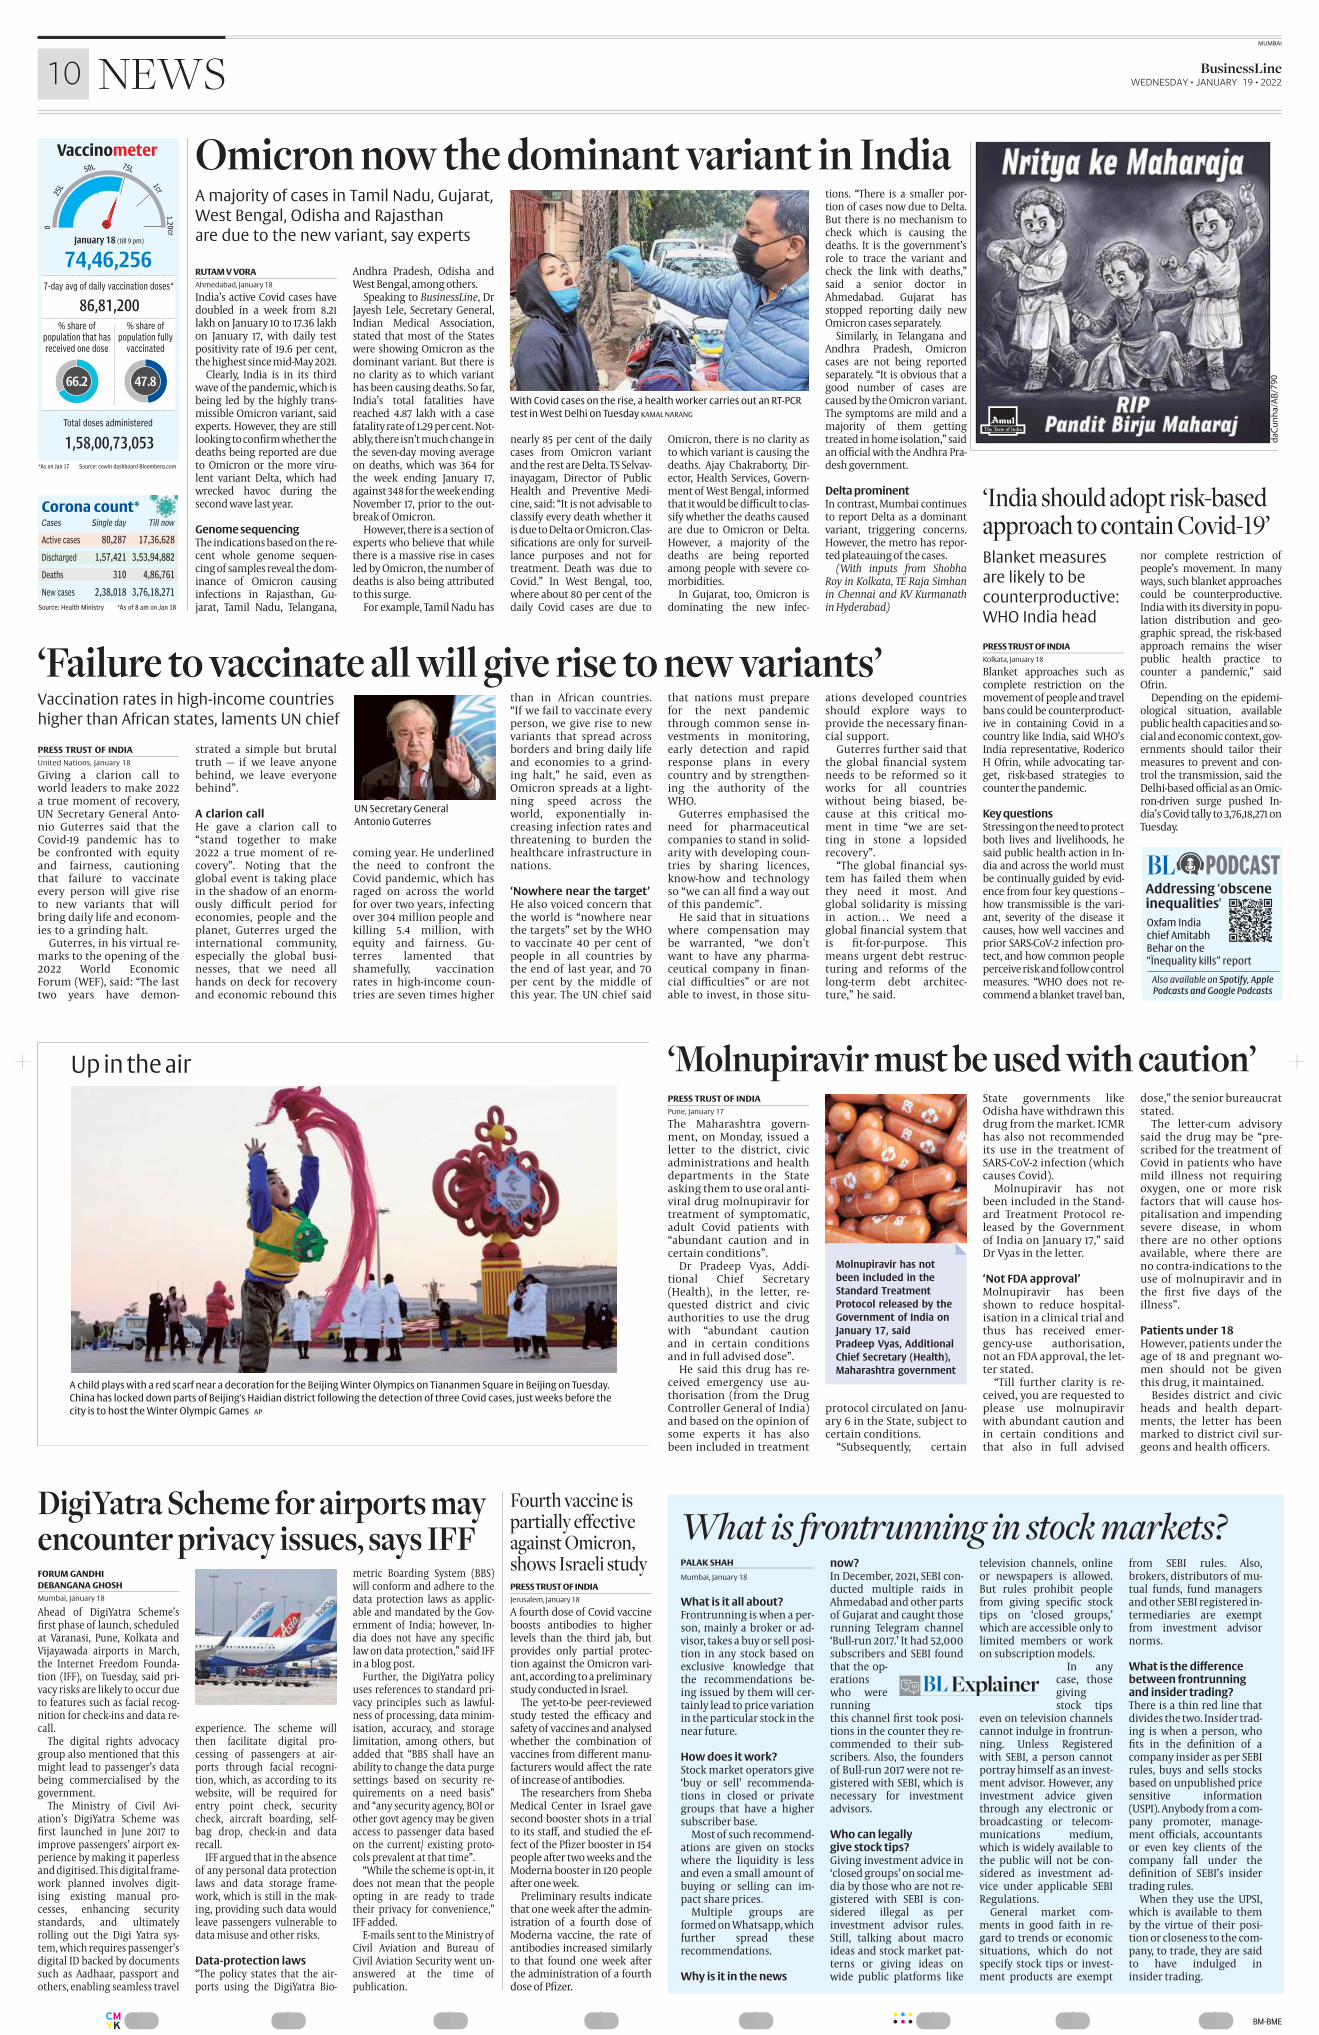
................BM-BMECMYK
MUMBAI
10 BusinessLine WEDNESDAY • JANUARY 19 • 2022NEWS
RUTAM V VORA
Ahmedabad, January 18
India’s active Covid cases havedoubled in a week from 8.21lakh on January 10 to 17.36 lakhon January 17, with daily testpositivity rate of 19.6 per cent,the highest since midMay 2021.
Clearly, India is in its thirdwave of the pandemic, which isbeing led by the highly transmissible Omicron variant, saidexperts. However, they are stilllooking to confi�rm whether thedeaths being reported are dueto Omicron or the more virulent variant Delta, which hadwrecked havoc during thesecond wave last year.
Genome sequencingThe indications based on the recent whole genome sequencing of samples reveal the dominance of Omicron causinginfections in Rajasthan, Gujarat, Tamil Nadu, Telangana,
Andhra Pradesh, Odisha andWest Bengal, among others.
Speaking to BusinessLine, DrJayesh Lele, Secretary General,Indian Medical Association,stated that most of the Stateswere showing Omicron as thedominant variant. But there isno clarity as to which varianthas been causing deaths. So far,India’s total fatalities havereached 4.87 lakh with a casefatality rate of 1.29 per cent. Notably, there isn’t much change inthe sevenday moving averageon deaths, which was 364 forthe week ending January 17,against 348 for the week endingNovember 17, prior to the outbreak of Omicron.
However, there is a section ofexperts who believe that whilethere is a massive rise in casesled by Omicron, the number ofdeaths is also being attributedto this surge.
For example, Tamil Nadu has
nearly 85 per cent of the dailycases from Omicron variantand the rest are Delta. TS Selvavinayagam, Director of PublicHealth and Preventive Medicine, said: “It is not advisable toclassify every death whether itis due to Delta or Omicron. Classifi�cations are only for surveillance purposes and not fortreatment. Death was due toCovid.” In West Bengal, too,where about 80 per cent of thedaily Covid cases are due to
Omicron, there is no clarity asto which variant is causing thedeaths. Ajay Chakraborty, Director, Health Services, Government of West Bengal, informedthat it would be diffi�cult to classify whether the deaths causedare due to Omicron or Delta.However, a majority of thedeaths are being reportedamong people with severe comorbidities.
In Gujarat, too, Omicron isdominating the new infec
tions. “There is a smaller portion of cases now due to Delta.But there is no mechanism tocheck which is causing thedeaths. It is the government’srole to trace the variant andcheck the link with deaths,”said a senior doctor inAhmedabad. Gujarat hasstopped reporting daily newOmicron cases separately.
Similarly, in Telangana andAndhra Pradesh, Omicroncases are not being reportedseparately. “It is obvious that agood number of cases arecaused by the Omicron variant.The symptoms are mild and amajority of them gettingtreated in home isolation,” saidan offi�cial with the Andhra Pradesh government.
Delta prominentIn contrast, Mumbai continuesto report Delta as a dominantvariant, triggering concerns.However, the metro has reported plateauing of the cases.
(With inputs from ShobhaRoy in Kolkata, TE Raja Simhanin Chennai and KV Kurmanathin Hyderabad)
Omicron now the dominant variant in IndiaA majority of cases in Tamil Nadu, Gujarat,
West Bengal, Odisha and Rajasthan
are due to the new variant, say experts
With Covid cases on the rise, a health worker carries out an RT-PCR
test in West Delhi on Tuesday KAMAL NARANG
PRESS TRUST OF INDIA
United Nations, January 18
Giving a clarion call toworld leaders to make 2022a true moment of recovery,UN Secretary General Antonio Guterres said that theCovid19 pandemic has tobe confronted with equityand fairness, cautioningthat failure to vaccinateevery person will give riseto new variants that willbring daily life and economies to a grinding halt.
Guterres, in his virtual remarks to the opening of the2022 World EconomicForum (WEF), said: “The lasttwo years have demon
strated a simple but brutaltruth — if we leave anyonebehind, we leave everyonebehind”.
A clarion callHe gave a clarion call to“stand together to make2022 a true moment of recovery”. Noting that theglobal event is taking placein the shadow of an enormously diffi�cult period foreconomies, people and theplanet, Guterres urged theinternational community,especially the global businesses, that we need allhands on deck for recoveryand economic rebound this
coming year. He underlinedthe need to confront theCovid pandemic, which hasraged on across the worldfor over two years, infectingover 304 million people andkilling 5.4 million, withequity and fairness. Guterres lamented thatshamefully, vaccinationrates in highincome countries are seven times higher
than in African countries.“If we fail to vaccinate everyperson, we give rise to newvariants that spread acrossborders and bring daily lifeand economies to a grinding halt,” he said, even asOmicron spreads at a lightning speed across theworld, exponentially increasing infection rates andthreatening to burden thehealthcare infrastructure innations.
‘Nowhere near the target’He also voiced concern thatthe world is “nowhere nearthe targets” set by the WHOto vaccinate 40 per cent ofpeople in all countries bythe end of last year, and 70per cent by the middle ofthis year. The UN chief said
that nations must preparefor the next pandemicthrough common sense investments in monitoring,early detection and rapidresponse plans in everycountry and by strengthening the authority of theWHO.
Guterres emphasised theneed for pharmaceuticalcompanies to stand in solidarity with developing countries by sharing licences,knowhow and technologyso “we can all fi�nd a way outof this pandemic”.
He said that in situationswhere compensation maybe warranted, “we don’twant to have any pharmaceutical company in fi�nancial diffi�culties” or are notable to invest, in those situ
ations developed countriesshould explore ways toprovide the necessary fi�nancial support.
Guterres further said thatthe global fi�nancial systemneeds to be reformed so itworks for all countrieswithout being biased, because at this critical moment in time “we are setting in stone a lopsidedrecovery”.
“The global fi�nancial system has failed them whenthey need it most. Andglobal solidarity is missingin action… We need aglobal fi�nancial system thatis fi�tforpurpose. Thismeans urgent debt restructuring and reforms of thelongterm debt architecture,” he said.
‘Failure to vaccinate all will give rise to new variants’
UN Secretary General
Antonio Guterres
Vaccination rates in high-income countries
higher than African states, laments UN chief
PRESS TRUST OF INDIA
Kolkata, January 18
Blanket approaches such ascomplete restriction on themovement of people and travelbans could be counterproductive in containing Covid in acountry like India, said WHO’sIndia representative, RodericoH Ofrin, while advocating target, riskbased strategies tocounter the pandemic.
Key questionsStressing on the need to protectboth lives and livelihoods, hesaid public health action in India and across the world mustbe continually guided by evidence from four key questions –how transmissible is the variant, severity of the disease itcauses, how well vaccines andprior SARSCoV2 infection protect, and how common peopleperceive risk and follow controlmeasures. “WHO does not recommend a blanket travel ban,
nor complete restriction ofpeople’s movement. In manyways, such blanket approachescould be counterproductive.India with its diversity in population distribution and geographic spread, the riskbasedapproach remains the wiserpublic health practice tocounter a pandemic,” saidOfrin.
Depending on the epidemiological situation, availablepublic health capacities and social and economic context, governments should tailor theirmeasures to prevent and control the transmission, said theDelhibased offi�cial as an Omicrondriven surge pushed India’s Covid tally to 3,76,18,271 onTuesday.
‘India should adopt risk-basedapproach to contain Covid-19’ Blanket measures
are likely to be
counterproductive:
WHO India head
FORUM GANDHI
DEBANGANA GHOSH
Mumbai, January 18
Ahead of DigiYatra Scheme’sfi�rst phase of launch, scheduledat Varanasi, Pune, Kolkata andVijayawada airports in March,the Internet Freedom Foundation (IFF), on Tuesday, said privacy risks are likely to occur dueto features such as facial recognition for checkins and data recall.
The digital rights advocacygroup also mentioned that thismight lead to passenger’s databeing commercialised by thegovernment.
The Ministry of Civil Aviation’s DigiYatra Scheme wasfi�rst launched in June 2017 toimprove passengers’ airport experience by making it paperlessand digitised. This digital framework planned involves digitising existing manual processes, enhancing securitystandards, and ultimatelyrolling out the Digi Yatra system, which requires passenger’sdigital ID backed by documentssuch as Aadhaar, passport andothers, enabling seamless travel
experience. The scheme willthen facilitate digital processing of passengers at airports through facial recognition, which, as according to itswebsite, will be required forentry point check, securitycheck, aircraft boarding, selfbag drop, checkin and datarecall.
IFF argued that in the absenceof any personal data protectionlaws and data storage framework, which is still in the making, providing such data wouldleave passengers vulnerable todata misuse and other risks.
Data-protection laws“The policy states that the airports using the DigiYatra Bio
metric Boarding System (BBS)will conform and adhere to thedata protection laws as applicable and mandated by the Government of India; however, India does not have any specifi�claw on data protection,” said IFFin a blog post.
Further, the DigiYatra policyuses references to standard privacy principles such as lawfulness of processing, data minimisation, accuracy, and storagelimitation, among others, butadded that “BBS shall have anability to change the data purgesettings based on security requirements on a need basis”and “any security agency, BOI orother govt agency may be givenaccess to passenger data basedon the current/ existing protocols prevalent at that time”.
“While the scheme is optin, itdoes not mean that the peopleopting in are ready to tradetheir privacy for convenience,”IFF added.
Emails sent to the Ministry ofCivil Aviation and Bureau ofCivil Aviation Security went unanswered at the time ofpublication.
DigiYatra Scheme for airports mayencounter privacy issues, says IFF
Up in the air
A child plays with a red scarf near a decoration for the Beijing Winter Olympics on Tiananmen Square in Beijing on Tuesday.
China has locked down parts of Beijing's Haidian district following the detection of three Covid cases, just weeks before the
city is to host the Winter Olympic Games AP
PRESS TRUST OF INDIA
Jerusalem, January 18
A fourth dose of Covid vaccineboosts antibodies to higherlevels than the third jab, butprovides only partial protection against the Omicron variant, according to a preliminarystudy conducted in Israel.
The yettobe peerreviewedstudy tested the effi�cacy andsafety of vaccines and analysedwhether the combination ofvaccines from diff�erent manufacturers would aff�ect the rateof increase of antibodies.
The researchers from ShebaMedical Center in Israel gavesecond booster shots in a trialto its staff�, and studied the effect of the Pfi�zer booster in 154people after two weeks and theModerna booster in 120 peopleafter one week.
Preliminary results indicatethat one week after the administration of a fourth dose ofModerna vaccine, the rate ofantibodies increased similarlyto that found one week afterthe administration of a fourthdose of Pfi�zer.
Fourth vaccine ispartially effectiveagainst Omicron,shows Israeli study PALAK SHAH
Mumbai, January 18
What is it all about?Frontrunning is when a person, mainly a broker or advisor, takes a buy or sell position in any stock based onexclusive knowledge thatthe recommendations being issued by them will certainly lead to price variationin the particular stock in thenear future.
How does it work?Stock market operators give‘buy or sell’ recommendations in closed or privategroups that have a highersubscriber base.
Most of such recommendations are given on stockswhere the liquidity is lessand even a small amount ofbuying or selling can impact share prices.
Multiple groups areformed on Whatsapp, whichfurther spread theserecommendations.
Why is it in the news
now?In December, 2021, SEBI conducted multiple raids inAhmedabad and other partsof Gujarat and caught thoserunning Telegram channel‘Bullrun 2017.’ It had 52,000subscribers and SEBI foundthat the operationswho wererunningthis channel fi�rst took positions in the counter they recommended to their subscribers. Also, the foundersof Bullrun 2017 were not registered with SEBI, which isnecessary for investmentadvisors.
Who can legallygive stock tips?Giving investment advice in‘closed groups’ on social media by those who are not registered with SEBI is considered illegal as perinvestment advisor rules.Still, talking about macroideas and stock market patterns or giving ideas onwide public platforms like
television channels, onlineor newspapers is allowed.But rules prohibit peoplefrom giving specifi�c stocktips on ‘closed groups,’which are accessible only tolimited members or workon subscription models.
In anycase, thosegivingstock tips
even on television channelscannot indulge in frontrunning. Unless Registeredwith SEBI, a person cannotportray himself as an investment advisor. However, anyinvestment advice giventhrough any electronic orbroadcasting or telecommunications medium,which is widely available tothe public will not be considered as investment advice under applicable SEBIRegulations.
General market comments in good faith in regard to trends or economicsituations, which do notspecify stock tips or investment products are exempt
from SEBI rules. Also,brokers, distributors of mutual funds, fund managersand other SEBI registered intermediaries are exemptfrom investment advisornorms.
What is the differencebetween frontrunningand insider trading?There is a thin red line thatdivides the two. Insider trading is when a person, whofi�ts in the defi�nition of acompany insider as per SEBIrules, buys and sells stocksbased on unpublished pricesensitive information(USPI). Anybody from a company promoter, management offi�cials, accountantsor even key clients of thecompany fall under thedefi�nition of SEBI’s insidertrading rules.
When they use the UPSI,which is available to themby the virtue of their position or closeness to the company, to trade, they are saidto have indulged ininsider trading.
What is frontrunning in stock markets?
PRESS TRUST OF INDIA
Pune, January 17
The Maharashtra government, on Monday, issued aletter to the district, civicadministrations and healthdepartments in the Stateasking them to use oral antiviral drug molnupiravir fortreatment of symptomatic,adult Covid patients with“abundant caution and incertain conditions”.
Dr Pradeep Vyas, Additional Chief Secretary(Health), in the letter, requested district and civicauthorities to use the drugwith “abundant cautionand in certain conditionsand in full advised dose”.
He said this drug has received emergency use authorisation (from the DrugController General of India)and based on the opinion ofsome experts it has alsobeen included in treatment
protocol circulated on January 6 in the State, subject tocertain conditions.
“Subsequently, certain
State governments likeOdisha have withdrawn thisdrug from the market. ICMRhas also not recommendedits use in the treatment ofSARSCoV2 infection (whichcauses Covid).
Molnupiravir has notbeen included in the Standard Treatment Protocol released by the Governmentof India on January 17,” saidDr Vyas in the letter.
‘Not FDA approval’Molnupiravir has beenshown to reduce hospitalisation in a clinical trial andthus has received emergencyuse authorisation,not an FDA approval, the letter stated.
“Till further clarity is received, you are requested toplease use molnupiravirwith abundant caution andin certain conditions andthat also in full advised
dose,” the senior bureaucratstated.
The lettercum advisorysaid the drug may be “prescribed for the treatment ofCovid in patients who havemild illness not requiringoxygen, one or more riskfactors that will cause hospitalisation and impendingsevere disease, in whomthere are no other optionsavailable, where there areno contraindications to theuse of molnupiravir and inthe fi�rst fi�ve days of theillness”.
Patients under 18However, patients under theage of 18 and pregnant women should not be giventhis drug, it maintained.
Besides district and civicheads and health departments, the letter has beenmarked to district civil surgeons and health offi�cers.
‘Molnupiravir must be used with caution’
WXMolnupiravir has not
been included in the
Standard Treatment
Protocol released by the
Government of India on
January 17, said
Pradeep Vyas, Additional
Chief Secretary (Health),
Maharashtra government
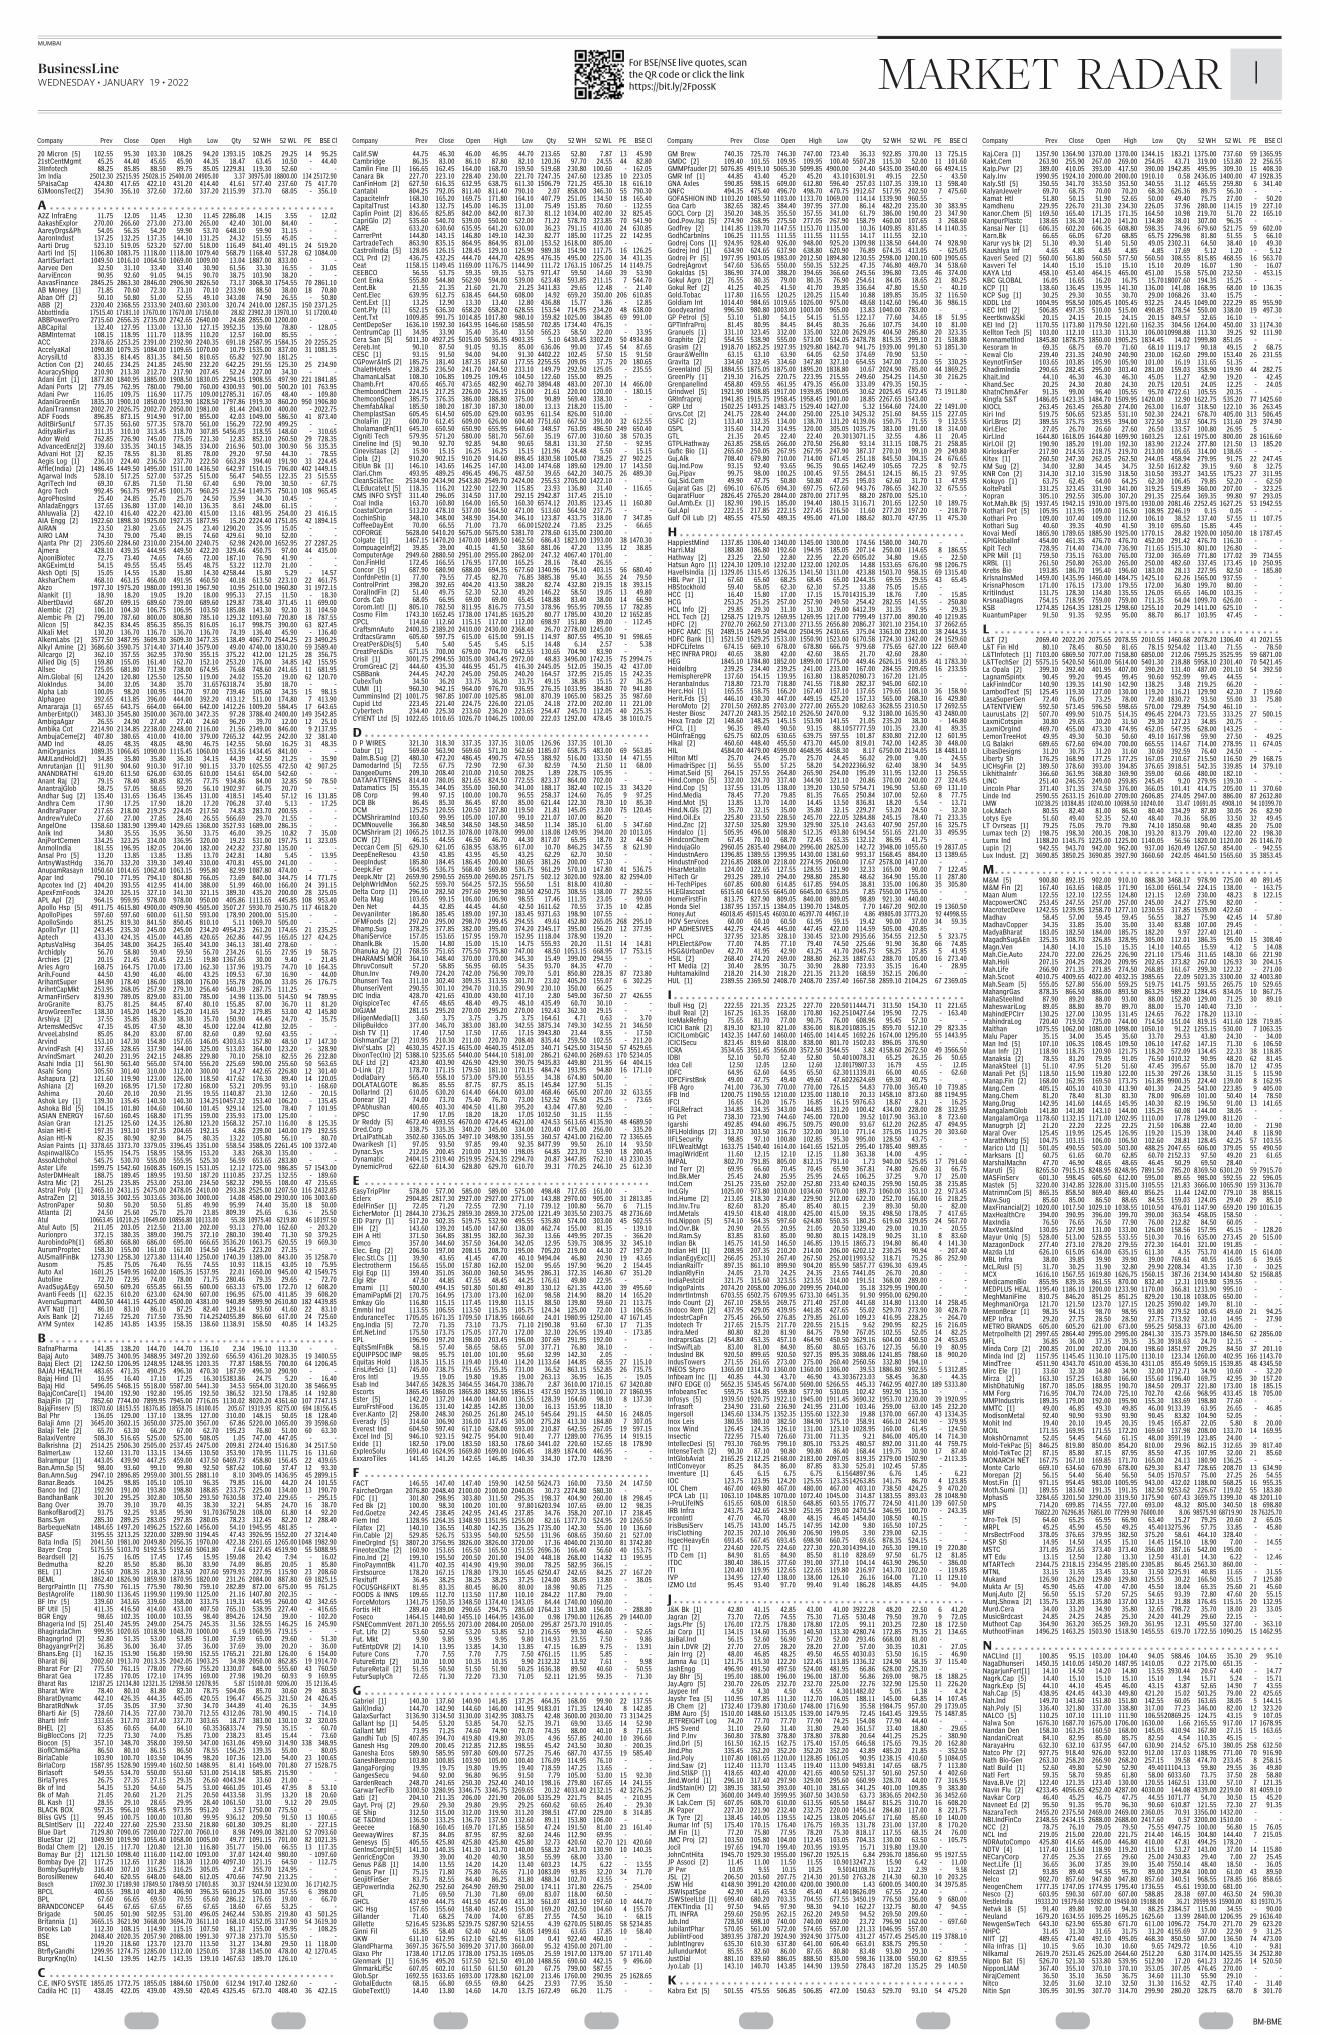
................BM-BMECMYK
Company Prev Close Open High Low Qty 52 WH 52 WL PE BSE Cl Company Prev Close Open High Low Qty 52 WH 52 WL PE BSE Cl Company Prev Close Open High Low Qty 52 WH 52 WL PE BSE Cl Company Prev Close Open High Low Qty 52 WH 52 WL PE BSE Cl
Kaj.Cera [1] 1357.90 1364.90 1370.00 1370.00 1344.15 183.21 1375.00 737.60 59 1365.95Kakt.Cem 263.90 255.90 267.00 269.00 254.05 43.71 319.00 153.80 22 256.55Kalp.Pwr [2] 389.00 410.05 393.00 417.50 390.00 1942.85 495.95 309.30 15 408.30Kaly.Inv 1990.95 1924.10 2000.00 2000.00 1910.10 0.58 2436.05 1400.00 47 1928.35Kaly.Stl [5] 350.55 341.70 353.50 353.50 340.55 31.12 465.55 259.80 6 341.40KalyanJewelr 69.70 68.75 70.00 70.20 68.30 626.36 89.75 56.30 - - Kamat Htl 51.80 50.15 51.90 52.65 50.00 49.40 75.75 27.00 - 50.20Kamdhenu 229.95 226.70 231.30 234.30 226.05 37.96 280.00 114.15 19 227.10Kanor.Chem [5] 169.50 165.40 171.35 171.35 164.50 10.98 219.70 51.70 22 165.10KanpurPlastc 138.65 136.30 141.20 141.20 134.80 38.01 307.00 96.35 - - Kansai Ner [1] 606.35 602.20 606.35 608.80 598.35 74.96 679.60 521.75 59 602.00Karn.Bk 66.65 66.05 67.20 68.85 65.75 2296.98 81.80 51.55 5 66.10Karur vys bk [2] 51.30 49.30 51.40 51.50 49.05 2302.31 64.50 38.40 10 49.30Kaushlya Inf 4.65 4.85 4.85 4.85 4.85 17.69 5.12 1.20 - 5.12Kaveri Seed [2] 560.00 563.80 560.50 577.50 560.50 308.55 815.85 468.55 16 563.70Kavveri Tel 14.40 15.10 15.10 15.10 15.10 20.09 16.07 1.90 - 16.07KAYA Ltd 458.10 453.40 464.15 465.00 451.00 15.58 575.00 232.50 - 453.15KBC GLOBAL 16.05 16.65 16.20 16.75 15.7018007.60 194.35 15.25 - - KCP [1] 138.60 136.45 139.95 141.30 136.00 141.08 168.95 68.00 10 136.35KCP Sug [1] 30.25 29.30 30.55 30.70 29.00 1068.26 33.40 15.75 - - KDDL Ltd 1004.95 958.50 1005.45 1005.45 932.25 24.45 1049.00 222.29 85 955.90KEC Intl [2] 506.85 497.35 510.00 515.00 490.85 178.54 550.00 338.00 19 497.30Keertknw&Skl 20.15 24.15 20.15 24.15 20.15 849.57 32.65 16.10 - - KEI Ind [2] 1170.55 1173.80 1179.50 1221.60 1162.35 304.56 1264.00 450.00 33 1174.30Kellton Tech [5] 103.00 112.10 113.30 113.30 106.0010998.88 113.30 39.25 92 111.90KennametlInd 1845.80 1878.75 1850.00 1905.25 1834.45 14.02 1999.80 851.05 - - Kesoram In 69.35 68.75 69.70 71.60 68.10 1119.17 90.18 49.15 2 68.75Kewal Clo 239.40 231.35 240.90 240.90 230.00 162.60 299.00 153.40 26 231.55KeynotFinSer 103.65 103.85 105.90 105.90 101.00 16.19 131.65 51.35 - - KhadimIndia 290.65 282.45 295.00 303.40 281.00 159.03 358.90 119.90 44 282.75Khait.Ind 44.10 46.30 46.30 46.30 45.05 11.27 42.90 19.20 - 42.45Khand.Sec 20.25 24.30 20.80 24.30 20.75 120.51 24.05 12.25 - 24.05KhatnChm&Fer 91.35 99.00 96.40 105.55 95.70 4722.61 105.55 20.35 - - Kingfa S&T 1486.05 1423.35 1484.70 1509.95 1420.00 12.90 1622.75 535.20 77 1425.60KIOCL 263.45 263.45 265.80 274.00 263.00 116.07 318.50 122.10 36 263.45Kiri Ind 519.75 506.65 523.85 531.10 502.30 224.21 678.70 405.00 313 506.45Kirl.Bros [2] 389.55 375.75 393.95 394.00 372.50 30.57 504.75 131.60 29 374.90Kirl.Elec 27.05 26.70 26.60 27.60 26.50 133.57 100.80 26.95 5 - Kirl.Ind 1644.80 1618.05 1644.80 1699.90 1603.25 12.61 1975.00 800.00 28 1616.60Kirl.Oil [2] 190.90 185.20 191.00 192.30 183.90 212.24 277.80 121.50 13 185.20KirloskarFer 217.90 214.55 218.75 219.70 213.00 105.65 314.00 138.65 - - Kitex [1] 260.50 247.30 262.05 262.50 244.05 458.94 279.95 91.75 22 247.45KM Sug [2] 34.00 32.80 34.45 34.75 32.50 1612.82 39.15 9.60 8 32.75KNR Con [2] 314.30 312.10 315.90 318.50 310.50 393.27 343.55 175.23 27 311.95Kokuyo [1] 63.75 62.45 64.00 64.25 62.30 106.45 79.85 52.20 - 62.50KoltePatil 331.25 323.45 331.90 341.00 319.25 519.89 360.00 207.00 - 323.25Kopran 305.10 292.55 305.00 307.20 291.35 225.64 369.35 99.80 97 293.05Kot.Mah.Bk [5] 1937.45 1942.15 1930.00 1975.00 1930.00 2081.46 2252.45 1627.25 53 1942.55Kothari Pet [5] 105.95 113.95 109.00 116.50 108.95 2246.19 0.15 0.05 - - Kothari Pro 109.00 107.40 109.00 112.00 106.10 38.52 137.40 57.55 11 107.75Kothari Sug 40.60 39.35 40.90 41.50 39.10 695.60 15.85 4.45 - - Kovai Medi 1865.90 1789.65 1885.90 1925.00 1770.15 28.82 1920.00 1050.00 18 1787.45KPIGlobalInf 454.00 461.35 476.70 476.70 452.00 291.42 476.70 116.30 - - Kpit Tech 728.95 714.40 734.00 736.90 711.65 1515.30 801.00 126.80 - - KPR Mill [1] 759.50 735.15 763.00 765.00 732.00 365.69 771.80 177.02 39 734.55KRBL [1] 261.50 250.80 263.00 265.00 250.00 482.60 337.45 173.45 10 250.95Krebs Bio 193.85 186.70 195.40 196.60 183.00 28.13 227.95 82.50 - 185.80KrisnaInsMed 1459.00 1435.95 1460.00 1484.75 1425.10 62.26 1565.00 937.55 - - KrisnaPhoscm 171.00 176.15 173.00 179.55 172.00 36.80 199.70 80.00 - - KritiIndust 131.75 128.30 134.80 135.55 126.05 65.65 146.00 103.35 - - KrsnaaDiagns 754.15 718.95 759.00 759.00 711.35 64.04 1099.70 626.00 - - KSB 1274.85 1264.35 1281.25 1298.60 1255.10 20.29 1411.00 625.10 - - KuantumPaper 91.50 91.35 92.95 95.00 88.70 86.17 103.95 47.45 - -
L . . . . . . . . . . . . . . . . . . . . . . . . . . . . . . . . . . . . . . . . . . . . . . . .L&T [2] 2069.40 2022.20 2075.65 2078.55 2010.55 1460.68 2078.20 1306.40 41 2021.55L&T Fin Hld 80.10 78.45 80.50 81.65 78.15 9254.02 113.40 71.55 - 78.50L&TInfotech [1] 7103.00 6869.50 7077.00 7158.80 6850.00 212.06 7595.25 3525.95 59 6871.00L&TTechSer [2] 5575.15 5420.50 5610.00 5614.00 5401.30 218.88 5958.10 2301.40 70 5421.45La Opala [2] 399.30 392.40 401.95 407.00 390.20 131.40 487.00 201.10 54 392.50LagnamSpintx 90.45 99.20 99.45 99.45 90.60 952.99 99.45 44.55 - - LakFinIndCor 140.90 139.35 141.90 142.90 138.25 3.48 219.25 66.20 - - LambodText [5] 125.45 119.30 127.00 130.00 119.20 116.21 129.90 42.30 7 119.60LasaSuperGen 72.40 76.05 73.25 78.00 72.40 1830.72 93.50 55.00 33 75.80LATENTVIEW 592.50 573.45 596.50 598.65 570.00 729.89 754.90 461.10 - - LaurusLabs [2] 507.70 499.90 510.75 514.35 496.45 2204.73 723.55 333.25 27 500.15LaxmiCotspin 30.80 29.65 30.20 31.50 29.30 127.23 34.85 20.75 - - LaxmiOrgInd 469.70 455.00 473.30 474.95 452.05 547.95 628.00 143.25 - - LemonTreeHot 49.95 49.30 50.30 50.60 49.10 1617.98 59.90 27.50 - 49.25LG Balakri 689.65 672.60 694.00 700.00 665.55 114.67 714.00 278.95 11 674.05LibasDesigns 31.20 30.75 31.20 31.60 30.60 392.59 76.40 24.50 - - Liberty Sh 176.25 168.90 177.25 177.25 167.05 210.67 215.50 116.50 29 168.75LICHsgFin [2] 389.50 378.60 393.00 394.85 376.65 3918.51 542.35 339.85 14 379.10LikhithaInfr 366.60 363.95 368.80 369.90 359.00 60.66 480.00 182.10 - - LINC 251.40 246.55 249.00 259.85 245.45 9.20 279.95 139.30 - - Lincoln Phar 371.40 371.35 374.50 376.00 366.05 101.41 414.75 205.00 11 370.60Linde Ind 2590.55 2633.15 2610.00 2709.00 2606.85 274.05 2947.00 886.00 87 2632.80LMW 10238.25 10384.85 10240.00 10698.50 10240.00 33.47 10691.05 4908.10 94 10399.70Lok.Mach 80.55 82.40 81.00 86.50 80.40 334.29 87.80 30.05 26 82.90Lotys Eye 51.60 49.40 52.35 52.40 48.40 70.36 58.05 33.50 32 49.45LT Ovrseas [1] 79.25 75.05 79.70 79.80 74.10 1850.68 90.40 48.85 20 75.00Lumax tech [2] 198.75 198.30 200.35 208.30 193.20 813.79 209.40 122.00 22 198.30Lumx Ind 1188.20 1145.75 1225.00 1225.00 1140.05 56.56 1820.00 1120.00 26 1146.70Lupin [2] 942.55 943.70 942.00 962.00 937.00 1620.49 1267.50 854.00 - 942.55Lux Indust. [2] 3690.85 3850.25 3690.85 3927.90 3660.60 242.05 4641.50 1565.60 35 3853.45
M. . . . . . . . . . . . . . . . . . . . . . . . . . . . . . . . . . . . . . . . . . . . . . . .M&M [5] 900.80 892.15 902.00 910.10 888.30 3468.17 978.90 725.00 40 891.45M&M Fin [2] 167.40 163.65 168.05 171.90 163.00 6561.54 224.15 138.00 - 163.75Maan Alum 122.55 122.10 122.55 124.80 121.15 12.69 230.00 48.23 8 122.15MacpowerCNC 253.45 247.55 257.00 257.00 245.00 24.27 275.90 82.00 - - MacrotecDeve 1242.55 1239.95 1258.70 1277.10 1230.55 317.85 1539.00 422.60 - - Madhav 58.45 57.00 59.45 59.45 56.55 38.27 75.90 42.45 14 57.80MadhavCopper 34.35 33.85 35.00 35.00 33.40 83.88 107.00 29.45 - - MadyaBharat 183.05 182.50 184.00 185.75 182.20 9.97 227.40 121.40 - - MagadhSug&En 325.35 308.70 326.85 328.95 305.00 112.01 386.35 95.00 15 308.40Magn.Ven 14.80 14.10 15.10 15.35 14.10 140.65 15.59 4.12 5 14.08Mah.Cie.Auto 224.70 222.00 226.25 226.90 221.10 175.46 311.65 148.30 66 221.90Mah.Holi 207.15 204.25 208.20 209.95 202.65 373.82 267.00 126.93 30 204.15Mah.Life 266.90 271.35 271.85 274.50 268.85 161.67 299.30 122.32 - 271.00Mah.Scoot 4010.75 4009.65 4022.00 4032.35 3985.65 22.09 5023.35 3300.00 32 4003.80Mah.Seam [5] 555.05 527.80 556.00 559.25 519.75 141.75 593.55 265.75 10 529.65MahangrGas 878.35 866.50 886.00 893.50 863.25 989.22 1284.45 834.05 10 867.75MahaSteelInd 87.90 89.20 88.00 93.00 88.00 152.80 129.00 71.25 30 89.10MaheswariLog 89.05 88.80 89.70 89.70 88.00 15.70 140.40 73.30 - - MahindEPCIrr 130.25 127.00 130.95 131.45 124.65 76.22 178.20 113.10 - - MahindraLog 720.40 719.50 725.00 744.00 714.50 151.04 819.15 411.60 128 719.85Maithan 1075.55 1062.00 1080.00 1098.00 1050.10 91.22 1255.15 530.00 7 1063.35Malu Paper 35.15 34.00 35.45 35.60 33.70 29.53 43.80 24.30 - 34.00Man Ind [5] 107.10 106.35 108.45 109.50 106.10 147.62 147.15 71.30 6 106.50Man Infr [2] 118.90 118.75 120.90 121.75 118.20 572.09 134.45 22.33 38 118.85Manaksia [2] 78.55 81.20 79.05 91.05 76.50 1010.32 90.95 48.20 62 81.45ManakSteel [1] 51.10 47.95 51.20 51.60 47.45 395.67 55.00 18.70 12 47.95Manali Pet [5] 118.50 115.90 119.80 122.00 115.30 297.26 138.50 31.15 5 115.90Manap.Fin [2] 168.00 162.95 169.50 173.75 161.85 9900.35 224.40 139.00 8 162.95Mang.Cem 405.15 405.10 410.30 413.90 401.30 24.25 543.00 223.85 9 405.00Mang.Chem 81.20 78.40 81.30 83.30 78.00 906.69 101.00 50.40 14 78.50Mang.Drug 142.95 141.60 144.65 145.95 140.30 82.19 196.50 91.00 13 141.65MangalamGlob 141.80 141.80 143.10 144.00 135.25 60.08 144.00 38.05 - - MangalamOrga 1178.60 1132.15 1171.00 1202.95 1110.00 17.78 1299.00 811.20 - - Manugrph [2] 21.20 22.20 22.25 22.25 21.50 106.88 22.40 10.00 - 21.90Maral Over 125.45 119.95 125.45 126.95 119.20 115.39 138.00 24.40 8 118.90MarathNxtg [5] 104.75 103.15 106.00 106.50 102.60 28.81 128.45 42.25 57 103.55Marico Ltd [1] 501.05 490.55 503.00 503.00 488.25 2047.65 606.00 379.05 55 490.50Marksans [1] 60.75 61.65 60.70 62.85 60.70 2152.33 97.50 49.20 23 61.65MarshalMachn 47.70 46.90 48.65 48.65 46.45 50.29 69.50 28.40 - - Maruti [5] 8265.50 7915.15 8248.95 8248.95 7891.50 785.20 8369.50 6301.20 59 7915.70MASFinServ 601.30 598.45 605.60 612.00 595.00 89.65 985.00 592.55 22 596.05Mastek [5] 3220.00 3142.85 3228.00 3315.00 3105.55 121.83 3666.00 1065.90 159 3136.70MatrimnCom [5] 865.35 858.50 869.40 869.40 856.25 11.44 1242.00 779.10 38 858.15Maw.Sug 85.60 85.00 86.50 88.65 84.55 159.03 124.05 29.40 29 85.10MaxFinancial[2] 1020.00 1017.50 1029.10 1038.55 1010.50 476.01 1147.90 659.20 190 1016.35MaxHealthCre 394.00 390.95 396.00 399.70 390.00 363.54 458.05 158.50 - - MaxIndia 76.50 76.65 76.50 77.90 76.00 212.82 84.50 60.05 - - MaxVent&Ind 130.05 127.90 131.00 133.00 126.00 158.56 157.95 45.15 - 128.20Mayur Uniq [5] 528.00 513.00 528.55 533.55 510.30 70.16 635.00 273.45 20 515.00MazagonDock 277.40 273.10 278.20 279.55 272.30 164.01 321.00 191.85 - - Mazda Ltd 626.10 615.05 634.00 635.15 611.30 4.35 753.70 414.00 15 614.00MBL Infra 38.00 39.85 39.90 39.90 39.00 769.61 40.55 16.05 6 39.65McL.Rusl [5] 31.70 30.25 31.90 32.80 29.90 2208.34 43.35 17.30 - 30.25MCX 1616.10 1567.55 1619.80 1626.75 1560.15 387.36 2134.90 1434.80 52 1568.85MedicamenBio 855.95 839.35 861.55 870.00 832.40 12.31 1019.80 539.55 - - MEDPLUS HEAL 1195.40 1186.10 1200.00 1233.90 1170.00 366.81 1233.90 995.10 - - MeghManiFine 810.75 846.20 851.25 851.25 829.20 130.18 1038.05 650.00 - - MeghmaniOrga 121.70 121.50 123.70 127.15 120.25 3590.02 149.70 81.10 - - MenonBear [1] 98.35 94.15 98.70 98.95 93.80 279.52 100.45 49.60 21 94.25MEP Infra 29.20 27.75 28.50 28.50 27.75 713.92 32.10 14.95 - 27.90METRO BRANDS 605.00 605.20 621.00 673.00 595.25 5058.33 673.00 426.00 - - Metrpolhelth [2] 2997.65 2864.40 2995.00 2995.00 2841.30 335.73 3579.00 1846.50 62 2856.00MFL 36.85 36.00 37.35 39.35 35.30 3918.63 24.70 12.15 - - Minda Corp [2] 200.85 201.00 202.00 204.00 198.60 1851.97 209.25 84.50 37 201.10Minda Ind [2] 1157.95 1145.45 1130.10 1175.00 1130.10 123.34 1260.00 402.95 166 1143.70MindTree 4511.90 4343.70 4510.00 4536.30 4311.05 855.49 5059.15 1539.85 48 4345.50Mirc Ele [1] 33.60 32.30 34.80 34.90 32.00 1712.71 34.90 10.60 - 32.20Mirza [2] 163.30 157.25 163.80 166.60 155.60 1196.40 169.75 42.95 30 157.20MishDhatuNig 187.70 185.05 188.95 190.70 184.50 209.37 221.80 173.00 18 185.15MM Forg 716.95 704.70 724.00 725.10 702.70 42.66 968.95 433.45 18 705.00MMPIndustris 189.35 179.00 192.00 195.90 155.30 183.69 198.80 77.60 - - MMTC [1] 49.00 46.85 49.30 49.85 46.00 9133.39 63.95 26.65 - 46.85ModisonMetal 92.40 90.90 93.90 93.90 90.45 83.82 104.90 52.05 - - Mohit Ind 19.40 20.10 19.45 20.35 19.45 165.87 22.05 5.80 8 20.00MOIL 171.55 169.95 171.55 172.20 169.60 137.98 208.00 133.70 14 169.95MokshOrnamnt 52.05 54.45 54.60 61.15 48.00 3591.19 123.85 24.00 - - Mold-TekPac [5] 846.25 819.80 850.00 854.20 810.00 29.96 862.15 312.65 39 817.40Mold-TekTec [2] 87.15 85.80 87.15 87.95 85.50 47.35 107.95 32.00 21 85.60MONARCH NET 167.75 167.10 169.85 171.70 165.00 24.13 180.90 136.25 - - Monte Carlo 669.10 634.60 670.90 678.00 629.30 83.47 728.65 208.70 13 634.90Morepan [2] 56.15 54.40 56.40 56.50 54.05 1570.57 75.00 27.25 26 54.55Most.Fin [1] 971.15 954.45 983.00 1005.95 943.00 432.02 1188.00 568.25 16 955.35Moth.Sumi [1] 189.55 183.60 191.35 191.35 182.50 9253.62 226.67 119.02 55 183.80MphasiS 3284.65 3201.50 3290.00 3319.50 3175.90 607.43 3659.75 1399.30 48 3201.10MPS 714.20 699.85 714.55 727.00 693.00 48.32 805.00 340.50 18 698.80MRF 76822.20 76296.85 76851.00 77299.90 76000.00 8.06 98575.90 68719.90 28 76325.70Mro-Tek [5] 64.60 65.25 65.95 66.90 63.40 15.27 79.25 20.60 2 65.05MRPL 45.25 45.90 45.50 49.25 45.4013275.96 57.75 33.85 - 45.80MrsBectrFood 378.05 376.65 379.95 382.50 375.20 58.61 464.10 328.40 - - MSP Stl 14.95 14.50 14.95 15.10 14.45 1154.10 18.90 7.00 - 14.55MSTC 371.05 357.65 373.40 373.40 356.00 387.16 542.00 195.00 - - MT Edu 13.15 12.50 12.80 13.30 12.50 431.01 14.30 6.22 - 12.46MTARTech 2344.75 2318.15 2354.95 2385.00 2305.85 86.45 2563.30 860.00 - - MTNL 33.15 31.55 33.45 33.50 31.50 3225.91 40.85 11.65 - 31.55Mukand 126.90 126.20 129.80 129.80 125.55 30.22 166.50 55.15 7 125.80Mukta Ar [5] 45.90 45.65 47.00 47.00 45.50 18.04 65.35 25.60 21 45.60Munj.Auto [2] 56.50 55.15 57.20 57.25 54.65 93.39 72.80 47.60 20 55.15Munj.Showa [2] 135.75 132.85 135.80 137.00 132.15 21.88 176.45 115.15 20 132.95Murd.Cera 34.00 33.20 34.90 35.80 32.65 798.72 35.70 18.00 23 33.05MusicBrdcast 24.85 24.25 24.85 25.30 24.20 441.29 29.60 22.15 - - Muthoot Cap 364.90 363.20 365.25 369.20 361.95 12.31 495.50 327.00 - 363.10MuthootFinan 1496.25 1463.25 1503.90 1518.90 1455.55 619.70 1722.55 1090.25 15 1462.95
N . . . . . . . . . . . . . . . . . . . . . . . . . . . . . . . . . . . . . . . . . . . . . . . .NACLInd [1] 100.85 95.15 103.00 104.40 94.05 588.46 104.65 35.30 29 95.10NagaDhunseri 1450.35 1410.05 1450.20 1487.95 1410.05 0.22 2175.00 651.35 - - NagarjunFert[1] 14.10 14.50 14.20 14.80 13.55 3930.44 20.67 4.40 - 14.77Nagrk.Cap [5] 14.40 15.10 15.10 15.10 15.10 1.94 15.71 5.24 - 15.71Nagrk.Exp [5] 44.10 44.10 45.45 46.00 43.15 43.87 52.65 14.90 7 43.55Nah.Cap [5] 438.95 424.45 443.30 449.80 421.20 15.02 503.25 79.00 22 425.65Nah.Ind 149.70 143.60 151.80 151.80 142.55 60.05 163.65 38.05 5 144.15Nah.Poly [5] 336.40 321.80 337.00 338.80 317.00 77.23 346.00 82.00 12 323.20NALCO [5] 110.25 107.10 111.10 111.90 106.5520869.25 124.75 43.15 9 107.05Nalwa Son 1676.30 1687.70 1675.00 1706.00 1630.00 1.66 2165.55 917.00 17 1678.95Nandan Den 158.30 163.25 160.50 168.00 145.05 410.94 167.80 27.15 15 163.65NandaniCreat 84.10 82.95 85.00 85.75 82.50 4.54 110.35 45.15 - - NarayaHru 632.30 632.10 637.95 647.00 630.90 214.52 675.10 380.05 258 632.50Natco Phr [2] 927.75 918.40 926.00 932.00 912.00 137.03 1188.95 771.00 70 916.90Nath Bio-Gen 263.30 258.20 266.90 268.20 257.15 39.58 474.70 233.45 8 258.15Natl Build [1] 52.60 49.80 52.90 52.90 49.4011104.13 59.80 29.55 36 49.80Natl Fert 59.35 58.70 59.85 61.80 58.00 6033.60 73.75 37.50 28 58.80Nava.B.Ve [2] 122.40 121.35 123.40 130.00 120.55 1462.51 133.00 57.10 7 121.35Navin Flu [2] 4233.45 4056.65 4252.00 4287.00 4030.00 144.08 4339.00 2219.00 81 4059.10Navkar Corp 46.40 45.25 46.75 47.75 44.55 1071.77 54.70 30.50 15 45.20Navneet Ed [2] 95.50 91.35 95.70 96.30 90.60 610.87 121.55 72.30 27 91.35NazaraTech 2455.20 2375.50 2469.00 2469.00 2360.05 70.91 3356.00 1432.00 - - NBI.IndFinCo 2348.55 2434.15 2688.00 2688.00 2417.60 0.57 3200.00 1510.00 - - NCC [2] 78.75 76.10 79.05 79.50 75.55 4947.75 100.00 56.80 15 76.05NCL Ind 219.05 215.00 220.00 221.75 214.40 146.15 304.80 144.40 7 215.05NDRAutoCompo 425.80 414.65 445.00 446.80 410.00 47.81 494.25 178.20 - - NDTV [4] 117.40 115.60 118.90 119.20 115.10 53.27 143.00 37.00 14 115.80NECaryCorp 27.05 25.35 27.65 29.60 25.00 2430.83 29.40 7.00 22 25.45Nect.Life [1] 36.65 36.00 37.85 39.00 35.40 7550.14 48.40 18.50 - 36.05Nelcast [2] 93.85 89.40 94.55 95.70 89.00 329.84 100.00 61.00 43 89.50Nelco 902.70 857.60 947.80 947.80 857.60 340.51 968.55 178.85 166 858.65NeogenChem 1777.35 1747.05 1774.95 1795.40 1736.55 45.61 1930.00 681.00 - - Nesco [2] 603.95 590.30 607.00 607.00 588.85 28.38 697.00 463.50 24 590.30NestleIndia 19333.20 19379.60 19282.00 19450.00 19188.00 36.21 20599.95 15900.00 83 19370.75Netwk 18 [5] 91.40 89.80 92.00 94.30 88.25 2384.57 115.00 34.55 - 90.00Neuland 1679.20 1634.55 1695.25 1695.25 1625.60 13.99 2840.00 1206.95 29 1636.40NewgenSwTech 643.30 623.90 655.80 671.70 611.00 1096.72 754.70 271.70 29 623.20NHPC 31.45 31.30 31.65 31.75 31.20 4155.69 37.00 22.90 9 31.25NIIT [2] 489.65 473.40 492.10 495.05 468.30 850.50 507.00 136.50 74 473.00Nila Infras [1] 10.15 9.65 10.30 10.60 9.65 7429.72 10.56 4.10 - 9.81Nilkamal 2619.70 2531.45 2625.00 2644.60 2512.20 6.80 3174.00 1425.55 34 2532.80Nippo Bat [5] 526.70 521.30 533.80 539.95 512.90 17.20 641.23 322.05 14 520.50NipponLIAM 367.40 355.10 370.10 370.10 353.05 307.05 476.45 270.00 - - NirajCement 36.50 35.10 36.50 36.75 34.60 111.30 55.90 29.10 - - Nitco 32.05 31.60 32.10 32.50 31.30 116.52 42.75 17.40 - 31.40Nitin Spn 305.95 301.95 307.70 314.70 299.90 280.20 328.75 68.70 8 301.70
20 Micron [5] 102.55 95.30 103.30 108.25 94.20 1393.15 108.25 29.25 14 95.2521stCentMgmt 45.25 44.40 45.65 45.90 44.35 18.47 63.45 10.50 - 44.403IInfotech 88.25 85.85 88.50 89.75 85.05 1229.81 119.30 52.60 - - 3m India 25012.30 25215.95 25028.15 25400.00 24905.00 3.37 30975.00 18800.00 134 25172.905PaisaCap 424.80 417.65 422.10 431.20 414.40 41.61 577.40 237.60 75 417.7063MoonsTec[2] 354.90 356.10 372.60 372.60 337.20 2115.99 373.70 68.05 - 356.10
A . . . . . . . . . . . . . . . . . . . . . . . . . . . . . . . . . . . . . . . . . . . . . . . .A2Z InfraEng 11.75 12.05 11.45 12.30 11.45 2286.08 14.15 3.55 - 12.02AakashExplor 270.00 266.60 273.00 273.00 265.00 42.40 301.00 84.40 - - AareyDrgs&Ph 54.05 56.35 54.20 59.90 53.70 648.10 59.90 31.15 - - AaronIndust 137.25 132.25 137.35 144.10 131.25 24.32 151.55 45.05 - - Aarti Drug 523.10 519.05 523.20 527.00 518.00 116.49 841.40 491.15 24 519.20Aarti Ind [5] 1106.80 1083.75 1118.00 1118.00 1079.40 568.79 1168.40 537.28 62 1084.00AartiSurfact 1049.50 1016.10 1064.50 1069.00 1009.00 13.04 1887.00 833.00 - - Aarvee Den 32.50 31.10 33.40 33.40 30.90 61.56 33.30 16.55 - 31.05AarviEncon 90.95 92.60 91.05 94.15 90.70 38.75 103.90 38.20 - - AavasFinance 2845.25 2863.30 2846.00 2906.90 2826.50 73.17 3068.30 1754.55 70 2861.10AB Money [1] 71.85 70.60 72.30 73.10 70.10 233.90 88.50 38.00 18 70.80Aban Off [2] 50.10 50.80 51.00 52.55 49.10 343.08 74.90 26.55 - 50.80ABB [2] 2320.40 2368.55 2333.90 2403.60 2303.00 320.74 2410.00 1287.35 150 2371.25AbbottIndia 17515.40 17181.10 17670.00 17670.00 17150.00 28.82 23902.30 13970.10 51 17200.40ABBPowerPro 2715.60 2656.35 2735.00 2742.65 2640.00 24.68 2855.00 1200.00 - - ABCapital 132.40 127.95 133.00 133.30 127.15 3952.35 139.60 78.80 - 128.05ABMInternat 108.15 118.95 111.70 118.95 110.20 12.57 160.00 85.55 - - ACC 2378.65 2253.25 2391.00 2392.90 2240.35 691.18 2587.95 1584.35 20 2255.25AccelyaKal 1090.80 1079.35 1084.00 1109.65 1070.00 10.79 1535.00 837.00 31 1081.35AcrysilLtd 833.35 814.45 831.35 841.50 810.65 65.82 927.90 181.25 - - Action Con [2] 240.65 234.25 241.85 245.90 232.20 642.25 291.55 125.30 25 234.90AcuracyShipg 210.90 213.30 212.70 217.90 207.45 52.24 227.00 34.30 - - Adani Ent [1] 1877.80 1840.95 1885.00 1908.50 1830.05 2294.15 1908.55 497.90 221 1841.85Adani Ports [2] 779.05 762.95 780.00 790.00 760.00 4300.93 901.00 500.20 101 763.95Adani Pwr 116.05 109.75 116.90 117.75 109.0012785.31 167.05 48.40 - 109.80AdaniGreenEn 1835.30 1900.10 1850.00 1923.90 1828.50 1797.86 1919.30 860.20 950 1906.80AdaniTranmsn 2002.70 2026.75 2002.70 2050.00 1981.00 81.44 2043.00 400.00 - 2022.75ADF Foods 896.85 873.15 914.90 917.00 855.00 42.03 1049.00 586.50 41 873.40AditBirSunLf 577.35 563.60 577.35 578.70 561.00 156.29 722.90 499.25 - - AdityaBirFas 311.35 310.10 313.45 318.70 307.85 5456.05 318.55 148.60 - 310.65Ador Weld 762.85 726.90 745.00 775.05 721.30 12.83 852.10 260.50 29 728.35AdvancedEnz[2] 339.60 335.35 340.15 348.35 334.00 216.96 503.00 300.90 56 335.35Advani Hot [2] 82.35 78.55 81.30 81.85 78.00 29.20 97.50 44.30 - 78.55Aegis Log [1] 236.10 224.40 236.50 237.70 222.50 663.28 394.40 191.90 33 224.45Affle(India) [2] 1486.45 1449.50 1495.00 1511.00 1436.50 642.97 1510.15 706.00 402 1449.15Agarwal Inds 528.10 517.25 527.00 537.25 515.00 56.47 540.55 122.35 23 515.55AgriTech Ind 69.30 67.85 71.50 71.50 67.40 6.90 79.00 30.50 - 67.75Agro Tech 992.45 963.75 997.45 1001.75 960.25 12.54 1149.75 750.10 108 965.45AgroPhosInd 25.40 24.85 25.70 25.70 24.50 75.99 34.30 10.45 - - AhladaEnggrs 137.65 136.80 137.00 140.10 136.35 8.61 248.00 61.15 - - Ahluwalia [2] 422.10 416.40 422.20 423.00 415.00 13.16 483.95 254.00 23 416.15AIA Engg [2] 1922.60 1898.30 1925.00 1927.35 1877.95 15.20 2224.40 1751.05 42 1894.15AIRAN 23.50 23.80 23.65 24.75 23.40 1290.20 35.95 15.05 - - AIRO LAM 74.30 79.00 75.40 89.15 74.60 429.61 90.10 52.00 - - Ajanta Phr [2] 2305.60 2284.60 2310.00 2354.00 2240.75 62.98 2420.00 1652.95 27 2287.25Ajmera 428.10 439.35 444.95 449.50 422.20 329.46 450.75 97.00 44 435.00AjooniBiotec 72.75 73.40 74.65 74.65 72.00 187.10 76.90 41.90 - - AKGEximLtd 54.15 49.55 55.45 55.45 48.75 53.22 112.70 21.00 - - Aksh Opti [5] 15.05 14.55 15.80 15.80 14.30 4258.44 15.80 5.29 - 14.57AksharChem 468.10 463.15 466.00 491.95 460.50 40.18 613.50 223.10 22 461.75Akzo 1977.30 1975.20 1980.00 1993.30 1967.90 10.95 2510.00 1960.80 31 1972.15Alankit [1] 18.90 18.20 19.05 19.20 18.00 995.33 27.15 11.50 - 18.30AlbertDavid 687.20 699.15 689.60 739.00 689.60 129.87 738.40 371.45 11 699.00Alembic [2] 106.10 104.30 106.75 106.95 103.50 185.08 143.30 92.30 31 104.50Alembic Ph [2] 799.00 787.60 800.00 808.80 785.10 129.32 1093.60 720.80 18 787.55Alicon [5] 842.35 834.45 856.35 856.35 816.05 16.17 998.75 390.00 63 827.45Alkali Met 130.20 136.70 136.70 136.70 136.70 74.39 136.40 45.90 - 136.40AlkemLabs [2] 3577.50 3487.95 3609.30 3609.30 3477.35 138.49 4067.70 2544.25 23 3490.25Alkyl Amine [2] 3686.60 3590.75 3714.40 3714.40 3579.00 49.00 4740.00 1830.00 59 3589.40Allcargo [2] 362.10 357.55 362.95 370.90 355.15 375.22 412.00 121.25 28 356.75Allied Dig [5] 159.80 155.05 161.40 162.70 152.10 253.20 176.00 34.85 142 155.95Allsec 725.05 681.80 731.90 738.00 674.95 76.68 748.60 241.65 11 681.95Alm.Global [6] 124.20 120.80 125.50 125.50 119.00 24.02 155.20 19.00 62 120.70AlokIndus 34.00 32.05 34.80 35.70 31.6576318.74 35.80 18.70 - - Alpha Lab 100.05 98.20 100.95 104.70 97.00 739.46 105.60 34.35 15 98.15Alphageo 392.65 413.85 396.00 444.00 392.20 413.12 511.00 174.80 7 413.90Amararaja [1] 657.65 643.75 664.00 664.00 642.00 1412.26 1009.20 584.45 17 643.65AmberEntp(I) 3483.30 3545.80 3500.00 3670.00 3472.35 97.28 3788.40 2400.00 149 3542.85AmbigaAgar 26.55 24.90 27.40 27.40 24.60 96.20 39.70 12.00 12 25.10Ambika Cot 2214.90 2134.85 2238.00 2248.00 2116.00 21.56 2349.00 846.00 9 2137.95AmbujaCeme[2] 407.80 380.65 410.00 410.00 379.00 7265.32 442.95 242.00 32 381.40AMD Ind 48.05 48.35 48.05 48.90 46.75 142.55 50.60 16.25 31 48.35AmiOrganics 1089.35 1066.45 1090.00 1115.45 1060.00 153.56 1434.45 841.00 - - AMJLandHold[2] 34.85 35.80 35.80 36.30 34.15 44.39 42.50 21.25 - 35.90Amrutanjan [1] 911.90 904.60 910.30 917.10 901.15 33.70 1025.55 472.50 42 907.25ANANDRATHI 619.00 613.50 626.00 630.05 610.00 154.61 654.00 542.60 - - Anant Raj [2] 79.15 78.40 80.85 82.95 77.75 934.86 84.00 32.85 50 78.50AnantrajGlob 58.75 57.05 58.65 59.20 56.10 1902.97 60.75 20.70 - - Andhar Sug [2] 135.40 131.65 136.45 136.45 131.00 418.51 145.40 57.12 16 131.85Andhra Cem 17.90 17.25 17.90 18.20 17.20 706.28 37.40 5.13 - 17.25AndhraPaper 217.65 218.00 219.25 224.05 217.50 74.83 283.70 200.55 - - AndrewYuleCo 27.60 27.00 27.85 28.40 26.55 566.69 29.70 21.55 - - AngelOne 1358.60 1383.90 1399.40 1429.65 1368.00 3527.93 1689.00 286.35 - - Anik Ind 34.80 35.55 35.95 36.50 33.75 46.00 39.25 10.82 7 35.00AnjPortCemen 334.25 323.25 334.00 336.95 320.00 19.23 531.00 197.75 11 323.05AnmolIndia 181.55 196.95 182.05 204.00 182.00 242.82 237.80 135.00 - - Ansal Pro [5] 13.20 13.85 13.85 13.85 13.70 242.81 14.80 5.45 - 13.95AntnyWastHdg 336.70 332.20 339.30 349.40 330.00 470.81 455.00 241.00 - - AnupamRasayn 1050.60 1014.65 1062.40 1063.15 995.80 82.99 1087.80 474.00 - - Apar Ind 790.10 771.95 794.10 804.80 766.05 73.69 840.00 344.75 14 771.75Apcotex Ind [2] 404.20 393.55 412.95 414.00 388.00 51.99 460.00 166.00 24 391.15ApexFznFoods 324.20 325.15 327.10 341.30 321.15 389.30 435.20 200.00 28 325.05APL Apl [2] 964.15 959.95 978.00 978.00 950.00 405.86 1113.65 445.85 108 953.40Apollo Hsp [5] 4911.75 4615.80 4900.00 4909.90 4505.00 3507.27 5930.70 2530.75 117 4618.20ApolloPipes 597.60 597.60 600.00 611.50 593.00 178.90 2000.00 515.00 - - ApolloSindo 851.25 819.30 841.50 850.45 810.10 5.11 1069.70 505.00 - - ApolloTyr [1] 243.45 235.30 245.00 245.00 234.20 4954.23 261.20 174.65 21 235.25Aptech 433.30 424.35 435.00 443.85 420.65 262.86 447.95 165.05 127 424.25AptusValHsg 364.05 348.00 364.25 365.40 343.00 346.13 381.40 278.60 - - Archidply 56.70 58.80 59.40 59.50 56.70 234.26 61.55 27.95 19 58.75Archies [2] 20.15 21.45 20.45 22.15 19.80 1367.65 30.00 9.40 - 21.45Aries Agro 168.75 164.75 170.00 173.00 162.30 137.96 193.75 74.70 10 164.35Arih.Found 44.50 43.90 46.00 46.00 43.25 109.53 67.30 16.90 - 44.00ArihantSuper 184.90 178.40 186.00 188.00 176.00 155.78 206.00 33.05 26 176.75ArihntCapMkt 253.95 268.05 257.90 279.30 256.40 540.39 287.75 111.25 - - ArmanFinServ 819.90 789.05 829.00 831.00 785.00 14.98 1135.00 514.50 94 789.95AroGranite 83.75 81.25 84.45 87.40 80.10 155.85 87.00 36.70 11 81.20ArowGreenTec 138.30 145.20 145.20 145.20 141.65 34.22 179.85 53.00 42 145.80Arshiya [2] 37.55 35.85 38.30 38.30 35.70 150.90 44.45 24.70 - 35.75ArtemsMedSvc 47.35 45.05 47.50 48.30 45.00 122.04 412.80 32.05 - - ArveeLabsInd 85.05 84.20 83.00 87.00 82.60 0.89 92.60 43.55 - - Arvind 153.10 147.30 154.80 157.65 146.05 4303.63 157.80 48.50 17 147.30ArvindFash [4] 337.65 328.65 337.90 344.00 325.00 513.03 364.00 123.20 - 328.90ArvindSmart 240.20 231.95 242.15 248.85 229.80 70.10 258.10 82.55 26 232.80Asahi India [1] 561.90 563.40 565.00 574.00 556.20 225.69 590.00 255.60 50 563.65Asahi Song 305.50 301.40 310.00 312.00 300.00 14.27 442.65 226.80 12 301.40Ashapura [2] 121.60 119.90 123.00 126.00 118.50 417.62 176.30 89.40 14 120.05Ashiana [2] 169.20 168.95 171.50 172.80 168.00 53.21 209.95 93.10 - 168.60Ashima 20.60 20.10 20.90 21.95 19.55 1140.87 23.30 12.60 - 20.15Ashok Ley [1] 139.30 135.45 140.30 140.30 134.2510457.32 153.40 106.20 - 135.45Ashoka Bld [5] 104.15 101.80 104.60 104.60 101.45 929.14 125.00 78.40 7 101.95ASIAN ENERGY 167.60 160.45 168.80 171.95 159.00 235.93 173.00 125.00 - - Asian Gran 121.25 125.60 124.35 126.80 123.20 1568.32 257.10 116.00 8 125.35Asian Htl-E 197.35 193.10 197.35 204.65 192.15 4.86 239.00 140.00 179 192.55Asian Htl-N 82.35 80.90 82.90 84.75 80.35 13.22 105.80 56.10 - 80.70Asian Paints [1] 3378.65 3373.70 3379.05 3396.45 3351.00 558.54 3588.05 2261.45 100 3372.40Aspinwall&Co 155.95 154.75 158.95 158.95 153.20 3.83 268.30 135.00 - - AssoAlchohol 545.75 530.70 555.00 555.95 525.30 56.59 653.65 283.80 - - Aster Life 1599.75 1542.60 1608.85 1609.15 1531.05 12.12 1725.00 986.85 57 1543.00AsterDMHealt 188.75 189.45 189.95 193.50 187.20 1110.85 237.25 132.55 - 189.60Astra Mic [2] 251.25 235.85 253.00 253.00 234.50 582.32 290.55 108.00 47 235.65Astral Poly [1] 2465.10 2431.15 2475.00 2478.05 2410.00 293.38 2525.00 1207.50 116 2432.85AstraZen [2] 3018.55 3002.55 3033.65 3036.00 3000.00 14.08 4580.00 2930.00 106 3003.60AstronPaper 50.80 50.20 50.50 51.85 49.90 95.99 74.40 35.00 18 50.00Atlanta [2] 24.50 25.60 25.70 25.70 23.85 809.39 25.65 6.36 - 25.50Atul 10663.45 10210.25 10649.00 10856.80 10133.00 55.38 10975.40 6219.80 46 10197.50Atul Auto [5] 211.05 203.05 212.50 213.00 202.00 93.13 270.00 162.60 - 203.20Aurionpro 372.15 380.35 389.00 390.75 372.10 280.30 390.40 71.30 50 379.25AurobindoPh[1] 685.80 668.80 686.00 695.00 666.65 3536.20 1063.75 620.55 19 669.30AurumProptec 158.30 155.00 161.00 161.00 154.50 164.25 223.20 27.35 - - AUSmallFinBk 1273.90 1258.30 1273.80 1314.40 1250.00 1740.39 1389.00 843.00 35 1258.70Ausom 75.85 75.05 76.40 76.55 74.55 10.93 118.15 43.05 10 75.95Auto Axl 1601.25 1549.95 1602.00 1605.35 1537.95 22.01 1650.00 945.00 42 1549.75Autoline 72.70 72.95 74.00 78.00 71.75 280.46 79.35 29.65 - 72.70AvadSug&Egy 650.50 609.20 655.85 661.55 600.00 663.33 675.00 172.70 12 608.20Avanti Feeds [1] 622.35 610.20 623.00 624.90 607.00 196.95 675.00 411.85 39 608.20AvenuSupmart 4400.50 4441.15 4425.00 4500.00 4381.00 940.89 5899.90 2610.80 182 4439.85AVT Natl [1] 86.10 83.10 86.10 87.25 82.40 129.14 93.60 41.60 22 83.10Axis Bank [2] 712.65 725.20 717.50 735.90 714.2524055.89 866.60 617.00 24 725.60AYM Syntex 142.85 143.85 143.95 158.35 138.60 1138.91 158.50 40.85 14 143.25
B . . . . . . . . . . . . . . . . . . . . . . . . . . . . . . . . . . . . . . . . . . . . . . . .BafnaPharma 141.85 138.20 144.70 144.70 136.10 2.34 196.10 113.30 - - Bajaj Auto 3489.75 3400.95 3488.95 3497.20 3392.60 656.59 4361.20 3028.35 19 3400.55Bajaj Elect [2] 1242.50 1206.95 1248.95 1248.95 1203.35 77.87 1588.55 700.00 64 1206.45BAJAJ HEALTH 483.65 471.35 490.25 496.30 470.30 187.59 496.30 290.90 - - Bajaj Hind [1] 16.95 16.40 17.10 17.25 16.3015383.86 24.75 5.20 - 16.40Bajaj Hld 5496.05 5468.15 5518.00 5587.00 5441.30 34.53 5654.00 3120.00 38 5466.95BajajConCare[1] 194.00 192.90 192.80 195.05 192.50 386.52 323.50 178.85 14 192.80BajajFin [2] 7852.60 7744.00 7899.95 7945.00 7716.05 1130.02 8020.20 4361.60 107 7747.15BajajFinserv [5] 18370.60 18153.55 18376.85 18558.75 18100.05 205.67 19319.95 8275.00 694 18156.45Bal Phr 136.05 129.00 137.10 138.95 127.00 310.00 148.15 50.05 18 128.40Balaji Amn [2] 3645.00 3602.15 3650.00 3725.00 3567.00 67.86 5220.00 1065.00 39 3598.60Balaji Tele [2] 65.70 63.30 66.20 67.00 62.70 195.23 76.80 51.00 60 63.30BalaxiVentre 508.30 516.65 525.00 525.00 508.05 1.05 747.00 447.05 - - Balkrishna [2] 2514.25 2506.30 2505.00 2537.45 2475.00 209.81 2724.40 1516.80 34 2517.50BalmerLaw 132.60 131.70 133.15 134.65 130.50 353.90 170.95 111.75 16 131.60Balrampur [1] 443.05 439.90 447.25 459.00 437.50 6469.73 458.80 156.45 22 439.65Ban.Amn.Sp [5] 98.00 93.60 99.10 99.80 92.50 587.62 100.60 37.47 12 93.30Ban.Amn.Sug 2947.10 2896.85 2959.00 3001.55 2881.10 8.10 3049.05 1436.95 45 2899.15Banar.Beads 104.25 98.85 105.10 105.10 96.35 79.85 116.00 44.20 24 101.55Banco Ind [2] 192.90 191.00 193.80 198.80 188.85 233.75 225.00 134.00 13 190.70BandhanBank 301.20 295.25 302.80 305.50 293.50 7630.58 372.40 229.65 - 295.15Bang Over 39.70 39.10 39.70 40.35 38.30 32.21 54.85 24.70 16 38.70BankofBarod[2] 93.75 92.25 93.85 95.90 91.7036750.28 108.00 61.80 14 92.20Bans.Syn 285.30 289.25 283.05 297.85 280.05 78.23 312.45 82.20 12 288.40BarbequeNatn 1484.65 1497.20 1496.25 1522.60 1456.00 54.10 1945.95 481.85 - - BASF 3195.55 3213.25 3220.00 3289.90 3194.45 47.43 3926.95 1552.00 27 3214.40Bata India [5] 2041.50 1981.00 2049.80 2056.35 1970.00 422.38 2261.65 1265.00 1048 1982.90Bayer Crop 5175.55 5103.70 5192.55 5192.60 5061.80 7.64 6127.45 4519.90 55 5088.95Beardsell [2] 16.75 16.05 17.45 17.45 15.95 159.08 20.42 7.94 - 16.02Bedmutha 82.20 85.50 85.80 86.30 83.90 74.09 86.85 20.05 1 85.80BEL [1] 216.50 208.35 218.30 218.50 207.60 5979.93 227.95 115.90 23 208.60BEML 1862.40 1826.90 1859.90 1870.95 1820.00 231.26 2084.00 887.80 69 1825.15BergrPaintIn [1] 775.90 761.15 775.90 780.90 759.10 282.89 872.00 675.00 95 761.25BestAgrolife 1180.90 1136.45 1199.90 1199.90 1125.00 21.16 1407.80 202.35 - - BF Inv [5] 339.60 343.65 339.60 358.00 333.75 119.31 445.95 260.00 42 342.65BF Util [5] 411.35 416.50 414.00 433.00 407.50 765.10 538.95 227.40 - 416.65BGR Engy 98.65 102.35 100.00 103.55 98.40 894.26 124.50 39.00 - 102.20Bhageria Ind [5] 251.40 245.95 249.00 254.75 245.35 31.56 328.55 146.25 16 245.90BhagiradaChm 999.95 1020.65 1018.90 1048.70 1000.00 6.19 1060.95 719.15 - - BhagngrInd [2] 52.80 51.35 53.00 53.85 51.00 37.59 65.00 29.60 - 51.30BhagyangrPr[2] 36.85 36.00 36.40 37.05 36.00 37.69 39.00 20.20 - 36.00Bhans.Eng [1] 162.35 153.90 156.80 159.90 152.55 1765.21 221.80 126.00 6 154.00Bharat Bij 2002.60 1913.70 2013.35 2042.05 1903.25 34.98 2050.00 862.85 19 1914.70Bharat For [2] 775.50 761.15 778.00 779.60 755.20 1330.07 848.00 555.60 43 760.50Bharat Gea 172.85 170.05 172.10 174.95 169.00 27.98 190.20 60.93 9 169.95Bharat Ras 12187.25 12134.80 12321.35 12598.50 12078.95 5.87 15100.00 9206.00 35 12136.45Bharat Wire 78.40 80.10 81.80 82.30 78.75 504.06 85.70 30.60 29 80.35BharatDynamc 442.10 426.35 444.35 445.05 420.55 196.47 456.25 321.50 24 426.45BharatRdNwk 37.05 35.05 37.90 37.90 34.70 344.89 41.40 26.35 - 34.95Bharti Air [5] 728.60 714.35 727.00 730.70 712.55 4312.06 781.90 490.15 - 714.10Bharti Infr 333.65 317.70 337.40 337.70 303.65 18.77 383.00 130.10 32 320.05BHEL [2] 63.85 60.65 64.00 64.10 60.3536833.74 79.50 35.15 - 60.70BigBlocCons [2] 72.25 73.30 74.00 75.85 73.00 238.23 83.45 15.44 - 73.60Biocon [5] 357.10 348.70 358.00 359.50 347.00 1631.06 459.60 314.90 338 348.95BioflChm&Pha 86.50 80.10 86.15 86.50 78.55 156.25 139.35 55.00 - 80.05BirlaCable 103.90 100.70 103.50 104.95 98.20 107.36 123.00 54.00 23 100.65BirlaCorp 1587.95 1528.90 1599.40 1602.50 1488.95 81.41 1649.00 701.80 27 1528.75Birlasoft 549.55 534.70 550.00 553.60 531.00 2514.18 585.85 215.90 - - BirlaTyres 26.75 27.35 27.15 29.35 26.60 4043.94 33.60 21.00 - - Bk of Ind 54.35 53.20 54.60 54.75 53.00 4661.05 101.45 47.95 8 53.10Bk of Mah 21.05 20.60 21.20 21.25 20.50 4433.58 31.95 13.20 18 20.60BL Kash [1] 28.55 29.10 28.65 29.95 28.40 1061.50 33.00 9.12 20 29.05BLACK BOX 957.35 956.10 958.45 973.95 951.20 3.57 1750.00 775.50 - - Bliss GVS [1] 99.45 100.75 100.00 103.80 99.95 936.12 209.50 91.50 13 100.65BLSIntlServ [1] 222.40 227.60 225.90 233.50 218.80 601.80 309.25 81.00 - 227.15Blue Dart 7129.80 7090.05 7200.00 7227.00 7060.10 8.98 7499.00 3821.00 52 7093.60BlueStar [2] 1049.90 1019.90 1055.40 1058.00 1005.00 49.77 1091.15 701.00 82 1021.35Bodal Chem [2] 120.15 117.70 120.80 121.30 116.80 351.77 150.00 66.55 13 117.35Bomay Bur [2] 1121.50 1098.40 1116.00 1142.00 1093.00 37.07 1424.40 980.00 - 1097.60Bombay Dye [2] 117.25 112.65 117.80 118.30 112.00 4097.30 121.15 64.50 - 112.75BombySuprHyb 316.40 307.10 316.25 316.25 305.05 2.47 355.70 124.95 - - BorosilRenew 640.40 620.55 648.00 648.00 612.05 470.66 747.90 213.25 - - Bosch 17692.30 17189.90 17849.50 17849.50 17003.85 30.37 19244.50 13230.00 36 17142.75BPCL 400.55 398.10 401.80 406.90 396.35 6610.25 503.00 357.55 6 398.00BPL 67.60 66.65 69.50 70.55 65.60 286.12 176.65 19.00 - 66.70BRANDCONCEP 64.45 67.65 67.65 67.65 67.65 18.60 67.65 53.25 - - Brigade 500.05 501.90 502.95 531.00 496.05 2462.44 530.85 219.80 43 501.25Britannia [1] 3665.15 3621.90 3668.00 3694.70 3611.10 168.10 4152.05 3317.90 54 3619.30Brooks Lab 112.30 108.15 114.90 115.15 107.50 81.17 155.00 49.95 - 108.25BSE 2048.40 2020.35 2057.90 2088.00 1991.30 977.38 2373.70 535.50 - - BSL 119.20 118.60 123.70 123.70 113.50 31.27 134.80 29.50 11 118.00BtrflyGandhi 1299.95 1274.75 1285.00 1312.00 1250.05 37.88 1345.00 478.00 42 1270.45BurgrKng(In) 141.50 139.95 142.75 143.35 139.10 1467.63 189.70 126.10 - -
C . . . . . . . . . . . . . . . . . . . . . . . . . . . . . . . . . . . . . . . . . . . . . . . .C.E. INFO SYSTE 1855.05 1772.75 1855.05 1884.60 1750.00 612.94 1917.40 1282.60 - - Cadila HC [1] 438.05 422.05 439.00 439.50 420.45 4325.45 673.70 408.40 36 422.15
Calif.SW 44.75 46.30 46.00 46.95 44.70 213.65 52.80 7.87 13 45.90Cambridge 86.35 83.00 86.10 87.80 82.10 120.36 97.70 24.55 44 82.80Camlin Fine [1] 166.65 162.45 164.00 168.70 159.50 519.68 230.80 100.60 - 162.05Canara Bk 227.70 223.10 228.40 230.00 221.70 7247.35 247.60 123.85 10 223.05CanFinHom [2] 627.50 616.35 632.95 638.75 611.30 1506.79 721.25 455.30 18 616.10Cantabil 804.25 792.05 811.40 811.40 790.10 2.07 858.00 346.30 55 790.30CapaciteInfr 168.30 165.20 169.75 171.80 164.10 407.79 251.05 134.50 18 165.40CapitalTrust 143.80 132.75 145.00 146.35 131.00 75.49 153.85 70.60 - 132.55Caplin Point [2] 836.65 825.85 842.00 842.00 817.30 81.12 1034.00 402.00 32 825.45CapriGlo [2] 535.60 540.70 539.00 550.00 522.00 71.22 578.70 323.85 70 541.90CARE 633.20 630.60 635.95 641.20 630.00 36.23 791.15 410.00 24 630.85CarrerPnt 144.80 143.15 146.80 149.10 142.30 82.77 185.00 117.25 22 142.95CartradeTech 863.90 835.15 864.95 864.95 831.00 153.52 1618.00 805.00 - - CastrolIndia [5] 128.05 126.15 128.45 129.10 125.90 989.38 154.90 117.75 16 126.25CCL Prd [2] 436.75 432.25 444.70 444.70 428.95 476.35 495.00 225.00 34 431.35Ceat 1158.15 1149.45 1169.00 1176.75 1144.90 111.72 1763.15 1067.25 14 1149.75CEEBCO 56.55 53.75 59.35 59.35 53.75 971.47 59.50 14.60 39 53.90Cent Enka 555.80 544.80 562.90 594.00 539.00 623.48 593.85 211.15 7 544.70Cent.Bk 21.55 21.35 21.60 21.70 21.25 3411.83 29.65 12.48 - 21.40Cent.Elec 639.95 612.75 638.45 644.50 608.00 14.92 659.20 350.00 206 610.85Cent.Ext [1] 13.25 12.90 13.30 13.40 12.80 436.88 15.77 3.86 - 12.85Cent.Ply [1] 652.15 636.30 658.20 658.20 628.55 153.54 714.95 234.20 48 638.00Cent.Txt 1009.85 991.75 1014.85 1017.80 980.10 359.82 1025.00 384.85 69 991.00CentDepoSer 1636.10 1592.30 1643.95 1646.60 1585.50 702.85 1734.40 476.35 - - CentrumCap [1] 34.95 33.90 35.40 35.40 33.50 565.23 58.50 22.00 - 33.95Cera San [5] 5011.30 4927.25 5015.00 5036.35 4903.35 5.10 6430.45 3302.20 50 4934.80Cereb.Int 90.10 87.50 91.05 93.35 85.00 636.06 99.00 37.45 54 87.65CESC [1] 93.15 91.50 94.00 94.00 91.30 4402.22 102.45 57.50 15 91.50CGPowr&InS [2] 185.75 181.40 187.35 187.60 177.55 2255.55 209.05 37.75 20 180.65ChaletHotels 238.25 236.50 241.70 244.50 233.10 149.79 292.50 125.05 - 235.55ChamanLalSat 108.30 106.85 109.25 109.45 104.50 122.60 155.00 89.25 - - Chamb.Frt 470.65 465.70 473.65 482.90 462.70 3894.48 483.00 207.30 14 466.00ChembondChem 224.15 217.25 226.00 226.15 216.00 21.61 220.00 120.00 - 180.15ChemconSpecl 385.75 376.35 386.00 388.80 375.00 90.89 569.40 338.30 - - ChemfabAlkal 185.50 180.20 187.30 187.30 180.00 13.13 218.20 115.00 - - ChemplastSan 605.45 614.50 605.00 629.00 603.95 611.54 826.00 510.00 - - CholaFin [2] 600.70 612.45 609.00 626.00 604.40 7751.60 667.50 391.00 32 612.55CholamandFn[1] 645.30 650.50 650.90 655.95 640.60 348.57 763.05 486.50 249 650.40Cigniti Tech 579.95 571.20 580.00 581.70 567.60 35.19 677.00 310.60 38 570.35Cineline Ind [5] 90.30 92.70 92.85 94.80 90.65 58.81 131.30 27.50 - 92.95Cinevistaas [2] 15.90 15.15 16.25 16.25 15.15 121.96 24.48 5.50 - 15.15Cipla [2] 910.20 902.15 910.20 914.60 898.45 1830.58 1005.00 738.25 27 902.25CitiUn Bk [1] 146.10 143.65 146.25 147.00 143.00 1474.68 189.60 129.00 17 143.50Clari.Chm 493.95 489.25 496.45 496.75 487.50 39.65 642.20 340.75 26 489.30CleanSci&Tec 2534.90 2434.90 2543.80 2549.70 2424.00 255.53 2705.00 1422.10 - - CLEducateLt [5] 118.35 116.20 122.90 122.90 115.85 23.93 136.80 31.40 - 116.65CMS INFO SYST 311.40 296.05 314.50 317.00 292.15 2942.87 317.45 215.10 - - Coal India 163.70 160.80 164.00 165.50 160.30 6574.12 203.85 123.45 11 160.80CoastalCorpn 513.20 478.10 537.00 564.50 471.00 513.60 564.50 237.75 - - CochinShip 348.10 348.00 348.90 354.00 346.10 123.87 433.75 318.00 7 347.85CoffeeDayEnt 70.00 66.55 71.00 73.70 66.0015202.24 73.85 23.25 - 66.65COFORGE 5628.00 5410.20 5675.00 5675.00 5381.70 278.60 6135.00 2300.00 - - Colgate [1] 1467.15 1470.20 1470.00 1489.50 1462.50 686.43 1823.00 1393.00 38 1470.30CompuageInf[2] 39.85 39.00 40.15 41.50 38.60 881.06 47.20 13.95 12 38.85ComputerAge 2949.60 2880.50 2951.00 2955.00 2862.00 247.32 4067.40 1701.00 - - Con.FinHld 172.45 166.55 176.95 177.00 165.25 28.16 78.40 26.55 - - Concor [5] 687.90 680.90 688.00 694.35 677.60 1340.96 754.10 403.15 56 680.40ConfdnPetIn [1] 77.00 79.55 77.45 82.70 76.85 3885.38 95.40 36.55 24 79.50ControlPrint 398.20 392.65 404.20 413.50 388.20 82.74 432.80 219.35 18 393.15CoralIndFin [2] 51.40 49.75 52.30 52.30 49.20 146.22 58.50 19.05 13 49.80Cords Cab 68.05 66.95 69.00 69.00 65.45 148.88 83.40 38.00 14 66.90Corom.Intl [1] 805.10 782.50 811.95 816.75 773.50 378.96 955.95 709.55 17 782.85Cosmo Film 1743.30 1652.45 1738.00 1741.85 1635.20 80.77 1785.00 430.20 12 1652.85CPCL 114.60 112.60 115.15 117.00 112.00 698.97 151.80 89.00 - 112.45CraftsmnAuto 2400.35 2389.20 2410.00 2430.00 2368.40 26.70 2778.00 1245.00 - - CrdtacsGramn 605.60 597.75 615.00 615.00 591.15 114.97 807.55 495.30 91 598.65CreatPer&Dis[5] 5.40 5.40 5.45 5.45 5.15 14.48 6.14 2.57 - 5.38CreatPer&Dis 671.15 700.00 679.00 704.70 642.55 130.65 704.90 83.90 - - Crisil [1] 3001.75 2994.55 3035.00 3043.45 2972.00 48.83 3496.00 1742.35 75 2994.75CromGreaC [2] 444.60 435.30 446.95 451.75 416.30 2445.05 512.05 350.35 42 437.00CSBBank 244.45 242.20 245.00 250.05 240.20 164.57 372.95 215.05 15 242.35CubexTub 34.50 36.20 33.75 36.20 33.75 49.15 38.85 15.15 27 36.25CUMI [1] 960.30 942.15 964.00 976.70 936.95 276.35 1033.95 384.80 70 941.80CumminsInd [2] 1001.75 987.85 1007.00 1025.85 981.00 870.39 1065.00 583.25 35 987.60Cupid Ltd 223.45 221.40 224.75 226.00 221.05 24.18 272.00 202.00 11 221.00Cybertech 234.40 225.30 233.60 236.20 223.65 254.47 245.70 112.05 40 225.35CYIENT Ltd [5] 1022.65 1010.65 1026.70 1046.25 1000.00 222.03 1292.00 478.45 38 1010.75
D . . . . . . . . . . . . . . . . . . . . . . . . . . . . . . . . . . . . . . . . . . . . . . . .D P WIRES 321.30 318.30 337.35 337.35 310.05 126.96 337.35 101.30 - - Dabur [1] 569.60 563.90 569.60 571.30 562.60 1185.07 658.75 483.00 69 563.85Dalm.B.Sug [2] 480.30 472.20 486.45 490.75 470.55 388.92 516.00 133.50 14 471.55DamodarInd [5] 72.55 67.75 72.90 72.90 67.30 82.59 74.50 21.50 11 68.00DangeeDums 209.30 208.40 210.00 210.50 208.25 1.89 228.75 105.95 - - DATAPATTERNS 814.40 780.05 821.65 824.50 772.55 823.37 864.00 702.00 - - Datamatics [5] 355.35 344.05 355.00 360.00 341.00 188.17 382.40 102.15 33 343.20DB Corp 99.40 97.15 100.00 100.70 96.55 258.37 124.60 76.05 9 97.25DCB Bk 86.45 85.30 86.45 87.00 85.00 621.44 122.30 78.30 10 85.30DCM 125.25 120.55 120.50 127.80 119.50 21.81 145.05 23.00 75 120.45DCMShriramInd 103.60 99.95 105.00 107.00 99.10 221.07 107.00 86.20 - - DCMNouvelle 366.80 348.50 348.50 348.50 348.50 11.34 385.10 61.00 5 347.60DCMShriram [2] 1065.25 1012.35 1078.00 1078.00 999.00 118.08 1249.95 394.00 20 1013.05DCW [2] 46.15 44.55 46.50 46.70 44.30 817.07 65.95 18.70 32 44.50Deccan Cem [5] 629.30 621.05 638.95 638.95 617.00 10.70 846.25 347.55 8 621.90DeepEneResou 43.50 43.85 43.95 45.50 43.25 62.29 62.70 30.50 - - DeepIndust 185.80 184.45 186.45 200.00 180.65 381.26 200.00 57.30 - - Deepk.Fer 564.95 536.75 568.40 569.80 536.75 961.29 570.10 147.80 41 536.75Deepk.Ntr [2] 2659.90 2590.55 2659.00 2690.05 2571.75 502.12 3020.00 928.00 82 2594.00DelphWrldMon 562.25 559.70 564.25 572.35 556.50 1.51 818.00 410.80 - - Delta Corp [1] 296.10 282.50 297.60 299.90 280.50 4250.75 308.55 138.00 77 282.55Delta Mag 103.65 99.15 106.00 106.90 98.55 17.46 111.35 23.05 - 99.00Den Net 44.35 42.85 44.45 44.60 42.50 1611.62 70.55 37.35 10 42.85DevyaniInter 186.80 185.45 189.00 197.30 183.45 9371.63 198.90 107.55 - - DFMFoods [2] 297.20 295.00 298.70 299.45 294.55 49.61 452.80 265.05 268 295.10Dhamp.Sug 378.25 377.85 382.00 395.00 374.20 2345.17 395.00 156.20 12 377.95DhaniService 157.05 153.65 157.95 159.70 152.95 1118.04 378.90 139.20 - - Dhanlk.Bk 15.00 14.80 15.00 15.10 14.75 555.93 20.20 11.51 14 14.81Dhanuka Ag [2] 768.55 751.65 775.50 775.80 747.00 48.50 1053.15 668.95 17 753.15DHARAMSI MOR 364.10 348.40 370.00 370.00 345.30 15.49 399.00 294.55 - - DhruvConsult 57.20 58.85 56.95 60.05 54.35 93.70 84.35 47.70 - - Dhun.Inv 749.00 724.20 742.00 756.90 709.70 5.01 850.80 228.35 87 723.80Dhunseri Tea 311.10 302.40 309.35 313.55 301.70 23.02 405.20 155.07 6 302.25DhunseriVent 290.55 301.10 294.70 310.35 290.90 230.10 350.00 66.25 - - DIC India 428.70 421.65 430.00 430.00 417.10 2.80 549.00 367.50 27 426.55DigispiceTec 47.65 48.65 48.40 49.75 48.10 435.49 60.70 30.10 - - DIGJAM 281.15 295.20 270.00 295.20 270.00 192.43 362.30 29.15 - - DiligenMedia[1] 3.60 3.75 3.75 3.75 3.75 164.61 4.71 0.63 - 3.70DilipBuildco 377.00 346.70 383.00 383.00 342.55 3875.34 749.30 342.55 21 346.50Dish TV [1] 17.40 17.50 17.50 17.65 17.15 3943.80 23.44 8.55 - 17.50DishmanCar [2] 210.95 210.30 211.00 220.70 208.40 835.44 259.50 102.55 - 211.20Divi'sLabs [2] 4630.35 4527.15 4635.00 4640.35 4512.05 340.71 5425.00 3154.50 57 4529.65DixonTec(In) [2] 5388.10 5235.65 5440.00 5444.10 5181.00 286.21 6240.00 2689.63 170 5234.05DLF Ltd [2] 423.80 403.90 426.90 429.90 390.75 9435.83 449.80 231.95 64 404.15D-Link [2] 178.70 171.15 179.50 181.10 170.15 484.74 193.95 94.80 16 171.10DodlaDairy 565.40 558.10 573.00 579.00 553.55 34.38 674.80 500.00 - - DOLATALGOTE 86.85 85.55 87.75 87.75 85.15 145.84 127.90 51.35 - - DollarInd [2] 610.05 630.20 614.40 664.00 603.00 468.46 665.00 207.00 32 633.55Donear [2] 74.00 73.70 75.40 76.70 73.00 152.52 76.50 25.25 - 73.65DPAbhushan 400.65 403.30 404.50 411.80 395.20 43.04 477.80 92.00 - - DPSC 17.90 17.05 18.20 18.20 17.05 1032.50 31.15 11.55 - - Dr Reddy [5] 4672.40 4693.55 4670.00 4724.45 4621.00 424.53 5613.65 4135.90 48 4689.50Dred.Corp 338.75 335.35 340.20 345.00 334.00 120.40 475.00 256.00 - 335.20DrLalPathLab 3502.60 3365.05 3497.10 3498.90 3351.55 360.57 4243.00 2162.00 72 3365.65Dwarikesh [1] 97.05 93.50 97.85 99.40 92.35 8477.99 99.50 26.10 14 93.50Dynac.Sys 212.05 200.45 210.00 213.90 198.05 64.85 223.70 53.90 18 200.45Dynamatic 2404.15 2319.40 2519.95 2524.35 2294.70 20.87 3447.85 762.10 43 2330.35DynemicProd 622.60 614.30 628.80 629.70 610.70 39.31 770.25 246.30 25 612.30
E . . . . . . . . . . . . . . . . . . . . . . . . . . . . . . . . . . . . . . . . . . . . . . . .EasyTripPlnr 578.00 577.00 585.00 589.00 575.00 498.48 717.65 161.00 - - Eclerx 2904.85 2817.30 2927.00 2927.00 2771.00 143.88 2970.00 905.00 31 2813.85EdelFinSer [1] 72.05 71.20 72.55 72.90 71.10 739.12 100.80 56.70 6 71.15EicherMotor [1] 2844.30 2736.25 2859.30 2859.30 2725.00 1221.49 3035.50 2303.75 48 2736.60EID Parry [1] 517.20 502.35 519.75 532.90 495.55 535.80 574.00 303.00 45 502.55EIH [2] 143.60 139.20 145.00 147.60 138.00 462.74 155.00 81.35 - 139.10EIH A Htl 371.50 364.85 381.95 382.00 362.30 13.66 449.95 207.35 - 366.20Eimco 357.00 344.60 357.50 364.00 342.05 12.95 539.75 308.95 32 345.10Elec. Eng [2] 206.50 197.00 208.15 208.70 195.00 705.20 219.00 44.30 27 197.20Elec.Stl.Cs [1] 39.90 43.65 41.45 47.00 40.10 9494.04 46.80 20.90 19 43.65Electrotherm 156.65 155.00 157.80 162.00 152.00 95.65 197.90 96.20 2 154.45Elgi Eqp [1] 359.40 351.05 360.00 360.50 345.95 286.31 372.35 146.80 67 351.20Elgi Rbr 47.50 44.85 47.55 48.45 44.25 176.61 49.80 22.95 - - Emami [1] 500.00 494.15 501.80 501.80 491.80 330.12 621.35 443.00 39 495.60EmamiPapMi [2] 170.75 164.95 173.00 173.00 162.00 98.58 214.90 88.20 14 165.20Emkay Glo 116.80 115.15 117.45 119.80 113.15 88.50 139.80 59.60 21 113.75Emmbi Ind 113.55 106.55 113.50 115.35 105.75 124.34 125.00 72.00 13 106.55EnduranceTec 1705.05 1671.35 1709.50 1718.95 1660.60 24.01 1980.95 1250.00 47 1671.45Eng.India [5] 72.70 71.35 73.10 73.75 71.10 2190.38 93.60 67.30 17 71.35Ent.Net.Ind 175.50 173.75 175.05 177.70 172.00 32.30 226.95 139.40 - 173.85EPL 196.90 197.20 198.00 203.45 196.00 307.69 291.95 192.00 - - EqitsSmlFnBk 58.15 57.40 58.65 58.65 57.00 377.71 76.80 38.10 - - EQUIPPSOC IMP 98.05 95.75 101.00 101.00 95.60 32.99 142.30 2.05 - - Equitas Hold 118.35 115.15 119.40 119.40 114.20 1133.64 144.85 68.55 27 115.10ErisLifeSci [1] 745.00 738.75 751.65 755.35 731.00 36.52 863.15 552.85 26 735.75Eros Intl 19.55 19.05 19.80 19.85 19.00 263.13 36.95 16.35 - 19.05Esab Ind 3447.65 3428.35 3464.55 3464.70 3386.70 2.87 3610.00 1710.15 67 3420.80Escorts 1865.45 1860.05 1865.80 1882.55 1856.15 437.50 1927.35 1100.10 27 1860.95Ester [5] 142.20 137.20 144.00 144.00 136.55 128.39 164.60 98.10 8 137.30EuroFrshFood 136.05 131.40 142.85 142.85 130.00 16.13 153.95 118.30 - - Ever.Kanto [2] 258.00 248.30 260.25 261.80 245.10 545.64 291.15 44.50 16 248.05Everady [5] 314.60 306.90 316.00 317.45 305.00 275.28 413.30 184.80 7 307.05Everest Ind 604.50 597.40 617.10 628.00 593.00 210.87 642.55 267.05 19 597.15Excel Ind [5] 946.10 923.15 942.75 954.00 910.40 7.77 1289.00 776.95 14 919.15Exide [1] 182.50 179.00 183.50 183.50 178.60 3441.02 220.60 152.65 18 178.90ExpleoSolu 1691.40 1624.95 1669.80 1699.00 1606.45 18.89 1874.00 446.95 - - ExxaroTiles 141.65 141.20 142.65 146.85 140.30 334.30 172.70 128.90 - -
F . . . . . . . . . . . . . . . . . . . . . . . . . . . . . . . . . . . . . . . . . . . . . . . .FACT 146.55 147.40 147.40 159.90 142.50 5624.73 160.00 73.50 24 147.50FaircheOrgan 2076.80 2048.40 2100.00 2100.00 2040.05 30.73 2274.80 580.30 - - FDC [1] 301.80 298.95 303.80 311.50 295.35 198.37 404.90 260.00 18 298.45Fed Bk [2] 100.00 98.30 100.20 101.00 97.8016203.94 107.65 69.00 12 98.35Fed.Goetze 242.45 238.45 242.95 243.45 237.85 34.76 358.20 207.10 17 238.45Fiem Ind 1328.95 1264.35 1348.90 1351.95 1255.00 82.16 1377.70 524.95 20 1265.50Filatex [2] 140.10 136.55 140.80 142.35 136.25 1735.00 142.30 55.00 10 136.60Fin.Cable [2] 529.85 526.75 533.95 540.00 525.50 131.96 608.65 350.60 21 527.00FineOrgInd [5] 3807.20 3756.95 3826.00 3826.00 3720.00 17.36 4040.00 2130.00 81 3742.80FineotexChe [2] 160.90 153.65 165.50 165.50 151.55 2696.36 166.40 56.60 40 153.75Fino.Ind [2] 199.10 195.50 200.50 201.00 194.00 448.18 268.00 114.82 13 195.95FinoPaymntBk 411.70 402.35 414.90 419.90 390.00 78.25 582.95 366.15 - - Firstsource 178.20 167.15 178.80 179.30 165.45 6250.47 242.65 84.25 27 167.20Flexituff 36.45 38.25 38.25 38.25 37.25 124.00 38.05 13.80 - 38.05FOCUSGH&FIXT 81.95 83.35 80.45 86.00 80.00 18.98 90.85 71.25 - - FOODS & INNS 109.65 112.70 113.50 117.80 110.10 284.22 117.80 79.00 - - ForceMotors 1341.75 1350.35 1348.50 1374.40 1343.05 84.44 1740.00 1060.00 - - Fortis Hlt 289.40 289.00 290.65 294.75 285.60 1764.33 313.80 156.00 - 288.80Foseco 1464.15 1440.60 1455.10 1464.95 1436.00 0.98 1790.00 1126.85 29 1440.00FSNECommVent 2071.30 2055.55 2073.00 2084.00 2050.00 295.87 2573.70 1910.05 - - Fut. Life [2] 53.60 52.50 53.20 53.85 52.10 216.55 99.30 46.60 - 52.65Fut. Mkt 9.90 9.85 9.95 9.95 9.80 114.93 23.55 7.50 - 9.86FutEntpDVR [2] 14.10 13.95 13.85 14.30 13.85 47.15 16.89 9.75 - 13.91Future Cons 7.70 7.55 7.70 7.75 7.50 4761.15 11.95 5.85 - - FutureEntp [2] 10.30 10.00 10.35 10.35 9.90 2132.32 13.92 7.61 - 9.98FutureRetail [2] 51.55 50.50 51.50 51.90 50.25 1636.38 89.50 40.60 - 50.55FuturSuplyCh 72.65 71.30 72.20 73.30 71.05 52.11 121.95 59.35 - 71.30
G . . . . . . . . . . . . . . . . . . . . . . . . . . . . . . . . . . . . . . . . . . . . . . . .Gabriel [1] 140.30 137.60 140.90 141.85 137.25 464.35 168.00 99.90 22 137.55Gail(India) 144.70 142.90 144.60 146.00 141.95 9183.01 171.35 124.40 8 142.85GalaxSurfact 3136.90 3134.50 3130.00 3142.95 3083.75 42.48 3600.00 2030.00 73 3134.25Gallant Isp [1] 54.05 53.20 53.85 54.70 52.75 39.71 69.90 33.65 14 52.90Gallant Mtl 73.95 71.25 74.60 74.90 70.70 74.35 88.00 40.10 8 71.65Gandhi Tub [5] 407.85 394.70 419.80 419.80 393.05 4.96 557.85 240.00 10 396.60Ganesh Hsg 209.00 200.45 212.85 212.85 198.55 45.42 243.50 30.80 - 200.35Ganesha Ecos 589.90 585.95 597.80 609.00 577.25 75.46 687.70 437.55 19 585.40GaneshBenzop 103.80 100.85 103.90 105.00 100.40 176.09 114.95 76.10 - - GangaForging 19.95 19.75 19.80 19.95 19.40 718.59 147.25 13.65 - - GangesSecu 94.60 92.00 96.80 96.95 91.50 7.79 105.00 53.00 15 92.30GardenReach 248.70 241.65 250.30 252.40 240.10 198.16 279.80 167.65 14 241.55GarwarTecFib 3300.50 3280.95 3346.75 3346.75 3269.65 20.32 4033.40 2132.15 42 3276.25Gati [2] 204.10 211.35 206.00 221.90 206.00 5335.29 221.75 84.05 - 210.95Gayt. Proj [2] 29.60 29.30 29.80 29.95 29.25 660.62 60.65 26.40 - 29.30GE Ship 312.50 315.00 312.00 319.90 311.20 398.51 477.00 229.00 8 314.85GE T&DInd 136.50 133.25 136.70 137.50 132.60 89.11 153.80 106.00 - - Geecee 168.90 160.45 169.70 171.85 158.50 47.24 191.50 81.00 23 161.40GeewayWires 87.35 84.05 87.95 87.95 82.60 24.46 112.90 69.95 - - Genesys [5] 405.55 425.80 425.80 425.80 425.80 32.73 420.60 62.70 121 420.60GenInsCorpIn[5] 141.30 140.35 141.30 143.70 140.00 558.32 243.70 130.90 10 140.35GenricEngCon 39.90 39.00 40.20 40.90 38.50 55.99 68.00 33.00 - - Genus P&B [1] 14.00 13.55 14.20 14.20 13.40 603.23 14.75 6.22 - 13.55Genus Pwr [1] 75.15 71.80 75.80 76.65 71.10 1083.09 93.85 32.20 34 71.70GeojitFinSer 83.75 82.55 84.40 86.25 81.80 488.34 102.70 43.55 - - GEPowerIndia 262.90 252.60 264.90 269.90 250.00 174.11 371.80 226.75 - 254.00GFL 71.05 69.50 71.30 71.80 69.00 83.07 118.00 60.50 - - GHCL 437.90 444.75 441.50 457.00 431.30 561.07 483.10 197.60 10 444.70GIC Hsg 157.65 155.60 158.40 162.45 155.00 169.20 202.50 104.60 4 155.70Gillander 71.40 68.25 74.00 74.00 67.85 27.55 74.50 36.10 - 68.15Gillette 5216.45 5236.85 5239.75 5287.90 5214.55 4.39 6270.05 5180.05 58 5234.85Ginni Fil 61.85 58.40 62.40 62.40 58.05 1499.61 63.65 17.85 10 58.40GKW 611.10 612.95 612.10 621.95 611.00 0.41 922.40 460.10 - - GlandPharma 3697.35 3675.50 3699.20 3717.00 3660.00 95.32 4350.00 2071.00 - - Glaxo Phr 1738.40 1712.05 1738.00 1753.35 1695.05 25.59 1917.00 1379.00 57 1711.40Glenmark [1] 516.95 495.20 517.50 521.50 491.00 1488.56 690.60 442.15 9 496.60GlnmarkLifSc 607.05 602.10 611.50 611.50 601.20 67.75 799.00 587.55 - - Glob.Spr 1692.55 1633.65 1693.00 1728.80 1621.00 213.46 1760.00 290.95 25 1628.65GlobalEductn 68.15 66.80 69.55 69.80 64.25 23.93 77.95 35.50 - - GlobeText(I) 14.40 13.80 14.60 14.70 13.75 1672.49 66.20 11.75 - -
GM Brew 740.35 725.70 746.30 747.00 723.40 36.33 922.85 370.00 13 725.15GMDC [2] 109.40 101.55 109.95 109.95 100.40 5507.28 115.30 52.00 11 101.60GMMPfauder [2] 5076.85 4919.10 5065.30 5099.85 4900.00 24.40 5435.00 3540.00 66 4924.15GMR Inf [1] 44.85 43.40 45.20 45.20 43.1016301.91 49.15 22.50 - 43.50GNA Axles 590.85 598.15 609.00 612.80 596.40 257.03 1107.35 339.10 13 598.40GNFC 494.35 475.40 496.70 498.70 470.75 1912.67 517.95 202.50 7 475.60GOFASHION IND 1103.20 1085.50 1103.00 1133.70 1069.00 114.14 1339.90 960.55 - - Goa Carb 382.65 382.45 384.40 397.95 377.00 86.14 482.20 235.00 30 383.95GOCL Corp [2] 350.20 348.35 355.50 357.55 341.00 61.79 386.00 190.00 23 347.90God.Pow.Isp [5] 274.90 268.95 275.50 277.05 267.90 158.79 460.00 107.65 3 268.60Godfrey [2] 1141.85 1139.70 1147.55 1153.70 1135.00 10.36 1409.85 831.85 14 1140.35GodhCarbnIns 106.25 111.55 111.55 111.55 111.55 14.17 111.55 32.10 - - Godrej Cons [1] 924.95 928.40 926.00 948.00 925.20 1309.98 1138.50 644.00 74 928.90Godrej Ind [1] 634.90 624.65 637.90 638.80 620.90 76.89 674.35 413.05 - 625.05Godrej Pr [5] 1977.95 1903.05 1983.00 2012.50 1894.80 1230.55 2598.00 1200.10 600 1905.65GodrejAgrovt 547.60 536.65 550.00 550.35 532.25 47.35 746.80 469.70 34 538.60Gokaldas [5] 386.90 374.00 388.20 394.65 366.60 245.56 396.80 73.05 46 374.00Gokul Agro [2] 76.55 80.35 79.00 80.35 76.90 254.61 84.05 18.65 21 80.25Gokul Ref [2] 41.25 40.25 41.50 41.70 39.85 336.64 47.80 15.50 - 40.10Gold.Tobac 117.80 116.55 120.25 120.25 115.40 10.88 189.85 35.05 32 116.50Goldiam Int 1014.40 984.65 1019.65 1026.00 975.00 48.68 1142.60 196.40 36 986.15GoodyearInd 996.50 980.80 1003.00 1003.00 965.00 13.83 1040.00 783.00 - - GP Petrol [5] 53.10 51.80 54.15 54.15 51.55 122.17 77.60 34.65 18 51.95GPTInfraProj 81.45 80.95 84.45 84.45 80.35 26.66 107.75 34.00 10 81.00Granuels [1] 331.10 323.45 332.00 335.00 322.00 2629.05 404.50 285.80 20 323.35Graphite [2] 554.55 538.90 555.00 573.00 534.05 2478.78 815.35 299.10 21 538.80Grasim [2] 1918.70 1852.25 1927.95 1929.80 1842.70 941.75 1939.00 991.80 53 1851.30Graur&WeilIn 63.15 63.10 63.90 64.05 62.50 374.69 70.90 53.50 - - Gravita [2] 334.60 332.45 334.60 347.80 327.10 654.55 347.00 73.00 55 330.25GreenlaInd [5] 1884.55 1875.05 1875.00 1895.20 1838.80 10.67 2024.90 785.00 44 1869.25GreenPly [1] 219.30 216.25 220.75 223.95 215.55 249.60 254.25 114.50 30 216.25GrenpanelInd 458.80 459.55 461.95 479.35 456.00 333.09 479.35 150.35 - - Grindwel [5] 1921.90 1908.85 1917.00 1939.85 1900.05 30.62 2025.45 672.45 73 1911.80GRInfraproj 1941.85 1915.75 1958.45 1958.45 1901.00 18.85 2267.65 1543.00 - - GRP Ltd 1502.25 1493.25 1483.75 1529.40 1427.00 5.32 1564.60 724.00 22 1491.00Grvs.Cot [2] 241.75 228.40 244.00 250.00 225.10 3425.32 251.60 84.55 115 227.05GSFC [2] 133.40 132.35 134.00 138.70 131.20 4139.06 150.75 71.55 9 132.55GSPL 315.60 314.20 314.95 320.00 305.05 1035.75 383.00 191.00 18 314.00GTL 21.35 20.45 22.40 22.40 20.3013071.15 32.55 4.86 11 20.45GTPLHathway 263.85 258.65 266.00 270.50 256.80 93.14 313.15 108.75 21 258.85Gufic Bio [1] 265.60 250.05 267.95 267.95 247.90 387.37 270.10 99.10 29 249.80Guj.Alk 708.40 679.80 710.00 714.00 671.45 251.18 845.50 304.35 24 676.65Guj.Ind.Pow 93.15 92.40 93.65 96.35 90.65 1462.49 105.65 72.25 8 92.75Guj.Pipav 99.75 98.00 100.25 100.45 97.55 284.51 124.15 86.15 23 97.95Guj.Sid.Cem 49.90 47.75 50.80 50.80 47.25 195.03 62.60 31.70 13 47.95Gujarat Gas [2] 696.10 676.05 694.30 697.75 672.60 943.76 786.65 342.30 32 675.55GujaratFluor 2826.45 2765.20 2844.00 2870.00 2717.95 88.20 2870.00 525.10 - - Gul.Amb.Ex [1] 182.90 190.15 185.00 194.40 180.15 3116.71 201.65 122.50 10 189.75Gul.Apl 222.15 217.85 222.15 227.45 216.50 11.60 277.20 197.20 - 218.70Gulf Oil Lub [2] 485.55 475.50 489.35 495.00 471.00 188.62 803.70 427.95 11 475.30
H . . . . . . . . . . . . . . . . . . . . . . . . . . . . . . . . . . . . . . . . . . . . . . . .HappiestMind 1337.85 1306.40 1340.00 1345.00 1300.00 174.56 1580.00 340.70 - - Harri.Mal 188.80 186.80 192.60 194.95 185.05 207.14 250.00 114.65 8 186.55Hathway [2] 23.25 22.50 22.80 22.95 22.20 6505.02 34.80 19.65 - 22.50Hatsun Agro [1] 1224.30 1209.10 1232.00 1232.00 1202.05 14.88 1533.65 676.00 98 1206.75HavellsIndia [1] 1329.05 1315.45 1326.35 1341.50 1311.00 423.88 1503.70 958.35 69 1315.40HBL Pwr [1] 67.60 65.60 68.25 68.45 65.00 1244.35 69.55 29.55 43 65.45HBStockhold 59.40 58.05 62.30 62.30 57.25 33.88 75.05 15.65 - - HCC [1] 16.40 15.80 17.00 17.15 15.7014315.39 18.76 7.00 - 15.85HCG 253.25 251.25 257.00 257.90 249.50 254.42 282.55 141.55 - 250.80HCL Info [2] 29.85 29.30 31.30 31.30 29.00 6412.39 31.35 7.95 - 29.35HCL Tech [2] 1258.75 1219.75 1269.95 1269.95 1217.00 7799.49 1377.00 890.00 40 1219.85HDFC [2] 2702.70 2662.50 2713.00 2713.55 2656.80 2086.27 3021.10 2354.10 37 2662.65HDFC AMC [5] 2489.15 2449.50 2494.00 2504.95 2430.65 375.04 3363.00 2281.00 38 2444.35HDFC Bank [1] 1521.50 1529.25 1533.00 1550.90 1523.00 6170.58 1724.30 1342.00 24 1529.60HDFCLifeIns 674.15 669.10 678.00 678.80 666.75 979.68 775.65 627.00 122 669.40HEC INFRA PROJ 40.65 38.80 42.00 42.60 38.65 21.70 42.60 28.80 - - HEG 1845.10 1784.80 1852.00 1899.00 1775.00 449.46 2626.15 910.85 41 1783.30Heidelbrg 239.25 234.40 239.25 241.00 233.00 167.00 284.55 209.65 16 233.55HemispherePR 137.60 154.15 139.95 163.80 138.8520280.73 167.20 121.05 - - HeranbaIndus 718.80 723.70 718.80 741.55 718.80 282.37 945.00 602.10 - - Herc.Hoi [1] 165.55 158.75 166.20 167.40 157.10 137.65 179.65 108.10 36 158.90Herit.Fds [5] 446.10 430.30 447.00 449.15 425.20 157.33 565.00 268.30 16 429.80HeroMoto [2] 2701.50 2692.85 2703.00 2727.00 2655.20 1082.63 3628.55 2310.50 17 2692.55Hester Biosc 2477.20 2483.35 2502.10 2526.50 2470.00 9.32 3180.00 1635.90 43 2480.00Hexa Trade [2] 148.60 148.25 145.15 153.90 141.55 21.05 235.20 38.30 - 146.80HFCL [1] 96.35 89.40 90.50 93.15 88.1057777.59 101.35 23.00 41 89.35HGInfraEngg 625.75 602.05 630.65 639.75 597.55 101.87 830.80 212.00 12 601.95Hikal [2] 460.60 448.40 455.50 473.70 445.00 819.01 742.00 142.85 30 448.00HIL 4584.00 4479.00 4599.00 4648.95 4458.30 8.17 6750.00 2134.05 18 4481.10Hilton Mtl 25.70 24.45 25.70 25.70 24.45 56.02 29.00 9.00 - 24.55HimadriSpec [1] 56.55 55.00 57.25 58.20 54.2022366.92 62.40 38.90 34 54.95Himat.Seid [5] 264.15 257.55 264.80 265.90 254.00 195.09 311.95 132.00 13 256.55Hind.Compo [5] 332.00 324.70 337.40 344.90 321.10 20.86 370.00 240.00 27 324.45Hind.Cop [5] 137.55 131.05 138.00 139.20 130.50 5754.71 196.90 53.60 69 131.10Hind.Media 78.45 77.20 79.85 81.35 76.65 250.84 107.00 52.60 8 77.75Hind.Mot [5] 13.85 13.70 14.00 14.45 13.50 836.81 18.20 5.54 - 13.71Hind.N.Gls [2] 35.70 32.15 35.00 35.80 32.15 229.27 53.20 24.50 - 32.30Hind.Oil.Ex 225.80 233.50 228.50 245.70 222.05 3284.88 245.15 78.40 71 233.35Hind.Znc [2] 327.50 325.80 329.90 329.90 325.10 243.63 407.90 257.00 16 325.75Hindalco [1] 505.95 496.00 508.80 512.35 493.80 6194.54 551.65 221.00 33 495.95HindconChem 67.45 70.10 68.70 72.45 63.35 132.12 86.95 41.75 - - HindujaGlo 2960.05 2835.40 2984.00 2996.00 2825.00 142.72 3948.00 1055.60 19 2837.05HindustnAero 1396.85 1389.55 1399.95 1430.00 1381.60 993.37 1568.45 884.00 13 1389.65HindustnFood 2216.85 2088.00 2218.00 2274.95 2060.00 17.67 2578.00 1417.00 - - HisarMetalIn 124.00 122.65 127.55 128.55 121.90 32.33 165.00 90.00 7 122.45HiTech Gr 293.25 289.10 294.00 298.80 285.80 48.62 364.90 155.00 11 287.80Hi-TechPipes 607.85 600.80 614.85 617.85 594.05 38.81 335.00 106.80 35 305.80HLEGlascoat 6515.60 6410.55 6645.00 6645.00 6352.05 7.85 7550.00 1755.00 - - HomeFirstFin 813.75 827.90 809.05 840.00 809.05 98.89 921.30 440.00 - - Honda Siel 1387.95 1357.15 1384.05 1390.70 1348.05 7.70 1467.20 902.00 19 1360.50Honey.Aut 46018.45 45015.45 46030.00 46397.70 44967.10 4.86 49805.00 37773.20 92 44998.55HOV Services 60.00 60.10 60.50 61.95 59.15 19.42 90.00 37.00 34 59.35HP ADHESIVES 442.75 424.45 445.00 447.45 422.00 114.59 505.00 420.85 - - HPCL 327.95 323.85 328.10 330.45 323.00 2935.66 354.55 212.50 5 323.75HPLElect&Pow 77.00 74.85 77.10 79.40 74.50 225.66 91.90 36.80 66 74.85HSG&UrbanDev 42.70 41.95 42.90 43.25 41.70 2045.75 58.25 37.85 5 41.95HSIL [2] 268.40 274.20 269.00 288.80 262.35 1887.63 288.70 105.00 16 273.40HT Media [2] 30.40 28.95 30.75 30.90 28.80 723.93 35.15 16.40 - 28.95HuhtamakiInd 218.20 214.30 218.20 221.35 213.20 168.59 352.15 206.00 - - HUL [1] 2389.55 2369.50 2408.70 2408.70 2357.40 1667.58 2859.10 2104.25 67 2369.05
I . . . . . . . . . . . . . . . . . . . . . . . . . . . . . . . . . . . . . . . . . . . . . . . . .Ibull Hsg [2] 222.55 221.35 223.25 227.70 220.5011444.71 313.50 154.30 11 221.65Ibull Real [2] 167.25 163.35 168.00 170.80 162.2510427.64 195.90 72.75 - 163.40IceMakRefrig 75.65 81.70 77.00 90.75 76.00 608.96 95.45 57.30 - - ICICI Bank [2] 819.30 823.10 821.00 836.00 818.2010835.15 859.70 512.10 29 823.35ICICILombGIC 1432.35 1447.60 1460.00 1465.00 1414.45 1692.26 1674.00 1295.00 55 1443.95ICICISecu 823.45 819.60 838.00 838.00 801.70 1502.03 896.05 376.90 - - ICRA 3534.65 3551.45 3566.00 3572.50 3544.55 3.82 4158.60 2672.50 49 3566.50IDBI 52.10 50.70 52.40 52.80 50.4010078.31 65.25 26.35 26 50.65Idea Cell 12.50 12.05 12.60 12.60 12.00179807.33 16.79 4.55 - 12.05IDFC 64.95 62.60 64.95 65.50 62.3011339.01 66.00 40.65 - 62.60IDFCFirstBnk 49.00 47.75 49.40 49.60 47.6022624.69 69.30 40.75 - - IFB Agro 741.00 736.30 770.00 770.00 726.15 54.83 770.00 365.40 10 739.85IFB Ind 1200.75 1190.55 1210.00 1235.00 1180.10 20.33 1458.10 873.60 88 1194.95IFCI 16.65 16.20 16.75 16.85 16.15 5976.63 18.87 8.21 - 16.25IFGLRefract 334.85 334.35 343.00 344.85 331.20 100.42 434.00 228.00 28 332.95IG Pet 738.30 723.90 744.60 745.00 720.00 39.52 1017.90 363.10 8 723.60Igarshi 492.85 494.60 496.75 509.75 490.00 93.67 612.20 262.85 47 494.95IIFLHoldings [2] 313.70 303.50 316.70 322.00 301.10 771.14 375.05 110.25 20 303.60IIFLSecurity 98.85 97.10 100.80 102.85 95.30 995.00 128.50 43.75 - - IIFLWealtMgt 1633.75 1540.40 1614.00 1641.65 1521.05 295.40 1785.40 989.85 - - ImagiWrldEnt 11.60 12.15 12.10 12.15 11.80 363.38 14.00 4.95 - - IMPAL 802.70 791.85 805.00 812.15 791.10 1.73 940.00 525.05 17 791.60Ind Terr [2] 69.95 66.60 70.45 70.45 65.90 367.81 74.80 26.60 31 66.75Ind.Bk.Mer 25.45 24.80 25.95 25.95 24.65 106.25 37.25 9.70 17 25.00Ind.Cem 251.25 235.60 252.00 252.80 233.40 6240.35 259.90 150.05 38 235.85Ind.Gly 1025.00 973.80 1030.00 1034.60 970.00 189.73 1060.00 353.10 22 973.45Ind.Hume [2] 213.05 218.30 214.80 229.90 212.00 622.30 252.70 166.00 16 218.25Ind.Inv.Tru 82.60 83.20 85.40 85.40 80.15 2.39 89.30 50.00 - 82.00Ind.Metals 419.50 418.40 418.00 425.00 415.00 59.35 498.50 178.05 7 417.65Ind.Nippon [5] 574.10 564.35 597.60 624.80 550.35 180.25 619.60 329.05 24 567.70Ind.Ovr.Bk 20.90 20.55 20.95 21.05 20.50 3329.40 29.00 10.30 - 20.55Ind.Ram.Sy 83.85 83.60 85.00 90.80 80.15 1428.19 90.25 31.10 8 83.60Indian Bk 145.75 141.50 146.50 146.85 139.15 1865.73 194.80 86.40 4 141.30Indian Htl [1] 208.95 207.35 210.20 214.00 206.00 6202.12 230.25 90.94 - 207.40IndianEgyExc[1] 266.05 253.10 267.40 267.50 252.0011993.52 318.71 75.25 86 252.90IndianRailTr 897.35 861.10 899.90 904.20 855.90 5857.77 6396.30 639.45 - - IndianRlyFin 24.05 23.70 24.25 24.35 23.65 7441.05 26.70 20.80 - - IndiaPestcid 321.75 315.60 323.55 323.55 314.00 191.51 368.00 289.00 - - IndigoPaints 2074.20 2058.00 2096.00 2099.95 2040.00 35.18 3329.95 1900.00 - - IndmrtIntmsh 6703.55 6502.75 6709.95 6733.30 6451.35 91.90 9950.00 6290.00 - - Indo Count [2] 267.10 258.55 269.75 271.40 257.00 441.68 314.80 113.00 14 258.45Indoco Rem [2] 437.95 429.05 439.95 441.85 427.65 55.02 529.70 273.90 30 428.70IndostrCapFn 275.45 266.50 276.85 279.85 261.00 109.23 416.95 228.25 - 264.70Indotech Tr 217.65 215.75 217.70 220.55 215.15 9.62 290.95 82.25 16 216.05Indra.Med 80.80 82.20 81.90 84.75 79.90 767.05 102.55 52.05 14 82.25IndraprsGas [2] 454.80 453.35 457.10 464.90 450.50 3629.16 604.00 450.50 24 453.05IndSwifLab 83.00 81.00 84.90 85.60 80.65 163.76 127.35 56.00 19 80.95IndusInd BK 920.50 899.65 920.50 927.35 895.35 3088.06 1241.85 788.60 18 900.20IndusTowers 271.55 261.65 273.00 275.00 260.40 2560.56 332.80 194.10 - - INEOS Styro 1365.00 1314.70 1360.00 1360.00 1306.00 39.53 1886.80 902.55 5 1312.85Infibeam Inc [1] 40.85 44.30 43.70 46.90 43.3036723.03 58.45 36.80 - 44.35INFO EDGE (I) 5652.35 5345.45 5674.00 5690.00 5266.55 445.33 7462.95 4027.00 189 5333.80InfobeansTec 559.75 534.85 559.80 577.90 530.05 102.42 592.90 135.30 - - Infosys [5] 1939.50 1920.75 1922.10 1945.00 1911.45 3690.32 1953.70 1230.00 39 1920.95Infrasoft 234.90 231.60 236.90 241.95 231.00 103.46 259.00 63.00 145 232.20Ingersoll 1345.60 1334.75 1352.35 1355.60 1322.30 19.88 1370.00 667.00 43 1334.35Inox Leis 380.55 380.10 382.50 384.90 375.10 358.91 466.10 241.90 - 379.95Inox Wind 126.45 124.35 126.10 131.00 123.10 1028.95 160.00 61.45 - 124.50Insectic 722.95 715.40 726.60 731.00 711.35 9.21 846.00 405.00 14 714.30IntellecDesi [5] 793.30 760.95 799.10 805.10 753.25 480.57 892.00 311.00 44 759.75IntenseTech [2] 90.30 87.10 90.80 90.80 86.40 168.44 119.75 30.90 17 87.40IntGlobAviat 2165.25 2112.25 2168.00 2183.00 2097.05 819.35 2379.00 1502.90 - 2113.35IntlConveyor 85.25 84.35 86.00 87.85 83.30 525.01 102.45 57.85 - - Inventure [1] 6.45 6.15 6.75 6.75 6.1564897.96 6.76 1.45 - 6.23IOC 123.75 123.95 124.20 125.55 123.3514263.85 141.75 86.70 4 123.85IOL Chem 467.00 469.80 467.00 480.00 467.00 403.10 738.50 424.25 9 470.20IPCA Lab [1] 1063.10 1048.85 1070.00 1072.40 1045.00 314.87 1383.55 893.03 28 1048.90I-PruLifeINS 615.65 608.00 618.50 648.85 603.55 1705.77 724.50 411.00 139 607.50IRB Infra 243.75 242.65 243.90 251.95 239.00 2470.54 346.95 100.70 - 243.35IrconIntl 47.70 46.70 48.00 48.15 46.45 1454.00 108.50 40.15 - - IrisBusiServ 145.75 143.00 145.75 147.95 142.00 9.80 165.50 107.25 - - IrisClothing 202.35 202.10 206.90 206.90 199.05 3.90 239.00 62.35 - - IsgecHeavyEn 693.45 667.45 693.45 698.90 660.75 69.65 878.35 524.15 - - ITC [1] 224.60 220.75 224.60 227.30 220.3014394.10 265.30 199.10 19 220.80ITD Cem [1] 84.90 81.65 84.90 85.50 81.10 828.69 97.50 61.75 12 81.85ITDC 380.40 386.15 377.60 391.00 377.10 104.14 463.90 296.50 - 386.00ITI 120.40 119.95 122.65 122.65 119.80 216.97 143.70 102.20 - 119.85IVP 134.95 127.40 138.00 138.00 126.10 26.16 164.00 71.10 11 129.10IZMO Ltd 95.45 93.40 97.70 99.40 91.40 186.28 148.85 44.05 - 94.00
J . . . . . . . . . . . . . . . . . . . . . . . . . . . . . . . . . . . . . . . . . . . . . . . . .J&K Bk [1] 42.80 41.15 42.85 43.00 41.00 3922.28 48.20 22.50 6 41.20Jagran [2] 73.70 72.05 74.55 75.30 71.65 530.48 79.50 39.70 9 72.05Jags.Phr [5] 176.00 172.75 178.80 178.80 172.05 99.11 203.25 72.80 18 172.50Jai Corp [1] 134.15 134.60 135.05 140.50 133.30 4280.74 172.85 79.35 21 134.65JaiBal.Ind 56.15 52.60 56.90 57.20 52.00 293.46 668.00 81.00 - - Jain I.DVR [2] 27.70 27.05 28.20 28.20 27.00 57.00 30.35 10.81 - 27.05Jain Irrg [2] 48.00 46.85 48.25 49.50 46.55 4030.03 53.50 16.15 - 46.90Jamna Au [1] 121.75 115.30 122.20 122.45 113.85 1336.32 124.90 58.35 37 115.40JashEngg 496.90 491.50 497.50 524.00 481.95 66.86 628.00 225.30 - - Jay Bhr [5] 195.00 188.00 196.00 196.00 187.00 56.86 269.00 98.75 18 188.25Jay.Agro [5] 230.70 226.05 232.70 232.70 225.00 22.76 322.90 125.50 11 226.20Jaypee Inf 4.50 4.30 4.50 4.55 4.3011482.02 5.05 1.38 - 4.24Jayshr Tea [5] 110.95 107.85 111.30 112.70 106.05 188.11 145.00 64.85 14 107.45JB Chem [2] 1732.40 1739.80 1730.60 1748.00 1716.90 35.58 1984.75 957.00 29 1739.05JBM Auro [5] 1510.00 1488.60 1513.05 1539.00 1479.95 72.45 1643.45 329.55 75 1487.85JETFREIGHT Log 74.20 77.70 77.70 77.90 74.25 154.08 77.90 44.40 - - JHS Svend 31.10 29.60 31.40 31.80 29.40 361.57 33.40 18.80 - 29.65Jind P.Inv 360.80 378.80 378.80 378.80 378.80 20.64 441.25 25.25 - 380.90Jind.Drl [5] 161.50 162.15 162.75 175.40 157.05 646.58 175.65 79.35 20 162.80Jind.Pho 335.45 352.20 352.20 352.20 352.20 43.89 485.20 21.85 - 352.50Jind.Poly 1107.80 1081.65 1120.00 1128.85 1061.05 90.95 1238.15 410.60 5 1084.05Jind.Saw [2] 112.40 113.70 113.45 119.40 113.00 9493.81 147.65 68.75 7 113.80Jind.Stl&P [1] 418.65 402.40 420.00 421.65 400.50 5251.37 501.60 257.50 4 402.60Jind.World [1] 296.10 317.40 297.90 329.00 295.60 660.99 328.70 44.00 77 316.95JindStain(H) [2] 389.35 383.50 393.00 401.10 381.65 341.25 401.00 109.85 9 383.80JK Cem 3600.00 3449.40 3599.95 3607.50 3430.50 63.73 3836.65 2042.50 36 3452.60JK Lak.Cem [5] 607.05 608.70 610.00 613.55 605.50 184.67 815.25 310.70 16 608.20JK Paper 227.30 221.90 232.40 232.75 220.00 1456.14 284.80 117.00 8 221.75JK Tyre [2] 138.45 140.05 139.55 142.25 138.05 2045.67 171.60 85.60 10 140.00Jkumar Inf [5] 175.40 170.15 176.40 176.75 169.35 131.78 231.00 137.00 8 170.20JM Fin [1] 77.20 75.80 77.95 78.20 75.30 818.17 117.55 68.35 24 76.00JMC Proj [2] 103.50 105.80 104.00 112.45 103.05 704.33 130.00 63.50 - 105.75Jocil 197.65 194.70 199.40 203.95 193.95 15.71 319.80 139.00 - - JohnCntHita 1945.70 1929.30 1955.00 1967.20 1925.15 6.84 2936.70 1856.60 95 1927.55JP Associ [2] 11.45 11.00 11.50 11.55 10.9013247.23 15.90 6.42 - 11.00JP Pwr 10.05 9.55 10.15 10.25 9.50141108.76 11.22 2.39 - 9.58JSL [2] 206.50 203.60 207.75 214.30 201.50 2763.28 214.30 60.30 10 203.25JSW Hld 4148.90 3991.20 4200.00 4200.00 3900.00 1.43 6000.05 3400.00 34 3975.85JSWIspatSpe 42.90 41.65 43.50 45.40 41.4018626.09 67.55 22.40 - - JSWSteelLtd [1] 699.40 680.20 703.35 704.55 677.55 3450.19 776.50 356.00 9 680.00JTEKTIndia [1] 97.50 94.65 97.90 98.30 94.10 162.27 132.75 80.00 47 94.55JTL INFRA 259.60 250.95 262.15 262.20 249.50 94.52 269.50 209.60 - - Jub.Ind 728.50 698.10 740.00 740.00 692.00 23.72 796.90 162.00 - 697.60JubilantPhar 570.05 561.00 572.00 574.65 557.00 121.33 1046.95 557.00 - - JublilntFood 3893.95 3787.20 3924.90 3924.90 3775.00 431.27 4577.45 2545.00 119 3788.10JublntIngrev 635.30 610.30 637.80 641.00 606.40 663.01 838.75 295.50 - - JullundurMot 85.55 82.60 86.00 87.65 80.80 83.48 93.80 29.30 - - JustDial 881.10 839.60 886.05 888.50 835.00 598.36 1138.00 550.00 62 839.55Jyo.Lab [1] 143.10 140.70 143.85 144.90 139.50 278.43 187.20 135.25 29 140.50
K . . . . . . . . . . . . . . . . . . . . . . . . . . . . . . . . . . . . . . . . . . . . . . . .Kabra Ext [5] 501.55 475.55 506.85 506.85 472.00 150.63 529.70 93.10 54 475.20
MUMBAI
BusinessLineWEDNESDAY • JANUARY 19 • 2022 IMARKET RADAR
For BSE/NSE live quotes, scan
the QR code or click the link
https://bit.ly/2FpossK
................BMBMECMYK
Company Prev Close Open High Low Qty 52 WH 52 WL PE BSE Cl Company Prev Close Open High Low Qty 52 WH 52 WL PE BSE Cl Company Prev Close Open High Low Qty 52 WH 52 WL PE BSE Cl Company Prev Close Open High Low Qty 52 WH 52 WL PE BSE Cl
NitirajEngg 75.10 72.75 75.10 76.30 72.10 3.09 82.80 38.20 NLC India 69.65 68.35 70.25 71.00 68.05 5187.38 80.00 46.25 8 68.40NMDC Ltd [1] 144.80 140.05 145.30 145.65 139.70 6137.01 213.15 103.60 4 140.20Nocil 256.15 248.05 255.05 257.00 247.00 472.80 321.00 140.05 30 248.30Noida Toll 9.85 9.40 10.05 10.05 9.40 470.69 10.33 5.13 9.37Norben 10.70 11.75 11.70 11.75 11.70 16.49 11.75 4.90 NovartisInd 772.05 780.95 778.90 793.05 768.95 28.36 927.00 750.15 NRAgarwalInd 264.45 259.55 266.65 266.65 258.20 12.87 361.15 193.85 NRB Bear [2] 180.65 171.65 180.00 184.20 170.10 365.73 189.65 95.25 20 172.50NRB Ind [2] 25.50 24.20 25.15 25.40 23.95 39.41 34.80 9.25 24.45NTPC 136.60 135.00 136.60 137.75 134.40 6473.38 152.10 88.20 9 134.90Nucleas Sw 576.85 557.65 579.75 579.75 554.00 35.12 765.35 476.00 25 557.35NURECA 1876.15 1849.25 1885.00 1917.05 1825.00 17.30 2315.00 555.60 NuvocoVistas 512.75 504.40 514.00 516.40 502.20 270.68 577.90 485.00 Nxtdigital 448.05 426.85 452.00 452.00 420.40 59.17 619.80 333.30
O . . . . . . . . . . . . . . . . . . . . . . . . . . . . . . . . . . . . . . . . . . . . . . . . .Oberoi 975.65 941.60 984.00 997.85 933.15 1987.22 1051.90 509.85 67 945.50OdishaCeme [2] 2066.70 1981.55 2082.00 2082.00 1969.95 118.65 2547.20 1082.00 321 1986.00Oil Country 9.70 9.85 9.70 10.00 9.60 31.90 12.92 3.81 9.84Oil India 224.65 224.05 226.35 229.75 221.05 1128.24 267.70 108.55 8 223.95OlectrGrnTec 811.05 793.45 815.00 818.80 790.00 146.70 877.80 55.00 Omax Auto 59.75 55.65 60.25 60.90 55.10 120.46 74.00 36.95 55.75Omaxe 89.20 87.50 91.00 91.50 86.60 189.66 102.20 56.00 87.70OMDC [1] 2909.80 2872.20 2934.85 3005.00 2850.00 32.14 3800.00 2211.00 2873.40OmInfraLtd 45.45 52.15 45.50 54.40 45.50 1745.76 54.40 18.95 Omkar Spl 39.40 37.50 38.60 40.45 37.45 232.51 47.05 4.74 37.30One97Communi 1105.30 1041.65 1105.50 1118.45 1030.00 4933.84 1955.00 1000.00 Onelife Cap 17.05 16.60 16.85 17.30 16.35 58.09 25.09 5.55 16.61OnePntOneSol 96.00 13.40 13.40 13.40 13.05 81.86 96.05 10.55 ONGC [5] 165.85 163.85 168.30 168.40 163.4011175.41 172.80 87.90 7 163.80OnMobile 134.65 128.85 137.00 137.05 128.00 1508.99 154.35 50.70 85 128.75Onward Te 355.00 353.50 362.00 372.75 345.00 178.08 372.55 82.05 93 353.25OptimusInfra 301.05 290.55 305.95 305.95 287.00 119.34 411.60 82.50 22 291.35OracleFinSer[5] 4073.65 3979.05 4069.15 4105.70 3965.00 86.96 5144.60 2933.05 20 3996.50Orbit Exp 102.55 93.50 101.00 102.90 91.05 200.71 107.10 55.20 30 93.70OrchidPharma 435.65 419.20 435.65 443.75 415.25 13.83 1667.00 387.50 Oricon Enter [2] 40.25 40.10 40.80 41.50 39.45 524.55 44.80 17.15 40.05Orient Bell 363.60 365.20 363.00 373.00 361.05 13.89 432.10 191.05 29 365.15Orient Cem [1] 176.05 170.30 177.35 177.80 169.15 441.78 185.50 79.10 12 169.95Orient Htls [1] 59.95 55.60 61.25 61.60 54.10 1313.00 65.90 21.10 55.95Orient Pap [1] 35.30 34.15 36.00 36.00 33.80 2332.49 39.40 19.80 34.10Orient Pres 92.15 84.40 92.30 92.90 83.05 79.05 123.80 62.20 83.90OrientAbr [1] 31.70 31.05 31.85 32.25 30.90 130.82 38.60 20.00 31.05OrientalArmt 795.55 799.15 800.00 813.00 793.00 9.98 1100.00 545.05 OrientalCar 981.90 986.55 999.00 1001.00 981.90 8.76 1321.00 830.05 13 984.15OrientElect 369.40 364.85 368.00 371.20 360.65 183.11 408.00 225.95 OrtinLabs 34.35 35.10 34.80 37.30 33.55 543.40 52.25 21.40 Oswal Chem 31.70 30.25 31.55 31.95 30.10 355.01 36.75 15.25 19 30.30OswalAgroMil 36.35 36.00 35.65 36.70 35.30 133.91 45.30 8.35 35.85
P . . . . . . . . . . . . . . . . . . . . . . . . . . . . . . . . . . . . . . . . . . . . . . . . .P&GHealth 5059.30 5052.25 5060.00 5127.95 5050.00 6.09 7500.00 4903.00 P&S Bk 16.85 16.65 17.00 17.00 16.55 282.97 23.79 12.60 16.65Page Ind 44450.45 43669.95 44584.95 44699.75 43500.00 19.70 45162.90 27053.05 110 43706.20PaisaloDigit 785.85 798.50 787.70 808.00 766.85 87.11 1143.15 560.10 55 795.45PalredTech 236.60 248.40 248.40 248.40 242.30 78.19 252.00 53.95 248.40Pan.Petro [2] 313.40 313.70 315.00 322.85 310.00 289.82 332.55 92.05 10 313.60Panac.Bio [1] 190.00 188.75 190.00 193.00 188.00 79.88 453.70 163.80 188.25PanachDigLif 70.10 68.50 72.15 72.20 68.00 9.83 94.80 39.15 PansriDevlop 134.20 130.55 140.00 140.00 127.50 4.06 176.45 57.75 ParagMilk 123.10 118.90 121.35 123.70 118.20 440.54 159.85 94.00 28 119.15ParasDef&Spc 729.80 712.60 732.95 734.75 710.00 184.76 1258.20 617.15 ParDrugs&Che 198.20 194.30 201.95 201.95 192.20 15.45 310.60 142.90 PasuptiAcryl 51.35 49.00 51.95 52.60 48.40 271.32 57.60 28.05 Patel Int 18.05 19.60 18.10 19.85 17.65 1020.37 19.85 9.75 19.55PBA Infra 16.10 15.55 16.85 16.90 15.30 116.20 22.73 7.50 1 15.68PBFintech 1022.60 998.80 1022.50 1027.00 980.10 702.68 1470.00 856.85 PC Jewl 27.80 26.85 27.80 27.90 26.75 1117.91 32.75 19.95 24 26.80PCBL 251.60 244.75 252.50 254.50 242.55 1260.48 277.30 173.00 PDS Multinat 1783.00 1764.15 1805.00 1829.90 1750.00 7.07 1901.00 587.50 95 1760.20Pearl Glo 500.60 490.35 508.75 509.95 490.00 40.28 537.95 157.90 213 490.45Pearl Poly 18.35 19.25 18.75 19.25 17.95 172.63 25.30 13.87 1 19.25Pennar Ind [5] 39.00 40.70 39.50 44.35 38.10 8600.98 44.35 16.25 17 40.75Persistnt 4377.85 4349.00 4352.10 4460.00 4309.25 273.43 4986.85 1482.05 57 4333.55Petronet 223.20 220.35 224.55 224.55 220.00 1429.48 260.90 209.60 11 220.20PFC 126.95 124.05 127.50 128.15 123.50 2338.77 153.75 104.10 3 124.00Pfi�zer 4875.25 4834.90 4865.00 4895.65 4822.25 105.83 6164.80 4200.00 38 4835.40PG Elec 821.85 817.80 827.65 839.00 814.00 46.98 870.00 131.10 76 816.75PGHH 15897.10 16045.95 15960.00 16230.85 15926.45 16.43 16402.00 10900.00 84 16075.35Phoenx.Mil [2] 1011.15 989.60 1019.00 1025.00 983.25 225.58 1199.95 672.00 53 988.40PI Ind [1] 2796.10 2713.10 2814.90 2814.90 2705.40 323.43 3533.30 1982.45 52 2715.30PidiliteInd [1] 2714.55 2685.10 2737.25 2737.25 2671.10 325.79 2764.60 1662.95 104 2686.00Pilani Inv 1931.00 1906.50 1951.00 1951.00 1898.00 7.05 2246.95 1523.90 15 1905.45Pion.Dist 189.65 183.50 190.00 192.80 182.00 13.28 209.30 92.00 185.00Pion.Emb 63.95 62.50 63.95 64.95 62.10 132.19 79.60 36.05 6 62.35PiramalEntp [2] 2671.85 2571.50 2679.00 2698.25 2557.00 486.55 3013.00 1303.60 240 2571.75PittiEngg [5] 278.80 277.00 292.70 292.70 274.10 357.08 292.95 54.10 18 278.20Plastiblen [5] 246.15 241.40 248.85 248.85 240.05 17.56 305.95 207.25 17 241.35PNB Gilts 74.95 72.95 75.20 75.45 72.60 395.46 94.65 40.05 5 73.00PNB Housing 514.35 490.75 515.50 517.80 488.65 467.03 924.00 325.25 10 491.20PNC Infratec [2] 307.35 298.45 311.70 311.70 293.30 360.76 395.55 177.00 17 298.90PodarHseDVPT 207.10 215.30 217.55 224.00 206.00 32.16 250.75 139.00 217.30PoddarPigmen 319.85 311.65 319.85 321.95 308.00 23.19 434.00 162.50 13 310.95Pokarna Ltd [2] 721.20 714.25 735.00 739.75 710.00 36.75 794.90 185.20 486 714.65Poly.Medi [5] 909.35 912.45 913.90 917.90 901.20 39.90 1163.00 485.00 61 910.45PolycabIndia 2702.75 2658.70 2723.00 2771.75 2643.40 864.19 2771.75 1126.10 Polyplex 1846.55 1819.05 1853.95 1860.90 1809.95 78.86 2108.00 655.15 10 1819.40PonawalaFinC 287.90 278.40 288.90 288.90 276.00 3660.57 302.90 41.10 Ponnie Sug 279.40 272.80 283.00 284.35 270.00 34.73 382.50 131.15 9 273.90Power Mech 990.95 989.30 991.00 1010.15 985.05 55.11 1094.70 410.80 14 990.75PowerGrid 206.35 205.15 206.25 207.85 204.60 6356.57 216.35 136.88 10 205.10Praj Ind [2] 427.15 417.40 434.00 435.85 414.70 1957.94 441.00 110.25 62 417.25PrakashPipes 158.25 157.30 158.25 162.00 154.35 130.07 194.70 105.65 Praksh.Ind 63.60 61.10 64.05 64.90 60.85 1287.26 104.65 47.20 7 61.20Praksh.Stl [1] 9.25 9.00 9.50 9.70 8.80 5566.64 9.92 0.72 8.98PratapSnack [5] 874.85 878.70 887.95 887.95 865.55 16.90 953.00 484.65 66 877.75PraxisHomeR[5] 60.75 62.65 58.10 63.75 58.00 89.92 63.65 17.83 62.45PrecisionCam 181.90 174.85 183.00 185.15 173.00 680.43 185.20 38.05 27 174.70Precot 392.15 372.55 396.00 400.00 372.55 56.57 400.00 91.70 Precsn.Pipe 239.15 240.10 242.00 250.00 236.95 35.74 339.35 173.65 23 239.75Precsn.Wre [1] 96.80 102.30 100.20 113.00 98.75 5056.87 113.00 26.62 21 102.50PremierExplo 246.45 241.45 246.45 248.95 237.50 23.71 287.55 117.00 196 240.20PremPolyfi�l [5] 93.35 89.90 94.60 94.60 89.10 17.51 58.87 26.27 45.20Pressman [2] 34.40 36.15 35.15 38.95 33.95 885.94 39.30 20.55 17 36.15Prestige Est 512.45 526.65 537.10 554.90 522.00 4939.55 553.40 260.15 79 525.45PRICOL [1] 134.00 127.80 135.15 136.40 127.00 2022.88 138.35 47.50 41 127.95Prime Foc [1] 66.55 69.85 67.85 69.85 65.70 115.02 96.40 45.10 28 69.90Prime.Sec [5] 123.00 114.90 123.50 126.95 113.40 38.13 133.25 38.00 32 114.30PrincPipeFit 736.15 721.00 740.00 743.55 715.35 397.20 897.00 282.30 PrismJohnson 151.00 148.25 152.90 152.95 146.70 721.93 160.00 83.00 25 148.05Prit.Nandi 60.55 60.45 60.55 64.10 59.10 104.20 73.00 17.10 60.35PritikAutoIn 19.70 19.60 20.05 21.40 19.25 2734.39 22.80 13.75 PriviSpecial 2227.75 2206.90 2227.75 2247.75 2200.00 26.16 2249.00 560.00 PSPProjects 514.70 500.30 516.00 531.90 488.00 328.29 552.20 394.00 14 496.85PTC 109.40 111.95 110.90 114.90 109.55 2114.16 144.45 57.30 8 111.90PTC Ind Fin 20.85 23.05 21.05 24.10 20.7020188.04 24.10 15.75 23 23.10PTL Ent [1] 37.35 35.95 38.10 38.10 35.75 396.16 41.80 17.53 12 36.00PudumjeePap[1] 44.15 42.95 44.50 44.90 42.50 253.25 50.90 20.20 6 42.90Pun.Natl.Bk [2] 39.85 39.10 40.00 40.20 39.0044095.23 47.60 31.50 13 39.20Punj.Chem 1606.00 1544.80 1610.00 1614.90 1533.00 12.38 1930.00 755.00 28 1548.00Punj.Mohta 29.55 29.65 29.25 30.15 29.20 56.62 36.75 12.20 29.90Puravankra [5] 146.55 143.05 147.70 152.90 141.30 374.88 166.35 63.00 19 143.75PVR 1573.05 1565.05 1577.00 1605.50 1552.00 1643.78 1838.00 961.00 1564.55
Q . . . . . . . . . . . . . . . . . . . . . . . . . . . . . . . . . . . . . . . . . . . . . . . . .Quess Corp 804.85 812.35 808.90 835.00 806.05 131.62 990.00 522.55 811.10QuickHealTec 235.35 231.10 236.20 237.95 229.70 164.84 319.90 150.10 14 230.95
R . . . . . . . . . . . . . . . . . . . . . . . . . . . . . . . . . . . . . . . . . . . . . . . . .R Sys Intl [1] 327.25 319.70 330.70 334.75 310.10 126.55 354.55 109.00 35 320.75Radaan [2] 1.90 1.95 1.95 1.95 1.95 2.84 2.14 0.75 2.14Radico [2] 1171.10 1144.25 1179.00 1186.60 1140.00 231.29 1299.85 481.00 54 1145.90RailTelCorp 121.40 120.30 122.40 122.40 120.10 747.98 189.70 101.00 RailVikasNgm 38.40 37.45 38.70 39.10 37.30 6571.09 44.80 26.35 Rain Ind [2] 248.40 232.65 248.85 248.85 229.30 3719.79 272.90 115.10 232.80Raj.Exp [1] 950.95 916.35 939.00 948.65 908.00 457.59 994.50 471.50 43 917.40RajnandniMet 187.85 187.40 189.80 189.80 187.25 5.91 192.80 37.25 RajOilMills 79.75 78.05 79.75 80.95 76.75 8.78 150.35 21.35 RajratanGlbl 2794.15 2714.15 2786.00 2929.90 2661.05 38.83 2929.90 239.05 RAJSHREE POLY 246.05 237.50 252.00 252.00 233.05 10.77 284.00 182.65 Rallis [1] 287.00 286.85 289.00 299.05 285.00 1536.59 362.00 243.85 30 287.15Rama News 21.55 21.05 21.55 21.90 20.80 168.38 27.60 13.85 21.05Rama Steel [5] 351.60 369.15 337.00 369.15 336.00 1457.99 455.15 66.60 65 369.90Ramco Cem [1] 1021.60 971.35 1024.80 1030.00 965.00 455.24 1130.95 765.85 21 972.45Ramco Ind [1] 276.30 279.00 278.95 291.00 273.05 358.45 366.00 205.00 19 278.95Ramco Sys 442.85 437.25 445.60 449.05 434.30 79.12 713.00 366.70 358 437.90Ramk.Forg 1046.05 1012.60 1060.00 1064.05 996.25 553.74 1259.60 484.85 21 1010.75Ramky Inf 234.00 251.80 235.50 258.50 234.15 1150.95 258.35 41.80 13 251.90Rana Sug 30.45 29.65 30.85 30.85 29.50 1318.81 38.30 5.99 3 29.60Rane (M) 435.90 420.00 440.70 442.00 416.55 97.47 496.00 245.00 20 419.75Rane Brk 833.00 817.90 842.70 843.00 815.10 6.92 1200.90 704.40 18 816.45Rane Eng 298.35 291.60 303.80 303.80 290.00 7.97 386.00 245.00 291.90Rane Hld 644.05 623.05 648.90 648.95 618.85 53.10 782.45 544.85 50 624.50RatanindiaEn 59.30 56.85 59.30 60.55 56.50 2022.42 65.90 4.55 RATEGAIN TRAV 493.90 515.20 496.00 525.00 485.20 2604.39 525.00 297.40 Ratnamani [2] 1903.10 1900.60 1911.00 1931.85 1892.15 30.17 2300.00 1455.00 30 1906.40RavindrHeigt 32.00 30.90 31.05 32.50 30.70 51.66 34.80 15.05 Raymond 782.15 734.40 784.80 788.55 729.00 1730.62 793.00 310.00 96 735.30RBL Bank 155.20 149.20 156.60 156.80 148.4517655.84 268.90 123.70 149.15RCF 83.95 84.40 84.30 88.65 83.8023452.88 100.15 51.70 10 84.35RECL 139.80 136.40 140.00 141.20 136.00 2748.28 168.70 122.20 3 136.45Redington [2] 172.90 166.50 173.25 173.70 165.10 5003.71 179.25 65.90 16 166.30Refex Ref 136.80 135.55 137.00 140.00 135.00 87.21 173.10 78.00 8 136.00Rel Cap 16.50 16.45 17.10 17.30 15.90 4406.54 30.80 9.30 16.41Rel.Ind.Inf 951.40 947.15 959.70 983.90 933.00 1267.15 1031.25 344.00 177 946.75Rel.Infra 105.55 101.95 106.90 107.50 101.50 1845.99 116.05 27.20 101.90Relaxo [1] 1332.70 1314.40 1343.00 1344.60 1310.00 79.65 1447.00 810.00 112 1314.10Reliance 2552.25 2521.80 2554.75 2562.35 2515.75 2868.24 2750.00 1830.00 50 2520.85Religare 137.05 132.05 137.90 139.10 131.50 642.50 194.50 60.70 132.05Remsons 240.20 239.80 252.00 252.00 235.25 9.42 313.80 102.00 32 238.35RenaisncGlob 1030.15 994.15 1038.45 1070.00 981.00 68.36 1090.90 275.00 Repco Home 269.80 270.80 273.50 277.35 268.00 127.47 429.25 237.10 6 270.85Repro 543.00 525.00 543.40 546.40 522.10 16.48 660.00 325.05 523.65Resp.Ind [1] 184.85 184.65 185.00 190.05 183.00 270.06 200.60 98.05 185.35Revathi 876.20 837.60 886.00 886.00 830.00 12.24 957.00 455.50 24 840.50RHIMagnesInd 430.05 419.25 437.00 440.00 416.15 251.40 440.00 212.60 Rico Auto [1] 48.40 46.40 48.55 48.75 46.05 490.44 62.30 33.50 25 46.35RITES 274.80 267.75 276.10 276.10 266.80 245.06 318.00 232.40 14 267.70
RKECProjects 68.00 65.55 69.50 69.50 65.05 21.33 117.00 44.50 RolexRings 1312.15 1260.00 1318.00 1325.00 1250.05 63.05 1394.00 994.80 RosariBiotec 1337.80 1290.60 1339.90 1349.75 1280.00 91.96 1619.00 818.05 Rossell [2] 163.00 158.70 164.65 167.00 158.00 56.59 216.05 98.25 39 158.85RouteMobile 1867.60 1838.70 1869.50 1886.70 1830.30 125.51 2389.00 1090.00 Royal Orchd 89.05 88.15 89.10 91.85 87.50 25.73 113.40 57.25 88.95RPG Life [8] 615.75 628.25 615.75 644.55 614.10 105.03 751.80 360.00 21 627.50RPower 15.65 16.10 16.40 16.40 15.55 103601.06 18.36 3.01 16.13RPP Infra 68.05 67.35 68.90 71.90 66.40 255.80 78.75 37.71 7 67.20RPSGVentures 719.50 702.70 729.00 729.05 700.00 65.66 1144.90 285.95 RS Soft [5] 48.25 46.20 48.90 49.00 45.50 197.87 51.90 23.55 46.15RSWM 532.35 504.10 542.20 546.90 495.00 187.55 546.00 149.70 6 503.15Ruby Mills [5] 427.70 402.40 424.00 424.00 390.00 349.74 432.10 156.55 21 403.25Ruch.Paper 85.75 83.75 86.80 86.90 83.25 45.75 105.60 57.00 10 83.65RuchiSoyaInd 896.70 889.35 907.95 909.70 885.10 13.98 1376.70 629.15 RudrabhshEnt 258.20 249.50 263.65 263.65 247.60 49.18 280.00 125.65 Rupa [1] 522.95 517.20 527.00 542.60 512.85 2240.16 547.00 279.65 21 517.15Rush.Decor 360.10 346.60 361.00 369.00 343.05 39.68 439.10 153.50 73 346.95
S . . . . . . . . . . . . . . . . . . . . . . . . . . . . . . . . . . . . . . . . . . . . . . . . .S H Kelkar 161.35 166.10 161.90 171.25 160.80 623.04 207.30 103.65 33 166.05Sadbhav [1] 40.95 40.30 41.05 41.15 40.10 356.50 96.30 37.30 9 40.20SadbhavInf 15.20 14.95 15.25 15.30 14.90 923.41 41.50 12.60 15.00SafariIndia 917.85 933.60 950.00 950.00 919.00 9.90 987.00 518.55 Sagar Cem [2] 269.45 266.80 268.05 276.00 264.20 76.79 319.00 129.61 21 266.55SAIL 107.40 105.30 108.00 108.10 105.0526528.09 151.10 55.30 3 105.35SakarHealth 157.50 155.80 155.05 159.00 155.05 12.76 212.00 84.60 Saksoft 1052.25 1042.70 1052.00 1064.30 1005.05 66.66 1172.35 305.30 58 1022.85Sakuma [1] 13.75 13.65 13.95 14.20 13.60 626.66 15.50 4.25 13.73SAL Stl 15.10 14.35 15.40 15.60 14.35 562.35 17.55 2.99 6 14.31SalasarTech 258.00 250.75 256.00 259.50 249.05 23.95 370.75 131.00 18 250.95SalonaCot 316.95 296.50 337.70 350.00 290.00 246.60 349.00 66.05 9 297.80Salzer Elec 237.05 235.80 239.90 247.65 234.00 147.67 263.50 109.50 15 235.25Sandesh 799.30 782.60 796.00 819.10 778.00 2.28 1079.00 610.60 7 781.45SandharTech 256.35 249.80 257.90 258.45 246.60 71.96 333.00 175.00 16 250.40Sangam 384.70 363.60 387.00 387.70 361.10 116.94 417.00 70.35 19 363.85Sangh.Mov [2] 243.10 231.45 245.80 246.90 229.30 114.81 262.00 99.00 231.30Sanghi Ind 64.05 62.00 64.45 64.50 61.55 332.45 84.70 34.50 16 62.10SanginitChem 27.50 26.95 27.50 28.45 26.75 197.81 47.20 18.00 Sanofi� 7508.25 7465.30 7515.00 7566.60 7460.30 31.69 9300.00 7344.00 28 7469.30SanseraEngg 778.90 767.05 775.00 786.45 764.65 45.96 889.00 682.00 SapireFoodIn 1439.65 1431.50 1460.00 1460.00 1403.25 175.21 1460.00 974.45 Sarda Ene 842.40 819.65 843.00 857.55 815.20 55.54 948.00 305.00 6 818.00Sarla Perf [1] 72.70 70.70 73.85 74.80 70.25 1027.64 75.00 23.25 11 70.70SARTHAK META 116.30 112.95 116.35 116.50 110.80 12.57 144.00 89.90 Sasken 1320.10 1291.15 1322.00 1339.75 1285.00 16.70 1528.95 792.50 16 1295.20SastaSunVent 520.35 497.45 524.00 524.90 494.35 64.60 583.00 97.00 497.25SatiaIndus 96.55 94.10 97.30 97.40 93.10 126.40 118.00 73.00 Savita 1229.35 1214.15 1235.00 1242.00 1210.00 13.13 1822.65 655.10 5 1213.45SBI [1] 514.00 506.80 514.00 517.45 505.0012592.51 542.20 269.55 14 506.65SBICards&Pay 886.55 877.55 890.00 892.30 875.00 885.49 1165.00 860.20 SBILifeInsur 1287.95 1265.90 1287.95 1293.00 1263.10 869.58 1293.00 838.20 102 1266.10Schaefl�erInd 9567.90 9384.85 9700.00 9700.00 9322.25 12.32 9640.05 4260.00 51 9384.25SChand&Co [5] 109.85 112.30 110.85 115.75 110.70 230.51 149.40 61.20 39 112.35Schneider [2] 116.05 112.00 116.30 116.85 110.25 427.00 147.00 86.50 112.40SCI 142.15 134.60 137.15 139.65 134.15 3205.83 160.20 82.00 12 134.80Seamec 1109.70 1097.70 1137.00 1137.00 1083.00 4.11 1284.35 385.50 39 1105.95SecureludTec 137.25 134.50 138.05 138.55 131.35 61.99 243.75 80.00 SecuriIntSvc [5] 463.85 470.45 464.60 483.00 464.60 620.10 548.60 350.45 65 469.95Selan Exp 155.90 157.65 158.00 165.85 153.75 626.81 180.05 113.10 34 158.00SelManufactr 72.00 75.60 75.60 75.60 75.60 0.03 75.60 8.10 Sequent Sc [2] 187.45 175.10 189.00 189.00 173.20 3675.99 336.40 144.95 175.45Sesh.Paper [2] 166.05 163.60 166.10 166.50 163.10 48.07 230.00 137.00 9 163.35SetcoAuto [2] 18.15 17.70 18.55 18.55 17.35 219.38 25.20 12.75 17.70SeyaIndus 62.05 62.55 62.05 66.45 61.15 52.39 85.00 47.50 Shah Alloy 54.35 53.20 55.05 55.05 52.00 45.81 63.95 7.73 6 52.85Shakt.Pump 682.25 630.20 687.60 711.10 625.00 1248.50 910.00 350.00 19 630.30Shal.Paints [2] 135.35 134.70 136.40 142.30 133.30 1175.82 142.25 82.90 134.75SHALBY 151.60 146.80 154.70 154.70 146.00 230.45 214.00 96.05 23 147.15ShankarBldg 538.75 518.60 541.45 541.85 516.00 42.22 683.00 326.75 35 518.85Shanthi Grs [1] 173.15 166.35 174.50 175.10 165.55 124.49 211.20 116.95 38 166.55ShardMotor [2] 868.20 859.75 887.85 898.00 855.15 23.41 950.00 323.65 18 857.40ShardaCropch 370.00 361.95 372.05 378.00 360.00 227.49 387.05 262.00 13 362.20ShareIndSec 1240.80 1231.55 1270.00 1270.00 1207.60 36.18 1270.80 170.75 SheelaFoam [5] 3615.10 3626.00 3628.00 3720.00 3569.00 25.16 3949.40 1900.00 79 3605.45Shemaroo Ent 132.60 128.20 132.80 134.85 126.70 69.38 181.00 63.25 80 128.15Shilpa Med [1] 552.40 558.55 555.00 565.00 547.00 236.04 670.95 317.05 46 558.95Shiv.Global 35.80 36.85 37.40 37.55 34.05 502.12 37.60 7.85 27 36.50SHIVALIK RASA 1118.05 1071.20 1137.75 1137.85 1051.05 6.42 1195.00 852.10 ShivalikBimt 464.85 440.90 464.00 470.00 434.30 103.50 480.80 115.10 Shivam Auto [2] 33.10 33.30 32.95 34.75 31.60 535.05 44.85 13.97 33.55ShivaMills 164.60 172.20 175.00 181.00 162.40 300.37 180.70 31.35 8 171.50ShivaTaxyarn 261.20 246.80 265.00 265.00 242.00 34.52 289.00 120.55 14 250.80Shop.Stop [5] 344.95 352.20 347.70 393.15 346.15 2750.50 408.70 180.00 352.15Shr.CU.Fin 1794.05 1734.30 1795.00 1833.55 1706.20 43.56 2600.00 975.05 11 1728.20Shr.EPC 10.05 9.70 9.90 10.05 9.60 1603.76 12.42 3.80 9.69Shr.Ren.Sug [1] 34.25 33.45 34.65 35.75 33.0517956.15 47.75 8.73 33.45Shr.Tr.Fin 1239.05 1203.90 1235.00 1267.00 1186.25 1426.83 1696.15 1097.80 13 1203.40ShradInfProj 68.00 65.35 70.45 70.45 63.80 27.94 77.00 35.55 Shre PushChe 246.20 239.65 252.00 252.00 236.95 133.74 274.95 115.50 21 240.35ShreDigvjCem 78.95 78.50 79.20 80.50 77.80 268.92 97.80 48.95 ShreeCement 27545.35 27155.55 27550.00 27639.65 26850.00 44.02 32050.00 22600.00 37 27141.05Shreyans 118.45 114.40 116.20 121.40 113.40 31.94 152.00 71.00 12 115.10Shreyas 258.75 251.90 259.90 263.00 250.80 35.62 448.00 68.00 6 251.90SHRIRAM PROP 94.20 103.35 95.25 110.00 94.2512955.22 110.00 79.50 ShyamCent [1] 17.90 18.35 18.45 18.70 18.00 615.88 20.45 4.82 11 18.35ShyamMetalic 353.40 349.15 355.50 356.90 347.00 355.51 461.15 300.00 Sical Log 16.85 16.90 17.65 17.65 16.70 2414.89 23.83 8.60 16.88Siemens [2] 2381.30 2324.70 2383.00 2397.25 2301.15 318.72 2577.45 1568.45 75 2324.95SIGACHI INDUS 391.25 382.45 393.70 393.70 381.00 276.29 494.00 376.40 SignetIndus 52.85 53.05 53.70 56.90 52.50 290.88 64.35 26.25 SikkoIndust 70.20 69.05 70.20 72.20 67.30 4.60 79.65 38.60 SIL Inv 332.80 322.15 337.95 337.95 321.15 3.70 378.00 166.60 12 321.15SilgoRetail 34.70 35.55 35.20 41.60 33.00 2041.15 66.70 28.50 SillymonkEnt 23.50 23.30 24.00 24.00 22.95 6.72 32.80 17.15 SimbholiSug 23.15 22.40 23.15 23.65 22.10 92.85 44.60 6.36 22.55Simp.Inf [2] 44.05 43.15 44.95 45.10 43.05 150.31 56.05 27.80 43.15SintercomInd 106.45 104.30 106.90 108.00 102.75 84.96 108.00 61.20 SintexPlaTec 10.00 9.50 9.55 10.45 9.5044585.72 15.30 2.95 SircPaintInd 553.60 542.15 555.00 560.90 540.00 29.35 625.00 283.00 Siyaram [2] 458.75 449.50 461.40 461.45 447.20 55.19 516.95 179.20 14 448.95SJSEnterpris 448.05 428.65 457.00 467.00 424.10 255.52 551.00 339.50 SJVN 31.40 31.00 31.60 31.75 30.90 3172.66 33.80 24.50 7 31.00SKF India 3990.75 3962.90 4024.00 4054.00 3942.00 54.25 4245.25 1735.30 46 3960.75Skipper [1] 82.20 79.10 83.65 83.85 78.65 254.56 98.35 51.50 52 79.10SKM Egg 82.35 78.40 83.30 83.90 76.60 138.82 98.45 43.65 18 78.50Smartlink [2] 184.80 178.45 186.00 188.35 176.00 50.39 253.80 78.10 98 177.40SMCGloblSecu 80.90 83.30 81.50 86.70 81.50 1442.74 104.75 65.80 SML Isuzu 677.65 663.65 682.00 687.00 661.15 14.75 842.80 430.05 664.25SMS Phr [1] 135.15 135.35 136.25 158.85 134.70 220.89 199.15 110.00 13 135.40SMSLifeScien 746.05 747.85 783.00 783.00 746.80 1.07 1024.90 469.75 SnowmanLogi 42.00 43.70 42.00 45.20 42.00 5873.58 62.80 36.20 43.70Sobha 969.55 962.40 970.00 1008.60 950.00 1533.04 1008.00 402.50 90 962.95Solar Ind [2] 2244.15 2214.50 2244.70 2265.00 2205.00 18.84 2932.95 1125.00 94 2216.90SolarActPhSc 1101.95 1067.75 1100.20 1119.00 1060.05 108.78 1859.95 980.00 Som Dist [5] 45.75 45.30 46.00 47.00 44.80 287.03 58.87 26.27 45.20Somany [2] 909.60 943.00 928.00 945.50 904.00 33.45 952.45 336.00 38 942.75SomanyHomInn 397.50 397.40 400.00 406.05 393.10 112.31 464.00 163.00 SomiConveyor 46.00 43.85 45.10 46.05 43.70 17.72 68.50 29.30 24 44.15SonaBLWPrecn 770.25 770.70 774.00 789.80 764.00 1800.34 839.90 295.00 Sonata [1] 872.15 859.80 920.00 926.00 842.60 965.47 1030.00 353.95 37 862.15SorilInfrRes 107.70 106.00 109.40 109.40 105.30 33.02 227.35 95.00 106.15South In Bk [1] 9.20 9.10 9.20 9.30 9.05 7567.41 13.95 7.54 9.11SouthWestPin 161.60 166.35 164.00 169.65 164.00 32.60 171.00 33.85 SpandnaSphor 390.55 382.70 391.05 393.85 380.00 121.69 820.00 380.00 SPApparels 489.35 470.65 492.15 494.85 463.85 56.35 514.00 132.00 20 471.80Spec.Rest 102.55 100.40 104.00 106.20 99.80 258.78 114.25 35.00 100.40SpencersRetl 107.55 105.65 107.95 109.95 104.80 439.97 144.30 65.70 SPIC 62.20 60.30 62.65 63.65 60.10 2815.47 68.45 21.75 10 60.30Spicejet 64.25 63.10 64.25 64.50 62.90 3605.08 93.80 59.40 SPL Ind 65.85 58.85 68.00 68.00 57.45 583.80 68.70 30.60 12 58.60SPML Infra [2] 45.90 48.15 47.50 48.15 43.65 691.06 48.70 8.20 48.55Sr.Leathrs 186.65 187.30 188.00 193.50 186.00 37.78 233.95 131.20 26 188.00Sr.Ray.HHP 356.85 348.05 361.90 361.95 347.20 13.70 417.00 223.20 9 347.35SREI Infr 6.60 6.75 6.90 6.90 6.60 2814.05 18.39 3.47 2 6.74SRF 2640.45 2615.15 2655.70 2669.60 2593.05 616.69 2679.00 1026.63 66 2612.20StampedeCap 10.40 10.90 9.95 10.90 9.90 359.59 13.35 1.20 STAR HEALTH 858.60 843.65 861.00 865.65 835.70 289.77 940.00 753.85 Star Pap 140.00 137.50 141.10 142.20 136.05 91.61 181.60 104.15 8 137.35StarCement [1] 100.40 98.05 101.00 101.00 97.20 118.36 120.00 88.50 22 98.05STC India 113.55 108.80 114.45 114.75 107.90 73.38 138.75 65.00 109.05Steel Strp [5] 816.60 801.50 826.00 826.00 800.00 22.13 995.00 280.25 13 803.60STEELCAST 327.85 316.50 330.00 330.20 316.10 12.09 336.00 259.90 SteelCitySec 68.40 66.25 69.30 69.30 65.00 35.62 98.70 31.10 Stel Hld [1] 172.15 164.25 169.60 173.95 162.55 25.86 0.24 0.20 Ster.Tool [2] 197.55 192.45 199.50 199.50 191.65 55.24 257.00 163.00 18 192.75Sterlg&Wilsn 417.75 395.30 419.00 420.00 391.50 1063.57 509.10 183.50 SterliteTech 271.55 269.25 273.90 277.50 267.00 970.02 318.00 171.45 StoveKraft 976.95 958.50 980.00 980.00 952.40 40.62 1133.70 406.10 Str.Arcolab 444.55 426.45 452.05 466.90 420.50 3026.06 946.80 403.55 58 426.50StylamIndust 1140.15 1085.40 1135.00 1146.00 1080.00 4.39 1419.90 927.25 SUBEX 53.45 52.00 53.80 53.85 51.65 5699.67 74.40 23.20 Subros [2] 385.85 375.75 386.95 387.80 373.15 26.74 418.00 283.40 40 374.40Sud.Chem [2] 591.45 576.20 590.00 590.00 572.85 56.67 791.95 486.10 34 575.85Sumeet 11.30 11.85 11.50 11.85 11.45 2239.94 12.78 2.56 6 11.92Sumit.Sec 694.40 682.55 694.30 700.15 680.00 2.53 861.55 460.05 32 685.25SumitomoChem 394.95 390.15 395.80 399.90 388.00 254.91 459.90 268.20 SumitWoods 16.45 15.80 16.95 16.95 15.65 110.83 22.00 8.00 Sun Pharma [1] 853.20 846.70 855.00 867.20 845.00 3354.71 871.00 550.70 114 845.90Sun Phr Adv [1] 321.00 314.50 323.45 324.80 311.40 718.50 335.05 141.00 314.60Sun TV [5] 516.45 507.35 517.00 518.95 505.00 410.20 611.25 446.00 12 507.20Sund.Brak 441.95 418.45 449.70 449.70 416.15 24.87 489.95 316.05 32 418.15Sund.Clay [5] 3909.85 3825.55 3901.00 3936.90 3801.00 2.44 5123.55 2616.60 45 3817.95Sund.Fast [1] 907.15 905.40 915.00 919.50 900.50 28.07 993.00 535.30 39 904.85Sund.Fin 2416.50 2386.20 2448.50 2448.70 2370.00 31.16 2883.95 1659.65 31 2386.80SundarFinHol 87.80 84.45 88.15 89.50 83.65 191.66 94.70 65.70 Sunfl�ag 80.10 78.75 80.75 81.00 77.90 499.35 96.55 55.00 6 78.70Sunteck [1] 573.05 549.85 575.00 589.90 535.10 1265.71 589.95 250.05 325 548.75Super Spn [1] 18.30 19.20 19.20 19.20 18.30 1066.96 19.26 4.00 19.25Superhouse 236.25 222.55 232.80 239.60 220.40 135.55 245.05 107.20 10 222.30Supr.Ind [2] 2297.75 2269.35 2308.55 2324.90 2261.00 82.33 2689.00 1663.45 30 2270.95Supr.Petro 736.25 713.95 741.95 741.95 706.00 45.99 820.00 349.00 10 713.35Suprajit [1] 426.45 423.25 430.90 432.90 417.35 149.87 478.00 196.30 38 423.10SupremeEngg 26.50 25.60 27.20 27.50 25.45 152.13 40.05 17.70 SUPRIYAFESCIE 535.30 570.25 547.20 601.90 542.0010248.84 601.90 383.20 Surya Rosh 538.15 518.50 536.15 537.50 515.10 322.72 868.40 308.35 14 518.35Suryalaxmi 88.75 86.45 91.80 91.80 85.90 37.71 98.90 27.40 16 86.85SuryodaySFB 149.15 146.15 149.95 151.00 145.30 79.86 296.35 138.50 Sutlej Te [1] 97.05 92.50 97.75 98.90 90.80 306.14 104.85 36.80 14 92.65SuumayaLife 299.55 292.35 304.70 305.00 291.00 75.99 736.85 139.30
Suven Lif [1] 93.60 93.70 94.30 97.00 92.85 983.50 124.40 69.45 93.65SuvenPharma 537.90 542.75 539.00 546.50 532.95 179.58 590.00 450.00 SuvidaInfSvc 12.75 12.25 12.90 13.05 12.15 677.73 59.65 9.70 Suzlon [2] 12.80 12.20 12.80 13.10 12.20170355.23 13.10 4.36 12.28SVPGlobalVen 75.75 75.45 77.00 79.85 74.60 796.62 164.85 70.00 Swan Ener [1] 178.80 175.15 179.90 180.00 174.10 164.34 185.05 112.50 175.15Swaraj Eng 1740.20 1689.65 1740.20 1759.65 1675.00 10.78 1989.90 1254.95 16 1686.70Symphony [2] 1077.45 1061.10 1078.00 1082.00 1051.00 123.94 1529.65 890.00 60 1061.90SynergGreen 213.90 214.35 213.70 243.00 209.50 200.08 243.00 135.90 Syngene Int 624.75 610.95 626.80 632.35 607.00 361.02 699.95 490.35 61 611.30
T . . . . . . . . . . . . . . . . . . . . . . . . . . . . . . . . . . . . . . . . . . . . . . . . .Tainwala 77.45 76.40 78.60 81.00 75.55 15.93 124.00 53.85 77.05Taj GVK [2] 139.80 137.25 140.00 141.75 137.00 121.31 161.15 102.20 137.30Take Sol [1] 45.35 44.75 45.80 45.80 44.60 506.77 74.65 42.30 44.70Talbros 634.50 598.40 640.00 645.00 585.00 113.36 654.90 165.60 20 599.15Tanla Sol [1] 1958.65 1874.30 1958.00 1958.00 1863.70 309.61 2094.40 655.45 199 1874.50Tarmat 73.90 71.55 74.90 75.45 70.35 111.48 98.00 42.10 17 71.85TARSONS PRO 716.50 725.65 723.40 741.00 711.80 415.77 924.90 581.45 TastyBiteEat 13927.30 13663.25 13933.05 14049.95 13562.45 0.68 21470.50 11479.30 98 13650.45Tata Chem 1029.25 1005.95 1029.90 1041.95 1000.15 1212.96 1158.00 466.40 41 1005.25Tata Cof [1] 221.45 217.90 222.40 224.20 216.90 1492.89 254.00 91.15 36 217.95Tata Com 1551.60 1485.45 1558.90 1564.60 1474.40 937.64 1590.00 930.05 44 1483.65Tata Elxsi 6398.10 6376.30 6480.00 6523.80 6301.00 274.45 6780.00 2333.35 86 6370.50Tata Inv 1538.30 1494.40 1549.80 1549.80 1490.00 43.61 1734.00 953.00 49 1494.45Tata M DVR [2] 265.10 259.35 267.90 268.00 257.20 3477.66 298.50 95.25 259.10Tata Metlk 882.20 864.20 880.00 883.25 861.00 131.77 1374.00 670.00 10 864.85Tata Motors [2] 525.00 510.80 527.90 528.50 507.1519353.20 536.50 241.15 510.95Tata Steel 1229.75 1194.85 1230.00 1233.75 1190.00 5840.90 1534.60 596.30 5 1194.50TataConsuPro 765.10 731.45 763.80 770.00 728.40 2674.15 889.00 554.25 TataPowerC [1] 247.85 239.10 250.00 250.60 237.8030408.20 269.70 74.50 26 239.05TataStlLngPr 825.35 779.85 800.00 802.15 771.30 290.46 1087.70 576.00 TatvaChinPha 2868.90 2610.65 2600.00 2676.00 2598.00 408.37 2977.80 2001.00 TCI Devl 359.70 368.50 365.00 372.50 356.80 1.04 549.00 285.50 367.70TCI Express [2] 2194.25 2145.90 2170.00 2219.00 2126.00 12.93 2570.00 807.00 62 2148.55TCNSClothing 803.10 786.40 806.90 817.05 781.50 34.51 932.00 392.00 TCPLPackage 543.90 536.65 556.95 556.95 530.30 6.07 612.00 336.05 TCS [1] 4019.15 3990.60 4033.95 4041.70 3980.00 2389.04 4045.50 2701.00 40 3990.25TD Power 448.30 440.20 440.00 452.40 438.00 17.37 466.70 127.90 40 439.60TeamleaseSvc 4214.05 4192.95 4200.00 4270.00 4128.95 8.33 5544.10 2645.00 79 4190.35TechInd Nirm 8.20 8.60 8.60 8.60 8.20 57.39 9.42 2.50 8.67TechMahind [5] 1722.40 1660.75 1740.00 1746.55 1650.05 4878.37 1837.75 915.05 32 1660.65Technocr 933.25 889.70 941.55 943.90 876.60 19.17 993.40 330.05 13 888.00TechnoEle&En 257.55 255.80 258.05 267.00 254.50 110.53 362.80 222.00 TEGA INDUSTRI 594.30 591.15 598.00 599.60 589.00 466.62 767.70 545.40 TejasNetwork 483.70 459.55 478.00 489.70 459.55 804.32 570.50 129.00 TemboGlblInd 280.30 270.85 288.80 288.80 267.50 84.42 334.55 116.50 TeraSoftware 55.85 54.85 55.10 56.85 54.50 64.02 85.00 33.00 54.85Tex.Infra [1] 65.95 65.05 66.50 67.65 64.95 90.25 83.75 51.10 65.10Tex.Pipe 96.10 93.60 100.90 100.90 92.00 1358.45 100.90 21.35 16 93.40Tex.Rail [1] 39.85 38.00 40.15 40.20 37.65 1489.81 42.75 21.83 25 38.00TGB Banq 10.95 10.45 11.40 11.45 10.45 78.88 12.90 4.14 10.56Thanga.Jwl 1386.70 1375.00 1415.00 1432.90 1370.00 12.10 1520.00 575.00 32 1372.60The Byke Hos 37.15 36.00 38.50 38.50 35.80 169.02 43.60 16.55 35.95TheAnupEngg 1187.90 991.30 1195.00 1199.85 982.00 334.36 1236.95 548.00 TheGrobTeaCo 1230.65 1229.40 1280.00 1280.00 1194.60 1.28 1444.80 730.35 TheInvstTrst 122.75 120.10 122.75 126.00 118.35 41.28 141.15 83.00 TheMandRetVe 17.40 16.75 17.60 17.60 16.65 134.93 25.00 10.35 16.85Themis 1023.60 1017.65 1045.00 1045.00 1001.35 10.68 1198.80 271.70 16 1018.20TheNewIndA [5] 140.85 140.40 142.00 144.80 140.00 465.68 197.00 124.45 24 140.40Thermax [2] 2100.75 2030.05 2100.75 2157.95 1963.00 374.45 2155.55 939.55 136 2028.75Thiru.Chem [1] 257.00 248.85 258.95 259.70 247.10 417.83 357.25 85.00 15 248.90Thom.Cook [1] 64.25 64.05 64.50 65.70 63.50 396.67 85.45 40.00 63.90ThyrocareTec 1022.75 1002.60 1026.00 1027.00 1000.00 46.45 1465.90 832.00 30 1002.40Tidewater [2] 1501.85 1486.85 1517.90 1527.85 1481.00 33.41 3693.75 840.00 25 1489.30TIL 161.60 152.50 163.80 164.90 151.65 32.55 245.00 128.05 152.25Time Gty 55.30 55.35 55.00 59.40 54.45 35.08 66.75 21.45 9 55.00Time Tech [1] 84.25 82.30 85.25 86.95 81.55 2257.62 94.50 49.10 21 82.40Timken 2076.75 2051.85 2092.00 2094.00 2040.00 31.31 2174.55 1165.00 68 2053.60Tinplate 322.05 353.65 323.00 364.90 312.55 6471.71 365.00 146.30 13 353.00TirpathiForg 13.40 12.80 13.05 13.60 12.75 100.68 38.35 11.60 Tita.Wag [2] 114.20 108.50 114.90 115.15 107.15 914.94 122.80 44.20 17 108.55TitanCompa[1] 2597.55 2600.60 2598.00 2635.00 2587.00 1221.31 2687.30 1396.25 132 2604.00TN News 127.05 124.40 127.70 128.90 124.00 122.39 182.80 116.45 124.40TN Petro 111.50 109.50 113.40 113.40 108.10 274.76 150.45 38.00 6 109.40Tokyo Pl 114.90 111.80 114.00 115.70 110.00 20.91 130.75 63.65 69 111.65Tor.Pwr 579.80 565.50 580.20 583.85 563.70 234.27 606.05 298.00 21 564.85TorrentPhar [5] 3191.00 3186.80 3198.00 3233.75 3158.10 141.01 3304.45 2311.30 47 3184.65Tou.Fin.Cor 68.10 67.40 69.80 69.80 66.00 819.85 83.30 48.00 7 68.10TouchwoodEnt 117.25 117.05 121.95 121.95 116.65 5.30 148.45 71.50 TPL Plastech 169.10 167.35 171.60 172.00 166.00 12.96 228.30 65.53 21 167.85Trans.Corp [2] 827.60 775.85 835.40 836.30 764.95 212.94 858.00 236.60 27 774.75Transwarnt 13.45 12.80 14.10 14.10 12.80 237.52 14.54 2.22 13.17TrejharaSolu 121.40 121.60 126.00 127.45 117.00 374.38 127.45 26.95 Trent [1] 1158.25 1144.30 1177.00 1177.00 1135.80 543.64 1208.30 587.95 211 1144.70Trib Bhimji 83.10 81.80 83.90 84.05 80.75 167.94 104.40 58.05 12 81.80Trident [1] 68.00 64.60 70.00 70.35 64.6037319.50 70.90 12.55 51 64.60Trigyn 204.85 192.65 201.40 206.90 191.00 480.02 218.60 57.05 192.30TRIL [1] 34.70 33.00 34.90 35.55 32.65 369.99 39.00 15.90 33.00Triv.Eng [1] 259.50 253.45 261.25 264.90 250.90 1244.56 267.25 69.00 19 253.60Triv.Tur [1] 204.55 199.95 205.05 212.80 196.10 1121.41 229.00 83.05 67 199.75TT 127.65 126.05 128.00 130.55 124.10 226.32 137.00 40.15 8 126.20TTK Prst [1] 1020.30 993.60 1030.00 1038.65 990.00 66.76 1269.60 583.96 48 993.75TTKHealtcare 695.10 695.50 695.00 708.95 688.10 6.65 827.50 456.80 28 697.40TubeInvIndia 1802.10 1791.05 1815.00 1815.00 1760.40 251.06 2025.00 750.10 TV Today [5] 417.70 397.10 418.40 420.50 396.05 226.80 460.00 236.40 14 397.10TV18 Br [2] 48.75 49.15 49.10 50.85 46.1535433.49 55.80 26.05 46 49.15TVS Elec 195.30 189.60 197.00 197.70 188.95 50.11 217.00 109.05 23 189.30TVS Mot [1] 657.45 643.20 660.00 660.70 640.20 900.91 793.45 488.90 34 643.30TVS Sri 2172.55 2128.50 2162.55 2238.10 2125.00 6.63 2588.00 1647.50 17 2131.60
U . . . . . . . . . . . . . . . . . . . . . . . . . . . . . . . . . . . . . . . . . . . . . . . . .UB [1] 1663.70 1625.05 1664.95 1682.55 1617.05 327.63 1793.65 1050.00 129 1624.65Ucal Fuel 166.10 160.60 168.40 168.40 159.15 53.92 206.10 120.00 9 161.10Uco Bk 13.30 13.20 13.35 13.35 13.15 3014.26 16.30 10.60 13.21UDAIPURCEME 39.10 38.15 39.45 39.45 38.00 352.13 41.80 33.00 Ufl�ex 544.70 531.65 548.90 556.60 525.10 561.89 658.45 337.75 18 531.55UFO Moviez 97.15 96.95 98.25 99.80 96.25 329.82 125.45 68.75 96.75Ugar Sug [1] 33.40 32.85 33.95 34.30 32.80 405.13 40.10 14.95 18 32.80UgroCapital 217.25 215.80 215.00 218.95 215.00 696.70 230.35 108.55 Ujaas [1] 6.90 7.20 7.20 7.20 6.6023615.02 7.38 2.26 7.30UjivanFinSer 149.55 151.25 149.55 158.00 149.50 2925.44 288.75 125.50 151.20UjjivanSFB 20.40 20.45 20.40 21.30 20.35 6134.33 40.40 17.00 UltraTech 7870.10 7555.90 7807.00 7894.00 7520.00 565.18 8267.00 5261.80 34 7566.25UmangDair [5] 86.40 82.90 87.20 87.85 82.10 75.22 99.00 50.40 83.25Unichm Lab [2] 286.30 292.25 287.75 299.00 281.55 206.03 374.90 197.50 292.40UNIINFO TELEC 39.65 39.65 41.60 41.60 38.50 8.95 42.90 36.60 Union Bk 45.65 44.60 45.70 45.90 44.40 7444.27 54.80 29.35 6 44.60Uniph.Ent [2] 147.50 145.10 147.50 149.60 144.50 22.97 157.00 69.80 18 145.20United Nil 380.10 365.65 387.65 387.65 351.25 3.92 499.90 280.40 UNITEDPOLYF 29.50 30.95 30.95 30.95 30.95 4.30 30.95 17.35 United Spr [2] 946.55 917.55 947.00 956.50 913.45 1587.78 1019.75 495.15 81 917.40UnitedDrilng 584.90 546.75 586.00 589.00 542.00 99.70 604.85 242.25 Univ.Cab 179.45 177.15 179.45 184.40 174.80 46.79 217.55 123.00 23 177.35UnivastIndia 86.15 82.05 85.25 87.85 81.00 69.07 98.00 27.15 UniversusImg 709.50 694.50 740.00 740.00 681.00 6.92 818.00 156.50 UPL [2] 824.75 799.10 821.55 825.00 795.85 2820.43 864.75 510.05 153 799.05Usha Mar [1] 94.85 91.05 95.50 95.60 90.00 947.69 102.65 28.35 19 91.15UTIAMC 1057.75 1058.45 1060.90 1085.00 1055.00 104.18 1216.20 538.00 Utm.Sug 231.80 223.10 233.90 236.10 221.20 300.59 307.25 88.05 12 223.20
V . . . . . . . . . . . . . . . . . . . . . . . . . . . . . . . . . . . . . . . . . . . . . . . . .V Mart 3983.15 4071.30 3999.00 4144.00 3965.50 61.04 4620.00 2342.95 2274 4063.30V2 Retail 157.05 154.10 158.90 161.20 153.00 58.71 206.95 98.80 154.30VA T Wab [2] 339.15 331.30 343.00 344.75 329.00 452.20 404.25 183.20 23 332.00Vadilal 931.20 912.85 931.25 938.95 910.30 9.03 1264.00 773.25 275 914.80VadivrSpeChe 307.90 305.50 305.65 311.50 305.10 15.31 332.00 105.55 Vaibhav [2] 559.65 540.40 560.00 560.00 536.75 143.96 1057.70 480.60 101 541.00VaishaliPhar 38.85 37.65 39.30 39.40 37.10 46.31 48.60 28.95 Vakrang [1] 42.75 41.10 42.90 43.45 40.75 3532.53 66.70 29.15 41.05ValiantOrgan 1217.30 1217.90 1227.50 1242.10 1205.00 32.69 1848.00 970.00 Vard Text 2729.25 2701.75 2738.25 2756.80 2678.15 145.04 2757.10 971.00 14 2701.80Vard.Acry 70.10 67.95 71.85 72.40 67.25 834.70 318.55 148.60 310.65Vard.Hld 4322.20 4134.05 4305.25 4346.65 4112.00 2.85 4667.55 1330.00 34 4135.20Vard.SPC 273.05 263.70 274.90 274.90 262.65 63.44 309.30 111.20 11 263.60VarrocEngg 443.25 443.85 441.25 450.75 428.55 1039.68 477.65 260.00 VarunBevera 942.50 923.25 950.00 950.00 915.00 274.34 1020.00 570.00 87 923.30Vascon 31.80 30.65 32.00 32.75 30.50 1443.56 36.70 13.30 30.60Vaswani 32.10 35.05 34.00 35.30 33.05 1941.31 35.30 6.74 20 35.10Vedanta [1] 325.80 322.45 324.90 327.95 320.1510477.12 385.75 160.20 9 322.35Venky's 2789.20 2710.90 2803.15 2809.65 2700.70 65.92 3950.00 1502.00 14 2712.75VenusRem 406.40 390.60 410.45 413.05 369.80 47.84 638.50 153.35 9 389.10VertozAdvtsg 124.10 115.25 125.00 125.00 113.00 134.39 322.00 79.60 Vesuvius 1106.95 1111.30 1114.90 1119.90 1103.70 6.49 1362.00 903.50 32 1111.20Veto Switch 116.40 118.45 117.70 125.30 115.10 721.13 171.85 85.00 10 118.45VGuard [1] 225.10 223.00 226.15 226.85 222.15 898.55 285.00 212.45 42 222.95VidhiSpclIng [1] 432.10 417.10 435.20 438.00 415.00 83.04 444.15 117.70 41 418.20VijayaDianos 545.85 537.70 549.00 549.00 535.55 64.21 672.00 505.20 VikasEcoTec [1] 4.65 4.85 4.85 4.85 4.85 1683.54 4.94 1.01 4.94Vimta Lab [2] 424.25 422.00 416.30 442.95 416.30 103.53 453.00 145.20 27 421.95Vinati Org [1] 2073.70 2073.40 2061.15 2083.75 2014.95 34.25 2180.40 1176.30 72 2072.80Vindh.Tel 1273.90 1249.10 1277.95 1290.00 1240.00 19.33 1499.00 765.05 14 1245.40VineetLabs 75.10 74.00 74.15 75.80 73.20 13.77 124.00 61.00 Vinyl Chm [1] 276.45 269.95 276.95 282.05 269.00 122.32 330.55 110.55 27 270.00VIP Ind [2] 596.85 581.10 599.80 607.40 572.45 223.56 668.00 309.00 579.85VIPClothing [2] 26.40 27.20 27.70 27.70 26.10 2105.22 27.80 11.76 27.40Vipul Ltd [1] 23.70 23.75 24.20 24.65 23.50 83.65 41.90 17.35 23.95Visa Stl 17.90 18.40 18.75 18.75 17.55 102.79 21.45 5.74 18.35Visak.Ind 687.50 671.70 704.00 708.00 667.25 57.17 873.55 375.05 9 671.55VishalFabric 136.75 128.50 137.40 140.00 126.70 587.33 147.75 40.70 VishwarajSug 24.05 25.05 24.05 25.15 23.9011355.24 220.00 20.20 Vivi Lab [2] 24.05 23.05 24.00 24.30 23.00 559.50 41.50 12.90 23.10VLS Fin 199.45 212.70 200.70 219.35 197.20 540.57 264.85 71.20 3 212.45Voltamp 1983.80 1929.65 1993.70 2002.95 1911.00 6.50 2255.00 986.40 17 1928.60Voltas [1] 1285.75 1262.65 1286.00 1303.35 1256.85 964.81 1356.90 876.90 70 1262.85VRL Logistic 477.85 483.90 480.80 496.00 477.25 164.72 534.00 165.00 36 484.15VST Ind 3228.65 3247.60 3250.00 3277.75 3218.00 5.16 3893.95 3039.00 17 3252.45VST Til 3070.05 2947.80 3120.00 3139.95 2902.00 15.92 3458.45 1650.00 26 2949.75
W . . . . . . . . . . . . . . . . . . . . . . . . . . . . . . . . . . . . . . . . . . . . . . . .Wabco Ind [5] 8513.40 8564.55 8533.00 8633.00 8504.25 11.87 8762.95 5285.00 106 8574.80Walch.Ind [2] 57.45 57.90 57.80 60.75 56.30 1658.64 92.00 39.30 58.00Waterbase 109.35 107.75 110.20 110.50 107.10 95.32 145.80 95.90 Webel SL 146.05 146.10 152.40 153.35 145.00 1237.46 172.75 35.25 66 146.25Weizman 60.75 61.15 61.70 62.65 59.50 13.93 76.10 37.30 27 61.50Wels.Corp [5] 195.15 185.65 196.50 197.30 183.15 1540.35 197.00 106.00 12 185.95Wels.India [1] 148.15 148.55 148.95 155.00 146.10 3132.29 170.75 65.00 24 148.65Wels.Inv 330.75 331.15 333.00 339.25 325.55 2.15 587.00 235.60 44 331.20Welspun Ent. 101.75 100.25 101.25 103.00 99.40 443.56 134.90 74.70 14 100.80
Wendt 5436.95 5360.15 5449.50 5515.00 5328.65 1.84 6249.00 3060.00 49 5366.00
West C Pap [2] 248.55 246.45 248.60 255.55 245.05 186.20 295.35 175.95 12 246.25
WestlifeDevp 538.45 532.25 538.45 545.00 529.10 99.10 629.00 385.10
Wheels Ind 750.15 759.30 753.95 765.00 742.50 30.15 1039.00 412.05 26 755.65
Whirlpool 1876.15 1829.30 1876.50 1893.75 1823.00 141.43 2777.00 1722.75 80 1830.65
Wil.Magor 25.15 24.95 24.85 25.80 24.85 15.02 40.00 16.45 25.05
Win.Diamond[2] 47.85 45.60 49.00 50.00 44.40 1085.06 50.00 16.90 16 45.70
WindlsBiotec 282.90 276.55 285.20 288.20 274.85 96.87 452.00 258.05
WINPRO INDUS 8.55 8.45 8.60 8.65 8.40 642.06 14.35 5.00
Wipro [2] 646.65 633.30 648.90 650.00 631.15 7164.99 739.80 398.00 36 633.40
Wockhardt [5] 422.90 417.80 424.40 427.50 415.00 332.68 804.50 388.00 418.00
WONDER FIBRO 122.45 128.55 128.55 128.55 128.55 0.05 128.55 122.45
WonderlaHoli 211.55 212.55 212.50 215.70 210.15 86.27 269.90 172.65 212.60
WorthPeriprl 108.45 104.65 109.00 111.00 104.25 56.17 119.45 45.55
X-Z . . . . . . . . . . . . . . . . . . . . . . . . . . . . . . . . . . . . . . . . . . . . . . .Xchang 118.20 111.45 119.00 119.20 110.85 656.45 141.25 60.20 56 111.35
XelpmocD&T 400.15 384.50 400.25 407.85 380.00 36.68 513.00 251.65
YAARI DIGI INT 86.05 84.45 87.00 87.00 84.00 167.96 183.45 81.35
Yes Bk [2] 14.10 13.80 14.10 14.15 13.7098757.39 18.15 10.51 13.79
YukenIndia 608.00 596.55 608.00 611.25 589.05 2.64 685.00 542.05
Zee Ent [1] 323.60 316.60 324.80 324.80 315.25 8259.95 378.60 166.80 20 316.35
Zee Learn [1] 17.05 16.50 17.15 17.25 16.40 2453.89 20.70 9.75 16.55
Zee Med [1] 16.20 15.65 16.20 16.45 15.55 3775.95 18.42 5.01 15.69
Zen Exp 88.65 89.30 89.25 90.00 89.10 1.31 116.00 60.55 90.15
Zen Tech. [1] 220.05 214.80 220.20 222.75 213.15 269.76 257.70 65.00 214.85
ZensarTec [2] 480.90 475.20 481.50 483.20 471.50 609.97 587.00 222.10 35 475.05
Zod.Clo 122.50 120.00 123.70 126.50 118.45 101.90 153.80 85.05 120.05
ZomatoLtd 134.00 133.05 134.50 134.60 132.80 9428.10 169.00 115.00
ZotaHealthCr 371.85 389.20 372.00 404.00 365.10 138.57 448.00 137.25
Zuari Ag 126.90 124.20 128.00 129.50 123.55 122.04 158.90 83.30 124.10
Zuari Glo 164.20 158.50 168.00 168.00 157.20 119.47 177.70 74.05 7 158.50
ZydusWel 1850.05 1821.70 1850.05 1859.80 1820.50 62.94 2472.85 1810.00 1821.95
Exchange Traded Funds
Company Pre Cl NSE Cl Vol 52 WH 52 WL BSE Cl
Axis Gold [1] 41.57 41.45 27.29 43.69 38.36 41.47
AXISAMC AXISBNKETF 383.41 384.24 0.71 449.40 296.69
AXISAMC AXISBPSETF 10.42 10.38 88.27 10.69 9.06
AXISAMC AXISCETF 72.28 71.69 1.83 81.00 60.00
AXISAMC AXISHCETF 87.42 86.94 2.22 105.00 82.00
AXISAMC AXISNIFTY 191.43 190.86 13.15 212.22 132.00
AXISAMC AXISTECETF 392.62 386.77 1.50 428.20 250.95
Bank BeEs [1] 385.30 384.67 397.61 420.43 298.08 384.60
Birla Gold 43.82 43.74 10.36 49.00 40.50 43.82
Birla Nifty [100] 20.37 20.14 3091.57 4810.00 4061.00 4391.00
BIRLASLAM ABSLBANETF 38.10 38.08 11.45 420.00 33.90
BIRLASLAM ABSLNN50ET 44.36 43.76 6.96 520.00 40.60
BIRLASLAMC BSLSENETFG 58.26 58.17 1.87 664.99 52.80
BIRLASLAMC HEALTHY 8.75 8.59 295.96 10.41 8.21
BIRLASLAMC TECH 38.58 38.09 5.80 43.75 33.56
ConsConstCon 144.00 142.35 126.88 156.00 95.00
DSPAMC DSPN50ETF 184.00 182.27 0.81 184.00 169.20
DSPAMC DSPNEWETF 203.05 202.09 11.00 204.70 158.90
DSPAMC DSPQ50ETF 183.80 181.56 2.95 186.00 172.04
DSPBRAMC QUIDETF 1000.00 1000.00 24.17 1020.00 805.90
EDELAMC BBETF0432 999.97 999.77 8.10 1005.00 997.10
EDELAMC EBANK 4049.99 3914.33 0.02 4398.00 3242.33
EDELAMC EBBETF0423 1157.51 1156.57 2.26 1181.38 900.00
EDELAMC EBBETF0425 1076.00 1077.56 32.29 1170.00 1005.00
EDELAMC EBBETF0430 1190.86 1191.77 6.85 1247.90 895.00
EDELAMC EBBETF0431 1062.95 1063.32 11.67 1143.10 994.01
Gold BeEs [1] 41.53 41.52 2549.06 43.40 38.17 41.53
Goldmanamc CPSEETF 32.22 31.79 964.66 32.83 18.91 31.80
HangSengBees [1] 303.38 303.43 1.69 382.00 287.00 301.90
HDFC Gold [1] 42.64 42.55 251.44 50.00 38.70 42.54
HDFCAMC HBANKETF 382.95 381.53 6.11 419.95 296.13
HDFCAmcNift [76] 195.95 194.24 310.99 202.00 144.01 194.16
HDFCAmcSens 656.09 650.36 19.95 6300.00 455.00
IBULLSAMC IBMFNIFTY 186.13 187.49 0.67 200.00 137.23
ICICIPRAMC BHARATIWIN 47.79 47.21 86.24 52.20 31.20
ICICIPRAMC ICICI500 26.05 25.70 35.15 283.80 23.12
ICICIPRAMC ICICIALPLV 182.98 179.50 97.80 197.60 131.70
ICICIPRAMC ICICIAUTO 116.61 117.44 25.41 124.40 117.00
ICICIPRAMC ICICIBANKP 191.39 191.99 25.05 227.70 159.50
ICICIPRAMC ICICICONSU 72.32 71.52 0.46 82.25 57.01
ICICIPRAMC ICICIFMCG 381.27 376.78 4.01 437.00 360.00
ICICIPRAMC ICICILIQ 1000.00 999.99 54.51 1040.00 971.50
ICICIPRAMC ICICIM150 122.34 119.72 75.04 132.70 77.00
ICICIPRAMC ICICINXT50 44.62 43.92 1247.31 50.97 31.30
ICICIPRAMC ICICIPHARM 87.63 86.22 199.29 105.00 82.00
ICICIPRAMC ICICITECH 396.38 389.24 27.81 419.70 201.48
ICICIPRAMC IPRU5008 381.49 380.58 6.27 449.70 285.00
ICICIPRNIFLWVL30ETF 42.61 42.64 413.17 49.21 37.05
ICICIPRNIFLWVL30ETF 108.96 107.01 17.79 115.00 76.20
ICICIPRUDENTIALNV20ETF 102.03 100.48 17.62 109.10 69.30
ICICIPRUDNIFTY100ETF 201.03 198.97 4.17 208.00 143.40
ICICIPRUDNIFTYETF 196.69 194.73 483.37 231.30 133.70
ICICIPRUDSENSEXETF 666.66 662.08 8.42 700.00 493.60
IDBI Gold [100] 4415.00 4384.50 0.03 4810.00 4061.00 4391.00
IDFCAMC IDFNIFTYET 192.42 190.41 0.18 223.00 141.50
Infra BeEs 551.86 542.56 1.61 1950.00 1413.50 1892.00
InvesIndGold [100] 4330.00 4324.35 0.06 4609.25 3400.25
InvesInNifty 2003.75 1981.70 0.05 2291.00 1441.15
Kotak Nifty [5] 193.03 191.12 32.56 2252.45 1627.25 1942.55
Kotak PSU Bk 273.49 268.54 16.93 299.30 170.26 269.00
KOTAKMAMKOTAKALPHA 36.20 35.85 187.62 41.00 33.57
KOTAKMAMC KOTAKIT 39.39 38.67 2544.98 46.00 23.36
KOTAKMAMCKOTKBKETF 386.34 386.36 200.62 429.70 298.90
KOTAKMAMCKTNV20ETF 103.97 102.44 7.83 104.98 72.05
Kotal Gold [1] 41.77 41.80 172.68 43.80 36.81 41.81
LICNAMC CNFENGP 193.53 193.66 1.62 202.99 140.00 193.06
LICNAMC CNFESGP 658.23 652.89 76.19 677.40 465.60
LICNAMC CNFNHGP 196.01 193.47 260.52 230.00 142.10
LICNAMC CNMFET 22.76 22.27 54.90 26.94 19.00
Liquid BeEs [1000] 999.99 1000.00 2998.64 1015.00 972.35 1000.00
MIRAEAMC MAESGETF 31.07 30.78 58.08 32.18 21.75
MIRAEAMC MAFANG 53.83 53.69 140.39 69.00 44.00
MIRAEAMC MAFSETF 18.48 18.49 101.27 21.00 15.05
MIRAEAMC MAHKTECH 18.37 18.08 121.44 23.00 16.60
MIRAEAMC MAN50ETF 189.06 187.04 268.98 210.80 139.00
MIRAEAMC MANXT50 435.90 430.20 6.23 530.18 315.29
MIRAEAMC MASPTOP50 29.94 29.91 138.17 37.00 24.20
MOTILOS MIDCAP100 ETF 33.70 33.26 148.43 35.95 22.00
MOTILOS NASDAQ100 ETF 114.46 113.67 913.12 1143.10 95.80
MOTILAL OSWAL M50 ETF 181.42 179.66 0.84 194.00 115.95
MOTILALAMC G5 49.21 49.21 4.95 58.00 45.00
MOTILALAMC MONQ50 61.12 60.24 13.38 78.00 49.05
NI I ETF NIFTY MIDCAP 150 122.12 120.23 138.81 127.00 78.73
NiftyBeEs [1] 198.03 195.97 1936.92 201.00 144.00 195.98
NiftyJrBeEs [1] 459.07 451.50 199.94 473.00 331.00 451.34
NIIndETFLong 22.48 22.52 59.16 25.80 20.80
NIPETFDivOpp 47.34 47.31 2.03 51.20 32.51
NIPP INDIA ETF NIFTY 100 190.88 188.58 5.04 219.40 135.66
NippnIndNim 107.36 107.36 0.12 109.25 101.50
NippoIndETF 79.17 77.93 34.13 86.00 60.36
NIPPON INDIA ETF NV20 105.18 103.11 8.56 118.00 73.87
NIPPONAMNETFPHARMA 13.93 13.77 367.34 17.44 13.12
PSU Bk BeEs [1] 30.31 29.94 2819.55 33.49 19.11 29.88
Qgold [2] 41.28 41.28 35.00 43.46 38.06 41.29
Qnifty 1907.90 1902.00 0.04 1950.00 1413.50 1892.00
RELCAPAMC NETFGILT5Y 49.18 49.13 0.23 59.00 41.99
RELCAPAMC NETFIT 39.64 39.00 1436.89 40.35 24.00
RELCAPAMCNETFSDL26 106.50 106.36 2.17 110.05 100.93
SBIAMC SBIETFCON 72.40 71.48 3.81 77.31 62.00
SBIAMC SBIETFIT 397.58 390.07 7.46 428.70 203.00
SBIAMC SBIETFPB 193.95 192.70 2.73 222.00 162.95
SBIAMC SBIETFQLTY 158.41 156.75 1.96 164.98 122.10
SBIAMC SETF10GILT 205.82 205.82 0.01 237.98 190.33
SBIETF Gold 42.56 42.55 449.36 4485.80 42.00
SBIETF NIFTY 50 187.09 185.32 1436.23 196.54 140.01
SBIETF NIFTY BANK 382.15 381.57 20.56 420.00 295.00
SBIETFNN50 454.89 447.20 9.59 468.60 327.30
Sharia BeEs 475.33 469.21 2.25 518.00 334.63 466.95
TATAAML NETF 189.28 188.95 268.72 222.68 152.60
TATAAML NPBET 196.41 194.55 1.54 228.89 162.95
UTI Gold [1] 41.50 41.50 78.60 44.90 39.21 41.42
UTIAMC UTIBANKETF 38.44 38.17 3.59 428.00 26.40
UTIAMC UTINEXT50 45.62 44.87 22.44 435.30 33.00
UTIAMC UTINIFT 1930.01 1899.40 27.56 2240.00 1412.00
UTIAMC UTISENS 643.02 637.67 0.77 737.55 452.95
UTIAMC UTISXN50 51.11 50.84 1.71 413.73 37.10
*: Closing price is the average of trade price(s) for the last half an hour;52Week High/Low fi�gurespertain to BSE.
Shares of face value other than ₹�10 is indicated in brackets immediately following the name of thecompany.
Qty (No of shares traded) is denoted in thousands.
The PE(priceearnings multiple) of each stock is based on the latest declared earnings.
The PE computation takes into account the per share earnings of each company for the latest 12months.
BSE Stocks
A.Sarabhai 37.50 36.60Aail [5] 67.20 67.95Aarey Drugs 54.00 56.20Aarnav 104.35 99.15Aartisurf 1050.05 1017.90Abslamc [5] 577.45 563.35Accel [2] 31.45 29.90Acrycil Ltd. [2] 832.90 813.55Adarsh Plant 26.90 25.60Ador Fontec [2] 81.05 77.10Aiil [1] 179.25 174.40Ajanta Soya 254.40 265.80Akspintex 69.95 73.40Alexander 28.30 28.65Alka India [1] 4.86 5.10Alu Fluoride 353.05 333.55Amardeep In[1] 2.24 2.13Amines&Plast [2] 123.30 120.35Amintan [1] 5.68 5.96Amiorg 1089.25 1065.15Amrawor Agr[1] 2.96 3.10Anandrathi [5] 618.25 614.45Andhra Petro 131.75 128.80Andrew Yule [2] 27.60 27.05Ang 386.60 367.30Angelone 1357.00 1384.30Anmol 181.50 197.70Anuh Pharma[5] 123.10 121.95Anup 1187.15 990.70Anupam [1] 3.85 3.73Anuras 1049.10 1013.25Apollotri [2] 873.15 847.65Aptus [2] 363.80 347.95Arcfi�n 18.40 19.12Arihant Cap. [5] 253.65 267.70Arnold Hold 20.07 18.80Ashirwa Cap [1] 11.03 10.48Asian Tea 23.65 22.95Asianene 167.65 160.85Asm Technolo 756.90 770.20Asrl 145.40 151.70Asso.Alcohol 545.80 530.20Available Fi 115.10 114.30Avi 50.35 52.85Avl 931.60 885.05Awhcl [5] 336.30 333.15B.N.Rathi Se 41.10 46.90B2b Soft. 46.50 46.20Bajaj Steel [5] 1030.20 1060.65Bajajhcare [5] 483.25 471.20
Balmer La.In 390.55 387.30Baluforge 124.60 121.60Bambino Agro 301.10 306.65Banas Fin. 120.35 126.35Barbeque [5] 1483.60 1495.05Baroda Extr. [1] 6.33 6.06Basant Agro [1] 21.69 22.77Bclenterpr 29.85 31.30Bcpl 54.95 53.05Bectorfood 378.25 377.25Bengla& Asm 2328.35 2464.50Bgjl 32.10 30.95Bhilwra Tec [1] 24.75 24.95Bihar Sponge 14.38 14.27Bilcare Ltd. 108.95 108.15Biogen [1] 0.98 1.02Birlatyres 26.75 27.35Bla Ros Ind [1] 224.70 221.40Bmw [1] 39.95 38.30Bridge Secur 22.95 24.05Burgerking 141.50 140.10Cams 2950.70 2876.10Captain Poly [2] 23.45 25.05Cartrade 863.15 834.35Chamanl Se [2] 108.50 106.90Chandni Te 60.75 61.45Charterlogis [1] 9.08 9.14Chemcon 385.50 376.40Chemplasts [5] 605.90 613.80Cheviot Co. 1422.90 1393.75Choice Int. 274.30 274.15Clean [1] 2534.00 2434.70Cmsinfo 311.60 295.90Coast Corp 512.50 477.75Com Fincap 42.00 43.90Comsyn 286.65 292.25Cosco India 216.20 243.45Cosmo Ferr. 389.90 371.15Craftsman [5] 2400.55 2391.65Cressanda So[1] 6.69 6.36Ctl [1] 20.55 19.53Cubical Fin. [2] 4.33 4.32DaiIchi Kar 436.65 483.40Daikaffil Ch 34.60 37.05Datapattns [2] 815.00 779.75Deccangold [1] 33.75 33.75Decipher 88.05 92.45Deep 656.15 623.35Deepak Spinn 362.65 341.60Deepind 185.70 184.65
Devyani [1] 186.65 185.60Dhanvarsha [2] 151.45 161.95Dharamsi Chm 363.75 348.85Dhruv 57.15 58.65Divya.Granit 76.90 85.25Dodla 565.80 558.35Dspnewetf 203.25 201.87Earum [2] 10.08 9.58Easemytrip [2] 577.55 576.85Eastwest [2] 11.89 11.98Ecoreco 139.45 137.15Eldeco Hous. [2] 849.50 851.70Equitasbnk 58.25 57.55Essar Secu 5.33 5.45Evexia [2] 9.96 9.68Exxaro 141.65 140.95Facor Alloys [1] 10.06 10.00Fairchemor 2076.10 2049.05Faze Three L 400.15 385.10Fiberwb In 48.10 50.80Filat Fash [5] 7.21 6.92Finopb 412.15 400.10Flomic 157.25 157.00Fluorochem [1] 2827.40 2763.75Foods & Inns [1] 108.55 112.00Force Motr 1340.85 1351.05G.V.Films [1] 1.58 1.65Ganesh Benz [1] 103.75 101.25Gbfl� 20.14 21.14Gennex Lab [1] 10.62 10.09Genpharma [1] 9.18 8.80Ggeng [2] 12.07 11.78Ggl 13.94 14.63Gland [1] 3694.15 3677.50Gls [2] 606.80 602.15Gnrl 22.80 22.30Gocolors 1102.85 1086.65Godavari Dru 65.60 68.35Grauer& Weil[1] 63.30 63.05Greenpanel [1] 459.45 459.80Grinfra [5] 1943.20 1916.90Grwrhitech 864.00 860.40Gstl 79.55 75.25Guj.Themis. [5] 498.15 485.95Haldyn Glass [1] 46.95 47.65Hansugar 9.53 10.00Happstmnds [2] 1337.50 1307.30Hawkins Cook 5882.40 5699.90Hemiprop 137.20 154.20Heranba 718.95 724.65
Hfi�l 24.85 24.05Hind.Foods 2216.50 2088.45Hind.Tin Wrk 113.40 117.00Hitech 610.30 594.30Hleglas 6503.45 6401.60Homefi�rst [2] 812.45 826.85Hpal 442.60 424.45Iifl�sec [2] 99.00 97.00Iifl�wam [2] 1630.90 1543.85Ind.Acrylics 18.50 17.95India Home 41.70 42.80Indiamart 6703.55 6503.00Indian Info. [1] 10.65 10.12Indo Amines [5] 128.35 121.95IndoCity In 12.70 13.33Indoboraxc [1] 145.40 144.65Indokem Ltd. 47.45 49.55Inn.Tech.Pac [1] 22.45 26.85Int.Conveyor [1] 85.40 84.30Integra Tele 32.10 31.65Inter.Travel 110.80 114.05Ion Exchange 2261.50 2198.95Ipl [1] 321.90 315.60Ircon [2] 47.65 46.75Irctc [2] 896.70 861.45Irfc 24.05 23.70Isec [5] 823.35 819.20Isgec [1] 692.55 667.05Isw Ltd [1] 5.64 5.92Jaibala Ind 56.15 52.85Jasch Indust 144.45 142.85Jaykay [1] 62.60 64.75Jayshri Chem 9.51 9.17Jct Ltd [2] 6.96 6.79Jstl 212.45 204.10Jtl Infra [2] 259.05 250.65Jublingrea [1] 634.95 610.65Kabsons Indu 20.81 20.06Kalyankjil 69.70 68.80Kaman Hsg 20.34 20.29Kanchi 873.75 857.30Kanelind 5.02 4.86Kcp Sugar In [1] 30.25 29.35Khaitan Che [1] 91.35 98.80Kic Metaliks [2] 59.15 64.10Kilpest (I) 481.70 469.25Kims 1458.30 1436.05Kingsinfra 42.00 50.15Kirl.Ferrous [5] 217.85 214.60Kirlosar Pn [2] 508.45 483.75
Kirloskar El 27.15 26.70Kmc Shil [1] 70.40 68.70Kocl 5.35 5.09Kpiglobal 454.55 461.60Kpittech 729.30 714.05Kriti Nutri [1] 48.35 45.70Krsnaa [5] 755.45 719.40Krypton Ind 22.95 25.70Kushal [2] 7.36 7.72Lancer 226.25 225.50Latentview [1] 592.45 573.40Lee&Nee Soft 27.40 26.05Lehar 46.10 47.95Lloyds Met E [1] 129.00 126.35Lodha 1243.60 1239.45Looks 14.90 14.75Ludolow Jute 114.05 110.45Lxchem [2] 469.35 454.95Madhavipl [1] 5.75 5.51Madrasfert 36.85 35.95Mafang [40] 53.87 53.63Mafatlal Ind 237.70 234.95Mahepc 130.25 127.75Mancredit 93.85 99.35Mangalam In[1] 8.40 8.70Manorama 1407.65 1392.00Manorg 1179.55 1127.55Manvijay [1] 97.40 93.15Mapmyindia [2] 1852.15 1773.50Maxhealth 393.90 391.10Mayukh [5] 24.05 23.55Mazdock 277.20 273.10Medi Caps 78.25 74.35MediaMatrix [1] 15.90 15.30Medicamen Bi 857.45 839.15Medplus [2] 1195.75 1184.55Mega Corpn. [1] 4.44 4.22MenonPiston[1] 61.35 60.15Metrobrand [5] 606.75 605.15Mfl� 810.95 847.95Mishtann [1] 30.95 32.45Mkexim 288.80 303.20Mol [1] 121.60 121.50Moschip [2] 85.10 89.35Mpl 11.63 12.21Mstc 371.05 357.30Mtartech 2345.90 2316.65Multibase I 262.60 250.75Muzali [1] 4.89 5.06Nat.Peroxide 1827.05 1812.15
Natural 15.40 14.97Nazara [4] 2451.15 2376.10Ncl Research [1] 2.69 2.82Ndrauto 432.55 418.45Neogen 1779.55 1747.85Newlight 33.95 33.55NglFine Chm [5] 2809.10 2831.40Nile Ltd. 606.20 616.55Nureca 1876.10 1852.95Nuvoco 511.85 504.15Nykaa [1] 2071.40 2055.00Oal [5] 796.75 798.80Omansh [2] 2.82 2.96Ontic 32.00 32.00Orchasp [2] 9.27 8.81Orientelec [1] 369.55 364.80Orosmiths [1] 8.57 8.99Osiajee 46.70 46.30P.H.Capital 171.15 179.15Pan India C 13.38 14.04Pana Energ 341.85 333.45Panch.Steel 160.70 151.25Paras 730.50 712.95Parleind 9.85 9.60Pas.Acrylon 51.40 48.95Patel Airtem 259.70 278.35Paushak Ltd 10097.55 10594.50Paytm [1] 1105.00 1042.50Perm Magnets 381.20 419.85Pharmaids Ph 17.90 18.75Piccadily Ag 34.05 33.35Pix Trans 1110.95 1119.70Pmcfi�n [1] 10.65 11.18Policybzr [2] 1021.55 998.50Polycab 2702.40 2659.15Powerindia [2] 2715.65 2657.50Ppl 158.20 157.40Princepipe 735.95 721.65Prism Medi 12.10 12.68Prismx [1] 8.86 8.74Pritikauto [2] 19.70 19.60Pun.Alkali 320.20 308.20Raclgear 642.60 645.55Radhe Devlop 270.65 265.70Railtel 121.40 120.25Raj Glo Wir 2804.40 2710.60Rajoo Engin. [1] 43.00 40.40Ram Rat.Wir[5] 176.65 186.20Rama Phosph 382.20 372.30Raminfo 156.50 152.75
Rasandik Eng 124.00 136.40Rasi Electro [2] 10.65 10.79Rategain [1] 493.90 514.45Rathi Bars 39.20 37.70Rdb Rasayan 118.45 113.80Regentrp 4.50 4.57Rexnord Ele. 81.60 78.40Rishiroop 173.00 167.95Rolexrings 1309.45 1255.85Rossari [2] 1338.20 1292.45Roto Pumps [2] 435.05 434.50Route 1867.65 1838.10Rubfi�la Int. [5] 125.00 118.95Rvnl 38.40 37.45Saboo Sodium 26.80 25.85Sacheta Met. 49.90 52.35Sadhan Nitr [1] 116.90 111.10SaintGobain 100.00 96.10Samrat Pharm 555.80 520.75Sandur Mang. 2508.70 2421.15Sanjivani Pa 49.65 50.35Sansera [2] 778.65 766.75Sapphire 1440.00 1435.25Sat Ind Ltd [2] 56.90 53.40Sauras.Cem. 83.50 82.55Sbicard 886.85 878.20Scanp Geom [2] 18.40 19.25Scanstl 45.30 44.35Seacoast [1] 18.60 20.30Setfnif50 187.13 185.13Sgil 214.40 214.40Sgrl 312.75 318.70Shahlon [2] 21.90 19.65Sharp Inv [1] 6.33 6.64Sheetal Dia [5] 12.98 12.52Shil [2] 393.70 397.70Shiv.Bimetal [2] 463.85 441.10ShivCement [2] 43.45 42.85Shiva Fert. 89.95 92.00Shivalik [5] 1119.70 1074.40Shree Global [1] 8.68 8.83Shreeganes 127.75 126.30ShrJagdamb [1] 997.80 1165.25Shrirampps 94.15 103.45Shyammetl 353.25 350.55Siddha Ven 11.78 11.20Sigachi 390.95 383.05Simran Farms 226.50 237.80Singer India [2] 63.55 63.40Sintexplast [1] 9.93 9.44
Sisl 1238.80 1223.30Sjs 448.55 431.00Smartfi�n [1] 9.34 9.76Smcglobal [2] 80.85 83.35Smfi�l [1] 9.49 9.23Smgold 270.05 274.95Solara 1103.00 1067.70Sonacoms 770.00 770.55Sp Capital 27.45 26.55Spandana 390.15 382.00Spel Semicon 78.45 82.35Spencer [5] 107.85 105.65Spicejet Ltd 64.20 63.20Srestha [2] 2.21 2.29Sri Digv Cem 79.10 78.35Sri Kpr Ind 30.60 30.20Starhealth 858.00 844.75Starhfl� 86.80 89.45Stovekraft 978.90 959.80Sumichem 394.20 390.00Super Crop. [2] 9.87 9.74SuperTanner [1] 8.22 8.03Superior 62.00 58.90Supremex [1] 7.76 7.38Supriya [2] 536.15 570.95Suraj Indus. 169.15 160.70Surat Text. [1] 29.40 30.80Suryoday 148.85 146.15Suvenphar [1] 538.30 543.70Suvidhaa [1] 12.81 12.23Svartcorp [1] 7.90 7.53Svcind 8.42 8.00Svpglob [1] 75.40 75.55Swarnasa 30.50 29.15Swasti Vinay [1] 13.05 12.93Swordedge [1] 1.97 2.06Swsolar [1] 417.60 395.50Synco Form. [1] 18.57 18.80Taalent 2038.00 1936.10Talbroseng 488.65 481.65Taneja Aero. [5] 152.20 145.15Tarc [2] 58.90 57.00Tarsons [2] 715.90 726.10Tata Yodogaw 190.50 181.00Tatia Glob [1] 5.42 5.15Tatva 2868.00 2609.90Tcnsbrands [2] 803.30 786.90Tdsl 28.45 30.10Technoe [2] 257.40 255.35Tega 593.70 590.65
Sharika [5] 18.04 18.94
Sportking 1575.80 1497.05
Steel Exch 252.90 240.30
Vikas Wsp [1] 5.00 4.78
Vikaslife [1] 6.88 7.22
Yasho 1683.85 1661.80
Zodiac 102.40 107.50
Bclil 439.85 459.35Bh.Immun&Bio 51.40 50.40Boroltd [1] 387.20 376.50GrmOverseas [2] 821.50 850.20Kpel 321.85 337.90Relhome 6.36 6.18Sbc 169.55 173.35Sctl 3.31 3.47
Yashpakka 92.30 87.85
Zeal [1] 10.66 10.52
Zenith Healt [1] 11.14 10.59
Zf Steering 541.70 536.15
Zomato [1] 133.95 133.05
Group T
Tejasnet 484.15 459.95Tgvsl 66.65 66.95Thinkink [5] 46.10 45.55Tiaanc 8.69 8.43Tiindia [1] 1806.60 1787.15Tilak [1] 26.15 24.85Timex Group [1] 98.25 90.60Titan Biotec 309.40 306.30Titan Secur. 24.60 24.15Toyamind [1] 6.35 6.66Transpek 2040.15 2019.35Trejhara 122.55 121.35Trio Mercan [2] 3.16 3.10Ttient 43.35 45.50Tutialka 32.55 30.95Udaip Ceme [4] 39.10 38.30Ugrocap 215.35 215.90Ultramarine [2] 360.25 350.35Unison 48.40 48.00United Drill 584.80 546.30Ushdev Intnl [1] 5.97 6.14Utiamc 1058.60 1057.60Utique 7.95 7.56Utlinds [1] 7.14 6.97Valiantorg 1221.90 1216.80Vama Inds [2] 12.73 13.46Varroc [1] 443.25 444.20Vedavaag 77.75 73.20Velan Hotels 11.58 11.01Vijaya [1] 545.80 537.40Vipulorg 191.05 197.30Virinchi 151.40 158.95Virtual Glo [1] 3.20 3.08Visagar Fin [2] 14.24 14.95Vishal [5] 136.55 128.75Vishwaraj [2] 24.10 25.05Vista Pharma[2] 14.41 13.77Vivid Ind [5] 38.90 46.65Waareertl 362.05 360.95Waterbase 109.55 107.90Welsplsol [6] 19.90 23.40Westlife Dev [2] 538.75 532.60Whiteorg 13.31 13.76Wim Plast Lt 506.70 500.65Windlas [5] 283.35 276.40Winsome Brew 15.73 15.66Wpil Ltd. 984.80 1005.75Xelpmoc 399.60 385.15Xtglobal [1] 60.40 63.40Yashchem 44.95 48.15
JSWEnergy 312.55 303.70Kaly.For 191.00 195.00Kanani Ind [1] 18.30 17.50KapstonFacil 144.10 136.90Karma Enr 32.85 33.55Kernx.Mic 132.60 126.00KilitchDrugs 251.85 243.50KridhanInfra[2] 8.10 7.80Landmark [1] 14.65 13.95LCC Info [2] 7.95 8.30LGB Forge [1] 18.50 17.60LloydsSteels[1] 24.75 25.10LovableLingr 179.00 171.40Lyka Labs 249.60 237.85LypsaGem&Jew 8.20 8.00MadhucnProj[1] 10.75 10.30MahaApexCorp 116.95 112.40ManakAlum [1] 27.50 26.85ManCoatMet[1] 48.65 46.25MARINELECT(I) 38.15 37.65Mask Invest 37.15 39.00McNally 8.70 8.85Mega Soft 62.20 65.30Mercator [1] 3.30 3.15MIC ELECTRON 33.15 31.50Mindtek(Ind) 231.85 242.65MITTALFE ST 27.35 26.00ModiRubber 81.00 78.40Morarj.Tex [7] 27.25 26.30Mot.Gen.Fin [5] 30.00 29.95Nah.Spg [5] 628.80 604.90NakodaGroup 285.25 279.95NilaSpaces 5.50 5.25NK Industrie 38.65 40.25Orient Green 24.45 23.25Orient Tri 13.05 12.55
De Nora 475.75 475.15Dhar.Sugar 21.40 21.75Digicontent [2] 19.70 19.20Ducon Infra [1] 24.40 24.90EmamiRealty[2] 89.70 87.60Energy Dev 34.05 32.35ESI [2] 11.20 10.65Essar Shp 12.25 11.65ExcelRealNIn 11.45 10.90FCS Soft [1] 7.95 8.30Glb.Vect 63.50 60.35Golds.Tech 87.70 91.25GoodluckIn[2] 380.30 378.45GrandFoundry 4.50 4.50GSS Info 142.05 135.20GTL Infra 2.30 2.35GujartRafInd 46.60 45.15GulshanPoly [1] 397.15 413.85Gyscoal [1] 7.25 6.90HindRectify [2] 243.40 240.10HLV 11.15 10.75Hubtown 65.20 68.30ICDSLTD 59.30 62.25IL&FS Ven [2] 9.75 9.40IMP Pwr 19.60 18.80IncredbleInd 31.00 29.50Ind.Card 293.65 283.70Indo Wnd 30.80 29.30IndoThai 404.25 417.00IndSwift [2] 15.95 16.70InoxWindEner 769.35 762.80InterntlCons 29.10 30.55ISMT [5] 53.35 56.00Jay.Neco 30.00 30.10JBF Ind 21.85 20.90JITFInfraLog [2] 121.95 117.90
3PLandHoldng 23.65 22.50AdaniTtlGas 1798.80 1815.45AdrotInfotec 15.15 15.60AjrInf&Toll 3.40 3.55AkashInfraPr 173.60 171.05AnkitMet&Pow 17.05 16.20Ansal Hsg 9.85 9.65Antartica [1] 2.30 2.40ApolloMicSys 159.35 156.25ArchidplyDec 55.90 57.80Arss Infra 40.65 38.70ArtNirman 120.10 114.10Auto Stamp 753.85 716.20AxiscadeEng[5] 117.85 121.10BAG Films [2] 5.80 5.55BalkrisPaper 42.65 42.60BankaBioloo 84.75 87.95Barak Val 25.60 25.30BCLINDUSTRI 439.10 455.35BCPowerCon[2] 8.45 8.05BhandHosie [1] 12.40 11.80BLB [1] 24.90 26.10BOROSIL 386.70 376.80BrightcomGr [2] 191.05 181.75Burnpur 7.35 7.00CCCL [2] 2.00 2.10Celebrity 18.20 17.50CMI 50.15 48.55CompucomS[2] 32.10 30.50CountrClbH [2] 8.85 8.70CountryCond[1] 7.90 8.25CrestVenture 159.80 157.95Cyber Med 18.55 18.75DB Realty 71.80 74.40DB(Int)StBrk[2] 38.30 36.40DCMFinlService 4.70 4.90
Company Pr Cl Cl Company Pr Cl Cl Company Pr Cl Cl Company Pr Cl Cl Company Pr Cl Cl Company Pr Cl Cl Company Pr Cl Cl Company Pr Cl Cl
Company Pr Cl ClCompany Pr Cl Cl
Company Pr Cl Cl
Company Pr Cl Cl
Company Pr Cl Cl Company Pr Cl Cl Company Pr Cl Cl
NSE Trade for Trade
MUMBAI
II BusinessLine WEDNESDAY • JANUARY 19 • 2022MARKET RADAR
For BSE/NSE live quotes, scan
the QR code or click the link
https://bit.ly/2FpossK