ongc annual report - ctb
TRANSCRIPT
1
2
3
4
5
6
Chairman’s Message
Dear Shareholders,
The business of oil and gas continues to be challenging, complex and uncertain. However, ONGC has continued to grow, first as a dominant E&P company and now as a diversified energy major with strong presence across the entire value chain. You have been an important partner and stakeholder of this transformative journey. Your faith in us, is what propels and sustains us through the ups and downs and the uncertainties that we face in this constant pursuit of business growth and value-creation while delivering on our role as the country’s foremost energy explorer.
FY’19 was yet again a year of growth for ONGC and its business. Internationally as well, it was a period of steady recovery in the oil and gas sector as crude oil prices stabilised at levels higher than a year ago and E&P sector recorded impressive numbers.
That being said, uncertainty, still, remains a key feature of the industry. Crude oil prices swung from a high of USD80 a barrel to around USD50 in a span of few months as markets reacted to, first, the impending impact of US sanctions on Iran and then to record US production and a more conservative
outlook on global economic growth due to escalating trade tensions between US and China.
While the need to plan for energy transition in the wake of the global consensus and policy actions on the issue of climate change and sustainability does make the current period within the oil and gas community an exciting one as it opens up new opportunity areas, it does bring its own set of challenges with it.
As a Maharatna NOC in the energy sector, ONGC’s decisions and actions during this period will be of immense consequence to the country’s future energy landscape and I want to assure you that the Company has chalked out a comprehensive roadmap for its future growth factoring in its historical competencies as well as emerging avenues that align with its business objective of ensuring country’s energy security.
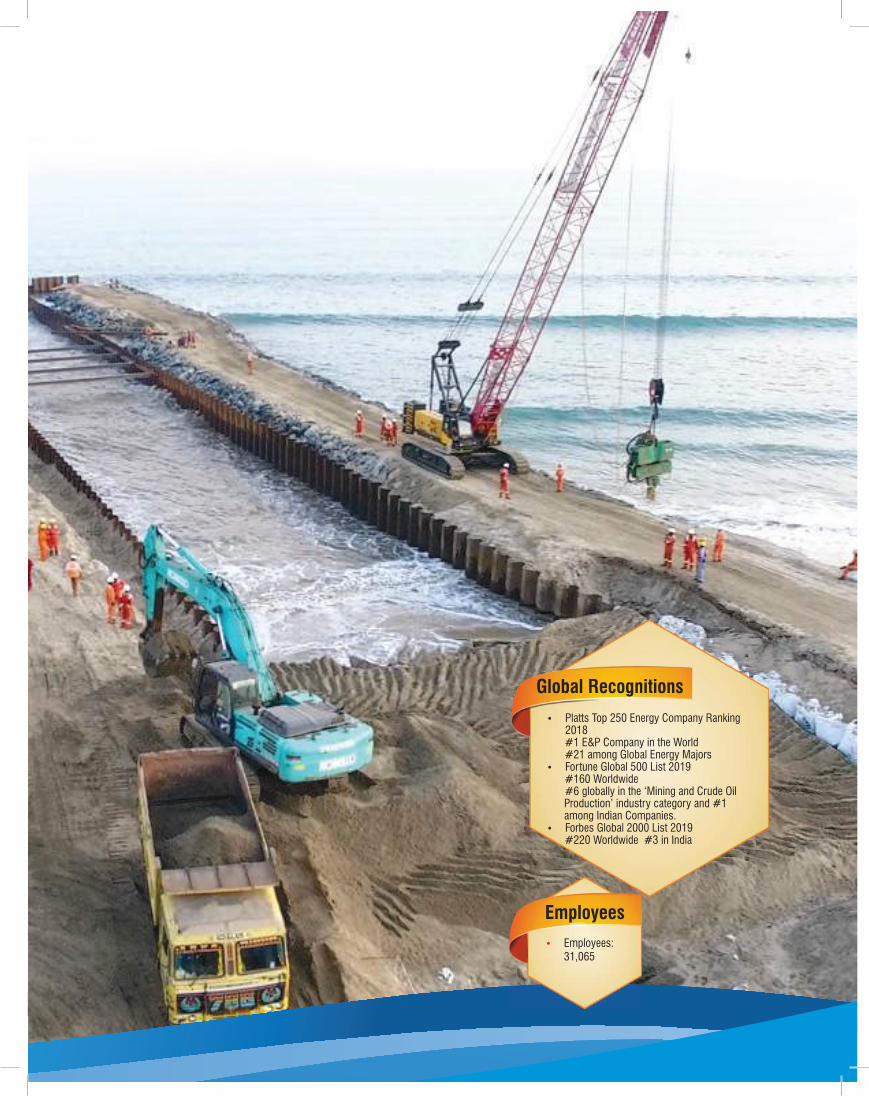
On behalf of the Board of Directors and around 31,000 dedicated energy soldiers of Oil & Natural Gas Corporation Ltd (ONGC), I now present to you the Company’s Annual Report for the financial year 2018-19.
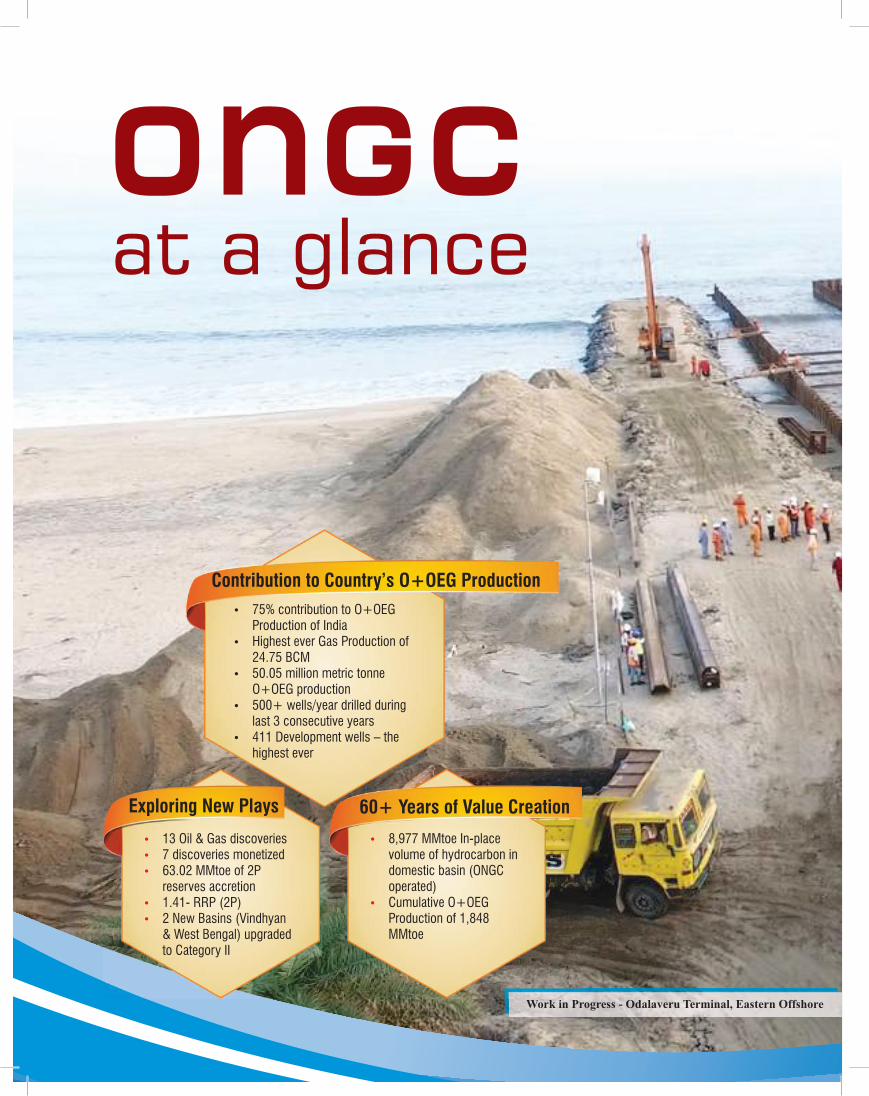
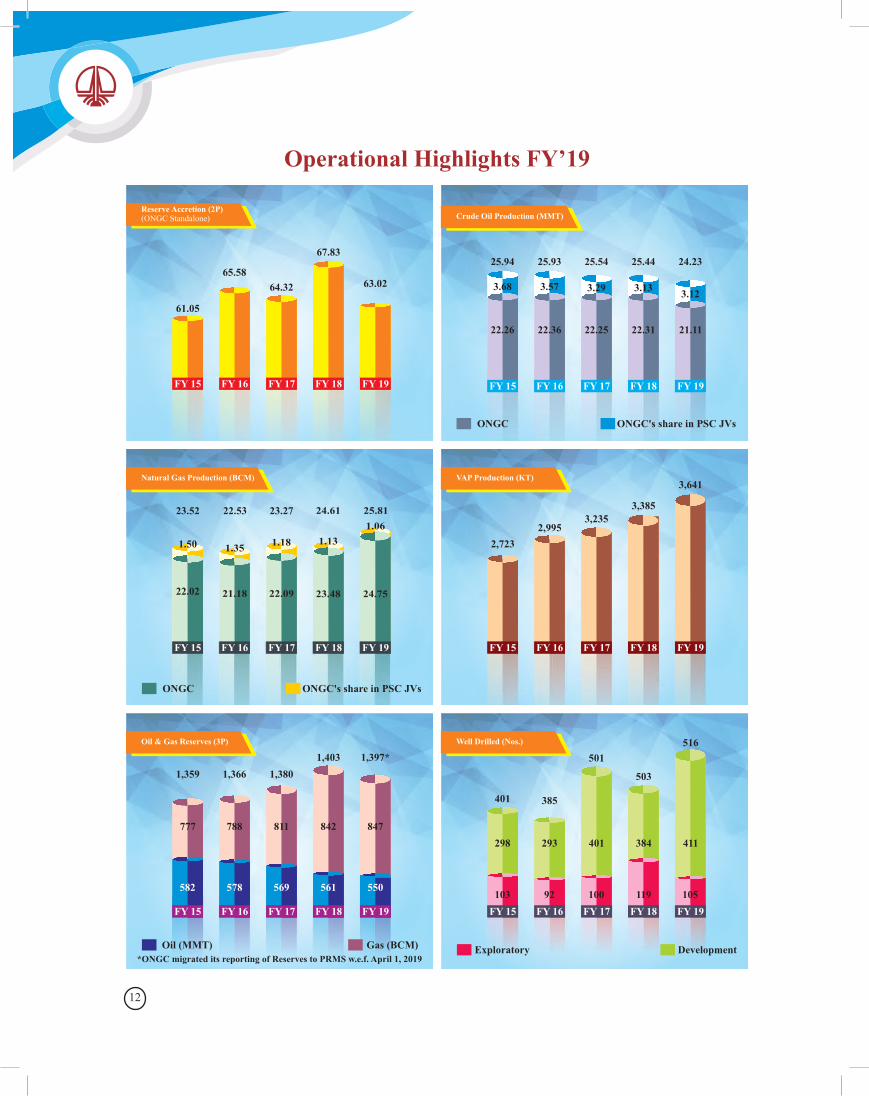
Performance in our core business of E&P remained impressive during FY’19. With another year of positive reserve replacement and meaningful discoveries, Exploration continues to power the Company’s promises of future growth in the domestic basins. We made a total of 13 discoveries during the year, of which 8 were onland and 5 in offshore areas. More importantly, we monetized 5 of those discoveries during the year itself. Reserve accretion for the year stood at 63.02 MMtoe on 2P basis and a Reserve replacement ratio of 1.41 means that we replenished more than the total quantum of hydrocarbon produced during the period.
A big positive of our exploratory efforts were the first-time discoveries in Bengal Basin (Well Asokenagar-1) and Vindhyan Basin (Well Hatta-2). With this exploratory success, these basins have now been upgraded to Category-II (basins with known accumulation of hydrocarbons) from Category III (basins with just having hydrocarbon shows).
Production of standalone oil and gas edged up marginally relative to FY’18 – we produced 45.86 MMtoe in FY’19 against 45.79 MMtoe in the preceding fiscal. The higher output was driven by pickup in gas output, which grew 5.4% year-on-year, on the back of additional supplies from
7
Daman in Western offshore, S1-Vashistha in deepwater Eastern offshore and Tripura onland. It represents the fourth yearsin succession that gas output has increased and production outlook remains positive for the next few years with significant contribution coming from East-Coast Deepwater development project KG-DWN-98/2 coupled with up swing in output from Daman in Western Offshore. In view of the critical role of energy, especially Oil and Gas in the country’s economic growth and development agenda, the Company is actively implementing redevelopment and Enhanced Oil Recovery schemes.
Overall, our cumulative domestic hydrocarbon volumes (inclusive of our share in JV-operated properties), stood at 50.04 MMtoe. Production of Value Added Products increased for the fifth consecutive year – VAP output in FY’19 stood at 3.64 MMT versus 3.39 MMT in FY’18 i.e. a growth of 7% over previous year.
Management will remain focussed on the E&P business, even as it diversifies into different areas of the hydrocarbon value-chain. 10 E&P projects, worth `112,585 Million, were completed during the year. As many as 25 projects, with an estimated outlay of around `830,000 Million, are currently under execution, of which 15 would directly contribute to hydrocarbon production. Envisaged cumulative oil and gas gains from these projects through their lifecycle stand at over 180 MMtoe.
Beyond greenfield projects, there is significant room for maximizing production fromour mature fields as well. Globally, as per Wood Mackenzie report, almost 20% of new production will come from incremental projects between 2017 and 2025. Within ONGC, we expect as much as 190 MMT of incremental oil from the 29 IOR/EOR projects that are currently underway. During FY’19, more than one-third of our standalone crude production came via these projects.
There is significant scope to increase production through EOR technologies in the mature fields. ONGC has been a pioneer in implementation of EOR technologies in India both in Onshore and Offshore fields. Presently, EOR projects contributes 9% of total onshore production. ONGC has given renewed thrust on Enhanced Oil Recovery (EOR) schemes after recently announced policy framework by the Government of India for incentivising production through improved recovery schemes in domestic fields. Some of the EOR schemes which are at various stages of implementation are Thermal EOR –Heavy Oil belt of Mehasana viz In-situ
combustion in Balol, Santhal and Cyclic Steam Stimulation in Lanwa; Chemical EOR-Polymer Flooding in North Kadi, Sanand, Bechraji and Alkali Surfactant Polymer in Viraj, Jhalora, Kalol, Sobhasan, Lakwa-Lakhmani (Assam); Gas based EOR - Immiscible Gas Injection in Borholla (Assam), Miscible Gas injection in Gandhar (Gujarat), Miscible CO2 injection (CCUS) in Gandhar (Gujarat), Gas Assisted Gravity Drainage (GAGD) in Kasomarigaon (Assam) besides Low Salinity Water Flooding at Mumbai High.
FY’19 marked another year of strong performance for our Drilling operations. ONGC drilled a record a number of wells – 516, the highest ever in the last 28 years. This comprised of 105 exploratory wells and 411 development wells.
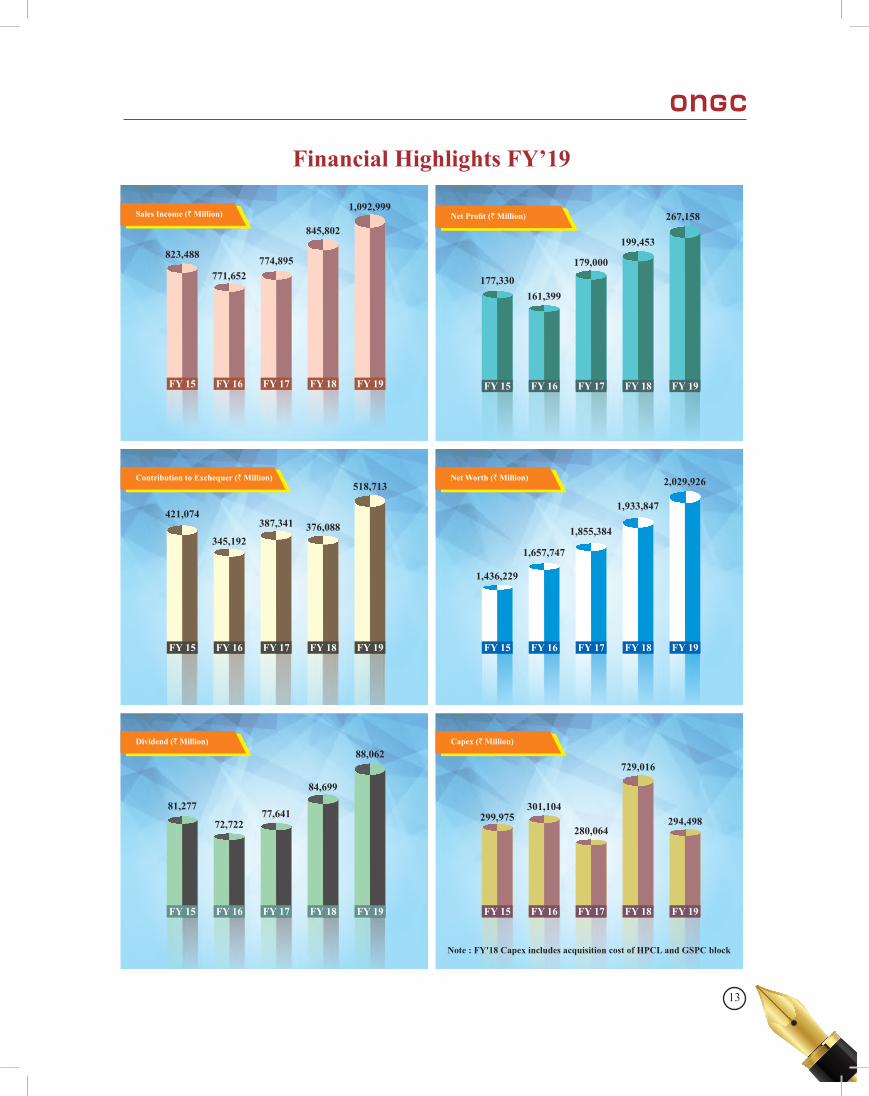
Oil and gas is a capital-intensive enterprise and your Company’s capital commitments over the years is testament to this. Capex for FY’19 stood at `294,498 Million, while budgeted capex for the ongoing fiscal i.e. FY’20 is `329,208 Million. Cumulative core capex, exclusive of any non-core expenditure on account of mergers/acquisitions etc., of the past 5 years stood at `1,495,106 Million.
Evidently, even through the downturn, when service sector costsdeflated, ONGC did not implement any cuts in its budget. While the focus on ‘doing more with less’ has gained substantial support in the E&P community in the aftermath of the recent oil price crisis, it is also true, at least in the case of our country, producing every additional barrel of oil has also become more difficult, complex and costly. This is why managing costs will be vital to securing profitability in the business, especially now when we are moving to more logistically difficult and operationally complex terrains such as deep and Ultra-deepwater, HP-HT etc.
In terms of financial performance, your Company recorded a Gross Revenue of `1,096,546 Million in FY’19 compared to `850,041 Million in FY’18. Net profit touched a record high at `267,158 Million (an increase of 34% as compared to FY’18 which was at `199,453 Million). The Company realized USD 68.19/bbl for crude sold in the domestic market in FY’19 as compared to USD 55.19/bbl in FY’18.
Dividend to shareholders for FY’19 remained healthy with a total payout of `88,062 Million which again was the highest ever with impressive payout ratio (including Dividend distribution tax) of 39.7%. Dividend per share was `7.00 as against `6.60 in FY’18. Even as your Company expands and diversifies its business, the Company remains steadfast
8
in its commitment to equitable value-creation for all its stakeholders, and a healthy and consistent dividend payment track record is part of this business philosophy.
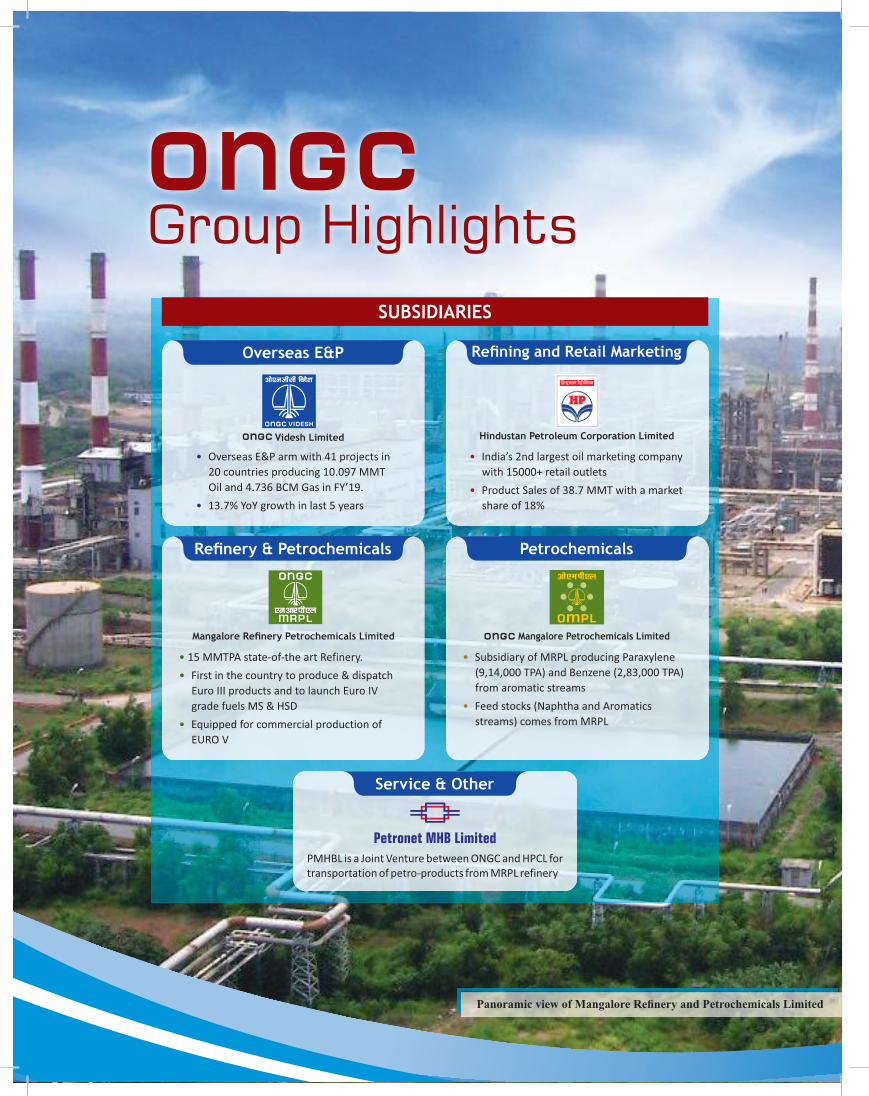
Your Company’s wholly-owned subsidiary mandated with international operations, ONGC Videsh Limited, has achieved a stellar landmark by achieving its higher-ever production of 14.833 MMToe for the year. This constitutes 23% of ONGC group production for the year, indicating the significance that the Group ascribes to its overseas operations. ONGC Videsh’s 2P reserves stand at 675.72 MMtoe at the end of the year, constituting 36% of ONGC group reserves. These two significant metrics establish that ONGC Videsh continues to be the second-largest E&P company of India, second only to its Parent. Consolidated revenue from operations and PAT for ONGC Videsh during FY’19 stood at `146,320 Million and `16,823 Million as against `104,176 Million and `9,815 Million in FY’18, respectively.
It also gives me great pleasure in informing you that production from Greater Pioneer Operating Company (GPOC), South Sudan project of ONGC Videsh, has resumed during the year after prolonged shutdown since December 2013, and presently the block is flowing crude oil at ~38,000 bopd. ONGC Videsh also achieved its second consecutive exploratory drilling success in Block CPO-5, Colombia. This follows the first success in the same block CPO-5 where commercial oil of 40° API was discovered in 2017. With above two wells, current production from CPO-5 is ~8000 bopd. Continuing its thrust towards ensuring equity oil, the first equity oil cargo of ONGC Videsh of Das Blend crude produced from Lower Zakum Concession, ADNOC Offshore, UAE, arrived at New Mangalore port on 08th June 2018. This equity crude of ONGC Videsh was refined at MRPL (a group company).
True to our vision of becoming an integrated energy major of global reckoning, your Company has, over the years, built up a sizeable presence in the downstream arena as well. The process of integration which was initiated with the acquisition of MRPL way back in 2003, has gained further steam with the acquisition of HPCL, the country’s third largest retailer, in FY’18. While E&P business remains the predominant cash-generator for the group, our downstream businesses lend the desirable balance to our energy portfolio and acts as a necessary hedge during periods of market volatility.
FY’19 was a strong year for our downstream refining and petrochemical units. Physical and financial performance of HPCL during the year has been very impressive. Its refineries at Mumbai and Vizag have maximized crude processing and achieved the highest ever combined refining throughput of 18.44 MMT with capacity utilization of 117%, compared to throughput of 18.28 MMT achieved during FY’18. It also achieved the highest ever market sales of 38.7 MMT.
HPCL also expanded its retail network by commissioning 478 new outlets, expanding its retail reach to a total of 15,440 as on March’19. Gross Sales during the financial year has increased to `2,957,126 Million as against `2,432,267 Million during the previous financial year. Net profit for the year stood at `60,287 Million, against `63,571 Million in FY’18. Further, FY’19 also marked the company’s foray into the gas distribution business as it received PNGRB authorization for CGD network in 20 geographical areas in 9 states.
MRPL registered highest ever throughput at 16.43 MMT in FY’19. At `723,151 Million, the company also recorded a 14.6% growth in its turnover while posting a net profit of `3,320 Million. During the year, MRPL also achieved the highest ever poly-propylene production of 388 TMT and LPG production of 970 TMT. A new retail outlet was also commissioned during the year, bringing the total number of operated outlets for the refiner to 7.
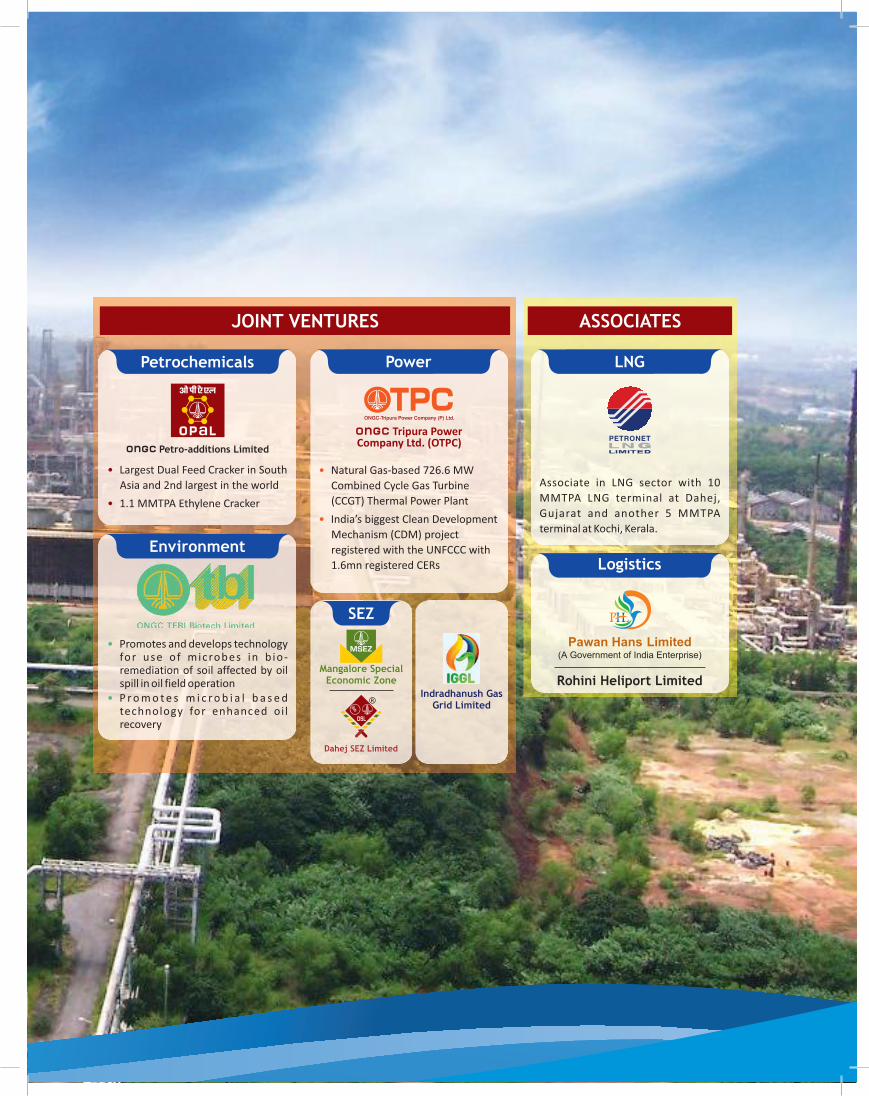
In the Petrochemical segment, both ONGC Petro additions Ltd (OPaL) and ONGC Mangalore Petrochemicals Limited (OMPL) registered operational successes and improved financial performance. During FY’19, OPaL has run at an average plant capacity of 70%; it is expected to reach 100% operating capacity in the current financial year. OPaL has sold more than 1 MMT of polymers and has grossed `97,854 Million as revenues. OMPL operated at close to 100% capacity in FY’19. It also achieved a 12.5% increase in its throughput and 18.2% exports growth. Total revenue in FY’19 stood at `83,624 Million. It also recorded its first-ever profits with PAT of `229 Million.
ONGC Tripura Power Company (OTPC), our Power JV in the country’s North-eastern state of Tripura, has been one of the most cost effective & efficient power producer in India having reliable fuel supply arrangements. During FY 2018-19, OTPC catered to about 29% of the total electricity requirement of the North Eastern region. With 5 years of consistent operations, OTPC has positioned itself well
9
and gained reputation of a credible power generator in the Region. As per the report published by Central Electricity Authority (CEA), OTPC has emerged as the largest central sector gas based power plant in the country in terms of generation during FY 18-19. It achieved its highest ever turnover of ̀ 14,558 Million and net profit of ̀ 2,139 Million. The largest Indian Clean development Mechanism (CDM) project, OTPC is also the only dividend paying standalone gas based Power Generation Company in India.
The global energy universe is changing – in fact change has been a constant theme in our business, be it through new technologies, or new markets or new oil and gas frontiers. But, the transformation of the current period has been brought on by a convergence of multiple factors, key among them being a near-universal acknowledgment of the need for a cleaner energy, increasing instability of traditional energy markets, sovereign policy support for renewables and electrification and, most importantly, a growing tribe of ‘conscious’ energy consumers. More and more, as we move forward, we will talk and act more as an ‘energy’ company and not merely as oil and gas explorer and producer.
It is through these lens that ONGC views the landscape of tomorrow and defines its role and responsibilities. The ONGC Board recently approved the business roadmap for the Company and its other group entities – “ONGC Energy Strategy 2040”. It envisions ONGC as “A diversified energy company with strong contribution from non E&P businesses; 3x revenues and ~5-6x market capitalization”. It aims to transform ONGC into a future-ready energy entity, one that positions itself well to respond to the challenges and opportunities of the tomorrow’s energy scene. Of course, Technology, Digitalization of operations, Meaningful partnerships and Organizational restructuring will play critical roles in the successful implementation of the plan.
Beyond business, our CSR initiatives have also helped the organization in making a positive impact in people’s lives. At the same time, it also sensitizes us to our role as an important stakeholder of the society and environment. In FY’19, your Company spent `6,146 Million for its various CSR programs with target areas spanning from Healthcare, Poverty, Environment, Women Empowerment and Heritage preservation.
Your Company has also taken a lead role in implementing the Government’s Startup India program within oil and gas. Having launched the `1,000 Million dedicated Startup
corpus, the Company, in response to Hon’ble PM’s call for a solar revolution, launched a nationwide Solar Chulha Challenge inviting Entrepreneurs/ Scientists/ Researchers to participate in the indigenous development effort of Solar Chulha suitable for cooking Indian food. Concepts of 3 teams (IIT-Bombay, NIT-Kurukhsetra and BMS College of Engg., Bangalore) were selected and awarded prizes by Hon’ble Minister of Petroleum and Natural Gas. ONGC took up the task of pilot project implementation. A total of 86 Solar PV cooking stoves were installed at two villages (74 at Bacha covering the entire village and 12 at Jamthi) in Betul District of Madhya Pradesh. With further reduction in cost of battery and PV module, it is believed that it can become one of the preferred cooking solution. An additional benefit of this solution can be to use the stored electrical energy to power home lighting systems and other appliances.
Your Company is committed to conduct the business in a legal, ethical and transparent manner and observes highest standards of corporate governance. Accordingly, your Company has been continuously rated “Excellent” grade for its compliances with the DPE Guidelines on corporate governance.
Here, I would like to thank the Government of India, especially our administrative Ministry of Petroleum and Natural Gas, for its positive approach to policymaking and the constant endeavours to improve attractiveness of the industry. As a National Energy Company with a mandate that goes beyond business, we are grateful for Government’s guiding hand and timely counsel on key issues. Before I conclude, I would like to make special mention of the dedication and commitment of all the employees of ONGC for contributing wholeheartedly to the success and growth of the Company.
Finally, while our operating environment may undergo changes, we are quietly reassured by your continued confidence in ONGC. We deeply value this relationship – it is a source of strength and stability to us, one that allows us to dream big while holding us accountable and responsible for all our plans and pursuits. I thank you for having chosen us and remaining invested through all these years. I firmly believe that the future energy landscape holds great promises and we can together add another meaningful chapter to ONGC’s rich history.
Sd/-Shashi Shanker
Chairman and Managing Director
10
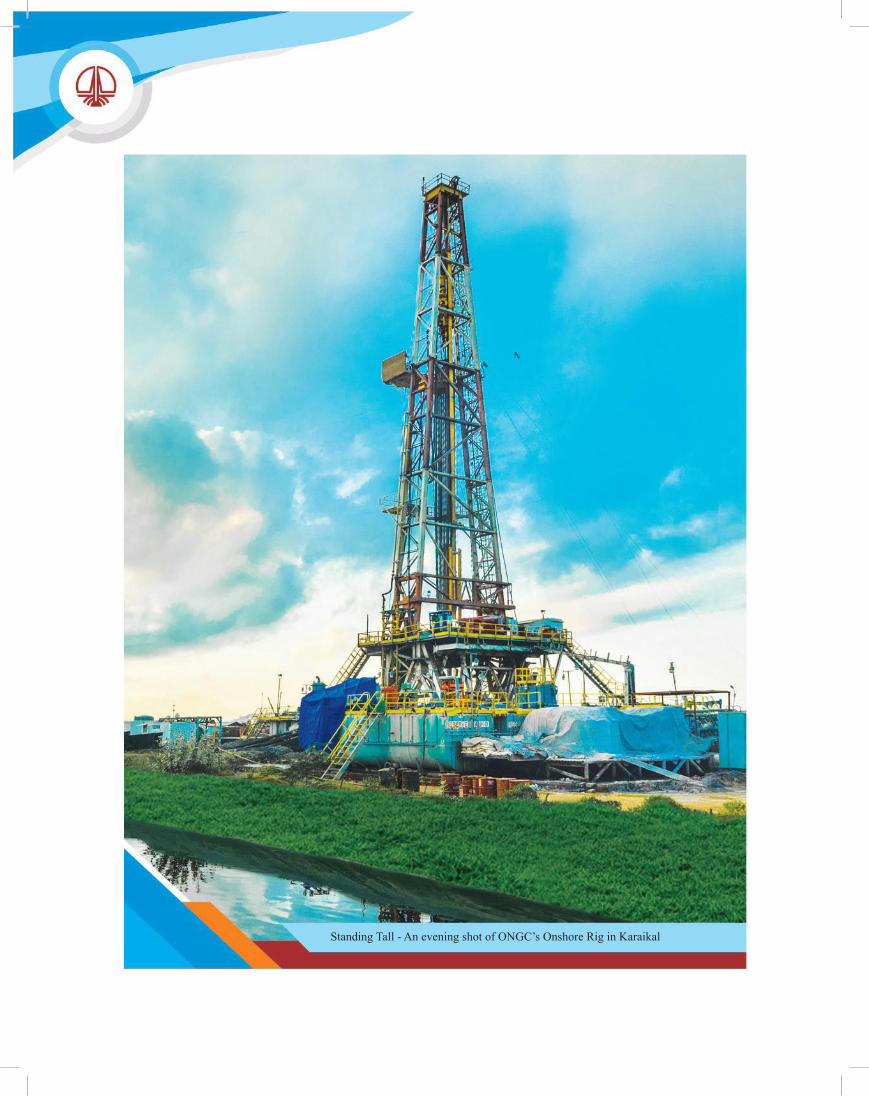
Standing Tall - An evening shot of ONGC’s Onshore Rig in Karaikal
11
12
13

14
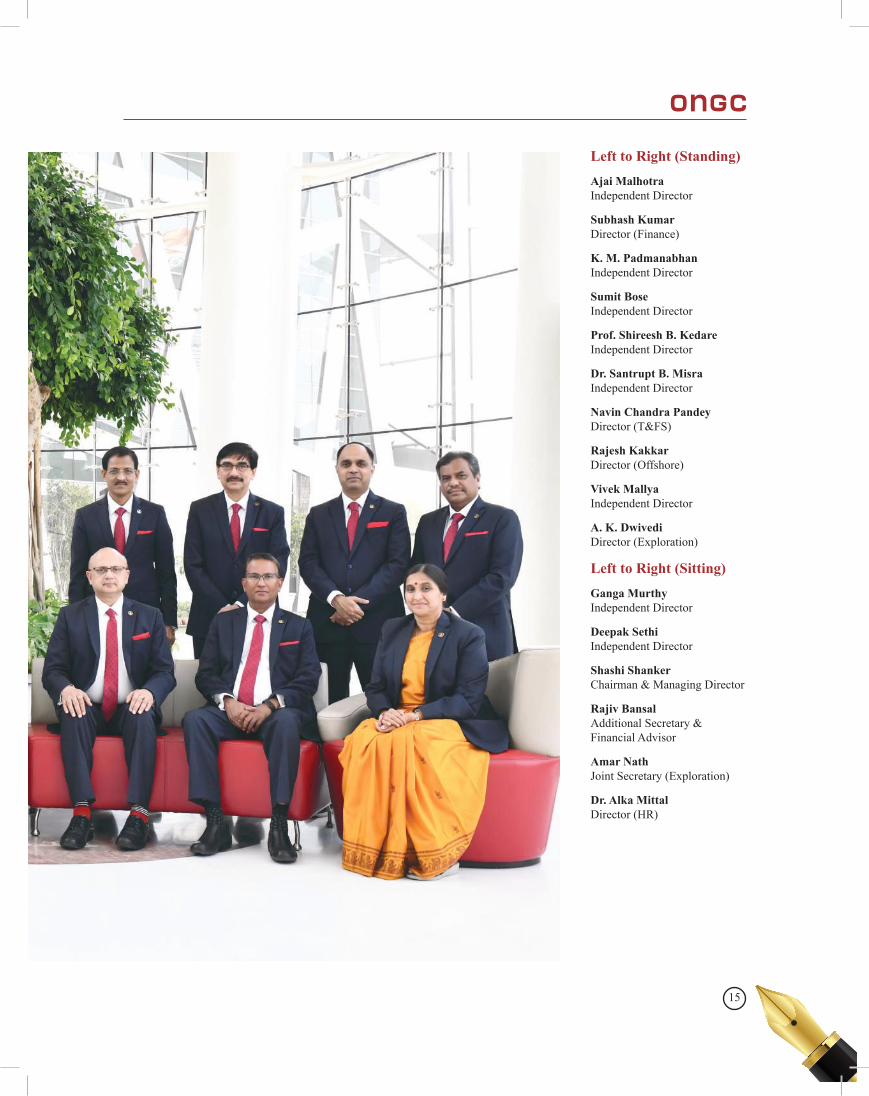
Board of Directors
15
Left to Right (Standing)Ajai Malhotra Independent Director
Subhash Kumar Director (Finance)
K. M. Padmanabhan Independent Director
Sumit Bose Independent Director
Prof. Shireesh B. Kedare Independent Director
Dr. Santrupt B. Misra Independent Director
Navin Chandra Pandey Director (T&FS)
Rajesh Kakkar Director (Offshore)
Vivek Mallya Independent Director
A. K. Dwivedi Director (Exploration)
Left to Right (Sitting)Ganga Murthy Independent Director
Deepak Sethi Independent Director
Shashi Shanker Chairman & Managing Director
Rajiv Bansal Additional Secretary & Financial Advisor
Amar Nath Joint Secretary (Exploration)
Dr. Alka Mittal Director (HR)
16
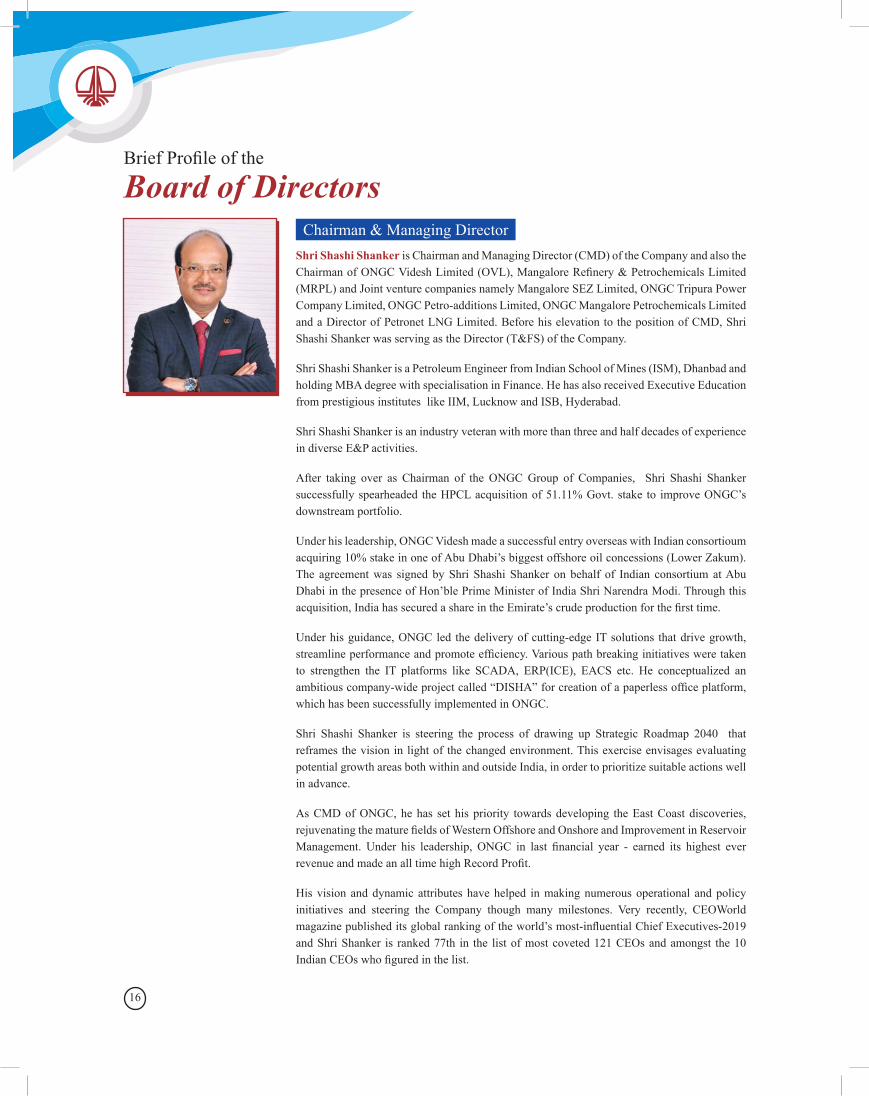
Shri Shashi Shanker is Chairman and Managing Director (CMD) of the Company and also the Chairman of ONGC Videsh Limited (OVL), Mangalore Refinery & Petrochemicals Limited (MRPL) and Joint venture companies namely Mangalore SEZ Limited, ONGC Tripura Power Company Limited, ONGC Petro-additions Limited, ONGC Mangalore Petrochemicals Limited and a Director of Petronet LNG Limited. Before his elevation to the position of CMD, Shri Shashi Shanker was serving as the Director (T&FS) of the Company.
Shri Shashi Shanker is a Petroleum Engineer from Indian School of Mines (ISM), Dhanbad and holding MBA degree with specialisation in Finance. He has also received Executive Education from prestigious institutes like IIM, Lucknow and ISB, Hyderabad.
Shri Shashi Shanker is an industry veteran with more than three and half decades of experience in diverse E&P activities.
After taking over as Chairman of the ONGC Group of Companies, Shri Shashi Shanker successfully spearheaded the HPCL acquisition of 51.11% Govt. stake to improve ONGC’s downstream portfolio.
Under his leadership, ONGC Videsh made a successful entry overseas with Indian consortioum acquiring 10% stake in one of Abu Dhabi’s biggest offshore oil concessions (Lower Zakum). The agreement was signed by Shri Shashi Shanker on behalf of Indian consortium at Abu Dhabi in the presence of Hon’ble Prime Minister of India Shri Narendra Modi. Through this acquisition, India has secured a share in the Emirate’s crude production for the first time.
Under his guidance, ONGC led the delivery of cutting-edge IT solutions that drive growth, streamline performance and promote efficiency. Various path breaking initiatives were taken to strengthen the IT platforms like SCADA, ERP(ICE), EACS etc. He conceptualized an ambitious company-wide project called “DISHA” for creation of a paperless office platform, which has been successfully implemented in ONGC.
Shri Shashi Shanker is steering the process of drawing up Strategic Roadmap 2040 that reframes the vision in light of the changed environment. This exercise envisages evaluating potential growth areas both within and outside India, in order to prioritize suitable actions well in advance.
As CMD of ONGC, he has set his priority towards developing the East Coast discoveries, rejuvenating the mature fields of Western Offshore and Onshore and Improvement in Reservoir Management. Under his leadership, ONGC in last financial year - earned its highest ever revenue and made an all time high Record Profit.
His vision and dynamic attributes have helped in making numerous operational and policy initiatives and steering the Company though many milestones. Very recently, CEOWorld magazine published its global ranking of the world’s most-influential Chief Executives-2019 and Shri Shanker is ranked 77th in the list of most coveted 121 CEOs and amongst the 10 Indian CEOs who figured in the list.
Brief Profile of the
Chairman & Managing Director
Board of Directors
17
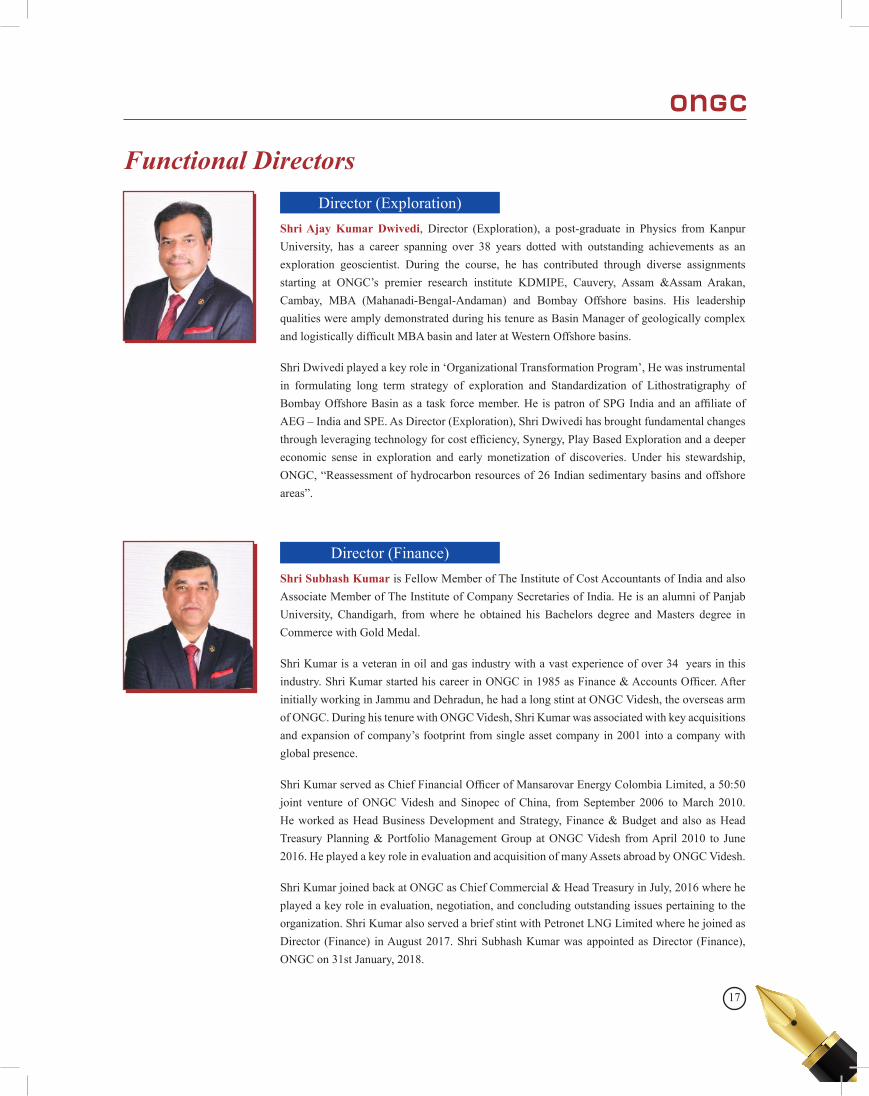
Shri Ajay Kumar Dwivedi, Director (Exploration), a post-graduate in Physics from Kanpur University, has a career spanning over 38 years dotted with outstanding achievements as an exploration geoscientist. During the course, he has contributed through diverse assignments starting at ONGC’s premier research institute KDMIPE, Cauvery, Assam &Assam Arakan, Cambay, MBA (Mahanadi-Bengal-Andaman) and Bombay Offshore basins. His leadership qualities were amply demonstrated during his tenure as Basin Manager of geologically complex and logistically difficult MBA basin and later at Western Offshore basins.
Shri Dwivedi played a key role in ‘Organizational Transformation Program’, He was instrumental in formulating long term strategy of exploration and Standardization of Lithostratigraphy of Bombay Offshore Basin as a task force member. He is patron of SPG India and an affiliate of AEG – India and SPE. As Director (Exploration), Shri Dwivedi has brought fundamental changes through leveraging technology for cost efficiency, Synergy, Play Based Exploration and a deeper economic sense in exploration and early monetization of discoveries. Under his stewardship, ONGC, “Reassessment of hydrocarbon resources of 26 Indian sedimentary basins and offshore areas”.
Shri Subhash Kumar is Fellow Member of The Institute of Cost Accountants of India and also Associate Member of The Institute of Company Secretaries of India. He is an alumni of Panjab University, Chandigarh, from where he obtained his Bachelors degree and Masters degree in Commerce with Gold Medal.
Shri Kumar is a veteran in oil and gas industry with a vast experience of over 34 years in this industry. Shri Kumar started his career in ONGC in 1985 as Finance & Accounts Officer. After initially working in Jammu and Dehradun, he had a long stint at ONGC Videsh, the overseas arm of ONGC. During his tenure with ONGC Videsh, Shri Kumar was associated with key acquisitions and expansion of company’s footprint from single asset company in 2001 into a company with global presence.
Shri Kumar served as Chief Financial Officer of Mansarovar Energy Colombia Limited, a 50:50 joint venture of ONGC Videsh and Sinopec of China, from September 2006 to March 2010. He worked as Head Business Development and Strategy, Finance & Budget and also as Head Treasury Planning & Portfolio Management Group at ONGC Videsh from April 2010 to June 2016. He played a key role in evaluation and acquisition of many Assets abroad by ONGC Videsh.
Shri Kumar joined back at ONGC as Chief Commercial & Head Treasury in July, 2016 where he played a key role in evaluation, negotiation, and concluding outstanding issues pertaining to the organization. Shri Kumar also served a brief stint with Petronet LNG Limited where he joined as Director (Finance) in August 2017. Shri Subhash Kumar was appointed as Director (Finance), ONGC on 31st January, 2018.
Director (Exploration)
Director (Finance)
Functional Directors
18
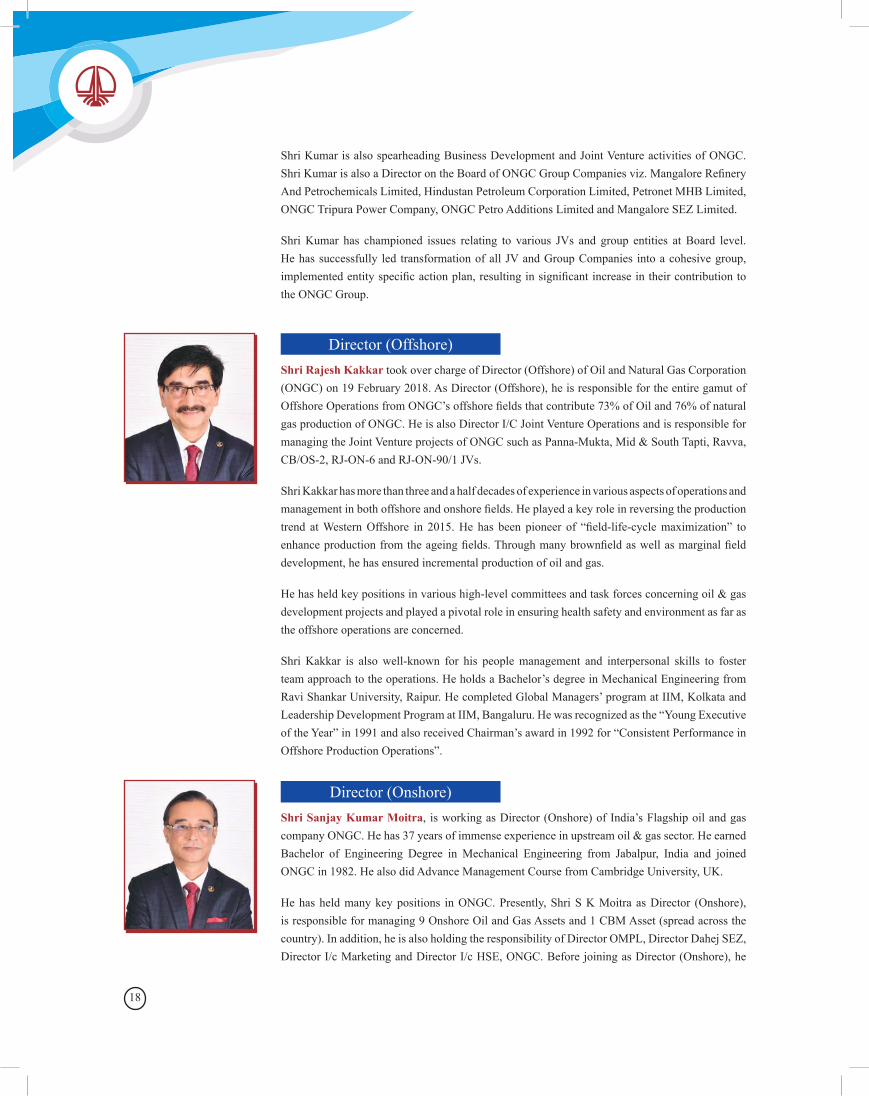
Shri Rajesh Kakkar took over charge of Director (Offshore) of Oil and Natural Gas Corporation (ONGC) on 19 February 2018. As Director (Offshore), he is responsible for the entire gamut of Offshore Operations from ONGC’s offshore fields that contribute 73% of Oil and 76% of natural gas production of ONGC. He is also Director I/C Joint Venture Operations and is responsible for managing the Joint Venture projects of ONGC such as Panna-Mukta, Mid & South Tapti, Ravva, CB/OS-2, RJ-ON-6 and RJ-ON-90/1 JVs.
Shri Kakkar has more than three and a half decades of experience in various aspects of operations and management in both offshore and onshore fields. He played a key role in reversing the production trend at Western Offshore in 2015. He has been pioneer of “field-life-cycle maximization” to enhance production from the ageing fields. Through many brownfield as well as marginal field development, he has ensured incremental production of oil and gas.
He has held key positions in various high-level committees and task forces concerning oil & gas development projects and played a pivotal role in ensuring health safety and environment as far as the offshore operations are concerned.
Shri Kakkar is also well-known for his people management and interpersonal skills to foster team approach to the operations. He holds a Bachelor’s degree in Mechanical Engineering from Ravi Shankar University, Raipur. He completed Global Managers’ program at IIM, Kolkata and Leadership Development Program at IIM, Bangaluru. He was recognized as the “Young Executive of the Year” in 1991 and also received Chairman’s award in 1992 for “Consistent Performance in Offshore Production Operations”.
Shri Sanjay Kumar Moitra, is working as Director (Onshore) of India’s Flagship oil and gas company ONGC. He has 37 years of immense experience in upstream oil & gas sector. He earned Bachelor of Engineering Degree in Mechanical Engineering from Jabalpur, India and joined ONGC in 1982. He also did Advance Management Course from Cambridge University, UK.
He has held many key positions in ONGC. Presently, Shri S K Moitra as Director (Onshore), is responsible for managing 9 Onshore Oil and Gas Assets and 1 CBM Asset (spread across the country). In addition, he is also holding the responsibility of Director OMPL, Director Dahej SEZ, Director I/c Marketing and Director I/c HSE, ONGC. Before joining as Director (Onshore), he
Director (Offshore)
Director (Onshore)
Shri Kumar is also spearheading Business Development and Joint Venture activities of ONGC. Shri Kumar is also a Director on the Board of ONGC Group Companies viz. Mangalore Refinery And Petrochemicals Limited, Hindustan Petroleum Corporation Limited, Petronet MHB Limited, ONGC Tripura Power Company, ONGC Petro Additions Limited and Mangalore SEZ Limited.
Shri Kumar has championed issues relating to various JVs and group entities at Board level. He has successfully led transformation of all JV and Group Companies into a cohesive group, implemented entity specific action plan, resulting in significant increase in their contribution to the ONGC Group.

19
Shri Navin Chandra Pandey has assumed the charge of Director – Technical and Field Services (T&FS) of Oil and Natural Gas Corporation Ltd (ONGC) on 29 October 2018. Shri Pandey is a Mechanical Engineering graduate from Motilal Nehru Regional Engineering College, Allahabad (NIT, Allahabad).
Shri Pandey joined ONGC in 1982. He has a vast experience of over 36 years in the oil and gas industry. He held various key positions in both offshore and onshore portfolio, handling challenging assignments in oil and gas asset management, operations and services. With his excellent project execution skills, Shri Pandey has a strong track record in project delivery.
He has a rich experience in offshore deep-waters and shallow waters as well as onshore drilling. As Operations Manager of deep-water areas, he brought about significant performance improvements in deep-water drilling operations. He is credited with successful management of floater drilling rigs Sagar Bhushan and Sagar Vijay. He was conferred CMD’s ‘Manager of the Year’ award in 2007.
As Asset Manager of CBM Asset Bokaro, he catalyzed a turnaround in the Asset operations by fast-tracking development activities in major CBM blocks including land acquisition and synergizing resource mobilization.
Director (T&FS)
was working as Asset Manager, Bassein & Satellite Asset, Western Offshore, Mumbai, the highest gas-producing Asset of country catering to about 30% of total gas production of country.
He has headed various high-level Committees and Task Forces concerning Oil & Gas Development Projects, Facility Renewable Projects and Operations related to major Issues & Technology Initiatives. He was the SPE - Programme Chairperson for Mumbai chapter and presently holding the position of Chairperson of SPE Delhi Chapter. He was the Chairman-Technical Committee for Petrotech 2019.
He attended the 18th World Petroleum Congress – 2005 with Indian Delegation led by Secretary to Govt. of India, Ministry of Petroleum & Natural Gas at Johannesburg, South Africa. He authored & presented the Paper on “Integrated Asset Model of Mumbai High Field at Offshore Technology Conference (OTC-2007), Houston, USA. He has also attended Offshore Europe-2009, Aberdeen, UK and Co-authored & presented the Paper on “Implementation of Integrated Network Optimization Model for the Mumbai High Field- Crucial to Field-Wide Optimization”.
Dr. Alka Mittal joined the Board of ONGC as Director (HR), ONGC, in November 2018 after having distinguished herself in diverse roles and challenging assignments over a period of more than 33 years in India’s Maharatna Energy Major. She is the first woman Functional Director on the Board of ONGC.
She is also on the Board of ONGC Mangalore Petrochemicals Limited (OMPL) as ONGC nominee Director since August 2015.
Dr Mittal is a post graduate in Economics, MBA (HRM) and a Doctorate in Commerce and Business Studies in the area of “Corporate Governance”.
Director (HR)

20
Shri Rajiv Bansal, IAS, Additional Secretary & Financial Adviser, Ministry of Petroleum and Natural Gas, Government of India (GoI)., is a Govt. Nominee Director. He joined the Board of the Company on 27.09.2017.
Shri Bansal is a Civil Engineer by profession having graduated from IIT, Delhi in 1986. He has also obtained a Diploma in Finance from ICFAI, Hyderabad and an Executive Masters in International Business from IIFT, New Delhi.
Shri Bansal, was earlier in Ministry of Electronics and Information Technology where he was looking after Digital Payments, IT Act, Aadhaar and Internet Governance. During his career spanning about 31 years, Shri Bansal has, inter-alia, worked as Secretary, Central Electricity Regulatory Commission, Joint Secretary, Department of Heavy Industries, GoI and Director, Ministry of Civil Aviation, GoI. He served on the Boards of BHEL, NACIL, AYCL, Airline Allied Services Ltd and HMT and presently he is on the Boards of India Strategic Petroleum Reserves Limited, Bharat Petroleum Corporation Limited and Bharat Yantra Nigam Limited. He has also held important assignments in the State Government.
Shri Amar Nath, is a Joint Secretary (Exploration) Ministry of Petroleum & Natural Gas, Government of India, also the Govt. nominee Director on the Board of the Company.
Shri Amar Nath, an IAS Officer (1994 AGMUT Cadre) is a Bachelor of Science (Mechanical Engineering) from National Institute of Technology, Kurukshetra, Kurukshetra University and MA (International Development Policy) from Duke University, USA.
Shri Amar Nath was Secretary to the Department of Health, Government of National Capital Territory of Delhi prior to the present assignment. He has held the positions of Administrator of Union Territory of Lakshadweep, Chief Executive Officer of Delhi Urban Shelter Improvement Board, and Chief Executive Officer of Chandigarh Housing Board in Chandigarh.
Government Nominee Directors
She has held many prolific assignments over the period of her distinguished career in ONGC. Before being appointed as Director (HR), as ONGC’s Chief of Skill Development, she steered the functioning of four regional skill development centres across India towards upgradation and skill development through strategic and innovative initiatives in learning practices.
Previously, as Head CSR, she contributed towards a number of impactful CSR initiatives in the areas of education, health care, entrepreneurship, skill development, empowerment of women & the underprivileged, etc., across the country.
She has vast experience of leading the HR function as In-charge HR-ER in various work centres of ONGC including Mumbai, Delhi and Jorhat (Assam), for over a decade.
She has also headed the Corporate Communication function, where she was instrumental in corporate image building & branding initiatives across various platforms.
She has a special penchant for training and mentoring and has trained more than 12000 young Graduate Trainees of ONGC since 2001 on “Corporate Governance”.
Dr Mittal is a member of the Board of Governors of IIM Trichy. She is actively involved with various national and international professional forums and bodies dedicated to the cause of Human Resource Management and empowerment of women, especially in the Energy Sector.

21
Shri Ajai Malhotra holds an M.A. in Economics from The Delhi School of Economics, University of Delhi. He joined the Indian Foreign Service (IFS) in 1977 and besides assignments at the Ministry of External Affairs, New Delhi, worked at Indian diplomatic missions in Bucharest, Geneva, Kuwait, Moscow, Nairobi, New York and Washington DC.
He was Minister (Commerce) at the Embassy of India, Washington DC (1999-2003), serving simultaneously from 2002-2003 as Chairman of the International Cotton Advisory Committee. He was Ambassador of India to Romania, concurrently accredited to Albania and Moldova (2003-2005), Ambassador and Deputy Permanent Representative of India to the United Nations, New York (2005-2009), Ambassador of India to Kuwait (2009-2011), and Ambassador of India to the Russian Federation (2011-2013), before retiring from the IFS on November 30, 2013, after nearly 37 years of distinguished service.
His has been on the Indian team negotiating issues such diverse issues as biological diversity, climate change, desertification, education, energy, forestry, health, human rights, human settlements, intellectual property rights, international law, labour, ozone depletion, sustainable development and international trade. In 2004, he was awarded an Honorary Doctorate by Western University of Arad, Romania, in recognition of his work in support of environment and development.
Since 2014, he is Distinguished Fellow & Senior Adviser (Climate Change) at The Energy and Resources Institute (TERI), New Delhi, besides being Chairman & Managing Trustee of two organisations serving the underprivileged in the fields of primary health care and education - CHIKITSA and SHIKSHA respectively. He is also Chairman, Nehru Trust for the Indian Collections at the Victoria & Albert Museum, and Chairman, NAB India Centre for Blind Women & Disability Studies, New Delhi. On 30/09/2017 he was elected Member, Advisory Committee, UN Human Rights Council, Geneva. He frequently contributes to seminars on economic, environmental, human rights, defence, political, trade and security issues.
Independent Directors
He has extensive experience of working in various Departments of Government at senior management positions such as Finance, Economic Planning, Tourism and Industrial Development in the states of Arunachal Pradesh, Pondicherry, Chandigarh and Delhi. Before joining IAS in 1994 he worked with State Bank of India and Steel Authority of India.
Shi Amar Nath is also Director on the Board of Oil India Limited.
Shri Deepak Sethi is an Independent Director of your Company. Shri Sethi is a Commerce Graduate and a Fellow member of the Institute of Chartered Accountants of India (ICAI), having rich experience of 34 years practice in conducting Statutory, Tax and Internal Audits of Companies, Partnership Firms, Proprietary concerns, Schools, Universities, Hospitals, Trusts etc. and is known for his work discipline, expertise, straightforward approach and professional presentations on various legislative, accounting and other developments.
He has an extensive practice of Direct & Indirect Taxation and has appeared before Appellate Tribunals of Service Tax, Sales Tax, Income Tax etc. He also possesses experience of Statutory
22
Prof. Shireesh B. Kedare has obtained his B.Tech. in Mechanical Engineering from IIT Bombay in 1985. He also obtained his Ph.D. in 1992 from IIT Bombay in “Reciprocating Wind Machine”. He spent three years (1992-95) as a volunteer in social sector working on different issues related to ‘Development’. He started his engineering consultancy in energy and environment in 1995. He worked as a Technical Consultant (1998-2001) to the Chairman, Khadi and Village Industries Commission when he worked on the issues related to Development of Rural Industries Clusters. He is presently associated with IIT Bombay as a Professor.
He joined Department of Energy Science and Engineering, IIT Bombay as an adjunct faculty and simultaneously Clique Developments Ltd., an engineering Company in Mumbai as its Director (R&D). Based on his studies on different renewable energy systems, he identified a need for developing concentrating solar thermal collectors for industrial process heat applications way back in 1997. He acted as a Principal Investigator (2004 to 2007) under IIT Bombay-Clique R & D project of ARUN 160 (160 sq.m Fresnel Paraboloid Solar Concentrator for industrial process heat) sponsored by MNRE (Ministry of New and Renewable Energy), New Delhi. He has also worked on integration of solar concentrator technology for a variety of industrial processes as well as commercial applications using steam, pressurized water or thermic fluid as media and for steam augmentation in thermal power plants.
Along with optimization of Solar Industrial Process Heat Systems with and without storage, his focus is on development of solar thermal power plant with storage working for 24 h/d suitable for Indian conditions. He is also associated with Centre for Technology Alternatives for Rural Areas (CTARA), IIT Bombay and is working on rural energy and other technologies. He is presently focusing on problem assessment and development and dissemination of small and affordable implements for performance improvement for traditional wood fired cook-stoves (Chulha) used in different regions of the country.
Shri Vivek Mallya is a Fellow member of the Institute of Chartered Accountants of India, a Certified Public Accountant (USA) and a Master’s Degree Holder in Commerce from Mysore University. He is also a Registered Insolvency Resolution Professional with the IBBI.
He has a rich experience of practice as a Chartered Accountant. His practice areas include International Taxation, Income tax, Foreign Exchange Management Act and Banking matters. He is the immediate Past President of Keshava Seva Samithi, a NGO working for Child Education and Health across 110 slums of Bangalore. Prior to Practising on his own, he was a Partner with PwC, a Big 4 Accounting Firm.
Shri Mallya is also on the Board of Mangalore Refinery and Petrochemicals Limited.
audit, inspection and revenue audits of Public Sector Banks, loss assessment for insurance Companies, Bank Financing for Manufacturing Trading & Services providers, Financial advisory & consulting work for Corporate and HNIs.
23
Shri Sumit Bose, is an Independent Director of the Company. Shri Bose is presently Vice Chairman, National Institute of Public Finance and Policy (NIPFP). He was the Union Finance Secretary & Revenue Secretary in the Ministry of Finance, Government of India till his retirement in March, 2014. Thereafter, he was a Member of the Expenditure Management Commission.
Educated at the Doon School, Dehradun (class of 1970), St. Stephen’s College, Delhi and the London School of Economics, he joined the Indian Administrative Service in 1976.
In the Ministry of Finance, Government of India, he was also Secretary, Department of Expenditure from May, 2011 to August, 2012 and Secretary, Department of Disinvestment from February, 2010 to May, 2011. He was Secretary in the Thirteenth Finance Commission, from August 2007 to January 2010. Earlier, between 2004 and 2007, he was the Principal Secretary, Finance in the Government of Madhya Pradesh. As Joint Secretary in the Ministry of Human Resource Development, Government of India, between 1998 and 2003, he undertook the task of launching the Sarva Shiksha Abhiyan. He had also served as Secretary, School Education in Madhya Pradesh between 1994 and 1996.
Shri Bose, is also on the Board of Coromandel International Limited, HDFC Standard Life Insurance Company Limited, Tata AIG General Insurance Company Limited, BSE Limited, Foundation to Educate Girls Globally, Jal Seva Charitable Foundation and Vidhi Centre For Legal Policy.
Shri K. M. Padmanabhan, is an Independent Director of the Company. Shri Padmanabhan is a Chartered Accountant in practice for more than 30 years and is the Senior Partner of SRINIVAS and PADMANABHAN, Chartered Accountants, Chennai.
As a practicing Chartered Accountant, he has created Internal Control Systems, processes and procedure besides rendering business consultancy for a very big South based educational institution spread into engineering, medical and also into hospitals.
He has been a regular Visiting Faculty in the area of Finance and Accounting at Indian Institute of Management (Indore), Indian Institute of Management (Raipur), Institute for Financial Management and Research (IFMR), RBI Staff Training College, Tamilnadu Judicial Academy, the Institute of Chartered Accountants of India (ICAI). He has been trained in Case Method Teaching at Harvard Business School, Boston, USA and at Harvard Business School Center, Shanghai, China.
He is the founder member of Prerana Helpline Foundation (NGO) that caters for the need of visually challenged people. He was able to eliminate wastes and non- value added expenditure through Business Process Reengineering and Kaizen cost Reduction Methods for various business units in the SME sector in the last 10 years of business consulting.
As a person trained in the pedagogy of Case Method Teaching at Indian Institute of Management, Ahmedabad and at Harvard Business School, Boston, USA, he had trained thousands of non-finance executives in Finance, costing, and kaizen cost Reduction with strategic orientation. He was also a member of the Managing committee of Madras Management Association one of most acclaimed management associations in India.
Shri Padmanabhan is also on the Board of Prerana Educational Media Private Limited.

24
Ms. Ganga Murthy is an M Phil from the Department of Economics in the Madras University. She joined the Indian Economic Service in 1976 and has over 3 decades of experience in planning, implementing, monitoring and evaluating schemes and programmes across different sectors of the economy in the Government of India. During her career also obtained an MSc in National Development and Project Planning from the University of Bradford, UK.
She began her career in the Planning Commission with planning for the decentralized sector and ways to address regional imbalances in the country. This was followed by stints of varying time periods in the Departments/ Ministries of Rural Development, Pensions, Economic Affairs, Chemicals & Petrochemicals, Health and Family Welfare and Consumer Affairs. She superannuated from the Ministry of Consumer Affairs in August 2013 as Principal Economic Adviser.
She was in-charge of the Economics Directorate in the Railways as Senior Economic Advisor, between 2009-11 before moving in as Principal Economic Adviser in Consumer Affairs from 2011-2013.
She also acted as the Deputy Secretary for the Public Accounts Committee and the Joint Parliamentary Committee to probe irregularities in Securities Transactions during an interesting stint in the Lok Sabha during 1991-93.
Dr. Santrupt Misra is currently the CEO, Birla Carbon; Director, Chemicals, Fertilizers & Insulators and Director, Group Human Resources at the Aditya Birla Group, and has been with the Group since 1996.
Dr. Misra holds two Post Graduate degrees in Political Science and in Personnel Management & Industrial Relations, from the Utkal University & the Tata Institute of Social Sciences, respectively. In addition, he also holds two PhDs, from India & UK, in Public Administration and Industrial Relations, respectively, and an honorary D.Sc. degree from Aston University, U.K. He is a Fellow of the National Academy of Human Resources (NAHR), USA; Hon. Fellow of the Coaching Federation of India; also an Eisenhower Fellow, an Aston Business School Fellow, an AIMA Fellow and a Commonwealth Scholar.
He has over three decades of professional experience in H.R., global business, research and organizational development in organizations such as the J.K. Group, the Tata Institute of Social Sciences and Hindustan Unilever Ltd., India and has been a consultant to over 40 organizations earlier in his career.
He is a Director in several companies of the Aditya Birla Group including Aditya Birla Capital Ltd. and holds Board position in several other professional bodies. He is an Independent Director on the Board of the Oil and Natural Gas Corporation Ltd., a leading Government of India enterprise, and the Chairperson of the Board of Governors of the National Institute of Technology, Rourkela.
He was the President of the National HRD Network for three years and has also been on other professional bodies such as the Managing Committee of the Aston Business School Advisory Board (UK); Association of Executive Search Consultants (AESC) U.S.A. He served as a member
25
of the SHRM Certification Commission, USA, for a three-year term and was a Board member of ERC Worldwide, Washington D.C. He has won a number of awards and recognitions for his professional work, which include:
• The HRD Excellence Award from the National HRD Network (NHRDN)
• The National Institute of Personnel Management (NIPM) Ratna Award
• ‘Ravi J Mathai National Fellow Award’ by Association of Indian Management Schools
• ‘Global Leader of the Year’ at the CEO India Awards 2014.
• Listed as ‘’India’s Most Trusted CEO’s 2017’’ by the World Consulting & Research Corporation
26
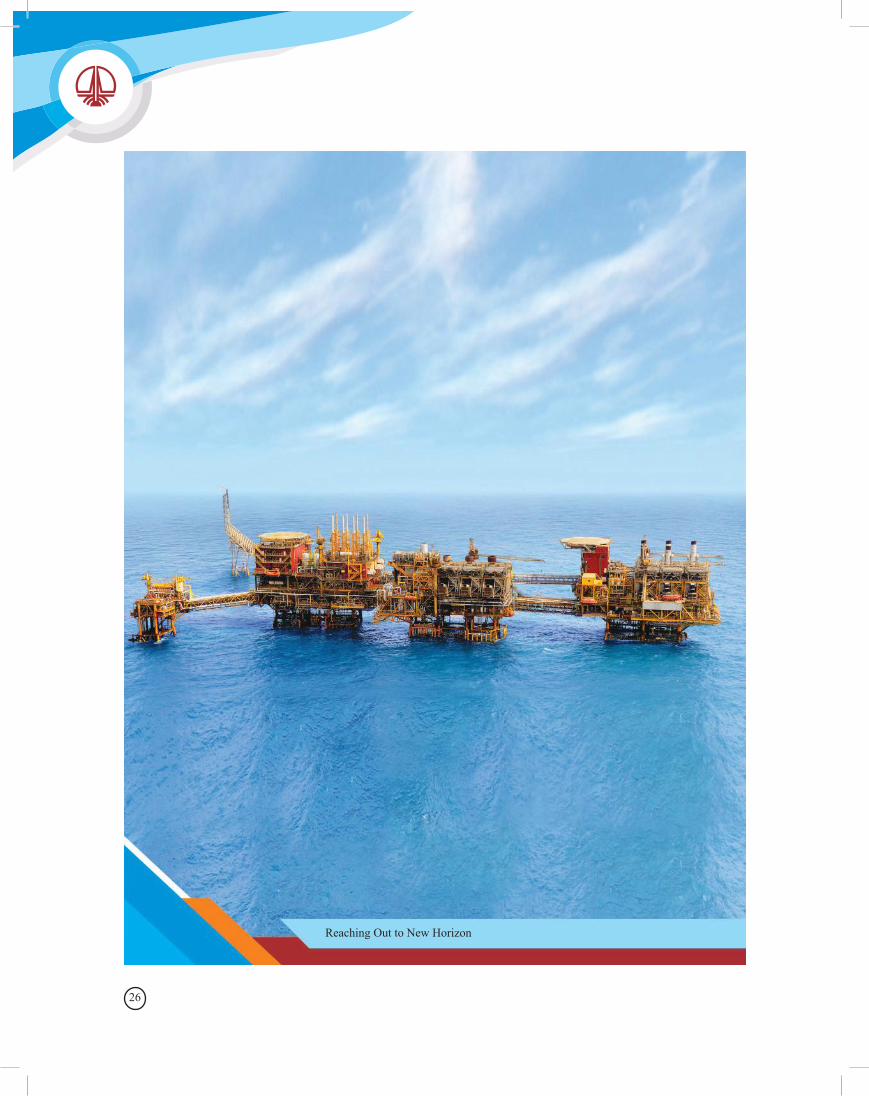
Reaching Out to New Horizon
27
28
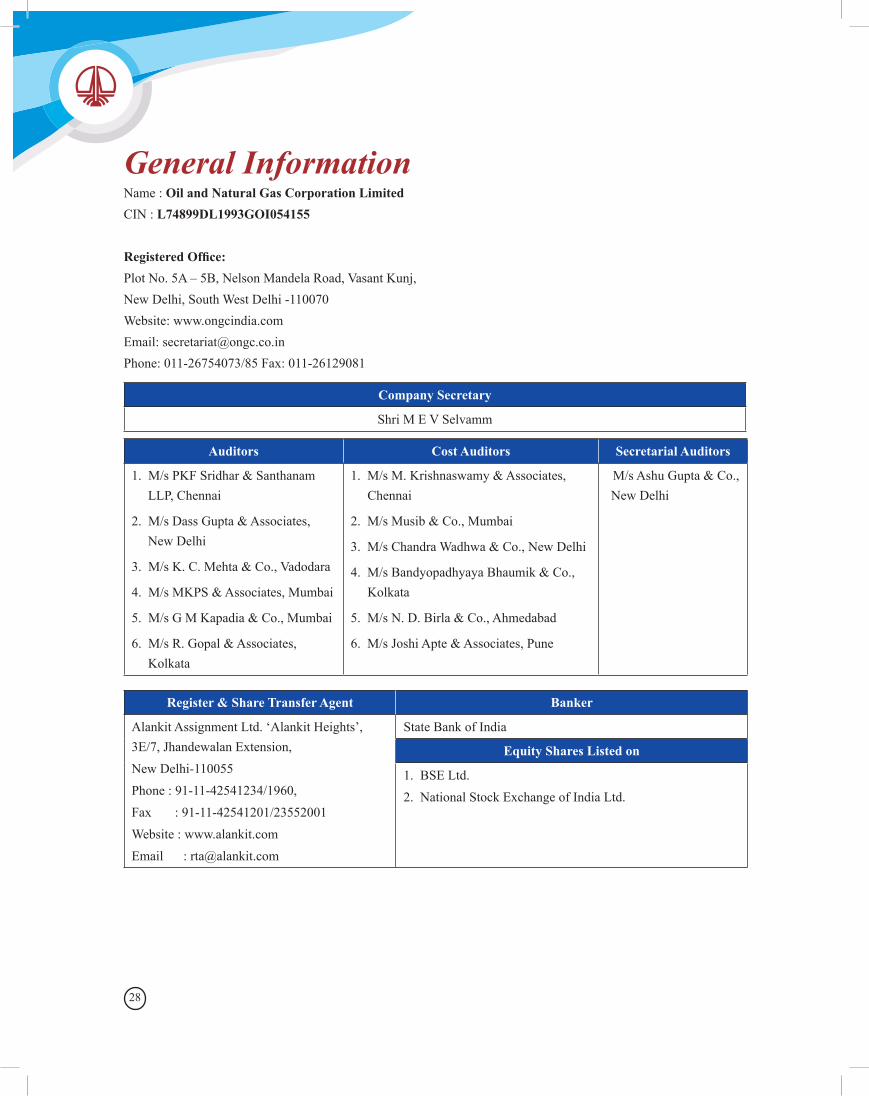
General InformationName : Oil and Natural Gas Corporation LimitedCIN : L74899DL1993GOI054155
Registered Office:Plot No. 5A – 5B, Nelson Mandela Road, Vasant Kunj,New Delhi, South West Delhi -110070Website: www.ongcindia.comEmail: [email protected]: 011-26754073/85 Fax: 011-26129081
Company Secretary
Shri M E V Selvamm
Auditors Cost Auditors Secretarial Auditors
1. M/s PKF Sridhar & Santhanam LLP, Chennai
2. M/s Dass Gupta & Associates, New Delhi
3. M/s K. C. Mehta & Co., Vadodara
4. M/s MKPS & Associates, Mumbai
5. M/s G M Kapadia & Co., Mumbai
6. M/s R. Gopal & Associates, Kolkata
1. M/s M. Krishnaswamy & Associates, Chennai
2. M/s Musib & Co., Mumbai
3. M/s Chandra Wadhwa & Co., New Delhi
4. M/s Bandyopadhyaya Bhaumik & Co., Kolkata
5. M/s N. D. Birla & Co., Ahmedabad
6. M/s Joshi Apte & Associates, Pune
M/s Ashu Gupta & Co., New Delhi
Register & Share Transfer Agent Banker
Alankit Assignment Ltd. ‘Alankit Heights’, 3E/7, Jhandewalan Extension,New Delhi-110055Phone : 91-11-42541234/1960, Fax : 91-11-42541201/23552001Website : www.alankit.comEmail : [email protected]
State Bank of India
Equity Shares Listed on
1. BSE Ltd.2. National Stock Exchange of India Ltd.
29
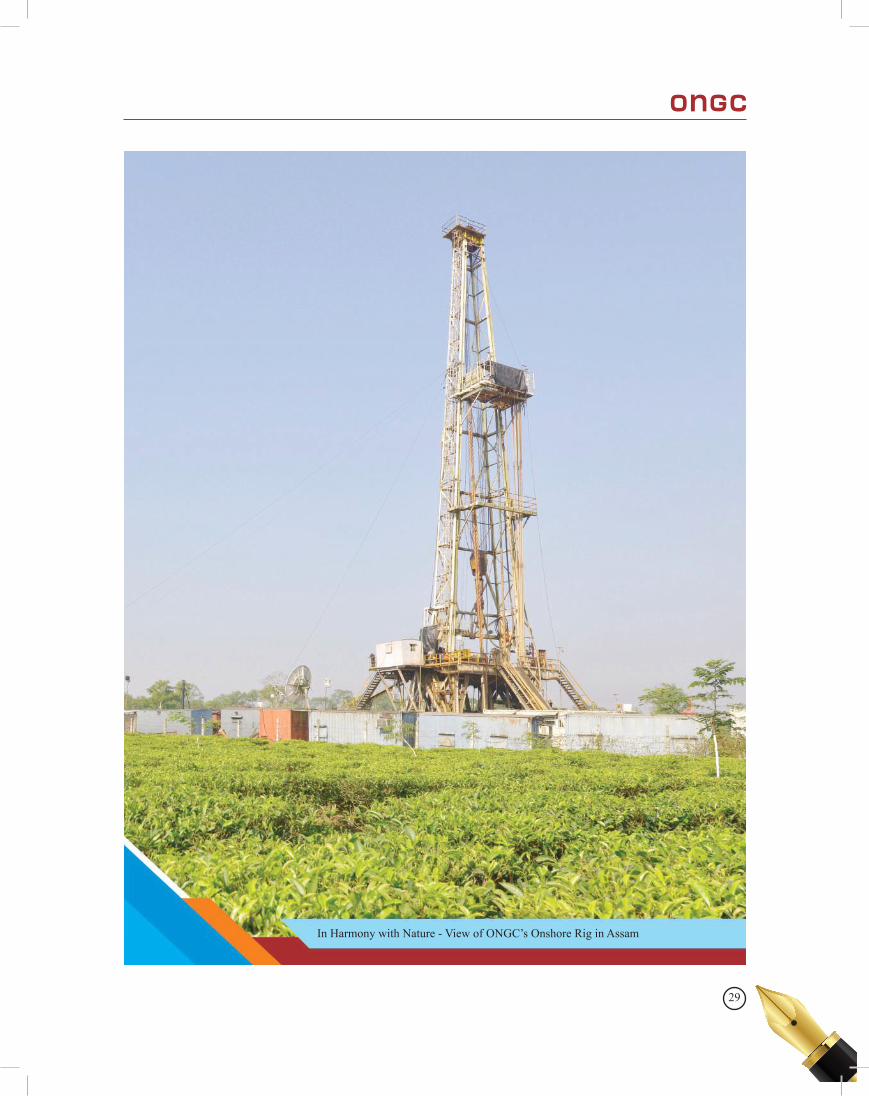
In Harmony with Nature - View of ONGC’s Onshore Rig in Assam
30
31
32
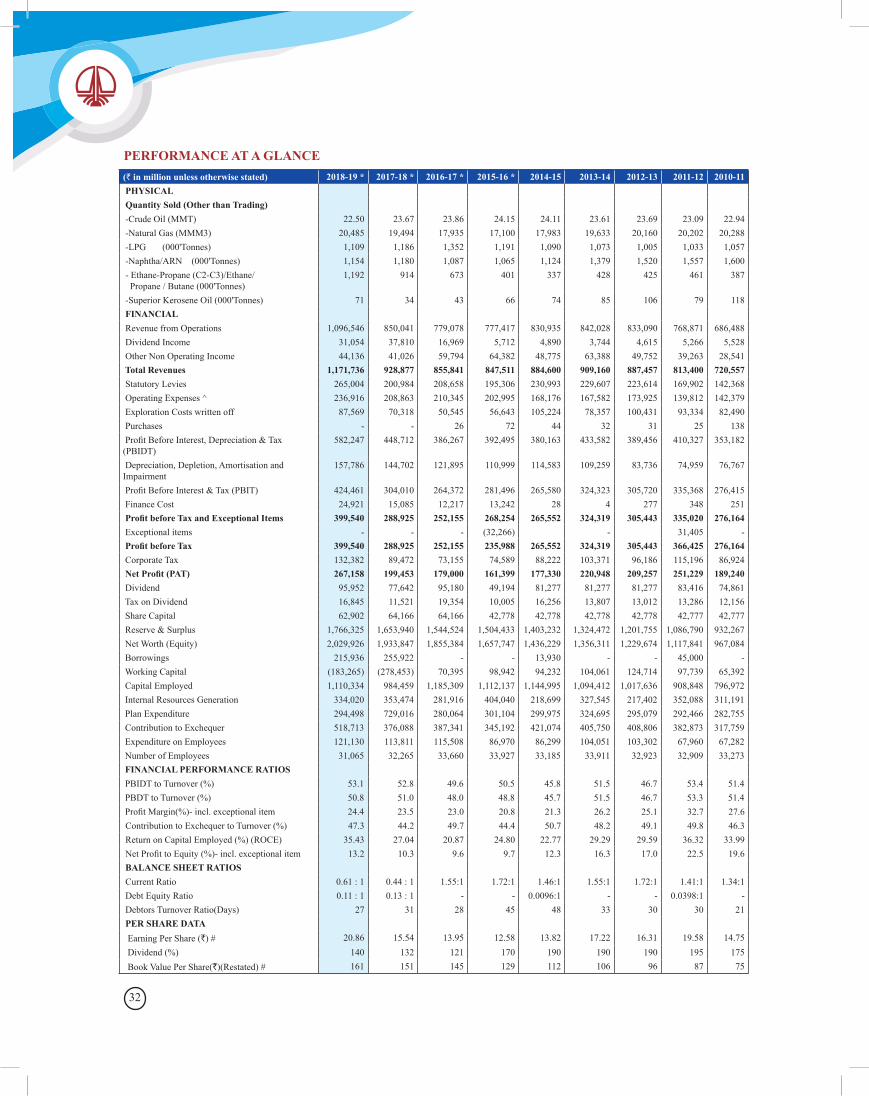
PERFORMANCE AT A GLANCE(` in million unless otherwise stated) 2018-19 * 2017-18 * 2016-17 * 2015-16 * 2014-15 2013-14 2012-13 2011-12 2010-11 PHYSICAL Quantity Sold (Other than Trading) -Crude Oil (MMT) 22.50 23.67 23.86 24.15 24.11 23.61 23.69 23.09 22.94 -Natural Gas (MMM3) 20,485 19,494 17,935 17,100 17,983 19,633 20,160 20,202 20,288 -LPG (000'Tonnes) 1,109 1,186 1,352 1,191 1,090 1,073 1,005 1,033 1,057 -Naphtha/ARN (000'Tonnes) 1,154 1,180 1,087 1,065 1,124 1,379 1,520 1,557 1,600 - Ethane-Propane (C2-C3)/Ethane/ Propane / Butane (000'Tonnes)
1,192 914 673 401 337 428 425 461 387
-Superior Kerosene Oil (000'Tonnes) 71 34 43 66 74 85 106 79 118 FINANCIAL Revenue from Operations 1,096,546 850,041 779,078 777,417 830,935 842,028 833,090 768,871 686,488 Dividend Income 31,054 37,810 16,969 5,712 4,890 3,744 4,615 5,266 5,528 Other Non Operating Income 44,136 41,026 59,794 64,382 48,775 63,388 49,752 39,263 28,541 Total Revenues 1,171,736 928,877 855,841 847,511 884,600 909,160 887,457 813,400 720,557 Statutory Levies 265,004 200,984 208,658 195,306 230,993 229,607 223,614 169,902 142,368 Operating Expenses ^ 236,916 208,863 210,345 202,995 168,176 167,582 173,925 139,812 142,379 Exploration Costs written off 87,569 70,318 50,545 56,643 105,224 78,357 100,431 93,334 82,490 Purchases - - 26 72 44 32 31 25 138 Profit Before Interest, Depreciation & Tax (PBIDT)
582,247 448,712 386,267 392,495 380,163 433,582 389,456 410,327 353,182
Depreciation, Depletion, Amortisation and Impairment
157,786 144,702 121,895 110,999 114,583 109,259 83,736 74,959 76,767
Profit Before Interest & Tax (PBIT) 424,461 304,010 264,372 281,496 265,580 324,323 305,720 335,368 276,415 Finance Cost 24,921 15,085 12,217 13,242 28 4 277 348 251 Profit before Tax and Exceptional Items 399,540 288,925 252,155 268,254 265,552 324,319 305,443 335,020 276,164 Exceptional items - - - (32,266) - 31,405 - Profit before Tax 399,540 288,925 252,155 235,988 265,552 324,319 305,443 366,425 276,164 Corporate Tax 132,382 89,472 73,155 74,589 88,222 103,371 96,186 115,196 86,924 Net Profit (PAT) 267,158 199,453 179,000 161,399 177,330 220,948 209,257 251,229 189,240 Dividend 95,952 77,642 95,180 49,194 81,277 81,277 81,277 83,416 74,861 Tax on Dividend 16,845 11,521 19,354 10,005 16,256 13,807 13,012 13,286 12,156 Share Capital 62,902 64,166 64,166 42,778 42,778 42,778 42,778 42,777 42,777 Reserve & Surplus 1,766,325 1,653,940 1,544,524 1,504,433 1,403,232 1,324,472 1,201,755 1,086,790 932,267 Net Worth (Equity) 2,029,926 1,933,847 1,855,384 1,657,747 1,436,229 1,356,311 1,229,674 1,117,841 967,084 Borrowings 215,936 255,922 - - 13,930 - - 45,000 - Working Capital (183,265) (278,453) 70,395 98,942 94,232 104,061 124,714 97,739 65,392 Capital Employed 1,110,334 984,459 1,185,309 1,112,137 1,144,995 1,094,412 1,017,636 908,848 796,972 Internal Resources Generation 334,020 353,474 281,916 404,040 218,699 327,545 217,402 352,088 311,191 Plan Expenditure 294,498 729,016 280,064 301,104 299,975 324,695 295,079 292,466 282,755 Contribution to Exchequer 518,713 376,088 387,341 345,192 421,074 405,750 408,806 382,873 317,759 Expenditure on Employees 121,130 113,811 115,508 86,970 86,299 104,051 103,302 67,960 67,282 Number of Employees 31,065 32,265 33,660 33,927 33,185 33,911 32,923 32,909 33,273 FINANCIAL PERFORMANCE RATIOS PBIDT to Turnover (%) 53.1 52.8 49.6 50.5 45.8 51.5 46.7 53.4 51.4 PBDT to Turnover (%) 50.8 51.0 48.0 48.8 45.7 51.5 46.7 53.3 51.4 Profit Margin(%)- incl. exceptional item 24.4 23.5 23.0 20.8 21.3 26.2 25.1 32.7 27.6 Contribution to Exchequer to Turnover (%) 47.3 44.2 49.7 44.4 50.7 48.2 49.1 49.8 46.3 Return on Capital Employed (%) (ROCE) 35.43 27.04 20.87 24.80 22.77 29.29 29.59 36.32 33.99 Net Profit to Equity (%)- incl. exceptional item 13.2 10.3 9.6 9.7 12.3 16.3 17.0 22.5 19.6 BALANCE SHEET RATIOS Current Ratio 0.61 : 1 0.44 : 1 1.55:1 1.72:1 1.46:1 1.55:1 1.72:1 1.41:1 1.34:1 Debt Equity Ratio 0.11 : 1 0.13 : 1 - - 0.0096:1 - - 0.0398:1 - Debtors Turnover Ratio(Days) 27 31 28 45 48 33 30 30 21 PER SHARE DATA Earning Per Share (`) # 20.86 15.54 13.95 12.58 13.82 17.22 16.31 19.58 14.75 Dividend (%) 140 132 121 170 190 190 190 195 175 Book Value Per Share(`)(Restated) # 161 151 145 129 112 106 96 87 75
33Performance at a Glance
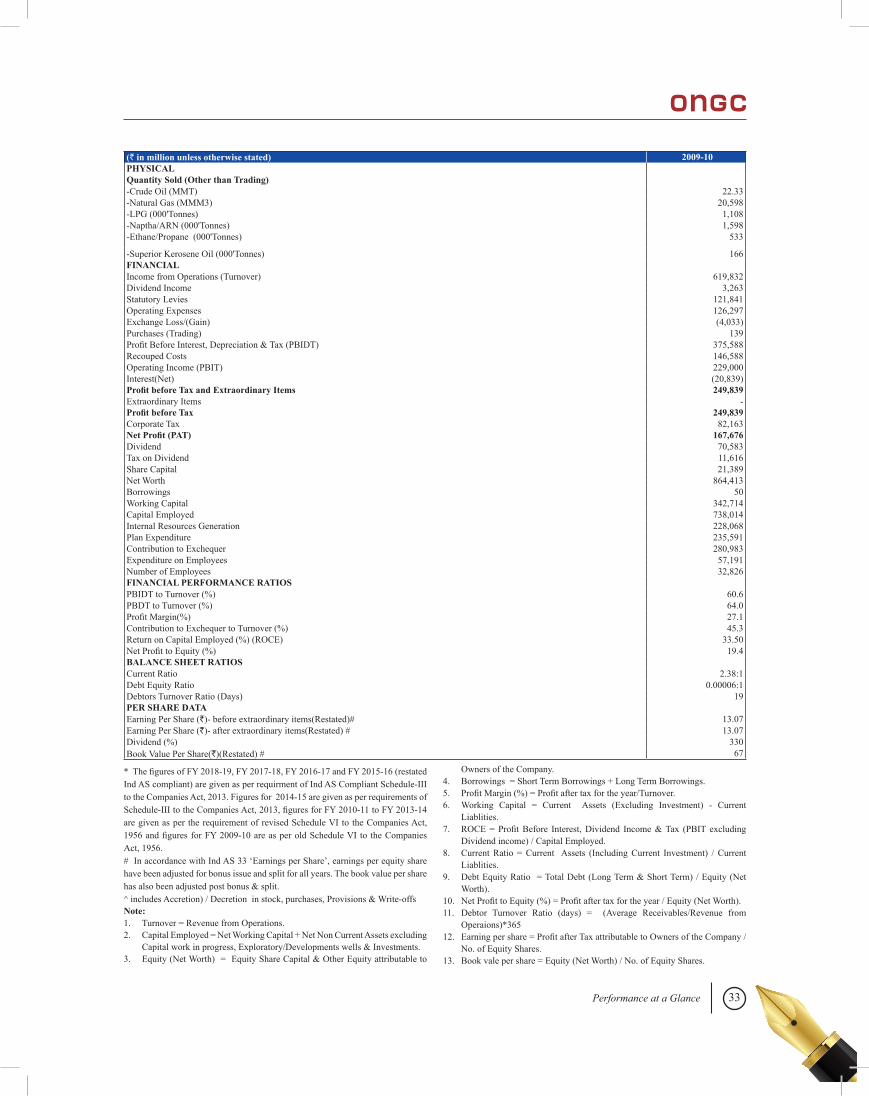
(` in million unless otherwise stated) 2009-10 PHYSICAL Quantity Sold (Other than Trading) -Crude Oil (MMT) 22.33 -Natural Gas (MMM3) 20,598 -LPG (000'Tonnes) 1,108 -Naptha/ARN (000'Tonnes) 1,598 -Ethane/Propane (000'Tonnes) 533
-Superior Kerosene Oil (000'Tonnes) 166 FINANCIAL Income from Operations (Turnover) 619,832 Dividend Income 3,263 Statutory Levies 121,841 Operating Expenses 126,297 Exchange Loss/(Gain) (4,033)Purchases (Trading) 139 Profit Before Interest, Depreciation & Tax (PBIDT) 375,588 Recouped Costs 146,588 Operating Income (PBIT) 229,000 Interest(Net) (20,839)Profit before Tax and Extraordinary Items 249,839 Extraordinary Items - Profit before Tax 249,839 Corporate Tax 82,163 Net Profit (PAT) 167,676 Dividend 70,583 Tax on Dividend 11,616 Share Capital 21,389 Net Worth 864,413 Borrowings 50 Working Capital 342,714 Capital Employed 738,014 Internal Resources Generation 228,068 Plan Expenditure 235,591 Contribution to Exchequer 280,983 Expenditure on Employees 57,191 Number of Employees 32,826 FINANCIAL PERFORMANCE RATIOS PBIDT to Turnover (%) 60.6 PBDT to Turnover (%) 64.0 Profit Margin(%) 27.1 Contribution to Exchequer to Turnover (%) 45.3 Return on Capital Employed (%) (ROCE) 33.50 Net Profit to Equity (%) 19.4 BALANCE SHEET RATIOS Current Ratio 2.38:1 Debt Equity Ratio 0.00006:1 Debtors Turnover Ratio (Days) 19 PER SHARE DATA Earning Per Share (`)- before extraordinary items(Restated)# 13.07 Earning Per Share (`)- after extraordinary items(Restated) # 13.07 Dividend (%) 330 Book Value Per Share(`)(Restated) # 67
* The figures of FY 2018-19, FY 2017-18, FY 2016-17 and FY 2015-16 (restated Ind AS compliant) are given as per requirment of Ind AS Compliant Schedule-III to the Companies Act, 2013. Figures for 2014-15 are given as per requirements of Schedule-III to the Companies Act, 2013, figures for FY 2010-11 to FY 2013-14 are given as per the requirement of revised Schedule VI to the Companies Act, 1956 and figures for FY 2009-10 are as per old Schedule VI to the Companies Act, 1956.# In accordance with Ind AS 33 ‘Earnings per Share’, earnings per equity share have been adjusted for bonus issue and split for all years. The book value per share has also been adjusted post bonus & split.^ includes Accretion) / Decretion in stock, purchases, Provisions & Write-offsNote:1. Turnover = Revenue from Operations.2. Capital Employed = Net Working Capital + Net Non Current Assets excluding
Capital work in progress, Exploratory/Developments wells & Investments.3. Equity (Net Worth) = Equity Share Capital & Other Equity attributable to
Owners of the Company.4. Borrowings = Short Term Borrowings + Long Term Borrowings.5. Profit Margin (%) = Profit after tax for the year/Turnover.6. Working Capital = Current Assets (Excluding Investment) - Current
Liablities.7. ROCE = Profit Before Interest, Dividend Income & Tax (PBIT excluding
Dividend income) / Capital Employed.8. Current Ratio = Current Assets (Including Current Investment) / Current
Liablities.9. Debt Equity Ratio = Total Debt (Long Term & Short Term) / Equity (Net
Worth).10. Net Profit to Equity (%) = Profit after tax for the year / Equity (Net Worth).11. Debtor Turnover Ratio (days) = (Average Receivables/Revenue from
Operaions)*36512. Earning per share = Profit after Tax attributable to Owners of the Company /
No. of Equity Shares.13. Book vale per share = Equity (Net Worth) / No. of Equity Shares.
34
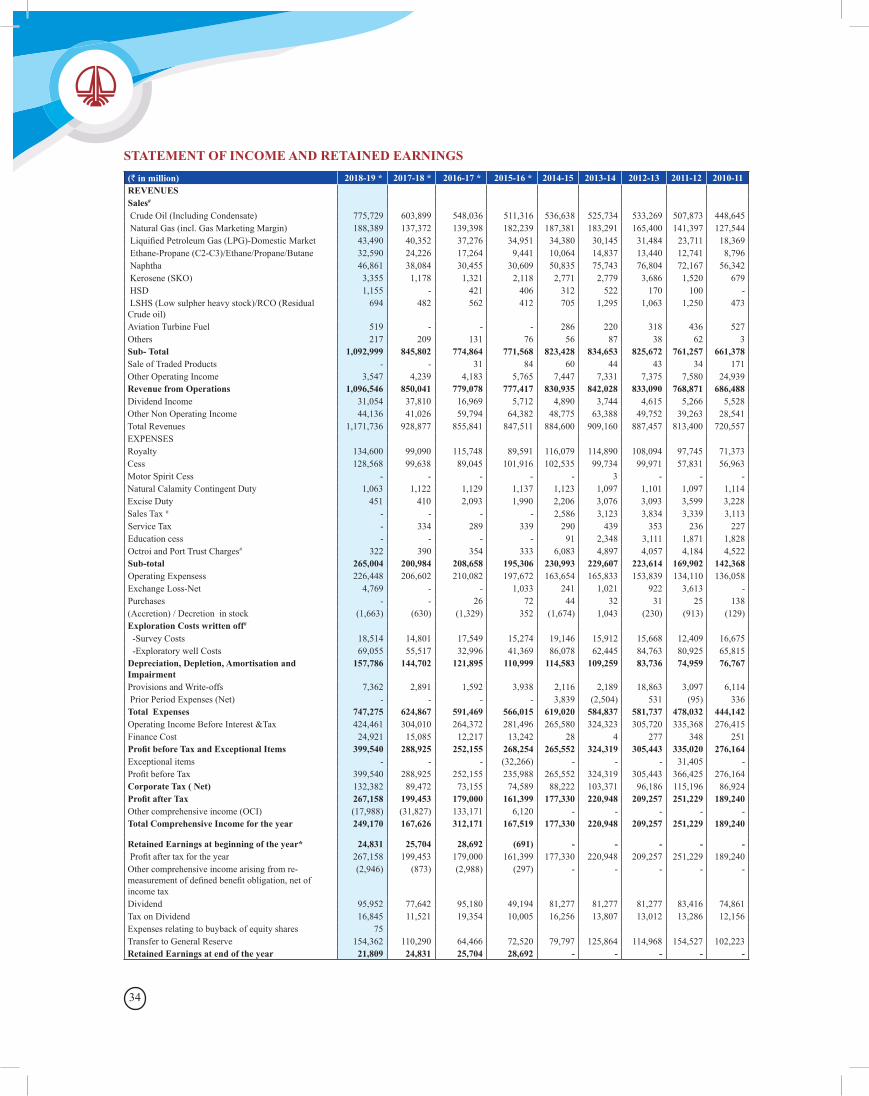
STATEMENT OF INCOME AND RETAINED EARNINGS(` in million) 2018-19 * 2017-18 * 2016-17 * 2015-16 * 2014-15 2013-14 2012-13 2011-12 2010-11REVENUESSales#
Crude Oil (Including Condensate) 775,729 603,899 548,036 511,316 536,638 525,734 533,269 507,873 448,645 Natural Gas (incl. Gas Marketing Margin) 188,389 137,372 139,398 182,239 187,381 183,291 165,400 141,397 127,544 Liquified Petroleum Gas (LPG)-Domestic Market 43,490 40,352 37,276 34,951 34,380 30,145 31,484 23,711 18,369 Ethane-Propane (C2-C3)/Ethane/Propane/Butane 32,590 24,226 17,264 9,441 10,064 14,837 13,440 12,741 8,796 Naphtha 46,861 38,084 30,455 30,609 50,835 75,743 76,804 72,167 56,342 Kerosene (SKO) 3,355 1,178 1,321 2,118 2,771 2,779 3,686 1,520 679 HSD 1,155 - 421 406 312 522 170 100 - LSHS (Low sulpher heavy stock)/RCO (Residual Crude oil)
694 482 562 412 705 1,295 1,063 1,250 473
Aviation Turbine Fuel 519 - - - 286 220 318 436 527 Others 217 209 131 76 56 87 38 62 3 Sub- Total 1,092,999 845,802 774,864 771,568 823,428 834,653 825,672 761,257 661,378 Sale of Traded Products - - 31 84 60 44 43 34 171 Other Operating Income 3,547 4,239 4,183 5,765 7,447 7,331 7,375 7,580 24,939 Revenue from Operations 1,096,546 850,041 779,078 777,417 830,935 842,028 833,090 768,871 686,488 Dividend Income 31,054 37,810 16,969 5,712 4,890 3,744 4,615 5,266 5,528 Other Non Operating Income 44,136 41,026 59,794 64,382 48,775 63,388 49,752 39,263 28,541 Total Revenues 1,171,736 928,877 855,841 847,511 884,600 909,160 887,457 813,400 720,557 EXPENSESRoyalty 134,600 99,090 115,748 89,591 116,079 114,890 108,094 97,745 71,373 Cess 128,568 99,638 89,045 101,916 102,535 99,734 99,971 57,831 56,963 Motor Spirit Cess - - - - - 3 - - - Natural Calamity Contingent Duty 1,063 1,122 1,129 1,137 1,123 1,097 1,101 1,097 1,114 Excise Duty 451 410 2,093 1,990 2,206 3,076 3,093 3,599 3,228 Sales Tax # - - - - 2,586 3,123 3,834 3,339 3,113 Service Tax - 334 289 339 290 439 353 236 227 Education cess - - - - 91 2,348 3,111 1,871 1,828 Octroi and Port Trust Charges# 322 390 354 333 6,083 4,897 4,057 4,184 4,522 Sub-total 265,004 200,984 208,658 195,306 230,993 229,607 223,614 169,902 142,368 Operating Expensess 226,448 206,602 210,082 197,672 163,654 165,833 153,839 134,110 136,058 Exchange Loss-Net 4,769 - - 1,033 241 1,021 922 3,613 - Purchases - - 26 72 44 32 31 25 138 (Accretion) / Decretion in stock (1,663) (630) (1,329) 352 (1,674) 1,043 (230) (913) (129)Exploration Costs written off#
-Survey Costs 18,514 14,801 17,549 15,274 19,146 15,912 15,668 12,409 16,675 -Exploratory well Costs 69,055 55,517 32,996 41,369 86,078 62,445 84,763 80,925 65,815 Depreciation, Depletion, Amortisation and Impairment
157,786 144,702 121,895 110,999 114,583 109,259 83,736 74,959 76,767
Provisions and Write-offs 7,362 2,891 1,592 3,938 2,116 2,189 18,863 3,097 6,114 Prior Period Expenses (Net) - - - - 3,839 (2,504) 531 (95) 336 Total Expenses 747,275 624,867 591,469 566,015 619,020 584,837 581,737 478,032 444,142 Operating Income Before Interest &Tax 424,461 304,010 264,372 281,496 265,580 324,323 305,720 335,368 276,415 Finance Cost 24,921 15,085 12,217 13,242 28 4 277 348 251 Profit before Tax and Exceptional Items 399,540 288,925 252,155 268,254 265,552 324,319 305,443 335,020 276,164 Exceptional items - - - (32,266) - - - 31,405 - Profit before Tax 399,540 288,925 252,155 235,988 265,552 324,319 305,443 366,425 276,164 Corporate Tax ( Net) 132,382 89,472 73,155 74,589 88,222 103,371 96,186 115,196 86,924 Profit after Tax 267,158 199,453 179,000 161,399 177,330 220,948 209,257 251,229 189,240 Other comprehensive income (OCI) (17,988) (31,827) 133,171 6,120 - - - - - Total Comprehensive Income for the year 249,170 167,626 312,171 167,519 177,330 220,948 209,257 251,229 189,240
Retained Earnings at beginning of the year* 24,831 25,704 28,692 (691) - - - - - Profit after tax for the year 267,158 199,453 179,000 161,399 177,330 220,948 209,257 251,229 189,240 Other comprehensive income arising from re-measurement of defined benefit obligation, net of income tax
(2,946) (873) (2,988) (297) - - - - -
Dividend 95,952 77,642 95,180 49,194 81,277 81,277 81,277 83,416 74,861 Tax on Dividend 16,845 11,521 19,354 10,005 16,256 13,807 13,012 13,286 12,156 Expenses relating to buyback of equity shares 75 Transfer to General Reserve 154,362 110,290 64,466 72,520 79,797 125,864 114,968 154,527 102,223 Retained Earnings at end of the year 21,809 24,831 25,704 28,692 - - - - -
35Performance at a Glance
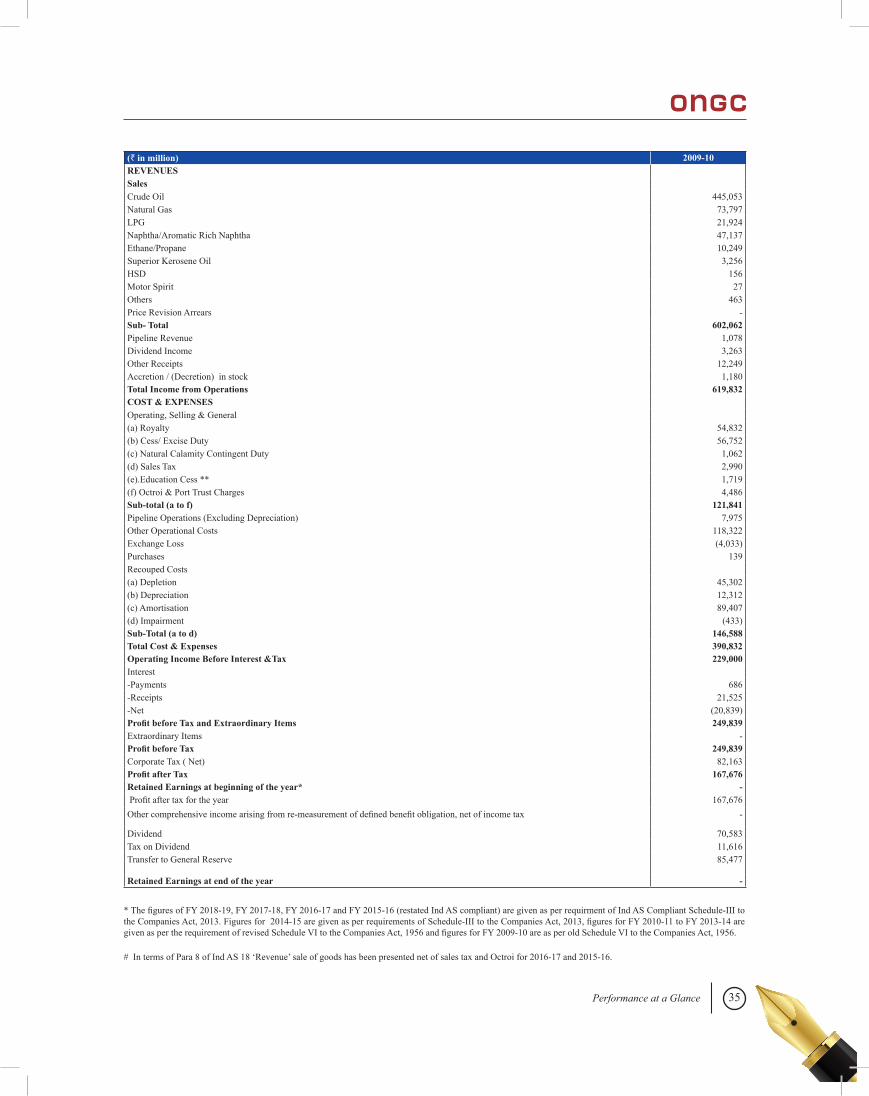
(` in million) 2009-10REVENUESSalesCrude Oil 445,053 Natural Gas 73,797 LPG 21,924 Naphtha/Aromatic Rich Naphtha 47,137 Ethane/Propane 10,249 Superior Kerosene Oil 3,256 HSD 156 Motor Spirit 27 Others 463 Price Revision Arrears - Sub- Total 602,062 Pipeline Revenue 1,078 Dividend Income 3,263 Other Receipts 12,249 Accretion / (Decretion) in stock 1,180 Total Income from Operations 619,832 COST & EXPENSESOperating, Selling & General(a) Royalty 54,832 (b) Cess/ Excise Duty 56,752 (c) Natural Calamity Contingent Duty 1,062 (d) Sales Tax 2,990 (e).Education Cess ** 1,719 (f) Octroi & Port Trust Charges 4,486 Sub-total (a to f) 121,841 Pipeline Operations (Excluding Depreciation) 7,975 Other Operational Costs 118,322 Exchange Loss (4,033)Purchases 139 Recouped Costs(a) Depletion 45,302 (b) Depreciation 12,312 (c) Amortisation 89,407 (d) Impairment (433)Sub-Total (a to d) 146,588 Total Cost & Expenses 390,832 Operating Income Before Interest &Tax 229,000 Interest-Payments 686 -Receipts 21,525 -Net (20,839)Profit before Tax and Extraordinary Items 249,839 Extraordinary Items - Profit before Tax 249,839 Corporate Tax ( Net) 82,163 Profit after Tax 167,676 Retained Earnings at beginning of the year* - Profit after tax for the year 167,676 Other comprehensive income arising from re-measurement of defined benefit obligation, net of income tax -
Dividend 70,583 Tax on Dividend 11,616 Transfer to General Reserve 85,477
Retained Earnings at end of the year -
* The figures of FY 2018-19, FY 2017-18, FY 2016-17 and FY 2015-16 (restated Ind AS compliant) are given as per requirment of Ind AS Compliant Schedule-III to the Companies Act, 2013. Figures for 2014-15 are given as per requirements of Schedule-III to the Companies Act, 2013, figures for FY 2010-11 to FY 2013-14 are given as per the requirement of revised Schedule VI to the Companies Act, 1956 and figures for FY 2009-10 are as per old Schedule VI to the Companies Act, 1956.
# In terms of Para 8 of Ind AS 18 ‘Revenue’ sale of goods has been presented net of sales tax and Octroi for 2016-17 and 2015-16.
36
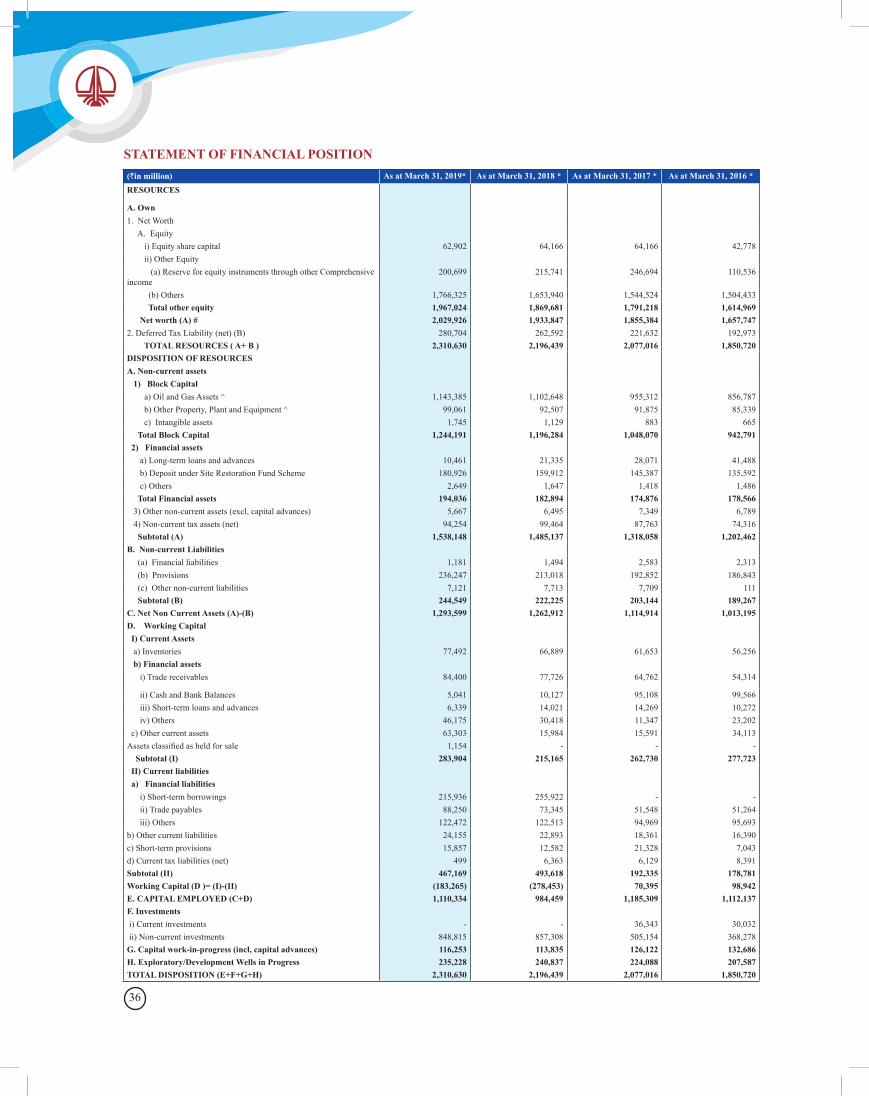
(`in million) As at March 31, 2019* As at March 31, 2018 * As at March 31, 2017 * As at March 31, 2016 *RESOURCES
A. Own1. Net Worth A. Equity i) Equity share capital 62,902 64,166 64,166 42,778 ii) Other Equity (a) Reserve for equity instruments through other Comprehensive income
200,699 215,741 246,694 110,536
(b) Others 1,766,325 1,653,940 1,544,524 1,504,433 Total other equity 1,967,024 1,869,681 1,791,218 1,614,969 Net worth (A) # 2,029,926 1,933,847 1,855,384 1,657,747 2. Deferred Tax Liability (net) (B) 280,704 262,592 221,632 192,973 TOTAL RESOURCES ( A+ B ) 2,310,630 2,196,439 2,077,016 1,850,720 DISPOSITION OF RESOURCESA. Non-current assets 1) Block Capital a) Oil and Gas Assets ^ 1,143,385 1,102,648 955,312 856,787 b) Other Property, Plant and Equipment ^ 99,061 92,507 91,875 85,339 c) Intangible assets 1,745 1,129 883 665 Total Block Capital 1,244,191 1,196,284 1,048,070 942,791 2) Financial assets a) Long-term loans and advances 10,461 21,335 28,071 41,488 b) Deposit under Site Restoration Fund Scheme 180,926 159,912 145,387 135,592 c) Others 2,649 1,647 1,418 1,486 Total Financial assets 194,036 182,894 174,876 178,566 3) Other non-current assets (excl, capital advances) 5,667 6,495 7,349 6,789 4) Non-current tax assets (net) 94,254 99,464 87,763 74,316 Subtotal (A) 1,538,148 1,485,137 1,318,058 1,202,462 B. Non-current Liabilities (a) Financial liabilities 1,181 1,494 2,583 2,313 (b) Provisions 236,247 213,018 192,852 186,843 (c) Other non-current liabilities 7,121 7,713 7,709 111 Subtotal (B) 244,549 222,225 203,144 189,267 C. Net Non Current Assets (A)-(B) 1,293,599 1,262,912 1,114,914 1,013,195 D. Working Capital I) Current Assets a) Inventories 77,492 66,889 61,653 56,256 b) Financial assets i) Trade receivables 84,400 77,726 64,762 54,314
ii) Cash and Bank Balances 5,041 10,127 95,108 99,566 iii) Short-term loans and advances 6,339 14,021 14,269 10,272 iv) Others 46,175 30,418 11,347 23,202 c) Other current assets 63,303 15,984 15,591 34,113 Assets classified as held for sale 1,154 - - - Subtotal (I) 283,904 215,165 262,730 277,723 II) Current liabilities a) Financial liabilities i) Short-term borrowings 215,936 255,922 - - ii) Trade payables 88,250 73,345 51,548 51,264 iii) Others 122,472 122,513 94,969 95,693 b) Other current liabilities 24,155 22,893 18,361 16,390 c) Short-term provisions 15,857 12,582 21,328 7,043 d) Current tax liabilities (net) 499 6,363 6,129 8,391 Subtotal (II) 467,169 493,618 192,335 178,781 Working Capital (D )= (I)-(II) (183,265) (278,453) 70,395 98,942 E. CAPITAL EMPLOYED (C+D) 1,110,334 984,459 1,185,309 1,112,137 F. Investments i) Current investments - - 36,343 30,032 ii) Non-current investments 848,815 857,308 505,154 368,278 G. Capital work-in-progress (incl, capital advances) 116,253 113,835 126,122 132,686 H. Exploratory/Development Wells in Progress 235,228 240,837 224,088 207,587 TOTAL DISPOSITION (E+F+G+H) 2,310,630 2,196,439 2,077,016 1,850,720
STATEMENT OF FINANCIAL POSITION
37Performance at a Glance
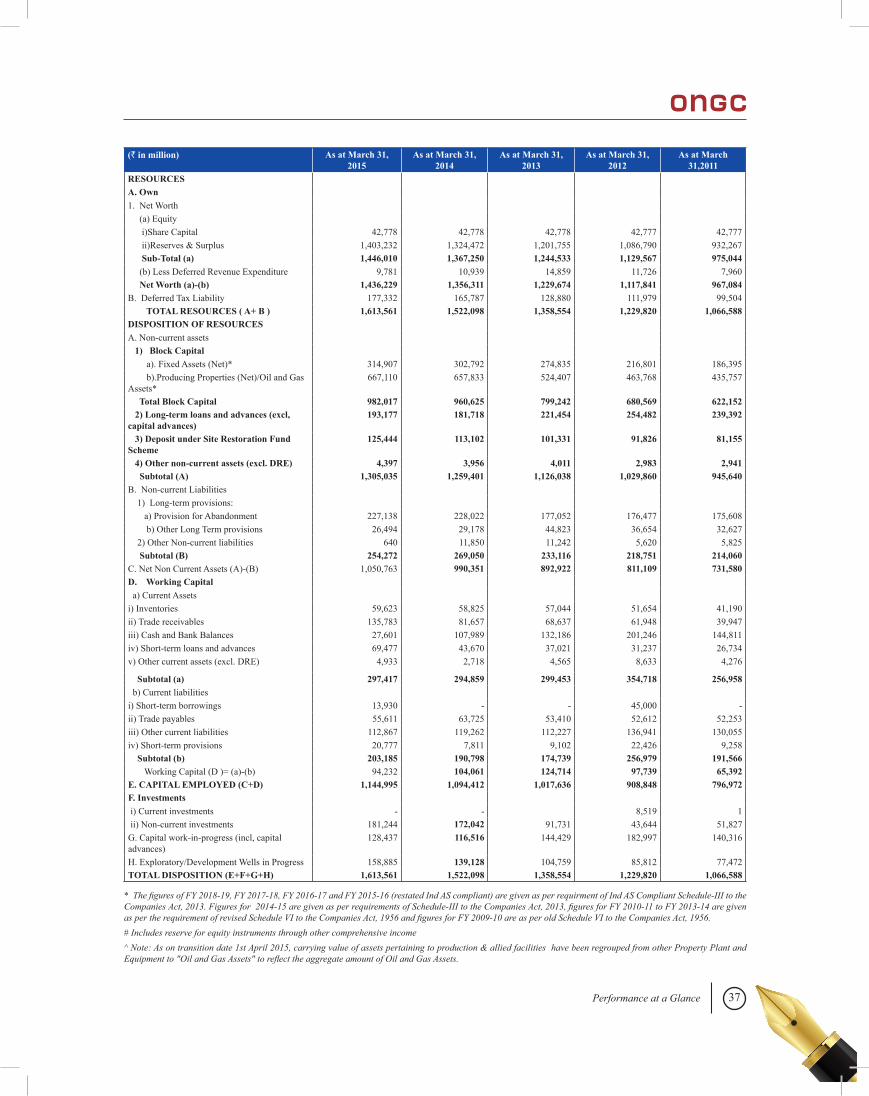
(` in million) As at March 31, 2015
As at March 31, 2014
As at March 31, 2013
As at March 31, 2012
As at March 31,2011
RESOURCESA. Own1. Net Worth (a) Equity i)Share Capital 42,778 42,778 42,778 42,777 42,777 ii)Reserves & Surplus 1,403,232 1,324,472 1,201,755 1,086,790 932,267 Sub-Total (a) 1,446,010 1,367,250 1,244,533 1,129,567 975,044 (b) Less Deferred Revenue Expenditure 9,781 10,939 14,859 11,726 7,960 Net Worth (a)-(b) 1,436,229 1,356,311 1,229,674 1,117,841 967,084 B. Deferred Tax Liability 177,332 165,787 128,880 111,979 99,504 TOTAL RESOURCES ( A+ B ) 1,613,561 1,522,098 1,358,554 1,229,820 1,066,588 DISPOSITION OF RESOURCESA. Non-current assets 1) Block Capital a). Fixed Assets (Net)* 314,907 302,792 274,835 216,801 186,395 b).Producing Properties (Net)/Oil and Gas Assets*
667,110 657,833 524,407 463,768 435,757
Total Block Capital 982,017 960,625 799,242 680,569 622,152 2) Long-term loans and advances (excl, capital advances)
193,177 181,718 221,454 254,482 239,392
3) Deposit under Site Restoration Fund Scheme
125,444 113,102 101,331 91,826 81,155
4) Other non-current assets (excl. DRE) 4,397 3,956 4,011 2,983 2,941 Subtotal (A) 1,305,035 1,259,401 1,126,038 1,029,860 945,640 B. Non-current Liabilities 1) Long-term provisions: a) Provision for Abandonment 227,138 228,022 177,052 176,477 175,608 b) Other Long Term provisions 26,494 29,178 44,823 36,654 32,627 2) Other Non-current liabilities 640 11,850 11,242 5,620 5,825 Subtotal (B) 254,272 269,050 233,116 218,751 214,060 C. Net Non Current Assets (A)-(B) 1,050,763 990,351 892,922 811,109 731,580 D. Working Capital a) Current Assetsi) Inventories 59,623 58,825 57,044 51,654 41,190 ii) Trade receivables 135,783 81,657 68,637 61,948 39,947 iii) Cash and Bank Balances 27,601 107,989 132,186 201,246 144,811 iv) Short-term loans and advances 69,477 43,670 37,021 31,237 26,734 v) Other current assets (excl. DRE) 4,933 2,718 4,565 8,633 4,276
Subtotal (a) 297,417 294,859 299,453 354,718 256,958 b) Current liabilitiesi) Short-term borrowings 13,930 - - 45,000 - ii) Trade payables 55,611 63,725 53,410 52,612 52,253 iii) Other current liabilities 112,867 119,262 112,227 136,941 130,055 iv) Short-term provisions 20,777 7,811 9,102 22,426 9,258 Subtotal (b) 203,185 190,798 174,739 256,979 191,566 Working Capital (D )= (a)-(b) 94,232 104,061 124,714 97,739 65,392 E. CAPITAL EMPLOYED (C+D) 1,144,995 1,094,412 1,017,636 908,848 796,972 F. Investments i) Current investments - - 8,519 1 ii) Non-current investments 181,244 172,042 91,731 43,644 51,827 G. Capital work-in-progress (incl, capital advances)
128,437 116,516 144,429 182,997 140,316
H. Exploratory/Development Wells in Progress 158,885 139,128 104,759 85,812 77,472 TOTAL DISPOSITION (E+F+G+H) 1,613,561 1,522,098 1,358,554 1,229,820 1,066,588
* The figures of FY 2018-19, FY 2017-18, FY 2016-17 and FY 2015-16 (restated Ind AS compliant) are given as per requirment of Ind AS Compliant Schedule-III to the Companies Act, 2013. Figures for 2014-15 are given as per requirements of Schedule-III to the Companies Act, 2013, figures for FY 2010-11 to FY 2013-14 are given as per the requirement of revised Schedule VI to the Companies Act, 1956 and figures for FY 2009-10 are as per old Schedule VI to the Companies Act, 1956.# Includes reserve for equity instruments through other comprehensive income ^ Note: As on transition date 1st April 2015, carrying value of assets pertaining to production & allied facilities have been regrouped from other Property Plant and Equipment to "Oil and Gas Assets" to reflect the aggregate amount of Oil and Gas Assets.
38
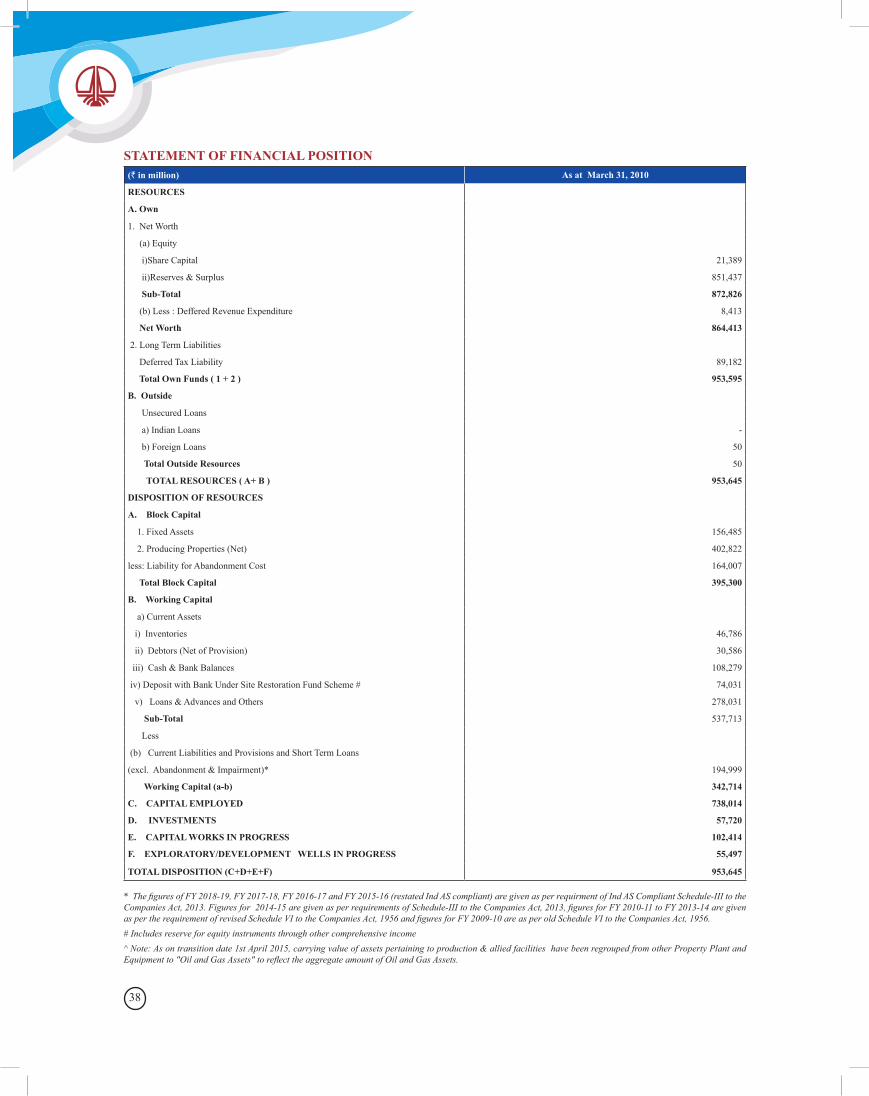
(` in million) As at March 31, 2010
RESOURCES
A. Own
1. Net Worth
(a) Equity
i)Share Capital 21,389
ii)Reserves & Surplus 851,437
Sub-Total 872,826
(b) Less : Deffered Revenue Expenditure 8,413
Net Worth 864,413
2. Long Term Liabilities
Deferred Tax Liability 89,182
Total Own Funds ( 1 + 2 ) 953,595
B. Outside
Unsecured Loans
a) Indian Loans -
b) Foreign Loans 50
Total Outside Resources 50
TOTAL RESOURCES ( A+ B ) 953,645
DISPOSITION OF RESOURCES
A. Block Capital
1. Fixed Assets 156,485
2. Producing Properties (Net) 402,822
less: Liability for Abandonment Cost 164,007
Total Block Capital 395,300
B. Working Capital
a) Current Assets
i) Inventories 46,786
ii) Debtors (Net of Provision) 30,586
iii) Cash & Bank Balances 108,279
iv) Deposit with Bank Under Site Restoration Fund Scheme # 74,031
v) Loans & Advances and Others 278,031
Sub-Total 537,713
Less
(b) Current Liabilities and Provisions and Short Term Loans
(excl. Abandonment & Impairment)* 194,999
Working Capital (a-b) 342,714
C. CAPITAL EMPLOYED 738,014
D. INVESTMENTS 57,720
E. CAPITAL WORKS IN PROGRESS 102,414
F. EXPLORATORY/DEVELOPMENT WELLS IN PROGRESS 55,497
TOTAL DISPOSITION (C+D+E+F) 953,645
* The figures of FY 2018-19, FY 2017-18, FY 2016-17 and FY 2015-16 (restated Ind AS compliant) are given as per requirment of Ind AS Compliant Schedule-III to the Companies Act, 2013. Figures for 2014-15 are given as per requirements of Schedule-III to the Companies Act, 2013, figures for FY 2010-11 to FY 2013-14 are given as per the requirement of revised Schedule VI to the Companies Act, 1956 and figures for FY 2009-10 are as per old Schedule VI to the Companies Act, 1956.# Includes reserve for equity instruments through other comprehensive income ^ Note: As on transition date 1st April 2015, carrying value of assets pertaining to production & allied facilities have been regrouped from other Property Plant and Equipment to "Oil and Gas Assets" to reflect the aggregate amount of Oil and Gas Assets.
STATEMENT OF FINANCIAL POSITION
39Performance at a Glance
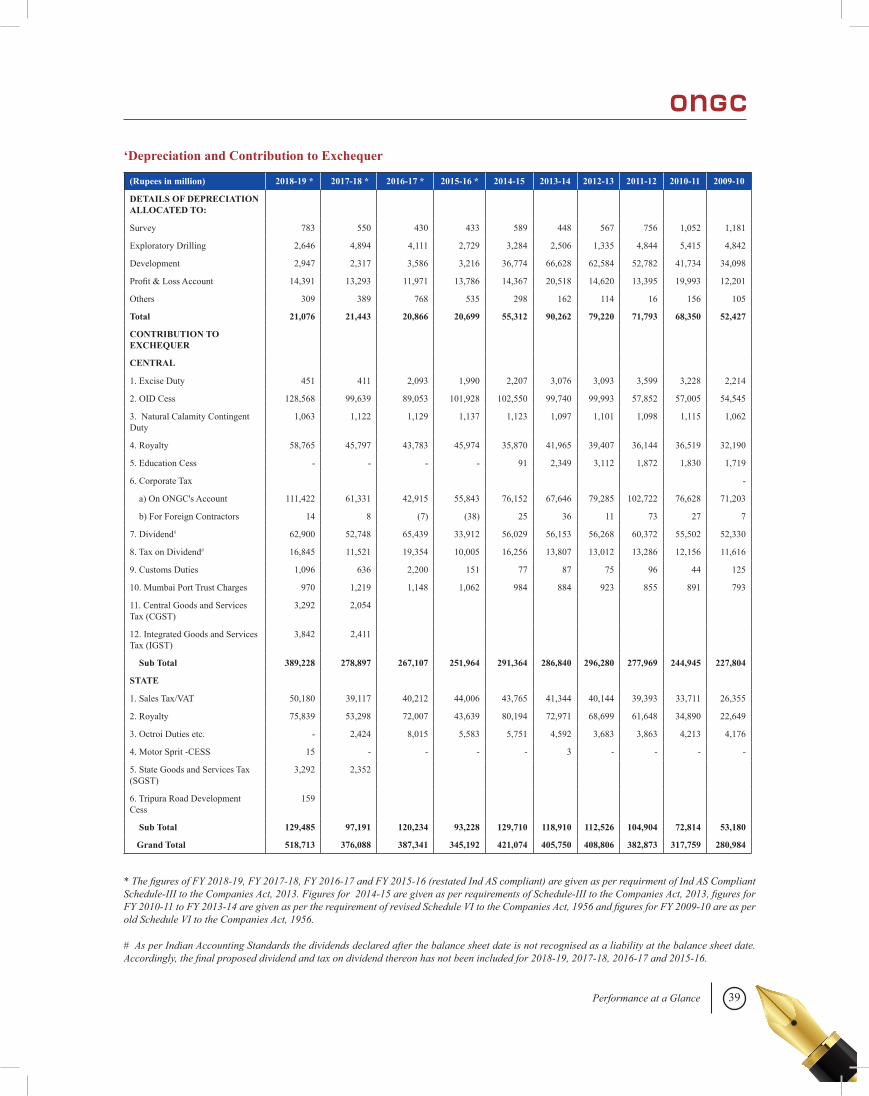
‘Depreciation and Contribution to Exchequer
(Rupees in million) 2018-19 * 2017-18 * 2016-17 * 2015-16 * 2014-15 2013-14 2012-13 2011-12 2010-11 2009-10
DETAILS OF DEPRECIATION ALLOCATED TO:
Survey 783 550 430 433 589 448 567 756 1,052 1,181
Exploratory Drilling 2,646 4,894 4,111 2,729 3,284 2,506 1,335 4,844 5,415 4,842
Development 2,947 2,317 3,586 3,216 36,774 66,628 62,584 52,782 41,734 34,098
Profit & Loss Account 14,391 13,293 11,971 13,786 14,367 20,518 14,620 13,395 19,993 12,201
Others 309 389 768 535 298 162 114 16 156 105
Total 21,076 21,443 20,866 20,699 55,312 90,262 79,220 71,793 68,350 52,427
CONTRIBUTION TO EXCHEQUER
CENTRAL
1. Excise Duty 451 411 2,093 1,990 2,207 3,076 3,093 3,599 3,228 2,214
2. OID Cess 128,568 99,639 89,053 101,928 102,550 99,740 99,993 57,852 57,005 54,545
3. Natural Calamity Contingent Duty
1,063 1,122 1,129 1,137 1,123 1,097 1,101 1,098 1,115 1,062
4. Royalty 58,765 45,797 43,783 45,974 35,870 41,965 39,407 36,144 36,519 32,190
5. Education Cess - - - - 91 2,349 3,112 1,872 1,830 1,719
6. Corporate Tax -
a) On ONGC's Account 111,422 61,331 42,915 55,843 76,152 67,646 79,285 102,722 76,628 71,203
b) For Foreign Contractors 14 8 (7) (38) 25 36 11 73 27 7
7. Dividend# 62,900 52,748 65,439 33,912 56,029 56,153 56,268 60,372 55,502 52,330
8. Tax on Dividend# 16,845 11,521 19,354 10,005 16,256 13,807 13,012 13,286 12,156 11,616
9. Customs Duties 1,096 636 2,200 151 77 87 75 96 44 125
10. Mumbai Port Trust Charges 970 1,219 1,148 1,062 984 884 923 855 891 793
11. Central Goods and Services Tax (CGST)
3,292 2,054
12. Integrated Goods and Services Tax (IGST)
3,842 2,411
Sub Total 389,228 278,897 267,107 251,964 291,364 286,840 296,280 277,969 244,945 227,804
STATE
1. Sales Tax/VAT 50,180 39,117 40,212 44,006 43,765 41,344 40,144 39,393 33,711 26,355
2. Royalty 75,839 53,298 72,007 43,639 80,194 72,971 68,699 61,648 34,890 22,649
3. Octroi Duties etc. - 2,424 8,015 5,583 5,751 4,592 3,683 3,863 4,213 4,176
4. Motor Sprit -CESS 15 - - - - 3 - - - -
5. State Goods and Services Tax (SGST)
3,292 2,352
6. Tripura Road Development Cess
159
Sub Total 129,485 97,191 120,234 93,228 129,710 118,910 112,526 104,904 72,814 53,180
Grand Total 518,713 376,088 387,341 345,192 421,074 405,750 408,806 382,873 317,759 280,984
* The figures of FY 2018-19, FY 2017-18, FY 2016-17 and FY 2015-16 (restated Ind AS compliant) are given as per requirment of Ind AS Compliant Schedule-III to the Companies Act, 2013. Figures for 2014-15 are given as per requirements of Schedule-III to the Companies Act, 2013, figures for FY 2010-11 to FY 2013-14 are given as per the requirement of revised Schedule VI to the Companies Act, 1956 and figures for FY 2009-10 are as per old Schedule VI to the Companies Act, 1956.
# As per Indian Accounting Standards the dividends declared after the balance sheet date is not recognised as a liability at the balance sheet date. Accordingly, the final proposed dividend and tax on dividend thereon has not been included for 2018-19, 2017-18, 2016-17 and 2015-16.
40
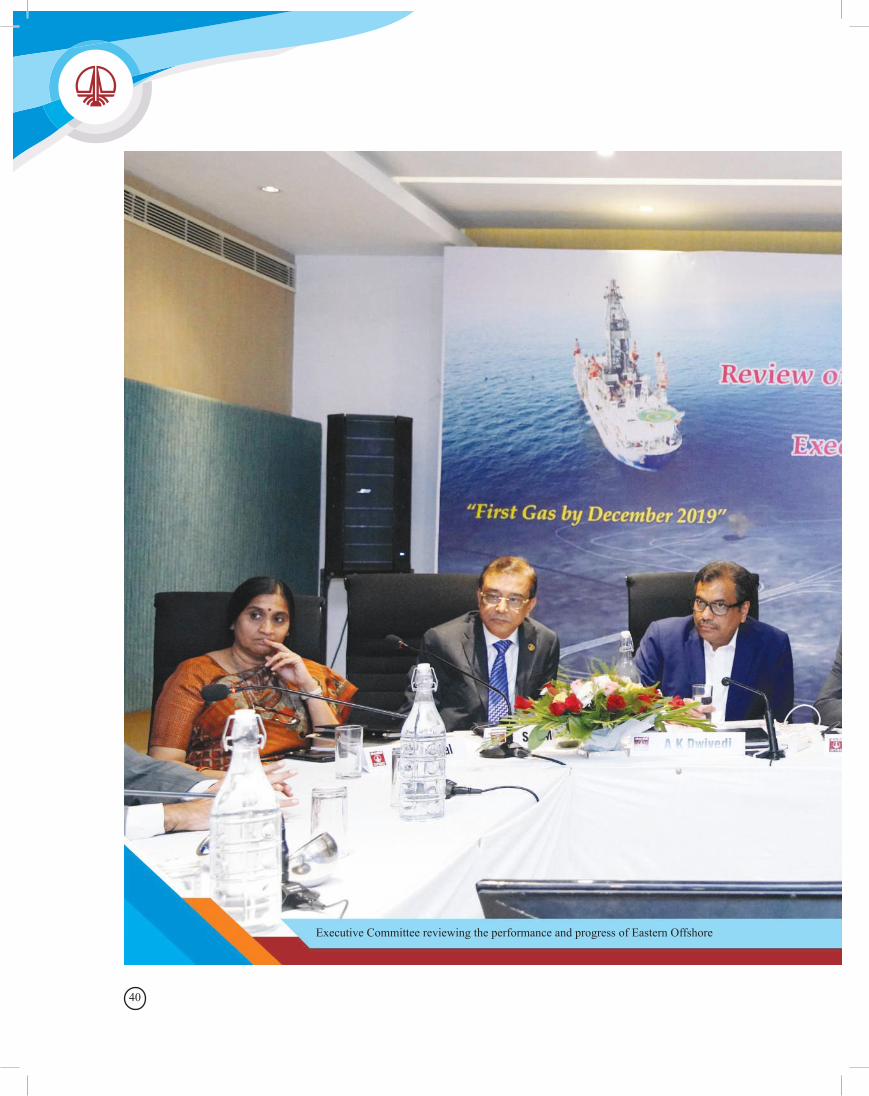
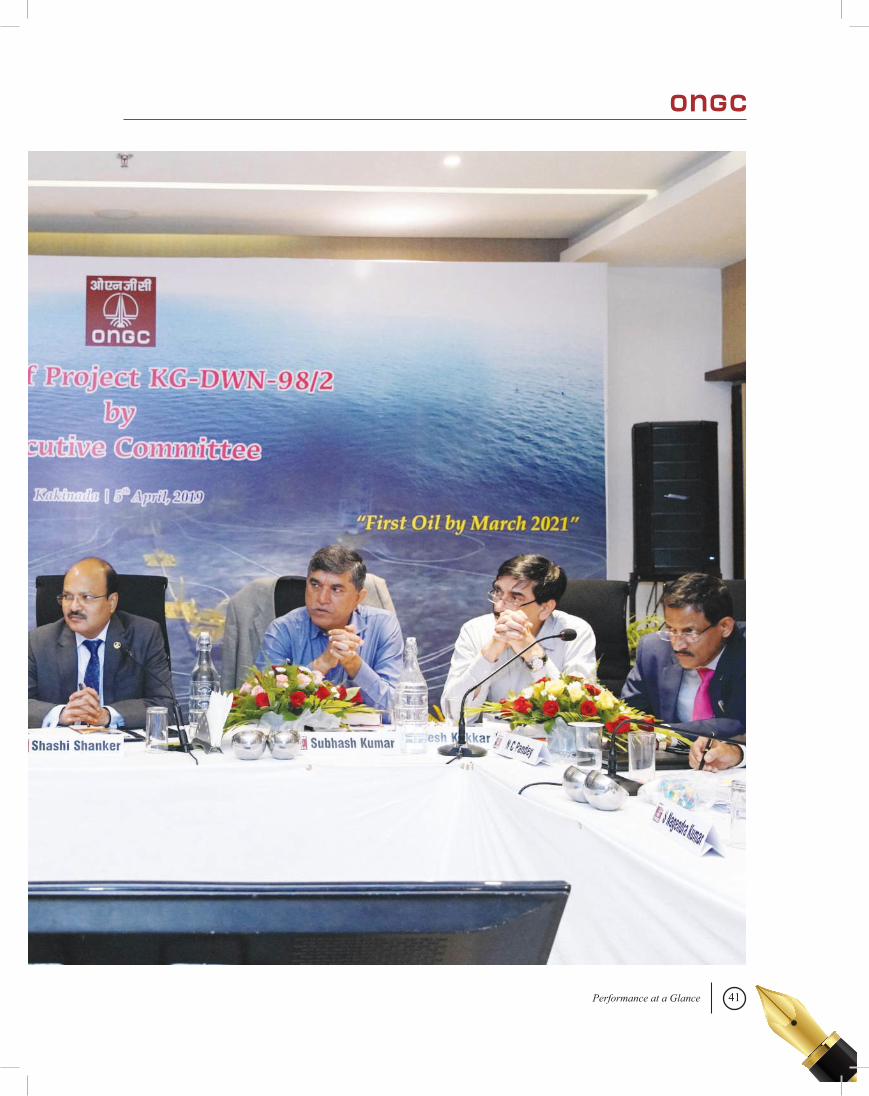
Executive Committee reviewing the performance and progress of Eastern Offshore
41Performance at a Glance
42
Glossary of Energy & Financial Terms
A. Energy Terms
Appraisal Well: A well drilled as part of an appraisal drilling programme, which is carried out to determine the physical extent of oil and gas reserves & characteristics thereof and the quantity of recoverable Petroleum therein.
Condensates: Liquid hydrocarbons produced with natural gas, separated by cooling and other means.
Development: Following discovery, drilling and related activities necessary to begin production of oil or natural gas.
Development Well: A well drilled within the proved area of an Oil and Gas reservoir to the depth of a horizon known to be productive.
Enhanced Recovery: Techniques used to increase or prolong production from oil and natural gas fields.
Exploration: Searching for oil and/or natural gas, including topographical surveys, geologic studies, geophysical surveys, seismic surveys and drilling wells.
Exploratory Well: A well that is not a development well, a service well, or a stratigraphic test well i.e. well drilled not in a proved area for the purpose of obtaining information pertaining to a specific geologic condition.
Heavy Cut: These are heavier hydrocarbons obtained in fractionation unit of Kerosene Recovery Process, where NGL is processed to yield Aromatic Rich Naphtha and Superior Kerosene Oil.
Integrated Petroleum Company: A company engaged in all aspects of the industry from exploration and production of crude oil and natural gas (upstream) to refining, marketing and transportation products (downstream).
Liquefied Natural Gas (LNG): Gas that is liquefied under extremely cold temperatures and high pressure to facilitate storage or transportation in specially designed vessels.
Liquefied Petroleum Gas (LPG): Light gases, such as butane and propane that can be maintained as liquids while under pressure.
Mining Lease: The license issued for offshore and onshore properties for conducting development and production activity.
Natural Gas Liquids (NGL): Separated from natural gas, these include ethane, propane, butane and natural gasoline.
Oil Equivalent Gas (OEG): The volume of natural gas that can be burnt to give the same amount of heat as a barrel of oil (6,000 cubic feet of gas equals one barrel of oil).
Petroleum Exploration License: The license issued for offshore and onshore properties for conducting exploration activity.
Reserves: Oil and Natural Gas contained in underground rock formations called reservoirs. Proved reserves are the estimated quantities that geologic and engineering data demonstrate can be produced with reasonable certainty from known reservoirs under existing economic and operating conditions. Reserve estimates change as additional information becomes available. Recoverable reserves are those that can be produced using all known primary and enhanced recovery methods.
Service well: A service well drilled or completed for the purpose of supporting production in an existing field. Wells in this class are drilled for gas injection, water injection, steam injection, air injection, polymer injection, salt-water disposal, water supply for injection, observation, or injection for combustion.
Unit Of Production Method: The method of depreciation (depletion) under which depreciation (depletion) is calculated on the basis of the number of production or similar units expected to be obtained from the asset by the enterprise.
Work-Over: Remedial work to the equipment within a well, the well pipe work or relating to attempts to increase the rate of flow.
B. Financial Terms
Accounting Policies: The specific accounting principles and the methods of applying those principles adopted
43Glossary of Energy & Financial Terms
by an enterprise in the preparation and presentation of financial statements.
Accrual Basis of Accounting: The method of recording transactions by which revenues, expenses, assets and liabilities are reflected in the accounts in the period in which they accrue. The ‘accrual basis of accounting’ includes considerations relating to deferrals, allocations, depreciation and amortization. This basis is also referred to as mercantile basis of accounting.
Acquisition Costs: These cover all costs incurred to purchase, lease or otherwise acquire a property or mineral right proved or unproved. These include lease/ signature bonus, brokers’ fees, legal costs, cost of temporary occupation of the land including crop compensation paid to farmers, consideration for firm-in arrangements and all other costs incurred in acquiring these rights. Acquisition Costs are recognized in the accounts note no. 3.10 (ii) in Significant Accounting Policies under Notes to Financial Statements.
Absorption Costing: A method whereby the cost is determined so as to include the appropriate share of both variable and fixed costs.
Balance Sheet: A statement of the financial position of an enterprise as at a given date, which exhibits its assets, liabilities, capital, reserves and other account balances at their respective book values.
Book Value: The amount at which an item appears in the books of account or financial statements. It does not refer to any particular basis on which the amount is determined e.g. cost, replacement value etc.
Business Combination under Common control: A business combination involving entities or businesses under common control is a business combination in which all the combining entities or businesses are ultimately controlled by the same party or parties both before and after the business combination, and that control is not transitory.
Capital Commitment: Future liability for capital expenditure in respect of which contracts have been made.
Capital Employed: The finances deployed by an enterprise in its net fixed assets, investments and working capital. Capital employed in an operation may, however, exclude investments made outside that operation.
Capital Reserve: A reserve of a corporate enterprise which is not available for distribution as dividend.
Contingent Asset is a possible asset that arises from past events and whose existence will be confirmed only by the occurrence or non-occurrence of one or more uncertain future events not wholly within the control of the entity.
Contingent Liability is a present obligation that arises from past events but is not recognised because:
it is not probable that an outflow of resources embodying economic benefits will be required to settle the obligation; or
the amount of the obligation cannot be measured with sufficient reliability.
Current Asset: An asset shall be classified as current when:
(a) it is expected to realise the asset, or intended to sell or consume it, in its normal operating cycle;
(b) it is held primarily for the purpose of trading;
(c) it is expected to realise the asset within twelve months after the reporting period; or
(d) the asset is cash or a cash equivalent unless the asset is restricted from being exchanged or used to settle a liability for at least twelve months after the reporting period.
Current Liability: A liability shall be classified as current when:
(a) it is expected to settle the liability in its normal operating cycle;
(b) it is held primarily for the purpose of trading;
(c) the liability is due to be settled within twelve months after the reporting period; or
(d) it does not have an unconditional right to defer
44
settlement of the liability for at least twelve months after the reporting period.
Cess: It is a levy imposed under The Oil Industry (Development) Act, 1974 on Crude oil acknowledged & received in the refinery and payable to the Central Government.
Decommissioning, restoration costs / provision: These are the costs incurred on discontinuation of all operations and surrendering the property back to the owner. These costs relate to plugging and abandoning of wells, dismantling of wellheads, production and transport facilities and to restoration of producing areas. Decommissioning Costs are recognized in the accounts as per note no.3.13 in Significant Accounting Policies under Notes to Financial Statements. Where the effect of the time value of money is material, these costs are required to be recognised at the present value of the expenditures expected to settle the obligation.
Development Costs: Costs incurred in preparing proved reserves for production i.e. costs incurred to obtain access to prove reserves and to provide facilities for extracting, treating, gathering and storing oil and gas.
Depreciation method: The depreciation method used reflects the pattern in which the asset’s future economic benefits are expected to be consumed. A variety of depreciation methods can be used to allocate the depreciable amount of an asset on a systematic basis over its useful life. These methods include the straight-line method, the diminishing balance method and the units of production method.
Dividend: A distribution to shareholders out of profits or reserves available for this purpose.
Effective interest rate method: It is a method of calculating the amortised cost of a financial asset or a financial liability and of allocating the interest income or interest expense over the relevant period. Effective interest rate is the rate that exactly discounts estimated future cash payments or receipts through the expected life of the financial asset or financial liability to the gross carrying amount of a financial asset or to the amortised cost of a financial liability.
Expenditure: Incurring a liability, disbursement of cash or transfer of property for the purpose of obtaining assets, goods and services.
Expense: A cost relating to the operations of an accounting period or to the revenue earned during the period or the benefits of which do not extend beyond that period.
Exploration Costs: Costs incurred in exploring property. Exploration involves identifying areas that may warrant examination and examining specific areas, including drilling exploratory wells.
Exploration Costs written off: It refers to the Survey expenditure and Dry wells expensed in the accounts in line with note no.3.8 (ii) and 3.10 (iii) in Significant Accounting Policies under Notes to Financial Statements.
Fair value: The price that would be received to sell an asset or paid to transfer a liability in an orderly transaction between market participants at the measurement date.
First In, First Out (FIFO): Computation of the cost of items sold or consumed during a period as though they were sold or consumed in order of their acquisition.
Financial asset is an asset that is cash, an equity instrument of another entity, a contractual right to receive cash or another financial asset from another entity or to exchange financial assets or financial liabilities with another entity under conditions that are potentially favorable to the entity; or a contract that will or may be settled in the entity’s own equity instruments and is non-derivative for which the entity is or may be obliged to receive a variable number of the entity’s own equity instruments or a derivative that will or may be settled other than by the exchange of a fixed amount of cash or other financial asset for a fixed number of the entity’s equity instruments.
Financial Instruments: A “financial instrument” is defined as any contract that gives rise to a financial asset of one entity and a financial liability or equity instrument of another entity.
Financial Liability is any liability that is a contractual obligation to deliver cash or another financial asset to another entity (e.g. a payable), to exchange financial assets or financial liabilities with another entity under
45Glossary of Energy & Financial Terms
conditions that are potentially unfavorable to the entity; or a contract that will or may be settled in the entity’s own equity instruments and is a non-derivative contract for which the entity is or may be obliged to deliver a variable number of its own equity instruments (e.g. an instrument that is redeemable in own shares to the value of the carrying amount of the instrument).
Fixed Cost: The cost of production which, by its very nature, remains relatively unaffected in a defined period of time by variations in the volume of production.
Fundamental Accounting Assumptions: Basic accounting assumption which underline the preparation and presentation of financial statements. They are going concern, consistency and accrual. Usually, they are not specifically stated because their acceptance and use are assumed. Disclosure is necessary if they are not followed.
Inventory: Tangible property held for sale in the ordinary course of business, or in the process of production for such sale, or for consumption in the production of goods or services for sale, including maintenance supplies and consumables other than machinery spares.
Investment: Expenditure on assets held to earn interest, income, profit or other benefits.
Impairment of Doubtful Debts: A provision made for debts considered doubtful of recovery.
Liability: A liability is a present obligation of the entity arising from past events, the settlement of which is expected to result in an outflow from the entity of resources embodying economic benefits.
Materiality: An accounting concept according to which all relatively important and relevant items, i.e., items the knowledge of which individually or collectively; influence the economic decisions that users make on the basis of the financial statements. Materiality depends on the size and nature of the omission or misstatement judged in the surrounding circumstances. The size or nature of the item, or a combination of both, could be the determining factor.
Net Assets: The excess of the book value of assets of an enterprise over its liabilities. This is also referred to as net worth or shareholders’ funds.
Net Profit: The excess of revenue over expenses during a particular accounting period. When the result of this computation is negative, it is referred to as net loss. The net profit may be shown before or after tax. The net profit / loss do not include other comprehensive income.
Net Realisable Value: The actual/ estimated selling price of an asset in the ordinary course of the business less cost of completion and cost necessarily to be incurred in order to make the sale.
Non Current Asset: All assets other than Current assets are classified as Non Current asset.
Non Current Liability: All liabilities other than Current liabilities are classified as non-current liability.
Non-controlling interests: Equity in a subsidiary not attributable, directly or indirectly, to a parent. It represents the proportion of income, other comprehensive income and net assets in subsidiaries that is not attributable to the Company's shareholders.
Net Present Value (NPV): NPV is the present (discounted) value of future cash inflows minus the present value of the cash outflows.
Oil & Gas Assets: These are created in respect of an area/field having proved developed oil and gas reserves. Oil & Gas Assets consist of successful Exploratory Wells, all Development Wells, Service Wells, Production facilities and estimated decommissioning cost.
Obsolescence: Diminution in the value of an asset by reason of its becoming out-of-date or less useful due to technological changes, improvement in production methods, change in market demand for the product or service output of the asset, or legal or other restrictions.
Operating Cycle: An Operating cycle is the time between the acquisition of assets for processing and their realization in cash or Cash equivalents.
Other comprehensive income (OCI): OCI comprises items of income and expenses (including reclassification adjustments) that are not recognised in profit or loss as required or permitted by Indian Accounting Standards. These are in effect unrealized gain or loss on long term
46
assets or liabilities. The components of OCI include: changes in revaluation surplus, re-measurements of defined benefit plans, gains and losses arising from translating the financial statements of a foreign operation, gains and losses from items designated / measured at fair value through other comprehensive income etc.
Property, Plant and Equipment (Fixed Assets): Assets held for the purpose of providing or producing goods or services and that is not held for resale in the normal course of business
Provision: A provision is a liability of uncertain timing or amount which cannot be determined with substantial accuracy.
Participating Interest: The share expressed as a percentage in the rights and obligations of each party to a Production Sharing Contract (PSC).
Production Costs: Costs incurred in lifting the oil and gas to the surface and in gathering, treating and storing the oil and gas.
Royalty: It is a levy imposed under The Petroleum and Natural Gas Rules, 1959 payable to the respective State or Central Government granting the lease (Central Government in case of offshore) on crude oil and natural gas.
Recouped Cost: It refers to Depreciation, Depletion, Impairment and Amortization charged in accounts. These are non-cash costs.
a) Depreciation: It is the systematic allocation of the depreciable amount of an asset over its useful life. It is provided for and allocated as mentioned in note no. 3.7 in Significant Accounting Policies under Notes to Financial Statements.
b) Depletion: A measure of exhaustion of Oil & Gas Assets represented by periodic write off of cost. It is computed with reference to the amortization base by taking the related capital cost incurred divided by hydrocarbon reserves and multiplied by production. It is recognised in the accounts as per note no. 3.11 in Significant Accounting Policies under Notes to Financial Statements.
c) Impairment: An impairment loss is the amount by which the carrying amount of an asset exceeds its recoverable amount. Impairment Loss is recognized in the accounts as per note no. 3.9 in Significant Accounting Policies under Notes to Financial Statements.
d) Amortization: It refers to the amount amortized in respect of Intangible Assets in line with note no. 3.8 (i) in Significant Accounting Policies under Notes to Financial Statements.
Statement of Profit and Loss: A financial statement which presents the revenues and expenses of an enterprise for an accounting period and shown the excess of revenues over expenses (or vice versa). It is also known as Statement of Profit and Loss.
Total comprehensive income (TCI): TCI is the change in equity during a period resulting from transactions and other events, other than those changes resulting from transactions with owners in their capacity as owners. Total comprehensive income comprises all components of ‘profit or loss’ and of ‘other comprehensive income’.
Trade Receivable: A Receivable is classified as “Trade Receivable” if it is in respect of amount due for goods sold or services rendered in the normal course of business.
Trade Payable: A payable is classified as “trade payable” if it is in respect of amount due on account of goods purchased or services received in normal course of business.
Useful life: Life which is either (i) the period over which a depreciable asset is expected to be used by the enterprise; or (ii) the number of production or similar units expected to be obtained from the use of the asset by the enterprise.
Working Capital: The funds available for conducting day-to-day operations of an enterprise. Also it is represented by the excess of current assets over current liabilities including short-term loans.
Work in Process: Work in Process includes all materials which have undergone manufacturing or processing operations, but upon which further operations are necessary before the product is ready for sale.
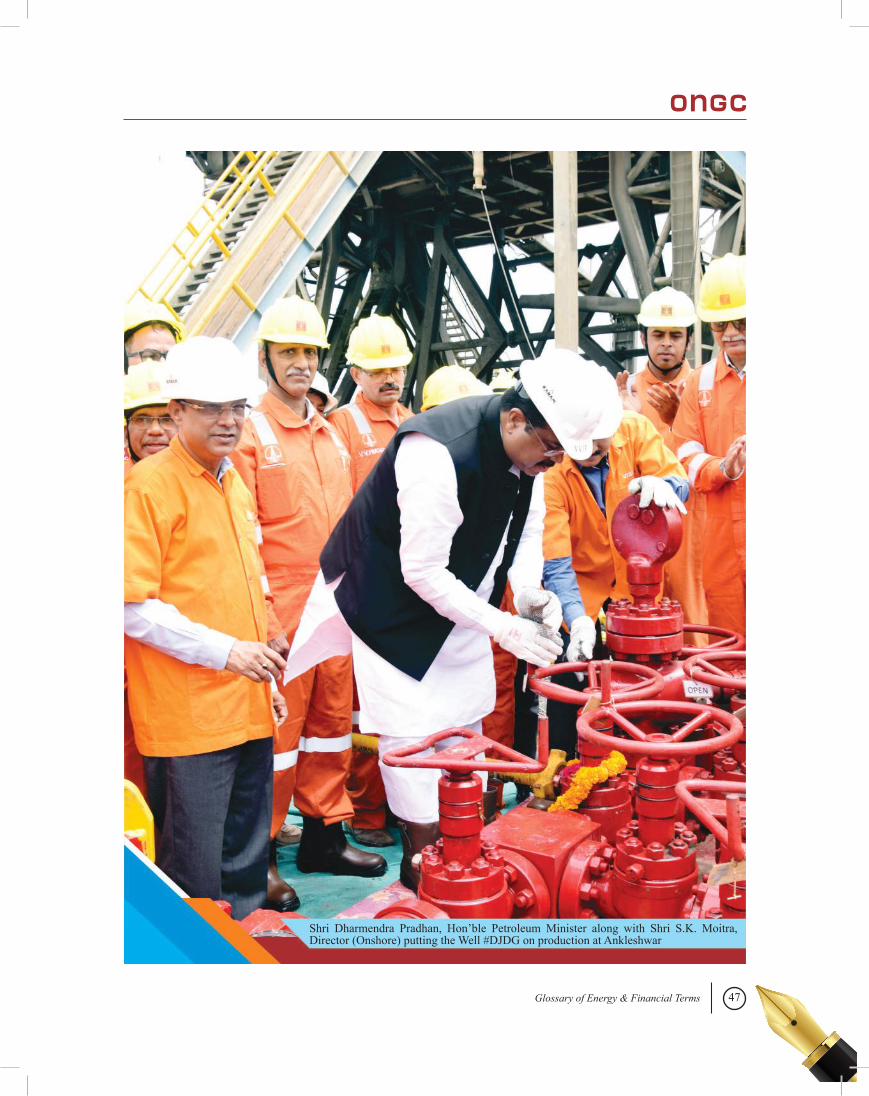
47Glossary of Energy & Financial Terms
Shri Dharmendra Pradhan, Hon’ble Petroleum Minister along with Shri S.K. Moitra, Director (Onshore) putting the Well #DJDG on production at Ankleshwar
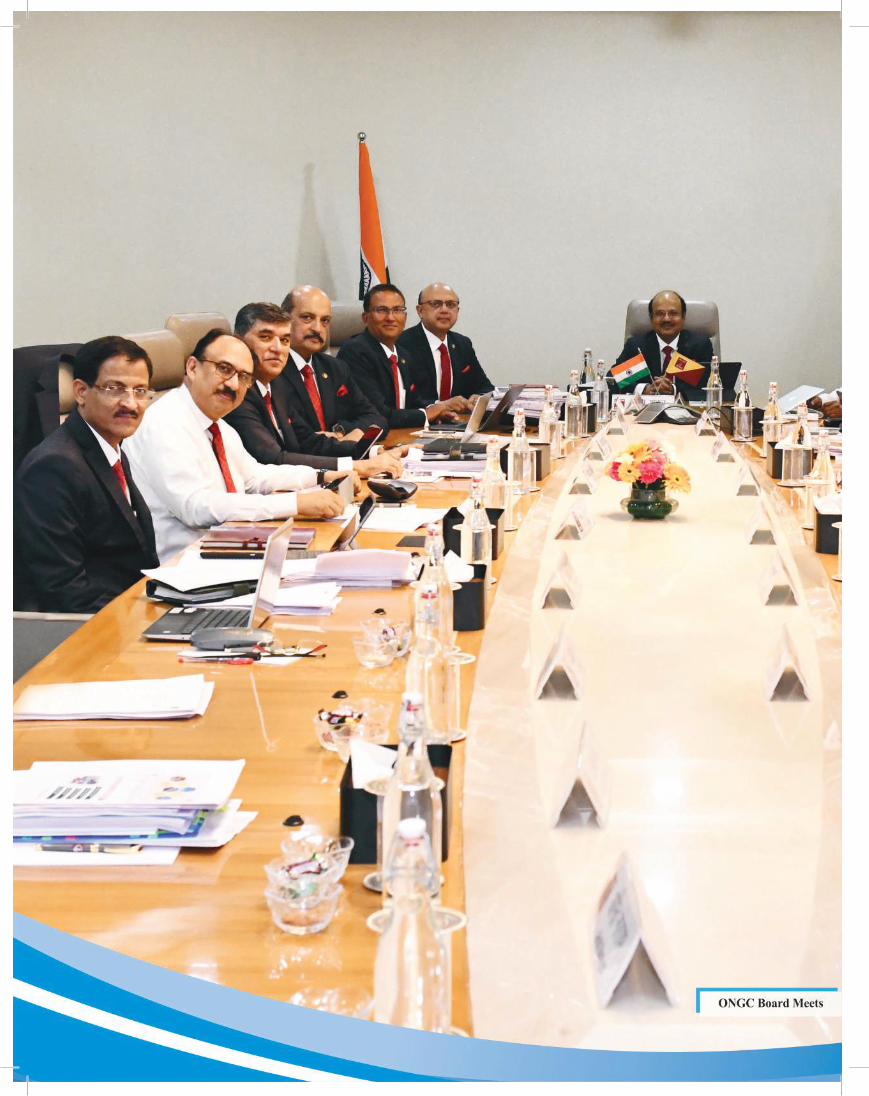
48
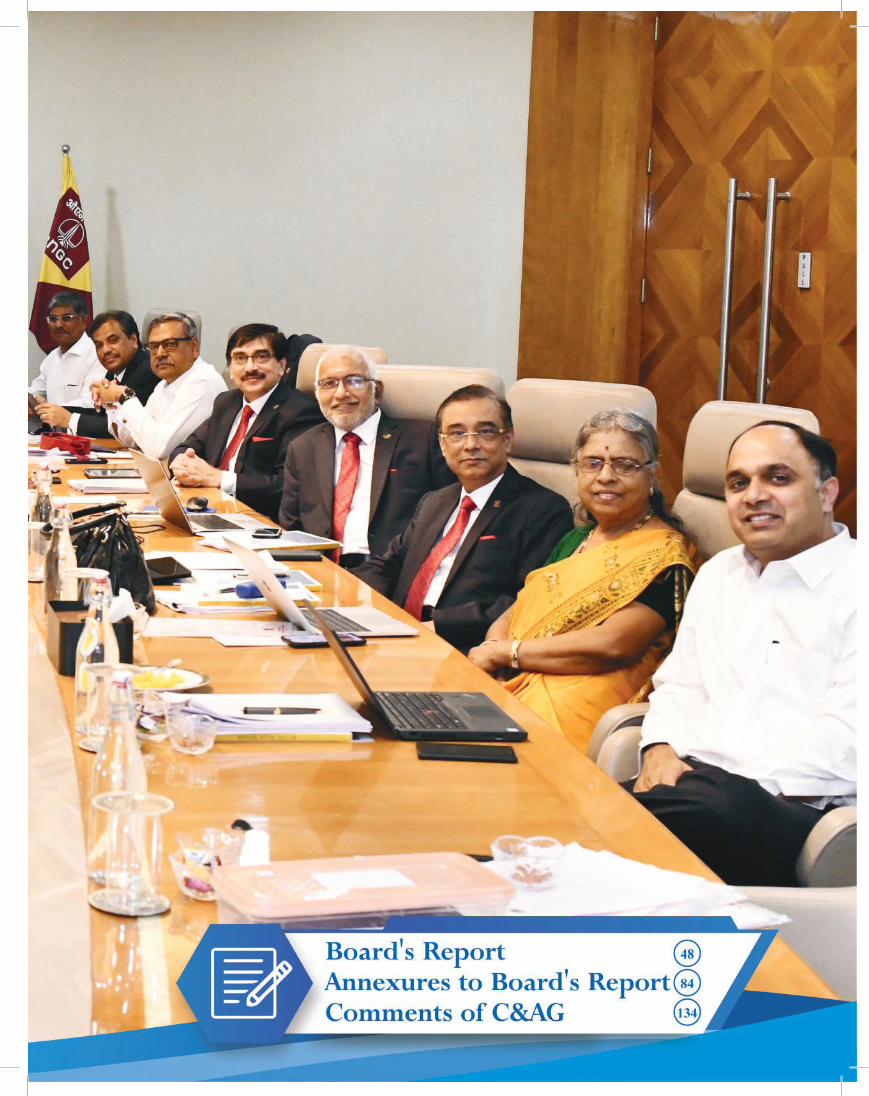
49Performance at a Glance
50
Board’s ReportDear Shareholders,
The Board of Directors of your Company (ONGC) are pleased to share with you the highlights, developments and the progress that your Company has made during the financial year ended 31.03.2019 and to present the 26th Annual Report on the business and operations of the Company and its Audited Statements of Accounts together with the Auditors’ Report and Comments on the Accounts by the Comptroller and Auditor General (CAG) of India.
The business environment was again marked by great uncertainty in FY’19. Disruptive socio-economic and political changes continued to affect growth in many parts of the world. In the emerging markets, economic volatility worsened as growth rates slowed and currencies weakened. In the developed markets, deflationary pressures and soft consumer demand resulted in a continuous challenging trading environment. In the face of such uncertainty, it was more important than ever to stay on course and remain loyal to our strategy, driving short-term performance while ensuring we made the right decisions to deliver our long-term goals.
We are pleased to share that, despite the uncertainty, your Company along with its group companies have registered yet another year of sustained performance. Exploration and production, our core business, set various milestones during the year. Besides that, performance in the areas where ONGC has engaged substantially also witnessed success with positive contributions.
During FY’19, on account of exploratory efforts, 137.05 Million Metric tonnes (MMt) of Oil and Oil Equivalent Gas (O+OEG) accretion to In-place Hydrocarbons (3P) from ONGC-operated areas in India has been realized. 95.42 MMt of O+OEG In-place volume (about 69.6 percent of Total In-place) have been accreted from New Discoveries and Delineation/Appraisal efforts. 41.63 MMt of O+OEG In-place volume (about 30.4 percent of Total In-place) have been accreted as an outcome of data generated through other exploratory efforts.
During the year, the Estimated Ultimate Recovery (EUR) accretion in 2P category from ONGC operated areas in India has been 63.02 MMt of O+OEG.
Accretion from JV non-operated areas in India has been 20.25 MMt (O+OEG) in In-place Volume and 11.45 MMt (O+OEG) in EUR.
Domestic crude oil and natural gas production of ONGC along with its share in the domestic joint ventures (PSC-JVs) during FY’19 has been 50.04 million metric tonnes of oil and oil equivalent gas (MMtoe) which has been almost at the same level as during FY’18.
All joint ventures of your Company established for value-chain integration i.e. ONGC Petroadditions Ltd (OPaL), ONGC Mangalore Petrochemicals Ltd. (OMPL), ONGC Tripura Power Company Ltd (OTPC), Dahej SEZ Ltd (DSEZ), Mangalore SEZ Ltd. (MSEZ) and ONGC Teri Biotech Limited (OTBL) contributed meaningfully towards sustained endeavors of your Company for growth.
1. Major Highlights: FY’2018-19
The significant milestones achieved by your Company during FY’2018-19:
a) ONGC’s standalone O+OEG production during 2018-19 was 45.86 MMtoe, an increase of 0.2% w.r.t. 2017-18 (45.79 MMtoe).
b) Natural gas production during 2018-19 was 24.75 BCM which was 5.4% more than the production during 2017-18.
c) ONGC’s gas production recorded an all-time high of 71 MMSCMD in November 2018 mainly due to ramping up of production from Daman in Western offshore, S1-Vashistha in Eastern offshore and Tripura in Onshore.
d) Production of Value Added Products (VAP) increased by 7.56% (3,641 KT 2018-19 against 3,385 KT in 2017-18).
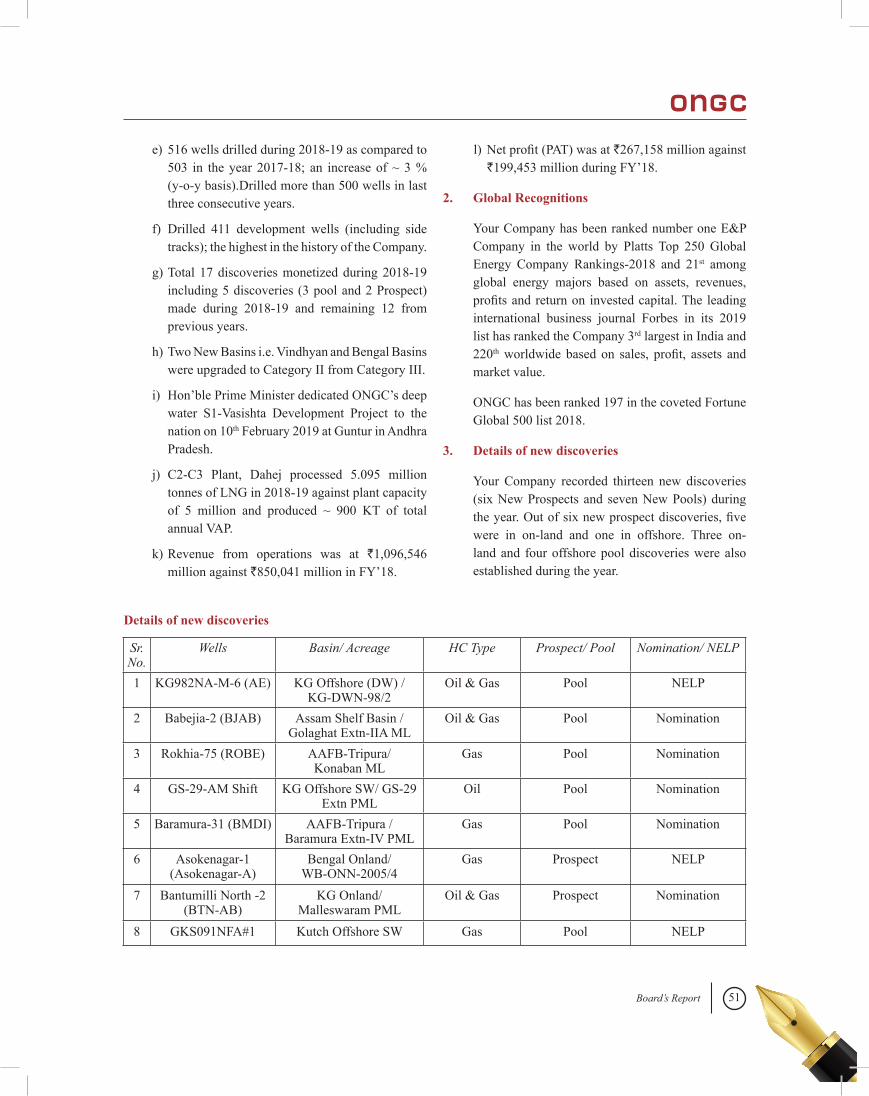
51Board’s Report
e) 516 wells drilled during 2018-19 as compared to 503 in the year 2017-18; an increase of ~ 3 % (y-o-y basis).Drilled more than 500 wells in last three consecutive years.
f) Drilled 411 development wells (including side tracks); the highest in the history of the Company.
g) Total 17 discoveries monetized during 2018-19 including 5 discoveries (3 pool and 2 Prospect) made during 2018-19 and remaining 12 from previous years.
h) Two New Basins i.e. Vindhyan and Bengal Basins were upgraded to Category II from Category III.
i) Hon’ble Prime Minister dedicated ONGC’s deep water S1-Vasishta Development Project to the nation on 10th February 2019 at Guntur in Andhra Pradesh.
j) C2-C3 Plant, Dahej processed 5.095 million tonnes of LNG in 2018-19 against plant capacity of 5 million and produced ~ 900 KT of total annual VAP.
k) Revenue from operations was at `1,096,546 million against `850,041 million in FY’18.
l) Net profit (PAT) was at `267,158 million against `199,453 million during FY’18.
2. Global Recognitions
Your Company has been ranked number one E&P Company in the world by Platts Top 250 Global Energy Company Rankings-2018 and 21st among global energy majors based on assets, revenues, profits and return on invested capital. The leading international business journal Forbes in its 2019 list has ranked the Company 3rd largest in India and 220th worldwide based on sales, profit, assets and market value.
ONGC has been ranked 197 in the coveted Fortune Global 500 list 2018.
3. Details of new discoveries
Your Company recorded thirteen new discoveries (six New Prospects and seven New Pools) during the year. Out of six new prospect discoveries, five were in on-land and one in offshore. Three on-land and four offshore pool discoveries were also established during the year.
Details of new discoveries
Sr.No.
Wells Basin/ Acreage HC Type Prospect/ Pool Nomination/ NELP
1 KG982NA-M-6 (AE) KG Offshore (DW) /KG-DWN-98/2
Oil & Gas Pool NELP
2 Babejia-2 (BJAB) Assam Shelf Basin / Golaghat Extn-IIA ML
Oil & Gas Pool Nomination
3 Rokhia-75 (ROBE) AAFB-Tripura/Konaban ML
Gas Pool Nomination
4 GS-29-AM Shift KG Offshore SW/ GS-29 Extn PML
Oil Pool Nomination
5 Baramura-31 (BMDI) AAFB-Tripura /Baramura Extn-IV PML
Gas Pool Nomination
6 Asokenagar-1 (Asokenagar-A)
Bengal Onland/WB-ONN-2005/4
Gas Prospect NELP
7 Bantumilli North -2 (BTN-AB)
KG Onland/Malleswaram PML
Oil & Gas Prospect Nomination
8 GKS091NFA#1 Kutch Offshore SW Gas Pool NELP
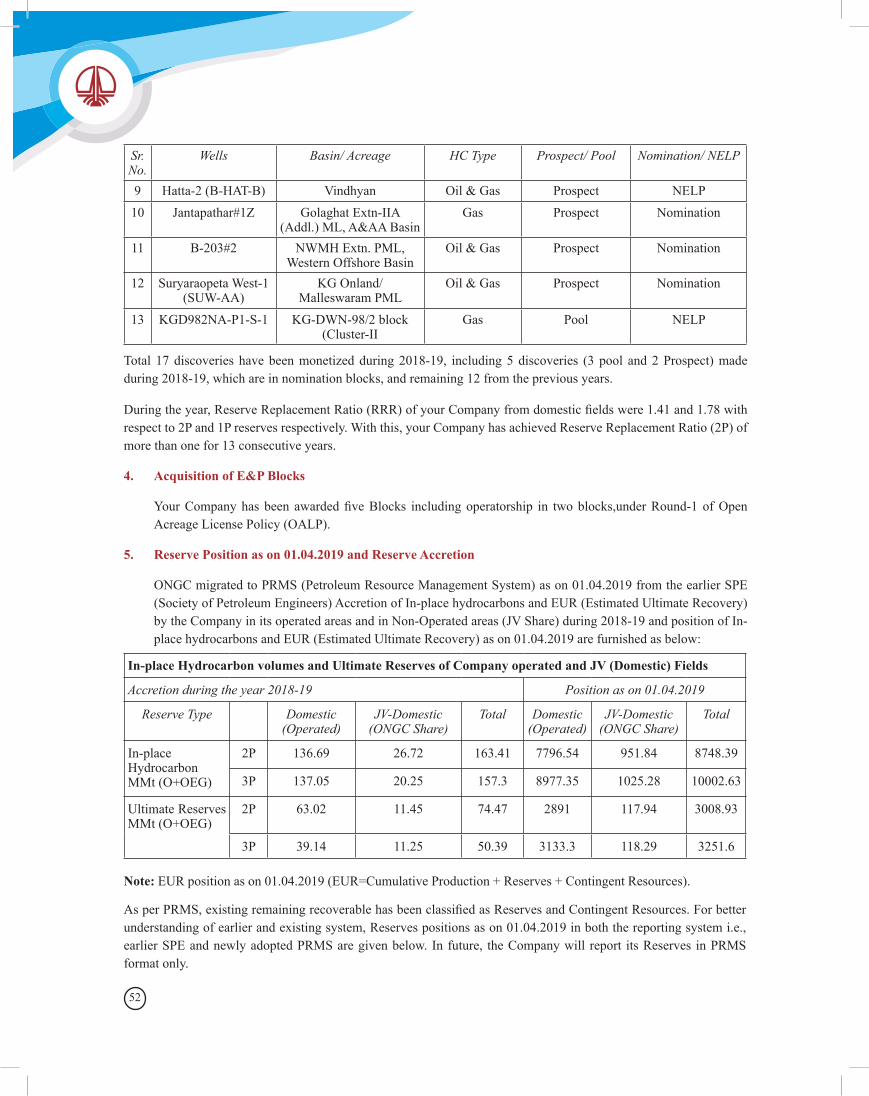
52
Sr.No.
Wells Basin/ Acreage HC Type Prospect/ Pool Nomination/ NELP
9 Hatta-2 (B-HAT-B) Vindhyan Oil & Gas Prospect NELP10 Jantapathar#1Z Golaghat Extn-IIA
(Addl.) ML, A&AA BasinGas Prospect Nomination
11 B-203#2 NWMH Extn. PML, Western Offshore Basin
Oil & Gas Prospect Nomination
12 Suryaraopeta West-1 (SUW-AA)
KG Onland/Malleswaram PML
Oil & Gas Prospect Nomination
13 KGD982NA-P1-S-1 KG-DWN-98/2 block (Cluster-II
Gas Pool NELP
Total 17 discoveries have been monetized during 2018-19, including 5 discoveries (3 pool and 2 Prospect) made during 2018-19, which are in nomination blocks, and remaining 12 from the previous years.
During the year, Reserve Replacement Ratio (RRR) of your Company from domestic fields were 1.41 and 1.78 with respect to 2P and 1P reserves respectively. With this, your Company has achieved Reserve Replacement Ratio (2P) of more than one for 13 consecutive years.
4. Acquisition of E&P Blocks
Your Company has been awarded five Blocks including operatorship in two blocks,under Round-1 of Open Acreage License Policy (OALP).
5. Reserve Position as on 01.04.2019 and Reserve Accretion
ONGC migrated to PRMS (Petroleum Resource Management System) as on 01.04.2019 from the earlier SPE (Society of Petroleum Engineers) Accretion of In-place hydrocarbons and EUR (Estimated Ultimate Recovery) by the Company in its operated areas and in Non-Operated areas (JV Share) during 2018-19 and position of In-place hydrocarbons and EUR (Estimated Ultimate Recovery) as on 01.04.2019 are furnished as below:
In-place Hydrocarbon volumes and Ultimate Reserves of Company operated and JV (Domestic) Fields
Accretion during the year 2018-19 Position as on 01.04.2019
Reserve Type Domestic (Operated)
JV-Domestic (ONGC Share)
Total Domestic (Operated)
JV-Domestic (ONGC Share)
Total
In-place Hydrocarbon MMt (O+OEG)
2P 136.69 26.72 163.41 7796.54 951.84 8748.39
3P 137.05 20.25 157.3 8977.35 1025.28 10002.63
Ultimate Reserves MMt (O+OEG)
2P 63.02 11.45 74.47 2891 117.94 3008.93
3P 39.14 11.25 50.39 3133.3 118.29 3251.6
Note: EUR position as on 01.04.2019 (EUR=Cumulative Production + Reserves + Contingent Resources).
As per PRMS, existing remaining recoverable has been classified as Reserves and Contingent Resources. For better understanding of earlier and existing system, Reserves positions as on 01.04.2019 in both the reporting system i.e., earlier SPE and newly adopted PRMS are given below. In future, the Company will report its Reserves in PRMS format only.
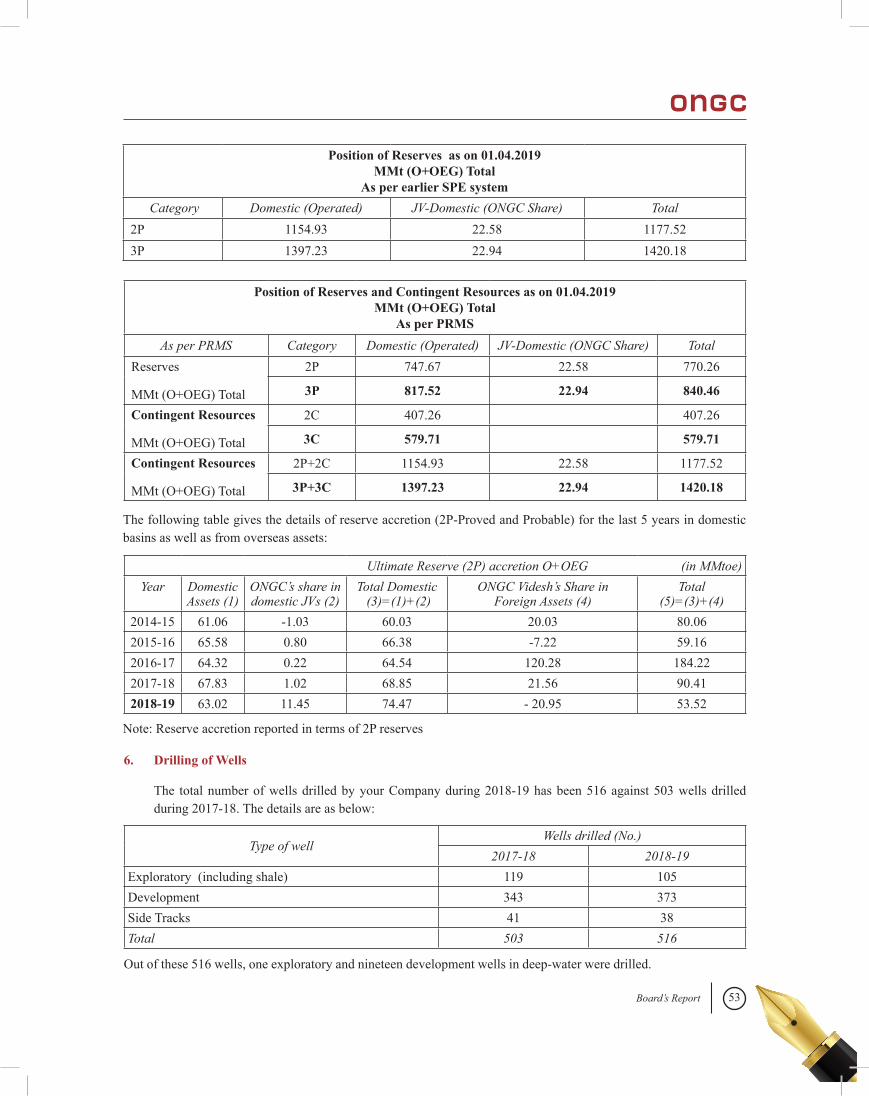
53Board’s Report
Position of Reserves as on 01.04.2019MMt (O+OEG) Total
As per earlier SPE system Category Domestic (Operated) JV-Domestic (ONGC Share) Total
2P 1154.93 22.58 1177.523P 1397.23 22.94 1420.18
Position of Reserves and Contingent Resources as on 01.04.2019MMt (O+OEG) Total
As per PRMSAs per PRMS Category Domestic (Operated) JV-Domestic (ONGC Share) Total
Reserves
MMt (O+OEG) Total
2P 747.67 22.58 770.26
3P 817.52 22.94 840.46
Contingent Resources
MMt (O+OEG) Total
2C 407.26 407.26
3C 579.71 579.71
Contingent Resources
MMt (O+OEG) Total
2P+2C 1154.93 22.58 1177.52
3P+3C 1397.23 22.94 1420.18
The following table gives the details of reserve accretion (2P-Proved and Probable) for the last 5 years in domestic basins as well as from overseas assets:
Ultimate Reserve (2P) accretion O+OEG (in MMtoe)Year Domestic
Assets (1)ONGC’s share in domestic JVs (2)
Total Domestic (3)=(1)+(2)
ONGC Videsh’s Share inForeign Assets (4)
Total(5)=(3)+(4)
2014-15 61.06 -1.03 60.03 20.03 80.062015-16 65.58 0.80 66.38 -7.22 59.162016-17 64.32 0.22 64.54 120.28 184.222017-18 67.83 1.02 68.85 21.56 90.412018-19 63.02 11.45 74.47 - 20.95 53.52
Note: Reserve accretion reported in terms of 2P reserves
6. Drilling of Wells
The total number of wells drilled by your Company during 2018-19 has been 516 against 503 wells drilled during 2017-18. The details are as below:
Type of wellWells drilled (No.)
2017-18 2018-19Exploratory (including shale) 119 105Development 343 373Side Tracks 41 38Total 503 516
Out of these 516 wells, one exploratory and nineteen development wells in deep-water were drilled.
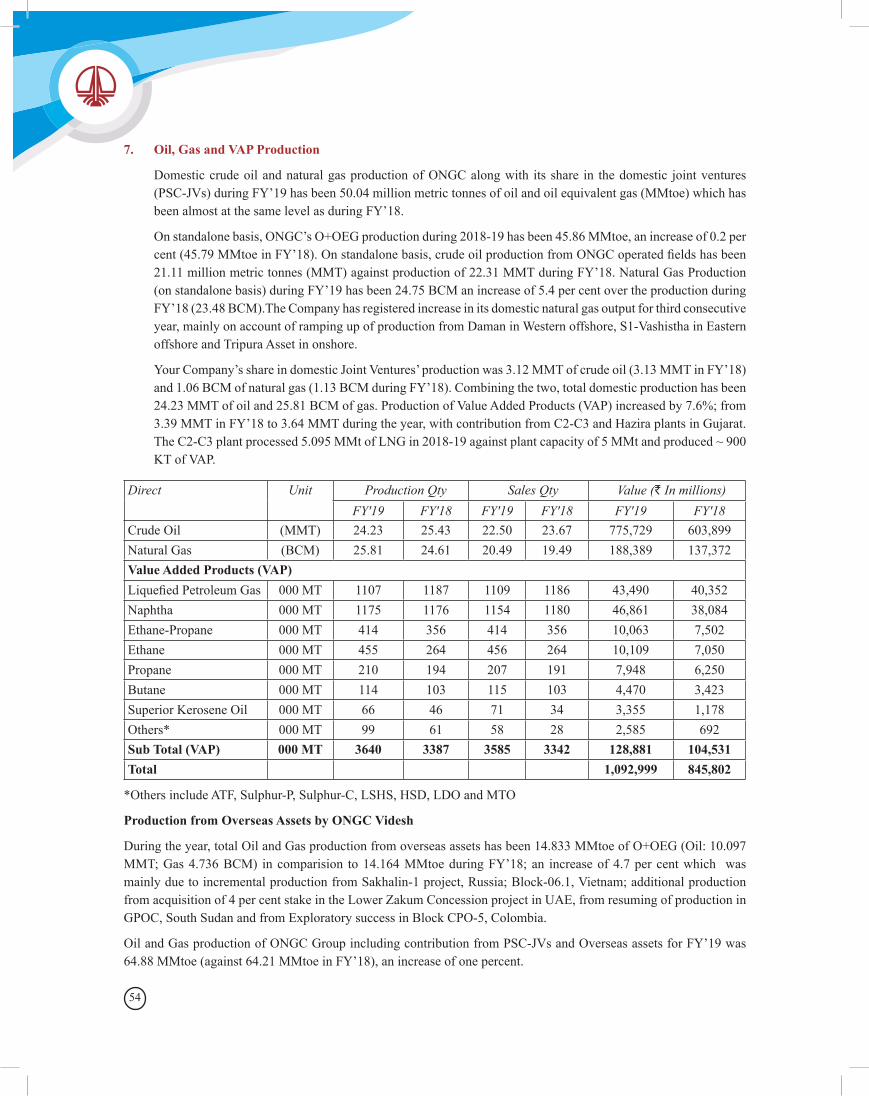
54
7. Oil, Gas and VAP Production
Domestic crude oil and natural gas production of ONGC along with its share in the domestic joint ventures (PSC-JVs) during FY’19 has been 50.04 million metric tonnes of oil and oil equivalent gas (MMtoe) which has been almost at the same level as during FY’18.
On standalone basis, ONGC’s O+OEG production during 2018-19 has been 45.86 MMtoe, an increase of 0.2 per cent (45.79 MMtoe in FY’18). On standalone basis, crude oil production from ONGC operated fields has been 21.11 million metric tonnes (MMT) against production of 22.31 MMT during FY’18. Natural Gas Production (on standalone basis) during FY’19 has been 24.75 BCM an increase of 5.4 per cent over the production during FY’18 (23.48 BCM).The Company has registered increase in its domestic natural gas output for third consecutive year, mainly on account of ramping up of production from Daman in Western offshore, S1-Vashistha in Eastern offshore and Tripura Asset in onshore.
Your Company’s share in domestic Joint Ventures’ production was 3.12 MMT of crude oil (3.13 MMT in FY’18) and 1.06 BCM of natural gas (1.13 BCM during FY’18). Combining the two, total domestic production has been 24.23 MMT of oil and 25.81 BCM of gas. Production of Value Added Products (VAP) increased by 7.6%; from 3.39 MMT in FY’18 to 3.64 MMT during the year, with contribution from C2-C3 and Hazira plants in Gujarat. The C2-C3 plant processed 5.095 MMt of LNG in 2018-19 against plant capacity of 5 MMt and produced ~ 900 KT of VAP.
Direct Unit Production Qty Sales Qty Value (` In millions)FY'19 FY'18 FY'19 FY'18 FY'19 FY'18
Crude Oil (MMT) 24.23 25.43 22.50 23.67 775,729 603,899Natural Gas (BCM) 25.81 24.61 20.49 19.49 188,389 137,372Value Added Products (VAP)Liquefied Petroleum Gas 000 MT 1107 1187 1109 1186 43,490 40,352Naphtha 000 MT 1175 1176 1154 1180 46,861 38,084Ethane-Propane 000 MT 414 356 414 356 10,063 7,502Ethane 000 MT 455 264 456 264 10,109 7,050Propane 000 MT 210 194 207 191 7,948 6,250Butane 000 MT 114 103 115 103 4,470 3,423Superior Kerosene Oil 000 MT 66 46 71 34 3,355 1,178Others* 000 MT 99 61 58 28 2,585 692Sub Total (VAP) 000 MT 3640 3387 3585 3342 128,881 104,531Total 1,092,999 845,802
*Others include ATF, Sulphur-P, Sulphur-C, LSHS, HSD, LDO and MTO
Production from Overseas Assets by ONGC Videsh
During the year, total Oil and Gas production from overseas assets has been 14.833 MMtoe of O+OEG (Oil: 10.097 MMT; Gas 4.736 BCM) in comparision to 14.164 MMtoe during FY’18; an increase of 4.7 per cent which was mainly due to incremental production from Sakhalin-1 project, Russia; Block-06.1, Vietnam; additional production from acquisition of 4 per cent stake in the Lower Zakum Concession project in UAE, from resuming of production in GPOC, South Sudan and from Exploratory success in Block CPO-5, Colombia.
Oil and Gas production of ONGC Group including contribution from PSC-JVs and Overseas assets for FY’19 was 64.88 MMtoe (against 64.21 MMtoe in FY’18), an increase of one percent.
55Board’s Report
8. Technology induction/up-gradation
Technology induction/ up-gradation in various areas of operations is a continuous process in your Company to remain effective and competitive. The following technologies were evaluated/ inducted in the year 2018-19:
a) Development of methodologies for oil to oil correlation using compound specific isotopic analysis of biomarkers (CSIB) and Total Scanning Fluorescence Spectrophotometry (TSF).
b) Development of methodology for estimation of thermal maturity of organic matter through Fourier Transform Infra-Red spectroscopy (FTIR).
c) Intrepid Software for processing and interpretation of potential field geophysics data: ground, airborne and marine surveys.
d) Nobel Gas Mass Spectrometer (NGMS): This new dating technology will be used particularly for absolute dating of basalts which will have bearing on sub-basalt Mesozoic hydrocarbon exploration, particularly in the Kutch-Saurashtra Basin, as well as to understand thermo-tectonic evolution of basement rocks from different sedimentary basins of India.
e) GCM Modelling through Landmark: Technology of making GCM through Landmark’s “Earth Modelling Module” has been inducted.
f) Technology by ESSEME: Pilot Project finalised to carry out “Thin Bed Resolution” study in Linch area through M/s ESSEME.
g) Broadband Processing has been established in OMEGA System by inducting Adaptive De-ghosting (AD) Technology on marine data to broaden the spectrum and improve the resolution by removing the source and receiver end ghosts.
h) Integration of reservoir model and 3D-MEM technology: This technique was used for optimization of hydro-fracturing in Re-development project of Gamij field.
i) Profile modifications and water shut off jobs: Carried out water shut off jobs using in house chemical formulations in different fields of ONGC.
j) Several MEOR jobs in huff-n-puff mode and PDB jobs for paraffin degradation in tubulars in Mehsana & Ankleshwar Assets were carried out. Scrapping free period improved significantly by application of in-house developed Paraffin Degrading Bacteria (PDB) microbial formulations in Mehsana and Ankleshwar Assets.
k) Chemical Tracer test: It was conducted for low salinity micro-pilot in a well of Mumbai High South. The in-house developed technology is used to estimate Remaining Oil Saturation to see the effect of Low salinity water flooding.
l) Gas Tracer: Application of in-house developed technology on Gas Tracer has been used for better understanding of migration of flue gases in reservoir. The technology was used for monitoring and analysis on real time basis of 26 wells.
m) Immiscible gas injection in Borholla field: Gravity assisted Immiscible gas injection in depleted reservoir in KSU-5 sand of Borholla field has been implemented with the objective to enhance oil production and increase recovery from a depleted dipping reservoir. The plan envisages incremental oil of 0.34 MMt.
n) Miscible CO2 in Gandhar field: Simulation for GS-9 and GS-11 was studied which envisaged incremental oil gain of 3.63 MMt (GS-9 Sand: ~1.7 MMt; GS-11 Sand ~1.93 MMt) by 2042 with 75 (GS-9 Sand: 14 OP + 11 CO2 Inj.; GS-11 Sand: 23 OP + 27 CO2 Inj.) new well inputs.
o) Laboratory study of LoSalin South Heera field: The laboratory results are encouraging and the conceptual plan is on the anvil. Simulation results for South Heera indicate 0.33 MMT of incremental oil gain (over the period of 17 years) by 2035.
56
p) Gas Assisted Gravity Drainage (GAGD): A study on Gas Assisted Gravity Drainage (GAGD) process has been carried out in Kasomarigaon field. It envisages cumulative oil of 0.86MMm3 (with 35% recovery) by drilling new horizontal oil producers and 2 new gas injectors. The process is envisaged to give dual benefit of maintaining reservoir health and reducing the gas flaring.
q) Polymer flood pilot in Bechraji, a heavy oil field (average viscosity of 270 cP) of Mehsana Asset was approved. This is the first time polymer flood is planned in heavy oil and envisaged potential to improve recovery by 4%.
r) Redevelopment of Gamij: The existing model was updated incorporating results of 55 new wells and integration of 3D-MEM for optimization of hydro-fracturing. A phase-wise development is suggested along with drilling of some parametric wells across the field to acquire high tech logs and core data to characterize sweet spots and optimize HF strategy.
s) “Development of Shockwave Assisted Fracking Tools: Filing of the second patent on “Shock tube tool for fracking of deep wells for oil and natural gas” is in progress.
t) Collaborative project with IIT-Delhi on “Development of direct hydrocarbon solid oxide fuel cell (SOFC) for utilization of low pressure gas for power generation at remote locations” is in progress under ONGC PAN-IIT Collaborative Research Program.
u) Collaborative project with IIT-Mumbai on “Flow Assurance of Waxy Crudes in Pipelines” is in progress under ONGC PAN-IIT Collaborative Research Program.
v) Collaborative project with IIT (ISM)-Dhanbad on “Development of Nano material based particle gel system for W&GSO in carbonate reservoirs” is in progress under ONGC PAN-IIT Collaborative Research Program.
w) i-Procalv-1: In-house developed process design software “i-Procalv-1”, which includes sizing
and rating of vertical as well as horizontal 3 phase separators including the effect of special internals.
x) PLUNGLift: IOGPT developed software, “PLUNGLift”, which can be used to determine if the existing well parameters are sufficient to operate the plunger. The software will also give an indicative design of plunger lift system.
y) Acquired technology for carrying out deep water riser and mooring analysis by procuring Orcaflex software (ORCINA) and training by experts from 2H Offshore, UK.
z) Developed software “MATCAP” for analysis of bearing capacity of offshore shallow foundations, especially mud-mat foundation on which offshore jackets are supported initially, till long piles are driven to permanently secure a platform in the offshore.
9. Other Exploration Initiatives/Activities
National Seismic Programme (NSP):
ONGC has been assigned by MoPNG the responsibility to carry out 2D seismic Acquisition, Processing & Interpretation (API) of 40,835 LKM of data in un-appraised areas of Indian sedimentary basins. In view of revision of basin boundaries, the volume of work assigned to ONGC was also increased to 42,211 LKM by DGH in June, 2018.
As on 31.03.2019, ONGC has acquired 32,319 LKM of seismic data (76.6 % of total revised target of 42,211 LKM) and processed about 13,346 LKM of complete seismic lines.
Basement Exploration: This year also, ONGC took up Basement Exploration as a major initiative. During the year 2018-19, 25 wells were drilled for with Basement exploration. Deliberate search of hydrocarbons in the Mesozoic sequence of Kutch Saurashtra block of western offshore basin has led to discovery of a new hydrocarbon bearing play in the fractured dolerite intrusives which flowed gas in substantial quantity extending the exploration frontier around the area. Encouraging results obtained
57Board’s Report
through drilling of a number of new prospects during the year in the Padra field of Cambay Basin and the UAS block of A&AA basin has further enhanced the scope of basement exploration. Development initiatives taken up for exploitation of the fractured Precambrian reservoirs in the Thirunagari and Pundi fields of Cauvery basin have been met with expected results, encouraging sustenance of scope for basement exploration and exploitation. Your Company has also identified 25 prospects from G&G interpretation for basement exploration which are being finalized.
HP-HT Exploration: HP-HT (High Pressure – High Temperature) regime begins at a minimum temperature-pressure domain of 150°C (300°F) and 10,000 Psi respectively. During the year 2018-19, in GS-OSN-2004/1 block of Western Offshore Basin, exploratory HP-HT well “GSS-041-NAA#C” has been successfully drilled and tested in Jhuran formation (Mesozoic) to be gas bearing. In KG offshore, HP-HT Well “YS-6-2#sub” has been successfully drilled to the target depth of 5,324m without complications and hermetically tested on March 28, 2019. The HP-HT well is being taken up for testing. In Cauvery Basin, HP-HT well “ABAA_KKL” has been drilled to 5,500m. After testing three objects, the well was abandoned. Further, the HP-HT well “VNAC” in Cauvery Basin has been concluded at depth of 3,760m against the target depth of 4,900m due to high pressure. The testing of the well is being taken up. In A&AA Basin, three HP wells in Khubal field had been drilled and tested with result of gas indication. Further, three HP wells in Kunjaban field have been taken up for drilling and testing for Lower Bhuban Formation.
10. Exploration and Production from Unconventional Sources
a) Coal Bed Methane (CBM):
Currently, ONGC is operating in four CBM Blocks, i.e., Jharia, Bokaro, North Karanpura (Jharkand) and Raniganj (West Bengal). After completion of Phase-I and II activities, development activities of Bokaro and North Karanpura is in progress. Revised Field Development Plans (FDP) for Jharia and Raniganj is under approval.
b) Shale Gas
During 2018-19, a total of 3 exclusive shale gas wells (NDSGA and NGSGA in Cambay basin and WGSGA in KG Basin) were drilled and one dual objective well NGSAA in KG Basin is presently under testing. So far, ONGC has completed drilling of 26 wells (of which 8 are exclusive wells and 18 are dual objective wells) in 21 blocks across four basins of Cambay, KG, Cauvery and A&AA Basins. Attempts are continuing to establish the shale gas/oil potential in the identified blocks. However, some indications of the presence of oil have been observed during the activation of the zones during hydro-fracturing in wells JMSGA and GNSGB in Cambay Basin and WGSGA in KG Basin. Presently, further activation is required in well WGSGA in KG Basin whereas well GNSGC in Cambay Basin is awaiting hydro-fracturing.
c) Underground Coal Gasification
Due to its inability to continue with UGC project, Gujarat Industries Power Company Limited expressed to withdraw from the Vastan UCG project. ONGC has done lot of ground work in this project and invested a lot of resources on UCG. A memorandum has been received from Ministry of Coal (MoC) on 31.10.2018, regarding allotment of the Vastan block to ONGC for testing of UCG pilot. MoC has sought confirmation from ONGC under UCG Policy terms and conditions, issued by MoC vide notification dated 26.09.2016. i.e., for full tenure 33 years of contract in 4 phases of exploration, pilot assessment, development and production. Allotment of Block from MoC is awaited.
d) Gas Hydrate Exploration Program
ONGC, as a NGHP Consortium Member of National Gas Hydrate Program of GoI, has played a significant role in G&G studies for the identification of sites for NGHP-01(2006)/ NGHP R&D Expedition-02 (2015) and successfully executed with on-board studies of both the expeditions.
The results of NGHP-02R&D Expedition are very encouraging and producible gas hydrates have
58
been discovered in KG deep offshore areas in sand reservoirs which will be taken up for production testing during NGHP-03.
Presently, Gas Hydrate Research and Technology Centre (GHRTC) is involved in R&D activities in exploration for gas hydrate prospects in Indian Deep waters and potential exploitation methodologies for gas hydrates through in-house efforts and
PAN IIT collaborations. About eight in-house and two collaborative projects were completed. Four collaborative projects are in progress. Potential exploitation methodologies besides in-house studies like sand control, well bore completions and Depressurisation techniques, various production simulation studies have been carried out in collaboration with USA.
11. Oil & Gas Projects
Projects completed in 2018-19
During the year 2018-19, ten major projects (3 development & 7 Infrastructure) costing around `112,585.50 Million were completed.
Sl No
Project Name Completion Date
Project Cost(` In Million)
Oil gain (MMT)
Gas Gain (BCM)
1 Construction of 3 ETPs, Mehsana 22.05.2018 881.80 - -
2 Six Pipeline Project, Assam 31.05.2018 1,523.20 - -
3 MH North Redevelopment Phase-III 31.05.2018 57,248.00 6.997 5.253
4 Development of C-26 Cluster Fields 31.05.2018 20,492.60 0.644 5.94
5 Pipeline Replacement Project, Ahmedabad 30.06.2018 1,470.40 - -
6 Construction of one ETP at GGS-Nada, Ankleshwar 31.07.2018 1,284.70 - -
7 Ahmedabad Gas compressor Project 05.09.2018 1,153.50 - -
8 Nawagam-Koyali pipeline project 14.09.2018 1,850.20 - -
9 PRP IV 31.12.2018 21,836.60 - -
10 Redevelopment of Gamij Field, Ahmedabad 15.02.2019 4,843.90 1.269 0.101
Total 112,585.50 8.91 11.294
12. Projects approved during the year for implementation
During 2018-19 the following four Offshore Projects have been approved for implementation-
a) Pipeline Replacement Project-V: Project was approved on 26.04.2018 with an investment of `7,663.70 Million. Project envisages laying and completion of 10 pipeline segments of ~60 Km under Mumbai High and Neela-Heera Assets. The project is expected to be completed by December 2019.
b) Mumbai High South Redevelopment Phase-IV: Project was approved on 14.02.2019 with an investment of `36,607.10 Million. The scheme envisages installation of WIS-R water injection process platform, pilot EOR scheme and drilling of 6 development wells and 24 side-track wells. The scheme envisages incremental gain of 2.432 MMt oil and 0.577 BCM gas from IOR inputs and 0.795 MMt oil from EOR pilot scheme by March 2035. The project is expected to be completed by April 2021.
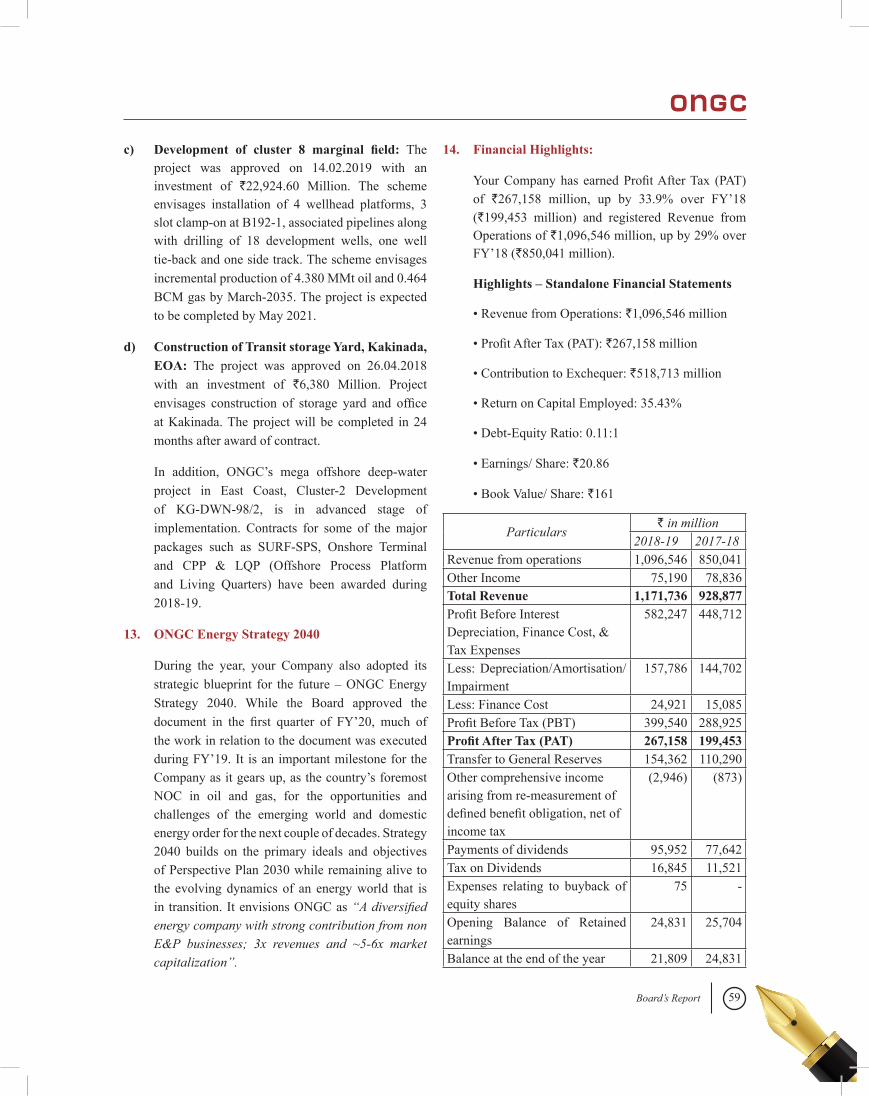
59Board’s Report
c) Development of cluster 8 marginal field: The project was approved on 14.02.2019 with an investment of `22,924.60 Million. The scheme envisages installation of 4 wellhead platforms, 3 slot clamp-on at B192-1, associated pipelines along with drilling of 18 development wells, one well tie-back and one side track. The scheme envisages incremental production of 4.380 MMt oil and 0.464 BCM gas by March-2035. The project is expected to be completed by May 2021.
d) Construction of Transit storage Yard, Kakinada, EOA: The project was approved on 26.04.2018 with an investment of `6,380 Million. Project envisages construction of storage yard and office at Kakinada. The project will be completed in 24 months after award of contract.
In addition, ONGC’s mega offshore deep-water project in East Coast, Cluster-2 Development of KG-DWN-98/2, is in advanced stage of implementation. Contracts for some of the major packages such as SURF-SPS, Onshore Terminal and CPP & LQP (Offshore Process Platform and Living Quarters) have been awarded during 2018-19.
13. ONGC Energy Strategy 2040
During the year, your Company also adopted its strategic blueprint for the future – ONGC Energy Strategy 2040. While the Board approved the document in the first quarter of FY’20, much of the work in relation to the document was executed during FY’19. It is an important milestone for the Company as it gears up, as the country’s foremost NOC in oil and gas, for the opportunities and challenges of the emerging world and domestic energy order for the next couple of decades. Strategy 2040 builds on the primary ideals and objectives of Perspective Plan 2030 while remaining alive to the evolving dynamics of an energy world that is in transition. It envisions ONGC as “A diversified energy company with strong contribution from non E&P businesses; 3x revenues and ~5-6x market capitalization”.
14. Financial Highlights:
Your Company has earned Profit After Tax (PAT) of `267,158 million, up by 33.9% over FY’18 (`199,453 million) and registered Revenue from Operations of `1,096,546 million, up by 29% over FY’18 (`850,041 million).
Highlights – Standalone Financial Statements
• Revenue from Operations: `1,096,546 million
• Profit After Tax (PAT): `267,158 million
• Contribution to Exchequer: `518,713 million
• Return on Capital Employed: 35.43%
• Debt-Equity Ratio: 0.11:1
• Earnings/ Share: `20.86
• Book Value/ Share: `161
Particulars` in million
2018-19 2017-18Revenue from operations 1,096,546 850,041Other Income 75,190 78,836Total Revenue 1,171,736 928,877Profit Before Interest Depreciation, Finance Cost, & Tax Expenses
582,247 448,712
Less: Depreciation/Amortisation/ Impairment
157,786 144,702
Less: Finance Cost 24,921 15,085Profit Before Tax (PBT) 399,540 288,925Profit After Tax (PAT) 267,158 199,453Transfer to General Reserves 154,362 110,290Other comprehensive income arising from re-measurement of defined benefit obligation, net of income tax
(2,946) (873)
Payments of dividends 95,952 77,642Tax on Dividends 16,845 11,521Expenses relating to buyback of equity shares
75 -
Opening Balance of Retained earnings
24,831 25,704
Balance at the end of the year 21,809 24,831
60
15. Buy-back of shares
The Board of Directors of the Company, at the meeting held on 20.12.2018 had approved the proposal for buy-back of equity shares upto 25,29,55,974 fully paid-up equity shares being 1.97% of the total paid-up equity shares of the Company at the price of `159 per equity shares payable in cash of an aggregate consideration not exceeding `40,220 million. The buy-back offer worked out to 2.50% of the net-worth of the Company as on 31.03.2017 and 2.34% as on 31.03.2018. The Company has completed the buy-back of 25,29,55,974 fully paid-up equity shares on 22.02.2019.
Upon completion of the buy-back, the number of equity shares of the Company reduced from 12,83,32,35,180 to 12,58,02,79,206 with corresponding reduction in the paid-up share capital from `64,166.17 million to `62,901.39 million.
16. Dividend
The Board of Directors of your Company is pleased to recommend a final dividend of `0.75 per equity share of the face value of `5 each (@15%), payable to those Shareholders whose names appear in the Register of Members as on the Book Closure / Record Date.
Your Company has paid two interim dividends of `5.25 per share (@105%) and `1.00 per share (@20%) of `5 each.
The total dividend for the year aggregates to `88,062 million including the proposed final dividend, besides `18,101 million applicable Dividend Distribution Tax (DDT) which is 39.74% of PAT (inclusive of DDT). The dividend pay-out were in accordance with the Company’s dividend distribution policy.
The Dividend Distribution policy as formulated by the Company, may be accessed at the web link
https://www.ongcindia.com/wps/wcm/connect/en/investors/policies.
17. Management Discussion and Analysis Report
As per the terms of regulations 34(2)(e) of the SEBI Listing Regulations, the Management Discussion and Analysis Report (MDAR) as appended, forms part of this Annual Report.
18. Financial Accounting
The Financial Statements have been prepared in compliance with Indian Accounting Standards (Ind-AS) issued by the Institute of Chartered Accountants of India (ICAI) effective from 01.04.2016 and applicable provisions of the Companies Act, 2013.
There have been no material changes and commitments, which affect the financial position of the Company, which have occurred between the end of the financial year to which the financial statements relate and the date of this Report.
19. Loans, Guarantees or Investments
Your Company is engaged in Exploration & Production (E&P) business which is covered under the exemption provided under Section 186(11) of the Companies Act, 2013. Accordingly, the details of loans given, investment made or guarantee or security given by the Company to subsidiaries and associates is not reported.
20. Details relating to deposits covered under Chapter V of the Act
Particulars Amount (in `)Deposits accepted during the year NilDeposits remaining unpaid or unclaimed as at the end of the year
Nil
Default in repayment of deposit or payment of interest thereon during the year
Nil
61Board’s Report
21. Credit Rating of Securities: Details of the Credit Rating of Debt Securities obtained by the Company:
Sl. No.
Particulars Details
1 Name of Debt Security
International Bonds issued by subsidiaries guaranteed by the Company
International Bonds issued by subsidiaries guaranteed by the Company
Commercial Paper upto `100,000 Million outstanding at any point of time
2 Credit Rating obtained
Long term Issuer Credit Rating
Foreign Currency Rating : Baa1 (Stable)
Local Currency Rating : Baa1 Stable
Issuer Credit Rating
Foreign Currency : BBB- (Stable)
[ICRA]A1+, CARE A1+
3 Name of the credit rating agency
Moody’s S&P Global Ratings ICRA Limited (ICRA), CARE Ratings Limited (CARE)
4 Date on which the credit rating was obtained
February 2005 and annual surveillance thereon every year.
November 2012 and annual surveillance thereon every year.
ICRA: 18th June, 2018 revalidated on 17th September, 2018, 11th December, 2018 and 14th March, 2019.
CARE: 25th June, 2018 and revalidated on 21st August, 2018, 27th December, 2018, 22nd February, 2019 and 29th April, 2019.
5 Revision in the credit rating
Not Applicable Not Applicable Not Applicable
6 Reasons provided by the rating agency for a downward revision, if any.
Not Applicable Not Applicable Not Applicable
22. Investor Education and Protection Fund (IEPF)
Details of transfer of unclaimed dividends and eligible shares to IEPF have been placed in the Corporate Governance Report, which forms part of the Boards’ Report.
23. Related Party Transaction
Particulars of contracts or arrangements with related parties as referred to in Section 188(1) of
the Companies Act, 2013, is provided in specified Form AOC-2, and placed at Annexure-A.
24. Subsidiaries, Associates and Joint Ventures
The Consolidated Financial Statements for the year ended 31.03.2019 of your Company has been prepared in accordance with Section 134 of the Companies Act, 2013, Ind AS 103 “Business Combinations” as per Pooling of Interest Method, Ind AS 110 “Consolidated Financial Statements”
62
and Ind AS 28 “Investments in Associates and Joint Ventures”. The audited Consolidated Financial Statements for the year ended 31.03.2019 form part of this Annual Report.
Full Annual Reports of subsidiaries of your Company will be made available to any shareholder upon request, the same is also available on Company’s website. Further, Annual Reports of ONGC Videsh, MRPL, HPCL and PMHBL are also available on websites www.ongcvidesh.com; www.mrpl.co.in; www.hindustanpetroleum.com and www.petronetmhbl.com respectively.
Financial position of subsidiaries, associates and joint venture companies, included in consolidated financial statement provided in AOC-1 prepared under the Companies Act, 2013 and Accounting Standards.
In addition, brief details about subsidiaries/ Associates and Joint Ventures are as under :-
a) ONGC Videsh Limited
ONGC Videsh, the wholly-owned subsidiary of your Company for E&P activities outside India, has participation in 41 oil and gas projects in 20 countries, viz. - Azerbaijan (2 projects), Bangladesh (2 Projects), Brazil (2 projects), Colombia (7 projects), Iran (1 project), Iraq (1 project), Israel (1 project), Kazakhstan (1 project), Libya (1 project), Mozambique (1 Project), Myanmar (6 projects), Namibia (1 project), New Zealand (1 Project), Russia (3 projects), South Sudan (2 projects), Sudan (2 projects), Syria (2 projects), UAE (1 project), Venezuela (2 projects) and Vietnam (2 projects).
Out of these 41 projects, ONGC Videsh is the Operator in 14 projects, Joint Operator in 7 projects and in remaining 20 projects it is non-operator. ONGC Videsh has a combination of 15 producing, 4 discovered/under development, 18 exploration projects and 4 pipeline projects.
ONGC Videsh’s share in production of oil and oil equivalent gas (O+OEG), together with its
wholly-owned subsidiaries ONGC Nile Ganga B.V., ONGC Amazon Alaknanda Limited, Imperial Energy Limited, Carabobo One AB and ONGC Videsh Singapore Pte. Ltd. has been 14.833 MMtoe during FY’19 as compared to 14.164 MMtoe during FY’18. The overall oil production increased from 9.353 MMt during FY’18 to 10.097 MMt during FY’19 (an increase of 8%). Gas production has been 4.736 BCM during FY’19 against 4.811 BCM during FY’18(lower by 1.6%).
During FY’19, the Company has made consolidated Profit After Tax of `16,823 million attributable to owners as compared to consolidated Profit After Tax of `9,815 million attributable to owners during FY’18. The increase in profit is mainly on account of higher production and higher crude oil prices.
Significant financial activities during the year
ONGC Videsh has repaid bonds of USD 300 million that matured on 07.05.2018 on due date by raising USD 150 million in short-term Foreign Currency Non Resident/Foreign Currency Term Loan facilities from Banks and the balance USD 150 million from internal resources.
Memorandum of Understanding (MoU)
A Cooperation Agreement was executed on 28.09.2018 between ONGC Videsh Limited and UzbekNefteGaz to jointly explore the possibilities to assess potential opportunities in exploration blocks, under development assets and producing fields/blocks located within the Republic of Uzbekistan and third countries pertaining to upstream sector, with an initial term of two years. A Joint Working Team with members from UNG and ONGC Videsh is formed and preliminary data is under review.
Significant events in the area of Exploration & Operation during FY’19:
A) GPOC, South Sudan: - Production from Greater Pioneer Operating Company
63Board’s Report
(GPOC), South Sudan project of ONGC Videsh has resumed after prolonged shutdown since December 2013. On August 25, 2018, officially declared the pumping of first crude oil from Toma South field of South Sudan to Heglig in Sudan.
B) CPO-5, Colombia:- Achieved second consecutive success in an onshore well Indico-1X, Colombia. The well Indico-1 was spudded on 07.11.2018 and drilling completed on 15.12.2018. During the test, the well flowed at self-flow rate of appx. 4,000 BOPD. Currently the well is under Short Term Testing with multi bean study for further evaluation. Importantly, first success was in the well Mariposa-1, which is located 6.5 km from Indico-1, and the continuation of same play is confirmed in the recent well.
C) Rovuma Area-1 Project, Mozambique:- The jointly owned marketing entity of ONGC Videsh and joint venture partners of Mozambique Rovuma Offshore Area 1 project incorporated at Singapore, has entered into long-term LNG Sale and Purchase Agreement (SPA) with Tokyo Gas Co. Ltd. (Tokyo Gas) and Centrica LNG Company Ltd., a subsidiary of Centrica plc (Centrica) through a co-purchasing agreement for sale of 2.6 million tonnes per annum (MMTPA) from the start-up of production until the early 2040s; CNOOC Gas and Power Singapore Trading & Marketing Pte. Ltd (CNOOC) for 1.5 MMTPA for a term of 13 years; Shell International Trading Middle East Ltd. (Shell) for 2 MMTPA for a term of 13 years; Bharat Gas Resources Ltd. a wholly owned subsidiary of Bharat Petroleum Corporation Ltd. for 1 MMTPA for a term of 15 years and Pertamina, a state owned oil and gas company of Indonesia, for 1 MMTPA for a term of 20 years.
These latest deals build upon previously executed deals for long term off-take of LNG from Rovuma Offshore Area 1 project and take long-term sales to more than 9.5 MMTPA. With the approval of the development plan in February 2018, ongoing resettlement implementation activities, site preparation and execution of these SPAs, the project is poised to take FID in H1 2019.
D) Lower Zakum Concession, UAE: The first equity cargo of Das Blend crude produced from Lower Zakum Concession, ADNOC Offshore, UAE arrived at New Mangalore port on 08.06.2018. This equity crude of ONGC Videsh was refined at MRPL, and is another step towards ensuring India’s energy security needs.
E) Block 06.1,Vietnam: Memorandum of Understanding (MoU) was signed on 18.04.2018 among ONGC Videsh, Rosneft, Vietnam BV (Operator) and PetroVietnam relating to further exploration activities in Block 06.1, for exploration in deeper Clastic prospect.
Direct Subsidiaries and Joint Ventures of ONGC Videsh:
i) ONGC Nile Ganga B.V. (ONGBV): ONGBV, a subsidiary of ONGC Videsh, is engaged in E&P activities directly or through its subsidiaries/JVs in Sudan, South Sudan, Syria, Venezuela, Brazil and Myanmar. ONGBV holds 25% Participating Interest (PI) in Greater Nile Oil Project (GNOP), Sudan with its share of oil production of about 0.257 MMT during FY’19. ONGBV also holds 25% PI in Greater Pioneer Operating Company (GPOC), South Sudan. Production from GPOC, South Sudan resumed on 25.08.2018 after prolonged shutdown since December 2013 and produced 0.131 MMT in FY’19.
64
ONGBV holds 16.66% to 18.75% PI in four Production Sharing Contracts in Al Furat Project (AFPC), Syria. Due to force majeure conditions in Syria, there was no production in AFPC project during FY’19. ONGBV holds 40% PI in San Cristobal Project in Venezuela through its wholly owned subsidiary ONGC Nile Ganga (San Cristobal) BV with its share of oil & oil equivalent gas production of about 0.286 MMTOE during FY’19. ONGBV holds 27% PI in BC-10 Project in Brazil through its wholly owned subsidiary ONGC Campos Ltd. with its share of oil and oil equivalent gas production of about 0.548 MMTOE during FY’19. It also holds 25% PI in Block BM-SEAL-4 located in deep-water offshore, Brazil through its wholly owned subsidiary ONGC Campos Ltda. ONGBV also holds 8.347% PI in South East Asia Gas Pipeline Co. Ltd., (SEAGP) for onshore Pipeline project, Myanmar through its wholly owned subsidiary ONGC Caspian E&P B.V.
ii) ONGC Narmada Limited (ONL): ONL has been retained for acquisition of future E&P projects in Nigeria.
iii) ONGC Amazon Alaknanda Limited (OAAL): OAAL, a wholly-owned subsidiary of ONGC Videsh, holds stake in E&P projects in Colombia, through Mansarovar Energy Colombia Limited (MECL), a 50:50 joint venture company with Sinopec of China. During FY’19, ONGC Videsh’s share of oil and oil equivalent gas production in MECL was about 0.444 MMtOE.
iv) Imperial Energy Limited (IEL): IEL, a wholly-owned subsidiary of ONGC Videsh incorporated in Cyprus, has its main activities in the Tomsk region of Western Siberia, Russia. During FY’19, Imperial Energy’s oil and oil equivalent gas production was about 0.242 MMtOE.
v) Carabobo One AB: Carabobo One AB, a subsidiary of ONGC Videsh incorporated in Sweden, indirectly holds 11% PI in Carabobo-1 Project, Venezuela. During FY’19, ONGC Videsh’s share of oil and oil equivalent gas production was about 0.127 MMtOE.
vi) ONGC BTC Limited: ONGC BTC Limited holds 2.36% interest in the Baku-TbilisiCeyhan Pipeline (“BTC”) which owns and operates 1,768 km oil pipeline running through Azerbaijan, Georgia and Turkey. The pipeline mainly carries crude from the ACG fields from Azerbaijan to the Mediterranean Sea.
vii) Beas Rovuma Energy Mozambique Limited (BREML): BREML was incorporated in British Virgin Islands (BVI) and has been migrated by continuation to Mauritius w.e.f. 23.01.2018. ONGC Videsh holds 60% shares in BREML and the balance 40% are held by Oil India Ltd. BREML holds 10% PI in Rovuma Area 1, Mozambique.
viii) ONGC Videsh Atlantic Inc. (OVAI): ONGC Videsh has setup a Geological and Geophysical (G&G) Centre at Houston, USA through its wholly owned subsidiary ONGC Videsh Atlantic Inc. The Centre caters to requirement of G&G studies for potential new acquisitions of ONGC Videsh including G&G studies of its existing portfolio of projects.
ix) ONGC Videsh Rovuma Limited: ONGC Videsh Rovuma Limited a wholly owned subsidiary of ONGC Videsh was incorporated in Mauritius for re-structuring of 10% PI in Rovuma Area 1, Mozambique.
x) ONGC Videsh Singapore Pte. Ltd.: The Company was incorporated on 18.04.2016 in Singapore for acquisition of shares in Vankorneft, Russia, through its subsidiary ONGC Videsh Vankorneft
65Board’s Report
Pte Limited (OVVL). OVVL holds 26% shares in Vankorneft, Russia and its share of production during FY’19 was 5.800 MMTOE.
xi) Indus East Mediterranean Exploration Ltd.: Indus East Mediterranean Exploration Limited, a wholly owned subsidiary of ONGC Videsh was incorporated in Israel on 27.02.2018 and engaged in E&P activities related to Block-32, Offshore Israel.
xii) ONGC Mittal Energy Limited (OMEL): ONGC Videsh along with Mittal Investments Sarl (MIS) promoted OMEL, a joint venture company incorporated in Cyprus. ONGC Videsh and MIS together hold 98% equity shares of OMEL in the ratio of 49.98:48.02, remaining 2% shares are held by SBI Capital Markets Ltd. OMEL also holds 1.20% of the issued share capital of ONGBV by way of Class-C shares issued by ONGBV exclusively for Syrian Assets and is being financed by Class-C Preference Shares issued by ONGBV.
xiii) SUDD Petroleum Operating Company: SUDD Petroleum Operating Company (SPOC), a Joint Operating Company incorporated in South Sudan to operate in Block 5A, South Sudan in which ONGC Videsh, Petronas & Nilepet of South Sudan holds 24.125%, 67.875% & 8% PI respectively. Block 5A is located in the prolific Muglad basin and is spread over an area of about 20,917 Square Km.
xiv) Mozambique LNG1 Company Pte. Ltd.: Mozambique LNG1 Company Pte. Ltd. has been incorporated at Singapore by Rovuma Area-1 Mozambique consortium to oversee marketing and shipping activities of LNG from first 2 trains of Golfinho-Atum field. ONGC Videsh Limited holds 16% interest in the Company which is in proportion to its interest in Rovuma Area-1 Project, Mozambique.
xv) Falcon Oil & Gas B.V. (FOGBV): FOGBV was incorporated in Netherlands on 06.02.2018. ONGC Videsh’s wholly owned subsidiary ONGBV holds 40% shares in FOGBV, IOC and BPRL holds 30% shares each though their respective Dutch subsidiaries. The transaction documents were executed with ADNOC, Supreme Petroleum Council (SPC) and the Operating Company (OPCO) on 10.02.2018 at Abu Dhabi for acquiring 10% PI in Lower Zakum Concession for a period of 40 years with effect from 09.03.2018. During FY’19, ONGC Videsh’s share of oil production was about 0.757 MMT.
b) Mangalore Refinery and Petrochemicals Limited (MRPL)
Your Company continues to hold 71.63 % equity stake in MRPL, a Schedule ‘A’ Mini Ratna company and listed entity, which is a single location 15 MMTPA Refinery on the West coast. Further, HPCL, another subsidiary of your Company, also continues to hold 16.96% in MRPL.
MRPL achieved the highest-ever crude oil processing of 16.23 MMT and lowest ever energy consumption of 74.27 MBN for FY’19. It also recorded the highest-ever high value Polypropylene production of 388 KT.
Even with the stressed global market conditions, MRPL achieved Net Profit of `3,320 million and GRM of 4.06 USD/bbl.
Subsidiary
ONGC Mangalore Petrochemicals Limited (OMPL), is a subsidiary of MRPL. It has set-up Aromatic Complex with an annual capacity 914 KTPA of Para-xylene and 283 KTPA of Benzene in Mangalore Special Economic Zone as value chain integration project. OMPL operated at capacity utilization of ~100% in FY’19. Total revenue in FY’19 was `83,624 million and net profit was `229 million. This is a maiden profit for OMPL.
66
Presently, MRPL holds 51% in the share capital of OMPL and ONGC holds 48.99% and thus OMPL is a subsidiary of MRPL. 4,000 shares (.0002%) are held by 13 individuals.
c) Hindustan Petroleum Corporation Limited (HPCL)
Your Company acquired 51.11% shareholding held by the President of India in HPCL on 31.01.2018, for a total cash consideration of `369,150 million. HPCL has recorded excellent physical and financial performance during the financial year 2018-19. HPCL achieved EBITDA of `130,772 million in FY’19 as compared to EBITDA of `125,214 million in FY 2017-18. In spite of volatile crude prices, lower cracks and depreciation of rupee, HPCL was able to achieve higher EBITDA due to increased thru’put at refinery, higher marketing sales volume, and better operational efficiency and inventory gains. During FY’19, PAT has been `60,287 million on standalone basis, as compared to PAT of `63,571 million during FY’18. Gross Sales during FY’19 increased to ̀ 29,57,126 million as against `24,32,267 million during the previous financial year.
During FY’19, HPCL refineries at Mumbai and Visakhapatnam have maximized crude processing and achieved the highest ever combined refining throughput of 18.44 Million Metric Tonnes (MMT) with capacity utilization of 117%, compared to throughput of 18.28 MMT achieved during FY’18. Both refineries recorded the best ever crude throughput performance on individual basis as well.
Maximization of crude processing at refineries helped HPCL achieve the highest ever production of LPG (896 TMT), Lube Oil Base Stock (474 TMT) and Bitumen (1,267 TMT). HPCL refineries also achieved excellent performance in the area of energy efficiency and recorded the lowest ever combined specific energy consumption during the year. HPCL achieved combined Gross Refining Margin (GRM) of USD 5.01 per barrel during the year as compared to USD 7.40 per barrel during FY’18. GRMs were lower in comparison to
previous year mainly on account of reduced cracks in all products except HSD and FO, higher fuel and loss cost due to increased crude price and exchange rate variation loss due to rupee depreciation.
During FY’19, HPCL achieved the highest ever sales volume of 38.7 MMT with a domestic sales growth of 4.7% over historical. Domestic sales of Motor Spirit (Petrol) increased by 6.8%, High Speed Diesel (HSD) by 2.1%, LPG by 7.1%, Aviation Turbine Fuel (ATF) by 20%, Bitumen by 26.4% and Lubes by 8%, compared to FY’18.
HPCL continues to be India’s largest lube marketer for the sixth consecutive year with overall lubricant sales volume of 650 TMT during the year. HPCL recorded market share gain of 0.17% in Motor Fuel sales amongst PSU OMCs during 2018-19. HPCL continues to be India’s second largest LPG marketer. In Industrial & Consumer (I&C) business, HPCL exceeded 5 MMT sales volume for the third consecutive year.
HPCL reported consolidated PAT of `66,906 million during 2018-19 as against `72,183 million during previous financial year. The consolidated PAT is lower due to reduction in profits of HMEL and MRPL, resulting in reduction of HPCL’s share of profits. Further share of profit from MRPL for FY 2018-19 was ̀ 588 million as against ̀ 3,389 million during 2017-18.
For the year 2018-19, HPCL has proposed a final dividend of `9.40 per share, in addition to the interim dividend of `6.50 per share aggregating `15.90 per share for FY’19.
Capital Projects of HPCL
During 2018-19, a number of capital projects were completed by HPCL with highest ever overall capital expenditure of `116,890 million. Pipeline project for capacity expansion of Ramanmandi-Bahadurgarh Pipeline (RBPL) from 4.71 to 7.11 MMTPA was completed within the scheduled time and cost. POL supply network was strengthened with commissioning of new railway tank wagon gantry at Visakh black oil terminal, revamp of
67Board’s Report
the existing tank wagon facility at Jabalpur depot and commissioning of new aviation fuel stations at Amritsar, Bhubaneshwar, Raipur and Kolhapur airports. LPG supply infrastructure was augmented with commissioning of a new LPG bottling plant at Warangal (Telangana) with bottling capacity of 60 TMPTA and additional bottling capacity augmentation of 330 TMTPA at existing LPG plants.
478 new retail outlets and 1,018 new LPG distributorships were commissioned during 2018-19 taking the number of total retail outlets to 15,440 and number of total LPG distributors to 5,866 as of 31.03.2019.
HPCL has expanded its global footprints and is supplying HP Lubricants to 11 countries.
HPCL’s Visakh Refinery Modernization Project and Mumbai Refinery expansion Project are progressing well. Major contracts have been awarded and site construction activities are in progress for both the projects. Licensor selection for all the process units has been completed for 9 MMTPA Greenfield refinery cum petrochemical complex project of HPCL Rajasthan Refinery Limited (HRRL) and site construction activities are in progress at Pachpadra in Barmer. Financial closure is achieved for Rajasthan Refinery project.
HPCL’s major ongoing pipeline projects
• Mundra Delhi Pipeline (MDPL) capacity expansion,
• Extension line from Palanpur to Vadodara including new greenfield terminal at Vadodara,
• Visakh Vijayawada Secunderabad pipeline (VVSPL) capacity expansion and
• Extension of Visakh Vijayawada Secunderabad pipeline (VVSPL) from Vijayawada to Dharmapuri & construction of marketing terminal at Dharmapuri are on track.
In addition, Uran Chakan LPG pipeline project is in advanced stage of completion. HPCL has been
authorized to set up CGD networks in 9 states. With this HPCL on its own and through its JV companies has authorization for CGD network in 20 geographical areas in 9 states. Environmental clearance is received for LNG, regasification terminal being set up in Joint Venture at Chhara Gujarat.
Subsidiaries of HPCL
i) Prize Petroleum Company Limited (PPCL)
Prize Petroleum Company Ltd (PPCL) is a wholly owned subsidiary of HPCL. PPCL is the upstream arm of HPCL and is in the business of Exploration and Production (E&P) of Hydrocarbons as well as providing services for management of E&P blocks.
ii) HPCL Bio Fuel Limited
HPCL Biofuels Ltd (HBL) is a wholly owned subsidiary of HPCL. The company was incorporated on 16.10.2009 as a backward integration initiative to foray into manufacture of ethanol. HPCL Biofuels Ltd. (HBL) is a wholly owned subsidiary company of HPCL. HBL was promoted as a backward integration initiative to enable HPCL’s foray into manufacturing of Ethanol for blending in Petrol. HBL presently has two integrated Sugar-Ethanol-Cogeneration plants at Sugauli and Lauriya in the state of Bihar.
iii) HPCL Rajasthan Refinery Limited
HPCL Rajasthan Refinery Ltd. (HRRL) is a joint venture of HPCL and Government of Rajasthan with 74% equity participation by HPCL and balance 26% by Government of Rajasthan. HRRL is setting up a 9 MMTPA capacity Greenfield refinery cum petrochemical complex in the state of Rajasthan. HPCL and the Government of Rajasthan entered into a revised Memorandum of Understanding on 18.04.2017 for the construction of the said Refinery with revised parameters. The revised Joint Venture Agreement was signed on 17.08.2017.
68
iv) HPCL Middle East FZCO
HPCL Middle East FZCO, a 100% Subsidiary of HPCL was incorporated on 11.02.2018 as a free zone company under Dubai Airport Free Zone and Establishment Card was issued on 22.03.2018 for the company. HPCL Middle East FZCO was established for trading of lubricants & greases, petrochemicals and refined petroleum products. The company has also commenced its operations. HPCL has expanded its global footprints and is supplying HP Lubricants to 11 Countries. Newly formed wholly owned subsidiary “HPCL Middle East FZCO” in Dubai has also commenced its operations.
d) Petronet MHB Limited (PMHBL)
Upon acquisition of controlling interest in the capital of HPCL on 31.01.2018, PMHBL has become a direct subsidiary of your Company. Both the Company and HPCL hold 65.44% (each 32.72%) in the capital of PMHBL. Balance 34.56% of equity being held by banks/ Financial Institutions.
PMHBL owns and operates a multi–product pipeline to transport MRPL’s products to the hinterland of Karnataka.
In FY’19 PMHBL pipeline has achieved a throughput of 3.36 MMT against total throughput of 3.50 MMT last year.
PMHBL has recorded total Revenue of `2,030 million as compared to `1,711 million in the previous year. Further, Profit After Tax of PMHBL was `1,118 million in FY’19 as compared to `835 million in FY’18.
Associates and Joint Ventures
e) Pawan Hans Limited (PHL)
PHL, an Associate of the Company (49%) was formed with the Government of India (51%), acting through Ministry of Civil Aviation inter-alia for catering to the logistic requirements of oil fields located at remote/far-flung areas. PHL is a Mini Ratna-I Category PSU, having 43 helicopters
including medi-chopper. The Government of India is taking action for identifying a strategic acquirer for its entire holding and hence, your Company has also decided to exit PHL along with the Government.
f) Petronet LNG Limited (PLL)
PLL, a JV of the Company, which was incorporated on 02.04.1998 with 12.50% equity holding along with identical stakes held by other Oil PSU co-promoters viz., IOCL, GAIL and BPCL, is a listed Company. PLL, one of the fastest growing world-class companies in the Indian energy sector, has set up the country’s first LNG receiving and regasification terminal at Dahej, Gujarat, and another terminal at Kochi, Kerala. While the Dahej terminal has a nominal capacity of 15 MMTPA, the Kochi terminal has a capacity of 5 MMTPA.
During FY’19, the Company’s Dahej Terminal operated at 107% of its name plate capacity and processed highest ever LNG quantities of 820 TBTU, as against the 816 TBTU of LNG quantities processed in FY 2017-18. The overall quantities processed by the Company in FY’19 was 844 TBTU as compared to 848 TBTU processed in FY’18.
The Company registered highest ever Profit before Tax of `32,336 million in FY’19, which stood at `30,551 million in the corresponding period, witnessing a growth of 6%. PAT for FY’19 was `21,554 million, which stood at `20,779 million in FY’18, registering a growth of 4%.
The increase in profit over the corresponding FY 2017-18, is due to higher volumes processed at the Dahej Terminal and better efficiency in operations.
The Board of Directors have recommended a dividend of `4.50 per equity share of `10 each (45%) for the FY 2018-19.
g) Dahej SEZ Limited (DSL)
DSL, a 50:50 JV of the Company along with Gujarat Industrial Development Corporation, was formed for establishing a multi-product SEZ at Dahej. Your Company has set up C2-C3 Extraction Plant
69Board’s Report
as a valuechainintegration project, which serve as feeder unit toONGC Petro- additions Limited.
Revenue from Operations of DSL during FY’19 was `578 million, Profit After Tax was `328 million.
h) ONGC Tripura Power Company Limited(OTPC)
OTPC was incorporated on 27.09.2004 as a joint venture of your Company (50%) along with the Government of Tripura (0.5%) and IL&FS Energy Development Co. Ltd. (IEDCL - an IL&FS subsidiary) (26%); the balance 23.5% has been tied up with India Infrastructure Fund – II acting through IDFC alternatives Limited.
OTPC has set up a 726.6 MW gas based Combined Cycle Power Plant at Palatana, Tripura at a project costof `40,470 million. The basic objective of the projectis to monetize idle gas assets of the Company in landlocked Tripura State and to boost exploratory efforts inthe region. Power evacuation for both the units is done through 663 KM long 400 KV double circuit transmission network by North-East Transmission Company Limited (NETC), a joint venture of Power Grid Corporation, OTPC and Governments of the North-Eastern states.OTPC’s both power units of 363.3 MW each are fully operational in two phases. Average Plant load factor (PLF) for the year FY’19 was 75%.
Total Income of OTPC during FY’19 was `14,558 million and Profit After Tax (PAT) was `2,139 million. OTPC paid an interim dividend of @8% and declared final dividend @6% also.
i) Mangalore SEZ Limited (MSEZL)
MSEZ is a Special Economic Zone promoted by the Company with an equity stake of 26% along with KIADB (23%), IL&FS (50%), OMPL (0.96%) and KCCI (0.04%). MSEZ, was set up as zone for development of necessary infrastructure to facilitate and locate industrial establishment including OMPL. MSEZ is operational since 01.04.2015. With investments exceeding USD 2 billion and exports of over USD 400 million worth of goods from its units, MSEZ has emerged as one
of the most vibrant operational multi-product SEZs in India.
Revenue from operations for FY’19 was `2,068 million and PAT was `24.10 million.
j) ONGC Petro additions Limited (OPaL)
OPaL is a mega petrochemical project established in Dahej SEZ for utilizing in-house production of C2-C3 and Naphtha from the nearby unit of the Company. The project cost of OPaL at completion was `308,260 million.
OPaL has started its production in 2016-17 and has been ramping up its production in phases. OPaL has established itself in domestic/export market with sale of prime grade products. OPaL operated at average 70% capacity in FY’19; and aggregated more than One Million Tonne of polymer sales.
Total Income of OPaL during the year FY’19 has been `97,854 million. Polymers produced by OPaL has been adjudged as the Best Polymer Brand of 2019 by Economic Times.
k) ONGC TERI Biotech Limited (OTBL)
OTBL is a JV formed by the Company (49.98%) along with The Energy Research Institute (48.02%) and the balance 2% shares are held by individuals.OTBL has developed various Biotechnical Solutions to oil and gas Industries through collaborative researches involving the Company and TERI. These technology include Bioremediation, Paraffin Degrading Bacteria (PDB), Wax Deposition Prevention (WDP) and Microbial Enhanced Oil Recovery (MeOR) which are being provided to oil and gas industries both in India and abroad.
Revenue from Operations of OTBL during FY’19 was `216 million and Profit After Tax was `67 million.
l) Rohini Heliport Limited (RHL):
Your Company has subscribed 49% equity capital in Rohini Heliport Limited, a mirror company of Pawan Hans Limited incorporated on 07.01.2019
70
for the purpose of operating Rohini Heliport independently.
m) Indradhanush Gas Grid Limited (IGGL)
Your Company has subscribed 20% equity capital in IGGL, a JV company of ONGC, IOCL, GAIL, OIL and NRL. The company has been incorporated in Guwahati, Assam for the purpose of laying 1656 KM pipeline covering north east states with a Capex of `92,650 Million. The company got incorporated on 10.08.2018 and has initiated the project related activities.
25. Companies Which Have Become/ Ceased To Be Company’s Subsidiaries, Joint Ventures And Associates Companies During The Year
a) Companies which has become subsidiaries during the financial year 2018-19: Nil.
b) Companies which has ceased to be subsidiaries during the financial year 2018-19: Nil.
c) Companies which has become a joint venture or associate during the financial year 2018-19:
i) Rohini Heliport Limited.
ii) Indradhanush Gas Grid Limited.
d) Companies which has ceased to be a joint venture or associate during the financial year 2018-19: Nil
26. ONGC’s Start-up Initiative
ONGC announced `1,000 million Start-up fund on its 60th foundation day, i.e. on 14.08.2016 to foster, nurture and incubate new ideas related to energy sector. The initiative, christened as ‘ONGC Start-up Fund’, is in line with the ‘Start-up India’ initiative launched by the Hon’ble Prime Minister of India on 16.01.2016.
The initiative is intended to promote entrepreneurship among young Indians by creating an ecosystem that is conducive for growth of Start-ups in the energy sector, which has a huge potential for technology-enabled ideas. The energy sector is contributing enormously to the growth of economy. Currently,
the sector faces various critical challenges and new ideas are required to mitigate these challenges.
On 07.12.2016 a dedicated website startup.ongc.co.in was launched by Honorable, Union Minister of State (I/C) Petroleum and Natural Gas for registration of proposals. The website also contains an application form to capture proposals for Funding support for Start-Ups.
In order to provide the entire support chain including seed capital, hand-holding, mentoring, market linkage and follow-ups, MoUs with SINE of IIT Bombay and L-Incubator of IIM-Lucknow (Incubators) were entered to support evaluation, selection, mentoring, monitoring and to construe an ecosystem to incubate new ideas related to energy sector and nurture them to become commercial ventures.
The associated institutes assist ONGC in evaluation, due-diligence, construction of documents and associated negotiations. The initiative has received very good response in four rounds held so far and one O&G 20 round held during Petrotech, 2019. ONGC has completed evaluation of two rounds and have provided support to five startups from energy sector. Evaluation of 3rd round is in progress. Pitching session for 4th and O&G 20 round is planned.
In addition to existing ongoing process, it has been decided that Oil &Gas CPSEs will create a common platform/ process through IITs/IIMs/ other educational Institutions for receiving and shortlisting proposals. ONGC is also a participant in the process, which shall provide access to increased number of Start-ups.
27. ONGC’s Solar Chulha Initiative
Hon’ble Prime Minister, while dedicating Deendayal Urja Bhavan to the nation, had exhorted ONGC to take up a challenge of developing an energy efficient electric cooking stove under ONGC Start-Up scheme, which would enable cooking through the use of solar energy.
71Board’s Report
ONGC launched a nationwide Solar Chulha Challenge inviting Entrepreneurs/ Scientists/ Researchers to participate in the Indigenous Development effort of Solar Chulha (Electric and Thermal), suitable for indoor cooking of Indian food (including frying, baking and chapati making).
A panel of eminent scientists drawn from various national institutions/ bodies was constituted under Dr. Anil Kakodkar, former Chairman, Atomic Energy Commission for evaluation of applications.
After two rounds of evaluation by the Expert Panel and prototype demonstration held in ONGC premises on 23-24 April, 2018, top three teams were awarded with cash prizes of `10, `5 and `3 Lakhs respectively.
The other two teams were given appreciation awards of `1 lakh each.
Teams from IIT Bombay and NIT Kurukshetra have installed 86 solar electric chulhas and 5 solar thermal chulhas respectively in Betul, MP, under pilot project.
BMS College’s proposal is under consideration against ONGC Start-up Initiative.
28. Health, Safety and Environment (HSE)
Being a high risk industry, safety of its employees is the top-most priority of your Company. Hydrocarbon exploration & production (E&P) operations are being carried out in varied climate and environment areas ranging from deserts to coastal areas, hilly terrains to forests, shallow to deep water and also in ultra-deep water areas. E&P activities often interact with the ecosystems and may have physico-chemical & bio-geochemical impact on the surrounding environment. Your Company, being a responsible Corporate makes all efforts for protection and preservation of environment.
The Company has recently revised its Environment Policy and e-Waste Policy in line with the existing rules, regulations and guidelines. Your Company has a dedicated Institute, viz. Institute of Petroleum Safety and Health Management (IPSHEM) at Goa
for research and development in the field of Health, Safety and Environment Management apart from conducting training programs.
Your Company takes all the requisite measures to minimize the impact of E&P activities on the environment by adoption of clean technologies for gaseous emissions, liquid effluent and solid waste generated out of its operations. Your Company has implemented globally recognized QHSE Management System conforming to requirements of QHSE Certifications ISO 9001, ISO 14001 and ISO 18001 (OHSAS) and certified by reputed agencies at all its operational units. Corporate guidelines on online incident reporting, investigation and compliance of audit observations have been developed and implemented for maintaining uniformity throughout the organization in line with international practice.
HSE Highlights during 2018-19 Internal Safety Audits (ISA) and External Safety
Audits (ESA) To check the conformity of activities and processes
to HSE management systems as well as to prevalent rules, regulations, guidelines and standards, regular audits are being conducted internally by multi-disciplinary teams of ONGC and external audits/ inspections by different agencies, namely Oil Industry Safety Directorate (OISD) and Directorate General of Mines Safety (DGMS). During the year 268 internal safety audits were conducted.
External Safety Audits OISD conducts Safety Audits on regular basis. In
the year 2018-19, 56 Safety Audit/Surprise Safety Audits and 2 Pre-Commissioning Audits were conducted by OISD. Compliance status as on 31.03.2019 was 91.48%.
DGMS is a Regulatory Agency under the Ministry of Labour and Employment, Government of India in matters pertaining to occupational safety, health and welfare of persons employed in mines (Coal, Metalliferous and oil-mines). It carries out periodic inspections of ONGC onshore facilities. Compliance status as on 31.03.2019 was 97.51%.
72
All efforts are being made to liquidate Safety Audit Recommendations within the stipulated timelines. Expected Date of Completion (EDC) for compliance of audit observation(s) is firmed up based on the criticality and volume of work involved. Suitable compensatory safety measures are put in place till the audit observations are complied with.
Waste Water Management: ONGC monitors the usage of waste water and quality of effluent discharged by meeting statutory requirements for discharge of treated effluent at surface/ subsurface through Effluent Treatment Plants (ETPs). ONGC has 32 number of ETPs across onshore work centres to treat approx. 92,710 m3/day of waste water produced during E&P operations. For Offshore effluent treatment, Produced Water Conditioners (PWCs) have been installed at process platforms. For treatment of sewage water generated in offshore facilities, Sewage Treatment Plants (STPs) are in place.
Solid Waste Management: For environmentally safe disposal of oily waste, ONGC has a Joint Venture Company ONGC-TERI Biotech Limited (OTBL) which has developed specialized patented technology for bioremediation of oily sludge/oil contaminated soil. The technology uses a consortium of Hydrocarbon degrading bacteria which reduces the TPH (Total Petroleum Hydrocarbons) levels in waste/ soil to less than 1%. During 2018-19, 23,681 MT of oily sludge/ oil contaminated waste has been bio-remediated.
Environmental Clearances: During the year 2018-19, 7 Nos. of environment clearances (ECs) comprising 24 exploratory and 354 development wells in 30 fields/ML/PEL/ blocks in onshore areas, GCS at Silchar and 4 Early Production Systems (EPS) at Raniganj block of CBM Asset were granted by MoEF&CC for carrying out exploration, development and production activities in acreages held by ONGC.
Other Initiatives during 2018-19:• Under Ten Safety Rules Awareness Programme,
around 13,214 personnel (both ONGC and contractual personnel) during 2018-19 and 41,711 personnel since inception of the programme (i.e
February, 2017) have been apprised. It continues to be a permanent feature of the Safety Campaign.
• HSE Index, introduced for benchmarking installations on various parameters like detection and suppression system, environment parameters, evacuation systems, equipment integrity etc., has been implemented at all work centres.
• Regular Mock drills are being conducted at installations/ rigs to check the efficacy of preparedness against defined emergency scenarios. During 2018-19, 12,132 Emergency Response Plan (ERP), 5 Offsite Disaster Management Plan (DMP), 15 Onsite DMP and 1 RCP (Regional Contingency Plan) drills have been conducted.
• Mines Vocational Training (MVT) is being imparted to both ONGC employees and contract personnel through 10 in house training centres.
• Efficient implementation of HSE Management and no accident leading to insurance claim resulted in appreciable decrease in Insurance premium for Offshore Installation (USD 16.6 million for the year 2018-19 for Asset Value of USD 40.0 billion against USD 18.6 million for Asset Value of USD 36.0 billion for the year 2017-18).
• A unique initiative of Online Safety Pledge was launched through in-house portal of “ONGC Reports” to further reinforce the commitment of ONGC employees towards safety. The pledge is followed by automatic generation of Certificate with signatures of Director- I/c HSE.
• During 2018-19, Annual Preparedness Review (APR) was carried out to understand roles and responsibilities of ONGC (participant member) and Oil Spill Response Ltd. (OSRL), United Kingdom to meet the exigencies during oil spill which included Walk-through Exercise and Mock Drill onboard ONGC MSV for the first time.
• India was chosen to host World Environment Day (WED) 2018 by United Nations Environment
73Board’s Report
Program (UNEP) with theme “Beat Plastic Pollution”. CMD along-with MD-ONGC Videsh and Board of Directors led the WED celebrations on 05.06.2018 and made a strong appeal to motivated ONGC employees to adopt eco-friendly lifestyles with sustainable alternatives to single use plastics. Additionally, ONGC was selected by Ministry of Environment, Forests and Climate Change (MoEF&CC) as Knowledge Partner in WED celebrations.
• Corporate-HSE along with Corporate-CSR collaborated with International Union for Conservation of Nature (IUCN) for Plastic Waste clean-up at Okhla Bird Sanctuary and Okhla Barrage on 07.06.2018 followed by a workshop on “Beat Plastic Pollution: From Rivers to the Oceans” on 20.06.2018 at ONGC Auditorium, Vasant Kunj, New Delhi.
• Safety Alert is a brief guidance material that highlights an incident or unsafe practice and outlines the required action to prevent their occurrence. The information is disseminated to stakeholders for evaluation and taking appropriate action. Corporate HSE has made it a practice to upload Safety Alerts on ONGC’s internal portal ongcreports.net for wider circulation and awareness. Safety Advisories were also issued on ongcreports.net for generic audit observations and their compliances to help in improving the performance during audits by external agencies.
• For the first time, comprehensive Waste Management Audits were carried out at select installations of Ahmedabad and Ankleshwar Assets during March 2019 to check compliance of applicable provisions of waste management rules, which include Solid Waste Management Rules, 2016; e-Waste (Management) Rules, 2016; Plastic Waste Management Rules, 2016; Hazardous & Other Waste (Management & Trans-boundary Movement) Rules, 2016 and Construction & Demolition Waste Management Rules, 2016.
• ONGC has been accredited by Quality Council of India (QCI) – National Accreditation Board
for Education & Training (NABET), since 2013, as an Environment Impact Assessment (EIA) Consultant Organization which is mandatory for preparing EIA reports required for Environmental Clearances. ONGC has completed two full cycles of accreditation scheme. For further accreditation, assessment was done by QCI –NABET assessors at Deendayal Urja Bhawan during 20-22.02.2019 and which recommended continuance of ONGC’s QCI-NABET accreditation.
29. Carbon Management and Sustainable Development
Sustainable Development is the overarching working template in the Company and this finds expression in our commitment to continually enhance the triple bottom line benchmarks of economic, environmental and social performance. Your Company has a dedicated set up called Carbon Management and Sustainability Group (CM&SG) at the corporate level to plan, implement and monitor sustainable development activities in association with Sustainable Development Officers (SDOs) located at work centres.
The major endeavors towards this initiative are as under:
Clean Development Mechanism (CDM):
Renewal of credit period of 51 MW wind power project at Surajbari, Gujarat. The final validation report was submitted to UNFCC for revalidation and renewal of the project on 18.02.2019. This request and related documents are available on the UNFCCC CDM website.
Development of CBM Asset - Bokaro as a new CDM project.
The baseline methodology applicable to the project was proposed to UNFCCC. UNFCCC has sought clarification on the proposed methodology for which responses are being submitted.
Verification of Five existing CDM projects
The verification of following five existing CDM projects has been taken up for the issuance of CERs:
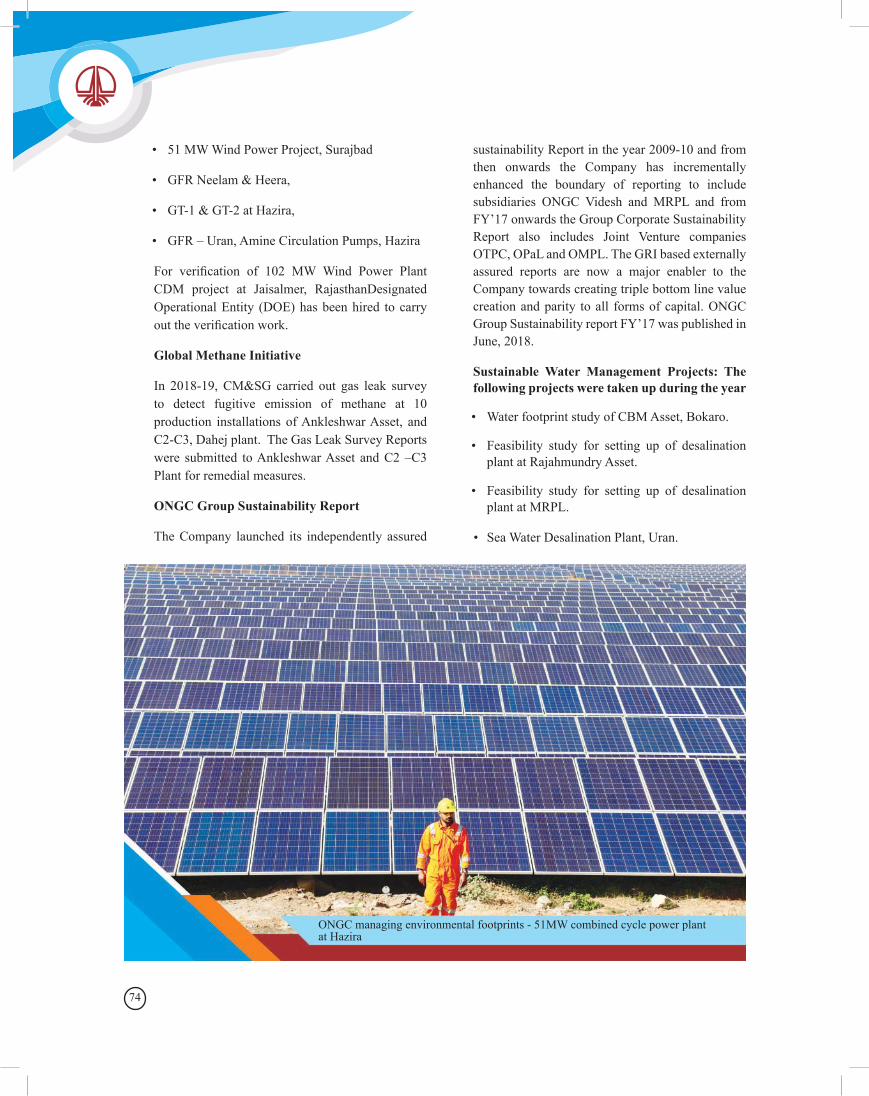
74
• 51 MW Wind Power Project, Surajbad
• GFR Neelam & Heera,
• GT-1 & GT-2 at Hazira,
• GFR – Uran, Amine Circulation Pumps, Hazira
For verification of 102 MW Wind Power Plant CDM project at Jaisalmer, RajasthanDesignated Operational Entity (DOE) has been hired to carry out the verification work.
Global Methane Initiative
In 2018-19, CM&SG carried out gas leak survey to detect fugitive emission of methane at 10 production installations of Ankleshwar Asset, and C2-C3, Dahej plant. The Gas Leak Survey Reports were submitted to Ankleshwar Asset and C2 –C3 Plant for remedial measures.
ONGC Group Sustainability Report
The Company launched its independently assured
sustainability Report in the year 2009-10 and from then onwards the Company has incrementally enhanced the boundary of reporting to include subsidiaries ONGC Videsh and MRPL and from FY’17 onwards the Group Corporate Sustainability Report also includes Joint Venture companies OTPC, OPaL and OMPL. The GRI based externally assured reports are now a major enabler to the Company towards creating triple bottom line value creation and parity to all forms of capital. ONGC Group Sustainability report FY’17 was published in June, 2018.
Sustainable Water Management Projects: The following projects were taken up during the year
• Water footprint study of CBM Asset, Bokaro.
• Feasibility study for setting up of desalination plant at Rajahmundry Asset.
• Feasibility study for setting up of desalination plant at MRPL.
• Sea Water Desalination Plant, Uran.
ONGC managing environmental footprints - 51MW combined cycle power plant at Hazira
75Board’s Report
30. Business Responsibility Report 2018-19
Clause (f) of sub-regulation (2) of regulation 34 of SEBI (Listing Obligations and Disclosure Requirements) Regulations, 2015, stipulates that the annual report shall contain a Business Responsibility Report describing the initiatives taken by the listed entity from an environmental, social and governance perspective in the format specified. Accordingly, the Business Responsibility Report for 2018-19 has been appended to this Annual Report.
31. Internal Control System
Your Company has put in place adequate Internal Financial Controls by laying down policies and procedures to ensure the efficient conduct of its business; safeguarding of its assets; prevention and detection of frauds and errors; accuracy and completeness of the accounting records; and timely preparation of reliable financial information, commensurate with the operations of the Company. Effectiveness of Internal Financial Controls is ensured through management reviews, control self-assessment and independent testing by the Internal Audit Team indicating that your Company has adequate Internal Financial Controls over Financial Reporting in compliance with the provisions of the Companies Act, 2013 and such Internal Financial Controls are operating effectively. The Audit Committee reviews the Internal Financial Controls to ensure their effectiveness for achieving the intended purpose. Independent Auditors Report on the Internal Financial Controls of the Company in terms of Clause (i) of Sub-Section 3 of Section 143 of the Companies Act, 2013 by the Statutory Auditors is attached along with the Financial Statements.
32. Human Resource Development
ONGC’s operations are in challenging terrains – deserts, jungles, border areas, remote fields and offshore. Your Company truly value our Human Resource who commit themselves towards pursuit of exploration and production of hydrocarbons to
ensure India’s Energy security. To keep their morale high, your Company extends welfare benefits to employees and their dependants by way of comprehensive medical care, education, housing, and social security.
There were 31,065 employees on rolls as on 31.03.2019. These ONGCians dedicated themselves for securing excellent performance of your Company during the year. The workforce intake strategy pursued by your Company caters to meeting the demands of maintaining a steady flow of talent, in a business which is characterized by high risks and uncertainties, enormous costs, rapid technological advances, physically challenging work environment, fluctuating product prices and growing competition. Your Company has drawn up a scientific manpower induction, retention and succession plan aligned to the business plans as well factoring the manpower profile of the Company.
During the year, your Company carried out Employee Engagement & Brand Perception Survey “Anubandhan” to understand the drivers of employee engagement and to know the attributes which are valued by the existing and prospective employees. More than 13,600 employees of your Company along with approx. 2,100 students from top B Schools and Engineering Colleges of India responded to the survey. Survey results indicated 85% engagement level.
Your Company emerged as the most preferred Corporate in the Oil and Gas Sector amongst engineering students.
During the year 2018-19, a total of 14,486 executives and 4,622 non-executives were imparted appropriate training, spanning 1,74,455 executive and 14,889 non-executive mandays’.
During 2018-19, 705 Graduate Trainees (in four batches) were exposed to various E&P activities as part of ‘Induction Training’. 19 training programmes were conducted through foreign faculty which were attended by 394 participants. Your Company also pursued structured initiatives

76
for maintaining a vibrant academia – industry interface through Chairs, participation in various academia-industry level forums, viz workshops, seminars, conferences, etc.
Your Company also initiated a program for identification of competencies and development of leadership for its identified Mid – Level executives through online development centres, with detailed Individual Development Plans for their development based on the assessments.
To keep the workplace lively and the workforce engaged and vibrant, your Company also conducted ‘Business Games’ to hone the business acumen of its executives through business quizzes, business simulations and case-study presentations. During the year 2018-19, a total of 248 teams and 961 executives participated in the event.
Similarly, ‘Fun Team Games’ (FTG) were organized for E0 and below level employees to inculcate MDT (Multi-disciplinary Team) concept and spirit of camaraderie and belongingness to the organization, which was very well received by the participants. A total of 178 Teams and 712 employees participated in FTG during the year 2018-19. The winners of Business Games and Fun Team Games were felicitated by the CMD during Republic Day Celebrations - 2019.
Employee Welfare Trusts
Your Company has established following Trusts for welfare / social security of employees:-
Employees Contributory Provident Fund (ECPF) Trust, manages Provident Fund accounts of employees of your Company.
The Post Retirement Benefit Scheme (PRBS) Trust of your Company manages the pension fund of employees of your company. The Scheme was converted into a Defined Contribution Scheme in accordance with DPE guidelines in Nov’2013.
The Composite Social Security Scheme (CSSS) formulated by your company provides an assured
ex-gratia payment in the event of unfortunate death or permanent disability of an employee while in service. In case of separation other than Death/Permanent total disability, employee’s own contribution alongwith interest is refunded.
Gratuity Fund Trust exists for payment of gratuity as per the provisions of the Gratuity Act.
Your Company has a Sahyog Trust for its Sahyog Yojana to provide ex-gratia financial grant for sustenance, medical assistance, treatment, rehabilitation, education, marriage of female dependent and alleviation of any hardship or distress to secure the welfare of the workforce and their kin, who do not have adequate means of support. The beneficiaries under this scheme include casual, contingent, daily rated, part time, adhoc, contract appointees, tenure based employees, apprentices and trainees employed by your Company besides regular and past employees. Under the scheme, an amount of `43.7 million was disbursed by the Trust during 2018-19 to 1178 beneficiaries.
Your Company has Asha Kiran Scheme to meet the emergency needs of the ex-employees retired prior to 01.01.2007. The scheme was launched as per DPE guidelines by creating a corpus of 1.5% PBT.
Implementation of Govt. Directives for Priority Section
Your Company complies with the Government directives for Priority Section of the society. The percentage of Scheduled Castes (SC) and Scheduled Tribe (ST) employees were 15.5 percent and 10.4 percent respectively as on 31.03.2019.
Your Company is fully committed for the welfare of SC and ST communities. The following welfare activities are carried out by your Company for their up-liftment in and around its operational areas:-
Annual Component Plan
Under Annual Component Plan for SC/ST, every year allocation of `200 million is made. Out of this, `60 million is distributed amongst all the work-
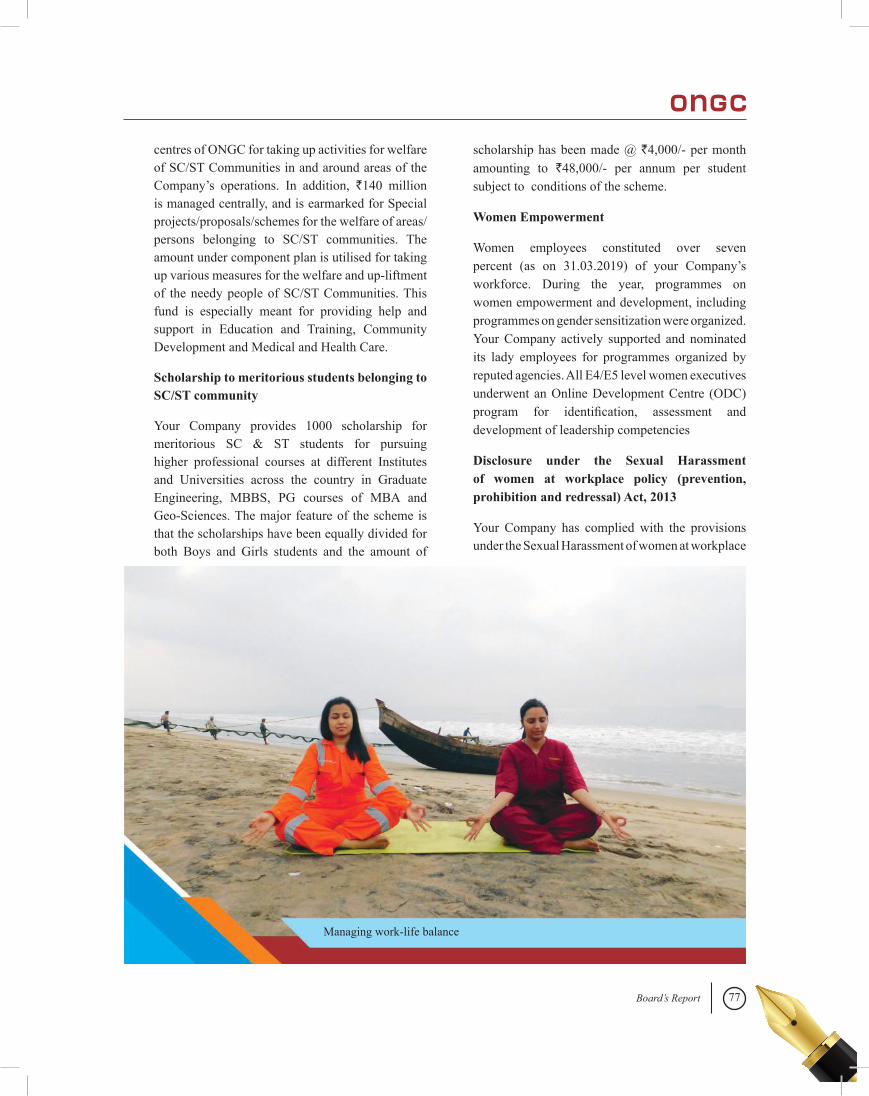
77Board’s Report
centres of ONGC for taking up activities for welfare of SC/ST Communities in and around areas of the Company’s operations. In addition, `140 million is managed centrally, and is earmarked for Special projects/proposals/schemes for the welfare of areas/persons belonging to SC/ST communities. The amount under component plan is utilised for taking up various measures for the welfare and up-liftment of the needy people of SC/ST Communities. This fund is especially meant for providing help and support in Education and Training, Community Development and Medical and Health Care.
Scholarship to meritorious students belonging to SC/ST community
Your Company provides 1000 scholarship for meritorious SC & ST students for pursuing higher professional courses at different Institutes and Universities across the country in Graduate Engineering, MBBS, PG courses of MBA and Geo-Sciences. The major feature of the scheme is that the scholarships have been equally divided for both Boys and Girls students and the amount of
scholarship has been made @ `4,000/- per month amounting to `48,000/- per annum per student subject to conditions of the scheme.
Women Empowerment
Women employees constituted over seven percent (as on 31.03.2019) of your Company’s workforce. During the year, programmes on women empowerment and development, including programmes on gender sensitization were organized. Your Company actively supported and nominated its lady employees for programmes organized by reputed agencies. All E4/E5 level women executives underwent an Online Development Centre (ODC) program for identification, assessment and development of leadership competencies
Disclosure under the Sexual Harassment of women at workplace policy (prevention, prohibition and redressal) Act, 2013
Your Company has complied with the provisions under the Sexual Harassment of women at workplace
Managing work-life balance
78
(Prevention, Prohibition and Redressal) Act, 2013 including constitution of Internal Complaints Committee (ICC) for dealing with complaints on sexual harassment of women at workplace. Two complaints of sexual harassment were received in the year 2018-19.
Work-Life Balance
Your Company believes in providing work-life balance to its employees. The townships at many work-centers have developed facilities like gymnasiums, music rooms, etc. Facilities for gym, yoga, etc. were also provided in Offshore Living Quarters. Outbound programmes with families were also organized at various work-centers. In addition, cultural programmes involving employees and their families were also conducted. ONGC Officers’ Mahila Samiti (OOMS) and Resident Welfare Associations (RWAs) were involved in organizing these cultural programs. Your Company has an adventure wing named ONGC Himalayan Association which organizes adventure programmes like mountaineering, trekking, water rafting, snow skiing, desert safari, Aero sports etc. which adds towards employee morale, engagement, team spirit, camaraderie, stress management and spirit to explore the unknown. 10 members of ONGC’s Team successfully scaled the third highest peak in the world, Mount Kanchenjunga, on 20-21 May, 2018.The Team comprised a woman employee and a female scholarship mountaineer.
Grievance Management System
Your Company has put in place an effective online response mechanism (https://grievance.ongc.co.in) since 2015 to enable all stake-holders viz. citizens/ vendors, employees, former employees, to register and get online redressal to their grievances related to any operational wing of ONGC.
Your Company has also put in place a Grievance Management System for redressing employee grievance, which provides for three-tier channel for grievance redressal with an Independent Appeals Committee, at Corporate Level, which is chaired
by an external professional to ensure transparency and justice. Each level of reporting at Controlling Officer (Channel-I), Sectional Head (Channel-II) and Asset/Basin/Institute/Plant/Office Head (Channel-III) has been mapped to provide access for settling individual grievances. An individual employee can enhance the level to the next Channel in case his grievance is not settled at the first, second or third Channels. The Appeals Committee situated at HQ can also be accessed for settlement of grievances in case the location Channels are not effective in resolving the grievance. Further, provision for representation through Chief Liaison Officers of SC/ST/OBC in the Appeals Committee is also built in to protect the interest of reserved category employees.
For external stakeholders, the Company has a well laid down grievance redressal system in place with adequate provisions to escalate the matters up to the Board (Stakeholders Relationship Committee – a Board level Committee headed by an Independent Director).
The Company voluntarily facilitates grievances through Independent External Monitors (IEMs) and through Outside Expert Committee (OEC).
33. Industrial Relations
During the year your Company maintained harmonious Industrial Relations throughout the Corporation. Man-days loss due to internal industrial action was reported as ‘NIL’ for the year 2018-19.
34. Implementation under the Right to Information Act, 2005
Your Company has a well-defined mechanism in place to deal with the RTI applications received under the RTI Act 2005. Your Company has a designated General Manager level officer as a ‘Nodal Officer ‘to oversee its implementation. The requests received are processed by the 22 senior personnel designated as ‘Central Public Information Officers’ (CPIOs) in various workcentres across the country, in compliance of Sections 5(1) and
79Board’s Report
5(2) of the Act. The particulars of all the quasi-judicial authorities under the ambit of RTI Act, 2005 have been uploaded on the company website (www.ongcindia.com) for information of the general public. Further in compliance of Government directives, your Company is successfully processing the applications under the Act, online.
Your Company received 1,963 applications (including 138 transferred by other Public Authorities to ONGC) during the period from April 2018 to March 2019, and 183 RTI applications were carried forward from the year 2017-18. A total of 1,843 applications were responded to, out of a total of 2,146 applications. Further, 43 applications were rejected and 57 applications were transferred to other public authorities, in accordance with the provisions of the RTI Act 2005. There were 357 first appeals, which were disposed-off during the period. Additionally, 66 Second Appeals which were listed for hearing at the CIC during FY 2018-19 were also processed.
35. Implementation of Official Language Policy
Your Company makes concerted efforts for promotion and implementation of Official Language. In this regard, some of the steps taken during the year were:
• Unicode Hindi software installed in all offices.
• Hindi workshops conducted at regular intervals in all work centres.
• Hindi Technical seminars, ‘Kavi Gosthies’ and Hindi plays organized at various work centres.
• Various programmes for promotion of ‘Rajbhasha’ were organised at all work centres of ONGC during ‘Rajbhasha Fortnight’ (14-28 Sep., 2018) and ‘Vishwa Hindi Diwas’ (10.01.2019).
• Hindi Teaching Scheme of Govt. of India was implemented effectively at all regional work centres of ONGC.
• E-Roster of Employees regarding working knowledge of Hindi was put in place.
• Hindi e-magazines were published at various work centres.
• Paperless office (DISHA) has been made bi-lingual for effective implementation of Official Language policy in the office works. Besides this installation of Unicode in SAP platform has been taken-up to enable bilingual work in SAP also.
In recognition of the initiatives taken for promotion of Rajbhasha, your Company bagged eight Town Official Language Implementation Committee (TOLIC) awards under various categories during the year.
36. Sports
• ONGC sportspersons earned laurels for the Company and the country by securing 15 medals including 3 Gold, 7 silver and 5 Bronze at Asian Games 2018 held at Jakarta & Palembang, Indonesia. 38 ONGCians represented the Indian contingent while participating in this mega Event.
• In Commonwealth Games 2018 at Gold Coast, Australia, ONGC sportspersons bagged 13 medals including 5 Gold, 3 Silver and 5 Bronze contributing to the overall tally of 66 medals of Team India. 21 ONGCians represented India in various game disciplines in this event.
• Your Company continued its large scale support for development of sports in the country in the form of employment to 171 sportspersons and scholarships to 289 budding talents in 25 game disciplines. Your Company also sponsored various sports associations / federations / sports bodies for organising sports events as well as to develop sporting infrastructure. The support has enabled many sportspersons to achieve and bring home laurels for the nation and the organisation.
• Three ONGCian’s were conferred the prestigious “Arjuna Award” for the year 2018 namely Ms. Hima Das (Scholarship Athlete), Shri Ankur Mittal (Shooting) and Shri G Sathiyan (Table Tennis).
80
• Shri Pankaj Advani, was conferred the third highest civilian award “Padma Bhushan” in the year 2018. He also won his 21st World title in cue sports by winning two World Titles in 2018 IBSF World Billiards Championship in time and point format at Myanmar in November 2018.
• Shri Virat Kohli (Cricket) was conferred the prestigious “Rajiv Gandhi Khel Ratna” for the year 2018. The total number of National Awardees in the organization stand at 44 ( Padma Bhushan – 1, Khel Ratna – 2, Padma Shri – 3 & Arjuna Award – 37 and Dhyanchand Award – 1).
• ONGC Scholarship Athlete Shri Suraj Panwar created history by winning Silver medal in 5000 m walk at Buenos Aires in Youth Olympic Games 2018.
• ONGCian Shri Sourav Kothari won ‘WBL World Billiards’ Title in Leeds, UK in October 2018.
• ONGCian Shri Sourabh Verma won the ‘Dutch Super Open 100’ International Badminton Tournament at Almere, Netherland in October 2018.
• ONGC’s Women Shooting Team comprising ONGCian Ms. Apurvi Chandela, and scholarship players Ms. Sriyanka Sadangi and Ms. Gayatri Pawaskar won Gold medal in the 62nd National Shooting Championship (Rifle Pistol event) at Trivandrum in November, 2018.
• Your Company organised the 2nd edition of the Para Games in March, 2019 in which 148 PWDs from different work-centres of ONGC participated.
37. Corporate Social Responsibility (CSR)
A report on CSR has been placed at Annexure B to the Report.
38. Accolades
Consistent with the trend in preceding years, your Company, its various operating units and its senior management have been recipients of various awards
and recognitions. Detail of such accolades is placed at Annexure- ‘C’.
39. Regulators or Courts order
During the Financial year 2018-19, there is no order ordirection of any court or tribunal or regulator which either affects Company’s status as a going concern or which significantly affects Company’s business operations.
40. Director’s Responsibility Statement
Pursuant to the requirement under Section 134(3) (c) of the Companies Act, 2013, with respect to Directors’ Responsibility Statement, it is hereby confirmed that:
a) In the preparation of the annual accounts, the applicable accounting standards have been followed and there is no material departures from the same;
b) The Directors have selected such accounting policies and applied them consistently and made judgments and estimates that are reasonable and prudent, so asto give a true and fair view of the state of affairs of the Company as at 31.03.2019 and of the profit of the Company for the year ended on that date;
c) The Directors have taken proper and sufficient care for the maintenance of adequate accounting records in accordance with the provisions of the Companies Act, 2013, for safeguarding the assets of the Company and for preventing and detecting fraud and other irregularities;
d) The Directors have prepared the annual accounts of the Company on a ‘going concern’ basis;
e) The Directors have laid down internal financial controls which are being followed by the Company and that such internal financial controls are adequate and are operating effectively; and
f) The Directors have devised proper systems to ensure compliance with the provisions of all applicable laws and that such systems are adequate and operating.
81Board’s Report
41. Corporate Governance
A detailed report on Corporate Governance as stipulated under Regulation 34(3) of SEBI (Listing Obligations and Disclosure Requirements) Regulations, 2015 is appended and forms part of the Board’s Report.
42. Statutory Disclosures
Your Directors have made necessary disclosures, as required under various enactments including the Companies Act, 2013 and the SEBI (Listing Obligations & Disclosure Requirements) Regulations, 2015.
43. Extract of Annual Return
As per requirement of Section 92(3) of the Companies Act, 2013, the extract of the annual return in form MGT-9 is placed at Annexure-D.
44. Particulars of Employees
Your Company being a Government Company, the provisions of Section 197(12) of the Companies Act, 2013 and relevant Rules issued thereunder do not apply in view of the Gazette notification dated 05.06.2015 issued by Government of India, Ministry of Corporate Affairs.
The terms and conditions of the appointment of Functional Directors are subject to the applicable guidelines issued by the Department of Public Enterprises, Government of India. The salary and terms and conditions of the appointment of Company Secretary, a Key Managerial Person (KMP) of the Company, is in line with the parameters prescribed by the Government of India.
45. Energy Conservation
The information required under section 134(3)(m) of the Companies Act, 2013, read with the Companies (Accounts) Rules, 2014, is annexed as Annexure – ‘E’.
46. Audit Committee
In compliance with Section 177(8) of the Companies Act, 2013, the details regarding Audit Committee
is provided under Corporate Governance report which forms part of this Annual Report. There is no instance during FY’19, where the Board had not accepted any recommendation of the Audit Committee.
47. Auditors
The Statutory Auditors of your Company are appointed by the Comptroller & Auditor General of India (C&AG).There were 6 chartered accountants firms namely M/s. PKF Sridhar & Santhanam LLP, M/s. Dass Gupta & Associates, M/s. K. C. Mehta & Co., M/s. MKPS & Associates, M/s. G M Kapadia & Co., M/s. R Gopal & Associates who were appointed as Joint Statutory Auditors of the Company for the financial year 2018-19.
The Statutory Auditors have been paid a total remuneration of `40.52 million towards audit fees, certification and other services. The above fees are inclusive of applicable service tax/ GST but exclusive of re-imbursement of travelling and out of pocket expenses actually incurred.
48. Auditors’ Report on the Accounts
The comments of Comptroller & Auditor General of India (C&AG) form part of this Report and is attached Annexure ‘F’. There is no qualification in the AuditorsReport on the Financial Statements of the Company.
During the year 2018-19, there has not been any fraud reported by the Statutory Auditors of the Company.
49. Cost Audit
There were 6 cost accountants firms namely M/s. M. Krishnaswamy & Associates, M/s. Musib & Co., M/s. Chandra Wadhwa & Co., M/s. Bandopadhyaya Bhaumik & Co., M/s. N. D. Birla & Co., M/s. Joshi Apte & Associates who were appointed as Joint Cost Auditors of the Company for the financial year 2018-19. Appointments were made by the Board of Directors. The Cost Audit Report for the year 2017-18 has been filed under XBRL mode on 29.08.2018 which was well within the due date of filing.
82
Further, the required cost records as specified under the Companies Act, 2013 are prepared and maintained by the Company.
50. Secretarial Audit
In terms of Section 204(1) of the Companies Act, 2013, the Company has engaged M/s. Ashu Gupta & Co., Company Secretaries in whole-time practice, as Secretarial Auditors for conducting Secretarial Compliance Audit for the financial year ended 31.03.2019. Their report has been annexed and forms part of the Annual Report.
The Secretarial Auditor has made observations regarding performance evaluation of Independent Directors by the entire Board of Directors under Regulation 17(10) and evaluation of non-independent directors and the Board of directors as a whole by Independent Directors under Regulation 25(4)of the SEBI (Listing Obligations and Disclosure Requirements) Regulations, 2015. In this regard, it is mentioned that the Ministry of Corporate Affairs (MCA) vide notification dated 05.06.2015 notified exemptions to government companies from provisions of Section 178(2), (3) and (4) regarding appointment, performance evaluation and remuneration to directors of government companies. Further, the MCA vide notification dated 05.07.2017 notified amendment to schedule IV of the Companies Act, 2013 provided exemption to government companies with respect to evaluation of performance of Non-Independent Directors, Chairperson and Board. It is learnt that Department of Public Enterprises has requested to SEBI through Department of Economic Affairs, Ministry of Finance for exemption to government companies regarding performance evaluation of directors as Government of India has independent mechanism for appointment and as well for assessment of performance of whole-time directors, government nominee directors and independent directors.
In respect of observation regarding prior approval of the Audit Committee for all Related Party
Transactions (RPTs), it is mentioned that in line with provisions of the Companies Act, 2013 and SEBI Regulations, a policy on RPT has been framed, which can be accessed at https://www.ongcindia.com/wps/wcm/connect/en/investors/policies/ In terms of RPT Policy, all the contracts/ arrangements/ transactions entered by the Company during FY’19 with related parties were in the ordinary course of business and on an arm’s length basis. Transactions with related parties have been disclosed as ‘Annexure A’ and forms part of this report. SEBI Regulations provide for prior approval of related party transactions except with government companies and with wholly-owned subsidiaries. In this regard, necessary system is being put-in place to ensure compliances.
51. Directors
a) Policy for Selection and appointment of Directors’ and their remuneration.
Your Company being a Government Company, the provisions of Section 134(3)(e) of the Companies Act, 2013 do not apply in view of the Gazette notification dated 05.06.2015 issued by Government of India, Ministry of Corporate Affairs.
b) Performance Evaluation
The provisions of Section 134(3)(p) of the Companies Act, 2013 relating to evaluation of Board/ Directors do not apply to your Company since necessary exemptions are provided to all government companies. The Company being a Government Company, the provisions relating to Performance Evaluation of Directors stand exempted. The Department of Public Enterprises has taken up with SEBI through the Department of Economic Affairs, Ministry of Finance to make suitable amendments in the LODR regulations in line the Companies Act, 2013.
c) Appointments/ Cessation etc.
Since the 25th Annual General Meeting held on
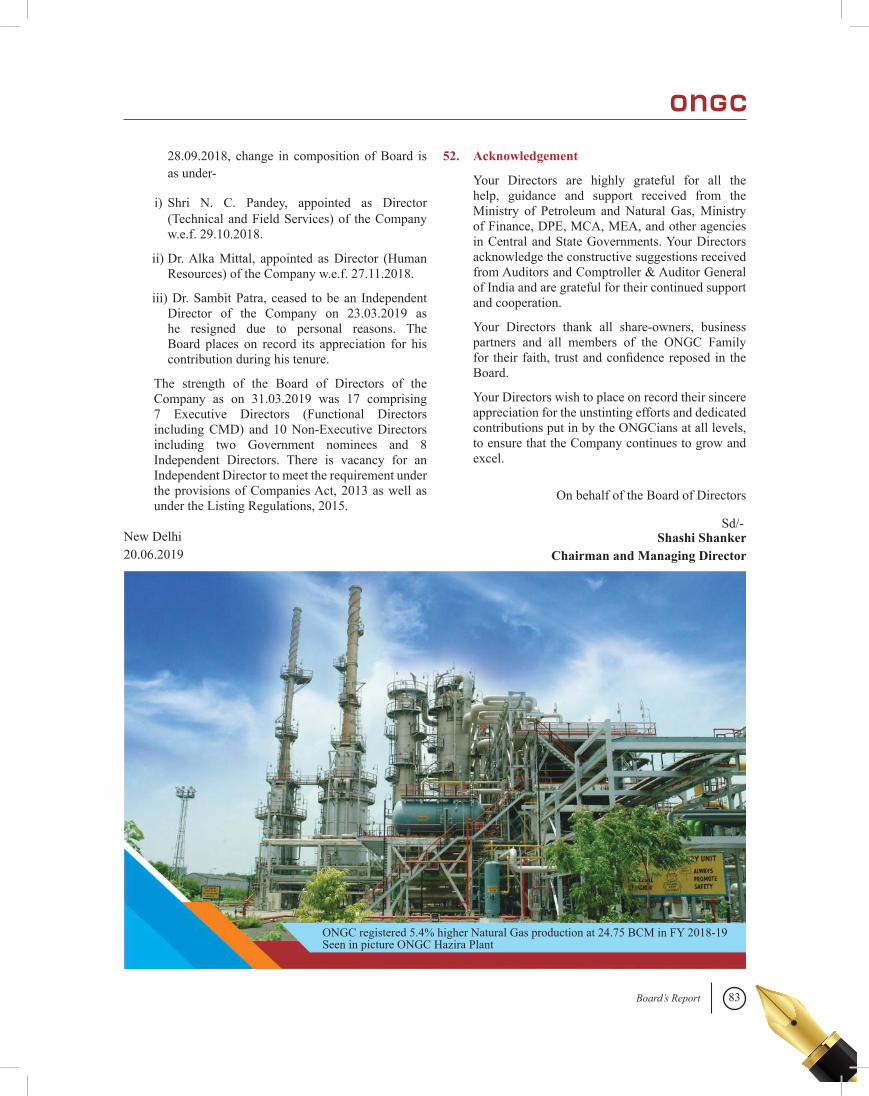
83Board’s Report
28.09.2018, change in composition of Board is as under-
i) Shri N. C. Pandey, appointed as Director (Technical and Field Services) of the Company w.e.f. 29.10.2018.
ii) Dr. Alka Mittal, appointed as Director (Human Resources) of the Company w.e.f. 27.11.2018.
iii) Dr. Sambit Patra, ceased to be an Independent Director of the Company on 23.03.2019 as he resigned due to personal reasons. The Board places on record its appreciation for his contribution during his tenure.
The strength of the Board of Directors of the Company as on 31.03.2019 was 17 comprising 7 Executive Directors (Functional Directors including CMD) and 10 Non-Executive Directors including two Government nominees and 8 Independent Directors. There is vacancy for an Independent Director to meet the requirement under the provisions of Companies Act, 2013 as well as under the Listing Regulations, 2015.
52. Acknowledgement
Your Directors are highly grateful for all the help, guidance and support received from the Ministry of Petroleum and Natural Gas, Ministry of Finance, DPE, MCA, MEA, and other agencies in Central and State Governments. Your Directors acknowledge the constructive suggestions received from Auditors and Comptroller & Auditor General of India and are grateful for their continued support and cooperation.
Your Directors thank all share-owners, business partners and all members of the ONGC Family for their faith, trust and confidence reposed in the Board.
Your Directors wish to place on record their sincere appreciation for the unstinting efforts and dedicated contributions put in by the ONGCians at all levels, to ensure that the Company continues to grow and excel.
On behalf of the Board of Directors
Sd/-Shashi Shanker
Chairman and Managing Director New Delhi20.06.2019
ONGC registered 5.4% higher Natural Gas production at 24.75 BCM in FY 2018-19 Seen in picture ONGC Hazira Plant
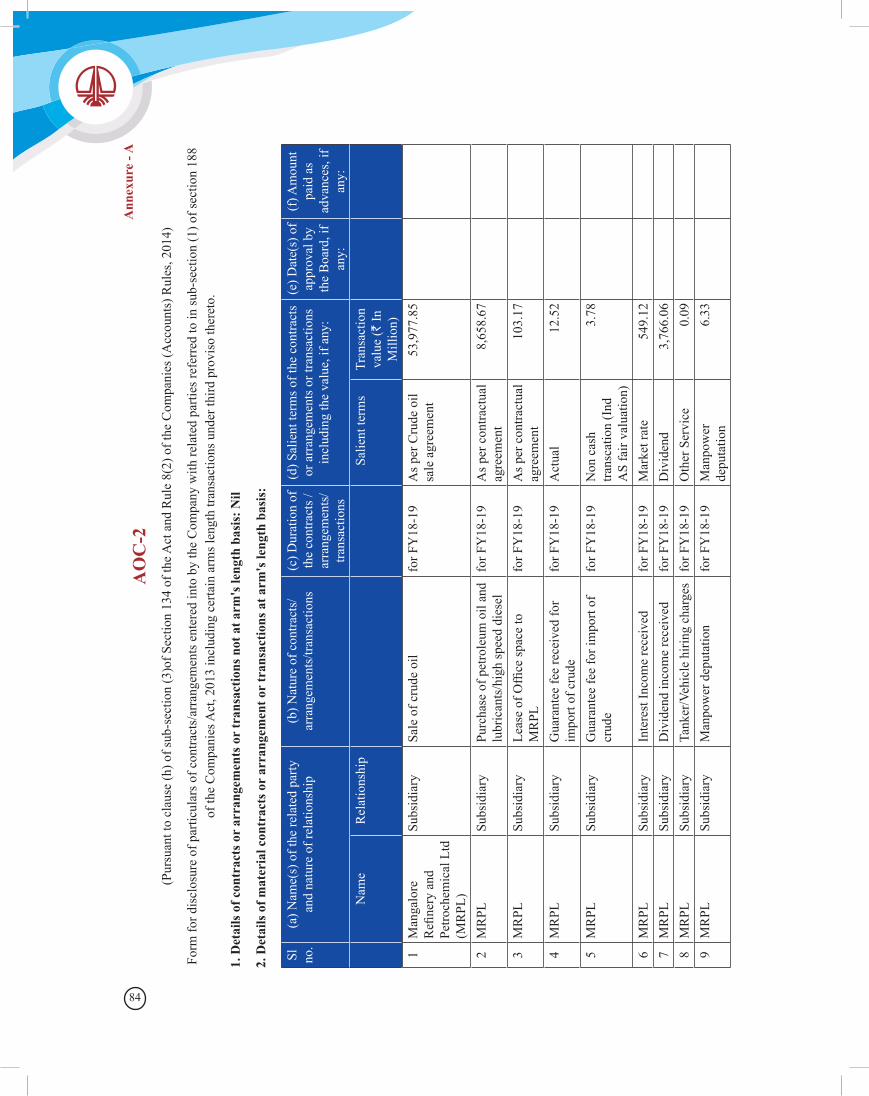
84
Ann
exur
e - A
AO
C-2
(Pur
suan
t to
clau
se (h
) of s
ub-s
ectio
n (3
)of S
ectio
n 13
4 of
the A
ct a
nd R
ule
8(2)
of t
he C
ompa
nies
(Acc
ount
s) R
ules
, 201
4)
Form
for d
iscl
osur
e of
par
ticul
ars o
f con
tract
s/ar
rang
emen
ts e
nter
ed in
to b
y th
e C
ompa
ny w
ith re
late
d pa
rties
refe
rred
to in
sub-
sect
ion
(1) o
f sec
tion
188
of th
e C
ompa
nies
Act
, 201
3 in
clud
ing
certa
in a
rms l
engt
h tra
nsac
tions
und
er th
ird p
rovi
so th
eret
o.
1. D
etai
ls o
f con
trac
ts o
r ar
rang
emen
ts o
r tr
ansa
ctio
ns n
ot a
t arm
's le
ngth
bas
is: N
il
2. D
etai
ls o
f mat
eria
l con
trac
ts o
r ar
rang
emen
t or
tran
sact
ions
at a
rm's
leng
th b
asis
:
Sl
no.
(a) N
ame(
s) o
f the
rela
ted
party
an
d na
ture
of r
elat
ions
hip
(b) N
atur
e of
con
tract
s/ar
rang
emen
ts/tr
ansa
ctio
ns(c
) Dur
atio
n of
th
e co
ntra
cts /
ar
rang
emen
ts/
trans
actio
ns
(d) S
alie
nt te
rms o
f the
con
tract
s or
arr
ange
men
ts o
r tra
nsac
tions
in
clud
ing
the
valu
e, if
any
:
(e) D
ate(
s) o
f ap
prov
al b
y th
e B
oard
, if
any:
(f) A
mou
nt
paid
as
adva
nces
, if
any:
Nam
e R
elat
ions
hip
Sal
ient
term
sTr
ansa
ctio
n va
lue
(` In
M
illio
n)1
Man
galo
re
Refi
nery
and
Pe
troch
emic
al L
td
(MR
PL)
Subs
idia
rySa
le o
f cru
de o
ilfo
r FY
18-1
9A
s per
Cru
de o
il sa
le a
gree
men
t53
,977
.85
2M
RPL
Subs
idia
ryPu
rcha
se o
f pet
role
um o
il an
d lu
bric
ants
/hig
h sp
eed
dies
elfo
r FY
18-1
9A
s per
con
tract
ual
agre
emen
t8,
658.
67
3M
RPL
Subs
idia
ryLe
ase
of O
ffice
spac
e to
M
RPL
for F
Y18
-19
As p
er c
ontra
ctua
l ag
reem
ent
103.
17
4M
RPL
Subs
idia
ryG
uara
ntee
fee
rece
ived
for
impo
rt of
cru
de
for F
Y18
-19
Act
ual
12.5
2
5M
RPL
Subs
idia
ryG
uara
ntee
fee
for i
mpo
rt of
cr
ude
for F
Y18
-19
Non
cas
h tra
nsca
tion
(Ind
A
S fa
ir va
luat
ion)
3.78
6M
RPL
Subs
idia
ryIn
tere
st In
com
e re
ceiv
edfo
r FY
18-1
9M
arke
t rat
e54
9.12
7M
RPL
Subs
idia
ryD
ivid
end
inco
me
rece
ived
for F
Y18
-19
Div
iden
d 3,
766.
068
MR
PLSu
bsid
iary
Tank
er/V
ehic
le h
iring
cha
rges
fo
r FY
18-1
9O
ther
Ser
vice
0.09
9M
RPL
Subs
idia
ryM
anpo
wer
dep
utat
ion
for F
Y18
-19
Man
pow
er
depu
tatio
n6.
33
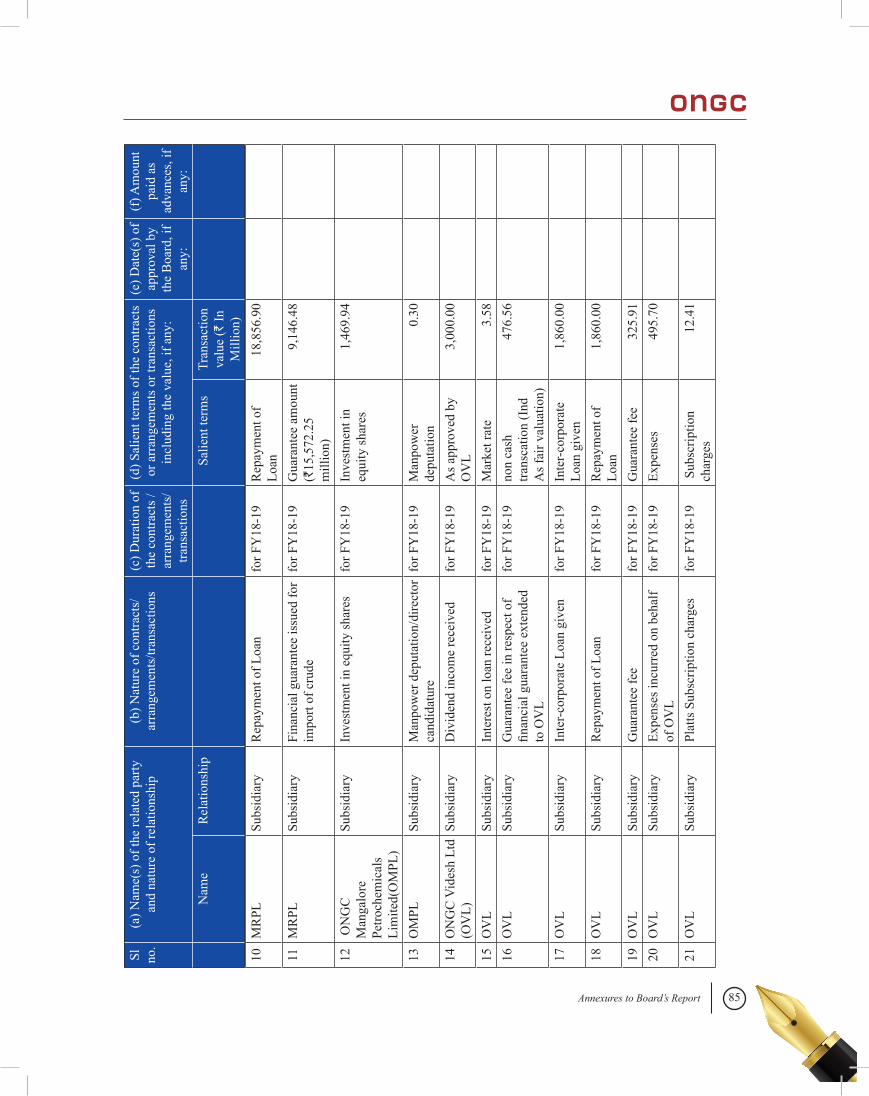
85Annexures to Board’s Report
Sl
no.
(a) N
ame(
s) o
f the
rela
ted
party
an
d na
ture
of r
elat
ions
hip
(b) N
atur
e of
con
tract
s/ar
rang
emen
ts/tr
ansa
ctio
ns(c
) Dur
atio
n of
th
e co
ntra
cts /
ar
rang
emen
ts/
trans
actio
ns
(d) S
alie
nt te
rms o
f the
con
tract
s or
arr
ange
men
ts o
r tra
nsac
tions
in
clud
ing
the
valu
e, if
any
:
(e) D
ate(
s) o
f ap
prov
al b
y th
e B
oard
, if
any:
(f) A
mou
nt
paid
as
adva
nces
, if
any:
Nam
e R
elat
ions
hip
Sal
ient
term
sTr
ansa
ctio
n va
lue
(` In
M
illio
n)10
MR
PLSu
bsid
iary
Rep
aym
ent o
f Loa
nfo
r FY
18-1
9R
epay
men
t of
Loan
18,8
56.9
0
11M
RPL
Subs
idia
ryFi
nanc
ial g
uara
ntee
issu
ed fo
r im
port
of c
rude
fo
r FY
18-1
9G
uara
ntee
am
ount
(`
15,5
72.2
5 m
illio
n)
9,14
6.48
12 O
NG
C
Man
galo
re
Petro
chem
ical
s Li
mite
d(O
MPL
)
Subs
idia
ryIn
vest
men
t in
equi
ty sh
ares
for F
Y18
-19
Inve
stm
ent i
n eq
uity
shar
es1,
469.
94
13O
MPL
Subs
idia
ryM
anpo
wer
dep
utat
ion/
dire
ctor
ca
ndid
atur
efo
r FY
18-1
9M
anpo
wer
de
puta
tion
0.30
14O
NG
C V
ides
h Lt
d (O
VL)
Subs
idia
ryD
ivid
end
inco
me
rece
ived
for F
Y18
-19
As a
ppro
ved
by
OV
L3,
000.
00
15O
VL
Subs
idia
ryIn
tere
st o
n lo
an re
ceiv
edfo
r FY
18-1
9M
arke
t rat
e3.
5816
OV
LSu
bsid
iary
Gua
rant
ee fe
e in
resp
ect o
f fin
anci
al g
uara
ntee
ext
ende
d to
OV
L
for F
Y18
-19
non
cash
tra
nsca
tion
(Ind
A
s fai
r val
uatio
n)
476.
56
17O
VL
Subs
idia
ryIn
ter-c
orpo
rate
Loa
n gi
ven
for F
Y18
-19
Inte
r-cor
pora
te
Loan
giv
en1,
860.
00
18O
VL
Subs
idia
ryR
epay
men
t of L
oan
for F
Y18
-19
Rep
aym
ent o
f Lo
an1,
860.
00
19O
VL
Subs
idia
ryG
uara
ntee
fee
for F
Y18
-19
Gua
rant
ee fe
e32
5.91
20O
VL
Subs
idia
ryEx
pens
es in
curr
ed o
n be
half
of O
VL
for F
Y18
-19
Expe
nses
495.
70
21O
VL
Subs
idia
ryPl
atts
Sub
scrip
tion
char
ges
for F
Y18
-19
Sub
scrip
tion
char
ges
12.4
1
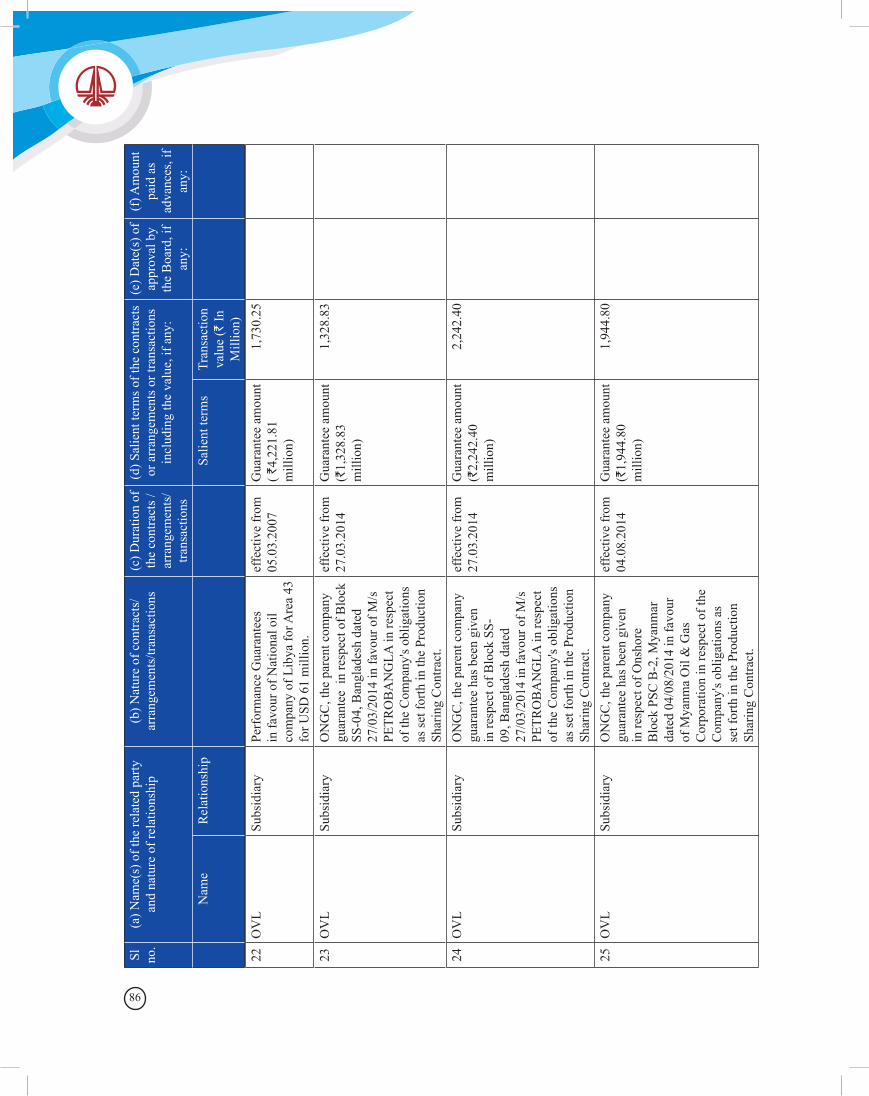
86
Sl
no.
(a) N
ame(
s) o
f the
rela
ted
party
an
d na
ture
of r
elat
ions
hip
(b) N
atur
e of
con
tract
s/ar
rang
emen
ts/tr
ansa
ctio
ns(c
) Dur
atio
n of
th
e co
ntra
cts /
ar
rang
emen
ts/
trans
actio
ns
(d) S
alie
nt te
rms o
f the
con
tract
s or
arr
ange
men
ts o
r tra
nsac
tions
in
clud
ing
the
valu
e, if
any
:
(e) D
ate(
s) o
f ap
prov
al b
y th
e B
oard
, if
any:
(f) A
mou
nt
paid
as
adva
nces
, if
any:
Nam
e R
elat
ions
hip
Sal
ient
term
sTr
ansa
ctio
n va
lue
(` In
M
illio
n)22
OV
LSu
bsid
iary
Perf
orm
ance
Gua
rant
ees
in fa
vour
of N
atio
nal o
il co
mpa
ny o
f Lib
ya fo
r Are
a 43
fo
r USD
61
mill
ion.
effe
ctiv
e fr
om
05.0
3.20
07G
uara
ntee
am
ount
( `
4,22
1.81
m
illio
n)
1,73
0.25
23O
VL
Subs
idia
ryO
NG
C, t
he p
aren
t com
pany
gu
aran
tee
in re
spec
t of B
lock
SS
-04,
Ban
glad
esh
date
d 27
/03/
2014
in fa
vour
of M
/s
PETR
OB
AN
GLA
in re
spec
t of
the
Com
pany
's ob
ligat
ions
as
set f
orth
in th
e Pr
oduc
tion
Shar
ing
Con
tract
.
effe
ctiv
e fr
om
27.0
3.20
14G
uara
ntee
am
ount
(`
1,32
8.83
m
illio
n)
1,32
8.83
24O
VL
Subs
idia
ryO
NG
C, t
he p
aren
t com
pany
gu
aran
tee
has b
een
give
n in
resp
ect o
f Blo
ck S
S-09
, Ban
glad
esh
date
d 27
/03/
2014
in fa
vour
of M
/s
PETR
OB
AN
GLA
in re
spec
t of
the
Com
pany
's ob
ligat
ions
as
set f
orth
in th
e Pr
oduc
tion
Shar
ing
Con
tract
.
effe
ctiv
e fr
om
27.0
3.20
14G
uara
ntee
am
ount
(`
2,24
2.40
m
illio
n)
2,24
2.40
25O
VL
Subs
idia
ryO
NG
C, t
he p
aren
t com
pany
gu
aran
tee
has b
een
give
n in
resp
ect o
f Ons
hore
B
lock
PSC
B-2
, Mya
nmar
da
ted
04/0
8/20
14 in
favo
ur
of M
yanm
a O
il &
Gas
C
orpo
ratio
n in
resp
ect o
f the
C
ompa
ny's
oblig
atio
ns a
s se
t for
th in
the
Prod
uctio
n Sh
arin
g C
ontra
ct.
effe
ctiv
e fr
om
04.0
8.20
14G
uara
ntee
am
ount
(`
1,94
4.80
m
illio
n)
1,94
4.80
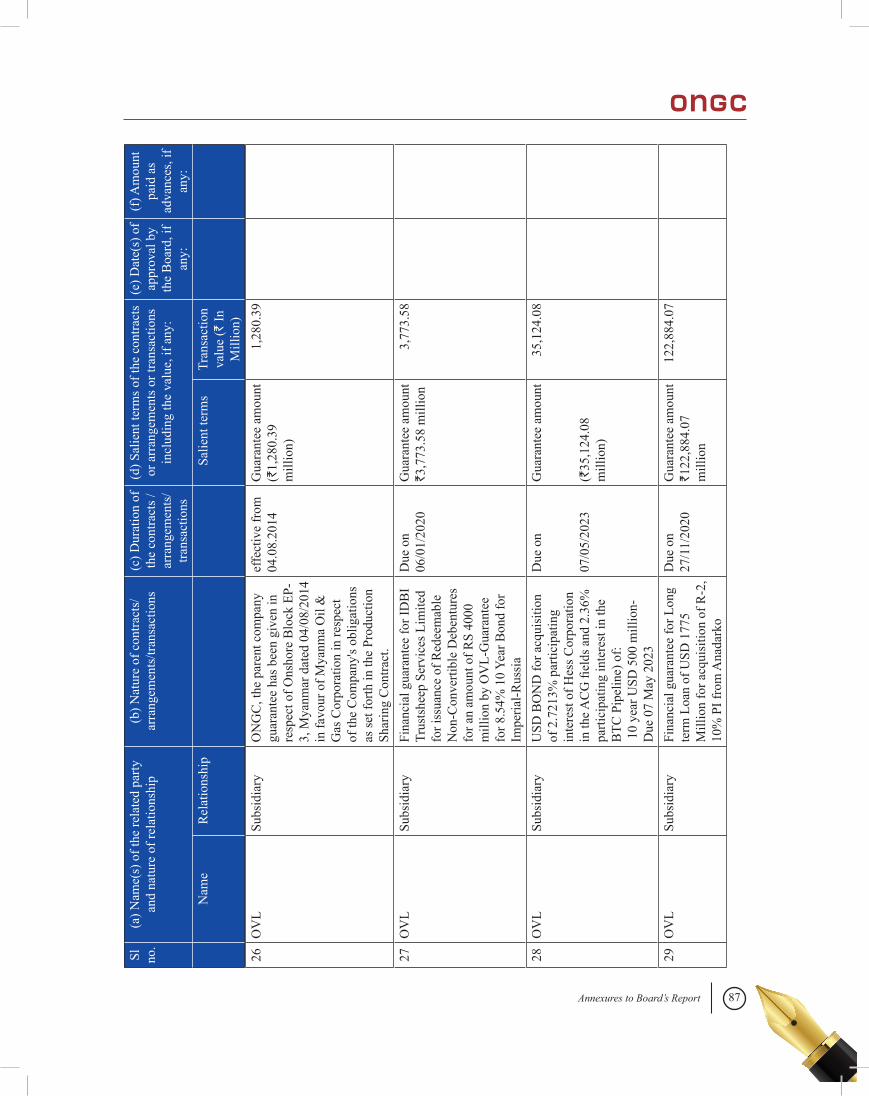
87Annexures to Board’s Report
Sl
no.
(a) N
ame(
s) o
f the
rela
ted
party
an
d na
ture
of r
elat
ions
hip
(b) N
atur
e of
con
tract
s/ar
rang
emen
ts/tr
ansa
ctio
ns(c
) Dur
atio
n of
th
e co
ntra
cts /
ar
rang
emen
ts/
trans
actio
ns
(d) S
alie
nt te
rms o
f the
con
tract
s or
arr
ange
men
ts o
r tra
nsac
tions
in
clud
ing
the
valu
e, if
any
:
(e) D
ate(
s) o
f ap
prov
al b
y th
e B
oard
, if
any:
(f) A
mou
nt
paid
as
adva
nces
, if
any:
Nam
e R
elat
ions
hip
Sal
ient
term
sTr
ansa
ctio
n va
lue
(` In
M
illio
n)26
OV
LSu
bsid
iary
ON
GC
, the
par
ent c
ompa
ny
guar
ante
e ha
s bee
n gi
ven
in
resp
ect o
f Ons
hore
Blo
ck E
P-3,
Mya
nmar
dat
ed 0
4/08
/201
4 in
favo
ur o
f Mya
nma
Oil
&
Gas
Cor
pora
tion
in re
spec
t of
the
Com
pany
's ob
ligat
ions
as
set f
orth
in th
e Pr
oduc
tion
Shar
ing
Con
tract
.
effe
ctiv
e fr
om
04.0
8.20
14G
uara
ntee
am
ount
(`
1,28
0.39
m
illio
n)
1,28
0.39
27O
VL
Subs
idia
ryFi
nanc
ial g
uara
ntee
for I
DB
I Tr
usts
heep
Ser
vice
s Lim
ited
for i
ssua
nce
of R
edee
mab
le
Non
-Con
verti
ble
Deb
entu
res
for a
n am
ount
of R
S 40
00
mill
ion
by O
VL-
Gua
rant
ee
for 8
.54%
10
Year
Bon
d fo
r Im
peria
l-Rus
sia
Due
on
06/0
1/20
20G
uara
ntee
am
ount
`3
,773
.58
mill
ion
3,77
3.58
28O
VL
Subs
idia
ryU
SD B
ON
D fo
r acq
uisi
tion
of 2
.721
3% p
artic
ipat
ing
inte
rest
of H
ess C
orpo
ratio
n in
the A
CG
fiel
ds a
nd 2
.36%
pa
rtici
patin
g in
tere
st in
the
BTC
Pip
elin
e) o
f: 1
0 ye
ar U
SD 5
00 m
illio
n-D
ue 0
7 M
ay 2
023
Due
on
07/0
5/20
23
Gua
rant
ee a
mou
nt
(`35
,124
.08
mill
ion)
35,1
24.0
8
29O
VL
Subs
idia
ryFi
nanc
ial g
uara
ntee
for L
ong
term
Loa
n of
USD
177
5 M
illio
n fo
r acq
uisi
tion
of R
-2,
10%
PI f
rom
Ana
dark
o
Due
on
27/1
1/20
20G
uara
ntee
am
ount
`1
22,8
84.0
7 m
illio
n
122,
884.
07
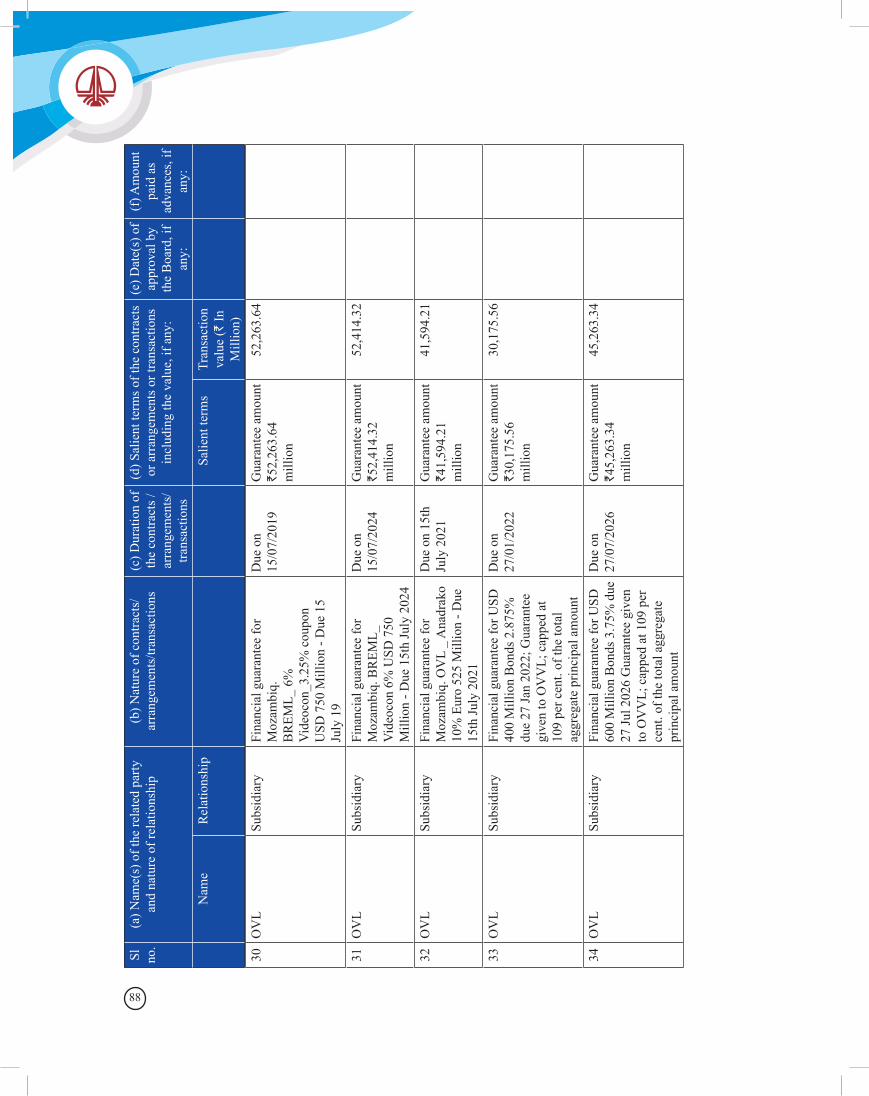
88
Sl
no.
(a) N
ame(
s) o
f the
rela
ted
party
an
d na
ture
of r
elat
ions
hip
(b) N
atur
e of
con
tract
s/ar
rang
emen
ts/tr
ansa
ctio
ns(c
) Dur
atio
n of
th
e co
ntra
cts /
ar
rang
emen
ts/
trans
actio
ns
(d) S
alie
nt te
rms o
f the
con
tract
s or
arr
ange
men
ts o
r tra
nsac
tions
in
clud
ing
the
valu
e, if
any
:
(e) D
ate(
s) o
f ap
prov
al b
y th
e B
oard
, if
any:
(f) A
mou
nt
paid
as
adva
nces
, if
any:
Nam
e R
elat
ions
hip
Sal
ient
term
sTr
ansa
ctio
n va
lue
(` In
M
illio
n)30
OV
LSu
bsid
iary
Fina
ncia
l gua
rant
ee fo
r M
ozam
biq.
B
REM
L_ 6
%
Vid
eoco
n_3.
25%
cou
pon
USD
750
Mill
ion
- Due
15
July
19
Due
on
15/0
7/20
19G
uara
ntee
am
ount
`5
2,26
3.64
m
illio
n
52,2
63.6
4
31O
VL
Subs
idia
ryFi
nanc
ial g
uara
ntee
for
Moz
ambi
q. B
REM
L_
Vid
eoco
n 6%
USD
750
M
illio
n - D
ue 1
5th
July
202
4
Due
on
15/0
7/20
24G
uara
ntee
am
ount
`5
2,41
4.32
m
illio
n
52,4
14.3
2
32O
VL
Subs
idia
ryFi
nanc
ial g
uara
ntee
for
Moz
ambi
q. O
VL
_ A
nadr
ako
10%
Eur
o 52
5 M
illio
n - D
ue
15th
July
202
1
Due
on
15th
Ju
ly 2
021
Gua
rant
ee a
mou
nt
`41,
594.
21
mill
ion
41,5
94.2
1
33O
VL
Subs
idia
ryFi
nanc
ial g
uara
ntee
for U
SD
400
Mill
ion
Bon
ds 2
.875
%
due
27 Ja
n 20
22; G
uara
ntee
gi
ven
to O
VV
L; c
appe
d at
10
9 pe
r cen
t. of
the
tota
l ag
greg
ate
prin
cipa
l am
ount
Due
on
27/0
1/20
22G
uara
ntee
am
ount
`3
0,17
5.56
m
illio
n
30,1
75.5
6
34O
VL
Subs
idia
ryFi
nanc
ial g
uara
ntee
for U
SD
600
Mill
ion
Bon
ds 3
.75%
due
27
Jul 2
026
Gua
rant
ee g
iven
to
OV
VL;
cap
ped
at 1
09 p
er
cent
. of t
he to
tal a
ggre
gate
pr
inci
pal a
mou
nt
Due
on
27/0
7/20
26G
uara
ntee
am
ount
`4
5,26
3.34
m
illio
n
45,2
63.3
4
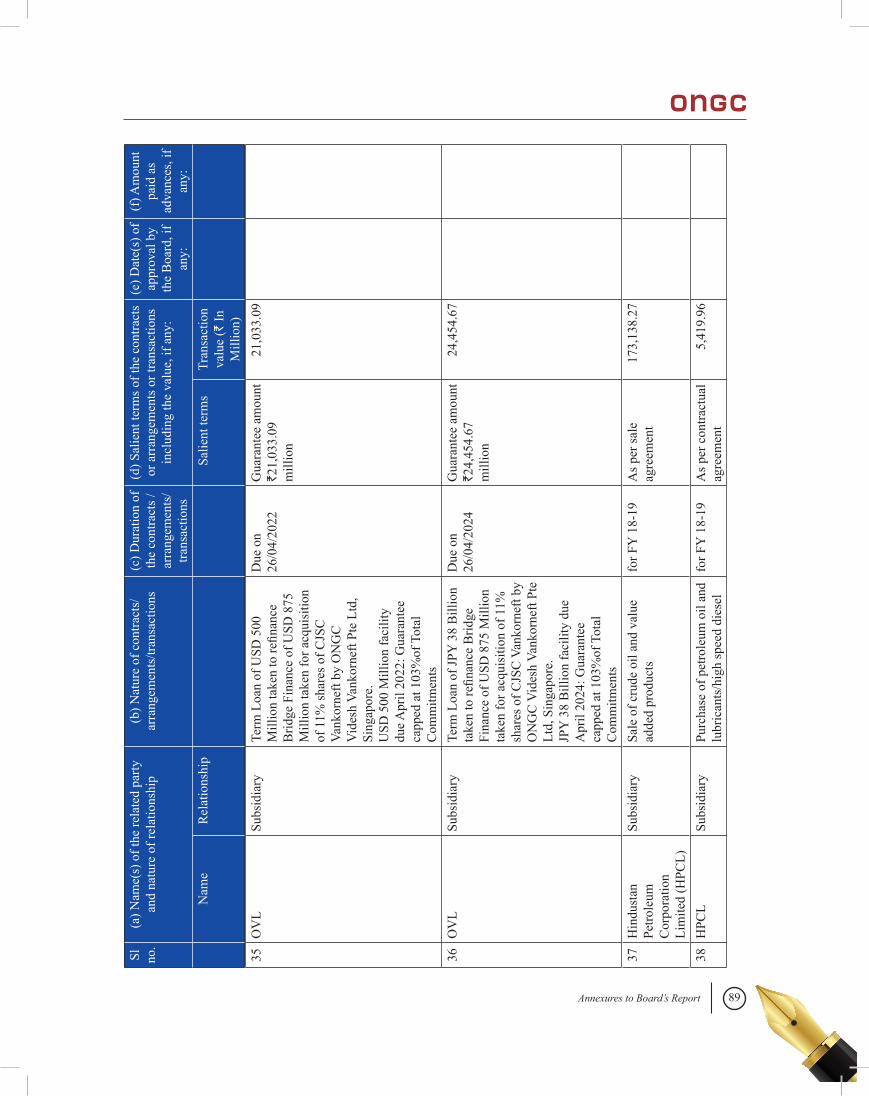
89Annexures to Board’s Report
Sl
no.
(a) N
ame(
s) o
f the
rela
ted
party
an
d na
ture
of r
elat
ions
hip
(b) N
atur
e of
con
tract
s/ar
rang
emen
ts/tr
ansa
ctio
ns(c
) Dur
atio
n of
th
e co
ntra
cts /
ar
rang
emen
ts/
trans
actio
ns
(d) S
alie
nt te
rms o
f the
con
tract
s or
arr
ange
men
ts o
r tra
nsac
tions
in
clud
ing
the
valu
e, if
any
:
(e) D
ate(
s) o
f ap
prov
al b
y th
e B
oard
, if
any:
(f) A
mou
nt
paid
as
adva
nces
, if
any:
Nam
e R
elat
ions
hip
Sal
ient
term
sTr
ansa
ctio
n va
lue
(` In
M
illio
n)35
OV
LSu
bsid
iary
Term
Loa
n of
USD
500
M
illio
n ta
ken
to re
finan
ce
Brid
ge F
inan
ce o
f USD
875
M
illio
n ta
ken
for a
cqui
sitio
n of
11%
shar
es o
f CJS
C
Vank
orne
ft by
ON
GC
V
ides
h Va
nkor
neft
Pte
Ltd,
Si
ngap
ore.
U
SD 5
00 M
illio
n fa
cilit
y du
e Apr
il 20
22: G
uara
ntee
ca
pped
at 1
03%
of T
otal
C
omm
itmen
ts
Due
on
26/0
4/20
22G
uara
ntee
am
ount
`2
1,03
3.09
m
illio
n
21,0
33.0
9
36O
VL
Subs
idia
ryTe
rm L
oan
of JP
Y 3
8 B
illio
n ta
ken
to re
finan
ce B
ridge
Fi
nanc
e of
USD
875
Mill
ion
take
n fo
r acq
uisi
tion
of 1
1%
shar
es o
f CJS
C V
anko
rnef
t by
ON
GC
Vid
esh
Vank
orne
ft Pt
e Lt
d, S
inga
pore
. JP
Y 3
8 B
illio
n fa
cilit
y du
e A
pril
2024
: Gua
rant
ee
capp
ed a
t 103
%of
Tot
al
Com
mitm
ents
Due
on
26/0
4/20
24G
uara
ntee
am
ount
`2
4,45
4.67
m
illio
n
24,4
54.6
7
37H
indu
stan
Pe
trole
um
Cor
pora
tion
Lim
ited
(HPC
L)
Subs
idia
rySa
le o
f cru
de o
il an
d va
lue
adde
d pr
oduc
tsfo
r FY
18-
19A
s per
sale
ag
reem
ent
173,
138.
27
38H
PCL
Subs
idia
ryPu
rcha
se o
f pet
role
um o
il an
d lu
bric
ants
/hig
h sp
eed
dies
elfo
r FY
18-
19A
s per
con
tract
ual
agre
emen
t5,
419.
96
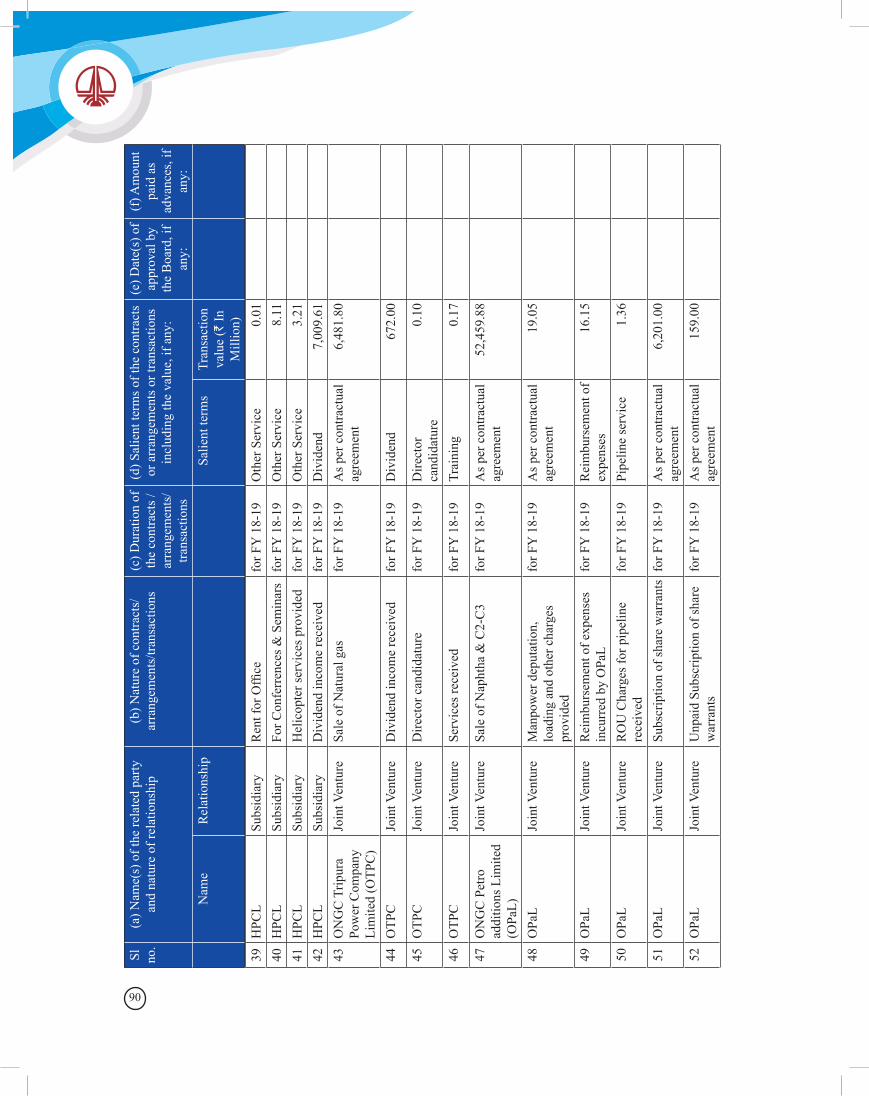
90
39H
PCL
Subs
idia
ryR
ent f
or O
ffice
for F
Y 1
8-19
Oth
er S
ervi
ce0.
0140
HPC
LSu
bsid
iary
For C
onfe
rren
ces &
Sem
inar
sfo
r FY
18-
19O
ther
Ser
vice
8.11
41H
PCL
Subs
idia
ryH
elic
opte
r ser
vice
s pro
vide
dfo
r FY
18-
19O
ther
Ser
vice
3.21
42H
PCL
Subs
idia
ryD
ivid
end
inco
me
rece
ived
for F
Y 1
8-19
Div
iden
d 7,
009.
6143
ON
GC
Trip
ura
Pow
er C
ompa
ny
Lim
ited
(OTP
C)
Join
t Ven
ture
Sale
of N
atur
al g
asfo
r FY
18-
19A
s per
con
tract
ual
agre
emen
t6,
481.
80
44O
TPC
Join
t Ven
ture
Div
iden
d in
com
e re
ceiv
edfo
r FY
18-
19D
ivid
end
672.
00
45O
TPC
Join
t Ven
ture
Dire
ctor
can
dida
ture
for F
Y 1
8-19
Dire
ctor
ca
ndid
atur
e0.
10
46O
TPC
Join
t Ven
ture
Serv
ices
rece
ived
for F
Y 1
8-19
Trai
ning
0.
17
47O
NG
C P
etro
ad
ditio
ns L
imite
d (O
PaL)
Join
t Ven
ture
Sale
of N
apht
ha &
C2-
C3
for F
Y 1
8-19
As p
er c
ontra
ctua
l ag
reem
ent
52,4
59.8
8
48O
PaL
Join
t Ven
ture
Man
pow
er d
eput
atio
n,
load
ing
and
othe
r cha
rges
pr
ovid
ed
for F
Y 1
8-19
As p
er c
ontra
ctua
l ag
reem
ent
19.0
5
49O
PaL
Join
t Ven
ture
Rei
mbu
rsem
ent o
f exp
ense
s in
curr
ed b
y O
PaL
for F
Y 1
8-19
Rei
mbu
rsem
ent o
f ex
pens
es
16.1
5
50O
PaL
Join
t Ven
ture
RO
U C
harg
es fo
r pip
elin
e re
ceiv
ed
for F
Y 1
8-19
Pipe
line
serv
ice
1.36
51O
PaL
Join
t Ven
ture
Subs
crip
tion
of sh
are
war
rant
sfo
r FY
18-
19A
s per
con
tract
ual
agre
emen
t6,
201.
00
52O
PaL
Join
t Ven
ture
Unp
aid
Subs
crip
tion
of sh
are
war
rant
sfo
r FY
18-
19A
s per
con
tract
ual
agre
emen
t15
9.00
Sl
no.
(a) N
ame(
s) o
f the
rela
ted
party
an
d na
ture
of r
elat
ions
hip
(b) N
atur
e of
con
tract
s/ar
rang
emen
ts/tr
ansa
ctio
ns(c
) Dur
atio
n of
th
e co
ntra
cts /
ar
rang
emen
ts/
trans
actio
ns
(d) S
alie
nt te
rms o
f the
con
tract
s or
arr
ange
men
ts o
r tra
nsac
tions
in
clud
ing
the
valu
e, if
any
:
(e) D
ate(
s) o
f ap
prov
al b
y th
e B
oard
, if
any:
(f) A
mou
nt
paid
as
adva
nces
, if
any:
Nam
e R
elat
ions
hip
Sal
ient
term
sTr
ansa
ctio
n va
lue
(` In
M
illio
n)
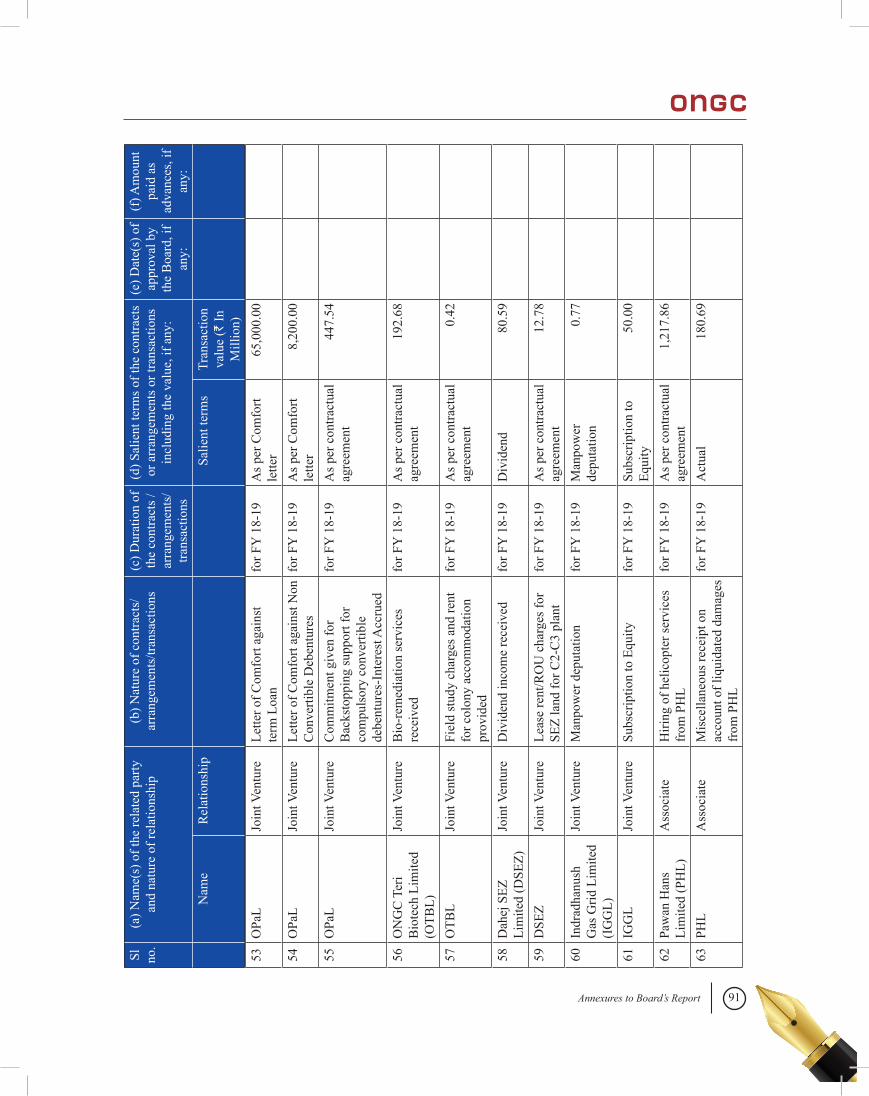
91Annexures to Board’s Report
Sl
no.
(a) N
ame(
s) o
f the
rela
ted
party
an
d na
ture
of r
elat
ions
hip
(b) N
atur
e of
con
tract
s/ar
rang
emen
ts/tr
ansa
ctio
ns(c
) Dur
atio
n of
th
e co
ntra
cts /
ar
rang
emen
ts/
trans
actio
ns
(d) S
alie
nt te
rms o
f the
con
tract
s or
arr
ange
men
ts o
r tra
nsac
tions
in
clud
ing
the
valu
e, if
any
:
(e) D
ate(
s) o
f ap
prov
al b
y th
e B
oard
, if
any:
(f) A
mou
nt
paid
as
adva
nces
, if
any:
Nam
e R
elat
ions
hip
Sal
ient
term
sTr
ansa
ctio
n va
lue
(` In
M
illio
n)53
OPa
LJo
int V
entu
reLe
tter o
f Com
fort
agai
nst
term
Loa
nfo
r FY
18-
19A
s per
Com
fort
lette
r65
,000
.00
54O
PaL
Join
t Ven
ture
Lette
r of C
omfo
rt ag
ains
t Non
C
onve
rtibl
e D
eben
ture
sfo
r FY
18-
19A
s per
Com
fort
lette
r8,
200.
00
55O
PaL
Join
t Ven
ture
Com
mitm
ent g
iven
for
Bac
ksto
ppin
g su
ppor
t for
co
mpu
lsor
y co
nver
tible
de
bent
ures
-Int
eres
t Acc
rued
for F
Y 1
8-19
As p
er c
ontra
ctua
l ag
reem
ent
447.
54
56O
NG
C T
eri
Bio
tech
Lim
ited
(OTB
L)
Join
t Ven
ture
Bio
-rem
edia
tion
serv
ices
re
ceiv
edfo
r FY
18-
19A
s per
con
tract
ual
agre
emen
t19
2.68
57O
TBL
Join
t Ven
ture
Fiel
d st
udy
char
ges a
nd re
nt
for c
olon
y ac
com
mod
atio
n pr
ovid
ed
for F
Y 1
8-19
As p
er c
ontra
ctua
l ag
reem
ent
0.42
58D
ahej
SEZ
Li
mite
d (D
SEZ)
Join
t Ven
ture
Div
iden
d in
com
e re
ceiv
edfo
r FY
18-
19D
ivid
end
80.5
9
59D
SEZ
Join
t Ven
ture
Leas
e re
nt/R
OU
cha
rges
for
SEZ
land
for C
2-C
3 pl
ant
for F
Y 1
8-19
As p
er c
ontra
ctua
l ag
reem
ent
12.7
8
60In
drad
hanu
sh
Gas
Grid
Lim
ited
(IG
GL)
Join
t Ven
ture
Man
pow
er d
eput
atio
nfo
r FY
18-
19M
anpo
wer
de
puta
tion
0.77
61IG
GL
Join
t Ven
ture
Subs
crip
tion
to E
quity
for F
Y 1
8-19
Subs
crip
tion
to
Equi
ty50
.00
62Pa
wan
Han
s Li
mite
d (P
HL)
Ass
ocia
teH
iring
of h
elic
opte
r ser
vice
s fr
om P
HL
for F
Y 1
8-19
As p
er c
ontra
ctua
l ag
reem
ent
1,21
7.86
63PH
LA
ssoc
iate
Mis
cella
neou
s rec
eipt
on
acco
unt o
f liq
uida
ted
dam
ages
fr
om P
HL
for F
Y 1
8-19
Act
ual
180.
69
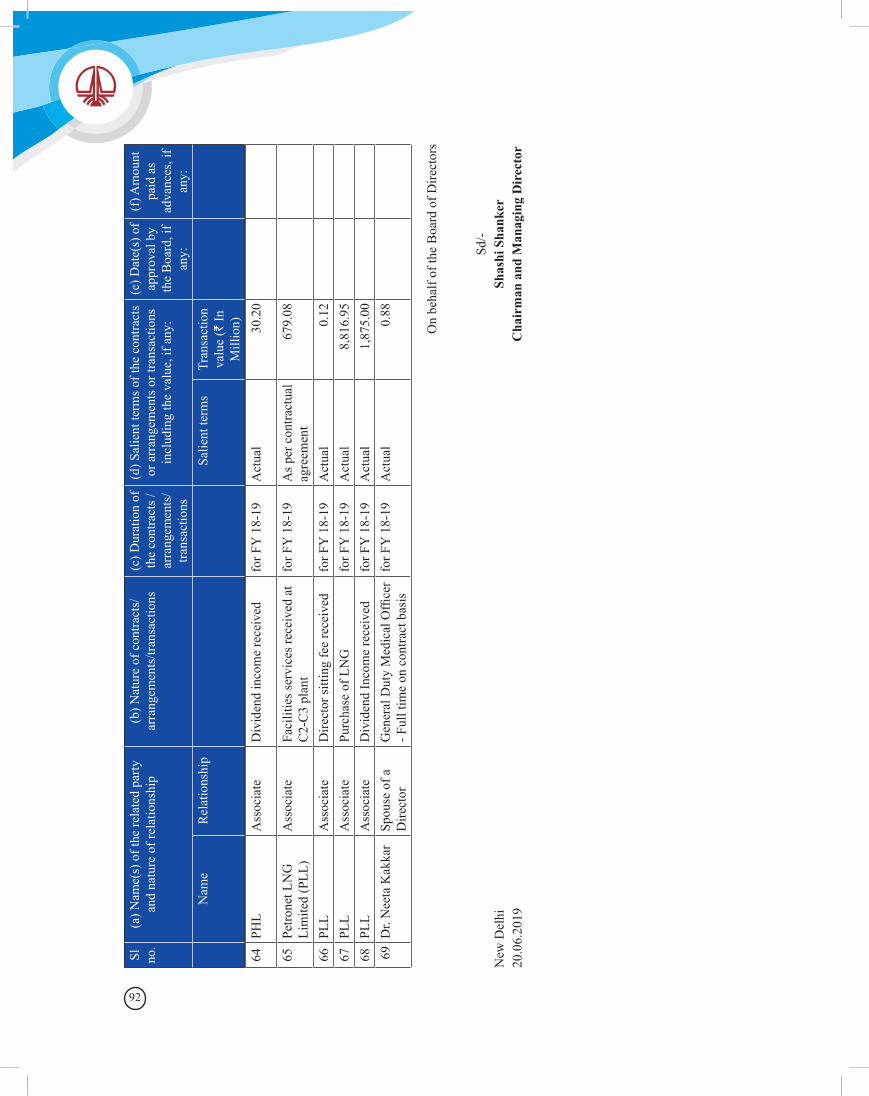
92
Sl
no.
(a) N
ame(
s) o
f the
rela
ted
party
an
d na
ture
of r
elat
ions
hip
(b) N
atur
e of
con
tract
s/ar
rang
emen
ts/tr
ansa
ctio
ns(c
) Dur
atio
n of
th
e co
ntra
cts /
ar
rang
emen
ts/
trans
actio
ns
(d) S
alie
nt te
rms o
f the
con
tract
s or
arr
ange
men
ts o
r tra
nsac
tions
in
clud
ing
the
valu
e, if
any
:
(e) D
ate(
s) o
f ap
prov
al b
y th
e B
oard
, if
any:
(f) A
mou
nt
paid
as
adva
nces
, if
any:
Nam
e R
elat
ions
hip
Sal
ient
term
sTr
ansa
ctio
n va
lue
(` In
M
illio
n)64
PHL
Ass
ocia
teD
ivid
end
inco
me
rece
ived
for F
Y 1
8-19
Act
ual
30.2
0
65Pe
trone
t LN
G
Lim
ited
(PLL
)A
ssoc
iate
Faci
litie
s ser
vice
s rec
eive
d at
C
2-C
3 pl
ant
for F
Y 1
8-19
As p
er c
ontra
ctua
l ag
reem
ent
679.
08
66PL
LA
ssoc
iate
Dire
ctor
sitti
ng fe
e re
ceiv
edfo
r FY
18-
19A
ctua
l0.
1267
PLL
Ass
ocia
tePu
rcha
se o
f LN
Gfo
r FY
18-
19A
ctua
l8,
816.
9568
PLL
Ass
ocia
teD
ivid
end
Inco
me
rece
ived
for F
Y 1
8-19
Act
ual
1,87
5.00
69D
r. N
eeta
Kak
kar
Spou
se o
f a
Dire
ctor
Gen
eral
Dut
y M
edic
al O
ffice
r - F
ull t
ime
on c
ontra
ct b
asis
for F
Y 1
8-19
Act
ual
0.88
On
beha
lf of
the
Boa
rd o
f Dire
ctor
s
Sd/-
Shas
hi S
hank
erC
hair
man
and
Man
agin
g D
irec
tor
New
Del
hi20
.06.
2019
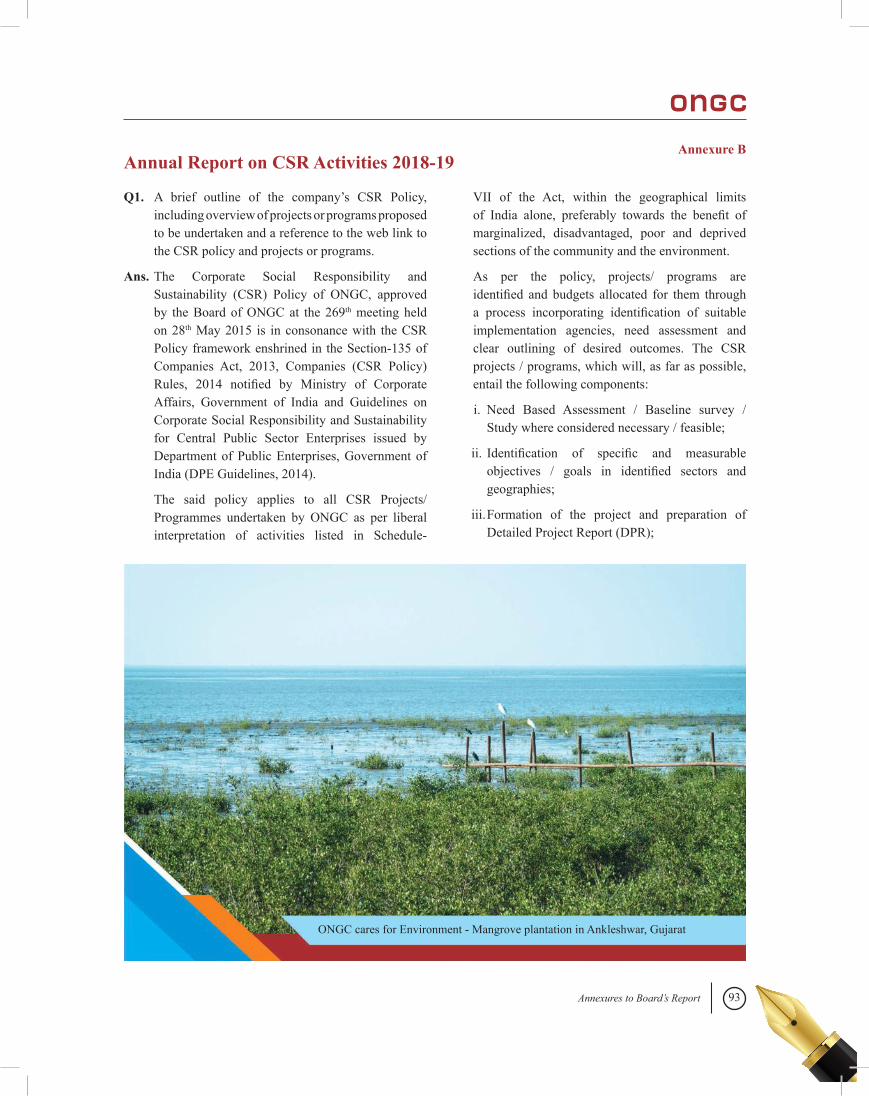
93Annexures to Board’s Report
Annexure BAnnual Report on CSR Activities 2018-19
Q1. A brief outline of the company’s CSR Policy, including overview of projects or programs proposed to be undertaken and a reference to the web link to the CSR policy and projects or programs.
Ans. The Corporate Social Responsibility and Sustainability (CSR) Policy of ONGC, approved by the Board of ONGC at the 269th meeting held on 28th May 2015 is in consonance with the CSR Policy framework enshrined in the Section-135 of Companies Act, 2013, Companies (CSR Policy) Rules, 2014 notified by Ministry of Corporate Affairs, Government of India and Guidelines on Corporate Social Responsibility and Sustainability for Central Public Sector Enterprises issued by Department of Public Enterprises, Government of India (DPE Guidelines, 2014).
The said policy applies to all CSR Projects/ Programmes undertaken by ONGC as per liberal interpretation of activities listed in Schedule-
VII of the Act, within the geographical limits of India alone, preferably towards the benefit of marginalized, disadvantaged, poor and deprived sections of the community and the environment.
As per the policy, projects/ programs are identified and budgets allocated for them through a process incorporating identification of suitable implementation agencies, need assessment and clear outlining of desired outcomes. The CSR projects / programs, which will, as far as possible, entail the following components:
i. Need Based Assessment / Baseline survey / Study where considered necessary / feasible;
ii. Identification of specific and measurable objectives / goals in identified sectors and geographies;
iii. Formation of the project and preparation of Detailed Project Report (DPR);
ONGC cares for Environment - Mangrove plantation in Ankleshwar, Gujarat
94
4 Rural development projects. approx. 20% of CSR budget
5 (1) Setting up homes and hostels for women and orphans; setting up old age homes, day care centres and other such facilities for senior citizens
(2) Protection of national heritage, art and culture including restoration of buildings and sites of historical importance and works of art; setting up public libraries; promotion and development of traditional arts and handicrafts
(3) Training to promote rural sports, regionally recognised sports, Paralympics sports and Olympic sports
(4) Other areas mentioned in Schedule - VII
approx. 20% of CSR budget
The website of ONGC,www.ongcindia.com, has the link to the CSR and Sustainability activities and to a host of policies directed towards the betterment of disadvantaged, vulnerable and marginalised section of stakeholders.
Q2. The composition of the CSR Committee as on 31.03.2019
Ans. CSR Committee comprises of the following members • Shri Ajai Malhotra, Independent Director –
Chairman• Dr. Santrupt B Misra, Independent Director –
Member• Shri A. K. Dwivedi, Director (Exploration)-
ONGC – Member • Shri Subhash Kumar, Director (Finance)-ONGC
– Member • Dr. Alka Mittal, Director (HR)-ONGC – Member
Q3. Average net profit of the Company for last three financial years.
Ans. Average net profit of the Company for last three financial years is as under;
Sl. No.
Sector of Activity Indicative Budget allocation
1 Promoting health care including preventative health care and sanitation and making available safe drinking water.
approx. 20% of CSR budget
2 Promoting education including special education and employment enhancing vocation skills especially among children, women, elderly, and the differently abled and livelihood enhancement projects.
approx. 20% of CSR budget
3 Ensuring environmental sustainability, ecological balance, protections of flora and fauna, animal welfare, agro forestry, conservation of natural resources and maintaining quality of soil, air and water.
approx. 20% of CSR budget
iv. Identification of time lines – clear specification of start date and end date;
v. Specification of annual financial allocation;
vi. Clear identification of beneficiaries (by name where possible);
vii. Clear identification of milestones for the complete duration of the Project/ programme;
viii. Preparation and signing of agreement with Implementing Agencies;
ix. Preparation and implementation of a comprehensive and concurrent documentation procedure;
x. Robust, periodic review and monitoring;
xi. Evaluation and Assessment, preferably both concurrent and final (wherever possible, by a competent third part);
xii. Mandatory Reporting;
The focus areas and budget allocation for individual CSR Projects / Programmes / activities are made by the Committee on CSR and Sustainability in the beginning of each financial year. The indicative budget allocation for broad sector of Activities are as under:
95Annexures to Board’s Report
Particulars 2015-16 2016-17 2017-18Profit as per Section 198 230,810.30 236,167.30 253,334.00
Average profit under Section 135 for the last three years
240,103.90
Q4. Prescribed CSR Expenditure (two per cent of the amount as in item 3 above)
Ans. The prescribed CSR expenditure for FY 2018-19 is `4,802.10 million (2% of the average profit under Section 135 for the last three years).
Q5. Details of CSR spent during the financial year
Ans. Out of the CSR Budget of `4,802.10 million, the Company spent an amount of `6,146.44 million in FY 2018-19. This translates to overall utilization of 128% of the CSR Budget for the year.
The details are enclosed.
` in million
Sd/-Shashi ShankerChairman and Managing Director
Sd/-Ajai Malhotra
Independent DirectorChairman, CSR
Committee
Q6. In case the company has failed to spend the two percent of the average net profit of the last three financial years or any part thereof, the company shall present the reasons for not spending the amount in the Board report
Ans. ONGC spent an amount of `6,146.44 million in FY 2018-19, which is more than two percent of the average net profit of the last three financial years.
Responsibility Statement
This is to certify that the implementation and monitoring of the CSR Policy in respect of all projects / programs covered under CSR initiatives for the year 2018-19, is in compliance with CSR objectives and Policy of the Company
ONGC supports girl child education.
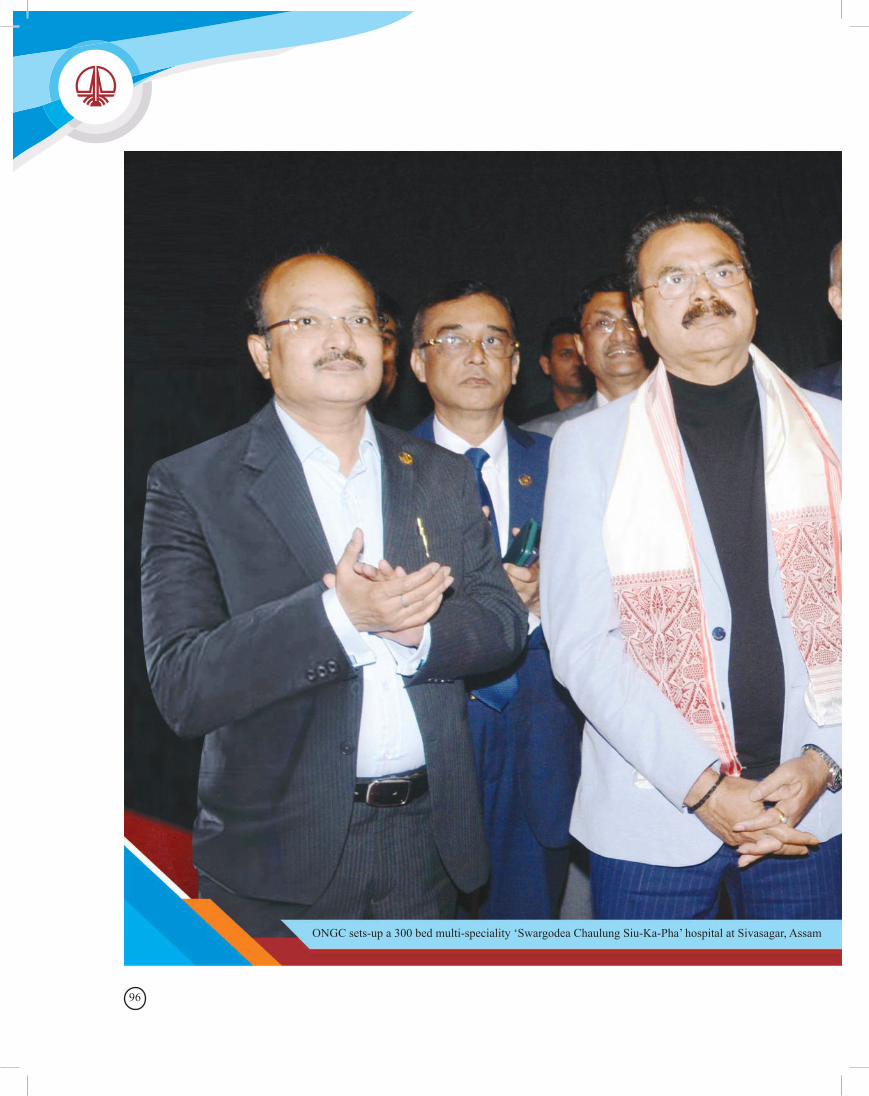
96
ONGC sets-up a 300 bed multi-speciality ‘Swargodea Chaulung Siu-Ka-Pha’ hospital at Sivasagar, Assam
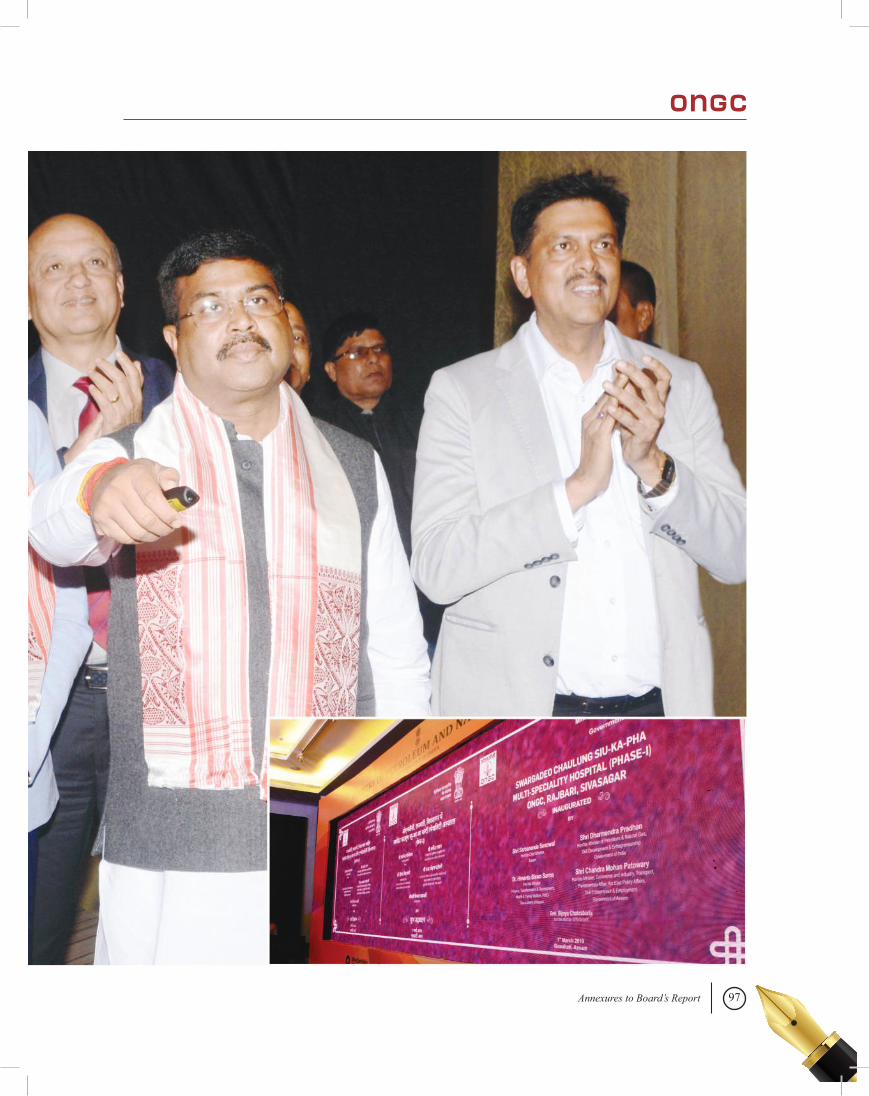
97Annexures to Board’s Report
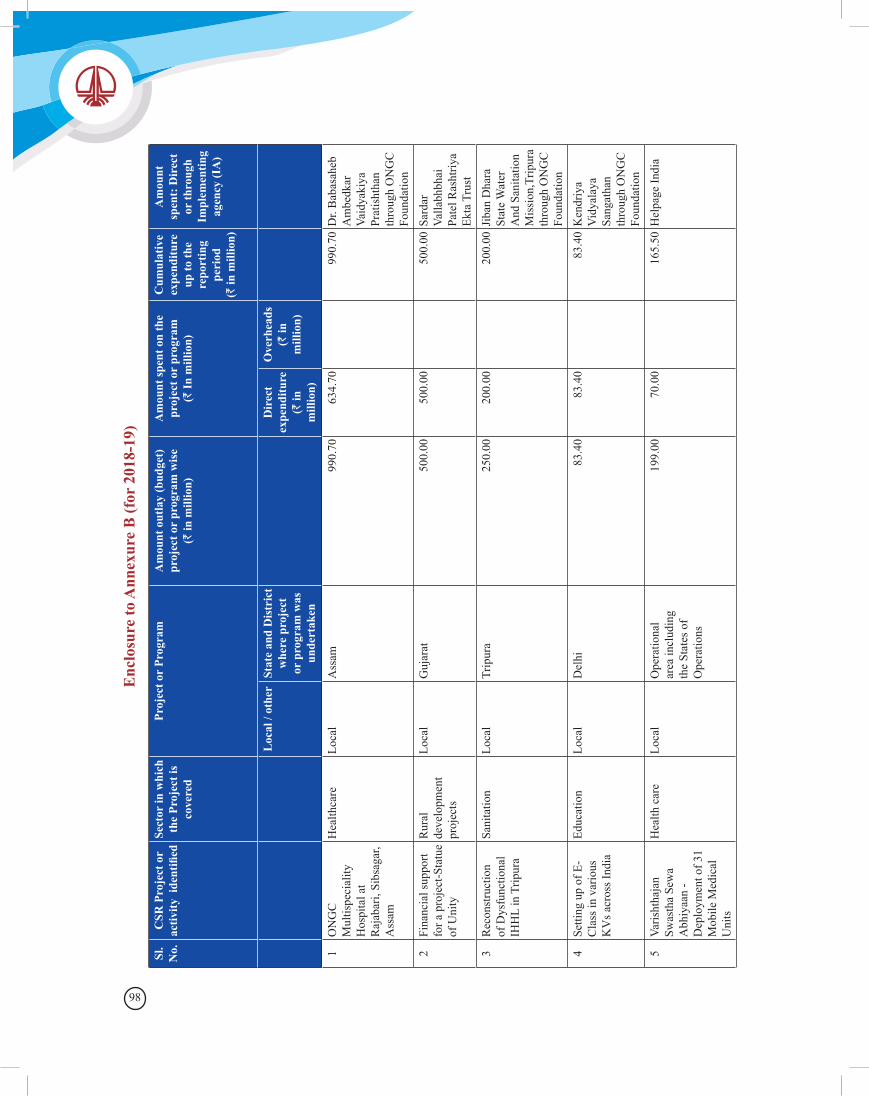
98
Enc
losu
re to
Ann
exur
e B
(for
201
8-19
)
Sl.
No.
CSR
Pro
ject
or
activ
ity i
dent
ified
Sect
or in
whi
ch
the
Proj
ect i
s co
vere
d
Proj
ect o
r Pr
ogra
mA
mou
nt o
utla
y (b
udge
t)
proj
ect o
r pr
ogra
m w
ise
(` in
mill
ion)
Am
ount
spen
t on
the
proj
ect o
r pr
ogra
m
(` In
mill
ion)
Cum
ulat
ive
expe
nditu
re
up to
the
repo
rtin
g pe
riod
(` in
mill
ion)
Am
ount
sp
ent:
Dir
ect
or th
roug
h Im
plem
entin
g ag
ency
(IA
)
Loc
al /
othe
rSt
ate
and
Dis
tric
t w
here
pro
ject
or
pro
gram
was
un
dert
aken
Dir
ect
expe
nditu
re(`
in
mill
ion)
Ove
rhea
ds(`
in
mill
ion)
1O
NG
C
Mul
tispe
cial
ity
Hos
pita
l at
Raj
abar
i, Si
bsag
ar,
Ass
am
Hea
lthca
reLo
cal
Ass
am99
0.70
634.
7099
0.70
Dr.
Bab
asah
eb
Am
bedk
ar
Vaid
yaki
ya
Prat
isht
han
th
roug
h O
NG
C
Foun
datio
n2
Fina
ncia
l sup
port
for a
pro
ject
-Sta
tue
of U
nity
Rur
al
deve
lopm
ent
proj
ects
Loca
lG
ujar
at50
0.00
500.
0050
0.00
Sard
ar
Valla
bhbh
ai
Pate
l Ras
htriy
a Ek
ta T
rust
3R
econ
stru
ctio
n of
Dys
func
tiona
l IH
HL
in T
ripur
a
Sani
tatio
nLo
cal
Trip
ura
250.
0020
0.00
200.
00Ji
ban
Dha
ra
Stat
e W
ater
A
nd S
anita
tion
Mis
sion
,Trip
ura
thro
ugh
ON
GC
Fo
unda
tion
4Se
tting
up
of E
- C
lass
in v
ario
us
KV
s acr
oss I
ndia
Educ
atio
nLo
cal
Del
hi83
.40
83.4
083
.40
Ken
driy
a V
idya
laya
Sa
ngat
han
thro
ugh
ON
GC
Fo
unda
tion
5Va
risht
haja
n Sw
asth
a Se
wa
Abh
iyaa
n -
Dep
loym
ent o
f 31
Mob
ile M
edic
al
Uni
ts
Hea
lth c
are
Loca
lO
pera
tiona
l ar
ea in
clud
ing
the
Stat
es o
f O
pera
tions
199.
0070
.00
165.
50H
elpa
ge In
dia
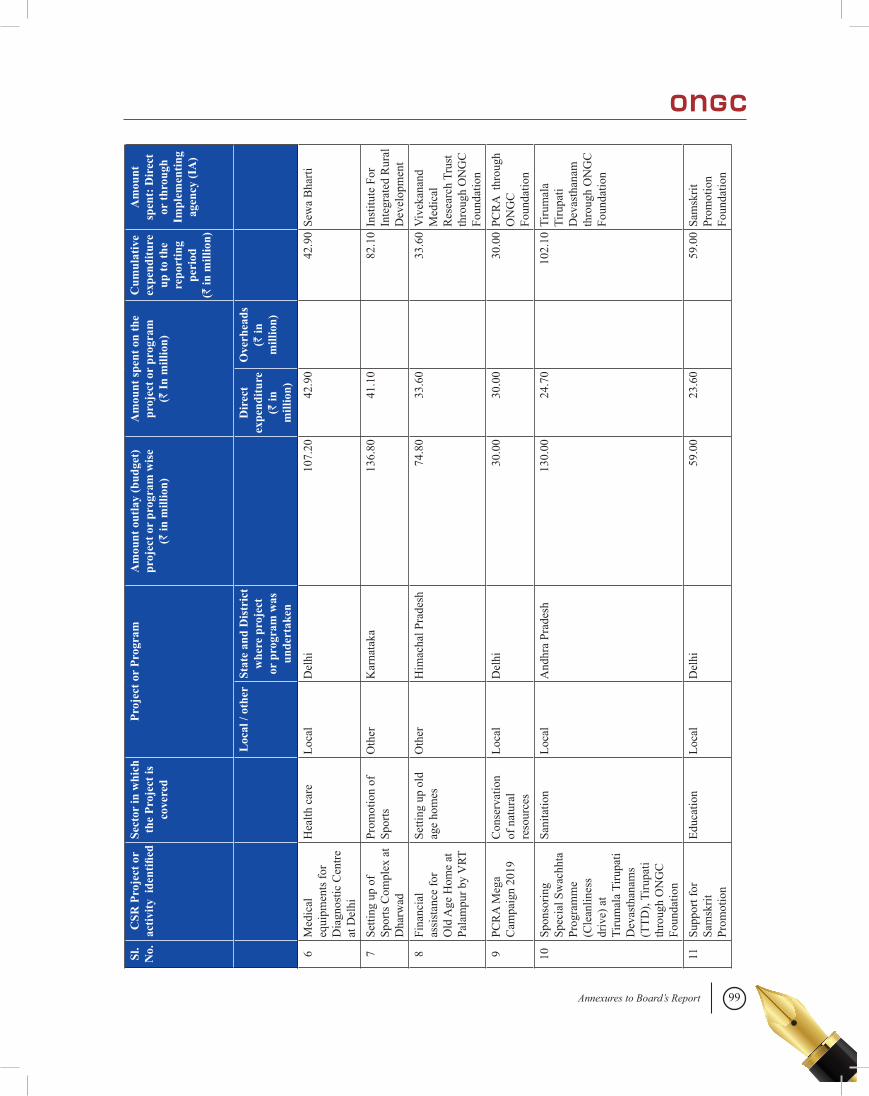
99Annexures to Board’s Report
Sl.
No.
CSR
Pro
ject
or
activ
ity i
dent
ified
Sect
or in
whi
ch
the
Proj
ect i
s co
vere
d
Proj
ect o
r Pr
ogra
mA
mou
nt o
utla
y (b
udge
t)
proj
ect o
r pr
ogra
m w
ise
(` in
mill
ion)
Am
ount
spen
t on
the
proj
ect o
r pr
ogra
m
(` In
mill
ion)
Cum
ulat
ive
expe
nditu
re
up to
the
repo
rtin
g pe
riod
(` in
mill
ion)
Am
ount
sp
ent:
Dir
ect
or th
roug
h Im
plem
entin
g ag
ency
(IA
)
Loc
al /
othe
rSt
ate
and
Dis
tric
t w
here
pro
ject
or
pro
gram
was
un
dert
aken
Dir
ect
expe
nditu
re(`
in
mill
ion)
Ove
rhea
ds(`
in
mill
ion)
6M
edic
al
equi
pmen
ts fo
r D
iagn
ostic
Cen
tre
at D
elhi
Hea
lth c
are
Loca
lD
elhi
107.
2042
.90
42.9
0Se
wa
Bha
rti
7Se
tting
up
of
Spor
ts C
ompl
ex a
t D
harw
ad
Prom
otio
n of
Sp
orts
Oth
erK
arna
taka
136.
8041
.10
82.1
0In
stitu
te F
or
Inte
grat
ed R
ural
D
evel
opm
ent
8Fi
nanc
ial
assi
stan
ce fo
r O
ld A
ge H
ome
at
Pala
mpu
r by
VRT
Setti
ng u
p ol
d ag
e ho
mes
Oth
erH
imac
hal P
rade
sh74
.80
33.6
033
.60
Viv
ekan
and
Med
ical
R
esea
rch
Trus
t th
roug
h O
NG
C
Foun
datio
n9
PCR
A M
ega
Cam
paig
n 20
19C
onse
rvat
ion
of n
atur
al
reso
urce
s
Loca
lD
elhi
30.0
030
.00
30.0
0PC
RA
thr
ough
O
NG
C
Foun
datio
n10
Spon
sorin
g Sp
ecia
l Sw
achh
ta
Prog
ram
me
(Cle
anlin
ess
driv
e) a
t Ti
rum
ala
Tiru
pati
Dev
asth
anam
s (T
TD),
Tiru
pati
thro
ugh
ON
GC
Fo
unda
tion
Sani
tatio
nLo
cal
And
hra
Prad
esh
130.
0024
.70
102.
10Ti
rum
ala
Tiru
pati
Dev
asth
anam
th
roug
h O
NG
C
Foun
datio
n
11Su
ppor
t for
Sa
msk
rit
Prom
otio
n
Educ
atio
nLo
cal
Del
hi59
.00
23.6
059
.00
Sam
skrit
Pr
omot
ion
Foun
datio
n
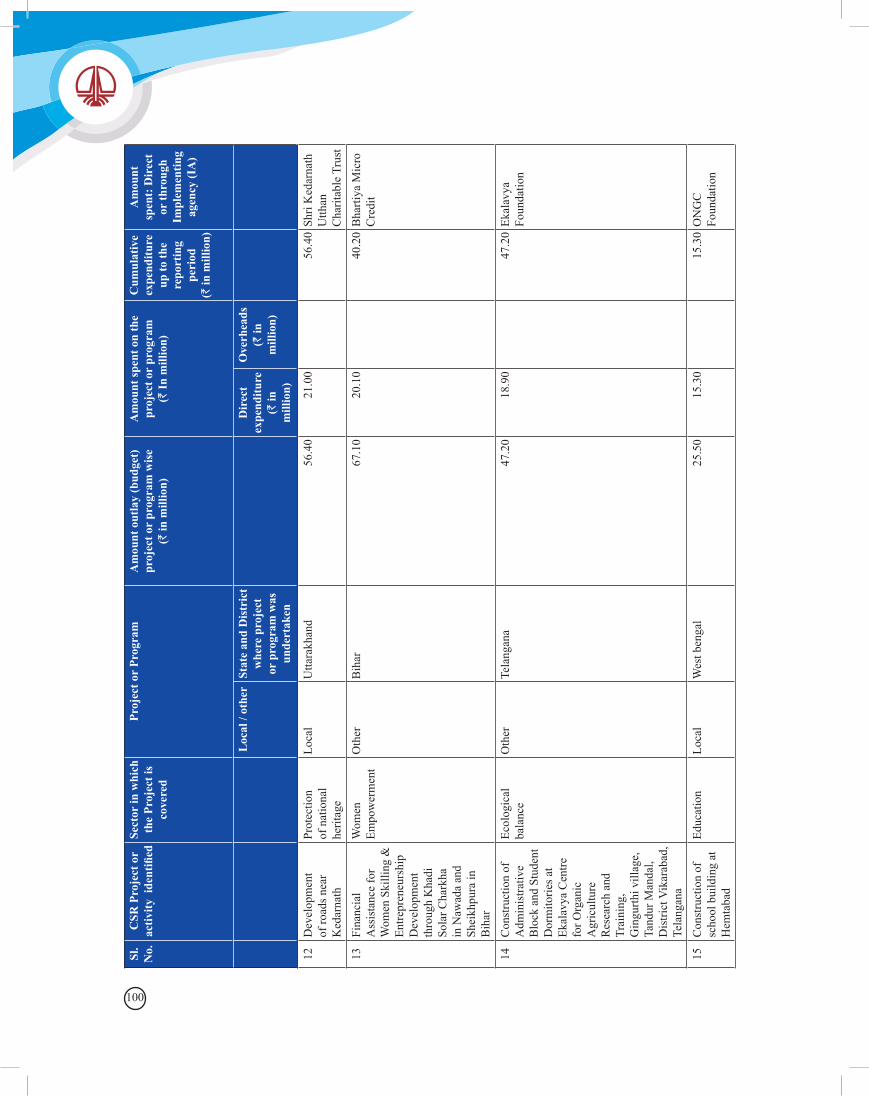
100
Sl.
No.
CSR
Pro
ject
or
activ
ity i
dent
ified
Sect
or in
whi
ch
the
Proj
ect i
s co
vere
d
Proj
ect o
r Pr
ogra
mA
mou
nt o
utla
y (b
udge
t)
proj
ect o
r pr
ogra
m w
ise
(` in
mill
ion)
Am
ount
spen
t on
the
proj
ect o
r pr
ogra
m
(` In
mill
ion)
Cum
ulat
ive
expe
nditu
re
up to
the
repo
rtin
g pe
riod
(` in
mill
ion)
Am
ount
sp
ent:
Dir
ect
or th
roug
h Im
plem
entin
g ag
ency
(IA
)
Loc
al /
othe
rSt
ate
and
Dis
tric
t w
here
pro
ject
or
pro
gram
was
un
dert
aken
Dir
ect
expe
nditu
re(`
in
mill
ion)
Ove
rhea
ds(`
in
mill
ion)
12D
evel
opm
ent
of ro
ads n
ear
Ked
arna
th
Prot
ectio
n of
nat
iona
l he
ritag
e
Loca
lU
ttara
khan
d56
.40
21.0
056
.40
Shri
Ked
arna
th
Utth
an
Cha
ritab
le T
rust
13Fi
nanc
ial
Ass
ista
nce
for
Wom
en S
killi
ng &
En
trepr
eneu
rshi
p D
evel
opm
ent
thro
ugh
Kha
di
Sola
r Cha
rkha
in
Naw
ada
and
Shei
khpu
ra in
B
ihar
Wom
en
Empo
wer
men
tO
ther
Bih
ar67
.10
20.1
040
.20
Bha
rtiya
Mic
ro
Cre
dit
14C
onst
ruct
ion
of
Adm
inis
trativ
e B
lock
and
Stu
dent
D
orm
itorie
s at
Ekal
avya
Cen
tre
for O
rgan
ic
Agr
icul
ture
R
esea
rch
and
Trai
ning
, G
ingu
rthi v
illag
e,
Tand
ur M
anda
l, D
istri
ct V
ikar
abad
, Te
lang
ana
Ecol
ogic
al
bala
nce
Oth
erTe
lang
ana
47.2
018
.90
47.2
0Ek
alav
ya
Foun
datio
n
15C
onst
ruct
ion
of
scho
ol b
uild
ing
at
Hem
taba
d
Educ
atio
nLo
cal
Wes
t ben
gal
25.5
015
.30
15.3
0O
NG
C
Foun
datio
n
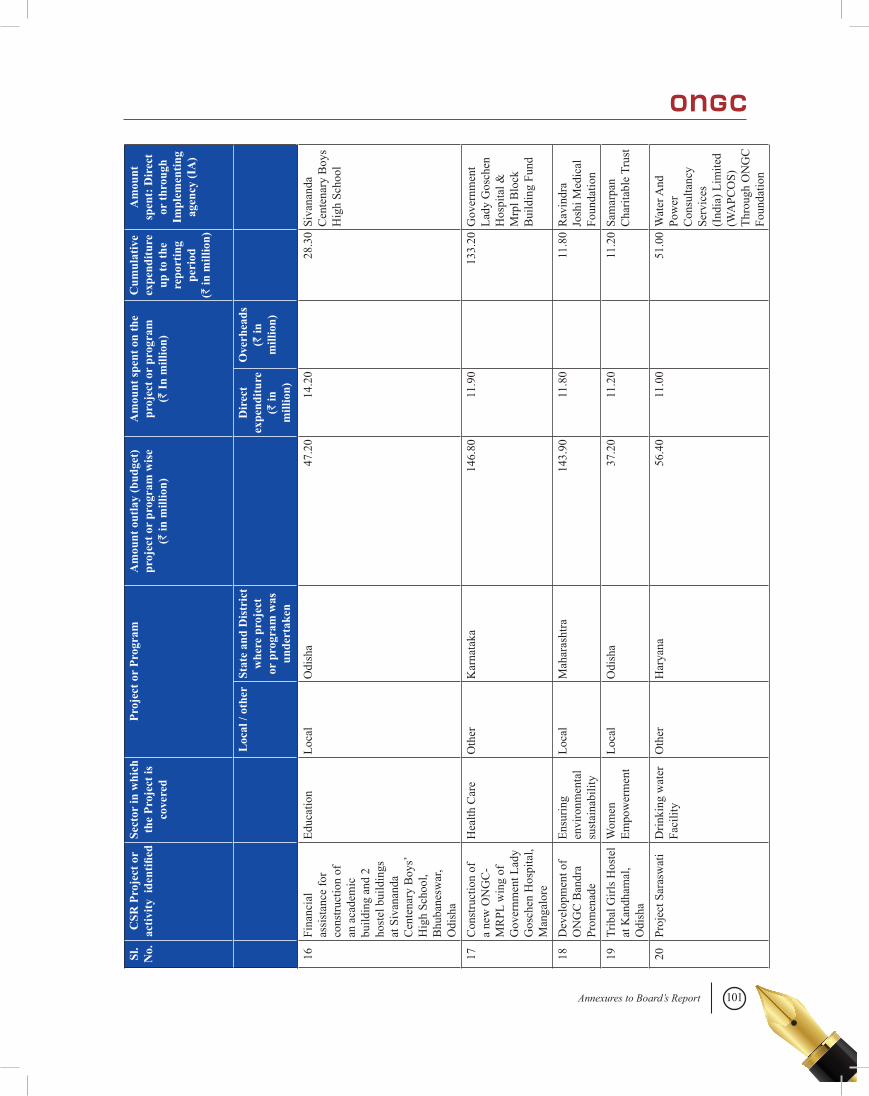
101Annexures to Board’s Report
Sl.
No.
CSR
Pro
ject
or
activ
ity i
dent
ified
Sect
or in
whi
ch
the
Proj
ect i
s co
vere
d
Proj
ect o
r Pr
ogra
mA
mou
nt o
utla
y (b
udge
t)
proj
ect o
r pr
ogra
m w
ise
(` in
mill
ion)
Am
ount
spen
t on
the
proj
ect o
r pr
ogra
m
(` In
mill
ion)
Cum
ulat
ive
expe
nditu
re
up to
the
repo
rtin
g pe
riod
(` in
mill
ion)
Am
ount
sp
ent:
Dir
ect
or th
roug
h Im
plem
entin
g ag
ency
(IA
)
Loc
al /
othe
rSt
ate
and
Dis
tric
t w
here
pro
ject
or
pro
gram
was
un
dert
aken
Dir
ect
expe
nditu
re(`
in
mill
ion)
Ove
rhea
ds(`
in
mill
ion)
16Fi
nanc
ial
assi
stan
ce fo
r co
nstru
ctio
n of
an
aca
dem
ic
build
ing
and
2 ho
stel
bui
ldin
gs
at S
ivan
anda
C
ente
nary
Boy
s’ H
igh
Scho
ol,
Bhu
bane
swar
, O
dish
a
Educ
atio
nLo
cal
Odi
sha
47.2
014
.20
28.3
0Si
vana
nda
Cen
tena
ry B
oys
Hig
h Sc
hool
17C
onst
ruct
ion
of
a ne
w O
NG
C-
MR
PL w
ing
of
Gov
ernm
ent L
ady
Gos
chen
Hos
pita
l, M
anga
lore
Hea
lth C
are
Oth
erK
arna
taka
146.
8011
.90
133.
20G
over
nmen
t La
dy G
osch
en
Hos
pita
l &
Mrp
l Blo
ck
Bui
ldin
g Fu
nd
18D
evel
opm
ent o
f O
NG
C B
andr
a Pr
omen
ade
Ensu
ring
envi
ronm
enta
l su
stai
nabi
lity
Loca
lM
ahar
asht
ra14
3.90
11.8
011
.80
Rav
indr
a Jo
shi M
edic
al
Foun
datio
n19
Trib
al G
irls H
oste
l at
Kan
dham
al,
Odi
sha
Wom
en
Empo
wer
men
tLo
cal
Odi
sha
37.2
011
.20
11.2
0Sa
mar
pan
Cha
ritab
le T
rust
20Pr
ojec
t Sar
asw
ati
Drin
king
wat
er
Faci
lity
Oth
erH
arya
na56
.40
11.0
051
.00
Wat
er A
nd
Pow
er
Con
sulta
ncy
Serv
ices
(I
ndia
) Lim
ited
(WA
PCO
S)
Thro
ugh
ON
GC
Fo
unda
tion

102
Sl.
No.
CSR
Pro
ject
or
activ
ity i
dent
ified
Sect
or in
whi
ch
the
Proj
ect i
s co
vere
d
Proj
ect o
r Pr
ogra
mA
mou
nt o
utla
y (b
udge
t)
proj
ect o
r pr
ogra
m w
ise
(` in
mill
ion)
Am
ount
spen
t on
the
proj
ect o
r pr
ogra
m
(` In
mill
ion)
Cum
ulat
ive
expe
nditu
re
up to
the
repo
rtin
g pe
riod
(` in
mill
ion)
Am
ount
sp
ent:
Dir
ect
or th
roug
h Im
plem
entin
g ag
ency
(IA
)
Loc
al /
othe
rSt
ate
and
Dis
tric
t w
here
pro
ject
or
pro
gram
was
un
dert
aken
Dir
ect
expe
nditu
re(`
in
mill
ion)
Ove
rhea
ds(`
in
mill
ion)
21C
onst
ruct
ion
of a
n ac
adem
ic
build
ing
and
a ho
stel
bui
ldin
g at
Sa
rasw
ati S
ishu
V
idya
Man
dir,
Dih
apad
hala
, B
hanj
anag
ar,
Gan
jam
dis
trict
, O
dish
a
Educ
atio
nLo
cal
Odi
sha
18.2
010
.90
10.9
0O
NG
C
Foun
datio
n
22C
onve
ntio
n C
entre
at K
apko
t, B
ages
war
Rur
al
deve
lopm
ent
proj
ects
Loca
lU
ttara
khan
d24
.00
10.8
010
.80
ON
GC
Fo
unda
tion
23Su
ppor
t to
Man
av
Sew
a Pr
atis
htan
fo
r Sch
ool,
host
el &
hal
l at
Kar
mad
ang,
Wes
t B
enga
l
Educ
atio
nLo
cal
Wes
t ben
gal
15.9
010
.40
15.1
0M
anav
Sev
a Pr
atis
than
24Yo
ga c
amps
in
Odi
sha
on IY
D
2018
Hea
lthca
reLo
cal
Odi
sha
10.0
010
.00
10.0
0Sw
ami
Viv
ekan
anda
Yo
ga
Anu
sand
hana
Sa
mst
hana
(S
VYA
SA)
25C
SR P
roje
cts o
f O
nsho
re A
sset
/ B
asin
Sche
dule
VII
of
the
Com
pani
es
Act
Loca
lO
pera
tiona
l ar
ea in
clud
ing
the
Stat
es o
f O
pera
tions
2403
.10
2004
.10
2165
.90
Vario
us
impl
emen
ting
Age
ncie
s
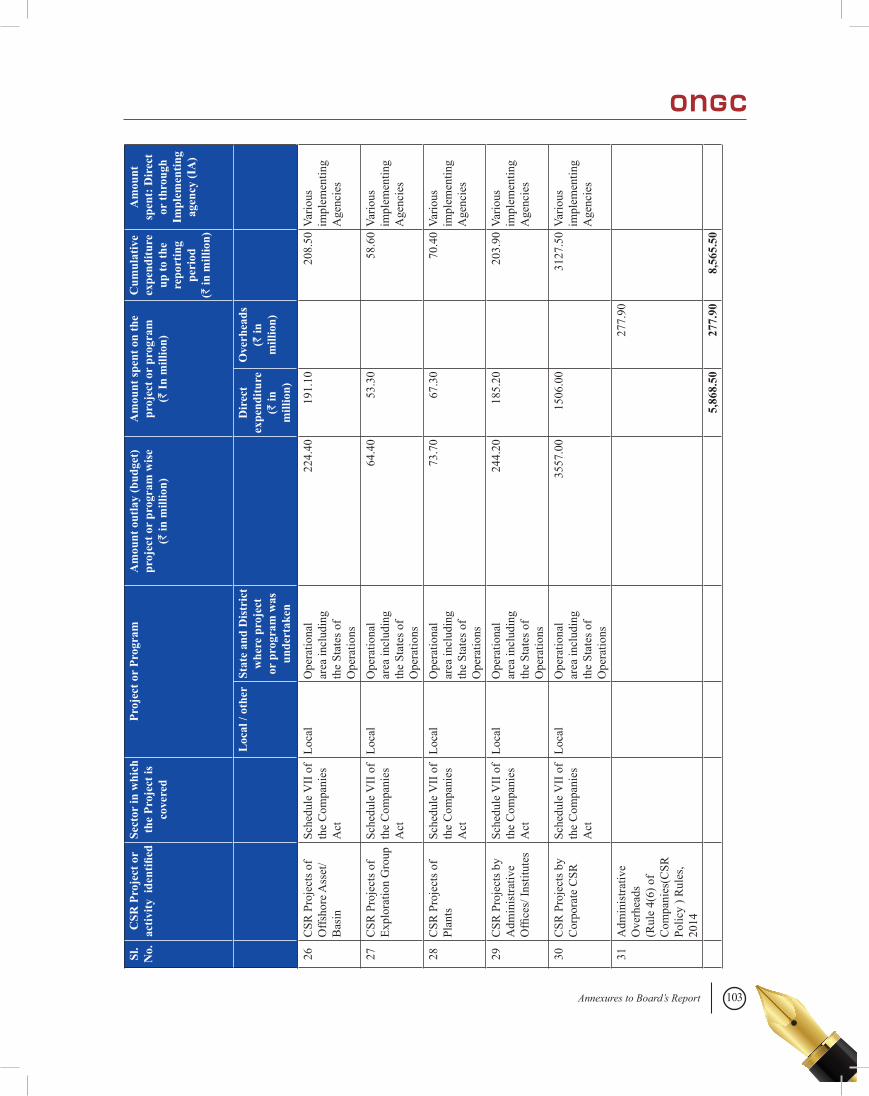
103Annexures to Board’s Report
Sl.
No.
CSR
Pro
ject
or
activ
ity i
dent
ified
Sect
or in
whi
ch
the
Proj
ect i
s co
vere
d
Proj
ect o
r Pr
ogra
mA
mou
nt o
utla
y (b
udge
t)
proj
ect o
r pr
ogra
m w
ise
(` in
mill
ion)
Am
ount
spen
t on
the
proj
ect o
r pr
ogra
m
(` In
mill
ion)
Cum
ulat
ive
expe
nditu
re
up to
the
repo
rtin
g pe
riod
(` in
mill
ion)
Am
ount
sp
ent:
Dir
ect
or th
roug
h Im
plem
entin
g ag
ency
(IA
)
Loc
al /
othe
rSt
ate
and
Dis
tric
t w
here
pro
ject
or
pro
gram
was
un
dert
aken
Dir
ect
expe
nditu
re(`
in
mill
ion)
Ove
rhea
ds(`
in
mill
ion)
26C
SR P
roje
cts o
f O
ffsho
re A
sset
/ B
asin
Sche
dule
VII
of
the
Com
pani
es
Act
Loca
lO
pera
tiona
l ar
ea in
clud
ing
the
Stat
es o
f O
pera
tions
224.
4019
1.10
208.
50Va
rious
im
plem
entin
g A
genc
ies
27C
SR P
roje
cts o
f Ex
plor
atio
n G
roup
Sche
dule
VII
of
the
Com
pani
es
Act
Loca
lO
pera
tiona
l ar
ea in
clud
ing
the
Stat
es o
f O
pera
tions
64.4
053
.30
58.6
0Va
rious
im
plem
entin
g A
genc
ies
28C
SR P
roje
cts o
f Pl
ants
Sc
hedu
le V
II o
f th
e C
ompa
nies
A
ct
Loca
lO
pera
tiona
l ar
ea in
clud
ing
the
Stat
es o
f O
pera
tions
73.7
067
.30
70.4
0Va
rious
im
plem
entin
g A
genc
ies
29C
SR P
roje
cts b
y A
dmin
istra
tive
Offi
ces/
Inst
itute
s
Sche
dule
VII
of
the
Com
pani
es
Act
Loca
lO
pera
tiona
l ar
ea in
clud
ing
the
Stat
es o
f O
pera
tions
244.
2018
5.20
203.
90Va
rious
im
plem
entin
g A
genc
ies
30C
SR P
roje
cts b
y C
orpo
rate
CSR
Sche
dule
VII
of
the
Com
pani
es
Act
Loca
lO
pera
tiona
l ar
ea in
clud
ing
the
Stat
es o
f O
pera
tions
3557
.00
1506
.00
3127
.50
Vario
us
impl
emen
ting
Age
ncie
s
31A
dmin
istra
tive
Ove
rhea
ds
(Rul
e 4(
6) o
f C
ompa
nies
(CSR
Po
licy
) Rul
es,
2014
277.
90
5,86
8.50
277.
908,
565.
50
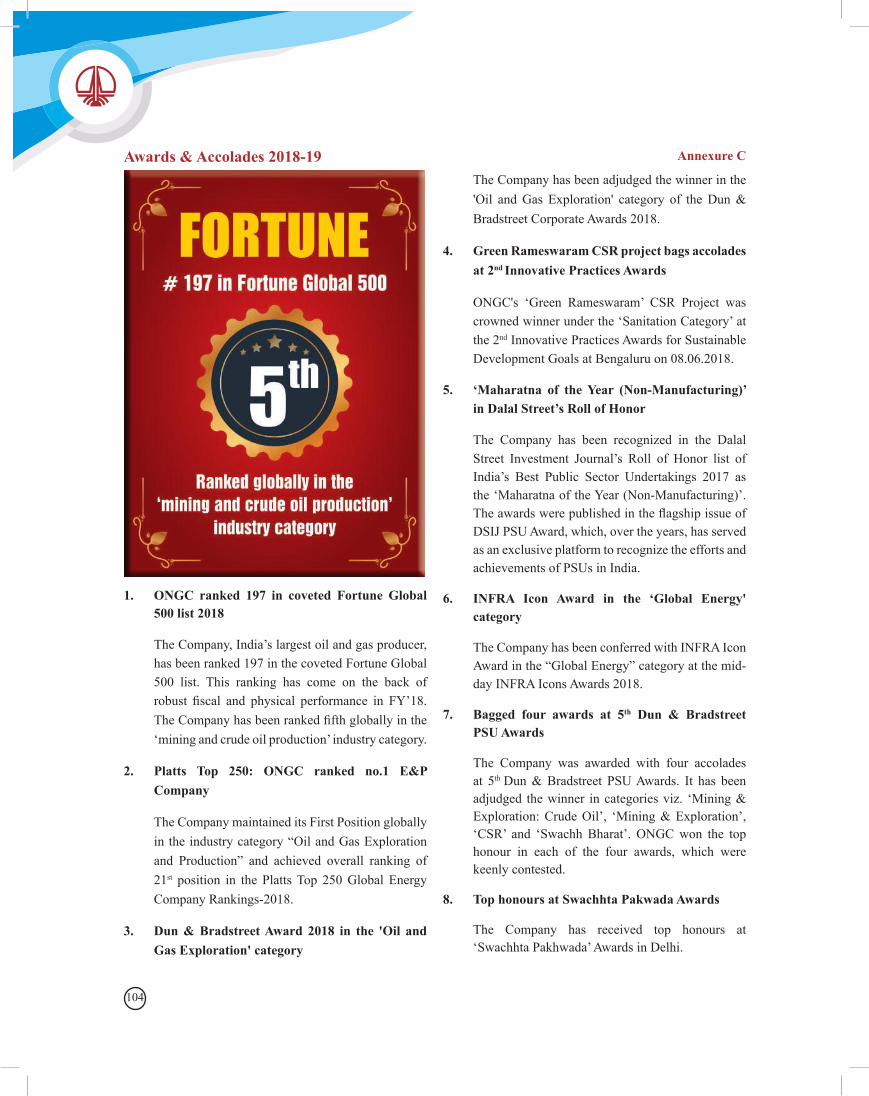
104
Annexure CAwards & Accolades 2018-19
1. ONGC ranked 197 in coveted Fortune Global 500 list 2018
The Company, India’s largest oil and gas producer, has been ranked 197 in the coveted Fortune Global 500 list. This ranking has come on the back of robust fiscal and physical performance in FY’18.The Company has been ranked fifth globally in the ‘mining and crude oil production’ industry category.
2. Platts Top 250: ONGC ranked no.1 E&P Company
The Company maintained its First Position globally in the industry category “Oil and Gas Exploration and Production” and achieved overall ranking of 21st position in the Platts Top 250 Global Energy Company Rankings-2018.
3. Dun & Bradstreet Award 2018 in the 'Oil and Gas Exploration' category
The Company has been adjudged the winner in the 'Oil and Gas Exploration' category of the Dun & Bradstreet Corporate Awards 2018.
4. Green Rameswaram CSR project bags accolades at 2nd Innovative Practices Awards
ONGC's ‘Green Rameswaram’ CSR Project was crowned winner under the ‘Sanitation Category’ at the 2nd Innovative Practices Awards for Sustainable Development Goals at Bengaluru on 08.06.2018.
5. ‘Maharatna of the Year (Non-Manufacturing)’ in Dalal Street’s Roll of Honor
The Company has been recognized in the Dalal Street Investment Journal’s Roll of Honor list of India’s Best Public Sector Undertakings 2017 as the ‘Maharatna of the Year (Non-Manufacturing)’. The awards were published in the flagship issue of DSIJ PSU Award, which, over the years, has served as an exclusive platform to recognize the efforts and achievements of PSUs in India.
6. INFRA Icon Award in the ‘Global Energy' category
The Company has been conferred with INFRA Icon Award in the “Global Energy” category at the mid-day INFRA Icons Awards 2018.
7. Bagged four awards at 5th Dun & Bradstreet PSU Awards
The Company was awarded with four accolades at 5th Dun & Bradstreet PSU Awards. It has been adjudged the winner in categories viz. ‘Mining & Exploration: Crude Oil’, ‘Mining & Exploration’, ‘CSR’ and ‘Swachh Bharat’. ONGC won the top honour in each of the four awards, which were keenly contested.
8. Top honours at Swachhta Pakwada Awards
The Company has received top honours at ‘Swachhta Pakhwada’ Awards in Delhi.
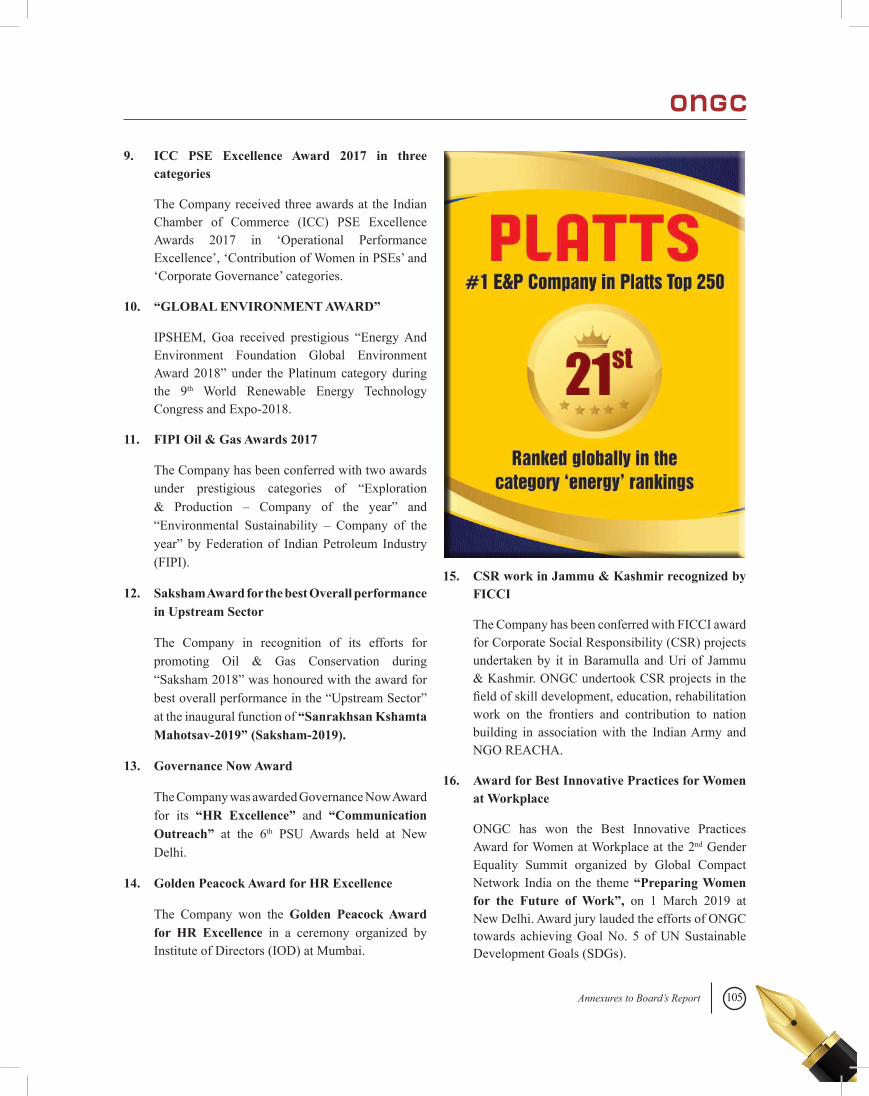
105Annexures to Board’s Report
9. ICC PSE Excellence Award 2017 in three categories
The Company received three awards at the Indian Chamber of Commerce (ICC) PSE Excellence Awards 2017 in ‘Operational Performance Excellence’, ‘Contribution of Women in PSEs’ and ‘Corporate Governance’ categories.
10. “GLOBAL ENVIRONMENT AWARD”
IPSHEM, Goa received prestigious “Energy And Environment Foundation Global Environment Award 2018” under the Platinum category during the 9th World Renewable Energy Technology Congress and Expo-2018.
11. FIPI Oil & Gas Awards 2017
The Company has been conferred with two awards under prestigious categories of “Exploration & Production – Company of the year” and “Environmental Sustainability – Company of the year” by Federation of Indian Petroleum Industry (FIPI).
12. Saksham Award for the best Overall performance in Upstream Sector
The Company in recognition of its efforts for promoting Oil & Gas Conservation during “Saksham 2018” was honoured with the award for best overall performance in the “Upstream Sector” at the inaugural function of “Sanrakhsan Kshamta Mahotsav-2019” (Saksham-2019).
13. Governance Now Award
The Company was awarded Governance Now Award for its “HR Excellence” and “Communication Outreach” at the 6th PSU Awards held at New Delhi.
14. Golden Peacock Award for HR Excellence
The Company won the Golden Peacock Award for HR Excellence in a ceremony organized by Institute of Directors (IOD) at Mumbai.
15. CSR work in Jammu & Kashmir recognized by FICCI
The Company has been conferred with FICCI award for Corporate Social Responsibility (CSR) projects undertaken by it in Baramulla and Uri of Jammu & Kashmir. ONGC undertook CSR projects in the field of skill development, education, rehabilitation work on the frontiers and contribution to nation building in association with the Indian Army and NGO REACHA.
16. Award for Best Innovative Practices for Women at Workplace
ONGC has won the Best Innovative Practices Award for Women at Workplace at the 2nd Gender Equality Summit organized by Global Compact Network India on the theme “Preparing Women for the Future of Work”, on 1 March 2019 at New Delhi. Award jury lauded the efforts of ONGC towards achieving Goal No. 5 of UN Sustainable Development Goals (SDGs).
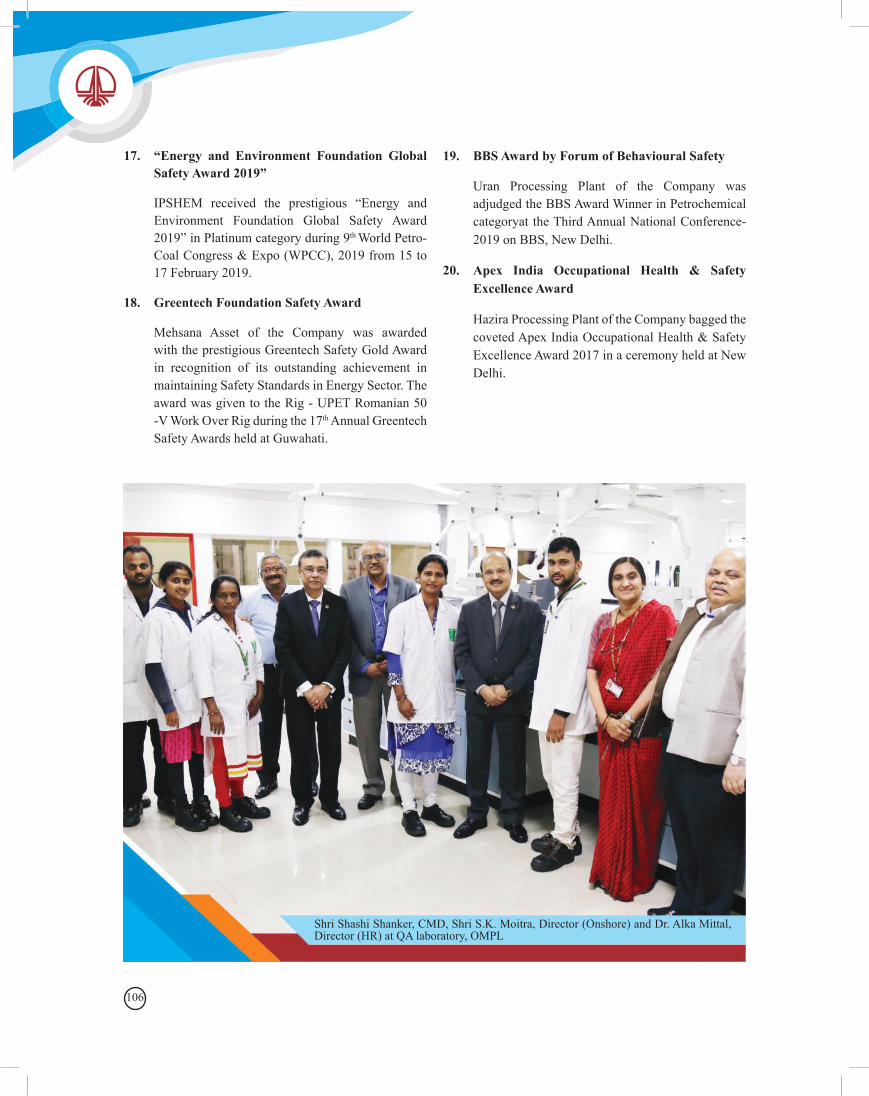
106
17. “Energy and Environment Foundation Global Safety Award 2019”
IPSHEM received the prestigious “Energy and Environment Foundation Global Safety Award 2019” in Platinum category during 9th World Petro-Coal Congress & Expo (WPCC), 2019 from 15 to 17 February 2019.
18. Greentech Foundation Safety Award
Mehsana Asset of the Company was awarded with the prestigious Greentech Safety Gold Award in recognition of its outstanding achievement in maintaining Safety Standards in Energy Sector. The award was given to the Rig - UPET Romanian 50 -V Work Over Rig during the 17th Annual Greentech Safety Awards held at Guwahati.
19. BBS Award by Forum of Behavioural Safety
Uran Processing Plant of the Company was adjudged the BBS Award Winner in Petrochemical categoryat the Third Annual National Conference- 2019 on BBS, New Delhi.
20. Apex India Occupational Health & Safety Excellence Award
Hazira Processing Plant of the Company bagged the coveted Apex India Occupational Health & Safety Excellence Award 2017 in a ceremony held at New Delhi.
Shri Shashi Shanker, CMD, Shri S.K. Moitra, Director (Onshore) and Dr. Alka Mittal, Director (HR) at QA laboratory, OMPL
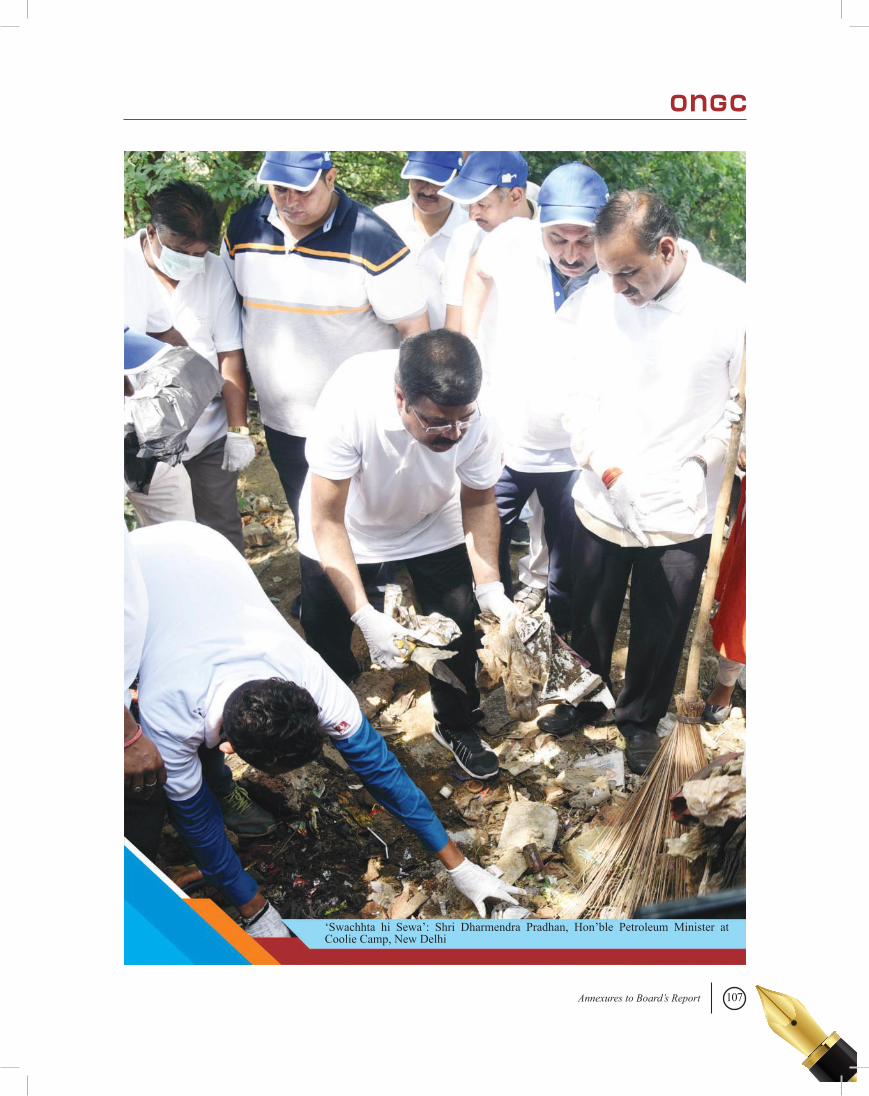
107Annexures to Board’s Report
‘Swachhta hi Sewa’: Shri Dharmendra Pradhan, Hon’ble Petroleum Minister at Coolie Camp, New Delhi
108
ANNEXURE- DForm No. MGT-9
EXTRACT OF ANNUAL RETURN for the Financial Year ended on March 31, 2019
[Pursuant to section 92 (3) of the Companies Act, 2013 and rule 12 (1) of the Companies (Management and Administration) Rules, 2014]
I. Registration and other details:
i) CIN : L74899DL1993GOI054155
ii) Registration Date : June 23, 1993
iii) Nameofthe Company : Oil and Natural Gas Corporation Limited
iv) Category/Sub-Category of the Company : Government Company
v) Address of the registered office and : Plot No. 5A - 5B, Nelson Mandela Road, Vasant contact details Kunj, New Delhi, Sout West Delhi -110070 Ph: 011-26754073 / 79, Fax: 011-26129081
vi) Whether listed Company : Yes
vii) Name, Address and Contact details of : Alankit Assignments Limited, ‘Alankit Heights’ Registrar and Transfer Agent, if any 3E/7, Jhandewalan Extension, New Delhi – 110055 Tel: 91-11-4254 1234/1960, Fax: 91-11-42541201/23552001, www.alankit.com, [email protected]
II. Principal business activities of the Company
All the business activities contributing10% or more of the total turnover of the Company shall be stated:-
Sl. No. Name and Description of main products/services
NIC Code of the Product/ service
% to total turnover of the Company
1 Crude Oil 061 70.74%2 Natural Gas 062 17.18%
III. Particulars of holding, subsidiary and associates companies
Sl. No.
Name and Address of the company
CIN/GLN Subsidiary/Joint
Venture Associate
% of Shares Held by ONGC
Applicable Section
1 ONGC Videsh Limited Plot No. 5A - 5B, Nelson Mandela Marg, Vasant Kunj New Delhi 110070
U74899DL1965GOI004343 Subsidiary 100.00% 2(87)
2 Mangalore Refinery and Petrochemicals LimitedMudapadav, Kuthethur P.O., Via Katipalla, Mangalore-575030
L23209KA1988GOI008959 Subsidiary 71.63% 2(87)
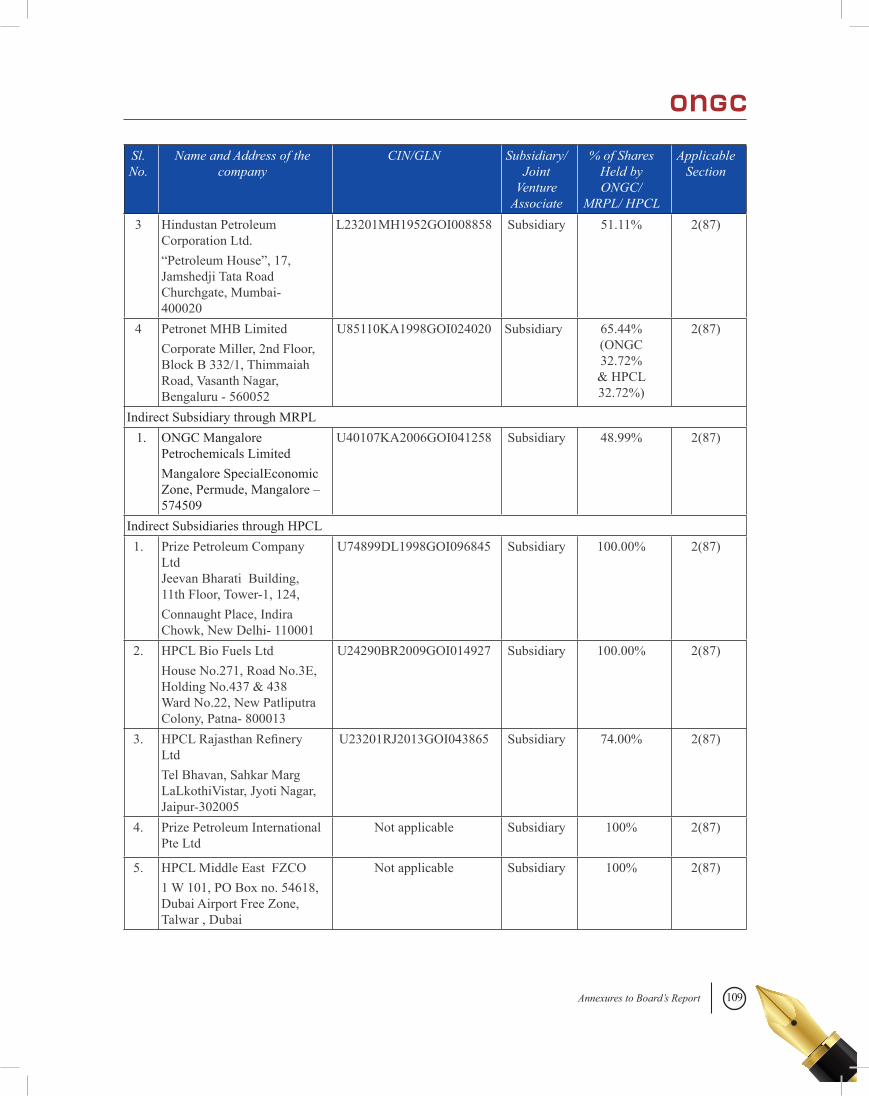
109Annexures to Board’s Report
Sl. No.
Name and Address of the company
CIN/GLN Subsidiary/Joint
Venture Associate
% of Shares Held by ONGC/
MRPL/ HPCL
Applicable Section
3 Hindustan Petroleum Corporation Ltd.“Petroleum House”, 17, Jamshedji Tata Road Churchgate, Mumbai- 400020
L23201MH1952GOI008858 Subsidiary 51.11% 2(87)
4 Petronet MHB LimitedCorporate Miller, 2nd Floor, Block B 332/1, Thimmaiah Road, Vasanth Nagar, Bengaluru - 560052
U85110KA1998GOI024020 Subsidiary 65.44% (ONGC 32.72% & HPCL 32.72%)
2(87)
Indirect Subsidiary through MRPL1. ONGC Mangalore
Petrochemicals LimitedMangalore SpecialEconomic Zone, Permude, Mangalore – 574509
U40107KA2006GOI041258 Subsidiary 48.99% 2(87)
Indirect Subsidiaries through HPCL1. Prize Petroleum Company
Ltd Jeevan Bharati Building, 11th Floor, Tower-1, 124,Connaught Place, Indira Chowk, New Delhi- 110001
U74899DL1998GOI096845 Subsidiary 100.00% 2(87)
2. HPCL Bio Fuels LtdHouse No.271, Road No.3E, Holding No.437 & 438 Ward No.22, New Patliputra Colony, Patna- 800013
U24290BR2009GOI014927 Subsidiary 100.00% 2(87)
3. HPCL Rajasthan Refinery LtdTel Bhavan, Sahkar Marg LaLkothiVistar, Jyoti Nagar, Jaipur-302005
U23201RJ2013GOI043865 Subsidiary 74.00% 2(87)
4. Prize Petroleum International Pte Ltd
Not applicable Subsidiary 100% 2(87)
5. HPCL Middle East FZCO1 W 101, PO Box no. 54618, Dubai Airport Free Zone, Talwar , Dubai
Not applicable Subsidiary 100% 2(87)
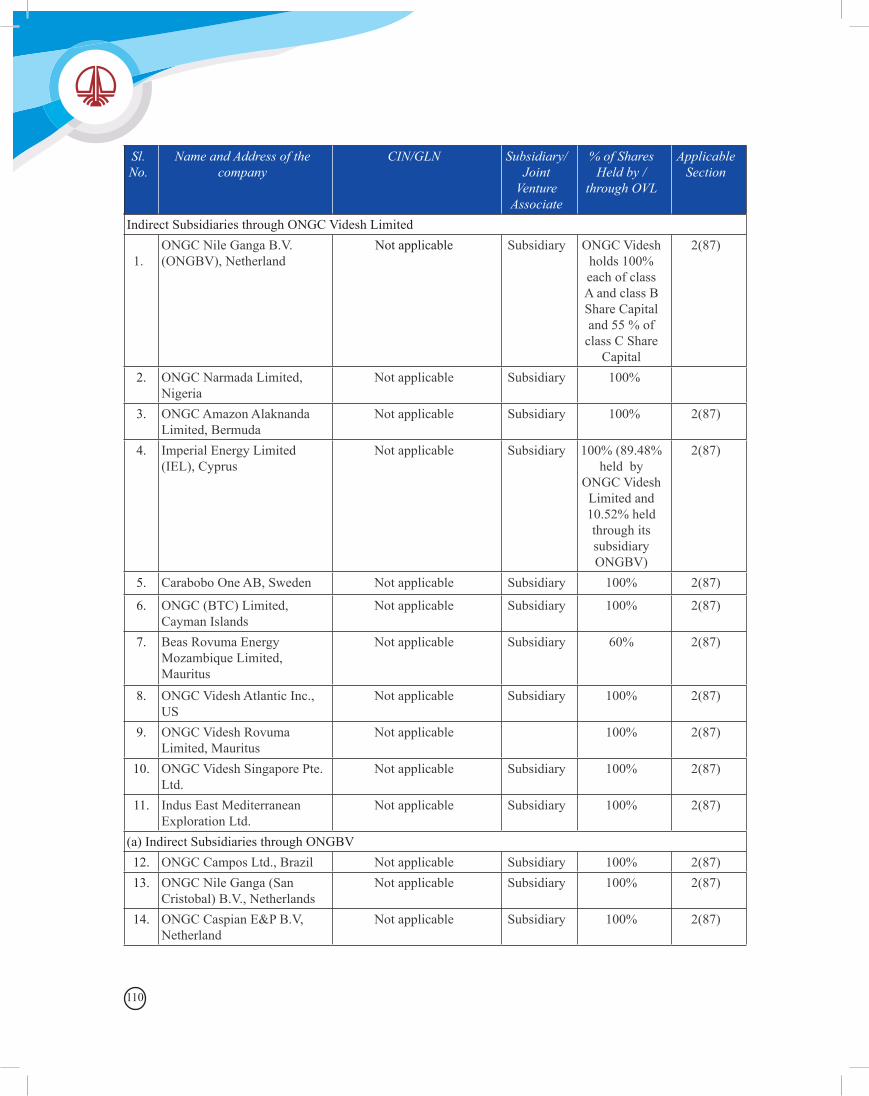
110
Indirect Subsidiaries through ONGC Videsh Limited 1.
ONGC Nile Ganga B.V. (ONGBV), Netherland
Not applicable Subsidiary ONGC Videsh holds 100% each of class A and class B Share Capital and 55 % of
class C Share Capital
2(87)
2. ONGC Narmada Limited, Nigeria
Not applicable Subsidiary 100%
3. ONGC Amazon Alaknanda Limited, Bermuda
Not applicable Subsidiary 100% 2(87)
4. Imperial Energy Limited (IEL), Cyprus
Not applicable Subsidiary 100% (89.48% held by
ONGC Videsh Limited and 10.52% held through its subsidiary ONGBV)
2(87)
5. Carabobo One AB, Sweden Not applicable Subsidiary 100% 2(87)
6. ONGC (BTC) Limited, Cayman Islands
Not applicable Subsidiary 100% 2(87)
7. Beas Rovuma Energy Mozambique Limited, Mauritus
Not applicable Subsidiary 60% 2(87)
8. ONGC Videsh Atlantic Inc., US
Not applicable Subsidiary 100% 2(87)
9. ONGC Videsh Rovuma Limited, Mauritus
Not applicable 100% 2(87)
10. ONGC Videsh Singapore Pte. Ltd.
Not applicable Subsidiary 100% 2(87)
11. Indus East Mediterranean Exploration Ltd.
Not applicable Subsidiary 100% 2(87)
(a) Indirect Subsidiaries through ONGBV12. ONGC Campos Ltd., Brazil Not applicable Subsidiary 100% 2(87)13. ONGC Nile Ganga (San
Cristobal) B.V., NetherlandsNot applicable Subsidiary 100% 2(87)
14. ONGC Caspian E&P B.V, Netherland
Not applicable Subsidiary 100% 2(87)
Sl. No.
Name and Address of the company
CIN/GLN Subsidiary/Joint
Venture Associate
% of Shares Held by /
through OVL
Applicable Section
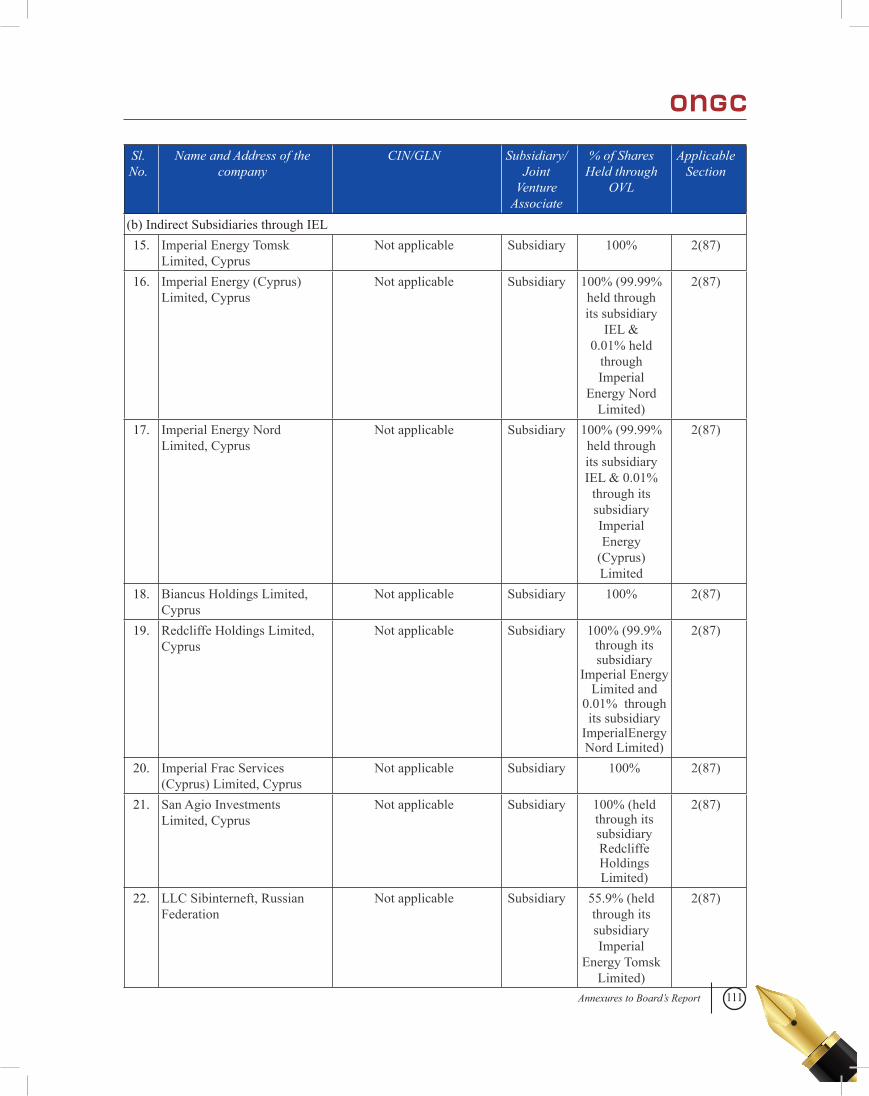
111Annexures to Board’s Report
Sl. No.
Name and Address of the company
CIN/GLN Subsidiary/Joint
Venture Associate
% of Shares Held through
OVL
Applicable Section
(b) Indirect Subsidiaries through IEL15. Imperial Energy Tomsk
Limited, CyprusNot applicable Subsidiary 100% 2(87)
16. Imperial Energy (Cyprus) Limited, Cyprus
Not applicable Subsidiary 100% (99.99% held through its subsidiary
IEL & 0.01% held
through Imperial
Energy Nord Limited)
2(87)
17. Imperial Energy Nord Limited, Cyprus
Not applicable Subsidiary 100% (99.99% held through its subsidiary IEL & 0.01%
through its subsidiary Imperial Energy
(Cyprus) Limited
2(87)
18. Biancus Holdings Limited, Cyprus
Not applicable Subsidiary 100% 2(87)
19. Redcliffe Holdings Limited, Cyprus
Not applicable Subsidiary 100% (99.9% through its subsidiary
Imperial Energy Limited and
0.01% through its subsidiary
ImperialEnergy Nord Limited)
2(87)
20. Imperial Frac Services (Cyprus) Limited, Cyprus
Not applicable Subsidiary 100% 2(87)
21. San Agio Investments Limited, Cyprus
Not applicable Subsidiary 100% (held through its subsidiary Redcliffe Holdings Limited)
2(87)
22. LLC Sibinterneft, Russian Federation
Not applicable Subsidiary 55.9% (held through its subsidiary Imperial
Energy Tomsk Limited)
2(87)
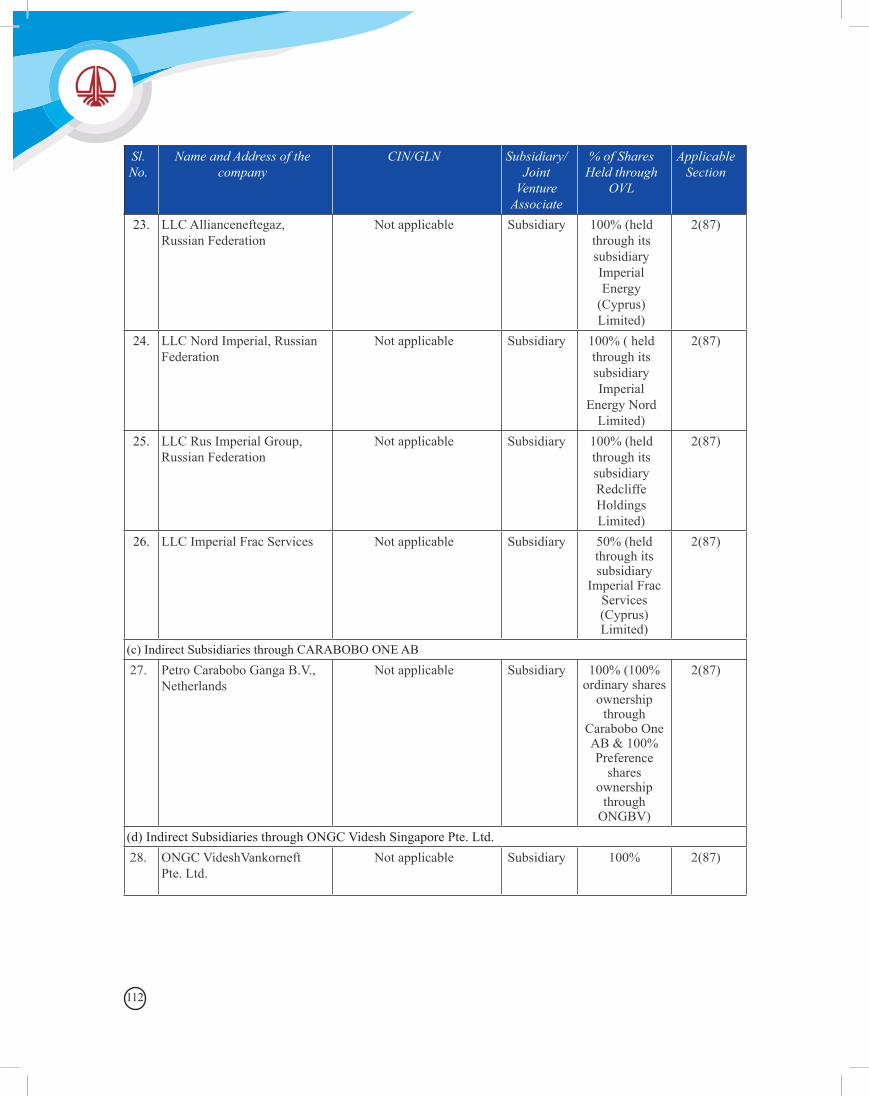
112
23. LLC Allianceneftegaz, Russian Federation
Not applicable Subsidiary 100% (held through its subsidiary Imperial Energy
(Cyprus) Limited)
2(87)
24. LLC Nord Imperial, Russian Federation
Not applicable Subsidiary 100% ( held through its subsidiary Imperial
Energy Nord Limited)
2(87)
25. LLC Rus Imperial Group, Russian Federation
Not applicable Subsidiary 100% (held through its subsidiary Redcliffe Holdings Limited)
2(87)
26. LLC Imperial Frac Services Not applicable Subsidiary 50% (held through its subsidiary
Imperial Frac Services (Cyprus) Limited)
2(87)
(c) Indirect Subsidiaries through CARABOBO ONE AB27. Petro Carabobo Ganga B.V.,
NetherlandsNot applicable Subsidiary 100% (100%
ordinary shares ownership
through Carabobo One AB & 100% Preference
shares ownership
through ONGBV)
2(87)
(d) Indirect Subsidiaries through ONGC Videsh Singapore Pte. Ltd.28. ONGC VideshVankorneft
Pte. Ltd. Not applicable Subsidiary 100% 2(87)
Sl. No.
Name and Address of the company
CIN/GLN Subsidiary/Joint
Venture Associate
% of Shares Held through
OVL
Applicable Section
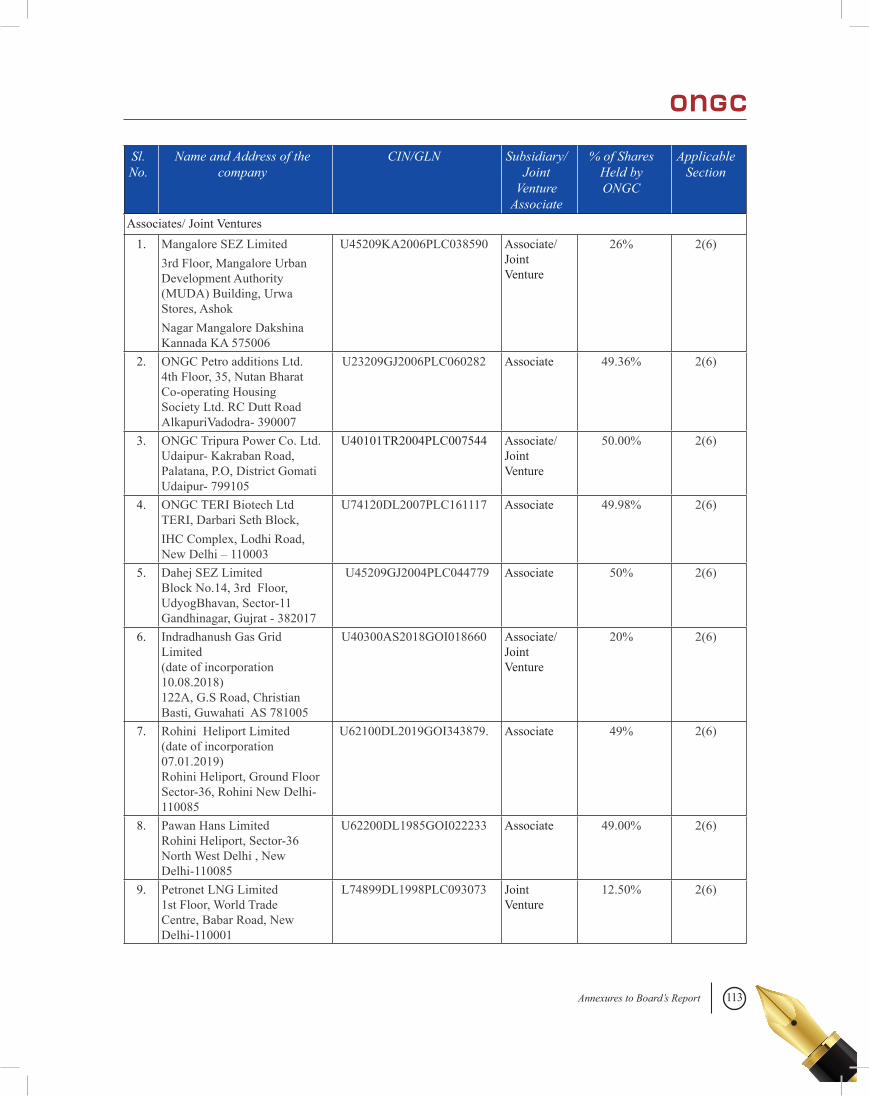
113Annexures to Board’s Report
Sl. No.
Name and Address of the company
CIN/GLN Subsidiary/Joint
Venture Associate
% of Shares Held by ONGC
Applicable Section
Associates/ Joint Ventures1. Mangalore SEZ Limited
3rd Floor, Mangalore Urban Development Authority (MUDA) Building, Urwa Stores, Ashok Nagar Mangalore Dakshina Kannada KA 575006
U45209KA2006PLC038590 Associate/ Joint Venture
26% 2(6)
2. ONGC Petro additions Ltd. 4th Floor, 35, Nutan Bharat Co-operating Housing Society Ltd. RC Dutt Road AlkapuriVadodra- 390007
U23209GJ2006PLC060282 Associate 49.36% 2(6)
3. ONGC Tripura Power Co. Ltd. Udaipur- Kakraban Road, Palatana, P.O, District Gomati Udaipur- 799105
U40101TR2004PLC007544 Associate/ Joint Venture
50.00% 2(6)
4. ONGC TERI Biotech Ltd TERI, Darbari Seth Block, IHC Complex, Lodhi Road, New Delhi – 110003
U74120DL2007PLC161117 Associate 49.98% 2(6)
5. Dahej SEZ Limited Block No.14, 3rd Floor, UdyogBhavan, Sector-11 Gandhinagar, Gujrat - 382017
U45209GJ2004PLC044779 Associate 50% 2(6)
6. Indradhanush Gas Grid Limited (date of incorporation 10.08.2018) 122A, G.S Road, Christian Basti, Guwahati AS 781005
U40300AS2018GOI018660 Associate/ Joint Venture
20% 2(6)
7. Rohini Heliport Limited (date of incorporation 07.01.2019) Rohini Heliport, Ground Floor Sector-36, Rohini New Delhi- 110085
U62100DL2019GOI343879. Associate 49% 2(6)
8. Pawan Hans Limited Rohini Heliport, Sector-36 North West Delhi , New Delhi-110085
U62200DL1985GOI022233 Associate 49.00% 2(6)
9. Petronet LNG Limited 1st Floor, World Trade Centre, Babar Road, New Delhi-110001
L74899DL1998PLC093073 Joint Venture
12.50% 2(6)
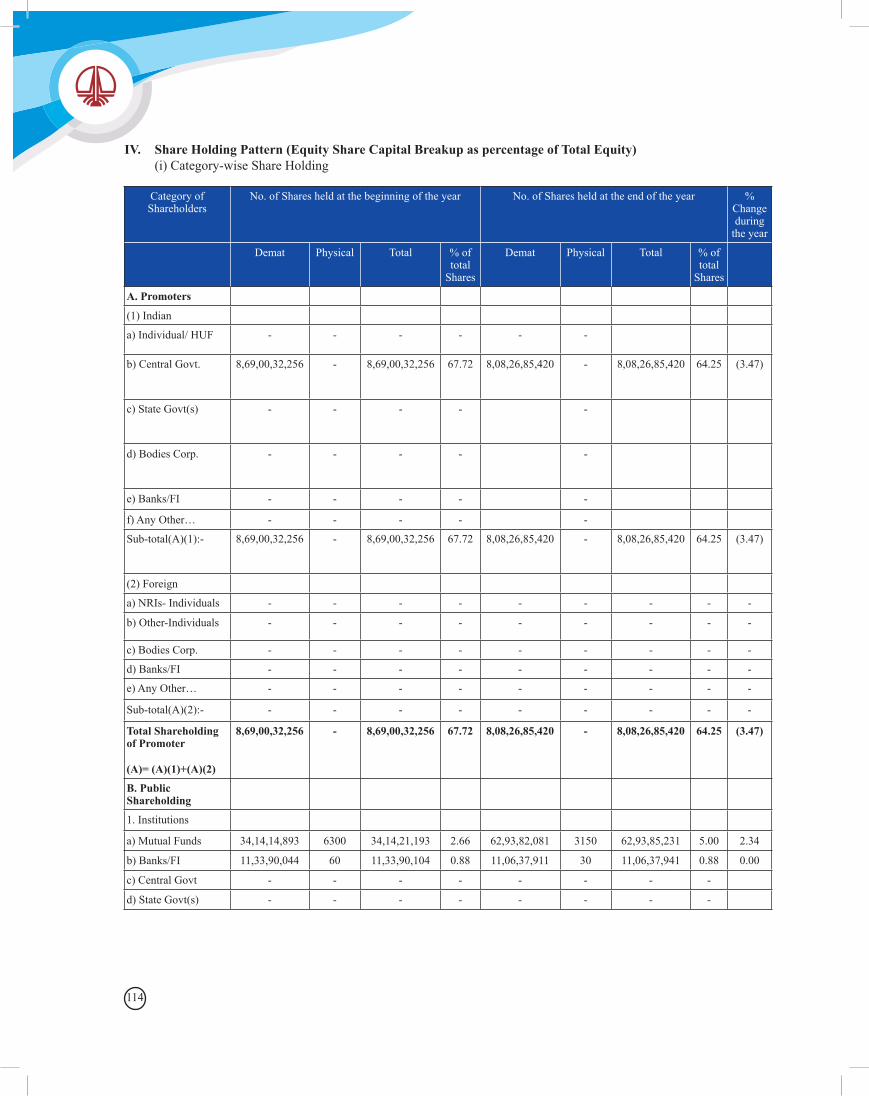
114
IV. Share Holding Pattern (Equity Share Capital Breakup as percentage of Total Equity) (i) Category-wise Share Holding
Category of Shareholders
No. of Shares held at the beginning of the year No. of Shares held at the end of the year % Change during
the year
Demat Physical Total % of total
Shares
Demat Physical Total % of total
Shares
A. Promoters
(1) Indian
a) Individual/ HUF - - - - - -
b) Central Govt. 8,69,00,32,256 - 8,69,00,32,256 67.72 8,08,26,85,420 - 8,08,26,85,420 64.25 (3.47)
c) State Govt(s) - - - - -
d) Bodies Corp. - - - - -
e) Banks/FI - - - - -
f) Any Other… - - - - -
Sub-total(A)(1):- 8,69,00,32,256 - 8,69,00,32,256 67.72 8,08,26,85,420 - 8,08,26,85,420 64.25 (3.47)
(2) Foreign
a) NRIs- Individuals - - - - - - - - -
b) Other-Individuals - - - - - - - - -
c) Bodies Corp. - - - - - - - - -
d) Banks/FI - - - - - - - - -
e) Any Other… - - - - - - - - -
Sub-total(A)(2):- - - - - - - - - -
Total Shareholding of Promoter
(A)= (A)(1)+(A)(2)
8,69,00,32,256 - 8,69,00,32,256 67.72 8,08,26,85,420 - 8,08,26,85,420 64.25 (3.47)
B. Public Shareholding
1. Institutions
a) Mutual Funds 34,14,14,893 6300 34,14,21,193 2.66 62,93,82,081 3150 62,93,85,231 5.00 2.34
b) Banks/FI 11,33,90,044 60 11,33,90,104 0.88 11,06,37,911 30 11,06,37,941 0.88 0.00
c) Central Govt - - - - - - - -
d) State Govt(s) - - - - - - - -
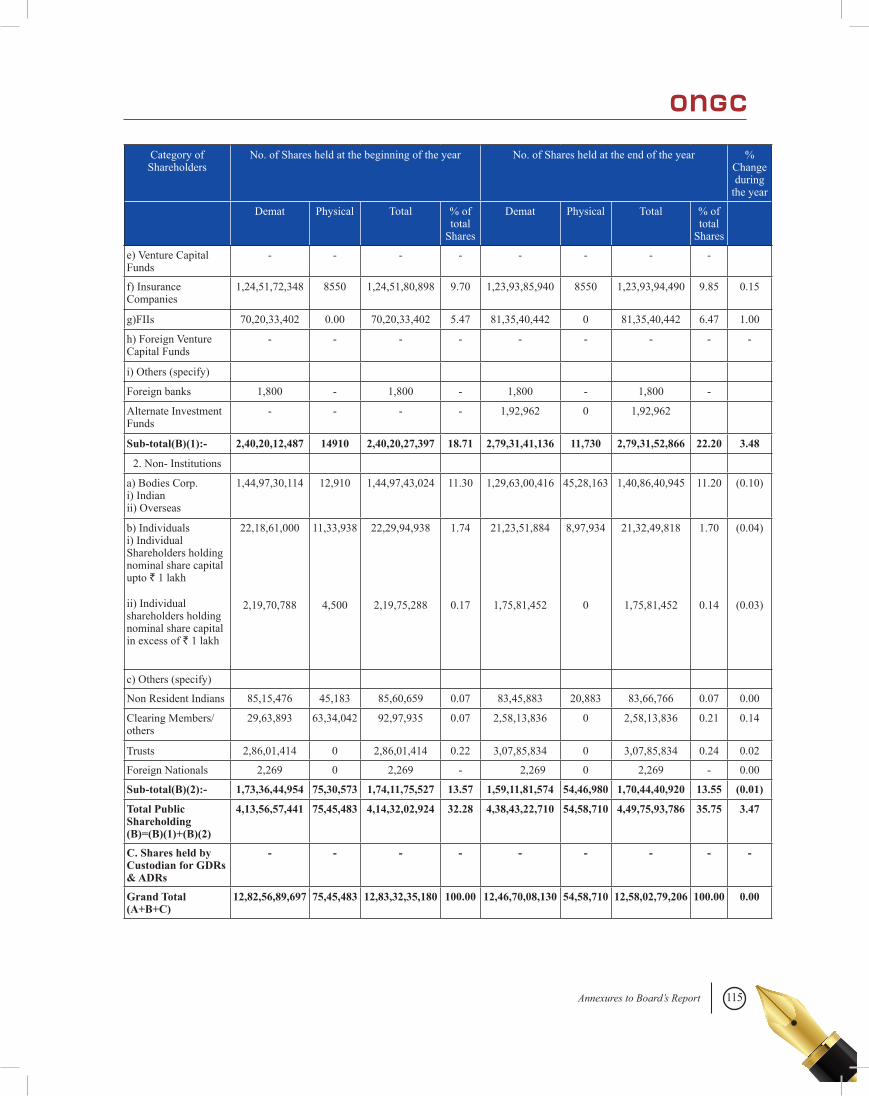
115Annexures to Board’s Report
Category of Shareholders
No. of Shares held at the beginning of the year No. of Shares held at the end of the year % Change during
the year
Demat Physical Total % of total
Shares
Demat Physical Total % of total
Shares
e) Venture Capital Funds
- - - - - - - -
f) Insurance Companies
1,24,51,72,348 8550 1,24,51,80,898 9.70 1,23,93,85,940 8550 1,23,93,94,490 9.85 0.15
g)FIIs 70,20,33,402 0.00 70,20,33,402 5.47 81,35,40,442 0 81,35,40,442 6.47 1.00
h) Foreign Venture Capital Funds
- - - - - - - - -
i) Others (specify)
Foreign banks 1,800 - 1,800 - 1,800 - 1,800 -
Alternate Investment Funds
- - - - 1,92,962 0 1,92,962
Sub-total(B)(1):- 2,40,20,12,487 14910 2,40,20,27,397 18.71 2,79,31,41,136 11,730 2,79,31,52,866 22.20 3.48
2. Non- Institutions
a) Bodies Corp. i) Indian ii) Overseas
1,44,97,30,114 12,910 1,44,97,43,024 11.30 1,29,63,00,416 45,28,163 1,40,86,40,945 11.20 (0.10)
b) Individuals i) Individual Shareholders holding nominal share capital upto ` 1 lakh
ii) Individual shareholders holding nominal share capital in excess of ` 1 lakh
22,18,61,000
2,19,70,788
11,33,938
4,500
22,29,94,938
2,19,75,288
1.74
0.17
21,23,51,884
1,75,81,452
8,97,934
0
21,32,49,818
1,75,81,452
1.70
0.14
(0.04)
(0.03)
c) Others (specify)
Non Resident Indians 85,15,476 45,183 85,60,659 0.07 83,45,883 20,883 83,66,766 0.07 0.00
Clearing Members/others
29,63,893 63,34,042 92,97,935 0.07 2,58,13,836 0 2,58,13,836 0.21 0.14
Trusts 2,86,01,414 0 2,86,01,414 0.22 3,07,85,834 0 3,07,85,834 0.24 0.02
Foreign Nationals 2,269 0 2,269 - 2,269 0 2,269 - 0.00
Sub-total(B)(2):- 1,73,36,44,954 75,30,573 1,74,11,75,527 13.57 1,59,11,81,574 54,46,980 1,70,44,40,920 13.55 (0.01)
Total Public Shareholding (B)=(B)(1)+(B)(2)
4,13,56,57,441 75,45,483 4,14,32,02,924 32.28 4,38,43,22,710 54,58,710 4,49,75,93,786 35.75 3.47
C. Shares held by Custodian for GDRs & ADRs
- - - - - - - - -
Grand Total (A+B+C)
12,82,56,89,697 75,45,483 12,83,32,35,180 100.00 12,46,70,08,130 54,58,710 12,58,02,79,206 100.00 0.00
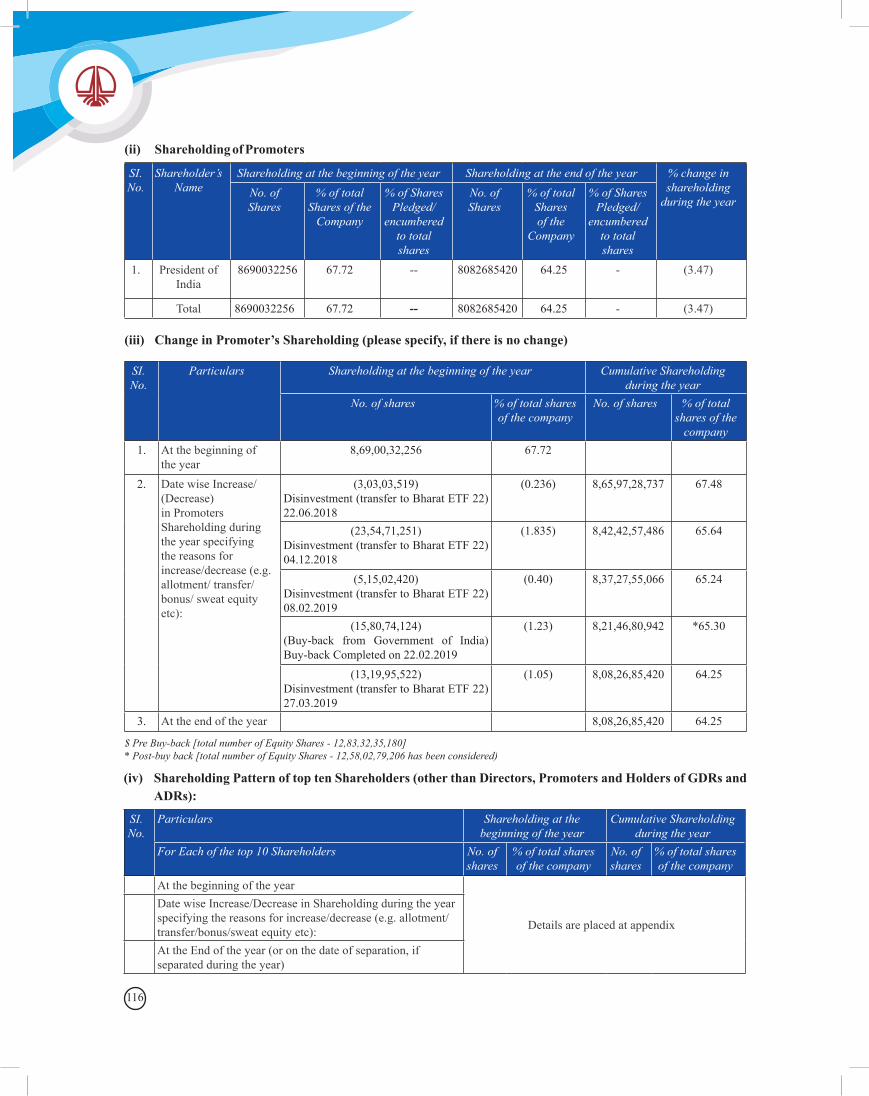
116
(ii) Shareholding of Promoters
SI. No.
Shareholder’s Name
Shareholding at the beginning of the year Shareholding at the end of the year % change in shareholding
during the yearNo. of Shares
% of total Shares of the
Company
% of Shares Pledged/
encumbered to total shares
No. of Shares
% of total Shares of the
Company
% of Shares Pledged/
encumbered to total shares
1. President of India
8690032256 67.72 -- 8082685420 64.25 - (3.47)
Total 8690032256 67.72 -- 8082685420 64.25 - (3.47)
(iii) Change in Promoter’s Shareholding (please specify, if there is no change)
SI. No.
Particulars Shareholding at the beginning of the year Cumulative Shareholding during the year
No. of shares % of total shares of the company
No. of shares % of total shares of the
company1. At the beginning of
the year8,69,00,32,256 67.72
2. Date wise Increase/(Decrease) in Promoters Shareholding during the year specifying the reasons for increase/decrease (e.g. allotment/ transfer/ bonus/ sweat equity etc):
(3,03,03,519)Disinvestment (transfer to Bharat ETF 22) 22.06.2018
(0.236) 8,65,97,28,737 67.48
(23,54,71,251)Disinvestment (transfer to Bharat ETF 22) 04.12.2018
(1.835) 8,42,42,57,486 65.64
(5,15,02,420)Disinvestment (transfer to Bharat ETF 22) 08.02.2019
(0.40) 8,37,27,55,066 65.24
(15,80,74,124)(Buy-back from Government of India) Buy-back Completed on 22.02.2019
(1.23) 8,21,46,80,942 *65.30
(13,19,95,522)Disinvestment (transfer to Bharat ETF 22) 27.03.2019
(1.05) 8,08,26,85,420 64.25
3. At the end of the year 8,08,26,85,420 64.25
$ Pre Buy-back [total number of Equity Shares - 12,83,32,35,180]* Post-buy back [total number of Equity Shares - 12,58,02,79,206 has been considered)
(iv) Shareholding Pattern of top ten Shareholders (other than Directors, Promoters and Holders of GDRs and ADRs):
SI. No.
Particulars Shareholding at the beginning of the year
Cumulative Shareholding during the year
For Each of the top 10 Shareholders No. of shares
% of total shares of the company
No. of shares
% of total shares of the company
At the beginning of the year
Details are placed at appendix
Date wise Increase/Decrease in Shareholding during the year specifying the reasons for increase/decrease (e.g. allotment/transfer/bonus/sweat equity etc):At the End of the year (or on the date of separation, if separated during the year)
117Annexures to Board’s Report
(v) Shareholding of Directors and Key Managerial Personnel:
SI. No.
Particulars Shareholding at the beginning of the year
Cumulative Shareholding during the year
No. of shares
% of total shares of the
company
No. of shares
% of total shares of the
company(A) At the beginning of the year(B) Date wise Increase/Decrease in Shareholding during the year
specifying the reasons for increase/ decrease (e.g. allotment/ transfer/ bonus/ sweat equity etc):
There was no change in the shareholding of Directors and KMP during the year
(C) At the End of the year
Shri Shashi Shanker (CMD) 5568 - 5568 -
Shri Desh Deepak Misra, Director (HR) ceased w.e.f. 30.06.2018
2250 - - -
Shri Ajay Kumar Dwivedi, Director (Exploration) 1230 - 1230 -
Shri Subhash Kumar, Director (Finance) 30 - 30 -Shri Rajesh Kakkar, Director (Offshore) 4758 - 4758 -Shri N.C Pandey, Director(T&FS)(appointed w.e.f. 29.10.2018)*
N.A - 600 -
Smt. Alka Mittal, Director(HR)(appointed w.e.f. 27.11.2018)*
N.A - 10428 -
Shri Ajai Malhotra, Independent Director 1650 - 1650 -Dr. Santrupt B. Misra, Independent Director 630 - 630 -Smt. Ganga Murthy, Independent Director appointed on .23.09.2017
455 - 435 -
The above shareholdings of Directors are negligible. Other Directors and KMPs did not hold any share during the year.*These directors’ shareholdings remain unchanged from their respective date of joining the Board.
V. INDEBTEDNESS Indebtedness of the Company including interest outstanding/accrued but not due for payment
Particulars Secured Loans excluding deposits
Unsecured Loans
Deposits Total Indebtedness
I. Indebtedness at the beginning of the financial yeari) Principal Amount - 255922 - 255922ii) Interest due but not paid - - - -iii) Interest accrued but not due - 12 - 12Total (i+ii+iii) - 255,934 - 255,934II. Change in Indebtedness during the financial year -Additions - 9,77,087 - 977087Reduction - 10,16,914 - 1016914
Net Change - (39,827) - (39,827)III. Indebtedness at the end of the financial yeari) Principal Amount - 2,15,936 - 2,15,936ii) Interest due but not paid - - - -iii) Interest accrued but not due - 170 - 170Total (I+II+III) - 2,16,106 - 2,16,106
(` in million)
118
VI. REMUNERATION OF DIRECTORS AND KEY MANAGERIAL PERSONNEL Remuneration to Managing Director, Whole-time Directors and/or Manager:
Sl. No.
Particulars of Remuneration
Name of MD/WTD/Manager Total Amount (`) in million Shri
Shashi Shanker
Shri A.K. Dwivedi
Shri Subhash Kumar
Shri Rajesh Kakkar
Shri S.K Moitra
Shri N.C Pandey
Shri D.D. Misra
Dr. Alka Mittal
CMD & CEO
Director (Exploration)
Director (Finance) and CFO
Director(Offshore)
Director (Onshore)
w.e.f.18.04.2018
Director (T&FS)
w.e.f. 29.10.2018
Director (HR)upto
30.06.2018
Director (HR)w.e.f.
27.11.2018
1. Gross salary(a) Salary as per provisions contained in section 17(1) of the Income-tax Act, 1961
3.72 3.71 3.58 3.39 3.51 3.50 0.63 4.12 26.16
(b) Value of perquisites u/s 17(2) Income-tax Act, 1961
1.66 1.69 0.33 1.41 1.31 1.20 0.49 0.31 8.40
(c) Profits in lieu of salary under section 17(3) Income-tax Act, 1961
2. Stock Option
3. Sweat Equity4. Commission
- As % of profit- Others, specify.
5. Others- please specify Leave encashment/gratuity on retirement
4.14 4.14
Performance incentive provision/ payment
3.22 2.66 2.12 2.41 2.52 1.04 0.61 0.81 15.39
Contribution to PF
0.81 0.80 0.70 0.72 0.76 0.76 0.18 0.74 5.47
Provision for leave , gratuity and post-retirement benefits as per AS-15
0.71 0.57 0.12 0.81 0.64 0.75 0.59 0.50 4.69
Total (A) 10.12 9.43 6.85 8.74 8.74 7.25 6.64 6.48 64.25 Overall ceiling as per the Act Not applicable, as Section 197 of the Companies Act 2013 has been exempted to Government
Companies.
119Annexures to Board’s Report
B. Remuneration to other Directors:
Sl. No.
Particulars of Remuneration
Name of Directors Total Amount (`) in
million
Shri Ajai Malhotra
Prof. Shireesh Balwant Kedare
Shri K.M. Padmanabhan
Shri Deepak
Sethi
Shri Vivek
Mallya
Shri Sumit Bose
Dr. Santrupt B. Misra
Smt. Ganga Murthy
Shri Sambit Patra
1. Independent Directors
• Fee for attending Board / Board level Committee meetings
• Commission• Others, please
specify
1.24 0.90 0.91 0.79 1.08 0.99 0.62 0.87 0.61 8.01
Total (1) 1.24 0.90 0.91 0.79 1.08 0.99 0.62 0.87 0.61 8.01
2. Other Non-Executive Directors
• Fee for attending board committee meetings
• Commission• Others, please
specify
Total (2) - - - - - - - - -
Total (B)=(1+2) 1.24 0.90 0.91 0.79 1.08 0.99 0.62 0.87 0.61 8.01
Total Managerial Remuneration 72.26
Ceiling as per the Act
Not applicable, as section 197 of Companies Act, 2013 shall not apply to Government Companies.
120
C. REMUNERATION TO KEY MANAGERIAL PERSONNEL OTHER THAN MD/MANAGER/WTD
Sl. No.
Particulars of Remuneration Key Managerial Personnel Total Amount (`) in million
CEO* Company Secretary CFO*
Shri M E V Selvamm1. Gross salary NA NA
(a) Salary as per provisions contained in Section 17(1) of the Income-Tax Act,1961
NA 2.68 NA 2.68
(b) Value of perquisites u/s 17(2) Income- Tax Act,1961
NA 0.47 NA 0.47
(c) Profit in lieu of salary under section 17(3) of Income Tax Act,1961
NA NA
2. Stock Option NA NA3. Sweat Equity NA NA4. Commission
- As % of Profit- Other, specify
NA NA
5. Others- Provision for PRP, Provision under As-15, Contribution to CSSS, PF, EPS, Reimbursement of employer paid taxes, Reimbursement not included under 17(2)
NA 1.72 NA 1.72
Total 4.87 4.87
VII. Penalties/Punishment/Compounding of offences:Type Section of the
Companies ActBrief
DescriptionDetails of Penalty/
Punishment/ Compounding fees imposed
Authority[RD/NCLT/
COURT]
Appeal made, if any (give
Details)
A. CompanyPenalty NIL NIL NIL NIL NIL
Punishment NIL NIL NIL NIL NILCompounding NIL NIL NIL NIL NILB. DirectorsPenalty NIL NIL NIL NIL NILPunishment NIL NIL NIL NIL NILCompounding NIL NIL NIL NIL NILC. Other Officers In DefaultPenalty NIL NIL NIL NIL NILPunishment NIL NIL NIL NIL NILCompounding NIL NIL NIL NIL NIL
* refer para VI above
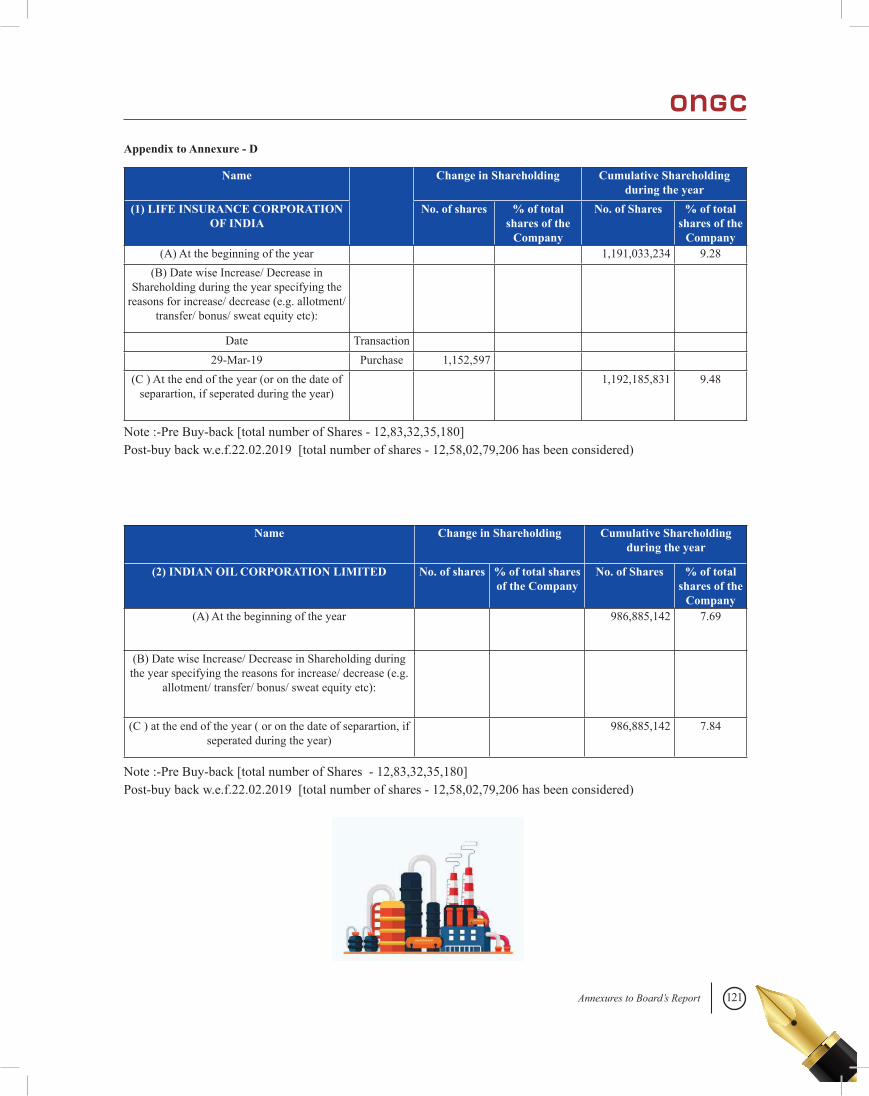
121Annexures to Board’s Report
Name Change in Shareholding Cumulative Shareholding during the year
(1) LIFE INSURANCE CORPORATION OF INDIA
No. of shares % of total shares of the
Company
No. of Shares % of total shares of the
Company(A) At the beginning of the year 1,191,033,234 9.28
(B) Date wise Increase/ Decrease in Shareholding during the year specifying the
reasons for increase/ decrease (e.g. allotment/ transfer/ bonus/ sweat equity etc):
Date Transaction 29-Mar-19 Purchase 1,152,597
(C ) At the end of the year (or on the date of separartion, if seperated during the year)
1,192,185,831 9.48
Appendix to Annexure - D
Note :-Pre Buy-back [total number of Shares - 12,83,32,35,180] Post-buy back w.e.f.22.02.2019 [total number of shares - 12,58,02,79,206 has been considered)
Name Change in Shareholding Cumulative Shareholding during the year
(2) INDIAN OIL CORPORATION LIMITED No. of shares % of total shares of the Company
No. of Shares % of total shares of the
Company(A) At the beginning of the year 986,885,142 7.69
(B) Date wise Increase/ Decrease in Shareholding during the year specifying the reasons for increase/ decrease (e.g.
allotment/ transfer/ bonus/ sweat equity etc):
(C ) at the end of the year ( or on the date of separartion, if seperated during the year)
986,885,142 7.84
Note :-Pre Buy-back [total number of Shares - 12,83,32,35,180] Post-buy back w.e.f.22.02.2019 [total number of shares - 12,58,02,79,206 has been considered)
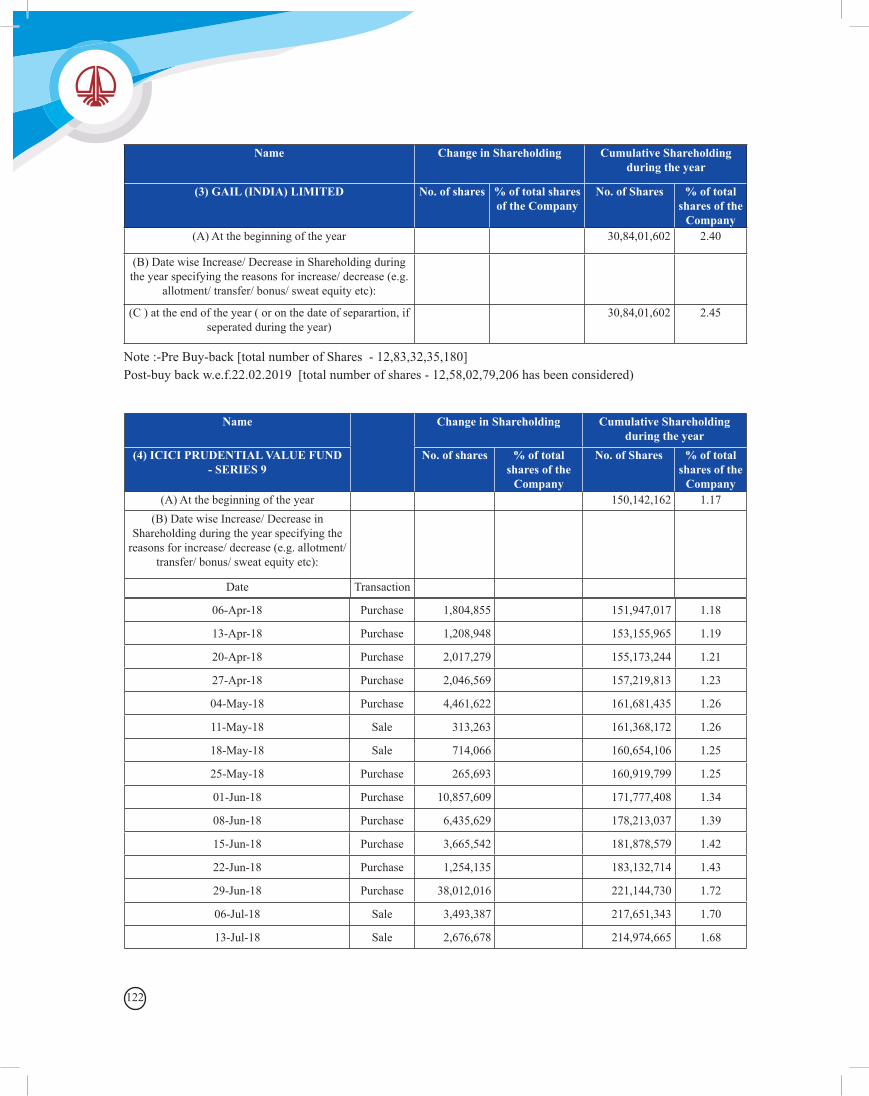
122
Name Change in Shareholding Cumulative Shareholding during the year
(3) GAIL (INDIA) LIMITED No. of shares % of total shares of the Company
No. of Shares % of total shares of the
Company(A) At the beginning of the year 30,84,01,602 2.40
(B) Date wise Increase/ Decrease in Shareholding during the year specifying the reasons for increase/ decrease (e.g.
allotment/ transfer/ bonus/ sweat equity etc):
(C ) at the end of the year ( or on the date of separartion, if seperated during the year)
30,84,01,602 2.45
Note :-Pre Buy-back [total number of Shares - 12,83,32,35,180] Post-buy back w.e.f.22.02.2019 [total number of shares - 12,58,02,79,206 has been considered)
Name Change in Shareholding Cumulative Shareholding during the year
(4) ICICI PRUDENTIAL VALUE FUND - SERIES 9
No. of shares % of total shares of the
Company
No. of Shares % of total shares of the
Company(A) At the beginning of the year 150,142,162 1.17
(B) Date wise Increase/ Decrease in Shareholding during the year specifying the
reasons for increase/ decrease (e.g. allotment/ transfer/ bonus/ sweat equity etc):
Date Transaction
06-Apr-18 Purchase 1,804,855 151,947,017 1.18
13-Apr-18 Purchase 1,208,948 153,155,965 1.19
20-Apr-18 Purchase 2,017,279 155,173,244 1.21
27-Apr-18 Purchase 2,046,569 157,219,813 1.23
04-May-18 Purchase 4,461,622 161,681,435 1.26
11-May-18 Sale 313,263 161,368,172 1.26
18-May-18 Sale 714,066 160,654,106 1.25
25-May-18 Purchase 265,693 160,919,799 1.25
01-Jun-18 Purchase 10,857,609 171,777,408 1.34
08-Jun-18 Purchase 6,435,629 178,213,037 1.39
15-Jun-18 Purchase 3,665,542 181,878,579 1.42
22-Jun-18 Purchase 1,254,135 183,132,714 1.43
29-Jun-18 Purchase 38,012,016 221,144,730 1.72
06-Jul-18 Sale 3,493,387 217,651,343 1.70
13-Jul-18 Sale 2,676,678 214,974,665 1.68
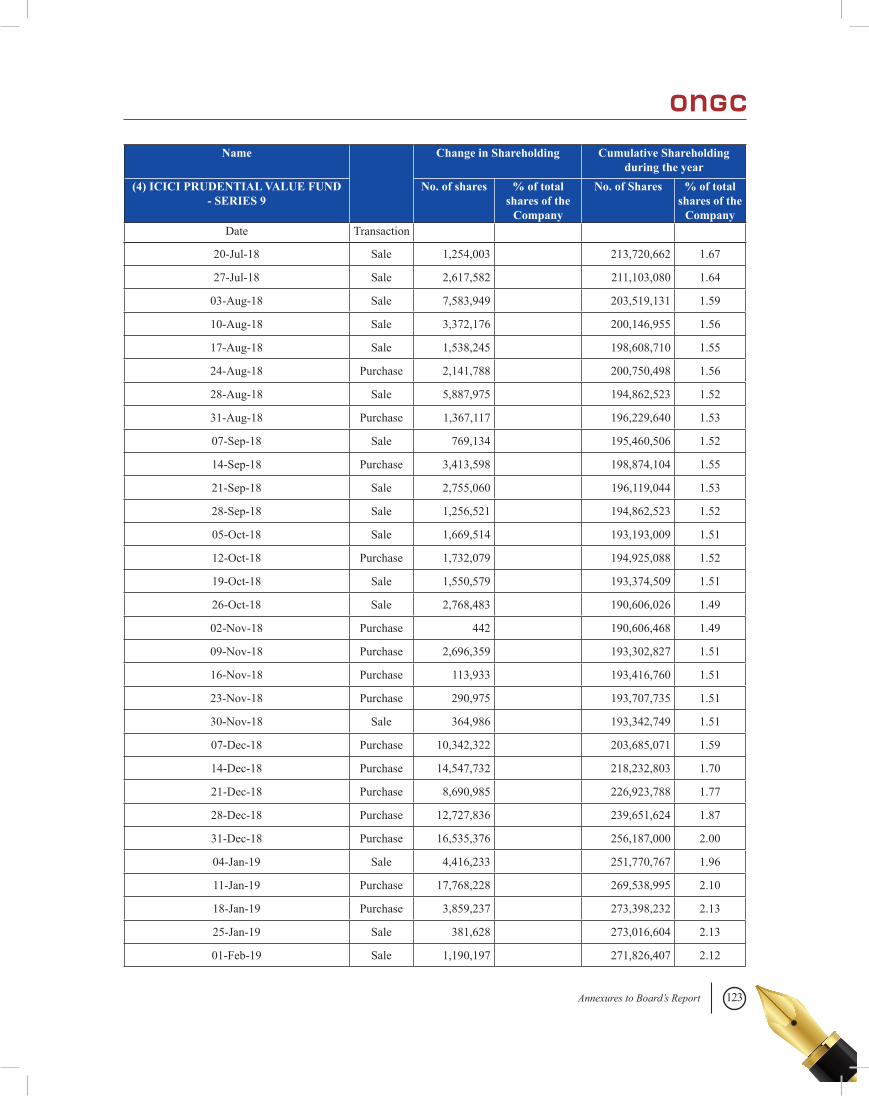
123Annexures to Board’s Report
Name Change in Shareholding Cumulative Shareholding during the year
(4) ICICI PRUDENTIAL VALUE FUND - SERIES 9
No. of shares % of total shares of the
Company
No. of Shares % of total shares of the
CompanyDate Transaction
20-Jul-18 Sale 1,254,003 213,720,662 1.67
27-Jul-18 Sale 2,617,582 211,103,080 1.64
03-Aug-18 Sale 7,583,949 203,519,131 1.59
10-Aug-18 Sale 3,372,176 200,146,955 1.56
17-Aug-18 Sale 1,538,245 198,608,710 1.55
24-Aug-18 Purchase 2,141,788 200,750,498 1.56
28-Aug-18 Sale 5,887,975 194,862,523 1.52
31-Aug-18 Purchase 1,367,117 196,229,640 1.53
07-Sep-18 Sale 769,134 195,460,506 1.52
14-Sep-18 Purchase 3,413,598 198,874,104 1.55
21-Sep-18 Sale 2,755,060 196,119,044 1.53
28-Sep-18 Sale 1,256,521 194,862,523 1.52
05-Oct-18 Sale 1,669,514 193,193,009 1.51
12-Oct-18 Purchase 1,732,079 194,925,088 1.52
19-Oct-18 Sale 1,550,579 193,374,509 1.51
26-Oct-18 Sale 2,768,483 190,606,026 1.49
02-Nov-18 Purchase 442 190,606,468 1.49
09-Nov-18 Purchase 2,696,359 193,302,827 1.51
16-Nov-18 Purchase 113,933 193,416,760 1.51
23-Nov-18 Purchase 290,975 193,707,735 1.51
30-Nov-18 Sale 364,986 193,342,749 1.51
07-Dec-18 Purchase 10,342,322 203,685,071 1.59
14-Dec-18 Purchase 14,547,732 218,232,803 1.70
21-Dec-18 Purchase 8,690,985 226,923,788 1.77
28-Dec-18 Purchase 12,727,836 239,651,624 1.87
31-Dec-18 Purchase 16,535,376 256,187,000 2.00
04-Jan-19 Sale 4,416,233 251,770,767 1.96
11-Jan-19 Purchase 17,768,228 269,538,995 2.10
18-Jan-19 Purchase 3,859,237 273,398,232 2.13
25-Jan-19 Sale 381,628 273,016,604 2.13
01-Feb-19 Sale 1,190,197 271,826,407 2.12
124
08-Feb-19 Purchase 2,387,731 274,214,138 2.14
15-Feb-19 Purchase 861,090 275,075,228 2.14
22-Feb-19 Purchase 45,798,496 320,873,724 2.50
01-Mar-19 Sale 33,184,080 287,689,644 2.29
08-Mar-19 Sale 14,777,006 272,912,638 2.17
15-Mar-19 Sale 8,145,785 264,766,853 2.10
22-Mar-19 Purchase 313,710 265,080,563 2.11
27-Mar-19 Sale 156,988 264,923,575 2.11
29-Mar-19 Sale 695,040 264,228,535 2.10
( C) at the end of the year ( or on the date of separation if separated during the year
264,228,535 2.10
Note :-Pre Buy-back [total number of Shares - 12,83,32,35,180] Post-buy back w.e.f. 22.02.2019 [total number of shares - 12,58,02,79,206 has been considered)
Name Change in Shareholding Cumulative Shareholding during the year
(4) ICICI PRUDENTIAL VALUE FUND - SERIES 9
No. of shares % of total shares of the
Company
No. of Shares % of total shares of the
CompanyDate Transaction
Safety First... Safety is Our Way of Life
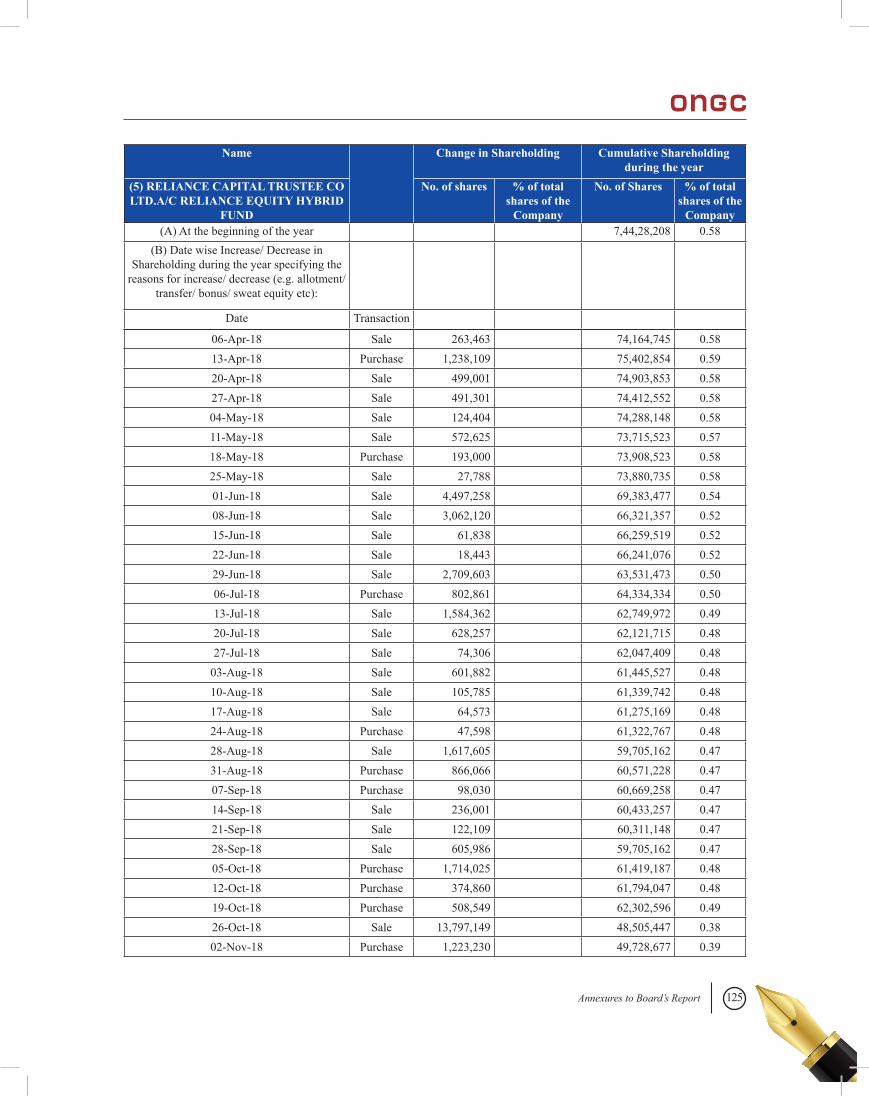
125Annexures to Board’s Report
Name Change in Shareholding Cumulative Shareholding during the year
(5) RELIANCE CAPITAL TRUSTEE CO LTD.A/C RELIANCE EQUITY HYBRID
FUND
No. of shares % of total shares of the
Company
No. of Shares % of total shares of the
Company(A) At the beginning of the year 7,44,28,208 0.58
(B) Date wise Increase/ Decrease in Shareholding during the year specifying the
reasons for increase/ decrease (e.g. allotment/ transfer/ bonus/ sweat equity etc):
Date Transaction
06-Apr-18 Sale 263,463 74,164,745 0.5813-Apr-18 Purchase 1,238,109 75,402,854 0.5920-Apr-18 Sale 499,001 74,903,853 0.5827-Apr-18 Sale 491,301 74,412,552 0.5804-May-18 Sale 124,404 74,288,148 0.5811-May-18 Sale 572,625 73,715,523 0.5718-May-18 Purchase 193,000 73,908,523 0.5825-May-18 Sale 27,788 73,880,735 0.5801-Jun-18 Sale 4,497,258 69,383,477 0.5408-Jun-18 Sale 3,062,120 66,321,357 0.5215-Jun-18 Sale 61,838 66,259,519 0.5222-Jun-18 Sale 18,443 66,241,076 0.5229-Jun-18 Sale 2,709,603 63,531,473 0.5006-Jul-18 Purchase 802,861 64,334,334 0.5013-Jul-18 Sale 1,584,362 62,749,972 0.4920-Jul-18 Sale 628,257 62,121,715 0.4827-Jul-18 Sale 74,306 62,047,409 0.48
03-Aug-18 Sale 601,882 61,445,527 0.4810-Aug-18 Sale 105,785 61,339,742 0.4817-Aug-18 Sale 64,573 61,275,169 0.4824-Aug-18 Purchase 47,598 61,322,767 0.4828-Aug-18 Sale 1,617,605 59,705,162 0.4731-Aug-18 Purchase 866,066 60,571,228 0.4707-Sep-18 Purchase 98,030 60,669,258 0.4714-Sep-18 Sale 236,001 60,433,257 0.4721-Sep-18 Sale 122,109 60,311,148 0.4728-Sep-18 Sale 605,986 59,705,162 0.4705-Oct-18 Purchase 1,714,025 61,419,187 0.4812-Oct-18 Purchase 374,860 61,794,047 0.4819-Oct-18 Purchase 508,549 62,302,596 0.4926-Oct-18 Sale 13,797,149 48,505,447 0.3802-Nov-18 Purchase 1,223,230 49,728,677 0.39
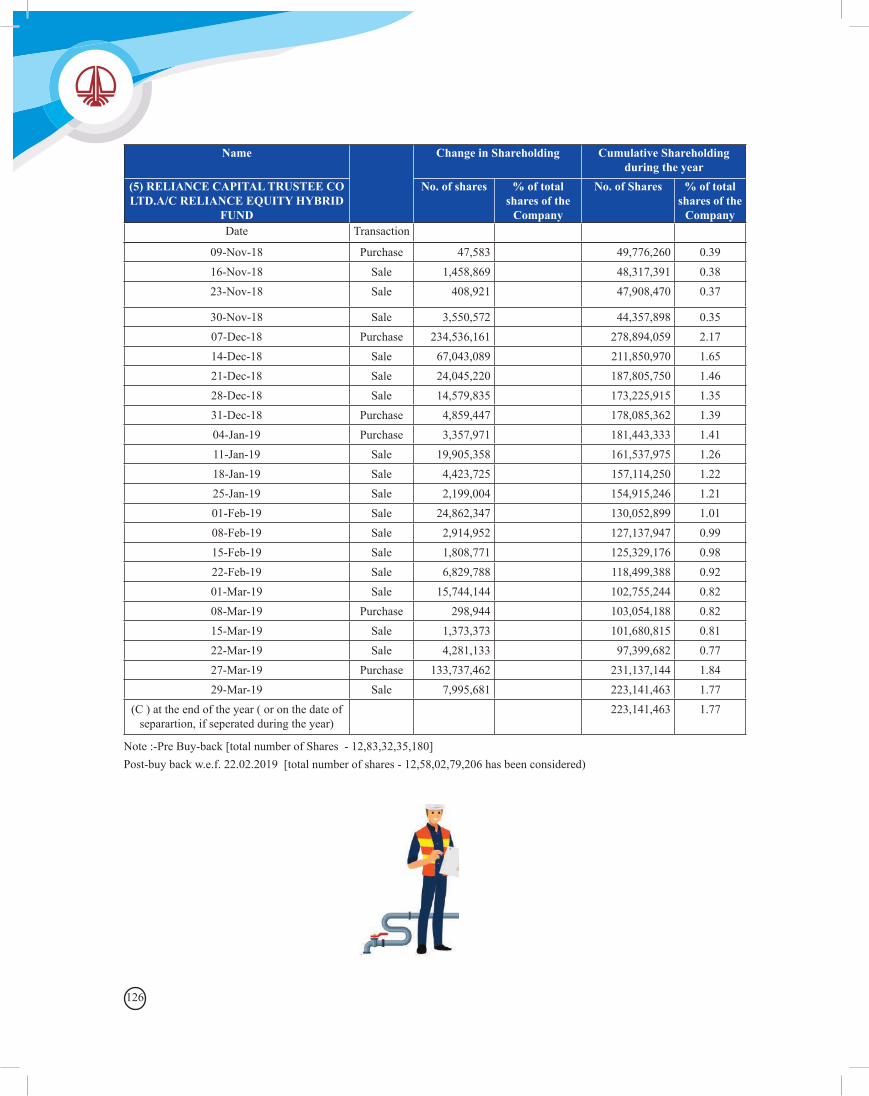
126
Name Change in Shareholding Cumulative Shareholding during the year
(5) RELIANCE CAPITAL TRUSTEE CO LTD.A/C RELIANCE EQUITY HYBRID
FUND
No. of shares % of total shares of the
Company
No. of Shares % of total shares of the
CompanyDate Transaction
09-Nov-18 Purchase 47,583 49,776,260 0.3916-Nov-18 Sale 1,458,869 48,317,391 0.3823-Nov-18 Sale 408,921 47,908,470 0.37
30-Nov-18 Sale 3,550,572 44,357,898 0.3507-Dec-18 Purchase 234,536,161 278,894,059 2.1714-Dec-18 Sale 67,043,089 211,850,970 1.6521-Dec-18 Sale 24,045,220 187,805,750 1.4628-Dec-18 Sale 14,579,835 173,225,915 1.3531-Dec-18 Purchase 4,859,447 178,085,362 1.3904-Jan-19 Purchase 3,357,971 181,443,333 1.4111-Jan-19 Sale 19,905,358 161,537,975 1.2618-Jan-19 Sale 4,423,725 157,114,250 1.2225-Jan-19 Sale 2,199,004 154,915,246 1.2101-Feb-19 Sale 24,862,347 130,052,899 1.0108-Feb-19 Sale 2,914,952 127,137,947 0.9915-Feb-19 Sale 1,808,771 125,329,176 0.9822-Feb-19 Sale 6,829,788 118,499,388 0.9201-Mar-19 Sale 15,744,144 102,755,244 0.8208-Mar-19 Purchase 298,944 103,054,188 0.8215-Mar-19 Sale 1,373,373 101,680,815 0.8122-Mar-19 Sale 4,281,133 97,399,682 0.7727-Mar-19 Purchase 133,737,462 231,137,144 1.8429-Mar-19 Sale 7,995,681 223,141,463 1.77
(C ) at the end of the year ( or on the date of separartion, if seperated during the year)
223,141,463 1.77
Note :-Pre Buy-back [total number of Shares - 12,83,32,35,180] Post-buy back w.e.f. 22.02.2019 [total number of shares - 12,58,02,79,206 has been considered)
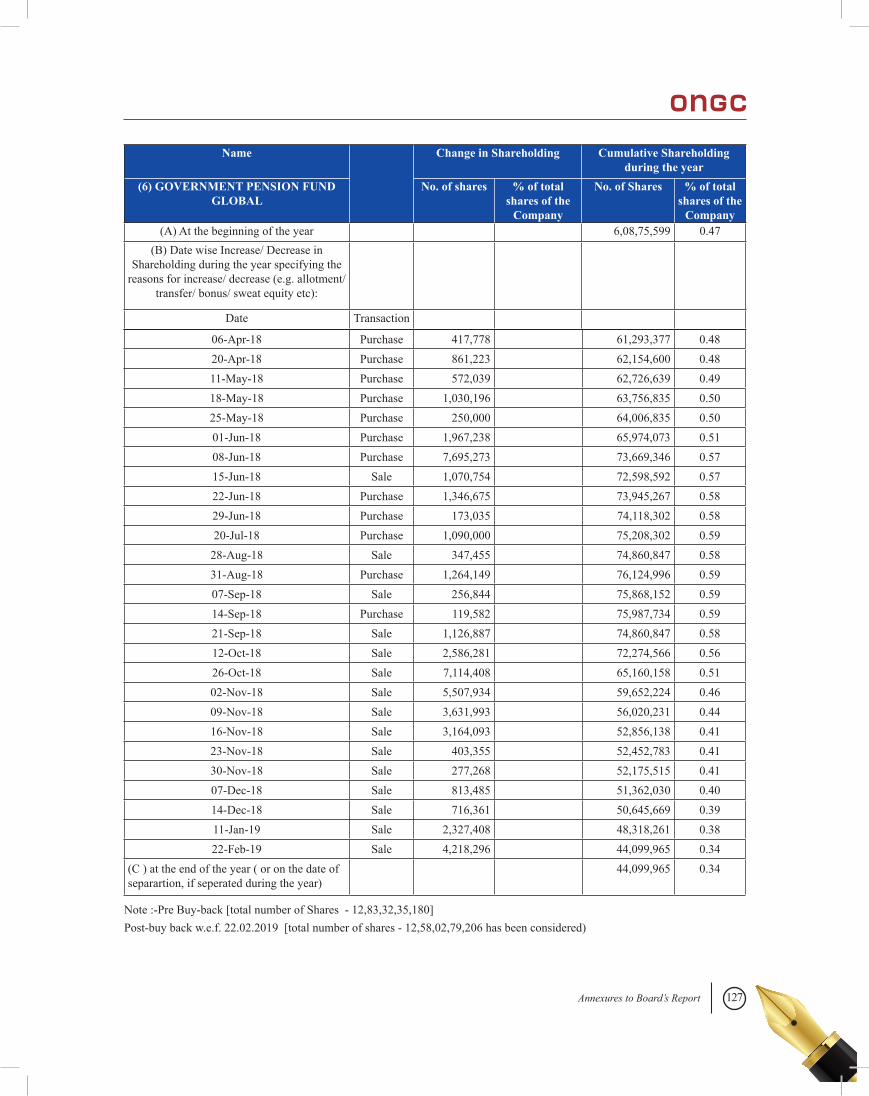
127Annexures to Board’s Report
Name Change in Shareholding Cumulative Shareholding during the year
(6) GOVERNMENT PENSION FUND GLOBAL
No. of shares % of total shares of the
Company
No. of Shares % of total shares of the
Company(A) At the beginning of the year 6,08,75,599 0.47
(B) Date wise Increase/ Decrease in Shareholding during the year specifying the
reasons for increase/ decrease (e.g. allotment/ transfer/ bonus/ sweat equity etc):
Date Transaction
06-Apr-18 Purchase 417,778 61,293,377 0.4820-Apr-18 Purchase 861,223 62,154,600 0.4811-May-18 Purchase 572,039 62,726,639 0.4918-May-18 Purchase 1,030,196 63,756,835 0.5025-May-18 Purchase 250,000 64,006,835 0.5001-Jun-18 Purchase 1,967,238 65,974,073 0.5108-Jun-18 Purchase 7,695,273 73,669,346 0.5715-Jun-18 Sale 1,070,754 72,598,592 0.5722-Jun-18 Purchase 1,346,675 73,945,267 0.5829-Jun-18 Purchase 173,035 74,118,302 0.5820-Jul-18 Purchase 1,090,000 75,208,302 0.59
28-Aug-18 Sale 347,455 74,860,847 0.5831-Aug-18 Purchase 1,264,149 76,124,996 0.5907-Sep-18 Sale 256,844 75,868,152 0.5914-Sep-18 Purchase 119,582 75,987,734 0.5921-Sep-18 Sale 1,126,887 74,860,847 0.5812-Oct-18 Sale 2,586,281 72,274,566 0.5626-Oct-18 Sale 7,114,408 65,160,158 0.5102-Nov-18 Sale 5,507,934 59,652,224 0.4609-Nov-18 Sale 3,631,993 56,020,231 0.4416-Nov-18 Sale 3,164,093 52,856,138 0.4123-Nov-18 Sale 403,355 52,452,783 0.4130-Nov-18 Sale 277,268 52,175,515 0.4107-Dec-18 Sale 813,485 51,362,030 0.4014-Dec-18 Sale 716,361 50,645,669 0.3911-Jan-19 Sale 2,327,408 48,318,261 0.3822-Feb-19 Sale 4,218,296 44,099,965 0.34
(C ) at the end of the year ( or on the date of separartion, if seperated during the year)
44,099,965 0.34
Note :-Pre Buy-back [total number of Shares - 12,83,32,35,180] Post-buy back w.e.f. 22.02.2019 [total number of shares - 12,58,02,79,206 has been considered)
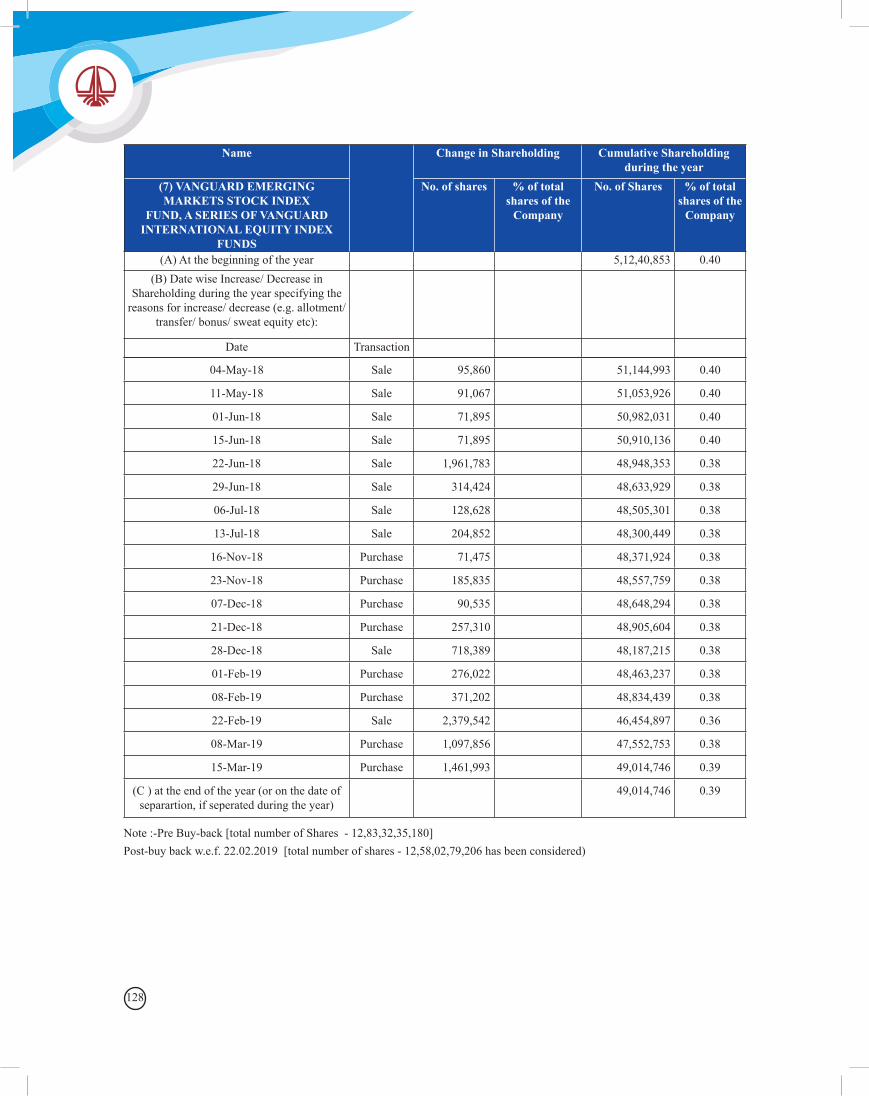
128
Name Change in Shareholding Cumulative Shareholding during the year
(7) VANGUARD EMERGING MARKETS STOCK INDEX
FUND, A SERIES OF VANGUARD INTERNATIONAL EQUITY INDEX
FUNDS
No. of shares % of total shares of the
Company
No. of Shares % of total shares of the
Company
(A) At the beginning of the year 5,12,40,853 0.40(B) Date wise Increase/ Decrease in
Shareholding during the year specifying the reasons for increase/ decrease (e.g. allotment/
transfer/ bonus/ sweat equity etc):
Date Transaction
04-May-18 Sale 95,860 51,144,993 0.40
11-May-18 Sale 91,067 51,053,926 0.40
01-Jun-18 Sale 71,895 50,982,031 0.40
15-Jun-18 Sale 71,895 50,910,136 0.40
22-Jun-18 Sale 1,961,783 48,948,353 0.38
29-Jun-18 Sale 314,424 48,633,929 0.38
06-Jul-18 Sale 128,628 48,505,301 0.38
13-Jul-18 Sale 204,852 48,300,449 0.38
16-Nov-18 Purchase 71,475 48,371,924 0.38
23-Nov-18 Purchase 185,835 48,557,759 0.38
07-Dec-18 Purchase 90,535 48,648,294 0.38
21-Dec-18 Purchase 257,310 48,905,604 0.38
28-Dec-18 Sale 718,389 48,187,215 0.38
01-Feb-19 Purchase 276,022 48,463,237 0.38
08-Feb-19 Purchase 371,202 48,834,439 0.38
22-Feb-19 Sale 2,379,542 46,454,897 0.36
08-Mar-19 Purchase 1,097,856 47,552,753 0.38
15-Mar-19 Purchase 1,461,993 49,014,746 0.39
(C ) at the end of the year (or on the date of separartion, if seperated during the year)
49,014,746 0.39
Note :-Pre Buy-back [total number of Shares - 12,83,32,35,180] Post-buy back w.e.f. 22.02.2019 [total number of shares - 12,58,02,79,206 has been considered)
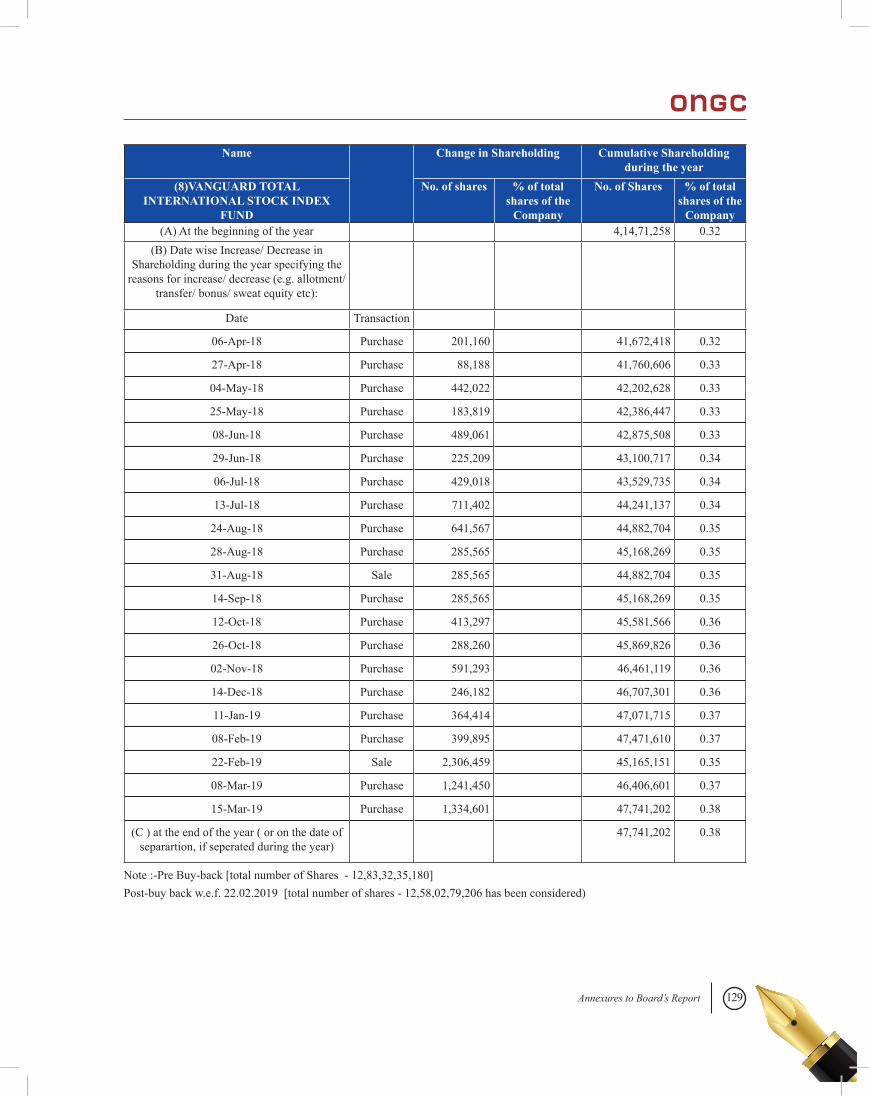
129Annexures to Board’s Report
Name Change in Shareholding Cumulative Shareholding during the year
(8)VANGUARD TOTAL INTERNATIONAL STOCK INDEX
FUND
No. of shares % of total shares of the
Company
No. of Shares % of total shares of the
Company(A) At the beginning of the year 4,14,71,258 0.32
(B) Date wise Increase/ Decrease in Shareholding during the year specifying the
reasons for increase/ decrease (e.g. allotment/ transfer/ bonus/ sweat equity etc):
Date Transaction
06-Apr-18 Purchase 201,160 41,672,418 0.32
27-Apr-18 Purchase 88,188 41,760,606 0.33
04-May-18 Purchase 442,022 42,202,628 0.33
25-May-18 Purchase 183,819 42,386,447 0.33
08-Jun-18 Purchase 489,061 42,875,508 0.33
29-Jun-18 Purchase 225,209 43,100,717 0.34
06-Jul-18 Purchase 429,018 43,529,735 0.34
13-Jul-18 Purchase 711,402 44,241,137 0.34
24-Aug-18 Purchase 641,567 44,882,704 0.35
28-Aug-18 Purchase 285,565 45,168,269 0.35
31-Aug-18 Sale 285,565 44,882,704 0.35
14-Sep-18 Purchase 285,565 45,168,269 0.35
12-Oct-18 Purchase 413,297 45,581,566 0.36
26-Oct-18 Purchase 288,260 45,869,826 0.36
02-Nov-18 Purchase 591,293 46,461,119 0.36
14-Dec-18 Purchase 246,182 46,707,301 0.36
11-Jan-19 Purchase 364,414 47,071,715 0.37
08-Feb-19 Purchase 399,895 47,471,610 0.37
22-Feb-19 Sale 2,306,459 45,165,151 0.35
08-Mar-19 Purchase 1,241,450 46,406,601 0.37
15-Mar-19 Purchase 1,334,601 47,741,202 0.38
(C ) at the end of the year ( or on the date of separartion, if seperated during the year)
47,741,202 0.38
Note :-Pre Buy-back [total number of Shares - 12,83,32,35,180] Post-buy back w.e.f. 22.02.2019 [total number of shares - 12,58,02,79,206 has been considered)
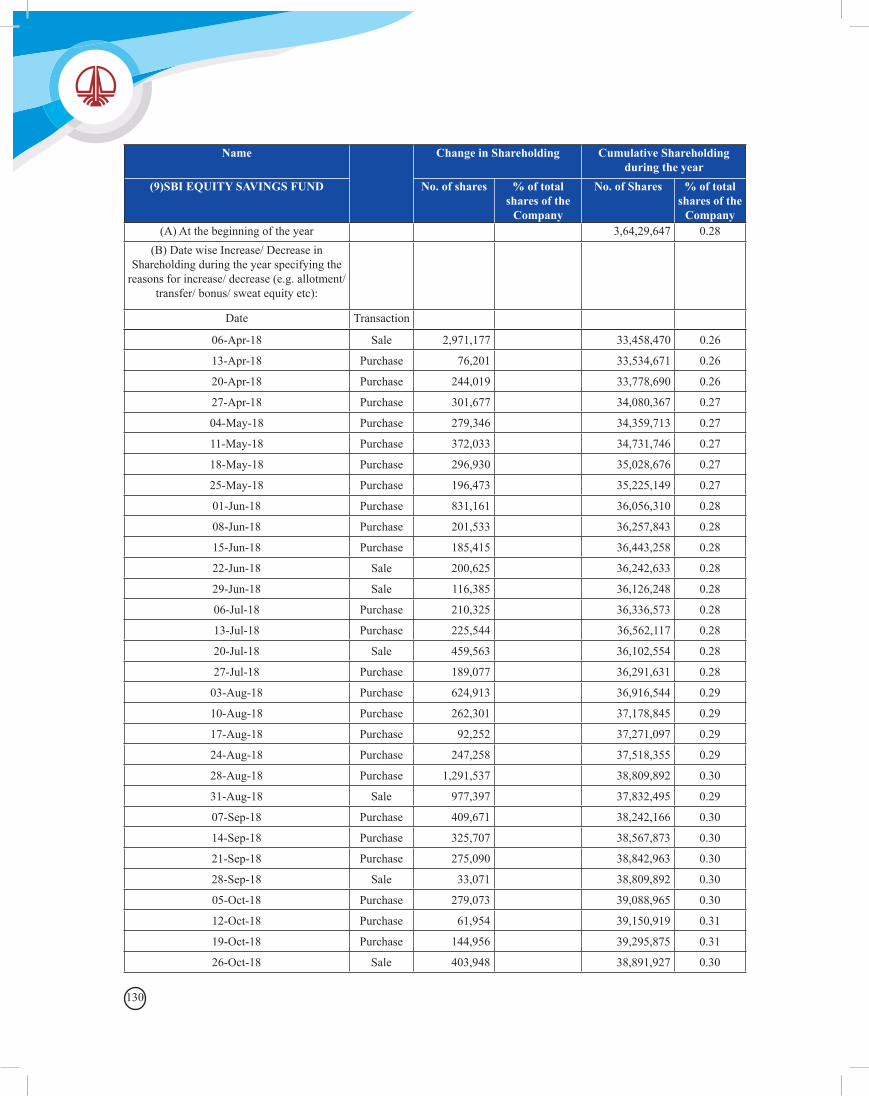
130
Name Change in Shareholding Cumulative Shareholding during the year
(9)SBI EQUITY SAVINGS FUND No. of shares % of total shares of the
Company
No. of Shares % of total shares of the
Company(A) At the beginning of the year 3,64,29,647 0.28
(B) Date wise Increase/ Decrease in Shareholding during the year specifying the
reasons for increase/ decrease (e.g. allotment/ transfer/ bonus/ sweat equity etc):
Date Transaction
06-Apr-18 Sale 2,971,177 33,458,470 0.26
13-Apr-18 Purchase 76,201 33,534,671 0.26
20-Apr-18 Purchase 244,019 33,778,690 0.26
27-Apr-18 Purchase 301,677 34,080,367 0.27
04-May-18 Purchase 279,346 34,359,713 0.27
11-May-18 Purchase 372,033 34,731,746 0.27
18-May-18 Purchase 296,930 35,028,676 0.27
25-May-18 Purchase 196,473 35,225,149 0.27
01-Jun-18 Purchase 831,161 36,056,310 0.28
08-Jun-18 Purchase 201,533 36,257,843 0.28
15-Jun-18 Purchase 185,415 36,443,258 0.28
22-Jun-18 Sale 200,625 36,242,633 0.28
29-Jun-18 Sale 116,385 36,126,248 0.28
06-Jul-18 Purchase 210,325 36,336,573 0.28
13-Jul-18 Purchase 225,544 36,562,117 0.28
20-Jul-18 Sale 459,563 36,102,554 0.28
27-Jul-18 Purchase 189,077 36,291,631 0.28
03-Aug-18 Purchase 624,913 36,916,544 0.29
10-Aug-18 Purchase 262,301 37,178,845 0.29
17-Aug-18 Purchase 92,252 37,271,097 0.29
24-Aug-18 Purchase 247,258 37,518,355 0.29
28-Aug-18 Purchase 1,291,537 38,809,892 0.30
31-Aug-18 Sale 977,397 37,832,495 0.29
07-Sep-18 Purchase 409,671 38,242,166 0.30
14-Sep-18 Purchase 325,707 38,567,873 0.30
21-Sep-18 Purchase 275,090 38,842,963 0.30
28-Sep-18 Sale 33,071 38,809,892 0.30
05-Oct-18 Purchase 279,073 39,088,965 0.30
12-Oct-18 Purchase 61,954 39,150,919 0.31
19-Oct-18 Purchase 144,956 39,295,875 0.31
26-Oct-18 Sale 403,948 38,891,927 0.30
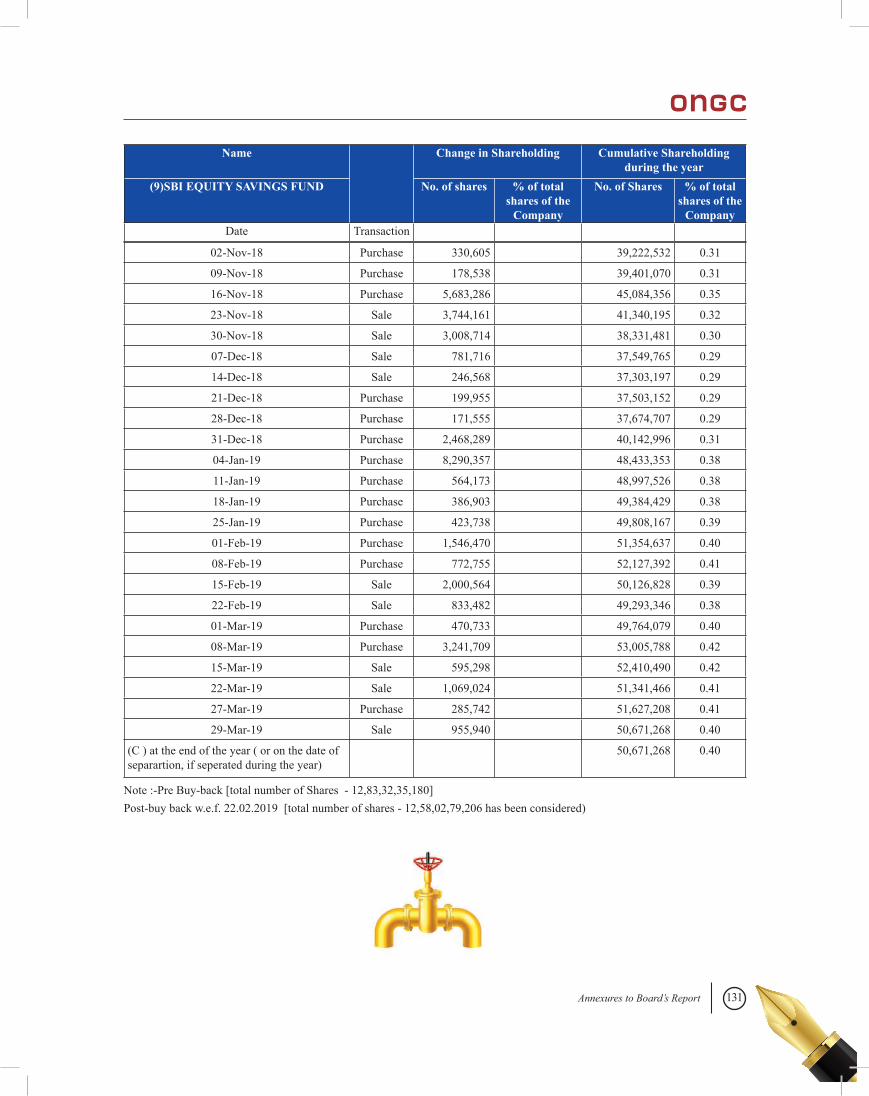
131Annexures to Board’s Report
Name Change in Shareholding Cumulative Shareholding during the year
(9)SBI EQUITY SAVINGS FUND No. of shares % of total shares of the
Company
No. of Shares % of total shares of the
CompanyDate Transaction
02-Nov-18 Purchase 330,605 39,222,532 0.31
09-Nov-18 Purchase 178,538 39,401,070 0.31
16-Nov-18 Purchase 5,683,286 45,084,356 0.35
23-Nov-18 Sale 3,744,161 41,340,195 0.32
30-Nov-18 Sale 3,008,714 38,331,481 0.30
07-Dec-18 Sale 781,716 37,549,765 0.29
14-Dec-18 Sale 246,568 37,303,197 0.29
21-Dec-18 Purchase 199,955 37,503,152 0.29
28-Dec-18 Purchase 171,555 37,674,707 0.29
31-Dec-18 Purchase 2,468,289 40,142,996 0.31
04-Jan-19 Purchase 8,290,357 48,433,353 0.38
11-Jan-19 Purchase 564,173 48,997,526 0.38
18-Jan-19 Purchase 386,903 49,384,429 0.38
25-Jan-19 Purchase 423,738 49,808,167 0.39
01-Feb-19 Purchase 1,546,470 51,354,637 0.40
08-Feb-19 Purchase 772,755 52,127,392 0.41
15-Feb-19 Sale 2,000,564 50,126,828 0.39
22-Feb-19 Sale 833,482 49,293,346 0.38
01-Mar-19 Purchase 470,733 49,764,079 0.40
08-Mar-19 Purchase 3,241,709 53,005,788 0.42
15-Mar-19 Sale 595,298 52,410,490 0.42
22-Mar-19 Sale 1,069,024 51,341,466 0.41
27-Mar-19 Purchase 285,742 51,627,208 0.41
29-Mar-19 Sale 955,940 50,671,268 0.40
(C ) at the end of the year ( or on the date of separartion, if seperated during the year)
50,671,268 0.40
Note :-Pre Buy-back [total number of Shares - 12,83,32,35,180] Post-buy back w.e.f. 22.02.2019 [total number of shares - 12,58,02,79,206 has been considered)
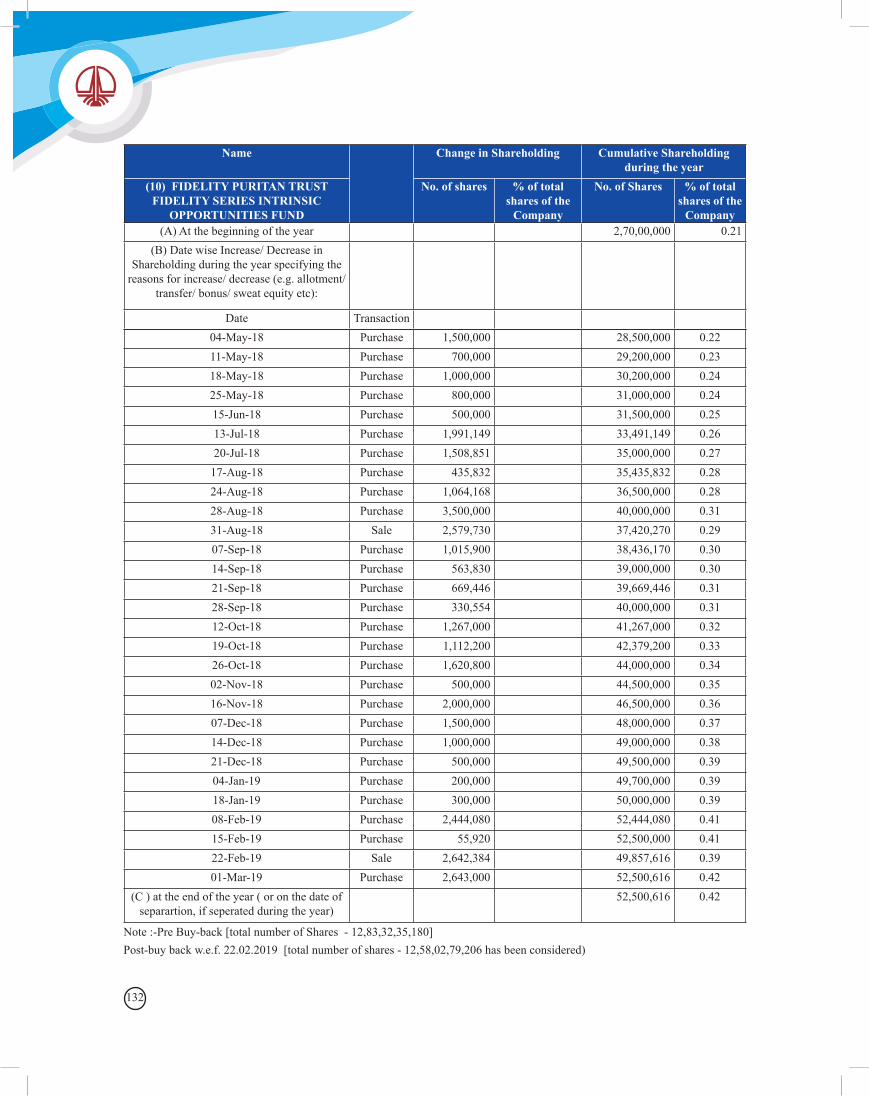
132
Name Change in Shareholding Cumulative Shareholding during the year
(10) FIDELITY PURITAN TRUST FIDELITY SERIES INTRINSIC
OPPORTUNITIES FUND
No. of shares % of total shares of the
Company
No. of Shares % of total shares of the
Company(A) At the beginning of the year 2,70,00,000 0.21
(B) Date wise Increase/ Decrease in Shareholding during the year specifying the
reasons for increase/ decrease (e.g. allotment/ transfer/ bonus/ sweat equity etc):
Date Transaction 04-May-18 Purchase 1,500,000 28,500,000 0.2211-May-18 Purchase 700,000 29,200,000 0.2318-May-18 Purchase 1,000,000 30,200,000 0.2425-May-18 Purchase 800,000 31,000,000 0.2415-Jun-18 Purchase 500,000 31,500,000 0.2513-Jul-18 Purchase 1,991,149 33,491,149 0.2620-Jul-18 Purchase 1,508,851 35,000,000 0.27
17-Aug-18 Purchase 435,832 35,435,832 0.2824-Aug-18 Purchase 1,064,168 36,500,000 0.2828-Aug-18 Purchase 3,500,000 40,000,000 0.3131-Aug-18 Sale 2,579,730 37,420,270 0.2907-Sep-18 Purchase 1,015,900 38,436,170 0.3014-Sep-18 Purchase 563,830 39,000,000 0.3021-Sep-18 Purchase 669,446 39,669,446 0.3128-Sep-18 Purchase 330,554 40,000,000 0.3112-Oct-18 Purchase 1,267,000 41,267,000 0.3219-Oct-18 Purchase 1,112,200 42,379,200 0.3326-Oct-18 Purchase 1,620,800 44,000,000 0.3402-Nov-18 Purchase 500,000 44,500,000 0.3516-Nov-18 Purchase 2,000,000 46,500,000 0.3607-Dec-18 Purchase 1,500,000 48,000,000 0.3714-Dec-18 Purchase 1,000,000 49,000,000 0.3821-Dec-18 Purchase 500,000 49,500,000 0.3904-Jan-19 Purchase 200,000 49,700,000 0.3918-Jan-19 Purchase 300,000 50,000,000 0.3908-Feb-19 Purchase 2,444,080 52,444,080 0.4115-Feb-19 Purchase 55,920 52,500,000 0.4122-Feb-19 Sale 2,642,384 49,857,616 0.3901-Mar-19 Purchase 2,643,000 52,500,616 0.42
(C ) at the end of the year ( or on the date of separartion, if seperated during the year)
52,500,616 0.42
Note :-Pre Buy-back [total number of Shares - 12,83,32,35,180] Post-buy back w.e.f. 22.02.2019 [total number of shares - 12,58,02,79,206 has been considered)
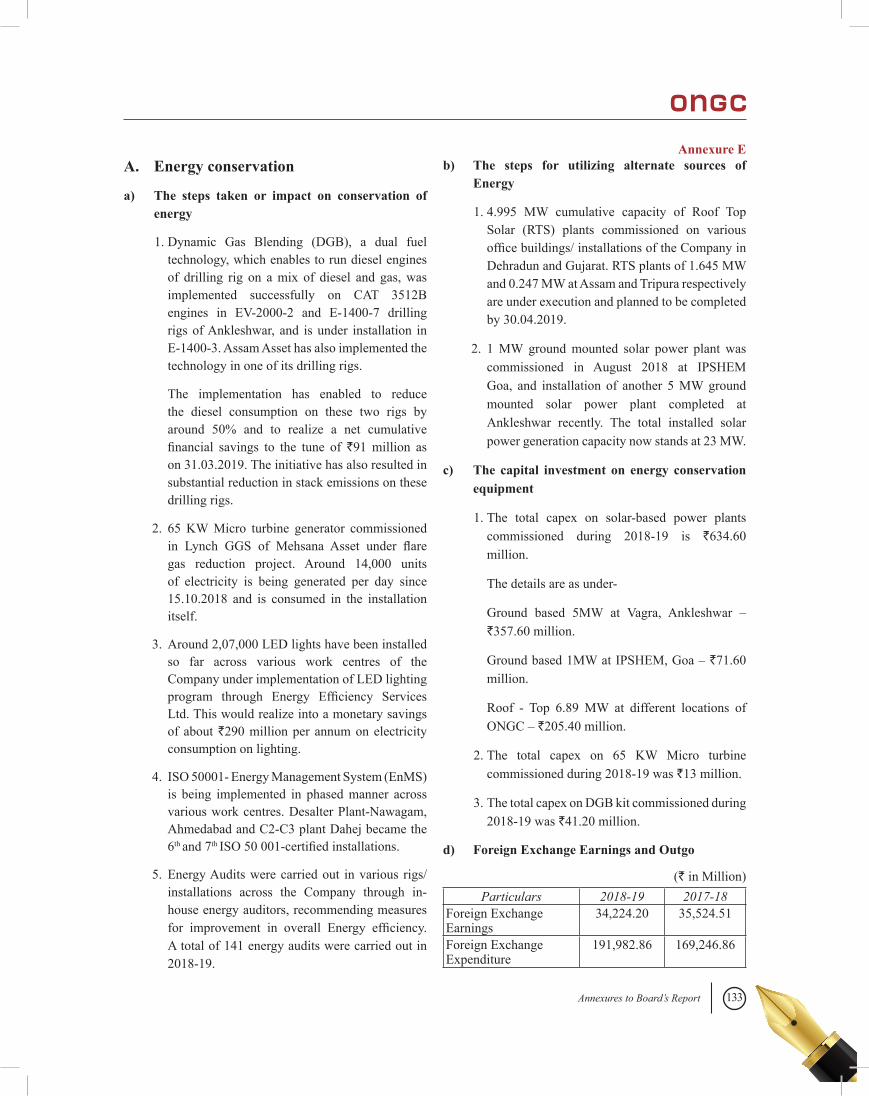
133Annexures to Board’s Report
Annexure EA. Energy conservation
a) The steps taken or impact on conservation of energy
1. Dynamic Gas Blending (DGB), a dual fuel technology, which enables to run diesel engines of drilling rig on a mix of diesel and gas, was implemented successfully on CAT 3512B engines in EV-2000-2 and E-1400-7 drilling rigs of Ankleshwar, and is under installation in E-1400-3. Assam Asset has also implemented the technology in one of its drilling rigs.
The implementation has enabled to reduce the diesel consumption on these two rigs by around 50% and to realize a net cumulative financial savings to the tune of `91 million as on 31.03.2019. The initiative has also resulted in substantial reduction in stack emissions on these drilling rigs.
2. 65 KW Micro turbine generator commissioned in Lynch GGS of Mehsana Asset under flare gas reduction project. Around 14,000 units of electricity is being generated per day since 15.10.2018 and is consumed in the installation itself.
3. Around 2,07,000 LED lights have been installed so far across various work centres of the Company under implementation of LED lighting program through Energy Efficiency Services Ltd. This would realize into a monetary savings of about `290 million per annum on electricity consumption on lighting.
4. ISO 50001- Energy Management System (EnMS) is being implemented in phased manner across various work centres. Desalter Plant-Nawagam, Ahmedabad and C2-C3 plant Dahej became the 6th and 7th ISO 50 001-certified installations.
5. Energy Audits were carried out in various rigs/installations across the Company through in-house energy auditors, recommending measures for improvement in overall Energy efficiency. A total of 141 energy audits were carried out in 2018-19.
b) The steps for utilizing alternate sources of Energy
1. 4.995 MW cumulative capacity of Roof Top Solar (RTS) plants commissioned on various office buildings/ installations of the Company in Dehradun and Gujarat. RTS plants of 1.645 MW and 0.247 MW at Assam and Tripura respectively are under execution and planned to be completed by 30.04.2019.
2. 1 MW ground mounted solar power plant was commissioned in August 2018 at IPSHEM Goa, and installation of another 5 MW ground mounted solar power plant completed at Ankleshwar recently. The total installed solar power generation capacity now stands at 23 MW.
c) The capital investment on energy conservation equipment
1. The total capex on solar-based power plants commissioned during 2018-19 is `634.60 million.
The details are as under-
Ground based 5MW at Vagra, Ankleshwar – `357.60 million.
Ground based 1MW at IPSHEM, Goa – `71.60 million.
Roof - Top 6.89 MW at different locations of ONGC – `205.40 million.
2. The total capex on 65 KW Micro turbine commissioned during 2018-19 was `13 million.
3. The total capex on DGB kit commissioned during 2018-19 was `41.20 million.
d) Foreign Exchange Earnings and Outgo
Particulars 2018-19 2017-18Foreign Exchange Earnings
34,224.20 35,524.51
Foreign Exchange Expenditure
191,982.86 169,246.86
(` in Million)
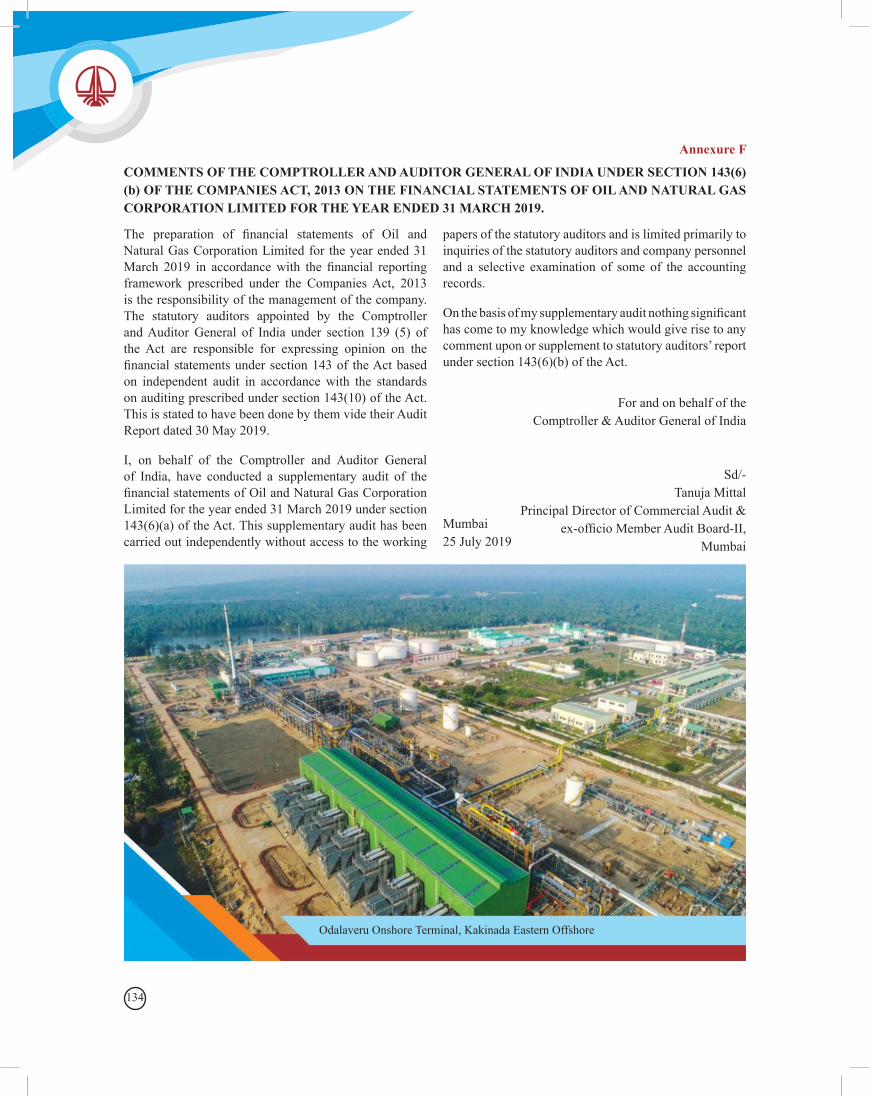
134
COMMENTS OF THE COMPTROLLER AND AUDITOR GENERAL OF INDIA UNDER SECTION 143(6) (b) OF THE COMPANIES ACT, 2013 ON THE FINANCIAL STATEMENTS OF OIL AND NATURAL GAS CORPORATION LIMITED FOR THE YEAR ENDED 31 MARCH 2019.
papers of the statutory auditors and is limited primarily to inquiries of the statutory auditors and company personnel and a selective examination of some of the accounting records.
On the basis of my supplementary audit nothing significant has come to my knowledge which would give rise to any comment upon or supplement to statutory auditors’ report under section 143(6)(b) of the Act.
Mumbai25 July 2019
Annexure F
The preparation of financial statements of Oil and Natural Gas Corporation Limited for the year ended 31 March 2019 in accordance with the financial reporting framework prescribed under the Companies Act, 2013 is the responsibility of the management of the company. The statutory auditors appointed by the Comptroller and Auditor General of India under section 139 (5) of the Act are responsible for expressing opinion on the financial statements under section 143 of the Act based on independent audit in accordance with the standards on auditing prescribed under section 143(10) of the Act. This is stated to have been done by them vide their Audit Report dated 30 May 2019.
I, on behalf of the Comptroller and Auditor General of India, have conducted a supplementary audit of the financial statements of Oil and Natural Gas Corporation Limited for the year ended 31 March 2019 under section 143(6)(a) of the Act. This supplementary audit has been carried out independently without access to the working
For and on behalf of the Comptroller & Auditor General of India
Sd/-Tanuja Mittal
Principal Director of Commercial Audit &ex-officio Member Audit Board-II,
Mumbai
Odalaveru Onshore Terminal, Kakinada Eastern Offshore
135Comments of C&AG
COMMENTS OF THE COMPTROLLER AND AUDITOR GENERAL OF INDIA UNDER SECTION 143(6) (b) READ WITH SECTION 129 (4) OF THE COMPANIES ACT, 2013 ON THE CONSOLIDATED FINANCIAL STATEMENTS OF OIL AND NATURAL GAS CORPORATION LIMITED FOR THE YEAR ENDED 31 MARCH 2019
The preparation of consolidated financial statements of Oil and Natural Gas Corporation Limited for the year ended 31 March 2019 in accordance with the financial reporting framework prescribed under the Companies Act, 2013 is the responsibility of the management of the company. The statutory auditors appointed by the Comptroller and Auditor General of India under section 139 (5)read with section 129 (4) of the Act are responsible for expressing opinion on the financial statements under section 143 read with section 129 (4) of the Act based on independent audit in accordance with the standards on auditing prescribed under section 143(10) of the Act. This is stated to have been done by them vide their Audit Report dated 30 May 2019.
I, on behalf of the Comptroller and Auditor General of India, have conducted a supplementary audit of the consolidated financial statements of Oil and Natural Gas Corporation Limited for the year ended 31 March 2019 under section 143(6)(a) read with section 129(4) of the Act. We conducted the supplementary audit of the financial statements of subsidiary/joint venture/ associate company(Annexure-I) but did not conduct supplementary audit of the financial statements of subsidiary/joint venture/associate company (Annexure-II) for the year ended on that date. Further, section 139(5) and 143 (6) (b) of the Act are not applicable to subsidiary/joint venture/ associate company(Annexure-III) being private entities incorporated in Foreign countries under the respective laws, for appointment of their Statutory Auditor and for
conduct of supplementary audit. Accordingly, Comptroller and Auditor General of India has neither appointed the Statutory Auditors nor conducted the supplementary audit of these companies. This supplementary audit has been carried out independently without access to the working papers of the statutory auditors and is limited primarily to inquiries of the statutory auditors and company personnel and a selective examination of some of the accounting records. This supplementary audit has been carried out independently without access to the working papers of the statutory auditors and is limited primarily to inquiries of the statutory auditors and company personnel and a selective examination of some of the accounting records.
On the basis of my supplementary audit nothing significant has come to my knowledge which would give rise to any comment upon or supplement to statutory auditors’ report under section 143(6)(b) of the Act.
For and on behalf of the Comptroller & Auditor General of India
Sd/-Tanuja Mittal
Principal Director of Commercial Audit &ex-officio Member Audit Board-II,
MumbaiMumbai25 July 2019
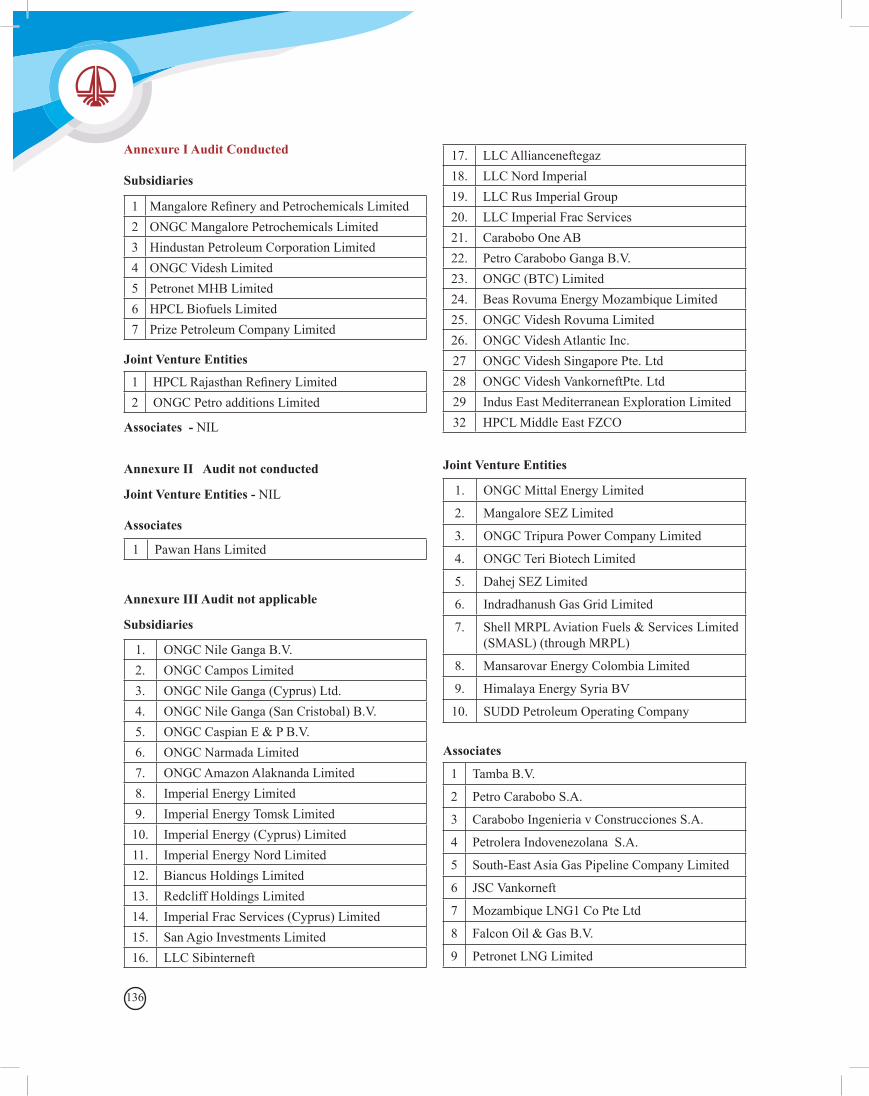
136
Annexure I Audit Conducted
Subsidiaries
1 Mangalore Refinery and Petrochemicals Limited2 ONGC Mangalore Petrochemicals Limited3 Hindustan Petroleum Corporation Limited4 ONGC Videsh Limited5 Petronet MHB Limited6 HPCL Biofuels Limited7 Prize Petroleum Company Limited
Joint Venture Entities
1 HPCL Rajasthan Refinery Limited2 ONGC Petro additions Limited
Associates - NIL
Annexure II Audit not conducted
Joint Venture Entities - NIL
Associates
1 Pawan Hans Limited
Annexure III Audit not applicable
Subsidiaries
1. ONGC Nile Ganga B.V.2. ONGC Campos Limited3. ONGC Nile Ganga (Cyprus) Ltd.4. ONGC Nile Ganga (San Cristobal) B.V.5. ONGC Caspian E & P B.V.6. ONGC Narmada Limited7. ONGC Amazon Alaknanda Limited8. Imperial Energy Limited9. Imperial Energy Tomsk Limited10. Imperial Energy (Cyprus) Limited11. Imperial Energy Nord Limited12. Biancus Holdings Limited13. Redcliff Holdings Limited14. Imperial Frac Services (Cyprus) Limited15. San Agio Investments Limited16. LLC Sibinterneft
17. LLC Allianceneftegaz18. LLC Nord Imperial19. LLC Rus Imperial Group20. LLC Imperial Frac Services21. Carabobo One AB22. Petro Carabobo Ganga B.V.23. ONGC (BTC) Limited24. Beas Rovuma Energy Mozambique Limited25. ONGC Videsh Rovuma Limited26. ONGC Videsh Atlantic Inc.27 ONGC Videsh Singapore Pte. Ltd28 ONGC Videsh VankorneftPte. Ltd29 Indus East Mediterranean Exploration Limited32 HPCL Middle East FZCO
Joint Venture Entities
1. ONGC Mittal Energy Limited
2. Mangalore SEZ Limited
3. ONGC Tripura Power Company Limited
4. ONGC Teri Biotech Limited
5. Dahej SEZ Limited
6. Indradhanush Gas Grid Limited
7. Shell MRPL Aviation Fuels & Services Limited (SMASL) (through MRPL)
8. Mansarovar Energy Colombia Limited
9. Himalaya Energy Syria BV
10. SUDD Petroleum Operating Company
Associates
1 Tamba B.V.
2 Petro Carabobo S.A.
3 Carabobo Ingenieria v Construcciones S.A.
4 Petrolera Indovenezolana S.A.
5 South-East Asia Gas Pipeline Company Limited
6 JSC Vankorneft
7 Mozambique LNG1 Co Pte Ltd
8 Falcon Oil & Gas B.V.
9 Petronet LNG Limited
137Managements Discussion and Analysis Report
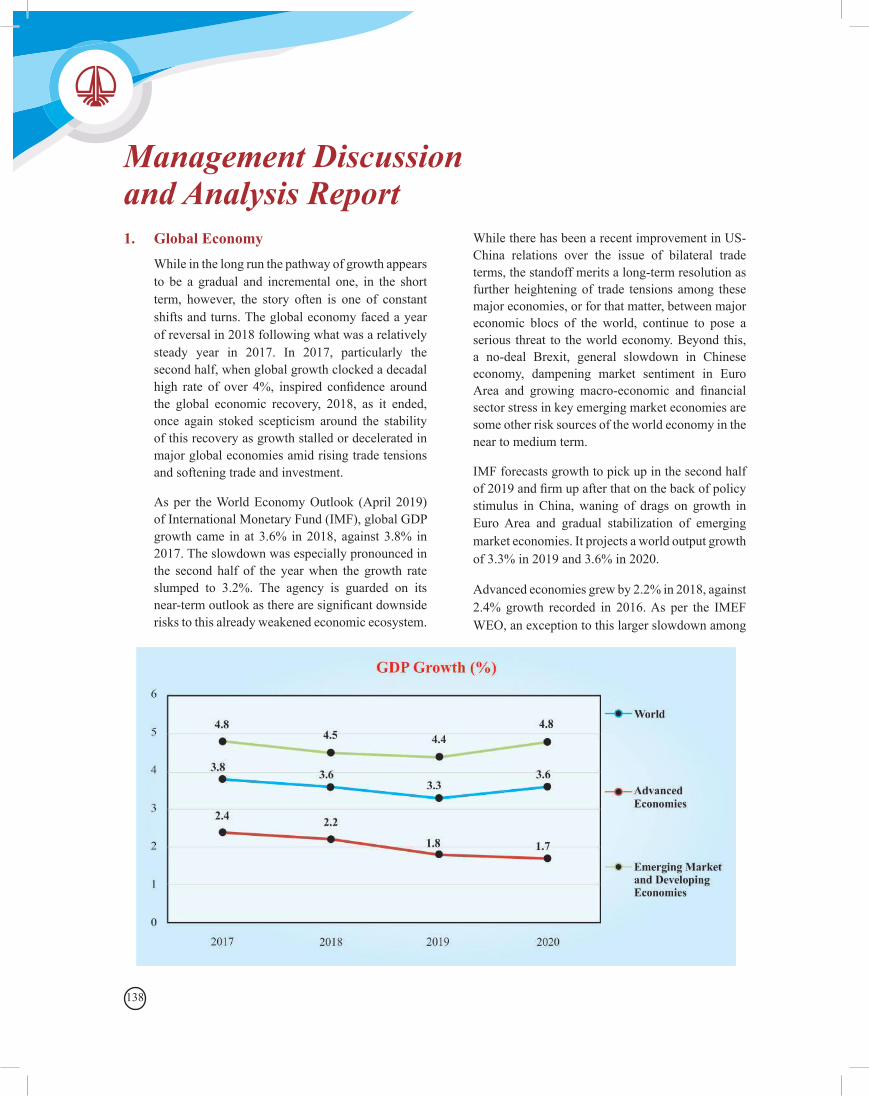
138
Management Discussionand Analysis Report 1. Global Economy While in the long run the pathway of growth appears
to be a gradual and incremental one, in the short term, however, the story often is one of constant shifts and turns. The global economy faced a year of reversal in 2018 following what was a relatively steady year in 2017. In 2017, particularly the second half, when global growth clocked a decadal high rate of over 4%, inspired confidence around the global economic recovery, 2018, as it ended, once again stoked scepticism around the stability of this recovery as growth stalled or decelerated in major global economies amid rising trade tensions and softening trade and investment.
As per the World Economy Outlook (April 2019) of International Monetary Fund (IMF), global GDP growth came in at 3.6% in 2018, against 3.8% in 2017. The slowdown was especially pronounced in the second half of the year when the growth rate slumped to 3.2%. The agency is guarded on its near-term outlook as there are significant downside risks to this already weakened economic ecosystem.
While there has been a recent improvement in US-China relations over the issue of bilateral trade terms, the standoff merits a long-term resolution as further heightening of trade tensions among these major economies, or for that matter, between major economic blocs of the world, continue to pose a serious threat to the world economy. Beyond this, a no-deal Brexit, general slowdown in Chinese economy, dampening market sentiment in Euro Area and growing macro-economic and financial sector stress in key emerging market economies are some other risk sources of the world economy in the near to medium term.
IMF forecasts growth to pick up in the second half of 2019 and firm up after that on the back of policy stimulus in China, waning of drags on growth in Euro Area and gradual stabilization of emerging market economies. It projects a world output growth of 3.3% in 2019 and 3.6% in 2020.
Advanced economies grew by 2.2% in 2018, against 2.4% growth recorded in 2016. As per the IMEF WEO, an exception to this larger slowdown among
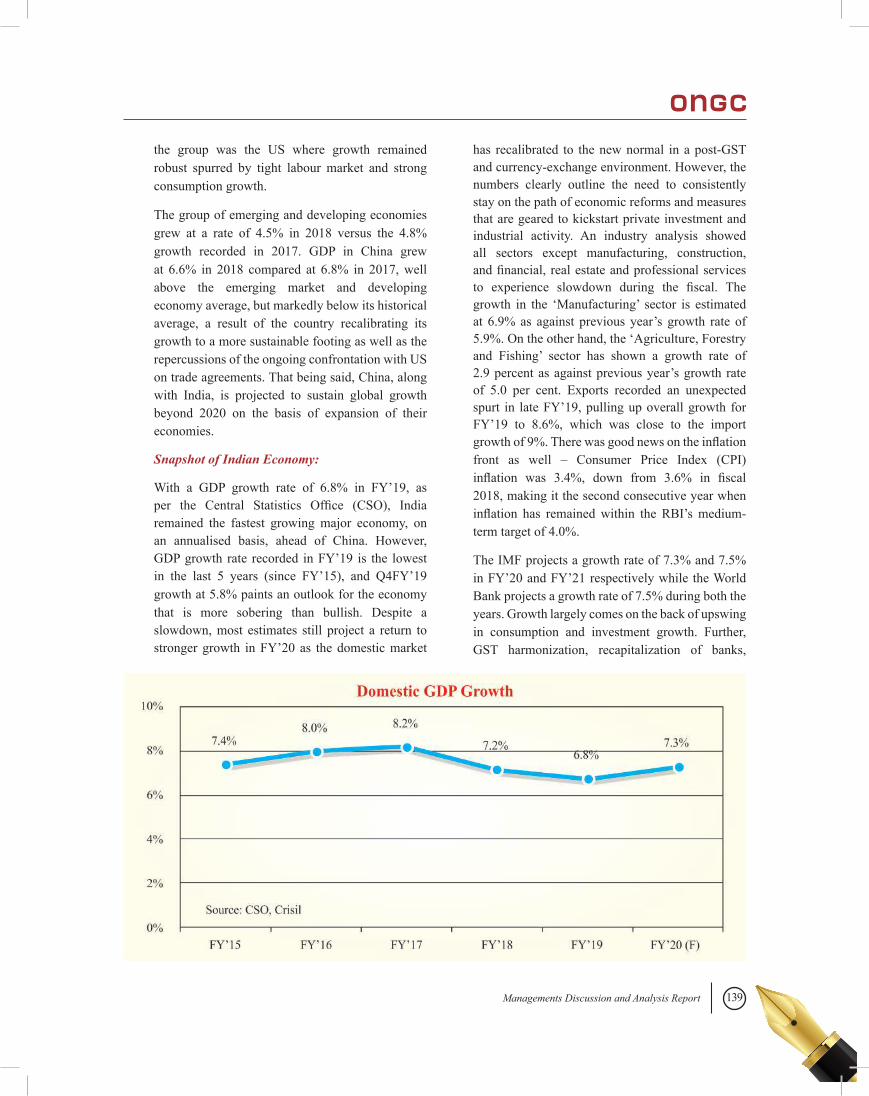
139Managements Discussion and Analysis Report
the group was the US where growth remained robust spurred by tight labour market and strong consumption growth.
The group of emerging and developing economies grew at a rate of 4.5% in 2018 versus the 4.8% growth recorded in 2017. GDP in China grew at 6.6% in 2018 compared at 6.8% in 2017, well above the emerging market and developing economy average, but markedly below its historical average, a result of the country recalibrating its growth to a more sustainable footing as well as the repercussions of the ongoing confrontation with US on trade agreements. That being said, China, along with India, is projected to sustain global growth beyond 2020 on the basis of expansion of their economies.
Snapshot of Indian Economy:
With a GDP growth rate of 6.8% in FY’19, as per the Central Statistics Office (CSO), India remained the fastest growing major economy, on an annualised basis, ahead of China. However, GDP growth rate recorded in FY’19 is the lowest in the last 5 years (since FY’15), and Q4FY’19 growth at 5.8% paints an outlook for the economy that is more sobering than bullish. Despite a slowdown, most estimates still project a return to stronger growth in FY’20 as the domestic market
has recalibrated to the new normal in a post-GST and currency-exchange environment. However, the numbers clearly outline the need to consistently stay on the path of economic reforms and measures that are geared to kickstart private investment and industrial activity. An industry analysis showed all sectors except manufacturing, construction, and financial, real estate and professional services to experience slowdown during the fiscal. The growth in the ‘Manufacturing’ sector is estimated at 6.9% as against previous year’s growth rate of 5.9%. On the other hand, the ‘Agriculture, Forestry and Fishing’ sector has shown a growth rate of 2.9 percent as against previous year’s growth rate of 5.0 per cent. Exports recorded an unexpected spurt in late FY’19, pulling up overall growth for FY’19 to 8.6%, which was close to the import growth of 9%. There was good news on the inflation front as well – Consumer Price Index (CPI) inflation was 3.4%, down from 3.6% in fiscal 2018, making it the second consecutive year when inflation has remained within the RBI’s medium-term target of 4.0%.
The IMF projects a growth rate of 7.3% and 7.5% in FY’20 and FY’21 respectively while the World Bank projects a growth rate of 7.5% during both the years. Growth largely comes on the back of upswing in consumption and investment growth. Further, GST harmonization, recapitalization of banks,
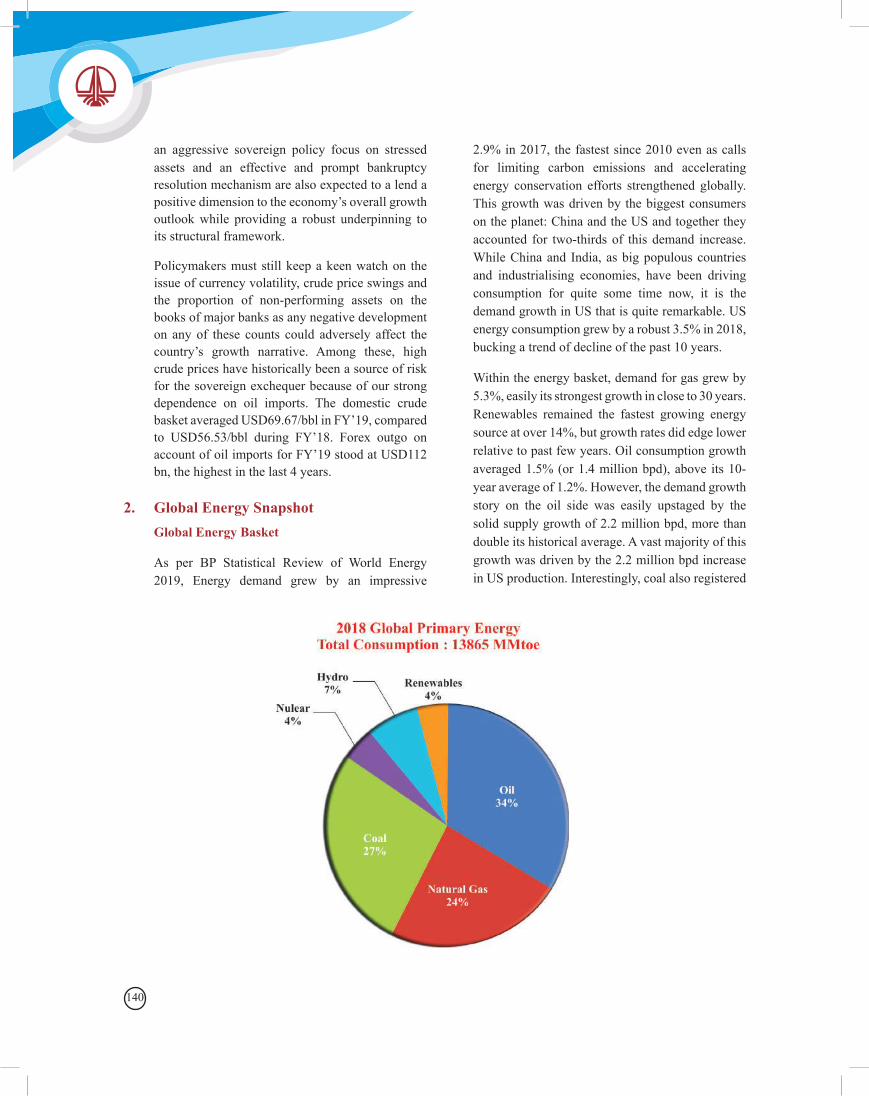
140
an aggressive sovereign policy focus on stressed assets and an effective and prompt bankruptcy resolution mechanism are also expected to a lend a positive dimension to the economy’s overall growth outlook while providing a robust underpinning to its structural framework.
Policymakers must still keep a keen watch on the issue of currency volatility, crude price swings and the proportion of non-performing assets on the books of major banks as any negative development on any of these counts could adversely affect the country’s growth narrative. Among these, high crude prices have historically been a source of risk for the sovereign exchequer because of our strong dependence on oil imports. The domestic crude basket averaged USD69.67/bbl in FY’19, compared to USD56.53/bbl during FY’18. Forex outgo on account of oil imports for FY’19 stood at USD112 bn, the highest in the last 4 years.
2. Global Energy Snapshot Global Energy Basket
As per BP Statistical Review of World Energy 2019, Energy demand grew by an impressive
2.9% in 2017, the fastest since 2010 even as calls for limiting carbon emissions and accelerating energy conservation efforts strengthened globally. This growth was driven by the biggest consumers on the planet: China and the US and together they accounted for two-thirds of this demand increase. While China and India, as big populous countries and industrialising economies, have been driving consumption for quite some time now, it is the demand growth in US that is quite remarkable. US energy consumption grew by a robust 3.5% in 2018, bucking a trend of decline of the past 10 years.
Within the energy basket, demand for gas grew by 5.3%, easily its strongest growth in close to 30 years. Renewables remained the fastest growing energy source at over 14%, but growth rates did edge lower relative to past few years. Oil consumption growth averaged 1.5% (or 1.4 million bpd), above its 10-year average of 1.2%. However, the demand growth story on the oil side was easily upstaged by the solid supply growth of 2.2 million bpd, more than double its historical average. A vast majority of this growth was driven by the 2.2 million bpd increase in US production. Interestingly, coal also registered
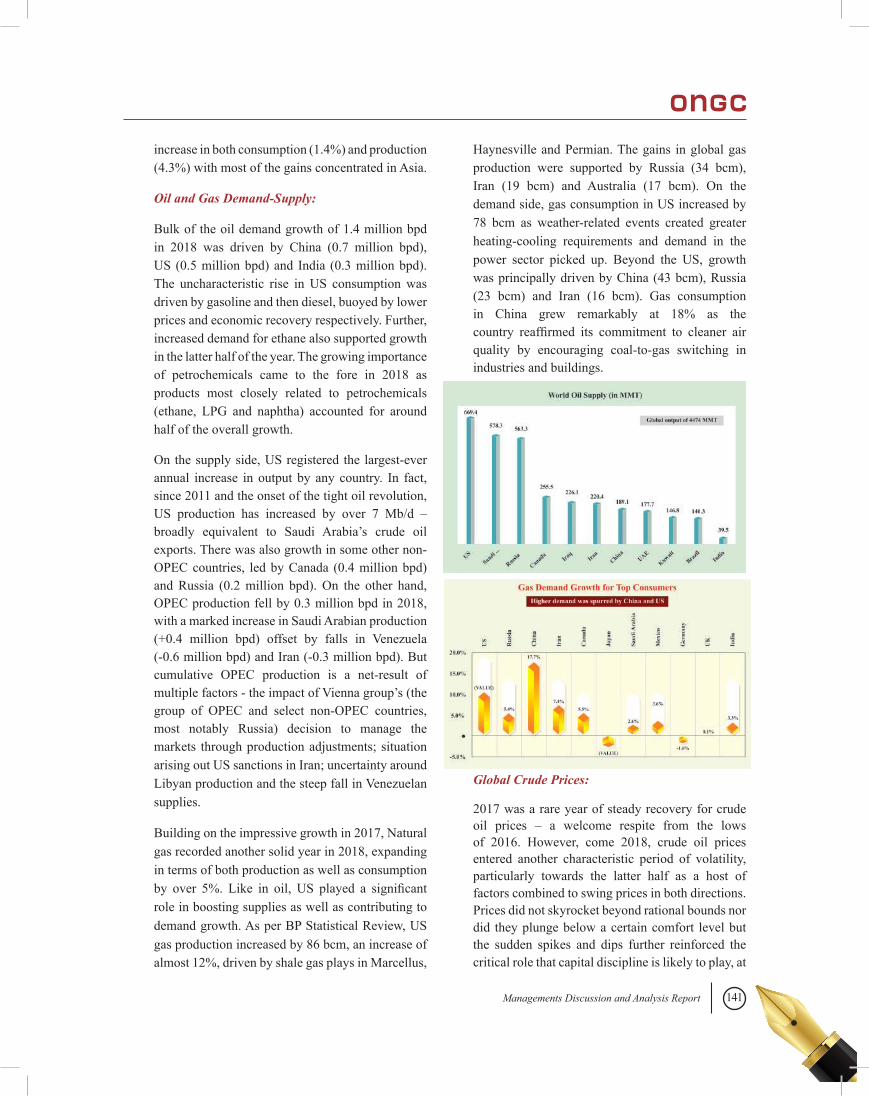
141Managements Discussion and Analysis Report
increase in both consumption (1.4%) and production (4.3%) with most of the gains concentrated in Asia.
Oil and Gas Demand-Supply:
Bulk of the oil demand growth of 1.4 million bpd in 2018 was driven by China (0.7 million bpd), US (0.5 million bpd) and India (0.3 million bpd). The uncharacteristic rise in US consumption was driven by gasoline and then diesel, buoyed by lower prices and economic recovery respectively. Further, increased demand for ethane also supported growth in the latter half of the year. The growing importance of petrochemicals came to the fore in 2018 as products most closely related to petrochemicals (ethane, LPG and naphtha) accounted for around half of the overall growth.
On the supply side, US registered the largest-ever annual increase in output by any country. In fact, since 2011 and the onset of the tight oil revolution, US production has increased by over 7 Mb/d – broadly equivalent to Saudi Arabia’s crude oil exports. There was also growth in some other non-OPEC countries, led by Canada (0.4 million bpd) and Russia (0.2 million bpd). On the other hand, OPEC production fell by 0.3 million bpd in 2018, with a marked increase in Saudi Arabian production (+0.4 million bpd) offset by falls in Venezuela (-0.6 million bpd) and Iran (-0.3 million bpd). But cumulative OPEC production is a net-result of multiple factors - the impact of Vienna group’s (the group of OPEC and select non-OPEC countries, most notably Russia) decision to manage the markets through production adjustments; situation arising out US sanctions in Iran; uncertainty around Libyan production and the steep fall in Venezuelan supplies.
Building on the impressive growth in 2017, Natural gas recorded another solid year in 2018, expanding in terms of both production as well as consumption by over 5%. Like in oil, US played a significant role in boosting supplies as well as contributing to demand growth. As per BP Statistical Review, US gas production increased by 86 bcm, an increase of almost 12%, driven by shale gas plays in Marcellus,
Haynesville and Permian. The gains in global gas production were supported by Russia (34 bcm), Iran (19 bcm) and Australia (17 bcm). On the demand side, gas consumption in US increased by 78 bcm as weather-related events created greater heating-cooling requirements and demand in the power sector picked up. Beyond the US, growth was principally driven by China (43 bcm), Russia (23 bcm) and Iran (16 bcm). Gas consumption in China grew remarkably at 18% as the country reaffirmed its commitment to cleaner air quality by encouraging coal-to-gas switching in industries and buildings.
Global Crude Prices:
2017 was a rare year of steady recovery for crude oil prices – a welcome respite from the lows of 2016. However, come 2018, crude oil prices entered another characteristic period of volatility, particularly towards the latter half as a host of factors combined to swing prices in both directions. Prices did not skyrocket beyond rational bounds nor did they plunge below a certain comfort level but the sudden spikes and dips further reinforced the critical role that capital discipline is likely to play, at
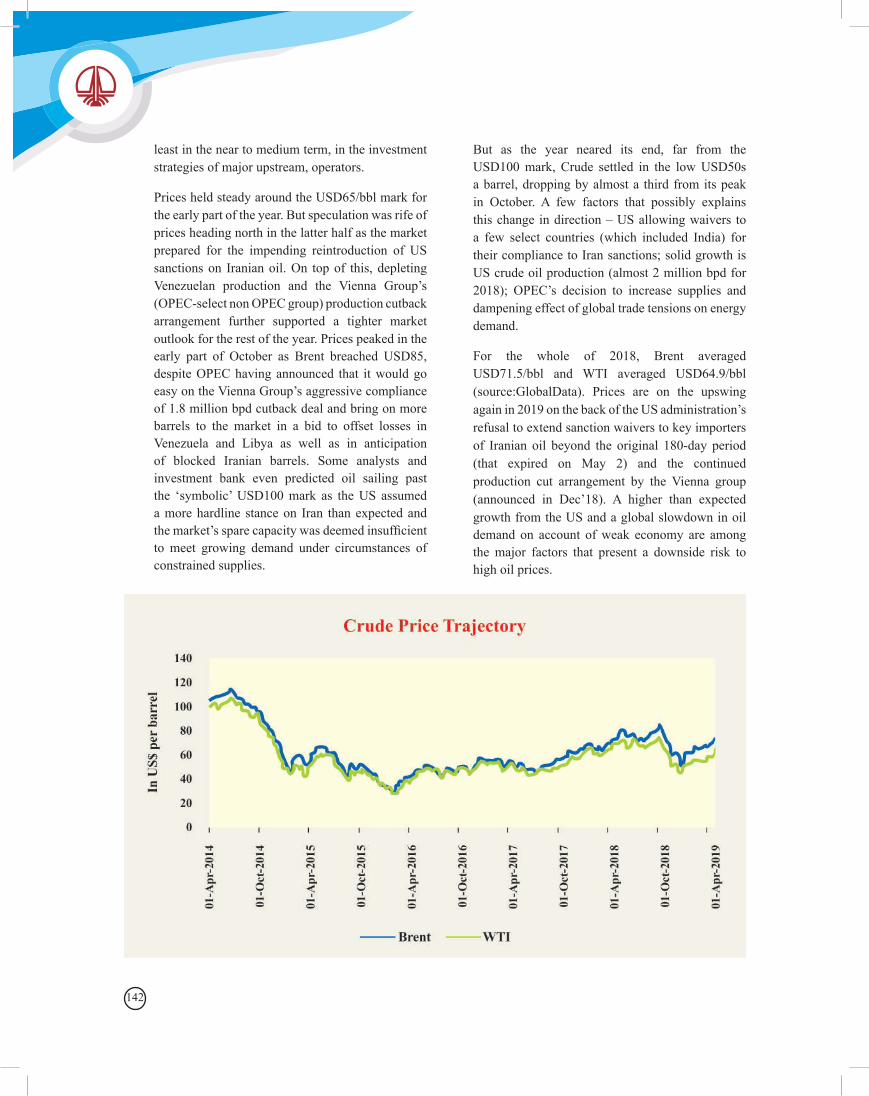
142
least in the near to medium term, in the investment strategies of major upstream, operators.
Prices held steady around the USD65/bbl mark for the early part of the year. But speculation was rife of prices heading north in the latter half as the market prepared for the impending reintroduction of US sanctions on Iranian oil. On top of this, depleting Venezuelan production and the Vienna Group’s (OPEC-select non OPEC group) production cutback arrangement further supported a tighter market outlook for the rest of the year. Prices peaked in the early part of October as Brent breached USD85, despite OPEC having announced that it would go easy on the Vienna Group’s aggressive compliance of 1.8 million bpd cutback deal and bring on more barrels to the market in a bid to offset losses in Venezuela and Libya as well as in anticipation of blocked Iranian barrels. Some analysts and investment bank even predicted oil sailing past the ‘symbolic’ USD100 mark as the US assumed a more hardline stance on Iran than expected and the market’s spare capacity was deemed insufficient to meet growing demand under circumstances of constrained supplies.
But as the year neared its end, far from the USD100 mark, Crude settled in the low USD50s a barrel, dropping by almost a third from its peak in October. A few factors that possibly explains this change in direction – US allowing waivers to a few select countries (which included India) for their compliance to Iran sanctions; solid growth is US crude oil production (almost 2 million bpd for 2018); OPEC’s decision to increase supplies and dampening effect of global trade tensions on energy demand.
For the whole of 2018, Brent averaged USD71.5/bbl and WTI averaged USD64.9/bbl (source:GlobalData). Prices are on the upswing again in 2019 on the back of the US administration’s refusal to extend sanction waivers to key importers of Iranian oil beyond the original 180-day period (that expired on May 2) and the continued production cut arrangement by the Vienna group (announced in Dec’18). A higher than expected growth from the US and a global slowdown in oil demand on account of weak economy are among the major factors that present a downside risk to high oil prices.
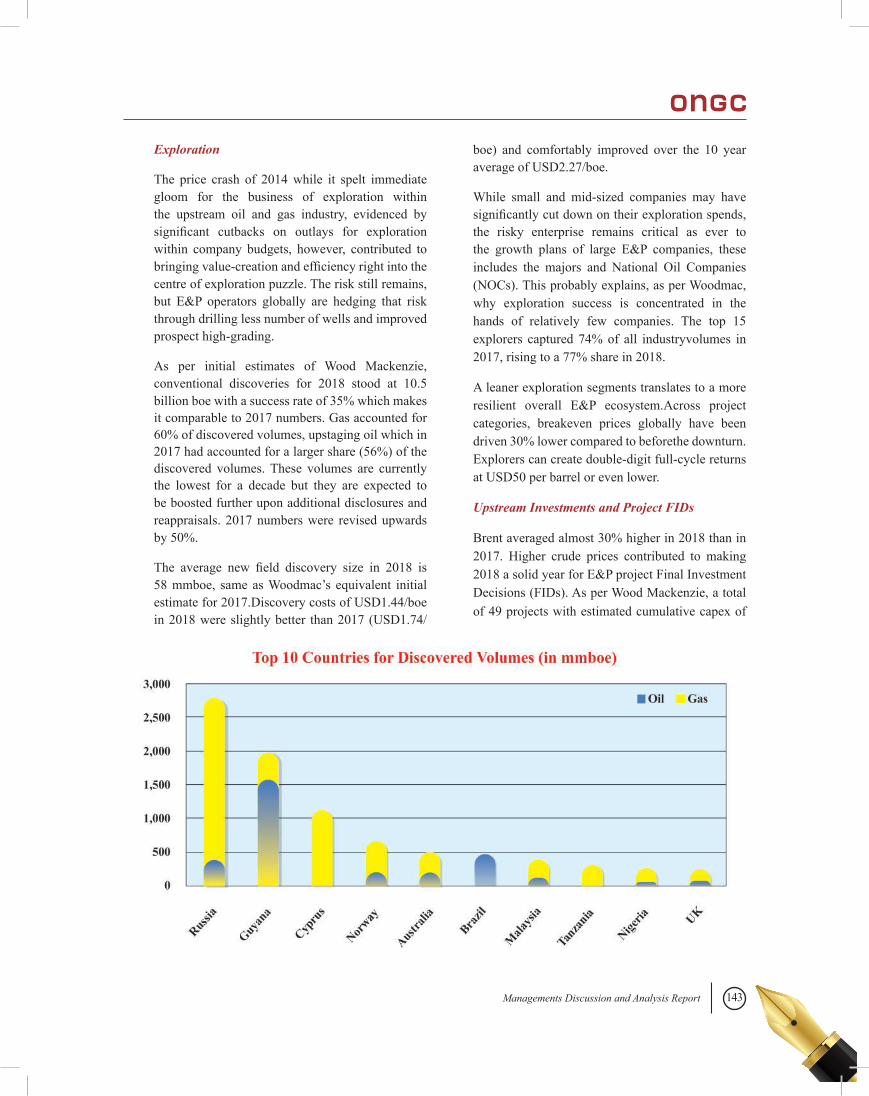
143Managements Discussion and Analysis Report
Exploration
The price crash of 2014 while it spelt immediate gloom for the business of exploration within the upstream oil and gas industry, evidenced by significant cutbacks on outlays for exploration within company budgets, however, contributed to bringing value-creation and efficiency right into the centre of exploration puzzle. The risk still remains, but E&P operators globally are hedging that risk through drilling less number of wells and improved prospect high-grading.
As per initial estimates of Wood Mackenzie, conventional discoveries for 2018 stood at 10.5 billion boe with a success rate of 35% which makes it comparable to 2017 numbers. Gas accounted for 60% of discovered volumes, upstaging oil which in 2017 had accounted for a larger share (56%) of the discovered volumes. These volumes are currently the lowest for a decade but they are expected to be boosted further upon additional disclosures and reappraisals. 2017 numbers were revised upwards by 50%.
The average new field discovery size in 2018 is 58 mmboe, same as Woodmac’s equivalent initial estimate for 2017.Discovery costs of USD1.44/boe in 2018 were slightly better than 2017 (USD1.74/
boe) and comfortably improved over the 10 year average of USD2.27/boe.
While small and mid-sized companies may have significantly cut down on their exploration spends, the risky enterprise remains critical as ever to the growth plans of large E&P companies, these includes the majors and National Oil Companies (NOCs). This probably explains, as per Woodmac, why exploration success is concentrated in the hands of relatively few companies. The top 15 explorers captured 74% of all industryvolumes in 2017, rising to a 77% share in 2018.
A leaner exploration segments translates to a more resilient overall E&P ecosystem.Across project categories, breakeven prices globally have been driven 30% lower compared to beforethe downturn. Explorers can create double-digit full-cycle returns at USD50 per barrel or even lower.
Upstream Investments and Project FIDs
Brent averaged almost 30% higher in 2018 than in 2017. Higher crude prices contributed to making 2018 a solid year for E&P project Final Investment Decisions (FIDs). As per Wood Mackenzie, a total of 49 projects with estimated cumulative capex of
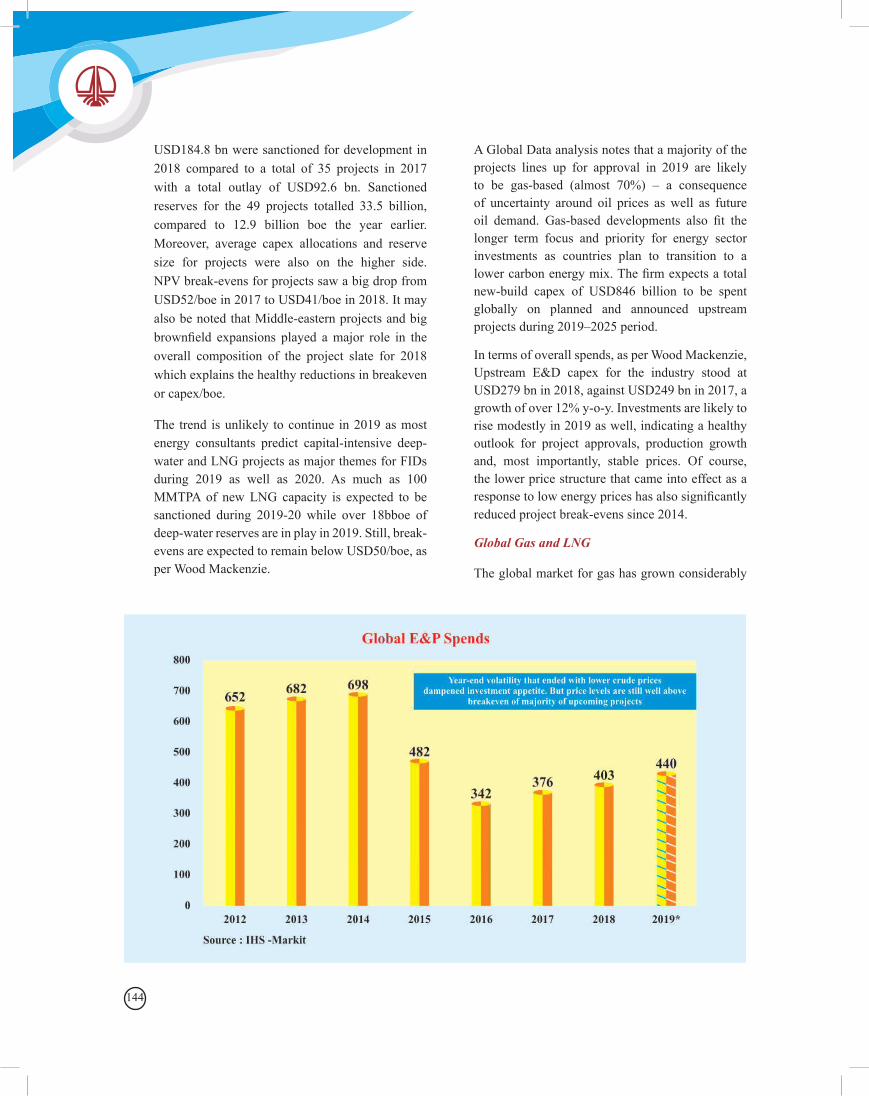
144
USD184.8 bn were sanctioned for development in 2018 compared to a total of 35 projects in 2017 with a total outlay of USD92.6 bn. Sanctioned reserves for the 49 projects totalled 33.5 billion, compared to 12.9 billion boe the year earlier. Moreover, average capex allocations and reserve size for projects were also on the higher side. NPV break-evens for projects saw a big drop from USD52/boe in 2017 to USD41/boe in 2018. It may also be noted that Middle-eastern projects and big brownfield expansions played a major role in the overall composition of the project slate for 2018 which explains the healthy reductions in breakeven or capex/boe.
The trend is unlikely to continue in 2019 as most energy consultants predict capital-intensive deep-water and LNG projects as major themes for FIDs during 2019 as well as 2020. As much as 100 MMTPA of new LNG capacity is expected to be sanctioned during 2019-20 while over 18bboe of deep-water reserves are in play in 2019. Still, break-evens are expected to remain below USD50/boe, as per Wood Mackenzie.
A Global Data analysis notes that a majority of the projects lines up for approval in 2019 are likely to be gas-based (almost 70%) – a consequence of uncertainty around oil prices as well as future oil demand. Gas-based developments also fit the longer term focus and priority for energy sector investments as countries plan to transition to a lower carbon energy mix. The firm expects a total new-build capex of USD846 billion to be spent globally on planned and announced upstream projects during 2019–2025 period.
In terms of overall spends, as per Wood Mackenzie, Upstream E&D capex for the industry stood at USD279 bn in 2018, against USD249 bn in 2017, a growth of over 12% y-o-y. Investments are likely to rise modestly in 2019 as well, indicating a healthy outlook for project approvals, production growth and, most importantly, stable prices. Of course, the lower price structure that came into effect as a response to low energy prices has also significantly reduced project break-evens since 2014.
Global Gas and LNG
The global market for gas has grown considerably
145Managements Discussion and Analysis Report
over the last decade and there are legitimate and strong prospects that the momentum will sustain, at least in the medium term. Gas has grown in an environment where there is a growing demand of cleaner energy systems across the map, primarily driven by a global consensus on the need to curb carbon-related emissions. As per the BP Energy Outlook 2019, the share of gas grows across all its outlook scenarios, from a 20% share in 2017 to not less than 25% in 2040.
Gas-based discoveries are also on the rise – the resource accounted for 56% of total discovered conventional hydrocarbon volumes in 2018. 2018’s largest discovery – NOVATEK’s North Obski-1 well in shallow waters of the mature South KaraSea basin (Russia) – was a gas find. Preliminary estimates peg its resources at over 11 tcf.
More importantly, the market is growing on either side – producers as well as consumers. The supply side dynamics is dominated by the US, which has been a recent and significant entrant to global gas trade because of abundance of cheap gas, and Russia, a traditional piped gas powerhouse which also is now making big-time plans for its LNG business. The entry of US, more than anything, has completely redefined the global gas landscape with ramifications across piped gas and LNG, forcing traditional players like Qatar (LNG) and Russia (piped gas) to reassess their market strategy. Today, North American natural gas resource stands at over 1300 tcf at a Henry Hubdelivered price of below $4/MMBtu as per IHS-Markit,enough to supply anticipated growth indomestic and export demand for decades with only slow increases in gas prices. It amply supports the emergence of US, along with Canada, as strong LNG suppliers in international markets. Coming to Russia, its exports to Europe alone breached 200 BCM in 2018, an all-time high. The country also has plans to develop as much as 100 MMTPA of LNG by 2030 and aims to be at par with Qatar, Australia or US. As of 2018, Qatar (with 78.7 MMT) and Australia (with 68.6 MMT) remain the top two LNG exporters in the globe, as per the International Gas Union’s World LNG Report.
Asia remains the hub for global gas demand and the epicentre of demand growth, as both traditional consumers Japan (biggest LNG importer) and South Korea and emerging consumers, China and India, are in this region. China is the world’s third largest gas market and the fastest-growing major gas market thanks to Beijing’s efforts to replace coal-burning boilers with gas-fired ones. South Korean LNG imports are also expected to support demand as the Government has prioritised gas over coal and nuclear in its energy transition plan. Here, in India, the outlook for gas is positive on the back of clear Government mandate to more than double the fuel’s share in the energy mix in the next 5 years as well as the aggressive expansion of downstream gas network and infrastructure. While gas plays a prominent role in European energy markets, its role, in the longer term, is likely to come under pressure as governments of the region have ambitious climate-targets and dis-incentivize unabated gas consumption growth.
Global LNG trade continued its growth for the fifth consecutive year. Trade volume reached 316.5 MMT, marking an increase of 28.2 MMT from 2017, or 9.8% year-on year growth, as per IGU’s Global LNG Report. Australia led all exporters in incremental growth (+12.2 MT), supported by the new Wheatstone LNG and Ichthys LNG projects. Bulk of the demand was driven by Asian consumers with China accounting for over 40% of the incremental volumes. Asian imports totalled over 70% of the 2017 trade volume.Asia remained the driver of international LNG demand - China added an astounding 16 MMT of LNG imports, representing 57% of the global incremental demand in 2018.
LNG project FIDs made some headway in 2018 after an unflattering two year period of 2016-17 when just 3 projects were sanctioned. 4 projects, totalling liquefaction capacity of 21.5 MMTPA, achieved FID in 2018. Most LNG-related prices around the world followed an upward trend in 2018, influenced by rising oil prices and strong LNG demand in Asia. Northeast Asian spot price
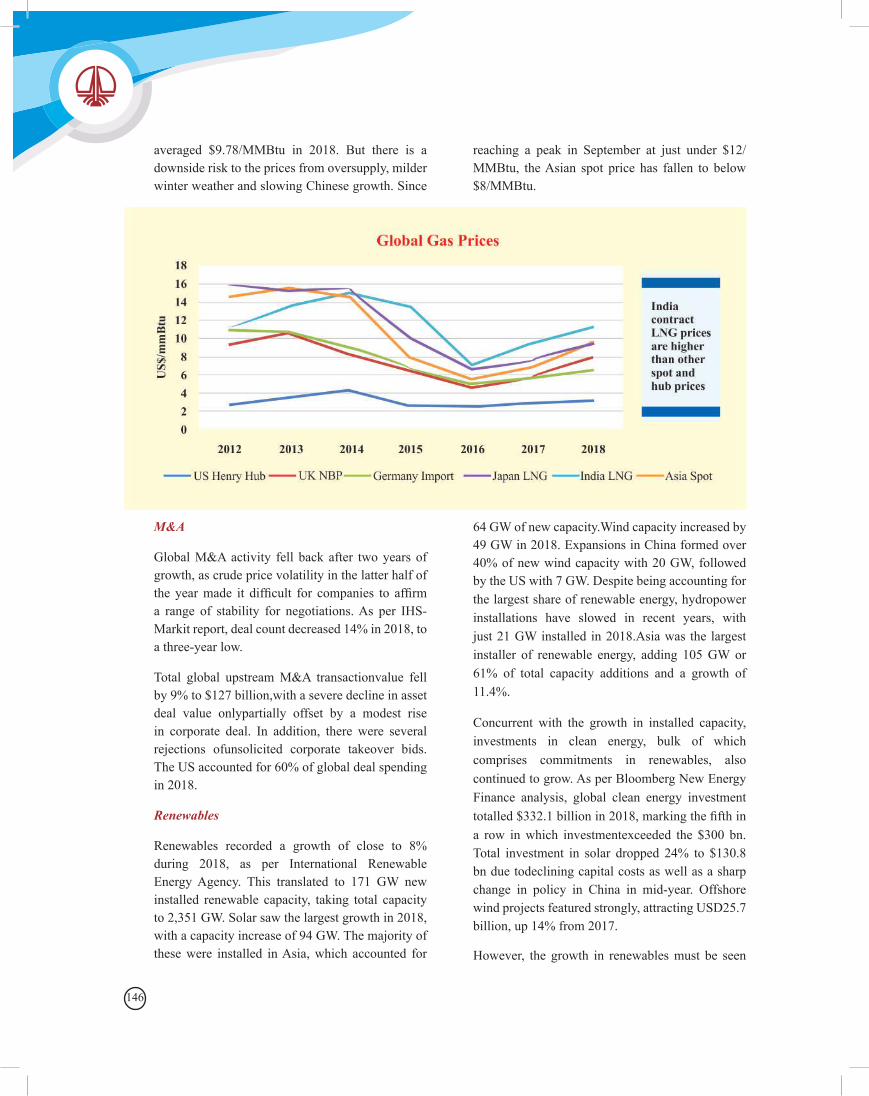
146
averaged $9.78/MMBtu in 2018. But there is a downside risk to the prices from oversupply, milder winter weather and slowing Chinese growth. Since
reaching a peak in September at just under $12/MMBtu, the Asian spot price has fallen to below $8/MMBtu.
M&A
Global M&A activity fell back after two years of growth, as crude price volatility in the latter half of the year made it difficult for companies to affirm a range of stability for negotiations. As per IHS-Markit report, deal count decreased 14% in 2018, to a three-year low.
Total global upstream M&A transactionvalue fell by 9% to $127 billion,with a severe decline in asset deal value onlypartially offset by a modest rise in corporate deal. In addition, there were several rejections ofunsolicited corporate takeover bids. The US accounted for 60% of global deal spending in 2018.
Renewables
Renewables recorded a growth of close to 8% during 2018, as per International Renewable Energy Agency. This translated to 171 GW new installed renewable capacity, taking total capacity to 2,351 GW. Solar saw the largest growth in 2018, with a capacity increase of 94 GW. The majority of these were installed in Asia, which accounted for
64 GW of new capacity.Wind capacity increased by 49 GW in 2018. Expansions in China formed over 40% of new wind capacity with 20 GW, followed by the US with 7 GW. Despite being accounting for the largest share of renewable energy, hydropower installations have slowed in recent years, with just 21 GW installed in 2018.Asia was the largest installer of renewable energy, adding 105 GW or 61% of total capacity additions and a growth of 11.4%.
Concurrent with the growth in installed capacity, investments in clean energy, bulk of which comprises commitments in renewables, also continued to grow. As per Bloomberg New Energy Finance analysis, global clean energy investment totalled $332.1 billion in 2018, marking the fifth in a row in which investmentexceeded the $300 bn. Total investment in solar dropped 24% to $130.8 bn due todeclining capital costs as well as a sharp change in policy in China in mid-year. Offshore wind projects featured strongly, attracting USD25.7 billion, up 14% from 2017.
However, the growth in renewables must be seen
147Managements Discussion and Analysis Report
in the context of growing global energy demand to gauge how effective the newer forms of energy have been in catering to the overarching objective of curtailing global carbon emissions. As per IEA’s Global Energy and CO2 Status Report, global energy consumption in 2018 increased at nearly twice the average rate of growth since 2010, resulting in Energy-related CO2 emissions to rise 1.7% to a historic high of 33.1 Gt CO2. While demand for renewable energy grew by 4%, it was still upstaged by gas consumption of which grew by 4.6%. This is where the opportunity opens up in areas such as Energy storage systems, Electric Vehicles (EVs), Carbon Capture and Storage (CCS) and Hydrogen.
The potential for renewable energy sources are significant in our country.India is ranked fourth in EY Renewable Energy Country Attractive Index 2018. As per the Ministry of New and Renewable Energy, India has a wind potential of more than 300 GW at a hub height of 100 metre, solar potential of ~750 GW assuming 3% wasteland is made available and small hydro potential of~20 GW. As of February 2019, total renewable power generation (including large hydro) installed capacity in the country stood at 120 GW, which is 34.3 per cent of the total installed capacity of 350 GW. As part of the country’s COP 21 commitments, the Government has formulated an action plan to achieve a total capacity of 60 GW from hydro power and 175 GW from other RES (excluding large hydro projects) by March, 2022, which includes 100 GW of Solar power, 60 GW from wind power, 10 GW from biomass power and 5 GW from small hydro power.
Geopolitics
Geopolitics continue to play a key role in influencing the market sentiment within the oil and gas industry.
A lot of speculation in 2018 centered on US administration’s execution of its decision to reintroduce the sanctions regime on Nuclear-capable Iran. Contrary to initial reports and analysis, a more stringent stance by US on the extent and timeline of compliance jolted oil markets into the bullish territory at a time when global liquids demand was
still registering a healthy growth. Iran that began 2018 with a production rate of 3.8 million bpd ended the year almost a million barrels down a day. With US disallowing any further sanction waivers to major importers of Iranian oil (including India), it is hard to see Iran finding it any easier to market its oil to customers willing to take the risk of drawing adverse reactions from the US.
IHS-Markit also expects a certain degree of uncertainty around the fallout of US sanctions on Russian energy entities and individuals because of Russia’s 2014 Crimean annexation in Ukraine. Another issue that is likely complicate between these two major political and energy heavyweights is Russia’s perceived support to the Maduro regime in Venezuela which is antithetical to the US stand on the country.
Beyond Iran and Russia, US’ worsening relationship with China over terms of trade is another potential crisis in the making. While the 3-month ceasefire announced in late-2018 brightened prospects of resolution between the world’s two largest economies, recent developments on this front (US decision to levy tariffs on more Chinese imports) indicate that it is still too early to make any assumptions on the outcome of this standoff.
The uneasy truce between members of the Vienna alliance (OPEC and select non OPEC players led by Russia) with an objective to manage crude prices through calculated and voluntary short-term production arrangements is also likely to be tested by US production growth and broader issues such as Russia’s role in the Middle East, and especially in Syria.
Amid all this, crumbling production in Venezuela adds further woes to the oil supply situation. Production there has fallen from a level of 1.75 million bpd to just over 600,000 bpd in March 2019. While output in Libya has recovered and hovers around the 1 million bd mark, it is still well below the high of 1.6 million bpd. In all, global supply disruptions are at 3 million bpd, a level not seen since 2015.
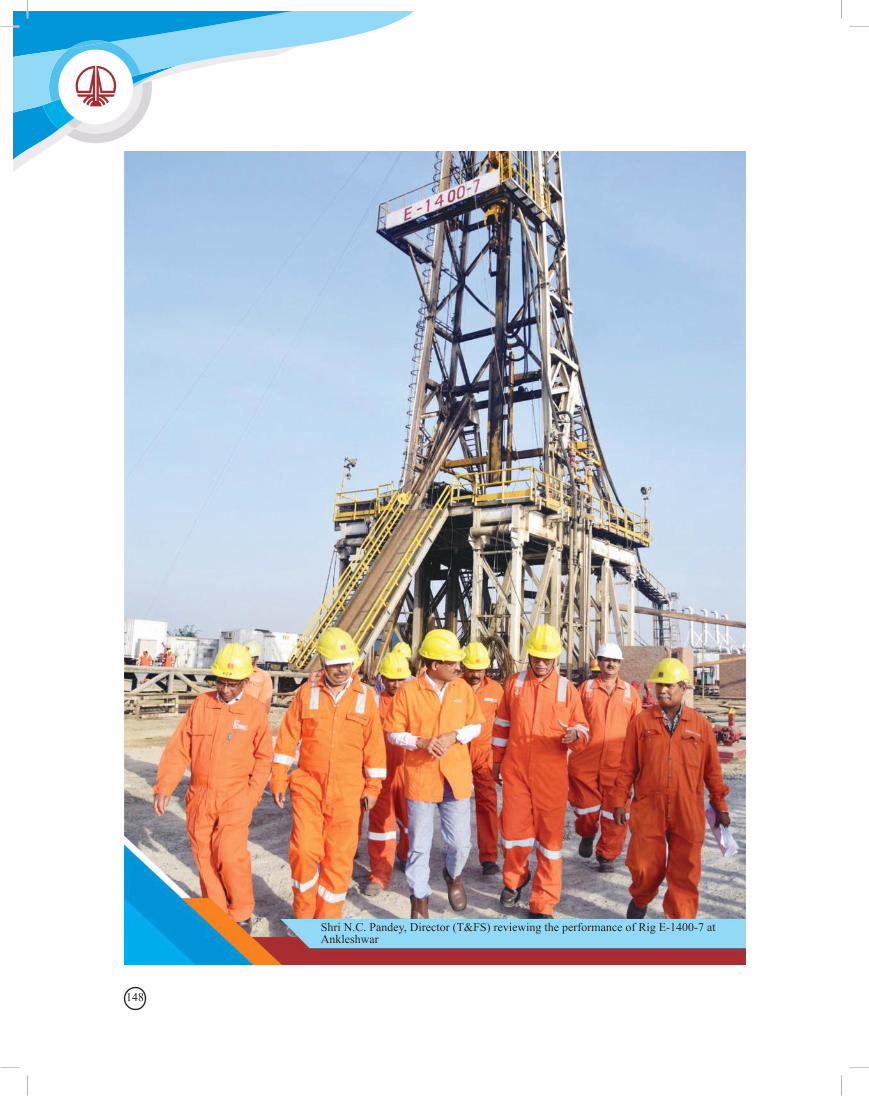
148
Shri N.C. Pandey, Director (T&FS) reviewing the performance of Rig E-1400-7 at Ankleshwar
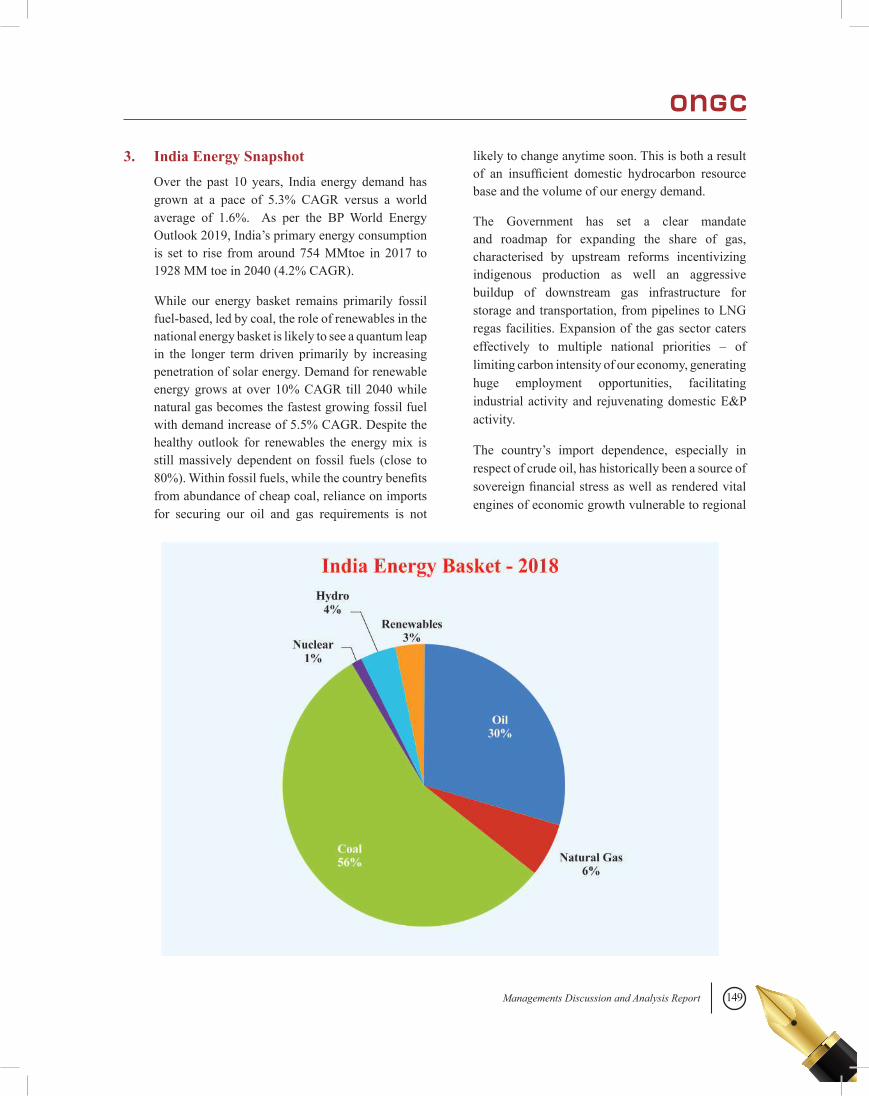
149Managements Discussion and Analysis Report
3. India Energy Snapshot Over the past 10 years, India energy demand has
grown at a pace of 5.3% CAGR versus a world average of 1.6%. As per the BP World Energy Outlook 2019, India’s primary energy consumption is set to rise from around 754 MMtoe in 2017 to 1928 MM toe in 2040 (4.2% CAGR).
While our energy basket remains primarily fossil fuel-based, led by coal, the role of renewables in the national energy basket is likely to see a quantum leap in the longer term driven primarily by increasing penetration of solar energy. Demand for renewable energy grows at over 10% CAGR till 2040 while natural gas becomes the fastest growing fossil fuel with demand increase of 5.5% CAGR. Despite the healthy outlook for renewables the energy mix is still massively dependent on fossil fuels (close to 80%). Within fossil fuels, while the country benefits from abundance of cheap coal, reliance on imports for securing our oil and gas requirements is not
likely to change anytime soon. This is both a result of an insufficient domestic hydrocarbon resource base and the volume of our energy demand.
The Government has set a clear mandate and roadmap for expanding the share of gas, characterised by upstream reforms incentivizing indigenous production as well an aggressive buildup of downstream gas infrastructure for storage and transportation, from pipelines to LNG regas facilities. Expansion of the gas sector caters effectively to multiple national priorities – of limiting carbon intensity of our economy, generating huge employment opportunities, facilitating industrial activity and rejuvenating domestic E&P activity.
The country’s import dependence, especially in respect of crude oil, has historically been a source of sovereign financial stress as well as rendered vital engines of economic growth vulnerable to regional
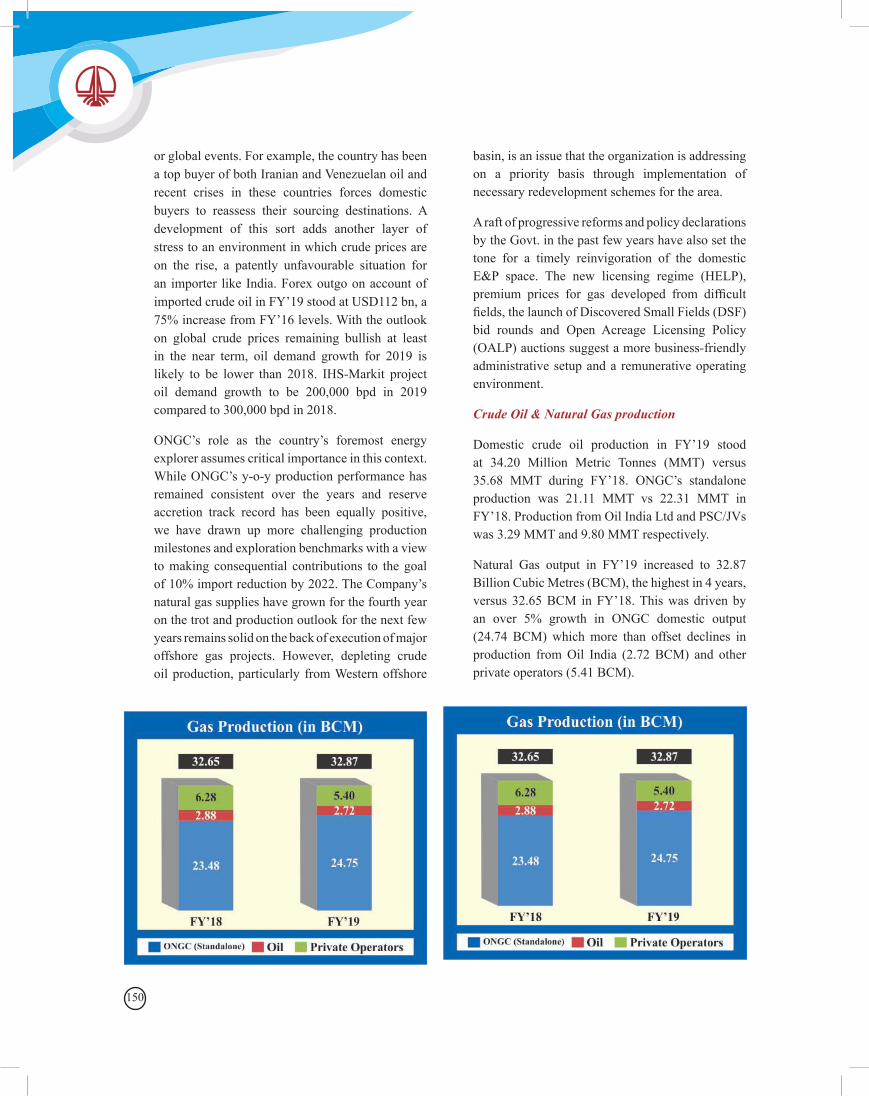
150
or global events. For example, the country has been a top buyer of both Iranian and Venezuelan oil and recent crises in these countries forces domestic buyers to reassess their sourcing destinations. A development of this sort adds another layer of stress to an environment in which crude prices are on the rise, a patently unfavourable situation for an importer like India. Forex outgo on account of imported crude oil in FY’19 stood at USD112 bn, a 75% increase from FY’16 levels. With the outlook on global crude prices remaining bullish at least in the near term, oil demand growth for 2019 is likely to be lower than 2018. IHS-Markit project oil demand growth to be 200,000 bpd in 2019 compared to 300,000 bpd in 2018.
ONGC’s role as the country’s foremost energy explorer assumes critical importance in this context. While ONGC’s y-o-y production performance has remained consistent over the years and reserve accretion track record has been equally positive, we have drawn up more challenging production milestones and exploration benchmarks with a view to making consequential contributions to the goal of 10% import reduction by 2022. The Company’s natural gas supplies have grown for the fourth year on the trot and production outlook for the next few years remains solid on the back of execution of major offshore gas projects. However, depleting crude oil production, particularly from Western offshore
basin, is an issue that the organization is addressing on a priority basis through implementation of necessary redevelopment schemes for the area.
A raft of progressive reforms and policy declarations by the Govt. in the past few years have also set the tone for a timely reinvigoration of the domestic E&P space. The new licensing regime (HELP), premium prices for gas developed from difficult fields, the launch of Discovered Small Fields (DSF) bid rounds and Open Acreage Licensing Policy (OALP) auctions suggest a more business-friendly administrative setup and a remunerative operating environment.
Crude Oil & Natural Gas production
Domestic crude oil production in FY’19 stood at 34.20 Million Metric Tonnes (MMT) versus 35.68 MMT during FY’18. ONGC’s standalone production was 21.11 MMT vs 22.31 MMT in FY’18. Production from Oil India Ltd and PSC/JVs was 3.29 MMT and 9.80 MMT respectively.
Natural Gas output in FY’19 increased to 32.87 Billion Cubic Metres (BCM), the highest in 4 years, versus 32.65 BCM in FY’18. This was driven by an over 5% growth in ONGC domestic output (24.74 BCM) which more than offset declines in production from Oil India (2.72 BCM) and other private operators (5.41 BCM).
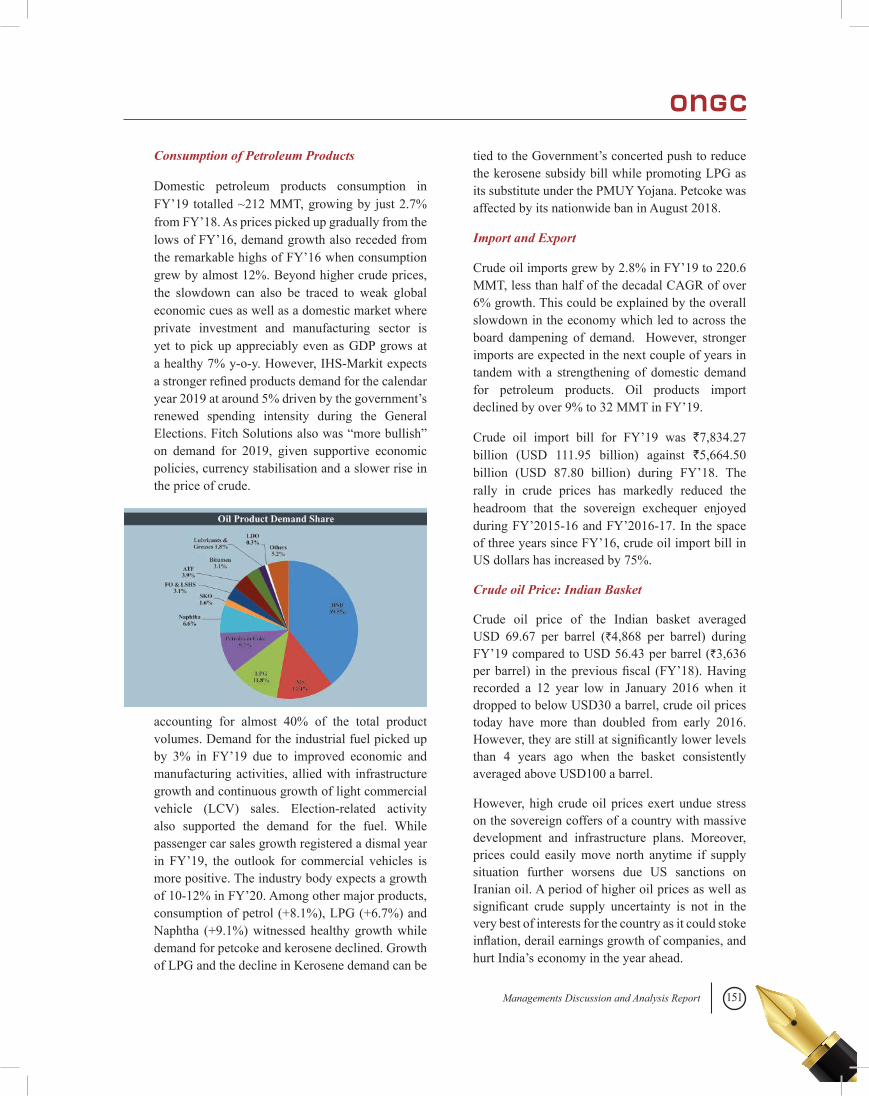
151Managements Discussion and Analysis Report
Consumption of Petroleum Products
Domestic petroleum products consumption in FY’19 totalled ~212 MMT, growing by just 2.7% from FY’18. As prices picked up gradually from the lows of FY’16, demand growth also receded from the remarkable highs of FY’16 when consumption grew by almost 12%. Beyond higher crude prices, the slowdown can also be traced to weak global economic cues as well as a domestic market where private investment and manufacturing sector is yet to pick up appreciably even as GDP grows at a healthy 7% y-o-y. However, IHS-Markit expects a stronger refined products demand for the calendar year 2019 at around 5% driven by the government’s renewed spending intensity during the General Elections. Fitch Solutions also was “more bullish” on demand for 2019, given supportive economic policies, currency stabilisation and a slower rise in the price of crude.
Diesel continued to be the most in-demand product
tied to the Government’s concerted push to reduce the kerosene subsidy bill while promoting LPG as its substitute under the PMUY Yojana. Petcoke was affected by its nationwide ban in August 2018.
Import and Export
Crude oil imports grew by 2.8% in FY’19 to 220.6 MMT, less than half of the decadal CAGR of over 6% growth. This could be explained by the overall slowdown in the economy which led to across the board dampening of demand. However, stronger imports are expected in the next couple of years in tandem with a strengthening of domestic demand for petroleum products. Oil products import declined by over 9% to 32 MMT in FY’19.
Crude oil import bill for FY’19 was `7,834.27 billion (USD 111.95 billion) against `5,664.50 billion (USD 87.80 billion) during FY’18. The rally in crude prices has markedly reduced the headroom that the sovereign exchequer enjoyed during FY’2015-16 and FY’2016-17. In the space of three years since FY’16, crude oil import bill in US dollars has increased by 75%.
Crude oil Price: Indian Basket
Crude oil price of the Indian basket averaged USD 69.67 per barrel (`4,868 per barrel) during FY’19 compared to USD 56.43 per barrel (`3,636 per barrel) in the previous fiscal (FY’18). Having recorded a 12 year low in January 2016 when it dropped to below USD30 a barrel, crude oil prices today have more than doubled from early 2016. However, they are still at significantly lower levels than 4 years ago when the basket consistently averaged above USD100 a barrel.
However, high crude oil prices exert undue stress on the sovereign coffers of a country with massive development and infrastructure plans. Moreover, prices could easily move north anytime if supply situation further worsens due US sanctions on Iranian oil. A period of higher oil prices as well as significant crude supply uncertainty is not in the very best of interests for the country as it could stoke inflation, derail earnings growth of companies, and hurt India’s economy in the year ahead.
accounting for almost 40% of the total product volumes. Demand for the industrial fuel picked up by 3% in FY’19 due to improved economic and manufacturing activities, allied with infrastructure growth and continuous growth of light commercial vehicle (LCV) sales. Election-related activity also supported the demand for the fuel. While passenger car sales growth registered a dismal year in FY’19, the outlook for commercial vehicles is more positive. The industry body expects a growth of 10-12% in FY’20. Among other major products, consumption of petrol (+8.1%), LPG (+6.7%) and Naphtha (+9.1%) witnessed healthy growth while demand for petcoke and kerosene declined. Growth of LPG and the decline in Kerosene demand can be
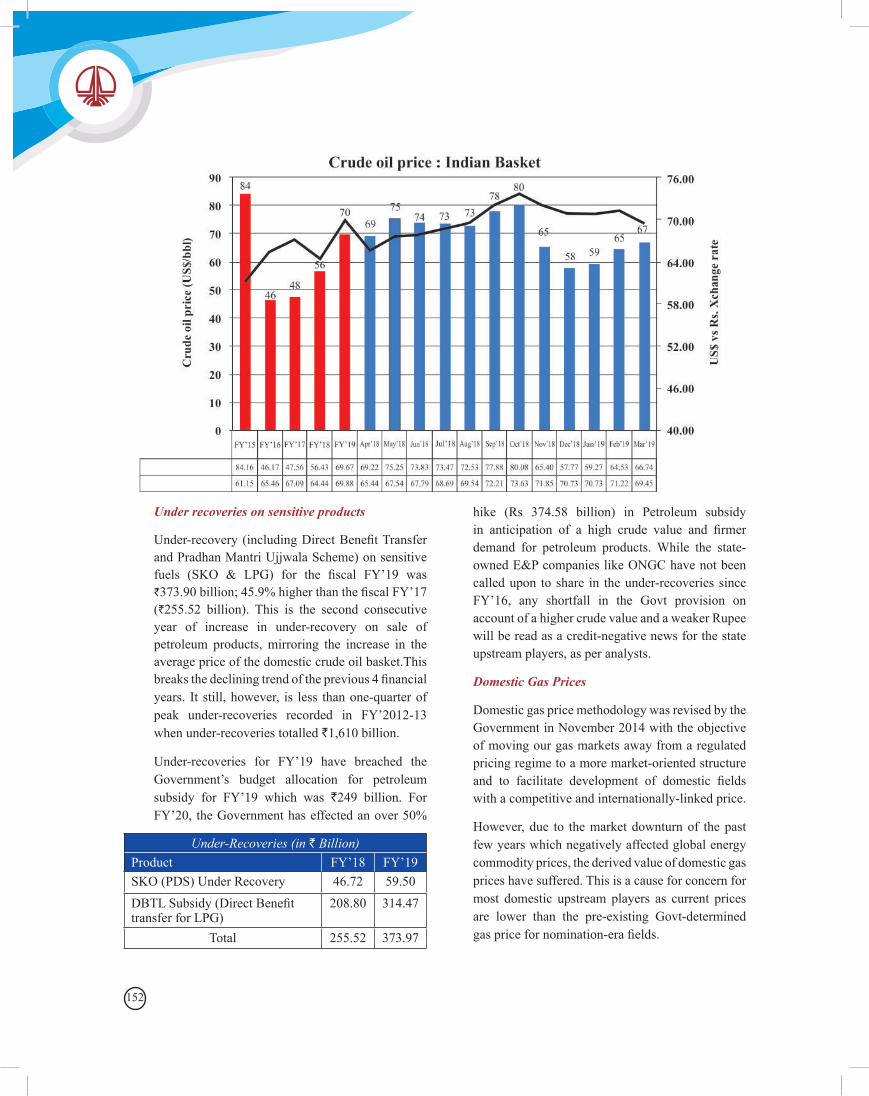
152
Under recoveries on sensitive products
Under-recovery (including Direct Benefit Transfer and Pradhan Mantri Ujjwala Scheme) on sensitive fuels (SKO & LPG) for the fiscal FY’19 was `373.90 billion; 45.9% higher than the fiscal FY’17 (`255.52 billion). This is the second consecutive year of increase in under-recovery on sale of petroleum products, mirroring the increase in the average price of the domestic crude oil basket.This breaks the declining trend of the previous 4 financial years. It still, however, is less than one-quarter of peak under-recoveries recorded in FY’2012-13 when under-recoveries totalled `1,610 billion.
Under-recoveries for FY’19 have breached the Government’s budget allocation for petroleum subsidy for FY’19 which was `249 billion. For FY’20, the Government has effected an over 50%
hike (Rs 374.58 billion) in Petroleum subsidy in anticipation of a high crude value and firmer demand for petroleum products. While the state-owned E&P companies like ONGC have not been called upon to share in the under-recoveries since FY’16, any shortfall in the Govt provision on account of a higher crude value and a weaker Rupee will be read as a credit-negative news for the state upstream players, as per analysts.
Domestic Gas Prices
Domestic gas price methodology was revised by the Government in November 2014 with the objective of moving our gas markets away from a regulated pricing regime to a more market-oriented structure and to facilitate development of domestic fields with a competitive and internationally-linked price.
However, due to the market downturn of the past few years which negatively affected global energy commodity prices, the derived value of domestic gas prices have suffered. This is a cause for concern for most domestic upstream players as current prices are lower than the pre-existing Govt-determined gas price for nomination-era fields.
Under-Recoveries (in ` Billion)Product FY’18 FY’19SKO (PDS) Under Recovery 46.72 59.50DBTL Subsidy (Direct Benefit transfer for LPG)
208.80 314.47
Total 255.52 373.97
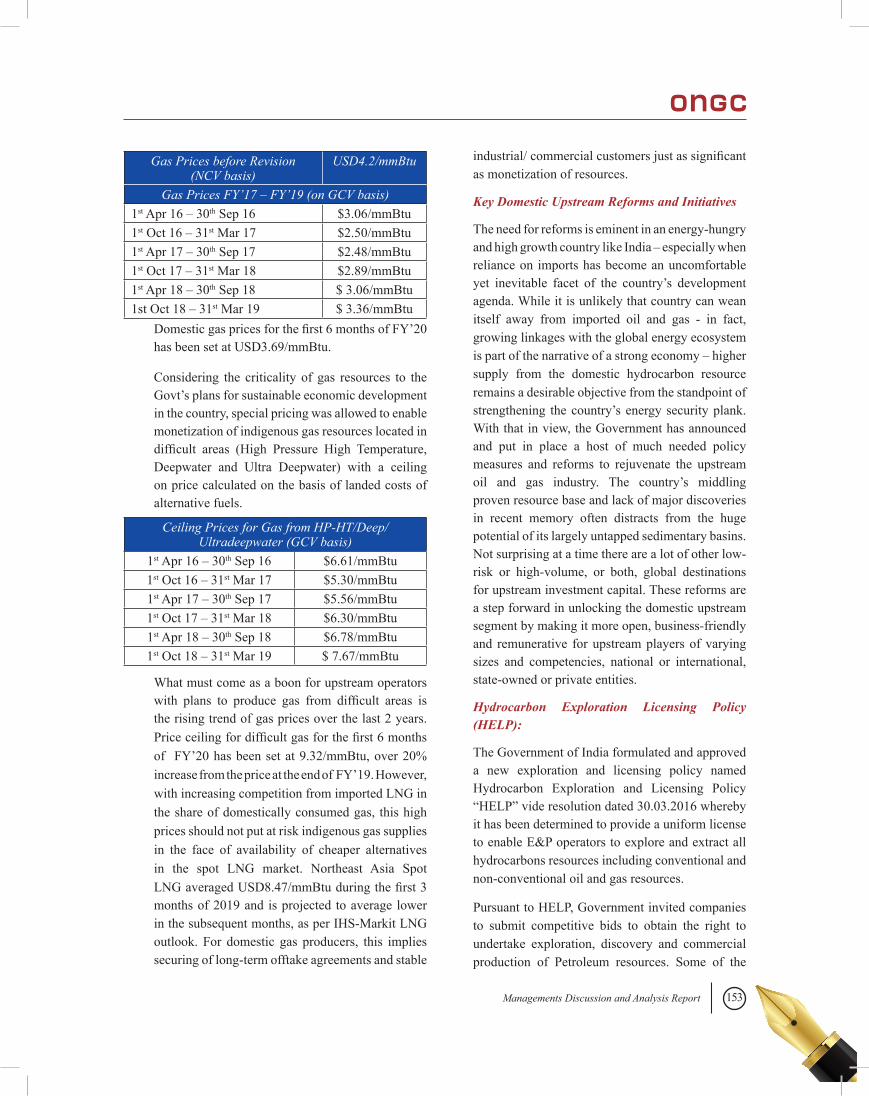
153Managements Discussion and Analysis Report
What must come as a boon for upstream operators with plans to produce gas from difficult areas is the rising trend of gas prices over the last 2 years. Price ceiling for difficult gas for the first 6 months of FY’20 has been set at 9.32/mmBtu, over 20% increase from the price at the end of FY’19. However, with increasing competition from imported LNG in the share of domestically consumed gas, this high prices should not put at risk indigenous gas supplies in the face of availability of cheaper alternatives in the spot LNG market. Northeast Asia Spot LNG averaged USD8.47/mmBtu during the first 3 months of 2019 and is projected to average lower in the subsequent months, as per IHS-Markit LNG outlook. For domestic gas producers, this implies securing of long-term offtake agreements and stable
Domestic gas prices for the first 6 months of FY’20 has been set at USD3.69/mmBtu.
Considering the criticality of gas resources to the Govt’s plans for sustainable economic development in the country, special pricing was allowed to enable monetization of indigenous gas resources located in difficult areas (High Pressure High Temperature, Deepwater and Ultra Deepwater) with a ceiling on price calculated on the basis of landed costs of alternative fuels.
Gas Prices before Revision (NCV basis)
USD4.2/mmBtu
Gas Prices FY’17 – FY’19 (on GCV basis)1st Apr 16 – 30th Sep 16 $3.06/mmBtu1st Oct 16 – 31st Mar 17 $2.50/mmBtu1st Apr 17 – 30th Sep 17 $2.48/mmBtu1st Oct 17 – 31st Mar 18 $2.89/mmBtu1st Apr 18 – 30th Sep 18 $ 3.06/mmBtu1st Oct 18 – 31st Mar 19 $ 3.36/mmBtu
Ceiling Prices for Gas from HP-HT/Deep/Ultradeepwater (GCV basis)
1st Apr 16 – 30th Sep 16 $6.61/mmBtu1st Oct 16 – 31st Mar 17 $5.30/mmBtu1st Apr 17 – 30th Sep 17 $5.56/mmBtu1st Oct 17 – 31st Mar 18 $6.30/mmBtu1st Apr 18 – 30th Sep 18 $6.78/mmBtu1st Oct 18 – 31st Mar 19 $ 7.67/mmBtu
industrial/ commercial customers just as significant as monetization of resources.
Key Domestic Upstream Reforms and Initiatives
The need for reforms is eminent in an energy-hungry and high growth country like India – especially when reliance on imports has become an uncomfortable yet inevitable facet of the country’s development agenda. While it is unlikely that country can wean itself away from imported oil and gas - in fact, growing linkages with the global energy ecosystem is part of the narrative of a strong economy – higher supply from the domestic hydrocarbon resource remains a desirable objective from the standpoint of strengthening the country’s energy security plank. With that in view, the Government has announced and put in place a host of much needed policy measures and reforms to rejuvenate the upstream oil and gas industry. The country’s middling proven resource base and lack of major discoveries in recent memory often distracts from the huge potential of its largely untapped sedimentary basins. Not surprising at a time there are a lot of other low-risk or high-volume, or both, global destinations for upstream investment capital. These reforms are a step forward in unlocking the domestic upstream segment by making it more open, business-friendly and remunerative for upstream players of varying sizes and competencies, national or international, state-owned or private entities.
Hydrocarbon Exploration Licensing Policy (HELP):
The Government of India formulated and approved a new exploration and licensing policy named Hydrocarbon Exploration and Licensing Policy “HELP” vide resolution dated 30.03.2016 whereby it has been determined to provide a uniform license to enable E&P operators to explore and extract all hydrocarbons resources including conventional and non-conventional oil and gas resources.
Pursuant to HELP, Government invited companies to submit competitive bids to obtain the right to undertake exploration, discovery and commercial production of Petroleum resources. Some of the
154
A total of 46 contract areas comprising of 67 oil and gas fields were on offer. 22 companies (singly or in consortium) were shortlisted for 31 Contract Areas. Of these 22 companies, 15 companies are new entrants to the E&P sector. Cumulative peak production of ~15000 bpd of oil and 2 MMSCMD of gas from all the awarded fields is anticipated.
DSF-II (2018): The second round of DSFP was launched by Government of India on9thAugust 2018 offering 25 Contract Areas for International Competitive Bidding. It has put on offer 25 contract areas encompassing 59 small fields covering an area of 3,000 sq km in eight sedimentary basins with a prospective resource base upwards of 1.4 billion boe. A total of 39 players, either flying solo or in consortia, submitted a total of 145 e-bids for 24 of the 25 contract areas, and it includes six overseas companies.
Simultaneous Exploitation of Unconventional Hydrocarbon (UHC)
The government in August 2018 permitted simultaneous exploitation of unconventional hydrocarbons like CBM and Shale along with conventional oil and natural gas to boost domestic output. This, however, will be subject to an additional payment of 10% profit petroleum or production level payment.
Incentives for Enhanced Oil & Gas Recovery
The government in October 2018 announced a policy framework to promote and incentivize enhanced recovery methods for oil and gas. This policy is applicable to fields in all contractual regimes (including those in nomination acreages) and the incentives will be available for a period of 10 years from the date of commencement of Enhanced Recovery (ER) or Unconventional hydrocarbon project and from the date of achievement of the prescribed benchmark of recovery rate for Improved Recovery (IR) projects. Fiscal incentives include waiver of 50% of cess on oil production and 75% on gas production on the eligible quantum of production volume (based on an ER/UHC/IR project).
key aspects of this new licensing regime are Open Acreage Licensing, uniform license for all types of hydrocarbons, Revenue sharing model, marketing and pricing freedom, low royalty for offshore fields, continuous exploration under contract period etc.
Open Acreage Licensing Policy (OALP):
To operationalize the HELP framework, Govt of India launched the Open Acreage Licensing Programme (OALP) wherein upstream operators are allowed to put in offers for blocks of their choice for contracting based on the data available in the National Data Repository (NDR) at any time by submitting an Expression of Interest (EOI) indicating the area. OALP is expected to boost the attractiveness of operating in the domestic upstream space through seamless and round-the-year access of G&G data and flexibility to choose contracts (Petroleum Operations Contract and Reconnaissance Contract).
So far, Govt has rolled out three OALP bid rounds. 55 exploratory blocks (46 onshore, 8 shelf and 1 deep-water block) awarded under OALP-1 round in 2018.
Government launched OALP Bid Round-II on 07th
January 2019 offering 14 Blocks under Petroleum Operation Contract for International Competitive Bidding. Out of 14 Blocks, 8 are in Onland, 5 in Shallow Water and 1 in Ultra deep water Spread over Category-I and Category-II Basins. Quick on the heels of Round-II, Round-III was launched on 10th February 2019 with 23 blocks across 12 basins (including 5 CBM blocks) are on offer. Total area on offer across both these rounds are over 60,000 sq.km.
Discovered Small Field Policy:
The government announced the Marginal Field Policy (MFP) in 2015 with a view to incentivize the development of small and marginal fields which were hitherto deemed commercially unviable. Two Discovered Small Fields (DSF) bid rounds have been conducted on the basis of the new policy.
DSF-I (2016): It was launched in May 2016 and results were announced by DGH in February 2017.
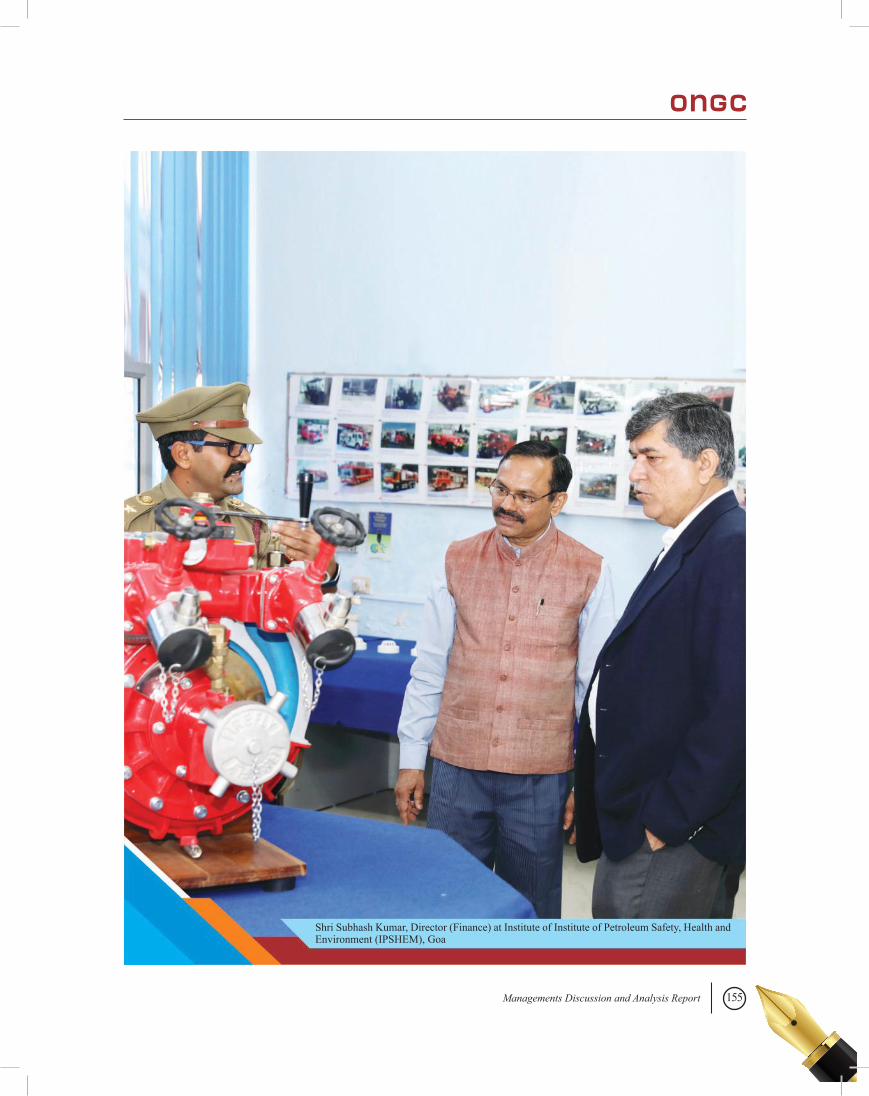
155Managements Discussion and Analysis Report
Shri Subhash Kumar, Director (Finance) at Institute of Institute of Petroleum Safety, Health and Environment (IPSHEM), Goa
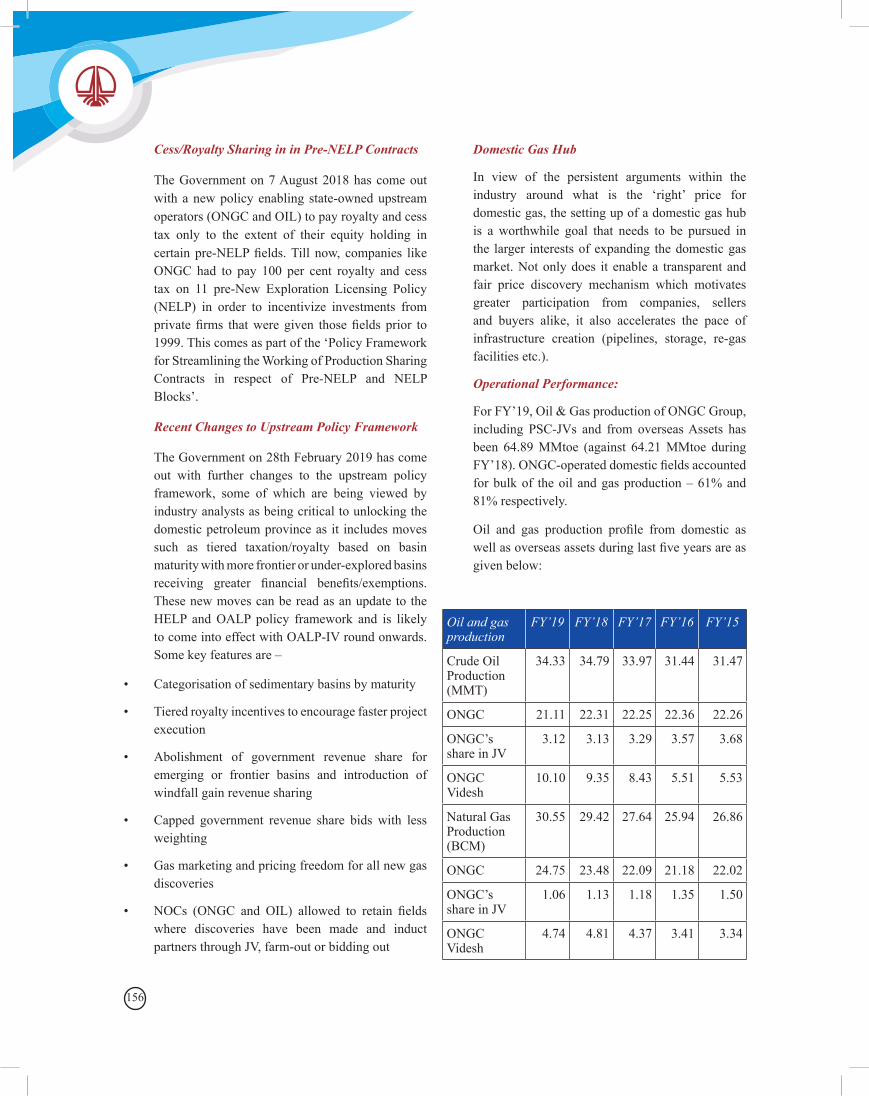
156
Cess/Royalty Sharing in in Pre-NELP Contracts
The Government on 7 August 2018 has come out with a new policy enabling state-owned upstream operators (ONGC and OIL) to pay royalty and cess tax only to the extent of their equity holding in certain pre-NELP fields. Till now, companies like ONGC had to pay 100 per cent royalty and cess tax on 11 pre-New Exploration Licensing Policy (NELP) in order to incentivize investments from private firms that were given those fields prior to 1999. This comes as part of the ‘Policy Framework for Streamlining the Working of Production Sharing Contracts in respect of Pre-NELP and NELP Blocks’.
Recent Changes to Upstream Policy Framework
The Government on 28th February 2019 has come out with further changes to the upstream policy framework, some of which are being viewed by industry analysts as being critical to unlocking the domestic petroleum province as it includes moves such as tiered taxation/royalty based on basin maturity with more frontier or under-explored basins receiving greater financial benefits/exemptions. These new moves can be read as an update to the HELP and OALP policy framework and is likely to come into effect with OALP-IV round onwards. Some key features are –
• Categorisation of sedimentary basins by maturity
• Tiered royalty incentives to encourage faster project execution
• Abolishment of government revenue share for emerging or frontier basins and introduction of windfall gain revenue sharing
• Capped government revenue share bids with less weighting
• Gas marketing and pricing freedom for all new gas discoveries
• NOCs (ONGC and OIL) allowed to retain fields where discoveries have been made and induct partners through JV, farm-out or bidding out
Domestic Gas Hub
In view of the persistent arguments within the industry around what is the ‘right’ price for domestic gas, the setting up of a domestic gas hub is a worthwhile goal that needs to be pursued in the larger interests of expanding the domestic gas market. Not only does it enable a transparent and fair price discovery mechanism which motivates greater participation from companies, sellers and buyers alike, it also accelerates the pace of infrastructure creation (pipelines, storage, re-gas facilities etc.).
Operational Performance:
For FY’19, Oil & Gas production of ONGC Group, including PSC-JVs and from overseas Assets has been 64.89 MMtoe (against 64.21 MMtoe during FY’18). ONGC-operated domestic fields accounted for bulk of the oil and gas production – 61% and 81% respectively.
Oil and gas production profile from domestic as well as overseas assets during last five years are as given below:
Oil and gas production
FY’19 FY’18 FY’17 FY’16 FY’15
Crude Oil Production (MMT)
34.33 34.79 33.97 31.44 31.47
ONGC 21.11 22.31 22.25 22.36 22.26
ONGC’s share in JV
3.12 3.13 3.29 3.57 3.68
ONGC Videsh
10.10 9.35 8.43 5.51 5.53
Natural Gas Production (BCM)
30.55 29.42 27.64 25.94 26.86
ONGC 24.75 23.48 22.09 21.18 22.02
ONGC’s share in JV
1.06 1.13 1.18 1.35 1.50
ONGC Videsh
4.74 4.81 4.37 3.41 3.34
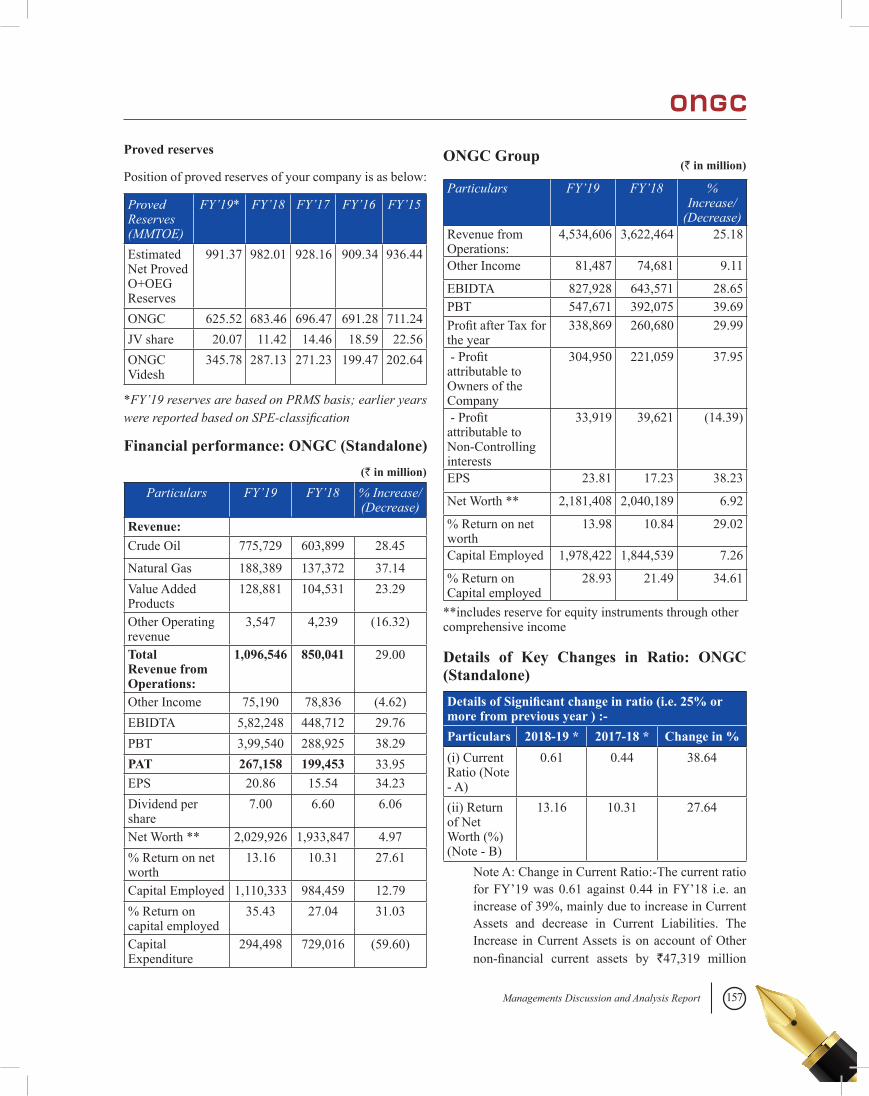
157Managements Discussion and Analysis Report
Proved reserves
Position of proved reserves of your company is as below:
Proved Reserves (MMTOE)
FY’19* FY’18 FY’17 FY’16 FY’15
Estimated Net Proved O+OEG Reserves
991.37 982.01 928.16 909.34 936.44
ONGC 625.52 683.46 696.47 691.28 711.24JV share 20.07 11.42 14.46 18.59 22.56ONGC Videsh
345.78 287.13 271.23 199.47 202.64
*FY’19 reserves are based on PRMS basis; earlier years were reported based on SPE-classification
Financial performance: ONGC (Standalone)
Particulars FY’19 FY’18 % Increase/(Decrease)
Revenue:Crude Oil 775,729 603,899 28.45
Natural Gas 188,389 137,372 37.14Value Added Products
128,881 104,531 23.29
Other Operating revenue
3,547 4,239 (16.32)
Total Revenue from Operations:
1,096,546 850,041 29.00
Other Income 75,190 78,836 (4.62)EBIDTA 5,82,248 448,712 29.76PBT 3,99,540 288,925 38.29PAT 267,158 199,453 33.95EPS 20.86 15.54 34.23Dividend per share
7.00 6.60 6.06
Net Worth ** 2,029,926 1,933,847 4.97% Return on net worth
13.16 10.31 27.61
Capital Employed 1,110,333 984,459 12.79% Return on capital employed
35.43 27.04 31.03
Capital Expenditure
294,498 729,016 (59.60)
(` in million)
**includes reserve for equity instruments through other comprehensive income
Details of Key Changes in Ratio: ONGC (Standalone)Details of Significant change in ratio (i.e. 25% or more from previous year ) :-Particulars 2018-19 * 2017-18 * Change in %(i) Current Ratio (Note - A)
0.61 0.44 38.64
(ii) Return of Net Worth (%)(Note - B)
13.16 10.31 27.64
Note A: Change in Current Ratio:-The current ratio for FY’19 was 0.61 against 0.44 in FY’18 i.e. an increase of 39%, mainly due to increase in Current Assets and decrease in Current Liabilities. The Increase in Current Assets is on account of Other non-financial current assets by `47,319 million
ONGC Group(` in million)
Particulars FY’19 FY’18 % Increase/
(Decrease)Revenue from Operations:
4,534,606 3,622,464 25.18
Other Income 81,487 74,681 9.11
EBIDTA 827,928 643,571 28.65PBT 547,671 392,075 39.69Profit after Tax for the year
338,869 260,680 29.99
- Profit attributable to Owners of the Company
304,950 221,059 37.95
- Profit attributable to Non-Controlling interests
33,919 39,621 (14.39)
EPS 23.81 17.23 38.23
Net Worth ** 2,181,408 2,040,189 6.92
% Return on net worth
13.98 10.84 29.02
Capital Employed 1,978,422 1,844,539 7.26
% Return on Capital employed
28.93 21.49 34.61
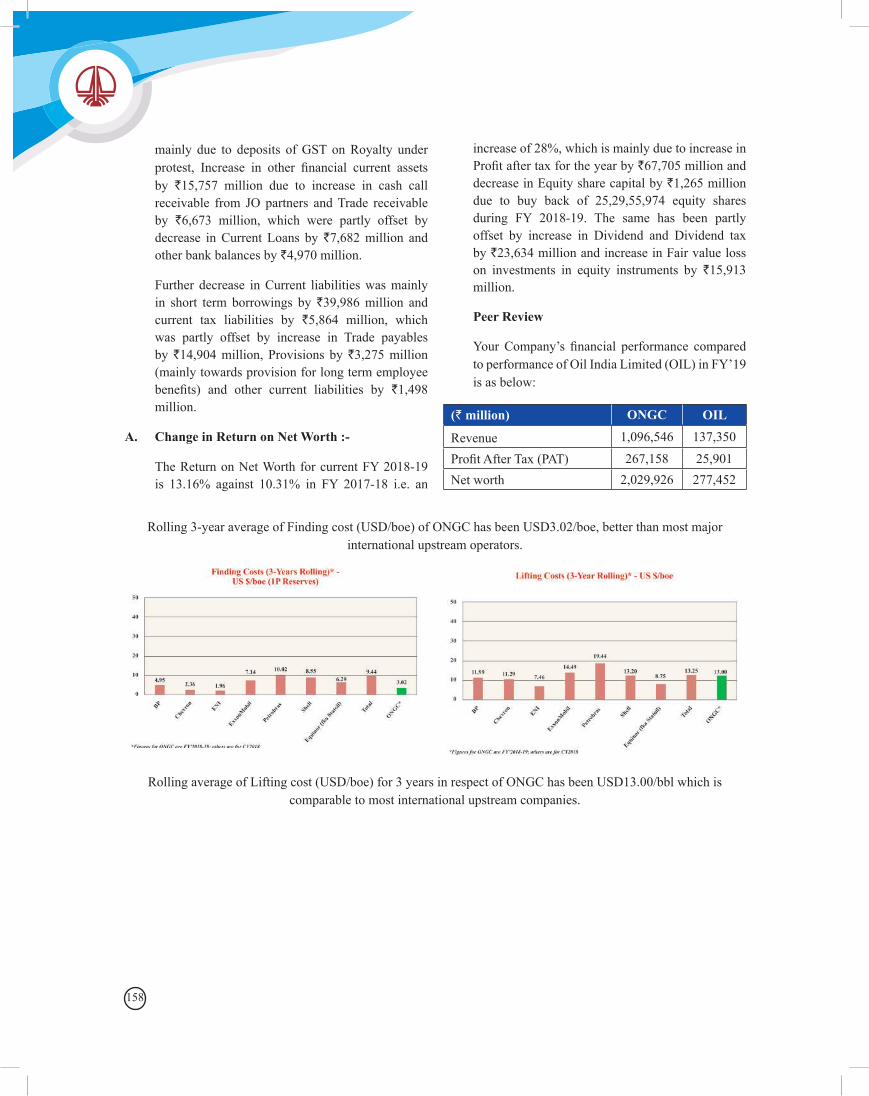
158
Rolling 3-year average of Finding cost (USD/boe) of ONGC has been USD3.02/boe, better than most major international upstream operators.
(` million) ONGC OIL
Revenue 1,096,546 137,350
Profit After Tax (PAT) 267,158 25,901Net worth 2,029,926 277,452
mainly due to deposits of GST on Royalty under protest, Increase in other financial current assets by `15,757 million due to increase in cash call receivable from JO partners and Trade receivable by `6,673 million, which were partly offset by decrease in Current Loans by `7,682 million and other bank balances by `4,970 million.
Further decrease in Current liabilities was mainly in short term borrowings by `39,986 million and current tax liabilities by `5,864 million, which was partly offset by increase in Trade payables by `14,904 million, Provisions by `3,275 million (mainly towards provision for long term employee benefits) and other current liabilities by `1,498 million.
A. Change in Return on Net Worth :-
The Return on Net Worth for current FY 2018-19 is 13.16% against 10.31% in FY 2017-18 i.e. an
increase of 28%, which is mainly due to increase in Profit after tax for the year by `67,705 million and decrease in Equity share capital by `1,265 million due to buy back of 25,29,55,974 equity shares during FY 2018-19. The same has been partly offset by increase in Dividend and Dividend tax by `23,634 million and increase in Fair value loss on investments in equity instruments by `15,913 million.
Peer Review
Your Company’s financial performance compared to performance of Oil India Limited (OIL) in FY’19 is as below:
Rolling average of Lifting cost (USD/boe) for 3 years in respect of ONGC has been USD13.00/bbl which is comparable to most international upstream companies.
159Managements Discussion and Analysis Report
4. Opportunities & Threats
Oil and gas markets have historically been among the more volatile industries in the global economy. Because of the industry’s intricate linkages to global economy and health of sovereign governments as well heightened volatility in the sector invariably pose a threat to stakeholders beyond the business. Price fluctuations are often taken as a proxy for market volatility. The 2014 crash in crude oil prices did not only just result in the loss of hundreds of billions of dollars of investments, company bankruptcies and massive manpower retrenchment, it also seriously jeopardized the stability of many resource-rich host governments. Venezuela is a classic example of that.
Low oil prices augur well for a net importer like India. But prices below a certain level, on the flip side, hampers the development of indigenous oil and gas resources thereby compromising the country’s internal supply outlook. For example, if the low oil prices of early 2016 make a return, many of ONGC’s key development projects – be it KG-DWN-98/2 or Neelam Redevelopment - will be rendered unviable. For ONGC, a price anywhere in the range of $60-$65/bbl is a sweet spot – a level that allows for a healthy level of project activity without exerting undue sovereign financial stress on the import side.
Even at the global level, the implications of capital-freeze in the short-term is likely to be manifest in the narrowing pipeline of future oil and gas supplies within the next few years on account of lower exploration spends as well as deferred project approval/expansion plans. Exploration business returned to profitability in 2017 and has sustained it in 2018 as well, but total discovered volumes as well as number of discoveries, despite a few big-ticket finds, remain at historically low levels.
India is tipped to be the hub of global energy demand growth for the next two decades. Both oil and gas requirements are projected to register significant gains during the period. In view of this rapid expansion of demand and to ease our reliance on external supplies, ONGC has committed to a
strong investment regimen even through a period of market downturn. Average E&P capex for the last 5 years for the Company has been Rs 292 billion. During the period 19 projects were also sanctioned with estimated lifecycle hydrocarbon gains of over 190 MMtoe.
The rapid expansion of unconventional hydrocar-bons in the past decade presents a strong opportunity to oil and gas players of all stripes and sizes to look beyond conventional deposits and mature basin areas to grow their portfolio. While North America led by the US have been the forerunners, there is potential for projects elsewhere as well – in places like Argentina (Vaca Muerta) and China (Sichuan and Fuling). Unconventional hydrocarbons are still at a very nascent stage within our country. ONGC operates 4 CBM blocks, of which Bokaro is at an advanced stage of development. The company is also leading the national campaign to explore the commercial feasibility of Shale Gas as well as exploring the potential of Gas Hydrates.
The deflated price environment of the last few years has forced companies to become more operationally efficient and adopt rigorous capital discipline while sanctioning and executing projects. So, from a high-risk high-volume approach companies today are targeting sustainable growth and profitability. A leaner cost-model does certainly lend a company more resilience during a price downturn. Project break-evens today are anywhere between 30%-40% lower than 2014 levels. Cost and operational efficiency is certainly an opportunity area for major domestic upstream player like ONGC - while findings costs for ONGC has come down noticeably in recent years, the same does not hold for our production costs because of a mature portfolio with legacy contracts. Key projects like the one in KG-DWN-98/2 deep-water project also involves greater logistical and operational complexity, thereby implying a higher cost structure. The special pricing regime for difficult gas certainly offers us the financial room to move the project ahead; however, timely execution is equally critical in order to take advantage of the brief window of reduced service and rig hiring costs in the offshore arena.
160
Despite underwhelming proven production potential till date, the domestic hydrocarbon province is likely to offer plenty of exciting opportunities for oil and gas explorers over the next few years. The Government’s prioritization of the oil and gas sector, particularly the domestic upstream segment as reflected by the raft of progressive policy measures announced in the last 5 years further support that view. Open acreage licensing round, marketing and pricing freedom especially for gas discoveries, fiscal incentives for activity in frontier areas, simultaneous exploitation of UHC etc. are moves that can potentially alter the dynamics, pace and volume of domestic upstream activity in the coming years. Our prognosticated resource base already stands doubled (42 billion toe versus erstwhile 28 billion toe), as per the latest reassessment exercise. Further, the completion of the National Seismic project, led by ONGC, should improve information on our basins. As the country’s leading energy explorer with extensive in-house support infrastructure, ONGC is positioned well to take advantage of the upcoming opportunities in the space.
The current period in oil and gas sector, and the energy industry, at large is also one of disruption. Renewables and the electrification of the mobility industry are the primary sources of stress to the traditional fossil-fuel heavy setup of the energy universe. Rapid growth and development in these areas in the last few years have necessitated important conversations within most major oil and gas companies. Most global and industry-level estimates still project oil and gas remaining dominant fuel sources for the next 20-30 years, but companies must do well to steer clear of any complacency as most estimates often downplay the pace of technology disruption as well as the extent of resultant change in existing industries.
Speaking of Renewables, it not only benefits from strong policy support, at the global multilateral level as well as country level, but also increasing acknowledgment and acceptance among consumers as a cleaner and more ethical source of energy. There are questions around if renewables can remain viable
as a reliable energy source when deployed at scale and, more importantly, without any government support – but there is general agreement on the fact that the industry is already down the road of a cleaner and more efficient energy ecosystem for the future. While adoption of Electric Vehicles still lags the growth of renewables significantly, its currency has definitely appreciated in the last few years with the increase of renewables’ share in the power grid, growing concerns around air quality in major industrial economies, increase of ride-hailing or cab-sharing utilities and gradual phasing out or outright bans of ICE vehicles in some countries.
Preference for cleaner energy will also mean oil and gas will now have to vie for funding and capital in the international financial markets. This is a troubling scenario for most E&P players as even to support a very modest level of demand growth capital requirements for the sector is substantial. As the energy industry transitions to a new reality, even pureplay E&P companies will have to consider investing in low-carbon segments of the industry.
It is also important to note that this need for reassessment of future roadmap has come just as the industry is coming out of a steep downturn which complicates the situation further for oil and gas players, as they must strike a balance between deciding for the future while protecting today’s prized assets.This probably explains why Royal Dutch Shell, which has made some of the more notable ventures into clean energy and is arguably doing more than its peers, still spends less than 10 percent of its capex budget on renewables.That being said, this is an opportunity for oil and gas companies to make their businesses future-ready and embark upon a road of sustainable value-creation, one that caters to business growth, shareholder wealth creation as well as enables the company to adequately respond to future energy challenges or priorities.
Energy Strategy 2040: For ONGC, this period of energy transitions is a moment in our journey that adds another important dimension to our evolution as one of the country’s pre-eminent energy
161Managements Discussion and Analysis Report
companies and the leading oil and gas producer. To respond to the challenges and opportunities of this period as well as to deliver our mandate as an NOC, we have come up with the growth blueprint for our future – ONGC Energy Strategy 2040. The strategic roadmap envisions a future-ready organization whose growth is predicated on a few important planks: consolidation of our core upstream business (domestic and international); expansion into value accreting adjacencies in the O&Gvalue chain (downstream and petrochemicals) and diversification into renewables (offshore wind) and select new frontier plays through dedicated venture fund.
• Upstream: Cumulative upstream output (domestic and international) is targeted to almost double from current levels with 2% and 5% CAGR in domestic and international operations respectively. There is priority accorded to select difficult plays (HP-HT, Ultradeepwater) with high-prospectivity and low stretch from current core, development of in-house EOR solutions to maximize legacy production, exploration-focussed technology partnerships, dedicated marginal fields unit as well as building decommissioning capabilities. Internationally, focus shifts to plays with volume in host regimes with a positive G2G relationship with India to secure stable energy long-term supplies
• Downstream: Total refining capacity is expected to triple from 35 MMTPA to around 90-100 MMTPA. Acquisition of state-owned Oil Marketing Company (OMC) Hindustan Petroleum (HPCL) was a positive step in the direction of value-chain integration as it gives the Group ownership of a refining entity with extensive retail reach (more than 15,000 outlets). There is significant room for deriving operational synergies through integrated crude sourcing, centralized trading, capability and infrastructure sharing etc. Expansion in petchem is based on the robust demand of outlook of 8%-9% CAGR for the country as well as ONGC’s significant presence in the market through OMPL, OPAL and HPCL’s petchem investments
• Beyond O&G: Investments in renewables will be driven by the aim to create an advantaged play at
scale by capitalizing on ONGC’s legacy positon. Target is to create a 5-10GW renewable portfolio with focus on offshore wind. The strategic roadmap also looks to create long term optionality through investor play (venture fund corpus of ~$1 billion) in select frontier themes such as Clean energy, AI or Reservoir/field services technology etc.
Beyond the guidelines of Strategy 2040 and the imperatives of Global Energy Transition, Sustainability has remained a core tenet of ONGC’s business philosophy. We have 15 Clean Development Mechanism (CDM) projects that have already earned us 2 million CERs. We also are among the first few domestic companies to have set a target for ‘Carbon Neutrality’.
In this period of transformation, technology has a critical role to play within the strategic framework of oil and gas companies. Digitalisation is an emerging opportunity within the larger realm of technology in upstream operations. According to Wood Mackenzie, while it is still too early to quantify the impact on long-term costs and efficiency, but digitalisation will be at the heart of a low breakeven future. As per Deloitte, digital technologies like Internet of Things (IoT), Big Data Analytics, Advanced Seismic Imaging and Artificial Intelligence/Machine Learning have the most opportunity of growth in the Indian ecosystem. In fact, ‘Digital’ is one of the key enablers for ONGC’s 2040 roadmap with substantial potential for impact in areas such as predictive exploration, smart drilling and wells, production optimization, digital procurement, maintenance optimization etc.
5. Risks and Concerns
Price risk is the foremost among the set of concerns that affect oil and gas companies. The last 5 years has seen prices fluctuate from a high of above $100/bb to historic low of under $30/bbl. While prices have recovered considerably today, there was enough volatility on display even during the phase of recovery to keep companies, investors and analysts speculating on the price trajectory on a regular basis. Extremely low prices make survival difficult for small and mid-sized companies in this capital
162
and risk-intensive sector and impairs the growth and profitability of larger companies. The resultant reduction in upstream spending often means fewer project FIDs which eventually could lead to a supply crunch down the road. High oil prices on the other hand exerts excessive load on the sovereign exchequer in energy-hungry importers like India while stoking inflationary pressures in domestic markets. Global benchmark Brent averaged $71/bbl in 2018 against $55/bbl in 2017 and is projected to remain at around the same level during 2019, as per IHS-Markit.
Continuing tension in global markets over any escalation in the US-China trade dispute at a time when other major markets in Europe and Asia (China) too are experiencing signs of a slowdown could significantly dampen global oil demand. Wood Mackenzie’s base-case scenario sees a 1.1 million bpd growth in 2019 but even modest slowdown in the global economy would push oil demand growth down by 0.8 million bpd in 2020. Despite a conspicuous supply shortage, robust US production buffers a lot of that impact. A possible upside to this bleak demand outlook could be IMO low-sulphur Fuel Oil implementation from January 2020 which could bump up crude demand to produce more middle distillates.
Rising costs are another source of risk for upstream operators as activity picks up in response to higher crude prices and service sector spare capacity dwindles. As per a Wood Mackenzie report, lifting costs have plummeted by 30% in the past 3-4 years. 2017 day rates for deep-water rigs are 65% below 2014 levels; but, the global service sector has no more capacity for margin cuts. Its costs will rebound by 2019-20, as demand strengthens.
Geopolitics will continue to be a stress factor in global energy markets. The list of countries posing geopolitical risk is largely Middle-East dominant – the biggest risk in terms of significant oil supply disruptions comes from Iran (because of US sanctions) and Venezuela (terminal production decline). While India, of late, has noticeably ramped up its energy diplomacy efforts with a
view to diversifying its supply sources, flare-up of geopolitical tensions in resource-rich regions still is a cause of concern for our import-dependent economy.
Fiscal and regulatory decisions of host governments are a constant source of risk in the oil and gas decisions with any changes to the status quo either adding to or subtracting from the risk quotient of the respective regimes. Stability of sovereign systems is of particular importance to ONGC in relation to its exposure to overseas markets through ONGC Videsh’ participation. Of particular importance within this context is the developments in Mexico in recent times – after historic opening up of the energy sector in 2013 the country has again embraced the plank of resource nationalism under its newly elected Government thereby calling into question the sanctity of contracts signed under the previous regime.
Along with depressed crude prices, low domestic gas prices are also a major risk factor, at least in the domestic arena, to the profitability of the gas business within the upstream portfolio of oil and gas companies like ONGC. While prices for H1 FY’20 of $ 3.69/mmBtu are almost 50% higher than they were during the same period two years back, they are still less than the pre-existing regulated APM gas price of $4.2/mmBtu (NCV basis). For a company like ONGC where bulk of our production comes from legacy fieldsand where production costs rise for every incremental barrel, a low price point is a significant disincentive for any major capital program. Moreover, the high price ceiling only applies to difficult gas and our shallow-water supplies do not qualify for that dispensation. Also, marketing and pricing freedom, which has been extended to all new gas projects, is not available to legacy gas. These factors make upstream gas development challenging under current circumstances. While numbers for FY19 are relatively better, the financials are still far from ideal. The linkage of prices with global comparators definitely marked a major improvement from the regime of regulated pricing, but with an experience of the past 4 years under the revised pricing model,
163Managements Discussion and Analysis Report
it is important to question the relevance of domestic prices in other markets (mostly net exporters) to our resource-deficient gas consumption heavy gas market like ours.
Furthermore, the level of cess imposed on domestically produced crude oil is another limiting factor to improved earnings performance. The 20% ad-valorem at today’s prices far exceeds the erstwhile flat rate of Rs 4500/tonne, essentially defeating the entire purpose of modifying the cess levy. Moreover, cess incurred by producers is not recoverable from refineries and thus, forms part of cost of production of crude oil. For state upstream companies like ONGC, the perpetual uncertainty pertaining to subsidy-sharing that resurfaces during periods of high crude prices adds another element of risk to its cashflows.
Globally, there is a lot of value that still can be derived from legacy fields. As per a Wood Mackenzie report, almost 20% of new production will come from incremental projects between 2017 and 2025. ONGC also remains focused on maximizing recovery from its aging fields - a total cumulative gain of over 190 MMT of oil is envisaged from the 29 IOR/EOR schemes that are underway. Low crude prices significantly dent the commerciality of such schemes which are usually higher on the cost-curve. The recently announced policy framework for improved recovery in domestic fields is a positive step – it is especially encouraging for EOR projects as it allows for fiscal incentives to be applicable from the date of commercial production. There is significant scope for EOR technologies in ONGC’s legacy fields and there are a handful ongoing commercial (Santhal in-situ combustion, Sanand Polymer Flood) and pilot projects (SWAG Pilot in Mumbai High) EOR projects in both Onshore and Offshore fields. But the high recovery benchmark (60% in case of oil and 80% for gas) for IR projects makes the current policy inconsequential to ONGC’s major redevelopment schemes.
Similar to the global landscape, there is a risk to exploration business in domestic segment too. While
globally the issue is one of investment level as well as discovery volumes which are at multi-decadal lows, the primary issue facing domestic explorers is one of prospectivity and lack of available basinal area for exploration. While near-field appraisal and re-estimations are being preferred by global players in view of the continuing uncertainty around oil prices and priority on ‘value’ and ‘faster return to cashflow’, there is a lot of scope for conventional exploration or ‘wildcats’ in our country given a lot of our sedimentary area is under-explored. The Government has acted proactively on incentivizing domestic exploration and the launch of the new policy regime along with regular launch of bid rounds with special incentives for carrying out frontier area activity is a statement of that intent. Added to this, the Cabinet decision to entirely delegate the power to award hydrocarbon blocks to the MoPNG will save both the Government and companies crucial time in the entire process.
The risk of an impending talent crunch – often termed as the ‘big crew change’ - in the oil and gas is a major risk to the growth plans of major oil and gas companies. Finding the right talent is extremely critical for success in any industry, but it is even more so in a technology-intensive and risk-laden business like upstream oil and gas where the talent pool is relatively smaller. Companies now must have plans not just to attract and retain people in the traditional disciplines of the business but also fulfil resource requirements in the emerging areas such as digital or clean energy. HR planners must also consciously draw up resource requirements for the future as the advent and gradual integration of digital technologies in the workstream is likely to reduce manpower requirements.
Operational safety is a high-risk element for most upstream operations. In fact, along with Safety, current industry emphasis on Sustainability requires companies to adopt a more holistic approach through a well-designed and strong HSE framework. Most well-designed disaster response/contingency plans and robust HSE frameworks may fail on a bad day, however that does not obviate the need for continuously improving the safety
164
standards followed within a company. ONGC has implemented improved OISD Standards to improve contingency combat capabilities. International underwriters, enabling a lower-than-peer insurance premium for these assets, have rated ONGC offshore assets under ‘acceptable risk’.
6. Outlook
Your Company’s outlook for the future remains positive on the basis of its fundamentally strong core business of E&P. ONGC continues to make meaningful discoveries while consolidating its reserves. On the production front, while legacy fields continue to be the mainstay of our base production, there is significant traction on the development of new fields as well as new schemes for maximizing recovery in mature areas. Presented below is a brief overview of our current exploration status as well as efforts in emerging areas and production enhancement efforts.
A. Exploration:
I. Exploration Acreage & Mining Lease
Your Company holds the largest exploration acreage in India as an operator. As on 31.03.2019, ONGC holds a total of 9 Nomination PEL blocks (36853.55 Km2), 345 Nomination PML blocks (55802.41 Km2) and 1 Pre-NELP blocks (892.0 Km2). In NELP regime, your company has 25 PEL covering an area of 22534.29 Km2. It also holds 9 PMLs (Area: 1265.47 Km2 including 5 PMLs in Gujarat, 1 PML in Andhra Pradesh, 2 in Shallow water and 1 deep-water PML,) carved out from NELP blocks. Besides, ONGC as non-operator has PI in 2 blocks (Area: 567.00 Km2 ) as Non-operator Exploration acreages (blocks). In addition, ONGC also holds 2 blocks as Operator under OALP-I round covering an area of 1456 Km2. Also as non-operator, it has 3 acreages covering an area of 1558 Km2.
II. Exploration Performance
During the year 2018-19, your Company has made 13 discoveries (5 in NELP, 7 in Nomination acreages). Of these, 6 are new prospects and 7 are new pool discoveries.
Significant among these are the breakthrough first-time discoveries in Bengal Basin (Well Asokenagar-1) and Vindhyan Basin (Well Hatta-2) that have opened up both these basins for further exploration and up-gradation of these basins. Also, gas discovery in Kutch Offshore NELP block GK-OSN-2009/1 in well GKS091NFA-1, made in Cretaceous (Igneous intrusive) is also a major breakthrough for opening a new play for exploration. This discovery has potential of 7.34 BCM gas volume.
Your Company has monetized 5 of the on-land discoveries (Babejia-2, Rokhia-75 & Baramura-31: A&AA Basin, Bantumilli North-2 & Suryaraopeta West-1: KG Basin) and efforts are underway to bring other discoveries on production as early as possible.
As on 01.04.2019, accretion to In-Place Hydrocarbons (3P-Proved, Probable and Possible), from the Company operated fields in India, stood at 137.05 MMtoe, out of which about 70 per cent accretion has been due to exploratory efforts. Total in-place reserve accretion during 2018-19 in domestic basins, including the Company’s share in PSC JVs, stands at 157.30 MMtoe (20.25 MMtoe from JVs).
As on 01.04.2019, total In-Place hydrocarbon volume of ONGC Operated and JV (Domestic) Fields stands at 10002.63 MMtoe against 9845.33 MMtoe as on 01.04.2018. The Estimated Ultimate Recovery (3P) at the end of FY’19 have been estimated at 3251.60 MMtoe as against 3201.21 for FY’18. It may be noted that ONGC migrated to PRMS (Petroleum Resource Management System) w.e.f. 01.04.2019.
III. Unconventional & Alternate sources of energy
Shale Gas/Oil Exploration:
Your Company has completed shale gas/oil exploration in 21 of the 50 nomination PML blocks located in Cambay, KG, Cauvery and A&AA basins, for assessing the Shale gas/oil prospectivity. As on 31.03.2019, 26 shale assessment wells (8
165Managements Discussion and Analysis Report
exclusive and 18 dual objective wells) in 21 PML blocks have been drilled and the required data has been evaluated for Shale gas/ oil assessment. A number of sweet spots/ zones of interest in various exclusive shale gas/ oil assessment wells have been identified for hydro fracturing. Accordingly, so far, 4 interesting zones in 3 exclusive shale assessment wells in Cambay Basin (JMSGA, GNSGA & GNSGB) and one zone in an exclusive well in KG Basin (WGSGA) have been hydro fractured to assess the shale gas/ oil prospectivity. The wells JMSGA and GNSGB in Cambay and WGSGA in KG Basin, showed the presence of little oil on HF, thus establishing the presence of shale oil petroleum system in these Basins. In the wells GNSGA and GNSGB, further shale assessment has been called off and presently feasibility of testing shallower conventional objectives are being explored. It is planned to carry out hydro fracturing in drilled exclusive wells GNSGC & NGSGA in Cambay Basin to evaluate shale gas/oil prospectivity.
Coal Bed Methane (CBM) Exploration:
Of the 9 original blocks that the Company was awarded as part of the four CBM bidding rounds, the Company relinquished 5 blocks on the basis of data generated from exploratory efforts and currently is operating 4 blocks (Jharia, Bokaro and North Karanpura in Jharkhand and Raniganj in West Bengal) where exploration activities have been completed.Developmental activities are at an advanced stage in three of these blocks viz. Bokaro, Jharia and North Karanpura.
Gas Hydrate Exploration:
Your Company has been an active participant on gas hydrates exploratory research in India under National Gas Hydrate Program (NGHP) of GoI since its inception in 1997. So far, your Company has played a significant role in G&G studies for the identification of sites for NGHP-01 and NGHP R&D Expedition-02 and has also successfully executed and completed on-board and Post-expedition studies for both the expeditions. With the focus on the pilot production testing, the gas hydrate reservoirs discovered during NGHP-
02 (Block KG-DWN- 98/5) have been delineated and Geocellular modelling for the gas hydrate rich reservoir has been completed to get detailed cell wise geophysical/ reservoir parameters around the proposed site for pilot production test. Additionally, more gas hydrate prospects have been identified in the Mahanadi and Cauvery area which may be taken up for future field expeditions in order to evaluate the gas hydrate prospectivity in the east coast deep waters.
Basement Exploration:
Concerted efforts for Basement Exploration, a frontier exploration play, have been taken up by the Company as a major initiative. During the year, your Company has drilled 25 wells including 13 exploratory wells with Basement as primary or secondary objective. Deliberate search of hydrocarbons in the Mesozoic sequence of Kutch Saurashtra block of western offshore basin has led to discovery of a new hydrocarbon bearing play in the fractured dolerite intrusives which flowed gas in substantial quantity extending the exploration frontier around the area. Encouraging results obtained through drilling of a number of new prospects this year in the Padra field of Cambay Basin and the UAS block of A&AA basin has further enhanced the scope of basement exploration. Development initiatives taken up for exploitation of the fractured Precambrian reservoirs in the Thirunagari and Pundi fields of Cauvery basin have been met with expected results encouraging sustenance of scope for basement exploration and exploitation. Your Company has also identified 25 prospects from G&G interpretation for basement exploration which are being finalized.
Exploration in HP-HT & Tight Reservoir:
The Company has prioritized HP-HT/Tight/Deeper plays in KG, Cauvery, Western Offshore Basin and Assam & Arakan Fold belt. These plays have been an exploration challenge for drilling as well as for testing. During the year 2018-19, in GS-OSN-2004/1 block of Western Offshore Basin, exploratory HPHT well “GSS-041-NAA#C” has been successfully drilled and tested in Jhuran formation (Mesozoic)
166
to be gas bearing. In KG offshore, HPHT Well “YS-6-2#sub” has been successfully drilled and hermetically tested on 28.03.2019. The HPHT well is being taken up for testing. In Cauvery Basin, HPHT well “ABAA_KKL” has been drilled and after testing three objects, the well was abandoned. Further, the HPHT well “VNAC” in Cauvery Basin has been concluded and the testing of the well is being taken up. In A&AA Basin, three HP wells in Khubal field had been drilled and tested with result of gas indication. Further, three HP wells in Kunjaban field have been taken up for drilling & testing for Lower Bhuban Formation.
B. Development of new fields
Your Company has also invested greater focus and expedited work on new field development projects as well as production maximizing brownfield schemes – some of which will play a substantial role in ONGC’s production profile in the coming years. Currently, 15 production projects (development and redevelopment), with an estimated outlay of over ̀ 590 Billion and envisaged lifecycle gains of over 175 MMtoe, are underway. This features our landmark deepwater project in eastern offshore – KG-DWN-98/2 – which at its peak output is projected to account for 17% and 24% of current standalone annual oil and gas production respectively. We also completed three projects during FY’19: MH North Redevelopment Ph-III, Development of C-26 Cluster Fieldsand Redevelopment of Gamij Field (Ahmedabad).
We remain firmly committed to the Hon’ble Prime Minister’s target of achieving a 10% reduction in hydrocarbon imports by the year 2022. As part of the 10% roadmap for production growth, we are envisaging a significant ramp-up in our domestic output, principally led by gas. Gas supplies are seen at over 40 BCM and oil production is pegged at around 26 MMT by FY’22.
7. Internal Control Systems
To manage this large portfolio, your Company has institutionalized robust internal control systems to continuously monitor critical businesses, functions and operations; particularly field operations.
The top management of your Company monitors and reviews the various activities on continuous basis. A set of standardized procedures and guidelines have been issued for all the facets of activities to ensure that best practices are adopted even up to ground level. Performance of every business unit is monitored by the respective directorates for suitable corrective measures, if any, in time.
Your Company has a dedicated Performance Management and Benchmarking Group (PMBG) which monitors the performance of each business unit against the Key Performance Indicators (KPIs) defined in the Performance Contracts between the top management and the Key Executives. These performance contracts are aligned to the goals and objectives of the organization.
As part of its push for systemic transformation and strengthening of control systems, your Company has placed adequate emphasis on institutionalization of tools, practices and systems that facilitate greater operational efficiencies and workplace productivity. The ‘Material Management Manual’ of the Company has been revamped to ensure procurement of quality materials and services and identification of world-class vendors. ‘Book of Delegated Powers’ (BDP) was revamped and implemented with the objective to empower working level officers and enhancement of delegation to put commensurate accountability on all decision makers and the same is being reviewed periodically to align with business needs. Your Company has also introduced E-Grievance handling mechanism for quick redressal of grievances of its various stake-holders.
Occupational health, safety and environmental protection are the adopted motto of your Company. Achieving highest standards in these areas remains a priority objective for your Company. Internal and external audits have been institutionalized and are conducted on a continuous basis to ensure compliance to various industry norms and benchmarks.
Your Company has dedicated Internal Audit (IA) group which carries out audits in-house. At the same time, based on requirement, specialized
167Managements Discussion and Analysis Report
agencies are engaged to carry out audit in the identified areas. Statutory auditors are appointed by Comptroller and Auditor General (CAG) of India for fixed tenures. Audits committee of the Board oversees the functioning of Internal Audit and control systems.
Third party safety audits are conducted regularly for offshore and onshore installations by established national and international HSE agencies such as Oil Industry Safety Directorate ("OISD"), an organization under the control of the MoPNG, which issues safety guidelines. Further, subject to the safety regulations prescribed by the Directorate General of Mines and Safety (DGMS), each work center has teams dedicated to HSE, which execute the safety guidelines prescribed by OISD as well as DGMS. HSE teams are also responsible for obtaining necessary licenses and clearances from the State Pollution Control Boards.
All transactions in the Company are carried out on SAP R/3 ERP based business portal. Proper and adequate system of internal control exists to ensure that all aspects are safeguarded and protected against loss from unauthorized use or disposition and that each transaction is authorized, recorded and reported. The system further ensures that financial and other records are fact-based and reliable for preparing the financial statements.
8. Human Resource Development
Your organization has always valued its most important human resource and due to sincere efforts only a vast pool of experienced and talented scientists, engineers and professionals today passionately take care of the energy needs of the country. ‘Strengthen staffing and capabilities’ has been the focus area all along in the Company’s pursuits towards structured Human Resource Development. This is a critical issue keeping in view crew change in next few years. The basic principle
revolves around grooming younger generations as future ‘energy leaders’. Talent replenishment and bridging competency gap become crucial aspect for human resource development. Further, your Company believes that continuous development of its human resource fosters engagement. There are multifaceted efforts for grooming technical talent and develop managerial competence. Structured training programmes have been developed to impart required skills to the people in identified critical areas. Besides training, work association with industry leaders in the challenging areas of business is yet another attempt to improve capabilities. Your Company also took structured initiatives to provide a desirable work-life balance to the employees as well as improving the living and working conditions. The endeavours of your Company, towards Human Resource development, are well recognized in the industry.
9. Corporate Governance
The initiatives taken by your Company are detailed in the Corporate Governance report, a part of the Annual report.
10. Corporate Social Responsibility (CSR)
Initiatives taken by your Company towards CSR are detailed in Directors’ Report.
11. Cautionary Statement
Statements in the Management Discussion and Analysis Report describing the Company’s strengths, strategies, projections and estimates, are forward-looking statements and progressive within the meaning of applicable laws and regulations. Actual results may vary from those expressed or implied, depending upon economic conditions, Government Policies and other incidental factors. Readers are cautioned not to place undue reliance on the forward looking statements.
168
Corporate GovernanceReportCorporate Governance involves a set of relationships between a company’s management, its board, its shareholders and other stakeholders. Corporate Governance also provides the structure through which the objectives of the company are set, and the means of attaining those objectives and monitoring.
Corporate governance implies the way in which a company is managed to ensure that all of its stakeholders get their fair share in its earnings and assets. Good corporate governance involves the commitment of a company to run its businesses in a legal, ethical and transparent manner.
1.1 Corporate Governance philosophy of ONGC
• Compliance of laws, rules and regulations inletter and spirit in the interest of stakeholders.
• System of risk analysis and measures to minimize/ migrate through risk management.
• A sound system of internal control to achieve business objectives, in short, medium and long term.
• Adherence to ethical standards for effective management and distribution of wealth and discharge of social responsibility for sustainable development of stakeholders.
• Clearly defined standards against which performance of responsibilities are measured.
• Accuracy and transparency in disclosures regarding operations, performance, risk and financial status.
• Timely and balanced disclosure of all material information to all the Stakeholders.
1.2 Further, the Company has ensured compliance with the objectives of ‘the principlesof Corporate’ Governance stated under the SEBI [Listing
Obligations and Disclosure Requirements] Regulations–2015 (Listing Regulations), as brought out below:
A. RIGHTS OF SHAREHOLDERS
The Company has taken all necessary steps to ensure the Rights of Shareholders and seek approval of the shareholders as and when required as per the provisions of the Companies Act, 2013 or other applicable legislations.
The Company issues press releases regarding the important events and the same have been submitted to Stock Exchanges for information of the valued investors.
The Annual Report and the notice of the Annual General Meeting (AGM) explains exhaustively the procedures governing the AGM, voting procedures etc. Sufficient opportunity is provided to the shareholders who attend the meeting to raise queries to the Board of Directors and queries parenting to accounts, Company’s future prospects etc. are clarified at the meeting.
The Company has a Board level Stakeholders’ Relationship Committee which meets periodically to redress the grievances of shareholders. The shareholders have the facility of directly approaching the Company as well as the Registrar and Share Transfer Agent (RTA) to address their queries/ grievances, which are generally addressed within a fortnight.
Interests of the minority shareholders are protected and there was no instance of abusive action by controlling shareholders.
B. TIMELY INFORMATION
The Company sends notices through email to all shareholders who have provided their e-mail id with the Company and/ or depository participants
169Corporate Governance Report
and to all others, printed copies aresent by post for providing timely information. Further, Company encourages investors to register their email ID to receive annual report via email.
The Annual Report of the Company is compiled exhaustively to provide every conceivable information on the functioning of the Company.
The website of the Company is updated continuously to keep the stakeholders informed of various developments including Notice of general meeting, Annual Reports, quarterly results, dividend information and other statutory information.
C. EQUITABLE TREATMENT
All the equity shareholders are treated equitably - irrespective of their location. For effective participation of the Shareholders, Company dispatches the notice for General meeting to Shareholders well in advance.
Further, the E-voting facility is provided to all Shareholders. Simple and inexpensive procedures are adopted to cast vote electronically as well as through poll.
D. ROLE OF STAKEHOLDERS IN CORPORATE GOVERNANCE
The Business Responsibility Report of the Company carries an exclusive section spelling the steps being taken by the Company in this regard. The Company, being a listed Public Sector Enterprise, conducts and governs itself with Ethics, Transparency and Accountability as per the law of land and ensures compliance of all the policies, rules, regulations, guidelines etc. mandated by the Government of India.
For effective participation in Corporate Governance, the Company disseminates various announcements from time to time in newspapers, Company website and other media to the stakeholders concerned.
Further, the Company is covered under the provisions of Right to Information Act, 2005 and it provides all information to the citizens of India as
provided under Act. The Company has a Vigilance Department which is headed by an officer on deputation from the Government of India in the rank of Joint Secretary or above.
The Company has implemented a Whistle Blower Mechanism which gives opportunity to the directors and employees to raise any concernof unethical or illegal or immoral activity occurring in the Company.
E. DISCLOSURE AND TRANSPARENCY
The Company ensures timely and complete dissemination of information on all matters which are required to be made public. The website of the Company and the Annual Report of the Company contain exhaustive information regarding every aspect of the functioning, financial health, ownership and governance practices of the Company.
All disclosures are made by the Company in the formats as prescribed under relevant enactments/ regulations in respect of accounting, financial and non-financial matters.
The Company disseminates information through press releases, official website and/or through the Stock Exchanges and access to all these modes are free for all users.
The Company maintains minutes of the proceedings of all meetings (Board/ Board Level Committees/ General Meeting) as per the Secretarial Standards prescribed under the Companies Act, 2013. The minutes are being maintained explicitly recording dissenting opinions as stipulated under law.
F. RESPONSIBILITIES OF THE BOARD OF DIRECTORS
Article 95 of the Articles of Association of the Company provides that the business of the Company shall be managed by the Board of Directors. However, based on the organizational requirements for day-to-day operations the Board of Directors has approved a Book of Delegated Powers (BDP) and other manuals like Material Management, Works manual etc., which spell out the processes
170
and define the level (Executive Committee / Whole-time Director / Key Executive and below) at which any decision is to be taken and the said BDP and other manuals are reviewed from time to time to ensure that they are updated and meet the needs of the organization.
The Board members as well as Key Managerial Personnel are required to declare their interest in all contracts and their shareholdings etc. which are noted by the Board. The Company ensures that all related party transactions are brought to the notice / approval of the Audit Committee / Board.
The Company being a Central Public Sector Enterprise (CPSE) all the Directors are appointed/re-appointed by the President of India, through the Administrative Ministry. The evaluation of the performance of the Directors and the Board including the fulfilment of independence criteria of Independent Directors and also, skills/expertise/competencies as required are being carried out by the Government of India as per its own internal processes and that the Board of the Company has no role to play in this regard.
The Agenda Items, circulated in advance to the members of the Board, are exhaustive in nature.Further, presentations are made during the course of discussion wherever required for the information of the directors. The Independent Directors are provided with every conceivable information to ensure that the interests of the minority shareholders are protected. Every agenda is examined and discussed in detail before necessary decision is taken. The Committees of the Board deliberate upon major proposals before being recommended to the Board.
The Board regularly monitors the Action Taken Report on its decisions. Risk areas are outlined and mitigation processes are put in place.
The terms of reference, quorum, periodicity of meeting etc. are clearly defined for each of the Board Committees, and approved by the Board.
The Board members disclose from time to time all the required information to the Board. The Board performs key functions by fulfilling the responsibilities for achieving economy, efficiency and effectiveness for Company vis-à-vis shareholders’ value creation.
The directors are nominated for various training programs conducted by reputed organizations/ bodies including DPE, SCOPE and CII.
1.3 Corporate Governance Recognitions
The Company’s Corporate Governance practices have secured many accolades in the past from Indian Chamber of Commerce, Institute of Directors and Institute of Company Secretaries of India. The Company continues with the sprit of Corporate Governance in every spear of its activities.
2. BOARD OF DIRECTORS2.1 Composition
The Board of Directors of the Company ensures the Company’s prosperity by collectively directing the company’s affairs, whilst meeting the appropriate interests of its shareholders and stakeholders. The Company, being a Government Company, the appointment of Directors are being done by Government of India. The Chairman and Managing Director (CMD) and Six Whole-Time Directors viz. Director (Exploration), Director (Finance), Director (Offshore), Director (Onshore), Director (Technology & Field Services) and Director (Human Resource) are the whole time directors who spearhead the day to day operations of the Company, the strategic decision(s) are under the overall supervision, control and guidance of the Board of Directors of the Company, which includes Government Nominee Directors and Independent Directors.
The Board of Directors has an optimum combination of Executive Directorsand Non-Executive Directors. As on 31st March, 2019, there were 17 Directors (including two women Directors) on the Board, comprising of 7 Executive Directors
171Corporate Governance Report
(including the Chairman and Managing Director) and 10 Non-Executive Directors - 2 Government Nominee Directors and 8 Independent Directors.
Further, as on 31.03.2019 the composition of the Board of Directors was not complied with the requirements under Regulation 17 (1) (b) i.e. at least half of the Board of Directors of the listed entity shall consist of Independent Directors, as Dr. Sambit Patra, ceased to be an Independent Director of the Company w.e.f. 23.03.2019 upon his resignation due to personal reasons. The Company has requested the Ministry of Petroleum and Natural Gas for appointment of an Independent Director against the vacant position and fill the vacancy on or before 22.06.2019, in terms of Regulation 25(6) of the Listing Regulations.
As required under Regulation 46(2) (b) of the Listing Regulations, the terms and conditions of appointment of Independent Directors are available on the Company’s website at web-link https://www.ongcindia.com/wps/wcm/connect/en/investors/independent-director/
2.2 Board/ Committee Meetings and Procedures
As a good governance practice and as per the guidance note issued by the Institute of Company Secretaries of India, the Board approves in advance, a tentative schedule of the Board Meetings to be held during the ensuing financial year considering the requirements under applicable laws w.r.t minimum number of meetings and maximum permissible time gap between two consecutive meetings. Additional meetings are also convened as and when required. In case of exigency, resolutions are passed by circulation as provided under the Companies Act, 2013.
The Company also offers video conferencing facility to the Directors to enable them to participate as may be permitted under law.
The agenda for the meetings are circulated in advance for informed decision making by the Directors. However, the agenda items containing
unpublished price sensitive information and agenda at shorter notice are tabled at the relevant meeting of Board/ Committee, with the permission of the Directors. The Company Secretary attends all the meetings of the Board and Committees and prepares draft minutes of such meetings.
2.3 Training of non-executive Board members
In line with Clause 3.7 of the Guidelines on Corporate Governance for Central Public Sector Enterprises, 2010, issued by Government of India,Department of Public Enterprises and requirement of Listing Regulations with regard to training of Directors, the Company has following training policy for non-executive Directors:
• Induction Training/ familiarization program
• External Training
Non-executive Board members are eminent personalities having wide experience in the field of business, education, industry, commerce and administration. Their presence on the Board is advantageous and fruitful in arriving at strategic decisions. The training policy of Directors and the details of familiarization/training programmes organized during fiscal 2018-19 are available at web-link: https://www.ongcindia.com/wps/wcm/connect/en/ investors/independent-director/
2.4 Board Meetings
During the fiscal 2018-19, Ten (10) meetings of Board were held on 26th April, 30th May, 29th June, 2nd August, 19th September, 3rd November, 20th, 21st December, 2018, 14th February, 23rd and 29th
March, 2019.
The information as required to be disclosed under Schedule V of the Listing Regulations, pertaining to Board and related mattersincluding number of Board Meetings attended by Directorsduring the financialyear 2018-19, attendance at the last Annual General Meetingby them and the number of other Directorship/Committee Membership in various companies as of 31.03.2019 are tabulated below:-
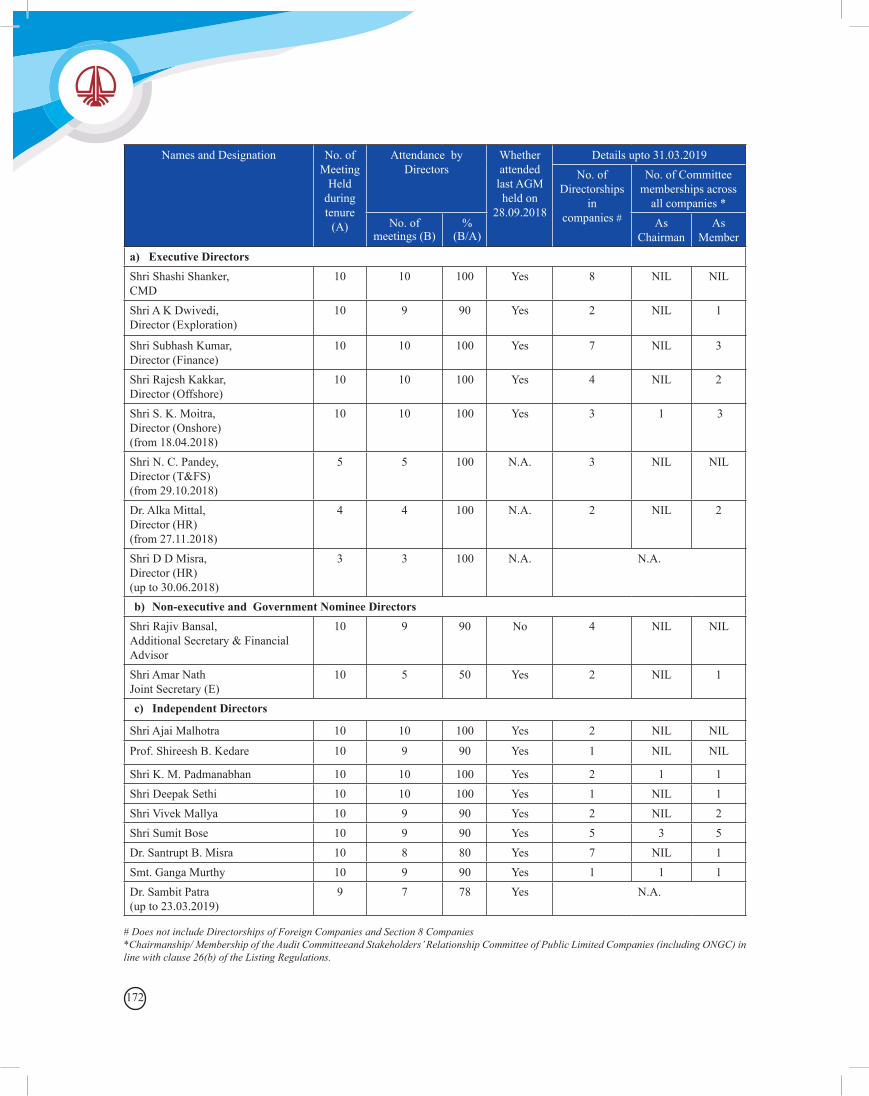
172
Names and Designation No. of Meeting
Held during tenure
(A)
Attendance by Directors
Whether attended
last AGM held on
28.09.2018
Details upto 31.03.2019No. of
Directorships in
companies #
No. of Committee memberships across
all companies *No. of
meetings (B)%
(B/A)As
ChairmanAs
Membera) Executive Directors Shri Shashi Shanker, CMD
10 10 100 Yes 8 NIL NIL
Shri A K Dwivedi, Director (Exploration)
10 9 90 Yes 2 NIL 1
Shri Subhash Kumar, Director (Finance)
10 10 100 Yes 7 NIL 3
Shri Rajesh Kakkar, Director (Offshore)
10 10 100 Yes 4 NIL 2
Shri S. K. Moitra,Director (Onshore)(from 18.04.2018)
10 10 100 Yes 3 1 3
Shri N. C. Pandey, Director (T&FS) (from 29.10.2018)
5 5 100 N.A. 3 NIL NIL
Dr. Alka Mittal, Director (HR) (from 27.11.2018)
4 4 100 N.A. 2 NIL 2
Shri D D Misra, Director (HR)(up to 30.06.2018)
3 3 100 N.A. N.A.
b) Non-executive and Government Nominee Directors Shri Rajiv Bansal, Additional Secretary & Financial Advisor
10 9 90 No 4 NIL NIL
Shri Amar Nath Joint Secretary (E)
10 5 50 Yes 2 NIL 1
c) Independent Directors
Shri Ajai Malhotra 10 10 100 Yes 2 NIL NIL
Prof. Shireesh B. Kedare 10 9 90 Yes 1 NIL NIL
Shri K. M. Padmanabhan 10 10 100 Yes 2 1 1Shri Deepak Sethi 10 10 100 Yes 1 NIL 1Shri Vivek Mallya 10 9 90 Yes 2 NIL 2Shri Sumit Bose 10 9 90 Yes 5 3 5Dr. Santrupt B. Misra 10 8 80 Yes 7 NIL 1Smt. Ganga Murthy 10 9 90 Yes 1 1 1Dr. Sambit Patra (up to 23.03.2019)
9 7 78 Yes N.A.
# Does not include Directorships of Foreign Companies and Section 8 Companies*Chairmanship/ Membership of the Audit Committeeand Stakeholders’ Relationship Committee of Public Limited Companies (including ONGC) in line with clause 26(b) of the Listing Regulations.
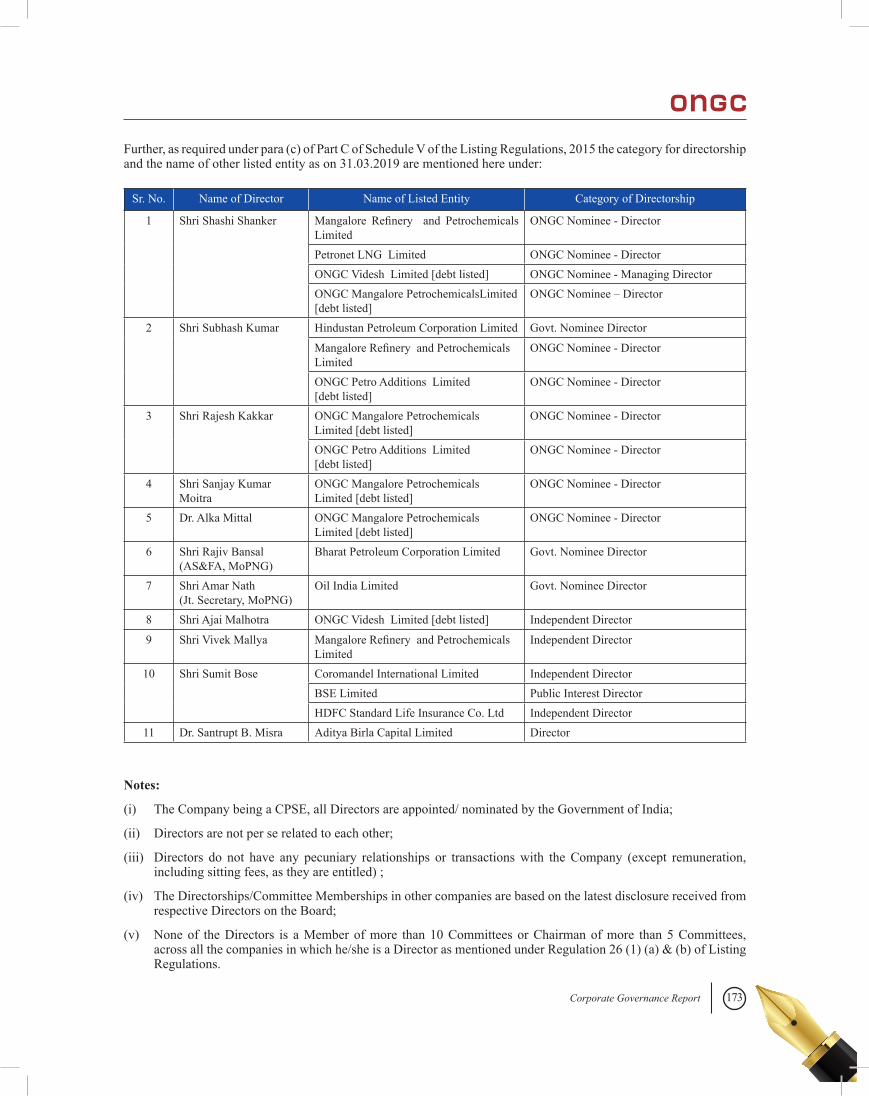
173Corporate Governance Report
Sr. No. Name of Director Name of Listed Entity Category of Directorship
1 Shri Shashi Shanker Mangalore Refinery and Petrochemicals Limited
ONGC Nominee - Director
Petronet LNG Limited ONGC Nominee - DirectorONGC Videsh Limited [debt listed] ONGC Nominee - Managing DirectorONGC Mangalore PetrochemicalsLimited [debt listed]
ONGC Nominee – Director
2 Shri Subhash Kumar Hindustan Petroleum Corporation Limited Govt. Nominee Director
Mangalore Refinery and Petrochemicals Limited
ONGC Nominee - Director
ONGC Petro Additions Limited[debt listed]
ONGC Nominee - Director
3 Shri Rajesh Kakkar ONGC Mangalore Petrochemicals Limited [debt listed]
ONGC Nominee - Director
ONGC Petro Additions Limited[debt listed]
ONGC Nominee - Director
4 Shri Sanjay Kumar Moitra
ONGC Mangalore Petrochemicals Limited [debt listed]
ONGC Nominee - Director
5 Dr. Alka Mittal ONGC Mangalore Petrochemicals Limited [debt listed]
ONGC Nominee - Director
6 Shri Rajiv Bansal(AS&FA, MoPNG)
Bharat Petroleum Corporation Limited Govt. Nominee Director
7 Shri Amar Nath (Jt. Secretary, MoPNG)
Oil India Limited Govt. Nominee Director
8 Shri Ajai Malhotra ONGC Videsh Limited [debt listed] Independent Director
9 Shri Vivek Mallya Mangalore Refinery and Petrochemicals Limited
Independent Director
10 Shri Sumit Bose Coromandel International Limited Independent DirectorBSE Limited Public Interest DirectorHDFC Standard Life Insurance Co. Ltd Independent Director
11 Dr. Santrupt B. Misra Aditya Birla Capital Limited Director
Notes:
(i) The Company being a CPSE, all Directors are appointed/ nominated by the Government of India;
(ii) Directors are not per se related to each other;
(iii) Directors do not have any pecuniary relationships or transactions with the Company (except remuneration, including sitting fees, as they are entitled) ;
(iv) The Directorships/Committee Memberships in other companies are based on the latest disclosure received from respective Directors on the Board;
(v) None of the Directors is a Member of more than 10 Committees or Chairman of more than 5 Committees, across all the companies in which he/she is a Director as mentioned under Regulation 26 (1) (a) & (b) of Listing Regulations.
Further, as required under para (c) of Part C of Schedule V of the Listing Regulations, 2015 the category for directorship and the name of other listed entity as on 31.03.2019 are mentioned here under:
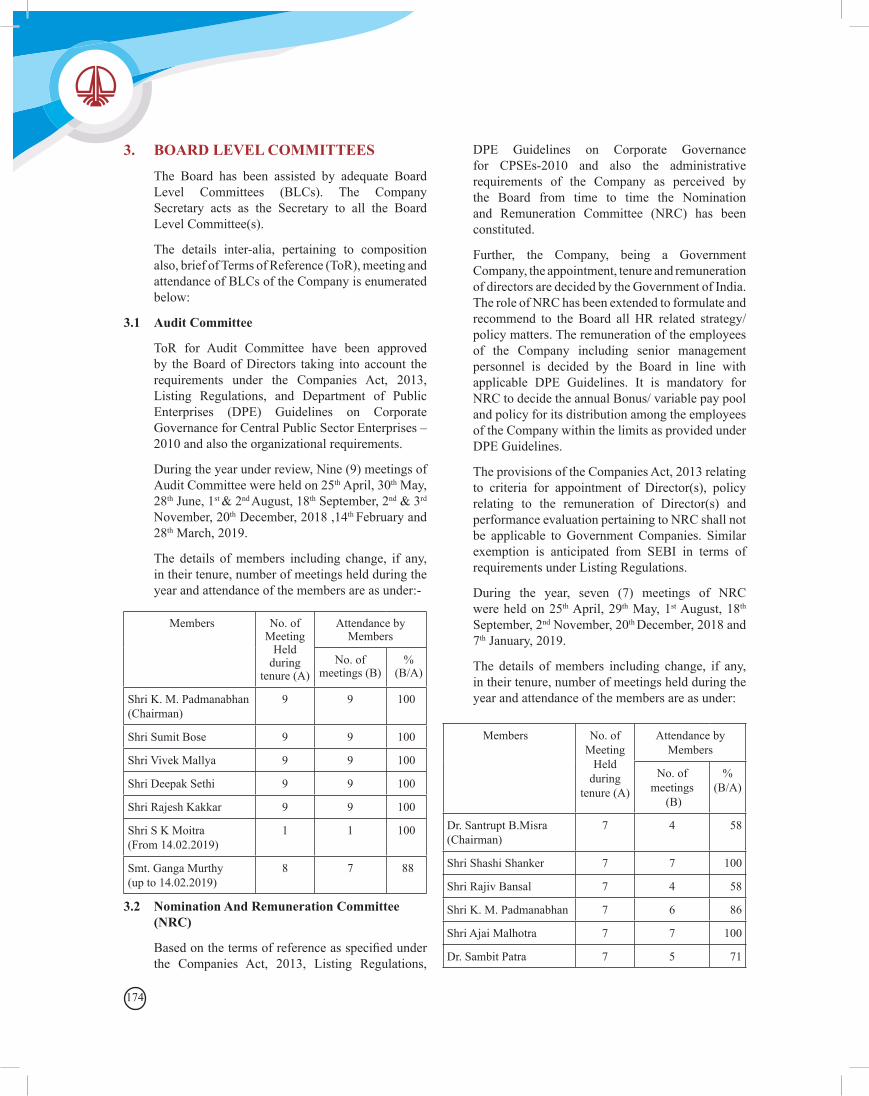
174
3. BOARD LEVEL COMMITTEES
The Board has been assisted by adequate Board Level Committees (BLCs). The Company Secretary acts as the Secretary to all the Board Level Committee(s).
The details inter-alia, pertaining to composition also, brief of Terms of Reference (ToR), meeting and attendance of BLCs of the Company is enumerated below:
3.1 Audit Committee
ToR for Audit Committee have been approved by the Board of Directors taking into account the requirements under the Companies Act, 2013, Listing Regulations, and Department of Public Enterprises (DPE) Guidelines on Corporate Governance for Central Public Sector Enterprises – 2010 and also the organizational requirements.
During the year under review, Nine (9) meetings of Audit Committee were held on 25th April, 30th May, 28th June, 1st & 2nd August, 18th September, 2nd & 3rd
November, 20th December, 2018 ,14th February and 28th March, 2019.
The details of members including change, if any, in their tenure, number of meetings held during the year and attendance of the members are as under:-
Members No. of Meeting
Held during
tenure (A)
Attendance by Members
No. of meetings (B)
%(B/A)
Shri K. M. Padmanabhan(Chairman)
9 9 100
Shri Sumit Bose 9 9 100
Shri Vivek Mallya 9 9 100
Shri Deepak Sethi 9 9 100
Shri Rajesh Kakkar 9 9 100
Shri S K Moitra(From 14.02.2019)
1 1 100
Smt. Ganga Murthy(up to 14.02.2019)
8 7 88
DPE Guidelines on Corporate Governance for CPSEs-2010 and also the administrative requirements of the Company as perceived by the Board from time to time the Nomination and Remuneration Committee (NRC) has been constituted.
Further, the Company, being a Government Company, the appointment, tenure and remuneration of directors are decided by the Government of India. The role of NRC has been extended to formulate and recommend to the Board all HR related strategy/policy matters. The remuneration of the employees of the Company including senior management personnel is decided by the Board in line with applicable DPE Guidelines. It is mandatory for NRC to decide the annual Bonus/ variable pay pool and policy for its distribution among the employees of the Company within the limits as provided under DPE Guidelines.
The provisions of the Companies Act, 2013 relating to criteria for appointment of Director(s), policy relating to the remuneration of Director(s) and performance evaluation pertaining to NRC shall not be applicable to Government Companies. Similar exemption is anticipated from SEBI in terms of requirements under Listing Regulations.
During the year, seven (7) meetings of NRC were held on 25th April, 29th May, 1st August, 18th
September, 2nd November, 20th December, 2018 and 7th January, 2019.
The details of members including change, if any, in their tenure, number of meetings held during the year and attendance of the members are as under:
3.2 Nomination And Remuneration Committee (NRC)
Based on the terms of reference as specified under the Companies Act, 2013, Listing Regulations,
Members No. of Meeting
Held during
tenure (A)
Attendance by Members
No. of meetings
(B)
% (B/A)
Dr. Santrupt B.Misra(Chairman)
7 4 58
Shri Shashi Shanker 7 7 100
Shri Rajiv Bansal 7 4 58
Shri K. M. Padmanabhan 7 6 86
Shri Ajai Malhotra 7 7 100
Dr. Sambit Patra 7 5 71
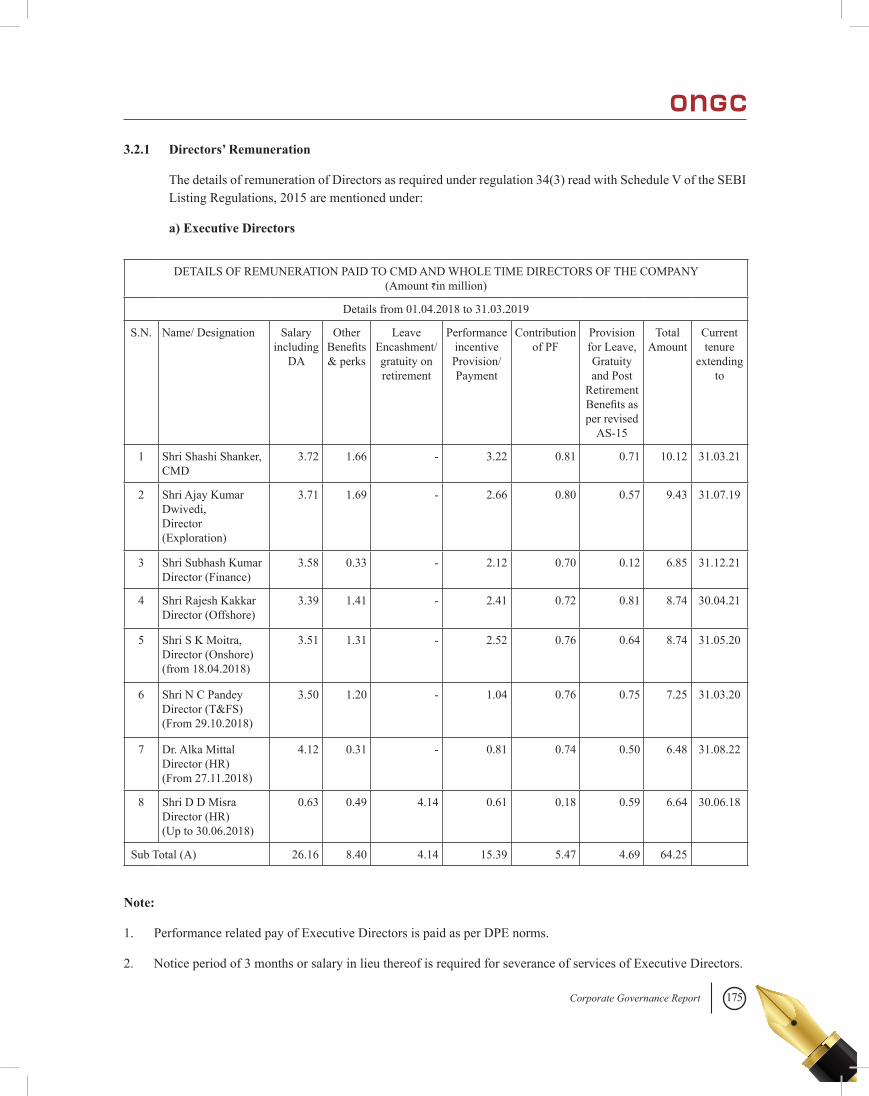
175Corporate Governance Report
3.2.1 Directors’ Remuneration
The details of remuneration of Directors as required under regulation 34(3) read with Schedule V of the SEBI Listing Regulations, 2015 are mentioned under:
a) Executive Directors
DETAILS OF REMUNERATION PAID TO CMD AND WHOLE TIME DIRECTORS OF THE COMPANY (Amount `in million)
Details from 01.04.2018 to 31.03.2019
S.N. Name/ Designation Salary including
DA
Other Benefits & perks
Leave Encashment/gratuity on retirement
Performance incentive Provision/Payment
Contribution of PF
Provision for Leave, Gratuity and Post
Retirement Benefits as per revised
AS-15
TotalAmount
Current tenure
extending to
1 Shri Shashi Shanker, CMD
3.72 1.66 - 3.22 0.81 0.71 10.12 31.03.21
2 Shri Ajay Kumar Dwivedi, Director (Exploration)
3.71 1.69 - 2.66 0.80 0.57 9.43 31.07.19
3 Shri Subhash KumarDirector (Finance)
3.58 0.33 - 2.12 0.70 0.12 6.85 31.12.21
4 Shri Rajesh KakkarDirector (Offshore)
3.39 1.41 - 2.41 0.72 0.81 8.74 30.04.21
5 Shri S K Moitra,Director (Onshore)(from 18.04.2018)
3.51 1.31 - 2.52 0.76 0.64 8.74 31.05.20
6 Shri N C PandeyDirector (T&FS)(From 29.10.2018)
3.50 1.20 - 1.04 0.76 0.75 7.25 31.03.20
7 Dr. Alka MittalDirector (HR)(From 27.11.2018)
4.12 0.31 - 0.81 0.74 0.50 6.48 31.08.22
8 Shri D D MisraDirector (HR)(Up to 30.06.2018)
0.63 0.49 4.14 0.61 0.18 0.59 6.64 30.06.18
Sub Total (A) 26.16 8.40 4.14 15.39 5.47 4.69 64.25
Note:
1. Performance related pay of Executive Directors is paid as per DPE norms.
2. Notice period of 3 months or salary in lieu thereof is required for severance of services of Executive Directors.
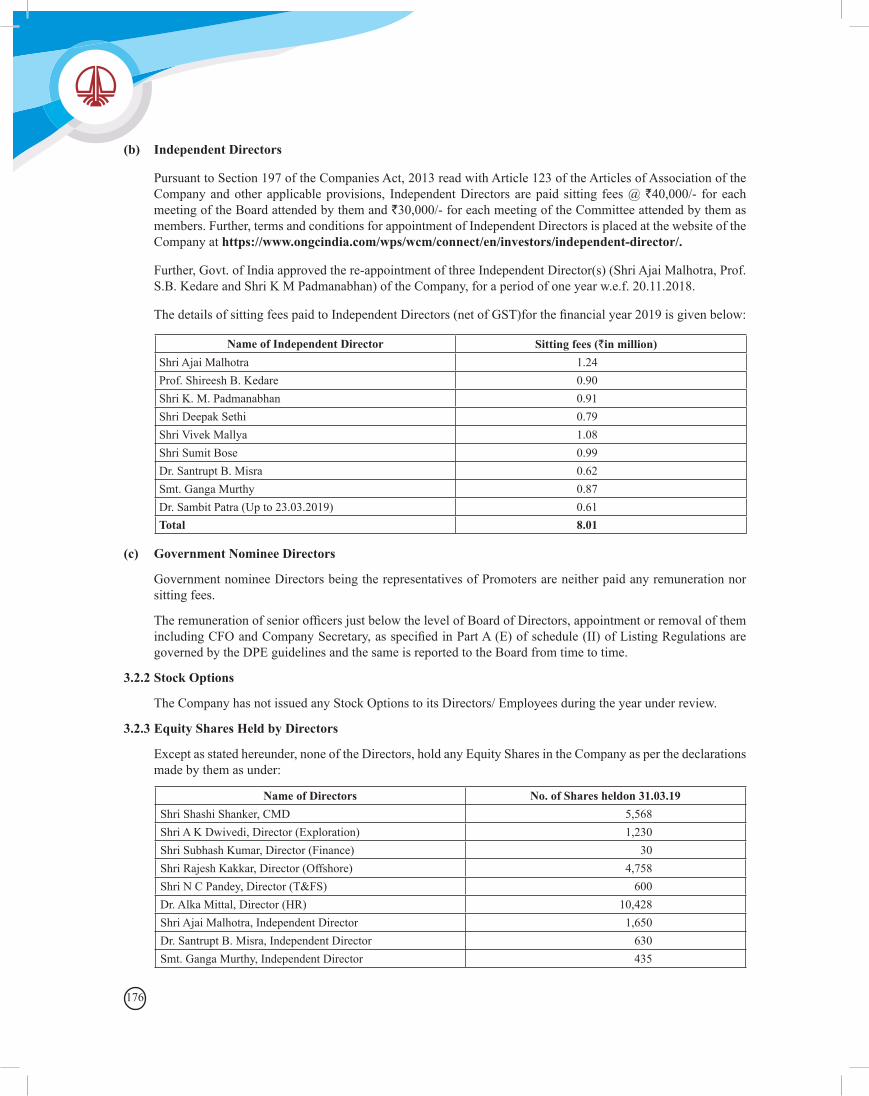
176
(b) Independent Directors
Pursuant to Section 197 of the Companies Act, 2013 read with Article 123 of the Articles of Association of the Company and other applicable provisions, Independent Directors are paid sitting fees @ `40,000/- for each meeting of the Board attended by them and `30,000/- for each meeting of the Committee attended by them as members. Further, terms and conditions for appointment of Independent Directors is placed at the website of the Company at https://www.ongcindia.com/wps/wcm/connect/en/investors/independent-director/.
Further, Govt. of India approved the re-appointment of three Independent Director(s) (Shri Ajai Malhotra, Prof. S.B. Kedare and Shri K M Padmanabhan) of the Company, for a period of one year w.e.f. 20.11.2018.
The details of sitting fees paid to Independent Directors (net of GST)for the financial year 2019 is given below:
Name of Independent Director Sitting fees (`in million) Shri Ajai Malhotra 1.24Prof. Shireesh B. Kedare 0.90Shri K. M. Padmanabhan 0.91Shri Deepak Sethi 0.79Shri Vivek Mallya 1.08Shri Sumit Bose 0.99Dr. Santrupt B. Misra 0.62Smt. Ganga Murthy 0.87Dr. Sambit Patra (Up to 23.03.2019) 0.61Total 8.01
(c) Government Nominee Directors
Government nominee Directors being the representatives of Promoters are neither paid any remuneration nor sitting fees.
The remuneration of senior officers just below the level of Board of Directors, appointment or removal of them including CFO and Company Secretary, as specified in Part A (E) of schedule (II) of Listing Regulations are governed by the DPE guidelines and the same is reported to the Board from time to time.
3.2.2 Stock Options
The Company has not issued any Stock Options to its Directors/ Employees during the year under review.
3.2.3 Equity Shares Held by Directors
Except as stated hereunder, none of the Directors, hold any Equity Shares in the Company as per the declarations made by them as under:
Name of Directors No. of Shares heldon 31.03.19Shri Shashi Shanker, CMD 5,568Shri A K Dwivedi, Director (Exploration) 1,230Shri Subhash Kumar, Director (Finance) 30Shri Rajesh Kakkar, Director (Offshore) 4,758Shri N C Pandey, Director (T&FS) 600Dr. Alka Mittal, Director (HR) 10,428Shri Ajai Malhotra, Independent Director 1,650Dr. Santrupt B. Misra, Independent Director 630Smt. Ganga Murthy, Independent Director 435
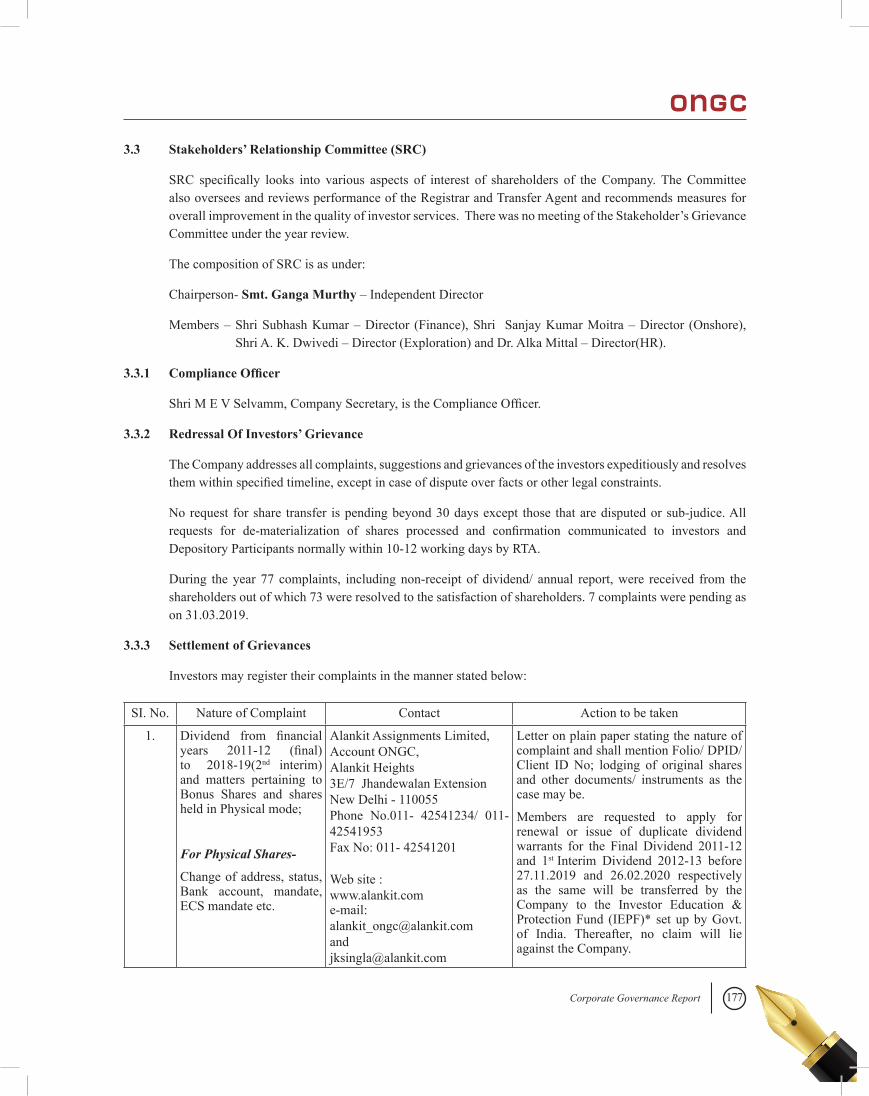
177Corporate Governance Report
3.3 Stakeholders’ Relationship Committee (SRC)
SRC specifically looks into various aspects of interest of shareholders of the Company. The Committee also oversees and reviews performance of the Registrar and Transfer Agent and recommends measures for overall improvement in the quality of investor services. There was no meeting of the Stakeholder’s Grievance Committee under the year review.
The composition of SRC is as under:
Chairperson- Smt. Ganga Murthy – Independent Director
Members – Shri Subhash Kumar – Director (Finance), Shri Sanjay Kumar Moitra – Director (Onshore), Shri A. K. Dwivedi – Director (Exploration) and Dr. Alka Mittal – Director(HR).
3.3.1 Compliance Officer
Shri M E V Selvamm, Company Secretary, is the Compliance Officer.
3.3.2 Redressal Of Investors’ Grievance
The Company addresses all complaints, suggestions and grievances of the investors expeditiously and resolves them within specified timeline, except in case of dispute over facts or other legal constraints.
No request for share transfer is pending beyond 30 days except those that are disputed or sub-judice. All requests for de-materialization of shares processed and confirmation communicated to investors and Depository Participants normally within 10-12 working days by RTA.
During the year 77 complaints, including non-receipt of dividend/ annual report, were received from the shareholders out of which 73 were resolved to the satisfaction of shareholders. 7 complaints were pending as on 31.03.2019.
3.3.3 Settlement of Grievances
Investors may register their complaints in the manner stated below:
SI. No. Nature of Complaint Contact Action to be taken
1. Dividend from financial years 2011-12 (final) to 2018-19(2nd interim)and matters pertaining to Bonus Shares and shares held in Physical mode;
For Physical Shares-
Change of address, status, Bank account, mandate, ECS mandate etc.
Alankit Assignments Limited, Account ONGC, Alankit Heights 3E/7 Jhandewalan Extension New Delhi - 110055Phone No.011- 42541234/ 011-42541953Fax No: 011- 42541201
Web site : www.alankit.come-mail: [email protected]@alankit.com
Letter on plain paper stating the nature of complaint and shall mention Folio/ DPID/ Client ID No; lodging of original shares and other documents/ instruments as the case may be.
Members are requested to apply for renewal or issue of duplicate dividend warrants for the Final Dividend 2011-12 and 1st Interim Dividend 2012-13 before 27.11.2019 and 26.02.2020 respectively as the same will be transferred by the Company to the Investor Education & Protection Fund (IEPF)* set up by Govt. of India. Thereafter, no claim will lie against the Company.
178
2. For shares held in Demat-
Change of address, status, Bank account, mandate, ECS mandate etc.
Depository Participant (DP) with the Shareholder is maintaining his/her account.
As per instructions of respective DP.
3. Complaints of any other category
Company Secretary Oil and Natural Gas Corporation Ltd.,Deendayal Urja Bhawan, 4th floor, 5, Nelson Mandela Marg, Vasant Kunj, New Delhi-110070.
Phone: 011-26754073e-mail:[email protected]
On plain paper stating nature of complaint, folio/DPID/Client ID No., Name and address, email ID and contact details.
* However, shareholder(s) whose unclaimed or unpaid amount has been transferred by the Company to IEPF may claim the same from the IEPF authority by filing Form IEPF-5 along with requisite documents. Further details and procedure is available on the weblink http://www.iepf.gov.in/IEPFA/refund.html
3.3.4 Investor Relations Cell
In line with global practices, the Company is committed towards maintaining, the highest standards of Corporate Governance, reinforcing the relationship between the Company and its Shareholders. The information frequently required by investors and analysts are available on the Company’s website www.ongcindia.com under the ‘Investor’page. The website provides updates on financial statements, investor-related events and presentations, annual reports, dividend information and shareholding pattern along with media releases, company overview and report on Corporate Governance etc. Existing and potential investors are able to interact with the Company through this link for their queries and for seeking information.
A Core Team comprising of senior, experienced officials, headed by Director (Finance) have been assigned the responsibility of up-keep of the said link and to serve as a platform for the shareholders to express their opinions, views, suggestions, to understand the influencing factors in their investment decision-making process. Besides, this, the team is also instrumental in maintaining close liaison and to share information through periodic meets including tele-conferencing in India and abroad, regular interactions with investment bankers, research analysts and institutional investors. The Company is committed to take such additional steps as may be necessary to fulfil the expectations of the stakeholders.
4.0 OTHER FUNCTIONAL/ ACTIVITY SPECIFIC COMMITTEES Apart from the above, the Board has constituted other statutory Committees viz., Corporate Social Responsibility
Committee, Risk Management Committee, Committee for Issue of Share Certificates and other Committees including Project Appraisal and Review Committee, Health Safety and Environment Committee, Committee on Dispute Resolution, Research and Development Committee, Asha Kiran etc.
Note
For seamless payment of dividend, all Investor are requested to update their client master (maintained with DP) with correct bank details and IFSC along with email address and Mobile number.
Physical Shareholder are requested to give bank mandate for transfer of divided directly to respective bank account.
179Corporate Governance Report
5.0 MEETINGS OF INDEPENDENT DIRECTORS As required under Schedule IV of the Companies Act, 2013 the Independent Directors are required to hold at
least one meeting in a year. However, there were four (4) meetings of Independent Directors held on 28th June, 3rd November, 20th December, 2018 and 29th March, 2019.
6.0 CODE OF CONDUCT FOR MEMBERS OF THE BOARD AND SENIOR MANAGEMENT
Pursuant to Regulation 26(3) of SEBI (Listing Obligations and Disclosure Requirements) Regulations, 2015 all the members of Board and senior management personal have affirmed compliance with the code of conduct of the Company, as placed on the Company’s website www.ongcindia.com
A declaration signed by the Chairman & Managing Director on 10.06.2019 is given below:
“I hereby confirm that the Company has obtained from the members of the Board and senior management (Key Executives), affirmation that they have complied with the Code of Conduct of Board of Directors and senior management in respect of the financial year 2018-19”
7.0 VIGIL MECHANISM/ WHISTLE BLOWER POLICY
The company has vigilance department and objective of the vigilance function is to insure maintenance of the adequate level of integrity among all employees of the company. The Whistle Blower Policy of the Company,as approved by the Board of Directors, provides ample opportunities to encourage the directors and employees to register complaints against the unethical practices, actual or suspected fraudulent transactions in the organization to the notice of the competent authority.
8.0 CODE ON INSIDER TRADING
In pursuance of the Securities and Exchange Board of India (Prohibition of Insider Trading) Regulations, 2015, the Board has approved “The Code of Internal Procedures and Conduct in dealing with the Securities of ONGC”.The objective of the Code is to prevent purchase and/ or sale of shares of the Company by an Insider on the basis of unpublished price sensitive information. Under this Code, Insiders (Directors, Advisors, Key Executives, Designated Employees and other concerned persons) are prohibited to deal in the Company’s shares/derivatives of the Company during the closure of Trading Window and other specified period(s). To deal in securities, beyond specified limit, permission of Compliance Officer is required. All Directors/ Advisors/ Officers/ designated employees are also required to disclose related information periodically as defined in the Code.
9.0 COMPLIANCE CERTIFICATE BY CEO/ CFO
In terms of Regulation 17(8) of Listing Regulations-2015, the Compliance certificate issued by the CEO and CFO on the financial statements and internal controls relating to financial reporting for the year 2018-19 was placed before the Board at the meeting held on 30th May, 2019.
10.0 SUBSIDIARY MONITORING FRAMEWORK
The Company has Four (4) direct subsidiary companies, Hindustan Petroleum Corporation Ltd (HPCL), Mangalore Refinery and Petrochemicals Ltd (MRPL), ONGC Videsh Ltd (OVL) and Petronet MHB Ltd.
In terms of the Listing Regulations and DPE guidelines, performance of the listed subsidiary companies are reviewed by the Audit Committee and the Board of the Company.
The Company does not have any material unlisted subsidiary company.The policy on material subsidiaries of the Company is available at weblink: https://www.ongcindia.com/wps/wcm/connect/en/investors/policies/
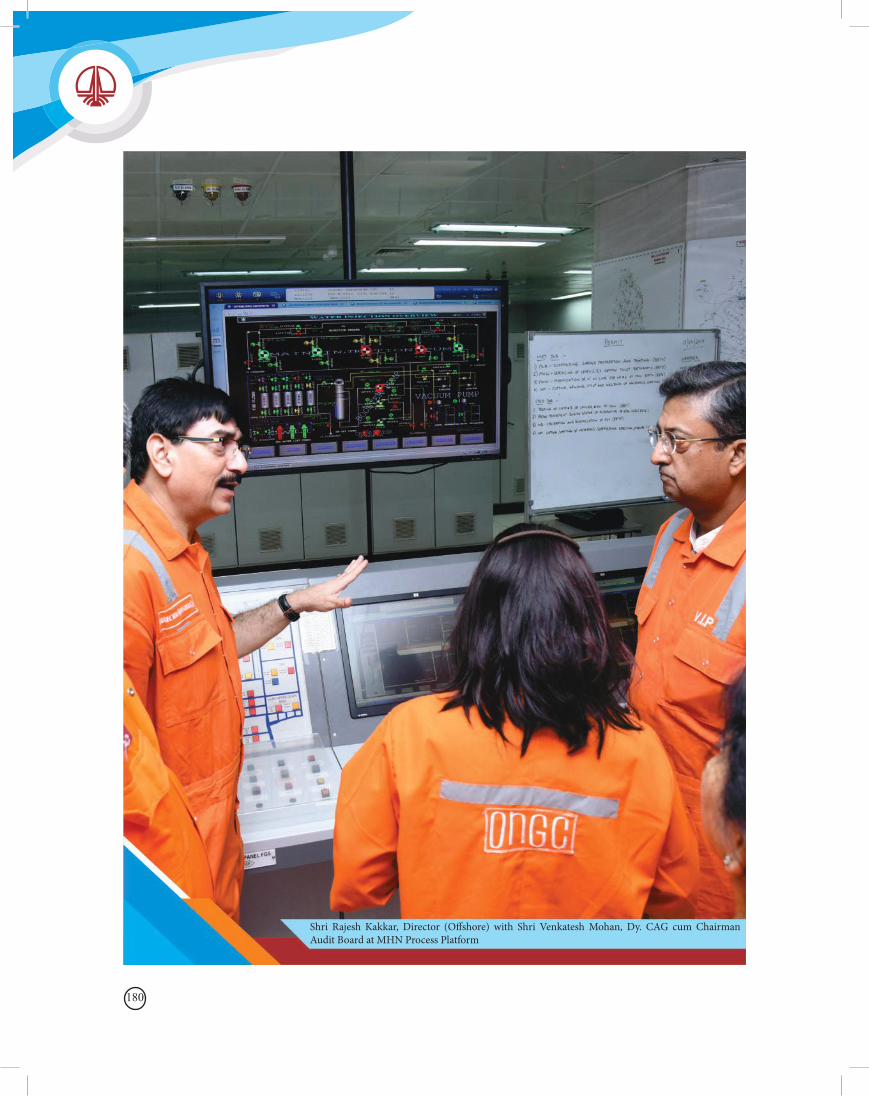
180
Shri Rajesh Kakkar, Director (Offshore) with Shri Venkatesh Mohan, Dy. CAG cum Chairman Audit Board at MHN Process Platform
181Corporate Governance Report
Year Location Date Time (IST) Special Resolution(s)
2015-16(23rd AGM)
Indira Gandhi Indoor Stadium, I.P.Estate, Near Rajghat, Grand Trunk Road, New Delhi-110002
08.09.2016 10.00 a.m No
2016-17(24thAGM)
Manekshaw Auditorium, Manekshaw, Centre, Parade Road, Khyber Lines, Delhi Cantonment,Delhi-110010
27.09.2017 10.00 a.m Yes
2017-18(25thAGM)
Manekshaw Auditorium, Manekshaw, Centre, Parade Road, Khyber Lines, Delhi Cantonment,Delhi-110010
28.09.2018 10.00 a.m Yes
During the year under review no resolution was passed through postal ballot and there is no special resolution proposed through postal ballot.
12. DISCLOSURE12.1 Material Contracts/ Related Party Transactions
The Company has not entered into any material financial or commercial transactions with the Directors or the Management or their relatives or the companies and firms, etc., in which they are either directly or through their relatives interested as Directors and/or Partners except with certain PSUs, where the Directors are Directors without the required shareholdings.
The details of transactions with related parties are disclosed in Note No. 44 of the Notes to Financial Statements for the year ended 31st March, 2019. The Company has disclosed details of transactions with related parties as per the disclosure requirements of Indian Accounting standard – 24 on Related Party disclosures and the exemption granted to Government companies.The policy on related party transactions of the Company may be accessed at https://www.ongcindia.com/wps/wcm/connect/en/investors/policies/
12.2 Compliances (Ref 10(b) of Part C, Schedule V)
The Company has complied with applicable rules (except as otherwise stated in this report) and the requirement of regulatory authorities on capital market and no penalties or strictures were imposed on the Company during last three years.
All returns/ reports were filed within stipulated time with stock exchanges/ other authorities.
13. MEANS OF COMMUNICATION• Quarterly/ Annual Results: The Company regularly intimates un-audited as well as audited financial results
to the Stock Exchanges, immediately after approval of Board. These financial results are normally published in the leading English and vernacular newspapers having nationwide circulation. The results are also displayed on the website of the Company www.ongcindia.com for wider circulation.
• News Release, Presentation etc.: The official news releases, detailed presentations made to media, institutional investors, financial analysts etc. are displayed on the Company’s website www.ongcindia.com.
• Website: The Company’s website www.ongcindia.com contains separate dedicated section ‘Investor Relations’ where the information for shareholders is available. Full Annual Report, Shareholding Pattern and Corporate Governance Report etc. are also available on the web-site.
• Annual Report: Annual Report containing inter-alia, Audited Accounts, Consolidated Financial Statements, Board’s Report, Management Discussion and Analysis (MD&A) Report, Business Responsibility Report,
11.0 ANNUAL GENERAL MEETINGS Location, date and time of the AGMs held during the preceding 3 years are as under:
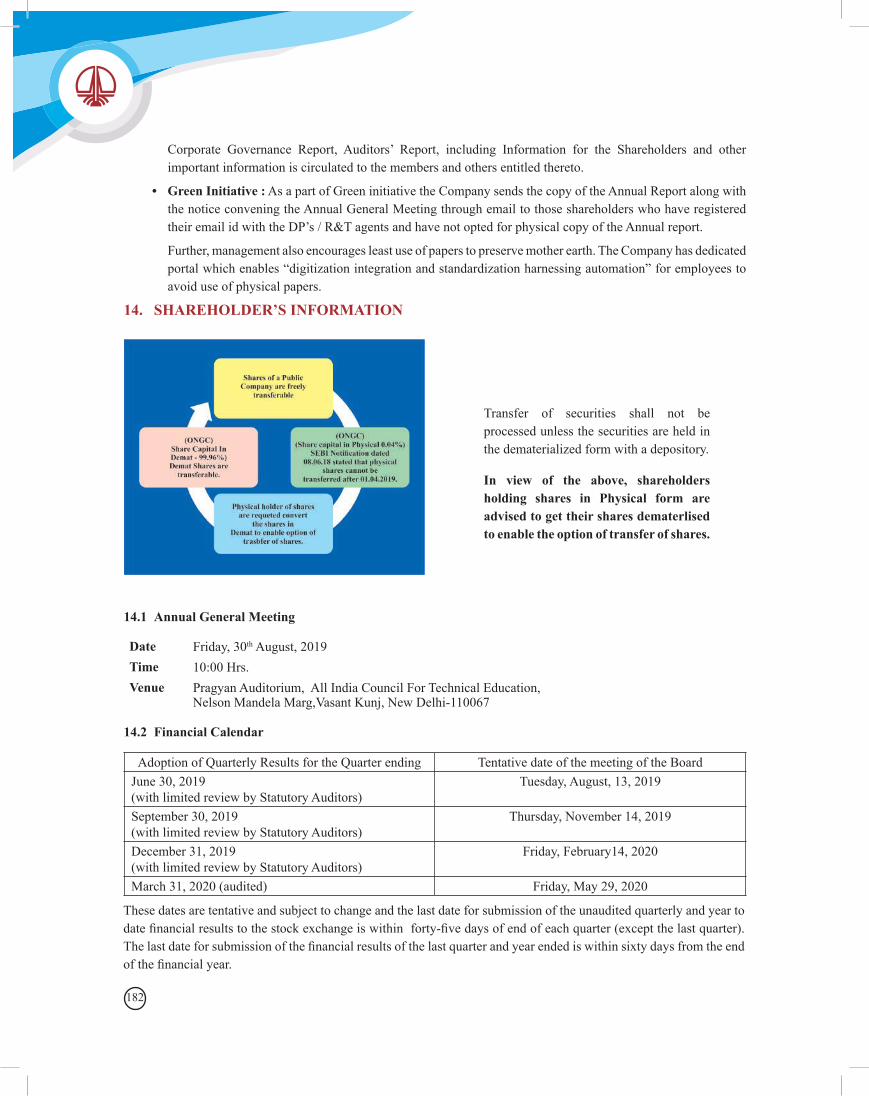
182
Corporate Governance Report, Auditors’ Report, including Information for the Shareholders and other important information is circulated to the members and others entitled thereto.
• Green Initiative : As a part of Green initiative the Company sends the copy of the Annual Report along with the notice convening the Annual General Meeting through email to those shareholders who have registered their email id with the DP’s / R&T agents and have not opted for physical copy of the Annual report.
Further, management also encourages least use of papers to preserve mother earth. The Company has dedicated portal which enables “digitization integration and standardization harnessing automation” for employees to avoid use of physical papers.
14. SHAREHOLDER’S INFORMATION
Transfer of securities shall not be processed unless the securities are held in the dematerialized form with a depository.
In view of the above, shareholders holding shares in Physical form are advised to get their shares dematerlised to enable the option of transfer of shares.
14.1 Annual General Meeting
14.2 Financial Calendar
Date Friday, 30th August, 2019Time 10:00 Hrs.Venue Pragyan Auditorium, All India Council For Technical Education,
Nelson Mandela Marg,Vasant Kunj, New Delhi-110067
Adoption of Quarterly Results for the Quarter ending Tentative date of the meeting of the BoardJune 30, 2019(with limited review by Statutory Auditors)
Tuesday, August, 13, 2019
September 30, 2019(with limited review by Statutory Auditors)
Thursday, November 14, 2019
December 31, 2019(with limited review by Statutory Auditors)
Friday, February14, 2020
March 31, 2020 (audited) Friday, May 29, 2020
These dates are tentative and subject to change and the last date for submission of the unaudited quarterly and year to date financial results to the stock exchange is within forty-five days of end of each quarter (except the last quarter). The last date for submission of the financial results of the last quarter and year ended is within sixty days from the end of the financial year.
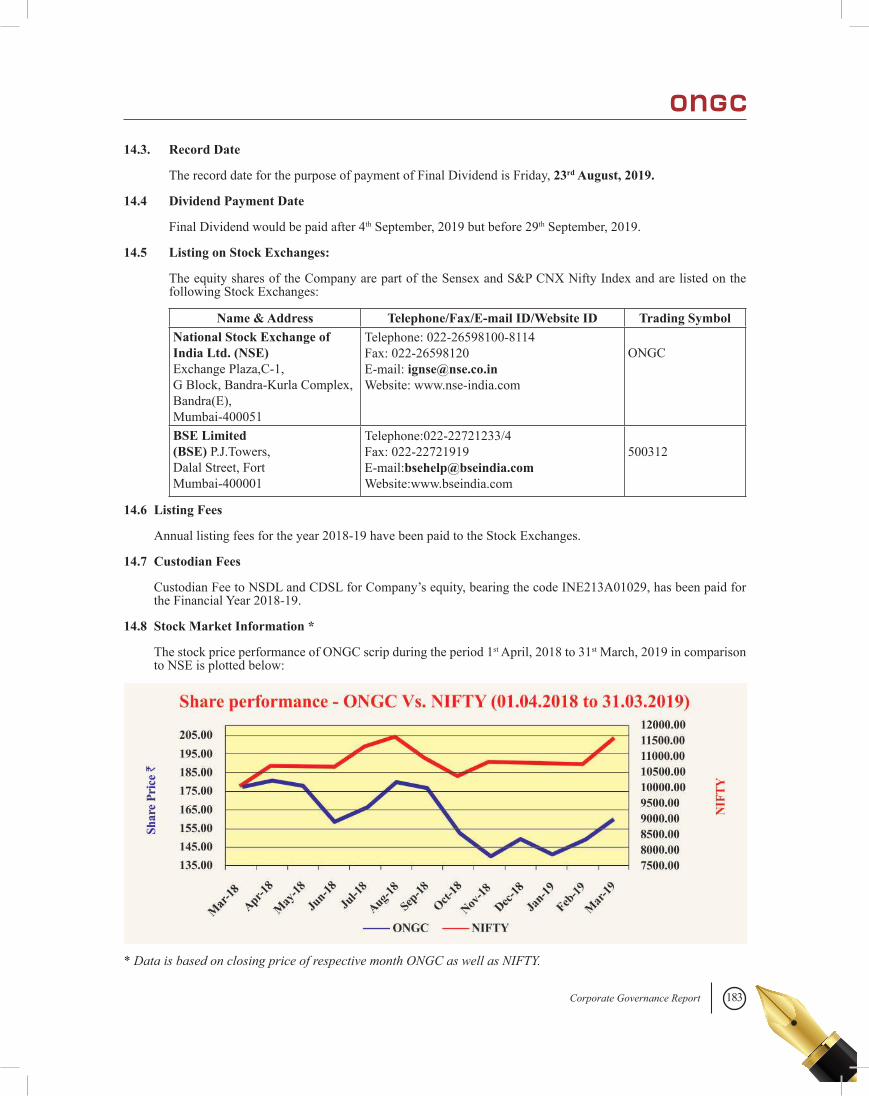
183Corporate Governance Report
14.3. Record Date
The record date for the purpose of payment of Final Dividend is Friday, 23rd August, 2019.
14.4 Dividend Payment Date
Final Dividend would be paid after 4th September, 2019 but before 29th September, 2019.
14.5 Listing on Stock Exchanges:
The equity shares of the Company are part of the Sensex and S&P CNX Nifty Index and are listed on the following Stock Exchanges:
Name & Address Telephone/Fax/E-mail ID/Website ID Trading SymbolNational Stock Exchange of India Ltd. (NSE)Exchange Plaza,C-1,G Block, Bandra-Kurla Complex, Bandra(E), Mumbai-400051
Telephone: 022-26598100-8114Fax: 022-26598120E-mail: [email protected]: www.nse-india.com
ONGC
BSE Limited (BSE) P.J.Towers, Dalal Street, FortMumbai-400001
Telephone:022-22721233/4Fax: 022-22721919E-mail:[email protected]:www.bseindia.com
500312
14.6 Listing Fees
Annual listing fees for the year 2018-19 have been paid to the Stock Exchanges.
14.7 Custodian Fees
Custodian Fee to NSDL and CDSL for Company’s equity, bearing the code INE213A01029, has been paid for the Financial Year 2018-19.
14.8 Stock Market Information *
The stock price performance of ONGC scrip during the period 1st April, 2018 to 31st March, 2019 in comparison to NSE is plotted below:
* Data is based on closing price of respective month ONGC as well as NIFTY.
184
14.8.1 Market Price Data:
The Monthly High and Low (traded price) and Number of shares traded (volume) at NSE and BSE for the financial year 2018-19 are as under:
Month National Stock Exchange* Bombay Stock Exchange*High(`) Low(`) Volume High(`) Low(`) Volume
Apr-18 186.25 174.70 87649198 186.00 174.90 4609155May-18 192.00 155.15 183057839 191.85 155.45 10682117Jun-18 176.00 151.80 134883633 176.30 152.45 8074753Jul-18 166.75 152.45 144365334 166.50 152.55 7536896Aug-18 181.90 162.50 134219251 181.80 162.60 12716111Sep-18 185.40 166.20 121619289 185.00 167.40 8029024Oct-18 183.50 144.70 215180326 183.45 144.90 11495672Nov-18 165.00 137.65 182506939 164.70 138.00 9055210Dec-18 151.50 134.75 288390244 151.25 134.75 13463273Jan-19 150.10 138.50 185615237 150.60 138.95 10596183Feb-19 150.70 127.60 280621910 150.35 127.90 10991738Mar-19 163.20 145.70 341828159 163.15 145.90 13481160Total 2299937359 120731292
*Source: Web-sites of BSE and NSE
14.9 Commodity Price Risk or Foreign Exchange risk and Hedging activities
Sale price of crude oil is denominated in United States dollar (USD) though billed and received in Indian Rupees (INR). The Company is, therefore, exposed to foreign currency risk principally out of INR appreciating against USD. Foreign Currency risks on account of receipts/ revenue and payments/ expenses are managed by netting off naturally- occurring opposite exposures through export earnings, wherever possible and carry unhedged exposures for the residual considering the natural hedge available to it from domestic sales.
15. SHARE TRANSFER SYSTEM Alankit Assignments Limited is the Registrar and Share Transfer Agent (RTA) of the Company.
The transfer of shares received in physical form is overseen by RTA along with the shares received for transfer, transmission, and dematerialization etc. The shares for transfer received in physical form are transferred within the prescribed timelines, provided the documents are complete and the share transfer is not under any dispute. The request received for re-materialization, consolidation and issue of duplicate shares are overseen by Committee for Issue of share certificate. A summary of transfer/ transmission of securities so reviewed are placed at Board Meetings along with minutes of the Committee for issue of share certificate. The share certificates duly endorsed are sent to the shareholders by RTA. Confirmation in respect to the requests for dematerialization of shares is sent to the respective depositories i.e. NSDL and CDSL, expeditiously.
With a view to further expedite the process of transfer and transmission of shares in physical mode, the Board of Directors have authorised the Share Transfer Agent to attend to the transfer/ transmission requests received from the shareholders.
185Corporate Governance Report
Pursuant to the Regulation 40 (10) of Listing Regulation-2015, certificates on half yearly basis confirming due compliance of share transfer formalities by the Company, certificate for timely dematerialization of the shares as per SEBI (Depositories and Participants) Regulations, 1996 are sent to the stock exchanges.
In addition, as a part of the capital integrity audit, a Reconciliation of Share Capital Audit confirming that the total issued capital of the Company is in agreement with the total number of shares in physical form and the total number of dematerialized shares held with NSDL and CDSL, is placed before the Board on a quarterly basis. A copy of the Audit Report is submitted to the stock exchanges.
The total number of transfer deeds processed and shares transferred (physical share transfer) during the last three (3) years were as under:
Years No. of transfer deeds processed No. of shares transferred
2018-19 11,953 90,8802017-18 4,774 48,739
2016-17 5,635 18,015
16. SHAREHOLDING PATTERN AS ON 31ST MARCH, 2019
Sl. No. Category No of folios No of Shares % to Equity1 President of India 1 8,08,26,85,420 64.252 Foreign Institutional Investors & Foreign
Portfolio Investors704 81,36,09,267 6.47
3 Non Resident Indian 12027 83,66,766 0.074 NBFC 28 68,825 0.005 Bodies Corporate
IOCL 1 98,68,85,142 7.84 GAIL 1 30,84,01,602 2.45 Other Body Corporates 2728 13,74,82,868 1.09
6 Banks 25 46,34,986 0.047 Financial Institutions/
Insurance companies56 1,34,53,99,245 10.69
8 Unit Trust of India 179 53,72,994 0.049 Mutual Funds 150 61,60,80,602 4.90
10 Employees 2773 44,85,255 0.0412 Public (Individual) 633285 26,58,61,387 2.1113 Investor Education And Protection Fund 1 10,13,672 0.01
Total 651959 12,58,02,79,206 100.00
186
16.1 Top 10 Shareholders As on 31st March, 2019
S.No Name of Share Holders No of shares held % of total shareholding1 President of India 8082685420 64.252 Life Insurance Corporation of India 1192177281 9.483 Indian Oil Corporation Limited 986885142 7.844 GAIL (India) Limited 308401602 2.455 CPSE ETF 219134629 1.746 ICICI Prudential Equity & Debt Fund 74261486 0.597 Fidelity Puritan Trust Fidelity Series Intrinsic
Opportunities Fund52500616 0.42
8 Vanguard Emerging Markets Stock Index Fund 49014746 0.399 Vanguard Total International Stock Index Fund 47741202 0.3810 ICICI Prudential Bluechip Fund 46151318 0.37
16.2 Distribution of Shareholding by Size as on 31st March, 2019
Category No. of Shareholders % of holder
No. of Shares % of Share Holding
Ph. Holders
Demat holders
Total holder
Ph. Shares
Dematd shares Total holding
1 to 500 3523 548846 552369 84.72 270481 66069998 66340479 0.53501 to 1000 367 54084 54451 8.35 297071 37337948 37635019 0.301001 to 2000 755 21112 21867 3.35 1138440 30159226 31297666 0.252001 to 3000 107 7355 7462 1.15 275610 18540976 18816586 0.153001 to 4000 133 4120 4253 0.65 475482 14474941 14950423 0.124001 to 5000 94 3135 3229 0.50 416010 14174137 14590147 0.125001 to 10000 462 5799 6261 0.96 2553708 37427688 39981396 0.3210001 to Above 0 2067 2067 0.32 0 12356667490 12356667490 98.22
Total 5441 646518 651959 100 5426802 12574852404 12580279206 100
187Corporate Governance Report
16.3 Geographical Distribution of Shareholders As on 31st March, 2019
City Name No of Folios/holders % age Holding % ageDelhi 42078 6.45 8417367922 66.91Mumbai 99042 15.19 3952853594 31.42Chennai 23511 3.61 25538090 0.20Calcutta 492 0.08 132513 0.00Ahmedabad 34736 5.33 17201819 0.14Vadodara 18521 2.84 10839587 0.09Bangalore 27846 4.27 8584820 0.07Pune 23286 3.57 5954095 0.05Hyderabad 15574 2.39 5220194 0.04Other Cities 366873 56.27 136586572 1.09Total 651959 100.00 12580279206 100.00
16.4 History of Paid-up Equity Share Capital
Year No. of Shares Cumulative Details
1993-94 10 10 Initial Subscription to the Memorandum Of Association on 23rd June, 1993.
1993-94 34,28,53,716 34,28,53,726 Issued to the President of India on 1st February, 1994 on transfer of Undertaking of Oil and Natural Gas Commission in terms of Oil and Natural Gas Commission (Transfer of Undertaking and Repeal) Act, 1993.
1994-95 66,39,300 34,94,93,026 Issued to the Employees at a premium of `260 per Share (includes 600 shares issued in 1995-96).
1995-96 107,64,40,966 142,59,33,992 Issue of Bonus Shares in ratio of 3.08: 1 on 24.04.1995 by Capitalization of General Reserve.
2006-07 (-)18,972 142,59,15,020 Forfeiture of Shares on 12.04.2006.
71,29,57,510 213,88,72,530Issue of Bonus Shares in ratio of 1:2 on 08.11.2006 by Capitalization of General Reserve.
2010-11 - 8,555,490,120 Each equity Share of the Company was split from the face value of `10 into two equity shares of the face value of `5 each.Bonus Shares were issued in the ratio of 1:1 by Capitalization of Reserves to the shareholders as on 09.02.2011 (Record Date).
2016-17 4,277,745,060 12,833,235,180 Issue of Bonus Shares in ratio of 1:2 on 18.12.2016 by Capitalization of General Reserves.
2018-19 (25,29,55,974) 12,58,02,79,206 Buy-Back of shares @ `159/- per shares (1.97% of pre-buyback capital).Record date 04.01.2019. Buy-back was completed on 22.02.2019.
188
17. CORPORATE BENEFITS DIVIDEND HISTORY
Years Rate (%) Per Share(`) Amount (` in million)2013-14
• First Interim 100 5.00 42,777.45• Second Interim 85 4.25 36,360.83• Final 5 0.25 2138.87
2014-15• First Interim 100 5.0 42,777.45• Second Interim 80 4.0 34221.96• Final 10 0.5 4,277.75
2015-16
• First Interim 90 4.50 38499.71
• Second Interim 15 0.75 6416.68• Final 65 3.25 27805.34
2016-17• First Interim 90 4.50 38499.71• Second Interim (Post- bonus)
45 2.25 28874.78
• Final 16 0.80 10266.612017-18
• First Interim 60 3.00 38499.71• Second Interim 45 2.25 28874.89• Final (proposed) 27 1.35 17324.87
2018-19• First Interim 105 5.25 66046.53• Second Interim 20 1.00 12580.28• Final (proposed) 15 0.75 9435.21
Members who have not encashed their dividends pertaining to the aforesaid periods may approach the RTA or the Company for obtaining payment/s thereof.
18. INVESTOR EDUCATION & PROTECTION FUND (IEPF)18.1 Transfer of Unpaid/Unclaimed Dividend Amount to IEPF
During the financial year 2018-19, amounts of ̀ 42,75,974.00 and ̀ 2,54,27,152.00 pertaining to unpaid dividends for the financial years 2010-11 (Final) and 2011-12 (Interim) respectively were transferred to the IEPF set up by the Central Government. There were no amount due and pending to be transferred to the IEPF as at the end of the year.
Given below are the proposed dates for transfer of the unclaimed dividend to IEPF which is due to be transferred during 2019-20 by the Company:-
189Corporate Governance Report
Financial Year Date of Declaration
Proposed Date/ Date for transfer to IEPF
2011-12 (2nd Interim)
15.03.2012 30.04.2019
2011-12(Final) 24.09.2012 30.11.20192012-13(1stInterim) 21.12.2012 26.02.2020
S. No.
Description No of Folios/holders
No of Shares % of total Equity Capital
1 CDSL 211224 9449670030 66.762 NSDL 435242 3125182374 32.403 Physical 5493 5426802 0.84
Total 651959 12580279206 100.00
18.2 SHARES TRANSFERRED TO IEPF
Pursuant to provisions of the Companies Act, 2013 read with IEPF Rules the shares on which dividend has not been paid or claimed by the shareholders for seven consecutive years or more years are required to be transferred to the demat account of the IEPF Authority.
Accordingly during current financial year 6,26,180 shares were transferred by the Company to IEPF on 18.03.2019.
Nodal Officer of the Company under the provisions of IEPF is as under:
Shri Shashi Bhushan Singh, Deputy Company Secretary
Phone No.: +91 11 26754085, Mobile: 09818279135 Email ID: [email protected] The details of Nodal Officer of the Company and
other details including procedure for clamming the unpaid dividend amount and shares transferred to IEPF are available on website link: https://www.ongcindia.com/wps/wcm/connect/en/investors/transfer-of-shares-to-iepf/
19. DEMATERIALIZATION OF SHARES AND LIQUIDITY(as on 31.03.2019)
The shares of the Company are in compulsory dematerialized segment and are available for trading in depository system of both National Securities Depository Limited (NSDL) and Central Depository Services (India) Limited (CDSL).
20. OUTSTANDING GDRs/ ADRs / WARRANTS OR CONVERTIBLE INSTRUMENTS
There are no GDRs/ ADRs/ Warrants or Convertible Instruments have been issued by the Company.
21. ASSETS/ BASINS/ PLANTS/ INSTITUTES
A. Assets / Exploratory Assets
1. Mumbai High Asset, Mumbai
2. Neelam & Heera Asset, Mumbai
3. Bassein & Satellite Asset, Mumbai
4. Eastern Offshore Asset, Kakkinada
5. Ahmedabad Asset, Ahmedabad
6. Ankleshwar Asset, Ankleshwar
7. Mehsana Asset, Mehsana
8. Rajahmundry Asset, Rajahmundry
9. Karaikal Asset, Karaikal (Cauvery)
10. Assam Asset, Nazira
11. Tripura Asset, Agartala
12. Cambay Asset, Cambay
13. CBM, Bokaro
14. Jorhat Asset, Jorhat
15. HPHT Asset, Kakinada
16. Rajasthan Kutch Onland Exploratory Asset (RKOEA)
17. Assam Arakkan Fold Belt Exploratory Asset (AAFBEA)
B. BASINS
1. Western Offshore Basin, Mumbai
2. Western Onshore Basin, Vadodara
190
3. KG-PG Basin, Chennai
4. Cauvery Basin, Chennai
5. Assam & Assam-Arakan Basin, Jorhat
6. MBA Basin and CBM Development Project, Kolkata/Bokaro
7. Frontier Basin, Dehradun
C. PLANTS
1. Uran Plant, Maharashtra
2. Hazira Plant, Gujarat
3. C2 C3 C4 Plant, Dahej Plant, Gujarat
D. INSTITUTES
1. Keshava Deva Malaviya Institute of Petroleum Exploration (KDMIPE), Dehradun
2. Institute of Drilling Technology (IDT), Dehradun
3. Institute of Reservoir Studies, (IRS) Ahmedabad
4. Institute of Oil & Gas Production Technology (IOGPT) Navi Mumbai
5. Institute of Engineering & Ocean Technology (IEOT) Navi Mumbai
6. Geo- data Processing & Interpretation Center (GEOPIC), Dehradun
7. ONGC Academy, Dehradun
8. Institute of Petroleum Safety, Health & Environment Management (IPSHEM),Goa
9. Institute of Biotechnology & Geotectonics Studies (INBIGS), Jorhat
10. School of Maintenance Practices (SMP), Vadodara
11. Centre for Excellence in Well Logging (CEWELL), Vadodara
12. Regional Training Institutes – Chennai, Mumbai, Shivasagar and Vadodara
13. ONGC Energy Centre, New Delhi.
14. Gas Hydrate Research & Technology Centre (GHR&TC), Panvel
22. COMPLIANCE CERTIFICATE OF THE AUDITORS
Certificate from the Auditors of the Company, confirming compliance with the conditions of Corporate Governance as stipulated under Schedule V (E) of the Listing Regulation-2015, is annexed as Annexure-A to this Report. The Certificate shall also beforwarded to the stock exchanges as a prat of Annual Report.
23. SECRETARIAL AUDIT REPORT AND CERTIFICATE(S) FROM COMPANY SECRETARY IN PRACTICE
The Secretarial Audit has been conducted by M/s Ashu Gupta & Co., Practicing Company Secretaries with respect to compliance to the applicable provisions of Companies Act, 2013, Listing Regulations and DPE Guidelines. The Secretarial Audit Report shall form part of Boards’ Report.
In terms of requirements of SEBI Circular No. CIR/CFD/CMD1/27/2019 dated 08.02.2019, M/s. Ashu Gupta & Co. has examined the compliances relation to applicable SEBI Guidelines and has issued Annual Secretarial Compliance report, which were submitted to stock exchanges on 30.05.2019.
Further, M/s Ashu Gupta & Co., Practicing Company Secretaries, has also issued a certificate as required under the Listing Regulations, confirming that none of the directors on the Board of the Company has been debarred or disqualified from being appointed or continuing as director of companies by the SEBI / Ministry of Corporate Affairs or any such statutory authority. The certificate is enclosed as Annexure B.
24. ADOPTION OF NON-MANDATORY REQUIREMENTS
Beside the mandatory requirement of the Listing Regulation, the Internal Auditor reports directly to the Audit Committee.
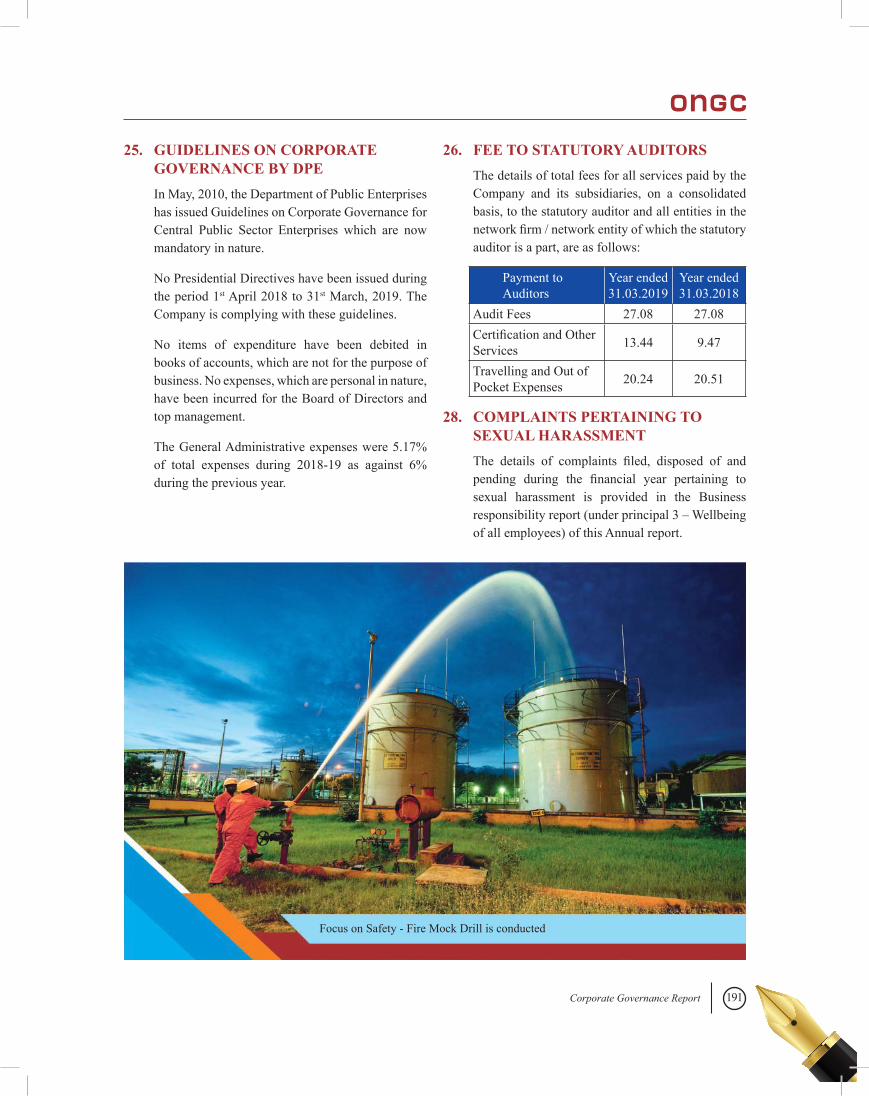
191Corporate Governance Report
25. GUIDELINES ON CORPORATE GOVERNANCE BY DPE
In May, 2010, the Department of Public Enterprises has issued Guidelines on Corporate Governance for Central Public Sector Enterprises which are now mandatory in nature.
No Presidential Directives have been issued during the period 1st April 2018 to 31st March, 2019. The Company is complying with these guidelines.
No items of expenditure have been debited in books of accounts, which are not for the purpose of business. No expenses, which are personal in nature, have been incurred for the Board of Directors and top management.
The General Administrative expenses were 5.17% of total expenses during 2018-19 as against 6% during the previous year.
Payment to Auditors
Year ended 31.03.2019
Year ended 31.03.2018
Audit Fees 27.08 27.08Certification and Other Services 13.44 9.47
Travelling and Out of Pocket Expenses 20.24 20.51
28. COMPLAINTS PERTAINING TO SEXUAL HARASSMENT
The details of complaints filed, disposed of and pending during the financial year pertaining to sexual harassment is provided in the Business responsibility report (under principal 3 – Wellbeing of all employees) of this Annual report.
26. FEE TO STATUTORY AUDITORS The details of total fees for all services paid by the
Company and its subsidiaries, on a consolidated basis, to the statutory auditor and all entities in the network firm / network entity of which the statutory auditor is a part, are as follows:
Focus on Safety - Fire Mock Drill is conducted
192
Annexure - A
Independent Auditors' Certificateon Corporate Governance To The Members,Oil and Natural Gas Corporation Limited
1. We have examined the compliance of conditions of Corporate Governance by Oil and Natural Gas Corporation Limited (“the Company”) for the year ended March 31, 2019, as stipulated in Regulations 17 to 27 and clauses (b) to (i) of Regulation 46(2) and para C, and D of Schedule V of the Securities and Exchange Board of India (Listing Obligations and Disclosures Requirements) Regulations, 2015 as amended (“Listing Regulations- 2015”).
Management’s Responsibility
2. The compliance of conditions of Corporate Governance is the responsibility of the Management. This responsibility includes the design, implementation and maintenance of internal control and procedures to ensure the compliance with the conditions of the Corporate Governance stipulated in the Listing Regulations- 2015.
Auditor's Responsibility
3. Our responsibility is limited to examining the procedures and implementation thereof, adopted by the Company for ensuring the compliance of the conditions of the Corporate Governance. It is neither an audit nor an expression of opinion on the financial statements of the Company.
4. We have examined the books of account and other relevant records and documents maintained by the Company for the purpose of providing reasonable assurance on the compliance with Corporate Governance requirements by the Company.
5. We conducted our examination of the relevant records of the Company in accordance with the Guidance Note on Reports or Certificates for
special purposes (Revised 2016) issued by the Institute of Chartered Accountants of India. The Guidance Note requires that we comply with the ethical requirements of the Code of Ethics issued by the Institute of Chartered Accountants of India.
6. We have complied with the relevant applicable requirements of the Standard on Quality (SQC) 1, Quality Control for Firms that perform Audits and Reviews of Historical Financial information, and other Assurance and related service engagements
Qualified Opinion
7. Based on our examination of the relevant records and in our opinion and according to the information and explanations provided to us, subject to the following:
a. Regulation 17(10) of the Listing Regulations -2015 requires performance evaluation of independent director by the entire board of directors. Further Regulation 25 (4) of the Listing Regulations 2015 requires independent directors to review of performance of non- independent directors, the chairperson and the board of directors as a whole, these are not complied with
b. The Company has complied with the requirements of Section 177 and 188 of the Companies Act 2013 with respect to transactions with the related parties, however prior approval of the audit committee for all related party transactions as required by regulation 23 (2) of the Listing Regulations - 2015 has not been complied.
we certify that the Company has complied with the conditions of Corporate Governance as stipulated in regulations 17 to 27 and clauses (b) to (i) of regulation 46 (2) and para C and D of Schedule V of the Listing Regulations- 2015 during the year ended March 31, 2019.
8. Without modifying our opinion, we report that, as stated in item no. 2.1 of the Corporate Governance Report, the company has not complied with the
193Auditor’s Certificate on Corporate Governance
requirement of Regulation 17 (l)(b) of the Listing Regulation - 2015 with regards to the composition of the Board of Directors comprising of at least 50% Independent Directors from 23.03.2019 as one of Independent Director ceased to be an Independent Director of the Company w.e.f. 23.03.2019 upon his resignation due to personal reasons and the Company has time till the immediate next meeting of the board of directors or three months from the date of such vacancy, whichever is later.
9. We further state that such compliance is neither an assurance as to the future viability of the Company nor of the efficiency or effectiveness with which
New Delhi28th June, 2019
For K. C. Mehta & Co.Chartered AccountantsFirm Reg. No. 106237W
For Dass Gupta & AssociatesChartered AccountantsFirm Reg. No. 000112N
For PKF Sridhar & Santhanam LLPChartered AccountantsFirm Reg. No. 003990S/S200018
For MKPS & AssociatesChartered AccountantsFirm Reg. No. 302014E
For R Gopal & AssociatesChartered AccountantsFirm Reg. No. 000846C
For G M Kapadia & Co.Chartered AccountantsFirm Reg. No. 104767W
Sd/-Neela R. ShahPartner (M. No. 045027)UDIN:19045027AAAACM4392
Sd/-Raaja JindalPartner (M. No. 504111)UDIN:19504111AAAAEG8063
Sd/-K ManigandanPartner (M. No. 224762)UDIN:19224762AAAAAE6038
Sd/-Nikhil K. AgrawallaPartner (M. No. 157955)UDIN:19157955AAAABJ7559
Sd/-Abhishek SinghPartner (M. No. 407549)UDIN:19407549AAAABJ8945
Sd/-Vikash AggarwalPartner (M. No. 519574)UDIN:19519574AAAACV1762
the Management has conducted the affairs of the Company.
Restrictions on use
10. The certificate is addressed and provided to the members of the Company solely for the purpose of complying with the requirement of the Listing Regulations - 2015, and it should not be used by any other person or for any other purpose. Accordingly, we do not accept or assume any liability or any duty of care for any other purpose or to any other person to whom this report is shown or into whose hands it may come without our prior consent in writing.

194
Hands On: ONGC millennial at Institute of Reservoir Studies (IRS), ONGC
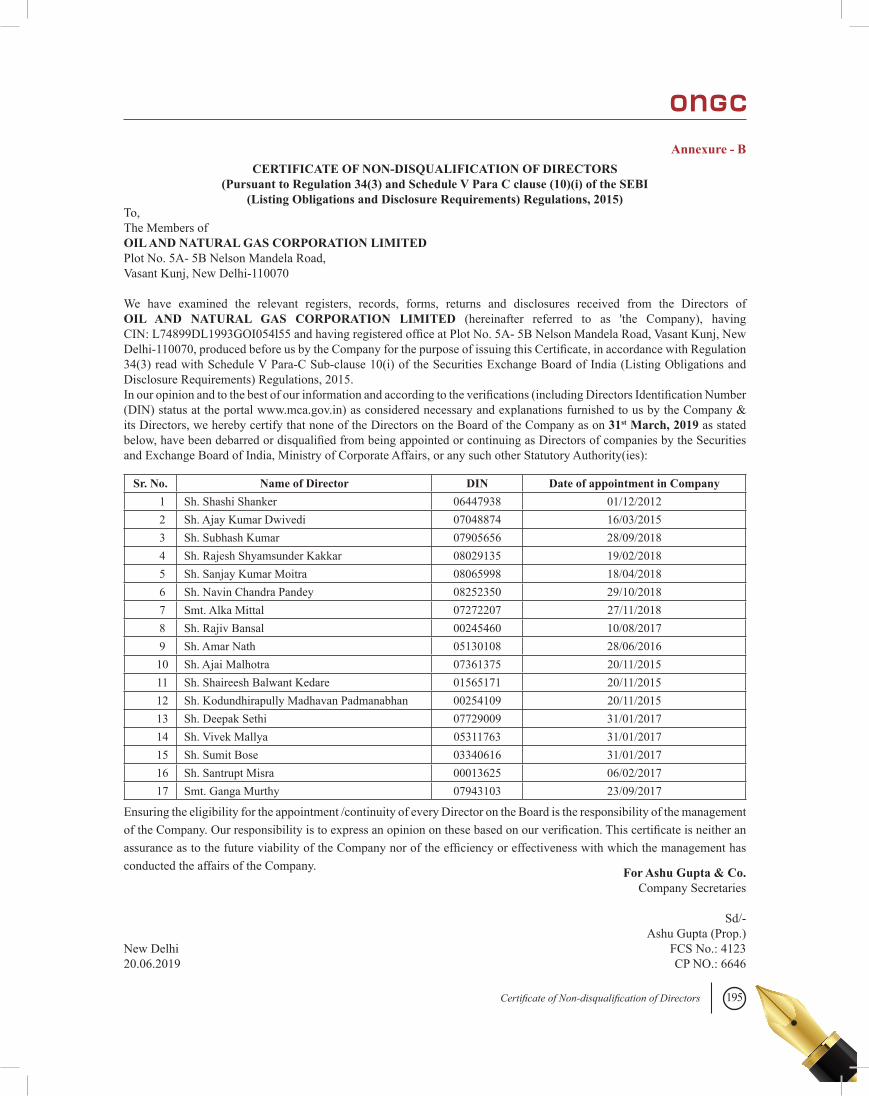
195Certificate of Non-disqualification of Directors
Annexure - BCERTIFICATE OF NON-DISQUALIFICATION OF DIRECTORS
(Pursuant to Regulation 34(3) and Schedule V Para C clause (10)(i) of the SEBI(Listing Obligations and Disclosure Requirements) Regulations, 2015)
To,The Members ofOIL AND NATURAL GAS CORPORATION LIMITEDPlot No. 5A- 5B Nelson Mandela Road,Vasant Kunj, New Delhi-110070
We have examined the relevant registers, records, forms, returns and disclosures received from the Directors of OIL AND NATURAL GAS CORPORATION LIMITED (hereinafter referred to as 'the Company), having CIN: L74899DL1993GOI054l55 and having registered office at Plot No. 5A- 5B Nelson Mandela Road, Vasant Kunj, New Delhi-110070, produced before us by the Company for the purpose of issuing this Certificate, in accordance with Regulation 34(3) read with Schedule V Para-C Sub-clause 10(i) of the Securities Exchange Board of India (Listing Obligations and Disclosure Requirements) Regulations, 2015.In our opinion and to the best of our information and according to the verifications (including Directors Identification Number (DIN) status at the portal www.mca.gov.in) as considered necessary and explanations furnished to us by the Company & its Directors, we hereby certify that none of the Directors on the Board of the Company as on 31st March, 2019 as stated below, have been debarred or disqualified from being appointed or continuing as Directors of companies by the Securities and Exchange Board of India, Ministry of Corporate Affairs, or any such other Statutory Authority(ies):
Sr. No. Name of Director DIN Date of appointment in Company1 Sh. Shashi Shanker 06447938 01/12/20122 Sh. Ajay Kumar Dwivedi 07048874 16/03/20153 Sh. Subhash Kumar 07905656 28/09/20184 Sh. Rajesh Shyamsunder Kakkar 08029135 19/02/20185 Sh. Sanjay Kumar Moitra 08065998 18/04/20186 Sh. Navin Chandra Pandey 08252350 29/10/20187 Smt. Alka Mittal 07272207 27/11/20188 Sh. Rajiv Bansal 00245460 10/08/20179 Sh. Amar Nath 05130108 28/06/201610 Sh. Ajai Malhotra 07361375 20/11/201511 Sh. Shaireesh Balwant Kedare 01565171 20/11/201512 Sh. Kodundhirapully Madhavan Padmanabhan 00254109 20/11/201513 Sh. Deepak Sethi 07729009 31/01/201714 Sh. Vivek Mallya 05311763 31/01/201715 Sh. Sumit Bose 03340616 31/01/201716 Sh. Santrupt Misra 00013625 06/02/201717 Smt. Ganga Murthy 07943103 23/09/2017
Ensuring the eligibility for the appointment /continuity of every Director on the Board is the responsibility of the management of the Company. Our responsibility is to express an opinion on these based on our verification. This certificate is neither an assurance as to the future viability of the Company nor of the efficiency or effectiveness with which the management has conducted the affairs of the Company.
New Delhi20.06.2019
For Ashu Gupta & Co.Company Secretaries
Sd/-Ashu Gupta (Prop.)
FCS No.: 4123CP NO.: 6646
196
FORM NO. MR-3
Secretarial Audit ReportFor the financial year ended 31st March, 2019[Pursuant to Section 204(1) of the Companies Act, 2013 and Rule 9 of The Companies (Appointment and Remuneration of Managerial Personnel) Rules, 2014 and Regulation 24A of SEBI (Listing Obligations and Disclosure Requirements) Regulations, 2015 as amended]
To,The Members,OIL AND NATURAL GAS CORPORATION LIMITED,(CIN: L74899DL1993GOI054155)Regd. Office: Plot No. 5A-5B,Nelson Mandela Road,Vasant Kunj, New Delhi-110070We have conducted the Secretarial Audit of the compliance of applicable statutory provisions and the adherence to good corporate practices by OIL AND NATURAL GAS CORPORATION LIMITED (hereinafter called “the Company”). Secretarial Audit was conducted in a manner that provided us a reasonable basis for evaluating the corporate conducts/statutory compliances and expressing our opinion thereon.
Based on our verification of the Company’s books, papers, minute books, forms and returns filed and other records maintained by the Company and also the information provided by the Company, its officers, agents and authorized representatives during the conduct of Secretarial Audit, we hereby report that in our opinion, the Company has during the audit period covering the Financial year ended on 31st March, 2019 (‘Audit Period’), complied with the statutory provisions listed hereunder and also that the Company has proper Board-processes and compliance-mechanism in place to the extent, in the manner and subject to the reporting made hereinafter.
We have examined the books, papers, minute books, forms and returns filed and other records maintained by the Company for the financial year ended on 31st March, 2019 according to the provision of:
(i) The Companies Act, 2013 (‘the Act’) and the rules made there under;
(ii) The Securities Contracts (Regulation) Act, 1956 (‘SCRA’) and the rules made there under;
(iii) The Depositories Act, 1996 and the Regulations and bye-laws framed there under;
(iv) Foreign Exchange Management Act, 1999 and the rules and regulations made there under to the extent of Foreign Direct Investment, Overseas Direct Investment and External Commercial Borrowings;
(v) The following Regulations and Guidelines prescribed under the Securities and Exchange Board of India Act, 1992 (‘SEBI Act’)
(a) The Securities and Exchange Board of India (Substantial Acquisition of Shares and Takeovers) Regulations, 2011;
(b) The Securities and Exchange Board of India (Prohibition of Insider Trading) Regulations, 2015;
(c) The Securities and Exchange Board of India (Issue of Capital and Disclosure Requirements) Regulations, 2018; (Not applicable to the Company during the audit period)
(d) The Securities and Exchange Board of India (Employee Stock Option Scheme and Employee Stock Purchase Scheme) Guidelines, 1999; and The Securities and Exchange Board of India (Share Based Employee Benefits) Regulations, 2014 (Not applicable to the Company during the audit period)
(e) The Securities and Exchange Board of India (Issue and Listing of Debt Securities) Regulations, 2008; (Not applicable to the Company during the audit period)
(f) The Securities and Exchange Board of India (Registrars to an Issue and Share Transfer Agents) Regulations, 1993 regarding the Companies Act and dealing with client; (Not applicable to the Company during the audit period)
197Secretarial Audit Report
(g) The Securities and Exchange Board of India (Delisting of Equity Shares) Regulations, 2009; (Not applicable to the Company during the audit period)
(h) The Securities and Exchange Board of India (Buyback of Securities) Regulations, 2018;
(i) Securities and Exchange Board of India (Depositories and Participants) Regulations, 2018.
(vi) I further report that, having regards to the compliance system prevailing in the Company and on examination of the relevant documents and records in pursuance thereof on test-check basis, the Company has complied with following laws applicable specifically to the Company;
a. DPE Guidelines on Corporate Governance for Central Public Sector Enterprises, 2010;
b. The Petroleum and Natural Gas Rules, 1959;
c. The Explosives Act, 1884;
d. The Minerals Concessional Rules, 1960;
e. The Atomic Energy (Factory) Rules, 1996;
f. The Petroleum Act, 1934 and the Rules made there under;
g. The Oil Fields (Regulation and Development) Act, 1948
h. The Oil Mines Regulations, 2017;
i. The Oil Industry (Development) Act, 1974;
j. The Oil Drilling and Gas Extraction Standards, 1996;
k. The Petroleum & Natural Gas Regulatory Board Act, 2006;
l. The Petroleum & Natural Gas (Safety in Offshore Operations) Rules, 2008;
m. The Mines Act, 1952 and the Rules made there under;
n. The Petroleum and Mineral Pipelines (Acquisition of Right of User in Land) Act, 1962;
o. The Offshore Areas Mineral (Development and Regulation) Act, 2002;
p. The Mines and Minerals (Development and Regulation) Act, 1957; and
q. The Merchant Shipping Act, 1958
We have also examined compliance with the applicable clauses of the following:
(i) Secretarial Standards issued by The Institute of Company Secretaries of India with respect to Board, Committee(s) and General Meeting(s).
(ii) SEBI (Listing Obligations & Disclosure Requirement) Regulations, 2015 and the Listing Agreements entered into by the Company with the Stock Exchanges.
During the period under review and based on the information, explanations and management representation, the Company has substantially complied with the provisions of the Act, Rules, Regulations, Guidelines, Standards, etc. mentioned above subject to the following observations:
a) The Company has not complied with Regulation 17(10) of SEBI (LODR), 2015, which requires performance evaluation of independent directors by the Board. Further, Regulation 25 (4) of SEBI (LODR), 2015 which requires independent directors to review of performance of non-independent directors, the chairperson and the board of directors as a whole, has also not been complied with;
b) Prior approval of the audit committee for all related party transactions as required under law has not been taken.
It is pertinent to mention that in terms of Regulation 17(1)(b) of SEBI (LODR), 2015 the number of Independent Directors fell below the minimum required, upon resignation of one of the Independent Director on 23.03.2019, however, in terms of Regulation 25(6) of SEBI (LODR), 2015, the Company has time till 22.06.2019 to fill such vacancy.
198
We further report that
The Board of Directors of the Company is duly constituted with proper balance of Executive Directors, Non-Executive Directors and Independent Directors, except for the reporting made hereinabove. The changes in the composition of the Board of Directors that took place during the period under review were carried out in compliance with the provisions of the Act.
Adequate notice is given to all directors to schedule the Board meetings at least seven days in advance (and in cases of shorter notice requisite consents from board members is being taken), agendas were sent in advance and a system exists for seeking and obtaining further information and clarifications on the agenda items before the meeting and for meaningful participation at the meeting.
Decisions at the Board or Committee Meetings were carried out unanimously except in such case where dissent of Director(s) was recorded specifically.
Based on the compliance mechanism established by the Company and on the basis of review of compliance reports pertaining to all applicable laws to the Company laid before and taken note by the Board of the Company, we are of the opinion that the management has systems and processes in the Company commensurate with the size and operations of the Company to monitor and ensure compliance with applicable laws, rules, regulations and guidelines.
We further report that during the audit period,
• The Company by passing Board Resolution in the Meeting held on 20.12.2018 had bought back 25,29,55,974 (Twenty Five Crore Twenty Nine Lakh Fifty Five Thousand Nine Hundred Seventy Four) Equity Shares of face value of `5/- each at a price of `159/- (Rupees One Hundred and Fifty Nine only) each representing 1.97% of the total number of equity shares in the paid-up share capital of the Company.
• The Company has sought and SEBI vide its letter no. SEBI/CFD/CMD/PR/OW/7388/2019 dated 23.09.2019 granted relaxation/exemption from the compliance requirements of said Regulation of the SEBI (LODR), 2015, for the purpose of declaration of 2nd interim dividend to its shareholders.
For Ashu Gupta & Co.Company Secretaries
Sd/-Ashu Gupta (Prop.)
FCS No.: 4123C.P. No.: 6646
New Delhi20.06.2019
Note: This Report is to be read with our letter of even date which is annexed as Annexure A and forms integral part of this Report.
199Secretarial Audit Report
Signed and dated by the Secretarial Auditor of the Company at New Delhi as at Page No. 198.
Annexure-A
To,The Members,OIL AND NATURAL GAS CORPORATION LIMITED,(CIN: L74899DL1993GOI054155)Regd. Office: Plot No. 5A-5B,Nelson Mandela Road,Vasant Kunj, New Delhi-110070
Our Report of even date is to be read along with this letter.
1. Maintenance of secretarial record is the responsibility of the management of the Company. Our responsibility is to express an opinion on these secretarial records based on our audit.
2. We have followed the audit practices and processes as were appropriate to obtain reasonable assurance about the correctness of the contents of the secretarial records. The verification was done on test check basis to ensure that correct facts are reflected in secretarial records. We believe that the process and practices, we followed provide a reasonable basis for our opinion.
3. The compliance by the Company of applicable financial laws such as direct and indirect tax laws and maintenance of financial records and books of accounts has not been reviewed in this Audit since the same have been subject to review by statutory audit and other designated professionals.
4. Wherever required, we have obtained the management representation about the compliance of laws, rules and regulations and happening of events etc.
5. The compliance of the provisions of Corporate and other applicable laws, rules, regulations, standards is the responsibility of the management. Our examination was limited to the verification of procedures on test basis.
6. The Secretarial Audit Report is neither and assurance as to the future viability of the Company nor of the efficiency or effectiveness with which the management has conducted the affairs of the Company.
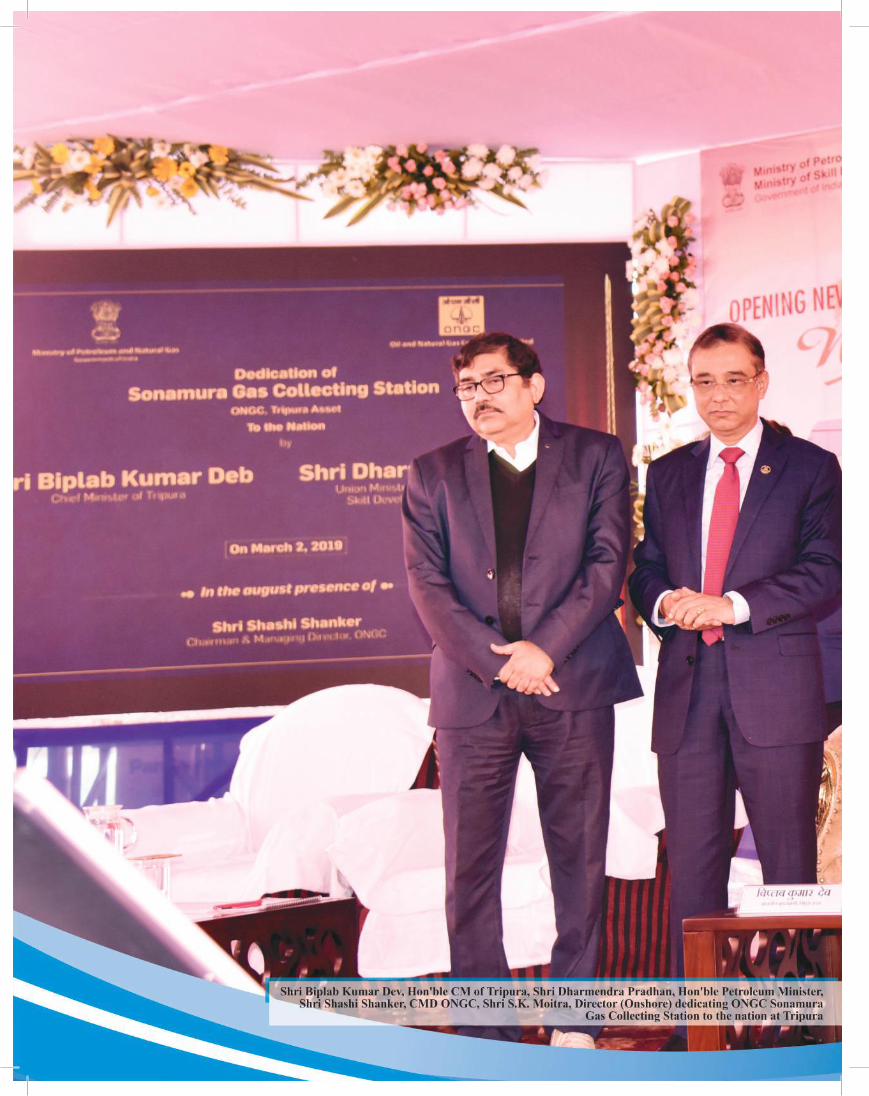
200
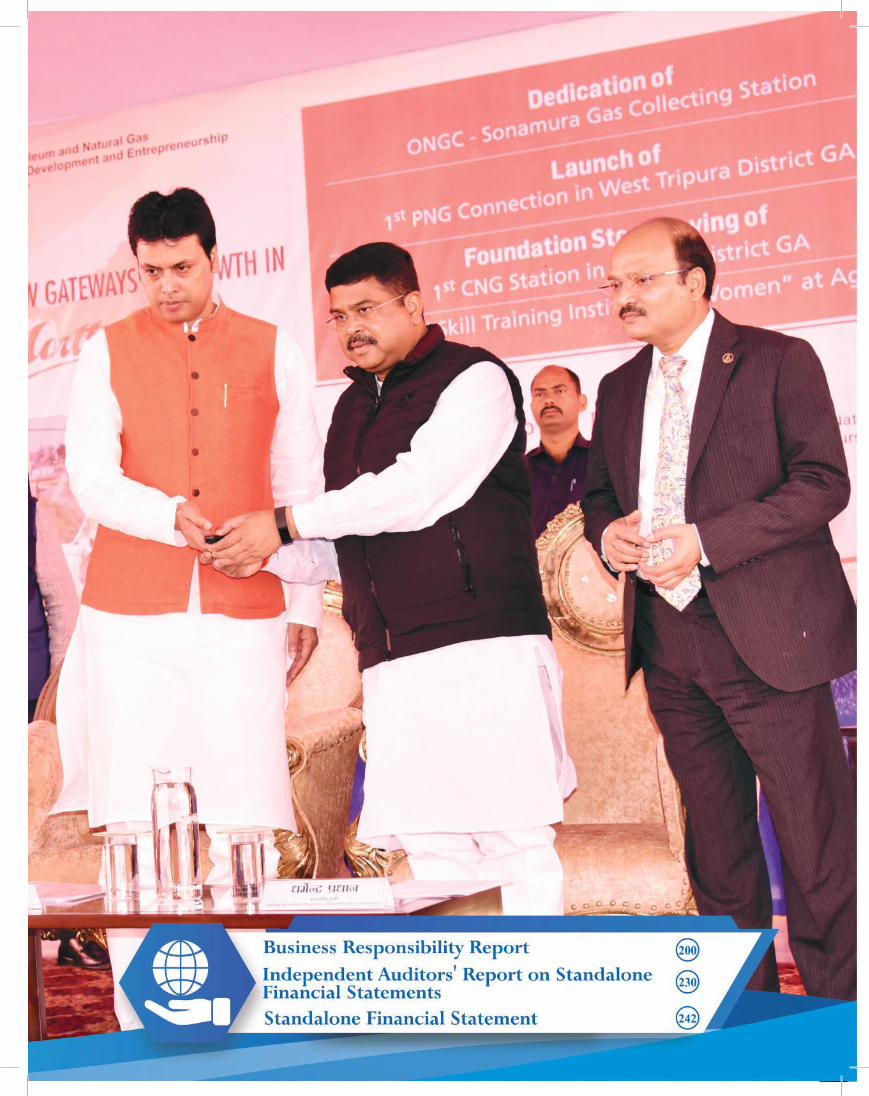
201Business Responsibility Report
202
Business Responsibility Report
SECTION A: GENERAL INFORMATION ABOUT THE COMPANY
1. Corporate Identity Number (CIN) : L74899DL1993GOI054155
2. Name : Oil and Natural Gas Corporation Limited.
3. Registered address : Plot No. 5A-5B, Nelson Mandela Road, Vasant Kunj, South West Delhi-110070. India
4. Website : www.ongcindia.com
5. E-mail id : [email protected]
6. Financial Year reported : 2018-19
7. Sector(s) that the Company is engaged in (industrial activity code-wise):Group Class Sub Class Description
061 061 06101 06102
Offshore extraction of crude Petroleum Onshore extraction of crude Petroleum
062 062 06201 06202
Offshore extraction of Natural gas Onshore extraction of Natural gas
091 0910 09101 09102 09103 09104
Services incidental to off shore oil extraction Services incidental to on shore oil extraction Services incidental to off shore gas extraction Services incidental to on shore gas extraction
493 4930 49300 Transport via Pipeline
192 1920 19201 Production of liquid and gaseous fuels, illuminating oils, lubricating oils or greases or other products from crude petroleum or bituminous minerals
8. List three key products/ services that the Company manufactures/provides (as in balance sheet):
(i) Crude Oil
(ii) Natural Gas
(iii)LiquefiedPetroleumGas
9. Total number of locations where business activity is undertaken by the Company
(a) Operational Locations: The Company has Pan-India business activities spread across the length and breadth of the country, both onshore and offshore. The major locations of the Company are mentioned at Sr. No. 21 of the Corporate Governance Report, a document forming part of the Annual Report.
203Business Responsibility Report
(b) Subsidiaries and Associates: Details of Subsidiaries and Associates are provided at Annexure D to the Board’s Reports.
(c) Number of International Locations: ONGC Videsh, the wholly-owned subsidiary of your Company for E&P activities outside India, has participation in 41 oil and gas projects in 20 Countries, viz. Azerbaijan (2 projects), Bangladesh (2 Projects), Brazil (2 projects), Colombia (7 projects), Iran (1 project), Iraq (1 project), Israel (1 project), Kazakhstan (1 project), Libya (1 project), Mozambique (1 Project), Myanmar (6 projects), Namibia (1 project), New Zealand (1 Project), Russia (3 projects), South Sudan (2 projects), Sudan (2 projects), Syria (2 projects), UAE (1 project), Venezuela (2 projects) and Vietnam (2 projects).
Further, HPCL, the other subsidiary of the Company holds two blocks T/L1 and T/18P in Australia through its subsidiary PPCL. HPCL Middle East FZCO, is a 100% Subsidiary of HPCL and was set up as a free zone Company under Dubai Airport Free Zone and Establishment Card was issued for the Company. HPCL MiddleEastFZCOwasestablishedfortradingoflubricants&greases,petrochemicalsandrefinedpetroleumproducts.
10. Markets served by the Company – Local/ State/ National
TheCompanyismarketingitsdomesticproducts,mainlycrudeoiltothePublicSectorrefiners–IOCL,BPCL,HPCL, NRL, CPCL & MRPL and the natural gas is mainly marketed through GAIL. However, part of the gas is also marketed directly by the Company.
The Value Added Products are marketed in bulk to the PSU Oil Marketing Companies (OMCs), ONGC Petro-additions Limited (OPaL) (an associate) and balance to private companies. Naphtha is exported because of lesser demand in domestic market.
SECTION B: FINANCIAL DETAILS OF THE COMPANY
1. Paid up Capital (` in Million) : 62,901.54
2. Total Income (` in Million) : 1,171,735.58
3. Totalprofitaftertaxes(` in Million) : 267,157.89
4. Total Spending on (CSR) as percentage of PAT : 2.30
5. List of activities in which expenditure in 4 above has been incurred:-
204
Sl. No.
Sector of Activity
1 Promoting health care including preventative health care, sanitation and making available safe drinking water.
2 Promoting education including special education and employment enhancing vocational skills especially among children, women, elderly, the differently abled and livelihood enhancement projects.
3 Ensuring environmental sustainability, ecologicalbalance,protectionsoffloraandfauna,animalwelfare,agro forestry, conservation of natural resources and maintaining quality of soil, air and water.
4 Rural development projects
5 (1) Setting up homes and hostels for women and orphans; setting up old age homes, day care centres and other such facilities for senior citizens
(2) Protection of national heritage, art and culture including restoration of buildings and sites of historical importance and works of art; setting up public libraries; promotion and development of traditional arts and handicrafts
(3) Training to promote rural sports, regionally recognised sports, Paralympics sports and Olympic sports
(4)OtherareasmentionedinSchedule–VII
SECTION C: OTHER DETAILS
1. Does the Company have any Subsidiary Company/ Companies:
Yes, please refer to Annexure D of the Boards’ Reports.
2. Do the Subsidiary Company/Companies participate in the BR Initiatives of the parent Company? If yes, then indicate the number of such Subsidiary Company(s)
Since the Subsidiary Companies are separate entities, they carry out Business Responsibility initiatives on their own as per the policies applicable to the respective companies.
3. Do any other entity/entities (e.g. suppliers, distributors etc.) that the Company does business with, participate in the BR initiatives of the Company? If yes, then indicate the percentage of such entity/entities? [Less than 30%, 30-60%, More than 60%]
The BR initiative of the Company has the cooperation of all its stakeholders, including Government of India, employees,vendors,andthelocalpopulace.However,itisdifficulttoestablishtheextentoftheirsupportinfacilitating the BR initiatives of the Company.
205Business Responsibility Report
SECTION D: BR INFORMATION
1. Details of Director/ Directors responsible for BR
(a) Details of the Director responsible for implementation of the BR policy/ policies
1. DIN Number : 06447938
2. Name : Shri Shashi Shanker
3. Designation : Chairman and Managing Director
(b) Details of the BR head
Sr. No. Particulars Details1 DIN Number (if applicable) Not Applicable2 Name Shri N J S Hunjan3 Designation ExecutiveDirector–ChiefofCM&SG4 Telephone number +91 11 267530075 e-mail id [email protected]
No. Questions P 1
P 2
P 3
P 4
P 5
P 6
P 7
P 8
P 9
1 Do you have a policy/ policies for Y Y Y Y Y Y N Y Y
P1: Code of conduct, Whistle Blower Policy, Related Party Policy, Investor insider Trading Policy, Policy on materiality for disclosure of events, Fraud Prevention Policy, Board of Delegated Powers 2015, HR Manual, Material Management Manual, Finance Manual.
P2: Code of conduct , HSE Policy, QHSE Policy
P3: HR Policies including for welfare measures.
P4: Material Subsidiary Policy, Corporate Social Responsibility and Sustainable Development Policy,
P5: Signatory to UNGC, CDA Rules, Internal Human Resources Policies, Fair wages policy for contract workers.
P6: Risk Management Policy, HSE Policy, Corporate Waste Management Policy
P7:
P8: CSR Policy, Dividend Distribution Policy.
P9: Crude Oil Sale Agreement (COSA), Gas Supply Agreement (GSA)
2. Principle-wise (as per NVGs) BR Policy/policies (Reply in Yes/ No)
206
No. Questions P 1
P 2
P 3
P 4
P 5
P 6
P 7
P 8
P 9
2 Has the policy been formulated in Consultation with the relevant stakeholders?
Y Y Y Y Y Y - Y Y
3 Does the policy conform to any National / International standards? If yes, specify? (50 words)
Y Y Y Y Y Y - Y Y
All the policies of the Company have been formulated conforming to applicable statutes/ guidelines/ rules/ regulations etc. issued by the Government of India. These policies were formulated keeping in view industry practices and standards.
4 Has the policy been approved by the Board?
If yes, has it been signed by MD/ Owner/ CEO/ appropriate Board Director?
Y Y Y Y Y Y - Y Y
Policies of the Company have been approved by the Board/ Competent Authorities as per Board Delegated Powers.
5 DoestheCompanyhaveaspecifiedCommitteeof theBoard/Director/Officialtooverseetheimplementation of the policy?
Y Y Y Y Y Y - Y Y
6 Indicate the link for the policy to be viewed online?
https://www.ongcindia.com/wps/wcm/connect/en/investors/policies/
7 Has the policy been formally communicated to all relevant internal and external stakeholders?
Y Y Y Y Y Y - Y Y
8 Does the Company have in-house structure to implement the policy/ policies.
Y Y Y Y Y Y - Y Y
9 Does the Company have a grievance redressal mechanism related to the policy/ policies to address stakeholders’ grievances related to the policy/ policies?
Y Y Y Y Y Y - Y Y
10 Has the Company carried out independent audit/ evaluation of the working of this policy by an internal or external agency?
Policies of the Company as such are not audited, however Policies have been amended from time to time as per regulatory/ business/ environmental requirements.
207Business Responsibility Report
(a) If answer to the question at serial number 1 against any principle, is ‘No’, please explain why: (Tick up to 2 options)
No. Questions P 1
P 2
P 3
P 4
P 5
P 6
P 7
P 8
P 9
1 The Company has not understood the Principles
Not Applicable
2 TheCompanyisnotatastagewhereitfindsitself in a position to formulate and implement thepoliciesonspecifiedprinciples
3 The Company does not have financial ormanpower resources available for the task
4 It is planned to be done within next 6 Months
5 It is planned to be done within the next 1 year
6 Any other reason (please specify)
3. Governance related to BR
(a) Indicate the frequency with which the Board of Directors, Committee of the Board or CEO to assess the BR performance of the Company. Within 3 months, 3-6 months, Annually, More than 1 year.
Various principles of BR performance are integral to the day-to-day operations of the Company and the same are reviewed by the Board/ Board Level Committee(s) as an integral item of business concerned.
(b) Does the Company publish a BR or a Sustainability Report? What is the hyperlink for viewing this report? How frequently it is published?
The Company has been publishing, both BR and Corporate ONGC Group Sustainability Report, annually. The BR and SR reports may be accessed respectively at following web-links:
https://www.ongcindia.com/wps/wcm/connect/en/investors/annual-reports/
https://www.ongcindia.com/wps/wcm/connect/en/sustainability/sustainability-reports/
SECTION E: PRINCIPLE-WISE PERFORMANCE
Principle 1: Businesses should conduct and govern themselves with Ethics, Transparency and Accountability
Principle 1.1
Do you have policy/policies for principle 1?
The Company, being a listed Public Sector Enterprise, conducts and governs itself with Ethics, Transparency and Accountability as per the policies mandated by Department of Public Enterprises (DPE), Guidelines on Corporate Governance, SEBI (Listing Obligations and Disclosure Requirement) Regulations, 2015 and other guidelines and policies of the DPE in particular and Govt. of India in general.
The Company also pursues some of the following policy initiatives voluntarily towards Ethics, Transparency and Accountability:
• The Company has a well-defined and a wellcodified Book of Delegated Powers which hasbeen thoroughly updated again in 2018 and after approval of the Board implemented across the organization, HR Manual, Integrated Materials Management Manual (which has also been reviewed, revised in 2019), Finance Manual for ensuring continuity, transparency and fairness in observing the laid down procedures. The Company has an Enterprise Risk Management Cell (ERM), risk framework, risk policy and risk portfolio which are periodically monitored by the Risk
208
Management Committee, Audit Committee and the Board. In terms of the SEBI (Listing Obligations & Disclosure Requirements) Regulations, 2015 (Listing Regulations), the Board has re-constituted the Risk Management Committee with Board level members.
• The Company has a well-structured vigilancedepartment with units spread across the organization at various Assets, Basins and Plants constantly ushering transparency, efficiency and integrityand best corporate practices in the working of the organization.
• TheCompanyhasaWhistleBlowerPolicymeantto provide a channel to the Employees to report genuine concerns about unethical behaviour, actual or suspected fraud within the organization.
• TheCompanyhaspositionedanIntegrityPact(inassociation with Transparency International) which is signed with bidders to enable them to raise any issues with regard to tenders floated from timeto time. The Company is the first among Indiancompanies to introduce signing of the Integrity Pact. People of high repute and integrity are appointed as Independent External Monitors to oversee implementation of the said Integrity Pact with the bidders.
Principle 1.2
Has the policy been formulated in consultation with the relevant stakeholders?
All policies have been formulated after extensive consultation and discussion amongst the relevant stakeholders and further the same get reviewed from time-to-time to cater to emerging and new business realities/ paradigms. The Company being a Public Sector Enterprise pursues policies laid down by the Government of India and other statutory bodies. The policies are framed after wider consultations with relevant stakeholders as per guidelines provided by statutory bodies and operational requirements of the Company.
Principle 1.3
Does the policy conform to any national/ international standards? If yes, specify?
The Company policies conform to statutes and policies
of the Government of India, DPE and other statutory / regulatory bodies. Further, the Company voluntarily follows international standards for transparency, including the ones prescribed by Transparency International and Global Reporting Initiatives (GRI).
Principle 1.4
Has the policy been approved by the Board? If yes, has it been signed by MD/owner/CEO/appropriate Board Director?
All policies as mandated by statutory/ regulatory bodies are followed by the Company. All other policies/manuals of the Company are implemented as duly approved by the Board of Directors or, the Competent Authority, as the case may be.
Principle 1.5
Does the Company have a specified committee of the Board/ Director/Official to oversee the implementation of the policy?
The Company has an Audit Committee which is bound by its Terms of Reference as per the Listing Regulations and the Companies Act, 2013 and is approved by the Board. The Company also has a well-structured vigilance department with units spread across the organization at various Assets, Basins and Plants constantly ushering transparency,efficiencyandintegrityandbestcorporatepractices. However, as the visage of the Principle is very wide, this is overseen by the executives at various levels in the Company.
Principle 1.6
Indicate the link for the policy to be viewed online.
The website of the Company (www.ongcindia.com) has reference to the various tenets as stated in the principle under the section on Corporate Governance.
Principle 1.7
Has the policy been formally communicated to all relevant internal and external stakeholders?
The Company policies and operational framework are availableontheCompany’swebsite–“ongcindia.com”
209Business Responsibility Report
forexternalstakeholdersandon“reports.ongc.co.in”foremployees.
The engagement routes across all the stakeholders are:
• The Customers are engaged through Crude OilSales Agreement (COSA), Gas Sales Agreement (GSA) and regular meetings with B2B partners.
• The Communities in and around our areas of operation are engaged through CSR projects.
• Business partners/vendors are engaged throughvendor meets, business partners meet and pre-bid conferences.
• Contract workers are engaged through regulartrainings and SAHYOG Scheme.
• Employeesareengagedthroughopenhouseforumslike – Vichar Manthan, Vichar Dhara, VicharVishlesan, Mantrana, etc., employee web portal and also through various in-house magazines.
• Regular engagement of Employees and otherexternal stakeholders (like Suppliers, Vendors, customers, Regulators, NGOs etc.) is also carried out as a mandatory input to ONGC Group Sustainability Report for identifying & prioritizing materiality issues of ONGC Group.
• Government and regulatory bodies are engagedthrough meetings with the administrative ministry i.e. Ministry of Petroleum & Natural Gas (MoP&NG), DPE under the Ministry of Heavy Industries & Public Enterprises (HI & PE), Oil Industry Safety Directorate (OISD), Oil Industry Development Board (OIDB) and Director General of Hydrocarbon (DGH).
• Shareholders and investors are engaged throughAnnual General Meeting, Investor & Analysts’ Meets, Investors’ Conferences, corporate website www.ongcindia.com and press releases/ press conferences etc.
Principle 1.8
Does the Company have in-house structure to implement the policy/policies?
The Company follows the laid down policy as per the companies’ manuals for every critical activity such as
–procurement,payment, tendering,contracting,humanresources,financeandotherfunctionsthataregovernedby well documented policies available for reference to all concerned.
Principle 1.9
Does the Company have a grievance redressal mechanism related to the policy/policies to address stakeholders’ grievances related to the policy/policies?
Yes. A structured four tier Grievance Management System is in place in the Company to address employee grievances related to policy/ policies. The channel of grievance is Reporting Authority of the employee, Sectional In-charge, Key Executive, Appeals Committee. Appeals Committee has outside professionals as members and is empowered to suggest measures to prevent similar grievances in future. CMD takes the final decision intotality on the grievance of the employee with inputs from Director (HR), if required.
For external stakeholders, the Company has a well laid down grievance redressal system in place with adequate provisions to escalate the matters up to the Board. Stakeholders Relationship Committee – a Board levelCommittee headed by an independent Director.
The Company voluntarily facilitates resolving grievances through Independent External Monitors (IEMs) and through Outside Expert Committee (OEC).
Further, there is an exclusive website maintained for grievance redressal (https://grievance.ongc.co.in).
Principle 1.10
Has the Company carried out independent audit/ evaluation of the working of this policy by an internal or external agency?
The implementation of obligations with regard to Corporate Governance as contained in Listing Regulation are brought out in the Corporate Governance Report and audited by the Statutory Auditors. Other policies are validated from time to time by the concerned authorities.
1. Does the policy relating to ethics, bribery and corruption cover only the Company?
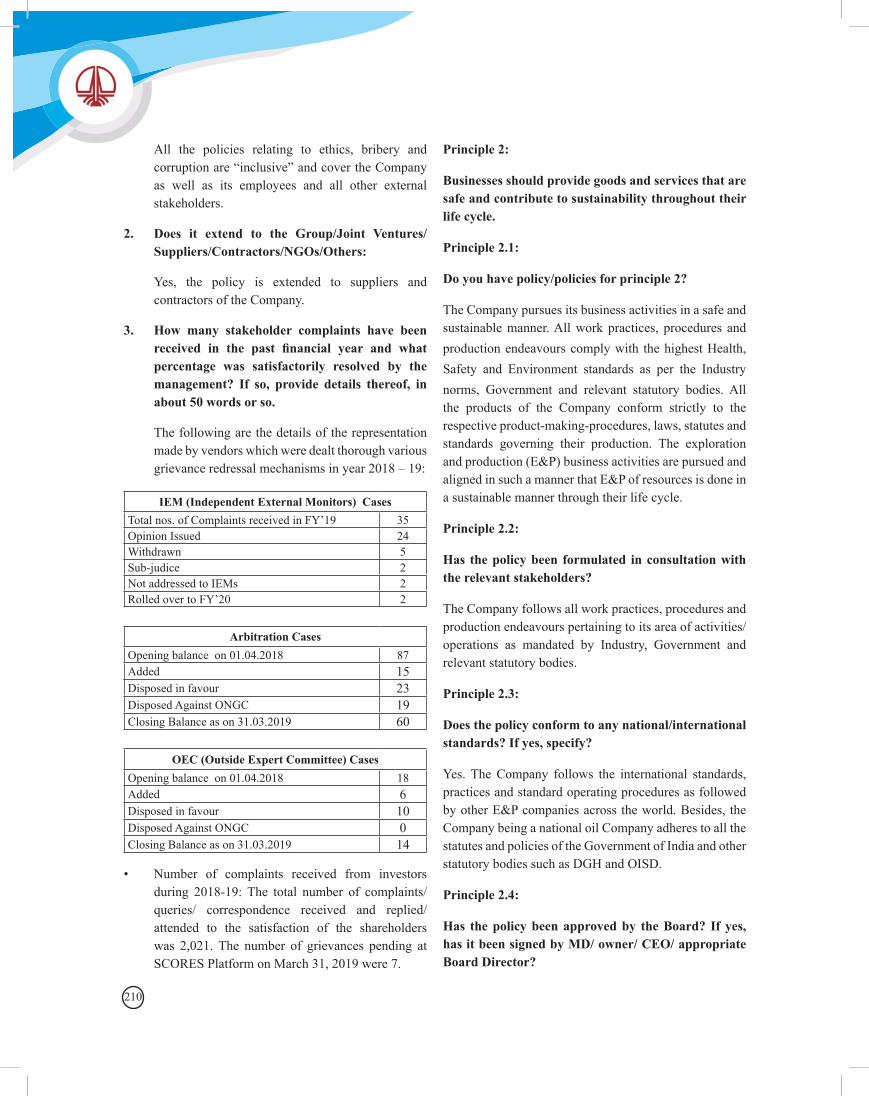
210
All the policies relating to ethics, bribery and corruptionare“inclusive”andcovertheCompanyas well as its employees and all other external stakeholders.
2. Does it extend to the Group/Joint Ventures/ Suppliers/Contractors/NGOs/Others:
Yes, the policy is extended to suppliers and contractors of the Company.
3. How many stakeholder complaints have been received in the past financial year and what percentage was satisfactorily resolved by the management? If so, provide details thereof, in about 50 words or so.
The following are the details of the representation made by vendors which were dealt thorough various grievanceredressalmechanismsinyear2018–19:
IEM (Independent External Monitors) CasesTotal nos. of Complaints received in FY’19 35Opinion Issued 24Withdrawn 5Sub-judice 2Not addressed to IEMs 2Rolled over to FY’20 2
Arbitration CasesOpening balance on 01.04.2018 87Added 15Disposed in favour 23Disposed Against ONGC 19Closing Balance as on 31.03.2019 60
OEC (Outside Expert Committee) CasesOpening balance on 01.04.2018 18Added 6Disposed in favour 10Disposed Against ONGC 0Closing Balance as on 31.03.2019 14
• Number of complaints received from investorsduring 2018-19: The total number of complaints/ queries/ correspondence received and replied/ attended to the satisfaction of the shareholders was 2,021. The number of grievances pending at SCORES Platform on March 31, 2019 were 7.
Principle 2:
Businesses should provide goods and services that are safe and contribute to sustainability throughout their life cycle.
Principle 2.1:
Do you have policy/policies for principle 2?
The Company pursues its business activities in a safe and sustainable manner. All work practices, procedures and production endeavours comply with the highest Health, Safety and Environment standards as per the Industry norms, Government and relevant statutory bodies. All the products of the Company conform strictly to the respective product-making-procedures, laws, statutes and standards governing their production. The exploration and production (E&P) business activities are pursued and aligned in such a manner that E&P of resources is done in a sustainable manner through their life cycle.
Principle 2.2:
Has the policy been formulated in consultation with the relevant stakeholders?
The Company follows all work practices, procedures and production endeavours pertaining to its area of activities/ operations as mandated by Industry, Government and relevant statutory bodies.
Principle 2.3:
Does the policy conform to any national/international standards? If yes, specify?
Yes. The Company follows the international standards, practices and standard operating procedures as followed by other E&P companies across the world. Besides, the Company being a national oil Company adheres to all the statutes and policies of the Government of India and other statutory bodies such as DGH and OISD.
Principle 2.4:
Has the policy been approved by the Board? If yes, has it been signed by MD/ owner/ CEO/ appropriate Board Director?
211Business Responsibility Report
Ministry of Petroleum & Natural Gas is the administrative ministry for the Hydrocarbon industry in the country. All other areas of operations fall under various laws as enacted by the Govt. of India. Accordingly, all internal policies, conforming to the directives of the Government, are approved by the Board or authority delegated for the same by the Board.
Principle 2.5:
Does the Company have a specified committee of the Board/ Director/Official to oversee the implementation of the policy?
The Board oversees the compliance and implementation of the policies through its various Committees as detailed in the Corporate Governance Report forming part of the Annual Report.
Principle 2.6:
Indicate the link for the policy to be viewed online.
The website of the Company (www.ongcindia.com) has reference to the various tenets as stated in the principle under various places. Further, internal policies applicable to various functions of the organization are available on intranet.
Principle 2.7:
Has the policy been formally communicated to all relevant internal and external stakeholders?
The Company policies and operational framework are available on the Company’s website as well as its intranet.
Principle 2.8:
Does the Company have in-house structure to implement the policy/policies?
Yes. The Company has well-established in-house infrastructure, manpower pool, documented standard operating procedure and other executive & administrative machineries to implement the given policies in the area of safe and sustainable production of goods and services of the Company. The HSE (Health, Safety & Environment) department of the Company along with apex management,
acts as the nodal department to execute and oversee policies pertaining to safe, healthy and environment friendly operations and compliance with sustainability parameters as mandated and desired. The CM&SG implements environment friendly projects for sustainable use of natural resources within the operational boundary of organization.
Principle 2.9:
Does the Company have a grievance redressal mechanism related to the policy/policies to address stakeholders’ grievances related to the policy/policies?
Yes: as detailed earlier in Principle 1.9.
Principle 2.10:
Has the Company carried out independent audit/evaluation of the working of this policy by an internal or external agency?
The Company is subjected to various audits such as StatutoryAudit by six firms of CharteredAccountantsappointed by the Comptroller & Auditor General, C&AG Audit, Cost Audit, Secretarial Audit, Technical Audits, Quality Audit, Energy Audit, Safety audit. These audits ensure compliance to various internal and external policies.
1. List up to 3 of your products or services whose design has incorporated social or environmental concerns, risks and/ or opportunities.
a. Solar Power Generation
(i) 1 MW Solar Power Plant at IPSHEM, Goa:
Giving a boost to the ambitious proposition of Government of India to increase the share of renewable energy of the total energy production, a solar PV Power Plant of 1 MW capacity has been installed at IPSHEM, Goa. Also, IPSHEM has become the First Carbon Neutral Institute of ONGC. It will reduce the energy bill of IPSHEM, besides generating revenue from the sale of surplus power. The yearly consumption of KWH units is expected to come down from 5.17 lakh units to approx.1.00 lakh unit. This
212
plant will also result in a reduction in CO2 emissions of approximate 1095 tons annually.
(ii) 10 MW PV Solar Plant at Hazira
Mr. Shashi Shanker, CMD-ONGC inaugurated the 10 MW PV Solar Unit at Hazira Plant, ONGC on 4 September 2018. By commissioning this unit, ONGC made yet another contribution to the Prime Minister’s ambitious campaign of ‘National Solar Mission’ which aims to install approximately 100 GW of Solar Power generation facilities by March 2022. This Solar Plant has a potential of generating around 16-18 Million solar units per year. The power generated by the solar plant will be consumed internally. It will also be used for offsetting the solar RPO obligation of the Hazira Plant. The solar plant will also contribute through reduction of carbon emission by approximately 14,000 metric tons per annum.
b. LED light installation
ONGC has installed 207000 LED light up to 31st March 2019.
c. Sea Water Desalination
With fresh water scarcity looming large across the world and especially in India, desalination of sea water has become one of the most important tools to address the increasing demand of fresh water. Process plant at Uran, Maharashtra is one of the most important plants of the Company, responsible for processing the crude oil / natural gas coming from Mumbai Offshore to make oil & gas saleable and produce value added products. Presently, Uran needs approx. 17000 m3 freshwater per day for its normal operations. The water is supplied by MIDC which is the sole supplier in this region. Due to rapid growth in and around Uran, the Company may face disruption of fresh water as MIDC has limited known sources of water. To avoid any future disruption, it has been proposed to set up 20MLD capacity desalination plant. The feasibility study has
been carried out by MECON and the project has received in principle approval from the Executive Committee for its implementation. It has been decided that a 10 MLD desalination plant, upgradable to 20 MLD capacity in future, will be set up at Uran, Maharashtra. Contract for PMC has been awarded.
Also Techno-commercial feasibility study has been done for 03 desalination plants namely Mori, Kesanapalli and Malleswaram of Rajahmundry Asset.
2. For each such product, provide the following details in respect of resource use (energy, water, raw material etc.) per unit of product (optional):
Measurement of usage of water, fuel, per unit is yet to be carried out. However the Company has put in place all policies and processes to conserve energy and natural resources.
Reduction during sourcing/production/ distribution achieved since the previous year throughout the value chain?
Reduction during usage by consumers (energy, water) has been achieved since the previous year?
The acquisition of energy and water consumption data for the year 2018-19 is in progress. Hence, the comparison with reference to previous year is not possible at this stage.
4. Does the Company have procedures in place for sustainable sourcing (including transportation)?
The Company has put in place a well-definedprocedure for sustainable sourcing. The Company has a well-documented Material Management Policy. This Policy has been revised as placed on the Company’s available website that helps in sourcing the requisites for operations and business activities in a steady, continuous and sustainable manner. The Company has policies of long-term contracts and rate-contracts to ensure that operations and business pursuits do not suffer owing to externalities.
Sustainability and Sustainable Development has
213Business Responsibility Report
been embedded in work practices as a Corporate Mantra and are aligned with Kyoto protocol negotiations, GHG mitigation, Carbon management, sustainability and greening the vendor chain.
If yes, what percentage of your inputs was sourced sustainably? Also, provide details thereof.
The Company at present does not have a process in place to measure this particular parameter. However, in future, efforts will be made to capture relevant information.
5. Has the Company taken any steps to procure goods and services from local & small producers, including communities surrounding their place of work?
Yes, Being an Indian CPSE (Central Public Sector Enterprise), the Company’s procurement policy and practices are guided by the Government Policies and practices. These are based on transparent procurement mechanisms which promote procurement from technically competent suppliers. However, care is also taken for the interest of local suppliers and contractors within the frame-work of various Govt. guidelines including those from CVC.
If yes, what steps have been taken to improve their capacity and capability of local and small vendors?
The Company has always encouraged local suppliers to participate in its tendering process and also promote them through vendor development programs. Our continued pursuit in this direction has seen improved participation of small local players and socio-economic development of communities in and around operational locations. At work centres, Vendors Meet is regularly held to explain procedures and policies pertaining to the procurements of goods and services to help small local vendors. The Company has taken necessary steps for implementation of the public procurement policy for procurement from MSEs. Necessary provisions have been incorporated in all tenders for materials and services. In general minimum 25% of the requirement has been reserved for eligible
MSEs in tenders. Procurement of `13,797.20 million was carried out from MSE Vendors during the year 2018-19. The Company has adopted the Government e-Marketplace (GeM) system of procurement for items which are available in GeM. Supply chain of the Company comprises of about 4,037 MSE business partners.
6. Does the Company have a mechanism to recycle products and waste? If yes what is the percentage of recycling of products and waste (separately as <5%, 5-10%, >10%). Also, provide details thereof.
The Company has a policy for Management of Hazardous Chemicals and Materials that was issued in 2002. As per the policy, personnel handling hazardous chemical are to be trained for safe handling practices. Separate designated areas are provided for storage of hazardous chemicals and all personnel are provided with Personnel ProtectiveEquipment (PPE)andfirstaid training.Further, instructions were issued for the auction/sale of Hazardous waste in 2004. The Ministry of Environment & Forest regulates the recycling/reprocessing of hazardous wastes such as used/waste oil, used lead acid batteries and other non-ferrous metal waste under registration scheme, with the objective of channelizing such waste to only those units which possess Environmentally Sound Management (ESM) facilities. The registration is being implemented by Central Pollution Control Board that regularly updates the list of registered units in their website http://cpcb.delhi.nic.in and the hazardous waste is required to be sold / auctioned only to units registered by CPCB. Thus clear instructions have been issued and the above policy is being followed. For example, all lead acid batteries are sold back to suppliers at the time of purchase of new batteries.
For disposal of e-waste, the limited tender from thefirmsregisteredwithCentralPollutionControlBoard for such items is to be invited and the items of e-waste is to be sold to them only to ensure safe disposal of the items. The Company has an e-waste policy to manage e-waste.
214
The Company is committed to recycling of materials, wherever feasible. ONGC’s Mehsana Asset has established effective infrastructure to control expenses, non-optimal usage of costly materials, ground water and also to effectively manage waste disposal and has upgraded existing mud preparation plants through enhancing the mud preparation and storage capacity.
Mehsana Asset is now transporting the costly polymer based drilling fluid from drill sites tocentralized mud plant for treatment and storage and thereafter sends to other drill sites, where new wells are being drilled. Drilling being most water intensiveoperation, recyclingofdrillingfluidhaseffectively reduced water consumption.
Waste generated in the Company during exploration and production operations are primarily drilling fluid and drill cuttings (non-hazardous), chemicalsludge and tank bottom sludge (hazardous). Chemical sludge is collected in lagoons having leachate collection facility where water is drained to reduce the quantity of sludge. This chemical sludgeisdisposedoffbylandfillinginaccordancewith norms of the State Pollution Control Board. To treat tank bottom sludge, which is mainly organic in content, bio-remediation techniques are employed. Best practices in the oil industry are adopted to manage solid waste arising from operations. Drilling fluid and cuttings are disposed, re-usedinlandfillingorsold to authorized vendors as per industry practices.
Waste managementhasbeenidentifiedasamaterialissue by ONGC for sustainable development activities. Accordingly, ONGC is working towards development of a waste management policy and plans to guide and improve its waste management system. ONGC has been adopting a three way strategy to reduce and manage waste:
• Know your waste footprint – Establish thewaste base line;
• Undertakewastemanagementproject,whereverfeasible and apply;
• Managewaste&reporting.
Solid & Oily waste Management
Drillcuttings,drillingfluidandgenerationofoilysludgefrom cleaning of storage tanks and from various process unitsofeffluenttreatmentplantsarefewimportantwastes.Thetankbottomsludgeandoilywastewereidentifiedashazardous waste and is disposed-off according to local statutory guidelines. Oily sludge removed periodically is treated by environmentally sound bioremediation techniques using a consortium of bacteria known as Oil Zappers and is rendered non-hazardous. Land is normally acquired by ONGC for short duration to carry out its drilling activities. The land degradation takes place during drilling operations due to discharge of waste water from various sources. The land acquired for drilling activities is reclaimed/ restored to its pristine condition before returning to land owners.
Produced water/ Effluents
The Water produced with the oil and gas, is the major effluent for the Company as part of its productionactivities.Theproducedwater,whichispartofwellfluidisseparatedandsenttoEffluentTreatmentPlants(ETPs)for further treatment. ONGC operates 32 ETPs to treat theeffluentgeneratedatonshoreInstallations.
In onshore locations, part of treated produced water is used for water injection to maintain reservoir pressure; the remaining quantities are re-injected into sub-surface disposal wells which are as deep as 1000 mts underground. In offshore location, produced water is treated and disposed off 40 mts below the sea surface.
At drill sites waste water generated during drilling activities is collected in a waste pit that is lined with High Density Poly Ethylene Sheets (HDPE). The waste water fromwastepit is recycled fordrillingfluidpreparationand other uses through mobile ETPs.
The Company has developed a comprehensive corporate waste management policy to quantify and, segregate waste at the source for better planning and management. For non-hazardous wastes, efforts are made to minimise the disposable quantity through reuse and recycle route.
Principle 3: Businesses should promote the wellbeing of all employees.
215Business Responsibility Report
Principle 3.1
Do you have policy/policies for principle 3?
Yes. The Company has a wide range of HR policies covering all categories of the employees (workers, officers, women employees, SC/ST employees, sportspersons, specially-abled individuals etc.). It addresses all aspects of professional skill & knowledge up-gradation, employee motivation and welfare measures spanning employees’ health (Preliminary Medical Examination) and general wellbeing measures, women empowerment, empowerment of SC/ST and other disadvantaged class of employees, separation / superannuation and post-retirement welfare measures.
Principle 3.2
Has the policy been formulated in consultation with the relevant stakeholders?
The HR policies of the Company are formulated in line with DPE guidelines and after due consultation with Collectives and representatives of employees.
Principle 3.3
Does the policy conform to any national/international standards? If yes, specify?
HR Policies of the Company conform to the best of International and National standards. The Company is perceived to be one of the best employers in the country.
Principle 3.4
Has the policy been approved by the Board? If yes, has it been signed by MD/owner/CEO/appropriate Board Director?
All HR policies are approved by Board or Competent Authorities as delegated by the Board and signed accordingly.
Principle 3.5
Does the Company have a specified committee of the Board/ Director/Official to oversee the implementation of the policy?
The Board of Directors have constituted a Board level Nomination and Remuneration Committee to oversee the major decisions in the area of human resources.
Principle 3.6
Indicate the link for the policy to be viewed online?
The HR policies and orders / circulars related to Human Resource are webhosted on “reports.ongc.co.in” forwider circulation among employees and at “ongcindia.com”forstakeholders.
Principle 3.7
Has the policy been formally communicated to all relevant internal and external stakeholders?
Yes. The Company’s HR policies are available on-line on the Company’s website as well as on the Company’s internal portal – “reports.ongc.co.in”. All policies,procedures and work-flows are documented and areavailable on-line for easy access, use and information of all employees. Any new initiatives, changes or new announcements are communicated to employees on-line through internal websites and also through formal orders posted on work-centre’s intranet notice boards and through circulation to individuals.
Principle 3.8
Does the Company have in-house structure to implement the policy/policies?
The Company has a structured Human Resource Department, headed by Director (HR) who implements the policies throughout the Company with the support of senior HR executives.
Principle 3.9
Does the Company have a grievance redressal mechanism related to the policy/policies to address stakeholders’ grievances related to the policy/policies?
Yes. The Company has a structured employees’ grievance redressal mechanism. Details have been provided at Principle 1.9 above. The mechanism/procedures allow employees to escalate their grievances to the level of
216
Director (HR) of the Company and in some case even to the Executive Committee for justifiable redressal ofissues&concerns.Collectives andOfficers associationare engaged/ associated at every stage to discuss/ negotiate the policy issues and address their concerns. An Executive Director level position oversees employee relations and industrial relations (ER&IR) and maintains cordial, motivated and a spirited work atmosphere. All the employees have access to CMD and Directors through e-mails as well.
Principle 3.10
Has the Company carried out independent audit/evaluation of the working of this policy by an internal or external agency?
The HR policies and practices are reviewed at regular intervals taking cognizance of emerging realities. Regular independent audits, both internal and external, gets carried out to gauge level of employee engagement and satisfaction. Wherever desired and warranted, expert advice from external agencies/ consultancies is solicited to ramp up our practices/ policies to best of industry standards.
The Company has carried out independent audit / evaluation of HR policies under the PCMM Framework during 2018-19 through external consultant.
1. Total number of employees : 31,065 (As on
31.03.2019)
2. Total number of employees hired on temporary/
contractual/casual basis.
•Contractualworkers : 21,106 (Includes 2,804 in Seasonal contracts)
•Tenurebased : 631 (As on 31.03.2019)
•Casualworkers/contingent : 238
3. Please indicate the number of permanent women employees : 2,180 (As on 31.03.2019)
4. Please indicate the number of permanent employees with disabilities : 343 (As on 31.03.2019)
5. Do you have an employee association that is recognized by management?
Yes.
A. Executive Cadre: TheAssociationofScientificandTechnicalOfficers(ASTO)hasbeenrecognizedtorepresent the issues related to the executives.
B. Non-Executive Cadre: Twelve recognized unions as under:
1. ONGC (BOP) Karmachari Sanghatana, Mumbai
2. ONGC Employees’ Association, Kolkata
3. Petroleum Employees Union, Chennai
4. Petroleum Employees Union, Karaikal
5. Petroleum Employees Union, Rajahmundry
6. Petroleum Employees Union, Ahmedabad
7. ONG Mazdoor Sangh, Ankleshwar
8. ONGC Employees Mazdoor Sabha, Baroda
9. ONGC Purbanchal Employees’ Association Sivasagar
10. ONGC Staff Union, Dehradun
11. ONGC Workers Union, Agartala
12. Trade Union of ONGC Workers, Silchar.
Besides above, All India SC/ ST Employees Welfare Association and All India OBC/ MOBC Employees Welfare Association are recognized by the Company to represent the specific employeegroups.
6. What percentage of your permanent employees is members of this recognized employee association?
Most executives are members of ASTO. The non-executive cadres of employees are affiliated tovarious recognized unions. ASTO has a membership of about 90% of executives. Twelve recognized unions have been conferred recognition by the
217Business Responsibility Report
Company on thebasisofverificationthroughsecretballot. They represent all the unionized categories of employees in their respective work-centres, though some employees may hold membership with rival unions
7. Please indicate the Number of complaints relating to child labour, forced labour, involuntary labour, sexual harassment in the last financial year and pending, as at the end of the financial year.
Sl. No
Category No. of complaints filed during the financial
year
No. of complaints pending at
the end of the financial year
1 Child labour/ forced labour/ involuntary labour
NIL NIL
2 Sexual harassment 2 1
3 Discriminatory employment
NIL NIL
8. What percentage of your under mentioned employees were given safety & skill up-gradation training in the last year?
•PermanentEmployees
•PermanentWomen Employees
•Casual/Temporary/ Contractual Employees
•Employeeswith Disabilities
19,108 employees were provided training through all the institutes of ONGC covering 1,89,343 training man days including permanent women employees and employees with disabilities. Apart from the above, casual, temporary and contractual employees were given requisite training in safety of operations.
Principle 4:
Businesses should respect the interests of, and be responsive towards all stakeholders, especially those who are disadvantaged, vulnerable and marginalized
Principle 4.1
Do you have policy/ policies for principle 4?
Yes. The Company complies with Government directives for upliftment of weaker sections of the society. It is fully
committed to the welfare of marginalized and vulnerable
sections of society. Each of our strategic business units (SBU) has the responsibility to identify and engage with relevant stakeholders to establish a symbiotic relationship.
The Company has a number of policies in place to address the interests of all stakeholders. As a PSE, the Company pursues all such policies as mandated by the Government. The Corporate Social Responsibility (CSR) and Sustainability policy along with a host of policies of the Government of India are directed towards disadvantaged, vulnerable and marginalized sections of the society. ONGC’sgoalisto:Connect,Listen,Respond,Sustain’–leading to business value creation with Economic, Social and Environmental sustainability at its core.
AsperCSR&Spolicy,theCompanyhasawell-definedsetofobjectives,clearlydelineatedbeneficiaries,strategyand project activities which characterize its social projects. The relevant provisions of section 135 and Schedule VII of the Companies Act, 2013 have also been takenintoaccountwhilefinalizingtheaforesaidpolicy.The projects are designed to yield discernible, long-term andsustainablebenefitsforthecommunities,especiallydisadvantaged, vulnerable and marginalized sections. Through community driven developments, we foster a symbiotic relationship with our stakeholders across communities to create more employment opportunities to realize our strategic objective of growing responsibility while improving the livelihoods of people.
The table below depicts the manner in which the Company engages to address the interest of all stake-holders:
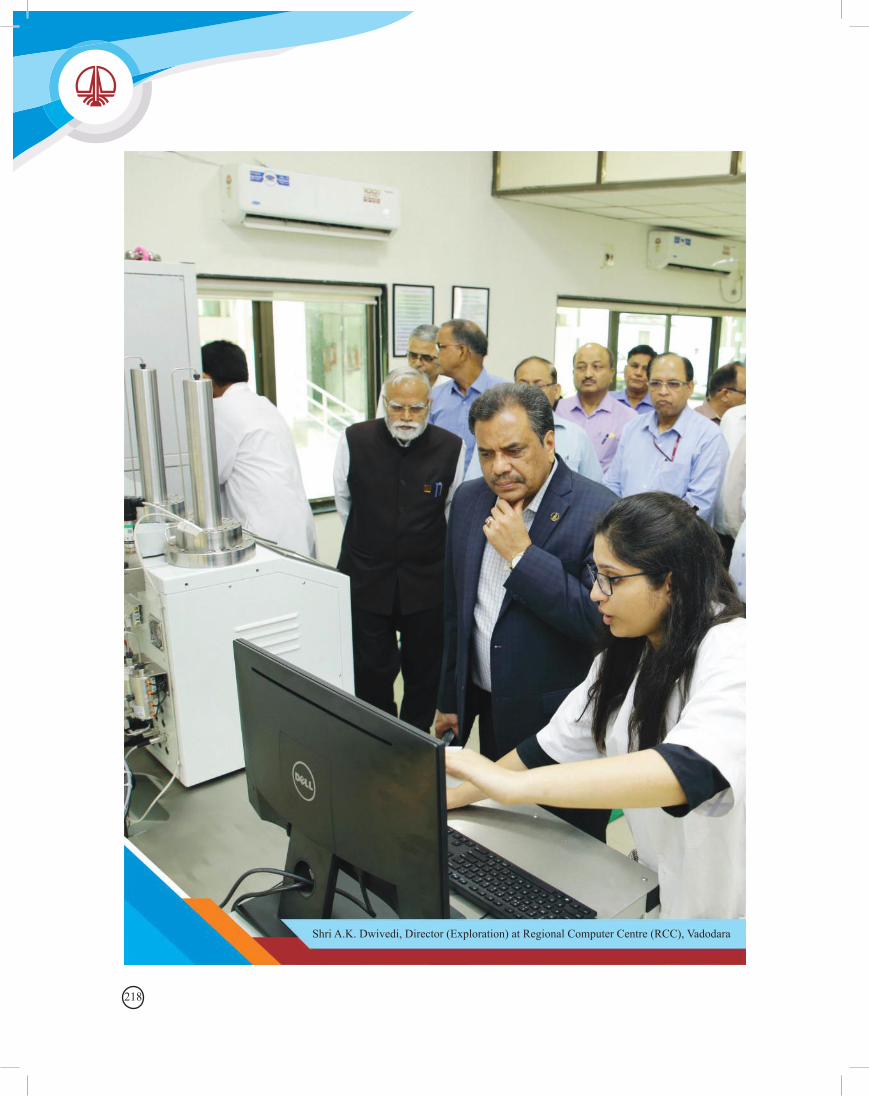
218
Shri A.K. Dwivedi, Director (Exploration) at Regional Computer Centre (RCC), Vadodara
219Business Responsibility Report
Stakeholders Mode of engagementCustomers Structured engagement through Crude Oil Sales Agreement (COSA) & Gas Sales Agreement
(GSA); Regular / periodic meetings with B2B partners and also through external stakeholders meet.
Communities Direct engagement at work centers through CSR programmes and HR departments.Business partners/ contractors/ vendors
Vendor meets; Business partner meets; Pre-bid conferences and also through external stakeholders meet.
Contract workers Safety trainings & SAHAYOG Scheme.Employees Open House; Vichar Manthan; Vichar-Dhara; Vichar-Vishlesan; Mantrana; Employee web
portal and also through internal stakeholders meet. Regular bilateral meetings with employee Unions and Associations.
Regulatory bodies (DGMS, NSE, BSE, SEBI, OISD, OIDB, etc.)
Structured engagement through meetings with administrative Ministry MoP&NG, DPE, HI & PE, OISD, OIDB, etc. and also through external stakeholder meet.
Government bodiesShareholders, investors Investor & Analyst Meet; AGM; Investor Conferences; Conference Calls, One-on-One &
Group Meetings; Corporate web site and press releases/ press conference and also through external stakeholder meet.
Principle 4.2
Has the policy been formulated in consultation with the relevant stakeholders?
The CSR policy and the policy of Sustainable development is in compliance with the Companies Act, 2013 and Companies (CSR Policy) Rules, 2014 and DPE Guidelines.
Principle 4.3
Does the policy conform to any national / international standards? if Yes, specify?
The policy and laid down procedures conforms to statutes and policies of the Govt. of India, DPE and other statutory bodies.
Principle 4.4
Has the policy been approved by the Board? If Yes, has it been signed by MD/owner/ CEO/ appropriate Board Director?
All such policies being pursued by the Company are duly approved by the Board of Directors and uploaded on the Company’s website.
Principle 4.5
Does the Company have a specified committee of the Board/ Director/ Official to oversee the implementation of the policy?
Yes. The Director (HR) has been delegated power to implement CSR initiatives. The implementation of CSR policy is to be overseen by a Board Level Committee on Corporate Social Responsibility (CSR). Further, in linewith the approvalof theBoard, anon-profit entityby name ‘ONGC Foundation’ has been formed and registered under the Indian Trust Act, 1882 for carrying out CSR activities.
Principle 4.6
Indicate the link for the policy to be viewed online.
The website of ONGC, www.ongcindia.com, has a link to the CSR Dept. page, where the CSR&S policy is available for all.
Principle 4.7
Has the policy been formally communicated to all relevant internal and external stakeholders?
Yes, for internal stakeholders, all these policies are available on-line on Company websites and also perpetuatedthroughitsCollectives,OfficersAssociationand other relevant associations. For external stakeholders, communication in this regard is pursued through interactions at multiple levels.
Principle 4.8
Does the Company have in-house structure to implement the policy/ policies?
220
The Company has a structured framework and laid down well documented procedures in place to execute and implement its policies. There is an exclusive Department for CSR- headed by Chief CSR, to implement CSR activities of the Company.
Principle 4.9
Does the Company have a grievance redressal mechanism related to the policy/policies to address the stakeholders’ grievance related to the policy / policies?
Yes.
Principle 4.10
1. Has the Company mapped its internal and external stakeholders?
Yes.
2. Out of the above, has the Company identifiedthe disadvantaged, vulnerable & marginalized stakeholders?
Yes. Over last nine years ONGC has moved from a ‘charity-based philanthropy’ approach to a ‘stakeholder participation’ approach where the communities in and around ONGC’s operational areas are seen as important stakeholders and therefore their development is seen in alignment with the Company’s business development. Since ONGC’s areas of operation are remote and backward areas, the process of engaging with the external stakeholders, including the community aroundourareasofoperation,givesussignificantinputs relating to the needs of the disadvantaged and vulnerable marginal stakeholders. Besides this, over a last couple of years, ONGC has carried out baseline survey and need assessment around a few of our areas of operation to have greater insight into the needs of the community through structured interactions and feedbacks.
3. Are there any special initiatives taken by the Company to engage with the disadvantaged, vulnerable and marginalized stakeholders. If so, provide details thereof.
The CSR policy of ONGC covers CSR Projects / Programmes undertaken by ONGC listed in Schedule-VII of the Act, within the geographical limits of India, preferably towards the benefit ofmarginalized, disadvantaged, poor and deprived sections of the community and the environment. This way the ultimate objective is to reach the bottom of the pyramid in our demographic strata and touch their lives in a positive manner. Thus, while ONGC has engaged in serving the society through various welfare measures since its inception, it has now adopted a more structured approach in undertaking such welfare measures. Many projects related to infrastructure development, education and healthcare have been undertaken in remote areas mainly populated with such disadvantaged groups.
Principle 5:
Businesses should respect and promote human rights.
Principle 5.1
Do you have policy/policies for principle 5?
All policies of the Company take into account the Human Rights of not only employees but also people likely to be affected by the operations of the Company.
The Company is committed to conducting its business operations and strategies with the ten universally accepted principles in the area of Human Rights, Child labour, Anti-corruption and Environment. The Company embraces and supports those ten principles, particularly those on Human Rights viz.: “Businesses shouldsupport and respect the protection of internationally proclaimedhumanrights”and“Makesurethattheyarenot complicit in human rights abuses”. The Companyis fully committed to the principles of United Nations Global Compact on human rights and subscribe to the international agreements/conventions such as Kyoto protocol, Montreal Protocol, UNCLOS (MMD), SOLAS and MARPOL within the framework of Government of India directives. The Company ensures compliance with various labour legislations such as Payment of Wages Act 1936, Minimum Wages Act 1948, Equal Remuneration
221Business Responsibility Report
Act 1976, Industrial Disputes Act 1947, Employees State Insurance Act 1948, Employees Provident fund and Miscellaneous Provisions Act 1952, Contract Labour (R&A) Act, 1970, Child Labour (Prohibition and Regulation) Act 1986 etc. As a responsible principal employer, the Company ensures that contract labours are treated fairly as per law and for any complaints or disputes, the contractor is advised to settle the issue in accordance with the law. Various in-house policies like service rules, leave rules, gratuity rule, CPF rules, HBA (House Building Advance), conveyance advance, education loans also conform to Human Right values. The Company has also implemented Fair Wage Policy for contractors’ workers to provide them wages much above the minimum wages and other statutory and non-statutory benefits.
Principle 5.2
Has the policy been formulated in consultation with the relevant stakeholders?
The Company being a Public Sector Enterprise is primarily guided by Government of India policies. The entire gamut of its policies, rules and regulations which govern its functioning have “people first” as itsfulcrum. The Fair Wage Policy for contract labourers was formulated in consultation with trade unions representing these workmen.
Principle 5.3
Does the policy conform to any national/ international standards? If yes, specify?
The policies of the Company are in line with national standards and relevant international standards for its operations and business pursuits.
Principle 5.4
Has the policy been approved by the Board? If yes, has it been signed by MD/owner/CEO/appropriate Board Director?
All the policies are approved either by the Board or by designated Competent Authorities as authorised by Board.
Principle 5.5
Does the Company have a specified committee of the Board/ Director/Official to oversee the implementation of the policy?
Each Policy incorporates safeguards to ensure that its functioning is overseen by a Competent Authority / Committee.
Principle 5.6
Indicate the link for the policy to be viewed online?
The website of the Company www.ongcindia.com has the link to various policies, rules and regulations of the Company.
Principle 5.7
Has the policy been formally communicated to all relevant internal and external stakeholders?
All Policies of the Company have been suitably communicated to concerned stakeholders, both internal as well as external.
Principle 5.8
Does the Company have in-house structure to implement the policy/policies?
Yes. The Company has in place a structured set-up with adequate empowerment to implement requisite policies.
Principle 5.9
Does the Company have a grievance redressal mechanism related to the policy/policies to address stakeholders’ grievances related to the policy/policies?
Yes (as detailed under Principle 1.9 above).
Principle 5.10
Has the Company carried out independent audit/ evaluation of the working of this policy by an internal or external agency?
The policies, rules and regulations in the direction as stipulated by the principle 5 are subject to periodic audit/reviews both by internal and external agencies.
222
1. Does the policy of the Company on human rights cover only the Company or extend to the Group/ Joint Ventures/ Suppliers/ Contractors/ NGOs/ Others?
Yes, the policies towards upholding the Human Rights extend to suppliers and contractors of the Company.
2. How many stakeholder complaints have been receivedinthepastfinancialyearandwhatpercentwas satisfactorily resolved by the management?
Please refer answer to para 3 of Principle 1.10.
Principle 6:
Business should respect, protect, and make efforts to restore the environment
Principle 6.1
Do you have policy/policies for principle 6?
The Company has always ensured that it protects and cares for the environment. The Company has an integrated Health, Safety & Environment (HSE) Policy and also separate policies for Environment Management, Sustainable Development, Waste Management and e-waste policy. The Company continually strives to mitigate the environmental impact that may arise from its business activities such as exploration, drilling & production, by investing in state-of-art technologies, effluent & solid waste management, environmentmonitoring and reporting, bio-diversity conservation efforts and up-gradation and sustenance of environment management systems. The Company has a robust process of internal and external audit and management review to maintain QHSE management system and regularly reviews its policies and maps risks. Some notable HSE practicesare–RegularQHSEinternalaudit,Firesafetymeasures,regularfiremock drill, health checkup program (PME), Material Safety Data Sheet (MSDS), Personal Protective Equipment, implementation of Environment Management Systems (EMS), Occupational Health Safety (OHS), near miss reporting, Governance, Risk management and Compliance reporting.
Principle 6.2
Has the policy been formulated in consultation with the relevant stakeholders?
Yes. All policies of the Company have been formulated in consultation with stakeholders, primarily in consultation with and under the guidelines of MoP&NG and Ministry of Environment, Govt. of India and other statutory bodies.
Principle 6.3
Does the policy conform to any national /international standards? If yes, specify?
The HSE policy of the Company is in line with International Standards and conforms to ISO - 14001 and OSHAS – 18001 standards. Policies conformto all standards, practices and statutes pertaining to environmental commitments as expected from and as mandated to a Company engaged in the oil & gas business.
Principle 6.4
Has the policy been approved by the Board? If yes, has it been signed by MD/owner/CEO/appropriate Board Director?
Yes, the policy has been approved by the Board and signed by CMD.
Principle 6.5
Does the Company have a specified committee of the Board/ Director/Official to oversee the implementation of the policy?
The Company has a Committee of Directors (COD) on Health, Safety & Environment chaired by an independent director. This Board level committee oversees and reviews decisions on policy matters concerning HSE.
Principle 6.6
Indicate the link for the policy to be viewed online?
The website of the Company, www.ongcindia.com, has a separate link for HSE activities. The policies concerned are available at “reports.ongc.co.in” assessable toemployee only.
223Business Responsibility Report
Principle 6.7
Has the policy been formally communicated to all relevant internal and external stakeholders?
The HSE Policy is displayed at all the work centres and has been communicated to each employee as well as contractual employees. Further, the Company continuously engages with stakeholders at multiple levels through diverse channels, which helps in the formulation of Company’s policies directed at progressively enriching practices and sustainable operations over time.
Principle 6.8
Does the Company have in-house structure to implement the policy/policies?
The Company has dedicated HSE Department at Corporate level as well as at the Strategic Business units (SBU’s) level comprising of Assets, Basin, Plants and Institutes. Safety officers suitably trained and certifiedare posted at SBU levels to effectively manage and report safety performance.
Principle 6.9
Does the Company have a grievance redressal mechanism related to the policy/policies to address stakeholders’ grievances related to the policy/policies?
Yes.
Principle 6.10
Has the Company carried out independent audit/evaluation of the working of this policy by an internal or external agency?
The Company undertakes HSE audit at regular pre-defined intervals. External bodies engaged in granting ISO-14001 and OHSAS-18001 and other certificationagencies conduct regular auditswithin the certificationperiod to oversee that pre-requisites are being met before grantingextensionstothesecertification.TheCompanyundertakes HSE auditatregularpre-definedintervals.
1. Does the policy related to Principle 6 cover only the Company or extends to the Group/Joint Ventures/Suppliers/Contractors/NGOs/others.
The HSE policy and processes cover all the stakeholders of the Company. All suppliers, NGOs and others Business partners doing business with the Company within the Company’s premise subscribes to the Company’s policies and commitment to the environment.
2. Does the Company have strategies/ initiatives to address global environmental issues such as climate change, global warming, etc.?
The Company is aware of the risks arising due to climate change. It has a dedicated Carbon Management & Sustainability Group (CM&SG) with a specificmandate topositionONGCas theleading organization in sustainable development (SD) and to voluntarily take up carbon management as an activity to synergize all business activities with sustainable development particularly to address issues related to climate change risks and opportunities arising from carbon mitigation initiatives. The management has been active in engaging with national and international climate change forums to ensure that the organization stays current with global climate change negotiations and India’s domestic commitments. Fugitive methane emissions from oil and natural gas systems are primarily the result of normal operations and system disruptions. These emissions can be cost-effectively reduced by upgrading technologies or equipment, and by improving operations. The Global Methane Initiative (GMI) is an action-oriented initiative from USEPA to reduce global fugitive methane emissions to enhance economic growth, promote energy security, improve the environment, and reduce greenhouse gases emission. The GMI facilitates cooperative mitigation activities that result in bringing more gas to markets through the Identification,Quantification,andReduction(IQR)path.
During August, 2007, the Company tied up with United States Environmental Protection Agency for GMI activities, then known as Methane to Market projects and formed a dedicated in-house team to carry out gas leak surveys to arrest fugitive methane emission in ONGC.
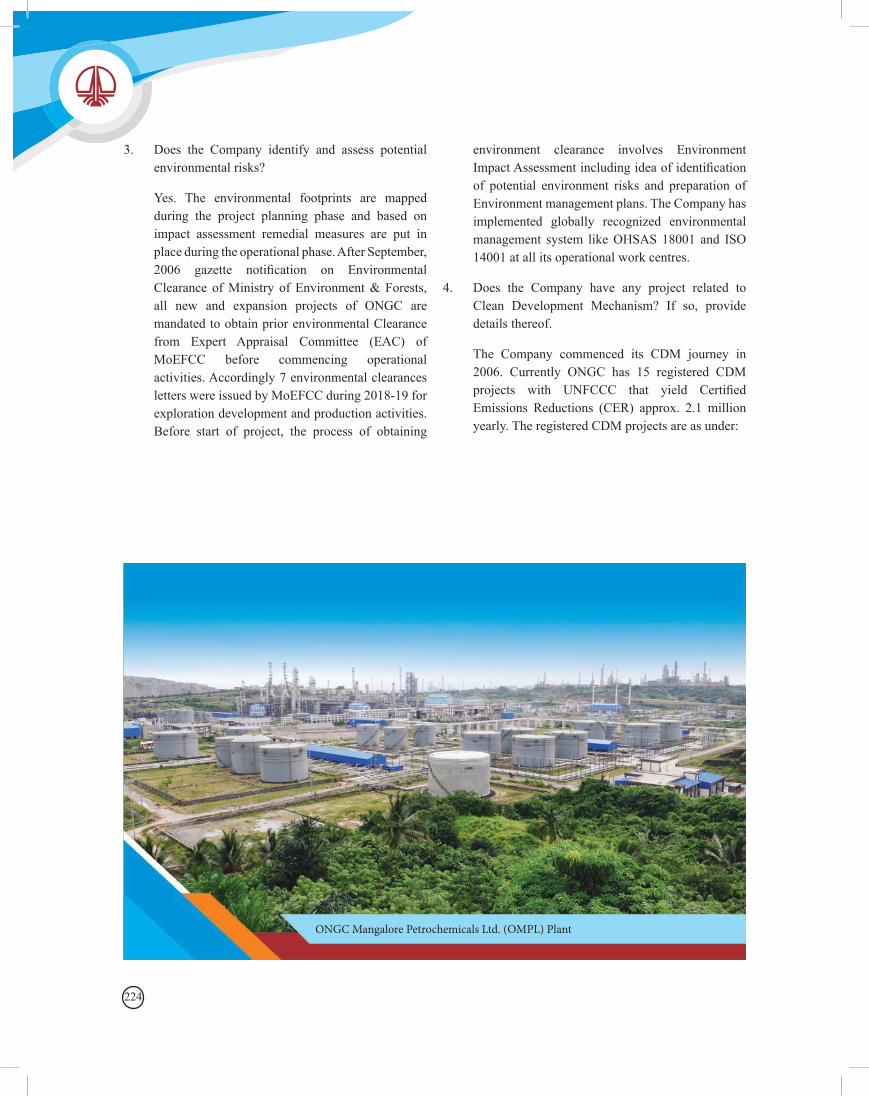
224
3. Does the Company identify and assess potential environmental risks?
Yes. The environmental footprints are mapped during the project planning phase and based on impact assessment remedial measures are put in place during the operational phase. After September, 2006 gazette notification on EnvironmentalClearance of Ministry of Environment & Forests, all new and expansion projects of ONGC are mandated to obtain prior environmental Clearance from Expert Appraisal Committee (EAC) of MoEFCC before commencing operational activities. Accordingly 7 environmental clearances letters were issued by MoEFCC during 2018-19 for exploration development and production activities. Before start of project, the process of obtaining
environment clearance involves Environment ImpactAssessmentincludingideaofidentificationof potential environment risks and preparation of Environment management plans. The Company has implemented globally recognized environmental management system like OHSAS 18001 and ISO 14001 at all its operational work centres.
4. Does the Company have any project related to Clean Development Mechanism? If so, provide details thereof.
The Company commenced its CDM journey in 2006. Currently ONGC has 15 registered CDM projects with UNFCCC that yield CertifiedEmissions Reductions (CER) approx. 2.1 million yearly. The registered CDM projects are as under:
ONGC Mangalore Petrochemicals Ltd. (OMPL) Plant
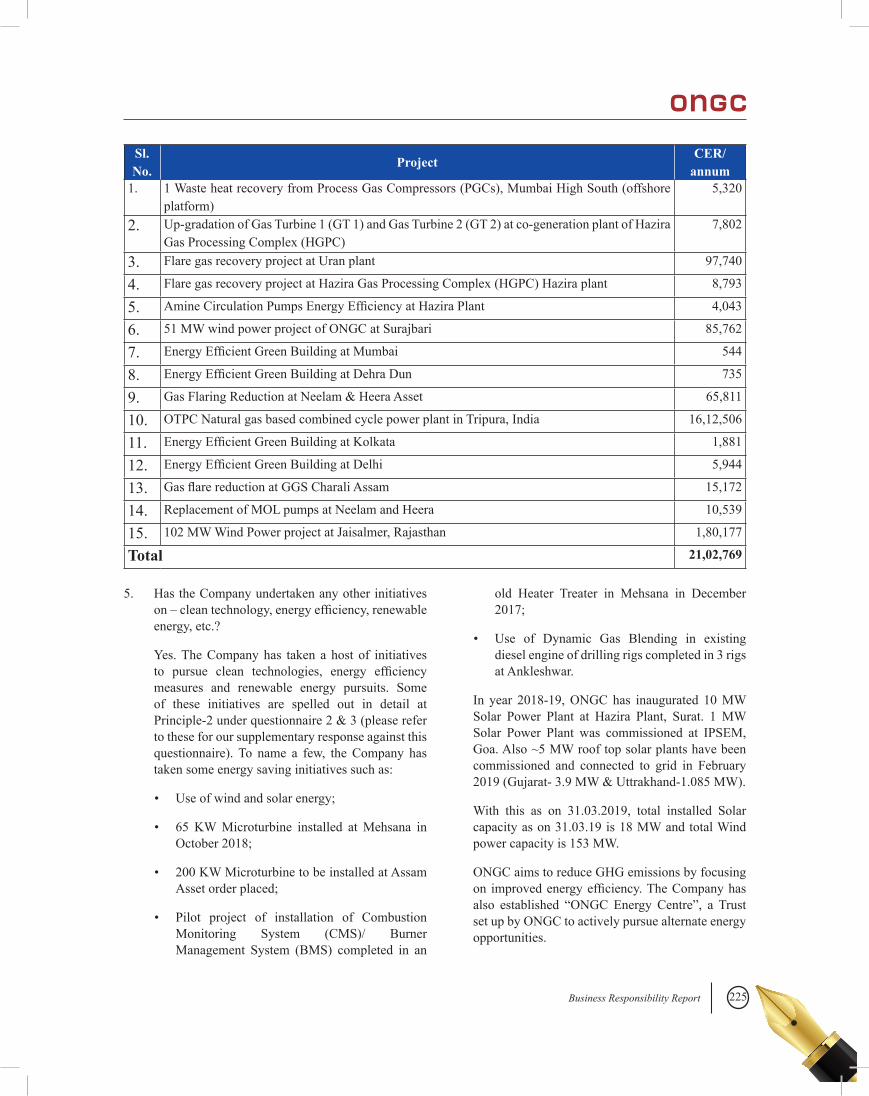
225Business Responsibility Report
Sl. No.
ProjectCER/
annum1. 1 Waste heat recovery from Process Gas Compressors (PGCs), Mumbai High South (offshore
platform)5,320
2. Up-gradation of Gas Turbine 1 (GT 1) and Gas Turbine 2 (GT 2) at co-generation plant of Hazira Gas Processing Complex (HGPC)
7,802
3. Flare gas recovery project at Uran plant 97,740
4. Flare gas recovery project at Hazira Gas Processing Complex (HGPC) Hazira plant 8,793
5. AmineCirculationPumpsEnergyEfficiencyatHaziraPlant 4,043
6. 51 MW wind power project of ONGC at Surajbari 85,762
7. EnergyEfficientGreenBuildingatMumbai 544
8. EnergyEfficientGreenBuildingatDehraDun 735
9. Gas Flaring Reduction at Neelam & Heera Asset 65,811
10. OTPC Natural gas based combined cycle power plant in Tripura, India 16,12,506
11. EnergyEfficientGreenBuildingatKolkata 1,881
12. EnergyEfficientGreenBuildingatDelhi 5,944
13. GasflarereductionatGGSCharaliAssam 15,172
14. Replacement of MOL pumps at Neelam and Heera 10,539
15. 102 MW Wind Power project at Jaisalmer, Rajasthan 1,80,177
Total 21,02,769
5. Has the Company undertaken any other initiatives on–cleantechnology,energyefficiency,renewableenergy, etc.?
Yes. The Company has taken a host of initiatives to pursue clean technologies, energy efficiencymeasures and renewable energy pursuits. Some of these initiatives are spelled out in detail at Principle-2 under questionnaire 2 & 3 (please refer to these for our supplementary response against this questionnaire). To name a few, the Company has taken some energy saving initiatives such as:
• Useofwindandsolarenergy;
• 65 KWMicroturbine installed atMehsana inOctober 2018;
• 200KWMicroturbinetobeinstalledatAssamAsset order placed;
• Pilot project of installation of CombustionMonitoring System (CMS)/ Burner Management System (BMS) completed in an
old Heater Treater in Mehsana in December 2017;
• Use of Dynamic Gas Blending in existingdiesel engine of drilling rigs completed in 3 rigs at Ankleshwar.
In year 2018-19, ONGC has inaugurated 10 MW Solar Power Plant at Hazira Plant, Surat. 1 MW Solar Power Plant was commissioned at IPSEM, Goa. Also ~5 MW roof top solar plants have been commissioned and connected to grid in February 2019 (Gujarat- 3.9 MW & Uttrakhand-1.085 MW).
With this as on 31.03.2019, total installed Solar capacity as on 31.03.19 is 18 MW and total Wind power capacity is 153 MW.
ONGC aims to reduce GHG emissions by focusing on improvedenergyefficiency.TheCompanyhasalso established “ONGC Energy Centre”, a Trustset up by ONGC to actively pursue alternate energy opportunities.
226
If yes, please give hyperlink for web page:
h t t p : / / w w w. o n g c i n d i a . c o m / w p s / w c m /c o n n e c t / o n g c i n d i a / H o m e / I n i t i a t i v e s /Corporate+Sustainability/
6. Are the Emissions/Waste generated by the Company within the permissible limits given by CPCB/SPCB forthefinancialyearbeingreported?
Yes. The emissions & waste generated by the Company is within permissible limits. Annual Environment Compliance reports are submitted by the respective work units to respective State Pollution Control Boards (SPCB). All the installations comply with environmental regulations. Procedures are in place for storage, handling and disposal of hazardous chemicals and wastes.
7. Number of show cause/ legal notices received from CPCB/SPCB which are pending (i.e. not resolved to satisfaction) as on end of Financial Year:
There are few incidental instances of environmental pollution as per regulations. All issues have been resolved with CPCB / SPCB.
Principle 7:
Businesses, when engaged in influencing public and regulatory policy, should do so in a responsible manner.
The Company being a Public Sector Enterprise is under the control of the Government of India, through the Ministry of Petroleum & Natural Gas.
Public and regulatory policies relating to operation of E&P Companies in India are formulated by the Government of India.TheCompany,perse,isnotengagedininfluencingpublic and regulatory policy. Being a PSE, the Company does not feel the necessity of having a policy on influencingthepublicandregulatorypolicies.
Principle 7.10
1. Is your Company a member of any trade and chamber or association? If Yes, Name only those major ones that your business deals with:
Yes. The Company has association with a number of trade chambers and associations such as:
• Federation of IndianChambers ofCommerceand Industry (FICCI)
• ConfederationofIndianIndustries(CII)
• Standing Conference on Public Enterprises(SCOPE)
• FederationofIndianPetroleumIndustry(FIPI)
2. Have you advocated/lobbied through above associations for the advancement or improvement of public good? Yes/No; if yes specify the broad areas (drop box: Governance and Administration, Economic Reforms, Inclusive Development Policies, Energy security, Water, Food Security, Sustainable Business Principles, Others)
The Company has always advocated constructive suggestion in areas of taxation matters, pricing policies, subsidy sharing, exploration and licensing policies, policies towards pursuing the energy security, sustainable development, corporate social responsibility and amendment to labour laws that arebeneficialtotheIndustryinspecificandsocietyin general. Further, details are available on the Company’s site www.ongcindia.com.
Principle 8:
Businesses should support inclusive growth and equitable development.
Principle 8.1
Do you have policy/ policies for principle 8?
The Company has a structured mechanism for Corporate Social Responsibility and Sustainable Development (CSR&SD). It aims to strengthen the fabric of society that the Company operates in. Through partners we identify the needs of the communities, and select and implement programs that address those needs. The CSR projects are targeted towards empowering the weakest sections of the society, such as children, women, and the elderly. The programs generate employment and business opportunities, improving the living standards of the community in turn improving the economy of the region.
Principle 8.2
Has the policy been formulated in consultation with the relevant stakeholders?
227Business Responsibility Report
The Company being a Central Public Sector Enterprise follows CSR Policy as per DPE Guidelines formulated by the Government of India and relevant provisions of the Companies Act, 2013.
Principle 8.3
Does the policy conform to any national/ international standards? if Yes, specify?
The CSR policy complies with Companies Act, 2013 and DPE Guidelines which meet International norms on CSR.
Principle 8.4
Has the policy been approved by the Board? If Yes, has it been signed by MD/ owner/ CEO/ appropriate Board Director?
Yes, CSR&S policies of the Company are approved by Board. All activities pursued under CSR schemes are approved by the Competent Authority as per the Company’s Book of Delegated Powers-2015.
Principle 8.5
Does the Company have a specified committee of the Board/ Director/ Official to oversee the implementation of the policy?
The Company has a Committee on CSR chaired by Independent Director which conforms to the DPE Guidelines on CSR & SD as well as Section 135 of the Companies Act, 2013. Director (HR) is the nodal Functional Director for implementation of CSR initiatives of ONGC who executes the activities through corporate and work centre level units.
Principle 8.6
Indicate the link for the policy to be viewed online?
The Company’s website, www.ongcindia.com, has link to CSR&S policies.
Principle 8.7
Has the policy been formally communicated to all relevant internal and external stakeholders?
Yes, for internal stakeholders, all these policies are available on-line on Company websites and also propagatedthroughitsCollectives,OfficersAssociation
and other relevant associations. For external stakeholders, communication in this regard is pursued through interactions at multiple levels.
Principle 8.8
Does the Company have in-house structure to implement the policy/ policies?
The Company has a structured framework and laid down well documented procedures in place to execute and implement its policies. There is an exclusive Department for CSR- headed by Chief CSR, to implement CSR activities throughout the organization.
Principle 8.9
Does the Company have a grievance redressal mechanism related to the policy/policies to address the stakeholders’ grievance related to the policy / policies?
Yes.
Principle 8.10
1. Does the Company have specified programmes/initiatives/projects in pursuit of the policy related to Principle 8?
ONGC is committed to understand the developmental needs of economically weaker, differently abled and less privileged sections in identifiedgeographicallocationsinIndiaprimarilyaround the remote operational areas of the Company thus creating a more inclusive and equitable world .
Corporate Social Responsibility (CSR) at ONGC is astructuredmechanismofengagingandbenefitingthe local communities in the areas where we operate. It aims to strengthen the fabric of the society that we operate in. Through our implementation partners we identify the needs of the communities, and select and implement programs that address those needs. Our CSR projects are targeted towards empowering the weakest sections of the society, such as children, women, and the elderly. Our programs generate employment & business opportunities, improving the living standards of the community in turn improving the economy of the region.
2. Are the programmes/projects undertaken through
228
in-house team/own foundation/external NGO/government structures/any other organization?
The CSR projects or programs are implemented through in-house CSR team and ONGC Foundation. ONGC also implements its CSR agenda through other trust, society or Company established under Section-8 of Companies Act, 2013, having a track record of three years in undertaking similar programs or projects.
3. Have you done any impact assessment of your initiative?
Impact assessment, both concurrent andfinal, areconducted by expert third party agency to assess the direct and indirect impact of a few select projects.
4. What is your Company’s direct contribution to community development projects-Amount in INR and the details of the projects undertaken?
`6146.40 million has been spent by ONGC during 2018-19 on community development projects as detailed at Annexure-B to Board’s Report 2018-19.
5. Have you taken steps to ensure that this community development initiative is successfully adopted by the community?
ONGC endeavors to understand the stakeholder expectations through a structured engagement process and communication strategy and leverages this understanding for betterment of all the stakeholders. Company’s endeavors in this regard are uniquely positioned to herald a business paradigm that is based on an interconnected vision of all people’s well-being, growth and contentment: by enabling citizens and local communities to be informed partners in the enterprise, be accountable in its consumption of environmental resources; and foster local communities that are prosperous and content; and manage their resources commonly and sustainably. To generate goodwill in the communities in and around ONGC’s operational areas by not only mitigating operational impact but through creating social value that is sustainable and inclusive.
Principle 9:
Businesses should engage with and provide value to their customers and consumers in a responsible
manner
Principle 9.1
Do you have policy/policies for principle 9?
The Company engages with customers and consumers in a manner that demonstrates best business practices and creates a win-win proposition for all doing business with the Company as per mutually agreed business principles and deliverables. The Company’s main customers are OilRefining&GasMarketingCompaniestowhichtheCompany’s produce, that is oil and gas, is allocated by the Government of India. The Company enters into a Crude Oil Sale Agreement (COSA) with the Oil Marketing Companies (OMCs) and Gas Sales Agreement (GSA) with GAIL to whom it sells the Crude Oil, Natural Gas etc., following the crude oil /gas sales allocations as done by Govt. of India. The COSA/GSA incorporates suitable provisions with regard to the quality and quantity of the product being supplied by ONGC. Besides this, the Company also sells its produce to other direct customers under GSA.
Principle 9.2
Has the policy been formulated in consultation with the relevant stakeholders?
The COSA/GSA of the Company has been arrived at in consultation with OMCs and Gas marketing companies on mutually agreed terms. Other sales or purchase agreement are also agreed mutually. The Company has therefore laid down policies and guidelines for engaging with and providing value to their customers and consumers in a responsible manner.
Principle 9.3
Does the policy conform to any national/international standards? If yes, specify?
ThespecificationsofqualityandmeasurementinCOSA/GSA are in accordance with International standards. Moreover, the Company ensures that policies followed are as per guidelines of the Government of India.
Principle 9.4
Has the policy been approved by the Board? If yes, has it been signed by MD/ owner/ CEO/ appropriate Board Director?
Yes. The COSA/ GSA are signed by the designated
229Business Responsibility Report
authorities after seeking approval as per Book of Delegated Powers 2015.
Principle 9.5
Does the Company have a specified committee of the Board/ Director/Official to oversee the implementation of the policy?
The Company has a structured and dedicated marketing department / establishment headed by E7/E8/E9 level executive to oversee implementation of relevant policies in this regard.
Principle 9.6
Indicate the link for the policy to be viewed online?
COSA/GSAbeingabipartiteagreementisaconfidentialdocument and is not available for inspection to the public. Further the general guidelines on standard terms of business and also contract terms and conditions of conducting business with the Company are available on the site www.ongcindia.com.
Principle 9.7
Has the policy been formally communicated to all relevant internal and external stakeholders?
Yes.
Principle 9.8
Does the Company have in-house structure to implement the policy/policies?
As given in response against 9.5 above.
Principle 9.9
Does the Company have a grievance redressal mechanism related to the policy/policies to address stakeholders’ grievances related to the policy/policies?
Yes. COSA/GSA has a built in mechanism for stakeholders’ grievance redressal.
Principle 9.10
Has the Company carried out independent audit/evaluation of the working of this policy by an internal or external agency?
The COSA/GSA is subject to review as may be mutually
agreed upon.
1. What percentage of customer complaints/consumer casesarependingasontheendoffinancialyear:
Customer complaints/consumer cases are being dealt at Asset/Plant level.
2. Does the Company display product information on the product label, over and above what is mandated as per local laws?
Forcrudeoilsale,Batchwisecertificatesareissuedfor Crude Oil, which includes various quality parameters including the BS&W. Product labelling related to storage procedures and safety precautions are clearly indicated at the Company’s installations holding the crude.
All Natural Gas supplied by the Company to various customers conforms to the agreed contractual specifications.
All VAP’s are supplied with batch-wise test reports and standard handling procedures to be followed in line with OISD/other statutory standards. Relevant BIS specifications (if applicable) andqualitycertificateswithparametersareissuedwhiledispatching. Product labelling related to storage procedures and safety precautions are clearly indicated at all the installations holding the VAP product.
3. Is there any casefiledby any stakeholder againstthe Company regarding unfair trade practices, irresponsible advertising and/or anti-competitive behaviourduringthelastfiveyearsandpendingasonendoffinancialyear:
No.
4. Did your Company carry out any consumer survey/ consumer satisfaction trends?
The Company interacts on regular basis with its B2B customers with respect to product quality and pricing. This kind of interaction with our partners ensures customer satisfaction. Any concerns related to the product by any of our consumers are addressed immediately. In view of constant interaction and feedback through meetings, no need has been felt to undertake separate surveys to measure customer satisfaction.
230
Independent Auditors’ ReportTo the Members of Oil and Natural Gas Corporation Limited
Report on the Audit of the Standalone Financial Statements
1. Opinion We have audited the accompanying standalone
financial statements of Oil and Natural GasCorporation Limited (“the Company”), whichcomprise the Balance Sheet as at 31st March 2019, theStatementofProfit andLoss (includingOther Comprehensive Income), the Statement of Changes in Equity and the Statement of Cash Flows for the year then ended, and notes to the standalone financial statements, including asummary of significant accounting policies andother explanatory information (hereinafter referred toas“thestandalonefinancialstatements”).
In our opinion and to the best of our information and according to the explanations given to us, the aforesaid standalone financial statements give theinformation required by the Companies Act, 2013 (“theAct”) in themanner so required and give atrue and fair view in conformity with the Indian AccountingStandardsspecifiedundersection133ofthe Act read with the Companies (Indian Accounting Standards) Rules, 2015, as amended, (‘IndAS”)and other accounting principles generally accepted in India, of the state of affairs of the Company as at 31stMarch2019,and itsprofit (includingothercomprehensive income), the changes in equity and itscashflowsfortheyearendedonthatdate.
2. Basis for Opinion Weconductedourauditofthestandalonefinancial
statements in accordance with the Standards on Auditing (SAs) specified under section 143(10)of the Act. Our responsibilities under those Standards are further described in the Auditor’s Responsibilities for the Audit of the Standalone Financial Statements section of our report. We are
independent of the Company in accordance with the Code of Ethics issued by the Institute of Chartered Accountants of India together with the ethical requirements that are relevant to our audit of the standalonefinancialstatementsundertheprovisionsof the Act and the Rules made thereunder, and we have fulfilled our other ethical responsibilities inaccordance with these requirements and the Code of Ethics. We believe that the audit evidence we have obtained issufficientandappropriate toprovideabasis for our opinion on the standalone financialstatements.
3. Emphasis of Matter We draw attention to Note 48.1.1(c) of the
standalonefinancialstatements,whereinitisstatedthat Directorate General of Hydrocarbons (DGH) had raised a demand on all the JV partners under the Production Sharing Contract with respect to Panna-Mukta and Mid and South Tapti contract areas (PMT JV), being BG Exploration and Production India Limited (BGEPIL) and Reliance Industries Limited (RIL) (together “theClaimants”)andtheCompanytowardsdifferentialGOI share of Profit Petroleum and Royaltyalleged to be payable by contractor pursuant to Government’s interpretation of the Final Partial Award (40% share of the Company amounting to USD 1624.05 million equivalent to `112,400.50 million, including interest upto 30th November, 2016). Subsequent to London High Court Orders dated 16th April, 2018 and 2nd May, 2018, DGH vide letter dated 4th May, 2018, 15th May, 2018 and 4th June, 2018 had asked for re-casting of accounts of the PMT JV and for remitting the respective PI share of balance dues including interest till the date of remittance. As the Company is not a party to the arbitration, the details of the proceedings of arbitration and copy of the order of London High Court are not available with the Company. The
231Independent Auditors’ Report
Company has responded that as of now, neither the Arbitral Tribunal nor the London High Court has passedanyorderorquantifiedanyamountdueandpayable by the Company and in the circumstances; the demand of DGH from the Company for any sum orinterestthereonisprematureandnotjustified.IntheCompany’sview,pendingfinalquantificationofliabilities by the Arbitration Tribunal, it is not liable to implement the Final Partial Award (FPA) being pre-mature and therefore no provision for the same has been considered necessary and the same has been considered as contingent liability.
Ouropiniononthestandalonefinancialstatements
isnotmodifiedinrespectoftheabovematter.
4. Key Audit Matters Key audit matters are those matters that, in our
professionaljudgment,wereofmostsignificanceinourauditofthesestandalonefinancialstatementsofthe current period. These matters were addressed in thecontextofourauditofthestandalonefinancialstatements as a whole, and in forming our opinion thereon, and we do not provide a separate opinion on these matters. We have determined the matters described below to be the key audit matters to be communicated in our report:
Key Audit Matter How our audit addressed the matterEvaluation of adequacy of provision for impairment for tangible and intangible assets (Refer Note 47 to the standalone financial statements)Management has assessed whether any provision needs to be recognised on account of impairment of tangible and intangible assets.
The Company reviews the carrying amount of its tangible and intangible assets (Oil and Gas Assets, Development Wells in Progress (DWIP), Property, Plant & Equipment (includingCapitalWorks-in-Progress) for the “CashGeneratingUnit”(CGU)determinedattheendofeachreporting period to assess whether there is any indication that those assets have suffered any impairment loss.
The determination of recoverable amount, being the higher of fair value less costs to sell and value- in-use, requires judgement on the part of management.
In case of exploration and evaluation assets, based on management judgment, assessment for impairment is carried out when further exploration activities are not planned innear futureorwhen sufficientdata indicatethat although a development is likely to proceed, the carrying amount of the exploration asset is unlikely to be recovered in full from successful development or by sale.
We have considered the measurement of impairment as KeyAuditMatterasitrequiressignificantmanagementjudgment.
Our audit procedures included the following:
We evaluated the appropriateness of management’s identificationoftheCGUsandexplorationandevaluationassets and tested the operating effectiveness of controls over the impairment assessment process, including indicators of impairment.
We performed testing of the mathematical accuracy of thecashflowmodelsandvalidatedtheappropriatenessof the related disclosures.
We evaluated management’s assessment whether any indicators of impairment existed by comparing the recoverable amount to the carrying amounts of respective CGUs in the books of accounts.
232
Estimation of Decommissioning liability (Refer Note 24.1 to the standalone financial statements)
The Company has an obligation to restore and rehabilitatethefieldsoperateduponbytheCompanyatthe end of their use. This decommissioning liability is recorded based on estimates of the costs required to fulfillthisobligation.
Our audit procedures included the following:
Evaluated the approach adopted by the management in determining the expected costs of decommissioning.
Identifiedthecostassumptionsusedthathavethemostsignificant impact on the provisions and tested theappropriateness of these assumptions.
The provision is based upon current cost estimates and has been determined on a discounted basis with reference to current legal requirements and technology. At each reporting date the decommissioning liability is reviewed and re- measured in line with changes in observable assumptions, timing and the latest estimates of the costs to be incurred at reporting date.
We have considered the measurement of decommissioning costs as Key Audit Matter as it requires significantmanagementjudgment,includingaccountingcalculations and estimates that involves high estimation uncertainty.
Reviewedtheappropriatenessofdiscountandinflationrates used in the estimation.
Verifiedtheunwindingofinterestaswellasunderstandingif any restoration was undertaken during the year.
Relied on the judgments of the internal experts for the use of technical /commercial evaluation.
Performed a review to ensure that all key movements were understood, corroborated and recorded correctly
Assessed the appropriateness of the disclosures made in thefinancialstatements.
Litigations and Claims (Refer Note 48 to the standalone financial statements)
Litigation and claims are pending with multiple tax and regulatory authorities and there are claims from vendors/suppliers and employees which have not been acknowledged as debt by the company (including Joint Operations).
In the normal course of business, financial exposuresmay arise from pending legal/regulatory proceedings and from above referred claims not acknowledged as debt by the company. Whether a claim needs to be recognized as liability, disclosed as contingent liability or considered as remote in the standalone financial statements isdependent on a number of significant assumptionsand judgments. The amounts involved are potentially significant and determining the amount, if any, to berecognized or disclosed in the financial statements, isinherently subjective.
We have considered Litigations and claims as Key Audit Matterasitrequiressignificantmanagementjudgment,including accounting estimates that involves high estimation uncertainty.
Our audit procedures included the following:
Understood Management’s process and control for determining tax litigations and other litigations and claims and its appropriate accounting and disclosure.
Tested key controls surrounding such litigations
Discussed pending matters with the Company’s legal department
Assessed management’s conclusions through understanding precedents set in similar cases.
We have assessed the appropriateness of presentation of the most significant contingent liabilities in thestandalonefinancialstatements
233Independent Auditors’ Report
5. Other Mattersi. We have placed reliance on technical/
commercial evaluation by the management in respect of categorization of wells as exploratory, development, producing and dry well, allocation of cost incurred on them, proved (developed and undeveloped)/ probable hydrocarbon reserves and depletion thereof on Oil and Gas Assets, impairment, liability for decommissioning costs, liability for NELP and nominated blocks for under performance against agreed Minimum Work Programme.
ii. The standalone financial statements includethe Company’s share in the total value of assets, liabilities, expenditure and income of 137 blocks under New Exploration Licensing Policy (NELP)/ Hydrocarbon Exploration and Licensing Policy (HELP) / Joint Operations (JO) accounts for exploration and production out of which:
a. 4 NELPs/ JOs accounts have been certifiedby other Chartered Accountants. In respect of these 4 NELPs/ JOs, standalone financialstatements include proportionate share in assets and liabilities as on 31st March, 2019 amounting to `26,142.08 million and `23,736.94 million respectively and revenue and profit includingother comprehensive Income for the year ended 31st March, 2019 amounting to `16,963.56 million and `6,697.93 million respectively, Our opinionisbasedsolelyonthecertificateoftheother Chartered Accountants
b. 13 NELPs / JOs have been certified by themanagement in respect of NELPs / JOs operated by other operators. In respect of these 13 NELPs / JOs, standalone financial statements includeproportionate share in assets and liabilities as on 31st March, 2019 amounting to `87,590.75 million and `44,793.78 million respectively and revenue and profit including othercomprehensive Income for the year ended 31st March, 2019 amounting to `104,402.84 million and `27,399.63 million respectively,
Our opinion is based solely on management certifiedaccounts.
iii. The standalone financial statements of theCompany for the year ended 31st March, 2018 were audited by joint auditors of the Company twoofwhich are the predecessor audit firms,andhaveexpressedanunmodifiedopiniondatedMay30,2018onsuchfinancialstatements.
Our opinion on the standalone financialstatementsisnotmodifiedinrespectofabovematters.
6. Information Other than the Standalone Financial Statements and Auditor’s Report Thereon
The Company’s Board of Directors is responsible for the preparation of the other information. The other information comprises the information included in the Board’s Report including Annexures to Board’s Report, Management Discussion and Analysis, Business Responsibility Report and Report on Corporate Governance but does not include the standalone financial statements and our auditors’report thereon. The above-referred information is expected to be made available to us after the date of this audit report.
Ouropiniononthestandalonefinancialstatementsdoes not cover the other information and we do not express any form of assurance conclusion thereon.
In connection with our audit of the standalone financialstatements,ourresponsibilityistoreadtheotherinformationidentifiedabovewhenitbecomesavailable and, in doing so, consider whether the other information is materially inconsistent with the standalone financial statements or our knowledgeobtained in the audit or otherwise appears to be materially misstated. If, based on the work we have performed, we conclude that there is a material misstatement of this other information, we are required to report that fact.
When we read the other information, if we conclude that there is a material misstatement therein, we are
234
required to communicate the matter to those charged with governance and take appropriate actions necessitated by the circumstances and the applicable laws and regulations.
7. Responsibilities of Management and Those Charged with Governance for the Standalone Financial Statements
The Company’s Board of Directors is responsible for the matters stated in section 134(5) of the Act with respect to the preparation of these standalone financial statements thatgivea trueand fairviewof the financial position, financial performance,changesinequityandcashflowsoftheCompanyin accordance with the accounting principles generally accepted in India, including the Indian Accounting Standards specified under section133 of the Act. This responsibility also includes maintenance of adequate accounting records in accordance with the provisions of the Act for safeguarding of the assets of the Company and for preventing and detecting frauds and other irregularities; selection and application of appropriate accounting policies; making judgments and estimates that are reasonable and prudent; and design, implementation and maintenance of adequate internal financial controls, that wereoperating effectively for ensuring the accuracy and completeness of the accounting records, relevant to the preparation and presentation of the standalone financial statements thatgivea trueand fairviewand are free from material misstatement, whether due to fraud or error.
Inpreparingthestandalonefinancialstatements,theBoard of Directors is responsible for assessing the Company’s ability to continue as a going concern, disclosing, as applicable, matters related to going concern and using the going concern basis of accounting unless management either intends to liquidate the Company or to cease operations, or has no realistic alternative but to do so.
Those Board of Directors are also responsible for overseeing the Company’s financial reportingprocess.
8. Auditor’s Responsibilities for the Audit of Standalone Financial Statements
Our objectives are to obtain reasonable assurance aboutwhetherthestandalonefinancialstatementsasa whole are free from material misstatement, whether due to fraud or error, and to issue an auditors’ report that includes our opinion. Reasonable assurance is a high level of assurance, but is not a guarantee that an audit conducted in accordance with SAs will always detect a material misstatement when it exists. Misstatements can arise from fraud or error and are considered material if, individually or in the aggregate, they could reasonably be expected to influencetheeconomicdecisionsofuserstakenonthebasisofthesestandalonefinancialstatements.
As part of an audit in accordance with SAs, we exercise professional judgment and maintain professional skepticism throughout the audit. We also:
• Identify and assess the risks of materialmisstatement of the standalone financialstatements, whether due to fraud or error, design and perform audit procedures responsive to those risks, and obtain audit evidence that is sufficientandappropriatetoprovideabasisforour opinion. The risk of not detecting a material misstatement resulting from fraud is higher than for one resulting from error, as fraud may involve collusion, forgery, intentional omissions, misrepresentations, or the override of internal control.
• Obtainanunderstandingofinternalcontrolrelevant to the audit in order to design audit procedures that are appropriate in the circumstances. Under section 143(3)(i) of the Act, we are also responsible for expressing our opinion on whether the Company has adequate internal financial controls with reference tofinancialstatementsinplaceandtheoperatingeffectiveness of such controls.
• Evaluate the appropriateness of accountingpolicies used and the reasonableness of accounting estimates and related disclosures made by management.
235Independent Auditors’ Report
• Conclude on the appropriateness ofmanagement’s use of the going concern basis of accounting and, based on the audit evidence obtained, whether a material uncertainty exists related to events or conditions that may cast significant doubt on theCompany’s ability tocontinue as a going concern. If we conclude that a material uncertainty exists, we are required to draw attention in our auditors’ report to the related disclosures in the standalone financial statements or, if such disclosuresare inadequate, to modify our opinion. Our conclusions are based on the audit evidence obtained up to the date of our auditors’ report. However, future events or conditions may cause the Company to cease to continue as a going concern.
• Evaluatetheoverallpresentation,structureandcontentof thestandalonefinancialstatements,including the disclosures, and whether the standalone financial statements represent theunderlying transactions and events in a manner that achieves fair presentation.
We communicate with those charged with governance regarding, among other matters, the plannedscopeandtimingoftheauditandsignificantauditfindings,includinganysignificantdeficienciesin internal control that we identify during our audit.
We also provide those charged with governance with a statement that we have complied with relevant ethical requirements regarding independence, and to communicate with them all relationships and
other matters that may reasonably be thought to bear on our independence, and where applicable, related safeguards.
From the matters communicated with those charged with governance, we determine those matters thatwere ofmost significance in the audit of thestandalone financial statements of the currentperiod and are therefore the key audit matters. We describe these matters in our auditors’ report unless law or regulation precludes public disclosure about the matters or when, in extremely rare circumstances, we determine that a matter should not be communicated in our report because the adverse consequences of doing so would reasonably beexpectedtooutweighthepublicinterestbenefitsof such communication
9. Report on Other Legal and Regulatory Requirements1. As required by the Companies (Auditor’s
Report)Order,2016(“theOrder”),issuedbytheCentral Government of India in terms of sub-section (11) of section 143 of the Companies Act,2013,wegivein“Annexure-1”astatementonthemattersspecifiedinparagraphs3and4of the Order, to the extent applicable.
2. Basedonverificationofbooksofaccountsofthe Company and according to information and explanations given to us, we give below a report on the Directions issued by the Comptroller and Auditor General of India in terms of Section 143(5) of the Act:
236
Directions Replies
Whether the Company has system in place to process all the accounting transactions through IT system? If yes, the implication on the integrity of the accounts along withthefinancialimplications,ifany,maybestated;
Yes, the Company has system in place to process all the accounting transactions through IT system, namely SAP.Basedontheverificationcarriedoutbyusduringthe course of our audit and based on the information and explanations given to us, we have not come across any instancehavingsignificantimplicationsontheintegrityof accounts.
Whether there is any restructuring of an existing loan or cases of waiver/ write-off of debts/ loans/ interest etc. made by a lender to the company due to the Company’s inability to repay the loan? Ifyes, thefinancial impactmay be stated;
There are no such cases made by a lender to the company due to its inability to repay the loan during the year
Whetherfundsreceived/receivableforspecificschemes from Central/ State agencies were properly accounted for/ utilized as per its term and conditions? List the cases of deviation.
As per the information and explanations given to us the Company does not have any funds received/ receivable forspecificschemesfromCentral/Stateagencies.
3. As required by Section 143(3) of the Act, we report that:
a. We have sought and obtained all the information and explanations which to the best of our knowledge and belief were necessary for the purposes of our audit;
b. In our opinion proper books of account as required by law have been kept by the Company so far as it appears from our examination of those books;
c. TheBalanceSheet,theStatementofProfitandLoss including Other Comprehensive Income, the Statement of Changes in Equity and Cash flowsdealtwithbythisReportareinagreementwith the books of account;
d. In our opinion, the aforesaid standalone financialstatementscomplywiththeIndASspecifiedunderSection133oftheAct;
e. AspernotificationnumberG.S.R.463(E)dated5th June, 2015 issued by Ministry of Corporate
Affairs, section 164(2) of the Act regarding the disqualificationsofDirectors isnotapplicableto the Company, since it is a Government Company;
f. With respect to the adequacy of the internal financial controls with referenceto financial statements of the Companyand the operating effectiveness of such controls, refer to our separate report in “Annexure2”;
g. AspernotificationnumberG.S.R.463(E)dated5th June, 2015 issued by Ministry of Corporate Affairs, section 197 of the Act regarding remuneration to director is not applicable to the Company, since it is a Government Company; and
h. with respect to the other matters to be included in the Auditors’ Report in accordance with Rule 11 of the Companies (Audit and Auditors)
237Independent Auditors’ Report
For K.C. Mehta & Co.Chartered AccountantsFirm Reg. No.106237W
Sd/-Vishal P. DoshiPartner (M.No. 101533)
For MKPS & AssociatesChartered AccountantsFirm Reg. No: 302014E
Sd/-Nikhil K. AgrawallaPartner (M.No. 157955)
For PKF Sridhar & Santhanam LLPChartered AccountantsFirm Reg. No. 003990S/S200018
Sd/-V. Kothandaraman Partner (M.No. 025973)
For G M Kapadia & Co.Chartered Accountants Firm Reg. No: 104767W
Sd/-Rajen AsharPartner (M.No. 048243)
For Dass Gupta & AssociatesChartered AccountantsFirm Reg. No. 000112N
Sd/-Nitesh GoelPartner (M.No.542071)
For R Gopal & AssociatesChartered AccountantsFirm Reg. No: 000846C
Sd/-Sunil Kumar AgarwalPartner (M.No. 093209)
New Delhi30th May, 2019
Rules, 2014, in our opinion and to the best of our information and according to the explanations given to us:
i. The Company has disclosed the impact of pending litigations on its financial position initsstandalonefinancialstatements–ReferNote48.1.1tothestandalonefinancialstatements;
ii. the Company did not have any long-term
contracts including derivative contracts for which there were any material foreseeable losses- Refer Note 54 to the standalone financialstatements;
iii. there has been no delay in transferring amounts, required to be transferred, to the Investor Education and Protection Fund by the Company.
238
Annexure - 1 to the Auditors’ Report
(Referred to in paragraph 9(1) under ‘Report on Other Legal and Regulatory Requirements’ section of our report of even date)
Nature Number of assets Gross Block Net BlockLease hold land 13 501.70 304.56Free hold land 3 58.17 58.17Building 6 154.92 54.34Total 22 714.79 417.07
(` in million)
i.a. The Company has generally maintained
proper records showing full particulars, including quantitative details and situation of fixedassets.
b. As per the information and explanations given to us and on the basis of our examination of the records of the Company, the fixed assetshaving substantial value, other than those which are underground/ submerged/ under joint operations have been physically verifiedby the management in a phased manner, which in our opinion is reasonable, having regard to the size of Company and nature of its business. The reconciliation of physically
verifiedassetswiththebookrecordsisinprogress. Discrepancies noticed on the physical verificationandconsequentialadjustmentsarecarried out on completion of reconciliation. According to information and explanations given by the management and in our opinion, the same are not material.
c. On the basis of the information to the extent compiled by the Company pending the reconciliation of the available records with the books of account and considering the voluminous nature and various locations, we report that the title/lease deeds of immovable properties are held in the name of Company except for the following where the title/lease deeds are not available with the Company:
ii. According to the information and explanations given tous,theinventoryhasbeenphysicallyverifiedinphased manner at reasonable intervals (excluding inventory lying with third parties, inventory under joint operations and material in transit) during the year by the management which did not reveal any material discrepancies.
iii. The Company has not granted loans, secured or unsecuredtoanycompanies,firms,limitedliabilitypartnerships or other parties covered in the register maintained under section 189 of the Act.
iv. In our opinion and according to the information and explanations given to us, the Company has not advanced loans to directors / to a Company in which the Director is interested to which provisions of section 185 of the Act apply. The provisions of section 186 of the Act, in our opinion, are not applicable to the Company.
v. In our opinion and according to information and explanations given to us, the Company has not accepted any deposits as per the provisions of the Act.
239Independent Auditors’ Report
(` in million)
Name of Statute Forum where Dispute is pending
Period to which the amount relates (Financial Year)
Gross Amount
Involved
Amount paid under
protest
AmountUnpaid
Central ExciseAct, 1944
Commissioner 2015-17;2018-19 16.37 13.02 3.35
Custom, Excise and Service Tax Appellate Tribunal
2001-09;2011-15 1,207.91 2.75 1,205.16
Hon. High Court1996-97;2007-14;2015-16
383.77 4.32 379.45
Hon. Supreme Court 2000-01 1,176.60 - 1,176.60Total (A) 2,784.65 20.09 2,764.56
The CustomsAct, 1962
Commissioner 1987-88 331.32 - 331.32Custom, Excise and Service Tax Appellate Tribunal
2007-08; 2010-11 5.00 1.00 4.00
Hon. High Court 2013 463.93 - 463.93Total (B) 800.25 1.00 799.25
Income Tax Act 1961
Commissioner/ (Appeals) and Additional Commissioner
2006-15 81,243.04 75,896.49 5,346.55
Income Tax Appellate Tribunal 2007-12; 2018-19 37,661.51 37,608.91 52.60
Hon High Court 1994-95; 2000-01 1,127.76 1,118.85 8.91Total (C) 1,20,032.31 1,14,624.25 5,408.06
vi. We have broadly reviewed the cost records maintained by the Company pursuant to the Companies (Cost Records and Audit) Rules, 2014, as amended and prescribed by the Central Government under sub section(1) of section 148 of the Act and we are of the opinion that prima facie the prescribed accounts and records have been made and maintained. However, we have not made a detailed examination of the cost records with the view to determine whether they are accurate or complete.
vii.
a. According to records of the Company, undisputed statutory dues including Provident Fund, Income
Tax, Sales Tax, Service Tax, Duty of Customs, Duty of Excise, Value Added Tax, Goods and Service Tax, Cess and other statutory dues have generally been regularly deposited with the appropriate authorities. According to the information and explanations given to us, no undisputed amounts payable in respect of the aforesaid dues were outstanding as at 31st March, 2019 for a period more than six months from the date of becoming payable.
b. According to the information and explanations given to us, there were no dues in respect of Income Tax, Duty of Excise, Duty of Customs, Sales Tax, Service Tax, Value Added Tax and Goods and Service Tax which have not been deposited on account of any dispute except the following:
240
Goods andServices Tax
Hon High Court 2017-18;2018-19 37,956.78 28,065.77 9,891.01
Total (D) 37,956.78 28,065.77 9,891.01
Central Sales Tax Act,1956 and Re-spective States' Sales Tax Acts
Commissioner/Joint Commissioner/Commissioner-Appeals/ Joint Commissioner- Appeals
2000-02;2005-06;2007-08;2009-13;2014-15
4,924.30 21.25 4,903.05
Appellate Tribunal/ FirstAppellate Authority
1993-94;1998-2000;2001-07;2011-13
8,349.43 66.61 8,282.82
Hon. High Court
1978-79;1992-95;2006-07;2011-13
51.77 26.48 25.29
Hon. Supreme Court 2002-13;2016-17 11,782.60 623.96 11,158.64
Total (E) 25,108.10 738.30 24,369.80
Service Tax
Commissioner/ (Appeals), Joint Comm., Additional Comm. of Custom, Excise and Service Tax
2004-05;2006-13;2015-17
7,926.93 5.34 7,921.59
Custom, Excise and Service Tax Appellate Tribunal/ First Appellate Authority
2003-15;2016-19 40,345.36 13,751.02 26,594.34
Hon. High Court2004-07;2012-13;2015-17
222.05 2.56 219.49
Hon. Supreme Court 2015-16 2.53 0.37 2.16Total (F) 48,496.87 13,759.29 34,737.58
Grand Total (A+B+C+D+E+F) 2,35,178.96 1,57,208.70 77,970.26
Name of Statute Forum where Dispute is pending
Period to which the amount relates (Financial Year)
Gross Amount
Involved
Amount paid under
protest
AmountUnpaid
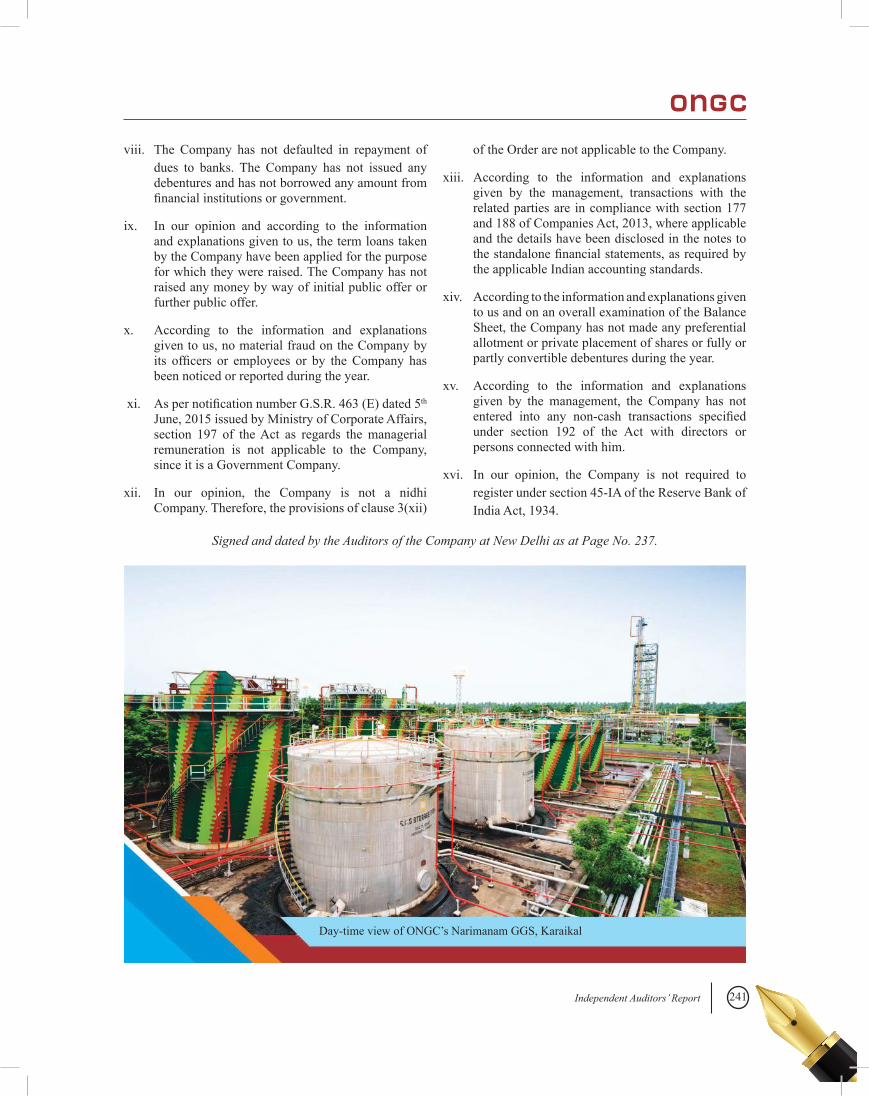
241Independent Auditors’ Report
viii. The Company has not defaulted in repayment of dues to banks. The Company has not issued any debentures and has not borrowed any amount from financialinstitutionsorgovernment.
ix. In our opinion and according to the information and explanations given to us, the term loans taken by the Company have been applied for the purpose for which they were raised. The Company has not raised any money by way of initial public offer or further public offer.
x. According to the information and explanations given to us, no material fraud on the Company by its officers or employees or by theCompany hasbeen noticed or reported during the year.
xi. AspernotificationnumberG.S.R.463(E)dated5th June, 2015 issued by Ministry of Corporate Affairs, section 197 of the Act as regards the managerial remuneration is not applicable to the Company, since it is a Government Company.
xii. In our opinion, the Company is not a nidhi Company. Therefore, the provisions of clause 3(xii)
of the Order are not applicable to the Company.
xiii. According to the information and explanations given by the management, transactions with the related parties are in compliance with section 177 and 188 of Companies Act, 2013, where applicable and the details have been disclosed in the notes to thestandalonefinancialstatements,asrequiredbythe applicable Indian accounting standards.
xiv. According to the information and explanations given to us and on an overall examination of the Balance Sheet, the Company has not made any preferential allotment or private placement of shares or fully or partly convertible debentures during the year.
xv. According to the information and explanations given by the management, the Company has not entered into any non-cash transactions specifiedunder section 192 of the Act with directors or persons connected with him.
xvi. In our opinion, the Company is not required to register under section 45-IA of the Reserve Bank of India Act, 1934.
Signed and dated by the Auditors of the Company at New Delhi as at Page No. 237.
Day-time view of ONGC’s Narimanam GGS, Karaikal
242
Annexure - 2 to Independent Auditors’ Report
(Referred to in paragraph 9 (3) (f) under ‘Report on Other Legal and Regulatory Requirements’ section of our report of even date)
Report on the Internal Financial Controls with reference to Financial Statements under Clause (i) of Sub-section 3 of Section 143 of the Companies Act, 2013 (“the Act”)
To the Members of Oil and Natural Gas Corporation Limited
We have audited the internal financial controls withreferencetofinancialstatementsofOilandNaturalGasCorporationLimited(“theCompany”)asof31st March, 2019 in conjunction with our audit of the standalone financialstatementsoftheCompanyfortheyearendedon that date.
Management’s Responsibility for Internal Financial Controls
The Company’s management is responsible for establishing andmaintaining internal financial controlsbased on the internal control over financial reportingcriteria established by the Company considering the essential components of internal control stated in the Guidance Note on Audit of Internal Financial Controls over Financial Reporting issued by the Institute of Chartered Accountants of India. These responsibilities include the design, implementation and maintenance of adequate internal financial controls thatwere operatingeffectivelyforensuringtheorderlyandefficientconductof its business, including adherence to the Company’s policies, the safeguarding of its assets, the prevention and detection of frauds and errors, the accuracy and completeness of the accounting records, and the timely preparationofreliablefinancialinformation,asrequiredunder the Act.
Auditors’ Responsibility
Our responsibility is to express an opinion on the Company’s internalfinancial controlswith reference tofinancial statements based on our audit.We conductedour audit in accordance with the Guidance Note on Audit of Internal Financial Controls over Financial Reporting (the“GuidanceNote”)andtheStandardsonAuditingasspecifiedundersection143(10)oftheAct,totheextentapplicabletoanauditofinternalfinancialcontrols,both
applicable to an audit of Internal Financial Controls and both issued by the Institute of Chartered Accountants of India. Those Standards and the Guidance Note require that we comply with ethical requirements and plan and perform the audit to obtain reasonable assurance aboutwhether adequate internal financial controlswithreference to financial statements was established andmaintained and if such controls operated effectively in all material respects.
Our audit involves performing procedures to obtain audit evidence about the adequacy of the internal financialcontrolswithreferencetofinancialstatementsandtheiroperating effectiveness. Our audit of internal financialcontrolswith reference tofinancial statements includedobtaininganunderstandingofinternalfinancialcontrolswith reference to financial statements, assessing therisk that a material weakness exists, and testing and evaluating the design and operating effectiveness of internal control based on the assessed risk. The procedures selected depend on the auditor’s judgment, including the assessment of the risks of material misstatement of thestandalonefinancialstatements,whetherduetofraudor error.
We believe that the audit evidence we have obtained is sufficientandappropriatetoprovideabasisforourauditopinionontheCompany’sinternalfinancialcontrolswithreferencetofinancialstatements.
Meaning of Internal Financial Controls with reference to financial statements
A Company’s internal financial control with referencetofinancial statements isaprocessdesigned toprovidereasonableassuranceregardingthereliabilityoffinancialreporting and the preparation of standalone financialstatements for external purposes in accordance with generally accepted accounting principles. A Company’s internal financial control with reference to financialstatements includes those policies and procedures that (1)
243Standalone Financial Statements
pertain to the maintenance of records that, in reasonable detail, accurately and fairly reflect the transactions anddispositions of the assets of the Company; (2) provide reasonable assurance that transactions are recorded as necessary to permit preparation of standalone financialstatements in accordance with generally accepted accounting principles, and that receipts and expenditures of the Company are being made only in accordance with authorizations of management and directors of the Company; and (3) provide reasonable assurance regarding prevention or timely detection of unauthorised acquisition, use, or disposition of the Company’s assets that could have a material effect on the standalone financialstatements.
Inherent Limitations of Internal Financial Controls with reference to financial statements
Becauseof the inherent limitationsof internalfinancialcontrolswithreferencetofinancialstatements,includingthe possibility of collusion or improper management, override of controls, material misstatements due to error
or fraud may occur and not be detected. Also, projections ofanyevaluationof the internalfinancialcontrolswithreference to financial statements to future periods aresubjecttotheriskthattheinternalfinancialcontrolwithreferencetofinancialstatementsmaybecomeinadequatebecause of changes in conditions, or that the degree of compliance with the policies or procedures may deteriorate.
Opinion
In our opinion, the Company has, in all material respects, anadequateinternalfinancialcontrolswithreferencetofinancial statementsandsuch internalfinancialcontrolswith reference to standalonefinancial statements wereoperating effectively as at 31st March, 2019, based on the internal control over financial reporting criteriaestablished by the Company considering the essential components of internal control stated in the Guidance Note on Audit of Internal Financial Controls Over Financial Reporting issued by the Institute of Chartered Accountants of India.
Signed and dated by the Auditors of the Company at New Delhi as at Page No. 237.
Working 24x7: ONGCian inside the control room during drilling operations
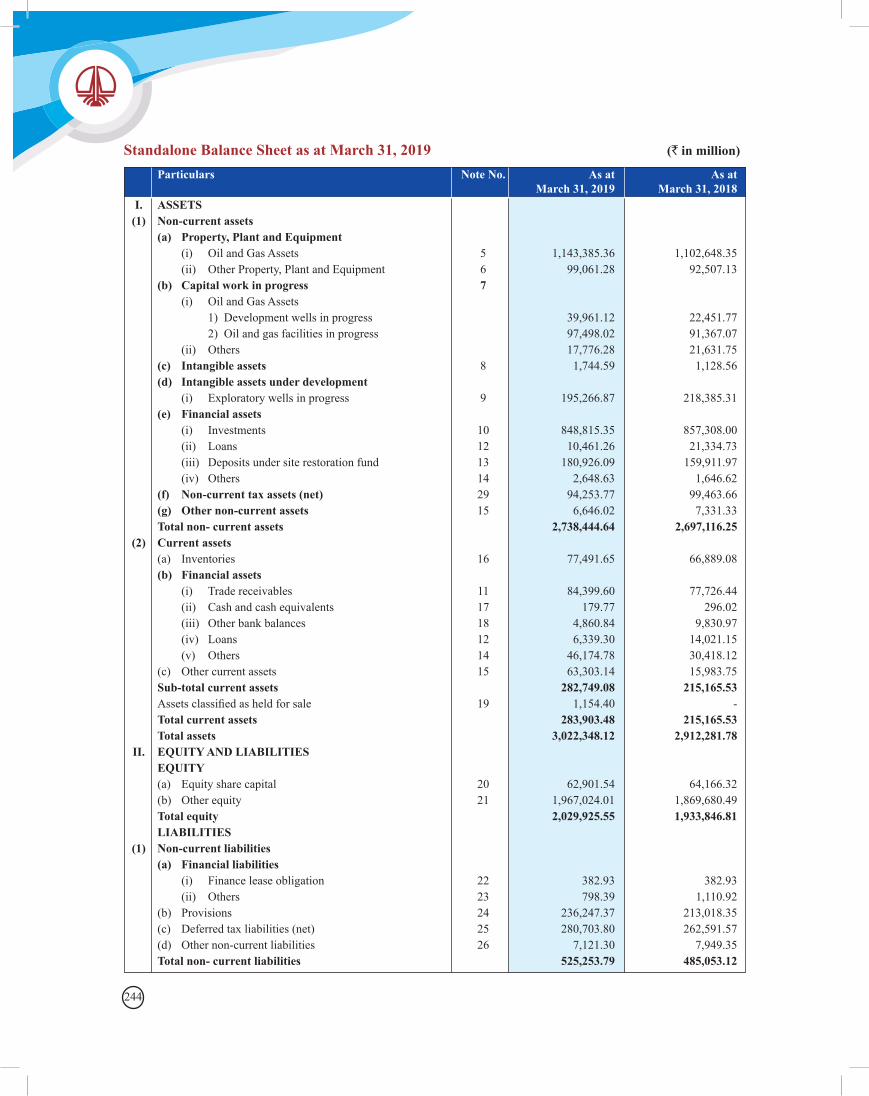
244
Standalone Balance Sheet as at March 31, 2019 (` in million)
Particulars Note No. As at As at March 31, 2019 March 31, 2018 I. ASSETS (1) Non-current assets (a) Property, Plant and Equipment (i) Oil and Gas Assets 5 1,143,385.36 1,102,648.35 (ii) Other Property, Plant and Equipment 6 99,061.28 92,507.13 (b) Capital work in progress 7 (i) Oil and Gas Assets 1) Development wells in progress 39,961.12 22,451.77 2) Oil and gas facilities in progress 97,498.02 91,367.07 (ii) Others 17,776.28 21,631.75 (c) Intangible assets 8 1,744.59 1,128.56 (d) Intangible assets under development (i) Exploratory wells in progress 9 195,266.87 218,385.31 (e) Financial assets (i) Investments 10 848,815.35 857,308.00 (ii) Loans 12 10,461.26 21,334.73 (iii) Deposits under site restoration fund 13 180,926.09 159,911.97 (iv) Others 14 2,648.63 1,646.62 (f) Non-current tax assets (net) 29 94,253.77 99,463.66 (g) Other non-current assets 15 6,646.02 7,331.33 Total non- current assets 2,738,444.64 2,697,116.25 (2) Current assets (a) Inventories 16 77,491.65 66,889.08 (b) Financial assets (i) Trade receivables 11 84,399.60 77,726.44 (ii) Cash and cash equivalents 17 179.77 296.02 (iii) Other bank balances 18 4,860.84 9,830.97 (iv) Loans 12 6,339.30 14,021.15 (v) Others 14 46,174.78 30,418.12 (c) Other current assets 15 63,303.14 15,983.75 Sub-total current assets 282,749.08 215,165.53 Assetsclassifiedasheldforsale 19 1,154.40 - Total current assets 283,903.48 215,165.53 Total assets 3,022,348.12 2,912,281.78 II. EQUITY AND LIABILITIES EQUITY (a) Equity share capital 20 62,901.54 64,166.32 (b) Other equity 21 1,967,024.01 1,869,680.49 Total equity 2,029,925.55 1,933,846.81 LIABILITIES (1) Non-current liabilities (a) Financial liabilities (i) Finance lease obligation 22 382.93 382.93 (ii) Others 23 798.39 1,110.92 (b) Provisions 24 236,247.37 213,018.35 (c) Deferred tax liabilities (net) 25 280,703.80 262,591.57 (d) Other non-current liabilities 26 7,121.30 7,949.35 Total non- current liabilities 525,253.79 485,053.12
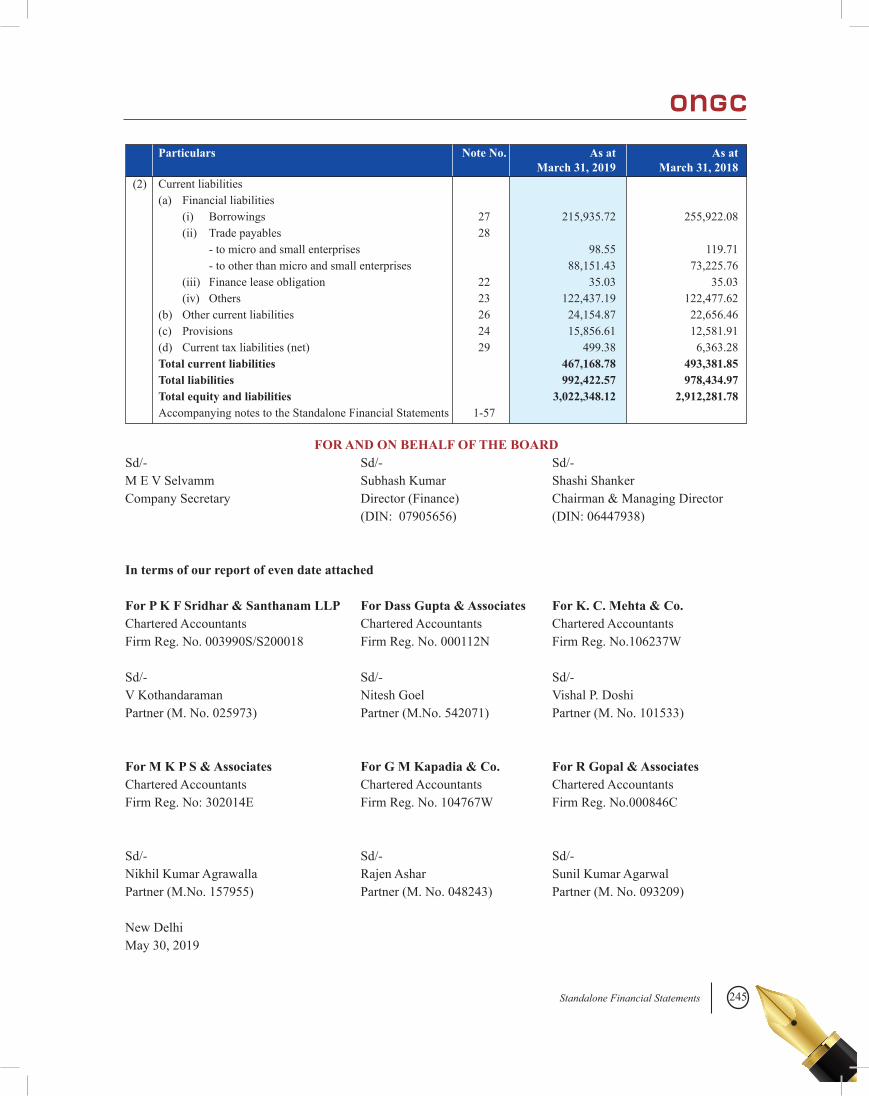
245Standalone Financial Statements
Particulars Note No. As at As at March 31, 2019 March 31, 2018 (2) Current liabilities (a) Financial liabilities (i) Borrowings 27 215,935.72 255,922.08 (ii) Trade payables 28 - to micro and small enterprises 98.55 119.71 - to other than micro and small enterprises 88,151.43 73,225.76 (iii) Finance lease obligation 22 35.03 35.03 (iv) Others 23 122,437.19 122,477.62 (b) Other current liabilities 26 24,154.87 22,656.46 (c) Provisions 24 15,856.61 12,581.91 (d) Current tax liabilities (net) 29 499.38 6,363.28 Total current liabilities 467,168.78 493,381.85 Total liabilities 992,422.57 978,434.97 Total equity and liabilities 3,022,348.12 2,912,281.78 Accompanying notes to the Standalone Financial Statements 1-57
FOR AND ON BEHALF OF THE BOARDSd/- Sd/- Sd/-M E V Selvamm Subhash Kumar Shashi ShankerCompany Secretary Director (Finance) Chairman & Managing Director (DIN: 07905656) (DIN: 06447938)
In terms of our report of even date attached
For P K F Sridhar & Santhanam LLP For Dass Gupta & Associates For K. C. Mehta & Co.Chartered Accountants Chartered Accountants Chartered AccountantsFirm Reg. No. 003990S/S200018 Firm Reg. No. 000112N Firm Reg. No.106237W
Sd/- Sd/- Sd/-V Kothandaraman Nitesh Goel Vishal P. DoshiPartner (M. No. 025973) Partner (M.No. 542071) Partner (M. No. 101533)
For M K P S & Associates For G M Kapadia & Co. For R Gopal & AssociatesChartered Accountants Chartered Accountants Chartered AccountantsFirm Reg. No: 302014E Firm Reg. No. 104767W Firm Reg. No.000846C
Sd/- Sd/- Sd/-Nikhil Kumar Agrawalla Rajen Ashar Sunil Kumar AgarwalPartner (M.No. 157955) Partner (M. No. 048243) Partner (M. No. 093209)
New DelhiMay 30, 2019
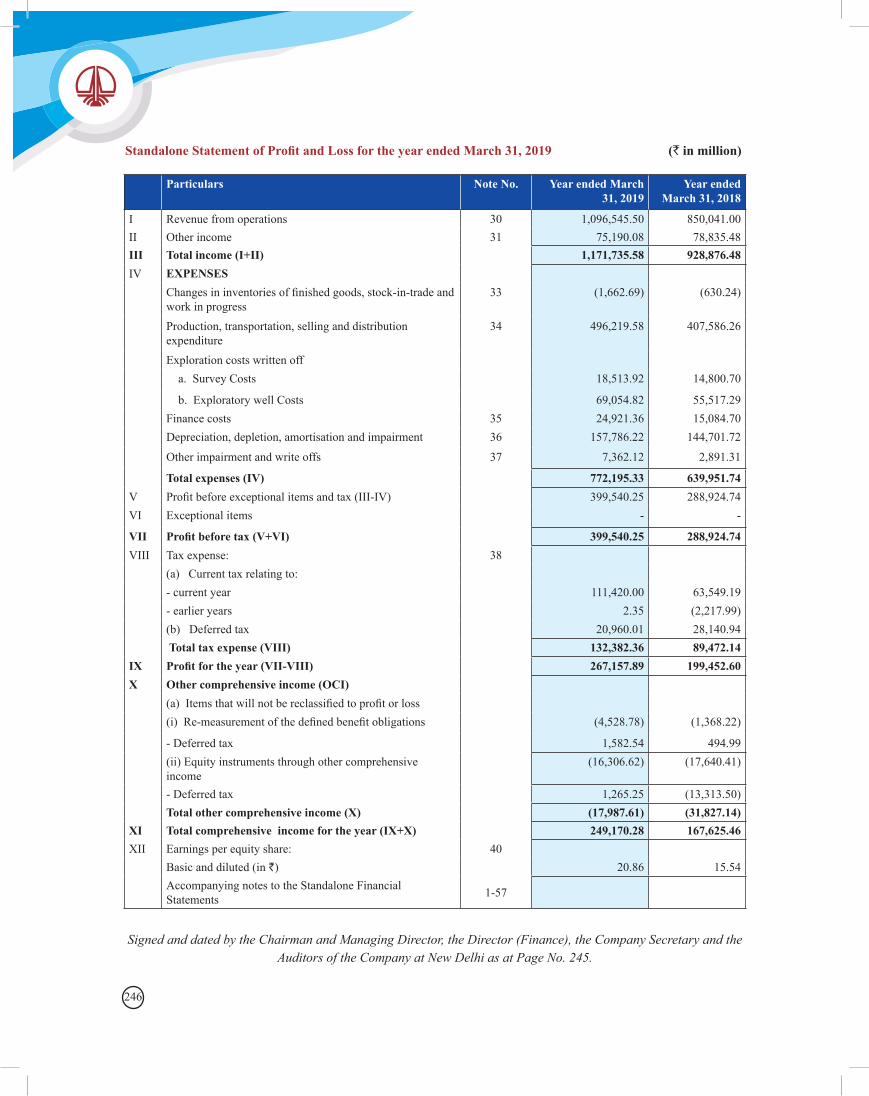
246
Particulars Note No. Year ended March 31, 2019
Year ended March 31, 2018
I Revenue from operations 30 1,096,545.50 850,041.00II Other income 31 75,190.08 78,835.48III Total income (I+II) 1,171,735.58 928,876.48IV EXPENSES
Changesininventoriesoffinishedgoods,stock-in-tradeandwork in progress
33 (1,662.69) (630.24)
Production, transportation, selling and distribution expenditure
34 496,219.58 407,586.26
Exploration costs written off a. Survey Costs 18,513.92 14,800.70
b. Exploratory well Costs 69,054.82 55,517.29Finance costs 35 24,921.36 15,084.70Depreciation, depletion, amortisation and impairment 36 157,786.22 144,701.72
Other impairment and write offs 37 7,362.12 2,891.31
Total expenses (IV) 772,195.33 639,951.74V Profitbeforeexceptionalitemsandtax(III-IV) 399,540.25 288,924.74VI Exceptional items - -
VII Profit before tax (V+VI) 399,540.25 288,924.74VIII Tax expense: 38
(a) Current tax relating to:- current year 111,420.00 63,549.19- earlier years 2.35 (2,217.99)(b) Deferred tax 20,960.01 28,140.94 Total tax expense (VIII) 132,382.36 89,472.14
IX Profit for the year (VII-VIII) 267,157.89 199,452.60X Other comprehensive income (OCI)
(a)Itemsthatwillnotbereclassifiedtoprofitorloss(i)Re-measurementofthedefinedbenefitobligations (4,528.78) (1,368.22)
- Deferred tax 1,582.54 494.99(ii) Equity instruments through other comprehensive income
(16,306.62) (17,640.41)
- Deferred tax 1,265.25 (13,313.50)Total other comprehensive income (X) (17,987.61) (31,827.14)
XI Total comprehensive income for the year (IX+X) 249,170.28 167,625.46XII Earnings per equity share: 40
Basic and diluted (in `) 20.86 15.54Accompanying notes to the Standalone Financial Statements 1-57
Standalone Statement of Profit and Loss for the year ended March 31, 2019 (` in million)
Signed and dated by the Chairman and Managing Director, the Director (Finance), the Company Secretary and the Auditors of the Company at New Delhi as at Page No. 245.
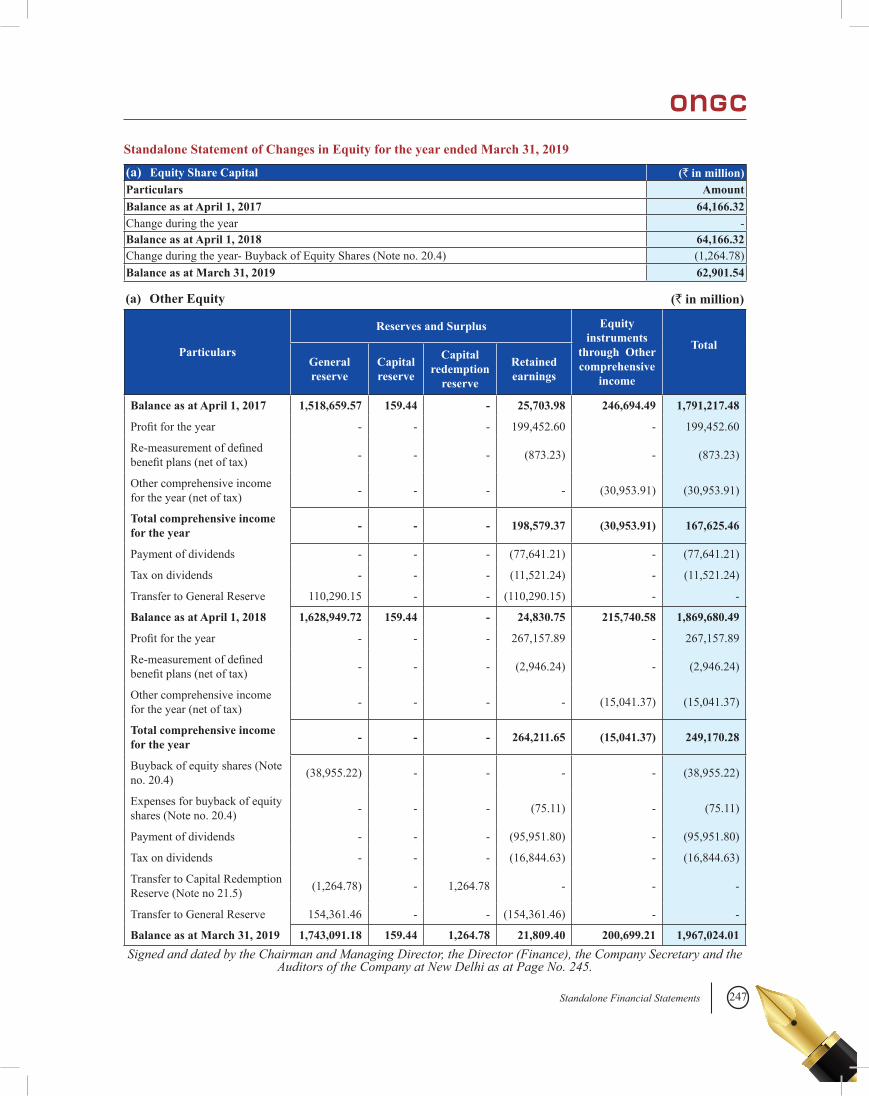
247Standalone Financial Statements
(a) Equity Share Capital (` in million)Particulars AmountBalance as at April 1, 2017 64,166.32Change during the year -Balance as at April 1, 2018 64,166.32Change during the year- Buyback of Equity Shares (Note no. 20.4) (1,264.78)Balance as at March 31, 2019 62,901.54
Particulars
Reserves and Surplus Equity instruments
through Other comprehensive
income
Total General
reserveCapital reserve
Capital redemption
reserve
Retained earnings
Balance as at April 1, 2017 1,518,659.57 159.44 - 25,703.98 246,694.49 1,791,217.48
Profitfortheyear - - - 199,452.60 - 199,452.60
Re-measurementofdefinedbenefitplans(netoftax) - - - (873.23) - (873.23)
Other comprehensive income for the year (net of tax) - - - - (30,953.91) (30,953.91)
Total comprehensive income for the year - - - 198,579.37 (30,953.91) 167,625.46
Payment of dividends - - - (77,641.21) - (77,641.21)
Tax on dividends - - - (11,521.24) - (11,521.24)
Transfer to General Reserve 110,290.15 - - (110,290.15) - -
Balance as at April 1, 2018 1,628,949.72 159.44 - 24,830.75 215,740.58 1,869,680.49
Profitfortheyear - - - 267,157.89 - 267,157.89
Re-measurementofdefinedbenefitplans(netoftax) - - - (2,946.24) - (2,946.24)
Other comprehensive income for the year (net of tax) - - - - (15,041.37) (15,041.37)
Total comprehensive income for the year - - - 264,211.65 (15,041.37) 249,170.28
Buyback of equity shares (Note no. 20.4) (38,955.22) - - - - (38,955.22)
Expenses for buyback of equity shares (Note no. 20.4) - - - (75.11) - (75.11)
Payment of dividends - - - (95,951.80) - (95,951.80)
Tax on dividends - - - (16,844.63) - (16,844.63)
Transfer to Capital Redemption Reserve (Note no 21.5) (1,264.78) - 1,264.78 - - -
Transfer to General Reserve 154,361.46 - - (154,361.46) - -
Balance as at March 31, 2019 1,743,091.18 159.44 1,264.78 21,809.40 200,699.21 1,967,024.01
(a) Other Equity (` in million)
Standalone Statement of Changes in Equity for the year ended March 31, 2019
Signed and dated by the Chairman and Managing Director, the Director (Finance), the Company Secretary and the Auditors of the Company at New Delhi as at Page No. 245.
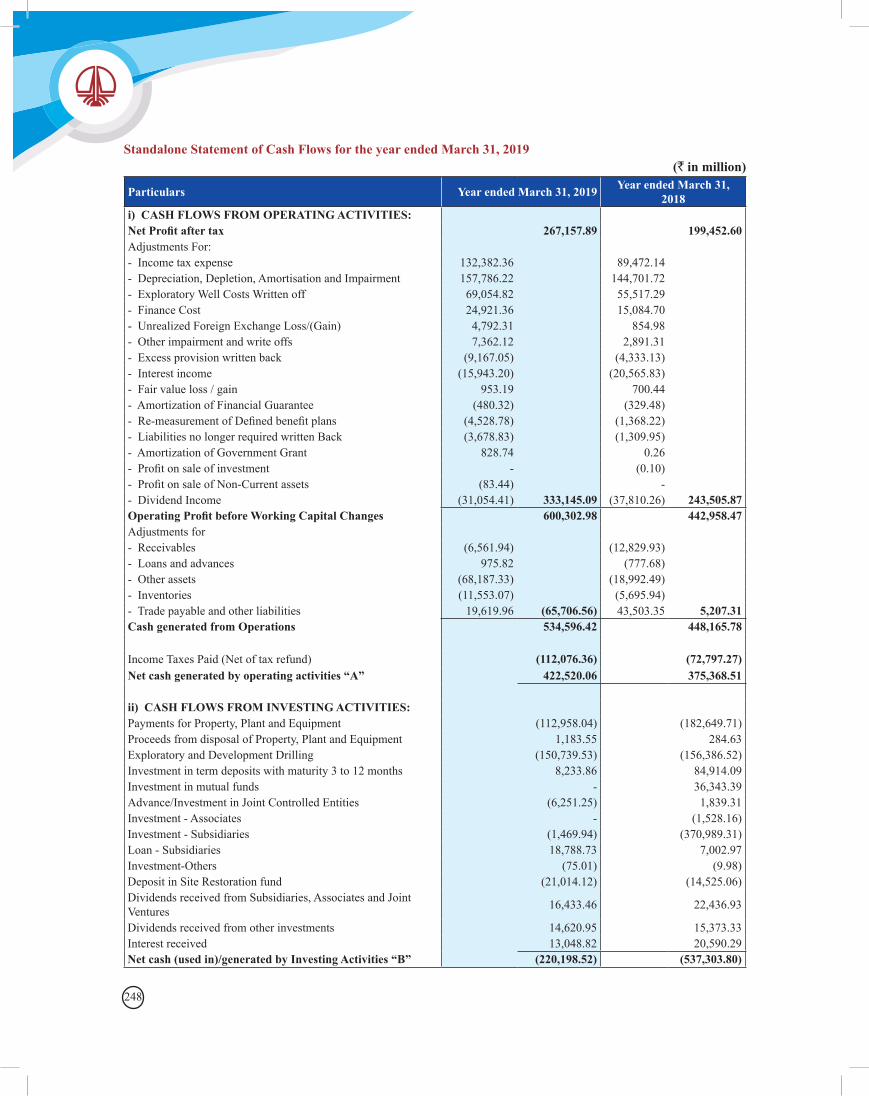
248
Standalone Statement of Cash Flows for the year ended March 31, 2019(` in million)
Particulars Year ended March 31, 2019 Year ended March 31, 2018
i) CASH FLOWS FROM OPERATING ACTIVITIES: Net Profit after tax 267,157.89 199,452.60Adjustments For:- Income tax expense 132,382.36 89,472.14- Depreciation, Depletion, Amortisation and Impairment 157,786.22 144,701.72- Exploratory Well Costs Written off 69,054.82 55,517.29- Finance Cost 24,921.36 15,084.70- Unrealized Foreign Exchange Loss/(Gain) 4,792.31 854.98- Other impairment and write offs 7,362.12 2,891.31- Excess provision written back (9,167.05) (4,333.13)- Interest income (15,943.20) (20,565.83)- Fair value loss / gain 953.19 700.44- Amortization of Financial Guarantee (480.32) (329.48)-Re-measurementofDefinedbenefitplans (4,528.78) (1,368.22)- Liabilities no longer required written Back (3,678.83) (1,309.95)- Amortization of Government Grant 828.74 0.26-Profitonsaleofinvestment - (0.10)-ProfitonsaleofNon-Currentassets (83.44) -- Dividend Income (31,054.41) 333,145.09 (37,810.26) 243,505.87Operating Profit before Working Capital Changes 600,302.98 442,958.47Adjustments for- Receivables (6,561.94) (12,829.93)- Loans and advances 975.82 (777.68)- Other assets (68,187.33) (18,992.49)- Inventories (11,553.07) (5,695.94)- Trade payable and other liabilities 19,619.96 (65,706.56) 43,503.35 5,207.31Cash generated from Operations 534,596.42 448,165.78
Income Taxes Paid (Net of tax refund) (112,076.36) (72,797.27)Net cash generated by operating activities “A” 422,520.06 375,368.51
ii) CASH FLOWS FROM INVESTING ACTIVITIES:Payments for Property, Plant and Equipment (112,958.04) (182,649.71)Proceeds from disposal of Property, Plant and Equipment 1,183.55 284.63Exploratory and Development Drilling (150,739.53) (156,386.52)Investment in term deposits with maturity 3 to 12 months 8,233.86 84,914.09Investment in mutual funds - 36,343.39Advance/Investment in Joint Controlled Entities (6,251.25) 1,839.31Investment - Associates - (1,528.16)Investment - Subsidiaries (1,469.94) (370,989.31)Loan - Subsidiaries 18,788.73 7,002.97Investment-Others (75.01) (9.98)Deposit in Site Restoration fund (21,014.12) (14,525.06)Dividends received from Subsidiaries, Associates and Joint Ventures 16,433.46 22,436.93
Dividends received from other investments 14,620.95 15,373.33Interest received 13,048.82 20,590.29Net cash (used in)/generated by Investing Activities “B” (220,198.52) (537,303.80)
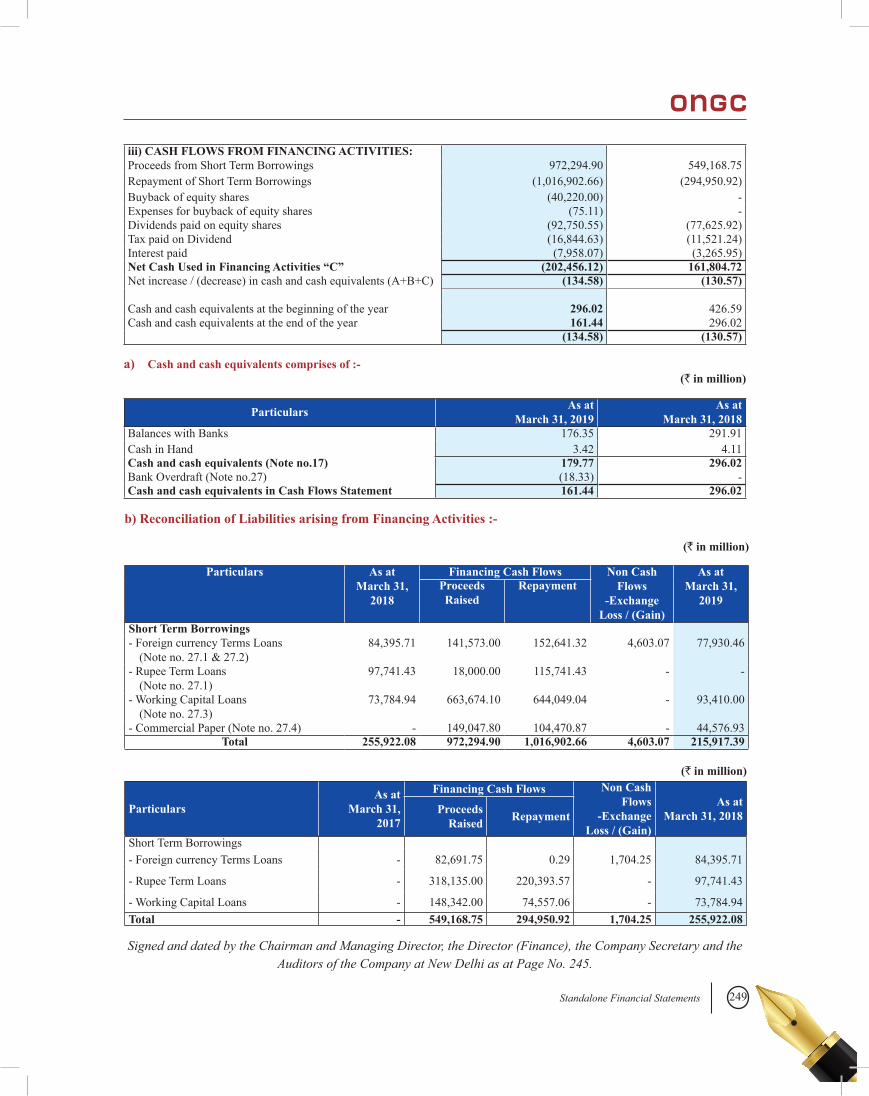
249Standalone Financial Statements
iii) CASH FLOWS FROM FINANCING ACTIVITIES:Proceeds from Short Term Borrowings 972,294.90 549,168.75Repayment of Short Term Borrowings (1,016,902.66) (294,950.92)Buyback of equity shares (40,220.00) -Expenses for buyback of equity shares (75.11) -Dividends paid on equity shares (92,750.55) (77,625.92)Tax paid on Dividend (16,844.63) (11,521.24)Interest paid (7,958.07) (3,265.95)Net Cash Used in Financing Activities “C” (202,456.12) 161,804.72Net increase / (decrease) in cash and cash equivalents (A+B+C) (134.58) (130.57)
Cash and cash equivalents at the beginning of the year 296.02 426.59Cash and cash equivalents at the end of the year 161.44 296.02
(134.58) (130.57)
a) Cash and cash equivalents comprises of :-(` in million)
Particulars As at March 31, 2019
As at March 31, 2018
Balances with Banks 176.35 291.91Cash in Hand 3.42 4.11Cash and cash equivalents (Note no.17) 179.77 296.02Bank Overdraft (Note no.27) (18.33) -Cash and cash equivalents in Cash Flows Statement 161.44 296.02
b) Reconciliation of Liabilities arising from Financing Activities :-
(` in million)
Particulars As at March 31,
2018
Financing Cash Flows Non Cash Flows
-Exchange Loss / (Gain)
As at March 31,
2019Proceeds Raised
Repayment
Short Term Borrowings- Foreign currency Terms Loans
(Note no. 27.1 & 27.2)84,395.71 141,573.00 152,641.32 4,603.07 77,930.46
- Rupee Term Loans (Note no. 27.1)
97,741.43 18,000.00 115,741.43 - -
- Working Capital Loans (Note no. 27.3)
73,784.94 663,674.10 644,049.04 - 93,410.00
- Commercial Paper (Note no. 27.4) - 149,047.80 104,470.87 - 44,576.93Total 255,922.08 972,294.90 1,016,902.66 4,603.07 215,917.39
ParticularsAs at
March 31, 2017
Financing Cash Flows Non Cash Flows
-Exchange Loss / (Gain)
As at March 31, 2018Proceeds
Raised Repayment
Short Term Borrowings- Foreign currency Terms Loans - 82,691.75 0.29 1,704.25 84,395.71
- Rupee Term Loans - 318,135.00 220,393.57 - 97,741.43
- Working Capital Loans - 148,342.00 74,557.06 - 73,784.94Total - 549,168.75 294,950.92 1,704.25 255,922.08
(` in million)
Signed and dated by the Chairman and Managing Director, the Director (Finance), the Company Secretary and the Auditors of the Company at New Delhi as at Page No. 245.
250
Notes to the Standalone Financial Statement for the year ended March 31, 2019
1. Corporate information
Oil and Natural Gas Corporation Limited (‘ONGC’ or ‘the Company’) is a public limited Company domiciled and incorporated in India having its registered office at Plot No. 5A-5B, NelsonMandela Road, Vasant Kunj, New Delhi, South WestDelhi – 110070.TheCompany’s shares arelisted and traded on Stock Exchanges in India. The Company is engaged in exploration, development and production of crude oil, natural gas and value added products.
2. Application of new Indian Accounting Standards
2.1 All the Indian Accounting Standards issued under section133oftheCompaniesAct,2013andnotifiedby the Ministry of Corporate Affairs (MCA) under the Companies (Indian Accounting Standards) Rules, 2015 (as amended) till the financialstatements are approved have been considered in preparation of these Financial Statements.
2.2 Standards issued but not yet effective:
The MCA has notified the Companies (IndianAccounting Standards/ Ind AS) Amendment Rules, 2019 on March 30, 2019, whereby Ind AS-116 relatingto“Leases”hasbeenmadeapplicablefromfinancialyear2019-20(i.e.April1,2019onwards).
Ind AS 116 Leases
The Standard supersedes the existing Ind AS 17 “Leases”. Ind AS 116 introduces a single lesseeaccounting model and requires a lessee to recognise assets and liabilities for all leases with a term of more than 12 months unless the underlying asset is of low value and sets out the principles for the recognition, measurement, presentation and disclosure of leases.
The Company is evaluating the requirements of the same and its effect on the Financial Statements is likely to be material.
Amendment to Ind AS 103 Business Combinations
The amendment to Ind AS 103 requires remeasurement of previously held interest changes in business combination in case of obtaining control of a joint operation wherein there was a joint control earlier.
As the Company does not have any arrangement wherein the Company has obtained control of an operation wherein there was a joint control earlier, the amendment has no effect on the financialstatements of the Company. The Company will apply the requirements when it obtains control of a business that is a joint operation.
Amendment to Ind AS 109 Financial Instruments
The amendment to Ind AS 109 requires accounting for prepayment features with negative compensation in case of debt instruments.
AstheCompanydoesnothaveanysuchfinancialinstruments which meet the conditions, the amendmenthasnoeffectonthefinancialstatementsof the Company.
Amendment to Ind AS 111 Joint Arrangements
The amendment to Ind AS 111 prescribes accounting in case of obtaining joint control of an operation wherein there was no joint control earlier.
As the Company does not have any arrangement wherein the Company has obtained joint control of an operation wherein there was no joint control earlier,theamendmenthasnoeffectonthefinancialstatements of the Company. The Company will apply the requirements when it obtains control of a business that is a joint operation.
Amendment to Ind AS 12 Income Taxes
The amendment to Ind AS 12 requires recognition of income tax consequences of dividends when an entity recognises a liability to pay a dividend in profit or loss, other comprehensive income orequity according to where the entity originally
251Standalone Financial Statements
recognised those past transactions or events. Further amendment to Appendix C to Ind AS 12 provides the requirements of the amendment are to be applied while performing the determination of taxableprofit(orTaxLoss), taxbases,unusedtaxlosses, unused tax credits, and tax rates, when there is uncertainty over income tax treatment of an item by tax authorities.
The Company is evaluating the requirements of the same and its effect on the Financial Statements.
Amendment to Ind AS 19 Employee Benefits
The amendment to Ind AS 19 prescribes accounting for plan amendment, curtailment or settlement occurring in-between the reporting periods in case oflong-termemployeebenefitplans.
The Company does not have any amendment, curtailment or settlement occurring in-between the reporting period in case of long-term employee benefitplans, theamendmenthasnoeffectonthefinancialstatementsoftheCompany.TheCompanywill apply the requirements when there is any amendment, curtailment or settlement of any long termemployeebenefitplan.
Amendment to Ind AS 23 Borrowing Costs
The amendment to Ind AS 23 prescribes the accounting treatment for specific borrowings postcapitalization of corresponding qualifying asset.
As the Company does not have any borrowings for the purpose of obtaining a qualifying asset, the amendmenthasnoeffectonthefinancialstatementsof the Company.
3. Significant accounting policies
3.1 Statement of compliance
In accordance with the notification dated 16thFebruary, 2015, issued by the Ministry of Corporate Affairs, the Company has adopted Indian Accounting Standards (referred to as “Ind AS”)issued under section 133 of the Companies Act, 2013 and notified under the Companies (Indian
Accounting Standards) Rules, 2015 (as amended) with effect from April 1, 2016.
The Financial Statements have been prepared in accordance with Ind AS notified under theCompanies (Indian Accounting Standards) Rules, 2015 (as amended) and Guidance Note on Accounting for Oil and Gas Producing Activities (Ind AS) issued by the Institute of Chartered Accountants of India.
3.2 Basis of preparation
The Financial Statements have been prepared on the historical cost convention on accrual basis except for certain assets and liabilities which are measured at fair value/amortised cost/Net present value at the end of each reporting period, as explained in the accounting policies below.
Historical cost is generally based on the fair value of the consideration given in exchange for goods and services.
As the operating cycle cannot be identified innormal course due to the special nature of industry, the same has been assumed to have duration of 12 months. Accordingly, all assets and liabilities have beenclassifiedascurrentornon-currentaspertheCompany’s operating cycle and other criteria set out in Ind AS-1 ‘Presentation of Financial Statements’ and Schedule III to the Companies Act, 2013.
The Standalone Financial Statements are presented in Indian Rupees and all values are rounded off to the nearest two decimal million except otherwise stated.
Fair value measurement
Fair value is the price that would be received to sell an asset or paid to transfer a liability in an orderly transaction between market participants at the measurement date under current market conditions.
The Company categorizes assets and liabilities measured at fair value into one of three levels depending on the ability to observe inputs employed in their measurement which are described as follows:
252
(a) Level 1 inputs are quoted prices (unadjusted) in active markets for identical assets or liabilities.
(b) Level 2 inputs are inputs that are observable, either directly or indirectly, other than quoted prices included within level 1 for the asset or liability.
(c) Level 3 inputs are unobservable inputs for the asset or liability reflecting significantmodificationstoobservablerelatedmarketdataor Company’s assumptions about pricing by market participants.
3.3 Investments in subsidiaries, associates and joint ventures
The Company records the investments in subsidiaries, associates and joint ventures at cost less impairment loss, if any.
When the Company issues financial guaranteeson behalf of subsidiaries, initially it measures the financial guarantees at their fair values andsubsequently measures at the higher of:
i. the amount of loss allowance determined in accordance with impairment requirements of Ind AS 109 ‘Financial Instruments’; and
ii. the amount initially recognized less, when appropriate, the cumulative amount of income recognised in accordance with the principles of Ind AS 115 ‘Revenue from Contracts with Customers’.
The Company records the initial fair value of financial guarantee as deemed investment witha corresponding liability recorded as deferred revenueunderfinancialguaranteeobligation.Suchdeemed investment is added to the carrying amount of investment in subsidiaries. Deferred revenue is recognizedintheStatementofProfitandLossovertheremainingperiodoffinancialguaranteeissuedas other income.
On disposal of investment in subsidiary, associate and joint venture, the difference between net disposal proceeds and the carrying amounts
(including corresponding value of dilution in deemed investment) are recognized in the Statement ofProfitandLoss.
Interest free loans provided to subsidiary are recognized at fair value on the date of disbursement and the difference on fair valuation is recognized as deemed investment in subsidiary. Such deemed investment is added to the carrying amount of investment in subsidiaries. Loans are accounted at amortized cost method using effective interest rate. If there is an early repayment of loan made by the subsidiary, the proportionate amount of the deemed investment recognized earlier is adjusted.
3.4 Interests in joint operations
A joint operation is a joint arrangement whereby the parties that have joint control of the arrangement have rights to the assets, and obligations for the liabilities, relating to the arrangement.
The Company has Joint Operations in the nature of Production Sharing Contracts (PSC) and Revenue Sharing Contracts (RSC) with the Government of India and various body corporates for exploration, development and production activities.
The Company’s share in the assets and liabilities along with attributable income and expenditure of the Joint Operations is merged on line by line basis with the similar items in the Financial Statements of the Company and adjusted for depreciation, depletion, survey, dry wells, decommissioning provision, impairment and sidetracking in accordance with the accounting policies of the Company.
The hydrocarbon reserves in such areas are taken in proportion to the participating interest of the Company.
Gain or loss on sale of interest in a block, is recognized in the Statement of Profit and Loss,except that no gain is recognized at the time of such sale if substantial uncertainty exists about the recovery of the costs applicable to the retained interest or if the Company has substantial obligation
253Standalone Financial Statements
for future performance. The gain in such situation is treated as recovery of cost related to that block.
3.5 Non-current assets held for sale
Non-currentassetsordisposalgroupsclassifiedasheld for sale are measured at the lower of carrying amount and fair value less costs to sell.
Non-currentassetsordisposalgroupsareclassifiedas held for sale if their carrying amounts will be recovered principally through a sale transaction rather than through continuing use. This condition is regarded as met only when the sale is highly probable and the asset or disposal group is available for immediate sale in its present condition subject only to terms that are usual and customary for sale of such assets. Management must be committed to the sale, which should be expected to qualify for recognition as a completed sale within one year fromthedateofclassificationasheldforsale,andactions required to complete the plan of sale should indicate that it isunlikely that significantchangesto the plan will be made or that the plan will be withdrawn.
Property, Plant and Equipment and intangible assets arenotdepreciatedoramortizedonceclassifiedasheld for sale.
3.6 Government Grants
Government grants, including non-monetary grants at fair value, are not recognised until there is reasonable assurance that the Company will comply with the conditions attached to them and that the grants will be received.
Government grants, whose primary condition is that the Company should purchase, construct or otherwise acquire non-current assets and non-monetary grants are recognised and disclosed as ‘deferred income’ under non-current liability in the Balance Sheet and transferred to the Statement of ProfitandLossonasystematicandrationalbasisover the useful lives of the related assets.
3.7 Property, Plant and Equipment (other than Oil and Gas Assets)
The Company had elected to continue with the carrying value of all of its Property, Plant and Equipment recognised as of April 1, 2015 (transition date) measured as per the Previous GAAP and used that carrying value as its deemed cost as of the transition date except adjustment related to decommissioning provisions.
Land and buildings held for use in the production or supply of goods or services, or for administrative purposes, are stated in the Balance Sheet at cost less accumulated depreciation and impairment losses, if any. Freehold land and land under perpetual lease are not depreciated.
Property, Plant and Equipment (PPE) in the course of construction for production, supply or administrative purposes are carried at cost, less any recognised impairment loss. The cost of an asset comprises its purchase price or its construction cost (net of applicable tax credits), any cost directly attributable to bring the asset into the location and condition necessary for it to be capable of operating in the manner intended by the Management and decommissioning cost as per Note no 3.13. It includes professional fees and, for qualifying assets, borrowing costs capitalised in accordance with the Company’s accounting policy. Such properties areclassified to theappropriatecategoriesofPPEwhen completed and ready for intended use. Parts of an item of PPE having different useful lives and significant value and subsequent expenditure onProperty, Plant and Equipment arising on account of capital improvement or other factors are accounted for as separate components. Expenditure on dry docking of rigs and vessels are accounted for as component of relevant assets.
Depreciation of PPE commences when the assets are ready for their intended use.
Depreciation is provided on the cost of PPE (other than freehold land, Oil and Gas Assets and properties under construction) less their residual values, using the written down value method (except for components of dry docking capitalised) over the useful life of PPE as stated in the Schedule
254
II to the Companies Act, 2013 or based on technical assessment by the Company. Estimated useful lives of these assets are as under:
Description YearsBuilding & Bunk Houses 3 to 60Plant & Machinery 2 to 40Furniture & Fixtures 3 to 15Vehicles, Ships & Boats 5 to 20OfficeEquipment 2 to 20
The estimated useful lives, residual values and depreciation method are reviewed on an annual basis and if necessary, changes in estimates are accounted for prospectively.
Depreciation on additions/deletions to PPE (other than of Oil and Gas Assets) during the year is provided for on a pro-rata basis with reference to the date of additions/deletions except low value items not exceeding `5,000/- which are fully depreciated at the time of addition.
Depreciation on subsequent expenditure on PPE (other than of Oil and Gas Assets) arising on account of capital improvement or other factors is provided for prospectively over the remaining useful life.
Depreciation on refurbished/revamped PPE (other than of Oil and Gas Assets) which are capitalized separately is provided for over the reassessed useful life.
Depreciation on expenditure on dry docking of rigs and vessels capitalized as component of relevant rig / vessels is charged over the dry dock period on straight line basis.
Depreciation on PPE (other than Oil and Gas Assets) including support equipment and facilities used for exploratory/ development drilling is initially capitalised as part of drilling cost and expensed / depleted as per note no. 3.11. Depreciation on equipment/ assets deployed for survey activities is chargedtotheStatementofProfitandLoss.
Assets held under finance leases are depreciatedover their expected useful lives on the same basis as owned assets.
An item of PPE is de-recognised upon disposal or whennofutureeconomicbenefitsareexpected toarise from the continued use of the asset. Any gain or loss arising on the disposal or retirement of an item of PPE is determined as the difference between the net sales proceeds and the carrying amount of theassetandisrecognisedintheStatementofProfitand Loss.
3.8 Intangible Assets
(i) Intangible assets acquired separately
The Company had elected to continue with the carrying value of all of its intangible assets recognised as of April 1, 2015 (transition date) measured as per the Previous GAAP and used that carrying value as its deemed cost as of the transition date.
Intangible assets with finite useful lives thatare acquired separately are carried at cost less accumulated amortisation and impairment losses. Amortisation is recognised on a straight-line basis overtheirestimatedusefullivesnotexceedingfiveyears from the date of capitalisation. The estimated useful life is reviewed at the end of each reporting period and the effect of any changes in estimate is accounted for prospectively.
Intangible assets are derecognised on disposal, or when no future economic benefits are expectedfrom use or disposal. Gains or losses arising from derecognition of an intangible asset are determined as the difference between the net disposal proceeds and the carrying amount of the asset, and recognised intheStatementofProfitandLosswhentheassetisderecognised.
(ii) Intangible assets under development - Exploratory Wells in Progress
All exploration and evaluation costs incurred in drilling and equipping exploratory and appraisal wells, are initially capitalized as Intangible assets under development - Exploratory Wells in Progress till the time these are either transferred to Oil and Gas Assets on completion as per note no.3.11
255Standalone Financial Statements
or expensed as exploration and evaluation cost (including allocated depreciation) as and when determined to be dry or of no further use, as the case may be.
Cost of drilling exploratory type stratigraphic test wells are initially capitalized as Intangible assets under development - Exploratory Wells in Progress till the time these are either transferred to Oil and Gas Assets as per note no. 3.11 or expensed as exploration and evaluation cost (including allocated depreciation) as when determined to be dry or the Petroleum Exploration License is surrendered.
Costs of exploratory wells are not carried over unless it could be reasonably demonstrated that there are indications of sufficient quantity ofreserves and sufficient progress has been madein assessing the reserves and the economic and operating viability of the project. All such carried over costs are subject to review for impairment as per the policy of the Company.
3.9 Impairment of Tangible and Intangible Assets
The Company reviews the carrying amount of its tangible and intangible assets (Oil and Gas Assets, Development Wells in Progress (DWIP), and Property, Plant and Equipment (including CapitalWorks-in-Progress)ofa“CashGeneratingUnit” (CGU) at the end of each reporting periodto determine whether there is any indication that those assets have suffered an impairment loss. If any such indication exists, the recoverable amount of the asset is estimated in order to determine the extent of the impairment loss (if any). When it is not possible to estimate the recoverable amount of an individual asset, the Company estimates the recoverable amount of the cash-generating unit to which the asset belongs.
Recoverable amount is the higher of fair value less costs of disposal and value in use. In assessing value in use, the estimatedfuturecashflowsarediscountedto their present value using a pre-tax discount rate thatreflectscurrentmarketassessmentsofthetimevalue of money and the risks specifictotheassetforwhich theestimatesof futurecashflowshavenotbeen adjusted.
If the recoverable amount of an asset (or cash-generating unit) is estimated to be less than its carrying amount, the carrying amount of the asset (or cash-generating unit) is reduced to its recoverable amount and impairment loss is recognised in the StatementofProfitandLoss.
An assessment is made at the end of each reporting period to see if there are any indications that impairment losses recognized earlier, may no longer exist or may have come down. The impairment loss is reversed, if there has been a change in the estimates used to determine the asset’s recoverable amount since the previous impairment loss was recognized. If it is so, the carrying amount of the asset is increased to the lower of its recoverable amount and the carrying amount that have been determined, net of depreciation, had no impairment loss been recognized for the asset in prior years. After a reversal, the depreciation charge is adjusted in future periods to allocate the asset’s revised carrying amount, less any residual value, on a systematic basis over its remaining useful life. Reversals of Impairment loss are recognized in the StatementofProfitandLoss.
Exploration and Evaluation assets are tested for Impairment when further exploration activities are not planned in near future or when sufficientdata exists to indicate that although a development is likely to proceed, the carrying amount of the exploration asset is unlikely to be recovered in full from successful development or by sale. Impairment loss is reversed subsequently, to the extent that conditions for impairment are no longer present.
3.10 Exploration & Evaluation, Development and Production Costs
(i) Pre-acquisition Cost
Expenditure incurred before obtaining the right(s) to explore, develop and produce oil and gas are expensed as and when incurred.
(ii) Acquisition Cost
Acquisition costs of Oil and Gas Assets are costs related to right to acquire mineral interest and are accounted as follows:-
256
Exploration and Development Stage
Acquisition cost relating to projects under exploration or development are initially accounted as Intangible Assets under development - exploratory wells in progress or Oil & Gas Assets under development - development wells in progress respectively. Such costs are capitalized by transferring to Oil and Gas Assets when a well is ready to commence commercial production. In case of abandonment / relinquishment of Intangible Assets under development - exploratory wells in progress, such costs are written off.
Production Stage
Acquisition costs of producing Oil and Gas Assets are capitalized as proved property acquisition cost under Oil and Gas Assets and amortized using the unit of production method over proved reserves of underlying assets.
(iii) Survey Cost
Cost of Survey and prospecting activities conducted in the search of oil and gas are expensed as exploration cost in the year in which these are incurred.
(iv) Oil & Gas Asset under Development - Development Wells in Progress
All costs relating to Development Wells are initially capitalized as ‘Development Wells in Progress’ and transferredto‘OilandGasAssets’on“completion”.
(v) Production Costs
Production costs include pre-well head and post-well head expenses including depreciation and applicable operating costs of support equipment and facilities.
3.11 Oil and Gas Assets
The Company had elected to continue with the carrying value of all of its Oil and Gas assets recognised as of April 1, 2015 (transition date) measured as per the Previous GAAP and used that
carrying value as its deemed cost as of the transition date except adjustment related to decommissioning provisions.
Oil and Gas Assets are stated at historical cost less accumulated depletion and impairment losses. Thesearecreatedinrespectofanarea/fieldhavingproved developed oil and gas reserves, when thewell in the area / field is ready to commencecommercial production.
Cost of temporary occupation of land, successful exploratory wells, all development wells (including service wells), allied facilities, depreciation on support equipment used for drilling and estimated future decommissioning costs are capitalised and classifiedasOilandGasAssets.
Oil and GasAssets are depleted using the “Unitof ProductionMethod”. The rate of depletion iscomputed with reference to an area covered by individual lease/license/asset/amortization base by considering the proved developed reserves and related capital costs incurred including estimated future decommissioning / abandonment costs net of salvage value. Acquisition cost of Oil and Gas Assets is depleted by considering the proved reserves. These reserves are estimated annually by the Reserve Estimates Committee of the Company, which follows the International Reservoir Engineering Procedures.
3.12 Side Tracking
In the case of an exploratory well, cost of side-tracking is treated in the same manner as the cost incurred on a new exploratory well. The cost of abandoned portion of side tracked exploratory wells is expensed as ‘Exploration cost written off’.
In the case of development wells, the entire cost of abandoned portion and side tracking is capitalized.
In the case of producing wells and service wells, if the side-tracking results in additional proved developed oil and gas reserves or increases the future economic benefits therefrom beyond previouslyassessed standard of performance, the cost incurred
257Standalone Financial Statements
on side tracking is capitalised, whereas the cost of abandoned portion of the well is depleted in the normal way. Otherwise, the cost of side tracking is expensed as ‘Work over Expenditure’.
3.13 Decommissioning Costs
Decommissioning cost includes cost of restoration. Provision for decommissioning costs is recognized when the Company has a legal or constructive obligation to plug and abandon a well, dismantle and remove a facility or an item of Property, Plant and Equipment and to restore the site on which it is located. The full eventual estimated provision towards costs relating to dismantling, abandoning and restoring well sites and allied facilities are recognized in respective assets when the well is complete / facilities or Property, Plant and Equipment are installed.
The amount recognized is the present value of the estimated future expenditure determined using existing technology at current prices and escalated using appropriate inflation rate till the expecteddate of decommissioning and discounted up to the reporting date using the appropriate risk free discount rate.
An amount equivalent to the decommissioning provision is recognized along with the cost of exploratory well or Property, Plant and Equipment. The decommissioning cost in respect of dry well is expensed as exploratory well cost.
Any change in the present value of the estimated decommissioning provision other than the periodic unwinding of discount is adjusted to the decommissioning provision and the corresponding carrying value of the related asset. In case reversal of decommissioning provision exceeds the corresponding carrying amount of the related asset, the excess amount is recognized in the Statement ofProfitandLoss.TheunwindingofdiscountonprovisionischargedintheStatementofProfitandLossasfinancecost.
Provision for decommissioning cost in respect of assets under Joint Operations is considered
as per participating interest of the Company on the basis of estimates approved by the respective operating committee. Wherever the same are not approved by the respective operating committee, decommissioning cost estimates of the Company are considered.
3.14 Inventories
Finished goods (other than Sulphur) including inventories in pipelines / tanks and carbon credits are valued at cost or net realisable value whichever is lower.Cost offinishedgoods is determinedonabsorption costing method. Sulphur is valued at net realisable value. The value of inventories includes excise duty, royalty (wherever applicable) but excludes cess.
Crude oil in semi-finished condition at GroupGathering Stations (GGS) is valued at cost on absorption costing method or net realisable value whichever is lower.
Crudeoil inunfinishedcondition inflow linesupto GGS / platform is not valued as the same is not measurable. Natural Gas is not valued as it is not stored.
Inventory of stores and spare parts is valued at Weighted Average Cost or Net Realisable Value, whichever is lower. Provisions are made for obsolete and non-moving inventories.
Unserviceable and scrap items, when determined, are valued at estimated net realisable value.
3.15 Revenue Recognition
The Company derives revenues primarily from sale of products and services, such as crude oil, natural gas, value added products, pipeline transportation and processing services.
Effective April 1, 2018, the Company adopted Ind AS115“RevenuefromContractswithCustomers”using the cumulative catch-up transition method, applied to contracts that were not completed as of April 1, 2018. In accordance with the cumulative catch-up transition method, the comparatives have
258
not been retrospectively adjusted. The effect on adoptionofIndAS115doesnothaveanysignificantimpact on the retained earnings as at April 01, 2018.
Revenue from contracts with customers is recognized at thepoint in timewhentheCompanysatisfiesaperformance obligation by transferring control of a promised product or service to a customer at an amountthatreflectstheconsiderationtowhichtheCompany expects to be entitled in exchange for the sale of products and service, net of discount, taxes or duties. The transfer of control on sale of crude oil, natural gas and value added products occurs at the point of delivery, where usually the title is passed and the customer takes physical possession, depending upon the contractual conditions. Any retrospective revision in prices is accounted for in the year of such revision.
Sale of crude oil and natural gas (net of levies) produced from Intangible assets under development – Exploratory Wells in Progress / Oil and Gasassets under development – Development Wellsin Progress is deducted from expenditure on such wells.
Any payment received in respect of contractual short lifted gas quantity for which an obligation exists to make-up such gas in subsequent periods is recognised as Contract Liabilities in the year of receipt. Revenue in respect of such contractual short lifted quantity of gas is recognized when such gas is actually supplied or when the customer’s right to make up is expired, whichever is earlier.
As per the Production Sharing Contracts for extracting the Oil and Gas Reserves with Government of India, out of the earnings from the exploitation of reserves after recovery of cost, a part of the revenue is paid to Government of India which is calledProfitPetroleum. It is reduced from therevenue from Sale of Products as Government of India’s Share inProfitPetroleum.
Revenue in respect of the following is recognized when collectability of the receivable is reasonably assured:
(i) Contractual short lifted quantity of gas with no obligation for make-up
(ii) Interest on delayed realization from customers and cash calls from JV partners
(iii) Liquidated damages from contractors/suppliers
Dividend and Interest Income
Dividend income from investments is recognised when the shareholder’s right to receive payment is established.
Interestincomefromfinancialassetsisrecognisedat the effective interest rate method applicable on initial recognition.
3.16 Leases
Leasesareclassifiedasfinanceleaseswhenevertheterms of the lease transfer substantially all the risks and rewards incidental to the ownership of an asset to theCompany.All other leases are classified asoperating leases.
Landunderperpetualleaseisaccountedasfinancelease which is recognized at upfront premium paid for the lease and the present value of the lease rent obligation. The corresponding liability is recognisedasafinanceleaseobligation.Landundernon-perpetual lease is treated as operating lease.
Operating lease payments for land are recognized as prepayments and amortised on a straight-line basis over the term of the lease. Contingent rentals, if any, arising under operating leases are recognised as an expense in the period in which they are incurred.
3.17 Foreign Exchange Transactions
The functional currency of the Company is Indian Rupees which represents the currency of the primary economic environment in which it operates.
Transactions in currencies other than the Company’s functional currency (foreign currencies) are recognised at the rates of exchange prevailing at the dates of the transactions. At the end of each reporting period, monetary items denominated in foreign
259Standalone Financial Statements
currencies are translated using mean exchange rate prevailing on the last day of the reporting period.
Exchange differences on monetary items are recognised in theStatement ofProfit andLoss inthe period in which they arise.
3.18 Employee Benefits
Employee benefits include salaries, wages,Contributory provident fund, gratuity, leave encashment towards un-availed leave, compensated absences, post-retirement medical benefits andotherterminalbenefits.
Allshorttermemployeebenefitsarerecognizedattheir undiscounted amount in the accounting period in which they are incurred.
Defined Contribution plans
EmployeeBenefitunderdefinedcontributionplanscomprising Contributory provident fund, Post Retirement benefit scheme, Employee pensionscheme-1995, composite social security scheme etc. is recognized based on the undiscounted amount of obligations of the Company to contribute to the plan. The same is paid to a fund administered through a separate trust.
Defined Benefit Plans
Defined retirement benefit plans comprising ofgratuity, post-retirement medical benefits andother terminal benefits, are recognized based onthe present value of defined benefit obligationwhich is computed using the projected unit credit method, with actuarial valuations being carried out at the end of each annual reporting period. These are accounted either as current employee cost or included in cost of assets as permitted.
Netinterestonthenetdefinedliabilityiscalculatedby applying the discount rate at the beginning of theperiodtothenetdefinedbenefitliabilityorassetandisrecognisedtheStatementofProfitandLossexcept those included in cost of assets as permitted.
Remeasurementofdefinedretirementbenefitplans
except for leave encashment towards un-availed leave and compensated absences, comprising actuarial gains and losses, the effect of the changes to the asset ceiling (if applicable) and the return on plan assets (excluding net interest as definedabove), are recognised in other comprehensive income except those included in cost of assets as permitted in the period in which they occur and are notsubsequentlyreclassifiedtoprofitorloss.
The Company contributes all ascertained liabilities with respect to gratuity and un-availed leave to the ONGC’s Gratuity Fund Trust (OGFT) and Life Insurance Corporation of India (LIC), respectively. Otherdefinedbenefitschemesareunfunded.
TheretirementbenefitobligationrecognisedintheFinancialStatementsrepresentstheactualdeficitorsurplus in the Company’sdefinedbenefitplans.Anysurplus resulting from this calculation is limited to thepresentvalueofanyeconomicbenefitsavailablein the form of reductions in future contributions to the plans.
Other Long Term Employee Benefits
Other long term employee benefit comprises ofleave encashment towards un-availed leave and compensated absences. These are recognized based on the present value of defined obligationwhich is computed using the projected unit credit method, with actuarial valuations being carried out at the end of each annual reporting period. These are accounted either as current employee cost or included in cost of assets as permitted.
Re-measurements of leave encashment towards un-availed leave and compensated absences are recognizedintheStatementofprofitandlossexceptthose included in cost of assets as permitted in the period in which they occur.
3.19 Voluntary Retirement Scheme
Expenditure on Voluntary Retirement Scheme (VRS) is charged to the Statement of Profit andLoss when incurred.
260
3.20 General Administrative Expenses
General administrative expenses which are directly attributable are allocated to activities and the balanceischargedtoStatementofProfitandLoss.
3.21 Insurance Claims
Insurance claims are accounted for on the basis of claims admitted/expected to be admitted to the extent that the amount recoverable can be measured reliably and it is virtually certain to expect ultimate collection.
3.22 Research and Development Expenditure
Expenditure of capital nature are capitalised and expenses of revenue nature are charged to the StatementofProfitandLoss,asandwhenincurred.
3.23 Income Taxes
Income tax expense represents the sum of the current tax and deferred tax.
(i) Current Tax
Thetaxcurrentlypayableisbasedontaxableprofitfor the year. Taxable profit differs from ‘profitbeforetax’asreportedintheStatementofProfitandLoss because of items of income or expense that are taxable or deductible in other years and items that are never taxable or deductible. The Company’s current tax is calculated using tax rates and laws that have been enacted or substantively enacted by the end of the reporting period.
(ii) Deferred tax
Deferred tax is recognised on temporary differences between the carrying amounts of assets and liabilities in the Financial Statements and the corresponding tax bases used in the computation of taxableprofit. Deferred tax liabilities are generally recognised for all taxable temporary differences. Deferred tax assets are generally recognised for all deductible temporary differences to the extent that it is probable that taxable profits will beavailable against which those deductible temporary differences can be utilised.
The carrying amount of deferred tax assets is reviewed at the end of each reporting period and reduced to the extent that it is no longer probable that sufficient taxable profits will be availableto allow all or part of the deferred tax asset to be utilized.
Deferred tax liabilities and assets are measured at the tax rates that are expected to apply in the period in which the liability is settled or the asset realised, based on tax rates (and tax laws) that have been enacted or substantively enacted by the end of the reporting period.
The measurement of deferred tax liabilities and assets reflects the tax consequences that wouldfollow from the manner in which the Company expects, at the end of the reporting period, to recover or settle the carrying amount of its assets and liabilities.
Deferred tax assets include Minimum Alternative Tax (MAT) paid in accordance with the tax laws in India, which is likely to give future economic benefitsintheformofavailabilityofsetoffagainstfuture income tax liability. Accordingly, MAT is recognised as deferred tax asset in the balance sheet when the asset can be measured reliably and it is probablethatthefutureeconomicbenefitassociatedwith asset will be realised.
(iii) Current and deferred tax expense for the year
Current and deferred tax expense is recognised in the Statement of Profit andLoss, exceptwhenthey relate to items that are recognised in other comprehensive income or directly in equity, in which case, the current and deferred tax are also recognised in other comprehensive income or directly in equity respectively.
3.24 Borrowing Costs
Borrowing costs specifically identified to theacquisition or construction of qualifying assets is capitalized as part of such assets. A qualifying asset is one that necessarily takes substantial period of time to get ready for intended use. All other
261Standalone Financial Statements
borrowing costs are charged to the Statement of ProfitandLoss.
3.25 Rig Days Costs
Rig movement costs are booked to the next location drilled/planned for drilling. Abnormal Rig day’s costs are considered as un-allocable and charged to theStatementofProfitandLoss.
3.26 Provisions, Contingent Liabilities and Contingent Assets
Provisions are recognised when the Company has a present obligation (legal or constructive) as a result of a past event, it is probable that the Company will be required to settle the obligation, and a reliable estimate can be made of the amount of the obligation.
The amount recognised as a provision is the best estimate of the consideration required to settle the present obligation at the end of the reporting period, taking into account the risks and uncertainties surrounding the obligation. When a provision is measuredusing the cashflows estimated to settlethe present obligation, its carrying amount is the presentvalueofthosecashflows(whentheeffectof the time value of money is material).
Contingent assets are disclosed in the Financial Statements by way of notes to accounts when an inflowofeconomicbenefitsisprobable.
Contingent liabilities are disclosed in the Financial Statements by way of notes to accounts, unless possibility of an outflow of resources embodyingeconomicbenefitisremote.
3.27 Financial Instruments
Financial assets and financial liabilities arerecognised when Company becomes a party to the contractual provisions of the instruments.
Financialassetsandfinancialliabilitiesareinitiallymeasured at fair value. Transaction costs that are directly attributable to the acquisition or issue of financialassetsandfinancial liabilities(otherthan
financialassetsandfinancialliabilitiesatfairvaluethroughprofitorloss)areaddedtoordeductedfromthe fair value of the financial assets or financialliabilities, as appropriate, on initial recognition. Transaction costs directly attributable to the acquisitionoffinancialassetsorfinancialliabilitiesat fair value throughprofit or loss are recognisedimmediatelyintheStatementofProfitandLoss.
3.28 Equity Instruments
Equity instruments issued by the Company are recorded at the proceeds received, net of direct issue costs.
3.29 Financial Assets
(i) Cash and Cash Equivalents
TheCompanyconsidersallhighlyliquidfinancialinstruments, which are readily convertible into known amounts of cash that are subject to an insignificant risk of change in value and havingoriginal maturities of three months or less from the date of purchase, to be cash equivalents. Cash and cash equivalents consist of balances with banks which are unrestricted for withdrawal and usage.
(ii) Financial Assets at a Amortised Cost
Financial assets are subsequently measured at amortised cost using the effective interest method if thesefinancialassetsareheldwithinabusinesswhose objective is to hold these assets in order to collect contractual cash flows and the contractualterms of the financial asset give rise on specifieddates to cash flows that are solely payments ofprincipal and interest on the principal amount outstanding.
(iii) Financial Assets at Fair Value Through Other Comprehensive Income
Financial assets are measured at fair value through other comprehensive income if these financialassets are held within a business whose objective is achievedbybothcollectingcontractualcashflowsandsellingfinancialassetsandthecontractualtermsofthefinancialassetgiveriseonspecifieddatesto
262
cashflowsthataresolelypaymentsofprincipalandinterest on the principal amount outstanding.
The Company has made an irrevocable election to present in other comprehensive income subsequent changes in the fair value of equity investments not held for trading.
(iv) Financial Assets at Fair Value Through Profit or Loss
Financial assets are measured at fair value through profit or loss unless it is measured at amortisedcost or at fair value through other comprehensive income on initial recognition.
(v) Impairment of Financial Assets
The Company assesses at each balance sheet date whetherafinancialassetoragroupoffinancialassetsis impaired. Ind AS 109 requires expected credit losses to be measured through a loss allowance. The Company recognises lifetime expected losses for tradereceivablesthatdonotconstituteafinancingtransaction.Forallotherfinancialassets,expectedcredit losses are measured at an amount equal to 12 month expected credit losses or at an amount equal to lifetime expected losses, if the credit risk on the financial asset has increased significantly sinceinitial recognition.
(vi) Derecognition of Financial Assets
TheCompanyderecognisesafinancialassetwhenthe contractual rights to the cash flows from theasset expire, or when it transfers the financialasset and substantially all the risks and rewards of ownership of the asset to another party.
On derecognition of afinancialassetinitsentirety(except for equity instruments designated as FVTOCI), the difference between the asset’s carrying amount and the sum of the consideration received and receivable is recognised in the StatementofProfitandLoss.
3.30 Financial Liabilities
(a) Financial Guarantee Contracts
A financial guarantee contract is a contract thatrequires the issuer tomake specifiedpayments toreimburse the holder for a loss it incurs because a specifieddebtorfailstomakepaymentswhenduein accordance with the terms of a debt instrument.
Financial guarantee contracts issued by the Company are initially measured at their fair values and, if not designated as at FVTPL, are subsequently measured at the higher of:
1. the amount of loss allowance determined in accordance with impairment requirements of Ind AS 109; and
ii. the amount initially recognised less, when appropriate, the cumulative amount of income recognised in accordance with the principles of Ind AS 115. [Note no. 3.3 for Financial guarantee issued to subsidiaries]
(b) Financial Liabilities
Financial liabilities are measured at amortised cost using the effective interest method.
(c) Derecognition of Financial Liabilities
The Company derecognises financial liabilitieswhen, and only when, the Company’s obligations are discharged, cancelled or have expired. The difference between the carrying amount of the financialliabilityderecognisedandtheconsiderationpaid and payable is recognised in the Statement of ProfitandLoss.
3.31 Earnings Per Share
Basic earnings per share are computed by dividing the net profit after tax by the weighted averagenumber of equity shares outstanding during the period. Diluted earnings per share is computed by dividingtheprofitaftertaxbytheweightedaveragenumber of equity shares considered for deriving basic earnings per share and also the weighted average number of equity shares that could have been issued upon conversion of all dilutive potential equity shares.
263Standalone Financial Statements
3.32 Statement of Cash Flows
Cashflowsarereportedusingtheindirectmethod,wherebyprofitaftertaxisadjustedfortheeffectsoftransactions of a non-cash nature, any deferrals or accruals of future or past operating cash receipts or payments and item of income or expenses associated with investing or financing cash flows. The cashflowsare segregated intooperating, investingandfinancingactivities.
3.33 Segment Reporting
Operating segments are identified and reportedtaking into account the different risks and returns, the organization structure and the internal reporting systems.
4. Critical Accounting Judgments, Assumptions and Key Sources of Estimation Uncertainty
Inherent in the application of many of the accounting policies used in preparing the Financial Statements is the need for Management to make judgments, estimates and assumptions that affect the reported amounts of assets and liabilities, the disclosure of contingent assets and liabilities, and the reported amounts of revenues and expenses. Actual outcomes could differ from the estimates and assumptions used.
Estimates and underlying assumptions are reviewed on an ongoing basis. Revisions to accounting estimates are recognised in the period in which the estimates are revised and future periods are affected.
Key source of judgments, assumptions and estimation uncertainty in the preparation of the Financial Statements which may cause a material adjustment to the carrying amounts of assets and liabilities within the next financial year, arein respect of Oil and Gas reserves, long term production profile, impairment, useful lives of Property, Plant and Equipment, depletion of oil and gas assets, decommissioning provision, employee benefit obligations, impairment, provision forincome tax, measurement of deferred tax assets, litigation and contingent assets and liabilities.
4.1 Critical Judgments in Applying Accounting Policies
The following are the critical judgements, apart from those involving estimations (Note no. 4.2), that the Management have made in the process of applying the Company’s accounting policies and that have the significant effect on the amountsrecognized in the Financial Statements.
(a) Determination of Functional Currency
Currency of the primary economic environment in which the Company operates (“the functionalcurrency”) is Indian Rupee (`) in which the Company primarily generates and expends cash. Accordingly, the Management has assessed its functional currency to be Indian Rupee (`).
(b) Classification of Investment
Judgment is required in assessing the level of control obtained in a transaction to acquire an interest in another entity; depending upon the facts and circumstances in each case, the Company may obtaincontrol,jointcontrolorsignificantinfluenceover the entity or arrangement. Transactions which give the Company control of a business are business combinations. If the Company obtains joint control of an arrangement, judgement is also required to assess whether the arrangement is a joint operation or a joint venture. If the Company has neither control nor joint control, it may be in a position to exercisesignificantinfluenceovertheentity,whichis then classifiedasanassociate.
The Company has 49.36% equity interest in ONGC Petro additions Limited (OPaL). The Company has also subscribed for 2,558 million share warrants entitling the Company to exchange each warrant with an equity share of face value of `10 each against which `9.75 each has been paid.
Further the Company has also entered into an arrangement for backstopping support towards repayment of principal and cumulative coupon amount for compulsorily convertible debentures
264
amounting to `77,780.00 million (previous year `77,780.00 million) issued by ONGC Petro additions Limited and interest for the year ending March 31, 2019 amounting to `5,117.73 million (previous year `4,670.19 million).
The Management has however evaluated the interest in OPaL to be in the nature of joint venture as the shareholder agreement between all the shareholders provides for sharing of control of the decisions of relevant activities that require the unanimous consent of all the parties sharing control.
(c) Determining Whether an Arrangement Contain Leases and Classification of Leases
The Company enters into service/hiring arrangements for various assets/services. The determination of lease and classification of theservice/ hiringarrangementasafinanceleaseoroperating lease is based on an assessment of several factors, including, but not limited to, transfer of ownership of leased asset at end of lease term, lessee’s option to purchase and estimated certainty of exercise of such option, proportion of lease term to the asset’s economic life, proportion of present value of minimum lease payments to fair value of leased asset and extent of specialized nature of the leased asset.
(d) Evaluation of Indicators for Impairment of Oil and Gas Assets
The evaluation of applicability of indicators of impairment of assets requires assessment of externalfactors(significantdeclineinasset’svalue,significant changes in the technological, market,economic or legal environment, market interest rates etc.) and internal factors (obsolescence or physical damage of an asset, poor economic performance of the asset etc.) which could result in significantchangeinrecoverableamountoftheOiland Gas Assets.
(e) Oil & Gas Accounting
The determination of whether potentially economic oil and natural gas reserves have been discovered by an exploration well is usually made within
one year of well completion, but can take longer, depending on the complexity of the geological structure. Exploration wells that discover potentially economic quantities of oil and natural gas and are in areas where major capital expenditure (e.g. an offshore platform or a pipeline) would be required before production could begin, and where the economic viability of that major capital expenditure depends on the successful completion of further exploration work in the area, remain capitalized on the balance sheet as long as additional exploration orappraisalworkisunderwayorfirmlyplanned.
It is not unusual to have exploration wells and exploratory-type stratigraphic test wells remaining suspended on the balance sheet for several years while additional appraisal drilling and seismic work on the potential oil and natural gas field isperformed or while the optimum development plans and timing are established. All such carried costs are subject to regular technical, commercial and management review on at least an annual basistoconfirmthecontinuedintenttodevelop,orotherwise extract value from the discovery. Where this is no longer the case, the costs are immediately expensed.
4.2 Assumptions and Key Sources of Estimation Uncertainty
Information about estimates and assumptions thathave thesignificanteffecton recognitionandmeasurement of assets, liabilities, income and expenses is provided below. Actual results may differ from these estimates.
(a) Estimation of Provision for Decommissioning
The Company estimates provision for decommissioning as per the principles of Ind AS 37 ‘Provisions, Contingent Liabilities and Contingent Assets’ for the future decommissioning of Oil and Gas assets at the end of their economic lives. Most of these decommissioning activities would be in the future, the exact requirements that may have to be met when the removal events occur are uncertain. Technologies and costs for decommissioning are constantly changing. The timing and amounts
265Standalone Financial Statements
of future cash flows are subject to significantuncertainty.
The timing and amount of future expenditures are reviewed at the end of each reporting period, together with rate of inflation for escalation ofcurrent cost estimates and the interest rate used in discounting thecashflows. Theeconomic lifeofthe Oil and Gas assets is estimated on the basis of longtermproductionprofileoftherelevantOilandGas asset. The General Consumer Price Index (CPI) forinflationi.e.2.86.%(Previousyear4.28%)hasbeen used for escalation of the current cost estimates and pre- tax discounting rate used to determine the balance sheet obligation as at the end of the year is 7.47% (Previous year 7.56%), which is the risk free government bond rate with 10 year yield.
(b) Determination of Cash Generating Unit (CGU)
The Company is engaged mainly in the business of oil and gas exploration and production in Onshore andOffshore.Incaseofonshoreassets,thefieldsareusing common production/transportation facilities and are sufficiently economically interdependentto constitute a single cash generating unit (CGU). Accordingly, impairment testof allonshorefieldsisperformedinaggregateofallthosefieldsattheAssetLevel. IncaseofOffshoreAssets,afield isgenerallyconsideredasCGUexceptforfieldswhichare developed as a Cluster, for which common facilities are used, in which case the impairment testing isperformed inaggregate forall thefieldsincluded in the cluster.
(c) Impairment of Assets
Determination as to whether, and by how much, a CGU is impaired involves Management estimates on uncertain matters such as future crude oil, natural gas and value added product (VAP) prices, the effectsofinflationonoperatingexpenses,discountrates,productionprofilesfor crude oil, natural gas and value added products. For Oil and Gas assets, theexpectedfuturecashflowsareestimatedusingManagement’s best estimate of future crude oil and natural gas prices, production and reserves volumes.
Thepresentvaluesofcashflowsaredeterminedbyapplying pre tax-discount rates of 14.71% (previous year 14.48%) for Rupee transactions and 9.79% (previous year 9.68%) for crude oil and value added products revenue, which are measured in US$.Futurecashinflowsfromsaleofcrudeoilandvalue added products are computed using the future prices, on the basis of market-based average prices of the Dated Brent crude oil as per assessment by ‘Platt’s Crude Oil Market wire’ and its co-relations with benchmark crudes and other petroleum products. Future cash flows from sale of naturalgas are also computed based on the expected future pricesonthebasisofthenotificationissuedbytheGovernment of India (GoI) and discounted applying the rate applicable to the cash flowsmeasured inUS$ in view of the new pricing guidelines issued by GoI.
The discount rate used is based upon the cost of capital from an established model.
The value in use of the producing/developing CGUs is determined under a multi-stage approach, wherein future cash flows are initially estimated based onProved Developed Reserves. Under circumstances where thefurtherdevelopmentof thefields in theCGUs is under progress and where the carrying value of the CGUs is not likely to be recovered through exploitation of proved developed reserves alone, the Proved and Probable reserves (2P) of the CGUs are also taken for the purpose of estimating futurecashflows. In such cases, full estimate of the expected cost of evaluation/development is also considered while determining the value in use.
The discount rates applied in the assessment of impairment calculation are re-assessed each year.
(d) Estimation of Reserves
Management estimates reserves in relation to all the Oil and Gas Assets based on the policies and procedures determined by the Reserves Estimation Committee of the Company (REC). The estimates so determined are used for the computation of depletion and impairment testing.
The year-end reserves of the Company are estimated
266
by the REC which follows international reservoir engineering procedures consistently. The Company hasmigratedfromclassificationofReservesunderSPE-1997 guidelines to Petroleum Resources Management System-PRMS (2018) sponsored by Society of Petroleum Engineers (SPE), World Petroleum Council (WPC), American Association of Petroleum Geologists(AAPG), Society of Petroleum Evaluation Engineers (SPEE), Society of Exploration Geophysicists (SEG), Society of Petrophysicists and Well Log Analysts (SPWLA) and European Association of Geoscientists and Engineers (EAGE).
PRMS(2018) defines Proved Reserves underReserves category as those quantities of petroleum that, by analysis of geoscience and engineering data, can be estimated with reasonable certainty to be commercially recoverable from a given date forward fromknownreservoirsandunderdefinedeconomicconditions, operating methods, and government regulations.FurtheritdefinesDevelopedReservesas expected quantities to be recovered from existing wells and facilities and Undeveloped Reserves as the Quantities expected to be recovered through futuresignificantinvestments.
Volumetric estimation is the main procedure in estimation which uses reservoir rock and fluidproperties to calculate hydrocarbons in-place and then estimate that portion which will be recovered from it.As thefield getsmatured and reasonablygood production history is available, then performance methods such as material balance, simulation, decline curve analysis are applied to get more accurate assessments of reserves.
The annual revision of estimates is based on the yearly exploratory and development activities and results thereof. New in-place Volume and Ultimate Reservesareestimatedfornewfielddiscoveriesor
newpooldiscoveries inalreadydiscoveredfields.Also, delineation/appraisal activities lead to revision in estimates due to new sub-surface data. Similarly, review /reinterpretation exercise is also carried out foroldfieldsduetonecessity of revision in petro-physical parameters, updating of static and dynamic models and performance analysis leading to change in reserves. Intervention of new technology, change in classifications and contractual provisions alsonecessitate revision in estimation of reserves.
The Company uses the services of third party agencies for due diligence and it gets the reserves of its assets audited periodically by third party internationally reputed consultants who adopt latest industry practices for their evaluation.
(e) Defined Benefit Obligation (DBO)
Management’s estimate of the DBO is based on a number of critical underlying assumptions such as standard ratesof inflation,medical cost trends,mortality, discount rate and anticipation of future salary increases. Variation in these assumptions maysignificantlyimpacttheDBOamountandtheannualdefinedbenefitexpenses.
(f) Litigations
From time to time, the Company is subject to legal proceedings and the ultimate outcome of each being always subject to many uncertainties inherent in litigation. A provision for litigation is made when it is considered probable that a payment will be made and the amount of the loss can be reasonably estimated. Significant judgment is made whenevaluating, among other factors, the probability of unfavourable outcome and the liability to make a reasonable estimate of the amount of potential loss. Provision for litigations are reviewed at the end of each accounting period and revisions made for the changes in facts and circumstances.
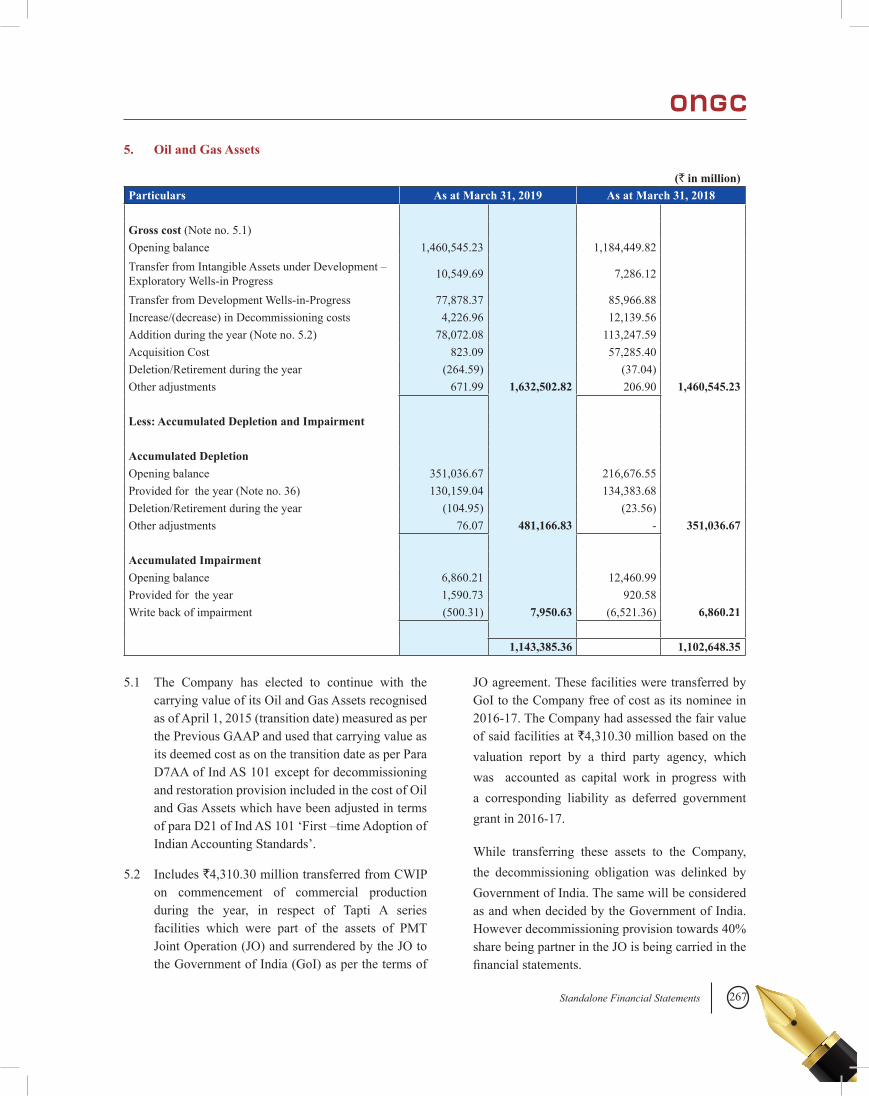
267Standalone Financial Statements
5. Oil and Gas Assets
(` in million)Particulars As at March 31, 2019 As at March 31, 2018
Gross cost (Note no. 5.1)Opening balance 1,460,545.23 1,184,449.82TransferfromIntangibleAssetsunderDevelopment–Exploratory Wells-in Progress 10,549.69 7,286.12
Transfer from Development Wells-in-Progress 77,878.37 85,966.88Increase/(decrease) in Decommissioning costs 4,226.96 12,139.56Addition during the year (Note no. 5.2) 78,072.08 113,247.59Acquisition Cost 823.09 57,285.40Deletion/Retirement during the year (264.59) (37.04)Other adjustments 671.99 1,632,502.82 206.90 1,460,545.23
Less: Accumulated Depletion and Impairment
Accumulated Depletion Opening balance 351,036.67 216,676.55Provided for the year (Note no. 36) 130,159.04 134,383.68Deletion/Retirement during the year (104.95) (23.56)Other adjustments 76.07 481,166.83 - 351,036.67
Accumulated ImpairmentOpening balance 6,860.21 12,460.99Provided for the year 1,590.73 920.58Write back of impairment (500.31) 7,950.63 (6,521.36) 6,860.21
1,143,385.36 1,102,648.35
5.1 The Company has elected to continue with the
carrying value of its Oil and Gas Assets recognised as of April 1, 2015 (transition date) measured as per the Previous GAAP and used that carrying value as its deemed cost as on the transition date as per Para D7AA of Ind AS 101 except for decommissioning and restoration provision included in the cost of Oil and Gas Assets which have been adjusted in terms ofparaD21ofIndAS101‘First–timeAdoptionofIndian Accounting Standards’.
5.2 Includes `4,310.30 million transferred from CWIP on commencement of commercial production during the year, in respect of Tapti A series facilities which were part of the assets of PMT Joint Operation (JO) and surrendered by the JO to the Government of India (GoI) as per the terms of
JO agreement. These facilities were transferred by GoI to the Company free of cost as its nominee in 2016-17. The Company had assessed the fair value of said facilities at `4,310.30 million based on the valuation report by a third party agency, which was accounted as capital work in progress with a corresponding liability as deferred government grant in 2016-17.
While transferring these assets to the Company, the decommissioning obligation was delinked by Government of India. The same will be considered as and when decided by the Government of India. However decommissioning provision towards 40% share being partner in the JO is being carried in the financialstatements.
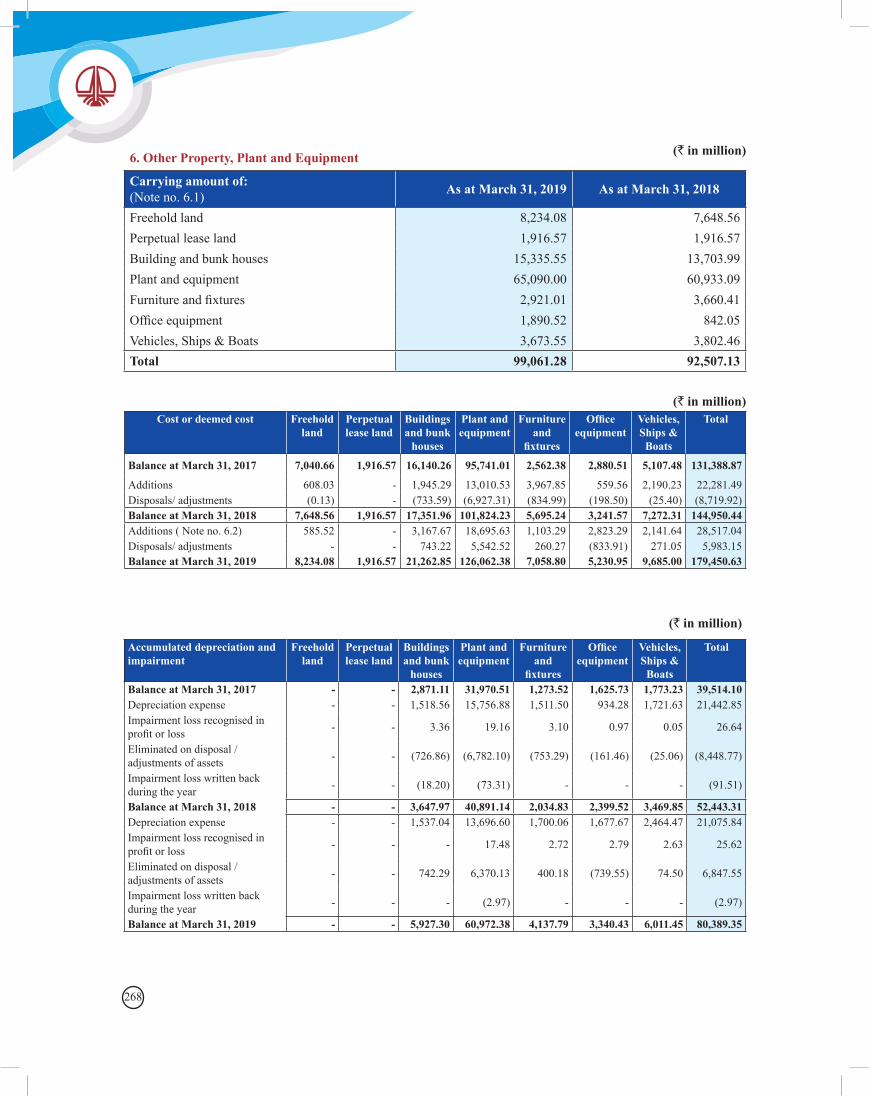
268
6. Other Property, Plant and Equipment
Carrying amount of: (Note no. 6.1) As at March 31, 2019 As at March 31, 2018
Freehold land 8,234.08 7,648.56Perpetual lease land 1,916.57 1,916.57Building and bunk houses 15,335.55 13,703.99Plant and equipment 65,090.00 60,933.09Furnitureandfixtures 2,921.01 3,660.41Officeequipment 1,890.52 842.05Vehicles, Ships & Boats 3,673.55 3,802.46Total 99,061.28 92,507.13
(` in million)
(` in million)Cost or deemed cost Freehold
landPerpetual lease land
Buildings and bunk
houses
Plant and equipment
Furniture and
fixtures
Office equipment
Vehicles, Ships &
Boats
Total
Balance at March 31, 2017 7,040.66 1,916.57 16,140.26 95,741.01 2,562.38 2,880.51 5,107.48 131,388.87
Additions 608.03 - 1,945.29 13,010.53 3,967.85 559.56 2,190.23 22,281.49Disposals/ adjustments (0.13) - (733.59) (6,927.31) (834.99) (198.50) (25.40) (8,719.92)Balance at March 31, 2018 7,648.56 1,916.57 17,351.96 101,824.23 5,695.24 3,241.57 7,272.31 144,950.44Additions ( Note no. 6.2) 585.52 - 3,167.67 18,695.63 1,103.29 2,823.29 2,141.64 28,517.04Disposals/ adjustments - - 743.22 5,542.52 260.27 (833.91) 271.05 5,983.15Balance at March 31, 2019 8,234.08 1,916.57 21,262.85 126,062.38 7,058.80 5,230.95 9,685.00 179,450.63
(` in million)
Accumulated depreciation and impairment
Freehold land
Perpetual lease land
Buildings and bunk
houses
Plant and equipment
Furniture and
fixtures
Office equipment
Vehicles, Ships &
Boats
Total
Balance at March 31, 2017 - - 2,871.11 31,970.51 1,273.52 1,625.73 1,773.23 39,514.10Depreciation expense - - 1,518.56 15,756.88 1,511.50 934.28 1,721.63 21,442.85Impairment loss recognised in profitorloss - - 3.36 19.16 3.10 0.97 0.05 26.64
Eliminated on disposal / adjustments of assets - - (726.86) (6,782.10) (753.29) (161.46) (25.06) (8,448.77)
Impairment loss written back during the year - - (18.20) (73.31) - - - (91.51)
Balance at March 31, 2018 - - 3,647.97 40,891.14 2,034.83 2,399.52 3,469.85 52,443.31Depreciation expense - - 1,537.04 13,696.60 1,700.06 1,677.67 2,464.47 21,075.84Impairment loss recognised in profitorloss - - - 17.48 2.72 2.79 2.63 25.62
Eliminated on disposal / adjustments of assets - - 742.29 6,370.13 400.18 (739.55) 74.50 6,847.55
Impairment loss written back during the year - - - (2.97) - - - (2.97)
Balance at March 31, 2019 - - 5,927.30 60,972.38 4,137.79 3,340.43 6,011.45 80,389.35
269Standalone Financial Statements
a. Land includes 3 numbers (Previous year 4) amounting to `58.17 million (Previous year `58.21 million) for which execution of conveyance deeds is in process.
b. Registration of title deeds in respect of 6 numbers (Previous year 6) buildings is pending execution having carrying amount of `54.34 million (Previous year `57.65 million).
c. Building includes cost of undivided interest in land.
6.1 The Company has elected to continue with the carrying value of its other Property Plant & Equipment (PPE) recognised as of April 1, 2015 (transition date) measured as per the Previous GAAP and used that carrying value as its deemed cost as on the transition date as per Para D7AA of Ind AS 101 except for decommissioning provision included in the cost of other Property, Plant and Equipment (PPE) which has been adjusted in terms ofparaD21ofIndAS101‘First–timeAdoptionofIndian Accounting Standards’ .
6.2 Includes `2,846.59 million transferred from CWIP on commencement of commercial production during the year, in respect of Tapti A series plant and machinery which were part of the assets of PMT Joint Operation (JO) and surrendered by the JO to the Government of India (GoI) as the terms of JO agreement. These assets were transferred by GoI to the Company free of cost as its nominee in 2016-17. The Company had assessed the fair value of said plant and machinery at `2,846.59 million based on the valuation report by a third party agency, which had been accounted as capital work in progress with a corresponding liability as deferred government grant in 2016-17.
While transferring these assets to the Company, the decommissioning obligation was delinked by Government of India. The same will be considered as and when decided by the Government of India. However decommissioning provision towards 40% share being partner in the JO is being carried in the financialstatements.
At ONGC, precision is in our DNA. ONGCians at work in field area of Ahmedabad Asset, Gujarat
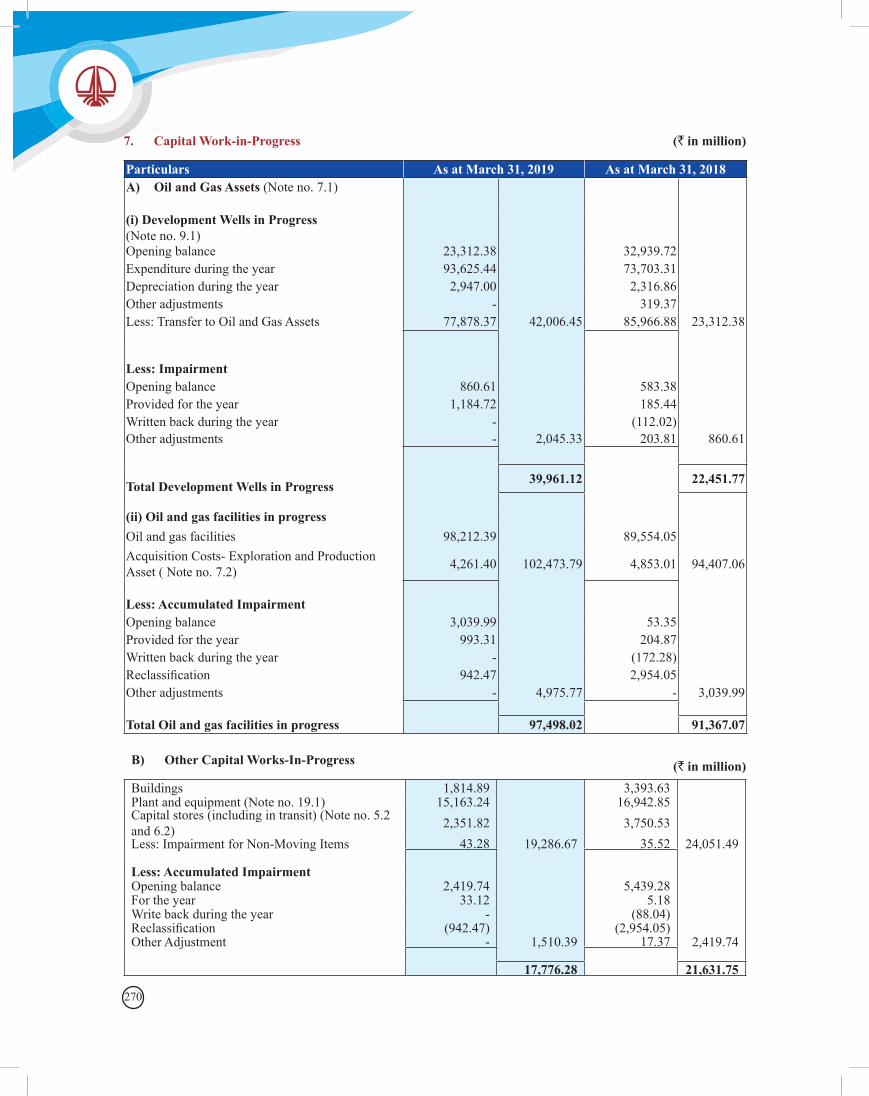
270
7. Capital Work-in-Progress (` in million)
Particulars As at March 31, 2019 As at March 31, 2018A) Oil and Gas Assets (Note no. 7.1)
(i) Development Wells in Progress (Note no. 9.1)Opening balance 23,312.38 32,939.72Expenditure during the year 93,625.44 73,703.31Depreciation during the year 2,947.00 2,316.86Other adjustments - 319.37Less: Transfer to Oil and Gas Assets 77,878.37 42,006.45 85,966.88 23,312.38
Less: ImpairmentOpening balance 860.61 583.38Provided for the year 1,184.72 185.44Written back during the year - (112.02)Other adjustments - 2,045.33 203.81 860.61
Total Development Wells in Progress 39,961.12 22,451.77
(ii) Oil and gas facilities in progressOil and gas facilities 98,212.39 89,554.05Acquisition Costs- Exploration and Production Asset ( Note no. 7.2) 4,261.40 102,473.79 4,853.01 94,407.06
Less: Accumulated ImpairmentOpening balance 3,039.99 53.35Provided for the year 993.31 204.87Written back during the year - (172.28)Reclassification 942.47 2,954.05Other adjustments - 4,975.77 - 3,039.99
Total Oil and gas facilities in progress 97,498.02 91,367.07
B) Other Capital Works-In-Progress
Buildings 1,814.89 3,393.63Plant and equipment (Note no. 19.1) 15,163.24 16,942.85Capital stores (including in transit) (Note no. 5.2 and 6.2) 2,351.82 3,750.53Less: Impairment for Non-Moving Items 43.28 19,286.67 35.52 24,051.49
Less: Accumulated ImpairmentOpening balance 2,419.74 5,439.28For the year 33.12 5.18Write back during the year - (88.04)Reclassification (942.47) (2,954.05)Other Adjustment - 1,510.39 17.37 2,419.74
17,776.28 21,631.75
(` in million)
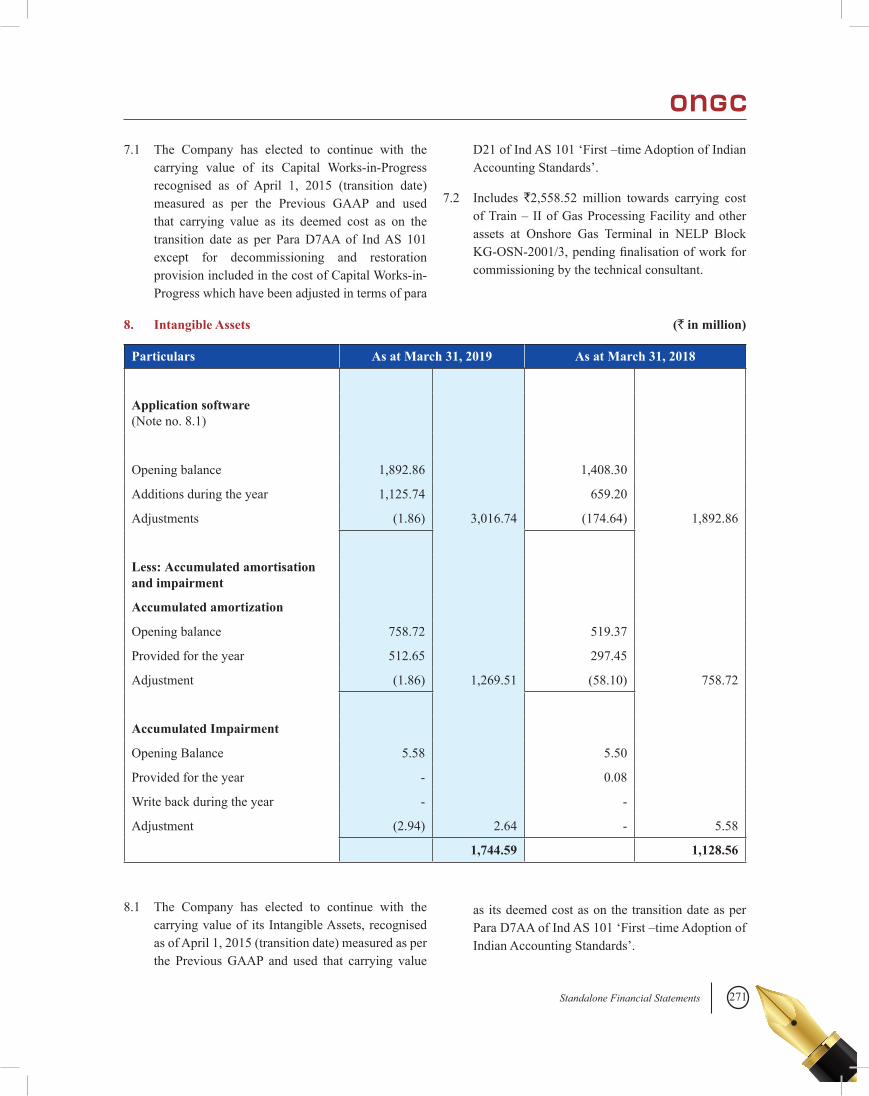
271Standalone Financial Statements
7.1 The Company has elected to continue with the carrying value of its Capital Works-in-Progress recognised as of April 1, 2015 (transition date) measured as per the Previous GAAP and used that carrying value as its deemed cost as on the transition date as per Para D7AA of Ind AS 101 except for decommissioning and restoration provision included in the cost of Capital Works-in-Progress which have been adjusted in terms of para
D21ofIndAS101‘First–timeAdoptionofIndianAccounting Standards’.
7.2 Includes `2,558.52 million towards carrying cost ofTrain–IIofGasProcessingFacilityandotherassets at Onshore Gas Terminal in NELP Block KG-OSN-2001/3,pendingfinalisationofworkforcommissioning by the technical consultant.
8. Intangible Assets (` in million)
Particulars As at March 31, 2019 As at March 31, 2018
Application software (Note no. 8.1)
Opening balance 1,892.86 1,408.30
Additions during the year 1,125.74 659.20
Adjustments (1.86) 3,016.74 (174.64) 1,892.86
Less: Accumulated amortisation and impairment
Accumulated amortization
Opening balance 758.72 519.37
Provided for the year 512.65 297.45
Adjustment (1.86) 1,269.51 (58.10) 758.72
Accumulated Impairment
Opening Balance 5.58 5.50
Provided for the year - 0.08
Write back during the year - -
Adjustment (2.94) 2.64 - 5.58
1,744.59 1,128.56
8.1 The Company has elected to continue with the carrying value of its Intangible Assets, recognised as of April 1, 2015 (transition date) measured as per the Previous GAAP and used that carrying value
as its deemed cost as on the transition date as per ParaD7AAofIndAS101‘First–timeAdoptionofIndian Accounting Standards’.
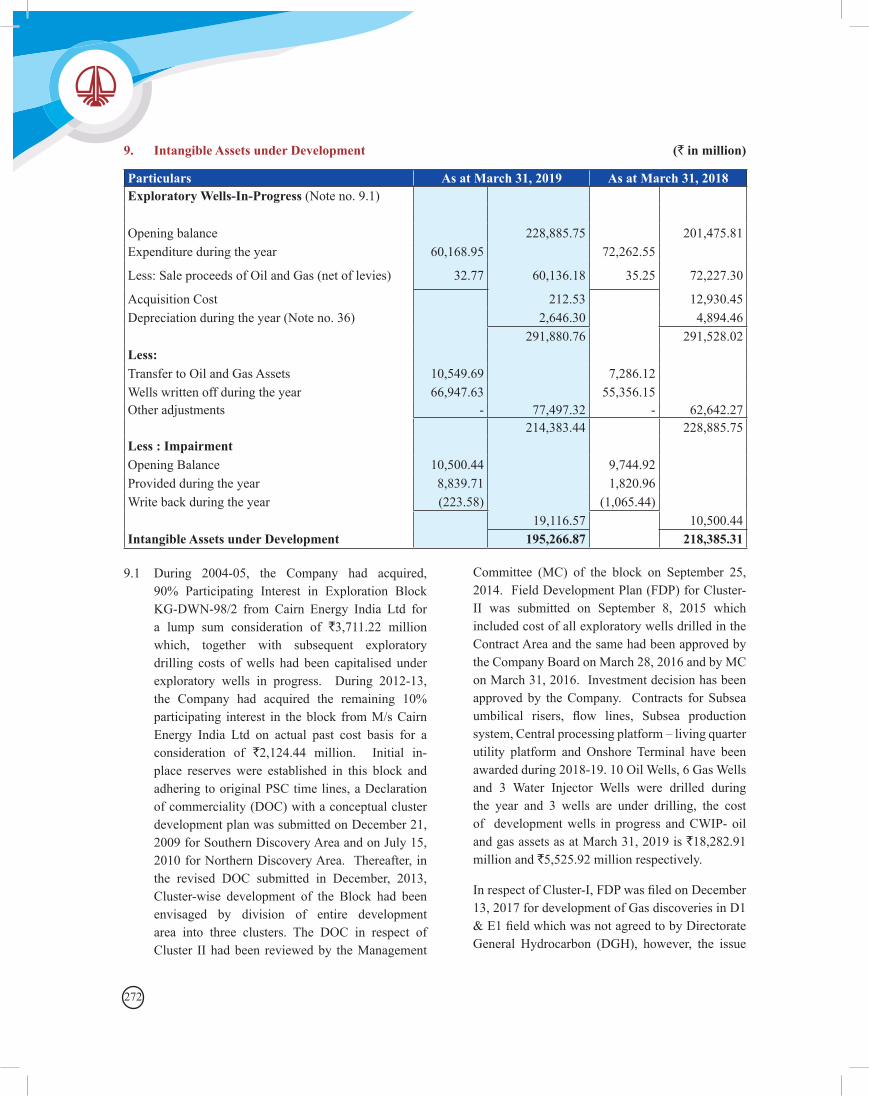
272
9. Intangible Assets under Development (` in million)
Particulars As at March 31, 2019 As at March 31, 2018Exploratory Wells-In-Progress (Note no. 9.1)
Opening balance 228,885.75 201,475.81Expenditure during the year 60,168.95 72,262.55
Less: Sale proceeds of Oil and Gas (net of levies) 32.77 60,136.18 35.25 72,227.30
Acquisition Cost 212.53 12,930.45Depreciation during the year (Note no. 36) 2,646.30 4,894.46
291,880.76 291,528.02Less:Transfer to Oil and Gas Assets 10,549.69 7,286.12Wells written off during the year 66,947.63 55,356.15Other adjustments - 77,497.32 - 62,642.27
214,383.44 228,885.75Less : Impairment Opening Balance 10,500.44 9,744.92Provided during the year 8,839.71 1,820.96Write back during the year (223.58) (1,065.44)
19,116.57 10,500.44Intangible Assets under Development 195,266.87 218,385.31
9.1 During 2004-05, the Company had acquired, 90% Participating Interest in Exploration Block KG-DWN-98/2 from Cairn Energy India Ltd for a lump sum consideration of `3,711.22 million which, together with subsequent exploratory drilling costs of wells had been capitalised under exploratory wells in progress. During 2012-13, the Company had acquired the remaining 10% participating interest in the block from M/s Cairn Energy India Ltd on actual past cost basis for a consideration of `2,124.44 million. Initial in-place reserves were established in this block and adhering to original PSC time lines, a Declaration of commerciality (DOC) with a conceptual cluster development plan was submitted on December 21, 2009 for Southern Discovery Area and on July 15, 2010 for Northern Discovery Area. Thereafter, in the revised DOC submitted in December, 2013, Cluster-wise development of the Block had been envisaged by division of entire development area into three clusters. The DOC in respect of Cluster II had been reviewed by the Management
Committee (MC) of the block on September 25, 2014. Field Development Plan (FDP) for Cluster-II was submitted on September 8, 2015 which included cost of all exploratory wells drilled in the Contract Area and the same had been approved by the Company Board on March 28, 2016 and by MC on March 31, 2016. Investment decision has been approved by the Company. Contracts for Subsea umbilical risers, flow lines, Subsea productionsystem,Centralprocessingplatform–livingquarterutility platform and Onshore Terminal have been awarded during 2018-19. 10 Oil Wells, 6 Gas Wells and 3 Water Injector Wells were drilled during the year and 3 wells are under drilling, the cost of development wells in progress and CWIP- oil and gas assets as at March 31, 2019 is `18,282.91 million and `5,525.92 million respectively.
InrespectofCluster-I,FDPwasfiledonDecember13, 2017 for development of Gas discoveries in D1 &E1fieldwhichwasnotagreedtobyDirectorateGeneral Hydrocarbon (DGH), however, the issue
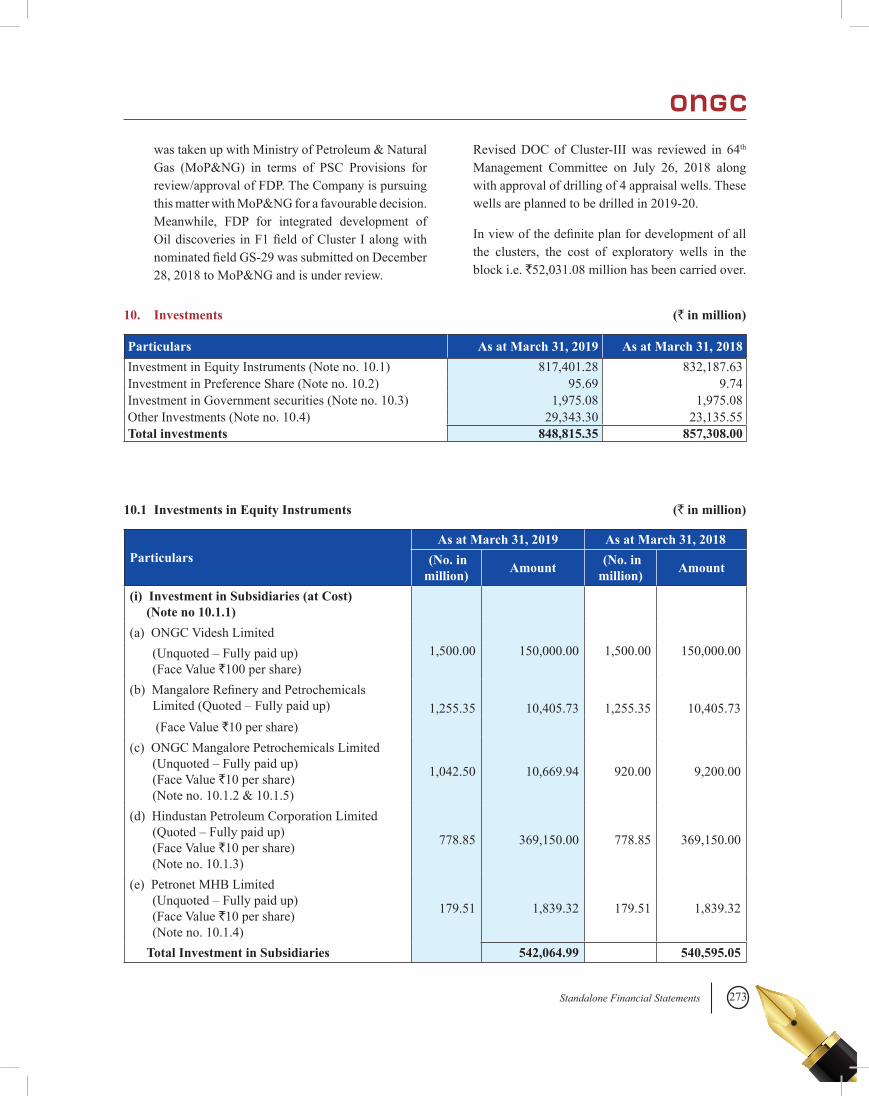
273Standalone Financial Statements
was taken up with Ministry of Petroleum & Natural Gas (MoP&NG) in terms of PSC Provisions for review/approval of FDP. The Company is pursuing this matter with MoP&NG for a favourable decision. Meanwhile, FDP for integrated development of Oildiscoveries inF1fieldofClusterIalongwithnominatedfieldGS-29wassubmittedonDecember28, 2018 to MoP&NG and is under review.
Revised DOC of Cluster-III was reviewed in 64th Management Committee on July 26, 2018 along with approval of drilling of 4 appraisal wells. These wells are planned to be drilled in 2019-20.
Inviewofthedefiniteplanfordevelopmentofallthe clusters, the cost of exploratory wells in the block i.e. `52,031.08 million has been carried over.
10. Investments (` in million)
Particulars As at March 31, 2019 As at March 31, 2018Investment in Equity Instruments (Note no. 10.1) 817,401.28 832,187.63Investment in Preference Share (Note no. 10.2) 95.69 9.74Investment in Government securities (Note no. 10.3) 1,975.08 1,975.08Other Investments (Note no. 10.4) 29,343.30 23,135.55Total investments 848,815.35 857,308.00
10.1 Investments in Equity Instruments (` in million)
ParticularsAs at March 31, 2019 As at March 31, 2018
(No. in million) Amount (No. in
million) Amount
(i) Investment in Subsidiaries (at Cost) (Note no 10.1.1)
(a) ONGC Videsh Limited1,500.00 150,000.00 1,500.00 150,000.00(Unquoted–Fullypaidup)
(Face Value `100 per share)(b)MangaloreRefineryandPetrochemicals
Limited(Quoted–Fullypaidup) 1,255.35 10,405.73 1,255.35 10,405.73 (Face Value `10 per share)
(c) ONGC Mangalore Petrochemicals Limited (Unquoted–Fullypaidup) (Face Value `10 per share) (Note no. 10.1.2 & 10.1.5)
1,042.50 10,669.94 920.00 9,200.00
(d) Hindustan Petroleum Corporation Limited (Quoted–Fullypaidup) (Face Value `10 per share) (Note no. 10.1.3)
778.85 369,150.00 778.85 369,150.00
(e) Petronet MHB Limited (Unquoted–Fullypaidup) (Face Value `10 per share) (Note no. 10.1.4)
179.51 1,839.32 179.51 1,839.32
Total Investment in Subsidiaries 542,064.99 540,595.05
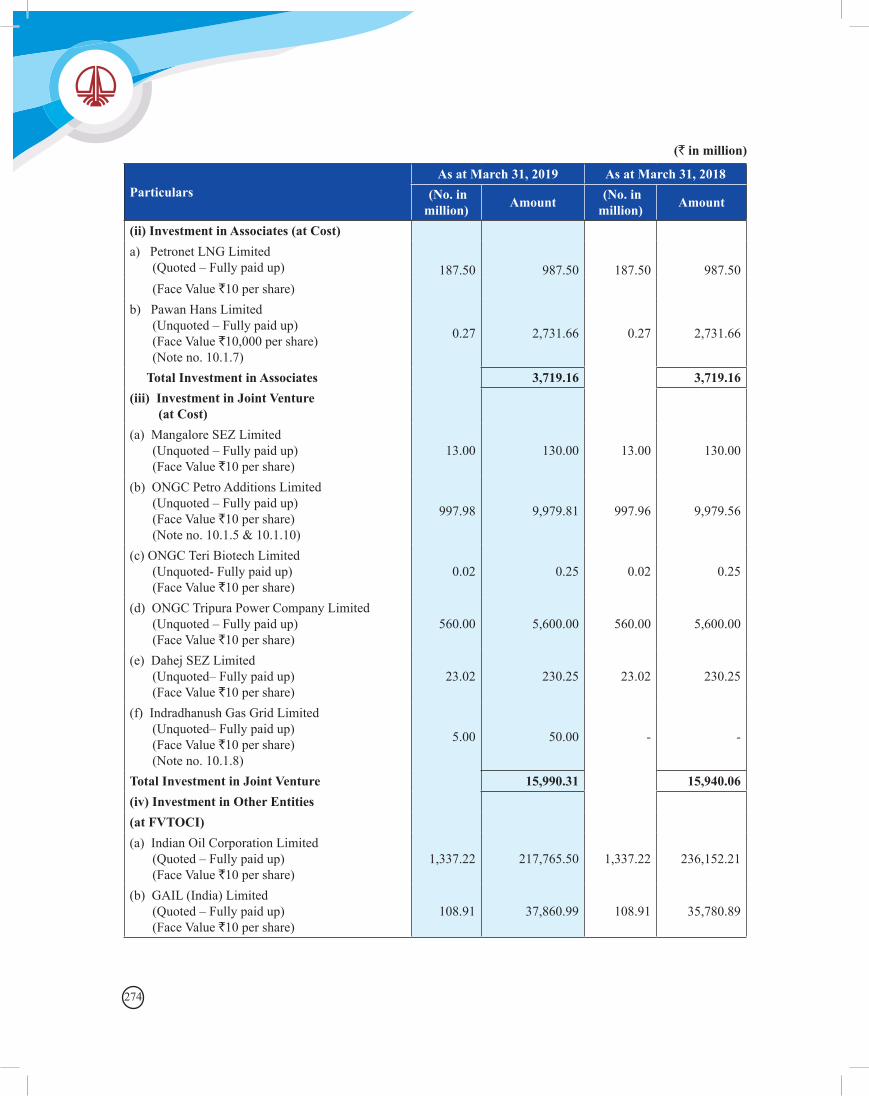
274
ParticularsAs at March 31, 2019 As at March 31, 2018
(No. in million) Amount (No. in
million) Amount
(ii) Investment in Associates (at Cost)a) Petronet LNG Limited
(Quoted–Fullypaidup) 187.50 987.50 187.50 987.50(Face Value `10 per share)
b) Pawan Hans Limited (Unquoted–Fullypaidup) (Face Value `10,000 per share) (Note no. 10.1.7)
0.27 2,731.66 0.27 2,731.66
Total Investment in Associates 3,719.16 3,719.16(iii) Investment in Joint Venture
(at Cost)(a) Mangalore SEZ Limited
(Unquoted–Fullypaidup) (Face Value `10 per share)
13.00 130.00 13.00 130.00
(b) ONGC Petro Additions Limited (Unquoted–Fullypaidup) (Face Value `10 per share) (Note no. 10.1.5 & 10.1.10)
997.98 9,979.81 997.96 9,979.56
(c) ONGC Teri Biotech Limited (Unquoted- Fully paid up) (Face Value `10 per share)
0.02 0.25 0.02 0.25
(d) ONGC Tripura Power Company Limited (Unquoted–Fullypaidup) (Face Value `10 per share)
560.00 5,600.00 560.00 5,600.00
(e) Dahej SEZ Limited (Unquoted–Fullypaidup) (Face Value `10 per share)
23.02 230.25 23.02 230.25
(f) Indradhanush Gas Grid Limited (Unquoted–Fullypaidup) (Face Value `10 per share) (Note no. 10.1.8)
5.00 50.00 - -
Total Investment in Joint Venture 15,990.31 15,940.06(iv) Investment in Other Entities(at FVTOCI)(a) Indian Oil Corporation Limited
(Quoted–Fullypaidup) (Face Value `10 per share)
1,337.22 217,765.50 1,337.22 236,152.21
(b) GAIL (India) Limited (Quoted–Fullypaidup) (Face Value `10 per share)
108.91 37,860.99 108.91 35,780.89
(` in million)
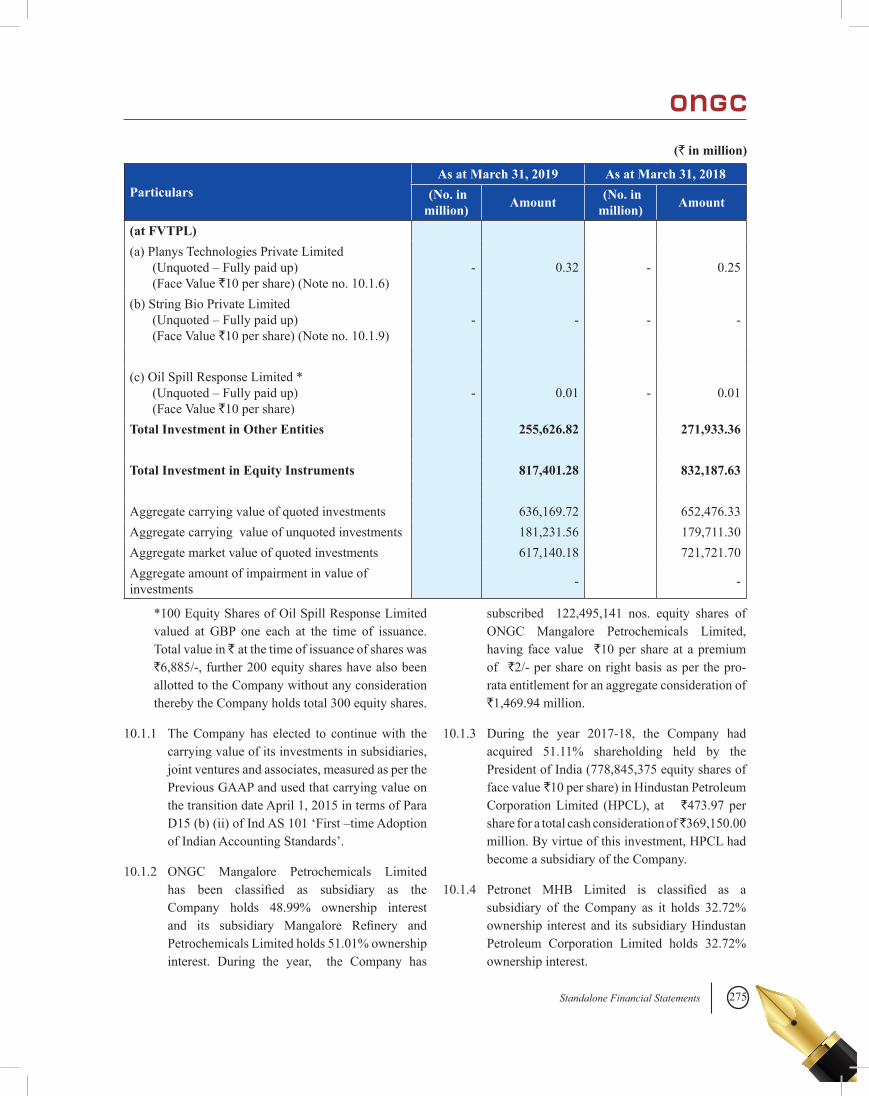
275Standalone Financial Statements
ParticularsAs at March 31, 2019 As at March 31, 2018
(No. in million) Amount (No. in
million) Amount
(at FVTPL)(a) Planys Technologies Private Limited
(Unquoted–Fullypaidup) (Face Value `10 per share) (Note no. 10.1.6)
- 0.32 - 0.25
(b) String Bio Private Limited (Unquoted–Fullypaidup) (Face Value `10 per share) (Note no. 10.1.9)
- - - -
(c) Oil Spill Response Limited * (Unquoted–Fullypaidup) (Face Value `10 per share)
- 0.01 - 0.01
Total Investment in Other Entities 255,626.82 271,933.36
Total Investment in Equity Instruments 817,401.28 832,187.63
Aggregate carrying value of quoted investments 636,169.72 652,476.33Aggregate carrying value of unquoted investments 181,231.56 179,711.30Aggregate market value of quoted investments 617,140.18 721,721.70Aggregate amount of impairment in value of investments - -
*100 Equity Shares of Oil Spill Response Limited valued at GBP one each at the time of issuance. Total value in ̀ at the time of issuance of shares was `6,885/-, further 200 equity shares have also been allotted to the Company without any consideration thereby the Company holds total 300 equity shares.
10.1.1 The Company has elected to continue with the carrying value of its investments in subsidiaries, joint ventures and associates, measured as per the Previous GAAP and used that carrying value on the transition date April 1, 2015 in terms of Para D15(b)(ii)ofIndAS101‘First–timeAdoptionof Indian Accounting Standards’.
10.1.2 ONGC Mangalore Petrochemicals Limited has been classified as subsidiary as theCompany holds 48.99% ownership interest and its subsidiary Mangalore Refinery andPetrochemicals Limited holds 51.01% ownership interest. During the year, the Company has
subscribed 122,495,141 nos. equity shares of ONGC Mangalore Petrochemicals Limited, having face value `10 per share at a premium of `2/- per share on right basis as per the pro-rata entitlement for an aggregate consideration of `1,469.94 million.
10.1.3 During the year 2017-18, the Company had acquired 51.11% shareholding held by the President of India (778,845,375 equity shares of face value ̀ 10 per share) in Hindustan Petroleum Corporation Limited (HPCL), at `473.97 per share for a total cash consideration of ̀ 369,150.00 million. By virtue of this investment, HPCL had become a subsidiary of the Company.
10.1.4 Petronet MHB Limited is classified as asubsidiary of the Company as it holds 32.72% ownership interest and its subsidiary Hindustan Petroleum Corporation Limited holds 32.72% ownership interest.
(` in million)
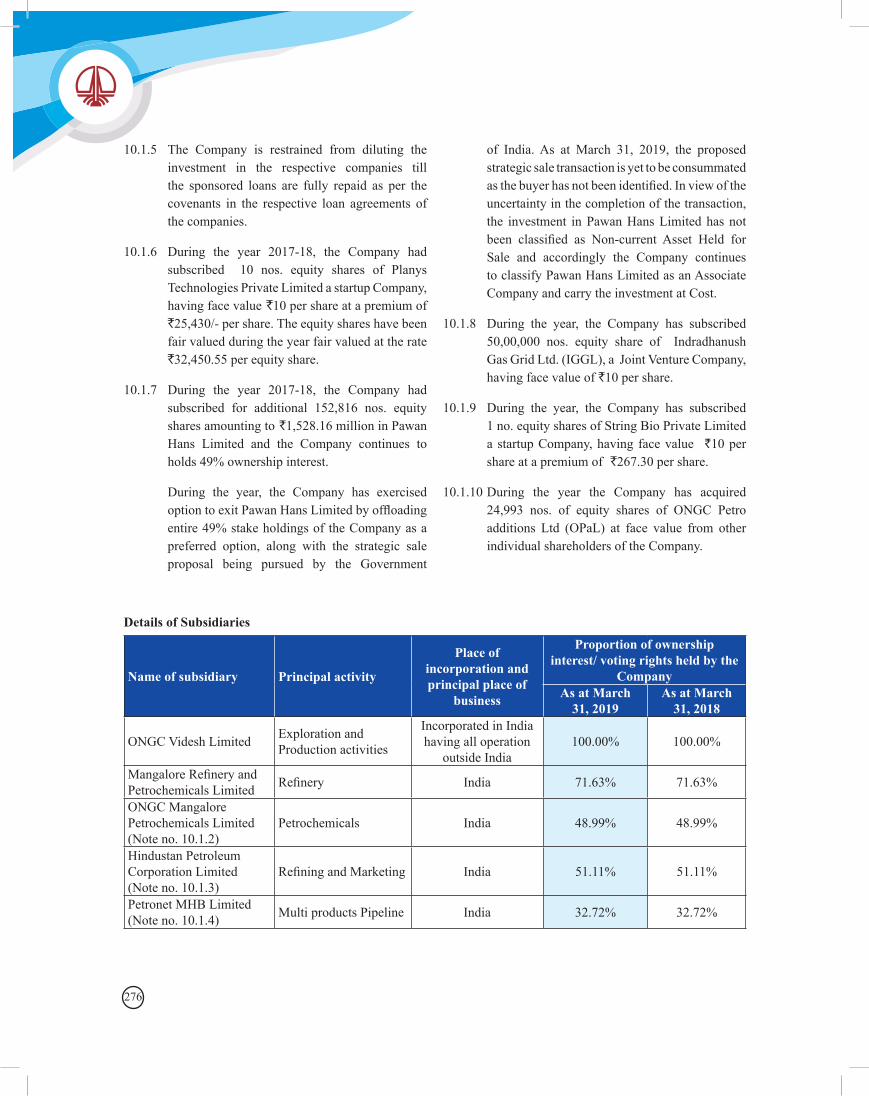
276
10.1.5 The Company is restrained from diluting the investment in the respective companies till the sponsored loans are fully repaid as per the covenants in the respective loan agreements of the companies.
10.1.6 During the year 2017-18, the Company had subscribed 10 nos. equity shares of Planys Technologies Private Limited a startup Company, having face value `10 per share at a premium of `25,430/- per share. The equity shares have been fair valued during the year fair valued at the rate `32,450.55 per equity share.
10.1.7 During the year 2017-18, the Company had subscribed for additional 152,816 nos. equity shares amounting to `1,528.16 million in Pawan Hans Limited and the Company continues to holds 49% ownership interest.
During the year, the Company has exercised optiontoexitPawanHansLimitedbyoffloadingentire 49% stake holdings of the Company as a preferred option, along with the strategic sale proposal being pursued by the Government
of India. As at March 31, 2019, the proposed strategic sale transaction is yet to be consummated asthebuyerhasnotbeenidentified.Inviewoftheuncertainty in the completion of the transaction, the investment in Pawan Hans Limited has not been classified as Non-current Asset Held forSale and accordingly the Company continues to classify Pawan Hans Limited as an Associate Company and carry the investment at Cost.
10.1.8 During the year, the Company has subscribed 50,00,000 nos. equity share of Indradhanush Gas Grid Ltd. (IGGL), a Joint Venture Company, having face value of `10 per share.
10.1.9 During the year, the Company has subscribed 1 no. equity shares of String Bio Private Limited a startup Company, having face value `10 per share at a premium of `267.30 per share.
10.1.10 During the year the Company has acquired 24,993 nos. of equity shares of ONGC Petro additions Ltd (OPaL) at face value from other individual shareholders of the Company.
Details of Subsidiaries
Name of subsidiary Principal activity
Place of incorporation and principal place of
business
Proportion of ownership interest/ voting rights held by the
CompanyAs at March
31, 2019As at March
31, 2018
ONGC Videsh Limited Exploration and Production activities
Incorporated in India having all operation
outside India100.00% 100.00%
MangaloreRefineryandPetrochemicals Limited Refinery India 71.63% 71.63%
ONGC Mangalore Petrochemicals Limited (Note no. 10.1.2)
Petrochemicals India 48.99% 48.99%
Hindustan Petroleum Corporation Limited (Note no. 10.1.3)
RefiningandMarketing India 51.11% 51.11%
Petronet MHB Limited (Note no. 10.1.4) Multi products Pipeline India 32.72% 32.72%
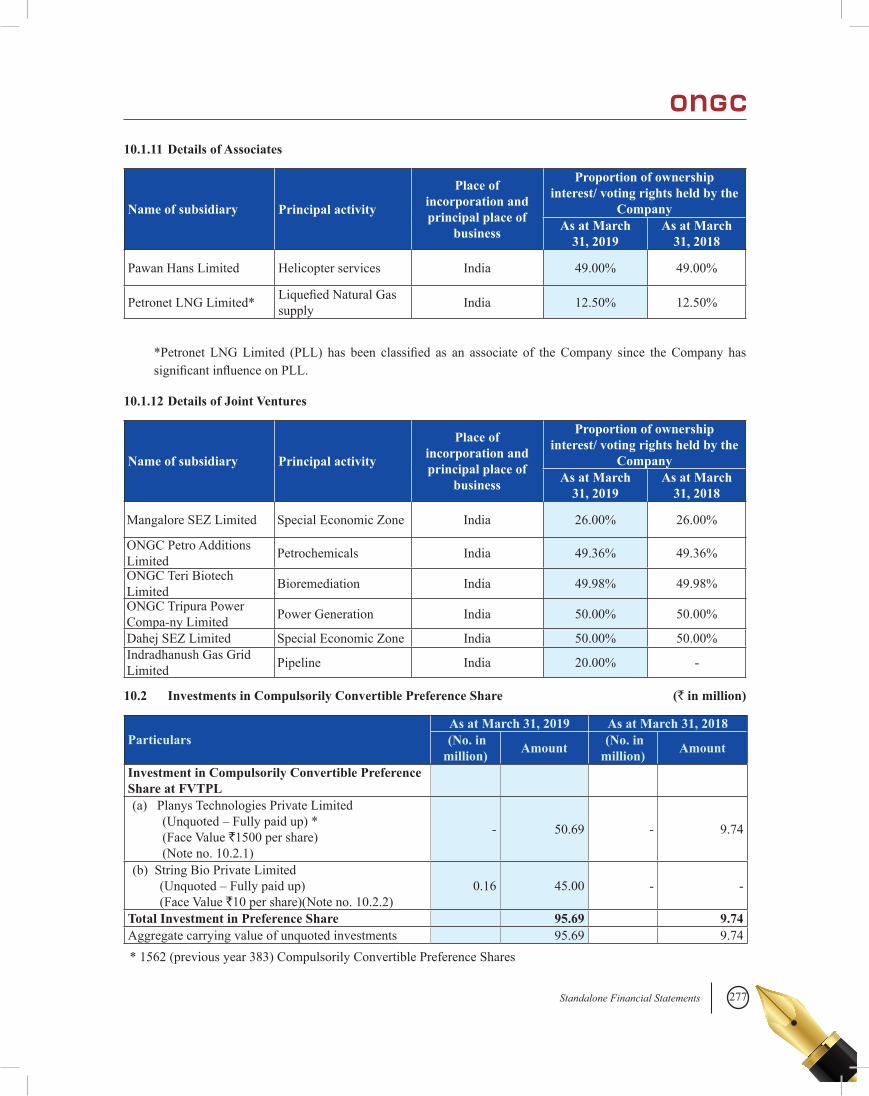
277Standalone Financial Statements
10.1.11 Details of Associates
Name of subsidiary Principal activity
Place of incorporation and principal place of
business
Proportion of ownership interest/ voting rights held by the
CompanyAs at March
31, 2019As at March
31, 2018
Pawan Hans Limited Helicopter services India 49.00% 49.00%
Petronet LNG Limited* LiquefiedNaturalGassupply India 12.50% 12.50%
*Petronet LNGLimited (PLL) has been classified as an associate of theCompany since theCompany hassignificantinfluenceonPLL.
10.1.12 Details of Joint Ventures
Name of subsidiary Principal activity
Place of incorporation and principal place of
business
Proportion of ownership interest/ voting rights held by the
CompanyAs at March
31, 2019As at March
31, 2018
Mangalore SEZ Limited Special Economic Zone India 26.00% 26.00%
ONGC Petro Additions Limited Petrochemicals India 49.36% 49.36%
ONGC Teri Biotech Limited Bioremediation India 49.98% 49.98%
ONGC Tripura Power Compa-ny Limited Power Generation India 50.00% 50.00%
Dahej SEZ Limited Special Economic Zone India 50.00% 50.00%Indradhanush Gas Grid Limited Pipeline India 20.00% -
10.2 Investments in Compulsorily Convertible Preference Share (` in million)
ParticularsAs at March 31, 2019 As at March 31, 2018
(No. in million) Amount (No. in
million) Amount
Investment in Compulsorily Convertible Preference Share at FVTPL(a) Planys Technologies Private Limited
(Unquoted–Fullypaidup)* (Face Value `1500 per share) (Note no. 10.2.1)
- 50.69 - 9.74
(b) String Bio Private Limited (Unquoted–Fullypaidup) (Face Value `10 per share)(Note no. 10.2.2)
0.16 45.00 - -
Total Investment in Preference Share 95.69 9.74Aggregate carrying value of unquoted investments 95.69 9.74* 1562 (previous year 383) Compulsorily Convertible Preference Shares
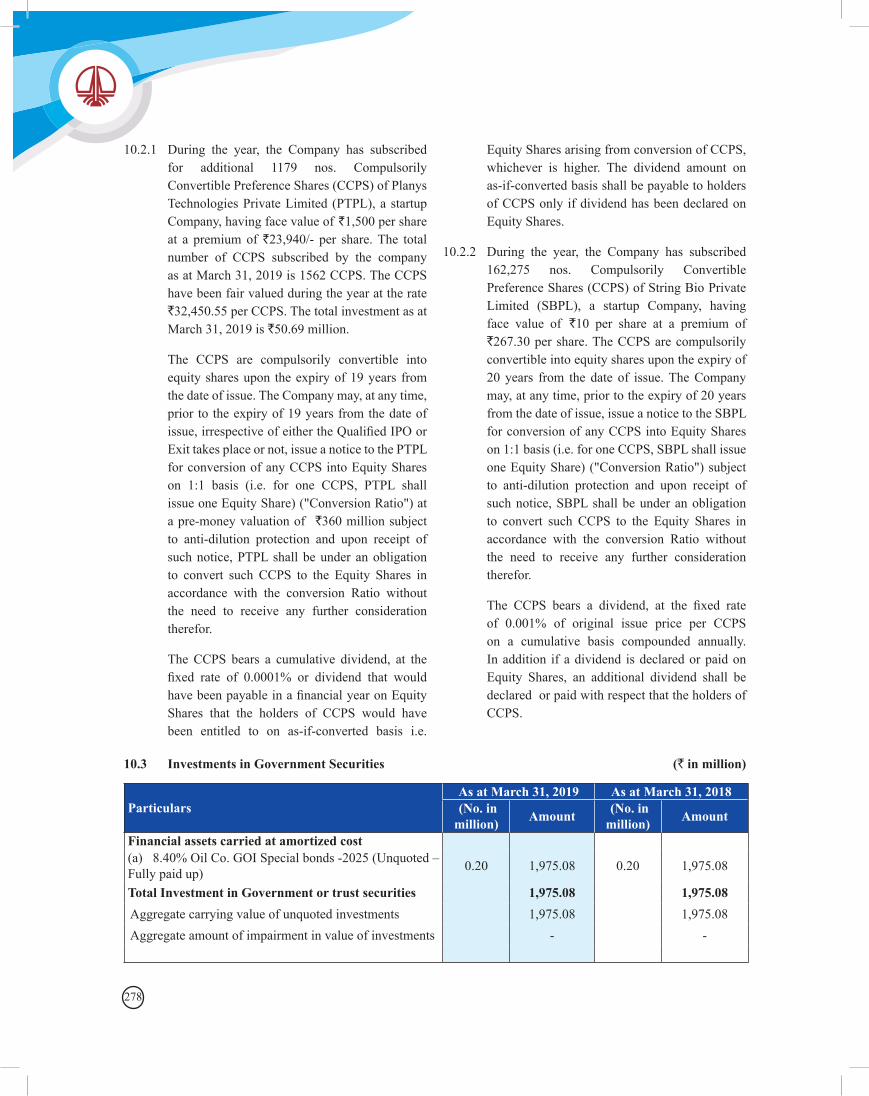
278
10.2.1 During the year, the Company has subscribed for additional 1179 nos. Compulsorily Convertible Preference Shares (CCPS) of Planys Technologies Private Limited (PTPL), a startup Company, having face value of `1,500 per share at a premium of `23,940/- per share. The total number of CCPS subscribed by the company as at March 31, 2019 is 1562 CCPS. The CCPS have been fair valued during the year at the rate `32,450.55 per CCPS. The total investment as at March 31, 2019 is `50.69 million.
The CCPS are compulsorily convertible into equity shares upon the expiry of 19 years from the date of issue. The Company may, at any time, prior to the expiry of 19 years from the date of issue,irrespectiveofeithertheQualifiedIPOorExit takes place or not, issue a notice to the PTPL for conversion of any CCPS into Equity Shares on 1:1 basis (i.e. for one CCPS, PTPL shall issue one Equity Share) ("Conversion Ratio") at a pre-money valuation of `360 million subject to anti-dilution protection and upon receipt of such notice, PTPL shall be under an obligation to convert such CCPS to the Equity Shares in accordance with the conversion Ratio without the need to receive any further consideration therefor.
The CCPS bears a cumulative dividend, at the fixed rate of 0.0001% or dividend that wouldhavebeenpayableinafinancialyearonEquityShares that the holders of CCPS would have been entitled to on as-if-converted basis i.e.
Equity Shares arising from conversion of CCPS, whichever is higher. The dividend amount on as-if-converted basis shall be payable to holders of CCPS only if dividend has been declared on Equity Shares.
10.2.2 During the year, the Company has subscribed 162,275 nos. Compulsorily Convertible Preference Shares (CCPS) of String Bio Private Limited (SBPL), a startup Company, having face value of `10 per share at a premium of `267.30 per share. The CCPS are compulsorily convertible into equity shares upon the expiry of 20 years from the date of issue. The Company may, at any time, prior to the expiry of 20 years from the date of issue, issue a notice to the SBPL for conversion of any CCPS into Equity Shares on 1:1 basis (i.e. for one CCPS, SBPL shall issue one Equity Share) ("Conversion Ratio") subject to anti-dilution protection and upon receipt of such notice, SBPL shall be under an obligation to convert such CCPS to the Equity Shares in accordance with the conversion Ratio without the need to receive any further consideration therefor.
The CCPS bears a dividend, at the fixed rateof 0.001% of original issue price per CCPS on a cumulative basis compounded annually. In addition if a dividend is declared or paid on Equity Shares, an additional dividend shall be declared or paid with respect that the holders of CCPS.
10.3 Investments in Government Securities (` in million)
ParticularsAs at March 31, 2019 As at March 31, 2018 (No. in million) Amount (No. in
million) Amount
Financial assets carried at amortized cost(a)8.40%OilCo.GOISpecialbonds-2025(Unquoted–Fully paid up) 0.20 1,975.08 0.20 1,975.08
Total Investment in Government or trust securities 1,975.08 1,975.08Aggregate carrying value of unquoted investments 1,975.08 1,975.08Aggregate amount of impairment in value of investments - -
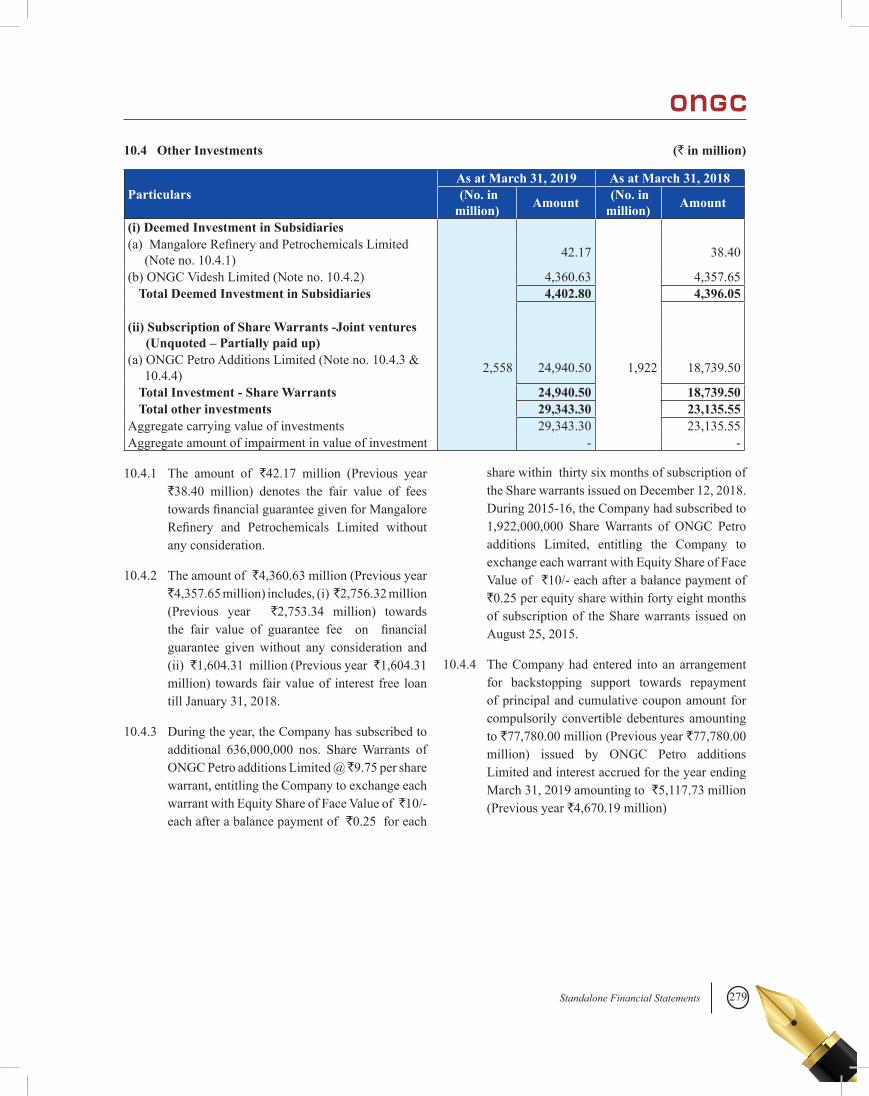
279Standalone Financial Statements
10.4 Other Investments (` in million)
ParticularsAs at March 31, 2019 As at March 31, 2018 (No. in million) Amount (No. in
million) Amount
(i) Deemed Investment in Subsidiaries (a)MangaloreRefineryandPetrochemicalsLimited
(Note no. 10.4.1) 42.17 38.40
(b) ONGC Videsh Limited (Note no. 10.4.2) 4,360.63 4,357.65Total Deemed Investment in Subsidiaries 4,402.80 4,396.05
(ii) Subscription of Share Warrants -Joint ventures (Unquoted – Partially paid up)
(a) ONGC Petro Additions Limited (Note no. 10.4.3 & 10.4.4) 2,558 24,940.50 1,922 18,739.50
Total Investment - Share Warrants 24,940.50 18,739.50Total other investments 29,343.30 23,135.55
Aggregate carrying value of investments 29,343.30 23,135.55Aggregate amount of impairment in value of investment - -
10.4.1 The amount of `42.17 million (Previous year `38.40 million) denotes the fair value of fees towardsfinancialguaranteegivenforMangaloreRefinery and Petrochemicals Limited withoutany consideration.
10.4.2 The amount of `4,360.63 million (Previous year `4,357.65 million) includes, (i) ̀ 2,756.32 million (Previous year `2,753.34 million) towards the fair value of guarantee fee on financialguarantee given without any consideration and (ii) `1,604.31 million (Previous year `1,604.31 million) towards fair value of interest free loan till January 31, 2018.
10.4.3 During the year, the Company has subscribed to additional 636,000,000 nos. Share Warrants of ONGC Petro additions Limited @ ̀ 9.75 per share warrant, entitling the Company to exchange each warrant with Equity Share of Face Value of ̀ 10/- each after a balance payment of `0.25 for each
share within thirty six months of subscription of the Share warrants issued on December 12, 2018. During 2015-16, the Company had subscribed to 1,922,000,000 Share Warrants of ONGC Petro additions Limited, entitling the Company to exchange each warrant with Equity Share of Face Value of `10/- each after a balance payment of `0.25 per equity share within forty eight months of subscription of the Share warrants issued on August 25, 2015.
10.4.4 The Company had entered into an arrangement for backstopping support towards repayment of principal and cumulative coupon amount for compulsorily convertible debentures amounting to `77,780.00 million (Previous year `77,780.00 million) issued by ONGC Petro additions Limited and interest accrued for the year ending March 31, 2019 amounting to `5,117.73 million (Previous year `4,670.19 million)
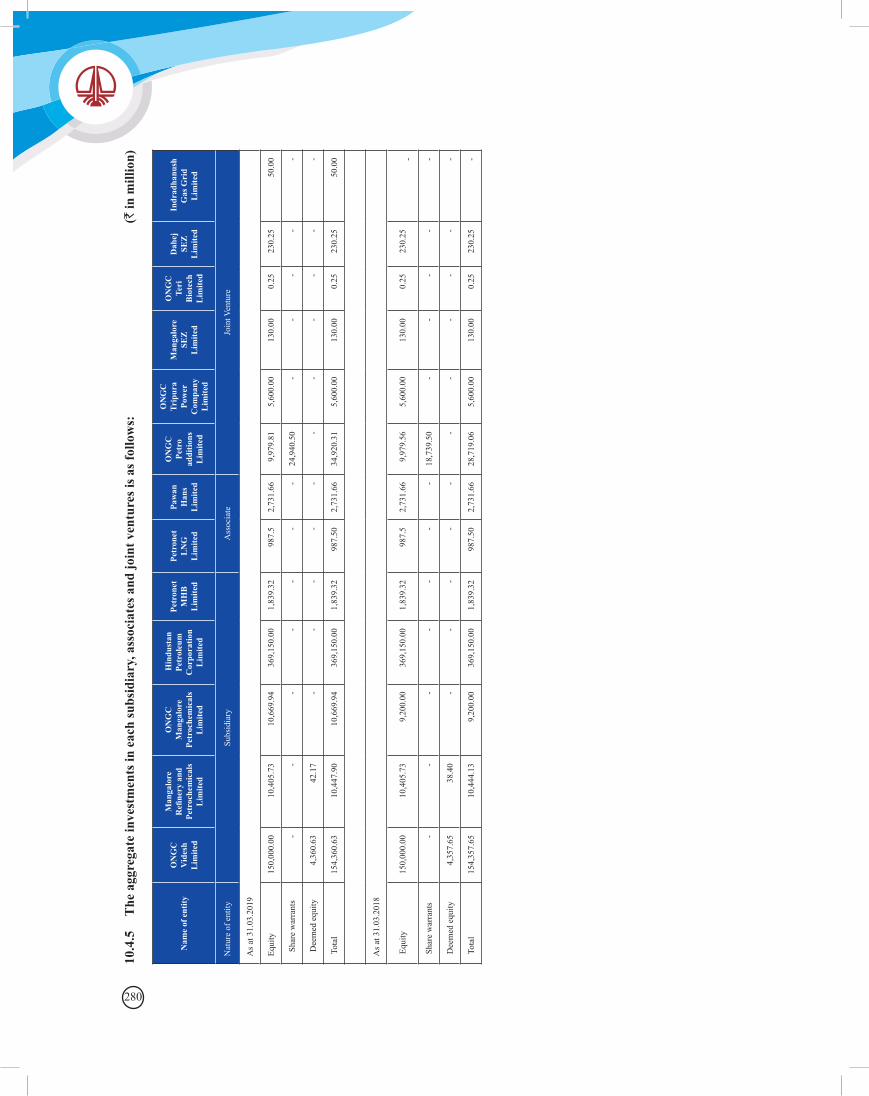
280
10.4
.5
The
agg
rega
te in
vest
men
ts in
eac
h su
bsid
iary
, ass
ocia
tes a
nd jo
int v
entu
res i
s as f
ollo
ws:
(`
in m
illio
n)
Nam
e of
ent
ityO
NG
C
Vid
esh
Lim
ited
Man
galo
re
Refi
nery
and
Pe
troc
hem
ical
s L
imite
d
ON
GC
M
anga
lore
Pe
troc
hem
ical
s L
imite
d
Hin
dust
an
Petr
oleu
m
Cor
pora
tion
Lim
ited
Petr
onet
M
HB
L
imite
d
Petr
onet
L
NG
L
imite
d
Paw
an
Han
s L
imite
d
ON
GC
Pe
tro
addi
tions
L
imite
d
ON
GC
Tr
ipur
a Po
wer
C
ompa
ny
Lim
ited
Man
galo
re
SEZ
L
imite
d
ON
GC
Te
ri
Bio
tech
L
imite
d
Dah
ej
SEZ
L
imite
d
Indr
adha
nush
G
as G
rid
Lim
ited
Nat
ure
of e
ntity
Subs
idia
ryA
ssoc
iate
Join
t Ven
ture
As a
t 31.
03.2
019
Equi
ty15
0,00
0.00
10,4
05.7
310
,669
.94
369,
150.
001,
839.
3298
7.5
2,73
1.66
9,97
9.81
5,60
0.00
130.
000.
2523
0.25
50.0
0
Sha
re w
arra
nts
- -
- -
- -
- 24
,940
.50
- -
- -
-
Dee
med
equ
ity4,
360.
6342
.17
- -
- -
--
- -
- -
-
Tot
al15
4,36
0.63
10,4
47.9
010
,669
.94
369,
150.
001,
839.
3298
7.50
2,73
1.66
34,9
20.3
15,
600.
0013
0.00
0.25
230.
2550
.00
As a
t 31.
03.2
018
Equ
ity15
0,00
0.00
10,4
05.7
39,
200.
0036
9,15
0.00
1,83
9.32
987.
52,
731.
669,
979.
565,
600.
0013
0.00
0.25
230.
25
-
Sha
re w
arra
nts
- -
- -
- -
- 18
,739
.50
- -
- -
-
Dee
med
equ
ity4,
357.
6538
.40
- -
- -
- -
- -
- -
-
Tot
al15
4,35
7.65
10,4
44.1
39,
200.
0036
9,15
0.00
1,83
9.32
987.
502,
731.
6628
,719
.06
5,60
0.00
130.
000.
2523
0.25
-

281Standalone Financial Statements
11. Trade receivables- Current (` in million)
Particulars As at March 31, 2019 As at March 31, 2018
(a) Considered Good- Secured (Note no. 11.1) 1,603.27 495.62
(b) Considered Good- Unsecured (Note no. 11.1 ) 82,796.33 77,230.82
(c) Credit impaired (Note no. 11.2) 1,648.15 2,945.62
Less: Impairment for doubtful receivables 1,648.15 2,945.62
Total 84,399.60 77,726.44
11.1 Generally, the Company enters into long-term crude oil and gas sales arrangement with its customers. The normal credit period on sales of crude, gas and value added products is 7 - 30 days. No interest is charged during this credit period. Thereafter, interest on delayed payments is charged at SBI Base rate plus 4%-6% per annum compounded each quarter on the outstanding balance.
Out of the gross trade receivables as at March 31, 2019, an amount of `72,589.33 million (as at March 31, 2018 `66,328.20 million) is due from Oil and Gas Marketing Companies, the Company’s largest customers. There are no other customers
who represent more than 5% of the total balance of trade receivables.
Accordingly, the Company assesses impairment loss on dues from Oil Marketing Companies on facts and circumstances relevant to each transaction.
The Company has concentration of credit risk due to the fact that the Company has significantreceivables from Oil and Gas Marketing Companies (refer note no. 44.2.2, 44.3.2 & 45.4). However, these companies are reputed and creditworthy public sector undertakings (PSUs).
11.2 Movement of Impairment for doubtful receivables (` in million)
Particulars As at March 31, 2019 As at March 31, 2018Balance at beginning of the year 2,945.62 1,552.03Addition 1.47 1,494.81Write back during the year (1,298.94) (101.22)Balance at end of the year 1,648.15 2,945.62
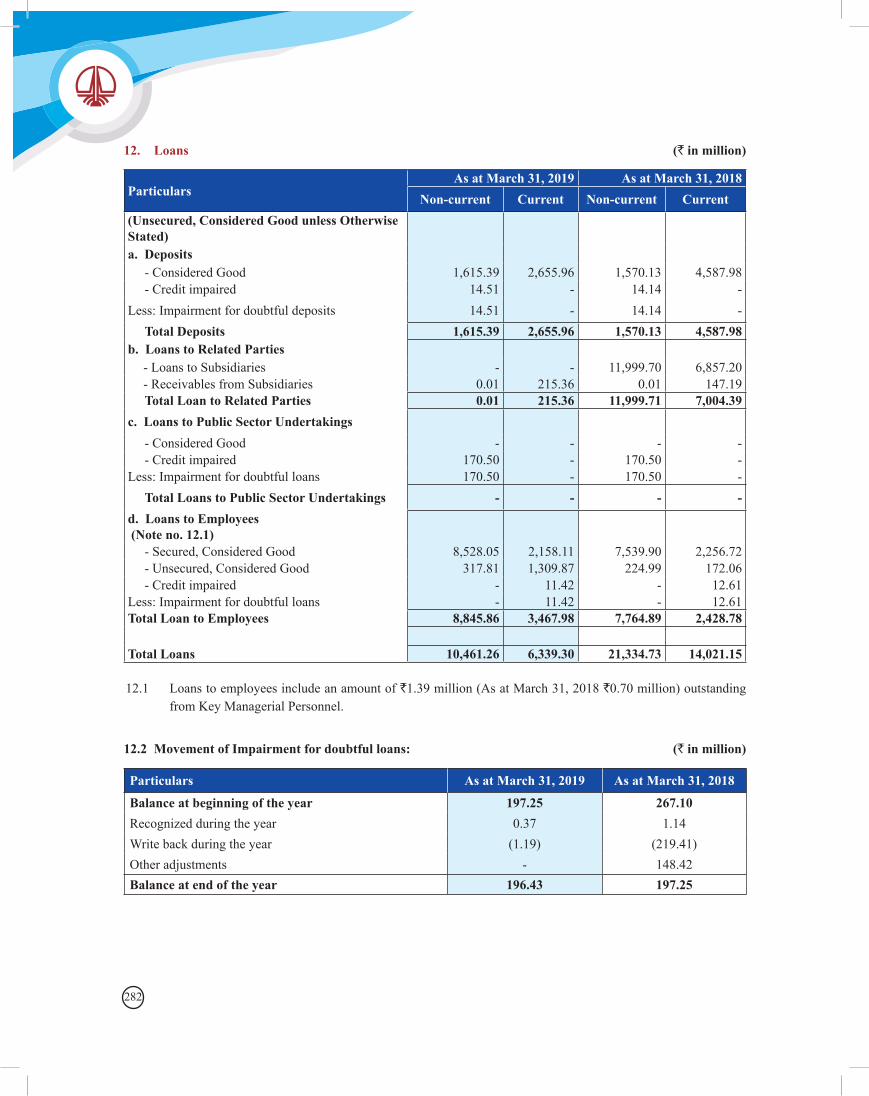
282
12. Loans (` in million)
ParticularsAs at March 31, 2019 As at March 31, 2018
Non-current Current Non-current Current(Unsecured, Considered Good unless Otherwise Stated)
a. Deposits - Considered Good 1,615.39 2,655.96 1,570.13 4,587.98- Credit impaired 14.51 - 14.14 -
Less: Impairment for doubtful deposits 14.51 - 14.14 - Total Deposits 1,615.39 2,655.96 1,570.13 4,587.98
b. Loans to Related Parties - Loans to Subsidiaries - - 11,999.70 6,857.20- Receivables from Subsidiaries 0.01 215.36 0.01 147.19Total Loan to Related Parties 0.01 215.36 11,999.71 7,004.39
c. Loans to Public Sector Undertakings - Considered Good - - - - - Credit impaired 170.50 - 170.50 -
Less: Impairment for doubtful loans 170.50 - 170.50 - Total Loans to Public Sector Undertakings - - - -
d. Loans to Employees (Note no. 12.1)
- Secured, Considered Good 8,528.05 2,158.11 7,539.90 2,256.72- Unsecured, Considered Good 317.81 1,309.87 224.99 172.06- Credit impaired - 11.42 - 12.61
Less: Impairment for doubtful loans - 11.42 - 12.61Total Loan to Employees 8,845.86 3,467.98 7,764.89 2,428.78
Total Loans 10,461.26 6,339.30 21,334.73 14,021.15
12.1 Loans to employees include an amount of `1.39 million (As at March 31, 2018 `0.70 million) outstanding from Key Managerial Personnel.
12.2 Movement of Impairment for doubtful loans: (` in million)
Particulars As at March 31, 2019 As at March 31, 2018
Balance at beginning of the year 197.25 267.10Recognized during the year 0.37 1.14Write back during the year (1.19) (219.41)Other adjustments - 148.42Balance at end of the year 196.43 197.25
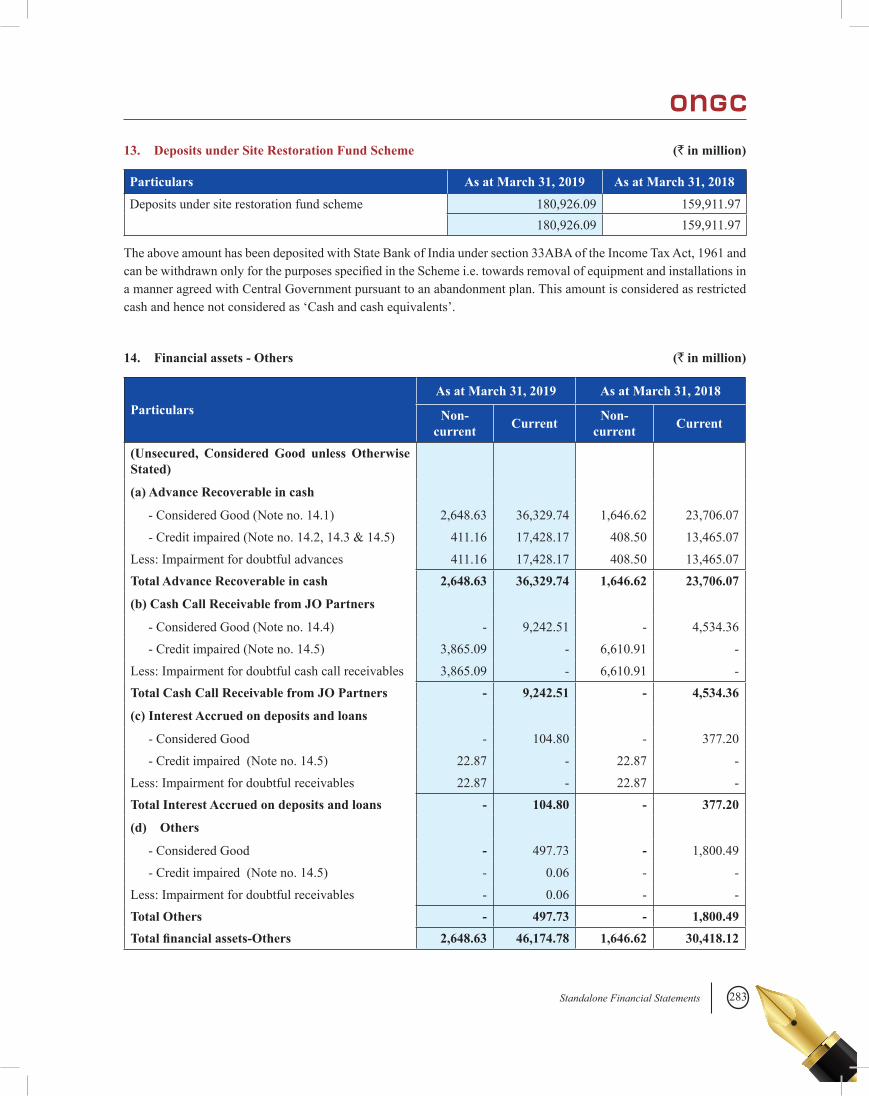
283Standalone Financial Statements
13. Deposits under Site Restoration Fund Scheme (` in million)
Particulars As at March 31, 2019 As at March 31, 2018
Deposits under site restoration fund scheme 180,926.09 159,911.97180,926.09 159,911.97
The above amount has been deposited with State Bank of India under section 33ABA of the Income Tax Act, 1961 and canbewithdrawnonlyforthepurposesspecifiedintheSchemei.e.towardsremovalofequipmentandinstallationsina manner agreed with Central Government pursuant to an abandonment plan. This amount is considered as restricted cash and hence not considered as ‘Cash and cash equivalents’.
14. Financial assets - Others (` in million)
ParticularsAs at March 31, 2019 As at March 31, 2018
Non- current Current Non-
current Current
(Unsecured, Considered Good unless Otherwise Stated)
(a) Advance Recoverable in cash
- Considered Good (Note no. 14.1) 2,648.63 36,329.74 1,646.62 23,706.07
- Credit impaired (Note no. 14.2, 14.3 & 14.5) 411.16 17,428.17 408.50 13,465.07
Less: Impairment for doubtful advances 411.16 17,428.17 408.50 13,465.07Total Advance Recoverable in cash 2,648.63 36,329.74 1,646.62 23,706.07
(b) Cash Call Receivable from JO Partners
- Considered Good (Note no. 14.4) - 9,242.51 - 4,534.36
- Credit impaired (Note no. 14.5) 3,865.09 - 6,610.91 -
Less: Impairment for doubtful cash call receivables 3,865.09 - 6,610.91 - Total Cash Call Receivable from JO Partners - 9,242.51 - 4,534.36
(c) Interest Accrued on deposits and loans
- Considered Good - 104.80 - 377.20
- Credit impaired (Note no. 14.5) 22.87 - 22.87 -
Less: Impairment for doubtful receivables 22.87 - 22.87 - Total Interest Accrued on deposits and loans - 104.80 - 377.20
(d) Others
- Considered Good - 497.73 - 1,800.49
- Credit impaired (Note no. 14.5) - 0.06 - -
Less: Impairment for doubtful receivables - 0.06 - - Total Others - 497.73 - 1,800.49Total financial assets-Others 2,648.63 46,174.78 1,646.62 30,418.12
284
14.1 Duringthefinancialyear2010-11,theOilMarketingCompanies, nominees of the GoI recovered US$ 32.07 million (equivalent to `2,219.56 million) ONGC’s share as per directives of GoI in respect of Joint Operation - Panna Mukta and Tapti. The recovery is towards certain observations raised by auditors appointed by the Director General of Hydrocarbons (DGH) under Production Sharing Contract (PSC) for the period 2002-03 to 2005-06 inrespectofcostandprofitpetroleumsharepayabletoGoI.BGEPILalongwithRIL(“Claimants”)haveserved a notice of arbitration on the GoI in respect of dispute, differences and claims arisen in connection with the terms of Panna, Mukta and Tapti PSCs. Since the Company is not a party to the arbitration proceedings, it had requested MoP&NG that in case of an arbitral award, the same be made applicable to the Company also, as a constituent of contractor for both the PSCs. Subsequently, vide letter dated July 4, 2011 MoP&NG has advised to the Company not to participate in the arbitration initiated by RIL and BGEPIL under Panna Mukta and Tapti PSCs. MoP&NG has also stated that in case of an arbitral award, the same will be applicable to the Company also as a constituent of the contractor for both the PSCs. A Final Partial Award (FPA) was pronounced by the Tribunal in the arbitration matter between RIL, BGEPIL and Union of India.
RIL and BGEPIL the JO partners have challenged the FPA before the English Commercial Court. Pending final quantification of liabilities by theArbitration Tribunal and decision of English Commercial Court, the same has been shown as Receivable from GoI under ‘Advance Recoverable in Cash’. (Figures in ` are restated).
14.2 In Ravva Joint Operation, the demand towards additional profit petroleum raised byGovernmentof India (GoI), due to differences in interpretation of the provisions of the Production Sharing Contract (PSC) in respect of computation of Post Tax Rate of Return (PTRR), based on the decision of the Malaysian High Court setting aside an earlier arbitral tribunal award in favor of operator, was disputed by the operator M/s Vedanta Ltd (erstwhile
M/s Cairn India Ltd). The Company is not a party to the dispute but has agreed to abide by the decision applicable to the operator. The Company is carrying an amount of `11,616.21 million (equivalent to US$ 167.84 million) after adjustments for interest and exchange rate fluctuations which has beenrecovered by GoI, this includes interest amounting to US$ 54.88 million (`3,798.24 million). The Company has made impairment provision towards this recovery made by the GoI.
In subsequent legal proceedings, the Appellate Authority of the Honorable Malaysian High Court of Kuala Lumpur had set aside the decision of the Malaysian High Court and the earlier decision of arbitral tribunal in favour of operator was restored, against which the GoI has preferred an appeal before the Federal Court of Malaysia. The Federal Court of Malaysia, vide its order dated October 11, 2011, has dismissed the said appeal of the GoI.
The Company has taken up the matter regarding refund of the recoveries made in view of the favorable judgment of the Federal Court of Malaysia with MoP&NG. However, according to a communication dated January 13, 2012, MoP&NG expressed the view that the Company’s proposal would be examined when the issue of carry in Ravva PSC is decided in its entirety by the Government along with other partners.
In view of the perceived uncertainties in obtaining the refund at this stage, the impairment made in the books as above has been retained and netted off against the amount recoverable as above in the Financial Statements for the year ending March 31, 2019. (Figures in ` are restated).
14.3 The Ravva PSC stipulates Base Development Cost of Ravva JV to be at US$ 188.98 million with a cap of 5% increase. Accordingly the development cost stated in the PSC is US$ 198.43 million. However, actual cost incurred by JV is more than amount stipulated in the PSC. Director General of Hydrocarbons did not approve the increase in base development cost for cost recovery and demanded additional profit petroleum vide letter dated
285Standalone Financial Statements
August 8, 2006 from the contractor / JV for an amount of US$ 166 million as short paid on account of cost recovery of Development cost in excess of Base Development Cost.
In August 2008 three JV partners excluding ONGC had invoked arbitration against Government of India (GoI) on the issue. The contention of claim as operator was that it should be allowed 100% Cost recovery of the Base Development cost. The issue was argued at various levels including court of Appeals and Malaysian Federal Court. The decision of court was in favour of JV partners. However the case for enforcement of award in India is pending at Delhi High Court.
Ministry of Petroleum and Natural Gas (MoP&NG), GoI vide letter dated October 10, 2018 issued a recovery notice to Oil Marketing companies (OMCs) for US$ 52 million plus applicable interest towards short payment of Government share of Profit Petroleum on account of disputeof Cost recovery of Base Development cost from the payments made to the Company towards the sales proceeds of Crude Oil and Natural Gas. During the year OMCs deducted and deposited the sales proceeds of Crude Oil and Natural Gas to MoP&NG and the entire amount of US$ 52 million (`3,598.92 million) has been recovered. In view of the uncertainties in obtaining the refund at this stage, provision has been created against the said receivables from OMC’s.
14.4 Farm Out Agreements (FOA) was signed between the Company and Petrobras International Braspetro B.V(PIB-BV)forthe3BlocksKG-DWN–98/2(15% PI); MN-DWN-98/3 (40% PI) & CY- DWN- 2001/1(25% PI) in India effective from June 04, 2007. The conditions precedents were satisfiedin the Blocks. Government of India approval for assignment of PI to PIB-BV was granted in the year 2008-09 in respect of Blocks KG-DWN-98/2,
CY-DWN-2001/1 and MN-DWN-98/3. Subsequently, PIB-BV separately notified itsintention to withdraw from KG-DWN-98/2 and MN-DWN-98/3. PIB-BV resolved the issues with the Company and re-assigned its Participating Interest (PI) to ONGC in KG-DWN-98/2.
However, PIB-BV’s attempted withdrawal in respect of MN-DWN-98/3 Block could not materialise, due to unresolved issues with PIB-BV in respect of Interim Period costs and pending cash calls in the Block. As regards CY-DWN-2001/1 Block, cash calls were also not paid by PIB-BV.
The Company invoked Arbitration against Petrobras Petroleo Brasileiro S.A (Petrobras) and PIB-BV in respect of outstanding dues in the Blocks MN-DWN-98/3 and CY-DWN-2001/1. London Court of International Arbitration (LCIA) passed the First Partial Award on 6th March, 2017, whereby it was held that Petrobras is neither a party to the FOA nor to the arbitration agreement contained in Article 10.2 thereof; hence the Tribunal opined that it lacks substantive jurisdiction over Petrobras. Accordingly, it was decided to accept the First Partial Award and persue the arbitration against PIB-BV only. The Company made a total claim of US$ 60.57 million (Block MN-DWN-98/3 –US$ 46.84 million & Block CY-DWN-2001/1 –US$13.73million).LCIAinitsFinalAwardofDecember 26, 2018 passed order in favour of the Company for US$ 46.84 million in respect of block MN-DWN-98/3 and US$ 4.13 million in respect of block CY-DWN-2001/1 along with interest till the date of payment at the Reference Interest Rate specifiedinArticle1.12oftheFOA.Consequentlyprovision against cash call amounting to `3,207.62 million has been written back during the year. An amount of US$ 54.20 million (Equivalent ̀ 3,722.23 million) has been remitted to the Company by PIB-BV in April 2019.
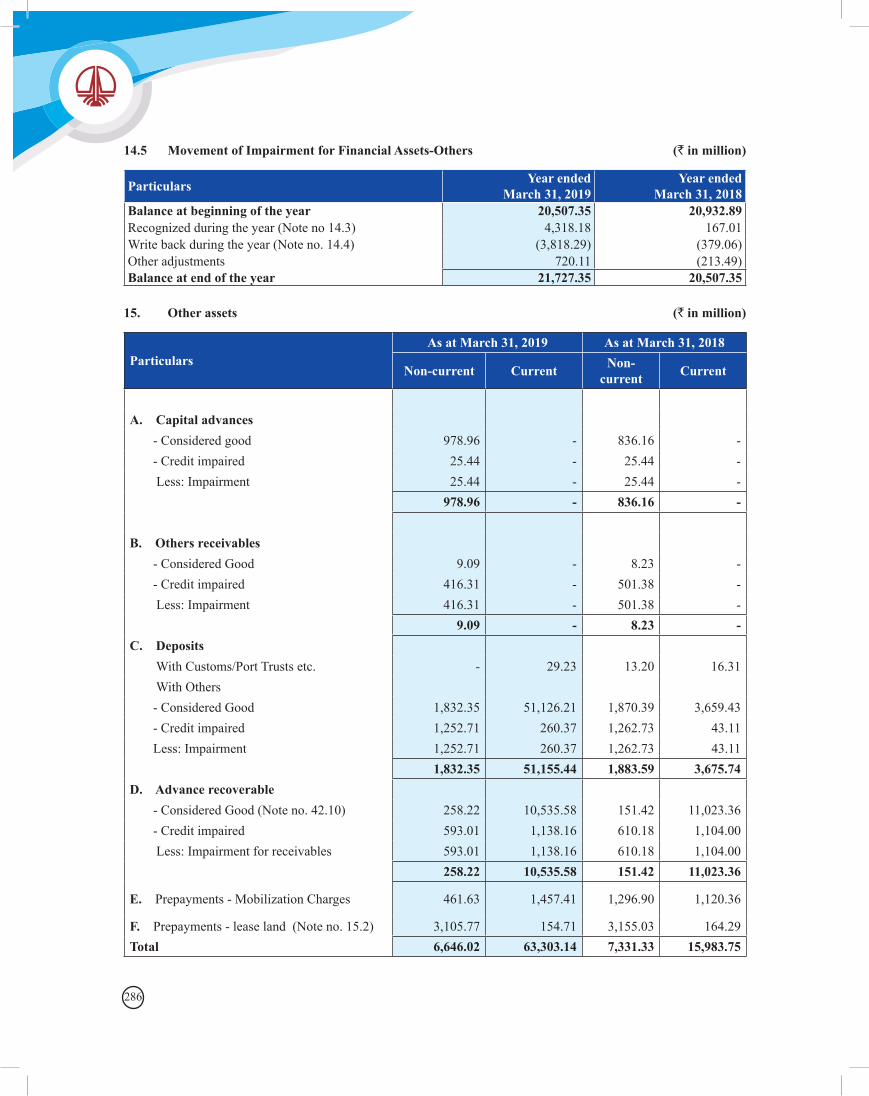
286
14.5 Movement of Impairment for Financial Assets-Others (` in million)
Particulars Year endedMarch 31, 2019
Year endedMarch 31, 2018
Balance at beginning of the year 20,507.35 20,932.89Recognized during the year (Note no 14.3) 4,318.18 167.01Write back during the year (Note no. 14.4) (3,818.29) (379.06)Other adjustments 720.11 (213.49)Balance at end of the year 21,727.35 20,507.35
15. Other assets (` in million)
ParticularsAs at March 31, 2019 As at March 31, 2018
Non-current Current Non-current Current
A. Capital advances
- Considered good 978.96 - 836.16 - - Credit impaired 25.44 - 25.44 -
Less: Impairment 25.44 - 25.44 - 978.96 - 836.16 -
B. Others receivables
- Considered Good 9.09 - 8.23 - - Credit impaired 416.31 - 501.38 -
Less: Impairment 416.31 - 501.38 - 9.09 - 8.23 -
C. Deposits With Customs/Port Trusts etc. - 29.23 13.20 16.31 With Others
- Considered Good 1,832.35 51,126.21 1,870.39 3,659.43 - Credit impaired 1,252.71 260.37 1,262.73 43.11 Less: Impairment 1,252.71 260.37 1,262.73 43.11
1,832.35 51,155.44 1,883.59 3,675.74D. Advance recoverable
- Considered Good (Note no. 42.10) 258.22 10,535.58 151.42 11,023.36 - Credit impaired 593.01 1,138.16 610.18 1,104.00
Less: Impairment for receivables 593.01 1,138.16 610.18 1,104.00258.22 10,535.58 151.42 11,023.36
E. Prepayments - Mobilization Charges 461.63 1,457.41 1,296.90 1,120.36
F. Prepayments - lease land (Note no. 15.2) 3,105.77 154.71 3,155.03 164.29Total 6,646.02 63,303.14 7,331.33 15,983.75
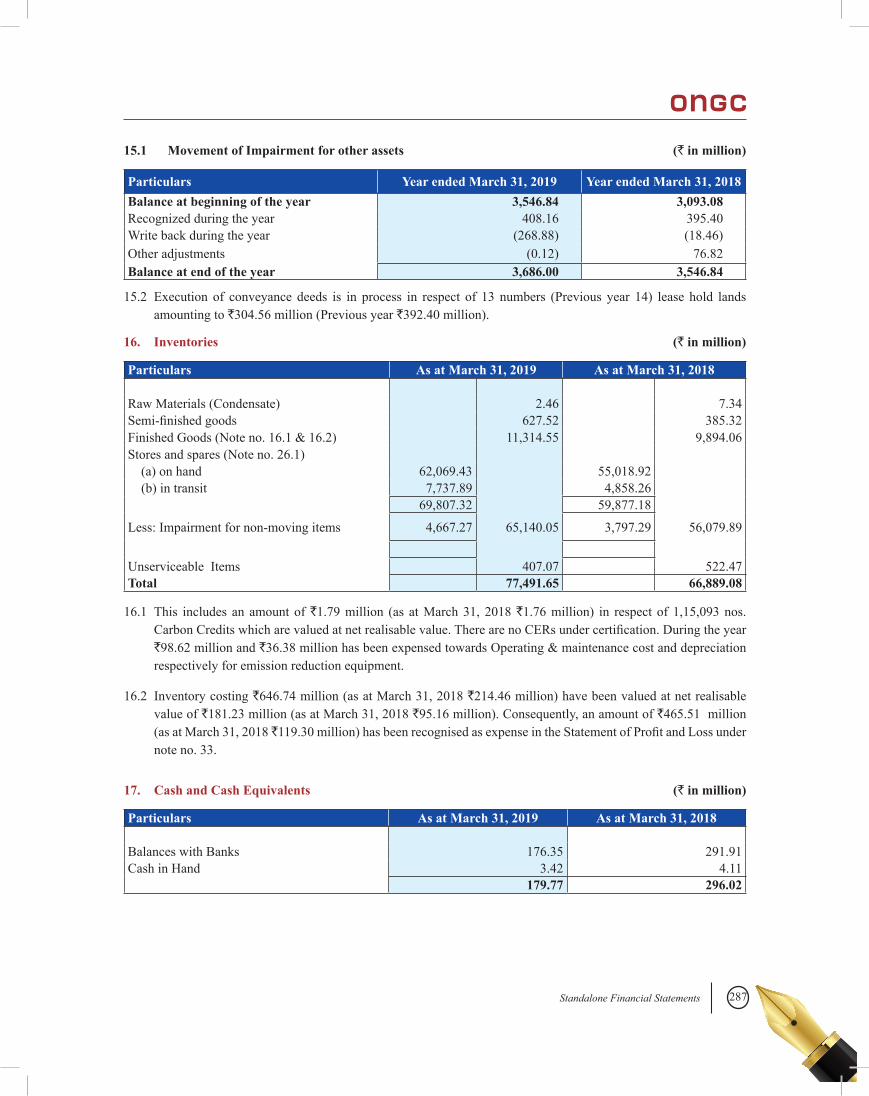
287Standalone Financial Statements
15.1 Movement of Impairment for other assets (` in million)
Particulars Year ended March 31, 2019 Year ended March 31, 2018Balance at beginning of the year 3,546.84 3,093.08Recognized during the year 408.16 395.40Write back during the year (268.88) (18.46)Other adjustments (0.12) 76.82Balance at end of the year 3,686.00 3,546.84
15.2 Execution of conveyance deeds is in process in respect of 13 numbers (Previous year 14) lease hold lands amounting to `304.56 million (Previous year `392.40 million).
16. Inventories (` in million)
Particulars As at March 31, 2019 As at March 31, 2018
Raw Materials (Condensate) 2.46 7.34Semi-finishedgoods 627.52 385.32Finished Goods (Note no. 16.1 & 16.2) 11,314.55 9,894.06Stores and spares (Note no. 26.1)
(a) on hand 62,069.43 55,018.92(b) in transit 7,737.89 4,858.26
69,807.32 59,877.18
Less: Impairment for non-moving items 4,667.27 65,140.05 3,797.29 56,079.89
Unserviceable Items 407.07 522.47Total 77,491.65 66,889.08
16.1 This includes an amount of `1.79 million (as at March 31, 2018 `1.76 million) in respect of 1,15,093 nos. CarbonCreditswhicharevaluedatnetrealisablevalue.TherearenoCERsundercertification.Duringtheyear`98.62 million and `36.38 million has been expensed towards Operating & maintenance cost and depreciation respectively for emission reduction equipment.
16.2 Inventory costing `646.74 million (as at March 31, 2018 `214.46 million) have been valued at net realisable value of `181.23 million (as at March 31, 2018 `95.16 million). Consequently, an amount of `465.51 million (as at March 31, 2018 `119.30million)hasbeenrecognisedasexpenseintheStatementofProfitandLossundernote no. 33.
17. Cash and Cash Equivalents (` in million)
Particulars As at March 31, 2019 As at March 31, 2018
Balances with Banks 176.35 291.91Cash in Hand 3.42 4.11
179.77 296.02
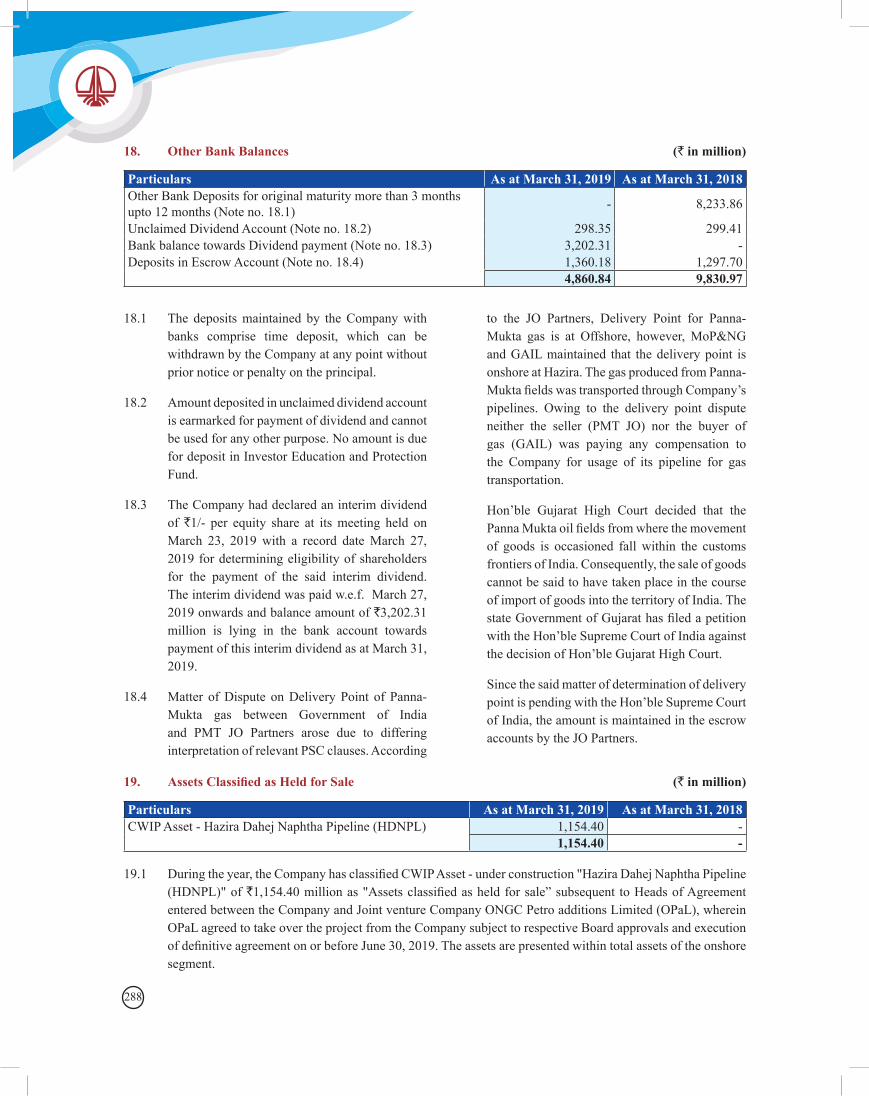
288
18. Other Bank Balances (` in million)
Particulars As at March 31, 2019 As at March 31, 2018Other Bank Deposits for original maturity more than 3 months upto 12 months (Note no. 18.1) - 8,233.86
Unclaimed Dividend Account (Note no. 18.2) 298.35 299.41Bank balance towards Dividend payment (Note no. 18.3) 3,202.31 - Deposits in Escrow Account (Note no. 18.4) 1,360.18 1,297.70
4,860.84 9,830.97
18.1 The deposits maintained by the Company with banks comprise time deposit, which can be withdrawn by the Company at any point without prior notice or penalty on the principal.
18.2 Amount deposited in unclaimed dividend account is earmarked for payment of dividend and cannot be used for any other purpose. No amount is due for deposit in Investor Education and Protection Fund.
18.3 The Company had declared an interim dividend of `1/- per equity share at its meeting held on March 23, 2019 with a record date March 27, 2019 for determining eligibility of shareholders for the payment of the said interim dividend. The interim dividend was paid w.e.f. March 27, 2019 onwards and balance amount of `3,202.31 million is lying in the bank account towards payment of this interim dividend as at March 31, 2019.
18.4 Matter of Dispute on Delivery Point of Panna-Mukta gas between Government of India and PMT JO Partners arose due to differing interpretation of relevant PSC clauses. According
to the JO Partners, Delivery Point for Panna-Mukta gas is at Offshore, however, MoP&NG and GAIL maintained that the delivery point is onshore at Hazira. The gas produced from Panna-MuktafieldswastransportedthroughCompany’spipelines. Owing to the delivery point dispute neither the seller (PMT JO) nor the buyer of gas (GAIL) was paying any compensation to the Company for usage of its pipeline for gas transportation.
Hon’ble Gujarat High Court decided that the PannaMuktaoilfieldsfromwherethemovementof goods is occasioned fall within the customs frontiers of India. Consequently, the sale of goods cannot be said to have taken place in the course of import of goods into the territory of India. The stateGovernmentofGujarathasfiledapetitionwith the Hon’ble Supreme Court of India against the decision of Hon’ble Gujarat High Court.
Since the said matter of determination of delivery point is pending with the Hon’ble Supreme Court of India, the amount is maintained in the escrow accounts by the JO Partners.
19. Assets Classified as Held for Sale (` in million)
Particulars As at March 31, 2019 As at March 31, 2018CWIP Asset - Hazira Dahej Naphtha Pipeline (HDNPL) 1,154.40 -
1,154.40 -
19.1 Duringtheyear,theCompanyhasclassifiedCWIPAsset-underconstruction"HaziraDahejNaphthaPipeline(HDNPL)" of `1,154.40millionas"Assetsclassifiedasheldforsale”subsequent toHeadsofAgreemententered between the Company and Joint venture Company ONGC Petro additions Limited (OPaL), wherein OPaL agreed to take over the project from the Company subject to respective Board approvals and execution ofdefinitiveagreementonorbeforeJune30,2019.Theassetsarepresentedwithintotalassetsoftheonshoresegment.
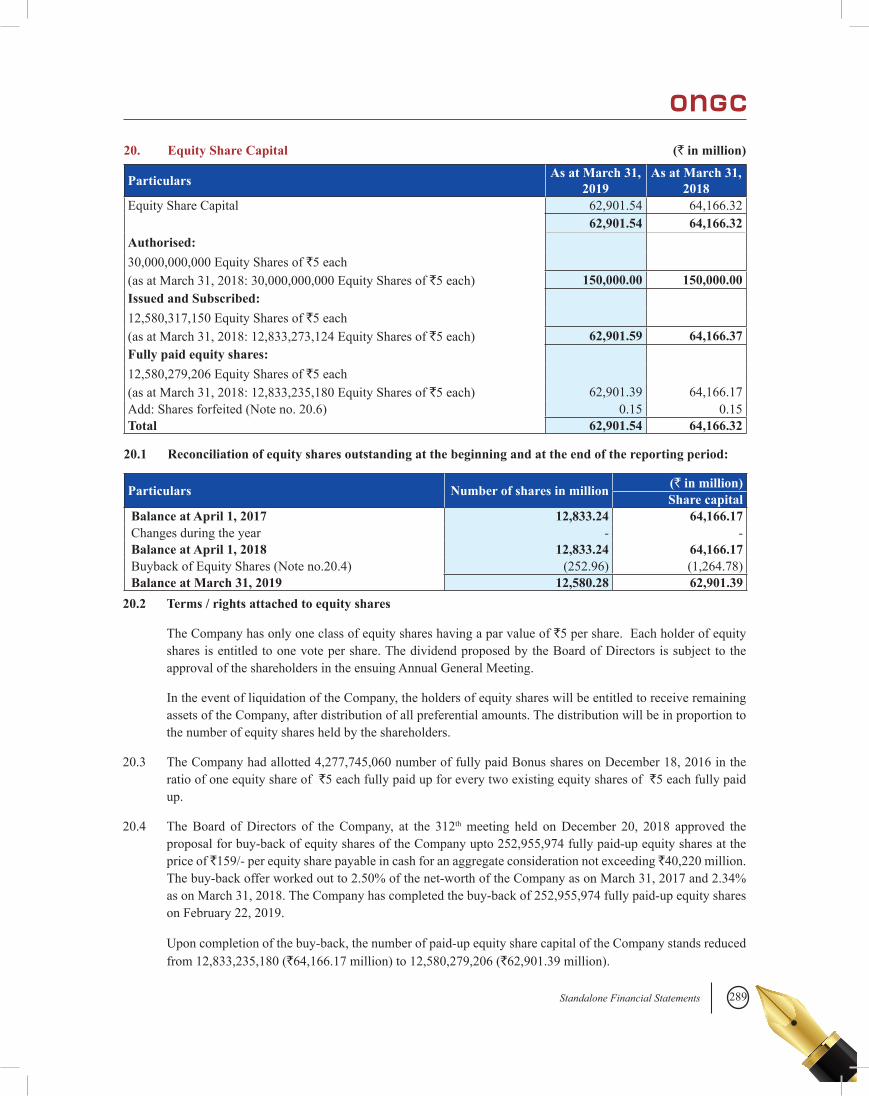
289Standalone Financial Statements
Particulars As at March 31, 2019
As at March 31, 2018
Equity Share Capital 62,901.54 64,166.3262,901.54 64,166.32
Authorised:30,000,000,000 Equity Shares of `5 each(as at March 31, 2018: 30,000,000,000 Equity Shares of `5 each) 150,000.00 150,000.00Issued and Subscribed: 12,580,317,150 Equity Shares of `5 each (as at March 31, 2018: 12,833,273,124 Equity Shares of `5 each) 62,901.59 64,166.37Fully paid equity shares: 12,580,279,206 Equity Shares of `5 each (as at March 31, 2018: 12,833,235,180 Equity Shares of `5 each) 62,901.39 64,166.17Add: Shares forfeited (Note no. 20.6) 0.15 0.15Total 62,901.54 64,166.32
20. Equity Share Capital (` in million)
20.1 Reconciliation of equity shares outstanding at the beginning and at the end of the reporting period:
Particulars Number of shares in million (` in million)Share capital
Balance at April 1, 2017 12,833.24 64,166.17 Changes during the year - - Balance at April 1, 2018 12,833.24 64,166.17 Buyback of Equity Shares (Note no.20.4) (252.96) (1,264.78) Balance at March 31, 2019 12,580.28 62,901.39
20.2 Terms / rights attached to equity shares
The Company has only one class of equity shares having a par value of `5 per share. Each holder of equity shares is entitled to one vote per share. The dividend proposed by the Board of Directors is subject to the approval of the shareholders in the ensuing Annual General Meeting.
In the event of liquidation of the Company, the holders of equity shares will be entitled to receive remaining assets of the Company, after distribution of all preferential amounts. The distribution will be in proportion to the number of equity shares held by the shareholders.
20.3 The Company had allotted 4,277,745,060 number of fully paid Bonus shares on December 18, 2016 in the ratio of one equity share of `5 each fully paid up for every two existing equity shares of `5 each fully paid up.
20.4 The Board of Directors of the Company, at the 312th meeting held on December 20, 2018 approved the proposal for buy-back of equity shares of the Company upto 252,955,974 fully paid-up equity shares at the price of `159/- per equity share payable in cash for an aggregate consideration not exceeding `40,220 million. The buy-back offer worked out to 2.50% of the net-worth of the Company as on March 31, 2017 and 2.34% as on March 31, 2018. The Company has completed the buy-back of 252,955,974 fully paid-up equity shares on February 22, 2019.
Upon completion of the buy-back, the number of paid-up equity share capital of the Company stands reduced from 12,833,235,180 (`64,166.17 million) to 12,580,279,206 (`62,901.39 million).
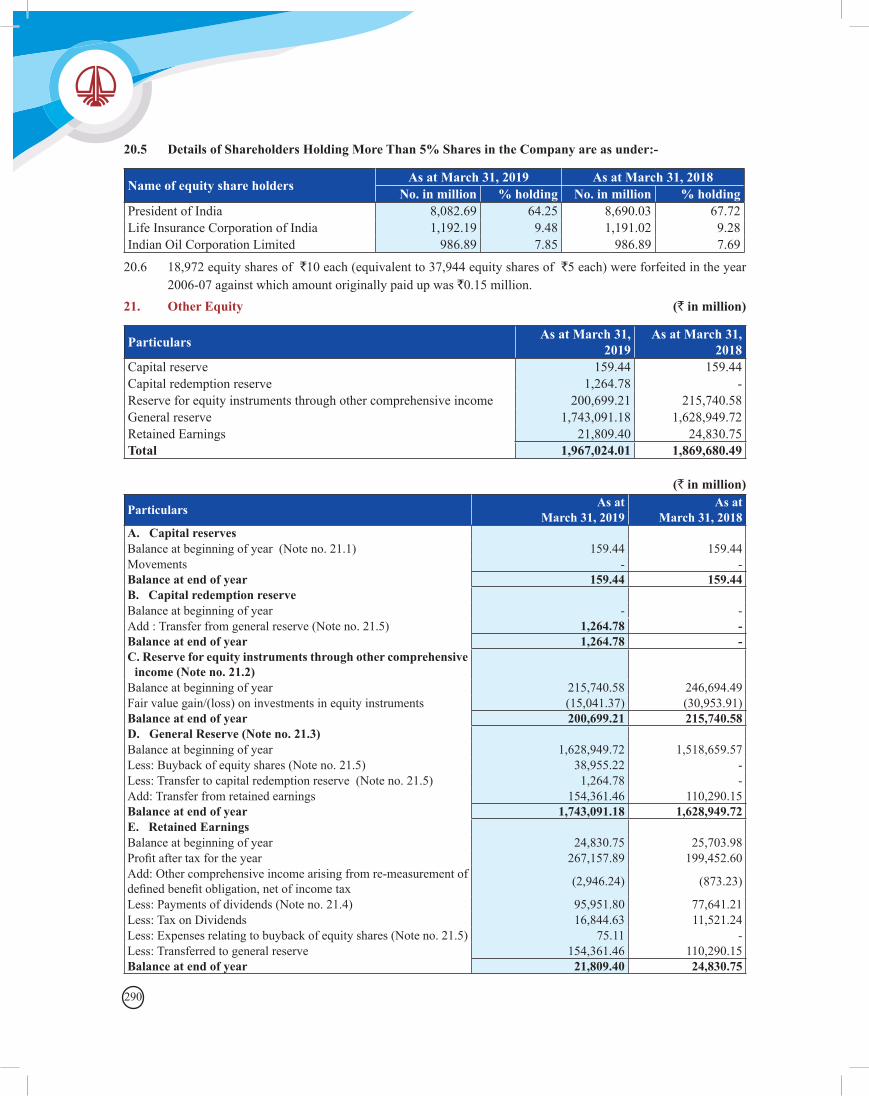
290
Name of equity share holders As at March 31, 2019 As at March 31, 2018No. in million % holding No. in million % holding
President of India 8,082.69 64.25 8,690.03 67.72Life Insurance Corporation of India 1,192.19 9.48 1,191.02 9.28Indian Oil Corporation Limited 986.89 7.85 986.89 7.69
20.5 Details of Shareholders Holding More Than 5% Shares in the Company are as under:-
20.6 18,972 equity shares of `10 each (equivalent to 37,944 equity shares of `5 each) were forfeited in the year 2006-07 against which amount originally paid up was `0.15 million.
21. Other Equity (` in million)
Particulars As at March 31, 2019
As at March 31, 2018
Capital reserve 159.44 159.44Capital redemption reserve 1,264.78 - Reserve for equity instruments through other comprehensive income 200,699.21 215,740.58General reserve 1,743,091.18 1,628,949.72Retained Earnings 21,809.40 24,830.75Total 1,967,024.01 1,869,680.49
(` in million)
Particulars As at As atMarch 31, 2019 March 31, 2018
A. Capital reserves Balance at beginning of year (Note no. 21.1) 159.44 159.44Movements - - Balance at end of year 159.44 159.44B. Capital redemption reserveBalance at beginning of year - - Add : Transfer from general reserve (Note no. 21.5) 1,264.78 - Balance at end of year 1,264.78 - C. Reserve for equity instruments through other comprehensive
income (Note no. 21.2)Balance at beginning of year 215,740.58 246,694.49Fair value gain/(loss) on investments in equity instruments (15,041.37) (30,953.91)Balance at end of year 200,699.21 215,740.58D. General Reserve (Note no. 21.3)Balance at beginning of year 1,628,949.72 1,518,659.57Less: Buyback of equity shares (Note no. 21.5) 38,955.22 - Less: Transfer to capital redemption reserve (Note no. 21.5) 1,264.78 - Add: Transfer from retained earnings 154,361.46 110,290.15Balance at end of year 1,743,091.18 1,628,949.72E. Retained EarningsBalance at beginning of year 24,830.75 25,703.98Profitaftertaxfortheyear 267,157.89 199,452.60Add: Other comprehensive income arising from re-measurement of definedbenefitobligation,netofincometax (2,946.24) (873.23)
Less: Payments of dividends (Note no. 21.4) 95,951.80 77,641.21Less: Tax on Dividends 16,844.63 11,521.24Less: Expenses relating to buyback of equity shares (Note no. 21.5) 75.11 - Less: Transferred to general reserve 154,361.46 110,290.15Balance at end of year 21,809.40 24,830.75
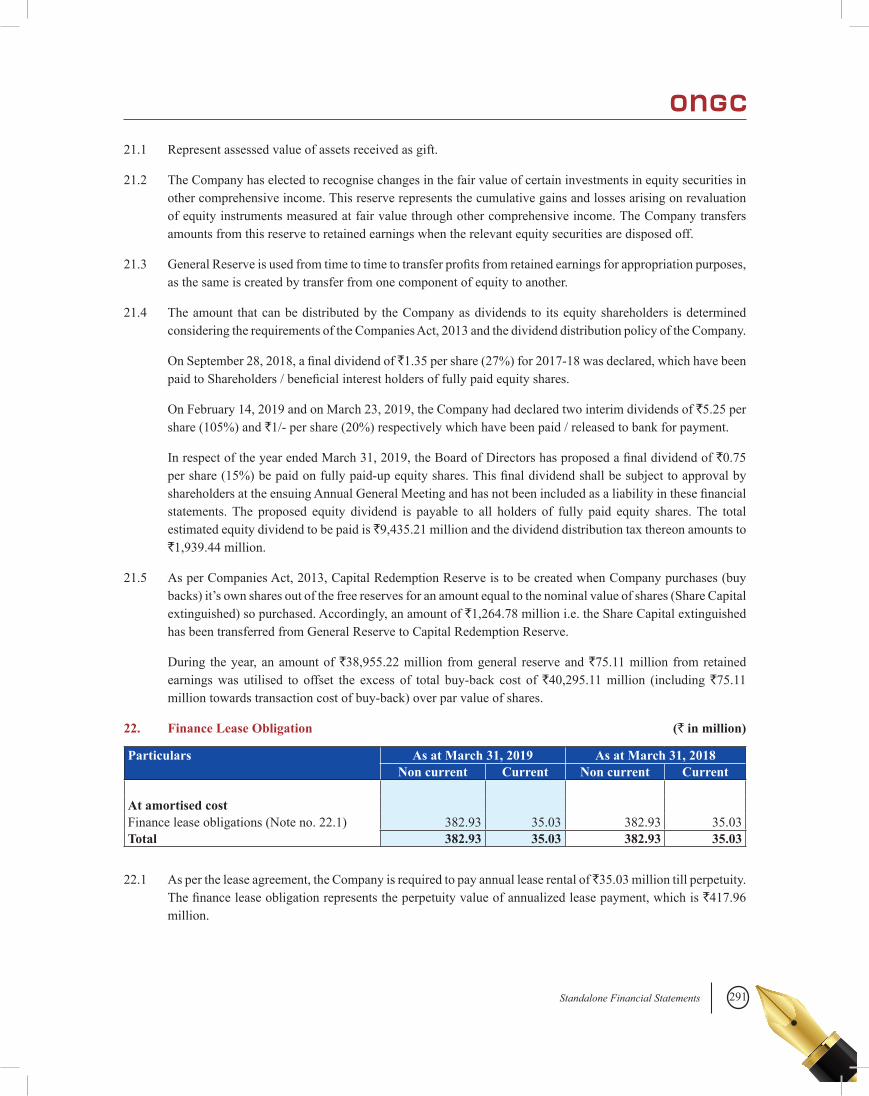
291Standalone Financial Statements
21.1 Represent assessed value of assets received as gift.
21.2 The Company has elected to recognise changes in the fair value of certain investments in equity securities in other comprehensive income. This reserve represents the cumulative gains and losses arising on revaluation of equity instruments measured at fair value through other comprehensive income. The Company transfers amounts from this reserve to retained earnings when the relevant equity securities are disposed off.
21.3 GeneralReserveisusedfromtimetotimetotransferprofitsfromretainedearningsforappropriationpurposes,as the same is created by transfer from one component of equity to another.
21.4 The amount that can be distributed by the Company as dividends to its equity shareholders is determined considering the requirements of the Companies Act, 2013 and the dividend distribution policy of the Company.
OnSeptember28,2018,afinaldividendof`1.35 per share (27%) for 2017-18 was declared, which have been paidtoShareholders/beneficialinterestholdersoffullypaidequityshares.
On February 14, 2019 and on March 23, 2019, the Company had declared two interim dividends of `5.25 per share (105%) and `1/- per share (20%) respectively which have been paid / released to bank for payment.
InrespectoftheyearendedMarch31,2019,theBoardofDirectorshasproposedafinaldividendof`0.75 pershare(15%)bepaidonfullypaid-upequityshares.ThisfinaldividendshallbesubjecttoapprovalbyshareholdersattheensuingAnnualGeneralMeetingandhasnotbeenincludedasaliabilityinthesefinancialstatements. The proposed equity dividend is payable to all holders of fully paid equity shares. The total estimated equity dividend to be paid is `9,435.21 million and the dividend distribution tax thereon amounts to `1,939.44 million.
21.5 As per Companies Act, 2013, Capital Redemption Reserve is to be created when Company purchases (buy backs) it’s own shares out of the free reserves for an amount equal to the nominal value of shares (Share Capital extinguished) so purchased. Accordingly, an amount of `1,264.78 million i.e. the Share Capital extinguished has been transferred from General Reserve to Capital Redemption Reserve.
During the year, an amount of `38,955.22 million from general reserve and `75.11 million from retained earnings was utilised to offset the excess of total buy-back cost of `40,295.11 million (including `75.11 million towards transaction cost of buy-back) over par value of shares.
22. Finance Lease Obligation (` in million)
Particulars As at March 31, 2019 As at March 31, 2018 Non current Current Non current Current
At amortised cost Finance lease obligations (Note no. 22.1) 382.93 35.03 382.93 35.03Total 382.93 35.03 382.93 35.03
22.1 As per the lease agreement, the Company is required to pay annual lease rental of ̀ 35.03 million till perpetuity. Thefinanceleaseobligationrepresentstheperpetuityvalueofannualizedleasepayment,whichis`417.96 million.
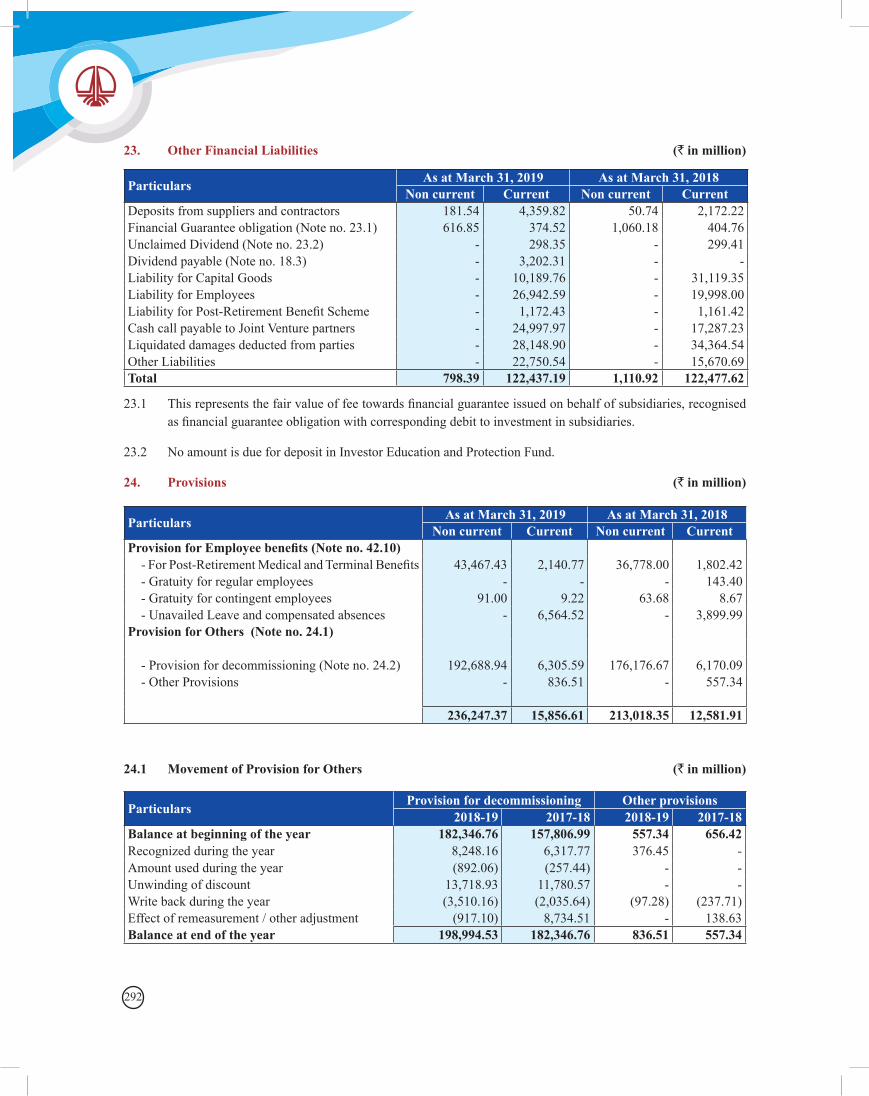
292
Particulars As at March 31, 2019 As at March 31, 2018Non current Current Non current Current
Deposits from suppliers and contractors 181.54 4,359.82 50.74 2,172.22Financial Guarantee obligation (Note no. 23.1) 616.85 374.52 1,060.18 404.76Unclaimed Dividend (Note no. 23.2) - 298.35 - 299.41Dividend payable (Note no. 18.3) - 3,202.31 - - Liability for Capital Goods - 10,189.76 - 31,119.35Liability for Employees - 26,942.59 - 19,998.00LiabilityforPost-RetirementBenefitScheme - 1,172.43 - 1,161.42Cash call payable to Joint Venture partners - 24,997.97 - 17,287.23Liquidated damages deducted from parties - 28,148.90 - 34,364.54Other Liabilities - 22,750.54 - 15,670.69Total 798.39 122,437.19 1,110.92 122,477.62
23. Other Financial Liabilities (` in million)
23.1 Thisrepresentsthefairvalueoffeetowardsfinancialguaranteeissuedonbehalfofsubsidiaries,recognisedasfinancialguaranteeobligationwithcorrespondingdebittoinvestmentinsubsidiaries.
23.2 No amount is due for deposit in Investor Education and Protection Fund.
24. Provisions (` in million)
Particulars As at March 31, 2019 As at March 31, 2018Non current Current Non current Current
Provision for Employee benefits (Note no. 42.10) -ForPost-RetirementMedicalandTerminalBenefits 43,467.43 2,140.77 36,778.00 1,802.42 - Gratuity for regular employees - - - 143.40 - Gratuity for contingent employees 91.00 9.22 63.68 8.67 - Unavailed Leave and compensated absences - 6,564.52 - 3,899.99Provision for Others (Note no. 24.1)
- Provision for decommissioning (Note no. 24.2) 192,688.94 6,305.59 176,176.67 6,170.09 - Other Provisions - 836.51 - 557.34
236,247.37 15,856.61 213,018.35 12,581.91
Particulars Provision for decommissioning Other provisions2018-19 2017-18 2018-19 2017-18
Balance at beginning of the year 182,346.76 157,806.99 557.34 656.42Recognized during the year 8,248.16 6,317.77 376.45 - Amount used during the year (892.06) (257.44) - - Unwinding of discount 13,718.93 11,780.57 - - Write back during the year (3,510.16) (2,035.64) (97.28) (237.71)Effect of remeasurement / other adjustment (917.10) 8,734.51 - 138.63Balance at end of the year 198,994.53 182,346.76 836.51 557.34
24.1 Movement of Provision for Others (` in million)
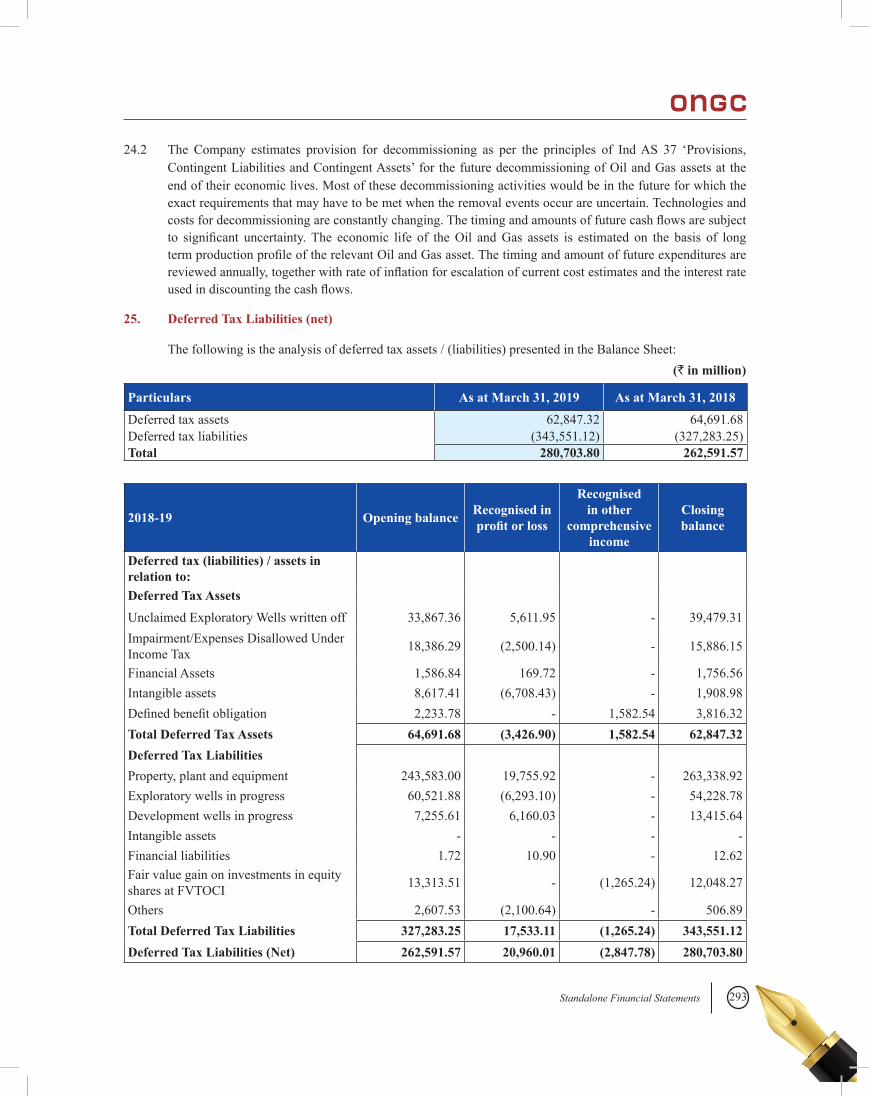
293Standalone Financial Statements
24.2 The Company estimates provision for decommissioning as per the principles of Ind AS 37 ‘Provisions, Contingent Liabilities and Contingent Assets’ for the future decommissioning of Oil and Gas assets at the end of their economic lives. Most of these decommissioning activities would be in the future for which the exact requirements that may have to be met when the removal events occur are uncertain. Technologies and costsfordecommissioningareconstantlychanging.Thetimingandamountsoffuturecashflowsaresubjectto significant uncertainty.The economic life of theOil andGas assets is estimated on the basis of longtermproductionprofileoftherelevantOilandGasasset.Thetimingandamountoffutureexpendituresarereviewedannually,togetherwithrateofinflationforescalationofcurrentcostestimatesandtheinterestrateusedindiscountingthecashflows.
25. Deferred Tax Liabilities (net)
The following is the analysis of deferred tax assets / (liabilities) presented in the Balance Sheet:(` in million)
Particulars As at March 31, 2019 As at March 31, 2018
Deferred tax assets 62,847.32 64,691.68Deferred tax liabilities (343,551.12) (327,283.25)Total 280,703.80 262,591.57
2018-19 Opening balance Recognised in profit or loss
Recognised in other
comprehensive income
Closing balance
Deferred tax (liabilities) / assets in relation to:Deferred Tax Assets Unclaimed Exploratory Wells written off 33,867.36 5,611.95 - 39,479.31Impairment/Expenses Disallowed Under Income Tax 18,386.29 (2,500.14) - 15,886.15
Financial Assets 1,586.84 169.72 - 1,756.56Intangible assets 8,617.41 (6,708.43) - 1,908.98Definedbenefitobligation 2,233.78 - 1,582.54 3,816.32Total Deferred Tax Assets 64,691.68 (3,426.90) 1,582.54 62,847.32Deferred Tax LiabilitiesProperty, plant and equipment 243,583.00 19,755.92 - 263,338.92Exploratory wells in progress 60,521.88 (6,293.10) - 54,228.78Development wells in progress 7,255.61 6,160.03 - 13,415.64Intangible assets - - - - Financial liabilities 1.72 10.90 - 12.62Fair value gain on investments in equity shares at FVTOCI 13,313.51 - (1,265.24) 12,048.27
Others 2,607.53 (2,100.64) - 506.89Total Deferred Tax Liabilities 327,283.25 17,533.11 (1,265.24) 343,551.12Deferred Tax Liabilities (Net) 262,591.57 20,960.01 (2,847.78) 280,703.80
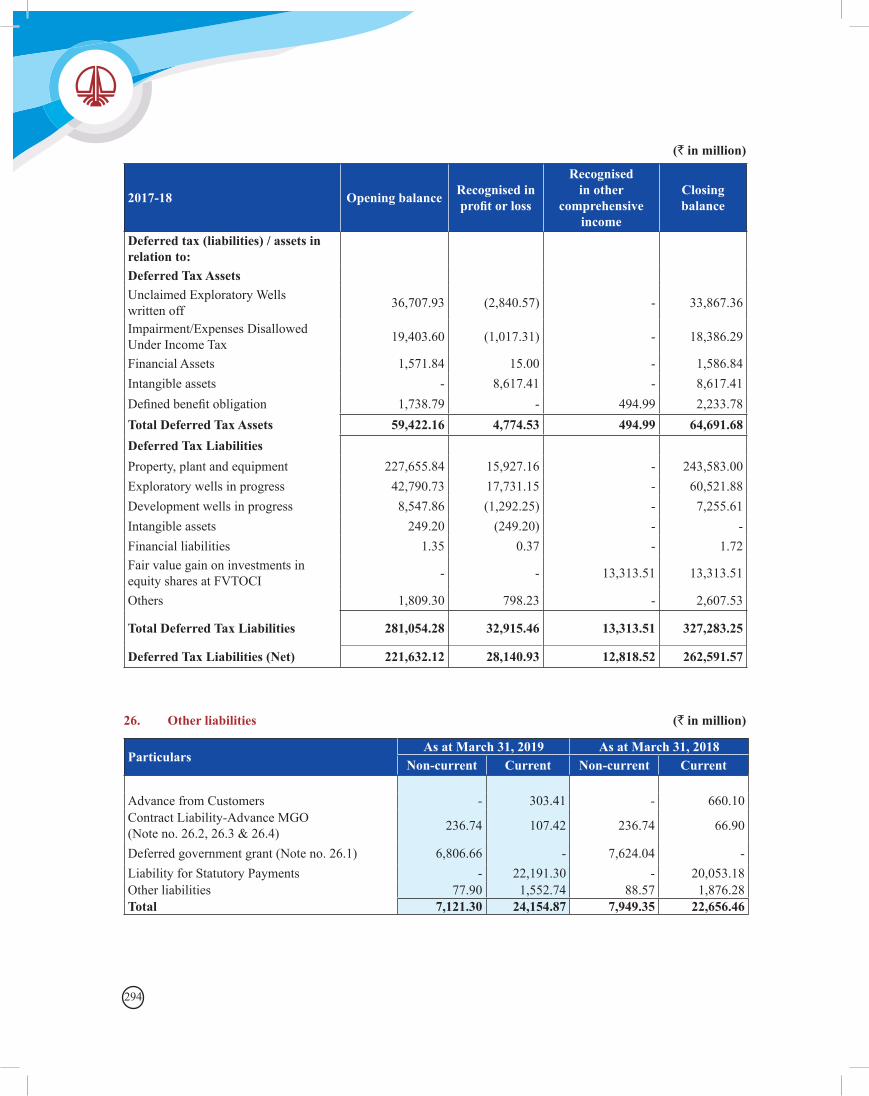
294
2017-18 Opening balance Recognised in profit or loss
Recognised in other
comprehensive income
Closing balance
Deferred tax (liabilities) / assets in relation to:Deferred Tax Assets Unclaimed Exploratory Wells written off 36,707.93 (2,840.57) - 33,867.36
Impairment/Expenses Disallowed Under Income Tax 19,403.60 (1,017.31) - 18,386.29
Financial Assets 1,571.84 15.00 - 1,586.84Intangible assets - 8,617.41 - 8,617.41Definedbenefitobligation 1,738.79 - 494.99 2,233.78Total Deferred Tax Assets 59,422.16 4,774.53 494.99 64,691.68Deferred Tax LiabilitiesProperty, plant and equipment 227,655.84 15,927.16 - 243,583.00Exploratory wells in progress 42,790.73 17,731.15 - 60,521.88Development wells in progress 8,547.86 (1,292.25) - 7,255.61Intangible assets 249.20 (249.20) - - Financial liabilities 1.35 0.37 - 1.72Fair value gain on investments in equity shares at FVTOCI - - 13,313.51 13,313.51
Others 1,809.30 798.23 - 2,607.53
Total Deferred Tax Liabilities 281,054.28 32,915.46 13,313.51 327,283.25
Deferred Tax Liabilities (Net) 221,632.12 28,140.93 12,818.52 262,591.57
ParticularsAs at March 31, 2019 As at March 31, 2018
Non-current Current Non-current Current
Advance from Customers - 303.41 - 660.10Contract Liability-Advance MGO (Note no. 26.2, 26.3 & 26.4) 236.74 107.42 236.74 66.90
Deferred government grant (Note no. 26.1) 6,806.66 - 7,624.04 - Liability for Statutory Payments - 22,191.30 - 20,053.18Other liabilities 77.90 1,552.74 88.57 1,876.28Total 7,121.30 24,154.87 7,949.35 22,656.46
26. Other liabilities (` in million)
(` in million)
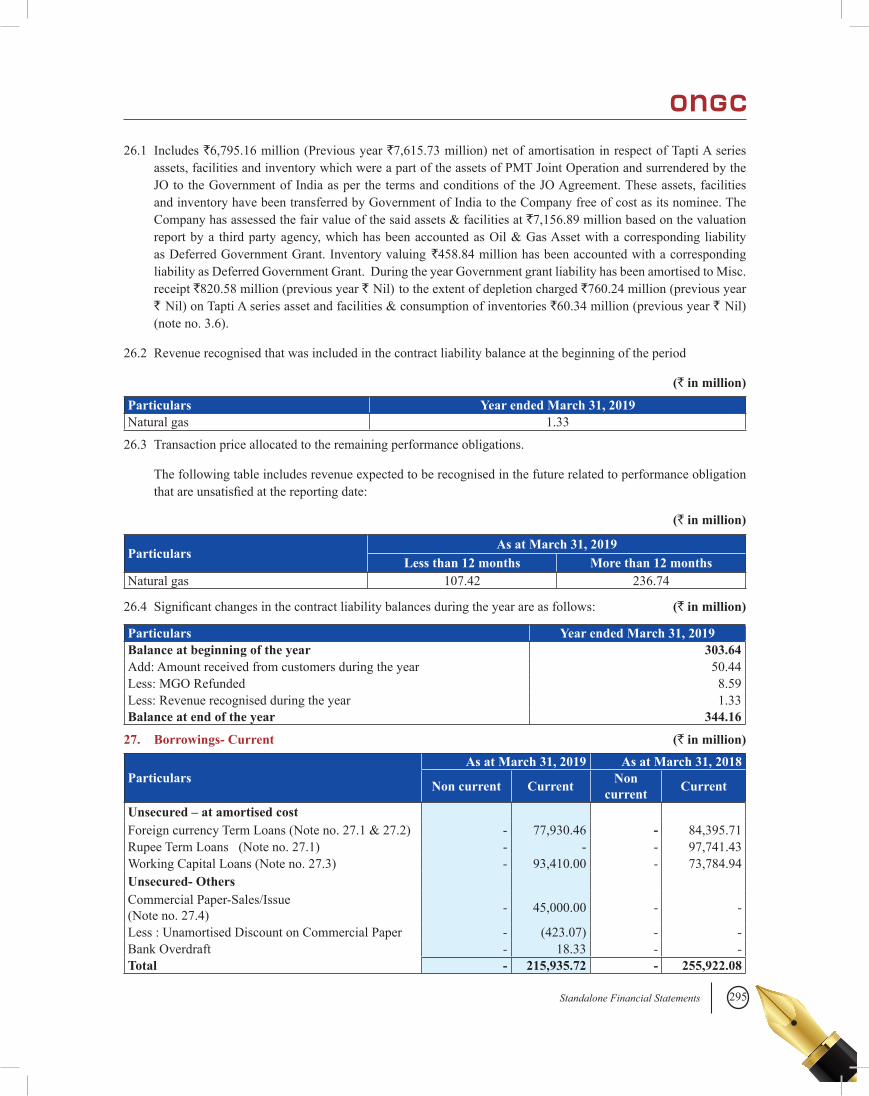
295Standalone Financial Statements
26.1 Includes `6,795.16 million (Previous year `7,615.73 million) net of amortisation in respect of Tapti A series assets, facilities and inventory which were a part of the assets of PMT Joint Operation and surrendered by the JO to the Government of India as per the terms and conditions of the JO Agreement. These assets, facilities and inventory have been transferred by Government of India to the Company free of cost as its nominee. The Company has assessed the fair value of the said assets & facilities at `7,156.89 million based on the valuation report by a third party agency, which has been accounted as Oil & Gas Asset with a corresponding liability as Deferred Government Grant. Inventory valuing `458.84 million has been accounted with a corresponding liability as Deferred Government Grant. During the year Government grant liability has been amortised to Misc. receipt `820.58 million (previous year ` Nil) to the extent of depletion charged `760.24 million (previous year ` Nil) on Tapti A series asset and facilities & consumption of inventories `60.34 million (previous year ` Nil) (note no. 3.6).
26.2 Revenue recognised that was included in the contract liability balance at the beginning of the period
(` in million)
Particulars Year ended March 31, 2019Natural gas 1.33
26.3 Transaction price allocated to the remaining performance obligations.
The following table includes revenue expected to be recognised in the future related to performance obligation thatareunsatisfiedatthereportingdate:
(` in million)
ParticularsAs at March 31, 2019
Less than 12 months More than 12 monthsNatural gas 107.42 236.74
26.4 Significantchangesinthecontractliabilitybalancesduringtheyearareasfollows: (` in million)
Particulars Year ended March 31, 2019Balance at beginning of the year 303.64Add: Amount received from customers during the year 50.44Less: MGO Refunded 8.59Less: Revenue recognised during the year 1.33Balance at end of the year 344.16
27. Borrowings- Current (` in million)
ParticularsAs at March 31, 2019 As at March 31, 2018
Non current Current Non current Current
Unsecured – at amortised cost Foreign currency Term Loans (Note no. 27.1 & 27.2) - 77,930.46 - 84,395.71Rupee Term Loans (Note no. 27.1) - - - 97,741.43Working Capital Loans (Note no. 27.3) - 93,410.00 - 73,784.94Unsecured- Others Commercial Paper-Sales/Issue (Note no. 27.4) - 45,000.00 - -
Less : Unamortised Discount on Commercial Paper - (423.07) - - Bank Overdraft - 18.33 - - Total - 215,935.72 - 255,922.08
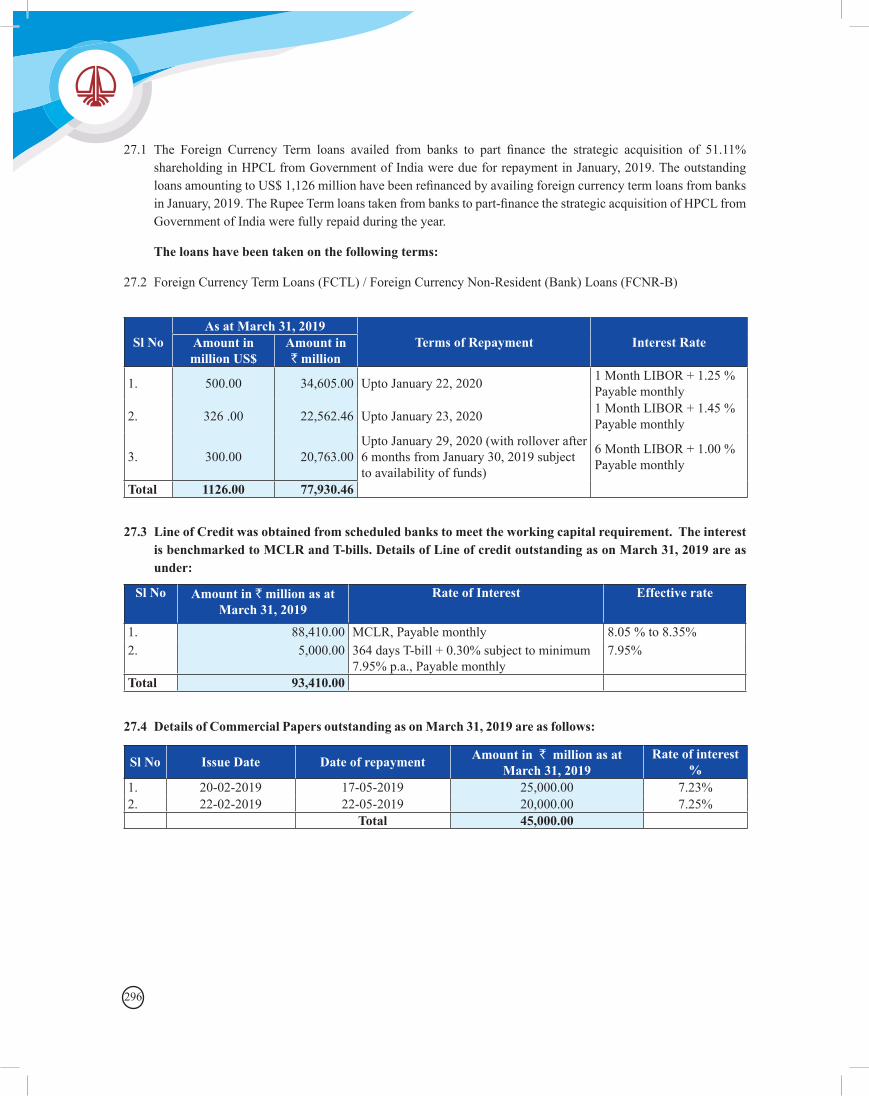
296
27.1 The Foreign Currency Term loans availed from banks to part finance the strategic acquisition of 51.11%shareholding in HPCL from Government of India were due for repayment in January, 2019. The outstanding loansamountingtoUS$1,126millionhavebeenrefinancedbyavailingforeigncurrencytermloansfrombanksinJanuary,2019.TheRupeeTermloanstakenfrombankstopart-financethestrategicacquisitionofHPCLfromGovernment of India were fully repaid during the year.
The loans have been taken on the following terms:
27.2 Foreign Currency Term Loans (FCTL) / Foreign Currency Non-Resident (Bank) Loans (FCNR-B)
Sl NoAs at March 31, 2019
Terms of Repayment Interest RateAmount in million US$
Amount in ` million
1. 500.00 34,605.00 Upto January 22, 2020 1 Month LIBOR + 1.25 %Payable monthly
2. 326 .00 22,562.46 Upto January 23, 2020 1 Month LIBOR + 1.45 %Payable monthly
3. 300.00 20,763.00Upto January 29, 2020 (with rollover after 6 months from January 30, 2019 subject to availability of funds)
6 Month LIBOR + 1.00 % Payable monthly
Total 1126.00 77,930.46
27.3 Line of Credit was obtained from scheduled banks to meet the working capital requirement. The interest is benchmarked to MCLR and T-bills. Details of Line of credit outstanding as on March 31, 2019 are as under:
Sl No Amount in ` million as at March 31, 2019
Rate of Interest Effective rate
1. 88,410.00 MCLR, Payable monthly 8.05 % to 8.35%2. 5,000.00 364 days T-bill + 0.30% subject to minimum
7.95% p.a., Payable monthly7.95%
Total 93,410.00
27.4 Details of Commercial Papers outstanding as on March 31, 2019 are as follows:
Sl No Issue Date Date of repayment Amount in ` million as at March 31, 2019
Rate of interest %
1. 20-02-2019 17-05-2019 25,000.00 7.23%2. 22-02-2019 22-05-2019 20,000.00 7.25%
Total 45,000.00
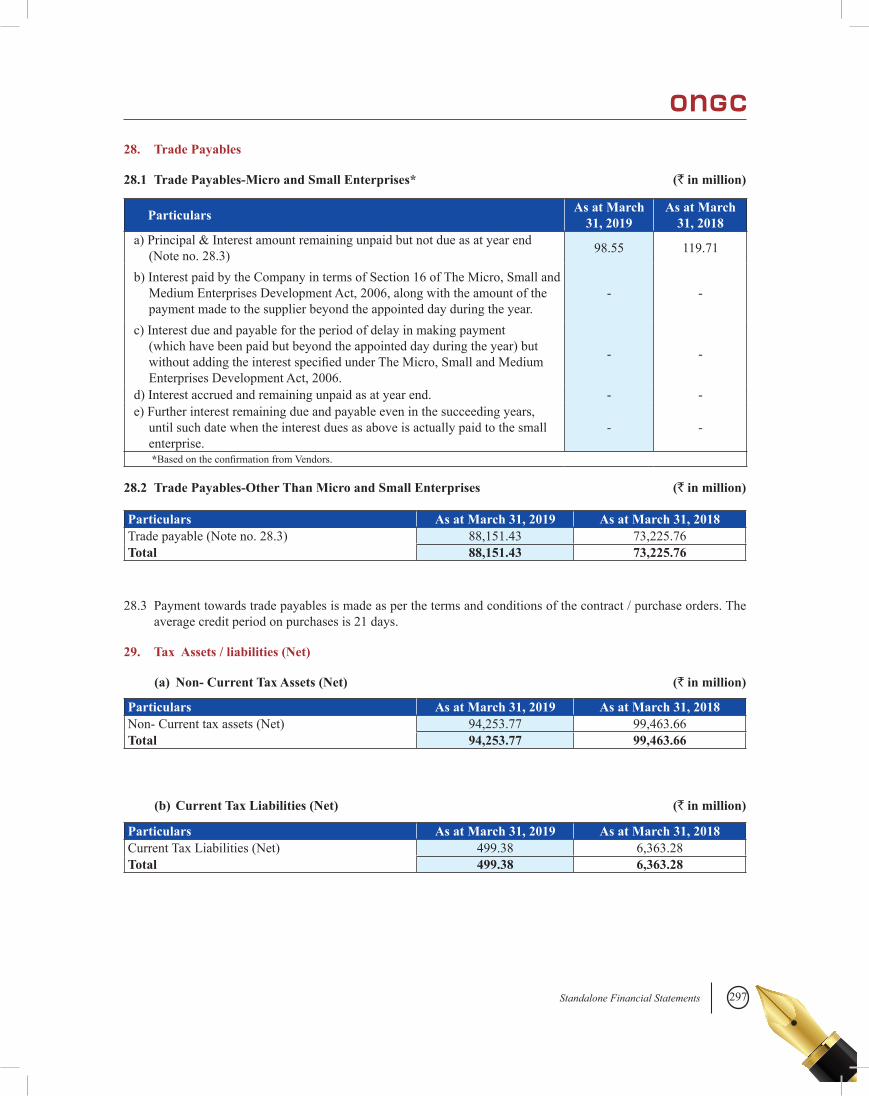
297Standalone Financial Statements
Particulars As at March 31, 2019
As at March 31, 2018
a) Principal & Interest amount remaining unpaid but not due as at year end (Note no. 28.3) 98.55 119.71
b) Interest paid by the Company in terms of Section 16 of The Micro, Small and Medium Enterprises Development Act, 2006, along with the amount of the payment made to the supplier beyond the appointed day during the year.
- -
c) Interest due and payable for the period of delay in making payment (which have been paid but beyond the appointed day during the year) but withoutaddingtheinterestspecifiedunderTheMicro,SmallandMediumEnterprises Development Act, 2006.
- -
d) Interest accrued and remaining unpaid as at year end. - - e) Further interest remaining due and payable even in the succeeding years,
until such date when the interest dues as above is actually paid to the small enterprise.
- -
*BasedontheconfirmationfromVendors.
28. Trade Payables
28.1 Trade Payables-Micro and Small Enterprises* (` in million)
Particulars As at March 31, 2019 As at March 31, 2018Trade payable (Note no. 28.3) 88,151.43 73,225.76Total 88,151.43 73,225.76
28.2 Trade Payables-Other Than Micro and Small Enterprises (` in million)
28.3 Payment towards trade payables is made as per the terms and conditions of the contract / purchase orders. The average credit period on purchases is 21 days.
29. Tax Assets / liabilities (Net)
(a) Non- Current Tax Assets (Net) (` in million)
Particulars As at March 31, 2019 As at March 31, 2018Non- Current tax assets (Net) 94,253.77 99,463.66Total 94,253.77 99,463.66
(b) Current Tax Liabilities (Net) (` in million)
Particulars As at March 31, 2019 As at March 31, 2018Current Tax Liabilities (Net) 499.38 6,363.28Total 499.38 6,363.28
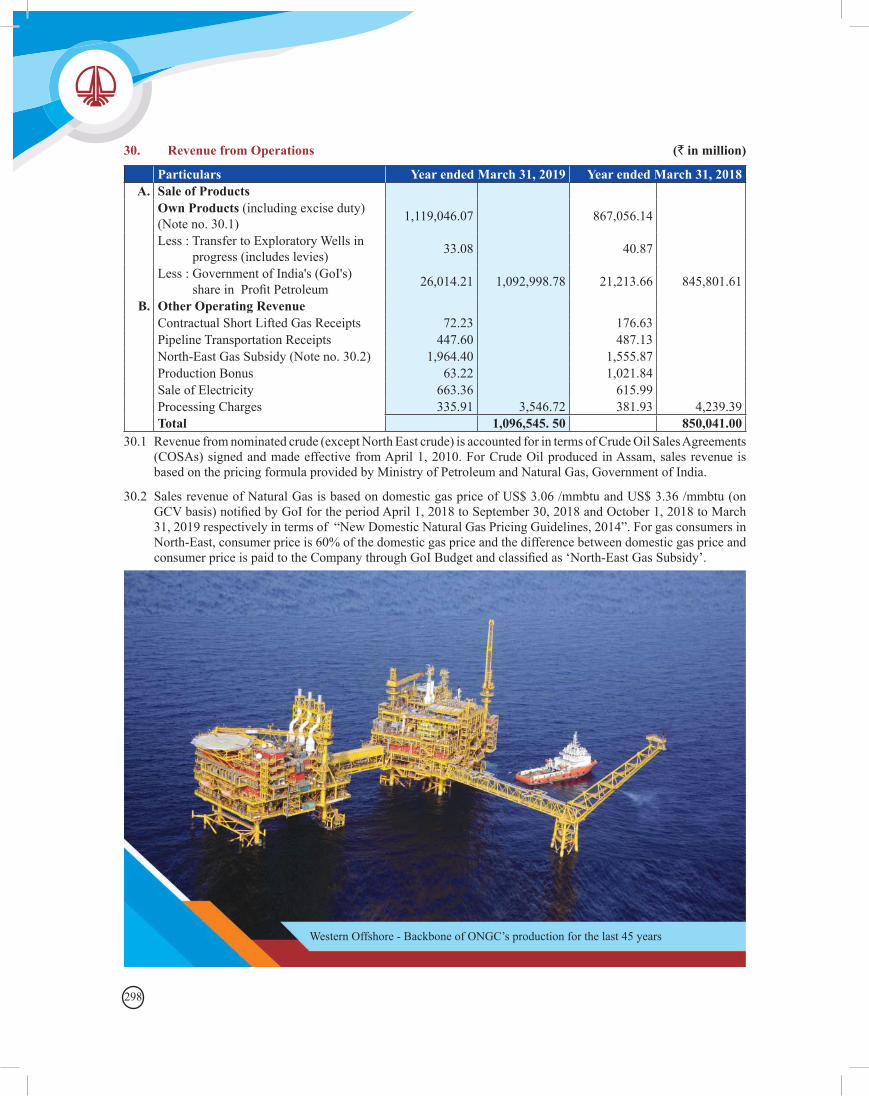
298
30. Revenue from Operations (` in million)
Particulars Year ended March 31, 2019 Year ended March 31, 2018A. Sale of Products
Own Products (including excise duty) (Note no. 30.1) 1,119,046.07 867,056.14
Less : Transfer to Exploratory Wells in progress (includes levies) 33.08 40.87
Less : Government of India's (GoI's) shareinProfitPetroleum 26,014.21 1,092,998.78 21,213.66 845,801.61
B. Other Operating RevenueContractual Short Lifted Gas Receipts 72.23 176.63Pipeline Transportation Receipts 447.60 487.13North-East Gas Subsidy (Note no. 30.2) 1,964.40 1,555.87Production Bonus 63.22 1,021.84Sale of Electricity 663.36 615.99Processing Charges 335.91 3,546.72 381.93 4,239.39Total 1,096,545. 50 850,041.00
30.1 Revenue from nominated crude (except North East crude) is accounted for in terms of Crude Oil Sales Agreements (COSAs) signed and made effective from April 1, 2010. For Crude Oil produced in Assam, sales revenue is based on the pricing formula provided by Ministry of Petroleum and Natural Gas, Government of India.
30.2 Sales revenue of Natural Gas is based on domestic gas price of US$ 3.06 /mmbtu and US$ 3.36 /mmbtu (on GCVbasis)notifiedbyGoIfortheperiodApril1,2018toSeptember30,2018andOctober1,2018toMarch31,2019respectivelyintermsof“NewDomesticNaturalGasPricingGuidelines,2014”.ForgasconsumersinNorth-East, consumer price is 60% of the domestic gas price and the difference between domestic gas price and consumerpriceispaidtotheCompanythroughGoIBudgetandclassifiedas‘North-EastGasSubsidy’.
Western Offshore - Backbone of ONGC’s production for the last 45 years
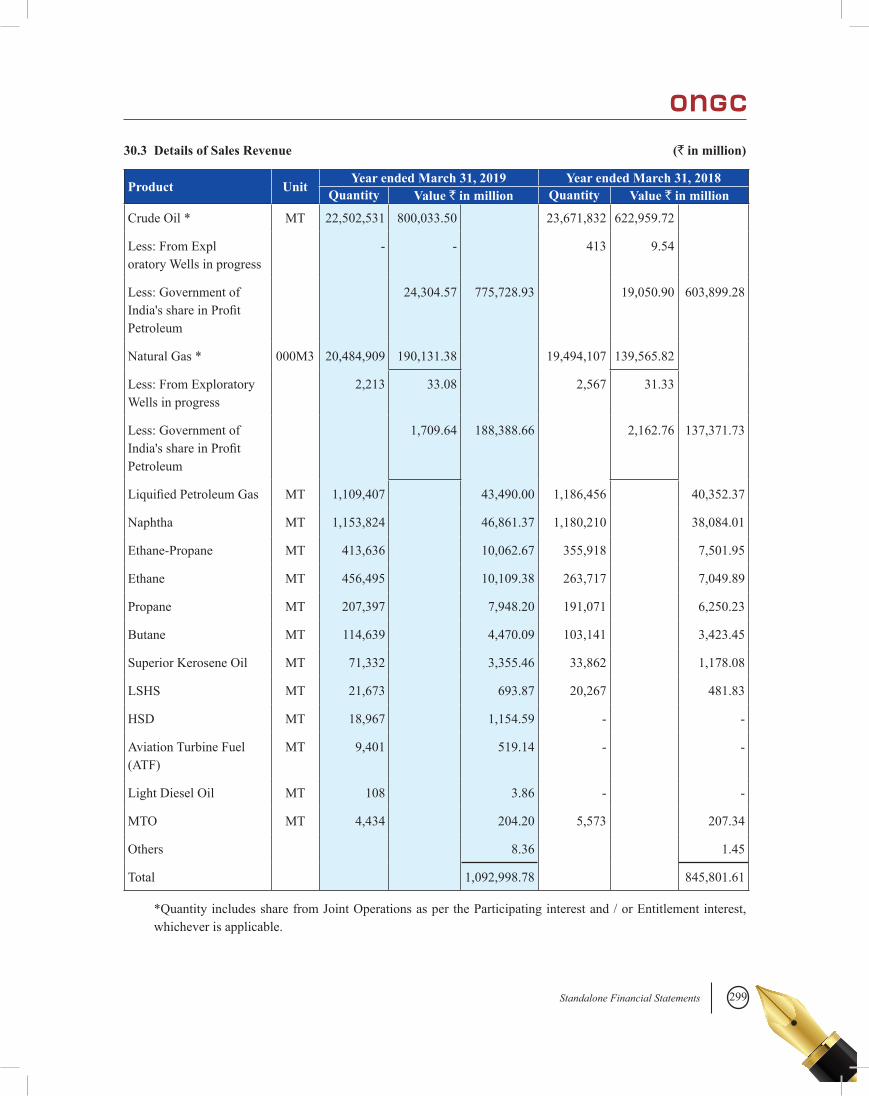
299Standalone Financial Statements
Product UnitYear ended March 31, 2019 Year ended March 31, 2018
Quantity Value ` in million Quantity Value ` in million
Crude Oil * MT 22,502,531 800,033.50 23,671,832 622,959.72
Less: From Expl oratory Wells in progress
- - 413 9.54
Less: Government of India'sshareinProfitPetroleum
24,304.57 775,728.93 19,050.90 603,899.28
Natural Gas * 000M3 20,484,909 190,131.38 19,494,107 139,565.82
Less: From Exploratory Wells in progress
2,213 33.08 2,567 31.33
Less: Government of India'sshareinProfitPetroleum
1,709.64 188,388.66 2,162.76 137,371.73
LiquifiedPetroleumGas MT 1,109,407 43,490.00 1,186,456 40,352.37
Naphtha MT 1,153,824 46,861.37 1,180,210 38,084.01
Ethane-Propane MT 413,636 10,062.67 355,918 7,501.95
Ethane MT 456,495 10,109.38 263,717 7,049.89
Propane MT 207,397 7,948.20 191,071 6,250.23
Butane MT 114,639 4,470.09 103,141 3,423.45
Superior Kerosene Oil MT 71,332 3,355.46 33,862 1,178.08
LSHS MT 21,673 693.87 20,267 481.83
HSD MT 18,967 1,154.59 - -
Aviation Turbine Fuel (ATF)
MT 9,401 519.14 - -
Light Diesel Oil MT 108 3.86 - -
MTO MT 4,434 204.20 5,573 207.34
Others 8.36 1.45
Total 1,092,998.78 845,801.61
30.3 Details of Sales Revenue (` in million)
*Quantity includes share from Joint Operations as per the Participating interest and / or Entitlement interest, whichever is applicable.
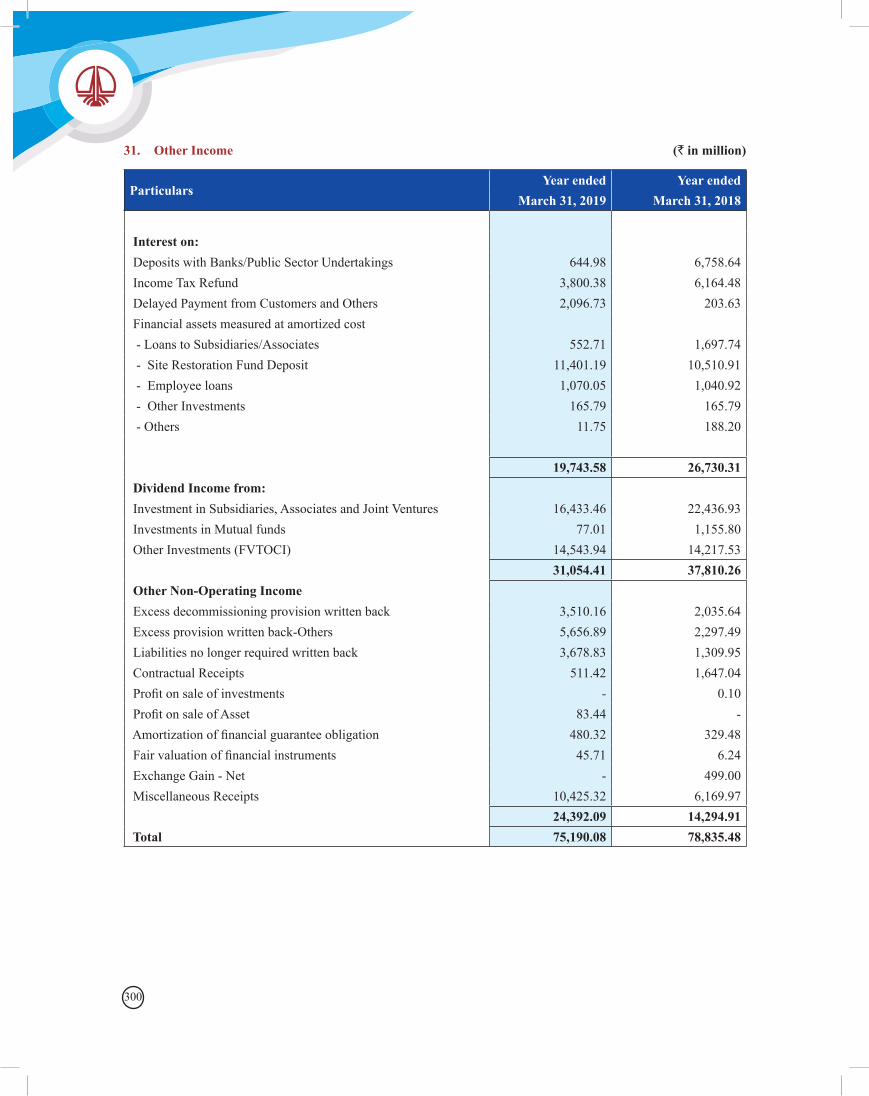
300
31. Other Income (` in million)
ParticularsYear ended Year ended
March 31, 2019 March 31, 2018
Interest on: Deposits with Banks/Public Sector Undertakings 644.98 6,758.64 Income Tax Refund 3,800.38 6,164.48 Delayed Payment from Customers and Others 2,096.73 203.63 Financial assets measured at amortized cost - Loans to Subsidiaries/Associates 552.71 1,697.74 - Site Restoration Fund Deposit 11,401.19 10,510.91 - Employee loans 1,070.05 1,040.92 - Other Investments 165.79 165.79 - Others 11.75 188.20
19,743.58 26,730.31 Dividend Income from: Investment in Subsidiaries, Associates and Joint Ventures 16,433.46 22,436.93 Investments in Mutual funds 77.01 1,155.80 Other Investments (FVTOCI) 14,543.94 14,217.53
31,054.41 37,810.26 Other Non-Operating Income Excess decommissioning provision written back 3,510.16 2,035.64 Excess provision written back-Others 5,656.89 2,297.49 Liabilities no longer required written back 3,678.83 1,309.95 Contractual Receipts 511.42 1,647.04Profitonsaleofinvestments - 0.10ProfitonsaleofAsset 83.44 - Amortizationoffinancialguaranteeobligation 480.32 329.48Fairvaluationoffinancialinstruments 45.71 6.24 Exchange Gain - Net - 499.00 Miscellaneous Receipts 10,425.32 6,169.97
24,392.09 14,294.91 Total 75,190.08 78,835.48
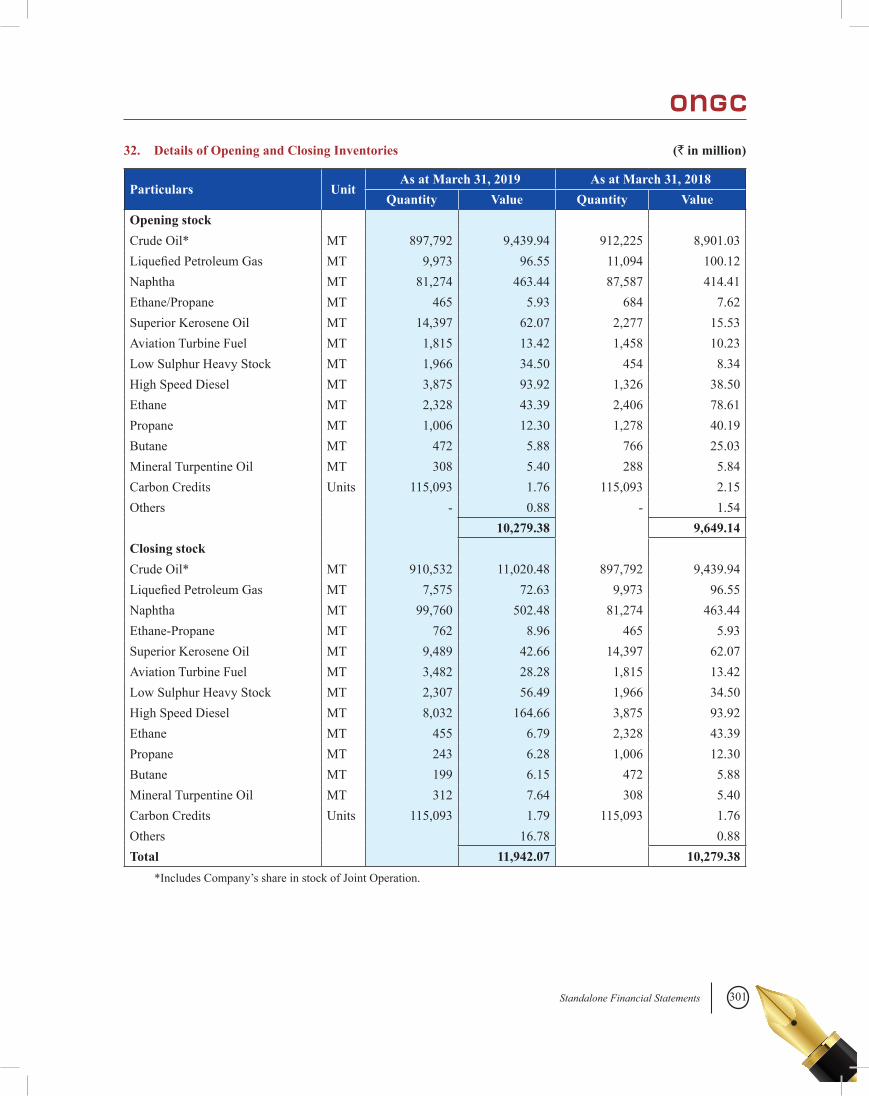
301Standalone Financial Statements
32. Details of Opening and Closing Inventories (` in million)
Particulars UnitAs at March 31, 2019 As at March 31, 2018
Quantity Value Quantity ValueOpening stockCrude Oil* MT 897,792 9,439.94 912,225 8,901.03LiquefiedPetroleumGas MT 9,973 96.55 11,094 100.12Naphtha MT 81,274 463.44 87,587 414.41Ethane/Propane MT 465 5.93 684 7.62Superior Kerosene Oil MT 14,397 62.07 2,277 15.53Aviation Turbine Fuel MT 1,815 13.42 1,458 10.23Low Sulphur Heavy Stock MT 1,966 34.50 454 8.34High Speed Diesel MT 3,875 93.92 1,326 38.50Ethane MT 2,328 43.39 2,406 78.61Propane MT 1,006 12.30 1,278 40.19Butane MT 472 5.88 766 25.03Mineral Turpentine Oil MT 308 5.40 288 5.84Carbon Credits Units 115,093 1.76 115,093 2.15Others - 0.88 - 1.54
10,279.38 9,649.14Closing stockCrude Oil* MT 910,532 11,020.48 897,792 9,439.94LiquefiedPetroleumGas MT 7,575 72.63 9,973 96.55Naphtha MT 99,760 502.48 81,274 463.44Ethane-Propane MT 762 8.96 465 5.93Superior Kerosene Oil MT 9,489 42.66 14,397 62.07Aviation Turbine Fuel MT 3,482 28.28 1,815 13.42Low Sulphur Heavy Stock MT 2,307 56.49 1,966 34.50High Speed Diesel MT 8,032 164.66 3,875 93.92Ethane MT 455 6.79 2,328 43.39Propane MT 243 6.28 1,006 12.30Butane MT 199 6.15 472 5.88Mineral Turpentine Oil MT 312 7.64 308 5.40Carbon Credits Units 115,093 1.79 115,093 1.76Others 16.78 0.88Total 11,942.07 10,279.38
*Includes Company’s share in stock of Joint Operation.
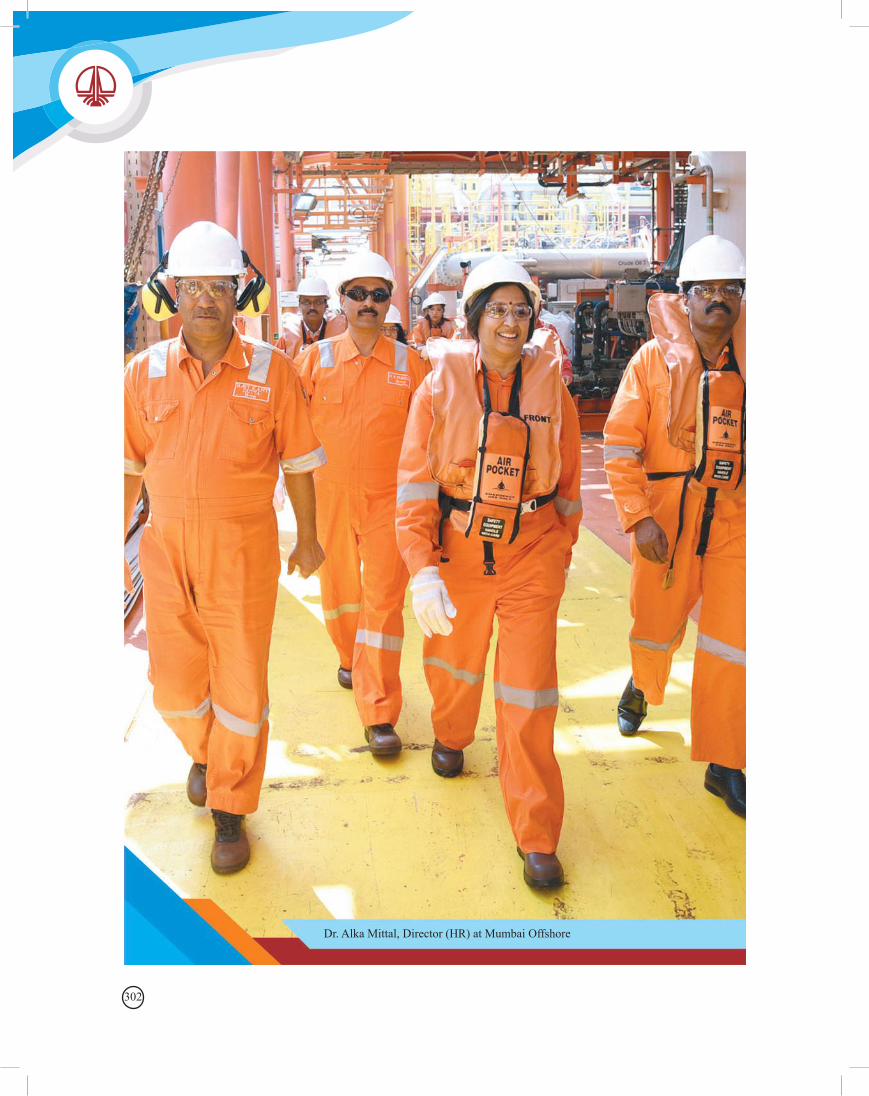
302
Dr. Alka Mittal, Director (HR) at Mumbai Offshore
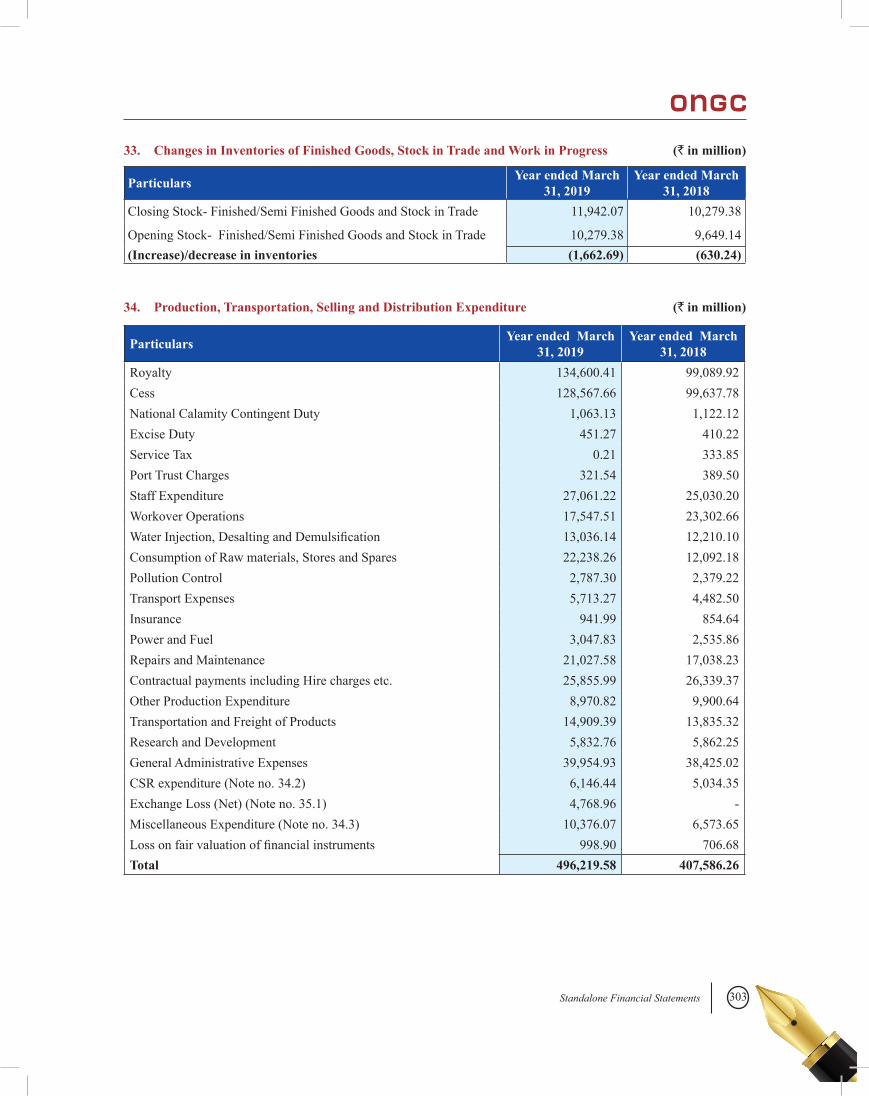
303Standalone Financial Statements
33. Changes in Inventories of Finished Goods, Stock in Trade and Work in Progress (` in million)
Particulars Year ended March 31, 2019
Year ended March 31, 2018
Closing Stock- Finished/Semi Finished Goods and Stock in Trade 11,942.07 10,279.38
Opening Stock- Finished/Semi Finished Goods and Stock in Trade 10,279.38 9,649.14(Increase)/decrease in inventories (1,662.69) (630.24)
34. Production, Transportation, Selling and Distribution Expenditure (` in million)
Particulars Year ended March 31, 2019
Year ended March 31, 2018
Royalty 134,600.41 99,089.92Cess 128,567.66 99,637.78National Calamity Contingent Duty 1,063.13 1,122.12Excise Duty 451.27 410.22Service Tax 0.21 333.85Port Trust Charges 321.54 389.50Staff Expenditure 27,061.22 25,030.20Workover Operations 17,547.51 23,302.66WaterInjection,DesaltingandDemulsification 13,036.14 12,210.10Consumption of Raw materials, Stores and Spares 22,238.26 12,092.18Pollution Control 2,787.30 2,379.22Transport Expenses 5,713.27 4,482.50Insurance 941.99 854.64Power and Fuel 3,047.83 2,535.86Repairs and Maintenance 21,027.58 17,038.23Contractual payments including Hire charges etc. 25,855.99 26,339.37Other Production Expenditure 8,970.82 9,900.64Transportation and Freight of Products 14,909.39 13,835.32Research and Development 5,832.76 5,862.25General Administrative Expenses 39,954.93 38,425.02CSR expenditure (Note no. 34.2) 6,146.44 5,034.35Exchange Loss (Net) (Note no. 35.1) 4,768.96 - Miscellaneous Expenditure (Note no. 34.3) 10,376.07 6,573.65Lossonfairvaluationoffinancialinstruments 998.90 706.68Total 496,219.58 407,586.26
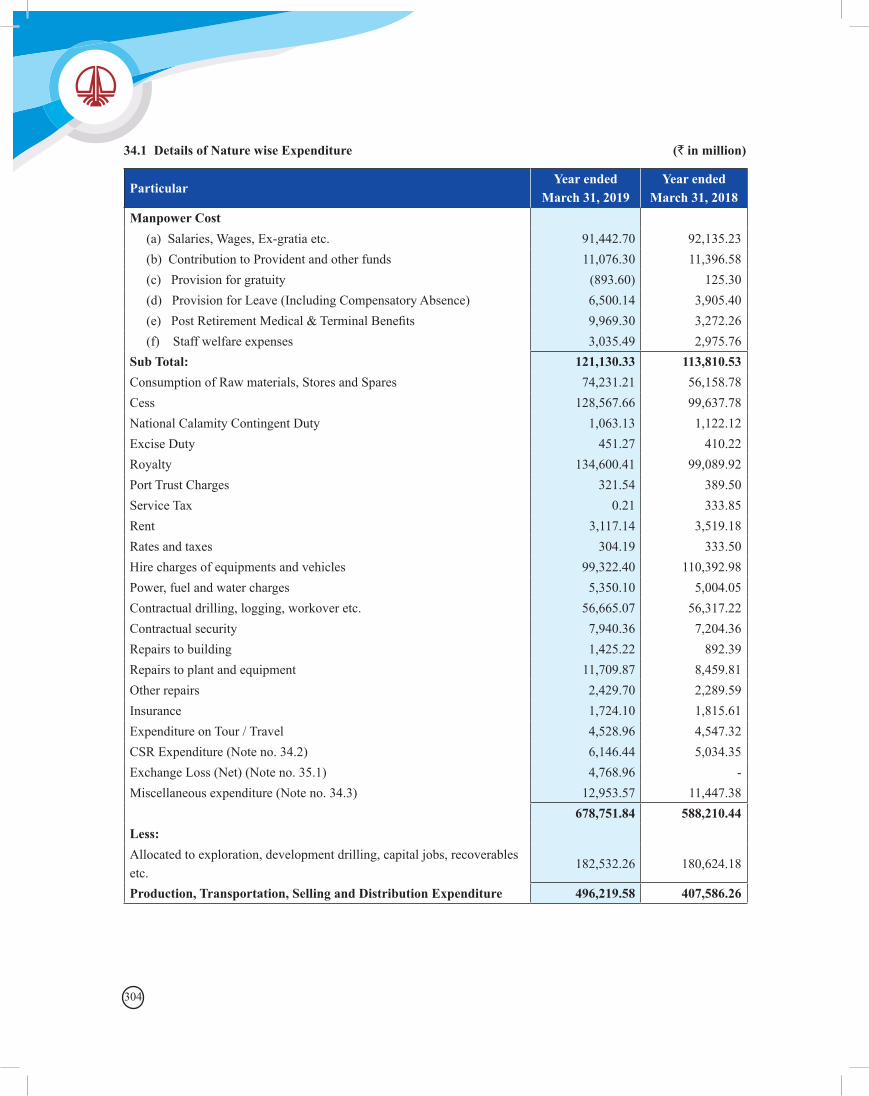
304
34.1 Details of Nature wise Expenditure (` in million)
ParticularYear ended
March 31, 2019Year ended
March 31, 2018Manpower Cost (a) Salaries, Wages, Ex-gratia etc. 91,442.70 92,135.23 (b) Contribution to Provident and other funds 11,076.30 11,396.58 (c) Provision for gratuity (893.60) 125.30 (d) Provision for Leave (Including Compensatory Absence) 6,500.14 3,905.40(e)PostRetirementMedical&TerminalBenefits 9,969.30 3,272.26 (f) Staff welfare expenses 3,035.49 2,975.76Sub Total: 121,130.33 113,810.53Consumption of Raw materials, Stores and Spares 74,231.21 56,158.78Cess 128,567.66 99,637.78National Calamity Contingent Duty 1,063.13 1,122.12Excise Duty 451.27 410.22Royalty 134,600.41 99,089.92Port Trust Charges 321.54 389.50Service Tax 0.21 333.85Rent 3,117.14 3,519.18Rates and taxes 304.19 333.50Hire charges of equipments and vehicles 99,322.40 110,392.98Power, fuel and water charges 5,350.10 5,004.05Contractual drilling, logging, workover etc. 56,665.07 56,317.22Contractual security 7,940.36 7,204.36Repairs to building 1,425.22 892.39Repairs to plant and equipment 11,709.87 8,459.81Other repairs 2,429.70 2,289.59Insurance 1,724.10 1,815.61Expenditure on Tour / Travel 4,528.96 4,547.32CSR Expenditure (Note no. 34.2) 6,146.44 5,034.35Exchange Loss (Net) (Note no. 35.1) 4,768.96 - Miscellaneous expenditure (Note no. 34.3) 12,953.57 11,447.38
678,751.84 588,210.44Less:Allocated to exploration, development drilling, capital jobs, recoverables etc.
182,532.26 180,624.18
Production, Transportation, Selling and Distribution Expenditure 496,219.58 407,586.26
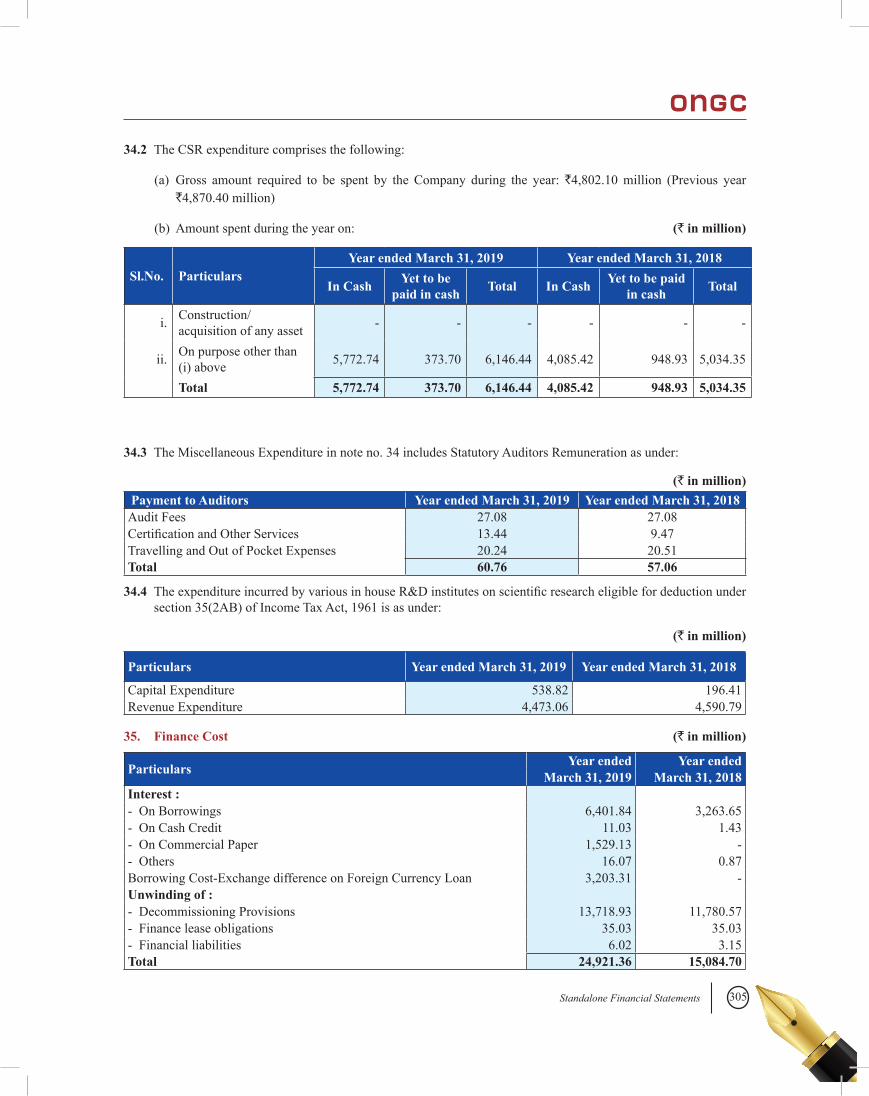
305Standalone Financial Statements
34.2 The CSR expenditure comprises the following:
(a) Gross amount required to be spent by the Company during the year: `4,802.10 million (Previous year `4,870.40 million)
(b) Amount spent during the year on: (` in million)
Sl.No. ParticularsYear ended March 31, 2019 Year ended March 31, 2018
In Cash Yet to be paid in cash Total In Cash Yet to be paid
in cash Total
i. Construction/acquisition of any asset - - - - - -
ii. On purpose other than (i) above 5,772.74 373.70 6,146.44 4,085.42 948.93 5,034.35
Total 5,772.74 373.70 6,146.44 4,085.42 948.93 5,034.35
34.3 The Miscellaneous Expenditure in note no. 34 includes Statutory Auditors Remuneration as under:
(` in million) Payment to Auditors Year ended March 31, 2019 Year ended March 31, 2018Audit Fees 27.08 27.08CertificationandOtherServices 13.44 9.47Travelling and Out of Pocket Expenses 20.24 20.51Total 60.76 57.06
34.4 TheexpenditureincurredbyvariousinhouseR&Dinstitutesonscientificresearcheligiblefordeductionundersection 35(2AB) of Income Tax Act, 1961 is as under:
(` in million)
Particulars Year ended March 31, 2019 Year ended March 31, 2018
Capital Expenditure 538.82 196.41Revenue Expenditure 4,473.06 4,590.79
35. Finance Cost (` in million)
Particulars Year ended Year ended March 31, 2019 March 31, 2018
Interest :- On Borrowings 6,401.84 3,263.65- On Cash Credit 11.03 1.43- On Commercial Paper 1,529.13 - - Others 16.07 0.87Borrowing Cost-Exchange difference on Foreign Currency Loan 3,203.31 - Unwinding of :- Decommissioning Provisions 13,718.93 11,780.57- Finance lease obligations 35.03 35.03- Financial liabilities 6.02 3.15Total 24,921.36 15,084.70
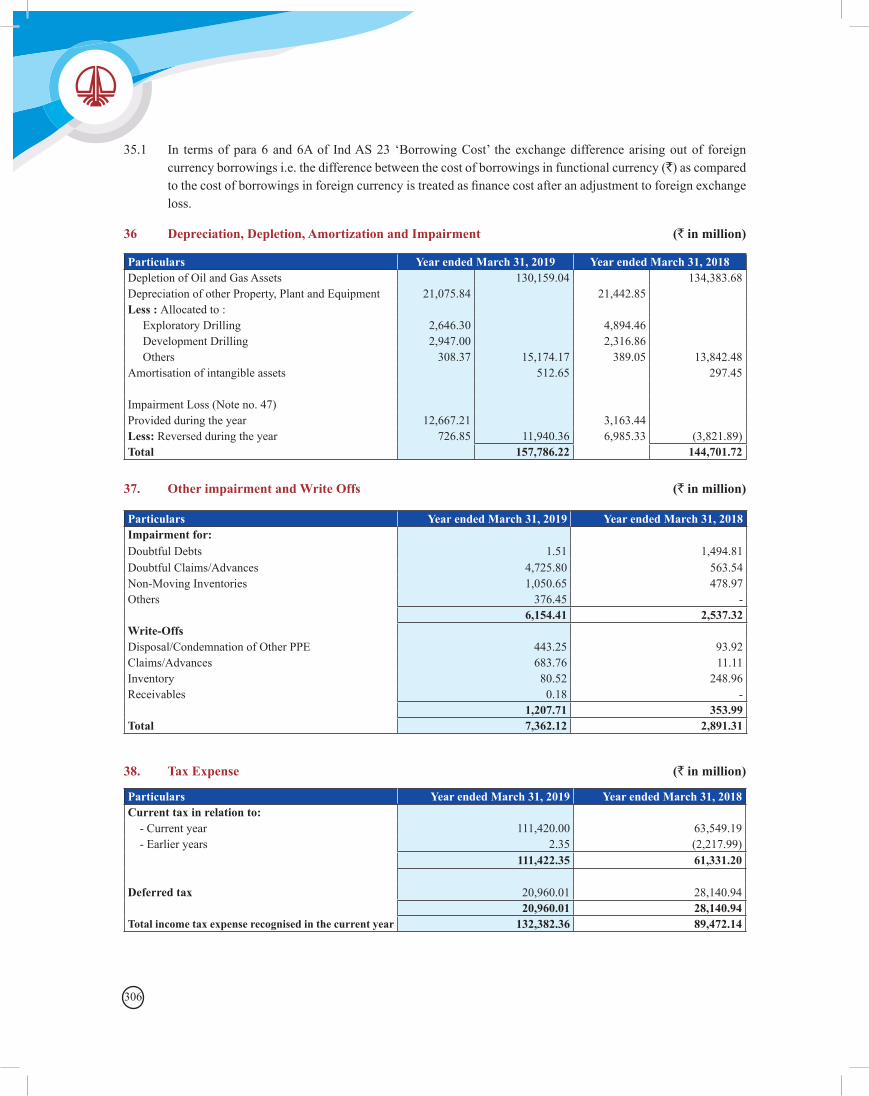
306
35.1 In terms of para 6 and 6A of Ind AS 23 ‘Borrowing Cost’ the exchange difference arising out of foreign currency borrowings i.e. the difference between the cost of borrowings in functional currency (`) as compared tothecostofborrowingsinforeigncurrencyistreatedasfinancecostafteranadjustmenttoforeignexchangeloss.
36 Depreciation, Depletion, Amortization and Impairment (` in million)
Particulars Year ended March 31, 2019 Year ended March 31, 2018Depletion of Oil and Gas Assets 130,159.04 134,383.68Depreciation of other Property, Plant and Equipment 21,075.84 21,442.85Less : Allocated to : Exploratory Drilling 2,646.30 4,894.46 Development Drilling 2,947.00 2,316.86 Others 308.37 15,174.17 389.05 13,842.48Amortisation of intangible assets 512.65 297.45
Impairment Loss (Note no. 47)Provided during the year 12,667.21 3,163.44Less: Reversed during the year 726.85 11,940.36 6,985.33 (3,821.89)Total 157,786.22 144,701.72
37. Other impairment and Write Offs (` in million)
Particulars Year ended March 31, 2019 Year ended March 31, 2018Impairment for: Doubtful Debts 1.51 1,494.81Doubtful Claims/Advances 4,725.80 563.54Non-Moving Inventories 1,050.65 478.97Others 376.45 -
6,154.41 2,537.32Write-OffsDisposal/Condemnation of Other PPE 443.25 93.92Claims/Advances 683.76 11.11Inventory 80.52 248.96Receivables 0.18 -
1,207.71 353.99Total 7,362.12 2,891.31
38. Tax Expense (` in million)
Particulars Year ended March 31, 2019 Year ended March 31, 2018Current tax in relation to: - Current year 111,420.00 63,549.19 - Earlier years 2.35 (2,217.99)
111,422.35 61,331.20
Deferred tax 20,960.01 28,140.9420,960.01 28,140.94
Total income tax expense recognised in the current year 132,382.36 89,472.14
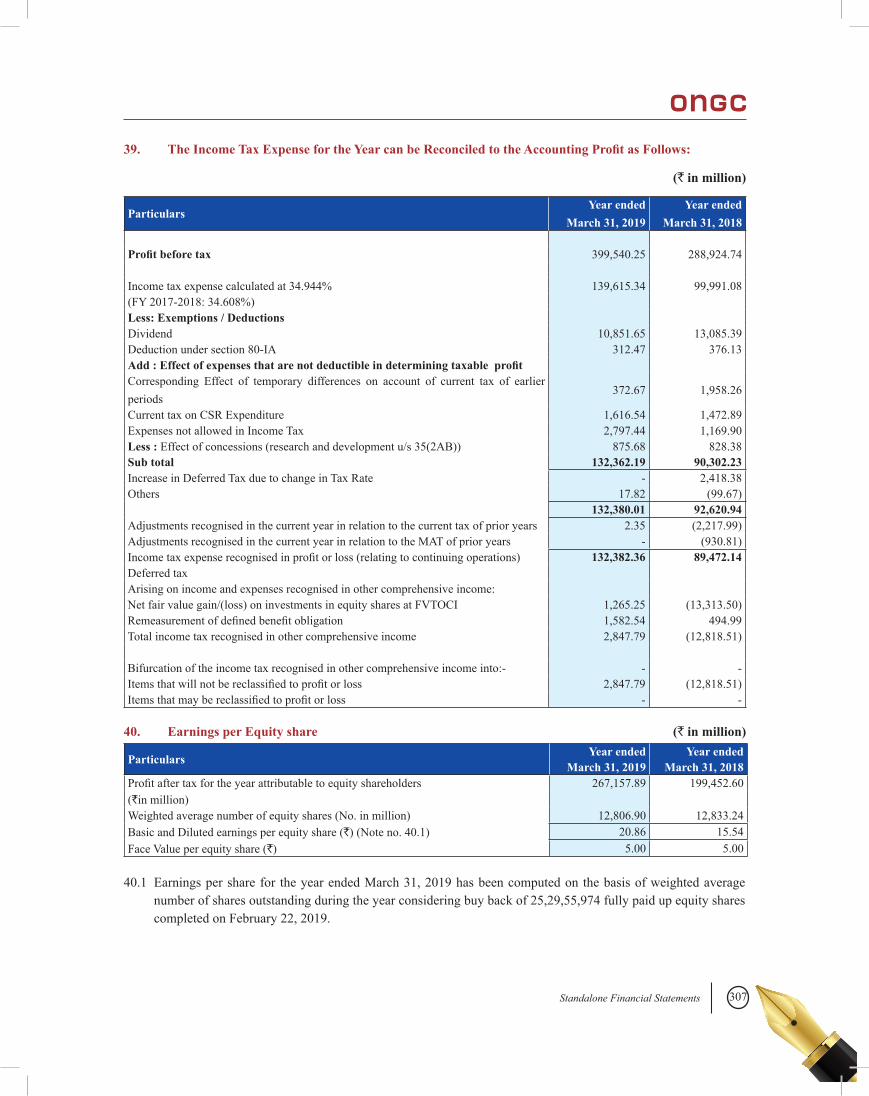
307Standalone Financial Statements
39. The Income Tax Expense for the Year can be Reconciled to the Accounting Profit as Follows:
(` in million)
ParticularsYear ended
March 31, 2019Year ended
March 31, 2018
Profit before tax 399,540.25 288,924.74
Income tax expense calculated at 34.944% 139,615.34 99,991.08(FY 2017-2018: 34.608%)Less: Exemptions / DeductionsDividend 10,851.65 13,085.39Deduction under section 80-IA 312.47 376.13Add : Effect of expenses that are not deductible in determining taxable profitCorresponding Effect of temporary differences on account of current tax of earlier periods
372.67 1,958.26
Current tax on CSR Expenditure 1,616.54 1,472.89Expenses not allowed in Income Tax 2,797.44 1,169.90Less : Effect of concessions (research and development u/s 35(2AB)) 875.68 828.38Sub total 132,362.19 90,302.23Increase in Deferred Tax due to change in Tax Rate - 2,418.38Others 17.82 (99.67)
132,380.01 92,620.94Adjustments recognised in the current year in relation to the current tax of prior years 2.35 (2,217.99)Adjustments recognised in the current year in relation to the MAT of prior years - (930.81)Incometaxexpenserecognisedinprofitorloss(relatingtocontinuingoperations) 132,382.36 89,472.14Deferred taxArising on income and expenses recognised in other comprehensive income:Net fair value gain/(loss) on investments in equity shares at FVTOCI 1,265.25 (13,313.50)Remeasurementofdefinedbenefitobligation 1,582.54 494.99Total income tax recognised in other comprehensive income 2,847.79 (12,818.51)
Bifurcation of the income tax recognised in other comprehensive income into:- - -Itemsthatwillnotbereclassifiedtoprofitorloss 2,847.79 (12,818.51)Itemsthatmaybereclassifiedtoprofitorloss - -
40. Earnings per Equity share (` in million)
Particulars Year ended Year ended March 31, 2019 March 31, 2018
Profitaftertaxfortheyearattributabletoequityshareholders 267,157.89 199,452.60(`in million)Weighted average number of equity shares (No. in million) 12,806.90 12,833.24Basic and Diluted earnings per equity share (`) (Note no. 40.1) 20.86 15.54Face Value per equity share (`) 5.00 5.00
40.1 Earnings per share for the year ended March 31, 2019 has been computed on the basis of weighted average number of shares outstanding during the year considering buy back of 25,29,55,974 fully paid up equity shares completed on February 22, 2019.
308
41. Leases
41.1 Finance Leases
41.1.1 Leasing Arrangements
Leaseholdlandwhereleasetermistillperpetuityhasbeenclassifiedunderfinancelease.
Obligations under Finance Lease (` in million)
ParticularsMinimum lease payments
Present value of minimum lease payments
As at March As at March As at March As at March31, 2019 31, 2018 31, 2019 31, 2018
Not later than one year 35.03 35.03 32.32 32.32Laterthanoneyearandnotlaterthanfiveyears 140.12 140.12 115.03 115.03Laterthanfiveyears* 417.96 417.96 417.96 417.96
Present value of minimum lease payments* 417.96 417.96 417.96 417.96
* Under the lease agreement, the Company is required to pay annual lease rental of ̀ 35.03 million till perpetuity. Thefinance leaseobligation represents theperpetuityvalueof annualized leasepayment,which is`417.96 million andwill remain same till perpetuity.Thefinance chargewill be`35.03 million on annual basis till perpetuity.
41.2 Operating leases
41.2.1 Leasing arrangements
The Company has applied Appendix C to Ind AS 17 ‘Leases’ to hiring / service contracts of rigs, vessels, helicopters, etc. to evaluate whether these contracts contains a lease or not. Based on evaluation of the terms and conditions of the arrangements, the Company has evaluated such arrangements to be operating leases.
Operating leases relate to leases of rigs, vessels, helicopters etc. with lease terms upto 10 years. The Company does not have an option to purchase the leased rigs, vessels, helicopters etc. at the expiry of the lease periods.
41.2.2 Payments recognized during the year (` in million)
Particulars Year ended Year ended March 31, 2019 March 31, 2018
Lease payments 100,419.16 113,513.94100,419.16 113,513.94
309Standalone Financial Statements
41.2.3 Non-Cancellable Operating Lease Commitments (` in million)
Particulars Year ended Year ended March 31, 2019 March 31, 2018
Not later than one year 71,723.89 86,000.99Laterthanoneyearandnotlaterthanfiveyears 53,250.97 96,332.85Laterthanfiveyears 128.76 5,202.91
125,103.62 187,536.75
42. Employee benefit plans
42.1 Defined Contribution plans:
42.1.1 Provident Fund
TheCompanypaysfixedcontributiontoprovidentfundatpredeterminedratestoaseparatetrust,whichinveststhe funds inpermitted securities.Theobligationof theCompany is tomake suchfixedcontributionand toensureaminimumrateofreturntothemembersasspecifiedbyGoI.Asperreportoftheactuary,overallinterestearnings and cumulative surplus is more than the statutory interest payment requirement. Hence, no further provision is considered necessary. The details of fair value of plan assets and obligations are as under:
(` in million)
Particulars Year ended Year ended March 31, 2019 March 31, 2018
Obligations at the end of the year 127,093.45 120,412.14Fair Value of Plan Assets at the end of the year 127,675.14 121,139.39
Provident Fund is governed through a separate trust. The board of trustees of the Trust functions in accordance with any applicable guidelines or directions that may be issued in this behalf from time to time by the Central Government or the Central Provident Fund Commissioner. The board of trustees have the following responsibilities:
(i) InvestmentsofthesurplusasperthepatternnotifiedbytheGovernmentinthisregardsoastomeettherequirements of the fund from time to time.
(ii) Raising of moneys as may be required for the purposes of the fund by sale, hypothecation or pledge of the investment wholly or partially.
(iii) Fixation of rate of interest to be credited to members’ accounts.
42.1.2 Post Retirement Benefit Scheme
ThedefinedcontributionpensionschemeoftheCompanyforitsemployeesisadministeredthroughaseparatetrust. The obligation of the Company is to contribute to the trust to the extent of amount not exceeding 30% of basic pay and dearness allowance as reduced by the employer’s contribution towards provident fund, gratuity, Post-RetirementMedicalBenefit(PRMB)oranyotherretirementbenefits.
The board of trustees of the Trust functions in accordance with any applicable guidelines or directions that may be issued in this behalf from time to time by the Central Government. The board of trustees have the following responsibilities:
310
(i) InvestmentsofthesurplusasperthepatternnotifiedbytheGovernmentinthisregardsoastomeettherequirements of the fund from time to time.
(ii) Fixation of rate of contribution and interest thereon.
(iii) Purchase of annuities for the members.
42.2 Employee Pension Scheme 1995
The Employee Pension Scheme -1995 is administered by Employees Provident Fund Organization of India, wherein the Company has to contribute 8.33% of salary (subject to maximum of `15,000 per month) out of the employer’s contribution to Provident Fund.
42.3 Composite Social Security Scheme (CSSS)
The Composite Social Security Scheme is formulated by the Company for the welfare of its regular employees and it is administered through a separate Trust, named as Composite Social Security Scheme Trust. The obligation of the Company is to provide matching contribution to the Trust to the extent of contribution of the regular employees of the Company. The Trust provides an assured lump sum support amount in the event of death or permanent total disablement of an employee while in service. In case of Separation other than Death/Permanent total disability, employees own contribution along with interest is refunded.
The Board of trustees of the Trust functions in accordance with Trust deed, Rule, Scheme and applicable guidelines or directions that may be issued by Management from time to time.
The Board of trustees has the following responsibilities:
(i) InvestmentsofthesurplusasperthepatternnotifiedbytheGovernmentinthisregardsoastomeettherequirements of the fund from time to time.
(ii) Fixation of rate of interest to be credited to member’s accounts.
(iii)ToprovidecashbenefitstothenomineesintheeventofdeathofanemployeeorPermanentTotalDisablementleading to the cessation from service and refund of own contribution along with interest in case of separation other than death.
42.4 Theamountsrecognizedinthefinancialstatementsbeforeallocationforthedefinedcontributionplansareasunder:
(` in million)
Defined Contribution Plans Amount recognized during Contribution for key management personnel
2018-19 2017-18 2018-19 2017-18Provident Fund 4,301.00 4,436.38 2.47 1.75PostRetirementBenefitScheme 5,842.16 5,981.42 3.23 2.21Employee Pension Scheme-1995 (EPS) 355.27 379.69 0.08 0.02Composite Social Security Scheme (CSSS) 577.87 599.09 0.20 0.13
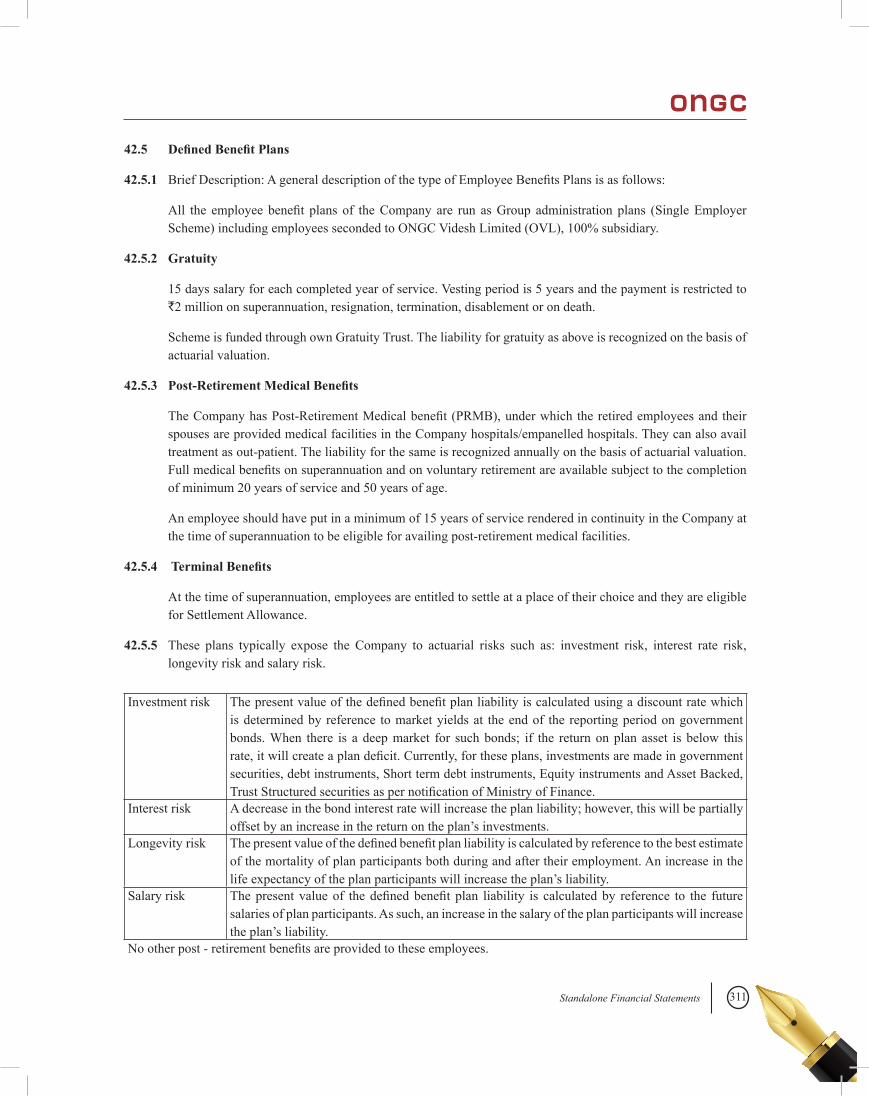
311Standalone Financial Statements
42.5 Defined Benefit Plans
42.5.1 BriefDescription:AgeneraldescriptionofthetypeofEmployeeBenefitsPlansisasfollows:
All the employee benefit plans of theCompany are run asGroup administrationplans (SingleEmployerScheme) including employees seconded to ONGC Videsh Limited (OVL), 100% subsidiary.
42.5.2 Gratuity
15 days salary for each completed year of service. Vesting period is 5 years and the payment is restricted to `2 million on superannuation, resignation, termination, disablement or on death.
Scheme is funded through own Gratuity Trust. The liability for gratuity as above is recognized on the basis of actuarial valuation.
42.5.3 Post-Retirement Medical Benefits
TheCompanyhasPost-RetirementMedicalbenefit(PRMB),underwhichtheretiredemployeesandtheirspouses are provided medical facilities in the Company hospitals/empanelled hospitals. They can also avail treatment as out-patient. The liability for the same is recognized annually on the basis of actuarial valuation. Fullmedicalbenefitsonsuperannuationandonvoluntaryretirementareavailablesubjecttothecompletionof minimum 20 years of service and 50 years of age.
An employee should have put in a minimum of 15 years of service rendered in continuity in the Company at the time of superannuation to be eligible for availing post-retirement medical facilities.
42.5.4 Terminal Benefits
At the time of superannuation, employees are entitled to settle at a place of their choice and they are eligible for Settlement Allowance.
42.5.5 These plans typically expose the Company to actuarial risks such as: investment risk, interest rate risk, longevity risk and salary risk.
Investment risk Thepresentvalueofthedefinedbenefitplanliabilityiscalculatedusingadiscountratewhichis determined by reference to market yields at the end of the reporting period on government bonds. When there is a deep market for such bonds; if the return on plan asset is below this rate,itwillcreateaplandeficit.Currently,fortheseplans,investmentsaremadeingovernmentsecurities, debt instruments, Short term debt instruments, Equity instruments and Asset Backed, TrustStructuredsecuritiesaspernotificationofMinistryofFinance.
Interest risk A decrease in the bond interest rate will increase the plan liability; however, this will be partially offset by an increase in the return on the plan’s investments.
Longevity risk Thepresentvalueofthedefinedbenefitplanliabilityiscalculatedbyreferencetothebestestimateof the mortality of plan participants both during and after their employment. An increase in the life expectancy of the plan participants will increase the plan’s liability.
Salary risk Thepresent valueof thedefinedbenefitplan liability is calculatedby reference to the futuresalaries of plan participants. As such, an increase in the salary of the plan participants will increase the plan’s liability.
Nootherpost-retirementbenefitsareprovidedtotheseemployees.
312
In respect of the above plans, the most recent actuarial valuation of the plan assets and the present value of thedefinedbenefitobligationwerecarriedoutasatMarch31,2019byamemberfirmof theInstituteofActuariesofIndia.Thepresentvalueofthedefinedbenefitobligation,andtherelatedcurrentservicecostandpast service cost, were measured using the projected unit credit method.
42.6 Other Long Term Employee Henefits
42.6.1 Brief Description: AgeneraldescriptionofthetypeofOtherlongtermemployeebenefitsisasfollows:
All the employee benefit plans of theCompany are run asGroup administrationplans (SingleEmployerScheme) including employees seconded to ONGC Videsh Limited (OVL), 100% subsidiary.
42.6.2 Earned Leave (EL) Benefit
Accrual–30daysperyear
Encashmentwhileinservice–75%ofEarnedLeavebalancesubjecttoamaximumof90dayspercalendaryear
Encashmentonretirement–maximum300days
Scheme is funded through Life Insurance Corporation of India (LIC).
42.6.3 Good Health Reward (Half pay leave)
Accrual - 20 days per year
Encashment while in service - Nil
Encashment on retirement - 50% of Half Pay Leave balance.
Scheme is funded through Life Insurance Corporation of India (LIC).
The liability for the same is recognized annually on the basis of actuarial valuation.
42.6.4 The principal assumptions used for the purposes of the actuarial valuations were as follows.
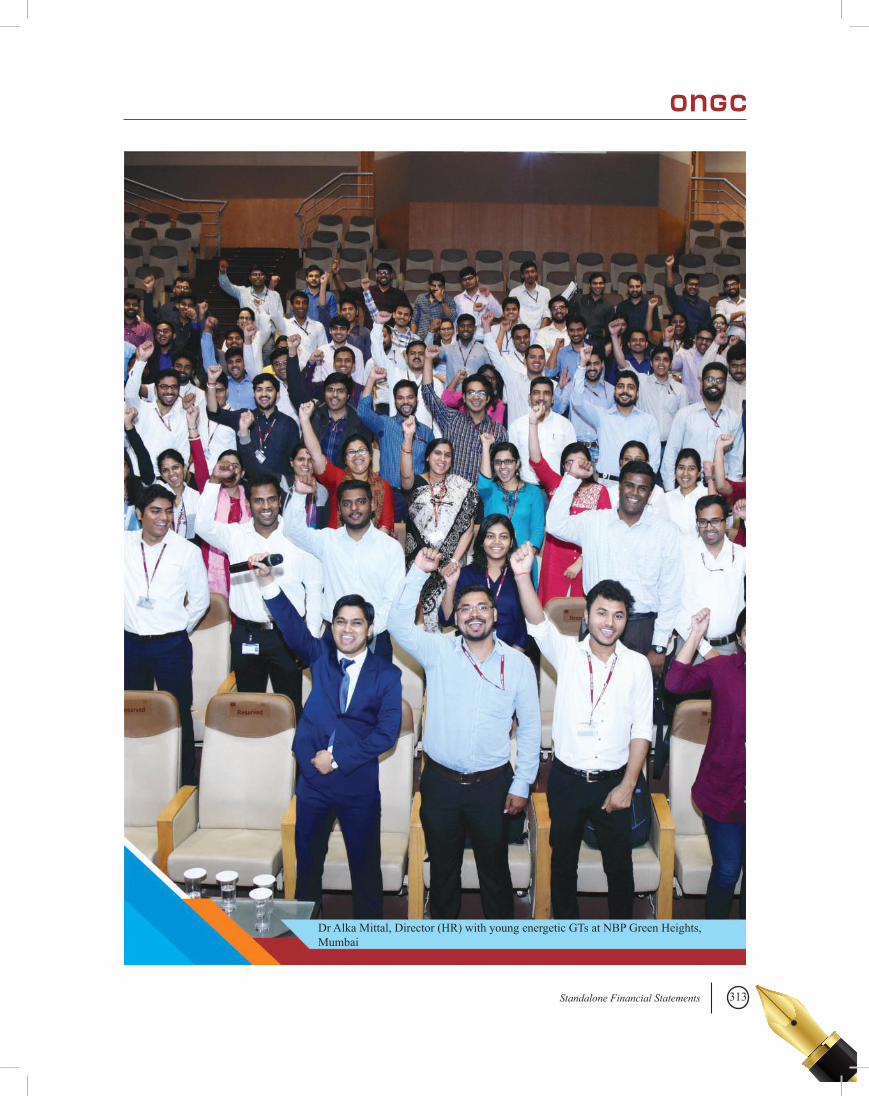
313Standalone Financial Statements
Dr Alka Mittal, Director (HR) with young energetic GTs at NBP Green Heights,Mumbai
314
S. No. Particulars As at March 31, 2019 As at March 31, 2018Gratuity
I. Discount rate (%) 7.77 7.66II. Expected return on plan assets (%) 7.77 7.66III. Annual increase in salary (%) 7.50 6.50
Leave IV. Discount rate (%) 7.77 7.66V. Expected return on plan assets(%) 7.77 7.66VI. Annual increase in salary(%) 7.50 6.50
Post-Retirement Medical BenefitsVII. Discount rate (%) 7.77 7.66VIII. Expected return on plan assets(%) NA NAIX. Annual increase in costs(%) 7.50 6.50
Terminal BenefitsX. Discount rate(%) 7.77 7.66XI. Expected return on plan assets(%) NA NAXII. Annual increase in costs(%) 7.50 6.50XIII. Annual increase in salary(%) 7.50 6.50
Employee Turnover (%)XIV. Up to 30 Years 3.00 3.00XV. From 31 to 44 years 2.00 2.00XVI. Above 44 years 1.00 1.00XVII. WeightedAverageDurationofPresentBenefitObligations 12.31 11.82
Mortality RateXVIII. Before retirement As per Indian Assured Lives Mortality Table (2006-08)XIX. After retirement As per Indian Assured Lives Mortality Table (2006-08)
The discount rate is based upon the market yield available on Government bonds at the Accounting date with a termthatmatches.Thesalarygrowthtakesaccountinflation,seniority,promotionandotherrelevantfactorsonlong term basis. Expected rate of return on plan assets is based on market expectation, at the beginning of the year, for return over the entire life of the related obligation.
42.7 AmountsrecognizedintheFinancialStatementsbeforeallocationinrespectofthesedefinedbenefitplansandotherlongtermemployeebenefitsareasfollows:
Gratuity : (` in million)
Particulars Year ended
March 31, 2019 Year ended
March 31, 2018 Service Cost : Current service cost 999.54 1,072.53 Past service cost and (gain)/loss from settlements - - Net interest expense 15.35 626.10 Increase or decrease due to adjustment in opening corpus consequent to audit 68.94 2.09 Additional Contribution Due to Pay Revision - (221.96)Components of defined benefit costs recognised in Employee Benefit expenses 1,083.83 1,478.76 Remeasurement on the net defined benefit liability: Actuarial (gains) / losses arising from changes in demographic assumptions - - Actuarial(gains)/lossesarisingfromchangesinfinancialassumptions 185.38 (478.05)Actuarial (gains) / losses arising from experience adjustments (753.27) (634.79)Return on Plan Assets excluding amount included in net interest cost (1,438.22) (232.40)Components of Remeasurement (2,006.11) (1,345.24)Total (922.28) 133.52
42.6.4 The principal assumptions used for the purposes of the actuarial valuations were as follows.
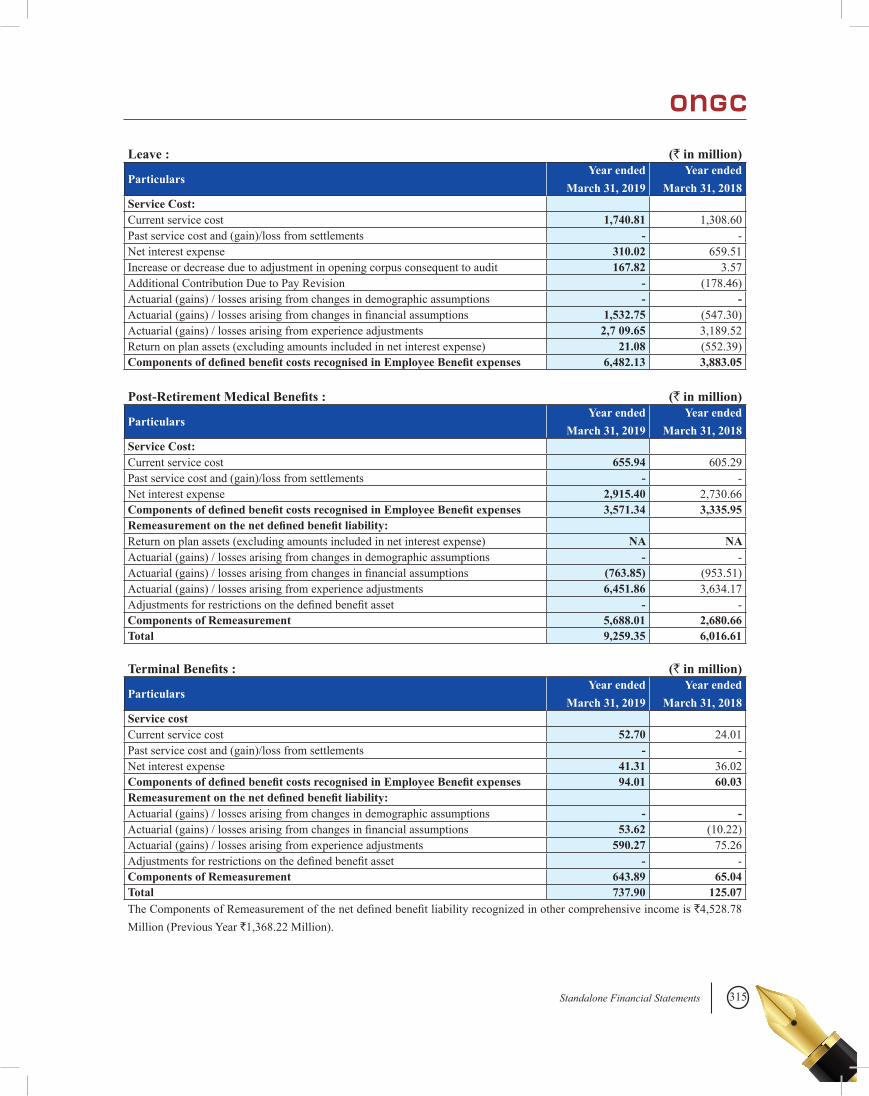
315Standalone Financial Statements
Leave : (` in million)
Particulars Year ended
March 31, 2019 Year ended
March 31, 2018 Service Cost: Current service cost 1,740.81 1,308.60Past service cost and (gain)/loss from settlements - -Net interest expense 310.02 659.51Increase or decrease due to adjustment in opening corpus consequent to audit 167.82 3.57Additional Contribution Due to Pay Revision - (178.46)Actuarial (gains) / losses arising from changes in demographic assumptions - -Actuarial(gains)/lossesarisingfromchangesinfinancialassumptions 1,532.75 (547.30)Actuarial (gains) / losses arising from experience adjustments 2,7 09.65 3,189.52Return on plan assets (excluding amounts included in net interest expense) 21.08 (552.39)Components of defined benefit costs recognised in Employee Benefit expenses 6,482.13 3,883.05
Post-Retirement Medical Benefits : (` in million)
Particulars Year ended
March 31, 2019 Year ended
March 31, 2018 Service Cost: Current service cost 655.94 605.29 Past service cost and (gain)/loss from settlements - - Net interest expense 2,915.40 2,730.66 Components of defined benefit costs recognised in Employee Benefit expenses 3,571.34 3,335.95 Remeasurement on the net defined benefit liability: Return on plan assets (excluding amounts included in net interest expense) NA NA Actuarial (gains) / losses arising from changes in demographic assumptions - - Actuarial(gains)/lossesarisingfromchangesinfinancialassumptions (763.85) (953.51)Actuarial (gains) / losses arising from experience adjustments 6,451.86 3,634.17 Adjustmentsforrestrictionsonthedefinedbenefitasset - - Components of Remeasurement 5,688.01 2,680.66 Total 9,259.35 6,016.61
Terminal Benefits : (` in million)
Particulars Year ended
March 31, 2019 Year ended
March 31, 2018 Service cost Current service cost 52.70 24.01 Past service cost and (gain)/loss from settlements - - Net interest expense 41.31 36.02 Components of defined benefit costs recognised in Employee Benefit expenses 94.01 60.03 Remeasurement on the net defined benefit liability: Actuarial (gains) / losses arising from changes in demographic assumptions - - Actuarial(gains)/lossesarisingfromchangesinfinancialassumptions 53.62 (10.22)Actuarial (gains) / losses arising from experience adjustments 590.27 75.26 Adjustmentsforrestrictionsonthedefinedbenefitasset - - Components of Remeasurement 643.89 65.04 Total 737.90 125.07 TheComponentsofRemeasurementofthenetdefinedbenefitliabilityrecognizedinothercomprehensiveincomeis`4,528.78 Million (Previous Year `1,368.22 Million).
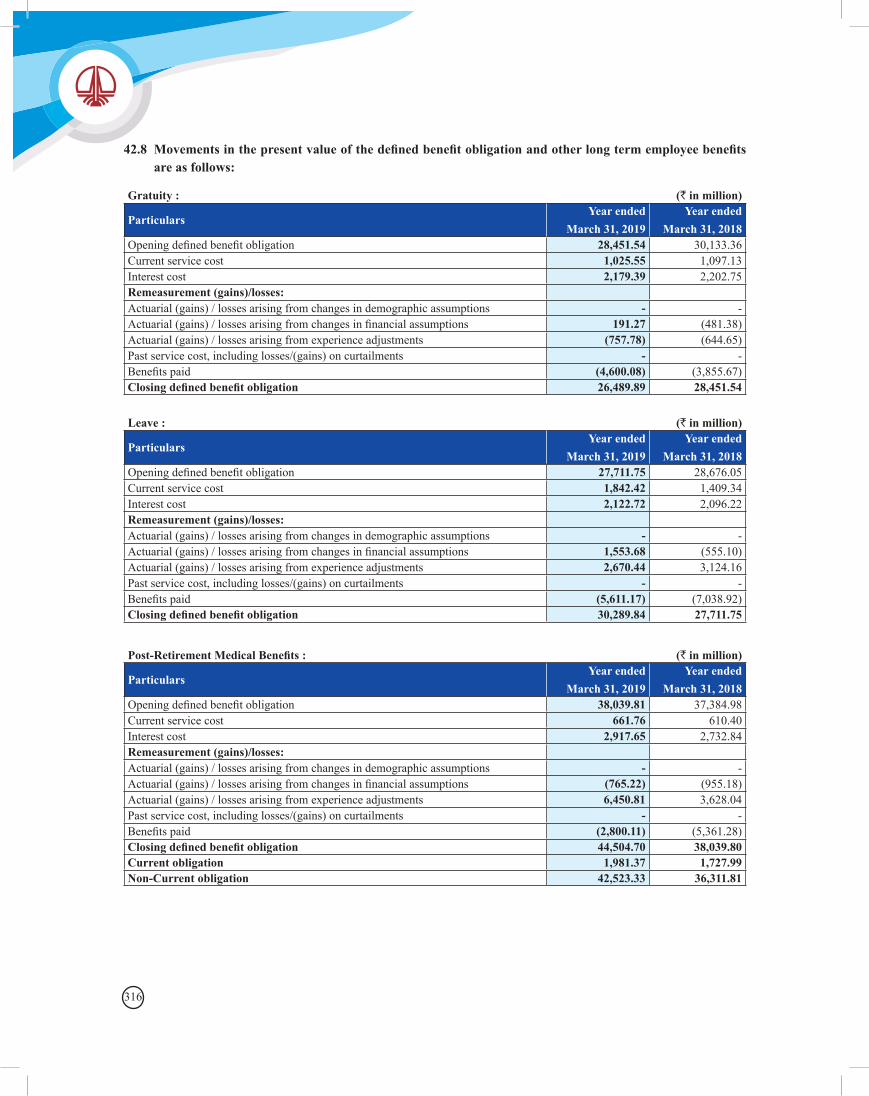
316
Gratuity : (` in million)
Particulars Year ended
March 31, 2019 Year ended
March 31, 2018 Openingdefinedbenefitobligation 28,451.54 30,133.36 Current service cost 1,025.55 1,097.13 Interest cost 2,179.39 2,202.75 Remeasurement (gains)/losses: Actuarial (gains) / losses arising from changes in demographic assumptions - - Actuarial(gains)/lossesarisingfromchangesinfinancialassumptions 191.27 (481.38)Actuarial (gains) / losses arising from experience adjustments (757.78) (644.65)Past service cost, including losses/(gains) on curtailments - - Benefitspaid (4,600.08) (3,855.67)Closing defined benefit obligation 26,489.89 28,451.54
42.8 Movements in the present value of the defined benefit obligation and other long term employee benefits are as follows:
Leave : (` in million)
Particulars Year ended
March 31, 2019 Year ended
March 31, 2018 Openingdefinedbenefitobligation 27,711.75 28,676.05 Current service cost 1,842.42 1,409.34 Interest cost 2,122.72 2,096.22 Remeasurement (gains)/losses: Actuarial (gains) / losses arising from changes in demographic assumptions - - Actuarial(gains)/lossesarisingfromchangesinfinancialassumptions 1,553.68 (555.10)Actuarial (gains) / losses arising from experience adjustments 2,670.44 3,124.16 Past service cost, including losses/(gains) on curtailments - - Benefitspaid (5,611.17) (7,038.92)Closing defined benefit obligation 30,289.84 27,711.75
Post-Retirement Medical Benefits : (` in million)
Particulars Year ended
March 31, 2019 Year ended
March 31, 2018 Openingdefinedbenefitobligation 38,039.81 37,384.98 Current service cost 661.76 610.40 Interest cost 2,917.65 2,732.84 Remeasurement (gains)/losses: Actuarial (gains) / losses arising from changes in demographic assumptions - - Actuarial(gains)/lossesarisingfromchangesinfinancialassumptions (765.22) (955.18)Actuarial (gains) / losses arising from experience adjustments 6,450.81 3,628.04 Past service cost, including losses/(gains) on curtailments - - Benefitspaid (2,800.11) (5,361.28)Closing defined benefit obligation 44,504.70 38,039.80 Current obligation 1,981.37 1,727.99 Non-Current obligation 42,523.33 36,311.81
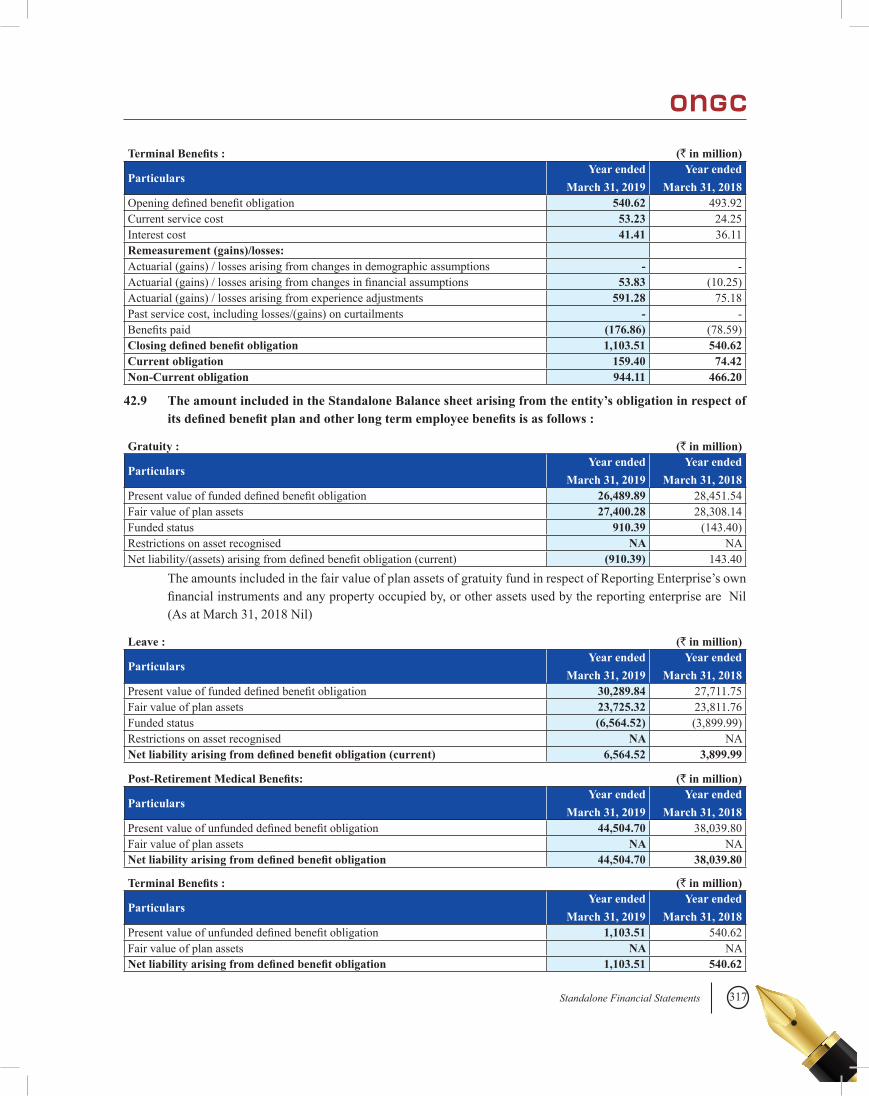
317Standalone Financial Statements
Terminal Benefits : (` in million)
Particulars Year ended
March 31, 2019 Year ended
March 31, 2018 Openingdefinedbenefitobligation 540.62 493.92Current service cost 53.23 24.25Interest cost 41.41 36.11Remeasurement (gains)/losses:Actuarial (gains) / losses arising from changes in demographic assumptions - -Actuarial(gains)/lossesarisingfromchangesinfinancialassumptions 53.83 (10.25)Actuarial (gains) / losses arising from experience adjustments 591.28 75.18Past service cost, including losses/(gains) on curtailments - -Benefitspaid (176.86) (78.59)Closing defined benefit obligation 1,103.51 540.62Current obligation 159.40 74.42Non-Current obligation 944.11 466.20
42.9 The amount included in the Standalone Balance sheet arising from the entity’s obligation in respect of its defined benefit plan and other long term employee benefits is as follows :
Gratuity : (` in million)
Particulars Year ended
March 31, 2019 Year ended
March 31, 2018 Presentvalueoffundeddefinedbenefitobligation 26,489.89 28,451.54Fair value of plan assets 27,400.28 28,308.14Funded status 910.39 (143.40)Restrictions on asset recognised NA NANetliability/(assets)arisingfromdefinedbenefitobligation(current) (910.39) 143.40
The amounts included in the fair value of plan assets of gratuity fund in respect of Reporting Enterprise’s own financialinstrumentsandanypropertyoccupiedby,orotherassetsusedbythereportingenterpriseareNil(As at March 31, 2018 Nil)
Leave : (` in million)
Particulars Year ended
March 31, 2019 Year ended
March 31, 2018 Presentvalueoffundeddefinedbenefitobligation 30,289.84 27,711.75Fair value of plan assets 23,725.32 23,811.76Funded status (6,564.52) (3,899.99)Restrictions on asset recognised NA NANet liability arising from defined benefit obligation (current) 6,564.52 3,899.99
Post-Retirement Medical Benefits: (` in million)
Particulars Year ended
March 31, 2019 Year ended
March 31, 2018 Presentvalueofunfundeddefinedbenefitobligation 44,504.70 38,039.80Fair value of plan assets NA NANet liability arising from defined benefit obligation 44,504.70 38,039.80
Terminal Benefits : (` in million)
Particulars Year ended
March 31, 2019 Year ended
March 31, 2018 Presentvalueofunfundeddefinedbenefitobligation 1,103.51 540.62 Fair value of plan assets NA NA Net liability arising from defined benefit obligation 1,103.51 540.62
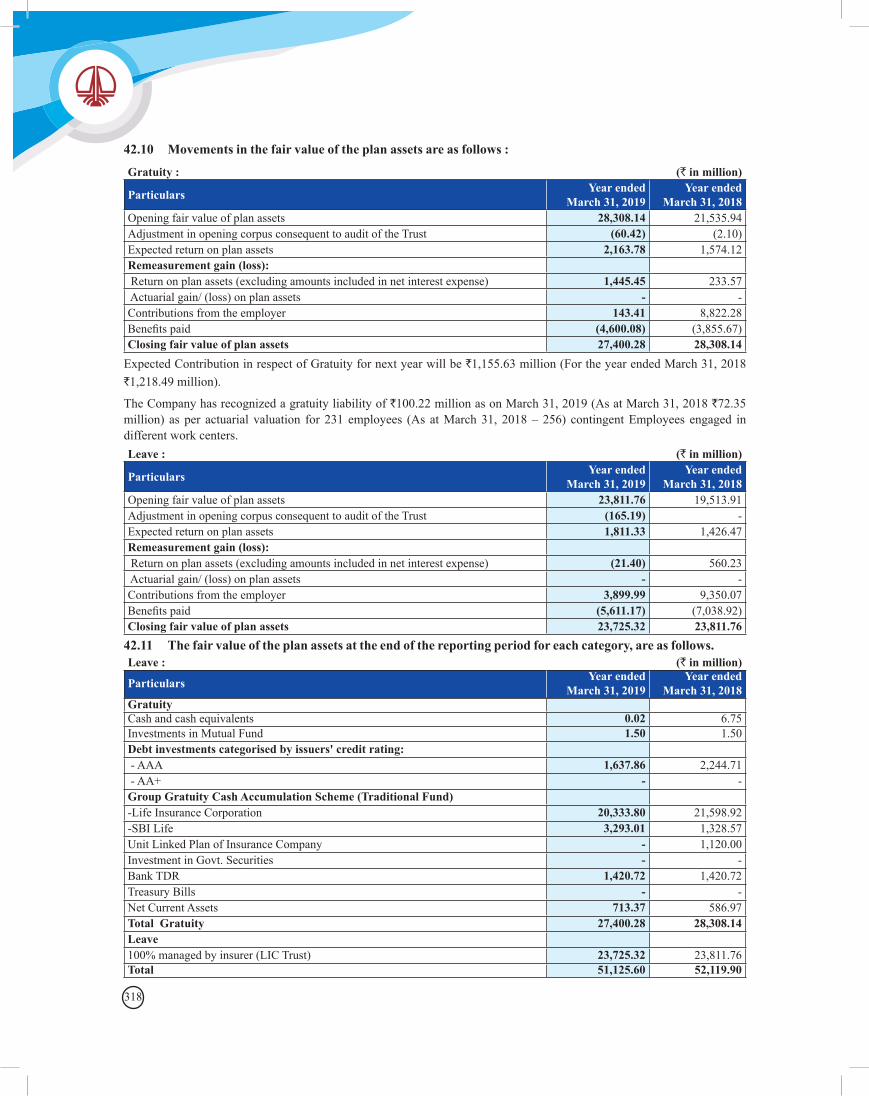
318
42.10 Movements in the fair value of the plan assets are as follows :
Gratuity : (` in million)
Particulars Year ended March 31, 2019
Year ended March 31, 2018
Opening fair value of plan assets 28,308.14 21,535.94 Adjustment in opening corpus consequent to audit of the Trust (60.42) (2.10)Expected return on plan assets 2,163.78 1,574.12 Remeasurement gain (loss): Return on plan assets (excluding amounts included in net interest expense) 1,445.45 233.57 Actuarial gain/ (loss) on plan assets - - Contributions from the employer 143.41 8,822.28 Benefitspaid (4,600.08) (3,855.67)Closing fair value of plan assets 27,400.28 28,308.14
Expected Contribution in respect of Gratuity for next year will be `1,155.63 million (For the year ended March 31, 2018 `1,218.49 million).
The Company has recognized a gratuity liability of `100.22 million as on March 31, 2019 (As at March 31, 2018 `72.35 million) asper actuarial valuation for231 employees (As atMarch31, 2018–256) contingentEmployees engaged indifferent work centers.Leave : (` in million)
Particulars Year ended March 31, 2019
Year ended March 31, 2018
Opening fair value of plan assets 23,811.76 19,513.91 Adjustment in opening corpus consequent to audit of the Trust (165.19) - Expected return on plan assets 1,811.33 1,426.47 Remeasurement gain (loss): Return on plan assets (excluding amounts included in net interest expense) (21.40) 560.23 Actuarial gain/ (loss) on plan assets - - Contributions from the employer 3,899.99 9,350.07 Benefitspaid (5,611.17) (7,038.92)Closing fair value of plan assets 23,725.32 23,811.76
42.11 The fair value of the plan assets at the end of the reporting period for each category, are as follows.Leave : (` in million)
Particulars Year ended March 31, 2019
Year ended March 31, 2018
Gratuity Cash and cash equivalents 0.02 6.75 Investments in Mutual Fund 1.50 1.50 Debt investments categorised by issuers' credit rating: - AAA 1,637.86 2,244.71 - AA+ - - Group Gratuity Cash Accumulation Scheme (Traditional Fund) -Life Insurance Corporation 20,333.80 21,598.92 -SBI Life 3,293.01 1,328.57 Unit Linked Plan of Insurance Company - 1,120.00 Investment in Govt. Securities - - Bank TDR 1,420.72 1,420.72 Treasury Bills - - Net Current Assets 713.37 586.97 Total Gratuity 27,400.28 28,308.14 Leave 100% managed by insurer (LIC Trust) 23,725.32 23,811.76 Total 51,125.60 52,119.90
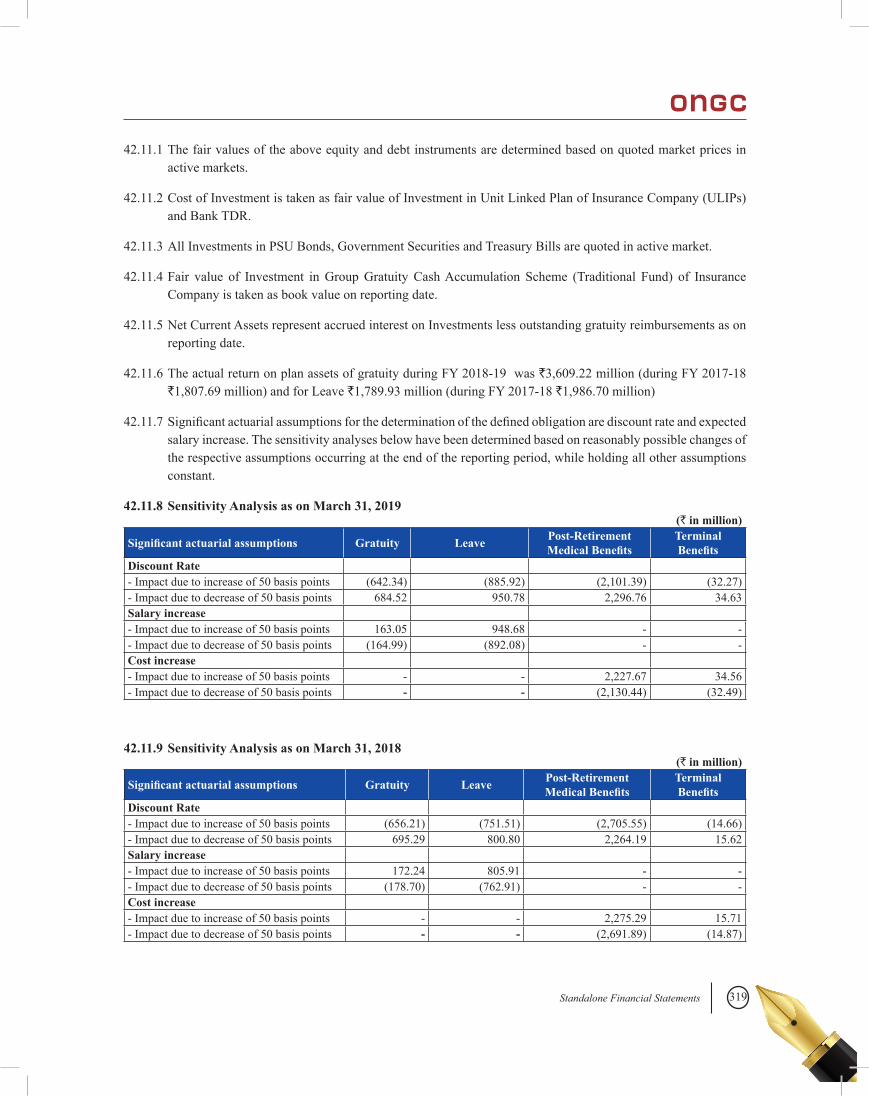
319Standalone Financial Statements
42.11.1 The fair values of the above equity and debt instruments are determined based on quoted market prices in active markets.
42.11.2 Cost of Investment is taken as fair value of Investment in Unit Linked Plan of Insurance Company (ULIPs) and Bank TDR.
42.11.3 All Investments in PSU Bonds, Government Securities and Treasury Bills are quoted in active market.
42.11.4 Fair value of Investment in Group Gratuity Cash Accumulation Scheme (Traditional Fund) of Insurance Company is taken as book value on reporting date.
42.11.5 Net Current Assets represent accrued interest on Investments less outstanding gratuity reimbursements as on reporting date.
42.11.6 The actual return on plan assets of gratuity during FY 2018-19 was `3,609.22 million (during FY 2017-18 `1,807.69 million) and for Leave `1,789.93 million (during FY 2017-18 `1,986.70 million)
42.11.7Significantactuarialassumptionsforthedeterminationofthedefinedobligationarediscountrateandexpectedsalary increase. The sensitivity analyses below have been determined based on reasonably possible changes of the respective assumptions occurring at the end of the reporting period, while holding all other assumptions constant.
42.11.8 Sensitivity Analysis as on March 31, 2019(` in million)
Significant actuarial assumptions Gratuity Leave Post-Retirement Medical Benefits
Terminal Benefits
Discount Rate - Impact due to increase of 50 basis points (642.34) (885.92) (2,101.39) (32.27)- Impact due to decrease of 50 basis points 684.52 950.78 2,296.76 34.63 Salary increase - Impact due to increase of 50 basis points 163.05 948.68 - - - Impact due to decrease of 50 basis points (164.99) (892.08) - - Cost increase - Impact due to increase of 50 basis points - - 2,227.67 34.56 - Impact due to decrease of 50 basis points - - (2,130.44) (32.49)
42.11.9 Sensitivity Analysis as on March 31, 2018(` in million)
Significant actuarial assumptions Gratuity Leave Post-Retirement Medical Benefits
Terminal Benefits
Discount Rate - Impact due to increase of 50 basis points (656.21) (751.51) (2,705.55) (14.66)- Impact due to decrease of 50 basis points 695.29 800.80 2,264.19 15.62 Salary increase - Impact due to increase of 50 basis points 172.24 805.91 - - - Impact due to decrease of 50 basis points (178.70) (762.91) - - Cost increase - Impact due to increase of 50 basis points - - 2,275.29 15.71 - Impact due to decrease of 50 basis points - - (2,691.89) (14.87)
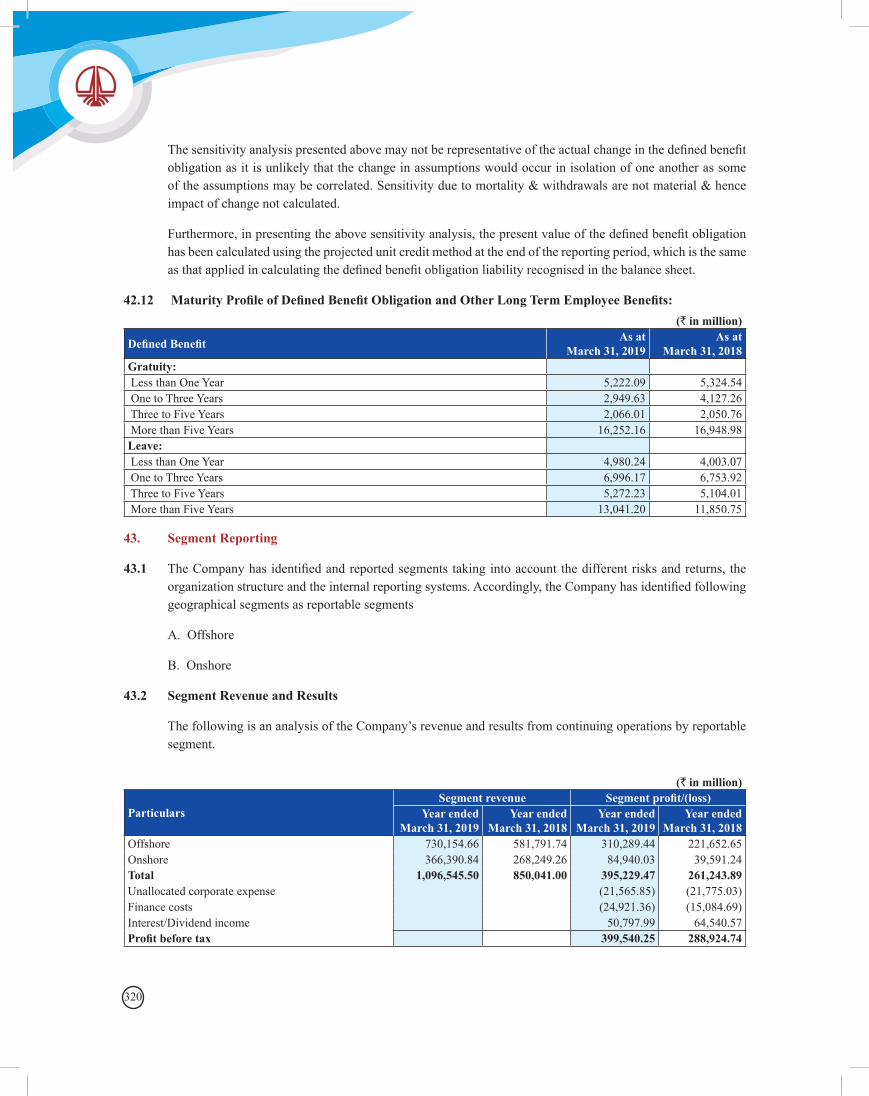
320
Thesensitivityanalysispresentedabovemaynotberepresentativeoftheactualchangeinthedefinedbenefitobligation as it is unlikely that the change in assumptions would occur in isolation of one another as some of the assumptions may be correlated. Sensitivity due to mortality & withdrawals are not material & hence impact of change not calculated.
Furthermore,inpresentingtheabovesensitivityanalysis,thepresentvalueofthedefinedbenefitobligationhas been calculated using the projected unit credit method at the end of the reporting period, which is the same asthatappliedincalculatingthedefinedbenefitobligationliabilityrecognisedinthebalancesheet.
42.12 Maturity Profile of Defined Benefit Obligation and Other Long Term Employee Benefits: (` in million)
Defined Benefit As at March 31, 2019
As at March 31, 2018
Gratuity: Less than One Year 5,222.09 5,324.54 One to Three Years 2,949.63 4,127.26 Three to Five Years 2,066.01 2,050.76 More than Five Years 16,252.16 16,948.98 Leave: Less than One Year 4,980.24 4,003.07 One to Three Years 6,996.17 6,753.92 Three to Five Years 5,272.23 5,104.01 More than Five Years 13,041.20 11,850.75
43. Segment Reporting
43.1 TheCompanyhasidentifiedandreportedsegmentstakingintoaccountthedifferentrisksandreturns, theorganizationstructureandtheinternalreportingsystems.Accordingly,theCompanyhasidentifiedfollowinggeographical segments as reportable segments
A. Offshore
B. Onshore
43.2 Segment Revenue and Results
The following is an analysis of the Company’s revenue and results from continuing operations by reportable segment.
(` in million)
ParticularsSegment revenue Segment profit/(loss)
Year ended March 31, 2019
Year ended March 31, 2018
Year ended March 31, 2019
Year ended March 31, 2018
Offshore 730,154.66 581,791.74 310,289.44 221,652.65Onshore 366,390.84 268,249.26 84,940.03 39,591.24Total 1,096,545.50 850,041.00 395,229.47 261,243.89Unallocated corporate expense (21,565.85) (21,775.03)Finance costs (24,921.36) (15,084.69)Interest/Dividend income 50,797.99 64,540.57Profit before tax 399,540.25 288,924.74
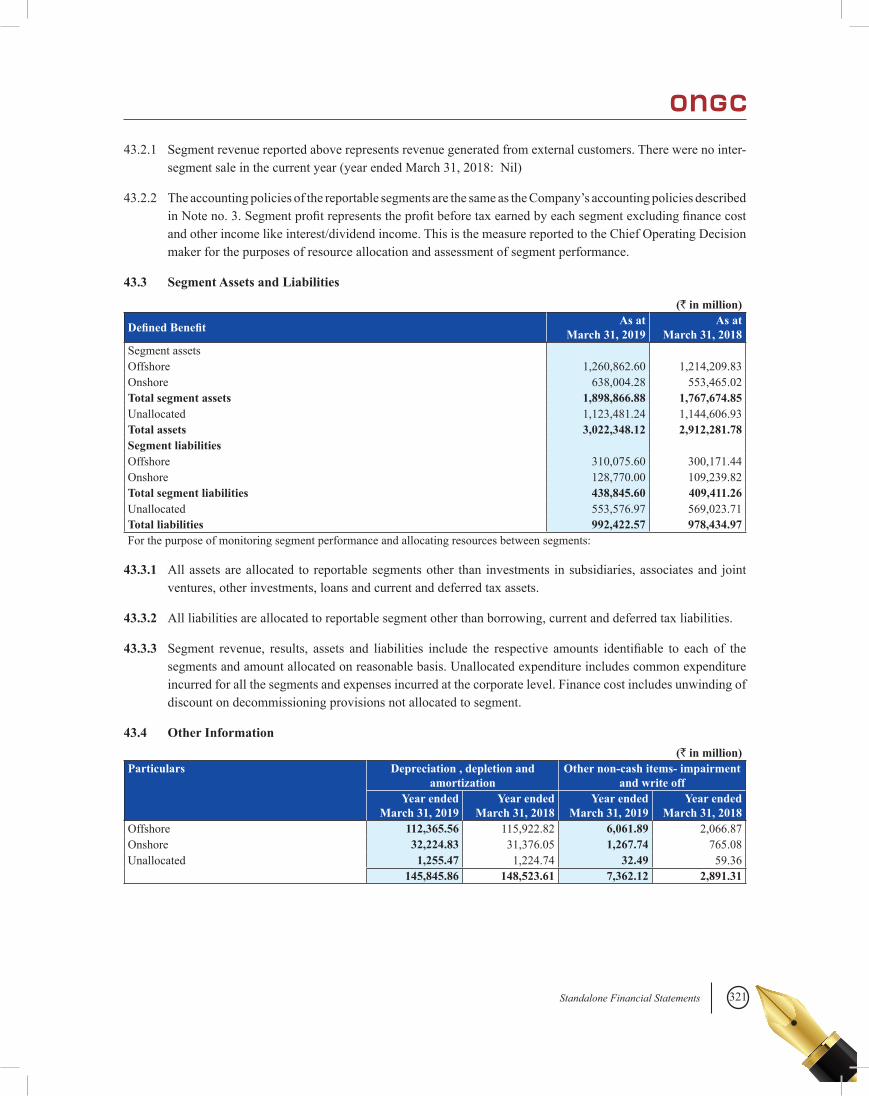
321Standalone Financial Statements
43.2.1 Segment revenue reported above represents revenue generated from external customers. There were no inter-segment sale in the current year (year ended March 31, 2018: Nil)
43.2.2 The accounting policies of the reportable segments are the same as the Company’s accounting policies described inNoteno.3.Segmentprofitrepresentstheprofitbeforetaxearnedbyeachsegmentexcludingfinancecostand other income like interest/dividend income. This is the measure reported to the Chief Operating Decision maker for the purposes of resource allocation and assessment of segment performance.
43.3 Segment Assets and Liabilities
(` in million)
Defined Benefit As at March 31, 2019
As at March 31, 2018
Segment assetsOffshore 1,260,862.60 1,214,209.83Onshore 638,004.28 553,465.02Total segment assets 1,898,866.88 1,767,674.85Unallocated 1,123,481.24 1,144,606.93Total assets 3,022,348.12 2,912,281.78Segment liabilitiesOffshore 310,075.60 300,171.44Onshore 128,770.00 109,239.82Total segment liabilities 438,845.60 409,411.26Unallocated 553,576.97 569,023.71Total liabilities 992,422.57 978,434.97For the purpose of monitoring segment performance and allocating resources between segments:
43.3.1 All assets are allocated to reportable segments other than investments in subsidiaries, associates and joint ventures, other investments, loans and current and deferred tax assets.
43.3.2 All liabilities are allocated to reportable segment other than borrowing, current and deferred tax liabilities.
43.3.3 Segment revenue, results, assets and liabilities include the respective amounts identifiable to each of thesegments and amount allocated on reasonable basis. Unallocated expenditure includes common expenditure incurred for all the segments and expenses incurred at the corporate level. Finance cost includes unwinding of discount on decommissioning provisions not allocated to segment.
43.4 Other Information(` in million)
Particulars Depreciation , depletion and amortization
Other non-cash items- impairment and write off
Year ended March 31, 2019
Year ended March 31, 2018
Year ended March 31, 2019
Year ended March 31, 2018
Offshore 112,365.56 115,922.82 6,061.89 2,066.87Onshore 32,224.83 31,376.05 1,267.74 765.08Unallocated 1,255.47 1,224.74 32.49 59.36
145,845.86 148,523.61 7,362.12 2,891.31
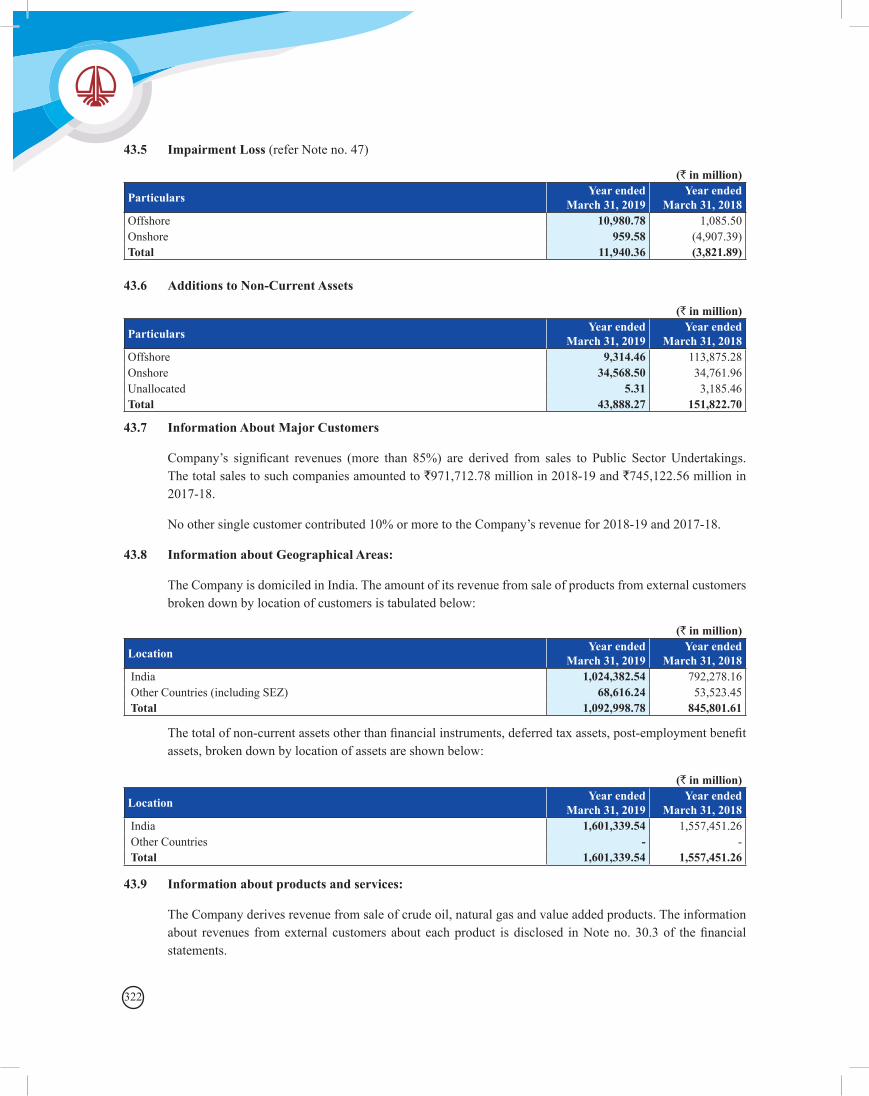
322
43.5 Impairment Loss (refer Note no. 47)
(` in million)
Particulars Year ended March 31, 2019
Year ended March 31, 2018
Offshore 10,980.78 1,085.50Onshore 959.58 (4,907.39)Total 11,940.36 (3,821.89)
43.6 Additions to Non-Current Assets
(` in million)
Particulars Year ended March 31, 2019
Year ended March 31, 2018
Offshore 9,314.46 113,875.28Onshore 34,568.50 34,761.96Unallocated 5.31 3,185.46Total 43,888.27 151,822.70
43.7 Information About Major Customers
Company’s significant revenues (more than 85%) are derived from sales to Public Sector Undertakings. The total sales to such companies amounted to `971,712.78 million in 2018-19 and `745,122.56 million in 2017-18.
No other single customer contributed 10% or more to the Company’s revenue for 2018-19 and 2017-18.
43.8 Information about Geographical Areas:
The Company is domiciled in India. The amount of its revenue from sale of products from external customers broken down by location of customers is tabulated below:
(` in million)
Location Year ended March 31, 2019
Year ended March 31, 2018
India 1,024,382.54 792,278.16 Other Countries (including SEZ) 68,616.24 53,523.45 Total 1,092,998.78 845,801.61
Thetotalofnon-currentassetsotherthanfinancialinstruments,deferredtaxassets,post-employmentbenefitassets, broken down by location of assets are shown below:
(` in million)
Location Year ended March 31, 2019
Year ended March 31, 2018
India 1,601,339.54 1,557,451.26 Other Countries - - Total 1,601,339.54 1,557,451.26
43.9 Information about products and services:
The Company derives revenue from sale of crude oil, natural gas and value added products. The information about revenues fromexternalcustomersabouteachproduct isdisclosed inNoteno.30.3of thefinancialstatements.
323Standalone Financial Statements
44. Related Party Disclosures
44.1 Name of related parties and description of relationship:
A. Subsidiaries
1. ONGC Videsh Limited (OVL)
1.1. ONGC Nile Ganga B.V. (ONGBV)
1.1.1. ONGC Campos Ltda.
1.1.2. ONGC Nile Ganga (Cyprus) Limited (Note 44.1.1)
1.1.3. ONGC Nile Ganga (San Cristobal) B.V.
1.1.4. ONGC Caspian E&P B.V.
1.2. ONGC Narmada Limited (ONL)
1.3. ONGC Amazon Alaknanda Limited (OAAL)
1.4. Imperial Energy Limited
1.4.1. Imperial Energy Tomsk Limited
1.4.2. Imperial Energy (Cyprus) Limited
1.4.3. Imperial Energy Nord Limited
1.4.4. Biancus Holdings Limited
1.4.5. Redcliffe Holdings Limited
1.4.6. Imperial Frac Services (Cyprus) Limited
1.4.7. San Agio Investments Limited
1.4.8. LLC Sibinterneft (Note 44.1.2)
1.4.9. LLC Allianceneftegaz
1.4.10. LLC Nord Imperial
1.4.11. LLC Rus Imperial Group
1.4.12. LLC Imperial Frac Services (Note 44.1.3)
1.5. Carabobo One AB
1.5.1. Petro Carabobo Ganga B.V.
1.6. ONGC (BTC) Limited
1.7. Beas Rovuma Energy Mozambique Ltd.
1.8. ONGC Videsh Rovuma Ltd. (OVRL)
1.9. ONGC Videsh Atlantic Inc. (OVAI)
1.10. ONGC Videsh Singapore Pte. Ltd.
1.10.1 ONGC Videsh Vankorneft Pte. Ltd.
1.11 Indus East Mediterranean Exploration Limited
2. Mangalore Refinery and Petrochemicals Limited(MRPL)
3. ONGC Mangalore Petrochemicals Limited (OMPL)
4. Hindustan Petroleum Corporation Limited (HPCL)
4.1 Prize Petroleum Company Limited
4.1.1 Prize Petroleum International Pte. Limited
4.2 HPCL Biofuels Limited
4.3 HPCL Middle East FZCO
5. Petronet MHB Limited (PMHBL)
B. Joint Ventures
1. Mangalore SEZ Limited (MSEZ)
2. ONGC Petro additions Limited (OPaL)
3. ONGC Tripura Power Company Limited (OTPC)
4. ONGC Teri Biotech Limited (OTBL)
5. Dahej SEZ Limited (DSEZ)
6. Indradhanush Gas Grid Limited (IGGL)(w.e.f. August 10, 2018 )
7. ONGC Mittal Energy Limited (OMEL) (through OVL)
8. Sudd Petroleum Operating Company (through OVL)
9. Mansarovar Energy Colombia Limited, Colombia (through OVL)
10. Himalaya Energy Syria BV, Netherlands (through OVL)
11. Shell MRPL Aviation Fuels and Services Limited (SMASL) (through MRPL)
12. HPCLRajasthanRefineryLimited(throughHPCL)
13. HPCL Mittal Energy Limited (through HPCL)
14. Hindustan Coals Private Limited (through HPCL)
15. South Asia LPG Company Private Limited (through HPCL)
324
16. Bhagyanagar Gas Limited (through HPCL)
17. Godavari Gas Private Limited (through HPCL)
18. HPCL Shapoorji Energy Private Limited (through HPCL)
19. Mumbai Aviation Fuel Farm Facility Private Limited (through HPCL)
20. Petronet India Limited (through HPCL, in process of voluntary winding up w.e.f. August 30, 2018)
21. Aavantika Gas Limited (through HPCL)
22. RatnagiriRefinery&PetrochemicalsLimited(throughHPCL)
23. HPOIL Gas Private Limited (incorporated on November 30, 2018, through HPCL)
24. Mangalore STP Limited (through MSEZ)
25. MSEZ Power Limited (through MSEZ)
26. Adani Petronet Dahej Port Pvt Ltd (APPPL) (through PLL)
27. India LNG Transport Company Private Limited (through PLL)
28. North East Transmission Company Limited (NETC) (through OTPC)
C. Associates
1. Pawan Hans Limited (PHL)
2. Petronet LNG Limited (PLL)
3. Mozambique LNG 1 Company Pte. Ltd. (through OVL)
4. Petro Carabobo SA, Venezuela (through OVL)
5. Carabobo Ingenieria Y Construcciones, SA, Venezuela (through OVL)
6. Petrolera Indovenezolana SA, Venezuela (through OVL)
7. South East Asia Gas Pipeline Ltd, Hongkong (through OVL)
8. Tamba BV, Netherlands (through OVL)
9. JSC Vankorneft, Russia (through OVL)
10. Falcon Oil & Gas BV, Netherlands (through OVL)
11. GSPL India Gasnet Limited (through HPCL)
12. GSPL India Transco Limited (through HPCL)
D. Trusts (including post retirement employee benefit trust) wherein ONGC having control
1. ONGC Contributory Provident Fund Trust
2. ONGC CSSS Trust
3. ONGC Sahyog Trust
4. ONGC PRBS Trust
5. ONGC Gratuity Fund
6. ONGC Energy Center
7. ONGC Foundation
8. MRPL Gratuity Fund Trust, (through MRPL)
9. MRPL Provident Fund Trust, (through MRPL)
10. Ujjwala Plus Foundation, (through HPCL)
E. Key Management Personnel
E.1. Whole-time Directors
1. Shri Shashi Shanker, Chairman and Managing Director
2. Shri D D Misra, Director (HR) (upto June 30, 2018)
3. Shri A K Dwivedi, Director (Exploration)
4. Shri Subhash Kumar, Director (Finance)
5. Shri Rajesh Kakkar, Director (Offshore)
6. Shri Sanjay Kumar Moitra, Director (Onshore) (w.e.f April 18, 2018)
7. Shri N C Pandey, Director (T&FS) (w.e.f. October 29, 2018)
8. Dr. Alka Mittal, Director (HR) (w.e.f. November 27, 2018)
E.2. Company Secretary
1. Shri M E V Selvamm, Company Secretary
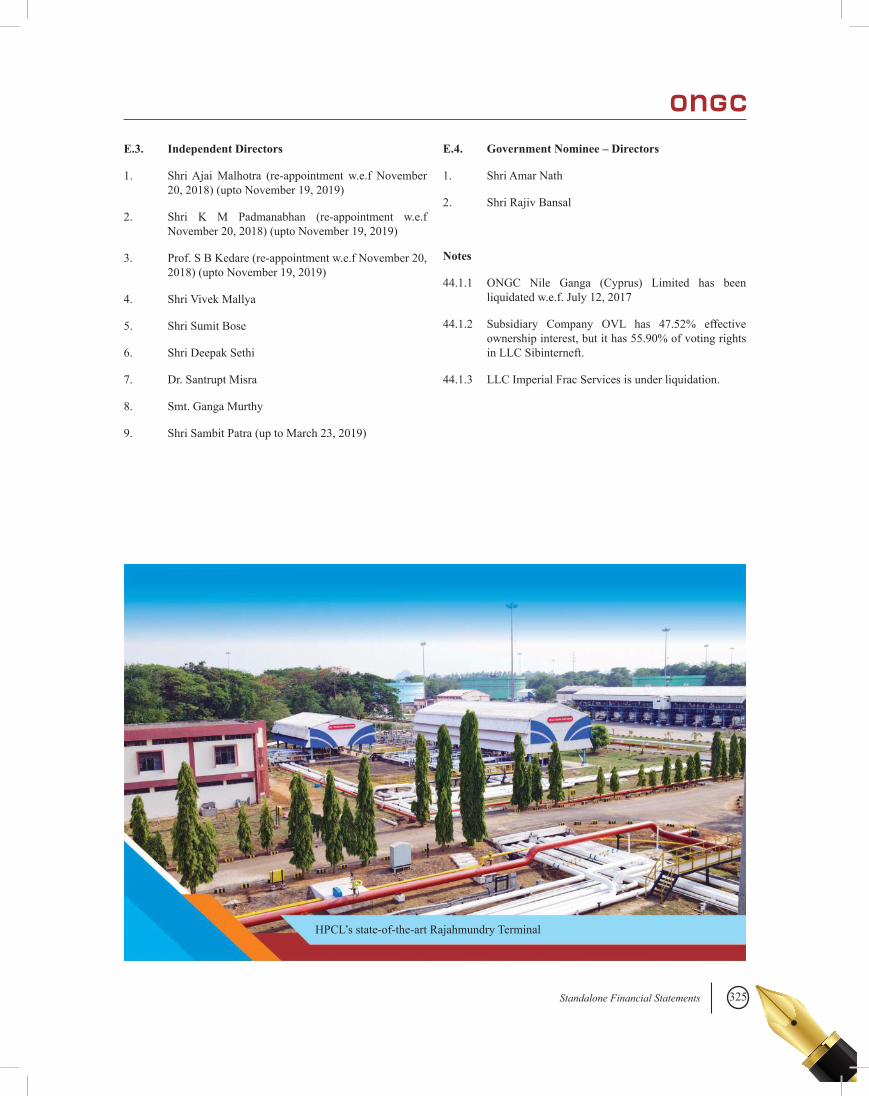
325Standalone Financial Statements
E.3. Independent Directors
1. Shri Ajai Malhotra (re-appointment w.e.f November 20, 2018) (upto November 19, 2019)
2. Shri K M Padmanabhan (re-appointment w.e.f November 20, 2018) (upto November 19, 2019)
3. Prof. S B Kedare (re-appointment w.e.f November 20, 2018) (upto November 19, 2019)
4. Shri Vivek Mallya
5. Shri Sumit Bose
6. Shri Deepak Sethi
7. Dr. Santrupt Misra
8. Smt. Ganga Murthy
9. Shri Sambit Patra (up to March 23, 2019)
E.4. Government Nominee – Directors
1. Shri Amar Nath
2. Shri Rajiv Bansal
Notes
44.1.1 ONGC Nile Ganga (Cyprus) Limited has been liquidated w.e.f. July 12, 2017
44.1.2 Subsidiary Company OVL has 47.52% effective ownership interest, but it has 55.90% of voting rights in LLC Sibinterneft.
44.1.3 LLC Imperial Frac Services is under liquidation.
HPCL’s state-of-the-art Rajahmundry Terminal
326
(` in million)
Name of related party Nature of transaction Year ended March 31,
2019
Year ended March 31,
2018(i) Sale of products to:
a) Mangalore Refinery and PetrochemicalsLimited
Sale of crude oil 53,977.85 48,868.99
b) Hindustan Petroleum Corporation Limited (w.e.f. January 31, 2018)
Sale of crude oil & value added products
173,138.27 37,506.46
(ii) Purchase of product from: a) Mangalore Refinery and PetrochemicalsLimited Purchase of petroleum oil and
lubricants/high speed diesel 8,658.67 8,453.89
b) Hindustan Petroleum Corporation Limited (w.e.f. January 31, 2018)
Purchase of petroleum oil and lubricants/high speed diesel
5,419.96 916.39
(iii) Services provided to:
a) Mangalore Refinery and PetrochemicalsLimited
Leasing of office includingmaintenance at Mumbai/Delhi
103.17 13.30
Vehicle hiring charges 0.09 -Guarantee fee 12.52 10.43Manpower deputation 6.33 7.97
b) ONGC Mangalore Petrochemicals Limited Director candidature 0.30 -
c) ONGC Videsh Limited Expenses incurred on behalf of OVL 495.70 375.81Guarantee fee 325.91 401.42Platts Subscription charges 12.41 -
d) Hindustan Petroleum Corporation LimitedRentforOffice 0.01 0.01For Conferences & Seminars 8.11 -Helicopter service provide 3.21 -
(iv) Loan Given / Repaid
a) ONGC Videsh Limited Inter-corporate Loan given 1,860.00 5,780.00Repayment of Loan 1,860.00 5,780.00
b) Mangalore Refinery and PetrochemicalsLimited
Repayment of Loan 18,856.90 6,857.20
(v) Advance against equity
a) ONGC Mangalore Petrochemicals LimitedAdvance for purchase for shares converted to equity
1,469.94 -
(vi) Dividend and interest income from: a) Mangalore Refinery and PetrochemicalsLimited
Dividend income 3,766.06 7,532.12
b) Mangalore Refinery and PetrochemicalsLimited
Interest income 549.12 1,657.81
c) ONGC Videsh Limited Dividend income 3,000.00 2,100.00d) ONGC Videsh Limited Interest income 3.58 3.98e) Hindustan Petroleum Corporation Limited Dividend income 7,009.61 11,293.26f) Petronet MHB Dividend income - 161.56
44.2 Details of Transactions:
44.2.1 Transactions with Subsidiaries
327Standalone Financial Statements
(` in million)
Name of related party Nature of transaction Year ended March 31,
2019
Year ended March 31,
2018(vii) Non cash transaction (Ind AS fair
valuations):
a) ONGC Videsh LimitedInterest income - 35.94Guarantee fee in respect of financialguarantee
476.56 321.60
b) Mangalore Refinery and PetrochemicalsLimited
Guarantee fee in respect of financialguarantee
3.78 7.88
(viii) Corporate Financial guarantee issued:
a) ONGC Videsh LimitedFinancial Guarantee against Terms loans
- 52,684.85
44.2.2 Outstanding balances with subsidiaries(` in million)
Name of related party Nature of transaction As at March
31, 2019As at March
31, 2018A. Loans (Unsecured):
a)MangaloreRefineryandPetrochemicalsLimited (Note 44.2.3)
Loans - 18,856.90
B. Amount receivable: a)MangaloreRefineryandPetrochemicalsLimited Trade and other receivables 4,167.68 8,332.80b) ONGC Videsh Limited Other receivables 529.00 198.11c) Hindustan Petroleum Corporation Limited Trade and other receivables 12,398.80 16,526.62
C. Amount payable: a)MangaloreRefineryandPetrochemicalsLimited Trade payables - 985.56b) Hindustan Petroleum Corporation Limited Trade payables 720.83 417.37
D. Corporate Financial guarantee issued on behalf of subsidiaries:
a) ONGC Videsh Limited (Note 23.1) Valueoffinancialguarantee 428,980.57 436,897.86b)MangaloreRefineryandPetrochemicalsLimited Valueoffinancialguarantee 9146.48 5,059.00
E. Outstanding value of commitment made: a) ONGC Videsh Limited Performance guarantee 8526.67 4972.87
44.2.3 The loan is unsecured carrying interest rate of 7.90% (previous year 7.17%) based on G-sec yield for 5 years tenor as per FIMMDA of 7.50 % plus spread of 0.40 bps and the loan has been fully repaid during the year 2018 19.
328
44.2.4 Transactions with joint ventures (` in million)
Name of related party Nature of transaction As at March 31, 2019
As at March 31, 2018
(i) Sale of products to: a) ONGC Tripura Power Company Limited Sale of natural gas 6,481.80 5,486.38 b) ONGC Petro additions Limited Sale of naphtha & C2-C3 52,459.88 36,599.87(ii) Services received from: a) ONGC Teri Biotech Limited Bio-remediation services 192.68 127.60 b) Dahej SEZ Limited Lease rent /ROU charges for SEZ
land for C2-C3 plant12.78 13.67
c) ONGC Tripura Power Company Limited Training 0.17 - d) ONGC Petro additions Limited Reimbursement of expenses
incurred by OPaL16.15 -
(iii) Services provided to: a) ONGC Petro additions Limited Manpower deputation, loading and
other charges19.05 202.12
ROU Charges for pipeline received 1.36 - b) ONGC Teri Biotech Limited Field study charges and rent for
colony accommodation0.42 0.19
c) ONGC Tripura Power Company Limited Management consultancy and interest charges
- 0.12
Director candidature 0.10 - d) Mangalore SEZ Other reimbursement - 0.09 e) Indradhanush Gas Grid Limited (IGGL) Manpower deputation 0.77 -(iv) Subscription to equity shares a) Indradhanush Gas Grid Limited (IGGL) Subscription to Equity 50.00 -(v) Subscription of share warrant a) ONGC Petro addition Limited Subscription of share warrants 6,201.00 -(vii) Dividend Income from: a) ONGC Tripura Power Company Limited Dividend of Equity Shares 672.00 700.00 b) Dahej SEZ Limited Dividend of Equity Shares 80.59 -(vi) Commitments given: a) ONGC Petro addition Limited Backstopping support for
compulsory convertible debentures- 21,630.00
Backstopping support for compulsory convertible debentures-Interest accrued
447.54 1,058.13
(vii) Letter of Comfort: Letter of Comfort against Term Loan
65,000.00 -a) ONGC Petro addition Limited
Letter of Comfort against Non- Convertible Debentures
8,200.00 -
329Standalone Financial Statements
44.2.5 Outstanding balances with joint ventures(` in million)
Name of related party Nature of transaction As at March 31, 2019
As at March 31, 2018
A. Amount receivable: a) ONGC Petro additions Limited Trade and other receivables 2,225.99 7,412.62 b) ONGC Tripura Power Company Limited Trade and other receivables 348.09 258.98 c) ONGC Teri Biotech Limited Trade and other receivables 0.01 0.01
d) Indradhanush Gas Grid Limited Trade and other receivables 0.83 -B. Amount payable: a) ONGC Teri Biotech Limited Trade payables 70.88 39.61
b) ONGC Petro additions Limited Trade payables 16.15 - c) Dahej SEZ Limited Trade payables 11.30 - d) ONGC Tripura Power Company Limited Trade payables and other payables 0.14 -C. Advance outstanding: a) ONGC Petro addition Limited Advance against equity/share
warrant pending allotment 24,940.50 18,739.50
D. Commitments: a) ONGC Petro addition Limited Unpaid subscription of share
warrants639.50 480.50
Backstopping support for compulsory convertible debentures
77,780.00 77,780.00
Backstopping support for compulsory convertible debentures-Interest accrued
5,117.73 4,670.19
E. Letter of Comfort: a) ONGC Petro addition Limited Letter of Comfort against Term
Loan65,000.00 -
Letter of Comfort against Non- Convertible Debentures
8,200.00 -
44.2.6 Transactions with associates (` in million)
Name of related party Nature of transaction Year ended March 31,
2019
Year ended March 31, 2018
A. Services received from: a) Pawan Hans Limited (PHL) Hiring of helicopter services 1,217.86 1,462.27 b) Petronet LNG Limited Purchase of LNG 8,816.95 2,025.47
Facilities charges at C2-C3 and reimbursement of consultant fee
679.08 210.69
B. Services provided to: a) Pawan Hans Limited (PHL) Miscellaneous receipt on account
of liquidated damages180.69 0.45
b) Petronet LNG Limited Director sitting fee and other charges
0.12 0.26
C. Income received from: a) Pawan Hans Limited (PHL) Dividend income 30.20 181.24 b) Petronet LNG Limited Dividend Income 1,875.00 468.75D. Investment a) Pawan Hans Limited (PHL) Investment in Equity shares - 1,528.16
330
44.2.7 Outstanding balances with associates(` in million)
Name of related party Nature of transaction As at March 31, 2019
As at March 31, 2018
A. Amount payable: a) Pawan Hans Limited (PHL) Trade payables 166.20 202.15 b) Petronet LNG Limited Trade payables 493.31 464.84
44.2.8 Transactions with Trusts(` in million)
Name of related party Nature of transaction Year ended March 31, 2019
Year ended March 31, 2018
A. Remittance of payment: a) ONGC Contributory Provident Fund Trust Contribution 12,666.43 12,158.32 b) ONGC CSSS Trust Contribution 1,174.24 1,217.78 c) ONGC Sahyog Trust Contribution 27.32 28.07 d) ONGC PRBS Trust Contribution 11,095.97 11,066.09 e) ONGC Gratuity Trust Contribution 286.80 8,822.28B. Reimbursement of Gratuity payment made on behalf of Trust: a) ONGC Gratuity Fund Reimbursement 4,676.48 3,651.09C. Contribution to trust a) ONGC Energy Center For research and development 190.00 300.00 b) ONGC Foundation Contribution 1,075.21 1,563.61
44.2.9 Compensation of key management personnel
(a) Whole-time Directors and Company secretary
(` in million)
Particulars Year ended March 31, 2019
Year ended March 31, 2018
Shorttermemployeebenefits 58.32 60.12Post-employmentbenefits 4.83 18.71Long-termbenefits 5.97 4.82Total 69.12 83.65
(b) Independent directors
(` in million)
Particulars Year ended March 31, 2019
Year ended March 31, 2018
Amount receivable 1.39 0.70Amount Payable 56.88 18.55
(` in million)
Particulars Year ended March 31, 2019
Year ended March 31, 2018
Sitting fees 9.45 13.54Total 9.45 13.54
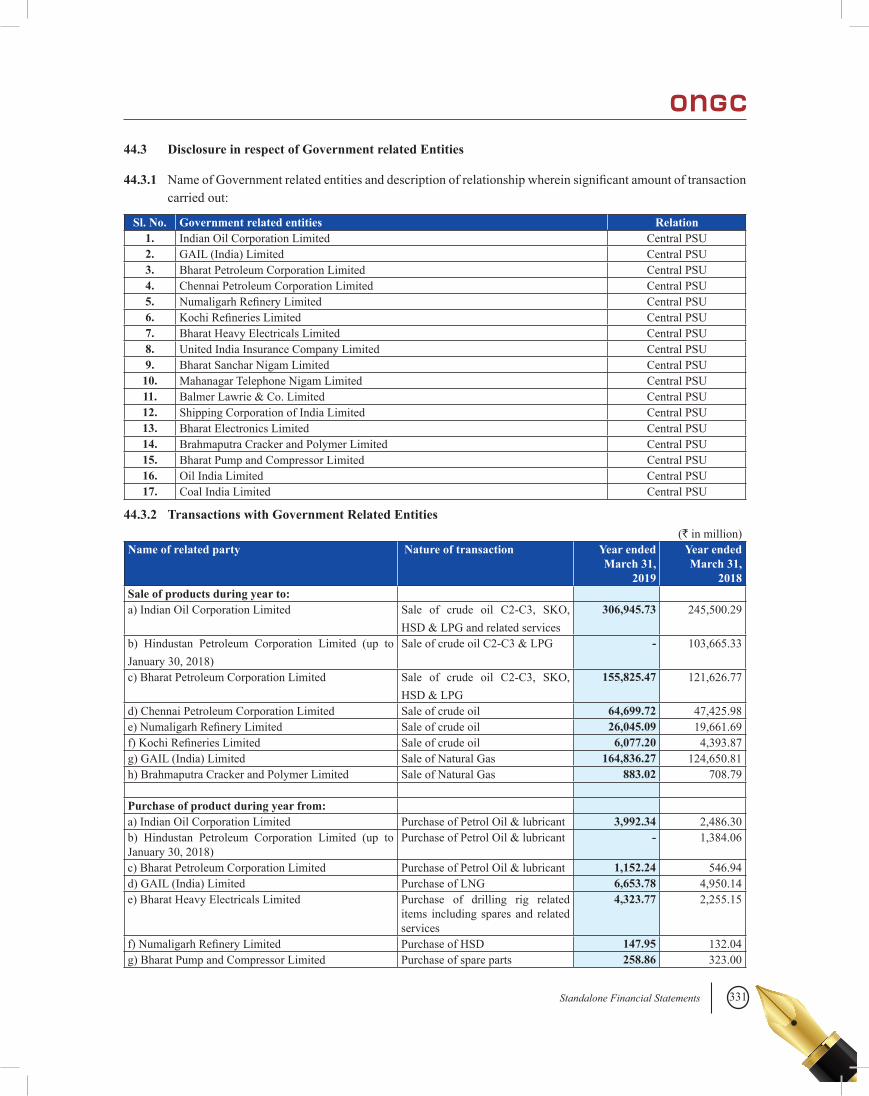
331Standalone Financial Statements
44.3 Disclosure in respect of Government related Entities
44.3.1 NameofGovernmentrelatedentitiesanddescriptionofrelationshipwhereinsignificantamountoftransactioncarried out:
Sl. No. Government related entities Relation 1. Indian Oil Corporation Limited Central PSU2. GAIL (India) Limited Central PSU3. Bharat Petroleum Corporation Limited Central PSU4. Chennai Petroleum Corporation Limited Central PSU5. NumaligarhRefineryLimited Central PSU6. KochiRefineriesLimited Central PSU7. Bharat Heavy Electricals Limited Central PSU8. United India Insurance Company Limited Central PSU9. Bharat Sanchar Nigam Limited Central PSU10. Mahanagar Telephone Nigam Limited Central PSU11. Balmer Lawrie & Co. Limited Central PSU12. Shipping Corporation of India Limited Central PSU13. Bharat Electronics Limited Central PSU14. Brahmaputra Cracker and Polymer Limited Central PSU15. Bharat Pump and Compressor Limited Central PSU16. Oil India Limited Central PSU17. Coal India Limited Central PSU
44.3.2 Transactions with Government Related Entities (` in million)
Name of related party Nature of transaction Year ended March 31,
2019
Year ended March 31,
2018Sale of products during year to: a) Indian Oil Corporation Limited Sale of crude oil C2-C3, SKO,
HSD & LPG and related services 306,945.73 245,500.29
b) Hindustan Petroleum Corporation Limited (up to January 30, 2018)
Sale of crude oil C2-C3 & LPG - 103,665.33
c) Bharat Petroleum Corporation Limited Sale of crude oil C2-C3, SKO, HSD & LPG
155,825.47 121,626.77
d) Chennai Petroleum Corporation Limited Sale of crude oil 64,699.72 47,425.98e)NumaligarhRefineryLimited Sale of crude oil 26,045.09 19,661.69f)KochiRefineriesLimited Sale of crude oil 6,077.20 4,393.87g) GAIL (India) Limited Sale of Natural Gas 164,836.27 124,650.81h) Brahmaputra Cracker and Polymer Limited Sale of Natural Gas 883.02 708.79 Purchase of product during year from: a) Indian Oil Corporation Limited Purchase of Petrol Oil & lubricant 3,992.34 2,486.30b) Hindustan Petroleum Corporation Limited (up to January 30, 2018)
Purchase of Petrol Oil & lubricant - 1,384.06
c) Bharat Petroleum Corporation Limited Purchase of Petrol Oil & lubricant 1,152.24 546.94d) GAIL (India) Limited Purchase of LNG 6,653.78 4,950.14e) Bharat Heavy Electricals Limited Purchase of drilling rig related
items including spares and related services
4,323.77 2,255.15
f)NumaligarhRefineryLimited Purchase of HSD 147.95 132.04g) Bharat Pump and Compressor Limited Purchase of spare parts 258.86 323.00
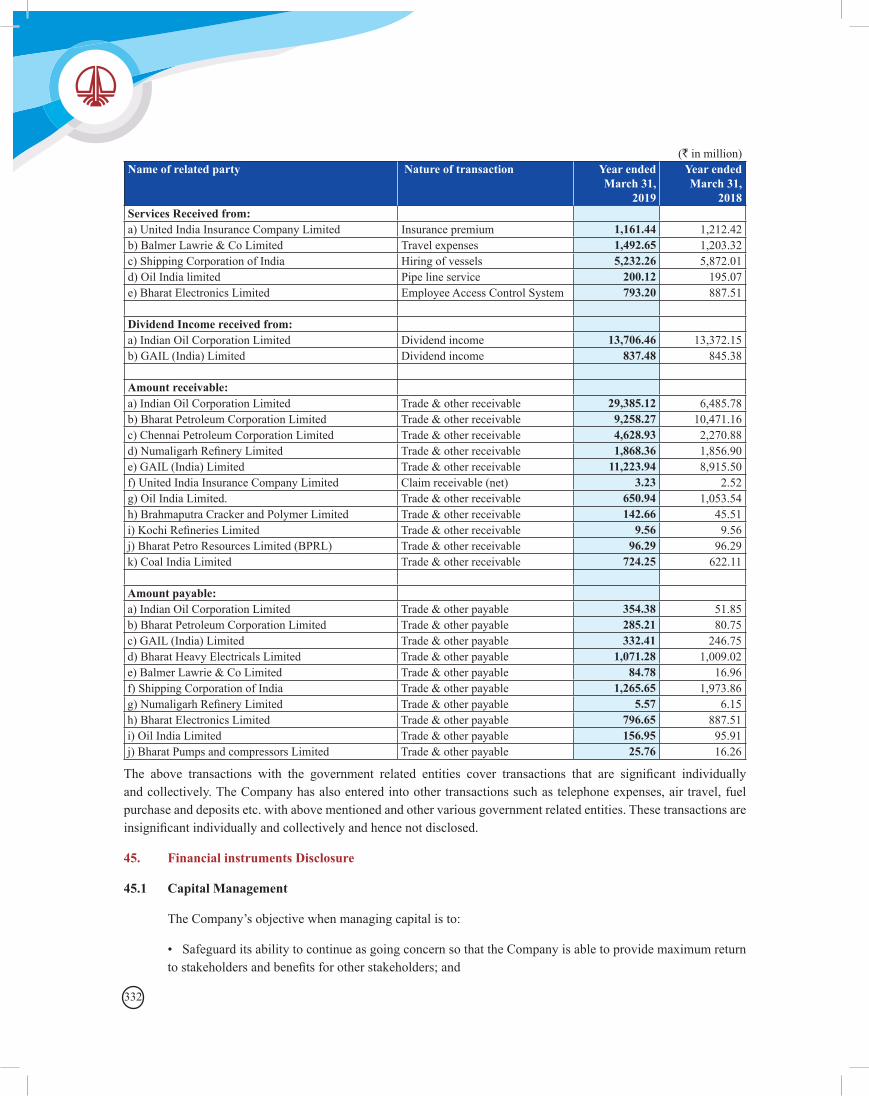
332
(` in million)Name of related party Nature of transaction Year ended
March 31, 2019
Year ended March 31,
2018Services Received from: a) United India Insurance Company Limited Insurance premium 1,161.44 1,212.42b) Balmer Lawrie & Co Limited Travel expenses 1,492.65 1,203.32c) Shipping Corporation of India Hiring of vessels 5,232.26 5,872.01d) Oil India limited Pipe line service 200.12 195.07e) Bharat Electronics Limited Employee Access Control System 793.20 887.51 Dividend Income received from: a) Indian Oil Corporation Limited Dividend income 13,706.46 13,372.15b) GAIL (India) Limited Dividend income 837.48 845.38 Amount receivable: a) Indian Oil Corporation Limited Trade & other receivable 29,385.12 6,485.78b) Bharat Petroleum Corporation Limited Trade & other receivable 9,258.27 10,471.16c) Chennai Petroleum Corporation Limited Trade & other receivable 4,628.93 2,270.88d)NumaligarhRefineryLimited Trade & other receivable 1,868.36 1,856.90e) GAIL (India) Limited Trade & other receivable 11,223.94 8,915.50f) United India Insurance Company Limited Claim receivable (net) 3.23 2.52g) Oil India Limited. Trade & other receivable 650.94 1,053.54h) Brahmaputra Cracker and Polymer Limited Trade & other receivable 142.66 45.51i)KochiRefineriesLimited Trade & other receivable 9.56 9.56j) Bharat Petro Resources Limited (BPRL) Trade & other receivable 96.29 96.29k) Coal India Limited Trade & other receivable 724.25 622.11 Amount payable: a) Indian Oil Corporation Limited Trade & other payable 354.38 51.85b) Bharat Petroleum Corporation Limited Trade & other payable 285.21 80.75c) GAIL (India) Limited Trade & other payable 332.41 246.75d) Bharat Heavy Electricals Limited Trade & other payable 1,071.28 1,009.02e) Balmer Lawrie & Co Limited Trade & other payable 84.78 16.96f) Shipping Corporation of India Trade & other payable 1,265.65 1,973.86g)NumaligarhRefineryLimited Trade & other payable 5.57 6.15h) Bharat Electronics Limited Trade & other payable 796.65 887.51i) Oil India Limited Trade & other payable 156.95 95.91j) Bharat Pumps and compressors Limited Trade & other payable 25.76 16.26
The above transactions with the government related entities cover transactions that are significant individuallyand collectively. The Company has also entered into other transactions such as telephone expenses, air travel, fuel purchase and deposits etc. with above mentioned and other various government related entities. These transactions are insignificantindividuallyandcollectivelyandhencenotdisclosed.
45. Financial instruments Disclosure
45.1 Capital Management
The Company’s objective when managing capital is to:
•SafeguarditsabilitytocontinueasgoingconcernsothattheCompanyisabletoprovidemaximumreturntostakeholdersandbenefitsforotherstakeholders;and
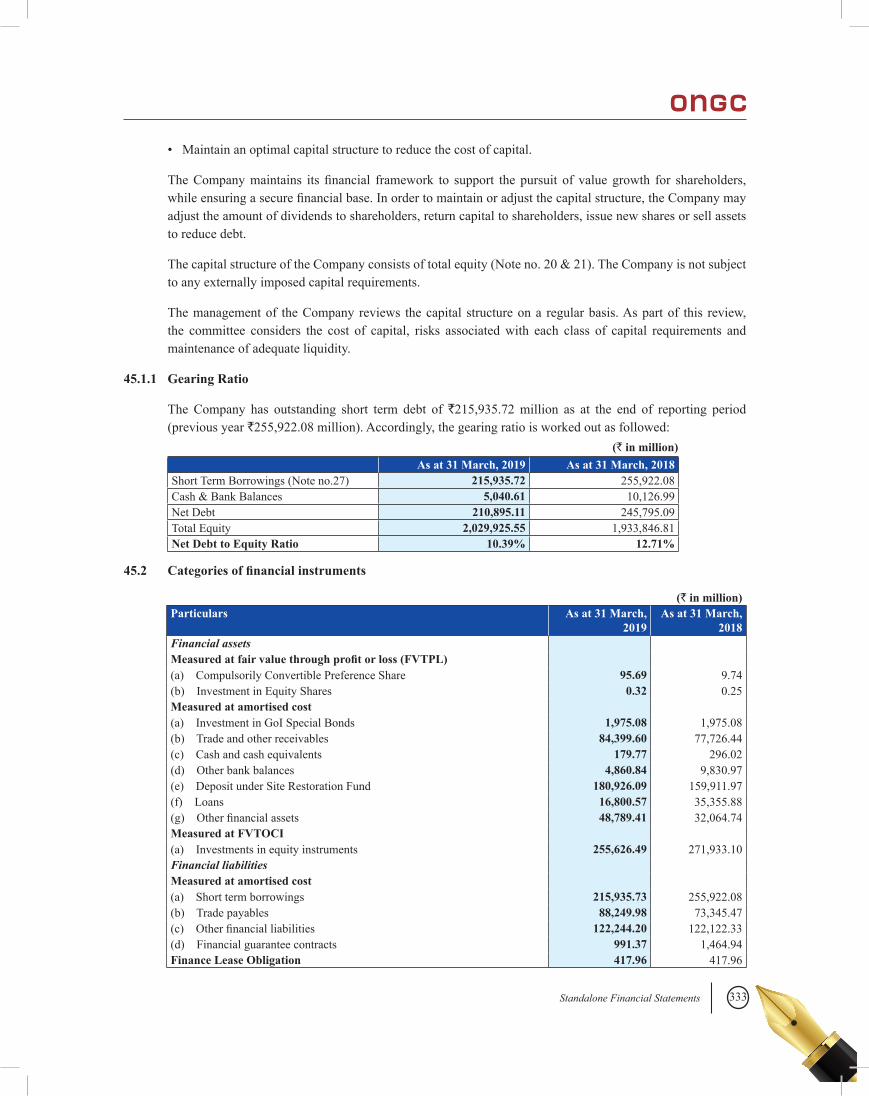
333Standalone Financial Statements
•Maintainanoptimalcapitalstructuretoreducethecostofcapital.
TheCompanymaintains its financial framework to support the pursuit of value growth for shareholders,whileensuringasecurefinancialbase.Inordertomaintainoradjustthecapitalstructure,theCompanymayadjust the amount of dividends to shareholders, return capital to shareholders, issue new shares or sell assets to reduce debt.
The capital structure of the Company consists of total equity (Note no. 20 & 21). The Company is not subject to any externally imposed capital requirements.
The management of the Company reviews the capital structure on a regular basis. As part of this review, the committee considers the cost of capital, risks associated with each class of capital requirements and maintenance of adequate liquidity.
45.1.1 Gearing Ratio
The Company has outstanding short term debt of `215,935.72 million as at the end of reporting period (previous year `255,922.08 million). Accordingly, the gearing ratio is worked out as followed:
As at 31 March, 2019 As at 31 March, 2018Short Term Borrowings (Note no.27) 215,935.72 255,922.08Cash & Bank Balances 5,040.61 10,126.99Net Debt 210,895.11 245,795.09Total Equity 2,029,925.55 1,933,846.81Net Debt to Equity Ratio 10.39% 12.71%
45.2 Categories of financial instruments
(` in million)Particulars As at 31 March,
2019As at 31 March,
2018Financial assetsMeasured at fair value through profit or loss (FVTPL)(a) Compulsorily Convertible Preference Share 95.69 9.74(b) Investment in Equity Shares 0.32 0.25Measured at amortised cost(a) Investment in GoI Special Bonds 1,975.08 1,975.08(b) Trade and other receivables 84,399.60 77,726.44(c) Cash and cash equivalents 179.77 296.02(d) Other bank balances 4,860.84 9,830.97(e) Deposit under Site Restoration Fund 180,926.09 159,911.97(f) Loans 16,800.57 35,355.88(g) Otherfinancialassets 48,789.41 32,064.74Measured at FVTOCI(a) Investments in equity instruments 255,626.49 271,933.10Financial liabilitiesMeasured at amortised cost(a) Short term borrowings 215,935.73 255,922.08(b) Trade payables 88,249.98 73,345.47(c) Otherfinancialliabilities 122,244.20 122,122.33(d) Financial guarantee contracts 991.37 1,464.94Finance Lease Obligation 417.96 417.96
(` in million)
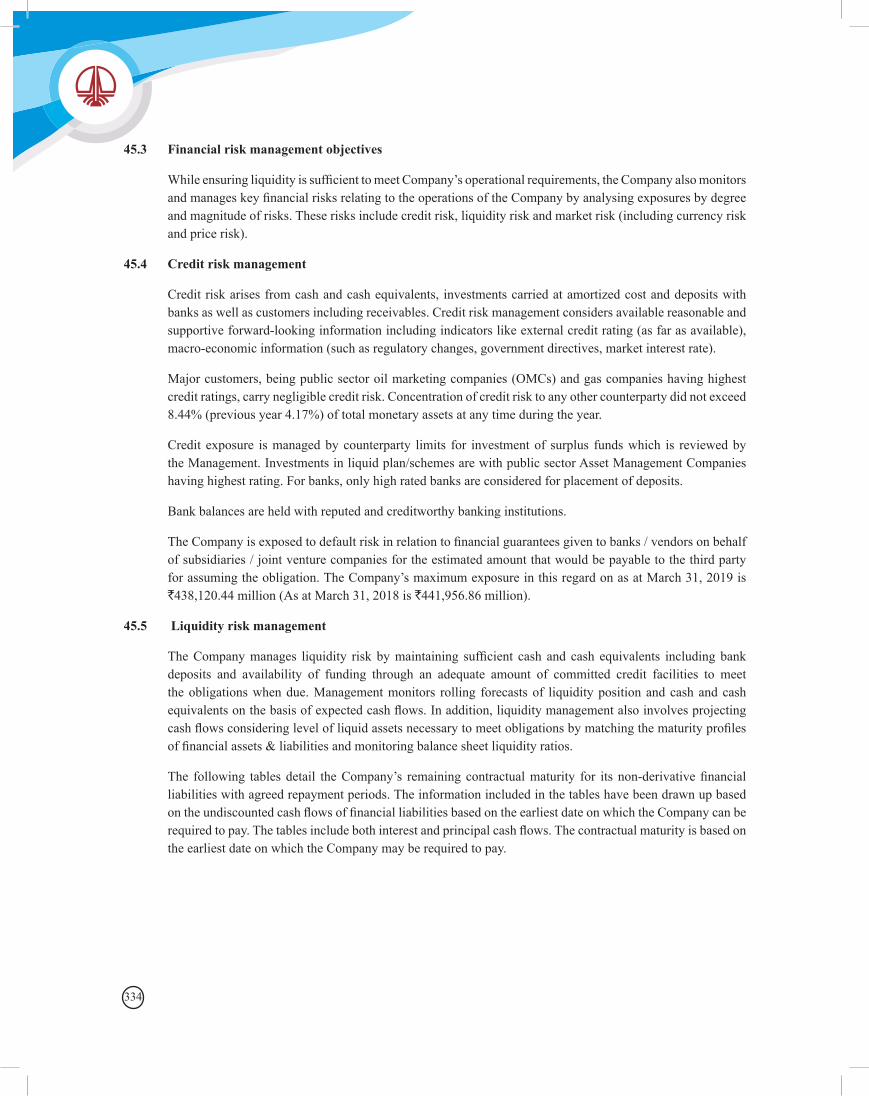
334
45.3 Financial risk management objectives
WhileensuringliquidityissufficienttomeetCompany’soperationalrequirements,theCompanyalsomonitorsandmanageskeyfinancialrisksrelatingtotheoperationsoftheCompanybyanalysingexposuresbydegreeand magnitude of risks. These risks include credit risk, liquidity risk and market risk (including currency risk and price risk).
45.4 Credit risk management
Credit risk arises from cash and cash equivalents, investments carried at amortized cost and deposits with banks as well as customers including receivables. Credit risk management considers available reasonable and supportive forward-looking information including indicators like external credit rating (as far as available), macro-economic information (such as regulatory changes, government directives, market interest rate).
Major customers, being public sector oil marketing companies (OMCs) and gas companies having highest credit ratings, carry negligible credit risk. Concentration of credit risk to any other counterparty did not exceed 8.44% (previous year 4.17%) of total monetary assets at any time during the year.
Credit exposure is managed by counterparty limits for investment of surplus funds which is reviewed by the Management. Investments in liquid plan/schemes are with public sector Asset Management Companies having highest rating. For banks, only high rated banks are considered for placement of deposits.
Bank balances are held with reputed and creditworthy banking institutions.
TheCompanyisexposedtodefaultriskinrelationtofinancialguaranteesgiventobanks/vendorsonbehalfof subsidiaries / joint venture companies for the estimated amount that would be payable to the third party for assuming the obligation. The Company’s maximum exposure in this regard on as at March 31, 2019 is `438,120.44 million (As at March 31, 2018 is `441,956.86 million).
45.5 Liquidity risk management
TheCompanymanages liquidity risk bymaintaining sufficient cash and cash equivalents includingbankdeposits and availability of funding through an adequate amount of committed credit facilities to meet the obligations when due. Management monitors rolling forecasts of liquidity position and cash and cash equivalentsonthebasisofexpectedcashflows.Inaddition,liquiditymanagementalsoinvolvesprojectingcashflowsconsideringlevelofliquidassetsnecessarytomeetobligationsbymatchingthematurityprofilesoffinancialassets&liabilitiesandmonitoringbalancesheetliquidityratios.
The following tablesdetail theCompany’s remaining contractualmaturity for its non-derivativefinancialliabilities with agreed repayment periods. The information included in the tables have been drawn up based ontheundiscountedcashflowsoffinancialliabilitiesbasedontheearliestdateonwhichtheCompanycanberequiredtopay.Thetablesincludebothinterestandprincipalcashflows.Thecontractualmaturityisbasedonthe earliest date on which the Company may be required to pay.
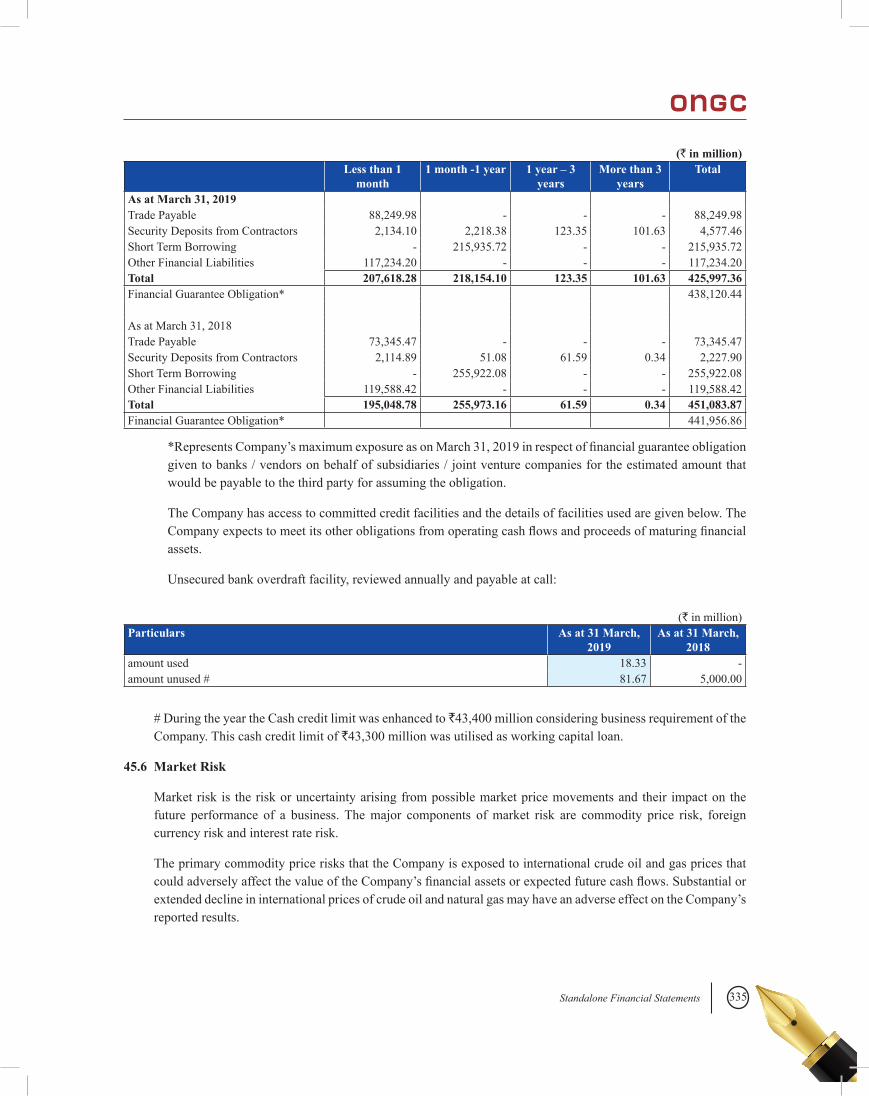
335Standalone Financial Statements
(` in million)Less than 1
month1 month -1 year 1 year – 3
yearsMore than 3
yearsTotal
As at March 31, 2019Trade Payable 88,249.98 - - - 88,249.98Security Deposits from Contractors 2,134.10 2,218.38 123.35 101.63 4,577.46Short Term Borrowing - 215,935.72 - - 215,935.72Other Financial Liabilities 117,234.20 - - - 117,234.20Total 207,618.28 218,154.10 123.35 101.63 425,997.36Financial Guarantee Obligation* 438,120.44
As at March 31, 2018Trade Payable 73,345.47 - - - 73,345.47Security Deposits from Contractors 2,114.89 51.08 61.59 0.34 2,227.90Short Term Borrowing - 255,922.08 - - 255,922.08Other Financial Liabilities 119,588.42 - - - 119,588.42Total 195,048.78 255,973.16 61.59 0.34 451,083.87Financial Guarantee Obligation* 441,956.86
*RepresentsCompany’smaximumexposureasonMarch31,2019inrespectoffinancialguaranteeobligationgiven to banks / vendors on behalf of subsidiaries / joint venture companies for the estimated amount that would be payable to the third party for assuming the obligation.
The Company has access to committed credit facilities and the details of facilities used are given below. The Companyexpectstomeetitsotherobligationsfromoperatingcashflowsandproceedsofmaturingfinancialassets.
Unsecured bank overdraft facility, reviewed annually and payable at call:
(` in million)Particulars As at 31 March,
2019As at 31 March,
2018amount used 18.33 -amount unused # 81.67 5,000.00
# During the year the Cash credit limit was enhanced to `43,400 million considering business requirement of the Company. This cash credit limit of `43,300 million was utilised as working capital loan.
45.6 Market Risk
Market risk is the risk or uncertainty arising from possible market price movements and their impact on the future performance of a business. The major components of market risk are commodity price risk, foreign currency risk and interest rate risk.
The primary commodity price risks that the Company is exposed to international crude oil and gas prices that couldadverselyaffectthevalueoftheCompany’sfinancialassetsorexpectedfuturecashflows.Substantialorextended decline in international prices of crude oil and natural gas may have an adverse effect on the Company’s reported results.
336
Shri Shashi Shanker, CMD, Shri A.K. Dwivedi, Director (Exploration), Shri Rajesh Kakkar, Director (Offshore), Shri N.C. Pandey, Director (T&FS) reviewing the activities of Nhava Supply Base
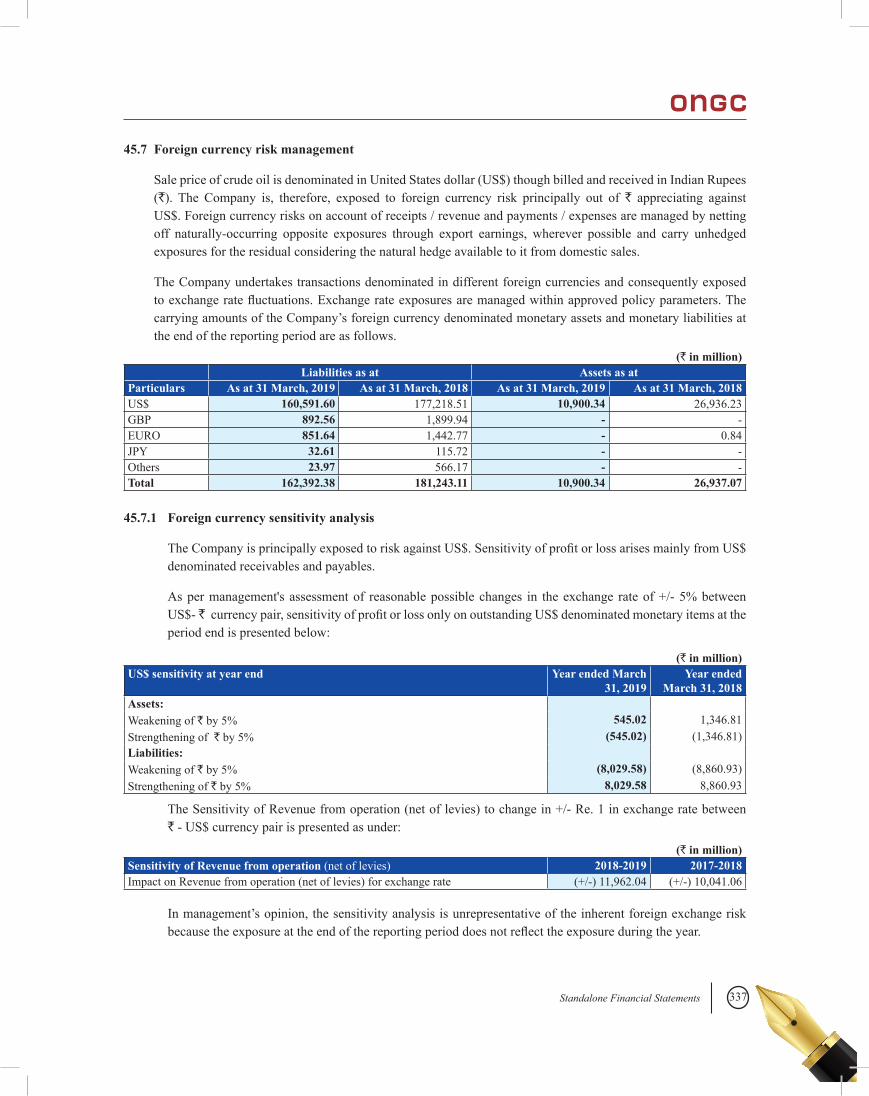
337Standalone Financial Statements
45.7 Foreign currency risk management
Sale price of crude oil is denominated in United States dollar (US$) though billed and received in Indian Rupees (`). The Company is, therefore, exposed to foreign currency risk principally out of ` appreciating against US$. Foreign currency risks on account of receipts / revenue and payments / expenses are managed by netting off naturally-occurring opposite exposures through export earnings, wherever possible and carry unhedged exposures for the residual considering the natural hedge available to it from domestic sales.
The Company undertakes transactions denominated in different foreign currencies and consequently exposed toexchangeratefluctuations.Exchangerateexposuresaremanagedwithinapprovedpolicyparameters.Thecarrying amounts of the Company’s foreign currency denominated monetary assets and monetary liabilities at the end of the reporting period are as follows.
(` in million)Liabilities as at Assets as at
Particulars As at 31 March, 2019 As at 31 March, 2018 As at 31 March, 2019 As at 31 March, 2018US$ 160,591.60 177,218.51 10,900.34 26,936.23GBP 892.56 1,899.94 - -EURO 851.64 1,442.77 - 0.84JPY 32.61 115.72 - -Others 23.97 566.17 - -Total 162,392.38 181,243.11 10,900.34 26,937.07
45.7.1 Foreign currency sensitivity analysis
TheCompanyisprincipallyexposedtoriskagainstUS$.SensitivityofprofitorlossarisesmainlyfromUS$denominated receivables and payables.
As per management's assessment of reasonable possible changes in the exchange rate of +/- 5% between US$- `currencypair,sensitivityofprofitorlossonlyonoutstandingUS$denominatedmonetaryitemsattheperiod end is presented below:
(` in million)US$ sensitivity at year end Year ended March
31, 2019Year ended
March 31, 2018Assets:Weakening of ` by 5% 545.02 1,346.81Strengthening of ` by 5% (545.02) (1,346.81)Liabilities:Weakening of ` by 5% (8,029.58) (8,860.93)Strengthening of ` by 5% 8,029.58 8,860.93
The Sensitivity of Revenue from operation (net of levies) to change in +/- Re. 1 in exchange rate between ` - US$ currency pair is presented as under:
(` in million)Sensitivity of Revenue from operation (net of levies) 2018-2019 2017-2018Impact on Revenue from operation (net of levies) for exchange rate (+/-) 11,962.04 (+/-) 10,041.06
In management’s opinion, the sensitivity analysis is unrepresentative of the inherent foreign exchange risk becausetheexposureattheendofthereportingperioddoesnotreflecttheexposureduringtheyear.
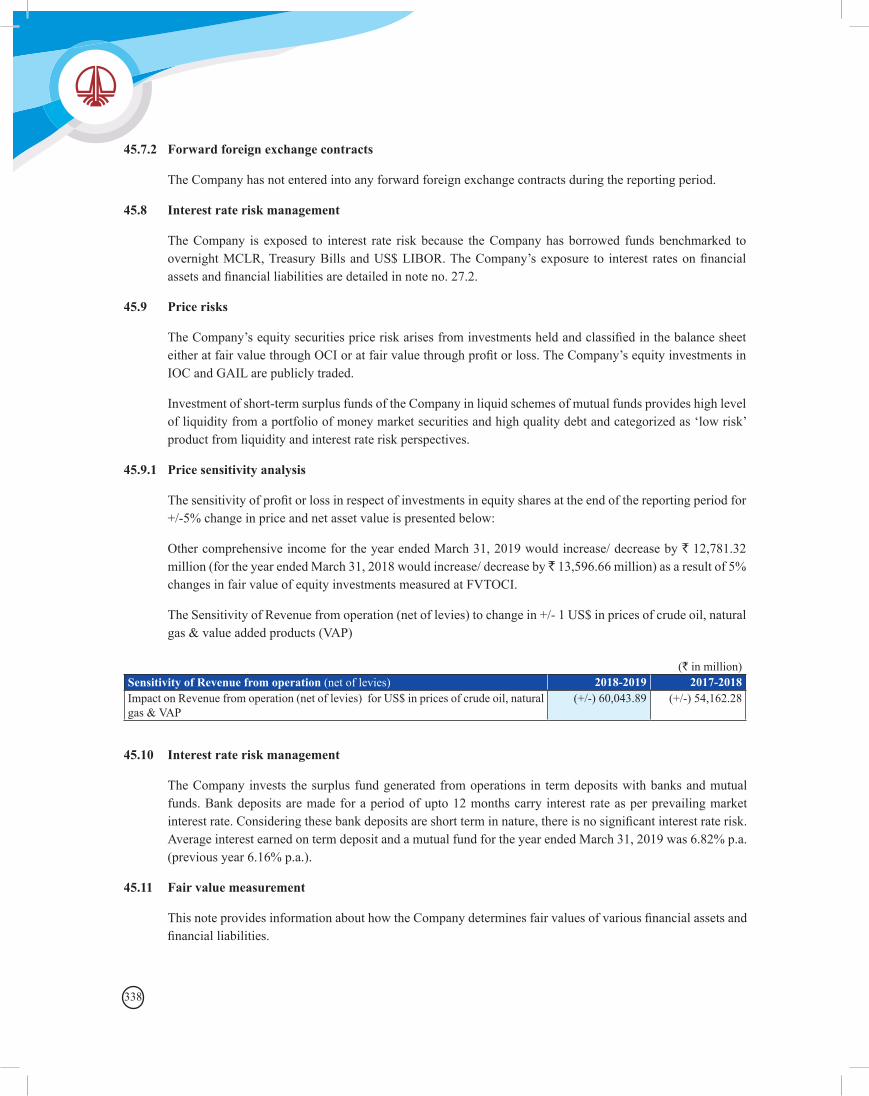
338
45.7.2 Forward foreign exchange contracts
The Company has not entered into any forward foreign exchange contracts during the reporting period.
45.8 Interest rate risk management
The Company is exposed to interest rate risk because the Company has borrowed funds benchmarked to overnightMCLR,TreasuryBillsandUS$LIBOR.TheCompany’sexposure to interest ratesonfinancialassetsandfinancialliabilitiesaredetailedinnoteno.27.2.
45.9 Price risks
TheCompany’sequitysecuritiespriceriskarisesfrominvestmentsheldandclassifiedinthebalancesheeteitheratfairvaluethroughOCIoratfairvaluethroughprofitorloss.TheCompany’sequityinvestmentsinIOC and GAIL are publicly traded.
Investment of short-term surplus funds of the Company in liquid schemes of mutual funds provides high level of liquidity from a portfolio of money market securities and high quality debt and categorized as ‘low risk’ product from liquidity and interest rate risk perspectives.
45.9.1 Price sensitivity analysis
Thesensitivityofprofitorlossinrespectofinvestmentsinequitysharesattheendofthereportingperiodfor+/-5% change in price and net asset value is presented below:
Other comprehensive income for the year ended March 31, 2019 would increase/ decrease by ` 12,781.32 million (for the year ended March 31, 2018 would increase/ decrease by ` 13,596.66 million) as a result of 5% changes in fair value of equity investments measured at FVTOCI.
The Sensitivity of Revenue from operation (net of levies) to change in +/- 1 US$ in prices of crude oil, natural gas & value added products (VAP)
(` in million)Sensitivity of Revenue from operation (net of levies) 2018-2019 2017-2018Impact on Revenue from operation (net of levies) for US$ in prices of crude oil, natural gas & VAP
(+/-) 60,043.89 (+/-) 54,162.28
45.10 Interest rate risk management
The Company invests the surplus fund generated from operations in term deposits with banks and mutual funds. Bank deposits are made for a period of upto 12 months carry interest rate as per prevailing market interestrate.Consideringthesebankdepositsareshortterminnature,thereisnosignificantinterestraterisk.Average interest earned on term deposit and a mutual fund for the year ended March 31, 2019 was 6.82% p.a. (previous year 6.16% p.a.).
45.11 Fair value measurement
ThisnoteprovidesinformationabouthowtheCompanydeterminesfairvaluesofvariousfinancialassetsandfinancialliabilities.
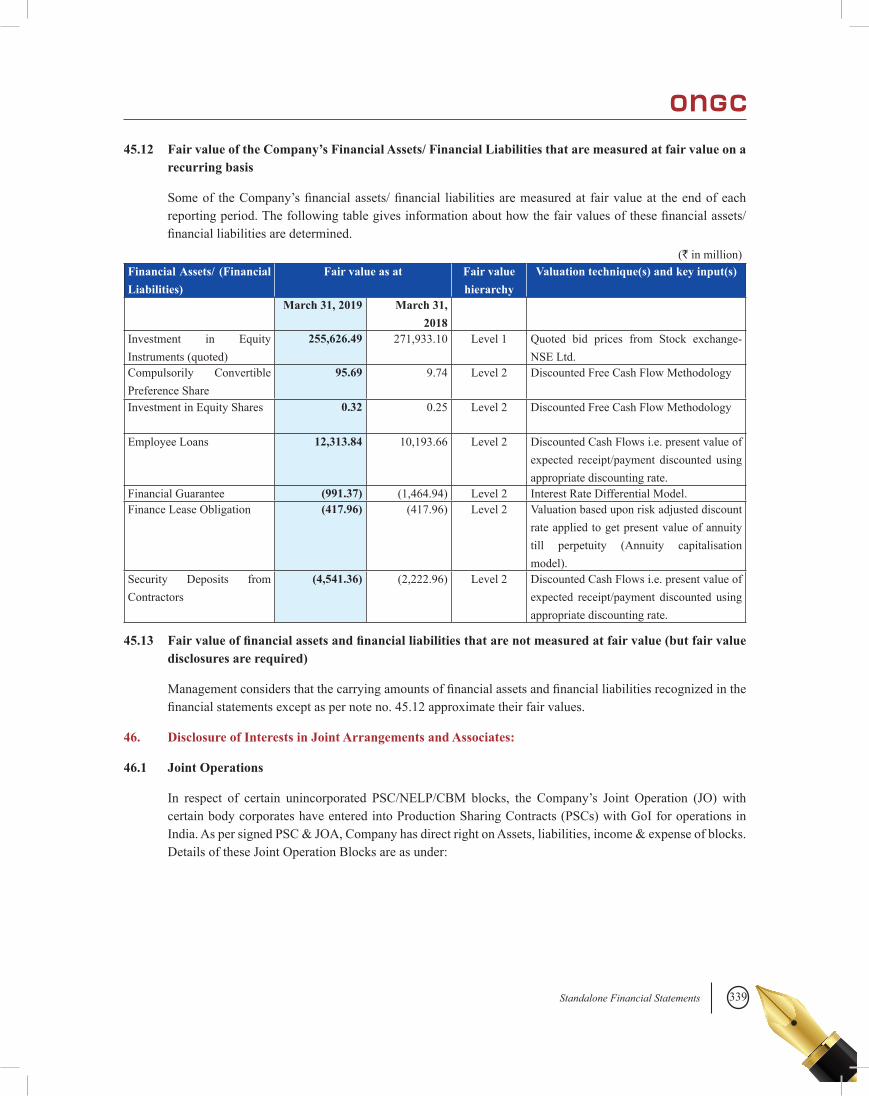
339Standalone Financial Statements
45.12 Fair value of the Company’s Financial Assets/ Financial Liabilities that are measured at fair value on a recurring basis
Someof theCompany’sfinancialassets/financial liabilitiesaremeasuredat fairvalueat theendofeachreportingperiod.Thefollowingtablegivesinformationabouthowthefairvaluesofthesefinancialassets/financialliabilitiesaredetermined.
(` in million)Financial Assets/ (Financial Liabilities)
Fair value as at Fair value hierarchy
Valuation technique(s) and key input(s)
March 31, 2019 March 31, 2018
Investment in Equity Instruments (quoted)
255,626.49 271,933.10 Level 1 Quoted bid prices from Stock exchange-NSE Ltd.
Compulsorily Convertible Preference Share
95.69 9.74 Level 2 Discounted Free Cash Flow Methodology
Investment in Equity Shares 0.32 0.25 Level 2 Discounted Free Cash Flow Methodology
Employee Loans 12,313.84 10,193.66 Level 2 Discounted Cash Flows i.e. present value of expected receipt/payment discounted using appropriate discounting rate.
Financial Guarantee (991.37) (1,464.94) Level 2 Interest Rate Differential Model. Finance Lease Obligation (417.96) (417.96) Level 2 Valuation based upon risk adjusted discount
rate applied to get present value of annuity till perpetuity (Annuity capitalisation model).
Security Deposits from Contractors
(4,541.36) (2,222.96) Level 2 Discounted Cash Flows i.e. present value of expected receipt/payment discounted using appropriate discounting rate.
45.13 Fair value of financial assets and financial liabilities that are not measured at fair value (but fair value disclosures are required)
Managementconsidersthatthecarryingamountsoffinancialassetsandfinancialliabilitiesrecognizedinthefinancialstatementsexceptaspernoteno.45.12approximatetheirfairvalues.
46. Disclosure of Interests in Joint Arrangements and Associates:
46.1 Joint Operations
In respect of certain unincorporated PSC/NELP/CBM blocks, the Company’s Joint Operation (JO) with certain body corporates have entered into Production Sharing Contracts (PSCs) with GoI for operations in India. As per signed PSC & JOA, Company has direct right on Assets, liabilities, income & expense of blocks. Details of these Joint Operation Blocks are as under:
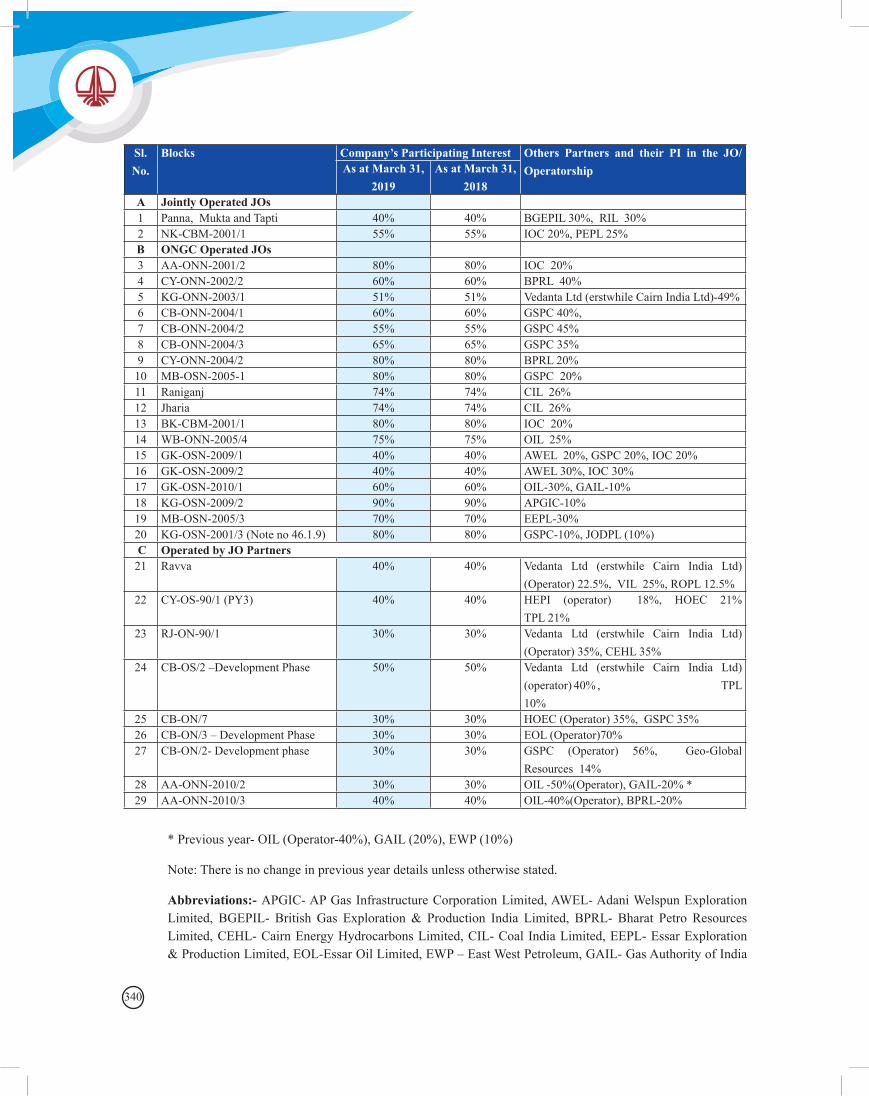
340
Sl. No.
Blocks Company’s Participating Interest Others Partners and their PI in the JO/OperatorshipAs at March 31,
2019As at March 31,
2018A Jointly Operated JOs1 Panna, Mukta and Tapti 40% 40% BGEPIL 30%, RIL 30%2 NK-CBM-2001/1 55% 55% IOC 20%, PEPL 25% B ONGC Operated JOs3 AA-ONN-2001/2 80% 80% IOC 20%4 CY-ONN-2002/2 60% 60% BPRL 40%5 KG-ONN-2003/1 51% 51% Vedanta Ltd (erstwhile Cairn India Ltd)-49%6 CB-ONN-2004/1 60% 60% GSPC 40%, 7 CB-ONN-2004/2 55% 55% GSPC 45% 8 CB-ONN-2004/3 65% 65% GSPC 35% 9 CY-ONN-2004/2 80% 80% BPRL 20%10 MB-OSN-2005-1 80% 80% GSPC 20%11 Raniganj 74% 74% CIL 26%12 Jharia 74% 74% CIL 26%13 BK-CBM-2001/1 80% 80% IOC 20%14 WB-ONN-2005/4 75% 75% OIL 25%15 GK-OSN-2009/1 40% 40% AWEL 20%, GSPC 20%, IOC 20%16 GK-OSN-2009/2 40% 40% AWEL 30%, IOC 30%17 GK-OSN-2010/1 60% 60% OIL-30%, GAIL-10%18 KG-OSN-2009/2 90% 90% APGIC-10%19 MB-OSN-2005/3 70% 70% EEPL-30% 20 KG-OSN-2001/3 (Note no 46.1.9) 80% 80% GSPC-10%, JODPL (10%) C Operated by JO Partners 21 Ravva 40% 40% Vedanta Ltd (erstwhile Cairn India Ltd)
(Operator) 22.5%, VIL 25%, ROPL 12.5%22 CY-OS-90/1 (PY3) 40% 40% HEPI (operator) 18%, HOEC 21%
TPL 21%23 RJ-ON-90/1 30% 30% Vedanta Ltd (erstwhile Cairn India Ltd)
(Operator) 35%, CEHL 35%24 CB-OS/2–DevelopmentPhase 50% 50% Vedanta Ltd (erstwhile Cairn India Ltd)
(operator) 40% , TPL 10%
25 CB-ON/7 30% 30% HOEC (Operator) 35%, GSPC 35%26 CB-ON/3–DevelopmentPhase 30% 30% EOL (Operator)70%27 CB-ON/2- Development phase 30% 30% GSPC (Operator) 56%, Geo-Global
Resources 14%28 AA-ONN-2010/2 30% 30% OIL -50%(Operator), GAIL-20% *29 AA-ONN-2010/3 40% 40% OIL-40%(Operator), BPRL-20%
* Previous year- OIL (Operator-40%), GAIL (20%), EWP (10%)
Note: There is no change in previous year details unless otherwise stated.
Abbreviations:- APGIC- AP Gas Infrastructure Corporation Limited, AWEL- Adani Welspun Exploration Limited, BGEPIL- British Gas Exploration & Production India Limited, BPRL- Bharat Petro Resources Limited, CEHL- Cairn Energy Hydrocarbons Limited, CIL- Coal India Limited, EEPL- Essar Exploration &ProductionLimited,EOL-EssarOilLimited,EWP–EastWestPetroleum,GAIL-GasAuthorityofIndia
341Standalone Financial Statements
Limited, GSPC- Gujarat State Petroleum Corporation Limited, HEPI- Hardy Exploration & Production India Limited, HOEC- Hindustan Oil Exploration Company Limited, IOC- Indian Oil Corporation Limited, JODPL- Jubilant Offshore Drilling Private Limited, OIL- Oil India Limited, PEPL-Prabha Energy Private Limited, RIL- Reliance Industries Limited, ROPL- Ravva Oil (Singapore) Private Limited, TPL- Tata Petrodyne Limited, VIL- Videocon Industries Limited.
46.1.1 List of the blocks surrendered during the year are given below:
Sl. No. Joint Operation / PSCsCompany’s Participating Interest
As at March 31, 2019 As at March 31, 2018
1 CB-ONN-2010/1 100% 100%2 CB-ONN-2010/9 100% 100%3 CB-OS/1 55.26% 55.26%
46.1.2 During the year 2018-19, Company has entered into Revenue Sharing Contracts with Government of India for two blocks i.e. MB-OSHP-2017/1 (PI 100%) & CY-ONHP-2017/1 (PI 100%), acquired under Open Acreage Licensing Policy (OALP-I). In respect of CY-ONHP-2017/1 block, the farm out agreement for 40% stake to Bharat Petro Resources Ltd (BPRL) has been entered into with effective date as February 20, 2019, which is subject to approval of Government of India. Similarly, Company has entered into farm in agreement for the blocks AA-ONHP-2017/10, AA-ONHP-2017/13 & CB-ONHP-2017/9 to acquire 30% stake from Oil India Limited in the blocks AA-ONHP-2017/10 & AA-ONHP-2017/13 with effective date as February 19, 2019 and 40% stake from BPRL in the block CB-ONHP-2017/9 with effective date as February 20, 2019, which are also subject to approval of Government of India.
46.1.3 Financial position of the Joint Operation –Company’s share are as under:
Thefinancialstatementsof124nos.(125inFY2017-18),outof137nos.(136inFY17-18)Jointoperationblock (JOs/NELP/HELP), have been incorporated in the accounts to the extent of Company’s participating interest in assets, liabilities, income, expenditure and profit / (loss) before tax on the basis of statementscertifiedinaccordancewithproductionsharingcontractandinrespectofbalance13(11inFY2017-18)Jointoperationblocks (JOs/NELP/CBMblocks), thefigureshavebeen incorporatedon thebasisofuncertifiedstatementspreparedundertheproductionsharingcontracts.Boththefigureshavebeenadjustedforchangesaspernoteno.3.4.ThefinancialpositionsofJO/NELP/HELPareasunder:-
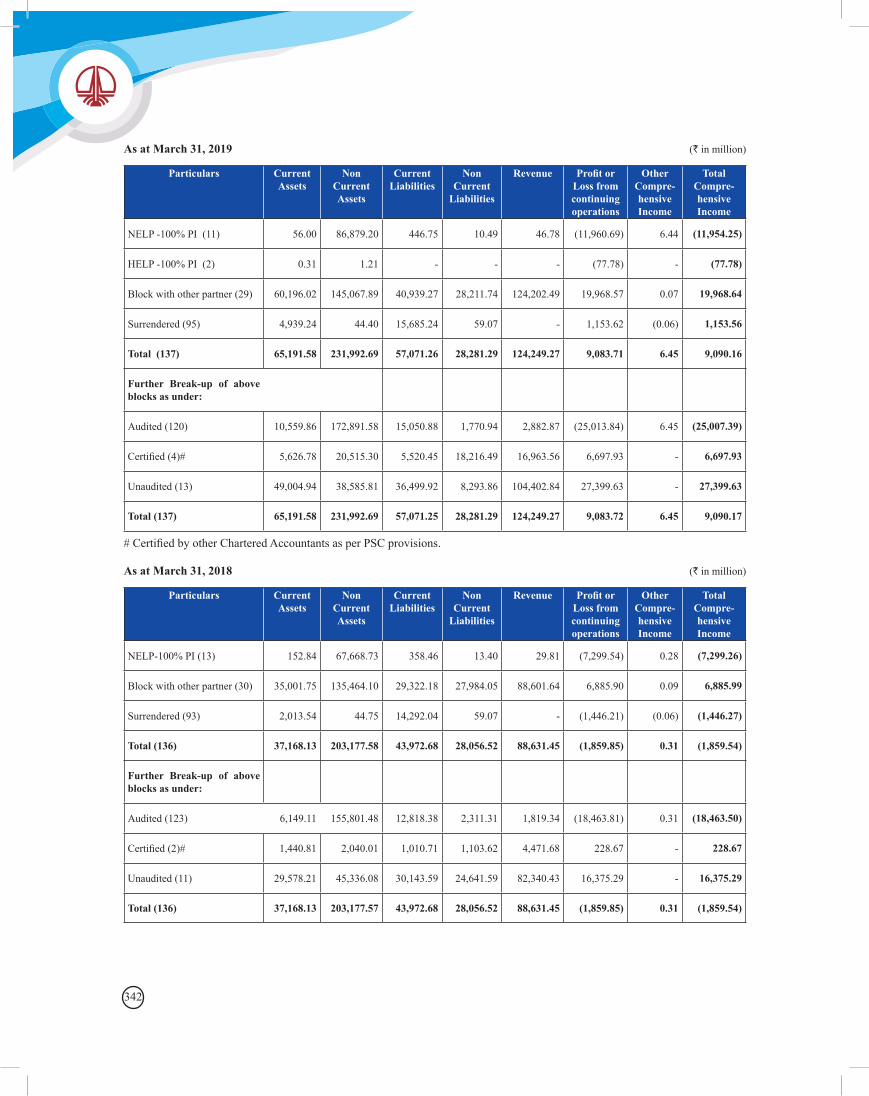
342
Particulars Current Assets
Non Current Assets
Current Liabilities
Non Current
Liabilities
Revenue Profit or Loss from continuing operations
Other Compre-hensive Income
Total Compre-hensive Income
NELP -100% PI (11) 56.00 86,879.20 446.75 10.49 46.78 (11,960.69) 6.44 (11,954.25)
HELP -100% PI (2) 0.31 1.21 - - - (77.78) - (77.78)
Block with other partner (29) 60,196.02 145,067.89 40,939.27 28,211.74 124,202.49 19,968.57 0.07 19,968.64
Surrendered (95) 4,939.24 44.40 15,685.24 59.07 - 1,153.62 (0.06) 1,153.56
Total (137) 65,191.58 231,992.69 57,071.26 28,281.29 124,249.27 9,083.71 6.45 9,090.16
Further Break-up of above blocks as under:
Audited (120) 10,559.86 172,891.58 15,050.88 1,770.94 2,882.87 (25,013.84) 6.45 (25,007.39)
Certified(4)# 5,626.78 20,515.30 5,520.45 18,216.49 16,963.56 6,697.93 - 6,697.93
Unaudited (13) 49,004.94 38,585.81 36,499.92 8,293.86 104,402.84 27,399.63 - 27,399.63
Total (137) 65,191.58 231,992.69 57,071.25 28,281.29 124,249.27 9,083.72 6.45 9,090.17
As at March 31, 2019 (` in million)
Particulars Current Assets
Non Current Assets
Current Liabilities
Non Current
Liabilities
Revenue Profit or Loss from continuing operations
Other Compre-hensive Income
Total Compre-hensive Income
NELP-100% PI (13) 152.84 67,668.73 358.46 13.40 29.81 (7,299.54) 0.28 (7,299.26)
Block with other partner (30) 35,001.75 135,464.10 29,322.18 27,984.05 88,601.64 6,885.90 0.09 6,885.99
Surrendered (93) 2,013.54 44.75 14,292.04 59.07 - (1,446.21) (0.06) (1,446.27)
Total (136) 37,168.13 203,177.58 43,972.68 28,056.52 88,631.45 (1,859.85) 0.31 (1,859.54)
Further Break-up of above blocks as under:
Audited (123) 6,149.11 155,801.48 12,818.38 2,311.31 1,819.34 (18,463.81) 0.31 (18,463.50)
Certified(2)# 1,440.81 2,040.01 1,010.71 1,103.62 4,471.68 228.67 - 228.67
Unaudited (11) 29,578.21 45,336.08 30,143.59 24,641.59 82,340.43 16,375.29 - 16,375.29
Total (136) 37,168.13 203,177.57 43,972.68 28,056.52 88,631.45 (1,859.85) 0.31 (1,859.54)
As at March 31, 2018 (` in million)
#CertifiedbyotherCharteredAccountantsasperPSCprovisions.
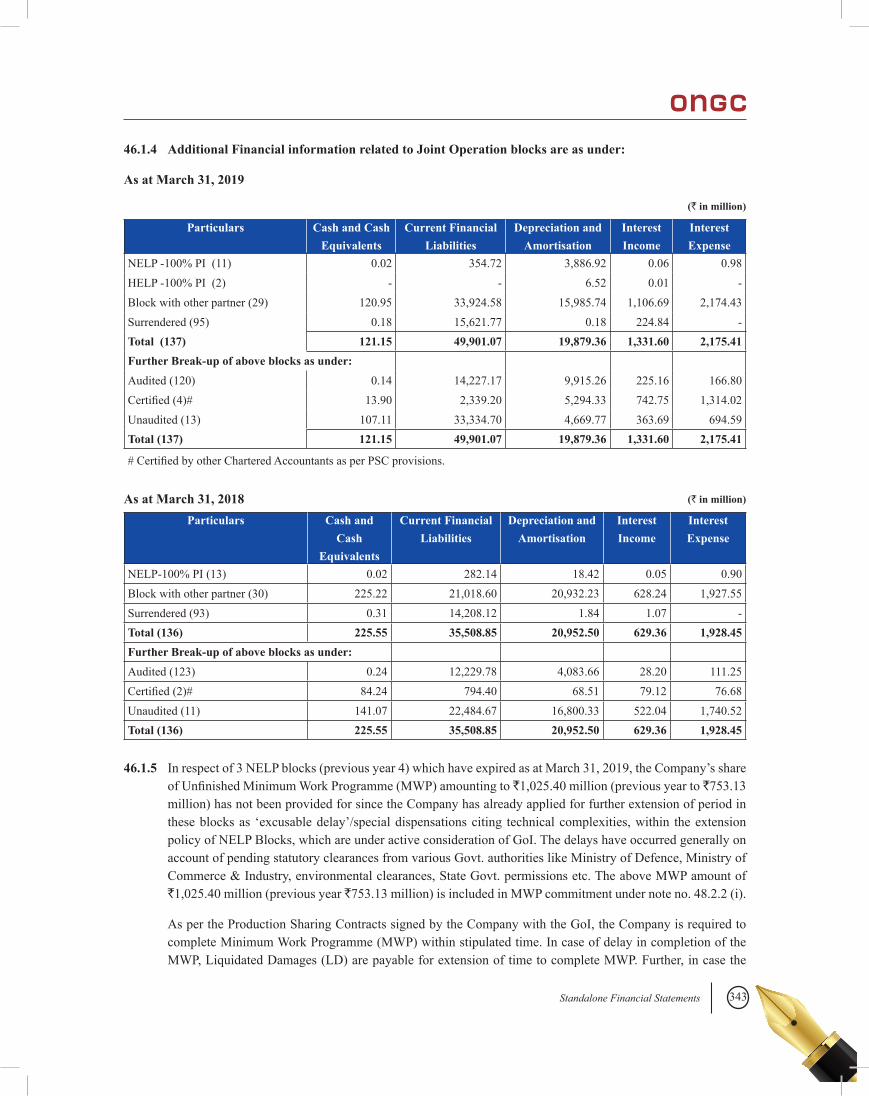
343Standalone Financial Statements
46.1.4 Additional Financial information related to Joint Operation blocks are as under:
As at March 31, 2019
Particulars Cash and Cash Equivalents
Current Financial Liabilities
Depreciation and Amortisation
Interest Income
Interest Expense
NELP -100% PI (11) 0.02 354.72 3,886.92 0.06 0.98HELP -100% PI (2) - - 6.52 0.01 -Block with other partner (29) 120.95 33,924.58 15,985.74 1,106.69 2,174.43Surrendered (95) 0.18 15,621.77 0.18 224.84 -Total (137) 121.15 49,901.07 19,879.36 1,331.60 2,175.41Further Break-up of above blocks as under:Audited (120) 0.14 14,227.17 9,915.26 225.16 166.80Certified(4)# 13.90 2,339.20 5,294.33 742.75 1,314.02Unaudited (13) 107.11 33,334.70 4,669.77 363.69 694.59Total (137) 121.15 49,901.07 19,879.36 1,331.60 2,175.41
#CertifiedbyotherCharteredAccountantsasperPSCprovisions.
As at March 31, 2018
(` in million)
(` in million)
Particulars Cash and Cash
Equivalents
Current Financial Liabilities
Depreciation and Amortisation
Interest Income
Interest Expense
NELP-100% PI (13) 0.02 282.14 18.42 0.05 0.90Block with other partner (30) 225.22 21,018.60 20,932.23 628.24 1,927.55Surrendered (93) 0.31 14,208.12 1.84 1.07 -Total (136) 225.55 35,508.85 20,952.50 629.36 1,928.45Further Break-up of above blocks as under:Audited (123) 0.24 12,229.78 4,083.66 28.20 111.25Certified(2)# 84.24 794.40 68.51 79.12 76.68Unaudited (11) 141.07 22,484.67 16,800.33 522.04 1,740.52Total (136) 225.55 35,508.85 20,952.50 629.36 1,928.45
46.1.5 In respect of 3 NELP blocks (previous year 4) which have expired as at March 31, 2019, the Company’s share ofUnfinishedMinimumWorkProgramme(MWP)amountingto`1,025.40 million (previous year to `753.13 million) has not been provided for since the Company has already applied for further extension of period in these blocks as ‘excusable delay’/special dispensations citing technical complexities, within the extension policy of NELP Blocks, which are under active consideration of GoI. The delays have occurred generally on account of pending statutory clearances from various Govt. authorities like Ministry of Defence, Ministry of Commerce & Industry, environmental clearances, State Govt. permissions etc. The above MWP amount of `1,025.40 million (previous year `753.13 million) is included in MWP commitment under note no. 48.2.2 (i).
As per the Production Sharing Contracts signed by the Company with the GoI, the Company is required to complete Minimum Work Programme (MWP) within stipulated time. In case of delay in completion of the MWP, Liquidated Damages (LD) are payable for extension of time to complete MWP. Further, in case the
344
Company does not complete MWP or surrender the block without completing the MWP, the estimated cost of completing balance work programme is required to be paid to the GoI. LD (net of reversal) amounting to `434.18 million (Previous year `688.06million)andcostofunfinishedMWP(netofreversal)`1,080.61 million (Previous year `160.71 million), paid/payable to the GoI is included in survey and wells written off expenditure respectively.
46.1.6 Government of India has approved the relinquishment of 30% Participating Interest (PI) of ONGC in SGL Field with future interest in block RJ-ON/6 in Jaisalmer Basin Rajasthan to Focus Energy Limited (Operator) and other JV partners on the condition that Focus Energy Limited (Operator) will pay towards 100 % past royalty obligation, PEL/ML fees, other statutory levies (total amount `1872.98 million as on March 31, 2019) and waive off development/production cost payable by the Company in SGL Field of the block as well as take all future 100% royalty obligation of the Company as licensee. Pending the execution of Farm-out Agreement and amendment in Production Sharing Contract (PSC), no adjustment is made in the accounts in respect of relinquishment of RJ-ON/6.
46.1.7 The Company is having 30% Participating interest in Block RJ-ON-90/1 along-with Vedanta Ltd (erstwhile Cairn India Ltd.) (Operator) and Cairn Energy Hydrocarbons Ltd. There are certain unresolved issues including cost recovery in respect of exploration, development and production cost of the total Joint Operations amounting to US$ 978.86 Million (`67,709.02 million) as on March 31, 2018, based on Audited Statements providedbyOperator.Thefiguresofcurrentyeari.e.FY2018-19areyettobereceivedfromtheoperator.The Company is not required to pay exploration cost of US$ 87.18 Million (`6,030.35 million), being 30% of US$ 290.60 million (`20,101.18 million), out of the above amount, as per PSC. Further, the Operator has also claimed exploration cost (beyond exploration phase as per PSC) of US$ 174.03 million (`12,037.88 Million) from ONGC for cost recovery, which in view of Company is not tenable. The Company has shown a sum of US$ 261.21 Million (`18,068.24 million) under Contingent Liabilities, as the issues are presently under Arbitration proceedings.
Pending settlement of issues, the amount of US$ 206.48 million (`14,290.34 million), which is 30% of US$ 688.26 million (`47,634.47 million) pertaining to development and production cost have been accounted for as per the participating interest of the Company.
Royalty on production is being paid by the Company as the licensee and the share of JV Partners of Royalty is recoverable through revenue from Sale of Crude Oil and Gas as per PSC. Accordingly, an amount of `28,544.74 million outstanding from JV Partners has been included in the revenue upto March 31, 2019.
46.1.8 In respect of Jharia CBM Block, revised Feasibility Report (FR) in line with DGH and DGMS approval has been prepared and submitted for Board approval. At this juncture, an overlap issue with BCCL affecting ~ 2.5 SKM surfaced. JV partner, Coal India Limited (CIL) has asked ONGC to re-visit the Development Plan /FR.Presently,ONGC isfinalizing theplan.Similarly, inRaniganjCBMBlock,AirportCityProject ofBengal Aerotropolis Projects Limited (BAPL) overlaps part of the FDP area of Raniganj CBM Block. The issue is being discussed with BAPL and Government of West Bengal. Environmental Clearance (EC) has been granted w.e.f. April 7, 2018.Techno-economics (FR) of the Block is being re-worked with cost optimization. PendingfinaldecisionontheBlock,animpairmentprovisionof`617.36 million has been provided in the books.
46.1.9 During the year 2017-18 the Company had acquired the entire 80% Participating Interest (PI) of Gujarat State Petroleum Corporation Limited (GSPC) along with operatorship rights, at a purchase consideration of US$ 995.26 million (`62,950.20 million) for Deen Dayal West (DDW) Field in the Block KG-OSN-2001/3.
345Standalone Financial Statements
A farm-in Farm-out agreement (FIFO) was signed with GSPC on March 10, 2017 and the said consideration hasbeenpaidonAugust04,2017beingtheclosingdatein2018-19,accountingforthefinalclosingadjustment(i.e., working capital and other adjustments) to sale consideration viz. transactions from the economic date up to the closing date has been carried out and a sum of `366.86million isnetpayable toGSPCasfinalsettlement,netofrisksandinfirmitiesof`655.50 million which had been incorporated and the same is under discussion with GSPC.
As per FIFO, the Company is entitled to receive sums as adjustments to the consideration already paid based on the actual gas production and the differential in agreed gas price. Pending executing mother wells and estimatingfutureproduction,thecontingentadjustmenttoconsiderationremainstobequantified.
The Company has also paid part consideration of US$ 200 million (`12,650.00 million) for six discoveries other than DDW Field in the Block KG-OSN-2001/3 to GSPC towards acquisition rights for these discoveries intheBlockKG-OSN-2001/3tobeadjustedagainstthevaluationofsuchfieldsbasedonvaluationparametersagreed between GSPC and the Company.
47. Disclosure under Indian Accounting Standard 36 – Impairment of Assets
47.1 The Company is engaged mainly in the business of oil and gas exploration and production in Onshore and Offshore.Incaseofonshoreassets,thefieldsareusingcommonproduction/transportationfacilitiesandaresufficiently economically interdependent to constitute a single cash generating unit (CGU).Accordingly,impairmenttestofallonshorefieldsisperformedinaggregateofallthosefieldsattheAssetLevel.IncaseofOffshoreAssets,afieldisgenerallyconsideredasCGUexceptforfieldswhicharedevelopedasaCluster,forwhich common facilities are used, in which case the impairment testing is performed in aggregate for all the fieldsincludedinthecluster.
47.2 The Value in Use of producing/developing CGUs is determined under a multi-stage approach, wherein future cash flows are initially estimated based on ProvedDevelopedReserves. Under the circumstanceswherefurtherdevelopmentofthefieldsintheCGUsareunderprogressandwherethecarryingvalueoftheCGUsisnot likely to be recovered through exploitation of proved developed reserves alone, the Proved and probable reserves(2P)oftheCGUsarealsotakenforthepurposeofestimatingfuturecashflows.Insuchcases,fullestimate of the expected cost of evaluation/development is also considered while determining the value in use.
47.3 Inassessingvalueinuse,theestimatedfuturecashflowsfromthecontinuinguseofassetsandfromitsdisposalattheendofitsusefullifearediscountedtotheirpresentvalue.Thepresentvalueofcashflowshasbeendetermined by applying discount rates of 14.71% (as at March 31, 2018 - 14.48 %) for Rupee transactions and 9.79% (as at March 31, 2018- 9.68 %) for crude oil and value added products revenue, which are measured inUS$.Futurecashinflowsfromsaleofcrudeoilandvalueaddedproductshavebeencomputedusingthefuture prices, on the basis of market-based average prices of dated Brent crude oil as per ‘Platt’s Crude oil marketwire’anditsCo-relationswithbenchmarkcrudeandotherpetroleumproducts.FuturecashflowsfromsaleofnaturalgasarealsocomputedbasedontheexpectedfuturepricesonthebasisofnotificationissuedbytheGovernmentofIndiaanddiscountedapplyingtherateapplicabletothecashflowsmeasuredinUS$inview of the new pricing guidelines issued by GOI. (Note no. 30.2)
47.4 The Company has assessed the impairment as at March 31, 2019 for its CGUs. During the year, `3,827.50 million (As on 31 March, 2018: `1,342.92 million) has been provided for impairment loss mainly consisting of Offshore CGUs WO-16 at Mumbai offshore (`1,415.96 million: note no. 47.5), Offshore Pre-NELP block CY-OS-90/1 (`746.46 million), NELP Joint Venture block KG-OSN-2004/1 (`431.37 million), onshore CGUs Silchar and Jodhpur (`755.06million)andOnshoreNELPblockCY–ONN-2004/2(`365.48 million).
346
47.5 During the year the Company has migrated from classification of Reserves under SPE-1997 guidelinesto Petroleum Resource Management System (PRMS) for estimating the reserves as on March 31, 2019. Consequent to its implementation, there is a shift in ultimate reserves to contingent resource category. As a result of this change, there has been an impairment loss amounting to `1,415.96 million for offshore CGU WO-16 Cluster and `365.48millionforOnshoreNELPblockCY–ONN-2004/2.
47.6 During the year `503.28 million (previous year `6,985.33 million) of impairment loss has been reversed. This mainlypertainstoTaptifieldamountingto`500.12 million.
47.7 The following 2P reserves for respective CGU were considered as a basis for the impairment testing as at March 31, 2019:
Name of the CGU Quantity of Reserves used for Impairment Assessment (In MMT)
G1 GS 15 4.65Silchar Onshore Asset 0.31Jodhpur 0.71RJ-ON-90/1 (Pre NELP PSC Block) 16.09Sibsagar Onshore Asset 39.32WO 16 3.34Rajahmundry Onshore 12.53Ankleshwar Asset 11.87B-127 1.96Ratna 8.37KG-OSN-2001/3 23.50
Impairment testing of assets under exploratory phase (Exploratory wells in progress) has been carried out as on March 31, 2019 and an amount of `8,839.71 million (year ended March 31, 2018 `1,820.94 million) has been provided during the year 2018-19 as impairment loss. Further, `223.58 million (year ended March 31, 2018 `1,065.43 million) impairment losses has been reversed as exploratory phase assets have been written off at Jodhpur and transferred to Oil & Gas Asset in DVP Jorhat.
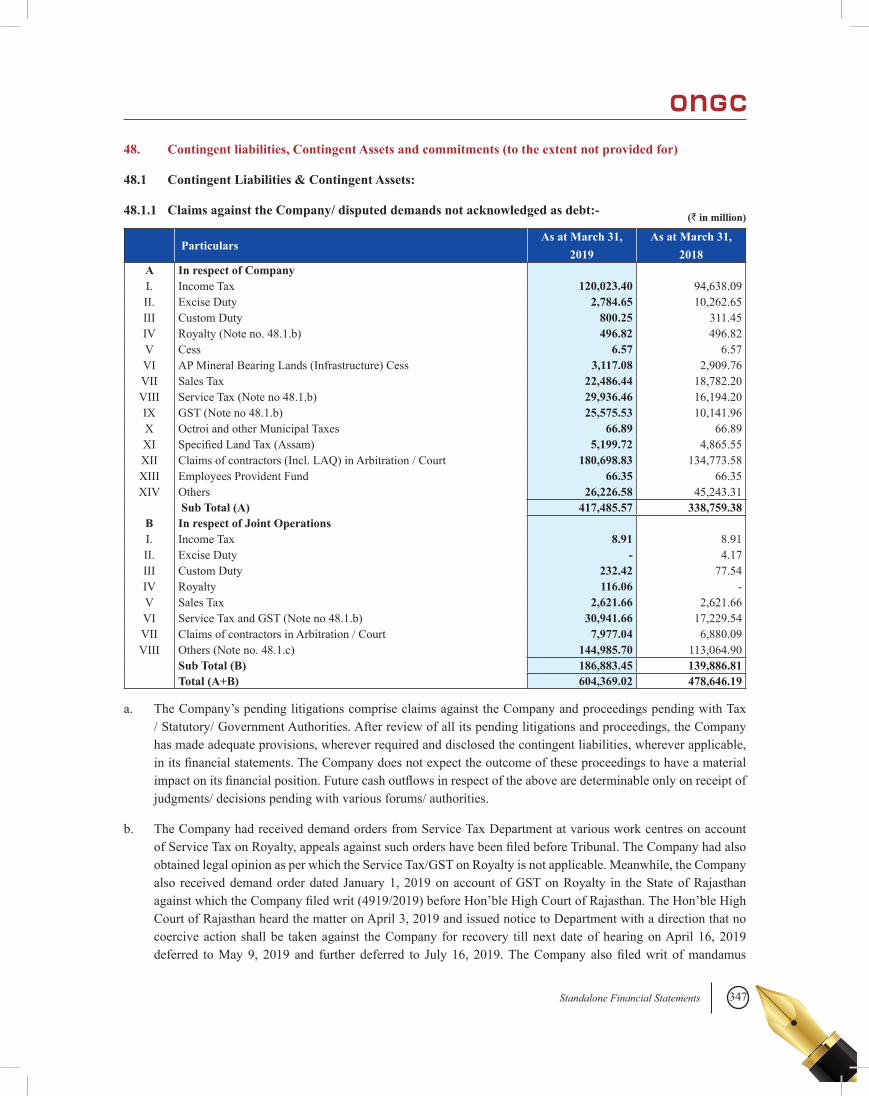
347Standalone Financial Statements
ParticularsAs at March 31,
2019As at March 31,
2018A In respect of CompanyI. Income Tax 120,023.40 94,638.09II. Excise Duty 2,784.65 10,262.65III Custom Duty 800.25 311.45IV Royalty (Note no. 48.1.b) 496.82 496.82V Cess 6.57 6.57VI AP Mineral Bearing Lands (Infrastructure) Cess 3,117.08 2,909.76VII Sales Tax 22,486.44 18,782.20VIII Service Tax (Note no 48.1.b) 29,936.46 16,194.20IX GST (Note no 48.1.b) 25,575.53 10,141.96X Octroi and other Municipal Taxes 66.89 66.89XI SpecifiedLandTax(Assam) 5,199.72 4,865.55XII Claims of contractors (Incl. LAQ) in Arbitration / Court 180,698.83 134,773.58XIII Employees Provident Fund 66.35 66.35XIV Others 26,226.58 45,243.31
Sub Total (A) 417,485.57 338,759.38B In respect of Joint OperationsI. Income Tax 8.91 8.91II. Excise Duty - 4.17III Custom Duty 232.42 77.54IV Royalty 116.06 -V Sales Tax 2,621.66 2,621.66VI Service Tax and GST (Note no 48.1.b) 30,941.66 17,229.54VII Claims of contractors in Arbitration / Court 7,977.04 6,880.09VIII Others (Note no. 48.1.c) 144,985.70 113,064.90
Sub Total (B) 186,883.45 139,886.81Total (A+B) 604,369.02 478,646.19
a. The Company’s pending litigations comprise claims against the Company and proceedings pending with Tax / Statutory/ Government Authorities. After review of all its pending litigations and proceedings, the Company has made adequate provisions, wherever required and disclosed the contingent liabilities, wherever applicable, initsfinancialstatements.TheCompanydoesnotexpecttheoutcomeoftheseproceedingstohaveamaterialimpactonitsfinancialposition.Futurecashoutflowsinrespectoftheabovearedeterminableonlyonreceiptofjudgments/ decisions pending with various forums/ authorities.
b. The Company had received demand orders from Service Tax Department at various work centres on account ofServiceTaxonRoyalty,appealsagainstsuchordershavebeenfiledbeforeTribunal.TheCompanyhadalsoobtained legal opinion as per which the Service Tax/GST on Royalty is not applicable. Meanwhile, the Company also received demand order dated January 1, 2019 on account of GST on Royalty in the State of Rajasthan againstwhichtheCompanyfiledwrit(4919/2019)beforeHon’bleHighCourtofRajasthan.TheHon’bleHighCourt of Rajasthan heard the matter on April 3, 2019 and issued notice to Department with a direction that no coercive action shall be taken against the Company for recovery till next date of hearing on April 16, 2019 deferred toMay9, 2019 and further deferred to July 16, 2019.TheCompany alsofiledwrit ofmandamus
48. Contingent liabilities, Contingent Assets and commitments (to the extent not provided for)
48.1 Contingent Liabilities & Contingent Assets:
48.1.1 Claims against the Company/ disputed demands not acknowledged as debt:- (` in million)
348
before Hon’ble High Court of Madras seeking stay on the levy of GST on royalty. The Hon’ble High Court of MadrasheardthematteronApril3,2019andtheDepartmenthasbeenallowedtofilecountersubmissionandtofinalizetherepresentation(under-protestletter)givenbyCompanytotheDepartment.Thetotalestimatedamount (including penalty and interest up to March 31, 2019) works out towards Service Tax is `38,616.33 million and GST is `37,956.77 million. Since the Company is contesting the demand, it has been considered as contingent liability. Further, as an abundant caution, the Company has deposited Service Tax and GST along-with interest under-protest amounting to `13,725.72 million and `28,065.77 million respectively.
c. The Company, with 40% Participating Interest (PI), is a Joint Operator in Panna-Mukta and Mid and South Tapti Fields alongwith Reliance Industries Limited (RIL) and BG Exploration and Production India Limited (BGEPIL)eachhaving30%PI,(allthreetogetherreferredtoas“Contractors”)signedtwoProductionsharingContracts (PSCs) with Government of India (Union of India) on December 22, 1994 for a period of 25 years. In December 2010, RIL & BGEPIL (JV Partners) invoked an international arbitration proceeding against the Union of India in respect of certain disputes, differences and claims arising out of and in connection with both the PSCs pursuant to the provisions of Article 33 of the PSCs and UNCITRAL Rules, 1976. The Ministry of Petroleum and Natural Gas (MoP&NG), vide their letter dated July 4, 2011, had directed the Company not to participate in the arbitration initiated by the JV Partners. MoP&NG has also stated that in case of an arbitral award, the same will be applicable to the Company also as a constituent of the contractor for both the PSCs .
Directorate General of Hydrocarbons (DGH), vide letters dated May 25, 2017 had informed the Company that on October 12, 2016, a Final Partial Award (FPA) was pronounced by the Tribunal in the said arbitrations. However, details of proceedings of the FPA are not available with the Company. DGH, vide their letter dated May 25, 2017 and June 04, 2018, marked to the Contractors, had directed the payment of differential Government of India shareofProfitPetroleumandRoyalty alleged tobepayablebyContractors pursuant toGovernmentsinterpretation of the FPA (40% share of the Company amounting to US$ 1,624.05 million, including interest upto November 30, 2016) equivalent to `112,400.50 million @ `69.21 (closing rate as on March 31, 2019). In response to the letters of DGH, the JV partners (with a copy marked to all Joint Venture Partners) had stated that demand of DGH was premature as the FPA did not make any money award in favour of Government of India, sincequantificationofliabilitiesweretobedeterminedduringthefinalproceedingsofthearbitration.Furtherthe award had also been challenged before the English Commercial Court (London High Court). Based on the abovefacts,theCompanyhadalsorespondedtothelettersofDGHstatingthatpendingthefinalityoftheorder,theamountdueandpayablebytheCompanywasnotquantifiable.IntheviewoftheCompany,anychangesapproved, if any, for increase in the Cost Recovery Limit (CRL) by the Management Committee (MC) as per the term of the PSCs the liability to DGH would potentially reduce.
TheEnglishCourt hasdelivered itsfinal verdict onMay2, 2018 followingwhich theArbitralTribunal re-consideredsomeofitsearlierfindingsfromthe2016FPA(RevisedAward).TheGovernmentofIndia,BGEPILand RIL have challenged parts of the Revised Award.
InJanuary2018,theCompanyalongwiththeJVpartnershasfiledanapplicationwithMCforincreaseinCRLin terms of the PSCs. The application has been rejected by MC. Pursuant to the rejection, the JV partners have filedaclaimwithArbitralTribunal.
DGH vide letter dated January 14, 2019 has advised to the contractors to re-cast the accounts for Panna-Mukta andMid and SouthTapti Fields for the year 2017-18. Pending finalization of the decision of theArbitralTribunal,theJVpartnersandtheCompanyhaveindicatedintheirletterstoDGHthatthefinalrecastingoftheaccounts is premature and the issues raised by DGH may be kept in abeyance.
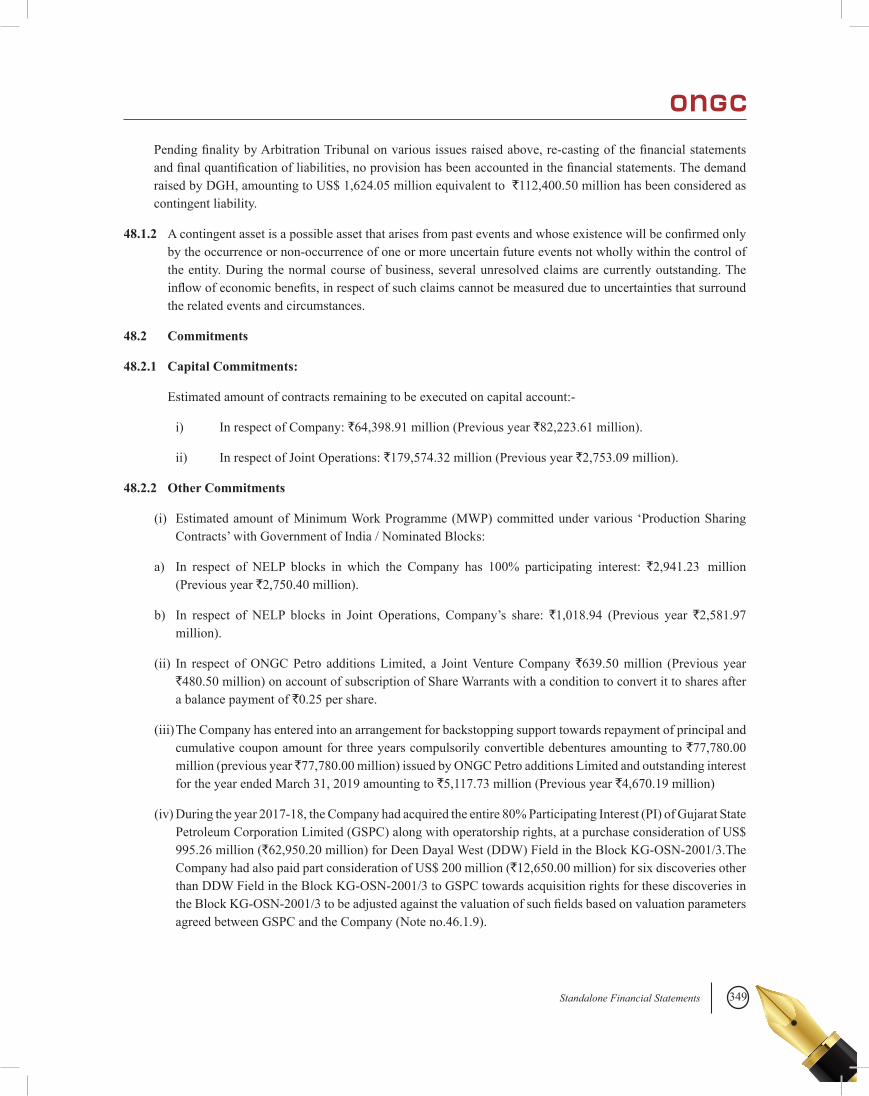
349Standalone Financial Statements
PendingfinalitybyArbitrationTribunalonvariousissuesraisedabove,re-castingofthefinancialstatementsandfinalquantificationofliabilities,noprovisionhasbeenaccountedinthefinancialstatements.Thedemandraised by DGH, amounting to US$ 1,624.05 million equivalent to `112,400.50 million has been considered as contingent liability.
48.1.2 Acontingentassetisapossibleassetthatarisesfrompasteventsandwhoseexistencewillbeconfirmedonlyby the occurrence or non-occurrence of one or more uncertain future events not wholly within the control of the entity. During the normal course of business, several unresolved claims are currently outstanding. The inflowofeconomicbenefits,inrespectofsuchclaimscannotbemeasuredduetouncertaintiesthatsurroundthe related events and circumstances.
48.2 Commitments
48.2.1 Capital Commitments:
Estimated amount of contracts remaining to be executed on capital account:-
i) In respect of Company: `64,398.91 million (Previous year `82,223.61 million).
ii) In respect of Joint Operations: `179,574.32 million (Previous year `2,753.09 million).
48.2.2 Other Commitments
(i) Estimated amount of Minimum Work Programme (MWP) committed under various ‘Production Sharing Contracts’ with Government of India / Nominated Blocks:
a) In respect of NELP blocks in which the Company has 100% participating interest: `2,941.23 million (Previous year `2,750.40 million).
b) In respect of NELP blocks in Joint Operations, Company’s share: `1,018.94 (Previous year `2,581.97 million).
(ii) In respect of ONGC Petro additions Limited, a Joint Venture Company `639.50 million (Previous year `480.50 million) on account of subscription of Share Warrants with a condition to convert it to shares after a balance payment of `0.25 per share.
(iii) The Company has entered into an arrangement for backstopping support towards repayment of principal and cumulative coupon amount for three years compulsorily convertible debentures amounting to `77,780.00 million (previous year ̀ 77,780.00 million) issued by ONGC Petro additions Limited and outstanding interest for the year ended March 31, 2019 amounting to `5,117.73 million (Previous year `4,670.19 million)
(iv) During the year 2017-18, the Company had acquired the entire 80% Participating Interest (PI) of Gujarat State Petroleum Corporation Limited (GSPC) along with operatorship rights, at a purchase consideration of US$ 995.26 million (`62,950.20 million) for Deen Dayal West (DDW) Field in the Block KG-OSN-2001/3.The Company had also paid part consideration of US$ 200 million (`12,650.00 million) for six discoveries other than DDW Field in the Block KG-OSN-2001/3 to GSPC towards acquisition rights for these discoveries in theBlockKG-OSN-2001/3tobeadjustedagainstthevaluationofsuchfieldsbasedonvaluationparametersagreed between GSPC and the Company (Note no.46.1.9).
350
Products Unit Year ended Year endedMarch 31, 2019 March 31, 2018
Crude Oil MT 24,231,087 25,434,914
Natural Gas 000 M 3 25,810,339 24,609,502
LiquifiedPetroleumGas MT 1,107,465 1,186,654
Ethane-Propane MT 413,957 355,723
Ethane MT 454,622 263,639
Propane MT 209,984 194,017
Butane MT 114,366 102,846
Naphtha MT 1,174,938 1,176,294
SKO MT 66,424 45,984
ATF MT 17,521 5,924
LSHS MT 22,013 21,779
HSD MT 49,724 26,873
MTO MT 4,438 5,593
Notes:
a) Production includes internal consumption and intermediary losses.
b) Crude oil production includes condensate of 1.485 MMT (Previous year 1.454 MMT).
49.2 Raw Material Consumed:
ForproductionofLiquefiedPetroleumGas,Ethane/Propane,Naphtha,SuperiorKeroseneOil,LowSulphurHigh Stock, Aviation Turbine Fuel and High Speed Diesel.
(` in million)
Particulars Year ended March 31, 2019 Year ended March 31, 2018Unit Quantity Value at cost Quantity Value at cost
Out of own production:Crude Oil MT 66,156 1,200.94 81,789 1,106.95Natural Gas 000M3 9,02,239 5,840.22 881,154 6,121.51Gas Equivalent Condensate 000M3 4,13,220 1,906.67 421,647 2,302.51PurchasesLiquefiedNaturalGas MT 8,52,267 15,482.10 645,312 6,730.51
49. Quantitative Details
49.1 Production Quantities (Certified by the Management):
351Standalone Financial Statements
49.3 Consumption of Stores and Spare Parts:
(` in million) Particulars Year ended March 31, 2019 Year ended March 31, 2018
Amount % Amount %Imported 10,379.19 17.88 13,935.68 28.31
Indigenous 47,681.35 82.12 35,284.36 71.69
Total 58,060.54 100.00 49,220.04 100.00
(` in million)Particulars Year ended March
31, 2019Year ended
March 31, 2018Capital items * 3,748.17 3,482.74Stores and Spare Parts 17,859.21 15,969.80 Total 21,607.38 19,452.54*Includes stage payments made against capital works.
49.4 Value of Imports on CIF Basis:
(` in million)Particulars Year ended March
31, 2019Year ended
March 31, 2018Services 188,364.91 167,992.28Others 3,617.95 1,254.58 Total 191,982.86 169,246.86
49.5 Expenditure in Foreign Currency:
(` in million)Particulars Year ended March
31, 2019Year ended
March 31, 2018Services 2,867.94 826.40FOB value of Sales 29,408.53 33,644.25Others 1,947.73 1,053.86Total 34,224.20 35,524.51
49.6 Earnings in Foreign Currency:
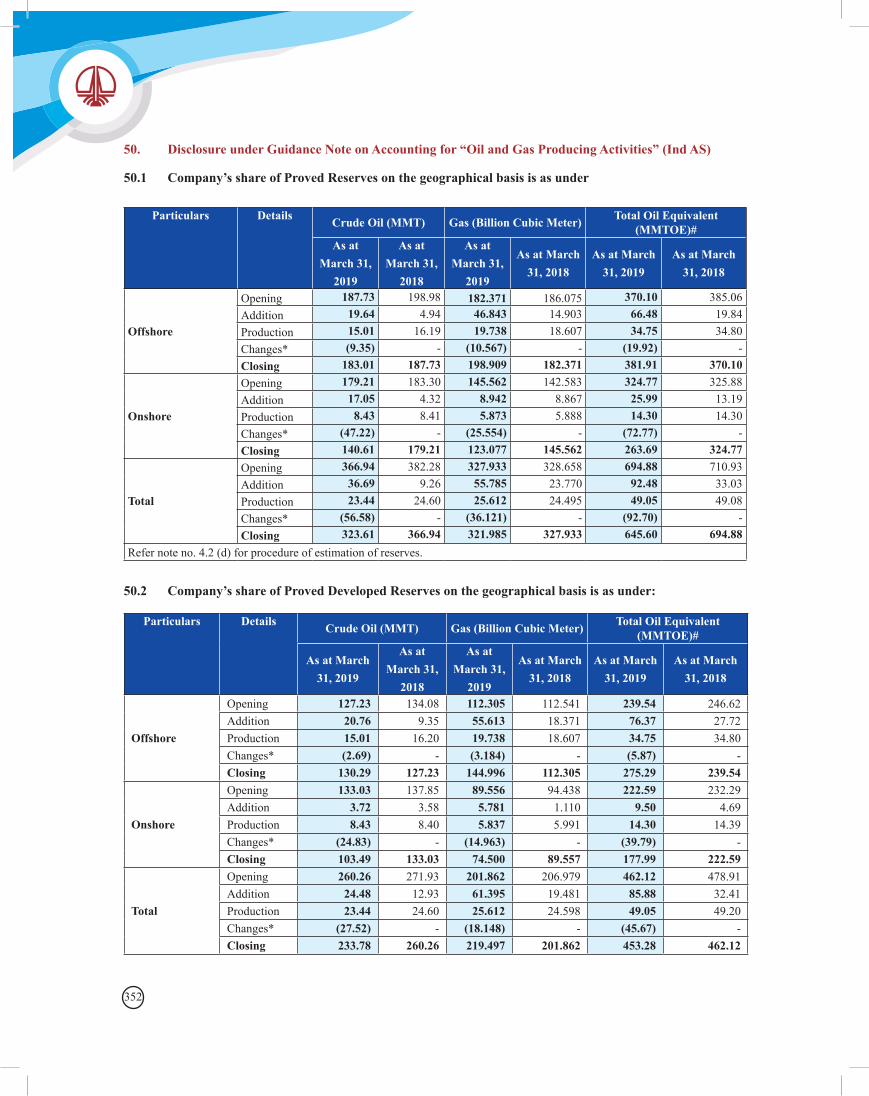
352
50. Disclosure under Guidance Note on Accounting for “Oil and Gas Producing Activities” (Ind AS)
50.1 Company’s share of Proved Reserves on the geographical basis is as under
Particulars Details Crude Oil (MMT) Gas (Billion Cubic Meter) Total Oil Equivalent (MMTOE)#
As at March 31,
2019
As at March 31,
2018
As at March 31,
2019
As at March 31, 2018
As at March 31, 2019
As at March 31, 2018
Offshore
Opening 187.73 198.98 182.371 186.075 370.10 385.06Addition 19.64 4.94 46.843 14.903 66.48 19.84Production 15.01 16.19 19.738 18.607 34.75 34.80Changes* (9.35) - (10.567) - (19.92) -Closing 183.01 187.73 198.909 182.371 381.91 370.10
Onshore
Opening 179.21 183.30 145.562 142.583 324.77 325.88Addition 17.05 4.32 8.942 8.867 25.99 13.19Production 8.43 8.41 5.873 5.888 14.30 14.30Changes* (47.22) - (25.554) - (72.77) -Closing 140.61 179.21 123.077 145.562 263.69 324.77
Total
Opening 366.94 382.28 327.933 328.658 694.88 710.93Addition 36.69 9.26 55.785 23.770 92.48 33.03Production 23.44 24.60 25.612 24.495 49.05 49.08Changes* (56.58) - (36.121) - (92.70) -Closing 323.61 366.94 321.985 327.933 645.60 694.88
Refer note no. 4.2 (d) for procedure of estimation of reserves.
50.2 Company’s share of Proved Developed Reserves on the geographical basis is as under:
Particulars Details Crude Oil (MMT) Gas (Billion Cubic Meter) Total Oil Equivalent (MMTOE)#
As at March 31, 2019
As at March 31,
2018
As at March 31,
2019
As at March 31, 2018
As at March 31, 2019
As at March 31, 2018
Offshore
Opening 127.23 134.08 112.305 112.541 239.54 246.62Addition 20.76 9.35 55.613 18.371 76.37 27.72Production 15.01 16.20 19.738 18.607 34.75 34.80Changes* (2.69) - (3.184) - (5.87) -Closing 130.29 127.23 144.996 112.305 275.29 239.54
Onshore
Opening 133.03 137.85 89.556 94.438 222.59 232.29Addition 3.72 3.58 5.781 1.110 9.50 4.69Production 8.43 8.40 5.837 5.991 14.30 14.39Changes* (24.83) - (14.963) - (39.79) -Closing 103.49 133.03 74.500 89.557 177.99 222.59
Total
Opening 260.26 271.93 201.862 206.979 462.12 478.91Addition 24.48 12.93 61.395 19.481 85.88 32.41Production 23.44 24.60 25.612 24.598 49.05 49.20Changes* (27.52) - (18.148) - (45.67) -Closing 233.78 260.26 219.497 201.862 453.28 462.12
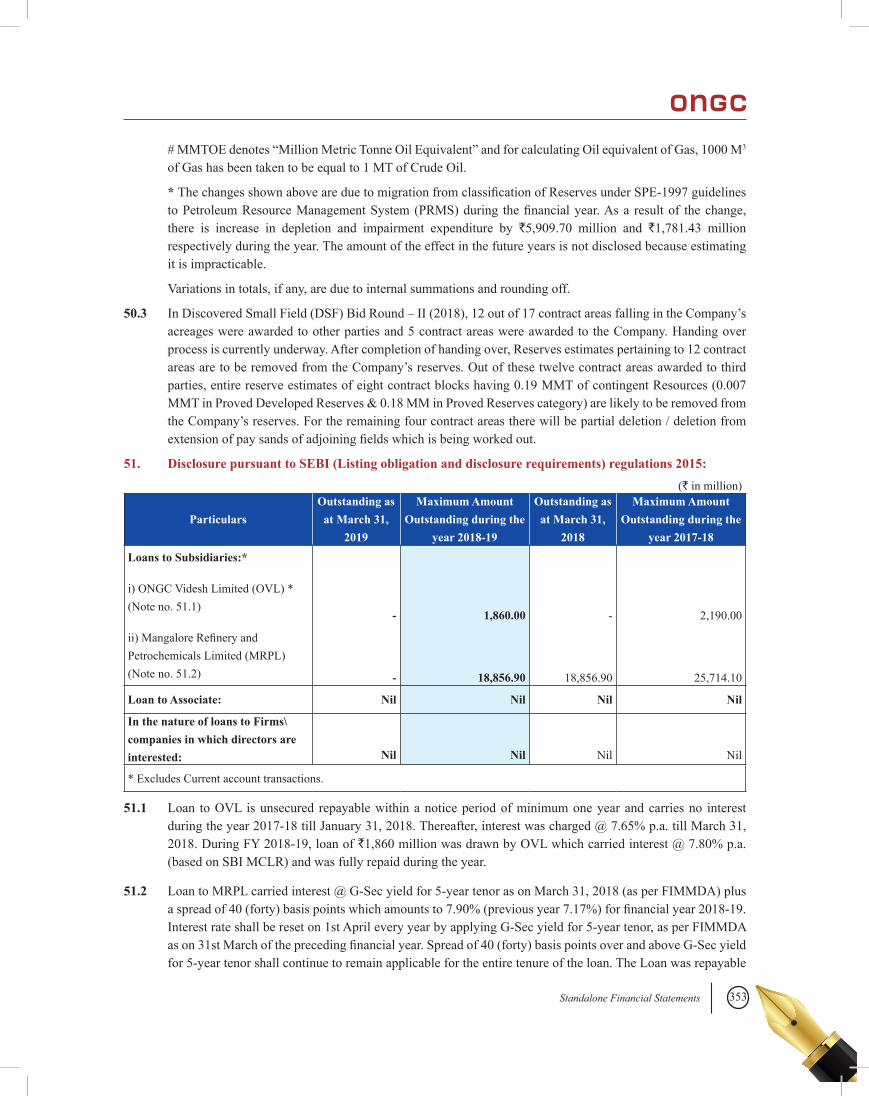
353Standalone Financial Statements
#MMTOEdenotes“MillionMetricTonneOilEquivalent”andforcalculatingOilequivalentofGas,1000M3
of Gas has been taken to be equal to 1 MT of Crude Oil.
* ThechangesshownaboveareduetomigrationfromclassificationofReservesunderSPE-1997guidelinestoPetroleumResourceManagementSystem(PRMS)during thefinancialyear.Asa resultof thechange,there is increase in depletion and impairment expenditure by `5,909.70 million and `1,781.43 million respectively during the year. The amount of the effect in the future years is not disclosed because estimating it is impracticable.
Variations in totals, if any, are due to internal summations and rounding off.
50.3 InDiscoveredSmallField(DSF)BidRound–II(2018),12outof17contractareasfallingintheCompany’sacreages were awarded to other parties and 5 contract areas were awarded to the Company. Handing over process is currently underway. After completion of handing over, Reserves estimates pertaining to 12 contract areas are to be removed from the Company’s reserves. Out of these twelve contract areas awarded to third parties, entire reserve estimates of eight contract blocks having 0.19 MMT of contingent Resources (0.007 MMT in Proved Developed Reserves & 0.18 MM in Proved Reserves category) are likely to be removed from the Company’s reserves. For the remaining four contract areas there will be partial deletion / deletion from extensionofpaysandsofadjoiningfieldswhichisbeingworkedout.
51. Disclosure pursuant to SEBI (Listing obligation and disclosure requirements) regulations 2015:(` in million)
ParticularsOutstanding as
at March 31, 2019
Maximum Amount Outstanding during the
year 2018-19
Outstanding as at March 31,
2018
Maximum Amount Outstanding during the
year 2017-18
Loans to Subsidiaries:*
i) ONGC Videsh Limited (OVL) * (Note no. 51.1)
ii)MangaloreRefineryandPetrochemicals Limited (MRPL) (Note no. 51.2)
-
-
1,860.00
18,856.90
-
18,856.90
2,190.00
25,714.10
Loan to Associate: Nil Nil Nil Nil
In the nature of loans to Firms\ companies in which directors are interested: Nil Nil Nil Nil
* Excludes Current account transactions.
51.1 Loan to OVL is unsecured repayable within a notice period of minimum one year and carries no interest during the year 2017-18 till January 31, 2018. Thereafter, interest was charged @ 7.65% p.a. till March 31, 2018. During FY 2018-19, loan of `1,860 million was drawn by OVL which carried interest @ 7.80% p.a. (based on SBI MCLR) and was fully repaid during the year.
51.2 Loan to MRPL carried interest @ G-Sec yield for 5-year tenor as on March 31, 2018 (as per FIMMDA) plus aspreadof40(forty)basispointswhichamountsto7.90%(previousyear7.17%)forfinancialyear2018-19.Interest rate shall be reset on 1st April every year by applying G-Sec yield for 5-year tenor, as per FIMMDA ason31stMarchoftheprecedingfinancialyear.Spreadof40(forty)basispointsoverandaboveG-Secyieldfor 5-year tenor shall continue to remain applicable for the entire tenure of the loan. The Loan was repayable
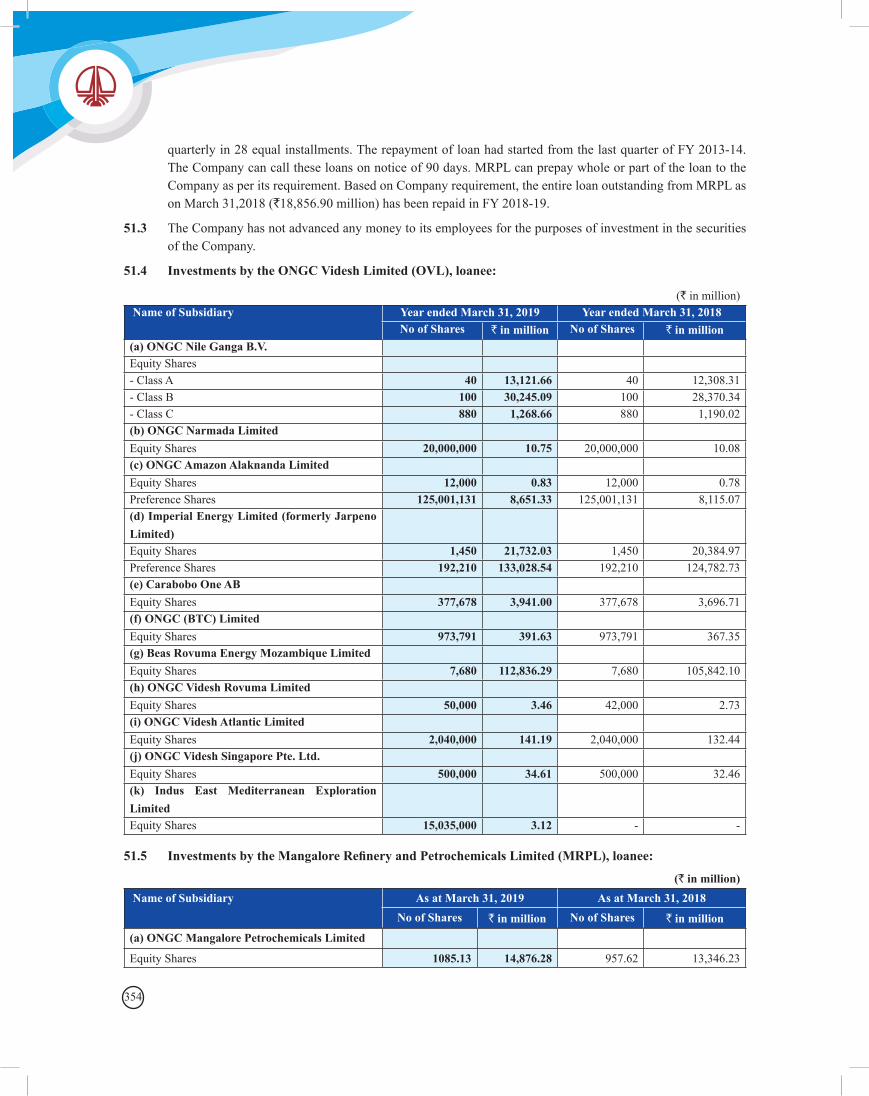
354
quarterly in 28 equal installments. The repayment of loan had started from the last quarter of FY 2013-14. The Company can call these loans on notice of 90 days. MRPL can prepay whole or part of the loan to the Company as per its requirement. Based on Company requirement, the entire loan outstanding from MRPL as on March 31,2018 (`18,856.90 million) has been repaid in FY 2018-19.
51.3 The Company has not advanced any money to its employees for the purposes of investment in the securities of the Company.
51.4 Investments by the ONGC Videsh Limited (OVL), loanee:
(` in million) Name of Subsidiary Year ended March 31, 2019 Year ended March 31, 2018
No of Shares ` in million No of Shares ` in million(a) ONGC Nile Ganga B.V.Equity Shares - Class A 40 13,121.66 40 12,308.31- Class B 100 30,245.09 100 28,370.34- Class C 880 1,268.66 880 1,190.02(b) ONGC Narmada LimitedEquity Shares 20,000,000 10.75 20,000,000 10.08(c) ONGC Amazon Alaknanda LimitedEquity Shares 12,000 0.83 12,000 0.78Preference Shares 125,001,131 8,651.33 125,001,131 8,115.07(d) Imperial Energy Limited (formerly Jarpeno Limited)Equity Shares 1,450 21,732.03 1,450 20,384.97Preference Shares 192,210 133,028.54 192,210 124,782.73(e) Carabobo One ABEquity Shares 377,678 3,941.00 377,678 3,696.71(f) ONGC (BTC) LimitedEquity Shares 973,791 391.63 973,791 367.35(g) Beas Rovuma Energy Mozambique LimitedEquity Shares 7,680 112,836.29 7,680 105,842.10 (h) ONGC Videsh Rovuma LimitedEquity Shares 50,000 3.46 42,000 2.73 (i) ONGC Videsh Atlantic LimitedEquity Shares 2,040,000 141.19 2,040,000 132.44 (j) ONGC Videsh Singapore Pte. Ltd.Equity Shares 500,000 34.61 500,000 32.46(k) Indus East Mediterranean Exploration LimitedEquity Shares 15,035,000 3.12 - -
51.5 Investments by the Mangalore Refinery and Petrochemicals Limited (MRPL), loanee:
(` in million) Name of Subsidiary As at March 31, 2019 As at March 31, 2018
No of Shares ` in million No of Shares ` in million(a) ONGC Mangalore Petrochemicals Limited
Equity Shares 1085.13 14,876.28 957.62 13,346.23
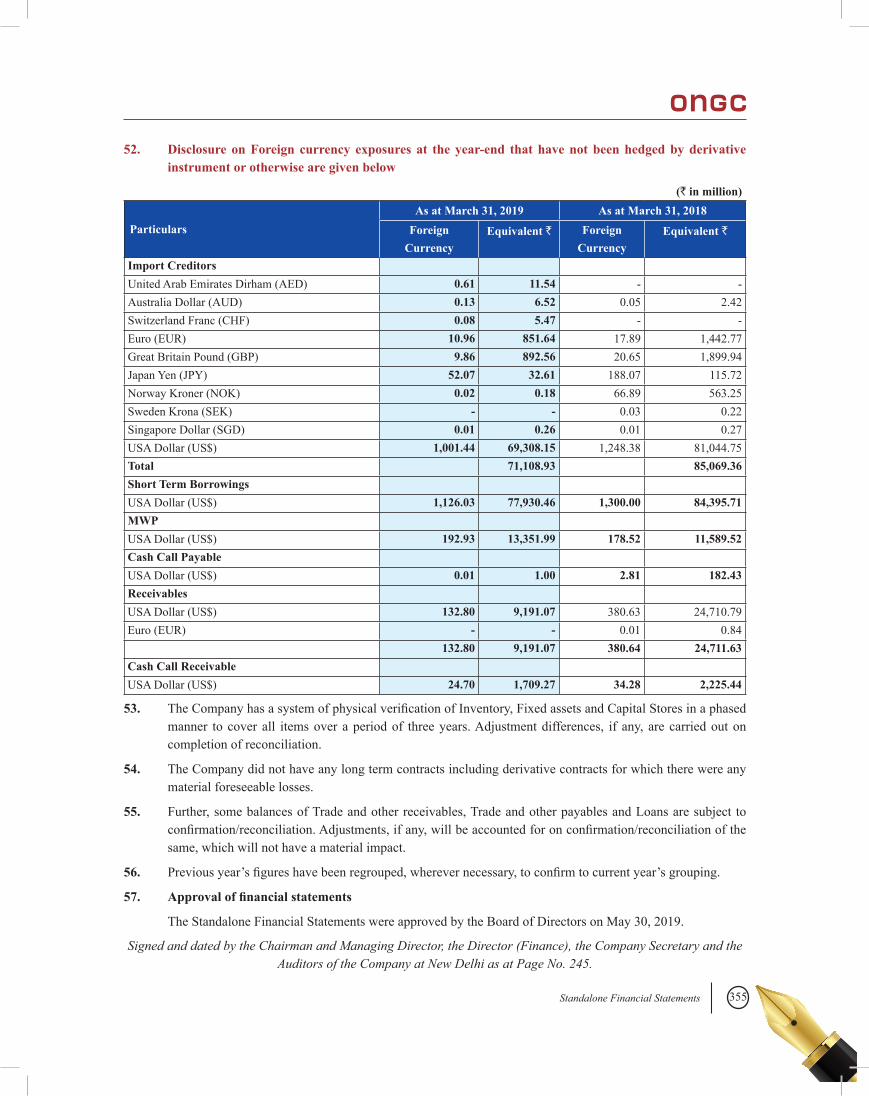
355Standalone Financial Statements
52. Disclosure on Foreign currency exposures at the year-end that have not been hedged by derivative instrument or otherwise are given below
(` in million)
ParticularsAs at March 31, 2019 As at March 31, 2018
Foreign Currency
Equivalent ` Foreign Currency
Equivalent `
Import CreditorsUnited Arab Emirates Dirham (AED) 0.61 11.54 - -Australia Dollar (AUD) 0.13 6.52 0.05 2.42Switzerland Franc (CHF) 0.08 5.47 - -Euro (EUR) 10.96 851.64 17.89 1,442.77Great Britain Pound (GBP) 9.86 892.56 20.65 1,899.94Japan Yen (JPY) 52.07 32.61 188.07 115.72Norway Kroner (NOK) 0.02 0.18 66.89 563.25Sweden Krona (SEK) - - 0.03 0.22Singapore Dollar (SGD) 0.01 0.26 0.01 0.27USA Dollar (US$) 1,001.44 69,308.15 1,248.38 81,044.75Total 71,108.93 85,069.36Short Term Borrowings USA Dollar (US$) 1,126.03 77,930.46 1,300.00 84,395.71MWP USA Dollar (US$) 192.93 13,351.99 178.52 11,589.52Cash Call Payable USA Dollar (US$) 0.01 1.00 2.81 182.43Receivables USA Dollar (US$) 132.80 9,191.07 380.63 24,710.79Euro (EUR) - - 0.01 0.84 132.80 9,191.07 380.64 24,711.63Cash Call Receivable USA Dollar (US$) 24.70 1,709.27 34.28 2,225.44
53. TheCompanyhasasystemofphysicalverificationofInventory,FixedassetsandCapitalStoresinaphasedmanner to cover all items over a period of three years. Adjustment differences, if any, are carried out on completion of reconciliation.
54. The Company did not have any long term contracts including derivative contracts for which there were any material foreseeable losses.
55. Further, some balances of Trade and other receivables, Trade and other payables and Loans are subject to confirmation/reconciliation.Adjustments,ifany,willbeaccountedforonconfirmation/reconciliationofthesame, which will not have a material impact.
56. Previousyear’sfigureshavebeenregrouped,wherevernecessary,toconfirmtocurrentyear’sgrouping.
57. Approval of financial statements
The Standalone Financial Statements were approved by the Board of Directors on May 30, 2019.
Signed and dated by the Chairman and Managing Director, the Director (Finance), the Company Secretary and the Auditors of the Company at New Delhi as at Page No. 245.
356
357Statement Pursuant to Section 129 (AOC-1)
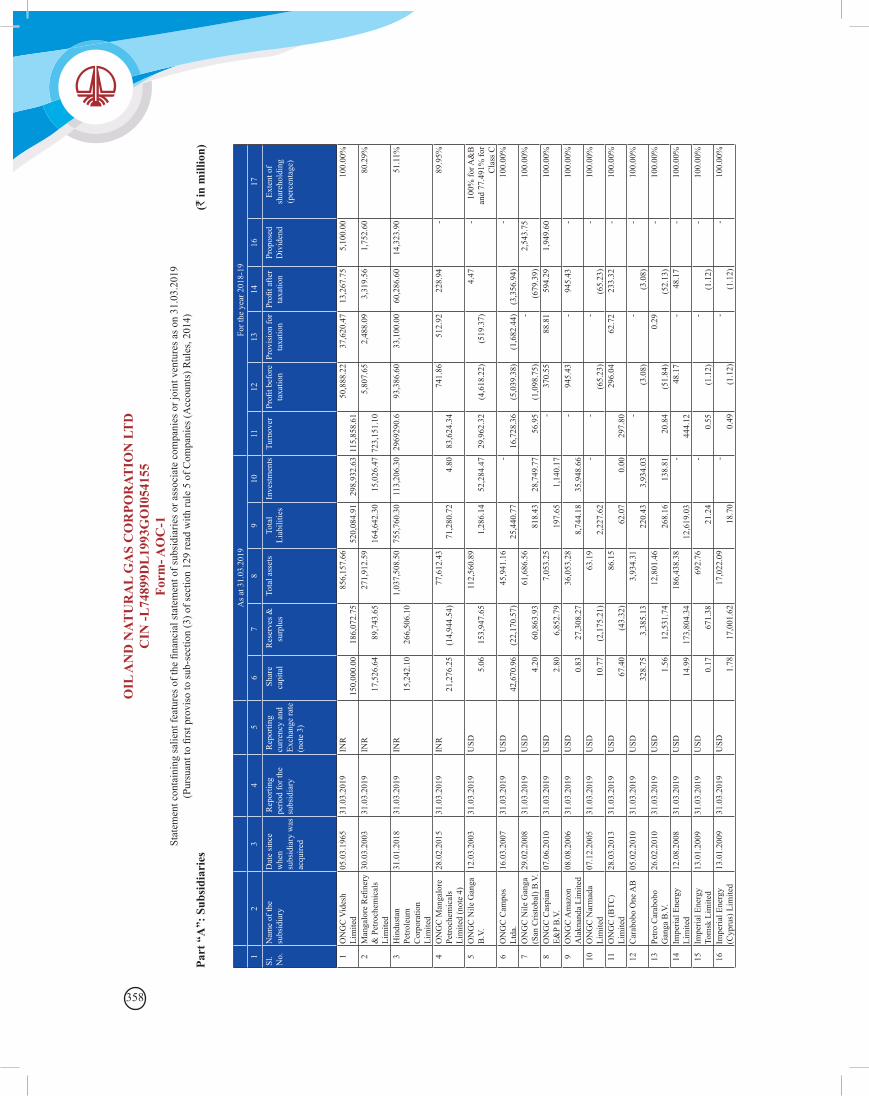
358
A
s at 3
1.03
.201
9Fo
r the
yea
r 201
8-19
12
34
56
78
910
1112
1314
1617
Sl.
No.
N
ame
of th
e su
bsid
iary
Dat
e si
nce
whe
n su
bsid
iary
was
ac
quire
d
Rep
ortin
g pe
riod
for t
he
subs
idia
ry
Rep
ortin
g cu
rren
cy a
nd
Exch
ange
rate
(n
ote
3)
Sha
re
capi
tal
Res
erve
s &
surp
lus
Tota
l ass
ets
Tota
l Li
abili
ties
Inve
stm
ents
Turn
over
Pr
ofit b
efor
e ta
xatio
nPr
ovis
ion
for
taxa
tion
Profi
t afte
r ta
xatio
n Pr
opos
ed
Div
iden
d Ex
tent
of
shar
ehol
ding
(p
erce
ntag
e)
1O
NG
C V
ides
h Li
mite
d05
.03.
1965
31.0
3.20
19IN
R
150,
000.
00
186,
072.
75
856
,157
.66
520,
084.
91
298,
932.
63
11
5,85
8.61
5
0,88
8.22
37,
620.
47
13,
267.
75
5
,100
.00
100.
00%
2M
anga
lore
Refi
nery
&
Pet
roch
emic
als
Lim
ited
30.0
3.20
0331
.03.
2019
INR
17,5
26.6
4
89,7
43.6
5
271
,912
.59
164,
642.
30
15,0
26.4
7
723,
151.
10
5
,807
.65
2,48
8.09
3,3
19.5
6
1,
752.
60
80.2
9%
3H
indu
stan
Pe
trole
um
Cor
pora
tion
Lim
ited
31.0
1.20
1831
.03.
2019
INR
15,2
42.1
0
26
6,50
6.10
1,0
37,5
08.5
0 75
5,76
0.30
1
13,2
06.3
0 29
6929
0.6
9
3,38
6.60
33,
100.
00
60,
286.
60
14
,323
.90
51.1
1%
4O
NG
C M
anga
lore
Pe
troch
emic
als
Lim
ited
(not
e 4)
28.0
2.20
15
31.0
3.20
19IN
R
21
,276
.25
(14,
944.
54)
77,
612.
43
71,2
80.7
2
4.80
83
,624
.34
7
41.8
6
512.
92
228
.94
-
89.9
5%
5O
NG
C N
ile G
anga
B
.V.
12.0
3.20
0331
.03.
2019
USD
5.
06
153,
947.
65
112
,560
.89
1,
286.
14
52,2
84.4
7
29
,962
.32
(4,6
18.2
2)
(519
.37)
4.47
- 10
0% fo
r A&
B
and
77.4
91%
for
Cla
ss C
6O
NG
C C
ampo
s Lt
da.
16.0
3.20
0731
.03.
2019
USD
42,6
70.9
6
(2
2,17
0.57
)
4
5,94
1.16
25
,440
.77
-
16
,728
.36
(5,0
39.3
8)
(1
,682
.44)
(3
,356
.94)
-
100.
00%
7O
NG
C N
ile G
anga
(S
an C
risto
bal)
B.V
.29
.02.
2008
31.0
3.20
19U
SD
4.20
60,8
63.9
3
6
1,68
6.56
81
8.43
28
,749
.77
56.9
5
(1
,098
.75)
-
(6
79.3
9)
2,
543.
75
100.
00%
8O
NG
C C
aspi
an
E&P
B.V
.07
.06.
2010
31.0
3.20
19U
SD
2.80
6,85
2.79
7,
053.
25
197.
65
1,
140.
17
-
37
0.55
88.
81
594
.29
1,94
9.60
10
0.00
%
9O
NG
C A
maz
on
Ala
knan
da L
imite
d 08
.08.
2006
31.0
3.20
19U
SD
0.83
27,3
08.2
7
3
6,05
3.28
8,74
4.18
35
,948
.66
-
945.
43
-
9
45.4
3
- 10
0.00
%
10O
NG
C N
arm
ada
Lim
ited
07.1
2.20
0531
.03.
2019
USD
10.7
7
(2,1
75.2
1)
6
3.19
2,22
7.62
-
-
(65.
23)
-
(65.
23)
-
100.
00%
11O
NG
C (B
TC)
Lim
ited
28.0
3.20
1331
.03.
2019
USD
67
.40
(43.
32)
86.
15
62
.07
0.
00
29
7.80
2
96.0
4
62.
72
233
.32
-
100.
00%
12C
arab
obo
One
AB
05.0
2.20
1031
.03.
2019
USD
328.
75
3,
385.
13
3,93
4.31
22
0.43
3,93
4.03
-
(3
.08)
-
(3
.08)
-
100.
00%
13Pe
tro C
arab
obo
Gan
ga B
.V.
26.0
2.20
1031
.03.
2019
USD
1.
56
12
,531
.74
12,
801.
46
268.
16
138.
81
20.8
4
(5
1.84
)
0
.29
(5
2.13
)
- 10
0.00
%
14Im
peria
l Ene
rgy
Lim
ited
12.0
8.20
0831
.03.
2019
USD
14.9
9
17
3,80
4.34
1
86,4
38.3
8
12
,619
.03
-
444.
12
48
.17
-
48.1
7
- 10
0.00
%
15Im
peria
l Ene
rgy
Tom
sk L
imite
d13
.01.
2009
31.0
3.20
19U
SD
0.17
67
1.38
692.
76
21
.24
-
0.55
(1
.12)
-
(1
.12)
-
100.
00%
16Im
peria
l Ene
rgy
(Cyp
rus)
Lim
ited
13.0
1.20
0931
.03.
2019
USD
1.
78
17
,001
.62
17,
022.
09
18
.70
-
0.49
(1
.12)
-
(1
.12)
-
100.
00%
OIL
AN
D N
ATU
RA
L G
AS
CO
RPO
RAT
ION
LT
DC
IN -L
7489
9DL
1993
GO
I054
155
Form
- AO
C-1
Stat
emen
t con
tain
ing
salie
nt fe
atur
es o
f the
fina
ncia
l sta
tem
ent o
f sub
sidi
arie
s or a
ssoc
iate
com
pani
es o
r joi
nt v
entu
res a
s on
31.0
3.20
19(P
ursu
ant t
o fir
st p
rovi
so to
sub-
sect
ion
(3) o
f sec
tion
129
read
with
rule
5 o
f Com
pani
es (A
ccou
nts)
Rul
es, 2
014)
Part
“A
”: S
ubsi
diar
ies
(` in
mill
ion)
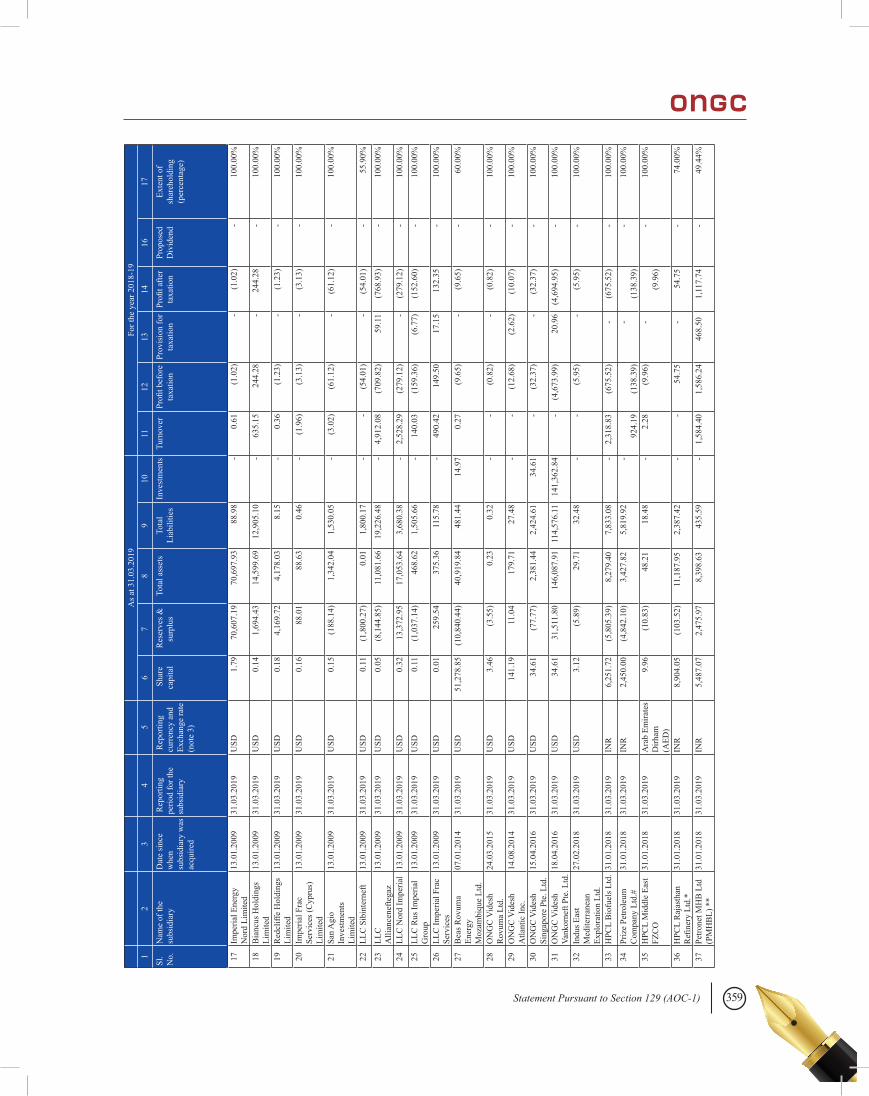
359Statement Pursuant to Section 129 (AOC-1)
A
s at 3
1.03
.201
9Fo
r the
yea
r 201
8-19
12
34
56
78
910
1112
1314
1617
Sl.
No.
N
ame
of th
e su
bsid
iary
Dat
e si
nce
whe
n su
bsid
iary
was
ac
quire
d
Rep
ortin
g pe
riod
for t
he
subs
idia
ry
Rep
ortin
g cu
rren
cy a
nd
Exch
ange
rate
(n
ote
3)
Sha
re
capi
tal
Res
erve
s &
surp
lus
Tota
l ass
ets
Tota
l Li
abili
ties
Inve
stm
ents
Turn
over
Pr
ofit b
efor
e ta
xatio
nPr
ovis
ion
for
taxa
tion
Profi
t afte
r ta
xatio
n Pr
opos
ed
Div
iden
d Ex
tent
of
shar
ehol
ding
(p
erce
ntag
e)
17Im
peria
l Ene
rgy
Nor
d Li
mite
d13
.01.
2009
31.0
3.20
19U
SD1.
79
70,6
07.1
9 70
,697
.93
88.9
8
-
0.61
(1
.02)
-
(1
.02)
-
10
0.00
%
18B
ianc
us H
oldi
ngs
Lim
ited
13.0
1.20
0931
.03.
2019
USD
0.14
1,
694.
43
14
,599
.69
12,9
05.1
0
-
635.
15
24
4.28
-
244
.28
-
10
0.00
%
19R
edcl
iffe
Hol
ding
s Li
mite
d13
.01.
2009
31.0
3.20
19U
SD0.
18
4,16
9.72
4
,178
.03
8.15
-
0.36
(1
.23)
-
(1
.23)
-
10
0.00
%
20Im
peria
l Fra
c Se
rvic
es (C
ypru
s)
Lim
ited
13.0
1.20
0931
.03.
2019
USD
0.16
88
.01
88.
63
0.46
-
(1.9
6)(3
.13)
-
(3
.13)
-
10
0.00
%
21Sa
n A
gio
Inve
stm
ents
Li
mite
d
13.0
1.20
0931
.03.
2019
USD
0.15
(1
88.1
4)
1,34
2.04
1,
530.
05
- (3
.02)
(61.
12)
-
(6
1.12
)
-
100.
00%
22LL
C S
ibin
tern
eft
13.0
1.20
0931
.03.
2019
USD
0.11
(1
,800
.27)
0
.01
1,80
0.17
-
-
(5
4.01
)
-
(54.
01)
-
55
.90%
23LL
C
Alli
ance
nefte
gaz
13.0
1.20
0931
.03.
2019
USD
0.05
(8
,144
.85)
11,
081.
66
19,2
26.4
8
-
4,91
2.08
(7
09.8
2)
59.
11
(768
.93)
-
10
0.00
%
24LL
C N
ord
Impe
rial
13.0
1.20
0931
.03.
2019
USD
0.32
13
,372
.95
17,
053.
64
3,68
0.38
-
2,52
8.29
(2
79.1
2)
-
(279
.12)
-
10
0.00
%
25LL
C R
us Im
peria
l G
roup
13.0
1.20
0931
.03.
2019
USD
0.11
(1
,037
.14)
468.
62
1,50
5.66
-
140.
03
(159
.36)
(6.7
7)(1
52.6
0)
-
100.
00%
26LL
C Im
peria
l Fra
c Se
rvic
es13
.01.
2009
31.0
3.20
19U
SD0.
01
259.
54
3
75.3
6 11
5.78
-
490.
42
14
9.50
17.
15
132
.35
-
10
0.00
%
27B
eas R
ovum
a En
ergy
M
ozam
biqu
e Lt
d.
07.0
1.20
1431
.03.
2019
USD
51,2
78.8
5 (1
0,84
0.44
)
4
0,91
9.84
48
1.44
14
.97
0.27
(9
.65)
-
(9
.65)
-
60
.00%
28O
NG
C V
ides
h R
ovum
a Lt
d.
24.0
3.20
1531
.03.
2019
USD
3.46
(3
.55)
0
.23
0.32
-
-
(0
.82)
-
(0
.82)
-
10
0.00
%
29O
NG
C V
ides
h A
tlant
ic In
c.
14.0
8.20
1431
.03.
2019
USD
141.
19
11.0
4
17
9.71
27
.48
-
-
(12.
68)
(2.6
2)(1
0.07
)
-
100.
00%
30O
NG
C V
ides
h Si
ngap
ore
Pte.
Ltd
.15
.04.
2016
31.0
3.20
19U
SD34
.61
(77.
77)
2,
381.
44
2,42
4.61
34
.61
-
(3
2.37
)
-
(32.
37)
-
10
0.00
%
31O
NG
C V
ides
h Va
nkor
neft
Pte.
Ltd
.18
.04.
2016
31.0
3.20
19U
SD34
.61
31,5
11.8
0
146
,087
.91
114,
576.
11
141,
362.
84
-
(4,6
73.9
9)
20.
96
(4,6
94.9
5)
-
100.
00%
32In
dus E
ast
Med
iterr
anea
n Ex
plor
atio
n Lt
d.
27.0
2.20
1831
.03.
2019
USD
3.12
(5
.89)
29.
71
32.4
8
-
-
(5
.95)
-
(5
.95)
-
10
0.00
%
33H
PCL
Bio
fuel
s Ltd
.31
.01.
2018
31.0
3.20
19IN
R6,
251.
72
(5,8
05.3
9)
8,27
9.40
7,
833.
08
- 2,
318.
83
(675
.52)
-
(6
75.5
2)
-
100.
00%
34Pr
ize
Petro
leum
C
ompa
ny L
td.#
31.0
1.20
1831
.03.
2019
INR
2,45
0.00
(4
,842
.10)
3,
427.
82
5,81
9.92
-
92
4.19
(138
.39)
-
(1
38.3
9)
-
100.
00%
35H
PCL
Mid
dle
East
FZ
CO
31.0
1.20
1831
.03.
2019
Ara
b Em
irate
s D
irham
(A
ED)
9.96
(1
0.83
)
4
8.21
18
.48
- 2.
28
(9.9
6)
-
(9.9
6)
-
100.
00%
36H
PCL
Raj
asth
an
Refi
nery
Ltd
.*31
.01.
2018
31.0
3.20
19IN
R8,
904.
05
(103
.52)
11,
187.
95
2,38
7.42
-
-
54.
75
-
54.
75
-
74
.00%
37Pe
trone
t MH
B L
td
(PM
HB
L) *
*31
.01.
2018
31.0
3.20
19IN
R5,
487.
07
2,47
5.97
8
,398
.63
435.
59
- 1,
584.
40
1,58
6.24
4
68.5
0
1,1
17.7
4
-
49.4
4%
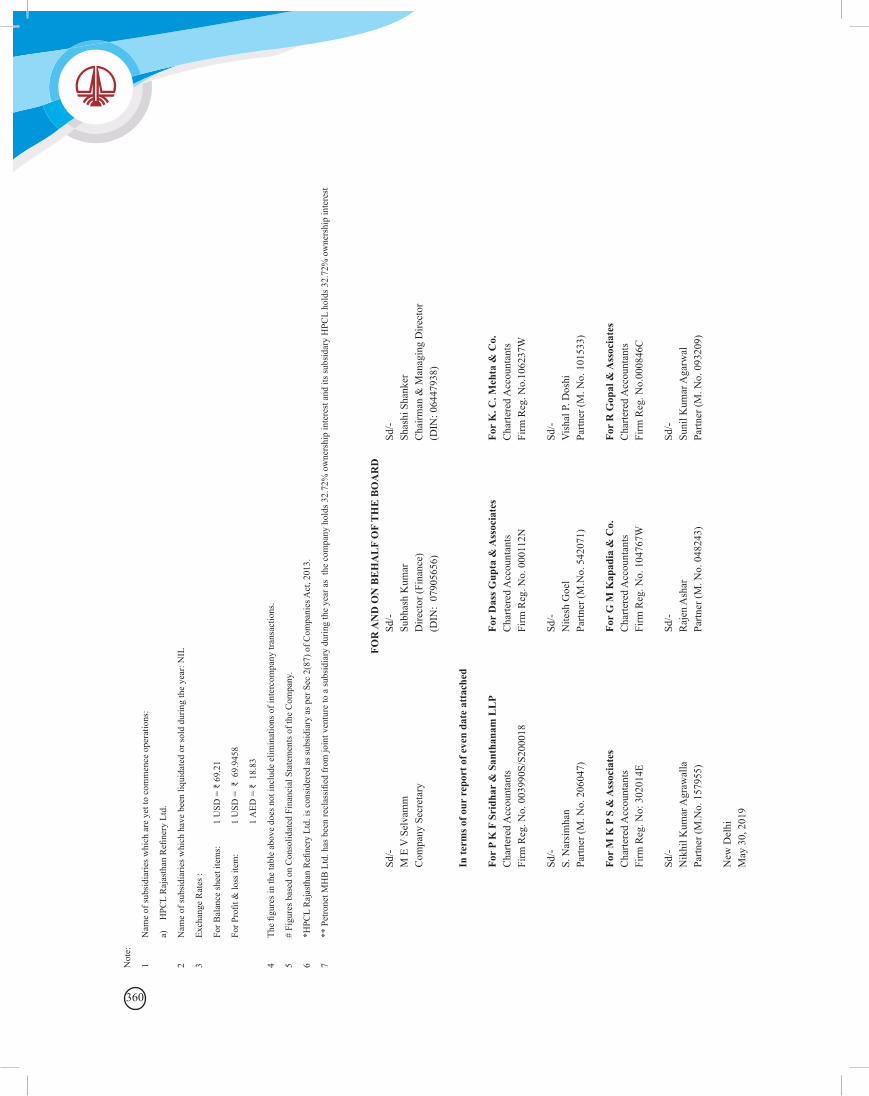
360
Not
e:
1 N
ame
of su
bsid
iarie
s whi
ch a
re y
et to
com
men
ce o
pera
tions
:
a)
H
PCL
Raj
asth
an R
efine
ry L
td.
2 N
ame
of su
bsid
iarie
s whi
ch h
ave
been
liqu
idat
ed o
r sol
d du
ring
the
year
: NIL
3 Ex
chan
ge R
ates
:
Fo
r Bal
ance
shee
t ite
ms:
1
USD
= ₹
69.
21
Fo
r Pro
fit &
loss
item
: 1
USD
= ₹
69.
9458
1 A
ED =
₹ 1
8.83
4 Th
e fig
ures
in th
e ta
ble
abov
e do
es n
ot in
clud
e el
imin
atio
ns o
f int
erco
mpa
ny tr
ansa
ctio
ns.
5 #
Figu
res b
ased
on
Con
solid
ated
Fin
anci
al S
tate
men
ts o
f the
Com
pany
.
6 *H
PCL
Raj
asth
an R
efine
ry L
td. i
s con
side
red
as su
bsid
iary
as p
er S
ec 2
(87)
of C
ompa
nies
Act
, 201
3.
7 **
Pet
rone
t MH
B L
td. h
as b
een
recl
assi
fied
from
join
t ven
ture
to a
subs
idia
ry d
urin
g th
e ye
ar a
s th
e co
mpa
ny h
olds
32.
72%
ow
ners
hip
inte
rest
and
its s
ubsi
dary
HPC
L ho
lds 3
2.72
% o
wne
rshi
p in
tere
st
FOR
AN
D O
N B
EH
AL
F O
F T
HE
BO
AR
DSd
/- Sd
/- Sd
/-M
E V
Sel
vam
m
Subh
ash
Kum
ar
Shas
hi S
hank
erC
ompa
ny S
ecre
tary
D
irect
or (F
inan
ce)
Cha
irman
& M
anag
ing
Dire
ctor
(D
IN:
0790
5656
) (D
IN: 0
6447
938)
In te
rms o
f our
rep
ort o
f eve
n da
te a
ttac
hed
For
P K
F S
ridh
ar &
San
than
am L
LP
For
Das
s Gup
ta &
Ass
ocia
tes
For
K. C
. Meh
ta &
Co.
Cha
rtere
d A
ccou
ntan
ts
Cha
rtere
d A
ccou
ntan
ts
Cha
rtere
d A
ccou
ntan
tsFi
rm R
eg. N
o. 0
0399
0S/S
2000
18
Firm
Reg
. No.
000
112N
Fi
rm R
eg. N
o.10
6237
W
Sd/-
Sd/-
Sd/-
S. N
arsi
mha
n N
itesh
Goe
l V
isha
l P. D
oshi
Partn
er (M
. No.
206
047)
Pa
rtner
(M.N
o. 5
4207
1)
Partn
er (M
. No.
101
533)
For
M K
P S
& A
ssoc
iate
s Fo
r G
M K
apad
ia &
Co.
Fo
r R
Gop
al &
Ass
ocia
tes
Cha
rtere
d A
ccou
ntan
ts
Cha
rtere
d A
ccou
ntan
ts
Cha
rtere
d A
ccou
ntan
tsFi
rm R
eg. N
o: 3
0201
4E
Firm
Reg
. No.
104
767W
Fi
rm R
eg. N
o.00
0846
C
Sd/-
Sd/-
Sd/-
Nik
hil K
umar
Agr
awal
la
Raj
en A
shar
Su
nil K
umar
Aga
rwal
Partn
er (M
.No.
157
955)
Pa
rtner
(M. N
o. 0
4824
3)
Partn
er (M
. No.
093
209)
New
Del
hiM
ay 3
0, 2
019
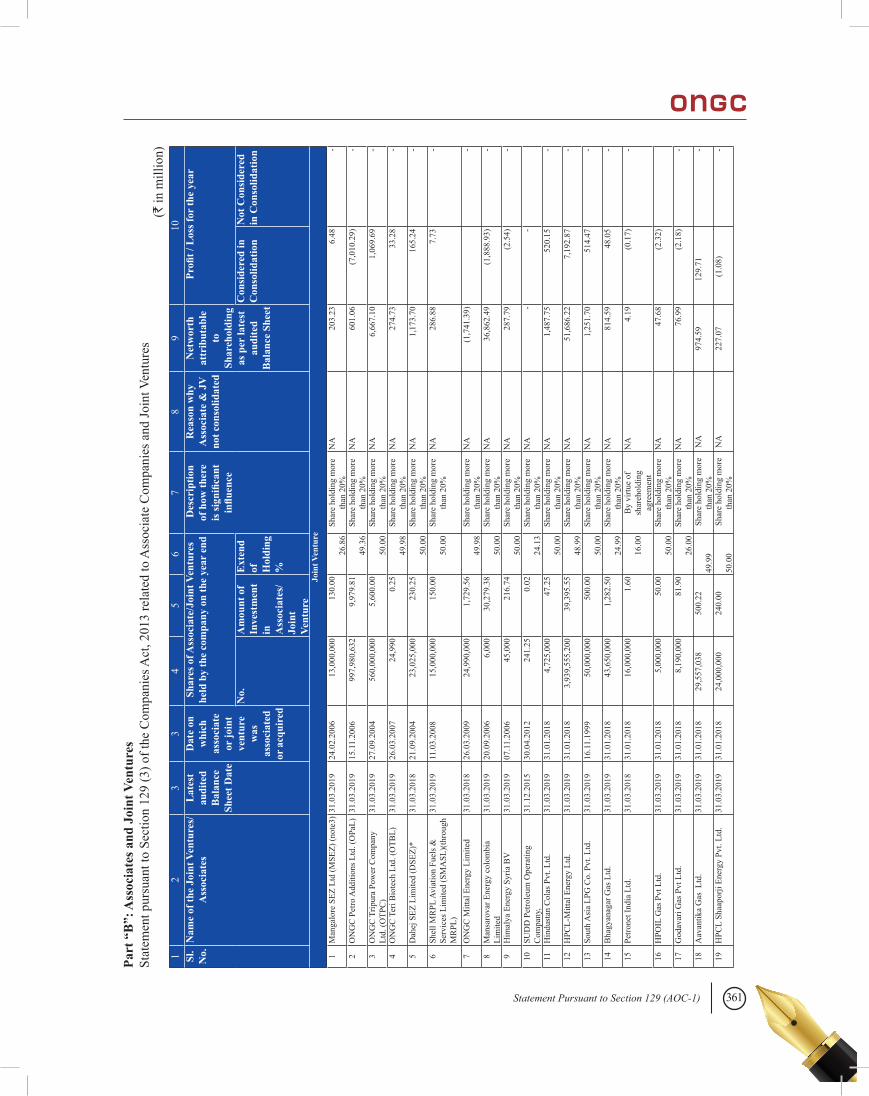
361Statement Pursuant to Section 129 (AOC-1)
Part
“B
”: A
ssoc
iate
s and
Joi
nt V
entu
res
Stat
emen
t pur
suan
t to
Sect
ion
129
(3) o
f the
Com
pani
es A
ct, 2
013
rela
ted
to A
ssoc
iate
Com
pani
es a
nd Jo
int V
entu
res
12
33
45
67
89
10Sl
. N
o. N
ame
of th
e Jo
int V
entu
res/
Ass
ocia
tes
Lat
est
audi
ted
Bal
ance
Sh
eet D
ate
Dat
e on
w
hich
as
soci
ate
or jo
int
vent
ure
was
as
soci
ated
or
acq
uire
d
Shar
es o
f Ass
ocia
te/J
oint
Ven
ture
s he
ld b
y th
e co
mpa
ny o
n th
e ye
ar e
nd D
escr
iptio
n of
how
ther
e is
sign
ifica
nt
influ
ence
Rea
son
why
A
ssoc
iate
& J
V
not c
onso
lidat
ed
Net
wor
th
attr
ibut
able
to
Sh
areh
oldi
ng
as p
er la
test
au
dite
d B
alan
ce S
heet
Pro
fit /
Los
s for
the
year
No.
Am
ount
of
Inve
stm
ent
in
Ass
ocia
tes/
Join
t Ve
ntur
e
Ext
end
of
Hol
ding
%
Con
side
red
in
Con
solid
atio
nN
ot C
onsi
dere
d in
Con
solid
atio
n
Join
t Ven
ture
1M
anga
lore
SEZ
Ltd
(MSE
Z) (n
ote3
)31
.03.
2019
24.0
2.20
06
13
,000
,000
130.
00
26
.86
Shar
e ho
ldin
g m
ore
than
20%
NA
20
3.23
6
.48
-
2O
NG
C P
etro
Add
ition
s Ltd
. (O
PaL)
31
.03.
2019
15.1
1.20
06
997
,980
,632
9,
979.
81
49
.36
Shar
e ho
ldin
g m
ore
than
20%
NA
60
1.06
(7,
010.
29)
-
3O
NG
C T
ripur
a Po
wer
Com
pany
Lt
d. (O
TPC
) 31
.03.
2019
27.0
9.20
04
560
,000
,000
5,
600.
00
50
.00
Shar
e ho
ldin
g m
ore
than
20%
NA
6,66
7.10
1
,069
.69
-
4O
NG
C T
eri B
iote
ch L
td. (
OTB
L)31
.03.
2019
26.0
3.20
07
2
4,99
0
0
.25
49
.98
Shar
e ho
ldin
g m
ore
than
20%
NA
27
4.73
33
.28
-
5D
ahej
SEZ
Lim
ited
(DSE
Z)*
31.0
3.20
1821
.09.
2004
23,0
25,0
00
23
0.25
50.0
0 Sh
are
hold
ing
mor
e th
an 2
0%N
A
1,
173.
70
1
65.2
4
-
6Sh
ell M
RPL
Avi
atio
n Fu
els &
Se
rvic
es L
imite
d (S
MA
SL)(
thro
ugh
MR
PL)
31.0
3.20
1911
.03.
2008
15,0
00,0
00
15
0.00
50.0
0 Sh
are
hold
ing
mor
e th
an 2
0%N
A
286.
88
7.7
3
-
7O
NG
C M
ittal
Ene
rgy
Lim
ited
31.0
3.20
1826
.03.
2009
24,9
90,0
00
1,72
9.56
49.9
8 Sh
are
hold
ing
mor
e th
an 2
0%N
A
(1,7
41.3
9)
-
8M
ansa
rova
r Ene
rgy
colo
mbi
a Li
mite
d31
.03.
2019
20.0
9.20
06
6,00
0
30,
279.
38
50
.00
Shar
e ho
ldin
g m
ore
than
20%
NA
3
6,86
2.49
(1,
888.
93)
-
9H
imal
ya E
nerg
y Sy
ria B
V31
.03.
2019
07.1
1.20
06
4
5,00
0
216.
74
50
.00
Shar
e ho
ldin
g m
ore
than
20%
NA
28
7.79
(2
.54)
-
10SU
DD
Pet
role
um O
pera
ting
Com
pany
, 31
.12.
2015
30.0
4.20
12
2
41.2
5
0
.02
24
.13
Shar
e ho
ldin
g m
ore
than
20%
NA
-
-
11H
indu
stan
Col
as P
vt. L
td.
31.0
3.20
1931
.01.
2018
4,7
25,0
00
4
7.25
50.0
0 Sh
are
hold
ing
mor
e th
an 2
0%N
A
1,
487.
75
5
20.1
5
-
12H
PCL-
Mitt
al E
nerg
y Lt
d.31
.03.
2019
31.0
1.20
18 3
,939
,555
,200
39,
395.
55
48
.99
Shar
e ho
ldin
g m
ore
than
20%
NA
5
1,68
6.22
7
,192
.87
-
13So
uth
Asi
a LP
G C
o. P
vt. L
td.
31.0
3.20
1916
.11.
1999
50,0
00,0
00
50
0.00
50.0
0 Sh
are
hold
ing
mor
e th
an 2
0%N
A
1,
251.
70
5
14.4
7
-
14B
hagy
anag
ar G
as L
td.
31.0
3.20
1931
.01.
2018
43,6
50,0
00
1,28
2.50
24.9
9 Sh
are
hold
ing
mor
e th
an 2
0%N
A
814.
59
48.0
5
-
15Pe
trone
t Ind
ia L
td.
31.0
3.20
1831
.01.
2018
16,0
00,0
00
1.6
0
16.0
0 B
y vi
rtue
of
shar
ehol
ding
ag
reem
ent
NA
4.1
9
(0
.17)
-
16H
POIL
Gas
Pvt
Ltd
.31
.03.
2019
31.0
1.20
18
5
,000
,000
50.
00
50
.00
Shar
e ho
ldin
g m
ore
than
20%
NA
4
7.68
(2
.32)
17G
odav
ari G
as P
vt L
td.
31.0
3.20
1931
.01.
2018
8,1
90,0
00
8
1.90
26.0
0 Sh
are
hold
ing
mor
e th
an 2
0%N
A
76.
99
(2.1
8)
-
18A
avan
tika
Gas
Ltd
.31
.03.
2019
31.0
1.20
18
29
,557
,038
500.
22
49
.99
Sha
re h
oldi
ng m
ore
than
20%
N
A
97
4.59
129
.71
-
19H
PCL
Shaa
porji
Ene
rgy
Pvt.
Ltd.
31.0
3.20
1931
.01.
2018
24,0
00,0
00
24
0.00
50.0
0 S
hare
hol
ding
mor
e th
an 2
0%
NA
227.
07
(1.0
8)
-
(` in
mill
ion)
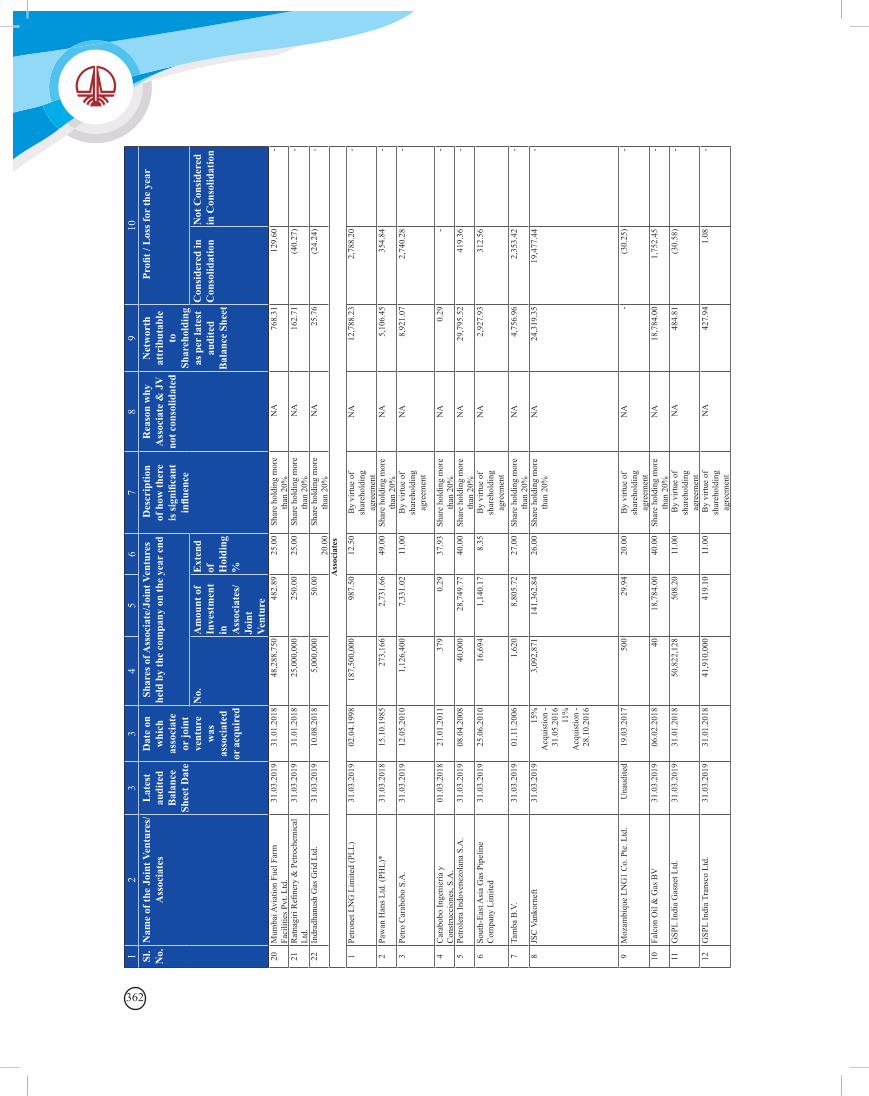
362
12
33
45
67
89
10Sl
. N
o. N
ame
of th
e Jo
int V
entu
res/
Ass
ocia
tes
Lat
est
audi
ted
Bal
ance
Sh
eet D
ate
Dat
e on
w
hich
as
soci
ate
or jo
int
vent
ure
was
as
soci
ated
or
acq
uire
d
Shar
es o
f Ass
ocia
te/J
oint
Ven
ture
s he
ld b
y th
e co
mpa
ny o
n th
e ye
ar e
nd D
escr
iptio
n of
how
ther
e is
sign
ifica
nt
influ
ence
Rea
son
why
A
ssoc
iate
& J
V
not c
onso
lidat
ed
Net
wor
th
attr
ibut
able
to
Sh
areh
oldi
ng
as p
er la
test
au
dite
d B
alan
ce S
heet
Pro
fit /
Los
s for
the
year
No.
Am
ount
of
Inve
stm
ent
in
Ass
ocia
tes/
Join
t Ve
ntur
e
Ext
end
of
Hol
ding
%
Con
side
red
in
Con
solid
atio
nN
ot C
onsi
dere
d in
Con
solid
atio
n
20M
umba
i Avi
atio
n Fu
el F
arm
Fa
cilit
ies P
vt. L
td.
31.0
3.20
1931
.01.
2018
48,2
88,7
50
48
2.89
25
.00
Sha
re h
oldi
ng m
ore
than
20%
N
A
76
8.31
129
.60
-
21R
atna
giri
Refi
nery
& P
etro
chem
ical
Lt
d.31
.03.
2019
31.0
1.20
18
25
,000
,000
250.
00
25.0
0 S
hare
hol
ding
mor
e th
an 2
0%
NA
162.
71
(4
0.27
)
-
22In
drad
hanu
sh G
as G
rid L
td.
31.0
3.20
1910
.08.
2018
5,0
00,0
00
5
0.00
20.0
0 S
hare
hol
ding
mor
e th
an 2
0%
NA
25.
76
(2
4.24
)
-
Ass
ocia
tes
1Pe
trone
t LN
G L
imite
d (P
LL)
31.0
3.20
1902
.04.
1998
1
87,5
00,0
00
98
7.50
12
.50
By
virtu
e of
sh
areh
oldi
ng
agre
emen
t
NA
1
2,78
8.23
2
,788
.20
-
2Pa
wan
Han
s Ltd
. (PH
L)*
31.0
3.20
1815
.10.
1985
2
73,1
66
2,73
1.66
49
.00
Shar
e ho
ldin
g m
ore
than
20%
NA
5,10
6.45
354
.84
-
3Pe
tro C
arab
obo
S.A
.31
.03.
2019
12.0
5.20
10
1
,126
,400
7,
331.
02
11.0
0 B
y vi
rtue
of
shar
ehol
ding
ag
reem
ent
NA
8,92
1.07
2
,740
.28
-
4C
arab
obo
Inge
nier
ía y
C
onst
rucc
ione
s, S.
A.
01.0
3.20
1821
.01.
2011
379
0.2
9 37
.93
Shar
e ho
ldin
g m
ore
than
20%
NA
0.2
9
-
-
5Pe
trole
ra In
dove
nezo
lana
S.A
.31
.03.
2019
08.0
4.20
08
4
0,00
0
28,
749.
77
40.0
0 Sh
are
hold
ing
mor
e th
an 2
0%N
A
29,
795.
52
4
19.3
6
-
6So
uth-
East
Asi
a G
as P
ipel
ine
Com
pany
Lim
ited
31.0
3.20
1925
.06.
2010
16,
694
1,14
0.17
8.
35
By
virtu
e of
sh
areh
oldi
ng
agre
emen
t
NA
2,92
7.93
312
.56
7Ta
mba
B.V
.31
.03.
2019
01.1
1.20
06
1,62
0
8,
805.
72
27.0
0 Sh
are
hold
ing
mor
e th
an 2
0%N
A
4,
756.
96
2,3
53.4
2
-
8JS
C V
anko
rnef
t31
.03.
2019
15%
A
cqui
stio
n -
31.0
5.20
16
11%
A
cqui
stio
n -
28.1
0.20
16
3,0
92,8
71
141
,362
.84
26.0
0 Sh
are
hold
ing
mor
e th
an 2
0%N
A
24,
319.
35
1
9,47
7.44
-
9M
ozam
biqu
e LN
G1
Co.
Pte
. Ltd
.U
naud
ited
19.0
3.20
17
50
0
29.
94
20.0
0 B
y vi
rtue
of
shar
ehol
ding
ag
reem
ent
NA
-
(30.
25)
-
10Fa
lcon
Oil
& G
as B
V31
.03.
2019
06.0
2.20
18
4
0
18,
784.
00
40.0
0 Sh
are
hold
ing
mor
e th
an 2
0%N
A
18,
784.
00
1,7
52.4
5
-
11G
SPL
Indi
a G
asne
t Ltd
.31
.03.
2019
31.0
1.20
18
50
,822
,128
508.
20
11.0
0 B
y vi
rtue
of
shar
ehol
ding
ag
reem
ent
NA
484.
81
(3
0.58
)
-
12G
SPL
Indi
a Tr
ansc
o Lt
d.31
.03.
2019
31.0
1.20
18
41
,910
,000
419.
10
11.0
0 B
y vi
rtue
of
shar
ehol
ding
ag
reem
ent
NA
427.
94
1.0
8
-
363Statement Pursuant to Section 129 (AOC-1)
Not
e:
1 N
ames
of a
ssoc
iate
s or j
oint
ven
ture
s whi
ch a
re y
et to
com
men
ce o
pera
tions
:
a)
H
POIL
Gas
Pvt
. Ltd
.
b)
G
SPL
Indi
a Tr
ansc
o Lt
d.
c)
H
PCL
Shap
oorji
Ene
rgy
Ltd.
d)
R
atna
giri
Refi
nery
& P
etro
chem
ical
s Ltd
.
e)
In
drad
hanu
sh G
as G
rid L
td.
2 N
ames
of a
ssoc
iate
s or j
oint
ven
ture
s whi
ch h
ave
been
liqu
idat
ed o
r sol
d du
ring
the
year
: NIL
.
3 In
clud
es h
oldi
ng o
f 0.9
6% b
y O
NG
C M
anga
lore
Pet
roch
emic
als L
imite
d
4 *
figur
es fo
r the
sam
e ar
e de
rived
bas
is u
naud
ited
finan
cial
of F
Y’1
9.
Sign
ed a
nd d
ated
by
the
Cha
irm
an a
nd M
anag
ing
Dire
ctor
, the
Dire
ctor
(Fin
ance
), th
e C
ompa
ny S
ecre
tary
and
the
Audi
tors
of t
he C
ompa
ny a
t New
D
elhi
as a
t Pag
e N
o. 3
60.
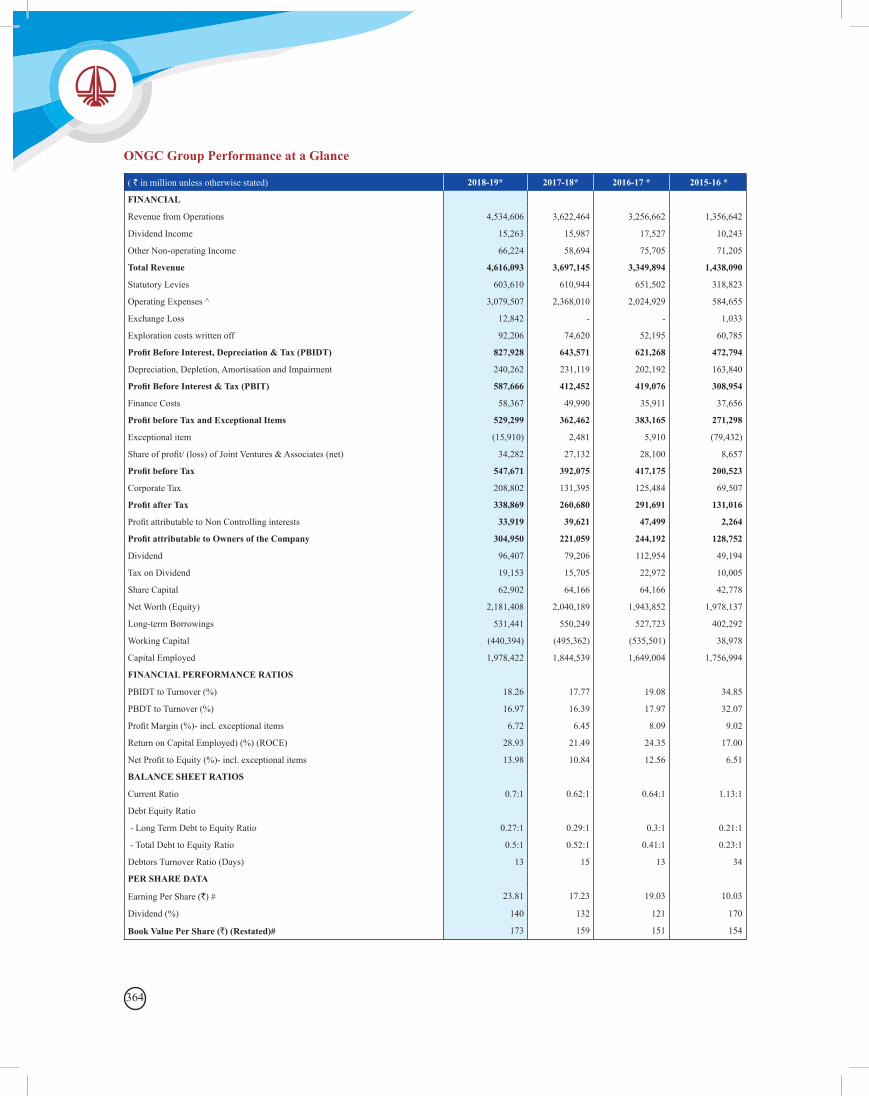
364
( ` in million unless otherwise stated) 2018-19* 2017-18* 2016-17 * 2015-16 *
FINANCIAL
Revenue from Operations 4,534,606 3,622,464 3,256,662 1,356,642
Dividend Income 15,263 15,987 17,527 10,243
Other Non-operating Income 66,224 58,694 75,705 71,205
Total Revenue 4,616,093 3,697,145 3,349,894 1,438,090
Statutory Levies 603,610 610,944 651,502 318,823
Operating Expenses ^ 3,079,507 2,368,010 2,024,929 584,655
Exchange Loss 12,842 - - 1,033
Exploration costs written off 92,206 74,620 52,195 60,785
Profit Before Interest, Depreciation & Tax (PBIDT) 827,928 643,571 621,268 472,794
Depreciation, Depletion, Amortisation and Impairment 240,262 231,119 202,192 163,840
Profit Before Interest & Tax (PBIT) 587,666 412,452 419,076 308,954
Finance Costs 58,367 49,990 35,911 37,656
Profit before Tax and Exceptional Items 529,299 362,462 383,165 271,298
Exceptional item (15,910) 2,481 5,910 (79,432)
Share of profit/ (loss) of Joint Ventures & Associates (net) 34,282 27,132 28,100 8,657
Profit before Tax 547,671 392,075 417,175 200,523
Corporate Tax 208,802 131,395 125,484 69,507
Profit after Tax 338,869 260,680 291,691 131,016
Profit attributable to Non Controlling interests 33,919 39,621 47,499 2,264
Profit attributable to Owners of the Company 304,950 221,059 244,192 128,752
Dividend 96,407 79,206 112,954 49,194
Tax on Dividend 19,153 15,705 22,972 10,005
Share Capital 62,902 64,166 64,166 42,778
Net Worth (Equity) 2,181,408 2,040,189 1,943,852 1,978,137
Long-term Borrowings 531,441 550,249 527,723 402,292
Working Capital (440,394) (495,362) (535,501) 38,978
Capital Employed 1,978,422 1,844,539 1,649,004 1,756,994
FINANCIAL PERFORMANCE RATIOS
PBIDT to Turnover (%) 18.26 17.77 19.08 34.85
PBDT to Turnover (%) 16.97 16.39 17.97 32.07
Profit Margin (%)- incl. exceptional items 6.72 6.45 8.09 9.02
Return on Capital Employed) (%) (ROCE) 28.93 21.49 24.35 17.00
Net Profit to Equity (%)- incl. exceptional items 13.98 10.84 12.56 6.51
BALANCE SHEET RATIOS
Current Ratio 0.7:1 0.62:1 0.64:1 1.13:1
Debt Equity Ratio
- Long Term Debt to Equity Ratio 0.27:1 0.29:1 0.3:1 0.21:1
- Total Debt to Equity Ratio 0.5:1 0.52:1 0.41:1 0.23:1
Debtors Turnover Ratio (Days) 13 15 13 34
PER SHARE DATA
Earning Per Share (`) # 23.81 17.23 19.03 10.03
Dividend (%) 140 132 121 170
Book Value Per Share (`) (Restated)# 173 159 151 154
ONGC Group Performance at a Glance
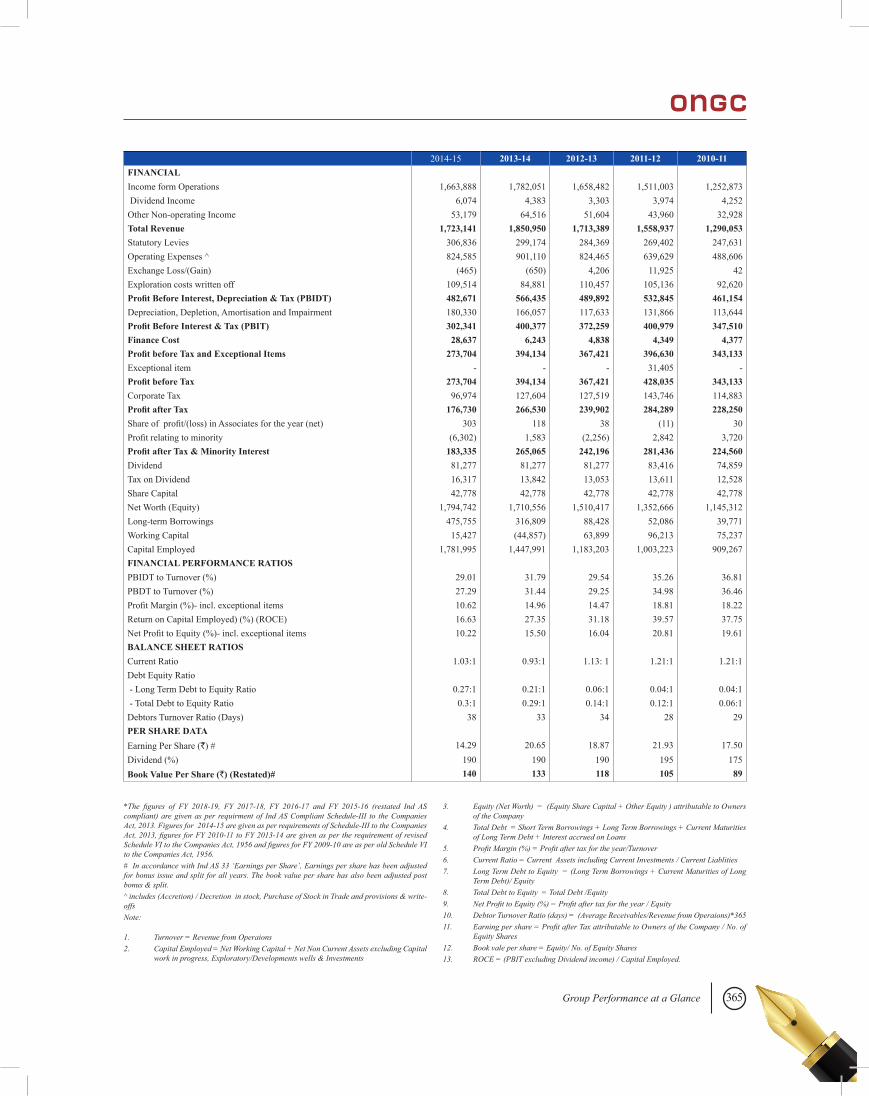
365Group Performance at a Glance
2014-15 2013-14 2012-13 2011-12 2010-11FINANCIALIncome form Operations 1,663,888 1,782,051 1,658,482 1,511,003 1,252,873 Dividend Income 6,074 4,383 3,303 3,974 4,252 Other Non-operating Income 53,179 64,516 51,604 43,960 32,928 Total Revenue 1,723,141 1,850,950 1,713,389 1,558,937 1,290,053Statutory Levies 306,836 299,174 284,369 269,402 247,631 Operating Expenses ^ 824,585 901,110 824,465 639,629 488,606 Exchange Loss/(Gain) (465) (650) 4,206 11,925 42 Exploration costs written off 109,514 84,881 110,457 105,136 92,620 Profit Before Interest, Depreciation & Tax (PBIDT) 482,671 566,435 489,892 532,845 461,154 Depreciation, Depletion, Amortisation and Impairment 180,330 166,057 117,633 131,866 113,644 Profit Before Interest & Tax (PBIT) 302,341 400,377 372,259 400,979 347,510 Finance Cost 28,637 6,243 4,838 4,349 4,377 Profit before Tax and Exceptional Items 273,704 394,134 367,421 396,630 343,133 Exceptional item - - - 31,405 - Profit before Tax 273,704 394,134 367,421 428,035 343,133 Corporate Tax 96,974 127,604 127,519 143,746 114,883 Profit after Tax 176,730 266,530 239,902 284,289 228,250 Share of profit/(loss) in Associates for the year (net) 303 118 38 (11) 30 Profit relating to minority (6,302) 1,583 (2,256) 2,842 3,720 Profit after Tax & Minority Interest 183,335 265,065 242,196 281,436 224,560 Dividend 81,277 81,277 81,277 83,416 74,859 Tax on Dividend 16,317 13,842 13,053 13,611 12,528 Share Capital 42,778 42,778 42,778 42,778 42,778 Net Worth (Equity) 1,794,742 1,710,556 1,510,417 1,352,666 1,145,312 Long-term Borrowings 475,755 316,809 88,428 52,086 39,771 Working Capital 15,427 (44,857) 63,899 96,213 75,237 Capital Employed 1,781,995 1,447,991 1,183,203 1,003,223 909,267 FINANCIAL PERFORMANCE RATIOSPBIDT to Turnover (%) 29.01 31.79 29.54 35.26 36.81 PBDT to Turnover (%) 27.29 31.44 29.25 34.98 36.46 Profit Margin (%)- incl. exceptional items 10.62 14.96 14.47 18.81 18.22 Return on Capital Employed) (%) (ROCE) 16.63 27.35 31.18 39.57 37.75 Net Profit to Equity (%)- incl. exceptional items 10.22 15.50 16.04 20.81 19.61 BALANCE SHEET RATIOSCurrent Ratio 1.03:1 0.93:1 1.13: 1 1.21:1 1.21:1Debt Equity Ratio - Long Term Debt to Equity Ratio 0.27:1 0.21:1 0.06:1 0.04:1 0.04:1 - Total Debt to Equity Ratio 0.3:1 0.29:1 0.14:1 0.12:1 0.06:1Debtors Turnover Ratio (Days) 38 33 34 28 29PER SHARE DATAEarning Per Share (`) # 14.29 20.65 18.87 21.93 17.50 Dividend (%) 190 190 190 195 175 Book Value Per Share (`) (Restated)# 140 133 118 105 89
*The figures of FY 2018-19, FY 2017-18, FY 2016-17 and FY 2015-16 (restated Ind AS compliant) are given as per requirment of Ind AS Compliant Schedule-III to the Companies Act, 2013. Figures for 2014-15 are given as per requirements of Schedule-III to the Companies Act, 2013, figures for FY 2010-11 to FY 2013-14 are given as per the requirement of revised Schedule VI to the Companies Act, 1956 and figures for FY 2009-10 are as per old Schedule VI to the Companies Act, 1956.# In accordance with Ind AS 33 ‘Earnings per Share’, Earnings per share has been adjusted for bonus issue and split for all years. The book value per share has also been adjusted post bonus & split.^ includes (Accretion) / Decretion in stock, Purchase of Stock in Trade and provisions & write-offsNote:
1. Turnover = Revenue from Operaions2. Capital Employed = Net Working Capital + Net Non Current Assets excluding Capital
work in progress, Exploratory/Developments wells & Investments
3. Equity (Net Worth) = (Equity Share Capital + Other Equity ) attributable to Owners of the Company
4. Total Debt = Short Term Borrowings + Long Term Borrowings + Current Maturities of Long Term Debt + Interest accrued on Loans
5. Profit Margin (%) = Profit after tax for the year/Turnover6. Current Ratio = Current Assets including Current Investments / Current Liablities7. Long Term Debt to Equity = (Long Term Borrowings + Current Maturities of Long
Term Debt)/ Equity8. Total Debt to Equity = Total Debt /Equity9. Net Profit to Equity (%) = Profit after tax for the year / Equity10. Debtor Turnover Ratio (days) = (Average Receivables/Revenue from Operaions)*36511. Earning per share = Profit after Tax attributable to Owners of the Company / No. of
Equity Shares12. Book vale per share = Equity/ No. of Equity Shares13. ROCE = (PBIT excluding Dividend income) / Capital Employed.
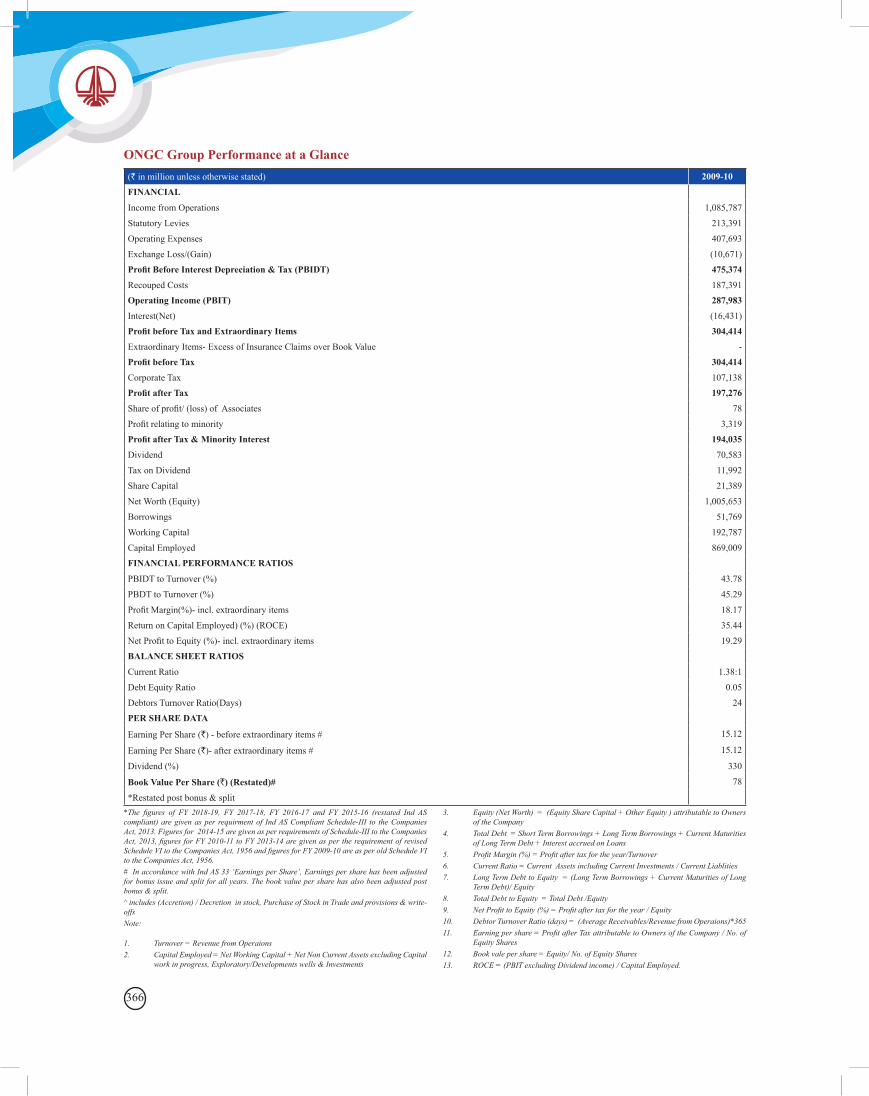
366
(` in million unless otherwise stated) 2009-10
FINANCIAL
Income from Operations 1,085,787
Statutory Levies 213,391
Operating Expenses 407,693
Exchange Loss/(Gain) (10,671)Profit Before Interest Depreciation & Tax (PBIDT) 475,374
Recouped Costs 187,391 Operating Income (PBIT) 287,983
Interest(Net) (16,431)Profit before Tax and Extraordinary Items 304,414
Extraordinary Items- Excess of Insurance Claims over Book Value - Profit before Tax 304,414
Corporate Tax 107,138 Profit after Tax 197,276
Share of profit/ (loss) of Associates 78
Profit relating to minority 3,319 Profit after Tax & Minority Interest 194,035
Dividend 70,583
Tax on Dividend 11,992
Share Capital 21,389
Net Worth (Equity) 1,005,653
Borrowings 51,769
Working Capital 192,787
Capital Employed 869,009 FINANCIAL PERFORMANCE RATIOS
PBIDT to Turnover (%) 43.78
PBDT to Turnover (%) 45.29
Profit Margin(%)- incl. extraordinary items 18.17
Return on Capital Employed) (%) (ROCE) 35.44
Net Profit to Equity (%)- incl. extraordinary items 19.29BALANCE SHEET RATIOS
Current Ratio 1.38:1
Debt Equity Ratio 0.05
Debtors Turnover Ratio(Days) 24PER SHARE DATA
Earning Per Share (`) - before extraordinary items # 15.12
Earning Per Share (`)- after extraordinary items # 15.12
Dividend (%) 330
Book Value Per Share (`) (Restated)# 78
*Restated post bonus & split *The figures of FY 2018-19, FY 2017-18, FY 2016-17 and FY 2015-16 (restated Ind AS compliant) are given as per requirment of Ind AS Compliant Schedule-III to the Companies Act, 2013. Figures for 2014-15 are given as per requirements of Schedule-III to the Companies Act, 2013, figures for FY 2010-11 to FY 2013-14 are given as per the requirement of revised Schedule VI to the Companies Act, 1956 and figures for FY 2009-10 are as per old Schedule VI to the Companies Act, 1956.# In accordance with Ind AS 33 ‘Earnings per Share’, Earnings per share has been adjusted for bonus issue and split for all years. The book value per share has also been adjusted post bonus & split.^ includes (Accretion) / Decretion in stock, Purchase of Stock in Trade and provisions & write-offsNote:
1. Turnover = Revenue from Operaions2. Capital Employed = Net Working Capital + Net Non Current Assets excluding Capital
work in progress, Exploratory/Developments wells & Investments
3. Equity (Net Worth) = (Equity Share Capital + Other Equity ) attributable to Owners of the Company
4. Total Debt = Short Term Borrowings + Long Term Borrowings + Current Maturities of Long Term Debt + Interest accrued on Loans
5. Profit Margin (%) = Profit after tax for the year/Turnover6. Current Ratio = Current Assets including Current Investments / Current Liablities7. Long Term Debt to Equity = (Long Term Borrowings + Current Maturities of Long
Term Debt)/ Equity8. Total Debt to Equity = Total Debt /Equity9. Net Profit to Equity (%) = Profit after tax for the year / Equity10. Debtor Turnover Ratio (days) = (Average Receivables/Revenue from Operaions)*36511. Earning per share = Profit after Tax attributable to Owners of the Company / No. of
Equity Shares12. Book vale per share = Equity/ No. of Equity Shares13. ROCE = (PBIT excluding Dividend income) / Capital Employed.
ONGC Group Performance at a Glance
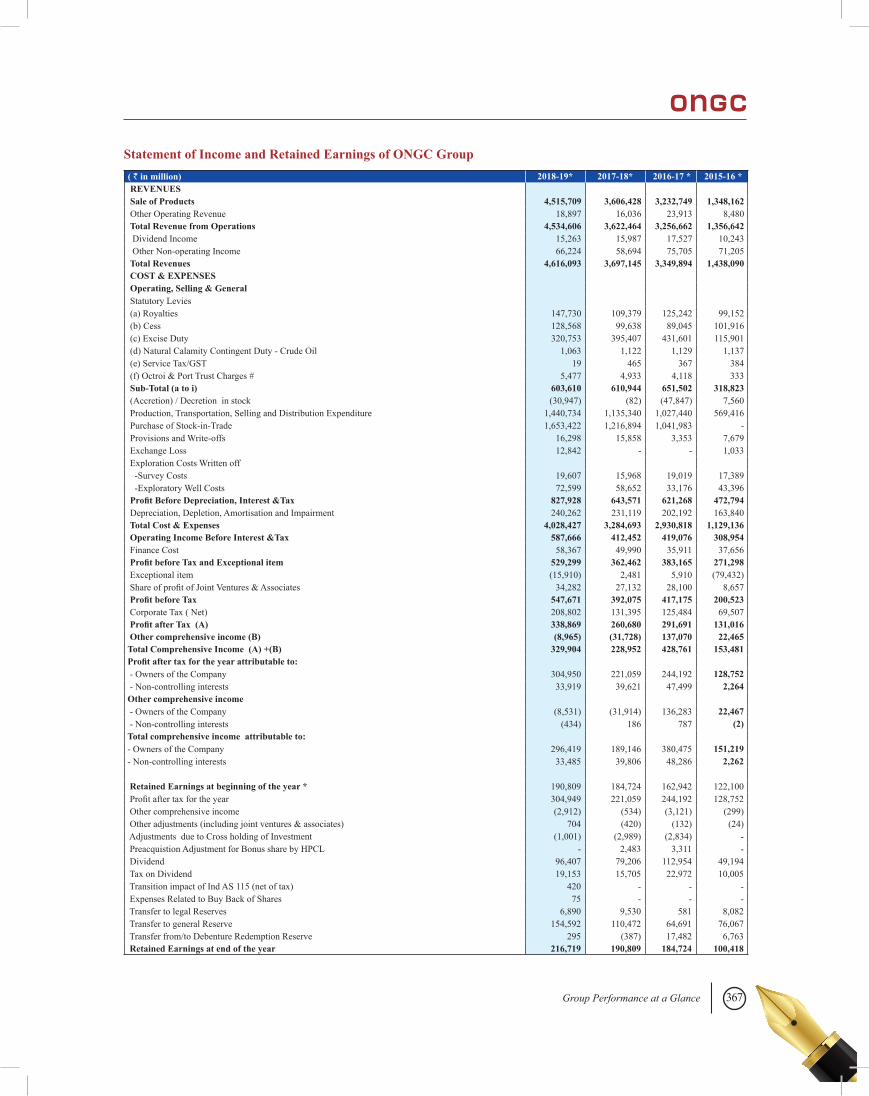
367Group Performance at a Glance
Statement of Income and Retained Earnings of ONGC Group( ` in million) 2018-19* 2017-18* 2016-17 * 2015-16 * REVENUES Sale of Products 4,515,709 3,606,428 3,232,749 1,348,162 Other Operating Revenue 18,897 16,036 23,913 8,480 Total Revenue from Operations 4,534,606 3,622,464 3,256,662 1,356,642 Dividend Income 15,263 15,987 17,527 10,243 Other Non-operating Income 66,224 58,694 75,705 71,205 Total Revenues 4,616,093 3,697,145 3,349,894 1,438,090 COST & EXPENSES Operating, Selling & General Statutory Levies (a) Royalties 147,730 109,379 125,242 99,152 (b) Cess 128,568 99,638 89,045 101,916 (c) Excise Duty 320,753 395,407 431,601 115,901 (d) Natural Calamity Contingent Duty - Crude Oil 1,063 1,122 1,129 1,137 (e) Service Tax/GST 19 465 367 384 (f) Octroi & Port Trust Charges # 5,477 4,933 4,118 333 Sub-Total (a to i) 603,610 610,944 651,502 318,823 (Accretion) / Decretion in stock (30,947) (82) (47,847) 7,560 Production, Transportation, Selling and Distribution Expenditure 1,440,734 1,135,340 1,027,440 569,416 Purchase of Stock-in-Trade 1,653,422 1,216,894 1,041,983 - Provisions and Write-offs 16,298 15,858 3,353 7,679 Exchange Loss 12,842 - - 1,033 Exploration Costs Written off -Survey Costs 19,607 15,968 19,019 17,389 -Exploratory Well Costs 72,599 58,652 33,176 43,396 Profit Before Depreciation, Interest &Tax 827,928 643,571 621,268 472,794 Depreciation, Depletion, Amortisation and Impairment 240,262 231,119 202,192 163,840 Total Cost & Expenses 4,028,427 3,284,693 2,930,818 1,129,136 Operating Income Before Interest &Tax 587,666 412,452 419,076 308,954 Finance Cost 58,367 49,990 35,911 37,656 Profit before Tax and Exceptional item 529,299 362,462 383,165 271,298 Exceptional item (15,910) 2,481 5,910 (79,432) Share of profit of Joint Ventures & Associates 34,282 27,132 28,100 8,657 Profit before Tax 547,671 392,075 417,175 200,523 Corporate Tax ( Net) 208,802 131,395 125,484 69,507 Profit after Tax (A) 338,869 260,680 291,691 131,016 Other comprehensive income (B) (8,965) (31,728) 137,070 22,465 Total Comprehensive Income (A) +(B) 329,904 228,952 428,761 153,481 Profit after tax for the year attributable to: - Owners of the Company 304,950 221,059 244,192 128,752 - Non-controlling interests 33,919 39,621 47,499 2,264 Other comprehensive income - Owners of the Company (8,531) (31,914) 136,283 22,467 - Non-controlling interests (434) 186 787 (2)Total comprehensive income attributable to:- Owners of the Company 296,419 189,146 380,475 151,219 - Non-controlling interests 33,485 39,806 48,286 2,262
Retained Earnings at beginning of the year * 190,809 184,724 162,942 122,100 Profit after tax for the year 304,949 221,059 244,192 128,752 Other comprehensive income (2,912) (534) (3,121) (299) Other adjustments (including joint ventures & associates) 704 (420) (132) (24) Adjustments due to Cross holding of Investment (1,001) (2,989) (2,834) - Preacquistion Adjustment for Bonus share by HPCL - 2,483 3,311 - Dividend 96,407 79,206 112,954 49,194 Tax on Dividend 19,153 15,705 22,972 10,005 Transition impact of Ind AS 115 (net of tax) 420 - - - Expenses Related to Buy Back of Shares 75 - - - Transfer to legal Reserves 6,890 9,530 581 8,082 Transfer to general Reserve 154,592 110,472 64,691 76,067 Transfer from/to Debenture Redemption Reserve 295 (387) 17,482 6,763 Retained Earnings at end of the year 216,719 190,809 184,724 100,418
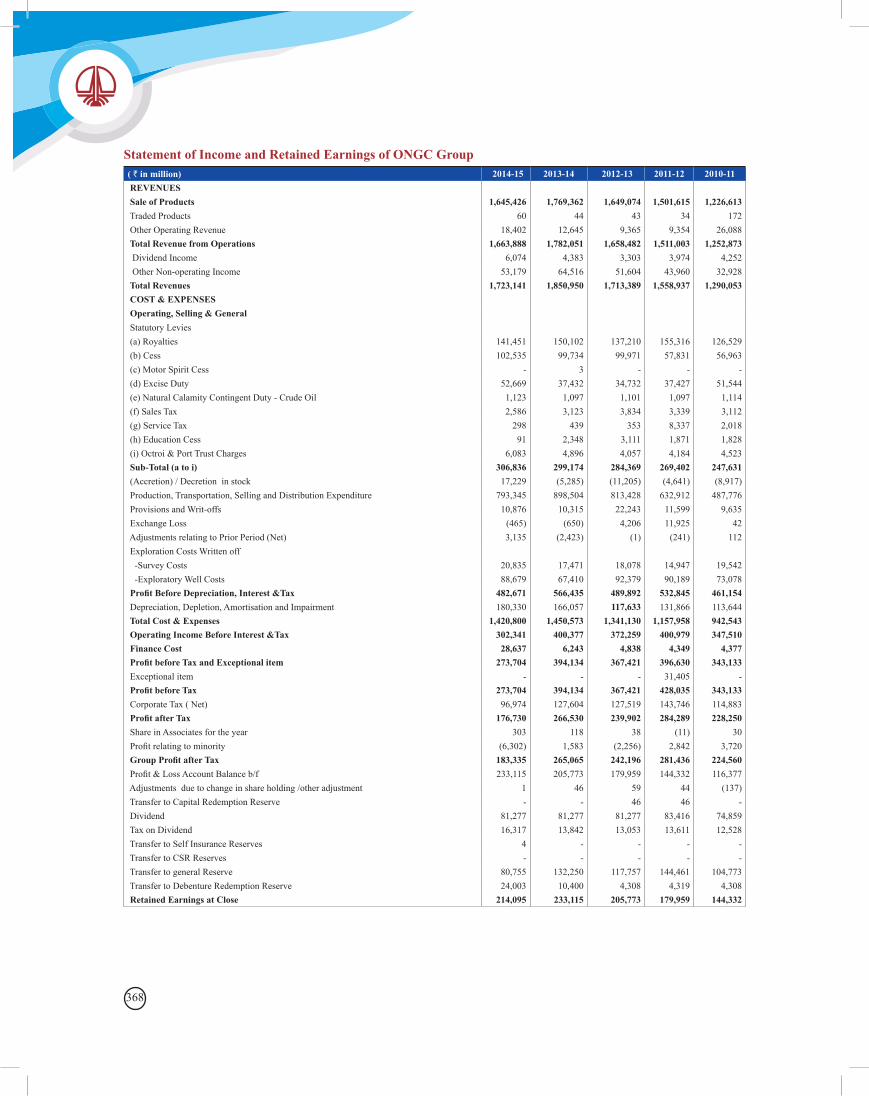
368
( ` in million) 2014-15 2013-14 2012-13 2011-12 2010-11 REVENUES Sale of Products 1,645,426 1,769,362 1,649,074 1,501,615 1,226,613 Traded Products 60 44 43 34 172 Other Operating Revenue 18,402 12,645 9,365 9,354 26,088 Total Revenue from Operations 1,663,888 1,782,051 1,658,482 1,511,003 1,252,873 Dividend Income 6,074 4,383 3,303 3,974 4,252 Other Non-operating Income 53,179 64,516 51,604 43,960 32,928 Total Revenues 1,723,141 1,850,950 1,713,389 1,558,937 1,290,053 COST & EXPENSES Operating, Selling & General Statutory Levies (a) Royalties 141,451 150,102 137,210 155,316 126,529 (b) Cess 102,535 99,734 99,971 57,831 56,963 (c) Motor Spirit Cess - 3 - - - (d) Excise Duty 52,669 37,432 34,732 37,427 51,544 (e) Natural Calamity Contingent Duty - Crude Oil 1,123 1,097 1,101 1,097 1,114 (f) Sales Tax 2,586 3,123 3,834 3,339 3,112 (g) Service Tax 298 439 353 8,337 2,018 (h) Education Cess 91 2,348 3,111 1,871 1,828 (i) Octroi & Port Trust Charges 6,083 4,896 4,057 4,184 4,523 Sub-Total (a to i) 306,836 299,174 284,369 269,402 247,631 (Accretion) / Decretion in stock 17,229 (5,285) (11,205) (4,641) (8,917) Production, Transportation, Selling and Distribution Expenditure 793,345 898,504 813,428 632,912 487,776 Provisions and Writ-offs 10,876 10,315 22,243 11,599 9,635 Exchange Loss (465) (650) 4,206 11,925 42 Adjustments relating to Prior Period (Net) 3,135 (2,423) (1) (241) 112 Exploration Costs Written off -Survey Costs 20,835 17,471 18,078 14,947 19,542 -Exploratory Well Costs 88,679 67,410 92,379 90,189 73,078 Profit Before Depreciation, Interest &Tax 482,671 566,435 489,892 532,845 461,154 Depreciation, Depletion, Amortisation and Impairment 180,330 166,057 117,633 131,866 113,644 Total Cost & Expenses 1,420,800 1,450,573 1,341,130 1,157,958 942,543 Operating Income Before Interest &Tax 302,341 400,377 372,259 400,979 347,510 Finance Cost 28,637 6,243 4,838 4,349 4,377 Profit before Tax and Exceptional item 273,704 394,134 367,421 396,630 343,133 Exceptional item - - - 31,405 - Profit before Tax 273,704 394,134 367,421 428,035 343,133 Corporate Tax ( Net) 96,974 127,604 127,519 143,746 114,883 Profit after Tax 176,730 266,530 239,902 284,289 228,250 Share in Associates for the year 303 118 38 (11) 30 Profit relating to minority (6,302) 1,583 (2,256) 2,842 3,720 Group Profit after Tax 183,335 265,065 242,196 281,436 224,560 Profit & Loss Account Balance b/f 233,115 205,773 179,959 144,332 116,377 Adjustments due to change in share holding /other adjustment 1 46 59 44 (137) Transfer to Capital Redemption Reserve - - 46 46 - Dividend 81,277 81,277 81,277 83,416 74,859 Tax on Dividend 16,317 13,842 13,053 13,611 12,528 Transfer to Self Insurance Reserves 4 - - - - Transfer to CSR Reserves - - - - - Transfer to general Reserve 80,755 132,250 117,757 144,461 104,773 Transfer to Debenture Redemption Reserve 24,003 10,400 4,308 4,319 4,308 Retained Earnings at Close 214,095 233,115 205,773 179,959 144,332
Statement of Income and Retained Earnings of ONGC Group
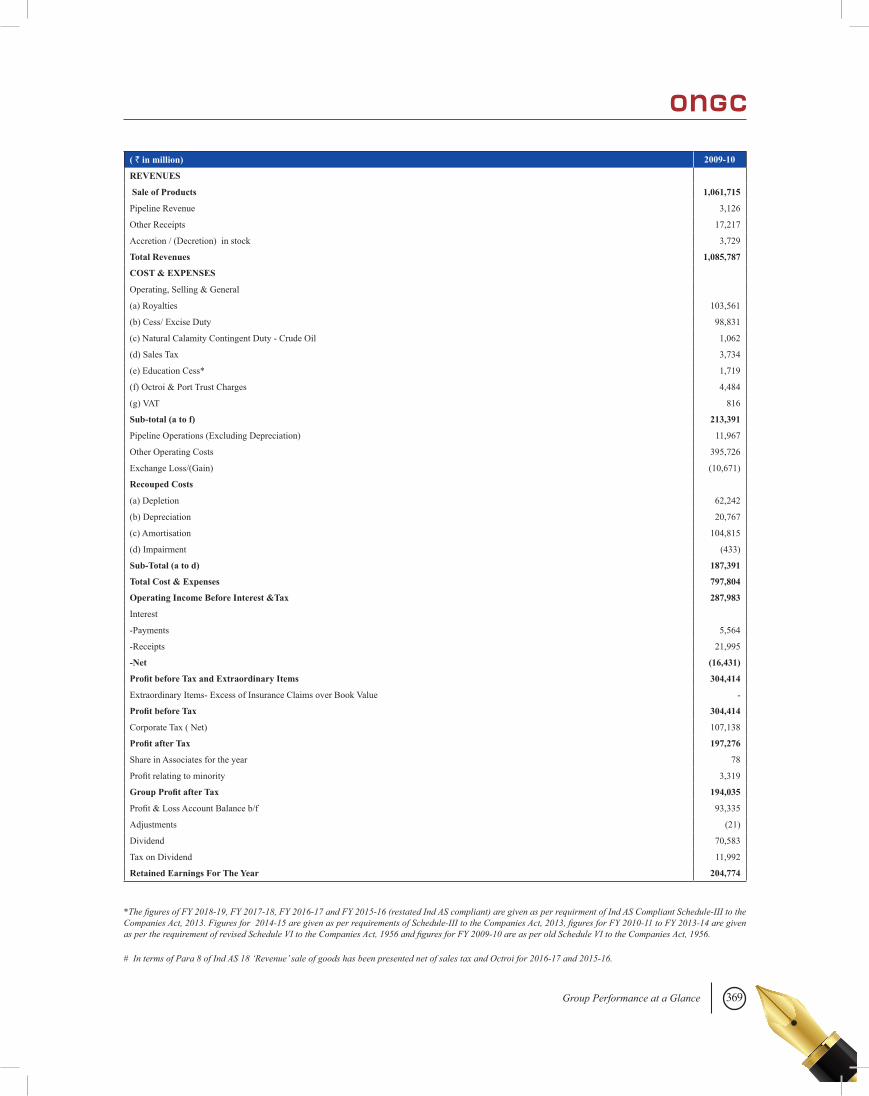
369Group Performance at a Glance
( ` in million) 2009-10
REVENUES
Sale of Products 1,061,715
Pipeline Revenue 3,126
Other Receipts 17,217
Accretion / (Decretion) in stock 3,729
Total Revenues 1,085,787
COST & EXPENSES
Operating, Selling & General
(a) Royalties 103,561
(b) Cess/ Excise Duty 98,831
(c) Natural Calamity Contingent Duty - Crude Oil 1,062
(d) Sales Tax 3,734
(e) Education Cess* 1,719
(f) Octroi & Port Trust Charges 4,484
(g) VAT 816
Sub-total (a to f) 213,391
Pipeline Operations (Excluding Depreciation) 11,967
Other Operating Costs 395,726
Exchange Loss/(Gain) (10,671)
Recouped Costs
(a) Depletion 62,242
(b) Depreciation 20,767
(c) Amortisation 104,815
(d) Impairment (433)
Sub-Total (a to d) 187,391
Total Cost & Expenses 797,804
Operating Income Before Interest &Tax 287,983
Interest
-Payments 5,564
-Receipts 21,995
-Net (16,431)
Profit before Tax and Extraordinary Items 304,414
Extraordinary Items- Excess of Insurance Claims over Book Value -
Profit before Tax 304,414
Corporate Tax ( Net) 107,138
Profit after Tax 197,276
Share in Associates for the year 78
Profit relating to minority 3,319
Group Profit after Tax 194,035
Profit & Loss Account Balance b/f 93,335
Adjustments (21)
Dividend 70,583
Tax on Dividend 11,992
Retained Earnings For The Year 204,774
*The figures of FY 2018-19, FY 2017-18, FY 2016-17 and FY 2015-16 (restated Ind AS compliant) are given as per requirment of Ind AS Compliant Schedule-III to the Companies Act, 2013. Figures for 2014-15 are given as per requirements of Schedule-III to the Companies Act, 2013, figures for FY 2010-11 to FY 2013-14 are given as per the requirement of revised Schedule VI to the Companies Act, 1956 and figures for FY 2009-10 are as per old Schedule VI to the Companies Act, 1956.
# In terms of Para 8 of Ind AS 18 ‘Revenue’ sale of goods has been presented net of sales tax and Octroi for 2016-17 and 2015-16.
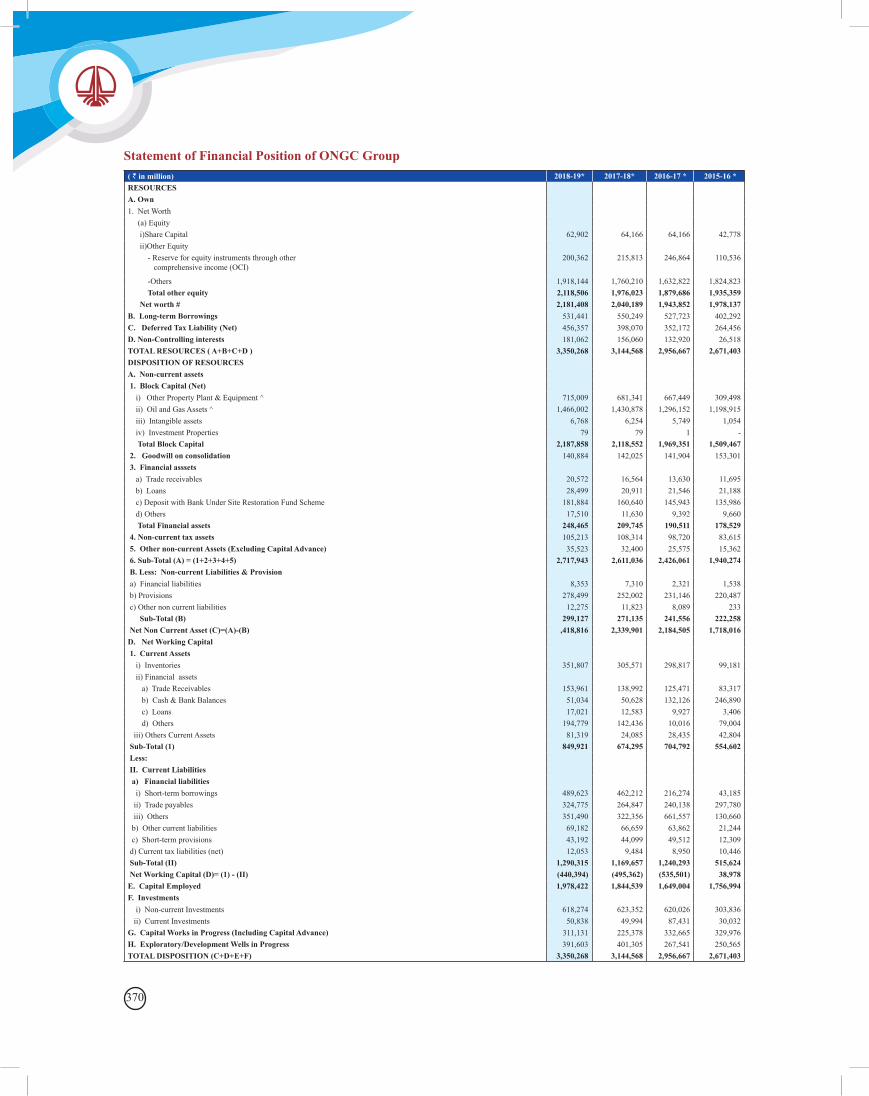
370
Statement of Financial Position of ONGC Group( ` in million) 2018-19* 2017-18* 2016-17 * 2015-16 *RESOURCESA. Own1. Net Worth (a) Equity i)Share Capital 62,902 64,166 64,166 42,778 ii)Other Equity - Reserve for equity instruments through other comprehensive income (OCI)
200,362 215,813 246,864 110,536
-Others 1,918,144 1,760,210 1,632,822 1,824,823 Total other equity 2,118,506 1,976,023 1,879,686 1,935,359 Net worth # 2,181,408 2,040,189 1,943,852 1,978,137 B. Long-term Borrowings 531,441 550,249 527,723 402,292 C. Deferred Tax Liability (Net) 456,357 398,070 352,172 264,456 D. Non-Controlling interests 181,062 156,060 132,920 26,518 TOTAL RESOURCES ( A+B+C+D ) 3,350,268 3,144,568 2,956,667 2,671,403 DISPOSITION OF RESOURCESA. Non-current assets 1. Block Capital (Net) i) Other Property Plant & Equipment ^ 715,009 681,341 667,449 309,498 ii) Oil and Gas Assets ^ 1,466,002 1,430,878 1,296,152 1,198,915 iii) Intangible assets 6,768 6,254 5,749 1,054 iv) Investment Properties 79 79 1 - Total Block Capital 2,187,858 2,118,552 1,969,351 1,509,467 2. Goodwill on consolidation 140,884 142,025 141,904 153,301 3. Financial asssets a) Trade receivables 20,572 16,564 13,630 11,695 b) Loans 28,499 20,911 21,546 21,188 c) Deposit with Bank Under Site Restoration Fund Scheme 181,884 160,640 145,943 135,986 d) Others 17,510 11,630 9,392 9,660 Total Financial assets 248,465 209,745 190,511 178,529 4. Non-current tax assets 105,213 108,314 98,720 83,615 5. Other non-current Assets (Excluding Capital Advance) 35,523 32,400 25,575 15,362 6. Sub-Total (A) = (1+2+3+4+5) 2,717,943 2,611,036 2,426,061 1,940,274 B. Less: Non-current Liabilities & Provision a) Financial liabilities 8,353 7,310 2,321 1,538 b) Provisions 278,499 252,002 231,146 220,487 c) Other non current liabilities 12,275 11,823 8,089 233 Sub-Total (B) 299,127 271,135 241,556 222,258 Net Non Current Asset (C)=(A)-(B) ,418,816 2,339,901 2,184,505 1,718,016 D. Net Working Capital 1. Current Assets i) Inventories 351,807 305,571 298,817 99,181 ii) Financial assets a) Trade Receivables 153,961 138,992 125,471 83,317 b) Cash & Bank Balances 51,034 50,628 132,126 246,890 c) Loans 17,021 12,583 9,927 3,406 d) Others 194,779 142,436 10,016 79,004 iii) Others Current Assets 81,319 24,085 28,435 42,804 Sub-Total (1) 849,921 674,295 704,792 554,602 Less: II. Current Liabilities a) Financial liabilities i) Short-term borrowings 489,623 462,212 216,274 43,185 ii) Trade payables 324,775 264,847 240,138 297,780 iii) Others 351,490 322,356 661,557 130,660 b) Other current liabilities 69,182 66,659 63,862 21,244 c) Short-term provisions 43,192 44,099 49,512 12,309 d) Current tax liabilities (net) 12,053 9,484 8,950 10,446 Sub-Total (II) 1,290,315 1,169,657 1,240,293 515,624 Net Working Capital (D)= (1) - (II) (440,394) (495,362) (535,501) 38,978 E. Capital Employed 1,978,422 1,844,539 1,649,004 1,756,994 F. Investments i) Non-current Investments 618,274 623,352 620,026 303,836 ii) Current Investments 50,838 49,994 87,431 30,032 G. Capital Works in Progress (Including Capital Advance) 311,131 225,378 332,665 329,976 H. Exploratory/Development Wells in Progress 391,603 401,305 267,541 250,565 TOTAL DISPOSITION (C+D+E+F) 3,350,268 3,144,568 2,956,667 2,671,403
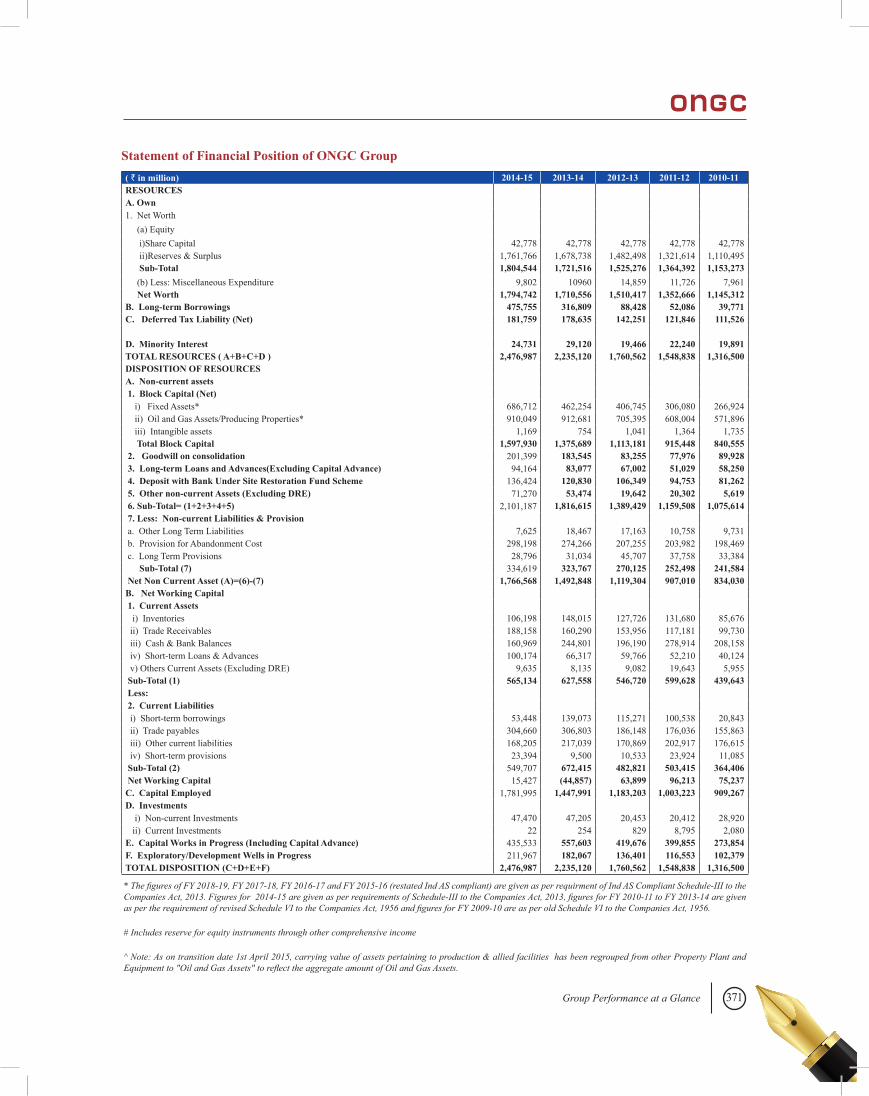
371Group Performance at a Glance
( ` in million) 2014-15 2013-14 2012-13 2011-12 2010-11RESOURCESA. Own1. Net Worth (a) Equity i)Share Capital 42,778 42,778 42,778 42,778 42,778 ii)Reserves & Surplus 1,761,766 1,678,738 1,482,498 1,321,614 1,110,495 Sub-Total 1,804,544 1,721,516 1,525,276 1,364,392 1,153,273 (b) Less: Miscellaneous Expenditure 9,802 10960 14,859 11,726 7,961 Net Worth 1,794,742 1,710,556 1,510,417 1,352,666 1,145,312B. Long-term Borrowings 475,755 316,809 88,428 52,086 39,771 C. Deferred Tax Liability (Net) 181,759 178,635 142,251 121,846 111,526
D. Minority Interest 24,731 29,120 19,466 22,240 19,891 TOTAL RESOURCES ( A+B+C+D ) 2,476,987 2,235,120 1,760,562 1,548,838 1,316,500DISPOSITION OF RESOURCESA. Non-current assets 1. Block Capital (Net) i) Fixed Assets* 686,712 462,254 406,745 306,080 266,924 ii) Oil and Gas Assets/Producing Properties* 910,049 912,681 705,395 608,004 571,896 iii) Intangible assets 1,169 754 1,041 1,364 1,735 Total Block Capital 1,597,930 1,375,689 1,113,181 915,448 840,555 2. Goodwill on consolidation 201,399 183,545 83,255 77,976 89,928 3. Long-term Loans and Advances(Excluding Capital Advance) 94,164 83,077 67,002 51,029 58,250 4. Deposit with Bank Under Site Restoration Fund Scheme 136,424 120,830 106,349 94,753 81,262 5. Other non-current Assets (Excluding DRE) 71,270 53,474 19,642 20,302 5,619 6. Sub-Total= (1+2+3+4+5) 2,101,187 1,816,615 1,389,429 1,159,508 1,075,614 7. Less: Non-current Liabilities & Provision a. Other Long Term Liabilities 7,625 18,467 17,163 10,758 9,731 b. Provision for Abandonment Cost 298,198 274,266 207,255 203,982 198,469 c. Long Term Provisions 28,796 31,034 45,707 37,758 33,384 Sub-Total (7) 334,619 323,767 270,125 252,498 241,584 Net Non Current Asset (A)=(6)-(7) 1,766,568 1,492,848 1,119,304 907,010 834,030B. Net Working Capital 1. Current Assets i) Inventories 106,198 148,015 127,726 131,680 85,676 ii) Trade Receivables 188,158 160,290 153,956 117,181 99,730 iii) Cash & Bank Balances 160,969 244,801 196,190 278,914 208,158 iv) Short-term Loans & Advances 100,174 66,317 59,766 52,210 40,124 v) Others Current Assets (Excluding DRE) 9,635 8,135 9,082 19,643 5,955 Sub-Total (1) 565,134 627,558 546,720 599,628 439,643 Less: 2. Current Liabilities i) Short-term borrowings 53,448 139,073 115,271 100,538 20,843 ii) Trade payables 304,660 306,803 186,148 176,036 155,863 iii) Other current liabilities 168,205 217,039 170,869 202,917 176,615 iv) Short-term provisions 23,394 9,500 10,533 23,924 11,085 Sub-Total (2) 549,707 672,415 482,821 503,415 364,406 Net Working Capital 15,427 (44,857) 63,899 96,213 75,237C. Capital Employed 1,781,995 1,447,991 1,183,203 1,003,223 909,267D. Investments i) Non-current Investments 47,470 47,205 20,453 20,412 28,920 ii) Current Investments 22 254 829 8,795 2,080 E. Capital Works in Progress (Including Capital Advance) 435,533 557,603 419,676 399,855 273,854F. Exploratory/Development Wells in Progress 211,967 182,067 136,401 116,553 102,379TOTAL DISPOSITION (C+D+E+F) 2,476,987 2,235,120 1,760,562 1,548,838 1,316,500
* The figures of FY 2018-19, FY 2017-18, FY 2016-17 and FY 2015-16 (restated Ind AS compliant) are given as per requirment of Ind AS Compliant Schedule-III to the Companies Act, 2013. Figures for 2014-15 are given as per requirements of Schedule-III to the Companies Act, 2013, figures for FY 2010-11 to FY 2013-14 are given as per the requirement of revised Schedule VI to the Companies Act, 1956 and figures for FY 2009-10 are as per old Schedule VI to the Companies Act, 1956.
# Includes reserve for equity instruments through other comprehensive income
^ Note: As on transition date 1st April 2015, carrying value of assets pertaining to production & allied facilities has been regrouped from other Property Plant and Equipment to "Oil and Gas Assets" to reflect the aggregate amount of Oil and Gas Assets.
Statement of Financial Position of ONGC Group
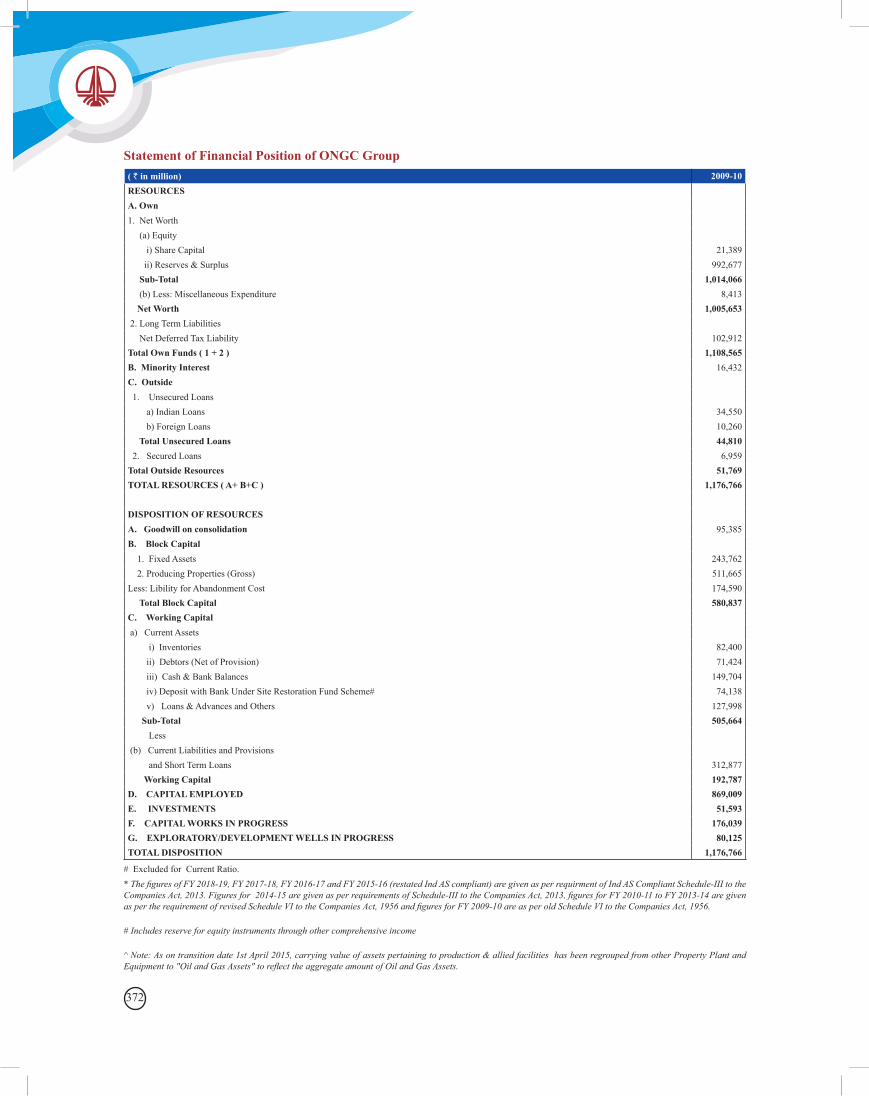
372
# Excluded for Current Ratio.* The figures of FY 2018-19, FY 2017-18, FY 2016-17 and FY 2015-16 (restated Ind AS compliant) are given as per requirment of Ind AS Compliant Schedule-III to the Companies Act, 2013. Figures for 2014-15 are given as per requirements of Schedule-III to the Companies Act, 2013, figures for FY 2010-11 to FY 2013-14 are given as per the requirement of revised Schedule VI to the Companies Act, 1956 and figures for FY 2009-10 are as per old Schedule VI to the Companies Act, 1956.
# Includes reserve for equity instruments through other comprehensive income
^ Note: As on transition date 1st April 2015, carrying value of assets pertaining to production & allied facilities has been regrouped from other Property Plant and Equipment to "Oil and Gas Assets" to reflect the aggregate amount of Oil and Gas Assets.
( ` in million) 2009-10RESOURCESA. Own1. Net Worth (a) Equity i) Share Capital 21,389 ii) Reserves & Surplus 992,677 Sub-Total 1,014,066 (b) Less: Miscellaneous Expenditure 8,413 Net Worth 1,005,653 2. Long Term Liabilities Net Deferred Tax Liability 102,912 Total Own Funds ( 1 + 2 ) 1,108,565B. Minority Interest 16,432 C. Outside 1. Unsecured Loans a) Indian Loans 34,550 b) Foreign Loans 10,260 Total Unsecured Loans 44,810 2. Secured Loans 6,959 Total Outside Resources 51,769 TOTAL RESOURCES ( A+ B+C ) 1,176,766
DISPOSITION OF RESOURCESA. Goodwill on consolidation 95,385 B. Block Capital 1. Fixed Assets 243,762 2. Producing Properties (Gross) 511,665 Less: Libility for Abandonment Cost 174,590 Total Block Capital 580,837C. Working Capital a) Current Assets i) Inventories 82,400 ii) Debtors (Net of Provision) 71,424 iii) Cash & Bank Balances 149,704 iv) Deposit with Bank Under Site Restoration Fund Scheme# 74,138 v) Loans & Advances and Others 127,998 Sub-Total 505,664 Less (b) Current Liabilities and Provisions and Short Term Loans 312,877 Working Capital 192,787D. CAPITAL EMPLOYED 869,009E. INVESTMENTS 51,593 F. CAPITAL WORKS IN PROGRESS 176,039G. EXPLORATORY/DEVELOPMENT WELLS IN PROGRESS 80,125 TOTAL DISPOSITION 1,176,766
Statement of Financial Position of ONGC Group
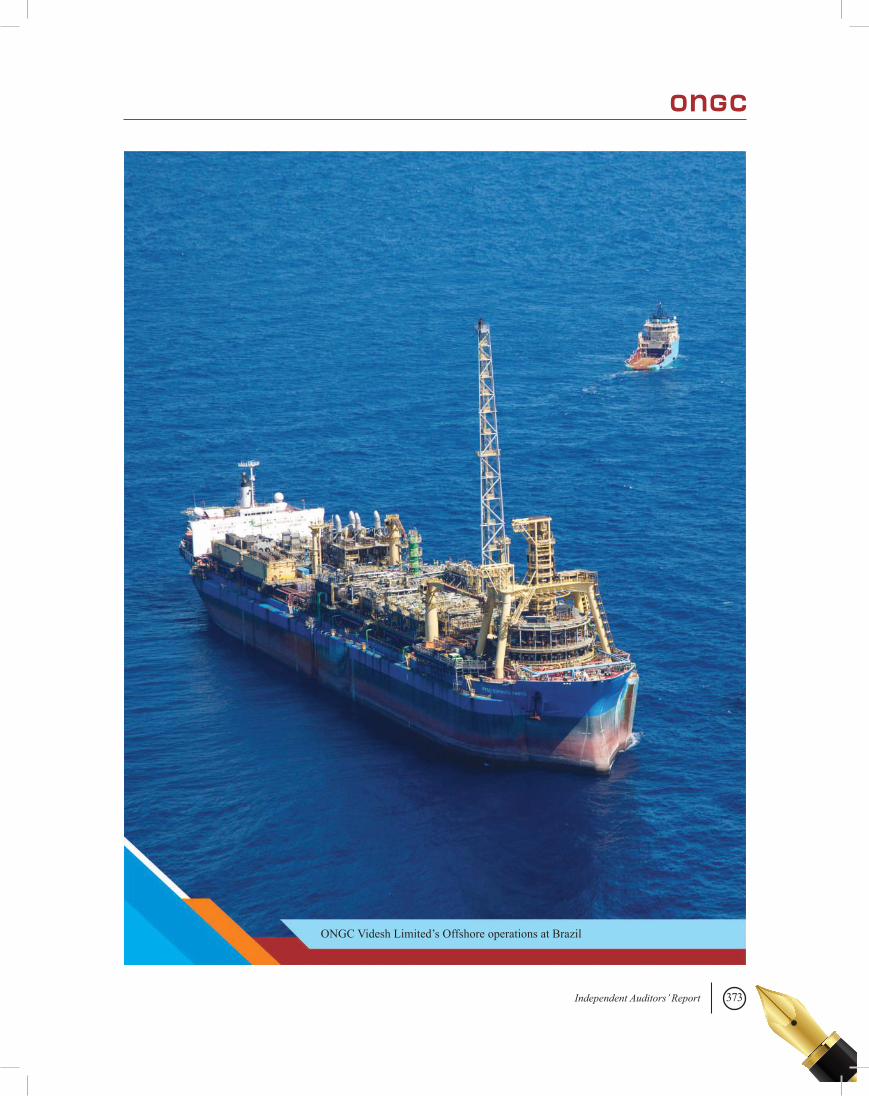
373Independent Auditors’ Report
ONGC Videsh Limited’s Offshore operations at Brazil
374
Independent Auditors’ ReportTo the Members of Oil and Natural Gas Corporation Limited
Report on the Audit of the Consolidated Financial Statements
1. Opinion
We have audited the accompanying consolidated financial statements of Oil and Natural Gas Corporation Limited (“the Holding Company”) and its subsidiaries (Holding Company and its subsidiaries together referred to as “the Group”), associates and joint ventures, which comprise the Consolidated Balance Sheet as at 31st March 2019, the Consolidated Statement of Profit and Loss (including Other Comprehensive Income), the Consolidated Statement of Changes in Equity and the Consolidated Statement of Cash Flows for the year then ended, and notes to the consolidated financial statements, including a summary of significant accounting policies and other explanatory information (hereinafter referred to as “the consolidated financial statements”).
In our opinion and to the best of our information and according to the explanations given to us and based on the consideration of reports of other auditors on separate financial statements and on the other financial information of the subsidiaries, associates and joint ventures, the aforesaid consolidated financial statements give the information required by the Companies Act, 2013 (“the Act”) in the manner so required and give a true and fair view in conformity with the Indian Accounting Standards specified under section 133 of the Act read with the Companies (Indian Accounting Standards) Rules, 2015, as amended (‘Ind AS’) and other accounting principles generally accepted in India, of the consolidated state of affairs of the Group, its associates and joint ventures as at 31st March 2019 and its consolidated profit (including other comprehensive income), consolidated changes in equity and consolidated cash flows for the year ended on that date.
2. Basis for Opinion We conducted our audit of the consolidated financial
statements in accordance with the Standards on Auditing (SAs) specified under section 143(10) of the Act. Our responsibilities under those Standards are further described in the Auditor’s Responsibilities for the Audit of the Consolidated Financial Statements section of our report. We are independent of the Group, its associates and joint ventures in accordance with the Code of Ethics issued by the Institute of Chartered Accountants of India together with the ethical requirements that are relevant to our audit of the consolidated financial statements under the provisions of the Act and the Rules made thereunder, and we have fulfilled our other ethical responsibilities in accordance with these requirements and the Code of Ethics.
We believe that the audit evidence we have obtained, and the audit evidence obtained by the other auditors in terms of their reports referred into Para 5(v) of the Other Matters paragraph below, is sufficient and appropriate to provide a basis for our opinion on the consolidated financial statements.
3. Emphasis of Matter We draw attention to Note 55.1.3 of the consolidated
financial statements, wherein it is stated that Directorate General of Hydrocarbons (DGH) had raised a demand on all the JV partners under the Production Sharing Contract with respect to Panna-Mukta and Mid and South Tapti contract areas (PMT JV), being BG Exploration and Production India Limited (BGEPIL) and Reliance Industries Limited (RIL) (together “the Claimants”) and the Company towards differential GOI share of Profit Petroleum and Royalty alleged to be payable by contractor pursuant to Government’s interpretation of the Final Partial Award (40% share of the Company amounting to USD 1624.05 million equivalent to `112,400.50 million, including interest upto 30th November, 2016). Subsequent to London High Court Orders dated 16th April, 2018 and 2nd May, 2018, DGH
375Independent Auditors’ Report
vide letter dated 4th May, 2018, 15th May, 2018 and 4th June, 2018 had asked for re-casting of accounts of the PMT JV and for remitting the respective PI share of balance dues including interest till the date of remittance. As the Company is not a party to the arbitration, the details of the proceedings of arbitration and copy of the order of London High Court are not available with the Company. The Company has responded that as of now, neither the Arbitral Tribunal nor the London High Court has passed any order or quantified any amount due and payable by the Company and in the circumstances; the demand of DGH from the Company for any sum or interest thereon is premature and not justified. In the Company’s view, pending final quantification of liabilities by the Arbitration Tribunal, it is not liable to implement the Final Partial Award (FPA) being
pre-mature and therefore no provision for the same has been considered necessary and the same has been considered as contingent liability.
Our opinion on the consolidated financial statements is not modified in respect of the above matter.
4. Key Audit Matters Key audit matters are those matters that, in our
professional judgment, were of most significance in our audit of these consolidated financial statements of the current period. These matters were addressed in the context of our audit of the consolidated financial statements as a whole, and in forming our opinion thereon, and we do not provide a separate opinion on these matters. We have determined the matters described below to be the key audit matters to be communicated in our report:
Key Audit Matter How our audit addressed the matterEvaluation of adequacy of provision for impairment for tangible and intangible assets (refer Note 54 to the consolidated financial statements)
Management of Holding Company has assessed whether any provision needs to be recognised on account of impairment of tangible and intangible assets.
The Holding Company reviews the carrying amount of its tangible and intangible assets (Oil and Gas Assets, Development Wells in Progress (DWIP), Property, Plant & Equipment (including Capital Works-in-Progress)) for the “Cash Generating Unit” (CGU) determined at the end of each reporting period to assess whether there is any indication that those assets have suffered any impairment loss.
The determination of recoverable amount, being the higher of fair value less costs to sell and value- in-use, requires judgement on the part of management.
In case of exploration and evaluation assets, based on management judgment, assessment for impairment is carried out when further exploration activities are not planned in near future or when sufficient data indicate that although a development is likely to proceed, the carrying amount of the exploration asset is unlikely to be recovered in full from successful development or by sale.
We have considered the measurement of impairment as Key Audit Matter as it requires significant management judgment.
Our audit procedures included the following:
We evaluated the appropriateness of Holding Company management’s identification of the CGUs and exploration and evaluation assets and tested the operating effectiveness of controls over the impairment assessment process, including indicators of impairment.
We performed testing of the mathematical accuracy of the cash flow models and validated the appropriateness of the related disclosures.
We evaluated Holding Company management’s assessment whether any indicators of impairment existed by comparing the recoverable amount to the carrying amounts of respective CGUs in the books of accounts.
376
Estimation of Decommissioning liability (refer Note 30.3 to the consolidated financial statements)
The Holding Company has an obligation to restore and rehabilitate the fields operated upon by the Holding Company at the end of their use. This decommissioning liability is recorded based on estimates of the costs required to fulfill this obligation.
Our audit procedures included the following:
Evaluated the approach adopted by the Holding Company management in determining the expected costs of decommissioning.
Identified the cost assumptions used that have the most significant impact on the provisions and tested the appropriateness of these assumptions.
The provision is based upon current cost estimates and has been determined on a discounted basis with reference to current legal requirements and technology. At each reporting date the decommissioning liability is reviewed and re-measured in line with changes in observable assumptions, timing and the latest estimates of the costs to be incurred at reporting date.
We have considered the measurement of decommissioning costs as Key Audit Matter as it requires significant management judgment, including accounting calculations and estimates that involves high estimation uncertainty.
Reviewed the appropriateness of discount and inflation rates used in the estimation.
Verified the unwinding of interest as well as understanding if any restoration was undertaken during the year.
Relied on the judgments of the internal experts for the use of technical /commercial evaluation.
Performed a review to ensure that all key movements were understood, corroborated and recorded correctly.
Assessed the appropriateness of the disclosures made in the financial statements.
Litigations and Claims (Refer Note 55 to the consolidated financial statements)
Litigation and claims are pending with multiple tax and regulatory authorities and there are claims from vendors/suppliers and employees which have not been acknowledged as debt by the Holding Company (including Joint Operations).
In the normal course of business, financial exposures may arise from pending legal/regulatory proceedings and from above referred claims not acknowledged as debt by the Holding Company. Whether a claim needs to be recognized as liability, disclosed as contingent liability or considered as remote in the consolidated financial statements is dependent on a number of significant assumptions and judgments. The amounts involved are potentially significant and determining the amount, if any, to be recognized or disclosed in the consolidated financial statements, is inherently subjective.
We have considered Litigations and claims as Key Audit Matter as it requires significant management judgment, including accounting estimates that involves high estimation uncertainty.
Our audit procedures included the following:
Understood Holding Company management’s process and control for determining tax litigations and other litigations and claims and its appropriate accounting and disclosure.
Tested key controls surrounding such litigations. Discussed pending matters with the Holding Company’s legal department.
Assessed management’s conclusions through understanding precedents set in similar cases.
We have assessed the appropriateness of presentation of the most significant contingent liabilities in the consolidated financial statements.
377Independent Auditors’ Report
5. Other Mattersi. We have placed reliance on technical/commercial
evaluation by the management in respect of categorization of wells as exploratory, development, producing and dry well, allocation of cost incurred on them, proved (developed and undeveloped)/ probable hydrocarbon reserves and depletion thereof on Oil and Gas Assets, impairment, liability for decommissioning costs, liability for NELP and nominated blocks for under performance against agreed Minimum Work Programme.
ii. The consolidated financial statements include the Holding Company’s share in the total value of assets, liabilities, expenditure and income of 137 blocks under New Exploration Licensing Policy (NELP)/ Hydrocarbon Exploration and Licensing Policy (HELP) / Joint Operations (JO) accounts for exploration and production out of which:
a. 4 NELPs/ JOs accounts have been certified by other Chartered Accountants. In respect of these 4 NELPs/ JOs, consolidated financial statements include proportionate share in assets and liabilities as on 31st March, 2019 amounting to `26,142.08 million and `23,736.94 million respectively and revenue and profit including
other comprehensive Income for the year ended 31st March, 2019 amounting to `16,963.56 million and `6,697.93 million respectively, Our opinion is based solely on the certificate of the other Chartered Accountants.
b 13 NELPs/JOs have been certified by the management in respect of NELPs/JOs operated by other operators. In respect of these 13 NELPs/JOs, consolidated financial statements include proportionate share in assets and liabilities as on 31st March, 2019 amounting to `87,590.75 million and `44,793.78 million respectively and revenue and profit including other comprehensive Income for the year ended 31st March, 2019 amounting to `104,402.84 million and `27,399.63 million respectively, Our opinion is based solely on management certified accounts.
iii. We did not audit the financial statements of four subsidiaries whose financial statements reflect total assets and total net assets as at 31st March, 2019, total revenues and net cash inflow/(outflow) for the year ended on that date considered as under in the Statement based on financial statements audited by other auditors:
Name of theSubsidiary
Total Assets as at 31st March, 2019
Total Net Assets as at 31st March,
2019
Total Revenue for the year ended
31st March, 2019
Net CashInflow/ (Outflow)
ONGC Videsh Limited (OVL)#
1,132,162.78 487,541.94 178,963.77 17,333.30
Mangalore Refinery and Petrochemicals Limited (MRPL)# $
327,662.56 99,457.77 738,531.11 (4,356.96)
Petronet MHB Limited (PMHBL)
8,398.63 7,963.04 2,030.20 1,016.68
Hindustan Petroleum Corporation Limited (HPCL)#
1,072,583.60 304,006.60 2,986,183.30 (2,304.90)
(` in million)
378
# As per the consolidated financial statements.
$ Consolidated financial statements of MRPL includes its subsidiary, ONGC Mangalore Petrochemicals Limited, which is an indirect Subsidiary of the Holding Company.
iv. The consolidated financial statements also includes the group’s share of net profit including other comprehensive income for the year ended 31st March, 2019 considered as under based on financial statements audited by other auditors:
Name of the Company Group share in Net Profit for the year ended31st March, 2019
Group share in Net Other Comprehensive
Income for the year ended 31st March, 2019
Group share – Total
Joint VenturesONGC Teri Biotech Lim-ited $
33.28 (0.01) 33.27
ONGC Tripura Power Company Limited *
1,069.69 0.22 1,069.91
ONGC Petro additions Limited $
(7,010.29) 3.28 (7,007.01)
Mangalore SEZ Limited * 6.48 (0.06) 6.42Indradhanush Gas Grid Limited$
(24.24) - (24.24)
Associate
Petronet LNG Limited * 2,788.20 (2.54) 2,785.66
(` in million)
$ As per the standalone financial statements.
* As per the consolidated financial statements.
v. The consolidated financial statements referred in Para 5(iii) and 5(iv) have been audited by other auditors whose reports have been furnished to us by the Holding Company management and our opinion on the consolidated financial statements, in so far as it relates to the amounts and disclosures included in
respect of these subsidiaries, joint ventures and an associate, is based solely on the reports of the other auditors.
vi. The consolidated financial statements also includes the group’s share of net profit including other comprehensive income for the year ended 31st March, 2019 considered as under based on financial statements not audited by us:
Name of the Company Group share in Net Profit for the year ended31st March, 2019
Group share in Net Other Comprehensive
Income for the year ended 31st March, 2019
Group share – Total
Joint VentureDahej SEZ Limited
163.83 - 163.83
AssociatePawan Hans Limited
(354.84) - (354.84)
(` in million)

379Independent Auditors’ Report
This financial information is unaudited and has been furnished to us by the management and our opinion on the consolidated financial statements in so far as it relates to the amounts and disclosures included as above, is based solely on unaudited financial information. In our opinion and according to information and explanations given to us by the Holding Company management, this financial information is not material to the Group.
vii. The consolidated financial statements of the Company for the year ended 31st March, 2018 were audited by joint auditors of the Company two of which are predecessor audit firms, and have expressed an unmodified opinion dated 30th May, 2018 on such financial statements.
Our opinion on the consolidated financial statements is not modified in respect of above matters.
6. Information Other than the Consolidated Financial Statements and Auditor’s Report Thereon
The Holding Company’s Board of Directors is responsible for the preparation of the other information. The other information comprises the information included in the Board’s Report including Annexures to Board’s Report, Management Discussion and Analysis, Business Responsibility Report and Report on Corporate Governance but does not include the consolidated financial statements and our auditor’s report thereon. The above-referred information is expected to be made available to us after the date of this audit report.
Our opinion on the consolidated financial statements does not cover the other information and we do not express any form of assurance conclusion thereon.
In connection with our audit of the consolidated financial statements, our responsibility is to read the other information, identified above when it becomes available and, in doing so, consider whether the other information is materially inconsistent with the consolidated financial statements or our knowledge obtained in the audit or otherwise appears to be materially misstated. If, based on the work we have
performed, we conclude that there is a material misstatement of this other information, we are required to report that fact.
When we read the information, if we conclude that there is a material misstatement therein, we are required to communicate the matter to those charged with governance and take appropriate actions necessitated by the circumstances & the applicable laws and regulations.
7. Responsibilities of Management and Those Charged with Governance for the Consolidated Financial Statements
The Holding Company’s Board of Directors is responsible for the matters stated in section 134(5) of the Act with respect to the preparation and presentation of these consolidated financial statements that give a true and fair view of the consolidated financial position, consolidated financial performance, consolidated changes in equity and consolidated cash flows of the Group, its associates and joint ventures in accordance with the accounting principles generally accepted in India, including the Indian Accounting Standards (Ind AS) specified under section 133 of the Act. This responsibility also includes maintenance of adequate accounting records in accordance with the provisions of the Act for safeguarding of the assets of the Group, its associates and joint ventures and for preventing and detecting frauds and other irregularities; the selection and application of appropriate accounting policies; making judgments and estimates that are reasonable and prudent; and design, implementation and maintenance of adequate internal financial controls, that were operating effectively for ensuring accuracy and completeness of the accounting records, relevant to the preparation and presentation of the consolidated financial statements that give a true and fair view and are free from material misstatement, whether due to fraud or error, which have been used for the purpose of preparation of the consolidated financial statements by the Directors of the Holding Company, as aforesaid.
380
In preparing the consolidated financial statements, the respective Board of Directors of the companies included in the Group, its associates and joint ventures are responsible for assessing the ability of the Group, its associates and joint ventures to continue as a going concern, disclosing, as applicable, matters related to going concern and using the going concern basis of accounting unless management either intends to liquidate the Group or to cease operations, or has no realistic alternative but to do so.
The respective Board of Directors of the companies included in the Group, its associates and joint ventures are also responsible for overseeing the financial reporting process of the Group, its associates and joint ventures.
8. Auditor’s Responsibilities for the Audit of the Consolidated Financial Statements
Our objectives are to obtain reasonable assurance about whether the consolidated financial statements as a whole are free from material misstatement, whether due to fraud or error, and to issue an auditors’ report that includes our opinion. Reasonable assurance is a high level of assurance but is not a guarantee that an audit conducted in accordance with SAs will always detect a material misstatement when it exists. Misstatements can arise from fraud or error and are considered material if, individually or in the aggregate, they could reasonably be expected to influence the economic decisions of users taken on the basis of these consolidated financial statements.
As part of an audit in accordance with SAs, we exercise professional judgment and maintain professional skepticism throughout the audit. We also:
• Identify and assess the risks of material misstatement of the consolidated financial statements, whether due to fraud or error, design and perform audit procedures responsive to those risks, and obtain audit evidence that is sufficient and appropriate to provide a basis for
our opinion. The risk of not detecting a material misstatement resulting from fraud is higher than for one resulting from error, as fraud may involve collusion, forgery, intentional omissions, misrepresentations, or the override of internal control.
• Obtain an understanding of internal control relevant to the audit in order to design audit procedures that are appropriate in the circumstances. Under section 143(3)(i) of the Act, we are also responsible for expressing our opinion on whether the Group and its associates and joint ventures incorporated in India have adequate internal financial controls with reference to financial statements in place and the operating effectiveness of such controls.
• Evaluate the appropriateness of accounting policies used and the reasonableness of accounting estimates and related disclosures made by management.
• Conclude on the appropriateness of management’s use of the going concern basis of accounting and, based on the audit evidence obtained, whether a material uncertainty exists related to events or conditions that may cast significant doubt on the ability of the Group, its associates and joint ventures to continue as a going concern. If we conclude that a material uncertainty exists, we are required to draw attention in our auditors’ report to the related disclosures in the consolidated financial statements or, if such disclosures are inadequate, to modify our opinion. Our conclusions are based on the audit evidence obtained up to the date of our auditors’ report. However, future events or conditions may cause the Group, its associates and joint ventures to cease to continue as a going concern.
• Evaluate the overall presentation, structure and content of the consolidated financial statements, including the disclosures, and whether the consolidated financial statements represent the underlying transactions and events in a manner that achieves fair presentation.
381Independent Auditors’ Report
• Obtain sufficient appropriate audit evidence regarding the financial information of the entities or business activities within the Group, its associates and joint ventures to express an opinion on the consolidated financial statements. We are responsible for the direction, supervision and performance of the audit of the consolidated financial statements of such entities included in the consolidated financial statements of which we are the independent auditors. For the other entities included in the consolidated financial statements, which have been audited by other auditors, such other auditors remain responsible for the direction, supervision and performance of the audits carried out by them. We remain solely responsible for our audit opinion.
We communicate with those charged with governance of the Holding company regarding, among other matters, the planned scope and timing of the audit and significant audit findings, including any significant deficiencies in internal control that we identify during our audit.
We also provide those charged with governance with a statement that we have complied with relevant ethical requirements regarding independence, and to communicate with them all relationships and other matters that may reasonably be thought to bear on our independence, and where applicable, related safeguards.
From the matters communicated with those charged with governance, we determine those matters that were of most significance in the audit of the consolidated financial statements of the current period and are therefore the key audit matters. We describe these matters in our auditors’ report unless law or regulation precludes public disclosure about the matter or when, in extremely rare circumstances, we determine that a matter should not be communicated in our report because the adverse consequences of doing so would reasonably be expected to outweigh the public interest benefits of such communication.
9. Report on Other Legal and Regulatory Requirements
i. Based on the comments in the auditors’ reports of the Holding company and the subsidiary companies as referred to in Para 5(iii) above, we report that a paragraph on the directions issued by the Comptroller and Auditors General of India in terms of section 143 (5) of the Act has been included in respect of the auditors’ report of Holding Company and its subsidiaries. Accordingly, we give a report on the directions issued by the Comptroller and Auditor General of India in terms of section 143 (5) of the Act in Annexure 1.
ii. As required by Section 143(3) of the Act, based on our audit and on the consideration of report of other auditors on separate financial statements and on the other financial information of subsidiaries, associates and joint ventures, as noted in ‘Other Matters’ paragraph, we report, to the extent applicable, that:
a. we have sought and obtained all the information and explanations which to the best of our knowledge and belief were necessary for the purposes of our audit of the aforesaid consolidated financial statements.
b. in our opinion, proper books of account as required by law relating to preparation of the aforesaid consolidated financial statements have been kept so far as it appears from our examination of those books and the reports of the other auditors.
c. the consolidated Balance Sheet, the consolidated Statement of Profit and Loss (including other comprehensive income), the consolidated Statement of Changes in Equity and the consolidated Statement of Cash Flows dealt with by this Report are in agreement with the relevant books of account maintained for the purpose of preparation of the consolidated financial statements.
d. in our opinion, the aforesaid consolidated financial statements comply with the Ind AS specified under Section 133 of the Act.
382
e. in respect of the Holding company and its subsidiary companies as per notification number G.S.R.
463 (E) dated June 5, 2015 issued by Ministry of Corporate Affairs, section 164(2) of the Act as regards the disqualifications of Directors is not applicable since they are government companies.
f. with respect to the adequacy of the internal financial controls with reference to financial statement of the Holding Company, its subsidiaries, associates and joint ventures incorporated in India and the operating effectiveness of such controls, refer to our separate report in “Annexure A”.
g. in respect of the Holding company and its subsidiary companies as per notification number G.S.R. 463 (E) dated 5th June, 2015 issued by Ministry of Corporate Affairs, section 197 of the Act regarding remuneration to director is not applicable since they are Government Companies.
h. with respect to the other matters to be included in the Auditors’ Report in accordance with Rule 11 of the Companies (Audit and Auditors) Rules, 2014, in our opinion and to the best of our information and according to the explanations given to us:
i. the consolidated financial statements have disclosed the impact of the pending litigations on its financial position of the Group, its associates and the joint ventures. –Refer Note 55.1 to the consolidated financial statements;
ii. according to information and explanations given to us, the Group, its associates and joint ventures have made provision for material foreseeable losses, if any, in respect of long- term contract including derivatives contracts; and
iii. there has been no delay in transferring amounts, required to be transferred, to the Investor Education and Protection Fund by the Group, its associates and joint ventures.
For K.C. Mehta & Co.Chartered AccountantsFirm Reg. No.106237W
Sd/-Vishal P. DoshiPartner (M.No. 101533
For MKPS & AssociatesChartered AccountantsFirm Reg. No: 302014E
Sd/-Nikhil Kumar AgrawallaPartner (M.No. 157955)
For PKF Sridhar & Santhanam LLPChartered accountantsFirm Reg. No. 003990S/S200018
Sd/-S. Narasimhan Partner (M.No. 206047)
For G M Kapadia & Co.Chartered Accountants Firm Reg. No: 104767W
Sd/-Rajen AsharPartner (M.No. 048243)
For Dass Gupta & AssociatesChartered AccountantsFirm Reg. No. 000112N
Sd/-Naresh KumarPartner (M. No. 082069)
For R Gopal & AssociatesChartered AccountantsFirm Reg. No: 000846C
Sd/-Sunil Kumar AgarwalPartner (M.No. 093209)
New Delhi30th May, 2019
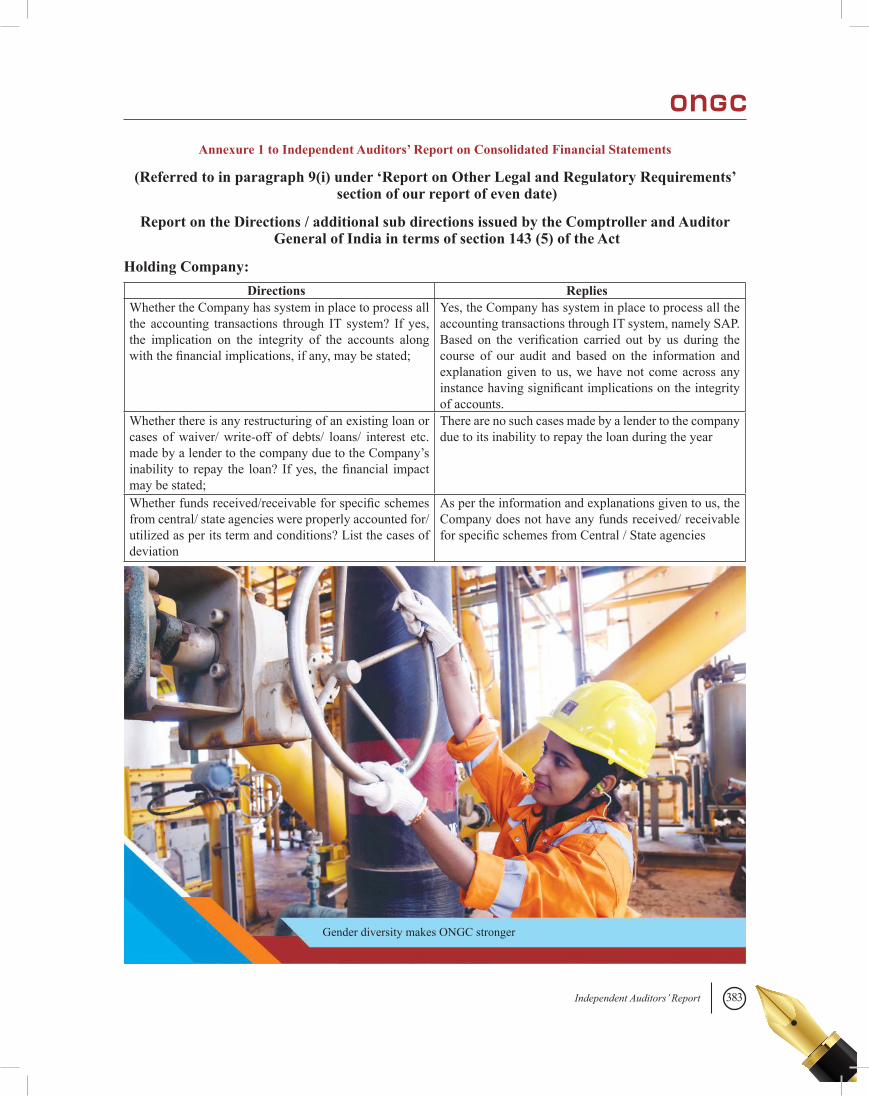
383Independent Auditors’ Report
Annexure 1 to Independent Auditors’ Report on Consolidated Financial Statements
(Referred to in paragraph 9(i) under ‘Report on Other Legal and Regulatory Requirements’ section of our report of even date)
Report on the Directions / additional sub directions issued by the Comptroller and Auditor General of India in terms of section 143 (5) of the Act
Holding Company:Directions Replies
Whether the Company has system in place to process all the accounting transactions through IT system? If yes, the implication on the integrity of the accounts along with the financial implications, if any, may be stated;
Yes, the Company has system in place to process all the accounting transactions through IT system, namely SAP. Based on the verification carried out by us during the course of our audit and based on the information and explanation given to us, we have not come across any instance having significant implications on the integrity of accounts.
Whether there is any restructuring of an existing loan or cases of waiver/ write-off of debts/ loans/ interest etc. made by a lender to the company due to the Company’s inability to repay the loan? If yes, the financial impact may be stated;
There are no such cases made by a lender to the company due to its inability to repay the loan during the year
Whether funds received/receivable for specific schemes from central/ state agencies were properly accounted for/ utilized as per its term and conditions? List the cases of deviation
As per the information and explanations given to us, the Company does not have any funds received/ receivable for specific schemes from Central / State agencies
Gender diversity makes ONGC stronger
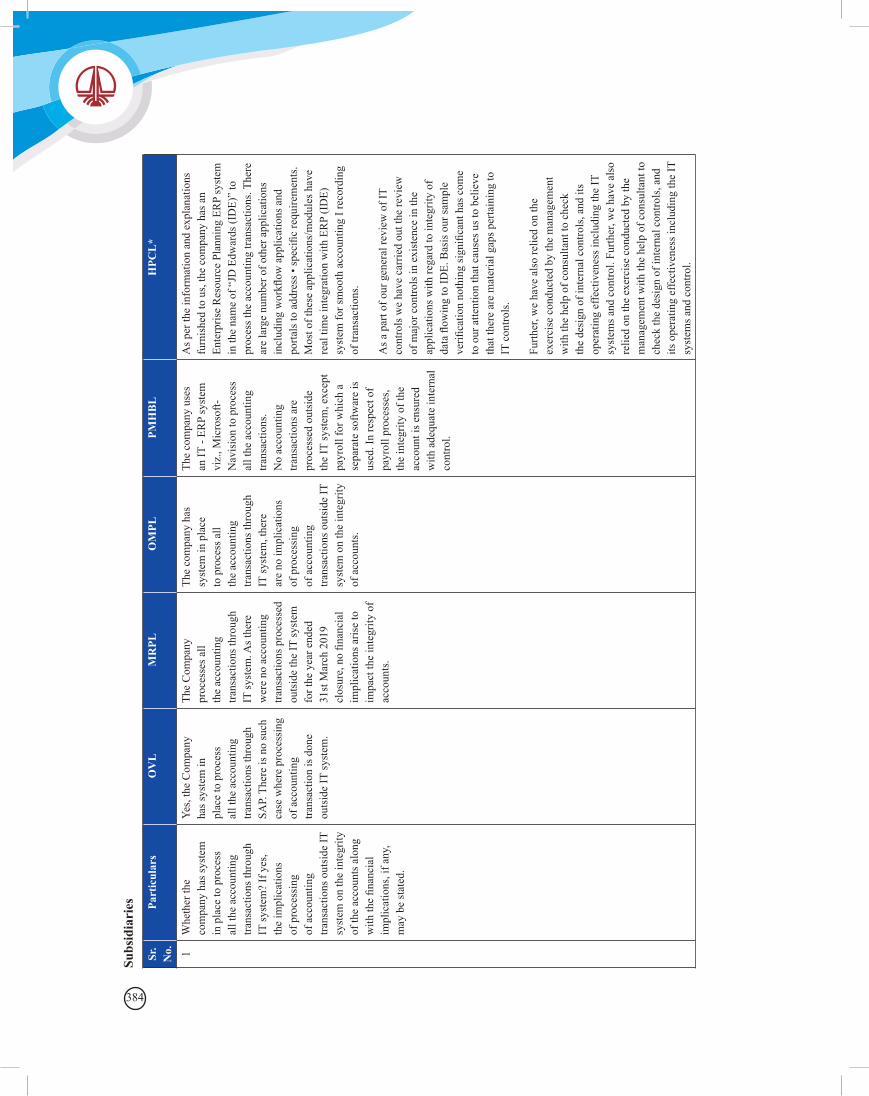
384
Sr.
No.
Part
icul
ars
OV
LM
RPL
OM
PLPM
HB
LH
PCL
*
1W
heth
er th
e co
mpa
ny h
as sy
stem
in
pla
ce to
pro
cess
al
l the
acc
ount
ing
trans
actio
ns th
roug
h IT
syst
em?
If y
es,
the
impl
icat
ions
of
pro
cess
ing
of a
ccou
ntin
g tra
nsac
tions
out
side
IT
syst
em o
n th
e in
tegr
ity
of th
e ac
coun
ts a
long
w
ith th
e fin
anci
al
impl
icat
ions
, if a
ny,
may
be
stat
ed.
Yes,
the
Com
pany
ha
s sys
tem
in
plac
e to
pro
cess
al
l the
acc
ount
ing
trans
actio
ns th
roug
h SA
P. T
here
is n
o su
ch
case
whe
re p
roce
ssin
g of
acc
ount
ing
trans
actio
n is
don
e ou
tsid
e IT
syst
em.
The
Com
pany
pr
oces
ses a
ll th
e ac
coun
ting
trans
actio
ns th
roug
h IT
syst
em. A
s the
re
wer
e no
acc
ount
ing
trans
actio
ns p
roce
ssed
ou
tsid
e th
e IT
syst
em
for t
he y
ear e
nded
31
st M
arch
201
9 cl
osur
e, n
o fin
anci
al
impl
icat
ions
aris
e to
im
pact
the
inte
grity
of
acco
unts
.
The
com
pany
has
sy
stem
in p
lace
to
pro
cess
all
the
acco
untin
g tra
nsac
tions
thro
ugh
IT sy
stem
, the
re
are
no im
plic
atio
ns
of p
roce
ssin
g of
acc
ount
ing
trans
actio
ns o
utsi
de IT
sy
stem
on
the
inte
grity
of
acc
ount
s.
The
com
pany
use
s an
IT -
ERP
syst
em
viz.
, Mic
roso
ft-
Nav
isio
n to
pro
cess
al
l the
acc
ount
ing
trans
actio
ns.
No
acco
untin
g tra
nsac
tions
are
pr
oces
sed
outs
ide
the
IT sy
stem
, exc
ept
payr
oll f
or w
hich
a
sepa
rate
softw
are
is
used
. In
resp
ect o
f pa
yrol
l pro
cess
es,
the
inte
grity
of t
he
acco
unt i
s ens
ured
w
ith a
dequ
ate
inte
rnal
co
ntro
l.
As p
er th
e in
form
atio
n an
d ex
plan
atio
ns
furn
ishe
d to
us,
the
com
pany
has
an
Ente
rpris
e R
esou
rce
Plan
ning
ER
P sy
stem
in
the
nam
e of
“JD
Edw
ards
(ID
E)”
to
proc
ess t
he a
ccou
ntin
g tra
nsac
tions
. The
re
are
larg
e nu
mbe
r of o
ther
app
licat
ions
in
clud
ing
wor
kflow
app
licat
ions
and
po
rtals
to a
ddre
ss •
spec
ific
requ
irem
ents
. M
ost o
f the
se a
pplic
atio
ns/m
odul
es h
ave
real
tim
e in
tegr
atio
n w
ith E
RP
(ID
E)
syst
em fo
r sm
ooth
acc
ount
ing
I rec
ordi
ng
of tr
ansa
ctio
ns.
As a
par
t of o
ur g
ener
al re
view
of I
T co
ntro
ls w
e ha
ve c
arrie
d ou
t the
revi
ew
of m
ajor
con
trols
in e
xist
ence
in th
e ap
plic
atio
ns w
ith re
gard
to in
tegr
ity o
f da
ta fl
owin
g to
IDE.
Bas
is o
ur sa
mpl
e ve
rifica
tion
noth
ing
sign
ifica
nt h
as c
ome
to o
ur a
ttent
ion
that
cau
ses u
s to
belie
ve
that
ther
e ar
e m
ater
ial g
aps p
erta
inin
g to
IT
con
trols
.
Furth
er, w
e ha
ve a
lso
relie
d on
the
exer
cise
con
duct
ed b
y th
e m
anag
emen
t w
ith th
e he
lp o
f con
sulta
nt to
che
ck
the
desi
gn o
f int
erna
l con
trols
, and
its
oper
atin
g ef
fect
iven
ess i
nclu
ding
the
IT
syst
ems a
nd c
ontro
l. Fu
rther
, we
have
als
o re
lied
on th
e ex
erci
se c
ondu
cted
by
the
man
agem
ent w
ith th
e he
lp o
f con
sulta
nt to
ch
eck
the
desi
gn o
f int
erna
l con
trols
, and
its
ope
ratin
g ef
fect
iven
ess i
nclu
ding
the
IT
syst
ems a
nd c
ontro
l.
Subs
idia
ries
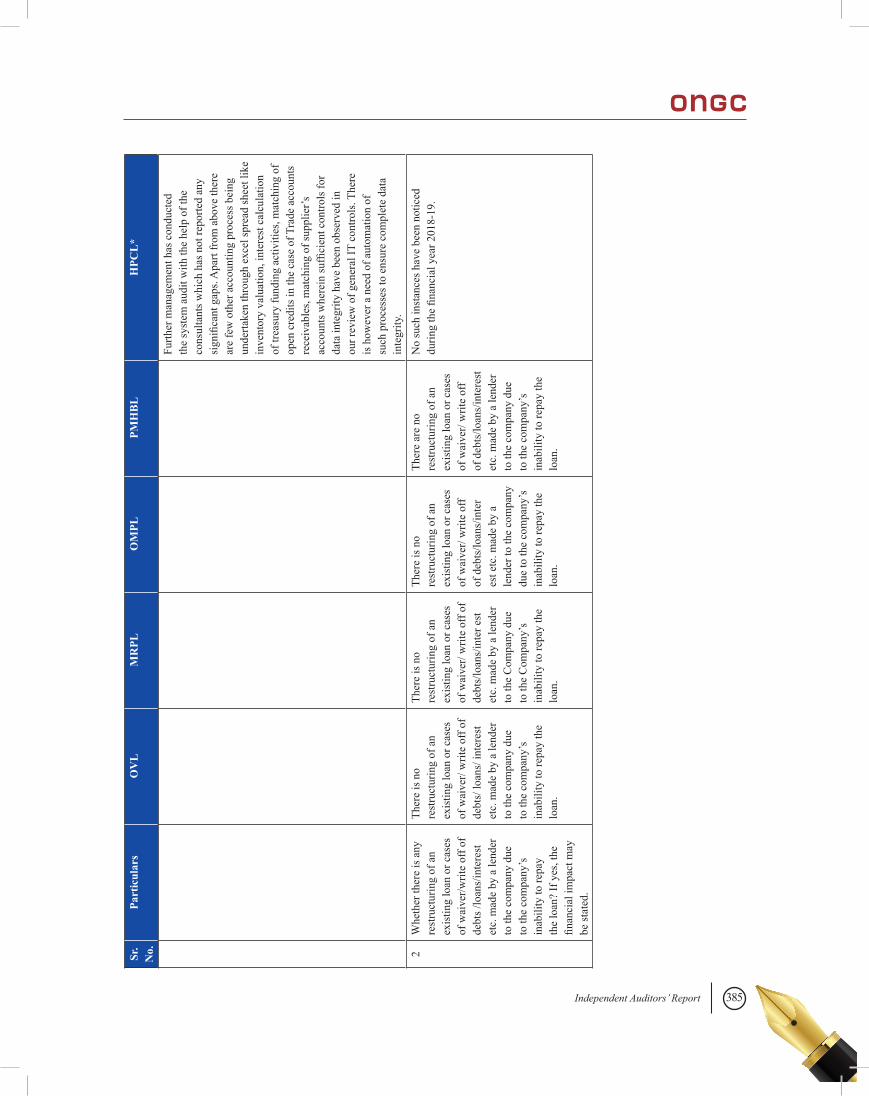
385Independent Auditors’ Report
Sr.
No.
Part
icul
ars
OV
LM
RPL
OM
PLPM
HB
LH
PCL
*
Furth
er m
anag
emen
t has
con
duct
ed
the
syst
em a
udit
with
the
help
of t
he
cons
ulta
nts w
hich
has
not
repo
rted
any
sign
ifica
nt g
aps.
Apa
rt fr
om a
bove
ther
e ar
e fe
w o
ther
acc
ount
ing
proc
ess b
eing
un
derta
ken
thro
ugh
exce
l spr
ead
shee
t lik
e in
vent
ory
valu
atio
n, in
tere
st c
alcu
latio
n of
trea
sury
fund
ing
activ
ities
, mat
chin
g of
op
en c
redi
ts in
the
case
of T
rade
acc
ount
s re
ceiv
able
s, m
atch
ing
of su
pplie
r’s
acco
unts
whe
rein
suffi
cien
t con
trols
for
data
inte
grity
hav
e be
en o
bser
ved
in
our r
evie
w o
f gen
eral
IT c
ontro
ls. T
here
is
how
ever
a n
eed
of a
utom
atio
n of
su
ch p
roce
sses
to e
nsur
e co
mpl
ete
data
in
tegr
ity.
2W
heth
er th
ere
is a
ny
rest
ruct
urin
g of
an
exis
ting
loan
or c
ases
of
wai
ver/w
rite
off o
f de
bts /
loan
s/in
tere
st
etc.
mad
e by
a le
nder
to
the
com
pany
due
to
the
com
pany
’s
inab
ility
to re
pay
the
loan
? If
yes
, the
fin
anci
al im
pact
may
be
stat
ed.
Ther
e is
no
rest
ruct
urin
g of
an
exis
ting
loan
or c
ases
of
wai
ver/
writ
e of
f of
debt
s/ lo
ans/
inte
rest
et
c. m
ade
by a
lend
er
to th
e co
mpa
ny d
ue
to th
e co
mpa
ny’s
in
abili
ty to
repa
y th
e lo
an.
Ther
e is
no
rest
ruct
urin
g of
an
exis
ting
loan
or c
ases
of
wai
ver/
writ
e of
f of
debt
s/lo
ans/
inte
r est
et
c. m
ade
by a
lend
er
to th
e C
ompa
ny d
ue
to th
e C
ompa
ny’s
in
abili
ty to
repa
y th
e lo
an.
Ther
e is
no
rest
ruct
urin
g of
an
exis
ting
loan
or c
ases
of
wai
ver/
writ
e of
f of
deb
ts/lo
ans/
inte
r es
t etc
. mad
e by
a
lend
er to
the
com
pany
du
e to
the
com
pany
’s
inab
ility
to re
pay
the
loan
.
Ther
e ar
e no
re
stru
ctur
ing
of a
n ex
istin
g lo
an o
r cas
es
of w
aive
r/ w
rite
off
of d
ebts
/loan
s/in
tere
st
etc.
mad
e by
a le
nder
to
the
com
pany
due
to
the
com
pany
’s
inab
ility
to re
pay
the
loan
.
No
such
inst
ance
s hav
e be
en n
otic
ed
durin
g th
e fin
anci
al y
ear 2
018-
19.
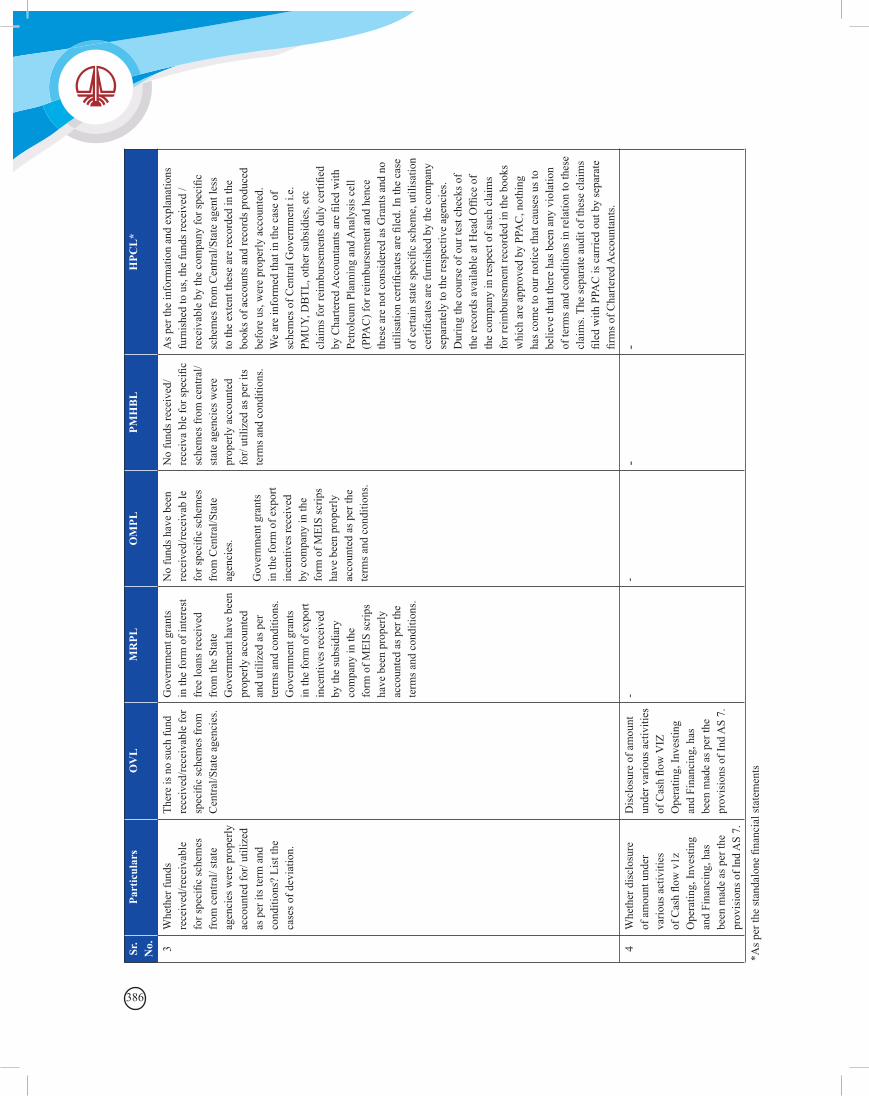
386
Sr.
No.
Part
icul
ars
OV
LM
RPL
OM
PLPM
HB
LH
PCL
*
3W
heth
er fu
nds
rece
ived
/rece
ivab
le
for s
peci
fic sc
hem
es
from
cen
tral/
stat
e ag
enci
es w
ere
prop
erly
ac
coun
ted
for/
utili
zed
as p
er it
s ter
m a
nd
cond
ition
s? L
ist t
he
case
s of d
evia
tion.
Ther
e is
no
such
fund
re
ceiv
ed/re
ceiv
able
for
spec
ific
sche
mes
from
C
entra
l/Sta
te a
genc
ies.
Gov
ernm
ent g
rant
s in
the
form
of i
nter
est
free
loan
s rec
eive
d fr
om th
e St
ate
Gov
ernm
ent h
ave
been
pr
oper
ly a
ccou
nted
an
d ut
ilize
d as
per
te
rms a
nd c
ondi
tions
. G
over
nmen
t gra
nts
in th
e fo
rm o
f exp
ort
ince
ntiv
es re
ceiv
ed
by th
e su
bsid
iary
co
mpa
ny in
the
form
of M
EIS
scrip
s ha
ve b
een
prop
erly
ac
coun
ted
as p
er th
e te
rms a
nd c
ondi
tions
.
No
fund
s hav
e be
en
rece
ived
/rece
ivab
le
for s
peci
fic sc
hem
es
from
Cen
tral/S
tate
ag
enci
es.
Gov
ernm
ent g
rant
s in
the
form
of e
xpor
t in
cent
ives
rece
ived
by
com
pany
in th
e fo
rm o
f MEI
S sc
rips
have
bee
n pr
oper
ly
acco
unte
d as
per
the
term
s and
con
ditio
ns.
No
fund
s rec
eive
d/re
ceiv
a bl
e fo
r spe
cific
sc
hem
es fr
om c
entra
l/ st
ate
agen
cies
wer
e pr
oper
ly a
ccou
nted
fo
r/ ut
ilize
d as
per
its
term
s and
con
ditio
ns.
As p
er th
e in
form
atio
n an
d ex
plan
atio
ns
furn
ishe
d to
us,
the
fund
s rec
eive
d /
rece
ivab
le b
y th
e co
mpa
ny fo
r spe
cific
sc
hem
es fr
om C
entra
l/Sta
te a
gent
less
to
the
exte
nt th
ese
are
reco
rded
in th
e bo
oks o
f acc
ount
s and
reco
rds p
rodu
ced
befo
re u
s, w
ere
prop
erly
acc
ount
ed.
We
are
info
rmed
that
in th
e ca
se o
f sc
hem
es o
f Cen
tral G
over
nmen
t i.e
. PM
UY,
DB
TL, o
ther
subs
idie
s, et
c cl
aim
s for
reim
burs
emen
ts d
uly
certi
fied
by C
harte
red
Acc
ount
ants
are
file
d w
ith
Petro
leum
Pla
nnin
g an
d A
naly
sis c
ell
(PPA
C) f
or re
imbu
rsem
ent a
nd h
ence
th
ese
are
not c
onsi
dere
d as
Gra
nts a
nd n
o ut
ilisa
tion
certi
ficat
es a
re fi
led.
In th
e ca
se
of c
erta
in st
ate
spec
ific
sche
me,
util
isat
ion
certi
ficat
es a
re fu
rnis
hed
by th
e co
mpa
ny
sepa
rate
ly to
the
resp
ectiv
e ag
enci
es.
Dur
ing
the
cour
se o
f our
test
che
cks o
f th
e re
cord
s ava
ilabl
e at
Hea
d O
ffice
of
the
com
pany
in re
spec
t of s
uch
clai
ms
for r
eim
burs
emen
t rec
orde
d in
the
book
s w
hich
are
app
rove
d by
PPA
C, n
othi
ng
has c
ome
to o
ur n
otic
e th
at c
ause
s us t
o be
lieve
that
ther
e ha
s bee
n an
y vi
olat
ion
of te
rms a
nd c
ondi
tions
in re
latio
n to
thes
e cl
aim
s. Th
e se
para
te a
udit
of th
ese
clai
ms
filed
with
PPA
C is
car
ried
out b
y se
para
te
firm
s of C
harte
red
Acc
ount
ants
.4
Whe
ther
dis
clos
ure
of a
mou
nt u
nder
va
rious
act
iviti
es
of C
ash
flow
v1z
O
pera
ting,
Inve
stin
g an
d Fi
nanc
ing,
has
be
en m
ade
as p
er th
e pr
ovis
ions
of l
nd A
S 7.
Dis
clos
ure
of a
mou
nt
unde
r var
ious
act
iviti
es
of C
ash
flow
VIZ
O
pera
ting,
Inve
stin
g an
d Fi
nanc
ing,
has
be
en m
ade
as p
er th
e pr
ovis
ions
of I
nd A
S 7.
--
--
*As p
er th
e st
anda
lone
fina
ncia
l sta
tem
ents
387Independent Auditors’ Report
Annexure - A to Independent Auditors’ Report on Consolidated Financial Statements
(Referred to in paragraph 9 (ii) (f) under ‘Report on Other Legal and Regulatory Requirements’ section of our report of even date)
Report on the Internal Financial Controls under Clause (i) of Sub-section 3 of Section 143 of the Companies Act, 2013 (“the Act”)
In conjunction with our audit of the consolidated financial statements of Oil and Natural Gas Corporation Limited (herein after referred to as “the Holding Company”) as of and for the year ended 31st March 2019, we have audited the internal financial controls with reference to financial statements of the Holding Company and its subsidiaries, Associates and Joint Ventures which are companies incorporated in India, as of that date.
Management’s Responsibility for Internal Financial Controls
The respective Board of Directors of the Holding company, its subsidiaries, associates and joint ventures which are companies incorporated in India, are responsible for establishing and maintaining internal financial controls based on the internal control with reference to financial statements criteria established by the Holding Company, its subsidiaries, associates a n d joint ventures which are companies incorporated in India, considering the essential components of internal control stated in the Guidance Note on Audit of Internal Financial Controls Over Financial Reporting issued by the Institute of Chartered Accountants of India. These responsibilities include the design, implementation and maintenance of adequate internal financial controls that were operating effectively for ensuring the orderly and efficient conduct of its business, including adherence to the respective company’s policies, the safeguarding of its assets, the prevention and detection of frauds and errors, the accuracy and completeness of the accounting records, and the timely preparation of reliable financial information, as required under the Act.
Auditor’s Responsibility
Our responsibility is to express an opinion on the internal financial controls with reference to financial statements of the Holding Company, its subsidiaries, associates and
joint ventures, which are companies incorporated in India, based on our audit. We conducted our audit in accordance with the Guidance Note on Audit of Internal Financial Controls over Financial Reporting (the “Guidance Note”) and the Standards on Auditing as specified under section 143(10) of the Act, to the extent applicable to an audit of internal financial controls, both applicable to an audit of Internal Financial Controls and both issued by the Institute of Chartered Accountants of India. Those Standards and the Guidance Note require that we comply with ethical requirements and plan and perform the audit to obtain reasonable assurance about whether adequate internal financial controls with reference to financial statements was established and maintained and if such controls operated effectively in all material respects.
Our audit involves performing procedures to obtain audit evidence about the adequacy of the internal financial controls system with reference to financial statements and their operating effectiveness. Our audit of internal financial controls with reference to financial statements included obtaining an understanding of internal financial controls with reference to financial statements, assessing the risk that a material weakness exists, and testing and evaluating the design and operating effectiveness of internal control based on the assessed risk. The procedures selected depend on the auditor’s judgment, including the assessment of the risks of material misstatement of the financial statements, whether due to fraud or error.
We believe that the audit evidence we have obtained and the audit evidence obtained by the other auditors in terms of the reports referred to in the “Other Matters” paragraph below, is sufficient and appropriate to provide a basis for our audit opinion on the internal financial controls system with reference to financial statements of the Holding Company, its subsidiaries, associates and joint ventures, which are companies incorporated in India.
Meaning of Internal Financial Controls with reference to Financial Statements
A Company’s internal financial controls with reference
388
to financial statements is a process designed to provide reasonable assurance regarding the reliability of financial reporting and the preparation of consolidated financial statements for external purposes in accordance with generally accepted accounting principles. A Company’s internal financial controls with reference to financial statements includes those policies and procedures that (1) pertain to the maintenance of records that, in reasonable detail, accurately and fairly reflect the transactions and dispositions of the assets of the Company; (2) provide reasonable assurance that transactions are recorded as necessary to permit preparation of consolidated financial statements in accordance with generally accepted accounting principles, and that receipts and expenditures of the company are being made only in accordance with authorizations of management and directors of the Company; and (3) provide reasonable assurance regarding prevention or timely detection of unauthorized acquisition, use, or disposition of the Company’s assets that could have a material effect on the financial statements.
Inherent Limitations of Internal Financial Controls with reference to Financial Statements
Because of the inherent limitations of internal financial controls with reference to financial statements, including the possibility of collusion or improper management override of controls, material misstatements due to error or fraud may occur and not be detected. Also, projections of any evaluation of the internal financial controls with reference to financial statements to future periods are subject to the risk that the internal financial controls with reference to financial statements may become inadequate because of changes in conditions, or that the degree of compliance with the policies or procedures may deteriorate.
Opinion
In our opinion, the Holding Company, its subsidiary companies, associates and joint ventures, which are companies incorporated in India, have, in all material respects, an adequate internal financial controls with reference to financial statements and such internal financial controls with reference to financial statements were operating effectively as at 31st March 2019, based on the internal controls with reference to financial statements criteria established by the Company considering the essential components of internal control stated in the Guidance Note on Audit of Internal Financial Controls over Financial Reporting issued by the Institute of Chartered Accountants of India.
Other Matters
Our aforesaid reports under Section 143(3) of the Act on the adequacy and operating effectiveness of the internal financial controls with reference to financial statements in so far as it relates to four subsidiary companies, an associate and five joint ventures which are companies incorporated in India, is based on the corresponding standalone/consolidated reports of the auditors, as applicable, of such companies incorporated in India.
Our aforesaid reports under Section 143(3) of the Act on the adequacy and operating effectiveness of the internal financial controls with reference to financial statements does not include in respect of one associate and one joint venture, which are companies incorporated in India whose audit reports are not available. In our opinion and according to information and explanations given to us by the Management, these financial information are not material to the Group.
Our opinion is not modified in respect of these matters.
Signed and dated by the Auditor’s of the Company at New Delhi as at Page No. 382.
389Consolidated Financial Statements
Shri Shashi Shanker, CMD at OMPL laboratory
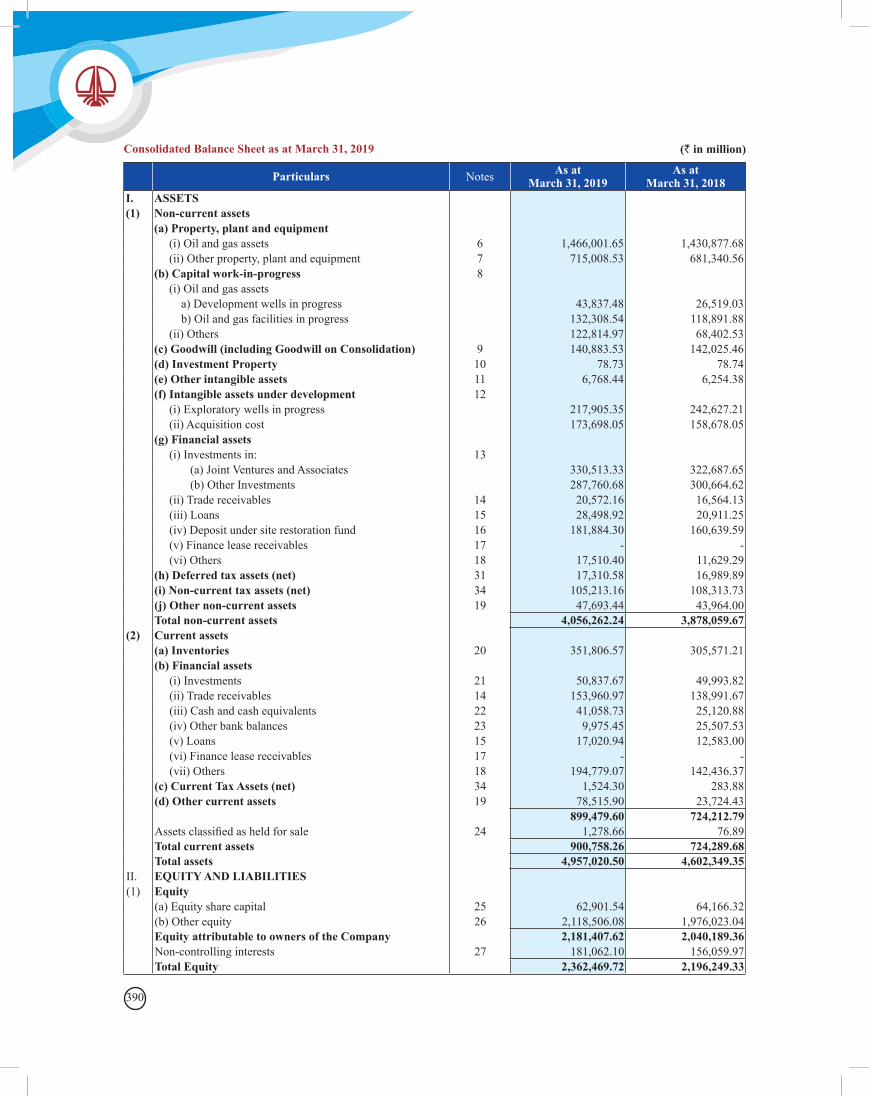
390
Consolidated Balance Sheet as at March 31, 2019 (` in million)
Particulars Notes As at March 31, 2019
As atMarch 31, 2018
I. ASSETS (1) Non-current assets (a) Property, plant and equipment (i) Oil and gas assets 6 1,466,001.65 1,430,877.68 (ii) Other property, plant and equipment 7 715,008.53 681,340.56 (b) Capital work-in-progress 8 (i) Oil and gas assets a) Development wells in progress 43,837.48 26,519.03 b) Oil and gas facilities in progress 132,308.54 118,891.88 (ii) Others 122,814.97 68,402.53 (c) Goodwill (including Goodwill on Consolidation) 9 140,883.53 142,025.46 (d) Investment Property 10 78.73 78.74 (e) Other intangible assets 11 6,768.44 6,254.38 (f) Intangible assets under development 12 (i) Exploratory wells in progress 217,905.35 242,627.21 (ii) Acquisition cost 173,698.05 158,678.05 (g) Financial assets (i) Investments in: 13 (a) Joint Ventures and Associates 330,513.33 322,687.65 (b) Other Investments 287,760.68 300,664.62 (ii) Trade receivables 14 20,572.16 16,564.13 (iii) Loans 15 28,498.92 20,911.25 (iv) Deposit under site restoration fund 16 181,884.30 160,639.59 (v) Finance lease receivables 17 - - (vi) Others 18 17,510.40 11,629.29 (h) Deferred tax assets (net) 31 17,310.58 16,989.89 (i) Non-current tax assets (net) 34 105,213.16 108,313.73 (j) Other non-current assets 19 47,693.44 43,964.00 Total non-current assets 4,056,262.24 3,878,059.67(2) Current assets (a) Inventories 20 351,806.57 305,571.21 (b) Financial assets (i) Investments 21 50,837.67 49,993.82 (ii) Trade receivables 14 153,960.97 138,991.67 (iii) Cash and cash equivalents 22 41,058.73 25,120.88 (iv) Other bank balances 23 9,975.45 25,507.53 (v) Loans 15 17,020.94 12,583.00 (vi) Finance lease receivables 17 - - (vii) Others 18 194,779.07 142,436.37 (c) Current Tax Assets (net) 34 1,524.30 283.88 (d) Other current assets 19 78,515.90 23,724.43 899,479.60 724,212.79 Assets classified as held for sale 24 1,278.66 76.89 Total current assets 900,758.26 724,289.68 Total assets 4,957,020.50 4,602,349.35II. EQUITY AND LIABILITIES (1) Equity (a) Equity share capital 25 62,901.54 64,166.32 (b) Other equity 26 2,118,506.08 1,976,023.04 Equity attributable to owners of the Company 2,181,407.62 2,040,189.36 Non-controlling interests 27 181,062.10 156,059.97 Total Equity 2,362,469.72 2,196,249.33
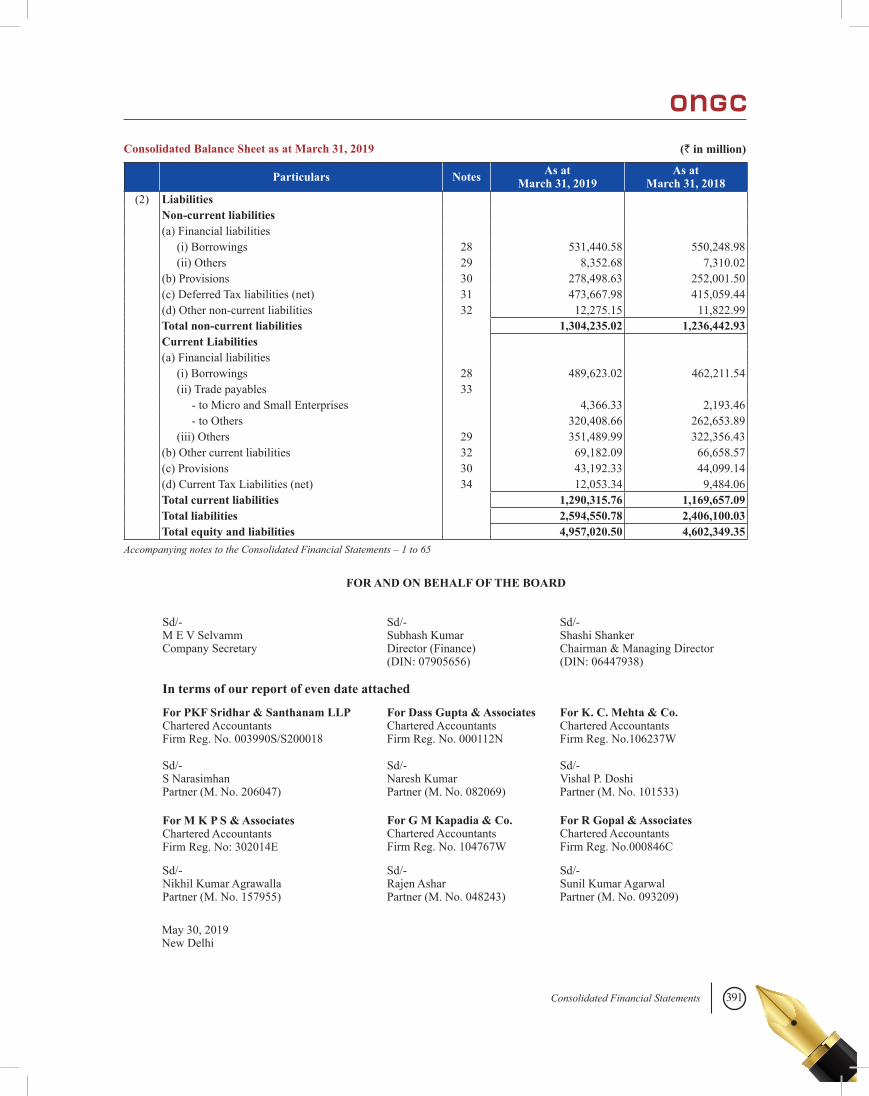
391Consolidated Financial Statements
Particulars Notes As at March 31, 2019
As at March 31, 2018
(2) Liabilities Non-current liabilities (a) Financial liabilities (i) Borrowings 28 531,440.58 550,248.98 (ii) Others 29 8,352.68 7,310.02 (b) Provisions 30 278,498.63 252,001.50 (c) Deferred Tax liabilities (net) 31 473,667.98 415,059.44 (d) Other non-current liabilities 32 12,275.15 11,822.99 Total non-current liabilities 1,304,235.02 1,236,442.93 Current Liabilities (a) Financial liabilities (i) Borrowings 28 489,623.02 462,211.54 (ii) Trade payables 33 - to Micro and Small Enterprises 4,366.33 2,193.46 - to Others 320,408.66 262,653.89 (iii) Others 29 351,489.99 322,356.43 (b) Other current liabilities 32 69,182.09 66,658.57 (c) Provisions 30 43,192.33 44,099.14 (d) Current Tax Liabilities (net) 34 12,053.34 9,484.06 Total current liabilities 1,290,315.76 1,169,657.09 Total liabilities 2,594,550.78 2,406,100.03 Total equity and liabilities 4,957,020.50 4,602,349.35
Consolidated Balance Sheet as at March 31, 2019 (` in million)
Accompanying notes to the Consolidated Financial Statements – 1 to 65
FOR AND ON BEHALF OF THE BOARD
In terms of our report of even date attached
Sd/-M E V SelvammCompany Secretary
Sd/-Nikhil Kumar AgrawallaPartner (M. No. 157955)
May 30, 2019New Delhi
Sd/-Subhash KumarDirector (Finance)(DIN: 07905656)
Sd/-Rajen AsharPartner (M. No. 048243)
Sd/-Shashi ShankerChairman & Managing Director(DIN: 06447938)
For PKF Sridhar & Santhanam LLPChartered AccountantsFirm Reg. No. 003990S/S200018
For Dass Gupta & AssociatesChartered AccountantsFirm Reg. No. 000112N
For K. C. Mehta & Co.Chartered AccountantsFirm Reg. No.106237W
Sd/-S NarasimhanPartner (M. No. 206047)
Sd/-Naresh KumarPartner (M. No. 082069)
Sd/-Vishal P. DoshiPartner (M. No. 101533)
For M K P S & AssociatesChartered AccountantsFirm Reg. No: 302014E
For G M Kapadia & Co.Chartered AccountantsFirm Reg. No. 104767W
For R Gopal & AssociatesChartered AccountantsFirm Reg. No.000846C
Sd/-Sunil Kumar AgarwalPartner (M. No. 093209)
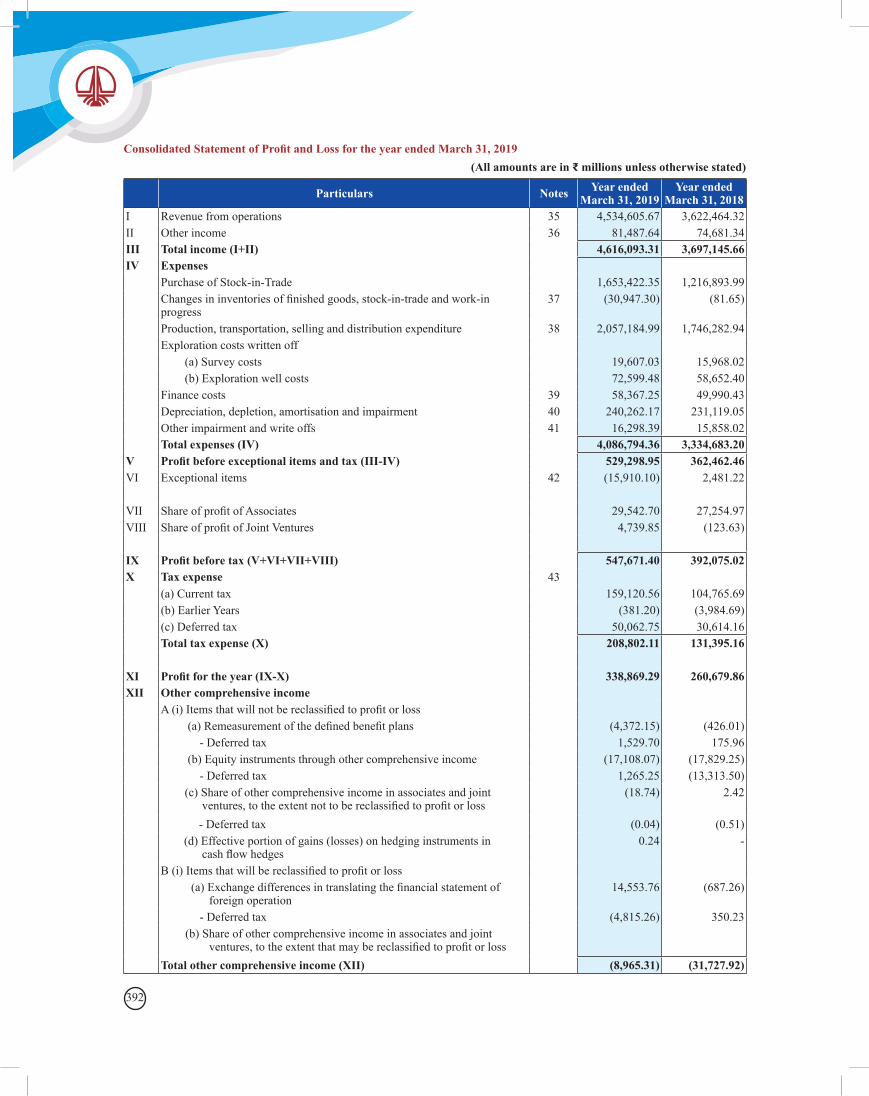
392
Consolidated Statement of Profit and Loss for the year ended March 31, 2019(All amounts are in ₹ millions unless otherwise stated)
Particulars Notes Year ended
March 31, 2019Year ended
March 31, 2018I Revenue from operations 35 4,534,605.67 3,622,464.32II Other income 36 81,487.64 74,681.34III Total income (I+II) 4,616,093.31 3,697,145.66IV Expenses Purchase of Stock-in-Trade 1,653,422.35 1,216,893.99 Changes in inventories of finished goods, stock-in-trade and work-in
progress37 (30,947.30) (81.65)
Production, transportation, selling and distribution expenditure 38 2,057,184.99 1,746,282.94 Exploration costs written off (a) Survey costs 19,607.03 15,968.02 (b) Exploration well costs 72,599.48 58,652.40 Finance costs 39 58,367.25 49,990.43 Depreciation, depletion, amortisation and impairment 40 240,262.17 231,119.05 Other impairment and write offs 41 16,298.39 15,858.02 Total expenses (IV) 4,086,794.36 3,334,683.20V Profit before exceptional items and tax (III-IV) 529,298.95 362,462.46VI Exceptional items 42 (15,910.10) 2,481.22 VII Share of profit of Associates 29,542.70 27,254.97VIII Share of profit of Joint Ventures 4,739.85 (123.63) IX Profit before tax (V+VI+VII+VIII) 547,671.40 392,075.02X Tax expense 43 (a) Current tax 159,120.56 104,765.69 (b) Earlier Years (381.20) (3,984.69) (c) Deferred tax 50,062.75 30,614.16 Total tax expense (X) 208,802.11 131,395.16 XI Profit for the year (IX-X) 338,869.29 260,679.86XII Other comprehensive income A (i) Items that will not be reclassified to profit or loss (a) Remeasurement of the defined benefit plans (4,372.15) (426.01) - Deferred tax 1,529.70 175.96 (b) Equity instruments through other comprehensive income (17,108.07) (17,829.25) - Deferred tax 1,265.25 (13,313.50) (c) Share of other comprehensive income in associates and joint
ventures, to the extent not to be reclassified to profit or loss (18.74) 2.42
- Deferred tax (0.04) (0.51) (d) Effective portion of gains (losses) on hedging instruments in
cash flow hedges 0.24 -
B (i) Items that will be reclassified to profit or loss (a) Exchange differences in translating the financial statement of
foreign operation 14,553.76 (687.26)
- Deferred tax (4,815.26) 350.23 (b) Share of other comprehensive income in associates and joint
ventures, to the extent that may be reclassified to profit or loss
Total other comprehensive income (XII) (8,965.31) (31,727.92)
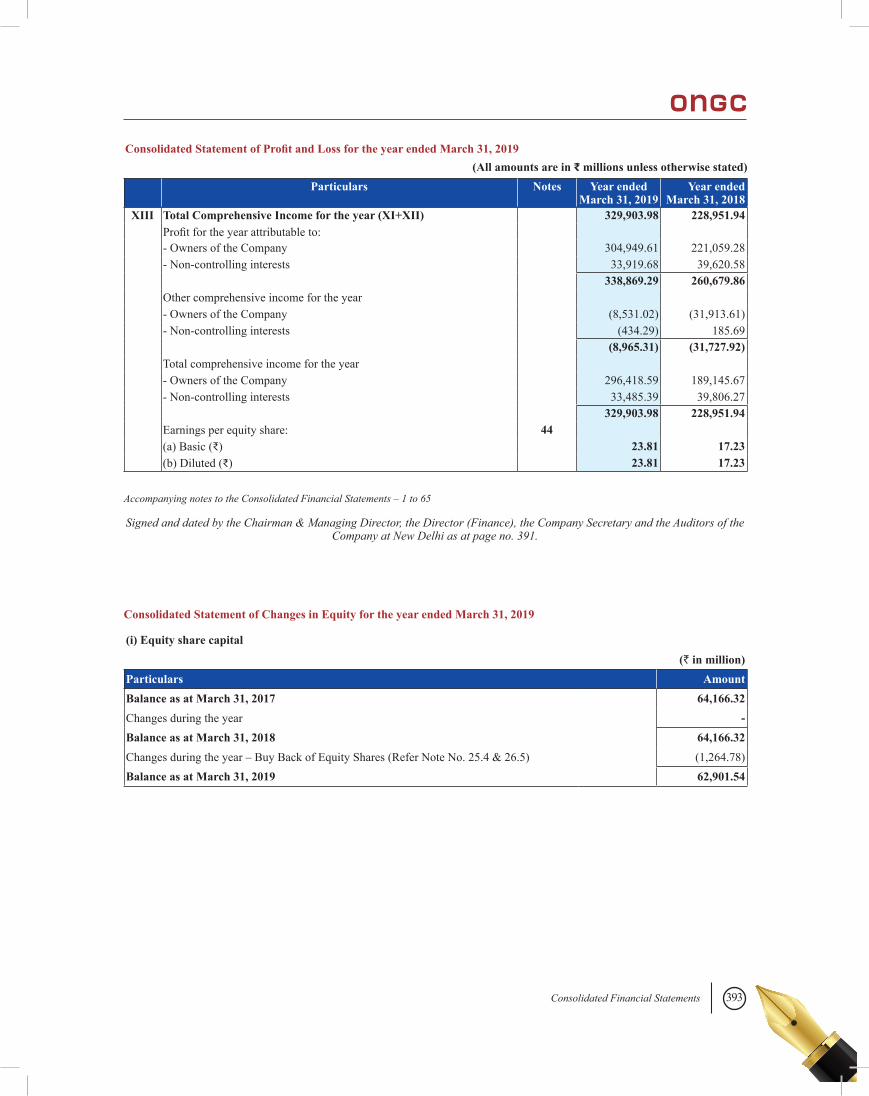
393Consolidated Financial Statements
Consolidated Statement of Profit and Loss for the year ended March 31, 2019
Consolidated Statement of Changes in Equity for the year ended March 31, 2019
Signed and dated by the Chairman & Managing Director, the Director (Finance), the Company Secretary and the Auditors of the Company at New Delhi as at page no. 391.
(All amounts are in ₹ millions unless otherwise stated) Particulars Notes Year ended
March 31, 2019Year ended
March 31, 2018XIII Total Comprehensive Income for the year (XI+XII) 329,903.98 228,951.94
Profit for the year attributable to: - Owners of the Company 304,949.61 221,059.28 - Non-controlling interests 33,919.68 39,620.58 338,869.29 260,679.86 Other comprehensive income for the year - Owners of the Company (8,531.02) (31,913.61) - Non-controlling interests (434.29) 185.69 (8,965.31) (31,727.92) Total comprehensive income for the year - Owners of the Company 296,418.59 189,145.67 - Non-controlling interests 33,485.39 39,806.27 329,903.98 228,951.94 Earnings per equity share: 44 (a) Basic (₹) 23.81 17.23 (b) Diluted (₹) 23.81 17.23
Accompanying notes to the Consolidated Financial Statements – 1 to 65
(i) Equity share capital(` in million)
Particulars AmountBalance as at March 31, 2017 64,166.32Changes during the year -Balance as at March 31, 2018 64,166.32Changes during the year – Buy Back of Equity Shares (Refer Note No. 25.4 & 26.5) (1,264.78)Balance as at March 31, 2019 62,901.54
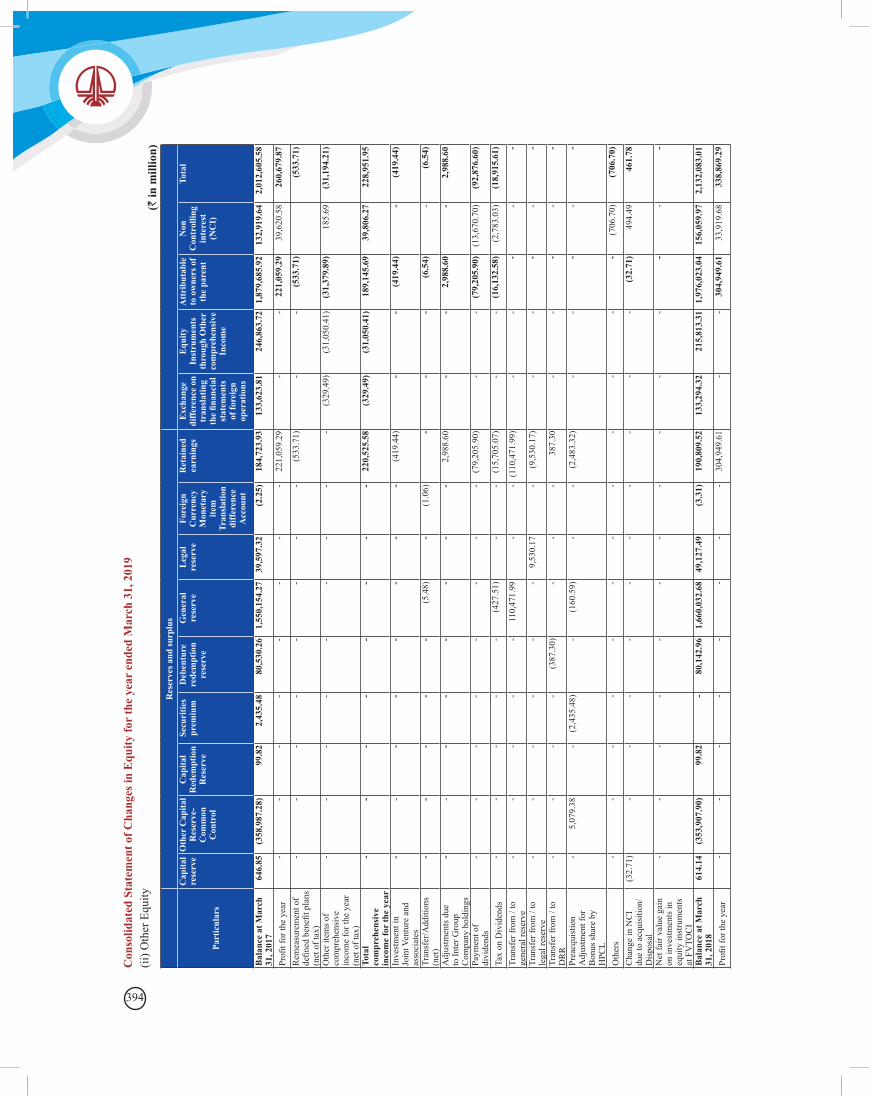
394
Con
solid
ated
Sta
tem
ent o
f Cha
nges
in E
quity
for
the
year
end
ed M
arch
31,
201
9
(` in
mill
ion)
(ii) O
ther
Equ
ity
Res
erve
s and
surp
lus
Part
icul
ars
Cap
ital
rese
rve
Oth
er C
apita
l R
eser
ve-
Com
mon
C
ontr
ol
Cap
ital
Red
empt
ion
Res
erve
Secu
ritie
s pr
emiu
mD
eben
ture
re
dem
ptio
n re
serv
e
Gen
eral
re
serv
eL
egal
re
serv
eFo
reig
n C
urre
ncy
Mon
etar
y ite
m
Tran
slat
ion
diff
eren
ce
Acc
ount
Ret
aine
d ea
rnin
gsE
xcha
nge
diff
eren
ce o
n tr
ansl
atin
g th
e fin
anci
al
stat
emen
ts
of fo
reig
n op
erat
ions
Equ
ity
Inst
rum
ents
th
roug
h O
ther
co
mpr
ehen
sive
In
com
e
Att
ribu
tabl
e to
ow
ners
of
the
pare
nt
Non
C
ontr
ollin
g in
tere
st
(NC
I)
Tota
l
Bal
ance
at M
arch
31
, 201
7 64
6.85
(358
,987
.28)
99.8
22,
435.
4880
,530
.26
1,55
0,15
4.27
39,5
97.3
2(2
.25)
184,
723.
9313
3,62
3.81
246,
863.
721,
879,
685.
9213
2,91
9.64
2,01
2,60
5.58
Profi
t for
the
year
--
--
--
--
221,
059.
29-
-22
1,05
9.29
39,6
20.5
826
0,67
9.87
Rem
easu
rem
ent o
f de
fined
ben
efit p
lans
(n
et o
f tax
)
--
--
--
--
(533
.71)
--
(533
.71)
(5
33.7
1)
Oth
er it
ems o
f co
mpr
ehen
sive
in
com
e fo
r the
yea
r (n
et o
f tax
)
--
--
--
--
-(3
29.4
9)(3
1,05
0.41
)(3
1,37
9.89
)18
5.69
(31,
194.
21)
Tota
l co
mpr
ehen
sive
in
com
e fo
r th
e ye
ar
--
--
--
--
220,
525.
58(3
29.4
9)(3
1,05
0.41
)18
9,14
5.69
39,8
06.2
722
8,95
1.95
Inve
stm
ent i
n Jo
int V
entu
re a
nd
asso
ciat
es
--
--
--
--
(419
.44)
--
(419
.44)
-(4
19.4
4)
Tran
sfer
/Add
ition
s (n
et)
--
--
-(5
.48)
-(1
.06)
--
-(6
.54)
-(6
.54)
Adj
ustm
ents
due
to
Inte
r Gro
up
Com
pany
hol
ding
s
--
--
--
--
2,98
8.60
--
2,98
8.60
-2,
988.
60
Paym
ent o
f di
vide
nds
--
--
--
--
(79,
205.
90)
--
(79,
205.
90)
(13,
670.
70)
(92,
876.
60)
Tax
on D
ivid
ends
--
--
-(4
27.5
1)-
-(1
5,70
5.07
)-
-(1
6,13
2.58
)(2
,783
.03)
(18,
915.
61)
Tran
sfer
from
/ to
ge
nera
l res
erve
--
--
-11
0,47
1.99
--
(110
,471
.99)
--
--
-
Tran
sfer
from
/ to
le
gal r
eser
ve-
--
--
-9,
530.
17-
(9,5
30.1
7)-
--
--
Tran
sfer
from
/ to
D
RR
--
--
(387
.30)
--
-38
7.30
--
--
-
Prea
cqui
stio
n A
djus
tmen
t for
B
onus
shar
e by
H
PCL
-5,
079.
38-
(2,4
35.4
8)-
(160
.59)
--
(2,4
83.3
2)-
--
--
Oth
ers
--
--
--
--
--
--
(706
.70)
(706
.70)
Cha
nge
in N
CI
due
to a
cqui
sitio
n/D
ispo
sal
(32.
71)
--
--
--
--
--
(32.
71)
494.
4946
1.78
Net
fair
valu
e ga
in
on in
vest
men
ts in
eq
uity
inst
rum
ents
at
FV
TOC
I
--
--
--
--
--
--
--
Bal
ance
at M
arch
31
, 201
861
4.14
(353
,907
.90)
99.8
2-
80,1
42.9
61,
660,
032.
6849
,127
.49
(3.3
1)19
0,80
9.52
133,
294.
3221
5,81
3.31
1,97
6,02
3.04
156,
059.
972,
132,
083.
01
Profi
t for
the
year
--
--
--
--
304,
949.
61-
-30
4,94
9.61
33,9
19.6
833
8,86
9.29
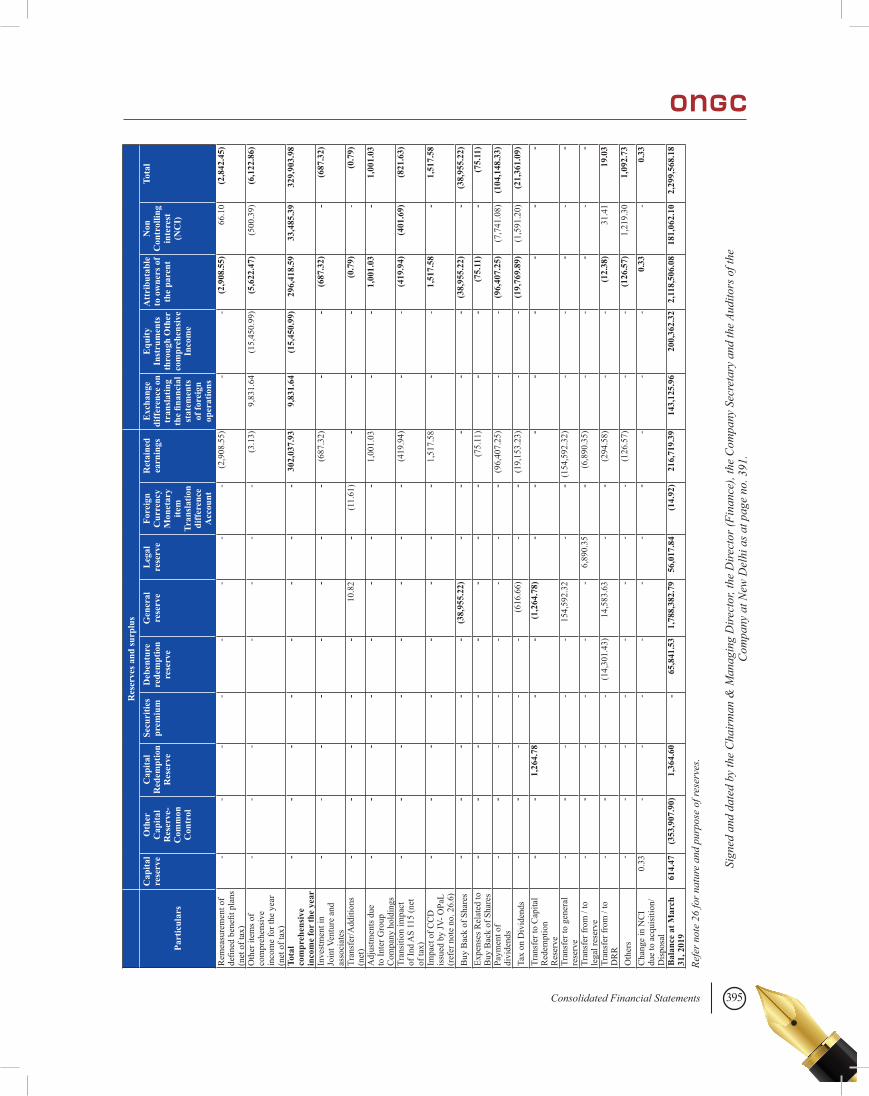
395Consolidated Financial Statements
Res
erve
s and
surp
lus
Part
icul
ars
Cap
ital
rese
rve
Oth
er
Cap
ital
Res
erve
- C
omm
on
Con
trol
Cap
ital
Red
empt
ion
Res
erve
Secu
ritie
s pr
emiu
mD
eben
ture
re
dem
ptio
n re
serv
e
Gen
eral
re
serv
eL
egal
re
serv
eFo
reig
n C
urre
ncy
Mon
etar
y ite
m
Tran
slat
ion
diff
eren
ce
Acc
ount
Ret
aine
d ea
rnin
gsE
xcha
nge
diff
eren
ce o
n tr
ansl
atin
g th
e fin
anci
al
stat
emen
ts
of fo
reig
n op
erat
ions
Equ
ity
Inst
rum
ents
th
roug
h O
ther
co
mpr
ehen
sive
In
com
e
Att
ribu
tabl
e to
ow
ners
of
the
pare
nt
Non
C
ontr
ollin
g in
tere
st
(NC
I)
Tota
l
Rem
easu
rem
ent o
f de
fined
ben
efit p
lans
(n
et o
f tax
)
--
--
--
--
(2,9
08.5
5)-
-(2
,908
.55)
66.1
0(2
,842
.45)
Oth
er it
ems o
f co
mpr
ehen
sive
in
com
e fo
r the
yea
r (n
et o
f tax
)
--
-
--
--
(3.1
3)9,
831.
64(1
5,45
0.99
)(5
,622
.47)
(500
.39)
(6,1
22.8
6)
Tota
l co
mpr
ehen
sive
in
com
e fo
r th
e ye
ar
--
--
--
--
302,
037.
939,
831.
64(1
5,45
0.99
)29
6,41
8.59
33,4
85.3
932
9,90
3.98
Inve
stm
ent i
n Jo
int V
entu
re a
nd
asso
ciat
es
--
--
--
--
(687
.32)
--
(687
.32)
-(6
87.3
2)
Tran
sfer
/Add
ition
s (n
et)
--
--
-10
.82
-(1
1.61
)-
--
(0.7
9)-
(0.7
9)
Adj
ustm
ents
due
to
Inte
r Gro
up
Com
pany
hol
ding
s
--
--
--
--
1,00
1.03
--
1,00
1.03
-1,
001.
03
Tran
sitio
n im
pact
of
Ind
AS
115
(net
of
tax)
--
--
--
--
(419
.94)
- -
(419
.94)
(401
.69)
(821
.63)
Impa
ct o
f CC
D
issu
ed b
y JV
- OPa
L (r
efer
not
e no
. 26.
6)
--
--
--
--
1,51
7.58
- -
1,51
7.58
-1,
517.
58
Buy
Bac
k of
Sha
res
--
--
-(3
8,95
5.22
)-
--
--
(38,
955.
22)
-(3
8,95
5.22
)
Expe
nses
Rel
ated
to
Buy
Bac
k of
Sha
res
--
--
--
--
(75.
11)
--
(75.
11)
-(7
5.11
)
Paym
ent o
f di
vide
nds
--
--
--
--
(96,
407.
25)
--
(96,
407.
25)
(7,7
41.0
8)(1
04,1
48.3
3)
Tax
on D
ivid
ends
--
--
-(6
16.6
6)-
-(1
9,15
3.23
)-
-(1
9,76
9.89
)(1
,591
.20)
(21,
361.
09)
Tran
sfer
to C
apita
l R
edem
ptio
n R
eser
ve
--
1,26
4.78
--
(1,2
64.7
8)-
--
--
--
-
Tran
sfer
to g
ener
al
rese
rve
--
--
-15
4,59
2.32
--
(154
,592
.32)
--
--
-
Tran
sfer
from
/ to
le
gal r
eser
ve-
--
--
-6,
890.
35-
(6,8
90.3
5)-
--
--
Tran
sfer
from
/ to
D
RR
--
--
(14,
301.
43)
14,5
83.6
3-
-(2
94.5
8)-
-(1
2.38
)31
.41
19.0
3
Oth
ers
--
--
--
--
(126
.57)
--
(126
.57)
1,21
9.30
1,09
2.73
Cha
nge
in N
CI
due
to a
cqui
sitio
n/D
ispo
sal
0.33
--
--
--
--
--
0.33
-0.
33
Bal
ance
at M
arch
31
, 201
961
4.47
(353
,907
.90)
1,36
4.60
-65
,841
.53
1,78
8,38
2.79
56,0
17.8
4(1
4.92
)21
6,71
9.39
143,
125.
9620
0,36
2.32
2,11
8,50
6.08
181,
062.
102,
299,
568.
18
Refe
r not
e 26
for n
atur
e an
d pu
rpos
e of
rese
rves
.
Sign
ed a
nd d
ated
by
the
Cha
irm
an &
Man
agin
g D
irect
or, t
he D
irect
or (F
inan
ce),
the
Com
pany
Sec
reta
ry a
nd th
e Au
dito
rs o
f the
C
ompa
ny a
t New
Del
hi a
s at p
age
no. 3
91.
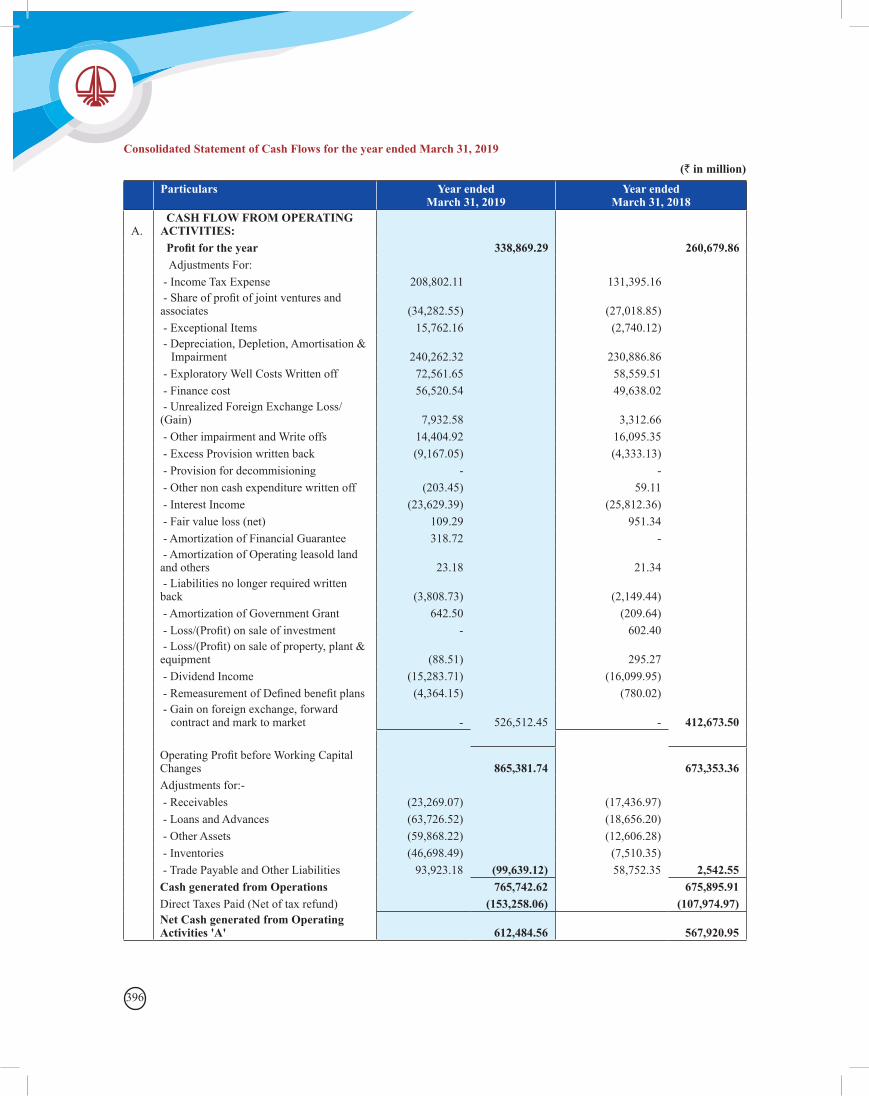
396
Consolidated Statement of Cash Flows for the year ended March 31, 2019
(` in million)
Particulars
Year endedMarch 31, 2019
Year endedMarch 31, 2018
A. CASH FLOW FROM OPERATING ACTIVITIES:
Profit for the year 338,869.29 260,679.86 Adjustments For: - Income Tax Expense 208,802.11 131,395.16
- Share of profit of joint ventures and associates (34,282.55) (27,018.85)
- Exceptional Items 15,762.16 (2,740.12)
- Depreciation, Depletion, Amortisation &
Impairment 240,262.32 230,886.86 - Exploratory Well Costs Written off 72,561.65 58,559.51 - Finance cost 56,520.54 49,638.02
- Unrealized Foreign Exchange Loss/(Gain) 7,932.58 3,312.66
- Other impairment and Write offs 14,404.92 16,095.35 - Excess Provision written back (9,167.05) (4,333.13) - Provision for decommisioning - - - Other non cash expenditure written off (203.45) 59.11 - Interest Income (23,629.39) (25,812.36) - Fair value loss (net) 109.29 951.34 - Amortization of Financial Guarantee 318.72 -
- Amortization of Operating leasold land and others 23.18 21.34
- Liabilities no longer required written back (3,808.73) (2,149.44)
- Amortization of Government Grant 642.50 (209.64) - Loss/(Profit) on sale of investment - 602.40
- Loss/(Profit) on sale of property, plant & equipment (88.51) 295.27
- Dividend Income (15,283.71) (16,099.95) - Remeasurement of Defined benefit plans (4,364.15) (780.02)
- Gain on foreign exchange, forward
contract and mark to market - 526,512.45 - 412,673.50
Operating Profit before Working Capital Changes 865,381.74 673,353.36
Adjustments for:- - Receivables (23,269.07) (17,436.97) - Loans and Advances (63,726.52) (18,656.20) - Other Assets (59,868.22) (12,606.28) - Inventories (46,698.49) (7,510.35) - Trade Payable and Other Liabilities 93,923.18 (99,639.12) 58,752.35 2,542.55 Cash generated from Operations 765,742.62 675,895.91 Direct Taxes Paid (Net of tax refund) (153,258.06) (107,974.97)
Net Cash generated from Operating Activities 'A' 612,484.56 567,920.95
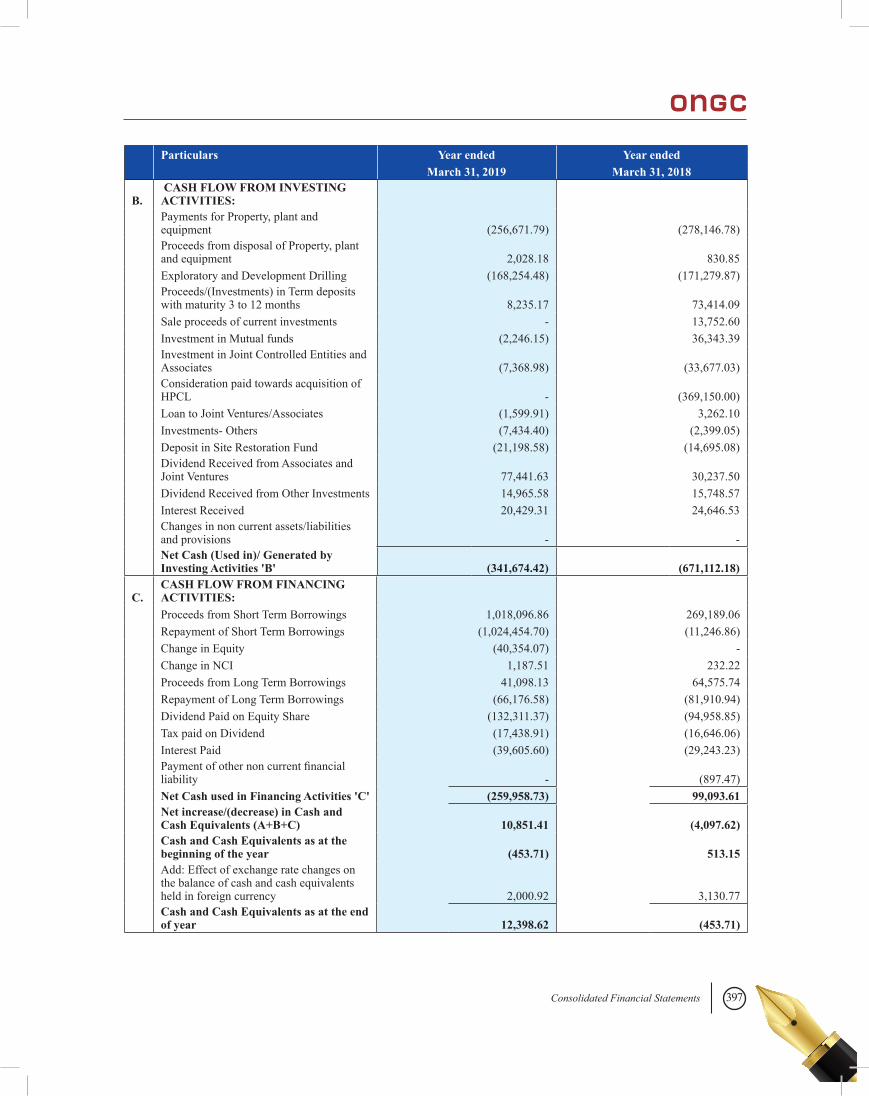
397Consolidated Financial Statements
Particulars Year ended Year ended March 31, 2019 March 31, 2018
B. CASH FLOW FROM INVESTING ACTIVITIES:
Payments for Property, plant and equipment (256,671.79) (278,146.78)
Proceeds from disposal of Property, plant and equipment 2,028.18 830.85
Exploratory and Development Drilling (168,254.48) (171,279.87)
Proceeds/(Investments) in Term deposits with maturity 3 to 12 months 8,235.17 73,414.09
Sale proceeds of current investments - 13,752.60 Investment in Mutual funds (2,246.15) 36,343.39
Investment in Joint Controlled Entities and Associates (7,368.98) (33,677.03)
Consideration paid towards acquisition of HPCL - (369,150.00)
Loan to Joint Ventures/Associates (1,599.91) 3,262.10 Investments- Others (7,434.40) (2,399.05) Deposit in Site Restoration Fund (21,198.58) (14,695.08)
Dividend Received from Associates and Joint Ventures 77,441.63 30,237.50
Dividend Received from Other Investments 14,965.58 15,748.57 Interest Received 20,429.31 24,646.53
Changes in non current assets/liabilities and provisions - -
Net Cash (Used in)/ Generated by Investing Activities 'B' (341,674.42) (671,112.18)
C.CASH FLOW FROM FINANCING ACTIVITIES:
Proceeds from Short Term Borrowings 1,018,096.86 269,189.06 Repayment of Short Term Borrowings (1,024,454.70) (11,246.86) Change in Equity (40,354.07) - Change in NCI 1,187.51 232.22 Proceeds from Long Term Borrowings 41,098.13 64,575.74 Repayment of Long Term Borrowings (66,176.58) (81,910.94) Dividend Paid on Equity Share (132,311.37) (94,958.85) Tax paid on Dividend (17,438.91) (16,646.06) Interest Paid (39,605.60) (29,243.23)
Payment of other non current financial liability - (897.47)
Net Cash used in Financing Activities 'C' (259,958.73) 99,093.61
Net increase/(decrease) in Cash and Cash Equivalents (A+B+C) 10,851.41 (4,097.62)
Cash and Cash Equivalents as at the beginning of the year (453.71) 513.15
Add: Effect of exchange rate changes on the balance of cash and cash equivalents held in foreign currency 2,000.92 3,130.77
Cash and Cash Equivalents as at the end of year 12,398.62 (453.71)
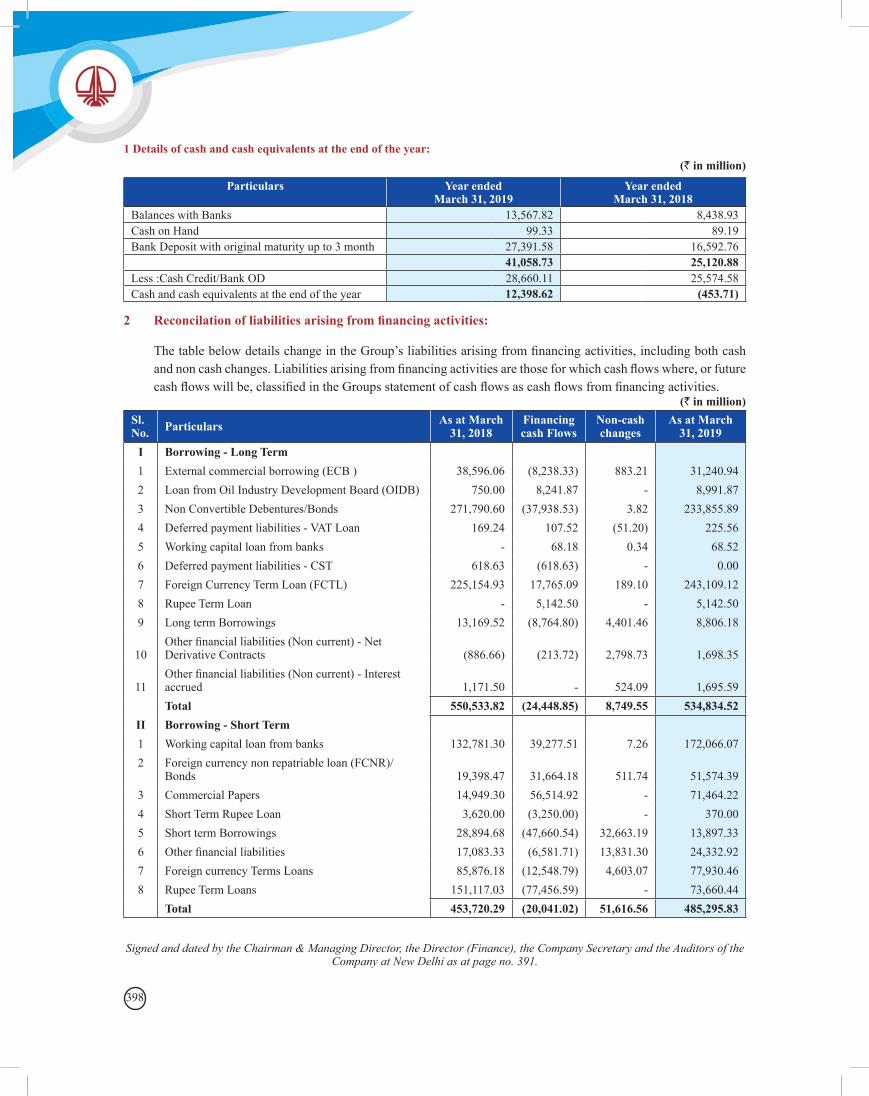
398
1 Details of cash and cash equivalents at the end of the year:(` in million)
(` in million)
Particulars Year endedMarch 31, 2019
Year endedMarch 31, 2018
Balances with Banks 13,567.82 8,438.93Cash on Hand 99.33 89.19Bank Deposit with original maturity up to 3 month 27,391.58 16,592.76 41,058.73 25,120.88Less :Cash Credit/Bank OD 28,660.11 25,574.58Cash and cash equivalents at the end of the year 12,398.62 (453.71)
2 Reconcilation of liabilities arising from financing activities:
The table below details change in the Group’s liabilities arising from financing activities, including both cash and non cash changes. Liabilities arising from financing activities are those for which cash flows where, or future cash flows will be, classified in the Groups statement of cash flows as cash flows from financing activities.
Sl. No. Particulars As at March
31, 2018Financing cash Flows
Non-cash changes
As at March 31, 2019
I Borrowing - Long Term 1 External commercial borrowing (ECB ) 38,596.06 (8,238.33) 883.21 31,240.942 Loan from Oil Industry Development Board (OIDB) 750.00 8,241.87 - 8,991.873 Non Convertible Debentures/Bonds 271,790.60 (37,938.53) 3.82 233,855.894 Deferred payment liabilities - VAT Loan 169.24 107.52 (51.20) 225.565 Working capital loan from banks - 68.18 0.34 68.526 Deferred payment liabilities - CST 618.63 (618.63) - 0.007 Foreign Currency Term Loan (FCTL) 225,154.93 17,765.09 189.10 243,109.128 Rupee Term Loan - 5,142.50 - 5,142.509 Long term Borrowings 13,169.52 (8,764.80) 4,401.46 8,806.18
10Other financial liabilities (Non current) - Net Derivative Contracts (886.66) (213.72) 2,798.73 1,698.35
11Other financial liabilities (Non current) - Interest accrued 1,171.50 - 524.09 1,695.59
Total 550,533.82 (24,448.85) 8,749.55 534,834.52II Borrowing - Short Term 1 Working capital loan from banks 132,781.30 39,277.51 7.26 172,066.072 Foreign currency non repatriable loan (FCNR)/
Bonds 19,398.47 31,664.18 511.74 51,574.393 Commercial Papers 14,949.30 56,514.92 - 71,464.224 Short Term Rupee Loan 3,620.00 (3,250.00) - 370.005 Short term Borrowings 28,894.68 (47,660.54) 32,663.19 13,897.336 Other financial liabilities 17,083.33 (6,581.71) 13,831.30 24,332.927 Foreign currency Terms Loans 85,876.18 (12,548.79) 4,603.07 77,930.468 Rupee Term Loans 151,117.03 (77,456.59) - 73,660.44
Total 453,720.29 (20,041.02) 51,616.56 485,295.83
Signed and dated by the Chairman & Managing Director, the Director (Finance), the Company Secretary and the Auditors of the Company at New Delhi as at page no. 391.
399Consolidated Financial Statements
Notes to the Consolidated Financial Statements for the year ended March 31, 2019
1. Corporate information Oil and Natural Gas Corporation Limited (“ONGC”
or “the Company”) is a public limited company domiciled and incorporated in India having its registered office at Deendayal Urja Bhawan, 5, Nelson Mandela Marg, Vasant Kunj, New Delhi – 110070. The Company’s shares are listed and traded on Stock Exchanges in India. The Consolidated Financial Statements relate to the Company, its Subsidiaries, Joint Venture Entities and Associates. The Group (comprising of the Company and its subsidiaries), Joint Venture Entities and Associates are mainly engaged in exploration, development and production of crude oil, natural gas and value added products in India and acquisition of oil and Gas acreages outside India for exploration, development and production, downstream (Refining and marketing of petroleum products), Petrochemicals, Power Generation, LNG supply, Pipeline Transportation, SEZ development and Helicopter services.
2. Application of new Indian Accounting Standards (Ind AS)
All the Indian Accounting Standards issued under section 133 of the Companies Act, 2013 and notified by the Ministry of Corporate Affairs (MCA) under the Companies (Indian Accounting Standards) Rules, 2015 (as amended) till the financial statements are approved have been considered in preparation of these Financial Statements.
2.1 Standards issued but not yet effective Ministry of Corporate Affairs (“MCA”) through
Companies (Indian Accounting Standards) Amendment Rules, 2019 and Companies (Indian Accounting Standards) Second Amendment Rules, has notified the following new and amendments to Ind AS which the Group has not applied as they are effective from April 1, 2019:
Ind AS-116 - Leases The Standard replaces the existing Ind AS 17
“Leases”. Ind AS 116 introduces a single lessee
accounting model and requires a lessee to recognise assets and liabilities for all leases with a term of more than 12 months, unless the underlying asset is of low value and sets out the principles for the recognition, measurement, presentation and disclosure of leases.
The Group is evaluating the requirements of the same and its effect on the Consolidated Financial Statements is likely to be material.
Other amendments:
Ind AS -12 Income taxes: The amendment relating to income tax consequences
of dividend clarify that an entity shall recognise the income tax consequences of dividends in profit or loss, other comprehensive income or equity according to where the entity originally recognised those past transactions or events.
The amendment to Appendix C of Ind AS 12 specifies that the amendment is to be applied to the determination of taxable profit (tax loss), tax bases, unused tax losses, unused tax credits and tax rates, when there is uncertainty over income tax treatments under Ind AS 12.
Ind AS 109 – Prepayment Features with Negative Compensation
The amendments relate to the existing requirements in Ind AS 109 regarding termination rights in order to allow measurement at amortised cost (or, depending on the business model, at fair value through other comprehensive income) even in the case of negative compensation payments.
Ind AS 19 – Plan Amendment, Curtailment or Settlement
The amendments clarify that if a plan amendment, curtailment or settlement occurs, it is mandatory that the current service cost and the net interest for the period after the re-measurement are determined using the assumptions used for the re-measurement.
400
In addition, amendments have been included to clarify the effect of a plan amendment, curtailment or settlement on the requirements regarding the asset ceiling.
Ind AS 23 – Borrowing Costs The amendments clarify that if any specific
borrowing remains outstanding after the related asset is ready for its intended use or sale, that borrowing becomes part of the funds that an entity borrows generally when calculating the capitalization rate on general borrowings.
Ind AS 28 – Long-term Interests in Associates and Joint Ventures
The amendments clarify that an entity applies Ind AS 109 Financial Instruments, to long-term interests in an associate or joint venture that form part of the net investment in the associate or joint venture but to which the equity method is not applied.
Ind AS 103 – Business Combinations and Ind AS 111 - Joint Arrangements
The amendments to Ind AS 103 relating to re-measurement clarify that when an entity obtains control of a business that is a joint operation, it re-measures previously held interests in that business. The amendments to Ind AS 111 clarify that when an entity obtains joint control of a business that is a joint operation, the entity does not re-measure previously held interests in that business.
The Group is evaluating the requirements of the other amendments and its effect on the Consolidated Financial Statements.
3. Significant Group Accounting Policies
3.1 Statement of compliance The Consolidated Financial Statements have been
prepared in accordance with Ind AS notified under the Companies (Indian Accounting Standards) Rules, 2015 (as amended) and Guidance Note on Accounting for Oil and Gas Producing Activities
(Ind AS) issued by the Institute of Chartered Accountants of India.
3.2 Basis of preparation The Consolidated Financial Statements have been
prepared on the historical cost convention except for certain assets and liabilities which are measured at Fair Value/Amortised Cost/Net Present value at the end of each reporting period, as explained in the accounting policies below:
Historical cost is generally based on the fair value of the consideration given in exchange for goods and services.
As the operating cycle cannot be identified in normal course due to the special nature of industry, the same has been assumed to have duration of 12 months. Accordingly, all assets and liabilities have been classified as current or non-current as per the operating cycle and other criteria set out in Ind AS-1 ‘Presentation of Financial Statements’ and Schedule III to the Companies Act, 2013.
The Consolidated Financial Statements are presented in Indian Rupees and all values are rounded off to the nearest two decimal million except otherwise stated.
Fair value measurement Fair value is the price that would be received to sell
an asset or paid to transfer a liability in an orderly transaction between market participants at the measurement date under current market conditions.
The Group categorizes assets and liabilities measured at fair value into one of the three levels depending on the ability to observe inputs employed in their measurement which are described as follows:
• Level 1 inputs are quoted prices (unadjusted) in active markets for identical assets or liabilities.
• Level 2 inputs are inputs that are observable, either directly or indirectly, other than quoted prices included within level 1 for the assets or liabilities.
401Consolidated Financial Statements
• Level 3 inputs are unobservable inputs for the asset or liability reflecting significant modifications to observable related market data or Group’s assumptions about pricing by market participants.
3.3 Principles of Consolidation The Consolidated Financial Statements incorporate
the financial statements of the Company and its subsidiaries (collectively referred as “the Group”). The Group has investments in associates and joint ventures which are accounted using equity method in these consolidated financial statements. Refer note 3.7 for the accounting policy of investment in associates and joint ventures in the Consolidated Financial Statements.
Subsidiaries are entities controlled by the Company. The Company controls an entity when it is exposed, or has rights to variable returns from its involvement with the entity and has the ability to affect those returns through its power to direct the relevant activities of the entity. Subsidiaries are consolidated from the date of their acquisition (except for Business Combinations under Common Control), being the date on which the Company obtains control and continue to be consolidated until the date that such control ceases.
The Consolidated Financial Statements are prepared using uniform accounting policies consistently for like transactions and other events in similar circumstances and are presented to the extent possible, in the same manner as the Company’s Standalone Financial Statements except otherwise stated. When necessary, adjustments are made to the financial statements of subsidiaries to bring their accounting policies in line with the Group’s Significant Accounting Policies.
The Consolidated Financial Statements have been prepared by combining the financial statements of the company and its subsidiaries on a line-by-line basis by adding together the book values of like items of assets, liabilities, equity, income, expenses and cash flow after eliminating in full intra-group
assets, liabilities, equity, income, expenses and cash flow relating to intra-group transactions and unrealized profits. Unrealized losses are also eliminated unless the transaction provides evidence of an impairment of the asset transferred. Such unrealized profits/losses are fully attributed to the Company.
Profit or loss and each component of other comprehensive income are attributed to the owners of the Company and to the non-controlling interests. Total comprehensive income is attributed to the owners of the Company and to the non-controlling interests even if this results in the non-controlling interests having a deficit balance.
Changes in the Group’s ownership interests in subsidiaries that do not result in the Group losing control over the subsidiaries are accounted for as equity transactions. The carrying amounts of the Group’s interests and the non-controlling interests are adjusted to reflect the changes in their relative interests in the subsidiaries. Any difference between the amount by which the non-controlling interests are adjusted and the fair value of the consideration paid or received is recognised directly in equity and attributed to the owners of the Company.
When the Group loses control of a subsidiary, a gain or loss is recognised in the consolidated statement of profit and loss and is calculated as the difference between (i) the aggregate of the fair value of the consideration received and the fair value of any retained interest and (ii) the previous carrying amount of the assets (including goodwill) and liabilities of the subsidiary and any non-controlling interests. All amounts previously recognised in other comprehensive income in relation to that subsidiary are accounted for as if the Group had directly disposed of the related assets or liabilities of the subsidiary (i.e. reclassified to the consolidated statement of profit and loss or transferred to another category of equity as specified/permitted by applicable Ind AS). The fair value of any investment retained in the former subsidiary at the date when control is lost is regarded as the fair value on initial recognition for subsequent accounting under Ind AS
402
109, or the cost on initial recognition as investment in an associate or a joint venture, when applicable.
3.4 Business Combination Acquisitions of businesses (except for Business
Combinations under Common Control) are accounted for using the acquisition method. The consideration transferred in a business combination is measured at fair value which is calculated as the sum of the acquisition date fair values of the assets transferred by the Group, liabilities incurred by the Group to the former owners of the acquiree and the equity interests issued by the Group in exchange of control of the acquiree. Acquisition related costs are generally recognised in consolidated statement of profit and loss as incurred.
At the acquisition date, the identifiable assets acquired and the liabilities assumed are recognised at their fair value, except that:
• Deferred tax assets or liabilities, and assets or liabilities related to employee benefit arrangements are recognised and measured in accordance with Ind AS 12 ‘Income Taxes’ and Ind AS 19 ‘Employee Benefits’ respectively;
• Assets (or disposal groups) that are classified as held for sale in accordance with Ind AS 105 ‘Non-current Assets Held for Sale and Discontinued Operations’ are measured in accordance with that Standard.
Goodwill is measured as the excess of the sum of the consideration transferred, the amount of any non-controlling interests in the acquiree, and the fair value of the acquirer’s previously held equity interest in the acquiree (if any) over the net of the acquisition date amounts of the identifiable assets acquired and the liabilities assumed.
In case of a bargain purchase, before recognising a gain in respect thereof, the Group determines whether there exists clear evidence of the underlying reasons for classifying the business combination as a bargain purchase. Thereafter, the Group reassesses whether it has correctly identified
all of the assets acquired and all of the liabilities assumed and recognises any additional assets or liabilities that are identified in that reassessment. The Group then reviews the procedures used to measure the amounts that Ind AS requires for the purposes of calculating the bargain purchase. If the gain remains after this reassessment and review, the Group recognises it in other comprehensive income and accumulates the same in equity as capital reserve. This gain is attributed to the acquirer. If there does not exist clear evidence of the underlying reasons for classifying the business combination as a bargain purchase, the Group recognises the gain, after reassessing and reviewing (as described above), directly in equity as capital reserve.
When the consideration transferred by the Group in a business combination includes assets or liabilities resulting from a contingent consideration arrangement, the contingent consideration is measured at its acquisition date fair value and included as part of the consideration transferred in a business combination. Changes in the fair value of the contingent consideration that qualify as measurement period adjustments are adjusted retrospectively, with corresponding adjustments against goodwill or capital reserve, as the case may be. Measurement period adjustments are adjustments that arise from additional information obtained by the Group during the ‘measurement period’ about facts and circumstances that existed at the acquisition date. Measurement period does not exceed one year from the acquisition date.
The subsequent accounting for changes in the fair value of the contingent consideration that do not qualify as measurement period adjustments depends on how the contingent consideration is classified. Contingent consideration that is classified as equity is not remeasured at subsequent reporting dates and its subsequent settlement is accounted for within equity. Contingent consideration that is classified as an asset or a liability is remeasured at fair value at subsequent reporting dates with the corresponding gain or loss being recognised in the consolidated statement of profit and loss.
403Consolidated Financial Statements
When a business combination is achieved in stages, the Group’s previously held equity interest in the acquiree is remeasured to its acquisition date fair value and the resulting gain or loss, if any, is recognised in the consolidated statement of profit and loss. Amounts arising from interests in the acquiree prior to the acquisition date that have previously been recognised in other comprehensive income are reclassified to the consolidated statement of profit and loss where such treatment would be appropriate if that interest were disposed of.
If the initial accounting for a business combination is incomplete by the end of the reporting period in which the combination occurs, the Group reports provisional amounts for the items for which the accounting is incomplete. Those provisional amounts are adjusted during the measurement period recognising additional assets or liabilities (if any) to reflect new information obtained about facts and circumstances that existed at the acquisition date that, if known, would have affected the amounts recognised at that date.
Business Combination under Common control
A business combination involving entities or businesses under common control is a business combination in which all of the combining entities or businesses are ultimately controlled by the same party or parties both before and after the business combination and the control is not transitory. The transactions between entities under common control are specifically covered by Appendix C to Ind AS 103 and are accounted for using the pooling-of-interest method as follows:
• The assets and liabilities of the combining entities are reflected at the carrying amounts.
• No adjustments are made to reflect fair values, or recognize new assets or liabilities. Adjustments are made to harmonize significant accounting policies.
• The financial information in the financial statements in respect of prior periods is restated
as if the business combination has occurred from the beginning of the preceding period in the financial statements, irrespective of the actual date of the combination.
The balance of the retained earnings appearing in the financial statements of the transferor is aggregated with the corresponding balance appearing in the financial statements of the transferee. The identity of the reserves are preserved and the reserves of the transferor become the reserves of the transferee.
The difference, if any, between the amounts recorded as share capital issued plus any additional consideration in the form of cash or other assets and the amount of share capital of the transferor is transferred to capital reserve and is presented separately from other capital reserves.
3.5 Non-controlling interests Non-controlling interests represent the proportion
of income, other comprehensive income and net assets in subsidiaries that is not attributable to the Company's shareholders.
Non-controlling interests are initially measured at the proportionate share of the recognised amounts of the acquiree’s identifiable net assets. Subsequent to acquisition, the carrying amount of non-controlling interests is the amount of the interest at initial recognition plus the non-controlling interests’ share of subsequent changes in equity.
3.6 Goodwill on consolidation Goodwill arising on an acquisition of a business is
carried at cost as established at the date of acquisition of the business less accumulated impairment losses, if any.
For the purposes of impairment testing, goodwill is allocated to each of the Group’s cash-generating units (or groups of cash-generating units) that is expected to benefit from the synergies of the combination.
A cash-generating unit to which goodwill has been allocated is tested for impairment annually, or more frequently when there is an indication that the cash
404
generating unit may be impaired. If the recoverable amount of the cash-generating unit is less than its carrying amount, the impairment loss is allocated first to reduce the carrying amount of any goodwill allocated to the cash generating unit and then to the other assets of the unit pro rata based on the carrying amount of each asset in the unit. Any impairment loss for goodwill is recognised directly in Consolidated Statement of Profit and Loss. An impairment loss recognised for goodwill is not reversed in subsequent periods.
On disposal of the relevant cash-generating unit, the attributable amount of goodwill is included in the determination of the Profit and Loss.
3.7 Investments in Associates and Joint Ventures
An Associate is an entity over which the Group has significant influence. Significant influence is the power to participate in the financial and operating policy decisions of the investee but is not control or joint control over those policies.
A Joint Venture is a joint arrangement whereby the parties that have joint control of the arrangement have rights to the net assets of the arrangement. Joint control is the contractually agreed sharing of control of an arrangement, which exists only when decisions about the relevant activities require unanimous consent of the parties sharing control.
The results, assets and liabilities of associates or joint ventures are incorporated in the Consolidated Financial Statements using the equity method of accounting, except when the investment, or a portion thereof, is classified as held for sale, in which case it is accounted for in accordance with Ind AS 105 ‘Non-current Assets Held for Sale and Discontinued Operations’. Under the equity method, an investment in an associate or a joint venture is initially recognised in the Consolidated Balance Sheet at cost and adjusted thereafter to recognize the Group’s share of profit or loss and other comprehensive income of the associate or joint venture. Distributions received from an associate
or a joint venture reduces the carrying amount of investment. When the Group’s share of losses of an associate or a joint venture exceeds the Group’s interest in that associate or joint venture (which includes any long term interests that, in substance, form part of the Group's net investment in the associate or joint venture), the Group discontinues recognizing its share of further losses. Additional losses are recognized only to the extent that the Group has legal or constructive obligations or made payments on behalf of the associate or joint venture.
Loans advanced to Associate & Joint Venture and that have the characteristics of financing through equity are also included in the investment of the Group's consolidated balance sheet. The Group’s share of amounts recognized directly in equity by Associate & Joint Venture is recognized in the Group’s consolidated statement of changes in equity.
Unrealized gains on transactions between the group and its Associate & Joint Venture are eliminated to the extent of the Group’s interest in Associate & Joint Venture. Unrealized losses are also eliminated to the extent of Group's interest unless the transaction provides evidence of an impairment of the asset transferred.
If an associate or a joint venture uses accounting policies other than those of the Group accounting policies for like transactions and events in similar circumstances, adjustments are made to make the associate’s or joint venture’s financial statements confirm to the Group’s significant accounting policies before applying the equity method, unless, in case of an associate where it is impracticable do so.
An investment in an Associate or a Joint Venture is accounted for using the equity method from the date on which the investee becomes an Associate or a Joint Venture. On acquisition of the investment in an Associate or a Joint Venture, any excess of the cost of the investment over the Group's share of the net fair value of the identifiable assets and liabilities of the investee is recognised as goodwill,
405Consolidated Financial Statements
which is included within the carrying amount of the investment. Any excess of the Group's share of the net fair value of the identifiable assets and liabilities over the cost of the investment, after reassessment, is recognised directly in equity as capital reserve in the period in which the investment is acquired.
After application of the equity method of accounting, the Group determines whether there is any objective evidence of impairment as a result of one or more events that occurred after the initial recognition of the net investment in an associate or a joint venture and that event (or events) has an impact on the estimated future cash flows from the net investment that can be reliably estimated. If there exists such an objective evidence of impairment, then Group recognises impairment loss with respect to the Group’s investment in an associate or a joint venture. When necessary, the entire carrying amount of the investment (including goodwill) is tested for impairment in accordance with Ind AS 36 ‘Impairment of Assets’ as a single asset by comparing its recoverable amount (higher of value in use and fair value less costs of disposal) with its carrying amount, Any impairment loss recognised forms part of the carrying amount of the investment. Any reversal of that impairment loss is recognised in accordance with Ind AS 36 to the extent that the recoverable amount of the investment subsequently increases.
The Group discontinues the use of the equity method from the date when the investment ceases to be an associate or a joint venture, or when the investment is classified as held for sale. When the Group retains an interest in the former associate or joint venture and the retained interest is a financial asset, the Group measures the retained interest at fair value at that date and the fair value is regarded as its fair value on initial recognition in accordance with Ind AS 109 ‘Financial Instruments’. The difference between the carrying amount of the associate or joint venture at the date the equity method was discontinued, and the fair value of any retained interest and any proceeds from disposing of a part interest in the associate or joint venture is included in the determination of the gain or
loss on disposal of the associate or joint venture. In addition, the Group accounts for all amounts previously recognised in other comprehensive income in relation to that associate or joint venture on the same basis as would be required if that associate or joint venture had directly disposed of the related assets or liabilities. Therefore, if a gain or loss previously recognised in other comprehensive income by that associate or joint venture would be reclassified to the consolidated statement of profit and loss on the disposal of the related assets or liabilities, the Group reclassifies the gain or loss from equity to the consolidated statement of profit and loss (as a reclassification adjustment) when the equity method is discontinued.
The Group continues to use the equity method when an investment in an associate becomes an investment in a joint venture or an investment in a joint venture becomes an investment in an associate. There is no remeasurement to fair value upon such changes in ownership interests.
When the Group reduces its ownership interest in an associate or a joint venture but the Group continues to use the equity method, the Group reclassifies to the consolidated statement of profit and loss the proportion of the gain or loss that had previously been recognised in other comprehensive income relating to that reduction in ownership interest as if that gain or loss would be reclassified to the consolidated statement of profit and loss on the disposal of the related assets or liabilities.
When a group entity transacts with an associate or a joint venture of the Group, profits and losses resulting from the transactions with the associate or joint venture are recognised in the Group’s consolidated financial statements only to the extent of interests in the associate or joint venture that are not related to the Group.
3.8 Interests in joint operations A joint operation is a joint arrangement whereby the
parties that have joint control of the arrangement have rights to the assets, and obligations for the
406
liabilities, relating to the arrangement. Joint control is the contractually agreed sharing of control of an arrangement, which exists only when decisions about the relevant activities require unanimous consent of the parties sharing control.
The Group has Joint Operations in the nature of Production Sharing Contracts (PSC) and Revenue Sharing Contracts (RSC) with the Government of India/other countries and various body corporates for exploration, development and production activities.
The Group’s share in the assets and liabilities along with attributable income and expenditure of the Joint Operations is merged on line by line basis with the similar items in the Consolidated Financial Statements and adjusted for leases, depreciation, overlift/ underlift, depletion, survey, dry wells, decommissioning provision, impairment and sidetracking in accordance with the accounting policies of the Group.
The hydrocarbon reserves in such areas are taken in proportion to the participating interest of the Group.
Gain or loss on sale of interest in a joint operation, is recognized in the Consolidated Statement of Profit and Loss, except that no gain is recognized at the time of such sale if substantial uncertainty exists about the recovery of the costs applicable to the retained interest or if the Group has substantial obligation for future performance. The gain in such situation is treated as recovery of cost related to that block.
3.9 Non-current assets held for sale Non-current assets or disposal groups classified as
held for sale are measured at the lower of carrying amount and fair value less costs to sell.
Non-current assets or disposal groups are classified as held for sale if their carrying amounts will be recovered principally through a sale transaction rather than through continuing use. This condition is regarded as met only when the sale is highly probable and the asset or disposal group is available
for immediate sale in its present condition subject only to terms that are usual and customary for sales of such assets. Management must be committed to the sale, which should be expected to qualify for recognition as a completed sale within one year from the date of classification as held for sale, and actions required to complete the plan of sale should indicate that it is unlikely that significant changes to the plan will be made or that the plan will be withdrawn.
Property, Plant and Equipment (PPE) and intangible assets are not depreciated or amortized once classified as held for sale.
3.10 Government Grant Government grants, including non-monetary
grants at fair value, are not recognised until there is reasonable assurance that the Group will comply with the conditions attached to them and that the grants will be received.
Government grants are recognised in Consolidated Statement of Profit and Loss on a systematic basis over the periods in which the Group recognises as expenses the related costs for which the grants are intended to compensate.
Government grants whose primary condition is that the Group should purchase, construct or otherwise acquire non-current assets and non-monetary grants are recognised and disclosed as 'deferred income' under non-current liability in the Consolidated Balance Sheet and transferred to the Consolidated Statement of Profit and Loss on a systematic and rational basis over the useful lives of the related assets.
The benefit of a government loan at a rate below the market rate of interest is treated as a government grant, and is measured as the difference between proceeds received and the fair value of the loan based on prevailing market interest rates.
3.11 Property Plant and Equipment (other than Oil and Gas Assets)
The Group (except for ONGC Videsh Ltd where due to change in functional currency, this exemption is
407Consolidated Financial Statements
not available as per para D7AA of Ind AS 101) has elected to continue with the carrying value of all of its Property Plant and Equipment recognised as of April 1, 2015 (transition date) measured as per the Previous GAAP and use that carrying value as its deemed cost as of the transition date except adjustment related to decommissioning liabilities.
Land and buildings held for use in the production or supply of goods or services, or for administrative purposes, are stated in the Balance Sheet at cost less accumulated depreciation and impairment losses, if any. Freehold land and land under perpetual lease are not depreciated.
Property, Plant and Equipment (PPE) in the course of construction for production, supply or administrative purposes are carried at cost, less any recognised impairment loss. The cost of an asset comprises its purchase price or its construction cost (net of applicable tax credits), any cost directly attributable to bring the asset into the location and condition necessary for it to be capable of operating in the manner intended by the Management and decommissioning cost as per note 3.17. It includes professional fees and, for qualifying assets, borrowing costs capitalised in accordance with the Group’s accounting policy. Such properties are classified to the appropriate categories of PPE when completed and ready for intended use. Parts of an item of PPE having different useful lives and significant value and subsequent expenditure on Property, Plant and Equipment arising on account of capital improvement or other factors are accounted for as separate components. Expenditure on dry docking of rigs and vessels are accounted for as component of relevant assets.
The estimated useful lives, residual values and depreciation method are reviewed on an annual basis and if necessary, changes in estimates are accounted for prospectively.
Depreciation on subsequent expenditure on PPE arising on account of capital improvements or other factors is provided for prospectively over the remaining useful life.
Assets held under finance leases are depreciated over their expected useful lives on the same basis as owned assets.
Depreciation on additions/deletions to PPE during the year is provided for on a pro-rata basis with reference to the date of additions/deletions except low value items not exceeding ` 5,000/- which are fully depreciated at the time of addition of Assets related to operations in India and items not exceeding US$ 100 which are fully depreciated at the time of addition of Assets related to operations outside India.
An item of PPE is de-recognised upon disposal or when no future economic benefits are expected to arise from the continued use of the asset. Any gain or loss arising on the disposal or retirement of an item of PPE is determined as the difference between the sales proceeds and the carrying amount of the asset and is recognised in the consolidated Statement of Profit and Loss.
Depreciation of these PPE commences when the assets are ready for their intended use.
The Group account for their depreciation on following basis:-
(a) Depreciation- PPE of Exploration & Production (E&P) (other than freehold land, Oil and Gas Assets and properties under construction)
Depreciation is provided on the cost of PPE of E&P operations less their residual values, using the written down value method (except for components of dry docking capitalised) over the useful life of PPE as stated in the Schedule II to the Companies Act, 2013 or based on technical assessment by the Company. In case of PPE pertaining to overseas blocks where the license period is less than the useful life of PPE, the company writes off the PPE in the financial year in which the license is expired or the block is surrendered, if no future economic benefits from the PPE are expected. Estimated useful lives of these assets are as under:
Description Useful life in yearsBuilding & Bunk Houses 3 to 60Plant &Machinery 2 to 40Furniture and Fixtures 3 to 15Vehicles 5 to 20Office Equipment 2 to 20
408
Depreciation on refurbished/revamped PPE which are capitalized separately is provided for over the reassessed useful life which is not more than the life specified in Schedule II to the Companies Act, 2013.
Depreciation on expenditure on dry docking of rigs and vessels capitalized as component of relevant rig / vessels is charged over the dry dock period on straight line basis.
Depreciation on PPE including support equipment and facilities used for exploratory/development drilling is initially capitalised as part of drilling cost and expensed/depleted as per Note 3.15. Depreciation on equipment/ assets deployed for survey activities is charged to the Consolidated Statement of Profit and Loss.
(b) Depreciation- PPE of Refining & Marketing, Crude oil Transportation business (other than freehold land and properties under construction)
Depreciation is provided on the cost of PPE less their residual values of asset associated with Refinery, Petrochemical, Crude oil Transportation, using Straight Line Method, over the useful life as specified in Schedule II to the Companies Act, 2013, except in case of certain components of the Plant and Equipment whose useful lives are determined based on technical evaluation. Useful lives are as follows:-
Asset categories Useful life in yearsBuildings 1-60Plant & Machinery 2-40Furniture 3-10Office equipment 3-15Vehicles 4-8
In respect of refining & marketing business, the useful lives of following assets are based on internal technical assessment:
Expenditure on overhaul and repairs on account of planned shutdown which are of significant value (5% of the value of particular assets) is capitalized as component of relevant items of PPE and is depreciated over the period till next shutdown on straight line basis. Catalyst whose life is more than one year is capitalised as property, plant and equipment and depreciated over the guaranteed useful life as specified by the supplier when the catalyst is put to use.
3.12 Intangible Assets(i) Intangible assets acquired separately
The Group (except for ONGC Videsh Ltd where due to change in functional currency this exemption is not available as per para D7AA of Ind AS 101 ) has elected to continue with the carrying value of all of its intangible assets recognised as of April 1, 2015 (transition date) measured as per the Previous GAAP and use that carrying value as its deemed cost as of the transition date except adjustment related to decommissioning liabilities.
Intangible assets are carried at cost net of accumulated amortization and accumulated impairment losses, if any. Internally generated intangibles, excluding development costs, are not capitalised and the related expenditure is reflected in Statement of Profit and Loss in the period in which the expenditure is incurred. Development costs are capitalised if technical and commercial feasibility of the project is demonstrated, future economic benefits are probable, the Group has an intention and ability to complete and use or sell the asset and the costs can be measured reliably.
In cases where, the Group has constructed assets and the Group has only a preferential right to use, these assets are classified as intangible assets and are amortised (after retaining the residual value, if applicable) over their useful life or the period of the agreement, whichever is lower.
Asset categories Useful life in yearsPlant and Machinery relating to Retail Outlets (other than Storage tanks and related equipment)
15 years
Cavern Structure 60 years
LPG cylinders & regulators (excluding cylinders held for sale)
15 years
409Consolidated Financial Statements
Intangible assets with finite useful lives that are acquired separately. amortized on a straight-line basis over their estimated useful life. Intangible assets in form of right to use is amortised on straight line basis over the useful life of underlying asset. The estimated useful life is reviewed at the end of each reporting period and the effect of any changes in estimate being accounted for prospectively and tested for impairment.
Intangible assets with indefinite useful lives that are acquired separately are not subject to amortisation and are carried at cost less accumulated impairment losses, if any.
An intangible asset is derecognised on disposal, or when no future economic benefits are expected from use or disposal. Gains or losses arising from derecognition of an intangible asset, measured as the difference between the net disposal proceeds and the carrying amount of the asset, and recognised in the Consolidated Statement of Profit and Loss, when the asset is derecognised.
Technical know-how/license fee relating to production process and process design are recognized as Intangible Assets.
Estimated lives of intangible assets (acquired) are as follows:
• Software – 2 to 10 years
• Technical know-how/license fees – 2 to 10 years
• Right to use-wind mills - 22 years
(ii) Intangible assets under development - Exploratory Wells in Progress
All exploration and evaluation costs incurred in drilling and equipping exploratory and appraisal wells, are initially capitalized as Intangible assets under development - Exploratory Wells in Progress till the time these are either transferred to Oil and Gas Assets on completion as per note no. 3.15 or expensed as exploration and evaluation cost (including allocated depreciation) as and
when determined to be dry or of no further use, as the case may be.
Cost of drilling exploratory type stratigraphic test wells are initially capitalized as Intangible assets under development - Exploratory Wells in Progress till the time these are either transferred to Oil and Gas Assets as per note no. 3.15 or expensed as exploration and evaluation cost (including allocated depreciation) as when determined to be dry or the petroleum exploration license/field/project is surrendered.
Costs of exploratory wells are not carried over unless it could be reasonably demonstrated that there are indications of sufficient quantity of reserves and sufficient progress has been made in assessing the reserves and the economic and operating viability of the project. All such carried over costs are subject to review for impairment as per the policy of the Group.
3.13 Impairment of tangible and intangible assets other than goodwill
The Group reviews the carrying amount of its tangible and intangible assets (Oil and Gas Assets, Development Wells in Progress (DWIP), and Property, Plant and Equipment (including Capital Works in Progress) of a “Cash Generating Unit” (CGU) at the end of each reporting period to determine whether there is any indication that those assets have suffered an impairment loss. If any such indication exists, the recoverable amount of the asset is estimated in order to determine the extent of the impairment loss (if any). When it is not possible to estimate the recoverable amount of an individual asset, the Group estimates the recoverable amount of the cash-generating unit to which the asset belongs.
Intangible assets with indefinite useful lives such as “Right of way” and intangible assets not yet available for use are tested for impairment at least annually or whenever there is an indication that the asset may be impaired.
Recoverable amount is the higher of fair value less costs of disposal and value in use. In assessing value
410
in use, the estimated future cash flows are discounted to their present value using a pre-tax discount rate that reflects current market assessments of the time value of money and the risks specific to the asset for which the estimates of future cash flows have not been adjusted.
If the recoverable amount of an asset (or cash-generating unit) is estimated to be less than its carrying amount, the carrying amount of the asset (or cash-generating unit) is reduced to its recoverable amount. An impairment loss is recognised immediately in the Consolidated Statement of Profit and Loss.
An assessment is made at the end of each reporting period to see if there are any indications that impairment losses recognized earlier may no longer exist or may have come down. The impairment loss is reversed, if there has been a change in the estimates used to determine the asset’s recoverable amount since the previous impairment loss was recognized. If it is so, the carrying amount of the asset is increased to the lower of its recoverable amount and the carrying amount that have been determined, net of depreciation, had no impairment loss been recognized for the asset in prior years. After a reversal, the depreciation charge is adjusted in future periods to allocate the asset’s revised carrying amount, less any residual value, on a systematic basis over its remaining useful life. Reversals of Impairment loss are recognized in the Consolidated Statement of Profit and Loss.
Exploration and Evaluation assets are tested for Impairment when further exploration activities are not planned in near future or when sufficient data exists to indicate that although a development is likely to proceed, the carrying amount of the exploration asset is unlikely to be recovered in full from successful development or by sale. Impairment loss is reversed subsequently, to the extent that conditions for impairment are no longer present.
3.14 Exploration & Evaluation, Development and Production Costs
(i) Pre-acquisition cost
Expenditure incurred before obtaining the right(s) to explore, develop and produce oil and gas are expensed as and when incurred.
(ii) Acquisition cost
Acquisition costs of an Oil and Gas Asset are costs related to right to acquire mineral interest and are accounted as follows:-
a) Exploration and development stage
Acquisition cost relating to projects under exploration or development are initially accounted as Intangible Assets under development - exploratory wells in progress or Oil & Gas Assets under development - development wells in progress respectively. Such costs are capitalized by transferring to Oil and Gas Assets when a well is ready to commence commercial production. In case of abandonment / relinquishment of Intangible Assets under development - exploratory wells in progress, such costs are written off.
b) Production stage
Acquisition costs of a producing Oil and Gas Assets are capitalized as proved property acquisition cost under Oil and Gas Assets and amortized using the unit of production method over proved reserves of underlying assets.
(iii) Survey cost
Cost of Survey and prospecting activities conducted in the search of oil and gas are expensed as exploration cost in the year in which these are incurred.
(iv) Oil & Gas asset under development - Development Wells in Progress
All costs relating to Development Wells are initially capitalized as ‘Development Wells in Progress’ and transferred to ‘Oil and Gas Assets’ on “completion”.
(v) Production costs
Production costs include pre-well head and post-well head expenses including depreciation and applicable operating costs of support equipment and facilities.
(vi) Impairment of Acquisition costs relating to participating rights
For the purposes of impairment testing, acquisition cost is allocated to each of the Group’s CGUs (or
411Consolidated Financial Statements
groups of CGUs) that is expected to benefit from the synergies of the combination.
A CGU to which acquisition cost has been allocated is tested for impairment annually when there is an indication that the unit may be impaired. If the recoverable amount of the cash-generating unit is less than its carrying amount, the impairment loss is allocated first to reduce the carrying amount of any acquisition cost allocated to the unit and then to the other assets of the unit pro rata based on the carrying amount of each asset in the unit. An impairment loss recognised for acquisition cost is not reversed in subsequent periods.
On disposal of the relevant CGU, the attributable carrying amount of acquisition cost is included in the determination of the profit or loss on disposal.
3.15 Oil and Gas Assets
The Group (except for ONGC Videsh Ltd where due to change in functional currency this exemption is not available as per para D7AA of Ind AS 101 ) has elected to continue with the carrying value of all of its Oil and Gas assets recognised as of April 1, 2015 (transition date) measured as per the Previous GAAP and use that carrying value as its deemed cost as of the transition date except adjustment related to decommissioning liabilities.
Oil and Gas Assets are stated at historical cost less accumulated depletion and impairment losses. These are created in respect of an area / field having proved developed oil and gas reserves, when the well in the area / field is ready to commence commercial production.
Cost of temporary occupation of land, successful exploratory wells, all development wells (including service wells), allied facilities, depreciation on support equipment used for drilling and estimated future decommissioning costs are capitalised and classified as Oil and Gas Assets
Oil and Gas Assets are depleted using the “Unit of Production Method”. The rate of depletion is computed with reference to an area covered by individual lease/license/asset/field/project/amortization base by considering the proved
developed reserves and related capital costs incurred including estimated future decommissioning/abandonment costs net of salvage value. Acquisition cost of Oil and Gas Assets is depleted by considering the proved reserves. These reserves are estimated annually by the Reserve Estimates Committee of the Company, which follows the International Reservoir Engineering Procedures.
3.16 Side tracking
In the case of an exploratory well, cost of side-tracking is treated in the same manner as the cost incurred on a new exploratory well. The cost of abandoned portion of side tracked exploratory wells is expensed as ‘Exploration cost written off.’
In the case of development wells, the entire cost of abandoned portion and side tracking is capitalized.
In the case of producing wells and service wells, if the side-tracking results in additional proved developed oil and gas reserves or increases the future economic benefits therefrom beyond previously assessed standard of performance, the cost incurred on side tracking is capitalised, whereas the cost of abandoned portion of the well is depleted in the normal way. Otherwise, the cost of side tracking is expensed as ‘Work over Expenditure.’
3.17 Decommissioning costs
Decommissioning cost includes cost of restoration. Provision for decommissioning costs are recognized when the Group has a legal or constructive obligation to plug and abandon a well, dismantle and remove a facility or an item of Property, Plant and Equipment and to restore the site on which it is located. The full eventual estimated provision towards costs relating to dismantling, abandoning and restoring well sites and allied facilities are recognized in respective assets when the well is complete / facilities or Property, Plant and Equipment are installed.
The amount recognized is the present value of the estimated future expenditure determined using existing technology at current prices and escalated using appropriate inflation rate till the expected date of decommissioning and discounted up to
412
the reporting date using the appropriate risk free discount rate.
An amount equivalent to the decommissioning provision is recognized along with the cost of exploratory well or Property, Plant and Equipment. The decommissioning cost in respect of dry well is expensed as exploratory well cost.
Any change in the present value of the estimated decommissioning provision other than the periodic unwinding of discount is adjusted to the decommissioning provision and the corresponding carrying value of the related asset. In case reversal of decommissioning provision exceeds the corresponding carrying amount of the related asset, the excess amount is recognized in the Consolidated Statement of Profit and Loss. The unwinding of discount on provision is charged in the Consolidated Statement of Profit and Loss as finance cost.
Provision for decommissioning cost in respect of assets under Joint Operations is considered as per participating interest of the Group on the basis of estimate approved by the respective operating committee. Wherever the same are not approved by the respective operating committee abandonment cost estimates of the company are considered.
3.18 Inventories
(a) Raw material and Stock in Process –Refinery & Petrochemicals
Raw material and Stock in Process is valued at lower of cost or net realizable value. Raw material is valued based on First in First Out (FIFO) basis. Cost of Stock in Process comprises of raw material cost and proportionate Conversion cost.
Raw materials for lubricants are valued at weighted average cost or at net realisable value, whichever is lower.
(b) Finished Goods and semi-finished :-
(i) Exploration and Production Operation (E&P)
Finished goods (other than Sulphur) including inventories in pipelines / tanks and carbon credits are valued at cost or net realisable value whichever is lower. Cost of finished goods is determined on
absorption costing method. Sulphur is valued at net realisable value. The value of inventories includes excise duty, royalty (wherever applicable) but excludes Cess.
Crude oil in semi-finished condition at Group Gathering Stations (GGS) is valued at cost on absorption costing method or net realisable value whichever is lower.
Crude oil in unfinished condition in flow lines up to GGS / platform is not valued as the same is not measurable. Natural Gas is not valued as it is not stored.
(ii) Refining & Petrochemicals
Cost of finished goods (other than lubricants) is determined based on raw material cost, conversion cost and excise duty.
Finished products (lubricants) are valued at weighted average cost or at net realisable value, whichever is lower.
Stock in trade are valued on weighted average cost basis.
Empty packages are valued at weighted average cost.
Cost of semi-finished goods is determined based on raw material cost and proportionate conversion cost.
Customs duty on Raw materials/Finished goods lying in bonded warehouse are provided for at the applicable rates except where liability to pay duty is transferred to consignee.
Excise duty on finished stocks lying at manufacturing locations is provided for at the assessable value applicable at each of the locations based on applicable duty.
The net realizable value of finished goods and stock in trade are final selling prices for sales to oil marketing companies and depot prices applicable to the locations. For the purpose of stock valuation, the proportion of sales of oil marketing companies and consumer sales are determined on location wise and product wise sales of subsequent period.
413Consolidated Financial Statements
(c) Store & Spares
Inventory of stores and spare parts is valued at weighted average cost or net realisable value, whichever is lower. Wherever, weighted average cost or net realisable value is not available, the cost made available by the operator is considered for valuation of Stores and Spares. Provisions are made for obsolete and non-moving inventories.
Unserviceable and scrap items, when determined, are valued at estimated net realisable value.
3.19 Revenue recognition
Effective April 01, 2018, the Group has adopted Ind AS 115 “Revenue from Contracts with customers” using the cumulative catch-up transition method applied to contracts that were not completed as of April 1, 2018. In accordance with the cumulative catch-up transition method, the comparatives have not been retrospectively adjusted. The effect on adoption of Ind AS 115 does not have any significant Impact on the retained earnings as at April 01, 2018 or on these consolidated financial statements.
Revenue from contracts with customers is recognized at the point in time the Company satisfies a performance obligation by transferring control of a promised product or service to a customer at an amount that reflects the consideration to which the Company expects to be entitled in exchange for the sale of products and service, net of discount, taxes or duties. The transfer of control on sale of crude oil, natural gas and value added products occurs at the point of delivery, where usually the title is passed and the customer takes physical possession, depending upon the contractual conditions. Any retrospective revision in prices is accounted for in the year of such revision.
Revenue from service is recognised in the accounting period in which the services are rendered at contractually agreed rates.
Sale of crude oil and natural gas (net of levies) produced from Intangible assets under development – Exploratory Wells in Progress / Oil and Gas assets under development – Development Wells
in Progress is deducted from expenditure on such wells.
Any payment received in respect of contractual short lifted gas quantity for which an obligation exists to make-up such gas in subsequent periods is recognised as Contract Liabilities in the year of receipt. Revenue in respect of such contractual short lifted quantity of gas is recognized when such gas is actually supplied or when the customer’s right to make up is expired, whichever is earlier.
Revenues from the production of crude oil and natural gas properties, in which the Group has an interest with other producers, are recognized based on actual quantity lifted over the period. Any difference as of the reporting date between the entitlement quantity minus the quantities lifted in respect of crude oil, if positive (i.e. under lift quantity) the proportionate production expenditure is treated as prepaid expenses and, if negative (i.e. over lift quantity), a liability for the best estimate of the Group’s proportionate share of production expenses as per the Joint Operating Agreement (JOA) / Production Sharing Agreement (PSA) is created in respect of the quantity of crude oil to be foregone in future period towards settlement of the overlift quantity of crude oil with corresponding charge to the Statement of Profit and Loss.
Revenue is allocated between loyalty programs and other components of the sale. The amount allocated to the loyalty program is deferred, and is recognised as revenue when the Group has fulfilled its obligation to supply the products under the terms of the program or when it is no longer probable that the points under the program will be redeemed. Where the Group acts as an agent on behalf of a third party, the associated income is recognised on a net basis.
Revenue in respect of the following is recognized when collectability of the receivable is reasonably assured:
(i) Contractual short lifted quantity of gas with no obligation for make-up.
(ii) Interest on delayed realization from customers and cash calls from JV partners.
414
(iii) Liquidated damages from contractors/suppliers.
As per the Production Sharing Contracts for extracting the Oil and Gas Reserves with Government of India, out of the earnings from the exploitation of reserves after recovery of cost, a part of the revenue is paid to Government of India which is called Profit Petroleum. It is reduced from the revenue from Sale of Products as Government of India’s Share in Profit Petroleum.
Dividend and interest income
Dividend income from investments is recognised when the shareholder's right to receive payment is established.
Interest income from financial assets is recognised, when it is probable that the economic benefits will flow to the Group and the amount of income can be measured reliably. Interest income is accrued on a time basis by reference to the principal outstanding and at the effective interest rate applicable on initial recognition.
3.20 Leases Leases are classified as finance leases whenever
the terms of the lease transfer substantially all the risks and rewards incidental to the ownership of an asset to the Group. All other leases are classified as operating leases.
Land under perpetual lease are accounted as finance leases which are recognized at upfront premium paid for the lease and the present value of the lease rent obligation. The corresponding liability is recognised as a finance lease obligation. Land under non-perpetual leases are treated as operating lease payments.
Operating lease payments are recognized as prepayments and amortised on a straight-line basis over the term of the lease. Contingent rentals, if any, arising under operating leases are recognised as an expense in the period in which they are incurred.
Finance income in respect of assets given on finance lease is recognised based on a pattern reflecting a constant periodic rate of return on the net investment outstanding in respect of the finance lease.
3.21 Foreign Exchange Transactions
Items included in the financial statements of each of the Group’s entities are measured using the currency of the primary economic environment in which the entity operates (the “functional currency”). The consolidated financial statements are presented in Indian Rupees (₹), which is the Company’s functional currency and the Group’s presentation currency.
Transactions in currencies other than the respective entities’ functional currency (foreign currencies) are recognised at the rates of exchange prevailing at the dates of the transactions. At the end of each reporting period, monetary items denominated in foreign currencies are retranslated using mean exchange rate prevailing on the last day of the reporting period. Non-monetary items carried at fair value that are denominated in foreign currencies are retranslated at the rates prevailing at the date when the fair value was determined. Non-monetary items that are measured in terms of historical cost in a foreign currency are translated using the exchange rates at the date of transaction.
Exchange differences on monetary items are recognised in the consolidated Statement of Profit and Loss in the period in which they arise except for exchange differences on foreign currency borrowings relating to assets under construction for future productive use, which are included in the cost of those assets when they are regarded as an adjustment to interest costs on those foreign currency borrowings.
Exchange differences on monetary items are recognised in the consolidated statement of profit and loss in the period in which they arise except for exchange differences on monetary item that forms part of a Group’s net investment in a foreign operation are recognised initially in other comprehensive income and reclassified from equity to the consolidated statement of profit and loss on repayment of the monetary items.
Exchange difference arising in respect of long term foreign currency monetary items is recognised in the statement of profit and loss except for the
415Consolidated Financial Statements
exchange difference related to long term foreign currency monetary items recognized as at March 31, 2016, in so far as, these related to the acquisition of depreciable assets, are adjusted against the cost of such assets and depreciate the said adjustment, over the balance life of asset and in other cases amortised over the balance period of the long term foreign currency monetary assets or liabilities.
On the disposal of a foreign operation (i.e. a disposal of the Group’s entire interest in a foreign operation, a disposal involving loss of control over a subsidiary that includes a foreign operation, or a partial disposal of an interest in a joint arrangement or an associate that includes a foreign operation of which the retained interest becomes a financial asset), all of the exchange differences accumulated in equity in respect of that operation attributable to the owners of the Company are reclassified to the consolidated statement of profit and loss.
In addition, in relation to a partial disposal of a subsidiary that includes a foreign operation that does not result in the Group losing control over the subsidiary, the proportionate share of accumulated exchange differences are re-attributed to non-controlling interests and are not recognised in the consolidated statement of profit and loss. For all other partial disposals (i.e. partial disposals of associates or joint arrangements that do not result in the Group losing significant influence or joint control), the proportionate share of the accumulated exchange differences is reclassified to the consolidated statement of profit and loss.
Goodwill and fair value adjustments to identifiable assets acquired and liabilities assumed through acquisition of a foreign operation are treated as assets and liabilities of foreign operation and translated at rate of exchange prevailing at the end of each reporting period. Exchange differences arising are recognised in other comprehensive income.
Entities with functional currency other than presentation currency are translated to the presentation currency in Indian Rupees (₹). The Group has applied the following principles for translating its results and financial position from functional currency to presentation currency (₹):-
• Assets and liabilities (excluding equity share capital and other equity) for each balance sheet presented (i.e. including comparatives) has been translated at the closing rate at the date of that balance sheet;
• Equity share capital including equity component of compound financial instruments have been translated at exchange rates at the dates of transaction. Capital reserve has been translated at exchange rate at the dates of transaction. Other reserves have been translated using average exchange rates of the period to which it relates;
• Income and expenses for each consolidated statement of profit and loss presented have been translated at exchange rates at the dates of transaction except for certain items average rate for the period is used;
3.22 Employee Benefits
Employee benefits include salaries, wages, contributory provident fund, gratuity, leave encashment towards un-availed leave, compensated absences, post-retirement medical benefits and other terminal benefits.
All short term employee benefits are recognized at their undiscounted amount in the accounting period in which they are incurred.
Defined contribution plans
Employee Benefit under defined contribution plans comprising contributory provident fund, Post Retirement benefit scheme, Employee Pension Scheme- 1995, composite social security scheme etc. is recognized based on the undiscounted amount of obligations of the Group to contribute to the plan. The same is paid to a fund administered through a separate trust.
Defined benefit plans
Defined retirement benefit plans comprising of gratuity, post-retirement medical benefits and other terminal benefits, are recognized based on the present value of defined benefit obligation which is computed using the projected unit credit method, with actuarial valuations being carried out
416
at the end of each annual reporting period. These are accounted either as current employee cost or included in cost of assets as permitted.
Net interest on the net defined liability is calculated by applying the discount rate at the beginning of the period to the net defined benefit liability or asset and is recognised in the Statement of Profit and Loss except those included in cost of assets as permitted.
Remeasurement of defined retirement benefit plans except for leave encashment towards un-availed leave and compensated absences, comprising actuarial gains and losses, the effect of the changes to the asset ceiling (if applicable) and the return on plan assets (excluding net interest as defined above), are recognised in other comprehensive income except those included in cost of assets as permitted in the period in which they occur and are not subsequently reclassified to profit or loss.
The Group contributes all ascertained liabilities with respect to gratuity to the respective Gratuity Fund Trust. All ascertained liabilities for un-availed leave are funded with Life Insurance Corporation of India (LIC) except in case of some subsidiaries. Other defined benefit schemes are unfunded.
The retirement benefit obligation recognised in the Consolidated Financial Statements represents the actual deficit or surplus in the Group’s defined benefit plans. Any surplus resulting from this calculation is limited to the present value of any economic benefits available in the form of reductions in future contributions to the plans.
Other long term employee benefits
Other long term employee benefit comprises of leave encashment towards un-availed leave and compensated absences, these are recognized based on the present value of defined obligation which is computed using the projected unit credit method, with actuarial valuations being carried out at the end of each annual reporting period. These are accounted for either as current employee cost or included in cost of assets as permitted.
Re-measurements of leave encashment towards un-availed leave and compensated absences are
recognized in the Statement of profit and loss except those included in cost of assets as permitted in the period in which they occur.
3.23 Voluntary Retirement Scheme
Expenditure on Voluntary Retirement Scheme (VRS) is charged to the Consolidated Statement of Profit and Loss when incurred.
3.24 General Administrative Expenses
General administrative expenses which are directly attributable are allocated to activities and the balance is charged to Consolidated Statement of Profit and Loss.
3.25 Insurance claims
Insurance claims are accounted for on the basis of claims admitted/expected to be admitted to the extent that the amount recoverable can be measured reliably and it is virtually certain to expect ultimate collection.
3.26 Research and Development Expenditure
Expenditure of capital nature are capitalised and expenses of revenue nature are charged to the Consolidated Statement of Profit and Loss, as and when incurred.
3.27 Income Taxes
Income tax expense represents the sum of the current tax expense and deferred tax.
(i) Current tax
The tax currently payable is based on taxable profit for the year. Taxable profit differs from ‘profit before tax’ as reported in the Consolidated Statement of Profit and Loss because of items of income or expense that are taxable or deductible in other years and items that are never taxable or deductible. The Group’s current tax is calculated using tax rates and laws that have been enacted or substantively enacted by the end of the reporting period.
(ii) Deferred tax
Deferred tax is recognised on temporary differences between the carrying amounts of assets and liabilities
417Consolidated Financial Statements
in the Consolidated Financial Statements and the corresponding tax bases used in the computation of taxable profit. Deferred tax liabilities are generally recognised for all taxable temporary differences. Deferred tax assets are generally recognised for all deductible temporary differences to the extent that it is probable that taxable profits will be available against which those deductible temporary differences can be utilised. Such deferred tax assets and liabilities are not recognised if the temporary difference arises from the initial recognition (other than in a business combination) of assets and liabilities in a transaction that affects neither the taxable profit nor the accounting profit. In addition, deferred tax liabilities are not recognised if the temporary difference arises from the initial recognition of goodwill.
The carrying amount of deferred tax assets is reviewed at the end of each reporting period and reduced to the extent that it is no longer probable that sufficient taxable profits will be available to allow all or part of the deferred tax asset to be utilized.
Deferred tax liabilities and assets are measured at the tax rates that are expected to apply in the period in which the liability is settled or the asset realised, based on tax rates (and tax laws) that have been enacted or substantively enacted by the end of the reporting period.
The measurement of deferred tax liabilities and assets reflects the tax consequences that would follow from the manner in which the Group expects, at the end of the reporting period, to recover or settle the carrying amount of its assets and liabilities.
Deferred tax assets and liabilities are presented separately in Consolidated Balance sheet except where there is a right of set-off within fiscal jurisdictions and an intention to settle such balances on a net basis.
Deferred tax liabilities are recognised for taxable temporary differences associated with investment in subsidiaries and associate and interests in joint ventures, except where the Group is able to control the reversal of the temporary difference and it is probable that the temporary difference will not reverse in the foreseeable future. Deferred tax assets
arising from deductible temporary differences associated with such interests are recognised only to the extent that it is probable that there will be sufficient taxable profits against which to utilise the benefits of the temporary differences and they are expected to reverse in the foreseeable future.
Deferred tax assets include Minimum Alternative Tax (MAT) paid in accordance with the tax laws in India, which is likely to give future economic benefits in the form of availability of set off against future income tax liability. Accordingly, MAT is recognised as deferred tax asset in the Consolidated Balance Sheet when the asset can be measured reliably and it is probable that the future economic benefit associated with asset will be realised.
(iii) Current and deferred tax for the year
Current and deferred tax expense is recognized in the Consolidated Statement of Profit and Loss, except when they relate to items that are recognized in other comprehensive income or directly in equity, in which case, the current and deferred tax are also recognized in other comprehensive income or directly in equity respectively.
3.28 Borrowing Costs
Borrowing costs specifically identified to the acquisition or construction of qualifying assets is capitalized as part of such assets. A qualifying asset is one that necessarily takes substantial period of time to get ready for intended use. All other borrowing costs are charged to the Consolidated Statement of Profit and Loss.
3.29 Rig Days Costs
Rig movement costs are booked to the next location drilled/planned for drilling. Abnormal Rig days’ costs are considered as un-allocable and charged to the Consolidated Statement of Profit and Loss.
3.30 Provisions, Contingent Liabilities and Contingent Assets
Provisions are recognized when the Group has a present obligation (legal or constructive) as a result of a past event, it is probable that the Group will be required to settle the obligation, and a
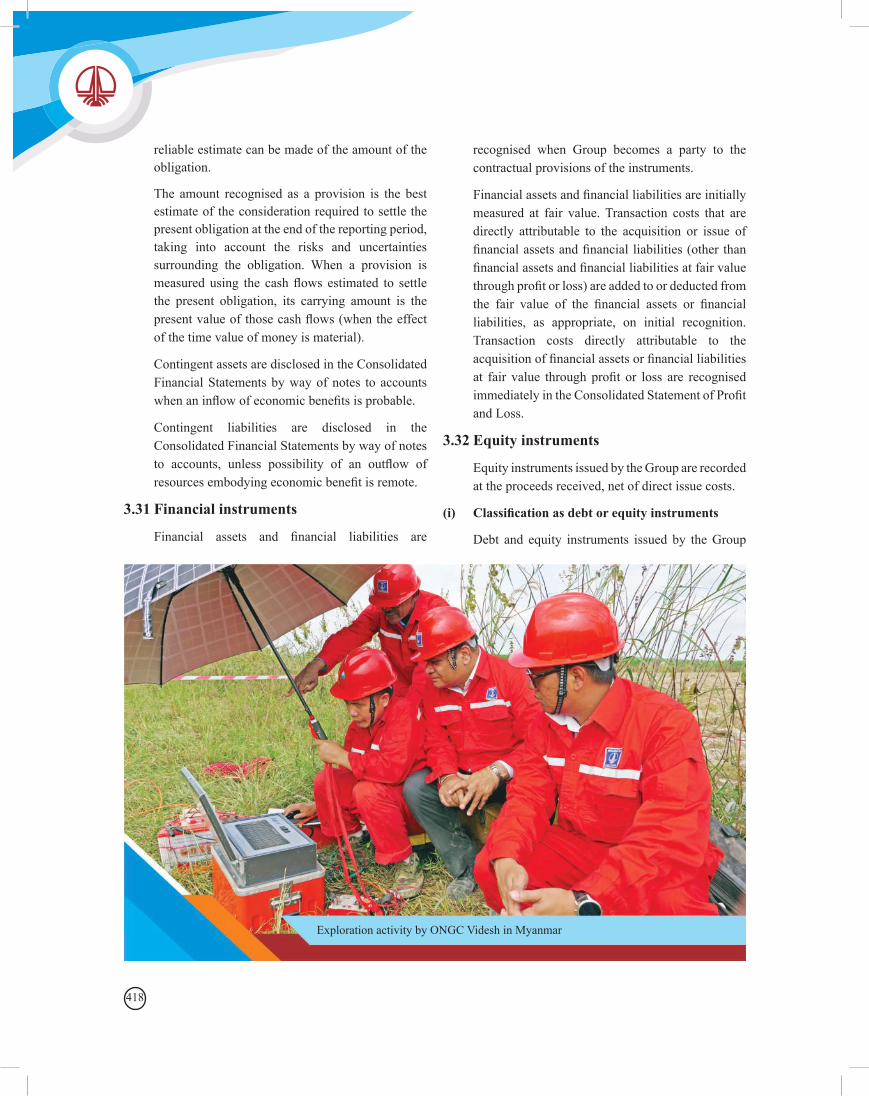
418
reliable estimate can be made of the amount of the obligation.
The amount recognised as a provision is the best estimate of the consideration required to settle the present obligation at the end of the reporting period, taking into account the risks and uncertainties surrounding the obligation. When a provision is measured using the cash flows estimated to settle the present obligation, its carrying amount is the present value of those cash flows (when the effect of the time value of money is material).
Contingent assets are disclosed in the Consolidated Financial Statements by way of notes to accounts when an inflow of economic benefits is probable.
Contingent liabilities are disclosed in the Consolidated Financial Statements by way of notes to accounts, unless possibility of an outflow of resources embodying economic benefit is remote.
3.31 Financial instruments
Financial assets and financial liabilities are
recognised when Group becomes a party to the contractual provisions of the instruments.
Financial assets and financial liabilities are initially measured at fair value. Transaction costs that are directly attributable to the acquisition or issue of financial assets and financial liabilities (other than financial assets and financial liabilities at fair value through profit or loss) are added to or deducted from the fair value of the financial assets or financial liabilities, as appropriate, on initial recognition. Transaction costs directly attributable to the acquisition of financial assets or financial liabilities at fair value through profit or loss are recognised immediately in the Consolidated Statement of Profit and Loss.
3.32 Equity instruments
Equity instruments issued by the Group are recorded at the proceeds received, net of direct issue costs.
(i) Classification as debt or equity instruments
Debt and equity instruments issued by the Group
Exploration activity by ONGC Videsh in Myanmar
419Consolidated Financial Statements
are classified as either financial liabilities or as equity in accordance with the substance of the contractual arrangements and the definitions of a financial liability and an equity instrument.
(ii) Compound financial instruments
The component parts of compound financial instruments issued by the Group are classified separately as financial liabilities and equity in accordance with the substance of the contractual arrangements. A conversion option that will be settled by the exchange of a fixed amount of cash or another financial asset for a fixed number of the Company’s own equity instruments is an equity instrument.
At the date of issue, the fair value of the liability component is estimated using the prevailing market interest rate for similar non-convertible instruments. This amount is recognised as a liability on an amortised cost basis using the effective interest method until extinguished upon conversion or at the instrument’s maturity date. The conversion option classified as equity is determined by deducting the amount of the liability component from the fair value of the compound financial instrument as a whole. This is recognised and included in equity, net of income tax effects, and is not subsequently remeasured. In addition, the conversion option classified as equity will remain in equity until the conversion option is exercised, in which case, the balance recognised in equity will be transferred to other component of equity. When the conversion option remains unexercised at the maturity date of the convertible note, the balance recognised in equity will be transferred to retained earnings. No gain or loss is recognised in profit or loss upon conversion or expiration of the conversion option.
Transaction costs that relate to the issue of the convertible notes are allocated to the liability and equity components in proportion to the allocation of the gross proceeds. Transaction costs relating to the equity component are recognised directly in equity. Transaction costs relating to the liability component are included in the carrying amount of the liability
component and are amortised over the lives of the convertible notes using the effective interest method
3.33 Financial assets
(i) Cash and cash equivalents
The Group considers all highly liquid financial instruments, which are readily convertible into known amounts of cash that are subject to an insignificant risk of change in value and having original maturities of three months or less from the date of purchase, to be cash equivalents. Cash and cash equivalents consist of balances with banks which are unrestricted for withdrawal and usage.
(ii) Financial assets at amortised cost
Financial assets are subsequently measured at amortised cost using the effective interest method if these financial assets are held within a business whose objective is to hold these assets in order to collect contractual cash flows and the contractual terms of the financial asset give rise on specified dates to cash flows that are solely payments of principal and interest on the principal amount outstanding.
(iii) Financial assets at fair value through other comprehensive income
Financial assets are measured at fair value through other comprehensive income if these financial assets are held within a business whose objective is achieved by both collecting contractual cash flows and selling financial assets and the contractual terms of the financial asset give rise on specified dates to cash flows that are solely payments of principal and interest on the principal amount outstanding.
The Group has made an irrevocable election to present in other comprehensive income subsequent changes in the fair value of equity investments not held for trading.
(iv) Financial assets at fair value through profit or loss
Financial assets are measured at fair value through
420
profit or loss unless it is measured at amortised cost or at fair value through other comprehensive income on initial recognition.
(v) Impairment of financial assets
The Group assesses at each Consolidated Balance Sheet date whether a financial asset or a group of financial assets is impaired. Ind AS 109 ‘Financial Instruments’ requires expected credit losses to be measured through a loss allowance. The Group recognises lifetime expected losses for trade receivables that do not constitute a financing transaction. For all other financial assets, expected credit losses are measured at an amount equal to 12 month expected credit losses or at an amount equal to lifetime expected losses, if the credit risk on the financial asset has increased significantly since initial recognition.
(vi) Derecognition of financial assets
The Group derecognises a financial asset when the contractual rights to the cash flows from the asset expire, or when it transfers the financial asset and substantially all the risks and rewards of ownership of the asset to another party.
On derecognition of a financial asset in its entirety (except for equity instruments designated as FVTOCI), the difference between the asset’s carrying amount and the sum of the consideration received and receivable is recognised in the Consolidated Statement of Profit and Loss.
3.34 Financial liabilities
(i) Financial liabilities
Financial liabilities are measured at amortised cost using the effective interest method.
(ii) Derecognition of financial liabilities
The Group derecognises financial liabilities when, and only when, the Group’s obligations are discharged, cancelled or have expired. The difference between the carrying amount of the financial liability derecognised and the consideration paid and payable is recognised in the Consolidated Statement of Profit and Loss.
3.35 Derivative financial instruments
The Group enters into a variety of derivative financial instruments to manage its exposure to interest rate and foreign exchange rate risks, including foreign exchange forward contracts and interest rate swaps.
Derivatives are initially recognised at fair value at the date the derivative contracts are entered into and are subsequently remeasured to their fair value at the end of each reporting period. The resulting gain or loss is recognised in profit or loss immediately unless the derivative is designated and effective as a hedging instrument, in which event the timing of the recognition in profit or loss depends on the nature of the hedging relationship and the nature of the hedged item.
Derivatives embedded in non-derivative host contracts that are not financial assets within the scope of Ind AS 109 ‘Financial Instruments’ are treated as separate derivatives when their risks and characteristics are not closely related to those of the host contracts and the host contracts are not measured at fair value through Profit & Loss (FVTPL).
3.36 Offsetting of financial instruments
Financial assets and financial liabilities are offset and the net amount is reported in the Balance Sheet if there is a currently enforceable legal right to offset the recognized amounts and there is an intention to settle on a net basis, or to realize the assets and settle the liabilities simultaneously.
3.37 Investment property
Investment properties are properties held to earn rentals and/or for capital appreciation. Investment properties are measured initially at cost, including transaction costs. Subsequent to initial recognition, investment properties are measured in accordance with Ind AS 16 requirements for cost model.
The Group depreciates building component of investment property over 30 years from the date of original construction, based on the useful life prescribed in Schedule II to the Companies Act, 2013 using the Straight-Line Method. The
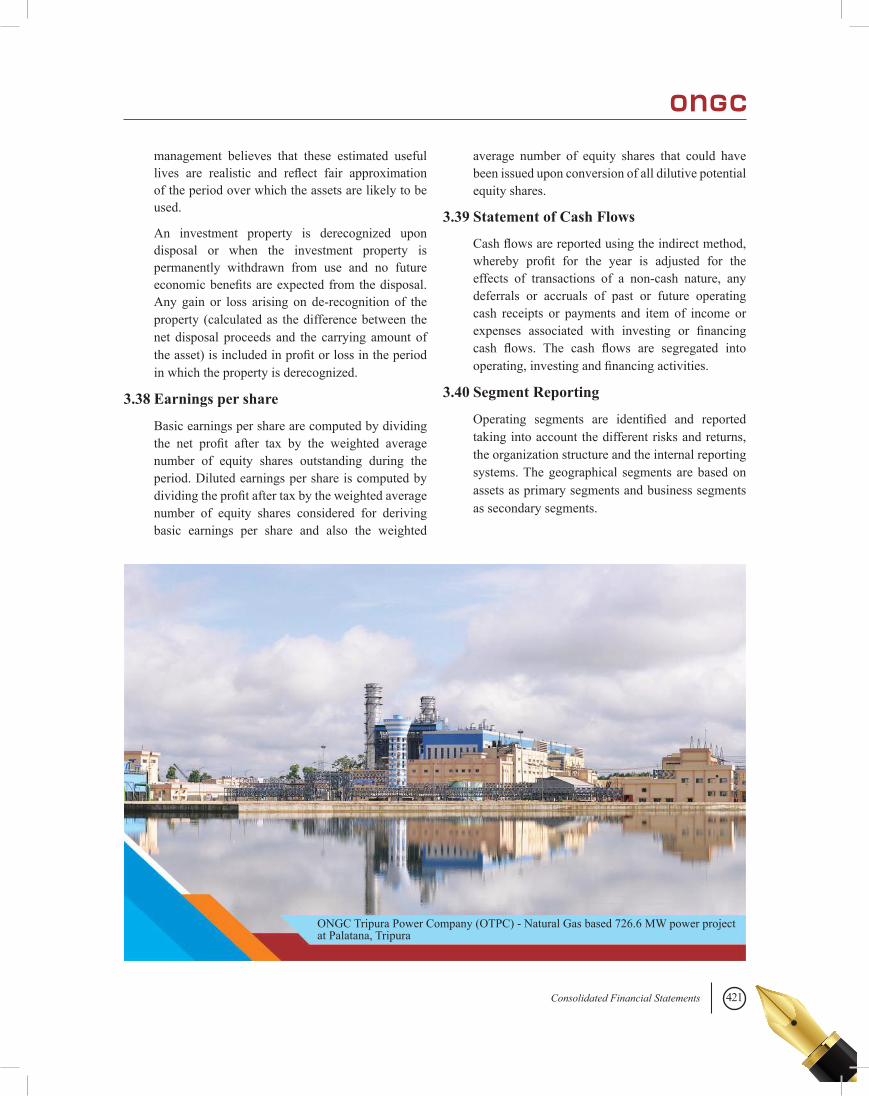
421Consolidated Financial Statements
management believes that these estimated useful lives are realistic and reflect fair approximation of the period over which the assets are likely to be used.
An investment property is derecognized upon disposal or when the investment property is permanently withdrawn from use and no future economic benefits are expected from the disposal. Any gain or loss arising on de-recognition of the property (calculated as the difference between the net disposal proceeds and the carrying amount of the asset) is included in profit or loss in the period in which the property is derecognized.
3.38 Earnings per share
Basic earnings per share are computed by dividing the net profit after tax by the weighted average number of equity shares outstanding during the period. Diluted earnings per share is computed by dividing the profit after tax by the weighted average number of equity shares considered for deriving basic earnings per share and also the weighted
average number of equity shares that could have been issued upon conversion of all dilutive potential equity shares.
3.39 Statement of Cash Flows
Cash flows are reported using the indirect method, whereby profit for the year is adjusted for the effects of transactions of a non-cash nature, any deferrals or accruals of past or future operating cash receipts or payments and item of income or expenses associated with investing or financing cash flows. The cash flows are segregated into operating, investing and financing activities.
3.40 Segment Reporting
Operating segments are identified and reported taking into account the different risks and returns, the organization structure and the internal reporting systems. The geographical segments are based on assets as primary segments and business segments as secondary segments.
ONGC Tripura Power Company (OTPC) - Natural Gas based 726.6 MW power project at Palatana, Tripura
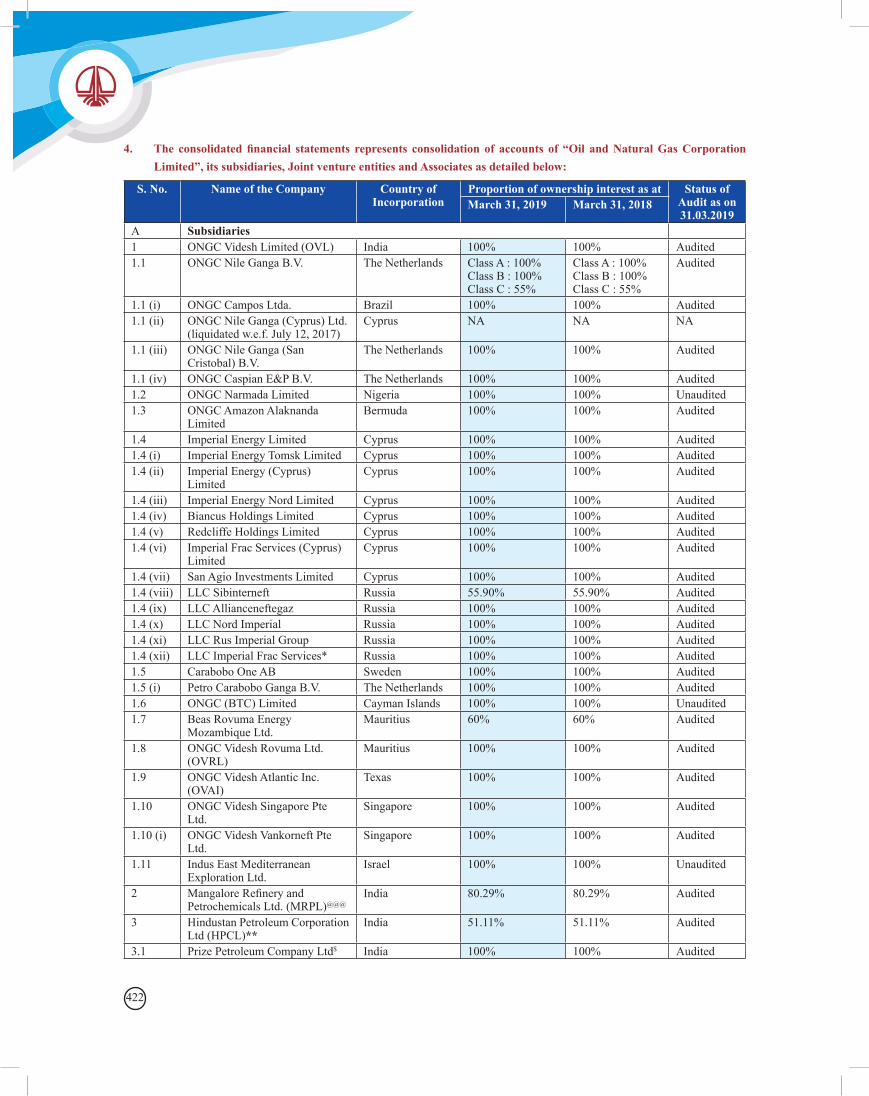
422
4. The consolidated financial statements represents consolidation of accounts of “Oil and Natural Gas Corporation Limited”, its subsidiaries, Joint venture entities and Associates as detailed below:
S. No. Name of the Company Country of Incorporation
Proportion of ownership interest as at Status of Audit as on 31.03.2019
March 31, 2019 March 31, 2018
A Subsidiaries1 ONGC Videsh Limited (OVL) India 100% 100% Audited 1.1 ONGC Nile Ganga B.V. The Netherlands Class A : 100%
Class B : 100% Class C : 55%
Class A : 100% Class B : 100% Class C : 55%
Audited
1.1 (i) ONGC Campos Ltda. Brazil 100% 100% Audited 1.1 (ii) ONGC Nile Ganga (Cyprus) Ltd.
(liquidated w.e.f. July 12, 2017)Cyprus NA NA NA
1.1 (iii) ONGC Nile Ganga (San Cristobal) B.V.
The Netherlands 100% 100% Audited
1.1 (iv) ONGC Caspian E&P B.V. The Netherlands 100% 100% Audited 1.2 ONGC Narmada Limited Nigeria 100% 100% Unaudited 1.3 ONGC Amazon Alaknanda
LimitedBermuda 100% 100% Audited
1.4 Imperial Energy Limited Cyprus 100% 100% Audited 1.4 (i) Imperial Energy Tomsk Limited Cyprus 100% 100% Audited 1.4 (ii) Imperial Energy (Cyprus)
LimitedCyprus 100% 100% Audited
1.4 (iii) Imperial Energy Nord Limited Cyprus 100% 100% Audited 1.4 (iv) Biancus Holdings Limited Cyprus 100% 100% Audited 1.4 (v) Redcliffe Holdings Limited Cyprus 100% 100% Audited 1.4 (vi) Imperial Frac Services (Cyprus)
LimitedCyprus 100% 100% Audited
1.4 (vii) San Agio Investments Limited Cyprus 100% 100% Audited 1.4 (viii) LLC Sibinterneft Russia 55.90% 55.90% Audited 1.4 (ix) LLC Allianceneftegaz Russia 100% 100% Audited 1.4 (x) LLC Nord Imperial Russia 100% 100% Audited 1.4 (xi) LLC Rus Imperial Group Russia 100% 100% Audited 1.4 (xii) LLC Imperial Frac Services* Russia 100% 100% Audited 1.5 Carabobo One AB Sweden 100% 100% Audited 1.5 (i) Petro Carabobo Ganga B.V. The Netherlands 100% 100% Audited 1.6 ONGC (BTC) Limited Cayman Islands 100% 100% Unaudited 1.7 Beas Rovuma Energy
Mozambique Ltd.Mauritius 60% 60% Audited
1.8 ONGC Videsh Rovuma Ltd. (OVRL)
Mauritius 100% 100% Audited
1.9 ONGC Videsh Atlantic Inc. (OVAI)
Texas 100% 100% Audited
1.10 ONGC Videsh Singapore Pte Ltd.
Singapore 100% 100% Audited
1.10 (i) ONGC Videsh Vankorneft Pte Ltd.
Singapore 100% 100% Audited
1.11 Indus East Mediterranean Exploration Ltd.
Israel 100% 100% Unaudited
2 Mangalore Refinery and Petrochemicals Ltd. (MRPL)@@@
India 80.29% 80.29% Audited
3 Hindustan Petroleum Corporation Ltd (HPCL)**
India 51.11% 51.11% Audited
3.1 Prize Petroleum Company Ltd$ India 100% 100% Audited
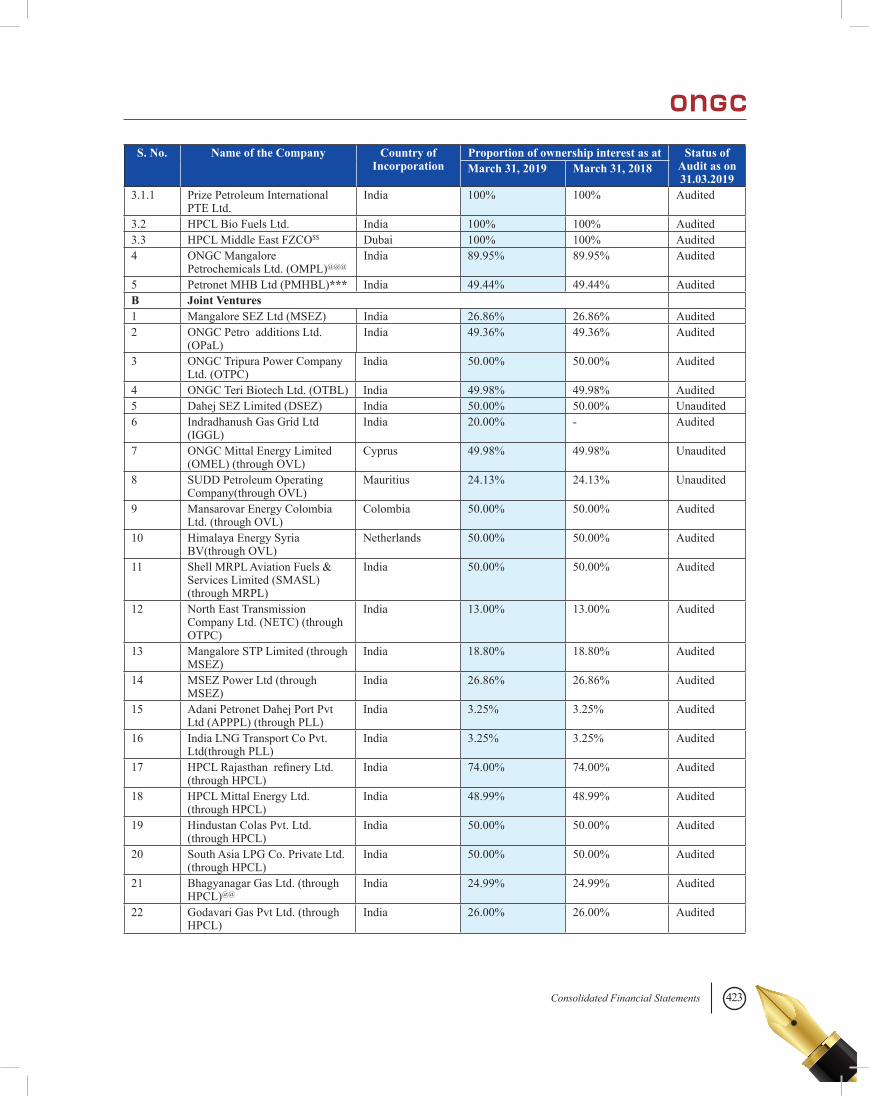
423Consolidated Financial Statements
S. No. Name of the Company Country of Incorporation
Proportion of ownership interest as at Status of Audit as on 31.03.2019
March 31, 2019 March 31, 2018
3.1.1 Prize Petroleum International PTE Ltd.
India 100% 100% Audited
3.2 HPCL Bio Fuels Ltd. India 100% 100% Audited 3.3 HPCL Middle East FZCO$$ Dubai 100% 100% Audited4 ONGC Mangalore
Petrochemicals Ltd. (OMPL)@@@India 89.95% 89.95% Audited
5 Petronet MHB Ltd (PMHBL)*** India 49.44% 49.44% AuditedB Joint Ventures1 Mangalore SEZ Ltd (MSEZ) India 26.86% 26.86% Audited 2 ONGC Petro additions Ltd.
(OPaL) India 49.36% 49.36% Audited
3 ONGC Tripura Power Company Ltd. (OTPC)
India 50.00% 50.00% Audited
4 ONGC Teri Biotech Ltd. (OTBL) India 49.98% 49.98% Audited 5 Dahej SEZ Limited (DSEZ) India 50.00% 50.00% Unaudited 6 Indradhanush Gas Grid Ltd
(IGGL)India 20.00% - Audited
7 ONGC Mittal Energy Limited (OMEL) (through OVL)
Cyprus 49.98% 49.98% Unaudited
8 SUDD Petroleum Operating Company(through OVL)
Mauritius 24.13% 24.13% Unaudited
9 Mansarovar Energy Colombia Ltd. (through OVL)
Colombia 50.00% 50.00% Audited
10 Himalaya Energy Syria BV(through OVL)
Netherlands 50.00% 50.00% Audited
11 Shell MRPL Aviation Fuels & Services Limited (SMASL) (through MRPL)
India 50.00% 50.00% Audited
12 North East Transmission Company Ltd. (NETC) (through OTPC)
India 13.00% 13.00% Audited
13 Mangalore STP Limited (through MSEZ)
India 18.80% 18.80% Audited
14 MSEZ Power Ltd (through MSEZ)
India 26.86% 26.86% Audited
15 Adani Petronet Dahej Port Pvt Ltd (APPPL) (through PLL)
India 3.25% 3.25% Audited
16 India LNG Transport Co Pvt. Ltd(through PLL)
India 3.25% 3.25% Audited
17 HPCL Rajasthan refinery Ltd. (through HPCL)
India 74.00% 74.00% Audited
18 HPCL Mittal Energy Ltd. (through HPCL)
India 48.99% 48.99% Audited
19 Hindustan Colas Pvt. Ltd. (through HPCL)
India 50.00% 50.00% Audited
20 South Asia LPG Co. Private Ltd. (through HPCL)
India 50.00% 50.00% Audited
21 Bhagyanagar Gas Ltd. (through HPCL)@@
India 24.99% 24.99% Audited
22 Godavari Gas Pvt Ltd. (through HPCL)
India 26.00% 26.00% Audited
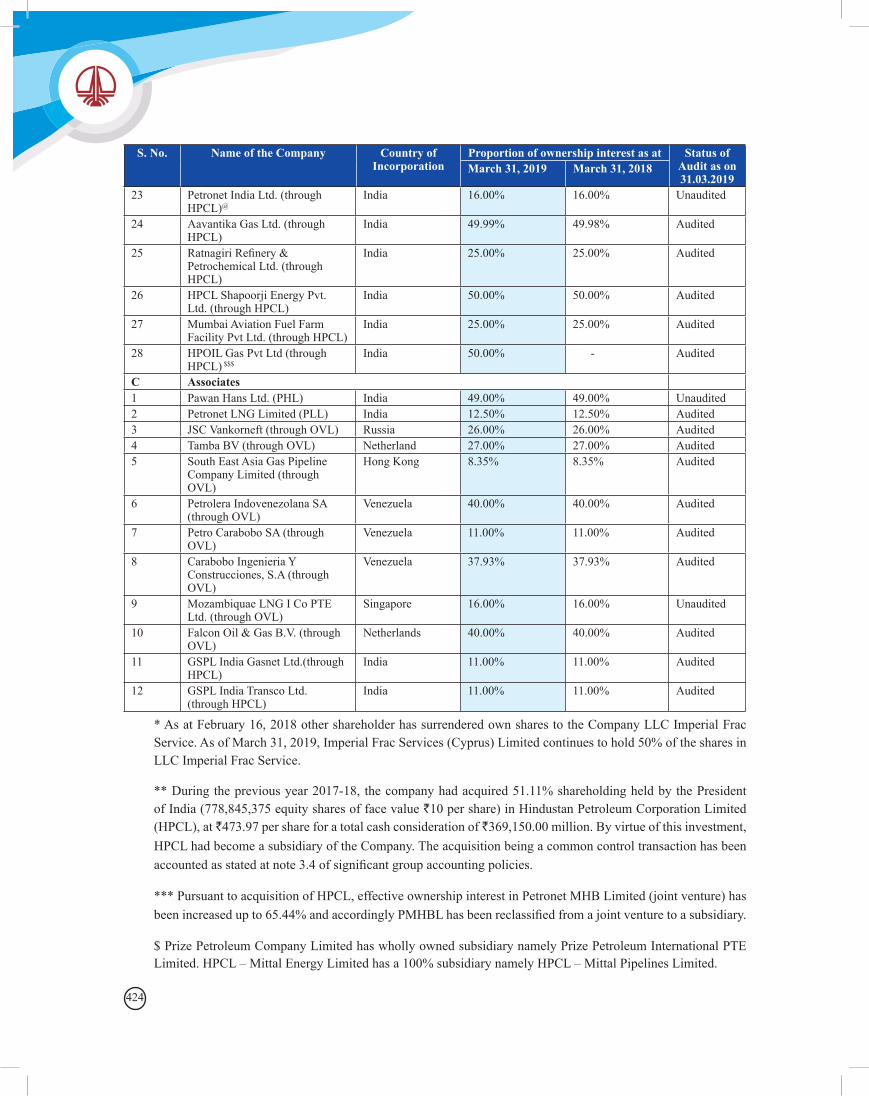
424
23 Petronet India Ltd. (through HPCL)@
India 16.00% 16.00% Unaudited
24 Aavantika Gas Ltd. (through HPCL)
India 49.99% 49.98% Audited
25 Ratnagiri Refinery & Petrochemical Ltd. (through HPCL)
India 25.00% 25.00% Audited
26 HPCL Shapoorji Energy Pvt. Ltd. (through HPCL)
India 50.00% 50.00% Audited
27 Mumbai Aviation Fuel Farm Facility Pvt Ltd. (through HPCL)
India 25.00% 25.00% Audited
28 HPOIL Gas Pvt Ltd (through HPCL) $$$
India 50.00% - Audited
C Associates1 Pawan Hans Ltd. (PHL) India 49.00% 49.00% Unaudited 2 Petronet LNG Limited (PLL) India 12.50% 12.50% Audited 3 JSC Vankorneft (through OVL) Russia 26.00% 26.00% Audited 4 Tamba BV (through OVL) Netherland 27.00% 27.00% Audited 5 South East Asia Gas Pipeline
Company Limited (through OVL)
Hong Kong 8.35% 8.35% Audited
6 Petrolera Indovenezolana SA (through OVL)
Venezuela 40.00% 40.00% Audited
7 Petro Carabobo SA (through OVL)
Venezuela 11.00% 11.00% Audited
8 Carabobo Ingenieria Y Construcciones, S.A (through OVL)
Venezuela 37.93% 37.93% Audited
9 Mozambiquae LNG I Co PTE Ltd. (through OVL)
Singapore 16.00% 16.00% Unaudited
10 Falcon Oil & Gas B.V. (through OVL)
Netherlands 40.00% 40.00% Audited
11 GSPL India Gasnet Ltd.(through HPCL)
India 11.00% 11.00% Audited
12 GSPL India Transco Ltd. (through HPCL)
India 11.00% 11.00% Audited
S. No. Name of the Company Country of Incorporation
Proportion of ownership interest as at Status of Audit as on 31.03.2019
March 31, 2019 March 31, 2018
* As at February 16, 2018 other shareholder has surrendered own shares to the Company LLC Imperial Frac Service. As of March 31, 2019, Imperial Frac Services (Cyprus) Limited continues to hold 50% of the shares in LLC Imperial Frac Service.
** During the previous year 2017-18, the company had acquired 51.11% shareholding held by the President of India (778,845,375 equity shares of face value `10 per share) in Hindustan Petroleum Corporation Limited (HPCL), at `473.97 per share for a total cash consideration of `369,150.00 million. By virtue of this investment, HPCL had become a subsidiary of the Company. The acquisition being a common control transaction has been accounted as stated at note 3.4 of significant group accounting policies.
*** Pursuant to acquisition of HPCL, effective ownership interest in Petronet MHB Limited (joint venture) has been increased up to 65.44% and accordingly PMHBL has been reclassified from a joint venture to a subsidiary.
$ Prize Petroleum Company Limited has wholly owned subsidiary namely Prize Petroleum International PTE Limited. HPCL – Mittal Energy Limited has a 100% subsidiary namely HPCL – Mittal Pipelines Limited.
425Consolidated Financial Statements
$$HPCL Middle East FZCO, a 100% Subsidiary of HPCL was incorporated as a Free Zone Company under Dubai Airport Free Zone for Trading in Lubricants & Grease, Petrochemicals and Refined Oil Products in Middle East and Africa.
$$$HPOIL Gas Pvt. Ltd. was incorporated on 30th November 2018 with Oil India Ltd. (OIL) and Hindustan Petroleum Corporation Ltd (HPCL) holding equity in the ratio 50%: 50%.
@ Petronet India Ltd. in which HPCL holds 16% stake has commenced voluntary winding up on 30th August 2018.
@@ As of 31st March 2014, paid up equity capital of BGL was ` 0.05 million, in which HPCL and GAIL were holding 24.99% each. Balance 50.02% of shares were held by Kakinada Seaports Ltd (KSPL) on warehousing basis. In addition, each one of HPCL and GAIL had paid ₹224.90 million as Advance against Equity / Share application money (totaling to ₹449.80 million) in earlier years. On 20th August 2014, BGL allotted 22,487,500 shares on preferential basis to each of HPCL and GAIL towards the money paid earlier. Meanwhile there are certain issues pending adjudication with another shareholder. Accordingly, keeping in view financial prudence, HPCL’s share has been considered at 24.99% (considered as 24.99% in F.Y. 2017-18).
@@@ Increase in effective holding due to acquisition of HPCL by ONGC wherein HPCL holds 16.96% in MRPL.
Ujjwala Plus Foundation, a joint venture of Indian Oil Corporation Limited (IOCL), Bharat Petroleum Corporation Limited (BPCL) and Hindustan Petroleum Corporation Ltd (HPCL) with fund contribution in the ratio 50%: 25%: 25%, respectively was incorporated on 21st July, 2017 as a not-for-profit Private Company Limited by Guarantee (without Share Capital) under Section 8 of the Companies Act 2013. Ujjwala Plus Foundation has not been considered for consolidation being a not-for-profit company.
5. Critical Accounting Judgments, Assumptions and Key Sources of Estimation Uncertainty
Inherent in the application of many of the accounting policies used in preparing the Consolidated Ind AS Financial Statements is the need for Management to make judgments, estimates and assumptions that affect the reported amounts of assets and liabilities, the disclosure of contingent assets and liabilities, and the reported amounts of revenues and expenses. Actual outcomes could differ from the estimates and assumptions used.
Estimates and underlying assumptions are reviewed on an ongoing basis. Revisions to accounting estimates are recognised in the period in which the estimates are revised and future periods are affected.
Key source of judgments, assumptions and estimation uncertainty in the preparation of the Consolidated Ind AS Financial Statements which may cause a material adjustment to the carrying amounts of assets and liabilities within the next financial year, are in respect of functional currency, Oil and Gas reserves, impairment, useful lives of Property, Plant and Equipment, depletion of oil and gas assets, decommissioning provision, employee benefit obligations, provisions, provision for income tax, measurement of deferred tax assets and contingent assets & liabilities.
5.1 Critical judgments in applying accounting policies The following are the critical judgements, apart from those involving estimations (Refer note 5.2), that the
Management have made in the process of applying the Group's accounting policies and that have the significant effect on the amounts recognized in the Consolidated Ind AS Financial Statements.
(a) Determination of functional currency
Currency of the primary economic environment in which the Group’s entities operates (“the functional currency”)
426
is Indian Rupee (₹) in which the entities primarily generates and expends cash. However, primary economic environment in which OVL group (ONGC Videsh Ltd and its subsidiaries) is US Dollar which is the currency in which it primarily generates and expends cash and accordingly the functional currency of OVL group has been assessed as US Dollar.
(b) Classification of investment
Judgement is required in assessing the level of control obtained in a transaction to acquire an interest in another entity; depending upon the facts and circumstances in each case, the Company may obtain control, joint control or significant influence over the entity or arrangement. Transactions which give the Company control of a business are business combinations. If the Company obtains joint control of an arrangement, judgement is also required to assess whether the arrangement is a joint operation or a joint venture. If the Company has neither control nor joint control, it may be in a position to exercise significant influence over the entity, which is then classified as an associate.
(i) In ONGC Petro additions Limited as joint venture (OPaL)
The Company has 49.36% equity interest in OPaL. The Company has also subscribed for 2,558 million share warrants entitling the Company to exchange each warrant with an equity share of face value of ₹10 each against which ₹9.75 has been paid.
Further, the Company has also entered into an arrangement on July 2, 2016 for backstopping support towards repayment of principal and cumulative coupon amount for compulsorily convertible debentures amounting to ₹77,780.00 million (previous year ₹77,780.00 million) issued by ONGC Petro additions Limited and interest for the year ending March 31, 2019 amounting to ₹5117.73 million (previous year ₹4,670.19 million).
The Management has however evaluated the interest in OPaL to be in the nature of joint venture as the shareholder agreement between all the shareholders provides for sharing of control of the decisions of relevant activities that require the unanimous consent of all the parties sharing control.
(ii) In associates despite participating share being less than 20%
Considering the power to participate in the financial and operating policy decisions of the investees exercised by the Group in accordance with the applicable agreements and /or otherwise, the following entities are considered associates of the Group despite the participating interest / shareholding percentage / right percentage being less than 20%:
• South East Asia Gas Pipeline (shareholding of the Group 8.347%)
• Petro Carabobo S.A., Venezuela (shareholding of the Group 11%)
The Company has 12.50% equity interest in PLL. It was classified as Joint Venture in Previous GAAP, however, in terms of Para 7 of Ind AS 111 “Joint Arrangements”, unanimous consent of all promoters is not required in relevant activities in PLL and therefore PLL is not classified as Joint Venture. The Company has significant influence on PLL by way of having right to appoint a director in PLL and participate in its business decisions, therefore the same has been classified as an Associate of the Company.
(c) In Joint venture despite participating share more than 50%
In case of HPCL Rajasthan Refinery Ltd. (HRRL) wherein subsidiary company HPCL held majority voting rights (74% stake), other JV partner has substantive participative rights through its right to affirmative vote items. Accordingly, being a company with joint control, HRRL have been considered as Joint Venture company for the purpose of consolidation of financial statement under Ind AS. However, for the purpose of Companies Act 2013, HRRL has been classified as subsidiary as defined under section 2 therein.
427Consolidated Financial Statements
(d) Determining whether an arrangement contain leases and classification of leases
The group enters into service / hiring arrangements for various assets / services. The determination of lease and classification of the service / hiring arrangement as a finance lease or operating lease is based on an assessment of several factors, including, but not limited to, transfer of ownership of leased asset at end of lease term, lessee’s option to purchase and estimated certainty of exercise of such option, proportion of lease term to the asset’s economic life, proportion of present value of minimum lease payments to fair value of leased asset and extent of specialized nature of the leased asset.
(e) Evaluation of indicators for impairment of Oil and Gas Assets
The evaluation of applicability of indicators of impairment of assets requires assessment of external factors (significant decline in asset’s value, significant changes in the technological, market, economic or legal environment, market interest rates etc.) and internal factors (obsolescence or physical damage of an asset, poor economic performance of the asset etc.) which could result in significant change in recoverable amount of the Oil and Gas Assets.
(f) Oil & Gas Accounting (Guidance Note on Accounting for Oil and Gas Producing Activities)
The determination of whether potentially economic oil and natural gas reserves have been discovered by an exploration well is usually made within one year of well completion, but can take longer, depending on the complexity of the geological structure. Exploration wells that discover potentially economic quantities of oil and natural gas and are in areas where major capital expenditure (e.g. an offshore platform or a pipeline) would be required before production could begin, and where the economic viability of that major capital expenditure depends on the successful completion of further exploration work in the area, remain capitalized on the consolidated balance sheet as long as additional exploration or appraisal work is under way or firmly planned.
It is not unusual to have exploration wells and exploratory-type stratigraphic test wells remaining suspended on the consolidated balance sheet for several years while additional appraisal drilling and seismic work on the potential oil and natural gas field is performed or while the optimum development plans and timing are established. All such carried costs are subject to regular technical, commercial and management review on at least an annual basis to confirm the continued intent to develop, or otherwise extract value from, the discovery. Where this is no longer the case, the costs are immediately expensed.
(g) Deferred tax liability / deferred tax asset in respect of undistributed profits/losses of subsidiaries, branches, investments in associates and joint ventures
The management exercises judgement in accounting for deferred tax liability / deferred tax asset in respect of Group’s investments in respect of undistributed profits/losses of subsidiaries, branches, investments in associates and joint ventures. In the judgement of the management, in respect of undistributed profits/losses of subsidiaries, branches, investments in joint ventures, the management is able to control the timing of the reversal of the temporary differences and the temporary differences will not be reversed in the foreseeable future.
Accordingly, the Group does not recognise a deferred tax liability for all taxable temporary differences associated with investments in subsidiaries, branches and interests in joint ventures.
5.2 Assumptions and key sources of estimation uncertainty Information about estimates and assumptions that have the significant effect on recognition and measurement of
assets, liabilities, income and expenses is provided below. Actual results may differ from these estimates.
428
(a) Estimation of provision for decommissioning
The Group estimates provision for decommissioning as per the principles of Ind AS 37 ‘Provisions, Contingent Liabilities and Contingent Assets’ for the future decommissioning of Oil & Gas assets at the end of their economic lives. Most of these decommissioning activities would be in the future, the exact requirements that may have to be met when the removal events occur involve uncertainty. Technologies and costs for decommissioning are constantly changing. The timing and amounts of future cash flows are subject to significant uncertainty.
The timing and amount of future expenditures are reviewed at the end of each reporting period, together with rate of inflation for escalation of current cost estimates and the interest rate used in discounting the cash flows. The economic life of the Oil & Gas assets is estimated on the basis of long term production profile of the relevant Oil & Gas asset.
(b) Impairment of assets
Determination as to whether, and by how much, a CGU is impaired involves Management estimates on uncertain matters such as future prices, the effects of inflation on operating expenses, discount rates, production profiles for crude oil, natural gas and value added products. For Oil & Gas assets, the expected future cash flows are estimated using Management’s best estimate of future crude oil and natural gas prices, production and reserves volumes.
The present values of cash flows are determined by applying pre tax-discount rates for crude oil and value added products revenue, which are measured in US$. Future cash inflows from sale of crude oil and value added products are computed using the future prices, on the basis of market-based average prices of the Dated Brent crude oil as per assessment by ‘Platt’s Crude Oil Market wire’ and its co-relations with benchmark crudes and other petroleum products. Future cash flows from sale of natural gas are also computed based on the expected future prices on the basis of the notification issued by the Government of India and discounted applying the rate applicable to the cash flows measured in US$ in view of the new pricing guidelines issued by GoI.
Further, the subsidiary company ONGC Videsh Ltd, present values of cash flows are determined by applying pre tax-discount rates that reflects current market assessments of time value of money and the risks specific to the liability in respect of each of the CGUs. Future cash inflows from sale of crude oil are computed using the future prices, on the basis of market-based forward prices of the Dated Brent crude oil as per assessment by Bloomberg and its co-relations with benchmark crudes and other petroleum products. Future cash flows from sale of natural gas are also computed based on the expected future prices on the basis of the prices determined in accordance with the respective agreements and / or market forecast.
The discount rate used is based upon the cost of capital from an established model.
The Value in use of the producing/developing CGUs is determined under a multi-stage approach, wherein future cash flows are initially estimated based on Proved Developed Reserves. Under circumstances where the further development of the fields in the CGUs is under progress and where the carrying value of the CGUs is not likely to be recovered through exploitation of proved developed reserves alone, the Proved and probable reserves (2P) of the CGUs are also taken for the purpose of estimating future cash flows. In such cases, full estimate of the expected cost of evaluation/development is also considered while determining the value in use.
The discount rates applied in the assessment of impairment calculation are re-assessed each year.
(c) Estimation of reserves
Management estimates reserves in relation to all the Oil and Gas Assets based on the policies and procedures determined by the Reserves Estimation Committee of the Company (REC). The estimates so determined are used for the computation of depletion and impairment testing.
The year-end reserves of the Group are estimated by the REC which follows international reservoir engineering procedures consistently. The Company has migrated from classification of Reserves under SPE-1997 guidelines
429Consolidated Financial Statements
to Petroleum Resources Management System-PRMS (2018) sponsored by Society of Petroleum Engineers (SPE), World Petroleum Council (WPC), American Association of Petroleum Geologists(AAPG), Society of Petroleum Evaluation Engineers (SPEE), Society of Exploration Geophysicists (SEG), Society of Petrophysicists and Well Log Analysts (SPWLA) and European Association of Geoscientists and Engineers (EAGE).
PRMS(2018) defines Proved Reserves under Reserves category as those quantities of petroleum that, by analysis of geoscience and engineering data, can be estimated with reasonable certainty to be commercially recoverable from a given date forward from known reservoirs and under defined economic conditions, operating methods, and government regulations. Further it defines Developed Reserves as expected quantities to be recovered from existing wells and facilities and Undeveloped Reserves as the Quantities expected to be recovered through future significant investments.
Volumetric estimation is the main procedure in estimation which uses reservoir rock and fluid properties to calculate hydrocarbons in-place and then estimate that portion which will be recovered from it. As the field gets matured and reasonably good production history is available, then performance methods such as material balance, simulation, decline curve analysis are applied to get more accurate assessments of reserves.
The annual revision of estimates is based on the yearly exploratory and development activities and results thereof. New in-place Volume and Ultimate Reserves are estimated for new field discoveries or new pool discoveries in already discovered fields. Also, delineation/appraisal activities lead to revision in estimates due to new sub-surface data. Similarly, review /reinterpretation exercise is also carried out for old fields due to necessity of revision in petro-physical parameters, updating of static and dynamic models and performance analysis leading to change in reserves. Intervention of new technology, change in classifications and contractual provisions also necessitate revision in estimation of reserves.
The Group uses the services of third party agencies for due diligence and it gets the reserves of its assets audited periodically by third party internationally reputed consultants who adopt latest industry practices for their evaluation.
(d) Determination of cash generating unit (CGU)
The Group is engaged mainly in the business of oil and gas exploration and production in Onshore and Offshore. In case of onshore assets, the fields are using common production/transportation facilities and are sufficiently economically interdependent to constitute a single cash generating unit (CGU). Accordingly, impairment test of all onshore fields in India is performed in aggregate of all those fields at the Asset Level. In case of Offshore Assets, a field is generally considered as CGU except for fields which are developed as a Cluster, for which common facilities are used, in which case the impairment testing is performed in aggregate for all the fields included in the cluster.
(e) Defined benefit obligation (DBO)
Management’s estimate of the DBO is based on a number of critical underlying assumptions such as standard rates of inflation, medical cost trends, mortality, discount rate and anticipation of future salary increases. Variation in these assumptions may significantly impact the DBO amount and the annual defined benefit expenses.
(f) Litigations
From time to time, the Group is subject to legal proceedings and the ultimate outcome of each being always subject to many uncertainties inherent in litigation. A provision for litigation is made when it is considered probable that a payment will be made and the amount of the loss can be reasonably estimated. Significant judgement is made when evaluating, among other factors, the probability of unfavourable outcome and the liability to make a reasonable estimate of the amount of potential loss. Provision for litigations are reviewed at the end of each accounting period and revisions made for the changes in facts and circumstances
430
6. Oil and gas assets
Particulars As at March 31, 2019
As at March 31, 2018
Gross Cost
Opening Balance (Refer Note 6.1) 2,129,289.75 1,825,356.33
Transfer from Intangible assets under development- Exploratory wells in progress 11,318.66 7,302.49
Transfer from Development Wells-in-Progress 94,577.94 99,535.09
Increase/(Decrease) in estimated decommissioning costs 3,772.69 12,206.37
Additions during the year 86,521.24 132,538.30
Acqusition Cost (refer note 50.1.9) 823.09 57,285.40
Deletion/Retirement during the year (264.89) (270.99)
Other Adjustments (7,790.36) (233.69)
Foreign currency translation adjustment (Refer Note 6.3) 24,634.79 (4,429.55)
Total 2,342,882.91 2,129,289.75
Less: Accumulated Depletion & Impairment
Accumulated Depletion
Opening Balance (Refer Note 6.1) 676,116.25 498,237.65
Depletion for the year (Refer Note 40) 163,577.91 180,433.76
Deletion / retirement during the year (105.04) 401.48
Other Adjustments (8,134.09) -
Foreign currency translation adjustment (Refer Note 6.3) 10,296.89 (2,956.64)
Total 841,751.92 676,116.25
Accumulated Impairment
Opening Balance (Refer Note 6.1) 22,295.82 30,967.08
Impairment provided during the year (Refer Note 6.4) 12,427.83 5,980.09
Write back of Impairment (500.31) (14,649.96)
Foreign currency translation adjustment (Refer Note 6.3) 906.00 (1.39)
Total 35,129.34 22,295.82
Carrying amount of Oil and Gas Assets 1,466,001.65 1,430,877.68
6.1 Except for the subsidiary OVL, the Group has elected to continue with the carrying value of its Oil and Gas Assets recognised as of April 1, 2015 (transition date) measured as per the Previous GAAP and used that carrying value as its deemed cost as on the transition date as per Para D7AA of Ind AS 101 except for decommissioning and restoration provision included in the cost of Oil and Gas Assets which have been adjusted in terms of para D21 of Ind AS 101 ‘First –time Adoption of Indian Accounting Standards’.
6.2 Includes ₹ 4,310.30 million transferred from CWIP on commencement of commercial production during the year, in respect of Tapti A series facilities which were part of the assets of PMT Joint Operation (JO) and surrendered by the JO to the Government of India (GoI) as per the terms of JO agreement. These facilities were transferred by GoI to ONGC free of cost as its nominee in 2016-17. The company had assessed the fair value of said facilities at ₹ 4,310.30 million based on the valuation report by a third party agency, which was accounted as capital work in progress with a corresponding liability as deferred government grant in 2016-17.
(` in million)
431Consolidated Financial Statements
7. Other Property, Plant and Equipment(` in million)
Exchange differences arising on reporting of long-term foreign currency monetary items relating to depreciable assets:
(` in million)
Particulars Year ended March 31, 2019
Year ended March 31, 2018
Amount remaining to be amortised at the beginning of the year 2,473.42 2,800.64 Add: Exchange loss/(gain) arising during the year 2,445.79 950.62 Less: Depletion charged to the statement of profit and loss for the year 1,330.65 1,155.02 Add: Effect of exchange differences (note 6.3) (423.76) (122.82)Amount remaining to be amortised at the end of the year 3,164.80 2,473.42
Carrying amount of: As at March 31, 2019
As at March 31, 2018
Freehold Land 17,741.73 16,615.84Perpetual Leasehold Land (Refer note 7.3.1 and 7.3.2) 5,639.29 5,418.30Building & bunk Houses (Refer note 7.2.3) 101,974.84 93,589.85Plant & equipment (Refer note 7.2.4, 7.3.3 and 7.3.4) 559,638.15 539,250.93Furniture & fixtures 4,972.47 5,645.69Office equipments 20,010.09 16,028.77Vehicles, Ships & Boats 5,031.96 4,791.18Total 715,008.53 681,340.56
While transferring these assets to the Company, the decommissioning obligation was delinked by Government of India. The same will be considered as and when decided by the Government of India. However, decommissioning provision towards 40% share being partner in the JO is being carried in the financial statements.
6.3 The subsidiary company OVL has determined its functional currency as US$. Above foreign exchange difference represents differences on account of translation of the consolidated financial statements of the ONGC Videsh Limited fromUS$ to Group’s presentation currency“₹”. Refer note 3.21and 5.1 (a).
6.4 Subsidiary OVL has 60% participating interest in Block XXIV, Syria. In view of deteriorating law and order situation in Syria, operations of the project are temporarily suspended since April 29, 2012. In view of the same, impairment had been made in respect of Oil and Gas Assets amounting to ₹ Nil million (year ended March 31, 2018₹ 68.53 million).The cumulative impairment as at March 31, 2019 is ₹ 73.57 million (as at March 31, 2018 ₹ 68.53 million) in respect of the project. (refer note no. 6.3)
6.5 In respect of subsidiary, OVL, BC-10, Brazil (an un-incorporated joint operation of the Group) has long-term finance lease agreement with Tamba BV. Netherlands (a joint venture company of the group), wherein the later is providing major oil field equipment’s like floating production storage and offloading vessel (FPSO) and other sub-sea assets to the former. The foreign exchange gain/loss arising on account of revaluation of non-current finance lease liability is capitalized to Oil and gas assets and depleted using unit of production method. The details of Oil and gas assets remaining to be amortised in respect of the long-term finance lease agreement is as below:
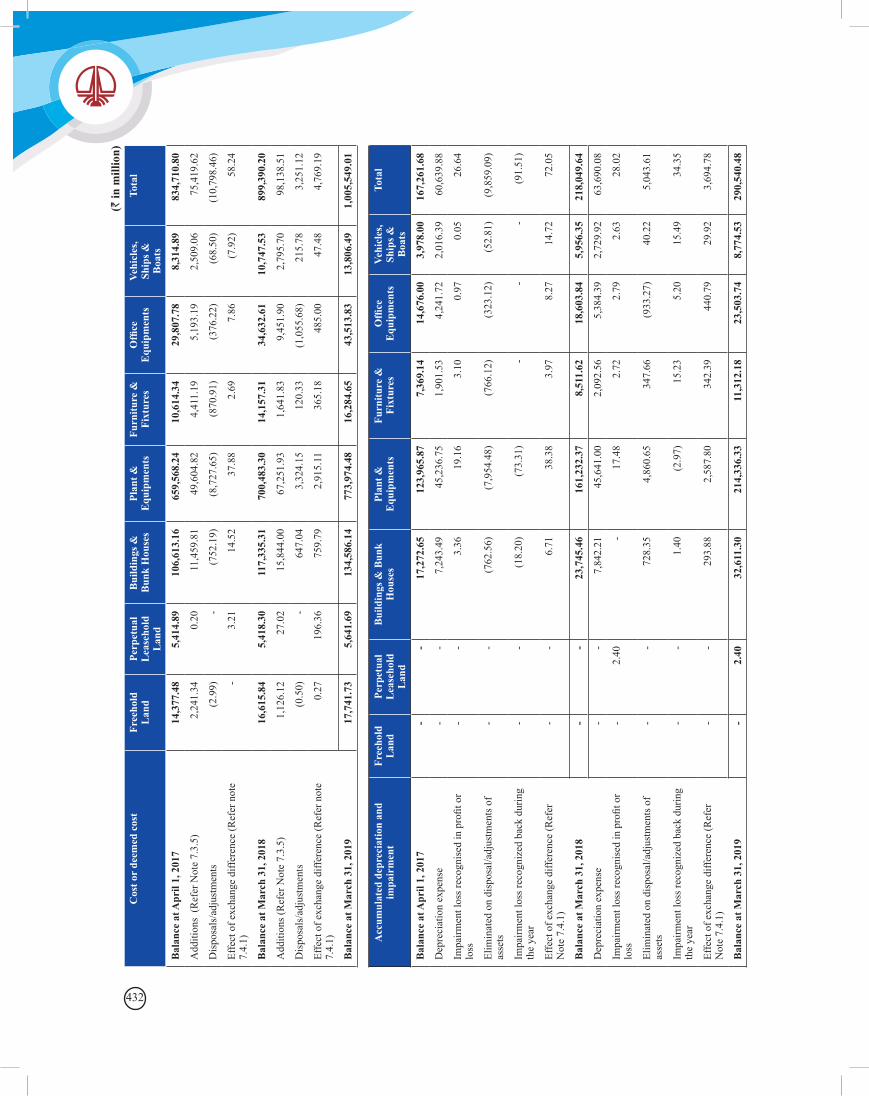
432
Cos
t or
deem
ed c
ost
Free
hold
L
and
Perp
etua
l L
ease
hold
L
and
Bui
ldin
gs &
B
unk
Hou
ses
Plan
t &
Equ
ipm
ents
Furn
iture
&
Fixt
ures
Offi
ce
Equ
ipm
ents
Vehi
cles
, Sh
ips &
B
oats
Tota
l
Bal
ance
at A
pril
1, 2
017
14,3
77.4
85,
414.
8910
6,61
3.16
659,
568.
2410
,614
.34
29,8
07.7
88,
314.
8983
4,71
0.80
Add
ition
s (R
efer
Not
e 7.
3.5)
2,24
1.34
0.20
11,4
59.8
149
,604
.82
4,41
1.19
5,19
3.19
2,50
9.06
75,4
19.6
2
Dis
posa
ls/a
djus
tmen
ts(2
.99)
-(7
52.1
9)(8
,727
.65)
(870
.91)
(376
.22)
(68.
50)
(10,
798.
46)
Effe
ct o
f exc
hang
e di
ffere
nce
(Ref
er n
ote
7.4.
1)-
3.21
14.5
237
.88
2.69
7.86
(7.9
2)58
.24
Bal
ance
at M
arch
31,
201
816
,615
.84
5,41
8.30
117,
335.
3170
0,48
3.30
14,1
57.3
134
,632
.61
10,7
47.5
389
9,39
0.20
Add
ition
s (R
efer
Not
e 7.
3.5)
1,12
6.12
27.0
215
,844
.00
67,2
51.9
31,
641.
839,
451.
902,
795.
7098
,138
.51
Dis
posa
ls/a
djus
tmen
ts(0
.50)
-64
7.04
3,32
4.15
120.
33(1
,055
.68)
215.
783,
251.
12
Effe
ct o
f exc
hang
e di
ffere
nce
(Ref
er n
ote
7.4.
1)0.
2719
6.36
759.
792,
915.
1136
5.18
485.
0047
.48
4,76
9.19
Bal
ance
at M
arch
31,
201
917
,741
.73
5,64
1.69
134,
586.
1477
3,97
4.48
16,2
84.6
543
,513
.83
13,8
06.4
91,
005,
549.
01
Acc
umul
ated
dep
reci
atio
n an
d im
pair
men
tFr
eeho
ld
Lan
dPe
rpet
ual
Lea
seho
ld
Lan
d
Bui
ldin
gs &
Bun
k H
ouse
sPl
ant &
E
quip
men
tsFu
rnitu
re &
Fi
xtur
esO
ffice
E
quip
men
tsVe
hicl
es,
Ship
s &
Boa
ts
Tota
l
Bal
ance
at A
pril
1, 2
017
--
17,2
72.6
512
3,96
5.87
7,36
9.14
14,6
76.0
03,
978.
0016
7,26
1.68
Dep
reci
atio
n ex
pens
e-
-7,
243.
4945
,236
.75
1,90
1.53
4,24
1.72
2,01
6.39
60,6
39.8
8
Impa
irmen
t los
s rec
ogni
sed
in p
rofit
or
loss
--
3.36
19.1
63.
100.
970.
0526
.64
Elim
inat
ed o
n di
spos
al/a
djus
tmen
ts o
f as
sets
--
(762
.56)
(7,9
54.4
8)(7
66.1
2)(3
23.1
2)(5
2.81
)(9
,859
.09)
Impa
irmen
t los
s rec
ogni
zed
back
dur
ing
the
year
--
(18.
20)
(73.
31)
--
-(9
1.51
)
Effe
ct o
f exc
hang
e di
ffere
nce
(Ref
er
Not
e 7.
4.1)
--
6.71
38.3
83.
978.
2714
.72
72.0
5
Bal
ance
at M
arch
31,
201
8-
-23
,745
.46
161,
232.
378,
511.
6218
,603
.84
5,95
6.35
218,
049.
64
Dep
reci
atio
n ex
pens
e-
-7,
842.
2145
,641
.00
2,09
2.56
5,38
4.39
2,72
9.92
63,6
90.0
8
Impa
irmen
t los
s rec
ogni
sed
in p
rofit
or
loss
-2.
40-
17.4
82.
722.
792.
6328
.02
Elim
inat
ed o
n di
spos
al/a
djus
tmen
ts o
f as
sets
--
728.
354,
860.
6534
7.66
(933
.27)
40.2
25,
043.
61
Impa
irmen
t los
s rec
ogni
zed
back
dur
ing
the
year
--
1.40
(2.9
7)15
.23
5.20
15.4
934
.35
Effe
ct o
f exc
hang
e di
ffere
nce
(Ref
er
Not
e 7.
4.1)
--
293.
882,
587.
8034
2.39
440.
7929
.92
3,69
4.78
Bal
ance
at M
arch
31,
201
9-
2.40
32,6
11.3
021
4,33
6.33
11,3
12.1
823
,503
.74
8,77
4.53
290,
540.
48
(` in
mill
ion)
433Consolidated Financial Statements
7.1 Except for subsidiary OVL, the Group has elected to continue with the carrying value of its other Property Plant and Equipment (PPE) recognised as of April 1, 2015 (transition date) measured as per the Previous GAAP and used that carrying value as its deemed cost as on the transition date as per Para D7AA of Ind AS 101 except for decommissioning provisions included in the cost of other PPE which has been adjusted in terms of para D21 of Ind AS 101 ‘First –time Adoption of Indian Accounting Standards’. The deemed cost is further reduced for the unamortised transaction cost on borrowings as at April 1, 2015, which were earlier capitalised with PPE.
7.2 In respect of the Company,
7.2.1 Land includes 3 numbers (Previous year 4) of lands in respect of certain units amounting to ₹58.17 million (Previous year ₹ 58.21 million) for which execution of conveyance deeds is in process.
7.2.2 Registration of title deeds in respect of 6 numbers (Previous year 6) buildings is pending execution having carrying amount of ₹ 54.34 million (Previous year₹ 57.65 million).
7.2.3 Building includes cost of undivided interest in land.
7.2.4 Includes ₹ 2,846.59 million transferred from CWIP on commencement of commercial production during the year, in respect of Tapti A series plant and machinery which were part of the assets of PMT Joint Operation (JO) and surrendered by the JO to the Government of India (GoI) as the terms of JO agreement. These assets were transferred by GoI to the company free of cost as its nominee in 2016-17. The company had assessed the fair value of said plant and machinery at ₹ 2,846.59 million based on the valuation report by a third party agency, which has been accounted as plant and machinery with a corresponding liability as deferred government grant in 2016-17.
While transferring these assets to the Company, the decommissioning obligation was delinked by Government of India. The same will be considered as and when decided by the Government of India. However decommissioning provision towards 40% share being partner in the JO is being carried in the financial statements.
7.3 In respect of subsidiary MRPL,
7.3.1 Leasehold lands are considered as finance lease in nature as the ownership will be transferred to the company at the end of the lease period. These leasehold lands are not depreciated.
7.3.2 Land under lease includes land value ₹ 265.06 million (As at March 31, 2018 ₹ 36.56 million), which is in possession of the company towards which formal lease deeds are yet to be executed.
7.3.3 Plant and equipment includes ₹ 39.15 million (As at March 31, 2018: ₹ 39.15 million) being Company’s share of an asset jointly owned with another company.
7.3.4 External commercial borrowing are secured by first pari passu charge over immovable property, plant and equipment and first ranking pari passu charge over movable property, plant and equipment (including but not limited to plant & machinery, spares, tools, furniture, fixtures, vehicles and all other movable property, plant & equipment) both present and future. Working capital borrowings from consortium banks are secured by way of first ranking pari passu charge by way of hypothecation of Company's stocks of Raw material, Finished goods, stock-in-process, stores, spares, components, trade receivables, outstanding money receivables, claims, bills, contract, engagements, securities both present and future and further secured by second ranking pari passu charge over companies movable and immovable property (all property, plant & equipment) both present and future.. [Refer Note 28.10].
7.3.5 Additions to property, plant and equipment includes ₹ 2,147.04 million (for the year ended March 31, 2018 ₹ 100.71 million) in relation to foreign exchange differences as borrowing costs capitalized. Asset class wise addition details are disclosed below:
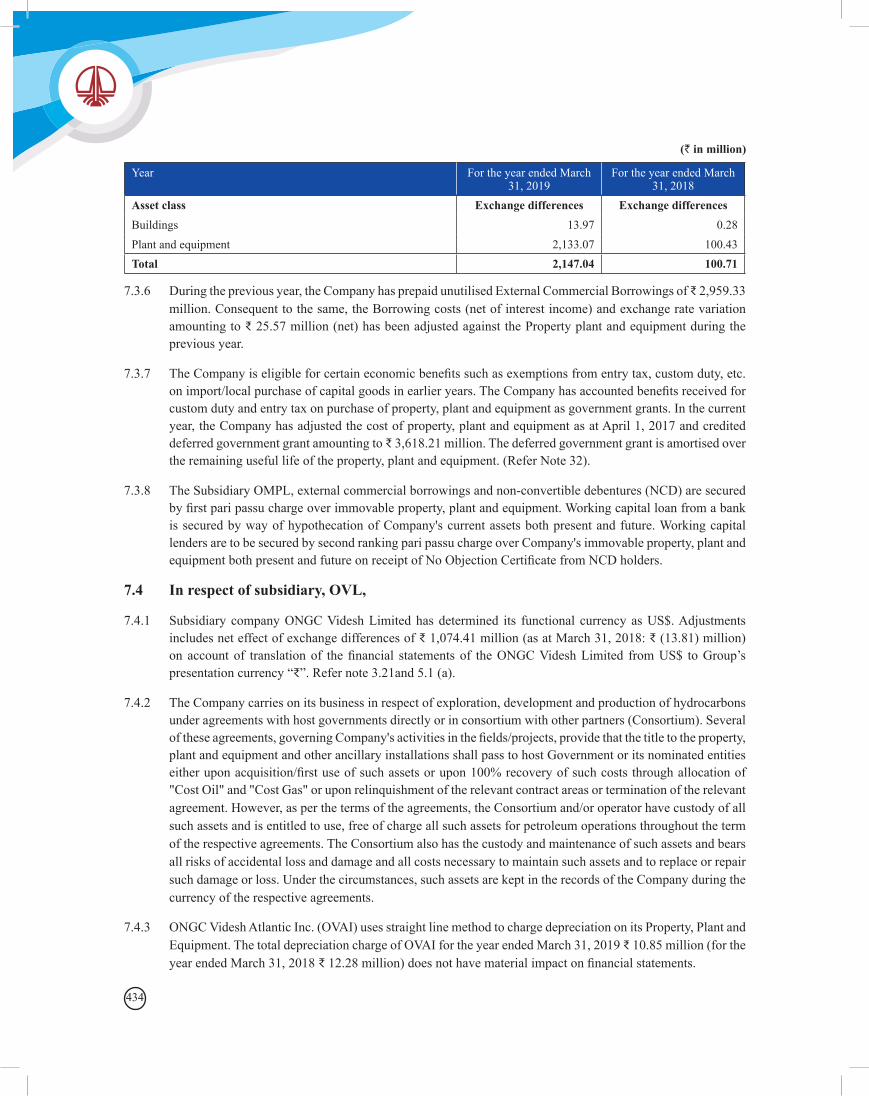
434
(` in million)
Year For the year ended March 31, 2019
For the year ended March 31, 2018
Asset class Exchange differences Exchange differencesBuildings 13.97 0.28 Plant and equipment 2,133.07 100.43 Total 2,147.04 100.71
7.3.6 During the previous year, the Company has prepaid unutilised External Commercial Borrowings of ₹ 2,959.33 million. Consequent to the same, the Borrowing costs (net of interest income) and exchange rate variation amounting to ₹ 25.57 million (net) has been adjusted against the Property plant and equipment during the previous year.
7.3.7 The Company is eligible for certain economic benefits such as exemptions from entry tax, custom duty, etc. on import/local purchase of capital goods in earlier years. The Company has accounted benefits received for custom duty and entry tax on purchase of property, plant and equipment as government grants. In the current year, the Company has adjusted the cost of property, plant and equipment as at April 1, 2017 and credited deferred government grant amounting to ₹ 3,618.21 million. The deferred government grant is amortised over the remaining useful life of the property, plant and equipment. (Refer Note 32).
7.3.8 The Subsidiary OMPL, external commercial borrowings and non-convertible debentures (NCD) are secured by first pari passu charge over immovable property, plant and equipment. Working capital loan from a bank is secured by way of hypothecation of Company's current assets both present and future. Working capital lenders are to be secured by second ranking pari passu charge over Company's immovable property, plant and equipment both present and future on receipt of No Objection Certificate from NCD holders.
7.4 In respect of subsidiary, OVL,
7.4.1 Subsidiary company ONGC Videsh Limited has determined its functional currency as US$. Adjustments includes net effect of exchange differences of ₹ 1,074.41 million (as at March 31, 2018: ₹ (13.81) million) on account of translation of the financial statements of the ONGC Videsh Limited from US$ to Group’s presentation currency “₹”. Refer note 3.21and 5.1 (a).
7.4.2 The Company carries on its business in respect of exploration, development and production of hydrocarbons under agreements with host governments directly or in consortium with other partners (Consortium). Several of these agreements, governing Company's activities in the fields/projects, provide that the title to the property, plant and equipment and other ancillary installations shall pass to host Government or its nominated entities either upon acquisition/first use of such assets or upon 100% recovery of such costs through allocation of "Cost Oil" and "Cost Gas" or upon relinquishment of the relevant contract areas or termination of the relevant agreement. However, as per the terms of the agreements, the Consortium and/or operator have custody of all such assets and is entitled to use, free of charge all such assets for petroleum operations throughout the term of the respective agreements. The Consortium also has the custody and maintenance of such assets and bears all risks of accidental loss and damage and all costs necessary to maintain such assets and to replace or repair such damage or loss. Under the circumstances, such assets are kept in the records of the Company during the currency of the respective agreements.
7.4.3 ONGC Videsh Atlantic Inc. (OVAI) uses straight line method to charge depreciation on its Property, Plant and Equipment. The total depreciation charge of OVAI for the year ended March 31, 2019 ₹ 10.85 million (for the year ended March 31, 2018 ₹ 12.28 million) does not have material impact on financial statements.
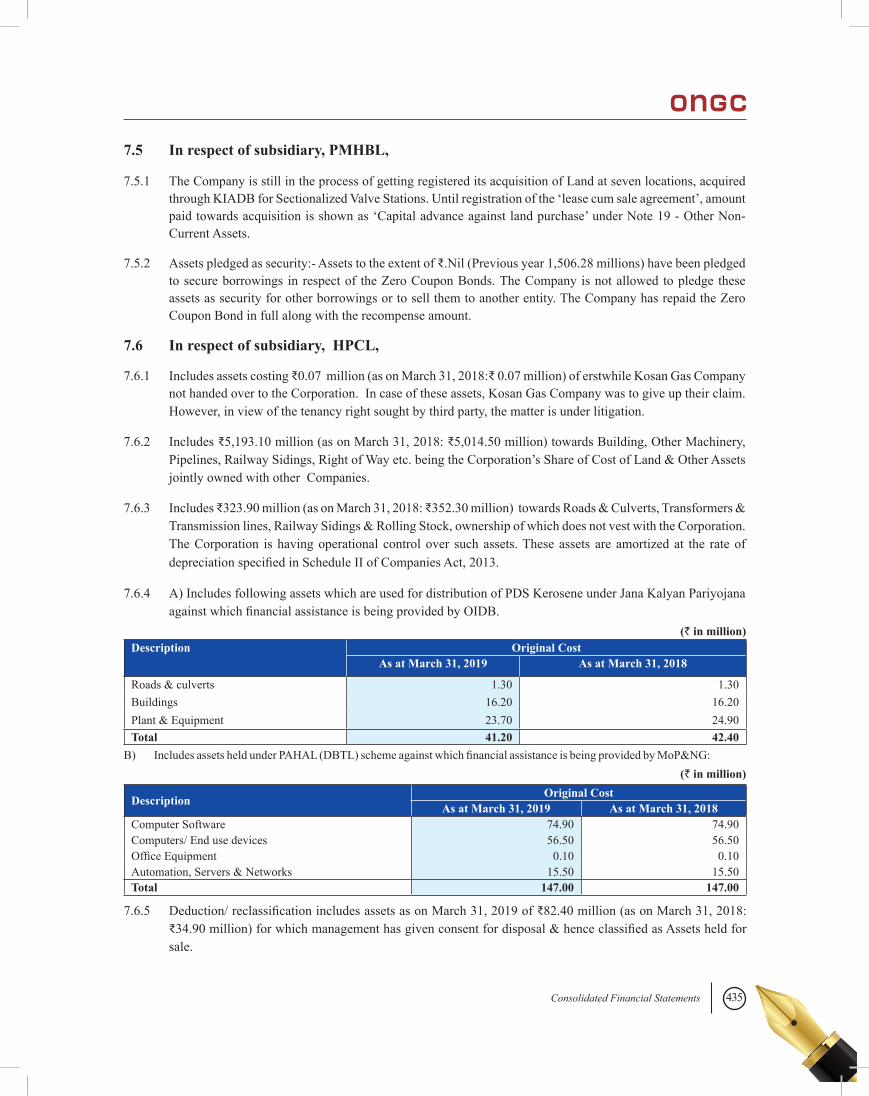
435Consolidated Financial Statements
(` in million)Description Original Cost
As at March 31, 2019 As at March 31, 2018
Roads & culverts 1.30 1.30 Buildings 16.20 16.20 Plant & Equipment 23.70 24.90 Total 41.20 42.40
B) Includes assets held under PAHAL (DBTL) scheme against which financial assistance is being provided by MoP&NG:(` in million)
Description Original CostAs at March 31, 2019 As at March 31, 2018
Computer Software 74.90 74.90Computers/ End use devices 56.50 56.50Office Equipment 0.10 0.10Automation, Servers & Networks 15.50 15.50Total 147.00 147.00
7.5 In respect of subsidiary, PMHBL,
7.5.1 The Company is still in the process of getting registered its acquisition of Land at seven locations, acquired through KIADB for Sectionalized Valve Stations. Until registration of the ‘lease cum sale agreement’, amount paid towards acquisition is shown as ‘Capital advance against land purchase’ under Note 19 - Other Non-Current Assets.
7.5.2 Assets pledged as security:- Assets to the extent of ₹.Nil (Previous year 1,506.28 millions) have been pledged to secure borrowings in respect of the Zero Coupon Bonds. The Company is not allowed to pledge these assets as security for other borrowings or to sell them to another entity. The Company has repaid the Zero Coupon Bond in full along with the recompense amount.
7.6 In respect of subsidiary, HPCL,
7.6.1 Includes assets costing ₹0.07 million (as on March 31, 2018:₹ 0.07 million) of erstwhile Kosan Gas Company not handed over to the Corporation. In case of these assets, Kosan Gas Company was to give up their claim. However, in view of the tenancy right sought by third party, the matter is under litigation.
7.6.2 Includes ₹5,193.10 million (as on March 31, 2018: ₹5,014.50 million) towards Building, Other Machinery, Pipelines, Railway Sidings, Right of Way etc. being the Corporation’s Share of Cost of Land & Other Assets jointly owned with other Companies.
7.6.3 Includes ₹323.90 million (as on March 31, 2018: ₹352.30 million) towards Roads & Culverts, Transformers & Transmission lines, Railway Sidings & Rolling Stock, ownership of which does not vest with the Corporation. The Corporation is having operational control over such assets. These assets are amortized at the rate of depreciation specified in Schedule II of Companies Act, 2013.
7.6.4 A) Includes following assets which are used for distribution of PDS Kerosene under Jana Kalyan Pariyojana against which financial assistance is being provided by OIDB.
7.6.5 Deduction/ reclassification includes assets as on March 31, 2019 of ₹82.40 million (as on March 31, 2018: ₹34.90 million) for which management has given consent for disposal & hence classified as Assets held for sale.
436
8 Capital Work in Progress(` in million)
Particulars As at March 31, 2019
As at March 31, 2018
A) Oil and Gas Assets (i) Development Wells in progress Opening Balance (Refer note 8.1) 27,487.63 40,978.03Expenditure during the year 110,213.81 83,440.55Depreciation during the year 2,947.00 2,316.86Transfer to Oil and Gas Assets (94,577.94) (99,535.09)Foreign currency translation adjustment (Refer note 8.8) 357.33 (32.09)Other adjustments - 319.37Total 46,427.83 27,487.63Less: Accumulated Impairment Opening balance (Refer note 8.6) 968.60 691.25Provided for the year 1,619.18 185.44Write back during the year - (112.02)Foreign currency translation adjustment (Refer note 8.8) 2.57 0.12Other adjustments - 203.81Total 2,590.35 968.60Carrying amount of Development wells in progress 43,837.48 26,519.03 (ii) Oil and Gas facilities in progress Oil and gas facilities (Refer note 8.1 ) 133,061.80 117,115.34Expenditure during the year - -Acquisition Costs- Exploration and Production Asset ( refer note 50.1.9) 4,261.40 4,853.01Total 137,323.20 121,968.35Less: Accumulated Impairment
7.6.6 Leasehold Land includes ₹275.70 million (as on March 31, 2018: ₹ 275.70 million) for land acquired on lease-cum-sale basis from Karnataka Industrial Area Development Board (KIADB) which is capitalized without being amortised over the period of lease. Lease shall be converted into Sale on fulfillment of certain terms and conditions, as per allotment letter.
7.6.7 In accordance with Para 7AA of Ind AS 21 read with Para D13AA of Ind AS 101, the Corporation has adjusted the exchange differences arising on long term foreign currency monetary items to the cost of assets and depreciated over the balance useful life of the assets.
7.6.8 The Group has considered the ISBL (Inside boundary Limit) pipeline directly associated as an integral part of Plant and Machinery / Tanks and has depreciated such pipelines based on the useful life of respective plants, which is considered as 25 years in line with the Schedule II of the Companies Act, 2013.
7.6.9 Includes assets having Net block of ₹ 13.0 million (31.03.2018: ₹ 13.90 million) towards Plant & Equipment, Buildings & Roads, where Infrastructure Facilities were provided at Railway Premises. However, No sales transactions were entered into during current financial year with such customers.
7.6.10 On the basis of the information to the extent compiled by the Corporation, pending the reconciliation of the available records, title/lease deeds for free hold/lease hold lands are not available with the Corporation in the case of 6 properties costing ₹3.0 million and in the case of 19 properties costing ₹24.90 million , property tax receipts are held by the Group. The data relating to lease deeds pending registration and refundable security deposit is under compilation and reconciliation.
437Consolidated Financial Statements
Provided for the year (net) 4,072.19 3,076.47Other adjustments 942.47 -Carrying amount of Oil and gas facilities in progress 132,308.54 118,891.88B) Other Capital Works-in-Progress Land and Buildings 4,467.34 5,394.82Plant and equipment 117,522.02 61,694.85Software 27.47 17.59Capital stores (including in transit) 2,351.82 3,750.53Less: Impairment for Non-Moving Items (43.28) (35.52)Total 124,325.37 70,822.27Less: Accumulated Impairment Opening Balance 2,419.75 5,439.28Provided for the year 33.12 5.18Other adjustments (942.47) (2,936.68)Written back during the year - (88.04)Carrying amount of capital work in progress 122,814.97 68,402.53
8.1 The Group (Except for OVL) has elected to continue with the carrying value of its Capital Works-in-Progress recognised as of April 1, 2015 (transition date) measured as per the Previous GAAP and used that carrying value as its deemed cost as on the transition date as per Para D7AA of Ind AS 101 except for decommissioning and restoration provision included in the cost of Capital Works-in-Progress which have been adjusted in terms of para D21 of Ind AS 101 ‘First –time Adoption of Indian Accounting Standards’.
8.2 In respect of the Company, Includes ₹ 2,558.52 million towards carrying cost of Train – II of Gas Processing Facility at Onshore Gas Terminal in NELP Block KG-OSN-2001/3, pending finalisation of work for commissioning by the technical consultant.
8.3 In respect of subsidiary MRPL, additions to CWIP includes borrowing costs amounting to ₹232.47 million (for the year ended March 31, 2018 ₹13.45 million) and allocated to different class of assets. The rate used to determine the amount of borrowing costs eligible for capitalization was 7.69% (For the year ended March 31, 2018 was 6.24%) which is the effective interest rate on borrowings.
8.4 In respect of subsidiary MRPL, leasehold lands includes land amounting to ₹717.31 million (as at March 31, 2018 ₹717.31 million), which is in possession of the Company towards which formal lease deeds are yet to be executed.
8.5 In respect of subsidiary MRPL, loan availed against OIDB, is secured by way of first ranking pari passu charge by way of hypothecation / mortgage only on property, plant & equipment / projects financed out of loan proceeds of OIDB. (Refer note 28.9).
8.6 In respect of subsidiary OVL, the company has 60% participating interest in Block XXIV, Syria. In view of deteriorating law and order situation in Syria, operations of the project are temporarily suspended since April 29, 2012. In view of the same, impairment had been made in respect of development wells in progress amounting to ₹Nil (for the year ended March 31, 2018 ₹Nil). The cumulative impairment as at March 31, 2019 is ₹115.13 million (as at March 31, 2018 ₹107.99 million) in respect of the project. (refer note no. 8.8)
8.7 In respect of subsidiary OVL,borrowing cost amounting to ₹172.28 million has been capitalised under the Oil and Gas facilities in progress during the year ended March 31, 2019 (for the year ended March 31, 2018 ₹121.86 million). The weighted average capitalization rate on funds borrowed is 4.74% per annum (during the year ended March 31, 2018 2.66% per annum).
8.8 Group’s subsidiary ONGC Videsh Limited has determined its functional currency as US$. Above foreign exchange difference represents differences on account of translation of the consolidated financial statements of the ONGC Videsh Limited from US$ to Group’s presentation currency“₹”. Refer note 3.21 and 5.1 (a).
438
9.2 Goodwill represents excess of consideration paid over net assets acquired for acquisition of nitrogen plant. Goodwill on consolidation.
9.3 Allocation of goodwill on consolidation to cash generating units is carried out in accordance with the accounting policy mentioned at note 3.6.
9.4 Group’s subsidiary ONGC Videsh Limited has determined its functional currency as US$. Above foreign exchange difference represents differences on account of translation of the financial statements of the ONGC Videsh Limited from US$ to Group’s presentation currency“₹”. Refer note 3.21 and 5.1 (a).
10. Investment Property
(` in million)
(` in million)Particulars As at March 31, 2019 As at March 31, 2018
Cost or deemed cost (Refer note 9.2) 4.04 4.04Accumulated impairment losses - -Carrying amount of goodwill (A) 4.04 4.04
Particulars As at March 31, 2019 As at March 31, 2018Cost or deemed cost Opening balance 205,586.19 205,395.85Additions during the year - -Effect of exchange differences 12,976.02 190.34Total 218,562.21 205,586.19Less: Accumulated amortisation Opening balance 63,564.77 63,496.23Additions during the year 10,022.94 -Effect of exchange differences 4,095.01 68.54Total 77,682.72 63,564.77Carrying amount of goodwill on consolidation (B) 140,879.49 142,021.42Carrying amount of total goodwill (A+B) 140,883.53 142,025.46
(` in million)Carrying amount of : As at March 31, 2019 As at March 31, 2018Freehold Land 78.48 78.48Building 0.25 0.26Total 78.73 78.74
Gross Carrying Amount Amount (₹)Balance as at April 1, 2017 0.82Reclassification from asset held for sale 77.96Additions during the year -Disposals/ Adjustment/ Transfer -Balance as at March 31, 2018 78.78Additions during the year -Disposals/ Adjustment/ Transfer -
Balance as at March 31, 2019 78.78
Accumulated Depreciation and Impairment Amount (₹)Balance as at April 1, 2017 0.03Add: Depreciation Expense 0.01Less: Eliminated on Disposal/ Adjustment/ Transfer -Balance as at March 31, 2018 0.04Add: Depreciation Expense 0.01Less: Eliminated on Disposal/ Adjustment/ Transfer -Balance as at March 31, 2019 0.05
9. Goodwill (including Goodwill on consolidation)9.1 Goodwill on asset purchased
439Consolidated Financial Statements
10.1 In respect of subsidiary, MRPL,
10.1.1 The Group had classified freehold land measuring 102.31 acres as "Current assets- Non-current assets held for sale" based on the Board's approval in 2007. During the previous year, the Group has reclassified the aforesaid land as "Non-current assets- Investment Property" based on the Board decision to hold the aforesaid land for capital appreciation.
10.1.2 The fair value of the freehold land is ₹255.80 million as at March 31, 2019(Previous year ₹255.80 million ) as per valuation carried out by independent valuer. There is no significant indication of change in fair value as at March 31, 2019.
10.2 In respect of subsidiary, PMHBL,
10.2.1 Assets pledged as security:- Land & Building at Mehsana, Gujarat with carrying amount of ₹ Nil (previous year : ₹0.78 millions) has been pledged to secure borrowings in respect of the Zero Coupon Bonds.
10.2.2 There were no Income earned or expenditure incurred on the above Investment Property other than land revenue tax of ₹ 0.00 million during the current year (Previous year ₹0.01 million) and depreciation mentioned above. The fair value of the Property as per valuation carried out by Government Approved Valuer is ₹2.21 million.
11. Other intangible assets
Particulars Software Right of Way Technical /Process Licenses
Wind Energy Equipments
Total
Balance at March 31, 2018 4,146.75 2,169.61 621.97 1,885.55 8,823.88Additions during the year 1,397.25 271.00 - - 1,668.25Disposal/adjustments (4.43) - - - (4.43)Foreign currency translation adjustment (Refer note 11.2) 79.50 - - - 79.50Balance at March 31, 2019 5,619.07 2,440.61 621.97 1,885.55 10,567.20Less: Accumulated amortisation and impairment Accumulated amortisation (Refer note 11.1) Balance at March 31, 2018 2,001.23 - 256.20 306.49 2,563.92Provision for the year 966.68 - 118.60 103.50 1,188.78Disposal/adjustments (3.52) - - - (3.52)Foreign currency translation adjustment (Refer note 11.2) 46.94 - - - 46.94Balance at March 31, 2019 3,011.33 - 374.80 409.99 3,796.12Accumulated Impairment Balance at March 31, 2018 5.58 - - - 5.58Provision for the year - - - - -Disposal/adjustments (2.94) - - - (2.94)Balance at March 31, 2019 2.64 - - - 2.64Carrying amount at March 31, 2018 2,139.93 2,169.61 365.78 1,579.06 6,254.38Carrying amount at March 31, 2019 2,605.09 2,440.61 247.18 1,475.56 6,768.44
(` in million)
11.1 Except for OVL, the Group has elected to continue with the carrying value of its other intangible assets, recognised as of April 1, 2015 (transition date) measured as per the Previous GAAP and used that carrying value as its deemed cost as on the transition date as per Para D7AA of Ind AS 101 ‘First –time Adoption of Indian Accounting Standards’.
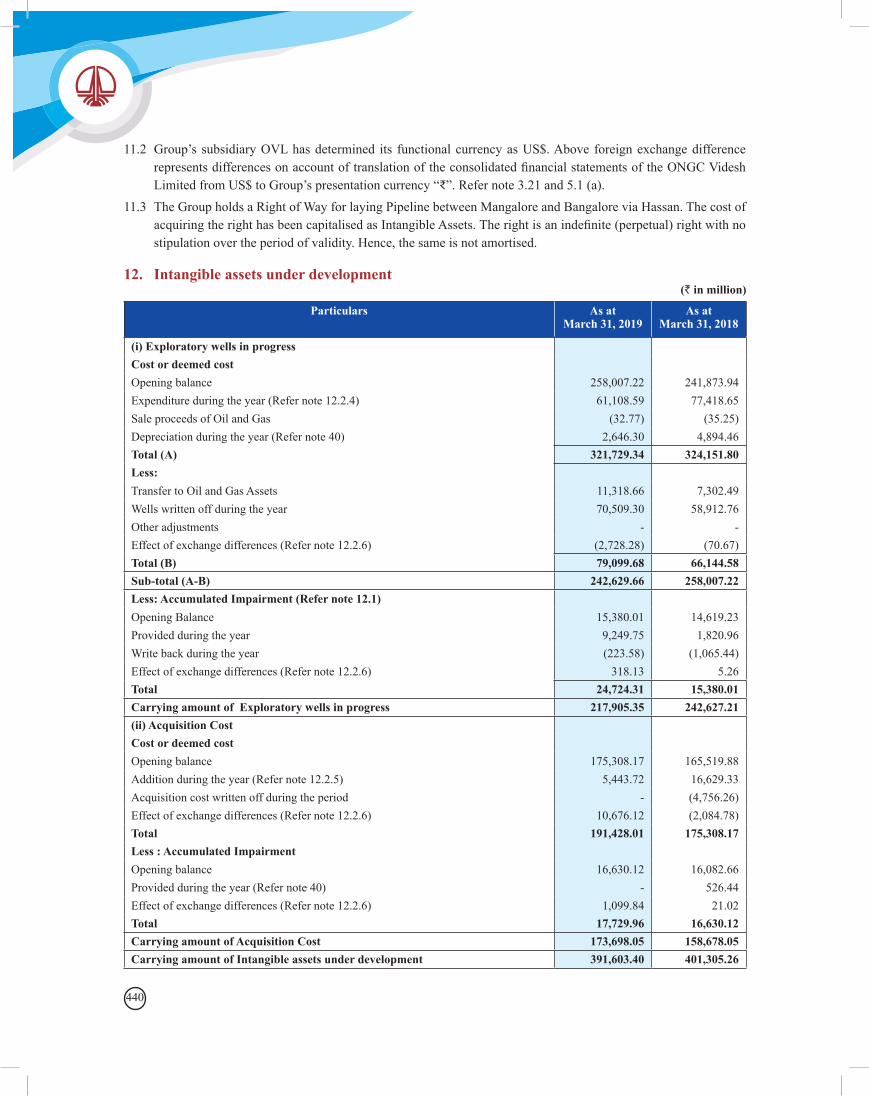
440
(` in million)12. Intangible assets under development
Particulars As at March 31, 2019
As at March 31, 2018
(i) Exploratory wells in progress Cost or deemed cost Opening balance 258,007.22 241,873.94Expenditure during the year (Refer note 12.2.4) 61,108.59 77,418.65Sale proceeds of Oil and Gas (32.77) (35.25)Depreciation during the year (Refer note 40) 2,646.30 4,894.46Total (A) 321,729.34 324,151.80Less: Transfer to Oil and Gas Assets 11,318.66 7,302.49Wells written off during the year 70,509.30 58,912.76Other adjustments - -Effect of exchange differences (Refer note 12.2.6) (2,728.28) (70.67)Total (B) 79,099.68 66,144.58Sub-total (A-B) 242,629.66 258,007.22Less: Accumulated Impairment (Refer note 12.1) Opening Balance 15,380.01 14,619.23Provided during the year 9,249.75 1,820.96Write back during the year (223.58) (1,065.44)Effect of exchange differences (Refer note 12.2.6) 318.13 5.26Total 24,724.31 15,380.01Carrying amount of Exploratory wells in progress 217,905.35 242,627.21(ii) Acquisition Cost Cost or deemed cost Opening balance 175,308.17 165,519.88Addition during the year (Refer note 12.2.5) 5,443.72 16,629.33Acquisition cost written off during the period - (4,756.26)Effect of exchange differences (Refer note 12.2.6) 10,676.12 (2,084.78)Total 191,428.01 175,308.17Less : Accumulated Impairment Opening balance 16,630.12 16,082.66Provided during the year (Refer note 40) - 526.44Effect of exchange differences (Refer note 12.2.6) 1,099.84 21.02Total 17,729.96 16,630.12Carrying amount of Acquisition Cost 173,698.05 158,678.05Carrying amount of Intangible assets under development 391,603.40 401,305.26
11.2 Group’s subsidiary OVL has determined its functional currency as US$. Above foreign exchange difference represents differences on account of translation of the consolidated financial statements of the ONGC Videsh Limited from US$ to Group’s presentation currency “₹”. Refer note 3.21 and 5.1 (a).
11.3 The Group holds a Right of Way for laying Pipeline between Mangalore and Bangalore via Hassan. The cost of acquiring the right has been capitalised as Intangible Assets. The right is an indefinite (perpetual) right with no stipulation over the period of validity. Hence, the same is not amortised.
441Consolidated Financial Statements
12.1 The Company had acquired during 2004-05, 90% Participating Interest in Exploration Block KG-DWN-98/2 from Cairn Energy India Ltd for a lump sum consideration of ₹ 3,711.22 million which, together with subsequent exploratory drilling costs of wells had been capitalised under exploratory wells in progress. During 2012-13, the Company had acquired the remaining 10% participating interest in the block from M/s Cairn Energy India Ltd on actual past cost basis for a consideration of ₹ 2,124.44 million. Initial in-place reserves were established in this block and adhering to original PSC time lines, a Declaration of commerciality (DOC) with a conceptual cluster development plan was submitted on December 21, 2009 for Southern Discovery Area and on July 15, 2010 for Northern Discovery Area. Thereafter, in the revised DOC submitted in December, 2013, Cluster-wise development of the Block had been envisaged by division of entire development area into three clusters. The DOC in respect of Cluster II had been reviewed by the Management Committee (MC) of the block on September 25, 2014. Field Development Plan (FDP) for Cluster-II was submitted on September 8, 2015 which included cost of all exploratory wells drilled in the Contract Area and the same had been approved by ONGC Board on 28th March 2016 and by MC on March 31, 2016. Investment decision has been approved by the Company. Contracts for Subsea umbilical risers, flow lines, Subsea production system, Central processing platform – living quarter utility platform and Onshore Terminal have been awarded during 2018-19. 10 Oil Wells, 6 Gas Wells and 3 Water Injector Wells were drilled during the year and 3 wells are under drilling, the cost of development wells in progress and CWIP- oil and gas assets as at March 31, 2019 is ₹ 18,282.91 million and ₹ 5,525.92 million respectively.
In respect of Cluster-I, FDP was filed on December 14, 2017 for development of Gas discoveries in D1 & E1 field which was not agreed to by DGH, however, the issue was taken up with MoP&NG in terms of PSC Provisions for review/approval of FDP.
The Company is pursuing this matter with MoP&NG for a favourable decision. Meanwhile, FDP for integrated development of Oil discoveries in F1 field of Cluster I along with nominated field GS-29 was submitted on December 28, 2018 to MoP&NG and is under review.
Revised DOC of Cluster-III was reviewed in 64th Management Committee on July 26, 2018 along with approval of drilling of 4 appraisal wells. These wells are planned to be drilled in 2019-20.
In view of the definite plan for development of all the clusters, the cost of exploratory wells in the block i.e. ₹ 52,031.08 million has been carried over.
12.2 In respect of subsidiary OVL,
12.2.1 The company has 60% Participating Interest in Block XXIV, Syria. In view of deteriorating law and order situation in Syria, operations of the project are temporarily suspended since April 29, 2012. In view of the same provision had been made in respect of exploratory wells in progress. The impairment as at March 31, 2019 is ₹ 2,842.46 million (as at March 31, 2018: ₹2,666.27 million) in respect of the project.
12.2.2 In respect of Block Farsi, Iran, the Company in consortium with other partners entered into an Exploration Service Contract (ESC) with National Iranian Oil Company (NIOC) on December 25, 2002. After exploratory drilling, FB area of the block proved to be a gas discovery and was later rechristened as Farzad-B. NIOC announced the Date of Commerciality for Farzad-B as August 18, 2008. However, the contractual arrangement with respect to development has not been finalized, so far. Impairment has been made in respect of the Company’s investment in exploration in the Farsi Block. The impairment as at March 31, 2019 ₹2359.56 million (as at March 31, 2018 ₹2,213.30 million).
12.2.3 Acquisition cost relates to the cost for acquiring property or mineral rights of proved or unproved oil and gas properties which are currently under Exploration/Development stage; such cost will be transferred to
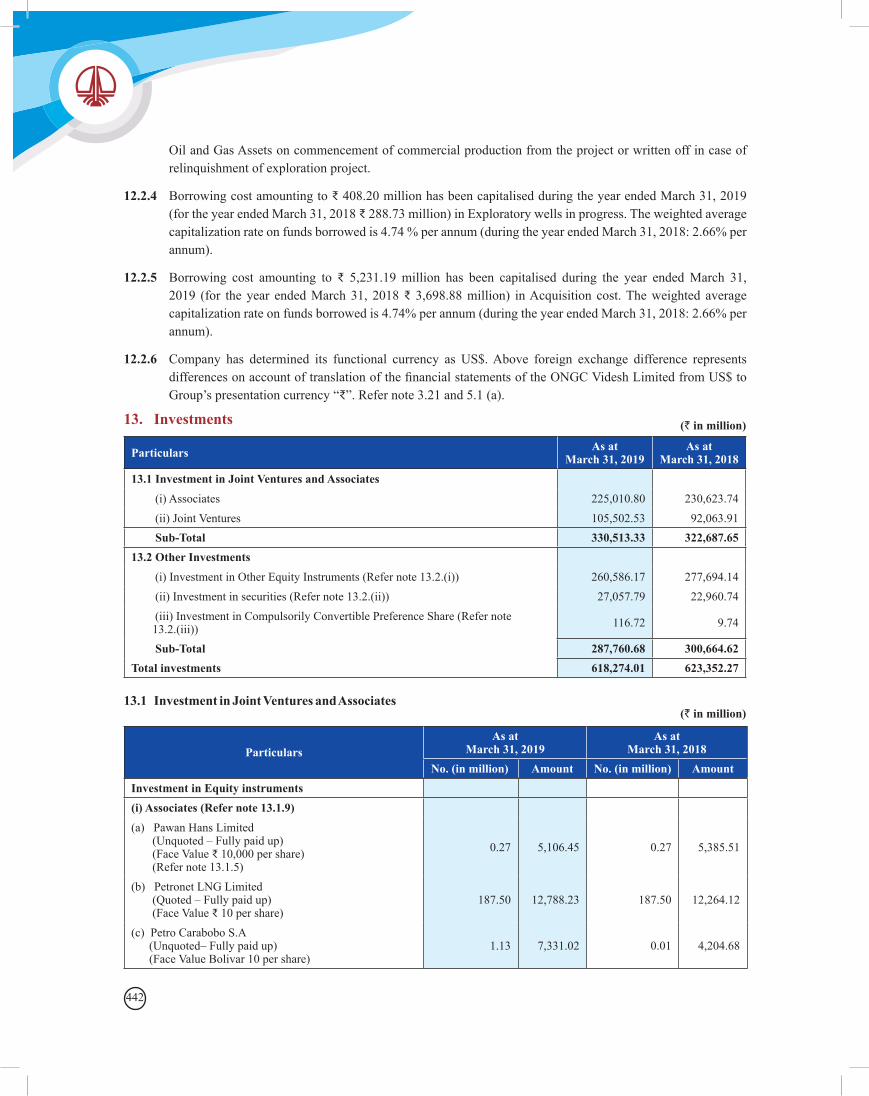
442
13.1 Investment in Joint Ventures and Associates
13. Investments
Particulars As at March 31, 2019
As at March 31, 2018
13.1 Investment in Joint Ventures and Associates (i) Associates 225,010.80 230,623.74(ii) Joint Ventures 105,502.53 92,063.91Sub-Total 330,513.33 322,687.65
13.2 Other Investments (i) Investment in Other Equity Instruments (Refer note 13.2.(i)) 260,586.17 277,694.14(ii) Investment in securities (Refer note 13.2.(ii)) 27,057.79 22,960.74(iii) Investment in Compulsorily Convertible Preference Share (Refer note 13.2.(iii)) 116.72 9.74
Sub-Total 287,760.68 300,664.62Total investments 618,274.01 623,352.27
(` in million)
(` in million)
ParticularsAs at
March 31, 2019As at
March 31, 2018No. (in million) Amount No. (in million) Amount
Investment in Equity instruments (i) Associates (Refer note 13.1.9) (a) Pawan Hans Limited
(Unquoted – Fully paid up) (Face Value ₹ 10,000 per share) (Refer note 13.1.5)
0.27 5,106.45 0.27 5,385.51
(b) Petronet LNG Limited (Quoted – Fully paid up) (Face Value ₹ 10 per share)
187.50 12,788.23 187.50 12,264.12
(c) Petro Carabobo S.A (Unquoted– Fully paid up) (Face Value Bolivar 10 per share)
1.13 7,331.02 0.01 4,204.68
Oil and Gas Assets on commencement of commercial production from the project or written off in case of relinquishment of exploration project.
12.2.4 Borrowing cost amounting to ₹ 408.20 million has been capitalised during the year ended March 31, 2019 (for the year ended March 31, 2018 ₹ 288.73 million) in Exploratory wells in progress. The weighted average capitalization rate on funds borrowed is 4.74 % per annum (during the year ended March 31, 2018: 2.66% per annum).
12.2.5 Borrowing cost amounting to ₹ 5,231.19 million has been capitalised during the year ended March 31, 2019 (for the year ended March 31, 2018 ₹ 3,698.88 million) in Acquisition cost. The weighted average capitalization rate on funds borrowed is 4.74% per annum (during the year ended March 31, 2018: 2.66% per annum).
12.2.6 Company has determined its functional currency as US$. Above foreign exchange difference represents differences on account of translation of the financial statements of the ONGC Videsh Limited from US$ to Group’s presentation currency “₹”. Refer note 3.21 and 5.1 (a).
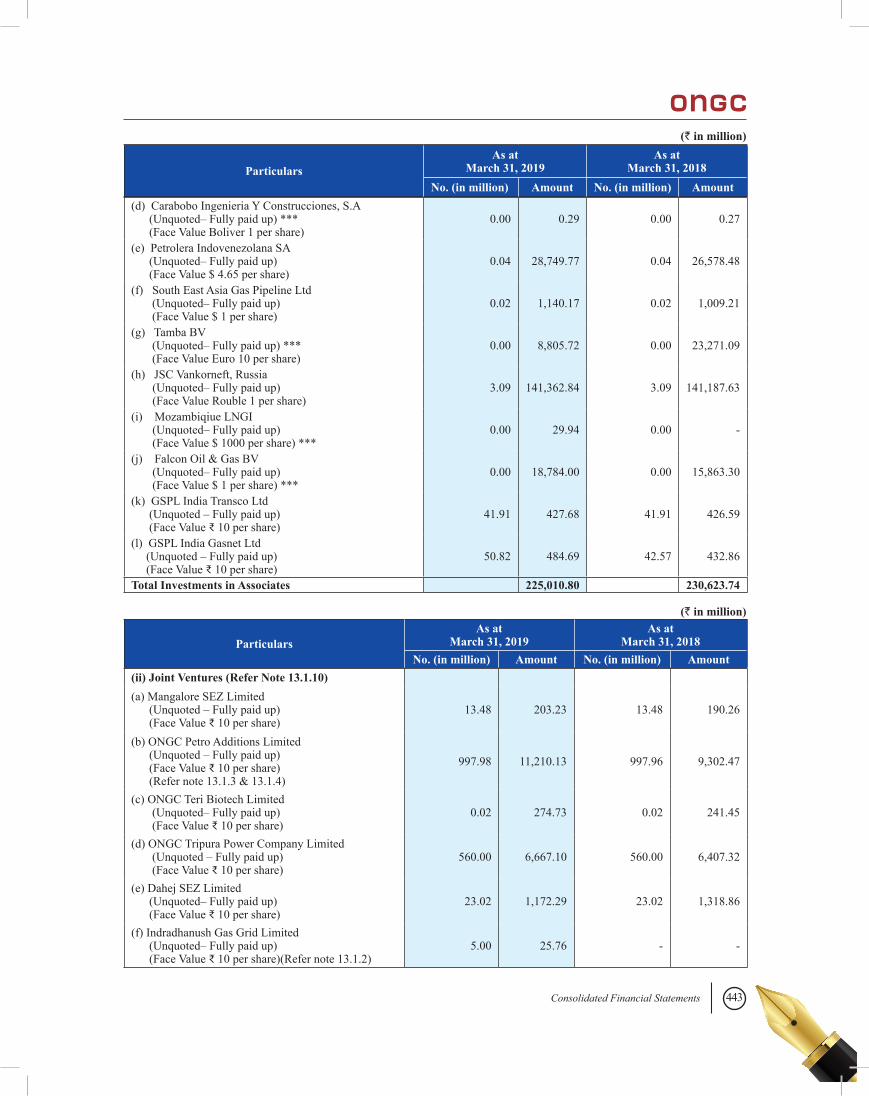
443Consolidated Financial Statements
ParticularsAs at
March 31, 2019As at
March 31, 2018No. (in million) Amount No. (in million) Amount
(d) Carabobo Ingenieria Y Construcciones, S.A (Unquoted– Fully paid up) *** (Face Value Boliver 1 per share)
0.00 0.29 0.00 0.27
(e) Petrolera Indovenezolana SA (Unquoted– Fully paid up) (Face Value $ 4.65 per share)
0.04 28,749.77 0.04 26,578.48
(f) South East Asia Gas Pipeline Ltd (Unquoted– Fully paid up) (Face Value $ 1 per share)
0.02 1,140.17 0.02 1,009.21
(g) Tamba BV (Unquoted– Fully paid up) *** (Face Value Euro 10 per share)
0.00 8,805.72 0.00 23,271.09
(h) JSC Vankorneft, Russia (Unquoted– Fully paid up) (Face Value Rouble 1 per share)
3.09 141,362.84 3.09 141,187.63
(i) Mozambiqiue LNGI (Unquoted– Fully paid up) (Face Value $ 1000 per share) ***
0.00 29.94 0.00 -
(j) Falcon Oil & Gas BV (Unquoted– Fully paid up) (Face Value $ 1 per share) ***
0.00 18,784.00 0.00 15,863.30
(k) GSPL India Transco Ltd (Unquoted – Fully paid up) (Face Value ₹ 10 per share)
41.91 427.68 41.91 426.59
(l) GSPL India Gasnet Ltd (Unquoted – Fully paid up) (Face Value ₹ 10 per share)
50.82 484.69 42.57 432.86
Total Investments in Associates 225,010.80 230,623.74
ParticularsAs at
March 31, 2019As at
March 31, 2018No. (in million) Amount No. (in million) Amount
(ii) Joint Ventures (Refer Note 13.1.10) (a) Mangalore SEZ Limited (Unquoted – Fully paid up) (Face Value ₹ 10 per share)
13.48 203.23 13.48 190.26
(b) ONGC Petro Additions Limited (Unquoted – Fully paid up) (Face Value ₹ 10 per share) (Refer note 13.1.3 & 13.1.4)
997.98 11,210.13 997.96 9,302.47
(c) ONGC Teri Biotech Limited (Unquoted– Fully paid up) (Face Value ₹ 10 per share)
0.02 274.73 0.02 241.45
(d) ONGC Tripura Power Company Limited (Unquoted – Fully paid up) (Face Value ₹ 10 per share)
560.00 6,667.10 560.00 6,407.32
(e) Dahej SEZ Limited (Unquoted– Fully paid up) (Face Value ₹ 10 per share)
23.02 1,172.29 23.02 1,318.86
(f) Indradhanush Gas Grid Limited (Unquoted– Fully paid up) (Face Value ₹ 10 per share)(Refer note 13.1.2)
5.00 25.76 - -
(` in million)
(` in million)
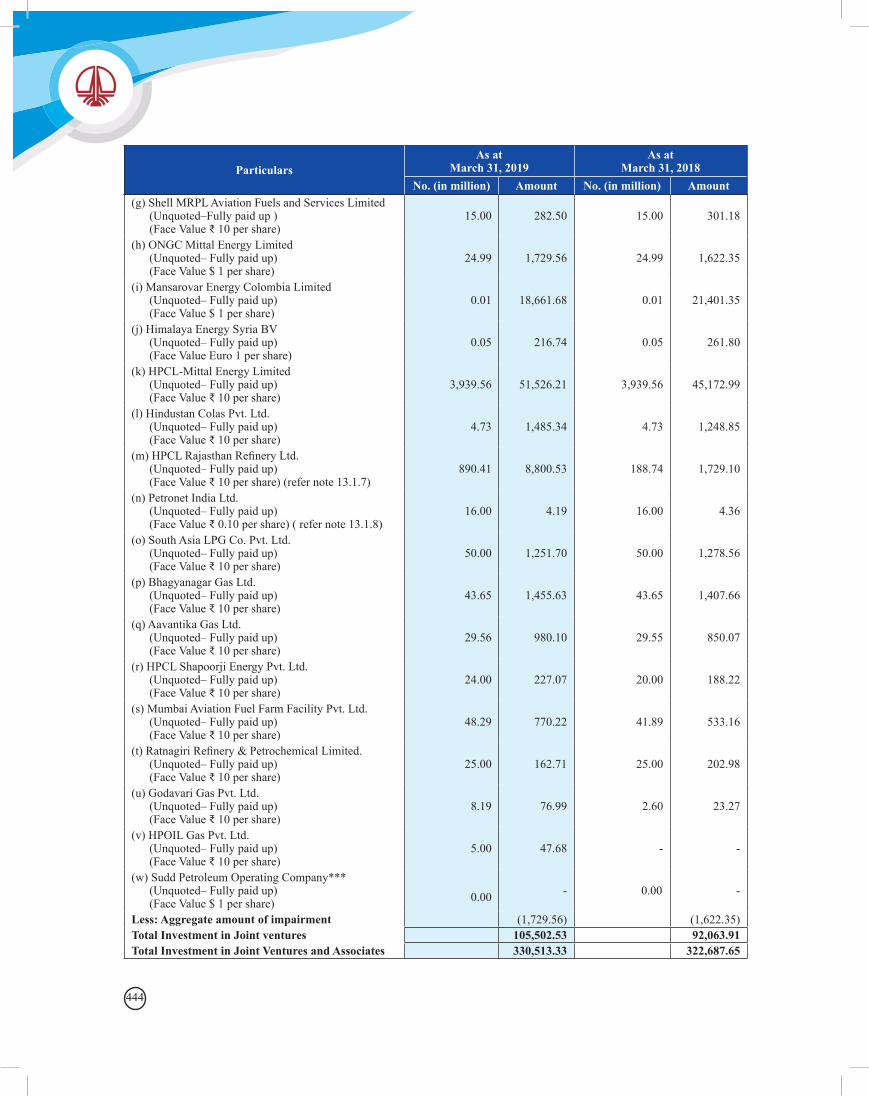
444
(g) Shell MRPL Aviation Fuels and Services Limited (Unquoted–Fully paid up ) (Face Value ₹ 10 per share)
15.00 282.50 15.00 301.18
(h) ONGC Mittal Energy Limited (Unquoted– Fully paid up) (Face Value $ 1 per share)
24.99 1,729.56 24.99 1,622.35
(i) Mansarovar Energy Colombia Limited (Unquoted– Fully paid up) (Face Value $ 1 per share)
0.01 18,661.68 0.01 21,401.35
(j) Himalaya Energy Syria BV (Unquoted– Fully paid up) (Face Value Euro 1 per share)
0.05 216.74 0.05 261.80
(k) HPCL-Mittal Energy Limited (Unquoted– Fully paid up) (Face Value ₹ 10 per share)
3,939.56 51,526.21 3,939.56 45,172.99
(l) Hindustan Colas Pvt. Ltd. (Unquoted– Fully paid up) (Face Value ₹ 10 per share)
4.73 1,485.34 4.73 1,248.85
(m) HPCL Rajasthan Refinery Ltd. (Unquoted– Fully paid up) (Face Value ₹ 10 per share) (refer note 13.1.7)
890.41 8,800.53 188.74 1,729.10
(n) Petronet India Ltd. (Unquoted– Fully paid up) (Face Value ₹ 0.10 per share) ( refer note 13.1.8)
16.00 4.19 16.00 4.36
(o) South Asia LPG Co. Pvt. Ltd. (Unquoted– Fully paid up) (Face Value ₹ 10 per share)
50.00 1,251.70 50.00 1,278.56
(p) Bhagyanagar Gas Ltd. (Unquoted– Fully paid up) (Face Value ₹ 10 per share)
43.65 1,455.63 43.65 1,407.66
(q) Aavantika Gas Ltd. (Unquoted– Fully paid up) (Face Value ₹ 10 per share)
29.56 980.10 29.55 850.07
(r) HPCL Shapoorji Energy Pvt. Ltd. (Unquoted– Fully paid up) (Face Value ₹ 10 per share)
24.00 227.07 20.00 188.22
(s) Mumbai Aviation Fuel Farm Facility Pvt. Ltd. (Unquoted– Fully paid up) (Face Value ₹ 10 per share)
48.29 770.22 41.89 533.16
(t) Ratnagiri Refinery & Petrochemical Limited. (Unquoted– Fully paid up) (Face Value ₹ 10 per share)
25.00 162.71 25.00 202.98
(u) Godavari Gas Pvt. Ltd. (Unquoted– Fully paid up) (Face Value ₹ 10 per share)
8.19 76.99 2.60 23.27
(v) HPOIL Gas Pvt. Ltd. (Unquoted– Fully paid up) (Face Value ₹ 10 per share)
5.00 47.68 - -
(w) Sudd Petroleum Operating Company*** (Unquoted– Fully paid up) (Face Value $ 1 per share)
0.00 - 0.00 -
Less: Aggregate amount of impairment (1,729.56) (1,622.35)Total Investment in Joint ventures 105,502.53 92,063.91Total Investment in Joint Ventures and Associates 330,513.33 322,687.65
ParticularsAs at
March 31, 2019As at
March 31, 2018No. (in million) Amount No. (in million) Amount
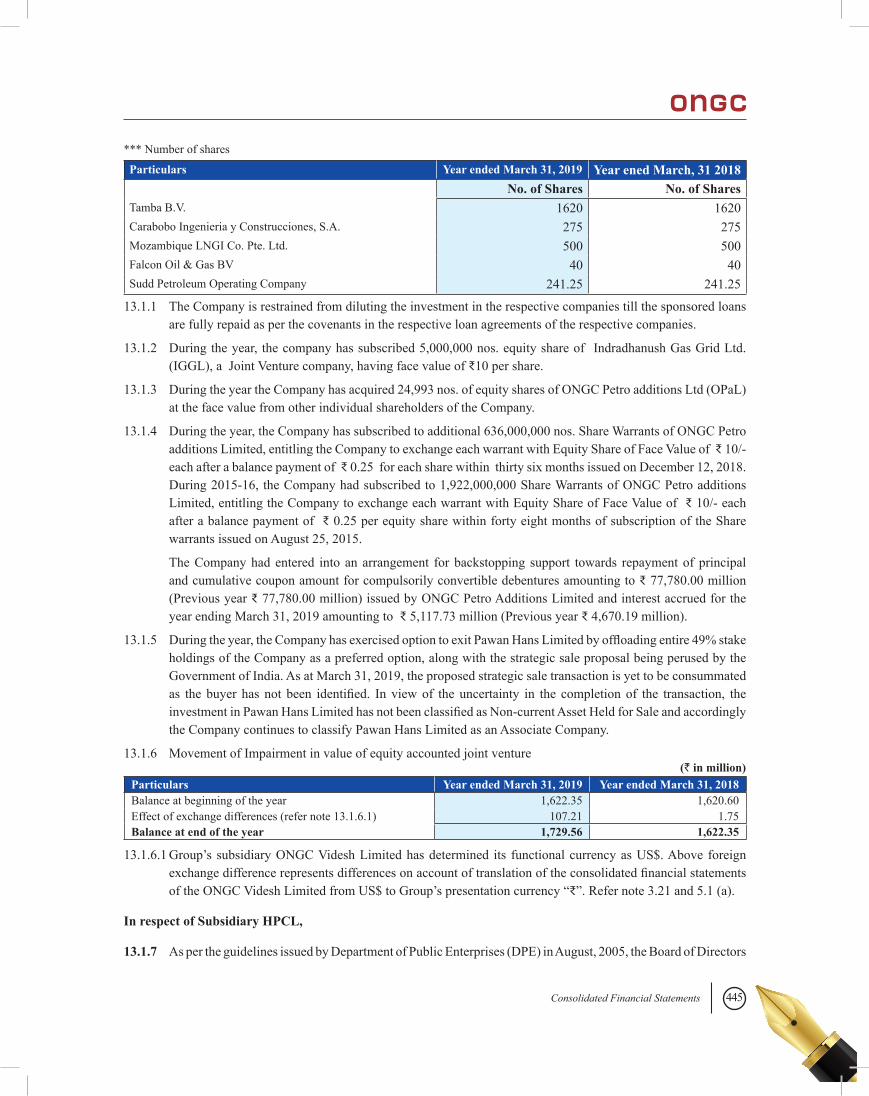
445Consolidated Financial Statements
*** Number of shares
Particulars Year ended March 31, 2019 Year ened March, 31 2018No. of Shares No. of Shares
Tamba B.V. 1620 1620Carabobo Ingenieria y Construcciones, S.A. 275 275Mozambique LNGI Co. Pte. Ltd. 500 500Falcon Oil & Gas BV 40 40Sudd Petroleum Operating Company 241.25 241.25
13.1.1 The Company is restrained from diluting the investment in the respective companies till the sponsored loans are fully repaid as per the covenants in the respective loan agreements of the respective companies.
13.1.2 During the year, the company has subscribed 5,000,000 nos. equity share of Indradhanush Gas Grid Ltd.(IGGL), a Joint Venture company, having face value of ₹10 per share.
13.1.3 During the year the Company has acquired 24,993 nos. of equity shares of ONGC Petro additions Ltd (OPaL) at the face value from other individual shareholders of the Company.
13.1.4 During the year, the Company has subscribed to additional 636,000,000 nos. Share Warrants of ONGC Petro additions Limited, entitling the Company to exchange each warrant with Equity Share of Face Value of ₹ 10/- each after a balance payment of ₹ 0.25 for each share within thirty six months issued on December 12, 2018. During 2015-16, the Company had subscribed to 1,922,000,000 Share Warrants of ONGC Petro additions Limited, entitling the Company to exchange each warrant with Equity Share of Face Value of ₹ 10/- each after a balance payment of ₹ 0.25 per equity share within forty eight months of subscription of the Share warrants issued on August 25, 2015.
The Company had entered into an arrangement for backstopping support towards repayment of principal and cumulative coupon amount for compulsorily convertible debentures amounting to ₹ 77,780.00 million (Previous year ₹ 77,780.00 million) issued by ONGC Petro Additions Limited and interest accrued for the year ending March 31, 2019 amounting to ₹ 5,117.73 million (Previous year ₹ 4,670.19 million).
13.1.5 During the year, the Company has exercised option to exit Pawan Hans Limited by offloading entire 49% stake holdings of the Company as a preferred option, along with the strategic sale proposal being perused by the Government of India. As at March 31, 2019, the proposed strategic sale transaction is yet to be consummated as the buyer has not been identified. In view of the uncertainty in the completion of the transaction, the investment in Pawan Hans Limited has not been classified as Non-current Asset Held for Sale and accordingly the Company continues to classify Pawan Hans Limited as an Associate Company.
13.1.6 Movement of Impairment in value of equity accounted joint venture(` in million)
Particulars Year ended March 31, 2019 Year ended March 31, 2018Balance at beginning of the year 1,622.35 1,620.60Effect of exchange differences (refer note 13.1.6.1) 107.21 1.75Balance at end of the year 1,729.56 1,622.35
13.1.6.1 Group’s subsidiary ONGC Videsh Limited has determined its functional currency as US$. Above foreign exchange difference represents differences on account of translation of the consolidated financial statements of the ONGC Videsh Limited from US$ to Group’s presentation currency “₹”. Refer note 3.21 and 5.1 (a).
In respect of Subsidiary HPCL,
13.1.7 As per the guidelines issued by Department of Public Enterprises (DPE) in August, 2005, the Board of Directors
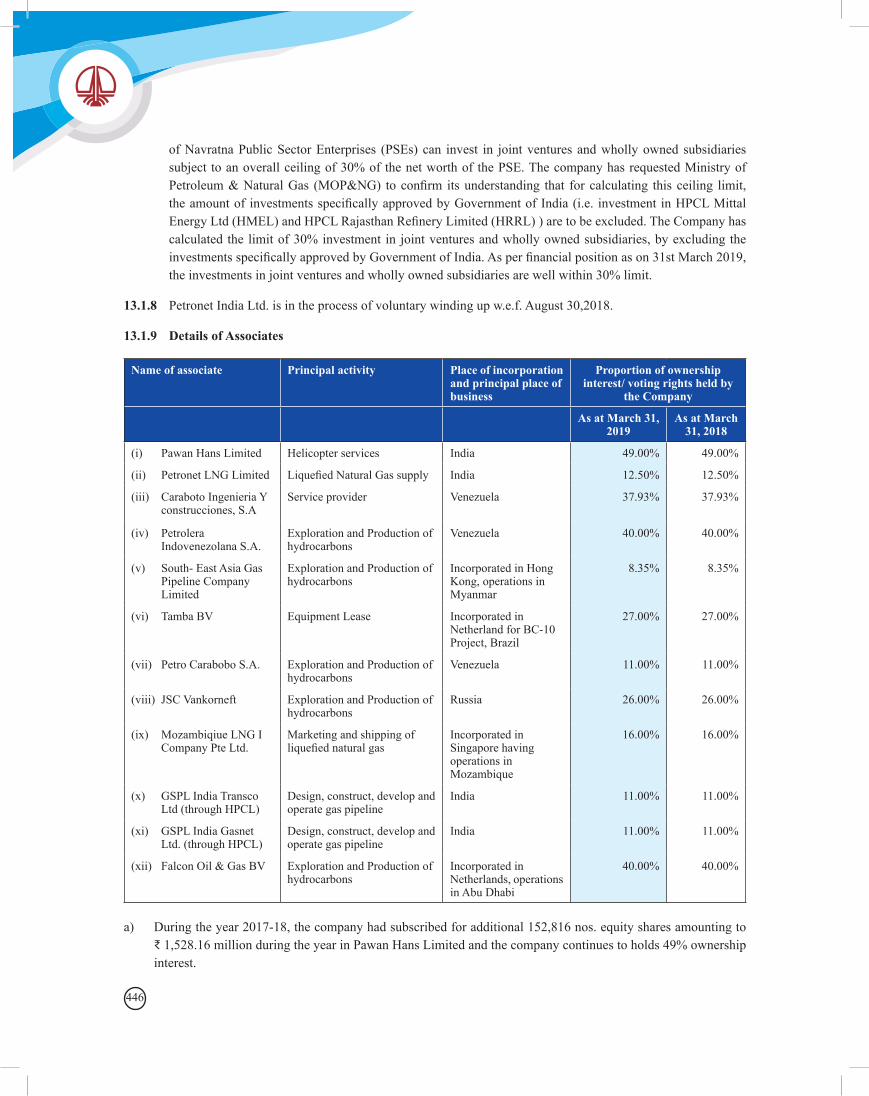
446
of Navratna Public Sector Enterprises (PSEs) can invest in joint ventures and wholly owned subsidiaries subject to an overall ceiling of 30% of the net worth of the PSE. The company has requested Ministry of Petroleum & Natural Gas (MOP&NG) to confirm its understanding that for calculating this ceiling limit, the amount of investments specifically approved by Government of India (i.e. investment in HPCL Mittal Energy Ltd (HMEL) and HPCL Rajasthan Refinery Limited (HRRL) ) are to be excluded. The Company has calculated the limit of 30% investment in joint ventures and wholly owned subsidiaries, by excluding the investments specifically approved by Government of India. As per financial position as on 31st March 2019, the investments in joint ventures and wholly owned subsidiaries are well within 30% limit.
13.1.8 Petronet India Ltd. is in the process of voluntary winding up w.e.f. August 30,2018.
13.1.9 Details of Associates
Name of associate Principal activity Place of incorporation and principal place of business
Proportion of ownership interest/ voting rights held by
the Company
As at March 31, 2019
As at March 31, 2018
(i) Pawan Hans Limited Helicopter services India 49.00% 49.00%
(ii) Petronet LNG Limited Liquefied Natural Gas supply India 12.50% 12.50%
(iii) Caraboto Ingenieria Y construcciones, S.A
Service provider Venezuela 37.93% 37.93%
(iv) Petrolera Indovenezolana S.A.
Exploration and Production of hydrocarbons
Venezuela 40.00% 40.00%
(v) South- East Asia Gas Pipeline Company Limited
Exploration and Production of hydrocarbons
Incorporated in Hong Kong, operations in Myanmar
8.35% 8.35%
(vi) Tamba BV Equipment Lease Incorporated in Netherland for BC-10 Project, Brazil
27.00% 27.00%
(vii) Petro Carabobo S.A. Exploration and Production of hydrocarbons
Venezuela 11.00% 11.00%
(viii) JSC Vankorneft Exploration and Production of hydrocarbons
Russia 26.00% 26.00%
(ix) Mozambiqiue LNG I Company Pte Ltd.
Marketing and shipping of liquefied natural gas
Incorporated in Singapore having operations in Mozambique
16.00% 16.00%
(x) GSPL India Transco Ltd (through HPCL)
Design, construct, develop and operate gas pipeline
India 11.00% 11.00%
(xi) GSPL India Gasnet Ltd. (through HPCL)
Design, construct, develop and operate gas pipeline
India 11.00% 11.00%
(xii) Falcon Oil & Gas BV Exploration and Production of hydrocarbons
Incorporated in Netherlands, operations in Abu Dhabi
40.00% 40.00%
a) During the year 2017-18, the company had subscribed for additional 152,816 nos. equity shares amounting to ₹ 1,528.16 million during the year in Pawan Hans Limited and the company continues to holds 49% ownership interest.
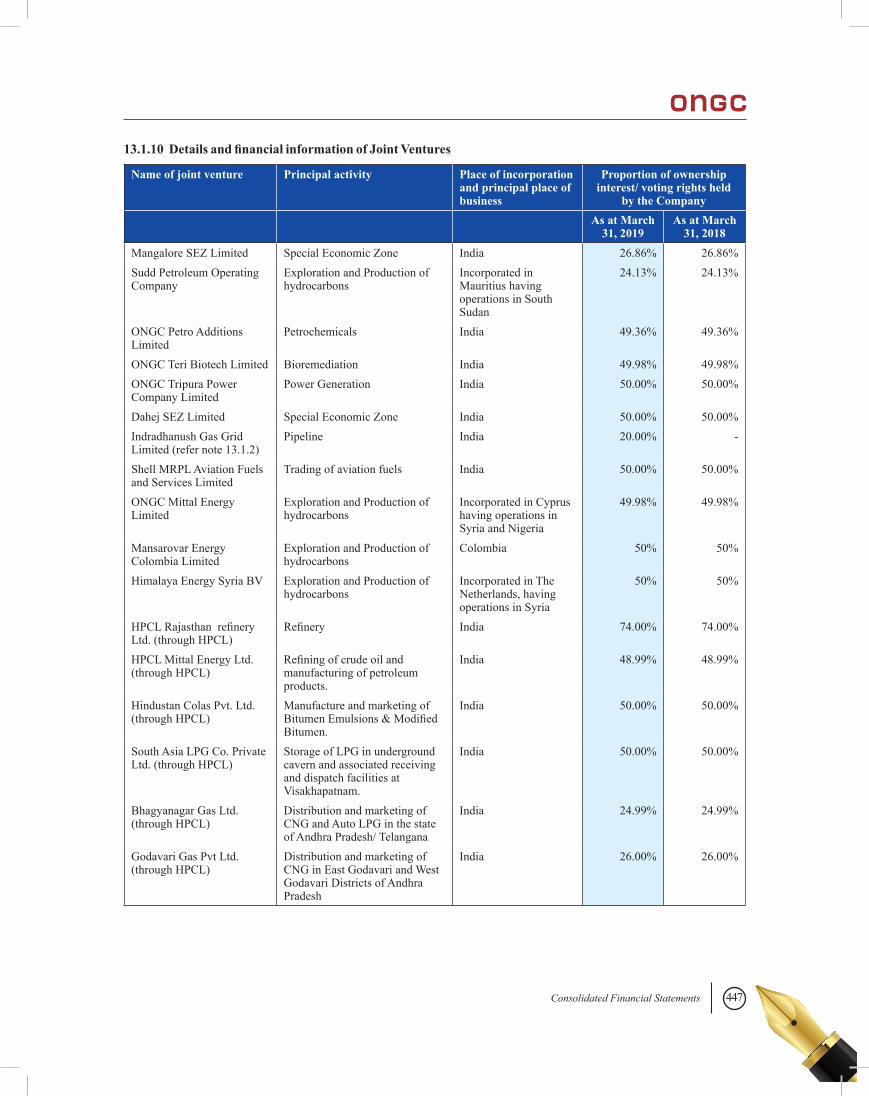
447Consolidated Financial Statements
13.1.10 Details and financial information of Joint Ventures
Name of joint venture Principal activity Place of incorporation and principal place of business
Proportion of ownership interest/ voting rights held
by the CompanyAs at March
31, 2019As at March
31, 2018Mangalore SEZ Limited Special Economic Zone India 26.86% 26.86%Sudd Petroleum Operating Company
Exploration and Production of hydrocarbons
Incorporated in Mauritius having operations in South Sudan
24.13% 24.13%
ONGC Petro Additions Limited
Petrochemicals India 49.36% 49.36%
ONGC Teri Biotech Limited Bioremediation India 49.98% 49.98%ONGC Tripura Power Company Limited
Power Generation India 50.00% 50.00%
Dahej SEZ Limited Special Economic Zone India 50.00% 50.00%Indradhanush Gas Grid Limited (refer note 13.1.2)
Pipeline India 20.00% -
Shell MRPL Aviation Fuels and Services Limited
Trading of aviation fuels India 50.00% 50.00%
ONGC Mittal Energy Limited
Exploration and Production of hydrocarbons
Incorporated in Cyprus having operations in Syria and Nigeria
49.98% 49.98%
Mansarovar Energy Colombia Limited
Exploration and Production of hydrocarbons
Colombia 50% 50%
Himalaya Energy Syria BV Exploration and Production of hydrocarbons
Incorporated in The Netherlands, having operations in Syria
50% 50%
HPCL Rajasthan refinery Ltd. (through HPCL)
Refinery India 74.00% 74.00%
HPCL Mittal Energy Ltd. (through HPCL)
Refining of crude oil and manufacturing of petroleum products.
India 48.99% 48.99%
Hindustan Colas Pvt. Ltd. (through HPCL)
Manufacture and marketing of Bitumen Emulsions & Modified Bitumen.
India 50.00% 50.00%
South Asia LPG Co. Private Ltd. (through HPCL)
Storage of LPG in underground cavern and associated receiving and dispatch facilities at Visakhapatnam.
India 50.00% 50.00%
Bhagyanagar Gas Ltd. (through HPCL)
Distribution and marketing of CNG and Auto LPG in the state of Andhra Pradesh/ Telangana
India 24.99% 24.99%
Godavari Gas Pvt Ltd. (through HPCL)
Distribution and marketing of CNG in East Godavari and West Godavari Districts of Andhra Pradesh
India 26.00% 26.00%
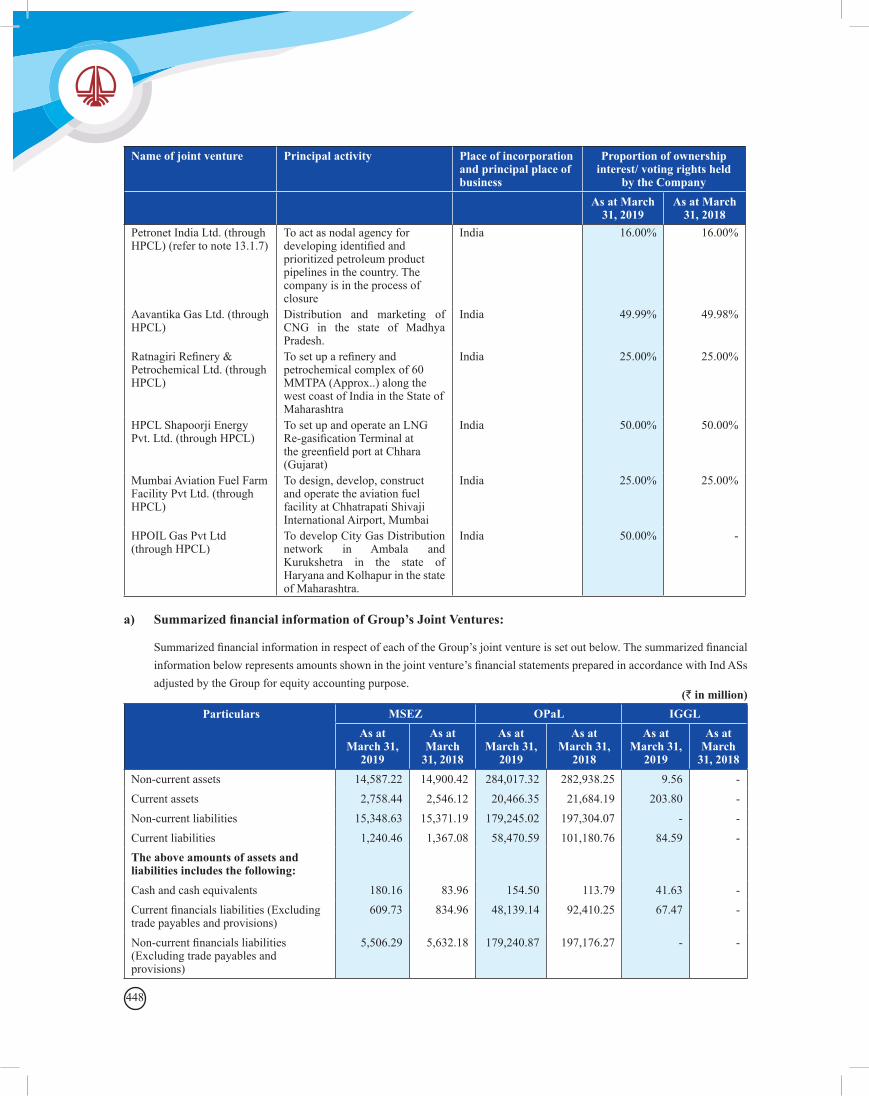
448
Name of joint venture Principal activity Place of incorporation and principal place of business
Proportion of ownership interest/ voting rights held
by the CompanyAs at March
31, 2019As at March
31, 2018Petronet India Ltd. (through HPCL) (refer to note 13.1.7)
To act as nodal agency for developing identified and prioritized petroleum product pipelines in the country. The company is in the process of closure
India 16.00% 16.00%
Aavantika Gas Ltd. (through HPCL)
Distribution and marketing of CNG in the state of Madhya Pradesh.
India 49.99% 49.98%
Ratnagiri Refinery & Petrochemical Ltd. (through HPCL)
To set up a refinery and petrochemical complex of 60 MMTPA (Approx..) along the west coast of India in the State of Maharashtra
India 25.00% 25.00%
HPCL Shapoorji Energy Pvt. Ltd. (through HPCL)
To set up and operate an LNG Re-gasification Terminal at the greenfield port at Chhara (Gujarat)
India 50.00% 50.00%
Mumbai Aviation Fuel Farm Facility Pvt Ltd. (through HPCL)
To design, develop, construct and operate the aviation fuel facility at Chhatrapati Shivaji International Airport, Mumbai
India 25.00% 25.00%
HPOIL Gas Pvt Ltd (through HPCL)
To develop City Gas Distribution network in Ambala and Kurukshetra in the state of Haryana and Kolhapur in the state of Maharashtra.
India 50.00% -
a) Summarized financial information of Group’s Joint Ventures:
Summarized financial information in respect of each of the Group’s joint venture is set out below. The summarized financial information below represents amounts shown in the joint venture’s financial statements prepared in accordance with Ind ASs adjusted by the Group for equity accounting purpose.
Particulars MSEZ OPaL IGGLAs at
March 31, 2019
As at March
31, 2018
As at March 31,
2019
As at March 31,
2018
As at March 31,
2019
As at March
31, 2018Non-current assets 14,587.22 14,900.42 284,017.32 282,938.25 9.56 -Current assets 2,758.44 2,546.12 20,466.35 21,684.19 203.80 -Non-current liabilities 15,348.63 15,371.19 179,245.02 197,304.07 - -Current liabilities 1,240.46 1,367.08 58,470.59 101,180.76 84.59 -The above amounts of assets and liabilities includes the following:
Cash and cash equivalents 180.16 83.96 154.50 113.79 41.63 -Current financials liabilities (Excluding trade payables and provisions)
609.73 834.96 48,139.14 92,410.25 67.47 -
Non-current financials liabilities (Excluding trade payables and provisions)
5,506.29 5,632.18 179,240.87 197,176.27 - -
(` in million)
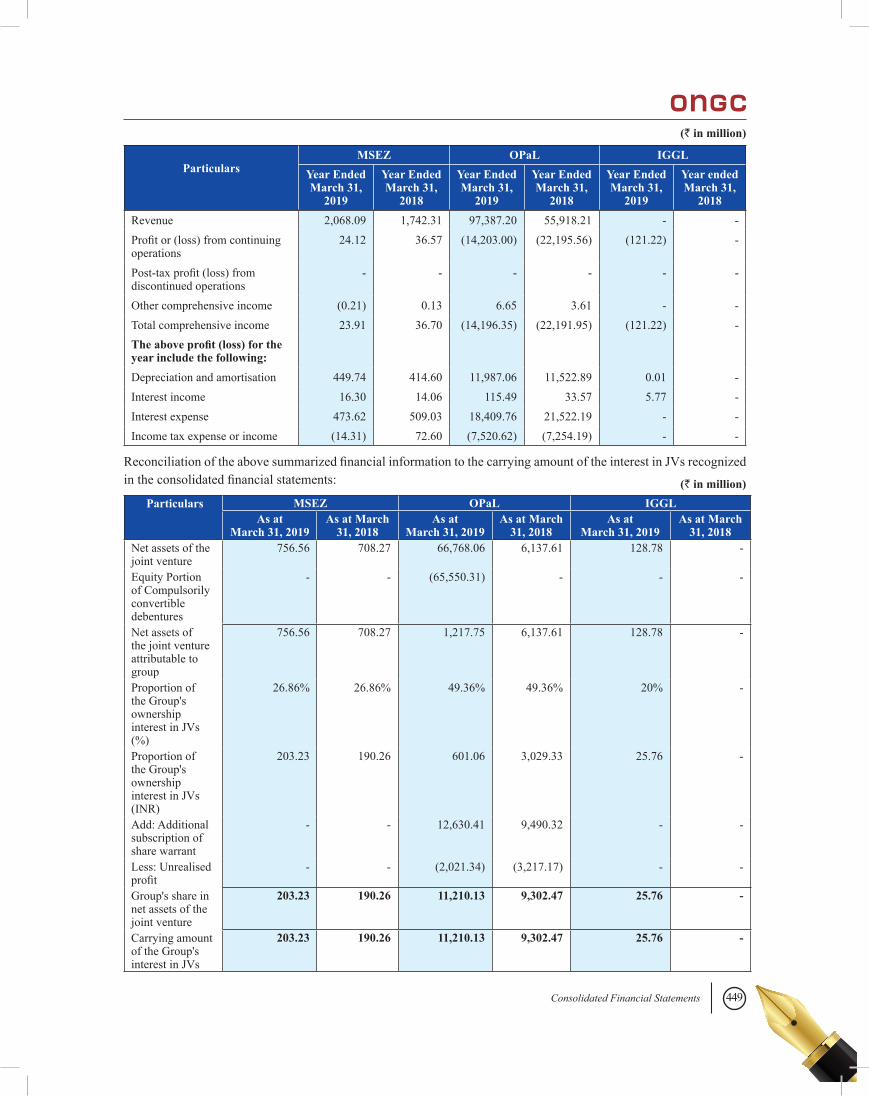
449Consolidated Financial Statements
Particulars
MSEZ OPaL IGGLYear Ended March 31,
2019
Year Ended March 31,
2018
Year Ended March 31,
2019
Year Ended March 31,
2018
Year Ended March 31,
2019
Year ended March 31,
2018Revenue 2,068.09 1,742.31 97,387.20 55,918.21 - -Profit or (loss) from continuing operations
24.12 36.57 (14,203.00) (22,195.56) (121.22) -
Post-tax profit (loss) from discontinued operations
- - - - - -
Other comprehensive income (0.21) 0.13 6.65 3.61 - -Total comprehensive income 23.91 36.70 (14,196.35) (22,191.95) (121.22) -The above profit (loss) for the year include the following:
Depreciation and amortisation 449.74 414.60 11,987.06 11,522.89 0.01 -Interest income 16.30 14.06 115.49 33.57 5.77 -Interest expense 473.62 509.03 18,409.76 21,522.19 - -Income tax expense or income (14.31) 72.60 (7,520.62) (7,254.19) - -
Reconciliation of the above summarized financial information to the carrying amount of the interest in JVs recognized in the consolidated financial statements:
Particulars MSEZ OPaL IGGLAs at
March 31, 2019As at March
31, 2018As at
March 31, 2019As at March
31, 2018As at
March 31, 2019As at March
31, 2018Net assets of the joint venture
756.56 708.27 66,768.06 6,137.61 128.78 -
Equity Portion of Compulsorily convertible debentures
- - (65,550.31) - - -
Net assets of the joint venture attributable to group
756.56 708.27 1,217.75 6,137.61 128.78 -
Proportion of the Group's ownership interest in JVs (%)
26.86% 26.86% 49.36% 49.36% 20% -
Proportion of the Group's ownership interest in JVs (INR)
203.23 190.26 601.06 3,029.33 25.76 -
Add: Additional subscription of share warrant
- - 12,630.41 9,490.32 - -
Less: Unrealised profit
- - (2,021.34) (3,217.17) - -
Group's share in net assets of the joint venture
203.23 190.26 11,210.13 9,302.47 25.76 -
Carrying amount of the Group's interest in JVs
203.23 190.26 11,210.13 9,302.47 25.76 -
(` in million)
(` in million)
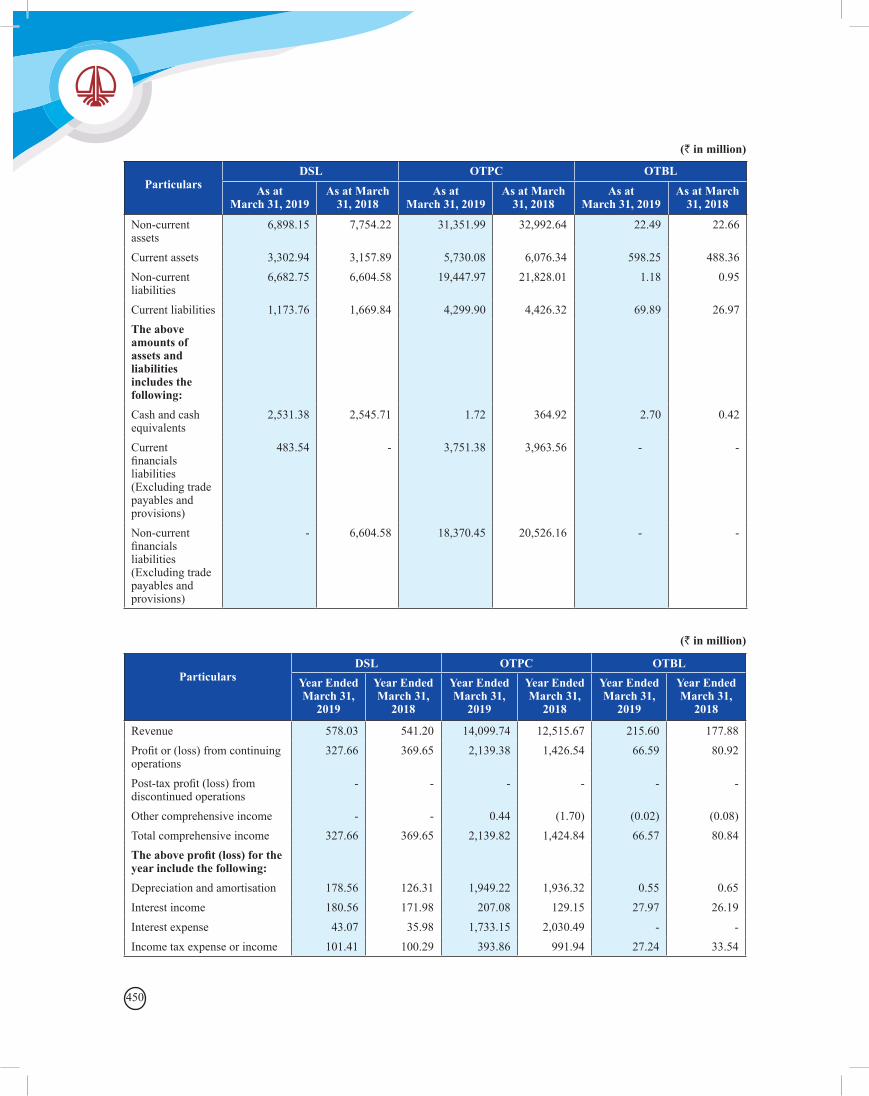
450
Particulars
DSL OTPC OTBL
As at March 31, 2019
As at March 31, 2018
As at March 31, 2019
As at March 31, 2018
As at March 31, 2019
As at March 31, 2018
Non-current assets
6,898.15 7,754.22 31,351.99 32,992.64 22.49 22.66
Current assets 3,302.94 3,157.89 5,730.08 6,076.34 598.25 488.36Non-current liabilities
6,682.75 6,604.58 19,447.97 21,828.01 1.18 0.95
Current liabilities 1,173.76 1,669.84 4,299.90 4,426.32 69.89 26.97The above amounts of assets and liabilities includes the following:
Cash and cash equivalents
2,531.38 2,545.71 1.72 364.92 2.70 0.42
Current financials liabilities (Excluding trade payables and provisions)
483.54 - 3,751.38 3,963.56 - -
Non-current financials liabilities (Excluding trade payables and provisions)
- 6,604.58 18,370.45 20,526.16 - -
(` in million)
(` in million)
Particulars
DSL OTPC OTBLYear Ended March 31,
2019
Year Ended March 31,
2018
Year Ended March 31,
2019
Year Ended March 31,
2018
Year Ended March 31,
2019
Year Ended March 31,
2018
Revenue 578.03 541.20 14,099.74 12,515.67 215.60 177.88Profit or (loss) from continuing operations
327.66 369.65 2,139.38 1,426.54 66.59 80.92
Post-tax profit (loss) from discontinued operations
- - - - - -
Other comprehensive income - - 0.44 (1.70) (0.02) (0.08)Total comprehensive income 327.66 369.65 2,139.82 1,424.84 66.57 80.84The above profit (loss) for the year include the following:
Depreciation and amortisation 178.56 126.31 1,949.22 1,936.32 0.55 0.65Interest income 180.56 171.98 207.08 129.15 27.97 26.19Interest expense 43.07 35.98 1,733.15 2,030.49 - -Income tax expense or income 101.41 100.29 393.86 991.94 27.24 33.54
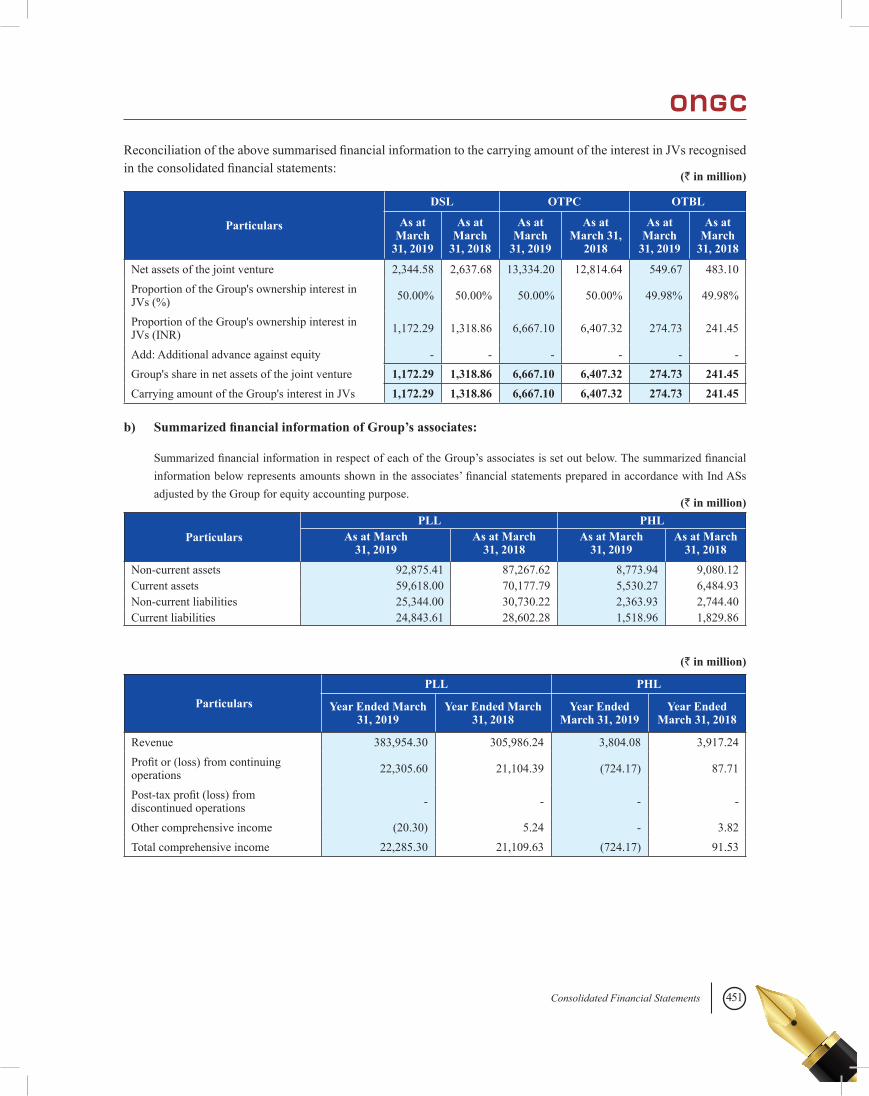
451Consolidated Financial Statements
Reconciliation of the above summarised financial information to the carrying amount of the interest in JVs recognised in the consolidated financial statements:
b) Summarized financial information of Group’s associates:
Summarized financial information in respect of each of the Group’s associates is set out below. The summarized financial information below represents amounts shown in the associates’ financial statements prepared in accordance with Ind ASs adjusted by the Group for equity accounting purpose.
(` in million)
(` in million)
(` in million)
Particulars
DSL OTPC OTBL
As at March
31, 2019
As at March
31, 2018
As at March
31, 2019
As at March 31,
2018
As at March
31, 2019
As at March
31, 2018
Net assets of the joint venture 2,344.58 2,637.68 13,334.20 12,814.64 549.67 483.10Proportion of the Group's ownership interest in JVs (%) 50.00% 50.00% 50.00% 50.00% 49.98% 49.98%
Proportion of the Group's ownership interest in JVs (INR) 1,172.29 1,318.86 6,667.10 6,407.32 274.73 241.45
Add: Additional advance against equity - - - - - -Group's share in net assets of the joint venture 1,172.29 1,318.86 6,667.10 6,407.32 274.73 241.45Carrying amount of the Group's interest in JVs 1,172.29 1,318.86 6,667.10 6,407.32 274.73 241.45
ParticularsPLL PHL
As at March31, 2019
As at March31, 2018
As at March31, 2019
As at March 31, 2018
Non-current assets 92,875.41 87,267.62 8,773.94 9,080.12Current assets 59,618.00 70,177.79 5,530.27 6,484.93Non-current liabilities 25,344.00 30,730.22 2,363.93 2,744.40Current liabilities 24,843.61 28,602.28 1,518.96 1,829.86
ParticularsPLL PHL
Year Ended March 31, 2019
Year Ended March 31, 2018
Year Ended March 31, 2019
Year Ended March 31, 2018
Revenue 383,954.30 305,986.24 3,804.08 3,917.24Profit or (loss) from continuing operations 22,305.60 21,104.39 (724.17) 87.71
Post-tax profit (loss) from discontinued operations - - - -
Other comprehensive income (20.30) 5.24 - 3.82Total comprehensive income 22,285.30 21,109.63 (724.17) 91.53
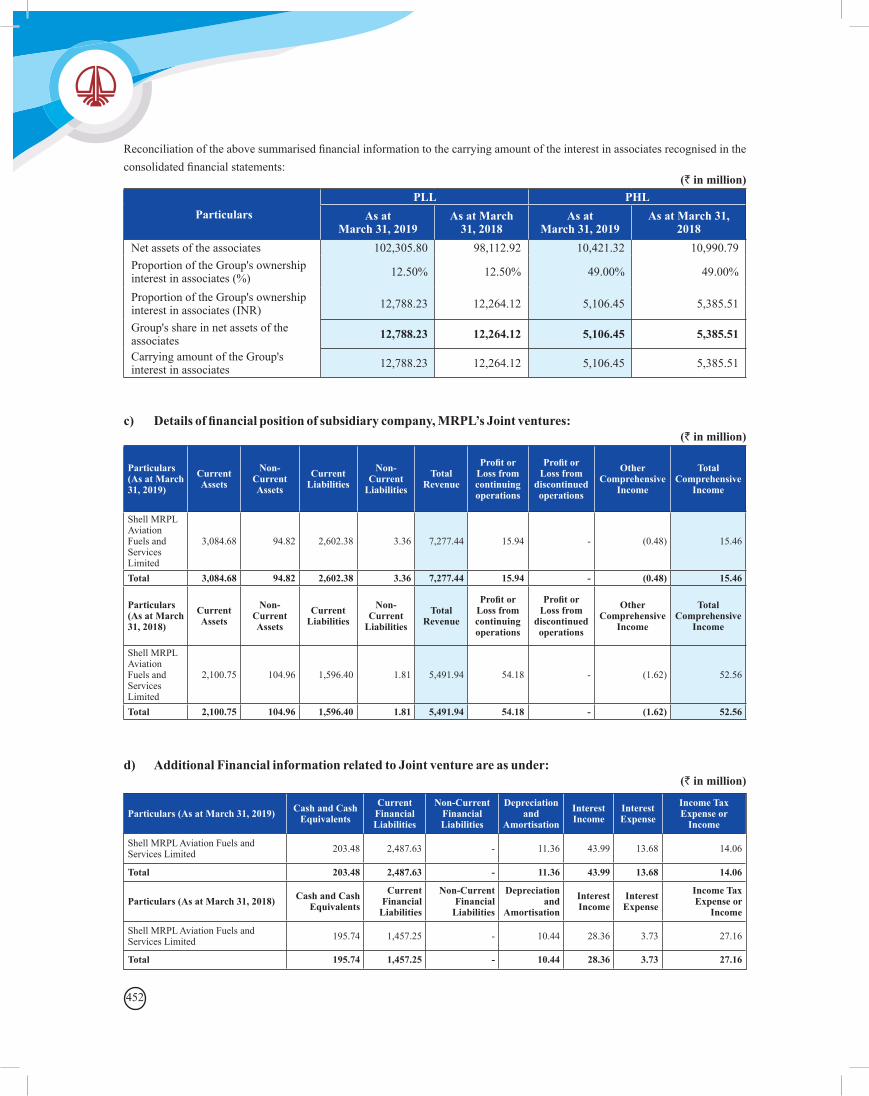
452
Reconciliation of the above summarised financial information to the carrying amount of the interest in associates recognised in the consolidated financial statements:
ParticularsPLL PHL
As at March 31, 2019
As at March 31, 2018
As at March 31, 2019
As at March 31, 2018
Net assets of the associates 102,305.80 98,112.92 10,421.32 10,990.79Proportion of the Group's ownership interest in associates (%) 12.50% 12.50% 49.00% 49.00%
Proportion of the Group's ownership interest in associates (INR) 12,788.23 12,264.12 5,106.45 5,385.51
Group's share in net assets of the associates 12,788.23 12,264.12 5,106.45 5,385.51
Carrying amount of the Group's interest in associates 12,788.23 12,264.12 5,106.45 5,385.51
(` in million)
(` in million)
(` in million)
c) Details of financial position of subsidiary company, MRPL’s Joint ventures:
d) Additional Financial information related to Joint venture are as under:
Particulars (As at March 31, 2019)
Current Assets
Non-Current Assets
Current Liabilities
Non-Current
LiabilitiesTotal
Revenue
Profit or Loss from continuing operations
Profit or Loss from
discontinued operations
Other Comprehensive
Income
Total Comprehensive
Income
Shell MRPL Aviation Fuels and Services Limited
3,084.68 94.82 2,602.38 3.36 7,277.44 15.94 - (0.48) 15.46
Total 3,084.68 94.82 2,602.38 3.36 7,277.44 15.94 - (0.48) 15.46
Particulars (As at March 31, 2018)
Current Assets
Non-Current Assets
Current Liabilities
Non-Current
LiabilitiesTotal
Revenue
Profit or Loss from continuing operations
Profit or Loss from
discontinued operations
Other Comprehensive
Income
Total Comprehensive
Income
Shell MRPL Aviation Fuels and Services Limited
2,100.75 104.96 1,596.40 1.81 5,491.94 54.18 - (1.62) 52.56
Total 2,100.75 104.96 1,596.40 1.81 5,491.94 54.18 - (1.62) 52.56
Particulars (As at March 31, 2019) Cash and Cash Equivalents
Current Financial Liabilities
Non-Current Financial Liabilities
Depreciation and
AmortisationInterest Income
Interest Expense
Income Tax Expense or
Income
Shell MRPL Aviation Fuels and Services Limited 203.48 2,487.63 - 11.36 43.99 13.68 14.06
Total 203.48 2,487.63 - 11.36 43.99 13.68 14.06
Particulars (As at March 31, 2018) Cash and Cash Equivalents
Current Financial
Liabilities
Non-Current Financial
Liabilities
Depreciation and
AmortisationInterest Income
Interest Expense
Income Tax Expense or
Income
Shell MRPL Aviation Fuels and Services Limited 195.74 1,457.25 - 10.44 28.36 3.73 27.16
Total 195.74 1,457.25 - 10.44 28.36 3.73 27.16
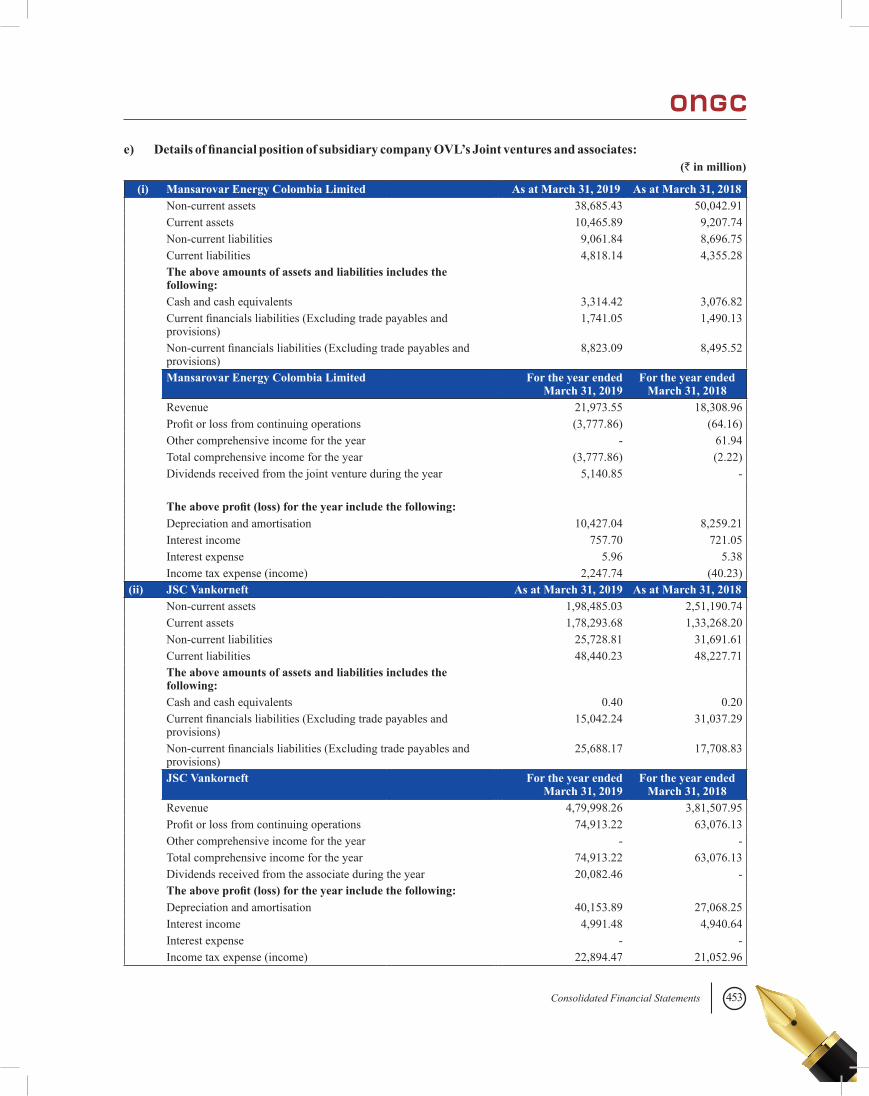
453Consolidated Financial Statements
e) Details of financial position of subsidiary company OVL’s Joint ventures and associates:(` in million)
(i) Mansarovar Energy Colombia Limited As at March 31, 2019 As at March 31, 2018Non-current assets 38,685.43 50,042.91Current assets 10,465.89 9,207.74Non-current liabilities 9,061.84 8,696.75Current liabilities 4,818.14 4,355.28The above amounts of assets and liabilities includes the following:Cash and cash equivalents 3,314.42 3,076.82Current financials liabilities (Excluding trade payables and provisions)
1,741.05 1,490.13
Non-current financials liabilities (Excluding trade payables and provisions)
8,823.09 8,495.52
Mansarovar Energy Colombia Limited For the year ended March 31, 2019
For the year ended March 31, 2018
Revenue 21,973.55 18,308.96Profit or loss from continuing operations (3,777.86) (64.16)Other comprehensive income for the year - 61.94Total comprehensive income for the year (3,777.86) (2.22)Dividends received from the joint venture during the year 5,140.85 -
The above profit (loss) for the year include the following:Depreciation and amortisation 10,427.04 8,259.21Interest income 757.70 721.05Interest expense 5.96 5.38Income tax expense (income) 2,247.74 (40.23)
(ii) JSC Vankorneft As at March 31, 2019 As at March 31, 2018Non-current assets 1,98,485.03 2,51,190.74Current assets 1,78,293.68 1,33,268.20Non-current liabilities 25,728.81 31,691.61Current liabilities 48,440.23 48,227.71The above amounts of assets and liabilities includes the following:Cash and cash equivalents 0.40 0.20Current financials liabilities (Excluding trade payables and provisions)
15,042.24 31,037.29
Non-current financials liabilities (Excluding trade payables and provisions)
25,688.17 17,708.83
JSC Vankorneft For the year ended March 31, 2019
For the year ended March 31, 2018
Revenue 4,79,998.26 3,81,507.95Profit or loss from continuing operations 74,913.22 63,076.13Other comprehensive income for the year - -Total comprehensive income for the year 74,913.22 63,076.13Dividends received from the associate during the year 20,082.46 -The above profit (loss) for the year include the following:Depreciation and amortisation 40,153.89 27,068.25Interest income 4,991.48 4,940.64Interest expense - -Income tax expense (income) 22,894.47 21,052.96
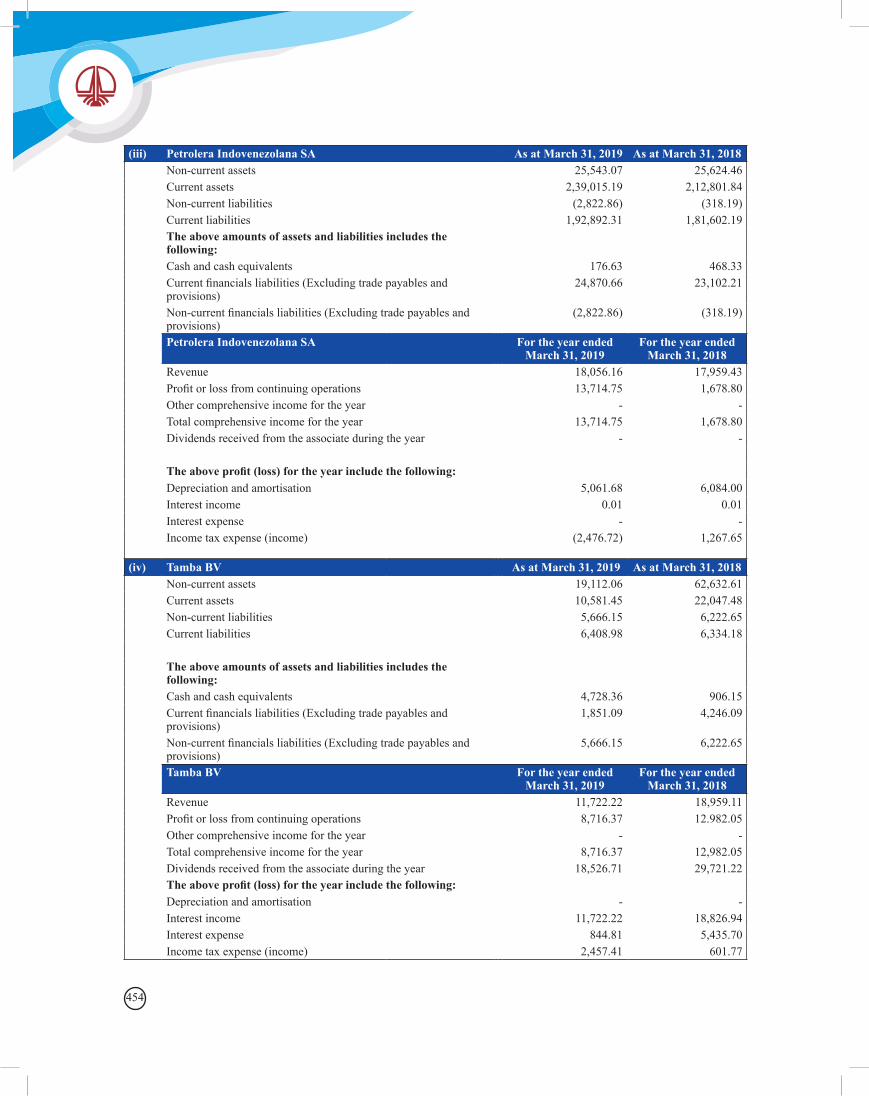
454
(iii) Petrolera Indovenezolana SA As at March 31, 2019 As at March 31, 2018Non-current assets 25,543.07 25,624.46Current assets 2,39,015.19 2,12,801.84Non-current liabilities (2,822.86) (318.19)Current liabilities 1,92,892.31 1,81,602.19The above amounts of assets and liabilities includes the following:Cash and cash equivalents 176.63 468.33Current financials liabilities (Excluding trade payables and provisions)
24,870.66 23,102.21
Non-current financials liabilities (Excluding trade payables and provisions)
(2,822.86) (318.19)
Petrolera Indovenezolana SA For the year ended March 31, 2019
For the year ended March 31, 2018
Revenue 18,056.16 17,959.43Profit or loss from continuing operations 13,714.75 1,678.80Other comprehensive income for the year - -Total comprehensive income for the year 13,714.75 1,678.80Dividends received from the associate during the year - -
The above profit (loss) for the year include the following:Depreciation and amortisation 5,061.68 6,084.00Interest income 0.01 0.01Interest expense - -Income tax expense (income) (2,476.72) 1,267.65
(iv) Tamba BV As at March 31, 2019 As at March 31, 2018Non-current assets 19,112.06 62,632.61Current assets 10,581.45 22,047.48Non-current liabilities 5,666.15 6,222.65Current liabilities 6,408.98 6,334.18
The above amounts of assets and liabilities includes the following:Cash and cash equivalents 4,728.36 906.15Current financials liabilities (Excluding trade payables and provisions)
1,851.09 4,246.09
Non-current financials liabilities (Excluding trade payables and provisions)
5,666.15 6,222.65
Tamba BV For the year ended March 31, 2019
For the year ended March 31, 2018
Revenue 11,722.22 18,959.11Profit or loss from continuing operations 8,716.37 12.982.05Other comprehensive income for the year - -Total comprehensive income for the year 8,716.37 12,982.05Dividends received from the associate during the year 18,526.71 29,721.22The above profit (loss) for the year include the following:Depreciation and amortisation - -Interest income 11,722.22 18,826.94Interest expense 844.81 5,435.70Income tax expense (income) 2,457.41 601.77
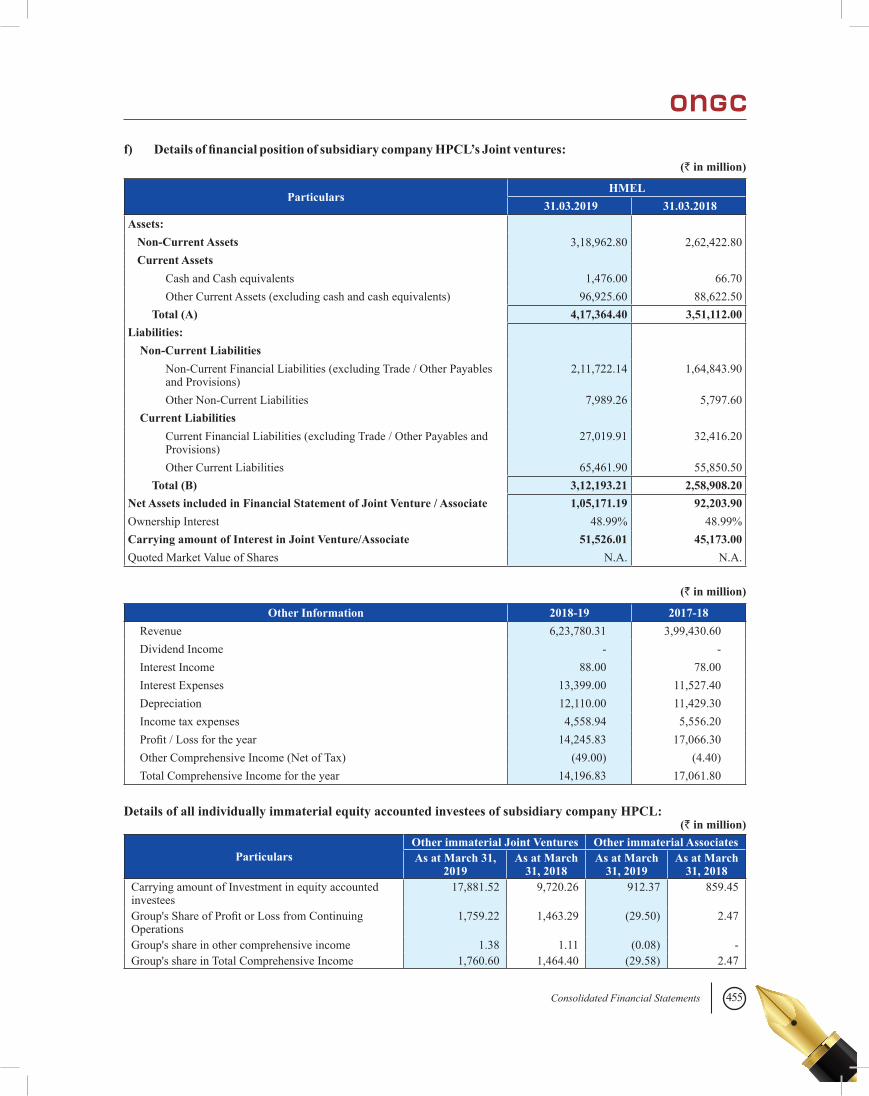
455Consolidated Financial Statements
f) Details of financial position of subsidiary company HPCL’s Joint ventures:
Details of all individually immaterial equity accounted investees of subsidiary company HPCL:
(` in million)
(` in million)
(` in million)
Particulars HMEL
31.03.2019 31.03.2018Assets:
Non-Current Assets 3,18,962.80 2,62,422.80 Current Assets
Cash and Cash equivalents 1,476.00 66.70 Other Current Assets (excluding cash and cash equivalents) 96,925.60 88,622.50
Total (A) 4,17,364.40 3,51,112.00 Liabilities:
Non-Current LiabilitiesNon-Current Financial Liabilities (excluding Trade / Other Payables and Provisions)
2,11,722.14 1,64,843.90
Other Non-Current Liabilities 7,989.26 5,797.60 Current Liabilities
Current Financial Liabilities (excluding Trade / Other Payables and Provisions)
27,019.91 32,416.20
Other Current Liabilities 65,461.90 55,850.50 Total (B) 3,12,193.21 2,58,908.20
Net Assets included in Financial Statement of Joint Venture / Associate 1,05,171.19 92,203.90 Ownership Interest 48.99% 48.99%Carrying amount of Interest in Joint Venture/Associate 51,526.01 45,173.00 Quoted Market Value of Shares N.A. N.A.
Other Information 2018-19 2017-18Revenue 6,23,780.31 3,99,430.60Dividend Income - -Interest Income 88.00 78.00Interest Expenses 13,399.00 11,527.40Depreciation 12,110.00 11,429.30Income tax expenses 4,558.94 5,556.20Profit / Loss for the year 14,245.83 17,066.30Other Comprehensive Income (Net of Tax) (49.00) (4.40)Total Comprehensive Income for the year 14,196.83 17,061.80
ParticularsOther immaterial Joint Ventures Other immaterial AssociatesAs at March 31,
2019As at March
31, 2018As at March
31, 2019As at March
31, 2018Carrying amount of Investment in equity accounted investees
17,881.52 9,720.26 912.37 859.45
Group's Share of Profit or Loss from Continuing Operations
1,759.22 1,463.29 (29.50) 2.47
Group's share in other comprehensive income 1.38 1.11 (0.08) -Group's share in Total Comprehensive Income 1,760.60 1,464.40 (29.58) 2.47
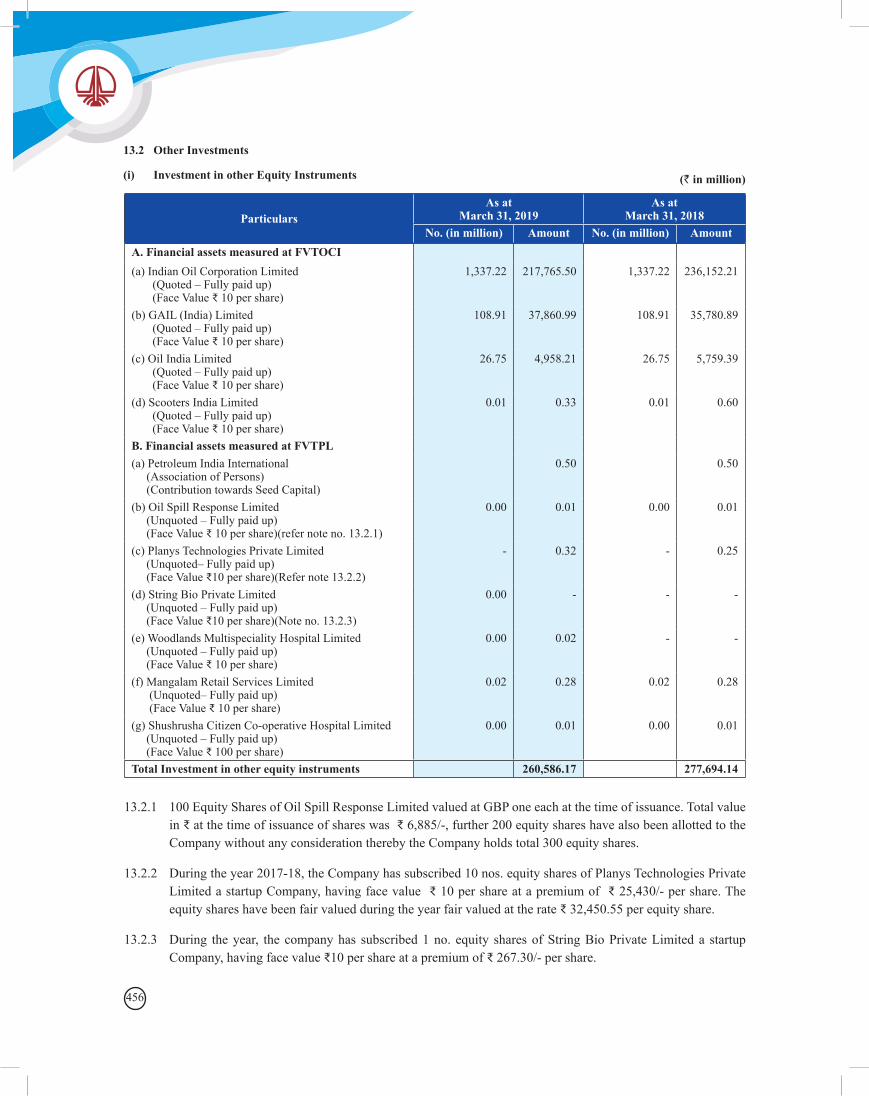
456
13.2 Other Investments
(i) Investment in other Equity Instruments
ParticularsAs at
March 31, 2019As at
March 31, 2018No. (in million) Amount No. (in million) Amount
A. Financial assets measured at FVTOCI (a) Indian Oil Corporation Limited (Quoted – Fully paid up) (Face Value ₹ 10 per share)
1,337.22 217,765.50 1,337.22 236,152.21
(b) GAIL (India) Limited (Quoted – Fully paid up) (Face Value ₹ 10 per share)
108.91 37,860.99 108.91 35,780.89
(c) Oil India Limited (Quoted – Fully paid up) (Face Value ₹ 10 per share)
26.75 4,958.21 26.75 5,759.39
(d) Scooters India Limited (Quoted – Fully paid up) (Face Value ₹ 10 per share)
0.01 0.33 0.01 0.60
B. Financial assets measured at FVTPL (a) Petroleum India International (Association of Persons) (Contribution towards Seed Capital)
0.50 0.50
(b) Oil Spill Response Limited (Unquoted – Fully paid up) (Face Value ₹ 10 per share)(refer note no. 13.2.1)
0.00 0.01 0.00 0.01
(c) Planys Technologies Private Limited (Unquoted– Fully paid up) (Face Value ₹10 per share)(Refer note 13.2.2)
- 0.32 - 0.25
(d) String Bio Private Limited (Unquoted – Fully paid up) (Face Value ₹10 per share)(Note no. 13.2.3)
0.00 - - -
(e) Woodlands Multispeciality Hospital Limited (Unquoted – Fully paid up) (Face Value ₹ 10 per share)
0.00 0.02 - -
(f) Mangalam Retail Services Limited (Unquoted– Fully paid up) (Face Value ₹ 10 per share)
0.02 0.28 0.02 0.28
(g) Shushrusha Citizen Co-operative Hospital Limited (Unquoted – Fully paid up) (Face Value ₹ 100 per share)
0.00 0.01 0.00 0.01
Total Investment in other equity instruments 260,586.17 277,694.14
(` in million)
13.2.1 100 Equity Shares of Oil Spill Response Limited valued at GBP one each at the time of issuance. Total value in ₹ at the time of issuance of shares was ₹ 6,885/-, further 200 equity shares have also been allotted to the Company without any consideration thereby the Company holds total 300 equity shares.
13.2.2 During the year 2017-18, the Company has subscribed 10 nos. equity shares of Planys Technologies Private Limited a startup Company, having face value ₹ 10 per share at a premium of ₹ 25,430/- per share. The equity shares have been fair valued during the year fair valued at the rate ₹ 32,450.55 per equity share.
13.2.3 During the year, the company has subscribed 1 no. equity shares of String Bio Private Limited a startup Company, having face value ₹10 per share at a premium of ₹ 267.30/- per share.
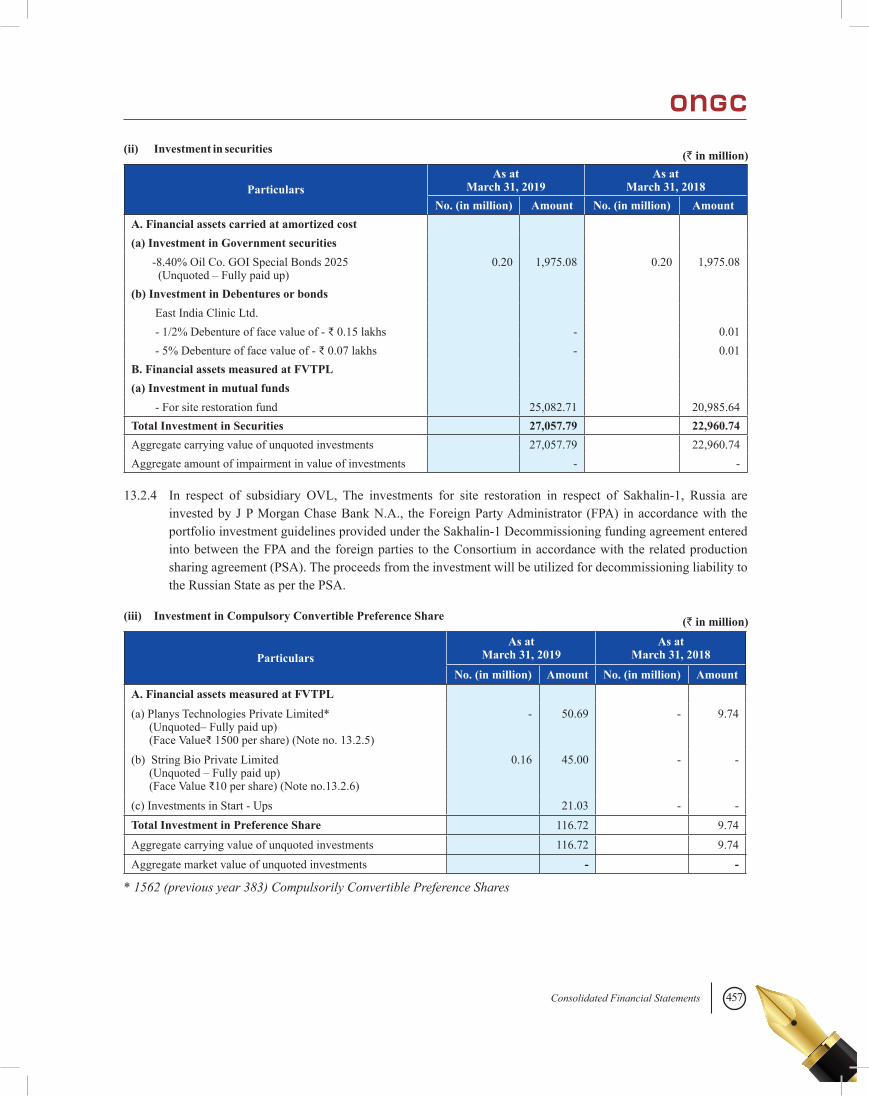
457Consolidated Financial Statements
(ii) Investment in securities
ParticularsAs at
March 31, 2019As at
March 31, 2018No. (in million) Amount No. (in million) Amount
A. Financial assets carried at amortized cost (a) Investment in Government securities
-8.40% Oil Co. GOI Special Bonds 2025 (Unquoted – Fully paid up)
0.20 1,975.08 0.20 1,975.08
(b) Investment in Debentures or bonds East India Clinic Ltd. - 1/2% Debenture of face value of - ₹ 0.15 lakhs - 0.01 - 5% Debenture of face value of - ₹ 0.07 lakhs - 0.01
B. Financial assets measured at FVTPL (a) Investment in mutual funds
- For site restoration fund 25,082.71 20,985.64Total Investment in Securities 27,057.79 22,960.74Aggregate carrying value of unquoted investments 27,057.79 22,960.74Aggregate amount of impairment in value of investments - -
13.2.4 In respect of subsidiary OVL, The investments for site restoration in respect of Sakhalin-1, Russia are invested by J P Morgan Chase Bank N.A., the Foreign Party Administrator (FPA) in accordance with the portfolio investment guidelines provided under the Sakhalin-1 Decommissioning funding agreement entered into between the FPA and the foreign parties to the Consortium in accordance with the related production sharing agreement (PSA). The proceeds from the investment will be utilized for decommissioning liability to the Russian State as per the PSA.
(iii) Investment in Compulsory Convertible Preference Share
ParticularsAs at
March 31, 2019As at
March 31, 2018
No. (in million) Amount No. (in million) AmountA. Financial assets measured at FVTPL (a) Planys Technologies Private Limited* (Unquoted– Fully paid up) (Face Value₹ 1500 per share) (Note no. 13.2.5)
- 50.69 - 9.74
(b) String Bio Private Limited (Unquoted – Fully paid up) (Face Value ₹10 per share) (Note no.13.2.6)
0.16 45.00 - -
(c) Investments in Start - Ups 21.03 - -Total Investment in Preference Share 116.72 9.74Aggregate carrying value of unquoted investments 116.72 9.74Aggregate market value of unquoted investments - -
* 1562 (previous year 383) Compulsorily Convertible Preference Shares
(` in million)
(` in million)
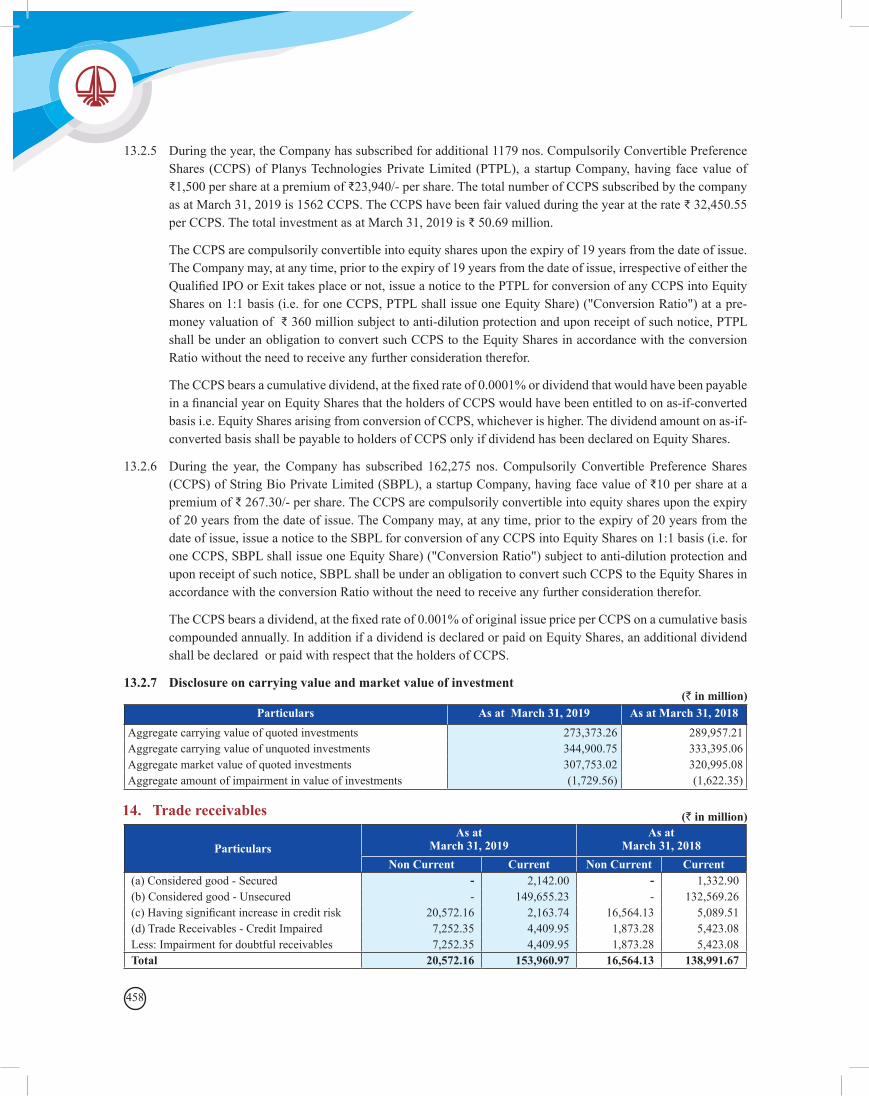
458
13.2.5 During the year, the Company has subscribed for additional 1179 nos. Compulsorily Convertible Preference Shares (CCPS) of Planys Technologies Private Limited (PTPL), a startup Company, having face value of ₹1,500 per share at a premium of ₹23,940/- per share. The total number of CCPS subscribed by the company as at March 31, 2019 is 1562 CCPS. The CCPS have been fair valued during the year at the rate ₹ 32,450.55 per CCPS. The total investment as at March 31, 2019 is ₹ 50.69 million.
The CCPS are compulsorily convertible into equity shares upon the expiry of 19 years from the date of issue. The Company may, at any time, prior to the expiry of 19 years from the date of issue, irrespective of either the Qualified IPO or Exit takes place or not, issue a notice to the PTPL for conversion of any CCPS into Equity Shares on 1:1 basis (i.e. for one CCPS, PTPL shall issue one Equity Share) ("Conversion Ratio") at a pre-money valuation of ₹ 360 million subject to anti-dilution protection and upon receipt of such notice, PTPL shall be under an obligation to convert such CCPS to the Equity Shares in accordance with the conversion Ratio without the need to receive any further consideration therefor.
The CCPS bears a cumulative dividend, at the fixed rate of 0.0001% or dividend that would have been payable in a financial year on Equity Shares that the holders of CCPS would have been entitled to on as-if-converted basis i.e. Equity Shares arising from conversion of CCPS, whichever is higher. The dividend amount on as-if-converted basis shall be payable to holders of CCPS only if dividend has been declared on Equity Shares.
13.2.6 During the year, the Company has subscribed 162,275 nos. Compulsorily Convertible Preference Shares (CCPS) of String Bio Private Limited (SBPL), a startup Company, having face value of ₹10 per share at a premium of ₹ 267.30/- per share. The CCPS are compulsorily convertible into equity shares upon the expiry of 20 years from the date of issue. The Company may, at any time, prior to the expiry of 20 years from the date of issue, issue a notice to the SBPL for conversion of any CCPS into Equity Shares on 1:1 basis (i.e. for one CCPS, SBPL shall issue one Equity Share) ("Conversion Ratio") subject to anti-dilution protection and upon receipt of such notice, SBPL shall be under an obligation to convert such CCPS to the Equity Shares in accordance with the conversion Ratio without the need to receive any further consideration therefor.
The CCPS bears a dividend, at the fixed rate of 0.001% of original issue price per CCPS on a cumulative basis compounded annually. In addition if a dividend is declared or paid on Equity Shares, an additional dividend shall be declared or paid with respect that the holders of CCPS.
13.2.7 Disclosure on carrying value and market value of investment
Particulars As at March 31, 2019 As at March 31, 2018Aggregate carrying value of quoted investments 273,373.26 289,957.21Aggregate carrying value of unquoted investments 344,900.75 333,395.06Aggregate market value of quoted investments 307,753.02 320,995.08Aggregate amount of impairment in value of investments (1,729.56) (1,622.35)
14. Trade receivables
ParticularsAs at
March 31, 2019As at
March 31, 2018Non Current Current Non Current Current
(a) Considered good - Secured - 2,142.00 - 1,332.90(b) Considered good - Unsecured - 149,655.23 - 132,569.26(c) Having significant increase in credit risk 20,572.16 2,163.74 16,564.13 5,089.51(d) Trade Receivables - Credit Impaired 7,252.35 4,409.95 1,873.28 5,423.08Less: Impairment for doubtful receivables 7,252.35 4,409.95 1,873.28 5,423.08Total 20,572.16 153,960.97 16,564.13 138,991.67
(` in million)
(` in million)
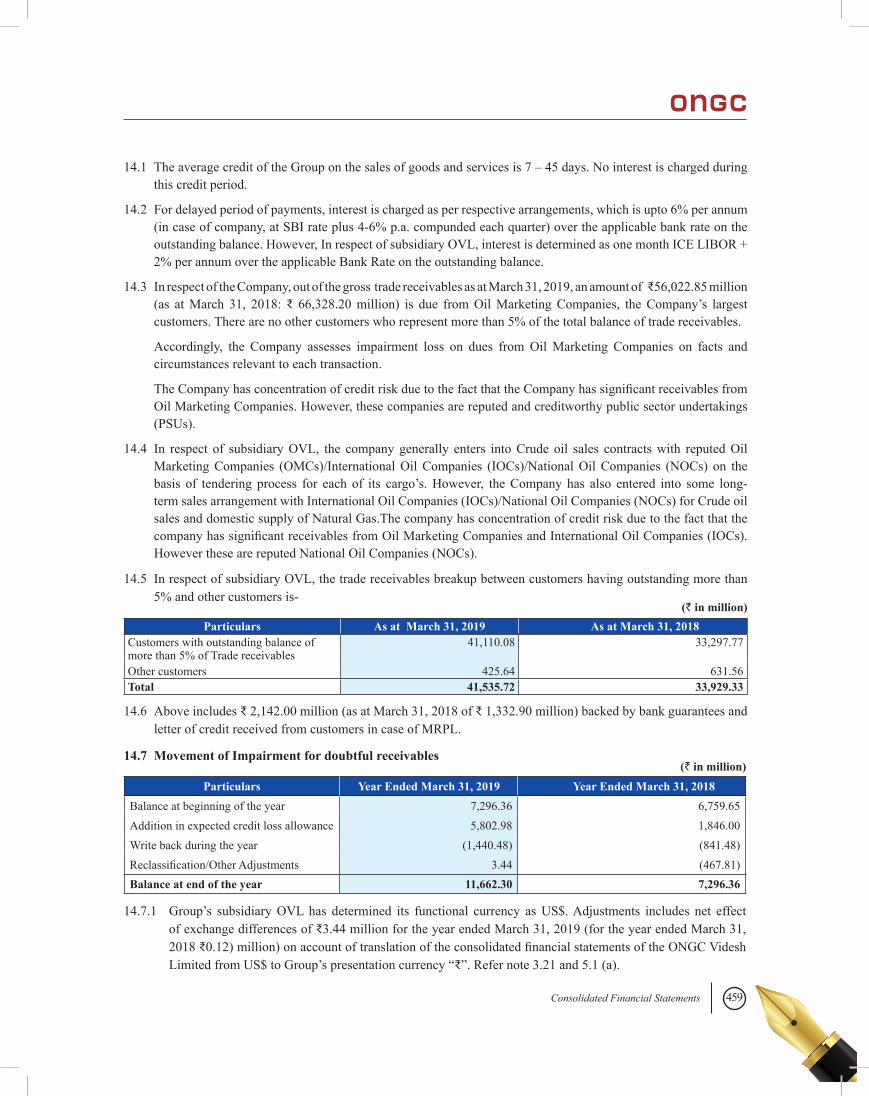
459Consolidated Financial Statements
14.1 The average credit of the Group on the sales of goods and services is 7 – 45 days. No interest is charged during this credit period.
14.2 For delayed period of payments, interest is charged as per respective arrangements, which is upto 6% per annum (in case of company, at SBI rate plus 4-6% p.a. compunded each quarter) over the applicable bank rate on the outstanding balance. However, In respect of subsidiary OVL, interest is determined as one month ICE LIBOR + 2% per annum over the applicable Bank Rate on the outstanding balance.
14.3 In respect of the Company, out of the gross trade receivables as at March 31, 2019, an amount of ₹56,022.85 million (as at March 31, 2018: ₹ 66,328.20 million) is due from Oil Marketing Companies, the Company’s largest customers. There are no other customers who represent more than 5% of the total balance of trade receivables.
Accordingly, the Company assesses impairment loss on dues from Oil Marketing Companies on facts and circumstances relevant to each transaction.
The Company has concentration of credit risk due to the fact that the Company has significant receivables from Oil Marketing Companies. However, these companies are reputed and creditworthy public sector undertakings (PSUs).
14.4 In respect of subsidiary OVL, the company generally enters into Crude oil sales contracts with reputed Oil Marketing Companies (OMCs)/International Oil Companies (IOCs)/National Oil Companies (NOCs) on the basis of tendering process for each of its cargo’s. However, the Company has also entered into some long-term sales arrangement with International Oil Companies (IOCs)/National Oil Companies (NOCs) for Crude oil sales and domestic supply of Natural Gas.The company has concentration of credit risk due to the fact that the company has significant receivables from Oil Marketing Companies and International Oil Companies (IOCs). However these are reputed National Oil Companies (NOCs).
14.5 In respect of subsidiary OVL, the trade receivables breakup between customers having outstanding more than 5% and other customers is-
Particulars As at March 31, 2019 As at March 31, 2018Customers with outstanding balance of more than 5% of Trade receivables
41,110.08 33,297.77
Other customers 425.64 631.56Total 41,535.72 33,929.33
(` in million)
14.6 Above includes ₹ 2,142.00 million (as at March 31, 2018 of ₹ 1,332.90 million) backed by bank guarantees and letter of credit received from customers in case of MRPL.
14.7 Movement of Impairment for doubtful receivables
Particulars Year Ended March 31, 2019 Year Ended March 31, 2018Balance at beginning of the year 7,296.36 6,759.65Addition in expected credit loss allowance 5,802.98 1,846.00Write back during the year (1,440.48) (841.48)Reclassification/Other Adjustments 3.44 (467.81)Balance at end of the year 11,662.30 7,296.36
(` in million)
14.7.1 Group’s subsidiary OVL has determined its functional currency as US$. Adjustments includes net effect of exchange differences of ₹3.44 million for the year ended March 31, 2019 (for the year ended March 31, 2018 ₹0.12) million) on account of translation of the consolidated financial statements of the ONGC Videsh Limited from US$ to Group’s presentation currency “₹”. Refer note 3.21 and 5.1 (a).
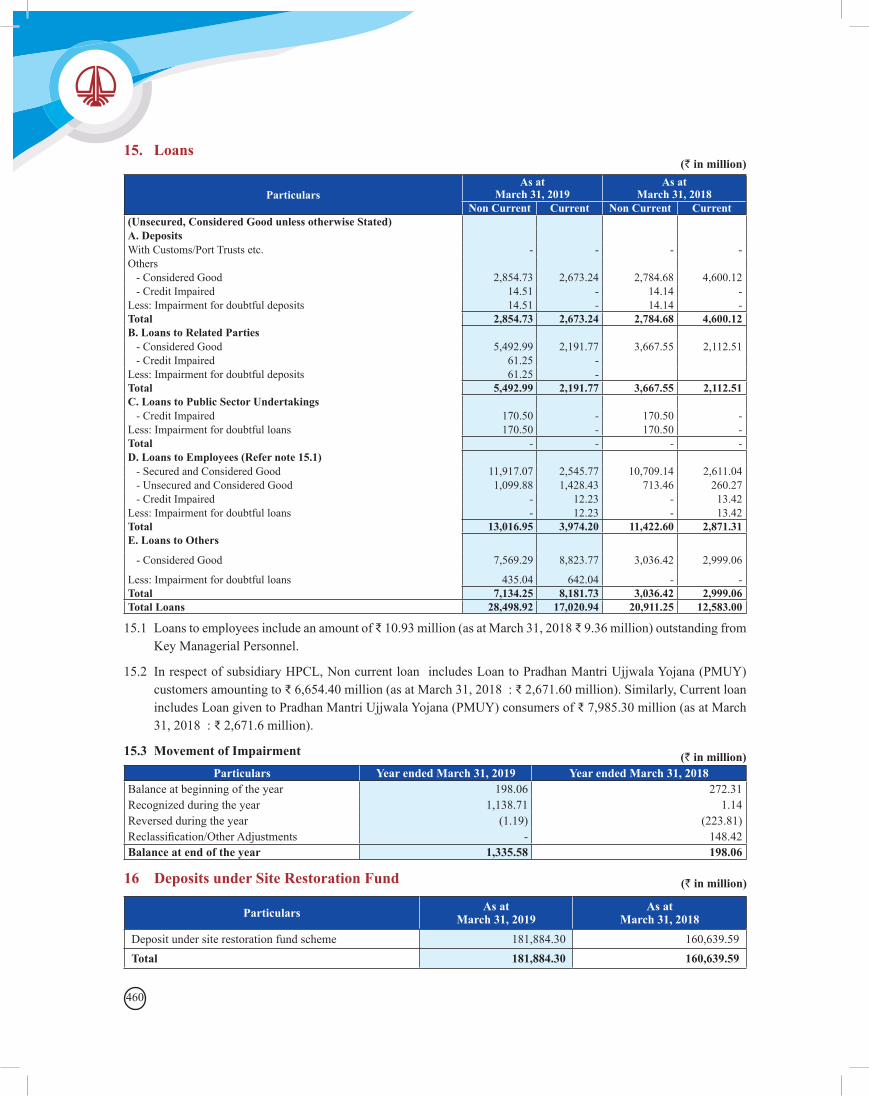
460
15. Loans
Particulars As at
March 31, 2019As at
March 31, 2018Non Current Current Non Current Current
(Unsecured, Considered Good unless otherwise Stated) A. Deposits With Customs/Port Trusts etc. - - - -Others - Considered Good 2,854.73 2,673.24 2,784.68 4,600.12 - Credit Impaired 14.51 - 14.14 -Less: Impairment for doubtful deposits 14.51 - 14.14 -Total 2,854.73 2,673.24 2,784.68 4,600.12B. Loans to Related Parties - Considered Good 5,492.99 2,191.77 3,667.55 2,112.51 - Credit Impaired 61.25 - Less: Impairment for doubtful deposits 61.25 - Total 5,492.99 2,191.77 3,667.55 2,112.51C. Loans to Public Sector Undertakings - Credit Impaired 170.50 - 170.50 -Less: Impairment for doubtful loans 170.50 - 170.50 -Total - - - -D. Loans to Employees (Refer note 15.1) - Secured and Considered Good 11,917.07 2,545.77 10,709.14 2,611.04 - Unsecured and Considered Good 1,099.88 1,428.43 713.46 260.27 - Credit Impaired - 12.23 - 13.42Less: Impairment for doubtful loans - 12.23 - 13.42Total 13,016.95 3,974.20 11,422.60 2,871.31E. Loans to Others
- Considered Good 7,569.29 8,823.77 3,036.42 2,999.06
Less: Impairment for doubtful loans 435.04 642.04 - -Total 7,134.25 8,181.73 3,036.42 2,999.06Total Loans 28,498.92 17,020.94 20,911.25 12,583.00
15.1 Loans to employees include an amount of ₹ 10.93 million (as at March 31, 2018 ₹ 9.36 million) outstanding from Key Managerial Personnel.
15.2 In respect of subsidiary HPCL, Non current loan includes Loan to Pradhan Mantri Ujjwala Yojana (PMUY) customers amounting to ₹ 6,654.40 million (as at March 31, 2018 : ₹ 2,671.60 million). Similarly, Current loan includes Loan given to Pradhan Mantri Ujjwala Yojana (PMUY) consumers of ₹ 7,985.30 million (as at March 31, 2018 : ₹ 2,671.6 million).
15.3 Movement of ImpairmentParticulars Year ended March 31, 2019 Year ended March 31, 2018
Balance at beginning of the year 198.06 272.31Recognized during the year 1,138.71 1.14Reversed during the year (1.19) (223.81)Reclassification/Other Adjustments - 148.42Balance at end of the year 1,335.58 198.06
(` in million)
(` in million)
16 Deposits under Site Restoration Fund
Particulars As at March 31, 2019
As at March 31, 2018
Deposit under site restoration fund scheme 181,884.30 160,639.59Total 181,884.30 160,639.59
(` in million)
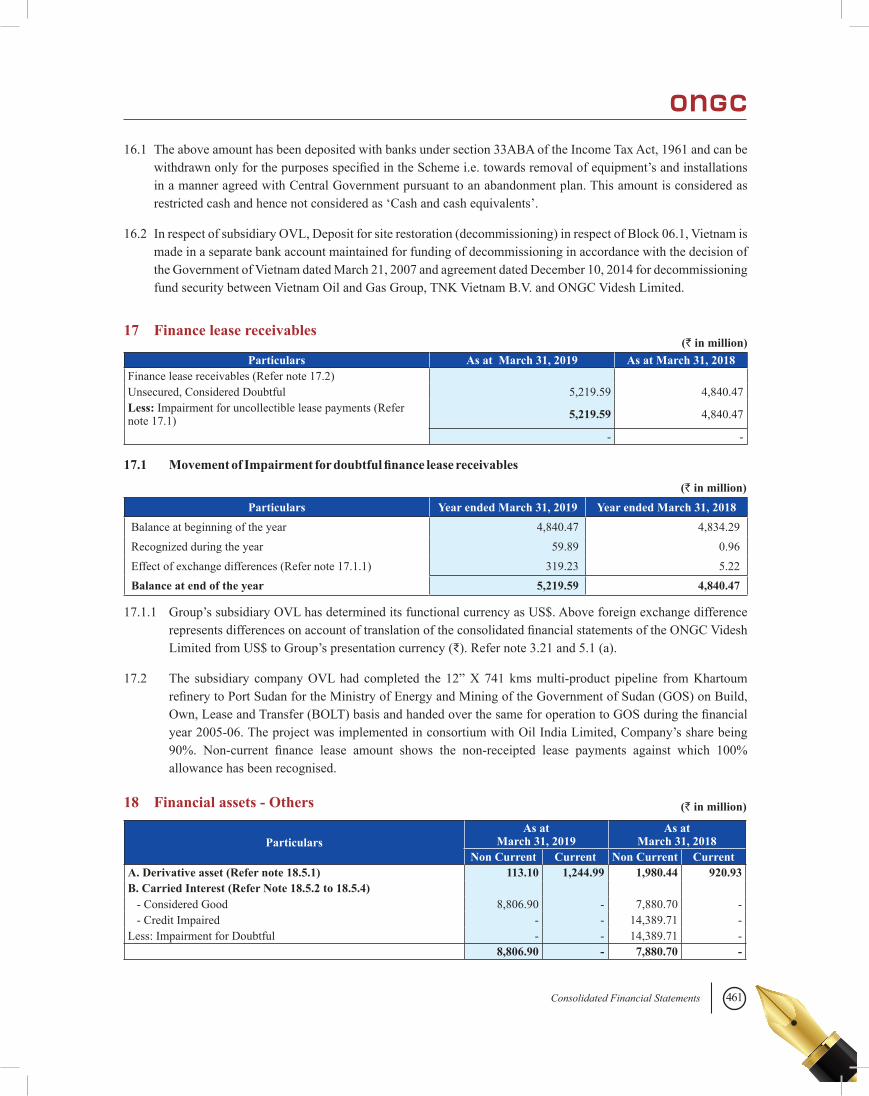
461Consolidated Financial Statements
17 Finance lease receivables
18 Financial assets - Others
16.1 The above amount has been deposited with banks under section 33ABA of the Income Tax Act, 1961 and can be withdrawn only for the purposes specified in the Scheme i.e. towards removal of equipment’s and installations in a manner agreed with Central Government pursuant to an abandonment plan. This amount is considered as restricted cash and hence not considered as ‘Cash and cash equivalents’.
16.2 In respect of subsidiary OVL, Deposit for site restoration (decommissioning) in respect of Block 06.1, Vietnam is made in a separate bank account maintained for funding of decommissioning in accordance with the decision of the Government of Vietnam dated March 21, 2007 and agreement dated December 10, 2014 for decommissioning fund security between Vietnam Oil and Gas Group, TNK Vietnam B.V. and ONGC Videsh Limited.
17.1.1 Group’s subsidiary OVL has determined its functional currency as US$. Above foreign exchange difference represents differences on account of translation of the consolidated financial statements of the ONGC Videsh Limited from US$ to Group’s presentation currency (₹). Refer note 3.21 and 5.1 (a).
17.2 The subsidiary company OVL had completed the 12” X 741 kms multi-product pipeline from Khartoum refinery to Port Sudan for the Ministry of Energy and Mining of the Government of Sudan (GOS) on Build, Own, Lease and Transfer (BOLT) basis and handed over the same for operation to GOS during the financial year 2005-06. The project was implemented in consortium with Oil India Limited, Company’s share being 90%. Non-current finance lease amount shows the non-receipted lease payments against which 100% allowance has been recognised.
(` in million)
(` in million)
Particulars As at March 31, 2019 As at March 31, 2018Finance lease receivables (Refer note 17.2)Unsecured, Considered Doubtful 5,219.59 4,840.47Less: Impairment for uncollectible lease payments (Refer note 17.1) 5,219.59 4,840.47
- -
ParticularsAs at
March 31, 2019As at
March 31, 2018Non Current Current Non Current Current
A. Derivative asset (Refer note 18.5.1) 113.10 1,244.99 1,980.44 920.93B. Carried Interest (Refer Note 18.5.2 to 18.5.4) - Considered Good 8,806.90 - 7,880.70 - - Credit Impaired - - 14,389.71 -Less: Impairment for Doubtful - - 14,389.71 - 8,806.90 - 7,880.70 -
Particulars Year ended March 31, 2019 Year ended March 31, 2018Balance at beginning of the year 4,840.47 4,834.29Recognized during the year 59.89 0.96Effect of exchange differences (Refer note 17.1.1) 319.23 5.22Balance at end of the year 5,219.59 4,840.47
(` in million)
17.1 Movement of Impairment for doubtful finance lease receivables
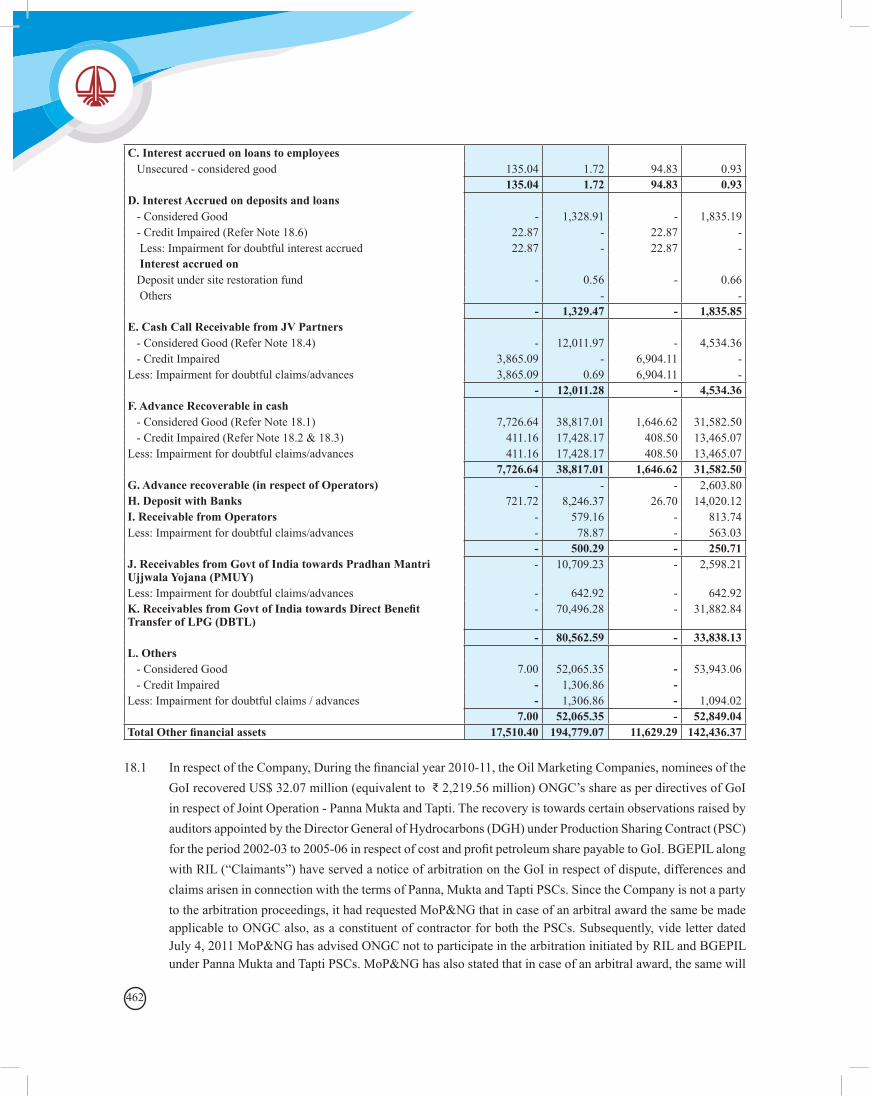
462
C. Interest accrued on loans to employees Unsecured - considered good 135.04 1.72 94.83 0.93 135.04 1.72 94.83 0.93D. Interest Accrued on deposits and loans - Considered Good - 1,328.91 - 1,835.19 - Credit Impaired (Refer Note 18.6) 22.87 - 22.87 -
Less: Impairment for doubtful interest accrued 22.87 - 22.87 -Interest accrued on
Deposit under site restoration fund - 0.56 - 0.66Others - -
- 1,329.47 - 1,835.85E. Cash Call Receivable from JV Partners - Considered Good (Refer Note 18.4) - 12,011.97 - 4,534.36 - Credit Impaired 3,865.09 - 6,904.11 -Less: Impairment for doubtful claims/advances 3,865.09 0.69 6,904.11 - - 12,011.28 - 4,534.36F. Advance Recoverable in cash - Considered Good (Refer Note 18.1) 7,726.64 38,817.01 1,646.62 31,582.50 - Credit Impaired (Refer Note 18.2 & 18.3) 411.16 17,428.17 408.50 13,465.07Less: Impairment for doubtful claims/advances 411.16 17,428.17 408.50 13,465.07 7,726.64 38,817.01 1,646.62 31,582.50G. Advance recoverable (in respect of Operators) - - - 2,603.80H. Deposit with Banks 721.72 8,246.37 26.70 14,020.12I. Receivable from Operators - 579.16 - 813.74Less: Impairment for doubtful claims/advances - 78.87 - 563.03 - 500.29 - 250.71J. Receivables from Govt of India towards Pradhan Mantri Ujjwala Yojana (PMUY)
- 10,709.23 - 2,598.21
Less: Impairment for doubtful claims/advances - 642.92 - 642.92K. Receivables from Govt of India towards Direct Benefit Transfer of LPG (DBTL)
- 70,496.28 - 31,882.84
- 80,562.59 - 33,838.13L. Others - Considered Good 7.00 52,065.35 - 53,943.06 - Credit Impaired - 1,306.86 - Less: Impairment for doubtful claims / advances - 1,306.86 - 1,094.02 7.00 52,065.35 - 52,849.04Total Other financial assets 17,510.40 194,779.07 11,629.29 142,436.37
18.1 In respect of the Company, During the financial year 2010-11, the Oil Marketing Companies, nominees of the GoI recovered US$ 32.07 million (equivalent to ₹ 2,219.56 million) ONGC’s share as per directives of GoI in respect of Joint Operation - Panna Mukta and Tapti. The recovery is towards certain observations raised by auditors appointed by the Director General of Hydrocarbons (DGH) under Production Sharing Contract (PSC) for the period 2002-03 to 2005-06 in respect of cost and profit petroleum share payable to GoI. BGEPIL along with RIL (“Claimants”) have served a notice of arbitration on the GoI in respect of dispute, differences and claims arisen in connection with the terms of Panna, Mukta and Tapti PSCs. Since the Company is not a party to the arbitration proceedings, it had requested MoP&NG that in case of an arbitral award the same be made applicable to ONGC also, as a constituent of contractor for both the PSCs. Subsequently, vide letter dated July 4, 2011 MoP&NG has advised ONGC not to participate in the arbitration initiated by RIL and BGEPIL under Panna Mukta and Tapti PSCs. MoP&NG has also stated that in case of an arbitral award, the same will
463Consolidated Financial Statements
be applicable to ONGC also as a constituent of the contractor for both the PSCs. A Final Partial Award (FPA) was pronounced by the Tribunal in the arbitration matter between RIL, BGEPIL and Union of India.
RIL and BGEPIL the JO partners have challenged the FPA before the English Commercial Court. Pending final quantification of liabilities by the Arbitration Tribunal and decision of English Commercial Court, the same has been shown as Receivable from GoI under ‘Advance Recoverable in Cash. (Figures in ₹ are restated).
18.2 In Ravva Joint Operation, the demand towards additional profit petroleum raised by Government of India (GoI), due to differences in interpretation of the provisions of the Production Sharing Contract (PSC) in respect of computation of Post Tax Rate of Return (PTRR), based on the decision of the Malaysian High Court setting aside an earlier arbitral tribunal award in favor of operator, was disputed by the operator M/s Vedanta Ltd (erstwhile M/s Cairn India Ltd). The Company is not a party to the dispute but has agreed to abide by the decision applicable to the operator. The Company is carrying an amount of ₹ 11,616.21 million (equivalent to US$ 167.84 million) after adjustments for interest and exchange rate fluctuations which has been recovered by GoI, this includes interest amounting to US$ 54.88 million (₹3,798.24 million). The Company has made impairment provision towards this recovery made by the GoI.
In subsequent legal proceedings, the Appellate Authority of the Honorable Malaysian High Court of Kuala Lumpur had set aside the decision of the Malaysian High Court and the earlier decision of arbitral tribunal in favour of operator was restored, against which the GoI has preferred an appeal before the Federal Court of Malaysia. The Federal Court of Malaysia, vide its order dated October 11, 2011, has dismissed the said appeal of the GoI.
The Company has taken up the matter regarding refund of the recoveries made in view of the favorable judgment of the Federal Court of Malaysia with MoP&NG. However, according to a communication dated January 13, 2012, MoP&NG expressed the view that the Company’s proposal would be examined when the issue of carry in Ravva PSC is decided in its entirety by the Government along with other partners.
In view of the perceived uncertainties in obtaining the refund at this stage, the impairment made in the books as above has been retained and netted off against the amount recoverable as above in the Financial Statements for the year ending March 31, 2019. (Figures in ₹ are restated).
18.3 The Ravva PSC stipulates Base Development Cost of Ravva JV to be at US$ 188.98 million with a cap of 5% increase. Accordingly the development cost stated in the PSC is US$ 198.43 million. However, actual cost incurred by JV is more than amount stipulated in the PSC. Director General of Hydrocarbons did not approve the increase in base development cost for cost recovery and demanded additional profit petroleum vide letter dated August 8, 2006 from the contractor/JV for an amount of US$ 166 million as short paid on account of cost recovery of Development cost in excess of BDC.
In August 2008 three JV partners excluding ONGC had invoked arbitration against Government of India (GoI) on the issue. The contention of claim as operator was that it should be allowed 100% Cost recovery of the Development cost. The issue was argued at various levels including court of Appeals and Malaysian Federal Court. The decision of court was in favour of JV partners. However the case for enforcement of award in India is pending at Delhi High Court.
Ministry of Petroleum and Natural Gas (MoP&NG), GoI vide letter dated October 10, 2018 issued a recovery notice to Oil Marketing companies (OMCs) for US$ 52 MM plus applicable interest towards short payment of Government share of Profit Petroleum on account of dispute of Cost recovery of Base Development cost from the payments made to the Company towards the sales proceeds of Crude Oil and Natural Gas. During
464
the year OMCs deducted and deposited the sales proceeds of Crude Oil and Natural Gas to MoP&NG and the entire amount of $52 million (₹ 3,598.92 million) has been recovered. In view of the uncertainties in obtaining the refund at this stage, provision has been created against the said receivables from OMC’s.
18.4 Farm Out Agreements (FOA) was signed between the Company and Petrobras International Braspetro B.V (PIB- BV) for the 3 Blocks. KG-DWN – 98/2 (15% PI); MN-DWN-98/3 (40% PI) & CY- DWN- 2001/1(25% PI) in India effective from June 04, 2007. The conditions precedents were satisfied in the Blocks. Government of India approval for assignment of PI to PIB-BV was granted in the year 2008-09 in respect of Blocks KG-DWN-98/2, CY-DWN-2001/1 and MN-DWN-98/3. Subsequently, PIB-BV separately notified its intention to withdraw from KG-DWN-98/2 and MN-DWN-98/3. PIB-BV resolved the issues with ONGC and re-assigned its Participating Interest (PI) to ONGC in KG-DWN-98/2.
However, PIB-BV’s attempted withdrawal in respect of MN-DWN-98/3 Block could not materialise, due to unresolved issues with PIB-BV in respect of Interim Period costs and pending cash calls in the Block. As regards CY-DWN-2001/1 Block, cash calls were also not paid by PIB-BV.
The Company invoked Arbitration against Petrobras Petroleo Brasileiro S.A (Petrobras) and PIB-BV in respect of outstanding dues in the Blocks MN-DWN-98/3 and CY-DWN-2001/1. London Court of International Arbitration (LCIA) passed the First Partial Award on 6th March, 2017, whereby it was held that Petrobras is neither a party to the FOA nor to the arbitration agreement contained in Article 10.2 thereof; hence the Tribunal opined that it lacks substantive jurisdiction over Petrobras. Accordingly, it was decided to accept the Frist Partial Award and prosecute the arbitration against PIB-BV only. The Company made a total claim of US$ 60.57 million (Block MN-DWN-98/3 – US$ 46.84 million & Block CY-DWN-2001/1 – US$ 13.73 million). LCIA in its Final Award of December 26, 2018 passed order in favour of the Company for US$ 46.84 million in respect of block MN-DWN-98/3 and US$ 4.13 million in respect of block CY-DWN-2001/1 along with interest till the date of payment at the Reference Interest Rate specified in Article 1.12 of the FOA. Consequently provision against call amounting to ₹ 3,207.62 million has been written back during the year. An amount of US$ 54.20 million (Equivalent ₹ 3,722.23 million) has been remitted to the Company by PIB-BV in April 2019.
18.5 In case of subsidiary OVL,
18.5.1 Company has entered into forward contracts covering Euro 199.50 million (in previous period Euro 199.5 million, upto Mar 2018) and option contract of Euro 35 million (in previous period Euro 35 million upto Mar 2018) out of the principal amount of 2.75% Euro 525 million Bonds 2021. There was MTM gain position as on 31st Mar 2018 for EUR forward contracts as well as option contracts which was reported as Derivative Assets. As on 31st Mar 2019 there is MTM gain position for option contract which is reported as Derivative Assets and MTM loss position for forward contract which is reported as Derivative Liabilities.
ONGC Videsh Vankorneft Pte Ltd has entered into option contract of JPY 5.7 billion (in previous period Nil upto March 2018) out of the principal amount of 38. Billion JPY Facility Agreement for which the first tranche of Principal payment is to be made in April 2022
18.5.2 The Company has 25% participating interest (PI) in the Satpayev Exploration Block Kazakhstan. As per the carry agreement, the Company is financing the expenditure (25% own PI plus 75% PI of KMG) in the exploration blocks during the exploration and appraisal period.
18.5.3 Impairment has been recognized towards the amount of carried interest as of March 31, 2019 ₹ Nil (as at March 31, 2018 ₹ 14,389.71 million) in view of the blocks being under exploration as there is no certainty of commercial discovery.
465Consolidated Financial Statements
18.5.4 As per the Carry Agreement in respect of exploration block Satpavey, Kazakshtan, in case the event of Commercial Production, KMG’s Costs Financed by the Company plus accrued and unpaid interest will have to be repaid to the Company from KMG’s Cash Flow. The interest on the financed Costs has not been accounted for in view of unsuccessful exploration outcome.
18.6 Movement of ImpairmentParticulars Year ended March 31, 2019 Year ended March 31, 2018
Balance at beginning of the year 37,490.23 32,032.36Recognized during the year 4,531.65 6,004.56Write back during the year (14,960.24) (379.06)Other adjustments (3,305.01) (167.63)Balance at end of the year 23,756.63 37,490.23
18.6.1 Group’s subsidiary OVL has determined its functional currency as US$. Adjustments includes net effect of exchange differencesas at March 31, 2019 of ₹ (4,025.12) million (as at March 31, 2018 ₹ 45.86 million) on account of translation of the consolidated financial statements of the ONGC Videsh Limited from US$ to Group’s presentation currency (₹). Refer note 3.21 and 5.1 (a).
18.7 Other financial assets include receivables of ONGC San Cristobal BV from its associate Petrolera Indovenezolana SA (PIVSA) on account of outstanding dividend as at March 31, 2019 is ₹ 28,571.13 million (as at March 31, 2018 ₹ 29,162.89 million). The underlying trade receivables in PIVSA books have been provided for as per lifetime expected credit loss method.
19 Others Assets (` in million)
(` in million)
ParticularsAs at
March 31, 2019As at
March 31, 2018Non Current Current Non Current Current
A. Capital advances - Considered Good 12,170.89 - 11,564.39 - - Credit Impaired 25.44 - 25.44 -Less: Impairment (Refer Note 19.6) 25.44 - 25.44 - 12,170.89 - 11,564.39 -B. Other receivables - Considered Good 9.09 - 8.23 337.39 - Credit Impaired 416.31 - 501.38 -Less: Impairment 416.31 - 501.38 - 9.09 - 8.23 337.39C. Deposits With Customs/Port Trusts etc. 7,835.81 3,389.86 7,653.47 1,107.14Others - Considered Good 2,661.89 51,126.21 2,455.95 3,659.43 - Credit Impaired 1,252.71 260.36 1,262.73 43.11Less: Impairment 1,252.71 260.36 1,262.73 43.11 10,497.70 54,516.07 10,109.42 4,766.57D. Advance recoverable - Considered Good 258.22 13,089.61 151.42 12,749.25 - Credit Impaired 593.01 1,085.23 610.18 1,104.00Less: Impairment 593.01 1,085.23 610.18 1,104.00 258.22 13,089.61 151.42 12,749.25E. Carried interest (Refer Note 19.2, 19.3 and 19.4)
- Considered Good 6,392.38 - 5,634.22 -
466
- Credit Impaired 193.59 - 155.35 -Less: Impairment 193.59 - 155.35 - 6,392.38 - 5,634.22 -F. Prepaid Expenses Prepayments- ETP facilities - - 1,302.29 110.56Prepayments - Mobilisation Charges 461.63 1,457.41 1,296.90 1,120.36Prepayments - Leasehold Land (refer note 19.1)
13,582.93 670.04 12,662.60 641.68
Other prepaid expenses 4,316.70 3,992.59 1,233.60 1,424.51Prepaid expenses for underlift quantity - 118.09 - 35.62
18,361.26 6,238.13 16,495.39 3,332.73G. Other Assets - Considered Good 3.90 4,672.09 0.93 2,538.49 - Credit Impaired - 94.32 - - Less: Impairment - 94.32 - - 3.90 4,672.09 0.93 2,538.49Total Other assets 47,693.44 78,515.90 43,964.00 23,724.43
19.1 In respect of the Company, Execution of conveyance deeds is in process in respect of 13 numbers (Previous year 14) lease hold lands amounting to ₹ 304.56 million (Previous year ₹ 392.40 million).
19.2 In respect of subsidiary OVL, the Company has participating interest (PI) in development project Area -1, Mozambique. As per the carry agreement, the Company is financing expenditure in the project for the national oil company ("carried interest"), which is shown under category Unsecured, Considered Good.
The Company also has participating interest (PI) in Blocks 5A South Sudan, SS-04 Bangladesh, SS-09 Bangladesh, EP-3 Myanmar and B-2 Myanmar. As per the carry agreements in respect of these exploratory blocks the carried interest during the exploratory period will be refunded in the event of commercial production from the project. The same is shown above as unsecured, considered as credit impaired.
19.3 In respect of subsidiary OVL, Impairment has been made towards the amount of carried interest as of March 31, 2019 is ₹ 193.59 million (as at March 31, 2018 ₹ 155.35 million) with respect to Blocks 5A South Sudan, Blocks SS-04 Bangladesh, SS-09 Bangladesh, EP-3 Myanmar and B-2 Myanmar being under exploration period, as there was no certainty of commercial discovery in the exploration stage.
19.4 Subsidiary OMPL - Mangalore SEZ Limited ('the Developer') is constructing the Corridor pipeline and allied facilities ('the Facilities'). The contribution paid by the Company for the said Facilities is shown under Prepayment of ROW Charges net of value amortized over the useful life of asset.
19.5 In respect of subsidiary PMHBL, Upon Payment of Allottment Consideration the Company has been given possession of land at 7 different locations. The Company is yet to enter into lease cum sale Agreement with KIADB for these lands. Hence the amount is not yet capitalised as freehold land.
19.6 Movement of Impairment(` in million)
Particulars Year ended March 31, 2019 Year ended March 31, 2018Balance at beginning of the year 3,702.19 3,211.27Recognized during the year 477.82 432.18Write back during the year (268.88) (18.46)Other adjustments 9.85 77.20Balance at end of the year 3,920.98 3,702.19
467Consolidated Financial Statements
19.6.1 Group’s subsidiary ONGC Videsh Limited has determined its functional currency as US$. Adjustments includes net effect of exchange differencesas at March 31, 2019 of ₹ 9.97 million (as at March 31, 2018 ₹ 0.38 million) on account of translation of the consolidated financial statements of the ONGC Videsh Limited from US$ to Group’s presentation currency “₹”. Refer note 3.21 and 5.1 (a).
20.1 This includes an amount of ₹1.79 million (as at March 31, 2018 ₹ 1.76 million) in respect of 115,093 nos. Carbon Credits which are valued at net realisable value. There are no CERs under certification. During the year ₹ 98.62 million and ₹ 36.38 million has been expensed towards Operating & maintenance cost and depreciation respectively for emission reduction equipment.
20.2 Inventory costing ₹ 646.74 million (as at March 31, 2018 ₹ 214.46 million) have been valued at net realisable value of ₹ 181.23 million (as at March 31, 2018 ₹ 95.16 million). Consequently, an amount of ₹ 465.51 million (as at March 31, 2018 ₹ 119.30 million) has been recognised as expense in the Statement of Profit and Loss under note no. 37.
20.3 In respect of subsidiary HPCL, the write-down of inventories to net realisable value (net) during the year amounted to ₹ 790.50 million (as at 31.03.2018 : ₹ 1143.50 million). The write downs and reversal are included in cost of materials consumed, changes in inventories of finished goods and work in progress.
20.4 Subsidiary OMPL has recognised cost of inventories as an expense includes ₹ Nil million (for the year ended March 31, 2018 ₹11.59) in respect of write down of finished goods inventory to net realisable value.
20.5 During the previous year, Subsidiary MRPL had changed inventory valuation method of Stock-in-trade from FIFO to weighted average method and the impact of the same was not material.
20.6 In respect of subsidiary OVL, In case of joint operators where the property in crude oil produced does not pass on upto a specific delivery point, the stock of crude oil till such delivery point is not recognized by the Company.
20. Inventories (valued as per accounting policy no. 3.18)
Particulars As at March 31, 2019
As at March 31, 2018
Raw Materials (Including Condensate) -on hand 38,096.14 34,836.04 -in Transit 18,265.22 17,882.27 56,361.36 52,718.31Finished Goods (Including Carbon Credits) (Refer Note 20.1 & 20.2) 104,302.43 91,526.54Less : Impairment for Stock Loss 5.91 5.91 104,296.52 91,520.63Traded Goods 86,980.10 75,477.88Stores and spare parts -on hand 86,028.86 76,135.57 -in transit (including inter-project transfers) 7,957.07 5,023.64Less: Impairment for non-moving items 8,147.49 6,958.60 85,838.44 74,200.61Stock in process 17,923.08 11,131.31Unservicable Items 407.07 522.47Total 351,806.57 305,571.21
(` in million)
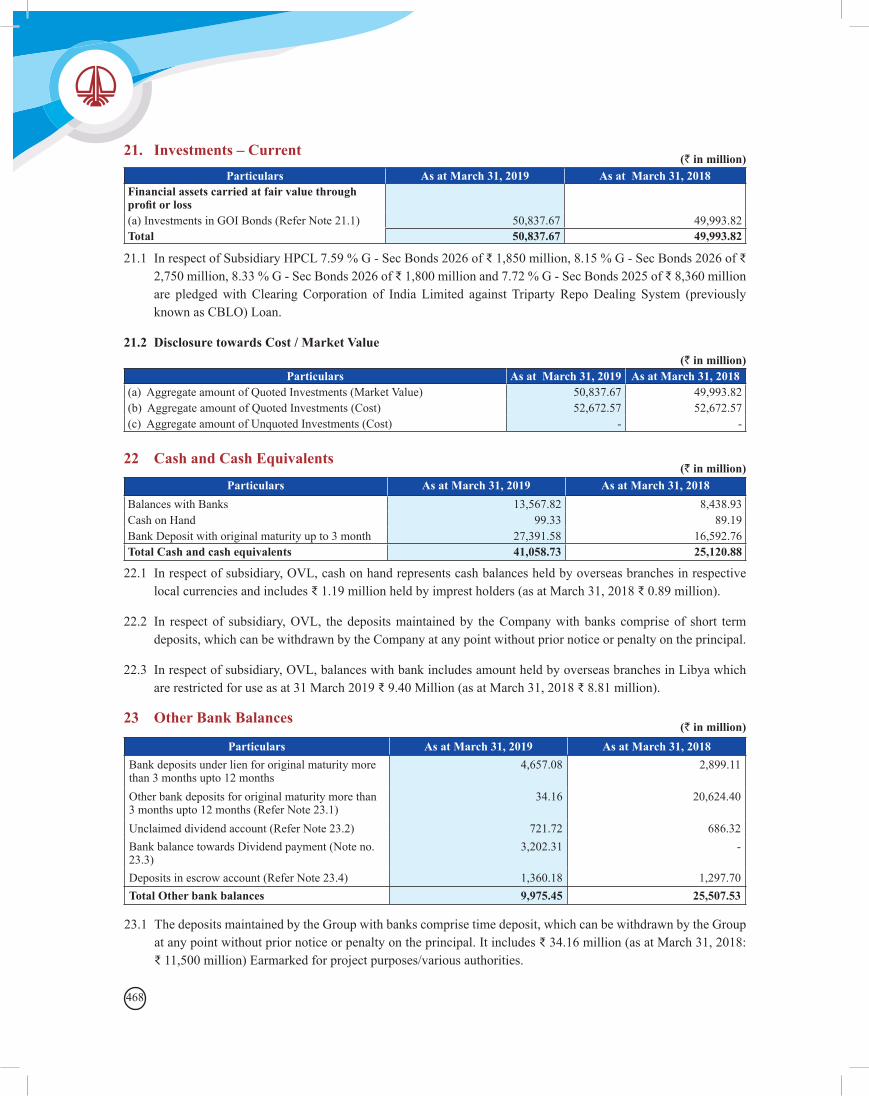
468
21. Investments – CurrentParticulars As at March 31, 2019 As at March 31, 2018
Financial assets carried at fair value through profit or loss
(a) Investments in GOI Bonds (Refer Note 21.1) 50,837.67 49,993.82Total 50,837.67 49,993.82
(` in million)
21.1 In respect of Subsidiary HPCL 7.59 % G - Sec Bonds 2026 of ₹ 1,850 million, 8.15 % G - Sec Bonds 2026 of ₹ 2,750 million, 8.33 % G - Sec Bonds 2026 of ₹ 1,800 million and 7.72 % G - Sec Bonds 2025 of ₹ 8,360 million are pledged with Clearing Corporation of India Limited against Triparty Repo Dealing System (previously known as CBLO) Loan.
21.2 Disclosure towards Cost / Market Value
22 Cash and Cash Equivalents(` in million)
(` in million)Particulars As at March 31, 2019 As at March 31, 2018
(a) Aggregate amount of Quoted Investments (Market Value) 50,837.67 49,993.82(b) Aggregate amount of Quoted Investments (Cost) 52,672.57 52,672.57(c) Aggregate amount of Unquoted Investments (Cost) - -
Particulars As at March 31, 2019 As at March 31, 2018Balances with Banks 13,567.82 8,438.93Cash on Hand 99.33 89.19Bank Deposit with original maturity up to 3 month 27,391.58 16,592.76Total Cash and cash equivalents 41,058.73 25,120.88
22.1 In respect of subsidiary, OVL, cash on hand represents cash balances held by overseas branches in respective local currencies and includes ₹ 1.19 million held by imprest holders (as at March 31, 2018 ₹ 0.89 million).
22.2 In respect of subsidiary, OVL, the deposits maintained by the Company with banks comprise of short term deposits, which can be withdrawn by the Company at any point without prior notice or penalty on the principal.
22.3 In respect of subsidiary, OVL, balances with bank includes amount held by overseas branches in Libya which are restricted for use as at 31 March 2019 ₹ 9.40 Million (as at March 31, 2018 ₹ 8.81 million).
23 Other Bank Balances(` in million)
Particulars As at March 31, 2019 As at March 31, 2018Bank deposits under lien for original maturity more than 3 months upto 12 months
4,657.08 2,899.11
Other bank deposits for original maturity more than 3 months upto 12 months (Refer Note 23.1)
34.16 20,624.40
Unclaimed dividend account (Refer Note 23.2) 721.72 686.32Bank balance towards Dividend payment (Note no. 23.3)
3,202.31 -
Deposits in escrow account (Refer Note 23.4) 1,360.18 1,297.70Total Other bank balances 9,975.45 25,507.53
23.1 The deposits maintained by the Group with banks comprise time deposit, which can be withdrawn by the Group at any point without prior notice or penalty on the principal. It includes ₹ 34.16 million (as at March 31, 2018: ₹ 11,500 million) Earmarked for project purposes/various authorities.
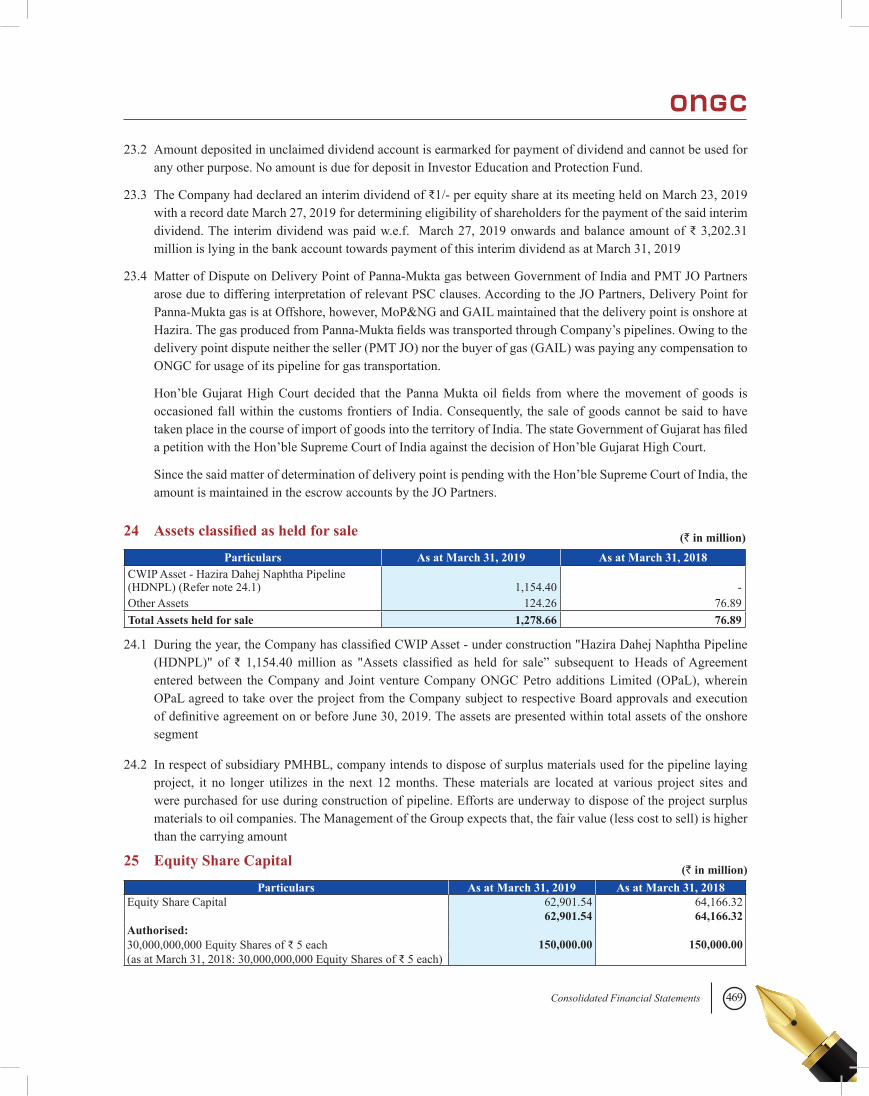
469Consolidated Financial Statements
23.2 Amount deposited in unclaimed dividend account is earmarked for payment of dividend and cannot be used for any other purpose. No amount is due for deposit in Investor Education and Protection Fund.
23.3 The Company had declared an interim dividend of ₹1/- per equity share at its meeting held on March 23, 2019 with a record date March 27, 2019 for determining eligibility of shareholders for the payment of the said interim dividend. The interim dividend was paid w.e.f. March 27, 2019 onwards and balance amount of ₹ 3,202.31 million is lying in the bank account towards payment of this interim dividend as at March 31, 2019
23.4 Matter of Dispute on Delivery Point of Panna-Mukta gas between Government of India and PMT JO Partners arose due to differing interpretation of relevant PSC clauses. According to the JO Partners, Delivery Point for Panna-Mukta gas is at Offshore, however, MoP&NG and GAIL maintained that the delivery point is onshore at Hazira. The gas produced from Panna-Mukta fields was transported through Company’s pipelines. Owing to the delivery point dispute neither the seller (PMT JO) nor the buyer of gas (GAIL) was paying any compensation to ONGC for usage of its pipeline for gas transportation.
Hon’ble Gujarat High Court decided that the Panna Mukta oil fields from where the movement of goods is occasioned fall within the customs frontiers of India. Consequently, the sale of goods cannot be said to have taken place in the course of import of goods into the territory of India. The state Government of Gujarat has filed a petition with the Hon’ble Supreme Court of India against the decision of Hon’ble Gujarat High Court.
Since the said matter of determination of delivery point is pending with the Hon’ble Supreme Court of India, the amount is maintained in the escrow accounts by the JO Partners.
24 Assets classified as held for sale (` in million)Particulars As at March 31, 2019 As at March 31, 2018
CWIP Asset - Hazira Dahej Naphtha Pipeline (HDNPL) (Refer note 24.1) 1,154.40 -Other Assets 124.26 76.89Total Assets held for sale 1,278.66 76.89
24.1 During the year, the Company has classified CWIP Asset - under construction "Hazira Dahej Naphtha Pipeline (HDNPL)" of ₹ 1,154.40 million as "Assets classified as held for sale” subsequent to Heads of Agreement entered between the Company and Joint venture Company ONGC Petro additions Limited (OPaL), wherein OPaL agreed to take over the project from the Company subject to respective Board approvals and execution of definitive agreement on or before June 30, 2019. The assets are presented within total assets of the onshore segment
24.2 In respect of subsidiary PMHBL, company intends to dispose of surplus materials used for the pipeline laying project, it no longer utilizes in the next 12 months. These materials are located at various project sites and were purchased for use during construction of pipeline. Efforts are underway to dispose of the project surplus materials to oil companies. The Management of the Group expects that, the fair value (less cost to sell) is higher than the carrying amount
25 Equity Share Capital(` in million)
Particulars As at March 31, 2019 As at March 31, 2018Equity Share Capital 62,901.54 64,166.32 62,901.54 64,166.32Authorised:30,000,000,000 Equity Shares of ₹ 5 each 150,000.00 150,000.00(as at March 31, 2018: 30,000,000,000 Equity Shares of ₹ 5 each)
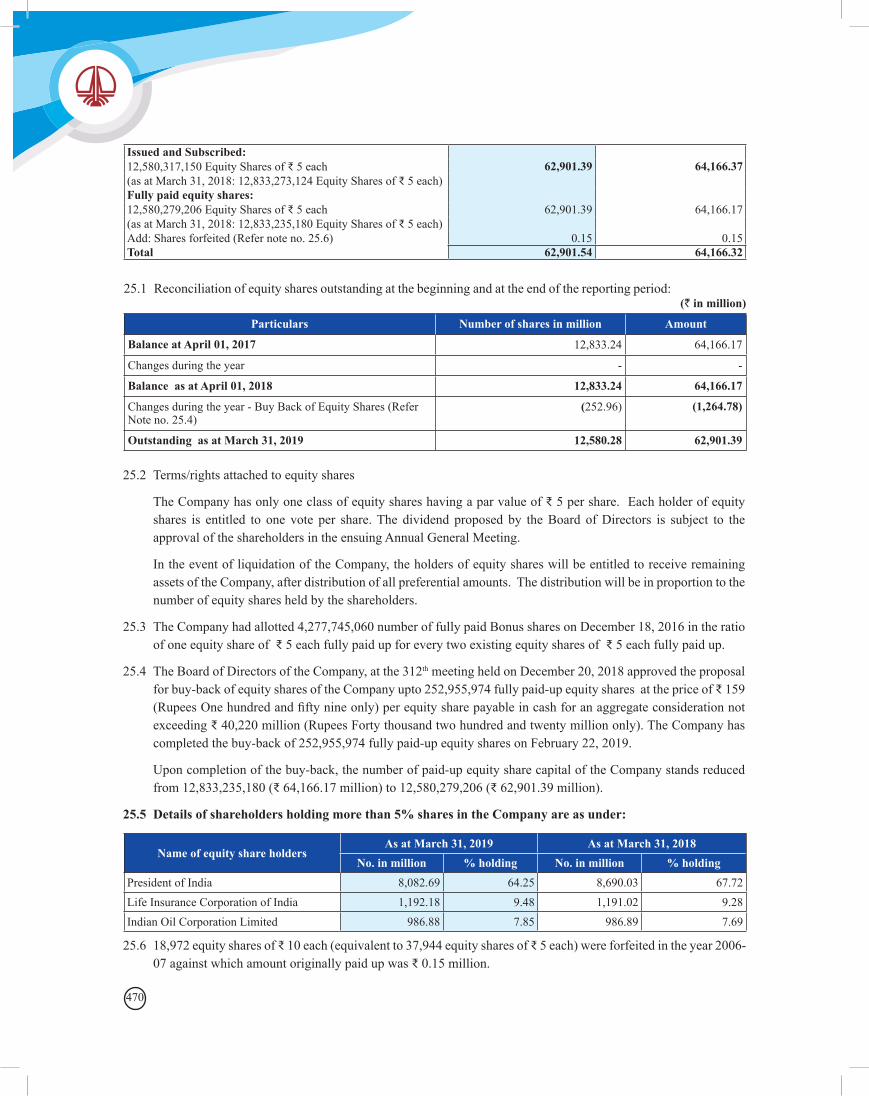
470
25.2 Terms/rights attached to equity shares
The Company has only one class of equity shares having a par value of ₹ 5 per share. Each holder of equity shares is entitled to one vote per share. The dividend proposed by the Board of Directors is subject to the approval of the shareholders in the ensuing Annual General Meeting.
In the event of liquidation of the Company, the holders of equity shares will be entitled to receive remaining assets of the Company, after distribution of all preferential amounts. The distribution will be in proportion to the number of equity shares held by the shareholders.
25.3 The Company had allotted 4,277,745,060 number of fully paid Bonus shares on December 18, 2016 in the ratio of one equity share of ₹ 5 each fully paid up for every two existing equity shares of ₹ 5 each fully paid up.
25.4 The Board of Directors of the Company, at the 312th meeting held on December 20, 2018 approved the proposal for buy-back of equity shares of the Company upto 252,955,974 fully paid-up equity shares at the price of ₹ 159 (Rupees One hundred and fifty nine only) per equity share payable in cash for an aggregate consideration not exceeding ₹ 40,220 million (Rupees Forty thousand two hundred and twenty million only). The Company has completed the buy-back of 252,955,974 fully paid-up equity shares on February 22, 2019.
Upon completion of the buy-back, the number of paid-up equity share capital of the Company stands reduced from 12,833,235,180 (₹ 64,166.17 million) to 12,580,279,206 (₹ 62,901.39 million).
25.5 Details of shareholders holding more than 5% shares in the Company are as under:
Name of equity share holdersAs at March 31, 2019 As at March 31, 2018
No. in million % holding No. in million % holdingPresident of India 8,082.69 64.25 8,690.03 67.72Life Insurance Corporation of India 1,192.18 9.48 1,191.02 9.28Indian Oil Corporation Limited 986.88 7.85 986.89 7.69
25.6 18,972 equity shares of ₹ 10 each (equivalent to 37,944 equity shares of ₹ 5 each) were forfeited in the year 2006-07 against which amount originally paid up was ₹ 0.15 million.
Issued and Subscribed: 12,580,317,150 Equity Shares of ₹ 5 each 62,901.39 64,166.37(as at March 31, 2018: 12,833,273,124 Equity Shares of ₹ 5 each) Fully paid equity shares: 12,580,279,206 Equity Shares of ₹ 5 each 62,901.39 64,166.17(as at March 31, 2018: 12,833,235,180 Equity Shares of ₹ 5 each) Add: Shares forfeited (Refer note no. 25.6) 0.15 0.15Total 62,901.54 64,166.32
(` in million)25.1 Reconciliation of equity shares outstanding at the beginning and at the end of the reporting period:
Particulars Number of shares in million Amount
Balance at April 01, 2017 12,833.24 64,166.17
Changes during the year - -
Balance as at April 01, 2018 12,833.24 64,166.17
Changes during the year - Buy Back of Equity Shares (Refer Note no. 25.4)
(252.96) (1,264.78)
Outstanding as at March 31, 2019 12,580.28 62,901.39
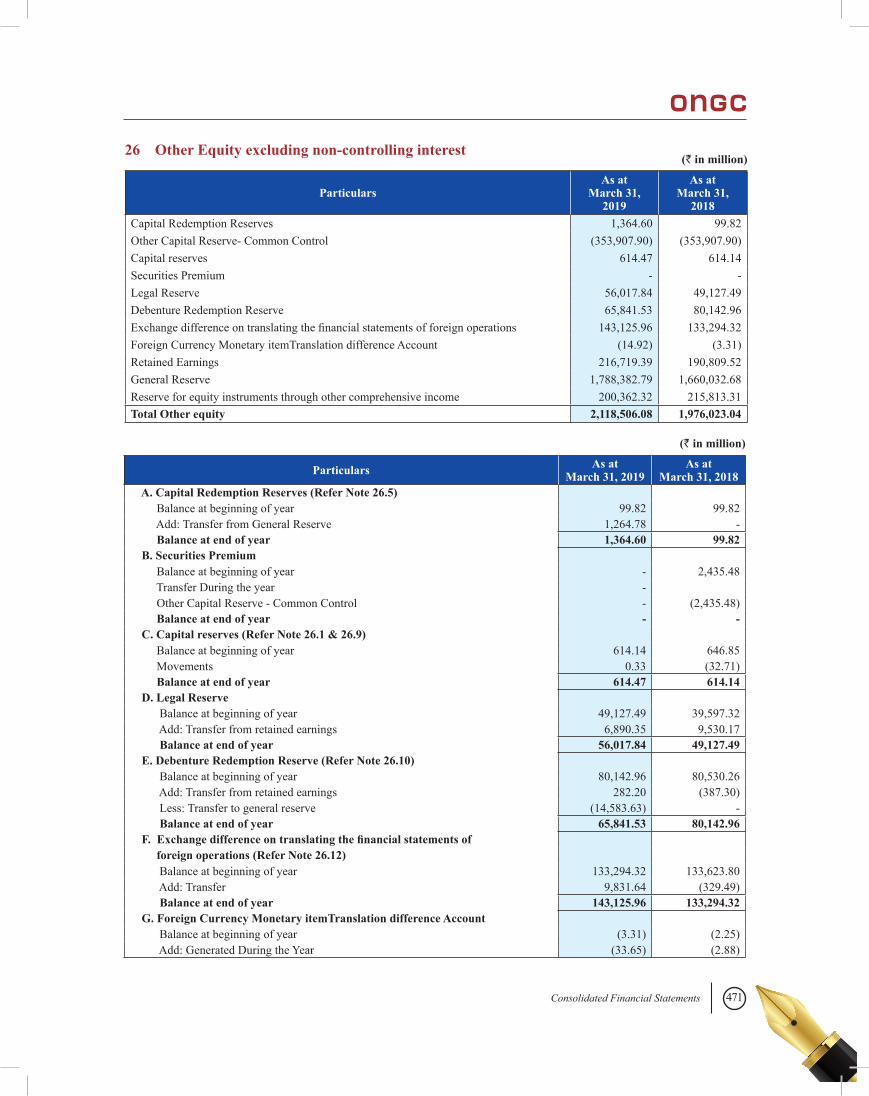
471Consolidated Financial Statements
26 Other Equity excluding non-controlling interest(` in million)
ParticularsAs at
March 31, 2019
As at March 31,
2018Capital Redemption Reserves 1,364.60 99.82Other Capital Reserve- Common Control (353,907.90) (353,907.90)Capital reserves 614.47 614.14Securities Premium - -Legal Reserve 56,017.84 49,127.49Debenture Redemption Reserve 65,841.53 80,142.96Exchange difference on translating the financial statements of foreign operations 143,125.96 133,294.32Foreign Currency Monetary itemTranslation difference Account (14.92) (3.31)Retained Earnings 216,719.39 190,809.52General Reserve 1,788,382.79 1,660,032.68Reserve for equity instruments through other comprehensive income 200,362.32 215,813.31Total Other equity 2,118,506.08 1,976,023.04
Particulars As at March 31, 2019
As at March 31, 2018
A. Capital Redemption Reserves (Refer Note 26.5) Balance at beginning of year 99.82 99.82 Add: Transfer from General Reserve 1,264.78 - Balance at end of year 1,364.60 99.82 B. Securities Premium Balance at beginning of year - 2,435.48 Transfer During the year - Other Capital Reserve - Common Control - (2,435.48) Balance at end of year - - C. Capital reserves (Refer Note 26.1 & 26.9) Balance at beginning of year 614.14 646.85 Movements 0.33 (32.71) Balance at end of year 614.47 614.14
D. Legal Reserve Balance at beginning of year 49,127.49 39,597.32 Add: Transfer from retained earnings 6,890.35 9,530.17 Balance at end of year 56,017.84 49,127.49
E. Debenture Redemption Reserve (Refer Note 26.10) Balance at beginning of year 80,142.96 80,530.26 Add: Transfer from retained earnings 282.20 (387.30) Less: Transfer to general reserve (14,583.63) - Balance at end of year 65,841.53 80,142.96
F. Exchange difference on translating the financial statements of foreign operations (Refer Note 26.12)
Balance at beginning of year 133,294.32 133,623.80 Add: Transfer 9,831.64 (329.49) Balance at end of year 143,125.96 133,294.32
G. Foreign Currency Monetary itemTranslation difference Account Balance at beginning of year (3.31) (2.25) Add: Generated During the Year (33.65) (2.88)
(` in million)
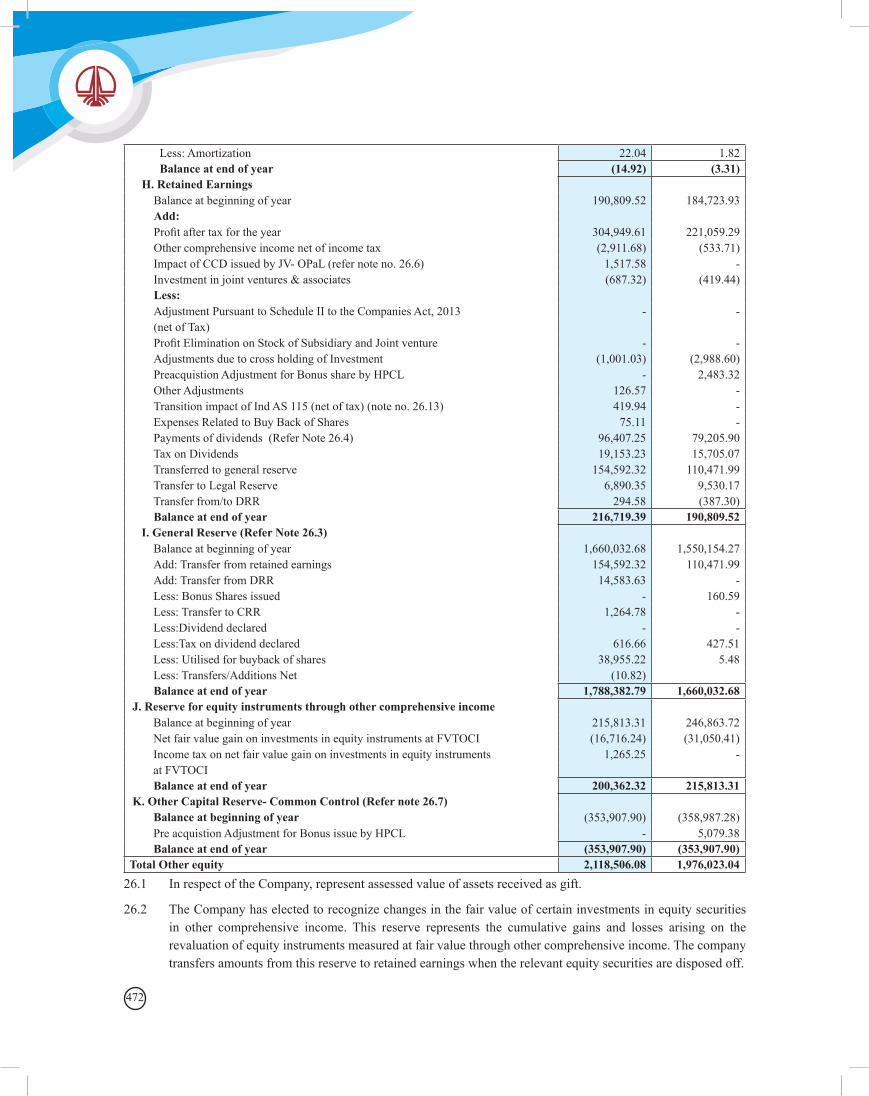
472
Less: Amortization 22.04 1.82 Balance at end of year (14.92) (3.31)
H. Retained Earnings Balance at beginning of year 190,809.52 184,723.93Add: Profit after tax for the year 304,949.61 221,059.29Other comprehensive income net of income tax (2,911.68) (533.71)Impact of CCD issued by JV- OPaL (refer note no. 26.6) 1,517.58 -Investment in joint ventures & associates (687.32) (419.44)Less: Adjustment Pursuant to Schedule II to the Companies Act, 2013 - -(net of Tax) Profit Elimination on Stock of Subsidiary and Joint venture - -Adjustments due to cross holding of Investment (1,001.03) (2,988.60)Preacquistion Adjustment for Bonus share by HPCL - 2,483.32Other Adjustments 126.57 -Transition impact of Ind AS 115 (net of tax) (note no. 26.13) 419.94 -Expenses Related to Buy Back of Shares 75.11 -Payments of dividends (Refer Note 26.4) 96,407.25 79,205.90Tax on Dividends 19,153.23 15,705.07Transferred to general reserve 154,592.32 110,471.99Transfer to Legal Reserve 6,890.35 9,530.17Transfer from/to DRR 294.58 (387.30)Balance at end of year 216,719.39 190,809.52
I. General Reserve (Refer Note 26.3) Balance at beginning of year 1,660,032.68 1,550,154.27Add: Transfer from retained earnings 154,592.32 110,471.99Add: Transfer from DRR 14,583.63 -Less: Bonus Shares issued - 160.59Less: Transfer to CRR 1,264.78 -Less:Dividend declared - -Less:Tax on dividend declared 616.66 427.51Less: Utilised for buyback of shares 38,955.22 5.48Less: Transfers/Additions Net (10.82) Balance at end of year 1,788,382.79 1,660,032.68
J. Reserve for equity instruments through other comprehensive income Balance at beginning of year 215,813.31 246,863.72Net fair value gain on investments in equity instruments at FVTOCI (16,716.24) (31,050.41)Income tax on net fair value gain on investments in equity instruments 1,265.25 -at FVTOCI Balance at end of year 200,362.32 215,813.31
K. Other Capital Reserve- Common Control (Refer note 26.7) Balance at beginning of year (353,907.90) (358,987.28)Pre acquistion Adjustment for Bonus issue by HPCL - 5,079.38Balance at end of year (353,907.90) (353,907.90)
Total Other equity 2,118,506.08 1,976,023.0426.1 In respect of the Company, represent assessed value of assets received as gift.
26.2 The Company has elected to recognize changes in the fair value of certain investments in equity securities in other comprehensive income. This reserve represents the cumulative gains and losses arising on the revaluation of equity instruments measured at fair value through other comprehensive income. The company transfers amounts from this reserve to retained earnings when the relevant equity securities are disposed off.
473Consolidated Financial Statements
26.3 The general reserve is used from time to time to transfer profits from retained earnings for appropriation purposes. As the general reserve is created by a transfer from one component of equity to another. It is not an item of other comprehensive income.
26.4 The amount that can be distributed by the Company as dividends to its equity shareholders is determined considering the requirements of the Companies Act, 2013 and the dividend distribution policy of the Company.
On September 28, 2018, a final dividend of ₹ 1.35 per share (27%) for 2017-18 was paid to Shareholders / beneficial interest holders of fully paid equity shares.
On February 14, 2019 and on March 23, 2019 the Company had declared two interim dividends of ₹ 5.25 per share (105%) and ₹ 1/- per share (20%) respectively which have been paid / released to bank for payment.
In respect of the year ended March 31, 2019, the Board of Directors has proposed a final dividend of ₹0.75 per share (15%) be paid on fully paid-up equity shares. This final dividend shall be subject to approval by shareholders at the ensuing Annual General Meeting and has not been included as a liability in these financial statements. The proposed equity dividend is payable to all holders of fully paid equity shares. The total estimated equity dividend to be paid is ₹9,435.21 million and the dividend distribution tax thereon amounts to ₹1,939.44 million.
26.5 As per Companies Act, 2013, Capital Redemption Reserve is to be created when Company purchases (buy backs) it’s own shares out of the free reserves for an amount equal to the nominal value of shares (Share Capital extinguished) so purchased. Accordingly, an amount of ₹ 1,264.78 million i.e. the Share Capital extinguished has been transferred from General Reserve to Capital Redemption Reserve.
During the year, an amount of ₹ 38,955.22 million from general reserve and ₹ 75.11 million from retained earnings was utilised to offset the excess of total buy-back cost of ₹ 40,295.11 million (including ₹ 75.11 million towards transaction cost of buy-back) over par value of shares.
26.6 Represents the adjustment made on account of valuation of compulsorily convertible debentures issued by Joint Venture Company ONGC Petro additions Limited into debt and equity as per Ind AS 32 on Financial Instruments. Also refer note no. 13.1.9(a)
26.7 Represents common control reserve on account of HPCL acquisition in the year 2017-18 (refer note 3.4)
26.8 In respect of subsidiary, MRPL, the company created Capital Redemption Reserve on Redemption of Preference Share Capital of ₹91.86 million in the financial years 2011-12 and 2012-13.
26.9 In respect of subsidiary OVL, capital reserve is recognized by the Company in respect of gains on the sale of a part of the participating interest in respect of Block 06.1, Vietnam where the consideration received for partial farm out in unproved property was not higher than the total cost.
26.10 In respect of subsidiary OVL, the Debentures Redemption Reserve position for above is as under:-
Particulars As at March 31, 2019 As at March 31, 2018Unsecured 8.54% 10 Years Non-Convertible Redeemable Bonds in the nature of Debentures- Series II
2,585.55 2,585.55
Unsecured 4.625% 10 year US$ Bonds - US$ 750 million 12,299.86 12,299.86Unsecured 3.75% 10 year US$ Bonds - US$ 500 million 12,153.02 12,153.02Unsecured 2.75% 7 year EUR Bonds - EUR 525 million 12,946.68 12,946.68Unsecured 3.25% 5 year US$ Bonds - US$ 750 million 24,606.46 24,606.46Unsecured 2.50% 5 year US$ Bonds - US$ 300 million* - 14,583.63Total 64,591.57 79,175.20
*Unsecured 2.50% 5 year US$ Bonds - US$ 300 million repaid on May 7, 2018.
(` in million)
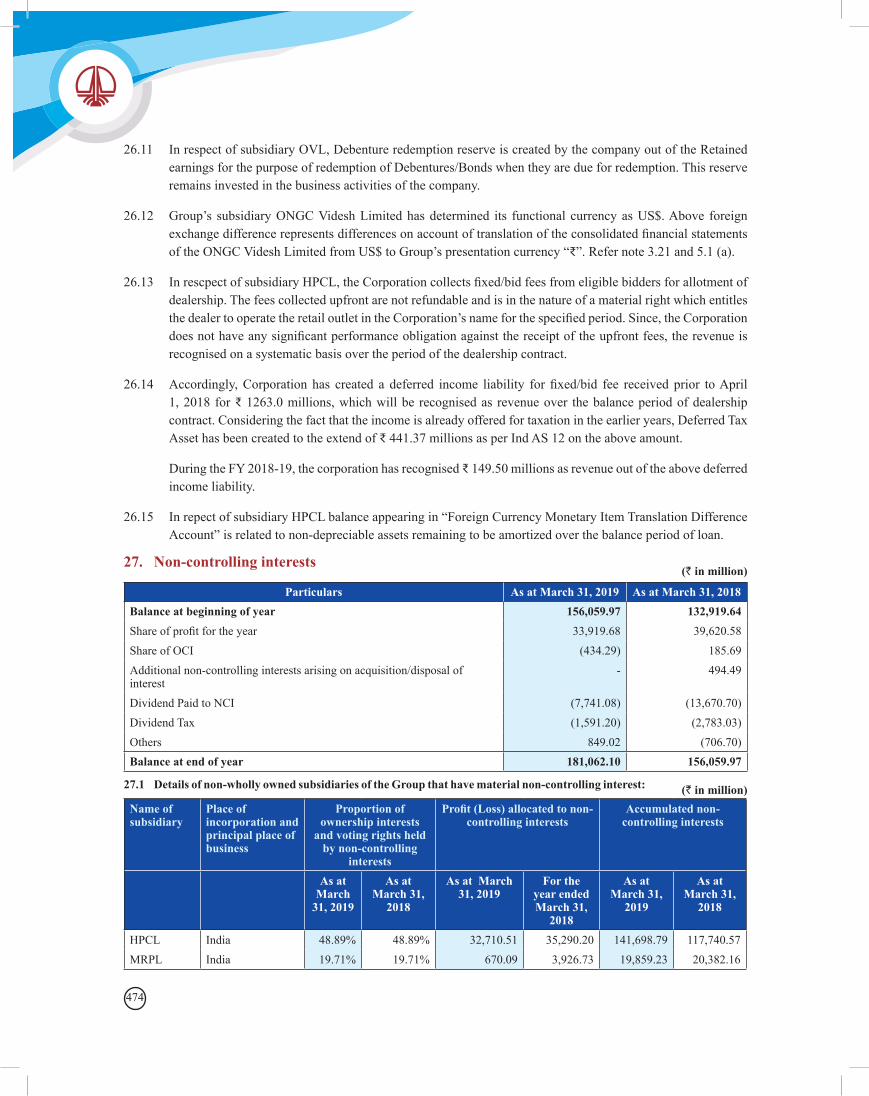
474
26.11 In respect of subsidiary OVL, Debenture redemption reserve is created by the company out of the Retained earnings for the purpose of redemption of Debentures/Bonds when they are due for redemption. This reserve remains invested in the business activities of the company.
26.12 Group’s subsidiary ONGC Videsh Limited has determined its functional currency as US$. Above foreign exchange difference represents differences on account of translation of the consolidated financial statements of the ONGC Videsh Limited from US$ to Group’s presentation currency “₹”. Refer note 3.21 and 5.1 (a).
26.13 In rescpect of subsidiary HPCL, the Corporation collects fixed/bid fees from eligible bidders for allotment of dealership. The fees collected upfront are not refundable and is in the nature of a material right which entitles the dealer to operate the retail outlet in the Corporation’s name for the specified period. Since, the Corporation does not have any significant performance obligation against the receipt of the upfront fees, the revenue is recognised on a systematic basis over the period of the dealership contract.
26.14 Accordingly, Corporation has created a deferred income liability for fixed/bid fee received prior to April 1, 2018 for ₹ 1263.0 millions, which will be recognised as revenue over the balance period of dealership contract. Considering the fact that the income is already offered for taxation in the earlier years, Deferred Tax Asset has been created to the extend of ₹ 441.37 millions as per Ind AS 12 on the above amount.
During the FY 2018-19, the corporation has recognised ₹ 149.50 millions as revenue out of the above deferred income liability.
26.15 In repect of subsidiary HPCL balance appearing in “Foreign Currency Monetary Item Translation Difference Account” is related to non-depreciable assets remaining to be amortized over the balance period of loan.
27. Non-controlling interests(` in million)
(` in million)
Particulars As at March 31, 2019 As at March 31, 2018Balance at beginning of year 156,059.97 132,919.64Share of profit for the year 33,919.68 39,620.58Share of OCI (434.29) 185.69Additional non-controlling interests arising on acquisition/disposal of interest
- 494.49
Dividend Paid to NCI (7,741.08) (13,670.70)Dividend Tax (1,591.20) (2,783.03)Others 849.02 (706.70)Balance at end of year 181,062.10 156,059.97
27.1 Details of non-wholly owned subsidiaries of the Group that have material non-controlling interest:
Name of subsidiary
Place of incorporation and principal place of business
Proportion of ownership interests
and voting rights held by non-controlling
interests
Profit (Loss) allocated to non-controlling interests
Accumulated non-controlling interests
As at March
31, 2019
As at March 31,
2018
As at March 31, 2019
For the year ended March 31,
2018
As at March 31,
2019
As at March 31,
2018
HPCL India 48.89% 48.89% 32,710.51 35,290.20 141,698.79 117,740.57 MRPL India 19.71% 19.71% 670.09 3,926.73 19,859.23 20,382.16
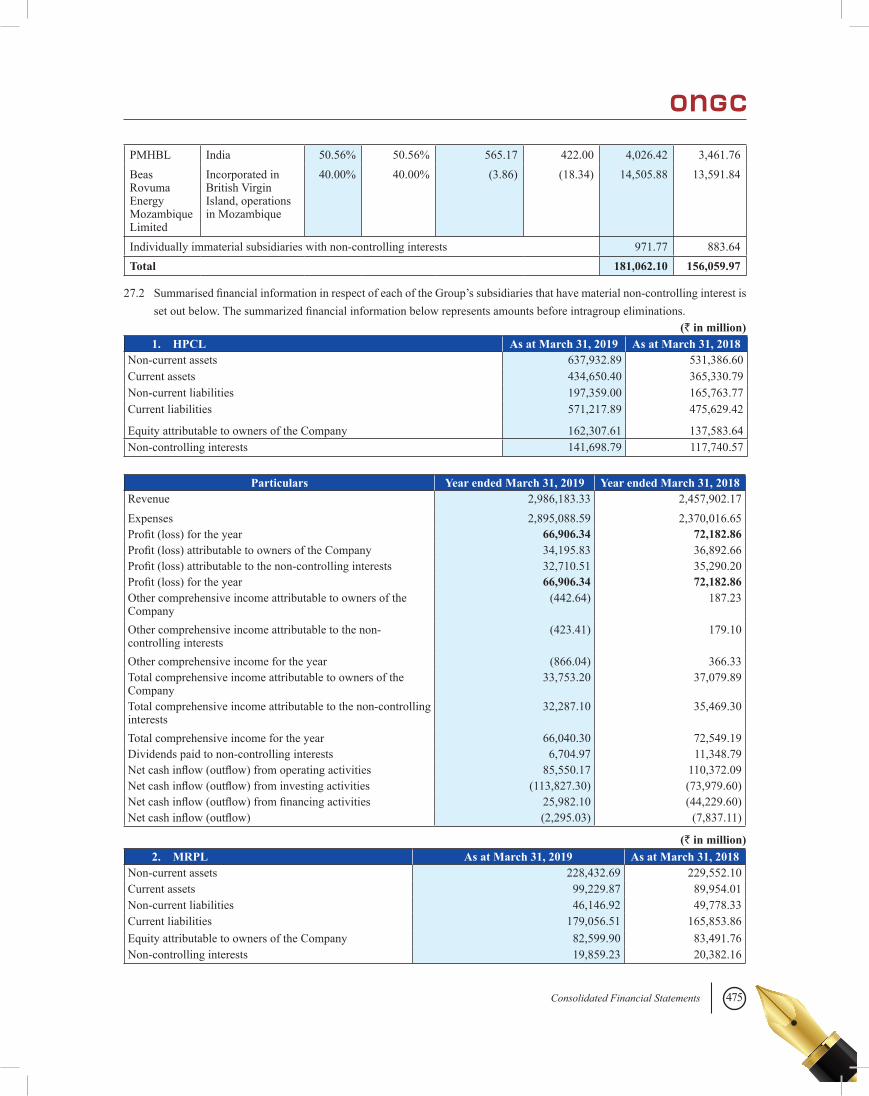
475Consolidated Financial Statements
PMHBL India 50.56% 50.56% 565.17 422.00 4,026.42 3,461.76 Beas Rovuma Energy Mozambique Limited
Incorporated in British Virgin Island, operations in Mozambique
40.00% 40.00% (3.86) (18.34) 14,505.88 13,591.84
Individually immaterial subsidiaries with non-controlling interests 971.77 883.64 Total 181,062.10 156,059.97
27.2 Summarised financial information in respect of each of the Group’s subsidiaries that have material non-controlling interest is set out below. The summarized financial information below represents amounts before intragroup eliminations.
1. HPCL As at March 31, 2019 As at March 31, 2018Non-current assets 637,932.89 531,386.60Current assets 434,650.40 365,330.79Non-current liabilities 197,359.00 165,763.77Current liabilities 571,217.89 475,629.42
Equity attributable to owners of the Company 162,307.61 137,583.64Non-controlling interests 141,698.79 117,740.57
Particulars Year ended March 31, 2019 Year ended March 31, 2018Revenue 2,986,183.33 2,457,902.17Expenses 2,895,088.59 2,370,016.65Profit (loss) for the year 66,906.34 72,182.86Profit (loss) attributable to owners of the Company 34,195.83 36,892.66Profit (loss) attributable to the non-controlling interests 32,710.51 35,290.20Profit (loss) for the year 66,906.34 72,182.86Other comprehensive income attributable to owners of the Company
(442.64) 187.23
Other comprehensive income attributable to the non-controlling interests
(423.41) 179.10
Other comprehensive income for the year (866.04) 366.33Total comprehensive income attributable to owners of the Company
33,753.20 37,079.89
Total comprehensive income attributable to the non-controlling interests
32,287.10 35,469.30
Total comprehensive income for the year 66,040.30 72,549.19Dividends paid to non-controlling interests 6,704.97 11,348.79Net cash inflow (outflow) from operating activities 85,550.17 110,372.09Net cash inflow (outflow) from investing activities (113,827.30) (73,979.60)Net cash inflow (outflow) from financing activities 25,982.10 (44,229.60)Net cash inflow (outflow) (2,295.03) (7,837.11)
2. MRPL As at March 31, 2019 As at March 31, 2018Non-current assets 228,432.69 229,552.10Current assets 99,229.87 89,954.01Non-current liabilities 46,146.92 49,778.33Current liabilities 179,056.51 165,853.86Equity attributable to owners of the Company 82,599.90 83,491.76Non-controlling interests 19,859.23 20,382.16
(` in million)
(` in million)
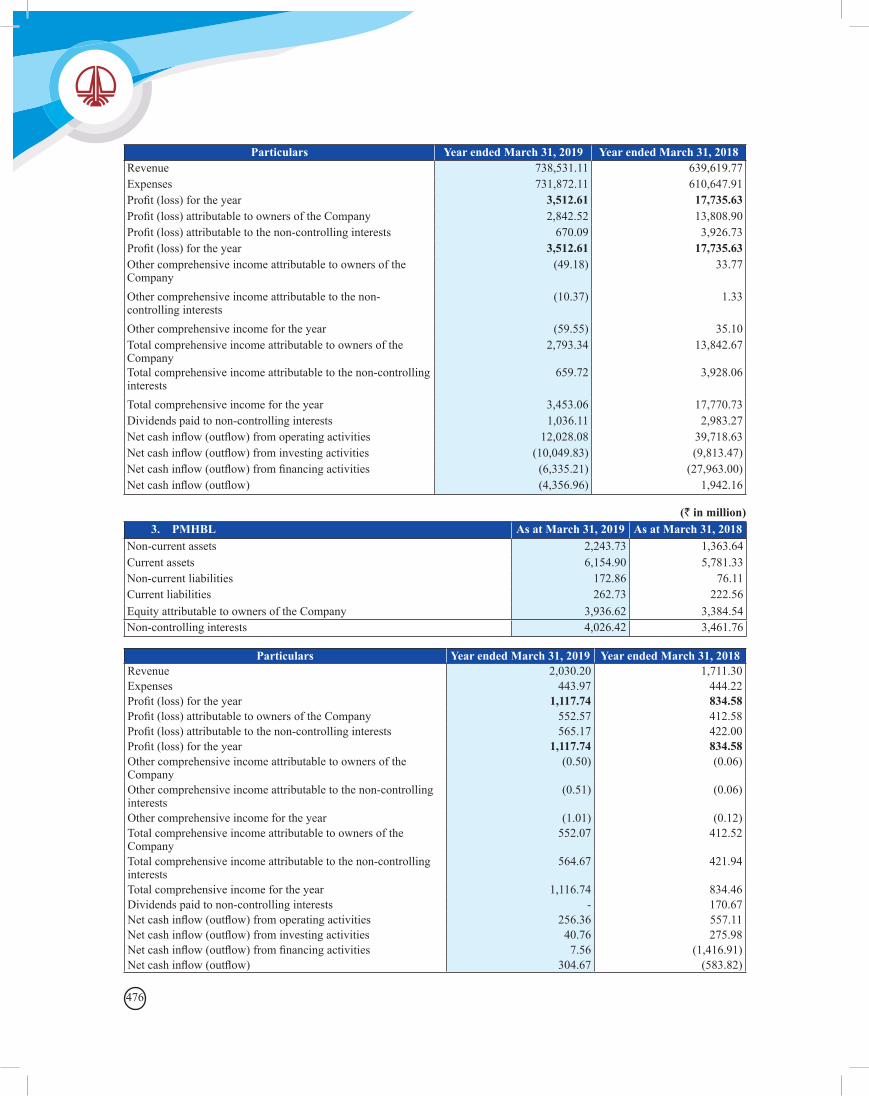
476
Particulars Year ended March 31, 2019 Year ended March 31, 2018Revenue 738,531.11 639,619.77Expenses 731,872.11 610,647.91Profit (loss) for the year 3,512.61 17,735.63Profit (loss) attributable to owners of the Company 2,842.52 13,808.90Profit (loss) attributable to the non-controlling interests 670.09 3,926.73Profit (loss) for the year 3,512.61 17,735.63Other comprehensive income attributable to owners of the Company
(49.18) 33.77
Other comprehensive income attributable to the non-controlling interests
(10.37) 1.33
Other comprehensive income for the year (59.55) 35.10Total comprehensive income attributable to owners of the Company
2,793.34 13,842.67
Total comprehensive income attributable to the non-controlling interests
659.72 3,928.06
Total comprehensive income for the year 3,453.06 17,770.73Dividends paid to non-controlling interests 1,036.11 2,983.27Net cash inflow (outflow) from operating activities 12,028.08 39,718.63Net cash inflow (outflow) from investing activities (10,049.83) (9,813.47)Net cash inflow (outflow) from financing activities (6,335.21) (27,963.00)Net cash inflow (outflow) (4,356.96) 1,942.16
3. PMHBL As at March 31, 2019 As at March 31, 2018Non-current assets 2,243.73 1,363.64Current assets 6,154.90 5,781.33Non-current liabilities 172.86 76.11Current liabilities 262.73 222.56Equity attributable to owners of the Company 3,936.62 3,384.54Non-controlling interests 4,026.42 3,461.76
(` in million)
Particulars Year ended March 31, 2019 Year ended March 31, 2018Revenue 2,030.20 1,711.30Expenses 443.97 444.22Profit (loss) for the year 1,117.74 834.58Profit (loss) attributable to owners of the Company 552.57 412.58Profit (loss) attributable to the non-controlling interests 565.17 422.00Profit (loss) for the year 1,117.74 834.58Other comprehensive income attributable to owners of the Company
(0.50) (0.06)
Other comprehensive income attributable to the non-controlling interests
(0.51) (0.06)
Other comprehensive income for the year (1.01) (0.12)Total comprehensive income attributable to owners of the Company
552.07 412.52
Total comprehensive income attributable to the non-controlling interests
564.67 421.94
Total comprehensive income for the year 1,116.74 834.46Dividends paid to non-controlling interests - 170.67Net cash inflow (outflow) from operating activities 256.36 557.11Net cash inflow (outflow) from investing activities 40.76 275.98Net cash inflow (outflow) from financing activities 7.56 (1,416.91)Net cash inflow (outflow) 304.67 (583.82)
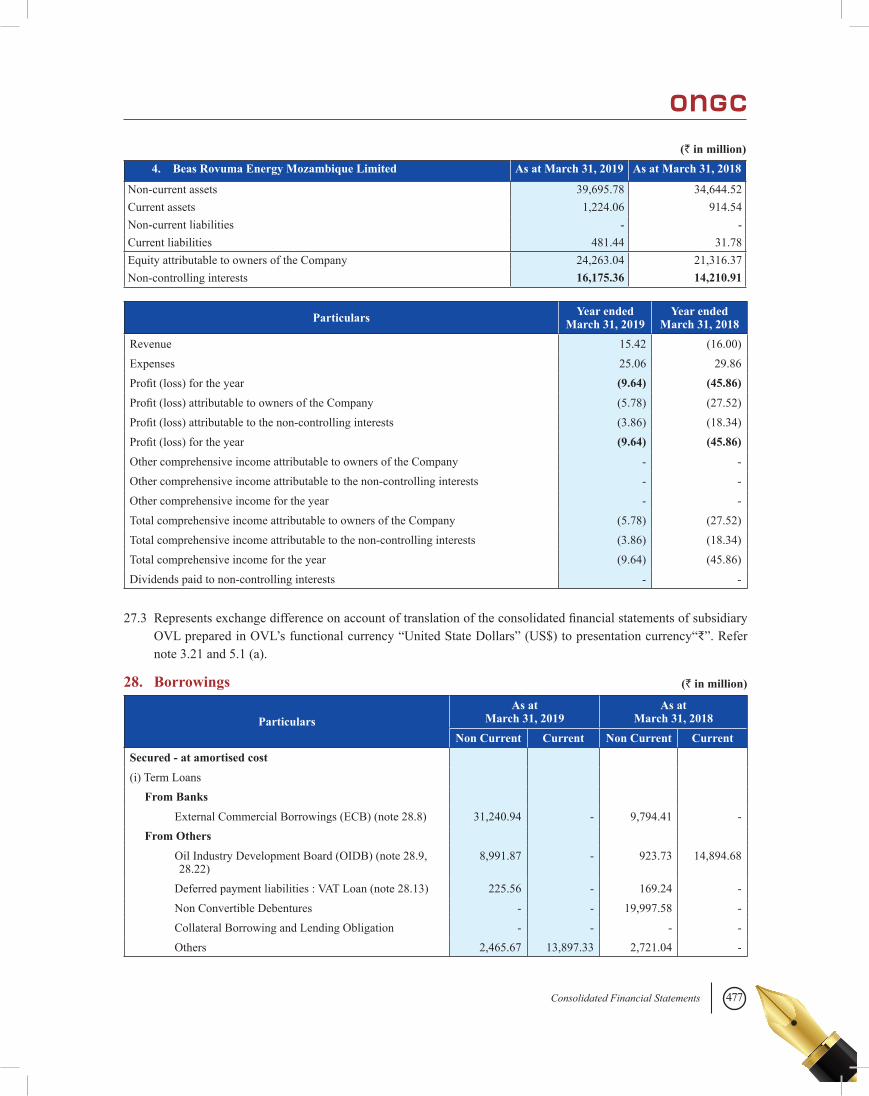
477Consolidated Financial Statements
(` in million)4. Beas Rovuma Energy Mozambique Limited As at March 31, 2019 As at March 31, 2018
Non-current assets 39,695.78 34,644.52Current assets 1,224.06 914.54Non-current liabilities - -Current liabilities 481.44 31.78Equity attributable to owners of the Company 24,263.04 21,316.37Non-controlling interests 16,175.36 14,210.91
Particulars Year ended March 31, 2019
Year ended March 31, 2018
Revenue 15.42 (16.00)Expenses 25.06 29.86Profit (loss) for the year (9.64) (45.86)Profit (loss) attributable to owners of the Company (5.78) (27.52)Profit (loss) attributable to the non-controlling interests (3.86) (18.34)Profit (loss) for the year (9.64) (45.86)Other comprehensive income attributable to owners of the Company - -Other comprehensive income attributable to the non-controlling interests - -Other comprehensive income for the year - -Total comprehensive income attributable to owners of the Company (5.78) (27.52)Total comprehensive income attributable to the non-controlling interests (3.86) (18.34)Total comprehensive income for the year (9.64) (45.86)Dividends paid to non-controlling interests - -
27.3 Represents exchange difference on account of translation of the consolidated financial statements of subsidiary OVL prepared in OVL’s functional currency “United State Dollars” (US$) to presentation currency“₹”. Refer note 3.21 and 5.1 (a).
(` in million)28. Borrowings
ParticularsAs at
March 31, 2019As at
March 31, 2018Non Current Current Non Current Current
Secured - at amortised cost (i) Term Loans From Banks External Commercial Borrowings (ECB) (note 28.8) 31,240.94 - 9,794.41 - From Others Oil Industry Development Board (OIDB) (note 28.9,
28.22)8,991.87 - 923.73 14,894.68
Deferred payment liabilities : VAT Loan (note 28.13) 225.56 - 169.24 - Non Convertible Debentures - - 19,997.58 - Collateral Borrowing and Lending Obligation - - - - Others 2,465.67 13,897.33 2,721.04 -
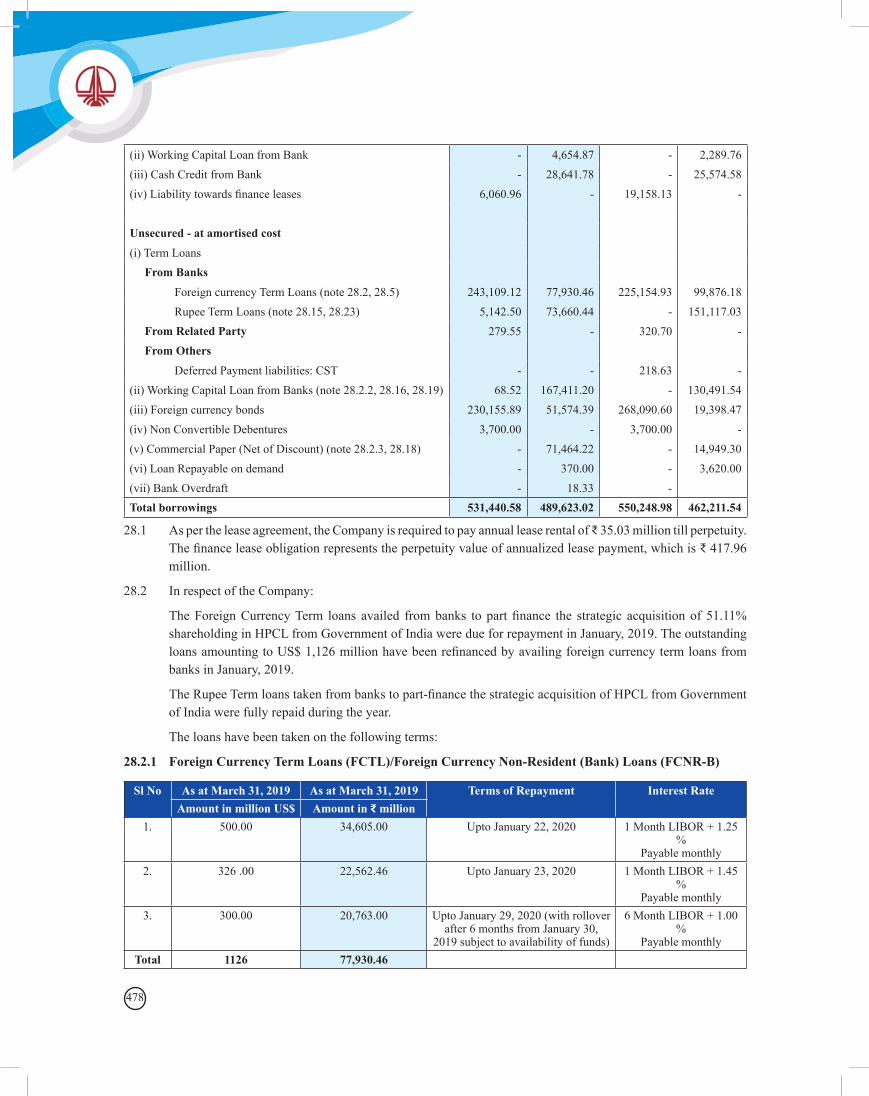
478
(ii) Working Capital Loan from Bank - 4,654.87 - 2,289.76(iii) Cash Credit from Bank - 28,641.78 - 25,574.58(iv) Liability towards finance leases 6,060.96 - 19,158.13 - Unsecured - at amortised cost (i) Term Loans From Banks Foreign currency Term Loans (note 28.2, 28.5) 243,109.12 77,930.46 225,154.93 99,876.18 Rupee Term Loans (note 28.15, 28.23) 5,142.50 73,660.44 - 151,117.03 From Related Party 279.55 - 320.70 - From Others Deferred Payment liabilities: CST - - 218.63 -(ii) Working Capital Loan from Banks (note 28.2.2, 28.16, 28.19) 68.52 167,411.20 - 130,491.54(iii) Foreign currency bonds 230,155.89 51,574.39 268,090.60 19,398.47(iv) Non Convertible Debentures 3,700.00 - 3,700.00 -(v) Commercial Paper (Net of Discount) (note 28.2.3, 28.18) - 71,464.22 - 14,949.30(vi) Loan Repayable on demand - 370.00 - 3,620.00(vii) Bank Overdraft - 18.33 - Total borrowings 531,440.58 489,623.02 550,248.98 462,211.54
28.1 As per the lease agreement, the Company is required to pay annual lease rental of ₹ 35.03 million till perpetuity. The finance lease obligation represents the perpetuity value of annualized lease payment, which is ₹ 417.96 million.
28.2 In respect of the Company:
The Foreign Currency Term loans availed from banks to part finance the strategic acquisition of 51.11% shareholding in HPCL from Government of India were due for repayment in January, 2019. The outstanding loans amounting to US$ 1,126 million have been refinanced by availing foreign currency term loans from banks in January, 2019.
The Rupee Term loans taken from banks to part-finance the strategic acquisition of HPCL from Government of India were fully repaid during the year.
The loans have been taken on the following terms:
28.2.1 Foreign Currency Term Loans (FCTL)/Foreign Currency Non-Resident (Bank) Loans (FCNR-B)
Sl No As at March 31, 2019 As at March 31, 2019 Terms of Repayment Interest RateAmount in million US$ Amount in ₹ million
1. 500.00 34,605.00 Upto January 22, 2020 1 Month LIBOR + 1.25 %
Payable monthly2. 326 .00 22,562.46 Upto January 23, 2020 1 Month LIBOR + 1.45
%Payable monthly
3. 300.00 20,763.00 Upto January 29, 2020 (with rollover after 6 months from January 30,
2019 subject to availability of funds)
6 Month LIBOR + 1.00 %
Payable monthlyTotal 1126 77,930.46
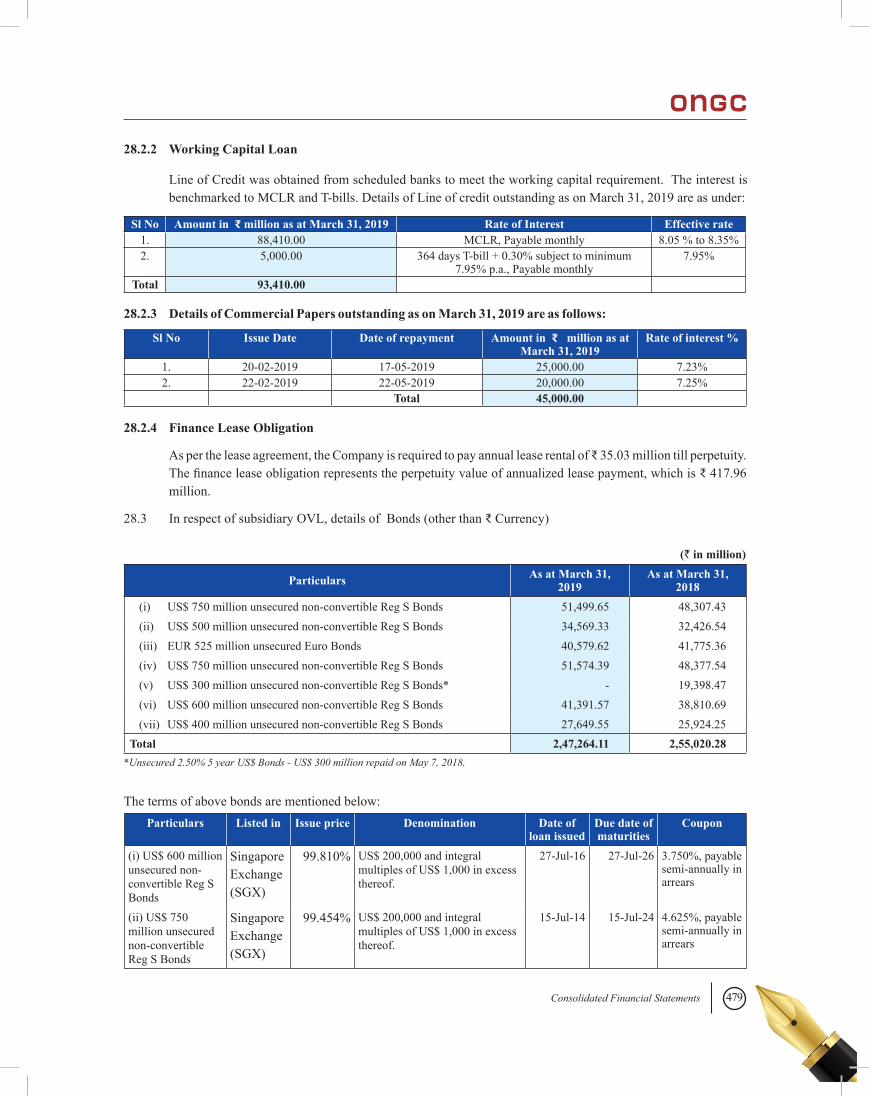
479Consolidated Financial Statements
28.2.2 Working Capital Loan
Line of Credit was obtained from scheduled banks to meet the working capital requirement. The interest is benchmarked to MCLR and T-bills. Details of Line of credit outstanding as on March 31, 2019 are as under:
28.2.3 Details of Commercial Papers outstanding as on March 31, 2019 are as follows:
Sl No Amount in ₹ million as at March 31, 2019 Rate of Interest Effective rate1. 88,410.00 MCLR, Payable monthly 8.05 % to 8.35%2. 5,000.00 364 days T-bill + 0.30% subject to minimum
7.95% p.a., Payable monthly7.95%
Total 93,410.00
Sl No Issue Date Date of repayment Amount in ₹ million as at March 31, 2019
Rate of interest %
1. 20-02-2019 17-05-2019 25,000.00 7.23%2. 22-02-2019 22-05-2019 20,000.00 7.25%
Total 45,000.00
28.2.4 Finance Lease Obligation
As per the lease agreement, the Company is required to pay annual lease rental of ₹ 35.03 million till perpetuity. The finance lease obligation represents the perpetuity value of annualized lease payment, which is ₹ 417.96 million.
28.3 In respect of subsidiary OVL, details of Bonds (other than ₹ Currency)
(` in million)
Particulars As at March 31, 2019
As at March 31, 2018
(i) US$ 750 million unsecured non-convertible Reg S Bonds 51,499.65 48,307.43 (ii) US$ 500 million unsecured non-convertible Reg S Bonds 34,569.33 32,426.54 (iii) EUR 525 million unsecured Euro Bonds 40,579.62 41,775.36 (iv) US$ 750 million unsecured non-convertible Reg S Bonds 51,574.39 48,377.54 (v) US$ 300 million unsecured non-convertible Reg S Bonds* - 19,398.47 (vi) US$ 600 million unsecured non-convertible Reg S Bonds 41,391.57 38,810.69 (vii) US$ 400 million unsecured non-convertible Reg S Bonds 27,649.55 25,924.25
Total 2,47,264.11 2,55,020.28 *Unsecured 2.50% 5 year US$ Bonds - US$ 300 million repaid on May 7, 2018.
The terms of above bonds are mentioned below:Particulars Listed in Issue price Denomination Date of
loan issuedDue date of maturities
Coupon
(i) US$ 600 million unsecured non-convertible Reg S Bonds
Singapore Exchange (SGX)
99.810% US$ 200,000 and integral multiples of US$ 1,000 in excess thereof.
27-Jul-16 27-Jul-26 3.750%, payable semi-annually in arrears
(ii) US$ 750 million unsecured non-convertible Reg S Bonds
Singapore Exchange (SGX)
99.454% US$ 200,000 and integral multiples of US$ 1,000 in excess thereof.
15-Jul-14 15-Jul-24 4.625%, payable semi-annually in arrears
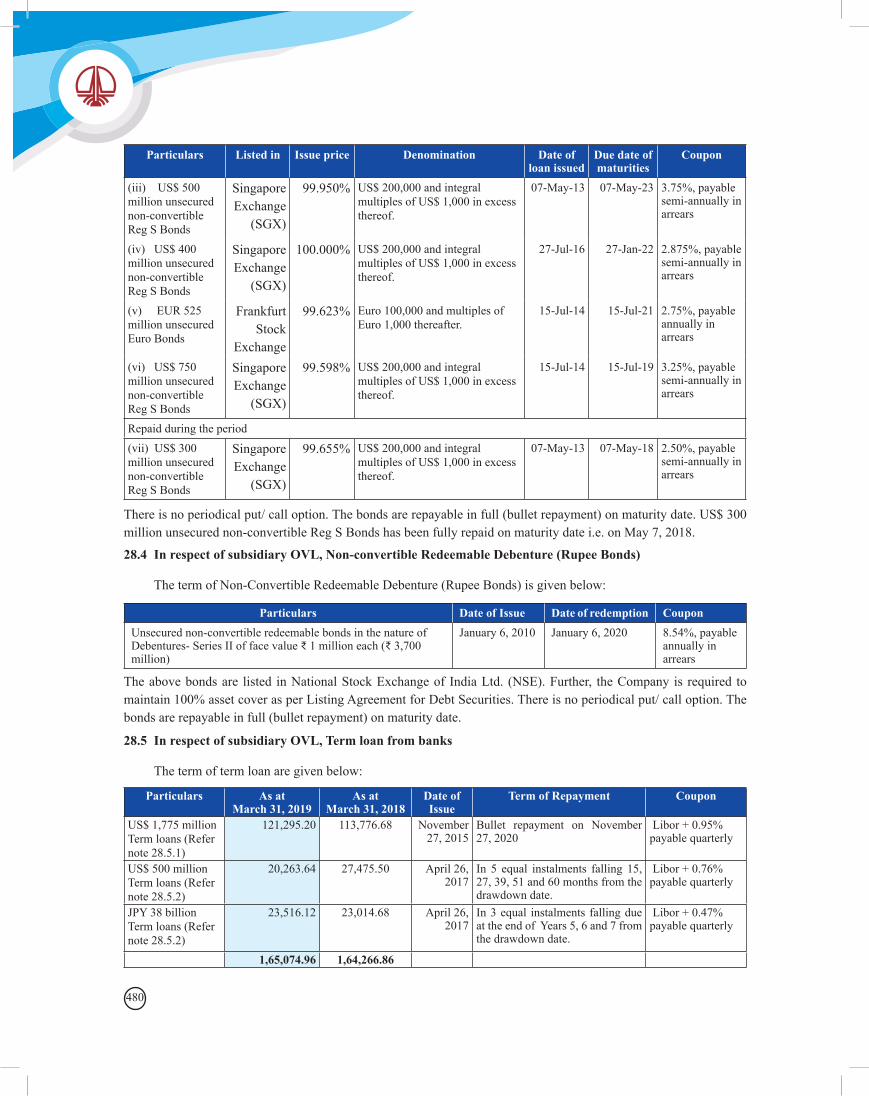
480
Particulars Listed in Issue price Denomination Date of loan issued
Due date of maturities
Coupon
(iii) US$ 500 million unsecured non-convertible Reg S Bonds
Singapore Exchange
(SGX)
99.950% US$ 200,000 and integral multiples of US$ 1,000 in excess thereof.
07-May-13 07-May-23 3.75%, payable semi-annually in arrears
(iv) US$ 400 million unsecured non-convertible Reg S Bonds
Singapore Exchange
(SGX)
100.000% US$ 200,000 and integral multiples of US$ 1,000 in excess thereof.
27-Jul-16 27-Jan-22 2.875%, payable semi-annually in arrears
(v) EUR 525 million unsecured Euro Bonds
Frankfurt Stock
Exchange
99.623% Euro 100,000 and multiples of Euro 1,000 thereafter.
15-Jul-14 15-Jul-21 2.75%, payable annually in arrears
(vi) US$ 750 million unsecured non-convertible Reg S Bonds
Singapore Exchange
(SGX)
99.598% US$ 200,000 and integral multiples of US$ 1,000 in excess thereof.
15-Jul-14 15-Jul-19 3.25%, payable semi-annually in arrears
Repaid during the period(vii) US$ 300 million unsecured non-convertible Reg S Bonds
Singapore Exchange
(SGX)
99.655% US$ 200,000 and integral multiples of US$ 1,000 in excess thereof.
07-May-13 07-May-18 2.50%, payable semi-annually in arrears
There is no periodical put/ call option. The bonds are repayable in full (bullet repayment) on maturity date. US$ 300 million unsecured non-convertible Reg S Bonds has been fully repaid on maturity date i.e. on May 7, 2018.
28.4 In respect of subsidiary OVL, Non-convertible Redeemable Debenture (Rupee Bonds)
The term of Non-Convertible Redeemable Debenture (Rupee Bonds) is given below:
Particulars Date of Issue Date of redemption CouponUnsecured non-convertible redeemable bonds in the nature of Debentures- Series II of face value ₹ 1 million each (₹ 3,700 million)
January 6, 2010 January 6, 2020 8.54%, payable annually in arrears
The above bonds are listed in National Stock Exchange of India Ltd. (NSE). Further, the Company is required to maintain 100% asset cover as per Listing Agreement for Debt Securities. There is no periodical put/ call option. The bonds are repayable in full (bullet repayment) on maturity date.
28.5 In respect of subsidiary OVL, Term loan from banks
The term of term loan are given below:
Particulars As at March 31, 2019
As at March 31, 2018
Date of Issue
Term of Repayment Coupon
US$ 1,775 million Term loans (Refer note 28.5.1)
121,295.20 113,776.68 November 27, 2015
Bullet repayment on November 27, 2020
Libor + 0.95% payable quarterly
US$ 500 million Term loans (Refer note 28.5.2)
20,263.64 27,475.50 April 26, 2017
In 5 equal instalments falling 15, 27, 39, 51 and 60 months from the drawdown date.
Libor + 0.76% payable quarterly
JPY 38 billion Term loans (Refer note 28.5.2)
23,516.12 23,014.68 April 26, 2017
In 3 equal instalments falling due at the end of Years 5, 6 and 7 from the drawdown date.
Libor + 0.47% payable quarterly
1,65,074.96 1,64,266.86
481Consolidated Financial Statements
28.5.1 The Term loan was obtained from a syndicate of commercial banks to part finance acquisition of 10% stake in Area 1, Mozambique from Anadarko. The Term loan is guaranteed for repayment of principal and payment of interest by Oil and Natural Gas Corporation Limited, the parent company. There is no periodical put/ call option. The Term loan is repayable in full (bullet repayment) on maturity date.
28.5.2 The Subsidiary company, ONGC Videsh, incorporated a wholly owned subsidiary ONGC Videsh Singapore Pte Ltd (“OVSL”). OVSL has in turn incorporated a wholly-owned subsidiary ONGC Videsh Vankorneft Pte Ltd (“OVVL”). OVVL acquired 26% shares of JSC Vankorneft (15% in May 2016 and 11% in October 2016) and raised two separate syndicated bridge loans from international banks to meet the purchase consideration requirements.
On July 27, 2016, OVVL issued notes for face value of US$ 600.00 Million (₹ 38,910.00 million), 3.75% Notes due July 27, 2026 and US$ 400.00 Million (₹25,940.00 million), 2.875% Notes due January 27, 2022. The bond issuance proceeds were utilized to prepay the bridge loan on July 29, 2016.
Subsequently, two separate facility loans from SBI of US$ 500 million (availed to the extent of US$ 491.74 million) and SMBC of JPY 38 billion were availed on April 26, 2017 to repay the outstanding balance of bridge loan facility. As on March 31, 2019, outstanding amounts were US$ 292.78 million & JPY 38 billion respectively against US$ 500 million facility and JPY 38 billion facility. All these loans are guaranteed by ONGC, the parent company.
28.6 ONGC Nile Ganga B.V. along with joint venture partners acquired 10% participating interest in the ADNOC Group owned offshore Lower Zakum Concession. To fund US$ 240 million for the acquisition, the Company has availed short-term TDR loan against long term deposits with the Company's bankers of US$ 205.11 (₹ 13,315.42 million) in March 2018.The outstanding balance as on March 31, 2019 is Nil.
28.7 Long term maturities of finance lease obligation
Under the lease agreement, the subsidiary company OVL, is required to pay annual lease rental of ₹ 31.65 million till perpetuity. The finance lease obligation represents the perpetuity value of annualized lease payment, which is ₹ 377.69 million. (Refer Note 39 and 45.1.1)
28.8 External Commercial Borrowing (ECB)
28.8.1 In respect of subsidiary MRPL, ECB taken are US$ denominated loans and carries variable rate of interest which is LIBOR (6 months) plus spread. Interest rate as at March 31, 2019 is 3.86% and range of interest rate as at March 31, 2018 was 3.63% to 4.45%. These are secured by first pari passu charge over immovable property, plant and equipment and first ranking pari passu charge over movable property, plant and equipment both present and future.
28.8.2 In respect of subsidiary OMPL, the company has entered into an External Commercial Borrowing (ECB) arrangement for US$ 331.32 million. Entire ECB facility of US$ 331.32 Million has been availed in three tranches. The ECB-Tranche I amounting to US$ 250 million is repayable in 14 equal half yearly installments commencing from April 1, 2015 and carries variable rate of interest which is LIBOR (6 months) plus spread of 2.40% . The ECB- Tranche II amounting to US$ 60 million is repayable in 14 equal half yearly installments commencing from October 31, 2015 and carries variable rate of interest which is LIBOR (6 months) plus spread of 2.40%. The ECB- Tranche III amounting to US$ 21.32 million is repayable in 14 equal half yearly installments commencing from October 31, 2016 and carries variable rate of interest which is LIBOR (6 months) plus spread of 2.40%.
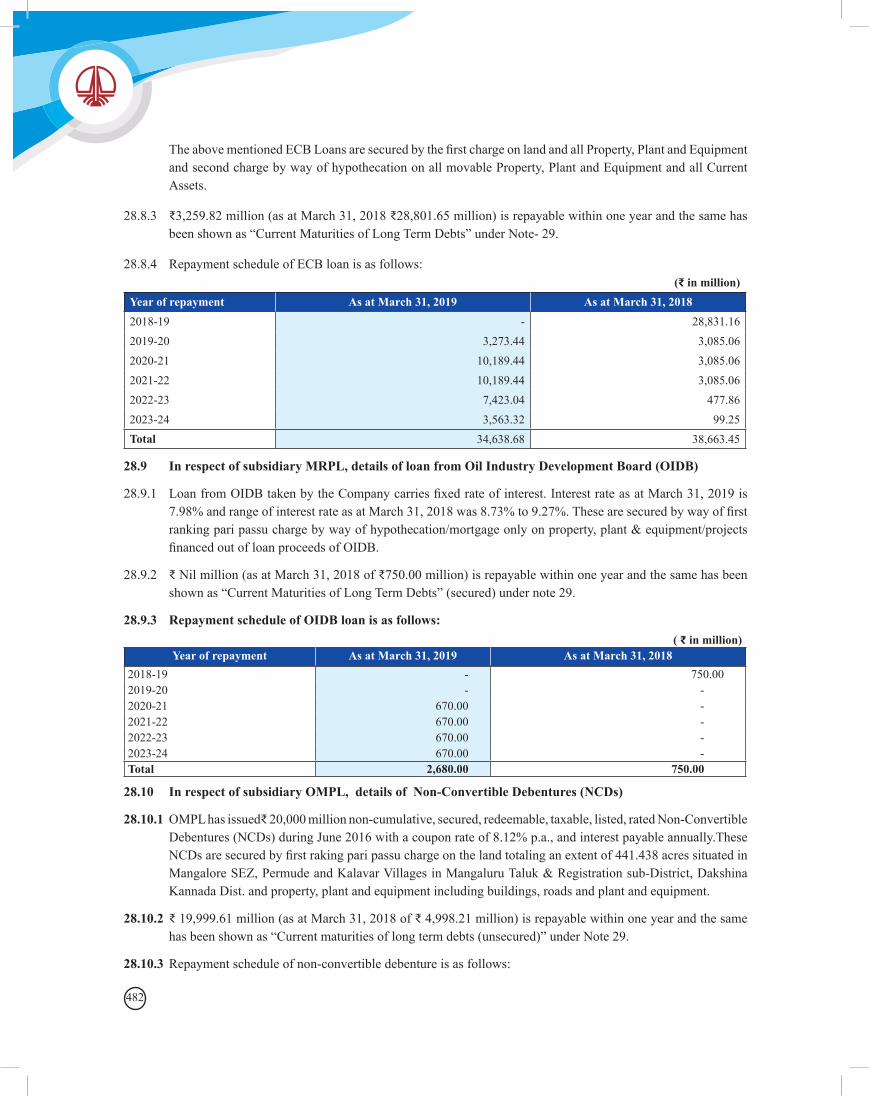
482
The above mentioned ECB Loans are secured by the first charge on land and all Property, Plant and Equipment and second charge by way of hypothecation on all movable Property, Plant and Equipment and all Current Assets.
28.8.3 ₹3,259.82 million (as at March 31, 2018 ₹28,801.65 million) is repayable within one year and the same has been shown as “Current Maturities of Long Term Debts” under Note- 29.
28.8.4 Repayment schedule of ECB loan is as follows:(₹ in million)
Year of repayment As at March 31, 2019 As at March 31, 20182018-19 - 28,831.162019-20 3,273.44 3,085.062020-21 10,189.44 3,085.062021-22 10,189.44 3,085.062022-23 7,423.04 477.862023-24 3,563.32 99.25Total 34,638.68 38,663.45
28.9 In respect of subsidiary MRPL, details of loan from Oil Industry Development Board (OIDB)
28.9.1 Loan from OIDB taken by the Company carries fixed rate of interest. Interest rate as at March 31, 2019 is 7.98% and range of interest rate as at March 31, 2018 was 8.73% to 9.27%. These are secured by way of first ranking pari passu charge by way of hypothecation/mortgage only on property, plant & equipment/projects financed out of loan proceeds of OIDB.
28.9.2 ₹ Nil million (as at March 31, 2018 of ₹750.00 million) is repayable within one year and the same has been shown as “Current Maturities of Long Term Debts” (secured) under note 29.
28.9.3 Repayment schedule of OIDB loan is as follows: ( ₹ in million)
Year of repayment As at March 31, 2019 As at March 31, 20182018-19 - 750.002019-20 - -2020-21 670.00 -2021-22 670.00 -2022-23 670.00 -2023-24 670.00 -Total 2,680.00 750.00
28.10 In respect of subsidiary OMPL, details of Non-Convertible Debentures (NCDs)
28.10.1 OMPL has issued₹ 20,000 million non-cumulative, secured, redeemable, taxable, listed, rated Non-Convertible Debentures (NCDs) during June 2016 with a coupon rate of 8.12% p.a., and interest payable annually.These NCDs are secured by first raking pari passu charge on the land totaling an extent of 441.438 acres situated in Mangalore SEZ, Permude and Kalavar Villages in Mangaluru Taluk & Registration sub-District, Dakshina Kannada Dist. and property, plant and equipment including buildings, roads and plant and equipment.
28.10.2 ₹ 19,999.61 million (as at March 31, 2018 of ₹ 4,998.21 million) is repayable within one year and the same has been shown as “Current maturities of long term debts (unsecured)” under Note 29.
28.10.3 Repayment schedule of non-convertible debenture is as follows:
483Consolidated Financial Statements
(₹ in million)Year of repayment As at March 31, 2019 As at March 31, 20182018-19 - 5,000.002019-20 20,000.00 20,000.00Total 20,000.00 25,000.00
28.11 In respect of subsidiary MRPL, working capital borrowings from consortium banks are secured by way of hypothecation of Company's stocks of Raw material, Finished goods, stock-in-process, stores, spares, components, trade receivables, outstanding money receivables, claims, bills, contract, engagements, securities both present and future and further secured by second ranking pari passu charge over companies movable and immovable property, plant and equipment both present and future. Working capital borrowings from banks in the form of overdraft facility against fixed deposits are secured by way of hypothecation on original fixed deposits.
Its subsidiary OMPL working capital lenders are to be secured by second ranking pari passu charge over Company's immovable property, plant and equipment both present and future on receipt of No Objection Certificate from NCD holders.
28.12 In respect of subsidiary MRPL, details of “Deferred Payment Liabilities: CST”
28.12.1 Deferred Payment liability against CST represents amount payable on account of sales tax liability to be paid after a specified period to the sales tax authority, Karnataka. Such deferral of sales tax liability is not liable for any interest.
28.12.2 ₹218.63 million (as at March 31, 2018 of ₹400.00 million) is repayable within one year and the same has been shown as “Current Maturities of Long Term Debts (unsecured)” under note 29.
28.12.3 Repayment schedule of deferred payment liability is as follows:(₹ in million)
Year of repayment As at March 31, 2019 As at March 31, 2018
2018-19 - 400.002019-20 218.63 218.63Total 218.63 618.63
28.13 In respect of subsidiary MRPL, details of “Deferred Payment Liabilities: VAT”
28.13.1 Deferred payment liability against VAT Loan represents amounts payable on account of "Interest free loan" received from Government of Karnataka. This interest free loan against VAT will be repaybale from March 31, 2028.
28.13.2 The benefit of a Government loan at a below-market rate of interest is treated as a government grant (Ind AS 20). The Interest free loan is recognised and measured in accordance with Ind AS 109, Financial Instruments. The benefit of the Interest free loan is measured as the difference between the initial carrying value of the loan determined in accordance with Ind AS 109, and the proceeds received. The benefit is accounted for in accordance with this Standard.
28.13.3 Deferred payment liabilities - VAT Loan are secured by bank guarantees given by MRPL.
28.13.4 Repayment schedule of Deferred payment liability VAT loan is as follows:
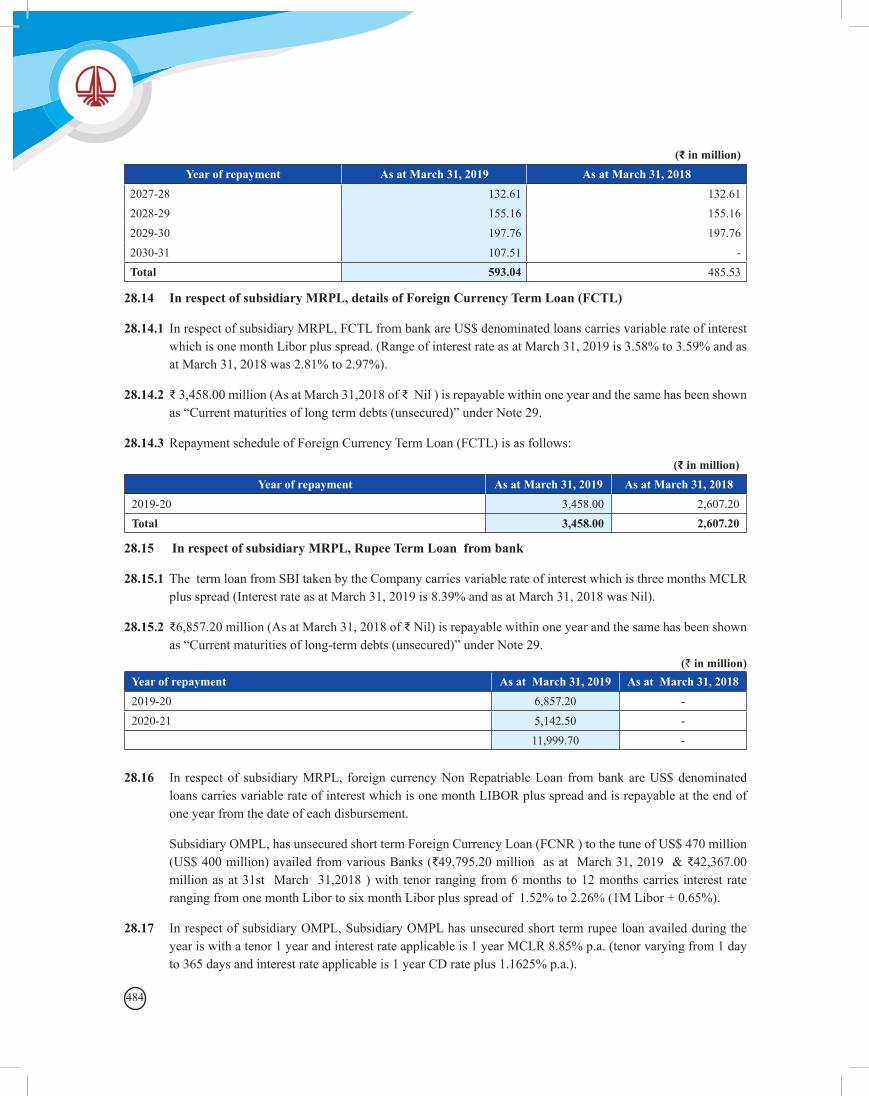
484
(₹ in million)Year of repayment As at March 31, 2019 As at March 31, 2018
2027-28 132.61 132.612028-29 155.16 155.162029-30 197.76 197.762030-31 107.51 -Total 593.04 485.53
28.14 In respect of subsidiary MRPL, details of Foreign Currency Term Loan (FCTL)
28.14.1 In respect of subsidiary MRPL, FCTL from bank are US$ denominated loans carries variable rate of interest which is one month Libor plus spread. (Range of interest rate as at March 31, 2019 is 3.58% to 3.59% and as at March 31, 2018 was 2.81% to 2.97%).
28.14.2 ₹ 3,458.00 million (As at March 31,2018 of ₹ Nil ) is repayable within one year and the same has been shown as “Current maturities of long term debts (unsecured)” under Note 29.
28.14.3 Repayment schedule of Foreign Currency Term Loan (FCTL) is as follows:(₹ in million)
Year of repayment As at March 31, 2019 As at March 31, 20182019-20 3,458.00 2,607.20Total 3,458.00 2,607.20
28.15 In respect of subsidiary MRPL, Rupee Term Loan from bank
28.15.1 The term loan from SBI taken by the Company carries variable rate of interest which is three months MCLR plus spread (Interest rate as at March 31, 2019 is 8.39% and as at March 31, 2018 was Nil).
28.15.2 ₹6,857.20 million (As at March 31, 2018 of ₹ Nil) is repayable within one year and the same has been shown as “Current maturities of long-term debts (unsecured)” under Note 29.
Year of repayment As at March 31, 2019 As at March 31, 20182019-20 6,857.20 -2020-21 5,142.50 -
11,999.70 -
28.16 In respect of subsidiary MRPL, foreign currency Non Repatriable Loan from bank are US$ denominated loans carries variable rate of interest which is one month LIBOR plus spread and is repayable at the end of one year from the date of each disbursement.
Subsidiary OMPL, has unsecured short term Foreign Currency Loan (FCNR ) to the tune of US$ 470 million (US$ 400 million) availed from various Banks (₹49,795.20 million as at March 31, 2019 & ₹42,367.00 million as at 31st March 31,2018 ) with tenor ranging from 6 months to 12 months carries interest rate ranging from one month Libor to six month Libor plus spread of 1.52% to 2.26% (1M Libor + 0.65%).
28.17 In respect of subsidiary OMPL, Subsidiary OMPL has unsecured short term rupee loan availed during the year is with a tenor 1 year and interest rate applicable is 1 year MCLR 8.85% p.a. (tenor varying from 1 day to 365 days and interest rate applicable is 1 year CD rate plus 1.1625% p.a.).
(` in million)
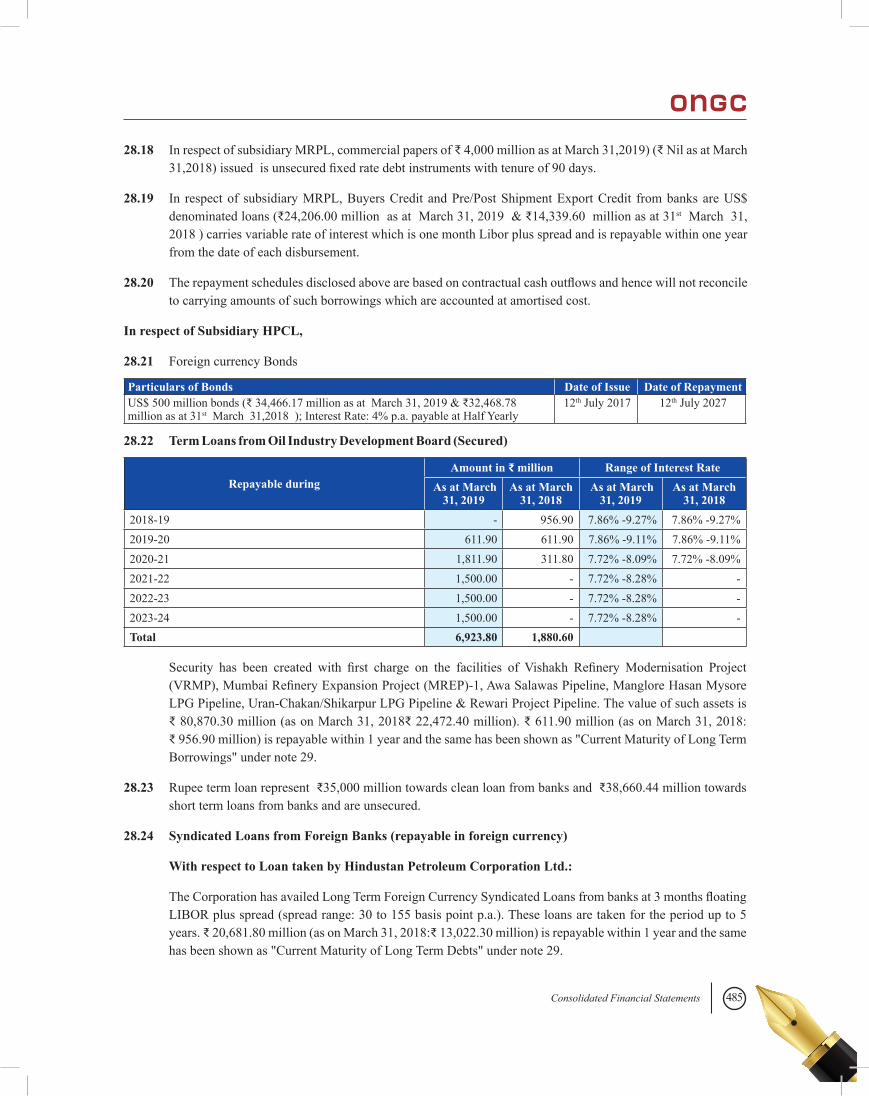
485Consolidated Financial Statements
28.18 In respect of subsidiary MRPL, commercial papers of ₹ 4,000 million as at March 31,2019) (₹ Nil as at March 31,2018) issued is unsecured fixed rate debt instruments with tenure of 90 days.
28.19 In respect of subsidiary MRPL, Buyers Credit and Pre/Post Shipment Export Credit from banks are US$ denominated loans (₹24,206.00 million as at March 31, 2019 & ₹14,339.60 million as at 31st March 31, 2018 ) carries variable rate of interest which is one month Libor plus spread and is repayable within one year from the date of each disbursement.
28.20 The repayment schedules disclosed above are based on contractual cash outflows and hence will not reconcile to carrying amounts of such borrowings which are accounted at amortised cost.
In respect of Subsidiary HPCL,
28.21 Foreign currency Bonds
Particulars of Bonds Date of Issue Date of Repayment US$ 500 million bonds (₹ 34,466.17 million as at March 31, 2019 & ₹32,468.78 million as at 31st March 31,2018 ); Interest Rate: 4% p.a. payable at Half Yearly
12th July 2017 12th July 2027
28.22 Term Loans from Oil Industry Development Board (Secured)
Repayable during Amount in ₹ million Range of Interest Rate
As at March 31, 2019
As at March 31, 2018
As at March 31, 2019
As at March 31, 2018
2018-19 - 956.90 7.86% -9.27% 7.86% -9.27% 2019-20 611.90 611.90 7.86% -9.11% 7.86% -9.11% 2020-21 1,811.90 311.80 7.72% -8.09% 7.72% -8.09% 2021-22 1,500.00 - 7.72% -8.28% -2022-23 1,500.00 - 7.72% -8.28% -2023-24 1,500.00 - 7.72% -8.28% -Total 6,923.80 1,880.60
Security has been created with first charge on the facilities of Vishakh Refinery Modernisation Project (VRMP), Mumbai Refinery Expansion Project (MREP)-1, Awa Salawas Pipeline, Manglore Hasan Mysore LPG Pipeline, Uran-Chakan/Shikarpur LPG Pipeline & Rewari Project Pipeline. The value of such assets is ₹ 80,870.30 million (as on March 31, 2018₹ 22,472.40 million). ₹ 611.90 million (as on March 31, 2018: ₹ 956.90 million) is repayable within 1 year and the same has been shown as "Current Maturity of Long Term Borrowings" under note 29.
28.23 Rupee term loan represent ₹35,000 million towards clean loan from banks and ₹38,660.44 million towards short term loans from banks and are unsecured.
28.24 Syndicated Loans from Foreign Banks (repayable in foreign currency)
With respect to Loan taken by Hindustan Petroleum Corporation Ltd.:
The Corporation has availed Long Term Foreign Currency Syndicated Loans from banks at 3 months floating LIBOR plus spread (spread range: 30 to 155 basis point p.a.). These loans are taken for the period up to 5 years. ₹ 20,681.80 million (as on March 31, 2018:₹ 13,022.30 million) is repayable within 1 year and the same has been shown as "Current Maturity of Long Term Debts" under note 29.
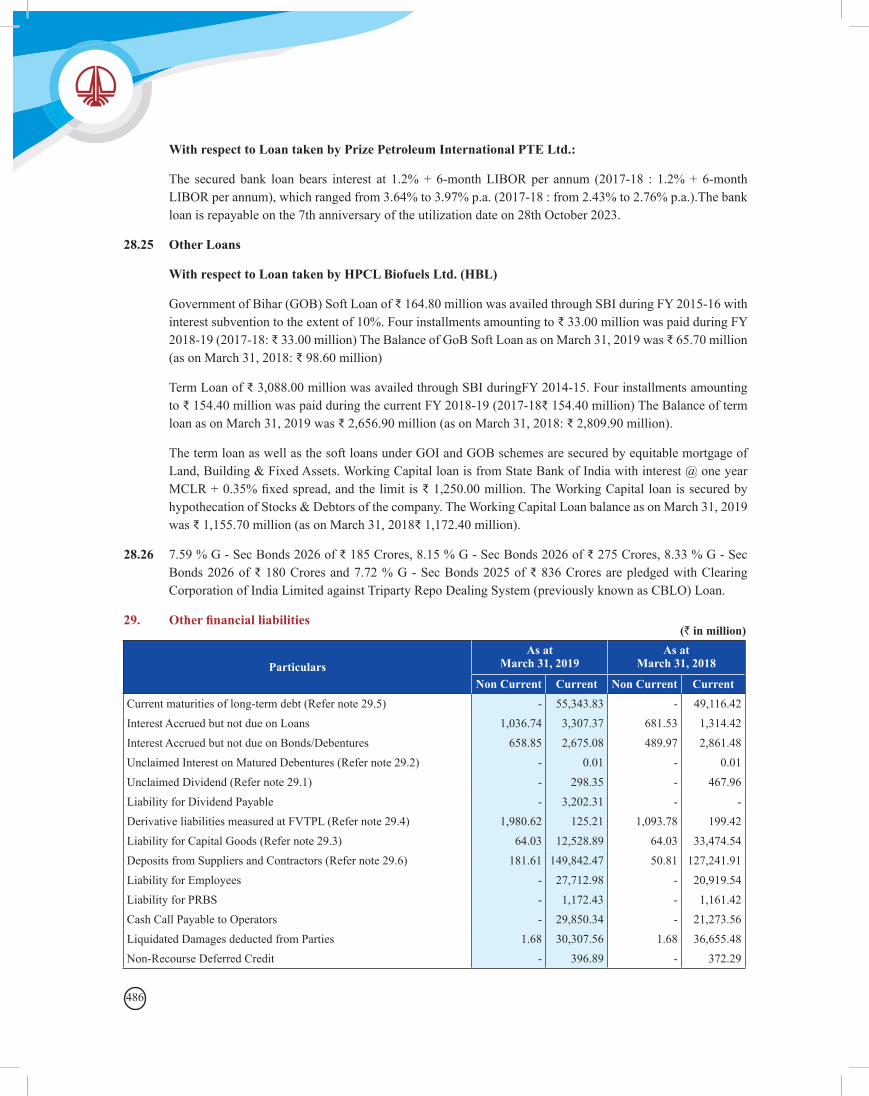
486
With respect to Loan taken by Prize Petroleum International PTE Ltd.:
The secured bank loan bears interest at 1.2% + 6-month LIBOR per annum (2017-18 : 1.2% + 6-month LIBOR per annum), which ranged from 3.64% to 3.97% p.a. (2017-18 : from 2.43% to 2.76% p.a.).The bank loan is repayable on the 7th anniversary of the utilization date on 28th October 2023.
28.25 Other Loans
With respect to Loan taken by HPCL Biofuels Ltd. (HBL)
Government of Bihar (GOB) Soft Loan of ₹ 164.80 million was availed through SBI during FY 2015-16 with interest subvention to the extent of 10%. Four installments amounting to ₹ 33.00 million was paid during FY 2018-19 (2017-18: ₹ 33.00 million) The Balance of GoB Soft Loan as on March 31, 2019 was ₹ 65.70 million (as on March 31, 2018: ₹ 98.60 million)
Term Loan of ₹ 3,088.00 million was availed through SBI duringFY 2014-15. Four installments amounting to ₹ 154.40 million was paid during the current FY 2018-19 (2017-18₹ 154.40 million) The Balance of term loan as on March 31, 2019 was ₹ 2,656.90 million (as on March 31, 2018: ₹ 2,809.90 million).
The term loan as well as the soft loans under GOI and GOB schemes are secured by equitable mortgage of Land, Building & Fixed Assets. Working Capital loan is from State Bank of India with interest @ one year MCLR + 0.35% fixed spread, and the limit is ₹ 1,250.00 million. The Working Capital loan is secured by hypothecation of Stocks & Debtors of the company. The Working Capital Loan balance as on March 31, 2019 was ₹ 1,155.70 million (as on March 31, 2018₹ 1,172.40 million).
28.26 7.59 % G - Sec Bonds 2026 of ₹ 185 Crores, 8.15 % G - Sec Bonds 2026 of ₹ 275 Crores, 8.33 % G - Sec Bonds 2026 of ₹ 180 Crores and 7.72 % G - Sec Bonds 2025 of ₹ 836 Crores are pledged with Clearing Corporation of India Limited against Triparty Repo Dealing System (previously known as CBLO) Loan.
29. Other financial liabilities
ParticularsAs at
March 31, 2019As at
March 31, 2018
Non Current Current Non Current CurrentCurrent maturities of long-term debt (Refer note 29.5) - 55,343.83 - 49,116.42Interest Accrued but not due on Loans 1,036.74 3,307.37 681.53 1,314.42Interest Accrued but not due on Bonds/Debentures 658.85 2,675.08 489.97 2,861.48Unclaimed Interest on Matured Debentures (Refer note 29.2) - 0.01 - 0.01Unclaimed Dividend (Refer note 29.1) - 298.35 - 467.96Liability for Dividend Payable - 3,202.31 - -Derivative liabilities measured at FVTPL (Refer note 29.4) 1,980.62 125.21 1,093.78 199.42Liability for Capital Goods (Refer note 29.3) 64.03 12,528.89 64.03 33,474.54Deposits from Suppliers and Contractors (Refer note 29.6) 181.61 149,842.47 50.81 127,241.91Liability for Employees - 27,712.98 - 20,919.54Liability for PRBS - 1,172.43 - 1,161.42Cash Call Payable to Operators - 29,850.34 - 21,273.56Liquidated Damages deducted from Parties 1.68 30,307.56 1.68 36,655.48Non-Recourse Deferred Credit - 396.89 - 372.29
(` in million)
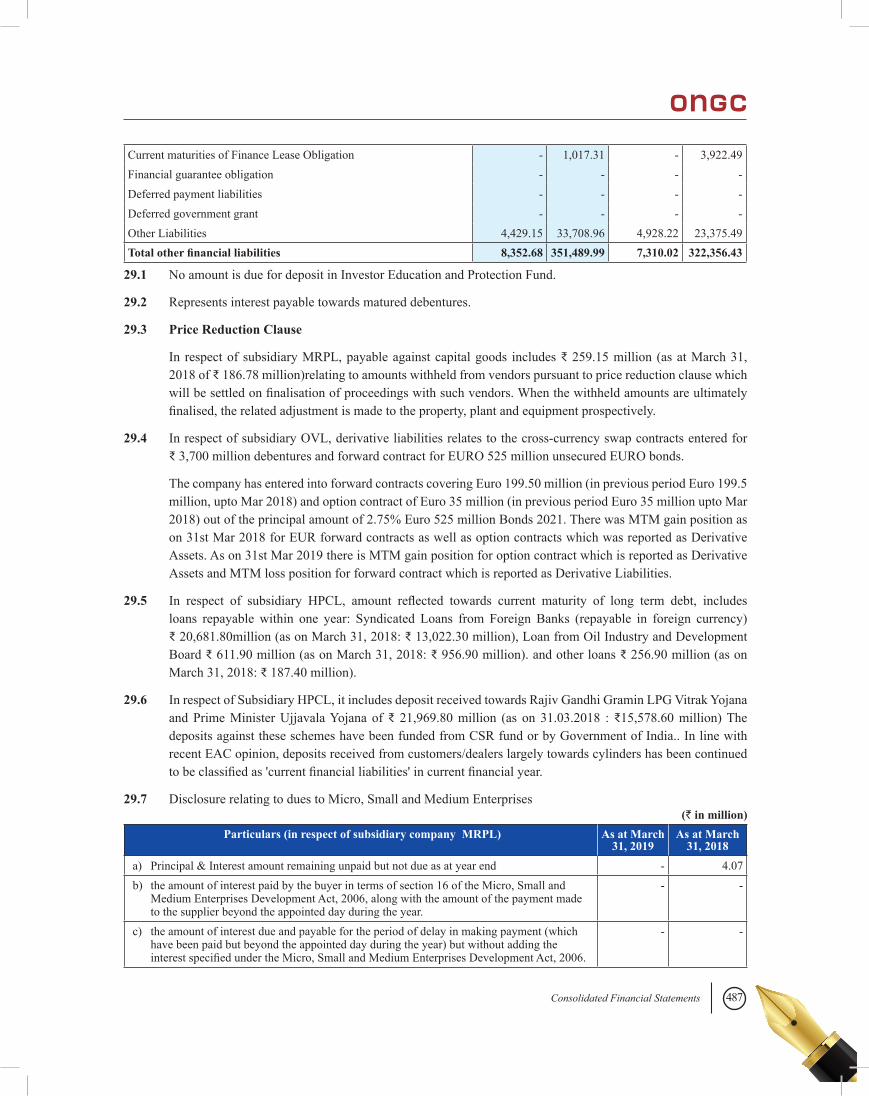
487Consolidated Financial Statements
Current maturities of Finance Lease Obligation - 1,017.31 - 3,922.49Financial guarantee obligation - - - -Deferred payment liabilities - - - -Deferred government grant - - - -Other Liabilities 4,429.15 33,708.96 4,928.22 23,375.49Total other financial liabilities 8,352.68 351,489.99 7,310.02 322,356.43
29.1 No amount is due for deposit in Investor Education and Protection Fund.
29.2 Represents interest payable towards matured debentures.
29.3 Price Reduction Clause
In respect of subsidiary MRPL, payable against capital goods includes ₹ 259.15 million (as at March 31, 2018 of ₹ 186.78 million)relating to amounts withheld from vendors pursuant to price reduction clause which will be settled on finalisation of proceedings with such vendors. When the withheld amounts are ultimately finalised, the related adjustment is made to the property, plant and equipment prospectively.
29.4 In respect of subsidiary OVL, derivative liabilities relates to the cross-currency swap contracts entered for ₹ 3,700 million debentures and forward contract for EURO 525 million unsecured EURO bonds.
The company has entered into forward contracts covering Euro 199.50 million (in previous period Euro 199.5 million, upto Mar 2018) and option contract of Euro 35 million (in previous period Euro 35 million upto Mar 2018) out of the principal amount of 2.75% Euro 525 million Bonds 2021. There was MTM gain position as on 31st Mar 2018 for EUR forward contracts as well as option contracts which was reported as Derivative Assets. As on 31st Mar 2019 there is MTM gain position for option contract which is reported as Derivative Assets and MTM loss position for forward contract which is reported as Derivative Liabilities.
29.5 In respect of subsidiary HPCL, amount reflected towards current maturity of long term debt, includes loans repayable within one year: Syndicated Loans from Foreign Banks (repayable in foreign currency) ₹ 20,681.80million (as on March 31, 2018: ₹ 13,022.30 million), Loan from Oil Industry and Development Board ₹ 611.90 million (as on March 31, 2018: ₹ 956.90 million). and other loans ₹ 256.90 million (as on March 31, 2018: ₹ 187.40 million).
29.6 In respect of Subsidiary HPCL, it includes deposit received towards Rajiv Gandhi Gramin LPG Vitrak Yojana and Prime Minister Ujjavala Yojana of ₹ 21,969.80 million (as on 31.03.2018 : ₹15,578.60 million) The deposits against these schemes have been funded from CSR fund or by Government of India.. In line with recent EAC opinion, deposits received from customers/dealers largely towards cylinders has been continued to be classified as 'current financial liabilities' in current financial year.
29.7 Disclosure relating to dues to Micro, Small and Medium Enterprises
Particulars (in respect of subsidiary company MRPL) As at March 31, 2019
As at March 31, 2018
a) Principal & Interest amount remaining unpaid but not due as at year end - 4.07b) the amount of interest paid by the buyer in terms of section 16 of the Micro, Small and
Medium Enterprises Development Act, 2006, along with the amount of the payment made to the supplier beyond the appointed day during the year.
- -
c) the amount of interest due and payable for the period of delay in making payment (which have been paid but beyond the appointed day during the year) but without adding the interest specified under the Micro, Small and Medium Enterprises Development Act, 2006.
- -
(` in million)
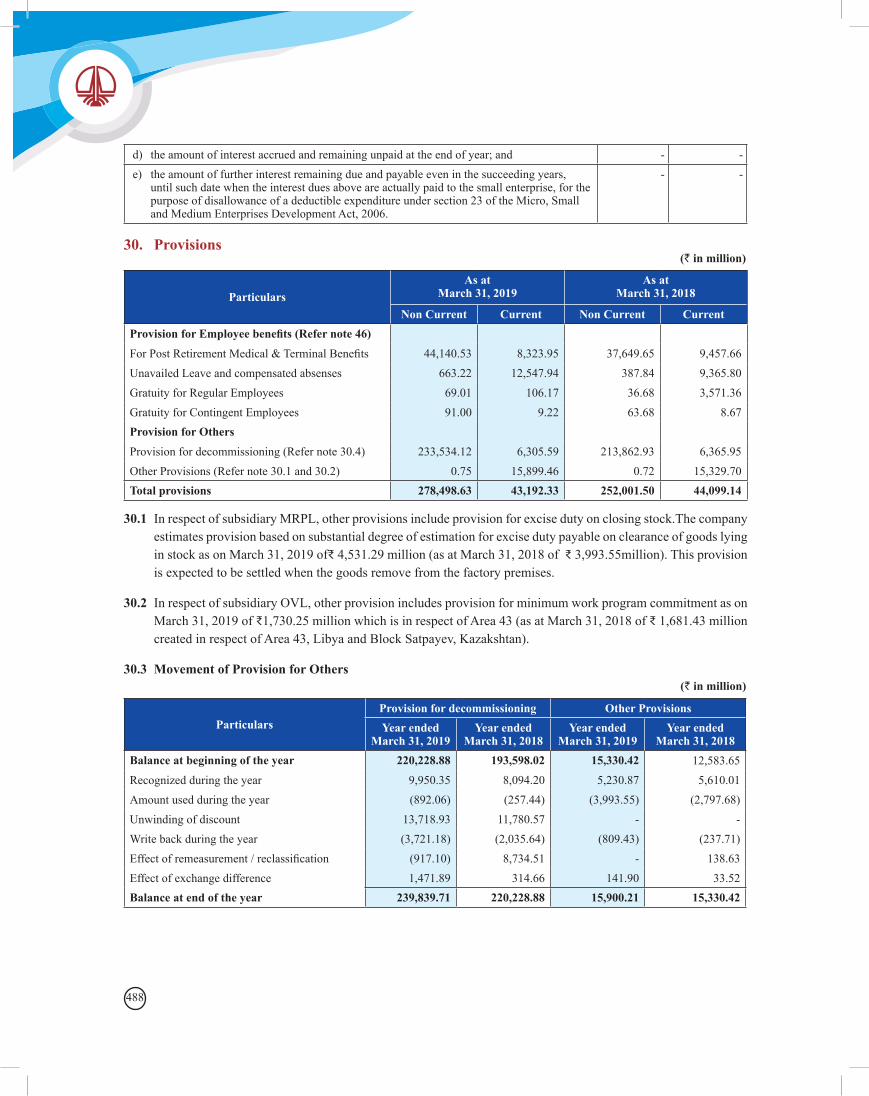
488
d) the amount of interest accrued and remaining unpaid at the end of year; and - -e) the amount of further interest remaining due and payable even in the succeeding years,
until such date when the interest dues above are actually paid to the small enterprise, for the purpose of disallowance of a deductible expenditure under section 23 of the Micro, Small and Medium Enterprises Development Act, 2006.
- -
30. Provisions(` in million)
ParticularsAs at
March 31, 2019As at
March 31, 2018
Non Current Current Non Current CurrentProvision for Employee benefits (Refer note 46) For Post Retirement Medical & Terminal Benefits 44,140.53 8,323.95 37,649.65 9,457.66Unavailed Leave and compensated absenses 663.22 12,547.94 387.84 9,365.80Gratuity for Regular Employees 69.01 106.17 36.68 3,571.36Gratuity for Contingent Employees 91.00 9.22 63.68 8.67Provision for Others Provision for decommissioning (Refer note 30.4) 233,534.12 6,305.59 213,862.93 6,365.95Other Provisions (Refer note 30.1 and 30.2) 0.75 15,899.46 0.72 15,329.70Total provisions 278,498.63 43,192.33 252,001.50 44,099.14
30.1 In respect of subsidiary MRPL, other provisions include provision for excise duty on closing stock.The company estimates provision based on substantial degree of estimation for excise duty payable on clearance of goods lying in stock as on March 31, 2019 of₹ 4,531.29 million (as at March 31, 2018 of ₹ 3,993.55million). This provision is expected to be settled when the goods remove from the factory premises.
30.2 In respect of subsidiary OVL, other provision includes provision for minimum work program commitment as on March 31, 2019 of ₹1,730.25 million which is in respect of Area 43 (as at March 31, 2018 of ₹ 1,681.43 million created in respect of Area 43, Libya and Block Satpayev, Kazakshtan).
30.3 Movement of Provision for Others
ParticularsProvision for decommissioning Other ProvisionsYear ended
March 31, 2019Year ended
March 31, 2018Year ended
March 31, 2019Year ended
March 31, 2018Balance at beginning of the year 220,228.88 193,598.02 15,330.42 12,583.65Recognized during the year 9,950.35 8,094.20 5,230.87 5,610.01Amount used during the year (892.06) (257.44) (3,993.55) (2,797.68)Unwinding of discount 13,718.93 11,780.57 - -Write back during the year (3,721.18) (2,035.64) (809.43) (237.71)Effect of remeasurement / reclassification (917.10) 8,734.51 - 138.63Effect of exchange difference 1,471.89 314.66 141.90 33.52Balance at end of the year 239,839.71 220,228.88 15,900.21 15,330.42
(` in million)
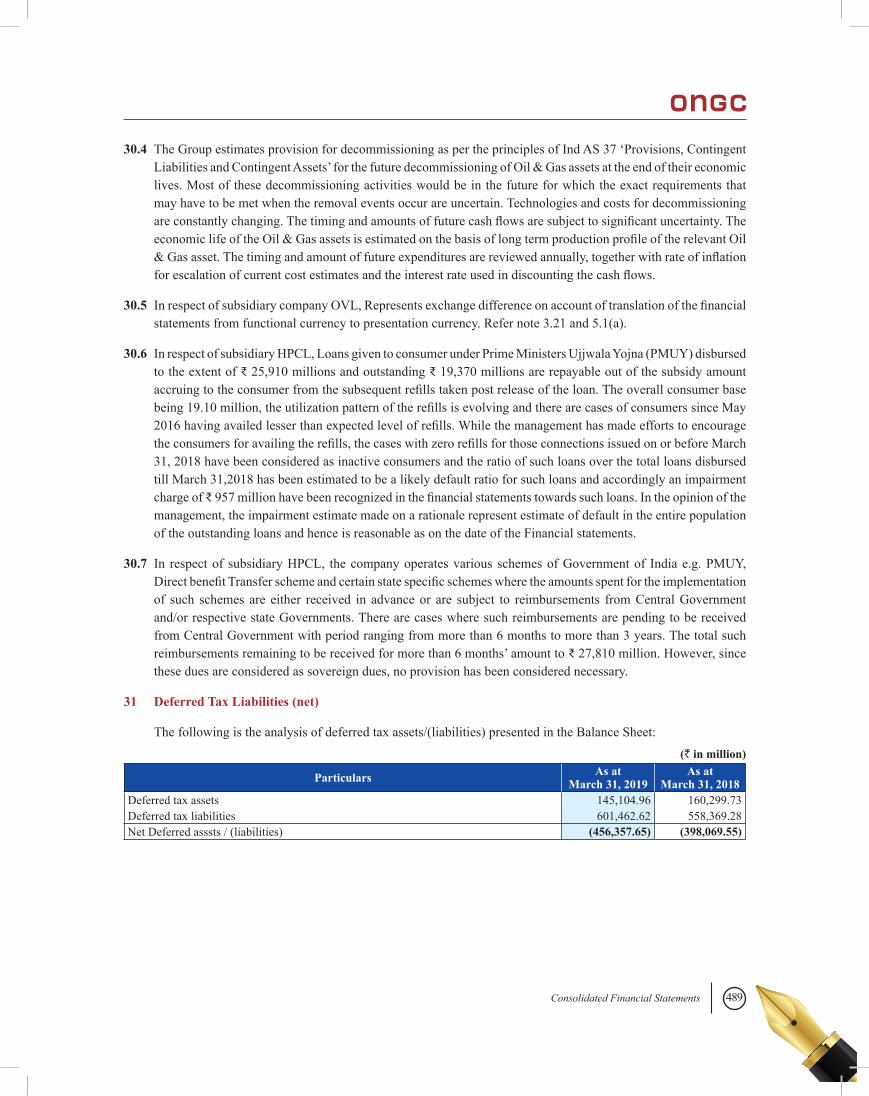
489Consolidated Financial Statements
30.4 The Group estimates provision for decommissioning as per the principles of Ind AS 37 ‘Provisions, Contingent Liabilities and Contingent Assets’ for the future decommissioning of Oil & Gas assets at the end of their economic lives. Most of these decommissioning activities would be in the future for which the exact requirements that may have to be met when the removal events occur are uncertain. Technologies and costs for decommissioning are constantly changing. The timing and amounts of future cash flows are subject to significant uncertainty. The economic life of the Oil & Gas assets is estimated on the basis of long term production profile of the relevant Oil & Gas asset. The timing and amount of future expenditures are reviewed annually, together with rate of inflation for escalation of current cost estimates and the interest rate used in discounting the cash flows.
30.5 In respect of subsidiary company OVL, Represents exchange difference on account of translation of the financial statements from functional currency to presentation currency. Refer note 3.21 and 5.1(a).
30.6 In respect of subsidiary HPCL, Loans given to consumer under Prime Ministers Ujjwala Yojna (PMUY) disbursed to the extent of ₹ 25,910 millions and outstanding ₹ 19,370 millions are repayable out of the subsidy amount accruing to the consumer from the subsequent refills taken post release of the loan. The overall consumer base being 19.10 million, the utilization pattern of the refills is evolving and there are cases of consumers since May 2016 having availed lesser than expected level of refills. While the management has made efforts to encourage the consumers for availing the refills, the cases with zero refills for those connections issued on or before March 31, 2018 have been considered as inactive consumers and the ratio of such loans over the total loans disbursed till March 31,2018 has been estimated to be a likely default ratio for such loans and accordingly an impairment charge of ₹ 957 million have been recognized in the financial statements towards such loans. In the opinion of the management, the impairment estimate made on a rationale represent estimate of default in the entire population of the outstanding loans and hence is reasonable as on the date of the Financial statements.
30.7 In respect of subsidiary HPCL, the company operates various schemes of Government of India e.g. PMUY, Direct benefit Transfer scheme and certain state specific schemes where the amounts spent for the implementation of such schemes are either received in advance or are subject to reimbursements from Central Government and/or respective state Governments. There are cases where such reimbursements are pending to be received from Central Government with period ranging from more than 6 months to more than 3 years. The total such reimbursements remaining to be received for more than 6 months’ amount to ₹ 27,810 million. However, since these dues are considered as sovereign dues, no provision has been considered necessary.
31 Deferred Tax Liabilities (net)
The following is the analysis of deferred tax assets/(liabilities) presented in the Balance Sheet:
Particulars As at March 31, 2019
As at March 31, 2018
Deferred tax assets 145,104.96 160,299.73Deferred tax liabilities 601,462.62 558,369.28Net Deferred asssts / (liabilities) (456,357.65) (398,069.55)
(` in million)
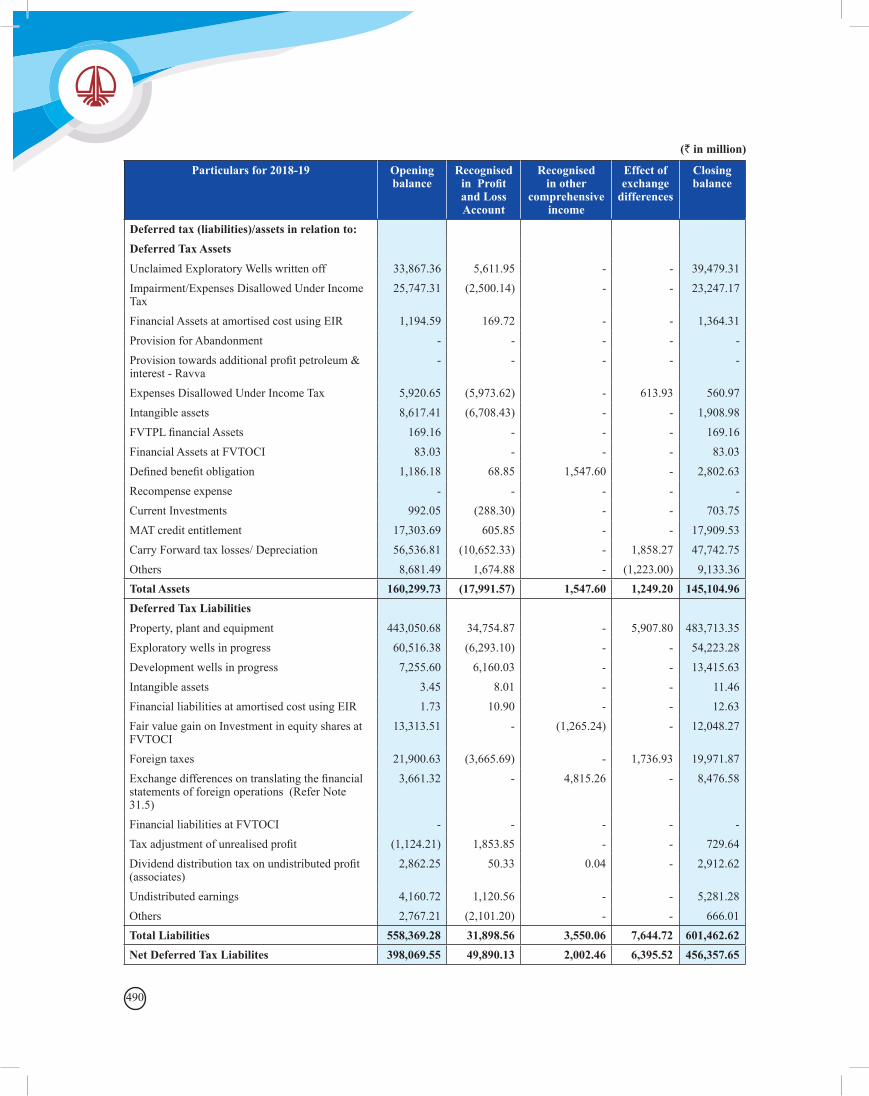
490
Particulars for 2018-19 Opening balance
Recognised in Profit and Loss Account
Recognised in other
comprehensive income
Effect of exchange
differences
Closing balance
Deferred tax (liabilities)/assets in relation to:Deferred Tax AssetsUnclaimed Exploratory Wells written off 33,867.36 5,611.95 - - 39,479.31Impairment/Expenses Disallowed Under Income Tax
25,747.31 (2,500.14) - - 23,247.17
Financial Assets at amortised cost using EIR 1,194.59 169.72 - - 1,364.31Provision for Abandonment - - - - -Provision towards additional profit petroleum & interest - Ravva
- - - - -
Expenses Disallowed Under Income Tax 5,920.65 (5,973.62) - 613.93 560.97Intangible assets 8,617.41 (6,708.43) - - 1,908.98FVTPL financial Assets 169.16 - - - 169.16Financial Assets at FVTOCI 83.03 - - - 83.03Defined benefit obligation 1,186.18 68.85 1,547.60 - 2,802.63Recompense expense - - - - -Current Investments 992.05 (288.30) - - 703.75MAT credit entitlement 17,303.69 605.85 - - 17,909.53Carry Forward tax losses/ Depreciation 56,536.81 (10,652.33) - 1,858.27 47,742.75Others 8,681.49 1,674.88 - (1,223.00) 9,133.36Total Assets 160,299.73 (17,991.57) 1,547.60 1,249.20 145,104.96Deferred Tax LiabilitiesProperty, plant and equipment 443,050.68 34,754.87 - 5,907.80 483,713.35Exploratory wells in progress 60,516.38 (6,293.10) - - 54,223.28Development wells in progress 7,255.60 6,160.03 - - 13,415.63Intangible assets 3.45 8.01 - - 11.46Financial liabilities at amortised cost using EIR 1.73 10.90 - - 12.63Fair value gain on Investment in equity shares at FVTOCI
13,313.51 - (1,265.24) - 12,048.27
Foreign taxes 21,900.63 (3,665.69) - 1,736.93 19,971.87Exchange differences on translating the financial statements of foreign operations (Refer Note 31.5)
3,661.32 - 4,815.26 - 8,476.58
Financial liabilities at FVTOCI - - - - -Tax adjustment of unrealised profit (1,124.21) 1,853.85 - - 729.64Dividend distribution tax on undistributed profit (associates)
2,862.25 50.33 0.04 - 2,912.62
Undistributed earnings 4,160.72 1,120.56 - - 5,281.28Others 2,767.21 (2,101.20) - - 666.01Total Liabilities 558,369.28 31,898.56 3,550.06 7,644.72 601,462.62Net Deferred Tax Liabilites 398,069.55 49,890.13 2,002.46 6,395.52 456,357.65
(` in million)
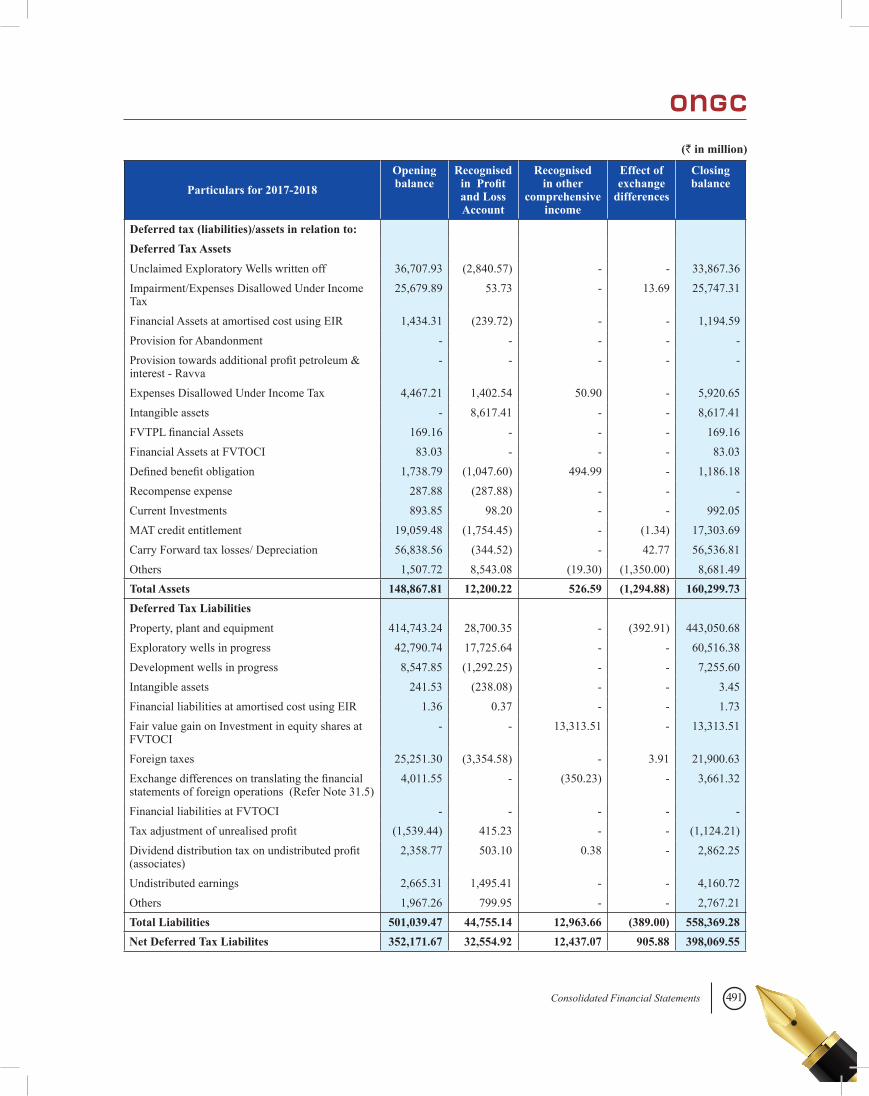
491Consolidated Financial Statements
(` in million)
Particulars for 2017-2018Opening balance
Recognised in Profit and Loss Account
Recognised in other
comprehensive income
Effect of exchange
differences
Closing balance
Deferred tax (liabilities)/assets in relation to:Deferred Tax AssetsUnclaimed Exploratory Wells written off 36,707.93 (2,840.57) - - 33,867.36Impairment/Expenses Disallowed Under Income Tax
25,679.89 53.73 - 13.69 25,747.31
Financial Assets at amortised cost using EIR 1,434.31 (239.72) - - 1,194.59Provision for Abandonment - - - - -Provision towards additional profit petroleum & interest - Ravva
- - - - -
Expenses Disallowed Under Income Tax 4,467.21 1,402.54 50.90 - 5,920.65Intangible assets - 8,617.41 - - 8,617.41FVTPL financial Assets 169.16 - - - 169.16Financial Assets at FVTOCI 83.03 - - - 83.03Defined benefit obligation 1,738.79 (1,047.60) 494.99 - 1,186.18Recompense expense 287.88 (287.88) - - -Current Investments 893.85 98.20 - - 992.05MAT credit entitlement 19,059.48 (1,754.45) - (1.34) 17,303.69Carry Forward tax losses/ Depreciation 56,838.56 (344.52) - 42.77 56,536.81Others 1,507.72 8,543.08 (19.30) (1,350.00) 8,681.49Total Assets 148,867.81 12,200.22 526.59 (1,294.88) 160,299.73Deferred Tax LiabilitiesProperty, plant and equipment 414,743.24 28,700.35 - (392.91) 443,050.68Exploratory wells in progress 42,790.74 17,725.64 - - 60,516.38Development wells in progress 8,547.85 (1,292.25) - - 7,255.60Intangible assets 241.53 (238.08) - - 3.45Financial liabilities at amortised cost using EIR 1.36 0.37 - - 1.73Fair value gain on Investment in equity shares at FVTOCI
- - 13,313.51 - 13,313.51
Foreign taxes 25,251.30 (3,354.58) - 3.91 21,900.63Exchange differences on translating the financial statements of foreign operations (Refer Note 31.5)
4,011.55 - (350.23) - 3,661.32
Financial liabilities at FVTOCI - - - - -Tax adjustment of unrealised profit (1,539.44) 415.23 - - (1,124.21)Dividend distribution tax on undistributed profit (associates)
2,358.77 503.10 0.38 - 2,862.25
Undistributed earnings 2,665.31 1,495.41 - - 4,160.72Others 1,967.26 799.95 - - 2,767.21Total Liabilities 501,039.47 44,755.14 12,963.66 (389.00) 558,369.28Net Deferred Tax Liabilites 352,171.67 32,554.92 12,437.07 905.88 398,069.55
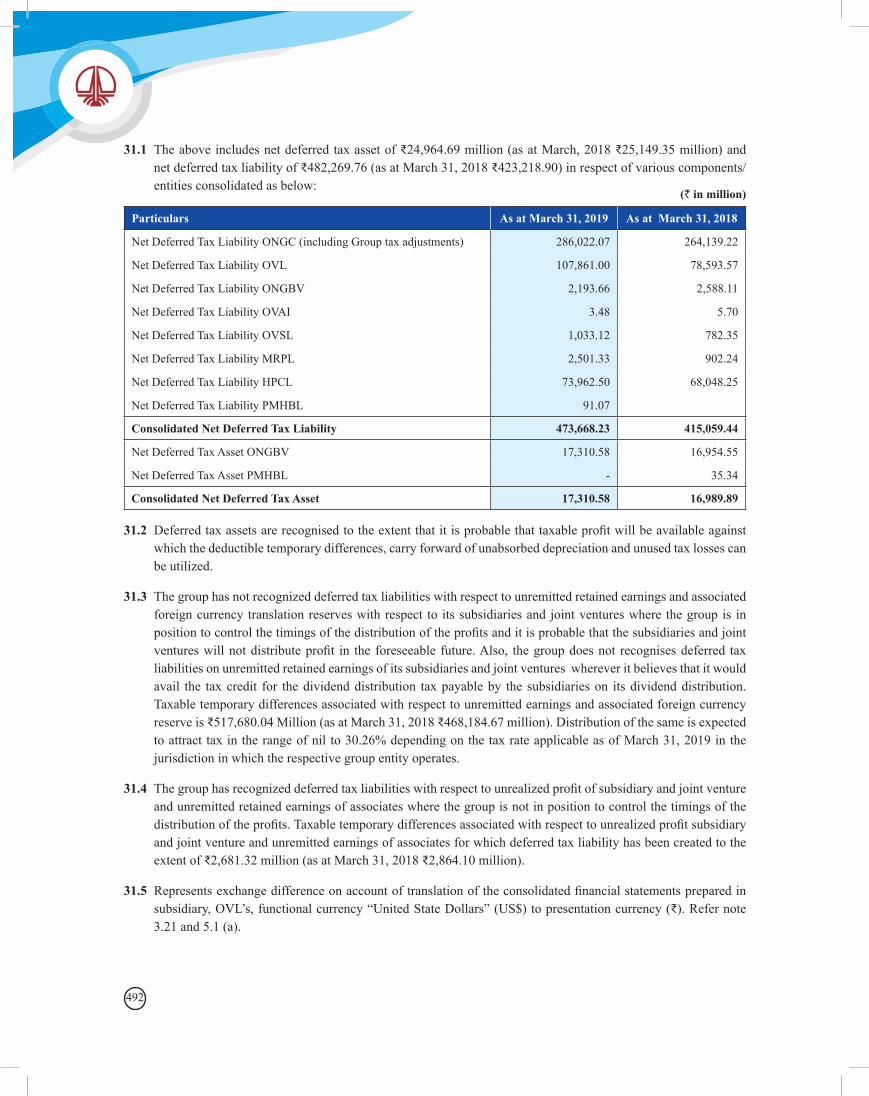
492
31.1 The above includes net deferred tax asset of ₹24,964.69 million (as at March, 2018 ₹25,149.35 million) and net deferred tax liability of ₹482,269.76 (as at March 31, 2018 ₹423,218.90) in respect of various components/entities consolidated as below:
(` in million)
Particulars As at March 31, 2019 As at March 31, 2018
Net Deferred Tax Liability ONGC (including Group tax adjustments) 286,022.07 264,139.22
Net Deferred Tax Liability OVL 107,861.00 78,593.57
Net Deferred Tax Liability ONGBV 2,193.66 2,588.11
Net Deferred Tax Liability OVAI 3.48 5.70
Net Deferred Tax Liability OVSL 1,033.12 782.35
Net Deferred Tax Liability MRPL 2,501.33 902.24
Net Deferred Tax Liability HPCL 73,962.50 68,048.25
Net Deferred Tax Liability PMHBL 91.07
Consolidated Net Deferred Tax Liability 473,668.23 415,059.44
Net Deferred Tax Asset ONGBV 17,310.58 16,954.55
Net Deferred Tax Asset PMHBL - 35.34
Consolidated Net Deferred Tax Asset 17,310.58 16,989.89
31.2 Deferred tax assets are recognised to the extent that it is probable that taxable profit will be available against which the deductible temporary differences, carry forward of unabsorbed depreciation and unused tax losses can be utilized.
31.3 The group has not recognized deferred tax liabilities with respect to unremitted retained earnings and associated foreign currency translation reserves with respect to its subsidiaries and joint ventures where the group is in position to control the timings of the distribution of the profits and it is probable that the subsidiaries and joint ventures will not distribute profit in the foreseeable future. Also, the group does not recognises deferred tax liabilities on unremitted retained earnings of its subsidiaries and joint ventures wherever it believes that it would avail the tax credit for the dividend distribution tax payable by the subsidiaries on its dividend distribution. Taxable temporary differences associated with respect to unremitted earnings and associated foreign currency reserve is ₹517,680.04 Million (as at March 31, 2018 ₹468,184.67 million). Distribution of the same is expected to attract tax in the range of nil to 30.26% depending on the tax rate applicable as of March 31, 2019 in the jurisdiction in which the respective group entity operates.
31.4 The group has recognized deferred tax liabilities with respect to unrealized profit of subsidiary and joint venture and unremitted retained earnings of associates where the group is not in position to control the timings of the distribution of the profits. Taxable temporary differences associated with respect to unrealized profit subsidiary and joint venture and unremitted earnings of associates for which deferred tax liability has been created to the extent of ₹2,681.32 million (as at March 31, 2018 ₹2,864.10 million).
31.5 Represents exchange difference on account of translation of the consolidated financial statements prepared in subsidiary, OVL’s, functional currency “United State Dollars” (US$) to presentation currency (₹). Refer note 3.21 and 5.1 (a).
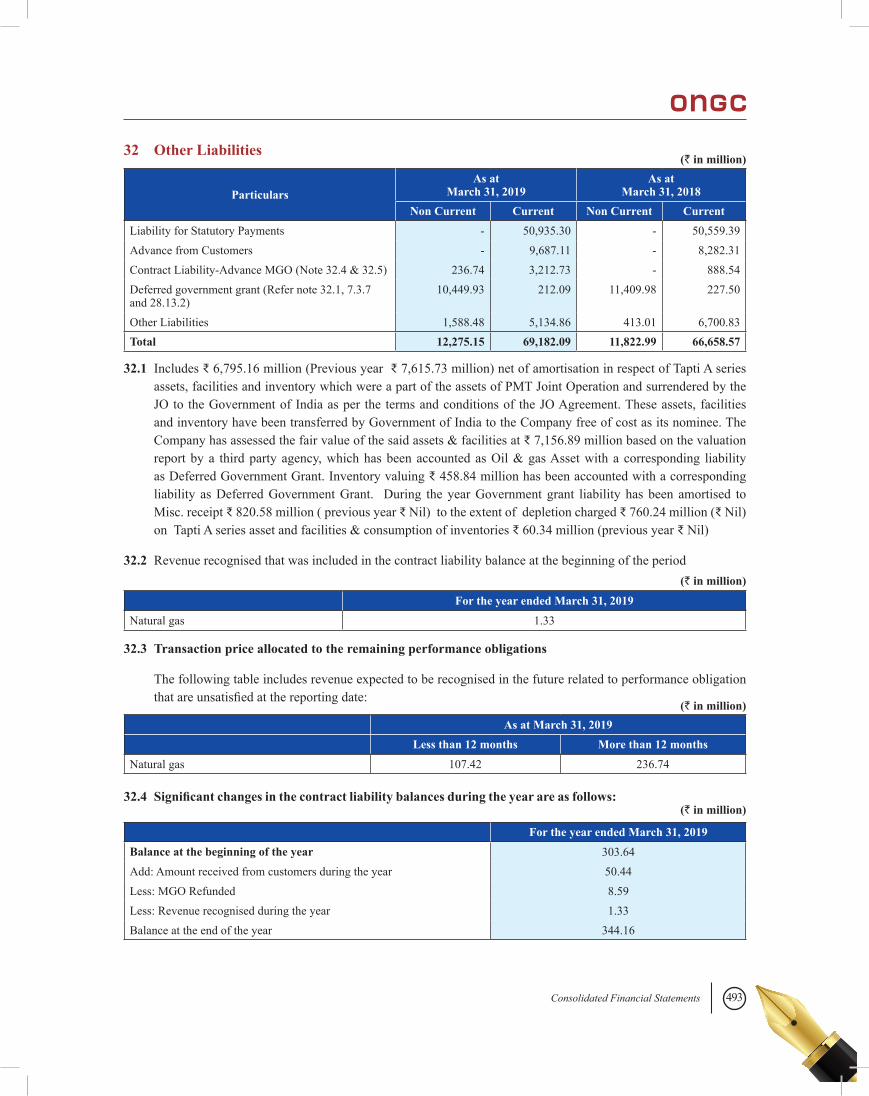
493Consolidated Financial Statements
32 Other Liabilities
ParticularsAs at
March 31, 2019As at
March 31, 2018Non Current Current Non Current Current
Liability for Statutory Payments - 50,935.30 - 50,559.39Advance from Customers - 9,687.11 - 8,282.31Contract Liability-Advance MGO (Note 32.4 & 32.5) 236.74 3,212.73 - 888.54Deferred government grant (Refer note 32.1, 7.3.7 and 28.13.2)
10,449.93 212.09 11,409.98 227.50
Other Liabilities 1,588.48 5,134.86 413.01 6,700.83Total 12,275.15 69,182.09 11,822.99 66,658.57
(` in million)
(` in million)
(` in million)
(` in million)
32.1 Includes ₹ 6,795.16 million (Previous year ₹ 7,615.73 million) net of amortisation in respect of Tapti A series assets, facilities and inventory which were a part of the assets of PMT Joint Operation and surrendered by the JO to the Government of India as per the terms and conditions of the JO Agreement. These assets, facilities and inventory have been transferred by Government of India to the Company free of cost as its nominee. The Company has assessed the fair value of the said assets & facilities at ₹ 7,156.89 million based on the valuation report by a third party agency, which has been accounted as Oil & gas Asset with a corresponding liability as Deferred Government Grant. Inventory valuing ₹ 458.84 million has been accounted with a corresponding liability as Deferred Government Grant. During the year Government grant liability has been amortised to Misc. receipt ₹ 820.58 million ( previous year ₹ Nil) to the extent of depletion charged ₹ 760.24 million (₹ Nil) on Tapti A series asset and facilities & consumption of inventories ₹ 60.34 million (previous year ₹ Nil)
32.2 Revenue recognised that was included in the contract liability balance at the beginning of the period
For the year ended March 31, 2019Natural gas 1.33
32.3 Transaction price allocated to the remaining performance obligations
The following table includes revenue expected to be recognised in the future related to performance obligation that are unsatisfied at the reporting date:
32.4 Significant changes in the contract liability balances during the year are as follows:
As at March 31, 2019Less than 12 months More than 12 months
Natural gas 107.42 236.74
For the year ended March 31, 2019Balance at the beginning of the year 303.64Add: Amount received from customers during the year 50.44Less: MGO Refunded 8.59Less: Revenue recognised during the year 1.33Balance at the end of the year 344.16
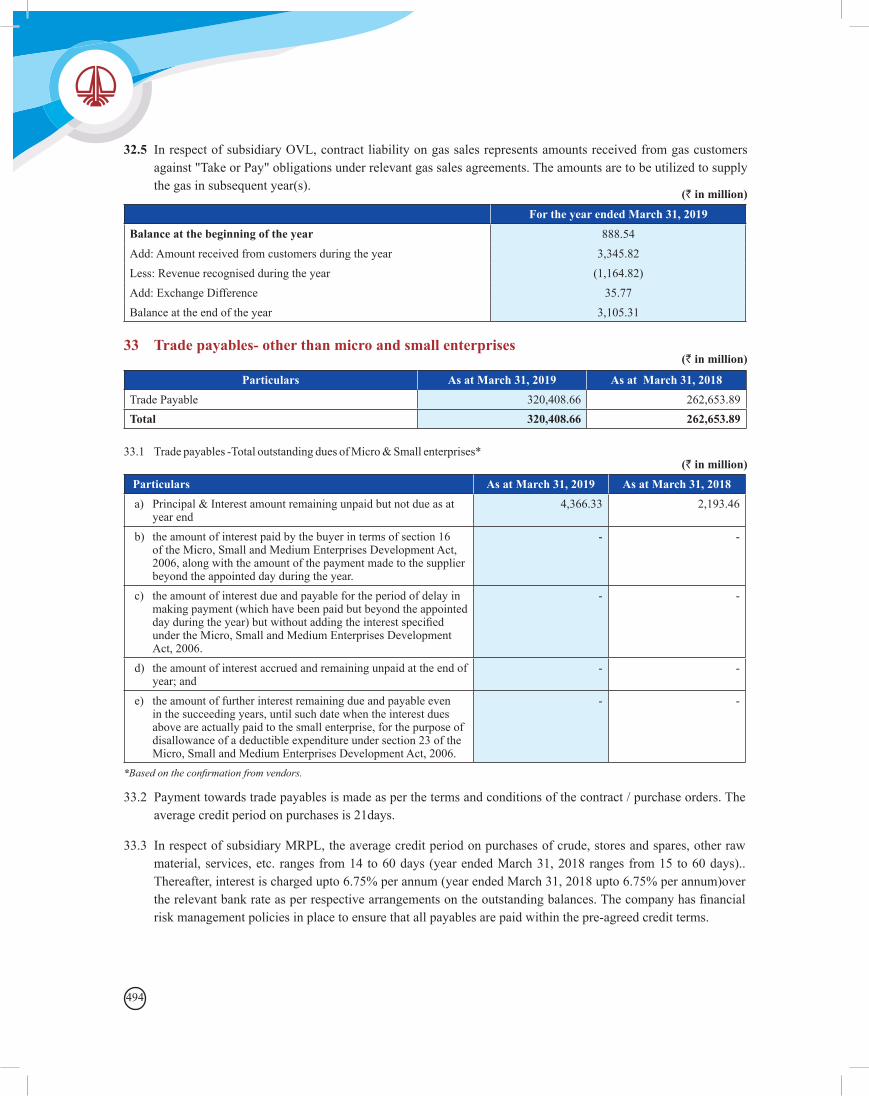
494
32.5 In respect of subsidiary OVL, contract liability on gas sales represents amounts received from gas customers against "Take or Pay" obligations under relevant gas sales agreements. The amounts are to be utilized to supply the gas in subsequent year(s).
(` in million)
(` in million)
(` in million)
For the year ended March 31, 2019Balance at the beginning of the year 888.54Add: Amount received from customers during the year 3,345.82Less: Revenue recognised during the year (1,164.82)Add: Exchange Difference 35.77Balance at the end of the year 3,105.31
33 Trade payables- other than micro and small enterprises
Particulars As at March 31, 2019 As at March 31, 2018Trade Payable 320,408.66 262,653.89Total 320,408.66 262,653.89
33.1 Trade payables -Total outstanding dues of Micro & Small enterprises*
Particulars As at March 31, 2019 As at March 31, 2018a) Principal & Interest amount remaining unpaid but not due as at
year end4,366.33 2,193.46
b) the amount of interest paid by the buyer in terms of section 16 of the Micro, Small and Medium Enterprises Development Act, 2006, along with the amount of the payment made to the supplier beyond the appointed day during the year.
- -
c) the amount of interest due and payable for the period of delay in making payment (which have been paid but beyond the appointed day during the year) but without adding the interest specified under the Micro, Small and Medium Enterprises Development Act, 2006.
- -
d) the amount of interest accrued and remaining unpaid at the end of year; and
- -
e) the amount of further interest remaining due and payable even in the succeeding years, until such date when the interest dues above are actually paid to the small enterprise, for the purpose of disallowance of a deductible expenditure under section 23 of the Micro, Small and Medium Enterprises Development Act, 2006.
- -
*Based on the confirmation from vendors.
33.2 Payment towards trade payables is made as per the terms and conditions of the contract / purchase orders. The average credit period on purchases is 21days.
33.3 In respect of subsidiary MRPL, the average credit period on purchases of crude, stores and spares, other raw material, services, etc. ranges from 14 to 60 days (year ended March 31, 2018 ranges from 15 to 60 days).. Thereafter, interest is charged upto 6.75% per annum (year ended March 31, 2018 upto 6.75% per annum)over the relevant bank rate as per respective arrangements on the outstanding balances. The company has financial risk management policies in place to ensure that all payables are paid within the pre-agreed credit terms.
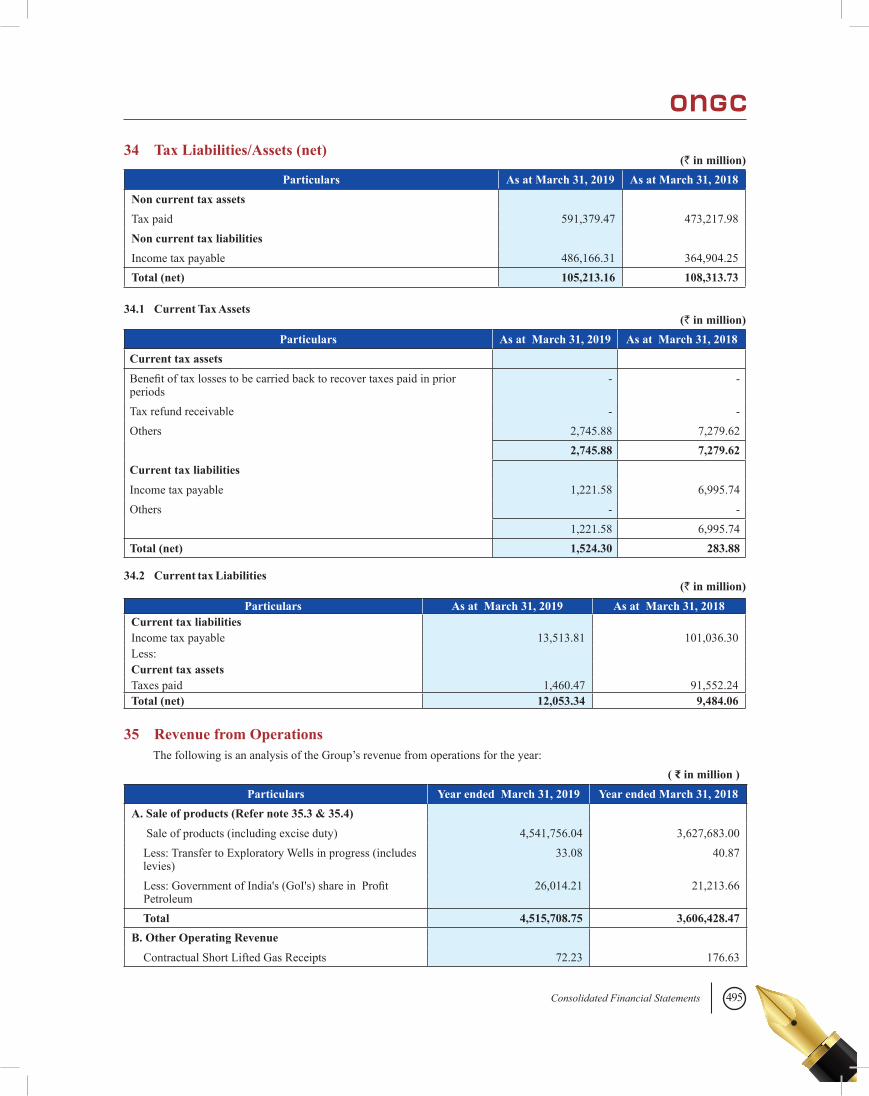
495Consolidated Financial Statements
34 Tax Liabilities/Assets (net)
Particulars As at March 31, 2019 As at March 31, 2018Non current tax assets Tax paid 591,379.47 473,217.98Non current tax liabilities Income tax payable 486,166.31 364,904.25Total (net) 105,213.16 108,313.73
(` in million)
(` in million)
(` in million)
34.1 Current Tax Assets
34.2 Current tax Liabilities
Particulars As at March 31, 2019 As at March 31, 2018Current tax assets Benefit of tax losses to be carried back to recover taxes paid in prior periods
- -
Tax refund receivable - -Others 2,745.88 7,279.62 2,745.88 7,279.62Current tax liabilities Income tax payable 1,221.58 6,995.74Others - - 1,221.58 6,995.74Total (net) 1,524.30 283.88
Particulars As at March 31, 2019 As at March 31, 2018Current tax liabilities Income tax payable 13,513.81 101,036.30Less: Current tax assets Taxes paid 1,460.47 91,552.24Total (net) 12,053.34 9,484.06
35 Revenue from OperationsThe following is an analysis of the Group’s revenue from operations for the year:
( ₹ in million )Particulars Year ended March 31, 2019 Year ended March 31, 2018
A. Sale of products (Refer note 35.3 & 35.4) Sale of products (including excise duty) 4,541,756.04 3,627,683.00 Less: Transfer to Exploratory Wells in progress (includes levies)
33.08 40.87
Less: Government of India's (GoI's) share in Profit Petroleum
26,014.21 21,213.66
Total 4,515,708.75 3,606,428.47 B. Other Operating Revenue
Contractual Short Lifted Gas Receipts 72.23 176.63
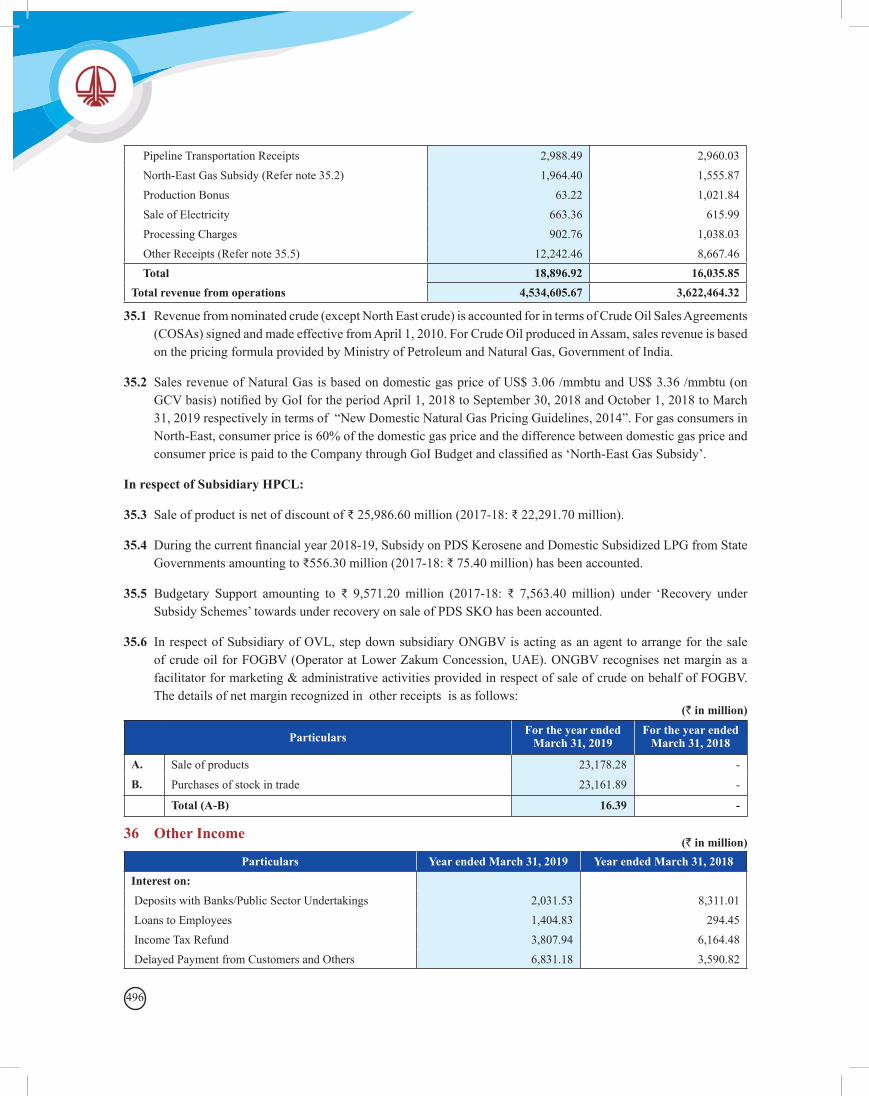
496
Pipeline Transportation Receipts 2,988.49 2,960.03 North-East Gas Subsidy (Refer note 35.2) 1,964.40 1,555.87 Production Bonus 63.22 1,021.84 Sale of Electricity 663.36 615.99 Processing Charges 902.76 1,038.03 Other Receipts (Refer note 35.5) 12,242.46 8,667.46
Total 18,896.92 16,035.85 Total revenue from operations 4,534,605.67 3,622,464.32
35.1 Revenue from nominated crude (except North East crude) is accounted for in terms of Crude Oil Sales Agreements (COSAs) signed and made effective from April 1, 2010. For Crude Oil produced in Assam, sales revenue is based on the pricing formula provided by Ministry of Petroleum and Natural Gas, Government of India.
35.2 Sales revenue of Natural Gas is based on domestic gas price of US$ 3.06 /mmbtu and US$ 3.36 /mmbtu (on GCV basis) notified by GoI for the period April 1, 2018 to September 30, 2018 and October 1, 2018 to March 31, 2019 respectively in terms of “New Domestic Natural Gas Pricing Guidelines, 2014”. For gas consumers in North-East, consumer price is 60% of the domestic gas price and the difference between domestic gas price and consumer price is paid to the Company through GoI Budget and classified as ‘North-East Gas Subsidy’.
In respect of Subsidiary HPCL:
35.3 Sale of product is net of discount of ₹ 25,986.60 million (2017-18: ₹ 22,291.70 million).
35.4 During the current financial year 2018-19, Subsidy on PDS Kerosene and Domestic Subsidized LPG from State Governments amounting to ₹556.30 million (2017-18: ₹ 75.40 million) has been accounted.
35.5 Budgetary Support amounting to ₹ 9,571.20 million (2017-18: ₹ 7,563.40 million) under ‘Recovery under Subsidy Schemes’ towards under recovery on sale of PDS SKO has been accounted.
35.6 In respect of Subsidiary of OVL, step down subsidiary ONGBV is acting as an agent to arrange for the sale of crude oil for FOGBV (Operator at Lower Zakum Concession, UAE). ONGBV recognises net margin as a facilitator for marketing & administrative activities provided in respect of sale of crude on behalf of FOGBV. The details of net margin recognized in other receipts is as follows:
Particulars For the year ended March 31, 2019
For the year ended March 31, 2018
A. Sale of products 23,178.28 - B. Purchases of stock in trade 23,161.89 -
Total (A-B) 16.39 -
(` in million)
(` in million)36 Other Income
Particulars Year ended March 31, 2019 Year ended March 31, 2018Interest on: Deposits with Banks/Public Sector Undertakings 2,031.53 8,311.01 Loans to Employees 1,404.83 294.45 Income Tax Refund 3,807.94 6,164.48 Delayed Payment from Customers and Others 6,831.18 3,590.82
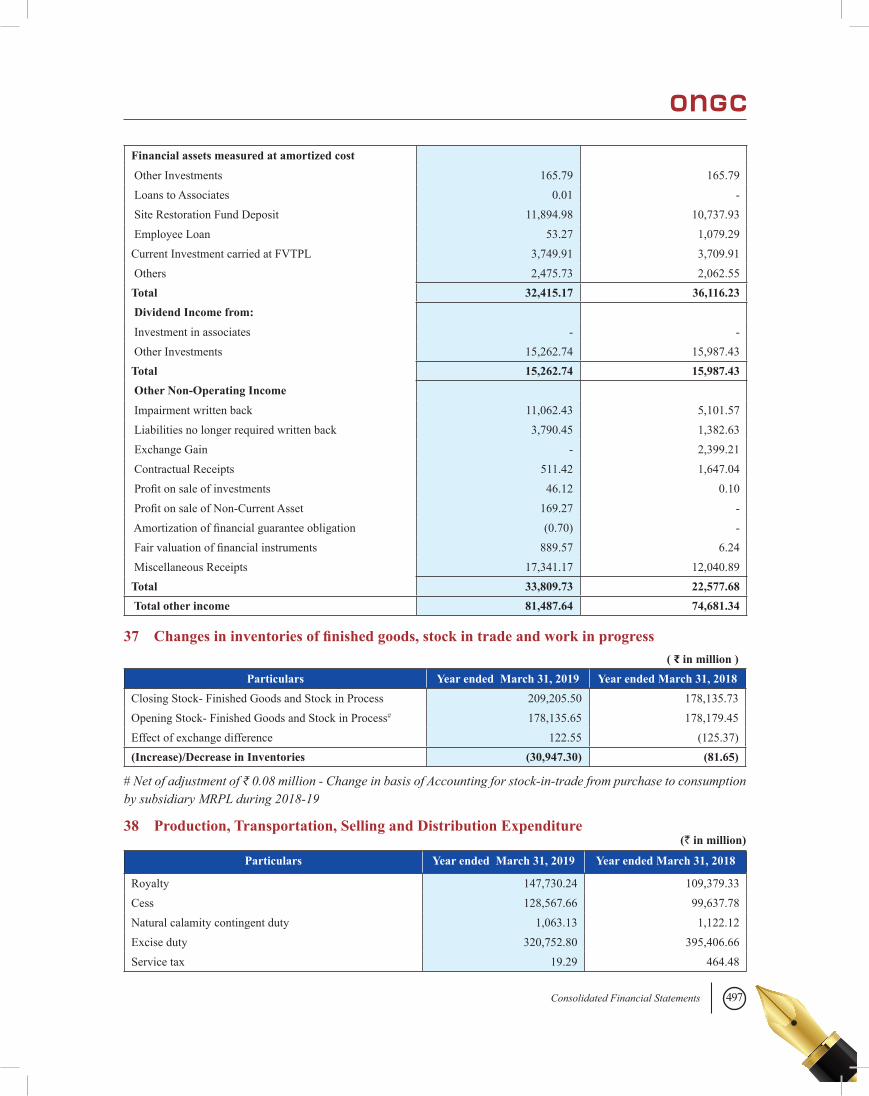
497Consolidated Financial Statements
37 Changes in inventories of finished goods, stock in trade and work in progress
38 Production, Transportation, Selling and Distribution Expenditure
Financial assets measured at amortized cost Other Investments 165.79 165.79 Loans to Associates 0.01 - Site Restoration Fund Deposit 11,894.98 10,737.93 Employee Loan 53.27 1,079.29Current Investment carried at FVTPL 3,749.91 3,709.91 Others 2,475.73 2,062.55Total 32,415.17 36,116.23 Dividend Income from: Investment in associates - - Other Investments 15,262.74 15,987.43Total 15,262.74 15,987.43 Other Non-Operating Income Impairment written back 11,062.43 5,101.57 Liabilities no longer required written back 3,790.45 1,382.63 Exchange Gain - 2,399.21 Contractual Receipts 511.42 1,647.04 Profit on sale of investments 46.12 0.10 Profit on sale of Non-Current Asset 169.27 - Amortization of financial guarantee obligation (0.70) - Fair valuation of financial instruments 889.57 6.24 Miscellaneous Receipts 17,341.17 12,040.89Total 33,809.73 22,577.68 Total other income 81,487.64 74,681.34
( ₹ in million )Particulars Year ended March 31, 2019 Year ended March 31, 2018
Closing Stock- Finished Goods and Stock in Process 209,205.50 178,135.73Opening Stock- Finished Goods and Stock in Process# 178,135.65 178,179.45Effect of exchange difference 122.55 (125.37)(Increase)/Decrease in Inventories (30,947.30) (81.65)
# Net of adjustment of ₹ 0.08 million - Change in basis of Accounting for stock-in-trade from purchase to consumption by subsidiary MRPL during 2018-19
(` in million)
Particulars Year ended March 31, 2019 Year ended March 31, 2018
Royalty 147,730.24 109,379.33Cess 128,567.66 99,637.78Natural calamity contingent duty 1,063.13 1,122.12Excise duty 320,752.80 395,406.66Service tax 19.29 464.48
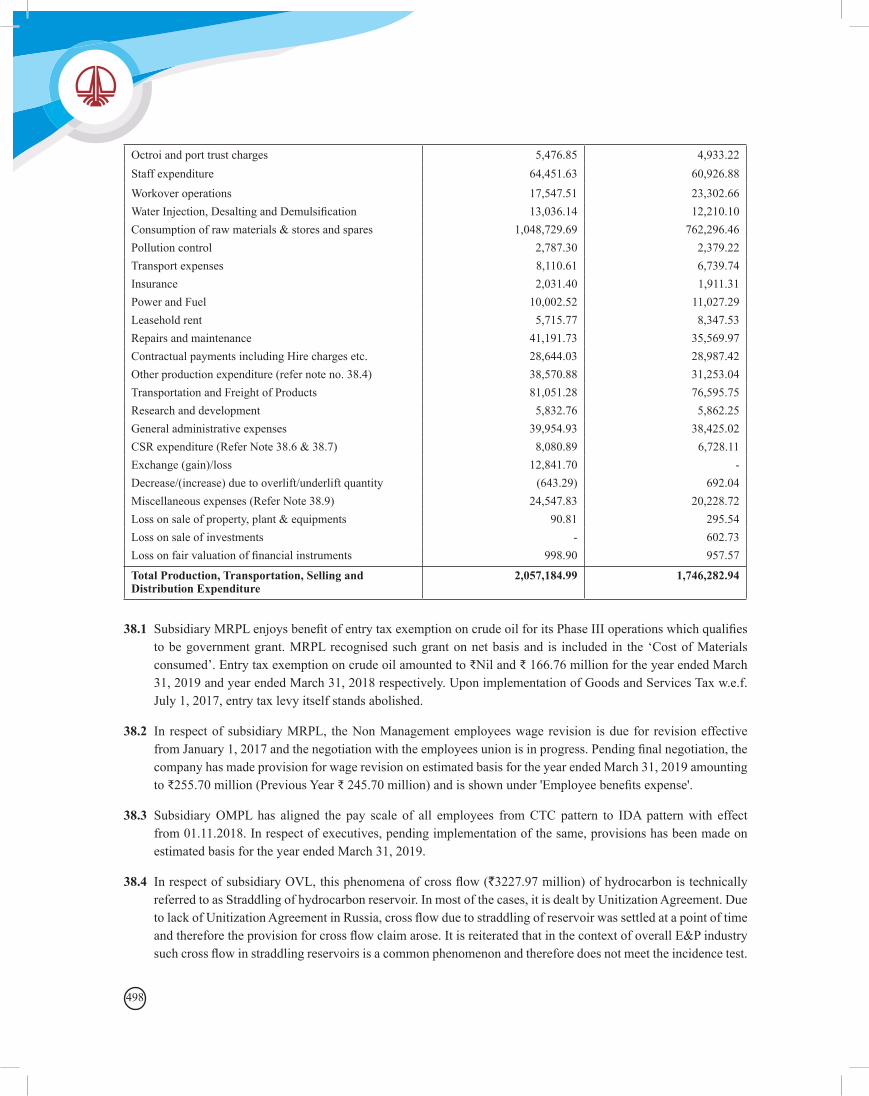
498
Octroi and port trust charges 5,476.85 4,933.22Staff expenditure 64,451.63 60,926.88Workover operations 17,547.51 23,302.66Water Injection, Desalting and Demulsification 13,036.14 12,210.10Consumption of raw materials & stores and spares 1,048,729.69 762,296.46Pollution control 2,787.30 2,379.22Transport expenses 8,110.61 6,739.74Insurance 2,031.40 1,911.31Power and Fuel 10,002.52 11,027.29Leasehold rent 5,715.77 8,347.53Repairs and maintenance 41,191.73 35,569.97Contractual payments including Hire charges etc. 28,644.03 28,987.42Other production expenditure (refer note no. 38.4) 38,570.88 31,253.04Transportation and Freight of Products 81,051.28 76,595.75Research and development 5,832.76 5,862.25General administrative expenses 39,954.93 38,425.02CSR expenditure (Refer Note 38.6 & 38.7) 8,080.89 6,728.11Exchange (gain)/loss 12,841.70 -Decrease/(increase) due to overlift/underlift quantity (643.29) 692.04Miscellaneous expenses (Refer Note 38.9) 24,547.83 20,228.72Loss on sale of property, plant & equipments 90.81 295.54Loss on sale of investments - 602.73Loss on fair valuation of financial instruments 998.90 957.57
Total Production, Transportation, Selling and Distribution Expenditure
2,057,184.99 1,746,282.94
38.1 Subsidiary MRPL enjoys benefit of entry tax exemption on crude oil for its Phase III operations which qualifies to be government grant. MRPL recognised such grant on net basis and is included in the ‘Cost of Materials consumed’. Entry tax exemption on crude oil amounted to ₹Nil and ₹ 166.76 million for the year ended March 31, 2019 and year ended March 31, 2018 respectively. Upon implementation of Goods and Services Tax w.e.f. July 1, 2017, entry tax levy itself stands abolished.
38.2 In respect of subsidiary MRPL, the Non Management employees wage revision is due for revision effective from January 1, 2017 and the negotiation with the employees union is in progress. Pending final negotiation, the company has made provision for wage revision on estimated basis for the year ended March 31, 2019 amounting to ₹255.70 million (Previous Year ₹ 245.70 million) and is shown under 'Employee benefits expense'.
38.3 Subsidiary OMPL has aligned the pay scale of all employees from CTC pattern to IDA pattern with effect from 01.11.2018. In respect of executives, pending implementation of the same, provisions has been made on estimated basis for the year ended March 31, 2019.
38.4 In respect of subsidiary OVL, this phenomena of cross flow (`3227.97 million) of hydrocarbon is technically referred to as Straddling of hydrocarbon reservoir. In most of the cases, it is dealt by Unitization Agreement. Due to lack of Unitization Agreement in Russia, cross flow due to straddling of reservoir was settled at a point of time and therefore the provision for cross flow claim arose. It is reiterated that in the context of overall E&P industry such cross flow in straddling reservoirs is a common phenomenon and therefore does not meet the incidence test.
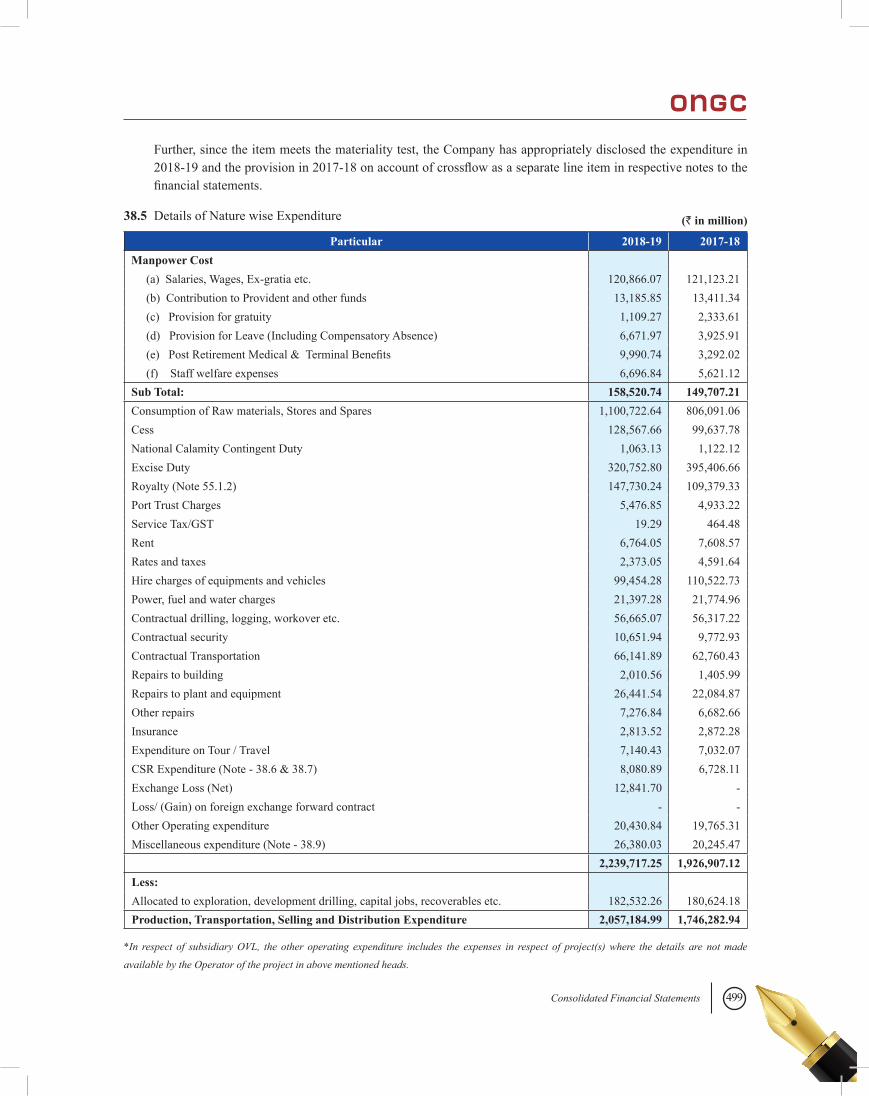
499Consolidated Financial Statements
Further, since the item meets the materiality test, the Company has appropriately disclosed the expenditure in 2018-19 and the provision in 2017-18 on account of crossflow as a separate line item in respective notes to the financial statements.
38.5 Details of Nature wise Expenditure
Particular 2018-19 2017-18Manpower Cost (a) Salaries, Wages, Ex-gratia etc. 120,866.07 121,123.21 (b) Contribution to Provident and other funds 13,185.85 13,411.34 (c) Provision for gratuity 1,109.27 2,333.61 (d) Provision for Leave (Including Compensatory Absence) 6,671.97 3,925.91 (e) Post Retirement Medical & Terminal Benefits 9,990.74 3,292.02 (f) Staff welfare expenses 6,696.84 5,621.12Sub Total: 158,520.74 149,707.21Consumption of Raw materials, Stores and Spares 1,100,722.64 806,091.06Cess 128,567.66 99,637.78National Calamity Contingent Duty 1,063.13 1,122.12Excise Duty 320,752.80 395,406.66Royalty (Note 55.1.2) 147,730.24 109,379.33Port Trust Charges 5,476.85 4,933.22Service Tax/GST 19.29 464.48Rent 6,764.05 7,608.57Rates and taxes 2,373.05 4,591.64Hire charges of equipments and vehicles 99,454.28 110,522.73Power, fuel and water charges 21,397.28 21,774.96Contractual drilling, logging, workover etc. 56,665.07 56,317.22Contractual security 10,651.94 9,772.93Contractual Transportation 66,141.89 62,760.43Repairs to building 2,010.56 1,405.99Repairs to plant and equipment 26,441.54 22,084.87Other repairs 7,276.84 6,682.66Insurance 2,813.52 2,872.28Expenditure on Tour / Travel 7,140.43 7,032.07CSR Expenditure (Note - 38.6 & 38.7) 8,080.89 6,728.11Exchange Loss (Net) 12,841.70 -Loss/ (Gain) on foreign exchange forward contract - -Other Operating expenditure 20,430.84 19,765.31Miscellaneous expenditure (Note - 38.9) 26,380.03 20,245.47
2,239,717.25 1,926,907.12Less:Allocated to exploration, development drilling, capital jobs, recoverables etc. 182,532.26 180,624.18Production, Transportation, Selling and Distribution Expenditure 2,057,184.99 1,746,282.94
*In respect of subsidiary OVL, the other operating expenditure includes the expenses in respect of project(s) where the details are not made
available by the Operator of the project in above mentioned heads.
(` in million)
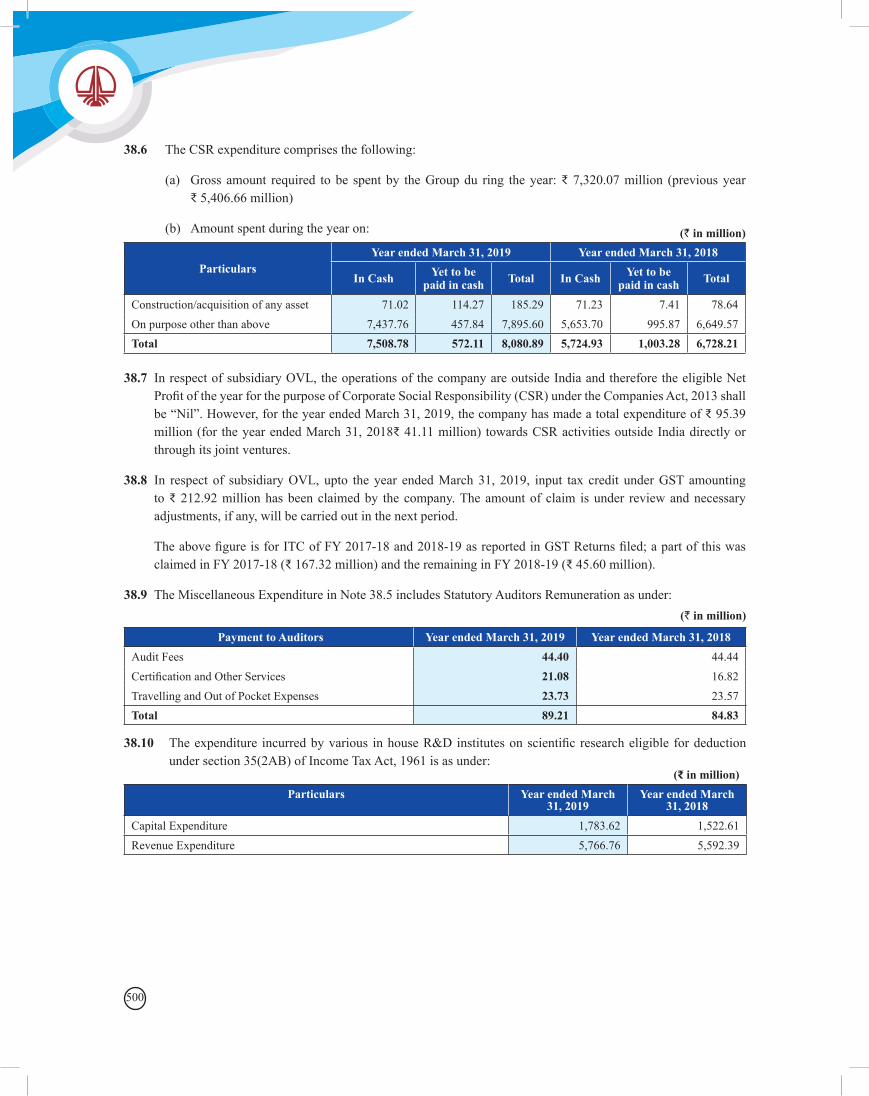
500
38.6 The CSR expenditure comprises the following:
(a) Gross amount required to be spent by the Group du ring the year: ₹ 7,320.07 million (previous year ₹ 5,406.66 million)
(b) Amount spent during the year on:
(` in million)
ParticularsYear ended March 31, 2019 Year ended March 31, 2018
In Cash Yet to be paid in cash Total In Cash Yet to be
paid in cash Total
Construction/acquisition of any asset 71.02 114.27 185.29 71.23 7.41 78.64On purpose other than above 7,437.76 457.84 7,895.60 5,653.70 995.87 6,649.57Total 7,508.78 572.11 8,080.89 5,724.93 1,003.28 6,728.21
38.7 In respect of subsidiary OVL, the operations of the company are outside India and therefore the eligible Net Profit of the year for the purpose of Corporate Social Responsibility (CSR) under the Companies Act, 2013 shall be “Nil”. However, for the year ended March 31, 2019, the company has made a total expenditure of ₹ 95.39 million (for the year ended March 31, 2018₹ 41.11 million) towards CSR activities outside India directly or through its joint ventures.
38.8 In respect of subsidiary OVL, upto the year ended March 31, 2019, input tax credit under GST amounting to ₹ 212.92 million has been claimed by the company. The amount of claim is under review and necessary adjustments, if any, will be carried out in the next period.
The above figure is for ITC of FY 2017-18 and 2018-19 as reported in GST Returns filed; a part of this was claimed in FY 2017-18 (₹ 167.32 million) and the remaining in FY 2018-19 (₹ 45.60 million).
38.9 The Miscellaneous Expenditure in Note 38.5 includes Statutory Auditors Remuneration as under:
Payment to Auditors Year ended March 31, 2019 Year ended March 31, 2018Audit Fees 44.40 44.44Certification and Other Services 21.08 16.82Travelling and Out of Pocket Expenses 23.73 23.57Total 89.21 84.83
38.10 The expenditure incurred by various in house R&D institutes on scientific research eligible for deduction under section 35(2AB) of Income Tax Act, 1961 is as under:
(₹ in million)Particulars Year ended March
31, 2019Year ended March
31, 2018Capital Expenditure 1,783.62 1,522.61Revenue Expenditure 5,766.76 5,592.39
(` in million)
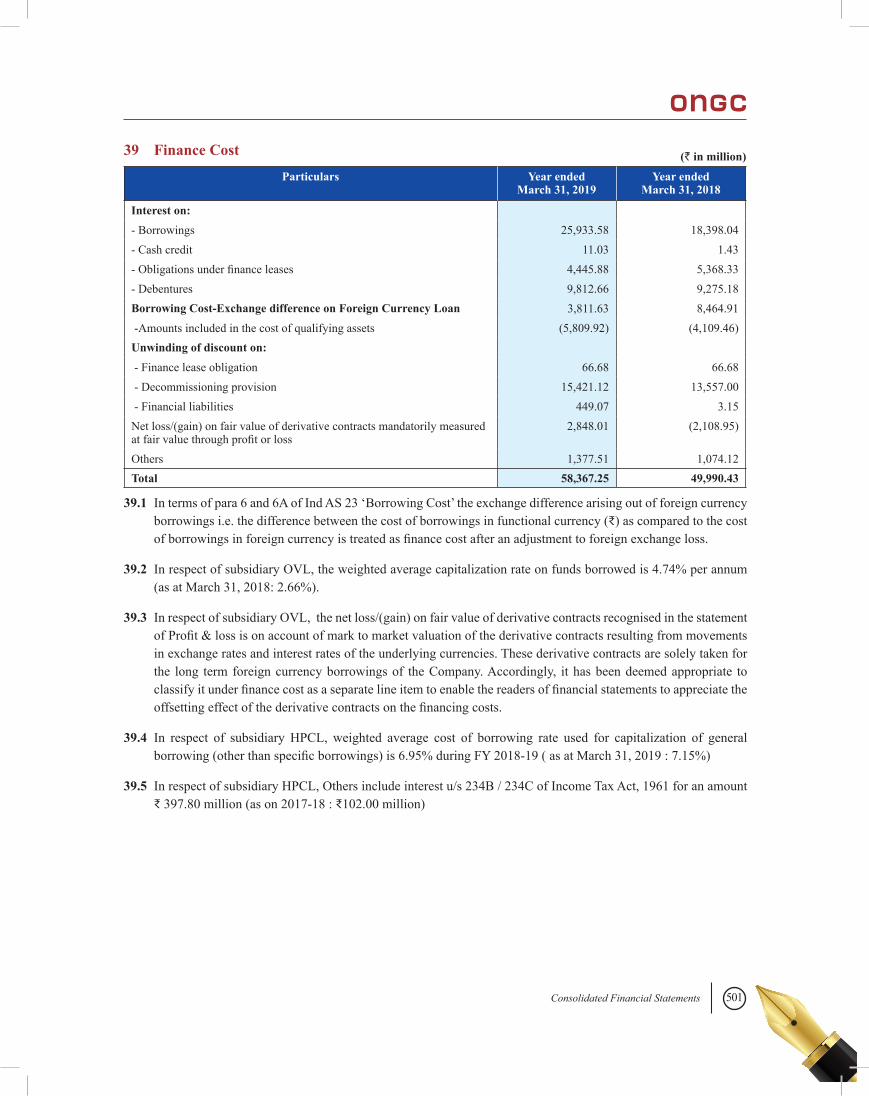
501Consolidated Financial Statements
39 Finance Cost
Particulars Year ended March 31, 2019
Year ended March 31, 2018
Interest on: - Borrowings 25,933.58 18,398.04 - Cash credit 11.03 1.43 - Obligations under finance leases 4,445.88 5,368.33 - Debentures 9,812.66 9,275.18 Borrowing Cost-Exchange difference on Foreign Currency Loan 3,811.63 8,464.91 -Amounts included in the cost of qualifying assets (5,809.92) (4,109.46)Unwinding of discount on: - Finance lease obligation 66.68 66.68 - Decommissioning provision 15,421.12 13,557.00 - Financial liabilities 449.07 3.15 Net loss/(gain) on fair value of derivative contracts mandatorily measured at fair value through profit or loss
2,848.01 (2,108.95)
Others 1,377.51 1,074.12 Total 58,367.25 49,990.43
(` in million)
39.1 In terms of para 6 and 6A of Ind AS 23 ‘Borrowing Cost’ the exchange difference arising out of foreign currency borrowings i.e. the difference between the cost of borrowings in functional currency (₹) as compared to the cost of borrowings in foreign currency is treated as finance cost after an adjustment to foreign exchange loss.
39.2 In respect of subsidiary OVL, the weighted average capitalization rate on funds borrowed is 4.74% per annum (as at March 31, 2018: 2.66%).
39.3 In respect of subsidiary OVL, the net loss/(gain) on fair value of derivative contracts recognised in the statement of Profit & loss is on account of mark to market valuation of the derivative contracts resulting from movements in exchange rates and interest rates of the underlying currencies. These derivative contracts are solely taken for the long term foreign currency borrowings of the Company. Accordingly, it has been deemed appropriate to classify it under finance cost as a separate line item to enable the readers of financial statements to appreciate the offsetting effect of the derivative contracts on the financing costs.
39.4 In respect of subsidiary HPCL, weighted average cost of borrowing rate used for capitalization of general borrowing (other than specific borrowings) is 6.95% during FY 2018-19 ( as at March 31, 2019 : 7.15%)
39.5 In respect of subsidiary HPCL, Others include interest u/s 234B / 234C of Income Tax Act, 1961 for an amount ₹ 397.80 million (as on 2017-18 : ₹102.00 million)
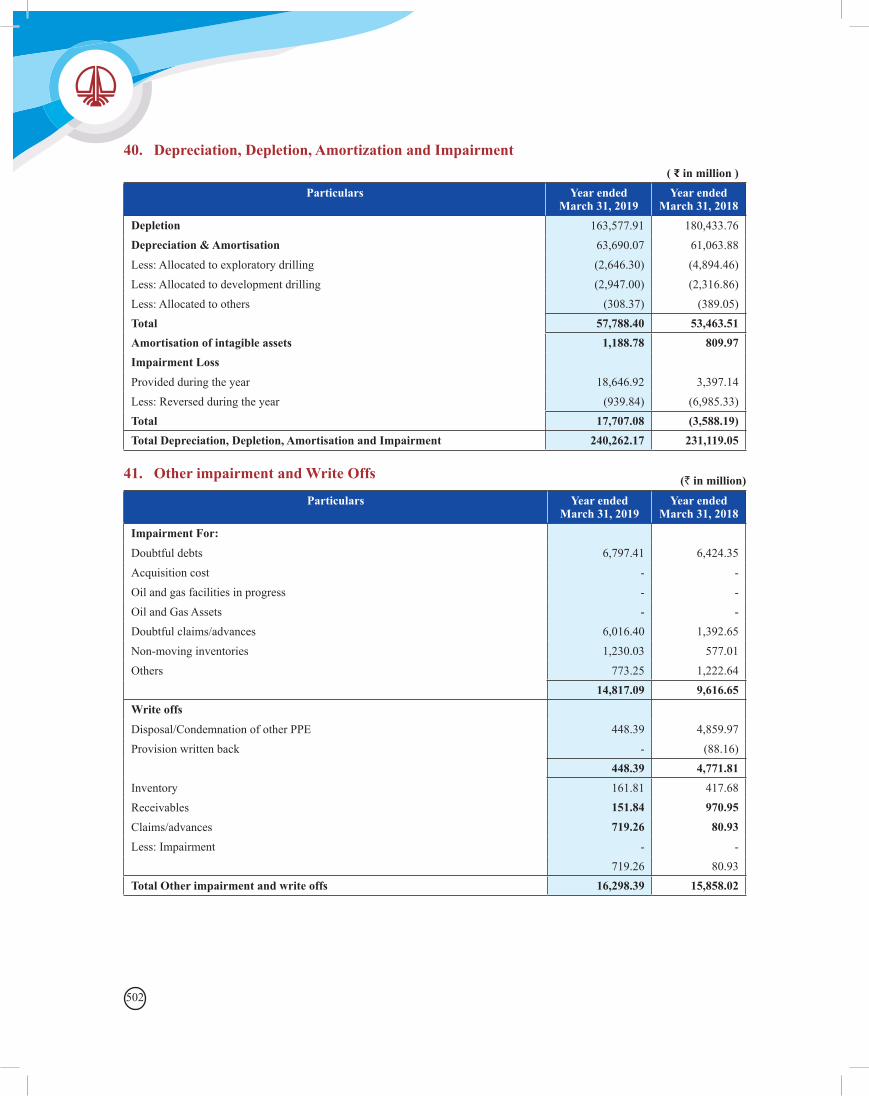
502
40. Depreciation, Depletion, Amortization and Impairment( ₹ in million )
Particulars Year ended March 31, 2019
Year ended March 31, 2018
Depletion 163,577.91 180,433.76Depreciation & Amortisation 63,690.07 61,063.88Less: Allocated to exploratory drilling (2,646.30) (4,894.46)Less: Allocated to development drilling (2,947.00) (2,316.86)Less: Allocated to others (308.37) (389.05)Total 57,788.40 53,463.51Amortisation of intagible assets 1,188.78 809.97Impairment Loss Provided during the year 18,646.92 3,397.14Less: Reversed during the year (939.84) (6,985.33)Total 17,707.08 (3,588.19)Total Depreciation, Depletion, Amortisation and Impairment 240,262.17 231,119.05
41. Other impairment and Write Offs
Particulars Year ended March 31, 2019
Year ended March 31, 2018
Impairment For: Doubtful debts 6,797.41 6,424.35Acquisition cost - -Oil and gas facilities in progress - -Oil and Gas Assets - -Doubtful claims/advances 6,016.40 1,392.65Non-moving inventories 1,230.03 577.01Others 773.25 1,222.64 14,817.09 9,616.65Write offs Disposal/Condemnation of other PPE 448.39 4,859.97Provision written back - (88.16) 448.39 4,771.81Inventory 161.81 417.68Receivables 151.84 970.95Claims/advances 719.26 80.93Less: Impairment - - 719.26 80.93Total Other impairment and write offs 16,298.39 15,858.02
(` in million)
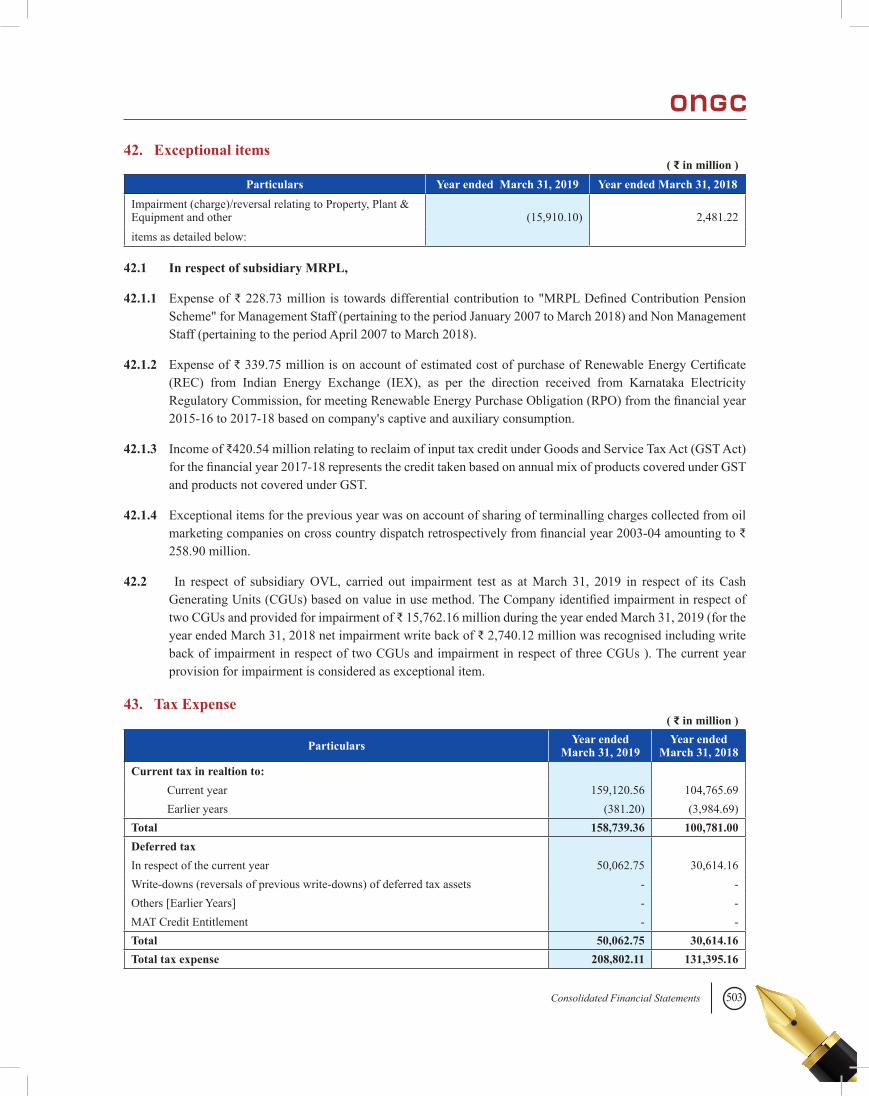
503Consolidated Financial Statements
42. Exceptional items
43. Tax Expense
( ₹ in million )Particulars Year ended March 31, 2019 Year ended March 31, 2018
Impairment (charge)/reversal relating to Property, Plant & Equipment and other (15,910.10) 2,481.22items as detailed below:
42.1 In respect of subsidiary MRPL,
42.1.1 Expense of ₹ 228.73 million is towards differential contribution to "MRPL Defined Contribution Pension Scheme" for Management Staff (pertaining to the period January 2007 to March 2018) and Non Management Staff (pertaining to the period April 2007 to March 2018).
42.1.2 Expense of ₹ 339.75 million is on account of estimated cost of purchase of Renewable Energy Certificate (REC) from Indian Energy Exchange (IEX), as per the direction received from Karnataka Electricity Regulatory Commission, for meeting Renewable Energy Purchase Obligation (RPO) from the financial year 2015-16 to 2017-18 based on company's captive and auxiliary consumption.
42.1.3 Income of ₹420.54 million relating to reclaim of input tax credit under Goods and Service Tax Act (GST Act) for the financial year 2017-18 represents the credit taken based on annual mix of products covered under GST and products not covered under GST.
42.1.4 Exceptional items for the previous year was on account of sharing of terminalling charges collected from oil marketing companies on cross country dispatch retrospectively from financial year 2003-04 amounting to ₹ 258.90 million.
42.2 In respect of subsidiary OVL, carried out impairment test as at March 31, 2019 in respect of its Cash Generating Units (CGUs) based on value in use method. The Company identified impairment in respect of two CGUs and provided for impairment of ₹ 15,762.16 million during the year ended March 31, 2019 (for the year ended March 31, 2018 net impairment write back of ₹ 2,740.12 million was recognised including write back of impairment in respect of two CGUs and impairment in respect of three CGUs ). The current year provision for impairment is considered as exceptional item.
( ₹ in million )
Particulars Year ended March 31, 2019
Year ended March 31, 2018
Current tax in realtion to: Current year 159,120.56 104,765.69Earlier years (381.20) (3,984.69)
Total 158,739.36 100,781.00Deferred tax In respect of the current year 50,062.75 30,614.16Write-downs (reversals of previous write-downs) of deferred tax assets - -Others [Earlier Years] - -MAT Credit Entitlement - -Total 50,062.75 30,614.16Total tax expense 208,802.11 131,395.16
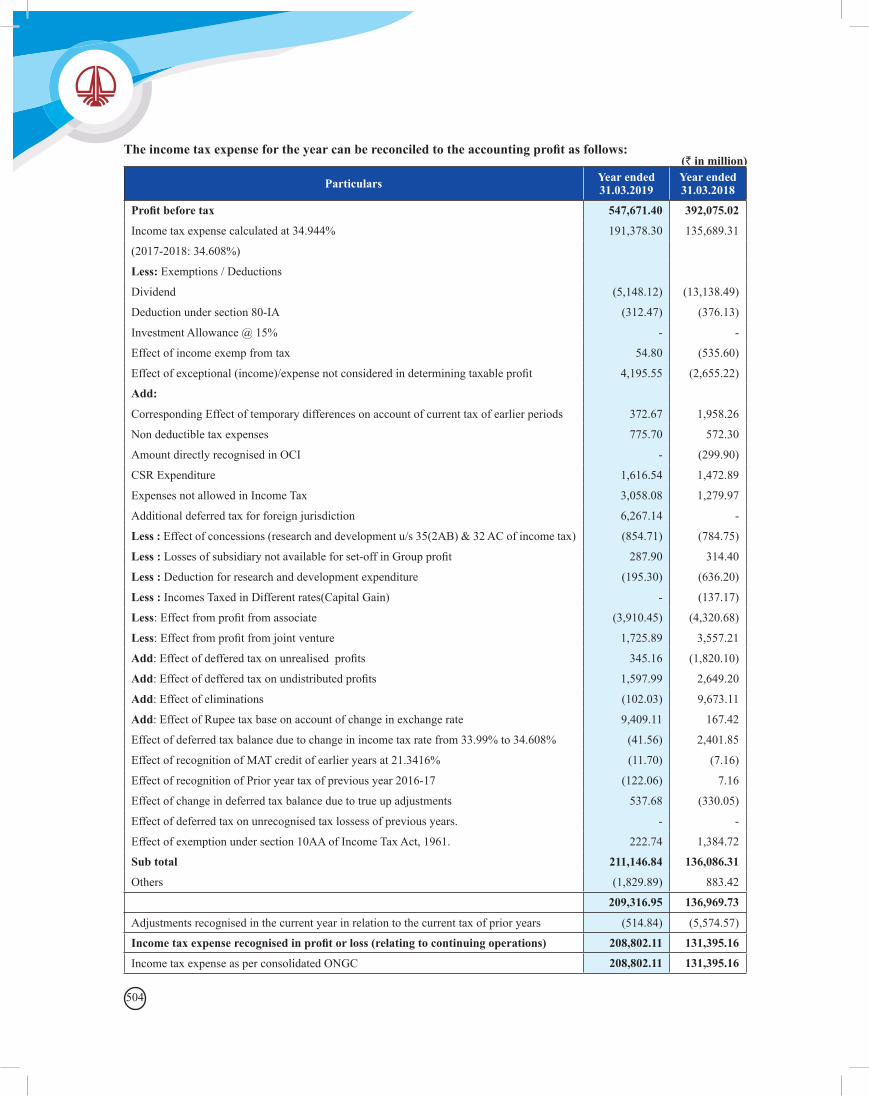
504
The income tax expense for the year can be reconciled to the accounting profit as follows:
Particulars Year ended 31.03.2019
Year ended 31.03.2018
Profit before tax 547,671.40 392,075.02
Income tax expense calculated at 34.944% 191,378.30 135,689.31
(2017-2018: 34.608%)
Less: Exemptions / Deductions
Dividend (5,148.12) (13,138.49)
Deduction under section 80-IA (312.47) (376.13)
Investment Allowance @ 15% - -
Effect of income exemp from tax 54.80 (535.60)
Effect of exceptional (income)/expense not considered in determining taxable profit 4,195.55 (2,655.22)
Add:
Corresponding Effect of temporary differences on account of current tax of earlier periods 372.67 1,958.26
Non deductible tax expenses 775.70 572.30
Amount directly recognised in OCI - (299.90)
CSR Expenditure 1,616.54 1,472.89
Expenses not allowed in Income Tax 3,058.08 1,279.97
Additional deferred tax for foreign jurisdiction 6,267.14 -
Less : Effect of concessions (research and development u/s 35(2AB) & 32 AC of income tax) (854.71) (784.75)
Less : Losses of subsidiary not available for set-off in Group profit 287.90 314.40
Less : Deduction for research and development expenditure (195.30) (636.20)
Less : Incomes Taxed in Different rates(Capital Gain) - (137.17)
Less: Effect from profit from associate (3,910.45) (4,320.68)
Less: Effect from profit from joint venture 1,725.89 3,557.21
Add: Effect of deffered tax on unrealised profits 345.16 (1,820.10)
Add: Effect of deffered tax on undistributed profits 1,597.99 2,649.20
Add: Effect of eliminations (102.03) 9,673.11
Add: Effect of Rupee tax base on account of change in exchange rate 9,409.11 167.42
Effect of deferred tax balance due to change in income tax rate from 33.99% to 34.608% (41.56) 2,401.85
Effect of recognition of MAT credit of earlier years at 21.3416% (11.70) (7.16)
Effect of recognition of Prior year tax of previous year 2016-17 (122.06) 7.16
Effect of change in deferred tax balance due to true up adjustments 537.68 (330.05)
Effect of deferred tax on unrecognised tax lossess of previous years. - -
Effect of exemption under section 10AA of Income Tax Act, 1961. 222.74 1,384.72
Sub total 211,146.84 136,086.31
Others (1,829.89) 883.42
209,316.95 136,969.73
Adjustments recognised in the current year in relation to the current tax of prior years (514.84) (5,574.57)
Income tax expense recognised in profit or loss (relating to continuing operations) 208,802.11 131,395.16
Income tax expense as per consolidated ONGC 208,802.11 131,395.16
(` in million)
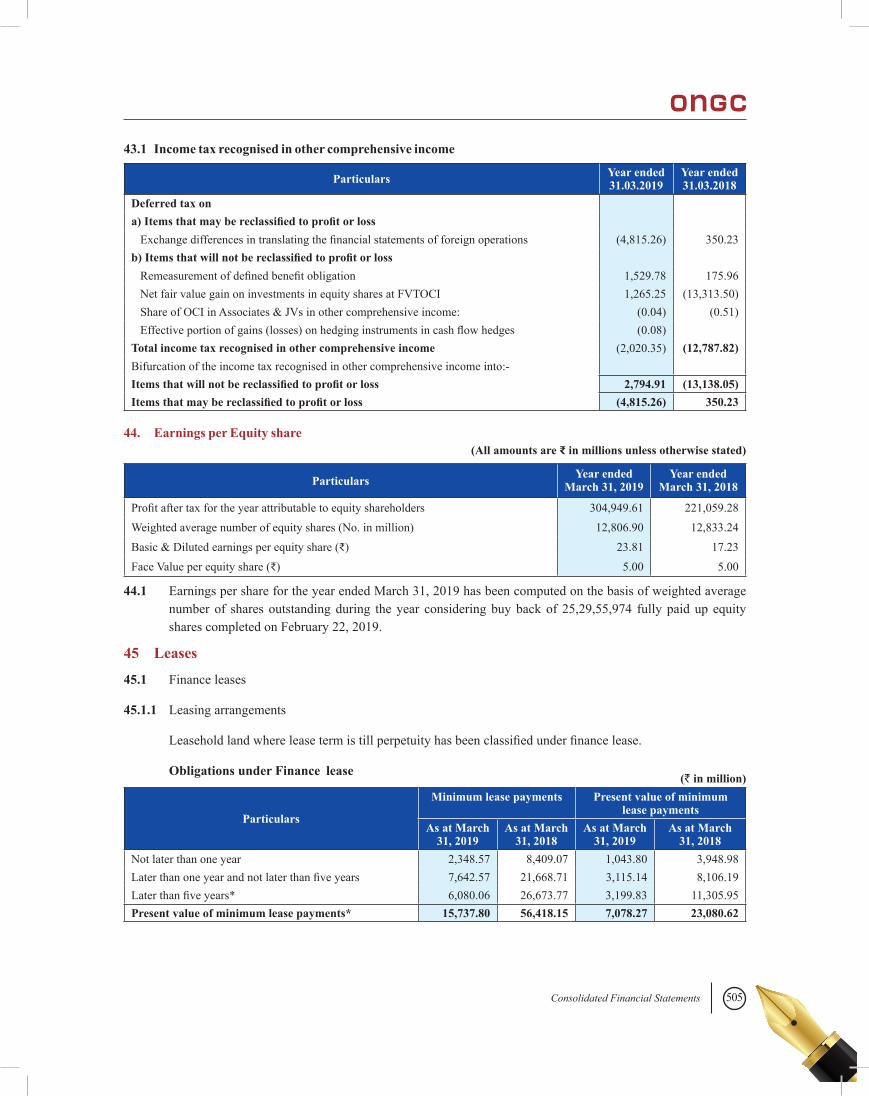
505Consolidated Financial Statements
43.1 Income tax recognised in other comprehensive income
Particulars Year ended 31.03.2019
Year ended 31.03.2018
Deferred tax on a) Items that may be reclassified to profit or loss Exchange differences in translating the financial statements of foreign operations (4,815.26) 350.23b) Items that will not be reclassified to profit or loss Remeasurement of defined benefit obligation 1,529.78 175.96 Net fair value gain on investments in equity shares at FVTOCI 1,265.25 (13,313.50) Share of OCI in Associates & JVs in other comprehensive income: (0.04) (0.51) Effective portion of gains (losses) on hedging instruments in cash flow hedges (0.08) Total income tax recognised in other comprehensive income (2,020.35) (12,787.82)Bifurcation of the income tax recognised in other comprehensive income into:- Items that will not be reclassified to profit or loss 2,794.91 (13,138.05)Items that may be reclassified to profit or loss (4,815.26) 350.23
44. Earnings per Equity share(All amounts are ₹ in millions unless otherwise stated)
Particulars Year ended March 31, 2019
Year ended March 31, 2018
Profit after tax for the year attributable to equity shareholders 304,949.61 221,059.28 Weighted average number of equity shares (No. in million) 12,806.90 12,833.24 Basic & Diluted earnings per equity share (₹) 23.81 17.23 Face Value per equity share (₹) 5.00 5.00
44.1 Earnings per share for the year ended March 31, 2019 has been computed on the basis of weighted average number of shares outstanding during the year considering buy back of 25,29,55,974 fully paid up equity shares completed on February 22, 2019.
45 Leases
45.1 Finance leases
45.1.1 Leasing arrangements
Leasehold land where lease term is till perpetuity has been classified under finance lease.
Obligations under Finance lease
Particulars
Minimum lease payments Present value of minimum lease payments
As at March 31, 2019
As at March 31, 2018
As at March 31, 2019
As at March 31, 2018
Not later than one year 2,348.57 8,409.07 1,043.80 3,948.98Later than one year and not later than five years 7,642.57 21,668.71 3,115.14 8,106.19Later than five years* 6,080.06 26,673.77 3,199.83 11,305.95Present value of minimum lease payments* 15,737.80 56,418.15 7,078.27 23,080.62
(` in million)
506
* Under the lease agreement, the Group is required to pay annual lease rental of ₹ 66.68 million till perpetuity. The finance lease obligation represents the perpetuity value of annualized lease payment, which is ₹ 795.65 Million and will remain same till perpetuity. The finance charge will be ₹ 66.68 million on annual basis till perpetuity.
In respect of subsidiary MRPL, the company has entered into lease agreements for lands which have been classified as finance leases. The ownership of the lands will be transferred to the Company at the end of the lease term with nominal payment of administrative charges. The average lease term ranges from 5 - 44 years. The Company has pledged these leasehold lands for obtaining borrowings.
Financial lease obligation as at March 31, 2019 is immaterial (as at March 31, 2018: immaterial).
In respect of subsidiary OVL,
The table above includes its share of 27% of the aggregate future payments from Shell Brazil Ltda. as operator of the BC10 joint venture for the lease of the FPSO "Espírito Santo" as well as the lease for the Subsea equipment.
The initial term of the FPSO lease contract is 15 years with priced extension options for more years according to the production lifetime. The Consolidated Rental Agreement for the Subsea equipment is a fixed term contract until December 31, 2039 with priced termination options for every year during the life of the contract. The interest rate implicit in the lease for the FPSO amounts to 13.74% per year.
During the period Tamba B.V. has transferred all the sub-sea assets to BC-10 project through a Sale Purchase Agreement (“SPA”) due to change in regulatory requirements of Brazil.
45.2 Operating lease arrangements
45.2.1 Leasing arrangements
In case of Company,
The Company has applied Appendix C to Ind AS 17 ‘Leases’ to hiring / service contracts of rigs, vessels, helicopters, etc. to evaluate whether these contracts contains a lease or not. Based on evaluation of the terms and conditions of the arrangements, the Company has evaluated such arrangements to be operating leases.
Operating leases relate to leases of rigs, vessels, helicopters etc. with lease terms upto 10 years. The Company does not have an option to purchase the leased rigs, vessels, helicopters etc. at the expiry of the lease periods.
In respect of subsidiary MRPL, the Company has entered into arrangements for right of way for pipelines and lease of land which have been classified as operating leases. The lease period for right of way ranges from 11 months to 30 years and for leases of land ranges from 5 to 99 years. In case of leasehold land, the Company does not have option to purchase the land at the end of the lease period. Generally, the lease arrangements for land requires Company to make upfront payments at the time of the execution of the lease arrangement with annual recurring charges with escalations in annual lease rentals.
Subsidiary OMPL has entered into land lease agreement for setting up SEZ unit with Mangalore SEZ Limited whose lease period is 47 years. The same has been classified as operating lease. The Company does not have option to purchase the land at the end of the lease period. Further the Company has made upfront payments at the time of the execution of the lease arrangement with annual recurring charges with no escalations in annual lease rentals. The Company has an option to renew the lease agreement for further period of 47 years after the expiry of the lease term on mutually agreed terms.
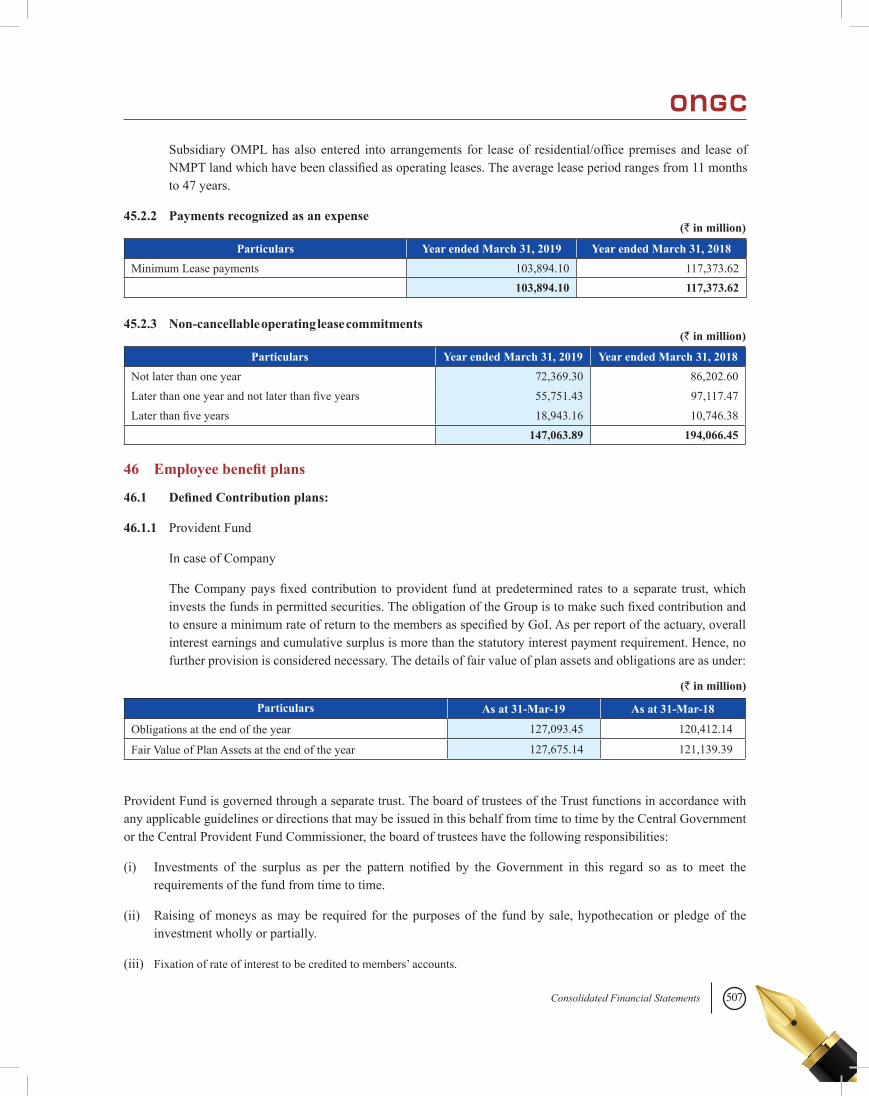
507Consolidated Financial Statements
Subsidiary OMPL has also entered into arrangements for lease of residential/office premises and lease of NMPT land which have been classified as operating leases. The average lease period ranges from 11 months to 47 years.
45.2.2 Payments recognized as an expense
Particulars Year ended March 31, 2019 Year ended March 31, 2018Minimum Lease payments 103,894.10 117,373.62
103,894.10 117,373.62
(` in million)
(` in million)45.2.3 Non-cancellable operating lease commitments
Particulars Year ended March 31, 2019 Year ended March 31, 2018Not later than one year 72,369.30 86,202.60Later than one year and not later than five years 55,751.43 97,117.47Later than five years 18,943.16 10,746.38
147,063.89 194,066.45
46.1 Defined Contribution plans:
46.1.1 Provident Fund
In case of Company
The Company pays fixed contribution to provident fund at predetermined rates to a separate trust, which invests the funds in permitted securities. The obligation of the Group is to make such fixed contribution and to ensure a minimum rate of return to the members as specified by GoI. As per report of the actuary, overall interest earnings and cumulative surplus is more than the statutory interest payment requirement. Hence, no further provision is considered necessary. The details of fair value of plan assets and obligations are as under:
46 Employee benefit plans
Particulars As at 31-Mar-19 As at 31-Mar-18
Obligations at the end of the year 127,093.45 120,412.14
Fair Value of Plan Assets at the end of the year 127,675.14 121,139.39
(` in million)
Provident Fund is governed through a separate trust. The board of trustees of the Trust functions in accordance with any applicable guidelines or directions that may be issued in this behalf from time to time by the Central Government or the Central Provident Fund Commissioner, the board of trustees have the following responsibilities:
(i) Investments of the surplus as per the pattern notified by the Government in this regard so as to meet the requirements of the fund from time to time.
(ii) Raising of moneys as may be required for the purposes of the fund by sale, hypothecation or pledge of the investment wholly or partially.
(iii) Fixation of rate of interest to be credited to members’ accounts.
508
46.1.2 Post Retirement Benefit Scheme
The defined contribution pension scheme of the Group for its employees is administered through a separate trust. The obligation of the Group is to contribute to the trust to the extent of amount not exceeding 30% of basic pay and dearness allowance as reduced by the employer’s contribution towards provident fund, gratuity, Post-Retirement Medical Benefit (PRMB) or any other retirement benefits.
The board of trustees of the Trust functions in accordance with any applicable guidelines or directions that may be issued in this behalf from time to time by the Central Government, the board of trustees have the following responsibilities:
(i) Investments of the surplus as per the pattern notified by the Government in this regard so as to meet the requirements of the fund from time to time.
(ii) Fixation of rate of contribution and interest thereon.
(iii) Purchase of annuities for the members.
46.2 Employee Pension Scheme 1995
The Employee Pension Scheme -1995 is administered by Employees Provident Fund Organization of India, wherein the Group has to contribute 8.33% of salary (subject to maximum of ₹15,000 per month) out of the employer’s contribution to Provident Fund.
46.3 Composite Social Security Scheme (CSSS)
The Composite Social Security Scheme is formulated by the Group for the welfare of its regular employees and it is administered through a separate Trust, named as Composite Social Security Scheme Trust. The obligation of the Group is to provide matching contribution to the Trust to the extent of contribution of the regular employees of the group. The Trust provides an assured lump sum support amount in the event of death or permanent total disablement of an employee while in service. In case of Separation other than Death/Permanent total disability, employees own contribution along with interest is refunded.
The Board of trustees of the Trust functions in accordance with Trust deed, Rule, Scheme and applicable guidelines or directions that may be issued by Management from time to time.
The Board of trustees has the following responsibilities:
(i) Investments of the surplus as per the pattern notified by the Government in this regard so as to meet the requirements of the fund from time to time.
(ii) Fixation of rate of interest to be credited to members’ accounts.
(iii) To provide cash benefits to the nominees in the event of death of an employee or Permanent Total Disablement leading to the cessation from service and refund of own contribution along with interest in case of separation other than death.
46.4 The following are the amounts before allocation recognized in the consolidated financial statements for the defined contribution plan:
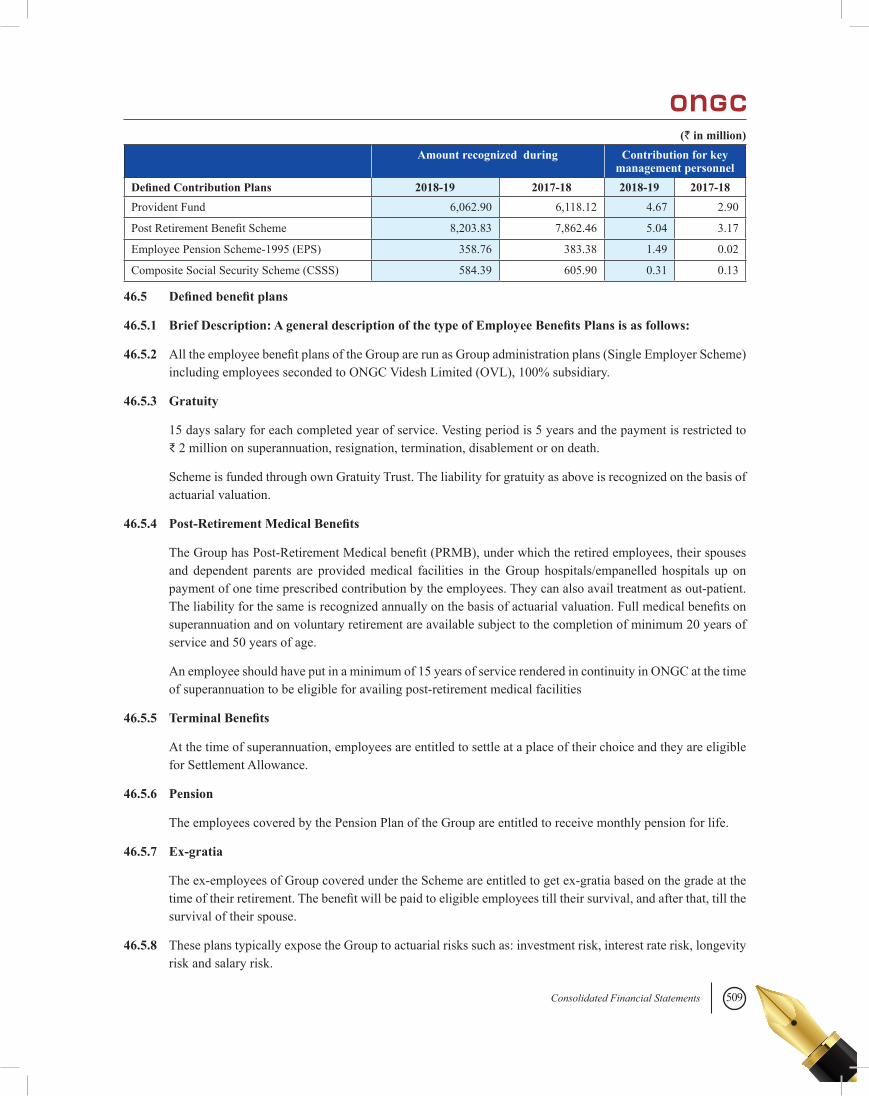
509Consolidated Financial Statements
Amount recognized during Contribution for key management personnel
Defined Contribution Plans 2018-19 2017-18 2018-19 2017-18Provident Fund 6,062.90 6,118.12 4.67 2.90
Post Retirement Benefit Scheme 8,203.83 7,862.46 5.04 3.17
Employee Pension Scheme-1995 (EPS) 358.76 383.38 1.49 0.02
Composite Social Security Scheme (CSSS) 584.39 605.90 0.31 0.13
46.5 Defined benefit plans
46.5.1 Brief Description: A general description of the type of Employee Benefits Plans is as follows:
46.5.2 All the employee benefit plans of the Group are run as Group administration plans (Single Employer Scheme) including employees seconded to ONGC Videsh Limited (OVL), 100% subsidiary.
46.5.3 Gratuity
15 days salary for each completed year of service. Vesting period is 5 years and the payment is restricted to ₹ 2 million on superannuation, resignation, termination, disablement or on death.
Scheme is funded through own Gratuity Trust. The liability for gratuity as above is recognized on the basis of actuarial valuation.
46.5.4 Post-Retirement Medical Benefits
The Group has Post-Retirement Medical benefit (PRMB), under which the retired employees, their spouses and dependent parents are provided medical facilities in the Group hospitals/empanelled hospitals up on payment of one time prescribed contribution by the employees. They can also avail treatment as out-patient. The liability for the same is recognized annually on the basis of actuarial valuation. Full medical benefits on superannuation and on voluntary retirement are available subject to the completion of minimum 20 years of service and 50 years of age.
An employee should have put in a minimum of 15 years of service rendered in continuity in ONGC at the time of superannuation to be eligible for availing post-retirement medical facilities
46.5.5 Terminal Benefits
At the time of superannuation, employees are entitled to settle at a place of their choice and they are eligible for Settlement Allowance.
46.5.6 Pension
The employees covered by the Pension Plan of the Group are entitled to receive monthly pension for life.
46.5.7 Ex-gratia
The ex-employees of Group covered under the Scheme are entitled to get ex-gratia based on the grade at the time of their retirement. The benefit will be paid to eligible employees till their survival, and after that, till the survival of their spouse.
46.5.8 These plans typically expose the Group to actuarial risks such as: investment risk, interest rate risk, longevity risk and salary risk.
(` in million)
510
Investment risk The present value of the defined benefit plan liability is calculated using a discount rate which is determined by reference to market yields at the end of the reporting period on government bonds. When there is a deep market for such bonds; if the return on plan asset is below this rate, it will create a plan deficit. Currently, for these plans, investments are made in government securities, debt instruments, Short term debt instruments, Equity instruments and Asset Backed, Trust Structured securities as per notification of Ministry of Finance.
Interest risk A decrease in the bond interest rate will increase the plan liability; however, this will be partially offset by an increase in the return on the plan’s investments.
Longevity risk The present value of the defined benefit plan liability is calculated by reference to the best estimate of the mortality of plan participants both during and after their employment. An increase in the life expectancy of the plan participants will increase the plan’s liability.
Salary risk The present value of the defined benefit plan liability is calculated by reference to the future salaries of plan participants. As such, an increase in the salary of the plan participants will increase the plan’s liability.
No other post-retirement benefits are provided to these employees.
In respect of the above plans, the most recent actuarial valuation of the plan assets and the present value of the defined benefit obligation were carried out as at March 31, 2019 by a member firm of the Institute of Actuaries of India. The present value of the defined benefit obligation, and the related current service cost and past service cost, were measured using the projected unit credit method.
46.6 Other long term employee benefits
46.6.1 Brief Description: A general description of the type of Other long term employee benefitsis as follows:
46.6.2 All the employee benefit plans of the Group are run as Group administration plans (Single Employer Scheme) including employees seconded to ONGC Videsh Limited (OVL), 100% subsidiary.
46.6.3 Earned Leave (EL) Benefit Accrual – 30 days per year Encashment while in service – 75% of Earned Leave balance subject to a maximum of 90 days per calendar year Encashment on retirement – maximum 300 days Scheme is funded through Life Insurance Corporation of India (LIC).
46.6.4 Good Health Reward (Half pay leave) Accrual - 20 days per year Encashment while in service - Nil Encashment on retirement - 50% of Half Pay Leave balance. Scheme is funded through Life Insurance Corporation of India. (LIC). The liability for the same is recognized annually on the basis of actuarial valuation.
46.7 The principal assumptions used for the purposes of the actuarial valuations were as follows:
S.No. Particulars 31-Mar-19 31-Mar-18 Gratuity
I Discount rate 7.60% -7.79% 7.66% -7.88%II Expected return on plan assets 7.60% -7.79% 7.66% -7.88%III Annual increase in salary 5.00%-8.00% 5.50%-8.00%
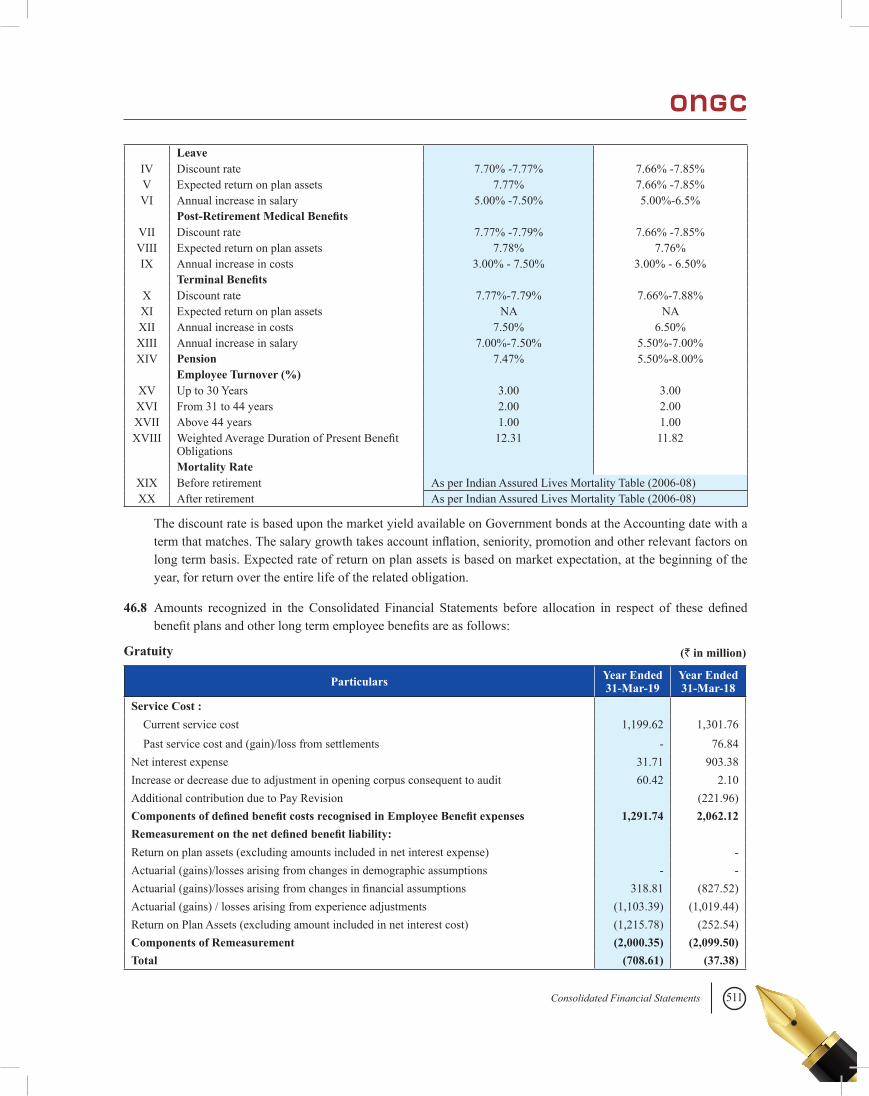
511Consolidated Financial Statements
Leave IV Discount rate 7.70% -7.77% 7.66% -7.85%V Expected return on plan assets 7.77% 7.66% -7.85%VI Annual increase in salary 5.00% -7.50% 5.00%-6.5% Post-Retirement Medical Benefits
VII Discount rate 7.77% -7.79% 7.66% -7.85%VIII Expected return on plan assets 7.78% 7.76%IX Annual increase in costs 3.00% - 7.50% 3.00% - 6.50% Terminal Benefits X Discount rate 7.77%-7.79% 7.66%-7.88%XI Expected return on plan assets NA NAXII Annual increase in costs 7.50% 6.50%XIII Annual increase in salary 7.00%-7.50% 5.50%-7.00%XIV Pension 7.47% 5.50%-8.00%
Employee Turnover (%) XV Up to 30 Years 3.00 3.00XVI From 31 to 44 years 2.00 2.00XVII Above 44 years 1.00 1.00XVIII Weighted Average Duration of Present Benefit
Obligations12.31 11.82
Mortality Rate XIX Before retirement As per Indian Assured Lives Mortality Table (2006-08)XX After retirement As per Indian Assured Lives Mortality Table (2006-08)
The discount rate is based upon the market yield available on Government bonds at the Accounting date with a term that matches. The salary growth takes account inflation, seniority, promotion and other relevant factors on long term basis. Expected rate of return on plan assets is based on market expectation, at the beginning of the year, for return over the entire life of the related obligation.
46.8 Amounts recognized in the Consolidated Financial Statements before allocation in respect of these defined benefit plans and other long term employee benefits are as follows:
Gratuity
Particulars Year Ended31-Mar-19
Year Ended31-Mar-18
Service Cost : Current service cost 1,199.62 1,301.76 Past service cost and (gain)/loss from settlements - 76.84Net interest expense 31.71 903.38Increase or decrease due to adjustment in opening corpus consequent to audit 60.42 2.10Additional contribution due to Pay Revision (221.96)Components of defined benefit costs recognised in Employee Benefit expenses 1,291.74 2,062.12Remeasurement on the net defined benefit liability: Return on plan assets (excluding amounts included in net interest expense) -Actuarial (gains)/losses arising from changes in demographic assumptions - -Actuarial (gains)/losses arising from changes in financial assumptions 318.81 (827.52)Actuarial (gains) / losses arising from experience adjustments (1,103.39) (1,019.44)Return on Plan Assets (excluding amount included in net interest cost) (1,215.78) (252.54)Components of Remeasurement (2,000.35) (2,099.50)Total (708.61) (37.38)
(` in million)
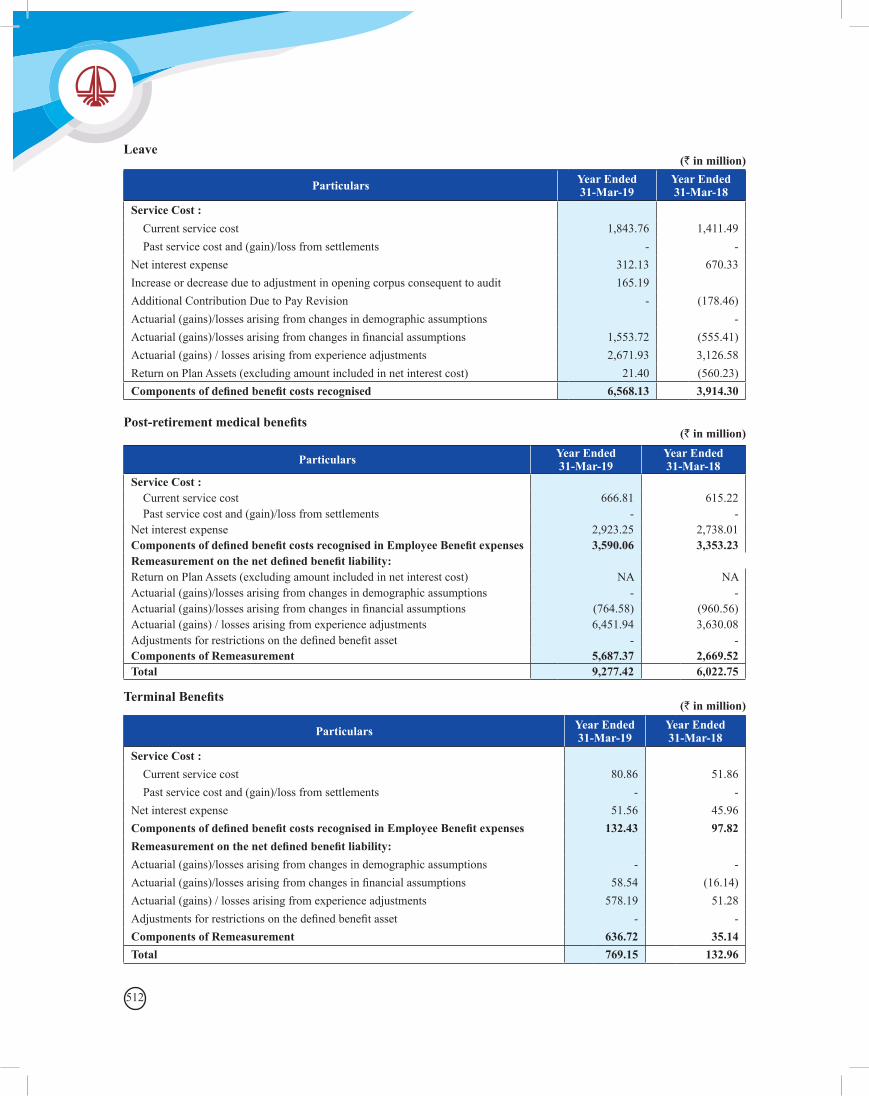
512
Leave(` in million)
Particulars Year Ended31-Mar-19
Year Ended31-Mar-18
Service Cost : Current service cost 1,843.76 1,411.49 Past service cost and (gain)/loss from settlements - -Net interest expense 312.13 670.33Increase or decrease due to adjustment in opening corpus consequent to audit 165.19 Additional Contribution Due to Pay Revision - (178.46)Actuarial (gains)/losses arising from changes in demographic assumptions -Actuarial (gains)/losses arising from changes in financial assumptions 1,553.72 (555.41)Actuarial (gains) / losses arising from experience adjustments 2,671.93 3,126.58Return on Plan Assets (excluding amount included in net interest cost) 21.40 (560.23)Components of defined benefit costs recognised 6,568.13 3,914.30
Post-retirement medical benefits(` in million)
Particulars Year Ended31-Mar-19
Year Ended31-Mar-18
Service Cost : Current service cost 666.81 615.22 Past service cost and (gain)/loss from settlements - -Net interest expense 2,923.25 2,738.01Components of defined benefit costs recognised in Employee Benefit expenses 3,590.06 3,353.23Remeasurement on the net defined benefit liability: Return on Plan Assets (excluding amount included in net interest cost) NA NAActuarial (gains)/losses arising from changes in demographic assumptions - -Actuarial (gains)/losses arising from changes in financial assumptions (764.58) (960.56)Actuarial (gains) / losses arising from experience adjustments 6,451.94 3,630.08Adjustments for restrictions on the defined benefit asset - -Components of Remeasurement 5,687.37 2,669.52Total 9,277.42 6,022.75
Terminal Benefits(` in million)
Particulars Year Ended31-Mar-19
Year Ended31-Mar-18
Service Cost : Current service cost 80.86 51.86 Past service cost and (gain)/loss from settlements - -Net interest expense 51.56 45.96Components of defined benefit costs recognised in Employee Benefit expenses 132.43 97.82Remeasurement on the net defined benefit liability: Actuarial (gains)/losses arising from changes in demographic assumptions - -Actuarial (gains)/losses arising from changes in financial assumptions 58.54 (16.14)Actuarial (gains) / losses arising from experience adjustments 578.19 51.28Adjustments for restrictions on the defined benefit asset - -Components of Remeasurement 636.72 35.14Total 769.15 132.96
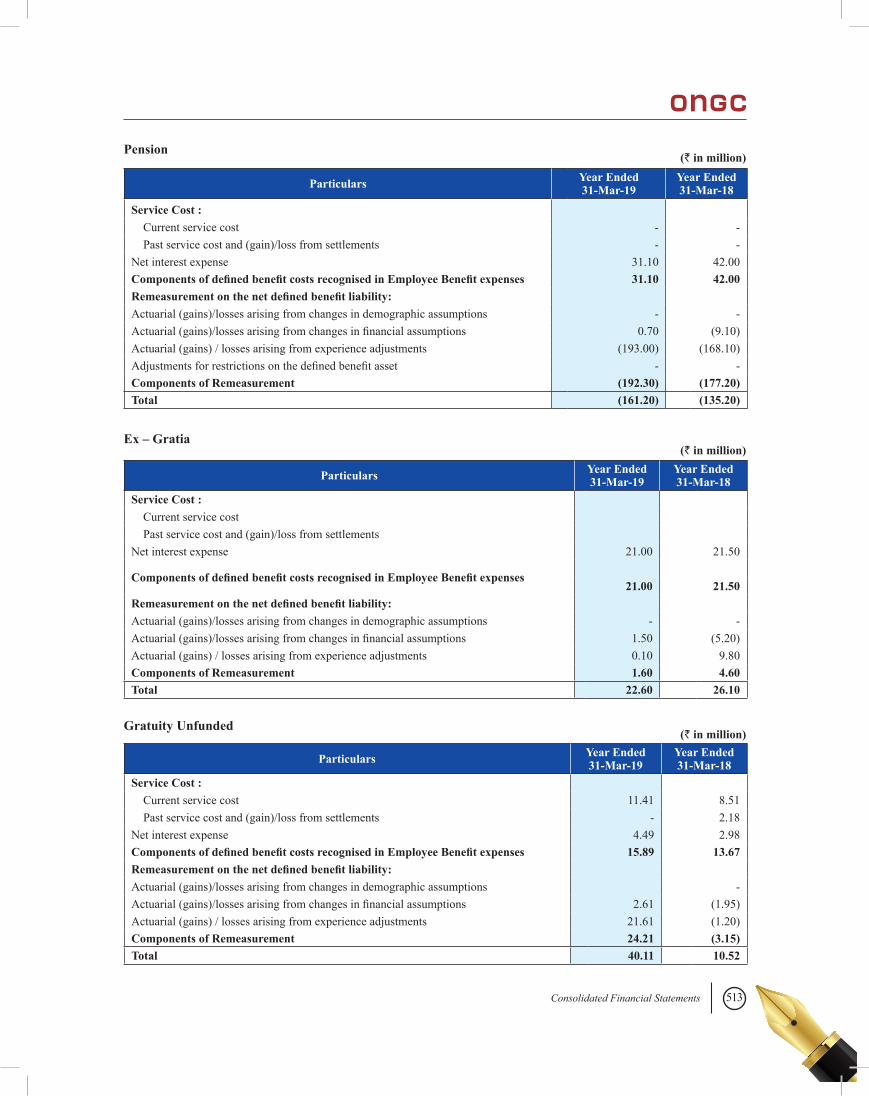
513Consolidated Financial Statements
Pension(` in million)
Particulars Year Ended31-Mar-19
Year Ended31-Mar-18
Service Cost : Current service cost - - Past service cost and (gain)/loss from settlements - -Net interest expense 31.10 42.00Components of defined benefit costs recognised in Employee Benefit expenses 31.10 42.00Remeasurement on the net defined benefit liability: Actuarial (gains)/losses arising from changes in demographic assumptions - -Actuarial (gains)/losses arising from changes in financial assumptions 0.70 (9.10)Actuarial (gains) / losses arising from experience adjustments (193.00) (168.10)Adjustments for restrictions on the defined benefit asset - -Components of Remeasurement (192.30) (177.20)Total (161.20) (135.20)
Ex – Gratia(` in million)
Particulars Year Ended31-Mar-19
Year Ended31-Mar-18
Service Cost : Current service cost Past service cost and (gain)/loss from settlements Net interest expense 21.00 21.50
Components of defined benefit costs recognised in Employee Benefit expenses
21.00 21.50Remeasurement on the net defined benefit liability: Actuarial (gains)/losses arising from changes in demographic assumptions - -Actuarial (gains)/losses arising from changes in financial assumptions 1.50 (5.20)Actuarial (gains) / losses arising from experience adjustments 0.10 9.80Components of Remeasurement 1.60 4.60Total 22.60 26.10
Gratuity Unfunded(` in million)
Particulars Year Ended31-Mar-19
Year Ended31-Mar-18
Service Cost : Current service cost 11.41 8.51 Past service cost and (gain)/loss from settlements - 2.18Net interest expense 4.49 2.98Components of defined benefit costs recognised in Employee Benefit expenses 15.89 13.67Remeasurement on the net defined benefit liability: Actuarial (gains)/losses arising from changes in demographic assumptions -Actuarial (gains)/losses arising from changes in financial assumptions 2.61 (1.95)Actuarial (gains) / losses arising from experience adjustments 21.61 (1.20)Components of Remeasurement 24.21 (3.15)Total 40.11 10.52

514
Post-Retirement Medical Benefits: Funded
Leave
(` in million)
(` in million)
Particulars Year Ended31-Mar-19
Year Ended31-Mar-18
Service Cost : Current service cost 569.50 521.70Net interest expense 6.60 64.10Contribution by Employee (28.40) (63.70)Components of defined benefit costs recognised in Employee Benefit expenses 547.70 522.10Remeasurement on the net defined benefit liability: Return on Plan Assets (excluding amount included in net interest cost) 15.80 (86.80)Actuarial (gains)/losses arising from changes in demographic assumptions - -Actuarial (gains)/losses arising from changes in financial assumptions (19.40) (293.70)Actuarial (gains) / losses arising from experience adjustments 14.90 408.20Components of Remeasurement 11.30 27.70Total 559.00 549.80
The Components of Remeasurement of the net defined benefit liability recognized in other comprehensive income is ₹ 4,591.57 million(Previous Year ₹1,248.00 million).
Gratuity(` in million)
46.9 Movements in the present value of the defined benefit obligation and other long term employee benefits are as follows:
Particulars Year Ended31-Mar-19
Year Ended31-Mar-18
Opening defined benefit obligation 37,735.29 39,614.47Current service cost 1,199.62 1,301.76Interest cost 2,894.16 2,891.69Remeasurement (gains)/losses: Actuarial (gains)/losses arising from changes in demographic assumptions - -Actuarial (gains)/losses arising from changes in financial assumptions 318.81 (827.52)Actuarial (gains) / losses arising from experience adjustments (1,103.39) (1,019.44)Past service cost, including losses/(gains) on curtailments - 76.84Benefits paid (5,333.24) (4,302.50)Closing defined benefit obligation 35,711.25 37,735.29
Particulars Year Ended31-Mar-19
Year Ended31-Mar-18
Opening defined benefit obligation 27,718.92 28,680.26Current service cost 1,843.76 1,411.49Interest cost 2,123.46 2,096.80Remeasurement (gains)/losses: Actuarial (gains)/losses arising from changes in demographic assumptions - -Actuarial (gains)/losses arising from changes in financial assumptions 1,553.72 (555.41)Actuarial (gains) / losses arising from experience adjustments 2,671.93 3,126.58Past service cost, including losses/(gains) on curtailments - -Benefits paid (5,612.06) (7,040.80)Closing defined benefit obligation 30,299.73 27,718.92
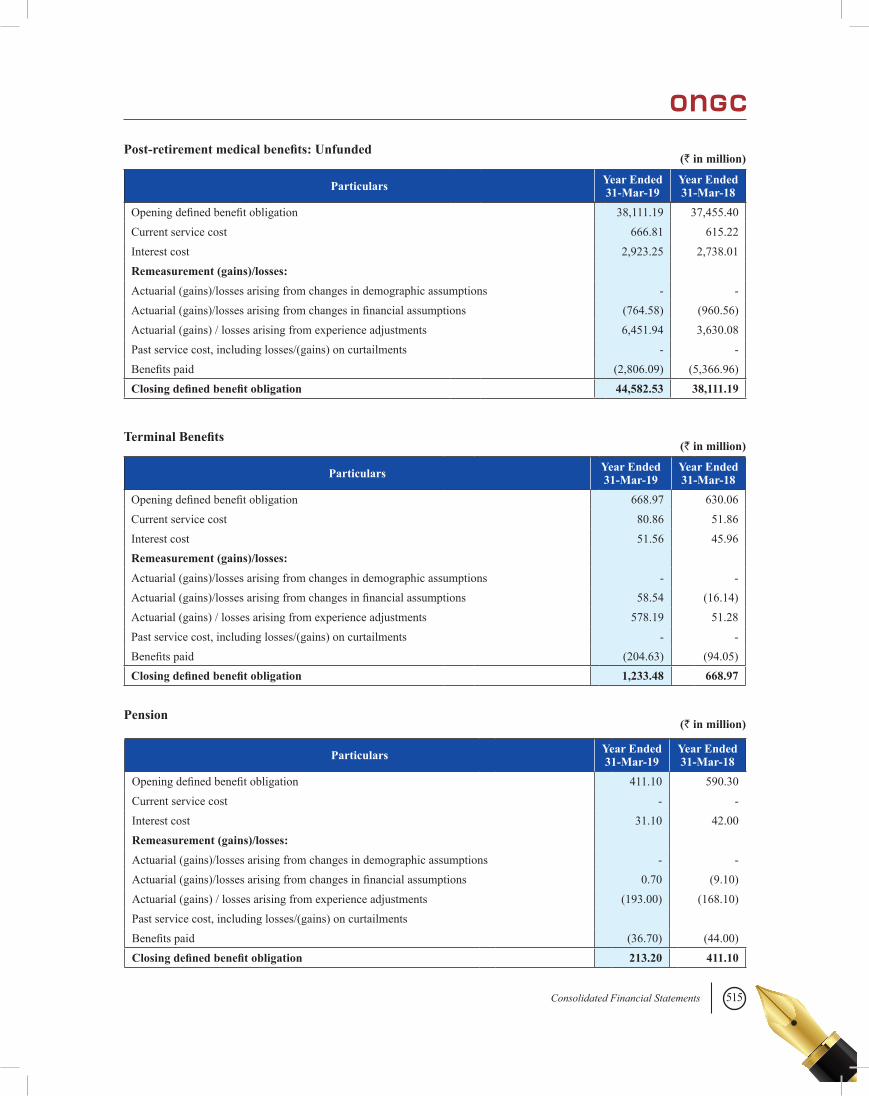
515Consolidated Financial Statements
Post-retirement medical benefits: Unfunded(` in million)
Particulars Year Ended31-Mar-19
Year Ended31-Mar-18
Opening defined benefit obligation 38,111.19 37,455.40Current service cost 666.81 615.22Interest cost 2,923.25 2,738.01Remeasurement (gains)/losses: Actuarial (gains)/losses arising from changes in demographic assumptions - -Actuarial (gains)/losses arising from changes in financial assumptions (764.58) (960.56)Actuarial (gains) / losses arising from experience adjustments 6,451.94 3,630.08Past service cost, including losses/(gains) on curtailments - -Benefits paid (2,806.09) (5,366.96)Closing defined benefit obligation 44,582.53 38,111.19
Terminal Benefits(` in million)
Particulars Year Ended31-Mar-19
Year Ended31-Mar-18
Opening defined benefit obligation 668.97 630.06Current service cost 80.86 51.86Interest cost 51.56 45.96Remeasurement (gains)/losses: Actuarial (gains)/losses arising from changes in demographic assumptions - -Actuarial (gains)/losses arising from changes in financial assumptions 58.54 (16.14)Actuarial (gains) / losses arising from experience adjustments 578.19 51.28Past service cost, including losses/(gains) on curtailments - -Benefits paid (204.63) (94.05)Closing defined benefit obligation 1,233.48 668.97
Pension(` in million)
Particulars Year Ended31-Mar-19
Year Ended31-Mar-18
Opening defined benefit obligation 411.10 590.30Current service cost - -Interest cost 31.10 42.00Remeasurement (gains)/losses: Actuarial (gains)/losses arising from changes in demographic assumptions - -Actuarial (gains)/losses arising from changes in financial assumptions 0.70 (9.10)Actuarial (gains) / losses arising from experience adjustments (193.00) (168.10)Past service cost, including losses/(gains) on curtailments Benefits paid (36.70) (44.00)Closing defined benefit obligation 213.20 411.10
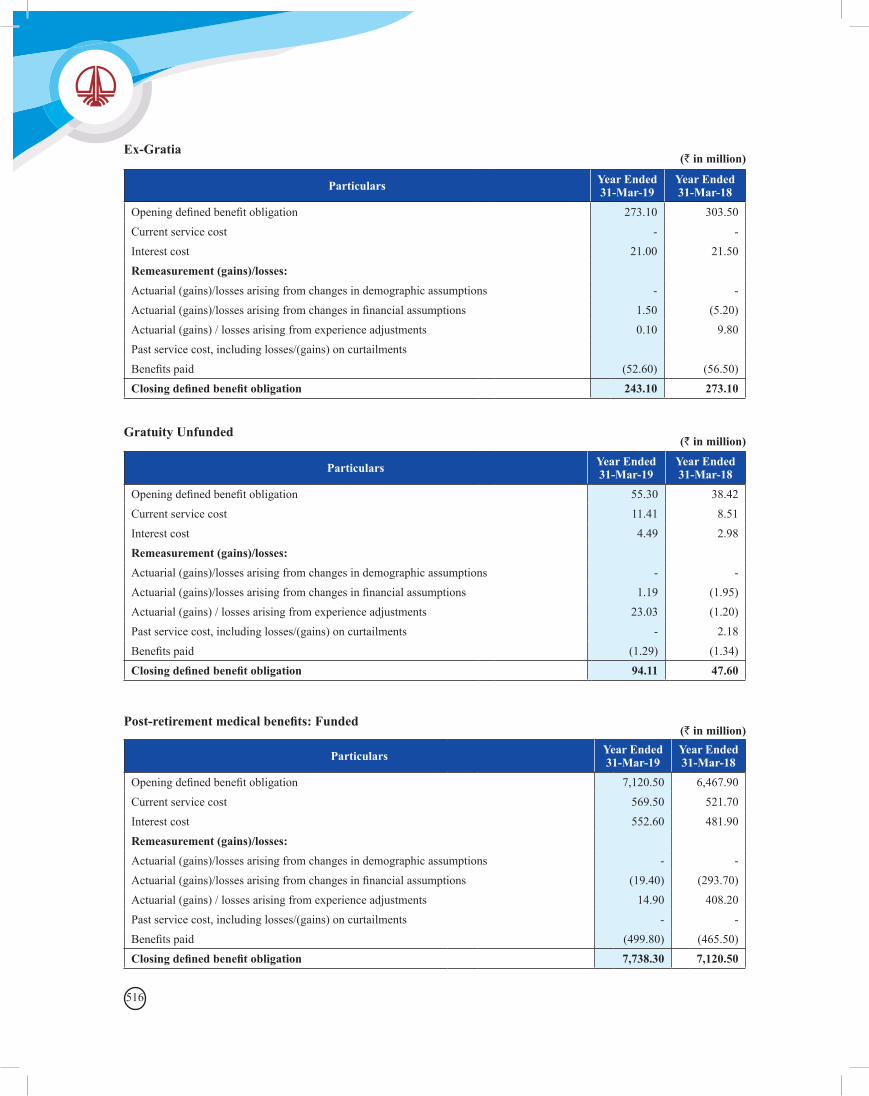
516
Ex-Gratia(` in million)
Particulars Year Ended31-Mar-19
Year Ended31-Mar-18
Opening defined benefit obligation 273.10 303.50Current service cost - -Interest cost 21.00 21.50Remeasurement (gains)/losses: Actuarial (gains)/losses arising from changes in demographic assumptions - -Actuarial (gains)/losses arising from changes in financial assumptions 1.50 (5.20)Actuarial (gains) / losses arising from experience adjustments 0.10 9.80Past service cost, including losses/(gains) on curtailments Benefits paid (52.60) (56.50)Closing defined benefit obligation 243.10 273.10
Gratuity Unfunded(` in million)
Particulars Year Ended31-Mar-19
Year Ended31-Mar-18
Opening defined benefit obligation 55.30 38.42Current service cost 11.41 8.51Interest cost 4.49 2.98Remeasurement (gains)/losses: Actuarial (gains)/losses arising from changes in demographic assumptions - -Actuarial (gains)/losses arising from changes in financial assumptions 1.19 (1.95)Actuarial (gains) / losses arising from experience adjustments 23.03 (1.20)Past service cost, including losses/(gains) on curtailments - 2.18Benefits paid (1.29) (1.34)Closing defined benefit obligation 94.11 47.60
Post-retirement medical benefits: Funded(` in million)
Particulars Year Ended31-Mar-19
Year Ended31-Mar-18
Opening defined benefit obligation 7,120.50 6,467.90Current service cost 569.50 521.70Interest cost 552.60 481.90Remeasurement (gains)/losses: Actuarial (gains)/losses arising from changes in demographic assumptions - -Actuarial (gains)/losses arising from changes in financial assumptions (19.40) (293.70)Actuarial (gains) / losses arising from experience adjustments 14.90 408.20Past service cost, including losses/(gains) on curtailments - -Benefits paid (499.80) (465.50)Closing defined benefit obligation 7,738.30 7,120.50
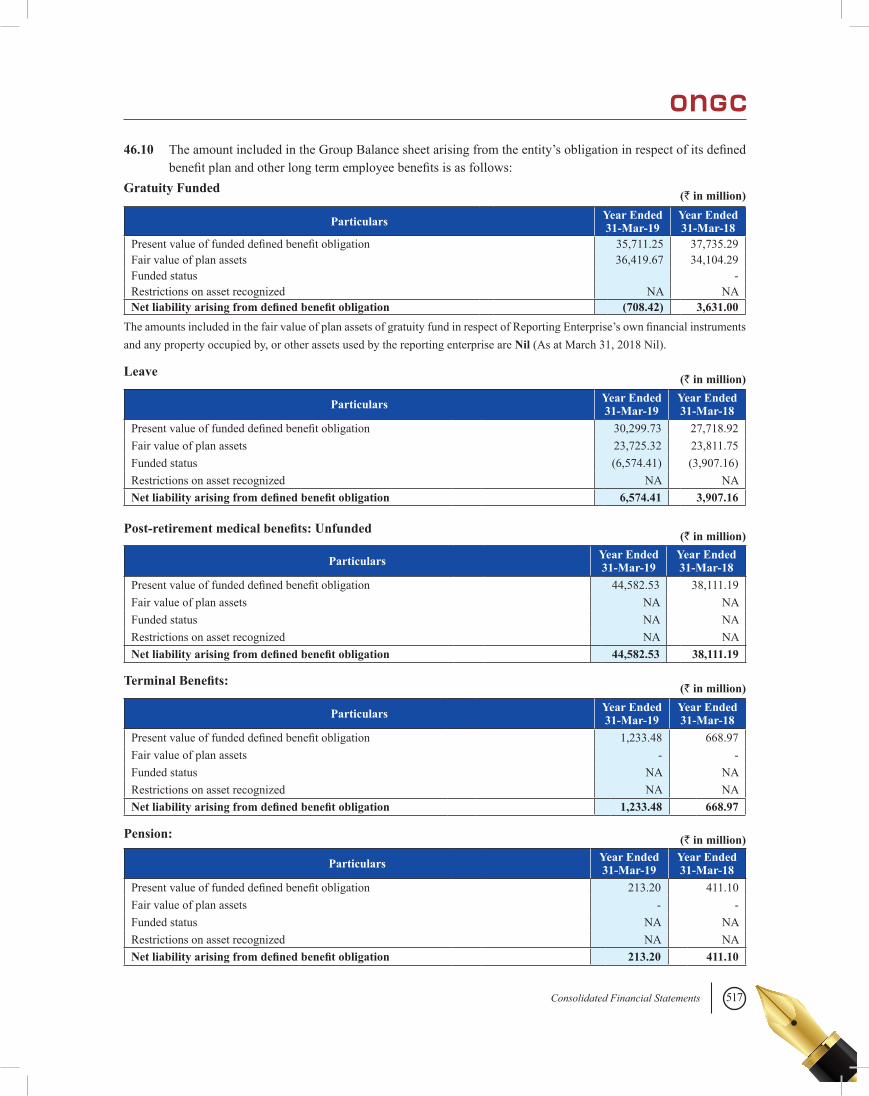
517Consolidated Financial Statements
46.10 The amount included in the Group Balance sheet arising from the entity’s obligation in respect of its defined benefit plan and other long term employee benefits is as follows:
Gratuity Funded (` in million)
Particulars Year Ended31-Mar-19
Year Ended31-Mar-18
Present value of funded defined benefit obligation 35,711.25 37,735.29Fair value of plan assets 36,419.67 34,104.29Funded status -Restrictions on asset recognized NA NANet liability arising from defined benefit obligation (708.42) 3,631.00
The amounts included in the fair value of plan assets of gratuity fund in respect of Reporting Enterprise’s own financial instruments and any property occupied by, or other assets used by the reporting enterprise are Nil (As at March 31, 2018 Nil).
Leave (` in million)
Particulars Year Ended31-Mar-19
Year Ended31-Mar-18
Present value of funded defined benefit obligation 30,299.73 27,718.92Fair value of plan assets 23,725.32 23,811.75Funded status (6,574.41) (3,907.16)Restrictions on asset recognized NA NANet liability arising from defined benefit obligation 6,574.41 3,907.16
Post-retirement medical benefits: Unfunded (` in million)
Particulars Year Ended31-Mar-19
Year Ended31-Mar-18
Present value of funded defined benefit obligation 44,582.53 38,111.19Fair value of plan assets NA NAFunded status NA NARestrictions on asset recognized NA NANet liability arising from defined benefit obligation 44,582.53 38,111.19
Terminal Benefits: (` in million)
Particulars Year Ended31-Mar-19
Year Ended31-Mar-18
Present value of funded defined benefit obligation 1,233.48 668.97Fair value of plan assets - -Funded status NA NARestrictions on asset recognized NA NANet liability arising from defined benefit obligation 1,233.48 668.97
Pension: (` in million)
Particulars Year Ended31-Mar-19
Year Ended31-Mar-18
Present value of funded defined benefit obligation 213.20 411.10Fair value of plan assets - -Funded status NA NARestrictions on asset recognized NA NANet liability arising from defined benefit obligation 213.20 411.10
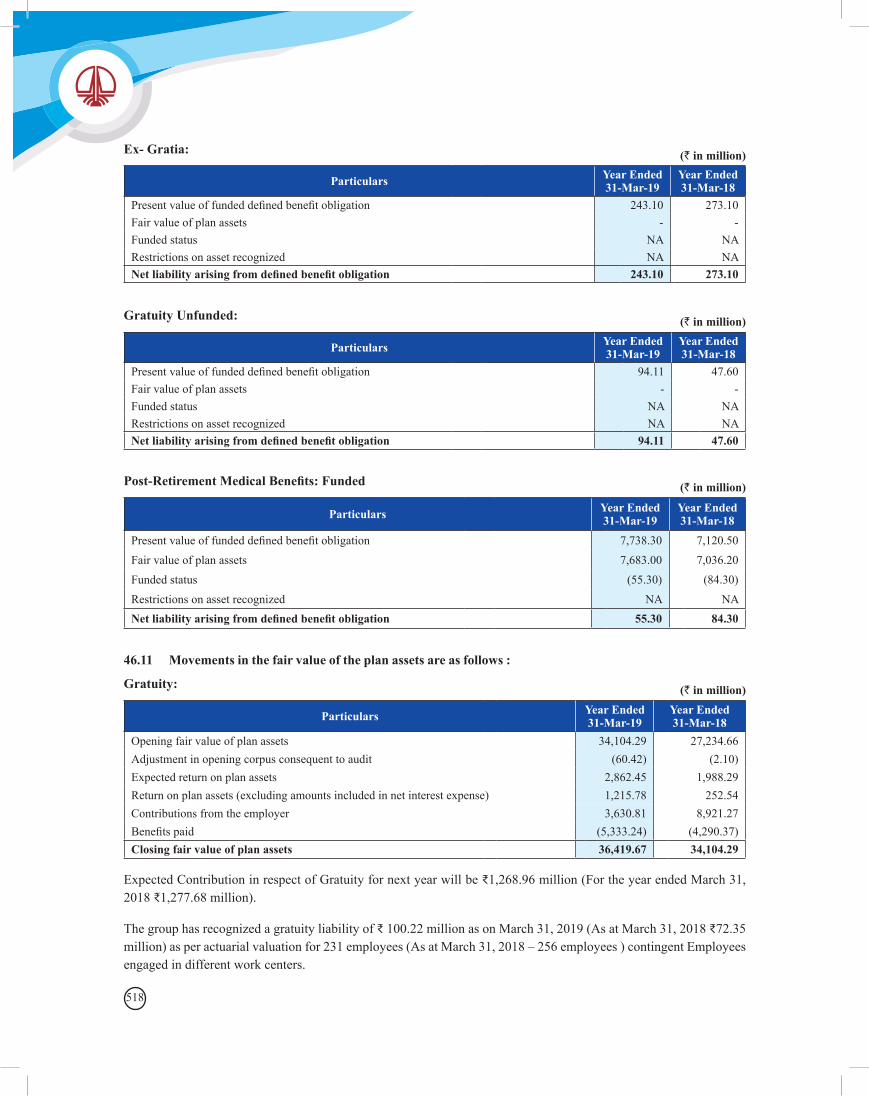
518
Ex- Gratia: (` in million)
Particulars Year Ended31-Mar-19
Year Ended31-Mar-18
Present value of funded defined benefit obligation 243.10 273.10Fair value of plan assets - -Funded status NA NARestrictions on asset recognized NA NANet liability arising from defined benefit obligation 243.10 273.10
Gratuity Unfunded: (` in million)
Particulars Year Ended31-Mar-19
Year Ended31-Mar-18
Present value of funded defined benefit obligation 94.11 47.60Fair value of plan assets - -Funded status NA NARestrictions on asset recognized NA NANet liability arising from defined benefit obligation 94.11 47.60
Post-Retirement Medical Benefits: Funded (` in million)
Particulars Year Ended31-Mar-19
Year Ended31-Mar-18
Present value of funded defined benefit obligation 7,738.30 7,120.50Fair value of plan assets 7,683.00 7,036.20Funded status (55.30) (84.30)Restrictions on asset recognized NA NANet liability arising from defined benefit obligation 55.30 84.30
Gratuity: (` in million)
46.11 Movements in the fair value of the plan assets are as follows :
Particulars Year Ended31-Mar-19
Year Ended31-Mar-18
Opening fair value of plan assets 34,104.29 27,234.66Adjustment in opening corpus consequent to audit (60.42) (2.10)Expected return on plan assets 2,862.45 1,988.29Return on plan assets (excluding amounts included in net interest expense) 1,215.78 252.54Contributions from the employer 3,630.81 8,921.27Benefits paid (5,333.24) (4,290.37)Closing fair value of plan assets 36,419.67 34,104.29
Expected Contribution in respect of Gratuity for next year will be ₹1,268.96 million (For the year ended March 31, 2018 ₹1,277.68 million).
The group has recognized a gratuity liability of ₹ 100.22 million as on March 31, 2019 (As at March 31, 2018 ₹72.35 million) as per actuarial valuation for 231 employees (As at March 31, 2018 – 256 employees ) contingent Employees engaged in different work centers.
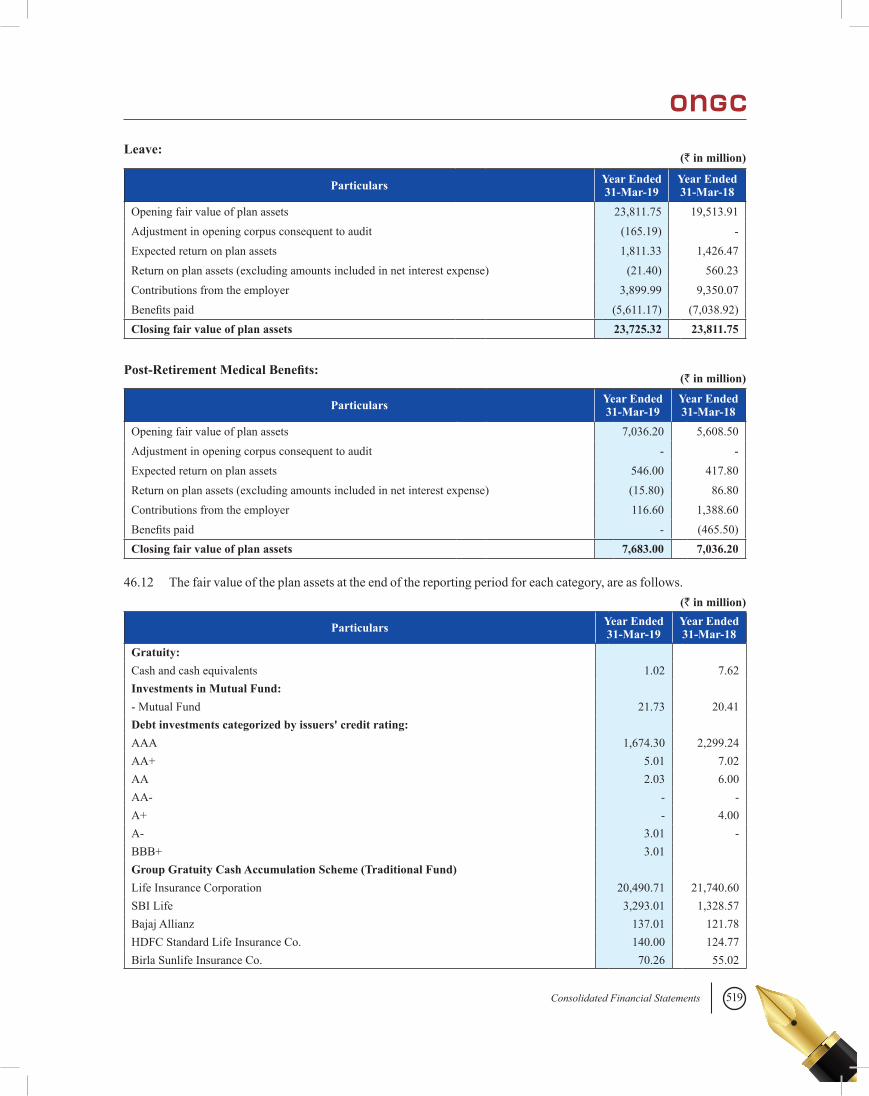
519Consolidated Financial Statements
Leave:
Post-Retirement Medical Benefits:
(` in million)
(` in million)
(` in million)
Particulars Year Ended31-Mar-19
Year Ended31-Mar-18
Opening fair value of plan assets 23,811.75 19,513.91Adjustment in opening corpus consequent to audit (165.19) -Expected return on plan assets 1,811.33 1,426.47Return on plan assets (excluding amounts included in net interest expense) (21.40) 560.23Contributions from the employer 3,899.99 9,350.07Benefits paid (5,611.17) (7,038.92)Closing fair value of plan assets 23,725.32 23,811.75
Particulars Year Ended31-Mar-19
Year Ended31-Mar-18
Opening fair value of plan assets 7,036.20 5,608.50Adjustment in opening corpus consequent to audit - -Expected return on plan assets 546.00 417.80Return on plan assets (excluding amounts included in net interest expense) (15.80) 86.80Contributions from the employer 116.60 1,388.60Benefits paid - (465.50)Closing fair value of plan assets 7,683.00 7,036.20
46.12 The fair value of the plan assets at the end of the reporting period for each category, are as follows.
Particulars Year Ended31-Mar-19
Year Ended31-Mar-18
Gratuity: Cash and cash equivalents 1.02 7.62Investments in Mutual Fund: - Mutual Fund 21.73 20.41Debt investments categorized by issuers' credit rating: AAA 1,674.30 2,299.24AA+ 5.01 7.02AA 2.03 6.00AA- - -A+ - 4.00A- 3.01 -BBB+ 3.01 Group Gratuity Cash Accumulation Scheme (Traditional Fund) Life Insurance Corporation 20,490.71 21,740.60SBI Life 3,293.01 1,328.57Bajaj Allianz 137.01 121.78HDFC Standard Life Insurance Co. 140.00 124.77Birla Sunlife Insurance Co. 70.26 55.02
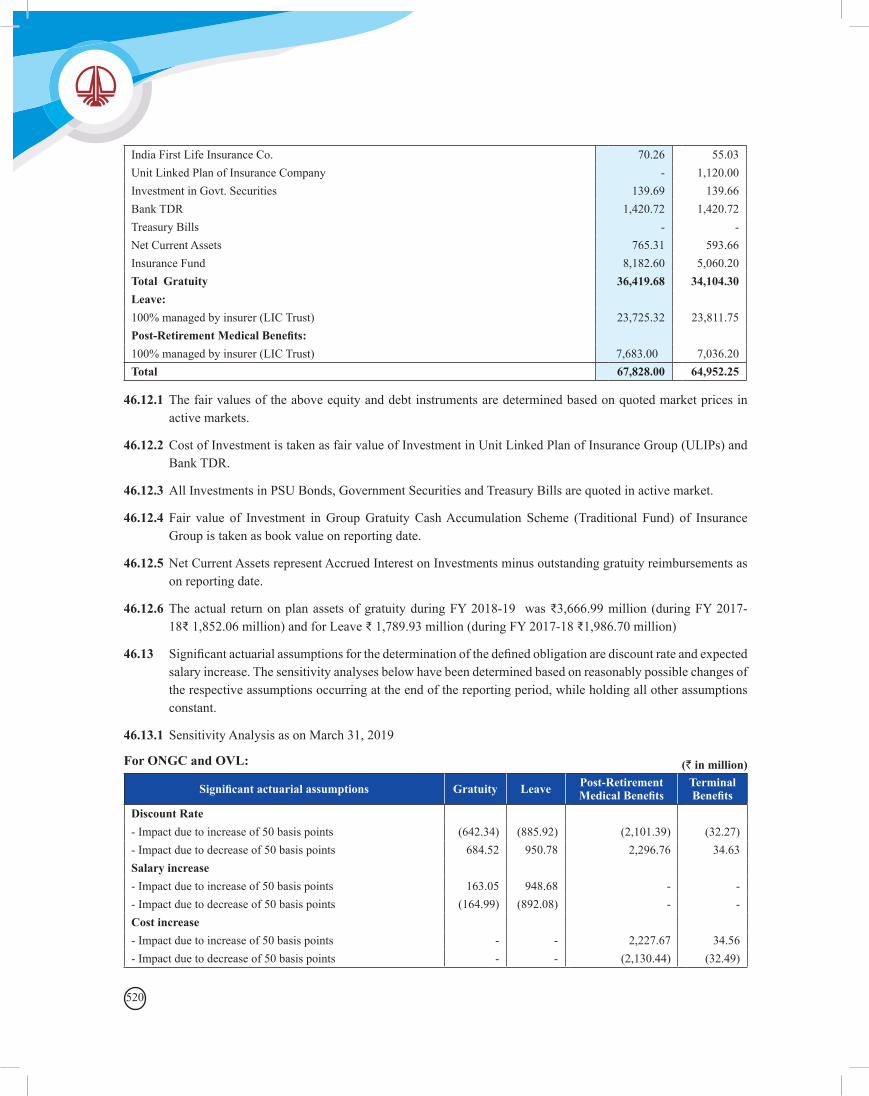
520
India First Life Insurance Co. 70.26 55.03Unit Linked Plan of Insurance Company - 1,120.00Investment in Govt. Securities 139.69 139.66Bank TDR 1,420.72 1,420.72Treasury Bills - -Net Current Assets 765.31 593.66Insurance Fund 8,182.60 5,060.20Total Gratuity 36,419.68 34,104.30Leave: 100% managed by insurer (LIC Trust) 23,725.32 23,811.75Post-Retirement Medical Benefits: 100% managed by insurer (LIC Trust) 7,683.00 7,036.20Total 67,828.00 64,952.25
46.12.1 The fair values of the above equity and debt instruments are determined based on quoted market prices in active markets.
46.12.2 Cost of Investment is taken as fair value of Investment in Unit Linked Plan of Insurance Group (ULIPs) and Bank TDR.
46.12.3 All Investments in PSU Bonds, Government Securities and Treasury Bills are quoted in active market.
46.12.4 Fair value of Investment in Group Gratuity Cash Accumulation Scheme (Traditional Fund) of Insurance Group is taken as book value on reporting date.
46.12.5 Net Current Assets represent Accrued Interest on Investments minus outstanding gratuity reimbursements as on reporting date.
46.12.6 The actual return on plan assets of gratuity during FY 2018-19 was ₹3,666.99 million (during FY 2017-18₹ 1,852.06 million) and for Leave ₹ 1,789.93 million (during FY 2017-18 ₹1,986.70 million)
46.13 Significant actuarial assumptions for the determination of the defined obligation are discount rate and expected salary increase. The sensitivity analyses below have been determined based on reasonably possible changes of the respective assumptions occurring at the end of the reporting period, while holding all other assumptions constant.
46.13.1 Sensitivity Analysis as on March 31, 2019
For ONGC and OVL:
Significant actuarial assumptions Gratuity Leave Post-Retirement Medical Benefits
TerminalBenefits
Discount Rate - Impact due to increase of 50 basis points (642.34) (885.92) (2,101.39) (32.27)- Impact due to decrease of 50 basis points 684.52 950.78 2,296.76 34.63Salary increase - Impact due to increase of 50 basis points 163.05 948.68 - -- Impact due to decrease of 50 basis points (164.99) (892.08) - -Cost increase - Impact due to increase of 50 basis points - - 2,227.67 34.56- Impact due to decrease of 50 basis points - - (2,130.44) (32.49)
(` in million)
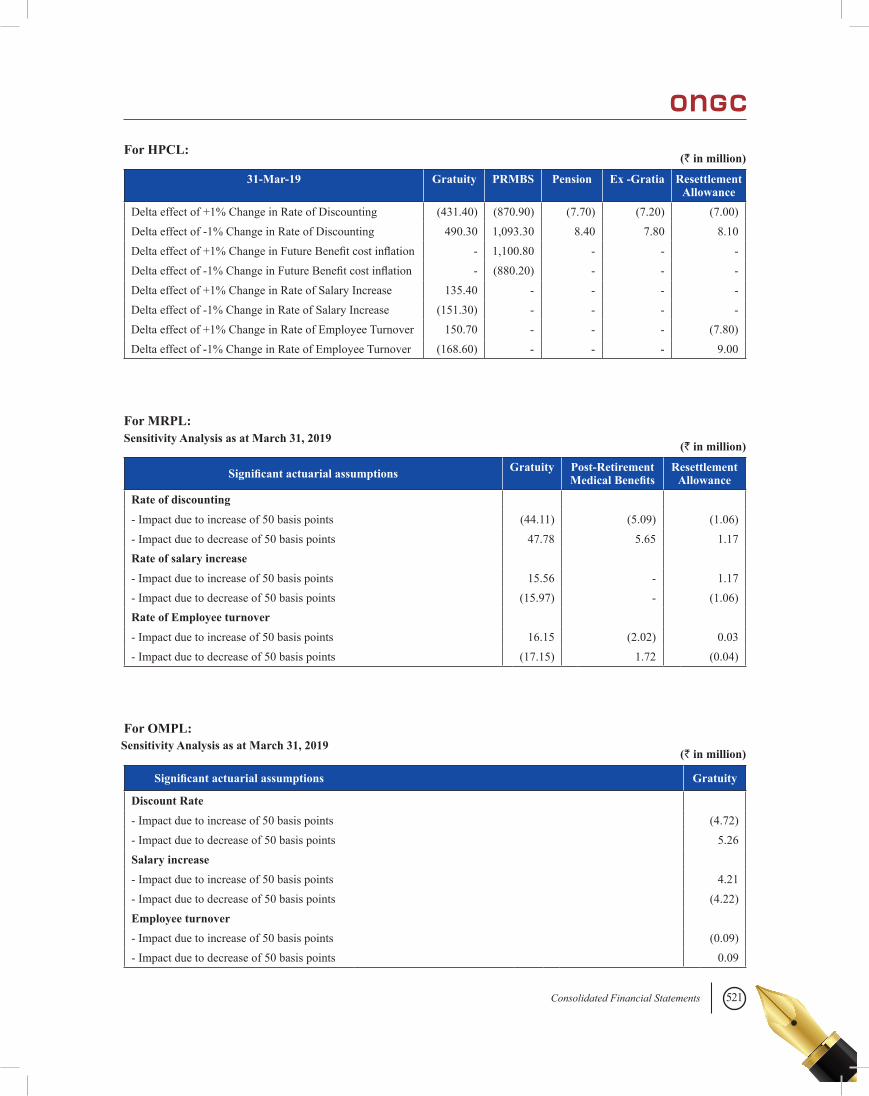
521Consolidated Financial Statements
For HPCL:(` in million)
31-Mar-19 Gratuity PRMBS Pension Ex -Gratia ResettlementAllowance
Delta effect of +1% Change in Rate of Discounting (431.40) (870.90) (7.70) (7.20) (7.00)Delta effect of -1% Change in Rate of Discounting 490.30 1,093.30 8.40 7.80 8.10Delta effect of +1% Change in Future Benefit cost inflation - 1,100.80 - - -Delta effect of -1% Change in Future Benefit cost inflation - (880.20) - - -Delta effect of +1% Change in Rate of Salary Increase 135.40 - - - -Delta effect of -1% Change in Rate of Salary Increase (151.30) - - - -Delta effect of +1% Change in Rate of Employee Turnover 150.70 - - - (7.80)Delta effect of -1% Change in Rate of Employee Turnover (168.60) - - - 9.00
For MRPL:
(` in million)Sensitivity Analysis as at March 31, 2019
Significant actuarial assumptions Gratuity Post-Retirement Medical Benefits
ResettlementAllowance
Rate of discounting - Impact due to increase of 50 basis points (44.11) (5.09) (1.06)- Impact due to decrease of 50 basis points 47.78 5.65 1.17Rate of salary increase - Impact due to increase of 50 basis points 15.56 - 1.17- Impact due to decrease of 50 basis points (15.97) - (1.06)Rate of Employee turnover - Impact due to increase of 50 basis points 16.15 (2.02) 0.03- Impact due to decrease of 50 basis points (17.15) 1.72 (0.04)
For OMPL:
(` in million)Sensitivity Analysis as at March 31, 2019
Significant actuarial assumptions Gratuity
Discount Rate - Impact due to increase of 50 basis points (4.72)- Impact due to decrease of 50 basis points 5.26Salary increase - Impact due to increase of 50 basis points 4.21- Impact due to decrease of 50 basis points (4.22)Employee turnover - Impact due to increase of 50 basis points (0.09)- Impact due to decrease of 50 basis points 0.09
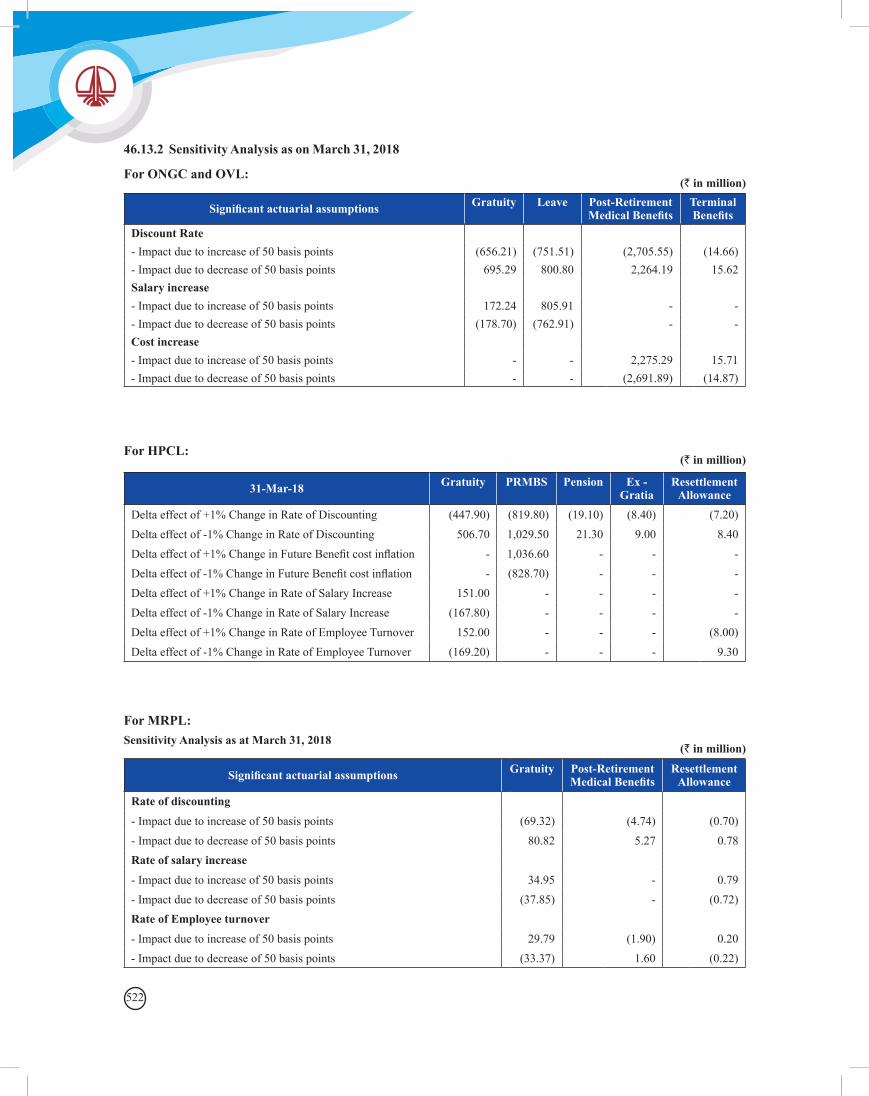
522
46.13.2 Sensitivity Analysis as on March 31, 2018
For ONGC and OVL:(` in million)
Significant actuarial assumptions Gratuity Leave Post-Retirement Medical Benefits
TerminalBenefits
Discount Rate - Impact due to increase of 50 basis points (656.21) (751.51) (2,705.55) (14.66)- Impact due to decrease of 50 basis points 695.29 800.80 2,264.19 15.62Salary increase - Impact due to increase of 50 basis points 172.24 805.91 - -- Impact due to decrease of 50 basis points (178.70) (762.91) - -Cost increase - Impact due to increase of 50 basis points - - 2,275.29 15.71- Impact due to decrease of 50 basis points - - (2,691.89) (14.87)
For HPCL:(` in million)
31-Mar-18 Gratuity PRMBS Pension Ex - Gratia
ResettlementAllowance
Delta effect of +1% Change in Rate of Discounting (447.90) (819.80) (19.10) (8.40) (7.20)Delta effect of -1% Change in Rate of Discounting 506.70 1,029.50 21.30 9.00 8.40Delta effect of +1% Change in Future Benefit cost inflation - 1,036.60 - - -Delta effect of -1% Change in Future Benefit cost inflation - (828.70) - - -Delta effect of +1% Change in Rate of Salary Increase 151.00 - - - -Delta effect of -1% Change in Rate of Salary Increase (167.80) - - - -Delta effect of +1% Change in Rate of Employee Turnover 152.00 - - - (8.00)Delta effect of -1% Change in Rate of Employee Turnover (169.20) - - - 9.30
For MRPL:
(` in million)Sensitivity Analysis as at March 31, 2018
Significant actuarial assumptions Gratuity Post-Retirement Medical Benefits
ResettlementAllowance
Rate of discounting - Impact due to increase of 50 basis points (69.32) (4.74) (0.70)- Impact due to decrease of 50 basis points 80.82 5.27 0.78Rate of salary increase - Impact due to increase of 50 basis points 34.95 - 0.79- Impact due to decrease of 50 basis points (37.85) - (0.72)Rate of Employee turnover - Impact due to increase of 50 basis points 29.79 (1.90) 0.20- Impact due to decrease of 50 basis points (33.37) 1.60 (0.22)
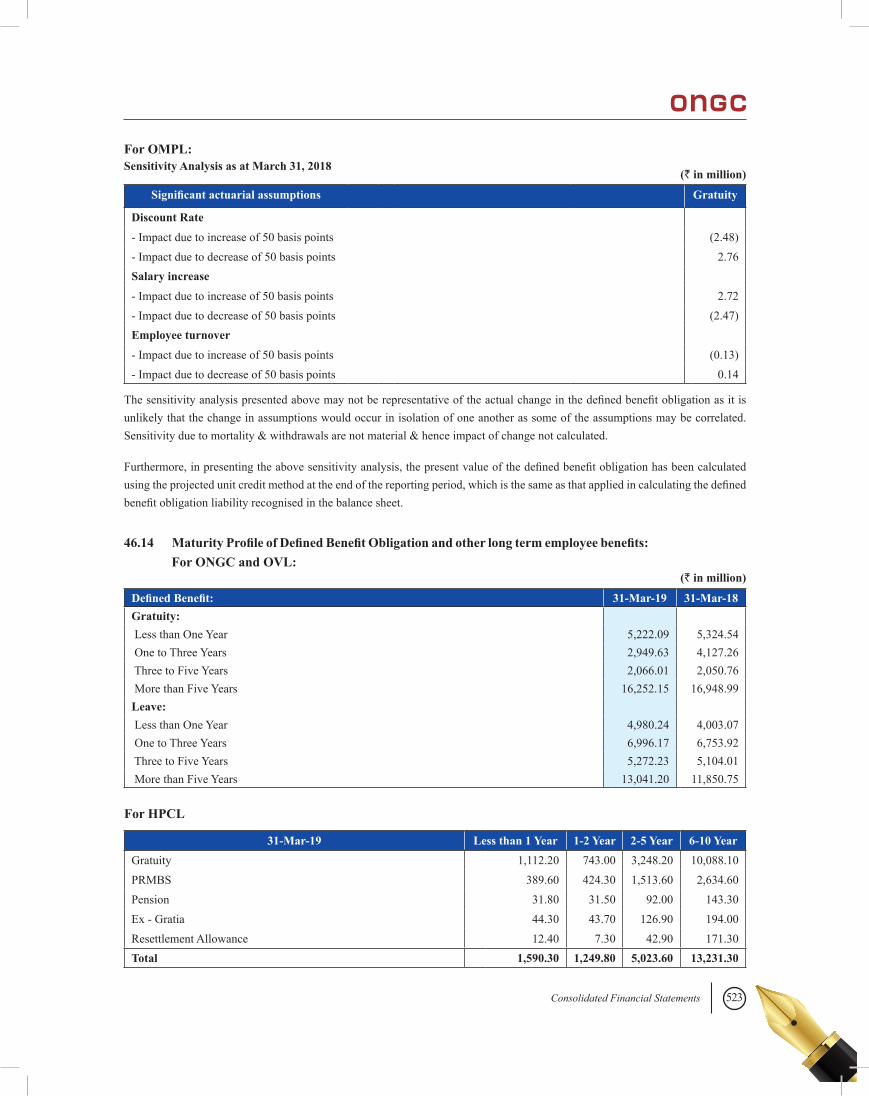
523Consolidated Financial Statements
For OMPL:
46.14 Maturity Profile of Defined Benefit Obligation and other long term employee benefits:
(` in million)
(` in million)
Sensitivity Analysis as at March 31, 2018
For ONGC and OVL:
For HPCL
Significant actuarial assumptions Gratuity
Discount Rate - Impact due to increase of 50 basis points (2.48)- Impact due to decrease of 50 basis points 2.76Salary increase - Impact due to increase of 50 basis points 2.72- Impact due to decrease of 50 basis points (2.47)Employee turnover - Impact due to increase of 50 basis points (0.13)- Impact due to decrease of 50 basis points 0.14
The sensitivity analysis presented above may not be representative of the actual change in the defined benefit obligation as it is unlikely that the change in assumptions would occur in isolation of one another as some of the assumptions may be correlated. Sensitivity due to mortality & withdrawals are not material & hence impact of change not calculated.
Furthermore, in presenting the above sensitivity analysis, the present value of the defined benefit obligation has been calculated using the projected unit credit method at the end of the reporting period, which is the same as that applied in calculating the defined benefit obligation liability recognised in the balance sheet.
Defined Benefit: 31-Mar-19 31-Mar-18Gratuity: Less than One Year 5,222.09 5,324.54 One to Three Years 2,949.63 4,127.26 Three to Five Years 2,066.01 2,050.76 More than Five Years 16,252.15 16,948.99Leave: Less than One Year 4,980.24 4,003.07 One to Three Years 6,996.17 6,753.92 Three to Five Years 5,272.23 5,104.01 More than Five Years 13,041.20 11,850.75
31-Mar-19 Less than 1 Year 1-2 Year 2-5 Year 6-10 YearGratuity 1,112.20 743.00 3,248.20 10,088.10PRMBS 389.60 424.30 1,513.60 2,634.60Pension 31.80 31.50 92.00 143.30Ex - Gratia 44.30 43.70 126.90 194.00Resettlement Allowance 12.40 7.30 42.90 171.30Total 1,590.30 1,249.80 5,023.60 13,231.30
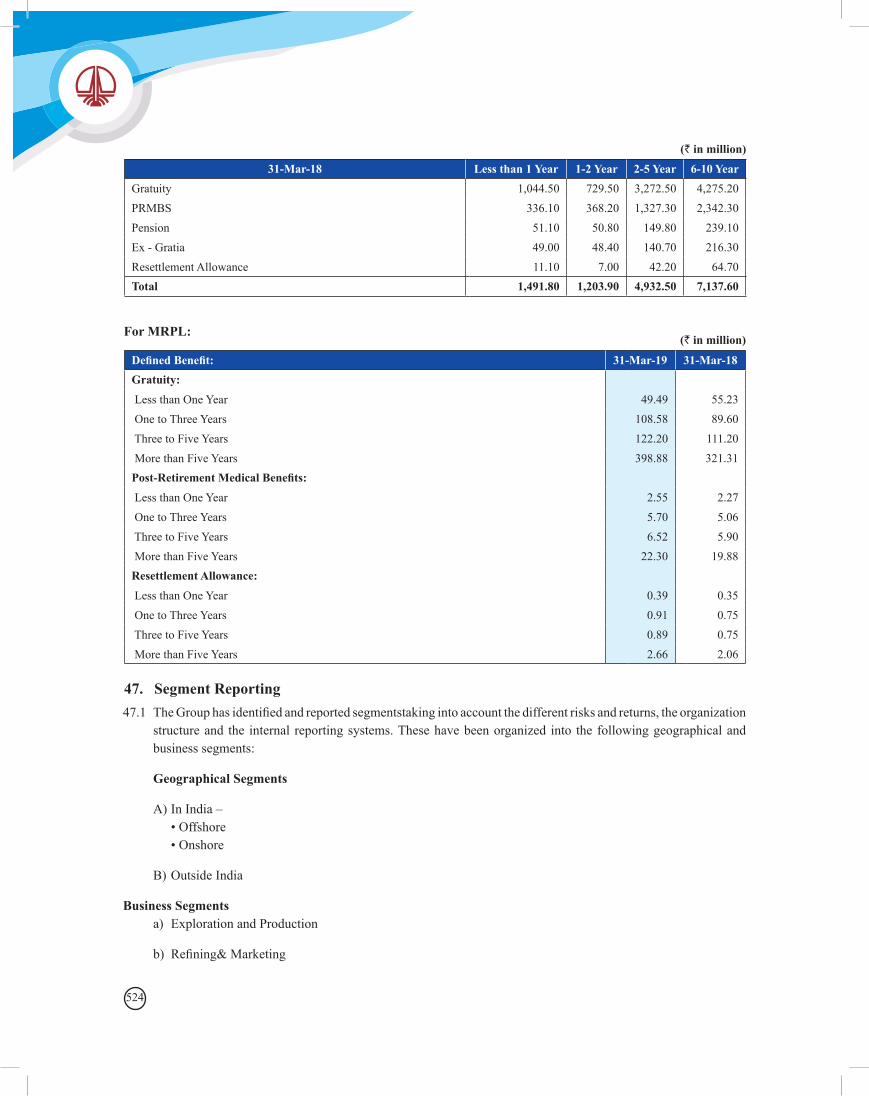
524
(` in million)
31-Mar-18 Less than 1 Year 1-2 Year 2-5 Year 6-10 YearGratuity 1,044.50 729.50 3,272.50 4,275.20PRMBS 336.10 368.20 1,327.30 2,342.30Pension 51.10 50.80 149.80 239.10Ex - Gratia 49.00 48.40 140.70 216.30Resettlement Allowance 11.10 7.00 42.20 64.70Total 1,491.80 1,203.90 4,932.50 7,137.60
For MRPL:(` in million)
Defined Benefit: 31-Mar-19 31-Mar-18Gratuity: Less than One Year 49.49 55.23 One to Three Years 108.58 89.60 Three to Five Years 122.20 111.20 More than Five Years 398.88 321.31Post-Retirement Medical Benefits: Less than One Year 2.55 2.27 One to Three Years 5.70 5.06 Three to Five Years 6.52 5.90 More than Five Years 22.30 19.88Resettlement Allowance: Less than One Year 0.39 0.35 One to Three Years 0.91 0.75 Three to Five Years 0.89 0.75 More than Five Years 2.66 2.06
47. Segment Reporting47.1 The Group has identified and reported segmentstaking into account the different risks and returns, the organization
structure and the internal reporting systems. These have been organized into the following geographical and business segments:
Geographical Segments
A) In India – • Offshore • Onshore
B) Outside India
Business Segments a) Exploration and Production
b) Refining& Marketing
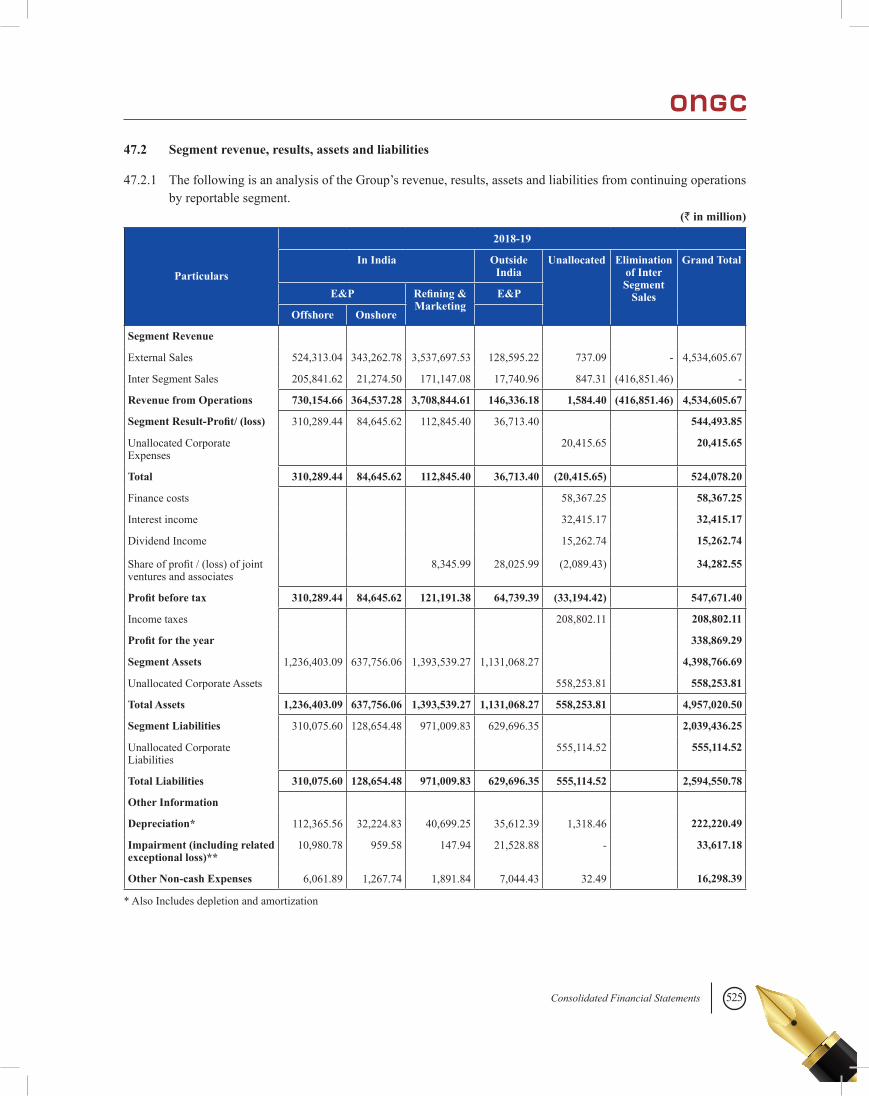
525Consolidated Financial Statements
47.2 Segment revenue, results, assets and liabilities
47.2.1 The following is an analysis of the Group’s revenue, results, assets and liabilities from continuing operations by reportable segment.
(` in million)
Particulars
2018-19
In India Outside India
Unallocated Elimination of Inter Segment
Sales
Grand Total
E&P Refining & Marketing
E&P
Offshore Onshore
Segment Revenue
External Sales 524,313.04 343,262.78 3,537,697.53 128,595.22 737.09 - 4,534,605.67
Inter Segment Sales 205,841.62 21,274.50 171,147.08 17,740.96 847.31 (416,851.46) -
Revenue from Operations 730,154.66 364,537.28 3,708,844.61 146,336.18 1,584.40 (416,851.46) 4,534,605.67
Segment Result-Profit/ (loss) 310,289.44 84,645.62 112,845.40 36,713.40 544,493.85
Unallocated Corporate Expenses
20,415.65 20,415.65
Total 310,289.44 84,645.62 112,845.40 36,713.40 (20,415.65) 524,078.20
Finance costs 58,367.25 58,367.25
Interest income 32,415.17 32,415.17
Dividend Income 15,262.74 15,262.74
Share of profit / (loss) of joint ventures and associates
8,345.99 28,025.99 (2,089.43) 34,282.55
Profit before tax 310,289.44 84,645.62 121,191.38 64,739.39 (33,194.42) 547,671.40
Income taxes 208,802.11 208,802.11
Profit for the year 338,869.29
Segment Assets 1,236,403.09 637,756.06 1,393,539.27 1,131,068.27 4,398,766.69
Unallocated Corporate Assets 558,253.81 558,253.81
Total Assets 1,236,403.09 637,756.06 1,393,539.27 1,131,068.27 558,253.81 4,957,020.50
Segment Liabilities 310,075.60 128,654.48 971,009.83 629,696.35 2,039,436.25
Unallocated Corporate Liabilities
555,114.52 555,114.52
Total Liabilities 310,075.60 128,654.48 971,009.83 629,696.35 555,114.52 2,594,550.78
Other Information
Depreciation* 112,365.56 32,224.83 40,699.25 35,612.39 1,318.46 222,220.49
Impairment (including related exceptional loss)**
10,980.78 959.58 147.94 21,528.88 - 33,617.18
Other Non-cash Expenses 6,061.89 1,267.74 1,891.84 7,044.43 32.49 16,298.39
* Also Includes depletion and amortization
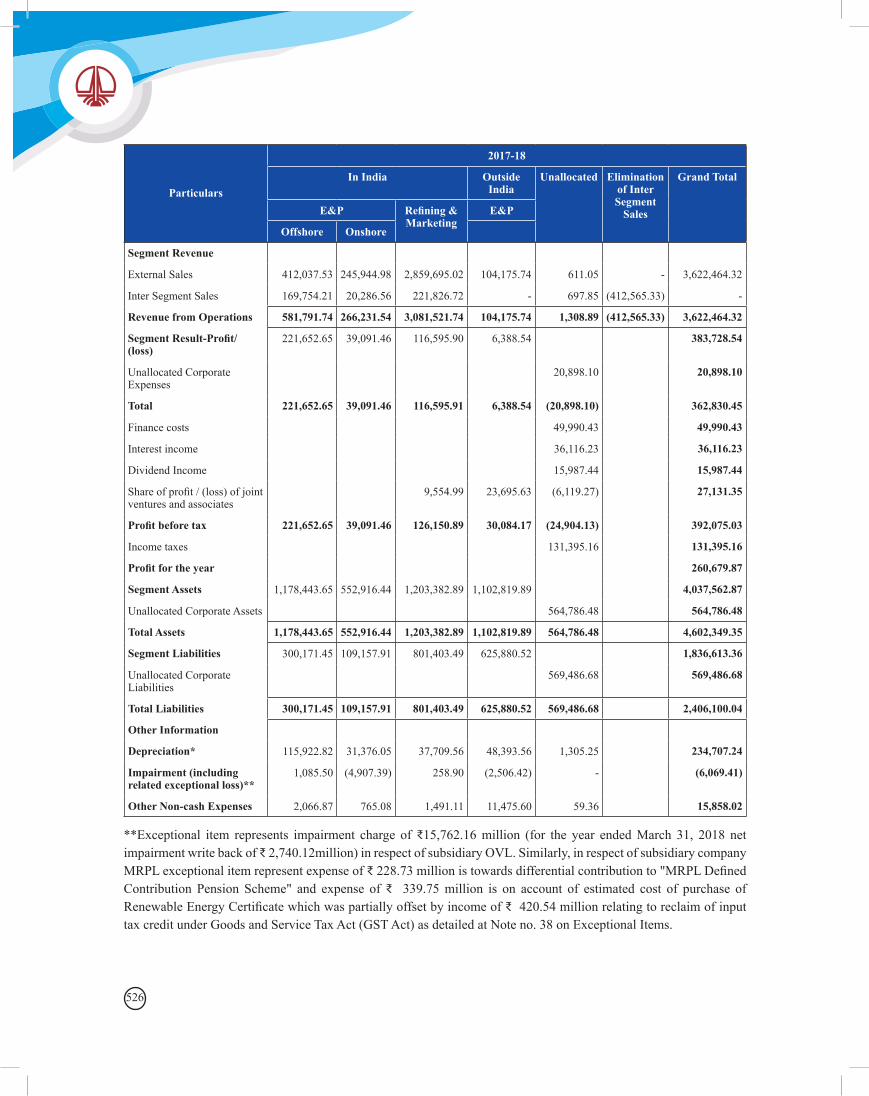
526
Particulars
2017-18
In India Outside India
Unallocated Elimination of Inter Segment
Sales
Grand Total
E&P Refining & Marketing
E&P
Offshore Onshore
Segment Revenue
External Sales 412,037.53 245,944.98 2,859,695.02 104,175.74 611.05 - 3,622,464.32
Inter Segment Sales 169,754.21 20,286.56 221,826.72 - 697.85 (412,565.33) -
Revenue from Operations 581,791.74 266,231.54 3,081,521.74 104,175.74 1,308.89 (412,565.33) 3,622,464.32
Segment Result-Profit/ (loss)
221,652.65 39,091.46 116,595.90 6,388.54 383,728.54
Unallocated Corporate Expenses
20,898.10 20,898.10
Total 221,652.65 39,091.46 116,595.91 6,388.54 (20,898.10) 362,830.45
Finance costs 49,990.43 49,990.43
Interest income 36,116.23 36,116.23
Dividend Income 15,987.44 15,987.44
Share of profit / (loss) of joint ventures and associates
9,554.99 23,695.63 (6,119.27) 27,131.35
Profit before tax 221,652.65 39,091.46 126,150.89 30,084.17 (24,904.13) 392,075.03
Income taxes 131,395.16 131,395.16
Profit for the year 260,679.87
Segment Assets 1,178,443.65 552,916.44 1,203,382.89 1,102,819.89 4,037,562.87
Unallocated Corporate Assets 564,786.48 564,786.48
Total Assets 1,178,443.65 552,916.44 1,203,382.89 1,102,819.89 564,786.48 4,602,349.35
Segment Liabilities 300,171.45 109,157.91 801,403.49 625,880.52 1,836,613.36
Unallocated Corporate Liabilities
569,486.68 569,486.68
Total Liabilities 300,171.45 109,157.91 801,403.49 625,880.52 569,486.68 2,406,100.04
Other Information
Depreciation* 115,922.82 31,376.05 37,709.56 48,393.56 1,305.25 234,707.24
Impairment (including related exceptional loss)**
1,085.50 (4,907.39) 258.90 (2,506.42) - (6,069.41)
Other Non-cash Expenses 2,066.87 765.08 1,491.11 11,475.60 59.36 15,858.02
**Exceptional item represents impairment charge of ₹15,762.16 million (for the year ended March 31, 2018 net impairment write back of ₹ 2,740.12million) in respect of subsidiary OVL. Similarly, in respect of subsidiary company MRPL exceptional item represent expense of ₹ 228.73 million is towards differential contribution to "MRPL Defined Contribution Pension Scheme" and expense of ₹ 339.75 million is on account of estimated cost of purchase of Renewable Energy Certificate which was partially offset by income of ₹ 420.54 million relating to reclaim of input tax credit under Goods and Service Tax Act (GST Act) as detailed at Note no. 38 on Exceptional Items.
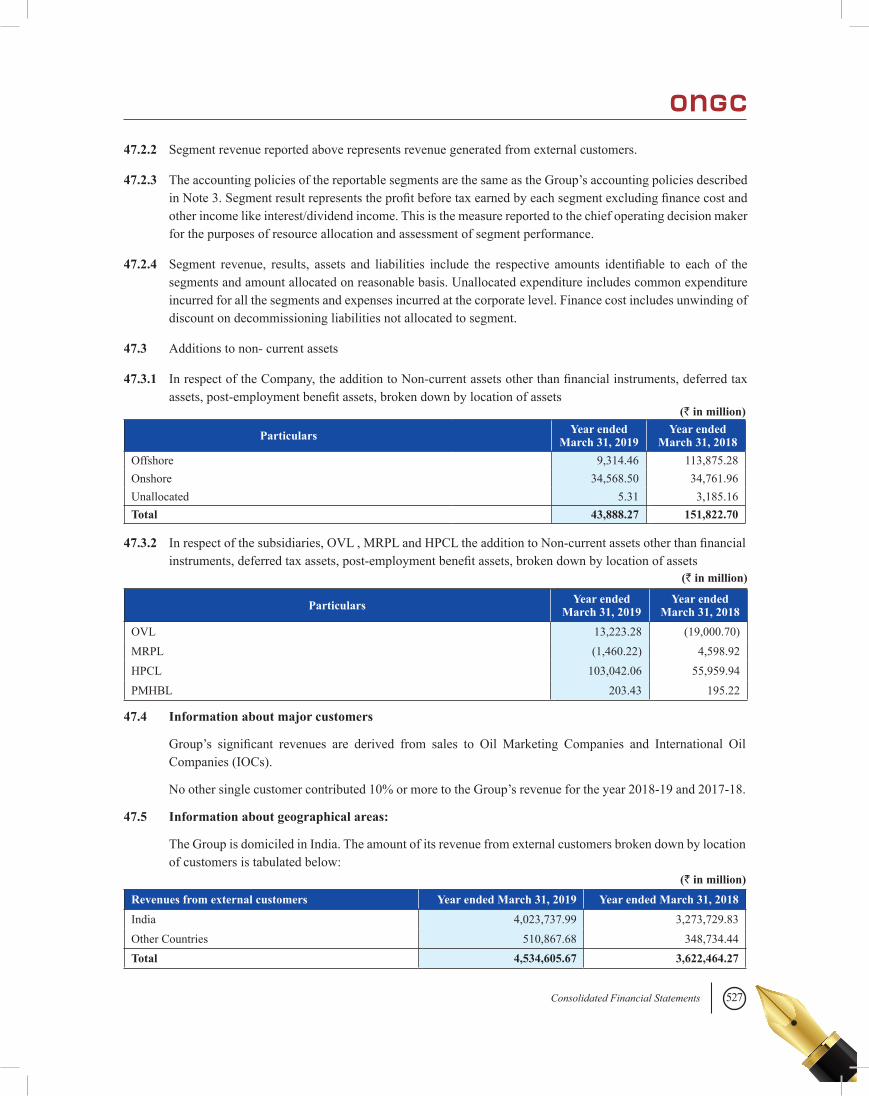
527Consolidated Financial Statements
47.2.2 Segment revenue reported above represents revenue generated from external customers.
47.2.3 The accounting policies of the reportable segments are the same as the Group’s accounting policies described in Note 3. Segment result represents the profit before tax earned by each segment excluding finance cost and other income like interest/dividend income. This is the measure reported to the chief operating decision maker for the purposes of resource allocation and assessment of segment performance.
47.2.4 Segment revenue, results, assets and liabilities include the respective amounts identifiable to each of the segments and amount allocated on reasonable basis. Unallocated expenditure includes common expenditure incurred for all the segments and expenses incurred at the corporate level. Finance cost includes unwinding of discount on decommissioning liabilities not allocated to segment.
47.3 Additions to non- current assets
47.3.1 In respect of the Company, the addition to Non-current assets other than financial instruments, deferred tax assets, post-employment benefit assets, broken down by location of assets
Particulars Year ended March 31, 2019
Year ended March 31, 2018
Offshore 9,314.46 113,875.28Onshore 34,568.50 34,761.96Unallocated 5.31 3,185.16Total 43,888.27 151,822.70
47.3.2 In respect of the subsidiaries, OVL , MRPL and HPCL the addition to Non-current assets other than financial instruments, deferred tax assets, post-employment benefit assets, broken down by location of assets
Particulars Year ended March 31, 2019
Year ended March 31, 2018
OVL 13,223.28 (19,000.70)MRPL (1,460.22) 4,598.92HPCL 103,042.06 55,959.94PMHBL 203.43 195.22
(` in million)
(` in million)
47.4 Information about major customers
Group’s significant revenues are derived from sales to Oil Marketing Companies and International Oil Companies (IOCs).
No other single customer contributed 10% or more to the Group’s revenue for the year 2018-19 and 2017-18.
47.5 Information about geographical areas:
The Group is domiciled in India. The amount of its revenue from external customers broken down by location of customers is tabulated below:
Revenues from external customers Year ended March 31, 2019 Year ended March 31, 2018India 4,023,737.99 3,273,729.83Other Countries 510,867.68 348,734.44Total 4,534,605.67 3,622,464.27
(` in million)
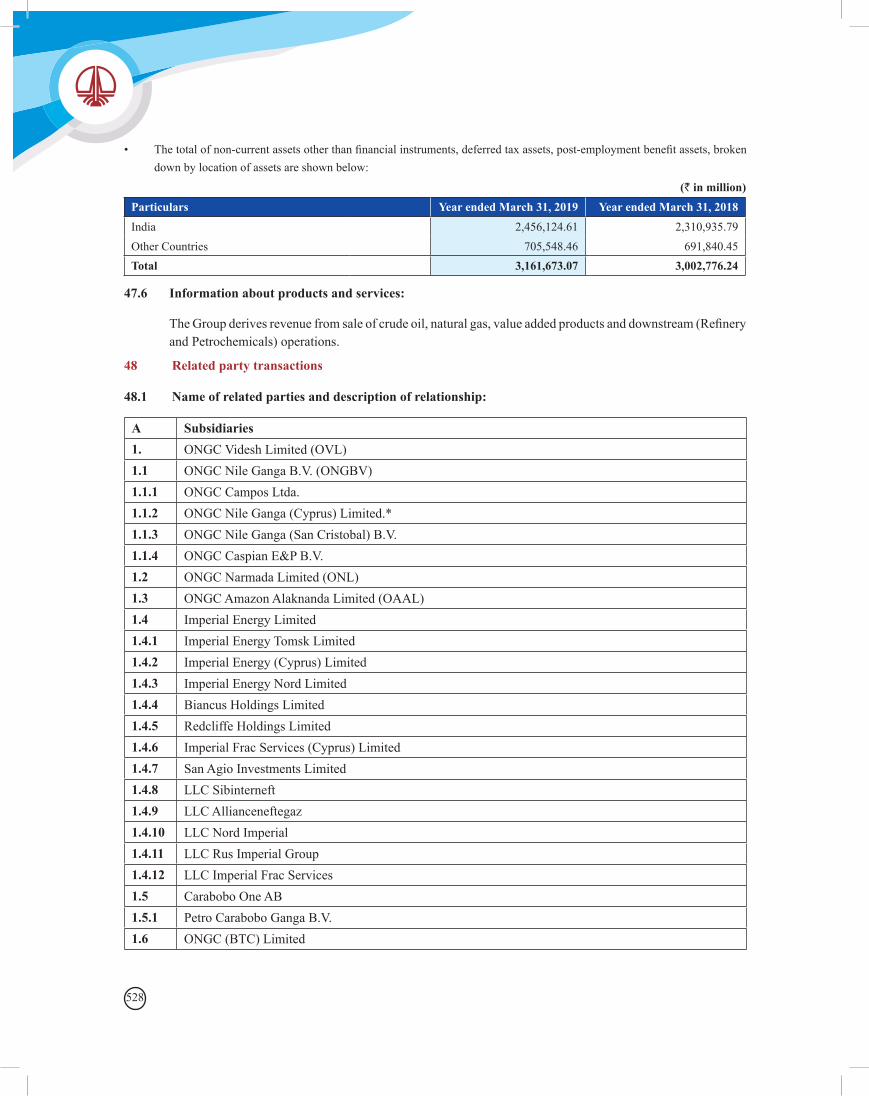
528
• The total of non-current assets other than financial instruments, deferred tax assets, post-employment benefit assets, broken down by location of assets are shown below:
Particulars Year ended March 31, 2019 Year ended March 31, 2018India 2,456,124.61 2,310,935.79Other Countries 705,548.46 691,840.45 Total 3,161,673.07 3,002,776.24
(` in million)
47.6 Information about products and services:
The Group derives revenue from sale of crude oil, natural gas, value added products and downstream (Refinery and Petrochemicals) operations.
48 Related party transactions
48.1 Name of related parties and description of relationship:
A Subsidiaries1. ONGC Videsh Limited (OVL)1.1 ONGC Nile Ganga B.V. (ONGBV) 1.1.1 ONGC Campos Ltda.1.1.2 ONGC Nile Ganga (Cyprus) Limited.*1.1.3 ONGC Nile Ganga (San Cristobal) B.V.1.1.4 ONGC Caspian E&P B.V.1.2 ONGC Narmada Limited (ONL)1.3 ONGC Amazon Alaknanda Limited (OAAL)1.4 Imperial Energy Limited1.4.1 Imperial Energy Tomsk Limited1.4.2 Imperial Energy (Cyprus) Limited1.4.3 Imperial Energy Nord Limited1.4.4 Biancus Holdings Limited1.4.5 Redcliffe Holdings Limited1.4.6 Imperial Frac Services (Cyprus) Limited1.4.7 San Agio Investments Limited1.4.8 LLC Sibinterneft1.4.9 LLC Allianceneftegaz1.4.10 LLC Nord Imperial1.4.11 LLC Rus Imperial Group1.4.12 LLC Imperial Frac Services1.5 Carabobo One AB1.5.1 Petro Carabobo Ganga B.V.1.6 ONGC (BTC) Limited
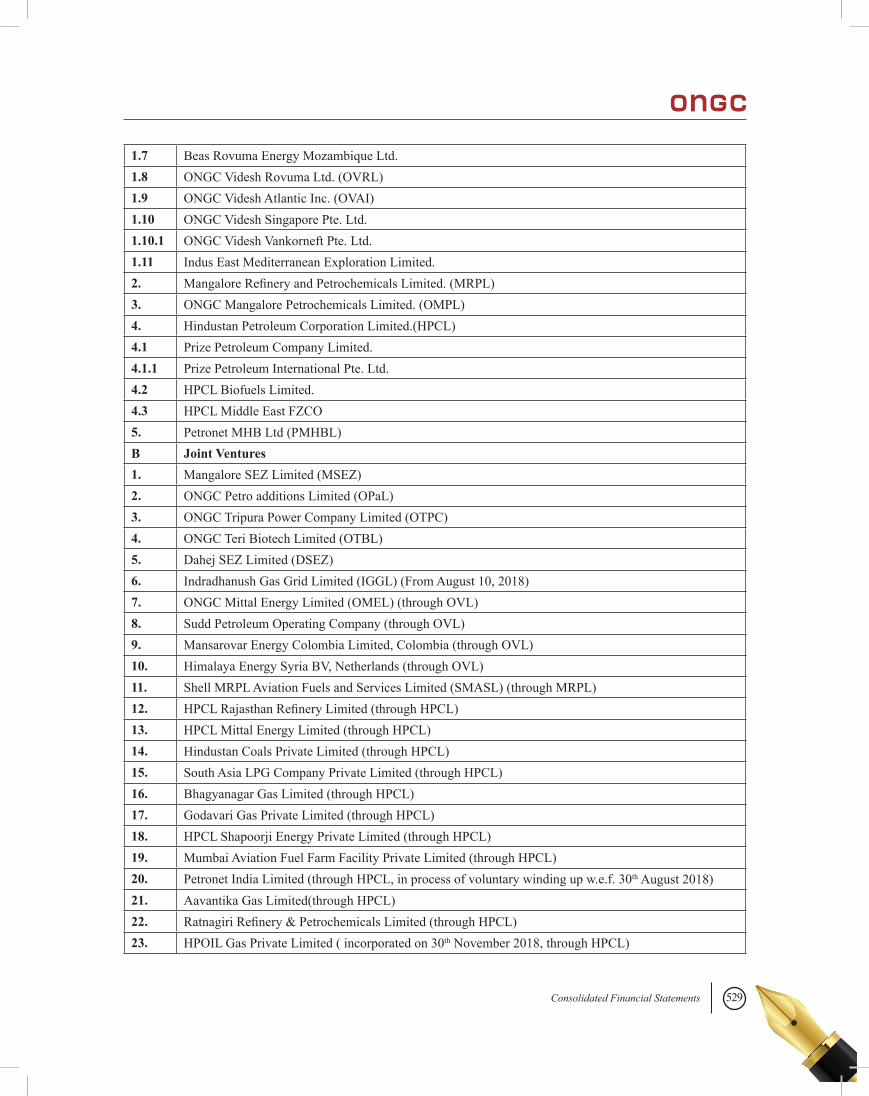
529Consolidated Financial Statements
1.7 Beas Rovuma Energy Mozambique Ltd.1.8 ONGC Videsh Rovuma Ltd. (OVRL)1.9 ONGC Videsh Atlantic Inc. (OVAI)1.10 ONGC Videsh Singapore Pte. Ltd.1.10.1 ONGC Videsh Vankorneft Pte. Ltd.1.11 Indus East Mediterranean Exploration Limited.2. Mangalore Refinery and Petrochemicals Limited. (MRPL)3. ONGC Mangalore Petrochemicals Limited. (OMPL)4. Hindustan Petroleum Corporation Limited.(HPCL) 4.1 Prize Petroleum Company Limited.4.1.1 Prize Petroleum International Pte. Ltd.4.2 HPCL Biofuels Limited.4.3 HPCL Middle East FZCO5. Petronet MHB Ltd (PMHBL) B Joint Ventures1. Mangalore SEZ Limited (MSEZ)2. ONGC Petro additions Limited (OPaL) 3. ONGC Tripura Power Company Limited (OTPC) 4. ONGC Teri Biotech Limited (OTBL)5. Dahej SEZ Limited (DSEZ)6. Indradhanush Gas Grid Limited (IGGL) (From August 10, 2018)7. ONGC Mittal Energy Limited (OMEL) (through OVL)8. Sudd Petroleum Operating Company (through OVL)9. Mansarovar Energy Colombia Limited, Colombia (through OVL)10. Himalaya Energy Syria BV, Netherlands (through OVL)11. Shell MRPL Aviation Fuels and Services Limited (SMASL) (through MRPL)12. HPCL Rajasthan Refinery Limited (through HPCL)13. HPCL Mittal Energy Limited (through HPCL)14. Hindustan Coals Private Limited (through HPCL)15. South Asia LPG Company Private Limited (through HPCL)16. Bhagyanagar Gas Limited (through HPCL)17. Godavari Gas Private Limited (through HPCL)18. HPCL Shapoorji Energy Private Limited (through HPCL)19. Mumbai Aviation Fuel Farm Facility Private Limited (through HPCL)20. Petronet India Limited (through HPCL, in process of voluntary winding up w.e.f. 30th August 2018)21. Aavantika Gas Limited(through HPCL)22. Ratnagiri Refinery & Petrochemicals Limited (through HPCL)23. HPOIL Gas Private Limited ( incorporated on 30th November 2018, through HPCL)
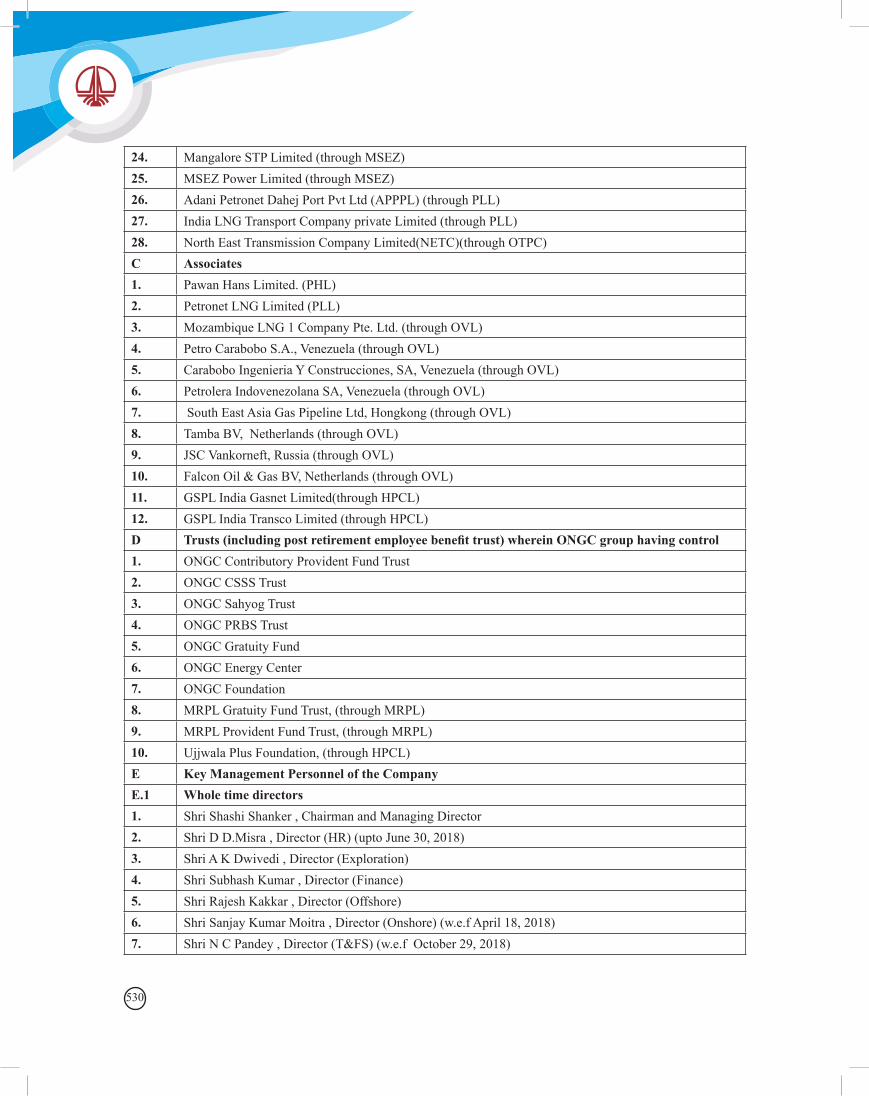
530
24. Mangalore STP Limited (through MSEZ)25. MSEZ Power Limited (through MSEZ)26. Adani Petronet Dahej Port Pvt Ltd (APPPL) (through PLL)27. India LNG Transport Company private Limited (through PLL)28. North East Transmission Company Limited(NETC)(through OTPC)C Associates1. Pawan Hans Limited. (PHL)2. Petronet LNG Limited (PLL) 3. Mozambique LNG 1 Company Pte. Ltd. (through OVL)4. Petro Carabobo S.A., Venezuela (through OVL)5. Carabobo Ingenieria Y Construcciones, SA, Venezuela (through OVL)6. Petrolera Indovenezolana SA, Venezuela (through OVL)7. South East Asia Gas Pipeline Ltd, Hongkong (through OVL)8. Tamba BV, Netherlands (through OVL)9. JSC Vankorneft, Russia (through OVL)10. Falcon Oil & Gas BV, Netherlands (through OVL)11. GSPL India Gasnet Limited(through HPCL)12. GSPL India Transco Limited (through HPCL)D Trusts (including post retirement employee benefit trust) wherein ONGC group having control1. ONGC Contributory Provident Fund Trust2. ONGC CSSS Trust3. ONGC Sahyog Trust 4. ONGC PRBS Trust5. ONGC Gratuity Fund 6. ONGC Energy Center7. ONGC Foundation8. MRPL Gratuity Fund Trust, (through MRPL)9. MRPL Provident Fund Trust, (through MRPL)10. Ujjwala Plus Foundation, (through HPCL)E Key Management Personnel of the CompanyE.1 Whole time directors1. Shri Shashi Shanker , Chairman and Managing Director 2. Shri D D.Misra , Director (HR) (upto June 30, 2018)3. Shri A K Dwivedi , Director (Exploration) 4. Shri Subhash Kumar , Director (Finance)5. Shri Rajesh Kakkar , Director (Offshore)6. Shri Sanjay Kumar Moitra , Director (Onshore) (w.e.f April 18, 2018)7. Shri N C Pandey , Director (T&FS) (w.e.f October 29, 2018)
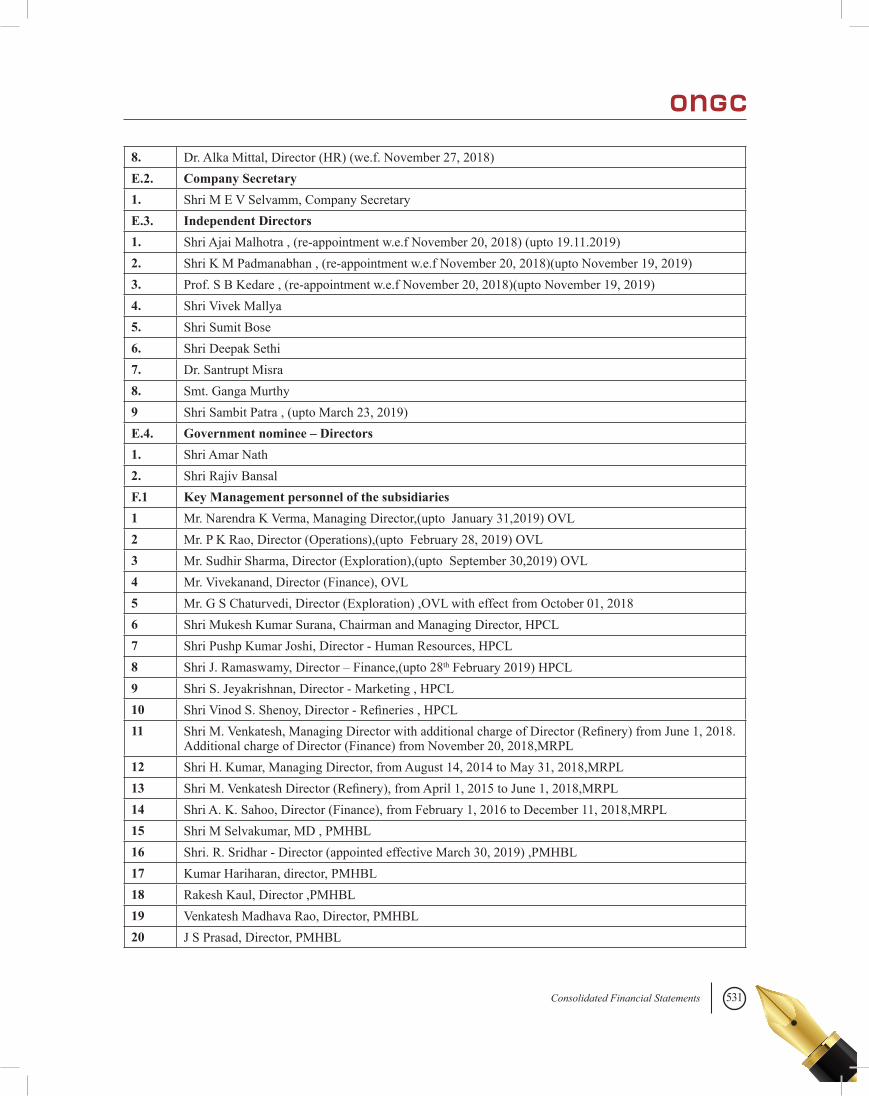
531Consolidated Financial Statements
8. Dr. Alka Mittal, Director (HR) (we.f. November 27, 2018) E.2. Company Secretary1. Shri M E V Selvamm, Company SecretaryE.3. Independent Directors1. Shri Ajai Malhotra , (re-appointment w.e.f November 20, 2018) (upto 19.11.2019)2. Shri K M Padmanabhan , (re-appointment w.e.f November 20, 2018)(upto November 19, 2019)3. Prof. S B Kedare , (re-appointment w.e.f November 20, 2018)(upto November 19, 2019)4. Shri Vivek Mallya 5. Shri Sumit Bose 6. Shri Deepak Sethi 7. Dr. Santrupt Misra 8. Smt. Ganga Murthy 9 Shri Sambit Patra , (upto March 23, 2019)E.4. Government nominee – Directors1. Shri Amar Nath2. Shri Rajiv BansalF.1 Key Management personnel of the subsidiaries1 Mr. Narendra K Verma, Managing Director,(upto January 31,2019) OVL2 Mr. P K Rao, Director (Operations),(upto February 28, 2019) OVL3 Mr. Sudhir Sharma, Director (Exploration),(upto September 30,2019) OVL4 Mr. Vivekanand, Director (Finance), OVL5 Mr. G S Chaturvedi, Director (Exploration) ,OVL with effect from October 01, 20186 Shri Mukesh Kumar Surana, Chairman and Managing Director, HPCL7 Shri Pushp Kumar Joshi, Director - Human Resources, HPCL8 Shri J. Ramaswamy, Director – Finance,(upto 28th February 2019) HPCL9 Shri S. Jeyakrishnan, Director - Marketing , HPCL10 Shri Vinod S. Shenoy, Director - Refineries , HPCL11 Shri M. Venkatesh, Managing Director with additional charge of Director (Refinery) from June 1, 2018.
Additional charge of Director (Finance) from November 20, 2018,MRPL 12 Shri H. Kumar, Managing Director, from August 14, 2014 to May 31, 2018,MRPL 13 Shri M. Venkatesh Director (Refinery), from April 1, 2015 to June 1, 2018,MRPL14 Shri A. K. Sahoo, Director (Finance), from February 1, 2016 to December 11, 2018,MRPL15 Shri M Selvakumar, MD , PMHBL16 Shri. R. Sridhar - Director (appointed effective March 30, 2019) ,PMHBL17 Kumar Hariharan, director, PMHBL18 Rakesh Kaul, Director ,PMHBL19 Venkatesh Madhava Rao, Director, PMHBL20 J S Prasad, Director, PMHBL
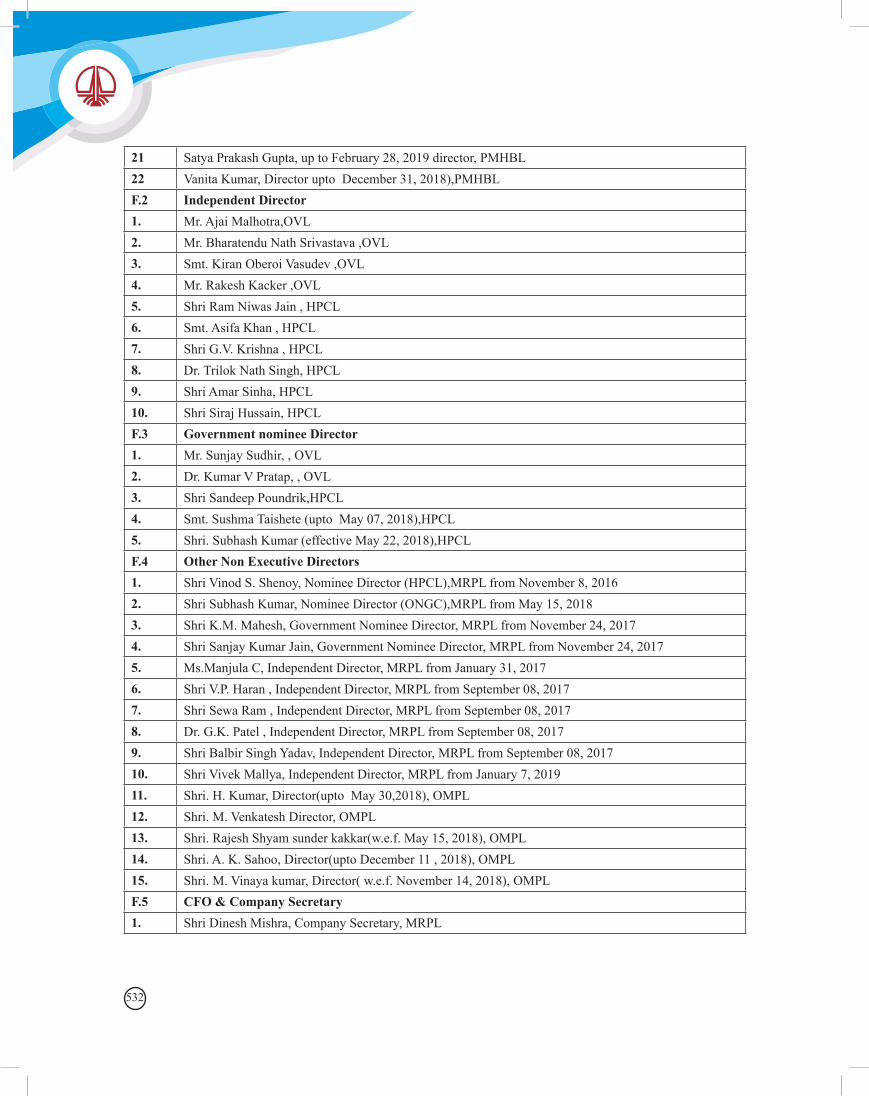
532
21 Satya Prakash Gupta, up to February 28, 2019 director, PMHBL22 Vanita Kumar, Director upto December 31, 2018),PMHBLF.2 Independent Director1. Mr. Ajai Malhotra,OVL2. Mr. Bharatendu Nath Srivastava ,OVL3. Smt. Kiran Oberoi Vasudev ,OVL4. Mr. Rakesh Kacker ,OVL5. Shri Ram Niwas Jain , HPCL6. Smt. Asifa Khan , HPCL7. Shri G.V. Krishna , HPCL8. Dr. Trilok Nath Singh, HPCL9. Shri Amar Sinha, HPCL10. Shri Siraj Hussain, HPCLF.3 Government nominee Director1. Mr. Sunjay Sudhir, , OVL2. Dr. Kumar V Pratap, , OVL3. Shri Sandeep Poundrik,HPCL4. Smt. Sushma Taishete (upto May 07, 2018),HPCL5. Shri. Subhash Kumar (effective May 22, 2018),HPCLF.4 Other Non Executive Directors1. Shri Vinod S. Shenoy, Nominee Director (HPCL),MRPL from November 8, 20162. Shri Subhash Kumar, Nominee Director (ONGC),MRPL from May 15, 20183. Shri K.M. Mahesh, Government Nominee Director, MRPL from November 24, 20174. Shri Sanjay Kumar Jain, Government Nominee Director, MRPL from November 24, 20175. Ms.Manjula C, Independent Director, MRPL from January 31, 20176. Shri V.P. Haran , Independent Director, MRPL from September 08, 20177. Shri Sewa Ram , Independent Director, MRPL from September 08, 20178. Dr. G.K. Patel , Independent Director, MRPL from September 08, 20179. Shri Balbir Singh Yadav, Independent Director, MRPL from September 08, 201710. Shri Vivek Mallya, Independent Director, MRPL from January 7, 201911. Shri. H. Kumar, Director(upto May 30,2018), OMPL12. Shri. M. Venkatesh Director, OMPL13. Shri. Rajesh Shyam sunder kakkar(w.e.f. May 15, 2018), OMPL14. Shri. A. K. Sahoo, Director(upto December 11 , 2018), OMPL15. Shri. M. Vinaya kumar, Director( w.e.f. November 14, 2018), OMPLF.5 CFO & Company Secretary1. Shri Dinesh Mishra, Company Secretary, MRPL
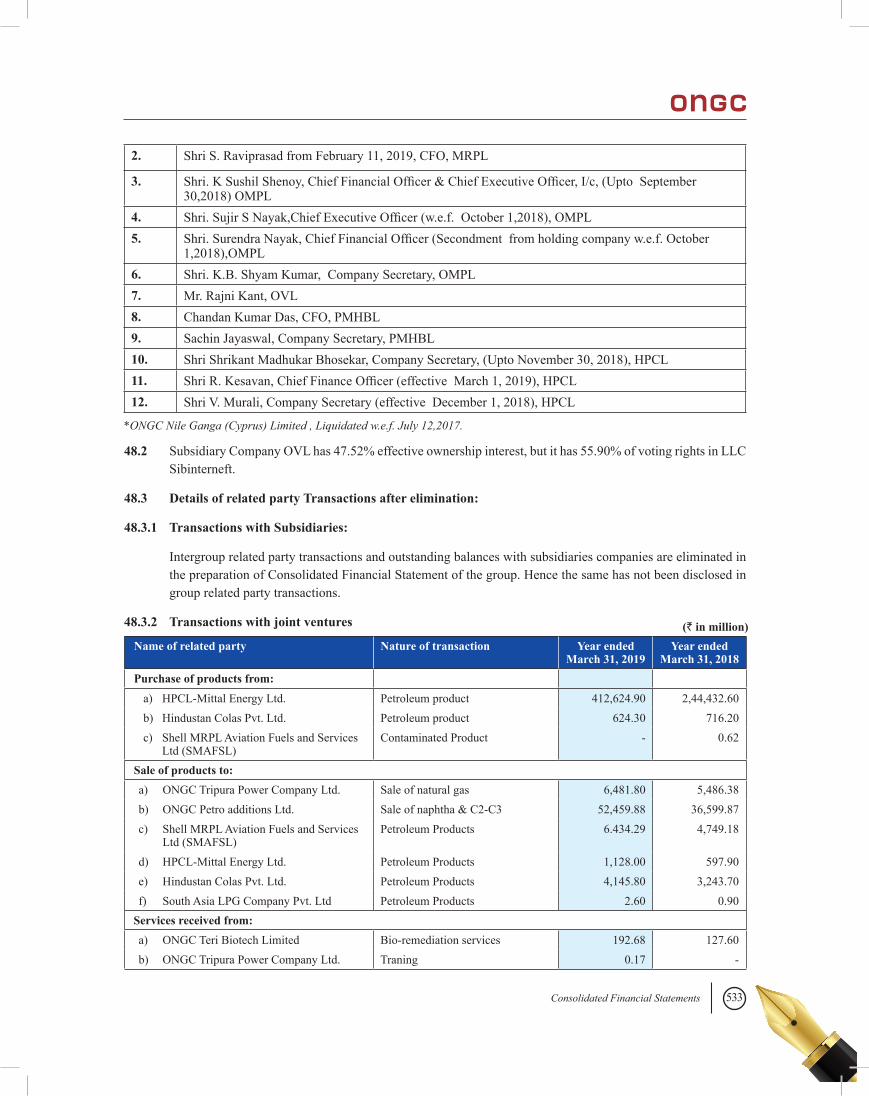
533Consolidated Financial Statements
2. Shri S. Raviprasad from February 11, 2019, CFO, MRPL
3. Shri. K Sushil Shenoy, Chief Financial Officer & Chief Executive Officer, I/c, (Upto September 30,2018) OMPL
4. Shri. Sujir S Nayak,Chief Executive Officer (w.e.f. October 1,2018), OMPL5. Shri. Surendra Nayak, Chief Financial Officer (Secondment from holding company w.e.f. October
1,2018),OMPL6. Shri. K.B. Shyam Kumar, Company Secretary, OMPL7. Mr. Rajni Kant, OVL8. Chandan Kumar Das, CFO, PMHBL9. Sachin Jayaswal, Company Secretary, PMHBL10. Shri Shrikant Madhukar Bhosekar, Company Secretary, (Upto November 30, 2018), HPCL11. Shri R. Kesavan, Chief Finance Officer (effective March 1, 2019), HPCL12. Shri V. Murali, Company Secretary (effective December 1, 2018), HPCL
*ONGC Nile Ganga (Cyprus) Limited , Liquidated w.e.f. July 12,2017.
48.2 Subsidiary Company OVL has 47.52% effective ownership interest, but it has 55.90% of voting rights in LLC Sibinterneft.
48.3 Details of related party Transactions after elimination:
48.3.1 Transactions with Subsidiaries:
Intergroup related party transactions and outstanding balances with subsidiaries companies are eliminated in the preparation of Consolidated Financial Statement of the group. Hence the same has not been disclosed in group related party transactions.
48.3.2 Transactions with joint ventures
Name of related party Nature of transaction Year ended March 31, 2019
Year ended March 31, 2018
Purchase of products from:a) HPCL-Mittal Energy Ltd. Petroleum product 412,624.90 2,44,432.60b) Hindustan Colas Pvt. Ltd. Petroleum product 624.30 716.20c) Shell MRPL Aviation Fuels and Services
Ltd (SMAFSL)Contaminated Product - 0.62
Sale of products to:a) ONGC Tripura Power Company Ltd. Sale of natural gas 6,481.80 5,486.38 b) ONGC Petro additions Ltd. Sale of naphtha & C2-C3 52,459.88 36,599.87c) Shell MRPL Aviation Fuels and Services
Ltd (SMAFSL)Petroleum Products 6.434.29 4,749.18
d) HPCL-Mittal Energy Ltd. Petroleum Products 1,128.00 597.90e) Hindustan Colas Pvt. Ltd. Petroleum Products 4,145.80 3,243.70f) South Asia LPG Company Pvt. Ltd Petroleum Products 2.60 0.90
Services received from:a) ONGC Teri Biotech Limited Bio-remediation services 192.68 127.60 b) ONGC Tripura Power Company Ltd. Traning 0.17 -
(` in million)
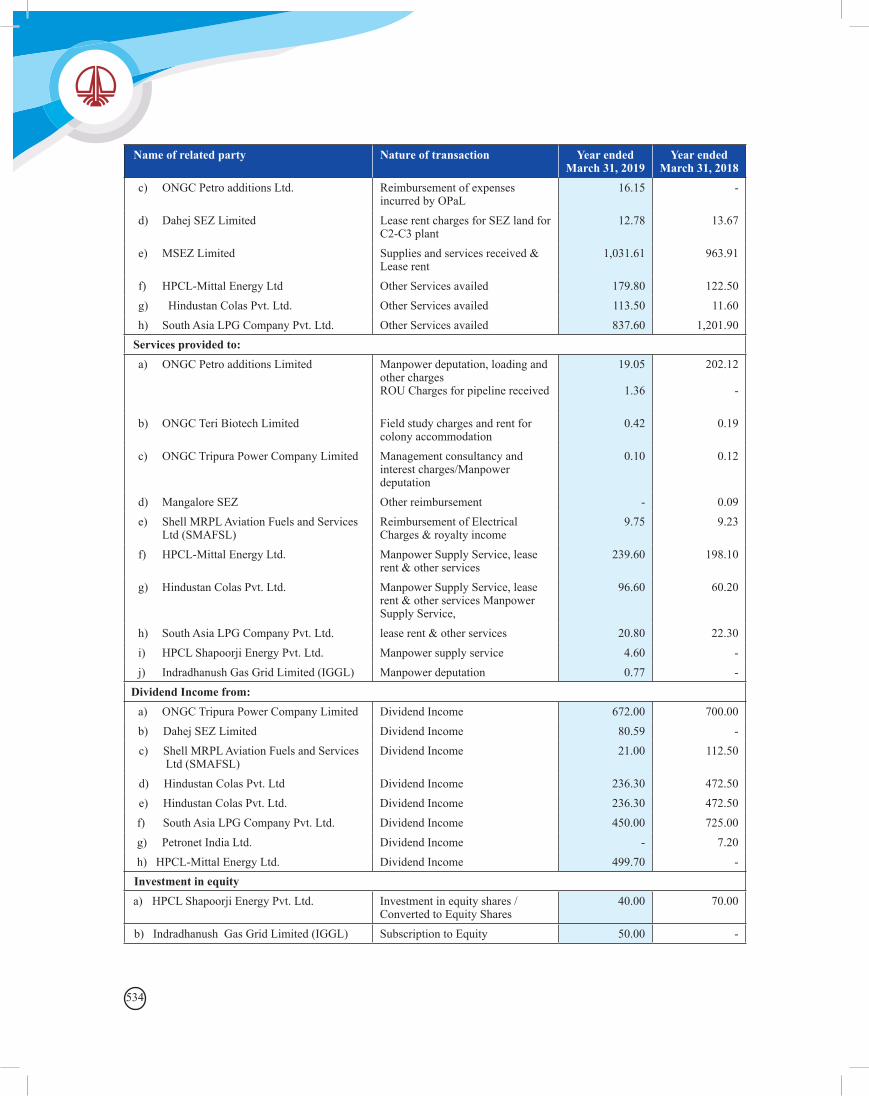
534
Name of related party Nature of transaction Year ended March 31, 2019
Year ended March 31, 2018
c) ONGC Petro additions Ltd. Reimbursement of expenses incurred by OPaL
16.15 -
d) Dahej SEZ Limited Lease rent charges for SEZ land for C2-C3 plant
12.78 13.67
e) MSEZ Limited Supplies and services received & Lease rent
1,031.61 963.91
f) HPCL-Mittal Energy Ltd Other Services availed 179.80 122.50g) Hindustan Colas Pvt. Ltd. Other Services availed 113.50 11.60h) South Asia LPG Company Pvt. Ltd. Other Services availed 837.60 1,201.90
Services provided to:a) ONGC Petro additions Limited Manpower deputation, loading and
other chargesROU Charges for pipeline received
19.05
1.36
202.12
-
b) ONGC Teri Biotech Limited Field study charges and rent for colony accommodation
0.42 0.19
c) ONGC Tripura Power Company Limited Management consultancy and interest charges/Manpower deputation
0.10 0.12
d) Mangalore SEZ Other reimbursement - 0.09 e) Shell MRPL Aviation Fuels and Services
Ltd (SMAFSL)Reimbursement of Electrical Charges & royalty income
9.75 9.23
f) HPCL-Mittal Energy Ltd. Manpower Supply Service, lease rent & other services
239.60 198.10
g) Hindustan Colas Pvt. Ltd. Manpower Supply Service, lease rent & other services Manpower Supply Service,
96.60 60.20
h) South Asia LPG Company Pvt. Ltd. lease rent & other services 20.80 22.30i) HPCL Shapoorji Energy Pvt. Ltd. Manpower supply service 4.60 -j) Indradhanush Gas Grid Limited (IGGL) Manpower deputation 0.77 -
Dividend Income from: a) ONGC Tripura Power Company Limited Dividend Income 672.00 700.00b) Dahej SEZ Limited Dividend Income 80.59 - c) Shell MRPL Aviation Fuels and Services
Ltd (SMAFSL)Dividend Income 21.00 112.50
d) Hindustan Colas Pvt. Ltd Dividend Income 236.30 472.50 e) Hindustan Colas Pvt. Ltd. Dividend Income 236.30 472.50
f) South Asia LPG Company Pvt. Ltd. Dividend Income 450.00 725.00 g) Petronet India Ltd. Dividend Income - 7.20 h) HPCL-Mittal Energy Ltd. Dividend Income 499.70 - Investment in equitya) HPCL Shapoorji Energy Pvt. Ltd. Investment in equity shares /
Converted to Equity Shares40.00 70.00
b) Indradhanush Gas Grid Limited (IGGL) Subscription to Equity 50.00 -
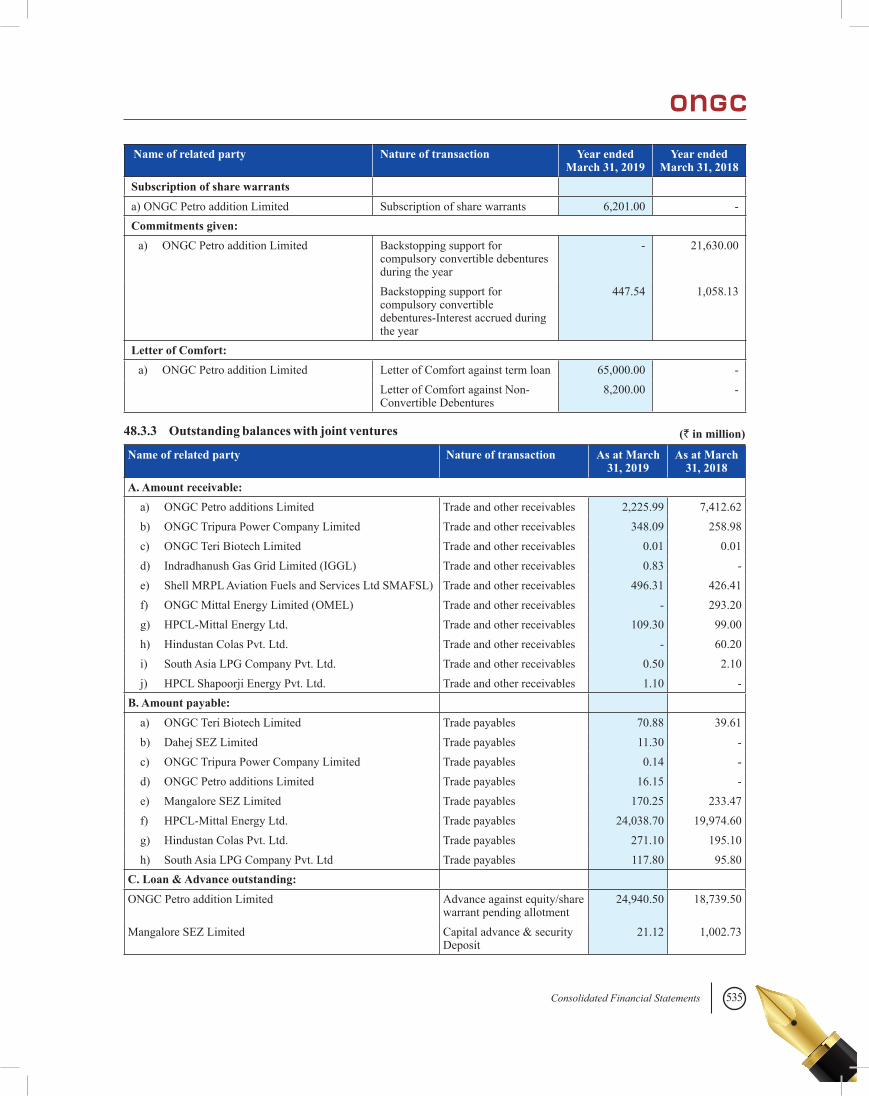
535Consolidated Financial Statements
Name of related party Nature of transaction Year ended March 31, 2019
Year ended March 31, 2018
Subscription of share warrantsa) ONGC Petro addition Limited Subscription of share warrants 6,201.00 -Commitments given:
a) ONGC Petro addition Limited Backstopping support for compulsory convertible debentures during the year
- 21,630.00
Backstopping support for compulsory convertible debentures-Interest accrued during the year
447.54 1,058.13
Letter of Comfort:a) ONGC Petro addition Limited Letter of Comfort against term loan 65,000.00 -
Letter of Comfort against Non-Convertible Debentures
8,200.00 -
48.3.3 Outstanding balances with joint ventures
Name of related party Nature of transaction As at March 31, 2019
As at March 31, 2018
A. Amount receivable:a) ONGC Petro additions Limited Trade and other receivables 2,225.99 7,412.62 b) ONGC Tripura Power Company Limited Trade and other receivables 348.09 258.98 c) ONGC Teri Biotech Limited Trade and other receivables 0.01 0.01 d) Indradhanush Gas Grid Limited (IGGL) Trade and other receivables 0.83 -e) Shell MRPL Aviation Fuels and Services Ltd SMAFSL) Trade and other receivables 496.31 426.41f) ONGC Mittal Energy Limited (OMEL) Trade and other receivables - 293.20g) HPCL-Mittal Energy Ltd. Trade and other receivables 109.30 99.00h) Hindustan Colas Pvt. Ltd. Trade and other receivables - 60.20i) South Asia LPG Company Pvt. Ltd. Trade and other receivables 0.50 2.10j) HPCL Shapoorji Energy Pvt. Ltd. Trade and other receivables 1.10 -
B. Amount payable:a) ONGC Teri Biotech Limited Trade payables 70.88 39.61b) Dahej SEZ Limited Trade payables 11.30 -c) ONGC Tripura Power Company Limited Trade payables 0.14 -d) ONGC Petro additions Limited Trade payables 16.15 -e) Mangalore SEZ Limited Trade payables 170.25 233.47f) HPCL-Mittal Energy Ltd. Trade payables 24,038.70 19,974.60g) Hindustan Colas Pvt. Ltd. Trade payables 271.10 195.10h) South Asia LPG Company Pvt. Ltd Trade payables 117.80 95.80
C. Loan & Advance outstanding:ONGC Petro addition Limited Advance against equity/share
warrant pending allotment24,940.50 18,739.50
Mangalore SEZ Limited Capital advance & security Deposit
21.12 1,002.73
(` in million)
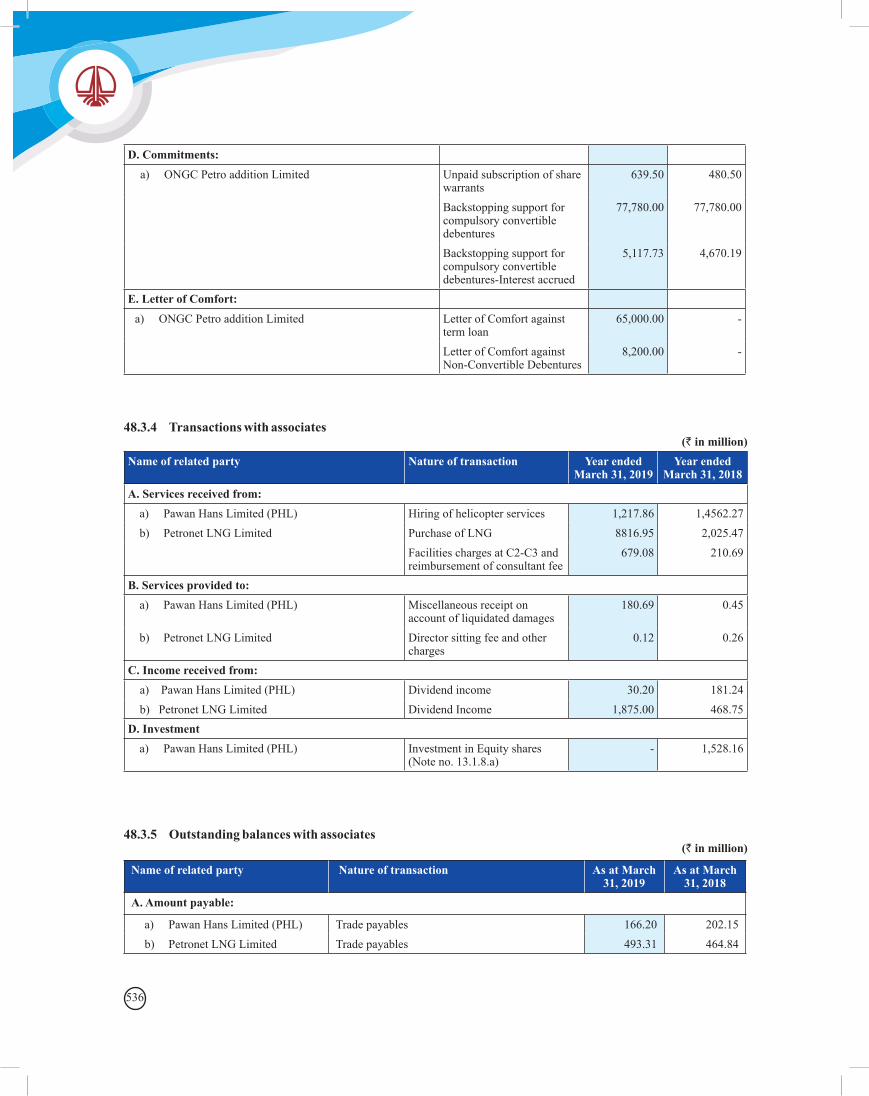
536
D. Commitments:a) ONGC Petro addition Limited Unpaid subscription of share
warrants639.50 480.50
Backstopping support for compulsory convertible debentures
77,780.00 77,780.00
Backstopping support for compulsory convertible debentures-Interest accrued
5,117.73 4,670.19
E. Letter of Comfort:a) ONGC Petro addition Limited Letter of Comfort against
term loan65,000.00 -
Letter of Comfort against Non-Convertible Debentures
8,200.00 -
48.3.4 Transactions with associates
Name of related party Nature of transaction Year ended March 31, 2019
Year ended March 31, 2018
A. Services received from:a) Pawan Hans Limited (PHL) Hiring of helicopter services 1,217.86 1,4562.27 b) Petronet LNG Limited Purchase of LNG 8816.95 2,025.47
Facilities charges at C2-C3 and reimbursement of consultant fee
679.08 210.69
B. Services provided to:a) Pawan Hans Limited (PHL) Miscellaneous receipt on
account of liquidated damages180.69 0.45
b) Petronet LNG Limited Director sitting fee and other charges
0.12 0.26
C. Income received from: a) Pawan Hans Limited (PHL) Dividend income 30.20 181.24 b) Petronet LNG Limited Dividend Income 1,875.00 468.75D. Investment
a) Pawan Hans Limited (PHL) Investment in Equity shares (Note no. 13.1.8.a)
- 1,528.16
(` in million)
48.3.5 Outstanding balances with associates(` in million)
Name of related party Nature of transaction As at March 31, 2019
As at March 31, 2018
A. Amount payable:
a) Pawan Hans Limited (PHL) Trade payables 166.20 202.15 b) Petronet LNG Limited Trade payables 493.31 464.84
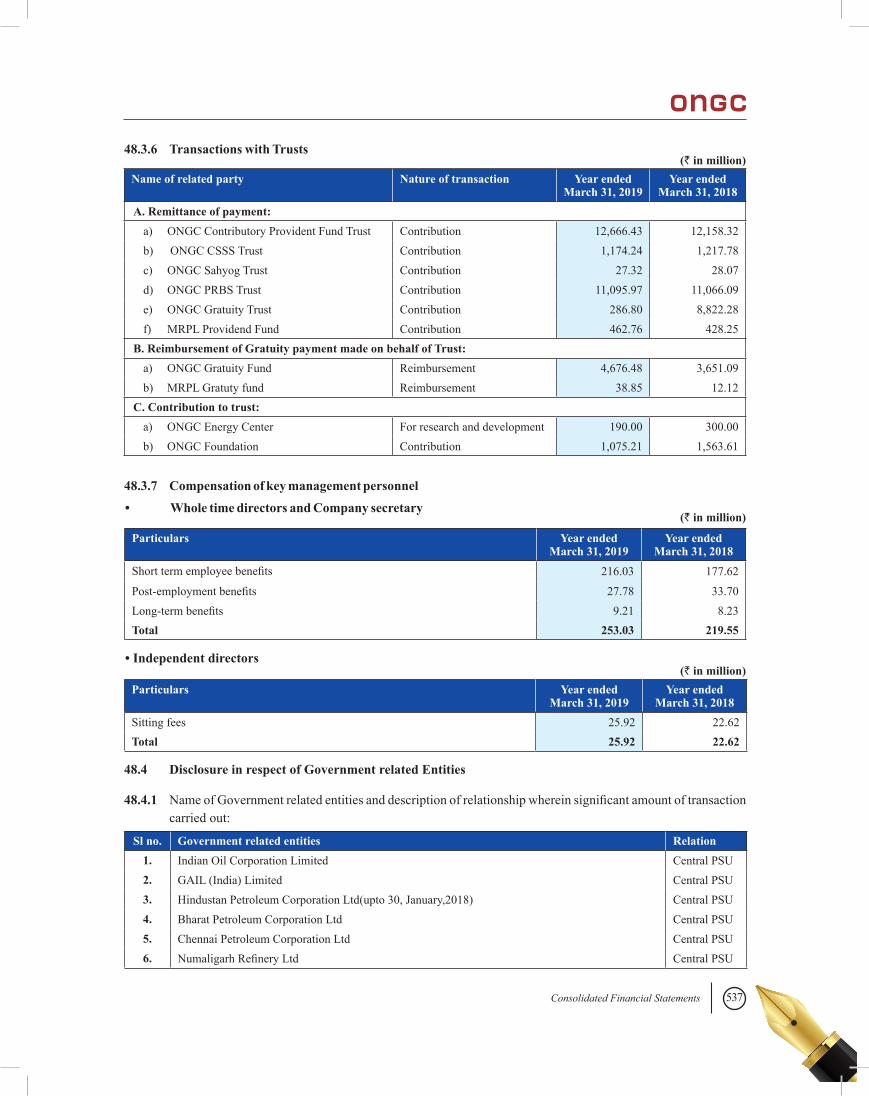
537Consolidated Financial Statements
Name of related party Nature of transaction Year ended March 31, 2019
Year ended March 31, 2018
A. Remittance of payment:a) ONGC Contributory Provident Fund Trust Contribution 12,666.43 12,158.32b) ONGC CSSS Trust Contribution 1,174.24 1,217.78c) ONGC Sahyog Trust Contribution 27.32 28.07d) ONGC PRBS Trust Contribution 11,095.97 11,066.09e) ONGC Gratuity Trust Contribution 286.80 8,822.28f) MRPL Providend Fund Contribution 462.76 428.25
B. Reimbursement of Gratuity payment made on behalf of Trust:a) ONGC Gratuity Fund Reimbursement 4,676.48 3,651.09b) MRPL Gratuty fund Reimbursement 38.85 12.12
C. Contribution to trust:a) ONGC Energy Center For research and development 190.00 300.00b) ONGC Foundation Contribution 1,075.21 1,563.61
(` in million)
(` in million)
(` in million)
48.3.6 Transactions with Trusts
48.3.7 Compensation of key management personnel
• Whole time directors and Company secretary
• Independent directors
Particulars Year ended March 31, 2019
Year ended March 31, 2018
Short term employee benefits 216.03 177.62
Post-employment benefits 27.78 33.70Long-term benefits 9.21 8.23Total 253.03 219.55
Particulars Year ended March 31, 2019
Year ended March 31, 2018
Sitting fees 25.92 22.62Total 25.92 22.62
48.4 Disclosure in respect of Government related Entities
48.4.1 Name of Government related entities and description of relationship wherein significant amount of transaction carried out:
Sl no. Government related entities Relation 1. Indian Oil Corporation Limited Central PSU2. GAIL (India) Limited Central PSU3. Hindustan Petroleum Corporation Ltd(upto 30, January,2018) Central PSU4. Bharat Petroleum Corporation Ltd Central PSU5. Chennai Petroleum Corporation Ltd Central PSU6. Numaligarh Refinery Ltd Central PSU
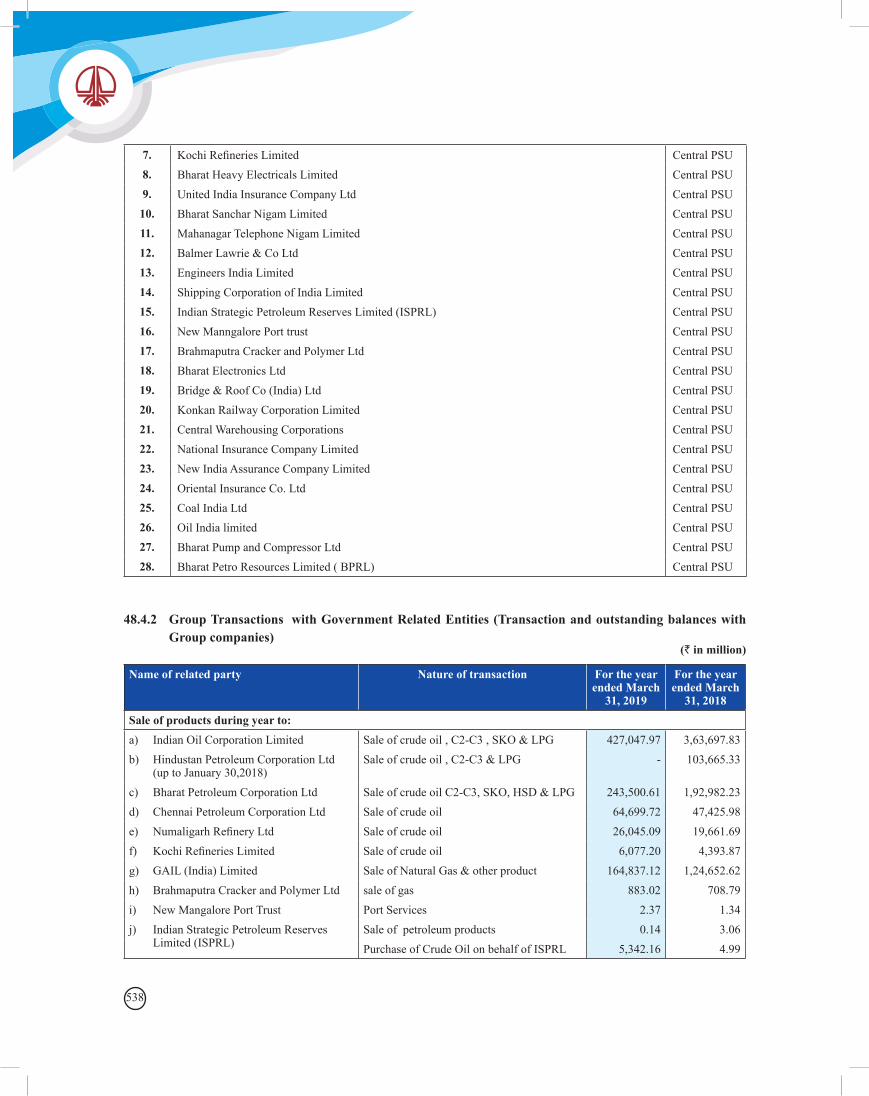
538
7. Kochi Refineries Limited Central PSU8. Bharat Heavy Electricals Limited Central PSU9. United India Insurance Company Ltd Central PSU10. Bharat Sanchar Nigam Limited Central PSU11. Mahanagar Telephone Nigam Limited Central PSU12. Balmer Lawrie & Co Ltd Central PSU13. Engineers India Limited Central PSU14. Shipping Corporation of India Limited Central PSU15. Indian Strategic Petroleum Reserves Limited (ISPRL) Central PSU16. New Manngalore Port trust Central PSU17. Brahmaputra Cracker and Polymer Ltd Central PSU18. Bharat Electronics Ltd Central PSU19. Bridge & Roof Co (India) Ltd Central PSU20. Konkan Railway Corporation Limited Central PSU21. Central Warehousing Corporations Central PSU22. National Insurance Company Limited Central PSU23. New India Assurance Company Limited Central PSU24. Oriental Insurance Co. Ltd Central PSU25. Coal India Ltd Central PSU26. Oil India limited Central PSU27. Bharat Pump and Compressor Ltd Central PSU28. Bharat Petro Resources Limited ( BPRL) Central PSU
48.4.2 Group Transactions with Government Related Entities (Transaction and outstanding balances with Group companies)
Name of related party Nature of transaction For the year ended March
31, 2019
For the year ended March
31, 2018Sale of products during year to: a) Indian Oil Corporation Limited Sale of crude oil , C2-C3 , SKO & LPG 427,047.97 3,63,697.83b) Hindustan Petroleum Corporation Ltd
(up to January 30,2018)Sale of crude oil , C2-C3 & LPG - 103,665.33
c) Bharat Petroleum Corporation Ltd Sale of crude oil C2-C3, SKO, HSD & LPG 243,500.61 1,92,982.23d) Chennai Petroleum Corporation Ltd Sale of crude oil 64,699.72 47,425.98e) Numaligarh Refinery Ltd Sale of crude oil 26,045.09 19,661.69f) Kochi Refineries Limited Sale of crude oil 6,077.20 4,393.87g) GAIL (India) Limited Sale of Natural Gas & other product 164,837.12 1,24,652.62h) Brahmaputra Cracker and Polymer Ltd sale of gas 883.02 708.79i) New Mangalore Port Trust Port Services 2.37 1.34j) Indian Strategic Petroleum Reserves
Limited (ISPRL)Sale of petroleum products 0.14 3.06Purchase of Crude Oil on behalf of ISPRL 5,342.16 4.99
(` in million)
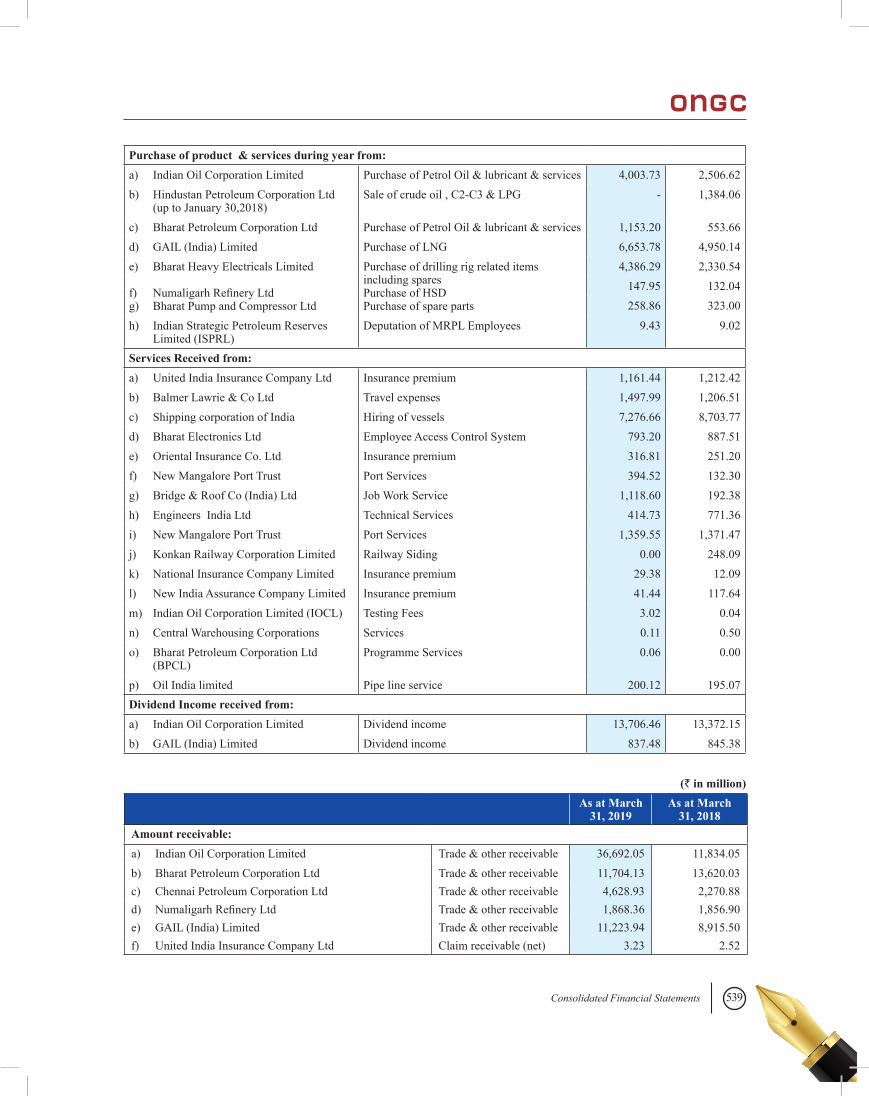
539Consolidated Financial Statements
Purchase of product & services during year from: a) Indian Oil Corporation Limited Purchase of Petrol Oil & lubricant & services 4,003.73 2,506.62b) Hindustan Petroleum Corporation Ltd
(up to January 30,2018)Sale of crude oil , C2-C3 & LPG - 1,384.06
c) Bharat Petroleum Corporation Ltd Purchase of Petrol Oil & lubricant & services 1,153.20 553.66d) GAIL (India) Limited Purchase of LNG 6,653.78 4,950.14e) Bharat Heavy Electricals Limited
f) Numaligarh Refinery Ltdg) Bharat Pump and Compressor Ltd
Purchase of drilling rig related items including sparesPurchase of HSDPurchase of spare parts
4,386.29 2,330.54147.95 132.04258.86 323.00
h) Indian Strategic Petroleum Reserves Limited (ISPRL)
Deputation of MRPL Employees 9.43 9.02
Services Received from: a) United India Insurance Company Ltd Insurance premium 1,161.44 1,212.42b) Balmer Lawrie & Co Ltd Travel expenses 1,497.99 1,206.51c) Shipping corporation of India Hiring of vessels 7,276.66 8,703.77d) Bharat Electronics Ltd Employee Access Control System 793.20 887.51e) Oriental Insurance Co. Ltd Insurance premium 316.81 251.20f) New Mangalore Port Trust Port Services 394.52 132.30g) Bridge & Roof Co (India) Ltd Job Work Service 1,118.60 192.38h) Engineers India Ltd Technical Services 414.73 771.36i) New Mangalore Port Trust Port Services 1,359.55 1,371.47j) Konkan Railway Corporation Limited Railway Siding 0.00 248.09k) National Insurance Company Limited Insurance premium 29.38 12.09l) New India Assurance Company Limited Insurance premium 41.44 117.64m) Indian Oil Corporation Limited (IOCL) Testing Fees 3.02 0.04n) Central Warehousing Corporations Services 0.11 0.50o) Bharat Petroleum Corporation Ltd
(BPCL)Programme Services 0.06 0.00
p) Oil India limited Pipe line service 200.12 195.07Dividend Income received from:a) Indian Oil Corporation Limited Dividend income 13,706.46 13,372.15b) GAIL (India) Limited Dividend income 837.48 845.38
(` in million) As at March
31, 2019As at March
31, 2018Amount receivable:a) Indian Oil Corporation Limited Trade & other receivable 36,692.05 11,834.05b) Bharat Petroleum Corporation Ltd Trade & other receivable 11,704.13 13,620.03c) Chennai Petroleum Corporation Ltd Trade & other receivable 4,628.93 2,270.88d) Numaligarh Refinery Ltd Trade & other receivable 1,868.36 1,856.90e) GAIL (India) Limited Trade & other receivable 11,223.94 8,915.50f) United India Insurance Company Ltd Claim receivable (net) 3.23 2.52
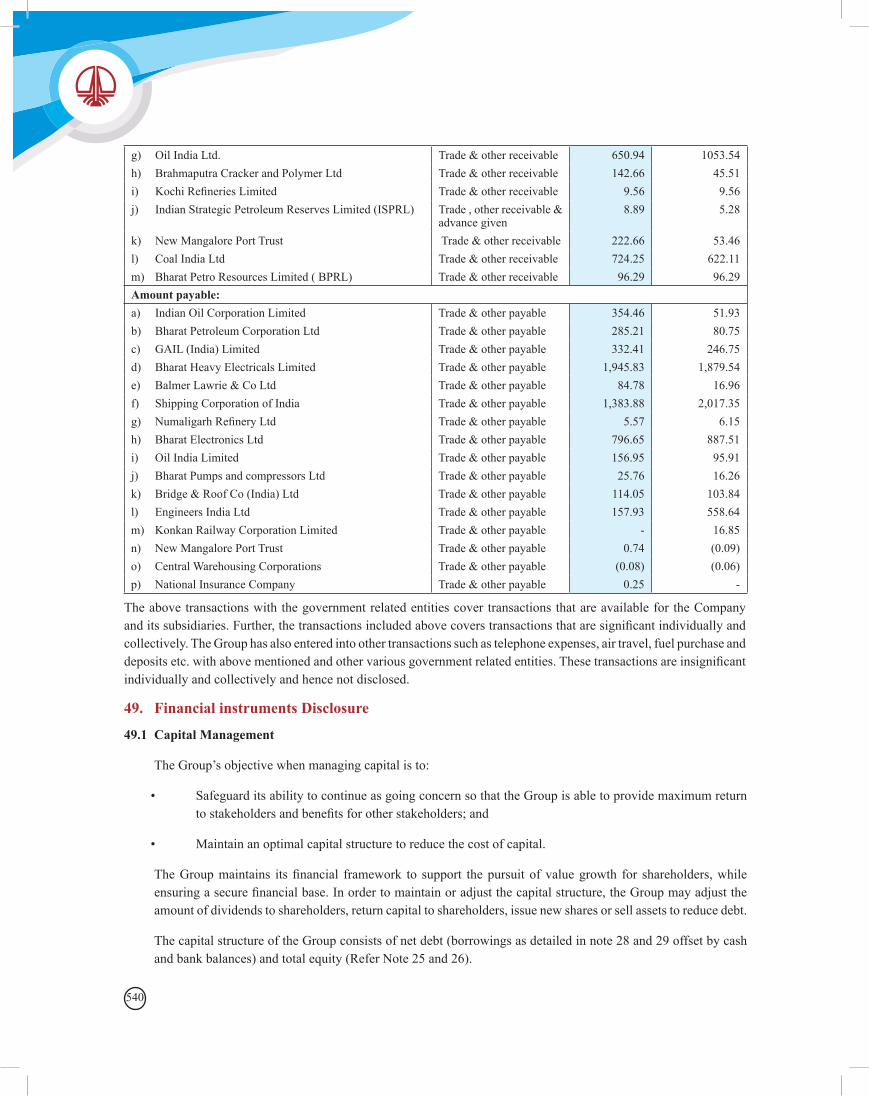
540
g) Oil India Ltd. Trade & other receivable 650.94 1053.54h) Brahmaputra Cracker and Polymer Ltd Trade & other receivable 142.66 45.51i) Kochi Refineries Limited Trade & other receivable 9.56 9.56j) Indian Strategic Petroleum Reserves Limited (ISPRL) Trade , other receivable &
advance given8.89 5.28
k) New Mangalore Port Trust Trade & other receivable 222.66 53.46l) Coal India Ltd Trade & other receivable 724.25 622.11m) Bharat Petro Resources Limited ( BPRL) Trade & other receivable 96.29 96.29Amount payable:a) Indian Oil Corporation Limited Trade & other payable 354.46 51.93b) Bharat Petroleum Corporation Ltd Trade & other payable 285.21 80.75c) GAIL (India) Limited Trade & other payable 332.41 246.75d) Bharat Heavy Electricals Limited Trade & other payable 1,945.83 1,879.54e) Balmer Lawrie & Co Ltd Trade & other payable 84.78 16.96f) Shipping Corporation of India Trade & other payable 1,383.88 2,017.35g) Numaligarh Refinery Ltd Trade & other payable 5.57 6.15h) Bharat Electronics Ltd Trade & other payable 796.65 887.51i) Oil India Limited Trade & other payable 156.95 95.91j) Bharat Pumps and compressors Ltd Trade & other payable 25.76 16.26k) Bridge & Roof Co (India) Ltd Trade & other payable 114.05 103.84l) Engineers India Ltd Trade & other payable 157.93 558.64m) Konkan Railway Corporation Limited Trade & other payable - 16.85n) New Mangalore Port Trust Trade & other payable 0.74 (0.09)o) Central Warehousing Corporations Trade & other payable (0.08) (0.06)p) National Insurance Company Trade & other payable 0.25 -
49.1 Capital Management
The Group’s objective when managing capital is to:
• Safeguard its ability to continue as going concern so that the Group is able to provide maximum return to stakeholders and benefits for other stakeholders; and
• Maintain an optimal capital structure to reduce the cost of capital.
The Group maintains its financial framework to support the pursuit of value growth for shareholders, while ensuring a secure financial base. In order to maintain or adjust the capital structure, the Group may adjust the amount of dividends to shareholders, return capital to shareholders, issue new shares or sell assets to reduce debt.
The capital structure of the Group consists of net debt (borrowings as detailed in note 28 and 29 offset by cash and bank balances) and total equity (Refer Note 25 and 26).
The above transactions with the government related entities cover transactions that are available for the Company and its subsidiaries. Further, the transactions included above covers transactions that are significant individually and collectively. The Group has also entered into other transactions such as telephone expenses, air travel, fuel purchase and deposits etc. with above mentioned and other various government related entities. These transactions are insignificant individually and collectively and hence not disclosed.
49. Financial instruments Disclosure
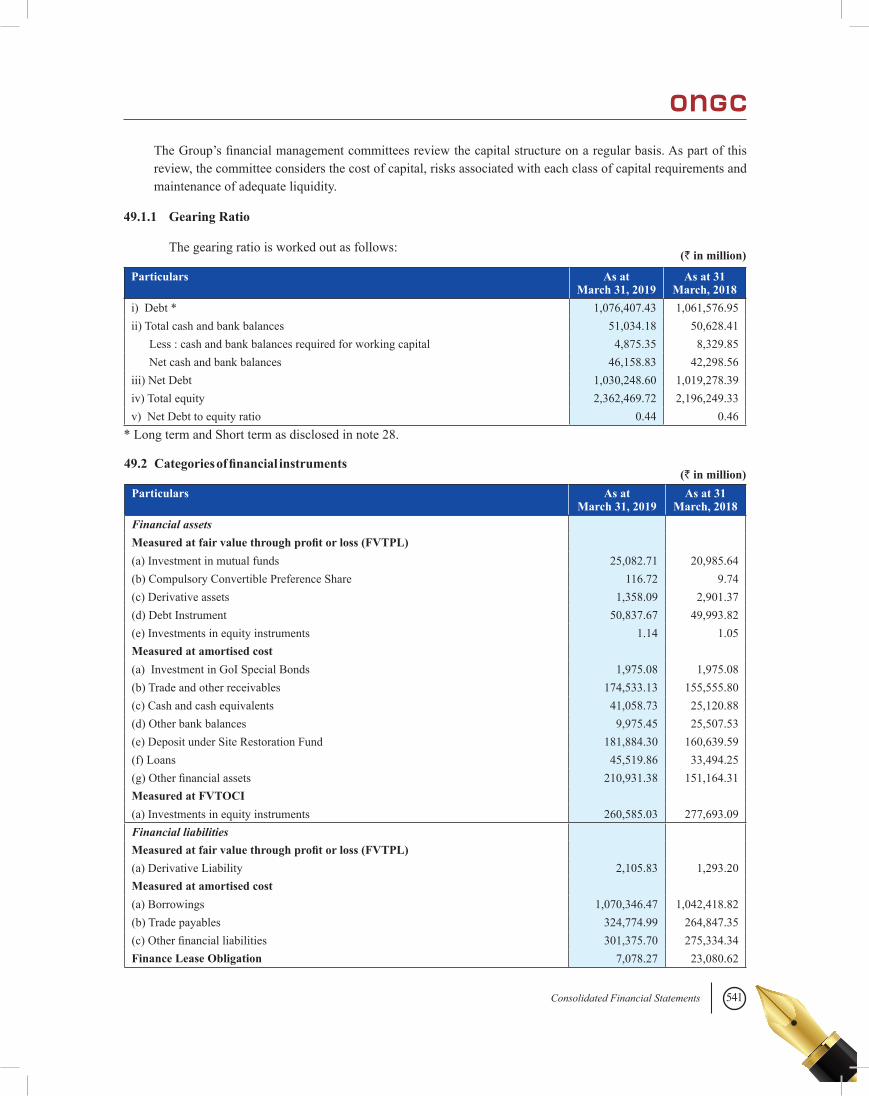
541Consolidated Financial Statements
The Group’s financial management committees review the capital structure on a regular basis. As part of this review, the committee considers the cost of capital, risks associated with each class of capital requirements and maintenance of adequate liquidity.
49.1.1 Gearing Ratio
The gearing ratio is worked out as follows:
* Long term and Short term as disclosed in note 28.
Particulars As at March 31, 2019
As at 31 March, 2018
i) Debt * 1,076,407.43 1,061,576.95ii) Total cash and bank balances 51,034.18 50,628.41 Less : cash and bank balances required for working capital 4,875.35 8,329.85 Net cash and bank balances 46,158.83 42,298.56iii) Net Debt 1,030,248.60 1,019,278.39iv) Total equity 2,362,469.72 2,196,249.33v) Net Debt to equity ratio 0.44 0.46
(` in million)
49.2 Categories of financial instruments
Particulars As at March 31, 2019
As at 31 March, 2018
Financial assets Measured at fair value through profit or loss (FVTPL) (a) Investment in mutual funds 25,082.71 20,985.64(b) Compulsory Convertible Preference Share 116.72 9.74(c) Derivative assets 1,358.09 2,901.37(d) Debt Instrument 50,837.67 49,993.82(e) Investments in equity instruments 1.14 1.05Measured at amortised cost (a) Investment in GoI Special Bonds 1,975.08 1,975.08(b) Trade and other receivables 174,533.13 155,555.80(c) Cash and cash equivalents 41,058.73 25,120.88(d) Other bank balances 9,975.45 25,507.53(e) Deposit under Site Restoration Fund 181,884.30 160,639.59(f) Loans 45,519.86 33,494.25(g) Other financial assets 210,931.38 151,164.31Measured at FVTOCI (a) Investments in equity instruments 260,585.03 277,693.09Financial liabilities Measured at fair value through profit or loss (FVTPL) (a) Derivative Liability 2,105.83 1,293.20Measured at amortised cost (a) Borrowings 1,070,346.47 1,042,418.82(b) Trade payables 324,774.99 264,847.35(c) Other financial liabilities 301,375.70 275,334.34Finance Lease Obligation 7,078.27 23,080.62
(` in million)
542
49.3 Financial risk management objectives
While ensuring liquidity is sufficient to meet Group operational requirements, the Group’s financial management committee also monitors and manages key financial risks relating to the operations of the Group by analysing exposures by degree and magnitude of risks. These risks include credit risk, liquidity risk and market risk (including currency risk and price risk).
In case of subsidiary OVL, the Company’s management seeks to minimise the effects of these risks by using derivative financial instruments to hedge risk exposures. The use of financial derivatives is governed by the company's policies approved by the Board of Directors, which provide written principles on foreign exchange risk, interest rate risk, credit risk, the use of financial derivatives and non-derivative financial instruments, and the investment of excess liquidity. Compliance with policies and exposure limits is reviewed by the internal auditors on a continuous basis. The Group does not enter into or trade financial instruments, including derivative financial instruments, for speculative purposes.
In case of subsidiary, HPCL, as per Risk Management Charter and Policy 2007, a robust governance structure has been developed and implemented across the organisation in its journey towards risk intelligence. The Risk Management Steering Committee (RMSC) constituted under the Risk Management Charter and Policy 2007, guides and monitors the Risk management process across the organization. Periodical reviews are held to ensure that risks are controlled through a properly defined framework. The Board is appraised about the risk assessment and mitigation procedures.
The Enterprise Risk Management (ERM) process is aimed at creating a risk culture wherein ‘risk consciousness’ is embedded in the decision-making process across the organisation. Technology has been used to integrate and manage the entire process of ERM. It has engaged the services of an independent expert to assist in continued implementation of effective Risk Management framework for providing a holistic view of risks and to facilitate more informed decision-making.
49.4 Credit risk management
Credit risk arises from cash and cash equivalents, investments carried at amortized cost and deposits with banks as well as customers including receivables. Credit risk management considers available reasonable and supportive forward-looking information including indicators like external credit rating (as far as available), macro-economic information (such as regulatory changes, government directives, market interest rate).
Credit exposure is managed by counterparty limits for investment of surplus funds which is reviewed by the Management. Investments in liquid plan/schemes are with public sector Asset Management Companies having highest rating. For banks, only high rated banks are considered for placement of deposits.
Bank balances are held with reputed and creditworthy banking institutions.
In respect of Company,
Major customers, being public sector oil marketing companies (OMCs) and gas companies having highest credit ratings, carry negligible credit risk. Concentration of credit risk to any other counterparty did not exceed 8.44% (previous year 4.17%) of total monetary assets at any time during the year.
The Company is exposed to default risk in relation to financial guarantees given to banks / vendors on behalf of subsidiaries / joint venture companies for the estimated amount that would be payable to the third party for assuming the obligation. The Company’s maximum exposure in this regard on as at March 31, 2019 is ₹ 438,120.44 million (as at March 31, 2018 is₹ 441,956.86 million).
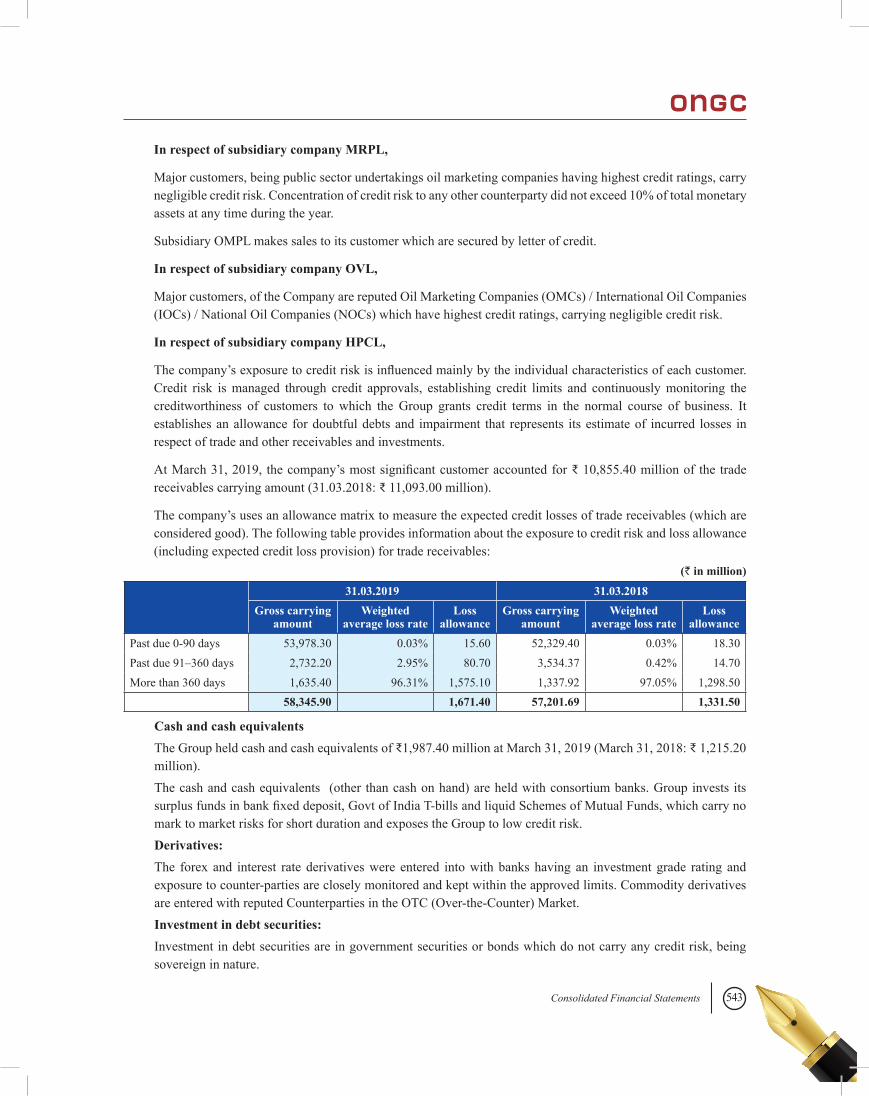
543Consolidated Financial Statements
In respect of subsidiary company MRPL,
Major customers, being public sector undertakings oil marketing companies having highest credit ratings, carry negligible credit risk. Concentration of credit risk to any other counterparty did not exceed 10% of total monetary assets at any time during the year.
Subsidiary OMPL makes sales to its customer which are secured by letter of credit.
In respect of subsidiary company OVL,
Major customers, of the Company are reputed Oil Marketing Companies (OMCs) / International Oil Companies (IOCs) / National Oil Companies (NOCs) which have highest credit ratings, carrying negligible credit risk.
In respect of subsidiary company HPCL,
The company’s exposure to credit risk is influenced mainly by the individual characteristics of each customer. Credit risk is managed through credit approvals, establishing credit limits and continuously monitoring the creditworthiness of customers to which the Group grants credit terms in the normal course of business. It establishes an allowance for doubtful debts and impairment that represents its estimate of incurred losses in respect of trade and other receivables and investments.
At March 31, 2019, the company’s most significant customer accounted for ₹ 10,855.40 million of the trade receivables carrying amount (31.03.2018: ₹ 11,093.00 million).
The company’s uses an allowance matrix to measure the expected credit losses of trade receivables (which are considered good). The following table provides information about the exposure to credit risk and loss allowance (including expected credit loss provision) for trade receivables:
31.03.2019 31.03.2018Gross carrying
amountWeighted
average loss rateLoss
allowanceGross carrying
amountWeighted
average loss rateLoss
allowancePast due 0-90 days 53,978.30 0.03% 15.60 52,329.40 0.03% 18.30 Past due 91–360 days 2,732.20 2.95% 80.70 3,534.37 0.42% 14.70 More than 360 days 1,635.40 96.31% 1,575.10 1,337.92 97.05% 1,298.50 58,345.90 1,671.40 57,201.69 1,331.50
Cash and cash equivalents The Group held cash and cash equivalents of ₹1,987.40 million at March 31, 2019 (March 31, 2018: ₹ 1,215.20
million). The cash and cash equivalents (other than cash on hand) are held with consortium banks. Group invests its
surplus funds in bank fixed deposit, Govt of India T-bills and liquid Schemes of Mutual Funds, which carry no mark to market risks for short duration and exposes the Group to low credit risk.
Derivatives: The forex and interest rate derivatives were entered into with banks having an investment grade rating and
exposure to counter-parties are closely monitored and kept within the approved limits. Commodity derivatives are entered with reputed Counterparties in the OTC (Over-the-Counter) Market.
Investment in debt securities: Investment in debt securities are in government securities or bonds which do not carry any credit risk, being
sovereign in nature.
(` in million)
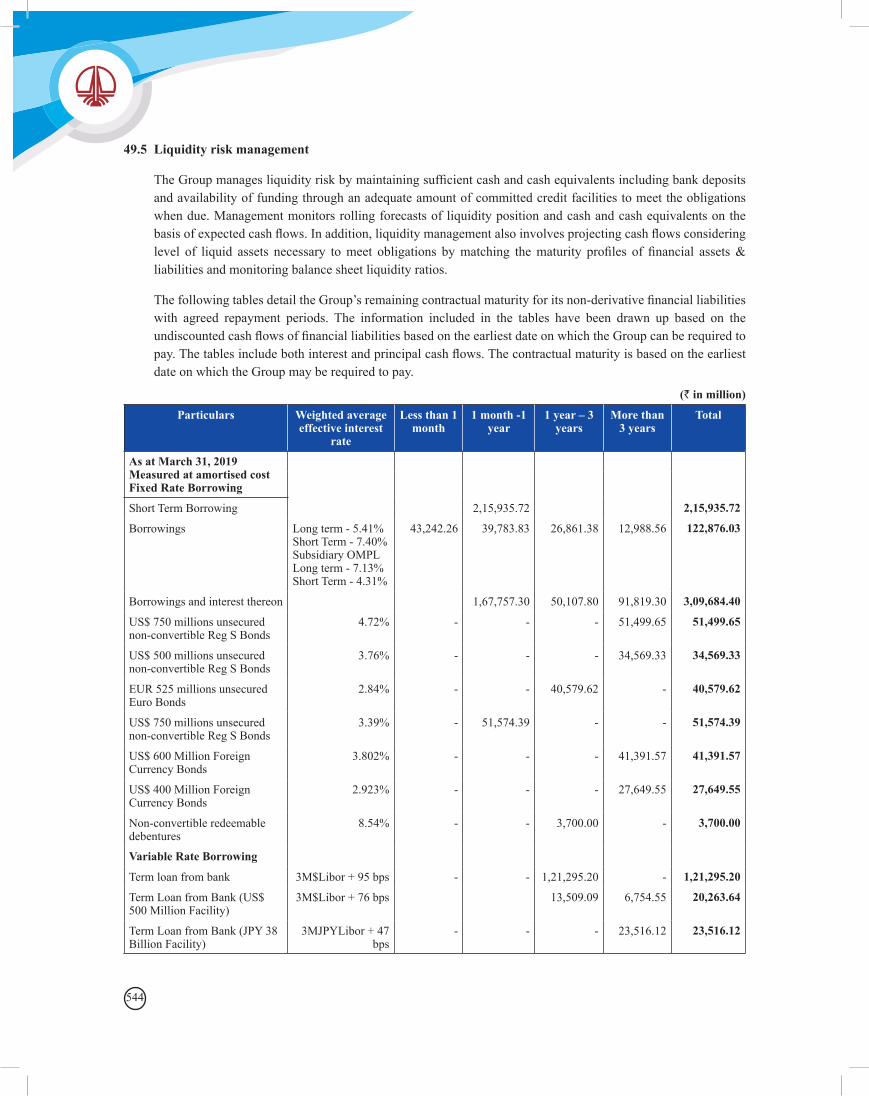
544
49.5 Liquidity risk management
The Group manages liquidity risk by maintaining sufficient cash and cash equivalents including bank deposits and availability of funding through an adequate amount of committed credit facilities to meet the obligations when due. Management monitors rolling forecasts of liquidity position and cash and cash equivalents on the basis of expected cash flows. In addition, liquidity management also involves projecting cash flows considering level of liquid assets necessary to meet obligations by matching the maturity profiles of financial assets & liabilities and monitoring balance sheet liquidity ratios.
The following tables detail the Group’s remaining contractual maturity for its non-derivative financial liabilities with agreed repayment periods. The information included in the tables have been drawn up based on the undiscounted cash flows of financial liabilities based on the earliest date on which the Group can be required to pay. The tables include both interest and principal cash flows. The contractual maturity is based on the earliest date on which the Group may be required to pay.
Particulars Weighted average effective interest
rate
Less than 1 month
1 month -1 year
1 year – 3 years
More than 3 years
Total
As at March 31, 2019Measured at amortised costFixed Rate Borrowing
Short Term Borrowing 2,15,935.72 2,15,935.72
Borrowings Long term - 5.41% Short Term - 7.40% Subsidiary OMPL Long term - 7.13% Short Term - 4.31%
43,242.26 39,783.83 26,861.38 12,988.56 122,876.03
Borrowings and interest thereon 1,67,757.30 50,107.80 91,819.30 3,09,684.40
US$ 750 millions unsecured non-convertible Reg S Bonds
4.72% - - - 51,499.65 51,499.65
US$ 500 millions unsecured non-convertible Reg S Bonds
3.76% - - - 34,569.33 34,569.33
EUR 525 millions unsecured Euro Bonds
2.84% - - 40,579.62 - 40,579.62
US$ 750 millions unsecured non-convertible Reg S Bonds
3.39% - 51,574.39 - - 51,574.39
US$ 600 Million Foreign Currency Bonds
3.802% - - - 41,391.57 41,391.57
US$ 400 Million Foreign Currency Bonds
2.923% - - - 27,649.55 27,649.55
Non-convertible redeemable debentures
8.54% - - 3,700.00 - 3,700.00
Variable Rate Borrowing
Term loan from bank 3M$Libor + 95 bps - - 1,21,295.20 - 1,21,295.20
Term Loan from Bank (US$ 500 Million Facility)
3M$Libor + 76 bps 13,509.09 6,754.55 20,263.64
Term Loan from Bank (JPY 38 Billion Facility)
3MJPYLibor + 47 bps
- - - 23,516.12 23,516.12
(` in million)
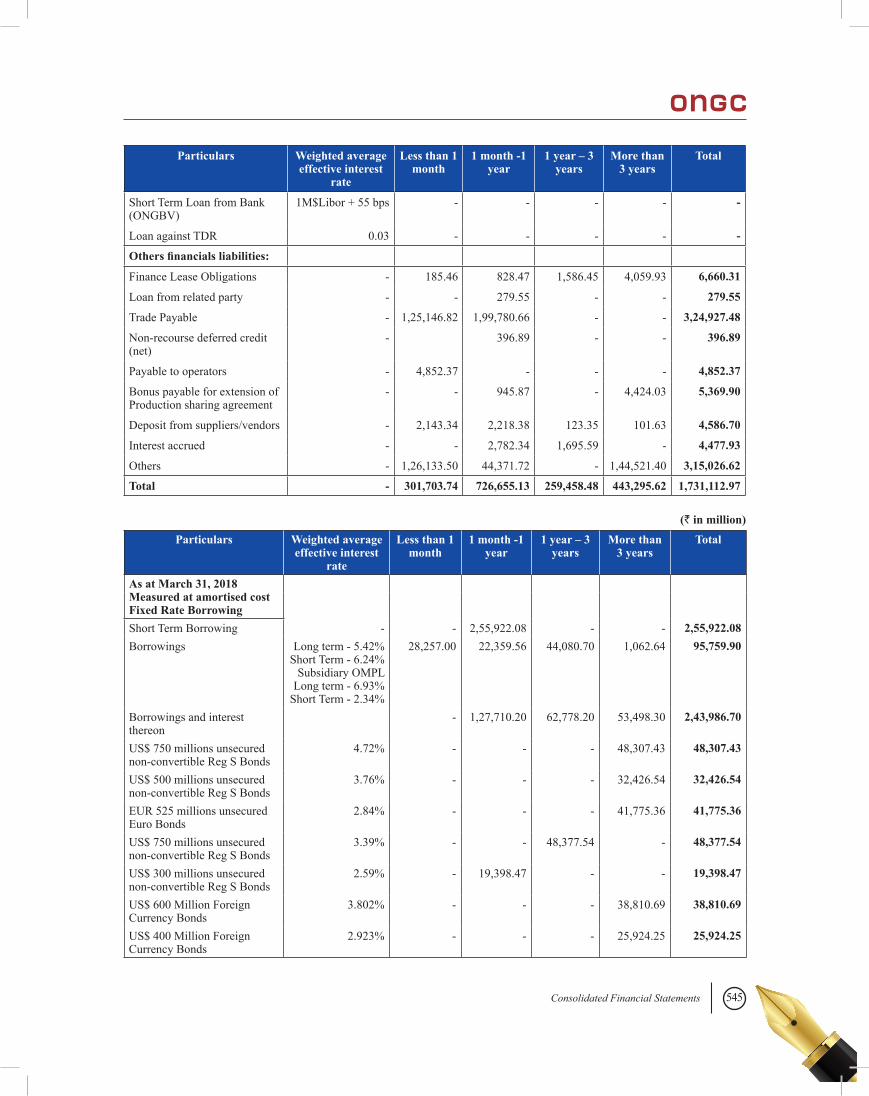
545Consolidated Financial Statements
Particulars Weighted average effective interest
rate
Less than 1 month
1 month -1 year
1 year – 3 years
More than 3 years
Total
Short Term Loan from Bank (ONGBV)
1M$Libor + 55 bps - - - - -
Loan against TDR 0.03 - - - - -
Others financials liabilities:
Finance Lease Obligations - 185.46 828.47 1,586.45 4,059.93 6,660.31
Loan from related party - - 279.55 - - 279.55
Trade Payable - 1,25,146.82 1,99,780.66 - - 3,24,927.48
Non-recourse deferred credit (net)
- 396.89 - - 396.89
Payable to operators - 4,852.37 - - - 4,852.37
Bonus payable for extension of Production sharing agreement
- - 945.87 - 4,424.03 5,369.90
Deposit from suppliers/vendors - 2,143.34 2,218.38 123.35 101.63 4,586.70
Interest accrued - - 2,782.34 1,695.59 - 4,477.93
Others - 1,26,133.50 44,371.72 - 1,44,521.40 3,15,026.62
Total - 301,703.74 726,655.13 259,458.48 443,295.62 1,731,112.97
Particulars Weighted average effective interest
rate
Less than 1 month
1 month -1 year
1 year – 3 years
More than 3 years
Total
As at March 31, 2018Measured at amortised costFixed Rate BorrowingShort Term Borrowing - - 2,55,922.08 - - 2,55,922.08Borrowings Long term - 5.42%
Short Term - 6.24% Subsidiary OMPL
Long term - 6.93% Short Term - 2.34%
28,257.00 22,359.56 44,080.70 1,062.64 95,759.90
Borrowings and interest thereon
- 1,27,710.20 62,778.20 53,498.30 2,43,986.70
US$ 750 millions unsecured non-convertible Reg S Bonds
4.72% - - - 48,307.43 48,307.43
US$ 500 millions unsecured non-convertible Reg S Bonds
3.76% - - - 32,426.54 32,426.54
EUR 525 millions unsecured Euro Bonds
2.84% - - - 41,775.36 41,775.36
US$ 750 millions unsecured non-convertible Reg S Bonds
3.39% - - 48,377.54 - 48,377.54
US$ 300 millions unsecured non-convertible Reg S Bonds
2.59% - 19,398.47 - - 19,398.47
US$ 600 Million Foreign Currency Bonds
3.802% - - - 38,810.69 38,810.69
US$ 400 Million Foreign Currency Bonds
2.923% - - - 25,924.25 25,924.25
(` in million)
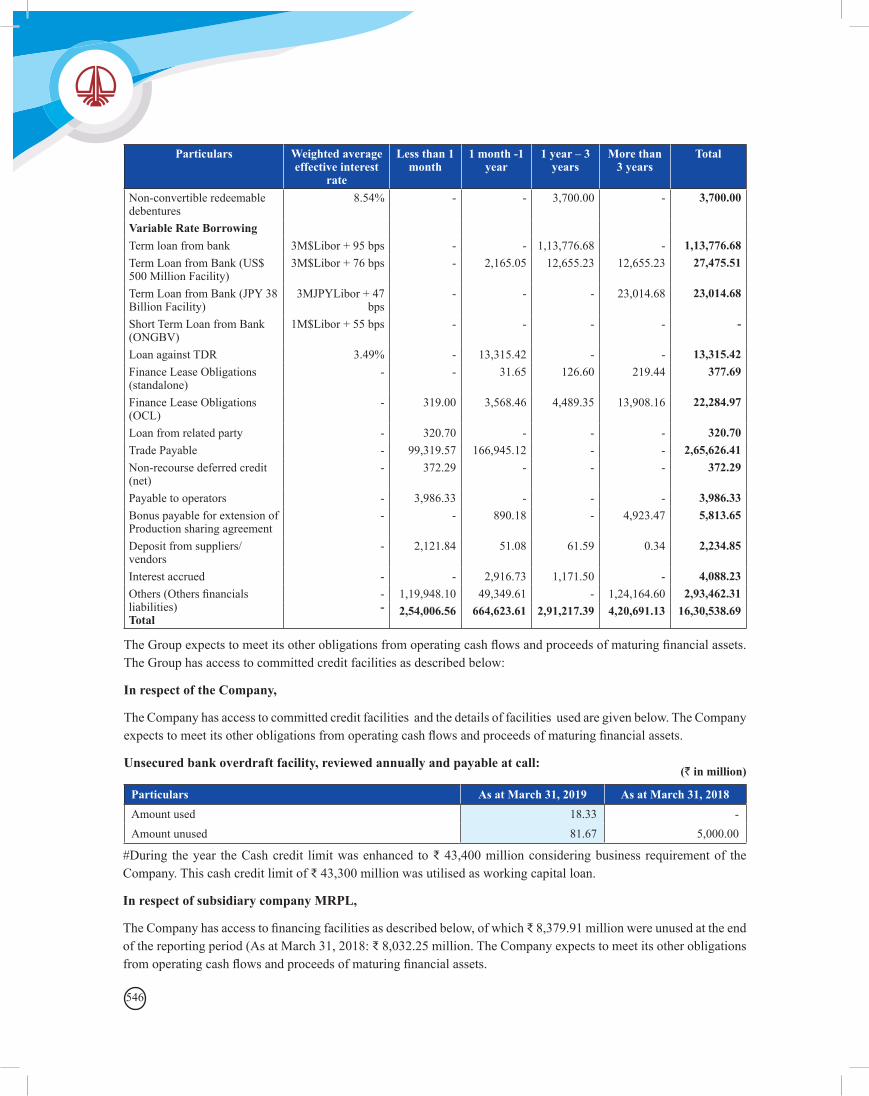
546
Particulars Weighted average effective interest
rate
Less than 1 month
1 month -1 year
1 year – 3 years
More than 3 years
Total
Non-convertible redeemable debentures
8.54% - - 3,700.00 - 3,700.00
Variable Rate BorrowingTerm loan from bank 3M$Libor + 95 bps - - 1,13,776.68 - 1,13,776.68Term Loan from Bank (US$ 500 Million Facility)
3M$Libor + 76 bps - 2,165.05 12,655.23 12,655.23 27,475.51
Term Loan from Bank (JPY 38 Billion Facility)
3MJPYLibor + 47 bps
- - - 23,014.68 23,014.68
Short Term Loan from Bank (ONGBV)
1M$Libor + 55 bps - - - - -
Loan against TDR 3.49% - 13,315.42 - - 13,315.42Finance Lease Obligations (standalone)
- - 31.65 126.60 219.44 377.69
Finance Lease Obligations (OCL)
- 319.00 3,568.46 4,489.35 13,908.16 22,284.97
Loan from related party - 320.70 - - - 320.70Trade Payable - 99,319.57 166,945.12 - - 2,65,626.41Non-recourse deferred credit (net)
- 372.29 - - - 372.29
Payable to operators - 3,986.33 - - - 3,986.33Bonus payable for extension of Production sharing agreement
- - 890.18 - 4,923.47 5,813.65
Deposit from suppliers/vendors
- 2,121.84 51.08 61.59 0.34 2,234.85
Interest accrued - - 2,916.73 1,171.50 - 4,088.23Others (Others financials liabilities)Total
--
1,19,948.10 49,349.61 - 1,24,164.60 2,93,462.312,54,006.56 664,623.61 2,91,217.39 4,20,691.13 16,30,538.69
The Group expects to meet its other obligations from operating cash flows and proceeds of maturing financial assets. The Group has access to committed credit facilities as described below:
In respect of the Company,
The Company has access to committed credit facilities and the details of facilities used are given below. The Company expects to meet its other obligations from operating cash flows and proceeds of maturing financial assets.
Unsecured bank overdraft facility, reviewed annually and payable at call:
Particulars As at March 31, 2019 As at March 31, 2018Amount used 18.33 -Amount unused 81.67 5,000.00
(` in million)
#During the year the Cash credit limit was enhanced to ₹ 43,400 million considering business requirement of the Company. This cash credit limit of ₹ 43,300 million was utilised as working capital loan.
In respect of subsidiary company MRPL,
The Company has access to financing facilities as described below, of which ₹ 8,379.91 million were unused at the end of the reporting period (As at March 31, 2018: ₹ 8,032.25 million. The Company expects to meet its other obligations from operating cash flows and proceeds of maturing financial assets.
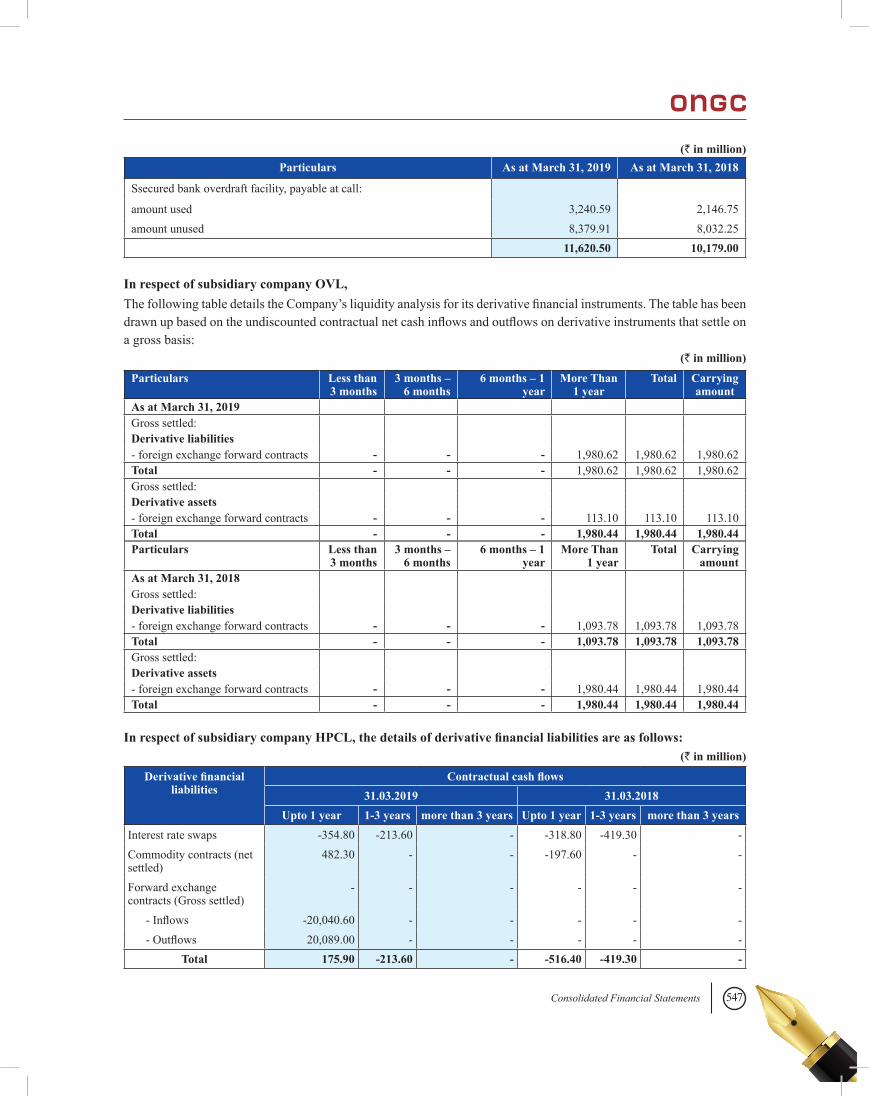
547Consolidated Financial Statements
Particulars As at March 31, 2019 As at March 31, 2018
Ssecured bank overdraft facility, payable at call:
amount used 3,240.59 2,146.75 amount unused 8,379.91 8,032.25
11,620.50 10,179.00
(` in million)
(` in million)
In respect of subsidiary company OVL,The following table details the Company’s liquidity analysis for its derivative financial instruments. The table has been drawn up based on the undiscounted contractual net cash inflows and outflows on derivative instruments that settle on a gross basis:
Particulars Less than 3 months
3 months – 6 months
6 months – 1 year
More Than 1 year
Total Carrying amount
As at March 31, 2019Gross settled:Derivative liabilities- foreign exchange forward contracts - - - 1,980.62 1,980.62 1,980.62Total - - - 1,980.62 1,980.62 1,980.62Gross settled:Derivative assets- foreign exchange forward contracts - - - 113.10 113.10 113.10Total - - - 1,980.44 1,980.44 1,980.44Particulars Less than
3 months3 months –
6 months6 months – 1
yearMore Than
1 yearTotal Carrying
amountAs at March 31, 2018Gross settled:Derivative liabilities- foreign exchange forward contracts - - - 1,093.78 1,093.78 1,093.78Total - - - 1,093.78 1,093.78 1,093.78Gross settled:Derivative assets- foreign exchange forward contracts - - - 1,980.44 1,980.44 1,980.44Total - - - 1,980.44 1,980.44 1,980.44
In respect of subsidiary company HPCL, the details of derivative financial liabilities are as follows:
Derivative financial liabilities
Contractual cash flows31.03.2019 31.03.2018
Upto 1 year 1-3 years more than 3 years Upto 1 year 1-3 years more than 3 yearsInterest rate swaps -354.80 -213.60 - -318.80 -419.30 - Commodity contracts (net settled)
482.30 - - -197.60 - -
Forward exchange contracts (Gross settled)
- - - - - -
- Inflows -20,040.60 - - - - - - Outflows 20,089.00 - - - - -
Total 175.90 -213.60 - -516.40 -419.30 -
(` in million)
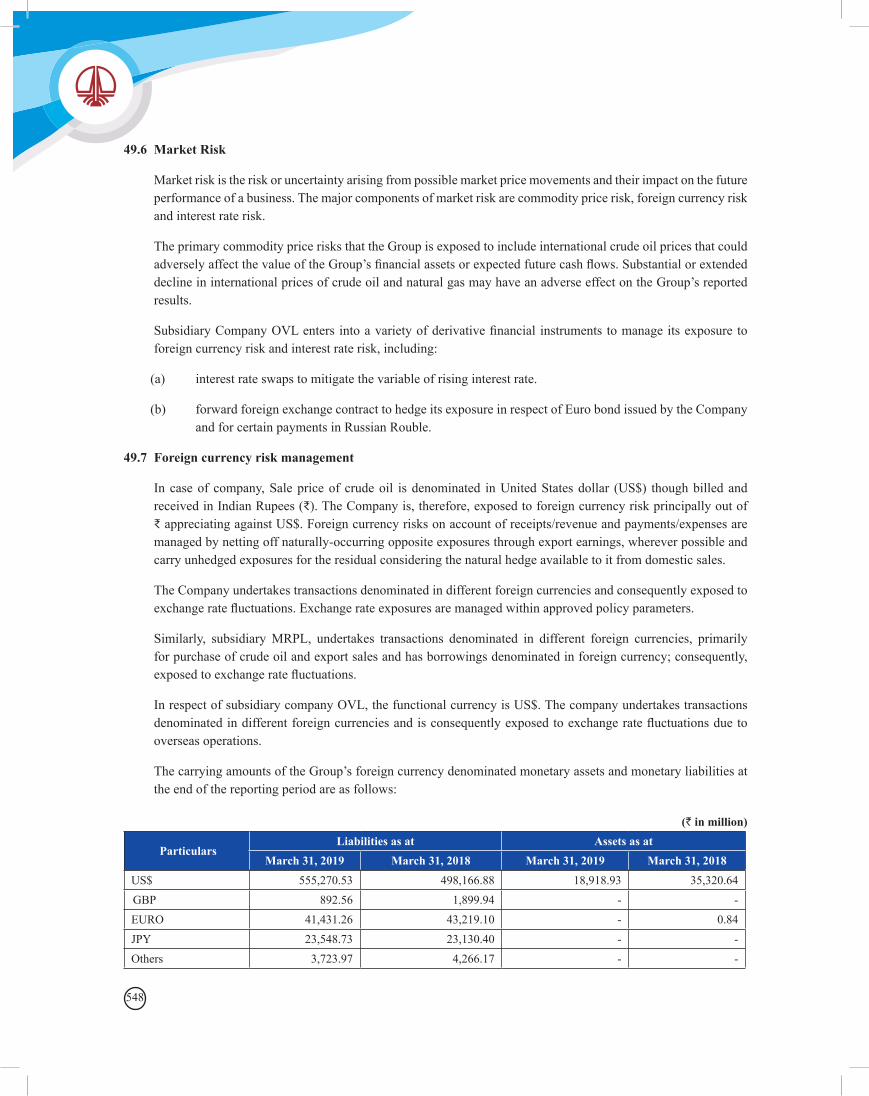
548
49.6 Market Risk
Market risk is the risk or uncertainty arising from possible market price movements and their impact on the future performance of a business. The major components of market risk are commodity price risk, foreign currency risk and interest rate risk.
The primary commodity price risks that the Group is exposed to include international crude oil prices that could adversely affect the value of the Group’s financial assets or expected future cash flows. Substantial or extended decline in international prices of crude oil and natural gas may have an adverse effect on the Group’s reported results.
Subsidiary Company OVL enters into a variety of derivative financial instruments to manage its exposure to foreign currency risk and interest rate risk, including:
(a) interest rate swaps to mitigate the variable of rising interest rate.
(b) forward foreign exchange contract to hedge its exposure in respect of Euro bond issued by the Company and for certain payments in Russian Rouble.
49.7 Foreign currency risk management
In case of company, Sale price of crude oil is denominated in United States dollar (US$) though billed and received in Indian Rupees (₹). The Company is, therefore, exposed to foreign currency risk principally out of ₹ appreciating against US$. Foreign currency risks on account of receipts/revenue and payments/expenses are managed by netting off naturally-occurring opposite exposures through export earnings, wherever possible and carry unhedged exposures for the residual considering the natural hedge available to it from domestic sales.
The Company undertakes transactions denominated in different foreign currencies and consequently exposed to exchange rate fluctuations. Exchange rate exposures are managed within approved policy parameters.
Similarly, subsidiary MRPL, undertakes transactions denominated in different foreign currencies, primarily for purchase of crude oil and export sales and has borrowings denominated in foreign currency; consequently, exposed to exchange rate fluctuations.
In respect of subsidiary company OVL, the functional currency is US$. The company undertakes transactions denominated in different foreign currencies and is consequently exposed to exchange rate fluctuations due to overseas operations.
The carrying amounts of the Group’s foreign currency denominated monetary assets and monetary liabilities at the end of the reporting period are as follows:
ParticularsLiabilities as at Assets as at
March 31, 2019 March 31, 2018 March 31, 2019 March 31, 2018US$ 555,270.53 498,166.88 18,918.93 35,320.64 GBP 892.56 1,899.94 - - EURO 41,431.26 43,219.10 - 0.84 JPY 23,548.73 23,130.40 - - Others 3,723.97 4,266.17 - -
(` in million)
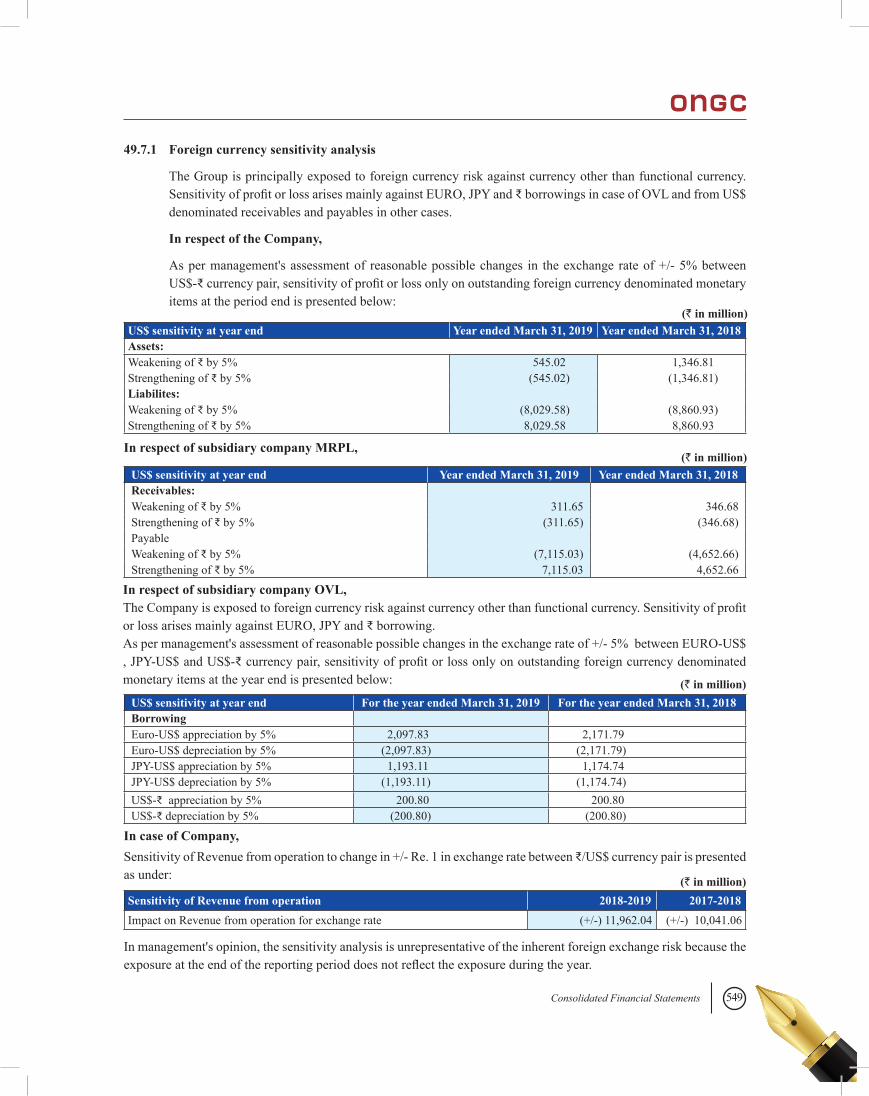
549Consolidated Financial Statements
49.7.1 Foreign currency sensitivity analysis
The Group is principally exposed to foreign currency risk against currency other than functional currency. Sensitivity of profit or loss arises mainly against EURO, JPY and ₹ borrowings in case of OVL and from US$ denominated receivables and payables in other cases.
In respect of the Company,
As per management's assessment of reasonable possible changes in the exchange rate of +/- 5% between US$-₹ currency pair, sensitivity of profit or loss only on outstanding foreign currency denominated monetary items at the period end is presented below:
US$ sensitivity at year end Year ended March 31, 2019 Year ended March 31, 2018Assets:Weakening of ₹ by 5% 545.02 1,346.81Strengthening of ₹ by 5% (545.02) (1,346.81)Liabilites:Weakening of ₹ by 5% (8,029.58) (8,860.93)Strengthening of ₹ by 5% 8,029.58 8,860.93
In respect of subsidiary company MRPL,
US$ sensitivity at year end Year ended March 31, 2019 Year ended March 31, 2018Receivables: Weakening of ₹ by 5% 311.65 346.68 Strengthening of ₹ by 5% (311.65) (346.68)Payable Weakening of ₹ by 5% (7,115.03) (4,652.66)Strengthening of ₹ by 5% 7,115.03 4,652.66
US$ sensitivity at year end For the year ended March 31, 2019 For the year ended March 31, 2018BorrowingEuro-US$ appreciation by 5% 2,097.83 2,171.79 Euro-US$ depreciation by 5% (2,097.83) (2,171.79)JPY-US$ appreciation by 5% 1,193.11 1,174.74 JPY-US$ depreciation by 5% (1,193.11) (1,174.74)US$-₹ appreciation by 5% 200.80 200.80 US$-₹ depreciation by 5% (200.80) (200.80)
(` in million)
(` in million)
In case of Company, Sensitivity of Revenue from operation to change in +/- Re. 1 in exchange rate between ₹/US$ currency pair is presented as under:
(` in million)
Sensitivity of Revenue from operation 2018-2019 2017-2018Impact on Revenue from operation for exchange rate (+/-) 11,962.04 (+/-) 10,041.06
In management's opinion, the sensitivity analysis is unrepresentative of the inherent foreign exchange risk because the exposure at the end of the reporting period does not reflect the exposure during the year.
In respect of subsidiary company OVL,The Company is exposed to foreign currency risk against currency other than functional currency. Sensitivity of profit or loss arises mainly against EURO, JPY and ₹ borrowing.As per management's assessment of reasonable possible changes in the exchange rate of +/- 5% between EURO-US$ , JPY-US$ and US$-₹ currency pair, sensitivity of profit or loss only on outstanding foreign currency denominated monetary items at the year end is presented below:
(` in million)
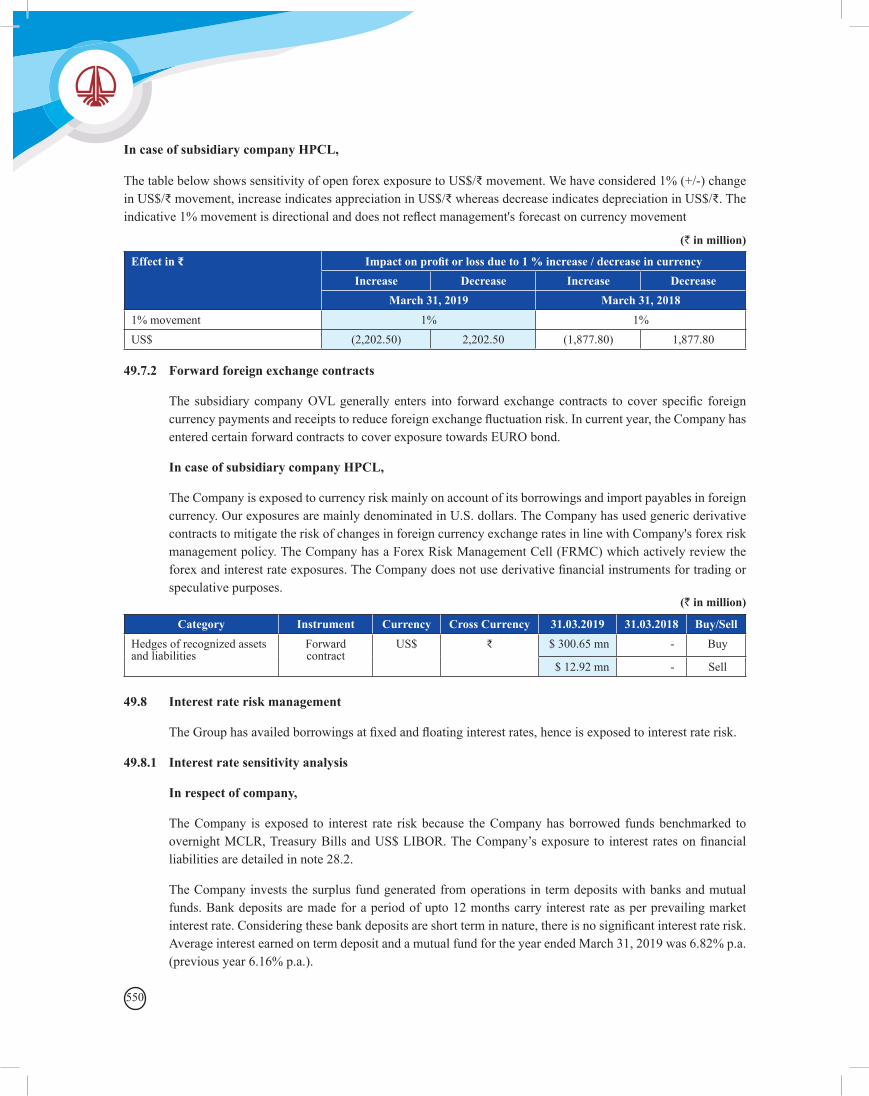
550
In case of subsidiary company HPCL,
The table below shows sensitivity of open forex exposure to US$/₹ movement. We have considered 1% (+/-) change in US$/₹ movement, increase indicates appreciation in US$/₹ whereas decrease indicates depreciation in US$/₹. The indicative 1% movement is directional and does not reflect management's forecast on currency movement
Effect in ₹ Impact on profit or loss due to 1 % increase / decrease in currencyIncrease Decrease Increase Decrease
March 31, 2019 March 31, 20181% movement 1% 1%US$ (2,202.50) 2,202.50 (1,877.80) 1,877.80
(` in million)
49.7.2 Forward foreign exchange contracts
The subsidiary company OVL generally enters into forward exchange contracts to cover specific foreign currency payments and receipts to reduce foreign exchange fluctuation risk. In current year, the Company has entered certain forward contracts to cover exposure towards EURO bond.
In case of subsidiary company HPCL,
The Company is exposed to currency risk mainly on account of its borrowings and import payables in foreign currency. Our exposures are mainly denominated in U.S. dollars. The Company has used generic derivative contracts to mitigate the risk of changes in foreign currency exchange rates in line with Company's forex risk management policy. The Company has a Forex Risk Management Cell (FRMC) which actively review the forex and interest rate exposures. The Company does not use derivative financial instruments for trading or speculative purposes.
(` in million)
Category Instrument Currency Cross Currency 31.03.2019 31.03.2018 Buy/SellHedges of recognized assets and liabilities
Forward contract
US$ ₹ $ 300.65 mn - Buy
$ 12.92 mn - Sell
49.8 Interest rate risk management
The Group has availed borrowings at fixed and floating interest rates, hence is exposed to interest rate risk.
49.8.1 Interest rate sensitivity analysis
In respect of company,
The Company is exposed to interest rate risk because the Company has borrowed funds benchmarked to overnight MCLR, Treasury Bills and US$ LIBOR. The Company’s exposure to interest rates on financial liabilities are detailed in note 28.2.
The Company invests the surplus fund generated from operations in term deposits with banks and mutual funds. Bank deposits are made for a period of upto 12 months carry interest rate as per prevailing market interest rate. Considering these bank deposits are short term in nature, there is no significant interest rate risk. Average interest earned on term deposit and a mutual fund for the year ended March 31, 2019 was 6.82% p.a. (previous year 6.16% p.a.).
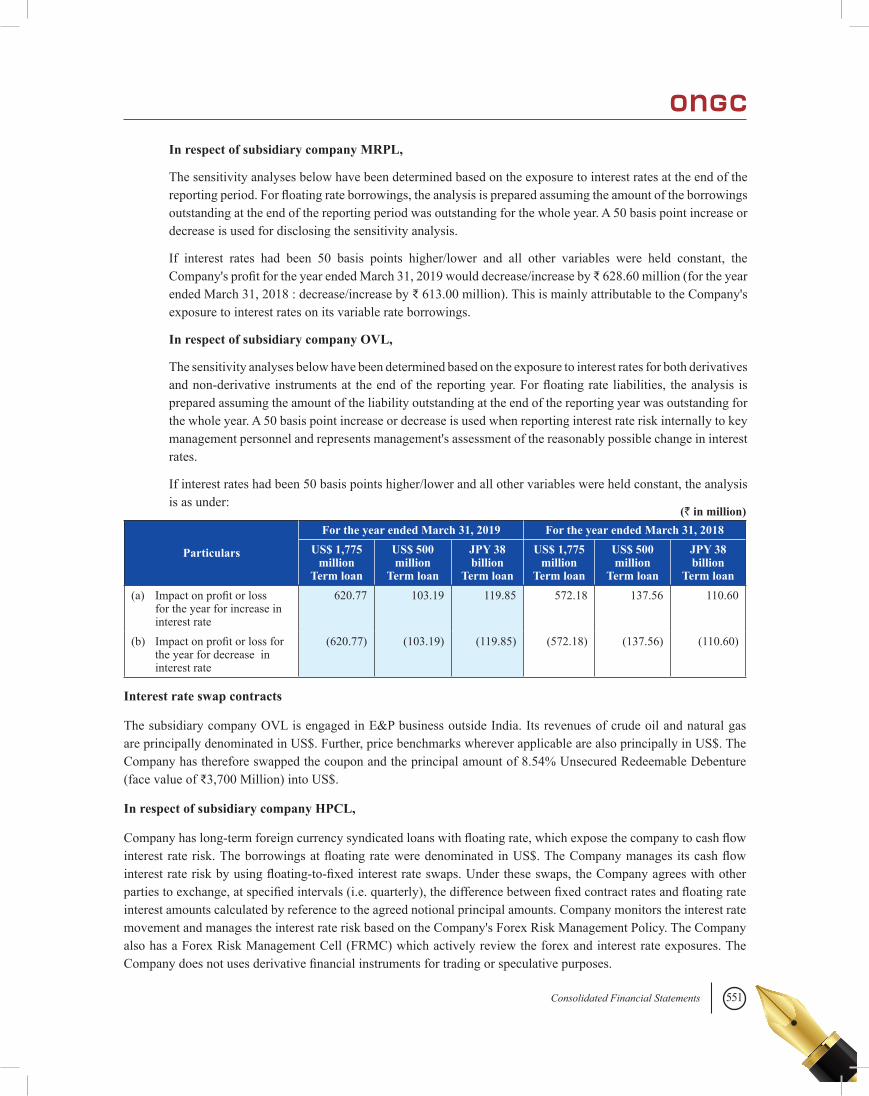
551Consolidated Financial Statements
In respect of subsidiary company MRPL,
The sensitivity analyses below have been determined based on the exposure to interest rates at the end of the reporting period. For floating rate borrowings, the analysis is prepared assuming the amount of the borrowings outstanding at the end of the reporting period was outstanding for the whole year. A 50 basis point increase or decrease is used for disclosing the sensitivity analysis.
If interest rates had been 50 basis points higher/lower and all other variables were held constant, the Company's profit for the year ended March 31, 2019 would decrease/increase by ₹ 628.60 million (for the year ended March 31, 2018 : decrease/increase by ₹ 613.00 million). This is mainly attributable to the Company's exposure to interest rates on its variable rate borrowings.
In respect of subsidiary company OVL,
The sensitivity analyses below have been determined based on the exposure to interest rates for both derivatives and non-derivative instruments at the end of the reporting year. For floating rate liabilities, the analysis is prepared assuming the amount of the liability outstanding at the end of the reporting year was outstanding for the whole year. A 50 basis point increase or decrease is used when reporting interest rate risk internally to key management personnel and represents management's assessment of the reasonably possible change in interest rates.
If interest rates had been 50 basis points higher/lower and all other variables were held constant, the analysis is as under:
Particulars
For the year ended March 31, 2019 For the year ended March 31, 2018US$ 1,775
million Term loan
US$ 500 million
Term loan
JPY 38 billion
Term loan
US$ 1,775 million
Term loan
US$ 500 million
Term loan
JPY 38 billion
Term loan(a) Impact on profit or loss
for the year for increase in interest rate
620.77 103.19 119.85 572.18 137.56 110.60
(b) Impact on profit or loss for the year for decrease in interest rate
(620.77) (103.19) (119.85) (572.18) (137.56) (110.60)
(` in million)
Interest rate swap contracts
The subsidiary company OVL is engaged in E&P business outside India. Its revenues of crude oil and natural gas are principally denominated in US$. Further, price benchmarks wherever applicable are also principally in US$. The Company has therefore swapped the coupon and the principal amount of 8.54% Unsecured Redeemable Debenture (face value of ₹3,700 Million) into US$.
In respect of subsidiary company HPCL,
Company has long-term foreign currency syndicated loans with floating rate, which expose the company to cash flow interest rate risk. The borrowings at floating rate were denominated in US$. The Company manages its cash flow interest rate risk by using floating-to-fixed interest rate swaps. Under these swaps, the Company agrees with other parties to exchange, at specified intervals (i.e. quarterly), the difference between fixed contract rates and floating rate interest amounts calculated by reference to the agreed notional principal amounts. Company monitors the interest rate movement and manages the interest rate risk based on the Company's Forex Risk Management Policy. The Company also has a Forex Risk Management Cell (FRMC) which actively review the forex and interest rate exposures. The Company does not uses derivative financial instruments for trading or speculative purposes.
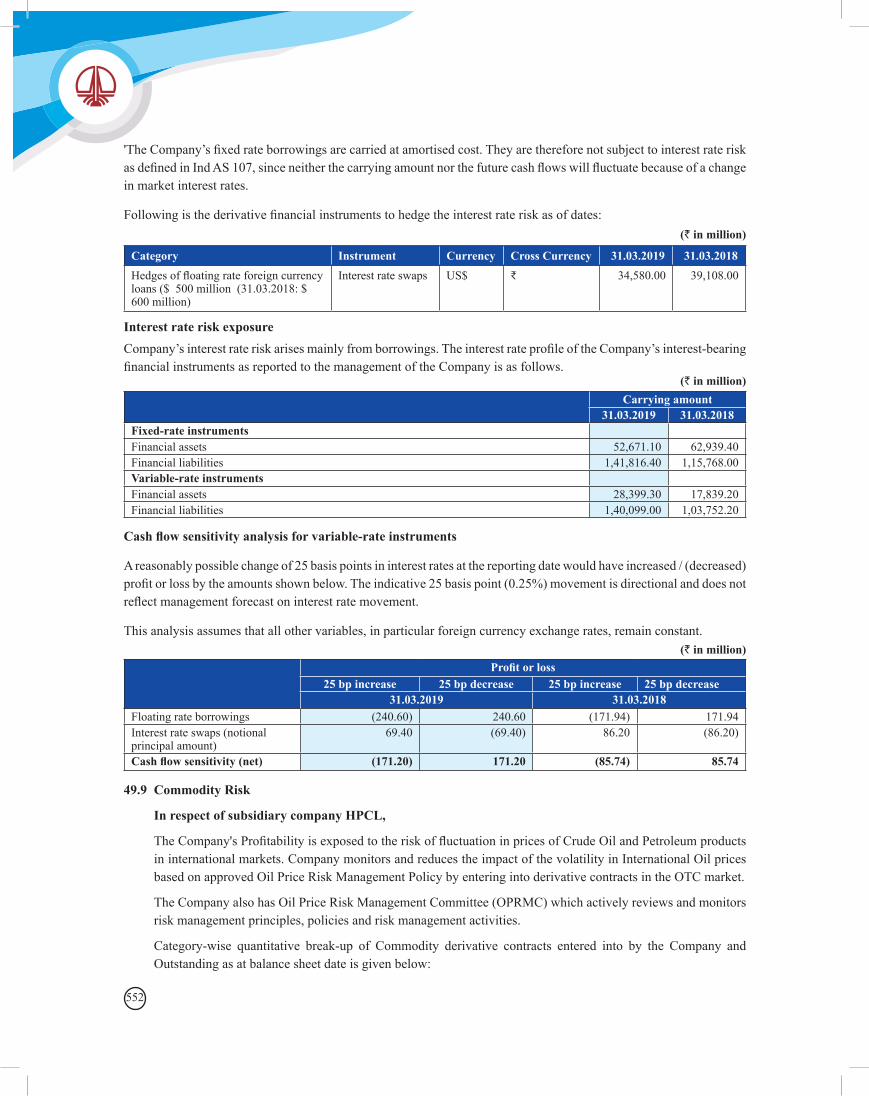
552
'The Company’s fixed rate borrowings are carried at amortised cost. They are therefore not subject to interest rate risk as defined in Ind AS 107, since neither the carrying amount nor the future cash flows will fluctuate because of a change in market interest rates.
Following is the derivative financial instruments to hedge the interest rate risk as of dates:
Category Instrument Currency Cross Currency 31.03.2019 31.03.2018Hedges of floating rate foreign currency loans ($ 500 million (31.03.2018: $ 600 million)
Interest rate swaps US$ ₹ 34,580.00 39,108.00
(` in million)
Interest rate risk exposureCompany’s interest rate risk arises mainly from borrowings. The interest rate profile of the Company’s interest-bearing financial instruments as reported to the management of the Company is as follows.
(` in million)
(` in million)
Carrying amount 31.03.2019 31.03.2018
Fixed-rate instruments Financial assets 52,671.10 62,939.40 Financial liabilities 1,41,816.40 1,15,768.00 Variable-rate instrumentsFinancial assets 28,399.30 17,839.20Financial liabilities 1,40,099.00 1,03,752.20
Cash flow sensitivity analysis for variable-rate instruments
A reasonably possible change of 25 basis points in interest rates at the reporting date would have increased / (decreased) profit or loss by the amounts shown below. The indicative 25 basis point (0.25%) movement is directional and does not reflect management forecast on interest rate movement.
This analysis assumes that all other variables, in particular foreign currency exchange rates, remain constant.
Profit or loss25 bp increase 25 bp decrease 25 bp increase 25 bp decrease
31.03.2019 31.03.2018Floating rate borrowings (240.60) 240.60 (171.94) 171.94 Interest rate swaps (notional principal amount)
69.40 (69.40) 86.20 (86.20)
Cash flow sensitivity (net) (171.20) 171.20 (85.74) 85.74
49.9 Commodity Risk
In respect of subsidiary company HPCL,
The Company's Profitability is exposed to the risk of fluctuation in prices of Crude Oil and Petroleum products in international markets. Company monitors and reduces the impact of the volatility in International Oil prices based on approved Oil Price Risk Management Policy by entering into derivative contracts in the OTC market.
The Company also has Oil Price Risk Management Committee (OPRMC) which actively reviews and monitors risk management principles, policies and risk management activities.
Category-wise quantitative break-up of Commodity derivative contracts entered into by the Company and Outstanding as at balance sheet date is given below:
553Consolidated Financial Statements
Particulars
Quantity (in Mn Barrels)31.03.2019 31.03.2018
Crude/Product Swaps 2.11 3.05
(` in million)
The sensitivity to a reasonable possible change of 10% in the price of crude/product swaps on the outstanding commodity hedging positions as on Balance sheet date would increase/decrease the profit or loss by amounts shown below. This 10% movement is directional and does not reflect any forecast of price movement.
Particulars
Effect on Profit before Tax (₹ in million)10%
Increase10%
Decrease10%
Increase10%
Decrease 31.03.2019 31.03.2018Crude/Product Swaps (130.00) 130.00 (162.70) 162.70
49.10 Price risks
The Company’s equity securities price risk arises from investments held and classified in the balance sheet either at fair value through OCI or at fair value through profit or loss. The Company’s equity investments in IOC and GAIL are publicly traded.
Investment of short-term surplus funds of the Company in liquid schemes of mutual funds provides high level of liquidity from a portfolio of money market securities and high quality debt and categorized as ‘low risk’ product from liquidity and interest rate risk perspectives.
49.10.1 Price sensitivity analysis
In respect of Company,
The sensitivity of profit or loss in respect of investments in equity shares at the end of the reporting period for +/-5% change in price and net asset value is presented below:
• Other comprehensive income for the year ended March 31, 2019 would increase/ decrease by ₹ 12,781.32 million (for the year ended March 31, 2018 would increase/ decrease by ₹ 13,596.66 million) as a result of 5% changes in fair value of equity investments measured at FVTOCI; and
• The Sensitivity of Revenue from operation to change in +/- 1 US$ in prices of crude oil, natural gas & value added products (VAP)
Sensitivity of Revenue from operation 2018-2019 2017-2018Impact on Revenue from operation for US$ in prices of crude oil, natural gas & VAP (+/-) 60,043.89 (+/-) 54,162.28
(` in million)
In respect of subsidiary, OVL,
The sensitivity of profit or loss in respect of investments in mutual funds at the end of the reporting period for +/-5% change in price and net asset value is presented below:
Profit before tax for the year ended March 31, 2019 would increase/decrease by ₹ 1,254.14 million (For the year ended March 31, 2018 would increase/decrease by ₹ 1,049.28 million) as a result of the changes in net asset value of investment in mutual funds.
In respect of subsidiary, HPCL,
The table below summarises the impact of increases/decreases in prices on Other comprehensive Income for the period
554
Equity Instruments through OCI1% Increase 1% Decrease 1% Increase 1% Decrease
31.03.2019 31.03.2018Equity Investment in Oil India Ltd. 49.60 (49.60) 57.60 (57.60)
(` in million)
(` in million)
(` in million)
49.11 Fair value measurement
This note provides information about how the Group determines fair values of various financial assets and financial liabilities.
49.11.1 Fair value of the Group’s financial assets that are measured at fair value on a recurring basis
Some of the Group’s financial assets are measured at fair value at the end of each reporting period. The following table gives information about how the fair values of these financial assets are determined.
In respect of company:
Financial Assets/ (Financial Liabilities)
Fair value as at Fair value hierarchy
Valuation technique(s) and key input(s)
March 31, 2019 March 31, 2018Investment in Equity Instruments (quoted)
255,626.49 271,933.10 Level 1 Quoted bid prices from Stock exchange-NSE Ltd.
Compulsorily Convertible Preference Share
95.69 9.74 Level 2 Discounted Free Cash Flow Methodology
Investment in Equity Instruments
0.32 0.25 Level 2 Discounted Free Cash Flow Methodology
Employee Loans 12,313.84 10,193.66 Level 2 Discounted Cash Flows i.e. present value of expected receipt/payment discounted using appropriate discounting rate.
Financial Guarantee (991.37) (1,464.94) Level 2 Interest Rate Differential Model. Finance Lease Obligation
(417.96) (417.96) Level 2 Valuation based upon risk adjusted discount rate applied to get present value of annuity till perpetuity (Annuity capitalisation model).
Security Deposits from Contractors
(4,541.36) (2,222.96) Level 2 Discounted Cash Flows i.e. present value of expected receipt/payment discounted using appropriate discounting rate.
In respect of subsidiary company OVL,Some of the Company’s financial assets are measured at fair value at the end of each reporting year. The following table gives information about how the fair values of these financial assets are determined
Particulars Fair value Fair value
hierarchy
Valuation technique and key input(s) As at March
31, 2019As at March
31, 2018Financial assetsInvestment in mutual funds
25,082.71 20,985.64 Level 1 NAV declared by respective Asset Management Companies
555Consolidated Financial Statements
Employee Loans 196.49 179.94 Level 2 Discounted Cash Flows i.e. present value of expected receipt/payment discounted using appropriate discounting rate.
Financial LiabilitiesFinance Lease Obligation 377.69 377.69 Level 2 Valuation based upon risk adjusted discount
rate applied to get present value of annuity till perpetuity (Annuity capitalisation model).
Finance Lease Obligation 6282.62 22,284.97 Level 2 Discounted Cash Flows i.e. present value of expected receipt/payment discounted using appropriate discounting rate.
In respect of subsidiary company HPCL,Fair value hierarchyThis section explains the judgments and estimates made in determining the fair values of the Financial Assets and Financial Liabilities that are recognized and measured at fair value and at amortised cost. To provide an indication about the reliability of the inputs used in determining fair value, Group has classified its Financial Assets and Financial Liabilities into the three levels prescribed under the accounting standard. It does not include fair value information for financial assets and financial liabilities not measured at fair value if the carrying amount is a reasonable approximation of fair value. An explanation of each level is provided under Significant Accounting Policy.
31.03.2019 31.03.2018Level 1 Level 2 Level 3 Level 1 Level 2 Level 3
Financial assetsInvestments - Investment in Equity Instruments 4,958.50 - - 5,760.00 - - - Investment in Debt Instruments 50,837.60 - - 49,993.80 - - - Others - 0.50 - - 0.50 - Loans & Advances - - - - - - - Employee Loans - 3,595.90 - - 3,372.40 - Derivative Assets - 1,075.80 - - 920.90 - Total 55,796.10 4,672.20 - 55,753.80 4,293.80 - Financial liabilitiesBorrowings - Foreign Currency Bonds
- 33,934.90 -
- 31,257.50 -
- Oil Industry Development Board Loan - 7,046.70 - - 1,903.90 - Derivative Liabilities - 125.20 - - 199.40 - Total - 41,106.80 - - 33,360.80 -
(` in million)
Valuation techniques used to determine Fair Value
Type Valuation techniqueDerivative instruments - forward exchange contracts
Discounted cash flow i.e. fair value of foreign exchange forward contracts is estimated by discounting the difference between the contractual forward price and the current forward price for the residual maturity of the contract.
Commodity derivatives Fair value of commodity derivative contracts is estimated by determining the difference between the contractual price and the current forward price for the residual maturity of the contract.
556
Derivative instruments - interest rate swap
Discounted cash flows i.e. Present value of expected receipt/payment.
Non current financial assets and liabilities measured at amortised cost
Discounted cash flows. The valuation model considers the present value of expected receipt/payment discounted using appropriate discounting rates.
49.12 Offsetting
In respect of subsidiary company HPCL,
The following table presents the recognized financial instruments that are eligible for offset and other similar arrangements but are not offset, as at 31.03.2019, 31.03.2018. The column 'net amount' shows the impact on the Company's balance sheet if all set-off rights are exercised.
Effect of offsetting on the balance sheet Related amounts not offsetGross
amounts Gross amounts
set off in the balance sheet
Net amounts presented in the
balance sheet
Financial Instrument collateral
Net Amount
March 31, 2019 Financial assets Trade Receivables 64,373.60 (7,699.30) 56,674.30 (2,413.60) 54,260.70 Other Current Financial Assets 1,05,159.90 - 1,05,159.90 - 1,05,159.90 Financial liabilities Trade Payables 1,98,233.30 (7,699.30) 1,90,534.00 - 1,90,534.00 Other Current Financial Liabilities
1,76,145.90 - 1,76,145.90 (2,413.60) 1,73,732.30
March 31, 2018 Financial assets Trade Receivables 92,731.90 (36,861.70) 55,870.20 (1,093.00) 54,777.20 Other Current Financial Assets 53,829.96 - 53,829.96 - 53,829.96 Financial liabilities Trade Payables 1,94,661.30 (36,861.70) 1,57,799.60 - 1,57,799.60 Other Current Financial Liabilities
1,45,672.10 - 1,45,672.10 (1,093.00) 1,44,579.10
(` in million)
49.13 Fair value of financial assets and financial liabilities that are not measured at fair value (but fair value disclosures are required)
Management considers that the carrying amounts of financial assets and financial liabilities recognized in the financial statements except as per note 49.10 approximate their fair values
50. Disclosure of Interests in Joint Operation:
50.1 Joint Operations in India
In respect of certain unincorporated PSC/NELP/CBM blocks, the Company’s Joint Operation (JO) with certain body corporates has entered into Production Sharing Contracts (PSCs) with GoI for operations in India. As per signed PSC & JOA, Company has direct right on Assets, liabilities, income & expense of blocks. Details of these Joint Operation Blocks are as under:
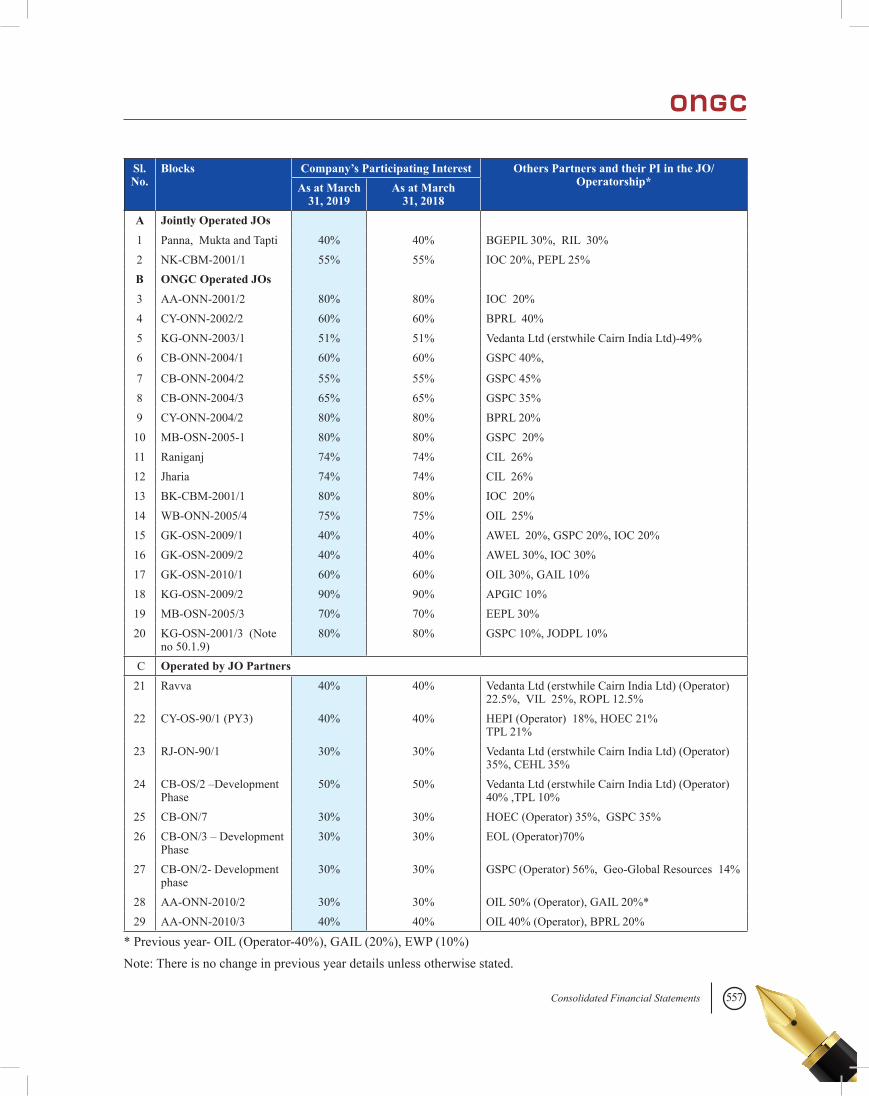
557Consolidated Financial Statements
Sl. No.
Blocks Company’s Participating Interest Others Partners and their PI in the JO/Operatorship*As at March
31, 2019As at March
31, 2018A Jointly Operated JOs1 Panna, Mukta and Tapti 40% 40% BGEPIL 30%, RIL 30%2 NK-CBM-2001/1 55% 55% IOC 20%, PEPL 25% B ONGC Operated JOs3 AA-ONN-2001/2 80% 80% IOC 20%4 CY-ONN-2002/2 60% 60% BPRL 40%5 KG-ONN-2003/1 51% 51% Vedanta Ltd (erstwhile Cairn India Ltd)-49%6 CB-ONN-2004/1 60% 60% GSPC 40%,
7 CB-ONN-2004/2 55% 55% GSPC 45% 8 CB-ONN-2004/3 65% 65% GSPC 35% 9 CY-ONN-2004/2 80% 80% BPRL 20%10 MB-OSN-2005-1 80% 80% GSPC 20%11 Raniganj 74% 74% CIL 26%12 Jharia 74% 74% CIL 26%13 BK-CBM-2001/1 80% 80% IOC 20%14 WB-ONN-2005/4 75% 75% OIL 25%15 GK-OSN-2009/1 40% 40% AWEL 20%, GSPC 20%, IOC 20%16 GK-OSN-2009/2 40% 40% AWEL 30%, IOC 30%17 GK-OSN-2010/1 60% 60% OIL 30%, GAIL 10%18 KG-OSN-2009/2 90% 90% APGIC 10%19 MB-OSN-2005/3 70% 70% EEPL 30% 20 KG-OSN-2001/3 (Note
no 50.1.9)80% 80% GSPC 10%, JODPL 10%
C Operated by JO Partners 21 Ravva 40% 40% Vedanta Ltd (erstwhile Cairn India Ltd) (Operator)
22.5%, VIL 25%, ROPL 12.5%22 CY-OS-90/1 (PY3) 40% 40% HEPI (Operator) 18%, HOEC 21%
TPL 21%23 RJ-ON-90/1 30% 30% Vedanta Ltd (erstwhile Cairn India Ltd) (Operator)
35%, CEHL 35%24 CB-OS/2 –Development
Phase50% 50% Vedanta Ltd (erstwhile Cairn India Ltd) (Operator)
40% ,TPL 10%25 CB-ON/7 30% 30% HOEC (Operator) 35%, GSPC 35%26 CB-ON/3 – Development
Phase30% 30% EOL (Operator)70%
27 CB-ON/2- Development phase
30% 30% GSPC (Operator) 56%, Geo-Global Resources 14%
28 AA-ONN-2010/2 30% 30% OIL 50% (Operator), GAIL 20%*29 AA-ONN-2010/3 40% 40% OIL 40% (Operator), BPRL 20%
* Previous year- OIL (Operator-40%), GAIL (20%), EWP (10%)Note: There is no change in previous year details unless otherwise stated.
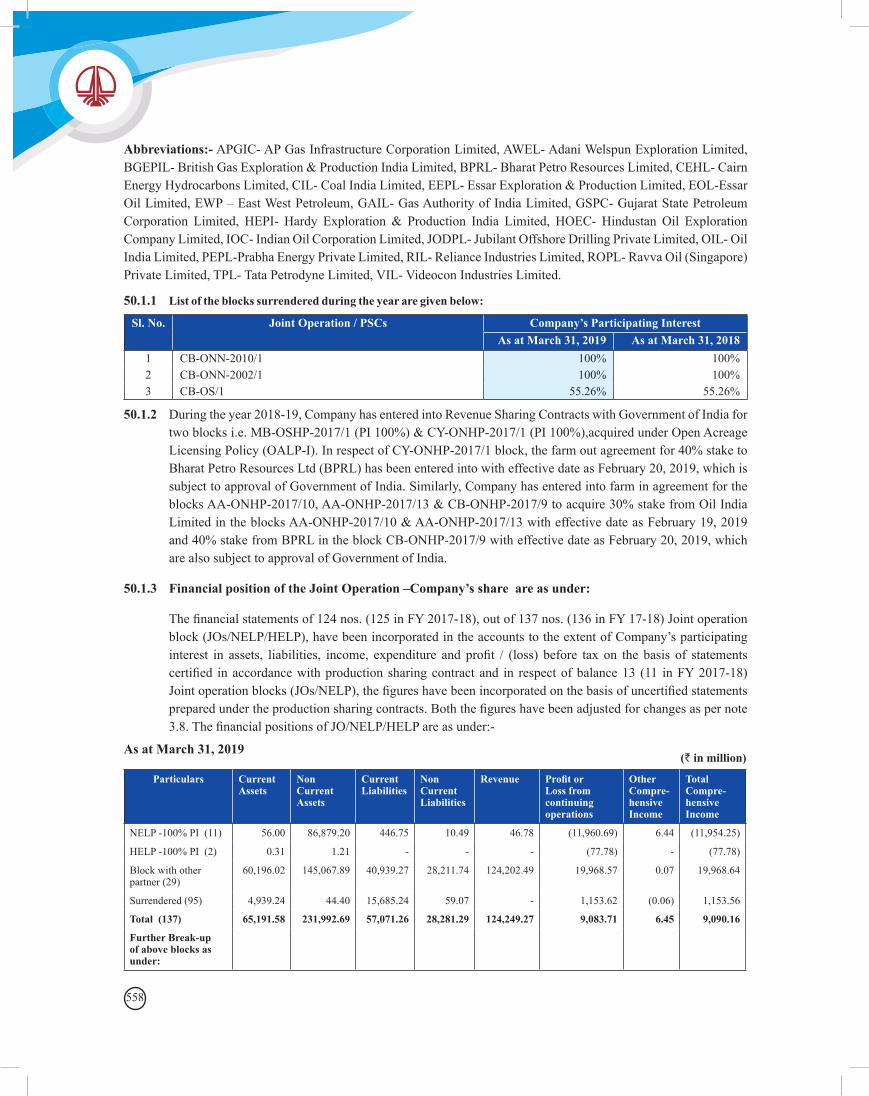
558
Abbreviations:- APGIC- AP Gas Infrastructure Corporation Limited, AWEL- Adani Welspun Exploration Limited, BGEPIL- British Gas Exploration & Production India Limited, BPRL- Bharat Petro Resources Limited, CEHL- Cairn Energy Hydrocarbons Limited, CIL- Coal India Limited, EEPL- Essar Exploration & Production Limited, EOL-Essar Oil Limited, EWP – East West Petroleum, GAIL- Gas Authority of India Limited, GSPC- Gujarat State Petroleum Corporation Limited, HEPI- Hardy Exploration & Production India Limited, HOEC- Hindustan Oil Exploration Company Limited, IOC- Indian Oil Corporation Limited, JODPL- Jubilant Offshore Drilling Private Limited, OIL- Oil India Limited, PEPL-Prabha Energy Private Limited, RIL- Reliance Industries Limited, ROPL- Ravva Oil (Singapore) Private Limited, TPL- Tata Petrodyne Limited, VIL- Videocon Industries Limited.
50.1.1 List of the blocks surrendered during the year are given below:
Sl. No. Joint Operation / PSCs Company’s Participating InterestAs at March 31, 2019 As at March 31, 2018
1 CB-ONN-2010/1 100% 100%2 CB-ONN-2002/1 100% 100%3 CB-OS/1 55.26% 55.26%
50.1.2 During the year 2018-19, Company has entered into Revenue Sharing Contracts with Government of India for two blocks i.e. MB-OSHP-2017/1 (PI 100%) & CY-ONHP-2017/1 (PI 100%),acquired under Open Acreage Licensing Policy (OALP-I). In respect of CY-ONHP-2017/1 block, the farm out agreement for 40% stake to Bharat Petro Resources Ltd (BPRL) has been entered into with effective date as February 20, 2019, which is subject to approval of Government of India. Similarly, Company has entered into farm in agreement for the blocks AA-ONHP-2017/10, AA-ONHP-2017/13 & CB-ONHP-2017/9 to acquire 30% stake from Oil India Limited in the blocks AA-ONHP-2017/10 & AA-ONHP-2017/13 with effective date as February 19, 2019 and 40% stake from BPRL in the block CB-ONHP-2017/9 with effective date as February 20, 2019, which are also subject to approval of Government of India.
50.1.3 Financial position of the Joint Operation –Company’s share are as under:
The financial statements of 124 nos. (125 in FY 2017-18), out of 137 nos. (136 in FY 17-18) Joint operation block (JOs/NELP/HELP), have been incorporated in the accounts to the extent of Company’s participating interest in assets, liabilities, income, expenditure and profit / (loss) before tax on the basis of statements certified in accordance with production sharing contract and in respect of balance 13 (11 in FY 2017-18) Joint operation blocks (JOs/NELP), the figures have been incorporated on the basis of uncertified statements prepared under the production sharing contracts. Both the figures have been adjusted for changes as per note 3.8. The financial positions of JO/NELP/HELP are as under:-
As at March 31, 2019
Particulars Current Assets
Non Current Assets
Current Liabilities
Non Current Liabilities
Revenue Profit or Loss from continuing operations
Other Compre-hensive Income
Total Compre-hensive Income
NELP -100% PI (11) 56.00 86,879.20 446.75 10.49 46.78 (11,960.69) 6.44 (11,954.25)
HELP -100% PI (2) 0.31 1.21 - - - (77.78) - (77.78)
Block with other partner (29)
60,196.02 145,067.89 40,939.27 28,211.74 124,202.49 19,968.57 0.07 19,968.64
Surrendered (95) 4,939.24 44.40 15,685.24 59.07 - 1,153.62 (0.06) 1,153.56
Total (137) 65,191.58 231,992.69 57,071.26 28,281.29 124,249.27 9,083.71 6.45 9,090.16
Further Break-up of above blocks as under:
(` in million)
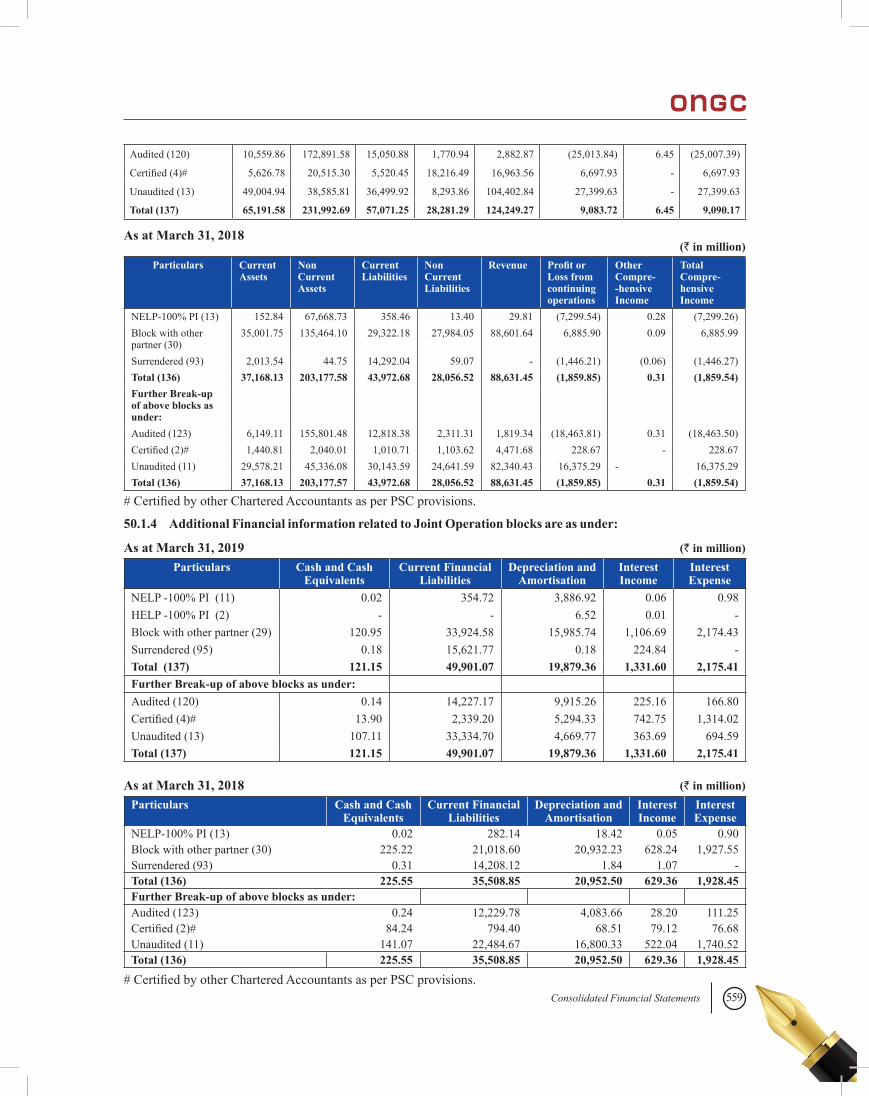
559Consolidated Financial Statements
Audited (120) 10,559.86 172,891.58 15,050.88 1,770.94 2,882.87 (25,013.84) 6.45 (25,007.39)
Certified (4)# 5,626.78 20,515.30 5,520.45 18,216.49 16,963.56 6,697.93 - 6,697.93
Unaudited (13) 49,004.94 38,585.81 36,499.92 8,293.86 104,402.84 27,399.63 - 27,399.63
Total (137) 65,191.58 231,992.69 57,071.25 28,281.29 124,249.27 9,083.72 6.45 9,090.17
As at March 31, 2018
As at March 31, 2019
As at March 31, 2018
Particulars Current Assets
Non Current Assets
Current Liabilities
Non Current Liabilities
Revenue Profit or Loss from continuing operations
Other Compre--hensive Income
Total Compre-hensive Income
NELP-100% PI (13) 152.84 67,668.73 358.46 13.40 29.81 (7,299.54) 0.28 (7,299.26)Block with other partner (30)
35,001.75 135,464.10 29,322.18 27,984.05 88,601.64 6,885.90 0.09 6,885.99
Surrendered (93) 2,013.54 44.75 14,292.04 59.07 - (1,446.21) (0.06) (1,446.27)Total (136) 37,168.13 203,177.58 43,972.68 28,056.52 88,631.45 (1,859.85) 0.31 (1,859.54)Further Break-up of above blocks as under:
Audited (123) 6,149.11 155,801.48 12,818.38 2,311.31 1,819.34 (18,463.81) 0.31 (18,463.50)Certified (2)# 1,440.81 2,040.01 1,010.71 1,103.62 4,471.68 228.67 - 228.67Unaudited (11) 29,578.21 45,336.08 30,143.59 24,641.59 82,340.43 16,375.29 - 16,375.29Total (136) 37,168.13 203,177.57 43,972.68 28,056.52 88,631.45 (1,859.85) 0.31 (1,859.54)
(` in million)
(` in million)
(` in million)
# Certified by other Chartered Accountants as per PSC provisions.
50.1.4 Additional Financial information related to Joint Operation blocks are as under:
Particulars Cash and Cash Equivalents
Current Financial Liabilities
Depreciation and Amortisation
Interest Income
Interest Expense
NELP -100% PI (11) 0.02 354.72 3,886.92 0.06 0.98HELP -100% PI (2) - - 6.52 0.01 -Block with other partner (29) 120.95 33,924.58 15,985.74 1,106.69 2,174.43Surrendered (95) 0.18 15,621.77 0.18 224.84 -Total (137) 121.15 49,901.07 19,879.36 1,331.60 2,175.41Further Break-up of above blocks as under:Audited (120) 0.14 14,227.17 9,915.26 225.16 166.80Certified (4)# 13.90 2,339.20 5,294.33 742.75 1,314.02Unaudited (13) 107.11 33,334.70 4,669.77 363.69 694.59Total (137) 121.15 49,901.07 19,879.36 1,331.60 2,175.41
Particulars Cash and Cash Equivalents
Current Financial Liabilities
Depreciation and Amortisation
Interest Income
Interest Expense
NELP-100% PI (13) 0.02 282.14 18.42 0.05 0.90Block with other partner (30) 225.22 21,018.60 20,932.23 628.24 1,927.55Surrendered (93) 0.31 14,208.12 1.84 1.07 -Total (136) 225.55 35,508.85 20,952.50 629.36 1,928.45Further Break-up of above blocks as under:Audited (123) 0.24 12,229.78 4,083.66 28.20 111.25Certified (2)# 84.24 794.40 68.51 79.12 76.68Unaudited (11) 141.07 22,484.67 16,800.33 522.04 1,740.52Total (136) 225.55 35,508.85 20,952.50 629.36 1,928.45
# Certified by other Chartered Accountants as per PSC provisions.
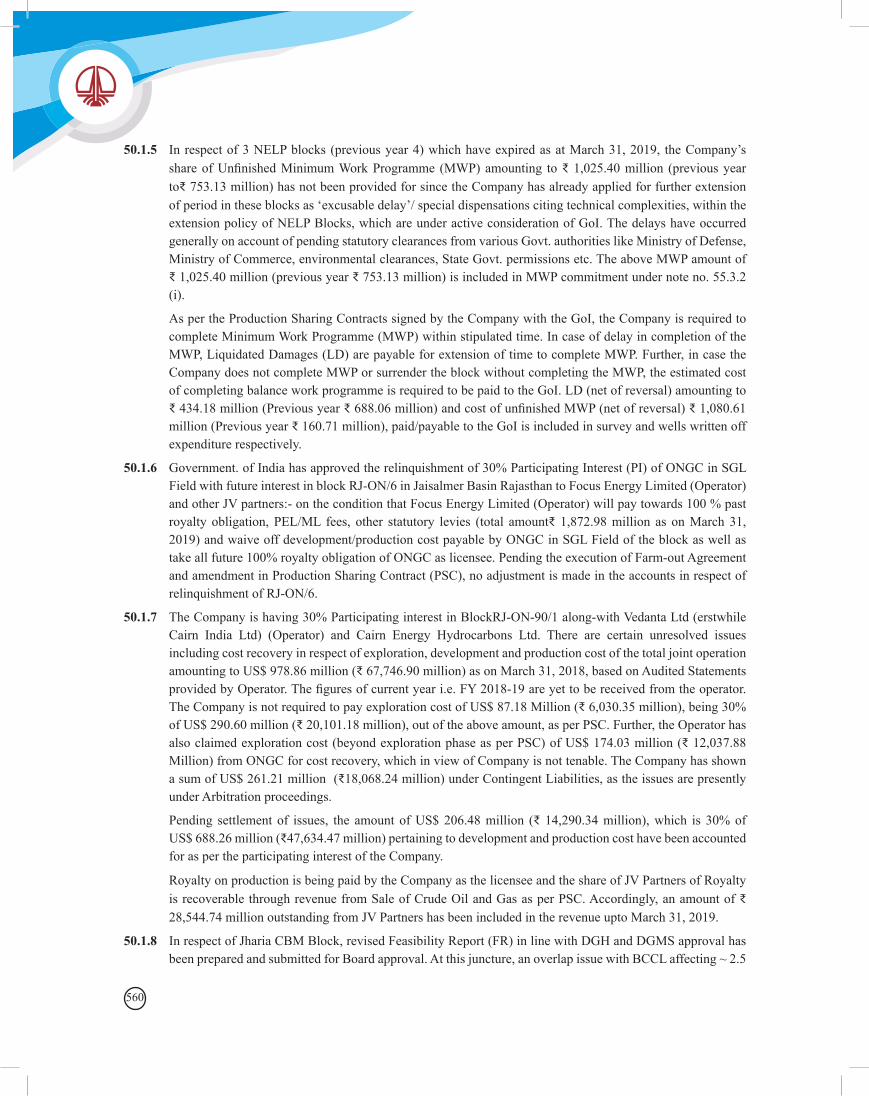
560
50.1.5 In respect of 3 NELP blocks (previous year 4) which have expired as at March 31, 2019, the Company’s share of Unfinished Minimum Work Programme (MWP) amounting to ₹ 1,025.40 million (previous year to₹ 753.13 million) has not been provided for since the Company has already applied for further extension of period in these blocks as ‘excusable delay’/ special dispensations citing technical complexities, within the extension policy of NELP Blocks, which are under active consideration of GoI. The delays have occurred generally on account of pending statutory clearances from various Govt. authorities like Ministry of Defense, Ministry of Commerce, environmental clearances, State Govt. permissions etc. The above MWP amount of ₹ 1,025.40 million (previous year ₹ 753.13 million) is included in MWP commitment under note no. 55.3.2 (i).
As per the Production Sharing Contracts signed by the Company with the GoI, the Company is required to complete Minimum Work Programme (MWP) within stipulated time. In case of delay in completion of the MWP, Liquidated Damages (LD) are payable for extension of time to complete MWP. Further, in case the Company does not complete MWP or surrender the block without completing the MWP, the estimated cost of completing balance work programme is required to be paid to the GoI. LD (net of reversal) amounting to ₹ 434.18 million (Previous year ₹ 688.06 million) and cost of unfinished MWP (net of reversal) ₹ 1,080.61 million (Previous year ₹ 160.71 million), paid/payable to the GoI is included in survey and wells written off expenditure respectively.
50.1.6 Government. of India has approved the relinquishment of 30% Participating Interest (PI) of ONGC in SGL Field with future interest in block RJ-ON/6 in Jaisalmer Basin Rajasthan to Focus Energy Limited (Operator)and other JV partners:- on the condition that Focus Energy Limited (Operator) will pay towards 100 % past royalty obligation, PEL/ML fees, other statutory levies (total amount₹ 1,872.98 million as on March 31, 2019) and waive off development/production cost payable by ONGC in SGL Field of the block as well as take all future 100% royalty obligation of ONGC as licensee. Pending the execution of Farm-out Agreement and amendment in Production Sharing Contract (PSC), no adjustment is made in the accounts in respect of relinquishment of RJ-ON/6.
50.1.7 The Company is having 30% Participating interest in BlockRJ-ON-90/1 along-with Vedanta Ltd (erstwhile Cairn India Ltd) (Operator) and Cairn Energy Hydrocarbons Ltd. There are certain unresolved issues including cost recovery in respect of exploration, development and production cost of the total joint operation amounting to US$ 978.86 million (₹ 67,746.90 million) as on March 31, 2018, based on Audited Statements provided by Operator. The figures of current year i.e. FY 2018-19 are yet to be received from the operator. The Company is not required to pay exploration cost of US$ 87.18 Million (₹ 6,030.35 million), being 30% of US$ 290.60 million (₹ 20,101.18 million), out of the above amount, as per PSC. Further, the Operator has also claimed exploration cost (beyond exploration phase as per PSC) of US$ 174.03 million (₹ 12,037.88 Million) from ONGC for cost recovery, which in view of Company is not tenable. The Company has shown a sum of US$ 261.21 million (₹18,068.24 million) under Contingent Liabilities, as the issues are presently under Arbitration proceedings.
Pending settlement of issues, the amount of US$ 206.48 million (₹ 14,290.34 million), which is 30% of US$ 688.26 million (₹47,634.47 million) pertaining to development and production cost have been accounted for as per the participating interest of the Company.
Royalty on production is being paid by the Company as the licensee and the share of JV Partners of Royalty is recoverable through revenue from Sale of Crude Oil and Gas as per PSC. Accordingly, an amount of ₹ 28,544.74 million outstanding from JV Partners has been included in the revenue upto March 31, 2019.
50.1.8 In respect of Jharia CBM Block, revised Feasibility Report (FR) in line with DGH and DGMS approval has been prepared and submitted for Board approval. At this juncture, an overlap issue with BCCL affecting ~ 2.5
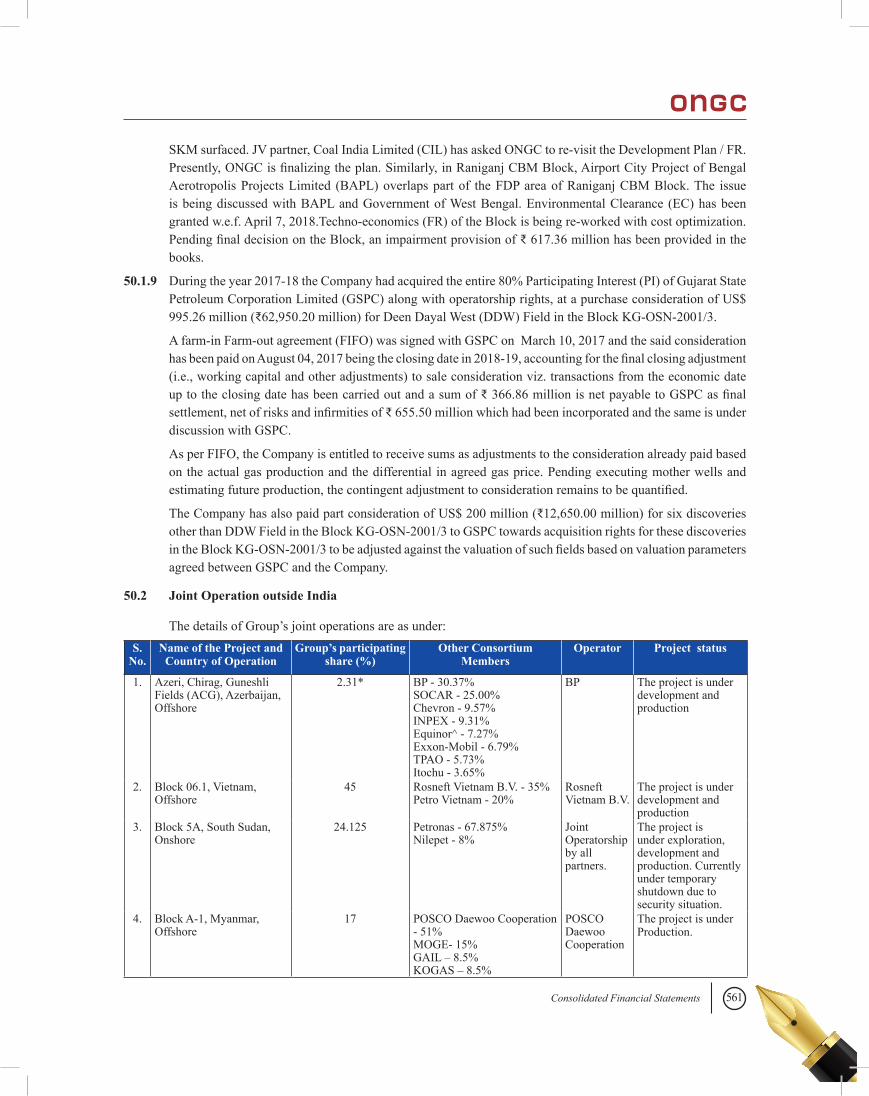
561Consolidated Financial Statements
SKM surfaced. JV partner, Coal India Limited (CIL) has asked ONGC to re-visit the Development Plan / FR. Presently, ONGC is finalizing the plan. Similarly, in Raniganj CBM Block, Airport City Project of Bengal Aerotropolis Projects Limited (BAPL) overlaps part of the FDP area of Raniganj CBM Block. The issue is being discussed with BAPL and Government of West Bengal. Environmental Clearance (EC) has been granted w.e.f. April 7, 2018.Techno-economics (FR) of the Block is being re-worked with cost optimization. Pending final decision on the Block, an impairment provision of ₹ 617.36 million has been provided in the books.
50.1.9 During the year 2017-18 the Company had acquired the entire 80% Participating Interest (PI) of Gujarat State Petroleum Corporation Limited (GSPC) along with operatorship rights, at a purchase consideration of US$ 995.26 million (₹62,950.20 million) for Deen Dayal West (DDW) Field in the Block KG-OSN-2001/3.
A farm-in Farm-out agreement (FIFO) was signed with GSPC on March 10, 2017 and the said consideration has been paid on August 04, 2017 being the closing date in 2018-19, accounting for the final closing adjustment (i.e., working capital and other adjustments) to sale consideration viz. transactions from the economic date up to the closing date has been carried out and a sum of ₹ 366.86 million is net payable to GSPC as final settlement, net of risks and infirmities of ₹ 655.50 million which had been incorporated and the same is under discussion with GSPC.
As per FIFO, the Company is entitled to receive sums as adjustments to the consideration already paid based on the actual gas production and the differential in agreed gas price. Pending executing mother wells and estimating future production, the contingent adjustment to consideration remains to be quantified.
The Company has also paid part consideration of US$ 200 million (₹12,650.00 million) for six discoveries other than DDW Field in the Block KG-OSN-2001/3 to GSPC towards acquisition rights for these discoveries in the Block KG-OSN-2001/3 to be adjusted against the valuation of such fields based on valuation parameters agreed between GSPC and the Company.
50.2 Joint Operation outside India
The details of Group’s joint operations are as under:S.
No.Name of the Project and
Country of OperationGroup’s participating
share (%)Other Consortium
MembersOperator Project status
1. Azeri, Chirag, Guneshli Fields (ACG), Azerbaijan, Offshore
2.31* BP - 30.37% SOCAR - 25.00% Chevron - 9.57% INPEX - 9.31% Equinor^ - 7.27% Exxon-Mobil - 6.79% TPAO - 5.73% Itochu - 3.65%
BP The project is under development and production
2. Block 06.1, Vietnam, Offshore
45 Rosneft Vietnam B.V. - 35% Petro Vietnam - 20%
Rosneft Vietnam B.V.
The project is under development and production
3. Block 5A, South Sudan, Onshore
24.125 Petronas - 67.875% Nilepet - 8%
Joint Operatorship by all partners.
The project is under exploration, development and production. Currently under temporary shutdown due to security situation.
4. Block A-1, Myanmar, Offshore
17 POSCO Daewoo Cooperation - 51% MOGE- 15% GAIL – 8.5% KOGAS – 8.5%
POSCO Daewoo Cooperation
The project is under Production.
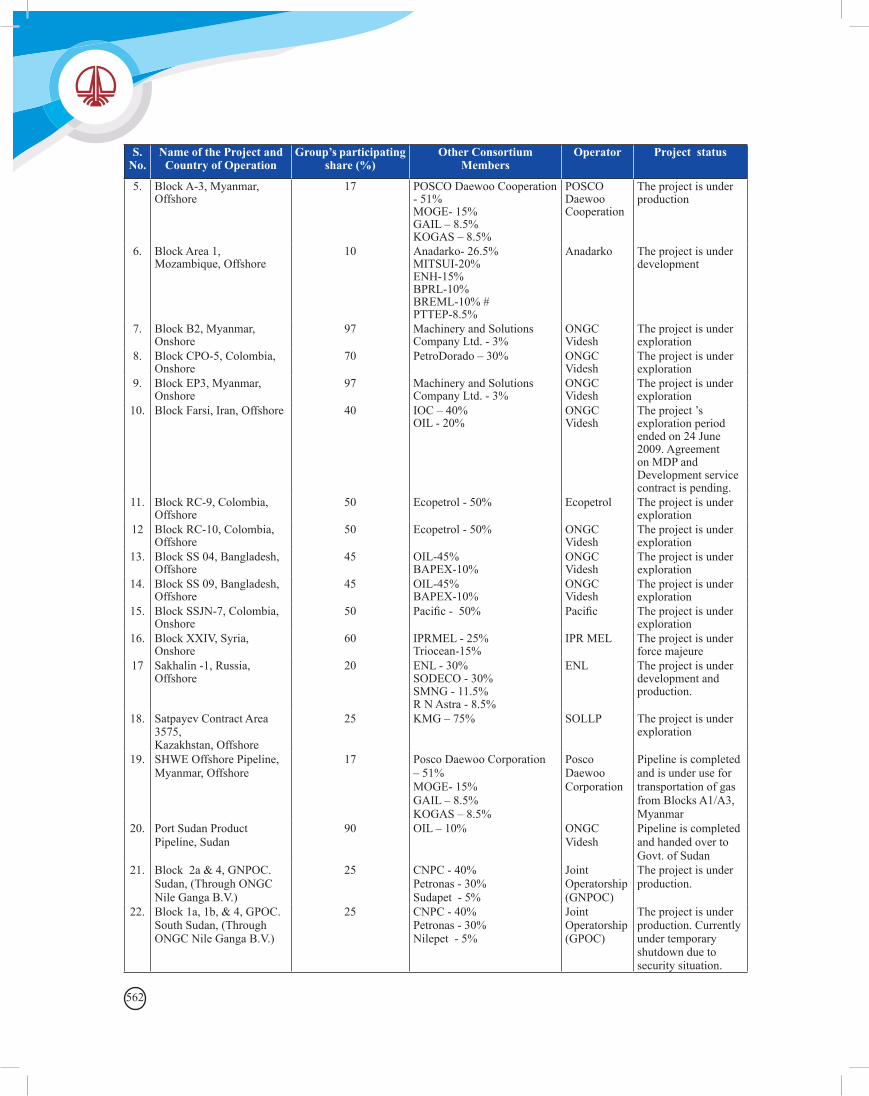
562
S. No.
Name of the Project and Country of Operation
Group’s participating share (%)
Other Consortium Members
Operator Project status
5. Block A-3, Myanmar, Offshore
17 POSCO Daewoo Cooperation - 51% MOGE- 15% GAIL – 8.5% KOGAS – 8.5%
POSCO Daewoo Cooperation
The project is under production
6. Block Area 1, Mozambique, Offshore
10 Anadarko- 26.5% MITSUI-20% ENH-15% BPRL-10% BREML-10% # PTTEP-8.5%
Anadarko The project is under development
7. Block B2, Myanmar, Onshore
97 Machinery and Solutions Company Ltd. - 3%
ONGC Videsh
The project is under exploration
8. Block CPO-5, Colombia, Onshore
70 PetroDorado – 30% ONGC Videsh
The project is under exploration
9. Block EP3, Myanmar, Onshore
97 Machinery and Solutions Company Ltd. - 3%
ONGC Videsh
The project is under exploration
10. Block Farsi, Iran, Offshore 40 IOC – 40% OIL - 20%
ONGC Videsh
The project ’s exploration period ended on 24 June 2009. Agreement on MDP and Development service contract is pending.
11. Block RC-9, Colombia, Offshore
50 Ecopetrol - 50% Ecopetrol The project is under exploration
12 Block RC-10, Colombia, Offshore
50 Ecopetrol - 50% ONGC Videsh
The project is under exploration
13. Block SS 04, Bangladesh, Offshore
45 OIL-45% BAPEX-10%
ONGC Videsh
The project is under exploration
14. Block SS 09, Bangladesh, Offshore
45 OIL-45% BAPEX-10%
ONGC Videsh
The project is under exploration
15. Block SSJN-7, Colombia, Onshore
50 Pacific - 50% Pacific The project is under exploration
16. Block XXIV, Syria, Onshore
60 IPRMEL - 25% Triocean-15%
IPR MEL The project is under force majeure
17 Sakhalin -1, Russia, Offshore
20 ENL - 30% SODECO - 30% SMNG - 11.5% R N Astra - 8.5%
ENL The project is under development and production.
18. Satpayev Contract Area 3575, Kazakhstan, Offshore
25 KMG – 75% SOLLP The project is under exploration
19. SHWE Offshore Pipeline, Myanmar, Offshore
17 Posco Daewoo Corporation – 51% MOGE- 15% GAIL – 8.5% KOGAS – 8.5%
Posco Daewoo Corporation
Pipeline is completed and is under use for transportation of gas from Blocks A1/A3, Myanmar
20. Port Sudan Product Pipeline, Sudan
90 OIL – 10% ONGC Videsh
Pipeline is completed and handed over to Govt. of Sudan
21. Block 2a & 4, GNPOC. Sudan, (Through ONGC Nile Ganga B.V.)
25 CNPC - 40% Petronas - 30% Sudapet - 5%
Joint Operatorship (GNPOC)
The project is under production.
22. Block 1a, 1b, & 4, GPOC. South Sudan, (Through ONGC Nile Ganga B.V.)
25 CNPC - 40% Petronas - 30% Nilepet - 5%
Joint Operatorship (GPOC)
The project is under production. Currently under temporary shutdown due to security situation.
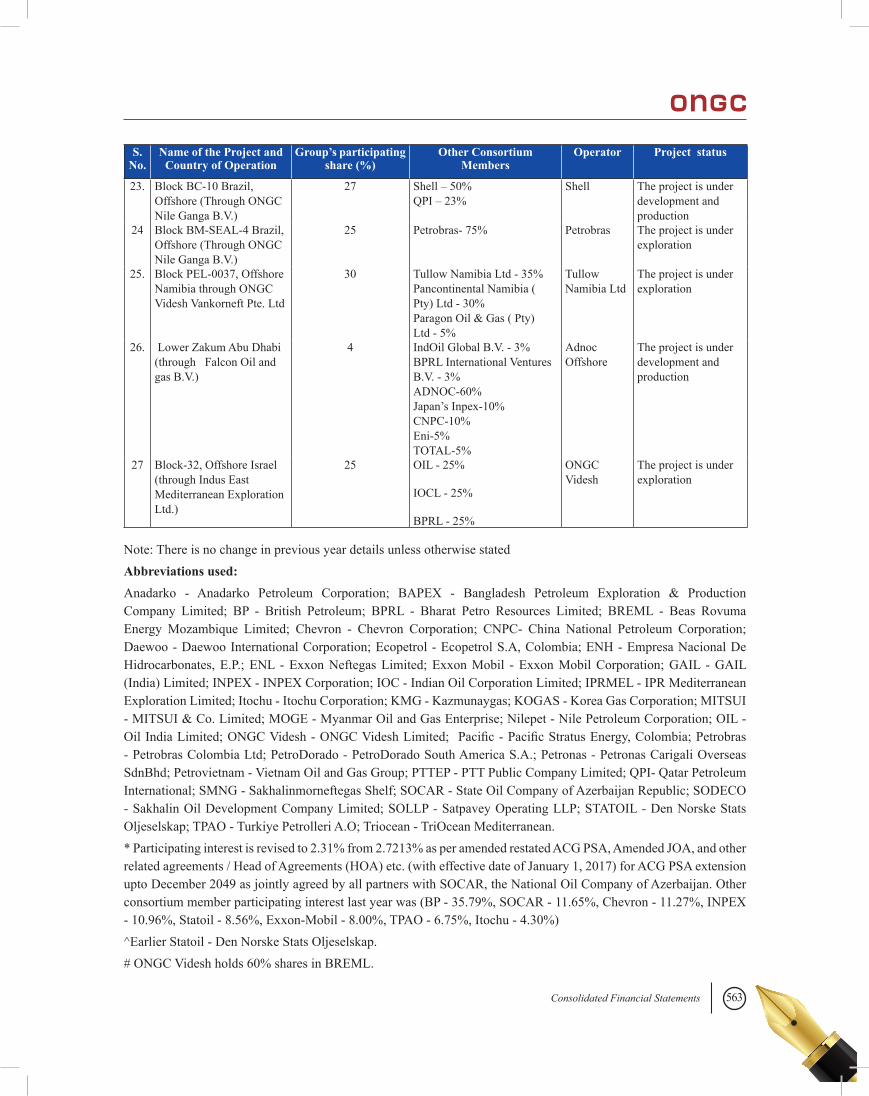
563Consolidated Financial Statements
S. No.
Name of the Project and Country of Operation
Group’s participating share (%)
Other Consortium Members
Operator Project status
23. Block BC-10 Brazil, Offshore (Through ONGC Nile Ganga B.V.)
27 Shell – 50% QPI – 23%
Shell The project is under development and production
24 Block BM-SEAL-4 Brazil, Offshore (Through ONGC Nile Ganga B.V.)
25 Petrobras- 75% Petrobras The project is under exploration
25. Block PEL-0037, Offshore Namibia through ONGC Videsh Vankorneft Pte. Ltd
30 Tullow Namibia Ltd - 35% Pancontinental Namibia ( Pty) Ltd - 30% Paragon Oil & Gas ( Pty) Ltd - 5%
Tullow Namibia Ltd
The project is under exploration
26. Lower Zakum Abu Dhabi (through Falcon Oil and gas B.V.)
4 IndOil Global B.V. - 3% BPRL International Ventures B.V. - 3% ADNOC-60% Japan’s Inpex-10% CNPC-10% Eni-5% TOTAL-5%
Adnoc Offshore
The project is under development and production
27 Block-32, Offshore Israel (through Indus East Mediterranean Exploration Ltd.)
25 OIL - 25%
IOCL - 25%
BPRL - 25%
ONGC Videsh
The project is under exploration
Note: There is no change in previous year details unless otherwise statedAbbreviations used:Anadarko - Anadarko Petroleum Corporation; BAPEX - Bangladesh Petroleum Exploration & Production Company Limited; BP - British Petroleum; BPRL - Bharat Petro Resources Limited; BREML - Beas Rovuma Energy Mozambique Limited; Chevron - Chevron Corporation; CNPC- China National Petroleum Corporation; Daewoo - Daewoo International Corporation; Ecopetrol - Ecopetrol S.A, Colombia; ENH - Empresa Nacional De Hidrocarbonates, E.P.; ENL - Exxon Neftegas Limited; Exxon Mobil - Exxon Mobil Corporation; GAIL - GAIL (India) Limited; INPEX - INPEX Corporation; IOC - Indian Oil Corporation Limited; IPRMEL - IPR Mediterranean Exploration Limited; Itochu - Itochu Corporation; KMG - Kazmunaygas; KOGAS - Korea Gas Corporation; MITSUI - MITSUI & Co. Limited; MOGE - Myanmar Oil and Gas Enterprise; Nilepet - Nile Petroleum Corporation; OIL - Oil India Limited; ONGC Videsh - ONGC Videsh Limited; Pacific - Pacific Stratus Energy, Colombia; Petrobras - Petrobras Colombia Ltd; PetroDorado - PetroDorado South America S.A.; Petronas - Petronas Carigali Overseas SdnBhd; Petrovietnam - Vietnam Oil and Gas Group; PTTEP - PTT Public Company Limited; QPI- Qatar Petroleum International; SMNG - Sakhalinmorneftegas Shelf; SOCAR - State Oil Company of Azerbaijan Republic; SODECO - Sakhalin Oil Development Company Limited; SOLLP - Satpavey Operating LLP; STATOIL - Den Norske Stats Oljeselskap; TPAO - Turkiye Petrolleri A.O; Triocean - TriOcean Mediterranean.* Participating interest is revised to 2.31% from 2.7213% as per amended restated ACG PSA, Amended JOA, and other related agreements / Head of Agreements (HOA) etc. (with effective date of January 1, 2017) for ACG PSA extension upto December 2049 as jointly agreed by all partners with SOCAR, the National Oil Company of Azerbaijan. Other consortium member participating interest last year was (BP - 35.79%, SOCAR - 11.65%, Chevron - 11.27%, INPEX - 10.96%, Statoil - 8.56%, Exxon-Mobil - 8.00%, TPAO - 6.75%, Itochu - 4.30%)^Earlier Statoil - Den Norske Stats Oljeselskap.# ONGC Videsh holds 60% shares in BREML.
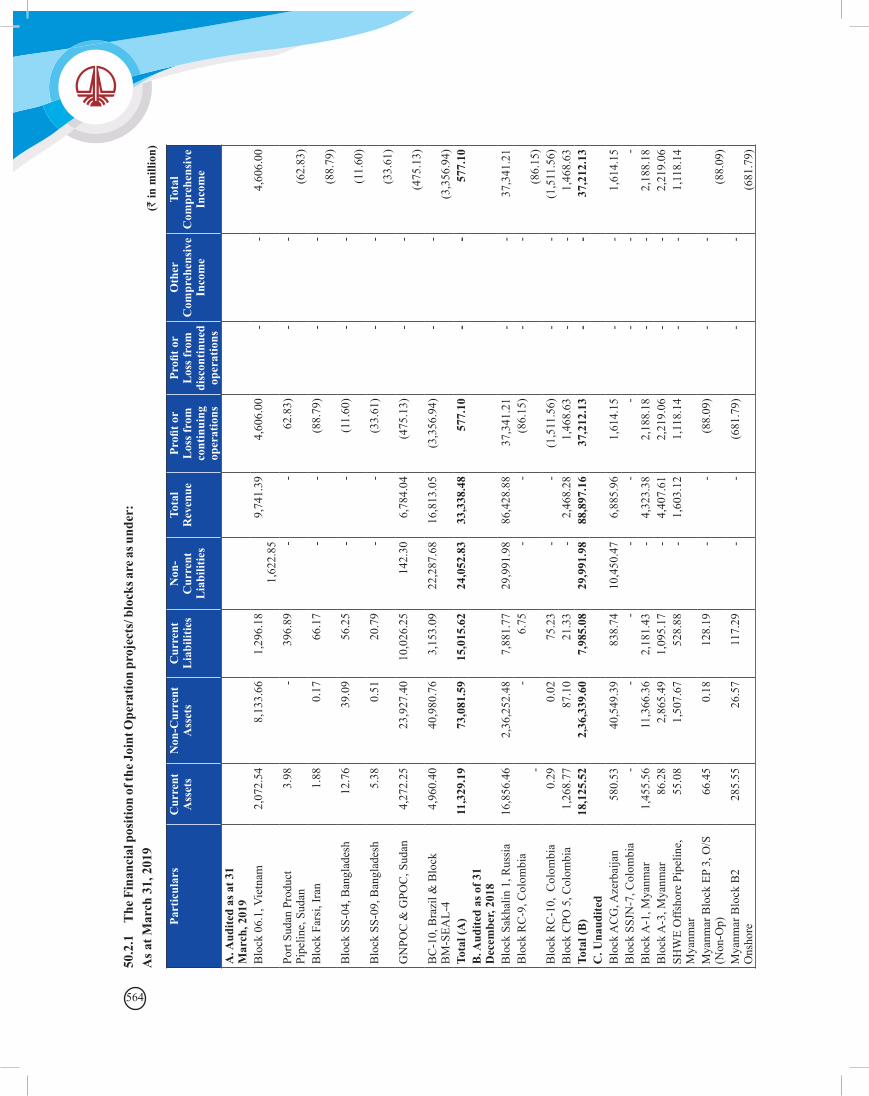
564
50.2
.1
The
Fin
anci
al p
ositi
on o
f the
Joi
nt O
pera
tion
proj
ects
/ blo
cks a
re a
s und
er:
As a
t Mar
ch 3
1, 2
019
Part
icul
ars
Cur
rent
A
sset
sN
on-C
urre
nt
Ass
ets
Cur
rent
L
iabi
litie
sN
on-
Cur
rent
L
iabi
litie
s
Tota
l R
even
uePr
ofit o
r L
oss f
rom
co
ntin
uing
op
erat
ions
Profi
t or
Los
s fro
m
disc
ontin
ued
oper
atio
ns
Oth
er
Com
preh
ensi
ve
Inco
me
Tota
l C
ompr
ehen
sive
In
com
e
A. A
udite
d as
at 3
1 M
arch
, 201
9
Blo
ck 0
6.1,
Vie
tnam
2,07
2.54
8,
133.
66
1,29
6.18
1,62
2.85
9,
741.
39
4,6
06.0
0
-
-
4
,606
.00
Port
Suda
n Pr
oduc
t Pi
pelin
e, S
udan
3.98
-
39
6.89
-
-
62.
83)
-
-
(62.
83)
Blo
ck F
arsi
, Ira
n
1.8
8
0
.17
6
6.17
-
- (8
8.79
)
-
-
(8
8.79
)B
lock
SS-
04, B
angl
ades
h12
.76
3
9.09
56.
25
- -
(11.
60)
-
-
(11.
60)
Blo
ck S
S-09
, Ban
glad
esh
5.38
0
.51
2
0.79
-
- (3
3.61
)
-
-
(3
3.61
)G
NPO
C &
GPO
C, S
udan
4,27
2.25
23,
927.
40
1
0,02
6.25
14
2.30
6,
784.
04
(475
.13)
-
-
(4
75.1
3)B
C-1
0, B
razi
l & B
lock
B
M-S
EAL-
4 4,
960.
40
4
0,98
0.76
3,
153.
09
22,2
87.6
8 16
,813
.05
(3,3
56.9
4)
-
-
(3
,356
.94)
Tota
l (A
) 1
1,32
9.19
7
3,08
1.59
1
5,01
5.62
24,
052.
83
33,3
38.4
8
577.
10
-
-
577.
10
B. A
udite
d as
of 3
1 D
ecem
ber,
2018
Blo
ck S
akha
lin 1
, Rus
sia
16,
856.
46
2,3
6,25
2.48
7,
881.
77
29,9
91.9
8 86
,428
.88
37,3
41.2
1
-
-
37,
341.
21
Blo
ck R
C-9
, Col
ombi
a
-
-
6.7
5
-
-
(86.
15)
-
-
(86.
15)
Blo
ck R
C-1
0, C
olom
bia
0.29
0
.02
7
5.23
-
- (1
,511
.56)
-
-
(1
,511
.56)
Blo
ck C
PO 5
, Col
ombi
a
1,26
8.77
87.
10
2
1.33
-
2,46
8.28
1
,468
.63
-
-
1,4
68.6
3 To
tal (
B)
18,
125.
52
2
,36,
339.
60
7
,985
.08
2
9,99
1.98
88
,897
.16
37
,212
.13
-
-
37,
212.
13
C. U
naud
ited
Blo
ck A
CG
, Aze
rbai
jan
580.
53
4
0,54
9.39
838.
74
10,
450.
47
6,88
5.96
1
,614
.15
-
-
1,6
14.1
5 B
lock
SSJ
N-7
, Col
ombi
a
-
-
-
-
-
-
-
-
-
B
lock
A-1
, Mya
nmar
1,4
55.5
6
11,
366.
36
2,18
1.43
-
4,32
3.38
2
,188
.18
-
-
2,1
88.1
8 B
lock
A-3
, Mya
nmar
8
6.28
2,
865.
49
1,09
5.17
-
4,40
7.61
2
,219
.06
-
-
2,2
19.0
6 SH
WE
Offs
hore
Pip
elin
e,
Mya
nmar
55.
08
1,50
7.67
528.
88
- 1,
603.
12
1,1
18.1
4
-
-
1
,118
.14
Mya
nmar
Blo
ck E
P 3,
O/S
(N
on-O
p)
66.
45
0.1
8
128.
19
- -
(88.
09)
-
-
(88.
09)
Mya
nmar
Blo
ck B
2 O
nsho
re 2
85.5
5
26.
57
11
7.29
-
- (6
81.7
9)
-
-
(681
.79)
(` in
mill
ion)
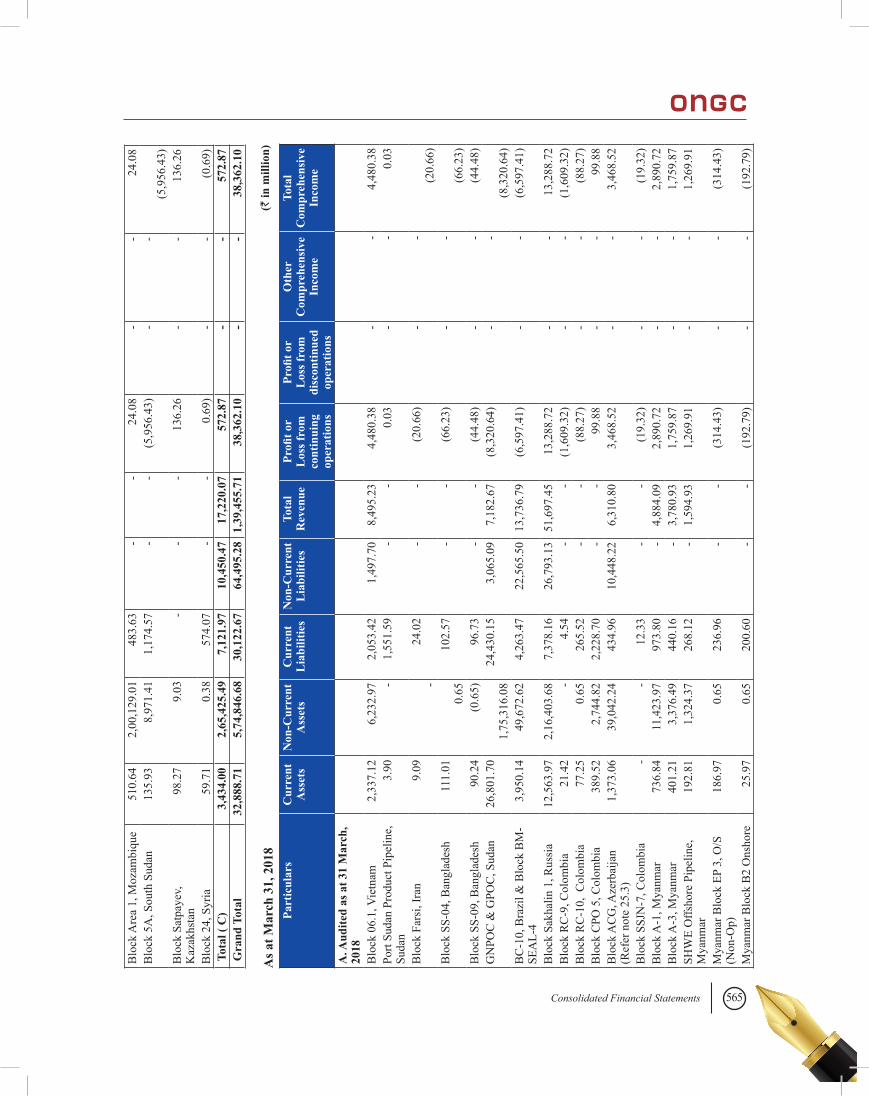
565Consolidated Financial Statements
(` in
mill
ion)
Part
icul
ars
Cur
rent
A
sset
sN
on-C
urre
nt
Ass
ets
Cur
rent
L
iabi
litie
sN
on-C
urre
nt
Lia
bilit
ies
Tota
l R
even
uePr
ofit o
r L
oss f
rom
co
ntin
uing
op
erat
ions
Profi
t or
Los
s fro
m
disc
ontin
ued
oper
atio
ns
Oth
er
Com
preh
ensi
ve
Inco
me
Tota
l C
ompr
ehen
sive
In
com
e
A. A
udite
d as
at 3
1 M
arch
, 20
18
Blo
ck 0
6.1,
Vie
tnam
2,3
37.1
2
6,23
2.97
2,0
53.4
2
1,49
7.70
8
,495
.23
4,4
80.3
8
-
-
4
,480
.38
Port
Suda
n Pr
oduc
t Pip
elin
e,
Suda
n3.
90
-
1,55
1.59
-
-
0.
03
-
-
0.0
3
Blo
ck F
arsi
, Ira
n9.
09
-
24.0
2
-
-
(
20.6
6)
-
-
(2
0.66
)B
lock
SS-
04, B
angl
ades
h11
1.01
0.65
10
2.57
-
-
(
66.2
3)
-
-
(6
6.23
)B
lock
SS-
09, B
angl
ades
h90
.24
(0.6
5)96
.73
-
-
(44
.48)
-
-
(44.
48)
GN
POC
& G
POC
, Sud
an26
,801
.70
1,
75,3
16.0
8 24
,430
.15
3,
065.
09
7,18
2.67
(8
,320
.64)
-
-
(8,3
20.6
4)B
C-1
0, B
razi
l & B
lock
BM
-SE
AL-
4 3,
950.
14
49
,672
.62
4,26
3.47
22
,565
.50
13,7
36.7
9
(6
,597
.41)
-
-
(6,5
97.4
1)
Blo
ck S
akha
lin 1
, Rus
sia
12,5
63.9
7 2,
16,4
03.6
8 7,
378.
16
26,7
93.1
3 51
,697
.45
13,2
88.7
2
-
-
13,
288.
72
Blo
ck R
C-9
, Col
ombi
a21
.42
- 4.
54
-
-
(1
,609
.32)
-
-
(1,6
09.3
2)B
lock
RC
-10,
Col
ombi
a77
.25
0.65
26
5.52
-
-
(
88.2
7)
-
- (8
8.27
)B
lock
CPO
5, C
olom
bia
389.
52
2,74
4.82
2,
228.
70
-
-
9
9.88
-
-
99
.88
Blo
ck A
CG
, Aze
rbai
jan
(Ref
er n
ote
25.3
)1,
373.
06
39,0
42.2
4 43
4.96
10
,448
.22
6,31
0.80
3
,468
.52
-
-
3,4
68.5
2
Blo
ck S
SJN
-7, C
olom
bia
- -
1
2.33
-
-
(
19.3
2)
-
- (1
9.32
)B
lock
A-1
, Mya
nmar
736.
84
11,4
23.9
7
973
.80
-
4,88
4.09
2
,890
.72
-
-
2,8
90.7
2 B
lock
A-3
, Mya
nmar
401.
21
3,37
6.49
44
0.16
-
3,
780.
93
1,7
59.8
7
-
-
1
,759
.87
SHW
E O
ffsho
re P
ipel
ine,
M
yanm
ar19
2.81
1,
324.
37
268.
12
-
1,59
4.93
1
,269
.91
-
-
1,2
69.9
1
Mya
nmar
Blo
ck E
P 3,
O/S
(N
on-O
p)18
6.97
0.
65
236.
96
-
-
(314
.43)
-
-
(314
.43)
Mya
nmar
Blo
ck B
2 O
nsho
re25
.97
0.65
20
0.60
-
-
(1
92.7
9)
-
- (1
92.7
9)
Blo
ck A
rea
1, M
ozam
biqu
e 5
10.6
4
2
,00,
129.
01
48
3.63
-
-
2
4.08
-
-
24
.08
Blo
ck 5
A, S
outh
Sud
an13
5.93
8,
971.
41
1,17
4.57
-
-
(5,
956.
43)
-
-
(5,9
56.4
3)B
lock
Sat
paye
v,
Kaz
akhs
tan
98
.27
9.0
3
-
- -
1
36.2
6
-
-
136
.26
Blo
ck 2
4, S
yria
59.7
1
0
.38
57
4.07
-
-
0
.69)
-
-
(0.6
9) T
otal
( C
)
3,4
34.0
0
2,6
5,42
5.49
7,1
21.9
7
10,
450.
47
17,2
20.0
7
572.
87
-
-
572.
87 G
rand
Tot
al 3
2,88
8.71
5,7
4,84
6.68
3
0,12
2.67
64,
495.
28
1,39
,455
.71
38
,362
.10
-
-
38,
362.
10
As a
t Mar
ch 3
1, 2
018
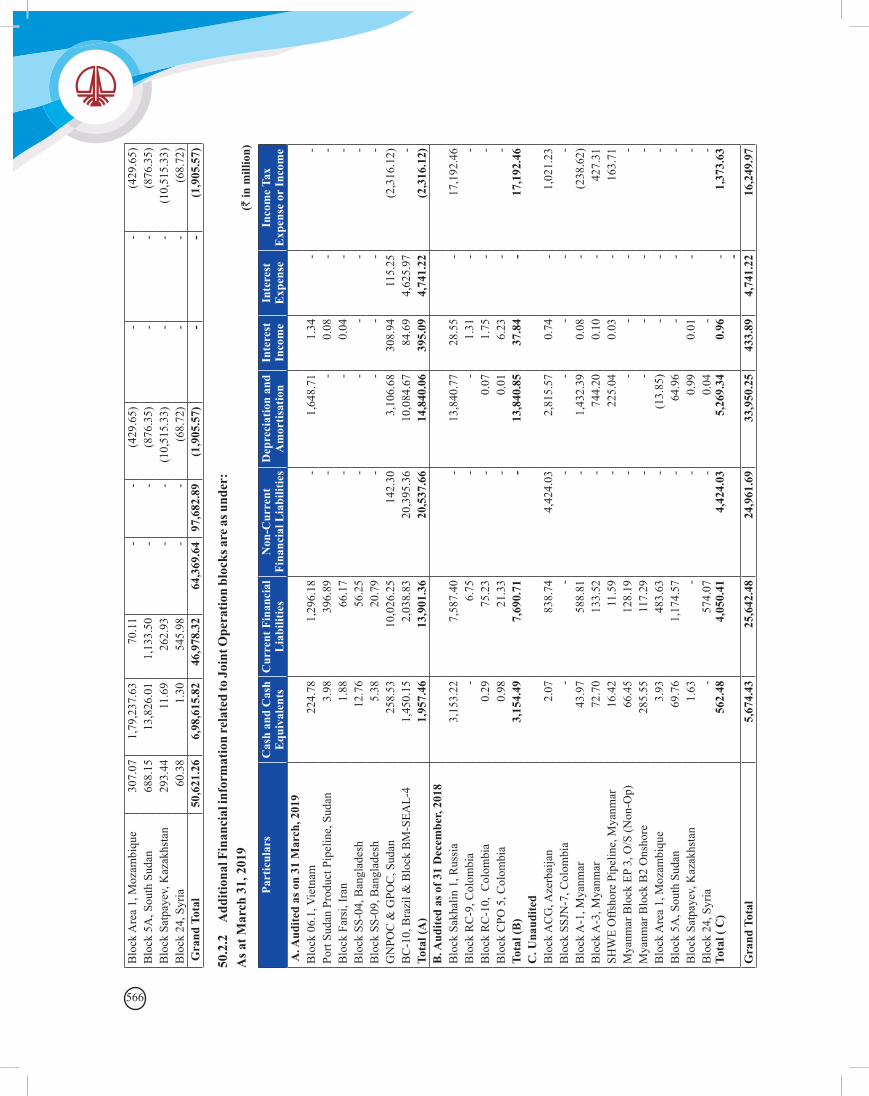
566
50.2
.2
Add
ition
al F
inan
cial
info
rmat
ion
rela
ted
to J
oint
Ope
ratio
n bl
ocks
are
as u
nder
:A
s at M
arch
31,
201
9(`
in m
illio
n)
Part
icul
ars
Cas
h an
d C
ash
Equ
ival
ents
Cur
rent
Fin
anci
al
Lia
bilit
ies
Non
-Cur
rent
Fi
nanc
ial L
iabi
litie
sD
epre
ciat
ion
and
Am
ortis
atio
nIn
tere
st
Inco
me
Inte
rest
E
xpen
seIn
com
e Ta
x E
xpen
se o
r In
com
e A
. Aud
ited
as o
n 31
Mar
ch, 2
019
Blo
ck 0
6.1,
Vie
tnam
22
4.78
1,
296.
18
-
1,64
8.71
1
.34
-
-
Port
Suda
n Pr
oduc
t Pip
elin
e, S
udan
3.9
8
396.
89
-
-
0.
08
-
-
Blo
ck F
arsi
, Ira
n
1
.88
6
6.17
-
-
0.04
-
- B
lock
SS-
04, B
angl
ades
h
12.
76
5
6.25
-
-
- -
- B
lock
SS-
09, B
angl
ades
h
5
.38
2
0.79
-
-
- -
- G
NPO
C &
GPO
C, S
udan
25
8.53
10,
026.
25
14
2.30
3,10
6.68
30
8.94
11
5.25
(2
,316
.12)
BC
-10,
Bra
zil &
Blo
ck B
M-S
EAL-
4
1,
450.
15
2,03
8.83
20,
395.
36
10,
084.
67
84.6
9 4,
625.
97
- To
tal (
A)
1,95
7.46
13,9
01.3
620
,537
.66
14,8
40.0
639
5.09
4,74
1.22
(2,3
16.1
2)B
. Aud
ited
as o
f 31
Dec
embe
r, 20
18B
lock
Sak
halin
1, R
ussi
a
3,
153.
22
7,58
7.40
-
13,
840.
77
28.5
5 -
17,1
92.4
6 B
lock
RC
-9, C
olom
bia
-
6
.75
-
-
1.
31
-
-
Blo
ck R
C-1
0, C
olom
bia
0.2
9
75.
23
-
0.0
7 1.
75
-
-
Blo
ck C
PO 5
, Col
ombi
a
0
.98
2
1.33
-
0
.01
6.23
-
- To
tal (
B)
3,15
4.49
7,69
0.71
-13
,840
.85
37.8
4-
17,1
92.4
6C
. Una
udite
dB
lock
AC
G, A
zerb
aija
n
2
.07
83
8.74
4,
424.
03
2,
815.
57
0.74
-
1,0
21.2
3 B
lock
SSJ
N-7
, Col
ombi
a
-
-
-
-
- -
- B
lock
A-1
, Mya
nmar
4
3.97
588.
81
-
1,43
2.39
0.
08
-
(238
.62)
Blo
ck A
-3, M
yanm
ar
72.
70
13
3.52
-
744.
20
0.10
-
4
27.3
1 SH
WE
Offs
hore
Pip
elin
e, M
yanm
ar
16.
42
1
1.59
-
225.
04
0.03
-
1
63.7
1 M
yanm
ar B
lock
EP
3, O
/S (N
on-O
p)
66.
45
12
8.19
-
-
- -
- M
yanm
ar B
lock
B2
Ons
hore
28
5.55
117.
29
-
-
-
-
-
Blo
ck A
rea
1, M
ozam
biqu
e
3
.93
48
3.63
-
(13.
85)
- -
- B
lock
5A
, Sou
th S
udan
6
9.76
1,
174.
57
-
6
4.96
-
-
-
Blo
ck S
atpa
yev,
Kaz
akhs
tan
1.6
3
-
-
0.9
9 0.
01
-
-
Blo
ck 2
4, S
yria
Tota
l ( C
)
-
562.
48
574.
07
4,05
0.41
-
4,
424.
03
0.0
4 5,
269.
34-
0.96
- -
- 1,
373.
63
Gra
nd T
otal
5
,674
.43
25,
642.
48
24,
961.
69
3
3,95
0.25
43
3.89
4,
741.
22
1
6,24
9.97
Blo
ck A
rea
1, M
ozam
biqu
e30
7.07
1,
79,2
37.6
3 70
.11
-
-
(429
.65)
-
-
(429
.65)
Blo
ck 5
A, S
outh
Sud
an68
8.15
13
,826
.01
1,13
3.50
-
-
(8
76.3
5)
-
- (8
76.3
5)B
lock
Sat
paye
v, K
azak
hsta
n29
3.44
11
.69
262.
93
-
-
(10,
515.
33)
-
-
(10,
515.
33)
Blo
ck 2
4, S
yria
60.3
8 1.
30
545.
98
-
-
(68
.72)
-
-
(68.
72)
Gra
nd T
otal
50,6
21.2
6
6,9
8,61
5.82
4
6,97
8.32
64,
369.
64
97,6
82.8
9
(1,9
05.5
7)
-
-
(1,9
05.5
7)
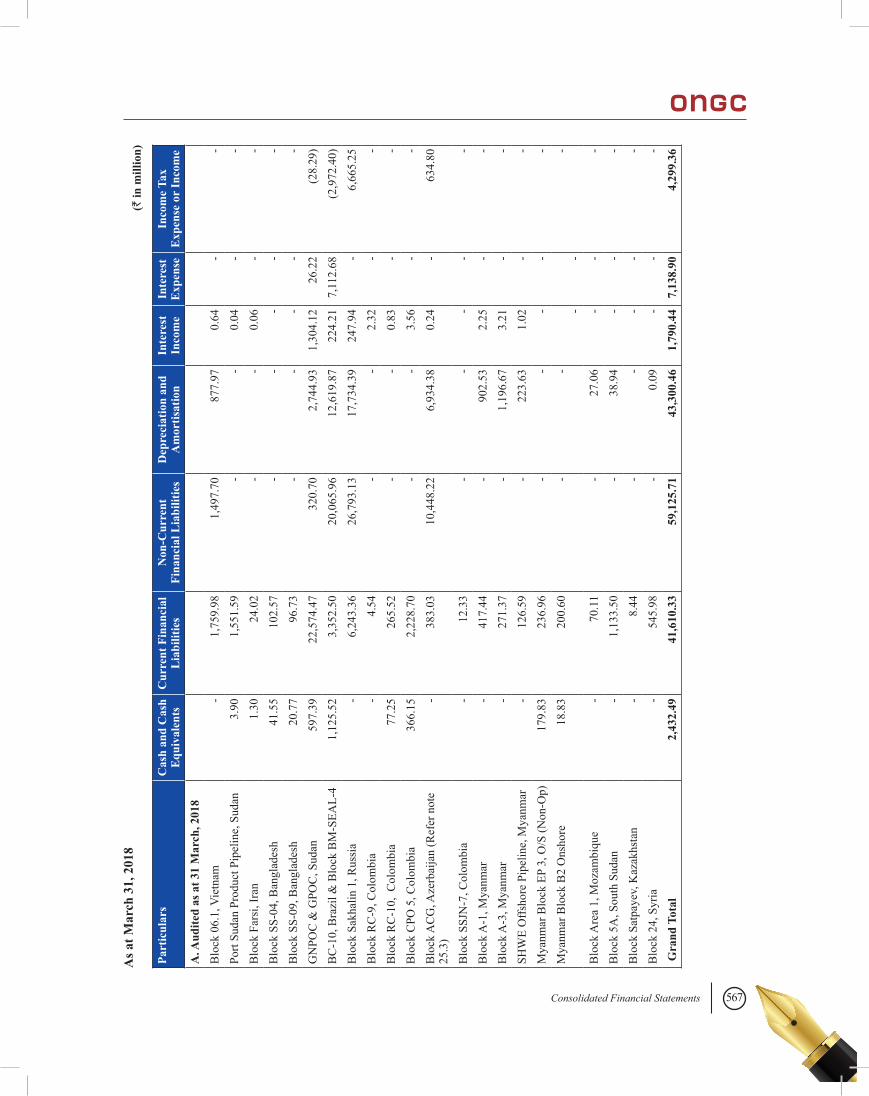
567Consolidated Financial Statements
Part
icul
ars
Cas
h an
d C
ash
Equ
ival
ents
Cur
rent
Fin
anci
al
Lia
bilit
ies
Non
-Cur
rent
Fi
nanc
ial L
iabi
litie
sD
epre
ciat
ion
and
Am
ortis
atio
nIn
tere
st
Inco
me
Inte
rest
E
xpen
seIn
com
e Ta
x E
xpen
se o
r In
com
eA
. Aud
ited
as a
t 31
Mar
ch, 2
018
Blo
ck 0
6.1,
Vie
tnam
-
1,
759.
98
1,49
7.70
87
7.97
0.
64
-
-
Port
Suda
n Pr
oduc
t Pip
elin
e, S
udan
3.9
0
1,
551.
59
-
-
0.
04
-
-
Blo
ck F
arsi
, Ira
n
1
.30
2
4.02
-
-
0.06
-
- B
lock
SS-
04, B
angl
ades
h
41.
55
10
2.57
-
-
- -
- B
lock
SS-
09, B
angl
ades
h
20.
77
9
6.73
-
-
- -
- G
NPO
C &
GPO
C, S
udan
59
7.39
22,
574.
47
32
0.70
2,74
4.93
1,
304.
12
26.2
2
(2
8.29
)B
C-1
0, B
razi
l & B
lock
BM
-SEA
L-4
1,12
5.52
3,
352.
50
2
0,06
5.96
1
2,61
9.87
22
4.21
7,
112.
68
(2,9
72.4
0)B
lock
Sak
halin
1, R
ussi
a
-
6,24
3.36
26,
793.
13
17,
734.
39
247.
94
-
6
,665
.25
Blo
ck R
C-9
, Col
ombi
a
-
4.5
4
-
-
2.32
-
- B
lock
RC
-10,
Col
ombi
a
77.
25
26
5.52
-
-
0.83
-
- B
lock
CPO
5, C
olom
bia
36
6.15
2,
228.
70
-
-
3.56
-
- B
lock
AC
G, A
zerb
aija
n (R
efer
not
e 25
.3)
-
383.
03
1
0,44
8.22
6,93
4.38
0.
24
-
634
.80
Blo
ck S
SJN
-7, C
olom
bia
-
12.
33
-
-
-
-
-
Blo
ck A
-1, M
yanm
ar
-
41
7.44
-
902.
53
2.25
-
- B
lock
A-3
, Mya
nmar
-
271.
37
-
1,19
6.67
3.
21
-
-
SHW
E O
ffsho
re P
ipel
ine,
Mya
nmar
-
126.
59
-
22
3.63
1.
02
-
-
Mya
nmar
Blo
ck E
P 3,
O/S
(Non
-Op)
17
9.83
236.
96
-
-
-
-
-
Mya
nmar
Blo
ck B
2 O
nsho
re
18.
83
20
0.60
-
-
-
-
-
Blo
ck A
rea
1, M
ozam
biqu
e
-
7
0.11
-
27.
06
- -
- B
lock
5A
, Sou
th S
udan
-
1,
133.
50
-
3
8.94
-
-
-
Blo
ck S
atpa
yev,
Kaz
akhs
tan
-
8
.44
-
-
-
-
-
Blo
ck 2
4, S
yria
-
545.
98
-
0.0
9 -
-
-
Gra
nd T
otal
2
,432
.49
41,
610.
33
59,
125.
71
4
3,30
0.46
1,
790.
44
7,13
8.90
4,
299.
36
(` in
mill
ion)
As a
t Mar
ch 3
1, 2
018
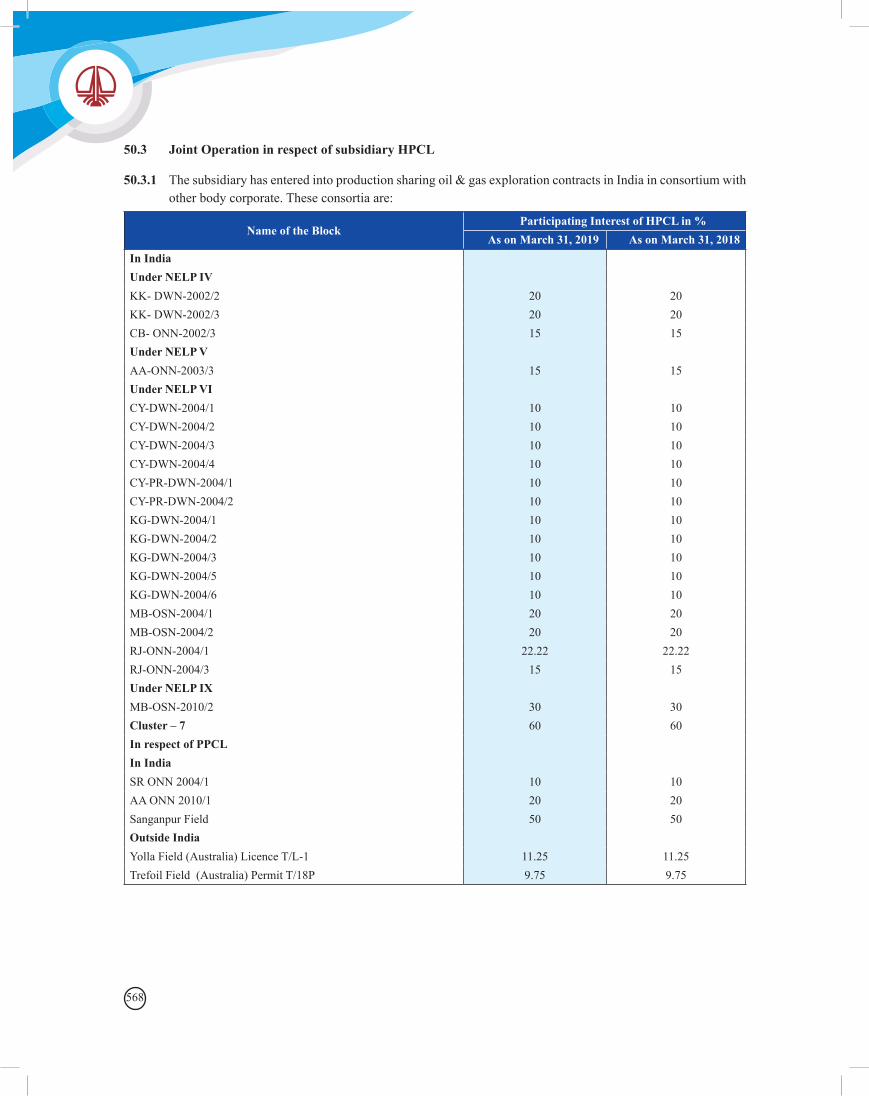
568
50.3 Joint Operation in respect of subsidiary HPCL
50.3.1 The subsidiary has entered into production sharing oil & gas exploration contracts in India in consortium with other body corporate. These consortia are:
Name of the BlockParticipating Interest of HPCL in %
As on March 31, 2019 As on March 31, 2018In IndiaUnder NELP IVKK- DWN-2002/2 20 20KK- DWN-2002/3 20 20CB- ONN-2002/3 15 15Under NELP VAA-ONN-2003/3 15 15Under NELP VICY-DWN-2004/1 10 10CY-DWN-2004/2 10 10CY-DWN-2004/3 10 10CY-DWN-2004/4 10 10CY-PR-DWN-2004/1 10 10CY-PR-DWN-2004/2 10 10KG-DWN-2004/1 10 10KG-DWN-2004/2 10 10KG-DWN-2004/3 10 10KG-DWN-2004/5 10 10KG-DWN-2004/6 10 10MB-OSN-2004/1 20 20MB-OSN-2004/2 20 20RJ-ONN-2004/1 22.22 22.22RJ-ONN-2004/3 15 15Under NELP IXMB-OSN-2010/2 30 30Cluster – 7 60 60In respect of PPCLIn IndiaSR ONN 2004/1 10 10AA ONN 2010/1 20 20Sanganpur Field 50 50Outside IndiaYolla Field (Australia) Licence T/L-1 11.25 11.25Trefoil Field (Australia) Permit T/18P 9.75 9.75
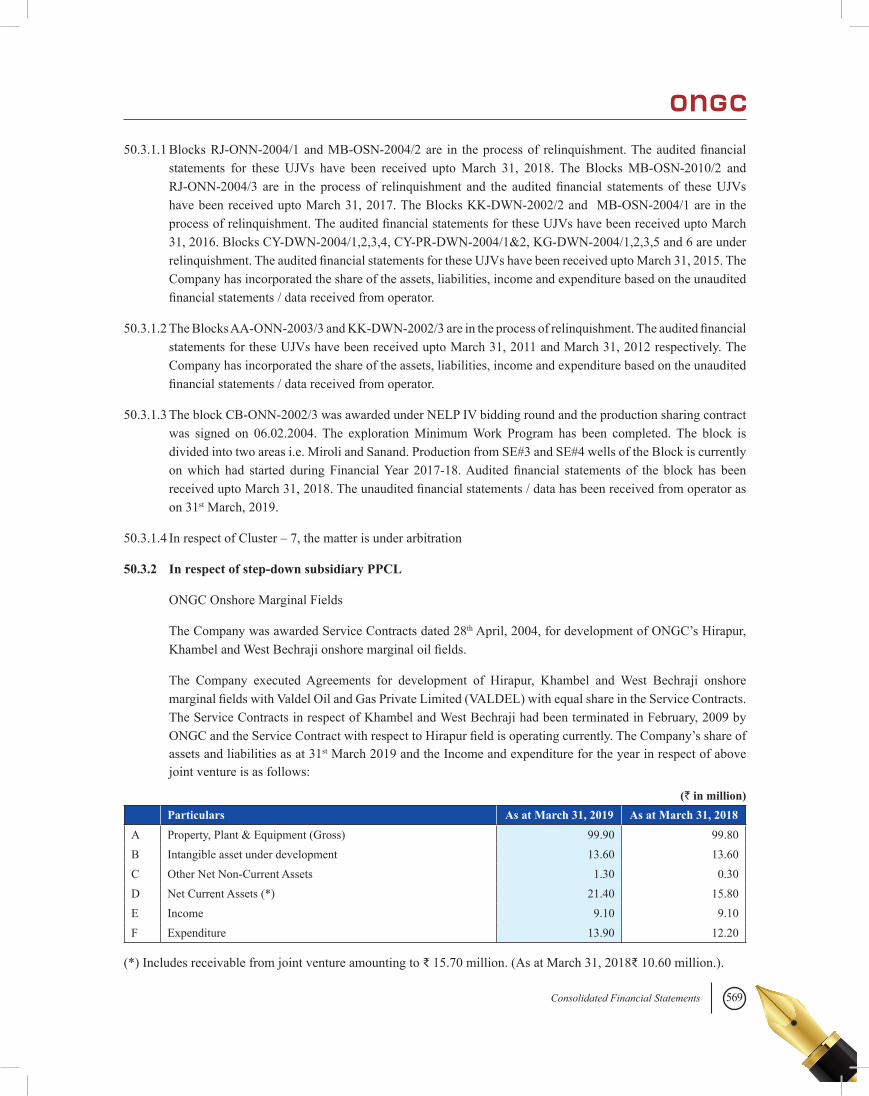
569Consolidated Financial Statements
50.3.1.1 Blocks RJ-ONN-2004/1 and MB-OSN-2004/2 are in the process of relinquishment. The audited financial statements for these UJVs have been received upto March 31, 2018. The Blocks MB-OSN-2010/2 and RJ-ONN-2004/3 are in the process of relinquishment and the audited financial statements of these UJVs have been received upto March 31, 2017. The Blocks KK-DWN-2002/2 and MB-OSN-2004/1 are in the process of relinquishment. The audited financial statements for these UJVs have been received upto March 31, 2016. Blocks CY-DWN-2004/1,2,3,4, CY-PR-DWN-2004/1&2, KG-DWN-2004/1,2,3,5 and 6 are under relinquishment. The audited financial statements for these UJVs have been received upto March 31, 2015. The Company has incorporated the share of the assets, liabilities, income and expenditure based on the unaudited financial statements / data received from operator.
50.3.1.2 The Blocks AA-ONN-2003/3 and KK-DWN-2002/3 are in the process of relinquishment. The audited financial statements for these UJVs have been received upto March 31, 2011 and March 31, 2012 respectively. The Company has incorporated the share of the assets, liabilities, income and expenditure based on the unaudited financial statements / data received from operator.
50.3.1.3 The block CB-ONN-2002/3 was awarded under NELP IV bidding round and the production sharing contract was signed on 06.02.2004. The exploration Minimum Work Program has been completed. The block is divided into two areas i.e. Miroli and Sanand. Production from SE#3 and SE#4 wells of the Block is currently on which had started during Financial Year 2017-18. Audited financial statements of the block has been received upto March 31, 2018. The unaudited financial statements / data has been received from operator as on 31st March, 2019.
50.3.1.4 In respect of Cluster – 7, the matter is under arbitration
50.3.2 In respect of step-down subsidiary PPCL
ONGC Onshore Marginal Fields
The Company was awarded Service Contracts dated 28th April, 2004, for development of ONGC’s Hirapur, Khambel and West Bechraji onshore marginal oil fields.
The Company executed Agreements for development of Hirapur, Khambel and West Bechraji onshore marginal fields with Valdel Oil and Gas Private Limited (VALDEL) with equal share in the Service Contracts. The Service Contracts in respect of Khambel and West Bechraji had been terminated in February, 2009 by ONGC and the Service Contract with respect to Hirapur field is operating currently. The Company’s share of assets and liabilities as at 31st March 2019 and the Income and expenditure for the year in respect of above joint venture is as follows:
Particulars As at March 31, 2019 As at March 31, 2018A Property, Plant & Equipment (Gross) 99.90 99.80 B Intangible asset under development 13.60 13.60 C Other Net Non-Current Assets 1.30 0.30 D Net Current Assets (*) 21.40 15.80 E Income 9.10 9.10 F Expenditure 13.90 12.20
(` in million)
(*) Includes receivable from joint venture amounting to ₹ 15.70 million. (As at March 31, 2018₹ 10.60 million.).
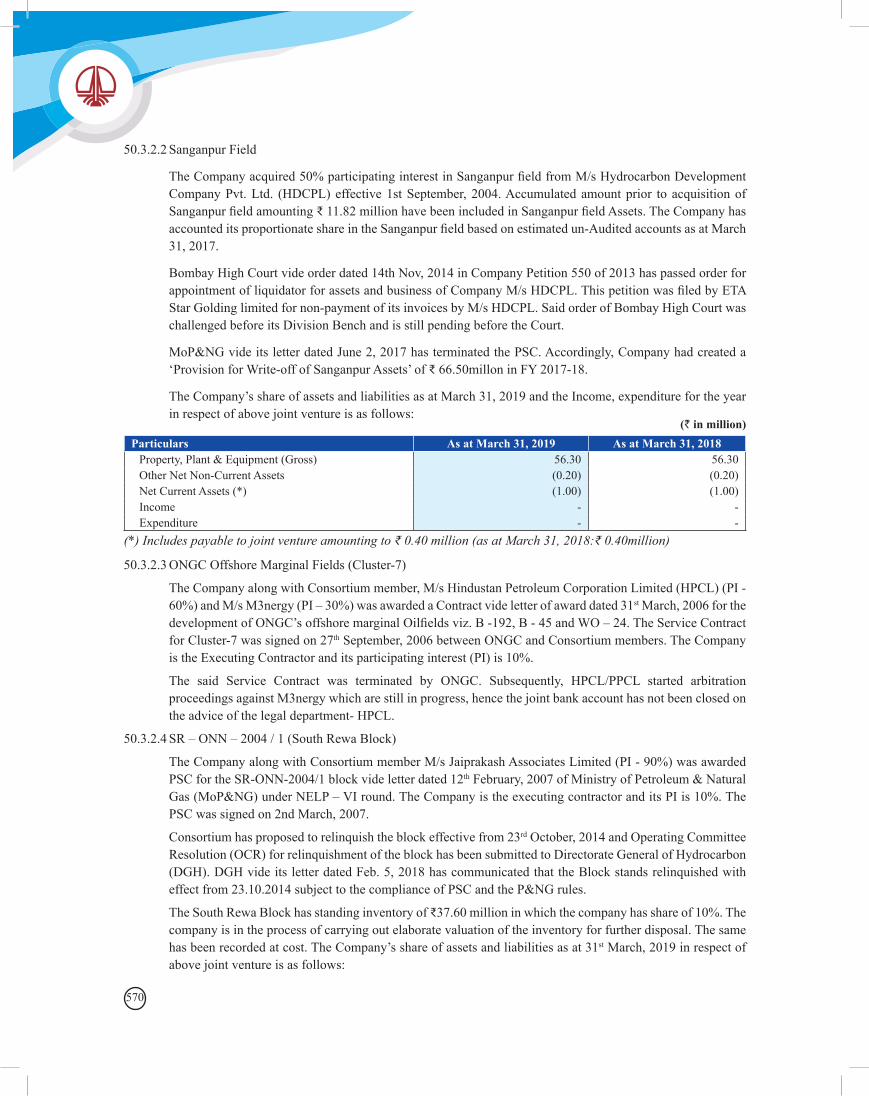
570
50.3.2.2 Sanganpur Field
The Company acquired 50% participating interest in Sanganpur field from M/s Hydrocarbon Development Company Pvt. Ltd. (HDCPL) effective 1st September, 2004. Accumulated amount prior to acquisition of Sanganpur field amounting ₹ 11.82 million have been included in Sanganpur field Assets. The Company has accounted its proportionate share in the Sanganpur field based on estimated un-Audited accounts as at March 31, 2017.
Bombay High Court vide order dated 14th Nov, 2014 in Company Petition 550 of 2013 has passed order for appointment of liquidator for assets and business of Company M/s HDCPL. This petition was filed by ETA Star Golding limited for non-payment of its invoices by M/s HDCPL. Said order of Bombay High Court was challenged before its Division Bench and is still pending before the Court.
MoP&NG vide its letter dated June 2, 2017 has terminated the PSC. Accordingly, Company had created a ‘Provision for Write-off of Sanganpur Assets’ of ₹ 66.50millon in FY 2017-18.
The Company’s share of assets and liabilities as at March 31, 2019 and the Income, expenditure for the year in respect of above joint venture is as follows:
Particulars As at March 31, 2019 As at March 31, 2018Property, Plant & Equipment (Gross) 56.30 56.30 Other Net Non-Current Assets (0.20) (0.20)Net Current Assets (*) (1.00) (1.00)Income - - Expenditure - -
(` in million)
(*) Includes payable to joint venture amounting to ₹ 0.40 million (as at March 31, 2018:₹ 0.40million)
50.3.2.3 ONGC Offshore Marginal Fields (Cluster-7)
The Company along with Consortium member, M/s Hindustan Petroleum Corporation Limited (HPCL) (PI - 60%) and M/s M3nergy (PI – 30%) was awarded a Contract vide letter of award dated 31st March, 2006 for the development of ONGC’s offshore marginal Oilfields viz. B -192, B - 45 and WO – 24. The Service Contract for Cluster-7 was signed on 27th September, 2006 between ONGC and Consortium members. The Company is the Executing Contractor and its participating interest (PI) is 10%.
The said Service Contract was terminated by ONGC. Subsequently, HPCL/PPCL started arbitration proceedings against M3nergy which are still in progress, hence the joint bank account has not been closed on the advice of the legal department- HPCL.
50.3.2.4 SR – ONN – 2004 / 1 (South Rewa Block)
The Company along with Consortium member M/s Jaiprakash Associates Limited (PI - 90%) was awarded PSC for the SR-ONN-2004/1 block vide letter dated 12th February, 2007 of Ministry of Petroleum & Natural Gas (MoP&NG) under NELP – VI round. The Company is the executing contractor and its PI is 10%. The PSC was signed on 2nd March, 2007.
Consortium has proposed to relinquish the block effective from 23rd October, 2014 and Operating Committee Resolution (OCR) for relinquishment of the block has been submitted to Directorate General of Hydrocarbon (DGH). DGH vide its letter dated Feb. 5, 2018 has communicated that the Block stands relinquished with effect from 23.10.2014 subject to the compliance of PSC and the P&NG rules.
The South Rewa Block has standing inventory of ₹37.60 million in which the company has share of 10%. The company is in the process of carrying out elaborate valuation of the inventory for further disposal. The same has been recorded at cost. The Company’s share of assets and liabilities as at 31st March, 2019 in respect of above joint venture is as follows:
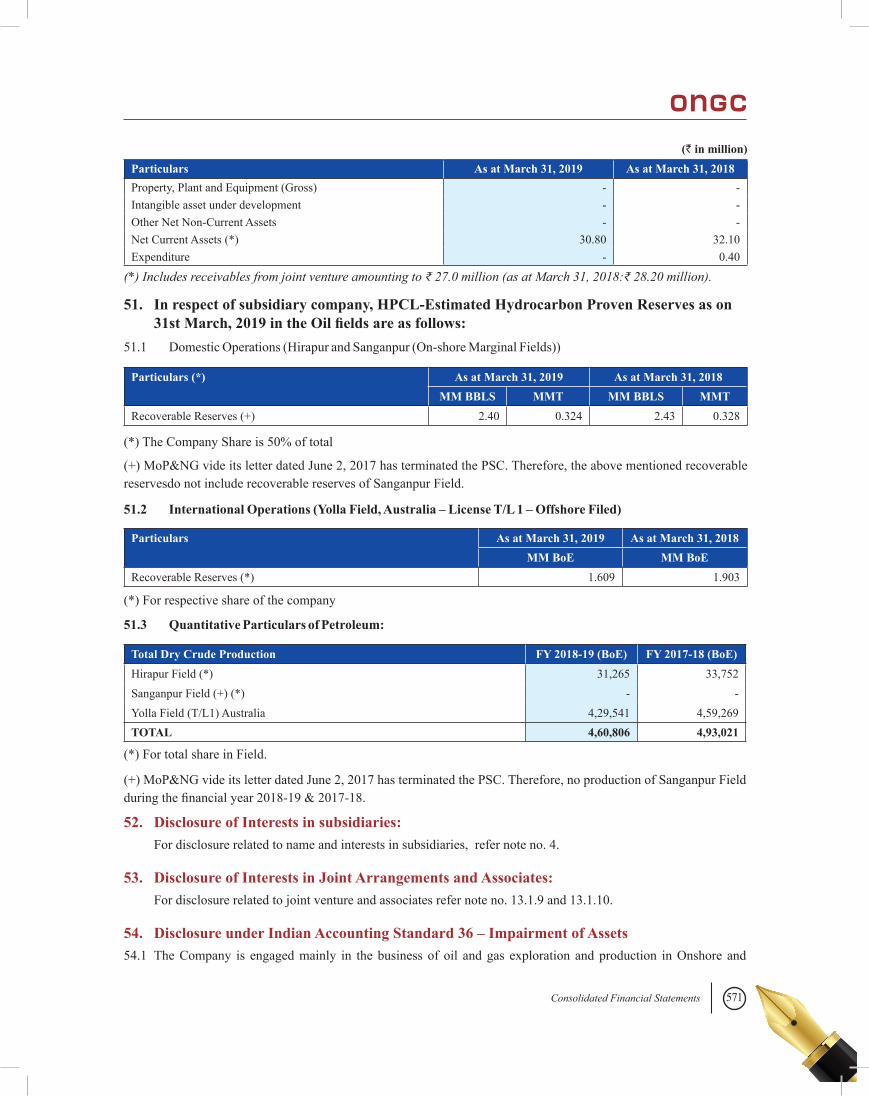
571Consolidated Financial Statements
Particulars As at March 31, 2019 As at March 31, 2018Property, Plant and Equipment (Gross) - - Intangible asset under development - - Other Net Non-Current Assets - - Net Current Assets (*) 30.80 32.10 Expenditure - 0.40
(*) Includes receivables from joint venture amounting to ₹ 27.0 million (as at March 31, 2018:₹ 28.20 million).
(` in million)
51. In respect of subsidiary company, HPCL-Estimated Hydrocarbon Proven Reserves as on 31st March, 2019 in the Oil fields are as follows:
51.1 Domestic Operations (Hirapur and Sanganpur (On-shore Marginal Fields))
Particulars (*) As at March 31, 2019 As at March 31, 2018MM BBLS MMT MM BBLS MMT
Recoverable Reserves (+) 2.40 0.324 2.43 0.328
(*) The Company Share is 50% of total
(+) MoP&NG vide its letter dated June 2, 2017 has terminated the PSC. Therefore, the above mentioned recoverable reservesdo not include recoverable reserves of Sanganpur Field.
51.2 International Operations (Yolla Field, Australia – License T/L 1 – Offshore Filed)
Particulars As at March 31, 2019 As at March 31, 2018MM BoE MM BoE
Recoverable Reserves (*) 1.609 1.903
(*) For respective share of the company
51.3 Quantitative Particulars of Petroleum:
Total Dry Crude Production FY 2018-19 (BoE) FY 2017-18 (BoE)Hirapur Field (*) 31,265 33,752Sanganpur Field (+) (*) - -Yolla Field (T/L1) Australia 4,29,541 4,59,269TOTAL 4,60,806 4,93,021
(*) For total share in Field.
(+) MoP&NG vide its letter dated June 2, 2017 has terminated the PSC. Therefore, no production of Sanganpur Field during the financial year 2018-19 & 2017-18.
52. Disclosure of Interests in subsidiaries: For disclosure related to name and interests in subsidiaries, refer note no. 4.
53. Disclosure of Interests in Joint Arrangements and Associates: For disclosure related to joint venture and associates refer note no. 13.1.9 and 13.1.10.
54. Disclosure under Indian Accounting Standard 36 – Impairment of Assets 54.1 The Company is engaged mainly in the business of oil and gas exploration and production in Onshore and
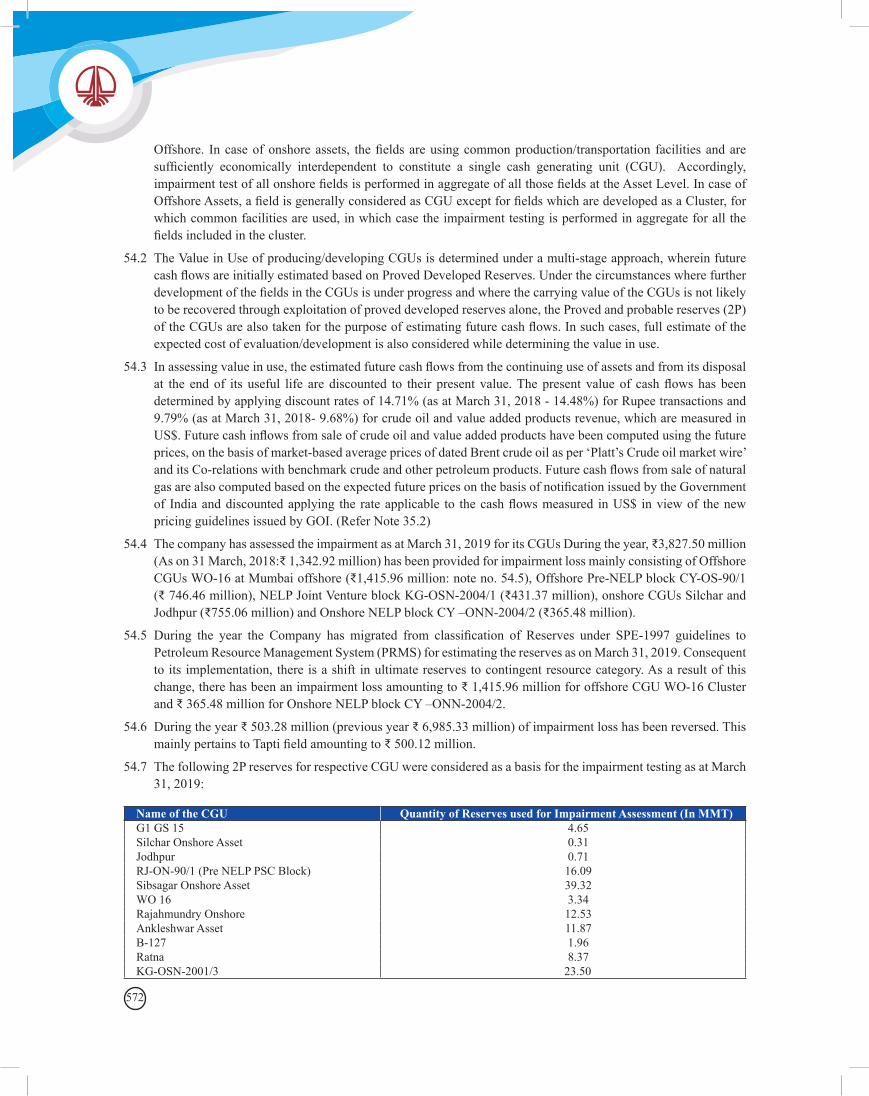
572
Offshore. In case of onshore assets, the fields are using common production/transportation facilities and are sufficiently economically interdependent to constitute a single cash generating unit (CGU). Accordingly, impairment test of all onshore fields is performed in aggregate of all those fields at the Asset Level. In case of Offshore Assets, a field is generally considered as CGU except for fields which are developed as a Cluster, for which common facilities are used, in which case the impairment testing is performed in aggregate for all the fields included in the cluster.
54.2 The Value in Use of producing/developing CGUs is determined under a multi-stage approach, wherein future cash flows are initially estimated based on Proved Developed Reserves. Under the circumstances where further development of the fields in the CGUs is under progress and where the carrying value of the CGUs is not likely to be recovered through exploitation of proved developed reserves alone, the Proved and probable reserves (2P) of the CGUs are also taken for the purpose of estimating future cash flows. In such cases, full estimate of the expected cost of evaluation/development is also considered while determining the value in use.
54.3 In assessing value in use, the estimated future cash flows from the continuing use of assets and from its disposal at the end of its useful life are discounted to their present value. The present value of cash flows has been determined by applying discount rates of 14.71% (as at March 31, 2018 - 14.48%) for Rupee transactions and 9.79% (as at March 31, 2018- 9.68%) for crude oil and value added products revenue, which are measured in US$. Future cash inflows from sale of crude oil and value added products have been computed using the future prices, on the basis of market-based average prices of dated Brent crude oil as per ‘Platt’s Crude oil market wire’ and its Co-relations with benchmark crude and other petroleum products. Future cash flows from sale of natural gas are also computed based on the expected future prices on the basis of notification issued by the Government of India and discounted applying the rate applicable to the cash flows measured in US$ in view of the new pricing guidelines issued by GOI. (Refer Note 35.2)
54.4 The company has assessed the impairment as at March 31, 2019 for its CGUs During the year, ₹3,827.50 million (As on 31 March, 2018:₹ 1,342.92 million) has been provided for impairment loss mainly consisting of Offshore CGUs WO-16 at Mumbai offshore (₹1,415.96 million: note no. 54.5), Offshore Pre-NELP block CY-OS-90/1 (₹ 746.46 million), NELP Joint Venture block KG-OSN-2004/1 (₹431.37 million), onshore CGUs Silchar and Jodhpur (₹755.06 million) and Onshore NELP block CY –ONN-2004/2 (₹365.48 million).
54.5 During the year the Company has migrated from classification of Reserves under SPE-1997 guidelines to Petroleum Resource Management System (PRMS) for estimating the reserves as on March 31, 2019. Consequent to its implementation, there is a shift in ultimate reserves to contingent resource category. As a result of this change, there has been an impairment loss amounting to ₹ 1,415.96 million for offshore CGU WO-16 Cluster and ₹ 365.48 million for Onshore NELP block CY –ONN-2004/2.
54.6 During the year ₹ 503.28 million (previous year ₹ 6,985.33 million) of impairment loss has been reversed. This mainly pertains to Tapti field amounting to ₹ 500.12 million.
54.7 The following 2P reserves for respective CGU were considered as a basis for the impairment testing as at March 31, 2019:
Name of the CGU Quantity of Reserves used for Impairment Assessment (In MMT)G1 GS 15 4.65Silchar Onshore Asset 0.31Jodhpur 0.71RJ-ON-90/1 (Pre NELP PSC Block) 16.09Sibsagar Onshore Asset 39.32WO 16 3.34Rajahmundry Onshore 12.53Ankleshwar Asset 11.87B-127 1.96Ratna 8.37KG-OSN-2001/3 23.50
573Consolidated Financial Statements
54.8 Impairment testing of assets under exploratory phase (Exploratory wells in progress) has been carried out as on March 31, 2019 and an amount of ₹ 8,839.71 million (year ended March 31, 2018 ₹ 1,820.94 million) has been provided during the year 2018-19 as impairment loss. Further,₹ 223.58 million (year ended March 31, 2018 ₹1,065.43 million) impairment losses has been reversed as exploratory phase assets have been written off at Jodhpur and transferred to Oil & Gas Asset in DVP Jorhat.
54.9 The subsidiary, OVL carried out impairment test as at March 31, 2019 in respect of its Cash Generating Units (CGUs) based on value in use method. The Company identified impairment in respect of two CGUs and provided for impairment of ₹ 15,762.16 million during the year ended March 31, 2019 (for the year ended March 31, 2018 net impairment write back of ₹ 2,740.12 million was recognised including write back of impairment in respect of two CGUs and impairment in respect of three CGUs ). The current year provision for impairment is considered as exceptional item.Refer note 42.2.
The following 2P reserves of the respective CGUs have been considered for the impairment assessment:No CGU Proved and Probable Reserves (MMToe)1 Imperial, Russia 95.7442 GNPOC, Sudan 6.9173 Block-5A, South Sudan 6.3114 MECL, Colombia 1.7285 Block BC-10, Brazil 4.0796 PIVSA, Venezuela 7.9377 Carabobo-1, Venezuela 52.3858 ACG, Azerbaijan 10.5539 Area-1,Mozambique 214.785
54.10 The subsidiary, OVL has considered the loans and accrued interest to its wholly owned subsidiary Imperial Energy as deemed investment for the purpose of impairment assessment. The cash flows for estimating value in use have considered the estimated life of block till 2060 based on the reserves and associated revenue estimates report of DeGolyer and MacNaughton as well as the existing provision in the Russian sub soil law stating that “The time lines of use of a subsoil area can be extended at the initiative of the subsoil user in case it is necessary to complete prospecting and appraisal or development of a mineral deposit or carry out abandonment/liquidation measures subject to absence of violations of the license terms by this subsoil user.
54.11 In respect of subsidiary HPCL, considering the Government policies and modalities of compensating the oil marketing companies towards under-recoveries, future cash flows have been worked out based on the desired margins for deciding on impairment of related Cash Generating Units. Since there is no indication of impairment of assets as at Balance Sheet date as per the assessment carried out, no impairment has been considered. In view of assumptions being technical, peculiar to the industry and Government policy, the auditors have relied on the same.
574
55. Contingent liabilities, Contingent Assets and commitments (to the extent not provided for)55.1 Contingent Liabilities: Claims / disputes not acknowledged as debt:-
S.No. Particular As at March 31,2019 As at March 31,2018I In respect of Group Income tax 147,742.22 112,875.17 Excise Duty 13,714.02 19,049.78 Custom Duty 1,955.82 1,231.54 Royalty(Note 55.1.2) 612.88 496.82 Cess 6.57 6.57 Sales Tax 47,043.21 42,235.52 Octroi and other Municipal Taxes 66.89 66.89 AP Mineral Bearing Land (Infrastructure) Cess 3,117.08 2,909.76 Specified Land Tax (Assam) 5,199.72 4,865.55 Claims of contractors in Arbitration/Court. 196,206.03 155,231.18 Service Tax 48,497.36 29,249.72 GST 37,956.78 14,315.98 Employees Provident Fund 66.35 66.35 Other Matters 184,168.99 168,715.22 Sub Total ( A ) 686,353.90 551,316.04II In respect of Joint Ventures and Associates Income tax 83.37 579.45 Excise Duty 715.68 847.55 Custom Duty 116.97 116.97 Sales Tax 2,562.33 2,360.92 Service Tax 81.09 214.42 GST - - Claims of contractors in Arbitration/Court. 2,059.36 456.89 Other 2,819.00 4,064.95 Sub Total ( B ) 8,437.80 8,641.14 Total ( A+B ) 694,791.71 559,957.18
(` in million)
55.1.1 The Group’s pending litigations comprise claims against the Group and proceedings pending with Tax / Statutory/ Government Authorities. After review of all its pending litigations and proceedings, the Company has made adequate provisions, wherever required and disclosed the contingent liabilities, wherever applicable, in its financial statements. The Group does not expect the outcome of these proceedings to have a material impact on its financial position. Future cash outflows in respect of the above are determinable only on receipt of judgments/ decisions pending with various forums/ authorities.
55.1.2 The Company had received demand orders from Service Tax Department at various work centres on account of Service Tax on Royalty, appeals against such orders have been filed before Tribunal. The Company had also obtained legal opinion as per which the Service Tax/GST on Royalty is not applicable. Meanwhile, the Company also received demand order dated January 1, 2019 on account of GST on Royalty in the State of Rajasthan against which the Company filed writ (4919/2019) before Hon’ble HC of Rajasthan. The Hon’ble HC of Rajasthan heard the matter on April 3, 2019 and issued notice to Department with a direction that no coercive action shall be taken against the Company for recovery till next date of hearing on April 16, 2019
575Consolidated Financial Statements
deferred to May 9, 2019 and further deferred to July 16, 2019. The Company also filed writ of mandamus before Hon’ble HC of Madras seeking stay on the levy of GST on royalty. The Hon’ble HC of Madras heard the matter on April 3, 2019 and the Department has been allowed to file counter and to finalize the representation (under-protest letter) given by Company to the Department. The total estimated amount (including penalty and interest up to March 31, 2019) works out towards Service Tax is ₹ 38,616.33 million and GST is ₹ 37,956.77 million. Since the Company is contesting the demand, it has been considered as contingent liability. Further, as an abundant caution, the Company has deposited Service Tax and GST along-with interest under-protest amounting to ₹ 13,725.72 million and ₹ 28,065.77 million respectively.
55.1.3 The Company, with 40% Participating Interest (PI), is a Joint Operator in Panna-Mukta and Mid and South Tapti Fields alongwith Reliance Industries Limited (RIL) and BG Exploration and Production India Limited (BGEPIL) each having 30% PI, (all three together referred to as “Contractors”) signed two Production sharing Contracts (PSCs) with Government of India (Union of India) on December 22, 1994 for a period of 25 years. In December 2010, RIL & BGEPIL (JV Partners) invoked an international arbitration proceeding against the Union of India in respect of certain disputes, differences and claims arising out of and in connection with both the PSCs pursuant to the provisions of Article 33 of the PSCs and UNCITRAL Rules, 1976. The Ministry of Petroleum and Natural Gas (MoP&NG), vide their letter dated July 4, 2011, had directed the Company not to participate in the arbitration initiated by the JV Partners. MoP&NG has also stated that in case of an arbitral award, the same will be applicable to the Company also as a constituent of the contractor for both the PSCs .
Directorate General of Hydrocarbons (DGH), vide letters dated May 25, 2017 has informed the Company that on October 12, 2016, a Final Partial Award (FPA) was pronounced by the Tribunal in the said arbitrations. However, details of proceedings of the FPA are not available with the Company. DGH, vide their letter dated May 25, 2017 and 4th June 2018, marked to the Contractors, has directed the payment of differential Government of India share of Profit Petroleum and Royalty alleged to be payable by Contractors pursuant to Governments interpretation of the FPA (40% share of the Company amounting to US$ 1,624.05 million, including interest upto November 30, 2016) equivalent to₹ 112,400.50 million @ ` 69.21 (closing rate as on March 31, 2019). In response to the letters of DGH, the JV partners (with a copy marked to all Joint Venture Partners) have stated that demand of DGH is premature as the FPA does not make any money award in favour of Government of India, since quantification of liabilities are to be determined during the final proceedings of the arbitration. Further the award has also been challenged before the English Commercial Court (London High Court). Based on the above facts, the Company has also responded to the letters of DGH stating that pending the finality of the order, the amount due and payable by the Company is not quantifiable. In the view of the Company, any changes approved, if any, for increase in the Cost Recovery Limit (CRL) by the Management Committee (MC) as per the term of the PSCs the liability to DGH would potentially reduce.
The English Court has delivered its final verdict on May 2, 2018 following which the Arbitral Tribunal re-considered some of its earlier findings from the 2016 FPA (Revised Award). The Government of India, BGEPIL and RIL have challenged parts of the Revised Award.
In January 2018 the Company along with the JV partners has filed an application with MC for increase in CRL in terms of the PSCs. The application has been rejected by MC. Pursuant to the rejection, the JV partners have filed a claim with Arbitral Tribunal.
DGH vide letter dated January 14, 2019 has advised to the contractors to re-cast the accounts for Panna-Mukta and Mid and South Tapti Fields for the year 2017-18. Pending finalization of the decision of the Arbitral Tribunal, the JV partners and the Company have indicated in their letters to DGH that the final recasting of the accounts is premature and the issues raised by DGH may be kept in abeyance.
576
Pending finality by Arbitration Tribunal on various issues raised above, re-casting of the financial statements and final quantification of liabilities, no provision has been accounted in the financial statements. The demand raised by DGH, amounting to US$ 1624.05 million equivalent to ₹ 112,400.50 million has been considered as contingent liability.
55.1.4 In respect of subsidiary, OVL
A show cause notice of ₹ 1.04 million (including cess) (previous year : ₹ 1.04 million) has been received for the period April 1, 2015 to June 30, 2017 for non-payment of Service Tax on ‘’Legal Services’’ under reverse charge mechanism. The Company is of the view that service tax is not payable and contesting the same. Moreover, the Supreme Court has stayed the operation of the Bombay High Court order which has upheld the applicablity of service tax on legal representational services.
The Service Tax Department had issued a demand cum show-cause notice dated October 11, 2011 requiring the Company to show cause why service tax amounting to ₹ 28,163.14 million (including Education Cess and SHE cess) (previous year : ₹ 28,163.14 million), the interest on such amount and penalty should not be demanded and recovered from the Company. Service Tax Department has calculated these tax amounts based on foreign currency expenditure reported in the Company’s financial statements covering the reporting periods from April 1, 2006 to December 31, 2010 and contending that these expenses represent business auxiliary services rendered by the Company's foreign branches and operator of the Joint Venture/ Consortium to the Company. Subsequently, five more demand-cum-show cause notices have been issued based on similar contentions covering the period upto March 31, 2015 to show cause why service tax amounting to ₹ 32,863.61 million (including Education cess and SHE cess) (previous year : ₹ 32,863.61 million), the interest on such amount and penalty should not be demanded and recovered from the Company. A demand-cum-show cause notice has been issued based on similar contentions covering the period April 1, 2015 to March 31, 2017 to show cause why service tax amounting to ₹ 15,633.22 million (including Education cess and SHE cess) (previous year : ₹ 15,633.22 million), the interest on such amount and penalty should not be demanded and recovered from the Company. In the assessment of the management based on independent and competent legal opinion obtained during the year and other attendant factors including circular no. 35/9/2018-GST dated March 05, 2018 issued by Central Board of Excise and Customs, the possibility of the success of the Company’s position is extremely high and the possibility of the success of contentions of the Department is very low. Since the chances of payability of the service tax itself have been evaluated by the management as being remote/very low, the chances of assessment of interest and penalty are evaluated to be much lower. Accordingly, the amounts covered by the abovementioned show-cause notices (i.e. tax amount as well as potential interest and penalty thereon) are not considered as contingent liability in accordance with the applicable accounting standards. Further, according to the legal opinion obtained by the Company, a show-cause notice in itself does not qualify as a demand and the chance of the claim being payable by the Company is remote as the Company has a very good case to argue and succeed before the concerned authorities based on the legal position as on date.
55.1.5 In respect of subsidiary, PMHBL,
In the following cases of claims against the company, no reliable estimate could be made of the liability:
(a) Writ Petition case filed by land owners against PMHBL at Hon’ble High Court of Karnataka, Bangalore for enhancement of compensation against order of Hasan District Court.
(b) Four cases filed by Land owners at Mangalore District Court for enhancement of Compensation.
(c) One writ Petition filed by by the Land owner in the High Court of Karnataka, Bangalore against the order of Chikkamangalure District Court for enhancement of Compensation.
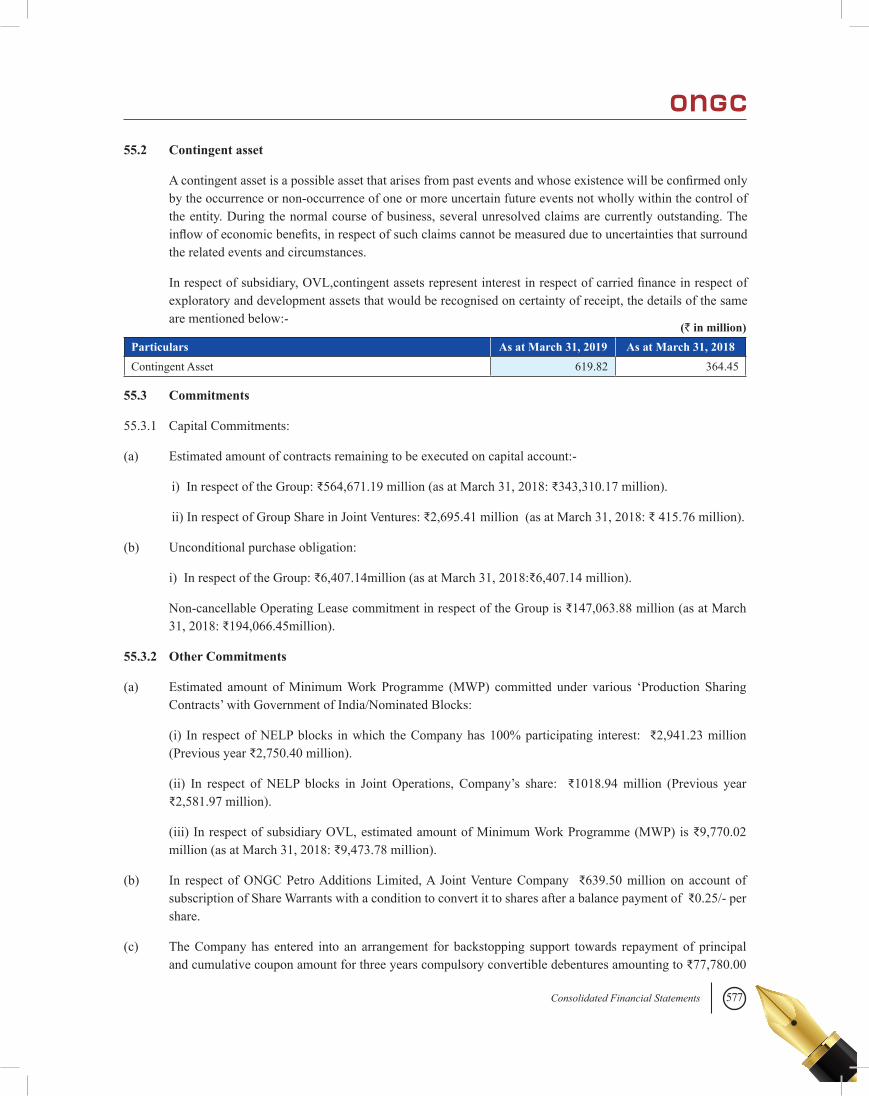
577Consolidated Financial Statements
55.2 Contingent asset
A contingent asset is a possible asset that arises from past events and whose existence will be confirmed only by the occurrence or non-occurrence of one or more uncertain future events not wholly within the control of the entity. During the normal course of business, several unresolved claims are currently outstanding. The inflow of economic benefits, in respect of such claims cannot be measured due to uncertainties that surround the related events and circumstances.
In respect of subsidiary, OVL,contingent assets represent interest in respect of carried finance in respect of exploratory and development assets that would be recognised on certainty of receipt, the details of the same are mentioned below:-
Particulars As at March 31, 2019 As at March 31, 2018Contingent Asset 619.82 364.45
(` in million)
55.3 Commitments
55.3.1 Capital Commitments:
(a) Estimated amount of contracts remaining to be executed on capital account:-
i) In respect of the Group: ₹564,671.19 million (as at March 31, 2018: ₹343,310.17 million).
ii) In respect of Group Share in Joint Ventures: ₹2,695.41 million (as at March 31, 2018: ₹ 415.76 million).
(b) Unconditional purchase obligation:
i) In respect of the Group: ₹6,407.14million (as at March 31, 2018:₹6,407.14 million).
Non-cancellable Operating Lease commitment in respect of the Group is ₹147,063.88 million (as at March 31, 2018: ₹194,066.45million).
55.3.2 Other Commitments
(a) Estimated amount of Minimum Work Programme (MWP) committed under various ‘Production Sharing Contracts’ with Government of India/Nominated Blocks:
(i) In respect of NELP blocks in which the Company has 100% participating interest: ₹2,941.23 million (Previous year ₹2,750.40 million).
(ii) In respect of NELP blocks in Joint Operations, Company’s share: ₹1018.94 million (Previous year ₹2,581.97 million).
(iii) In respect of subsidiary OVL, estimated amount of Minimum Work Programme (MWP) is ₹9,770.02 million (as at March 31, 2018: ₹9,473.78 million).
(b) In respect of ONGC Petro Additions Limited, A Joint Venture Company ₹639.50 million on account of subscription of Share Warrants with a condition to convert it to shares after a balance payment of ₹0.25/- per share.
(c) The Company has entered into an arrangement for backstopping support towards repayment of principal and cumulative coupon amount for three years compulsory convertible debentures amounting to ₹77,780.00
578
million(previous year ₹ 77,780.00 million) issued by ONGC Petro additions Limited and interest for the year ending March 31, 2019 amounting to ₹ 5,117.73 million (previous year ₹ 4,670.19 million)
(d) During the year 2017-18 the Company has acquired the entire 80% Participating Interest (PI) of Gujarat State Petroleum Corporation Limited (GSPC) along with operatorship rights, at a purchase consideration of US$ 995.26 million (₹ 62,950.20 million) for Deen Dayal West (DDW) Field in the Block KG-OSN-2001/3.The Company has also paid part consideration of US$ 200 million (₹ 12,650.00 million) for six discoveries other than DDW Field in the Block KG-OSN-2001/3 to GSPC towards acquisition rights for these discoveries in the Block KG-OSN-2001/3 to be adjusted against the valuation of such fields based on valuation parameters agreed between GSPC and the Company (Refer Note no. 50.1.9).
In respect of subsidiary MRPL,
(a) Pending commitment on account of Refinery-MRPL is in possession of certain land provisionally measuring 36.69 acres ceded by HPCL for use by MRPL Phase III expansion and upgradation work. The consideration for such land is mutually agreed to be by way of swapping of land in possession of MRPL/HPCL. The final documentation in this regard is pending to be executed.
(b) Pending commitment on account of Refinery performance improvement programme by M\s.Shell Global International Solution (M/s.Shell GIS) as at March 31, 2019 US$ 1.46 million net of advance (As at March 31, 2018US$ 1.46 million net of advance).
(c) The Company has an export obligation as at March 31,2019 ₹ Nil million (As at March 31, 2018 ₹496.81 million) on account of concessional rate of customs duty availed under EPCG license scheme on import of capital goods.
(d) In response to an enquiry from the Customs Department contending incorrect classification of reformate for the purpose of payment of Import duty, the Group has deposited an amount of ₹ 2,125.25 million under protest towards differential customs duty being pre-deposit. As the duty paid under protest by the group could be refundable or otherwise only upon the completion of assessments and reaching finality, it is not practicable to make a realistic impact of the actual liability if any, at this stage on the company.
(e) The Subsidiary company, OMPL has taken 441.438 acres of land taken on lease for a period of 47 years and 10 months from Mangalore SEZ Limited. The annual lease rental payable to Mangalore SEZ Limited is ₹ 23.40 million.
(f) The Subsidiary company, OMPL has entered into tripartite agreement with Mangalore SEZ Limited and Mangalore Refinery & Petrochemicals Limited for supply of 3.86 million gallons per day (MGD) of water by Mangalore SEZ Limited for 15 years. The annual charges payable to Mangalore SEZ Limited is ₹ 85.60 million.
56 Disclosure under Guidance Note on Accounting for “Oil and Gas Producing Activities” (Revised)
56.1 Group's share of Proved Reserves on the geographical basis is as under:
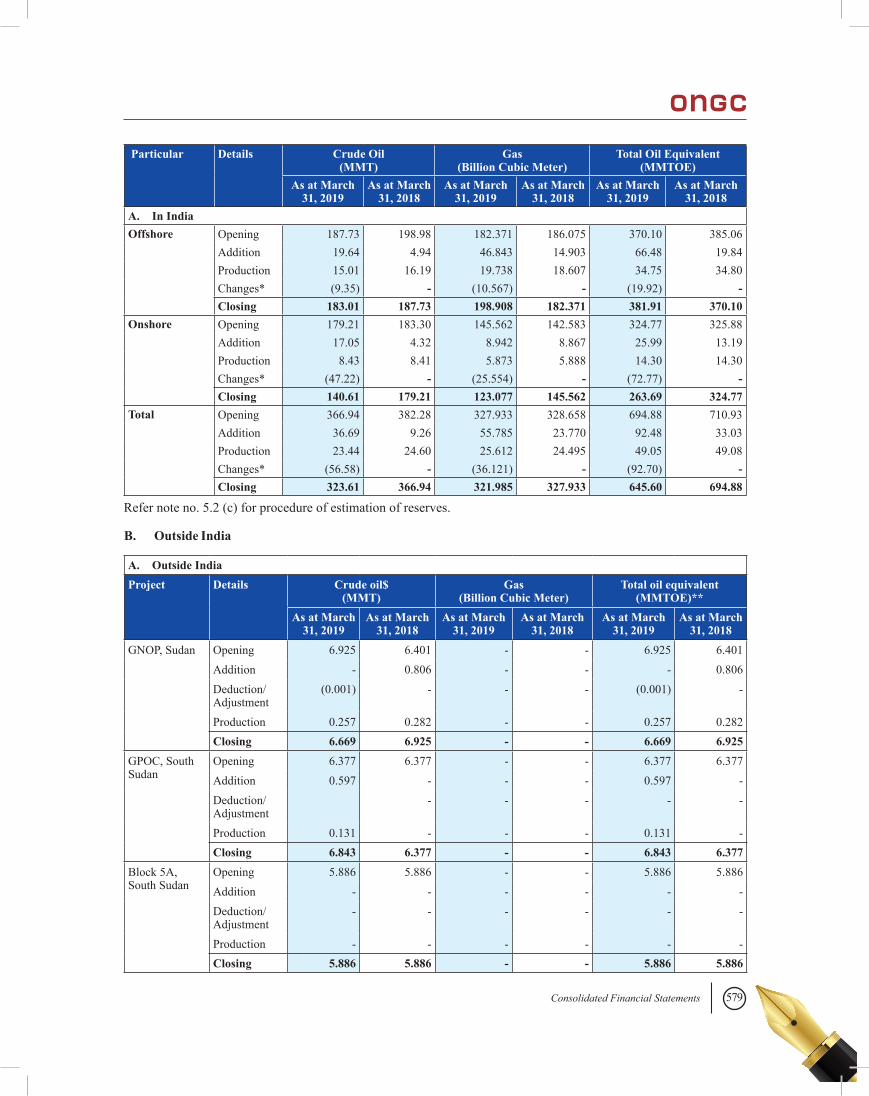
579Consolidated Financial Statements
Particular
Details
Crude Oil(MMT)
Gas(Billion Cubic Meter)
Total Oil Equivalent (MMTOE)
As at March 31, 2019
As at March 31, 2018
As at March 31, 2019
As at March 31, 2018
As at March 31, 2019
As at March 31, 2018
A. In IndiaOffshore Opening 187.73 198.98 182.371 186.075 370.10 385.06
Addition 19.64 4.94 46.843 14.903 66.48 19.84Production 15.01 16.19 19.738 18.607 34.75 34.80Changes* (9.35) - (10.567) - (19.92) -Closing 183.01 187.73 198.908 182.371 381.91 370.10
Onshore Opening 179.21 183.30 145.562 142.583 324.77 325.88Addition 17.05 4.32 8.942 8.867 25.99 13.19Production 8.43 8.41 5.873 5.888 14.30 14.30Changes* (47.22) - (25.554) - (72.77) -Closing 140.61 179.21 123.077 145.562 263.69 324.77
Total Opening 366.94 382.28 327.933 328.658 694.88 710.93Addition 36.69 9.26 55.785 23.770 92.48 33.03Production 23.44 24.60 25.612 24.495 49.05 49.08Changes* (56.58) - (36.121) - (92.70) -Closing 323.61 366.94 321.985 327.933 645.60 694.88
Refer note no. 5.2 (c) for procedure of estimation of reserves.
B. Outside India
A. Outside IndiaProject Details Crude oil$
(MMT)Gas
(Billion Cubic Meter)Total oil equivalent
(MMTOE)**As at March
31, 2019As at March
31, 2018As at March
31, 2019As at March
31, 2018As at March
31, 2019As at March
31, 2018GNOP, Sudan Opening 6.925 6.401 - - 6.925 6.401
Addition - 0.806 - - - 0.806 Deduction/ Adjustment
(0.001) - - - (0.001) -
Production 0.257 0.282 - - 0.257 0.282 Closing 6.669 6.925 - - 6.669 6.925
GPOC, South Sudan
Opening 6.377 6.377 - - 6.377 6.377 Addition 0.597 - - - 0.597 - Deduction/ Adjustment
- - - - -
Production 0.131 - - - 0.131 - Closing 6.843 6.377 - - 6.843 6.377
Block 5A, South Sudan
Opening 5.886 5.886 - - 5.886 5.886 Addition - - - - - - Deduction/ Adjustment
- - - - - -
Production - - - - - - Closing 5.886 5.886 - - 5.886 5.886
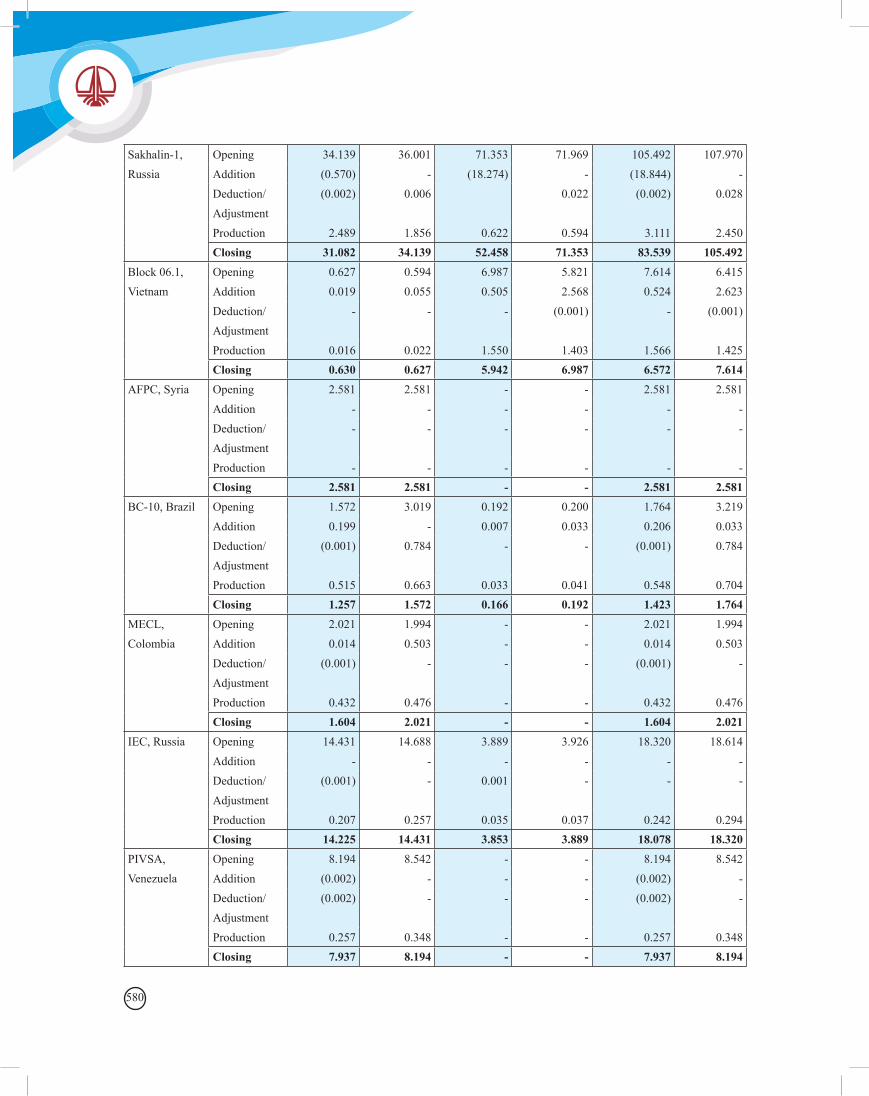
580
Sakhalin-1, Russia
Opening 34.139 36.001 71.353 71.969 105.492 107.970 Addition (0.570) - (18.274) - (18.844) - Deduction/ Adjustment
(0.002) 0.006 0.022 (0.002) 0.028
Production 2.489 1.856 0.622 0.594 3.111 2.450 Closing 31.082 34.139 52.458 71.353 83.539 105.492
Block 06.1, Vietnam
Opening 0.627 0.594 6.987 5.821 7.614 6.415 Addition 0.019 0.055 0.505 2.568 0.524 2.623 Deduction/ Adjustment
- - - (0.001) - (0.001)
Production 0.016 0.022 1.550 1.403 1.566 1.425 Closing 0.630 0.627 5.942 6.987 6.572 7.614
AFPC, Syria Opening 2.581 2.581 - - 2.581 2.581 Addition - - - - - - Deduction/ Adjustment
- - - - - -
Production - - - - - - Closing 2.581 2.581 - - 2.581 2.581
BC-10, Brazil Opening 1.572 3.019 0.192 0.200 1.764 3.219 Addition 0.199 - 0.007 0.033 0.206 0.033 Deduction/ Adjustment
(0.001) 0.784 - - (0.001) 0.784
Production 0.515 0.663 0.033 0.041 0.548 0.704 Closing 1.257 1.572 0.166 0.192 1.423 1.764
MECL, Colombia
Opening 2.021 1.994 - - 2.021 1.994 Addition 0.014 0.503 - - 0.014 0.503 Deduction/ Adjustment
(0.001) - - - (0.001) -
Production 0.432 0.476 - - 0.432 0.476 Closing 1.604 2.021 - - 1.604 2.021
IEC, Russia Opening 14.431 14.688 3.889 3.926 18.320 18.614 Addition - - - - - - Deduction/ Adjustment
(0.001) - 0.001 - - -
Production 0.207 0.257 0.035 0.037 0.242 0.294 Closing 14.225 14.431 3.853 3.889 18.078 18.320
PIVSA, Venezuela
Opening 8.194 8.542 - - 8.194 8.542 Addition (0.002) - - - (0.002) - Deduction/ Adjustment
(0.002) - - - (0.002) -
Production 0.257 0.348 - - 0.257 0.348 Closing 7.937 8.194 - - 7.937 8.194
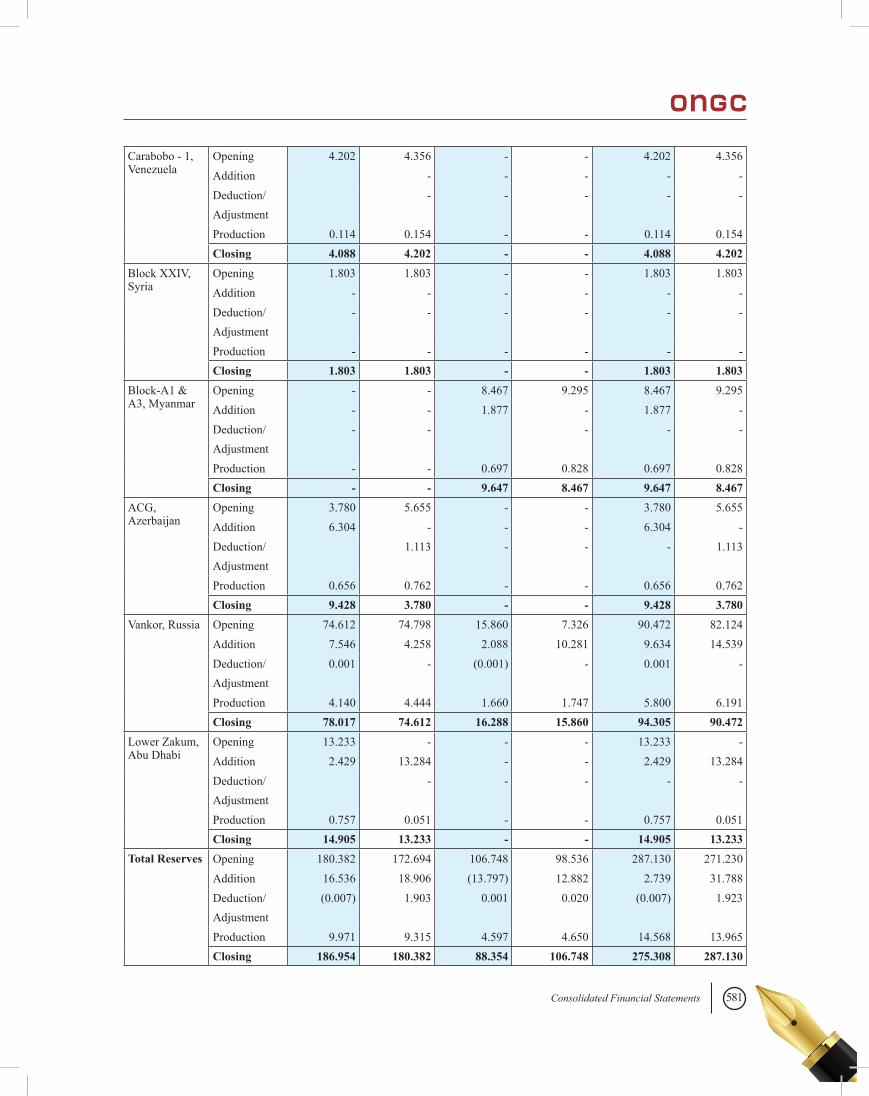
581Consolidated Financial Statements
Carabobo - 1, Venezuela
Opening 4.202 4.356 - - 4.202 4.356 Addition - - - - - Deduction/ Adjustment
- - - - -
Production 0.114 0.154 - - 0.114 0.154 Closing 4.088 4.202 - - 4.088 4.202
Block XXIV, Syria
Opening 1.803 1.803 - - 1.803 1.803 Addition - - - - - - Deduction/ Adjustment
- - - - - -
Production - - - - - - Closing 1.803 1.803 - - 1.803 1.803
Block-A1 & A3, Myanmar
Opening - - 8.467 9.295 8.467 9.295 Addition - - 1.877 - 1.877 - Deduction/ Adjustment
- - - - -
Production - - 0.697 0.828 0.697 0.828 Closing - - 9.647 8.467 9.647 8.467
ACG, Azerbaijan
Opening 3.780 5.655 - - 3.780 5.655 Addition 6.304 - - - 6.304 - Deduction/ Adjustment
1.113 - - - 1.113
Production 0.656 0.762 - - 0.656 0.762 Closing 9.428 3.780 - - 9.428 3.780
Vankor, Russia Opening 74.612 74.798 15.860 7.326 90.472 82.124 Addition 7.546 4.258 2.088 10.281 9.634 14.539 Deduction/ Adjustment
0.001 - (0.001) - 0.001 -
Production 4.140 4.444 1.660 1.747 5.800 6.191 Closing 78.017 74.612 16.288 15.860 94.305 90.472
Lower Zakum, Abu Dhabi
Opening 13.233 - - - 13.233 - Addition 2.429 13.284 - - 2.429 13.284 Deduction/ Adjustment
- - - - -
Production 0.757 0.051 - - 0.757 0.051 Closing 14.905 13.233 - - 14.905 13.233
Total Reserves Opening 180.382 172.694 106.748 98.536 287.130 271.230 Addition 16.536 18.906 (13.797) 12.882 2.739 31.788 Deduction/ Adjustment
(0.007) 1.903 0.001 0.020 (0.007) 1.923
Production 9.971 9.315 4.597 4.650 14.568 13.965 Closing 186.954 180.382 88.354 106.748 275.308 287.130
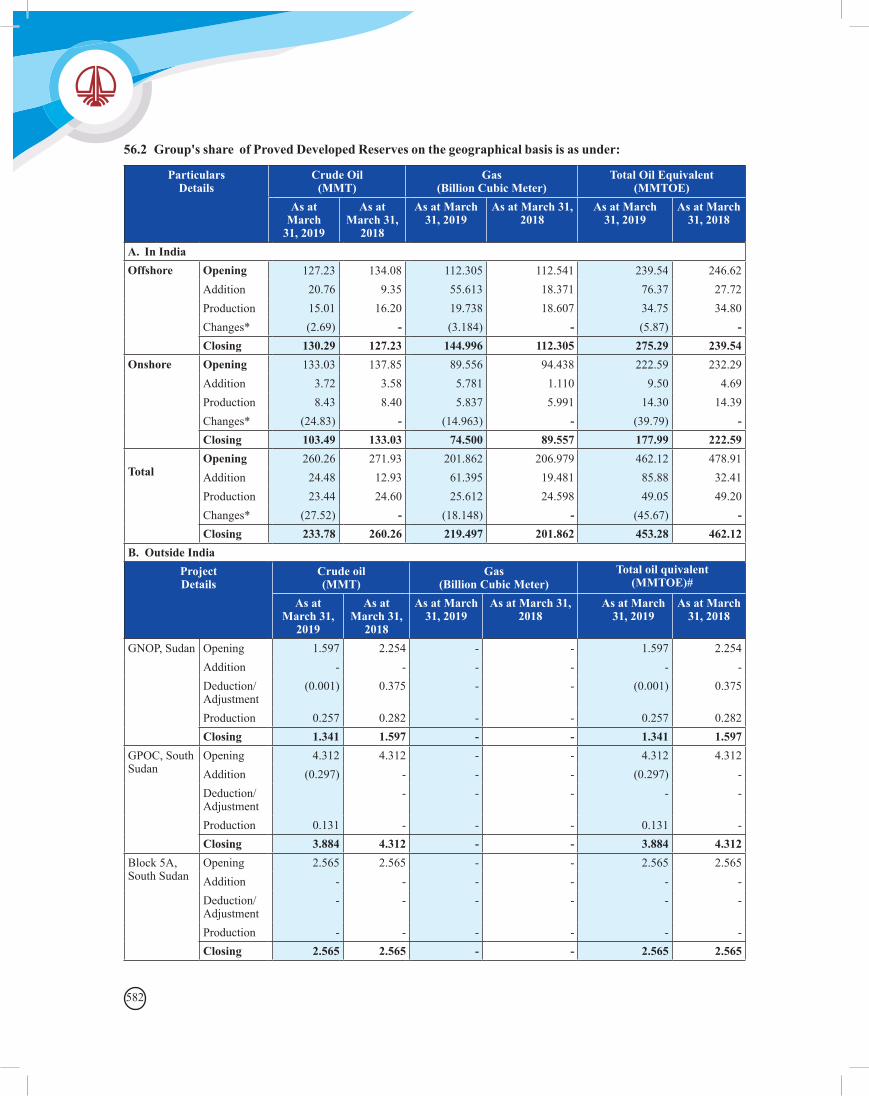
582
56.2 Group's share of Proved Developed Reserves on the geographical basis is as under:
ParticularsDetails
Crude Oil(MMT)
Gas(Billion Cubic Meter)
Total Oil Equivalent (MMTOE)
As at March
31, 2019
As at March 31,
2018
As at March 31, 2019
As at March 31, 2018
As at March 31, 2019
As at March 31, 2018
A. In IndiaOffshore Opening 127.23 134.08 112.305 112.541 239.54 246.62
Addition 20.76 9.35 55.613 18.371 76.37 27.72Production 15.01 16.20 19.738 18.607 34.75 34.80Changes* (2.69) - (3.184) - (5.87) -Closing 130.29 127.23 144.996 112.305 275.29 239.54
Onshore Opening 133.03 137.85 89.556 94.438 222.59 232.29Addition 3.72 3.58 5.781 1.110 9.50 4.69Production 8.43 8.40 5.837 5.991 14.30 14.39Changes* (24.83) - (14.963) - (39.79) -Closing 103.49 133.03 74.500 89.557 177.99 222.59
TotalOpening 260.26 271.93 201.862 206.979 462.12 478.91Addition 24.48 12.93 61.395 19.481 85.88 32.41Production 23.44 24.60 25.612 24.598 49.05 49.20Changes* (27.52) - (18.148) - (45.67) -Closing 233.78 260.26 219.497 201.862 453.28 462.12
B. Outside IndiaProject Details
Crude oil (MMT)
Gas (Billion Cubic Meter)
As at March 31,
2019
As at March 31,
2018
As at March 31, 2019
As at March 31, 2018
As at March 31, 2019
As at March 31, 2018
GNOP, Sudan Opening 1.597 2.254 - - 1.597 2.254Addition - - - - - -Deduction/ Adjustment
(0.001) 0.375 - - (0.001) 0.375
Production 0.257 0.282 - - 0.257 0.282Closing 1.341 1.597 - - 1.341 1.597
GPOC, South Sudan
Opening 4.312 4.312 - - 4.312 4.312Addition (0.297) - - - (0.297) -Deduction/ Adjustment
- - - - -
Production 0.131 - - - 0.131 -Closing 3.884 4.312 - - 3.884 4.312
Block 5A, South Sudan
Opening 2.565 2.565 - - 2.565 2.565Addition - - - - - -Deduction/ Adjustment
- - - - - -
Production - - - - - -Closing 2.565 2.565 - - 2.565 2.565
Total oil quivalent (MMTOE)#
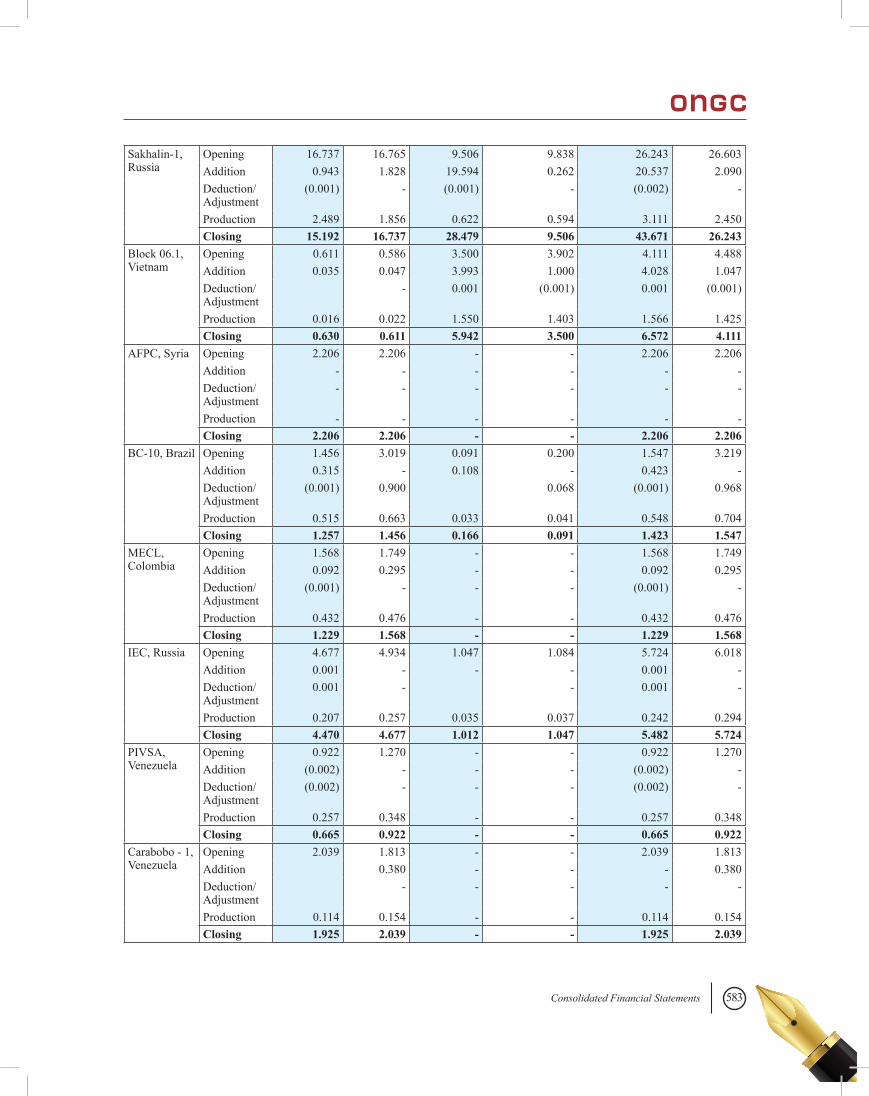
583Consolidated Financial Statements
Sakhalin-1, Russia
Opening 16.737 16.765 9.506 9.838 26.243 26.603Addition 0.943 1.828 19.594 0.262 20.537 2.090Deduction/ Adjustment
(0.001) - (0.001) - (0.002) -
Production 2.489 1.856 0.622 0.594 3.111 2.450Closing 15.192 16.737 28.479 9.506 43.671 26.243
Block 06.1, Vietnam
Opening 0.611 0.586 3.500 3.902 4.111 4.488Addition 0.035 0.047 3.993 1.000 4.028 1.047Deduction/ Adjustment
- 0.001 (0.001) 0.001 (0.001)
Production 0.016 0.022 1.550 1.403 1.566 1.425Closing 0.630 0.611 5.942 3.500 6.572 4.111
AFPC, Syria Opening 2.206 2.206 - - 2.206 2.206Addition - - - - - -Deduction/ Adjustment
- - - - - -
Production - - - - - -Closing 2.206 2.206 - - 2.206 2.206
BC-10, Brazil Opening 1.456 3.019 0.091 0.200 1.547 3.219Addition 0.315 - 0.108 - 0.423 -Deduction/ Adjustment
(0.001) 0.900 0.068 (0.001) 0.968
Production 0.515 0.663 0.033 0.041 0.548 0.704Closing 1.257 1.456 0.166 0.091 1.423 1.547
MECL, Colombia
Opening 1.568 1.749 - - 1.568 1.749Addition 0.092 0.295 - - 0.092 0.295Deduction/ Adjustment
(0.001) - - - (0.001) -
Production 0.432 0.476 - - 0.432 0.476Closing 1.229 1.568 - - 1.229 1.568
IEC, Russia Opening 4.677 4.934 1.047 1.084 5.724 6.018Addition 0.001 - - - 0.001 -Deduction/ Adjustment
0.001 - - 0.001 -
Production 0.207 0.257 0.035 0.037 0.242 0.294Closing 4.470 4.677 1.012 1.047 5.482 5.724
PIVSA, Venezuela
Opening 0.922 1.270 - - 0.922 1.270Addition (0.002) - - - (0.002) -Deduction/ Adjustment
(0.002) - - - (0.002) -
Production 0.257 0.348 - - 0.257 0.348Closing 0.665 0.922 - - 0.665 0.922
Carabobo - 1, Venezuela
Opening 2.039 1.813 - - 2.039 1.813Addition 0.380 - - - 0.380Deduction/ Adjustment
- - - - -
Production 0.114 0.154 - - 0.114 0.154Closing 1.925 2.039 - - 1.925 2.039
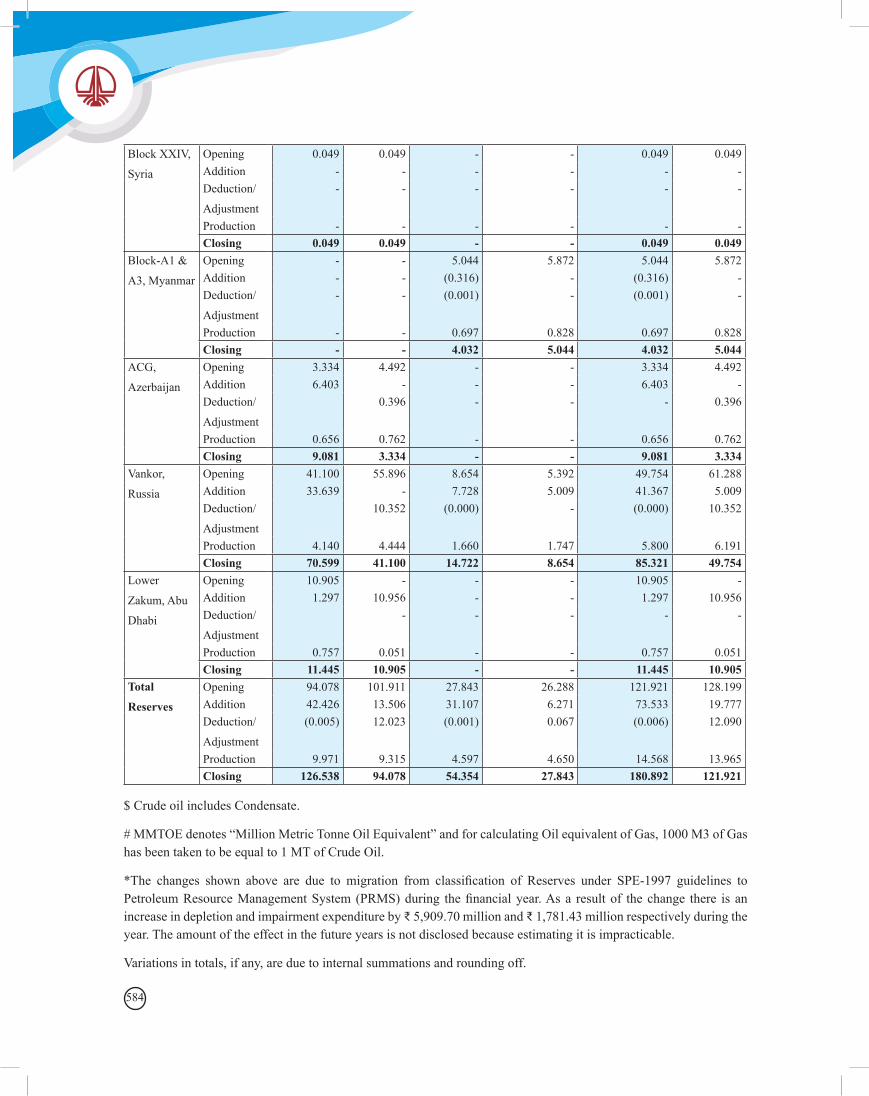
584
Block XXIV,
Syria
Opening 0.049 0.049 - - 0.049 0.049Addition - - - - - -Deduction/
Adjustment
- - - - - -
Production - - - - - -Closing 0.049 0.049 - - 0.049 0.049
Block-A1 &
A3, Myanmar
Opening - - 5.044 5.872 5.044 5.872Addition - - (0.316) - (0.316) -Deduction/
Adjustment
- - (0.001) - (0.001) -
Production - - 0.697 0.828 0.697 0.828Closing - - 4.032 5.044 4.032 5.044
ACG,
Azerbaijan
Opening 3.334 4.492 - - 3.334 4.492Addition 6.403 - - - 6.403 -Deduction/
Adjustment
0.396 - - - 0.396
Production 0.656 0.762 - - 0.656 0.762Closing 9.081 3.334 - - 9.081 3.334
Vankor,
Russia
Opening 41.100 55.896 8.654 5.392 49.754 61.288Addition 33.639 - 7.728 5.009 41.367 5.009Deduction/
Adjustment
10.352 (0.000) - (0.000) 10.352
Production 4.140 4.444 1.660 1.747 5.800 6.191Closing 70.599 41.100 14.722 8.654 85.321 49.754
Lower
Zakum, Abu
Dhabi
Opening 10.905 - - - 10.905 -Addition 1.297 10.956 - - 1.297 10.956Deduction/
Adjustment
- - - - -
Production 0.757 0.051 - - 0.757 0.051Closing 11.445 10.905 - - 11.445 10.905
Total
Reserves
Opening 94.078 101.911 27.843 26.288 121.921 128.199Addition 42.426 13.506 31.107 6.271 73.533 19.777Deduction/
Adjustment
(0.005) 12.023 (0.001) 0.067 (0.006) 12.090
Production 9.971 9.315 4.597 4.650 14.568 13.965Closing 126.538 94.078 54.354 27.843 180.892 121.921
$ Crude oil includes Condensate.
# MMTOE denotes “Million Metric Tonne Oil Equivalent” and for calculating Oil equivalent of Gas, 1000 M3 of Gas has been taken to be equal to 1 MT of Crude Oil.
*The changes shown above are due to migration from classification of Reserves under SPE-1997 guidelines to Petroleum Resource Management System (PRMS) during the financial year. As a result of the change there is an increase in depletion and impairment expenditure by ₹ 5,909.70 million and ₹ 1,781.43 million respectively during the year. The amount of the effect in the future years is not disclosed because estimating it is impracticable.
Variations in totals, if any, are due to internal summations and rounding off.
585Consolidated Financial Statements
56.3 In Discovered Small Field (DSF) Bid Round – II (2018), 12 out of 17 contract areas falling in the Company’s acreages were awarded to other parties and 5 contract areas were awarded to the Company. Handing over process is currently underway. After completion of handing over, Reserves estimates pertaining to 12 contract areas are to be removed from the Company’s reserves. Out of these twelve contract areas awarded to third parties, entire reserve estimates of eight contract blocks having 0.19 MMT of contingent Resources (0.007 MMT in Proved Developed Reserves & 0.18 MM in Proved Reserves category) are likely to be removed the Company’s reserves. For the remaining four contract areas there will be partial deletion / deletion from extension of pay sands of adjoining fields which is being worked out.
57. Subsidiary OMPL has prepared the Financials statements on going concern basis. The Company is a greenfield project and had incurred losses in earlier Financial Years resulting in significant reduction in net worth. However, through improved physical performance and various profitability improvement measures, the Company after overcoming initial period challenges, has earned profits during current financial year besides achieving considerable improvement in net worth. The promoter Companies have extended support by way of equity infusion during current financial year. Company has fully serviced its debt and interest obligations till date. The company has developed firm plans to ensure sustained operations of the company. Based on future projections of the performance and with strong parentage of promoters, the company believes that it will be able to service its debt as well as interest obligations on time.
58 Subsidiary OMPL has recognised deferred tax asset on tax losses as at March 31, 2019. The Company has incurred losses in the past and is having convincing evidence in respect of the recognition of deferred tax asset which includes committed long-term/short-term offtake arrangement entered with customer for its products, various measures taken to enhance the capacity utilization and the profitability.
The extent to which deferred tax assets can be recognized is based on an assessment of the probability of the Company’s future taxable income against which the deferred tax assets can be utilized. Such assessment has been carried out based on detailed analysis of past and future performance of the Company besides budget and profitability forecast as well as compatibility with legal and economic factors.
59. Subsidiary OMPL operates in special economic zone (SEZ) in Mangalore, accordingly is eligible for certain economic benefits such as exemptions from GST, custom duty, excise duty, service tax , value added tax, entry tax, etc. which are in the nature of government assistance. These benefits are subject to fulfillment of certain obligations by the Company.
60. The Board had accorded consent for amalgamation of the subsidiary ONGC Mangalore Petrochemicals Limited with the Mangalore Refinery and Petrochemicals Limited (MRPL), subject to necessary approvals. The Company had received “No Objection” vide letter dated April 18, 2018 from Ministry of Petroleum & Natural Gas. No effect is considered towards the same in the financial statements as it is still at a preliminary stage.
61. In respect of subsidiary OVL, the Company has reviewed the geopolitical situation in Sudan and has considered the option for exit from the operations in Block 2A/4 in terms of Article 14.1 of the JOA. The intention in this regard has been conveyed to the Government of Sudan on 10th May 2019. Consequently the Company has provided ₹ 5,979.71 million against the associated oil & gas and other assets in its consolidated financial statements.
62. Changes in accounting policy – Ind AS 115
In respect of subsidiary OVL,
The company has applied Ind AS 115 for the first time using the modified retrospective method for transition with the date of application of April 1, 2018. Comparative of the prior period has not been adjusted.
586
Statement of profit and loss (extract) year ended 31 March 2019
31 March 2019 without adoption of Ind AS 115
Increase/ (Decrease)
31 March 2019 as reported
Revenue from operations: -Sale of products Crude oil 128,022.18 (4,697.79) 123,324.39 Expenses: Production, transportation, selling & distribution expenditure 48,739.19 (3,634.72) 45,104.47 Current Tax 19,923.77 (1,063.07) 18,860.70
In respect of subsidiary HPCL,
Disaggregation of revenue
Particulars 2018-19 2017-18Exports 27,900.90 17,560.90Other than export 2,931,967.80 2,416,433.10
2,959,868.70 2,433,994,00
(` in million)
During the year ended March 31, 2019 , the company recognized revenue of ₹ 5,386.90 million arising from opening unearned revenue as of April 1, 2018. This includes the amount pertaining to loyalty points which has been arrived basis the utilization pattern of Loyalty points.
Transaction price allocated to the remaining performance obligations
The Corporation recognises revenue when it satisfies a performance obligation by transferring a promised good or service to a customer. As at 31st March 2019, the amount allocated will be recognised as revenue when (a) in case of revenue received in advance, when the product is delivered to the customer, (b) in case of loyalty points, when the award points are redeemed / expires and (c) in case of non-refundable bid fee, over the period of dealership agreement.
63. The Figures in respect of the company, Subsidiaries/Joint Venture and Associates Companies have been regrouped/rearranged based upon the details obtained from the management as part of consolidation process, Audited/unaudited accounts of respective group companies, some balances of Trade/Other receivables Trade/Other payables and Loans & Advances are subject to confirmation/reconciliation. Adjustments, if any, will be accounted for on confirmation/ reconciliation of the same which will not have a material impact.
(` in million)
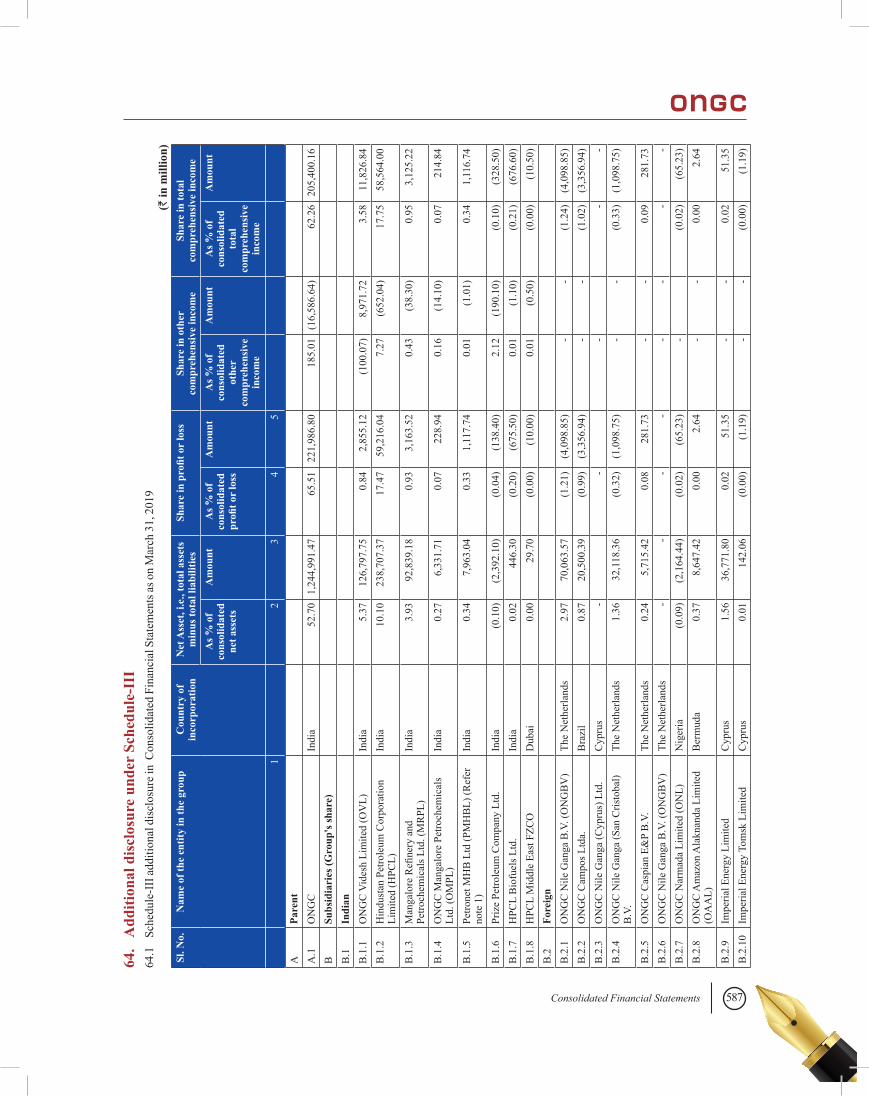
587Consolidated Financial Statements
(` in
mill
ion)
64.
Add
ition
al d
iscl
osur
e un
der
Sche
dule
-III
64.1
Sc
hedu
le-I
II ad
ditio
nal d
iscl
osur
e in
Con
solid
ated
Fin
anci
al S
tate
men
ts as
on
Mar
ch 3
1, 2
019
Sl. N
o.N
ame
of th
e en
tity
in th
e gr
oup
Cou
ntry
of
inco
rpor
atio
nN
et A
sset
, i.e
., to
tal a
sset
s m
inus
tota
l lia
bilit
ies
Shar
e in
pro
fit o
r lo
ssSh
are
in o
ther
co
mpr
ehen
sive
inco
me
Shar
e in
tota
l co
mpr
ehen
sive
inco
me
As %
of
cons
olid
ated
ne
t ass
ets
Am
ount
As %
of
cons
olid
ated
pr
ofit o
r lo
ss
Am
ount
As %
of
cons
olid
ated
ot
her
com
preh
ensi
ve
inco
me
Am
ount
As %
of
cons
olid
ated
to
tal
com
preh
ensi
ve
inco
me
Am
ount
1
2
34
5
APa
rent
A
.1O
NG
CIn
dia
52.7
01,
244,
991.
4765
.51
221,
986.
8018
5.01
(16,
586.
64)
62.2
620
5,40
0.16
BSu
bsid
iari
es (G
roup
's sh
are)
B
.1In
dian
B.1
.1O
NG
C V
ides
h Li
mite
d (O
VL)
Indi
a5.
3712
6,79
7.75
0.84
2,85
5.12
(100
.07)
8,97
1.72
3.58
11,8
26.8
4B
.1.2
Hin
dust
an P
etro
leum
Cor
pora
tion
Lim
ited
(HPC
L)In
dia
10.1
023
8,70
7.37
17.4
759
,216
.04
7.27
(652
.04)
17.7
558
,564
.00
B.1
.3M
anga
lore
Refi
nery
and
Pe
troch
emic
als L
td. (
MR
PL)
Indi
a3.
9392
,839
.18
0.93
3,16
3.52
0.43
(38.
30)
0.95
3,12
5.22
B.1
.4O
NG
C M
anga
lore
Pet
roch
emic
als
Ltd.
(OM
PL)
Indi
a0.
276,
331.
710.
0722
8.94
0.16
(14.
10)
0.07
214.
84
B.1
.5Pe
trone
t MH
B L
td (P
MH
BL)
(Ref
er
note
1)
Indi
a0.
347,
963.
040.
331,
117.
740.
01(1
.01)
0.34
1,11
6.74
B.1
.6Pr
ize
Petro
leum
Com
pany
Ltd
.In
dia
(0.1
0)(2
,392
.10)
(0.0
4)(1
38.4
0)2.
12(1
90.1
0)(0
.10)
(328
.50)
B.1
.7H
PCL
Bio
fuel
s Ltd
.In
dia
0.02
446.
30(0
.20)
(675
.50)
0.01
(1.1
0)(0
.21)
(676
.60)
B.1
.8H
PCL
Mid
dle
East
FZC
OD
ubai
0.00
29.7
0(0
.00)
(10.
00)
0.01
(0.5
0)(0
.00)
(10.
50)
B.2
Fore
ign
B
.2.1
ON
GC
Nile
Gan
ga B
.V. (
ON
GB
V)
The
Net
herla
nds
2.97
70,0
63.5
7(1
.21)
(4,0
98.8
5)-
-(1
.24)
(4,0
98.8
5)B
.2.2
ON
GC
Cam
pos L
tda.
Bra
zil
0.87
20,5
00.3
9(0
.99)
(3,3
56.9
4)-
-(1
.02)
(3,3
56.9
4)B
.2.3
ON
GC
Nile
Gan
ga (C
ypru
s) L
td.
Cyp
rus
-
-
-
--
B.2
.4O
NG
C N
ile G
anga
(San
Cris
toba
l) B
.V.
The
Net
herla
nds
1.36
32,1
18.3
6(0
.32)
(1,0
98.7
5)-
-(0
.33)
(1,0
98.7
5)
B.2
.5O
NG
C C
aspi
an E
&P
B.V
.Th
e N
ethe
rland
s0.
245,
715.
420.
0828
1.73
--
0.09
281.
73B
.2.6
ON
GC
Nile
Gan
ga B
.V. (
ON
GB
V)
The
Net
herla
nds
--
--
--
--
B.2
.7O
NG
C N
arm
ada
Lim
ited
(ON
L)N
iger
ia(0
.09)
(2,1
64.4
4)(0
.02)
(65.
23)
-
(0.0
2)(6
5.23
)B
.2.8
ON
GC
Am
azon
Ala
knan
da L
imite
d (O
AA
L)B
erm
uda
0.37
8,64
7.42
0.00
2.64
--
0.00
2.64
B.2
.9Im
peria
l Ene
rgy
Lim
ited
Cyp
rus
1.56
36,7
71.8
00.
0251
.35
--
0.02
51.3
5B
.2.1
0Im
peria
l Ene
rgy
Tom
sk L
imite
dC
ypru
s0.
0114
2.06
(0.0
0)(1
.19)
--
(0.0
0)(1
.19)
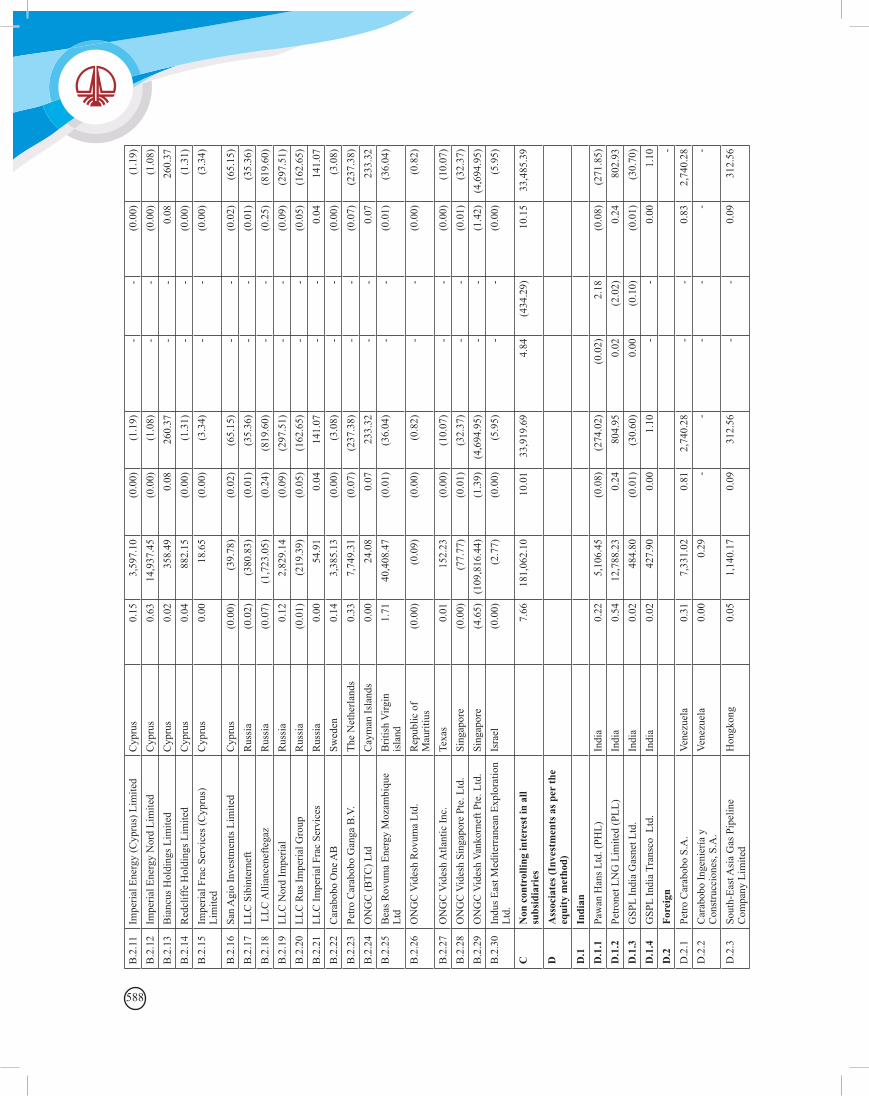
588
B.2
.11
Impe
rial E
nerg
y (C
ypru
s) L
imite
dC
ypru
s0.
153,
597.
10(0
.00)
(1.1
9)-
-(0
.00)
(1.1
9)B
.2.1
2Im
peria
l Ene
rgy
Nor
d Li
mite
dC
ypru
s0.
6314
,937
.45
(0.0
0)(1
.08)
--
(0.0
0)(1
.08)
B.2
.13
Bia
ncus
Hol
ding
s Lim
ited
Cyp
rus
0.02
358.
490.
0826
0.37
--
0.08
260.
37B
.2.1
4R
edcl
iffe
Hol
ding
s Lim
ited
Cyp
rus
0.04
882.
15(0
.00)
(1.3
1)-
-(0
.00)
(1.3
1)B
.2.1
5Im
peria
l Fra
c Se
rvic
es (C
ypru
s)
Lim
ited
Cyp
rus
0.00
18.6
5(0
.00)
(3.3
4)-
-(0
.00)
(3.3
4)
B.2
.16
San
Agi
o In
vest
men
ts L
imite
dC
ypru
s(0
.00)
(39.
78)
(0.0
2)(6
5.15
)-
-(0
.02)
(65.
15)
B.2
.17
LLC
Sib
inte
rnef
tR
ussi
a(0
.02)
(380
.83)
(0.0
1)(3
5.36
)-
-(0
.01)
(35.
36)
B.2
.18
LLC
Alli
ance
nefte
gaz
Rus
sia
(0.0
7)(1
,723
.05)
(0.2
4)(8
19.6
0)-
-(0
.25)
(819
.60)
B.2
.19
LLC
Nor
d Im
peria
lR
ussi
a0.
122,
829.
14(0
.09)
(297
.51)
--
(0.0
9)(2
97.5
1)B
.2.2
0LL
C R
us Im
peria
l Gro
upR
ussi
a(0
.01)
(219
.39)
(0.0
5)(1
62.6
5)-
-(0
.05)
(162
.65)
B.2
.21
LLC
Impe
rial F
rac
Serv
ices
Rus
sia
0.00
54.9
10.
0414
1.07
--
0.04
141.
07B
.2.2
2C
arab
obo
One
AB
Swed
en0.
143,
385.
13(0
.00)
(3.0
8)-
-(0
.00)
(3.0
8)B
.2.2
3Pe
tro C
arab
obo
Gan
ga B
.V.
The
Net
herla
nds
0.33
7,74
9.31
(0.0
7)(2
37.3
8)-
-(0
.07)
(237
.38)
B.2
.24
ON
GC
(BTC
) Ltd
Cay
man
Isla
nds
0.00
24.0
80.
0723
3.32
--
0.07
233.
32B
.2.2
5B
eas R
ovum
a En
ergy
Moz
ambi
que
Ltd
Brit
ish
Virg
in
isla
nd1.
7140
,408
.47
(0.0
1)(3
6.04
)-
-(0
.01)
(36.
04)
B.2
.26
ON
GC
Vid
esh
Rov
uma
Ltd.
Rep
ublic
of
Mau
ritiu
s(0
.00)
(0.0
9)(0
.00)
(0.8
2)-
-(0
.00)
(0.8
2)
B.2
.27
ON
GC
Vid
esh
Atla
ntic
Inc.
Texa
s0.
0115
2.23
(0.0
0)(1
0.07
)-
-(0
.00)
(10.
07)
B.2
.28
ON
GC
Vid
esh
Sing
apor
e Pt
e. L
td.
Sing
apor
e(0
.00)
(77.
77)
(0.0
1)(3
2.37
)-
-(0
.01)
(32.
37)
B.2
.29
ON
GC
Vid
esh
Vank
orne
ft Pt
e. L
td.
Sing
apor
e(4
.65)
(109
,816
.44)
(1.3
9)(4
,694
.95)
--
(1.4
2)(4
,694
.95)
B.2
.30
Indu
s Eas
t Med
iterr
anea
n Ex
plor
atio
n Lt
d.Is
rael
(0.0
0)(2
.77)
(0.0
0)(5
.95)
--
(0.0
0)(5
.95)
CN
on c
ontr
ollin
g in
tere
st in
all
subs
idia
ries
7.
6618
1,06
2.10
10.0
133
,919
.69
4.84
(434
.29)
10.1
533
,485
.39
DA
ssoc
iate
s (In
vest
men
ts a
s per
the
equi
ty m
etho
d)
D.1
Indi
an
D
.1.1
Paw
an H
ans L
td. (
PHL)
Indi
a0.
225,
106.
45(0
.08)
(274
.02)
(0.0
2)2.
18(0
.08)
(271
.85)
D.1
.2Pe
trone
t LN
G L
imite
d (P
LL)
Indi
a0.
5412
,788
.23
0.24
804.
950.
02(2
.02)
0.24
802.
93D
.1.3
GSP
L In
dia
Gas
net L
td.
Indi
a0.
0248
4.80
(0.0
1)(3
0.60
)0.
00(0
.10)
(0.0
1)(3
0.70
)D
.1.4
GSP
L In
dia
Tran
sco
Ltd
.In
dia
0.02
427.
900.
001.
10-
-0.
001.
10D
.2Fo
reig
n
-
D.2
.1Pe
tro C
arab
obo
S.A
.Ve
nezu
ela
0.31
7,33
1.02
0.81
2,74
0.28
--
0.83
2,74
0.28
D.2
.2C
arab
obo
Inge
nier
ía y
C
onst
rucc
ione
s, S.
A.
Vene
zuel
a0.
000.
29-
--
--
-
D.2
.3So
uth-
East
Asi
a G
as P
ipel
ine
Com
pany
Lim
ited
Hon
gkon
g0.
051,
140.
170.
0931
2.56
--
0.09
312.
56
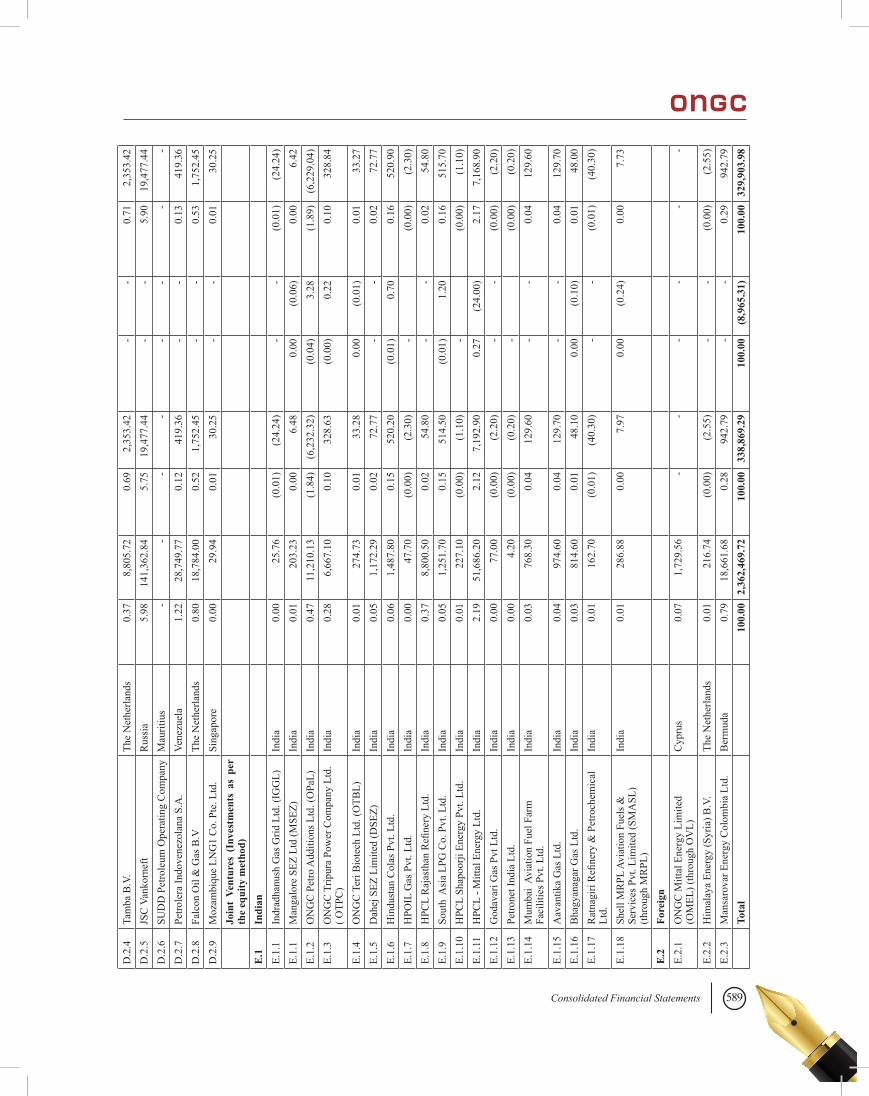
589Consolidated Financial Statements
D.2
.4Ta
mba
B.V
.Th
e N
ethe
rland
s0.
378,
805.
720.
692,
353.
42-
-0.
712,
353.
42D
.2.5
JSC
Van
korn
eft
Rus
sia
5.98
141,
362.
845.
7519
,477
.44
--
5.90
19,4
77.4
4D
.2.6
SUD
D P
etro
leum
Ope
ratin
g C
ompa
nyM
aurit
ius
--
--
--
--
D.2
.7Pe
trole
ra In
dove
nezo
lana
S.A
.Ve
nezu
ela
1.22
28,7
49.7
70.
1241
9.36
--
0.13
419.
36D
.2.8
Falc
on O
il &
Gas
B.V
The
Net
herla
nds
0.80
18,7
84.0
00.
521,
752.
45-
-0.
531,
752.
45D
.2.9
Moz
ambi
que
LNG
1 C
o. P
te. L
td.
Sing
apor
e0.
0029
.94
0.01
30.2
5-
-0.
0130
.25
Jo
int
Vent
ures
(In
vest
men
ts a
s pe
r th
e eq
uity
met
hod)
E.1
Indi
an
E.
1.1
Indr
adha
nush
Gas
Grid
Ltd
. (IG
GL)
Indi
a0.
0025
.76
(0.0
1)(2
4.24
)-
-(0
.01)
(24.
24)
E.1.
1M
anga
lore
SEZ
Ltd
(MSE
Z)
Indi
a0.
0120
3.23
0.00
6.48
0.00
(0.0
6)0.
006.
42E.
1.2
ON
GC
Pet
ro A
dditi
ons L
td. (
OPa
L)
Indi
a0.
4711
,210
.13
(1.8
4)(6
,232
.32)
(0.0
4)3.
28(1
.89)
(6,2
29.0
4)E.
1.3
ON
GC
Trip
ura
Pow
er C
ompa
ny L
td.
( OTP
C)
Indi
a0.
286,
667.
100.
1032
8.63
(0.0
0)0.
220.
1032
8.84
E.1.
4O
NG
C T
eri B
iote
ch L
td. (
OTB
L)In
dia
0.01
274.
730.
0133
.28
0.00
(0.0
1)0.
0133
.27
E.1.
5D
ahej
SEZ
Lim
ited
(DSE
Z)In
dia
0.05
1,17
2.29
0.02
72.7
7-
-0.
0272
.77
E.1.
6H
indu
stan
Col
as P
vt. L
td.
Indi
a0.
061,
487.
800.
1552
0.20
(0.0
1)0.
700.
1652
0.90
E.1.
7H
POIL
Gas
Pvt
. Ltd
.In
dia
0.00
47.7
0(0
.00)
(2.3
0)-
(0
.00)
(2.3
0)E.
1.8
HPC
L R
ajas
than
Refi
nery
Ltd
.In
dia
0.37
8,80
0.50
0.02
54.8
0-
-0.
0254
.80
E.1.
9So
uth
Asi
a LP
G C
o. P
vt. L
td.
Indi
a0.
051,
251.
700.
1551
4.50
(0.0
1)1.
200.
1651
5.70
E.1.
10H
PCL
Shap
oorji
Ene
rgy
Pvt.
Ltd.
Indi
a0.
0122
7.10
(0.0
0)(1
.10)
-
(0.0
0)(1
.10)
E.1.
11H
PCL
- Mitt
al E
nerg
y Lt
d.In
dia
2.19
51,6
86.2
02.
127,
192.
900.
27(2
4.00
)2.
177,
168.
90E.
1.12
God
avar
i Gas
Pvt
Ltd
.In
dia
0.00
77.0
0(0
.00)
(2.2
0)-
-(0
.00)
(2.2
0)E.
1.13
Petro
net I
ndia
Ltd
.In
dia
0.00
4.20
(0.0
0)(0
.20)
-
(0.0
0)(0
.20)
E.1.
14M
umba
i Av
iatio
n Fu
el F
arm
Fa
cilit
ies P
vt. L
td.
Indi
a0.
0376
8.30
0.04
129.
60-
-0.
0412
9.60
E.1.
15A
avan
tika
Gas
Ltd
.In
dia
0.04
974.
600.
0412
9.70
--
0.04
129.
70E.
1.16
Bha
gyan
agar
Gas
Ltd
.In
dia
0.03
814.
600.
0148
.10
0.00
(0.1
0)0.
0148
.00
E.1.
17R
atna
giri
Refi
nery
& P
etro
chem
ical
Lt
d.In
dia
0.01
162.
70(0
.01)
(40.
30)
--
(0.0
1)(4
0.30
)
E.1.
18Sh
ell M
RPL
Avi
atio
n Fu
els &
Se
rvic
es P
vt. L
imite
d (S
MA
SL)
(thro
ugh
MR
PL)
Indi
a0.
0128
6.88
0.00
7.97
0.00
(0.2
4)0.
007.
73
E.2
Fore
ign
E.
2.1
ON
GC
Mitt
al E
nerg
y Li
mite
d
(OM
EL) (
thro
ugh
OV
L)C
ypru
s0.
071,
729.
56-
--
--
-
E.2.
2H
imal
aya
Ener
gy (S
yria
) B.V
.Th
e N
ethe
rland
s0.
0121
6.74
(0.0
0)(2
.55)
--
(0.0
0)(2
.55)
E.2.
3M
ansa
rova
r Ene
rgy
Col
ombi
a Lt
d.B
erm
uda
0.79
18,6
61.6
80.
2894
2.79
--
0.29
942.
79
Tota
l
100.
002,
362,
469.
7210
0.00
338,
869.
2910
0.00
(8,9
65.3
1)10
0.00
329,
903.
98
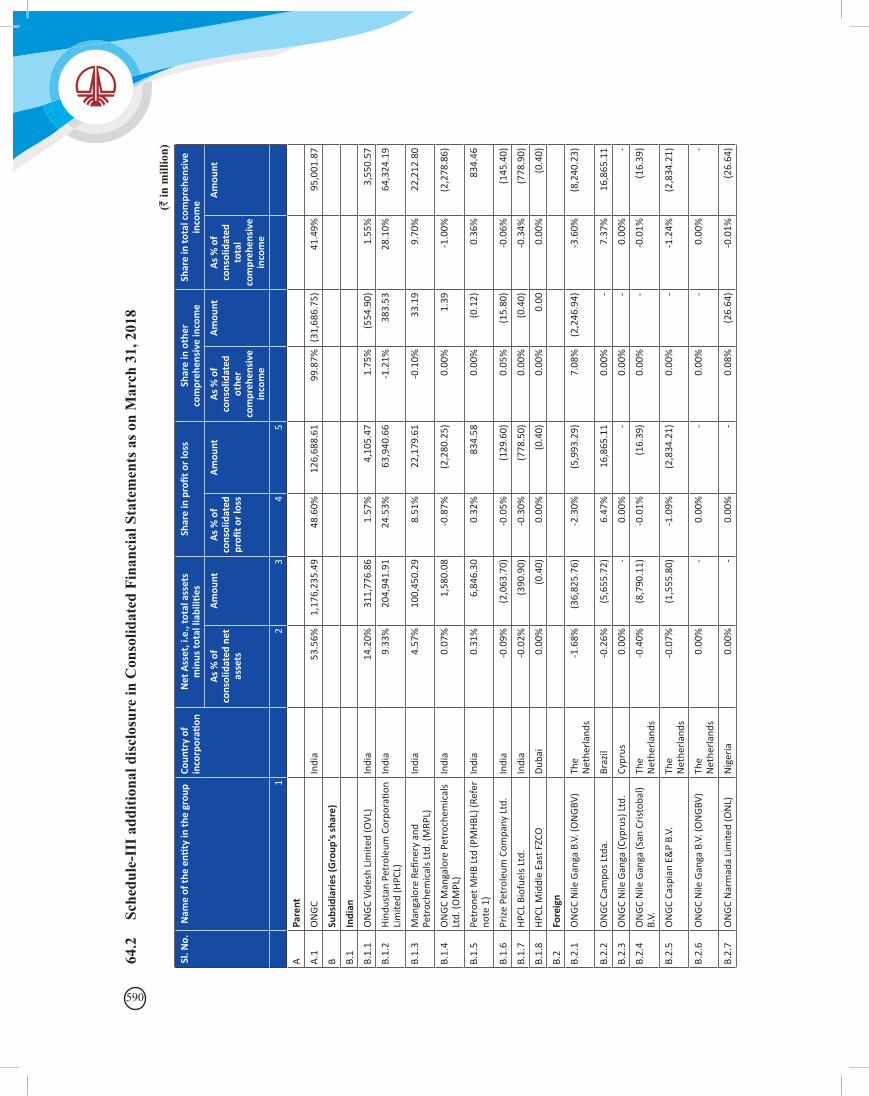
590
(` in
mill
ion)
64.
2 Sc
hedu
le-I
II a
dditi
onal
dis
clos
ure
in C
onso
lidat
ed F
inan
cial
Sta
tem
ents
as o
n M
arch
31,
201
8
Sl. N
o.N
ame
of th
e en
tity
in th
e gr
oup
Coun
try
of
inco
rpor
ation
Net
Ass
et, i
.e.,
tota
l ass
ets
min
us to
tal l
iabi
lities
Shar
e in
pro
fit o
r lo
ssSh
are
in o
ther
co
mpr
ehen
sive
inco
me
Shar
e in
tota
l com
preh
ensi
ve
inco
me
As
% o
f co
nsol
idat
ed n
et
asse
ts
Am
ount
As
% o
f co
nsol
idat
ed
profi
t or
loss
Am
ount
As
% o
f co
nsol
idat
ed
othe
r co
mpr
ehen
sive
in
com
e
Am
ount
As
% o
f co
nsol
idat
ed
tota
l co
mpr
ehen
sive
in
com
e
Am
ount
1
2
34
5
APa
rent
A.1
ON
GC
Indi
a53
.56%
1,17
6,23
5.49
48.6
0%12
6,68
8.61
99.8
7%(3
1,68
6.75
)41
.49%
95,0
01.8
7
BSu
bsid
iari
es (G
roup
's s
hare
)
B.1
Indi
an
B.1.
1O
NG
C Vi
desh
Lim
ited
(OVL
)In
dia
14.2
0%31
1,77
6.86
1.57
%4,
105.
471.
75%
(554
.90)
1.55
%3,
550.
57
B.1.
2H
indu
stan
Pet
role
um C
orpo
ratio
n Li
mite
d (H
PCL)
Indi
a9.
33%
204,
941.
9124
.53%
63,9
40.6
6-1
.21%
383.
5328
.10%
64,3
24.1
9
B.1.
3M
anga
lore
Refi
nery
and
Pe
troc
hem
ical
s Lt
d. (M
RPL)
Indi
a4.
57%
100,
450.
298.
51%
22,1
79.6
1-0
.10%
33.1
99.
70%
22,2
12.8
0
B.1.
4O
NG
C M
anga
lore
Pet
roch
emic
als
Ltd.
(OM
PL)
Indi
a0.
07%
1,58
0.08
-0.8
7%(2
,280
.25)
0.00
%1.
39-1
.00%
(2,2
78.8
6)
B.1.
5Pe
tron
et M
HB
Ltd
(PM
HBL
) (Re
fer
note
1)
Indi
a0.
31%
6,84
6.30
0.32
%83
4.58
0.00
%(0
.12)
0.36
%83
4.46
B.1.
6Pr
ize
Petr
oleu
m C
ompa
ny L
td.
Indi
a-0
.09%
(2,0
63.7
0)-0
.05%
(129
.60)
0.05
%(1
5.80
)-0
.06%
(145
.40)
B.1.
7H
PCL
Biof
uels
Ltd
.In
dia
-0.0
2%(3
90.9
0)-0
.30%
(778
.50)
0.00
%(0
.40)
-0.3
4%(7
78.9
0)
B.1.
8H
PCL
Mid
dle
East
FZC
OD
ubai
0.00
%(0
.40)
0.00
%(0
.40)
0.00
%0.
000.
00%
(0.4
0)
B.2
Fore
ign
B.2.
1O
NG
C N
ile G
anga
B.V
. (O
NG
BV)
The
Net
herl
ands
-1.6
8%(3
6,82
5.76
)-2
.30%
(5,9
93.2
9)7.
08%
(2,2
46.9
4)-3
.60%
(8,2
40.2
3)
B.2.
2O
NG
C Ca
mpo
s Lt
da.
Braz
il-0
.26%
(5,6
55.7
2)6.
47%
16,8
65.1
10.
00%
-7.
37%
16,8
65.1
1
B.2.
3O
NG
C N
ile G
anga
(Cyp
rus)
Ltd
. Cy
prus
0.00
%-
0.00
%-
0.00
%-
0.00
%-
B.2.
4O
NG
C N
ile G
anga
(San
Cri
stob
al)
B.V.
The
Net
herl
ands
-0.4
0%(8
,790
.11)
-0.0
1%(1
6.39
)0.
00%
--0
.01%
(16.
39)
B.2.
5O
NG
C Ca
spia
n E&
P B.
V.Th
e N
ethe
rlan
ds-0
.07%
(1,5
55.8
0)-1
.09%
(2,8
34.2
1)0.
00%
--1
.24%
(2,8
34.2
1)
B.2.
6O
NG
C N
ile G
anga
B.V
. (O
NG
BV)
The
Net
herl
ands
0.00
%-
0.00
%-
0.00
%-
0.00
%-
B.2.
7O
NG
C N
arm
ada
Lim
ited
(ON
L)N
iger
ia0.
00%
-0.
00%
-0.
08%
(26.
64)
-0.0
1%(2
6.64
)
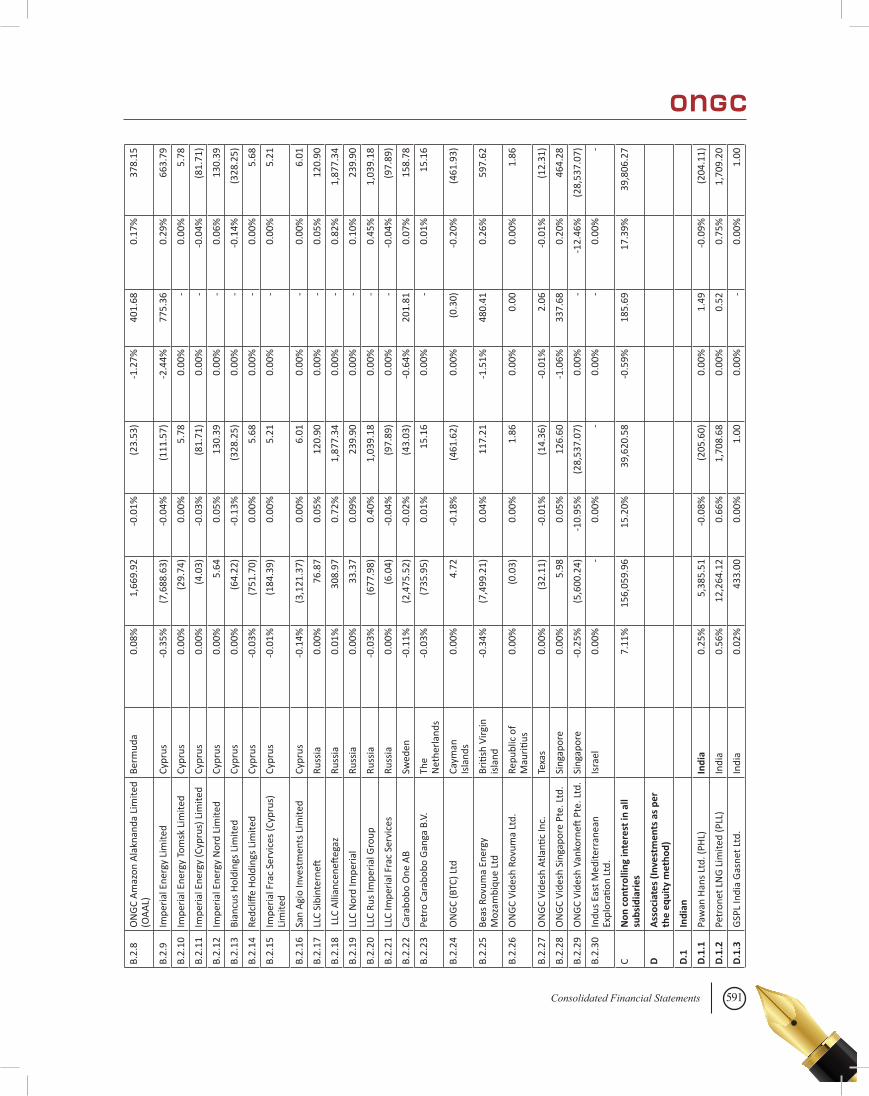
591Consolidated Financial Statements
B.2.
8O
NG
C A
maz
on A
lakn
anda
Lim
ited
(OA
AL)
Berm
uda
0.08
%1,
669.
92-0
.01%
(23.
53)
-1.2
7%40
1.68
0.17
%37
8.15
B.2.
9Im
peri
al E
nerg
y Li
mite
dCy
prus
-0.3
5%(7
,688
.63)
-0.0
4%(1
11.5
7)-2
.44%
775.
360.
29%
663.
79
B.2.
10Im
peri
al E
nerg
y To
msk
Lim
ited
Cypr
us0.
00%
(29.
74)
0.00
%5.
780.
00%
-0.
00%
5.78
B.2.
11Im
peri
al E
nerg
y (C
ypru
s) L
imite
dCy
prus
0.00
%(4
.03)
-0.0
3%(8
1.71
)0.
00%
--0
.04%
(81.
71)
B.2.
12Im
peri
al E
nerg
y N
ord
Lim
ited
Cypr
us0.
00%
5.64
0.05
%13
0.39
0.00
%-
0.06
%13
0.39
B.2.
13Bi
ancu
s H
oldi
ngs
Lim
ited
Cypr
us0.
00%
(64.
22)
-0.1
3%(3
28.2
5)0.
00%
--0
.14%
(328
.25)
B.2.
14Re
dcliff
e H
oldi
ngs
Lim
ited
Cypr
us-0
.03%
(751
.70)
0.00
%5.
680.
00%
-0.
00%
5.68
B.2.
15Im
peri
al F
rac
Serv
ices
(Cyp
rus)
Li
mite
dCy
prus
-0.0
1%(1
84.3
9)0.
00%
5.21
0.00
%-
0.00
%5.
21
B.2.
16Sa
n A
gio
Inve
stm
ents
Lim
ited
Cypr
us-0
.14%
(3,1
21.3
7)0.
00%
6.01
0.00
%-
0.00
%6.
01
B.2.
17LL
C Si
bint
erne
ftRu
ssia
0.00
%76
.87
0.05
%12
0.90
0.00
%-
0.05
%12
0.90
B.2.
18 L
LC A
llian
cene
fteg
az
Russ
ia0.
01%
308.
970.
72%
1,87
7.34
0.00
%-
0.82
%1,
877.
34
B.2.
19LL
C N
ord
Impe
rial
Russ
ia0.
00%
33.3
70.
09%
239.
900.
00%
-0.
10%
239.
90
B.2.
20LL
C Ru
s Im
peri
al G
roup
Russ
ia-0
.03%
(677
.98)
0.40
%1,
039.
180.
00%
-0.
45%
1,03
9.18
B.2.
21LL
C Im
peri
al F
rac
Serv
ices
Russ
ia0.
00%
(6.0
4)-0
.04%
(97.
89)
0.00
%-
-0.0
4%(9
7.89
)
B.2.
22Ca
rabo
bo O
ne A
BSw
eden
-0.1
1%(2
,475
.52)
-0.0
2%(4
3.03
)-0
.64%
201.
810.
07%
158.
78
B.2.
23Pe
tro
Cara
bobo
Gan
ga B
.V.
The
Net
herl
ands
-0.0
3%(7
35.9
5)0.
01%
15.1
60.
00%
-0.
01%
15.1
6
B.2.
24O
NG
C (B
TC) L
tdCa
yman
Is
land
s0.
00%
4.72
-0.1
8%(4
61.6
2)0.
00%
(0.3
0)-0
.20%
(461
.93)
B.2.
25Be
as R
ovum
a En
ergy
M
ozam
biqu
e Lt
dBr
itish
Virg
in
isla
nd-0
.34%
(7,4
99.2
1)0.
04%
117.
21-1
.51%
480.
410.
26%
597.
62
B.2.
26O
NG
C Vi
desh
Rov
uma
Ltd.
Repu
blic
of
Mau
ritiu
s0.
00%
(0.0
3)0.
00%
1.86
0.00
%0.
000.
00%
1.86
B.2.
27O
NG
C Vi
desh
Atla
ntic
Inc.
Texa
s0.
00%
(32.
11)
-0.0
1%(1
4.36
)-0
.01%
2.06
-0.0
1%(1
2.31
)
B.2.
28O
NG
C Vi
desh
Sin
gapo
re P
te. L
td.
Sing
apor
e0.
00%
5.98
0.05
%12
6.60
-1.0
6%33
7.68
0.20
%46
4.28
B.2.
29O
NG
C Vi
desh
Van
korn
eft P
te. L
td.
Sing
apor
e-0
.25%
(5,6
00.2
4)-1
0.95
%(2
8,53
7.07
)0.
00%
--1
2.46
%(2
8,53
7.07
)
B.2.
30In
dus
East
Med
iterr
anea
n Ex
plor
ation
Ltd
.Is
rael
0.00
%-
0.00
%-
0.00
%-
0.00
%-
CN
on c
ontr
ollin
g in
tere
st in
all
subs
idia
ries
7.
11%
156,
059.
9615
.20%
39,6
20.5
8-0
.59%
185.
6917
.39%
39,8
06.2
7
DA
ssoc
iate
s (I
nves
tmen
ts a
s pe
r th
e eq
uity
met
hod)
D.1
Indi
an
D.1
.1Pa
wan
Han
s Lt
d. (P
HL)
Indi
a0.
25%
5,38
5.51
-0.0
8%(2
05.6
0)0.
00%
1.49
-0.0
9%(2
04.1
1)
D.1
.2Pe
tron
et L
NG
Lim
ited
(PLL
) In
dia
0.56
%12
,264
.12
0.66
%1,
708.
680.
00%
0.52
0.75
%1,
709.
20
D.1
.3G
SPL
Indi
a G
asne
t Ltd
.In
dia
0.02
%43
3.00
0.00
%1.
000.
00%
-0.
00%
1.00
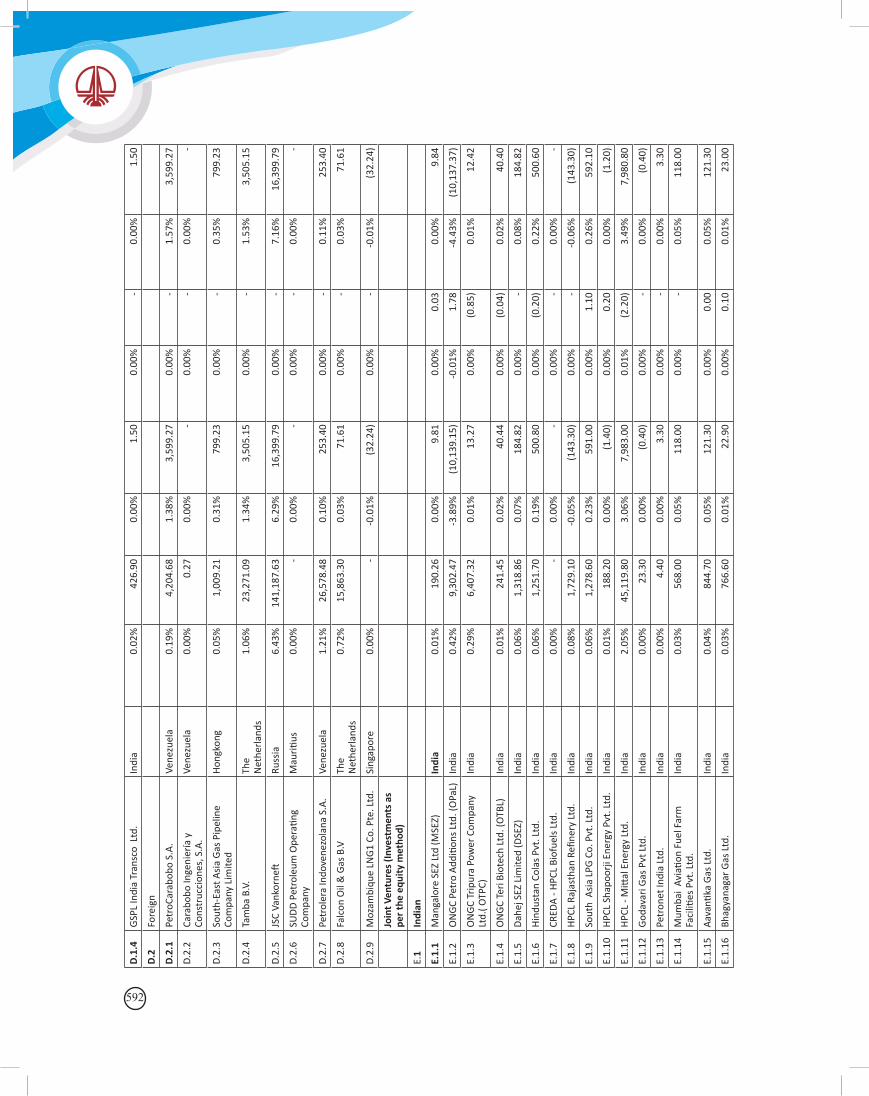
592
D.1
.4G
SPL
Indi
a Tr
ansc
o L
td.
Indi
a0.
02%
426.
900.
00%
1.50
0.00
%-
0.00
%1.
50
D.2
Fore
ign
D.2
.1Pe
troC
arab
obo
S.A
.Ve
nezu
ela
0.19
%4,
204.
681.
38%
3,59
9.27
0.00
%-
1.57
%3,
599.
27
D.2
.2Ca
rabo
bo In
geni
ería
y
Cons
truc
cion
es, S
.A.
Vene
zuel
a0.
00%
0.27
0.00
%-
0.00
%-
0.00
%-
D.2
.3So
uth-
East
Asi
a G
as P
ipel
ine
Com
pany
Lim
ited
Hon
gkon
g0.
05%
1,00
9.21
0.31
%79
9.23
0.00
%-
0.35
%79
9.23
D.2
.4Ta
mba
B.V
.Th
e N
ethe
rlan
ds1.
06%
23,2
71.0
91.
34%
3,50
5.15
0.00
%-
1.53
%3,
505.
15
D.2
.5JS
C Va
nkor
neft
Russ
ia6.
43%
141,
187.
636.
29%
16,3
99.7
90.
00%
-7.
16%
16,3
99.7
9
D.2
.6SU
DD
Pet
role
um O
pera
ting
Com
pany
Mau
ritiu
s0.
00%
-0.
00%
-0.
00%
-0.
00%
-
D.2
.7Pe
trol
era
Indo
vene
zola
na S
.A.
Vene
zuel
a1.
21%
26,5
78.4
80.
10%
253.
400.
00%
-0.
11%
253.
40
D.2
.8Fa
lcon
Oil
& G
as B
.VTh
e N
ethe
rlan
ds0.
72%
15,8
63.3
00.
03%
71.6
10.
00%
-0.
03%
71.6
1
D.2
.9M
ozam
biqu
e LN
G1
Co. P
te. L
td.
Sing
apor
e0.
00%
--0
.01%
(32.
24)
0.00
%-
-0.0
1%(3
2.24
)
Jo
int V
entu
res
(Inv
estm
ents
as
per
the
equi
ty m
etho
d)
E.1
Indi
an
E.1.
1M
anga
lore
SEZ
Ltd
(MSE
Z)
Indi
a0.
01%
190.
260.
00%
9.81
0.00
%0.
030.
00%
9.84
E.1.
2O
NG
C Pe
tro
Add
ition
s Lt
d. (O
PaL)
In
dia
0.42
%9,
302.
47-3
.89%
(10,
139.
15)
-0.0
1%1.
78-4
.43%
(10,
137.
37)
E.1.
3O
NG
C Tr
ipur
a Po
wer
Com
pany
Lt
d.( O
TPC)
In
dia
0.29
%6,
407.
320.
01%
13.2
70.
00%
(0.8
5)0.
01%
12.4
2
E.1.
4O
NG
C Te
ri B
iote
ch L
td. (
OTB
L)In
dia
0.01
%24
1.45
0.02
%40
.44
0.00
%(0
.04)
0.02
%40
.40
E.1.
5D
ahej
SEZ
Lim
ited
(DSE
Z)In
dia
0.06
%1,
318.
860.
07%
184.
820.
00%
-0.
08%
184.
82
E.1.
6H
indu
stan
Col
as P
vt. L
td.
Indi
a0.
06%
1,25
1.70
0.19
%50
0.80
0.00
%(0
.20)
0.22
%50
0.60
E.1.
7CR
EDA
- H
PCL
Biof
uels
Ltd
.In
dia
0.00
%-
0.00
%-
0.00
%-
0.00
%-
E.1.
8H
PCL
Raja
stha
n Re
finer
y Lt
d.In
dia
0.08
%1,
729.
10-0
.05%
(143
.30)
0.00
%-
-0.0
6%(1
43.3
0)
E.1.
9So
uth
Asi
a LP
G C
o. P
vt. L
td.
Indi
a0.
06%
1,27
8.60
0.23
%59
1.00
0.00
%1.
100.
26%
592.
10
E.1.
10H
PCL
Shap
oorj
i Ene
rgy
Pvt.
Ltd
.In
dia
0.01
%18
8.20
0.00
%(1
.40)
0.00
%0.
200.
00%
(1.2
0)
E.1.
11H
PCL
- Mitt
al E
nerg
y Lt
d.In
dia
2.05
%45
,119
.80
3.06
%7,
983.
000.
01%
(2.2
0)3.
49%
7,98
0.80
E.1.
12G
odav
ari G
as P
vt L
td.
Indi
a0.
00%
23.3
00.
00%
(0.4
0)0.
00%
-0.
00%
(0.4
0)
E.1.
13Pe
tron
et In
dia
Ltd.
Indi
a0.
00%
4.40
0.00
%3.
300.
00%
-0.
00%
3.30
E.1.
14M
umba
i Av
iatio
n Fu
el F
arm
Fa
ciliti
es P
vt. L
td.
Indi
a0.
03%
568.
000.
05%
118.
000.
00%
-0.
05%
118.
00
E.1.
15A
avan
tika
Gas
Ltd
.In
dia
0.04
%84
4.70
0.05
%12
1.30
0.00
%0.
000.
05%
121.
30
E.1.
16Bh
agya
naga
r G
as L
td.
Indi
a0.
03%
766.
600.
01%
22.9
00.
00%
0.10
0.01
%23
.00
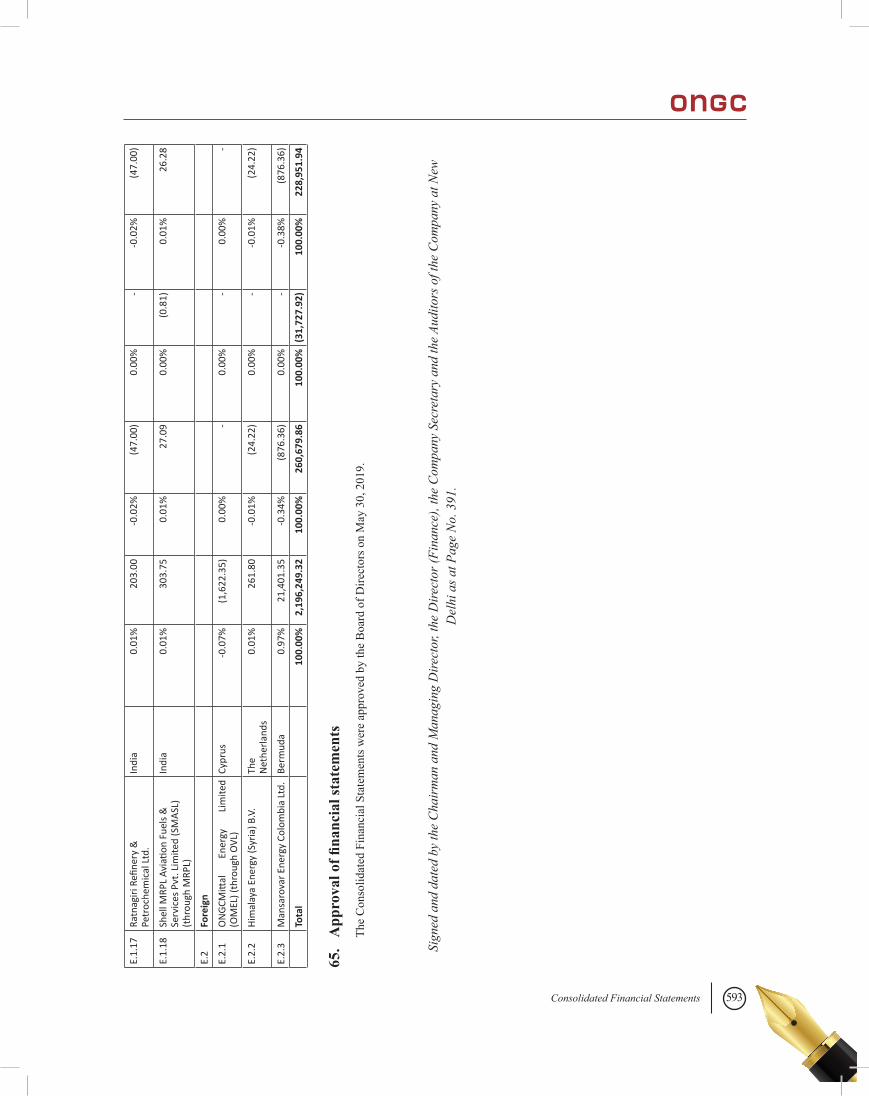
593Consolidated Financial Statements
E.1.
17Ra
tnag
iri R
efine
ry &
Pe
troc
hem
ical
Ltd
.In
dia
0.01
%20
3.00
-0.0
2%(4
7.00
)0.
00%
--0
.02%
(47.
00)
E.1.
18Sh
ell M
RPL
Avia
tion
Fuel
s &
Se
rvic
es P
vt. L
imite
d (S
MA
SL)
(thr
ough
MRP
L)
Indi
a0.
01%
303.
750.
01%
27.0
90.
00%
(0.8
1)0.
01%
26.2
8
E.2
Fore
ign
E.2.
1O
NG
CMitt
al
Ener
gy
Lim
ited
(OM
EL) (
thro
ugh
OVL
)Cy
prus
-0.0
7%(1
,622
.35)
0.00
%-
0.00
%-
0.00
%-
E.2.
2H
imal
aya
Ener
gy (S
yria
) B.V
.Th
e N
ethe
rlan
ds0.
01%
261.
80-0
.01%
(24.
22)
0.00
%-
-0.0
1%(2
4.22
)
E.2.
3M
ansa
rova
r En
ergy
Col
ombi
a Lt
d.Be
rmud
a0.
97%
21,4
01.3
5-0
.34%
(876
.36)
0.00
%-
-0.3
8%(8
76.3
6)
To
tal
10
0.00
%2,
196,
249.
3210
0.00
%26
0,67
9.86
100.
00%
(31,
727.
92)
100.
00%
228,
951.
94
65.
App
rova
l of fi
nanc
ial s
tate
men
ts
The
Con
solid
ated
Fin
anci
al S
tate
men
ts w
ere
appr
oved
by
the
Boa
rd o
f Dire
ctor
s on
May
30,
201
9.
Sign
ed a
nd d
ated
by
the
Cha
irm
an a
nd M
anag
ing
Dire
ctor
, the
Dire
ctor
(Fin
ance
), th
e C
ompa
ny S
ecre
tary
and
the
Audi
tors
of t
he C
ompa
ny a
t New
D
elhi
as a
t Pag
e N
o. 3
91.

594

595

596