ongc annual report 10-11 (pdf)
TRANSCRIPT
Explore. Evolve. Excel.
A N N U A L R E P O R T 2 0 1 0 - 2 0 1 1

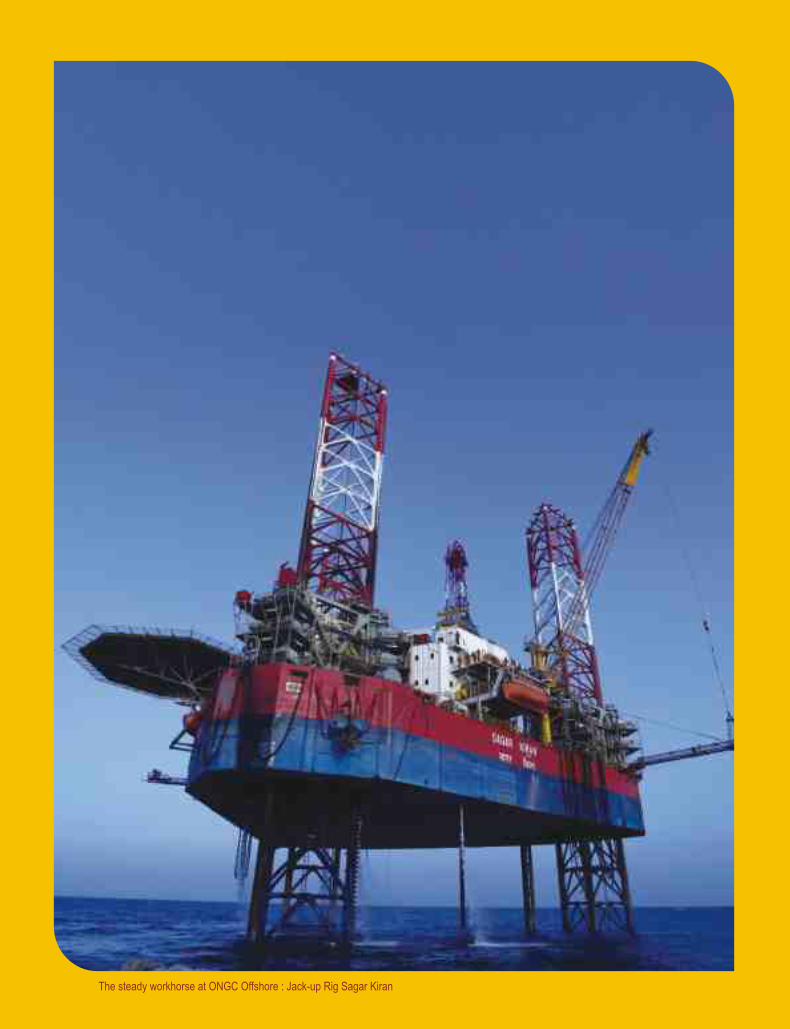
The steady workhorse at ONGC Offshore : Jack-up Rig Sagar Kiran

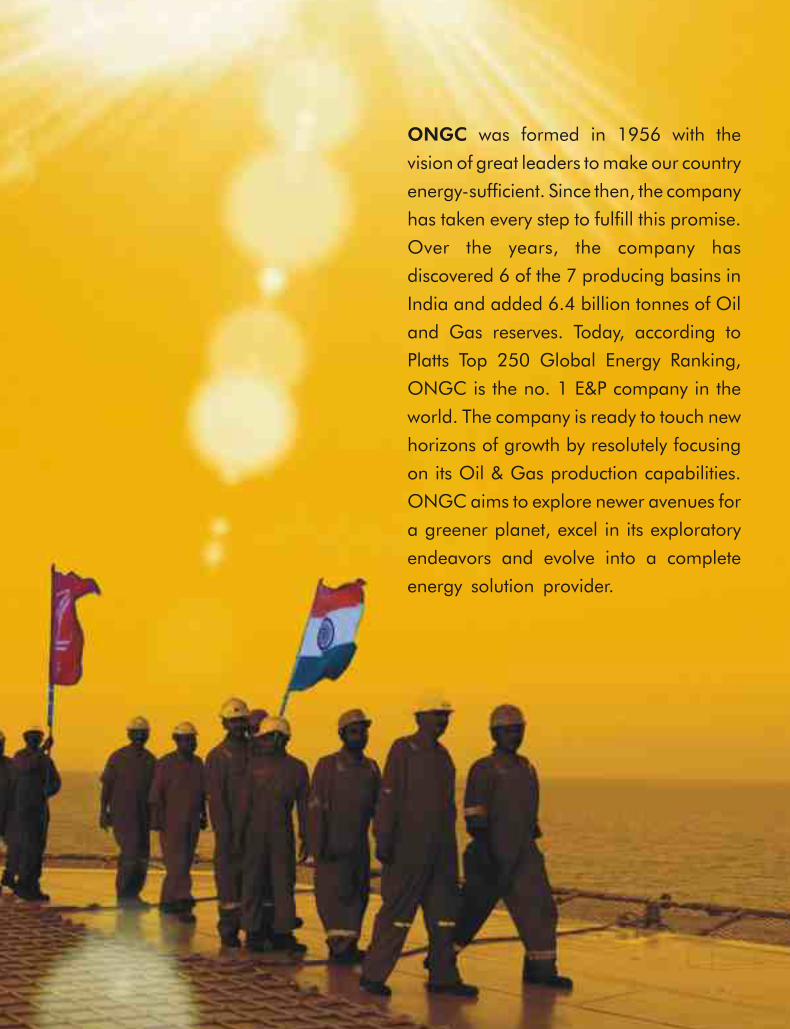
ONGC was formed in 1956 with the
vision of great leaders to make our country
energy-sufficient. Since then, the company
has taken every step to fulfill this promise.
Over the years, the company has
discovered 6 of the 7 producing basins in
India and added 6.4 billion tonnes of Oil
and Gas reserves. Today, according to
Platts Top 250 Global Energy Ranking,
ONGC is the no. 1 E&P company in the
world. The company is ready to touch new
horizons of growth by resolutely focusing
on its Oil & Gas production capabilities.
ONGC aims to explore newer avenues for
a greener planet, excel in its exploratory
endeavors and evolve into a complete
energy solution provider.
Dear Shareholders
The fiscal 2010-11 has been the year of achievements for your Company and it is indeed a privilege for
me to share the same with you. First of all, your Company recorded highest-ever production (including
the production share from its domestic joint ventures and the production of OVL) of 62.05 million
tonne of oil and oil equivalent gas (MMTOE). Ultimate reserve accretion of 83.56 MMTOE in domestic
operated fields has been the highest in last two decades. Your Company also made a significant
breakthrough in Shale gas exploration.
Your Company made highest ever Net Profit of `189,240 million despite sharing ` 248,924 million as
under recoveries of the Oil Marketing Companies as per the government directives towards
subsidizing petroleum products i.e., HSD, LPG and SKO. Net Worth of your Company increased to
` 967, 084 million; up by 6.6% over the last year. The aggregate dividend for FY’11 at ̀ 35 per share has
been 20% more than the last year and the highest-ever dividend in absolute terms.
In recent times, the emerging economies particularly in Asia Pacific region, led by China and India,
emerged as the largest energy consuming centres in the world. India is now the fourth largest energy
consumer after China, USA and Japan.
Energy demand pressure is building up and it will be only intense in the future. However, supply side
remains challenged; particularly for crude oil which accounts for largest slice (38%) in the global energy
basket. Industry expects that it may be able to maintain demand supply balance with increased level of
production from non-conventional oil, probably by 2050.
The uncertainties in the oil industry due to ongoing turmoil in the Middle East and North African
(MENA) region continues to bring unprecedented volatility in the industry; especially throwing the
crude oil prices in the range of US$ 100-125 per bbl. In such high price regime, the growth momentum
of the oil import dependent economies like India have taken a heavy toll. If the same scenario continues,
Indian economy may be severely impacted.
The average crude oil price for Indian basket during FY’11 has been US$ 85.09 per barrel; 22% higher
than FY’10 (US$ 69.76/bbl). To make crucial petroleum products available at affordable prices, the
Government had little option but to subsidize the prices. The upstream companies had to share this
subsidy burden by 38.8%, instead of past practices of 33.3%, out of which ONGC had to share 82%. Our
outgo on account of the subsidy payment of ` 248,920 million resulted in the net crude oil price
realization at US$ 53.77 per bbl in FY’11 against US$ 55.94 per bbl during the last year.
It is also pertinent to mention that the high oil prices always escalate the cost of oil field services. Thus
while the cost of input is increasing due to high oil prices, our net realization is reducing due to higher
subsidy burden. This double impact of rising oil prices seriously affects our investment capacity for
upcoming cost intensive projects.
You will appreciate that despite such challenging business environment, your Company has been
consistently performing well. Its strategic pursuits maintain focus on locating and creating new
hydrocarbon assets, prudent reservoir management, sourcing equity oil and gas, exploration of new
Chairman's Message
Chairman's MessageChairman's Message
Chairman's Message
Dear Shareholders
The fiscal 2010-11 has been the year of achievements for your Company and it is indeed a privilege for
me to share the same with you. First of all, your Company recorded highest-ever production (including
the production share from its domestic joint ventures and the production of OVL) of 62.05 million
tonne of oil and oil equivalent gas (MMTOE). Ultimate reserve accretion of 83.56 MMTOE in domestic
operated fields has been the highest in last two decades. Your Company also made a significant
breakthrough in Shale gas exploration.
Your Company made highest ever Net Profit of `189,240 million despite sharing ` 248,924 million as
under recoveries of the Oil Marketing Companies as per the government directives towards
subsidizing petroleum products i.e., HSD, LPG and SKO. Net Worth of your Company increased to
` 967, 084 million; up by 6.6% over the last year. The aggregate dividend for FY’11 at ̀ 35 per share has
been 20% more than the last year and the highest-ever dividend in absolute terms.
In recent times, the emerging economies particularly in Asia Pacific region, led by China and India,
emerged as the largest energy consuming centres in the world. India is now the fourth largest energy
consumer after China, USA and Japan.
Energy demand pressure is building up and it will be only intense in the future. However, supply side
remains challenged; particularly for crude oil which accounts for largest slice (38%) in the global energy
basket. Industry expects that it may be able to maintain demand supply balance with increased level of
production from non-conventional oil, probably by 2050.
The uncertainties in the oil industry due to ongoing turmoil in the Middle East and North African
(MENA) region continues to bring unprecedented volatility in the industry; especially throwing the
crude oil prices in the range of US$ 100-125 per bbl. In such high price regime, the growth momentum
of the oil import dependent economies like India have taken a heavy toll. If the same scenario continues,
Indian economy may be severely impacted.
The average crude oil price for Indian basket during FY’11 has been US$ 85.09 per barrel; 22% higher
than FY’10 (US$ 69.76/bbl). To make crucial petroleum products available at affordable prices, the
Government had little option but to subsidize the prices. The upstream companies had to share this
subsidy burden by 38.8%, instead of past practices of 33.3%, out of which ONGC had to share 82%. Our
outgo on account of the subsidy payment of ` 248,920 million resulted in the net crude oil price
realization at US$ 53.77 per bbl in FY’11 against US$ 55.94 per bbl during the last year.
It is also pertinent to mention that the high oil prices always escalate the cost of oil field services. Thus
while the cost of input is increasing due to high oil prices, our net realization is reducing due to higher
subsidy burden. This double impact of rising oil prices seriously affects our investment capacity for
upcoming cost intensive projects.
You will appreciate that despite such challenging business environment, your Company has been
consistently performing well. Its strategic pursuits maintain focus on locating and creating new
hydrocarbon assets, prudent reservoir management, sourcing equity oil and gas, exploration of new
Chairman's MessageChairman's Message
sources of energy and meaningful integration in Out of 21 Improved Oil Recovery (IOR)/ Enhanced Oil
hydrocarbon value chain. Recovery (EOR) and redevelopment schemes for
improving recovery factor, 15 schemes have already For locating and creating new hydrocarbon assets, your
been completed and six are under implementation. As Company intensified exploratory efforts and these stof 31 March, 2011, your Company has made an efforts yielded desired results. During the last five years
investment of ` 257.97 billion in these schemes which we accreted 1,124 MMTOE in-place volumes of
has yielded desired results. hydrocarbons, making average Reserve Replacement
Ratio (3P reserves) 1.53 for this period, which is one of Development of new and marginal fields has also been the most important parameters for sustaining the the focus area of your Company. We have taken up 10 growth of your Company. major projects for development of new & marginal
fields and one project for additional development of During FY’11, reserves of 63 major domestic fields,
D-1 field with estimated investment of ̀ 248.90 billion. operated by your Company and having 80.6% of the
The fields under development are- C-Series, B-22 total 3P reserves of 1211.39 MMTOE were audited by
cluster, B-193 cluster, B-46 cluster, North Tapti gas field, independent hydrocarbon reserve consultants. The
Cluster-7, BHE & BH-35, WO-16 cluster, G-1 & GS-15 overseas reserves of OVL for all its assets were also
and SB-14. These fields are expected to be on stream by audited, and the 3P reserves were found to be more
2013-14. than what was estimated in-house.
ONGC Videsh Ltd (OVL), a 100% subsidiary of ONGC, Your Company made some significant discoveries in the
has established itself as our growth vehicle by pre-NELP blocks of East Coast like G-1 & GS-15, G-4 &
meaningful expansion in global E&P business. OVL GS-29, Vashishtha and S-1. Some discoveries in NELP
remains focused on expanding its E&P portfolio and its blocks like KG-DWN-98/2 in KG Basin and MN-
equity oil sourcing is increasing every year. During DWN-98/3 and MN-OSN-2000/2 blocks in Mahanadi FY’11, it produced 9.45 million tonne of oil and oil Basin are also significant. Most of these are gas equivalent gas; the highest-ever. Presently it has 33 discoveries and efforts are on to monetize them. As far projects in 14 countries.as discoveries in pre- NELP blocks in East Coast are
Your Company achieved a breakthrough in Shale gas concerned, your Company is planning to develop them exploration in its maiden R&D Pilot venture in as clusters through common facilities to optimize cost. Damodar Basin at Durgapur, West Bengal. We are
DOC (Declaration of Commerciality) for the KG- planning to take up exploration in other potential Shale DWN-98/2 along with adjoining discoveries in basins like - Cambay, Krishna Godavari, Cauvery and nomination blocks and MN-DWN-98/3 has already Assam-Arakan.been submitted to DGH with request for permission to
After successful commissioning of a 50 MW Wind drill additional appraisal wells that would help us firming Farm in Gujarat, your Company is setting up another up the reserves as well as our development plan. wind farm of 102 MW capacity in Rajasthan. Besides
14 major fields, which contribute more than 71% of the that, ONGC Energy Centre (OEC) is pursuing several total production of ONGC, are 25-50 years of vintage. projects like, Thermo-Chemical Reactor for Hydrogen Improving recovery factor of these fields with prudent generation, Bio-conversion of Lignite to methane, Solar reservoir management practices and induction of new Thermal engine, exploration and exploitation of technology has been the focus area of your Company. Uranium reserves and LED Project.
The refining capacity of Mangalore Refinery & and transparent business practices.
Petrochemicals Ltd (MRPL), a subsidiary of your The first assured sustainability report of your
Company is being enhanced to 15 MMTPA and it is Company was released on the day of last AGM, that is
expected that progressive commissioning may begin rd23 September, 2010. This year, we are working from January 2012, as per schedule.
aggressively to bring out the second issue conforming Two petrochemical projects, ONGC Petro-additions to international standards and confirming our Limited (OPaL) and ONGC Mangalore Petrochemicals commitment to sustainable growth. Limited (OMPL) promoted by your Company are
The Corporate Social Responsibility (CSR) initiatives progressing well and expected to be commissioned in
of your Company continues to primarily focus on 2012 and 2013 respectively.
education, health, entrepreneurship development, 726.6 MW (363.3 MW x 2 units) gas based Combined women’s empowerment, girl child development and Cycle Power Plant (CCPP) is being set up at Palatana, water management. While our dedication in this front Tripura by ONGC Tripura Power Company Ltd. has brought us millions of smiles, it has also made us a (OTPC), an SPV promoted by your Company. The distinct Company that cares not only for its project aims to monetize the idle gas asset in the state shareholders but all stakeholders, especially the of Tripura. This is a unique project for which all 90 underprivileged section.packages of Over-dimension Cargos (ODC) are being
You will also be pleased to know that as per a survey transported through Bangladesh. Despite logistical
thconducted by Business Today (6 February, 2011 issue); challenges, the first GT (weighing about 300 tonnes) your Company has been ranked as the 'Best Employer along with its ODCs has been successfully transported to Work For' among all PSUs as well as the ‘Best and expected to be commissioned as per schedule i.e. Employer to Work For’ in the Core Sector, including March 2012. private and public.
Good Corporate Governance has been the focus area Your unstinted support and patronage has always given of your Company. We have started implementing the us confidence to achieve new milestones at voluntary guidelines on Corporate Governance issued performance fronts on continuous basis. I am sure the by Ministry of Corporate Affairs. At the same time, a management of your Company will continue to receive comprehensive Enterprise-wide Risk Management the same, encouraging us to maintain our commitment (ERM) framework has also been put in place.for assured sustainable growth in the years to come.
You will be happy to learn that besides the conferment With Best Compliments,of ‘Maharatna’ status to your Company by the Hon’ble
President of India in April, 2011, another significant
achievement in the last year has been the recognition by
the Transparency International. As per the “Promoting
Revenue Transparency (PRT) Report 2011” by (A.K.Hazarika)Transparency International and Revenue Watch, Chairman & Managing DirectorONGC occupies the Top rank among 44 global oil and
gas companies in the world as far as Organizational
Disclosure Practices are concerned. You will agree that
this is a genuine international recognition of our ethical
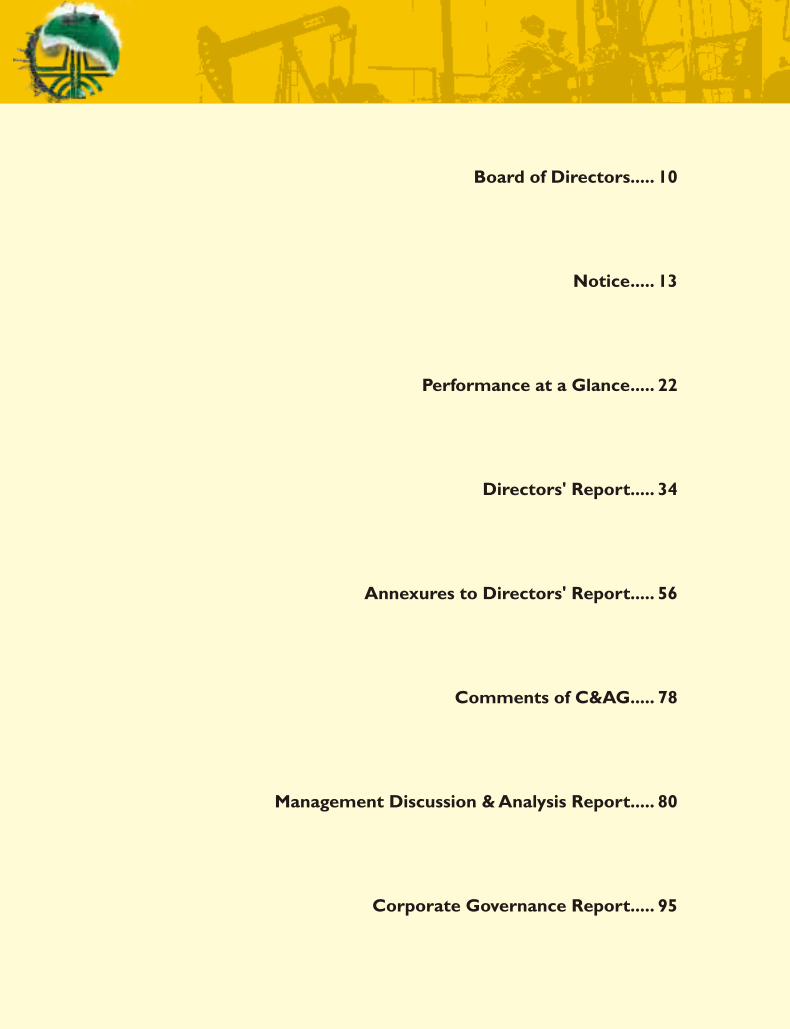
Board of Directors..... 10
Notice..... 13
Performance at a Glance..... 22
Directors' Report..... 34
Annexures to Directors' Report..... 56
Comments of C&AG..... 78
Management Discussion & Analysis Report..... 80
Corporate Governance Report..... 95
119 .....Secretarial Audit Report
124 .....Auditors' Report
130 .....Balance Sheet, Profit and Loss Account and Schedules
174 .....Cash Flow Statement
176 .....Balance Sheet abstract and Company's General Business Profile
178 .....Statement Pursuant to Section 212 of the Companies Act,1956
186 .....Auditors' Report ONGC Group
190 .....Consolidated Financial Statements of ONGC Group
ContentContent
Gas (BCM) Oil (MMT)
47.5147.78MTOE
FY’07
48.49 48.28 47.85
FY'07 FY'08 FY'09 FY'10
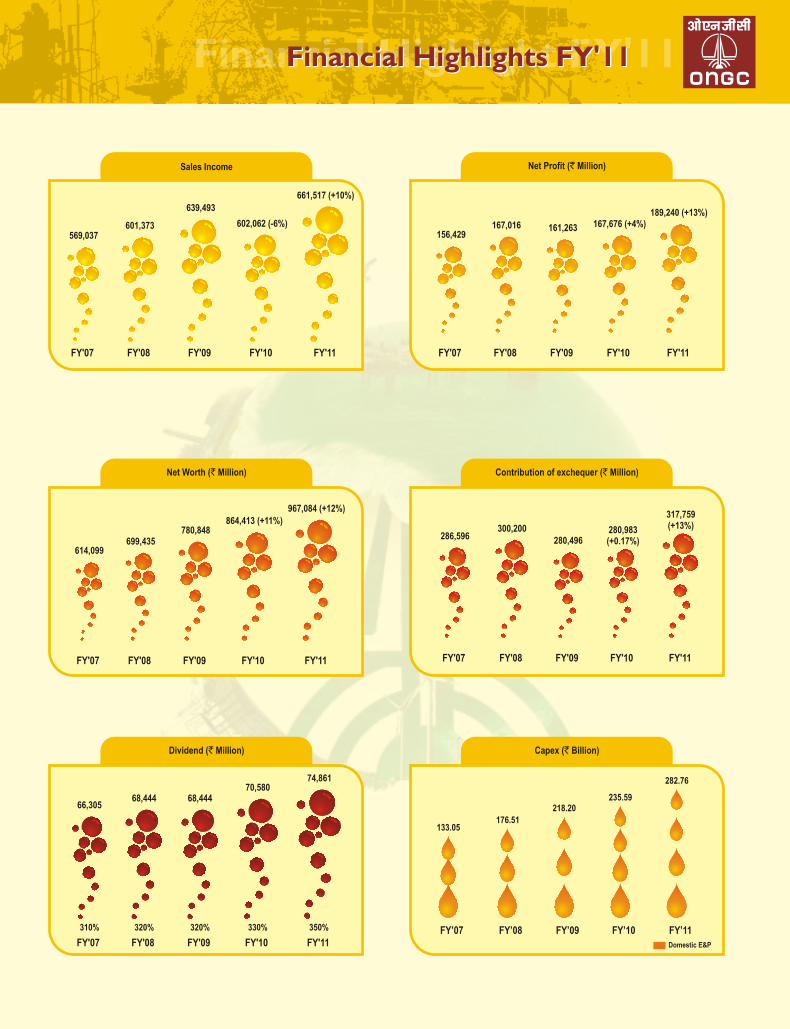
569,037601,373
639,493
FY'11
602,062 (-6%)
661,517 (+10%)
FY'07 FY'08 FY'09
156,429167,016 161,263
FY'10
167,676 (+4%)
FY'07 FY'08 FY'09
614,099699,435
780,848
FY'10
864,413 (+11%)
FY'07 FY'08 FY'09
286,596300,200
280,496
FY'10
280,983(+0.17%)
Dividend (` Million)
FY'07 FY'08 FY'09
66,30568,444 68,444
FY'10
70,580
330%310% 320% 320%
FY’08 FY’09 FY’10 FY’11
Financial Highlights FY'11Financial Highlights FY'11Operational Highlights FY'11Operational Highlights FY'11
24.6
7
24.4
2
23.1
1
23.0
9
25.3
7
22.4
8
25.9
5
22.3
3
26.0
5
22.4
4
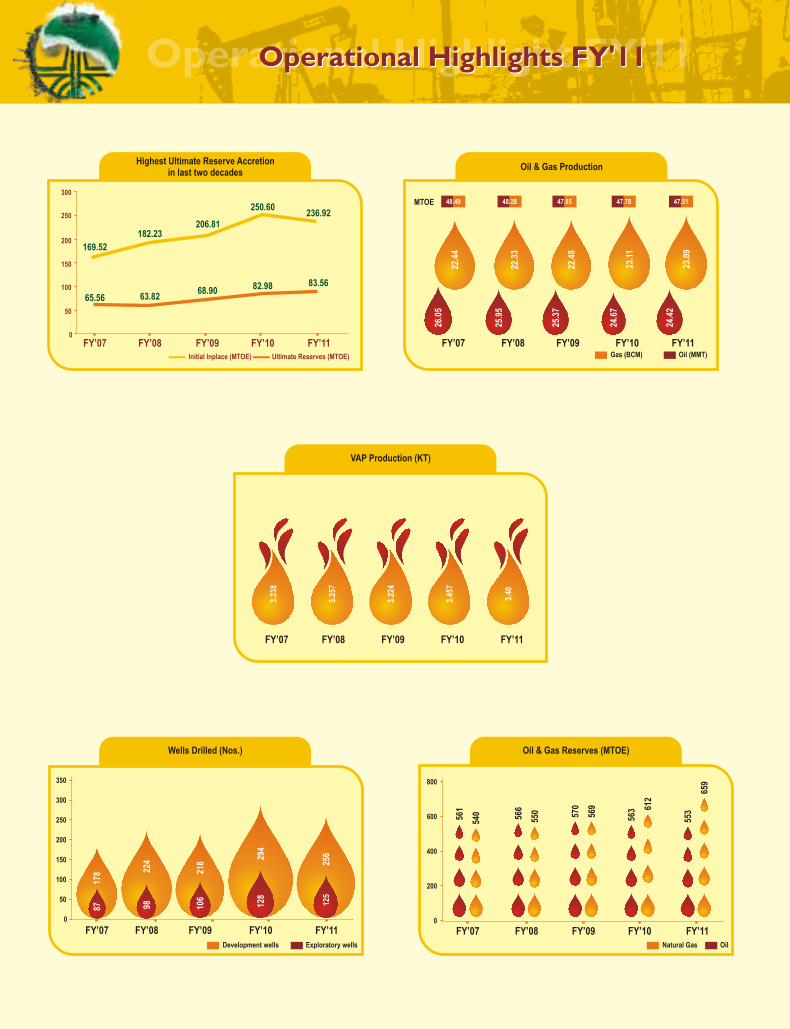
Oil & Gas ProductionHighest Ultimate Reserve Accretion
in last two decades
50
100
150
200
250
0
Initial Inplace (MTOE) Ultimate Reserves (MTOE)
FY’07
65.56 63.8268.90
169.52
182.23206.81
82.98
250.60
300
FY’08 FY’09 FY’10 FY’11
83.56
236.92
FY'11
189,240 (+13%)
FY'11
967,084 (+12%)
FY'11
317,759(+13%)
FY'11
74,861
350%
Wells Drilled (Nos.)
Development wells Exploratory wells
FY’11FY’07 FY’08 FY’09 FY’10
50
100
150
200
250
0
300
350
178 22
4
218
294
128
87 98 106
125
256
FY’11FY’07 FY’08 FY’09 FY’100
800
Oil & Gas Reserves (MTOE)
200
400
600
Natural Gas Oil
540561
550
566
569
570 61
2
563
659
553
FY’11FY’07 FY’08 FY’09 FY’10
Capex (` Billion)
Domestic E&P
282.76
133.05176.51
218.20235.59
3.23
8
FY’07 FY’08 FY’09 FY’10 FY’11
3.25
7
3.45
7
3.22
4
3.40
VAP Production (KT)
Sales Income Net Profit (` Million)
Net Worth (` Million) Contribution of exchequer (` Million)
Gas (BCM) Oil (MMT)
47.5147.78MTOE
FY’07
48.49 48.28 47.85
FY'07 FY'08 FY'09 FY'10
569,037601,373
639,493
FY'11
602,062 (-6%)
661,517 (+10%)
FY'07 FY'08 FY'09
156,429167,016 161,263
FY'10
167,676 (+4%)
FY'07 FY'08 FY'09
614,099699,435
780,848
FY'10
864,413 (+11%)
FY'07 FY'08 FY'09
286,596300,200
280,496
FY'10
280,983(+0.17%)
Dividend (` Million)
FY'07 FY'08 FY'09
66,30568,444 68,444
FY'10
70,580
330%310% 320% 320%
FY’08 FY’09 FY’10 FY’11
Financial Highlights FY'11Financial Highlights FY'11Operational Highlights FY'11Operational Highlights FY'11
24.6
7
24.4
2
23.1
1
23.0
9
25.3
7
22.4
8
25.9
5
22.3
3
26.0
5
22.4
4
Oil & Gas ProductionHighest Ultimate Reserve Accretion
in last two decades
50
100
150
200
250
0
Initial Inplace (MTOE) Ultimate Reserves (MTOE)
FY’07
65.56 63.8268.90
169.52
182.23206.81
82.98
250.60
300
FY’08 FY’09 FY’10 FY’11
83.56
236.92
FY'11
189,240 (+13%)
FY'11
967,084 (+12%)
FY'11
317,759(+13%)
FY'11
74,861
350%
Wells Drilled (Nos.)
Development wells Exploratory wells
FY’11FY’07 FY’08 FY’09 FY’10
50
100
150
200
250
0
300
350
178 22
4
218
294
128
87 98 106
125
256
FY’11FY’07 FY’08 FY’09 FY’100
800
Oil & Gas Reserves (MTOE)
200
400
600
Natural Gas Oil
540561
550
566
569
570 61
2
563
659
553
FY’11FY’07 FY’08 FY’09 FY’10
Capex (` Billion)
Domestic E&P
282.76
133.05176.51
218.20235.59
3.23
8
FY’07 FY’08 FY’09 FY’10 FY’11
3.25
7
3.45
7
3.22
4
3.40
VAP Production (KT)
Sales Income Net Profit (` Million)
Net Worth (` Million) Contribution of exchequer (` Million)
10 11
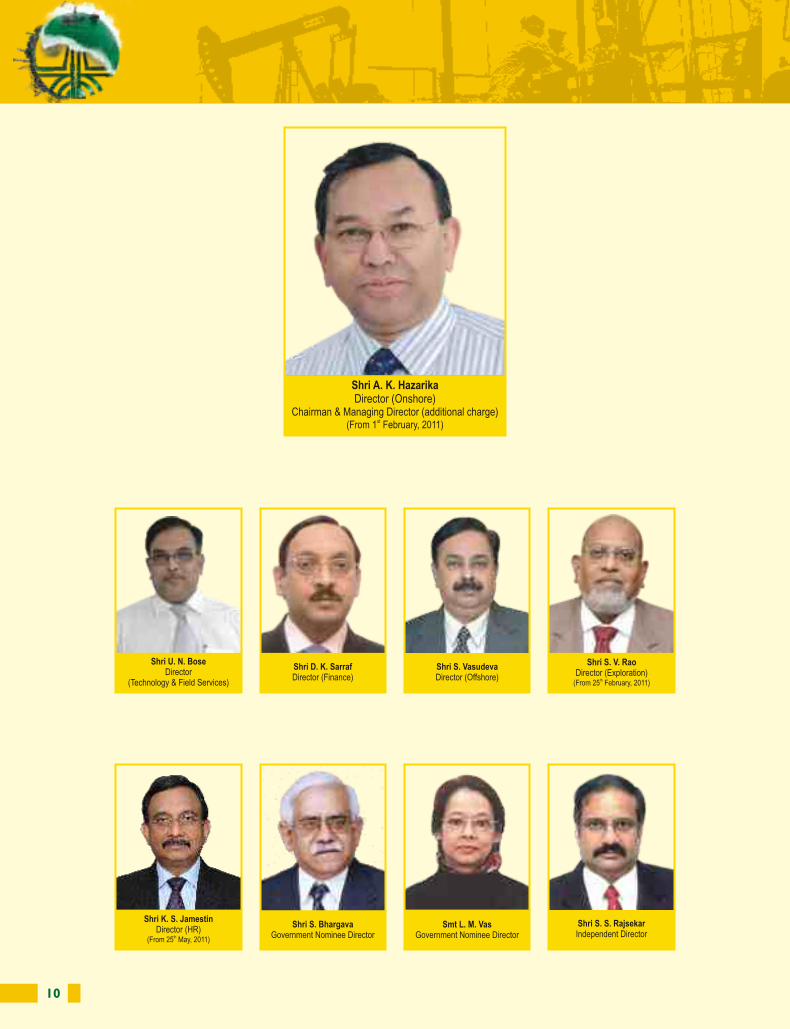
Shri U. N. Bose Director
(Technology & Field Services)
Shri D. K. SarrafDirector (Finance)
Shri S. V. RaoDirector (Exploration)
th(From 25 February, 2011)
Shri K. S. JamestinDirector (HR)
th(From 25 May, 2011)
Shri S. VasudevaDirector (Offshore)
Shri S. BhargavaGovernment Nominee Director
Smt L. M. VasGovernment Nominee Director
Shri S. S. RajsekarIndependent Director
Shri A. K. HazarikaDirector (Onshore)
Chairman & Managing Director (additional charge)st(From 1 February, 2011)
10 11
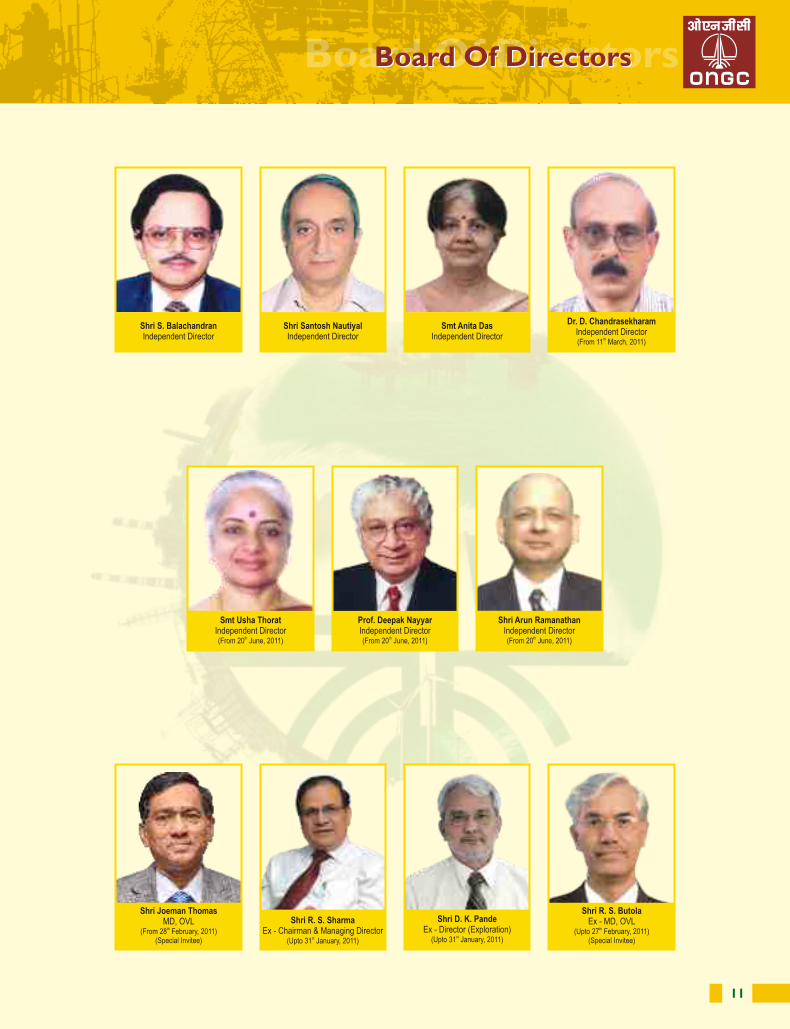
Shri S. BalachandranIndependent Director
Shri Santosh NautiyalIndependent Director
Smt Anita DasIndependent Director
Dr. D. ChandrasekharamIndependent Director
th(From 11 March, 2011)
Shri Arun RamanathanIndependent Director
th(From 20 June, 2011)
Prof. Deepak NayyarIndependent Director
th(From 20 June, 2011)
Smt Usha ThoratIndependent Director
th(From 20 June, 2011)
Board Of DirectorsBoard Of Directors
Shri D. K. PandeEx - Director (Exploration)
st(Upto 31 January, 2011)
Shri R. S. ButolaEx - MD, OVL
th(Upto 27 February, 2011)(Special Invitee)
Shri Joeman ThomasMD, OVL
th(From 28 February, 2011)(Special Invitee)
Shri R. S. SharmaEx - Chairman & Managing Director
st(Upto 31 January, 2011)
12 13
Registered Office Corporate OfficeTower II, Jeevan Bharati Building, Tel Bhavan, Dehradun – 248 003124, Indira Chowk, New Delhi – 110 001 Uttarakhand
Statutory Auditors Cost AuditorsM/s Arun K. Agarwal & Associates, New Delhi M/s A. B. K. Associates, MumbaiM/s Kalyaniwalla & Mistry, Mumbai M/s N. D. Birla & Co., AhmedabadM/s Ray & Ray, Kolkata M/s M. Krishnaswamy and Associates, ChennaiM/s M. Kuppuswamy P S G & Co., Chennai M/s Bandyopadhyaya Bhaumik & Co., Kolkata M/s S. Bhandari & Co., Mumbai M/s A. C. Dutta & Co., Kolkata
M/s. N.I. Mehta & Co. Mumbai M/s. Ramanath Iyer & Co., Delhi
BankersState Bank of India
SubsidiariesONGC Videsh Ltd.Mangalore Refinery & Petrochemicals Ltd.
Registrar & Share Transfer AgentM/s. Karvy Computershare Private Ltd. Plot No.17-24, Vittal Rao Nagar,Madhapur, Hyderabad - 500 081
105 – 108, 1st Floor Arunachal Building19, Barakhamba Road, New Delhi – 110 001
Listed atBombay Stock ExchangeNational Stock Exchange
DepositoriesNational Securities Depository Ltd.Central Depository Services (India) Ltd.
Company SecretaryN. K. Sinha
Notice is hereby given that the 18th Annual General Meeting of the Members of OIL AND NATURAL GAS CORPORATION LIMITED thwill be held on Tuesday, the 30 August, 2011 at 10:00 hrs. at Siri Fort Auditorium, Khel Gaon, August Kranti Marg,
New Delhi-110 049, to transact the following business:
ORDINARY BUSINESS:st1. To receive, consider and adopt the audited Balance Sheet as at 31 March, 2011, Profit & Loss Account for the year ended
st31 March, 2011 together with the Reports of the Directors and the Auditors' thereon and comments of the Comptroller & Auditor General of India in terms of Section 619 of the Companies Act, 1956.
2. To confirm the payment of interim dividend and declare final dividend on equity shares for the year 2010-11.3. To appoint a Director in place of Shri S. S. Rajsekar, who retires by rotation and being eligible, offers himself for re-appointment.4. To appoint a Director in place of Shri S. Balachandran, who retires by rotation and being eligible, offers himself for re-appointment.5. To appoint a Director in place of Shri S. Nautiyal, who retires by rotation and being eligible, offers himself for re-appointment.6. To authorise Board of Directors of the Company to fix the remuneration of the Joint Statutory Auditors of the Company for the
Financial Year 2011-12, in terms of the provisions of section 619(2) read with section 224(8)(aa) of the Companies Act, 1956 and to pass the following resolution, with or without modification(s), as Ordinary Resolution:
“RESOLVED THAT the Board of Directors of the Company be and are hereby authorised to decide and fix the remuneration of the Joint Statutory Auditors of the Company for the Financial Year 2011-12, as may be deemed fit by the Board”
SPECIAL BUSINESS:
ITEM No. 7
To consider and if thought fit, to pass with or without modification(s), the following resolution as an Ordinary Resolution:
“RESOLVED THAT Shri S. V. Rao, who was appointed as an Additional Director and designated as Director (Exploration) under th thSection 260 of the Companies Act, 1956, effective 25 February, 2011 and holds office up to the 18 Annual General Meeting
and in respect of whom, the Company has received a notice in writing, under Section 257 of the Companies Act, 1956, from a member proposing his candidature for the office of director, be and is hereby appointed as a Director of the Company, liable to retire by rotation.”
ITEM No. 8
To consider and if thought fit, to pass with or without modification(s), the following resolution as an Ordinary Resolution:
“RESOLVED THAT Dr. D. Chandrasekharam, who was appointed as an Additional Director (part-time non-official Director) th th under Section 260 of the Companies Act, 1956, effective 11 March, 2011 and holds office up to the 18 Annual General Meeting
and in respect of whom, the Company has received a notice in writing, under Section 257 of the Companies Act, 1956, from a member proposing his candidature for the office of director, be and is hereby appointed as a Director of the Company, liable to retire by rotation.”
ITEM No. 9
To consider and if thought fit, to pass with or without modification(s), the following resolution as an Ordinary Resolution:
“RESOLVED THAT Shri K. S. Jamestin, who was appointed as an Additional Director and designated as Director (Human th thResources) under Section 260 of the Companies Act, 1956, effective 25 May, 2011 and holds office up to the 18 Annual
General Meeting and in respect of whom, the Company has received a notice in writing, under Section 257 of the Companies Act, 1956, from a member proposing his candidature for the office of director, be and is hereby appointed as a Director of the Company, liable to retire by rotation.”
NoticeNotice
14 15
ITEM No. 10
To consider and if thought fit, to pass with or without modification(s), the following resolution as an Ordinary Resolution:
“RESOLVED THAT Smt. Usha Thorat, who was appointed as an Additional Director (part-time non-official Director) under th thSection 260 of the Companies Act, 1956, effective 20 June, 2011 and holds office up to the 18 Annual General Meeting and in
respect of whom, the Company has received a notice in writing, under Section 257 of the Companies Act, 1956, from a member proposing her candidature for the office of director, be and is hereby appointed as a Director of the Company, liable to retire by rotation.”
ITEM No. 11
To consider and if thought fit, to pass with or without modification(s), the following resolution as an Ordinary Resolution:
“RESOLVED THAT Prof. Deepak Nayyar, who was appointed as an Additional Director (part-time non-official Director) under th thSection 260 of the Companies Act, 1956, effective 20 June, 2011 and holds office up to the 18 Annual General Meeting and in
respect of whom, the Company has received a notice in writing, under Section 257 of the Companies Act, 1956, from a member proposing his candidature for the office of director, be and is hereby appointed as a Director of the Company, liable to retire by rotation.”
ITEM No. 12
To consider and if thought fit, to pass with or without modification(s), the following resolution as an Ordinary Resolution:
“RESOLVED THAT Shri Arun Ramanathan, who was appointed as an Additional Director (part-time non-official Director) th thunder Section 260 of the Companies Act, 1956, effective 20 June, 2011 and holds office up to the 18 Annual General Meeting
and in respect of whom, the Company has received a notice in writing, under Section 257 of the Companies Act, 1956, from a member proposing his candidature for the office of director, be and is hereby appointed as a Director of the Company, liable to retire by rotation.”
By Order of the Board of Directors
Regd. Office:Jeevan Bharti BuildingTower II, 124 Indira Chowk, New Delhi - 110 001.
(N. K. SINHA) Company Secretary
th15 July, 2011
NOTES:
1. A MEMBER ENTITLED TO ATTEND AND VOTE AT THE MEETING IS ENTITLED TO APPOINT A PROXY TO ATTEND AND VOTE INSTEAD OF HIMSELF AND THE PROXY NEED NOT BE A MEMBER OF THE COMPANY. THE PROXY FORM SHOULD BE DEPOSITED AT THE REGISTERED OFFICE OF THE COMPANY NOT LATER THAN FORTY-EIGHT HOURS (48 HRS.) BEFORE THE TIME OF COMMENCEMENT OF THE MEETING. BLANK PROXY FORM IS ATTACHED.
2. Relevant Explanatory Statement pursuant to Section 173(2) of the Companies Act, 1956, in respect of Special Business, as set out above is annexed hereto.
3. Brief resume of the Directors seeking re-appointment as mandated under Clause 49 of the Listing Agreement with the Stock Exchanges is annexed hereto and forms part of the Notice.
rd4. The Register of Members and Share Transfer Books of the Company will remain closed from Tuesday, the 23 August, 2011 to thTuesday, the 30 August, 2011(both days inclusive).
th5. The Board had recommended a final Dividend of 15% at its meeting held on 30 May, 2011. The dividend, if approved by the thMembers at the said Annual General Meeting, will be paid before 28 September, 2011 to the members whose names appear on
the Register of Members of the Company after giving effect to all valid share transfers in physical form lodged with the ndCompany on or before Monday, the 22 August, 2011, and the respective Beneficial Owners as at the close of business
ndhours on Monday, the 22 August, 2011, as per details thereof to be furnished by the depositories.
6. Share transfer documents and all correspondence relating thereto, should be addressed to the Registrar and Transfer Agent of the Company – M/s. Karvy Computershare Private Ltd. (Karvy), Plot No. 17-24, Vittal Rao Nagar, Madhapur, HYDERABAD – 500 081 Phone Nos. 040-23420815-19 & 1600-345-4001(Toll Free), Fax No. 040-23420814; e-mail: [email protected]. Karvy is also the depository interface of the Company with both NSDL and CDSL.
However, keeping in view the convenience of the Shareholders, documents relating to shares will continue to be accepted at Karvy Computershare Private Ltd. 105-108, 1st Floor, Arunachal Building, 19, Barakhamba Road, Connaught Place, New Delhi-110001, Phone Nos. 011-41036370 (tele-fax) & 43528522 ; e-mail: [email protected] and at the Registered Office of the Company at 8th Floor, Jeevan Bharati, Tower-II, 124, Indira Chowk, New Delhi- 110001, Phone No.011-23301277/23301299; e-mail: [email protected] .
7. The Company has designated an exclusive e-mail ID called [email protected] for redressal of shareholders’/investors’ complaints/grievances. In case you have any queries/complaints or grievances, then please write to us at the above e-mail address.
8. Members holding shares in electronic form may please note that the bank account details and 9-digit MICR Code of their Bankers, as noted in the records of their depository, shall be used for the purpose of remittance of dividend through Electronic Clearing Service (ECS), or for printing on dividend warrants wherever applicable. Members are therefore requested to update their bank account particulars, change of address and other details with their respective Depository Participants for shares held in demat mode and to the Registrar and Share Transfer Agent for shares held in physical form.
9. Reserve Bank of India (RBI) is providing ECS facility for payment of dividend in select cities. Members holding shares in physical form are advised to submit particulars of their bank account, viz., names and address of the branch of the bank, 9 digit MICR code of
ndthe branch, type of account and account number latest by 22 August, 2011 to M/s Karvy Computershare Private Ltd.
10. Pursuant to Section 205A(5) and 205C of the Companies Act, 1956, the Company has transferred the unpaid/unclaimed amount of th thdividend declared on 29 September, 2003 for the financial year 2002-03 and interim dividend declared on 4 February, 2004,
for the financial year 2003-04, to the Investor Education and Protection Fund of the Central Government. The unpaid/ unclaimed thamount of Final Dividend declared on 29 September, 2004 for the financial year 2003-04 and interim dividend declared on
th24 December, 2004, for the financial year 2004-05, will be transferred to the Investor Education and Protection Fund (IEPF) th rdof the Central Government by 28 October, 2011 and 23 January, 2012 respectively. Members who have not encashed
their dividend warrants pertaining to the said year may approach the Company or its Registrar & Share Transfer Agent for obtaining payment thereof.
11. In order to avoid the incidence of fraudulent encashment of dividend warrants, the Members holding shares in physical form are requested to provide their Bank Account Number, Name and Address of the Bank/Branch to the Company or Karvy to enable them to incorporate the same in the dividend warrant.
16 17
12. Members desirous of obtaining any information/clarification (s) concerning the accounts and operations of the Company or intending to raise any query are requested to forward the same at least 10 days before the date of the meeting to Company Secretary at the Registered Office of the Company, so that the same may be attended to appropriately.
13. Members who have not encashed their dividend warrants within its validity period may write to the Company at its Registered Office or M/s Karvy Computershare Private Limited, Registrar & Share Transfer Agent of the Company, for revalidating the warrants or payment in lieu of such warrants in the form of demand draft.
14. In terms of Section 109A of the Companies Act, 1956, nomination facility is available to individual shareholders. Members holding shares in physical form may nominate a person in respect of all the shares held by them whether singly or jointly. Members who hold shares in individual name are advised to avail of the nomination facility by filing Form No. 2B in their own interest. Blank form can be had from Karvy on request. Members holding shares in dematerialised form may contact their respective DPs for registration of nomination.
15. Members holding physical shares in multiple folios in identical names are requested to send their share certificates to Company’s Registrar and Share Transfer Agent, M/s Karvy Computershare Private Ltd. for consolidation.
16. Pursuant to Section 619(2) read with Section 224(8)(aa) of the Companies Act, 1956, the Auditors of a Government Company are appointed or re-appointed by the Comptroller and Auditor General (C&AG) of India and their remuneration is to be fixed by the Company in the Annual General Meeting. The General Meeting may authorise the Board to fix up an appropriate remuneration of Auditors for the year 2011-12 after taking into consideration the increase in volume of work and prevailing inflation etc.
17. Members are requested:
i) to bring their copies of Annual Report and Attendance Slip duly completed and signed at the meeting.
ii) to quote their Folio/DP & Client identification No. in all correspondence.
iii) not to bring brief case, bags, eatables, cell phone etc. as they are prohibited inside the meeting hall for security reasons.
iv) to notify immediately any change of their address and bank particulars to the Company or its Share Transfer Agent, in case shares are held in physical form.
AND
In case their shares are held in dematerialised form, information should be passed on directly to their respective DepositoryParticipants and not to the Company/Share Transfer Agent, without any delay.
v) to note that no gift will be distributed at the meeting.
EXPLANATORY STATEMENT PURSUANT TO SECTION 173(2) OF THE COMPANIES ACT, 1956
Item No.7
APPOINTMENT OF SHRI S. V. RAOthShri S. V. Rao, was appointed as an Additional Director and designated as Director (Exploration) on the Board of ONGC effective 25
February, 2011 in place of Shri D. K. Pande, who retired on 31.01.2011. In terms of Section 260 of the Companies Act, 1956 he holds hoffice up to the 18t Annual General Meeting of the Company. The Company has received a notice in writing from a member pursuant to
the provisions of Section 257 of the Companies Act, 1956, signifying intention to propose Shri S. V. Rao as candidate for the office of Director. Shri S. V. Rao, if appointed, will be liable to retire by rotation under Sections 255 and 256 of the Companies Act, 1956 and subject to retirement by rotation under the Articles of Association of the Company.
Shri S.V. Rao, aged 57 years, holds a Bachelor’s degree in Science and a Master’s Degree in Applied Geology from the University of Bombay. He has about 35 years of experience in the exploration and exploitation of oil and gas fields, well-site investigation, geological and geophysical assessment and has handled geological and geophysical assessment of the KG-PG and Western Offshore Basins, supervision and monitoring of geological operations at the oil and gas wells of ONGC at Ankleshwar Asset and Cauvery basin. He has officiated as the Head of the exploration and Development Directorate, Dehradun. Prior to joining the Board Shri Rao was the ED-Chief, Offshore Exploration and Development and In-Charge of the Western Offshore Basin and deep water areas.
Shri S. V. Rao is a director on the Board of ONGC Videsh Limited and Energistics (a foreign company). He holds 2880 equity shares of ` 5 each in ONGC.
None of the Directors except Shri S. V. Rao is interested or concerned in the resolution.
The Board of Directors considers that in view of the background and experience of Shri S. V. Rao, it would be in the interest of the Company to appoint him as a Director of the Company. The Board recommends the resolution for your approval.
Item No.8
APPOINTMENT OF DR. D. CHANDRASEKHARAM
Dr. D. Chandrasekharam, has been appointed as an Additional Director (part-time non-official Director) on 11.03.2011 for a period of 3 thyears. In terms of Section 260 of the Companies Act, 1956 he holds office up to the 18 Annual General Meeting of the Company. The
Company has received a notice in writing from a member pursuant to the provisions of Section 257 of the Companies Act, 1956, signifying intention to propose Dr. D. Chandrasekharam as candidate for the office of Director. Dr. D. Chandrasekharam, if appointed, will be liable to retire by rotation under Sections 255 and 256 of the Companies Act, 1956 and subject to retirement by rotation under the Articles of Association of the Company.
Dr. D. Chandrashekharam, aged 63 years, holds a Bachelor’s degree in geology, a Master’s degree in Applied Geology and a Doctor of Philosophy degree in Volcanology and Geochemistry from the Indian Institute of Technology, Mumbai. Dr. Chandrashekharam has over 30 years of research and teaching experience in the field of Earth Sciences, including, inter alia, officiating as the Head of the Department of Earth Sciences, Head, Centre of Studies in Resource Engineering at the Indian Institute of Technology Bombay, Mumbai. He has served as a Senior Scientist at the Centre for Earth Science Studies, Trivandrum and served as a Senior Scientist at the Centre for Water Resources Development, Kerala. He is also currently a member of the International Geothermal Association (serving in its Board of Directors), the Geothermal Resources Council, USA, the Current Science Association, India and the International Association for Hydrogeologists. Dr. Chandrashekharam has over 20 years of experience in petroliferous basins of India.
Dr. D. Chandrasekharam is a director on the Board of Indian Rare Earths Limited and Western Coalfields Limited. He does not hold any shares in ONGC.
None of the Directors except Dr. D. Chandrasekharam is interested or concerned in the resolution.
The Board of Directors considers that in view of the background and experience of Dr. D. Chandrasekharam, it would be in the interest of the Company to appoint him as a Director of the Company. The Board recommends the resolution for your approval.
Item No.9
APPOINTMENT OF SHRI K. S. JAMESTIN
Shri K. S. Jamestin, was appointed as an Additional Director and designated as Director (Human Resources) on the Board of ONGC theffective 25 May, 2011 in place of Dr. A. K. Balyan, who resigned on 15.07.2010. In terms of Section 260 of the Companies Act, 1956 he
thholds office up to the 18 Annual General Meeting of the Company. The Company has received a notice in writing from a member pursuant to the provisions of Section 257 of the Companies Act, 1956, signifying intention to propose Shri K. S. Jamestin as candidate for the office of Director. Shri K. S. Jamestin, if appointed, will be liable to retire by rotation under Sections 255 and 256 of the Companies Act, 1956 and subject to retirement by rotation under the Articles of Association of the Company.
thBorn on 16 July, 1954, Shri K. S. Jamestin has 34 years of experience in the petroleum and natural gas sector. Prior to becoming Director (HR) of ONGC he served as Chief HRD where he re-engineered and e-enabled all HR processes in ONGC. Shri K. S. Jamestin is a first class B. Sc (Engg) in Electronics and Telecommunications branch from Faculty of Engineering, University of Kerala, MBA in Finance, Diploma in Operations Management and Certified Project Management Professional. He joined ONGC as a Graduate trainee in March 1977 and has served the organisation in various capacities. He had also served as Head Regional Office, Mumbai and as Project leader for Project ICE, ONGC’s award winning SAP-ERP implementation Project, rated as one of the biggest and most successful SAP implementations in the world.
Shri K. S. Jamestin is a director on the Board of ONGC Videsh Ltd. He holds 3600 equity shares of ̀ 5 each in ONGC.
None of the Directors except Shri K. S. Jamestin is interested or concerned in the resolution.
The Board of Directors considers that in view of the background and experience of Shri K. S. Jamestin, it would be in the interest of the Company to appoint him as a Director of the Company. The Board recommends the resolution for your approval.
18 19
Item No.10
APPOINTMENT OF MRS. USHA THORAT
Mrs. Usha Thorat has been appointed as an Additional Director (part-time non-official Director) on 20.06.2011 for a period of 3 years. In hterms of Section 260 of the Companies Act, 1956 she holds office up to the 18t Annual General Meeting of the Company. The Company
has received a notice in writing from a member pursuant to the provisions of Section 257 of the Companies Act, 1956, signifying intention to propose Mrs. Usha Thorat as candidate for the office of Director. Mrs. Usha Thorat, if appointed, will be liable to retire by rotation under Sections 255 and 256 of the Companies Act, 1956 and subject to retirement by rotation under the Articles of Association of the Company.
Born on February 20, 1950, Mrs. Thorat has a Master's degree in Economics from the Delhi School of Economics. She joined the Reserve Bank in April 1972. During her career in the RBI spanning 38 years, she has had a stint in virtually each and every area of central banking. Besides banking regulation/supervision, rural/urban cooperative banking, deposit insurance and currency management, she has rich experience in the areas of foreign exchange and reserves management, debt management of central and state governments, development and regulation of money, forex and government securities markets, rural planning and credit, cooperative banking, customer service and grievance redressal, and payment and settlement systems. She was also the Appellate Authority under the Right to Information Act, 2005 as well as under the Banking Ombudsman Scheme, 2006. She has played a key role in training and capacity building, both in the RBI and banks, as Chairperson of the College of Agricultural Banking and the Reserve Bank’s Staff College, besides serving as a Member of Faculty at the latter.
Prior to her elevation as Deputy Governor, Mrs. Thorat was the Executive Director of the Reserve Bank (since April 2003). As Executive Director, she represented RBI on the BIS Committee on Global Financial Systems (CGFS). She had also served as a member on the CPSS-IOSCO Task Force on Securities Settlement Systems (1999-2001). After a distinguished service of nearly four decades with the Reserve Bank of India, Mrs. Usha Thorat retired in November 2010 as its Deputy Governor, a post which she held for five years. The other important positions held by Ms. Thorat during her tenure as Deputy Governor included Member on the Board of Securities Exchange Board of India (SEBI), Chairperson of the Bharatiya Reserve Bank Note Mudran Private Limited, Chairperson of the Deposit Insurance and Credit Guarantee Corporation (2005-09) and Director on the Board of National Bank for Agriculture and Rural Development (2005 – 09).
She is presently serving as Director of the Centre for Advanced Financial Research and Learning (CAFRAL) in January 2011. CAFRAL is promoted by Reserve Bank of India as a centre of excellence for research and learning in the field of banking and finance. She does not hold any shares in ONGC.
None of the Directors except Mrs. Usha Thorat is interested or concerned in the resolution.
The Board of Directors considers that in view of the background and experience of Mrs. Usha Thorat, it would be in the interest of the Company to appoint her as a Director of the Company. The Board recommends the resolution for your approval.
Item No.11
APPOINTMENT OF PROF. DEEPAK NAYYAR
Prof. Deepak Nayyar has been appointed as an Additional Director (part-time non-official Director) on 20.06.2011 for a period of 3 years. thIn terms of Section 260 of the Companies Act, 1956 he holds office up to the 18 Annual General Meeting of the Company. The Company
has received a notice in writing from a member pursuant to the provisions of Section 257 of the Companies Act, 1956, signifying intention to propose Prof. Deepak Nayyar as candidate for the office of Director. Prof. Deepak Nayyar, if appointed, will be liable to retire by rotation under Sections 255 and 256 of the Companies Act, 1956 and subject to retirement by rotation under the Articles of Association of the Company.
thProf. Deepak Nayyar born on 26 September 1946, is an eminent economist and Independent Director on the Board of ONGC. He is Professor of Economics at Jawaharlal Nehru University, New Delhi. Earlier, he has taught at the University of Oxford, the University of Sussex, the Indian Institute of Management, Calcutta and the New School for Social Research, New York. Prof, Nayyar was Vice Chancellor of the University of Delhi from 2000 to 2005. He also served as Chief Economic Adviser to the Government of India and Secretary in the Ministry of Finance. In the past, he was a Director on the Boards of State Trading Corporation of India, the State Bank of India, Export-Import Bank of India, Maruti Udyog.
He was educated at St. Stephen’s College, University of Delhi. Thereafter, as a Rhodes Scholar, he went on to study at Balliol College, University of Oxford, where he obtained a B. Phil and a D. Phil in Economics. He has received the V.K.R.V. Rao Award for his
contribution to research in Economics. He is an Honorary Fellow of Balliol College, Oxford. Professor Nayyar served as Chairman of the Board of Governors of the UNU World Institute for Development Economics Research, Helsinki, a Member of the Board of Directors of the Social Science Research Council in the United States, and Chairman of the Advisory Council for the Department of International Development, Queen Elizabeth House, University of Oxford. He also served as a member of the National Knowledge Commission in India and Vice President of the International Association of Universities, Paris.
At present, he is a Director on the Board of Steel Authority of India Limited, Birla Corporation Ltd. and ICRA. He does not hold any shares in ONGC.
None of the Directors except Prof. Deepak Nayyar is interested or concerned in the resolution.
The Board of Directors considers that in view of the background and experience of Prof. Deepak Nayyar, it would be in the interest of the Company to appoint him as a Director of the Company. The Board recommends the resolution for your approval.
Item No.12
APPOINTMENT OF SHRI ARUN RAMANATHAN
Shri Arun Ramanathan has been appointed as an Additional Director (part-time non-official Director) on 20.06.2011 for a period of 3 thyears. In terms of Section 260 of the Companies Act, 1956 he holds office up to the 18 Annual General Meeting of the Company. The
Company has received a notice in writing from a member pursuant to the provisions of Section 257 of the Companies Act, 1956, signifying intention to propose Shri Arun Ramanathan as candidate for the office of Director. Shri Arun Ramanathan, if appointed, will be liable to retire by rotation under Sections 255 and 256 of the Companies Act, 1956 and subject to retirement by rotation under the Articles of Association of the Company.
thShri Arun Ramanathan was born on 25 April, 1949. Apart from holding post graduate degrees in Nuclear Physics, Business Administration and Development Economics, he is also an Associate Member of the Institute of Cost and Works Accountants of India. Shri Arun Ramanathan joined the IAS in July 1973 where he held several assignments in Industry, Finance, Food, Consumer Protection, Transport and General Administration. In the GOI, he was Secretary (Chemicals & Petrochemicals), Secretary (Financial Services) and finally the Union Finance Secretary. Mr. Ramanathan was the Finance Secretary at the time of the global financial crisis and was nominated by the Prime Minister to Chair the Group of Secretaries to recommend measures needed to counter the meltdown in the financial and industrial sectors.
Shri Arun Ramanathan is a director on the Board of National Textile Corporation, JCT Electronics, Indian Clearing Company Ltd., United Stock Exchange Ltd. and Shipping Corporation of India Ltd. He does not hold any shares in ONGC.
None of the Directors except Shri Arun Ramanathan is interested or concerned in the resolution.
The Board of Directors considers that in view of the background and experience of Shri Arun Ramanathan, it would be in the interest of the Company to appoint him as a Director of the Company. The Board recommends the resolution for your approval.
By Order of the Board of Directors
Regd. Office:
Jeevan Bharati Building
Tower II, 124 Indira Chowk,
New Delhi - 110 001
( N K SINHA)Company Secretary
th15 July, 2011
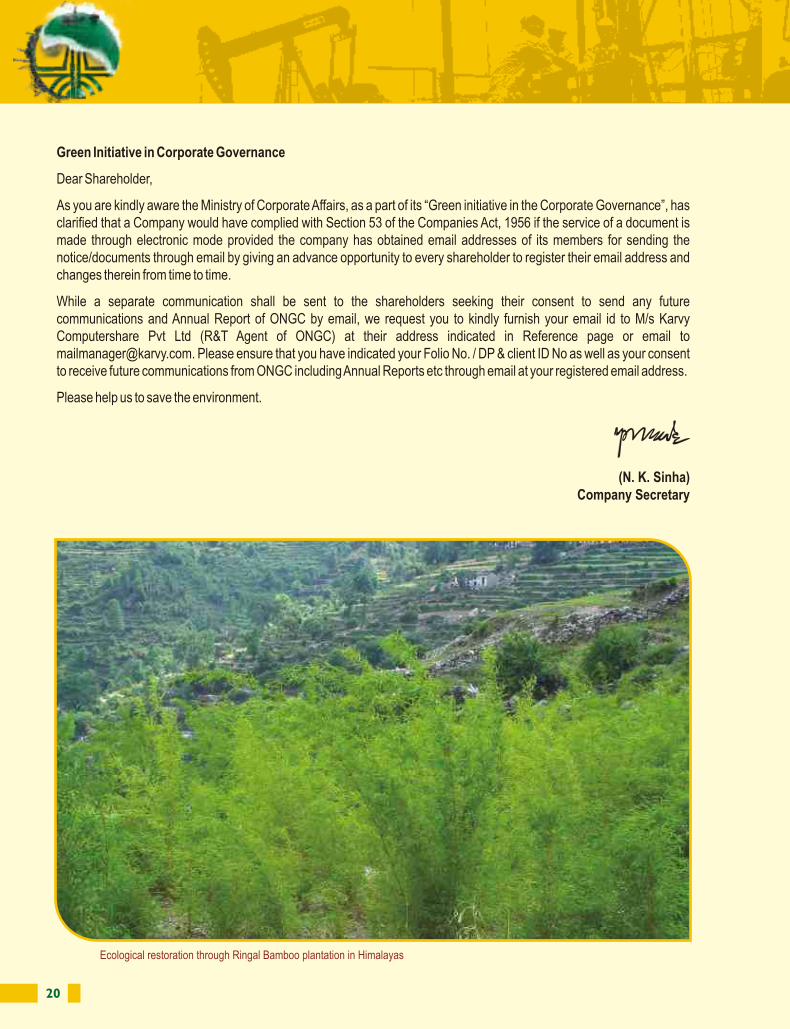
20 21
Name
Date of Birth & Age
Date of Appointment
Qualifications
No. of Shares heldExperience in Specific Functional Areas
Directorship held in other Public companies
Chairmanship/Membership of Committees across all Public companies
Shri S. S. RAJSEKAR
May 29, 1954, 57 years
November 11, 2011
Chemical Engineer
0Sh S.S. Rajsekar is an accomplished professional, a first generation entrepreneur with over 30 years experience in real estate promotion and trade. He has been involved in the area of rural agriculture management and social and community development. A proactive Rotarian, he is involved in several socially relevant projects in and around Tamil Nadu.
a. Chennai Consultancy Services Private Limited
b. Chidbhava Constructions and Properties Private Limited
c. C o r o m a n d e l E n g i n e e r i n g Company Limited
d. ONGC TERI Biotech Limitede. Tamilnadu Corporat ion for
development of Women Limited
ONGC Chairman• Human Resource Management • Health, Safety & EnvironmentMember• Project Appraisal • COD for redressal of Grievances
of the Parties• Audit & Ethics• S h a r e h o l d e r s ’ / I n v e s t o r s ’ Grievance• Remuneration
C o r o m a n d e l E n g i n e e r i n g Company LimitedMember• Audit Committee• S h a r e h o l d e r s ’ G r i e v a n c e Committee
Shri S. BALACHANDRAN
August 27, 1946, 65 years
November 11, 2011
B.Sc. Gold Medallist
M.Sc. First Class
0He joined Indian Railway Accounts Service in 1971. He has served in various capacities in Railways and on deputation outside in Corporate and other Government Sectors. He served in the senior management level in Indian Railway Finance Corporat ion including as i ts Managing Director. He was involved in setting up of Railtel Corporation, Rail Vikas Nigam Ltd and Joint ventures l ike Karnataka Rail I n f r a s t r u c t u r e D e v e l o p m e n t Enterprises, Hassan Mangalore Rail Development Company, Pipavav Rail Corporation, etc apart from being a director in some of these companies. He worked as Under Secretary and Deputy Secretary of UPSC and Joint Director of C&AG.
ONGCChairman• Audit & Ethics• Financial ManagementMember• Project Appraisal • Human Resource Management• Shareholders’/Investors’
Grievance • Remuneration• COD for redressal of Grievances
of the Parties
Dredging Corporation of IndiaMember• Audit Committee• Grievance Committee• Remuneration
PTC Energy LimitedMember• Audit Committee
PTC India LimitedMember• Audit Committee
a. Dredging Corporation of Indiab. ONGC Petro-additions Limitedc. PTC Energy Limitedd. PTC India Limited
Shri S. NAUTIYAL
July 18, 1946, 65 years
November 11, 2011
Post Graduate in Political Science
and Public Administration.
0Shri Santosh Nautiyal, is an IAS (Orissa – 1968). During the 38 years of his service he worked as MD, IPICOL, Orissa, Principal Secretary to the Government of Orissa, Joint Secretary, Ministry of Steel, Additional Secretary, Department of Consumer Affairs, Chairman, Food Corporation of India. He retired as the Chairman of National Highways Authority of India in July 2006. He had a long experience of over 18 years in the Industries Sector and infrastructure development in various capacities and has been on the B o a r d o f N a t i o n a l M i n e r a l Development Corporation Ltd. (NMDC) and Kudremukh Iron Ore Company Ltd. (KIOCL).
ONGCChairman• Project Appraisal• COD for redressal of Grievances
of the PartiesMember• Audit & Ethics • Human Resource Management• Remuneration• Health Safety & Environment• Financial Management
Central Warehousing CorporationChairman• Audit Committee
a. Central Warehousing Corporationb. Mangalore SEZ Limitedc. NTPC Limitedd. ONGC Mangalore Petrochemicals Limited
Brief Resume and Other Information in Respect thof Directors Seeking Re-election at the 18 AGM
Brief Resume and Other Information in Respect th
of Directors Seeking Re-election at the 18 AGM
Green Initiative in Corporate Governance
Dear Shareholder,
As you are kindly aware the Ministry of Corporate Affairs, as a part of its “Green initiative in the Corporate Governance”, has clarified that a Company would have complied with Section 53 of the Companies Act, 1956 if the service of a document is made through electronic mode provided the company has obtained email addresses of its members for sending the notice/documents through email by giving an advance opportunity to every shareholder to register their email address and changes therein from time to time.
While a separate communication shall be sent to the shareholders seeking their consent to send any future communications and Annual Report of ONGC by email, we request you to kindly furnish your email id to M/s Karvy Computershare Pvt Ltd (R&T Agent of ONGC) at their address indicated in Reference page or email to [email protected]. Please ensure that you have indicated your Folio No. / DP & client ID No as well as your consent to receive future communications from ONGC including Annual Reports etc through email at your registered email address.
Please help us to save the environment.
(N. K. Sinha)Company Secretary
Ecological restoration through Ringal Bamboo plantation in Himalayas
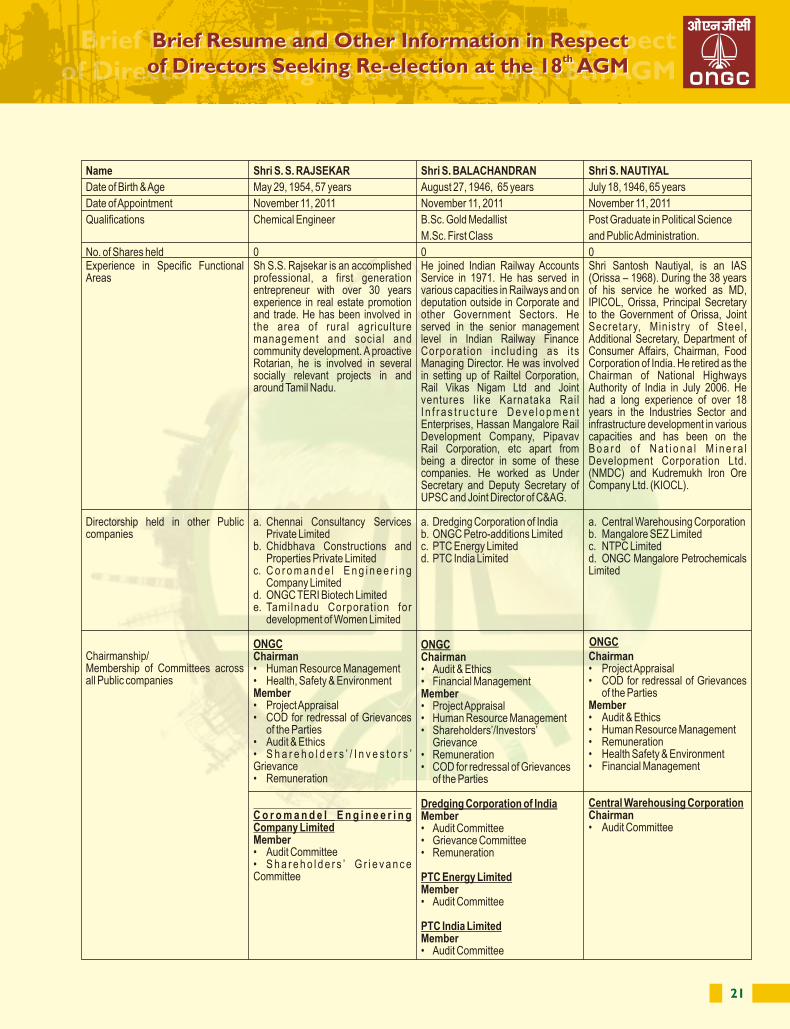
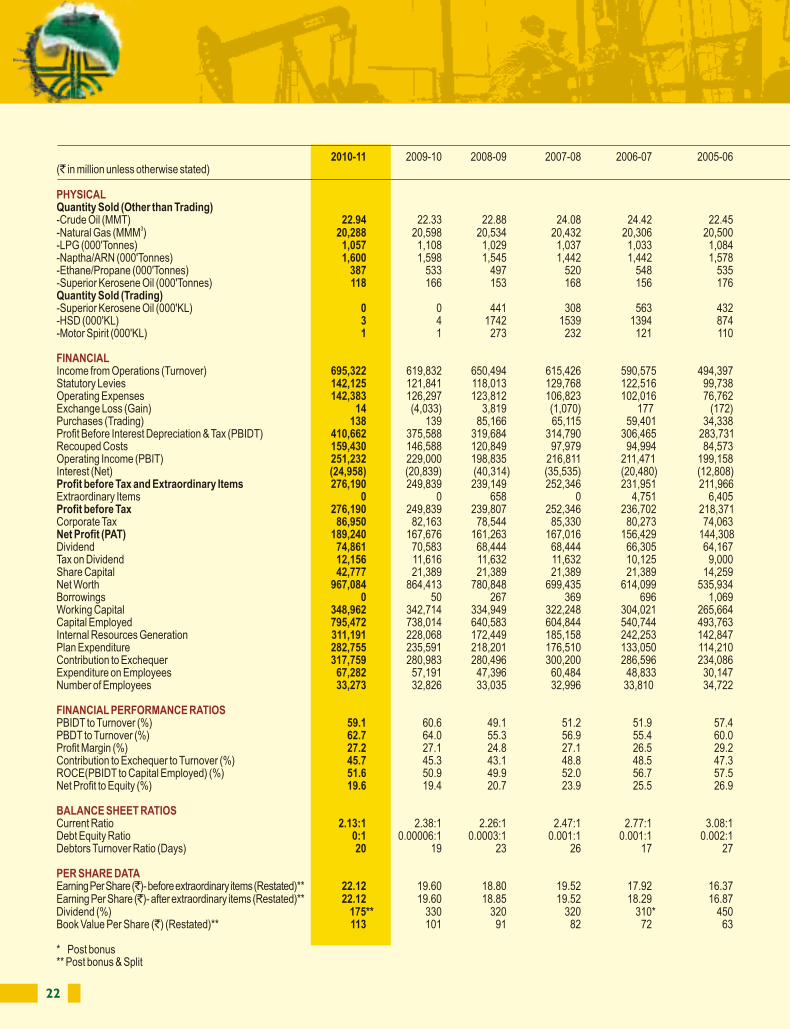
22 23
Financial ratios: trend
FY’07
52515052
57
FY’08 FY’09 FY’10 FY’11
2.772.47
2.26 2.382.13
FY’07 FY’08 FY’09 FY’10 FY’11
Restated EPS (` per share)
ROCE (%)
Current Ratio (X:1)
Restated Book Value (` per share)
Performance at a GlancePerformance at a Glance
25.00
20.00
15.00
10.00
5.00
0.00
2006-7 2007-08 2008-09 2009-10 2010-11
18.29
19.52
18.8519.60
22.12
EPS
120
80
60
40
20
0
2006-7 2007-08 2008-09 2009-10 2010-11
7282
91101
113100
Book Value
2010-11 2009-10 2008-09 2007-08 2006-07 2005-06 2004-05 2003-04 2002-03 2001-02(` in million unless otherwise stated)
Quantity Sold (Other than Trading)-Crude Oil (MMT) 22.94 22.33 22.88 24.08 24.42 22.45 24.09 23.94 23.90 22.86
3-Natural Gas (MMM ) 20,288 20,598 20,534 20,432 20,306 20,500 20,644 21,103 21,110 20,446-LPG (000'Tonnes) 1,057 1,108 1,029 1,037 1,033 1,084 1,086 1,161 1,198 1,157-Naptha/ARN (000'Tonnes) 1,600 1,598 1,545 1,442 1,442 1,578 1,567 1,656 1,642 1,681-Ethane/Propane (000'Tonnes) 387 533 497 520 548 535 528 534 619 528-Superior Kerosene Oil (000'Tonnes) 118 166 153 168 156 176 177 218 234 231Quantity Sold (Trading)-Superior Kerosene Oil (000'KL) 0 0 441 308 563 432 970 0 0 0-HSD (000'KL) 3 4 1742 1539 1394 874 1538 0 0 0-Motor Spirit (000'KL) 1 1 273 232 121 110 262 0 0 0
Income from Operations (Turnover) 695,322 619,832 650,494 615,426 590,575 494,397 472,454 329,270 353,872 238,574Statutory Levies 142,125 121,841 118,013 129,768 122,516 99,738 103,258 89,156 92,334 59,742Operating Expenses 142,383 126,297 123,812 106,823 102,016 76,762 71,397 58,848 70,855 49,084Exchange Loss (Gain) 14 (4,033) 3,819 (1,070) 177 (172) 2 36 191 469Purchases (Trading) 138 139 85,166 65,115 59,401 34,338 51,013 0 0 0Profit Before Interest Depreciation & Tax (PBIDT) 410,662 375,588 319,684 314,790 306,465 283,731 246,784 181,230 190,492 129,279Recouped Costs 159,430 146,588 120,849 97,979 94,994 84,573 62,016 55,881 41,439 38,399 Operating Income (PBIT) 251,232 229,000 198,835 216,811 211,471 199,158 184,768 125,349 149,053 90,880Interest (Net) (24,958) (20,839) (40,314) (35,535) (20,480) (12,808) (11,887) (10,741) (12,185) (7,672)Profit before Tax and Extraordinary Items 276,190 249,839 239,149 252,346 231,951 211,966 196,655 136,090 161,238 98,552Extraordinary Items 0 0 658 0 4,751 6,405 0 0 0 0Profit before Tax 276,190 249,839 239,807 252,346 236,702 218,371 196,655 136,090 161,238 98,552Corporate Tax 86,950 82,163 78,544 85,330 80,273 74,063 66,825 49,446 55,945 36,573 Net Profit (PAT) 189,240 167,676 161,263 167,016 156,429 144,308 129,830 86,644 105,293 61,979Dividend 74,861 70,583 68,444 68,444 66,305 64,167 57,037 34,222 42,778 19,963Tax on Dividend 12,156 11,616 11,632 11,632 10,125 9,000 7,763 4,385 2,375 0Share Capital 42,777 21,389 21,389 21,389 21,389 14,259 14,259 14,259 14,259 14,259Net Worth 967,084 864,413 780,848 699,435 614,099 535,934 463,142 400,024 356,081 295,119Borrowings 0 50 267 369 696 1,069 1,490 2,118 3,627 30,381Working Capital 348,962 342,714 334,949 322,248 304,021 265,664 212,895 191,535 127,132 109,249Capital Employed 795,472 738,014 640,583 604,844 540,744 493,763 419,926 395,299 352,170 329,061Internal Resources Generation 311,191 228,068 172,449 185,158 242,253 142,847 117,120 93,069 81,735 68,448Plan Expenditure 282,755 235,591 218,201 176,510 133,050 114,210 106,813 68,520 50,890 40,403Contribution to Exchequer 317,759 280,983 280,496 300,200 286,596 234,086 228,117 168,582 191,016 108,799Expenditure on Employees 67,282 57,191 47,396 60,484 48,833 30,147 27,465 25,619 25,921 21,847Number of Employees 33,273 32,826 33,035 32,996 33,810 34,722 36,185 38,033 39,352 40,280
PBIDT to Turnover (%) 59.1 60.6 49.1 51.2 51.9 57.4 52.2 55.0 53.8 54.1PBDT to Turnover (%) 62.7 64.0 55.3 56.9 55.4 60.0 54.8 58.3 57.2 57.3Profit Margin (%) 27.2 27.1 24.8 27.1 26.5 29.2 27.5 26.3 29.8 26.0Contribution to Exchequer to Turnover (%) 45.7 45.3 43.1 48.8 48.5 47.3 48.3 51.2 54.0 45.6ROCE(PBIDT to Capital Employed) (%) 51.6 50.9 49.9 52.0 56.7 57.5 58.8 45.8 54.0 39.2Net Profit to Equity (%) 19.6 19.4 20.7 23.9 25.5 26.9 28.0 21.7 29.6 21.0
Current Ratio 2.13:1 2.38:1 2.26:1 2.47:1 2.77:1 3.08:1 2.62:1 2.79:1 2.45:1 2.62:1Debt Equity Ratio 0:1 0.00006:1 0.0003:1 0.001:1 0.001:1 0.002:1 0.003:1 0.01:1 0.01:1 0.10:1Debtors Turnover Ratio (Days) 20 19 23 26 17 27 29 26 41 34
Earning Per Share (`)- before extraordinary items (Restated)** 22.12 19.60 18.80 19.52 17.92 16.37 15.18 10.13 12.30 7.24Earning Per Share (`)- after extraordinary items (Restated)** 22.12 19.60 18.85 19.52 18.29 16.87 15.18 10.13 12.30 7.24Dividend (%) 175** 330 320 320 310* 450 400 240 300 140Book Value Per Share (`) (Restated)** 113 101 91 82 72 63 54 47 42 34
* Post bonus** Post bonus & Split
PHYSICAL
FINANCIAL
FINANCIAL PERFORMANCE RATIOS
BALANCE SHEET RATIOS
PER SHARE DATA
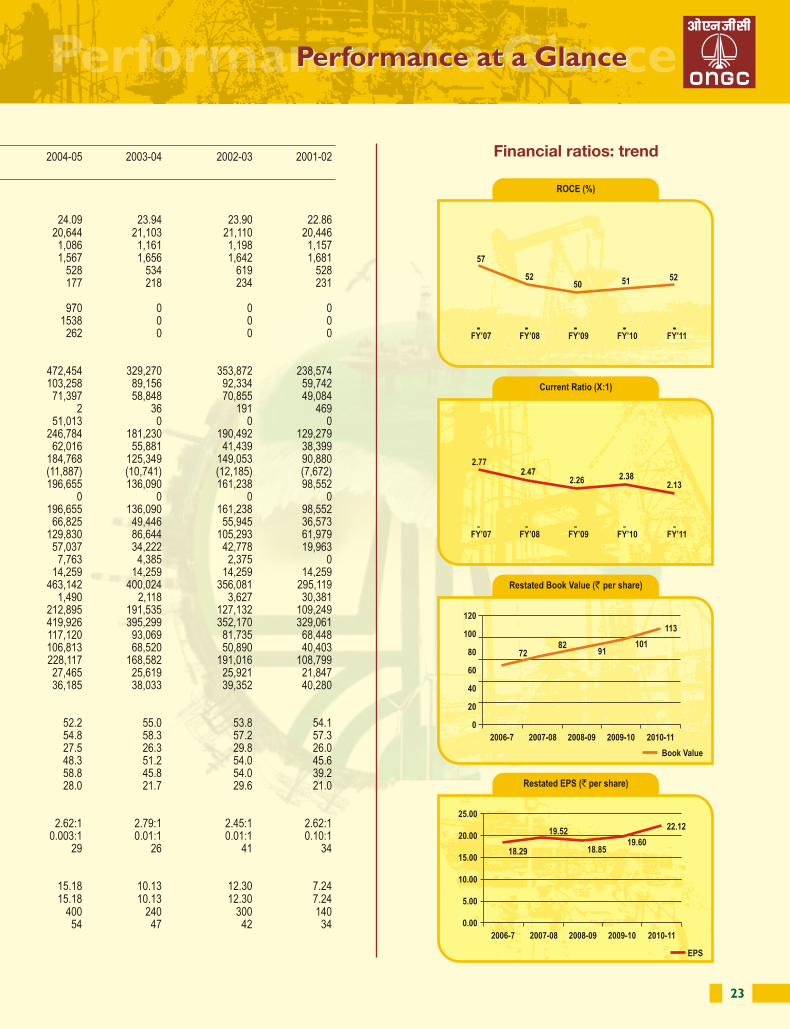
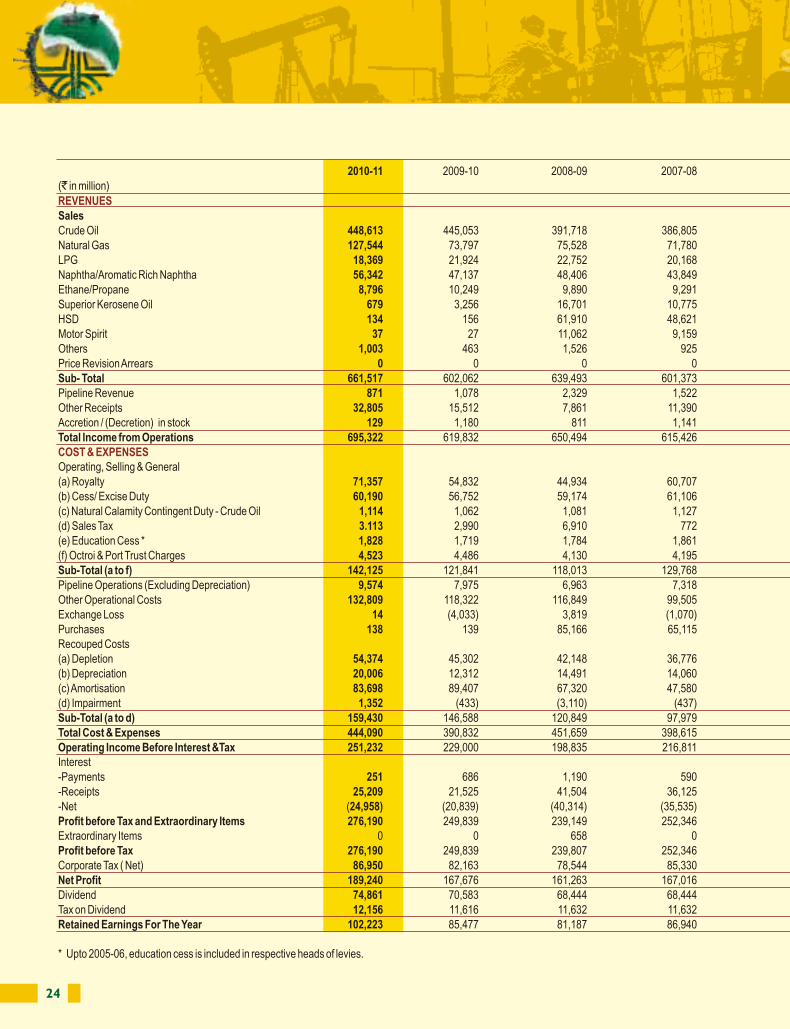
24 25
2010-11 2009-10 2008-09 2007-08 2006-07 2005-06 2004-05 2003-04 2002-03 2001-02(` in million)
SalesCrude Oil 448,613 445,053 391,718 386,805 372,090 317,357 311,824 222,124 244,131 137,115Natural Gas 127,544 73,797 75,528 71,780 72,113 66,701 53,206 52,039 49,986 49,446LPG 18,369 21,924 22,752 20,168 14,866 16,293 12,066 16,352 19,087 11,473Naphtha/Aromatic Rich Naphtha 56,342 47,137 48,406 43,849 37,907 35,679 29,260 22,538 22,035 18,782Ethane/Propane 8,796 10,249 9,890 9,291 9,095 7,401 5,705 4,779 5,837 4,082Superior Kerosene Oil 679 3,256 16,701 10,775 15,754 10,605 16,896 2,658 3,188 1,731HSD 134 156 61,910 48,621 42,037 23,403 29,277 85 80 0Motor Spirit 37 27 11,062 9,159 4,530 3,797 6,846 0 0 0Others 1,003 463 1,526 925 634 617 1,434 1,060 995 766Price Revision Arrears 0 0 0 0 11 156 584 3,461 1,568 5,017Sub- Total 661,517 602,062 639,493 601,373 569,037 482,009 467,098 325,096 346,907 228,412Pipeline Revenue 871 1,078 2,329 1,522 82 15 23 24 478 3,966Other Receipts 32,805 15,512 7,861 11,390 21,653 10,257 5,034 4,262 6,276 6,194Accretion / (Decretion) in stock 129 1,180 811 1,141 (197) 2,116 299 (112) 211 2Total Income from Operations 695,322 619,832 650,494 615,426 590,575 494,397 472,454 329,270 353,872 238,574
Operating, Selling & General(a) Royalty 71,357 54,832 44,934 60,707 53,428 46,181 37,911 28,451 30,002 25,142(b) Cess/ Excise Duty 60,190 56,752 59,174 61,106 62,024 44,302 46,498 46,302 46,994 25,660(c) Natural Calamity Contingent Duty - Crude Oil 1,114 1,062 1,081 1,127 1,149 1,081 1,138 1,117 98 0(d) Sales Tax 3.113 2,990 6,910 772 1,380 5,727 14,580 11,050 12,561 7,713(e) Education Cess * 1,828 1,719 1,784 1,861 1,303 (f) Octroi & Port Trust Charges 4,523 4,486 4,130 4,195 3,232 2,447 3,131 2,236 2,679 1,227Sub-Total (a to f) 142,125 121,841 118,013 129,768 122,516 99,738 103,258 89,156 92,334 59,742Pipeline Operations (Excluding Depreciation) 9,574 7,975 6,963 7,318 6,460 5,907 8,982 5,717 5,452 4,951Other Operational Costs 132,809 118,322 116,849 99,505 95,556 70,855 62,415 53,131 65,403 44,133Exchange Loss 14 (4,033) 3,819 (1,070) 177 (172) 2 36 191 469Purchases 138 139 85,166 65,115 59,401 34,338 51,013 - - -Recouped Costs(a) Depletion 54,374 45,302 42,148 36,776 33,849 29,702 24,851 23,323 17,497 15,638(b) Depreciation 20,006 12,312 14,491 14,060 16,249 23,759 5,437 6,057 7,599 8,286(c) Amortisation 83,698 89,407 67,320 47,580 43,167 31,437 31,588 26,339 16,181 14,228(d) Impairment 1,352 (433) (3,110) (437) 1,729 (325) 140 162 162 247Sub-Total (a to d) 159,430 146,588 120,849 97,979 94,994 84,573 62,016 55,881 41,439 38,399Total Cost & Expenses 444,090 390,832 451,659 398,615 379,104 295,239 287,686 203,921 204,819 147,694Operating Income Before Interest &Tax 251,232 229,000 198,835 216,811 211,471 199,158 184,768 125,349 149,053 90,880Interest-Payments 251 686 1,190 590 215 470 377 468 1,132 2,469-Receipts 25,209 21,525 41,504 36,125 20,695 13,278 12,264 11,209 13,317 10,141-Net (24,958) (20,839) (40,314) (35,535) (20,480) (12,808) (11,887) (10,741) (12,185) (7,672)Profit before Tax and Extraordinary Items 276,190 249,839 239,149 252,346 231,951 211,966 196,655 136,090 161,238 98,552Extraordinary Items 0 0 658 0 4,751 6,405 0 0 0 0Profit before Tax 276,190 249,839 239,807 252,346 236,702 218,371 196,655 136,090 161,238 98,552Corporate Tax ( Net) 86,950 82,163 78,544 85,330 80,273 74,063 66,825 49,446 55,945 36,573Net Profit 189,240 167,676 161,263 167,016 156,429 144,308 129,830 86,644 105,293 61,979Dividend 74,861 70,583 68,444 68,444 66,305 64,167 57,037 34,222 42,778 19,963Tax on Dividend 12,156 11,616 11,632 11,632 10,125 9,000 7,763 4,385 2,375 0Retained Earnings For The Year 102,223 85,477 81,187 86,940 79,999 71,141 65,030 48,037 60,140 42,016
* Upto 2005-06, education cess is included in respective heads of levies.
REVENUES
COST & EXPENSES
Statement of Income and Retained EarningsStatement of Income and Retained Earnings
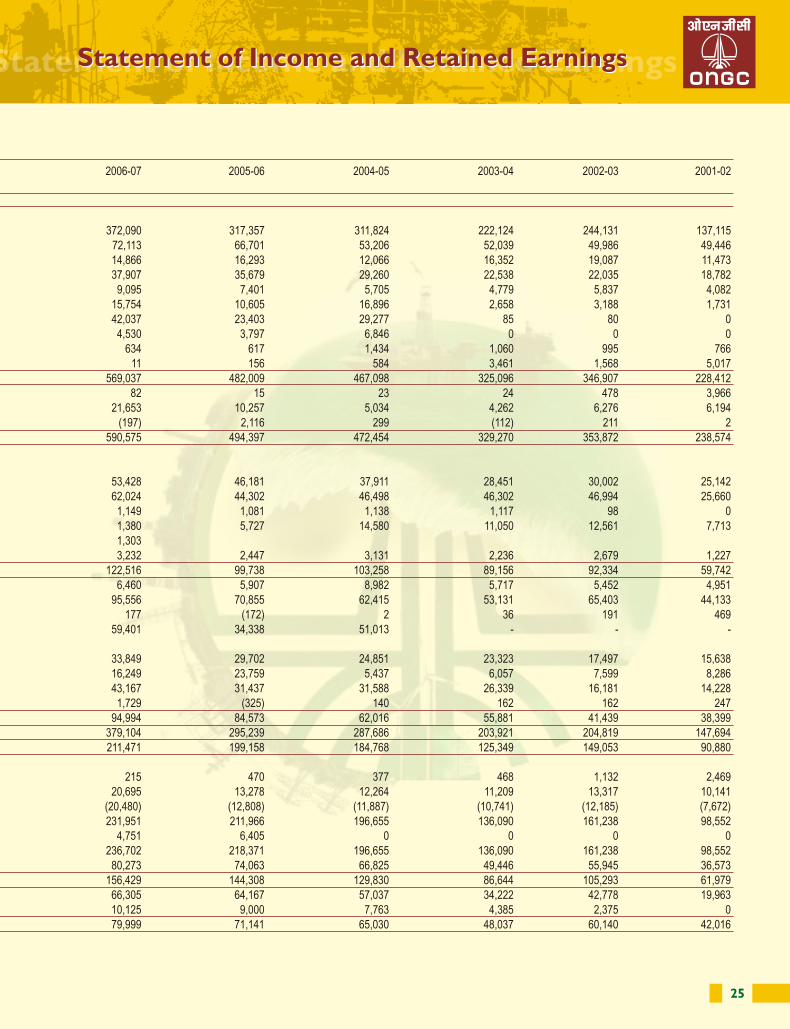
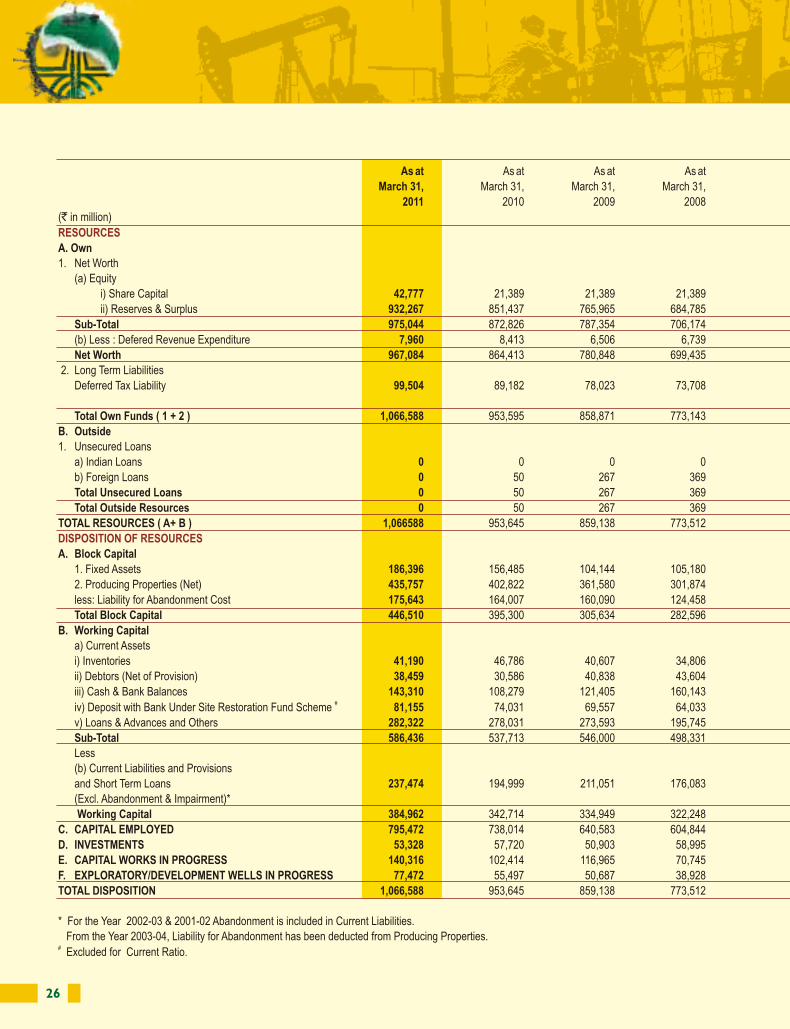
26 27
As at As at As at As at As at As at As at As at As at As at
March 31, March 31, March 31, March 31, March 31, March 31, March 31, March 31, March 31, March 31,
2011 2010 2009 2008 2007 2006 2005 2004 2003 2002
( in million)
A. Own
1. Net Worth
(a) Equity
i) Share Capital 42,777 21,389 21,389 21,389 21,389 14,259 14,259 14,259 14,259 14,259
ii) Reserves & Surplus 932,267 851,437 765,965 684,785 597,851 525,338 454,195 391,172 343,130 282,963
Sub-Total 975,044 872,826 787,354 706,174 619,240 539,597 468,454 405,431 357,389 297,222
(b) Less : Defered Revenue Expenditure 7,960 8,413 6,506 6,739 5,141 3,663 5,312 5,407 1,308 2,103
Net Worth 967,084 864,413 780,848 699,435 614,099 535,934 463,142 400,024 356,081 295,119
2. Long Term Liabilities
Deferred Tax Liability 99,504 89,182 78,023 73,708 65,227 63,551 54,438 58,420 52,348 53,471
Total Own Funds ( 1 + 2 ) 1,066,588 953,595 858,871 773,143 679,326 599,485 517,580 458,444 408,429 348,590
B. Outside
1. Unsecured Loans
a) Indian Loans 0 0 0 0 202 404 607 809 1,011 1,213
b) Foreign Loans 0 50 267 369 494 665 883 1,309 2,616 29,168
Total Unsecured Loans 0 50 267 369 696 1,069 1,490 2,118 3,627 30,381
Total Outside Resources 0 50 267 369 696 1,069 1,490 2,118 3,627 30,381
TOTAL RESOURCES ( A+ B ) 1,066588 953,645 859,138 773,512 680,022 600,554 519,070 460,562 412,056 378,971
A. Block Capital
1. Fixed Assets 186,396 156,485 104,144 105,180 88,391 78,422 58,365 56,684 53,928 56,008
2. Producing Properties (Net) 435,757 402,822 361,580 301,874 295,685 275,833 229,607 227,372 171,110 163,804
less: Liability for Abandonment Cost 175,643 164,007 160,090 124,458 147,353 126,156 80,941 80,292
Total Block Capital 446,510 395,300 305,634 282,596 236,723 228,099 207,031 203,764 225,038 219,812
B. Working Capital
a) Current Assets
i) Inventories 41,190 46,786 40,607 34,806 30,338 30,385 25,692 24,057 15,710 14,526
ii) Debtors (Net of Provision) 38,459 30,586 40,838 43,604 27,594 37,043 37,293 23,178 39,359 22,514
iii) Cash & Bank Balances 143,310 108,279 121,405 160,143 136,704 42,792 58,488 55,735 36,309 49,105#iv) Deposit with Bank Under Site Restoration Fund Scheme 81,155 74,031 69,557 64,033 56,103 45,336 36,181 31,682 24,781 6,350
v) Loans & Advances and Others 282,322 278,031 273,593 195,745 193,214 216,059 164,004 145,963 98,811 84,164
Sub-Total 586,436 537,713 546,000 498,331 443,953 371,615 321,658 280,615 214,970 176,659
Less
(b) Current Liabilities and Provisions
and Short Term Loans 237,474 194,999 211,051 176,083 139,932 105,951 108,763 89,080 87,838 67,410
(Excl. Abandonment & Impairment)*
Working Capital 384,962 342,714 334,949 322,248 304,021 265,664 212,895 191,535 127,132 109,249
C. CAPITAL EMPLOYED 795,472 738,014 640,583 604,844 540,744 493,763 419,926 395,299 352,170 329,061
D. INVESTMENTS 53,328 57,720 50,903 58,995 57,021 48,885 40,367 44,217 39,826 33,232
E. CAPITAL WORKS IN PROGRESS 140,316 102,414 116,965 70,745 48,251 28,303 41,419 9,826 9,329 6,903
F. EXPLORATORY/DEVELOPMENT WELLS IN PROGRESS 77,472 55,497 50,687 38,928 34,006 29,603 17,358 11,220 10,731 9,775
TOTAL DISPOSITION 1,066,588 953,645 859,138 773,512 680,022 600,554 519,070 460,562 412,056 378,971
* For the Year 2002-03 & 2001-02 Abandonment is included in Current Liabilities.
From the Year 2003-04, Liability for Abandonment has been deducted from Producing Properties.# Excluded for Current Ratio.
`
RESOURCES
DISPOSITION OF RESOURCES
Statement of Financial PositionStatement of Financial Position
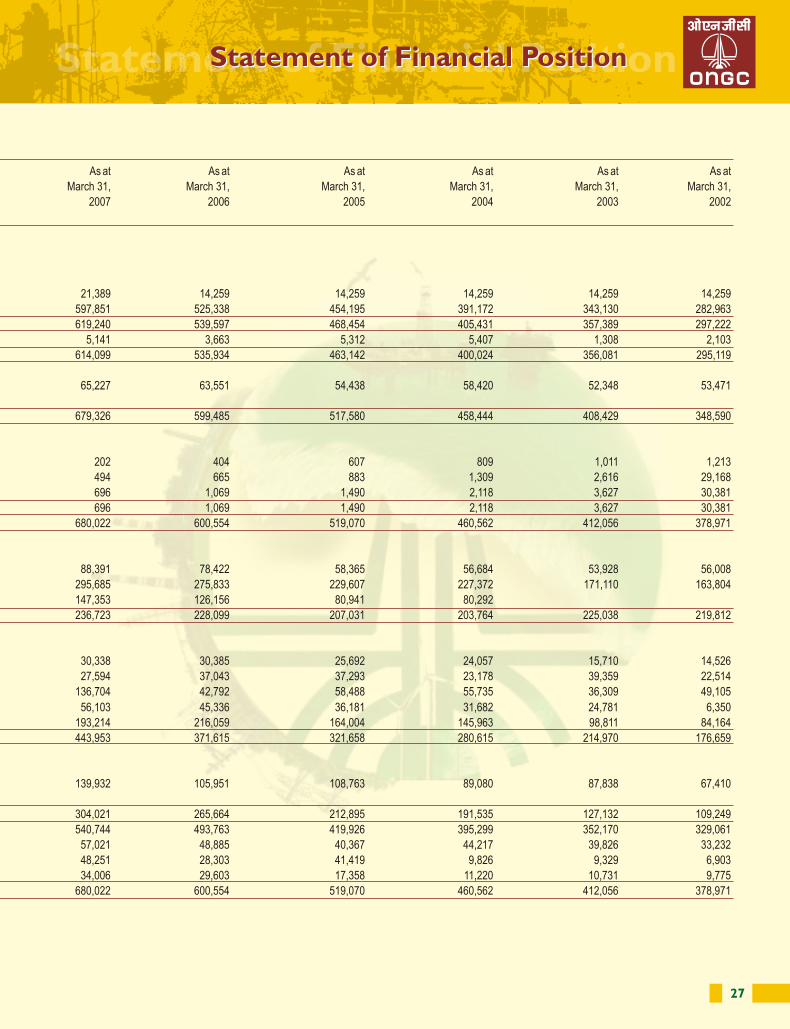
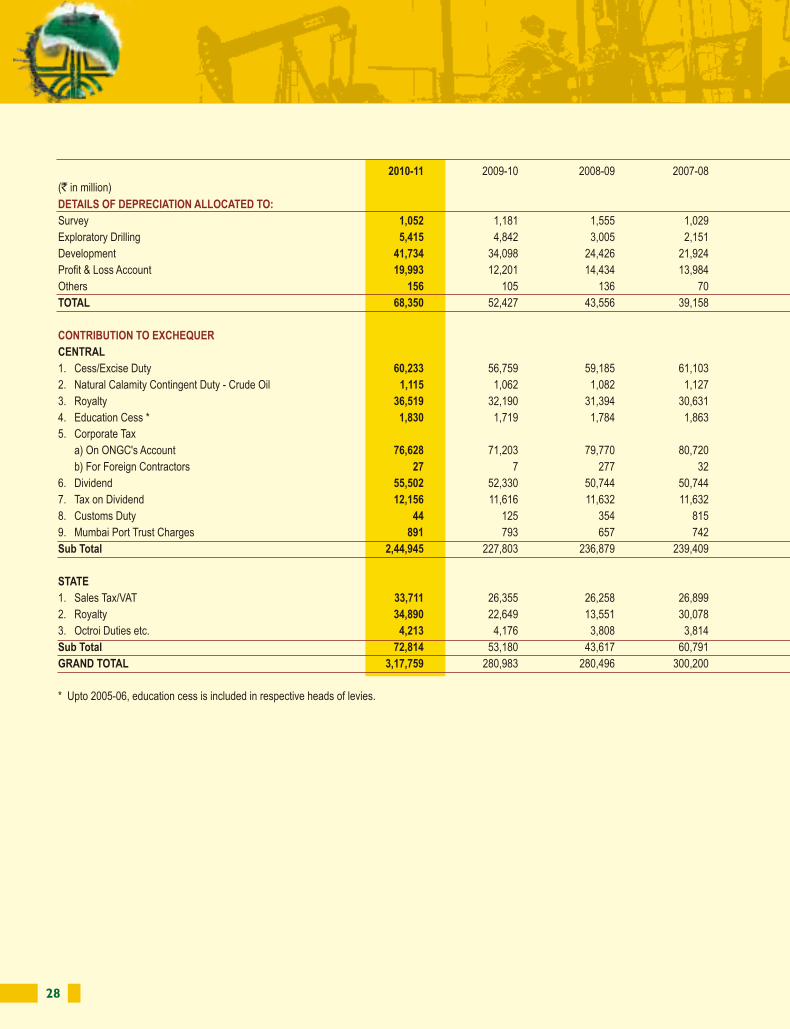
28 29
2010-11 2009-10 2008-09 2007-08 2006-07 2005-06 2004-05 2003-04 2002-03 2001-02
( in million)
Survey 1,052 1,181 1,555 1,029 863 722 575 760 712 370
Exploratory Drilling 5,415 4,842 3,005 2,151 1,672 1,885 1,503 1,517 1,590 1,748
Development 41,734 34,098 24,426 21,924 14,251 13,605 10,623 9,322 9,587 9,725
Profit & Loss Account 19,993 12,201 14,434 13,984 16,094 22,226 5,435 6,056 7,594 7,865
Others 156 105 136 70 48 89 106 25 55 0
TOTAL 68,350 52,427 43,556 39,158 32,928 38,527 18,242 17,680 19,538 19,708
CENTRAL
1. Cess/Excise Duty 60,233 56,759 59,185 61,103 62,028 44,302 46,501 46,314 47,008 25,662
2. Natural Calamity Contingent Duty - Crude Oil 1,115 1,062 1,082 1,127 1,149 1,081 1,138 1,117 98
3. Royalty 36,519 32,190 31,394 30,631 27,920 23,056 21,811 16,202 17,380 16,602
4. Education Cess * 1,830 1,719 1,784 1,863 1,303
5. Corporate Tax
a) On ONGC's Account 76,628 71,203 79,770 80,720 78,403 64,025 69,817 43,516 58,850 31,012
b) For Foreign Contractors 27 7 277 32 34 3 23 20 24 32
6. Dividend 55,502 52,330 50,744 50,744 49,159 47,573 42,287 27,364 35,981 16,791
7. Tax on Dividend 12,156 11,616 11,632 11,632 10,125 8,999 7,763 4,385 2,375 0
8. Customs Duty 44 125 354 815 1,441 888 2,423 4,114 1,432 1,213
9. Mumbai Port Trust Charges 891 793 657 742 691 710 2,999 364 345 260
Sub Total 2,44,945 227,803 236,879 239,409 232,253 190,637 194,762 143,396 163,493 91,572
STATE
1. Sales Tax/VAT 33,711 26,355 26,258 26,899 25,998 18,263 14,581 11,060 12,561 7,719
2. Royalty 34,890 22,649 13,551 30,078 25,513 23,126 16,103 12,249 12,623 8,541
3. Octroi Duties etc. 4,213 4,176 3,808 3,814 2,832 2,060 2,671 1,877 2,339 967
Sub Total 72,814 53,180 43,617 60,791 54,343 43,449 33,355 25,186 27,523 17,227
GRAND TOTAL 3,17,759 280,983 280,496 300,200 286,596 234,086 228,117 168,582 191,016 108,799
* Upto 2005-06, education cess is included in respective heads of levies.
`
DETAILS OF DEPRECIATION ALLOCATED TO:
CONTRIBUTION TO EXCHEQUER
Depreciation and Contribution to ExchequerDepreciation and Contribution to Exchequer
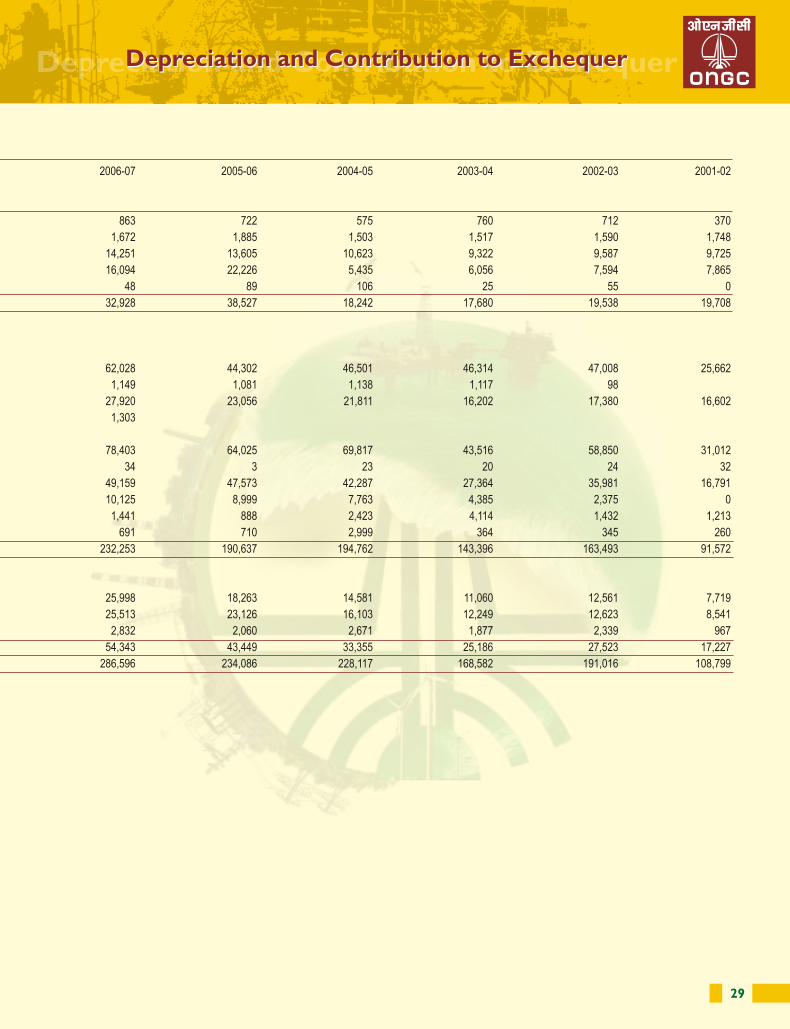
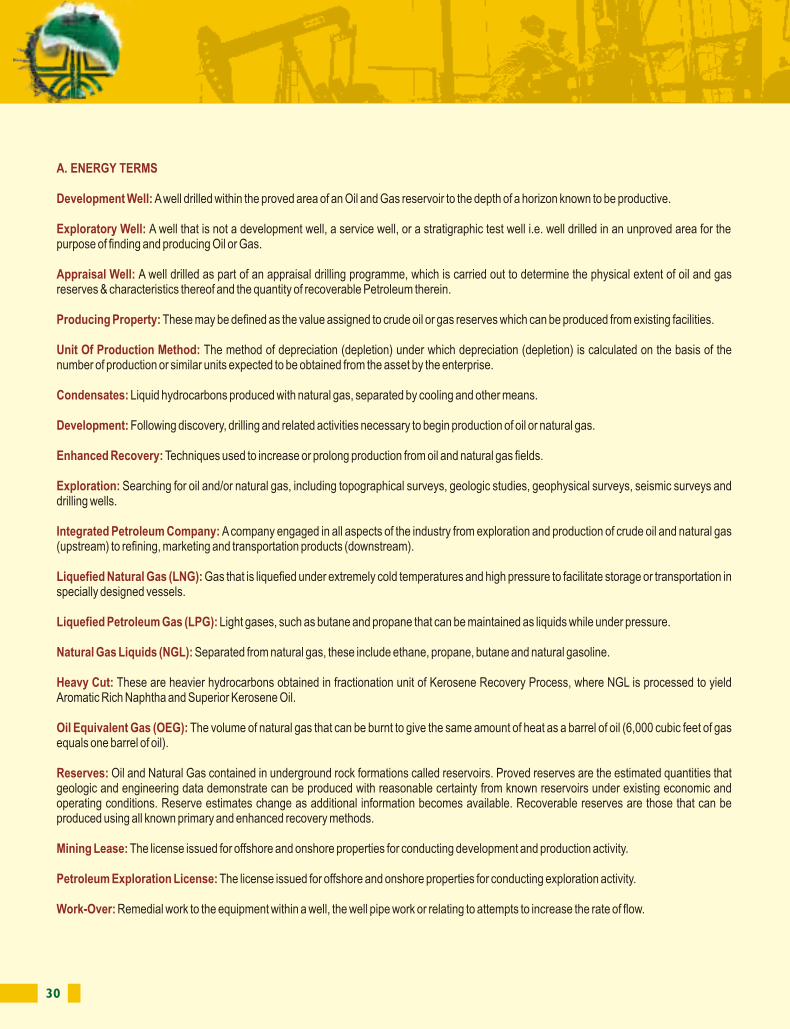
30 31
A. ENERGY TERMS
Development Well:
Exploratory Well:
Appraisal Well:
Producing Property:
Unit Of Production Method:
Condensates:
Development:
Enhanced Recovery:
Exploration:
Integrated Petroleum Company:
Liquefied Natural Gas (LNG):
Liquefied Petroleum Gas (LPG):
Natural Gas Liquids (NGL):
Heavy Cut:
Oil Equivalent Gas (OEG):
Reserves:
Mining Lease:
Petroleum Exploration License:
Work-Over:
A well drilled within the proved area of an Oil and Gas reservoir to the depth of a horizon known to be productive.
A well that is not a development well, a service well, or a stratigraphic test well i.e. well drilled in an unproved area for the purpose of finding and producing Oil or Gas.
A well drilled as part of an appraisal drilling programme, which is carried out to determine the physical extent of oil and gas reserves & characteristics thereof and the quantity of recoverable Petroleum therein.
These may be defined as the value assigned to crude oil or gas reserves which can be produced from existing facilities.
The method of depreciation (depletion) under which depreciation (depletion) is calculated on the basis of the number of production or similar units expected to be obtained from the asset by the enterprise.
Liquid hydrocarbons produced with natural gas, separated by cooling and other means.
Following discovery, drilling and related activities necessary to begin production of oil or natural gas.
Techniques used to increase or prolong production from oil and natural gas fields.
Searching for oil and/or natural gas, including topographical surveys, geologic studies, geophysical surveys, seismic surveys and drilling wells.
A company engaged in all aspects of the industry from exploration and production of crude oil and natural gas (upstream) to refining, marketing and transportation products (downstream).
Gas that is liquefied under extremely cold temperatures and high pressure to facilitate storage or transportation in specially designed vessels.
Light gases, such as butane and propane that can be maintained as liquids while under pressure.
Separated from natural gas, these include ethane, propane, butane and natural gasoline.
These are heavier hydrocarbons obtained in fractionation unit of Kerosene Recovery Process, where NGL is processed to yield Aromatic Rich Naphtha and Superior Kerosene Oil.
The volume of natural gas that can be burnt to give the same amount of heat as a barrel of oil (6,000 cubic feet of gas equals one barrel of oil).
Oil and Natural Gas contained in underground rock formations called reservoirs. Proved reserves are the estimated quantities that geologic and engineering data demonstrate can be produced with reasonable certainty from known reservoirs under existing economic and operating conditions. Reserve estimates change as additional information becomes available. Recoverable reserves are those that can be produced using all known primary and enhanced recovery methods.
The license issued for offshore and onshore properties for conducting development and production activity.
The license issued for offshore and onshore properties for conducting exploration activity.
Remedial work to the equipment within a well, the well pipe work or relating to attempts to increase the rate of flow.
B. FINANCIAL TERMS
Recouped Cost:
a) Depreciation:
b) Depletion:
c) Impairment:
d) Amortisation:
Royalty:
Cess:
Exploration Costs:
Development Costs:
Production Costs:
Abandonment Cost:
Absorption Costing:
Accounting Policies:
Accrual Basis of Accounting:
Balance Sheet:
Book Value:
Capital Commitment:
It refers to Depreciation, Depletion, Impairment and Amortisation charged in accounts. These are non-cash costs.
A measure of the wearing out, consumption or other loss of value of a depreciable asset arising from use, efflux of time or obsolescence through technology and market changes. It is provided for and allocated as mentioned in para 13 of the Significant Accounting Policies.
A measure of exhaustion of a wasting asset (Producing Properties) represented by periodic write off of cost. It is computed with reference to the amortisation base by taking the related capital cost incurred divided by hydrocarbon reserves and multiplied by production.
An impairment loss is the amount by which the carrying amount of an asset exceeds its recoverable amount. Impairment Loss is recognized in the accounts as per para 7 of the Significant Accounting Policies.
It refers to the Dry wells and Survey expenditure expensed in the accounts in line with para 6.3.1 and 6.2 of the Significant Accounting Policies.
It is a levy imposed under The Petroleum and Natural Gas Rules, 1959 payable to the respective State or Central Government granting the lease (Central Government in case of offshore) on crude oil and natural gas.
It is a levy imposed under The Oil Industry (Development) Act, 1974 on crude oil produced and payable to the Central Government.
Costs incurred in exploring property. Exploration involves identifying areas that may warrant examination and examining specific areas, including drilling exploratory wells.
Costs incurred in preparing proved reserves for production i.e. costs incurred to obtain access to proved reserves and to provide facilities for extracting, treating, gathering and storing oil and gas.
Costs incurred in lifting the oil and gas to the surface and in gathering, treating and storing the oil and gas.
Abandonment costs are the costs incurred on discontinuation of all operations and surrendering the property back to the owner. These costs relate to plugging and abandoning of wells, dismantling of wellheads, production and transport facilities and to restoration of producing areas. Abandonment Cost is recognized in the accounts as per para 8 of the Significant Accounting Policies.
A method whereby the cost is determined so as to include the appropriate share of both variable and fixed costs.
The specific accounting principles and the methods of applying those principles adopted by an enterprise in the preparation and presentation of financial statements.
The method of recording transactions by which revenues, costs, assets and liabilities are reflected in the accounts in the period in which they accrue. The 'accrual basis of accounting' includes considerations relating to deferrals, allocations, depreciation and amortisation. This basis is also referred to as mercantile basis of accounting.
A statement of the financial position of an enterprise as at a given date, which exhibits its assets, liabilities, capital, reserves and other account balances at their respective book values.
The amount at which an item appears in the books of account or financial statements. It does not refer to any particular basis on which the amount is determined, e.g., cost, replacement value, etc.
Future liability for capital expenditure in respect of which contracts have been made.
Glossary of Energy & Financial TermsGlossary of Energy & Financial Terms
32 33
Capital Employed:
Capital Reserve:
Cess:
Contingent Liability:
Current Assets:
Deferred Expenditure:
Diminishing Balance Method:
Dividend:
Earning Per Share:
Expenditure:
Expense:
Extraordinary Item:
Fictitious Assets:
First In, First Out (FIFO):
Fixed Assets:
Fixed Cost:
Fundamental Accounting Assumptions:
Inventory:
The finances deployed by an enterprise in its net fixed assets, investments and working capital. Capital employed in an operation may, however, exclude investments made outside that operation.
A reserve of a corporate enterprise which is not available for distribution as dividend.
It is a levy imposed under The Oil Industry (Development) Act, 1974 on the Crude Oil quantity acknowledged & received in the refinery and payable to the Central Government.
An obligation relating to an existing condition or situation which may arise in future depending on the occurrence or non-occurrence of one or more uncertain future events.
Cash and other assets that are expected to be converted into cash or consumed in the production of goods or rendering of services in the normal course of business.
Expenditure for which payment has been made or a liability incurred but which is carried forward on the presumption that it will be of benefit over a subsequent period or periods. This is also referred to as deferred revenue expenditure.
A method under which the periodic charge for depreciation of an asset is computed by applying a fixed percentage to its historical cost or substituted amount less accumulated depreciation (net book value). This is also referred to as written down value method.
A distribution to shareholders out of profits or reserves available for this purpose.
The earnings in monetary terms attributable to each equity share, based on net profit for the period, before taking into account prior period items, extraordinary items and adjustments resulting from changes in accounting policies but after deducting tax appropriate thereto and preference dividends, divided by the number of equity shares issued and ranking for dividends in respect of that period.
Incurring a liability, disbursement of cash or transfer of property for the purpose of obtaining assets, goods and services.
A cost relating to the operations of an accounting period or to the revenue earned during the period or the benefits of which do not extend beyond that period.
Gain or loss which arises from events or transactions that are distinct from ordinary activities of the enterprise and which are both material and expected not to recur frequently or regularly. This would also include material adjustments necessitated by circumstances, which, though related to previous periods, are determined in the current period.
Item grouped under assets in a balance sheet which has no real value (e.g. the debit balance of the profit and loss statement).
Computation of the cost of items sold or consumed during a period as though they were sold or consumed in order of their acquisition.
Assets held for the purpose of providing or producing goods or services and that is not held for resale in the normal course of business
The cost of production which by its very nature remains relatively unaffected in a defined period of time by variations in the volume of production.
Basic accounting assumption which underline the preparation and presentation of financial statements. They are going concern, consistency and accrual. Usually, they are not specifically stated because their acceptance and use are assumed. Disclosure is necessary if they are not followed.
Tangible property held for sale in the ordinary course of business, or in the process of production for such sale, or for consumption in
the production of goods or services for sale, including maintenance supplies and consumables other than machinery spares.
Expenditure on assets held to earn interest, income, profit or other benefits.
An accounting concept according to which all relatively important and relevant items, i.e., items the knowledge of which might influence the decisions of the user of the financial statements are disclosed in the financial statements.
The excess of the book value of assets (other than fictitious assets) of an enterprise over its liabilities. This is also referred to as net worth or shareholders' funds.
The excess of revenue over expenses during a particular accounting period. When the result of this computation is negative, it is referred to as net loss. The net profit may be shown before or after tax.
The actual/estimated selling price of an asset in the ordinary course of the business less cost of completion and cost necessarily to be incurred in order to make the sale.
Diminution in the value of an asset by reason of its becoming out-of-date or less useful due to technological changes, improvement in production methods, change in market demand for the product or service output of the asset, or legal or other restrictions.
A material charge or credit which arises in the current period as a result of errors or omissions in the preparation of the financial statements of one or more prior periods.
A financial statement which presents the revenues and expenses of an enterprise for an accounting period and shown the excess of revenues over expenses (or vice versa). It is also known as profit and loss account.
An amount written off or retained by way of providing for depreciation or diminution in value of assets or retained by way of providing for any known liability the amount of which cannot be determined with substantial accuracy.
A provision made for debts considered doubtful of recovery.
The method under which the periodic charge for depreciation is computed by dividing the depreciable amount of a depreciable asset by the estimated number of years of its useful life.
Person from whom amounts are due for goods sold or services rendered or in respect of contractual obligations. Also termed as debtor, trade debtor, account receivable.
Credit balance in the profit and loss statement after providing for proposed appropriations, e.g., dividend or reserves.
Life which is either (i) the period over which a depreciable asset is expected to be used by the enterprise; or (ii) the number of production or similar units expected to be obtained from the use of the asset by the enterprise.
Natural resource which is subject to depletion through the process of extraction or use, e.g., mines, quarries.
The funds available for conducting day-to-day operations of an enterprise. Also represented by the excess of current assets over current liabilities including short-term loans.
Work in Process includes all materials which have undergone manufacturing or processing operations, but upon which further operations are necessary before the product is ready for sale.
NPV is the present (discounted) value of future cash inflows minus the present value of the cash outflows.
The share expressed as a percentage in the rights and obligations of each party to a Production Sharing Contract (PSC).
Investment:
Materiality:
Net Assets:
Net Profit:
Net Realisable Value:
Obsolescence:
Prior Period Item:
Profit and Loss Statement:
Provision:
Provisions for Doubtful Debts:
Straight Line Method:
Sundry Debtor:
Surplus:
Useful life:
Wasting Asset:
Working Capital:
Work in Process:
Net Present Value:
Participating Interest:
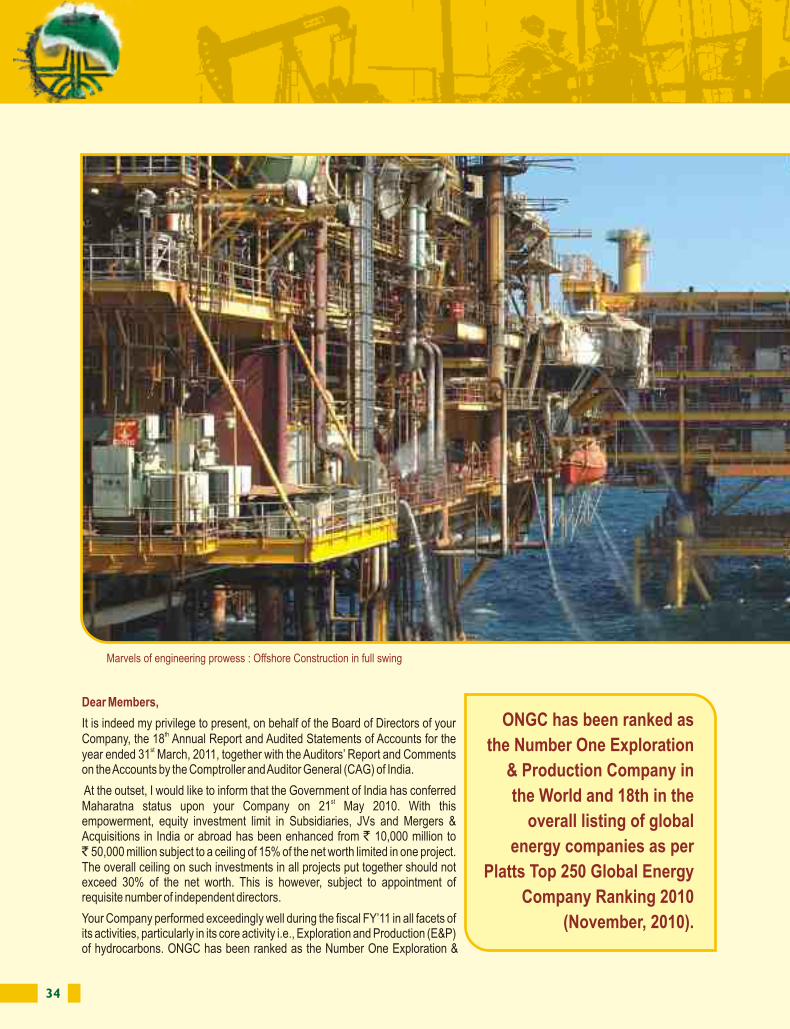
34 35
Dear Members,
It is indeed my privilege to present, on behalf of the Board of Directors of your thCompany, the 18 Annual Report and Audited Statements of Accounts for the
styear ended 31 March, 2011, together with the Auditors’ Report and Comments on the Accounts by the Comptroller and Auditor General (CAG) of India.
At the outset, I would like to inform that the Government of India has conferred stMaharatna status upon your Company on 21 May 2010. With this
empowerment, equity investment limit in Subsidiaries, JVs and Mergers & Acquisitions in India or abroad has been enhanced from ` 10,000 million to ` 50,000 million subject to a ceiling of 15% of the net worth limited in one project. The overall ceiling on such investments in all projects put together should not exceed 30% of the net worth. This is however, subject to appointment of requisite number of independent directors.
Your Company performed exceedingly well during the fiscal FY’11 in all facets of its activities, particularly in its core activity i.e., Exploration and Production (E&P) of hydrocarbons. ONGC has been ranked as the Number One Exploration &
Directors' ReportDirectors' Report
Production Company in the World and 18th in the overall listing of global energy companies as per Platts Top 250 Global Energy Company Ranking 2010 (November, 2010).
ndONGC has been ranked at 172 position in Forbes Global 2000 list 2011 of world’s biggest companies for 2010 (April, 2011). It has retained the number one rank among Indian companies and has been ranked at second position in Financial Express FE500 listing of Indian companies both in terms of Net Worth and Overall Composite Ranking.
During FY’11, your Company has made 24 discoveries in domestic fields (operated by
Physical Performance: 2010-11
Exploration
Marvels of engineering prowess : Offshore Construction in full swing
KG Offshore
Cauvery Onland
Total
KG Onland
Western Onshore
Mahanadi Offshore
l Discoveries in new prospects: 15 (Oil: 9; Gas: 6)
l Discoveries new pools: 9 (Oil: 5; Gas: 4)
3
3
24
7
1
1 2
21
15 9
4 4
6 1
1
l Geographical distribution l
Western Offshore
A&AA Basin
5
1
2 3
1
ONGC has been ranked as
the Number One Exploration
& Production Company in
the World and 18th in the
overall listing of global
energy companies as per
Platts Top 250 Global Energy
Company Ranking 2010
(November, 2010).
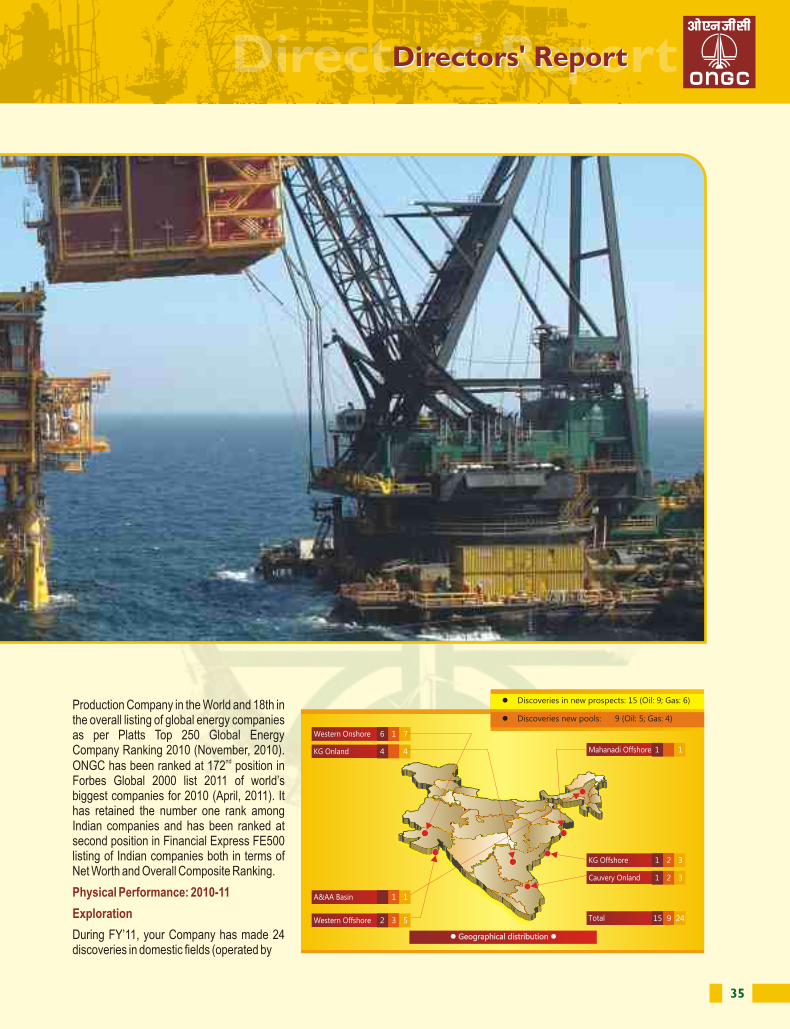
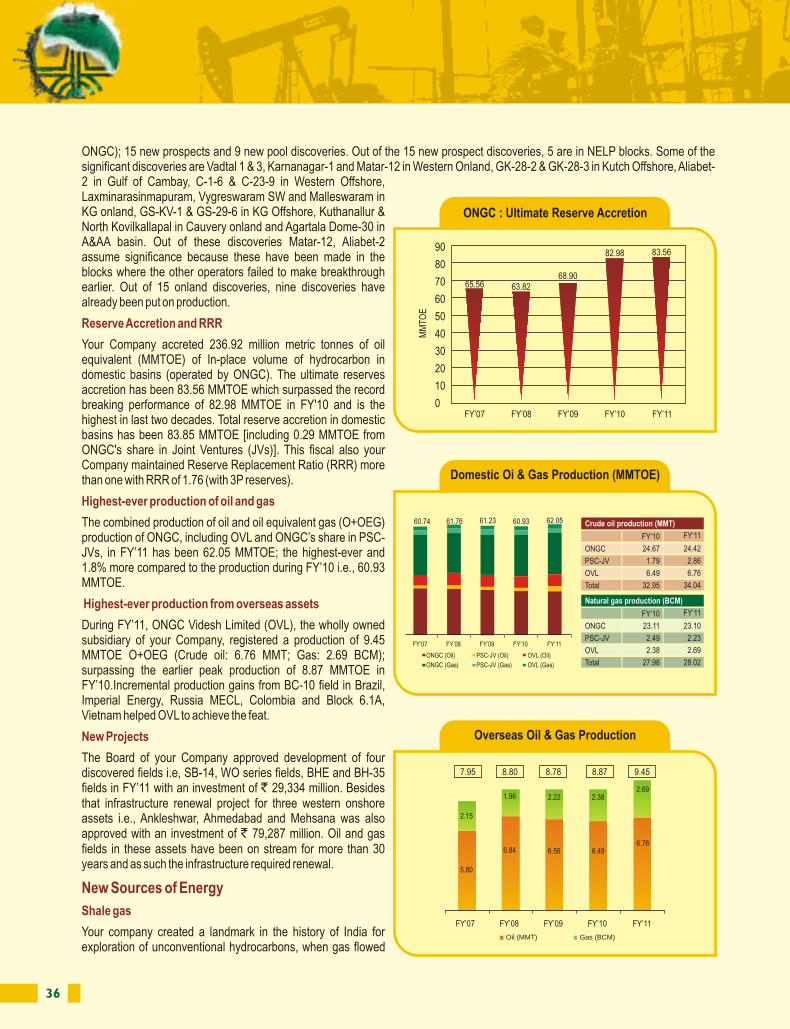
36 37
ONGC); 15 new prospects and 9 new pool discoveries. Out of the 15 new prospect discoveries, 5 are in NELP blocks. Some of the significant discoveries are Vadtal 1 & 3, Karnanagar-1 and Matar-12 in Western Onland, GK-28-2 & GK-28-3 in Kutch Offshore, Aliabet-2 in Gulf of Cambay, C-1-6 & C-23-9 in Western Offshore, Laxminarasinmapuram, Vygreswaram SW and Malleswaram in KG onland, GS-KV-1 & GS-29-6 in KG Offshore, Kuthanallur & North Kovilkallapal in Cauvery onland and Agartala Dome-30 in A&AA basin. Out of these discoveries Matar-12, Aliabet-2 assume significance because these have been made in the blocks where the other operators failed to make breakthrough earlier. Out of 15 onland discoveries, nine discoveries have already been put on production.
Your Company accreted 236.92 million metric tonnes of oil equivalent (MMTOE) of In-place volume of hydrocarbon in domestic basins (operated by ONGC). The ultimate reserves accretion has been 83.56 MMTOE which surpassed the record breaking performance of 82.98 MMTOE in FY'10 and is the highest in last two decades. Total reserve accretion in domestic basins has been 83.85 MMTOE [including 0.29 MMTOE from ONGC's share in Joint Ventures (JVs)]. This fiscal also your Company maintained Reserve Replacement Ratio (RRR) more than one with RRR of 1.76 (with 3P reserves).
The combined production of oil and oil equivalent gas (O+OEG) production of ONGC, including OVL and ONGC’s share in PSC-JVs, in FY’11 has been 62.05 MMTOE; the highest-ever and 1.8% more compared to the production during FY’10 i.e., 60.93 MMTOE.
During FY’11, ONGC Videsh Limited (OVL), the wholly owned subsidiary of your Company, registered a production of 9.45 MMTOE O+OEG (Crude oil: 6.76 MMT; Gas: 2.69 BCM); surpassing the earlier peak production of 8.87 MMTOE in FY’10.Incremental production gains from BC-10 field in Brazil, Imperial Energy, Russia MECL, Colombia and Block 6.1A, Vietnam helped OVL to achieve the feat.
The Board of your Company approved development of four discovered fields i.e, SB-14, WO series fields, BHE and BH-35 fields in FY’11 with an investment of ` 29,334 million. Besides that infrastructure renewal project for three western onshore assets i.e., Ankleshwar, Ahmedabad and Mehsana was also approved with an investment of ` 79,287 million. Oil and gas fields in these assets have been on stream for more than 30 years and as such the infrastructure required renewal.
Your company created a landmark in the history of India for exploration of unconventional hydrocarbons, when gas flowed
Reserve Accretion and RRR
Highest-ever production of oil and gas
Highest-ever production from overseas assets
New Projects
New Sources of Energy
Shale gas
out from the Barren Measure shale at a depth of around 1,700 m in its first Research & Development well RNSG-1 at Icchapur, near thDurgapur, West Bengal on 25 Jan 2011. This breakthrough has encouraged your Company to venture into many shale sequences in
well explored Cambay, KG, Cauvery and Assam-Arakan Basins for exploitation of Shale Gas.
Your company is currently operating in five CBM blocks i.e., Jharia, Bokaro, North Karanpura and South Karanpura Blocks in Jharkhand and Raniganj block in West Bengal. Final Development Plan (FDP) for Parbatpur area measuring 18 Sq.Km in Jharia Block has been submitted to the Government of India (GoI) for approval. However, at present, incidentally produced gas during production testing is being sold to Calcutta Compression & Liquefaction Ltd. (CC&L) with the approval of GoI.
Your company has selected Vastan Mine block in Surat district, Gujarat for UCG Pilot project. Environmental clearance for the project has been obtained from Ministry of Environment and Forest, Government of India and request has been submitted to Ministry of Coal for award of mining lease which is awaited.
The 51 MW Wind farms which has been set up near Bhuj in Gujarat is operating well and electricity generated is wheeled through the Gujarat State Electricity Grid for captive consumption by ONGC at Ankleshwar, Ahmedabad, Mehsana and Vadodara. Your Company is in the process of setting up one more Wind farm of 102 MW capacity in Rajasthan with an investment of ̀ 8,000 million.
ONGC Energy Centre set up by your Company for holistic research for new and alternate energy sources has been pursuing a number of new projects like Application of Solar Thermal Engine, Thermo-chemical generation of hydrogen, Bioconversion of coal/oil to methane gas, Uranium exploration, Solid state lighting, Solar PV Energy Farm, etc.
ONGC Energy Centre (OEC), a dedicated centre towards alternate sources of energy is pursuing various alternate energy sources projects to establish lead and mass scale commercialization. OEC successfully installed the three state-of-the-art Solar Thermal Engines at the Solar Energy Centre (SEC), Ministry of New and Renewable Energy (MNRE) campus at Gurgaon. Some of the other significant projects which OEC is pursuing are Thermo-Chemical Reactor for Hydrogen generation, Bio Conversion of Coal to methane, exploration and exploitation of Uranium Reserves globally and LED Project.
Inspite of fluctuating crude prices and increased burden of its share of under-recovery on account of the losses suffered by the Oil Marketing Companies, your Company has earned a Profit After Tax of ̀ 189,240 million (` 167,676 million in 2009-10), up 12.86 %, which is incidentally the highest-ever. During the year under review, your Company registered Gross revenue of ` 695,322 million(` 619,832 million in 2009-10), up 12.18%.
Coal Bed Methane (CBM)
Underground Coal Gasification (UCG)
Alternate sources of energy
1. Financial Results
65.56 63.82 68.90
82.98 83.5690
80
70
60
50
40
30
20
10
0
MM
TOE
FY’07 FY’08 FY’09 FY’10 FY’11
ONGC : Ultimate Reserve Accretion
Domestic Oi & Gas Production (MMTOE)
60.74 61.76 61.23 60.93 62.05
FY’07 FY’08 FY’09 FY’10 FY’11
ONGC (Oil)
ONGC (Gas)
PSC-JV (Oil)
PSC-JV (Gas)
OVL (Oil)
OVL (Gas)
Crude oil production (MMT)
FY’10
24.67
1.79
6.49
32.95
FY’11
24.42
2.86
6.76
34.04
ONGC
PSC-JV
OVL
Total
Natural gas production (BCM)
FY’10
23.11
2.49
2.38
27.98
FY’11
23.10
2.23
2.69
28.02
ONGC
PSC-JV
OVL
Total
Overseas Oil & Gas Production
FY’07 FY’08 FY’09 FY’10 FY’11
7.95 8.80 8.78 8.87 9.45
2.15
5.80
1.96
6.84
2.22
6.56
2.38
6.49
2.69
6.76
Oil (MMT) Gas (BCM)
Gross Revenue (` in million)
FY’07 FY’08 FY’09 FY’10 FY’11
590,575
615,426
650,494
619,832
Not yet Received
12%
PAT (` in million)
156,429167,016 161,263 167,676
189,240
13%
FY’07 FY’08 FY’09 FY’10 FY’11
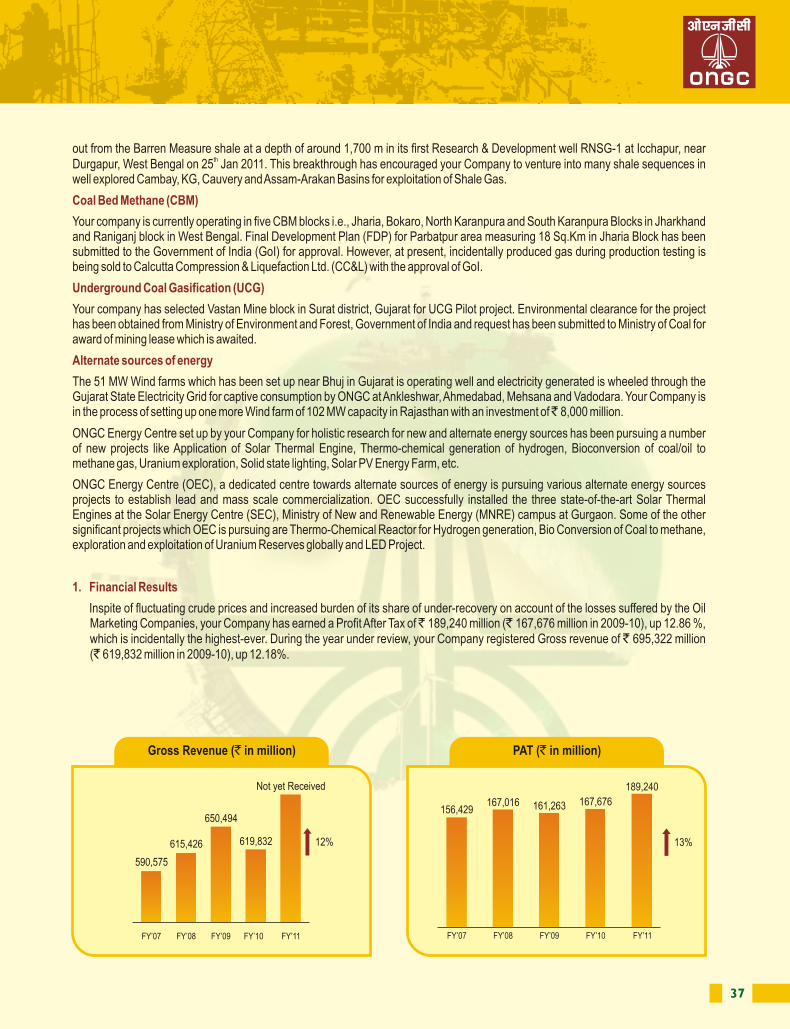
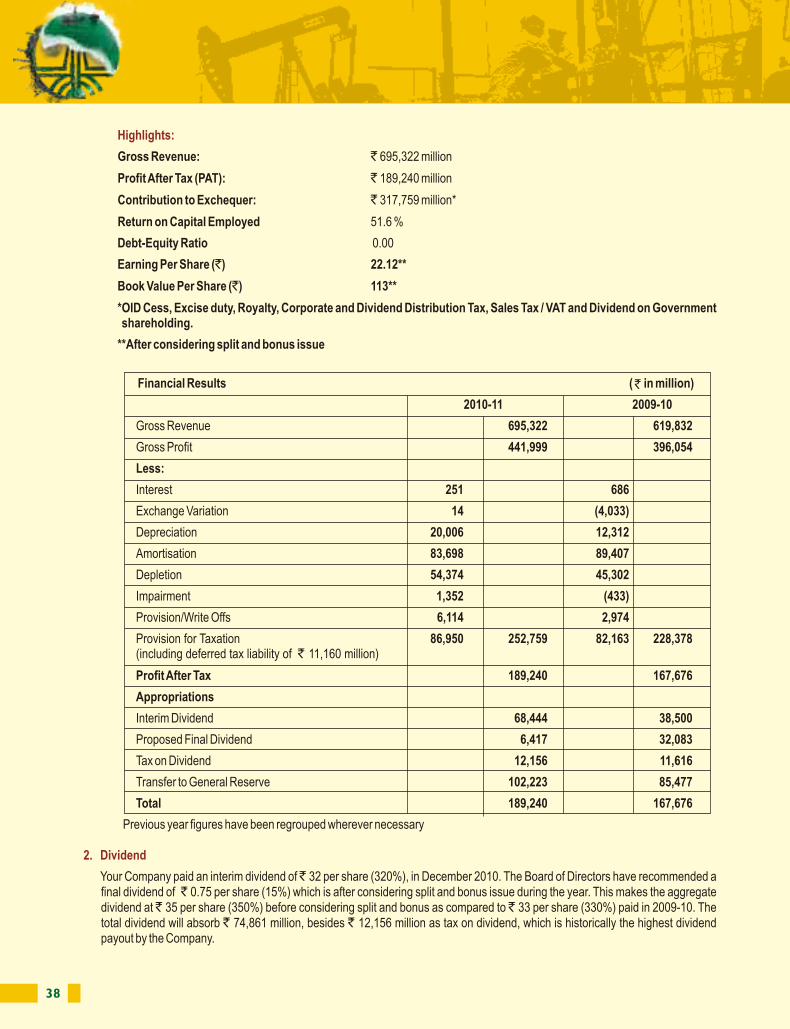
38 39
Gross Revenue: ` 695,322 million
Profit After Tax (PAT): ` 189,240 million
Contribution to Exchequer: ` 317,759 million*
Return on Capital Employed 51.6 %
Debt-Equity Ratio 0.00
Earning Per Share (`) 22.12**
Book Value Per Share (`) 113**
*OID Cess, Excise duty, Royalty, Corporate and Dividend Distribution Tax, Sales Tax / VAT and Dividend on Government shareholding.
**After considering split and bonus issue
Your Company paid an interim dividend of ̀ 32 per share (320%), in December 2010. The Board of Directors have recommended a final dividend of ̀ 0.75 per share (15%) which is after considering split and bonus issue during the year. This makes the aggregate dividend at ̀ 35 per share (350%) before considering split and bonus as compared to ̀ 33 per share (330%) paid in 2009-10. The total dividend will absorb ` 74,861 million, besides ` 12,156 million as tax on dividend, which is historically the highest dividend payout by the Company.
Highlights:
2. Dividend
Financial Results ( in million)
2010-11 2009-10
Gross Revenue 695,322 619,832
Gross Profit 441,999 396,054
Less:
Interest 251 686
Exchange Variation 14 (4,033)
Depreciation 20,006 12,312
Amortisation 83,698 89,407
Depletion 54,374 45,302
Impairment 1,352 (433)
Provision/Write Offs 6,114 2,974
Provision for Taxation 86,950 252,759 82,163 228,378(including deferred tax liability of ` 11,160 million)
Profit After Tax 189,240 167,676
Appropriations
Interim Dividend 68,444 38,500
Proposed Final Dividend 6,417 32,083
Tax on Dividend 12,156 11,616
Transfer to General Reserve 102,223 85,477
Total 189,240 167,676
Previous year figures have been regrouped wherever necessary
3. Management Discussion and Analysis Report
5. Oil & Gas Reserves
In terms of Clause 49(IV)(F) of the Listing Agreement with the Stock Exchanges, a Management Discussion and Analysis Report has been included and forms part of the Annual Report of the Company.
Your Company has made voluntary disclosures in respect of Oil & Gas Reserves, conforming to SPE classification 1994 and US Financial Accounting Standards Board (FASB-69). ONGC has added 236.92 MMTOE of oil and oil–equivalent gas (O+OEG) initial in-place volume with 83.56 MMTOE of O+OEG as the ultimate reserve component during FY ’11 in domestic fields (operated by ONGC). The ultimate reserves accretion, including its share in joint ventures is 83.85 MMTOE of O+OEG, which is the highest in last two decades.
4. Production and Sales
Highlights of production and sales of Crude Oil, Natural Gas and Value- added products:
Unit Production Sales Value ( in million) 2010-11 2009-10 2010-11 2009-10 2010-11 2009-10
Direct
Crude Oil (MMT) *27.28 *26.46 22.94 22.33 448,645 445,040
Natural Gas (BCM) **25.32 **25.59 20.29 20.60 127,544 73,797
Ethane/Propane 000 MT 388 535 387 533 8,796 10,249
LPG 000 MT 1054 1105 1057 1108 18,369 21,924
Naphtha 000 MT 1570 1592 1600 1598 56,342 47,137
SKO 000 MT 116 165 118 166 679 3,255
ATF 000 NT 19 8 14 2 527 52
Others 475 411
Sub Total 661,377 601,865
Trading
Motor Spirit 000 KL 0.63 0.55 36 27
HSD 000 KL 3.27 4.29 134 156
Others 2
Sub Total 172 183
Total 661,549 602,048
* includes 2.86 MMT (Previous year 1.79 MMT) from Joint Ventures.
** includes 2.23 BCM (Previous year 2.49 BCM) from Joint Ventures.
Ultimate Reserve (3P) accretion O+OEG (in MMTOE)
Year Domestic ONGC's Total OVL's TotalAssets share in Domestic Share in
Domestic Reserve Foreign JVs Assets
(1) (2) (3)=(1)+(2) (4) (5)=(3)+(4)
2008-09 68.90 2.82 71.72 135.08 206.80
2009-10 82.98 4.39 87.37 0.35 87.72
2010-11 83.56 0.29 83.85 33.49 117.34
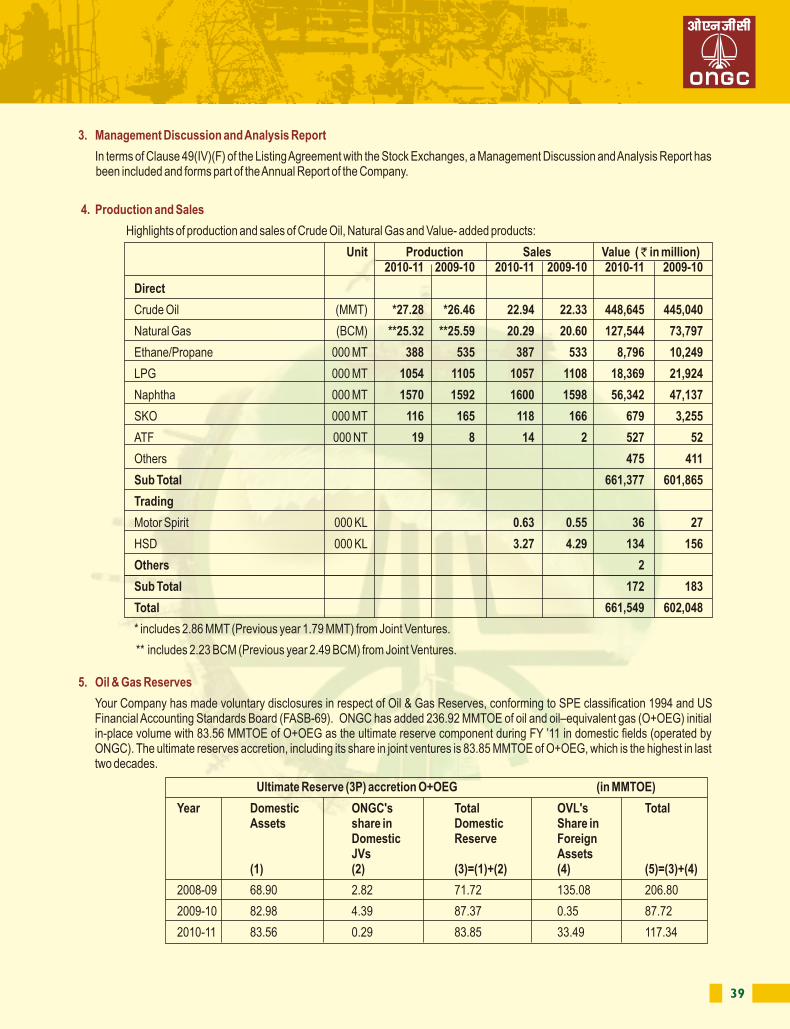
40 41
6. Statement of Reserve Recognition Accounting
7. Financial Accounting
8. Internal Control System
9. Subsidiaries
The concept of Reserve Recognition Accounting attempts to recognize income at the point of discovery of reserves and seeks to demonstrate the intrinsic strength of an organization with reference to its future earning capacity in terms of current prices for income as well as expenditure. This information is based on the estimated net proved reserves (developed and undeveloped) as determined by the Reserves Estimates Committee.
As per FASB-69 on disclosure about Oil and Gas producing activities, publicly traded enterprises that have significant Oil and Gas producing activities, are to disclose with complete set of annual financial statements, the following supplemental information:
(a) Proved Oil and Gas reserve quantities
(b) Capitalized costs relating to Oil and Gas producing activities
(c) Cost incurred for property acquisition, exploration and development activities
(d) Results of operations for Oil and Gas producing activities
(e) A standardized measure of discounted future net cash flows relating to proved Oil and Gas reserve quantities
Your Company has disclosed information in respect of (a) and (d) above in the Annual Financial Statements.
Your Company has made voluntary disclosure on standardized measure of discounted future net cash flows relating to proved oil and gas reserve at Annexure-A to this report as Statement of Reserve Recognition Accounting (RRA).
The Financial Statements have been prepared in accordance with the Generally Accepted Accounting Principles (GAAP) and in compliance with all applicable Accounting Standards (AS-1 to AS-29) and Successful Efforts Method as per the Guidance Note on Accounting for Oil & Gas Producing Activities issued by Institute of Chartered Accountants of India (ICAI) and provisions of the Companies Act, 1956.
The operations of your company have been structured to provide adequate support and controls. Standard procedures and guidelines issued to the business units from time to time to support best practices are followed in all facets of activities, Accounting and Financial Management, Personnel Management, Repairs and Maintenance, Materials Management and Project Implementations.
(I) ONGC Videsh Limited (OVL)
ONGC Videsh Limited (OVL), the wholly-owned subsidiary of your Company for overseas E&P activities, recorded impressive performance during the year 2010-11. OVL’s share in production of oil and oil equivalent gas (O+OEG) together with its wholly-owned subsidiaries ONGC Nile Ganga B.V., ONGC Amazon Alaknanda Limited and Jarpeno Limited was the highest ever production with 9.45 MMTOE during 2010-11 up by 7% as compared to 8.87 MMTOE ofO+OEG during 2009-10. OVL’s consolidated gross revenue increased by 21% from ̀ 153,830 million during 2009-10
to ̀ 186,830 million during 2010-11 and consolidated net profit after tax increased by 29% from ̀ 20,900 million during 2009-10 to` 26,910 million during 2010-11.
OVL added one asset in its portfolio of exploratory assets by signing agreements with KazMunaiGas (KMG), the national oil thcompany of Kazakhstan for acquisition of 25% participating interest in Satpayev exploration block on 16 April, 2011 at Astana,
Kazakhstan in the presence of Hon’ble Prime Minister of India and the President of Kazakhstan. This transaction marks the maiden entry of OVL in Kazakhstan hydrocarbon sector. Satpayev exploration block, located in the Kazakhstan sector of the Caspian Sea, covers an area of 1482 sq.km and is at a water depth of 6-8 mts. Satpayev is situated in close proximity to major discoveries in the North Caspian Sea. The block contains two prospective structures, namely Satpayev and Satpayev Vostochni (East) with estimated hydrocarbon resources of about 256 MMT.
OVL presently has participation in 33 projects in 14 countries. Out of 33 projects, OVL is operator in 11 projects and joint operator in 6 projects. OVL is currently producing oil and gas from 9 projects viz., Greater Nile Oil Project and Block 5A in Sudan, Block 06.1 in
Vietnam, Al Furat Project in Syria, Sakhalin-I Project and Imperial Energy in Russia, Mansarovar Energy Project in Colombia, San Cristobal Project in Venezuela and Block BC-10 in Brazil. In addition to 9 producing projects, Exploration Block XXIV, Syria is on extended production testing. Blocks A-1 and A-3 in Myanmar, Carabobo-1 project in Venezuela and Farsi Block, Iran have discoveries and further work is being carried out. One Pipeline Project was executed and completed by OVL and handed over to Government of Sudan in October, 2005 and is currently under lease. The remaining projects are in exploration phase.
a) ONGC Nile Ganga B.V. (ONGBV):
• ONGBV, a subsidiary of OVL, is engaged in E&P activities in Sudan, Syria, Venezuela, Brazil and Myanmar.
• ONGBV holds 25% Participating Interest (PI) in Greater Nile Oil Project (GNOP), Sudan with its share of oilproduction of about 1.801 MMT during 2010-11.
• ONGBV holds 16.66% to 18.75% PI in four Production Sharing Contracts in Al Furat Project (AFPC), Syria with itsshare of oil and gas production of about 0.662 MMTOE during 2010-11.
• ONGBV holds 40% PI in San Cristobal Project in Venezuela with its share of oil production of about 0.757 MMTduring 2010-11.
• ONGBV holds 15% PI in BC-10 Project in Brazil with its share of oil and gas production of about 0.586 MMTOE during2010-11.
• ONGBV holds 43.5% PI and 100% PI as operator of exploratory blocks BM-S-73 and BM-ES-42 respectively andalso holds 43.5% PI in exploratory block BM-S-74 and 25% PI each in exploratory blocks Block BM-SEAL-4 andBlock BM-BAR-1 all located in Deepwater Offshore, Brazil.
• ONGBV holds 8.347% PI in South East Asia Gas Pipeline Co. Ltd., (SEAGP) for Pipeline project, Myanmar.
Direct Subsidiaries of OVL:
OVL footprints in 33 projects across 14 countries
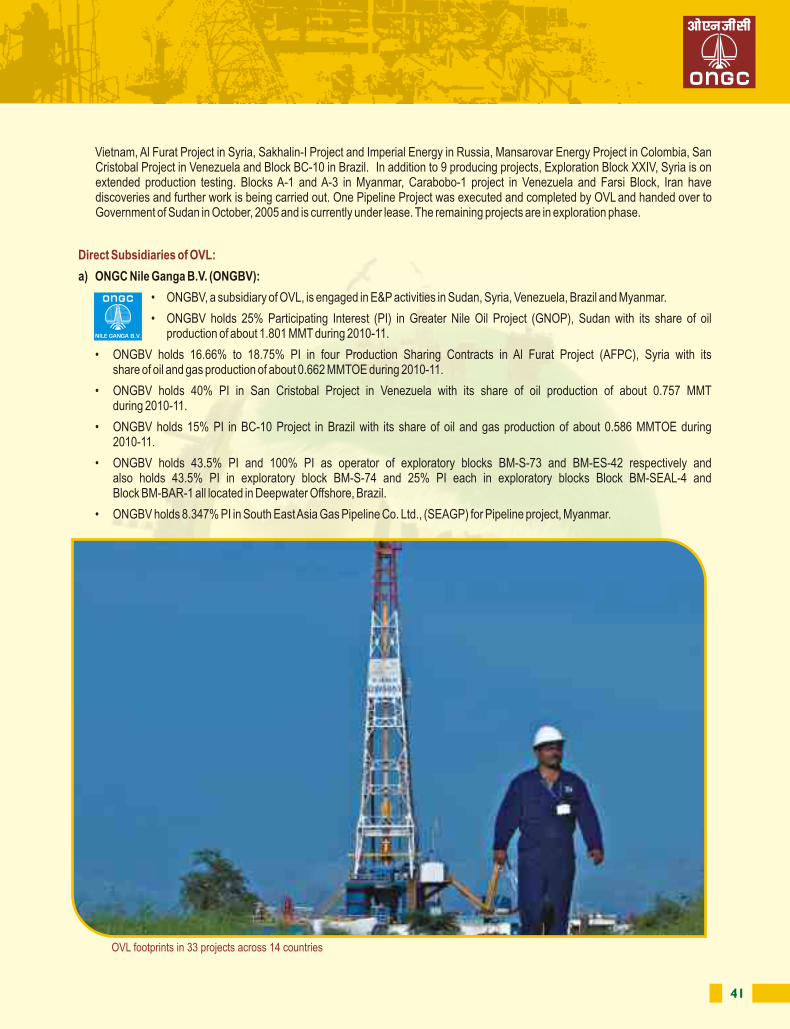
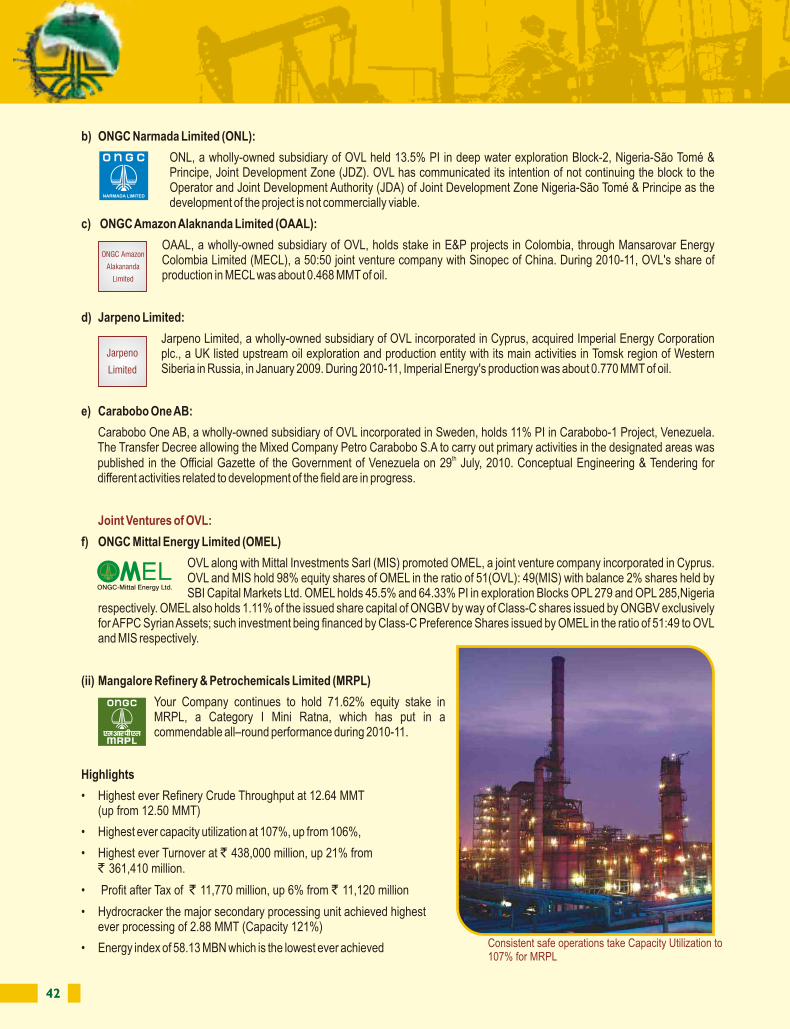
42 43
b) ONGC Narmada Limited (ONL):
ONL, a wholly-owned subsidiary of OVL held 13.5% PI in deep water exploration Block-2, Nigeria-São Tomé & Principe, Joint Development Zone (JDZ). OVL has communicated its intention of not continuing the block to the Operator and Joint Development Authority (JDA) of Joint Development Zone Nigeria-São Tomé & Principe as the development of the project is not commercially viable.
c) ONGC Amazon Alaknanda Limited (OAAL):
OAAL, a wholly-owned subsidiary of OVL, holds stake in E&P projects in Colombia, through Mansarovar Energy Colombia Limited (MECL), a 50:50 joint venture company with Sinopec of China. During 2010-11, OVL's share of production in MECL was about 0.468 MMT of oil.
d) Jarpeno Limited:
Jarpeno Limited, a wholly-owned subsidiary of OVL incorporated in Cyprus, acquired Imperial Energy Corporation plc., a UK listed upstream oil exploration and production entity with its main activities in Tomsk region of Western Siberia in Russia, in January 2009. During 2010-11, Imperial Energy's production was about 0.770 MMT of oil.
e) Carabobo One AB:
Carabobo One AB, a wholly-owned subsidiary of OVL incorporated in Sweden, holds 11% PI in Carabobo-1 Project, Venezuela. The Transfer Decree allowing the Mixed Company Petro Carabobo S.A to carry out primary activities in the designated areas was
thpublished in the Official Gazette of the Government of Venezuela on 29 July, 2010. Conceptual Engineering & Tendering for different activities related to development of the field are in progress.
f) ONGC Mittal Energy Limited (OMEL)
OVL along with Mittal Investments Sarl (MIS) promoted OMEL, a joint venture company incorporated in Cyprus. OVL and MIS hold 98% equity shares of OMEL in the ratio of 51(OVL): 49(MIS) with balance 2% shares held by SBI Capital Markets Ltd. OMEL holds 45.5% and 64.33% PI in exploration Blocks OPL 279 and OPL 285,Nigeria
respectively. OMEL also holds 1.11% of the issued share capital of ONGBV by way of Class-C shares issued by ONGBV exclusivelyfor AFPC Syrian Assets; such investment being financed by Class-C Preference Shares issued by OMEL in the ratio of 51:49 to OVLand MIS respectively.
(ii) Mangalore Refinery & Petrochemicals Limited (MRPL)
Your Company continues to hold 71.62% equity stake inMRPL, a Category I Mini Ratna, which has put in acommendable all–round performance during 2010-11.
Highlights
• Highest ever Refinery Crude Throughput at 12.64 MMT(up from 12.50 MMT)
• Highest ever capacity utilization at 107%, up from 106%,
• Highest ever Turnover at ` 438,000 million, up 21% from` 361,410 million.
• Profit after Tax of ` 11,770 million, up 6% from ` 11,120 million
• Hydrocracker the major secondary processing unit achieved highest ever processing of 2.88 MMT (Capacity 121%)
• Energy index of 58.13 MBN which is the lowest ever achieved
Joint Ventures of OVL:
Keeping in view its plans to make investments in various projects, a dividend of 12% has been recommended by its Board. In view of the continued under recoveries in retail marketing of Auto Fuel, the company has continued with its miniscule presence in retail Marketing thereby is not burdened with under recoveries. The direct marketing sales turnover covering Bitumen, CRMB, ATF, Furnace Oil, Mixed Xylene, Naphtha and Sulphur amounts to ̀ 22,910 million registering a marginal increase over ̀ 22,780 million of last year. A major growth is achieved in the area of marketing ATF and Mixed Xylene.
The excellent standards maintained by the Refinery on the production, energy conservation, environment management and safety front have enabled MRPL to bag several awards:
th• MRPL has bagged the Petrofed 'Refinery of the Year' award on 10 May, 2011 for excellent performance during FY'10. This recognizes leading performance in production and operational efficiency in refining operations, while meeting the norms of health, safety and environmental protection.
• Oil Industry Safety directorate ranks MRPL as the 1st in 'Most consistent safety performer in Refineries' for the year 2009-10
• ICRA and CRISIL reaffirmed Issuer rating of 'Ir AAA' and 'Cr AAA' to MRPL for lowest credit risk.
• Best Exporter Award (Gold) - 2010 for exporting products through NMPT, by Federation of Karnataka Chamber of Commerce & Industries.
• The 'Oil & Gas Conservation Award-2010' for Furnace/Boiler Efficiency instituted by CHT.
(i) ONGC Tripura Power Company Limited (OTPC)
` `
(ii) ONGC Petro-additions Limited (OPaL)
` `
10. Exemption in respect of Annual Report of Subsidiaries and Consolidated Financial Statement
11. Joint Ventures/ Associates
Ministry of Corporate Affairs (MCA) has vide circular dated 08.02.2011 and clarification dated 21.02.2011 decided to grant a general exemption from the applicability of Section 212 of the Companies Act, 1956 from attaching the Balance Sheet and Profit & Loss Account prepared regarding the financial year ending on or after 31.03.2011, in relation to subsidiaries of those companies which fulfill the various conditions including inter-alia approval of the Board of Directors for not attaching the balance sheet of the subsidiary concerned. Your Board has accorded necessary approval in this regard for not attaching the Balance Sheet and Profit & Loss Account of its subsidiaries (i) ONGC Videsh Limited (OVL) and (ii) Mangalore Refinery & Petrochemicals Ltd. (MRPL). All the conditions mentioned in the circular are being complied with by ONGC. Full Annual Report of ONGC including its subsidiaries will be made available to any shareholder, if he/she desires. Further, Annual Reports of MRPL and OVL are also available on website www.mrpl.co.in and www.ongcvidesh.com respectively.
In accordance with the Accounting Standard (AS)–21 on “Consolidated Financial Statements” read with AS-23 on “Accounting for Investments in Associates” and AS-27 on “Financial Reporting of Interests in Joint Ventures”, audited Consolidated Financial
stStatements for the year ended 31 March, 2011 of the Company and its subsidiaries form part of the Annual Report.
ONGC has promoted OTPC with envisaged equity stake of 50% along with Govt of Tripura (0.5%) and IL&FS (26%) to set-up 726.6 MW (2 x 363.3MW) gas based Combined Cycle Power Plant (CCPP) at Pallatana in Tripura to monetize idle gas assets in Tripura. The generation project is in advanced stage of implementation
by Bharat Heavy Electricals Limited, which is engaged as the turnkey EPC agency. The financial closure of the project has earlierbeen achieved and various linkages like gas supply from ONGC and power off-take by NE states has already been tied up. The JVCompany is making all-out efforts to commission the project, being set up at a challenging location, as per schedule i.e. by March
st2012. The total Capex commitment of the JV Company is 25,286 million and total expenditure is 16,009 million till 31 May 2011.
Your Company has promoted a JV company “ONGC Petro-additions Limited” (OPaL) with envisaged equity stake of 26% along with GAIL (17%) and Gujarat State Petroleum Corporation Ltd (GSPCL) (5%) to implement a mega petrochemical complex comprising of 1.1 MMTPA ethylene Cracker and global scale polymer units within Dahej SEZ as a step towards downstream integration. Project implementation is in progress with major contracts, like Site Infrastructure Development, DFCU, LSTK for HDPE etc., already awarded. The total Capex commitment of the JV
stCompany is 141,449 million and total expenditure is 56,380 million till 31 May 2011.
ONGC Amazon
Alakananda
Limited
Jarpeno
Limited
Consistent safe operations take Capacity Utilization to 107% for MRPL
44 45
(iii) Mangalore Special Economic Zone Limited (MSEZ)
ONGC with envisaged equity stake of 26% in MSEZ along with KIADB (23%) and IEDCL+KCCI (51%), is promoting another SEZ in coastal Mangalore. Ministry of Commerce & Industry has formally notified to set up a Petro-chemical Specific SEZ in 1630 acres of land. Total land in possession is 2317 acres out of which 542 acres has been allotted to OMPL, ISPRL etc. Resettlement and Rehabilitation work of Project Displaced Family (PDF) is in progress and Chief Minister of Karnataka has approved Comprehensive Action Plan for employment of PDF
nominees of MSEZ Phase-I. The total Capex commitment of the JV Company is 7,799 million and total expenditure is 4,431stmillion till 31 May 2011.
(iv) ONGC Mangalore Petrochemicals Limited (OMPL)
ONGC has promoted OMPL with envisaged equity participation of 46%, along with MRPL (3%) for setting up manufacturing facilities for 0.92 MMTPA Para-Xylene and 0.14 MMTPA Benzene from MRPL's aromatic streams in Mangalore SEZ as value addition project. Around 93.5% of project cost has been awarded which includes major contracts relating to project management, technology licensor and LSTK contract for process packages etc. Project implementation is in full swing. The total Capex commitment of the JV Company is 43,335 million and total
stexpenditure is 10,309 million till 31 May 2011.
(v) ONGC TERI Biotech Limited (OTBL)thOTBL is a Joint Venture company of ONGC, incorporated on 26 March, 2007, with The Energy Research
Institute (TERI) with shareholding of 49% each and balance 2% equity is held by the Financial Institutions. The JV has been promoted for addressing the requirement of Bioremediation of oily sludge, Microbial Enhanced Oil Recovery, prevention of wax deposition in tubular and solution for other oil field problems. The turnover of OTBL
in FY 2010-11 is 129.54 million and Profit after Tax is 27.48 million as against turnover of 73.85 million and PAT of 16.33 million in FY 2009-10.
(vi)Petronet MHB Limited (PMHBL)
PMHBL is a JV company of ONGC (28.766%), HPCL (28.766%) and PIL (7.898%). Balance 34.57% of equity is held by the leading banks. It owns and operates a multi–product pipeline to transport MRPL's products to hinterland of Karnataka. As per audited results for the year 2010-11, the turnover of PMHBL is 786.50 million against 691.80 million in the year 2009-10. However due to change in
depreciation policy as observed by C&AG, adjustments of previous year were also accounted for in the current year balance sheetcausing net loss of 194.40 million.
(vii) Petronet LNG Limited (PLL)
ONGC has 12.5% equity stake in PLL, identical to similar stake by other Oil PSUs co-promoters viz., IOCL, GAIL and BPCL. Dahej LNG terminal of PLL which was expanded to 10 MMTPA capacities in June 2009 is currently meeting around
20% of the total gas demand of the country. A new LNG terminal of 2.5 MMTPA is under construction at Kochiwhich is expandable upto 5.0 MMTPA depending on theLNG supplies and market conditions. The turnover ofPLL during 2010-11 was 131,972.8 million (previousyear 106,491 million) and net profit is 6,196 million(previous year 4,045 million). PLL has declared adividend of 17.5 % same as the previous year.
(viii) Pawan Hans Helicopters Limited (PHHL)
The Company has increased its equity stake in PHHL from 21.5% to 49% during 2010-11. Balance 51% equity is held by the Government of India. PHHL is one of Asia’s largest
` `
` `
` ` ` `
` `
`
` ` `
`
helicopter operators having a well balanced operational fleet of 40 helicopters. It provides helicopter support for ONGC’s offshoreoperations. PHHL was successful in providing all the 12 Dauphin N and N3 helicopters fully compliant with AS-4 as per the newcontract with ONGC. The accounts of PHHL for 2010-11 are under finalisation.
(ix) Dahej SEZ Limited (DSL)
Your Company with envisaged equity stake of 23 % along with Gujarat Industrial Development Corporation (26%) is developing a multi-product SEZ at Dahej in coastal Gujarat over 1717 hectares of land through an SPV “Dahej Special Economic Zone Ltd”. About 1068 hectares of land has already been allotted and 140 hectares has been committed to 61 allottees. SEZ is operational with 5 of its units and has exported more than 4,000 million worth of
st products. The total Capex commitment of the JV Company is 9,010 million as on 31 May 2011. Further, DSL has made a net profit of 86 million in FY 2010-11.
Company’s C2-C3 extraction plant at Dahej, using LNG imported by Petronet LNG Limited as feed stock, was mechanically completed on 30.12.08. with an investment of ` 6,194.65 million. Subsequently, evacuation facilities were completed on 24.02.11 with an investment of ` 1,647.04 million. The Commissioning of the plant has been deferred pending resolution of certain commercial and taxation related issues.
Wind Power Project
Based on success of 51 MW Wind Farm at Kutch (Gujarat), your Company, in its mission of providing value linkages in other sectors of energy business, is setting up another 102 MW Wind Farm at Rajasthan for which ONGC Board has already accorded approval for investment of 6,500 million. Tendering activities for project implementation is in progress.
Agreement with Petroleos de Venezuela SA (PDVSA)th ONGC Videsh Ltd (OVL) led consortium inked an agreement on 12 May 2010 at Caracas, Venezuela with Petroleos de
Venezuela SA (PDVSA), national oil company of Venezuela for the development and production of hydrocarbons from the Carabobo project in the Orinoco region of Venezuela.
MOU with Uzbekneftegaz (UNG) for E&P cooperation in Uzbekistan
Joint Study agreement with M/s Stealth Ventures, Canada
A Joint Study Agreement (JSA) was signed by ONGC and M/s Stealth Ventures, Canada for assessment of unconventional th th resources (hydrocarbons) on 9 June, 2010. Subsequently, a Confidentiality Agreement (CA) was signed on 30 June,
2010 for enabling data viewing at ONGC and the scope of work was signed for execution of the project detailed in the JSA in three stages; Preliminary Stage, Screening Stage and Study of Prioritised Areas.
MOU with NGRI and IPT
ONGC has signed MOU with NGRI, India and IPT (Institute of Petroleum Technology) of NTNU (Norwegian University of Science & Technology), Norway to work on 'Reservoir modeling for Enhanced Oil Recovery using Fractals and 4D Seismic' for analyzing existing EOR Projects so as to develop and demonstrate more potent technique for increasing oil/gas recovery rate within the oil fields of ONGC and also to develop knowledge base as reservoir surveillance.
` `
`
(a) C2-C3-C4 Extraction Plant :
`
(b) Partnerships for growth
(i)
(ii)th ONGC Videsh limited (OVL) entered into a Memorandum of Understanding (MOU) on 17 May, 2011 with Uzbekneftegaz
(UNG), the National Oil Company of Uzbekistan for joint cooperation in the Upstream E&P sector of Uzbekistan as well as third countries. The MOU was signed by Mr. S.P. Garg, Director (Finance), OVL and Mr. Shokir Faizullayev, Chairman, Uzbekneftegaz in the presence of H.E. Mr. Rustam Azimov, First Deputy Prime Minister, Minister of Finance of Uzbekistan.
(iii) Operating agreement for Farm-in in HF-ONN-2001/1th ONGC signed Operating Agreement with MOL Hungarian Oil & Gas Plc on 9 Nov 2010 to conclude farm-in process by the
Hungarian company into ONGC's NELP-III exploratory block HF-ONN-2001/1 located in the Himalayan foothills in Himachal Pradesh. MOL is a fully integrated petroleum company with global operations from exploration to marketing and petrochemicals. It was the National Oil Company of Hungary prior to disinvestment in 1995.
(iv)
(v)
12. Other Projects / Business initiatives
PHHL operations at ONGC offshore
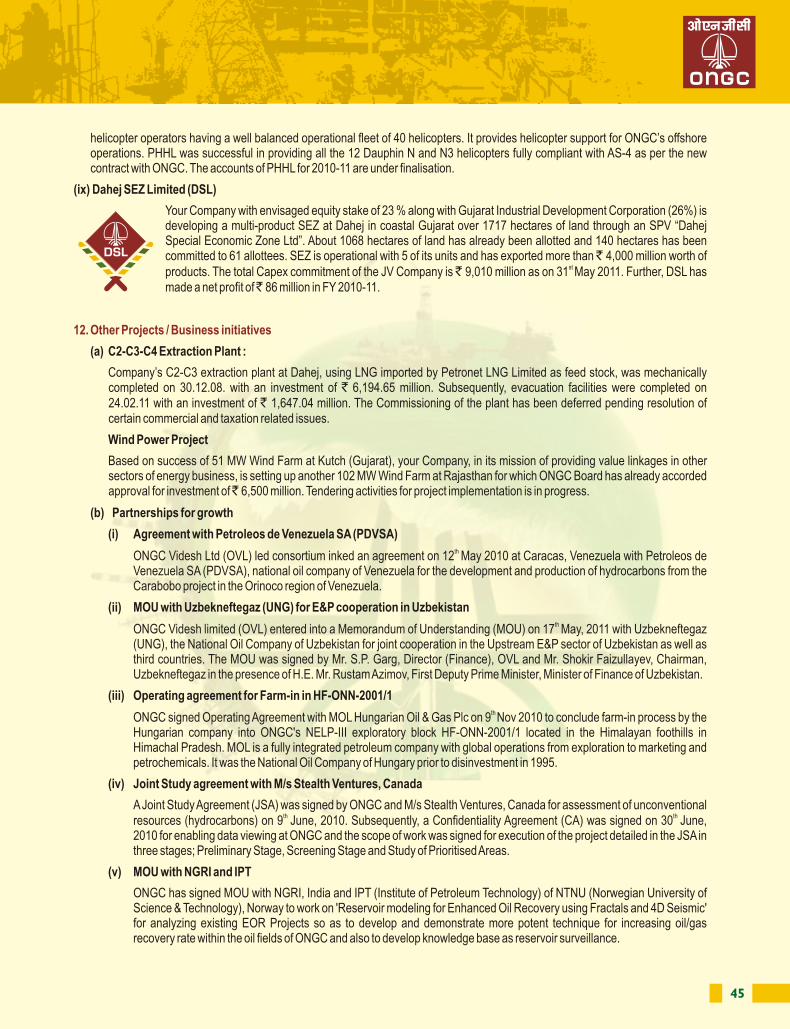
44 45
(iii) Mangalore Special Economic Zone Limited (MSEZ)
ONGC with envisaged equity stake of 26% in MSEZ along with KIADB (23%) and IEDCL+KCCI (51%), is promoting another SEZ in coastal Mangalore. Ministry of Commerce & Industry has formally notified to set up a Petro-chemical Specific SEZ in 1630 acres of land. Total land in possession is 2317 acres out of which 542 acres has been allotted to OMPL, ISPRL etc. Resettlement and Rehabilitation work of Project Displaced Family (PDF) is in progress and Chief Minister of Karnataka has approved Comprehensive Action Plan for employment of PDF
nominees of MSEZ Phase-I. The total Capex commitment of the JV Company is 7,799 million and total expenditure is 4,431stmillion till 31 May 2011.
(iv) ONGC Mangalore Petrochemicals Limited (OMPL)
ONGC has promoted OMPL with envisaged equity participation of 46%, along with MRPL (3%) for setting up manufacturing facilities for 0.92 MMTPA Para-Xylene and 0.14 MMTPA Benzene from MRPL's aromatic streams in Mangalore SEZ as value addition project. Around 93.5% of project cost has been awarded which includes major contracts relating to project management, technology licensor and LSTK contract for process packages etc. Project implementation is in full swing. The total Capex commitment of the JV Company is 43,335 million and total
stexpenditure is 10,309 million till 31 May 2011.
(v)ONGC TERI Biotech Limited (OTBL)thOTBL is a Joint Venture company of ONGC, incorporated on 26 March, 2007, with The Energy Research
Institute (TERI) with shareholding of 49% each and balance 2% equity is held by the Financial Institutions. The JV has been promoted for addressing the requirement of Bioremediation of oily sludge, Microbial Enhanced Oil Recovery, prevention of wax deposition in tubular and solution for other oil field problems. The turnover of OTBL
in FY 2010-11 is 129.54 million and Profit after Tax is 27.48 million as against turnover of 73.85 million and PAT of 16.33 million in FY 2009-10.
(vi)Petronet MHB Limited (PMHBL)
PMHBL is a JV company of ONGC (28.766%), HPCL (28.766%) and PIL (7.898%). Balance 34.57% of equity is held by the leading banks. It owns and operates a multi–product pipeline to transport MRPL's products to hinterland of Karnataka. As per audited results for the year 2010-11, the turnover of PMHBL is 786.50 million against 691.80 million in the year 2009-10. However due to change in
depreciation policy as observed by C&AG, adjustments of previous year were also accounted for in the current year balance sheetcausing net loss of 194.40 million.
(vii) Petronet LNG Limited (PLL)
ONGC has 12.5% equity stake in PLL, identical to similar stake by other Oil PSUs co-promoters viz., IOCL, GAIL and BPCL. Dahej LNG terminal of PLL which was expanded to 10 MMTPA capacities in June 2009 is currently meeting around
20% of the total gas demand of the country. A new LNG terminal of 2.5 MMTPA is under construction at Kochiwhich is expandable upto 5.0 MMTPA depending on theLNG supplies and market conditions. The turnover ofPLL during 2010-11 was 131,972.8 million (previousyear 106,491 million) and net profit is 6,196 million(previous year 4,045 million). PLL has declared adividend of 17.5 % same as the previous year.
(viii) Pawan Hans Helicopters Limited (PHHL)
The Company has increased its equity stake in PHHL from 21.5% to 49% during 2010-11. Balance 51% equity is held by the Government of India. PHHL is one of Asia’s largest
` `
` `
` ` ` `
` `
`
` ` `
`
helicopter operators having a well balanced operational fleet of 40 helicopters. It provides helicopter support for ONGC’s offshoreoperations. PHHL was successful in providing all the 12 Dauphin N and N3 helicopters fully compliant with AS-4 as per the newcontract with ONGC. The accounts of PHHL for 2010-11 are under finalisation.
(ix) Dahej SEZ Limited (DSL)
Your Company with envisaged equity stake of 23 % along with Gujarat Industrial Development Corporation (26%) is developing a multi-product SEZ at Dahej in coastal Gujarat over 1717 hectares of land through an SPV “Dahej Special Economic Zone Ltd”. About 1068 hectares of land has already been allotted and 140 hectares has been committed to 61 allottees. SEZ is operational with 5 of its units and has exported more than 4,000 million worth of
st products. The total Capex commitment of the JV Company is 9,010 million as on 31 May 2011. Further, DSL has made a net profit of 86 million in FY 2010-11.
Company’s C2-C3 extraction plant at Dahej, using LNG imported by Petronet LNG Limited as feed stock, was mechanically completed on 30.12.08. with an investment of ` 6,194.65 million. Subsequently, evacuation facilities were completed on 24.02.11 with an investment of ` 1,647.04 million. The Commissioning of the plant has been deferred pending resolution of certain commercial and taxation related issues.
Wind Power Project
Based on success of 51 MW Wind Farm at Kutch (Gujarat), your Company, in its mission of providing value linkages in other sectors of energy business, is setting up another 102 MW Wind Farm at Rajasthan for which ONGC Board has already accorded approval for investment of 6,500 million. Tendering activities for project implementation is in progress.
Agreement with Petroleos de Venezuela SA (PDVSA)th ONGC Videsh Ltd (OVL) led consortium inked an agreement on 12 May 2010 at Caracas, Venezuela with Petroleos de
Venezuela SA (PDVSA), national oil company of Venezuela for the development and production of hydrocarbons from the Carabobo project in the Orinoco region of Venezuela.
MOU with Uzbekneftegaz (UNG) for E&P cooperation in Uzbekistan
Joint Study agreement with M/s Stealth Ventures, Canada
A Joint Study Agreement (JSA) was signed by ONGC and M/s Stealth Ventures, Canada for assessment of unconventional th th resources (hydrocarbons) on 9 June, 2010. Subsequently, a Confidentiality Agreement (CA) was signed on 30 June,
2010 for enabling data viewing at ONGC and the scope of work was signed for execution of the project detailed in the JSA in three stages; Preliminary Stage, Screening Stage and Study of Prioritised Areas.
MOU with NGRI and IPT
ONGC has signed MOU with NGRI, India and IPT (Institute of Petroleum Technology) of NTNU (Norwegian University of Science & Technology), Norway to work on 'Reservoir modeling for Enhanced Oil Recovery using Fractals and 4D Seismic' for analyzing existing EOR Projects so as to develop and demonstrate more potent technique for increasing oil/gas recovery rate within the oil fields of ONGC and also to develop knowledge base as reservoir surveillance.
` `
`
(a) C2-C3-C4 Extraction Plant :
`
(b) Partnerships for growth
(i)
(ii)th ONGC Videsh limited (OVL) entered into a Memorandum of Understanding (MOU) on 17 May, 2011 with Uzbekneftegaz
(UNG), the National Oil Company of Uzbekistan for joint cooperation in the Upstream E&P sector of Uzbekistan as well as third countries. The MOU was signed by Mr. S.P. Garg, Director (Finance), OVL and Mr. Shokir Faizullayev, Chairman, Uzbekneftegaz in the presence of H.E. Mr. Rustam Azimov, First Deputy Prime Minister, Minister of Finance of Uzbekistan.
(iii) Operating agreement for Farm-in in HF-ONN-2001/1th ONGC signed Operating Agreement with MOL Hungarian Oil & Gas Plc on 9 Nov 2010 to conclude farm-in process by the
Hungarian company into ONGC's NELP-III exploratory block HF-ONN-2001/1 located in the Himalayan foothills in Himachal Pradesh. MOL is a fully integrated petroleum company with global operations from exploration to marketing and petrochemicals. It was the National Oil Company of Hungary prior to disinvestment in 1995.
(iv)
(v)
12. Other Projects / Business initiatives
PHHL operations at ONGC offshore
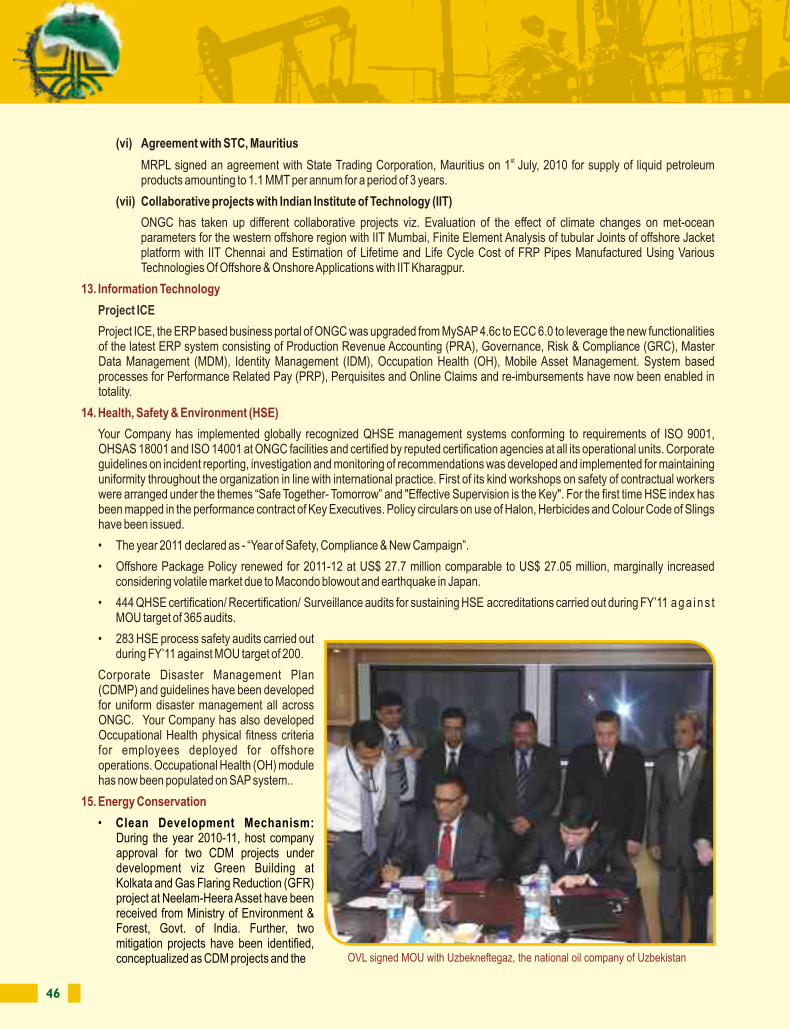
46 47
(vi) Agreement with STC, Mauritius st MRPL signed an agreement with State Trading Corporation, Mauritius on 1 July, 2010 for supply of liquid petroleum
products amounting to 1.1 MMT per annum for a period of 3 years.
(vii) Collaborative projects with Indian Institute of Technology (IIT)
Project ICE, the ERP based business portal of ONGC was upgraded from MySAP 4.6c to ECC 6.0 to leverage the new functionalities of the latest ERP system consisting of Production Revenue Accounting (PRA), Governance, Risk & Compliance (GRC), Master Data Management (MDM), Identity Management (IDM), Occupation Health (OH), Mobile Asset Management. System based processes for Performance Related Pay (PRP), Perquisites and Online Claims and re-imbursements have now been enabled in totality.
Your Company has implemented globally recognized QHSE management systems conforming to requirements of ISO 9001, OHSAS 18001 and ISO 14001 at ONGC facilities and certified by reputed certification agencies at all its operational units. Corporate guidelines on incident reporting, investigation and monitoring of recommendations was developed and implemented for maintaining uniformity throughout the organization in line with international practice. First of its kind workshops on safety of contractual workers were arranged under the themes “Safe Together- Tomorrow” and "Effective Supervision is the Key". For the first time HSE index has been mapped in the performance contract of Key Executives. Policy circulars on use of Halon, Herbicides and Colour Code of Slings have been issued.
• The year 2011 declared as - “Year of Safety, Compliance & New Campaign”.
• Offshore Package Policy renewed for 2011-12 at US$ 27.7 million comparable to US$ 27.05 million, marginally increasedconsidering volatile market due to Macondo blowout and earthquake in Japan.
• 444 QHSE certification/ Recertification/ Surveillance audits for sustaining HSE accreditations carried out during FY’11 aga ins tMOU target of 365 audits.
• 283 HSE process safety audits carried outduring FY’11 against MOU target of 200.
Corporate Disaster Management Plan (CDMP) and guidelines have been developed for uniform disaster management all across ONGC. Your Company has also developed Occupational Health physical fitness criteria for employees deployed for offshore operations. Occupational Health (OH) module has now been populated on SAP system..
ONGC has taken up different collaborative projects viz. Evaluation of the effect of climate changes on met-ocean parameters for the western offshore region with IIT Mumbai, Finite Element Analysis of tubular Joints of offshore Jacket platform with IIT Chennai and Estimation of Lifetime and Life Cycle Cost of FRP Pipes Manufactured Using Various Technologies Of Offshore & Onshore Applications with IIT Kharagpur.
13. Information Technology
14. Health, Safety & Environment (HSE)
15. Energy Conservation
Project ICE
• Clean Development Mechanism: During the year 2010-11, host company approval for two CDM projects under development viz Green Building at Kolkata and Gas Flaring Reduction (GFR) project at Neelam-Heera Asset have been received from Ministry of Environment & Forest, Govt. of India. Further, two mitigation projects have been identified, conceptualized as CDM projects and the
same are under development. ONGC tally of registered CDM projects as of now stands at six. Annual CERs earned from these projects are 209,460.
• GHG Accounting: ONGC has pioneered in the field of GHG accounting. This is the first step towards carbon footprinting and full fledged carbon disclosure system and the first step for attaining carbon neutrality. GHG accounting will also help ONGC in benchmarking its operations leading to energy efficiency and help develop new CDM projects. As per the plan, ONGC has undertaken pilot GHG accounting at nine of its selected installations this year. During the year, third party verification and certification as per GHG protocol and ISO 140064 for the GHG inventory of nine representative sites has been completed.
•
Your Company has established the following major Trusts for welfare of the employees:
• Employees Contributory Provident Fund (ECPF) Trust, managing Provident Fund accounts of employees of your Company.
• The Post Retirement Benefit Scheme (PRBS) Trust of your Company manages the pension scheme of the employees.
• The Composite Social Security Scheme (CSSS) formulated by your Company provides an assured ex-gratia payment in the event of unfortunate death or permanent disability of an employee in service. Families of deceased employees get a financial assistance under the scheme ranging between 1.5 million to 2.0 million.
• ONGC Sahayog Trust has been created for welfare of secondary workforce or their heirs, who are in financial distress.
• Gratuity Fund Trust has been created for payment of gratuity with provision of Gratuity Rules.th• Your Company implemented the Employees Pension Scheme (EPS–1995), retrospectively w.e.f. 16 November, 1995.
Your Company implemented a single integrated seamless computerised accounting system for all welfare trusts pertaining to investments, accounts, settlement and contribution etc. Employee accounts are now maintained on the new system, duly reconciled and updated, and can be viewed by the employees themselves on Company’s intranet. All payments are made to the members through e-payment gateway
Carbon Disclosure Project (CDP): An independent not-for-profit organization headquartered in London has issued its Annual 2010 Global 500 Report. ONGC is the only Indian E&P Company participating in the Carbon Disclosure Project (CDP) initiative and disclosing the information voluntarily for the last four years in succession. ONGC's disclosure scores have risen from 15 in 2008 to 42 in 2010. Higher score indicating greater commitment to understanding climate related issues and increased ability to measure and manage the company's carbon footprint. The key ONGC initiative of gas flaring reduction projects has also found a specific mention in the CDP 2010-India 200 report which has been compiled by Price Waterhouse on behalf of CDP.
Implementation Of Government Directives For Priority Section
) Annual component plan:
16. Human Resources
17. Employee Welfare Trusts
You are aware that your Company has vast pool of skilled and talented professionals–the most valuable asset for the company. Your Company continued to extend several welfare benefits to the employees and their families by way of comprehensive medical care, education, housing and social security. During the year 2010-11, your Company implemented various new and revised welfare policies for its employees. 86 employees were released under the Voluntary Retirement Scheme during the year. The Human Resource value of the employees based on “Lev and Schwartz” Model is enclosed at Annexure B.
Wage revision of unionised staff
The Unions had submitted their charter of demands in 2007 and a working group comprising representatives of Unions and the Management was constituted. After lengthy negotiations, an MoU was signed in the meeting of the Wage Revision Committee held
th on 26 August, 2010.Thereafter, a tripartite Long Term Settlement (LTS) was signed on 18.09.2010 by the Management and Union th ndbefore Regional Labour Commissioner (RLC). The ONGC Board, in its 209 meeting held on 22 September, 2010 accorded
approval for implementation of this tripartite settlement for Wage Revision of Unionised category of employees of ONGC w.e.f. 1.1.2007.
` `
Your Company complies with the Government directives for Priority Section of the society. The percentage of Scheduled Caste (SC) stand Scheduled Tribe (ST) employees was 15.76% and 8.74% respectively as on 31 March, 2011. Your Company is fully committed
for the welfare of SC & ST communities. The following welfare activities are carried out by your Company for their upliftment in and around its operational areas:
i
An amount of ̀ 31.00 million is distributed to various work centres of ONGC for implementation of welfare schemes. This fund is especially meant for providing help and support in areas like Education and training, Community development, Health care, etc.
OVL signed MOU with Uzbekneftegaz, the national oil company of Uzbekistan
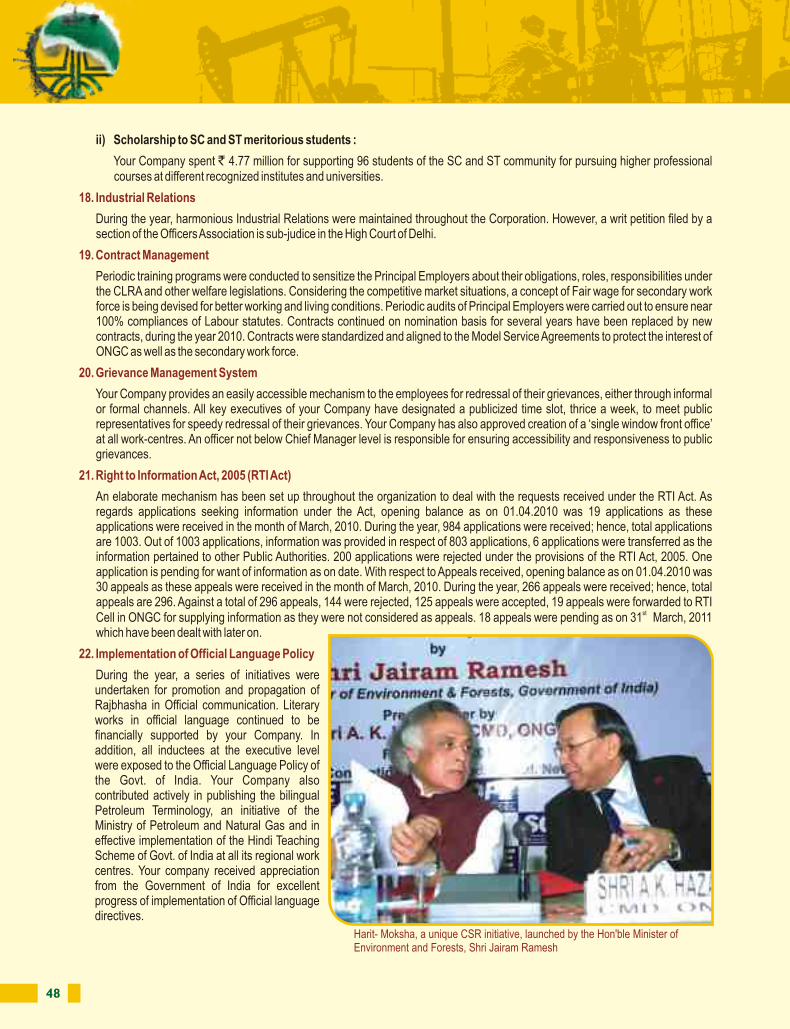
48 49
ii) Scholarship to SC and ST meritorious students :
Your Company spent ` 4.77 million for supporting 96 students of the SC and ST community for pursuing higher professional courses at different recognized institutes and universities.
An elaborate mechanism has been set up throughout the organization to deal with the requests received under the RTI Act. As regards applications seeking information under the Act, opening balance as on 01.04.2010 was 19 applications as these applications were received in the month of March, 2010. During the year, 984 applications were received; hence, total applications are 1003. Out of 1003 applications, information was provided in respect of 803 applications, 6 applications were transferred as the information pertained to other Public Authorities. 200 applications were rejected under the provisions of the RTI Act, 2005. One application is pending for want of information as on date. With respect to Appeals received, opening balance as on 01.04.2010 was 30 appeals as these appeals were received in the month of March, 2010. During the year, 266 appeals were received; hence, total appeals are 296. Against a total of 296 appeals, 144 were rejected, 125 appeals were accepted, 19 appeals were forwarded to RTI
stCell in ONGC for supplying information as they were not considered as appeals. 18 appeals were pending as on 31 March, 2011 which have been dealt with later on.
18. Industrial Relations
20. Grievance Management System
21. Right to Information Act, 2005 (RTI Act)
22. Implementation of Official Language Policy
During the year, harmonious Industrial Relations were maintained throughout the Corporation. However, a writ petition filed by a section of the Officers Association is sub-judice in the High Court of Delhi.
Periodic training programs were conducted to sensitize the Principal Employers about their obligations, roles, responsibilities under the CLRA and other welfare legislations. Considering the competitive market situations, a concept of Fair wage for secondary work force is being devised for better working and living conditions. Periodic audits of Principal Employers were carried out to ensure near 100% compliances of Labour statutes. Contracts continued on nomination basis for several years have been replaced by new contracts, during the year 2010. Contracts were standardized and aligned to the Model Service Agreements to protect the interest of ONGC as well as the secondary work force.
Your Company provides an easily accessible mechanism to the employees for redressal of their grievances, either through informal or formal channels. All key executives of your Company have designated a publicized time slot, thrice a week, to meet public representatives for speedy redressal of their grievances. Your Company has also approved creation of a ‘single window front office’ at all work-centres. An officer not below Chief Manager level is responsible for ensuring accessibility and responsiveness to public grievances.
During the year, a series of initiatives were undertaken for promotion and propagation of Rajbhasha in Official communication. Literary works in official language continued to be financially supported by your Company. In addition, all inductees at the executive level were exposed to the Official Language Policy of the Govt. of India. Your Company also contributed actively in publishing the bilingual Petroleum Terminology, an initiative of the Ministry of Petroleum and Natural Gas and in effective implementation of the Hindi Teaching Scheme of Govt. of India at all its regional work centres. Your company received appreciation from the Government of India for excellent progress of implementation of Official language directives.
19. Contract Management
23. Human Resource Developmentst33,229 ONGCians (as on 31 March, 2011) dedicated themselves for the excellent performance of your company during the year.
The workforce intake strategy pursued by ONGC caters to meeting the demands of maintaining a steady flow of talent, in a business which is characterized by high risks and uncertainties, enormous costs, fast changing level of technology, physically challenging work environment, fluctuating product prices and growing competition. ONGC has drawn up a scientific five-year manpower induction plan aligned to the business plans as well factoring the manpower profile of ONGC. During the year, HR ensured that adequate numbers with requisite skill-sets were inducted to meet the requirements of the Company as well as replenish the manpower loss on account of high superannuation.
Your company believes that continuous development of its human resource fosters engagement and drives competitive advantage. Towards that end, during the year, ONGC conducted Business Games to hone the business acumen of its executives. Business Games in ONGC was introduced for executives in 2007. It has proved to be a very popular initiative and tests the ability of the executives through business quizzes, business simulations and case-study presentations. The winners of the Business Games are felicitated by the CMD at Republic Day Celebrations.
For the first time, Fun Team Games (FTGs) were initiated for E0 and staff level employees to inculcate MDT (Multi-disciplinary Team) concept and spirit of camaraderie and belongingness to the organization, which was very well received by the participants. The winners are felicitated by the CMD at Republic Day Celebrations. ONGC also conducted the Assessment Development Centre (ADC) programs for 189 DGM level executives and provided them developmental inputs. An engagement survey was conducted across ONGC, providing valuable inputs for the management to take follow-up action.
a. Performance Management System and Performance Related Pay
Your Company, in line with the DPE Guidelines is devising a robust performance management system which is effective in identifying and rewarding high performers. As part of the process, the performance appraisal system has been completely e-enabled. To strengthen transparency in the system performance ratings of the executives have been disclosed to them. Incentive payments for the year 2009-10 were made during the year to the executives of your Company based on the MoU rating of the Company and the individual’s performance.
b. Training
Skill upgradation is a vital component for the Human Resource Development. In pursuance to the mandate of equipping the executives with latest knowledge in the specialized fields of upstream oil and gas sector, attempts were made to organise training
Harit- Moksha, a unique CSR initiative, launched by the Hon'ble Minister of Environment and Forests, Shri Jairam Ramesh
Sustained toil on derrick floor
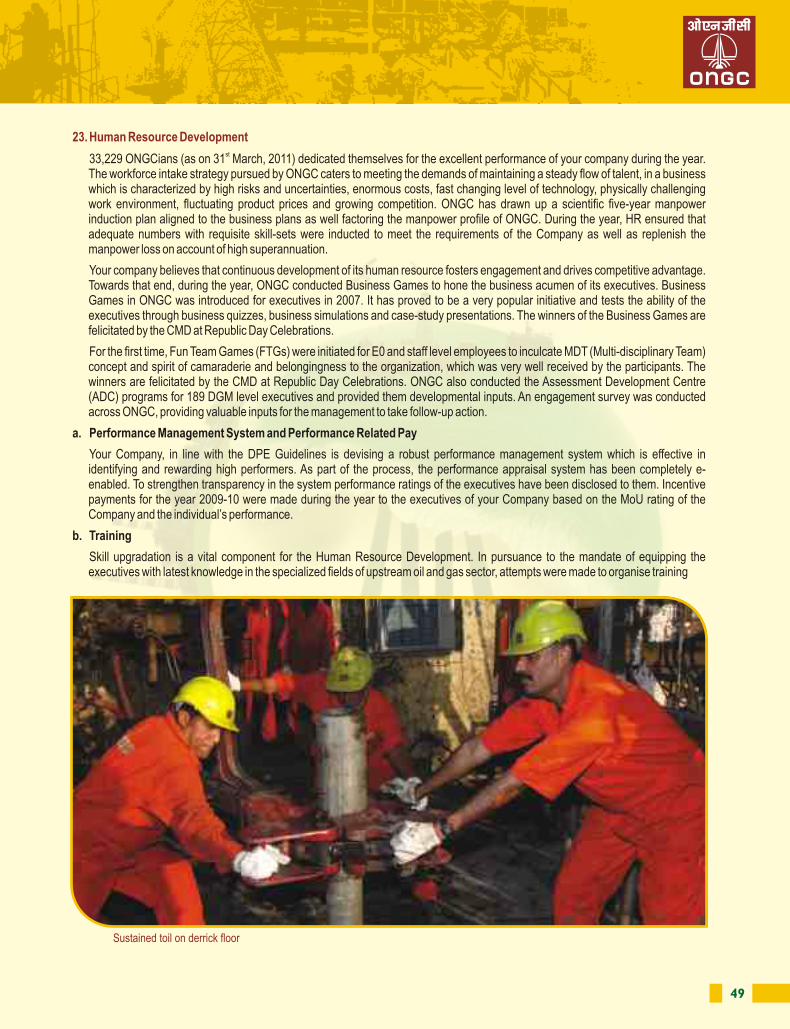
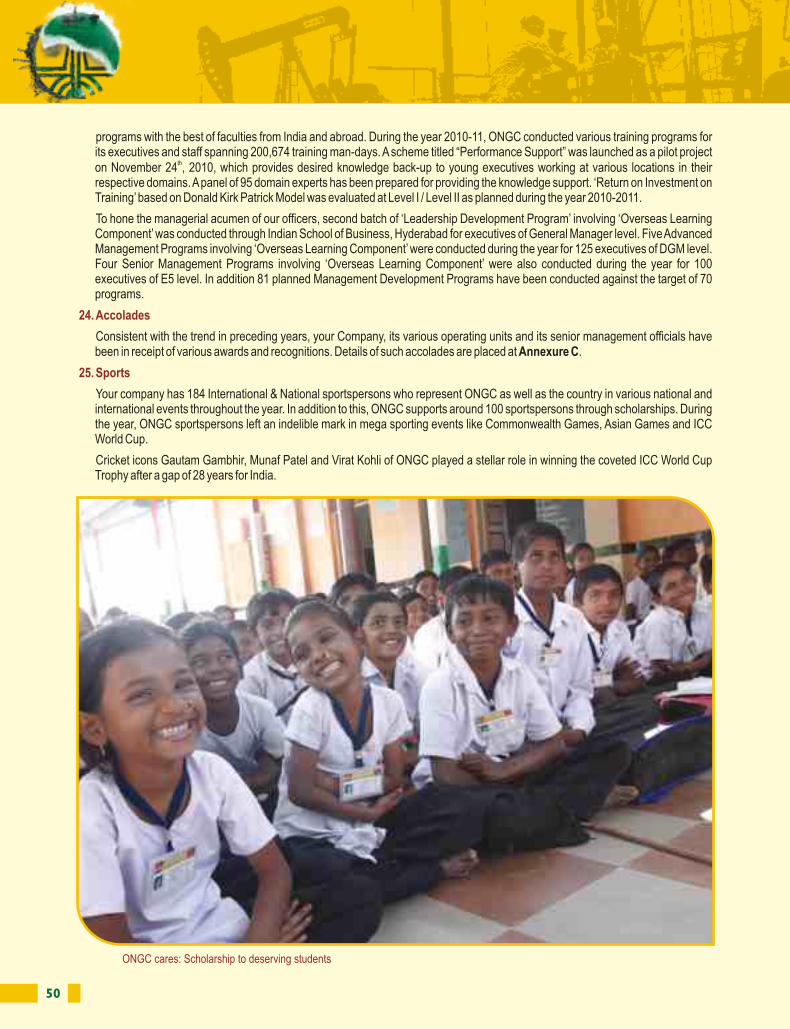
50 51
programs with the best of faculties from India and abroad. During the year 2010-11, ONGC conducted various training programs for its executives and staff spanning 200,674 training man-days. A scheme titled “Performance Support” was launched as a pilot project
thon November 24 , 2010, which provides desired knowledge back-up to young executives working at various locations in their respective domains. A panel of 95 domain experts has been prepared for providing the knowledge support. ‘Return on Investment on Training’ based on Donald Kirk Patrick Model was evaluated at Level I / Level II as planned during the year 2010-2011.
To hone the managerial acumen of our officers, second batch of ‘Leadership Development Program’ involving ‘Overseas Learning Component’ was conducted through Indian School of Business, Hyderabad for executives of General Manager level. Five Advanced Management Programs involving ‘Overseas Learning Component’ were conducted during the year for 125 executives of DGM level. Four Senior Management Programs involving ‘Overseas Learning Component’ were also conducted during the year for 100 executives of E5 level. In addition 81 planned Management Development Programs have been conducted against the target of 70 programs.
Consistent with the trend in preceding years, your Company, its various operating units and its senior management officials have been in receipt of various awards and recognitions. Details of such accolades are placed at Annexure C.
Your company has 184 International & National sportspersons who represent ONGC as well as the country in various national and international events throughout the year. In addition to this, ONGC supports around 100 sportspersons through scholarships. During the year, ONGC sportspersons left an indelible mark in mega sporting events like Commonwealth Games, Asian Games and ICC World Cup.
Cricket icons Gautam Gambhir, Munaf Patel and Virat Kohli of ONGC played a stellar role in winning the coveted ICC World Cup Trophy after a gap of 28 years for India.
24. Accolades
25. Sports
ONGC cares: Scholarship to deserving students
For ONGC sportspersons, winning is a habit
Thirteen ONGCians won ten medals in CWG 2010 which includes two gold medals. ONGCians followed their CWG performance with exceptional display at 2010 Asian games held at China grabbing 12 medals in all out of which four were gold. Out of India’s total tally of 64 medals ONGCians contributed 12.
Besides splendid performance in Asian Games and CWG, Ronjan Sodhi secured a gold medal in shooting World Cup. Alok Kumar became the only player in India who won all the four National titles in cue sports i.e. Billiards, Snooker, 8 ball Pool and 9 ball Pool.
ONGC has been maintaining its supremacy in Petroleum sector & has won Petroleum Minister’s trophy for excellence for seventh year in succession.
Women employees constitute 6.2% of ONGC's workforce. During the year, programs for empowerment and development, including program on gender sensitization was organized. Your Company actively supported and nominated its lady employees for programs organised by ‘Women in Public Sector’ (WIPS) and ‘Women in Leadership Roles’.
Green Buildings: As part of its commitment to sustainable development, ONGC has taken up development of Green Buildings at Delhi, Mumbai, Kolkata & Dehradun. These buildings are expected to save 50 to 60% energy as compared to baseline buildings. Apart from savings in energy, they shall also save water by about 30%, harvest 100% rainwater, discharge zero sewage, and provide higher occupant comfort levels in terms of air quality and personalized controls for temperature and lighting while improving
26. ISO Certification for HR processes
27. Women Empowerment
28. Improvement in Living/Working Conditions
As part of the increase in the pace of continual improvement in HR-ER functions, ONGC has taken the significant initiative for certifying ISO 9001:2008 of HR-ER functions through reputed agency in sixteen work centres including functions During the year, all these 16 work centres went through this vigorous process under their respective Incharge HR-ER including preparation of documentation (Quality Manual, Procedure Manual, Procedure Format), conducting internal audits, holding ISO sensitization programs and Management Review Meetings. Thereafter, the auditors of Certified Agency visited all the work centres and checked the entire process in the pre-assessment audit. During this process, observations raised by auditors were rectified by HR-ER personnel immediately, who were closely associated with this process.
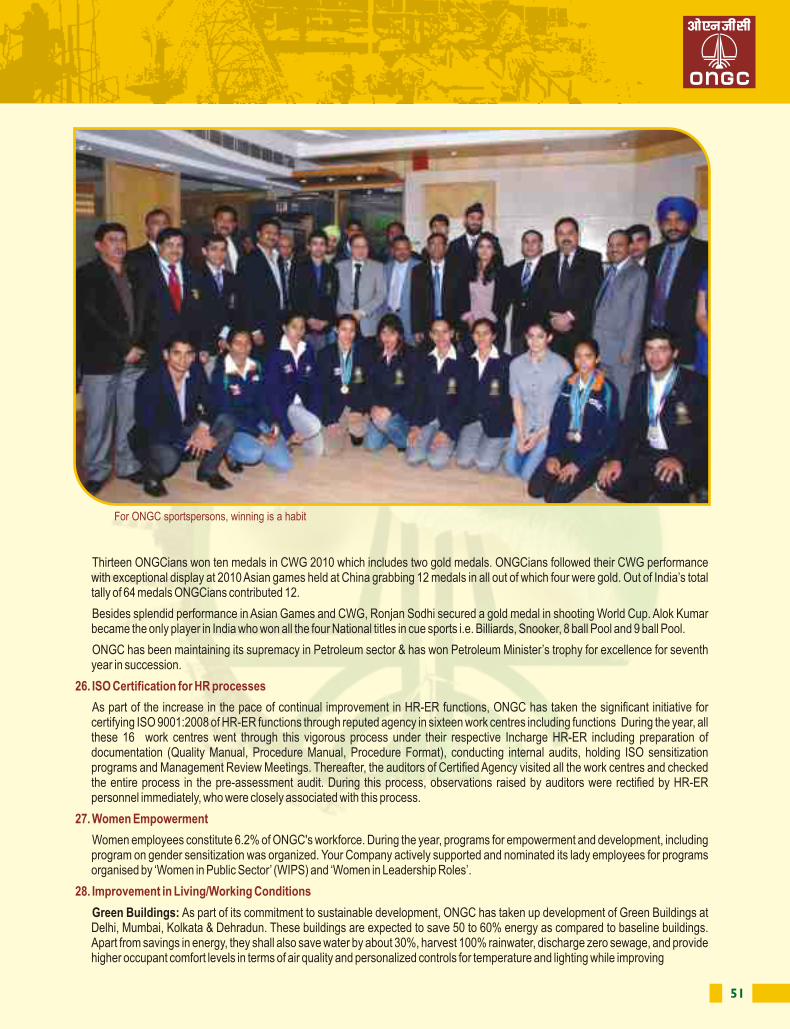
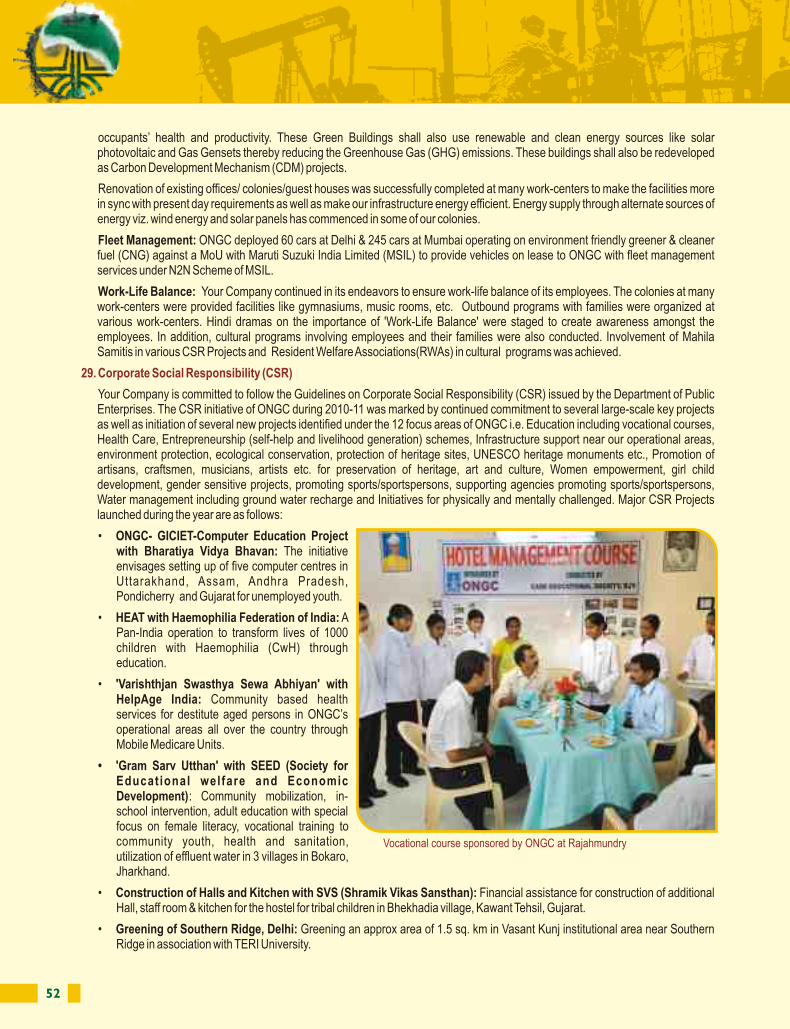
52 53
• TERI-ONGC “Soldiers of the Earth” project: The Soldiers of the Earth campaign is an all encompassing, environmental awareness generation program. The campaign undertaken at Dehradun, Ankleshwar and Nazira is aimed at sensitizing children and young adults towards a greener future.
• Badhte Kadam: A massive pan-India disability awareness raising program throughout the country.
• Mokshda Green Cremation System: Setting up of 30 energy efficient and environmental friendly green cremation system in association with local municipal bodies at work centers of ONGC.
• "Amulya Dharohar" Conservation of Ahom monuments with ASI & NCF: To support the endeavour of Archaeological Survey of India for conservation and development of four Ahom monuments at Sivasagar, Assam.
• 'Ashadeep' – Girl child education program: Aimed to ensure continued schooling of the girl students belonging to economically weaker sections of society, with observable improved learning levels of the support receiving students.
• Project Saraswati with NGRI: Exploring deep underground water resources in Rajasthan to provide new sources of ground water in the desert / drought prone areas with possible scope for long distance recharge.
Pursuant to the requirement under Section 217(2AA) of the Companies Act, 1956, with respect to Directors’ ResponsibilityStatement, it is hereby confirmed that:
(i) In the preparation of the annual accounts, the applicable accounting standards have been followed and there are no material departures from the same;
(ii) The Directors have selected such accounting policies and applied them consistently and made judgments and estimates that stare reasonable and prudent, so as to give a true and fair view of the state of affairs of the Company as at 31 March, 2011 and of
the profit of the Company for the year ended on that date;
(iii) The Directors have taken proper and sufficient care for the maintenance of adequate accounting records in accordance with the provisions of the Companies Act, 1956, for safeguarding the assets of the Company and for preventing and detecting fraud and other irregularities; and
(iv) The Directors have prepared the annual accounts of the Company on a ‘going concern’ basis.
30. Directors' Responsibility Statement
31. Corporate Governance
Your Company has taken structured initiatives towards Corporate Governance and its practices are valued by the various stakeholders. The practices evolve around multi-layered checks and balances to ensure transparency.
In terms of Clause 49 of the Listing Agreement, a report on Corporate Governance for the year ended 31.03.2011, supported by a certificate from the Company’s Auditors confirming compliance of conditions, forms part of this Report.
Guidelines of Department of Public Enterprises (DPE), Government of India, on Corporate Governance which were earlier voluntary, have been made mandatory from May, 2010. ONGC has implemented the DPE guidelines to the maximum extent possible except with regard to appointment of requisite number of Independent Directors, which is being followed up with the Ministry of Petroleum & Natural Gas.
stYour Company has voluntarily got its Secretarial Compliance Audit conducted for the financial year ended 31 March, 2011 from M/s A.N. Kukreja & Co., Company Secretaries in whole-time practice; their report forms part of this Annual Report.
In line with global practices, your Company has made all information, required by investors, available on the Company’s corporate website www.ongcindia.com/investercenter.asp.
Apart from the mandatory measures required to be implemented as a part of Corporate Governance, ONGC has gone the extra mile in this regard for the benefit of the stakeholders :
(a) Whistle Blower Policy: A Whistle Blower Policy has been implemented and is functional from 1st December, 2009. The policy ensures that a genuine Whistle Blower is granted due protection from any victimization. The Policy is available to all employees of the Company and has been uploaded on the intranet of the Company.
(b) Annual Report on working of the Audit & Ethics Committee : With a view to apprise the Board of the working of the Audit & Ethics Committee during the year, annual report on the working of the Audit & Ethics Committee for FY ’10 and FY ’11 has been prepared and will be put up to Board for its information. This is in line with the recommendation of the C&AG.
occupants’ health and productivity. These Green Buildings shall also use renewable and clean energy sources like solar photovoltaic and Gas Gensets thereby reducing the Greenhouse Gas (GHG) emissions. These buildings shall also be redeveloped as Carbon Development Mechanism (CDM) projects.
Renovation of existing offices/ colonies/guest houses was successfully completed at many work-centers to make the facilities more in sync with present day requirements as well as make our infrastructure energy efficient. Energy supply through alternate sources of energy viz. wind energy and solar panels has commenced in some of our colonies.
• ONGC- GICIET-Computer Education Project with Bharatiya Vidya Bhavan: The initiative envisages setting up of five computer centres in Uttarakhand, Assam, Andhra Pradesh, Pondicherry and Gujarat for unemployed youth.
• HEAT with Haemophilia Federation of India: A Pan-India operation to transform lives of 1000 children with Haemophilia (CwH) through education.
• 'Varishthjan Swasthya Sewa Abhiyan' with HelpAge India: Community based health services for destitute aged persons in ONGC’s operational areas all over the country through Mobile Medicare Units.
• 'Gram Sarv Utthan' with SEED (Society for Educat ional welfare and Economic Development): Community mobilization, in-school intervention, adult education with special focus on female literacy, vocational training to community youth, health and sanitation, utilization of effluent water in 3 villages in Bokaro, Jharkhand.
• Construction of Halls and Kitchen with SVS (Shramik Vikas Sansthan): Financial assistance for construction of additional Hall, staff room & kitchen for the hostel for tribal children in Bhekhadia village, Kawant Tehsil, Gujarat.
• Greening of Southern Ridge, Delhi: Greening an approx area of 1.5 sq. km in Vasant Kunj institutional area near Southern Ridge in association with TERI University.
Fleet Management: ONGC deployed 60 cars at Delhi & 245 cars at Mumbai operating on environment friendly greener & cleaner fuel (CNG) against a MoU with Maruti Suzuki India Limited (MSIL) to provide vehicles on lease to ONGC with fleet management services under N2N Scheme of MSIL.
Work-Life Balance: Your Company continued in its endeavors to ensure work-life balance of its employees. The colonies at many work-centers were provided facilities like gymnasiums, music rooms, etc. Outbound programs with families were organized at various work-centers. Hindi dramas on the importance of 'Work-Life Balance' were staged to create awareness amongst the employees. In addition, cultural programs involving employees and their families were also conducted. Involvement of Mahila Samitis in various CSR Projects and Resident Welfare Associations(RWAs) in cultural programs was achieved.
Your Company is committed to follow the Guidelines on Corporate Social Responsibility (CSR) issued by the Department of Public Enterprises. The CSR initiative of ONGC during 2010-11 was marked by continued commitment to several large-scale key projects as well as initiation of several new projects identified under the 12 focus areas of ONGC i.e. Education including vocational courses, Health Care, Entrepreneurship (self-help and livelihood generation) schemes, Infrastructure support near our operational areas, environment protection, ecological conservation, protection of heritage sites, UNESCO heritage monuments etc., Promotion of artisans, craftsmen, musicians, artists etc. for preservation of heritage, art and culture, Women empowerment, girl child development, gender sensitive projects, promoting sports/sportspersons, supporting agencies promoting sports/sportspersons, Water management including ground water recharge and Initiatives for physically and mentally challenged. Major CSR Projects launched during the year are as follows:
29. Corporate Social Responsibility (CSR)
Vocational course sponsored by ONGC at Rajahmundry
54 55
37. Directors
38. Acknowledgement
During the year under report, Shri R. S. Sharma, former CMD and Shri D. K. Pande, former Director (Exploration) retired from the services of ONGC on 31.01.2011. Shri S. V. Rao was appointed as Director (Exploration), ONGC on 25.02.2011 and Shri K. S. Jamestin was appointed as Director (Human Resources), ONGC on 25.05.2011. Further, with a view to ensure that the Board structure of ONGC conforms to the provisions of Clause 49 of the Listing Agreement, the Government has appointed Dr D. Chandrasekharam (on 11.03.2011), Smt. Usha Thorat, Prof. Deepak Nayyar and Shri Arun Ramanathan (on 20.06.2011) as Non-official Part–time Directors on the Board of ONGC. As a result, the Company can now exercise its enhanced powers under the Maharatna dispensation.
The Board places on record its deep appreciation for the excellent contributions made by Shri R. S. Sharma and Shri D. K. Pande during their tenure.
The strength of the Board of Directors of ONGC as on 24.06.2011 is 16 Directors, comprising 6 Executive Directors (Functional Directors) and 10 Non-Executive Directors–2 Government nominees and 8 Independent Directors.
Pursuant to the provisions of Section 255 and 256 of the Companies Act, 1956 and Clause 104(l) of the Articles of Association of the thCompany, Shri S. S. Rajsekar, Shri S. Balachandran and Shri S. Nautiyal retire by rotation at the 18 Annual General Meeting and
being eligible, offer themselves for reappointment.
Shri S. V. Rao, Dr. D. Chandrasekharam, Shri K. S. Jamestin, Smt. Usha Thorat, Prof. Deepak Nayyar and Shri Arun Ramanathan thwho were appointed as Additional Directors after the last AGM, hold office up to the 18 AGM. The Company has received notice in
writing from a member pursuant to the provisions of Section 257 of the Companies Act, 1956, proposing their candidature for appointment as Directors of the Company liable to retire by rotation.
Brief resume of the Directors seeking Appointment / Re-appointment, together with the nature of their expertise in specific functional areas and names of the companies in which they hold the directorship, number of shares held and the membership/ chairmanship of committees of the Board, as stipulated under Clause 49 of the Listing Agreement with the Stock Exchanges are given in the notice
thconvening the 18 AGM of the Company, and form part of the Annual Report.
On behalf of the Board of Directors
Place: New Delhi (A. K. Hazarika)thDate: 14 July, 2011 Chairman and Managing Director
Your Directors are highly grateful for all the help, guidance and support received from the Ministry of Petroleum and Natural Gas, Ministry of Finance, DPE, MCA, MEA and other agencies in Central and State Governments. Your Directors acknowledge the constructive suggestions received from Statutory Auditors and Comptroller & Auditor General of India and are grateful for their continued support and cooperation.
Your Directors thank all share-owners, business partners and members of the ONGC Family for their faith, trust and confidence reposed in ONGC.
Your Directors wish to place on record their sincere appreciation for the unstinting efforts and dedicated contributions put in by the ONGCians at all levels, to ensure that the Company continues to grow and excel.
(c) MCA Voluntary Guidelines on Corporate Governance: ONGC has implemented the voluntary guidelines on Corporate Governance issued by Ministry of Corporate Affairs to the extent feasible and within the competency domain of the management.
(d) Enterprise-wide Risk Management (ERM) framework: In line with the requirements of Clause 49 (of the Listing Agreement) your Company has developed a comprehensive Enterprise-wide Risk Management (ERM) framework. Under the framework Risk Register portfolio has been compiled and an ERM Policy has been firmed up. The Risk Register and the draft Risk Management policy of ONGC has been reviewed by the Audit and Ethics Committee and approved by the Board of Directors. The ERM framework has been rolled throughout the organization and the risk policy adopted by the company is being displayed at all the Assets/Basins/Plants/Institutes across all the locations of ONGC. The risk policy of ONGC is stated below:
The Statutory Auditors of your Company are appointed by the Comptroller & Auditor General of India (C&AG). M/s Arun K. Agarwal & Associates, M/s Kalyaniwalla & Mistry, M/s S. Bhandari & Co, M/s Ray and Ray and M/s M. Kuppuswamy PSG & Co, Chartered Accountants were appointed as joint Statutory Auditors for the financial year 2010-11. The Statutory Auditors have been paid a remuneration of .25 million for Annual Audit assignment and Certification of Corporate Governance. The above fees are exclusive of applicable service tax and reimbursement of reasonable travelling and out of pocket expenses actually incurred.
The Comments of Comptroller & Auditor General of India (C&AG) form part of this Report as per Annexure E. There is no qualification in the Auditors Report and there are no supplementary comments by C&AG under section 619(4) of the Companies Act, 1956. Notes to the Accounts referred to in the Auditors Report are self explanatory and therefore do not call for any further comments.
You would be pleased to know that your Company has received ‘Nil’ comments from C&AG and Statutory Auditors for the year 2010-11. This is the fifth time in a row that the organization has received ‘Nil’ comments and seven times in last eight years.
Pursuant to the directions of the Central Government for audit of Cost Accounts, the proposal for appointment of 7 firms of Cost stAccountants as Cost Auditors for auditing the cost accounts of your Company for the year ended 31 March, 2011 was approved by
the Central Government and they have accordingly been appointed.
“ONGC shall identify the possible risks associated with its business and commits itself to put in place a Risk Management Framework to address the risks involved on an ongoing basis to ensure achievement of the business objectives without any interruptions.
ONGC shall optimize the risks involved by managing their exposure and bringing them in line with the acceptable risk appetite of the company”.
The risk reporting structure has already been put in place and all the stakeholders are being trained to enumerate risks in their functional area. The Risk Management Cell is receiving reports from the various functional areas. The Risk Management Committee is reviewing the same on a periodical basis.
Section 274(1)(g) of the Companies Act, 1956 is not applicable to the Government Companies. Your Directors have made necessary disclosures, as required under various provisions of the Act and Clause 49 of the Listing Agreement.
Particulars of EmployeesstAs per Notification No. GSR 289(E) dated 31 March, 2011 issued by the Ministry of Corporate Affairs, amending the provisions of
the Companies (Particulars of Employees) Rules, 1975 issued in terms of section 217(2A) of the Companies Act, 1956, it is not necessary for Government companies to include the particulars of employees drawing salaries of ` 60 lakhs or more per annum, employed throughout the financial year or, ` 5 lakhs per month, if employed for part of the financial year. As your company is a Government company, the information has not been included as a part of the Directors’ Report.
The information required under section 217(1)(e) of the Companies Act, 1956, read with the Companies (Disclosure of Particulars in the Report of Board of Directors) Rules, 1988, is annexed as Annexure D.
` 14
32. Statutory Disclosures
33. Energy Conservation
34. Auditors
36. Cost Audit
35. Auditors' Report on the Accounts
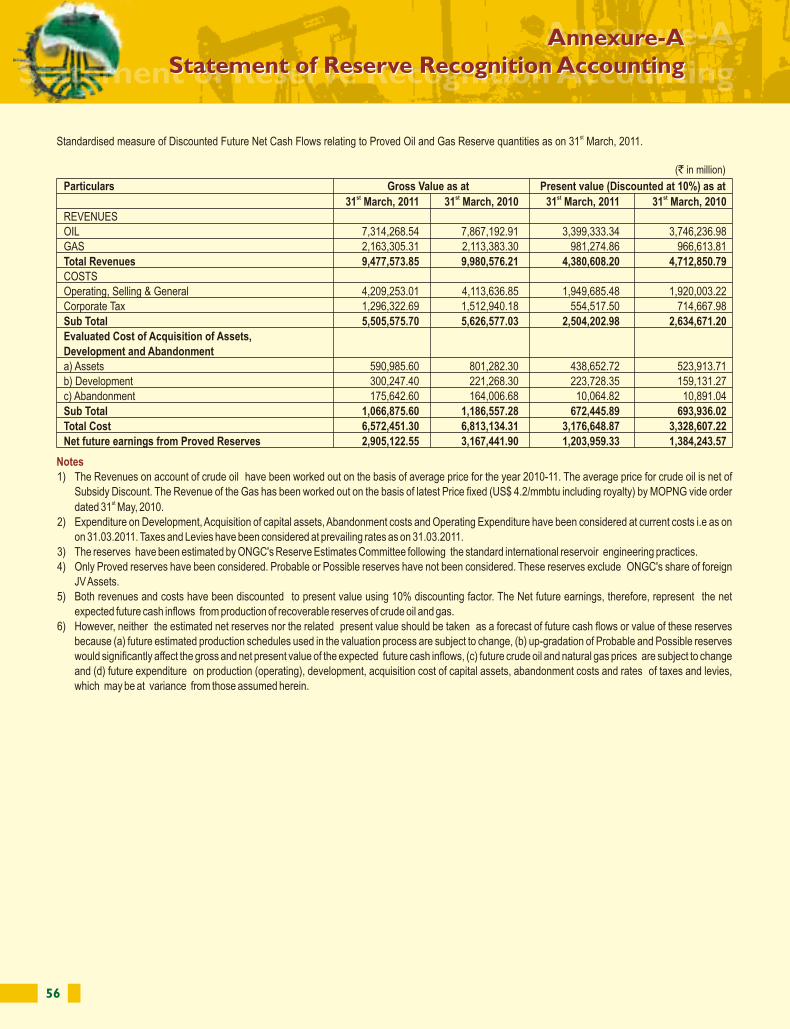
56 57
stStandardised measure of Discounted Future Net Cash Flows relating to Proved Oil and Gas Reserve quantities as on 31 March, 2011.
Particulars Gross Value as at Present value (Discounted at 10%) as atst st st st31 March, 2011 31 March, 2010 31 March, 2011 31 March, 2010
REVENUESOIL 7,314,268.54 7,867,192.91 3,399,333.34 3,746,236.98GAS 2,163,305.31 2,113,383.30 981,274.86 966,613.81
Total Revenues 9,477,573.85 9,980,576.21 4,380,608.20 4,712,850.79COSTSOperating, Selling & General 4,209,253.01 4,113,636.85 1,949,685.48 1,920,003.22Corporate Tax 1,296,322.69 1,512,940.18 554,517.50 714,667.98
Sub Total 5,505,575.70 5,626,577.03 2,504,202.98 2,634,671.20
Evaluated Cost of Acquisition of Assets,
Development and Abandonmenta) Assets 590,985.60 801,282.30 438,652.72 523,913.71b) Development 300,247.40 221,268.30 223,728.35 159,131.27c) Abandonment 175,642.60 164,006.68 10,064.82 10,891.04
Sub Total 1,066,875.60 1,186,557.28 672,445.89 693,936.02
Total Cost 6,572,451.30 6,813,134.31 3,176,648.87 3,328,607.22
Net future earnings from Proved Reserves 2,905,122.55 3,167,441.90 1,203,959.33 1,384,243.57
1) The Revenues on account of crude oil have been worked out on the basis of average price for the year 2010-11. The average price for crude oil is net of Subsidy Discount. The Revenue of the Gas has been worked out on the basis of latest Price fixed (US$ 4.2/mmbtu including royalty) by MOPNG vide order
stdated 31 May, 2010.2) Expenditure on Development, Acquisition of capital assets, Abandonment costs and Operating Expenditure have been considered at current costs i.e as on
on 31.03.2011. Taxes and Levies have been considered at prevailing rates as on 31.03.2011. 3) The reserves have been estimated by ONGC's Reserve Estimates Committee following the standard international reservoir engineering practices.4) Only Proved reserves have been considered. Probable or Possible reserves have not been considered. These reserves exclude ONGC's share of foreign
JV Assets.5) Both revenues and costs have been discounted to present value using 10% discounting factor. The Net future earnings, therefore, represent the net
expected future cash inflows from production of recoverable reserves of crude oil and gas.6) However, neither the estimated net reserves nor the related present value should be taken as a forecast of future cash flows or value of these reserves
because (a) future estimated production schedules used in the valuation process are subject to change, (b) up-gradation of Probable and Possible reserves would significantly affect the gross and net present value of the expected future cash inflows, (c) future crude oil and natural gas prices are subject to change and (d) future expenditure on production (operating), development, acquisition cost of capital assets, abandonment costs and rates of taxes and levies, which may be at variance from those assumed herein.
Notes
stEmployees as on 31 March, 2011
Employee Group Age Distribution Total
<31 31-40 41-50 51-60 2010-11 2009-10
(A) Technical
Executive 1,694 1,211 7,396 9,653 19,954 19,542
Non-Executive 689 670 1,093 928 3,380 3,066
Total (A) 2,383 1,881 8,489 10,581 23,334 22,608
(B) Non-Technical
Executive 182 477 1,472 2,910 5,041 4,942
Non-Executive 40 546 1,815 2,497 4,898 5,276
Total (B) 222 1,023 3,287 5,407 9,939 10,218
Grand Total (A+B) 2,605 2,904 11,776 15,988 33,273 32,826
stValuation as on 31 March, 2011
Employee Group Age Distribution Total Value per Employee
<31 31-40 41-50 51-60 2010-11 2009-10
(A) Technical
Executive 38,415 32,424 153,834 111,480 336,153 16.85 15.41
Non-Executive 7,992 7,904 15,141 8,105 39,142 11.58 9.31
Total (A) 46,407 40,328 168,975 119,585 375,295 16.08 14.58
(B) Non-Technical
Executive 4,039 11,749 26,154 28,179 70,121 13.91 13.55
Non-Executive 493 6,396 20,073 17,177 44,139 9.01 6.60
Total (B) 4,532 18,145 46,227 45,356 114,260 11.50 10.02
Grand Total (A+B) 50,939 58,473 215,202 164,941 489,555 14.71 13.10
• Based on " Lev & Schwartz" model which is a cost based valuation of employee expenditure
• Aggregate future earnings (with annual increment) during remaining employment period of employees, discounted @ 8% p.a. provides the present valuation
(` in million)
(` in million)
Annexure-BHuman Resource Value
Annexure-A Statement of Reserve Recognition Accounting
Annexure-BHuman Resource Value
Annexure-A Statement of Reserve Recognition Accounting
Note: Whole time Directors excluded
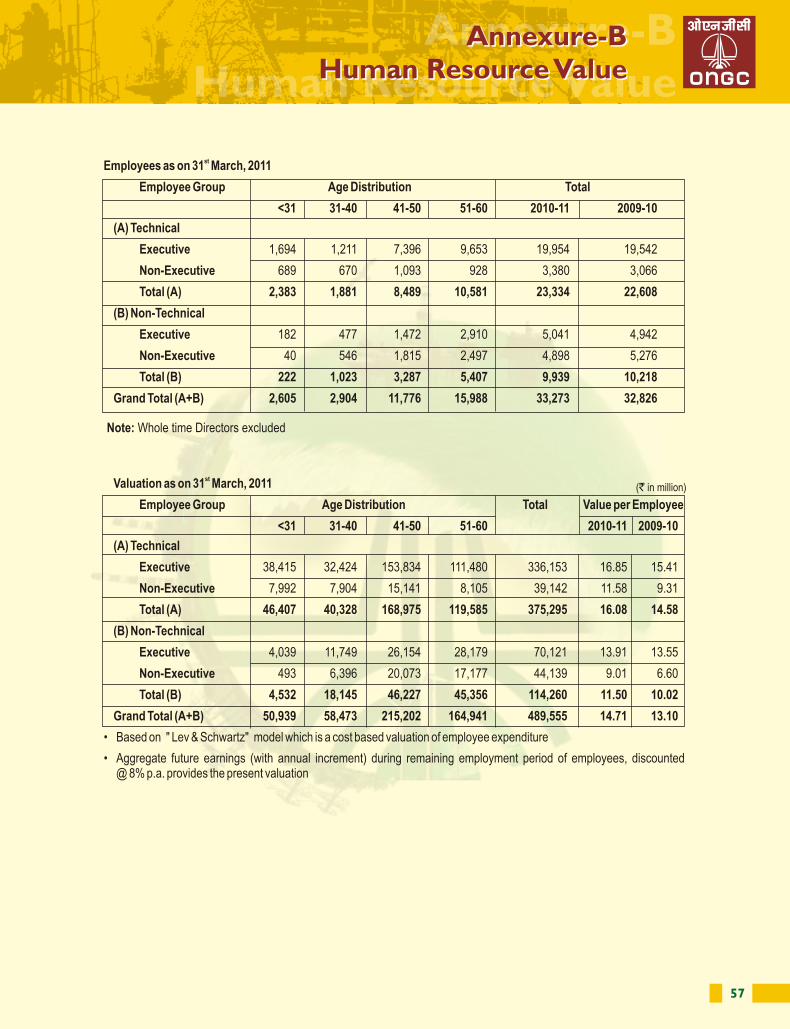
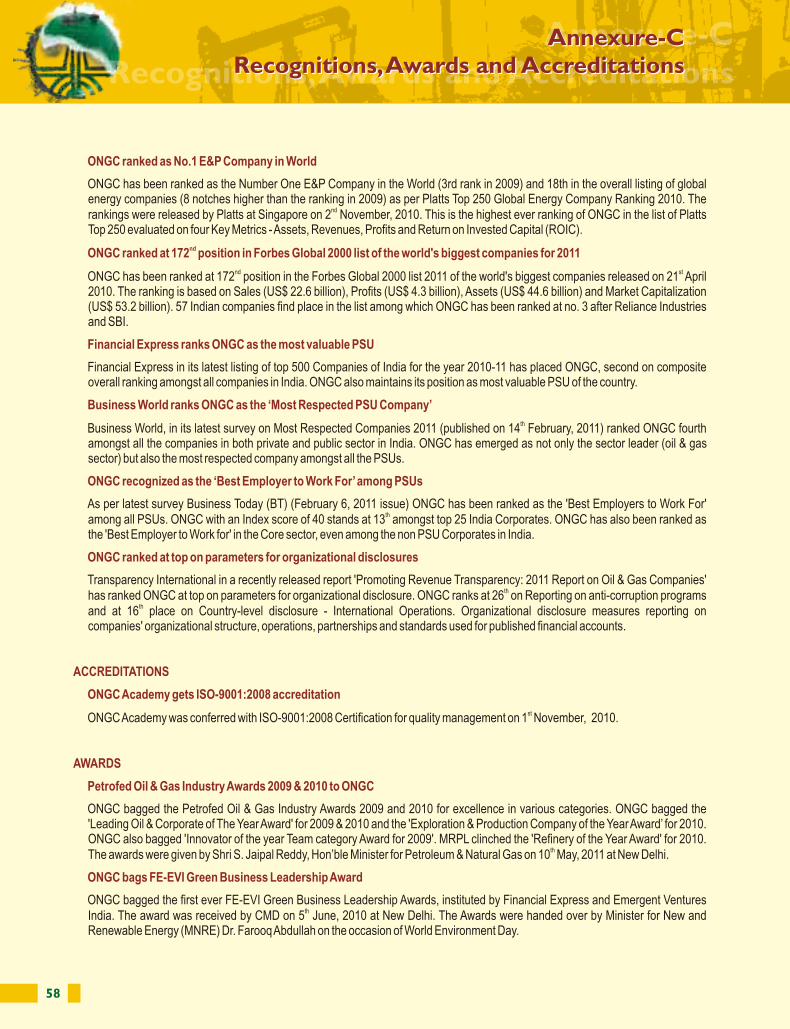
58 59
ONGC ranked as No.1 E&P Company in World
ndONGC ranked at 172 position in Forbes Global 2000 list of the world's biggest companies for 2011
Financial Express ranks ONGC as the most valuable PSU
Business World ranks ONGC as the ‘Most Respected PSU Company’
ONGC recognized as the ‘Best Employer to Work For’ among PSUs
ONGC ranked at top on parameters for organizational disclosures
ACCREDITATIONS
ONGC Academy gets ISO-9001:2008 accreditation
AWARDS
Petrofed Oil & Gas Industry Awards 2009 & 2010 to ONGC
ONGC bags FE-EVI Green Business Leadership Award
ONGC has been ranked as the Number One E&P Company in the World (3rd rank in 2009) and 18th in the overall listing of global energy companies (8 notches higher than the ranking in 2009) as per Platts Top 250 Global Energy Company Ranking 2010. The
ndrankings were released by Platts at Singapore on 2 November, 2010. This is the highest ever ranking of ONGC in the list of Platts Top 250 evaluated on four Key Metrics - Assets, Revenues, Profits and Return on Invested Capital (ROIC).
nd stONGC has been ranked at 172 position in the Forbes Global 2000 list 2011 of the world's biggest companies released on 21 April 2010. The ranking is based on Sales (US$ 22.6 billion), Profits (US$ 4.3 billion), Assets (US$ 44.6 billion) and Market Capitalization (US$ 53.2 billion). 57 Indian companies find place in the list among which ONGC has been ranked at no. 3 after Reliance Industries and SBI.
Financial Express in its latest listing of top 500 Companies of India for the year 2010-11 has placed ONGC, second on composite overall ranking amongst all companies in India. ONGC also maintains its position as most valuable PSU of the country.
thBusiness World, in its latest survey on Most Respected Companies 2011 (published on 14 February, 2011) ranked ONGC fourth amongst all the companies in both private and public sector in India. ONGC has emerged as not only the sector leader (oil & gas sector) but also the most respected company amongst all the PSUs.
As per latest survey Business Today (BT) (February 6, 2011 issue) ONGC has been ranked as the 'Best Employers to Work For' thamong all PSUs. ONGC with an Index score of 40 stands at 13 amongst top 25 India Corporates. ONGC has also been ranked as
the 'Best Employer to Work for' in the Core sector, even among the non PSU Corporates in India.
Transparency International in a recently released report 'Promoting Revenue Transparency: 2011 Report on Oil & Gas Companies' thhas ranked ONGC at top on parameters for organizational disclosure. ONGC ranks at 26 on Reporting on anti-corruption programs
thand at 16 place on Country-level disclosure - International Operations. Organizational disclosure measures reporting on companies' organizational structure, operations, partnerships and standards used for published financial accounts.
stONGC Academy was conferred with ISO-9001:2008 Certification for quality management on 1 November, 2010.
ONGC bagged the Petrofed Oil & Gas Industry Awards 2009 and 2010 for excellence in various categories. ONGC bagged the 'Leading Oil & Corporate of The Year Award' for 2009 & 2010 and the 'Exploration & Production Company of the Year Award’ for 2010. ONGC also bagged 'Innovator of the year Team category Award for 2009'. MRPL clinched the 'Refinery of the Year Award' for 2010.
thThe awards were given by Shri S. Jaipal Reddy, Hon’ble Minister for Petroleum & Natural Gas on 10 May, 2011 at New Delhi.
ONGC bagged the first ever FE-EVI Green Business Leadership Awards, instituted by Financial Express and Emergent Ventures thIndia. The award was received by CMD on 5 June, 2010 at New Delhi. The Awards were handed over by Minister for New and
Renewable Energy (MNRE) Dr. Farooq Abdullah on the occasion of World Environment Day.
ONGC bagged the Silver Trophy for Best HR Practices, 2011 at the inaugural ceremony of the NIPM National Conference held in thDelhi on 14 February, 2011. The award was given by Shri Bhaskar Chatterjee, Secretary, DPE, Govt. of India.
The Shine.Com HR leadership Awards were announced by the IES Group of Companies in collaboration with the World HRD congress and Shine.Com of Hindustan Times. The Jury conferred upon ONGC, the award for the Best Leadership Practices in the
tharea of Corporate Social Responsibility in a function in Mumbai on 9 February, 2011.
ONGC bagged the Corporate Governance Certificate for excellence in corporate governance practices instituted by the Institute of Company Secretaries India (ICSI). The accolade was received from the Hon’ble Finance Minister of India, Shri Pranab Mukherjee on
th16 December, 2010 at New Delhi.
ONGC bagged the PCRA 'Award for Excellence' for the Best Overall Performance in the Upstream Sector. The Award was received thfrom the then Hon'ble Minister for Petroleum and Natural Gas, Shri Murli Deora on 19 January, 2011 at New Delhi.
ONGC won the NIPM Best HR Practices Silver Trophy
ONGC receives the 'Shine.Com HR Leadership Award' for its CSR activities
ONGC bagged Certificate for excellence in Corporate Governance
ONGC gets PCRA award for Best Overall performance for energy conservation in upstream sector
Annexure-CRecognitions, Awards and Accreditations
Annexure-CRecognitions, Awards and Accreditations
ONGC received the Petrofed Oil & Gas Industry Awards 2009-10 for excellence in various categories from Shri S. Jaipal Reddy, Hon'ble Minister for P&NG
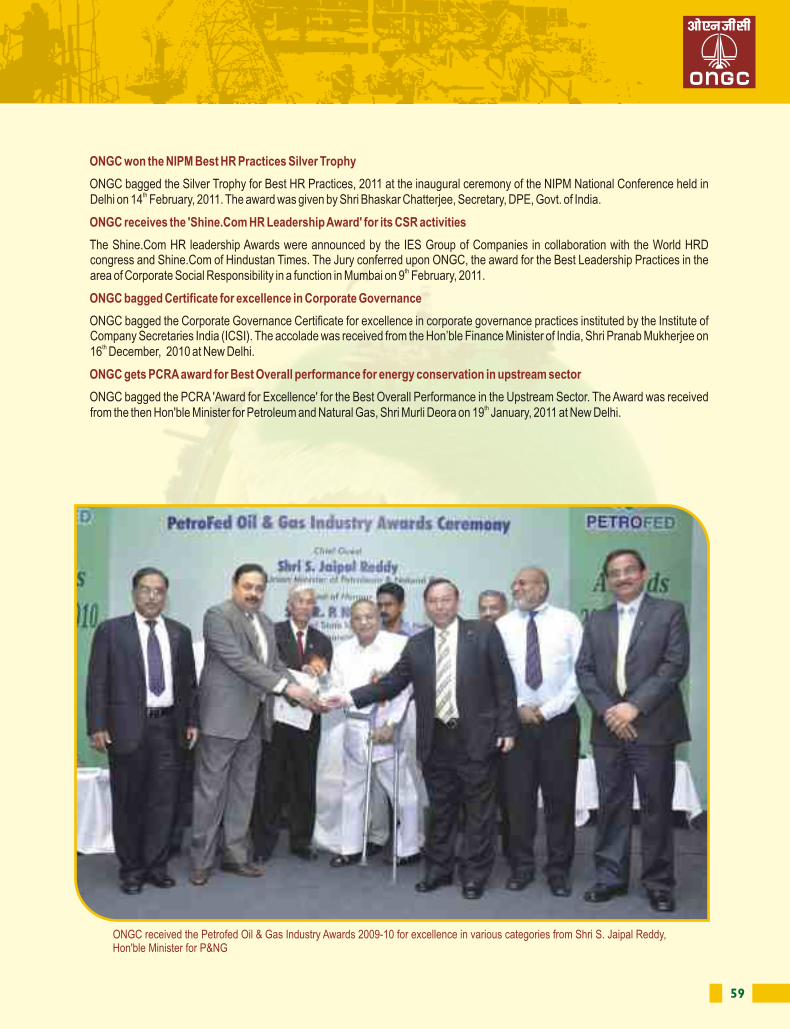
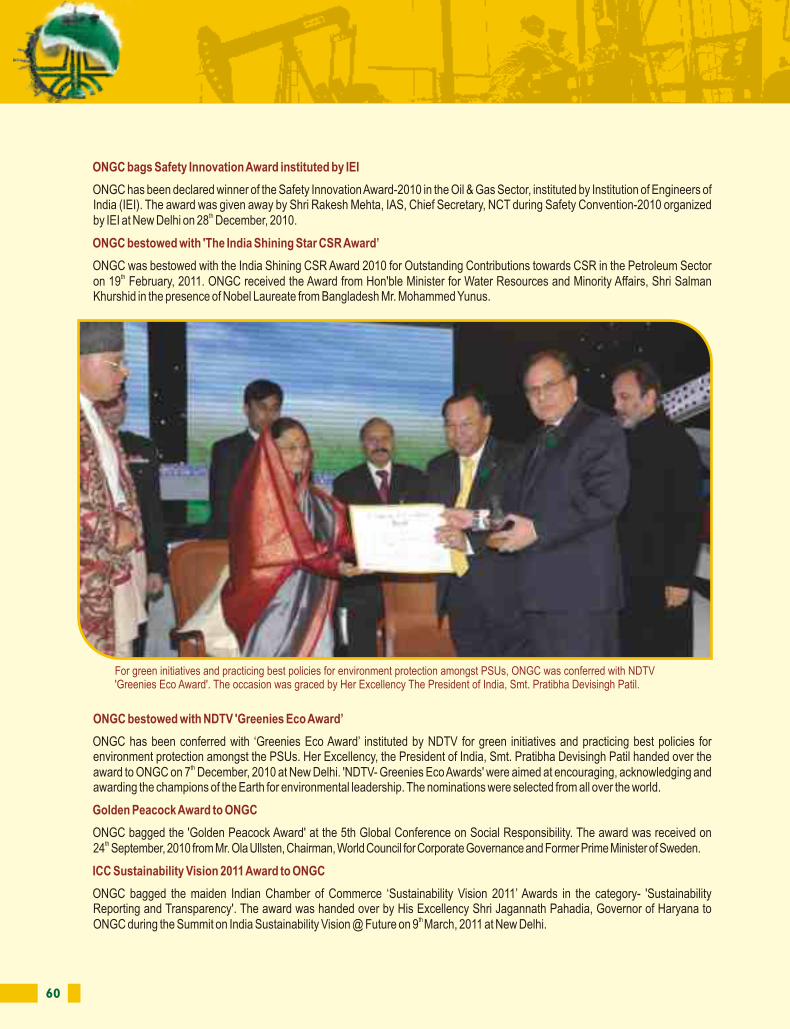
60 61
ONGC has been declared winner of the Safety Innovation Award-2010 in the Oil & Gas Sector, instituted by Institution of Engineers of India (IEI). The award was given away by Shri Rakesh Mehta, IAS, Chief Secretary, NCT during Safety Convention-2010 organized
thby IEI at New Delhi on 28 December, 2010.
ONGC was bestowed with the India Shining CSR Award 2010 for Outstanding Contributions towards CSR in the Petroleum Sector thon 19 February, 2011. ONGC received the Award from Hon'ble Minister for Water Resources and Minority Affairs, Shri Salman
Khurshid in the presence of Nobel Laureate from Bangladesh Mr. Mohammed Yunus.
ONGC has been conferred with ‘Greenies Eco Award’ instituted by NDTV for green initiatives and practicing best policies for environment protection amongst the PSUs. Her Excellency, the President of India, Smt. Pratibha Devisingh Patil handed over the
thaward to ONGC on 7 December, 2010 at New Delhi. 'NDTV- Greenies Eco Awards' were aimed at encouraging, acknowledging and awarding the champions of the Earth for environmental leadership. The nominations were selected from all over the world.
ONGC bagged the 'Golden Peacock Award' at the 5th Global Conference on Social Responsibility. The award was received on th24 September, 2010 from Mr. Ola Ullsten, Chairman, World Council for Corporate Governance and Former Prime Minister of Sweden.
ONGC bagged the maiden Indian Chamber of Commerce ‘Sustainability Vision 2011’ Awards in the category- 'Sustainability Reporting and Transparency'. The award was handed over by His Excellency Shri Jagannath Pahadia, Governor of Haryana to
th ONGC during the Summit on India Sustainability Vision @ Future on 9 March, 2011 at New Delhi.
ONGC bags Safety Innovation Award instituted by IEI
ONGC bestowed with 'The India Shining Star CSR Award’
ONGC bestowed with NDTV 'Greenies Eco Award’
Golden Peacock Award to ONGC
ICC Sustainability Vision 2011 Award to ONGC
ONGC bagged the awards on Best Financial Performance and Corporate Governance given by Department of Public Enterprises Government of India in association with Indian Chamber of Commerce and Deloitte, the Knowledge Partner. Hon'ble Union Minister of Heavy Industries and Public Enterprises, Shri Vilasrao
stDeshmukh presented the award on 1 December, 2010 at a Summit on India Public Sector Agenda @ 2015 at New Delhi.
ONGC bagged the Golden peacock award for Climate Security -10. Dr. Ola Ullsten, Former Prime Minister, Sweden and Chairman, World Council for Corporate Governance handed over the award to
thONGC on 30 July, 2010 during the Global Summit on Sustainability held at London.
The Institute of Drilling Technology (IDT) has been awarded the "Shiksha Bharti Puraskar" instituted by the All India Achievers
thFoundation for outstanding contribution in the field of training in India on 11 February, 2011 in New Delhi at the hands of Dr. Bhisma Narayan Singh, former Governor and Union Minister.
Uran Plant has been awarded Level 8 under ISRS7 edition by M/s DNV. Uran Plant of ONGC is the only oil & gas installation in India to achieve this level. In addition, the Quality Circle team “Ujjwal” of Uran Plant awarded the Golden Trophy at the International
th thConvention on Quality Concept Circles (ICQCC-2010) held on Hyderabad during 12 to 15 October, 2010. “Ujjwal” was the only quality circle team representing ONGC in this international convention.
School of Maintenance Practices, Vadodara received the Golden Peacock National Training Award 2010 being bestowed by His thExcellency Governor of Maharashtra, Shri K. Sankara Narayanan on 29 January, 2011 at Mumbai.
thHazira Plant received Greentech Gold Award-2010 for outstanding achievement in Safety Management on 24 May, 2010.
Shri R.S. Sharma, former CMD, ONGC, was conferred with honorary fellowship by All India Management Association (AIMA) on th7 August, 2010 in recognition of significant contribution for professional management and commitment to the objectives of the
Association. The fellowship was received from Shri R.C. Bhargava, Maruti Suzuki India Chairman & Shri M. Damodaran, the former Chairman of Securities and Exchange Board of India (SEBI).
Shri R.S. Sharma, former CMD, ONGC was given the Honorary CEPM - PMA (Centre For Excellence in Project Management & th Project Management Associate) fellowship on 6 December, 2010 at New Delhi. The fellowship was handed over by Hon’ble Chief
th Minister of Delhi, Smt. Sheila Dixit during the 18 Global Symposium organized by CEPM-PMA.
ONGC bagged awards for Best Financial Performance and Corporate Governance
Golden Peacock Award for Climate Security-10
AWARDS TO THE BUSINESS UNITS
IDT bags Shiksha Bharti Puraskar
Uran Plant bags Level 8 under ISRS7
School of Maintenance Practices bags National Award for Training
Hazira Plant bags Greentech Award
RECOGNITION TO THE INDIVIDUALS
CMD conferred with AIMA Honorary Fellowship
CEPM-PMA fellowship to CMD
For green initiatives and practicing best policies for environment protection amongst PSUs, ONGC was conferred with NDTV 'Greenies Eco Award'. The occasion was graced by Her Excellency The President of India, Smt. Pratibha Devisingh Patil.
Union Finance Minister Shri Pranab Mukherjee conferred the BusinessToday Best CFO Awards. Shri D.K. Sarraf, Director (Finance) was the recipient of the 'Best CFO in Public Sector' award.
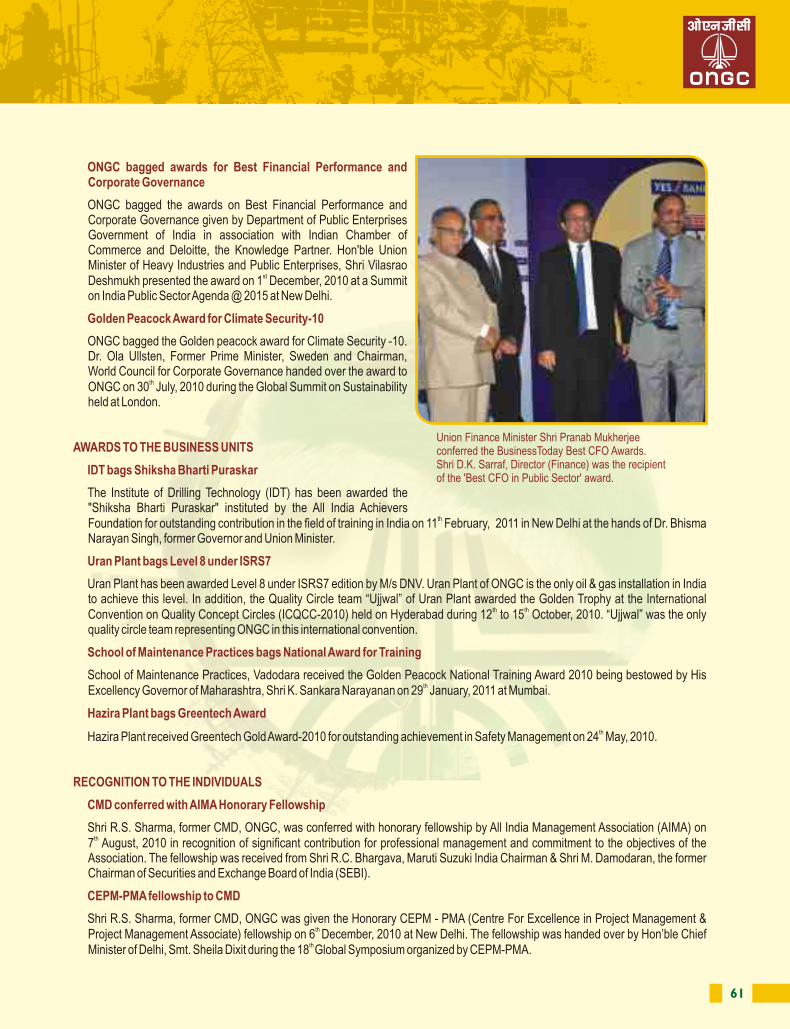
62 63
Shri D. K. Pande, former Director (Exploration) has been conferred with "Geologist of Fame" award instituted by Drilling and Exploration World (DEW) Journal. Shri Sudhir Bhargava, Additional Secretary, MoP&NG gave the award to Shri Pande on
nd22 November, 2010 at New Delhi.
ONGC bagged SPE Regional Distinguished Corporate Support Award 2010 for its contribution towards SPE at regional level which is first such award for any Indian Company.
Shri Sudhir Vasudeva, Director (Offshore) was conferred with SPE Regional Service Award 2010 for his exceptional contributions to the SPE at section and regional levels during the awards function at 2010 SPE Middle East Regional Awards function held on
th4 October, 2010 at Manama, Bahrain.
Mumbai Section of SPE received the 'Most Improved Section' award 2010 from SPE President Dr. Behrooz Fattahi. The award was conferred in the President's Luncheon meeting during the SPE Annual Technical Conference & Exhibition held in Florence, Italy on
nd 22 September, 2010.
Shri Sudhir Vasudeva, Director (Offshore), ONGC, has been nominated as the ‘At-large Director’ on the Board of Society of Petroleum Engineers. He is the first Indian to be nominated for this coveted position. SPE has more than 64,000 members spread across 110 countries.
th Shri K. S. Jamestin, former ED, HRO was conferred with the HR Leadership Award at the 19 Global HR Excellence Awards meet in th Mumbai on 11 February, 2011. Shri Bhaskar Chaterjee, Secretary, DPE, Govt. of India presented the award to Shri Jamestin.
Four ONGCians,
1. Shri S. R. Subramanian, Manager (Fire Services), Cauvery Asset,
2. Shri R. R. Brahmbhatt, Fire Officer, Cambay Sub-Asset,
3. Shri George Mathew, Sr. Asstt. Chief Inspector (Fire), Ahmedabad Asset and
4. Shri P. C. Sharma, Asstt. Chief Inspector (Fire), Mehsana Asset
have been bestowed with the prestigious "Fire Service Medal for Meritorious Service" by the Government of India on the occasion of Independence Day 2010.
“Geologist of Fame” award to Director (E)
SPE Award to Director (Offshore)
Director (Offshore) nominated as 'At-large Director’, on the Board of SPE
Shri K. S. Jamestin, former ED, HRO Honoured for Leadership in HR
FIRE SERVICE MEDAL TO ONGCIANS
th ONGC conferred with Maharatna status on 16 November, 2010
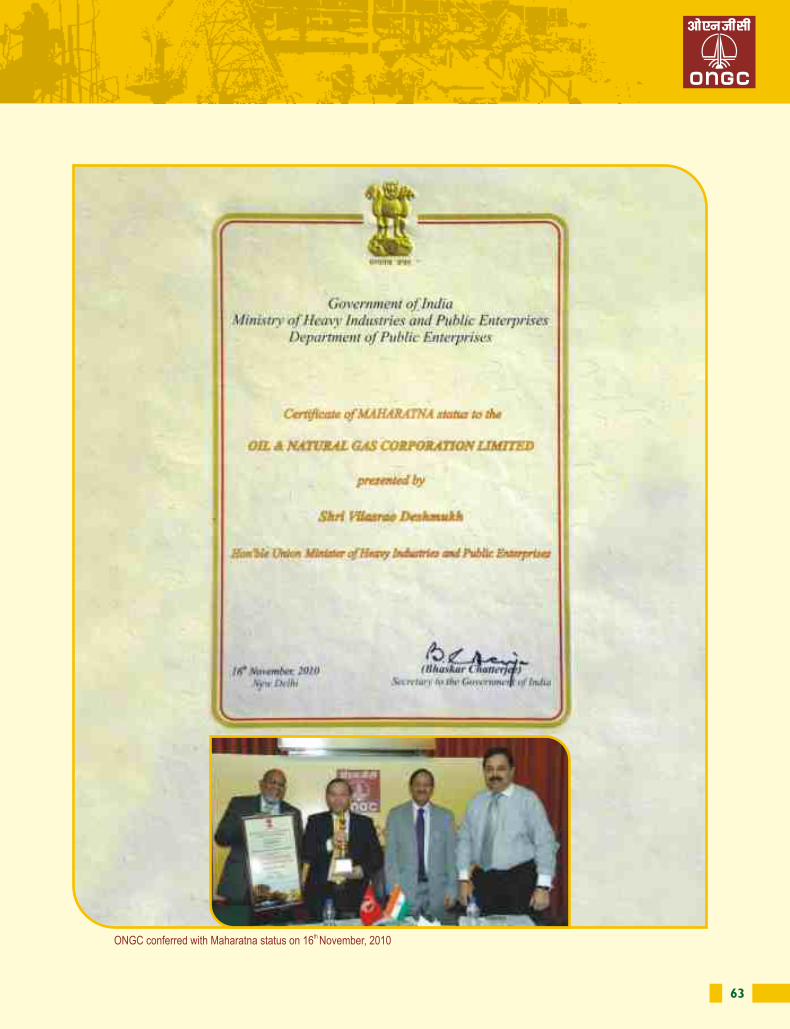
64 65
A.ENERGY CONSERVATION
The following measures were taken towards energy conservation during 2010-11
Energy Conservation measures taken earlier which are contributing to annual savings
• 225 nos. of Energy Audits were conducted during FY'11. 164 nos. of Energy Audit Recommendations were closed during the year.
• Hazira Plant: Revamped 22 years old central A/C plant with energy efficient chillers carrying environment friendly refrigerant (R134A). Revamping will save energy approx. to the tune of 416000 units i.e. 0.8 million per year. Also 8 nos. VFD panels commissioned in AHU of Administration building for auto control of AHU speed by sensing the return air temperature. It enhanced the life of motor with substantial energy saving.
• Uran Plant: Dismantled old AHU and installed 08 nos. new AHU. Area-Energy saving 157248 units/year. Overhauled chillers, AHU and replaced chiller water head tank with PVC molded round bottom tanks of 1000 liters duly insulated. Energy Saving 142613 units/year.
• CBM Project, Bokaro: Variable Frequency Drive starters (07 nos.) incorporated in lift motors of CBM wells instead of conventional electrical starters. Expected energy saving - 15 to 20%. Highest energy efficiency motors purchased for SRPs with incremental efficiency of 8 to 10%.
• IRS, Ahmedabad: Existing conventional fluorescent tubelight fittings are being replaced with energy efficient T-5 type fluorescent fittings with electronic ballasts on failure and need basis. All three transformers at IRS are optimally loaded so as to increase transformer efficiency taking cognizance of seasonal variation in temperature.
• KDMIPE, Dehradun: 4 nos. 1000 KVA each DG Sets meant for captive power generation were integrated to existing APFC Panels to improve Power Factor up to 0.92 thereby enhancing the KVA capacity of Captive power to the tune of 400-450 KVA approximately. Power factor of Electrical load is maintained more than 0.98 with the help of APFC (Automatic power factor correction) panel above the standard power factor of 0.85. Energy efficient light fixtures introduced (1X36W, 2X36W, 3X36W, 18W & 11W CFL and 28/24 W T5-Tube light fixtures) in all New/Renovation/Revamping Electrical works.
• ONGC has carried out different activities for creating energy conservation awareness and efficient use of energy like cycle rally, LPG Quiz program, quiz for ladies, employees and school children, drawing, slogan, essay competition, Drivers' awareness programs, workshop on energy conservation, exhibition, free pollution check up, street play etc.
• Observed Rajiv Gandhi Akhshay Urja Divas to promote the nation wide campaign for effective utilization of renewable energy.
• 12000 LPD Solar water heating system added at ONGC Colony, Noida.
• A substantial number of Energy efficient lightings are installed in all Assets/ Basins / Offices.
• Process Energy Audit of Uran Plant has been carried out and five projects have been identified for implementation with a potential savings of approximately ̀ 200 million per year.
• To create awareness and educate the common masses on “Energy Conservation”, programs were organized with message propagation through electronic and print media.
• Total 54 nos. Energy efficient Diesel engines are replaced at onshore drilling rigs.
• On installation of Wind Farm in Kutch, Gujarat in 2008-09 electricity generated from wind power plant is 95 MU in the year 2010-11 amounting to 475 million.
• Use of waste heat recovery at platforms, rigs & plants at Hazira & Uran for oil heating, water purification & steam generation.
• Use of energy efficient equipment, devices and turbo expanders. Thermal energy cost reduction achieved by maintenance of steam traps at processing plants at Hazira & Uran.
• CBM Project, Bokaro: Energy efficient electrical fixtures installed in CBM office. Expected saving per annum from above measures is to the tune of 2.5 million per annum.
• IRS, Ahmedabad: Replacement of the existing conventional type fluorescent type fittings with energy efficient T-5 type Fluorescent fittings with electronic ballasts was planned and being changed on replacement basis. In streetlight circuits, instead of manual switching, light-sensor based time switches have been installed resulting in energy saving.
`
`
`
• KDMIPE, Dehradun: A 2 KW Solar Power Plant was commissioned along with associated Electrical works. 4 Nos. 1000 KVA each DG Sets meant for captive power generation were integrated to existing APFC Panels to improve Power Factor up to 0.92 thereby enhancing the KVA capacity of Captive power to the tune of 400-450 KVA approximately. Energy Efficient light fixtures introduced (1X36W, 2X36W, 3X36W, 18W & 11W CFL and 28/24 W T5-Tube light fixtures) in all New/Renovation/Revamping Electrical works.
• Harnessed solar energy by using solar water heaters and use of photovoltaic panels at Dehradun, Uran, Unmanned platforms in offshore, Rajahmundry and Vadodara.
• Use of gas engines and gas turbines for power generation at Rajahmundry, Cauvery, Assam, Ankleshwar Assets, Hazira & Uran Plants & platforms in offshore .
• Reduction of contract demand and improvement of PF at different locations.
• Inter fuel substitution at Bokaro, Agartala, Rajahmundry & Karaikal and proper capacity utilization of equipments.
• Avoiding parallel running of engines on drilling rigs.
• Reduction of gas flaring by using gas in water heating system installed at various locations of ONGC.
The above measures have resulted in reduction of significant quantity of fuel consumption (HSD, Natural Gas and electricity).
• ONGC along with TERI has been carrying out R&D in the field of Microbial Enhanced Oil Recovery, Paraffin Degrading Bacteria and Flow Assurance for the last 3-4 years. Field trials on pilot scale were conducted.
• Conceptualized PTDR (Plasma Thermal Destruction Recovery) Technology for Waste to Energy with IEOT who proposed a plant at Uran. Execution of Pilot Project at Uran plant is in pipeline.
• Study to explore advances that have taken place in field of material selection and guidelines practiced worldwide along with update on relevant standards and codes.
• Application of composite material pipes for effluent and produced water lines in Onshore Assets.
• Feasibility study on Surface Coal Gasification.
• Identification of suitable chemical methodology for improving flow assurance of waxy/ asphaltic crude oil in down hole tubular as well as in transportation lines.
• Designing of suitable chemical formulations for water shut-off/ profile modification for arresting water production/improving sweep efficiency in oil & gas wells in various Indian oil fields.
• Analysis of sub-surface samples to generate PVT parameters for reservoir engineering calculation and prediction.
• Reservoir characterization (in terms of permeability) of different Indian oil/gas fields for optimum exploitation strategy.
• A rapid technique was developed and put to field trial for geomicrobial survey in Charada-Mansa area of Cambay basin.
• Feasibility of detecting and mass production of micro algae from Indian water bodies for hydrocarbon production as a biofuel (project is in progress, scheduled completion March 2012).
• Prospecting for gas & liquid hydrocarbons in uphole sediment samples.
Impact of measures for reduction of energy consumption and consequent impact on the cost of production of goods
B.RESEARCH AND DEVELOPMENT
1. Specific areas in which R&D was carried out
Annexure-D
Uran Plant : Energy saving 142613 units per year
Annexure-DAnnexure-D
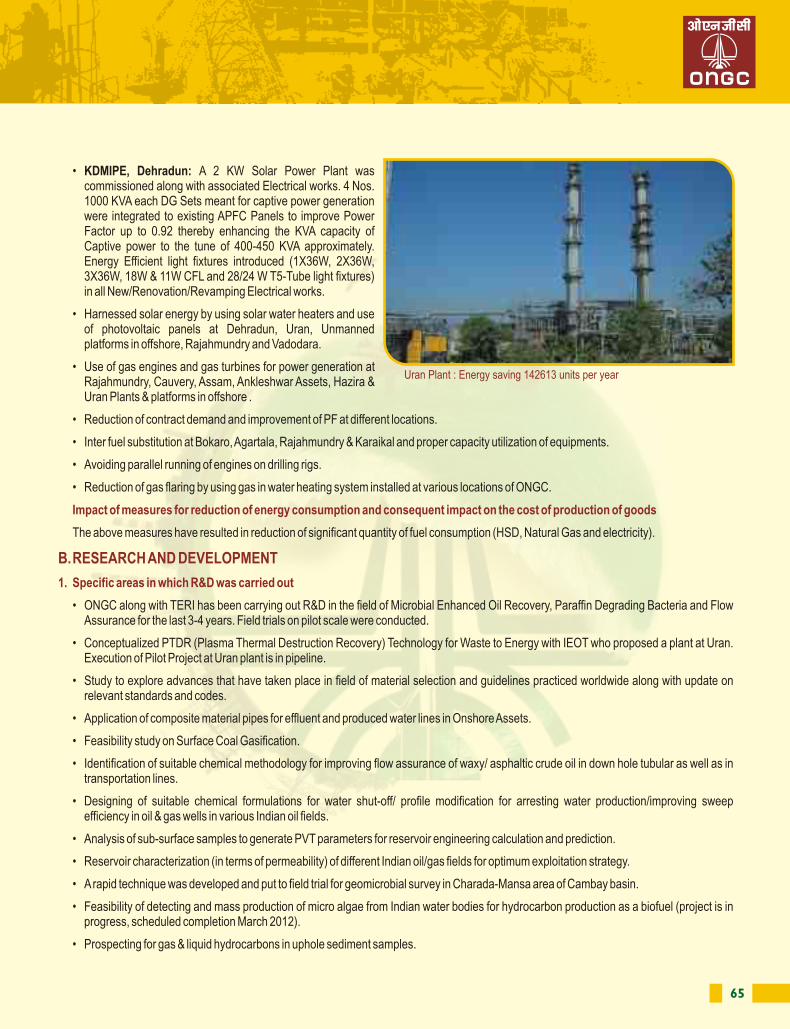
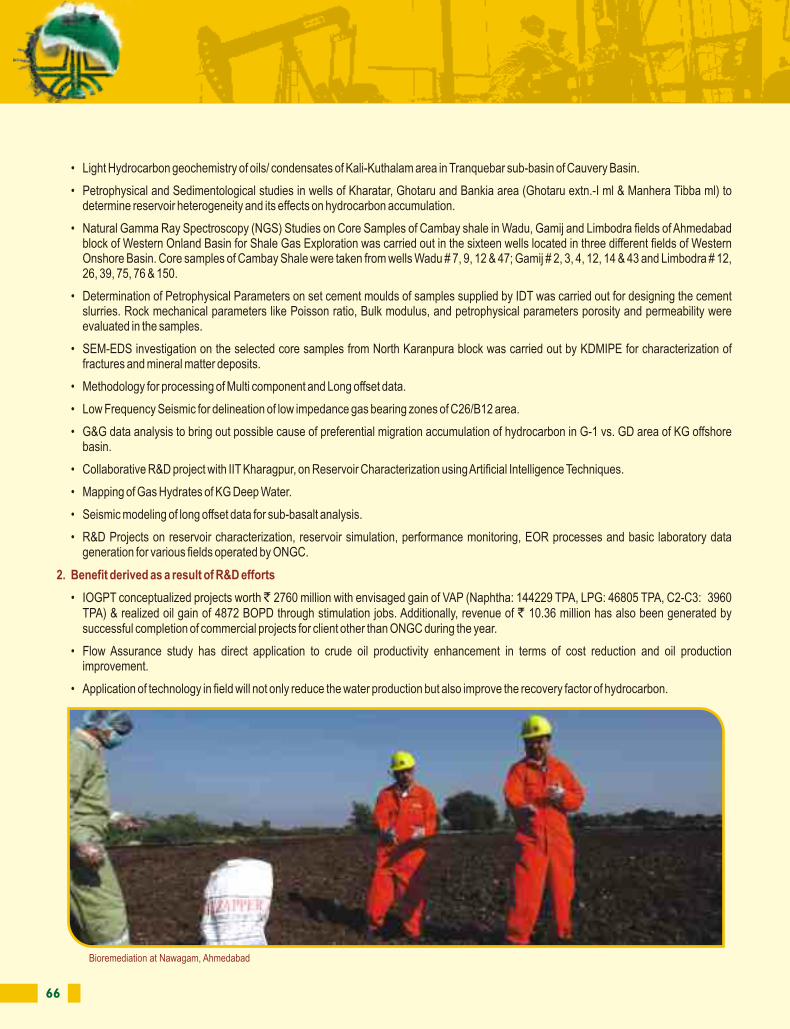
66 67
• Light Hydrocarbon geochemistry of oils/ condensates of Kali-Kuthalam area in Tranquebar sub-basin of Cauvery Basin.
• Petrophysical and Sedimentological studies in wells of Kharatar, Ghotaru and Bankia area (Ghotaru extn.-I ml & Manhera Tibba ml) to determine reservoir heterogeneity and its effects on hydrocarbon accumulation.
• Natural Gamma Ray Spectroscopy (NGS) Studies on Core Samples of Cambay shale in Wadu, Gamij and Limbodra fields of Ahmedabad block of Western Onland Basin for Shale Gas Exploration was carried out in the sixteen wells located in three different fields of Western Onshore Basin. Core samples of Cambay Shale were taken from wells Wadu # 7, 9, 12 & 47; Gamij # 2, 3, 4, 12, 14 & 43 and Limbodra # 12, 26, 39, 75, 76 & 150.
• Determination of Petrophysical Parameters on set cement moulds of samples supplied by IDT was carried out for designing the cement slurries. Rock mechanical parameters like Poisson ratio, Bulk modulus, and petrophysical parameters porosity and permeability were evaluated in the samples.
• SEM-EDS investigation on the selected core samples from North Karanpura block was carried out by KDMIPE for characterization of fractures and mineral matter deposits.
• Methodology for processing of Multi component and Long offset data.
• Low Frequency Seismic for delineation of low impedance gas bearing zones of C26/B12 area.
• G&G data analysis to bring out possible cause of preferential migration accumulation of hydrocarbon in G-1 vs. GD area of KG offshore basin.
• Collaborative R&D project with IIT Kharagpur, on Reservoir Characterization using Artificial Intelligence Techniques.
• Mapping of Gas Hydrates of KG Deep Water.
• Seismic modeling of long offset data for sub-basalt analysis.
• R&D Projects on reservoir characterization, reservoir simulation, performance monitoring, EOR processes and basic laboratory data generation for various fields operated by ONGC.
• IOGPT conceptualized projects worth 2760 million with envisaged gain of VAP (Naphtha: 144229 TPA, LPG: 46805 TPA, C2-C3: 3960 TPA) & realized oil gain of 4872 BOPD through stimulation jobs. Additionally, revenue of 10.36 million has also been generated by successful completion of commercial projects for client other than ONGC during the year.
• Flow Assurance study has direct application to crude oil productivity enhancement in terms of cost reduction and oil production improvement.
• Application of technology in field will not only reduce the water production but also improve the recovery factor of hydrocarbon.
2. Benefit derived as a result of R&D efforts
` `
• Generated PVT data used in various reservoir engineering calculations for optimal field exploitation.
• Characterization of reservoir heterogeneity in terms of permeability provides valuable information useful in the context of further field development, profile modification, water shut off and stimulation jobs.
• The developed technique for geo-microbial survey is efficient, faster and cost effective.
• An in-house method has been developed for selection of samples for further molecular level geochemical characterization, based on adsorbed gas analysis & Rock Eval screening parameters of uphole sediment samples. The application of this method will reduce time & cost of the project.
• A good oil-oil / oil-condensate correlation tool established.
• The study explains the reason behind the porosity loss and poor reservoir characteristics in Lower Goru and Pariwar formations. It also explains the reasons for poor hydrocarbon retention capacity of these formations in terms of reservoir heterogeneity and likely areas of accumulation of hydrocarbons. The study will be useful in developing suitable interpretation work flow and future exploration strategies in this area.
• Integrated log analysis and mineralogical studies to identify productive petrofacies in LBS unit of Laplingaon Area of Assam Arakan Basin.
• The study has indicated dominantly open micro cleat system and rank of the coal are found to be favorable for pursuing further CBM activities in the area.
• Multi component seismic is a developing tool which is meant for special studies and reservoir characterization. Present study will establish the in-house capability of processing Multi component data. It is a R&D project. Processing of long offset seismic data requires special treatment and may be different in many ways in comparison to conventional seismic data processing. Proper utilization of reflections captured at longer offset can help in deeper seismic imaging including sub-basalt imaging.
• It will be helpful in the identification of probable gas bearing zones in low impedance area, where normal interpretation is difficult because of lack of seismic signature.
• It will be helpful in distinguishing between gas sands and water bearing sands. If the present study is successful, it will be applied on other areas of similar problems.
• Development of new concept for identifying gas/oil bearing zones.
• This project will be helpful in identifying the zone of Gas Hydrates in the deep water area of KG Offshore. Till date no attempt has been made to map the gas hydrate zone combining seismic and log and this project will attempt to do this task.
• This project is mainly useful for deciding various field/processing parameters for different images below the basaltic layers which cannot be imagined using conventional methods. This modeling is a prelude to subsequent acquisition and processing technique especially in the areas where the sub basalt image does not appear in the seismic section.
• Amongst the new development schemes are Linch, Bechraji, Santhal, Nardipur Low, K-VA of Kalol field, Viraj, GS-12 sand of Gandhar, Kaikalur, Kanjirangudi, B-173A, KG-DWN-98/2 prospects and G-1/GS-15. After study for field scale WAG implementation in GS-11 sand of Gandhar field, WAG pilot in GS-9 sand have been studied showing scope of recovery enhancement.
• ASP flood pilot in Jhalora K-IV sand has shown initial encouraging results and pilot expansion is being planned.
• Study for targeting bypassed oil in mature Ankleshwar field has shown scope for further enhancement in recovery in sand S3+4. The learning was extended to other sands namely S1, S5, S6+7 and S8+9 and suitable workover candidate wells along with infill wells have been identified. The workover and drilling results are encouraging.
• The revival efforts of ISC process in Santhal and Balol have started showing positive results. Oil production in Santhal field has increased from the low of 830 tpd to +1500 tpd. Similarly oil production in Balol is also picking up (from low of 180 tpd to about 190 tpd).
• IOR scheme for Bechraji field indicated significant enhancement in oil production level with enhanced liquid withdrawal along with infill drilling in the field.
• Integrated model of Greater Bassein was prepared resulting in enhanced/sustained production profile of gas from the giant gas field.
• Streamline Modeling through in-house developed software in MHS for better water flood management was carried out. Studies for development of B-127/B-59 cluster were carried out envisaging peak oil rate of 8600 BOPD.
Bioremediation at Nawagam, Ahmedabad
68 69
• Development studies of Kanjirangudi, major gas field of Cauvery Asset, indicate potential of 3-fold increase in gas production from current rate of about 4.5 LCMD.
3 3• Similarly, studies on Kaikalur in Rajamundry Asset envisage increase in gas production rate from present 50000 m /d to +300000 m /d with high angle wells.
• Mega G&G models for Limbodra, Agartala Dome and Greater Bassein fields were prepared in 2010-11.
• In areas of unconventional energy, simulation of CBM with dual porosity model has been carried out for Bokaro block with vertical well placement and the development plan is under consideration at DGH.
• On UCG front, the engineering design of Vastan UCG pilot has been completed. The environmental clearance for UCG pilot has also been obtained and application for ML has been submitted to Ministry of Coal. The schedule of first gas from Vastan pilot is after 15 months of obtaining ML and first commercial gas is expected after next 36 months.
• The indigenously developed Microbial bacterial consortia have been successfully applied in highly viscous Charada#3 for improving oil mobility. After microbial treatment, the viscosity has been reduced from +900000 cp to 6100 cp and production is stabilized in the well as
3well with cumulative oil production of about 300 m . Maiden field trial of high temperature MEOR is planned in South Kadi field (SK#111). Collaborative work on methanogenes suggests more methanogenes from coal in comparison to oil reservoirs. Complex simulation models of thermal and chemical EOR were put on stream with the help of cluster system and CMG’s parallel processor with Dynagrid facility. This significantly reduced the runtime in the existing models for EOR processes.
• Microbial Enhanced Oil Recovery (MEOR) jobs have been successfully carried out in 5 wells of Assam Asset.
• Feasibility studies of Cationics as Non Damaging drilling fluid and Non Invasive fluid.
Benefits: Prevention of pay zone damage, enhancement of drilling efficiency through control of mud loss and mitigation of well bore instability are few benefits associated with Cationics.
• Challenges in casing cementation in salt dome formations.
Benefits: As a pro-active measure to gear ONGC with in-house facilities and expertise to case in salt dome formations without any complications.
• Mineralogical study for drilling through Babaguru formation without dampening ROP and borehole stability.
Benefits: Enhancement of ROP in Babaguru formation, enhancement in drilling productivity.
• Optimization of Mud System to overcome borehole instability in Nandasan area.
Benefits: Stabilised borehole, enhancement of productivity.
• Feasibility for use of low solid (Non Damaging) mud system / or LTMOBM (Low Toxic Mineral Oil Base Mud) in Cauvery Basin for effective removal of drill cuttings, improving ROP and minimize formation exposure time.
Benefits: Trouble free drilling with minimum hassles as far as the drilling fluid engineering is concerned. Should ultimately result in improving the present ROP of 1.68 m/ hour.
• Well clean up solutions for water base system and LTMOBM for HPHT wells.
Benefits: Reduction in activation time and increased productivity of reservoirs.
• Formulation of high density based reservoir drill in completion fluids for Tapti Daman fields (Mumbai region) and Rajahmundry Asset.
Benefits: Development of drill in (NDDF) fluids for Tapti Daman fields and Rajahmundry asset.
• Feasibility of development of low toxic mineral base oil indigenously for offshore and onshore drilling operations.
Benefits: This should lead to drastic savings to ONGC, if we are able to substitute imported base oil with indigenously available resources.
• Identification and evaluation of compatible lubricants for LTMOBM and brines for reduction in torque/drag in ERD wells of Mumbai offshore.
3. Institute of Drilling Technology: Specific area in which R&D was carried out during 2010-11 & benefits derived as a result of theabove R&D
Benefits: Reduction in torque/ drag in ERD wells of Mumbai Offshore.
• Poor bond (under 0 psi) in small interval within the zone of interest, whereas the other depths being very good cement bond. Also for the suggestion to avoid such phenomenon.
Benefits: Lessons learnt during the poor cement bond against producing zones and redesigning of improved cement slurry would mitigate the problems in near future.
• Detail study of the effect of contamination of cement slurry with LTMOBM and water base mud system separately for 'C' series fields of Mumbai Region for OWC (DCF & ACC).
Benefits: Analysis of the problem by which cement is being contaminated with mud systems & insight to the causes of contamination problem shall enable the operators to take suitable corrective measures to eliminate/minimize cement contamination with mud systems.
• Field support services for framing drilling fluid policies for Hitech wells as and when proposed by different Asset and Basin.
Benefits: Successful and complication free drilling of the well.
• HTHP slurry design for long liner casing cementation with wide temperature difference at bottom and hanger top for KG Project.
Benefits: A base line data will be prepared for well planning of HTHP wells with long liner and wide temperature difference at bottom and top by designing suitable cement slurry.
• Spacer design with indigenous chemicals for cementation with SOBM system.
Benefits: Successful removal of mud cake, isolating LTOBM from cement slurry and its uncontaminated recovery and improving cement job/bond, providing perfect zonal isolation.
• Field implementation of Polyamines enhanced high performance water base mud (HPWBM) system in Mehsana.
Benefits: Replacement of KCl, minimising accretion, enhancing drilling productivity, ecofriendly system.
• Field implementation of IDT developed cross linked stiff rubbery gel loss control solutions for wells in Western offshore.
Benefits: Recently developed LCM can be used in wide range of temperature during drilling. This pill can also be used before cement to stop the dilution and migration effect of cement in loss zone which provides the temporary barrier to cement. The benefit from this study would be self reliance in technology in the development and evaluation of LCM formulated with indigenous products easily available in local market.
• Cementing operation simulation planning of critical wells cementation.
Benefits: Assured well integrity and well life through optimization of cementing program.
• Slurry design for casing cementation of ongoing field exploration/development projects.
Benefits: Customized cement slurry designing will enable good cementation jobs leading to perfect zonal isolation of wells in these work centers. MBP, Kolkata; CBM, Bokaro; FB, Dehradun are dependent on IDT for cement slurry design as there are no cementing laboratories at these work centers. Few specific slurries are also tailor made for KG and Tripura.
• Technology Advances, Challenges, Best Practices in Underbalanced Drilling and its feasibility in ONGC.
Benefits: Successful and faster completion of Deep Water wells. Reduction of well cost by optimizing well planning w.r.t. utilizing/ implementing industry’s latest trends in drilling in Deep Waters. Minimizes formation damage resulting in increased production.
• Well Planning for Well # BM-S-73 of Santos Basin, Brazil and well # N-34/35, Cuba.
Benefits: Successful and timely completion of the wells.
• Study of wells above 4500 mts with suggestive Casing Policy for Assam Asset.
Benefits: Successful and timely completion of the wells.
• Well profile & plan for Tapti Daman Block with large production casing size (9-5/8”) in pay zone for higher productivity per well.
Benefits: Successful and timely completion of the wells.
70 71
• Casing Policy for exploitation of hydrocarbons from Upper, Lower and Deeper pay zones of Nawagam field of Ahmedabad Asset.
Benefits: Successful and timely completion of the wells.
• Development of 20 marginal fields through outsourcing.
• Field trial is proposed for the execution of lab findings for enhancing oil production/assuring fluid flow improvement.
• Acquisition of state of the art Mercury free PVT equipment for generation of PVT data for catering the needs of operational area of ONGC.
• Assessment of polymer gel formulation for disproportionate permeability reduction thereby reducing the time and cost for rig less WSO jobs.
• Ultimate objective is to develop three dimensional model of permeability and storage capacity which can be useful for better understanding of reservoir heterogeneity as well as for more realistic performance prediction.
• The existing geomicrobial surface prospecting technique for evaluating the hydrocarbon prospects of an area will be substituted by the newly developed rapid geomicrobial technique.
• The developed methodology for selection of samples for further molecular level geochemical characterization will be applied in new frontier areas.
• The light hydrocarbons study to be further extended to Karaikal Horst- Nagapattinam sub-basin of Cauvery Basin for the year 2011-12.
• Procurement of high temperature and high pressure AVS instrument and NGS equipment is planned for the year 2011-12.
• Identify & initiate purchase of latest hardware to suit prevailing requirements of latest State of Art Technology software from reputed vendors for strengthening OH-log data evaluation capabilities.
• Continuous in-situ estimation of Archie’s cementation exponent ‘m’ in fresh water formations drilled with high salinity mud systems and its application in petrophysical evaluation of shaly sand reservoirs.
• Gas Hydrate Exploration in Indian Offshore Areas.
• Exploring the Shale Gas potential of Damodar Valley Basin.
• Assessment of disproportionate permeability reduction by various pore filling polymer gels for rig-less water shut-off jobs.
• Integrated log analysis and mineralogical studies to identify productive petrofacies in LBS unit of Laplingaon area.
• API of Gravity, Magnetic & MT data in Chambal Valley.
• Hydro-geochemical evaluation of formation/surface/effluent water samples and major/trace element analysis of oil/soil/sediment/chemical samples.
• Feasibility study of selected Micro algae for Hydrocarbon Production.
• Collaborative work on MEOR application in high temperature reservoirs. More field trials will be planned for establishing the process.
• MEOR for mitigating wax deposition in Offshore wherein the technology is to be tried in new surface flow lines.
• Micro CT image analysis on core samples of sandstone reservoirs has been carried out in Laiplingaon field. Similar studies for more complex sandstone systems will be taken up.
• “End user PC Training” project has been taken up to increase IT proficiency of ONGC officials and executives. The modules covered are Desk top Management, MS Office, E-mail Lotus Notes and detailed applications on Smart Mobile.
• Upgradation and revamping of IT Infrastructure including upgradation of enterprise IT Network is being taken up. This will be implemented through hiring of consultant services.
• To provide high bandwidth broadband connectivity to remote installations in NE and South for Voice and IT applications, Point to Multi Point communication system has been planned and under process of implementation.
4. Future plan of action
• Design, Development and Evaluation of mud loss control solutions for partial to total loss situation.
• Formulation of mud system with Clay hydration suppressant.
• Formulation of NDDF for drilling sub-hydrostatic reservoir facies in L-III and Bassein formation in western offshore areas.
• Identification of effective Pre-gelatinised starch as fluid loss agent for clay free NDDF reservoir drilling fluid.
• Formulation/recommendation of environment friendly higher performance drilling fluid system for high pressure wells of Tripura asset to phase out CL-CLS system.
• Dose optimization of Choline Chloride on shale samples of Wasna, Nawagaon, Mahilaj & Kalol field and to formulate best suited drilling fluid system with a combination of Choline Chloride and Sodium Chloride.
• To design a suitable mud system for drilling second phase of wells in Ankleshwar asset in the absence of CL-CLS-RL.
• Optimisation of Clay free drilling fluid for penetrating horizontal pay zones in South Khartar area, Jaisalmer basin.
• The means to minimise formation damage in low permeability formations drilled with high mud weights upto 1.80.
• Study on Choline Chloride as shale stabilizer with different core samples.
• Mud filterate damage and post drilling clean up in horizontal wells for sub hydrostatic reservoirs of Kalol- Nawagam field.
• Implementation of Choline Chloride in place of KCl in Geleky, Assam for a cost effective and environment friendly solution.
• Rheological studies of HTHP mud system over a temperature range.
• Field support services for framing drilling fluid policies for Hitech wells as and when proposed by different Asset and Basin.
• Field support services for testing drilling fluid formulations for Hitech wells as and when proposed by different Asset and Basin.
• Field support services for quality assurance of mud additives.
• Toxicology studies of different drilling fluids on marine organisms as per MOEF guidelines.
• Determination of Collapse pressure from Logs.
• Field implementation of Polyamines (Choline Chloride) enhanced high performance water base mud (HPWBM) system in Mehsana, Ankleshwar and Karaikal.
• Field implementation of Formate system in Mumbai.
• Spacer formulation for cementation of wells having Water Base Mud & Low Toxic Mineral Oil Mud system.
• Strategy for slim hole cementation in highly deviated wells having losses.
• Strategy to cure severe loss using cement plug in wells of “Vasai Field”.
• Explore application of well life concepts in development wells to prolong useful life of the well.
• Slurry design & Cementing technique for Shallow Wells in Ankleshwar & Cambay Asset.
• Cement slurry design for cementation jobs through CTU.
• Field Implementation of PPC in oil well cementation.
• Cementing Operation simulation planning of critical wells.
• Slurry design for casing cementation of ongoing exploration/development wells.
• Study of Blowouts and Consequent Major Disasters in ONGC & Hydrocarbon Industry Worldwide. Lessons Learnt and Remedial Measures.
• Technology Advances, Challenges in Laser Drilling Technology and its likely application.
• Well Planning and Casing Design for well, CYON041NCAB, TD 5013m/Basement.
72 73
• Study of Silchar Wells for probable application of Turbo Drilling.
• Repairing 20” Damaged/Corroded Conductor Casing/Well Head of Water Injector Platforms. (WI-11, WI-4, WI-2, WI-8) of MH Asset.
• Planning & Design of High Angle Well KIDA.
• Drilling Well on Paper (DWOP) for Well IP-12 (Side Tracked) - ERD of MH.
• Borehole Stability studies for two wells each in Balol and Santhal field.
• Planning & Design for Sidetrack of Well AKM-1.
• Borehole Stability study for 4 wells each in Ankleshwar and Gandhar fields.
• Feasibility of Turbo-Drilling for Deeper Sections in Frontier Basin.
• Study of Coal Bed Methane field(s) for application of Underbalanced Drilling for exploitation of hydrocarbons.
• Collaborative study of suitable field(s) for MPD / UBD application and facilities required for technology implementation.
• Geo-mechanical studies of a specific area to build Geo-mechanical model in MHN field.
• Well Planning and Casing design for well, CYON041NCAA, TD 4914m / Basement.
• Study of Air Drilling of Deeper Sections & its applicability in Frontier Basin.
• Planning and Designing of deep wells in Koyana area (CDS, Mumbai).
• Revising Casing Policy of MH and B&S Fields.
• Adopted a two pronged strategy to arrest the decline/augment oil and gas production and improve recovery from mature fields through Redevelopment Schemes.
• Early monetization of Marginal Fields is now being made viable through induction of the state-of-the-art technologies, optimization of facilities, regrouping of fields etc.
• Commencement of production from Eastern Offshore expected end of July 2011.
• New wells under VSEA project which could not sustain initial production were successfully revived and put on production through technological intervention with the installation of Auto Gas Lift device. VSEA #15 has been completed with new technology “Cement installed external casing packer”.
• First time in western offshore, new development well VW # 4H completed with Auto Gas Lift of M/s Baker tools.
• Applied Merus Technology for reduction of scaling/paraffin deposition in well fluid/gas lift lines and riser.
• Hazira Plant: Upgradation of Gas Turbines No 1 & 2 from GE Speedtronic MARK –IV to MARK –VI was carried out. It is triple modular redundant system with complete integrated control, protection and monitoring system for generator and mechanical drive applications. With this upgrade power generation output is expected to increase by 10%. United Nations Framework Convention for Climate Change (UNFCCC) has registered the project as CDM project. The annual estimation of GHG emission abatement for the project is 7802 CER.
• Uran Plant: Pilot scale project for H S removal from acid gas: The pilot scale project was to absorb the H S present in acid gas and output of 2 2
H S shall be in the range of 0-3 ppm. The project has been successfully completed on 07.03.2011.2
• Vortex tube: The technology of Vortex tube has been implemented at Co-gen plant for panels installed in the open area. The implementation of cooling of panel with static equipment known as Vortex tube has reduced the failure of electronic control cards.
• Upgradation of twin lobe to tri lobe blower: The upgradation of twin lobe to tri lobe blower with enhanced features acoustic enclosures, enhanced capacity, modified cooling with water. The LOI has been placed on M/s Swam Pneumatics on 16.2.2011.
• Pilot operated safety valves: The Kalrez material has been introduced in the pilot operated safety valves. The high performance and safety kalrez seal material technology has been introduced in safety valve.
5. Technology absorption and adaptation
• Continuous Flow Isotope Ratio Mass Spectrometer (CF-IRMS): The technology is used to determine the hydrogen isotope ratio in addition to the molecular and carbon isotopic composition of natural gases. This technique has been utilized for genetically characterizing natural gases from Mahanadi and KG Basins.
• Coreval-30: Measurement of Porosity & Permeability.
• Helium Survey: Technology by M/s ‘Actual Geology’, Russia is being inducted and absorbed for Helium Survey. A pilot scale project “Helium survey for identification of sweet spots” is planned to be tested in Jaisalmer basin.
• Licensing of Interpretation Software: The following new software has been inducted: SKUA software from M/s Paradigm and Fugro Jason Work Bench Software.
• Procurement of Storage System Software: SATA-II disks based SAN storage systems has been procured.
• PERISCOPE (LWD): Resistivity imaging measurement used for precision placement of drain holes relative to reservoir boundaries water detection and avoidance and refining reservoir models thereby maximising production.
• Exploration of Uranium: ONGC Energy Center has undertaken a project to examine the archived logs of ONGC wells to identify potential uranium rich zones and generate geological models to predict uranium occurrence. Designing of leachents for in-situ leaching of uranium from sedimentary rocks is also planned. In-Situ Leaching (ISL) process is to be developed in collaboration with the Atomic Minerals Directorate for Exploration Research and Pune University for exploitation of uranium.
• Use of Video Conferencing has been facilitated and supported by Infocom Services, for enhanced communications, for EC/EPC meetings, VIP interactions and operations meetings. This has led to fast adaptation of Video Conferencing in the organization at various levels.
• To have an enterprise-level managed authentication and access to network resources, to improve ease of access to enterprise network for users on tour to other work centers and improved manageability of desktop PC environment, Active Directory Services was adapted and all user profiles and desktop PCs were migrated to single forest single domain architecture in the enterprise Active Directory. This shall streamline the software patches and updates management and allows centralized policy management related to desktops and laptops.
• Cross linked stiff rubbery gel for loss control: Successfully implemented in #MYAB, Cauvery asset, Karaikal and well VSEA# 2ZH,MR.
• Polyamine (Choline Chloride) base high performance water base mud in Mehsana: Extended to AWP 2011-12 as material under procurement. Implemented successfully in wells #LMHT; LMHR, Limbodra field in 2009-10 and wells # KLQK; # KLSK, Kalol field and #NGGO, Nawagaon field of Ahmedabad Asset in 2010-11. Application will be rolled out to Cauvery Asset, Karaikal and Ankleshwar Asset during 2011-12.
• Aldehyde based bactericide for KCl-PHPA system: Implemented successfully in wells # NRDI, # NRDF, #MRAI & #HZAC, A&AA Basin, Jorhat.
• Thermal and light weight cement slurry was used for cementation of development wells in in-situ fields of Mehsana Asset.
• Work over was done in 29 wells based on Cased Hole Formation Resistivity logs, resulted in oil gain of 195 TPD of Mehsana Asset.
• In Ahmedabad Asset, Integrated SRP Automation Project, first of its kind in Onshore Assets, for monitoring and optimization of 25 SRP wells thof South Kadi field launched on 7 June, 2010 at a cost of 34.7 million. Estimated cost saving on account of this project during the year was
22.2 million.
• Ahmedabad Asset has undertaken digitization of gas injection system in 20 wells of Kalol field on intermittent gas lift by installing Solenoid Operated Valves (SOVs) in place of Time Cycle Controller (TCC). This effort is expected to result in enhanced system reliability, better diagnosis for optimization, increased process visibility and staggering of injection time.
• Light Dependent Resistance (LDR) circuit for auto on/ off of outdoor lighting at CPP Lakwa has been introduced in Assam Asset.
• Rig Environment Detonator (RED) was used for the first time in well KPRAA to carryout shallow squeeze perforation at 155 m in Rajahmundry Asset.
• Rajahmundry Asset has taken in-house initiative of producing Mineral Turpentine Oil (MTO) in place of SKO by process modification and without any additional CAPEX or manpower. Initial lab test by M/s HPCL and that of quality parameters by IOGPT have been successful. Production of MTO is expected to generate additional revenue of about 180 million / annum. Production of MTO started from 01.04.11.
` `
`
74 75
th• Online Gas Chromatograph lined up for billing at Kovilkallapal and Ramnad installations from 16 February, 2011 and Kuthalam and Thiruvarur from first week of March, 2011 of Cauvery Asset.
rdSustainability Reporting: ONGC brought out its first ‘Sustainability Report” for FY-09-10 which was released in the AGM held on 23 September, 2010. This report has been prepared based on the reporting principles and methodology given in the Global Reporting Initiative (GRI) 2006 Sustainability Reporting Guidelines Version 3.0 (G3) guidelines. The report has been developed for GRI application level of B and has been externally assured by Det Norkse Veritas against Account Ability’s AA 1000 Assurance Standard 2008 (AA1000 AS 2008). Reporting boundary for the first report covers ONGC’s domestic exploration and production operations at onshore and offshore (excluding joint ventures and subsidiaries).
Waste to Energy project: TERI Enhanced Acidification & Methanation (TEAM) plant has been inaugurated at ONGC colony, Noida. The plant can handle kitchen/ organic waste up to 100 kg/ day and can generate 5 kg of biogas which is being used to run the kitchen of the Guest House.
Oil Spill Management: ONGC inked MoU with MPT, JNPT & other oil companies for the implementation of the National Oil Spill Disaster thContingency Plan (NOS-DCP) within Mumbai harbor on 18 February, 2011. In addition to this ONGC renewed its agreement on oil spill
response with OSRL, UK.
Bioremediation of Oily Sludge: An environmentally sound technique of bioremediation is being employed effectively in ONGC since 2007. More than 35000 tons of oily sludge was treated through bioremediation during the year 2010-11.
Ringal Plantation: In continuation of Ringal plantation in Upper Himalayan Region, ONGC signed phase II agreement with Uttarakhand Bamboo and Fiber Development Board (UBFDB), Dehradun for four lakh Ringal plantation in 160 ha in the Upper Himalayan Region. In the phase I of the project 0.337 million plantation was carried out in an area of 135 ha in Nandadevi biosphere and Kedarnath wild life division in Upper Himalayas.Apart from the above areas, Munsyari has also been included in phase II of the project for plantation.
Mangrove Plantation: Following the successful implementation of the project on mangrove plantation at Ankleshwar, ONGC inked an MOU with BNHS for phase II of the project to continue mangrove plantations at Ankleshwar and also has included Hazira for new plantations.
Greening the Vendor Chain: A vendors meet focusing on greening the vendor’s chain on the topic “Greening the supply chain –carbon rd thmanagement and sustainable development” was organized on 23 -24 February, 2011. This is part of the phased implementation of the
approved work program under “Greening the vendors chain”.
• Carbon Management Group steered to make Petrotech 2010 a carbon neutral event, a first in the history of Petrotech. This was made possible by purchasing 3144 verified emission reduction units (VER).
• 2 million contribution made towards “SAVE LIONS” in Gir Forest to Govt. of Gujarat.
• Gas flaring in ONGC has been reduced from 6.0% of production in 2001-02 to 2.72 % of production in 2010-11, a reduction of 55 %.
• In continuous effort for environment protection, IEOT has developed a non-carcinogenic corrosion inhibitor composition as a substitute to sodium dichromate to prevent the corrosion of Carbon Steel down hole tubing and casing. The patent for the same has been filed and is under examination.
6. Environment Protection and Conservation, Technological Conservation, Renewable energy developments, Foreign Exchange Conservation
Other Initiatives:
`
7. Information regarding imported technology for last five years
S. No. Technology Imported Year
A (i) • Data Station (DASTA – 720) 2006-07
• GV Isoprime Continuous Flow Isotope Ratio Mass Spectrometry (CF-IRMS)
• Varian CP3800 Natural Gas Analyzer
• GC-MS-MS (Varian)
• Latest releases of Landmark/Hampson Russell/Jason/GeoQuest Interpretation Software installedas part of regular M&S
• Geo-Vision Centre (Virtual Reality Centre) with SGI Onyx 3900 Server (16 CPU, 64 GB RAM) installed for 3 Pipe, Curved screen, immersive volume visualization using the software from M/s Paradigm
• Petrel Suite of Software along with Interactive Petrophysics from M/s GeoQuest Systems Installed
• Latest release of Solaris Operating System version 10 installed and configured for future migration of Landmark Application Software
• Netvault Backup Software for Lanfree/SAN backup installed
• ZFS (Zeta Byte file system) was created on one SUN machine with Solaris 10 for performance evaluation with respect to existing UFS file system
• BigIron Foundry Gigabit Ethernet switch upgraded to 120 gigabit fiber ports along with redundant power module to provide seamless gigabit network connectivity to all servers and clients throughout GEOPIC
• EPOS3SE upgraded to RFC (Rock & Fluid Canvas)
• Q – Marine
• Sea bed logging
• GX Technology
• Digital Multilevel Vertical seismic profiling (VSP)
• Air borne Electromagnetic Survey
• Multi Transient Electro Magnetic (MTEM) technique
• Virtual Drilling Technology
(ii) • Rapid Solvent Extraction Unit (Soxtherm System) 2007-08
• Petrobank Master Data Store (MDS), from M/s Halliburton Offshore Services Inc.-a multi-client solution for the management of E&P technical data
• 64 CPUs SGI ALTIX machine
• 48 node IBM PC Cluster system with dual CPU per node equipped with Geocluster4.1 application software of M/s CGG
• 272 node IBM PC Cluster system with dual CPU per node equipped with OMEGA application software of M/s Western Geco
• Corporate Licensing of Interpretation software from M/s Hampson Russel, M/s Landmark, M/s Geoquest and M/s Paradigm
• CGG Geocluster application software for processing
• WGC Omega: application software for processing
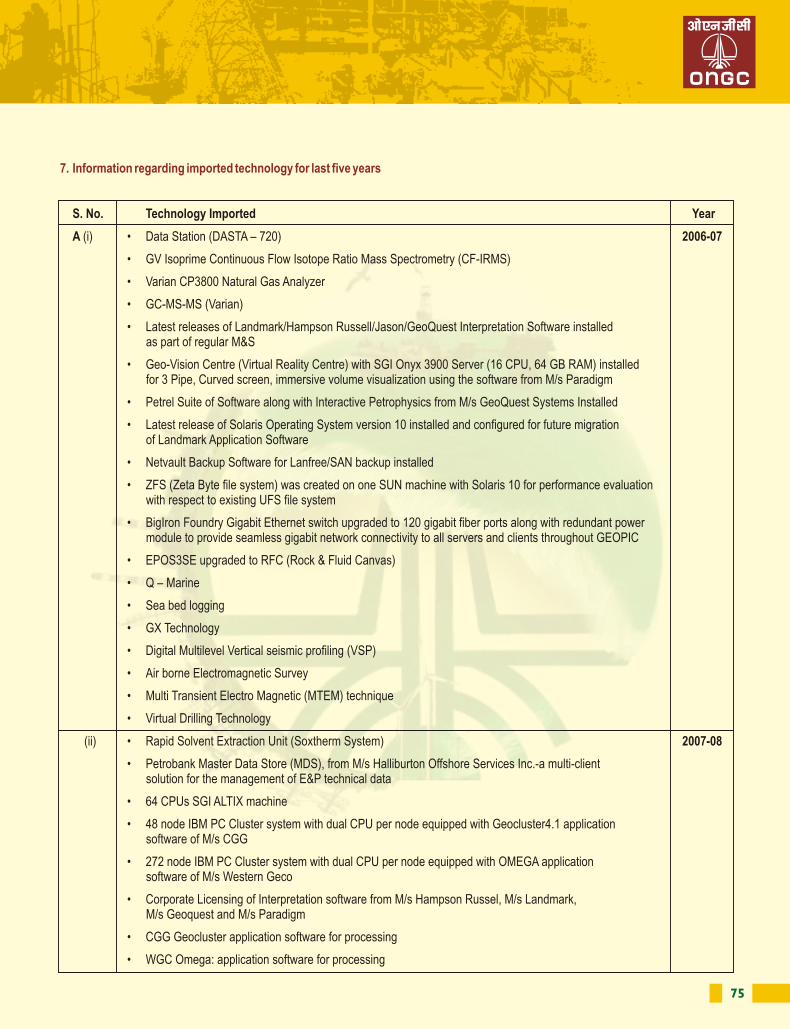
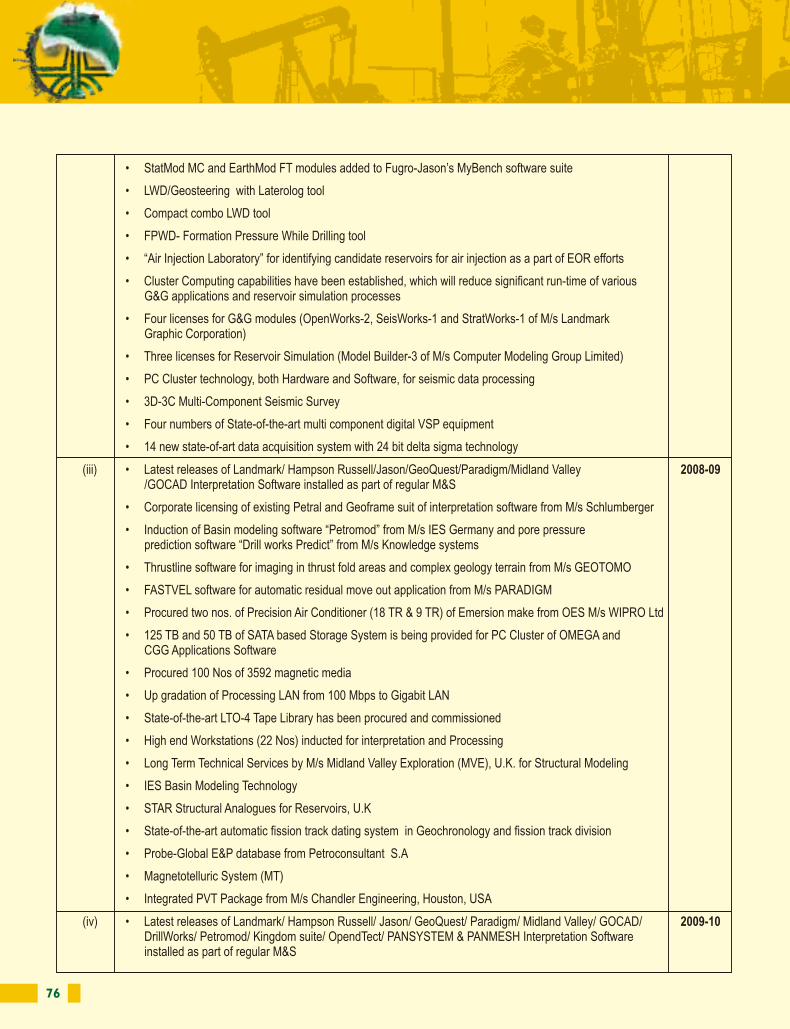
76 77
• StatMod MC and EarthMod FT modules added to Fugro-Jason’s MyBench software suite
• LWD/Geosteering with Laterolog tool
• Compact combo LWD tool
• FPWD- Formation Pressure While Drilling tool
• “Air Injection Laboratory” for identifying candidate reservoirs for air injection as a part of EOR efforts
• Cluster Computing capabilities have been established, which will reduce significant run-time of various G&G applications and reservoir simulation processes
• Four licenses for G&G modules (OpenWorks-2, SeisWorks-1 and StratWorks-1 of M/s Landmark Graphic Corporation)
• Three licenses for Reservoir Simulation (Model Builder-3 of M/s Computer Modeling Group Limited)
• PC Cluster technology, both Hardware and Software, for seismic data processing
• 3D-3C Multi-Component Seismic Survey
• Four numbers of State-of-the-art multi component digital VSP equipment
• 14 new state-of-art data acquisition system with 24 bit delta sigma technology
(iii) • Latest releases of Landmark/ Hampson Russell/Jason/GeoQuest/Paradigm/Midland Valley 2008-09/GOCAD Interpretation Software installed as part of regular M&S
• Corporate licensing of existing Petral and Geoframe suit of interpretation software from M/s Schlumberger
• Induction of Basin modeling software “Petromod” from M/s IES Germany and pore pressure prediction software “Drill works Predict” from M/s Knowledge systems
• Thrustline software for imaging in thrust fold areas and complex geology terrain from M/s GEOTOMO
• FASTVEL software for automatic residual move out application from M/s PARADIGM
• Procured two nos. of Precision Air Conditioner (18 TR & 9 TR) of Emersion make from OES M/s WIPRO Ltd
• 125 TB and 50 TB of SATA based Storage System is being provided for PC Cluster of OMEGA and CGG Applications Software
• Procured 100 Nos of 3592 magnetic media
• Up gradation of Processing LAN from 100 Mbps to Gigabit LAN
• State-of-the-art LTO-4 Tape Library has been procured and commissioned
• High end Workstations (22 Nos) inducted for interpretation and Processing
• Long Term Technical Services by M/s Midland Valley Exploration (MVE), U.K. for Structural Modeling
• IES Basin Modeling Technology
• STAR Structural Analogues for Reservoirs, U.K
• State-of-the-art automatic fission track dating system in Geochronology and fission track division
• Probe-Global E&P database from Petroconsultant S.A
• Magnetotelluric System (MT)
• Integrated PVT Package from M/s Chandler Engineering, Houston, USA
(iv) • Latest releases of Landmark/ Hampson Russell/ Jason/ GeoQuest/ Paradigm/ Midland Valley/ GOCAD/ 2009-10DrillWorks/ Petromod/ Kingdom suite/ OpendTect/ PANSYSTEM & PANMESH Interpretation Software installed as part of regular M&S
• Unlimited site specific license of PANSYSTEM s/w for all ONGC offices within corporate deal and 3 licenses of PANMESH s/w under corporate license from M/s EPS
• 100% Corporate licensing of Geoframe/ Petrel s/w from M/s GeoQuest and finalization of its corporate AMC
• 100% corporate licensing of Paradigm interpretation s/w and finalization of its corporate AMC
• RokDoc software (1D/ 2D/ 3D/ Chronoseis) from M/s ICON SCIENCE has been inducted in GEOPIC
• IES Basin Modeling Technology
• Auto Counting FT system
• Landmark’s R5000 software was successfully installed in Linux Based workstation
• Pipe conveyed logging system
(v) • Continuous Flow Isotope Ratio Mass Spectrometer (CF-IRMS) 2010-11
• COREVAL-30
• SKUA software from M/s Paradigm
• Fugro Jason Work Bench Software
• SATA-II disks based SAN storage systems
B Has the technology been fully absorbed? Yes
C If not fully absorbed, areas where this has not taken place, reasons thereof, and future plans of action N/A
2010-11 2009-10
Capital 134.33 213.67
Recurring 4,329.93 1.985.78
Total 4,464.26 2,199.45
Total R&D Expenditure as a percentage of Total Turnover 0.62% 0.35%
2010-11 2009-10
Foreign Exchange Earnings 47,115.50 45,870.97
Foreign Exchange Outgo 181,531.72 147,775.81
8. Expenditure on Research & Development
9. Information on Foreign Exchange Earnings and Outgo
(` in million)
(` in million)
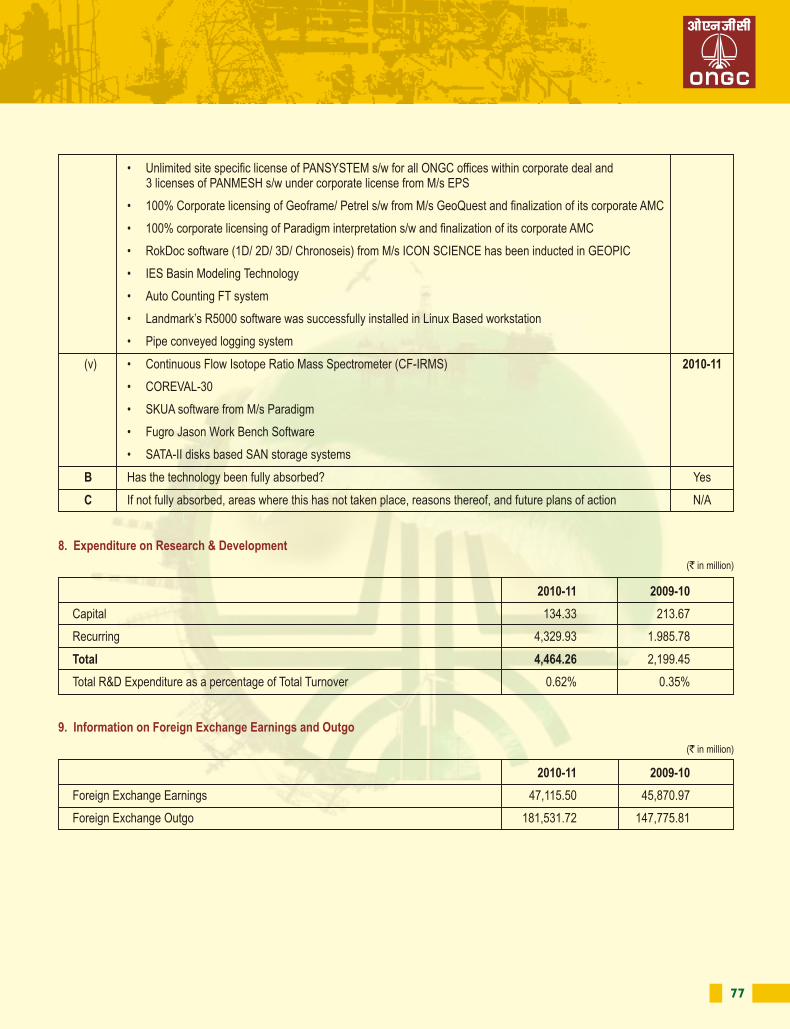
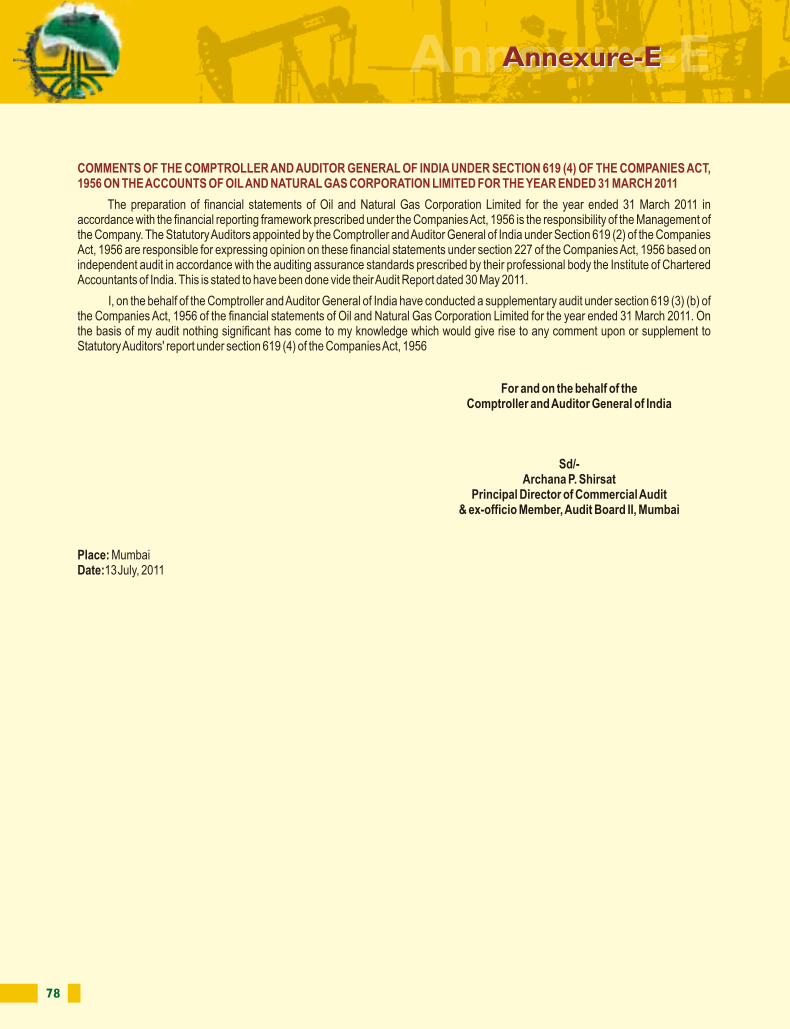
78 79
COMMENTS OF THE COMPTROLLER AND AUDITOR GENERAL OF INDIA UNDER SECTION 619 (4) OF THE COMPANIES ACT, 1956 ON THE ACCOUNTS OF OIL AND NATURAL GAS CORPORATION LIMITED FOR THE YEAR ENDED 31 MARCH 2011
The preparation of financial statements of Oil and Natural Gas Corporation Limited for the year ended 31 March 2011 in accordance with the financial reporting framework prescribed under the Companies Act, 1956 is the responsibility of the Management of the Company. The Statutory Auditors appointed by the Comptroller and Auditor General of India under Section 619 (2) of the Companies Act, 1956 are responsible for expressing opinion on these financial statements under section 227 of the Companies Act, 1956 based on independent audit in accordance with the auditing assurance standards prescribed by their professional body the Institute of Chartered Accountants of India. This is stated to have been done vide their Audit Report dated 30 May 2011.
I, on the behalf of the Comptroller and Auditor General of India have conducted a supplementary audit under section 619 (3) (b) of the Companies Act, 1956 of the financial statements of Oil and Natural Gas Corporation Limited for the year ended 31 March 2011. On the basis of my audit nothing significant has come to my knowledge which would give rise to any comment upon or supplement to Statutory Auditors' report under section 619 (4) of the Companies Act, 1956
For and on the behalf of theComptroller and Auditor General of India
Sd/-Archana P. Shirsat
Principal Director of Commercial Audit& ex-officio Member, Audit Board II, Mumbai
Place: Mumbai Date:13July, 2011
The victory sign : Fighting odds and winning in crisis management
Annexure-EAnnexure-E
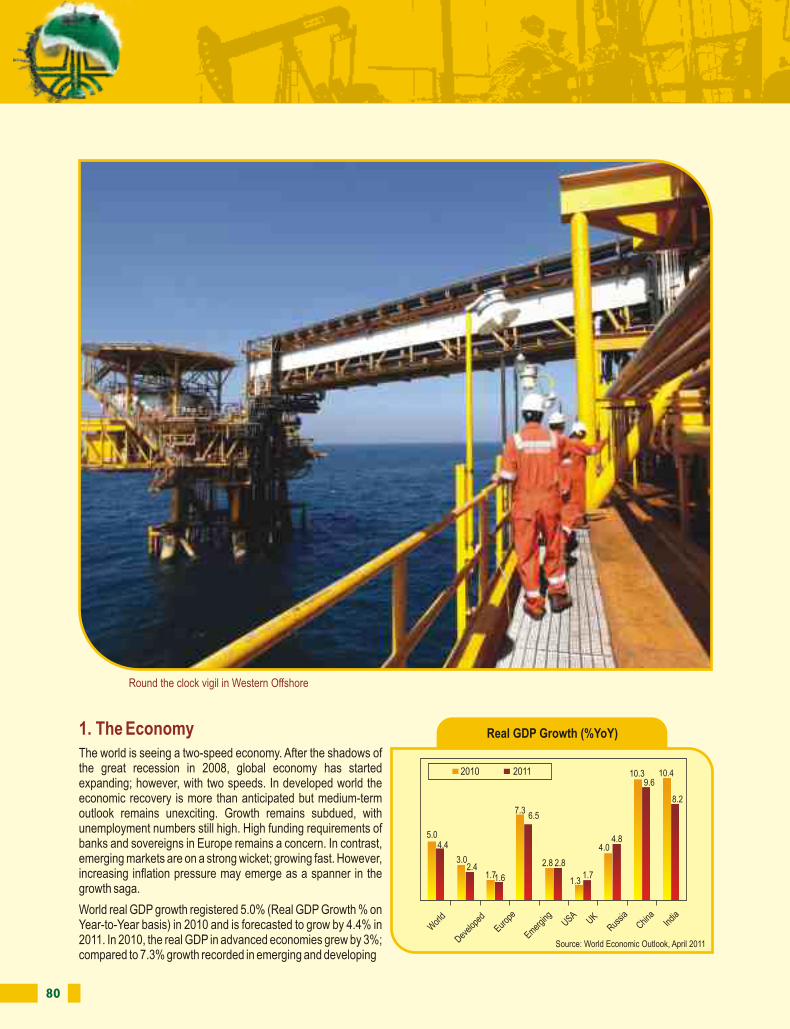
80 81
1. The EconomyThe world is seeing a two-speed economy. After the shadows of the great recession in 2008, global economy has started expanding; however, with two speeds. In developed world the economic recovery is more than anticipated but medium-term outlook remains unexciting. Growth remains subdued, with unemployment numbers still high. High funding requirements of banks and sovereigns in Europe remains a concern. In contrast, emerging markets are on a strong wicket; growing fast. However, increasing inflation pressure may emerge as a spanner in the growth saga.
World real GDP growth registered 5.0% (Real GDP Growth % on Year-to-Year basis) in 2010 and is forecasted to grow by 4.4% in 2011. In 2010, the real GDP in advanced economies grew by 3%; compared to 7.3% growth recorded in emerging and developing
Round the clock vigil in Western Offshore
Real GDP Growth (%YoY)
2010 2011
Wor
ld
Develo
ped
Europ
e
Emergin
gUSA
UKRus
siaChin
aInd
ia
5.04.4
3.02.4
1.71.6
6.57.3
2.8 2.8
4.0
1.31.7
4.8
10.39.6
10.4
8.2
Management Discussion and Analysis ReportManagement Discussion and Analysis Report
10 largest economies in the world (US$ billion)
14,658
10,086
4,310 4,060
2,9402,223 2,173 2,172 2,145 1,774
USAChin
a
Japa
nInd
ia
Russia UK
Brazil
Franc
eIta
ly
German
y
Source : World Economic Outlook Database, April 2011
economies; India and China grew by 10.4% and 10.3% respectively. World Economic Outlook (April, 2011) has projected that GDP of advanced and emerging economies will grow by 2.4% and 6.5% respectively in 2011 (Source: World Economic Outlook, April 2011 and International Monetary Fund Publication).
Post liberalization the Indian economy progressed at rapid pace registering 8-9% growth in recent years and now it is the fourth largest economy in the world (in purchasing power parity terms) after the United States of America, China and Japan (Source: World Economic Outlook Database, April 2011).
For the last fiscal 2010-11, the overall growth of GDP at factor cost at constant prices, as per advance estimates (Feb’11), was pegged at 8.6 per cent; representing an increase from the revised growth estimates of 8.0 per cent made during 2009-10. CMIE expects India's economy to maintain the over 8% trajectory in FY'12. The WEO, April, 2011 report, too has only slightly moderated India’s GDP growth estimates to 8.2% in 2011 and 7.8% in 2012 which is still expected to retain above trend.
2010 proved to be the second strongest year for global oil demand growth in the past 30 years, with absolute demand levels expected to surpass pre-recession highs. During 2010 the total liquid supply grew by 2.4% (from 82.96 mb/d in 2009 to 84.96 mb/d in 2010). It is projected that the demand may rise to 86.37 mb/d in 2011 and 87.83 mb/d in 2012 (Source: PFC Energy).
Rising prosperity fuelled by economic growth in the emerging economies and also strong demand in Middle East are driving strong demand for oil and other energy sources. The WEO, 2011, expects that the difference between supply and demand would be made up from rising production of natural gas liquids and unconventional oil, notably Canadian oil sands and biofuels.
During 2010, the liquid supply from non-OPEC countries averaged 41.77 mb/d; 49.2% of the total supplies against OPEC average supplies of 29.21 mb/d (34.4%). Natural Gas Liquid (NGL) and condensate supply has been around 13.98 mb/d (16.4% of the total liquid supply). Gains in non-OPEC supplies and NGL is good news for the industry.
However, the political unrest in Middle East and North African (MENA) region is likely to have adverse impact on crude oil supplies. Gulf states currently remain stable; however, sentiments may dampen in case MENA unrest intensifies. This delicate balance may be worrisome for supply side and in turn consequently may upset oil market dynamics.
2.Oil & Gas Industry & developmentsIncreasing oil demand
Crude oil supplies
Global Liquid supply
Mill
ion
barr
els
per
day-
----
>
82.7882.17
84.23
83.34 82.96
84.96
86.37
87.83
2005 2006 2007 2008 2009 2010 2011 2012
Global Liquid supply (mb/d)
100
90
80
70
60
50
40
30
20
10
0
2000 2001 2002 2003 2004 2005 2006 2007 2008 2009 2010 2011 2012
OPEC Crude Non-OPEC Crude NGL+Condendsate
Source: World Economic Outlook, April 2011
Source: PFC Energy (www.pfcenergy.com)
Source: PFC Energy (www.pfcenergy.com)
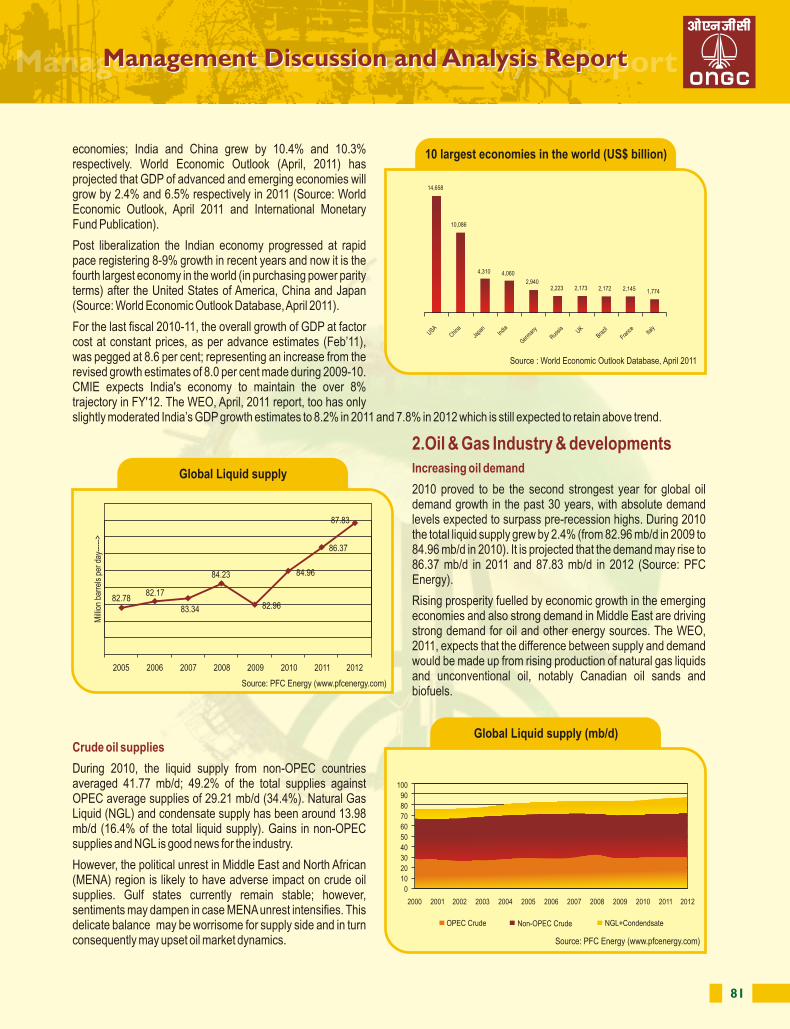
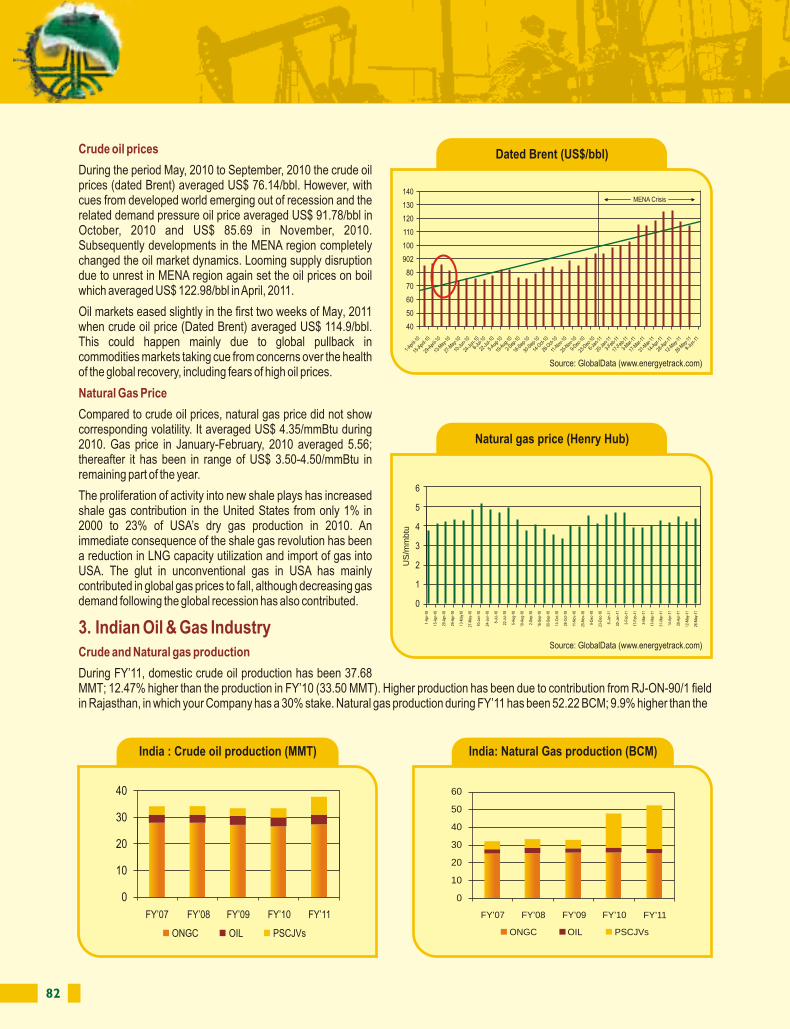
82 83
Crude oil prices
Natural Gas Price
3. Indian Oil & Gas IndustryCrude and Natural gas production
During the period May, 2010 to September, 2010 the crude oil prices (dated Brent) averaged US$ 76.14/bbl. However, with cues from developed world emerging out of recession and the related demand pressure oil price averaged US$ 91.78/bbl in October, 2010 and US$ 85.69 in November, 2010. Subsequently developments in the MENA region completely changed the oil market dynamics. Looming supply disruption due to unrest in MENA region again set the oil prices on boil which averaged US$ 122.98/bbl in April, 2011.
Oil markets eased slightly in the first two weeks of May, 2011 when crude oil price (Dated Brent) averaged US$ 114.9/bbl. This could happen mainly due to global pullback in commodities markets taking cue from concerns over the health of the global recovery, including fears of high oil prices.
Compared to crude oil prices, natural gas price did not show corresponding volatility. It averaged US$ 4.35/mmBtu during 2010. Gas price in January-February, 2010 averaged 5.56; thereafter it has been in range of US$ 3.50-4.50/mmBtu in remaining part of the year.
The proliferation of activity into new shale plays has increased shale gas contribution in the United States from only 1% in 2000 to 23% of USA’s dry gas production in 2010. An immediate consequence of the shale gas revolution has been a reduction in LNG capacity utilization and import of gas into USA. The glut in unconventional gas in USA has mainly contributed in global gas prices to fall, although decreasing gas demand following the global recession has also contributed.
During FY’11, domestic crude oil production has been 37.68 MMT; 12.47% higher than the production in FY’10 (33.50 MMT). Higher production has been due to contribution from RJ-ON-90/1 field in Rajasthan, in which your Company has a 30% stake. Natural gas production during FY’11 has been 52.22 BCM; 9.9% higher than the
Dated Brent (US$/bbl)
140
130
120
110
100
902
80
70
60
50
40
1-Apr
il-10
15-A
pril-1
0
29-A
pril-1
0
13-M
ay-1
0
27-M
ay-1
0
10-Ju
n-10
24-Ju
n-10
8-Ju
l-10
22-Ju
l-10
5-Aug
-10
19-A
ug-1
0
2-Sep
-10
16-S
ep-1
0
30-S
ep-1
0
14-O
ct-10
28-O
ct-10
11-N
ov-1
0
25-N
ov-1
0
9-Dec
-10
23-D
ec-1
0
6-Ja
n-11
20-Ja
n-11
3-Feb
-11
17-F
eb-11
3-Mar
-11
17-M
ar-11
31-M
ar-11
14-A
pr-11
28-A
pr-11
12-M
ay-11
26-M
ay-11
9-Ju
n-11
MENA Crisis
Natural gas price (Henry Hub)
6
5
4
3
2
1
0
US
/mm
btu
1-A
pr-1
0
15-A
pr-1
0
29-A
pr-1
0
29-A
pr-1
0
13-M
ay10
27-M
ay-1
0
10-J
un-1
0
24-J
un-1
0
8-Ju
l-10
22-J
ul-1
0
5-A
ug-1
0
19-A
ug-1
0
2-S
ep-1
0
16-S
ep-1
0
30-S
ep-1
0
14-O
ct-1
0
28-O
ct-1
0
11-N
ov-1
0
25-N
ov-1
0
9-D
ec-1
0
23-D
ec-1
0
6-Ja
n-11
20-J
an-1
1
3-F
eb-1
1
17-F
eb-1
1
3-M
ar-1
1
17-M
ar-1
1
31-M
ar-1
1
14-A
pr-1
1
28-A
pr-1
1
12-M
ay-1
1
26-M
ay-1
1
40
30
20
10
0
FY’07 FY’08 FY’09 FY’10 FY’11
ONGC OIL PSCJVs
India : Crude oil production (MMT) India: Natural Gas production (BCM)
60
50
40
30
20
10
0
FY’07 FY’08 FY’09 FY’10 FY’11
ONGC OIL PSCJVs
production during FY’10 (47.51 MMT) mainly on account of higher contribution from East Coast fields. (Source: MoP&NG and ONGC data).
During FY’11, your Company has been the largest producer of the oil and gas in the country; contributing 72.4% of the crude oil and 48.5% of the natural gas production.
During the year 2010-11, total consumption of petroleum products has been 141.75 MMT; 2.86% higher than the previous year 2009-10 (Source: PPAC, MoP&NG).
Among the petroleum products, Motor Spirit (MS) registered highest consumption growth which increased by 10.78%; Liquefied Petroleum Gas (LPG) consumption increased by 9.07%; Aviation Turbine Fuel (ATF) registered a growth of 9.75%; Naphtha by 5.35% and HSD by 6.65%. These products constitute about 74% of the consumption basket. Rest of the products like Superior Kerosene Oil (SKO), Bitumen, Lubes, LDO, FO/LSHS and other products registered decline in consumption over 2009-10.
The subsidized products i.e., SKO (6%), HSD (42%) and LPG (10%), accounted for 58% of the total petroleum products consumption.
The composition of Indian Basket of Crude represents Average of Oman & Dubai for sour grades and Brent (Dated) for sweet grade in the ratio of 67.6:32.4 for the year 2010-11.
The average crude oil price for Indian basket during FY’11 has been US$ 85.09 per barrel; 22% higher than the price in FY’10 (US$ 69.76/bbl).
ONGC’s average gross price in FY’11 has been US$ 89.41/bbl (US$ 71.65 in FY’10). However, as per the instructions of the Government of India, your Company shared ̀ 248.92 billion (previous year ̀ 115.54 billion) towards under-recoveries of Oil
Consumption of petroleum products
Crude oil price (Indian Basket) and under-recoveries
Consumption of Petroleum Products (MMT)
160
140
120
100
80
60
40
20
0
8.0
7.0
6.0
5.0
4.0
3.0
2.0
1.0
0.0
FY’07 FY’08 FY’09 FY’10 FY’11
Consumption YoY % Growth
Petroleum Products consumption basket
SKO6% MS
10%
FO/LSHS8%
HSD42%
Others7%
LPG10%
Naphtha8%
ATF4%
LUBES2%
Bitumen3%
India basket: Crude oil price (US$/bbl) ONGC: Crude oil price realized (US$/bbl)
62.46
79.25 83.57
69.76
85.09
FY’07 FY’08 FY’09 FY’10 FY’11
120
100
80
60
40
20
0
Cru
de o
il pr
ice
(US
$/bb
l)
75
63
50
38
25
13
0
Dis
coun
t (U
S$/
bbl)
Q1’10 Q2’10 Q3’10 Q4’10 Q1’11 Q2’11 Q3’11 Q4’11
Discount Realizable price Realized price
Source: GlobalData (www.energyetrack.com)
Source: GlobalData (www.energyetrack.com)
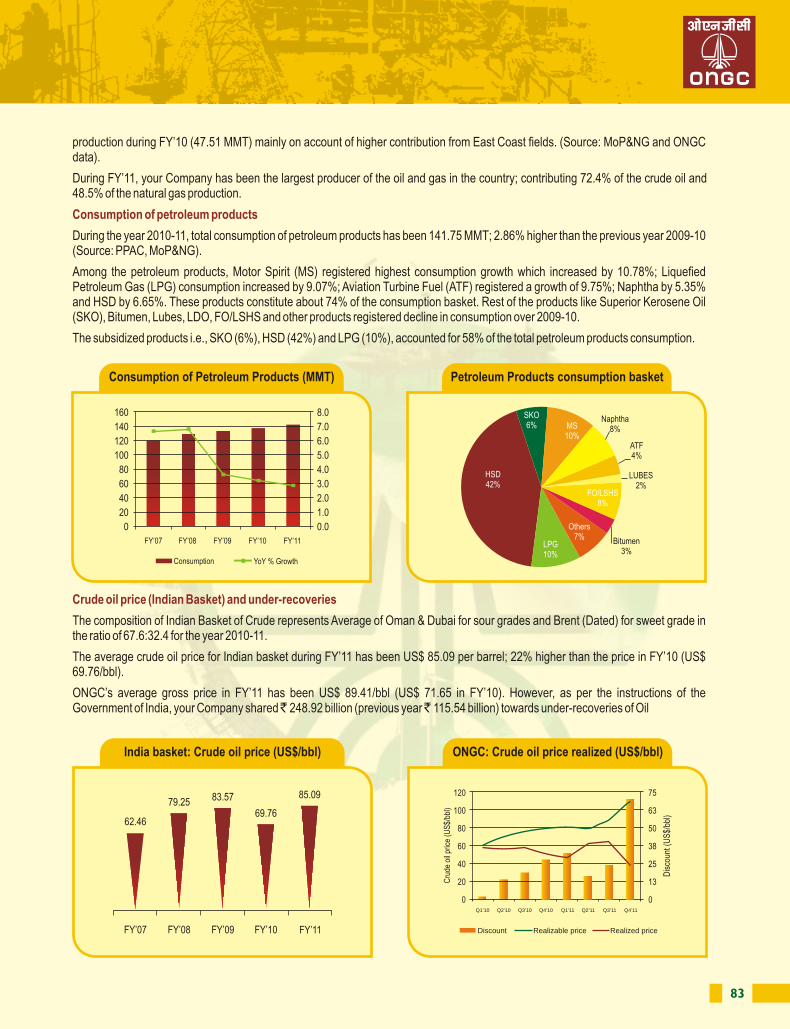
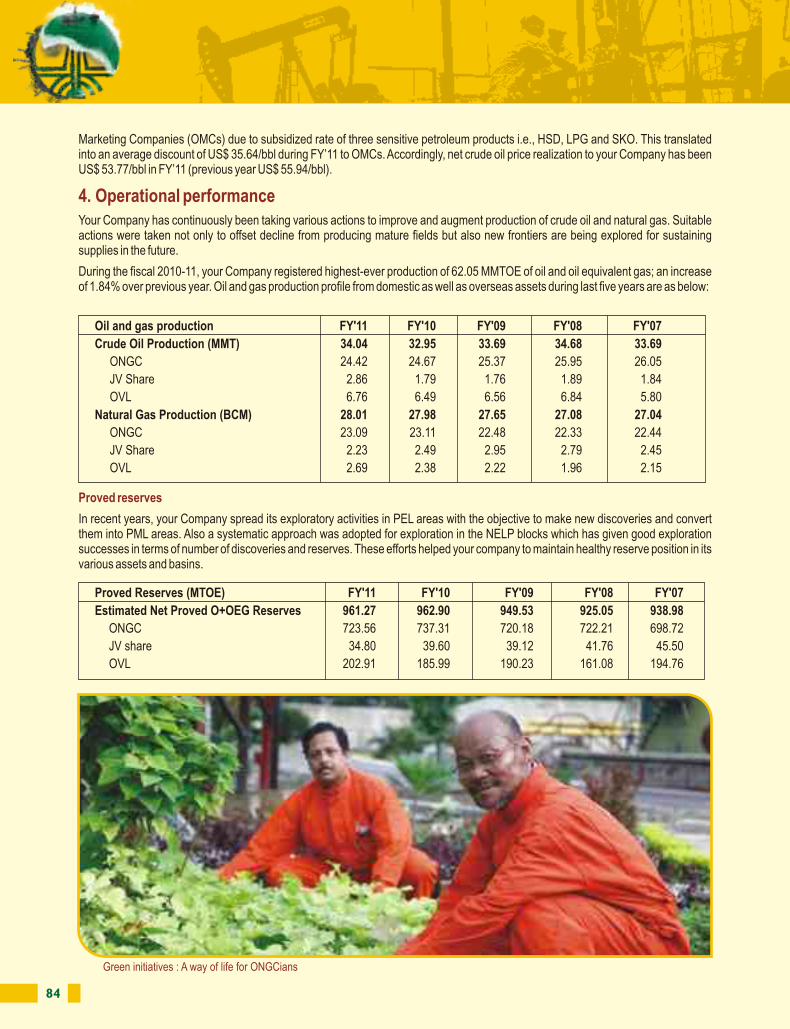
84 85
Marketing Companies (OMCs) due to subsidized rate of three sensitive petroleum products i.e., HSD, LPG and SKO. This translated into an average discount of US$ 35.64/bbl during FY’11 to OMCs. Accordingly, net crude oil price realization to your Company has been US$ 53.77/bbl in FY’11 (previous year US$ 55.94/bbl).
Your Company has continuously been taking various actions to improve and augment production of crude oil and natural gas. Suitable actions were taken not only to offset decline from producing mature fields but also new frontiers are being explored for sustaining supplies in the future.
During the fiscal 2010-11, your Company registered highest-ever production of 62.05 MMTOE of oil and oil equivalent gas; an increase of 1.84% over previous year. Oil and gas production profile from domestic as well as overseas assets during last five years are as below:
In recent years, your Company spread its exploratory activities in PEL areas with the objective to make new discoveries and convert them into PML areas. Also a systematic approach was adopted for exploration in the NELP blocks which has given good exploration successes in terms of number of discoveries and reserves. These efforts helped your company to maintain healthy reserve position in its various assets and basins.
4. Operational performance
Proved reserves
Proved Reserves (MTOE) FY'11 FY'10 FY'09 FY'08 FY'07
Estimated Net Proved O+OEG Reserves 961.27 962.90 949.53 925.05 938.98
ONGC 723.56 737.31 720.18 722.21 698.72
JV share 34.80 39.60 39.12 41.76 45.50
OVL 202.91 185.99 190.23 161.08 194.76
Oil and gas production FY'11 FY'10 FY'09 FY'08 FY'07
Crude Oil Production (MMT) 34.04 32.95 33.69 34.68 33.69
ONGC 24.42 24.67 25.37 25.95 26.05
JV Share 2.86 1.79 1.76 1.89 1.84
OVL 6.76 6.49 6.56 6.84 5.80
Natural Gas Production (BCM) 28.01 27.98 27.65 27.08 27.04
ONGC 23.09 23.11 22.48 22.33 22.44
JV Share 2.23 2.49 2.95 2.79 2.45
OVL 2.69 2.38 2.22 1.96 2.15
Green initiatives : A way of life for ONGCians
5. Third party audit of the reserves
Audit of the reserves of overseas assets
During the year 2010-11, reserves of the 63 major domestic fields, operated by your company and having 80.6% of the total 3P reserves of 1211.39 MMTOE, were audited by the independent hydrocarbon reserve consultants.
M/s DeGolyer & MacNaughton (D&M) audited the reserves of 62 major onland fields while M/s Gaffney Cline & Associates (GCA) carried out the audit of Mumbai High fields. Reserves in almost all the overseas assets (except small portion of reserves in Sudan) were audited by M/s D&M and M/s Sproule International Limited (Sproule).
Audited estimates of the domestic reserves in the fields operated by your Company vis-à-vis your Company’s own estimates are tabulated as below:
The audited estimates of 3P reserves of oil as well as gas by the consultants are more than your Company’s own estimates; however, 1P and 2P reserves estimated by the consultants are slightly lower than the estimates of your Company.
The difference between D&M’s audited reserves estimates and your Company’s estimates were due to reductions in 1P and 2P reserves of the fields in Assam because of difference between planned and actual implementation of field development schemes. In case of 3P reserves, D&M estimates were more than your Company’s estimates. As the difference in 1P reserve estimates were less than 10% and keeping in view the already approved investment for Assam Renewal Project (ARP) it was decided not to revise the reserves estimates.
In case of Mumbai High reserves, the audited reserve estimates were higher than the estimates of your Company. The Consultant assumed that the investment plans for increasing water injection in the field may result in higher 2P and 3P reserves. However, your Company based on its own estimates decided not to revise reserve figures upwards.
The audited 3P reserves of overseas assets are much higher than the estimates of the ONGC Videsh Limited (OVL); however, 1P and 2P reserves were estimated to be lower than the estimates of OVL.
ONGC operated domestic fields
Consultant ONGC’s estimates Audited Reserves
1P 2P 3P 1P 2P 3P
Oil plus Condensate (MMT)
62 fields D&M 217.60 255.15 282.57 194.82 234.13 287.18
Mumbai High GCA 119.92 131.70 185.96 130.80 226.90 265.00
Total Oil+Condensate 337.52 386.85 468.53 325.62 461.03 552.18
Natural Gas (BCM)
62 fields D&M 241.29 366.76 435.93 235.71 362.22 447.07
Mumbai High GCA 46.46 58.28 72.64 37.70 53.20 80.60
Total gas (BCM) 287.75 425.04 508.57 273.41 415.42 527.67
Total for 63 fields 625.27 811.89 977.09 599.03 415.42 527.68
Uncertified reserves 98.29 173.69 234.89(owned and operated)
Domestic JV 34.80 39.16 41.30(ONGC’s participative interest)
Total (certified + uncertified) 758.36 1024.74 1253.28
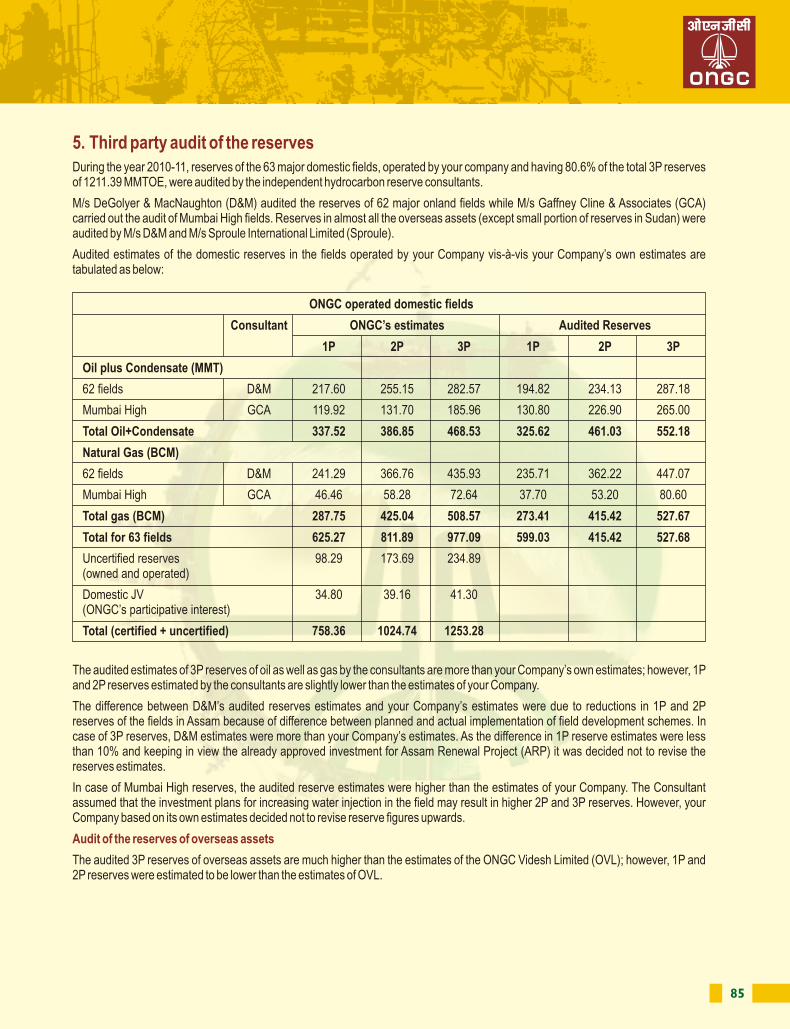
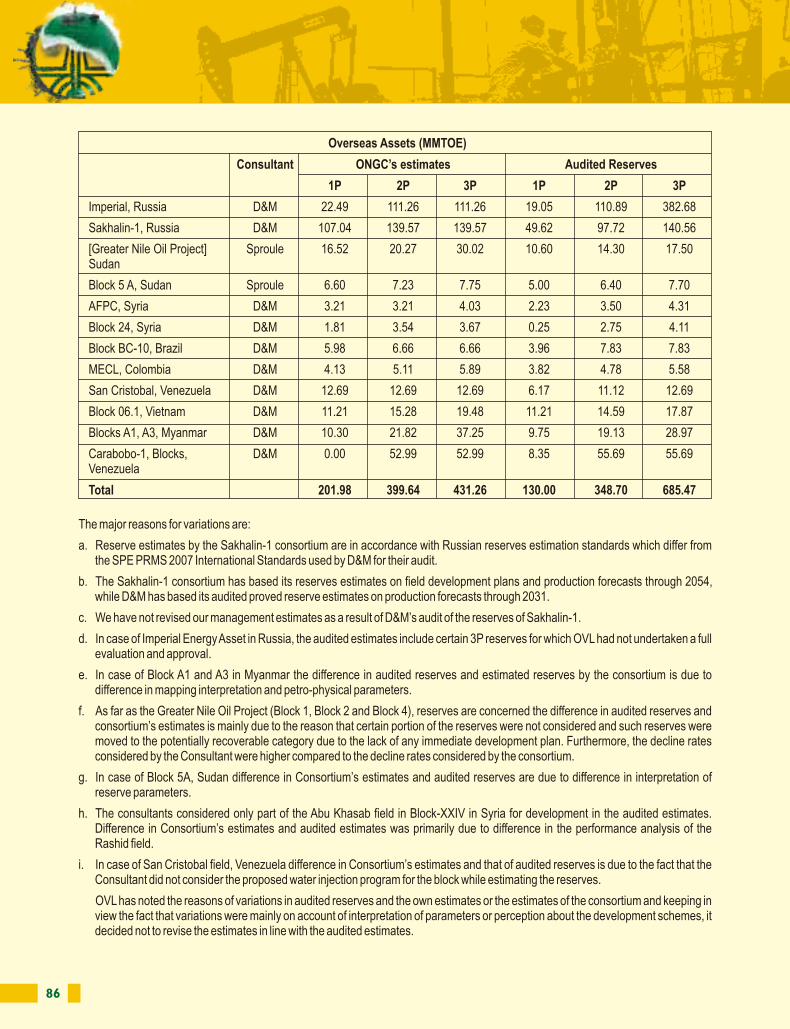
86 87
The major reasons for variations are:
a. Reserve estimates by the Sakhalin-1 consortium are in accordance with Russian reserves estimation standards which differ from the SPE PRMS 2007 International Standards used by D&M for their audit.
b. The Sakhalin-1 consortium has based its reserves estimates on field development plans and production forecasts through 2054, while D&M has based its audited proved reserve estimates on production forecasts through 2031.
c. We have not revised our management estimates as a result of D&M’s audit of the reserves of Sakhalin-1.
d. In case of Imperial Energy Asset in Russia, the audited estimates include certain 3P reserves for which OVL had not undertaken a full evaluation and approval.
e. In case of Block A1 and A3 in Myanmar the difference in audited reserves and estimated reserves by the consortium is due to difference in mapping interpretation and petro-physical parameters.
f. As far as the Greater Nile Oil Project (Block 1, Block 2 and Block 4), reserves are concerned the difference in audited reserves and consortium’s estimates is mainly due to the reason that certain portion of the reserves were not considered and such reserves were moved to the potentially recoverable category due to the lack of any immediate development plan. Furthermore, the decline rates considered by the Consultant were higher compared to the decline rates considered by the consortium.
g. In case of Block 5A, Sudan difference in Consortium’s estimates and audited reserves are due to difference in interpretation of reserve parameters.
h. The consultants considered only part of the Abu Khasab field in Block-XXIV in Syria for development in the audited estimates. Difference in Consortium’s estimates and audited estimates was primarily due to difference in the performance analysis of the Rashid field.
i. In case of San Cristobal field, Venezuela difference in Consortium’s estimates and that of audited reserves is due to the fact that the Consultant did not consider the proposed water injection program for the block while estimating the reserves.
OVL has noted the reasons of variations in audited reserves and the own estimates or the estimates of the consortium and keeping in view the fact that variations were mainly on account of interpretation of parameters or perception about the development schemes, it decided not to revise the estimates in line with the audited estimates.
Overseas Assets (MMTOE)
Consultant ONGC’s estimates Audited Reserves
1P 2P 3P 1P 2P 3P
Imperial, Russia D&M 22.49 111.26 111.26 19.05 110.89 382.68
Sakhalin-1, Russia D&M 107.04 139.57 139.57 49.62 97.72 140.56
[Greater Nile Oil Project] Sproule 16.52 20.27 30.02 10.60 14.30 17.50Sudan
Block 5 A, Sudan Sproule 6.60 7.23 7.75 5.00 6.40 7.70
AFPC, Syria D&M 3.21 3.21 4.03 2.23 3.50 4.31
Block 24, Syria D&M 1.81 3.54 3.67 0.25 2.75 4.11
Block BC-10, Brazil D&M 5.98 6.66 6.66 3.96 7.83 7.83
MECL, Colombia D&M 4.13 5.11 5.89 3.82 4.78 5.58
San Cristobal, Venezuela D&M 12.69 12.69 12.69 6.17 11.12 12.69
Block 06.1, Vietnam D&M 11.21 15.28 19.48 11.21 14.59 17.87
Blocks A1, A3, Myanmar D&M 10.30 21.82 37.25 9.75 19.13 28.97
Carabobo-1, Blocks, D&M 0.00 52.99 52.99 8.35 55.69 55.69Venezuela
Total 201.98 399.64 431.26 130.00 348.70 685.47
Particulars FY'11 FY'10 % Increase/(Decrease)
Income:
Crude Oil 448,613 445,053 0.80
Natural Gas 127,544 73,797 72.83
Value Added Products 85,360 83,212 2.58
Total Sales 661,517 602,062 9.88
Other Income 33,676 16,590 102.99
Gross Margin 441,999 396,054 11.60
EBIDTA 410,662 375,588 9.34
PAT 189,240 167,676 12.86
EPS 22.12* 19.60** 12.86
Dividend per share 35 33 6.06
Net Worth 967,084 864,413 11.88
% Return on net worth 19.60 19.40
Capital Employed 795,472 738,013 7.79
% Return on capital employed 51.62 50.89
Capital Expenditure 282,755 235,590 20.02
Particulars FY'11 FY'10 % increase/(Decrease)
Sales:
Crude Oil 558,453 527,312 5.91
Natural Gas 135,824 81,405 66.85
Value Added Products 533,363 452,998 17.74
Total Sales 1,227,640 1,061,715 15.63
Other Income 42,489 20,343 108.86
Gross Margin 568,617 489,453 16.17
EBIDTA 528,024 475,374 11.08
PAT 224,559 194,035 15.73
EPS 26.25# 22.68^ 15.73
Net Worth 1,145,312 1,005,653 13.89
% Return on net worth 19.61 19.29
Capital Employed 910,001 869,009 4.72
% Return on capital employed 58.02 54.70
6. Financial performanceONGC (Stand alone)
Note: Segment information as per Accounting Standard – AS 17, is detailed elsewhere in the report.
# Post Bonus and Split ^ Restated EPS
(` in million)
(` in million)
* Post Bonus and Split ** Restated EPS
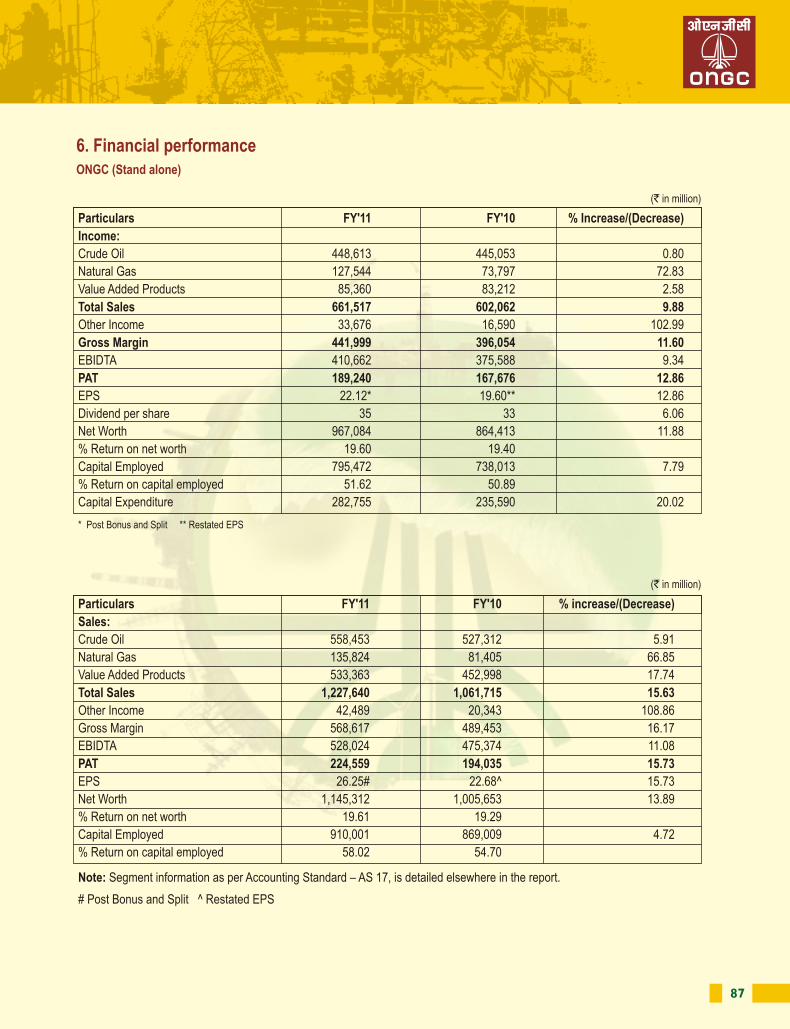
88 89
7. Opportunities & Threats
8. Risks and Concerns
India is fast emerging as an activated economy centre in the world. The fourth largest economy in the world on Purchase Power Parity (PPP) is also emerging as a notable consumption centre and particularly for all forms of energy. Creating suitable energy infrastructure has become the first priority. Your Company being a leader in the E&P sector thus has enormous opportunity to meaningfully integrate in the entire energy value-chain to leverage business opportunities.
Government of India is now looking for Open Acreage Licensing Policy (OALP), an operator friendly flexible system. Your Company will have opportunity to leverage its vast exploration data and knowledge base to its advantage.
At the same time, the Government of India is in the process of firming up policy for exploration and exploitation of Shale gas. Your company has taken structured initiatives towards R&D for Shale gas exploration and as such the new policy may provide opportunity to the company for taking the lead by its first mover initiatives.
The hydrocarbon potential of vast majority of the sedimentary basins remains to be established. This gives immense business opportunity for E&P companies like ONGC.
Improving recovery factor of the existing matured fields provides enormous opportunity in terms of production upside to your Company. These established fields have significant scope in terms of brown-field development leveraging superior technology. The Improved Oil Recovery (IOR) and Enhanced Oil Recovery (EOR) techniques which your Company has mastered over the years provide good opportunity for association and growth in global oil business as number of operators or countries are looking for such know-how and skills.
Subsidiary of your Company, OVL has large presence in global E&P sector and is associating with a large number of NOCs (National Oil Companies) as well as IOCs (International Oil Companies). These associations may provide OVL an opportunity to increases its presence.
Commercialization of new sources of energy like CBM, UCG, Shale gas, etc., has substantial upside for growth. At the same time alternate sources of energy also have enormous potential. Early lead in cost effective commercialization of these sources through innovative technologies and solutions is an opportunity.
The frontier areas like deepwater, ultra-deepwater, Arctic regions, etc., are emerging as opportune hydrocarbon resource centers. However, these challenging regions would require cost-intensive and technology driven innovative solutions. As such collaborations with the technology leaders become imperative.
Political unrest in the MENA region is a major threat for the oil industry. In case the unrest prolongs for long it will adversely affect the oil industry globally.
E&P business, characterized by inherent uncertainties, has always been highly risky.
Ongoing unrest in MENA region and related volatility in oil prices is a concern for your organization. As in high oil price regime the cost of services has all potential to go up and adversely affect the finances of your Company.
The existing subsidy sharing mechanism is a major concern for your organization. The sharing of the under-recoveries of oil marketing companies has adversely affected financials of your Company. Net realization towards crude oil sale has been significantly lower than the international price.
Your Company being the licensee, has to pay the entire liability towards royalty in JV operated Blocks like - CY-OS-90/1, CB/OS-2 and RJ-ON-90/1, though its Participating Interest varies from 30 to 50%. It is also bearing the entire liability towards Cess for fields in CY-OS-90/1, CB/OS-2 and PY-3 blocks.
Your Company has taken up intensive exploration to locate hydrocarbon reserves even in challenging locales like deep-water and ultra-deepwater regions. Exploration and development in these regions is not only cost intensive but technologically challenging as well.
Maintaining production levels from the matured field is cost and technology intensive. At the same time, reducing size of the new discoveries and monetizing them cost effectively is a challenge.
Inherent risks are associated with oil and gas field operations like – spillage, rupture, blowout of wells, earthquake, tsunami, terrorist activities, etc. These risks are being mitigated right from design stage; however probability of emergency cannot be totally eliminated. In the event of any such unfortunate events the risk of significant liabilities always exists.
Land acquisition for exploration and development projects and particularly for new sources of energy like CBM, UCG, Shale gas, etc., remains an area of major concern.
Naphtha demand in the country remains volatile due to which marketing/ evacuation of produced naphtha is challenging.
Important factors that continue to influence the operations include, demand and supply, availability of inputs, their prices, changing Govt. policies, legislations, taxes, political and economic developments-both within and outside the country.
Your company dedicates itself to its core activity i.e., Exploration and Production (E&P) of hydrocarbons. E&P is a continuous pursuit which requires technology intensive focused endeavours to create future hydrocarbon assets for sustaining growth. At the same time, your Company is focused on opening new growth avenues through exploration of new sources of energy and meaningful integration in the entire hydrocarbon value chain. Accordingly, your Company focused on the following strategic pursuits:
a. Focused exploration to increase hydrocarbon reserve base
b. Focus on early monetization of discoveries
c. Improving recovery factor of the existing assets
d. Augment international reserves and production
e. Developing new and alternate sources of energy
f. Capture value through forward integration
In recent years your Company intensified its exploratory efforts in all the seven producing basins and at the same time stepped up exploratory efforts in frontier basins. Exploratory activities have been driven by the following objectives:
i. Exploring deeper objectives and new hydrocarbon plays in producing sectors and
ii. Knowledge building in less explored sectors ofproducing as well as frontier basins.
iii. Consolidate leads in yet-to-be-proven basins forestablishing leads.
thDuring the first four years of the 11 plan period (FY’08 to FY’11) 123,392 Line Kilometre (LKM) 2D seismic and 87,240 Sq.Km of 3D seismic data was acquired. 457 exploratory wells were drilled by your Company. During the last five years (FY’07 to FY’11), total accretion of in-place volume of hydrocarbon has been 1,124.08 MMTOE (Ultimate reserves: 364.82 MMTOE). Your Company maintained Reserve Replacement Ratio (RRR) of more than one (with 3P reserves) since last six years.
Your Company made 158 hydrocarbon discoveries (99 in onshore and 59 in offshore) since FY’03. Out of 99 onshore discoveries, 67 discoveries have already been monetized. 5 discoveries in Tripura are linked with the commissioning of 726.6 MW Power Plant scheduled for commissioning in March, 2012. 7 discoveries are under production sharing contract, for which approval for development are awaited. 6 discoveries are pending for want of marketing arrangements and balance 14 discoveries are at various stages of appraisal and development. Most of the discoveries in offshore were marginal in nature and quite a few of them in deepwater. Most of these fields were not techno-economically viable earlier and are now being made viable through induction of the state-of-the-art technologies, optimization of facilities, regrouping of fields through cluster developments, etc. Your Company has taken up 11 projects for development of various offshore fields with envisaged investment of` 248.90 billion. Most of these fields are anticipated to be on stream by 2013-14.
9. Strategic business pursuits: building future
a. Focused exploration to increase hydrocarbon reserve base
b. Focus on monetization of discoveries
In-place accretion & RRR
300
250
200
150
100
50
0
(MM
TO
E) 169.52 182.23
284.81
250.60 236.92
2.00
1.83
1.67
1.50
1.33
1.17
1.00
FY’07 FY’08 FY’09 FY’10 FY’11
In-place volume of O+OEG RRR
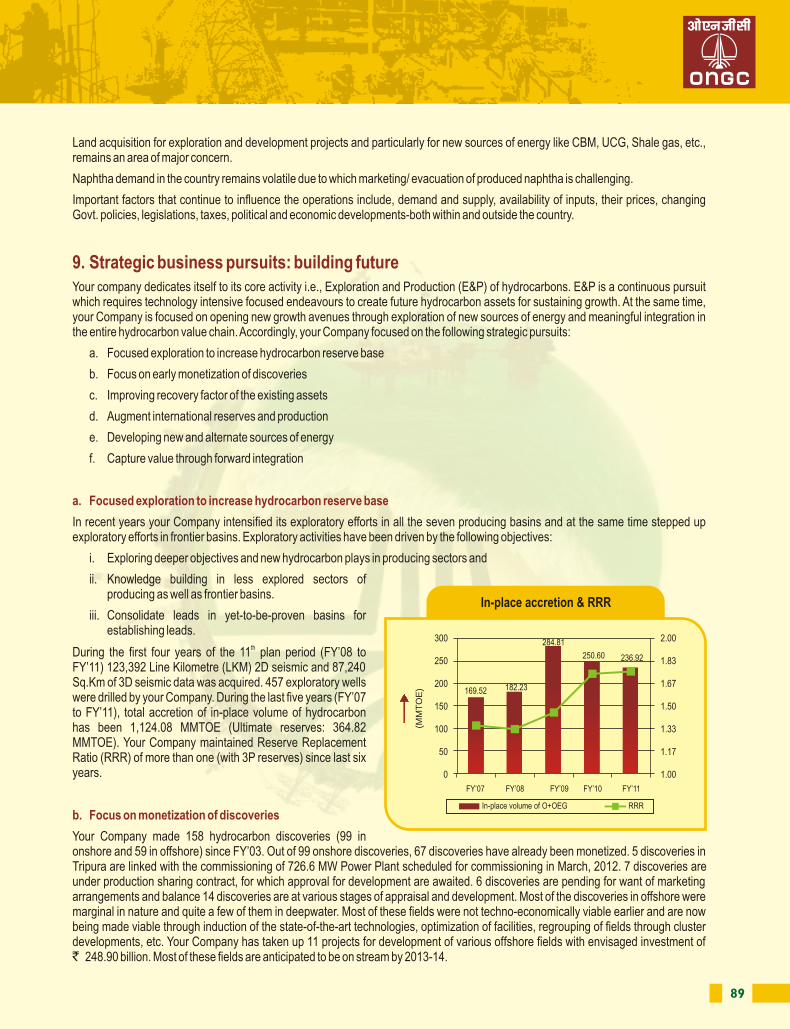
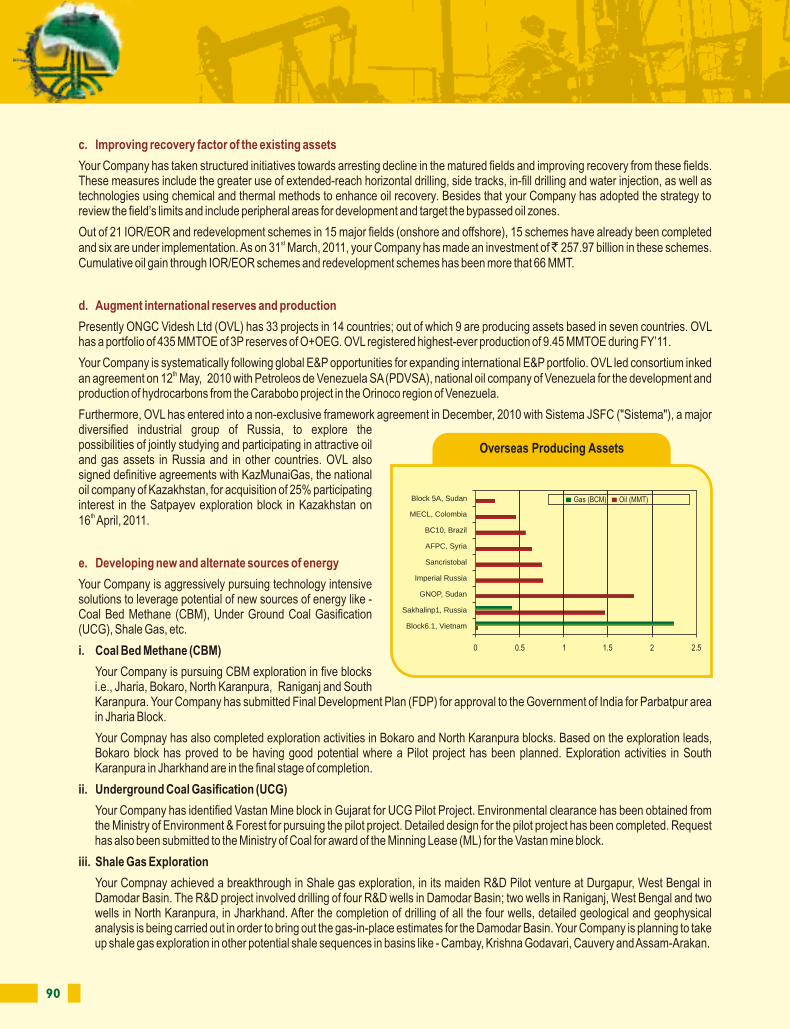
90 91
c. Improving recovery factor of the existing assets
d. Augment international reserves and production
e. Developing new and alternate sources of energy
Your Company has taken structured initiatives towards arresting decline in the matured fields and improving recovery from these fields. These measures include the greater use of extended-reach horizontal drilling, side tracks, in-fill drilling and water injection, as well as technologies using chemical and thermal methods to enhance oil recovery. Besides that your Company has adopted the strategy to review the field’s limits and include peripheral areas for development and target the bypassed oil zones.
Out of 21 IOR/EOR and redevelopment schemes in 15 major fields (onshore and offshore), 15 schemes have already been completed stand six are under implementation. As on 31 March, 2011, your Company has made an investment of ̀ 257.97 billion in these schemes.
Cumulative oil gain through IOR/EOR schemes and redevelopment schemes has been more that 66 MMT.
Presently ONGC Videsh Ltd (OVL) has 33 projects in 14 countries; out of which 9 are producing assets based in seven countries. OVL has a portfolio of 435 MMTOE of 3P reserves of O+OEG. OVL registered highest-ever production of 9.45 MMTOE during FY’11.
Your Company is systematically following global E&P opportunities for expanding international E&P portfolio. OVL led consortium inked than agreement on 12 May, 2010 with Petroleos de Venezuela SA (PDVSA), national oil company of Venezuela for the development and
production of hydrocarbons from the Carabobo project in the Orinoco region of Venezuela.
Furthermore, OVL has entered into a non-exclusive framework agreement in December, 2010 with Sistema JSFC ("Sistema"), a major diversified industrial group of Russia, to explore the possibilities of jointly studying and participating in attractive oil and gas assets in Russia and in other countries. OVL also signed definitive agreements with KazMunaiGas, the national oil company of Kazakhstan, for acquisition of 25% participating interest in the Satpayev exploration block in Kazakhstan on
th16 April, 2011.
Your Company is aggressively pursuing technology intensive solutions to leverage potential of new sources of energy like - Coal Bed Methane (CBM), Under Ground Coal Gasification (UCG), Shale Gas, etc.
i. Coal Bed Methane (CBM)
Your Company is pursuing CBM exploration in five blocks i.e., Jharia, Bokaro, North Karanpura, Raniganj and South Karanpura. Your Company has submitted Final Development Plan (FDP) for approval to the Government of India for Parbatpur area in Jharia Block.
Your Compnay has also completed exploration activities in Bokaro and North Karanpura blocks. Based on the exploration leads, Bokaro block has proved to be having good potential where a Pilot project has been planned. Exploration activities in South Karanpura in Jharkhand are in the final stage of completion.
ii. Underground Coal Gasification (UCG)
Your Company has identified Vastan Mine block in Gujarat for UCG Pilot Project. Environmental clearance has been obtained from the Ministry of Environment & Forest for pursuing the pilot project. Detailed design for the pilot project has been completed. Request has also been submitted to the Ministry of Coal for award of the Minning Lease (ML) for the Vastan mine block.
iii. Shale Gas Exploration
Your Compnay achieved a breakthrough in Shale gas exploration, in its maiden R&D Pilot venture at Durgapur, West Bengal in Damodar Basin. The R&D project involved drilling of four R&D wells in Damodar Basin; two wells in Raniganj, West Bengal and two wells in North Karanpura, in Jharkhand. After the completion of drilling of all the four wells, detailed geological and geophysical analysis is being carried out in order to bring out the gas-in-place estimates for the Damodar Basin. Your Company is planning to take up shale gas exploration in other potential shale sequences in basins like - Cambay, Krishna Godavari, Cauvery and Assam-Arakan.
Overseas Producing Assets
2.5
Gas (BCM) Oil (MMT)
1.5 2 0.5 1
Block 5A, Sudan
MECL, Colombia
BC10, Brazil
AFPC, Syria
Sancristobal
Imperial Russia
GNOP, Sudan
Sakhalinp1, Russia
Block6.1, Vietnam
0
iv. Alternate sources of energy
After successful commissioning of a 50 MW wind farm in Gujarat, your Company is setting up 102 MW wind farm in Rajasthan. Further, feasibility of setting up a 10 MW grid-connected Solar Photo Voltaic (PV) project is being studied.
ONGC Energy Centre (OEC) successfully installed the three state-of-the-art Solar Thermal Engines at the Solar Energy Centre (SEC), Ministry of New and Renewable Energy (MNRE) campus at Gurgaon and their performance is under evaluation. Besides that OEC is pursing the following projects:
• Thermo-Chemical Reactor for Hydrogen generation• Bio Conversion of Coal to methane• Exploration and exploitation of Uranium Reserves globally• LED Project
i. Refining
The refining capacity of Mangalore Refinery & Petrochemicals Ltd (MRPL), subsidiary of your Company, is being enhanced to 15 MMTPA. Project is on track and is aligned for progressive commissioning, beginning January 2012, as per Schedule.
ii. Petrochemicals
The two petrochemical plants ONGC Petro-additions Limited (OPaL) and ONGC Mangalore Petrochemicals Limited (OMPL) promoted by your Company are progressing well and are expected to become operational in 2012 and 2013 respectively. These projects have basically been promoted for value-multiplication of in-house produced Naphtha at Uran, Hazira, and Mangalore and C2-C3 components at C2-C3 extraction plant at Dahej.
iii. Gas based power plant
726.6 MW (363.3 x 2) gas based Combined Cycle Power Plant (CCPP) is being set up by ONGC Tripura Power Company Ltd. (OTPC), an SPV promoted by your Company, at Pallatana, Tripura. The project aims to monetize idle gas assets in the state of Tripura. The generation project is in advanced stage of implementation. The financial closure of the project has earlier been achieved and various linkages like gas supply from ONGC and power off-take by NE states has already been tied up. The project is expected to be completed as per schedule i.e. by March 2012.
iv. Nuclear power plant
Your Company in association with Nuclear Power Corporation of India Limited (NPCIL) is studying the feasibility of setting up 1400 MW nuclear power plant.
v. CGD Project
Your Company is evaluating the feasibility to venture in City Gas Distribution (CGD) project in 10 cities in collaboration with reputed companies.
Considering the Petroleum Exploration License’s (PEL) life cycle and available rig resources, your Company has prioritized exploratory inputs so that the PELs can be retained or converted into Mining Lease (ML). The number of MLs held as on 01.04.2010 were 320 (area: 26,130 sq km) which have (as on 01.04.2011) now increased to 330 (area: 27,891 sq km). However during the same period the number of PELs decreased from 62 (area: 80,982 sq km) to 40 (area: 73,840 sq km).
Several significant discoveries have been made in some nomination PEL blocks during the regrant cycle in Western Offshore, Cambay, Assam Shelf, Tripura, KG and Cauvery Basins. Keeping in view the discoveries and potential of these blocks, your Company requested Government of India to grant a one time extension of two years beyond the seven year period to complete the ongoing exploration/ appraisal of the blocks which has been agreed. This would facilitate your Company to carry out intensive exploration in these blocks (3 in Mumbai Offshore, 5 in A & AA, 2 each in KG and Cauvery, 3 in Cambay and 1 in Vindhyan Basins) to establish hydrocarbon reserves.
f. Capture value through forward integration
10. Outlooka. Exploration acreage
b. Extension of time period for nomination PELs
92 93
c. Exploration programme
d. NELP discoveries
e. Development of new fields
Plan expenditure
In first four years (FY’08, FY’09, FY’10 & FY’11) of XI Plan period, your Company has acquired 123,392 LKM of 2D data and 87,240 Sq.Km of 3D data. Total 1,404 wells (Exploratory wells: 457 & Development wells: 947) were drilled during the period. Your Company accreted 954.56 MMTOE of O+OEG in-place hydrocarbon reserves in first four years of plan against XI Plan target of 1,000 MMTOE. With the present deployment of 121 drilling rigs (78 owned and 43 charter-hired) your Company plans to drill 430 wells (Exploratory: 158 & Development: 272), including 16 deepwater wells during FY’12, the terminal year of the XI plan period.
Your Company has so far made 18 discoveries (Offshore: 12 Onland: 6) in NELP blocks of which five discoveries have been made in FY’11. These discoveries are governed by PSC stipulations with clear-cut stages and time frames for putting a discovery to commercial production. During the year, efforts were made to expedite the process so that these discoveries can be brought on production at the earliest. In this context:
• DOC (Declaration of Commerciality) for the block KG-DWN-98/2 (northern & southern discovery area) and MN-DWN-98/3 has been submitted and approval of DGH is awaited.
• For the block MN-OSN-2000/2 of Mahanadi basin DOC has been submitted and approved by DGH.
ONGC has also made six discoveries in onland NELP blocks of which five are in Cambay basin and one in the A&AA basin.
• Discoveries in Cambay basin are: West Patan-3 in CB-ONN-2002/1, Nadiad-1 in CB-ONN-2001/1, Karnangar-1 in CB-ONN2004/1 and Vadtal-1 & Vadtal-3 in CB-ONN-2004/2. In the A&AA basin, Khubal-4 is the discovery in AA-ONN-2001/1 block.
• DOC for Cambay basin discovery viz. West Patan has been submitted to DGH.
• Appraisal Plan for two other onland discoveries namely Nadiad and Khubal has also been submitted to DGH. Karnnagar andVadtal are the recent discoveries in Cambay basin made during FY’11 and appraisal plan for the same will be submitted shortly.
Your Company has taken up 10 major projects for development of new fields and one project for additional development of D-1 field with estimated investment of ̀ 248.90 billion. The projects are:
a. Development of C-Series
b. Additional development of D-1 field
c. Development of B-22 cluster fields
d. Development of B-193 cluster fields
e. Development of B-46 cluster fields
f. Development of North Tapti gas field
g. Development of Cluster-7 fields
h. Development of BHE & BH-35 fields
i. Development of WO-16 cluster fields
j. Development of G-1 & GS-15 fields
k. Development of SB-14
All these fields are marginal fields. Your Company took structured initiatives to monetize these fields cost-effectively through cluster development. These fields are anticipated to be on stream by 2013-14.
During the first four years of the XI Plan period (FY’08 to FY’11) your Company’s plan expenditure has been ̀ 913,056 million against Plan outlay of ̀ 759,838 million. Increase in Plan expenditure has been mainly due to increased exploratory inputs in terms of seismic survey and exploratory drilling. Against the XI Plan target of 547 exploratory wells, 457 wells have already been drilled in the first four years of the plan period (FY’08 to FY’11) out of which 25 wells (against the plan of 33 wells during the XI Plan) are cost intensive deep and ultra-deepwater wells. In last four years, exploratory drilling expenditure increased by more than 3 times.
Further, higher expenditure towards exploratory drilling has been due to higher rates for charter-hiring drilling rigs particularly deepwater and ultra-deepwater rigs. Plan expenditure against capital purchases and projects has also been more as a large number of field development and redevelopment projects have been taken up in the first four years of the Plan period. During the year FY’12, your Company has earmarked a budget of ` 300,400 million for domestic operations. In first four years of XI Plan Capex for OVL has been` 313.76 billion against the plan outlay of ̀ 453 billion for the XI Plan.
The very nature of the business of your Company, inherent with operational and functional complexities, demands a robust internal control mechanism. Internal control systems in ONGC have been evolved with the objective to continuously monitor critical functions and operations particularly technology and field operations.
Standard procedures and guidelines are issued from time to time to institutionalize best practices in all facets of activities. Performance of every business unit is monitored by the respective directorates for suitable corrective measures, if any. Performance management and benchmarking is being done through performance contracts between the top management and the Key Executives based on the Key Performance Indicators (KPIs) in line with goals and assigned targets.
Your Company is committed to maintaining high standards of occupational health, safety and environmental protection. Several internal and external audits are conducted to ensure compliance of the norms, and to maintain effective waste prevention and reduction capabilities.
Third party audits are conducted regularly for offshore and onshore installations by established national and international HSE agencies such as Oil Industry Safety Directorate (OISD), an organization under the control of the MoPNG, which issues safety guidelines. Further, subject to the safety regulations prescribed by the Directorate General of Mines and Safety (DGMS), each work center has teams dedicated to HSE, which execute the safety guidelines prescribed by OISD as well as DGMS. HSE teams are also responsible for obtaining necessary licenses and clearances from the State Pollution Control Boards.
All transactions in the company are carried out on SAP R/3 ERP based business portal. Proper and adequate system of internal control exists to ensure that all aspects are safeguarded and protected against loss from unauthorized use or disposition and that each transaction is authorized, recorded and reported, has also been established. The system further ensures that financial and other records are reliable for preparing the financial statements.
Internal audit is conducted in-house as well as through outsourcing in certain areas requiring specialization. Statutory auditors are appointed by Comptroller and Auditor General (CAG) of India for fixed tenures. Audit and Ethics committee of the Board oversees the functioning of Internal Audit and control systems.
Human resource is one of the biggest strengths of your Company and as a strategy it has been a constant endeavour to maintain steady inflow of talent. Your Company has drawn up a five-year manpower induction plan aligned to the business plans as well as factoring the
11. Internal Control Systems
12. Human Resource Development
ONGC: Capex trend
FY’08 FY’10
FY’12(Estimated)
140
120
100
80
60
40
20
0
` bi
llion
Seismic survey Exploratory drillingDevelopment drilling Capital projects
OVL’s Capex (` Billion)
45.29
161.05
56.5049.92
FY’08 FY’09 FY’10 FY’11
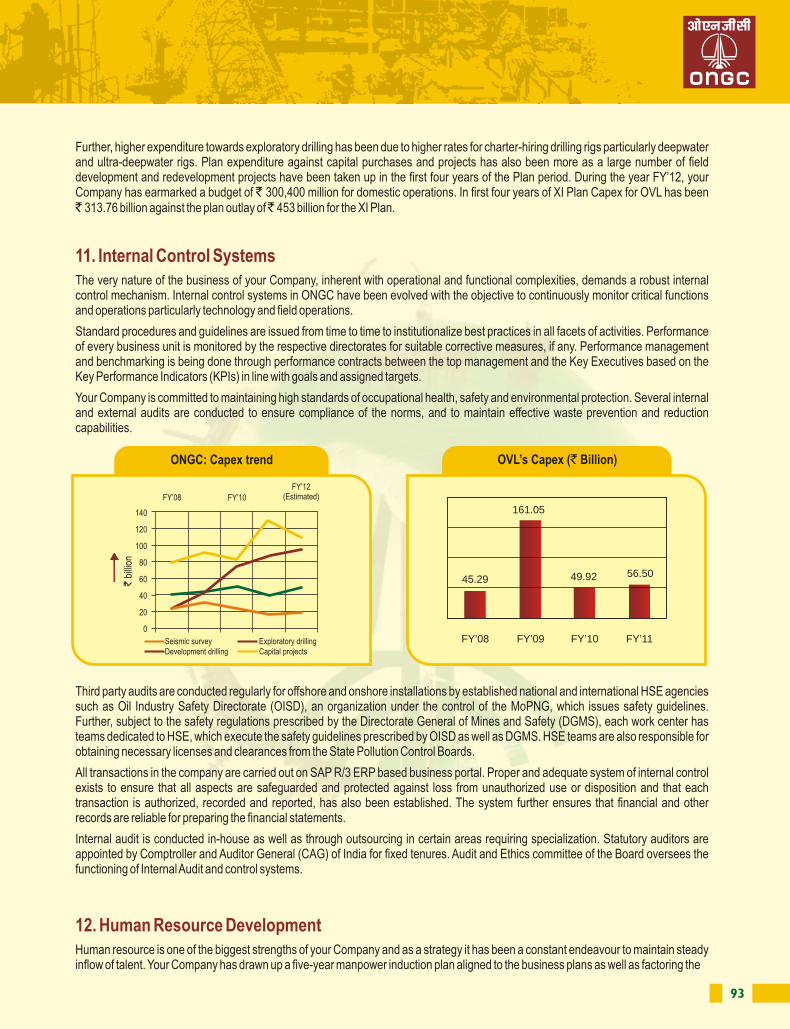
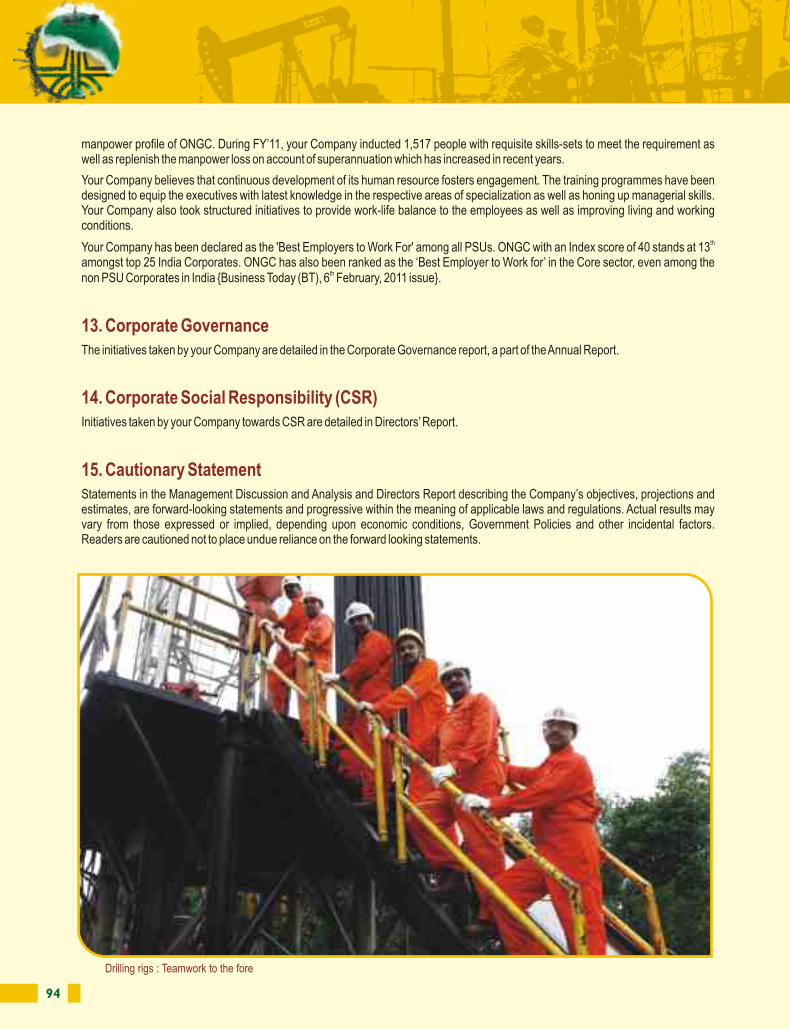
94
manpower profile of ONGC. During FY’11, your Company inducted 1,517 people with requisite skills-sets to meet the requirement as well as replenish the manpower loss on account of superannuation which has increased in recent years.
Your Company believes that continuous development of its human resource fosters engagement. The training programmes have been designed to equip the executives with latest knowledge in the respective areas of specialization as well as honing up managerial skills. Your Company also took structured initiatives to provide work-life balance to the employees as well as improving living and working conditions.
thYour Company has been declared as the 'Best Employers to Work For' among all PSUs. ONGC with an Index score of 40 stands at 13 amongst top 25 India Corporates. ONGC has also been ranked as the ‘Best Employer to Work for’ in the Core sector, even among the
thnon PSU Corporates in India {Business Today (BT), 6 February, 2011 issue}.
The initiatives taken by your Company are detailed in the Corporate Governance report, a part of the Annual Report.
Initiatives taken by your Company towards CSR are detailed in Directors’ Report.
Statements in the Management Discussion and Analysis and Directors Report describing the Company’s objectives, projections and estimates, are forward-looking statements and progressive within the meaning of applicable laws and regulations. Actual results may vary from those expressed or implied, depending upon economic conditions, Government Policies and other incidental factors. Readers are cautioned not to place undue reliance on the forward looking statements.
13. Corporate Governance
14. Corporate Social Responsibility (CSR)
15. Cautionary Statement
Drilling rigs : Teamwork to the fore
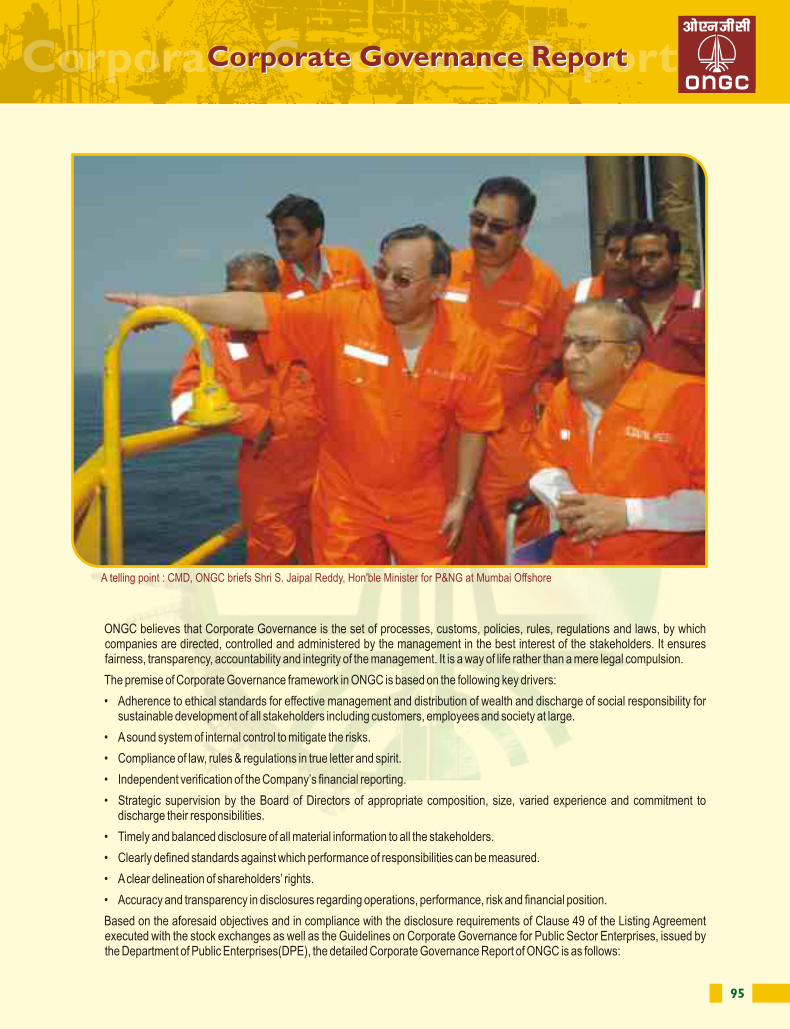
95
ONGC believes that Corporate Governance is the set of processes, customs, policies, rules, regulations and laws, by which companies are directed, controlled and administered by the management in the best interest of the stakeholders. It ensures fairness, transparency, accountability and integrity of the management. It is a way of life rather than a mere legal compulsion.
The premise of Corporate Governance framework in ONGC is based on the following key drivers:
• Adherence to ethical standards for effective management and distribution of wealth and discharge of social responsibility for sustainable development of all stakeholders including customers, employees and society at large.
• A sound system of internal control to mitigate the risks.
• Compliance of law, rules & regulations in true letter and spirit.
• Independent verification of the Company’s financial reporting.
• Strategic supervision by the Board of Directors of appropriate composition, size, varied experience and commitment todischarge their responsibilities.
• Timely and balanced disclosure of all material information to all the stakeholders.
• Clearly defined standards against which performance of responsibilities can be measured.
• A clear delineation of shareholders’ rights.
• Accuracy and transparency in disclosures regarding operations, performance, risk and financial position.
Based on the aforesaid objectives and in compliance with the disclosure requirements of Clause 49 of the Listing Agreement executed with the stock exchanges as well as the Guidelines on Corporate Governance for Public Sector Enterprises, issued by the Department of Public Enterprises(DPE), the detailed Corporate Governance Report of ONGC is as follows:
Corporate Governance ReportCorporate Governance Report
A telling point : CMD, ONGC briefs Shri S. Jaipal Reddy, Hon'ble Minister for P&NG at Mumbai Offshore
96 97
(iii) The agenda papers are prepared by the concerned officials, sponsored by the concerned functional Directors and approved by the CMD. Duly approved agenda papers are circulated amongst the members of the Board/Committee by the Company Secretary or by the convener of the Committee.
(iv) The meetings of the Board/Committees are generally held at the Company's Registered Office in New Delhi.
(v) Presentations are made to the Board/Committee covering Finance, Production, Operations, major Business Segments, Human Resources, Marketing, Joint Venture operations.
(vi) The members of the Board/Committee have complete access to all information of the Company and are also free to recommend inclusion of any matter in agenda for discussion. Senior officials are called to provide additional inputs to the items being discussed by the Board/Committee, as and when required.
(vii) Each Committee has the authority to engage outside experts, advisors and counsels to the extent it considers appropriate to assist the Committee in its work.
(C) Recording minutes of proceedings at the Board / Committee Meeting
Minutes of the proceedings of each Board/Committee meeting are recorded. Draft minutes are circulated amongst all members of the Board/ Committee for their critical appreciation and comments. The comments are incorporated in the minutes, which are finally approved by the Chairman of the Board/Committee. These minutes are confirmed in the next Board/ Committee Meeting. Minutes of the meetings of the Committees are also noted by the Board in its next meeting. The finalized minutes are entered in the Minutes Book.
(D) Follow-up mechanism
The guidelines for the Board/Committee meetings provide for an effective post-meeting follow-up, review and reporting process for the action taken on decisions/instructions/directions of the Board and Committee. As per the Board’s decision, the Company Secretary intimates the Action Points arising from deliberation during the meeting to the Functional Directors who in turn provide updates to be apprised to the Board on the areas of their responsibilities in the next meeting. Functional Directors submit follow-up Action Taken Report (ATR) once in a quarter.
(E) Compliance
Functional Directors are responsible to ensure adherence to all the applicable provisions of law, rules, guidelines etc. A Quarterly Compliance Report (collected from all work centres) confirming adherence to all the applicable laws, rules, guidelines and internal instructions/ manuals, including on Corporate Governance, is reviewed by the Audit & Ethics Committee and the Board.
(F) Training and Evaluation of non-executive Board members
The non-executive Board members are eminent personalities having wide experience in the field of business, education, industry, commerce and administration. Their presence on the Board has been advantageous and fruitful in taking business decisions. Detailed presentation on the business module, performance, plans etc of ONGC are made to the non-executive Board members on their induction on the Board of ONGC. They are nominated by the Company for suitable programmes/seminars from time to time. However, at the Board/Committee/other meetings, detailed presentations are made by senior executives/ professionals/consultants on business related issues, risk assessment, impact of regulatory changes on strategy etc. The Company has not adopted any mechanism for evaluating individual performance of non-executive Board members.
1. CORPORATE GOVERNANCE RECOGNITIONS
2. BOARD OF DIRECTORS
At the outset, it may be mentioned that many organisations have recognised the excellence in Corporate Governance in ONGC and the following accolades have been conferred on ONGC in recent years:
(i) ‘ICSI National Award for Excellence in Corporate Governance-2003’- by the Institute of Company Secretaries of India;
(ii) 'SCOPE Meritorious Award for Corporate Governance 2006-07' by the Standing Conference on the Public Enterprises;
(iii) ‘Golden Peacock Award for Excellence in Corporate Governance‘ by the Institute of Directors in the years 2002, 2005 and 2006;
(iv) ‘Golden Peacock Global Award’ for Corporate Governance by World Council for Corporate Governance, U.K. in the years 2005, 2007, 2008 and 2009;
(v) ‘ICSI National Award for Excellence in Corporate Governance-2010’- by the Institute of Company Secretaries of India;
(vi) ‘Golden Peacock Award for Excellence in Corporate Social Responsibility in Emerging Economics - 2006' by World Council for Corporate Governance, U.K in 2006.
2.1 COMPOSITION, MEETINGS AND ATTENDANCE
The Company is managed by the Board of Directors, which formulates strategies, policies and reviews its performance periodically. The Chairman & Managing Director (CMD) and six Whole-Time Directors viz. Director (Onshore), Director (Technology & Field Services), Director (Finance), Director (Offshore), Director (Exploration) and Director (Human Resource), manage the business of the Company under the overall supervision, control and guidance of the Board.
2.2 COMPOSITION stThe Board of Directors has an adequate combination of Executive (Functional) and Non-executive Directors. As on 31 March,
2011, the Board had 12 members, comprising of 5 Functional Directors (including the Chairman & Managing Director) and 7 Non-executive Directors (comprising 2 part-time official nominee Directors and 5 part-time non-official Directors) nominated by the Government of India. To share the global experience and business strategies, Managing Director, ONGC Videsh Limited (OVL) is a permanent invitee to the meetings of the Board.
The composition of the Board of Directors of ONGC as on 31.03.2011, does not comply with provisions of Clause 49 of the Listing Agreement. It may be noted that in terms of Article 104 of Articles of Association of ONGC, the President of India has the powers to appoint all directors on the Board of ONGC. The matter of appointment of requisite number of independent directors to comply with the provisions of Clause 49 of the Listing Agreement is under consideration of the Government of India. The matter is being pursued with Ministry of Petroleum & Natural Gas.
2.3 Board/ Committee Meetings and Procedures
(A) Institutionalised decision making process
With a view to institutionalize all corporate affairs and setting up systems and procedures for advance planning for matters requiring discussion/ decisions by the Board, the Company has defined guidelines for the meetings of the Board of Directors and Committees thereof. These guidelines seek to systematize the decision making process at the meetings of Board/ Committees, in an informed and efficient manner. Company’s guidelines relating to Board Meetings are applicable to Committee Meetings as far as practicable.
(B) Scheduling and selection of agenda items for Board/ Committee Meetings
(i) The meetings are convened by giving appropriate advance notice after obtaining approval of the Chairman of the Board/ Committee. To address specific urgent need, meetings are also being called at a shorter notice. In case of exigencies or urgency, resolutions are passed by circulation.
(ii) Detailed agenda containing the management reports and other explanatory statements are circulated in advance in the defined agenda format amongst the members for facilitating meaningful, informed and focused decisions at the meetings. Where it is not practicable to circulate any document or the agenda is of confidential nature, the same is tabled with the approval of CMD. Sensitive subject matters are discussed at the meeting without written material being circulated. In special and exceptional circumstances, additional or supplemental item(s) on the agenda are permitted.
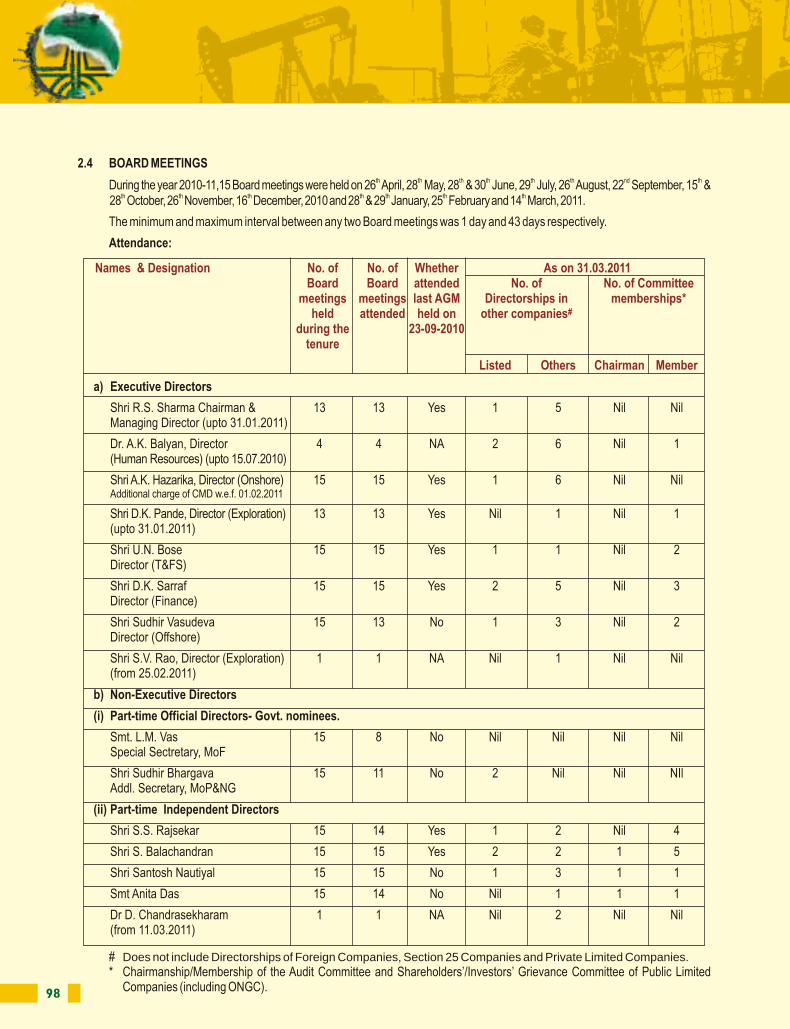
98 99
Notes: (i) The Company being a PSU, all Directors are appointed/ nominated by the President of India;
(ii) Directors are not per se related to each other;
(iii) Directors do not have any pecuniary relationships or transactions with the Company;
(iv) The Directorships/Committee Memberships are based on the latest disclosure received;
(v) None of the Director is a Member of more than 10 Committees or Chairman of more than 5 Committees, across allthe companies in which he is a Director.
To have the benefit of cumulative knowledge and experience of the elders of the ONGC family, an assembly of the past and thpresent members of the erstwhile Oil & Natural Gas Commission and Board is organized every year. 9 ONGC Conclave was
th thorganized during July 10 & 11 , 2010 at Goa. The Conclave focused on SWOT analysis of ONGC and future growth strategy.
The Key Executives In-charges of Assets, Basins, Services, Institutes and Corporate Functions meet periodically with CMD and ththe functional Directors to review performance and to formulate future plans. During the year under review, 10 Key Executives
th th thMeet (Vichar Vishleshan-X) was organized on 17 , 18 & 19 December, 2010 at Mumbai. The theme of the meet was “Unleashing Potential: Chartering Growth”.
The brief resume of Directors retiring by rotation and Additional Director seeking appointment including nature of their experience in specific functional areas, names of companies in which they hold directorship and membership/ chairmanship of Board/ Committee is appended to the notice for calling Annual General Meeting.
The Company has the following Committees of the Board:
6.1 AUDIT & ETHICS COMMITTEE
The terms of reference of the Audit & Ethics Committee are in accordance with Section 292A of the Companies Act, 1956, guidelines set out in Clause 49 of the Listing Agreement and the Guidelines on Corporate Governance for Central Public Sector Enterprises issued by the Department of Public Enterprises in May, 2010.
Composition
The Committee is headed under the stewardship of Shri S.Balachandran, an Independent non-executive Director w.e.f. 11.11.2008. Shri S. Balachandran is a B.Sc Gold medalist and an M.Sc. First class. He joined Indian Railway Accounts Service in 1971. He served in the Senior Management level in Indian Railway Finance Corporation Limited including as its Managing Director. He worked as Under Secretary and Deputy Secretary of UPSC and Joint Director of C&AG. All members of the Committee have requisite financial and management experience and have held senior positions in other reputed organizations.
Director (Finance), Chief-Corporate Finance and Chief Internal Audit are the permanent invitees. Representatives of Statutory Auditors and Cost Auditors are invited to attend and participate in the meetings. Functional Directors, Executives of Finance and other departments are invited on need basis.
The Chairman of the Audit & Ethics Committee was present at the last AGM of the Company.
Company Secretary acts as the Secretary to the Committee.
(i) Oversight of the company's financial reporting process and the disclosure of its financial information to ensure that the financial statement is correct, sufficient and credible.
(ii) Recommending to the Board, the appointment, re-appointment and, if required, the replacement or removal of the statutory auditor and the fixation of audit fees of the Statutory Auditors.
(iii) Approval of payment to statutory auditors for any other services rendered by the statutory auditors.
(iv) Reviewing, with the management, the annual financial statements before submission to the Board for approval, with particular reference to:
3. CONCLAVE
4. VICHAR VISHLESHAN
5. RESUME OF DIRECTORS PROPOSED TO BE RE-APPOINTED
6. BOARD COMMITTEES
The role of the Audit & Ethics Committee includes the following:
2.4 BOARD MEETINGS th th th th th th nd thDuring the year 2010-11,15 Board meetings were held on 26 April, 28 May, 28 & 30 June, 29 July, 26 August, 22 September, 15 &
th th th th th th th28 October, 26 November, 16 December, 2010 and 28 & 29 January, 25 February and 14 March, 2011.
The minimum and maximum interval between any two Board meetings was 1 day and 43 days respectively.
Attendance:
# * Chairmanship/Membership of the Audit Committee and Shareholders’/Investors’ Grievance Committee of Public Limited
Companies (including ONGC).
Does not include Directorships of Foreign Companies, Section 25 Companies and Private Limited Companies.
a) Executive Directors
Shri R.S. Sharma Chairman & 13 13 Yes 1 5 Nil NilManaging Director (upto 31.01.2011)
Dr. A.K. Balyan, Director 4 4 NA 2 6 Nil 1(Human Resources) (upto 15.07.2010)
Shri A.K. Hazarika, Director (Onshore) 15 15 Yes 1 6 Nil NilAdditional charge of CMD w.e.f. 01.02.2011
Shri D.K. Pande, Director (Exploration) 13 13 Yes Nil 1 Nil 1(upto 31.01.2011)
Shri U.N. Bose 15 15 Yes 1 1 Nil 2Director (T&FS)
Shri D.K. Sarraf 15 15 Yes 2 5 Nil 3Director (Finance)
Shri Sudhir Vasudeva 15 13 No 1 3 Nil 2Director (Offshore)
Shri S.V. Rao, Director (Exploration) 1 1 NA Nil 1 Nil Nil(from 25.02.2011)
b) Non-Executive Directors
(i) Part-time Official Directors- Govt. nominees.
Smt. L.M. Vas 15 8 No Nil Nil Nil NilSpecial Sectretary, MoF
Shri Sudhir Bhargava 15 11 No 2 Nil Nil NIlAddl. Secretary, MoP&NG
(ii) Part-time Independent Directors
Shri S.S. Rajsekar 15 14 Yes 1 2 Nil 4
Shri S. Balachandran 15 15 Yes 2 2 1 5
Shri Santosh Nautiyal 15 15 No 1 3 1 1
Smt Anita Das 15 14 No Nil 1 1 1
Dr D. Chandrasekharam 1 1 NA Nil 2 Nil Nil(from 11.03.2011)
Names & Designation No. of No. of Whether As on 31.03.2011Board Board attended No. of No. of Committee
meetings meetings last AGM Directorships in memberships*#held attended held on other companies
during the 23-09-2010tenure
Listed Others Chairman Member
100 101
Audit & Ethics Committee Meetings
Attendance:
During the year 2010-11, nine meetings of Audit & Ethics Committee were held on April 26, May 28, June 25, July 29 , August 26, September 22 & October 28, 2010 and January 28 and February 25, 2011.
6.2 REMUNERATION COMMITTEE
The Department of Public Enterprises has directed that each CPSE should constitute a Remuneration Committee headed by an Independent Director. Accordingly, the Remuneration Committee of ONGC is headed by Smt Anita Das, an Independent Director. Shri Santosh Nautiyal, Independent Director, Shri S. Balachandran, Independent Director, Shri S.S. Rajsekar, Independent Director are the members of the Committee. Director (HR) and Director (Finance) are permanent Invitees.
ONGC being a Government Company, terms and conditions of appointment and remuneration of Executive (whole-time functional) Directors are determined by the Government through administrative ministry, the Ministry of Petroleum & Natural Gas. Non-executive (part-time official) Directors do not draw any remuneration. The Non-executive (part-time non-official) Directors are paid sitting fees @ ̀ 20,000/- for each Board/Committee meeting attended by them.
th thTwo meetings of the above Committee were held on 16 December, 2010 and 25 February, 2011. All members were present.
6.2.1 DIRECTORS' REMUNERATIONstRemuneration of Directors for the year ended 31 March, 2011 was as follows:
a) Executive Directors
Note: • Notice period of 3 months or salary in lieu thereof is required for severance of service.
Members No. of Meetings held No. of Meetingsduring the tenure Attended
Shri S. Balachandran 9 9
Shri Santosh Nautiyal 9 9
Shri S.S. Rajsekar 9 9
Smt Anita Das 9 8
Permanent Invitees:
Shri D.K. Sarraf, Director (Finance) 9 9
Shri S. Dhandapani, GGM-Chief Corporate Finance 9 9
Shri Pradeep Prasad - Chief Internal Audit 9 7
SI. Names Salary Other Performance Contribution Provision Grand TermNo. including benefits Incentives to PF & other for Leave, Total
DA & perks Funds Gratuity & PRBS as per AS- 15
1. Shri R.S. Sharma 1.60 1.10 1.70 0.15 - 4.55 31.01.2011
2. Dr. A. K. Balyan 0.41 2.62 0.43 0.03 - 3.49 15.07.2010
4. Shri A.K. Hazarika 1.85 0.41 1.48 0.17 0.48 4.39 30.09.2012
5. Shri D.K. Pande 1.70 1.12 1.27 0.14 0.36 4.23 31.01.2011
6. Shri U.N. Bose 2.12 0.30 1.47 0.17 0.46 4.52
7. Shri D.K. Sarraf 1.98 0.07 1.43 0.17 0.36 4.01 26.12.2012
8. Shri Sudhir Vasudeva 1.69 0.38 1.39 0.16 0.31 3.93 31.01.2014
9. Shri S.V. Rao 0.19 - 1.44 0.02 0.28 1.93 31.03.2013
• Matters required to be included in the Director's Responsibility Statement to be included in the Board's report in terms of clause (2AA) of Section 217 of the Companies Act, 1956
• Changes, if any, in accounting policies and practices and reasons for the same
• Major accounting entries involving estimates based on the exercise of judgment by management
• Significant adjustments made in the financial statements arising out of audit findings
• Compliance with listing and other legal requirements relating to financial statements
• Disclosure of any related party transactions
• Qualifications in the draft audit report
(v) Reviewing, with the management, the quarterly financial statements before submission to the Board for approval.
(vi) Reviewing, with the management, the statement of uses / application of funds raised through an issue (public issue, rights issue, preferential issue, etc.), the statement of funds utilized for purposes other than those stated in the offer document/prospectus/notice and the report submitted by the monitoring agency monitoring the utilisation of proceeds of a public or rights issue, and making appropriate recommendations to the Board to take up steps in this matter.
(vii) Reviewing, with the management, performance of statutory and internal auditors, adequacy of the internal control systems.
(viii) Reviewing the adequacy of internal audit function, if any, including the structure of the internal audit department, staffing and seniority of the official heading the department, reporting structure coverage and frequency of internal audit.
(ix) Discussion with internal auditors any significant findings and follow up there on.
(x) Reviewing the findings of any internal investigations by the internal auditors into matters where there is suspected fraud or irregularity or a failure of internal control systems of a material nature and reporting the matter to the Board.
(xi) Discussion with statutory auditors before the audit commences, about the nature and scope of audit as well as post-audit discussion to ascertain any area of concern.
(xii) To look into the reasons for substantial defaults in the payment to the depositors, shareholders (in case of non payment of declared dividends) and creditors.
(xiii) To review the functioning of the Whistle Blower Mechanism.
(xiv) The Audit Committee should have discussions with the auditors periodically about internal control systems, the scope of audit including the observations of the auditors and review the half-yearly and annual financial statements before submission to the Board and also ensure compliance of internal control systems.
(xv) To review the Audit paras referred to A&EC by the Internal Audit / Board and / or Govt. of India and to provide its suggestions / guidance / comments on the issues referred to it.
(xvi) Carrying out any other function as is mentioned in the terms of reference of the Audit Committee.
(xvii) The Audit Committee shall review the financial statements, in particular, the investments made by the unlisted subsidiary company
As advised by the Comptroller & Auditor General (C&AG) in its Report No. CA 22 on Corporate Governance in Listed Government Companies, in order to present a comprehensive view of the working of the Audit & Ethics Committee of ONGC the second and third Annual Report on the working of the Audit Committee for the year 2009-10 and 2010-11 are under finalisation and shall be presented to the Audit & Ethics Committee shortly.
The aforementioned report briefly give a background about the constitution, the legal framework, terms of reference, items considered by the Audit Committee and the details of observation/suggestion of Audit Committee and action taken thereon during the year.
Annual Report on the working of the Audit & Ethics Committee
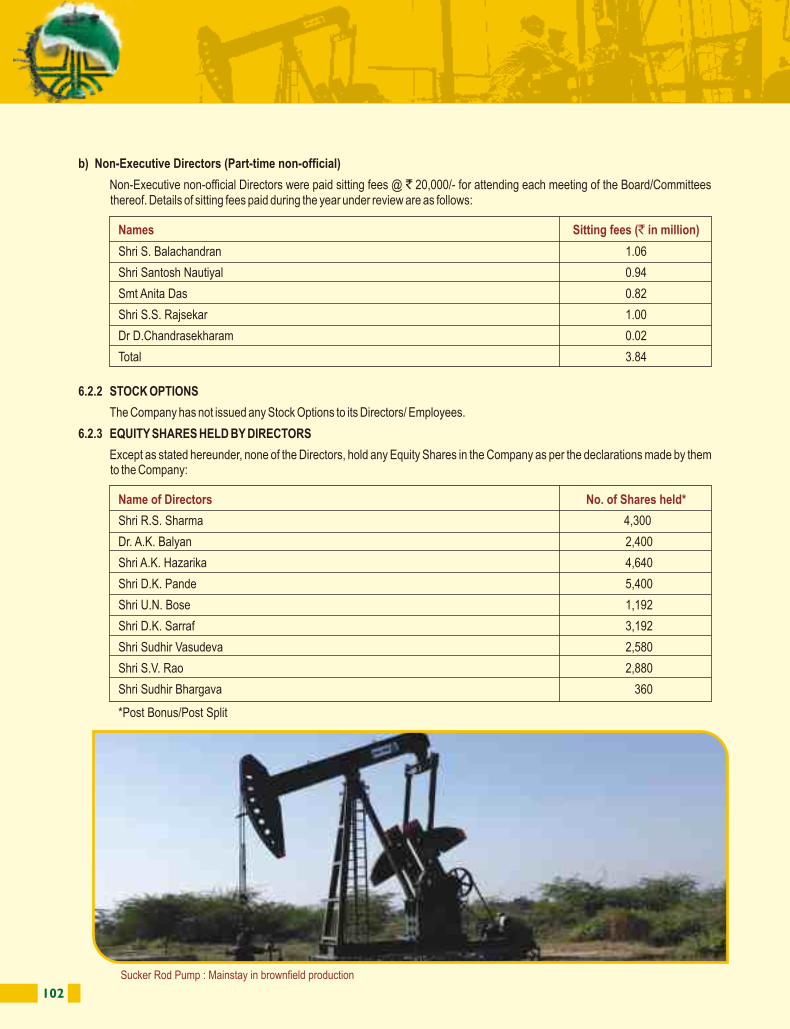
102 103
6.3 SHAREHOLDERS'/ INVESTORS' GRIEVANCES COMMITTEE
The Shareholders’/Investors’ Grievances Committee specifically looks into redressing of Shareholders’ and Investors’ complaints/ grievances pertaining to transfer/transmission of shares, non-receipt of annual reports, dividend payments, issue of duplicate share certificates and other miscellaneous complaints. The Committee oversees and reviews performance of the Registrar and Transfer Agent and recommends measures for overall improvement in the quality of investor services. The Committee also monitors implementation and compliance of Company’s Code of Conduct for Prevention of Insider Trading in ONGC’s securities.
The Committee is headed by Smt Anita Das, an Independent Director. Shri S.S. Rajsekar, Shri S. Balachandran, Director (HR) and Director (Finance) are the Members of the Committee. The Company Secretary acts as a Convener to the Committee.
th th th During the year 2010-11, three meetings were held on 28 June, 2010, 18 January and 25 February, 2011. The attendance particulars are as under:
6.3.1 COMPLIANCE OFFICER
Shri N K Sinha, Company Secretary is the Compliance Officer. The Company Secretary is primarily responsible to ensure compliance with applicable statutory requirements and is the interface between the management and the regulatory authorities for governance matters.
6.3.2 REDRESSAL OF INVESTORS' GRIEVANCE
The Company addresses all complaints, suggestions and grievances of the investors expeditiously and usually sends/ resolves the issues within 7 days except in case of dispute over facts or other legal constraints.
Except for the complaints pertaining to ‘Offer for Sale’ by Government of India, the Company received 18 shareholders’ complaints from Stock Exchanges/ SEBI which inter-alia includes non-receipt of dividend/ annual report, issue of Bonus Shares, payment for fraction Bonus Shares etc. The complaints were duly attended to and the Company/ RTA have furnished necessary documents / information to the shareholders. As far as the Investors’ Grievances on “ONGC Offer for Sale-2004” is concerned, considerable progress has been made by constant interaction with SEBI and MCS.
No request for share transfer is pending beyond 30 days except those that are disputed or sub-judice. All requests for de-materialization of shares are likewise processed and confirmation communicated to investors and Depository Participants within 10 working days.
The total number of complaints/ queries/ correspondence received and replied/ attended to the satisfaction of the shareholders st was 4256. There was no complaint pending as on 31 March, 2011.
Members No. of Meetings No. of Meetingsheld during the tenure attended
Smt Anita Das 3 3
Shri S.S. Rajsekar 3 3
Shri S. Balachandran 3 3
Dr. A. K. Balyan (Up to 15.07.2010) 1 0
Shri D. K. Sarraf 3 3
Shri A. K. Hazarika (As Director HR) 1 1
b) Non-Executive Directors (Part-time non-official)
Non-Executive non-official Directors were paid sitting fees @ ` 20,000/- for attending each meeting of the Board/Committees thereof. Details of sitting fees paid during the year under review are as follows:
6.2.2 STOCK OPTIONS
The Company has not issued any Stock Options to its Directors/ Employees.
6.2.3 EQUITY SHARES HELD BY DIRECTORS
Except as stated hereunder, none of the Directors, hold any Equity Shares in the Company as per the declarations made by them to the Company:
Names Sitting fees (` in million)
Shri S. Balachandran 1.06
Shri Santosh Nautiyal 0.94
Smt Anita Das 0.82
Shri S.S. Rajsekar 1.00
Dr D.Chandrasekharam 0.02
Total 3.84
Name of Directors No. of Shares held*
Shri R.S. Sharma 4,300
Dr. A.K. Balyan 2,400
Shri A.K. Hazarika 4,640
Shri D.K. Pande 5,400
Shri U.N. Bose 1,192
Shri D.K. Sarraf 3,192
Shri Sudhir Vasudeva 2,580
Shri S.V. Rao 2,880
Shri Sudhir Bhargava 360
*Post Bonus/Post Split
Sucker Rod Pump : Mainstay in brownfield production
104 105
6.4 HUMAN RESOURCE MANAGEMENT COMMITTEE
The terms of reference include consideration of all issues/ areas concerning Human Resource Planning & Management, HR policies & initiatives and Promotions for the post of Group General Manager (GGM) and Executive Director (ED) and appeals of officers in terms of CDA Rules of ONGC.
Shri S. S. Rajsekar is the Chairman of the Committee. Shri Sudhir Bhargava, Shri S. Balachandran, CMD and all Functional Directors are the members of the Committee. Director (HR) is the Member-Convener of the Committee.
th th th nd th thDuring the year 2010-11, six meetings were held on 26 April, 28 May, 28 July, 22 September, 26 November, 2010 and 12 March, 2011. These meetings were attended by the members of the Committee, as under:
6.5 PROJECT APPRAISAL COMMITTEE
The Project Appraisal Committee examines and makes recommendations to the Board on projects/ capital investment exceeding ` 2500 million. Proposals upto ` 2500 million are appraised in-house, while the proposals exceeding ` 2500 million are first appraised by Financial Institutions and thereafter considered by the Project Appraisal Committee which recommends the proposal to the Board with its views. The Project Appraisal Committee also monitors IOR/ EOR Schemes.
Shri Santosh Nautiyal, Independent Director is the Chairman of the Committee. Shri Sudhir Bhargava, Shri S. Balachandran, Shri S.S. Rajsekar, Smt Anita Das, Shri Sudhir Vasudeva, Shri D.K. Sarraf & concerned Functional Directors are the members of the Committee. Director (Offshore) is the Member-Convener of the Committee.
th th th th th During the year 2010-11, seven meetings were held on: 28 June, 28 July, 26 August, 28 October, 24 November, 2010, th th18 January and 12 March, 2011. These meetings were attended by the members of the Committee, as under:
Members No. of meetings held No. of meetings during the tenure attended
Shri S.S. Rajsekar 6 6
Shri S. Balachandran 6 6
Shri R.S. Sharma (Upto 31.01.2011) 5 5
Dr. A.K. Balyan (Upto 15.07.2010) 2 2
Shri A.K. Hazarika* 6 6
Shri D.K. Pande (Upto 31.01.2011) 5 5
Shri U.N. Bose 6 6
Shri D.K. Sarraf 6 5
Shri Sudhir Vasudeva 6 5
Shri S.V. Rao (From 25.02.2011) 1 1
Shri Sudhir Bhargava 6 2
* Shri A.K. Hazarika holding additional charge of Director (Exploration) and Director (HR)
Manifold series : Enhancing production
6.3.3 SETTLEMENT OF GRIEVANCES
Investors may register their complaints in the manner stated below
6.3.4 INVESTOR RELATIONS CELL
In line with global practices, the Company is committed to maintain, the highest standards of Corporate Governance, reinforcing the relationship between the Company and its Shareholders. ‘Investor Service Center’ with information frequently required by investors and analysis is available on the Company’s corporate website www.ongcindia.com. This website provides updates on financial statements, investor-related events and presentations, annual reports, dividend information and shareholding pattern along with media releases, company overview and report on Corporate Governance etc. Existing and potential investors are able to interact with the Company through this link for their queries and seeking information.
A Core Team comprising of senior, experienced officials, headed by Director (Finance) have been assigned the responsibilities for up-keeping the said link and also to serve as a platform for the shareholders to express their opinions, views, suggestions, etc. to understand the influencing factors in their investment decision-making process. Besides, the said team is also instrumental in maintaining close liaison and to share information through periodic meets including tele-conferencing in India and abroad, regular press meets with investment bankers, research analysts, the media, institutional investors etc. The Company is committed to take such other steps as may be necessary to fulfil the expectations of the stakeholders.
Sl. No.
1
2
3
4
Nature of Complaint
Complaint regarding allocation of Shares, Refund order under Offer for Sale, 2004 by Govt. of India
Dividend from financial years 2003-2004 (final) to 2010-11 (interim) and all matters pertaining to Bonus Shares and shares held in Physical mode;
For Physical Shares-
Change of address, status, Bank account, mandate, ECS mandate etc.
For Dematted Shares-
Change of address, status, Bank account, mandate, ECS mandate etc.
All complaints except of Sl.no.3
Contact Office
Shri S Biswas, Director MCS Limited, F-65, Okhla Industrial Area, Phase-I, Delhi- 110020.PhoneNos.011-41406149,51-52 Fax Nos. 011-41709881.e-mail: [email protected]
M/s Karvy Computershare Private Ltd., Plot No.17-24, Vittal Rao Nagar, Madhapur, Hyderabad - 500081. Phone Nos. 040- 23420815-819.Fax No: 040- 23420814.e-mail: [email protected]
OR
Karvy Computershare Private Ltd., 105-108 Arunachal Building, Ist floor, 19, Barakhambha Road, New Delhi-110001, Phone Nos. 011-41036370 (tele-fax) & 43528522 e-mail: [email protected]
Concerned Depository Participant (DP) where the Shareholder is maintaining his/her account
Company Secretary Oil and Natural Gas Corporation Ltd.,124, Indira Chowk, New Delhi-110001Phone: 011-23301299 & 23301257e-mail: [email protected]
Action to be taken
Application giving details of Application No, No. of shares applied, No. of Shares allotted, DP ID, Client ID, Nature of complaint, Applicant Name(s) andc o m p l e t e p o s t a l a d d r e s s .
Letter on plain paper stating the nature of complaint, Folio/ DPID/ Client ID No; lodging of original shares and other documents/ instruments as the case may be.
Members are requested to apply for renewal or issue of duplicate dividend warrants for the final
t hDividend 2003-04 before 30 September, 2011. The unpaid dividend amount for the year 2003-04
thwill be transferred on or before 28 October, 2011 by the Company to the Investor Education & Protection Fund (IEPF) set up by Govt. of India and no claim will lie neither against IEPF nor against the Company.
As per instructions of DP
On plain paper stating nature of complaint, folio/DPID/Client ID No., Name and address.
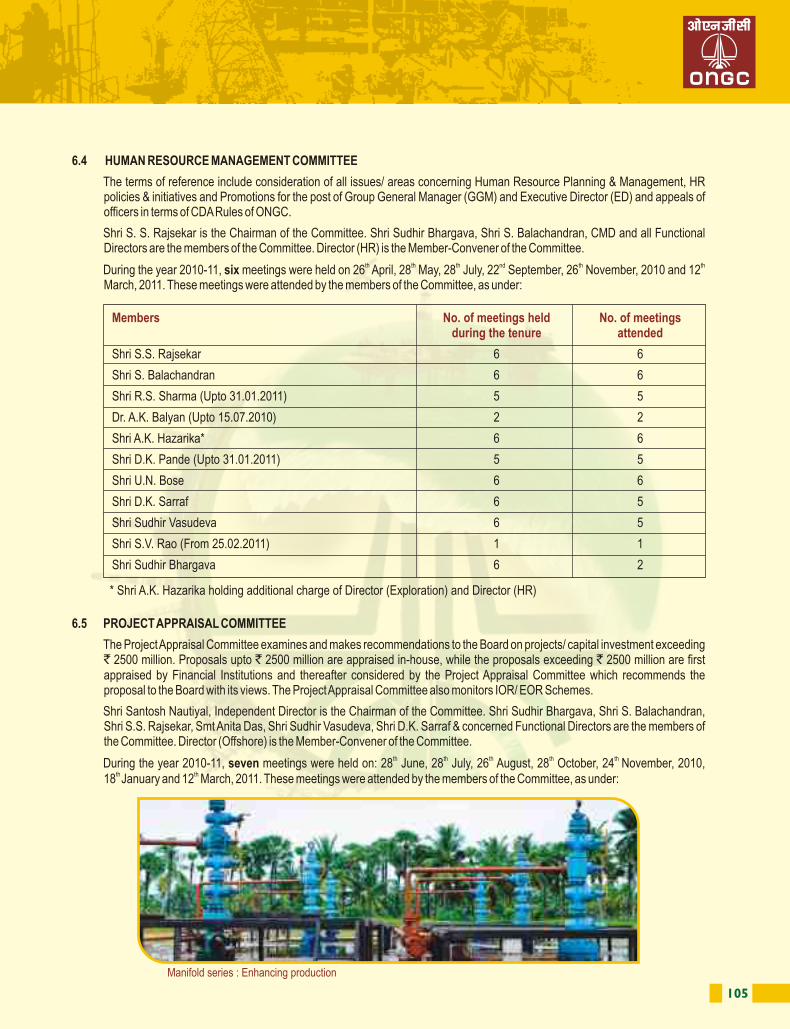
106 107
th th th th During the year 2010-11, four meetings of the Committee were held on 25 June, 15 October, 24 November, 2010 and 28January, 2011. These meetings were attended by the members of the Committee, as under:
6.8 COD FOR REDRESSAL OF GRIEVANCES OF THE PARTIES
COD for Redressal of grievances of the parties has been constituted to review the grievances of the parties for suitable Redressal.
Shri Santosh Nautiyal, an Independent Director is the Chairman of the Committee. Other members of the Committee are Shri S.S. Rajsekar, Shri S. Balachandran, Smt Anita Das, Shri A.K. Hazarika, Shri U.N. Bose, Shri D.K. Sarraf and concerned Functional Directors. Director (T&FS) is the Member-Convener of the Committee.
th th th th During the year 2010-11, six meetings of the committee were held on 27 May, 26 August, 26 November, 29 December, 2010, th th18 January and 25 February, 2011. These meetings were attended by the members of the Committee, as under:
6.9 OTHER FUNCTIONAL COMMITTEES
Apart from the above, the Board also from time to time, constitutes Functional Committees with specific terms of reference as it may deem fit. Meetings of such Committees are held as and when the need for discussing the matter concerning the purpose arises. Time schedule for holding the meetings of such Committees is finalized in consultation with the Committee members.
The Company is committed to conducting business in accordance with the highest standards of business ethics and complying with applicable laws, rules and regulations. A code of conduct, evolved in line with the industry practices was adopted by the
7. CODE OF CONDUCT FOR MEMBERS OF THE BOARD AND SENIOR MANAGEMENT
Members No. of meetings No. of meetingsheld during the tenure attended
Shri S. Balachandran 4 4
Shri Santosh Nautiyal 4 4
Smt Anita Das 4 3
Shri D.K. Sarraf 4 4
Members No. of meetings No. of meetingsheld during the tenure attended
Shri S.S. Rajsekar 6 6
Shri Santosh Nautiyal 6 6
Shri S. Balachandran 6 4
Smt Anita Das 6 5
Shri A.K. Hazarika 6 5
Shri D.K. Pande* 1 1
Shri U.N. Bose 6 5
Shri D.K. Sarraf 6 4
Shri A.K. Balyan* 1 1
Shri Sudhir Vasudeva* 3 3
*These Directors attended the meetings as member concerning the Projects of their responsibilities.
6.6 HEALTH, SAFETY & ENVIRONMENT COMMITTEE
The terms of reference includes review of policy, processes and systems on Safety, Health, Environment and Ecology aspects. Shri S.S. Rajsekar, an Independent Director is the Chairman of the Committee. Director (Onshore) acts as a Member-Convener. The other members of the Committee are Shri Sudhir Bhargava, Shri Santosh Nautiyal, CMD and all functional Directors.
rd thDuring the year 2010-11, two meetings were held on: 23 September and 29 December, 2010. These meetings were attended by the members of the Committee, as under:
6.7 FINANCIAL MANAGEMENT COMMITTEE
Mandate of the Committee includes looking into the matters pertaining to Budget, Delegation of Powers (Empowerment), Commercial Issues, Forex and Treasury Management, Investments, Risk Management, Capital Structure, Issue of Securities, Short and Long Term Loans, Periodical Performance Review of subsidiaries.
Shri S. Balachandran is the Chairman of the Committee. Shri Santosh Nautiyal, Smt Anita Das, Shri D.K. Sarraf and concerned Functional Directors are the members. Director (Finance) is the Member –Convener.
Members No. of meetings No. of meetingsheld during the tenure attended
Shri S. Balachandran 7 7
Shri Santosh Nautiyal 7 7
Shri S.S. Rajsekar 7 7
Smt Anita Das 7 6
Shri Sudhir Vasudeva 7 7
Shri D.K. Sarraf 7 7
Shri Sudhir Bhargava 7 4
Dr. A.K. Balyan* 1 1
Shri A.K. Hazarika* 1 1
Shri D.K. Pande* 1 1
Shri U.N. Bose * 2 2
*These Directors attended the meetings as member concerning the Projects of their responsibilities
Members No. of meetings No. of meetingsheld during the tenure attended
Shri S.S. Rajsekar 2 2
Shri Santosh Nautiyal 2 2
Shri R.S. Sharma (Upto 31.01.2011) 2 1
Shri A.K. Hazarika 2 2
Shri D.K. Pande (Upto 31.01.2011) 2 1
Shri U.N. Bose 2 2
Shri D.K. Sarraf 2 0
Shri Sudhir Vasudeva 2 1
Shri Sudhir Bhargava 2 1
108 109
10. ANNUAL GENERAL MEETINGS
11. DISCLOSURES
12. MEANS OF COMMUNICATION
Location, date and time of the AGMs held during the preceding 3 years are as under:
There was no special resolution passed by the Company at the last 3 AGMs. A Special Resolution (to amend the Articles of Association for sub-division of equity shares of `10 each into 2 equity shares of ` 5 each) was passed on 28.01.2011 by the Company’s members through postal ballot for the purpose of Split of Shares and issue of Bonus shares. A total number of 22,886 postal ballots were polled for 1,976,757,932 shares. Out these, 20,929 postal ballots (91.449%) for 1,976,474,669 shares (99.986%) were polled in favour of the Special Resolution and 120 postal ballots (0.524%) for 16,788 shares (0.001%) were polled against the resolution and 1,837 postal ballots (8.027%) for 266,394 shares (0.013%) were declared invalid. The Postal Ballot was conducted in accordance with Section 192A of the Companies Act, 1956 read with Companies (Passing of resolutions by Postal Ballot) Rules, 2001 by Shri A N Kukreja of M/s A N Kukreja & Co., Practising Company Secretaries who were appointed by the Board. At the ensuing AGM, there is no Resolution proposed to be passed through postal ballot.
11.1 MATERIAL CONTRACTS/ RELATED PARTY TRANSACTIONS
The Company has not entered into any material financial or commercial transactions with the Directors or the Management or their relatives or the companies and firms, etc., in which they are either directly or through their relatives interested as Directors and/or Partners except with certain PSUs, where the Directors are Directors without the required shareholdings. The Company has obtained declarations from all concerned in this regard, which were noted by the Board.
Transactions with related parties are disclosed in Note No. 17 of Schedule 27 to the Accounts in the Annual Report. Being a State Enterprise, no disclosure has been made in respect of the transactions with State Enterprises, including subsidiary companies, in line with Accounting Standard-18 on Related Party Transactions.
11.2 COMPLIANCES
The Company has complied with applicable rules and the requirement of regulatory authorities on capital market and no penalties or strictures were imposed on the Company during last three years.
All returns/ reports were filed within stipulated time with stock exchanges/ other authorities.
• Quarterly/ Annual Results: The Company regularly intimates un-audited as well as audited financial results to the Stock Exchanges, immediately after these are approved. These financial results are normally published in the leading English and vernacular dailies having wide circulation across the country. The results are also displayed on the website of the Company www.ongcindia.com. The results are not sent individually to the shareholders.
• News Release, Presentation etc.: The official news releases, detailed presentations made to media, institutional investors, financial analysts etc. are displayed on the Company's website www.ongcindia.com.
• Website: The Company's website www.ongcindia.com contains separate dedicated section 'Investor Relations' where the shareholders information is available. Full Annual Report, Shareholding Pattern and Corporate Governance Report etc. are also available on the web-site in a user-friendly manner.
• Annual Report: Annual Report containing inter-alia, Audited Accounts, Consolidated Financial Statements, Directors' Report, Management Discussion and Analysis (MD&A) Report, Auditors' Report, Corporate Governance Report including Information for the Shareholders and other important information is circulated to the members and others entitled thereto.
Year Location Date Time (IST)
2007-08 Siri Fort Auditorium, Khel Gaon, August Kranti Marg, New Delhi- 110049 19.09.2008 10.00 a.m
2008-09 Siri Fort Auditorium, Khel Gaon, August Kranti Marg, New Delhi- 110049 23.09.2009 10.00 a.m
2009-10 Siri Fort Auditorium, Khel Gaon, August Kranti Marg, New Delhi- 110049 23.09.2010 10.00 a.m
Board on the recommendations of Audit and Ethics Committee. A copy of the Code has been placed on the Company's website www.ongcindia.com.
All members of the Board and Senior Management i.e. 'Key Executives' have confirmed compliance with the Code of Conduct for the year under review. A declaration signed by Chairman & Managing Director is given below:
“I hereby confirm that the Company has obtained from the members of the Board and senior management (Key Executives), affirmation that they have complied with the Code of Conduct for Directors and senior management in respect of the financial year 2010-11”
7.1 ONGC'S CODE ON INSIDER TRADING
In pursuance of the Securities and Exchange Board of India (Prohibition of Insider Trading) Regulations, 1992, the Board has approved "The Code of Internal Procedures and Conduct in dealing with the Securities of ONGC”. The objective of the Code is to prevent purchase and/ or sale of shares of the Company by an Insider on the basis of unpublished price sensitive information. Under this Code, Insiders (Directors, Advisors, Key Executives, Designated Employees and other concerned persons) are prohibited to deal in the Company's shares/derivatives of the Company during the closure of Trading Window and other specified period(s). To deal in securities, beyond specified limit, permission of Compliance Officer is required. All Directors/ Advisors/ Officers/ designated employees are also required to disclose related information periodically as defined in the Code.
7.2 CEO/ CFO CERTIFICATION
In terms of revised Clause 49 of the Listing Agreement, the certification by the CEO/ CFO on the financial statements and internal thcontrols relating to financial reporting for the year 2010-11 was submitted to the Board in its meeting held on 30 May, 2011
thWith the approval of EC, Finance Manual has been issued on 4 June, 2009. ONGC Finance Manual is a compendium based on the existing practices and systems, comprehensively covering various finance activities such as accounting, budgeting, costing, pre-audit, treasury management etc. This manual provides the users with existing practices, processes, finance policies & procedures, and guides Finance officers while ensuring consistency and uniformity across locations in terms of processes and methodologies followed. The detailed documented guidelines/policies of Finance function in ONGC is also of great help for new incumbents and Finance officers on transfers. The knowledge documented would enlighten new team members including outside agencies like Statutory Auditors, Government Auditors associated with ONGC for years to come.
The Company has two direct subsidiary companies, Mangalore Refinery & Petrochemicals Ltd. (MRPL, listed, material) and ONGC Videsh Ltd. (OVL, unlisted, non-material). The list of subsidiaries of MRPL and OVL is given in the consolidated accounts of ONGC, which forms part of the Annual Report.
All subsidiaries of the Company are Board managed with their Boards having the rights and obligations to manage such companies in the best interest of their stakeholders. As a majority shareholder, the Company nominates its representatives on the Boards of subsidiary companies and monitors the performance of such companies periodically.
In terms of Clause 49.III (ii) and (iii) of the Listing Agreement and DPE guidelines, performance of the listed and unlisted subsidiary companies is reviewed by the Audit and Ethics Committee and the Board as under:
a) Financial Statements of the listed and unlisted subsidiary companies, are reviewed by the Audit and Ethics Committee;
b) Minutes of the meetings of the Board of Directors are placed before the Company's Board, periodically;
c) A statement of all significant transactions and arrangements entered into by the Subsidiary Company are also reviewed by theCompany.
The Company does not have any material unlisted subsidiary companies in terms of the Clause 49 of the Listing Agreement.
8. FINANCE MANUAL
9. SUBSIDIARY MONITORING FRAMEWORK
110 111
13.8 STOCK MARKET INFORMATION
The stock price performance of ONGC scrip during the last financial year in comparison to BSE is plotted below:
13.8.1MARKET PRICE DATA; HIGH, LOW DURING EACH MONTH IN LAST FINANCIAL YEAR
Month Bombay Stock Exchange National Stock Exchange
High(`) Low(`) Volume High(`) Low(`) Volume
Apr‘10 1,106.95 997.35 2,555,700 1,110.00 996.00 14,824,347
May‘10 1,175.00 1,014.00 3,508,210 1,177.65 1,012.00 29,531,538
Jun ‘10 1,330.80 1,140.00 5,908,595 1,331.40 1,140.00 33,585,420
Jul ‘10 1,346.00 1,221.10 2,617,352 1,346.90 1,220.00 22,363,352
Aug ‘10 1,360.00 1,151.30 2,677,050 1,359.90 1,208.00 19,894,847
Sep ‘10 1,472.00 1,320.25 2,641,912 1,472.60 1,320.00 23,757,134
Oct ‘10 1,444.65 1,289.50 2,314,317 1,444.40 1,290.00 19,993,164
Nov ‘10 1,395.00 1,192.00 1,871,614 1,396.00 1,192.00 14,577,627
Dec ‘10 1,364.90 1,247.00 3,879,897 1,363.85 1,246.50 21,295,768
Jan ‘11 1,299.50 1,101.40 3,328,078 1,304.00 1,122.20 23,160,546
Feb‘11 1,231.90 261.00* 9,625,389 1,233.15 260.10* 66,887,897
Mar‘11 292.70 262.10* 8,753,773 294.20* 262.00* 70,737,027
Source: Web-sites of BSE and NSE *Post -split & post- bonus
ONGC Share price performance: ONGC vs BSE Sensex (2010-11)
1,500
1,400
1,300
1,200
1,100
1,000
900
800
700
600
500
400
300
200
Sh
are
pri
ce (`)
24,461
22,830
21,200
19,569
17,938
16,307
14,677
13,046
11,415
9,784
8,154
6,523
4,892
3,261
BS
E S
ense
x
01/A
pr/1
0
15/A
pr/1
0
29/A
pr/1
0
13/M
ay/1
0
27/M
ay/1
0
10Ju
n/10
24/J
un/1
0
08/J
un/1
0
22/J
ul/1
0
05/A
ug/1
0
19/A
ug/1
0
02/S
ep/1
0
16/S
ep/1
0
30/S
ep/1
0
14/O
ct/1
0
28/O
ct/1
0
11/N
ov/1
0
25/N
ov/1
0
09/D
ec/1
0
23/D
ec/1
0
06/J
an/1
1
20/J
an/1
1
03/F
eb/1
1
17/F
eb/1
1
03/M
ar/1
1
17/M
ar/1
1
31/M
ar/1
1
ONGC Share Price Share price post bonus & split BS Sensex
ONGC Share price from 7th Feb 2011 - adjusted for pre-bonus & pre-split
13. SHAREHOLDERS' INFORMATION
13.1 ANNUAL GENERAL MEETINGth Date : 30 August, 2011
Time : 10:00 Hrs
Venue : Siri Fort Auditorium, Khel Gaon, August Kranti Marg, New Delhi-110049.
13.2 FINANCIAL CALENDAR
These dates are subject to change and the last date for submission of the unaudited quarterly and year to date financial results to the stock exchange is within forty-five days of end of each quarter (except the last quarter). The last date for submission of the financial results of the last quarter is within sixty days from the end of the financial year.
13.3 BOOK CLOSURE PERIODrd thThe Book Closure period is from Tuesday, the 23 August, 2011 to Tuesday, the 30 August, 2011 (both days inclusive) for the
payment of Final Dividend.
13.4 DIVIDEND PAYMENT DATErdFinal Dividend would be paid on or after 3 September, 2011.
13.5 LISTING ON STOCK EXCHANGES
The equity shares of the Company are part of the Sensex and S&P CNX Nifty Index and are listed on the following Stock Exchanges:
13.6 LISTING FEES
Annual listing fees for the year 2010-11, as applicable has been paid to the above Stock Exchanges.
13.7 DEMAT ISIN NUMBERS IN NSDL and CDSL
(Stock Code): INE213A01011stCustody Fee of NSDL and CDSL has been paid till 31 March, 2011
Adoption of Quarterly Results for the Quarter ending Tentative date of the meeting of the BoardthJune 30, 2011 28 July, 2011st September 30, 2011 31 October, 2011th December 31, 2011 30 January 2012thMarch 31, 2012(audited) 30 May, 2012
Name & Address Telephone / Fax / E-mail ID / Website Trading Symbol
Bombay Stock Exchange (BSE) Telephone:022-22721233/4 500312 ONG CORP. LTD.P.J.Towers, Dalal Street, Fax: 022-22721919Mumbai-400001 E-mail: [email protected]
Website:www.bseindia.com
National Stock Exchange of India Ltd. (NSE) Telephone: 022-26598100-8114 ONGCExchange Plaza, Plot no. C/1, Facsimile: 022-26598120G-Block, Bandra-Kurla Complex, E-mail: [email protected](E), Mumbai-400051 Website:www.nseindia.com
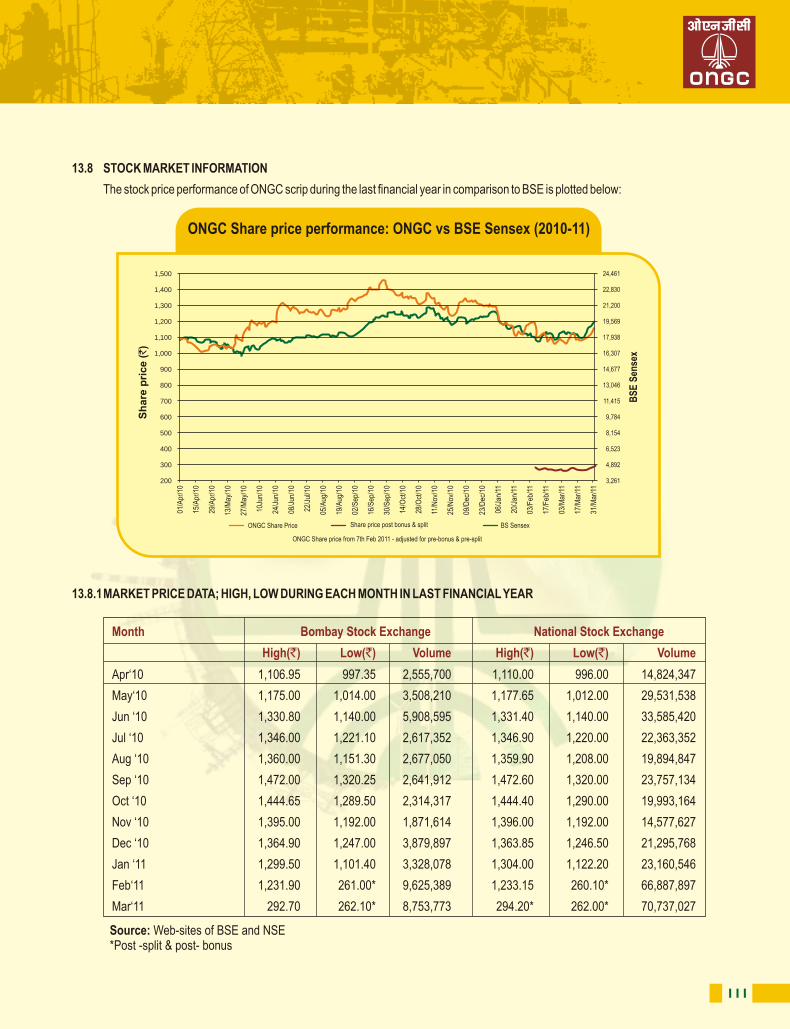
112 113
st15.1 TOP 10 SHAREHOLDERS AS ON 31 MARCH, 2011
st15.2 DISTRIBUTION OF SHAREHOLDING BY SIZE AS ON 31 MARCH, 2011
st15.3 GEOGRAPHICAL DISTRIBUTION OF SHAREHOLDERS AS ON 31 MARCH, 2011
S.No Name No.of Shares held % of total Shareholding
1 President of India 6,342,962,692 74.14
2 Indian Oil Corporation Limited 657,923,428 7.69
3 Life Insurance Corporation Of India 261,528,616 3.06
4 GAIL (India) Limited 205,601,068 2.40
5 Franklin Templeton Investment Funds 79,774,484 0.93
6 LIC Of India Money Plus 41,307,106 0.48
7 LIC Of India – Market Plus 41,106,528 0.48
8 ICICI Prudential Life Insurance Company Limited 36,556,692 0.43
9 LIC Of India Market Plus – 1 33,595,504 0.39
10 Life Insurance Corporation of India – Profit Plus 31,252,404 0.37
Category Number of Shareholders % of Shareholders Total number of Shares % of Shareholding
1 - 500 458,273 88.74 63,279,760 0.74
501 - 1000 27,075 5.24 19,525,914 0.23
1001 - 2000 13,749 2.66 20,080,548 0.23
2001 - 3000 6,394 1.24 15,944,749 0.19
3001 - 4000 6,114 1.18 21,797,622 0.25
4001 - 5000 1,764 0.34 7,814,312 0.09
5001 - 10000 1,588 0.31 10,444,364 0.12
10001 & Above 1,517 0.29 8,396,602,851 98.15
Total 516,474 100.00 8,555,490,120 100.00
S. No City Shareholders Shareholding
Nos % age No of shares %age of shareholding
1 MUMBAI 108,101 20.93 1,854,109,623 21.67
2 NEW DELHI 37,127 7.19 6,564,845,122 76.73
3 AHMEDABAD 32,468 6.29 11,693,648 0.14
4 KOLKATA 25,327 4.90 14,718,485 0.17
5 BANGALORE 21,475 4.16 5,527,467 0.06
6 PUNE 18,565 3.59 4,612,528 0.05
7 CHENNAI 18,478 3.58 17,919,183 0.21
8 VADODARA 16,501 3.19 7,719,414 0.09
9 DEHRADUN 5,233 1.01 5,816,245 0.07
10 JORHAT 4,148 0.80 4,731,221 0.06
11 OTHERS 229,051 44.35 63,797,184 0.75
Total 516,474 100.00 8,555,490,120 100.00
14. SHARE TRANSFER SYSTEM
st15. SHAREHOLDING PATTERN AS ON 31 MARCH, 2011
Karvy Computershare Private Ltd. (Karvy) is the Registrar and Share Transfer Agent (RTA) for physical shares. Karvy is also the depository interface of the Company with both National Securities Depository Ltd. (NSDL) and Central Depository Services (India) Ltd. (CDSL)
With a view to expedite the process of share transfer which are received in physical form, the Board had constituted an Officers Committee which usually meets once in a fortnight to consider and approve the shares received for transfer, transmission, re-materialization and dematerialization etc. The shares for transfer received in physical form are transferred expeditiously, provided the documents are complete and the share transfer is not under any dispute. The Minutes of the aforesaid Committee are placed to the Shareholders'/ Investors' Grievance Committee. A summary of transfer/ transmission of securities so approved by the aforesaid Committee are placed at Board Meetings. The share certificates duly endorsed are sent to the shareholders by RTA. Confirmation in respect to the requests for dematerialization of shares is sent to the respective depositories i.e. NSDL and CDSL, expeditiously.
Pursuant to the Clause 47-C of the Listing Agreement, certificates on quarterly basis confirming due compliance of share transfer formalities by the Company, certificate for timely dematerialization of the shares as per SEBI (Depositories and Participants) Regulations, 1996 are sent to the stock exchanges.
In addition, as a part of the capital integrity audit, a Secretarial Audit Report for reconciliation of the share capital confirming that the total issued capital of the Company is in agreement with the total number of shares in physical form and the total number of dematerialized shares held with NSDL and CDSL, is placed before the Board on a quarterly basis. A copy of the Audit Report is submitted to the stock exchanges.
The total number of transfer deeds processed and shares transferred during the last three years are as under:
Years No. of transfer No. of sharesdeeds processed transferred
2010-11 475 11,991
2009-10 175 16,575
2008-09 420 17,944
Category No. of Shares held Percentage ofShareholding
President of India 6,342,962,692 74.14
Banks, Financial Institutions and Insurance Companies 472,078,320 5.52
Foreign Institutional Investors 380,659,367 4.45
Mutual Funds & UTI 180,081,629 2.11
NRIs 4,550,052 0.05
Bodies Corporate:• Government Companies 863,524,496 10.09• Others 140,995,992 1.65
Employees 7,059,704 0.08
Public 163,577,868 1.91
Total 8,555,490,120 100.00
114 115
Central Government. This is in accordance with the Sections 205A and 205C of the Companies Act, 1956 requiring transfer of dividend remaining unclaimed and unpaid for a period of 7 years from the due date to the IEPF.
th The unpaid/unclaimed amount of Final Dividend declared on 29 September, 2004 for the financial year 2003-04 and thinterim dividend declared on 24 December, 2004 for the financial year 2004-05 will be transferred to the Investor
th rdEducation and Protection Fund (IEPF) of the Central Government by 28 October, 2011 and 23 January, 2012 respectively. Members who have not encashed their dividend warrants pertaining to the said years may approach the Company or its Registrar & Share Transfer Agent for obtaining payment thereof.
Given below are the proposed dates for transfer of the unclaimed dividend to IEPF by the Company:
The shares of the Company are in compulsory dematerialized segment and are available for trading in depository system of both stNational Securities Depository Limited and Central Depository Services (India) Limited. As on 31 March, 2011, 99.91% of the
shareholding, stood dematerialized.
No GDRs/ ADRs/ Warrants or Convertible Instruments have been issued by the Company during the year.
A. ASSETS
1. Mumbai High Asset, Mumbai
2. Neelam & Heera Asset, Mumbai
3. Bassein & Satellite Asset, Mumbai
4. Ahmedabad Asset, Ahmedabad
5. Ankleshwar Asset, Ankleshwar
6. Mehsana Asset, Mehsana
7. Rajahmundry Asset, Rajahmundry
8. Karaikal Asset, Karaikal
9. Assam Asset, Nazira
10. Tripura Asset, Agartala
11. Eastern Offshore Asset, Kakinada, Andhra Pradesh
18. DEMATERIALIZATION OF SHARES AND LIQUIDITY
19. OUTSTANDING GDRs/ ADRs / WARRANTS OR CONVERTIBLE INSTRUMENTS
20. ASSETS/ BASINS/ PLANTS/ INSTITUTES
Financial Year Date of Declaration Proposed Date for transfer to IEPF*
2003-04-Final 29.09.2004 28.10.2011
2004-05 Interim 24.12.2004 23.01.2012
*Indicative dates, actual dates may vary
S.No. Description No. of Share Holders Shares % of Equity
1. CDSL 114,936 7,245,619,913 84.69
2. NSDL 394,576 1,301,780,992 15.22
3. PHYSICAL 6,962 8,089,215 0.09
Total 516,474 8,555,490,120 100.00
15.4 History of Paid-up Equity Share Capital (Face value of ̀ 10 each)
Note: The face value of equity share changed from ̀ 10 each to ̀ 5 each from 09.02.2011 on split in to two equity shares of ̀ 5 each
DIVIDEND HISTORY
Apart from the above, the Company had issued Bonus Shares in October, 2006 in the ratio of 1 bonus share for every 2 shares held and in February, 2011, in the ratio of 1 Bonus Share for every 1 share held (Post split).
During the year under report, an amount of ̀ 34,22,498.00 and ̀ 32,61,846.00 pertaining to unpaid dividend for the financial year 2002-03 and 2003-04(Interim) respectively was transferred to the Investor Education & Protection Fund (IEPF) set up by the
16. CORPORATE BENEFITS
17. TRANSFER OF UNPAID/ UNCLAIMED DIVIDEND AMOUNT TO INVESTOR EDUCATION & PROTECTION FUND (IEPF)
Year No. of Shares Cumulative Details
1993-94 10 10 Initial Subscription to the Memorandum Of Association on 23rd June, 1993
1993-94 34,28,53,716 34,28,53,726 Issued to the President of India on 1st February, 1994 on transfer ofUndertaking of Oil and Natural Gas Commission in terms of Oil andNatural Gas Commission(Transfer of Undertaking and Repeal) Act, 1993
1994-95 66,39,300 34,94,93,026 Issued to the Employees at a premium of ` 260 per Share(includes 600 shares issued in 1995-96)
1995-96 107,64,40,966 142,59,33,992 Issue of Bonus Shares in ratio of 3.08: 1 on 24.04.1995 byCapitalization of General Reserve
2006-07 (-)18,972 142,59,15,020 Forfeiture of Shares on 12.04.2006
71,29,57,510 213,88,72,530 Issue of Bonus Shares in ratio of 1:2 on 08.11.2006 by Capitalization of General Reserve.
2010-11 8,555,490,120 Each equity Share of ONGC was split from the face value of `10 intotwo equity shares of the face value of `5 eachBonus Shares were issued in the ratio of 1:1 by Capitalization ofReserves to the shareholders as on 09.02.2011 (Record Date).
Years Rate (%) Per Share (`) Amount (` in million)
2006-07Interim 180 18 38,499.66Final 130 13 27,805.31
2007-08Interim 180 18 38,499.66Final 140 14 29,944.22
2008-09Interim 180 18 38,499.66Final 140 14 29,944.22
2009-10Interim 180 18 38,499.66Final 150 15 32083.09
2010-11Interim 320 32 68443.92Final (Proposed on each equity share of `5) 15 0.75 6416.62
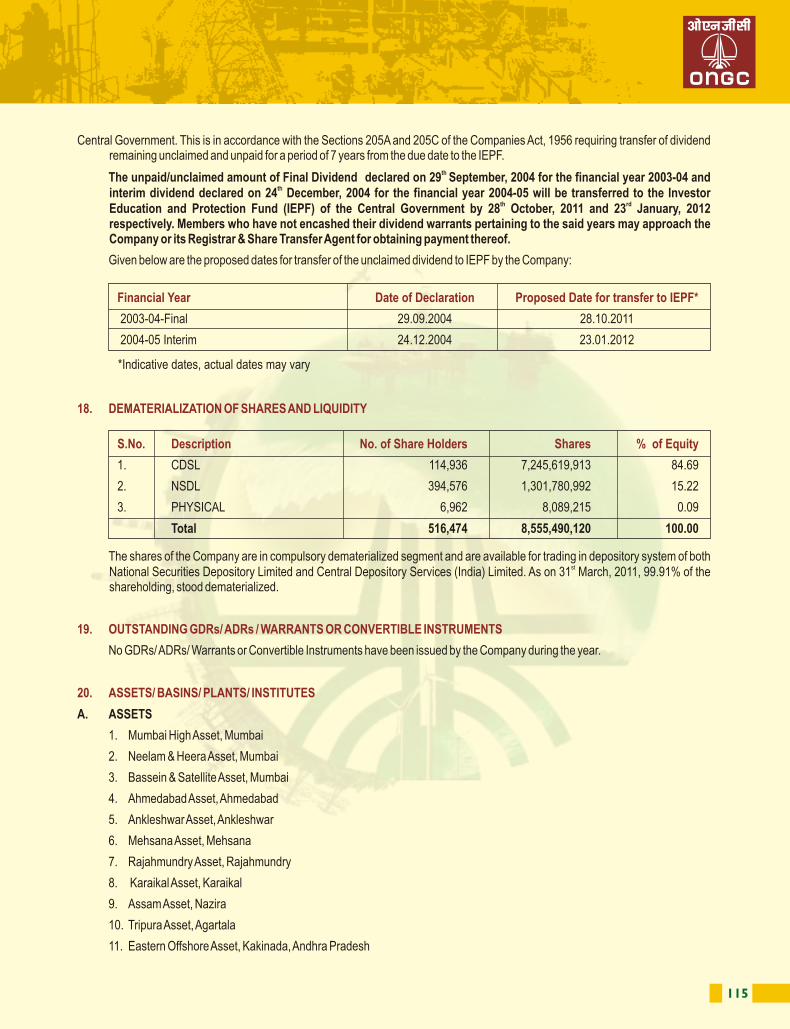
116 117
24. ADOPTION OF NON-MANDATORY REQUIREMENTS OF CLAUSE 49
25. GUIDELINES ON CORPORATE GOVERNANCE BY DPE
26. SECRETARIAL COMPLIANCE REPORT
27. FEE TO STATUTORY AUDITORS
The following non-mandatory requirements have been implemented and reflected elsewhere in this report:
• The Company has constituted a Remuneration Committee refer to para 6.2.
• With regard to Shareholders' Rights, communication of financial results are being published widely and also hosted on theCompany's website (refer para 12)
• Information on training of Board members and mechanism for evaluation of non-executive Board members is reflectedin para 2.3(f)
• As far as Audit Qualifications are concerned, the Company is in the regime of unqualified financial statements
Whistle Blower Policy
In terms of Clause 49 of the Listing Agreement, one of the non-mandatory clauses provides that a Listed company may establish a mechanism for employees to report to the management concerns about unethical behaviour, actual or suspected fraud or violation of the company's code of conduct or ethics policy. Also in terms of Clause 8 of DPE guidelines on Corporate Governance for CPSEs issued in 2007, Company may establish a mechanism for employees to report to the management concerns of
thunethical behaviour etc. Accordingly ONGC has implemented Whistle Blower Policy on 30 November, 2009.
ONGC has provided ample opportunities to encourage the employees to become whistle blowers (employees who voluntarily and confidentially want to bring the unethical practices, actual or suspected fraudulent transactions in the organization to the notice of the competent authority for the greater interest of the organization and the nation). It has also ensured a very robust mechanism within the same framework to protect them (whistle blowers) from any kind of harm. It is hereby affirmed that no personnel has been denied access to the Audit Committee.
In May, 2010, the Department of Public Enterprises has come out with Guidelines on Corporate Governance for Central Public Sector Enterprises which have replaced the Guidelines issued in 2007. The fresh guidelines of 2010 are now mandatory in nature. ONGC is complying with these guidelines.
No Presidential Directives have been issued during 2010-11.
No items of expenditure have been debited in books of accounts, which are not for the purpose of business. No expenses, which are personal in nature, have been incurred for the Board of Directors and top management.
The administrative and office expenses were 4.95% of total expenses during 2010-11 as against 5.21% during the previous year.
Secretarial Compliance Report confirming compliance to the applicable provisions of Companies Act, 1956, Listing Agreement, SEBI guidelines, DPE guidelines and all other related rules and regulations relating to capital market, though not mandatory, obtained from a practicing Company Secretary, was noted by the Board and forms part of the Directors' Report.
The fee paid / payable to the Statutory Auditors for the year was ` 15.85 million (previous year ` 12.96 million) including ` 0.83 million (previous year ` 0.83 million) as fee for certification of Corporate Governance Report, and ` 3.31 million (previous year ` 3.09 million) for limited review report and ` 0.13 million (previous year ` 0.22 million) for NELP certification plus reasonable travelling and out of pocket expenses actually incurred / reimbursable.
B. BASINS
1. Western Offshore Basin, Mumbai
2. Western Onshore Basin, Vadodara
3. KG-PG Basin, Chennai
4. Cauvery Basin, Chennai
5. Assam & Assam-Arakan Basin, Jorhat
6. MBA Basin and CBM Development Project, Kolkata/Bokaro
7. Frontier Basin, Dehradun
C. PLANTS
1. Uran Plant, Uran
2. Hazira Plant, Hazira
3. C C C Plant, Dahej, Gujarat2 3 4
D. INSTITUTES
1. Keshava Deva Malaviya Institute of Petroleum Exploration (KDMIPE), Dehradun
2. Institute of Drilling Technology (IDT), Dehradun
3. Institute of Reservoir Studies, (IRS) Ahmedabad
4. Institute of Oil & Gas Production Technology (IOGPT) Navi Mumbai
5. Institute of Engineering & Ocean Technology (IEOT) Navi Mumbai
6. Geo- data Processing & Interpretation Center (GEOPIC), Dehradun
7. ONGC Academy, Dehradun
8. Institute of Petroleum Safety, Health & Environment Management (IPSHEM) Goa
9. Institute of Biotechnology & Geotectonics Studies (INBIGS), Jorhat
10. School of Maintenance Practices (SMP), Vadodara
11. Centre for Excellence in Well Logging (CEWL), Vadodara
12. Regional Training Institutes (RTIs) Navi Mumbai, Chennai, Sivasagar & Vadodara
These have been given at 6.3.3 and 6.3.4 above
The Risk Management Policy has been rolled out across the organization in all Assets, Basins, Plants, Institutes and offices. The Risk Management Committee reviews various types of risks whether present or future and apprises the same to the management
Certificate from the Auditors of the Company, confirming compliance with the conditions of Corporate Governance as stipulated under Clause 49 of the Listing Agreement, is annexed to the Directors' Report forming part of the Annual Report. The Certificate has also been forwarded to the stock exchanges where the securities of the Company are listed.
21. INVESTOR SERVICES AND ADDRESSES FOR SHAREHOLDERS' CORRESPONDENCE
22. RISK MANAGEMENT
23. COMPLIANCE CERTIFICATE FROM THE AUDITORS
118 119
To The MembersOil And Natural Gas Corporation Ltd.
We have examined the compliance of conditions of Corporate Governance by Oil And Natural Gas Corporation Limited for the year ended st31 March, 2011, as stipulated in Clause 49 of the Listing Agreement entered into by the Company with the Stock Exchanges.
The Compliance of conditions of Corporate Governance is the responsibility of the management. Our examination was carried out in accordance with the Guidance Note on Certification of Corporate Governance (as stipulated in Clause 49 of the Listing Agreement) issued by The Institute of Chartered Accountants of India and limited to a review of the procedures and implementation thereof, adopted by the Company, for ensuring the compliance of the conditions of Corporate Governance. It is neither an audit nor an expression of an opinion on the financial statements of the Company.
In our opinion and to the best of our information and according to the explanations given to us, we certify that the Company has complied with the conditions of Corporate Governance as stipulated in Clause 49 of the Listing Agreement EXCEPT that the Board of Directors does not comprise of the required number of Independent Directors and non-executive Directors as per the terms of the provisions of the above mentioned Listing Agreement.
We further state that such compliance is neither an assurance as to the future viability of the Company nor the efficiency or effectiveness with which the management has conducted the affairs of the Company.
The Board of Directors,Oil and Natural Gas Corporation LtdRegd. Office: Jeevan Bharti,Tower II,124, Indira Chowk,New Delhi-110001.
We have examined the registers, records and documents of Oil and Natural Gas Corporation Ltd. (the Company) for the period 1.4.2010 to 31.03.2011 according to the provisions of:
The Companies Act, 1956 and Rules made under the Act;
The Depositories Act, 1996 and the Regulations and Byelaws framed under the Act;
The Securities and Exchange Board of India (Substantial Acquisition of Shares and Takeovers) Regulations, 1997;
The Securities and Exchange Board of India (Prohibition of Insider Trading (Regulations), 1992;
The Equity Listing Agreements with the Bombay Stock Exchange Ltd. and the National Stock Exchange of India Ltd. and
thGuidelines on Corporate Governance for Central Public Sector Enterprises as stipulated in the O.M.No. 18(8)/2005-GM dated 14 May, 2010 of the Ministry of Heavy Industries and Public Enterprises, Government of India (“the DPE Guidelines on Corporate Governance”).
Based on our examination and verification of records produced to us and according to the information and explanations given to us by the Company, in our opinion, the Company has complied with the provisions of the Companies Act, 1956 (“the Act”) and Rules made under the Act and the Memorandum and Articles of Association of the Company with regard to:
(a) Maintenance of statutory registers and documents and making necessary entries therein;
(b) Filing of the requisite forms and returns with the Registrar of Companies, NCT of Delhi and Haryana within the time prescribed under the Act and the Rules made thereunder.
(c) Service of documents by the Company on its members and the Registrar of Companies.
th rd(d) Closure of Register of Members and Share Transfer Books of the Company from 14 September, 2010 to 23 September, 2010 (both days inclusive).
(e) Notice of Board Meetings and Committee meetings of Directors;
(f) Convening and holding of the meetings of Directors and Committees of Directors including passing of resolutions by circulation;
th rd(g) The 17 Annual General Meeting held on 23 September, 2010.
(h) Minutes of proceedings of General Meeting and meetings of Board and its committees.
(i) Constitution of Board of Directors and appointment, retirement and re-appointment of directors;
(j) Appointment of Chairman and Managing Director, Whole Time Directors and non-executive Directors and their remuneration.
(k) The Directors disclosed their interests and concerns in contracts and arrangements, shareholdings and directorships in other companies and interests in other entities and their disclosures have been noted an recorded by the Board.
(l) Transfers and transmission of shares and issue and delivery of original and duplicate certificates of shares; dematerialization/ rematerialization of shares;
(m) Declaration and payment of dividend including interim dividend;
(n) Transfer of certain amounts as required under the Act to the Investor Education and Protection Fund;
(o) Investment of Company’s funds including inter corporate loans and investments.
(p) Appointment and remuneration of Auditors/Cost Auditors.
Secretarial Audit ReportAuditors' Certificate on Compliance
of Conditions of Corporate GovernanceAuditors' Certificate on Compliance
of Conditions of Corporate Governance Secretarial Audit Report
For Kalyaniwalla & Mistry For Arun K. Agarwal & Associates For Ray & Ray Chartered Accountants
Chartered Accountants Chartered Accountants Chartered Accountants
(Firm Regn No : 104607W) (Firm Regn. No : 003917N) (Firm Regn. No : 301072E)
(Ermin K. Irani) (Arun Agarwal) (A K Sharma)
Partner (Mem. No. 35646) Partner (Mem. No. 82899) Partner (Mem. No. 080885)
For M Kuppuswamy P S G & Co. For S Bhandari & Co.
Chartered Accountants Chartered Accountants
(Firm Regn. No : 001616S) (Firm Regn. No : 000560C)
(M.K.Krishnan) (P. P. Pareek )
Partner (Mem. No. 020116) Partner (Mem. No. 71213)
New Delhith8 July, 2011
120 121
(q) The Company wherever necessary has kept in abeyance rights to dividend declared at the Annual General Meeting held on rd23 September, 2010 and Special interim dividend declared on 16.12.2010, pending registration of transfer of shares in compliance with
the provisions of the Act.
(r) The Company has not invited/accepted any deposits falling within the purview of Section 58A of the Act during the relevant period.
(s) The Company has not made any secured borrowings during the relevant period
(t) The Company has not bought back any shares during the relevant period
(u) The Company obtained approval of shareholders by Postal Ballot process under Section 192A of the Act and Rules framed thereunder for sub-division of each equity share of ` 10/- each into two equity shares of ` 5/-each; consequent amendments of relevant clauses of Memorandum and Articles of Association and issuance of Bonus Shares by capitalizing a sum of ` 2138,87,25,300 from the General Reserve/Securities Premium Account. The Company has complied with provisions of the Act and other applicable laws.
(v) The Company allotted 427,77,45,060 new equity shares of ` 5/- each as bonus shares by capitalizing a sum of ` 2138,87,25,300 (comprising of ` 168,117,088/- of Securities premium Account and balance ` 2122,06,08,212 out General Reserve as per audited accounts for the financial year ended 31.3.2011 and has complied with the provisions of the Act and other applicable laws.
(w) The Company has created a trust, namely, the ONGC Employees Contributory Provident Fund Trust for its employees. The Company has deposited both the employees’ and employer’s contribution with the above Trust within the prescribed time pursuant to Section 418 of the Act during the relevant period.
(x) The Company has substantially observed the Secretarial Standards issued by the Institute of Company Secretaries of India, although recommendatory in nature.
(y) There was no prosecution initiated against or show cause notice received by the Company and no fines or any other punishment was imposed on the Company, its Directors and officers during the relevant period for any offences under the Act.
2. We further report that the Company has complied with the provisions of the Depositories Act, 1996 and Regulations framed thereunder with regard to dematerialisation/ rematerialisation of securities and reconciliation of records of dematerialized securities with all securities issued by the Company.
3. We further report that:
(i) The Company has complied with the requirements of Equity Listing Agreements entered into with the Bombay Stock Exchange Ltd and the National Stock Exchange of India Ltd. except that the Board of Directors does not comprise of the required number of independent and non-executive directors as per clause 49(I)(A) of the Listing Agreements.
(ii) The Company has complied with the provisions of Securities and Exchange Board of India (Substantial Acquisition of Shares and Takeovers) Regulations, 1997 with regard to disclosures and maintenance of records required under the Regulations.
(iii) The Company has complied with the provisions of Securities and Exchange Board of India (Prohibition of Insider Trading) Regulations, 1992 with regard to disclosures and maintenance of records required under the Regulations.
4. In our opinion and to the best of our information and according to explanations given to us by the management, we certify that, except the composition of the Board of Directors with regard to independent Directors, and appointment of one independent Director on the Boards of its subsidiary companies, the Company has complied with the DPE guidelines on Corporate Governance.
For A. N. Kukreja & Co.Company Secretaries.
(A. N. Kukreja)Proprietor
CP No.2318
th28 June, 2011.ONGCians excel in field operations
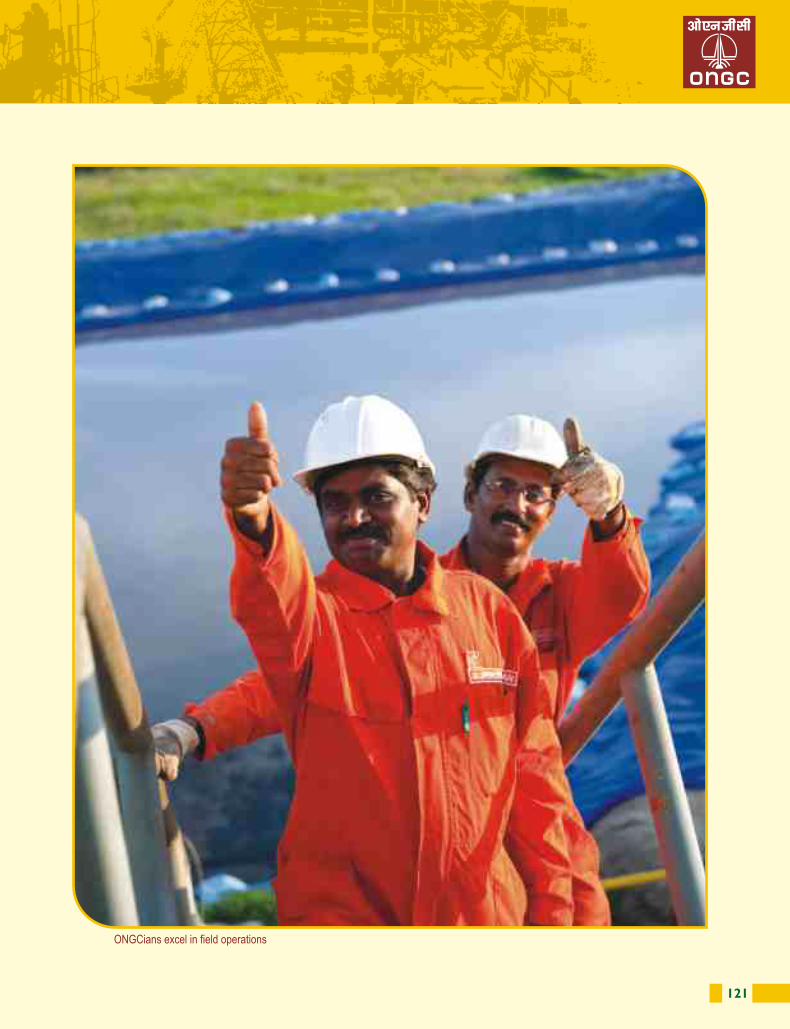
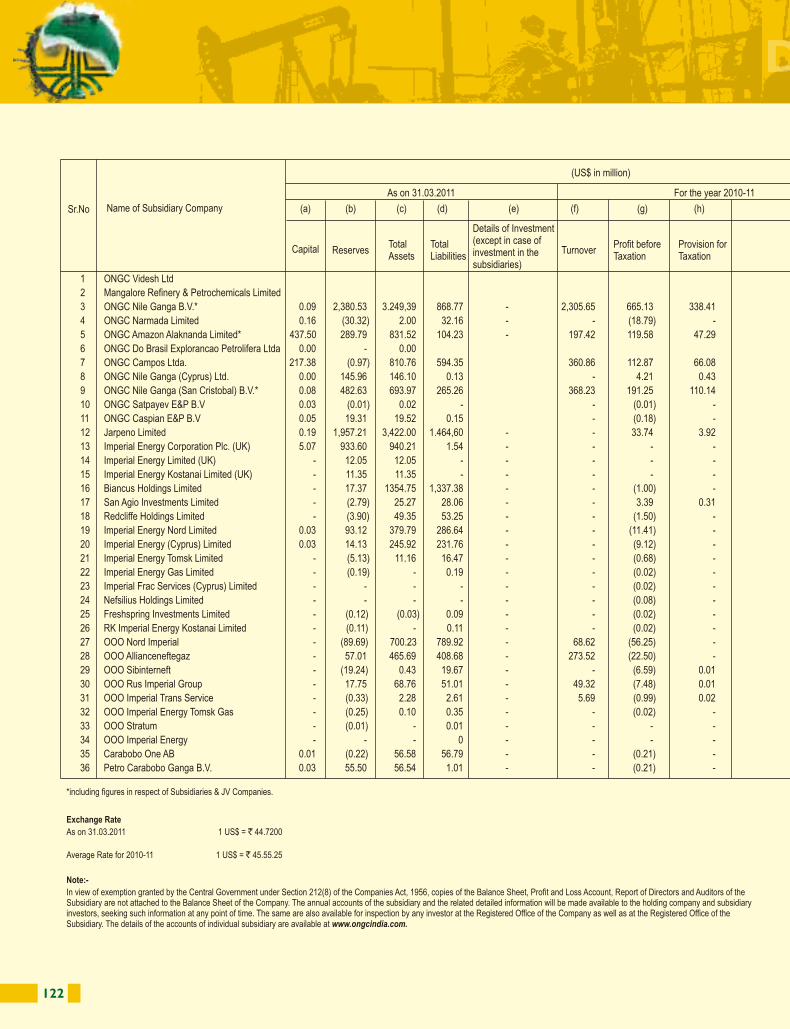
122 123
Sr.No Name of Subsidiary Company
Capital ReservesTotal Assets
Total Liabilities
Details of Investment (except in case of investment in the subsidiaries)
TurnoverProfit before Taxation
Provision for Taxation
Profit after Taxation
Proposed Dividend
Capital ReservesTotal Assets
Total Liabilities
Details of Investment (except in case of investment in the subsidiaries)
TurnoverProfit before Taxation
Provision for Taxation
Profit after Taxation
Proposed Dividend
(a) (b) (c) (d) (e) (f) (g) (h) (i) (j) (a) (b) (c) (d) (e) (f) (g) (h) (i) (j)
As on 31.03.2011 For the year 2010-11
(US$ in million)
As on 31.03.2011 For the year 2010-11
(` in million)
Exchange Rate
As on 31.03.2011 1 US$ = ` 44.7200
Average Rate for 2010-11 1 US$ = ` 45.55.25
Note:-
In view of exemption granted by the Central Government under Section 212(8) of the Companies Act, 1956, copies of the Balance Sheet, Profit and Loss Account, Report of Directors and Auditors of the Subsidiary are not attached to the Balance Sheet of the Company. The annual accounts of the subsidiary and the related detailed information will be made available to the holding company and subsidiary investors, seeking such information at any point of time. The same are also available for inspection by any investor at the Registered Office of the Company as well as at the Registered Office of the Subsidiary. The details of the accounts of individual subsidiary are available at www.ongcindia.com.
1 ONGC Videsh Ltd - 10,000.0 70,659.07 3,11,652.07 2,26,199.98 1,37,924.85 55,682.53 25,705.98 4,281.38 21,424.60 -
2 Mangalore Refinery & Petrochemicals Limited 17.618.50 47.670.51 1,84,799.02 1,19,510.01 948.25 3,89,566.73 17,374.92 5,608.59 11,766.33 2,103.13
3 ONGC Nile Ganga B.V.* 0.09 2,380.53 3.249,39 868.77 - 2,305.65 665.13 338.41 326.71 32.89 4.14 1,06,457.31 1,45,312.82 38,851.37 - 1,05,028.12 30,298.20 15,415.52 14,882.67 1,498.11
4 ONGC Narmada Limited 0.16 (30.32) 2.00 32.16 - - (18.79) - (18.79) 7.16 (1,355.91) 89.44 1,438.20 - - (855.93) - (855.93) -
5 ONGC Amazon Alaknanda Limited* 437.50 289.79 831.52 104.23 - 197.42 119.58 47.29 72.29 19,565.00 12,959.60 37,185.66 4,661.06 - 8,992.84 5,446.98 2,154.12 3,292.86 -
6 ONGC Do Brasil Explorancao Petrolifera Ltda 0.00 - 0.00 - 0.02 - 0.02 - - - - - - -
7 ONGC Campos Ltda. 217.38 (0.97) 810.76 594.35 360.86 112.87 66.08 46.80 - 9,721.18 (43.53) 36,257.09 26,579.44 - 16,438.19 5,141.68 3,009.98 2,131.70 -
8 ONGC Nile Ganga (Cyprus) Ltd. 0.00 145.96 146.10 0.13 - 4.21 0.43 3.78 - 0.11 6,527.45 6,533.47 5.91 - - 191.76 19.62 172.14 -
9 ONGC Nile Ganga (San Cristobal) B.V.* 0.08 482.63 693.97 265.26 368.23 191.25 110.14 81.12 - 3.43 19,168.29 31,034.35 11,862.63 - 16,773.61 8,712.09 5,016.93 3,695.15 -
10 ONGC Satpayev E&P B.V 0.03 (0.01) 0.02 - - (0.01) - (0.01) - 1.14 (0.45) 0.69 - - - (0.38) - (0.38) -
11 ONGC Caspian E&P B.V 0.05 19.31 19.52 0.15 - (0.18) - (0.18) - 2.29 863.70 872.83 6.84 - - (8.37) - (8.37) -
12 Jarpeno Limited 0.19 1,957.21 3,422.00 1.464,60 - - 33.74 3.92 29.82 - 8.50 87,526.43 1,53,031.84 65,496.91 - - 1,536.94 178.57 1,358.38 -
13 Imperial Energy Corporation Plc. (UK) 5.07 933.60 940.21 1.54 - - - - - - 226.73 41,750.59 42,046.19 68.87 - - - - - -
14 Imperial Energy Limited (UK) - 12.05 12.05 - - - - - - - - 538.88 538.88 - - - - - - -
15 Imperial Energy Kostanai Limited (UK) - 11.35 11.35 - - - - - - - - 507.57 507.57 - - - - - - -
16 Biancus Holdings Limited - 17.37 1354.75 1,337.38 - - (1.00) - (1.00) - - 776.79 60,584.42 59,807.63 - - (45.55) - (45.55) -
17 San Agio Investments Limited - (2.79) 25.27 28.06 - - 3.39 0.31 3.08 - - (124.77) 1,130.07 1,254.84 - - 154.42 14.12 140.30 -
18 Redcliffe Holdings Limited - ( 3.90) 49.35 53.25 - - (1.50) - (1.50) - - (174.41) 2,206.93 2,381.34 - - (68.33) - (68.33) -
19 Imperial Energy Nord Limited 0.03 93.12 379.79 286.64 - - (11.41) - (11.41) - 1.34 4,164.33 16,984.21 12,818.54 - - (519.75) - (519.75) -
20 Imperial Energy (Cyprus) Limited 0.03 14.13 245.92 231.76 - - (9.12) - (9.12) - 1.34 631.89 10,997.54 10,364.31 - - (415.44) - (415.44) -
21 Imperial Energy Tomsk Limited - (5.13) 11.16 16.47 - - (0.68) - (0.68) - - (237.46) 499.08 736.54 - - (30.98) - (30.98) -
22 Imperial Energy Gas Limited - (0.19) - 0.19 - - (0.02) - (0.02) - - (8.50) - 8.50 - - (0.91) - (0.91) -
23 Imperial Frac Services (Cyprus) Limited - - - - - - (0.02) - (0.02) - - - - - - - (0.91) - (0.91) -
24 Nefsilius Holdings Limited - - - - - - (0.08) - (0.08) - - - - - - - (3.64) - (3.64) -
25 Freshspring Investments Limited - (0.12) (0.03) 0.09 - - (0.02) - (0.02) - - (5.37) (1.34) 4.02 - - (0.91) - (0.91) -
26 RK Imperial Energy Kostanai Limited - (0.11) - 0.11 - - (0.02) - (0.02) - - (4.92) - 4.92 - - (0.91) - (0.91) -
27 OOO Nord Imperial - ( 89.69) 700.23 789.92 - 68.62 (56.25) - (56.25) - - (4,010.94) 31,314.29 35,325.22 - 3,125.81 (2,562.33) - (2,562.33) -
28 OOO Allianceneftegaz - 57.01 465.69 408.68 - 273.52 (22.50) - (22.50) - - 2,549.49 20,825.66 18,276.17 - 12,459.52 (1,024.93) - (1,024.93) -
29 OOO Sibinterneft - (19.24) 0.43 19.67 - - (6.59) 0.01 (6.60) - - (860.41) 19.23 879.64 - - (300.19) 0.46 (300.65) -
30 OOO Rus Imperial Group - 17.75 68.76 51.01 - 49.32 (7.48) 0.01 (7.49) - - 793.78 3,074.95 2,281.17 - 2,246.65 (340.73) 0.46 (341.19) -
31 OOO Imperial Trans Service - (0.33) 2.28 2.61 - 5.69 (0.99) 0.02 (1.01) - - (14.76) 101.96 116.72 - 259.19 (45.10) 0.91 (46.01) -
32 OOO Imperial Energy Tomsk Gas - (0.25) 0.10 0.35 - - (0.02) - (0.02) - - (11.18) 4.47 15.65 - - (0.91) - (0.91) -
33 OOO Stratum - (0.01) - 0.01 - - - - - - - (0.45) - 0.45 - - - - - -
34 OOO Imperial Energy - - - 0 - - - - - - - - - - - - - - - -
35 Carabobo One AB 0.01 (0.22) 56.58 56.79 - - (0.21) - (0.21) - 0.63 (9.72) 2,530.37 2,539.46 - - (9.53) - (9.53) -
36 Petro Carabobo Ganga B.V. 0.03 55.50 56.54 1.01 - - (0.21) - (0.21) - 1.14 2,482.12 2,528.50 45.23 - - (9.51) - (9.51) -
*including figures in respect of Subsidiaries & JV Companies.
Details of Subsidiary CompaniesDetails of Subsidiary Companies
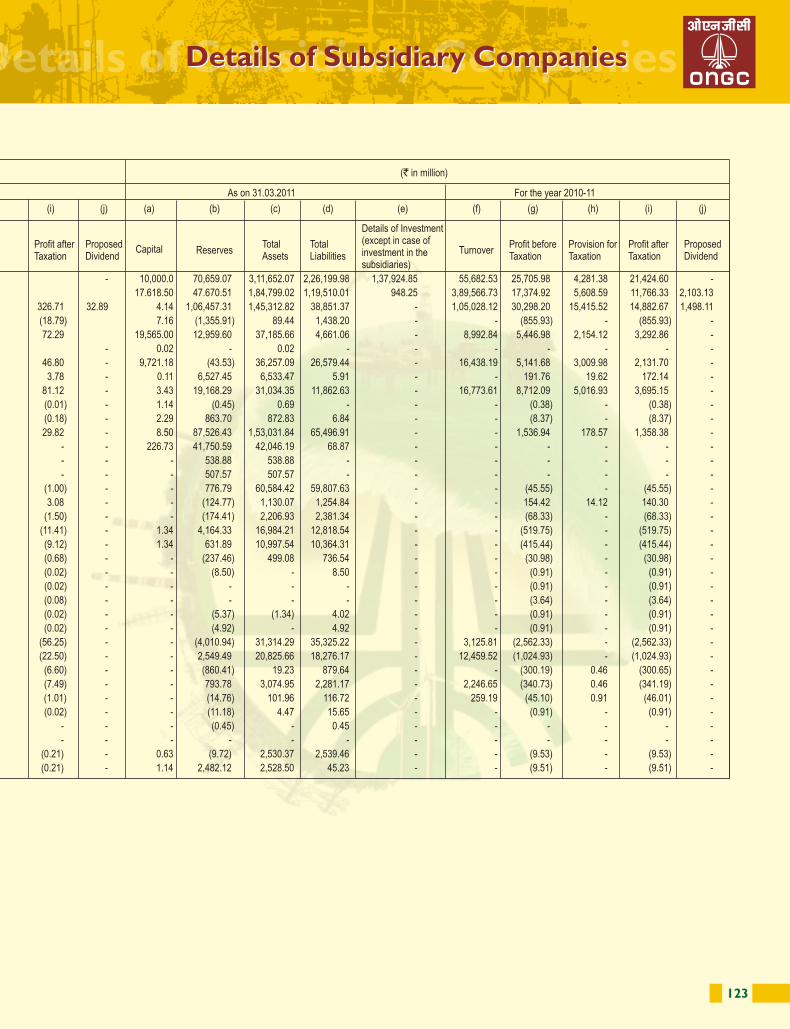
124 125
To
The Members Of Oil And Natural Gas Corporation Limited
1. We have audited the attached Balance Sheet of OIL AND NATURAL GAS CORPORATION LIMITED (the Company) as at
st31 March, 2011, the Profit and Loss Account and the Cash Flow Statement for the year ended on that date, annexed thereto in
which are incorporated the Company’s share in the total value of assets, liabilities, expenditure and income of 135 blocks under
New Exploration Licensing Policy (NELPs)/ Joint Venture (JVs) accounts for exploration and production out of which 12 NELPs
/JVs accounts have been certified by other firms of Chartered Accountants and 7 NELP/JVs are as certified by the management in
respect of NELPs/ JVs operated by other operators (Refer Note 20.3.1 and 20.3.2 of Schedule 27 of the financial statements).
These financial statements are the responsibility of the Company’s management. Our responsibility is to express an opinion on
these financial statements based on our audit.
2. We conducted our audit in accordance with auditing standards generally accepted in India. Those standards require that we plan
and perform the audit to obtain reasonable assurance about whether the financial statements are free of material misstatement.
An audit includes examining, on a test basis, evidence supporting the amount and disclosures in the financial statements. An audit
also includes assessing the accounting principles used and significant estimates made by the management, as well as evaluating
the overall financial statement presentation. We believe that our audit provides a reasonable basis for our opinion.
3. We have placed reliance on technical/ commercial evaluation by the management in respect of categorization of wells as
exploratory, development and producing, allocation of cost incurred on them, depletion of producing properties / impairment on the
basis of the proved developed hydrocarbon reserves, liability for abandonment costs, liability under NELP and nominated blocks
for under performance against agreed Minimum Work Programme and allocation of depreciation on process platforms to
transportation and facilities.
4. As required by the Companies (Auditor’s Report) Order, 2003 (as amended) issued by the Central Government of India in terms of
Section 227(4A) of the Companies Act, 1956, we enclose in the Annexure (read with paragraph 1 above) a statement on the
matters specified in paragraph 4 and 5 of the said Order.
5. Further to our comments referred to in paragraph 4 above we report as follows:
5.1. We have obtained all the information and explanations which to the best of our knowledge and belief were necessary for the
purposes of our audit;
5.2. In our opinion, proper books of account as required by law have been kept by the Company so far as appears from our examination
of those books;
5.3. The Balance Sheet, the Profit and Loss Account and the Cash Flow Statement dealt with by this report are in agreement with the
books of account;
5.4. In our opinion, the Balance Sheet, the Profit and Loss Account and the Cash Flow Statement comply with the accounting standards
referred to in sub-section (3C) of Section 211 of the Companies Act, 1956.
5.5. Disclosure in terms of clause (g) of sub-section (1) of section 274 of the Companies Act, 1956 is not required as per notification
number GSR 829(E) dated October 21, 2003 issued by the Department of Company Affairs.
5.6. Without qualifying our opinion we invite attention to Note no. 2.1 of Schedule 27 of financial statement in respect of recognition of
sales revenue of crude oil and natural gas, in our opinion and to the best of our information and according to the explanations given
to us, the said accounts read with notes to account, give the information required by the Companies Act, 1956 in the manner so
required and give a true and fair view in conformity with the accounting principles generally accepted in India:
sta) In the case of the Balance Sheet, of the state of affairs of the Company as at 31 March, 2011;
b) In the case of the Profit & Loss Account, of the profit of the Company for the year ended on that date; and
c) In the case of the Cash Flow Statement, of the cash flows of the Company for the year ended on that date.
For M/s Kalyaniwalla & Mistry For M/s Arun K Agarwal & Associates For M/s S Bhandari & Co.
Chartered Accountants Chartered Accountants Chartered Accountants
Firm Reg No. 104607W Firm Reg No. 003917N Firm Reg No.000560C
(Ermin K. Irani) (Vimal Kumar Jain) (P.P.Pareek)
Partner (Mem. No. 035646) Partner (Mem. No. 086657) Partner (Mem. No. 071213)
For M/s Ray & Ray For M/s M Kuppuswamy P S G & Co.
Chartered Accountants Chartered Accountants
Firm Reg No.301072E Firm Reg No.001616S
(B.K. Ghosh) (M.K. Krishnan)
Partner (Mem. No. 051028) Partner (Mem. No.020116)
New DelhithMay 30 , 2011
Auditors' ReportAuditors' Report
126 127
1. a) The Company has generally maintained proper records showing full particulars including quantitative details and situation of fixed assets.
b) As per information and explanations given to us, the fixed assets having substantial value, other than those which are underground/ submerged/ under joint venture/assets held by employees have been physically verified by the management in phased manner, which in our opinion is reasonable, having regard to the size of the Company and nature of its business. The reconciliation of physically verified assets with the book records is in progress. Discrepancies noticed on physical verification and consequential adjustments are carried out on completion of reconciliation. According to the information and explanations given by the management and in our opinion, the same is not material.
c) The Company has not disposed off a substantial part of fixed assets during the year.
2. a) The inventory has been physically verified in a phased manner (excluding inventory lying with third parties, at some of the site- locations, inventory with joint ventures and material in transit) during the year by the management. In our opinion, the frequency of verification is reasonable.
b) In our opinion, the procedures of physical verification of inventory followed by the management were generally reasonable and adequate in relation to the size of the Company and nature of its business.
c) The Company has generally maintained proper records of inventory except for recording of consumption at a few of its site-locations. In our opinion the discrepancies noticed on physical verification between the physical stock and book records were not material having regard to the size of the Company and nature of its business. In case where discrepancies noticed on physical verification have been identified with inventory records, necessary adjustments have been carried out in the books. In respect of cases where the reconciliation is not complete, the management has stated that the same would be adjusted in due course.
3. a) The Company has granted secured loans to 3 parties covered in the register maintained under section 301 of the Companies Act, 1956. The amount outstanding at the year end is 0.26 million and the maximum amount outstanding at any time during the year was 0.56 million.
b) The rate of interest and other terms and conditions of the loans granted are not prima facie prejudicial to the interest of the Company.
c) The payment of principal amount and interest are regular.
d) There is no overdue amount in respect of loans granted to the parties listed in the register maintained under Section 301 of the Companies Act, 1956.
e) The Company has not taken any loans, secured or unsecured, from companies, firms or other parties covered in the register maintained under section 301 of the Companies Act, 1956. And consequently, the requirement of clause (iii) (f) and (iii) (g) of paragraph 4 of the Companies (Auditor`s Report) Order, 2003 are not applicable.
4. In our opinion, and according to the information and explanations given to us, the internal control procedures are generally adequate and commensurate with the size of the Company and the nature of its business with regard to purchases of inventory, fixed assets and sale of goods and services. During the course of our audit we have not observed any continuing failure to correct major weaknesses in internal controls.
5. a) In our opinion and according to the information and explanations given to us, there is no contract or arrangement that needs to be entered in the register required to be maintained in pursuance of section 301 of the Companies Act, 1956.
b) Accordingly, the provisions of clause 4 (v) (b) of the Companies (Auditor’s Report) Order, 2003 is not applicable to the Company.
6. The Company has not accepted any deposits from the public.
7. In our opinion, the Company has an internal audit system commensurate with the size and nature of its business.
8. We have broadly reviewed the books of account relating to materials, labour and other items of costs maintained by the Company pursuant to the Rule made by the Central Government for the maintenance of cost records under section 209 (1)(d) of the Companies Act, 1956 and we are of the opinion that prima facie the prescribed accounts and records have been made and maintained.
9. a) The Company is generally regular in depositing with appropriate authorities undisputed statutory dues including Provident Fund, Investor Education and Protection Fund, Employees’ State Insurance, Income Tax, Sales Tax, Service Tax, Wealth Tax, Custom Duty, Excise Duty, Cess and other statutory dues applicable to it. There are no such material outstanding statutory dues accrued in accounts as of the last date of the financial year concerned for a period of more than six months from the date they became payable.
``
Further, since the Central Government has till date not prescribed the amount of cess payable under section 441A of the Companies Act, 1956, we are not in position to comment upon regularity or otherwise of the Company in depositing the same.
b) According to the information and explanations given to us, the disputed statutory dues are as under:
Annexure to The Auditors' Report(Referred to in paragraph 4 of our report of even date)
Annexure to The Auditors' Report(Referred to in paragraph 4 of our report of even date)
Annexure to The Auditors' Report(Referred to in paragraph 4 of our report of even date)
Nature of the Nature of Amount Period to which Forum where
Statute the dues (` In Million) the amount relates dispute is pending
(financial year)
Income tax Act, 1961 Income Tax / 8,506.95 1991-2011 Revisionary Authority
Penalty / 1,873.46 2004-2011 Appellate Authority
Interest 147.61 1995-2011 High Court
673.60 1984-2011 Supreme Court
Total 11,201.62
Central Excise Act 1944 Central Excise duty / 850.27 2002-2011 Commissioner of Central
Service Tax / Excise, Customs & Service Tax
Interest / Penalty 957.85 2005-2011 Central Board of Excise & Customs
1,882.69 2007-2011 Custom, Excise and Service
Tax Appellate Tribunal
1,233.30 1984-2011 Supreme Court
Total 4,924.11
The Customs Act, 1962 Customs Duty / 4,895.28 1995-2011 Asst. Commissioner of Central Excise, Penalty / Interest Customs & Service Tax
10.00 2007-2011 Custom Excise and Service
Tax Appellate Tribunal
Total 4,905.28
Oilfields (Regulation & Royalty / 19,484.60 1992-2011 Dept. of Geology and
Development Act, 1948) / Surface rent / Mining. AP High Court
AP Mines and Geology Act Interest / Penalty
AP Mineral Bearing Lands Cess 1,470.22 2005-2011 Dept. of Geology and
(Infrastructure) Cell Mining. AP High Court
Oil Industries Cess / Interest 6.57 2005-2011 Commissioner of Central Excise,
(Development) Act,1974 Customs & Service Tax
Central Sales Tax Act 1956 Sales tax / 2,959.04 2002-2011 Demand Notice
and respective States' Turnover Tax / 1,900.52 2001-2011 Deputy Commissioner
Sales Tax Act Penalty / Interest 7,934.40 1999-2011 Joint Commissioner CT - Appeals
19,359.75 1994-2011 Appellate Tribunal
270.75 1977-2011 High Court
Total 32,424.46
Municipal Corporation Octroi Duty 66.89 1978-79 to 2010-11 Supreme Court
of Mumbai Act
(Octroi Rules, 1956)
Assam Specified Land Tax on Crude oil and 2,526.40 2004-2011 Guwahati High Court
Taxation Act Natural Gas
Service Tax Service Tax / Cess 1,197.33 2004-2011 Commissioner of Central Excise, Customs & Service Tax
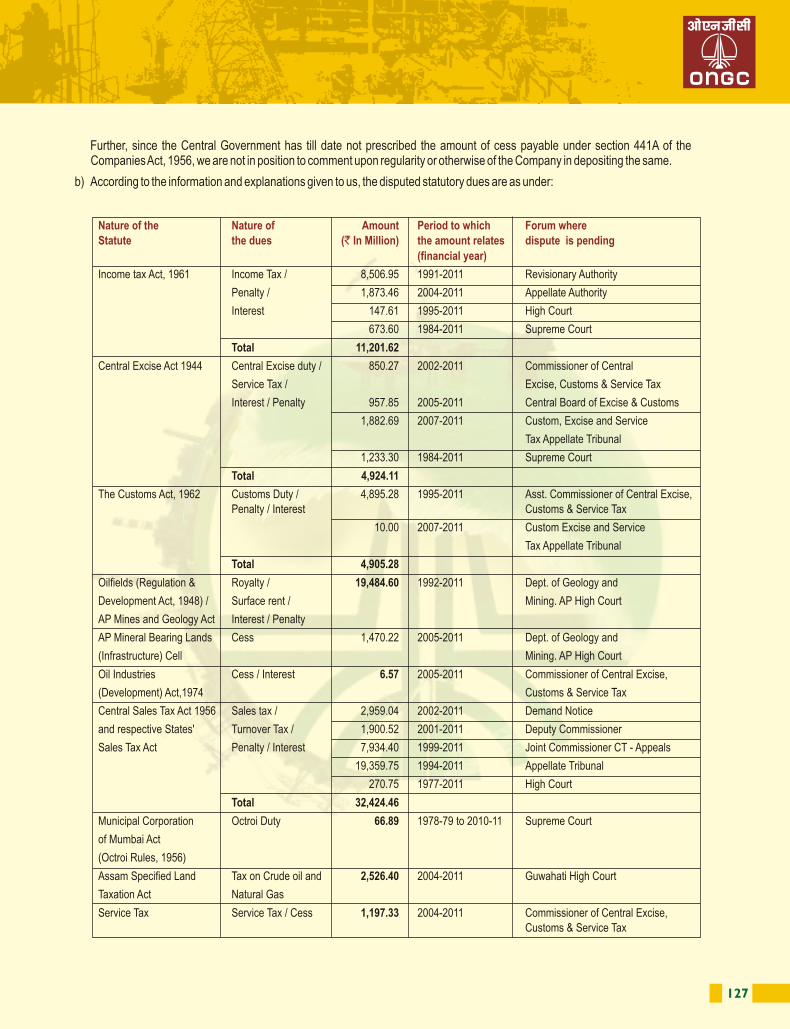
128 129
10. The Company does not have accumulated losses at the end of the current financial year and has not incurred cash losses either during the year or during the immediately preceding financial year.
11. The Company has not issued any debentures and has not defaulted in repayment of dues to financial institutions or banks.
12. In our opinion and according to the information and explanations given to us, the Company has not granted loans and advances on the basis of security by way of pledge of shares, debentures and other securities.
13. The Company is not a chit fund or a nidhi, mutual benefit fund/ society. Accordingly, the provisions of clause (xiii) of paragraph 4 of the Companies (Auditor’s Report) Order, 2003 are not applicable to the Company.
14. In our opinion and according to the information and explanations given to us, the Company is not dealing or trading in shares, securities, debentures and other investments.
15. In our opinion and according to the information and explanations given to us, the terms and conditions on which the Company has given guarantees for loans taken by others from banks or financial institutions are not prima facie prejudicial to the interest of the Company, since these guarantees are given for the subsidiary/ company promoted by the Company.
16. In our opinion, the term loans have been applied for the purpose for which they were raised.
17. According to the information and explanations given to us and on an overall examination of the balance sheet of the Company, we report that no funds raised on short terms basis have been used for long term investment.
18. The Company has not made any preferential allotment of shares during the year.
19. The Company has not issued any debentures.
20. The Company has not raised any money by way of public issue during the year.
21. According to the information and explanations given to us, there was a fraud on the Company by way of theft of pipelines reported during the year. The same is under investigation and the amount involved on account of theft has been ascertained by the Company at 119.44 million. Other than this, there was no fraud on or by the Company noticed or reported during the year.`
Agartala GCS : Production work on at Konaban well no. 44
For M/s Kalyaniwalla & Mistry For M/s Arun K Agarwal & Associates For M/s S Bhandari & Co.
Chartered Accountants Chartered Accountants Chartered Accountants
Firm Reg No. 104607W Firm Reg No. 003917N Firm Reg No.000560C
(Ermin K. Irani) (Vimal Kumar Jain) (P.P.Pareek)
Partner (Mem. No. 035646) Partner (Mem. No. 086657) Partner (Mem. No. 071213)
For M/s Ray & Ray For M/s M Kuppuswamy P S G & Co.
Chartered Accountants Chartered Accountants
Firm Reg No.301072E Firm Reg No.001616S
(B.K. Ghosh) (M.K. Krishnan)
Partner (Mem. No. 051028) Partner (Mem. No.020116)
New DelhithMay 30 , 2011
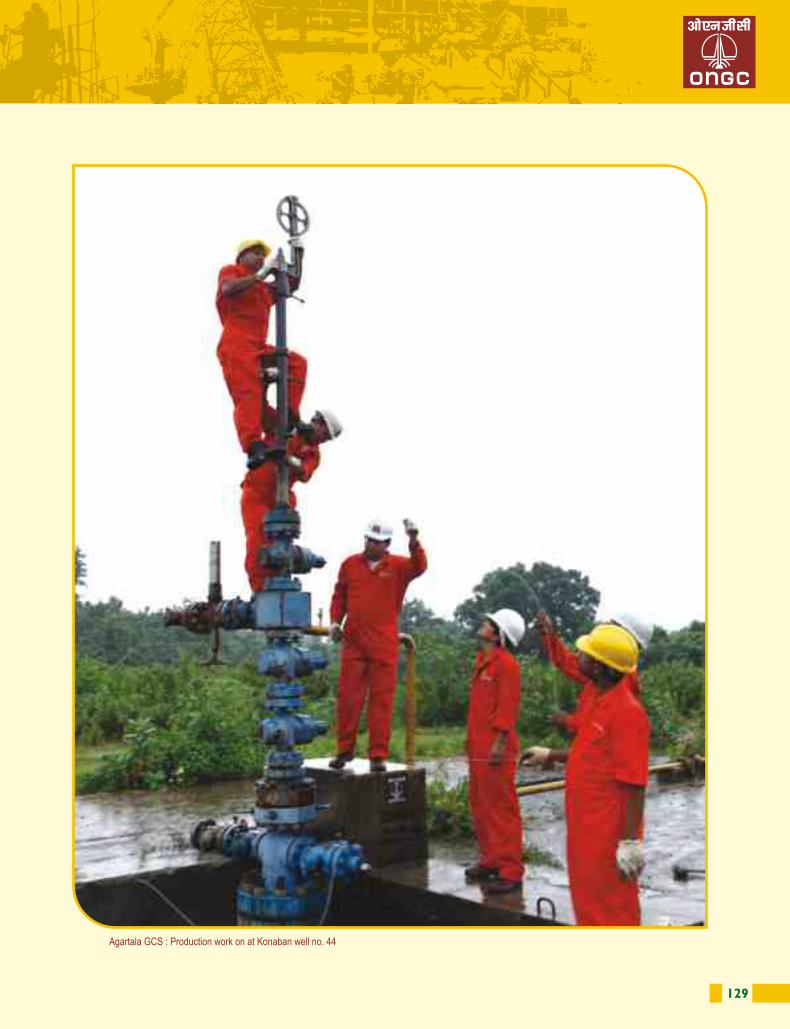
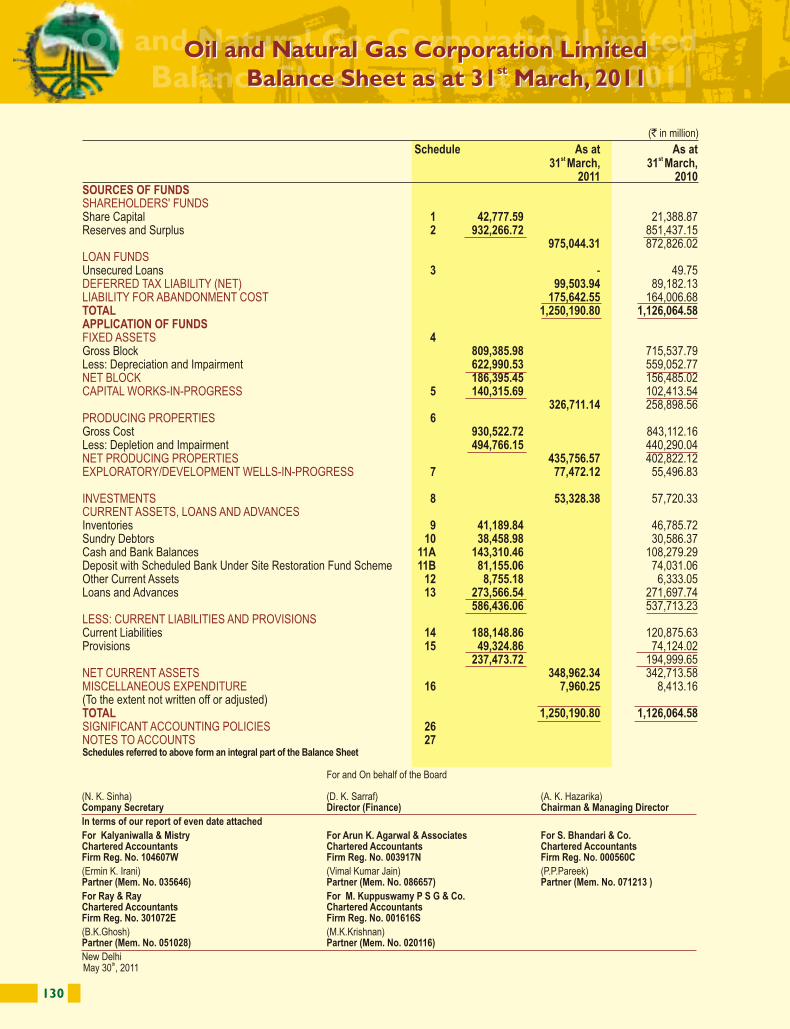
130 131
Schedule As at As at st st 31 March, 31 March,
2011 2010
Share Capital 1 42,777.59 21,388.87Reserves and Surplus 2 932,266.72 851,437.15
975,044.31 872,826.02
Unsecured Loans 3 - 49.7599,503.94 89,182.13
175,642.55 164,006.681,250,190.80 1,126,064.58
4Gross Block 809,385.98 715,537.79Less: Depreciation and Impairment 622,990.53 559,052.77
186,395.45 156,485.025 140,315.69 102,413.54
326,711.14 258,898.566
Gross Cost 930,522.72 843,112.16Less: Depletion and Impairment 494,766.15 440,290.04
435,756.57 402,822.127 77,472.12 55,496.83
8 53,328.38 57,720.33
Inventories 9 41,189.84 46,785.72Sundry Debtors 10 38,458.98 30,586.37Cash and Bank Balances 11A 143,310.46 108,279.29Deposit with Scheduled Bank Under Site Restoration Fund Scheme 11B 81,155.06 74,031.06Other Current Assets 12 8,755.18 6,333.05Loans and Advances 13 273,566.54 271,697.74
586,436.06 537,713.23
Current Liabilities 14 188,148.86 120,875.63Provisions 15 49,324.86 74,124.02
237,473.72 194,999.65348,962.34 342,713.58
16 7,960.25 8,413.16(To the extent not written off or adjusted)
1,250,190.80 1,126,064.582627
Schedules referred to above form an integral part of the Balance Sheet
SOURCES OF FUNDS SHAREHOLDERS' FUNDS
LOAN FUNDS
DEFERRED TAX LIABILITY (NET)LIABILITY FOR ABANDONMENT COSTTOTALAPPLICATION OF FUNDSFIXED ASSETS
NET BLOCKCAPITAL WORKS-IN-PROGRESS
PRODUCING PROPERTIES
NET PRODUCING PROPERTIES EXPLORATORY/DEVELOPMENT WELLS-IN-PROGRESS
INVESTMENTS CURRENT ASSETS, LOANS AND ADVANCES
LESS: CURRENT LIABILITIES AND PROVISIONS
NET CURRENT ASSETSMISCELLANEOUS EXPENDITURE
TOTALSIGNIFICANT ACCOUNTING POLICIESNOTES TO ACCOUNTS
(` in million)
Oil and Natural Gas Corporation LimitedProfit and Loss Account for The Year Ended
st31 March, 2011
Oil and Natural Gas Corporation LimitedstBalance Sheet as at 31 March, 2011
Oil and Natural Gas Corporation LimitedProfit and Loss Account for The Year Ended
st31 March, 2011
Oil and Natural Gas Corporation LimitedstBalance Sheet as at 31 March, 2011
(N. K. Sinha) (D. K. Sarraf) (A. K. Hazarika)Company Secretary Director (Finance) Chairman & Managing Director
In terms of our report of even date attached
For Kalyaniwalla & Mistry For Arun K. Agarwal & Associates For S. Bhandari & Co.Chartered Accountants Chartered Accountants Chartered AccountantsFirm Reg. No. 104607W Firm Reg. No. 003917N Firm Reg. No. 000560C
(Ermin K. Irani) (Vimal Kumar Jain) (P.P.Pareek)Partner (Mem. No. 035646) Partner (Mem. No. 086657) Partner (Mem. No. 071213 )
For Ray & Ray For M. Kuppuswamy P S G & Co. Chartered Accountants Chartered AccountantsFirm Reg. No. 301072E Firm Reg. No. 001616S
(B.K.Ghosh) (M.K.Krishnan) Partner (Mem. No. 051028) Partner (Mem. No. 020116)
New DelhithMay 30 , 2011
For and On behalf of the Board
Schedule 2010-11 2009-10
Gross Sales 17 661,548.77 602,048.19Less Excise Duty 3,098.80 2,185.42
658,449.97 599,862.77Other Income 18 59,007.70 41,866.86
717,457.67 641,729.63
(Increase)/ Decrease in stock 19 (129.11) (1,180.38)Purchases 138.35 139.31Production, Transportation, Selling and Distribution Expenditure 20 275,300.61 243,199.46Depreciation, Depletion, Amortisation and Impairment 21 159,256.53 146,431.88Financing Costs 22 251.07 144.23Provisions and Write-offs 23 6,114.27 2,974.01Adjustments relating to Prior Period (Net) 24 336.25 182.69
441,267.97 391,891.20276,189.70 249,838.43
Provision for Taxation - Current Tax (including Wealth Tax ` 26.00 million, Previous year ` 22.50 million) 81,226.00 71,202.50- Earlier years (4,517.94) (199.41)- Deferred Tax 10,321.82 11,159.78- Fringe Benefit Tax (80.20) -
189,240.02 167,675.56Surplus at the beginning 0.28 0.13
189,240.30 167,675.69
Proposed Dividend 6,416.62 32,083.09Interim Dividend 68,443.92 38,499.71Tax on Dividend 12,156.46 11,615.61Transfer to General Reserve 102,223.30 85,477.00Balance carried to Balance Sheet - 0.28
189,240.30 167,675.6925 22.12 19.60
(Face Value ` 5/-Per Share) (Previous Year Face Value ` 10/- Per Share)
2627
Schedules referred to above form an integral part of the Profit & Loss Account.
INCOME
Net Sales
EXPENDITURE
Profit before Tax
Profit after Taxation
BALANCE AVAILABLE FOR APPROPRIATION APPROPRIATIONS
Earning per Equity Share - Basic and Diluted (Restated) (`)
SIGNIFICANT ACCOUNTING POLICIESNOTES TO ACCOUNTS
(` in million)
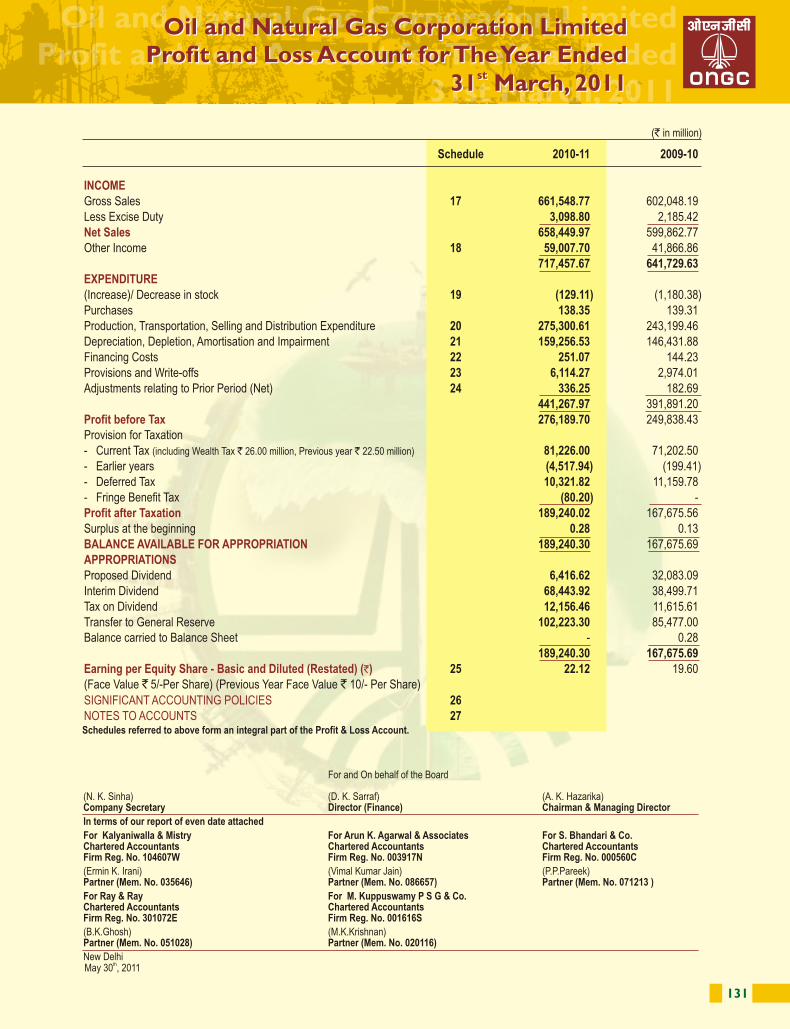
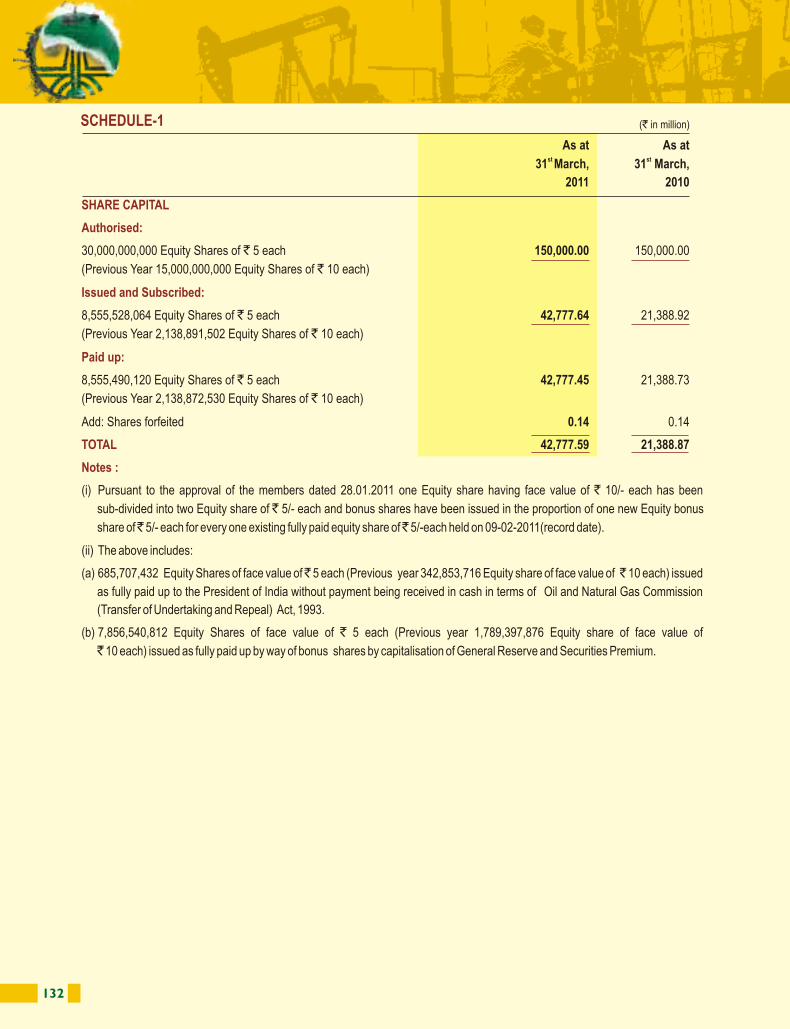
132 133
SCHEDULE-1
SHARE CAPITAL
Authorised:
Issued and Subscribed:
Paid up:
TOTAL
Notes :
As at As at st st31 March, 31 March,
2011 2010
30,000,000,000 Equity Shares of ` 5 each 150,000.00 150,000.00
(Previous Year 15,000,000,000 Equity Shares of ` 10 each)
8,555,528,064 Equity Shares of ` 5 each 42,777.64 21,388.92
(Previous Year 2,138,891,502 Equity Shares of ` 10 each)
8,555,490,120 Equity Shares of ` 5 each 42,777.45 21,388.73
(Previous Year 2,138,872,530 Equity Shares of ` 10 each)
Add: Shares forfeited 0.14 0.14
42,777.59 21,388.87
(i) Pursuant to the approval of the members dated 28.01.2011 one Equity share having face value of ` 10/- each has been
sub-divided into two Equity share of ` 5/- each and bonus shares have been issued in the proportion of one new Equity bonus
share of ̀ 5/- each for every one existing fully paid equity share of ̀ 5/-each held on 09-02-2011(record date).
(ii) The above includes:
(a) 685,707,432 Equity Shares of face value of ̀ 5 each (Previous year 342,853,716 Equity share of face value of ̀ 10 each) issued
as fully paid up to the President of India without payment being received in cash in terms of Oil and Natural Gas Commission
(Transfer of Undertaking and Repeal) Act, 1993.
(b) 7,856,540,812 Equity Shares of face value of ` 5 each (Previous year 1,789,397,876 Equity share of face value of
` 10 each) issued as fully paid up by way of bonus shares by capitalisation of General Reserve and Securities Premium.
(` in million) SCHEDULE-2
RESERVES AND SURPLUSCapital Reserve *
Securities Premium Account
Deferred Government Grant
Insurance Reserve
General Reserve
Profit and Loss Account
TOTAL
As at As at st st31 March, 31 March,
2011 2010
159.44 159.44(As per last year Balance Sheet)
a) As per last year Balance Sheet 168.12 168.12b) Less: Bonus Share issued 168.12 -
- 168.12
a) As per last year Balance Sheet 39.45 44.73b) Less: Deduction during the year ** 4.72 5.28
34.73 39.45
a) As per last year Balance Sheet 2,500.00 2,500.00b) Less: Transfer to General Reserve 2,500.00 -
- 2,500.00
a) As per last year Balance Sheet 848,569.86 763,092.86b) Add: Transferred from Insurance Reserve 2,500.00 -c) Add: Transferred from Profit and Loss Account 102,223.30 85,477.00d) Less: Bonus Share issued 21,220.61 -
932,072.55 848,569.86- 0.28
932,266.72 851,437.15
* Represents assessed value of assets received as gift**Represents the amount equivalent to Depreciation transferred to Profit & Loss Account
(` in million)
SCHEDULE-3
UNSECURED LOANSLong Term
TOTAL
As at As at
st st 31 March, 31 March, 2011 2010
Foreign Currency Loans: - From Banks - 49.75
- 49.75
Repayable within one year - 49.75
(` in million)
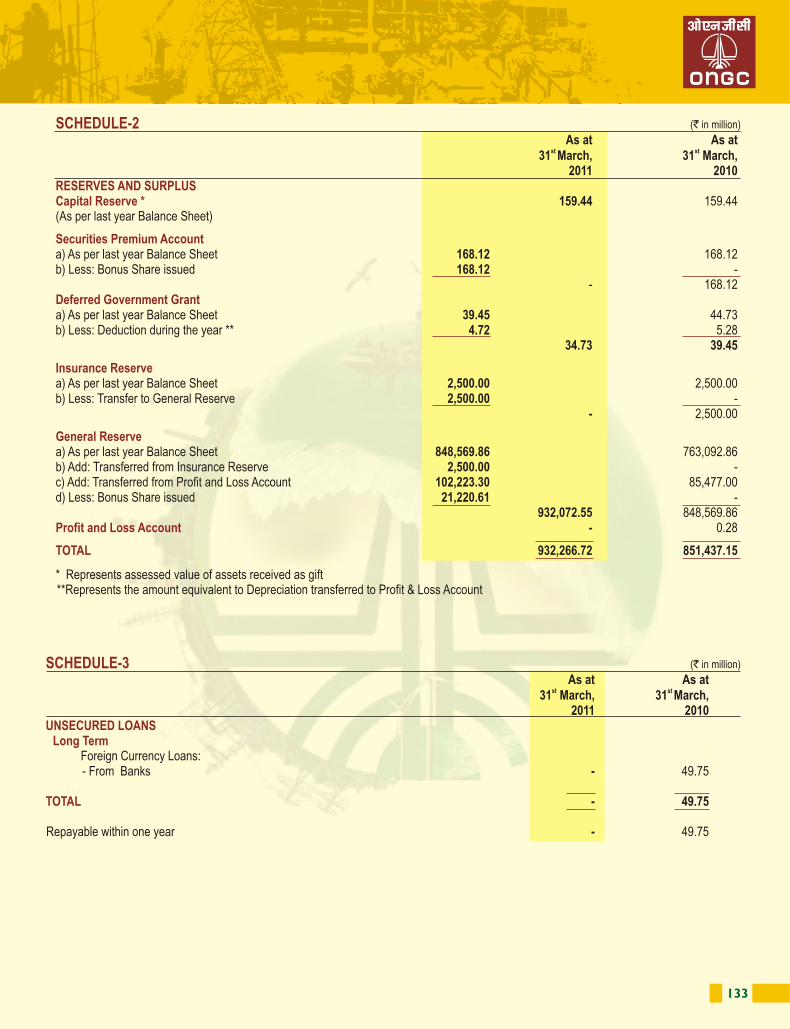
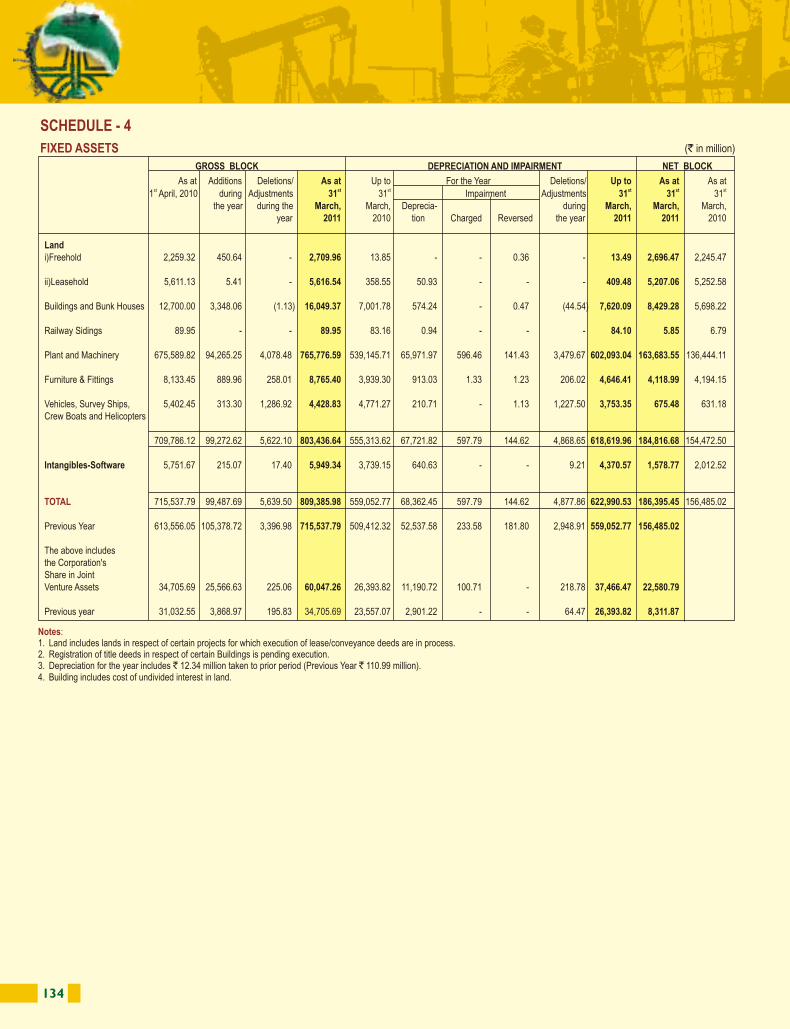
134 135
GROSS BLOCK DEPRECIATION AND IMPAIRMENT NET BLOCK
As at Additions Deletions/ As at Up to For the Year Deletions/ Up to As at As atst st st st st st1 April, 2010 during Adjustments 31 31 Impairment Adjustments 31 31 31
the year during the March, March, Deprecia- during March, March, March, year 2011 2010 tion Charged Reversed the year 2011 2011 2010
Land i)Freehold 2,259.32 450.64 - 2,709.96 13.85 - - 0.36 - 13.49 2,696.47 2,245.47
ii)Leasehold 5,611.13 5.41 - 5,616.54 358.55 50.93 - - - 409.48 5,207.06 5,252.58 Buildings and Bunk Houses 12,700.00 3,348.06 (1.13) 16,049.37 7,001.78 574.24 - 0.47 (44.54) 7,620.09 8,429.28 5,698.22 Railway Sidings 89.95 - - 89.95 83.16 0.94 - - - 84.10 5.85 6.79
Plant and Machinery 675,589.82 94,265.25 4,078.48 765,776.59 539,145.71 65,971.97 596.46 141.43 3,479.67 602,093.04 163,683.55 136,444.11 Furniture & Fittings 8,133.45 889.96 258.01 8,765.40 3,939.30 913.03 1.33 1.23 206.02 4,646.41 4,118.99 4,194.15
Vehicles, Survey Ships, 5,402.45 313.30 1,286.92 4,428.83 4,771.27 210.71 - 1.13 1,227.50 3,753.35 675.48 631.18Crew Boats and Helicopters
709,786.12 99,272.62 5,622.10 803,436.64 555,313.62 67,721.82 597.79 144.62 4,868.65 618,619.96 184,816.68 154,472.50
Intangibles-Software 5,751.67 215.07 17.40 5,949.34 3,739.15 640.63 - - 9.21 4,370.57 1,578.77 2,012.52
715,537.79 99,487.69 5,639.50 809,385.98 559,052.77 68,362.45 597.79 144.62 4,877.86 622,990.53 186,395.45 156,485.02
Previous Year 613,556.05 105,378.72 3,396.98 715,537.79 509,412.32 52,537.58 233.58 181.80 2,948.91 559,052.77 156,485.02
The above includesthe Corporation's Share in Joint Venture Assets 34,705.69 25,566.63 225.06 60,047.26 26,393.82 11,190.72 100.71 - 218.78 37,466.47 22,580.79
Previous year 31,032.55 3,868.97 195.83 34,705.69 23,557.07 2,901.22 - - 64.47 26,393.82 8,311.87
TOTAL
SCHEDULE - 4
FIXED ASSETS
Notes: 1. Land includes lands in respect of certain projects for which execution of lease/conveyance deeds are in process. 2. Registration of title deeds in respect of certain Buildings is pending execution.3. Depreciation for the year includes ` 12.34 million taken to prior period (Previous Year ` 110.99 million).4. Building includes cost of undivided interest in land.
(` in million)
SCHEDULE-5
CAPITAL WORKS-IN-PROGRESS
TOTAL
Less: Impairment
TOTAL
NET CAPITAL WORKS-IN-PROGRESS
SCHEDULE - 6
PRODUCING PROPERTIES
Gross Cost
TOTAL
Less: Depletion & Impairment
TOTAL
NET PRODUCING PROPERTIES
As at As at st st 31 March, 31 March,
2011 2010
Buildings 1,630.30 776.45Plant and Machinery 137,792.28 101,161.19Advances for Capital Works and Progress Payments 546.67 20.12Capital Stores (including in transit) 1,550.57 1,457.20 Less: Provision for Non-Moving Items 49.27 43.26
1,501.30 1,413.94141,470.55 103,371.70
Opening Balance 958.16 701.26 Provided for the year 553.14 364.17 Transfer to Fixed Assets (355.48) (61.64)Write back of Impairment (0.96) (45.63)
1,154.86 958.16
140,315.69 102,413.54
As at As at st st 31 March, 31 March,
2011 2010
Opening Balance 843,112.16 757,297.13
Transfer from Exploratory Wells-in-Progress 2,748.48 1,720.38
Transfer from Development Wells-in-Progress 37,251.92 52,128.45
Depreciation on Facilities 36,389.62 29,119.11
Increase/(Decrease) in estimated Abandonment costs 11,018.97 2,847.09
Other Adjustment 1.57 -
930,522.72 843,112.16
Opening Balance 440,290.04 395,717.19
Depletion for the year 54,369.72 45,301.63
Transfer of Impairment from Development Wells in Progress 0.57 17.96
Impairment provided for the year 136.20 11.50
Write back of Impairment (34.93) (758.24)
Other Adjustment 4.55 -
494,766.15 440,290.04
435,756.57 402,822.12
(` in million)
(` in million)
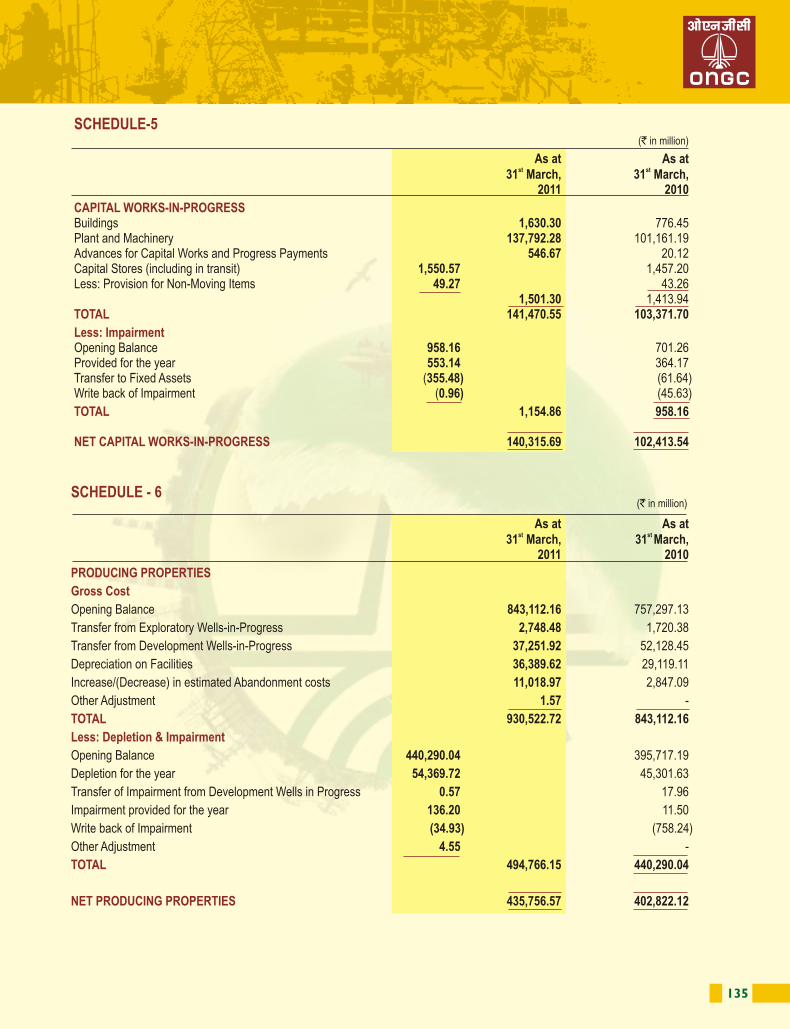
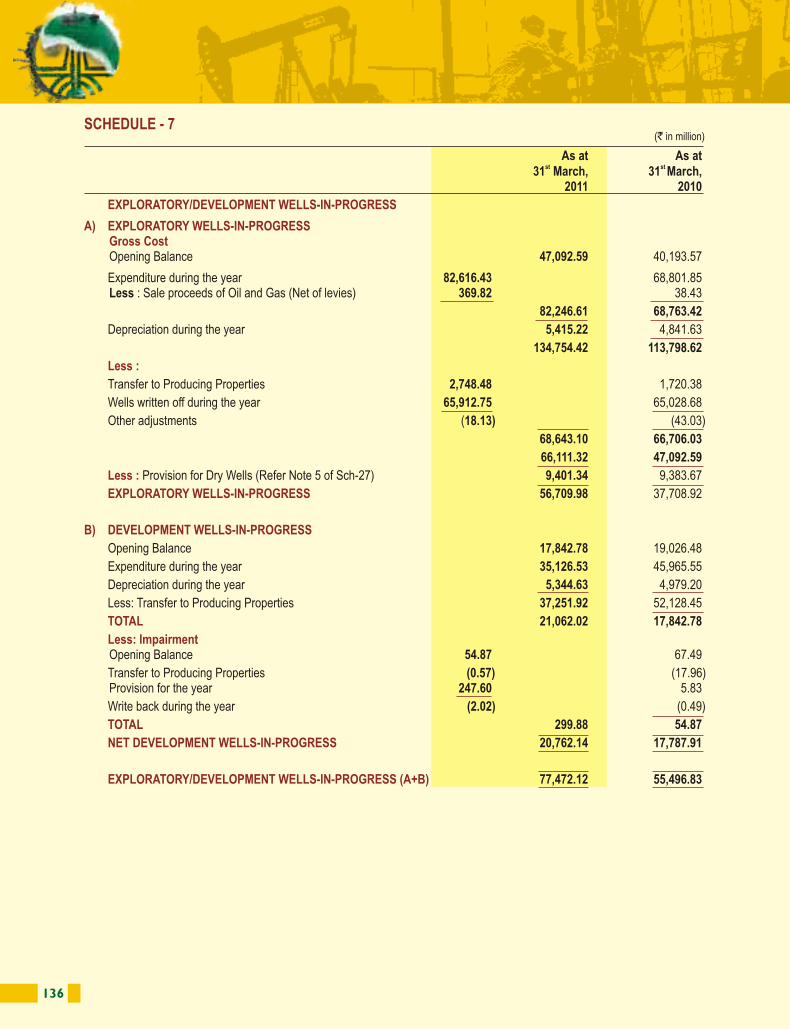
136 137
(` in million)SCHEDULE - 8
INVESTMENTS (AT COST)LONG-TERM INVESTMENTS (Fully Paid Up, unless otherwise stated)
A. TRADE INVESTMENTS1. Equity Shares (Quoted)
2. Equity Shares (Unquoted)
3. Oil Companies Govt. of India Special Bonds (Unquoted)
TOTAL TRADE INVESTMENTS
B. NON-TRADE INVESTMENTS (Unquoted)
CURRENT INVESTMENTS NON-TRADE INVESTMENTS
TOTAL CURRENT INVESTMENTSGRAND TOTAL
Total Quoted InvestmentsTotal Unquoted Investments
Total Market value of Quoted Investments
No. of Face Value As at As at
st stShares/ per Share/ 31 March, 31 March, Bonds/Units Bond/Unit 2011 2010
(in `)
i) Indian Oil Corporation Limited 212,906,190 10 13,720.49 13,720.49ii) GAIL (India) Limited 61,259,323 10 2,451.06 2,451.06iii) Mangalore Refinery and Petrochemicals Ltd.(Subsidiary) 1,255,354,097 10 10,405.73 10,405.73iv) Petronet LNG Limited 93,750,000 10 987.50 987.50
i) Pawan Hans Helicopter Limited 120,350 10,000 1,203.50 245.00(24,500)
ii) Petronet MHB Limited 157,841,000 10 1,578.41 1,578.41iii) Oil Spill Response Limited 100 * 0.01 0.01iv) In wholly owned subsidiary ONGC-Videsh Ltd. 100,000,000 100 10,000.00 10,000.00v) Mangalore SEZ Limited 13,000,000 10 130.00 130.00vi) ONGC Mangalore Petrochemicals Ltd. 23,000 10 0.23 0.23vii) ONGC Petro Additions Limited 20,967 10 0.21 0.21viii) ONGC Teri Biotech Limited 24,990 10 0.25 0.25ix) ONGC Tripura Power Company Ltd.
- Fully Paid 52,000 10 0.52 0.52 - Partly Paid (` 5 per share) 267,438,000 10 1,337.19 1,337.19
x) Dahej SEZ Limited 24,800 10 0.25 0.25
i) 7% Government of India Special Bonds 2012 851,907 10,000 8,519.07 8,519.07ii) 8.40% Oil Companies' Government of India Special Bonds 2025 197,370 10,000 1,973.70 1,973.70
52,308.12 51,349.62Less: Provision for Diminution 480.67 446.66
51,827.45 50,902.96
12% UP State Development Loan-2011 1 500,000 0.50 0.50
Mutual Funds (Unquoted)i) UTI Liquid Cash Plan 1,471,809 1,500.43 5,100.51
(5,003,216)ii) UTI Treasury Advantage Fund - - 1,716.36
(1,715,997)
1,500.43 6,816.8753,328.38 57,720.33
27,564.78 27,564.78 25,763.60 30,155.55
53,328.38 57,720.33 191,679.24 190,907.75
* GBP one each, total value ` 6,885/- Figures in parenthesis relate to previous year.
(` in million)
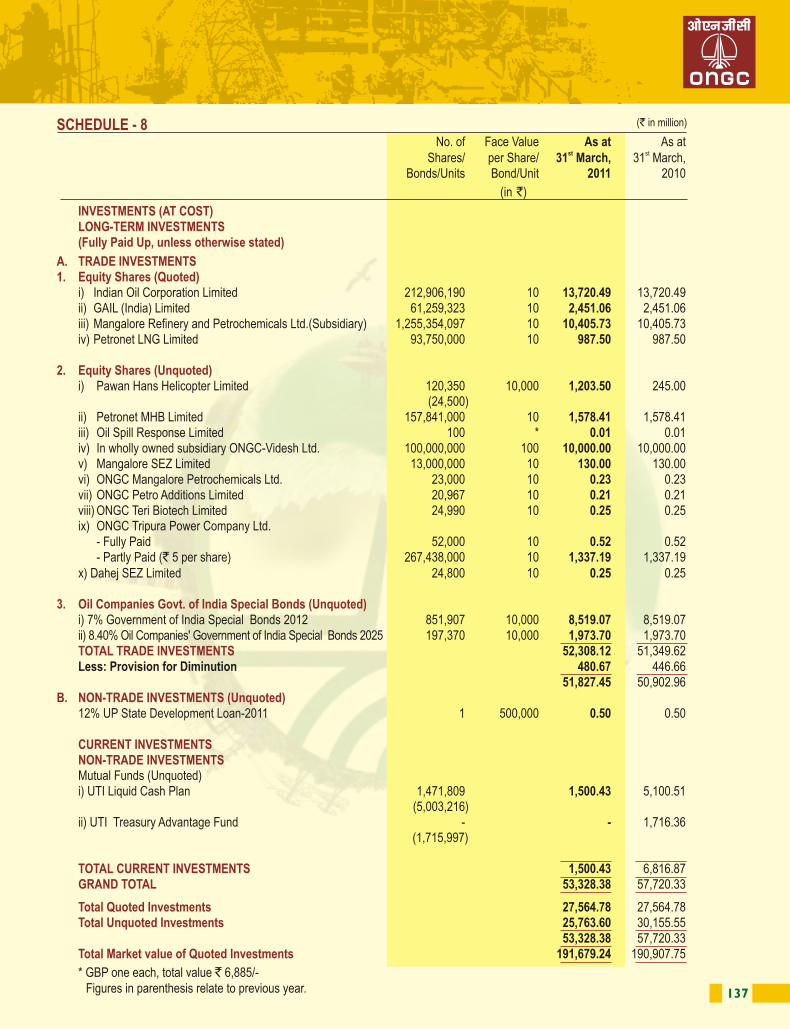
136 137
(` in million)SCHEDULE - 8
INVESTMENTS (AT COST)LONG-TERM INVESTMENTS (Fully Paid Up, unless otherwise stated)
A. TRADE INVESTMENTS1. Equity Shares (Quoted)
2. Equity Shares (Unquoted)
3. Oil Companies Govt. of India Special Bonds (Unquoted)
TOTAL TRADE INVESTMENTS
B. NON-TRADE INVESTMENTS (Unquoted)
CURRENT INVESTMENTS NON-TRADE INVESTMENTS
TOTAL CURRENT INVESTMENTSGRAND TOTAL
Total Quoted InvestmentsTotal Unquoted Investments
Total Market value of Quoted Investments
No. of Face Value As at As at
st stShares/ per Share/ 31 March, 31 March, Bonds/Units Bond/Unit 2011 2010
(in `)
i) Indian Oil Corporation Limited 212,906,190 10 13,720.49 13,720.49ii) GAIL (India) Limited 61,259,323 10 2,451.06 2,451.06iii) Mangalore Refinery and Petrochemicals Ltd.(Subsidiary) 1,255,354,097 10 10,405.73 10,405.73iv) Petronet LNG Limited 93,750,000 10 987.50 987.50
i) Pawan Hans Helicopter Limited 120,350 10,000 1,203.50 245.00(24,500)
ii) Petronet MHB Limited 157,841,000 10 1,578.41 1,578.41iii) Oil Spill Response Limited 100 * 0.01 0.01iv) In wholly owned subsidiary ONGC-Videsh Ltd. 100,000,000 100 10,000.00 10,000.00v) Mangalore SEZ Limited 13,000,000 10 130.00 130.00vi) ONGC Mangalore Petrochemicals Ltd. 23,000 10 0.23 0.23vii) ONGC Petro Additions Limited 20,967 10 0.21 0.21viii) ONGC Teri Biotech Limited 24,990 10 0.25 0.25ix) ONGC Tripura Power Company Ltd.
- Fully Paid 52,000 10 0.52 0.52 - Partly Paid (` 5 per share) 267,438,000 10 1,337.19 1,337.19
x) Dahej SEZ Limited 24,800 10 0.25 0.25
i) 7% Government of India Special Bonds 2012 851,907 10,000 8,519.07 8,519.07ii) 8.40% Oil Companies' Government of India Special Bonds 2025 197,370 10,000 1,973.70 1,973.70
52,308.12 51,349.62Less: Provision for Diminution 480.67 446.66
51,827.45 50,902.96
12% UP State Development Loan-2011 1 500,000 0.50 0.50
Mutual Funds (Unquoted)i) UTI Liquid Cash Plan 1,471,809 1,500.43 5,100.51
(5,003,216)ii) UTI Treasury Advantage Fund - - 1,716.36
(1,715,997)
1,500.43 6,816.8753,328.38 57,720.33
27,564.78 27,564.78 25,763.60 30,155.55
53,328.38 57,720.33 191,679.24 190,907.75
* GBP one each, total value ` 6,885/- Figures in parenthesis relate to previous year.
(` in million)
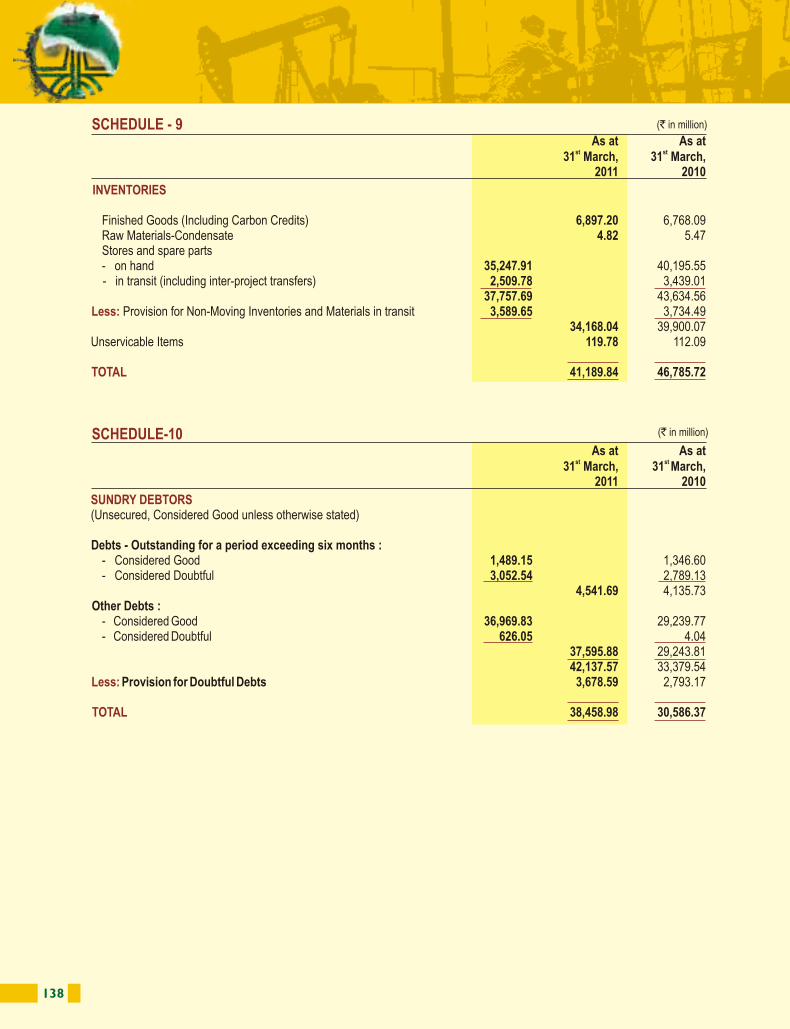
138 139
SCHEDULE - 9
INVENTORIES
Less:
TOTAL
SCHEDULE-10
SUNDRY DEBTORS
Less:
TOTAL
As at As at st st 31 March, 31 March,
2011 2010
Finished Goods (Including Carbon Credits) 6,897.20 6,768.09Raw Materials-Condensate 4.82 5.47Stores and spare parts- on hand 35,247.91 40,195.55 - in transit (including inter-project transfers) 2,509.78 3,439.01
37,757.69 43,634.56 Provision for Non-Moving Inventories and Materials in transit 3,589.65 3,734.49
34,168.04 39,900.07Unservicable Items 119.78 112.09
41,189.84 46,785.72
As at As at st st 31 March, 31 March,
2011 2010
(Unsecured, Considered Good unless otherwise stated)
Debts - Outstanding for a period exceeding six months :- Considered Good 1,489.15 1,346.60 - Considered Doubtful 3,052.54 2,789.13
4,541.69 4,135.73Other Debts :
- Considered Good 36,969.83 29,239.77 - Considered Doubtful 626.05 4.04 37,595.88 29,243.81
42,137.57 33,379.54 Provision for Doubtful Debts 3,678.59 2,793.17
38,458.98 30,586.37
(` in million)
(` in million)
As at As at st st 31 March, 31 March,
2011 2010
6.37 8.36
Current Accounts 3,494.77 2,664.43Fixed Deposits 139,744.94 105,450.76
Current Account with Citi Bank- London 51.74 108.82(Maximum balance outstanding at any time during the year ` 350.27 million, Previous year ̀ 241.79 million)
Current Account with Barclays Bank- London 12.64 46.92(Maximum balance outstanding at any time during the year ` 69.11 million, Previous year ̀ 196.46 million)
143,310.46 108,279.29
81,155.06 74,031.06
* Deposited u/s 33ABA of the Income Tax Act, 1961 and can be withdrawn only for the purposes specified in the Scheme.
As at As at st st 31 March, 31 March,
2011 2010
(Unsecured, Considered Good unless otherwise stated)Interest Accrued On
- Investments 37.85 37.85- Deposits with Banks/PSUs 3,979.54 3,288.57 - Others - Considered Good 3,038.34 2,978.08 - Considered Doubtful 27.05 24.20
3,065.39 3,002.28 Provision 27.05 24.20
3,038.34 2,978.08Gas Subsidy receivable from Government of India (GoI) 1,641.99 -Other Accounts pending adjustment
- Considered Good 57.46 28.55 - Considered Doubtful 575.13 430.79
632.59 459.34Less: Provision for Doubtful Accounts 575.13 430.79
57.46 28.558,755.18 6,333.05
SCHEDULE-11
A) CASH AND BANK BALANCES
Cash balance on hand
Balances with Scheduled Banks in:
Balances with Non-Scheduled Banks in:
TOTAL
B) DEPOSIT WITH SCHEDULED BANK UNDER SITE RESTORATION FUND SCHEME*
SCHEDULE - 12
OTHER CURRENT ASSETS
Less:
TOTAL
(` in million)
(` in million)
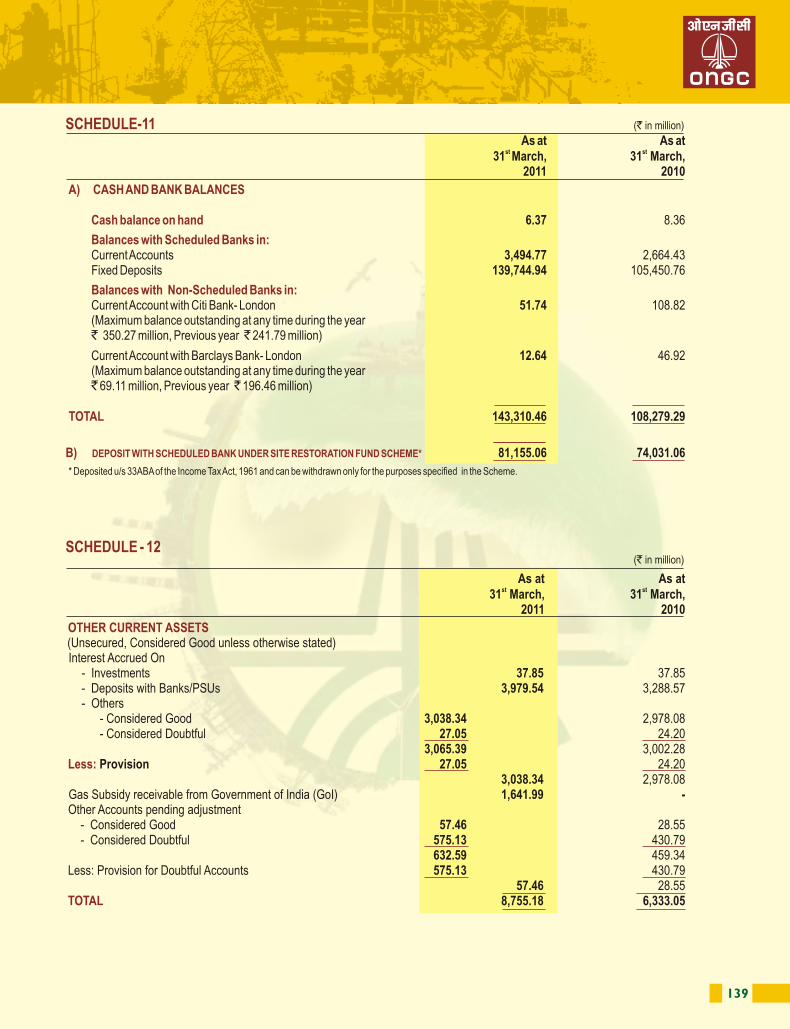
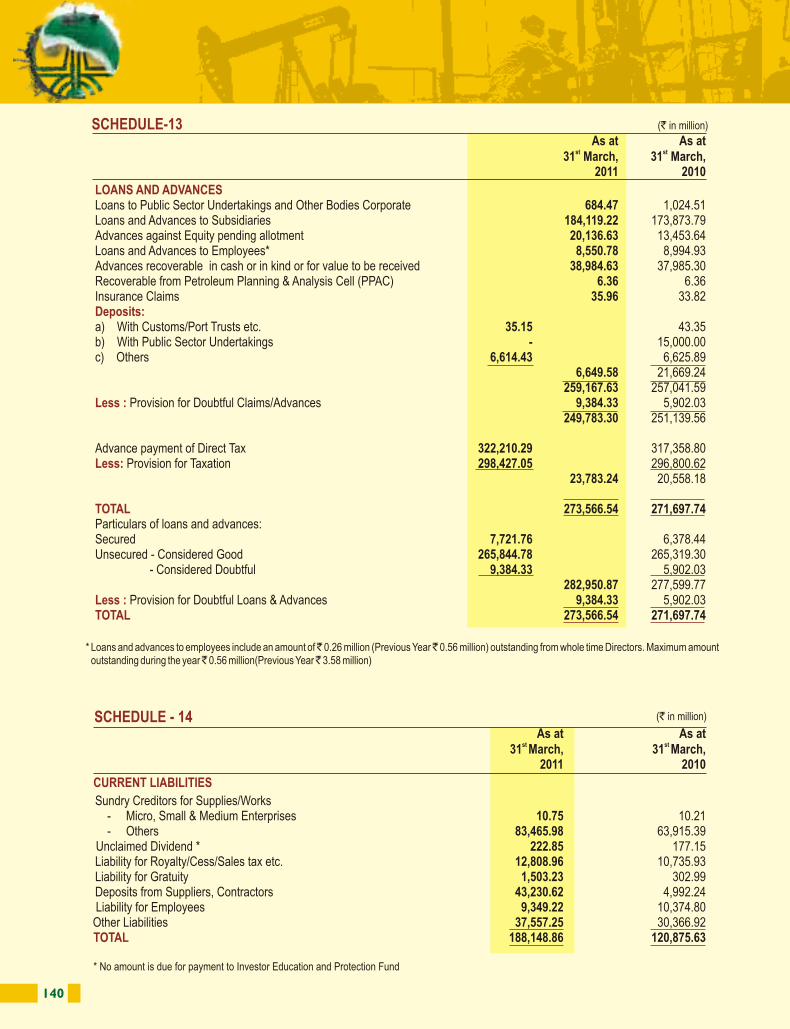
140 141
SCHEDULE-13
LOANS AND ADVANCES
Deposits:
Less :
Less:
TOTAL
Less : TOTAL
As at As at
st st 31 March, 31 March,2011 2010
Loans to Public Sector Undertakings and Other Bodies Corporate 684.47 1,024.51Loans and Advances to Subsidiaries 184,119.22 173,873.79Advances against Equity pending allotment 20,136.63 13,453.64Loans and Advances to Employees* 8,550.78 8,994.93Advances recoverable in cash or in kind or for value to be received 38,984.63 37,985.30Recoverable from Petroleum Planning & Analysis Cell (PPAC) 6.36 6.36Insurance Claims 35.96 33.82
a) With Customs/Port Trusts etc. 35.15 43.35b) With Public Sector Undertakings - 15,000.00c) Others 6,614.43 6,625.89
6,649.58 21,669.24259,167.63 257,041.59
Provision for Doubtful Claims/Advances 9,384.33 5,902.03249,783.30 251,139.56
Advance payment of Direct Tax 322,210.29 317,358.80
Provision for Taxation 298,427.05 296,800.62 23,783.24 20,558.18
273,566.54 271,697.74
Particulars of loans and advances: Secured 7,721.76 6,378.44Unsecured - Considered Good 265,844.78 265,319.30 - Considered Doubtful 9,384.33 5,902.03
282,950.87 277,599.77Provision for Doubtful Loans & Advances 9,384.33 5,902.03
273,566.54 271,697.74
* Loans and advances to employees include an amount of ̀ 0.26 million (Previous Year ̀ 0.56 million) outstanding from whole time Directors. Maximum amount outstanding during the year ̀ 0.56 million(Previous Year ̀ 3.58 million)
(` in million)
SCHEDULE - 14
CURRENT LIABILITIES
TOTAL
As at As at st st 31 March, 31 March,
2011 2010
Sundry Creditors for Supplies/Works - Micro, Small & Medium Enterprises 10.75 10.21 - Others 83,465.98 63,915.39 Unclaimed Dividend * 222.85 177.15Liability for Royalty/Cess/Sales tax etc. 12,808.96 10,735.93Liability for Gratuity 1,503.23 302.99Deposits from Suppliers, Contractors 43,230.62 4,992.24 Liability for Employees 9,349.22 10,374.80Other Liabilities 37,557.25 30,366.92
188,148.86 120,875.63
* No amount is due for payment to Investor Education and Protection Fund
(` in million)
SCHEDULE - 15
PROVISIONS
TOTAL
SCHEDULE - 16
MISCELLANEOUS EXPENDITURE
Deferred Revenue Expenditure
TOTAL
As at As at st st 31 March, 31 March,
2011 2010
Proposed Dividend 6,416.62 32,083.09Tax on Proposed Dividend 1,040.94 5,328.60Leave Encashment 16,180.23 13,934.10Post Retirement Medical & Terminal Benefits 17,554.33 14,719.48Others 8,132.74 8,058.75
49,324.86 74,124.02
As at As at st st31 March, 31 March,
2011 2010
(to the extent not written off or adjusted)
Dry Docking Charges 6,117.60 6,612.99Mobilisation Charges 1,842.65 1,800.17
7,960.25 8,413.16
SCHEDULE - 17
SALES
Less :
TOTAL
For the For the Year 2010-11 Year 2009-10
Own Products 677,194.09 617,335.70
Transfer to Exploratory Wells in Progress 472.11 52.70 Government of India's (GoI's) share in Profit Petroleum 15,344.76 15,418.29
15,816.87 15,470.99661,377.22 601,864.71
Traded Products 171.55 183.48
661,548.77 602,048.19
(` in million)
(` in million)
(` in million)
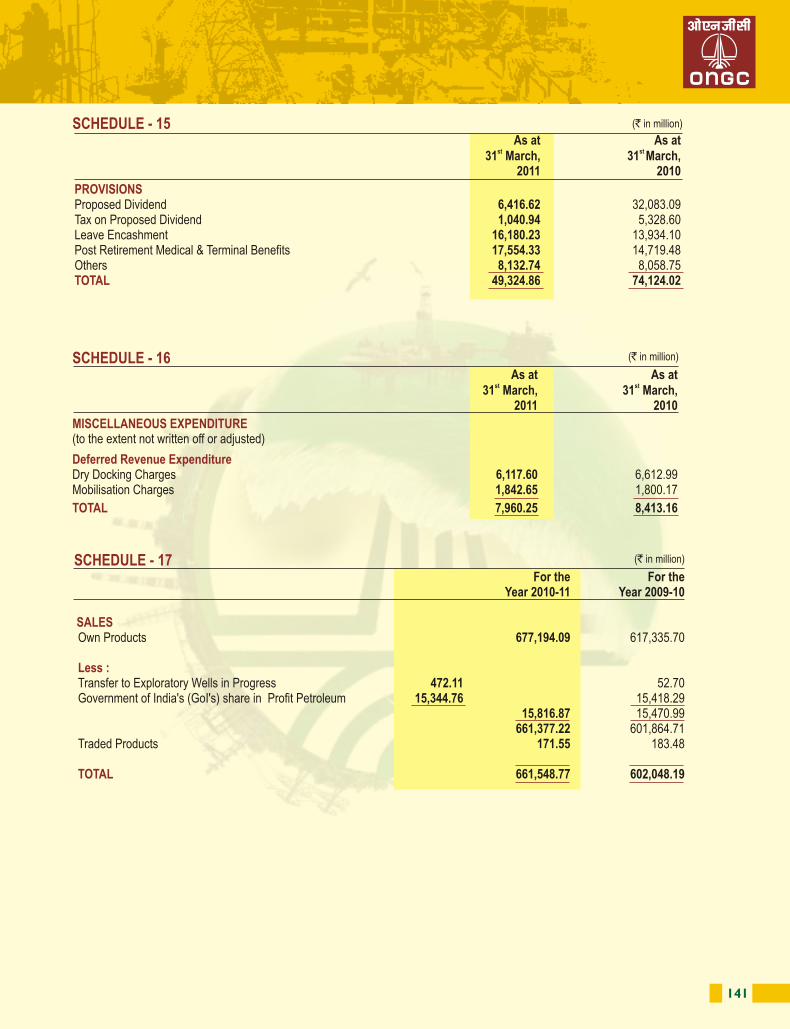
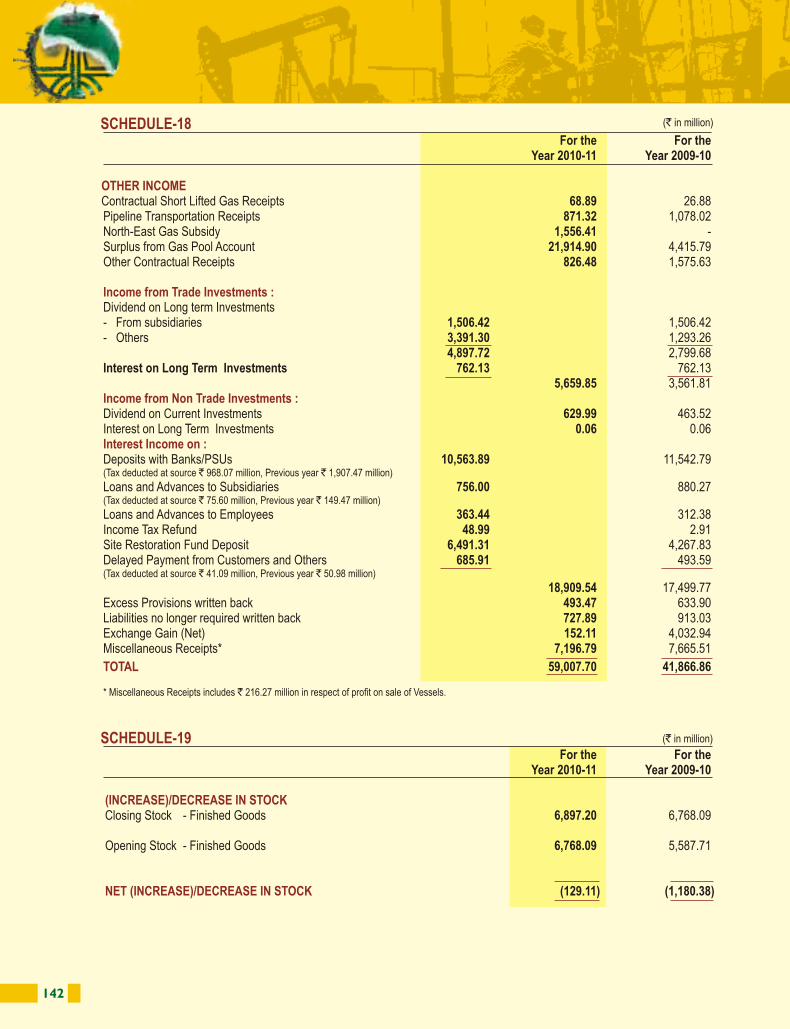
142 143
SCHEDULE-20
PRODUCTION, TRANSPORTATION, SELLINGAND DISTRIBUTION EXPENDITURE
TOTALNote:
SCHEDULE-21
DEPRECIATION, DEPLETION, AMORTISATION AND IMPAIRMENT
Less :
Impairment Loss
Less:
TOTAL
For the For the Year 2010-11 Year 2009-10
Royalty 71,372.91 54,899.51Cess 56,962.72 54,538.03Natural Calamity Contingent Duty 1,113.96 1,061.67Excise Duty on stock (Net) 128.63 0.22Sales Tax 3,112.62 2,989.58Service Tax 226.65 212.75Education cess 1,828.44 1,718.99Octroi and Port Trust Charges 4,522.45 4,484.28Staff Expenditure 13,031.25 11,074.85Workover Operations 27,851.95 31,172.60Water Injection, Desalting and Demulsification 12,710.45 11,037.73Consumption of Raw Materials, Stores and Spares 6,214.63 5,703.12Pollution Control 5,095.87 4,376.50Transport Expenses 4,016.56 3,235.67Insurance 988.43 974.46Power and Fuel 1,425.66 1,163.41Repairs and Maintenance 8,466.98 5,682.10Contractual payments including Hire charges etc. 7,890.12 6,410.32Other Production Expenditure 5,423.70 3,684.78Transportation and Freight of Products 9,573.95 7,975.10Research and Development 3,582.44 1,985.78General Administrative Expenses 21,821.51 20,430.78Other Expenditure 7,938.73 8,387.23
275,300.61 243,199.46The above expenses have been classified in accordance with Part II of Schedule VI to the Companies Act, 1956 and exhibited in note 23.7 of Schedule 27.
For the For the Year 2010-11 Year 2009-10
Survey 17,725.98 23,524.49Wells written off 65,815.26 65,837.75Depletion 54,369.72 45,301.63Depreciation 68,350.11 52,426.59
Allocated to :Survey 1,051.59 1,181.07Exploratory Drilling 5,415.22 4,841.63Development Drilling 5,344.63 4,979.20Depreciation on Facilities 36,389.62 29,119.11Others 155.68 104.85
48,356.74 40,225.8619,993.37 12,200.73
During the year 1,534.73 553.44 Reversal during the year 182.53 986.16
1,352.20 (432.72)159,256.53 146,431.88
(` in million)
(` in million)
(` in million)SCHEDULE-18
OTHER INCOME
Income from Trade Investments :
Income from Non Trade Investments :
Interest Income on :
TOTAL
SCHEDULE-19
(INCREASE)/DECREASE IN STOCK
NET (INCREASE)/DECREASE IN STOCK
For the For the Year 2010-11 Year 2009-10
Contractual Short Lifted Gas Receipts 68.89 26.88Pipeline Transportation Receipts 871.32 1,078.02North-East Gas Subsidy 1,556.41 -Surplus from Gas Pool Account 21,914.90 4,415.79Other Contractual Receipts 826.48 1,575.63
Dividend on Long term Investments - From subsidiaries 1,506.42 1,506.42 - Others 3,391.30 1,293.26
4,897.72 2,799.68 Interest on Long Term Investments 762.13 762.13
5,659.85 3,561.81
Dividend on Current Investments 629.99 463.52Interest on Long Term Investments 0.06 0.06
Deposits with Banks/PSUs 10,563.89 11,542.79 (Tax deducted at source ` 968.07 million, Previous year ` 1,907.47 million)
Loans and Advances to Subsidiaries 756.00 880.27 (Tax deducted at source ` 75.60 million, Previous year ` 149.47 million)
Loans and Advances to Employees 363.44 312.38 Income Tax Refund 48.99 2.91 Site Restoration Fund Deposit 6,491.31 4,267.83 Delayed Payment from Customers and Others 685.91 493.59 (Tax deducted at source ` 41.09 million, Previous year ` 50.98 million)
18,909.54 17,499.77Excess Provisions written back 493.47 633.90Liabilities no longer required written back 727.89 913.03Exchange Gain (Net) 152.11 4,032.94Miscellaneous Receipts* 7,196.79 7,665.51
59,007.70 41,866.86
* Miscellaneous Receipts includes ` 216.27 million in respect of profit on sale of Vessels.
For the For the Year 2010-11 Year 2009-10
Closing Stock - Finished Goods 6,897.20 6,768.09
Opening Stock - Finished Goods 6,768.09 5,587.71
(129.11) (1,180.38)
(` in million)
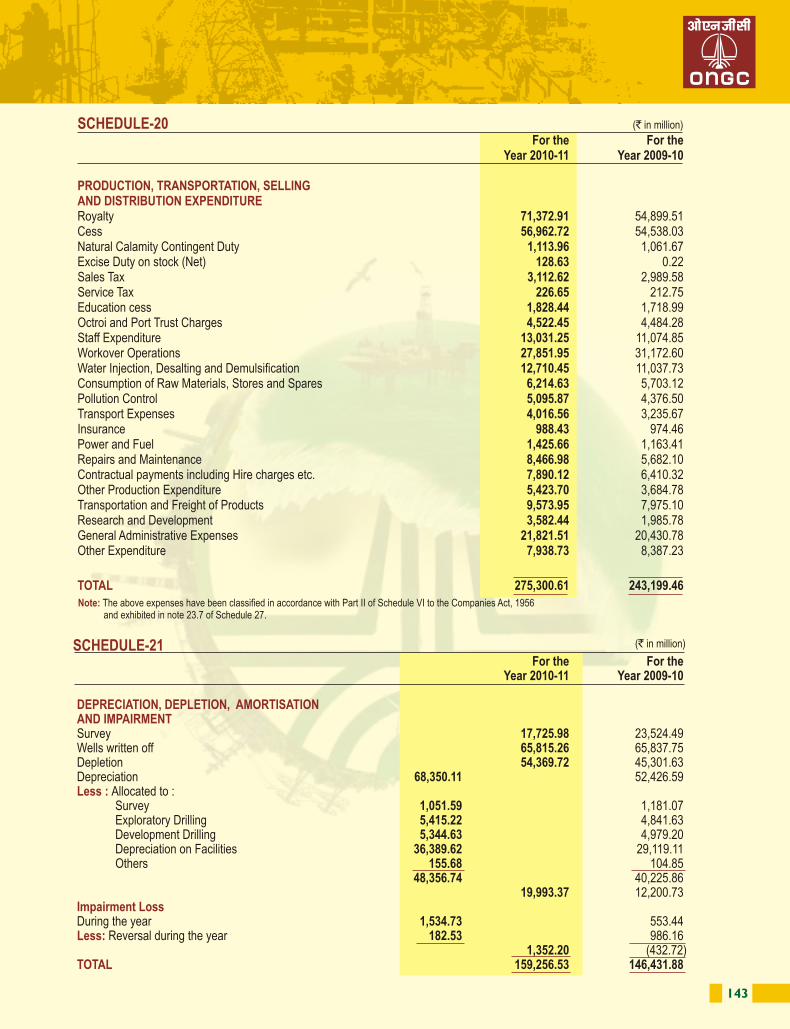
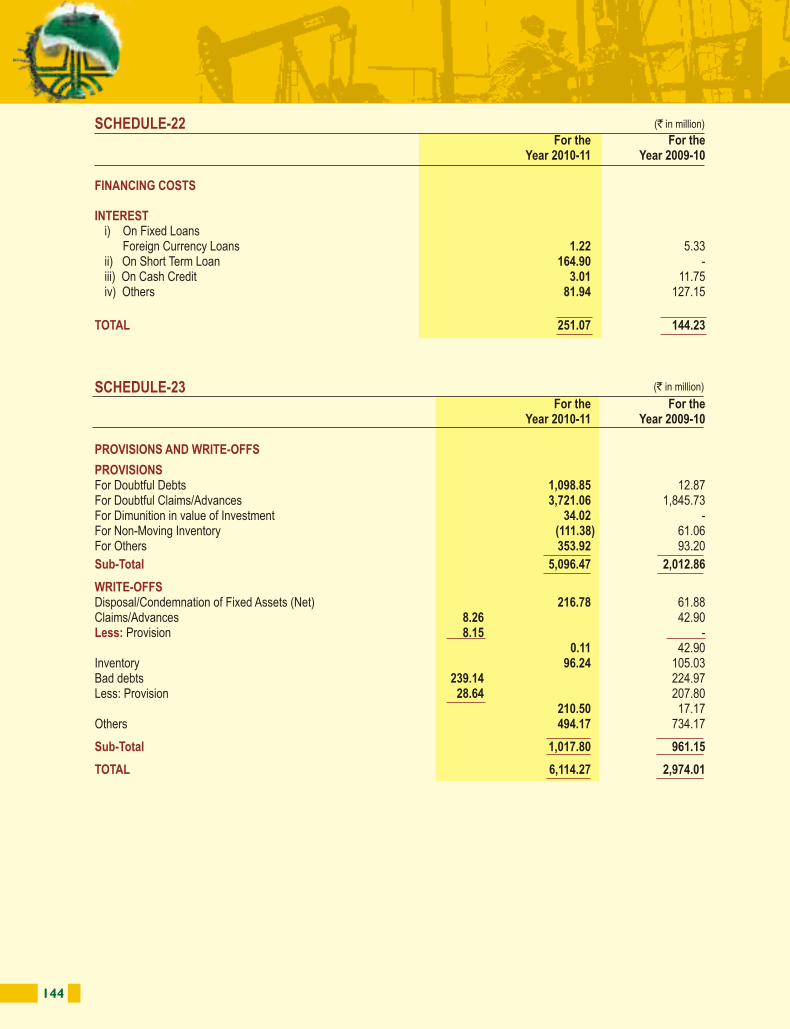
144 145
(` in million)
(` in million)
SCHEDULE-22
FINANCING COSTS
INTEREST
TOTAL
SCHEDULE-23
PROVISIONS AND WRITE-OFFS
PROVISIONS
Sub-Total
WRITE-OFFS
Less:
Sub-Total
TOTAL
For the For the Year 2010-11 Year 2009-10
i) On Fixed Loans Foreign Currency Loans 1.22 5.33ii) On Short Term Loan 164.90 -iii) On Cash Credit 3.01 11.75iv) Others 81.94 127.15
251.07 144.23
For the For the Year 2010-11 Year 2009-10
For Doubtful Debts 1,098.85 12.87For Doubtful Claims/Advances 3,721.06 1,845.73For Dimunition in value of Investment 34.02 -For Non-Moving Inventory (111.38) 61.06For Others 353.92 93.20
5,096.47 2,012.86
Disposal/Condemnation of Fixed Assets (Net) 216.78 61.88Claims/Advances 8.26 42.90
Provision 8.15 -0.11 42.90
Inventory 96.24 105.03Bad debts 239.14 224.97Less: Provision 28.64 207.80
210.50 17.17 Others 494.17 734.17
1,017.80 961.15
6,114.27 2,974.01
(` in million)
SCHEDULE-24
ADJUSTMENTS RELATING TO PRIOR PERIOD (NET)
A. EXPENDITURE
Sub-Total
B. INCOME
Sub-Total
TOTAL
SCHEDULE-25
EARNINGS PER EQUITY SHARE
Basic & Diluted earnings per equity share
For the For the Year 2010-11 Year 2009-10
Statutory levies * (15.71) (32.18)Other production, selling & distribution expenditure * 9.42 (188.55)Exchange Fluctuation 166.45 -Interest -Others - 542.24Survey 41.31 (64.40)Dry Wells 115.16 109.40Depletion 4.55 -Depreciation 12.34 110.99
333.52 477.50
Sales (32.08) 13.29Interest -Others 9.24 0.07Other Income 20.11 281.45
(2.73) 294.81
336.25 182.69
* The above expenses have been classified in accordance with Part II of Schedule VI to the Companies Act, 1956 and exhibited in note 23.7 of Schedule 27.
For the For the Year 2010-11 Year 2009-10
A) Net Profit after Tax 189,240.02 167,675.56
B) Number of Shares 8,555,490,120 2,138,872,530
C) Restarted Number of Shares 8,555,490,120 8,555,490,120
#22.12 19.60
# EPS has been restated for split of share from ` 10 to ` 5 each and issue of bonus shares in the ratio of 1:1 as per Accounting Standard-20 on EPS.
(` in million)
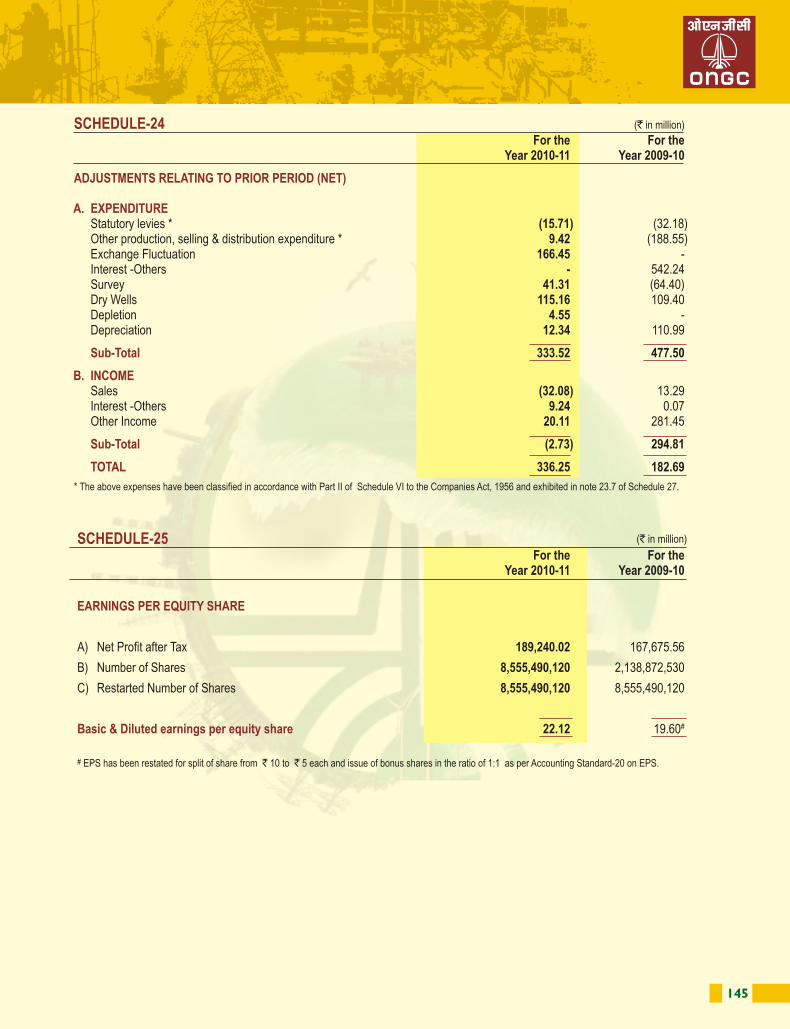
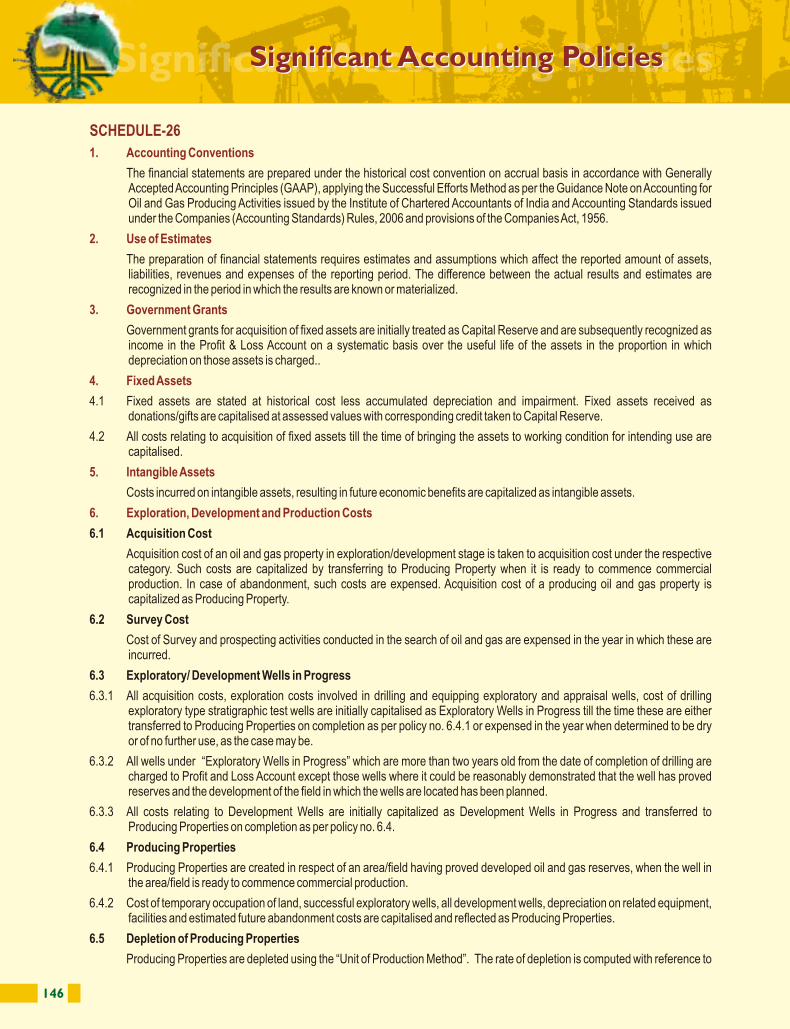
146 147
SCHEDULE-26
1. Accounting Conventions
2. Use of Estimates
3. Government Grants
4. Fixed Assets
5. Intangible Assets
6. Exploration, Development and Production Costs
The financial statements are prepared under the historical cost convention on accrual basis in accordance with Generally Accepted Accounting Principles (GAAP), applying the Successful Efforts Method as per the Guidance Note on Accounting for Oil and Gas Producing Activities issued by the Institute of Chartered Accountants of India and Accounting Standards issued under the Companies (Accounting Standards) Rules, 2006 and provisions of the Companies Act, 1956.
The preparation of financial statements requires estimates and assumptions which affect the reported amount of assets, liabilities, revenues and expenses of the reporting period. The difference between the actual results and estimates are recognized in the period in which the results are known or materialized.
Government grants for acquisition of fixed assets are initially treated as Capital Reserve and are subsequently recognized as income in the Profit & Loss Account on a systematic basis over the useful life of the assets in the proportion in which depreciation on those assets is charged..
4.1 Fixed assets are stated at historical cost less accumulated depreciation and impairment. Fixed assets received as donations/gifts are capitalised at assessed values with corresponding credit taken to Capital Reserve.
4.2 All costs relating to acquisition of fixed assets till the time of bringing the assets to working condition for intending use are capitalised.
Costs incurred on intangible assets, resulting in future economic benefits are capitalized as intangible assets.
6.1 Acquisition Cost
Acquisition cost of an oil and gas property in exploration/development stage is taken to acquisition cost under the respective category. Such costs are capitalized by transferring to Producing Property when it is ready to commence commercial production. In case of abandonment, such costs are expensed. Acquisition cost of a producing oil and gas property is capitalized as Producing Property.
6.2 Survey Cost
Cost of Survey and prospecting activities conducted in the search of oil and gas are expensed in the year in which these are incurred.
6.3 Exploratory/ Development Wells in Progress
6.3.1 All acquisition costs, exploration costs involved in drilling and equipping exploratory and appraisal wells, cost of drilling exploratory type stratigraphic test wells are initially capitalised as Exploratory Wells in Progress till the time these are either transferred to Producing Properties on completion as per policy no. 6.4.1 or expensed in the year when determined to be dry or of no further use, as the case may be.
6.3.2 All wells under “Exploratory Wells in Progress” which are more than two years old from the date of completion of drilling are charged to Profit and Loss Account except those wells where it could be reasonably demonstrated that the well has proved reserves and the development of the field in which the wells are located has been planned.
6.3.3 All costs relating to Development Wells are initially capitalized as Development Wells in Progress and transferred to Producing Properties on completion as per policy no. 6.4.
6.4 Producing Properties
6.4.1 Producing Properties are created in respect of an area/field having proved developed oil and gas reserves, when the well in the area/field is ready to commence commercial production.
6.4.2 Cost of temporary occupation of land, successful exploratory wells, all development wells, depreciation on related equipment, facilities and estimated future abandonment costs are capitalised and reflected as Producing Properties.
6.5 Depletion of Producing Properties
Producing Properties are depleted using the “Unit of Production Method”. The rate of depletion is computed with reference to
an area covered by individual lease/licence/asset/amortization base by considering the proved developed reserves and related capital costs incurred including estimated future abandonment costs. In case of acquisition, cost of Producing Properties is depleted by considering the proved reserves. These reserves are estimated annually by the Reserve Estimates Committee of the Company, which follows the International Reservoir Engineering Procedures.
6.6 Production Costs
Production costs include pre-well head and post well head expenses including depreciation and applicable operating costs of support equipment and facilities.
6.7 Side tracking
6.7.1 The cost of abandoned portion of side tracked exploratory wells is charged to Profit and Loss Account as dry wells.
6.7.2 The cost of abandoned portion of side tracked development wells is considered as part of cost of development wells.
6.7.3 The cost of sidetracking in respect of existing producing wells is capitalized if it increases the proved developed reserves otherwise, charged to Profit and Loss Account as workover expenditure.
Producing Properties, Development Wells in Progress (DWIP) and Fixed Assets (including Capital Works in Progress) of a “Cash Generating Unit” (CGU) are reviewed for impairment at each Balance Sheet date. In case, events and circumstances indicate any impairment, recoverable amount of these assets is determined. An impairment loss is recognized, whenever the carrying amount of such assets exceeds the recoverable amount. The recoverable amount is its 'value in use' or 'net selling price' (if determinable) whichever is higher. In assessing value in use, the estimated future cash flows from the use of assets and from its disposal at the end of its useful life are discounted to their present value at appropriate rate.
An impairment loss is reversed if there is change in the recoverable amount and such loss either no longer exists or has decreased. Impairment loss / reversal thereof is adjusted to the carrying value of the respective assets, which in case of CGU, is allocated to its assets on a pro-rata basis. Subsequent to impairment, depreciation is provided on the revised carrying value of the assets over the remaining useful life.
8.1 The full eventual estimated liability towards costs relating to dismantling, abandoning and restoring offshore well sites and allied facilities are recognized in respective assets when the well is complete / facilities are installed.
8.2 The full eventual estimated liability towards costs relating to dismantling, abandoning and restoring onshore well sites are recognized when the well is complete. Cost relating to dismantling, abandoning and restoring its allied facilities are accounted for in the year in which such costs are incurred as the salvage value is expected to take care of the abandonment costs. The abandonment cost on dry well is charged to Profit and Loss Account.
Liability for abandonment cost is updated based on the technical assessment available at current costs with the Company.
The Company has Joint Ventures in the nature of Production Sharing Contracts (PSC) with the Government of India and various bodies corporate for exploration, development and production activities.
9.1 The income, expenditure, assets and liabilities of the Jointly Controlled Assets are merged on line by line basis according to the participating interest with the similar items in the Financial Statements of the Company and adjusted for depreciation, depletion, survey, dry wells, abandonment, impairment and sidetracking in accordance with the accounting policies of the Company.
9.2 Consideration for the right to participate in operations recoverable from new Joint Venture Partners are :
1. Reduced from respective capitalized cost wherever applicable.
2. Reduced from current expenditure to the extent it relates to current year.
3. Balance is considered as miscellaneous receipts.
9 .3 The hydrocarbon reserves in such areas are taken in proportion to the participating interest of the Company.
Long-term investments are valued at cost. Provision is made for any diminution, other than temporary, in the value of such investments.
Current Investments are valued at lower of cost and fair value.
7. Impairment
8. Abandonment Cost
9. Joint Ventures
10. Investments
Significant Accounting PoliciesSignificant Accounting Policies
148 149
11.1 Finished Goods (other than Sulphur) and stock in pipelines/tanks and carbon credits are valued at Cost or net realisable value whichever is lower. Cost of Finished Goods is determined on absorption costing method. Sulphur is valued at net realisable value. The value of inventories includes excise duty, royalty (wherever applicable) but excludes cess.
11.2 Crude oil in unfinished condition in flow lines upto Group Gathering Stations/Platforms and Natural Gas in Pipelines are not valued.
11.3 Inventory of stores and spare parts is valued at Weighted Average Cost or net realisable value whichever is lower. Provisions are made for obsolete and non moving inventories.
11.4 Unserviceable items, when determined, are valued at estimated net realizable value.
12.1 Revenue from sale of products is recognized on transfer of custody to customers.
12.2 Sale of crude oil and gas (net of levies) produced from Exploratory Wells in Progress is deducted from expenditure on such wells.
12.3 Sales are inclusive of all statutory levies except Value Added Tax (VAT). Any retrospective revision in prices is accounted for in the year of such revision.
12.4 Revenue in respect of the following is recognized when there is reasonable certainty regarding ultimate collection:
a. Short-lifted quantity of gas.
b. Gas pipeline transportation charges and statutory duties thereon.
c. Reimbursable subsidies and grants.
d. Interest on delayed realization from customers.
e. Liquidated damages from contractors/suppliers.
13.1 Depreciation on fixed assets is provided for under the written down value method in accordance with the rates specified in Schedule XIV to the Companies Act, 1956.
13.2 Depreciation on additions/deletions during the year is provided on pro rata basis with reference to the date of additions/deletions except items of Plant and Machinery used in wells with 100% rate of depreciation and low value items not exceeding Rs.5000/- which are fully depreciated at the time of addition.
13.3 Depreciation on subsequent expenditure on fixed assets arising on account of capital improvement or other factors, is provided for prospectively.
Depreciation on refurbished/revamped assets which are capitalized separately is provided for over the reassessed useful life at rates which are not less than the rates specified in Schedule XIV to the Companies Act, 1956.
13.4 Depreciation on fixed assets (including support equipment and facilities) used for exploration, drilling activities and on related equipment and facilities is initially capitalised as part of exploration cost, development cost or producing properties and expensed/depleted as stated in policy 6 above.
13.5 Leasehold land is amortized over the lease period except perpetual leases.
13.6 Intangible assets are amortized over the useful life not exceeding five years from the date of capitalization.
Transactions in foreign currencies are accounted for at the exchange rate prevailing on the date of the transaction. Foreign currency monetary assets and liabilities at the year end are translated using mean exchange rate prevailing on the last day of the financial year. The loss or gain thereon and also the exchange differences on settlement of the foreign currency transactions during the year are recognized as income or expense and adjusted to the profit and loss account except where such liabilities and /or transactions relate to fixed assets/ projects and these were incurred/ entered into before 1.4.2004 in which case, these are adjusted to the cost of respective fixed assets.
15.1 All short term employee benefits are recognized at their undiscounted amount in the accounting period in which they are incurred.
11. Inventories
12. Revenue Recognition
13. Depreciation and Amortisation
14. Foreign Exchange Transactions
15. Employee Benefits
15.2 Employee Benefit under defined contribution plans comprising provident fund etc. is recognized based on the undiscounted obligations of the company to contribute to the plan. The same is paid to a fund administered through a separate trust.
15.3 Employee benefits under defined benefit plans comprising of gratuity, leave encashment, compensated absences, post retirement medical benefits and other terminal benefits are recognized based on the present value of defined benefit obligation, which is computed on the basis of actuarial valuation using the Projected Unit Credit Method. Actuarial Liability in excess of respective plan assets is recognized during the year. Actuarial gains and losses in respect of post employment and other long-term benefits are recognized during the year.
15.4 Liability for gratuity as per actuarial valuation is funded with a separate trust.
Expenditure on Voluntary Retirement Scheme (VRS) is charged to Profit and Loss Account when incurred.
General administrative expenses which are identifiable to Assets, Basins & Services are allocated to activities and the balance are charged to Profit and Loss Account. Such expenses at Headquarters are charged to Profit and Loss Account.
The company accounts for insurance claims as under :-
18.1 In case of total loss of asset by transferring, either the carrying cost of the relevant asset or insurance value (subject to deductibles), whichever is lower under the head “Claims Recoverable-Insurance” on intimation to Insurer. In case insurance claim is less than carrying cost, the difference is charged to Profit and Loss Account.
18.2 In case of partial or other losses, expenditure incurred/payments made to put such assets back into use, to meet third party or other liabilities (less policy deductibles) if any, are accounted for as “Claims Recoverable-Insurance”. Insurance Policy deductibles are expensed in the year the corresponding expenditure is incurred.
18.3 As and when claims are finally received from insurer, the difference, if any, between Claims Recoverable-Insurance and claims received is adjusted to Profit and Loss Account.
Revenue expenses on Research are charged to Profit and Loss Account, when incurred.
Provision for current tax is made as per the provisions of the Income Tax Act, 1961. Deferred Tax Liability / Asset resulting from 'timing difference' between book and taxable profit is accounted for considering the tax rate and laws that have been enacted or substantively enacted as on the Balance Sheet date. Deferred Tax Asset is recognized and carried forward only to the extent that there is virtual certainty that the asset will be realized in future.
Borrowing Cost specifically identified to the acquisition or construction of qualifying assets is capitalized as part of such assets. A qualifying asset is one that necessarily takes substantial period of time to get ready for intended use. All other borrowing costs are charged to Profit and Loss Account.
Rig movement costs are booked to the next location planned for drilling. Abnormal Rig days' costs are considered as unallocable and charged to Profit and Loss Account.
Dry docking charges of Rigs/ Multipurpose Supply Vessels (MSVs), Geo Technical Vessels (GTVs), Well Stimulation Vessels, Offshore Supply Vessels (OSVs), Rig/equipment mobilization expenses and other related expenditure are considered as deferred expenditure and amortized over the period of use not exceeding five years.
Provisions involving substantial degree of estimation in measurement are recognized when there is a present obligation as a result of past events and it is probable that there will be an outflow of resources. Contingent Assets are neither recognized nor disclosed in the financial statements. Contingent liabilities are disclosed by way of notes to accounts.
16. Voluntary Retirement Scheme
17. General Administrative Expenses
18. Insurance claims
19. Research Expenditure
20. Taxes on Income
21. Borrowing Costs
22. Rig Days Costs
23. Deferred Revenue Expenditure
24. Provisions, Contingent Liabilities and Contingent Assets
150 151
Accounting Policy No. 6.3. Subsequent exploratory drilling costs of wells in this block were capitalized as Exploratory Wells in Progress. Initial-in-Place-Reserves have been established in this block and a conceptual development plan as part of the proposal for Declaration of Commerciality has been submitted to Management Committee (MC) for review on 15.07.2010. However, the Company as an abundant precaution made a provision of ` 6,104.80 million, ` 2,360.39 million and ` 918.48 million in respect of above costs in 2007-08, 2008-09 and 2009-10 respectively. Since there is no significant change in status of this block during the current year, the expenditure amounting to ` 17.67 million on the wells completed upto 31st March 2009, being more than two years old is provided for in the current year.
6 As per the Production Sharing Contracts signed by the Company with the GoI, the Company is required to complete Minimum Work Programme (MWP) within stipulated time. In case of delay in completion of the MWP, Liquidated Damages (LD) is payable for extension of time to complete MWP. Further, in case the Company does not complete MWP or surrender the block without completing the MWP, the estimated cost of completing balance work programme is required to be paid to the GoI. LD amounting to ̀ 113.72 million (Previous year ̀ (-)78.41 million) net of reversal and cost of unfinished MWP ̀ 919.81 million (Previous year ̀ 3,148.58 million) paid/payable to the GoI is included in survey and wells written off expenditure in Schedule 21.
7 The Finance (No.2) Act, 2009, has specified the definition of “undertaking” for the purpose of claiming tax holiday under section 80-IB(9) of Income Tax Act, 1961 to be ‘all blocks licensed under a single contract’ retrospectively whereas the company had earlier considered each ‘Well’ as an undertaking. Since the amendment still requires clarity on various issues and also considering the advice of legal experts, the company continued to make provision for tax without considering the benefit u/s 80-IB(9).
8 Capital Works in Progress (CWIP) includes an amount of ` 7841.69 million in respect of C2 C3 plant which is mechanically complete and will be capitalized on completion of test run.
9 During the year, the Oil Marketing Companies, nominees of GoI had recovered ` 1,432.34 million (USD 32.07 million) ONGC’s share as per directives of GoI in respect Jointly Controlled Assets - Panna Mukta & Tapti. The recovery is towards certain observations raised by auditors appointed by Director General Hydrocarbon (DGH) under Production Sharing Contract for the period 2002-03 to 2005-06 in respect of cost and profit petroleum share payable to GoI. BGEPIL along with RIL (“Claimants”) have served a notice of arbitration on the GOI in respect of dispute, differences and claims arisen in connection with the term of Panna, Mukta & Tapti PSCs. Since the company is not a party to the arbitration proceedings, it has requested MoP&NG that in case of an arbitral award, the same be made applicable to ONGC also, as a constituent of contractor for both the PSCs. Pending final arbitral award, the same has been shown as ‘Receivable from GoI’.
10 Details of purchase and sale/ redemption of Current Investments during the year:
11 The Company has been charging depreciation on all Trunk Pipelines and Onshore Flow Lines (assets below ground) @ 100% based on technical assessment by the management.
12 The Company has a system of physical verification of Inventory, Fixed Assets and Capital Stores in a phased manner at regular intervals. Adjustment of differences, if any, is carried out on completion of reconciliation.
13 Some balances of Debtors, Creditors and Loans & Advances are subject to confirmation/ reconciliation. Adjustments, if any, will be accounted for on confirmation/ reconciliation of the same, which will not have a material impact.
SCHEDULE-27
1. In terms of the decision of Government of India (GoI), the company has shared under-recoveries of Oil Marketing Companies (OMCs) on price sensitive products viz Petrol (upto 24.06.2010), Diesel, Domestic LPG and PDS Kerosene for the year 2010-11 by extending the discount in the prices of Crude Oil, Domestic LPG and PDS Kerosene based on the provisional rates of discount communicated by Petroleum Planning and Analysis Cell (PPAC), Ministry of Petroleum and Natural Gas (MoP&NG). The company does not envisage any material impact on finalization of discount rates. The impact of discount is as under:
2.1 Sales revenue in respect of Crude Oil is based on the pricing formula agreed with the customers for the period from 01.04.2002 to 31.03.2004. Pending finalization of fresh Memorandum of Understanding (MOU)/Crude Oil Sale Agreement (COSA) with the customers, the same pricing formula has been provisionally adopted from 01.04.2004 onwards. However, for Crude Oil produced in Assam, benchmark price revised by MoP&NG w.e.f. 01.04.2008 has been adopted. Adjustments, if any, on account of this shall be carried out on finalization of agreements/ receipt of Government directives. However, the Company does not envisage any material impact on current year’s results on finalization.
2.2 Sales revenue of Natural Gas under Administrative Price Mechanism (APM) was based on the gas prices fixed on provisional basis as per directives dated 20.06.2005 and 05.06.2006 of MoP&NG, GoI upto 31.05.2010. GoI, vide letter dated 31.05.2010, decided to fix the producer price of APM gas produced by National Oil Companies (NOCs) at US$ 4.2/mmbtu inclusive of royalty effective from 01.06.2010. For APM consumers, except for consumers in North Eastern states, the consumer price would be same as producer price, i.e. US$ 4.2/ mmbtu inclusive of royalty. For APM consumers in North-East, consumer price is 60% of the producer price, i.e., US$ 2.52/ mmbtu inclusive of royalty. In North-East, the difference between producer price and consumer price is paid to the company through GoI Budget.
3 The company is supplying Natural Gas to GAIL (India) Limited (GAIL) which also purchases gas from other sources and sells to APM and non APM consumers. In case GAIL generates surplus in Gas Pool Account during the financial year, same is transferred to ONGC/ Oil India Limited (OIL) at the end of financial year in accordance with their contribution. Accordingly, an amount of ̀ 21,914.90 million (Previous year ̀ 4,415.79 million) is accounted as Surplus from Gas Pool Account under ‘Other Income’ in Schedule -18.
4 In Ravva Joint Venture, the demand towards additional profit petroleum raised by GoI, based on the decision of the Malaysian High Court, was disputed by the Operator M/s Cairn Energy India Limited, due to difference in interpretation of provision of Production Sharing Contract (PSC) in respect of computation of Post Tax Rate of Return (PTRR). The Company is not a party to the dispute but agreed to abide by the decision applicable to the Operator. As the dispute between the Operator and GoI was not resolved, the Company made a provision in Financial Year 2008-09 amounting to ` 5,771.14 million (USD 113.82 million) on account of additional profit petroleum and ̀ 2,829.86 million (USD 54.88 Million) towards interest thereon totaling to ̀ 8,601.00 million (USD 168.70 Million) as an abundant precaution. GoI had recovered such amount subsequently.
The appellate authority of Honorable Malaysian High Court of Kuala Lumpur, Malaysia had set aside the decision of the Malaysian High Court and the decision of arbitral tribunal in favour of Operator was restored on 15th September 2009. GoI has filed an appeal in the Federal Court of Malaysia against such restoration.
stPending final outcome of this appeal, the provision is maintained as on 31 March, 2011 amounting to ̀ 5,090.17 Million (USD 113.82 Million) on account of additional Profit Petroleum and ` 2,415.83 Million (USD 54.02 Million) towards interest thereon totaling to ̀ 7,506.00 million (USD 167.84 million) as per the demand of DGH after reversal for interest of ̀ 103.42 million (USD 2.31 million) against provision of interest ` 65.41 million (USD 1.45 million) in 2009-10 and adjustment of exchange gain of ̀ 69.78 million (Previous year ̀ 987.20 million).
5 The Company acquired 90% Participating Interest in Exploration Block KG-DWN-98/2 from M/s Cairn Energy India Ltd. in 2004-05 for a lump sum consideration of ̀ 3,711.22 million which was capitalized under Exploratory Wells in Progress as per
Decrease in For the year ended
2010-11 2009-10
Gross Revenue 248,924.30 115,543.07
Less: Value Added Tax (VAT) 6,159.47 2,760.27
Sales Revenue 242,764.83 112,782.80
Less: Statutory Levies 29,418.00 13,534.06
Profit Before Tax 213,346.83 99,248.74
Particulars UTI Liquid Cash Plan UTI Treasury Advantage Fund
No of Units Amount ( ` in million) No of Units Amount ( ` in million)@ ` 1019.4457 @ ` 1000.2141
Opening Balance 5,003,216.394 5,100.51 1,715,997.416 1,716.36 (-) (-) (-) (-)
Purchases 526,246,181.973 536,479.41 157,616,254.400 157,650.00(468,866,246.935) (477,983.68) (193,059,225.362) (193,100.55)
Dividend Reinvested 341,894.265 348.54 281,388.585 281.45(108,501.298) (110.61) (352,837.098) (352.91)
Redemption 530,119,483.663 540,428.03 159,613,640.401 159,647.81(463,971,531.839) (472,993.78) (191,696,065.044) (191,737.10)
Closing Balance 1,471,808.969 1,500.43 (-) (-)(5,003,216.394) (5,100.51) (1,715,997.416) (1,716.36)
Notes to AccountsNotes to Accounts
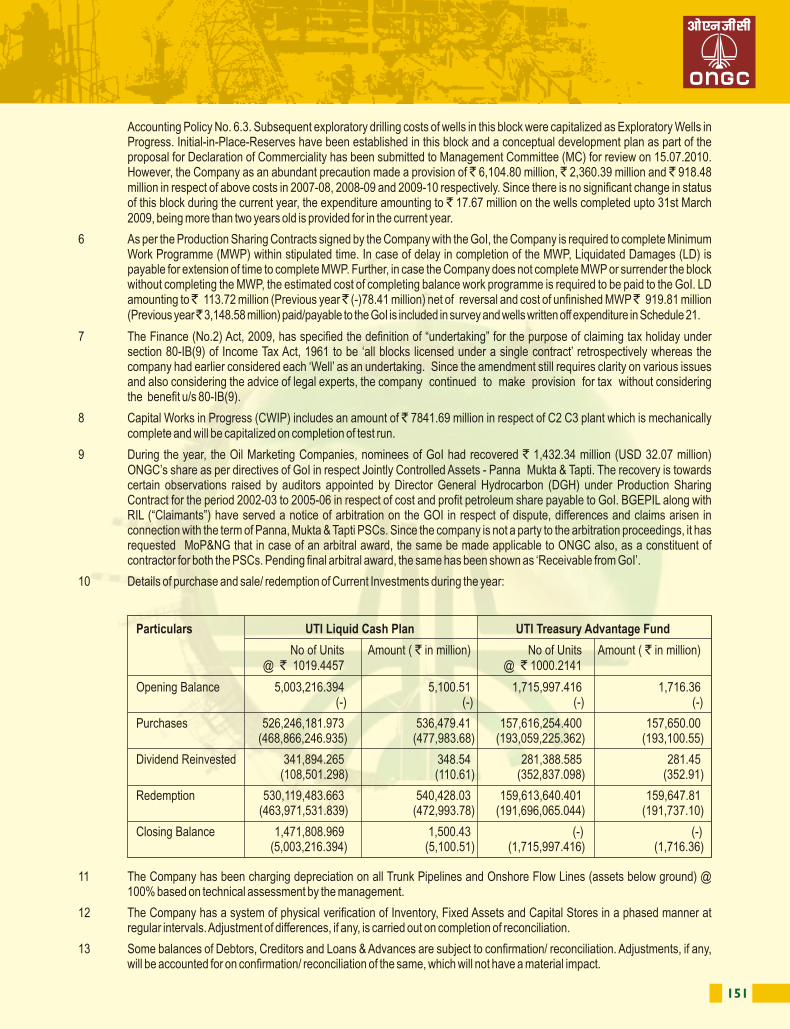
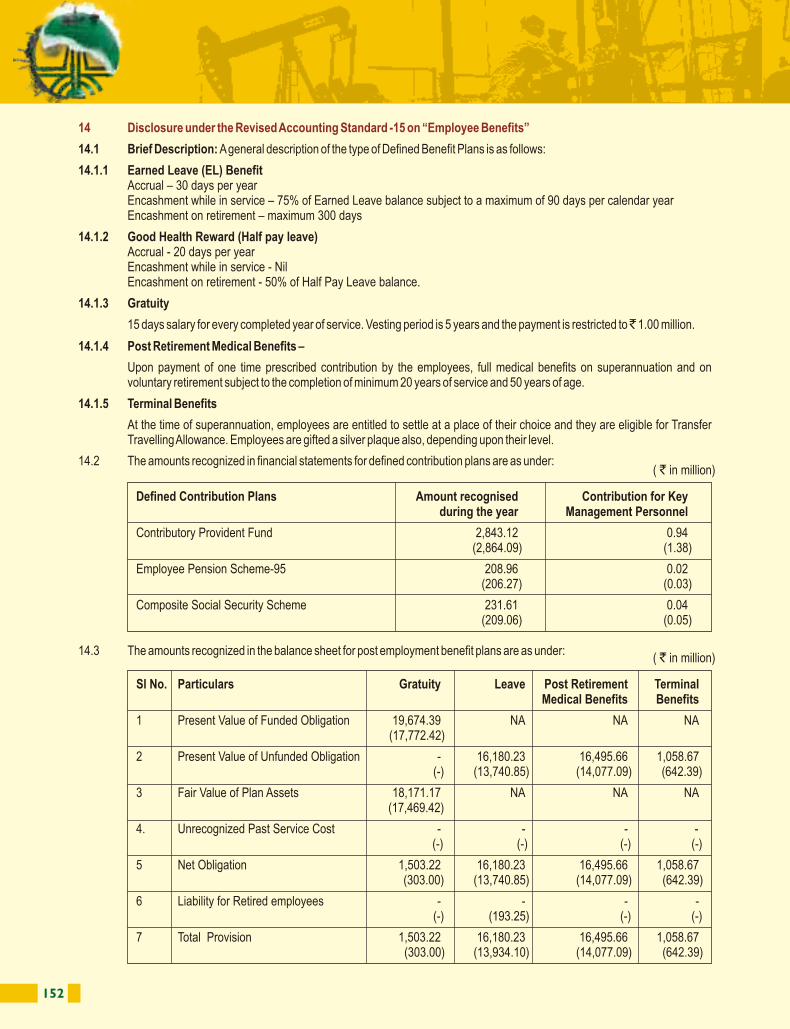
152 153
14 Disclosure under the Revised Accounting Standard -15 on “Employee Benefits”
14.1 Brief Description: A general description of the type of Defined Benefit Plans is as follows:
14.1.1 Earned Leave (EL) Benefit Accrual – 30 days per yearEncashment while in service – 75% of Earned Leave balance subject to a maximum of 90 days per calendar yearEncashment on retirement – maximum 300 days
14.1.2 Good Health Reward (Half pay leave) Accrual - 20 days per yearEncashment while in service - NilEncashment on retirement - 50% of Half Pay Leave balance.
14.1.3 Gratuity
15 days salary for every completed year of service. Vesting period is 5 years and the payment is restricted to ̀ 1.00 million.
14.1.4 Post Retirement Medical Benefits –
Upon payment of one time prescribed contribution by the employees, full medical benefits on superannuation and on voluntary retirement subject to the completion of minimum 20 years of service and 50 years of age.
14.1.5 Terminal Benefits
At the time of superannuation, employees are entitled to settle at a place of their choice and they are eligible for Transfer Travelling Allowance. Employees are gifted a silver plaque also, depending upon their level.
14.2 The amounts recognized in financial statements for defined contribution plans are as under:
14.3 The amounts recognized in the balance sheet for post employment benefit plans are as under:
14.4 The amounts included in the fair value of plan assets of gratuity fund in respect of Reporting Enterprise’s own financial instruments and any property occupied by, or other assets used by the reporting enterprise are ̀ Nil (Previous Year Nil)
14.5 Reconciliation showing the movements during the period in the net liability recognized in the balance sheet:
14.6 The total amount recognized in the financial statements before allocation is as follows
Defined Contribution Plans Amount recognised Contribution for Keyduring the year Management Personnel
Contributory Provident Fund 2,843.12 0.94(2,864.09) (1.38)
Employee Pension Scheme-95 208.96 0.02(206.27) (0.03)
Composite Social Security Scheme 231.61 0.04 (209.06) (0.05)
( ` in million)
Sl No. Particulars Gratuity Leave Post Retirement TerminalMedical Benefits Benefits
1 Present Value of Funded Obligation 19,674.39 NA NA NA(17,772.42)
2 Present Value of Unfunded Obligation - 16,180.23 16,495.66 1,058.67(-) (13,740.85) (14,077.09) (642.39)
3 Fair Value of Plan Assets 18,171.17 NA NA NA(17,469.42)
4. Unrecognized Past Service Cost - - - -(-) (-) (-) (-)
5 Net Obligation 1,503.22 16,180.23 16,495.66 1,058.67(303.00) (13,740.85) (14,077.09) (642.39)
6 Liability for Retired employees - - - -(-) (193.25) (-) (-)
7 Total Provision 1,503.22 16,180.23 16,495.66 1,058.67(303.00) (13,934.10) (14,077.09) (642.39)
( ` in million)
Sl No. Particulars Gratuity Leave Post Retirement TerminalMedical Benefits Benefits
1 Opening defined benefit obligation 17,772.42 13,740.84 14,077.09 642.39(17,423.08) (13,235.47) (12,728.86) (480.40)
2 Current Service Cost 803.08 706.90 295.97 42.45(732.74) (594.44) (281.44) (26.58)
3 Past Service Cost - - - -(-) (-) (-) (-)
4. Interest Cost 1,421.79 1,099.27 1,126.17 51.39(1,306.73) (992.65) (954.66) (36.03)
5. Actuarial losses (gains) 830.70 2,861.77 1,953.27 353.80(-502.66) (1,876.44) (3,075.28) (130.05)
6. Exchange differences on foreign plans - - - -(-) (-) (-) (-)
7. Benefits paid 1,153.59 2,228.57 956.83 31.36(1,187.47) (2,958.17) (2963.16) (30.66)
8. Closing defined benefit obligation 19,674.40 16,180.23 16,495.67 1,058.67(17,772.42) (13,740.84) (14,077.09) (642.39)
( ` in million)
Sl No. Particulars Gratuity Leave Post Retirement TerminalMedical Benefits Benefits
1 Current Service Cost 803.08 706.90 295.97 42.45(732.74) (594.43) (281.44) (26.57)
2 Interest on Obligation 1,421.79 1,099.27 1,126.17 51.39(1,306.73) (992.65) (954.66) (36.03)
3 Expected return on plan assets 1,526.65 NA NA NA(1,451.37)
4. Net actuarial Losses / (Gains) 995.16 2,861.78 1,953.27 353.80recognized in year (-284.77) (1,876.44) ( 3,075.28) (130.05)
5 Past Service Cost - - - -(-) (-) (-) (-)
6 Losses (Gains) on curtailments - - - -and settlement (-) (-) (-) (-)
7 Total included in ‘employee 1,693.38 4,667.95 3,375.40 447.64benefit expense’. (303.34) (3,463.54) (4,311.39) (192.65)
8. Actual return on plan assets 1,362.19 NA NA NA(1,233.47)
( ` in million)
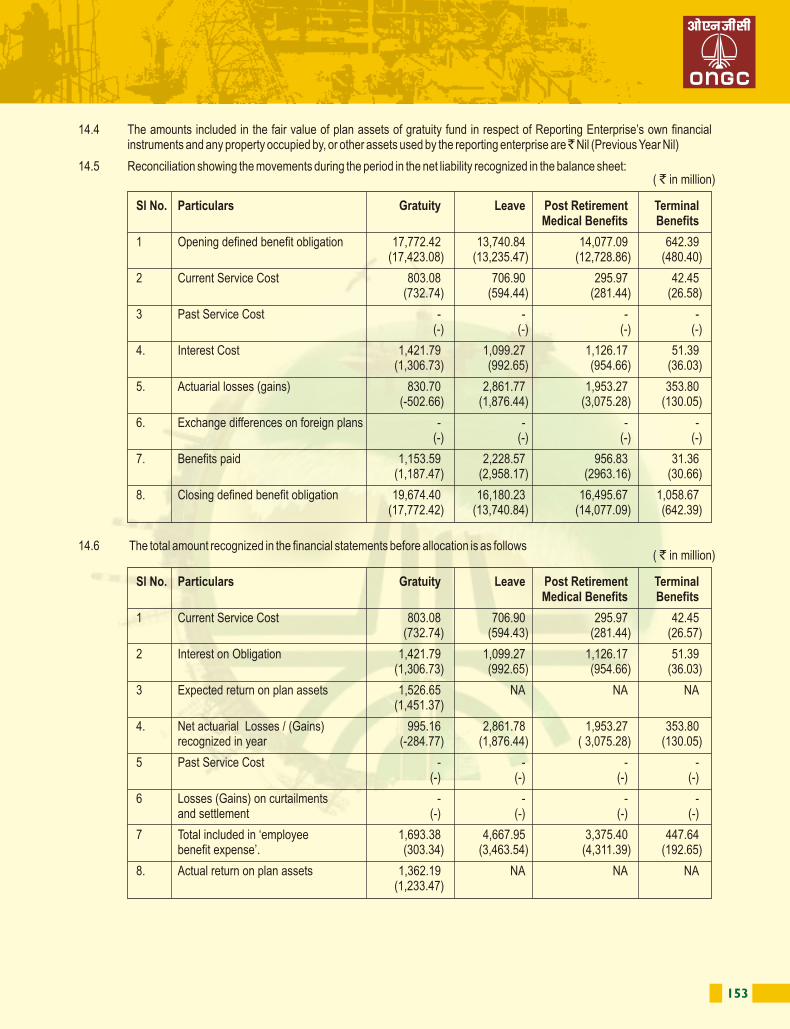
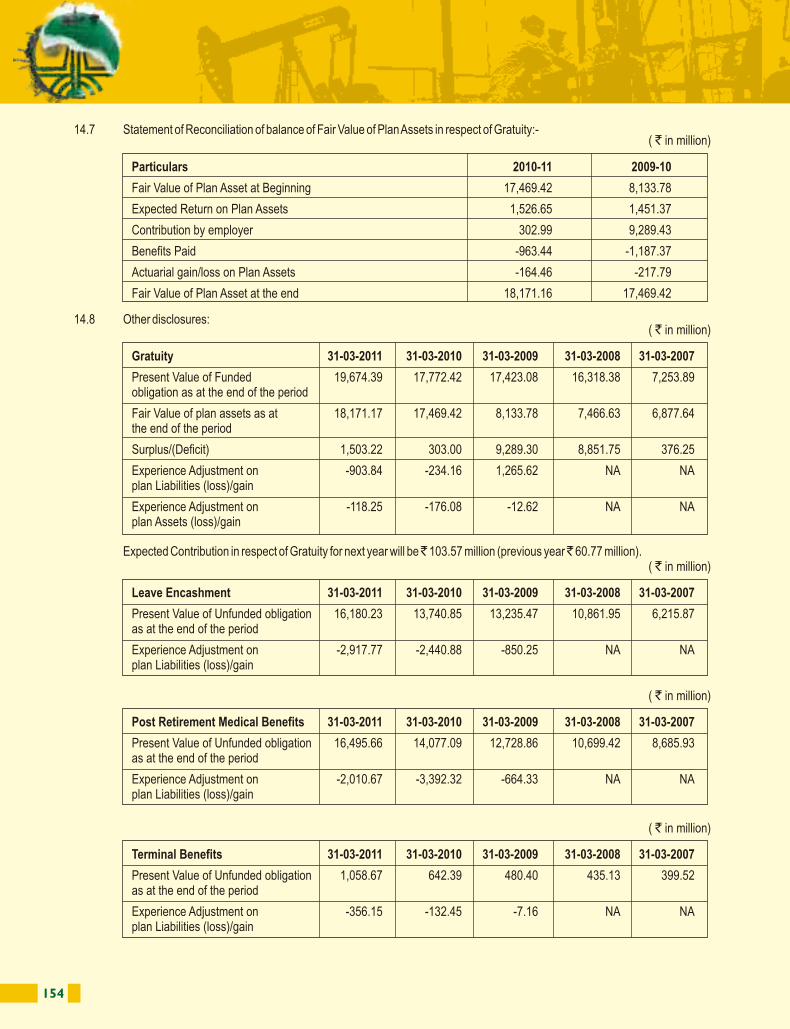
154 155
14.7 Statement of Reconciliation of balance of Fair Value of Plan Assets in respect of Gratuity:-
14.8 Other disclosures:
Expected Contribution in respect of Gratuity for next year will be ̀ 103.57 million (previous year ̀ 60.77 million).
14.9 Investments of Gratuity Trust
14.10 Principal actuarial assumption at the balance sheet date (expressed as weighted averages):
The discount rate is based upon the market yield available on Government bonds at the Accounting date with a term that matches. The salary growth rate takes account of inflation, seniority, promotion and other relevant factor on long term basis. Expected rate of return on plan assets is based on market expectation, at the beginning of the year, for return over the entire life of the related obligation.
The Company did not incur any borrowing cost for any qualifying asset. No borrowing cost is capitalized during the year (previous year Nil).
The segment information is presented under the notes to accounts of the Consolidated Financial Statements as required under the standard.
15 Disclosure under Accounting Standard-16 on “Borrowing Costs”
16 Disclosure under Accounting Standard -17 on “Segment Reporting”
Particulars 2010-11 2009-10
Fair Value of Plan Asset at Beginning 17,469.42 8,133.78
Expected Return on Plan Assets 1,526.65 1,451.37
Contribution by employer 302.99 9,289.43
Benefits Paid -963.44 -1,187.37
Actuarial gain/loss on Plan Assets -164.46 -217.79
Fair Value of Plan Asset at the end 18,171.16 17,469.42
( ` in million)
Gratuity 31-03-2011 31-03-2010 31-03-2009 31-03-2008 31-03-2007
Present Value of Funded 19,674.39 17,772.42 17,423.08 16,318.38 7,253.89obligation as at the end of the period
Fair Value of plan assets as at 18,171.17 17,469.42 8,133.78 7,466.63 6,877.64 the end of the period
Surplus/(Deficit) 1,503.22 303.00 9,289.30 8,851.75 376.25
Experience Adjustment on -903.84 -234.16 1,265.62 NA NAplan Liabilities (loss)/gain
Experience Adjustment on -118.25 -176.08 -12.62 NA NAplan Assets (loss)/gain
( ` in million)
Leave Encashment 31-03-2011 31-03-2010 31-03-2009 31-03-2008 31-03-2007
Present Value of Unfunded obligation 16,180.23 13,740.85 13,235.47 10,861.95 6,215.87as at the end of the period
Experience Adjustment on -2,917.77 -2,440.88 -850.25 NA NAplan Liabilities (loss)/gain
( ` in million)
Post Retirement Medical Benefits 31-03-2011 31-03-2010 31-03-2009 31-03-2008 31-03-2007
Present Value of Unfunded obligation 16,495.66 14,077.09 12,728.86 10,699.42 8,685.93 as at the end of the period
Experience Adjustment on -2,010.67 -3,392.32 -664.33 NA NAplan Liabilities (loss)/gain
( ` in million)
Terminal Benefits 31-03-2011 31-03-2010 31-03-2009 31-03-2008 31-03-2007
Present Value of Unfunded obligation 1,058.67 642.39 480.40 435.13 399.52as at the end of the period
Experience Adjustment on -356.15 -132.45 -7.16 NA NAplan Liabilities (loss)/gain
( ` in million)
Particulars % of Investment as at
As at 31.03.11 As at 31.03.10
Central Govt. Securities 30.25 30.56
State Govt. Securities 14.61 14.24
PSU Bonds 29.48 29.99
Treasury Bills 0.07 1.43
Insurance Investment 25.19 23.40
Equity Mutual Fund 0.40 0.38
Total 100.00 100.00
( ` in million)
Sl No. Particulars Gratuity Leave Post Retirement TerminalMedical Benefits Benefits
1 Discount rate 8.0% 8.0% 8.0% 8.0%(7.5%) (7.5%) (7.5%) (7.5%)
2 Expected return on plan assets 8.59% NA NA NA(8.33%)
3. Annual increase in costs NA NA 5.5 % 5.5 %(5%) (5%)
4. Annual Increase in Salary 5.5% 5.5 % NA NA(5%) (5%)
( ` in million)
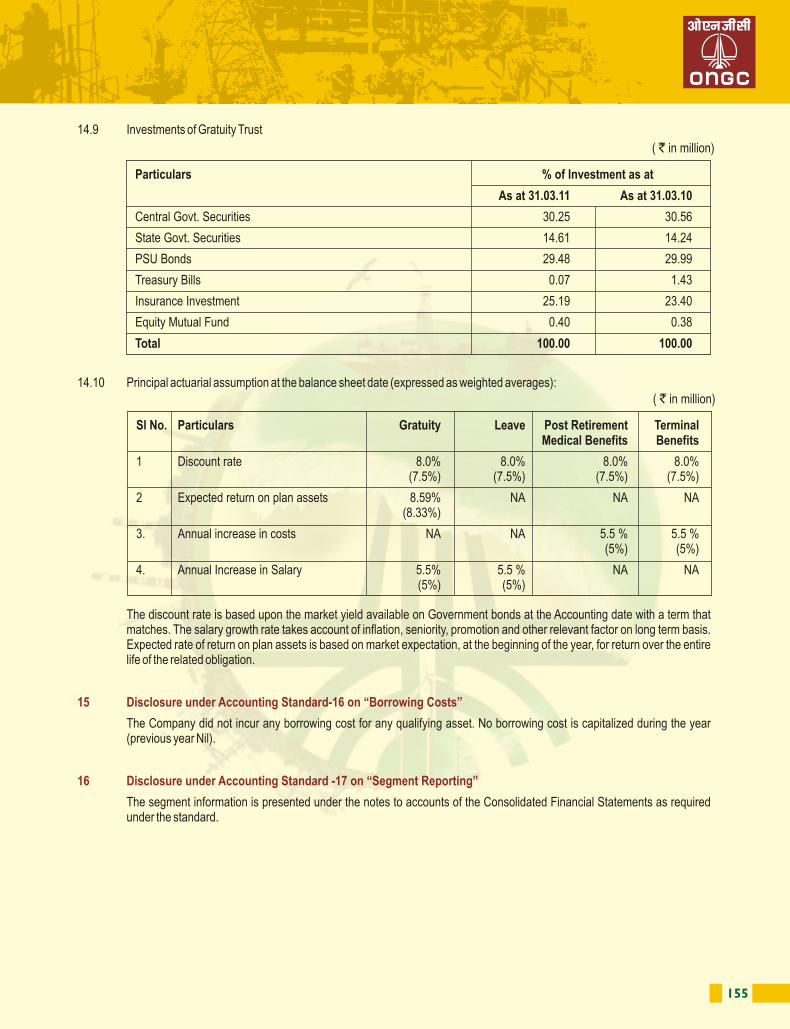
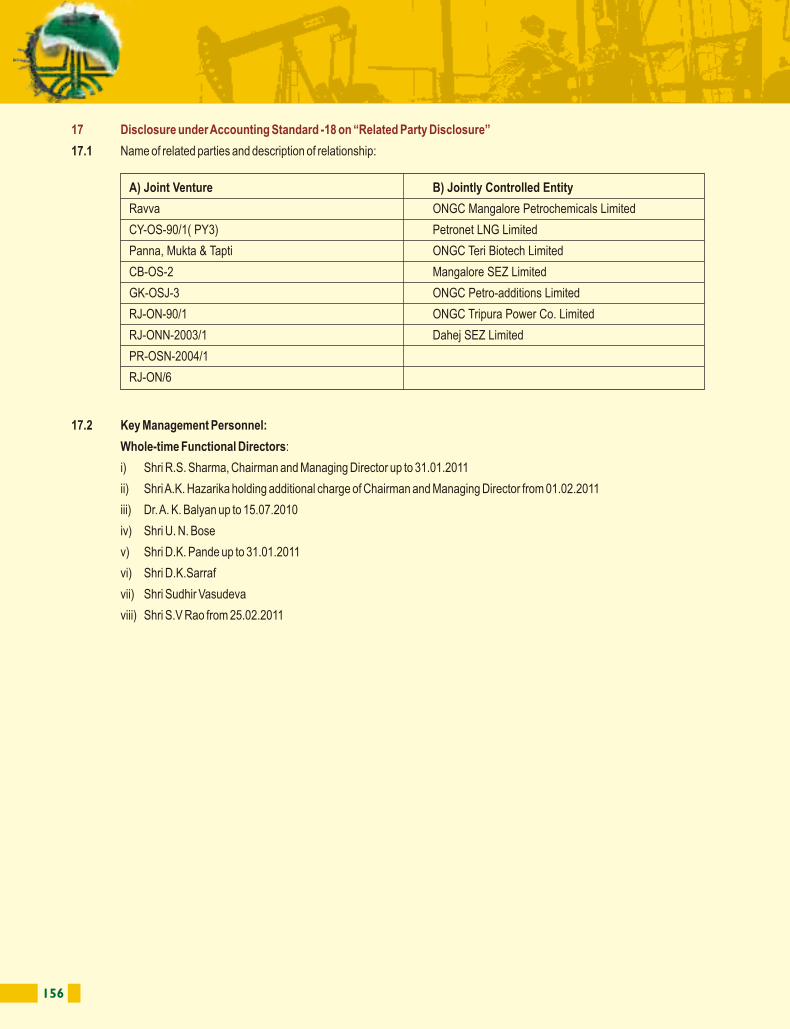
156 157
17 Disclosure under Accounting Standard -18 on “Related Party Disclosure”
17.1 Name of related parties and description of relationship:
17.2 Key Management Personnel:
Whole-time Functional Directors:
i) Shri R.S. Sharma, Chairman and Managing Director up to 31.01.2011
ii) Shri A.K. Hazarika holding additional charge of Chairman and Managing Director from 01.02.2011
iii) Dr. A. K. Balyan up to 15.07.2010
iv) Shri U. N. Bose
v) Shri D.K. Pande up to 31.01.2011
vi) Shri D.K.Sarraf
vii) Shri Sudhir Vasudeva
viii) Shri S.V Rao from 25.02.2011
17.3 Details of Transactions
17.3.1 Joint Ventures/ Jointly Controlled Entities
17.3.2 Key Management Personnel
A) Joint Venture B) Jointly Controlled Entity
Ravva ONGC Mangalore Petrochemicals Limited
CY-OS-90/1( PY3) Petronet LNG Limited
Panna, Mukta & Tapti ONGC Teri Biotech Limited
CB-OS-2 Mangalore SEZ Limited
GK-OSJ-3 ONGC Petro-additions Limited
RJ-ON-90/1 ONGC Tripura Power Co. Limited
RJ-ONN-2003/1 Dahej SEZ Limited
PR-OSN-2004/1
RJ-ON/6
Details 2010-11 2009-10
Services Received from :
a) Ravva 84.10 60.40b) ONGC Teri Biotech Limited 94.51 151.26c) Dahej SEZ Ltd. 23.92 -d) ONGC Mangalore Petrochemicals Limited 0.04 -
Services Provided to :
a) Ravva 13.30 11.19b) Panna Mukta & Tapti 1,553.34 2,329.66c) ONGC Petro-additions Limited 126.28 162.54d) Petronet LNG Limited - 3.57e) ONGC Teri Biotech Limited 0.81 -f) Mangalore SEZ Limited 2.46 1.80g) ONGC Tripura Power Co. Limited 3.67 3.94
Purchase of Condensate (Panna Mukta & Tapti) 2,805.57 4,584.91
Dividend Received - Petronet LNG Limited 164.06 164.06
Advance :
a) ONGC Petro-additions Limited 1,852.99 4,560.00b) ONGC Mangalore Petrochemicals Limited 4,830.00 1424.00
Amount Receivable :
a) Panna Mukta & Tapti 1,981.18 2,009.68b) ONGC Petro-additions Limited 29.03 138.99 c) ONGC Tripura Power Co. Limited 0.90 0.95d) Petronet LNG Limited - 0.60e) ONGC Teri Biotech Limited 0.81 -f) Ravva 4.41 -
Amount Payable :
a) Panna Mukta & Tapti 252.48 67.96b) ONGC Teri Biotech Limited 47.02 31.26c) Ravva 12.72 -
Advance outstanding :
a) ONGC Petro-addition Limited 9,702.99 7,850.00b) ONGC Tripura Power Co. Limited 1,233.87 1,233.87c) ONGC Mangalore Petrochemicals Limited 9,199.77 4,369.77
( ` in million)
Particulars 2010-11 2009-10
Remuneration to Directors 31.05 34.35
Amount Receivable 0.75 0.56
Amount Payable 10.61 3.58
( ` in million)
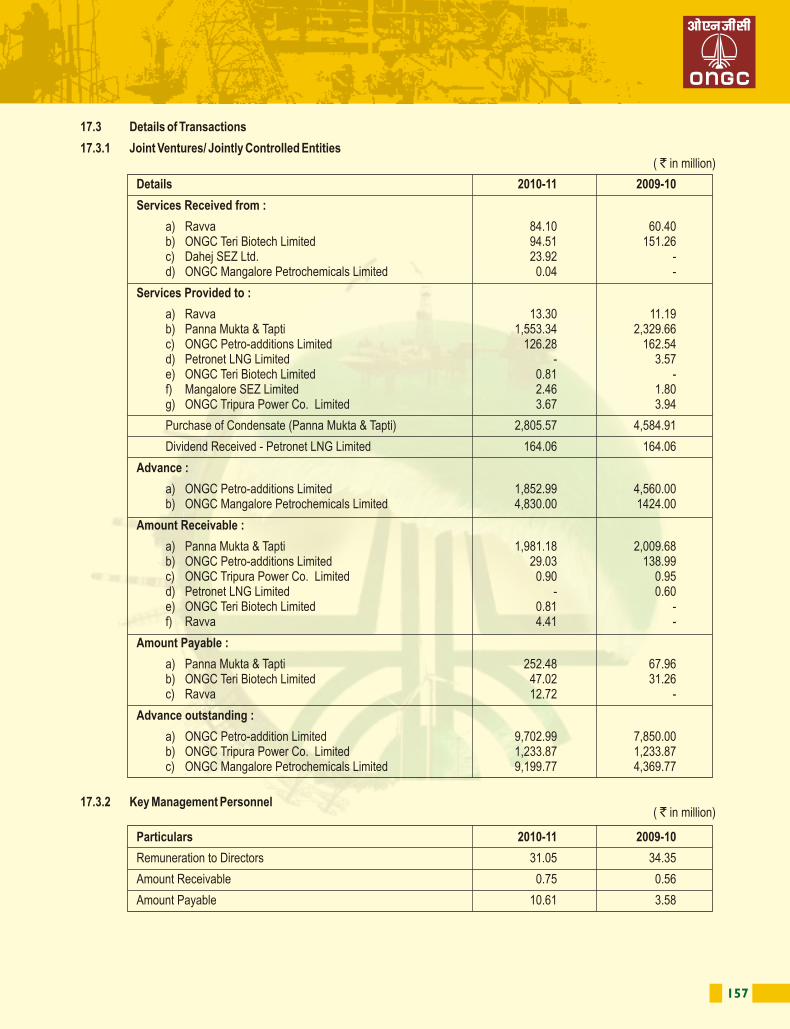
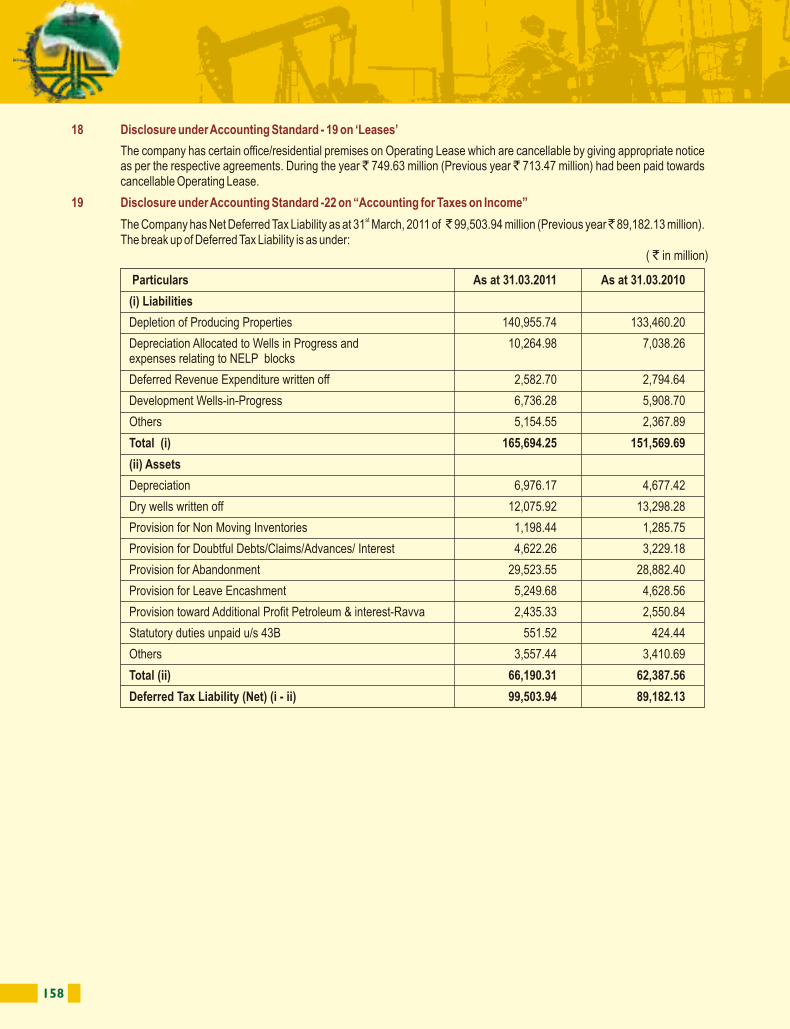
158 159
18 Disclosure under Accounting Standard - 19 on ‘Leases’
19 Disclosure under Accounting Standard -22 on “Accounting for Taxes on Income”
The company has certain office/residential premises on Operating Lease which are cancellable by giving appropriate notice as per the respective agreements. During the year ̀ 749.63 million (Previous year ` 713.47 million) had been paid towards cancellable Operating Lease.
stThe Company has Net Deferred Tax Liability as at 31 March, 2011 of ̀ 99,503.94 million (Previous year ̀ 89,182.13 million). The break up of Deferred Tax Liability is as under:
20 Disclosure under Accounting Standard - 27 on Financial Reporting of Interest in Joint Ventures:
20.1 Jointly Controlled Assets
In respect of certain blocks, the Company’s Joint Ventures (JV) with certain bodies corporate have entered into Production Sharing Contracts (PSCs) with GoI. Details of these blocks and JVs as on 31.03.2011 are as under:
Particulars As at 31.03.2011 As at 31.03.2010
(i) Liabilities
Depletion of Producing Properties 140,955.74 133,460.20
Depreciation Allocated to Wells in Progress and 10,264.98 7,038.26expenses relating to NELP blocks
Deferred Revenue Expenditure written off 2,582.70 2,794.64
Development Wells-in-Progress 6,736.28 5,908.70
Others 5,154.55 2,367.89
Total (i) 165,694.25 151,569.69
(ii) Assets
Depreciation 6,976.17 4,677.42
Dry wells written off 12,075.92 13,298.28
Provision for Non Moving Inventories 1,198.44 1,285.75
Provision for Doubtful Debts/Claims/Advances/ Interest 4,622.26 3,229.18
Provision for Abandonment 29,523.55 28,882.40
Provision for Leave Encashment 5,249.68 4,628.56
Provision toward Additional Profit Petroleum & interest-Ravva 2,435.33 2,550.84
Statutory duties unpaid u/s 43B 551.52 424.44
Others 3,557.44 3,410.69
Total (ii) 66,190.31 62,387.56
Deferred Tax Liability (Net) (i - ii) 99,503.94 89,182.13
( ` in million)
Sl. No. Blocks Company’s PI * Others Partners and theirPI in the JV/Operatorship***
A Jointly Operated JVs
1 Panna, Mukta and Tapti 40% (40%) BGEPIL 30%,RIL 30%
B ONGC Operated JVs
2 CB-OS/1 Exploration Phase 32.89 % (32.89%) TPL 10%, HOEC 57.11%
CB-OS/1 Development Phase** 55.26% (55.26%) TPL 6.7%, HOEC 38.04%
3 KG-DWN-98/2 ** 90% (65%) CEIL 10%
(PIB BV 15%)
(HEIBV 10%)
4 KG-DWN-98/4 55% (55%) OIL 15% BGEPIL 30%
5 MN-DWN-98/3 60% (60%) PIBBV 40%
6 MN-OSN-2000/2 40% (40%) GAIL 20%, IOC 20%, OIL 20%
7 CY-DWN-2001/1 45% (55%) OIL 20% , PIBBV 25%,
Rocksource ASA 10%
8 AA-ONN-2001/2 80% (80%) IOC 20%
9 AA-ONN-2001/3 85% (85%) OIL 15%
10 KK-DWN-2002/2 80% (80%) HPCL 20%
11 KK-DWN-2002/3 80% (80%) HPCL 20%
12 KG-DWN-2002/1 70% (70%) OIL 20% , BPRL 10%
13 MN-DWN-2002/1 36% (36%) OIL 20% , BPRL 10%, ENI 34%
14 CY-ONN-2002/2 60% (60%) BPRL 40%
15 AA-ONN-2002/4 90% (90%) OIL 10%
16 MN-DWN-2002/2 75% (75%) BGEPIL 25%
17 KK-DWN-2004/1 45% (45%) CIL 40%, TATA 15%
18 CY-DWN-2004/1 70% (70%) GSPC 10%,HPCL 10%, GAIL 10%
19 CY-DWN-2004/2 70% (70%) GSPC 10%, HPCL 10% , GAIL 10%
20 CY-DWN-2004/3 70% (70%) GSPC 10%, HPCL 10%, GAIL 10%
21 CY-DWN-2004/4 70% (70%) GSPC 10% , HPCL 10% GAIL 10%
22 CY-PR-DWN-2004/1 70% (70%) GSPC 10%, HPCL 10%, GAIL 10%
23 CY-PR-DWN-2004/2 70% (70%) GSPC 10%,HPCL 10% ,GAIL 10%
24 KG-DWN-2004/1 70% (70%) GSPC 10%, HPCL 10%, GAIL 10%
25 KG-DWN-2004/2 60% (60%) GSPC 10%, HPCL 10%,
GAIL 10% , BPCL 10%
26 KG-DWN-2004/3 70% (70%) GSPC 10%, HPCL 10%, GAIL 10%
27 KG-DWN-2004/5 50% (50%) GSPC 10%, HPCL 10%, GAIL 10%
OIL 10%, BPRL 10%
28 KG-DWN-2004/6 60% (60%) GSPC 10%, HPCL 10%,
GAIL 10% , OIL 10%
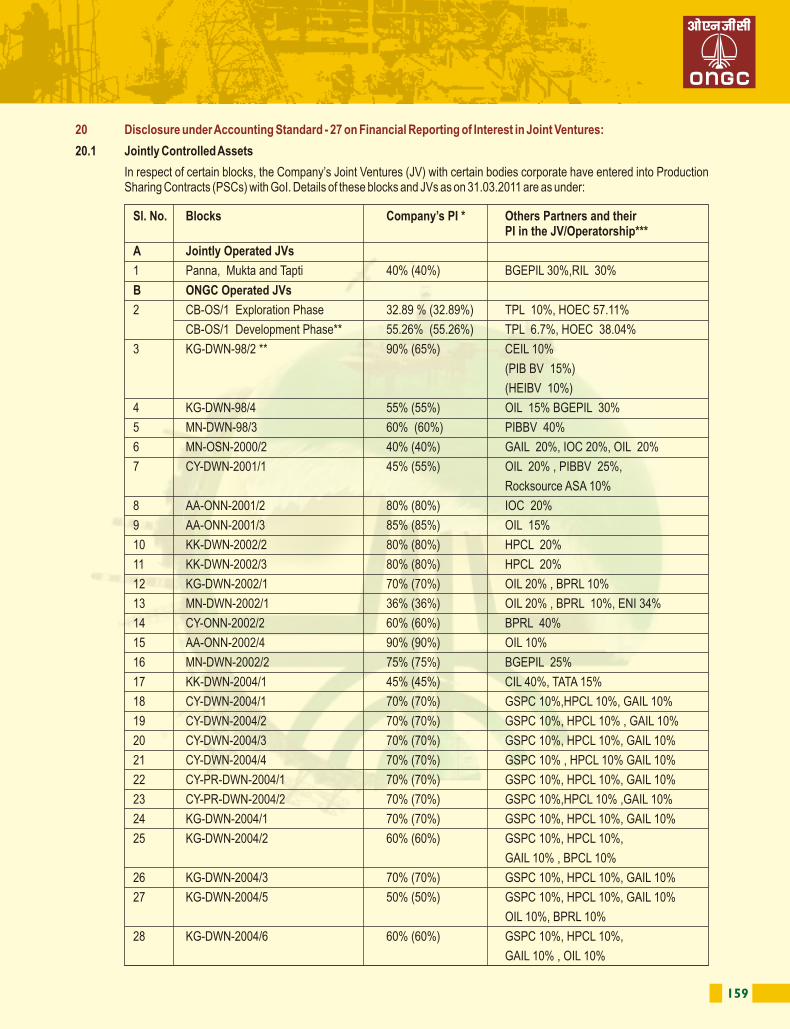
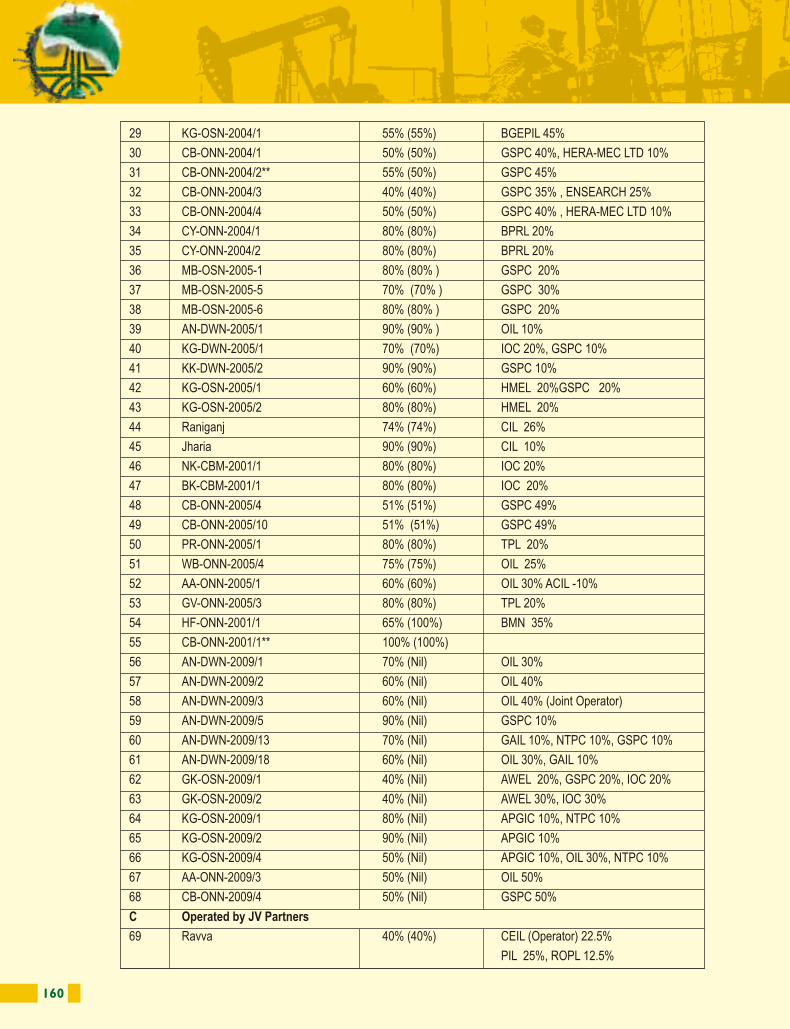
160 161
* PI - Participating Interest
** Approval towards assignment of PI is awaited from GoI
*** There is no change in previous year details unless otherwise stated.
Abbreviations:- BGEPIL- British Gas Exploration & Production India Ltd., BPRL-Bharat Petroleum Refinery Ltd., MBN- BMN Investment Ltd, CEIL-Cairn Energy India Ltd, CIL-Coal India Ltd., ENI- ENI India Ltd., GAIL -Gail India Ltd., GSPC-Gujarat State Petroleum Corporation Ltd., HOEC- Hindustan Oil Exploration Co. Ltd., HPCL- Hindustan Petroleum Corporation Ltd, HOEC- Hindustan Oil Exploration Company Ltd., HMEL- HPCL-Mittal Energy Ltd., OIL -Oil India Ltd., IOC- Indian Oil Corporation Ltd., RIL- Reliance Industries Ltd., TPL-Tata Petrodyne Ltd. HEPI - Hardy Exploration & Production (India) Inc., PIL- Petrocon India Ltd. ROPL-Ravva Oil (Singapore) Pte. Ltd, CEIPL- Cairn Energy India Pty Ltd, CEHL- Cairn Energy Hydrocarbons Ltd, TIOL - Tullow India Operations Ltd, SRL – Suntera Resources Ltd. NTPC- National Thermal Power Corporation Ltd. AWEL-Adani welspur Exploration ltd, APGIC-Andra Pradesh Gas Infrastructure Corporation Ltd, PIBBV-Petrobras International Braspero BV, HEIBV-Hydro Oil & Energy India BV, ROPL-Ravva Oil (Sigapur) Ltd, HEPI-hrady Exploration & Production (India), PIL-Petrocon India Ltd.
29 KG-OSN-2004/1 55% (55%) BGEPIL 45%
30 CB-ONN-2004/1 50% (50%) GSPC 40%, HERA-MEC LTD 10%
31 CB-ONN-2004/2** 55% (50%) GSPC 45%
32 CB-ONN-2004/3 40% (40%) GSPC 35% , ENSEARCH 25%
33 CB-ONN-2004/4 50% (50%) GSPC 40% , HERA-MEC LTD 10%
34 CY-ONN-2004/1 80% (80%) BPRL 20%
35 CY-ONN-2004/2 80% (80%) BPRL 20%
36 MB-OSN-2005-1 80% (80% ) GSPC 20%
37 MB-OSN-2005-5 70% (70% ) GSPC 30%
38 MB-OSN-2005-6 80% (80% ) GSPC 20%
39 AN-DWN-2005/1 90% (90% ) OIL 10%
40 KG-DWN-2005/1 70% (70%) IOC 20%, GSPC 10%
41 KK-DWN-2005/2 90% (90%) GSPC 10%
42 KG-OSN-2005/1 60% (60%) HMEL 20%GSPC 20%
43 KG-OSN-2005/2 80% (80%) HMEL 20%
44 Raniganj 74% (74%) CIL 26%
45 Jharia 90% (90%) CIL 10%
46 NK-CBM-2001/1 80% (80%) IOC 20%
47 BK-CBM-2001/1 80% (80%) IOC 20%
48 CB-ONN-2005/4 51% (51%) GSPC 49%
49 CB-ONN-2005/10 51% (51%) GSPC 49%
50 PR-ONN-2005/1 80% (80%) TPL 20%
51 WB-ONN-2005/4 75% (75%) OIL 25%
52 AA-ONN-2005/1 60% (60%) OIL 30% ACIL -10%
53 GV-ONN-2005/3 80% (80%) TPL 20%
54 HF-ONN-2001/1 65% (100%) BMN 35%
55 CB-ONN-2001/1** 100% (100%)
56 AN-DWN-2009/1 70% (Nil) OIL 30%
57 AN-DWN-2009/2 60% (Nil) OIL 40%
58 AN-DWN-2009/3 60% (Nil) OIL 40% (Joint Operator)
59 AN-DWN-2009/5 90% (Nil) GSPC 10%
60 AN-DWN-2009/13 70% (Nil) GAIL 10%, NTPC 10%, GSPC 10%
61 AN-DWN-2009/18 60% (Nil) OIL 30%, GAIL 10%
62 GK-OSN-2009/1 40% (Nil) AWEL 20%, GSPC 20%, IOC 20%
63 GK-OSN-2009/2 40% (Nil) AWEL 30%, IOC 30%
64 KG-OSN-2009/1 80% (Nil) APGIC 10%, NTPC 10%
65 KG-OSN-2009/2 90% (Nil) APGIC 10%
66 KG-OSN-2009/4 50% (Nil) APGIC 10%, OIL 30%, NTPC 10%
67 AA-ONN-2009/3 50% (Nil) OIL 50%
68 CB-ONN-2009/4 50% (Nil) GSPC 50%
C Operated by JV Partners
69 Ravva 40% (40%) CEIL (Operator) 22.5%
PIL 25%, ROPL 12.5%
70 CY-OS-90/1 (PY3) 40% (40%) HEPI (operator) 18%
HOEC 21%, TPL 21%
71 RJ-ON-90/1 30% (30%) CEIPL (Operator) 35%, CEHL 35%
72 CB-OS/2 -Development Phase 50% (50%) CEIPL (operator) 6.70%,
CEIWBV 13.20%, CECBV 10.10%,
CEGBV 10%, TPL 10%
73 CB-ON/7 -Development Phase** 30% (30%) HOEC (Operator) 35%, GSPC 35%
74 CB-ON/3 - Development Phase** 30% (30%) EOL (Operator)70%
75 GK-OSJ-3 25% (25%) RIL (operator) 60%, OIL 15%
76 AA-ONN-2002/3 70% (70%) OIL (Operator) 30%
77 AN-DWN-2003/2 45%(45%) ENI (Operator) 40%, GAIL 15%
78 KG-ONN-2003/1 51% (51%) CEIL 24% (Operator), Cairn India 25%
79 RJ-ONN-2003/1 36%(36%) ENI (Operator) 34%, CIL 30%
80 PR-OSN-2004/1 35% (35%) Cairn Energy(Operator) 10%
Cairn India 25%, TPL 30%
81 CB-ON/2- Development phase** 30% (30%) GSPC (Operator) 56%,
Geo-Global Resources 14%
82 RJ-ONN-2005/3 40% (40%) GSPC (Operator) 60%
83 AA-ONN-2009/4 50% (Nil) OIL(Operator) 50%
84 CY-OSN-2009/2 50% (Nil) OIL 50% (Operator)
85 KG-DWN-2009/1 45% (Nil) BGEPIL 30%(Operataor),
OIL 15%, APGIC 10%
86 RJ-ON/6 - Development phase 30% (Nil) Focus Energy Ltd (Operator) 7%
I services Investment Ltd, Mauritius 45.5%
Newbury Oil Co. Ltd, Cyprus 17.5%
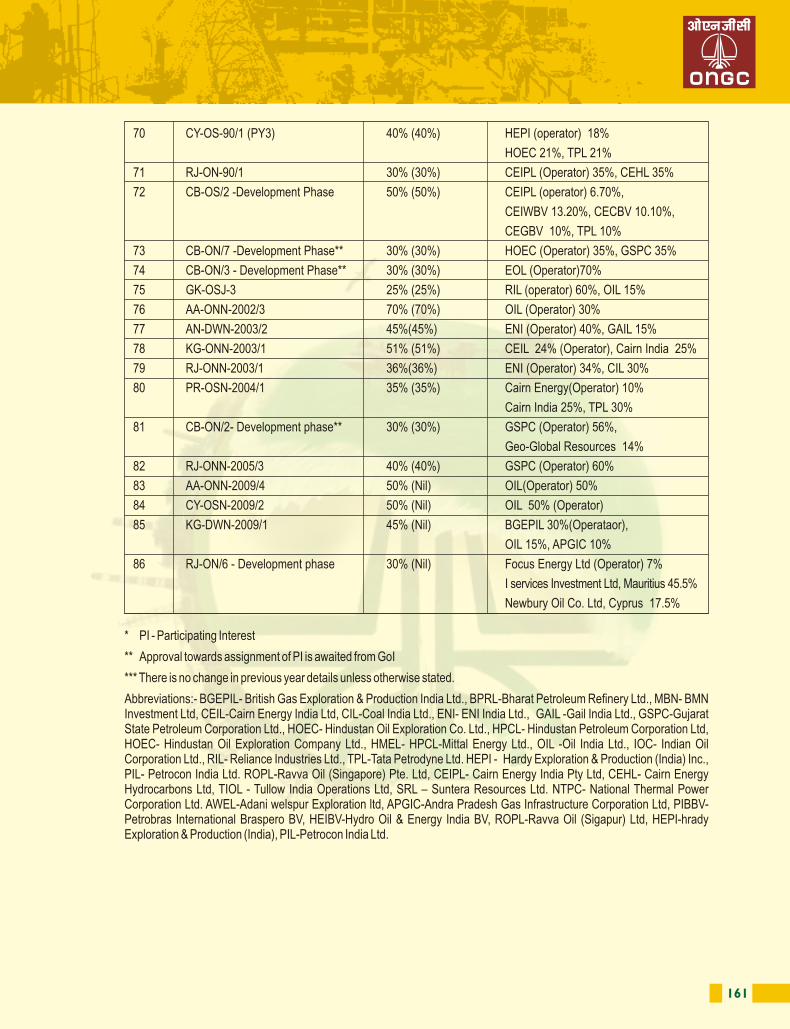
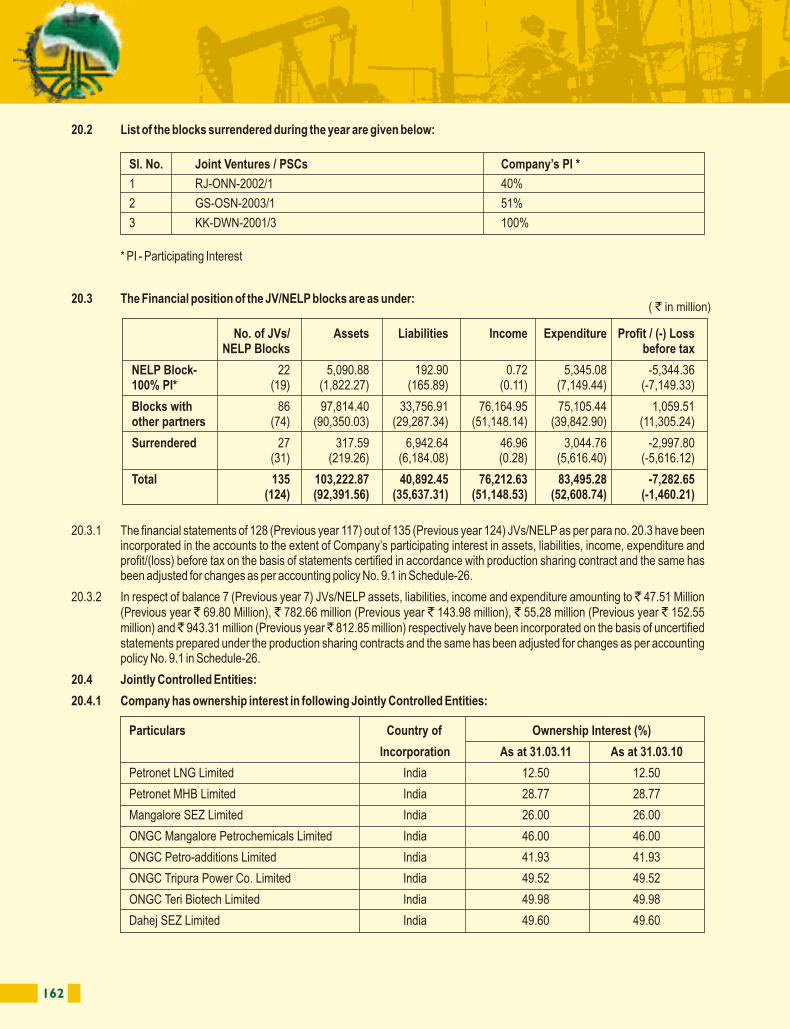
162 163
20.4.2 The Company’s share in assets, liabilities, income, expenses, contingent liabilities and capital commitments of Jointly Controlled Entities:
Above includes unaudited figures in respect of Dahej SEZ Limited.
20.4.3 The Company has given an undertaking to Power Finance Corporation (PFC), for an additional funding up to ` 2,234.00 million in respect of ONGC Tripura Power Co. Limited (OTPC) for cost overrun, if any.
21.1 The Company is engaged mainly in the business of oil and gas exploration and production where each cost centre used for depreciation (depletion) purposes is identified as independent Cash Generating Unit (CGU) for assessing the impairment in Producing Properties and fixed assets etc. on the basis of ‘value in use’. The Company has tested all its CGUs for impairment as on 31.03.2011 by applying discount rates of 17.16% (Previous year 17.31%) for Rupee transactions and 12.80 % (Previous year 13.07 %) for crude oil and value added products revenue measured in USD as on 31.03.2011.
21.2 During the year ̀ 1,534.73 million (Previous year ̀ 553.45 million) was provided as an impairment loss. Out of this, ̀ 600.07 million (Previous year ̀ 553.45 million) has been provided as additional impairment in respect of Onshore CGUs - Jodhpur and Silchar. Balance of ` 319.37 million (Previous year Nil) represents impairment provided for "Kuthalam Value added Plant" due to uncertain marketability of its products and ` 615.29 (Previous year Nil) in respect of certain Onshore NELP Blocks due to adjustment of cost recovery from revenue and sharing of 100% royalty. Further, impairment loss to the extent of ` 43.76 million (Previous year ̀ 986.17 million) has been reversed in respect of Onshore Agartala and Offshore Ratna CGUs due to increased sale price and ̀ 138.77 million (Previous year Nil) reversed in Jodhpur onshore due to transfer of assets to another CGU.
Movement in Provisions – Others
For Court cases, arbitration and others, where the timing of expected outflows is upon settlement of the proceedings:
21 Disclosure under Accounting Standard - 28 on “Impairment of Assets”
22 Disclosure under Accounting Standard - 29 on “Provisions, Contingent Liabilities and Contingent Assets”:
20.2 List of the blocks surrendered during the year are given below:
* PI - Participating Interest
20.3 The Financial position of the JV/NELP blocks are as under:
20.3.1 The financial statements of 128 (Previous year 117) out of 135 (Previous year 124) JVs/NELP as per para no. 20.3 have been incorporated in the accounts to the extent of Company’s participating interest in assets, liabilities, income, expenditure and profit/(loss) before tax on the basis of statements certified in accordance with production sharing contract and the same has been adjusted for changes as per accounting policy No. 9.1 in Schedule-26.
20.3.2 In respect of balance 7 (Previous year 7) JVs/NELP assets, liabilities, income and expenditure amounting to ̀ 47.51 Million (Previous year ` 69.80 Million), ` 782.66 million (Previous year ` 143.98 million), ` 55.28 million (Previous year ` 152.55 million) and ̀ 943.31 million (Previous year ̀ 812.85 million) respectively have been incorporated on the basis of uncertified statements prepared under the production sharing contracts and the same has been adjusted for changes as per accounting policy No. 9.1 in Schedule-26.
20.4 Jointly Controlled Entities:
20.4.1 Company has ownership interest in following Jointly Controlled Entities:
Sl. No. Joint Ventures / PSCs Company’s PI *
1 RJ-ONN-2002/1 40%
2 GS-OSN-2003/1 51%
3 KK-DWN-2001/3 100%
No. of JVs/ Assets Liabilities Income Expenditure Profit / (-) LossNELP Blocks before tax
NELP Block- 22 5,090.88 192.90 0.72 5,345.08 -5,344.36100% PI* (19) (1,822.27) (165.89) (0.11) (7,149.44) (-7,149.33)
Blocks with 86 97,814.40 33,756.91 76,164.95 75,105.44 1,059.51other partners (74) (90,350.03) (29,287.34) (51,148.14) (39,842.90) (11,305.24)
Surrendered 27 317.59 6,942.64 46.96 3,044.76 -2,997.80(31) (219.26) (6,184.08) (0.28) (5,616.40) (-5,616.12)
Total 135 103,222.87 40,892.45 76,212.63 83,495.28 -7,282.65(124) (92,391.56) (35,637.31) (51,148.53) (52,608.74) (-1,460.21)
( ` in million)
Particulars Country of Ownership Interest (%)
Incorporation As at 31.03.11 As at 31.03.10
Petronet LNG Limited India 12.50 12.50
Petronet MHB Limited India 28.77 28.77
Mangalore SEZ Limited India 26.00 26.00
ONGC Mangalore Petrochemicals Limited India 46.00 46.00
ONGC Petro-additions Limited India 41.93 41.93
ONGC Tripura Power Co. Limited India 49.52 49.52
ONGC Teri Biotech Limited India 49.98 49.98
Dahej SEZ Limited India 49.60 49.60
Particulars 2010-11 2009-10
Opening Balance 8,058.75 9,129.04
Add: Provision made during the year 353.92 93.20
Less: Provision written back/ reclassified/ reduction during the year 279.93 1,163.49
Closing Balance 8,132.74 8,058.75
( ` in million)
Description As at 31.03.2011 As at 31.03.2010
i) Assets
Long term assets 47,793.76 25,391.73
Investments 2,253.50 748.38
Current assets 3,994.51 3,585.24
ii) Liabilities
Current liabilities and provisions 12,111.12 5,132.17
Other liabilities 24,930.17 12,195.27
iii) Deferred tax liabilities 197.62 243.45
iv) Income 17,160.77 13,686.42
v) Expenses 15,962.49 12,874.03
vi) Contingent liabilities 3,077.14 1,815.24
vii) Capital commitments 47,639.97 46,051.70
( ` in million)
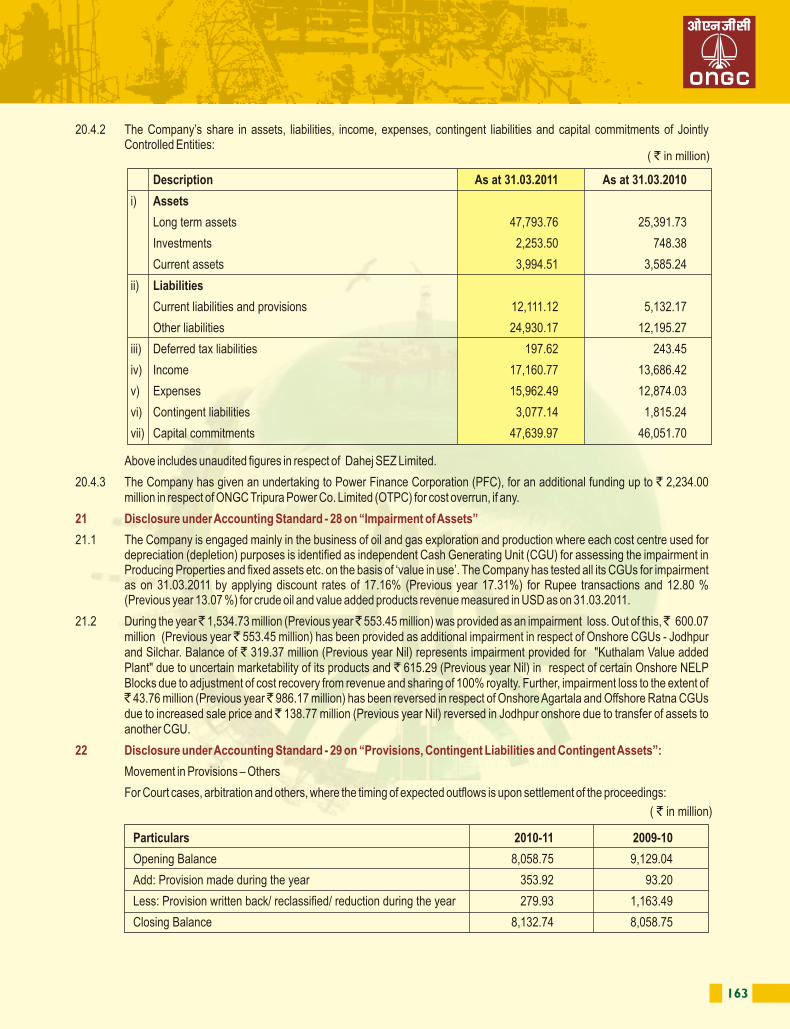
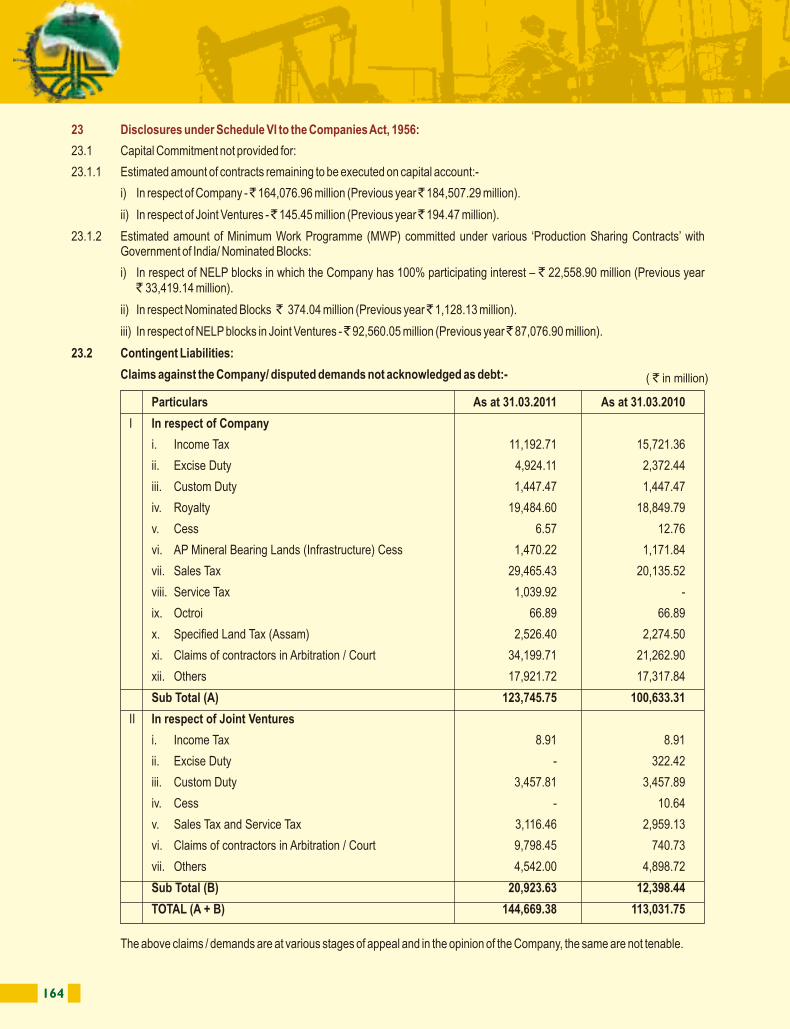
164 165
23.3 Bank Guarantees given by the Company:
i) ` 2,299.97 million (Previous year ` 3,426.38 million) including ` 1,330.82 million (Previous year ` 1,142.37 million) forNELP Blocks where the Company has 100% participating interest.
ii) In respect of Joint Ventures – ̀ 5,898.49 million (Previous year ̀ 7,082.46 million).
iii) Out of total Bank Guarantees of ONGC an amount of ` 7,603.35 million (Previous year ` 7,044.00 million) has beenprovided in respect of MWP committed under various ‘Production Sharing Contracts’ with Government of India andNominated Blocks which is also included in Capital Commitments under para 23.1.2.
23.4 Corporate Guarantees executed by the Company on behalf of its wholly owned subsidiary, ONGC Videsh Limited (OVL) and ONGC Nile Ganga BV (wholly owned subsidiary of OVL):
23.4.1 Guarantees executed for financial obligations:
i) Amount of Guarantee ̀ 36,371.66 million (Previous year ̀ 38,043.51 million).
ii) Amount Outstanding ̀ 33,934.69 million (Previous year ̀ 34,932.70 million).
23.4.2 Performance Guarantees executed under the contracts:
Guarantee in respect of Sakhalin Project in favour of Exxonneftgas Ltd., M/s. Roseneft-S, SMNG-S and RN-Astra towards performance of Company’s obligation under Joint Operating Agreement without any financial ceiling.
23.5 Corporate Guarantees executed by the Company on behalf of its subsidiary, MRPL:
i) Amount of Guarantee ̀ 7,155.20 million (Previous year ̀ 16,246.80 million).
ii) Amount Outstanding ̀ 3,442.99 million (Previous year ̀ 4,828.91 million).
23.6 Uncalled liability on partly paid shares is ` 1,337.19 million (Previous Year ` 1,337.19 million) against which advance paid ` 1,233.87 million (Previous Year ̀ 1,233.87 million).
23 Disclosures under Schedule VI to the Companies Act, 1956:
23.1 Capital Commitment not provided for:
23.1.1 Estimated amount of contracts remaining to be executed on capital account:-
i) In respect of Company - ̀ 164,076.96 million (Previous year ̀ 184,507.29 million).
ii) In respect of Joint Ventures - ̀ 145.45 million (Previous year ̀ 194.47 million).
23.1.2 Estimated amount of Minimum Work Programme (MWP) committed under various ‘Production Sharing Contracts’ with Government of India/ Nominated Blocks:
i) In respect of NELP blocks in which the Company has 100% participating interest – ` 22,558.90 million (Previous year ` 33,419.14 million).
ii) In respect Nominated Blocks ̀ 374.04 million (Previous year ̀ 1,128.13 million).
iii) In respect of NELP blocks in Joint Ventures - ̀ 92,560.05 million (Previous year ̀ 87,076.90 million).
23.2 Contingent Liabilities:
Claims against the Company/ disputed demands not acknowledged as debt:-
The above claims / demands are at various stages of appeal and in the opinion of the Company, the same are not tenable.
Particulars As at 31.03.2011 As at 31.03.2010
I In respect of Company
i. Income Tax 11,192.71 15,721.36
ii. Excise Duty 4,924.11 2,372.44
iii. Custom Duty 1,447.47 1,447.47
iv. Royalty 19,484.60 18,849.79
v. Cess 6.57 12.76
vi. AP Mineral Bearing Lands (Infrastructure) Cess 1,470.22 1,171.84
vii. Sales Tax 29,465.43 20,135.52
viii. Service Tax 1,039.92 -
ix. Octroi 66.89 66.89
x. Specified Land Tax (Assam) 2,526.40 2,274.50
xi. Claims of contractors in Arbitration / Court 34,199.71 21,262.90
xii. Others 17,921.72 17,317.84
Sub Total (A) 123,745.75 100,633.31
II In respect of Joint Ventures
i. Income Tax 8.91 8.91
ii. Excise Duty - 322.42
iii. Custom Duty 3,457.81 3,457.89
iv. Cess - 10.64
v. Sales Tax and Service Tax 3,116.46 2,959.13
vi. Claims of contractors in Arbitration / Court 9,798.45 740.73
vii. Others 4,542.00 4,898.72
Sub Total (B) 20,923.63 12,398.44
TOTAL (A + B) 144,669.38 113,031.75
( ` in million)
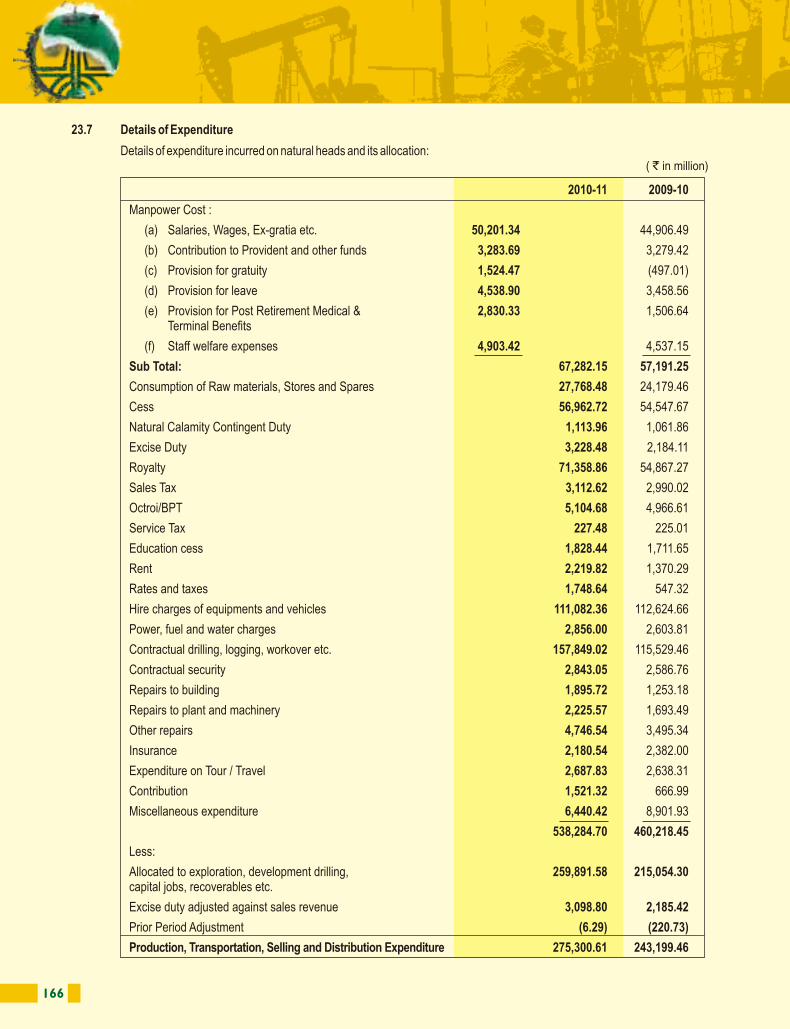
166 167
23.8 Quantitative Details
23.8.1 Sales
*Quantity includes share from Joint Ventures
23.8.2 Opening and Closing Stock of goods produced:
23.7 Details of Expenditure
Details of expenditure incurred on natural heads and its allocation:
2010-11 2009-10
Manpower Cost :
(a) Salaries, Wages, Ex-gratia etc. 50,201.34 44,906.49
(b) Contribution to Provident and other funds 3,283.69 3,279.42
(c) Provision for gratuity 1,524.47 (497.01)
(d) Provision for leave 4,538.90 3,458.56
(e) Provision for Post Retirement Medical & 2,830.33 1,506.64Terminal Benefits
(f) Staff welfare expenses 4,903.42 4,537.15
Sub Total: 67,282.15 57,191.25
Consumption of Raw materials, Stores and Spares 27,768.48 24,179.46
Cess 56,962.72 54,547.67
Natural Calamity Contingent Duty 1,113.96 1,061.86
Excise Duty 3,228.48 2,184.11
Royalty 71,358.86 54,867.27
Sales Tax 3,112.62 2,990.02
Octroi/BPT 5,104.68 4,966.61
Service Tax 227.48 225.01
Education cess 1,828.44 1,711.65
Rent 2,219.82 1,370.29
Rates and taxes 1,748.64 547.32
Hire charges of equipments and vehicles 111,082.36 112,624.66
Power, fuel and water charges 2,856.00 2,603.81
Contractual drilling, logging, workover etc. 157,849.02 115,529.46
Contractual security 2,843.05 2,586.76
Repairs to building 1,895.72 1,253.18
Repairs to plant and machinery 2,225.57 1,693.49
Other repairs 4,746.54 3,495.34
Insurance 2,180.54 2,382.00
Expenditure on Tour / Travel 2,687.83 2,638.31
Contribution 1,521.32 666.99
Miscellaneous expenditure 6,440.42 8,901.93
538,284.70 460,218.45
Less:
Allocated to exploration, development drilling, 259,891.58 215,054.30capital jobs, recoverables etc.
Excise duty adjusted against sales revenue 3,098.80 2,185.42
Prior Period Adjustment (6.29) (220.73)
Production, Transportation, Selling and Distribution Expenditure 275,300.61 243,199.46
( ` in million)2010-11 2009-10
Product Unit Quantity Value ( ` in million) Quantity Value ( ` in million)
Crude Oil* MT 22,943,996 461,251.26 22,331,012 454,867.46
Less: From Exploratory areas 17,033 226.13 2,870 42.43
Less: Government of India's 12,380.37 448,644.76 9,785.35 445,039.68share in Profit Petroleum
3Natural Gas* 000M 20,287,778 130,754.80 20,598,972 79,440.41
Less: From Exploratory areas 38,787 245.98 3,056 10.27
Less: Government of India's 2,964.39 127,544.43 5,632.94 73,797.20share in Profit Petroleum
Liquified Petroleum Gas MT 1,057,266 18,368.49 1,107,556 21,923.69
Naphtha MT 1,600,399 56,342.30 1,598,430 47,137.36
Ethane/Propane MT 387,086 8,795.78 533,383 10,248.63
Superior Kerosene Oil MT 118,074 678.80 165,542 3,255.42
Low Sulphur Heavy Stock MT 16,141 473.42 15,908 411.09
HSD incl. ULS HSD (Trading) KL 3,268 134.45 4,289 155.97
Motor Spirit (Trading) KL 625 36.48 548 26.97
Aviation Turbine Fuel (ATF) MT 13,504 527.21 1,718 51.72
Liquid Diesel Oil MT 53 2.03 - -
Others 0.62 0.46
Total 661,548.77 602,048.19
As at 31.03.11 As at 31.03.10
Product Unit Quantity Value ( ` in million) Quantity Value ( ` in million)
Opening stock
Crude Oil MT 1,025,390 6,244.55 974,231 5,062.67
Liquefied Petroleum Gas MT 7,061 32.90 7437 30.65
Naphtha MT 110,614 418.23 117,353 403.14
Ethane/Propane MT 838 7.00 841 6.67
Superior Kerosene Oil MT 8,540 32.11 9,107 39.05
Aviation Turbine Fuel MT 915 5.03 1,136 6.32
Low Sulphur Heavy Stock MT 644 5.92 166 1.09
High Speed Diesel MT 1,855 19.03 4,121 35.71
Propane MT 82 0.13 - -
High Speed Diesel * KL 52 1.64 54 1.29
Motor Spirit* KL 13 0.55 14 0.43
Carbon Credits Units 10,508 0.56 - -
Others 0.44 0.69
6,768.09 5,587.71
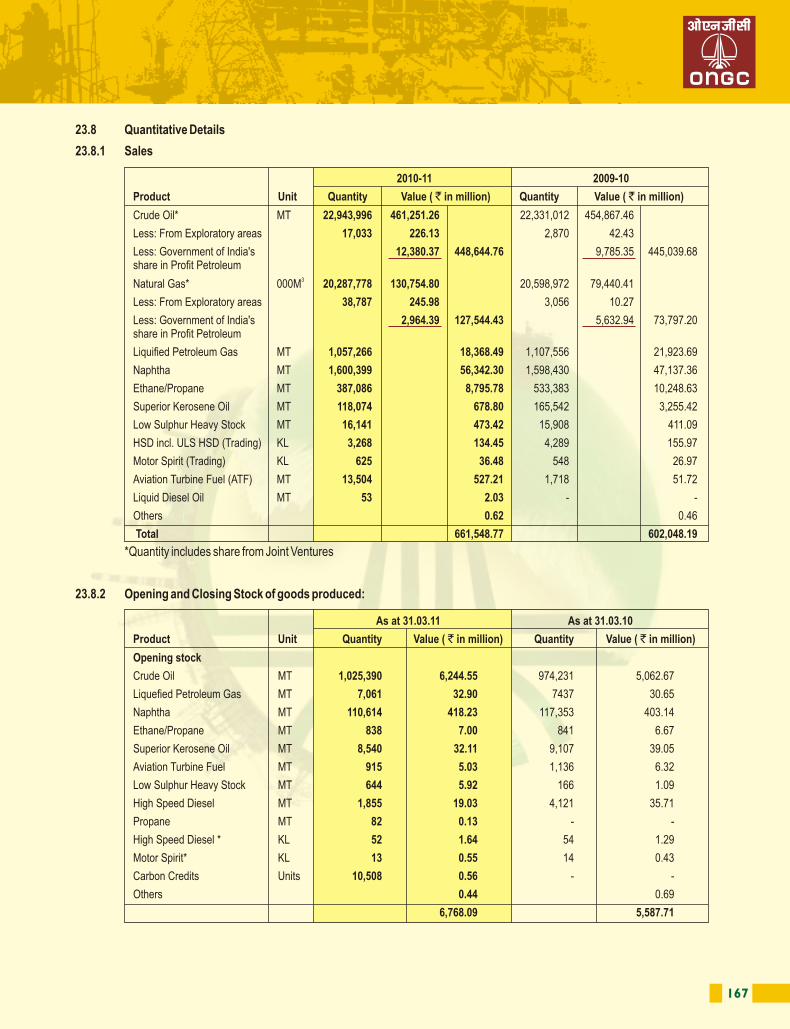
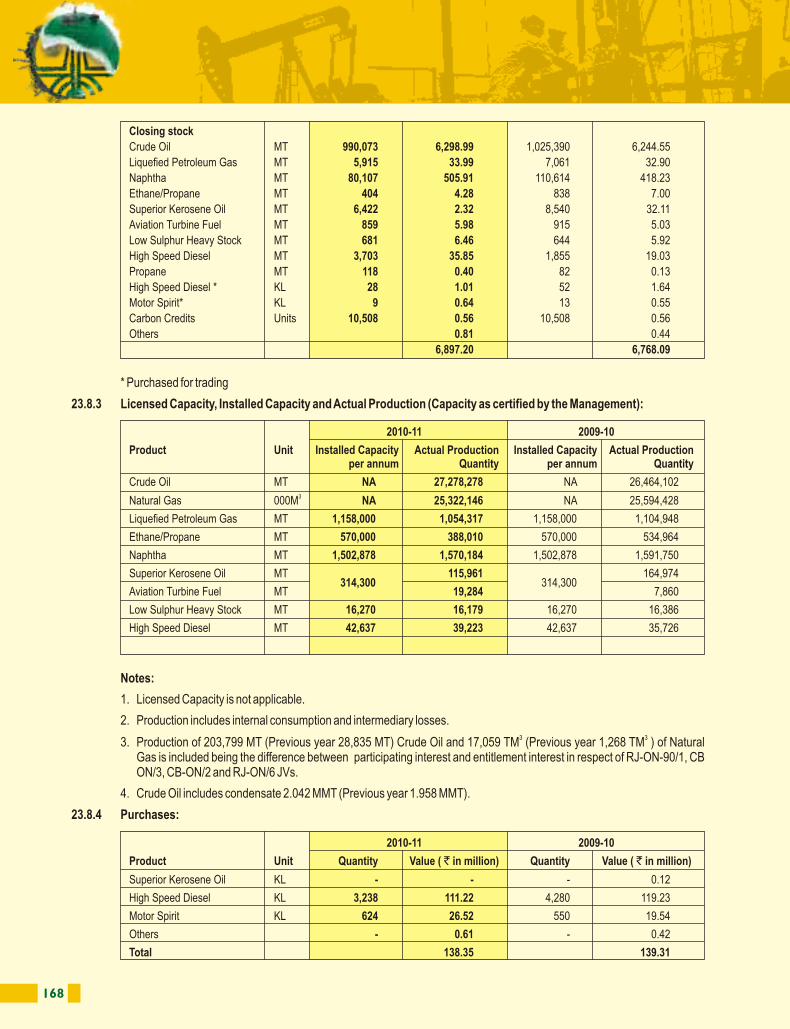
168 169
23.8.5 Raw Material Consumed:
23.9 Consumption of Raw Materials, Stores and Spare Parts:
23.10 Value of Imports on CIF Basis:
*Includes stage payments made against capital works.
23.11 Expenditure in Foreign Currency:
23.12 Earnings in Foreign Currency:
* Purchased for trading
23.8.3 Licensed Capacity, Installed Capacity and Actual Production (Capacity as certified by the Management):
Notes:
1. Licensed Capacity is not applicable.
2. Production includes internal consumption and intermediary losses.3 33. Production of 203,799 MT (Previous year 28,835 MT) Crude Oil and 17,059 TM (Previous year 1,268 TM ) of Natural
Gas is included being the difference between participating interest and entitlement interest in respect of RJ-ON-90/1, CBON/3, CB-ON/2 and RJ-ON/6 JVs.
4. Crude Oil includes condensate 2.042 MMT (Previous year 1.958 MMT).
23.8.4 Purchases:
Closing stock
Crude Oil MT 990,073 6,298.99 1,025,390 6,244.55
Liquefied Petroleum Gas MT 5,915 33.99 7,061 32.90
Naphtha MT 80,107 505.91 110,614 418.23
Ethane/Propane MT 404 4.28 838 7.00
Superior Kerosene Oil MT 6,422 2.32 8,540 32.11
Aviation Turbine Fuel MT 859 5.98 915 5.03
Low Sulphur Heavy Stock MT 681 6.46 644 5.92
High Speed Diesel MT 3,703 35.85 1,855 19.03
Propane MT 118 0.40 82 0.13
High Speed Diesel * KL 28 1.01 52 1.64
Motor Spirit* KL 9 0.64 13 0.55
Carbon Credits Units 10,508 0.56 10,508 0.56
Others 0.81 0.44
6,897.20 6,768.09
2010-11 2009-10
Product Unit Installed Capacity Actual Production Installed Capacity Actual Productionper annum Quantity per annum Quantity
Crude Oil MT NA 27,278,278 NA 26,464,102 3Natural Gas 000M NA 25,322,146 NA 25,594,428
Liquefied Petroleum Gas MT 1,158,000 1,054,317 1,158,000 1,104,948
Ethane/Propane MT 570,000 388,010 570,000 534,964
Naphtha MT 1,502,878 1,570,184 1,502,878 1,591,750
Superior Kerosene Oil MT 115,961 164,974 314,300 314,300
Aviation Turbine Fuel MT 19,284 7,860
Low Sulphur Heavy Stock MT 16,270 16,179 16,270 16,386
High Speed Diesel MT 42,637 39,223 42,637 35,726
2010-11 2009-10
Product Unit Quantity Value ( ` in million) Quantity Value ( ` in million)
Superior Kerosene Oil KL - - - 0.12
High Speed Diesel KL 3,238 111.22 4,280 119.23
Motor Spirit KL 624 26.52 550 19.54
Others - 0.61 - 0.42
Total 138.35 139.31
2010-11 2009-10
Amount ( ` in million) % Amount ( ` in million) %
Imported 6,483.77 23.35 4,867.53 20.14
Indigenous 21,284.71 76.65 19,311.93 79.86
Total 27,768.48 100.00 24,179.46 100.00
2010-11 2009-10
Unit Quantity Value Quantity Value( ` in million) ( ` in million)
For production of Liquefied Petroleum Gas, Ethane/Propane, Naphtha, Superior Kerosene Oil, Low Sulphur High Stock, Aviation Turbine Fuel and High Speed Diesel.
Out of own production:
Crude Oil MT 131,207 702.25 118,167 585.223Natural Gas 000M 697,700 2,949.13 830,668 3,150.973Gas Equivalent Condensate 000M 476,865 1,113.96 496,881 916.93
Purchases
Gas Equivalent Condensate MT 89,746 2,805.57 112,116 2,766.01
2010-11 2009-10
Capital items * 182,974.34 55,433.81
Stores and Spare Parts 6,648.04 7,548.87
Total 189,622.38 62,982.68
( ` in million)
2010-11 2009-10
Interest 0.75 5.33
Services 94,866.66 102,562.41
Others 86,664.31 37,278.43
Total 181,531.72 139,846.17
( ` in million)
2010-11 2009-10
Interest 5.06 -
Services 2.72 27.25
FOB value of Sales 47,105.49 45,832.44
Others 2.23 11.28
Total 47,115.50 45,870.97
( ` in million)
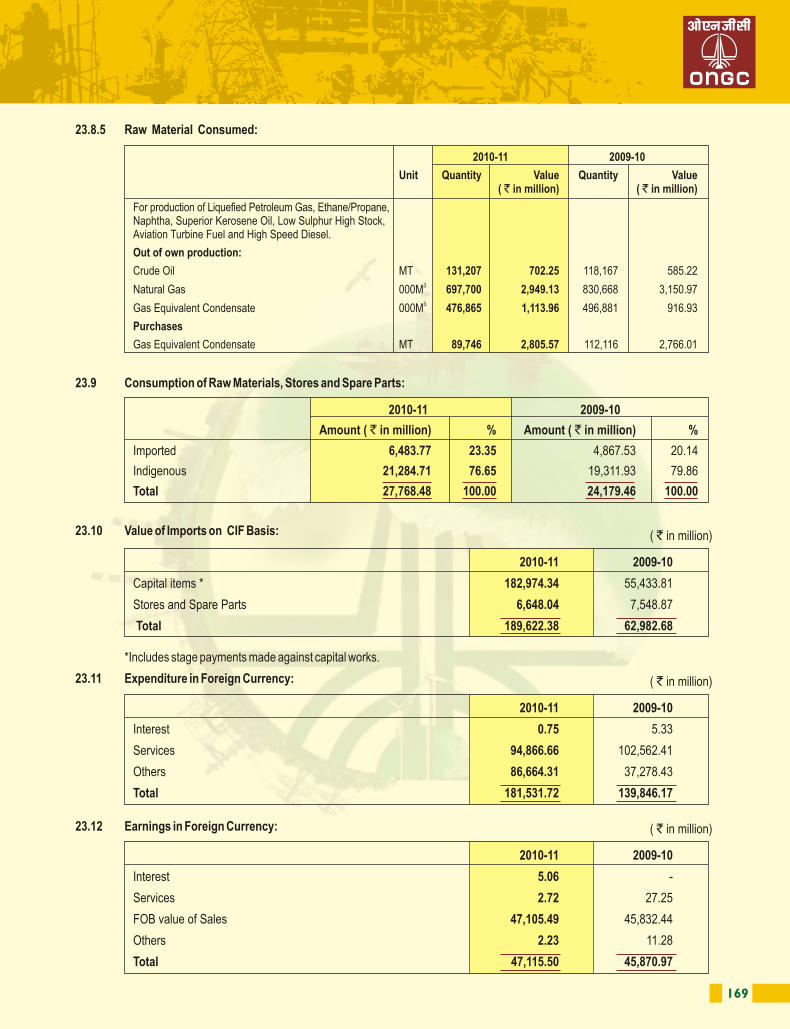
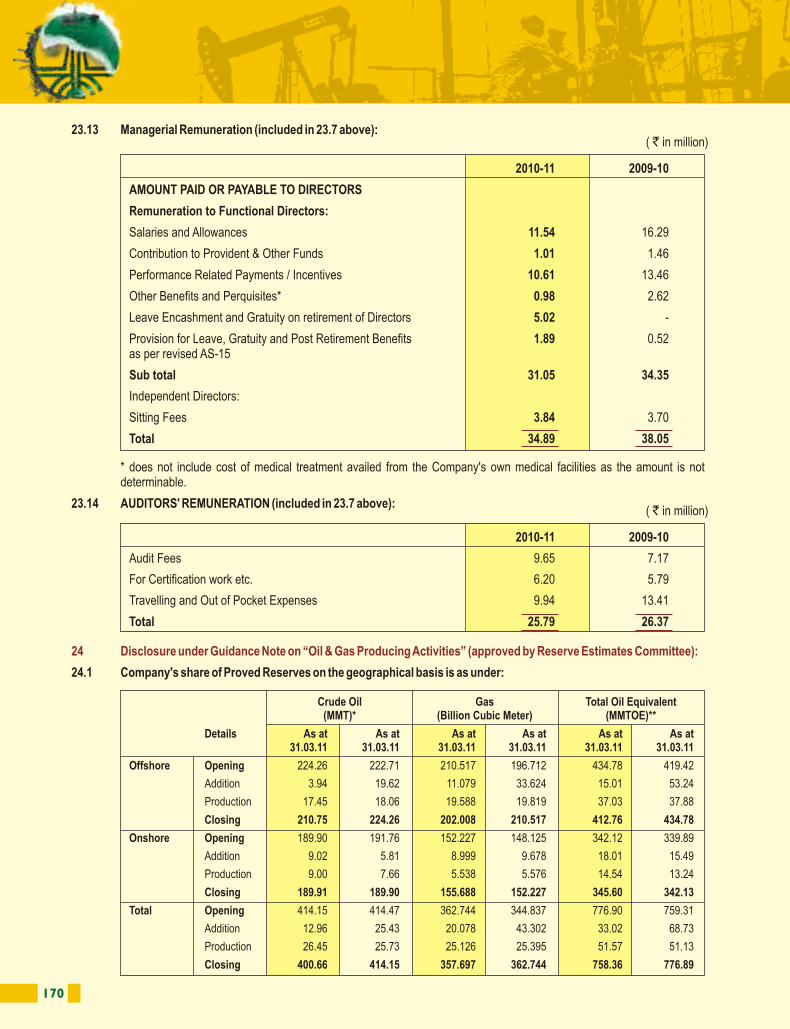
170 171
24.2 Company's share of Proved Developed Reserves on the geographical basis is as under:
* Crude Oil includes oil condensate and does not include 0.7083 MMT (previous year 0.940 MMT) of Condensate due to line3 3 condensation and 191.6 MMM (previous year 198.6 MMM ) of CSU off gas.
3**MMTOE denotes “Million Metric Tonne Oil Equivalent” and for calculating Oil equivalent of Gas, 1000 M of Gas has been taken to be equal to 1 MT of Crude Oil.
Variations in totals, if any, are due to internal summation and rounding off.
*Excludes Current account transactions
25 Disclosure pursuant to the clause 32 of the Listing Agreement
23.13 Managerial Remuneration (included in 23.7 above):
* does not include cost of medical treatment availed from the Company's own medical facilities as the amount is not determinable.
23.14 AUDITORS' REMUNERATION (included in 23.7 above):
24.1 Company's share of Proved Reserves on the geographical basis is as under:
24 Disclosure under Guidance Note on “Oil & Gas Producing Activities” (approved by Reserve Estimates Committee):
2010-11 2009-10
AMOUNT PAID OR PAYABLE TO DIRECTORS
Remuneration to Functional Directors:
Salaries and Allowances 11.54 16.29
Contribution to Provident & Other Funds 1.01 1.46
Performance Related Payments / Incentives 10.61 13.46
Other Benefits and Perquisites* 0.98 2.62
Leave Encashment and Gratuity on retirement of Directors 5.02 -
Provision for Leave, Gratuity and Post Retirement Benefits 1.89 0.52as per revised AS-15
Sub total 31.05 34.35
Independent Directors:
Sitting Fees 3.84 3.70
Total 34.89 38.05
( ` in million)
2010-11 2009-10
Audit Fees 9.65 7.17
For Certification work etc. 6.20 5.79
Travelling and Out of Pocket Expenses 9.94 13.41
Total 25.79 26.37
( ` in million)
Crude Oil Gas Total Oil Equivalent(MMT)* (Billion Cubic Meter) (MMTOE)**
Details As at As at As at As at As at As at31.03.11 31.03.11 31.03.11 31.03.11 31.03.11 31.03.11
Offshore Opening 224.26 222.71 210.517 196.712 434.78 419.42
Addition 3.94 19.62 11.079 33.624 15.01 53.24
Production 17.45 18.06 19.588 19.819 37.03 37.88
Closing 210.75 224.26 202.008 210.517 412.76 434.78
Onshore Opening 189.90 191.76 152.227 148.125 342.12 339.89
Addition 9.02 5.81 8.999 9.678 18.01 15.49
Production 9.00 7.66 5.538 5.576 14.54 13.24
Closing 189.91 189.90 155.688 152.227 345.60 342.13
Total Opening 414.15 414.47 362.744 344.837 776.90 759.31
Addition 12.96 25.43 20.078 43.302 33.02 68.73
Production 26.45 25.73 25.126 25.395 51.57 51.13
Closing 400.66 414.15 357.697 362.744 758.36 776.89
Crude Oil Gas Total Oil Equivalent(MMT)* (Billion Cubic Meter) (MMTOE)**
Details As at As at As at As at As at As at31.03.11 31.03.11 31.03.11 31.03.11 31.03.11 31.03.11
Offshore Opening 173.44 176.44 129.860 126.770 303.30 303.21
Addition 2.77 15.06 10.276 22.910 13.05 37.97
Production 17.45 18.06 19.588 19.819 37.03 37.88
Closing 158.76 173.44 120.549 129.860 279.31 303.30
Onshore Opening 146.26 148.49 111.178 111.069 257.44 259.56
Addition 13.46 5.39 5.012 5.644 18.47 11.03
Production 8.95 7.61 5.441 5.535 14.39 13.15
Closing 150.77 146.26 110.749 111.178 261.52 257.44
Total Opening 319.71 324.93 241.039 237.839 560.74 562.77
Addition 16.23 20.45 15.287 28.554 31.51 49.00
Production 26.40 25.67 25.029 25.354 51.42 51.02
Closing 309.54 319.71 231.297 241.039 540.83 560.75
Particulars Outstanding as Maximum Amount Outstanding as Maximum Amountat 31.03.2011 Outstanding during at 31.03.2010 Outstanding during
the year 2010-11 the year 2009-10
a) Loans to Subsidiaries*
i) ONGC Videsh Limited (OVL)* 172,786.16 174,914.01 162,722.58 162,722.58
ii) Mangalore Refinery & 10,800.00 10,800.00 10,800.00 15,000.00Petrochemicals Limited.(MRPL)
b) To Associates Nil Nil Nil Nil
c) Where there is no 172,786.16 174,914.01 162,722.58 162,722.58repayment schedule ONGC Videsh Limited (OVL)
d) Having repayment schedule 7,721.76 7,721.76 6378.44 6378.44of beyond seven years :to employees
e) Where no interest or interest 172,786.16 174,914.01 162,722.58 162,722.58below Section 372A ofCompanies Act ONGC Videsh Limited (OVL)
f) In the nature of loans to Nil Nil Nil NilFirms\companies in which directors are interested
( ` in million)
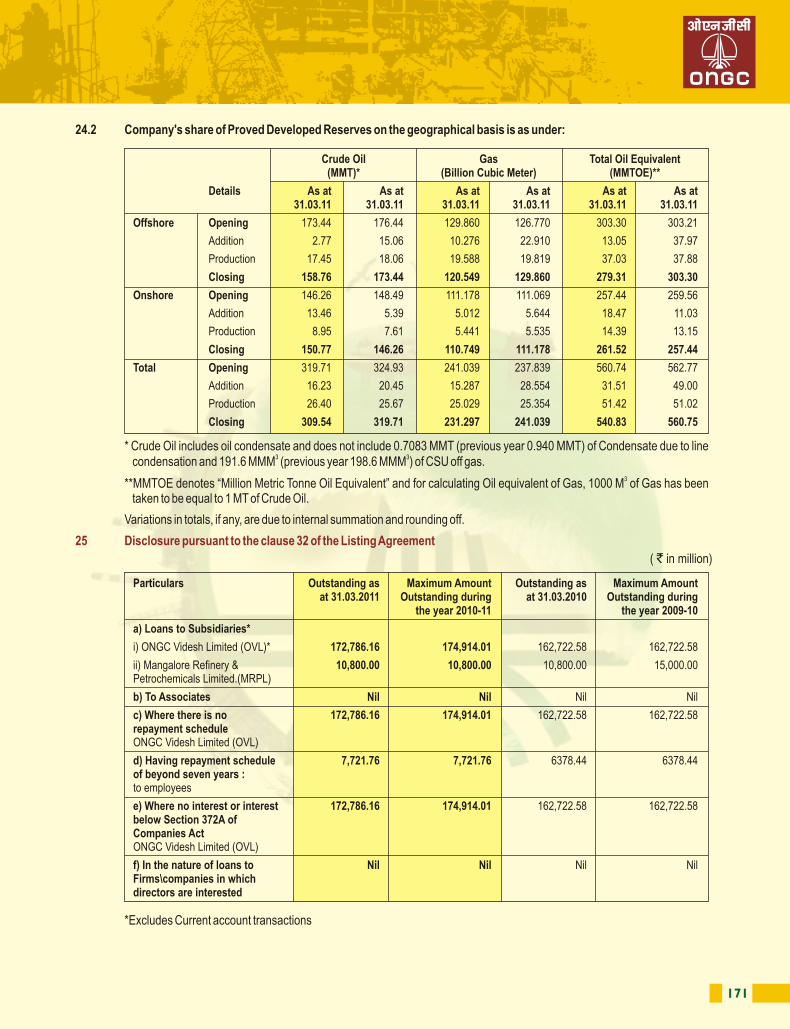
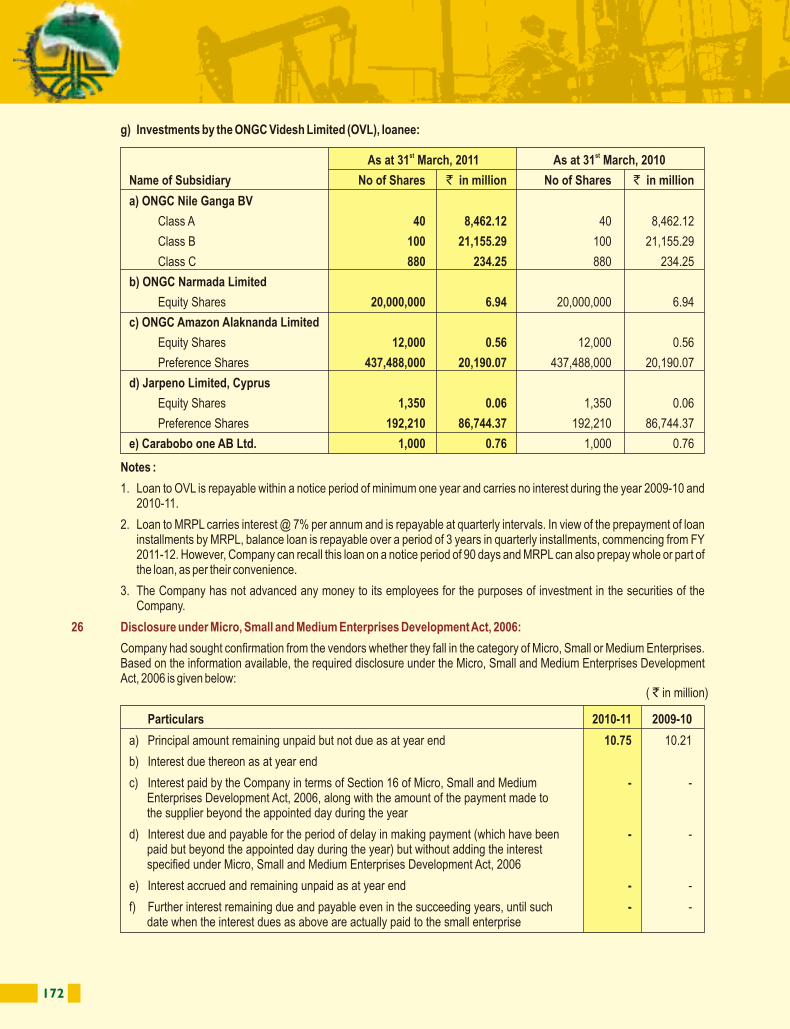
172 173
27 Disclosure on Foreign currency exposures at year end that have not been hedged by derivative instrument or otherwise are given below:
28 During the financial year 2010-11, the company has incurred expenditure on scientific research in in-house R&D centres, which are in the process of being approved by the prescribed authority. The Gross expenditure incurred by various in house R&D institutes are as under:-
29 Previous year's figures have been regrouped/ reclassified, wherever necessary, to confirm to current year's classification.
30 Figures in parenthesis as given in these Notes to Accounts relate to previous year.
Capital Expenditure ` 134.33 million
Revenue Expenditure ` 4,329.93 million
g) Investments by the ONGC Videsh Limited (OVL), loanee:
Notes :
1. Loan to OVL is repayable within a notice period of minimum one year and carries no interest during the year 2009-10 and2010-11.
2. Loan to MRPL carries interest @ 7% per annum and is repayable at quarterly intervals. In view of the prepayment of loaninstallments by MRPL, balance loan is repayable over a period of 3 years in quarterly installments, commencing from FY2011-12. However, Company can recall this loan on a notice period of 90 days and MRPL can also prepay whole or part ofthe loan, as per their convenience.
3. The Company has not advanced any money to its employees for the purposes of investment in the securities of theCompany.
Company had sought confirmation from the vendors whether they fall in the category of Micro, Small or Medium Enterprises. Based on the information available, the required disclosure under the Micro, Small and Medium Enterprises Development Act, 2006 is given below:
26 Disclosure under Micro, Small and Medium Enterprises Development Act, 2006:
st stAs at 31 March, 2011 As at 31 March, 2010
Name of Subsidiary No of Shares ` in million No of Shares ` in million
a) ONGC Nile Ganga BV
Class A 40 8,462.12 40 8,462.12
Class B 100 21,155.29 100 21,155.29
Class C 880 234.25 880 234.25
b) ONGC Narmada Limited
Equity Shares 20,000,000 6.94 20,000,000 6.94
c) ONGC Amazon Alaknanda Limited
Equity Shares 12,000 0.56 12,000 0.56
Preference Shares 437,488,000 20,190.07 437,488,000 20,190.07
d) Jarpeno Limited, Cyprus
Equity Shares 1,350 0.06 1,350 0.06
Preference Shares 192,210 86,744.37 192,210 86,744.37
e) Carabobo one AB Ltd. 1,000 0.76 1,000 0.76
Particulars 2010-11 2009-10
a) Principal amount remaining unpaid but not due as at year end 10.75 10.21
b) Interest due thereon as at year end
c) Interest paid by the Company in terms of Section 16 of Micro, Small and Medium - -Enterprises Development Act, 2006, along with the amount of the payment made to the supplier beyond the appointed day during the year
d) Interest due and payable for the period of delay in making payment (which have been - -paid but beyond the appointed day during the year) but without adding the interest specified under Micro, Small and Medium Enterprises Development Act, 2006
e) Interest accrued and remaining unpaid as at year end - -
f) Further interest remaining due and payable even in the succeeding years, until such - -date when the interest dues as above are actually paid to the small enterprise
( ` in million)
st stAs at 31 March, 2011 As at 31 March, 2010
Amount in Equivalent Amount in EquivalentForeign Currency Rupees Foreign Currency Rupees
Loans Japanese Yen - - 102.97 49.75
Import Creditors
Australian Dollar - - - -
Euros 28.94 1,825.13 28.48 1,722.11
British Pound 4.30 307.73 1.67 113.50
Japanese Yen 1,090.50 587.89 413.29 199.64
Norwegian Kroner 4.12 32.89 4.61 34.71
Singapore Dollar 0.19 6.59 0.09 2.79
Canadian Dollar - - 0.04 1.98
United States Dollar 959.62 42,914.33 758.34 34,220.66
Malaysian Ringgit 0.28 3.96 - -
Total 45,678.52 36,295.39
Export Receivables United States Dollar 73.15 3,271.29 68.25 3,079.78
( Figures in million)
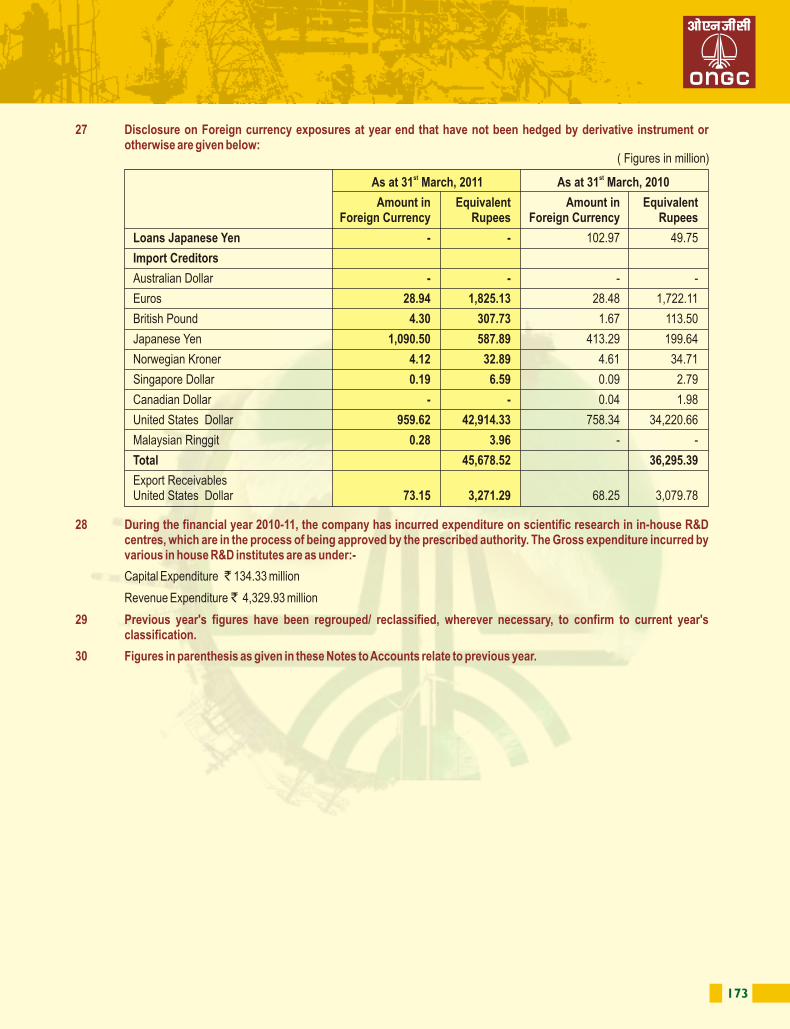
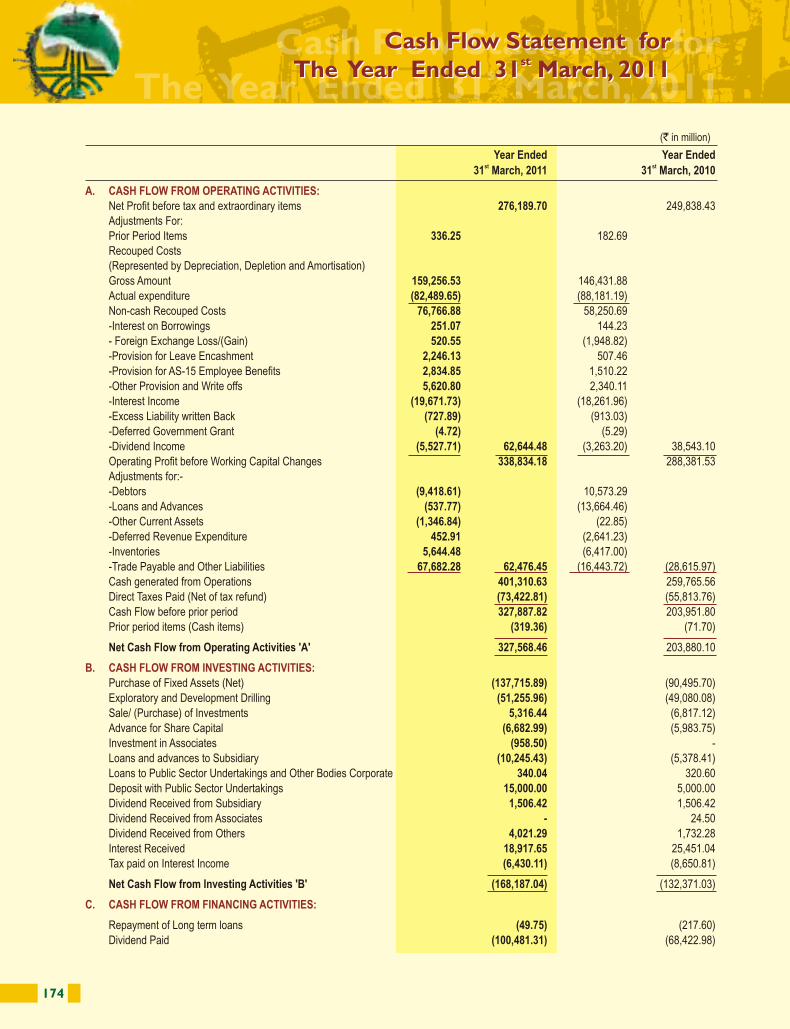
174 175
Cash Flow Statement for st
The Year Ended 31 March, 2011
Year Ended Year Endedst st 31 March, 2011 31 March, 2010
Net Profit before tax and extraordinary items 276,189.70 249,838.43Adjustments For:
Prior Period Items 336.25 182.69Recouped Costs(Represented by Depreciation, Depletion and Amortisation)
Gross Amount 159,256.53 146,431.88
Actual expenditure (82,489.65) (88,181.19)
Non-cash Recouped Costs 76,766.88 58,250.69
-Interest on Borrowings 251.07 144.23
- Foreign Exchange Loss/(Gain) 520.55 (1,948.82)
-Provision for Leave Encashment 2,246.13 507.46
-Provision for AS-15 Employee Benefits 2,834.85 1,510.22
-Other Provision and Write offs 5,620.80 2,340.11
-Interest Income (19,671.73) (18,261.96)
-Excess Liability written Back (727.89) (913.03)
-Deferred Government Grant (4.72) (5.29)
-Dividend Income (5,527.71) 62,644.48 (3,263.20) 38,543.10
Operating Profit before Working Capital Changes 338,834.18 288,381.53 Adjustments for:-
-Debtors (9,418.61) 10,573.29
-Loans and Advances (537.77) (13,664.46)
-Other Current Assets (1,346.84) (22.85)
-Deferred Revenue Expenditure 452.91 (2,641.23)
-Inventories 5,644.48 (6,417.00)
-Trade Payable and Other Liabilities 67,682.28 62,476.45 (16,443.72) (28,615.97)
Cash generated from Operations 401,310.63 259,765.56
Direct Taxes Paid (Net of tax refund) (73,422.81) (55,813.76)
Cash Flow before prior period 327,887.82 203,951.80
Prior period items (Cash items) (319.36) (71.70)
Net Cash Flow from Operating Activities 'A' 327,568.46 203,880.10
Purchase of Fixed Assets (Net) (137,715.89) (90,495.70)
Exploratory and Development Drilling (51,255.96) (49,080.08)
Sale/ (Purchase) of Investments 5,316.44 (6,817.12)
Advance for Share Capital (6,682.99) (5,983.75)
Investment in Associates (958.50) -
Loans and advances to Subsidiary (10,245.43) (5,378.41)
Loans to Public Sector Undertakings and Other Bodies Corporate 340.04 320.60
Deposit with Public Sector Undertakings 15,000.00 5,000.00
Dividend Received from Subsidiary 1,506.42 1,506.42
Dividend Received from Associates - 24.50
Dividend Received from Others 4,021.29 1,732.28
Interest Received 18,917.65 25,451.04
Tax paid on Interest Income (6,430.11) (8,650.81)
Net Cash Flow from Investing Activities 'B' (168,187.04) (132,371.03)
Repayment of Long term loans (49.75) (217.60)
Dividend Paid (100,481.31) (68,422.98)
A. CASH FLOW FROM OPERATING ACTIVITIES:
B. CASH FLOW FROM INVESTING ACTIVITIES:
C. CASH FLOW FROM FINANCING ACTIVITIES:
Year Ended Year Endedst st 31 March, 2011 31 March, 2010
Tax on Dividend (16,444.12) (11,376.03)
Interest Paid (251.07) (144.23)
Net Cash Flow from Financing Activities 'C' (117,226.25) (80,160.84)
Net increase/(decrease) in Cash and Cash Equivalents (A+B+C) 42,155.17 (8,651.77)
Cash and Cash Equivalents as at 1st April, 2010 (Opening Balance) 182,310.35 190,962.12
Cash and Cash Equivalents as at 31st March, 2011 (Closing Balance) 224,465.52 182,310.35
42,155.17 (8651.77)
1. The above Cash Flow Statement has been prepared under the 'Indirect Method' as set out in the Accounting Standard-3 on Cash FlowStatements issued by The Institute of Chartered Accountants of India.
2. Adjustments have not been made to "Purchase of Fixed Assets" (Investing Activities), on account of increase/decrease in Capital Creditors. The impact of the above is not readily ascertainable.
Cash and Cash equivalents represent:-
3. Brackets indicate cash outflow/ deduction.
4. Previous year figures have been re-grouped/re-classified wherever necessary to confirm to the current years presentation.
*Deposited u/s 33ABA of the Income Tax Act, 1961 and can be withdrawn only for the purposes specified in the scheme.
Notes:
(` in million) (` in million)
(` in million)
2010-11 2009-10
a) Cash and Bank Balances (Schedule 11A) 143,310.46 108,279.29
b) Deposits with Bank under Site Restoration Fund Scheme (Schedule 11B)* 81,155.06 74,031.06
Total 224,465.52 182,310.35
(N. K. Sinha) (D. K. Sarraf) (A. K. Hazarika)Company Secretary Director (Finance) Chairman & Managing Director
In terms of our report of even date attached
For Kalyaniwalla & Mistry For Arun K. Agarwal & Associates For S. Bhandari & Co.Chartered Accountants Chartered Accountants Chartered AccountantsFirm Reg. No. 104607W Firm Reg. No. 003917N Firm Reg. No. 000560C
(Ermin K. Irani) (Vimal Kumar Jain) (P.P.Pareek)Partner (Mem .No. 035646) Partner (Mem. No. 086657) Partner (Mem. No. 071213 )
For Ray & Ray For M. Kuppuswamy P S G & Co. Chartered Accountants Chartered AccountantsFirm Reg. No. 301072E Firm Reg. No. 001616S
(B.K.Ghosh) (M.K.Krishnan) Partner (Mem. No. 051028) Partner (Mem .No. 020116)
New DelhithMay 30 , 2011
For and On behalf of the Board
Cash Flow Statement for stThe Year Ended 31 March, 2011
Cash Flow Statement for st
The Year Ended 31 March, 2011
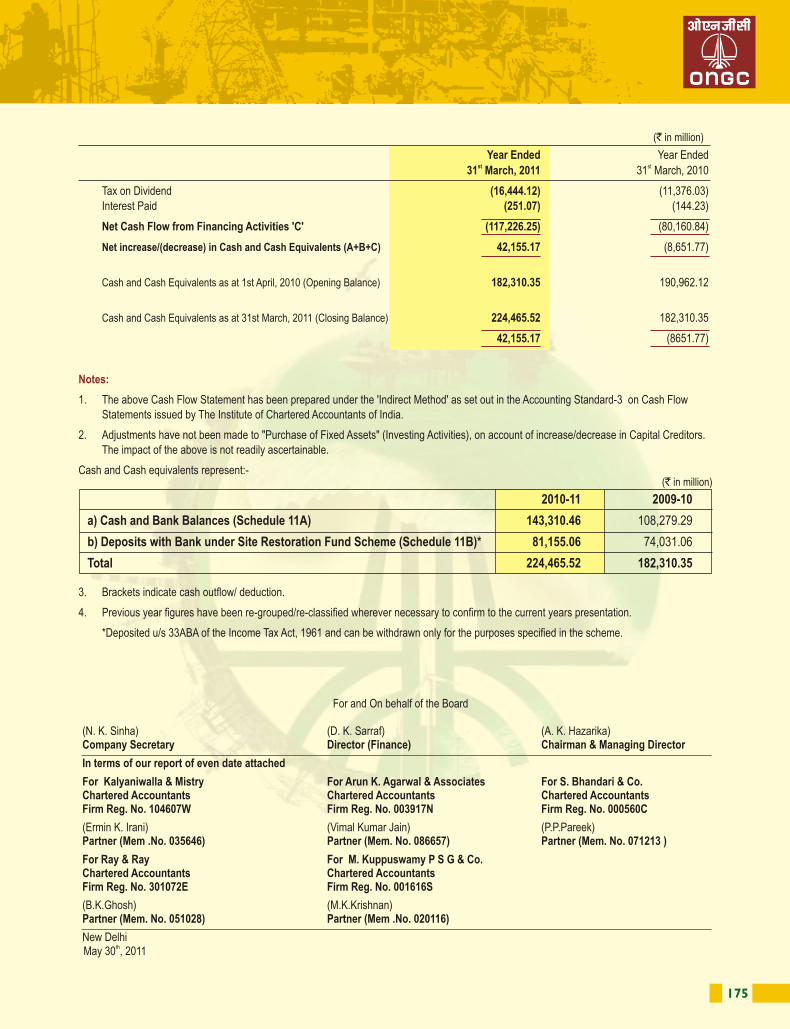
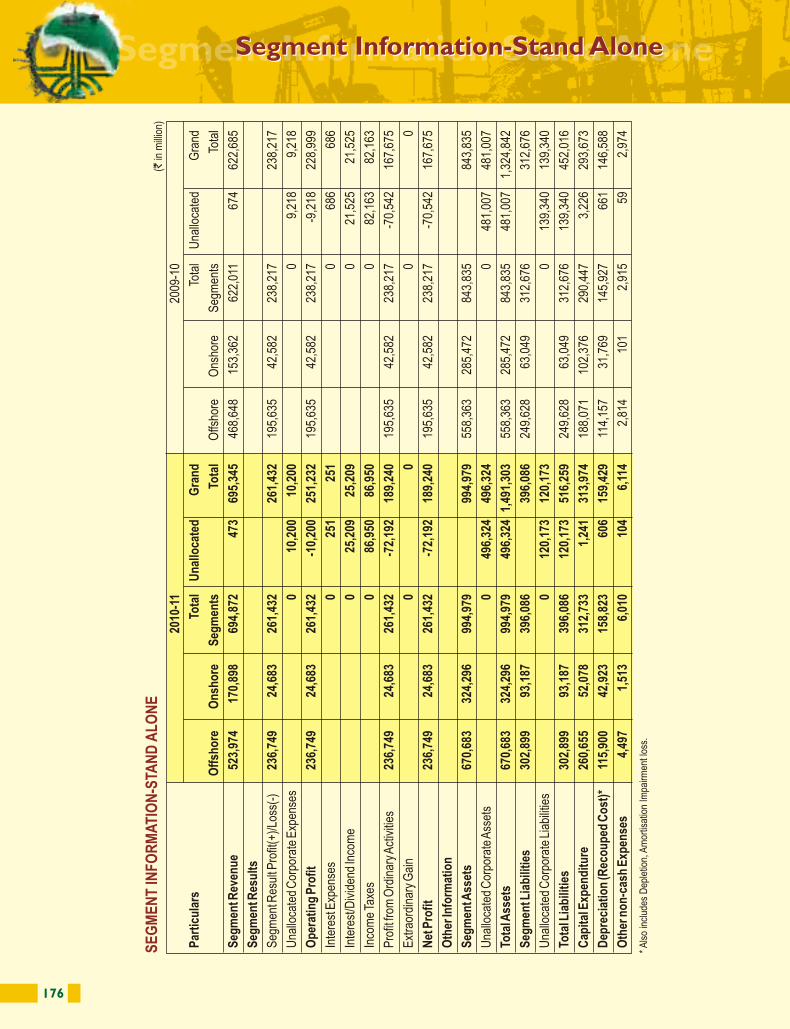
Registration No. 55-54155 State Code 55
Balance Sheet Date 31-03-2011
Public Issue Right Issue
- -
Bonus Issue Private Placement
(Issued to employees only)
21388725 -
Total Liabilities Total Assets
1487664516 1487664516
Paid-up Capital Reserves & Surplus
42777598 932266724
Secured Loans Unsecured Loans
- -
Deferred Tax Liability Liability For Abandonment Cost
99503945 175642547
Current Liability
237473702
Net fixed Assets Investments
839939842 53328371
Current Assets Misc. Expenditure
586436053 7960251
Accumulated Losses
Turnover(Gross Revenue) Total Expenditure
717457662 441267968
Profit /(Loss) Before Tax Profit /(Loss) After Tax
276189694 189240020
Earning per Share in ` Dividend Rate %
22.12 175%*
*Post split and bonus
Item Code No. 27090000
Product Description Crude Oil
Item Code No. 27112100
Product Description Natural Gas
Item Code No. 27111900
Product Description Liquified Petroleum Gas
(N. K. Sinha) (D.K. Sarraf) (A.K. Hazarika)Company Secretary Director(Finance) Chairman & Managing Director
Place: New DelhithDated: May 30 , 2011
I. Registration Details
II. Capital Raised during the year (Amount in ` Thousands)
III. Position of Mobilisation and Deployment of funds(Amount in ` Thousands)
Source of Funds
Application of Funds
IV. Performance of Company ( Amount In ` Thousands )
V. Generic Name of Three Principal Products / Services of Company (as per monetary terms)
2010
-11
2009
-10
Par
ticu
lars
Tota
l U
nal
loca
ted
Gra
nd
Tota
l U
nallo
cate
dG
rand
Off
sho
reO
nsh
ore
Seg
men
tsTo
tal
Offs
hore
Ons
hore
Seg
men
tsTo
tal
Seg
men
t Rev
enu
e52
3,97
417
0,89
869
4,87
247
369
5,34
546
8,64
815
3,36
262
2,01
167
462
2,68
5
Seg
men
t Res
ult
s
Seg
men
t Res
ult P
rofit
(+)/
Loss
(-)
236,
749
24,6
8326
1,43
226
1,43
219
5,63
542
,582
238,
217
238,
217
Una
lloca
ted
Cor
pora
te E
xpen
ses
010
,200
10,2
000
9,21
89,
218
Op
erat
ing
Pro
fit
236,
749
24,6
8326
1,43
2-1
0,20
025
1,23
219
5,63
542
,582
238,
217
-9,2
1822
8,99
9
Inte
rest
Exp
ense
s0
251
251
068
668
6
Inte
rest
/Div
iden
d In
com
e0
25,2
0925
,209
021
,525
21,5
25
Inco
me
Taxe
s0
86,9
5086
,950
082
,163
82,1
63
Pro
fit fr
om O
rdin
ary
Act
iviti
es23
6,74
924
,683
261,
432
-72,
192
189,
240
195,
635
42,5
8223
8,21
7-7
0,54
216
7,67
5
Ext
raor
dina
ry G
ain
00
00
Net
Pro
fit
236,
749
24,6
8326
1,43
2-7
2,19
218
9,24
019
5,63
542
,582
238,
217
-70,
542
167,
675
Oth
er In
form
atio
n
Seg
men
t Ass
ets
670,
683
324,
296
994,
979
994,
979
558,
363
285,
472
843,
835
843,
835
Una
lloca
ted
Cor
pora
te A
sset
s0
496,
324
496,
324
048
1,00
748
1,00
7
Tota
l Ass
ets
670,
683
324,
296
994,
979
496,
324
1,49
1,30
355
8,36
328
5,47
284
3,83
548
1,00
71,
324,
842
Seg
men
t Lia
bili
ties
302,
899
93,1
8739
6,08
639
6,08
624
9,62
863
,049
312,
676
312,
676
Una
lloca
ted
Cor
pora
te L
iabi
litie
s0
120,
173
120,
173
013
9,34
013
9,34
0
Tota
l Lia
bili
ties
302,
899
93,1
8739
6,08
612
0,17
351
6,25
924
9,62
863
,049
312,
676
139,
340
452,
016
Cap
ital
Exp
end
itu
re26
0,65
552
,078
312,
733
1,24
131
3,97
418
8,07
110
2,37
629
0,44
73,
226
293,
673
Dep
reci
atio
n (R
eco
up
ed C
ost
)*11
5,90
042
,923
158,
823
606
159,
429
114,
157
31,7
6914
5,92
766
114
6,58
8
Oth
er n
on
-cas
h E
xpen
ses
4,49
71,
513
6,01
010
46,
114
2,81
410
12,
915
592,
974
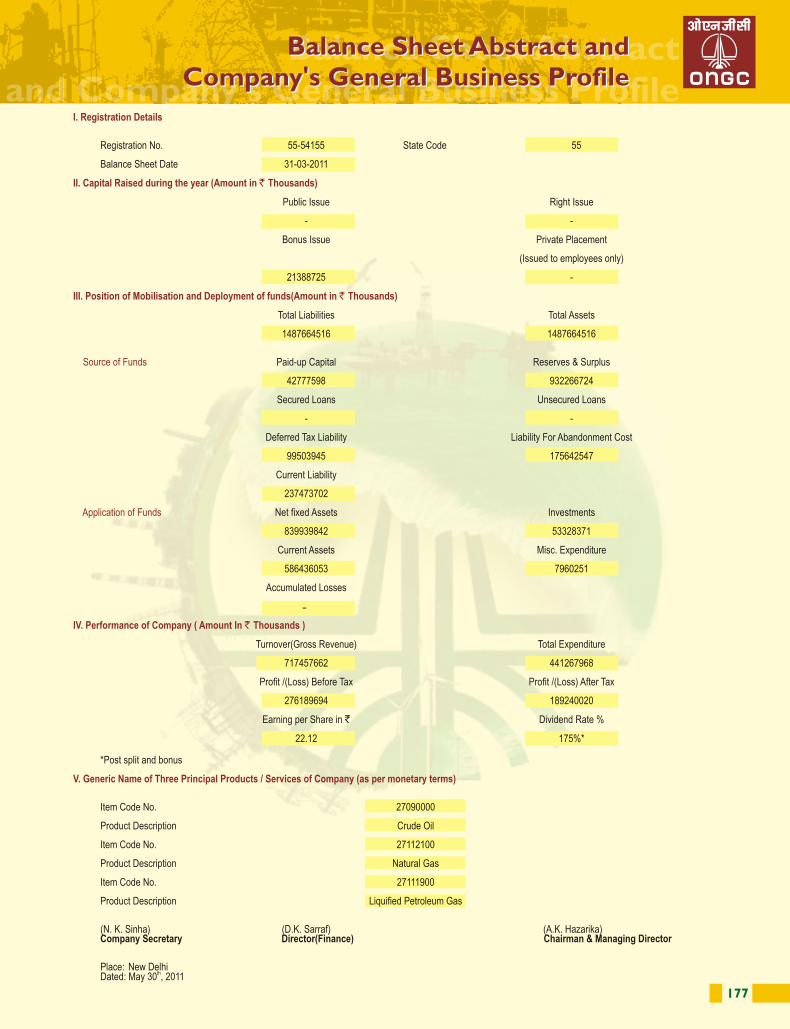
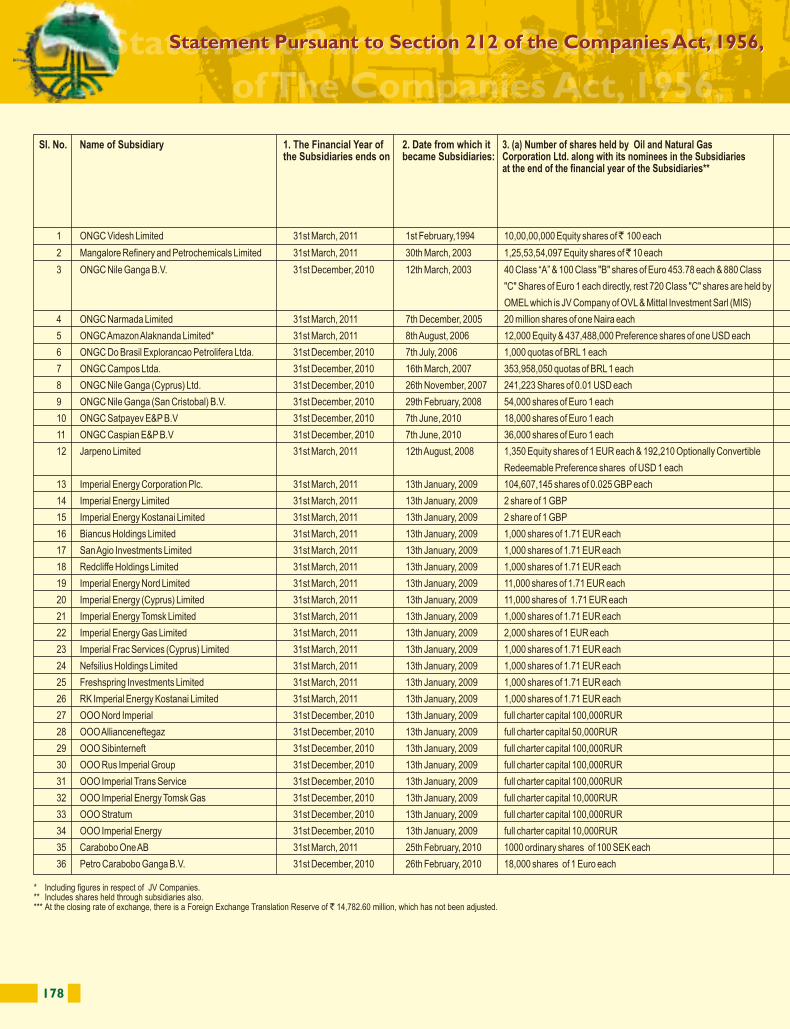
178 179
(N K Sinha) (D K Sarraf) (A K Hazarika)Company Secretary Director (Finance) Chairman
Place: New DelhiDated: May 30, 2011
* Including figures in respect of JV Companies.** Includes shares held through subsidiaries also.*** At the closing rate of exchange, there is a Foreign Exchange Translation Reserve of ` 14,782.60 million, which has not been adjusted.
1. The Financial Year of the Subsidiaries ends on
2. Date from which it became Subsidiaries:
3. (a) Number of shares held by Oil and Natural Gas Corporation Ltd. along with its nominees in the Subsidiaries at the end of the financial year of the Subsidiaries**
3. (b) Extent of interest of Holding Company at the end of the financial year of the Subsidiaries
4. The net aggregate amount of the Subsidiary’s Profit/(Loss) so far it concerns the members of the Holding Company:
4. (a) Not dealt within the Holding Company’s accounts 4. (b) Dealt within the Holding Company’s accounts:
4. (a) (i) For the period st1st April, 2010 to 31 March,
2011 (` in million)***
4. (a) (ii) For the previous period (s) of the Subsidiaries since it became the Holding Company's Subsidiary (` in million):
4. (b) (i) For the period 1st April, 2010 to
st31 March, 2011 (` in million)
4. (b) (ii) For the previous period (s) of the Subsidiaries since it became the Holding Company's Subsidiary (` in million):
1 ONGC Videsh Limited 31st March, 2011 1st February,1994 10,00,00,000 Equity shares of ̀ 100 each 100% 17,116.96 54,682.26 - 1,050.00
2 Mangalore Refinery and Petrochemicals Limited 31st March, 2011 30th March, 2003 1,25,53,54,097 Equity shares of ̀ 10 each 71.63% 8,428.22 33,776.31 1,506.42 6,151.22
3 ONGC Nile Ganga B.V. 31st December, 2010 12th March, 2003 40 Class “A” & 100 Class "B" shares of Euro 453.78 each & 880 Class Class A & B 100% 5,553.09 59,115.47 818.11 14,098.77
"C" Shares of Euro 1 each directly, rest 720 Class "C" shares are held by Class C 77.49%
OMEL which is JV Company of OVL & Mittal Investment Sarl (MIS)
4 ONGC Narmada Limited 31st March, 2011 7th December, 2005 20 million shares of one Naira each 100% -855.93 -517.67 - -
5 ONGC Amazon Alaknanda Limited* 31st March, 2011 8th August, 2006 12,000 Equity & 437,488,000 Preference shares of one USD each 100% 3,292.86 9,773.22 - -
6 ONGC Do Brasil Explorancao Petrolifera Ltda. 31st December, 2010 7th July, 2006 1,000 quotas of BRL 1 each 100% 0.00 - -
7 ONGC Campos Ltda. 31st December, 2010 16th March, 2007 353,958,050 quotas of BRL 1 each 100% 2,131.70 -1,690.84 - -
8 ONGC Nile Ganga (Cyprus) Ltd. 31st December, 2010 26th November, 2007 241,223 Shares of 0.01 USD each 100% 172.14 46.13 - -
9 ONGC Nile Ganga (San Cristobal) B.V. 31st December, 2010 29th February, 2008 54,000 shares of Euro 1 each 100% 3,695.15 7,333.35 - -
10 ONGC Satpayev E&P B.V 31st December, 2010 7th June, 2010 18,000 shares of Euro 1 each 100% -0.38 0.00 - -
11 ONGC Caspian E&P B.V 31st December, 2010 7th June, 2010 36,000 shares of Euro 1 each 100% -8.37 0.00 - -
12 Jarpeno Limited 31st March, 2011 12th August, 2008 1,350 Equity shares of 1 EUR each & 192,210 Optionally Convertible 100% 1,358.38 170.03 - -
Redeemable Preference shares of USD 1 each
13 Imperial Energy Corporation Plc. 31st March, 2011 13th January, 2009 104,607,145 shares of 0.025 GBP each 100% 0.00 1,154.25 - -
14 Imperial Energy Limited 31st March, 2011 13th January, 2009 2 share of 1 GBP 100% 0.00 -440.14 - -
15 Imperial Energy Kostanai Limited 31st March, 2011 13th January, 2009 2 share of 1 GBP 100% 0.00 -2.59 - -
16 Biancus Holdings Limited 31st March, 2011 13th January, 2009 1,000 shares of 1.71 EUR each 100% -45.55 143.08 - -
17 San Agio Investments Limited 31st March, 2011 13th January, 2009 1,000 shares of 1.71 EUR each 100% 140.30 -353.43 - -
18 Redcliffe Holdings Limited 31st March, 2011 13th January, 2009 1,000 shares of 1.71 EUR each 100% -68.33 -59.21 - -
19 Imperial Energy Nord Limited 31st March, 2011 13th January, 2009 11,000 shares of 1.71 EUR each 100% -519.75 -388.44 - -
20 Imperial Energy (Cyprus) Limited 31st March, 2011 13th January, 2009 11,000 shares of 1.71 EUR each 100% -415.44 -347.83 - -
21 Imperial Energy Tomsk Limited 31st March, 2011 13th January, 2009 1,000 shares of 1.71 EUR each 85% -30.98 -36.13 - -
22 Imperial Energy Gas Limited 31st March, 2011 13th January, 2009 2,000 shares of 1 EUR each 100% -0.91 -1.42 - -
23 Imperial Frac Services (Cyprus) Limited 31st March, 2011 13th January, 2009 1,000 shares of 1.71 EUR each 100% -0.91 -1.61 - -
24 Nefsilius Holdings Limited 31st March, 2011 13th January, 2009 1,000 shares of 1.71 EUR each 100% -3.64 -2.10 - -
25 Freshspring Investments Limited 31st March, 2011 13th January, 2009 1,000 shares of 1.71 EUR each 100% -0.91 -1.46 - -
26 RK Imperial Energy Kostanai Limited 31st March, 2011 13th January, 2009 1,000 shares of 1.71 EUR each 100% -0.91 -1.11 - -
27 OOO Nord Imperial 31st December, 2010 13th January, 2009 full charter capital 100,000RUR 100% -2,562.33 -8,956.44 - -
28 OOO Allianceneftegaz 31st December, 2010 13th January, 2009 full charter capital 50,000RUR 100% -1,024.93 -3,383.24 - -
29 OOO Sibinterneft 31st December, 2010 13th January, 2009 full charter capital 100,000RUR 55.9% (Net Interest 47.5%) -300.65 -307.87 - -
30 OOO Rus Imperial Group 31st December, 2010 13th January, 2009 full charter capital 100,000RUR 100% -341.19 -157.20 - -
31 OOO Imperial Trans Service 31st December, 2010 13th January, 2009 full charter capital 100,000RUR 100% -46.01 -4.44 - -
32 OOO Imperial Energy Tomsk Gas 31st December, 2010 13th January, 2009 full charter capital 10,000RUR 95% -0.91 -4.27 - -
33 OOO Stratum 31st December, 2010 13th January, 2009 full charter capital 100,000RUR 100% 0.00 -0.19 - -
34 OOO Imperial Energy 31st December, 2010 13th January, 2009 full charter capital 10,000RUR 100% 0.00 0.00 - -
35 Carabobo One AB 31st March, 2011 25th February, 2010 1000 ordinary shares of 100 SEK each 100% (9.53) 0.02 - -
36 Petro Carabobo Ganga B.V. 31st December, 2010 26th February, 2010 18,000 shares of 1 Euro each 100% (9.51) (0.38) - -
Statement Pursuant to Section 212 of the Companies Act, 1956, relating to Company’s Interest in the Subsidiary CompaniesStatement Pursuant to Section 212 of the Companies Act, 1956, relating to Company’s Interest in the Subsidiary Companies
Sl. No. Name of Subsidiary
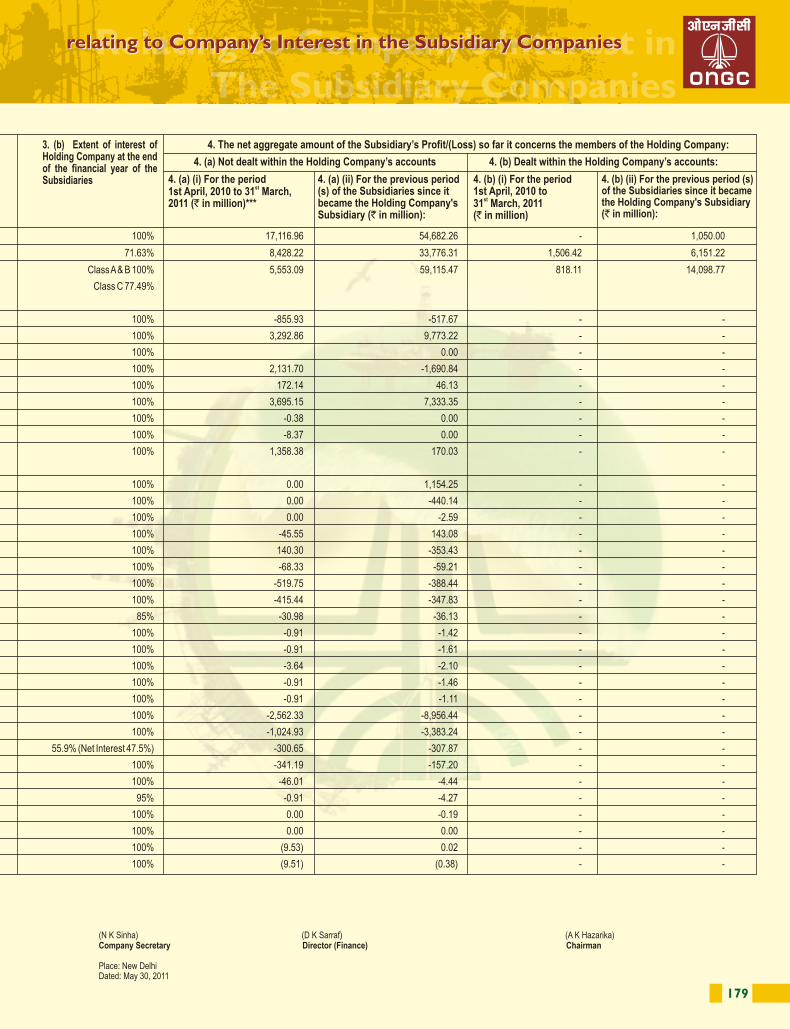
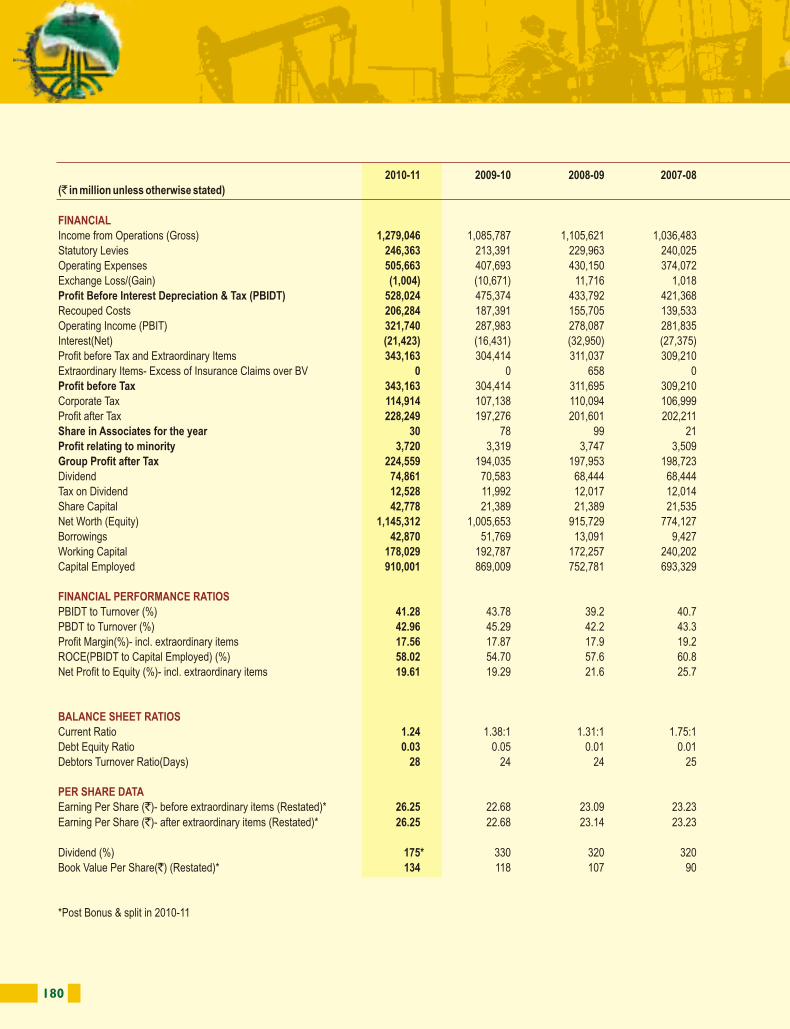
180 181
2010-11 2009-10 2008-09 2007-08 2006-07 2005-06 2004-05 2003-04 2002-03 2001-02
(` in million unless otherwise stated)
Income from Operations (Gross) 1,279,046 1,085,787 1,105,621 1,036,483 898,872 755,854 630,663 465,200 355,082 238,679
Statutory Levies 246,363 213,391 229,963 240,025 216,411 175,823 155,922 118,979 93,177 59,742
Operating Expenses 505,663 407,693 430,150 374,072 307,502 255,258 186,967 139,374 72,330 49,161
Exchange Loss/(Gain) (1,004) (10,671) 11,716 1,018 (2,675) (463) 203 61 356 118
Profit Before Interest Depreciation & Tax (PBIDT) 528,024 475,374 433,792 421,368 377,634 325,236 287,571 206,786 189,219 129,658
Recouped Costs 206,284 187,391 155,705 139,533 124,154 103,549 73,940 65,797 41,681 38,743
Operating Income (PBIT) 321,740 287,983 278,087 281,835 253,480 221,687 213,631 140,989 147,538 90,915
Interest(Net) (21,423) (16,431) (32,950) (27,375) (19,241) (11,715) (109,91) (7,772) (12,671) (7,894)
Profit before Tax and Extraordinary Items 343,163 304,414 311,037 309,210 272,721 233,402 224,622 148,761 160,209 98,809
Extraordinary Items- Excess of Insurance Claims over BV 0 0 658 0 4,751 6,405 0 0 0 0
Profit before Tax 343,163 304,414 311,695 309,210 277,472 239,807 224,622 148,761 160,209 98,809
Corporate Tax 114,914 107,138 110,094 106,999 98,454 84,932 79,416 53,880 55,785 36,593
Profit after Tax 228,249 197,276 201,601 202,211 179,018 154,875 145,206 94,881 104,424 62,216
Share in Associates for the year 30 78 99 21 102 107 114 156 (8) 0
Profit relating to minority 3,720 3,319 3,747 3,509 1,424 1,006 1,930 1,234 (259) 0
Group Profit after Tax 224,559 194,035 197,953 198,723 177,696 153,976 143,390 93,803 104,675 62,216
Dividend 74,861 70,583 68,444 68,444 66,305 64,167 57,535 34,222 42,778 19,963
Tax on Dividend 12,528 11,992 12,017 12,014 10,383 9,172 8,156 4,385 2,375 0
Share Capital 42,778 21,389 21,389 21,535 21,416 14,259 14,259 14,259 14,259 14,259
Net Worth (Equity) 1,145,312 1,005,653 915,729 774,127 661,994 564,017 480,583 407,397 356,388 296,357
Borrowings 42,870 51,769 13,091 9,427 12,964 22,342 23,870 29,073 55,527 32,644
Working Capital 178,029 192,787 172,257 240,202 202,408 173,164 135,348 107,709 91,928 95,400
Capital Employed 910,001 869,009 752,781 693,329 618,263 513,037 430,333 405,765 389,478 311,787
PBIDT to Turnover (%) 41.28 43.78 39.2 40.7 42.0 43.0 45.6 44.5 53.3 54.3
PBDT to Turnover (%) 42.96 45.29 42.2 43.3 44.2 44.6 47.3 46.1 56.9 57.6
Profit Margin(%)- incl. extraordinary items 17.56 17.87 17.9 19.2 19.8 20.4 22.7 20.2 29.5 26.1
ROCE(PBIDT to Capital Employed) (%) 58.02 54.70 57.6 60.8 61.1 63.4 66.8 51.0 48.6 41.6
Net Profit to Equity (%)- incl. extraordinary items 19.61 19.29 21.6 25.7 26.8 27.3 29.8 23.0 29.4 21.0
Current Ratio 1.24 1.38:1 1.31:1 1.75:1 1.79:1 1.97:1 1.74:1 1.67:1 1.82:1 2.39:1
Debt Equity Ratio 0.03 0.05 0.01 0.01 0.02 0.04 0.05 0.07 0.16 0.11
Debtors Turnover Ratio(Days) 28 24 24 25 20 21 27 23 44 34
Earning Per Share (`)- before extraordinary items (Restated)* 26.25 22.68 23.09 23.23 20.40 17.50 16.76 10.96 12.23 7.27
Earning Per Share (`)- after extraordinary items (Restated)* 26.25 22.68 23.14 23.23 20.77 18.00 16.76 10.96 12.23 7.27
Dividend (%) 175* 330 320 320 310 450 400 240 300 140
Book Value Per Share(`) (Restated)* 134 118 107 90 77 66 56 48 42 35
*Post Bonus & split in 2010-11
FINANCIAL
FINANCIAL PERFORMANCE RATIOS
BALANCE SHEET RATIOS
PER SHARE DATA
ONGC Group Performance at a GlanceONGC Group Performance at a Glance
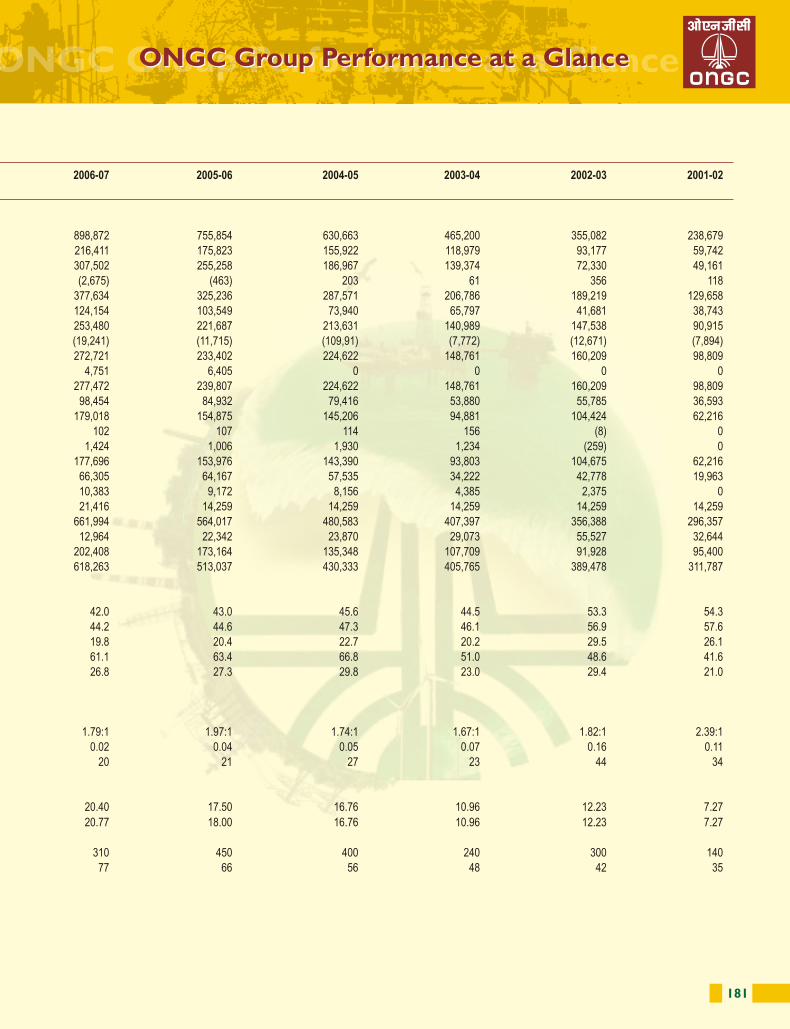
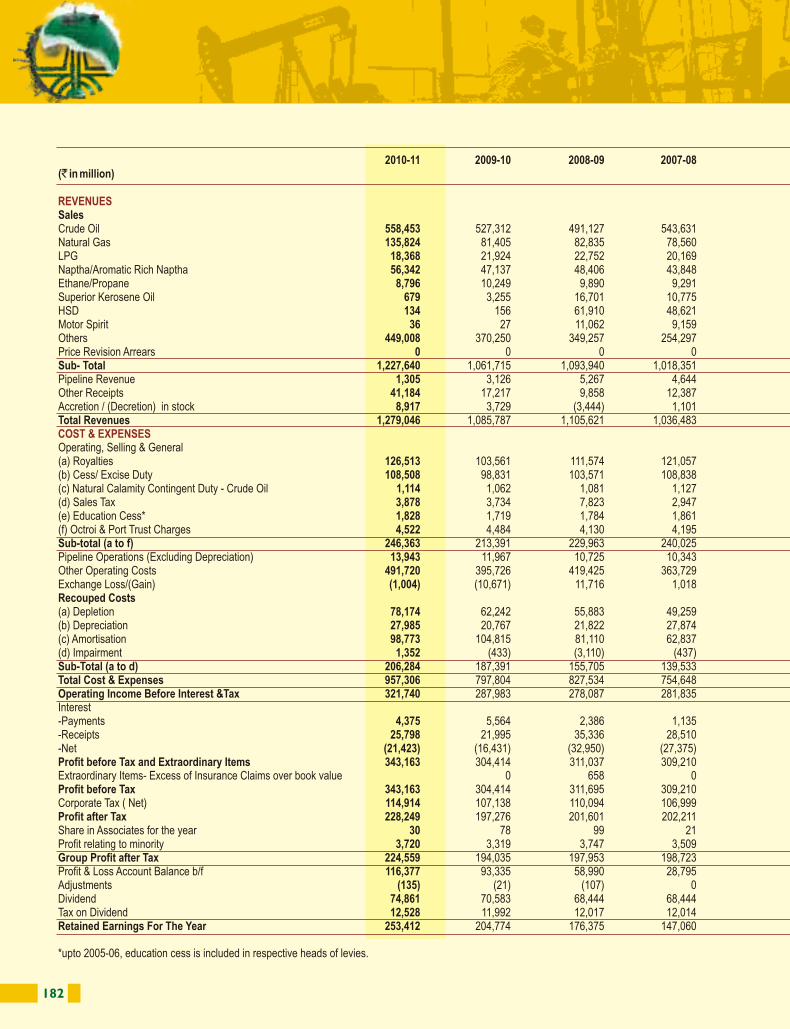
182 183
Statement of Income and Retained Earnings of ONGC Group
Statement of Income and Retained Earnings of ONGC Group
Statement of Income and Retained Earnings of ONGC Group
2010-11 2009-10 2008-09 2007-08 2006-07 2005-06 2004-05 2003-04 2002-03 2001-02(` in million)
SalesCrude Oil 558,453 527,312 491,127 543,631 475,295 382,311 299,765 222,347 245,049 137,155 Natural Gas 135,824 81,405 82,835 78,560 80,117 73,383 57,759 53,508 50,858 49,446 LPG 18,368 21,924 22,752 20,169 14,867 16,279 12,066 16,352 19,087 11,473 Naptha/Aromatic Rich Naptha 56,342 47,137 48,406 43,848 37,907 35,679 29,260 22,538 22,035 18,782 Ethane/Propane 8,796 10,249 9,890 9,291 9,095 7,401 5,705 4,779 5,837 4,082 Superior Kerosene Oil 679 3,255 16,701 10,775 15,754 10,605 16,896 2,658 3,189 1,731 HSD 134 156 61,910 48,621 42,037 23,403 29,277 85 80 0 Motor Spirit 36 27 11,062 9,159 4,530 3,797 6,846 0 0 0 Others 449,008 370,250 349,257 254,297 183,064 188,892 164,217 127,037 1,748 725 Price Revision Arrears 0 0 0 0 11 156 584 3,461 1,568 5,017 Sub- Total 1,227,640 1,061,715 1,093,940 1,018,351 862,677 741,906 622,375 452,765 349,451 228,411 Pipeline Revenue 1,305 3,126 5,267 4,644 3,351 3,214 23 24 478 3,966 Other Receipts 41,184 17,217 9,858 12,387 23,029 11,279 6,989 11,028 6,268 6,300 Accretion / (Decretion) in stock 8,917 3,729 (3,444) 1,101 9,815 (545) 1,276 1,383 (1,115) 2 Total Revenues 1,279,046 1,085,787 1,105,621 1,036,483 898,872 755,854 630,663 465,200 355,082 238,679
Operating, Selling & General(a) Royalties 126,513 103,561 111,574 121,057 104,558 85,242 65,692 44,740 30,762 25,141 (b) Cess/ Excise Duty 108,508 98,831 103,571 108,838 100,160 76,755 68,556 58,647 47,057 25,660 (c) Natural Calamity Contingent Duty - Crude Oil 1,114 1,062 1,081 1,127 1,149 1,080 1,138 1,117 98 0 (d) Sales Tax 3,878 3,734 7,823 2,947 6,009 10,299 17,405 12,239 12,572 7,714 (e) Education Cess* 1,828 1,719 1,784 1,861 1,303 0 0 0 0 0 (f) Octroi & Port Trust Charges 4,522 4,484 4,130 4,195 3,232 2,447 3,131 2,236 2,688 1,227 Sub-total (a to f) 246,363 213,391 229,963 240,025 216,411 175,823 155,922 118,979 93,177 59,742 Pipeline Operations (Excluding Depreciation) 13,943 11,967 10,725 10,343 9,122 7,732 10,320 6,095 5,500 4,951 Other Operating Costs 491,720 395,726 419,425 363,729 298,380 247,526 176,647 133,279 66,830 44,210 Exchange Loss/(Gain) (1,004) (10,671) 11,716 1,018 (2,675) (463) 203 61 356 118 Recouped Costs(a) Depletion 78,174 62,242 55,883 49,259 46,439 34,318 27,802 25,748 17,637 15,961 (b) Depreciation 27,985 20,767 21,822 27,874 29,060 28,556 10,223 10,758 7,651 8,288 (c) Amortisation 98,773 104,815 81,110 62,837 46,925 41,001 35,774 29,129 16,231 14,247 (d) Impairment 1,352 (433) (3,110) (437) 1,730 (326) 141 162 162 247 Sub-Total (a to d) 206,284 187,391 155,705 139,533 124,154 103,549 73,940 65,797 41,681 38,743 Total Cost & Expenses 957,306 797,804 827,534 754,648 645,392 534,167 417,032 324,211 207,544 147,764 Operating Income Before Interest &Tax 321,740 287,983 278,087 281,835 253,480 221,687 213,631 140,989 147,538 90,915 Interest-Payments 4,375 5,564 2,386 1,135 1,906 1,597 1,644 3,785 1,183 2,493 -Receipts 25,798 21,995 35,336 28,510 21,147 13,312 12,635 11,557 13,854 10,387 -Net (21,423) (16,431) (32,950) (27,375) (19,241) (11,715) (10,991) (7,772) (12,671) (7,894)Profit before Tax and Extraordinary Items 343,163 304,414 311,037 309,210 272,721 233,402 224,622 148,761 160,209 98,809 Extraordinary Items- Excess of Insurance Claims over book value 0 658 0 4,751 6,405 0 0 0 0 Profit before Tax 343,163 304,414 311,695 309,210 277,472 239,807 224,622 148,761 160,209 98,809 Corporate Tax ( Net) 114,914 107,138 110,094 106,999 98,454 84,932 79,416 53,880 55,785 36,593 Profit after Tax 228,249 197,276 201,601 202,211 179,018 154,875 145,206 94,881 104,424 62,216 Share in Associates for the year 30 78 99 21 102 107 114 156 (8) 0 Profit relating to minority 3,720 3,319 3,747 3,509 1,424 1,006 1,930 1,234 (259) 0 Group Profit after Tax 224,559 194,035 197,953 198,723 177,696 153,976 143,390 93,803 104,675 62,216 Profit & Loss Account Balance b/f 116,377 93,335 58,990 28,795 8,848 1 1 0 58 (179)Adjustments (135) (21) (107) 0 0 0 0 0 0 0 Dividend 74,861 70,583 68,444 68,444 66,305 64,167 57,535 34,222 42,778 19,963 Tax on Dividend 12,528 11,992 12,017 12,014 10,383 9,172 8,156 4,385 2,375 0 Retained Earnings For The Year 253,412 204,774 176,375 147,060 109,856 80,638 77,700 55,196 59,580 42,074
*upto 2005-06, education cess is included in respective heads of levies.
REVENUES
COST & EXPENSES
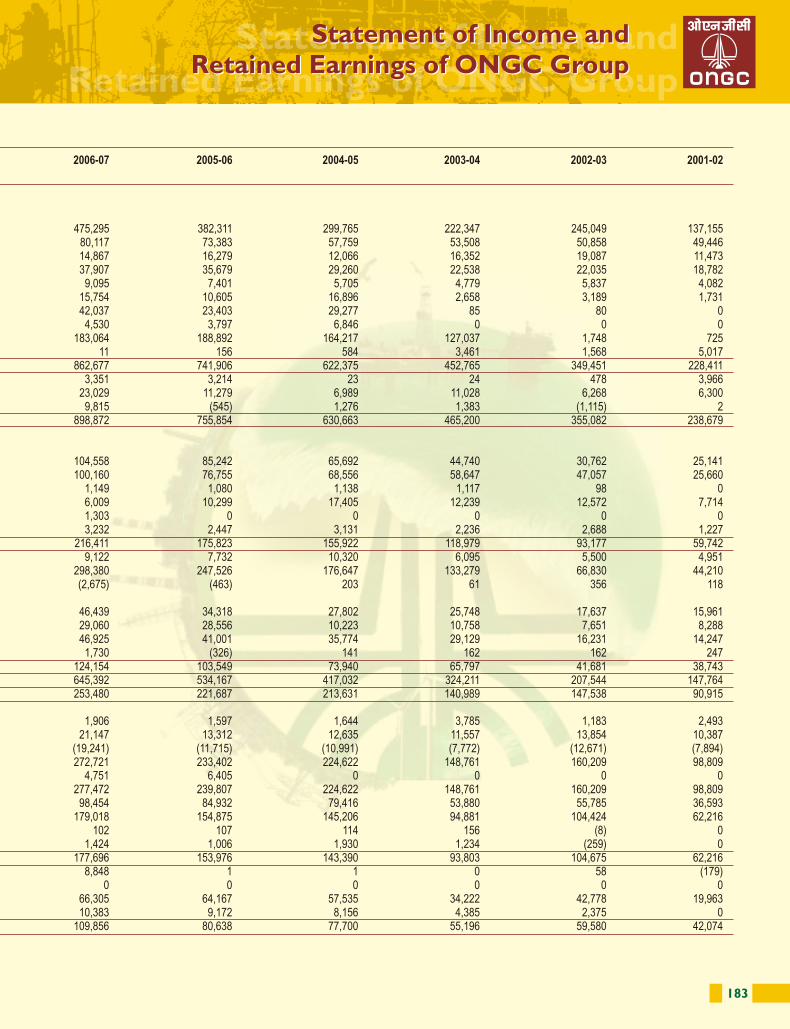
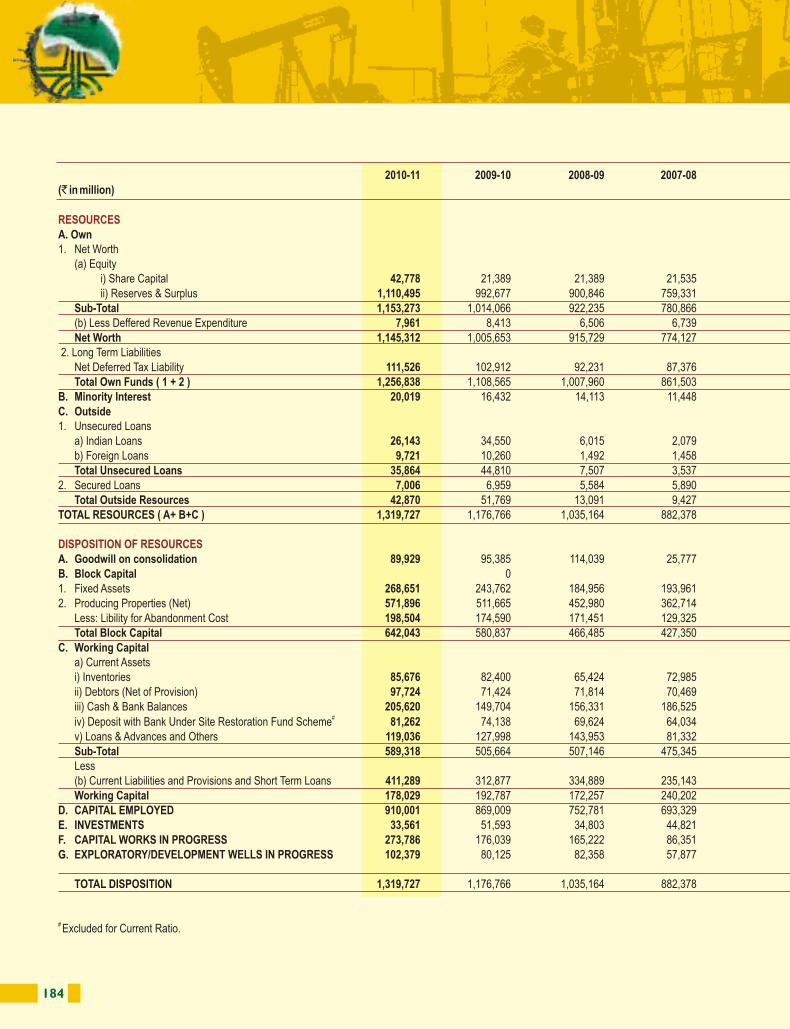
184 185
2010-11 2009-10 2008-09 2007-08 2006-07 2005-06 2004-05 2003-04 2002-03 2001-02(` in million)
A. Own1. Net Worth
(a) Equityi) Share Capital 42,778 21,389 21,389 21,535 21,416 14,259 14,259 14,259 14,259 14,259 ii) Reserves & Surplus 1,110,495 992,677 900,846 759,331 645,719 553,421 471,941 399,158 344,433 284,289
Sub-Total 1,153,273 1,014,066 922,235 780,866 667,135 567,680 486,200 413,417 358,692 298,548 (b) Less Deffered Revenue Expenditure 7,961 8,413 6,506 6,739 5,141 3,663 5,617 6,020 2,304 2,191 Net Worth 1,145,312 1,005,653 915,729 774,127 661,994 564,017 480,583 407,397 356,388 296,357
2. Long Term LiabilitiesNet Deferred Tax Liability 111,526 102,912 92,231 87,376 81,119 71,633 57,894 54,250 47,116 53,471 Total Own Funds ( 1 + 2 ) 1,256,838 1,108,565 1,007,960 861,503 743,113 635,650 538,477 461,647 403,504 349,828
B. Minority Interest 20,019 16,432 14,113 11,448 8,321 7,230 6,204 4,274 5,029 0 C. Outside1. Unsecured Loans
a) Indian Loans 26,143 34,550 6,015 2,079 1,881 1,745 1,643 1,541 5,729 1,658 b) Foreign Loans 9,721 10,260 1,492 1,458 4,526 13,181 11,718 8,431 5,488 30,986 Total Unsecured Loans 35,864 44,810 7,507 3,537 6,407 14,926 13,361 9,972 11,217 32,644
2. Secured Loans 7,006 6,959 5,584 5,890 6,557 7,416 10,509 19,101 44,310 0 Total Outside Resources 42,870 51,769 13,091 9,427 12,964 22,342 23,870 29,073 55,527 32,644
TOTAL RESOURCES ( A+ B+C ) 1,319,727 1,176,766 1,035,164 882,378 764,398 665,222 568,551 494,994 464,060 382,472
A. Goodwill on consolidation 89,929 95,385 114,039 25,777 30,616 17,103 13,683 14,591 12,790 0 B. Block Capital 0 1. Fixed Assets 268,651 243,762 184,956 193,961 185,355 138,806 116,689 117,049 119,932 56,013 2. Producing Properties (Net) 571,896 511,665 452,980 362,714 351,741 312,639 245,554 246,708 190,493 166,913
Less: Libility for Abandonment Cost 198,504 174,590 171,451 129,325 151,857 128,675 80,941 80,292 25,665 6,539 Total Block Capital 642,043 580,837 466,485 427,350 385,239 322,770 281,302 283,465 284,760 216,387
C. Working Capitala) Current Assetsi) Inventories 85,676 82,400 65,424 72,985 58,744 49,432 43,730 35,529 25,635 14,526 ii) Debtors (Net of Provision) 97,724 71,424 71,814 70,469 48,167 44,271 47,091 29,310 42,843 22,514 iii) Cash & Bank Balances 205,620 149,704 156,331 186,525 150,653 45,721 66,035 64,564 40,035 50,845
#iv) Deposit with Bank Under Site Restoration Fund Scheme 81,262 74,138 69,624 64,034 56,103 45,336 36,180 31,682 24,781 6,350 v) Loans & Advances and Others 119,036 127,998 143,953 81,332 74,738 120,683 77,192 60,835 40,456 65,315 Sub-Total 589,318 505,664 507,146 475,345 388,405 305,443 270,228 221,920 173,750 159,550 Less(b) Current Liabilities and Provisions and Short Term Loans 411,289 312,877 334,889 235,143 185,997 132,279 134,880 114,211 81,822 64,150 Working Capital 178,029 192,787 172,257 240,202 202,408 173,164 135,348 107,709 91,928 95,400
D. CAPITAL EMPLOYED 910,001 869,009 752,781 693,329 618,263 513,037 430,333 405,765 389,478 311,787 E. INVESTMENTS 33,561 51,593 34,803 44,821 35,832 35,579 26,555 30,307 30,603 30,232 F. CAPITAL WORKS IN PROGRESS 273,786 176,039 165,222 86,351 64,055 76,292 87,775 13,520 9,338 6,903 G. EXPLORATORY/DEVELOPMENT WELLS IN PROGRESS 102,379 80,125 82,358 57,877 46,248 40,314 23,888 45,402 34,641 33,550
TOTAL DISPOSITION 1,319,727 1,176,766 1,035,164 882,378 764,398 665,222 568,551 494,994 464,060 382,472
# Excluded for Current Ratio.
RESOURCES
DISPOSITION OF RESOURCES
Statement of Financial Position of ONGC Group
Statement of Financial Position of ONGC Group
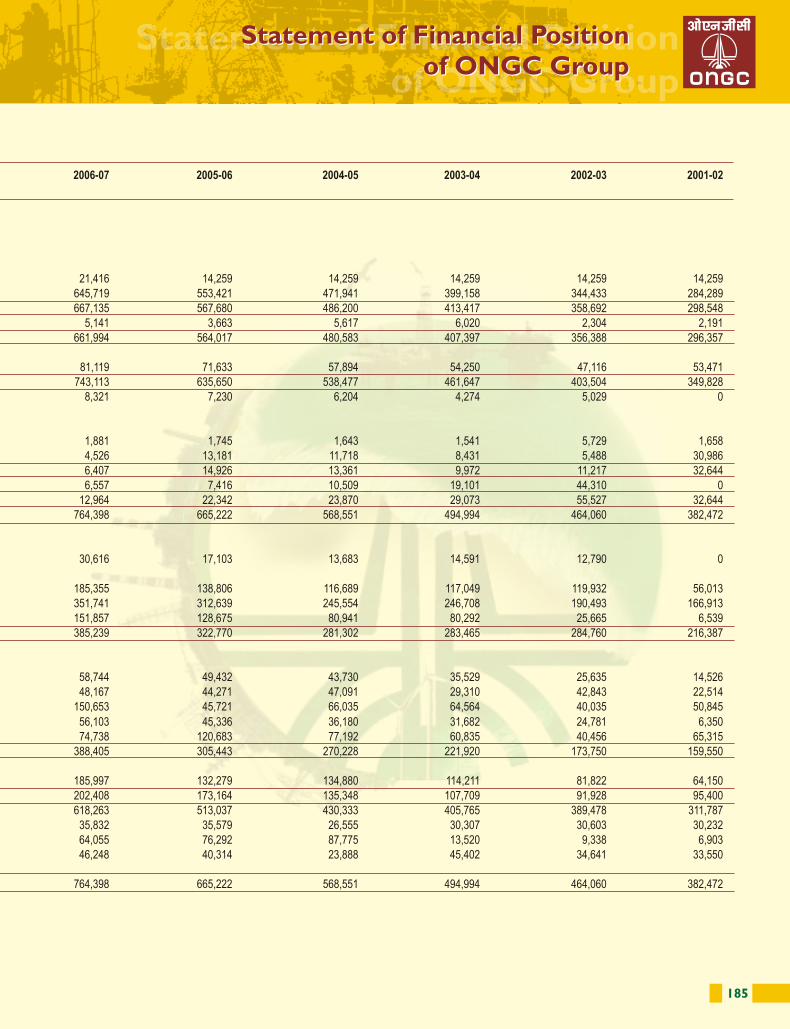
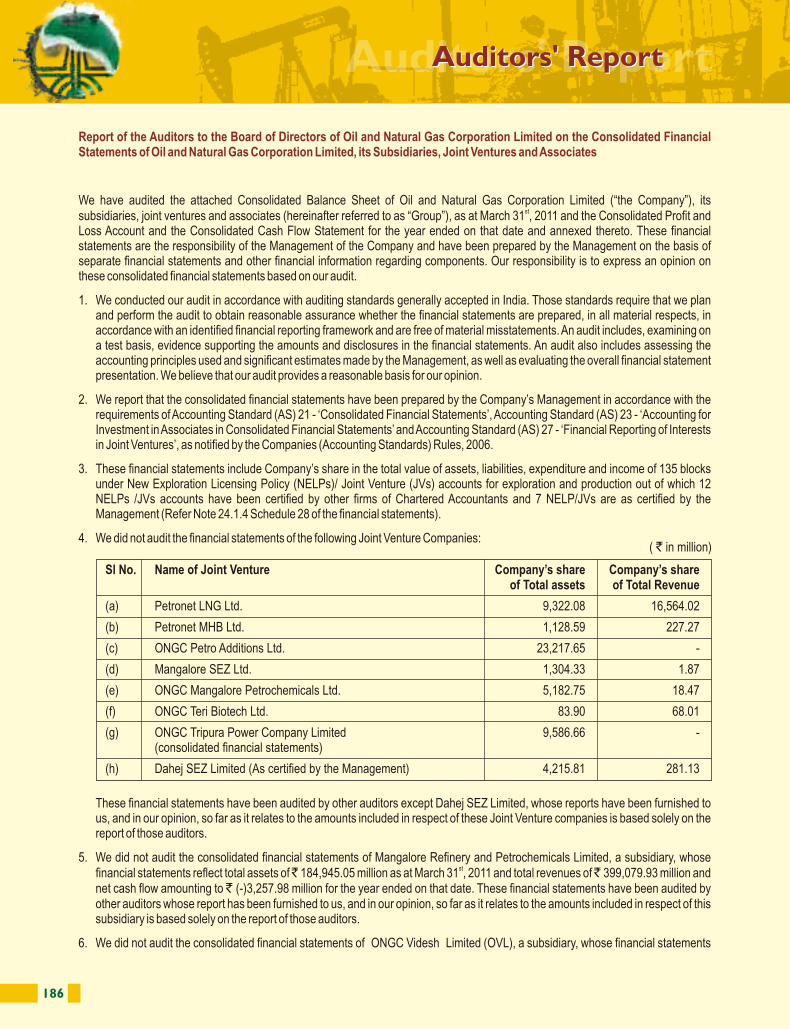
186 187
Report of the Auditors to the Board of Directors of Oil and Natural Gas Corporation Limited on the Consolidated Financial Statements of Oil and Natural Gas Corporation Limited, its Subsidiaries, Joint Ventures and Associates
We have audited the attached Consolidated Balance Sheet of Oil and Natural Gas Corporation Limited (“the Company”), its stsubsidiaries, joint ventures and associates (hereinafter referred to as “Group”), as at March 31 , 2011 and the Consolidated Profit and
Loss Account and the Consolidated Cash Flow Statement for the year ended on that date and annexed thereto. These financial statements are the responsibility of the Management of the Company and have been prepared by the Management on the basis of separate financial statements and other financial information regarding components. Our responsibility is to express an opinion on these consolidated financial statements based on our audit.
1. We conducted our audit in accordance with auditing standards generally accepted in India. Those standards require that we plan and perform the audit to obtain reasonable assurance whether the financial statements are prepared, in all material respects, in accordance with an identified financial reporting framework and are free of material misstatements. An audit includes, examining on a test basis, evidence supporting the amounts and disclosures in the financial statements. An audit also includes assessing the accounting principles used and significant estimates made by the Management, as well as evaluating the overall financial statement presentation. We believe that our audit provides a reasonable basis for our opinion.
2. We report that the consolidated financial statements have been prepared by the Company’s Management in accordance with the requirements of Accounting Standard (AS) 21 - ‘Consolidated Financial Statements’, Accounting Standard (AS) 23 - ‘Accounting for Investment in Associates in Consolidated Financial Statements’ and Accounting Standard (AS) 27 - ‘Financial Reporting of Interests in Joint Ventures’, as notified by the Companies (Accounting Standards) Rules, 2006.
3. These financial statements include Company’s share in the total value of assets, liabilities, expenditure and income of 135 blocks under New Exploration Licensing Policy (NELPs)/ Joint Venture (JVs) accounts for exploration and production out of which 12 NELPs /JVs accounts have been certified by other firms of Chartered Accountants and 7 NELP/JVs are as certified by the Management (Refer Note 24.1.4 Schedule 28 of the financial statements).
4. We did not audit the financial statements of the following Joint Venture Companies:
These financial statements have been audited by other auditors except Dahej SEZ Limited, whose reports have been furnished to us, and in our opinion, so far as it relates to the amounts included in respect of these Joint Venture companies is based solely on the report of those auditors.
5. We did not audit the consolidated financial statements of Mangalore Refinery and Petrochemicals Limited, a subsidiary, whose stfinancial statements reflect total assets of ̀ 184,945.05 million as at March 31 , 2011 and total revenues of ̀ 399,079.93 million and
net cash flow amounting to ̀ (-)3,257.98 million for the year ended on that date. These financial statements have been audited by other auditors whose report has been furnished to us, and in our opinion, so far as it relates to the amounts included in respect of this subsidiary is based solely on the report of those auditors.
6. We did not audit the consolidated financial statements of ONGC Videsh Limited (OVL), a subsidiary, whose financial statements
streflect total assets of ` 437,135.18 million as at March 31 , 2011 and total revenues of ` 186,831.96 million and net cash flow amounting to ` 20,507.87 million for the year ended on that date. These consolidated financial statements of OVL have been audited by other auditors whose consolidated report has been furnished to us, and in our opinion, so far as it relates to the amounts included in respect of the above is based solely on the report of those auditors. These consolidated financial statements of OVL comprise of:
(a) Consolidated financial statements of the following Subsidiaries / Joint Venture Companies which are prepared under respective local laws / Production Sharing Contract/ Joint Operating Agreement.
(i) Subsidiaries audited by local firm of auditors:
(ii) Subsidiary / Joint Venture Company unaudited, as certified by the Management:
Auditors' ReportAuditors' Report
Particulars Total Asset Total Liability Revenue Profit/(Loss) aftertax for the year
stended March 31 , 2011 (Consolidated)
ONGC Nile Ganga BV 116,958.73 10,497.28 106,762.94 14,890.97
Jarpeno Limited 99,988.86 28,914.79 14,813.40 (7,204.70)
ONGC Narmada Limited 79.69 1,428.74 1.40 (855.80)
ONGC Amazon Alaknanda Limited. 33,332.64 808.04 9,556.93 3,292.30
Particulars Total Asset Total Liability Revenue Profit/(Loss) aftertax for the year
stended March 31 , 2011 (Consolidated)
Carabobo One AB Ltd. (9.09) - - (9.51)
ONGC Mittal Energy Ltd. (JV) 3,011.30 6,444.94 361.96 (2,494.18)
( in million)`
Pipeline assembly : Flow assurance studies ensure production improvement
( in million)`
Sl No. Name of Joint Venture Company’s share Company’s shareof Total assets of Total Revenue
(a) Petronet LNG Ltd. 9,322.08 16,564.02
(b) Petronet MHB Ltd. 1,128.59 227.27
(c) ONGC Petro Additions Ltd. 23,217.65 -
(d) Mangalore SEZ Ltd. 1,304.33 1.87
(e) ONGC Mangalore Petrochemicals Ltd. 5,182.75 18.47
(f) ONGC Teri Biotech Ltd. 83.90 68.01
(g) ONGC Tripura Power Company Limited 9,586.66 -(consolidated financial statements)
(h) Dahej SEZ Limited (As certified by the Management) 4,215.81 281.13
( ` in million)
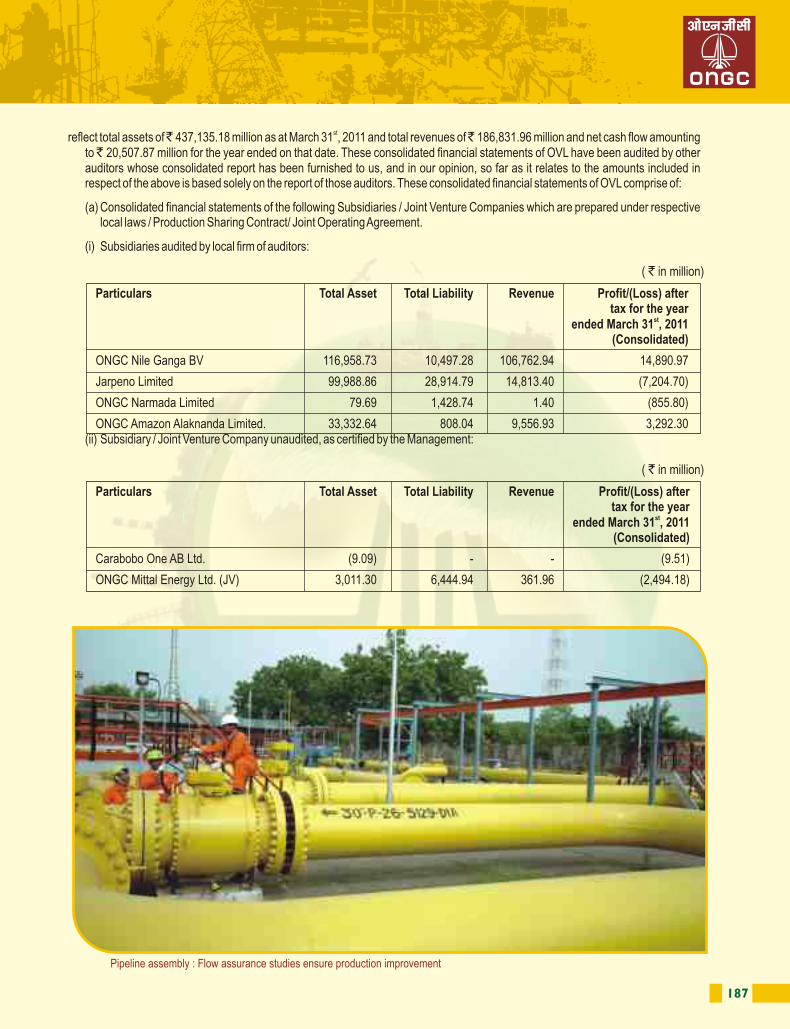
186 187
Report of the Auditors to the Board of Directors of Oil and Natural Gas Corporation Limited on the Consolidated Financial Statements of Oil and Natural Gas Corporation Limited, its Subsidiaries, Joint Ventures and Associates
We have audited the attached Consolidated Balance Sheet of Oil and Natural Gas Corporation Limited (“the Company”), its stsubsidiaries, joint ventures and associates (hereinafter referred to as “Group”), as at March 31 , 2011 and the Consolidated Profit and
Loss Account and the Consolidated Cash Flow Statement for the year ended on that date and annexed thereto. These financial statements are the responsibility of the Management of the Company and have been prepared by the Management on the basis of separate financial statements and other financial information regarding components. Our responsibility is to express an opinion on these consolidated financial statements based on our audit.
1. We conducted our audit in accordance with auditing standards generally accepted in India. Those standards require that we plan and perform the audit to obtain reasonable assurance whether the financial statements are prepared, in all material respects, in accordance with an identified financial reporting framework and are free of material misstatements. An audit includes, examining on a test basis, evidence supporting the amounts and disclosures in the financial statements. An audit also includes assessing the accounting principles used and significant estimates made by the Management, as well as evaluating the overall financial statement presentation. We believe that our audit provides a reasonable basis for our opinion.
2. We report that the consolidated financial statements have been prepared by the Company’s Management in accordance with the requirements of Accounting Standard (AS) 21 - ‘Consolidated Financial Statements’, Accounting Standard (AS) 23 - ‘Accounting for Investment in Associates in Consolidated Financial Statements’ and Accounting Standard (AS) 27 - ‘Financial Reporting of Interests in Joint Ventures’, as notified by the Companies (Accounting Standards) Rules, 2006.
3. These financial statements include Company’s share in the total value of assets, liabilities, expenditure and income of 135 blocks under New Exploration Licensing Policy (NELPs)/ Joint Venture (JVs) accounts for exploration and production out of which 12 NELPs /JVs accounts have been certified by other firms of Chartered Accountants and 7 NELP/JVs are as certified by the Management (Refer Note 24.1.4 Schedule 28 of the financial statements).
4. We did not audit the financial statements of the following Joint Venture Companies:
These financial statements have been audited by other auditors except Dahej SEZ Limited, whose reports have been furnished to us, and in our opinion, so far as it relates to the amounts included in respect of these Joint Venture companies is based solely on the report of those auditors.
5. We did not audit the consolidated financial statements of Mangalore Refinery and Petrochemicals Limited, a subsidiary, whose stfinancial statements reflect total assets of ̀ 184,945.05 million as at March 31 , 2011 and total revenues of ̀ 399,079.93 million and
net cash flow amounting to ̀ (-)3,257.98 million for the year ended on that date. These financial statements have been audited by other auditors whose report has been furnished to us, and in our opinion, so far as it relates to the amounts included in respect of this subsidiary is based solely on the report of those auditors.
6. We did not audit the consolidated financial statements of ONGC Videsh Limited (OVL), a subsidiary, whose financial statements
streflect total assets of ̀ 437,135.18 million as at March 31 , 2011 and total revenues of ̀ 186,831.96 million and net cash flow amounting to ̀ 20,507.87 million for the year ended on that date. These consolidated financial statements of OVL have been audited by other auditors whose consolidated report has been furnished to us, and in our opinion, so far as it relates to the amounts included in respect of the above is based solely on the report of those auditors. These consolidated financial statements of OVL comprise of:
(a) Consolidated financial statements of the following Subsidiaries / Joint Venture Companies which are prepared under respective local laws / Production Sharing Contract/ Joint Operating Agreement.
(i) Subsidiaries audited by local firm of auditors:
(ii) Subsidiary / Joint Venture Company unaudited, as certified by the Management:
Auditors' ReportAuditors' Report
Particulars Total Asset Total Liability Revenue Profit/(Loss) aftertax for the year
stended March 31 , 2011 (Consolidated)
ONGC Nile Ganga BV 116,958.73 10,497.28 106,762.94 14,890.97
Jarpeno Limited 99,988.86 28,914.79 14,813.40 (7,204.70)
ONGC Narmada Limited 79.69 1,428.74 1.40 (855.80)
ONGC Amazon Alaknanda Limited. 33,332.64 808.04 9,556.93 3,292.30
Particulars Total Asset Total Liability Revenue Profit/(Loss) aftertax for the year
stended March 31 , 2011 (Consolidated)
Carabobo One AB Ltd. (9.09) - - (9.51)
ONGC Mittal Energy Ltd. (JV) 3,011.30 6,444.94 361.96 (2,494.18)
( in million)`
Pipeline assembly : Flow assurance studies ensure production improvement
( in million)`
Sl No. Name of Joint Venture Company’s share Company’s shareof Total assets of Total Revenue
(a) Petronet LNG Ltd. 9,322.08 16,564.02
(b) Petronet MHB Ltd. 1,128.59 227.27
(c) ONGC Petro Additions Ltd. 23,217.65 -
(d) Mangalore SEZ Ltd. 1,304.33 1.87
(e) ONGC Mangalore Petrochemicals Ltd. 5,182.75 18.47
(f) ONGC Teri Biotech Ltd. 83.90 68.01
(g) ONGC Tripura Power Company Limited 9,586.66 -(consolidated financial statements)
(h) Dahej SEZ Limited (As certified by the Management) 4,215.81 281.13
( ` in million)
188 189
In respect of:
I. Item no. (i) above so far it relates to amounts included, is based solely on the report of the other auditors and
II. Item no. (ii) above so far it relates to amounts included, we do not express any opinion on the same and also do not haveresponsibility for the impact, if any, in the consolidated financial statements.
(b) Company’s share of Assets, Liabilities, Revenues and Expenditure in the Joint Ventures of OVL include 29 projects held in the books of the respective Subsidiary/Joint Venture as mentioned in 6(a) above and 20 projects which have been certified under respective local laws / Production Sharing Contract/ Joint Operating Agreement by local audit firm and 9 projects have been certified by the Management as detailed in Note no. 24.2.2 of Schedule 28.
7. For the purpose of considering the investment in Pawan Hans Helicopters Ltd, an associate in the consolidated financial statements, stthe share of profit for the year ended 31 March, 2011, amounting to ` 28.67 million based on unaudited accounts has been
considered in the current year. We did not audit the financial statements of this associate, and in our opinion, so far as it relates to the amounts included in respect of this associate, is based solely on the financial statements certified by the Management.
8. We have placed reliance on technical / commercial evaluation by the Management in respect of categorization of wells as exploratory, development and producing, allocation of cost incurred on them, depletion of producing properties / impairment on the basis of proved developed hydrocarbon reserves, liability for abandonment costs, liabilities under NELP for under performance against Minimum Work Programme and allocation of depreciation on process platforms to transportation and facilities.
9. Without qualifying our opinion attention is invited to note no. 8.1 of Schedule 28 in respect of recognition of sales Revenue of crude oil and natural gas
10. We report that on the basis of information and explanations given to us and on the consideration of the audit reports on financial statements of the Company, its subsidiaries, joint ventures and associates and certification of Management in respect of unaudited accounts referred to in Para 3, 4(h) and 6 (a)(ii) above, we are of the opinion that the consolidated financial statements read with notes to accounts give a true and fair view in conformity with the accounting principles generally accepted in India:
sta. in the case of the Consolidated Balance Sheet, of the state of affairs of the Group as at March 31 , 2011; and
b. in the case of the Consolidated Profit and Loss Account, of the profit of the Group for the year ended on that date; and
c. in the case of the Consolidated Cash Flow Statement, of the cash flows of the Group for the year ended on that date.
Gas collecting station at Nazira : Round-the-clock monitoring
For M/s Kalyaniwalla & Mistry For M/s Arun K Agarwal & Associates For M/s S Bhandari & Co.
Chartered Accountants Chartered Accountants Chartered Accountants
Firm Reg No. 104607W Firm Reg No. 003917N Firm Reg No.000560C
(Ermin K. Irani) (Vimal Kumar Jain) (P.P.Pareek)
Partner (Mem. No. 035646) Partner (Mem. No. 086657) Partner (Mem. No. 071213)
For M/s Ray & Ray For M/s M Kuppuswamy P S G & Co.
Chartered Accountants Chartered Accountants
Firm Reg No.301072E Firm Reg No.001616S
(B.K. Ghosh) (M.K. Krishnan)
Partner (Mem. No. 051028) Partner (Mem. No.020116)
New DelhithMay 30 , 2011
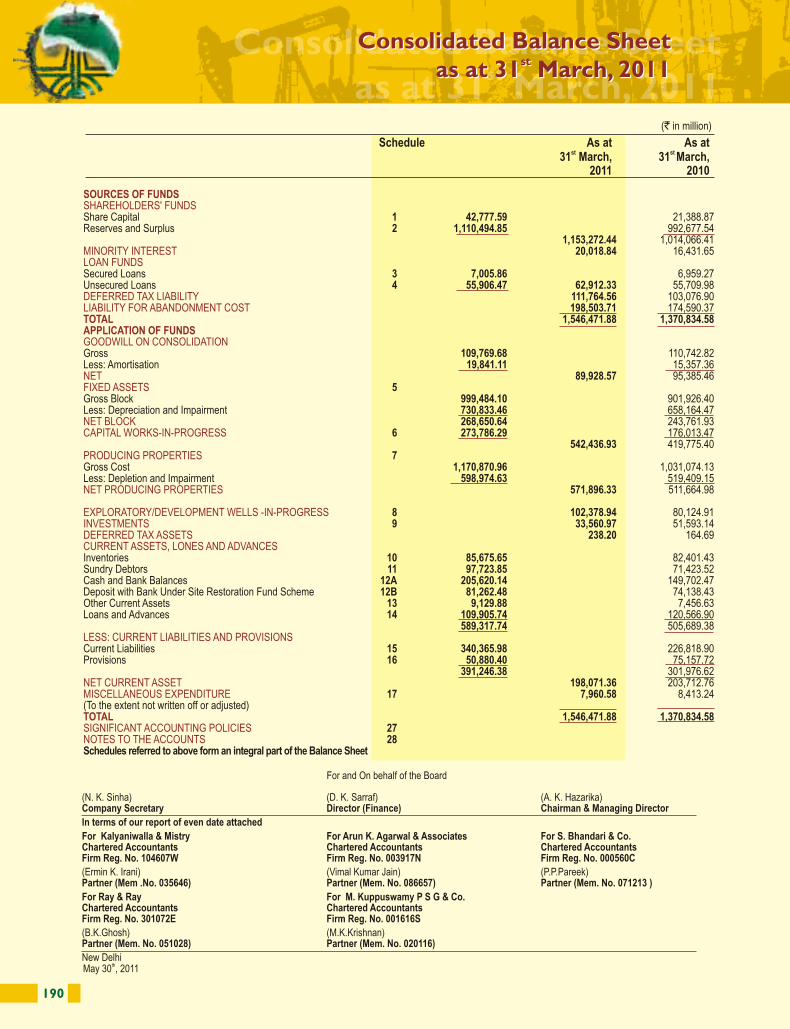
190 191
SOURCES OF FUNDSSHAREHOLDERS' FUNDS
MINORITY INTERESTLOAN FUNDS
DEFERRED TAX LIABILITYLIABILITY FOR ABANDONMENT COSTTOTALAPPLICATION OF FUNDSGOODWILL ON CONSOLIDATION
NETFIXED ASSETS
NET BLOCKCAPITAL WORKS-IN-PROGRESS
PRODUCING PROPERTIES
NET PRODUCING PROPERTIES EXPLORATORY/DEVELOPMENT WELLS -IN-PROGRESSINVESTMENTS DEFERRED TAX ASSETSCURRENT ASSETS, LONES AND ADVANCES
LESS: CURRENT LIABILITIES AND PROVISIONS
NET CURRENT ASSETMISCELLANEOUS EXPENDITURE
TOTALSIGNIFICANT ACCOUNTING POLICIESNOTES TO THE ACCOUNTS
Share Capital 1 42,777.59 21,388.87Reserves and Surplus 2 1,110,494.85 992,677.54
1,153,272.44 1,014,066.41 20,018.84 16,431.65
Secured Loans 3 7,005.86 6,959.27Unsecured Loans 4 55,906.47 62,912.33 55,709.98
111,764.56 103,076.90198,503.71 174,590.37
1,546,471.88 1,370,834.58
Gross 109,769.68 110,742.82Less: Amortisation 19,841.11 15,357.36
89,928.57 95,385.465
Gross Block 999,484.10 901,926.40 Less: Depreciation and Impairment 730,833.46 658,164.47
268,650.64 243,761.93 6 273,786.29 176,013.47
542,436.93 419,775.407
Gross Cost 1,170,870.96 1,031,074.13 Less: Depletion and Impairment 598,974.63 519,409.15
571,896.33 511,664.98
8 102,378.94 80,124.91 9 33,560.97 51,593.14
238.20 164.69
Inventories 10 85,675.65 82,401.43 Sundry Debtors 11 97,723.85 71,423.52Cash and Bank Balances 12A 205,620.14 149,702.47Deposit with Bank Under Site Restoration Fund Scheme 12B 81,262.48 74,138.43 Other Current Assets 13 9,129.88 7,456.63Loans and Advances 14 109,905.74 120,566.90
589,317.74 505,689.38
Current Liabilities 15 340,365.98 226,818.90Provisions 16 50,880.40 75,157.72
391,246.38 301,976.62198,071.36 203,712.76
17 7,960.58 8,413.24 (To the extent not written off or adjusted)
1,546,471.88 1,370,834.582728
Schedules referred to above form an integral part of the Balance Sheet
Schedule As at As at st st 31 March, 31 March,
2011 2010
(` in million)
(N. K. Sinha) (D. K. Sarraf) (A. K. Hazarika)Company Secretary Director (Finance) Chairman & Managing Director
In terms of our report of even date attached
For Kalyaniwalla & Mistry For Arun K. Agarwal & Associates For S. Bhandari & Co.Chartered Accountants Chartered Accountants Chartered AccountantsFirm Reg. No. 104607W Firm Reg. No. 003917N Firm Reg. No. 000560C
(Ermin K. Irani) (Vimal Kumar Jain) (P.P.Pareek)Partner (Mem .No. 035646) Partner (Mem. No. 086657) Partner (Mem. No. 071213 )
For Ray & Ray For M. Kuppuswamy P S G & Co. Chartered Accountants Chartered AccountantsFirm Reg. No. 301072E Firm Reg. No. 001616S
(B.K.Ghosh) (M.K.Krishnan) Partner (Mem. No. 051028) Partner (Mem. No. 020116)
New DelhithMay 30 , 2011
For and On behalf of the Board
Consolidated Profit and Loss Account for stThe Year Ended 31 March, 2011
Consolidated Balance Sheet st
as at 31 March, 2011
Consolidated Balance Sheet stas at 31 March, 2011
Consolidated Profit and Loss Account for stThe Year Ended 31 March, 2011
Consolidated Balance Sheet st
as at 31 March, 2011Consolidated Profit and Loss Account for
stThe Year Ended 31 March, 2011
Schedule 2010-11 2009-10
INCOME
Net Sales
EXPENDITURE
Profit before Tax Provision for Taxation
Profit after Taxation
Group Profit after Tax
BALANCE AVAILABLE FOR APPROPRIATION
APPROPRIATIONS
Earning per Equity Share - Basic and Diluted/(restated) (`)
SIGNIFICANT ACCOUNTING POLICIESNOTES TO THE ACCOUNTS
Gross Sales 18 1,227,685.75 1,061,688.44 Less : Excise Duty 51,534.46 44,142.77
1,176,151.29 1,017,545.67 Other Income 19 69,289.33 52,708.18
1,245,440.62 1,070,253.85
(Increase)/ Decrease in stock 20 (8,916.91) (3,728.81)Purchases 0.64 37.92 Production, Transportation, Selling and Distribution Expenditure 21 684,645.19 571,725.94 Depreciation, Depletion, Amortisation and Impairment 22 206,263.38 187,188.30 Financing Costs 23 4,374.43 5,021.90 Provisions and Write-offs (Net) 24 15,799.01 5,995.57 Adjustments relating to Prior Period (Net) 25 111.71 (400.61)
902,277.45 765,840.21
343,163.17 304,413.64
Current Tax (including Wealth Tax ` 130.75 million Previous year ` 141.11 million) 114,051.32 95,756.65 For Earlier years (7,853.61) (176.45) Deferred Tax 8,795.93 11,557.72 Fringe Benefit Tax (80.20) -
228,249.73 197,275.72 Add: Share of Profit/(Loss) in Associate 30.00 78.13 Less: Share of Profit/(Loss)- Minority Interest 3,720.41 3,318.53
224,559.32 194,035.32 Surplus at the beginning 116,377.36 93,335.23 Excess provision for dividend in earlier years 1.47 -Adjustment due to Change in holding/other adjustment (136.74) (21.32)
340,801.41 287,349.23
Proposed Dividend on Equity Shares 6,416.62 32,083.09 Tax on Proposed Dividend 1,412.54 5,705.15 Interim Dividend 68,443.92 38,499.71 Tax on Interim Dividend 11,115.52 6,287.01 Transfer to General Reserve 104,795.62 87,242.72 Transfer to Debenture Redumption Reserve 4,307.64 1,154.19 Balance carried to Balance Sheet 144,309.55 116,377.36
340,801.41 287,349.23
26 26.25 22.68(Face Value ` 5/-Per Share) (Previous Year Face Value ` 10/-Per Share)
2728
Schedules referred to above form an integral part of the Profit & Loss Accounts
(` in million)
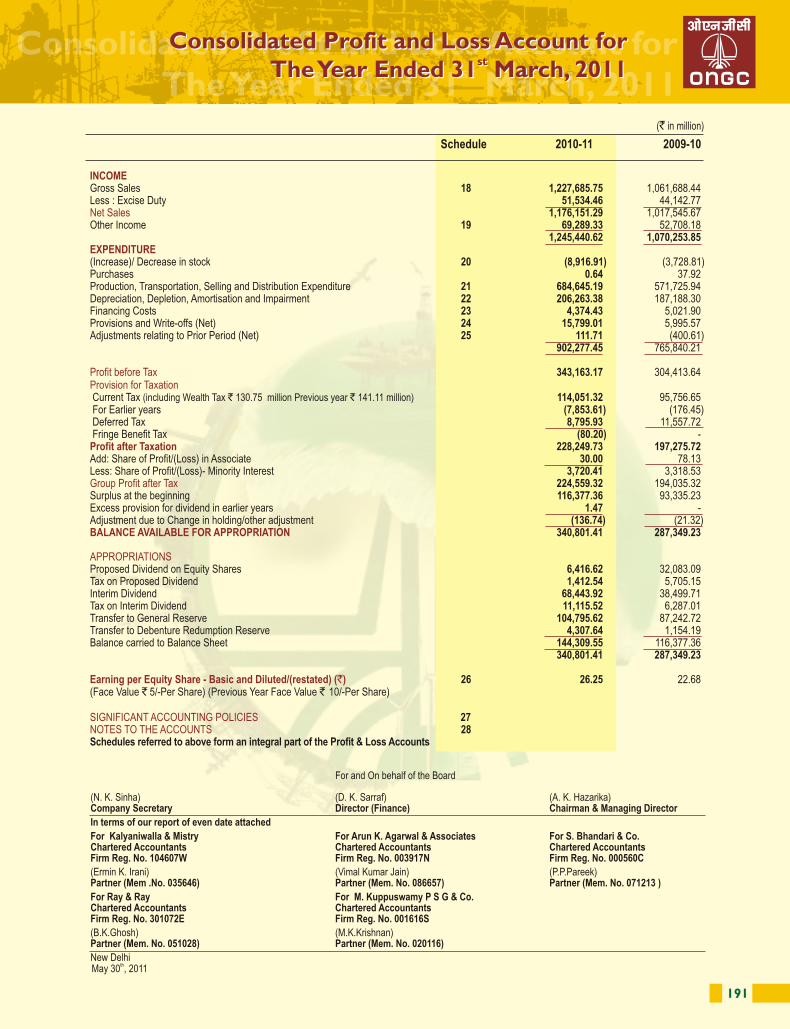
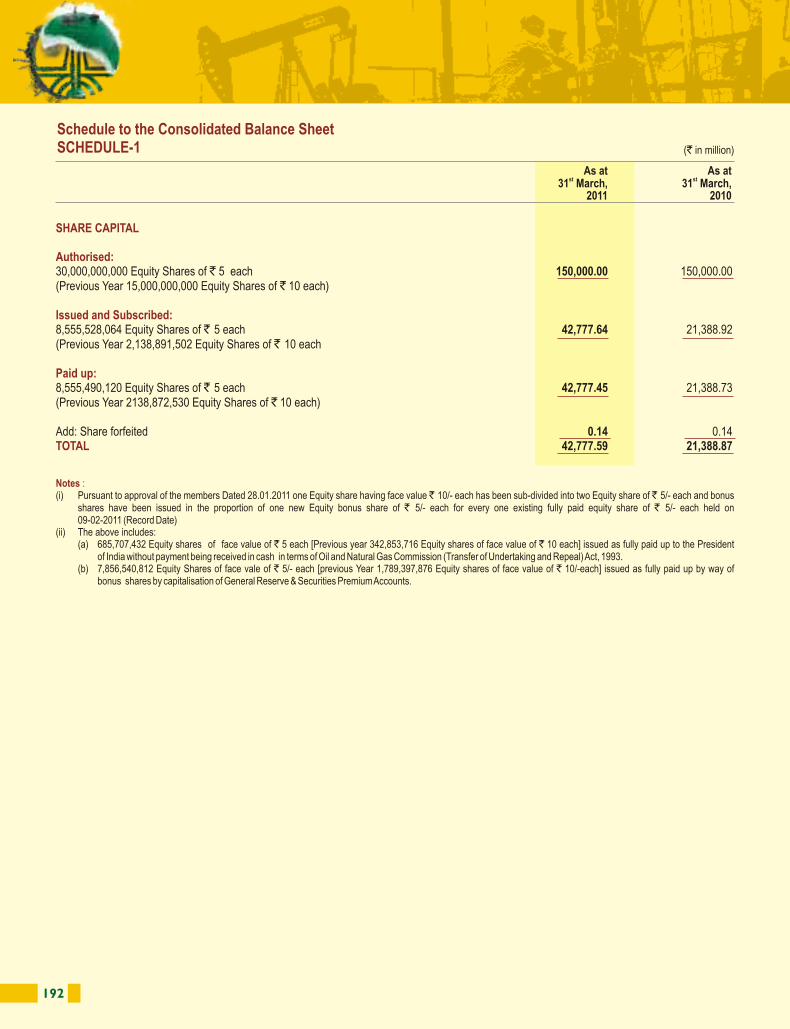
192 193
(` in million)
SHARE CAPITAL
Authorised:
Issued and Subscribed:
Paid up:
TOTAL
Notes :
30,000,000,000 Equity Shares of ` 5 each 150,000.00 150,000.00 (Previous Year 15,000,000,000 Equity Shares of ` 10 each)
8,555,528,064 Equity Shares of ` 5 each 42,777.64 21,388.92 (Previous Year 2,138,891,502 Equity Shares of ` 10 each
8,555,490,120 Equity Shares of ` 5 each 42,777.45 21,388.73(Previous Year 2138,872,530 Equity Shares of ` 10 each)
Add: Share forfeited 0.14 0.14 42,777.59 21,388.87
(i) Pursuant to approval of the members Dated 28.01.2011 one Equity share having face value ` 10/- each has been sub-divided into two Equity share of ` 5/- each and bonus shares have been issued in the proportion of one new Equity bonus share of ` 5/- each for every one existing fully paid equity share of ` 5/- each held on 09-02-2011 (Record Date)
(ii) The above includes:(a) 685,707,432 Equity shares of face value of ` 5 each [Previous year 342,853,716 Equity shares of face value of ` 10 each] issued as fully paid up to the President
of India without payment being received in cash in terms of Oil and Natural Gas Commission (Transfer of Undertaking and Repeal) Act, 1993.(b) 7,856,540,812 Equity Shares of face vale of ` 5/- each [previous Year 1,789,397,876 Equity shares of face value of ` 10/-each] issued as fully paid up by way of
bonus shares by capitalisation of General Reserve & Securities Premium Accounts.
Schedule to the Consolidated Balance SheetSCHEDULE-1
Schedule to the Consolidated Balance SheetSCHEDULE-2
RESERVES AND SURPLUS
Capital Reserve *
Capital Redemption Reserve
Securities Premium Account
Deferred Government Grant
Insurance Reserve
Foreign Exchange Translation Reserve
General Reserve
Profit and Loss AccountDebenture Redumption Reserve
TOTAL
Note:
a) As per Last Balance Sheet** 1,015.06 1,103.02b) Addition/(deduction) during the year (6.15) (87.96)
1,008.91 1,015.06
a) As per Last Balance Sheet 0.09 0.09
a) As per Last Balance Sheet 312.45 312.45b) Less: Bonus share issued 168.12 -
144.33 312.45
a) As per Last Balance Sheet 39.45 44.73b) Less : Transfer to General Reserve*** 4.72 5.28
34.73 39.45
a) As per Last Balance Sheet 2,500.00 2,500.00b) Less: Transfer to General Reserve 2,500.00 - -
2,500.00 a) As per Last Balance Sheet (4,115.28) 15,399.10b) Addition/(deletion) 2,181.46 (19,514.38)
(1,933.82) (4,115.28)
a) As per Last Balance Sheet 875,394.22 788,151.50b) Add: Transferred from Insurance reserve 2,500.00 -c) Add: Transferred from Profit and Loss Account 104,795.62 87,242.72c) Less : Bonus Shares issued 21,220.61 -
961,469.23 875,394.22144,309.55 116,377.36
a) As per Last Balance Sheetb) Transferred from Profit and Loss Account 4,307.64 1,154.19
5,461.83 1,154.191,110,494.85 992,677.54
Includes ` (-) 3075.31 million share of jointly controlled entities. (Previous year ` (-) 380.82 million)
* Includes ` 159.44 million being assesed value of assets received as gift.** Includes Capital Reserve on Consolidation ` 4.18 million (Previous year ` 4.18 million)***Represents the amount equivalent to Depreciation for the year transferred to Profit and Loss Account.
1,154.19
(` in million)
As atst31 March,
2010
As atst31 March,
2010
As atst31 March,
2011
As atst31 March,
2011
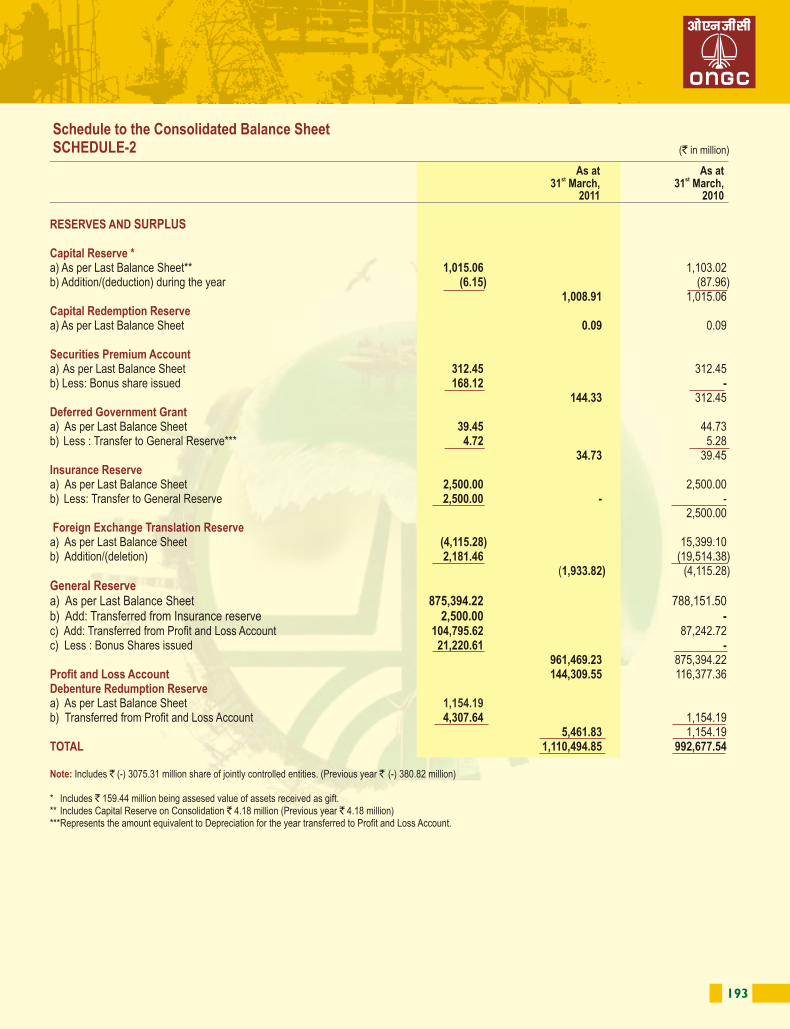
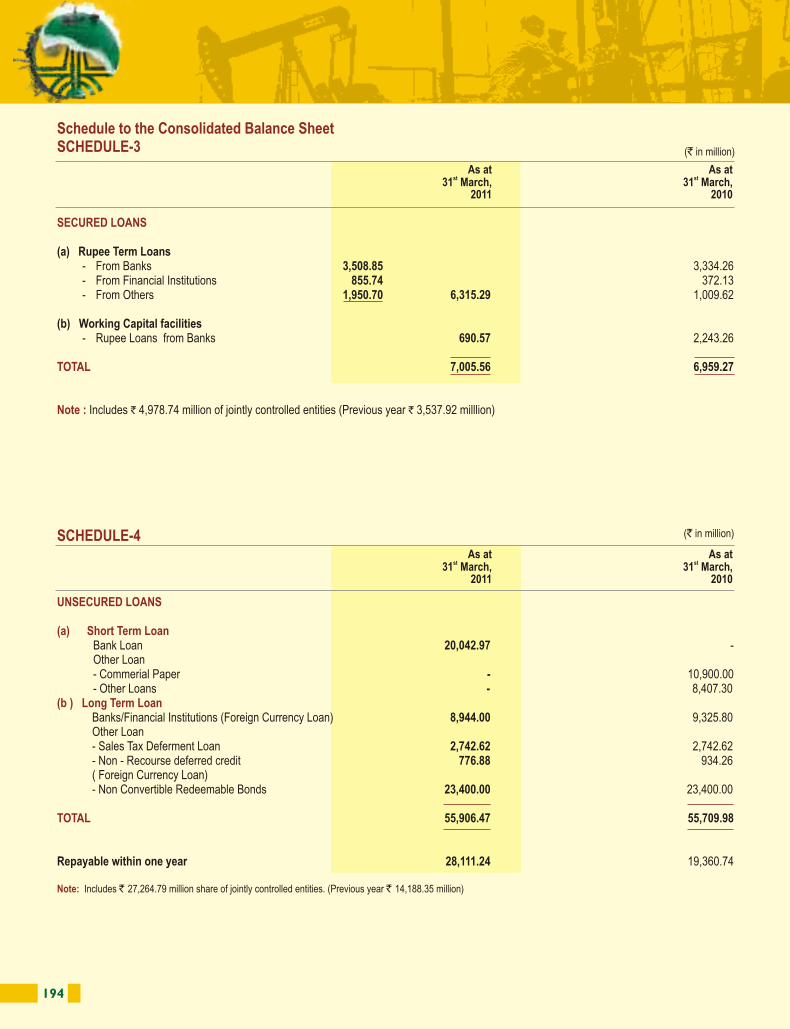
194 195
(` in million)
Schedule to the Consolidated Balance SheetSCHEDULE-5
PARTICULARSAs at
st1 April,2010
Additionsduring the
year
Deletions/adjustments
during theyear
As atst31
March,2011
Uptost31 March
2010 Charged Reversed
Deletions/Adjustments
during theyear
Uptost31 March
2011
As atst31 March,
2011
As atst31 March,
2010
GROSS BLOCK D E P R E C I A T I O N AND I M PA I R M E N T NET BLOCK
Impairment
Notes:1. Additions to Plant and Machinery are net of ` 100.23 million on account of foreign currency translation adjustment during the year (previous year ` (-) 3,122.02 million)2. Land includes land in respect of certain projects for which execution of lease/conveyance deeds are in process. 3. Registration of title deeds in respect of certain Buildings is pending execution.4. Plant & Machinery-owned includes an amount of ` 782.98 million (previous year ` 782.98 million) being MRPL's share of an asset jointly owned with another company. Net Block ` 29.92 million
(Previous Year `4.19 million).5. Net Fixed Assets include ` 9057.24million share of jointly controlled entities. (Previous year ` 6,741.12 million)6. Depreciation for the year includes `204.29 million taken to prior period. (Previous year ` 119.66 million)7. Plant & Machinery includes Jetty & Trestle (Gross block of ` 45,437.82 million). As per the agreement, ownership of assets will be transferred to the Gujarat Maritime Board in the year 2035.8. Building includes cost of undivided interest in land
Land I) Freehold 2,356.51 453.61 (0.01) 2,810.13 13.85 - - 0.36 - 13.49 2,796.64 2,342.66 ii) Leasehold 9,664.54 330.01 (2,550.42) 12,544.97 364.65 173.02 - - (91.66) 629.33 11,915.64 9,299.89
Buildings and Bunk Houses 22,048.68 4,578.73 356.74 26,270.67 8,503.92 940.36 - 0.47 (12.46) 9,456.27 16,814.40 13,544.76
Railway Sidings 134.62 0.06 - 134.68 83.82 1.05 - - - 84.87 49.81 50.80
Plant and Machinery I) Owned 841,748.83 113,582.65 23,386.39 931,945.09 634,001.38 81,081.95 596.46 141.43 10,979.96 704,558.40 227,386.69 207,747.45
ii) Leased 428.13 - 428.13 - - - - - - - - 428.13
Furniture and Fittings 12,623.57 1,140.59 466.99 13,297.17 5,730.33 1,369.16 1.33 1.23 332.65 6,766.94 6,530.23 6,893.24
Vehicles, Survey Ships, Crew Boats, Aircrafts and Helicopters 6,782.12 494.76 1,211.17 6,065.71 5,495.22 419.21 - 1.13 1,266.37 4,646.93 1,418.78 1,286.90
895,787.00 120,580.41 23,298.99 993,068.42 654,193.17 83,984.75 597.79 144.62 12,474.86 726,156.23 266,912.19 241,593.83
Intangibles 6,139.40 298.75 22.47 6,415.68 3,971.30 719.13 - 0.01 13.19 4,677.23 1,738.45 2,168.10
TOTAL 901,926.40 120,879.16 23,321.46 999,484.10 658,164.47 84,703.88 597.79 144.63 12,488.05 730,833.46 268,650.64 243,761.93
Previous year 784,247.57 124,616.26 6,937.43 901,926.40 599,291.73 57,130.43 233.58 181.80 (1,690.53) 658,164.47 243,761.93 184,955.84
The above includes the Corporation's share in Joint Venture Assets 135,066.99 44,515.88 9,289.84 170,293.03 81,684.78 29,733.95 100.71 - 11,878.69 99,640.75 70,652.28
Previous year 119,279.17 19,241.31 3,453.49 135,066.99 73,878.86 9,778.28 - - 1,972.36 81,684.78 53,382.21
(` in million)
Schedule to the Consolidated Balance SheetSCHEDULE-3
SECURED LOANS
TOTAL
Note :
(a) Rupee Term Loans - From Banks 3,508.85 3,334.26 - From Financial Institutions 855.74 372.13 - From Others 1,950.70 6,315.29 1,009.62
(b) Working Capital facilities - Rupee Loans from Banks 690.57 2,243.26
7,005.56 6,959.27
Includes ` 4,978.74 million of jointly controlled entities (Previous year ` 3,537.92 milllion)
(` in million)SCHEDULE-4
UNSECURED LOANS
(a) Short Term Loan
(b ) Long Term Loan
TOTAL
Note:
Bank Loan 20,042.97 - Other Loan - Commerial Paper - 10,900.00 - Other Loans - 8,407.30
Banks/Financial Institutions (Foreign Currency Loan) 8,944.00 9,325.80 Other Loan - Sales Tax Deferment Loan 2,742.62 2,742.62 - Non - Recourse deferred credit 776.88 934.26 ( Foreign Currency Loan) - Non Convertible Redeemable Bonds 23,400.00 23,400.00
55,906.47 55,709.98
Repayable within one year 28,111.24 19,360.74
Includes ` 27,264.79 million share of jointly controlled entities. (Previous year ` 14,188.35 million)
FIXED ASSETS
Depreciation
For the Year
As atst31 March,
2010
As atst31 March,
2010
As atst31 March,
2011
As atst31 March,
2011
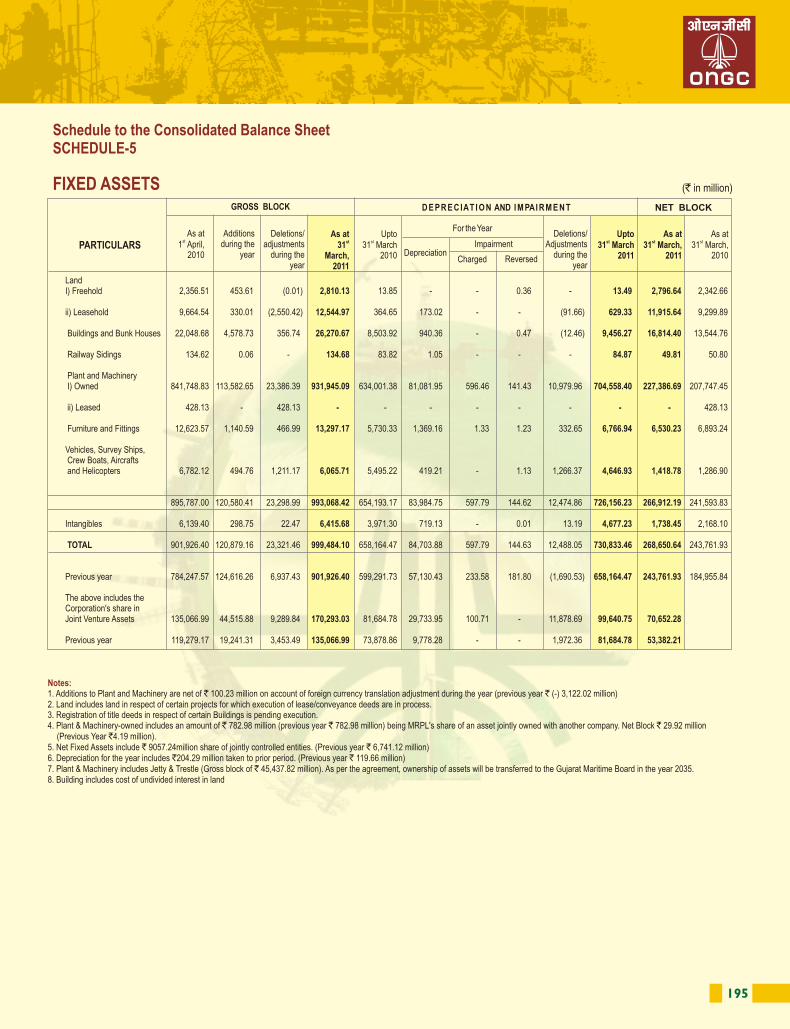
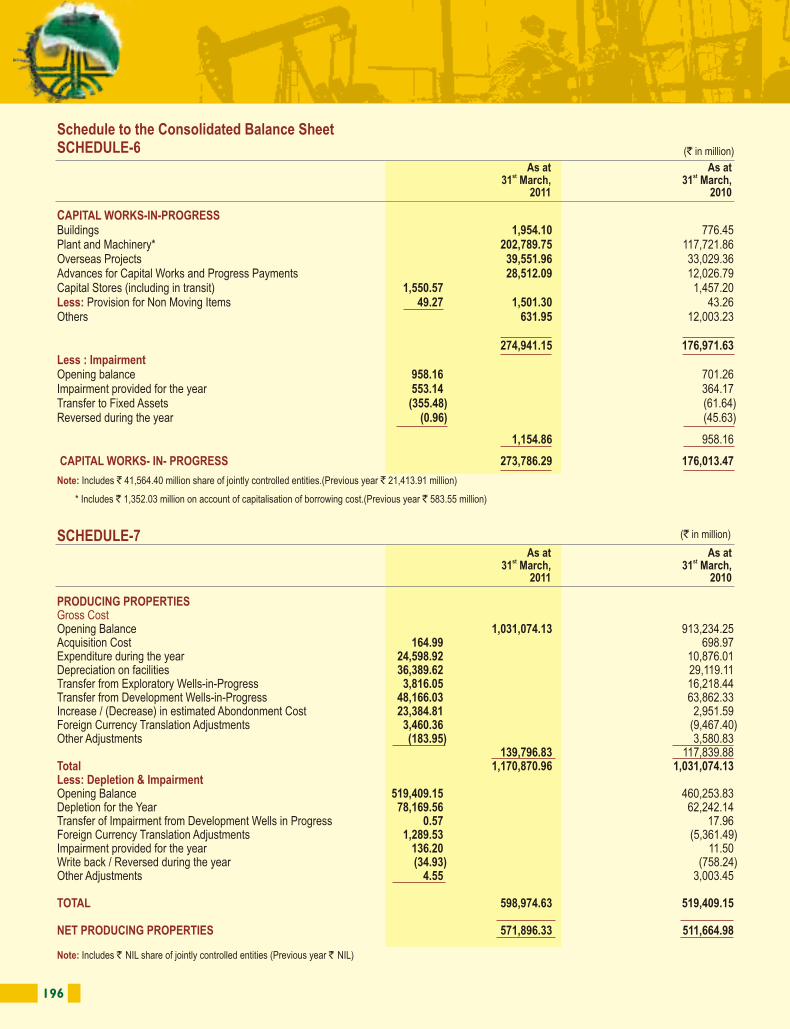
196 197
(` in million)
Schedule to the Consolidated Balance SheetSCHEDULE-6
Schedule to the Consolidated Balance SheetSCHEDULE-8
CAPITAL WORKS-IN-PROGRESS
Less:
Less : Impairment
CAPITAL WORKS- IN- PROGRESS
Note:
Buildings 1,954.10 776.45 Plant and Machinery* 202,789.75 117,721.86 Overseas Projects 39,551.96 33,029.36Advances for Capital Works and Progress Payments 28,512.09 12,026.79 Capital Stores (including in transit) 1,550.57 1,457.20
Provision for Non Moving Items 49.27 1,501.30 43.26 Others 631.95 12,003.23
274,941.15 176,971.63
Opening balance 958.16 701.26 Impairment provided for the year 553.14 364.17 Transfer to Fixed Assets (355.48) (61.64)Reversed during the year (0.96) (45.63)
1,154.86 958.16
273,786.29 176,013.47
Includes ` 41,564.40 million share of jointly controlled entities.(Previous year ` 21,413.91 million)
* Includes ` 1,352.03 million on account of capitalisation of borrowing cost.(Previous year ` 583.55 million)
SCHEDULE-7 (` in million)
PRODUCING PROPERTIESGross Cost
Total Less: Depletion & Impairment
TOTAL
NET PRODUCING PROPERTIES
Note:
Opening Balance 1,031,074.13 913,234.25 Acquisition Cost 164.99 698.97 Expenditure during the year 24,598.92 10,876.01 Depreciation on facilities 36,389.62 29,119.11 Transfer from Exploratory Wells-in-Progress 3,816.05 16,218.44 Transfer from Development Wells-in-Progress 48,166.03 63,862.33 Increase / (Decrease) in estimated Abondonment Cost 23,384.81 2,951.59 Foreign Currency Translation Adjustments 3,460.36 (9,467.40) Other Adjustments (183.95) 3,580.83
139,796.83 117,839.88 1,170,870.96 1,031,074.13
Opening Balance 519,409.15 460,253.83 Depletion for the Year 78,169.56 62,242.14 Transfer of Impairment from Development Wells in Progress 0.57 17.96 Foreign Currency Translation Adjustments 1,289.53 (5,361.49) Impairment provided for the year 136.20 11.50Write back / Reversed during the year (34.93) (758.24)Other Adjustments 4.55 3,003.45
598,974.63 519,409.15
571,896.33 511,664.98
Includes ` NIL share of jointly controlled entities (Previous year ` NIL)
EXPLORATORY/DEVELOPMENT WELLS -IN-PROGRESS
A) EXPLORATORY WELLS-IN-PROGRESS
Gross Cost
Less:
EXPLORATORY WELLS-IN-PROGRESS
B) DEVELOPMENT WELLS-IN-PROGRESS (A)
Less : Impairment
DEVELOPMENT WELLS - IN - PROGRESS (B)
EXPLORATORY/DEVELOPMENT WELLS -IN-PROGRESS (A+B)
Opening Balance 67,696.54 69,047.13
Expenditure during the year 87,727.73 87,454.80
Less : Sale proceeds of Oil and Gas (Net of levies) 369.82 87,357.91 38.43
Depreciation during the year 5,415.22 7,671.69
160,469.67 164,135.19
Transfer to Producing Properties 3,816.05 16,218.44
Wells written off during the year 73,175.23 72,124.75
Other Adjustments (170.79) 8,720.82
Foreign Currency Translation Adjustments 853.21 (625.36)
82,795.97 67,696.54
Less: Provision for Dry Wells 9,449.50 9,409.63
73,346.47 58,286.91
Opening Balance 21892.87 21,908.76
Expenditure during the year 49,833.23 50,718.54
Depreciation during the year 5,344.63 4,979.20
Other Adjustments (5.30) 8,519.55
Foreign Currency Translation Adjustments 432.95 (370.85)
Less: Transfer to Producing Properties 48,166.03 63,862.33
29,332.35 21,892.87
Opening balance 54.87 67.49
Transfer to Producing Properties (0.57) (17.96)
Provision for the year 247.60 5.83
Write back / Reversed during the year (2.02) (0.49)
299.88 54.87
29,032.47 21,838.00
102,378.94 80,124.91
Note: Includes ` Nil million share of jointly controlled entities (Previous year ` 1,376.59 million).
(` in million)
As atst31 March,
2010
As atst31 March,
2011
As atst31 March,
2010
As atst31 March,
2011
As atst31 March,
2010
As atst31 March,
2011
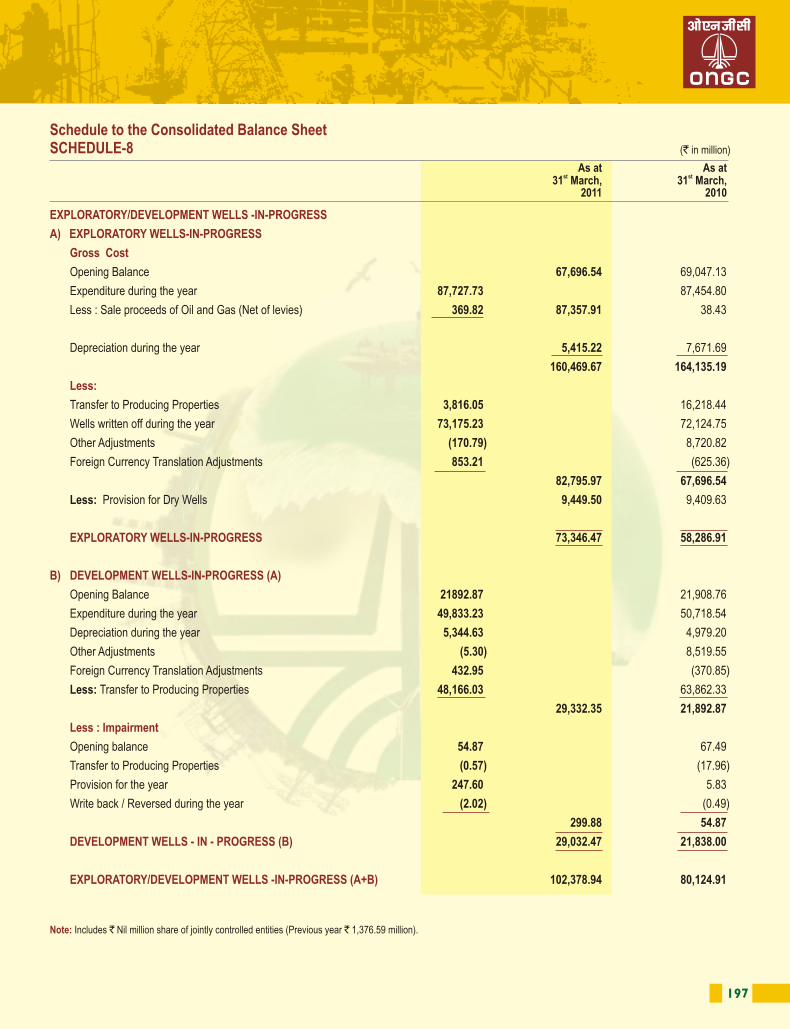
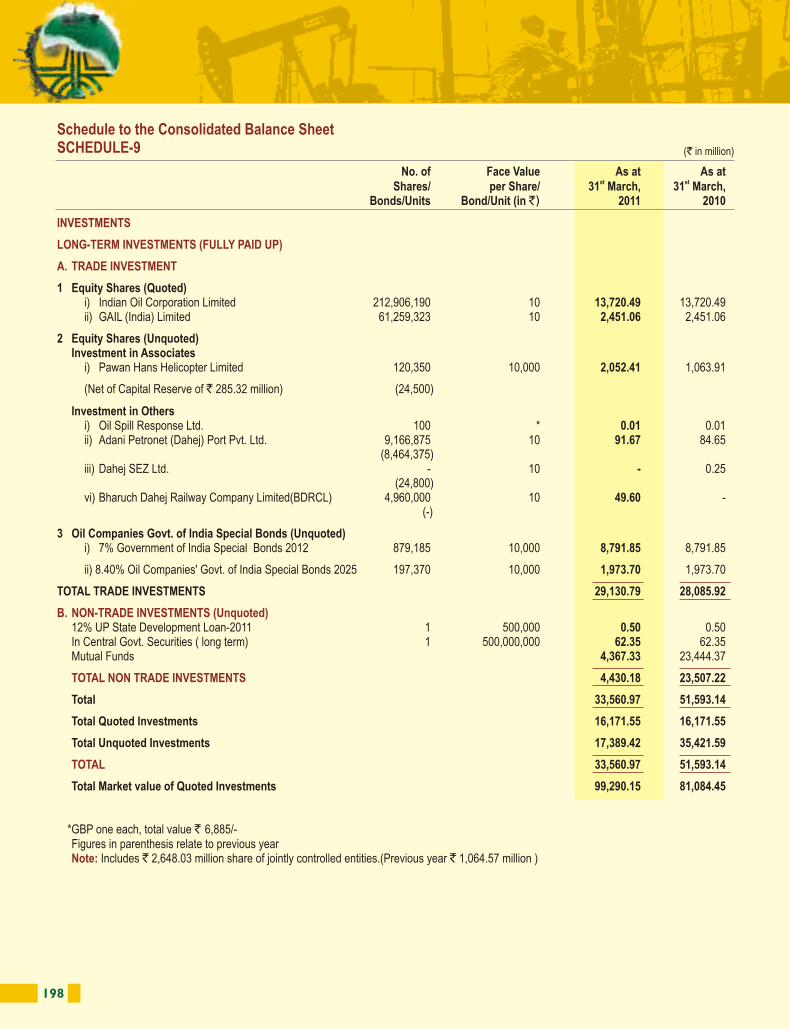
198 199
(` in million)
Schedule to the Consolidated Balance SheetSCHEDULE-9
No. of Face Value As at As atst stShares/ per Share/ 31 March, 31 March,
Bonds/Units Bond/Unit (in `) 2011 2010
1 Equity Shares (Quoted)i) Indian Oil Corporation Limited 212,906,190 10 13,720.49 13,720.49ii) GAIL (India) Limited 61,259,323 10 2,451.06 2,451.06
2 Equity Shares (Unquoted)Investment in Associates
i) Pawan Hans Helicopter Limited 120,350 10,000 2,052.41 1,063.91
(Net of Capital Reserve of ` 285.32 million) (24,500)
Investment in Othersi) Oil Spill Response Ltd. 100 * 0.01 0.01ii) Adani Petronet (Dahej) Port Pvt. Ltd. 9,166,875 10 91.67 84.65
(8,464,375)iii) Dahej SEZ Ltd. - 10 - 0.25
(24,800)vi) Bharuch Dahej Railway Company Limited(BDRCL) 4,960,000 10 49.60 -
(-)
3 Oil Companies Govt. of India Special Bonds (Unquoted) i) 7% Government of India Special Bonds 2012 879,185 10,000 8,791.85 8,791.85
ii) 8.40% Oil Companies' Govt. of India Special Bonds 2025 197,370 10,000 1,973.70 1,973.70
TOTAL TRADE INVESTMENTS 29,130.79 28,085.92
12% UP State Development Loan-2011 1 500,000 0.50 0.50In Central Govt. Securities ( long term) 1 500,000,000 62.35 62.35Mutual Funds 4,367.33 23,444.37
4,430.18 23,507.22
Total 33,560.97 51,593.14
Total Quoted Investments 16,171.55 16,171.55
Total Unquoted Investments 17,389.42 35,421.59
33,560.97 51,593.14
Total Market value of Quoted Investments 99,290.15 81,084.45
*GBP one each, total value ` 6,885/- Figures in parenthesis relate to previous year
Includes ` 2,648.03 million share of jointly controlled entities.(Previous year ` 1,064.57 million )
INVESTMENTS
LONG-TERM INVESTMENTS (FULLY PAID UP)
A. TRADE INVESTMENT
B. NON-TRADE INVESTMENTS (Unquoted)
TOTAL NON TRADE INVESTMENTS
TOTAL
Note:
(` in million)
Schedule to the Consolidated Balance SheetSCHEDULE-10
INVENTORIES
25,461.55 19,275.18 2,414.79 1,090.92
- in hand 7,559.99 10,547.66 - in transit 10,583.23 5,400.09
18,143.22 15,947.75
- in hand 41,790.57 46,734.36 - in transit (including inter-project transfers) 2,553.98 3,510.15
44,344.55 50,244.51 Provision for Non- Moving Stores and Spare parts 4,808.24 4,269.02
39,536.31 45,975.49
119.78 112.09
85,675.65 82,401.43
Includes ` 383.49 million share of jointly controlled entities (Previous year ` 344.73 million)
Finished Goods (Including Carbon Credits)Stock in Process
Raw Material
Stores and spare parts
Less:
Unserviceable Items
TOTAL
Note:
As atst31 March,
2010
As atst31 March,
2011
(` in million)SCHEDULE-11
SUNDRY DEBTORS
Debts
Other debts :
Less:
TOTAL
Note:
(Unsecured, Considered Good unless otherwise stated)
- Outstanding for a period exceeding six months : - Considered Good 17,604.67 2,054.36
- Considered Doubtful 3,704.63 3,444.96 21,309.30 5,499.32
- Considered Good 80,119.18 69,369.16 - Considered Doubtful 646.48 21.07 80,765.66 69,390.23
102,074.96 74,889.55 Provision for Doubtful Debts 4,351.11 3,466.03
97,723.85 71,423.52
Includes ` 1,231.12 million share of jointly controlled entities. (Previous year ` 662.79 million )
As atst31 March,
2010
As atst31 March,
2011
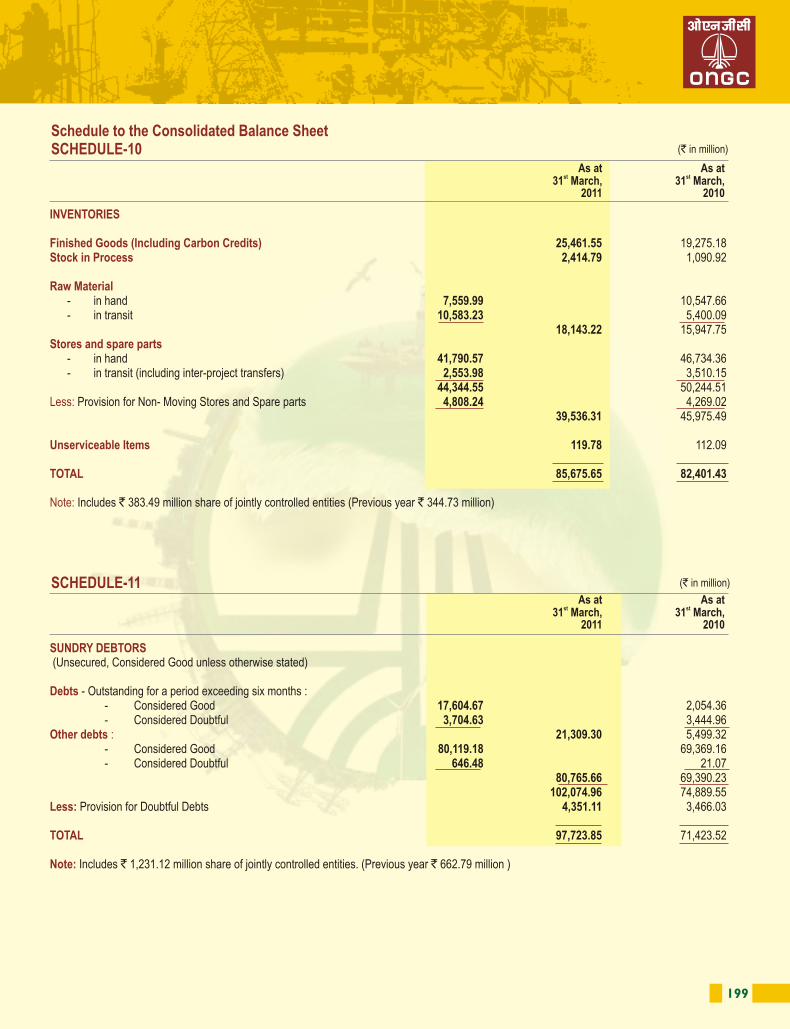
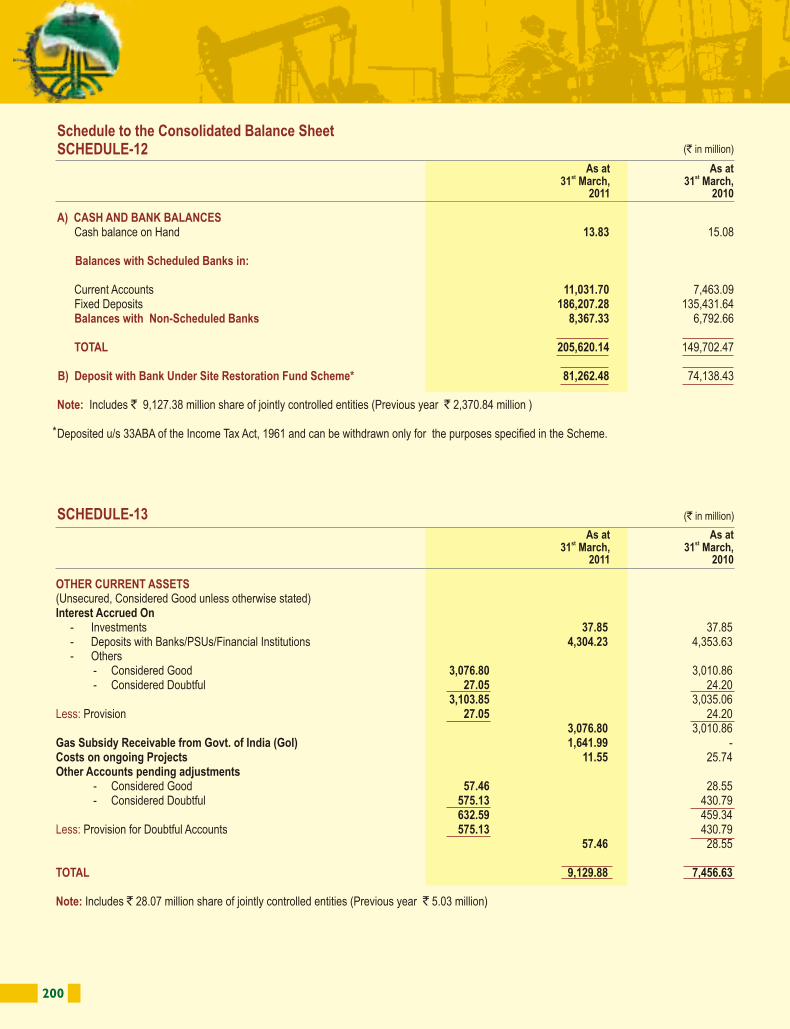
200 201
Schedule to the Consolidated Balance SheetSCHEDULE-12
(` in million)SCHEDULE-13
OTHER CURRENT ASSETS
Less:
Less:
TOTAL
Note:
(Unsecured, Considered Good unless otherwise stated)Interest Accrued On - Investments 37.85 37.85 - Deposits with Banks/PSUs/Financial Institutions 4,304.23 4,353.63 - Others - Considered Good 3,076.80 3,010.86 - Considered Doubtful 27.05 24.20
3,103.85 3,035.06 Provision 27.05 24.20
3,076.80 3,010.86 Gas Subsidy Receivable from Govt. of India (GoI) 1,641.99 - Costs on ongoing Projects 11.55 25.74 Other Accounts pending adjustments - Considered Good 57.46 28.55 - Considered Doubtful 575.13 430.79
632.59 459.34 Provision for Doubtful Accounts 575.13 430.79
57.46 28.55
9,129.88 7,456.63
Includes ` 28.07 million share of jointly controlled entities (Previous year ` 5.03 million)
A) CASH AND BANK BALANCES
Balances with Scheduled Banks in:
Balances with Non-Scheduled Banks
TOTAL
B) Deposit with Bank Under Site Restoration Fund Scheme*
Note:
Cash balance on Hand 13.83 15.08
Current Accounts 11,031.70 7,463.09 Fixed Deposits 186,207.28 135,431.64 8,367.33 6,792.66
205,620.14 149,702.47
81,262.48 74,138.43
Includes ` 9,127.38 million share of jointly controlled entities (Previous year ` 2,370.84 million )
Deposited u/s 33ABA of the Income Tax Act, 1961 and can be withdrawn only for the purposes specified in the Scheme.
(` in million) (` in million)
LOANS AND ADVANCES
Deposits:
Less :
Less:
Less :
TOTAL
Note:
Loans to Public Sector Undertakings & Other Body Corporate 684.47 1,024.51 Advance against equity pending allotment 10,008.96 7,058.01 Loans and Advances to Employees 8,770.18 9,361.78 Advances Recoverable in Cash or in Kind or for Value to be received 57,439.51 55,160.22 Recoverable from Petroleum Planning & Analysis cell (PPAC) 6.36 6.36 Carry finance 7,752.91 7,723.69 Insurance Claims 35.96 33.82 Investment in Lease 3,543.59 5,697.53
a) With Customs/Port Trusts etc. 46.72 54.70 b) With Financial Institutions/PSUs - 15,000.00 c) Others 6,986.58 6,955.53
7,033.30 22,010.23 95,275.24 108,076.15
Provision for Doubtful Claims/advances 16,818.75 13,167.61 78,456.49 94,908.54
Advance payment of Direct Tax 367,870.35 353,439.67
Provision for taxation 336,421.10 327,781.31 31,449.25 25,658.36
109,905.74 120,566.90 Particulars of loans and advances: Secured 7,811.58 6,446.24 Unsecured - Considered Good 102,094.16 114,120.66 - Considered Doubtful 16,818.75 13,167.61
126,724.49 133,734.51 Considered Doubtful and provided for 16,818.75 13,167.61
109,905.74 120,566.90
Includes ` 1,650.96 million share of jointly controlled entities. (Previous year ` 761.64 million )Loans to employees include an amount of ` 0.35 million (Previous year ` 0.70 million) outstanding from whole time Directors.Maximum amount outstanding during the year ` 0.66 million. (Previous year ` 4.27 million )
Schedule to the Consolidated Balance SheetSCHEDULE-14
As atst31 March,
2010
As atst31 March,
2011
As atst31 March,
2010
As atst31 March,
2011
As atst31 March,
2010
As atst31 March,
2011
*
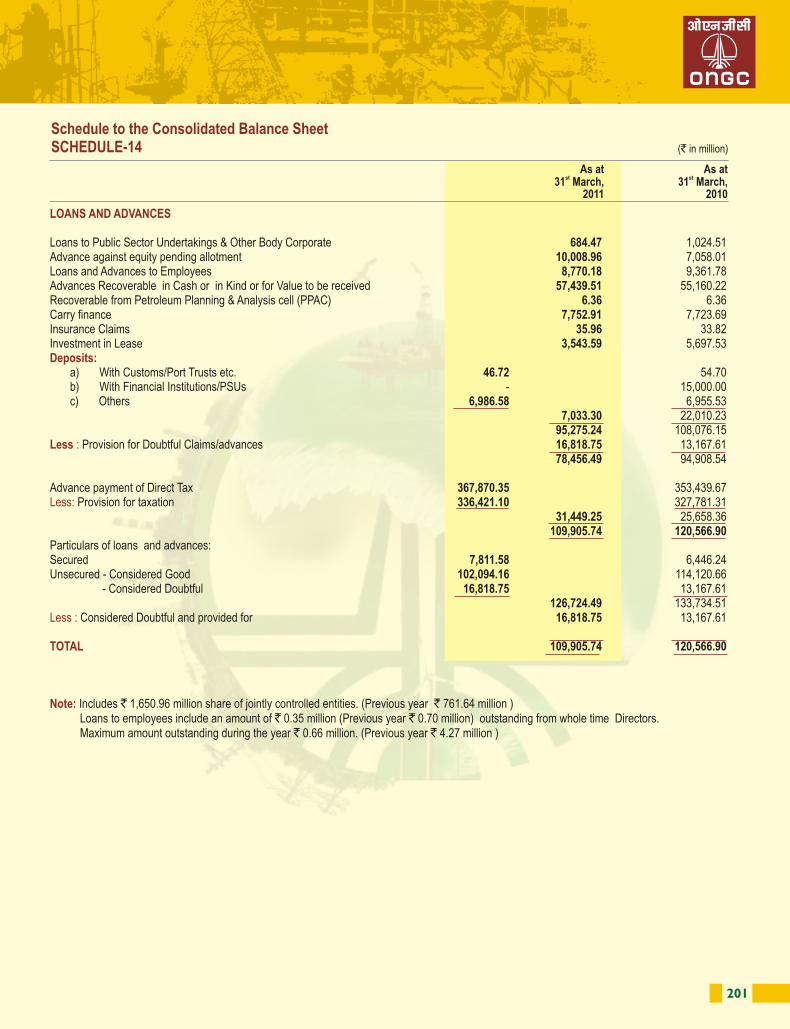
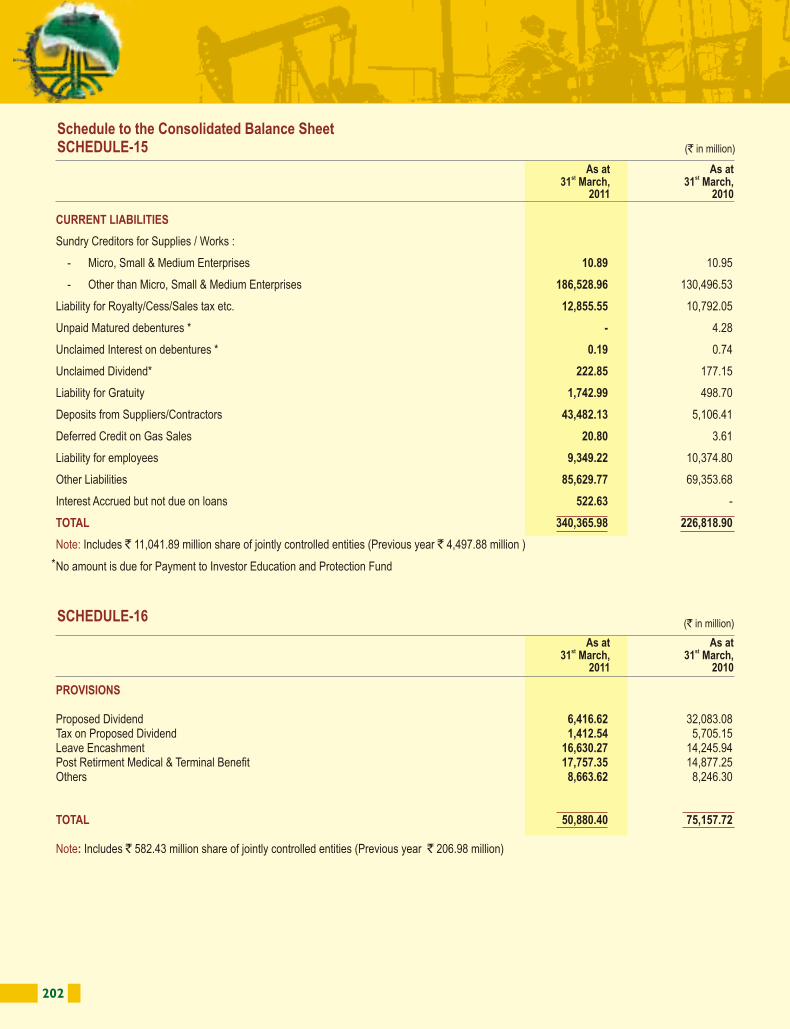
202 203
Schedule to the Consolidated Balance SheetSCHEDULE-15
CURRENT LIABILITIES
TOTAL
Note:
Sundry Creditors for Supplies / Works :
- Micro, Small & Medium Enterprises 10.89 10.95
- Other than Micro, Small & Medium Enterprises 186,528.96 130,496.53
Liability for Royalty/Cess/Sales tax etc. 12,855.55 10,792.05
Unpaid Matured debentures * - 4.28
Unclaimed Interest on debentures * 0.19 0.74
Unclaimed Dividend* 222.85 177.15
Liability for Gratuity 1,742.99 498.70
Deposits from Suppliers/Contractors 43,482.13 5,106.41
Deferred Credit on Gas Sales 20.80 3.61
Liability for employees 9,349.22 10,374.80
Other Liabilities 85,629.77 69,353.68
Interest Accrued but not due on loans 522.63 -
340,365.98 226,818.90
Includes ` 11,041.89 million share of jointly controlled entities (Previous year ` 4,497.88 million )
No amount is due for Payment to Investor Education and Protection Fund
(` in million)SCHEDULE-16
PROVISIONS
TOTAL
Note:
Proposed Dividend 6,416.62 32,083.08 Tax on Proposed Dividend 1,412.54 5,705.15 Leave Encashment 16,630.27 14,245.94 Post Retirment Medical & Terminal Benefit 17,757.35 14,877.25 Others 8,663.62 8,246.30
50,880.40 75,157.72
Includes ` 582.43 million share of jointly controlled entities (Previous year ` 206.98 million)
(` in million) (` in million)
MISCELLANEOUS EXPENDITURE
Deferred Revenue Expenditure
TOTAL
Note:
(to the extent not written off or adjusted)
Dry Docking Charges 6,117.60 6,612.99 Mobilisation Charges 1,842.98 1,800.25
7,960.58 8,413.24
Includes ` 0.33 million share of jointly controlled entities (Previous year ` 0.08 million).
(` in million)
GROSS SALES
TOTAL
Note:
Gross Sales 1,243,502.62 1,077,159.43 Less : Transfer to Exploratory Wells in Progress 472.11 52.70 Government of India's (GoI's) share in Profit Petroleum 15,344.76 15,418.29
15,816.87 15,470.99
1,227,685.75 1,061,688.44
Includes ` 18,237.88 million share of jointly controlled entities. (Previous year ` 14,442.57 million)
For the Year 2009-10
Schedule to the Consolidated Balance SheetSCHEDULE-17
Schedule to the Consolidated Profit and Loss Account SCHEDULE-18
For the Year 2010-11
As atst31 March,
2010
As atst31 March,
2011
As atst31 March,
2010
As atst31 March,
2011
As atst31 March,
2010
As atst31 March,
2011
*
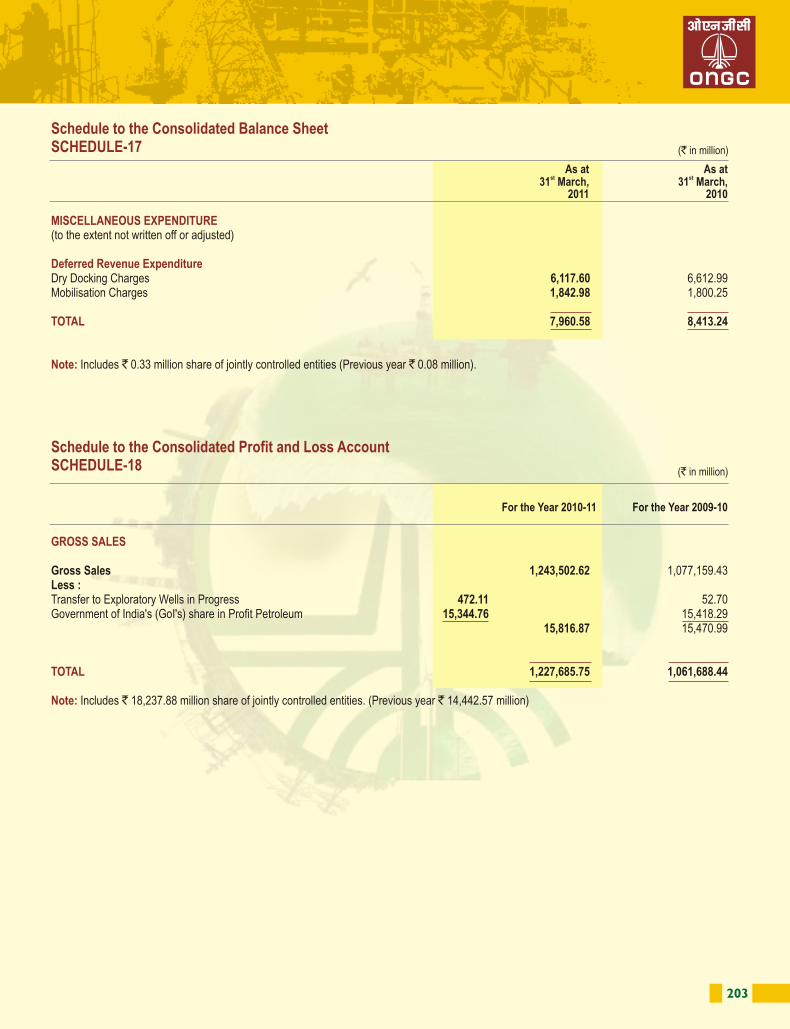
202 203
Schedule to the Consolidated Balance SheetSCHEDULE-15
CURRENT LIABILITIES
TOTAL
Note:
Sundry Creditors for Supplies / Works :
- Micro, Small & Medium Enterprises 10.89 10.95
- Other than Micro, Small & Medium Enterprises 186,528.96 130,496.53
Liability for Royalty/Cess/Sales tax etc. 12,855.55 10,792.05
Unpaid Matured debentures * - 4.28
Unclaimed Interest on debentures * 0.19 0.74
Unclaimed Dividend* 222.85 177.15
Liability for Gratuity 1,742.99 498.70
Deposits from Suppliers/Contractors 43,482.13 5,106.41
Deferred Credit on Gas Sales 20.80 3.61
Liability for employees 9,349.22 10,374.80
Other Liabilities 85,629.77 69,353.68
Interest Accrued but not due on loans 522.63 -
340,365.98 226,818.90
Includes ` 11,041.89 million share of jointly controlled entities (Previous year ` 4,497.88 million )
No amount is due for Payment to Investor Education and Protection Fund
(` in million)SCHEDULE-16
PROVISIONS
TOTAL
Note:
Proposed Dividend 6,416.62 32,083.08 Tax on Proposed Dividend 1,412.54 5,705.15 Leave Encashment 16,630.27 14,245.94 Post Retirment Medical & Terminal Benefit 17,757.35 14,877.25 Others 8,663.62 8,246.30
50,880.40 75,157.72
Includes ` 582.43 million share of jointly controlled entities (Previous year ` 206.98 million)
(` in million) (` in million)
MISCELLANEOUS EXPENDITURE
Deferred Revenue Expenditure
TOTAL
Note:
(to the extent not written off or adjusted)
Dry Docking Charges 6,117.60 6,612.99 Mobilisation Charges 1,842.98 1,800.25
7,960.58 8,413.24
Includes ` 0.33 million share of jointly controlled entities (Previous year ` 0.08 million).
(` in million)
GROSS SALES
TOTAL
Note:
Gross Sales 1,243,502.62 1,077,159.43 Less : Transfer to Exploratory Wells in Progress 472.11 52.70 Government of India's (GoI's) share in Profit Petroleum 15,344.76 15,418.29
15,816.87 15,470.99
1,227,685.75 1,061,688.44
Includes ` 18,237.88 million share of jointly controlled entities. (Previous year ` 14,442.57 million)
For the Year 2009-10
Schedule to the Consolidated Balance SheetSCHEDULE-17
Schedule to the Consolidated Profit and Loss Account SCHEDULE-18
For the Year 2010-11
As atst31 March,
2010
As atst31 March,
2011
As atst31 March,
2010
As atst31 March,
2011
As atst31 March,
2010
As atst31 March,
2011
*
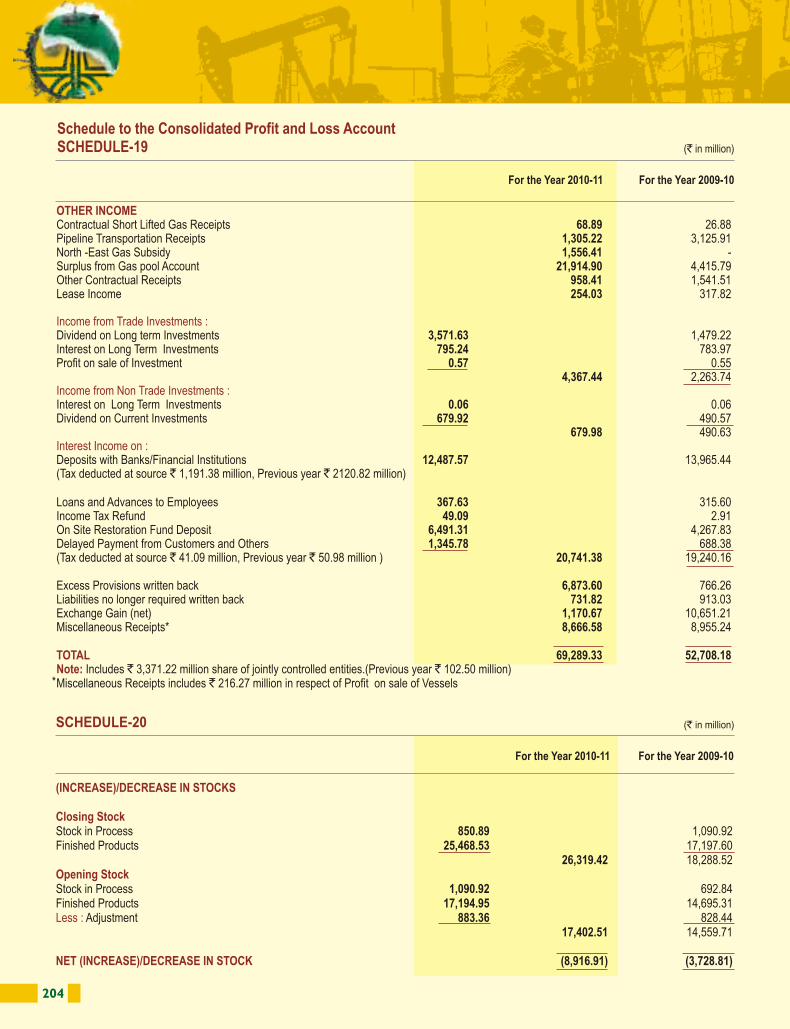
204 205
(` in million)
Schedule to the Consolidated Profit and Loss Account SCHEDULE-19
(` in million)
(INCREASE)/DECREASE IN STOCKS
Closing Stock
Opening Stock
Less :
NET (INCREASE)/DECREASE IN STOCK
Stock in Process 850.89 1,090.92 Finished Products 25,468.53 17,197.60
26,319.42 18,288.52
Stock in Process 1,090.92 692.84 Finished Products 17,194.95 14,695.31
Adjustment 883.36 828.44 17,402.51 14,559.71
(8,916.91) (3,728.81)
SCHEDULE-20
OTHER INCOME
Income from Trade Investments :
Income from Non Trade Investments :
Interest Income on :
TOTALNote:
Contractual Short Lifted Gas Receipts 68.89 26.88 Pipeline Transportation Receipts 1,305.22 3,125.91 North -East Gas Subsidy 1,556.41 - Surplus from Gas pool Account 21,914.90 4,415.79 Other Contractual Receipts 958.41 1,541.51 Lease Income 254.03 317.82
Dividend on Long term Investments 3,571.63 1,479.22 Interest on Long Term Investments 795.24 783.97 Profit on sale of Investment 0.57 0.55
4,367.44 2,263.74
Interest on Long Term Investments 0.06 0.06 Dividend on Current Investments 679.92 490.57
679.98 490.63
Deposits with Banks/Financial Institutions 12,487.57 13,965.44 (Tax deducted at source ` 1,191.38 million, Previous year ` 2120.82 million)
Loans and Advances to Employees 367.63 315.60 Income Tax Refund 49.09 2.91 On Site Restoration Fund Deposit 6,491.31 4,267.83 Delayed Payment from Customers and Others 1,345.78 688.38 (Tax deducted at source ` 41.09 million, Previous year ` 50.98 million ) 20,741.38 19,240.16
Excess Provisions written back 6,873.60 766.26 Liabilities no longer required written back 731.82 913.03 Exchange Gain (net) 1,170.67 10,651.21 Miscellaneous Receipts* 8,666.58 8,955.24
69,289.33 52,708.18 Includes ` 3,371.22 million share of jointly controlled entities.(Previous year ` 102.50 million)
Miscellaneous Receipts includes ` 216.27 million in respect of Profit on sale of Vessels
For the Year 2010-11 For the Year 2009-10
For the Year 2010-11 For the Year 2009-10
(` in million)
PRODUCTION, TRANSPORTATION, SELLINGAND DISTRIBUTION EXPENDITURE
TOTAL
Note:
Royalty 126,528.57 103,592.72 Cess 56,962.72 54,538.03 Sales Tax 3,878.45 3,733.74 Natural Calamity Contingent Duty 1,113.96 1,061.67 Excise Duty on Stocks (Net) 10.57 150.29 Service Tax 2,017.80 906.88 Education Cess 1,828.44 1,718.99 Octroi and Port Trust Charges 4,522.45 4,484.28 Staff Expenditure 17,155.48 14,070.70 Workover Operations 27,851.95 31,172.60 Water Injection, Desalting and Demulsification 12,710.45 11,037.73 Consumption of Raw material, Stores and Spares & etc. 321,430.92 257,080.89 Pollution Control 5,048.63 4,315.68 Transport Expenses 4,016.56 3,235.67 Insurance 1,139.31 1,185.45 Power and Fuel 1,644.62 1,347.28 Repairs and Maintenance 9,409.08 6,700.45 Contractual payments including Hire charges etc. 7,890.14 6,410.32 Other Production Expenditure 23,187.38 19,310.75 Transportation and Freight of Products 13,943.39 11,966.97 Research and Development 3,582.44 1,985.78 General Administrative Expenses 21,821.51 20,430.78 Hedging (Gain)/Loss 41.85 (19.42)Adjustments for overlift/(underlift) (283.32) - Written Back of income due to Surender of sudan pipeline 5,079.72 - Other Expenditure 12,112.12 11,307.71
684,645.19 571,725.94
Includes ` 16,759.93 million share of jointly controlled entities (Previous year ` 12,420.93 million). The above expenses classified in accordance with Part II of Schedule VI to the Companies Act, 1956 and exhibited in Note no. 27.4 of Schedule 28.
For the Year 2009-10
Schedule to the Consolidated Profit and Loss Account SCHEDULE-21
For the Year 2010-11
*
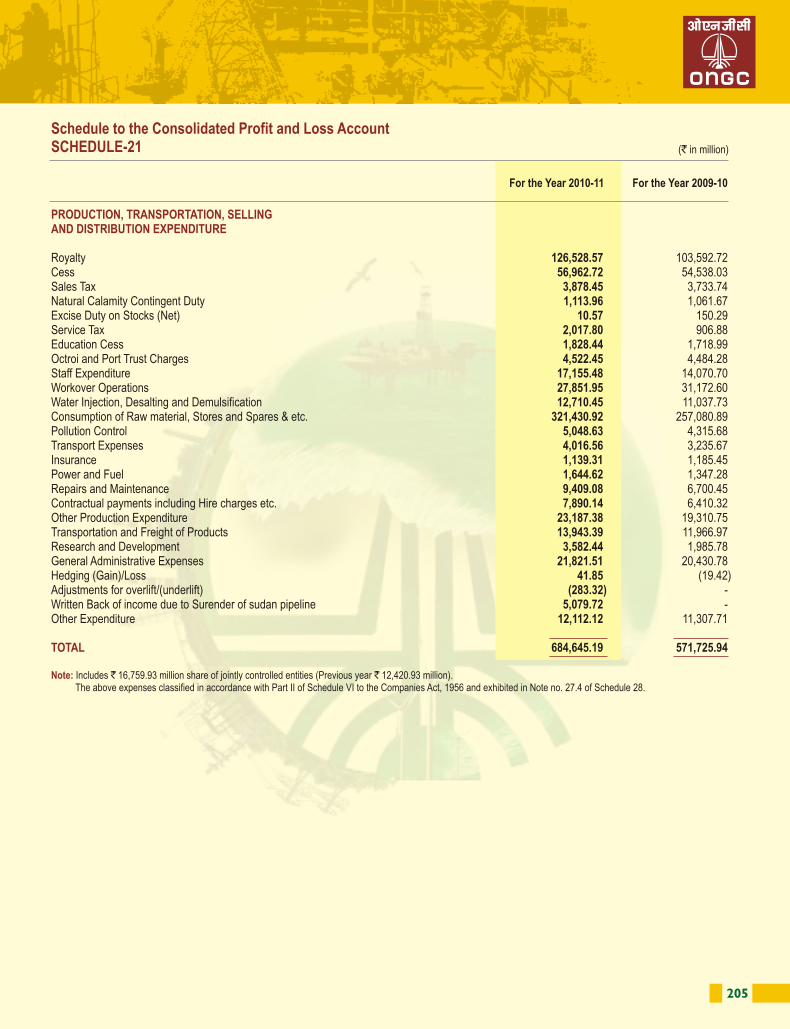
204 205
(` in million)
Schedule to the Consolidated Profit and Loss Account SCHEDULE-19
(` in million)
(INCREASE)/DECREASE IN STOCKS
Closing Stock
Opening Stock
Less :
NET (INCREASE)/DECREASE IN STOCK
Stock in Process 850.89 1,090.92 Finished Products 25,468.53 17,197.60
26,319.42 18,288.52
Stock in Process 1,090.92 692.84 Finished Products 17,194.95 14,695.31
Adjustment 883.36 828.44 17,402.51 14,559.71
(8,916.91) (3,728.81)
SCHEDULE-20
OTHER INCOME
Income from Trade Investments :
Income from Non Trade Investments :
Interest Income on :
TOTALNote:
Contractual Short Lifted Gas Receipts 68.89 26.88 Pipeline Transportation Receipts 1,305.22 3,125.91 North -East Gas Subsidy 1,556.41 - Surplus from Gas pool Account 21,914.90 4,415.79 Other Contractual Receipts 958.41 1,541.51 Lease Income 254.03 317.82
Dividend on Long term Investments 3,571.63 1,479.22 Interest on Long Term Investments 795.24 783.97 Profit on sale of Investment 0.57 0.55
4,367.44 2,263.74
Interest on Long Term Investments 0.06 0.06 Dividend on Current Investments 679.92 490.57
679.98 490.63
Deposits with Banks/Financial Institutions 12,487.57 13,965.44 (Tax deducted at source ` 1,191.38 million, Previous year ` 2120.82 million)
Loans and Advances to Employees 367.63 315.60 Income Tax Refund 49.09 2.91 On Site Restoration Fund Deposit 6,491.31 4,267.83 Delayed Payment from Customers and Others 1,345.78 688.38 (Tax deducted at source ` 41.09 million, Previous year ` 50.98 million ) 20,741.38 19,240.16
Excess Provisions written back 6,873.60 766.26 Liabilities no longer required written back 731.82 913.03 Exchange Gain (net) 1,170.67 10,651.21 Miscellaneous Receipts* 8,666.58 8,955.24
69,289.33 52,708.18 Includes ` 3,371.22 million share of jointly controlled entities.(Previous year ` 102.50 million)
Miscellaneous Receipts includes ` 216.27 million in respect of Profit on sale of Vessels
For the Year 2010-11 For the Year 2009-10
For the Year 2010-11 For the Year 2009-10
(` in million)
PRODUCTION, TRANSPORTATION, SELLINGAND DISTRIBUTION EXPENDITURE
TOTAL
Note:
Royalty 126,528.57 103,592.72 Cess 56,962.72 54,538.03 Sales Tax 3,878.45 3,733.74 Natural Calamity Contingent Duty 1,113.96 1,061.67 Excise Duty on Stocks (Net) 10.57 150.29 Service Tax 2,017.80 906.88 Education Cess 1,828.44 1,718.99 Octroi and Port Trust Charges 4,522.45 4,484.28 Staff Expenditure 17,155.48 14,070.70 Workover Operations 27,851.95 31,172.60 Water Injection, Desalting and Demulsification 12,710.45 11,037.73 Consumption of Raw material, Stores and Spares & etc. 321,430.92 257,080.89 Pollution Control 5,048.63 4,315.68 Transport Expenses 4,016.56 3,235.67 Insurance 1,139.31 1,185.45 Power and Fuel 1,644.62 1,347.28 Repairs and Maintenance 9,409.08 6,700.45 Contractual payments including Hire charges etc. 7,890.14 6,410.32 Other Production Expenditure 23,187.38 19,310.75 Transportation and Freight of Products 13,943.39 11,966.97 Research and Development 3,582.44 1,985.78 General Administrative Expenses 21,821.51 20,430.78 Hedging (Gain)/Loss 41.85 (19.42)Adjustments for overlift/(underlift) (283.32) - Written Back of income due to Surender of sudan pipeline 5,079.72 - Other Expenditure 12,112.12 11,307.71
684,645.19 571,725.94
Includes ` 16,759.93 million share of jointly controlled entities (Previous year ` 12,420.93 million). The above expenses classified in accordance with Part II of Schedule VI to the Companies Act, 1956 and exhibited in Note no. 27.4 of Schedule 28.
For the Year 2009-10
Schedule to the Consolidated Profit and Loss Account SCHEDULE-21
For the Year 2010-11
*
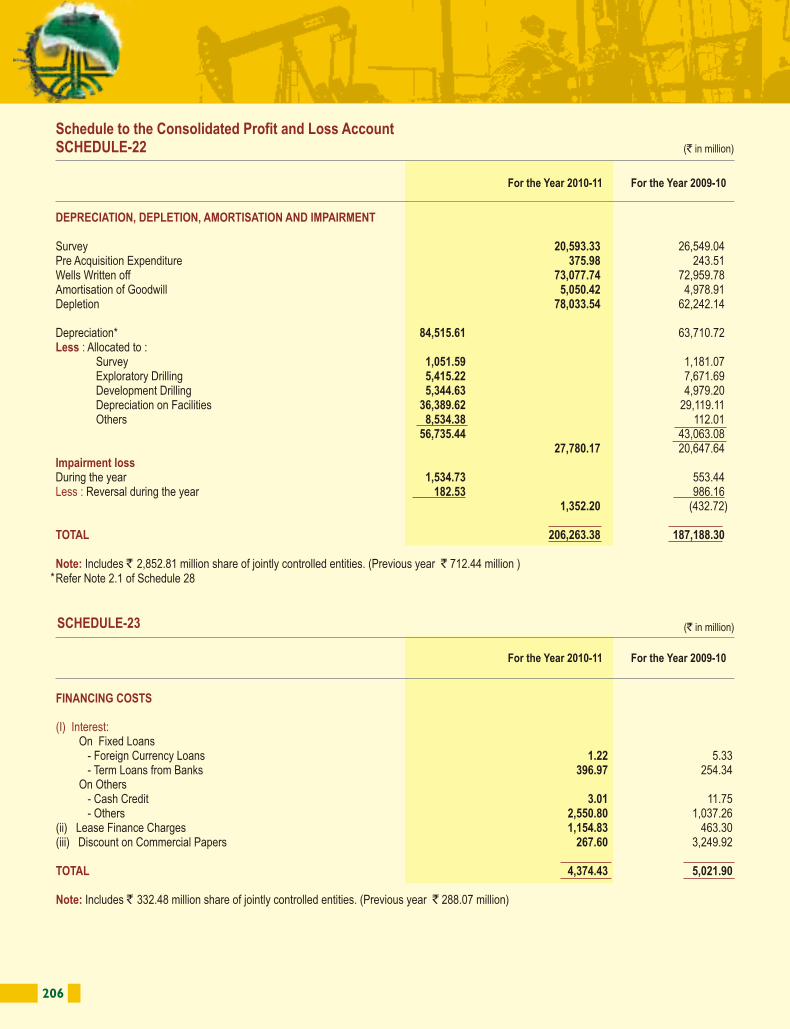
206 207
(` in million)
FINANCING COSTS
(I) Interest:
TOTAL
Note:
On Fixed Loans - Foreign Currency Loans 1.22 5.33 - Term Loans from Banks 396.97 254.34 On Others - Cash Credit 3.01 11.75 - Others 2,550.80 1,037.26 (ii) Lease Finance Charges 1,154.83 463.30 (iii) Discount on Commercial Papers 267.60 3,249.92
4,374.43 5,021.90
Includes ` 332.48 million share of jointly controlled entities. (Previous year ` 288.07 million)
SCHEDULE-23
(` in million)
DEPRECIATION, DEPLETION, AMORTISATION AND IMPAIRMENT
Less :
Impairment loss
Less :
TOTAL
Note:
Survey 20,593.33 26,549.04 Pre Acquisition Expenditure 375.98 243.51 Wells Written off 73,077.74 72,959.78 Amortisation of Goodwill 5,050.42 4,978.91 Depletion 78,033.54 62,242.14
Depreciation* 84,515.61 63,710.72 Allocated to :
Survey 1,051.59 1,181.07 Exploratory Drilling 5,415.22 7,671.69 Development Drilling 5,344.63 4,979.20 Depreciation on Facilities 36,389.62 29,119.11 Others 8,534.38 112.01
56,735.44 43,063.08 27,780.17 20,647.64
During the year 1,534.73 553.44 Reversal during the year 182.53 986.16
1,352.20 (432.72)
206,263.38 187,188.30
Includes ` 2,852.81 million share of jointly controlled entities. (Previous year ` 712.44 million )Refer Note 2.1 of Schedule 28
Schedule to the Consolidated Profit and Loss Account SCHEDULE-22
For the Year 2010-11 For the Year 2009-10
For the Year 2010-11 For the Year 2009-10
(` in million)
PROVISIONS AND WRITE-OFFS
PROVISIONS
Sub-Total
WRITE-OFFS
Less:
Less:
Sub-Total
TOTAL
Note:
Provision for Doubtful Debts 1,421.35 1,160.60 Provision for Doubtful Claims/Advances 3,721.06 1,845.73 Provision against Non-Moving Inventories 585.62 145.49 Provison for Others 1,317.98 93.20
7,046.01 3,245.02
Loss on Disposal/Condemnation of Fixed Assets (Net) 224.12 71.58 Claims/Advances Written Off 8.26 42.90
Provisions 8.15 - 0.11 114.48
Inventories Written Off 96.24 105.03 Bad debts Written Off 239.14 224.97
Provisions 28.64 207.80 210.50 17.17
Other Write offs 8,222.03 2,513.87
8,753.00 2,750.55
15,799.01 5,995.57
Includes ` 181.61 million share of jointly controlled entities. (Previous year ` 874.49 million)
For the Year 2009-10
Schedule to the Consolidated Profit and Loss Account SCHEDULE-24
For the Year 2010-11
*
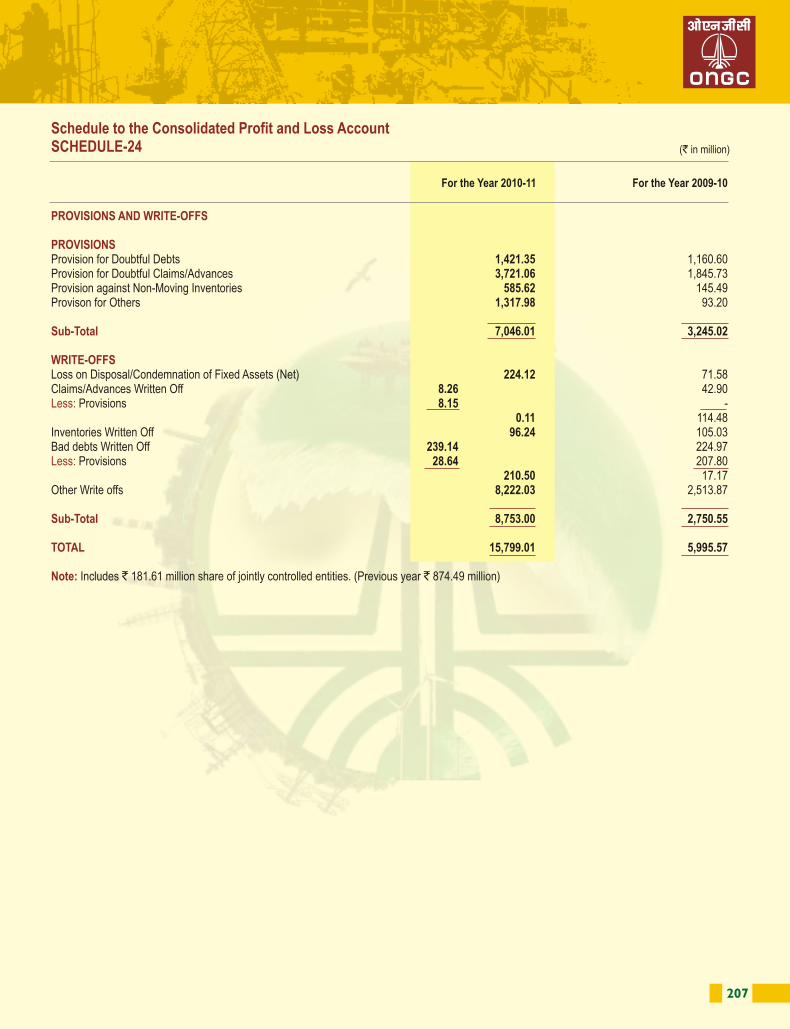
206 207
(` in million)
FINANCING COSTS
(I) Interest:
TOTAL
Note:
On Fixed Loans - Foreign Currency Loans 1.22 5.33 - Term Loans from Banks 396.97 254.34 On Others - Cash Credit 3.01 11.75 - Others 2,550.80 1,037.26 (ii) Lease Finance Charges 1,154.83 463.30 (iii) Discount on Commercial Papers 267.60 3,249.92
4,374.43 5,021.90
Includes ` 332.48 million share of jointly controlled entities. (Previous year ` 288.07 million)
SCHEDULE-23
(` in million)
DEPRECIATION, DEPLETION, AMORTISATION AND IMPAIRMENT
Less :
Impairment loss
Less :
TOTAL
Note:
Survey 20,593.33 26,549.04 Pre Acquisition Expenditure 375.98 243.51 Wells Written off 73,077.74 72,959.78 Amortisation of Goodwill 5,050.42 4,978.91 Depletion 78,033.54 62,242.14
Depreciation* 84,515.61 63,710.72 Allocated to :
Survey 1,051.59 1,181.07 Exploratory Drilling 5,415.22 7,671.69 Development Drilling 5,344.63 4,979.20 Depreciation on Facilities 36,389.62 29,119.11 Others 8,534.38 112.01
56,735.44 43,063.08 27,780.17 20,647.64
During the year 1,534.73 553.44 Reversal during the year 182.53 986.16
1,352.20 (432.72)
206,263.38 187,188.30
Includes ` 2,852.81 million share of jointly controlled entities. (Previous year ` 712.44 million )Refer Note 2.1 of Schedule 28
Schedule to the Consolidated Profit and Loss Account SCHEDULE-22
For the Year 2010-11 For the Year 2009-10
For the Year 2010-11 For the Year 2009-10
(` in million)
PROVISIONS AND WRITE-OFFS
PROVISIONS
Sub-Total
WRITE-OFFS
Less:
Less:
Sub-Total
TOTAL
Note:
Provision for Doubtful Debts 1,421.35 1,160.60 Provision for Doubtful Claims/Advances 3,721.06 1,845.73 Provision against Non-Moving Inventories 585.62 145.49 Provison for Others 1,317.98 93.20
7,046.01 3,245.02
Loss on Disposal/Condemnation of Fixed Assets (Net) 224.12 71.58 Claims/Advances Written Off 8.26 42.90
Provisions 8.15 - 0.11 114.48
Inventories Written Off 96.24 105.03 Bad debts Written Off 239.14 224.97
Provisions 28.64 207.80 210.50 17.17
Other Write offs 8,222.03 2,513.87
8,753.00 2,750.55
15,799.01 5,995.57
Includes ` 181.61 million share of jointly controlled entities. (Previous year ` 874.49 million)
For the Year 2009-10
Schedule to the Consolidated Profit and Loss Account SCHEDULE-24
For the Year 2010-11
*
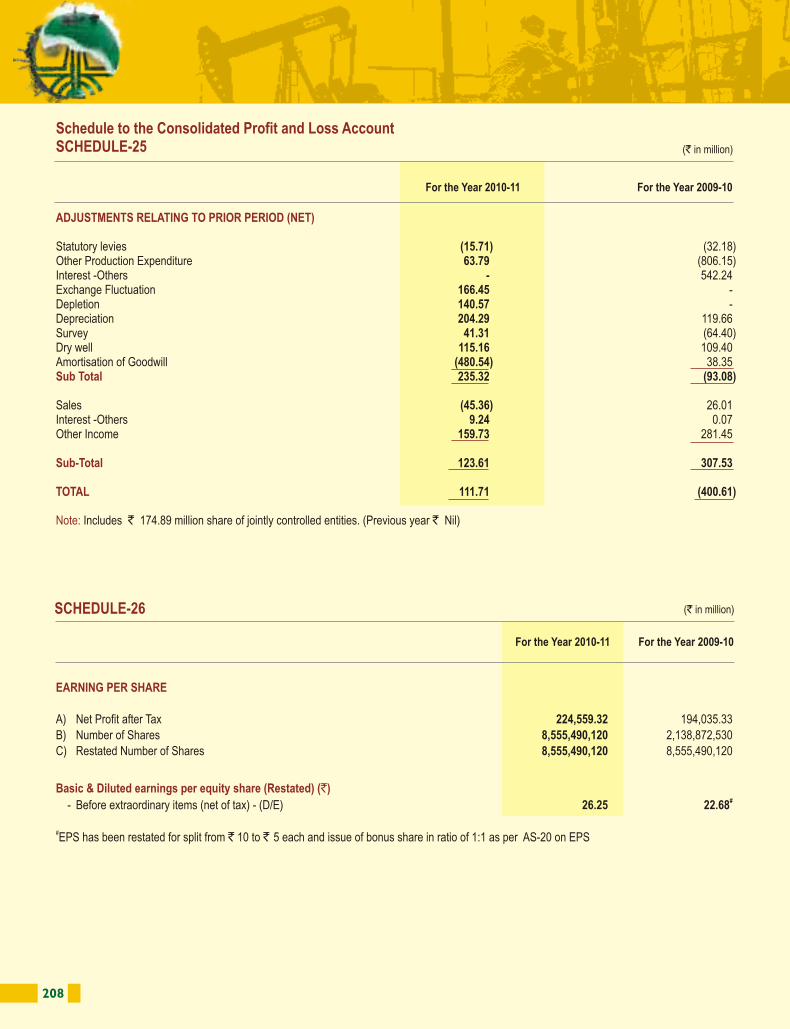
208
Schedule to the Consolidated Profit and Loss Account SCHEDULE-25 (` in million)
ADJUSTMENTS RELATING TO PRIOR PERIOD (NET)
Sub Total
Sub-Total
TOTAL
Note:
Statutory levies (15.71) (32.18)Other Production Expenditure 63.79 (806.15)Interest -Others - 542.24 Exchange Fluctuation 166.45 - Depletion 140.57 - Depreciation 204.29 119.66 Survey 41.31 (64.40)Dry well 115.16 109.40 Amortisation of Goodwill (480.54) 38.35
235.32 (93.08)
Sales (45.36) 26.01 Interest -Others 9.24 0.07 Other Income 159.73 281.45
123.61 307.53
111.71 (400.61)
Includes ` 174.89 million share of jointly controlled entities. (Previous year ` Nil)
For the Year 2010-11 For the Year 2009-10
(` in million)
EARNING PER SHARE
Basic & Diluted earnings per equity share (Restated) (`)
A) Net Profit after Tax 224,559.32 194,035.33
B) Number of Shares 8,555,490,120 2,138,872,530
C) Restated Number of Shares 8,555,490,120 8,555,490,120
# - Before extraordinary items (net of tax) - (D/E) 26.25 22.68
#EPS has been restated for split from ` 10 to ` 5 each and issue of bonus share in ratio of 1:1 as per AS-20 on EPS
SCHEDULE-26
For the Year 2010-11 For the Year 2009-10
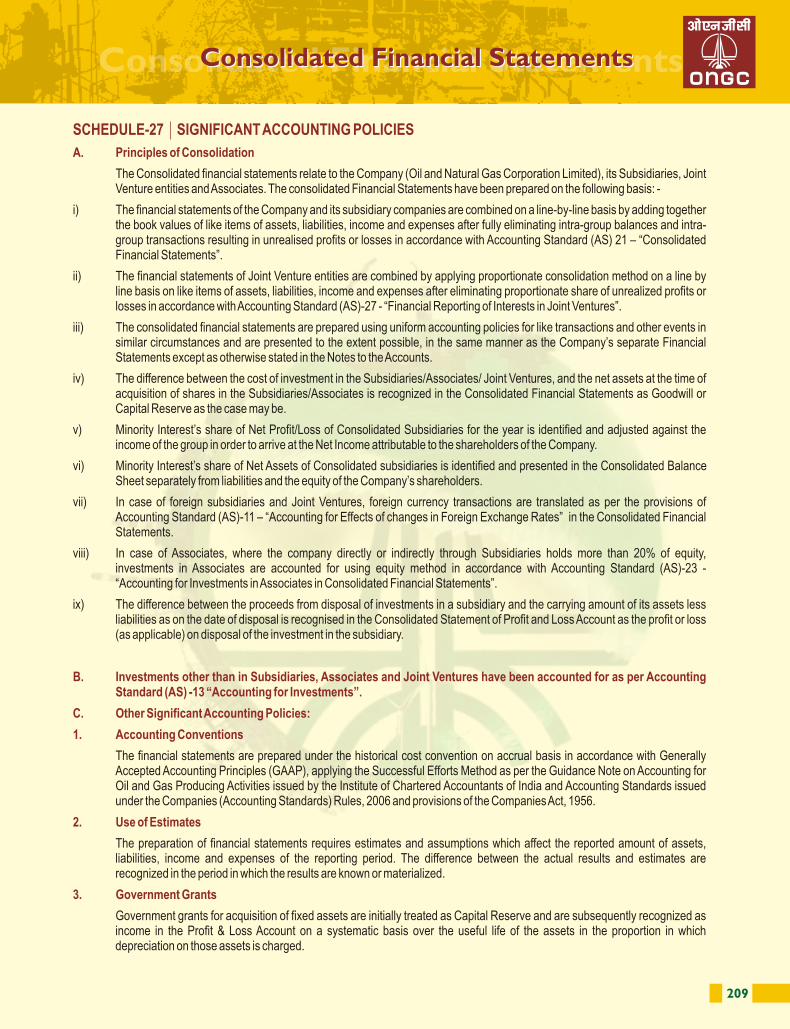
209
SCHEDULE-27 SIGNIFICANT ACCOUNTING POLICIES
A. Principles of Consolidation
B. Investments other than in Subsidiaries, Associates and Joint Ventures have been accounted for as per Accounting Standard (AS) -13 “Accounting for Investments”.
C. Other Significant Accounting Policies:
1. Accounting Conventions
2. Use of Estimates
3. Government Grants
The Consolidated financial statements relate to the Company (Oil and Natural Gas Corporation Limited), its Subsidiaries, Joint Venture entities and Associates. The consolidated Financial Statements have been prepared on the following basis: -
i) The financial statements of the Company and its subsidiary companies are combined on a line-by-line basis by adding together the book values of like items of assets, liabilities, income and expenses after fully eliminating intra-group balances and intra-group transactions resulting in unrealised profits or losses in accordance with Accounting Standard (AS) 21 – “Consolidated Financial Statements”.
ii) The financial statements of Joint Venture entities are combined by applying proportionate consolidation method on a line by line basis on like items of assets, liabilities, income and expenses after eliminating proportionate share of unrealized profits or losses in accordance with Accounting Standard (AS)-27 - “Financial Reporting of Interests in Joint Ventures”.
iii) The consolidated financial statements are prepared using uniform accounting policies for like transactions and other events in similar circumstances and are presented to the extent possible, in the same manner as the Company’s separate Financial Statements except as otherwise stated in the Notes to the Accounts.
iv) The difference between the cost of investment in the Subsidiaries/Associates/ Joint Ventures, and the net assets at the time of acquisition of shares in the Subsidiaries/Associates is recognized in the Consolidated Financial Statements as Goodwill or Capital Reserve as the case may be.
v) Minority Interest’s share of Net Profit/Loss of Consolidated Subsidiaries for the year is identified and adjusted against the income of the group in order to arrive at the Net Income attributable to the shareholders of the Company.
vi) Minority Interest’s share of Net Assets of Consolidated subsidiaries is identified and presented in the Consolidated Balance Sheet separately from liabilities and the equity of the Company’s shareholders.
vii) In case of foreign subsidiaries and Joint Ventures, foreign currency transactions are translated as per the provisions of Accounting Standard (AS)-11 – “Accounting for Effects of changes in Foreign Exchange Rates” in the Consolidated Financial Statements.
viii) In case of Associates, where the company directly or indirectly through Subsidiaries holds more than 20% of equity, investments in Associates are accounted for using equity method in accordance with Accounting Standard (AS)-23 - “Accounting for Investments in Associates in Consolidated Financial Statements”.
ix) The difference between the proceeds from disposal of investments in a subsidiary and the carrying amount of its assets less liabilities as on the date of disposal is recognised in the Consolidated Statement of Profit and Loss Account as the profit or loss (as applicable) on disposal of the investment in the subsidiary.
The financial statements are prepared under the historical cost convention on accrual basis in accordance with Generally Accepted Accounting Principles (GAAP), applying the Successful Efforts Method as per the Guidance Note on Accounting for Oil and Gas Producing Activities issued by the Institute of Chartered Accountants of India and Accounting Standards issued under the Companies (Accounting Standards) Rules, 2006 and provisions of the Companies Act, 1956.
The preparation of financial statements requires estimates and assumptions which affect the reported amount of assets, liabilities, income and expenses of the reporting period. The difference between the actual results and estimates are recognized in the period in which the results are known or materialized.
Government grants for acquisition of fixed assets are initially treated as Capital Reserve and are subsequently recognized as income in the Profit & Loss Account on a systematic basis over the useful life of the assets in the proportion in which depreciation on those assets is charged.
Consolidated Financial StatementsConsolidated Financial Statements
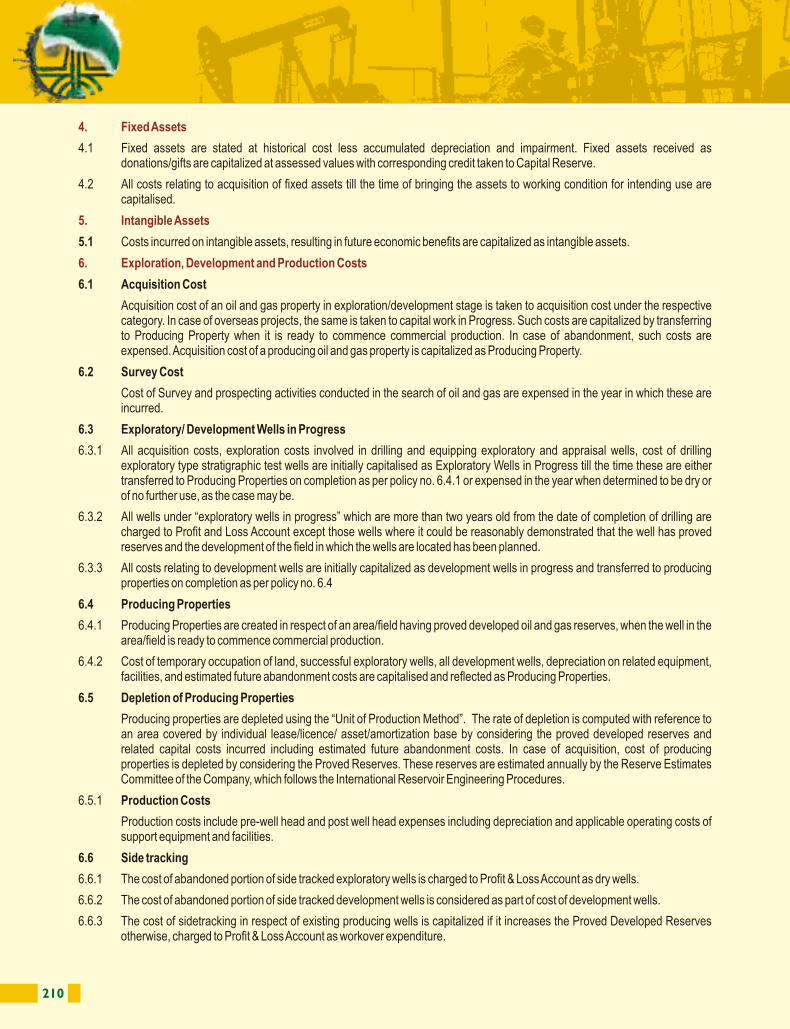
210 211
7. Impairment
8. Abandonment Cost
9. Joint Ventures
10. Investments
11. Inventories
Producing Properties, Development Wells in Progress (DWIP) and Fixed Assets (incl. Capital Works in Progress) of a “Cash Generating Unit” (CGU) are reviewed for impairment at each Balance Sheet date. In case, events and circumstances indicate any impairment, recoverable amount of these assets is determined. An impairment loss is recognized, whenever the carrying amount of such assets exceeds the recoverable amount. The recoverable amount is its ‘value in use’ or ‘net selling price’ (if determinable) whichever is higher. In assessing value in use, the estimated future cash flows from the use of assets and from its disposal at the end of its useful life are discounted to their present value at appropriate rate.
An impairment loss is reversed if there is change in the recoverable amount and such loss either no longer exists or has decreased. Impairment loss / reversal thereof is adjusted to the carrying value of the respective assets, which in case of CGU, is allocated to its assets on a pro-rata basis. Subsequent to Impairment, depreciation is provided on the revised carrying value of the assets over the remaining useful life.
8.1 The full eventual estimated liability towards costs relating to dismantling, abandoning and restoring offshore well sites and allied facilities are recognized in respective assets when the well is complete / facilities are installed.
8.2 The full eventual estimated liability towards costs relating to dismantling, abandoning and restoring onshore well sites are recognized when the well is complete. Cost relating to dismantling, abandoning and restoring its allied facilities are accounted for in the year in which such costs are incurred as the salvage value is expected to take care of the abandonment costs. The abandonment cost on dry well is charged to Profit and Loss Account.
Liability for abandonment cost is updated based on the technical assessment available at current costs with the Company.
The Company has Joint Ventures in the nature of Production Sharing Contracts (PSC) with the Government of India, Govt. of foreign countries and various bodies corporate for exploration, development and production activities.
9.1 The income, expenditure, assets and liabilities of the Jointly Controlled Assets are merged on line by line basis according to the participating interest with the similar items in the Financial Statements of the Company and adjusted for depreciation, depletion, survey, dry wells, abandonment, impairment and sidetracking in accordance with the accounting policies of the Company.
9.2 Consideration for the right to participate in operations recoverable from new Joint Venture Partners are :
1. Reduced from respective capitalized cost wherever applicable.
2. Reduced from current expenditure to the extent it relates to current year.
3. Balance is considered as miscellaneous receipts.
9.3 The hydrocarbon reserves in such areas are taken in proportion to the participating interest of the Company.
10.1 Long-term investments are valued at cost. Provision is made for any diminution, other than temporary, in the value of such investments.
10.2 Current Investments are valued at lower of cost and fair value.
11.1 Finished goods (other than Sulphur) and stock in pipelines/tanks and carbon credits are valued at Cost or net realisable value whichever is lower. Cost of finished goods is determined on absorption costing method. Sulphur is valued at net realisable value. The value of inventories includes excise duty and royalty wherever applicable but excludes cess.
11.2 Crude Oil in unfinished condition in flow lines upto Group Gathering Stations/platform and Natural Gas in Pipelines are not valued.
Stock-in-Process is valued at cost or net realizable value whichever is lower. Cost is determined at Raw material and Proportionate Conversion cost.
11.3 Raw material is valued at lower of cost or net realisable value. Cost is determined on First in First Out (FIFO) basis.
11.4 Inventory of stores and spare parts is valued at Weighted Average Cost or net realisable value whichever is lower. Provisions are made for obsolete and non moving inventories.
4. Fixed Assets
5. Intangible Assets
6. Exploration, Development and Production Costs
4.1 Fixed assets are stated at historical cost less accumulated depreciation and impairment. Fixed assets received as donations/gifts are capitalized at assessed values with corresponding credit taken to Capital Reserve.
4.2 All costs relating to acquisition of fixed assets till the time of bringing the assets to working condition for intending use are capitalised.
5.1 Costs incurred on intangible assets, resulting in future economic benefits are capitalized as intangible assets.
6.1 Acquisition Cost
Acquisition cost of an oil and gas property in exploration/development stage is taken to acquisition cost under the respective category. In case of overseas projects, the same is taken to capital work in Progress. Such costs are capitalized by transferring to Producing Property when it is ready to commence commercial production. In case of abandonment, such costs are expensed. Acquisition cost of a producing oil and gas property is capitalized as Producing Property.
6.2 Survey Cost
Cost of Survey and prospecting activities conducted in the search of oil and gas are expensed in the year in which these are incurred.
6.3 Exploratory/ Development Wells in Progress
6.3.1 All acquisition costs, exploration costs involved in drilling and equipping exploratory and appraisal wells, cost of drilling exploratory type stratigraphic test wells are initially capitalised as Exploratory Wells in Progress till the time these are either transferred to Producing Properties on completion as per policy no. 6.4.1 or expensed in the year when determined to be dry or of no further use, as the case may be.
6.3.2 All wells under “exploratory wells in progress” which are more than two years old from the date of completion of drilling are charged to Profit and Loss Account except those wells where it could be reasonably demonstrated that the well has proved reserves and the development of the field in which the wells are located has been planned.
6.3.3 All costs relating to development wells are initially capitalized as development wells in progress and transferred to producing properties on completion as per policy no. 6.4
6.4 Producing Properties
6.4.1 Producing Properties are created in respect of an area/field having proved developed oil and gas reserves, when the well in the area/field is ready to commence commercial production.
6.4.2 Cost of temporary occupation of land, successful exploratory wells, all development wells, depreciation on related equipment, facilities, and estimated future abandonment costs are capitalised and reflected as Producing Properties.
6.5 Depletion of Producing Properties
Producing properties are depleted using the “Unit of Production Method”. The rate of depletion is computed with reference to an area covered by individual lease/licence/ asset/amortization base by considering the proved developed reserves and related capital costs incurred including estimated future abandonment costs. In case of acquisition, cost of producing properties is depleted by considering the Proved Reserves. These reserves are estimated annually by the Reserve Estimates Committee of the Company, which follows the International Reservoir Engineering Procedures.
6.5.1 Production Costs
Production costs include pre-well head and post well head expenses including depreciation and applicable operating costs of support equipment and facilities.
6.6 Side tracking
6.6.1 The cost of abandoned portion of side tracked exploratory wells is charged to Profit & Loss Account as dry wells.
6.6.2 The cost of abandoned portion of side tracked development wells is considered as part of cost of development wells.
6.6.3 The cost of sidetracking in respect of existing producing wells is capitalized if it increases the Proved Developed Reserves otherwise, charged to Profit & Loss Account as workover expenditure.
212 213
the date when the fair value of such item was determined.
14.3 The loss or gain thereon and also the exchange differences on settlement of the foreign currency transactions during the year are recognized as income or expense and adjusted to the profit and loss account except where such liabilities and /or transactions relate to fixed assets/ projects and these were incurred/ entered into before 1.4.2004; in which case, these are adjusted to the cost of respective fixed assets.
14.4 In respect of the Company’s integral foreign operations:
14.4.1 The foreign currency transactions on initial recognition in the reporting currency are recorded following the policy stated in 14.1. For practical reasons, the average exchange rate of the relevant month is taken for the transactions of the month in respect of joint venture operations, where actual date of transaction is not available.
14.4.2 At each Balance Sheet date, monetary and non-monetary items are translated following the policy stated in 14.2.
14.4.3 All exchange differences are treated following the policy stated in 14.3.
14.5 The financial statements of the non-integral foreign operations of the company are incorporated in the financial statements using the following principles:
14.5.1 The assets and liabilities, both monetary and non-monetary, of the non-integral foreign operation are translated at the average of the exchange rate prevailing on the date of the balance sheet.
14.5.2 Income and expense items of the non-integral foreign operation are translated at the average exchange rates for the period to which the financial statements relate.
14.5.3 The resulting exchange differences are accumulated in a foreign currency translation reserve until the disposal of the net investment in the non-integral foreign operation.
14.5.4 Exchange differences arising on the company’s net investment in a non-integral foreign operation are accumulated in a foreign currency translation reserve until the disposal of such investment, at which time they are recognized as income or as expenses.
14.6 In the case of forward exchange contracts, the premium or discount arising at the inception of such contracts, is amortised as income or expense over the life of the contract as well as exchange difference on such contracts, i.e. difference between the exchange rate at the reporting / settlement date and the exchange rate on the date of inception / the last reporting date, is recognized as income / expense for the period.
Forward exchange contracts other than those covered under –Accounting Standard-11 on The effect of Changes in Foreign Exchange Rates, are marked to market basis at the reporting date and the losses are charged to Profit & Loss A/c. Unrealized gains are ignored.
15.1 All short term employee benefits are recognized at their undiscounted amount in the accounting period in which they are incurred.
15.2 Employee Benefit under defined contribution plans comprising provident fund etc. is recognized based on the undiscounted obligations of the company to contribute to the plan. The same is paid to a fund administered through a separate trust.
15.3 Employee benefits under defined benefit plans comprising of gratuity, leave encashment, compensated absences, post retirement medical benefits and other terminal benefits are recognized based on the present value of defined benefit obligation, which is computed on the basis of actuarial valuation using the projected unit credit method. Actuarial Liability in excess of respective plan assets is recognized during the year. Actuarial gains and losses in respect of post employment and other long-term benefits are recognized during the year.
15.4 Provision for gratuity as per actuarial valuation is funded with a separate trust.
Expenditure on Voluntary Retirement Scheme (VRS) is charged to Profit and Loss Account when incurred.
General Administrative Expenses which are identifiable to Assets, Basins & Services are allocated to activities and the balance are charged to Profit and Loss Account. Such expenses at Headquarters are charged to Profit and Loss Account.
15. Employee Benefits
16. Voluntary Retirement Scheme
17. General Administrative Expenses
11.5 Unserviceable items, when determined, are valued at estimated net realizable value.
12.1 Revenue from sale of products is recognized on transfer of custody to customers. Any difference as of the reporting date between the entitlement quantity minus the quantities sold in respect of crude oil (including condensate), if positive (i.e. under lift quantity) the proportionate production expenditure is treated as prepaid expenses and, if negative (i.e. over lift quantity), a liability for the best estimate of the Company’s proportionate share of production expenses as per the Joint Operating Agreement / Production Sharing Agreement is created in respect of the quantity of crude oil to be foregone in future period towards settlement of the overlift quantity of crude oil with corresponding charge to Profit & Loss Account.
12.2 Any payment received in respect of short lifted gas quantity for which an obligation exists to supply such gas in subsequent periods is recognized as Deferred Revenue in the year of receipt. The same is recognized as revenue in the year in which such gas is actually supplied for the quantity supplied or in the year in which the obligation to supply such gas ceases, whichever is earlier.
12.3 Sale of crude oil and gas (net of levies) produced from exploratory wells in progress is deducted from expenditure on such wells.
12.4 Sales are inclusive of all statutory levies except Value Added Tax (VAT). Any retrospective revision in prices is accounted for in the year of such revision.
12.5 Revenue in respect of fixed price contracts is recognized for the quantum of work done on the basis of percentage of completion method. The quantum of work done is measured in proportion of cost incurred to date to the estimated total cost of the contract or based on reports of physical work done.
12.6 Finance income in respect of assets given on finance lease is recognized based on a pattern reflecting a constant periodic rate of return on the net investment outstanding in respect of the finance lease.
12.7 Revenue in respect of the following is recognized when there is reasonable certainty regarding ultimate collection:
a. Short lifted quantity of gas.
b. Gas pipeline transportation charges and statutory duties thereon.
c. Reimbursable subsidies and grants.
d. Interest on delayed realization from customers.
e. Liquidated damages from contractors/suppliers.
13.1 Depreciation on fixed assets (including those taken on finance lease) is provided for under the written down value method in accordance with the rates specified in Schedule XIV to the Companies Act, 1956.
13.2 Depreciation on additions/deletions during the year is provided for on prorata basis with reference to the date of additions/deletions except items of Plant and Machinery used in wells with 100% rate of depreciation and low value items not exceeding ̀ 5000/- which are fully depreciated at the time of addition.
13.3 Depreciation on subsequent expenditure on fixed assets arising on account of capital improvement or other factor is provided for prospectively.
Depreciation on refurbished/revamped assets which are capitalized separately is provided for over the reassessed useful life at rates which are not less than the rates specified in Schedule XIV to the Companies Act, 1956.
13.4 Depreciation on fixed assets (including support equipment and facilities and taken on finance lease) used for exploration, drilling activities and on related equipment and facilities is initially capitalised as part of exploration cost, development cost or producing properties and expensed/depleted as stated in policy 6 above.
13.5 Leasehold land is amortised over the lease period except perpetual leases
13.6 Intangible assets are amortized over the estimated useful life not exceeding ten years from the date of capitalization.
14.1 Foreign currency transactions on initial recognition in the reporting currency are accounted for at the exchange rates prevailing on the date of transaction.
14.2 At each Balance Sheet date, foreign currency monetary items are translated using the mean exchange rates prevailing on the balance sheet date and non-monetary items are translated using the exchange rate prevailing on the date of transaction or on
12. Revenue Recognition
13. Depreciation and Amortisation
14. Foreign Exchange Transactions
214 215
fixed interest rate and installment as derived from the underlying agreement. The lease commitments are carried under liabilities exclusive of interest. The interest component is recognised in the profit and loss account in accordance with the lease installments.
25.2.2 Assets acquired on lease where a significant portion of the risks and rewards of ownership are retained by the lessor are classified as operating leases. Lease rentals are charged to the Profit and Loss Account on accrual basis.
Provisions involving substantial degree of estimation in measurement are recognized when there is a present obligation as a result of past events and it is probable that there will be an outflow of resources. Contingent Assets are neither recognized nor disclosed in the financial statements. Contingent liabilities, if material, are disclosed by way of notes to accounts.
As per the ICAI Announcement, Accounting for Derivatives, other than those covered under AS-11, is done on market to market basis and the losses are charged to Profit & Loss Account. Unrealized gains are ignored.
Goodwill arising on Consolidation of Companies having Hydrocarbon reserve is amortized based on “Unit of Production Method” considering the related Proved Reserves. Other goodwill on consolidation is not amortized.
26. Provisions, Contingent Liabilities and Contingent Assets
27 Accounting for derivatives
28 Goodwill on Consolidation
18. Insurance claims
19. Research Expenditure
20. Taxes on Income
21. Borrowing Costs
22. Rig Days Costs
23. Deferred Revenue Expenditure
24. Claims
25. Lease
The company accounts for insurance claims as under :-
18.1 In case of total loss of asset by transferring, either the Carrying cost of the relevant asset or Insurance Value (subject to deductibles), whichever is lower under the head “Claims Recoverable-Insurance” on intimation to Insurer. In case insurance claim is less than carrying cost, the difference is charged to Profit and Loss Account.
18.2 In case of partial or other losses, expenditure incurred/payments made to put such assets back into use, to meet third party or other liabilities (Less policy deductibles) if any, are accounted for as “Claims Recoverable-Insurance”. Insurance Policy deductibles are expensed in the year the corresponding expenditure is incurred.
18.3 As and when claims are finally received from Insurer, the difference, if any, between Claims Recoverable-Insurance and Claims received is adjusted to Profit and Loss Account.
Revenue expenses on Research are charged to Profit and Loss Account, when incurred.
Provision for current tax is made as per the provisions of the Income Tax Act, 1961/other applicable tax laws. Deferred Tax Liability / Asset resulting from ‘timing differences’ between book and taxable profit is accounted for considering the tax rate and laws that have been enacted or substantively enacted as on the Balance Sheet date. Deferred Tax Asset is recognized and carried forward only to the extent that there is virtual certainty that the asset will be realized in future.
Borrowing Cost specifically identified to the acquisition or construction of qualifying assets is capitalized as part of such asset. A qualifying asset is one that necessarily takes substantial period of time to get ready for intended use. All other borrowing costs are charged to Profit and Loss Account.
Rig movement costs are booked to the next location planned for drilling. Abnormal rig days’ costs are considered as unallocable and charged to Profit and Loss Account.
23.1 Dry docking charges of Rigs/ Multipurpose Supply Vessels (MSVs), Geo Technical Vessels (GTVs), Well Stimulation Vessels, Offshore Supply Vessels (OSVs), Rig/equipment mobilization expenses and other related expenditure are considered as deferred expenditure and amortized over the period of use not exceeding five years.
23.2 Transportation Costs in respect of the quantity of gas short transported, for which the right exists to transport such gas in subsequent periods at no charge, is treated as Deferred Expenditure in the year of payment. The same is treated as cost in the year in which the gas is actually transported for the quantity transported or in the year in which the right to transport such gas ceases, whichever is earlier.
Claims/Surrenders on/to Petroleum Planning and Analysis Cell, Government of India are booked on ‘in principle acceptance’ thereof on the basis of available instructions/clarifications subject to final adjustments, as stipulated. All other claims and provisions are booked on the merits of each case.
25.1 Assets given on Lease:
25.1.1 Assets given on finance lease are accounted for as per Accounting Standard (AS) 19 “Leases”. Such assets are included as a receivable at an amount equal to the net investment in the lease.
25.1.2 Initial direct costs incurred in respect of finance leases are recognised in the statement of profit and loss in the year in which such costs are incurred.
25.2 Assets taken on Lease:
25.2.1 Assets taken on finance lease are capitalised and recognised at the lower of the fair value of the asset and the discounted value of the minimum lease installments. The lease payments are bifurcated into repayment and interest components, based on a
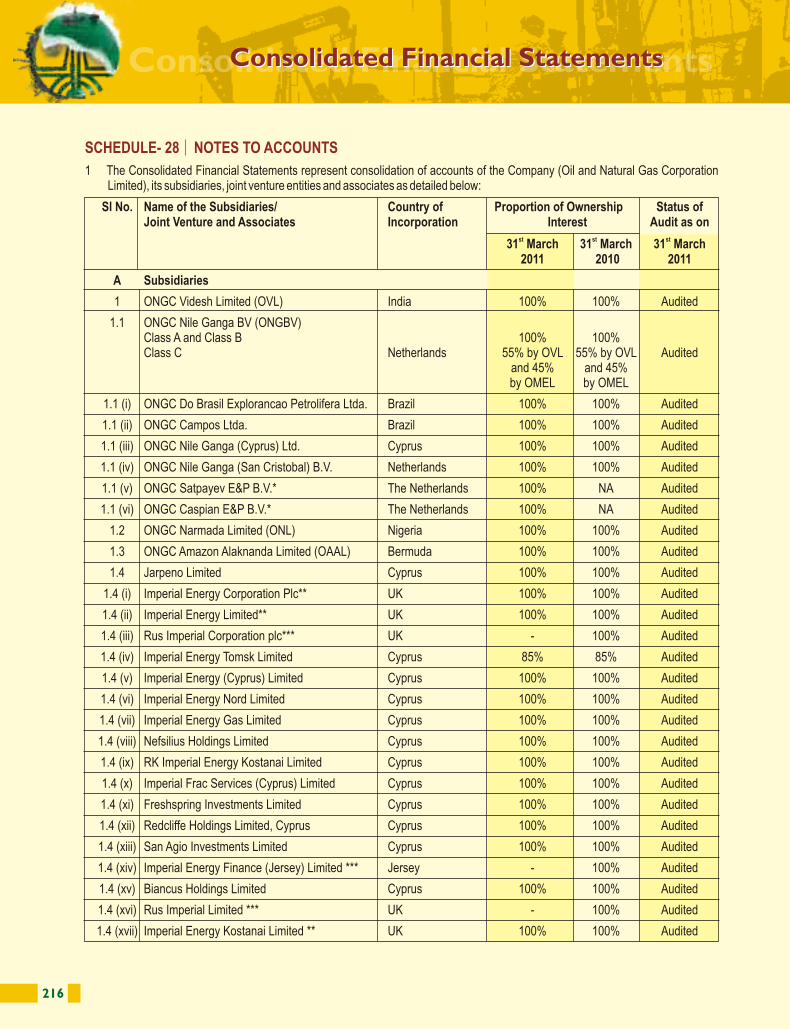
216 217
Consolidated Financial StatementsConsolidated Financial Statements
SCHEDULE- 28 NOTES TO ACCOUNTS
1 The Consolidated Financial Statements represent consolidation of accounts of the Company (Oil and Natural Gas Corporation Limited), its subsidiaries, joint venture entities and associates as detailed below:
Sl No. Name of the Subsidiaries/ Country of Proportion of Ownership Status ofJoint Venture and Associates Incorporation Interest Audit as on
st st st31 March 31 March 31 March2011 2010 2011
A Subsidiaries
1 ONGC Videsh Limited (OVL) India 100% 100% Audited
1.1 ONGC Nile Ganga BV (ONGBV)Class A and Class B 100% 100%Class C Netherlands 55% by OVL 55% by OVL Audited
and 45% and 45%by OMEL by OMEL
1.1 (i) ONGC Do Brasil Explorancao Petrolifera Ltda. Brazil 100% 100% Audited
1.1 (ii) ONGC Campos Ltda. Brazil 100% 100% Audited
1.1 (iii) ONGC Nile Ganga (Cyprus) Ltd. Cyprus 100% 100% Audited
1.1 (iv) ONGC Nile Ganga (San Cristobal) B.V. Netherlands 100% 100% Audited
1.1 (v) ONGC Satpayev E&P B.V.* The Netherlands 100% NA Audited
1.1 (vi) ONGC Caspian E&P B.V.* The Netherlands 100% NA Audited
1.2 ONGC Narmada Limited (ONL) Nigeria 100% 100% Audited
1.3 ONGC Amazon Alaknanda Limited (OAAL) Bermuda 100% 100% Audited
1.4 Jarpeno Limited Cyprus 100% 100% Audited
1.4 (i) Imperial Energy Corporation Plc** UK 100% 100% Audited
1.4 (ii) Imperial Energy Limited** UK 100% 100% Audited
1.4 (iii) Rus Imperial Corporation plc*** UK - 100% Audited
1.4 (iv) Imperial Energy Tomsk Limited Cyprus 85% 85% Audited
1.4 (v) Imperial Energy (Cyprus) Limited Cyprus 100% 100% Audited
1.4 (vi) Imperial Energy Nord Limited Cyprus 100% 100% Audited
1.4 (vii) Imperial Energy Gas Limited Cyprus 100% 100% Audited
1.4 (viii) Nefsilius Holdings Limited Cyprus 100% 100% Audited
1.4 (ix) RK Imperial Energy Kostanai Limited Cyprus 100% 100% Audited
1.4 (x) Imperial Frac Services (Cyprus) Limited Cyprus 100% 100% Audited
1.4 (xi) Freshspring Investments Limited Cyprus 100% 100% Audited
1.4 (xii) Redcliffe Holdings Limited, Cyprus Cyprus 100% 100% Audited
1.4 (xiii) San Agio Investments Limited Cyprus 100% 100% Audited
1.4 (xiv) Imperial Energy Finance (Jersey) Limited *** Jersey - 100% Audited
1.4 (xv) Biancus Holdings Limited Cyprus 100% 100% Audited
1.4 (xvi) Rus Imperial Limited *** UK - 100% Audited
1.4 (xvii) Imperial Energy Kostanai Limited ** UK 100% 100% Audited
1.4 (xviii) OOO Sibinterneft Russian Federation 47.5% 47.5% Audited
1.4 (xix) OOO Allianceneftegaz Russian Federation 100% 100% Audited
1.4 (xx) OOO Nord Imperial Russian Federation 100% 100% Audited
1.4 (xxi) OOO Imperial Energy Russian Federation 100% 100% Audited
1.4 (xxii) OOO Imperial Energy Tomsk Gas Russian Federation 95% 95% Audited
1.4 (xxiii) OOO Stratum Russian Federation 100% 100% Audited
1.4 (xxiv) OOO Imperial Trans Service Russian Federation 100% 100% Audited
1.4 (xxv) OOO Rus Imperial Group Russian Federation 100% 100% Audited
1.4 (xxvi) TOO Sevkazgra*** Kazakhstan - 100% Audited
1.4 (xxvii) OOO Imperial Frac Service Russian Federation 50% 50% Audited
1.5 Carabobo One AB Sweden 100% 100% Unaudited
1.5.(i) Petro Carabobo Ganga B.V. The Netherlands 100% 100% Unaudited
2. Mangalore Refinery and India 71.62% 71.62% AuditedPetrochemicals Ltd. (MRPL)
B Joint Venture Entities
1. Petronet LNG Limited (PLL) India 12.50% 12.50% Audited
2. Petronet MHB Ltd (PMHBL) India 28.77% 28.77% Audited$3. Mangalore SEZ Ltd (MSEZ) India 26.46% 26.46% Audited
#4. ONGC Managalore Petrochemicals Ltd.(OMPL) India 48.15% 48.15% Audited
5. ONGC Petro Additions Ltd. (OPaL) India 41.93% 41.93% Audited
6. ONGC Tripura Power Company Ltd. (OTPC) India 49.52% 49.52% Audited
7. ONGC Teri Biotec Ltd. (OTBL) India 49.98% 49.98% Audited
8. Dahej SEZ Limited (DSL) India 49.60% 49.60% Unaudited
9. ONGC Mittal Energy Limited Cyprus 49.98% 49.98% Unaudited(OMEL) through OVL
10. Shell MRPL Aviation Fuels & India 50% 50% AuditedServices Pvt. Limited through MRPL
11. North East Transmission Company India 28.85% 46.71% AuditedLtd. Limited through OTPC
C Associates
1 Pawan Hans Helicopters Ltd. (PHHL) India 49.00 % 21.54 % Unaudited
* Incorporated during the year ** Under Liquidation *** Liquidated during the year$ includes holding of 0.96% by OMPL. # includes holding of 3% by MRPL
Sl No. Name of the Subsidiaries/ Country of Proportion of Ownership Status ofJoint Venture and Associates Incorporation Interest Audit as on
st st st31 March 31 March 31 March2011 2010 2011
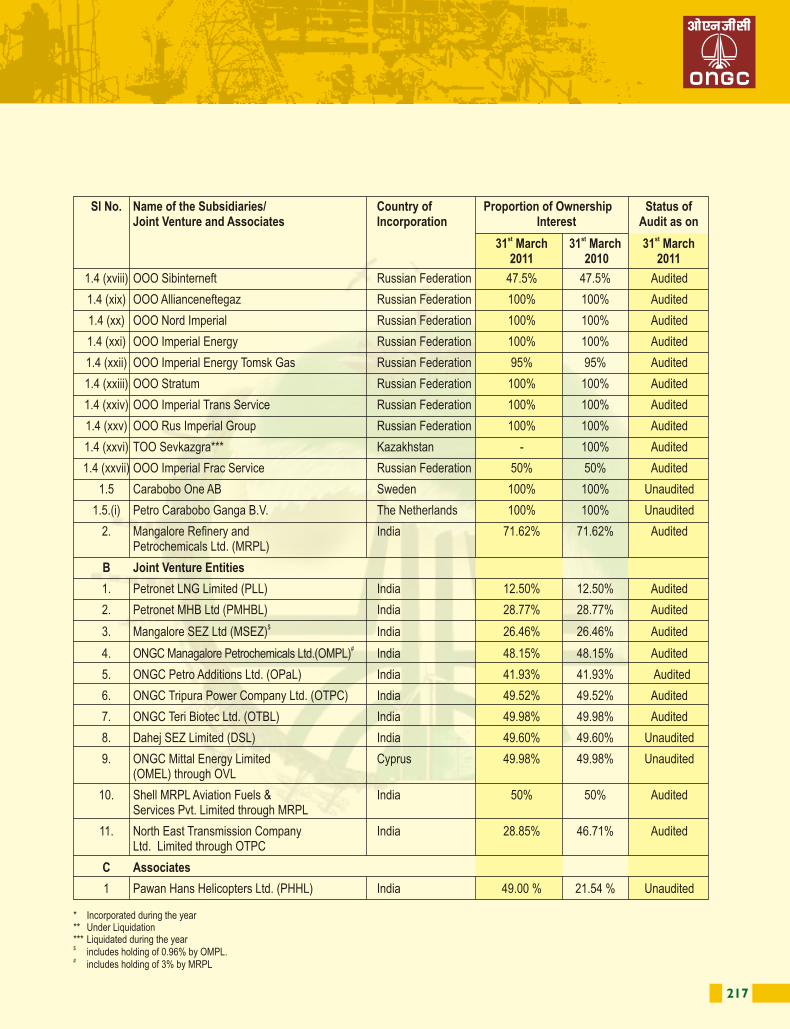
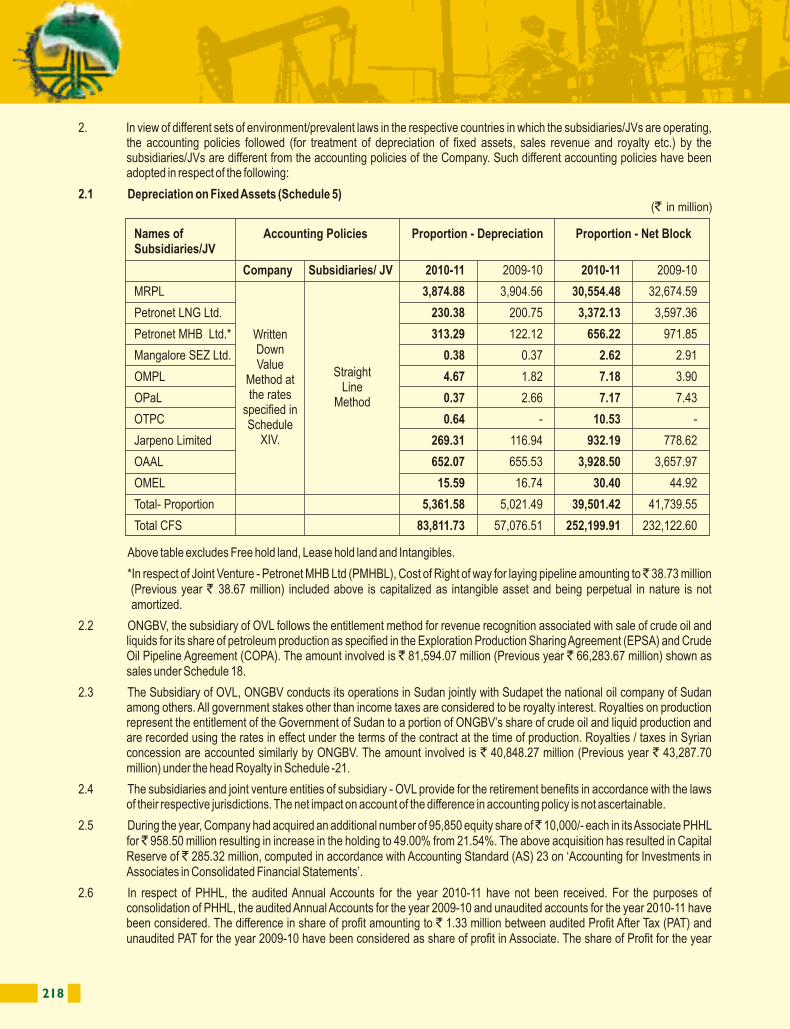
218 219
2. In view of different sets of environment/prevalent laws in the respective countries in which the subsidiaries/JVs are operating, the accounting policies followed (for treatment of depreciation of fixed assets, sales revenue and royalty etc.) by the subsidiaries/JVs are different from the accounting policies of the Company. Such different accounting policies have been adopted in respect of the following:
2.1 Depreciation on Fixed Assets (Schedule 5)
Above table excludes Free hold land, Lease hold land and Intangibles.
*In respect of Joint Venture - Petronet MHB Ltd (PMHBL), Cost of Right of way for laying pipeline amounting to ̀ 38.73 million (Previous year ` 38.67 million) included above is capitalized as intangible asset and being perpetual in nature is not amortized.
2.2 ONGBV, the subsidiary of OVL follows the entitlement method for revenue recognition associated with sale of crude oil and liquids for its share of petroleum production as specified in the Exploration Production Sharing Agreement (EPSA) and Crude Oil Pipeline Agreement (COPA). The amount involved is ` 81,594.07 million (Previous year ` 66,283.67 million) shown as sales under Schedule 18.
2.3 The Subsidiary of OVL, ONGBV conducts its operations in Sudan jointly with Sudapet the national oil company of Sudan among others. All government stakes other than income taxes are considered to be royalty interest. Royalties on production represent the entitlement of the Government of Sudan to a portion of ONGBV’s share of crude oil and liquid production and are recorded using the rates in effect under the terms of the contract at the time of production. Royalties / taxes in Syrian concession are accounted similarly by ONGBV. The amount involved is ` 40,848.27 million (Previous year ` 43,287.70 million) under the head Royalty in Schedule -21.
2.4 The subsidiaries and joint venture entities of subsidiary - OVL provide for the retirement benefits in accordance with the laws of their respective jurisdictions. The net impact on account of the difference in accounting policy is not ascertainable.
2.5 During the year, Company had acquired an additional number of 95,850 equity share of ̀ 10,000/- each in its Associate PHHL for ̀ 958.50 million resulting in increase in the holding to 49.00% from 21.54%. The above acquisition has resulted in Capital Reserve of ` 285.32 million, computed in accordance with Accounting Standard (AS) 23 on ‘Accounting for Investments in Associates in Consolidated Financial Statements’.
2.6 In respect of PHHL, the audited Annual Accounts for the year 2010-11 have not been received. For the purposes of consolidation of PHHL, the audited Annual Accounts for the year 2009-10 and unaudited accounts for the year 2010-11 have been considered. The difference in share of profit amounting to ` 1.33 million between audited Profit After Tax (PAT) and unaudited PAT for the year 2009-10 have been considered as share of profit in Associate. The share of Profit for the year
2010-11 amounting to ` 28.67 million, has also been considered as share of profit in Associate. No dividend has been received during the year.
2.7 Due to different nature of their operations, PHHL, the Associate of the Company, follows different accounting policies in respect of depreciation. Depreciation is charged by PHHL on Straight Line Method rates specified in Schedule XIV where as the company provides at Written Down Value Method rates specified in Schedule XIV. It is not practicable for the Company to make adjustment for the purposes of applying the equity method.
3. Change in Accounting Policies
3.1 During the year, the Subsidiary of OVL has changed its accounting policy with regard to accounting treatment for over lift quantities & under lift quantities of Crude Oil based on the opinion taken from the Expert Advisory Committee (EAC) of ICAI. Till last year, under lift quantities were treated as Inventories which are now treated as Prepaid Expenses. This change in the accounting treatment has no implication on Financial Statements. Till last year, for overlift quantities, liability was recognized by reversing the related sales/revenue of the Company at the recent sales price of the crude oil. The EAC has suggested for recognition of the consideration received from sale of over lift quantity as Revenue, creating liability for the best estimate of the Company’s proportionate share of production expenses as per the JOA / PSA in respect of the quantity of crude oil to be foregone in future period towards settlement of the overlift quantity of crude oil with corresponding charge to Profit and Loss Account. Since there was no overlift quantity as on 31st March 2011, the change in accounting policy had no implication on Financial Statements for the year.
3.2 During the year, OTPC, Joint Venture, has changed, its accounting policy relating to charging of depreciation from Written Down Value Method (WDV) as per rates prescribed in Schedule XIV of the Companies Act, 1956 to Straight Line Method (SLM) as per provisions of CERC Tariff Regulations 2009, retrospectively with effect from 1st April 2009. The aforesaid change has resulted in writing back of depreciation for earlier years amounting to ̀ 0.31 million, which has been credited to Capital Work In Progress, being charged to that account in earlier years. This has also resulted in lower charge of depreciation during the year amounting to ̀ 0.54 million.
4. Debenture Redemption Reserve
During the year 2009-10, the subsidiary OVL had raised funds from the financial markets by issuance of non-convertible redeemable bonds as follows :
The above securities have been listed in National Stock Exchange of India Ltd. (NSE).
Debenture redemption reserve has been created as follows in respect of the above Bonds:
Sl No Particulars Amount Date of issue
1 8.40 % 5 Years Unsecured Non Convertible Redeemable 19,700 23 December 2009Bonds in the nature of Debentures- Series I
2 8.54 % 10 Years Unsecured Non Convertible 3,700 6 January 2010Redeemable Bonds in the nature of Debentures- Series II
( ` in million)
Particulars Balance as on Additions Balance as on March 31, 2010 March 31, 2011
Series-I 1,068.07 3,937.84 5,005.91
Series-II 86.12 369.80 455.92
Total 1,154.19 4,307.64 5,461.83
( ` in million)
Names of Accounting Policies Proportion - Depreciation Proportion - Net BlockSubsidiaries/JV
Company Subsidiaries/ JV 2010-11 2009-10 2010-11 2009-10
MRPL 3,874.88 3,904.56 30,554.48 32,674.59
Petronet LNG Ltd. 230.38 200.75 3,372.13 3,597.36
Petronet MHB Ltd.* 313.29 122.12 656.22 971.85
Mangalore SEZ Ltd. 0.38 0.37 2.62 2.91
OMPL 4.67 1.82 7.18 3.90
OPaL 0.37 2.66 7.17 7.43
OTPC 0.64 - 10.53 -
Jarpeno Limited 269.31 116.94 932.19 778.62
OAAL 652.07 655.53 3,928.50 3,657.97
OMEL 15.59 16.74 30.40 44.92
Total- Proportion 5,361.58 5,021.49 39,501.42 41,739.55
Total CFS 83,811.73 57,076.51 252,199.91 232,122.60
(` in million)
Written Down Value
Method at the rates
specified in Schedule
XIV.
Straight Line
Method
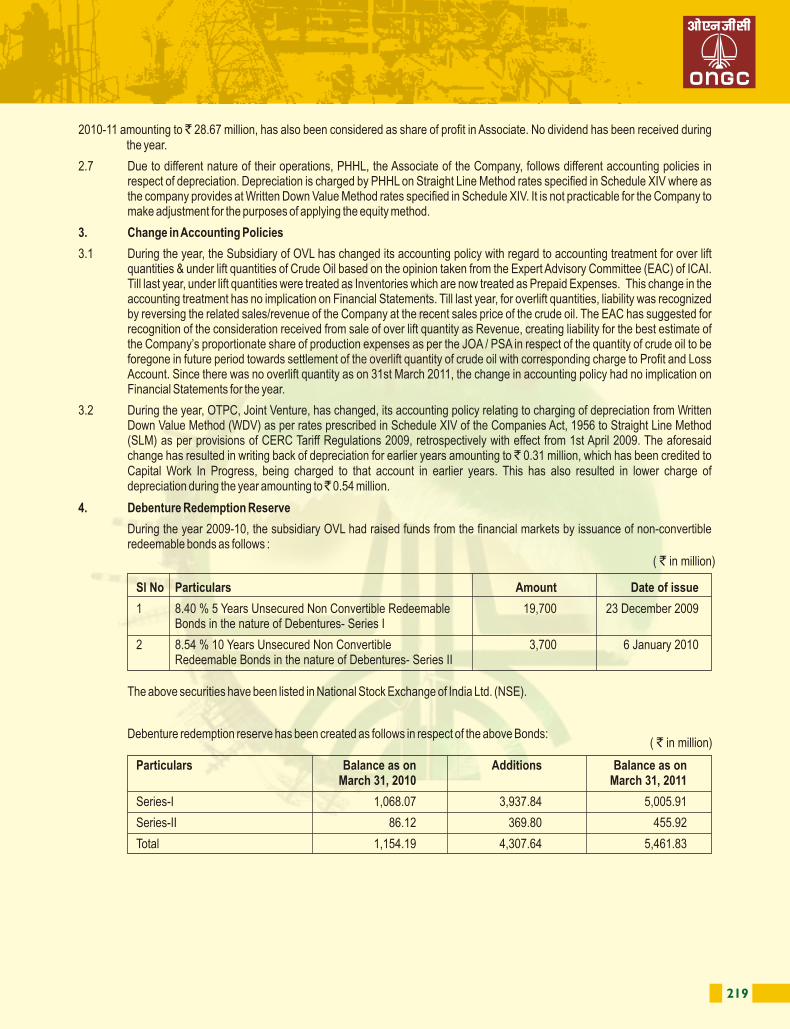
218 219
2. In view of different sets of environment/prevalent laws in the respective countries in which the subsidiaries/JVs are operating, the accounting policies followed (for treatment of depreciation of fixed assets, sales revenue and royalty etc.) by the subsidiaries/JVs are different from the accounting policies of the Company. Such different accounting policies have been adopted in respect of the following:
2.1 Depreciation on Fixed Assets (Schedule 5)
Above table excludes Free hold land, Lease hold land and Intangibles.
*In respect of Joint Venture - Petronet MHB Ltd (PMHBL), Cost of Right of way for laying pipeline amounting to ̀ 38.73 million (Previous year ` 38.67 million) included above is capitalized as intangible asset and being perpetual in nature is not amortized.
2.2 ONGBV, the subsidiary of OVL follows the entitlement method for revenue recognition associated with sale of crude oil and liquids for its share of petroleum production as specified in the Exploration Production Sharing Agreement (EPSA) and Crude Oil Pipeline Agreement (COPA). The amount involved is ` 81,594.07 million (Previous year ` 66,283.67 million) shown as sales under Schedule 18.
2.3 The Subsidiary of OVL, ONGBV conducts its operations in Sudan jointly with Sudapet the national oil company of Sudan among others. All government stakes other than income taxes are considered to be royalty interest. Royalties on production represent the entitlement of the Government of Sudan to a portion of ONGBV’s share of crude oil and liquid production and are recorded using the rates in effect under the terms of the contract at the time of production. Royalties / taxes in Syrian concession are accounted similarly by ONGBV. The amount involved is ` 40,848.27 million (Previous year ` 43,287.70 million) under the head Royalty in Schedule -21.
2.4 The subsidiaries and joint venture entities of subsidiary - OVL provide for the retirement benefits in accordance with the laws of their respective jurisdictions. The net impact on account of the difference in accounting policy is not ascertainable.
2.5 During the year, Company had acquired an additional number of 95,850 equity share of ̀ 10,000/- each in its Associate PHHL for ̀ 958.50 million resulting in increase in the holding to 49.00% from 21.54%. The above acquisition has resulted in Capital Reserve of ` 285.32 million, computed in accordance with Accounting Standard (AS) 23 on ‘Accounting for Investments in Associates in Consolidated Financial Statements’.
2.6 In respect of PHHL, the audited Annual Accounts for the year 2010-11 have not been received. For the purposes of consolidation of PHHL, the audited Annual Accounts for the year 2009-10 and unaudited accounts for the year 2010-11 have been considered. The difference in share of profit amounting to ` 1.33 million between audited Profit After Tax (PAT) and unaudited PAT for the year 2009-10 have been considered as share of profit in Associate. The share of Profit for the year
2010-11 amounting to ̀ 28.67 million, has also been considered as share of profit in Associate. No dividend has been received during the year.
2.7 Due to different nature of their operations, PHHL, the Associate of the Company, follows different accounting policies in respect of depreciation. Depreciation is charged by PHHL on Straight Line Method rates specified in Schedule XIV where as the company provides at Written Down Value Method rates specified in Schedule XIV. It is not practicable for the Company to make adjustment for the purposes of applying the equity method.
3. Change in Accounting Policies
3.1 During the year, the Subsidiary of OVL has changed its accounting policy with regard to accounting treatment for over lift quantities & under lift quantities of Crude Oil based on the opinion taken from the Expert Advisory Committee (EAC) of ICAI. Till last year, under lift quantities were treated as Inventories which are now treated as Prepaid Expenses. This change in the accounting treatment has no implication on Financial Statements. Till last year, for overlift quantities, liability was recognized by reversing the related sales/revenue of the Company at the recent sales price of the crude oil. The EAC has suggested for recognition of the consideration received from sale of over lift quantity as Revenue, creating liability for the best estimate of the Company’s proportionate share of production expenses as per the JOA / PSA in respect of the quantity of crude oil to be foregone in future period towards settlement of the overlift quantity of crude oil with corresponding charge to Profit and Loss Account. Since there was no overlift quantity as on 31st March 2011, the change in accounting policy had no implication on Financial Statements for the year.
3.2 During the year, OTPC, Joint Venture, has changed, its accounting policy relating to charging of depreciation from Written Down Value Method (WDV) as per rates prescribed in Schedule XIV of the Companies Act, 1956 to Straight Line Method (SLM) as per provisions of CERC Tariff Regulations 2009, retrospectively with effect from 1st April 2009. The aforesaid change has resulted in writing back of depreciation for earlier years amounting to ̀ 0.31 million, which has been credited to Capital Work In Progress, being charged to that account in earlier years. This has also resulted in lower charge of depreciation during the year amounting to ̀ 0.54 million.
4. Debenture Redemption Reserve
During the year 2009-10, the subsidiary OVL had raised funds from the financial markets by issuance of non-convertible redeemable bonds as follows :
The above securities have been listed in National Stock Exchange of India Ltd. (NSE).
Debenture redemption reserve has been created as follows in respect of the above Bonds:
Sl No Particulars Amount Date of issue
1 8.40 % 5 Years Unsecured Non Convertible Redeemable 19,700 23 December 2009Bonds in the nature of Debentures- Series I
2 8.54 % 10 Years Unsecured Non Convertible 3,700 6 January 2010Redeemable Bonds in the nature of Debentures- Series II
( ` in million)
Particulars Balance as on Additions Balance as on March 31, 2010 March 31, 2011
Series-I 1,068.07 3,937.84 5,005.91
Series-II 86.12 369.80 455.92
Total 1,154.19 4,307.64 5,461.83
( ` in million)
Names of Accounting Policies Proportion - Depreciation Proportion - Net BlockSubsidiaries/JV
Company Subsidiaries/ JV 2010-11 2009-10 2010-11 2009-10
MRPL 3,874.88 3,904.56 30,554.48 32,674.59
Petronet LNG Ltd. 230.38 200.75 3,372.13 3,597.36
Petronet MHB Ltd.* 313.29 122.12 656.22 971.85
Mangalore SEZ Ltd. 0.38 0.37 2.62 2.91
OMPL 4.67 1.82 7.18 3.90
OPaL 0.37 2.66 7.17 7.43
OTPC 0.64 - 10.53 -
Jarpeno Limited 269.31 116.94 932.19 778.62
OAAL 652.07 655.53 3,928.50 3,657.97
OMEL 15.59 16.74 30.40 44.92
Total- Proportion 5,361.58 5,021.49 39,501.42 41,739.55
Total CFS 83,811.73 57,076.51 252,199.91 232,122.60
(` in million)
Written Down Value
Method at the rates
specified in Schedule
XIV.
Straight Line
Method
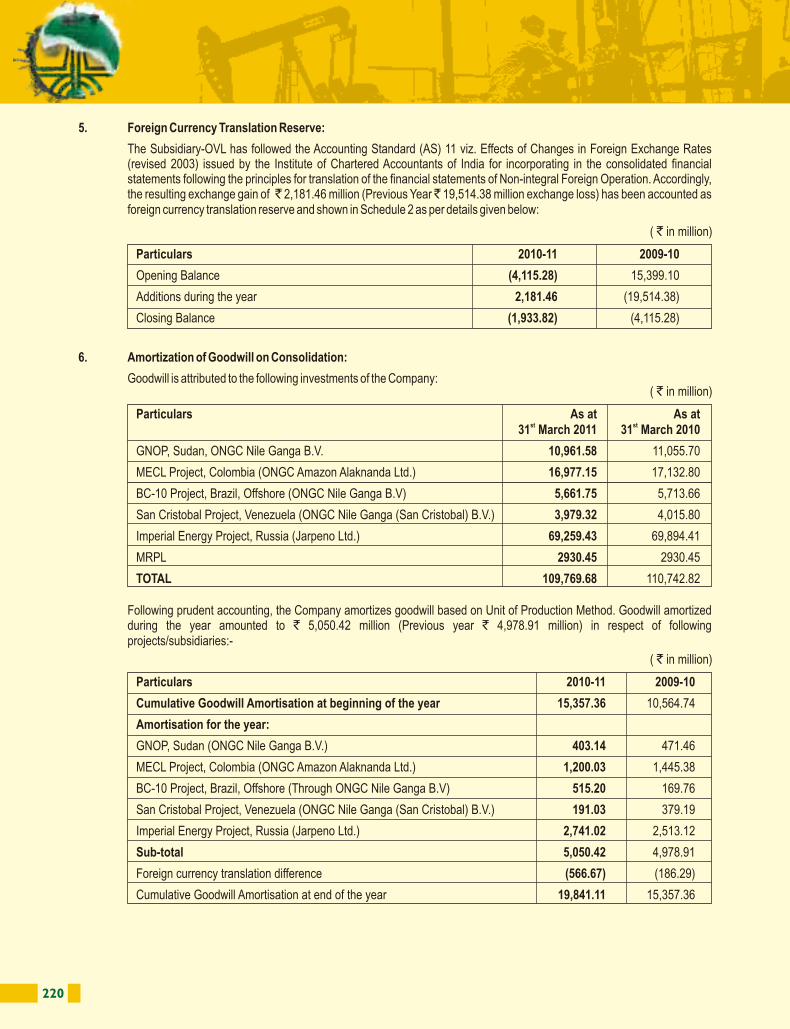
220 221
5. Foreign Currency Translation Reserve:
The Subsidiary-OVL has followed the Accounting Standard (AS) 11 viz. Effects of Changes in Foreign Exchange Rates (revised 2003) issued by the Institute of Chartered Accountants of India for incorporating in the consolidated financial statements following the principles for translation of the financial statements of Non-integral Foreign Operation. Accordingly, the resulting exchange gain of ̀ 2,181.46 million (Previous Year ̀ 19,514.38 million exchange loss) has been accounted as foreign currency translation reserve and shown in Schedule 2 as per details given below:
6. Amortization of Goodwill on Consolidation:
Goodwill is attributed to the following investments of the Company:
Following prudent accounting, the Company amortizes goodwill based on Unit of Production Method. Goodwill amortized during the year amounted to ` 5,050.42 million (Previous year ` 4,978.91 million) in respect of following projects/subsidiaries:-
7. In terms of the decision of Government of India (GoI), the company has shared under-recoveries of Oil Marketing Companies (OMCs) on price sensitive products viz Petrol (upto 24.06.2010), Diesel, Domestic LPG and PDS Kerosene for the year 2010-11 by extending the discount in the prices of Crude Oil, Domestic LPG and PDS Kerosene based on the provisional rates of discount communicated by Petroleum Planning and Analysis Cell (PPAC), Ministry of Petroleum and Natural Gas (MoP&NG). The company does not envisage any material impact on finalization of discount rates. The impact of discount is as under:
8.1 Sales revenue in respect of Crude Oil is based on the pricing formula agreed with the customers for the period from 01.04.2002 to 31.03.2004. Pending finalization of fresh Memorandum of Understanding (MOU)/Crude Oil Sale Agreement (COSA) with the customers, the same pricing formula has been provisionally adopted from 01.04.2004 onwards. However, for Crude Oil produced in Assam, benchmark price revised by MoP&NG w.e.f. 01.04.2008 has been adopted. Adjustments, if any, on account of this shall be carried out on finalization of agreements/ receipt of Government directives. However, the Company does not envisage any material impact on current year’s results on finalisation.
8.2 Sales revenue of Natural Gas under Administrative Price Mechanism (APM) was based on the gas prices fixed on provisional basis as per directives dated 20.06.2005 and 05.06.2006 of MoP&NG, GoI upto 31.05.2010. GoI, vide letter dated 31.05.2010, decided to fix the producer price of APM gas produced by National Oil Companies (NOCs) at US$ 4.2/mmbtu inclusive of royalty effective from 01.06.2010. For APM consumers, except for consumers in North Eastern states, the consumer price would be same as producer price, i.e. US$ 4.2/ mmbtu inclusive of royalty. For APM consumers in North-East, consumer price is 60% of the producer price, i.e., US$ 2.52/ mmbtu inclusive of royalty. In North-East, the difference between producer price and consumer price is paid to the company through GoI Budget.
9. The company is supplying Natural Gas to GAIL (India) Limited (GAIL) which also purchases gas from other sources and sells to APM and non APM consumers. In case GAIL generates surplus in Gas Pool Account during the financial year, same is transferred to ONGC/ Oil India Limited (OIL) at the end of financial year in accordance with their contribution. Accordingly, an amount of ` 21,914.90 million (Previous year ` 4,415.79 million) is accounted as Surplus from Gas Pool Account under ‘Other Income’ in Schedule -19.
10. The Subsidiary-OVL had entered into a Settlement Agreement, signed by all three Foreign Parties including ONGBV and ndGovernment of Sudan (GoS) on 22 December 2010. As per the Settlement Agreement the ownership of the Transportation
System shall be transferred to the GoS as follows: st sta) 70% ownership as of 1 October 2006 till 31 August 2014.
stb) 100% ownership as of 1 September 2014 to be transferred to the GoS.
The 70% of all the Net Revenues generated by the Transportation System and retained by the Foreign Parties since st st1 October 2006 till 31 October 2010, USD 572.16 million shall be returned to and paid to the GoS as follows:
Particulars 2010-11 2009-10
Cumulative Goodwill Amortisation at beginning of the year 15,357.36 10,564.74
Amortisation for the year:
GNOP, Sudan (ONGC Nile Ganga B.V.) 403.14 471.46
MECL Project, Colombia (ONGC Amazon Alaknanda Ltd.) 1,200.03 1,445.38
BC-10 Project, Brazil, Offshore (Through ONGC Nile Ganga B.V) 515.20 169.76
San Cristobal Project, Venezuela (ONGC Nile Ganga (San Cristobal) B.V.) 191.03 379.19
Imperial Energy Project, Russia (Jarpeno Ltd.) 2,741.02 2,513.12
Sub-total 5,050.42 4,978.91
Foreign currency translation difference (566.67) (186.29)
Cumulative Goodwill Amortisation at end of the year 19,841.11 15,357.36
( ` in million)
Parties % PI Amount in Amount inSurrendered USD Million ` Million
China National Petroleum Corporation (CNPC) 75.36 259.35 11,814.04
Petronas Carigialli Nile Ltd. (PCNL) 75.36 194.51 8,860.42
ONGC Nile Ganga BV (ONGBV) 55.00 118.30 5,388.86
Total 572.16 26,063.32
Particulars 2010-11 2009-10
Opening Balance (4,115.28) 15,399.10
Additions during the year 2,181.46 (19,514.38)
Closing Balance (1,933.82) (4,115.28)
( ` in million)
Particulars As at As atst st31 March 2011 31 March 2010
GNOP, Sudan, ONGC Nile Ganga B.V. 10,961.58 11,055.70
MECL Project, Colombia (ONGC Amazon Alaknanda Ltd.) 16,977.15 17,132.80
BC-10 Project, Brazil, Offshore (ONGC Nile Ganga B.V) 5,661.75 5,713.66
San Cristobal Project, Venezuela (ONGC Nile Ganga (San Cristobal) B.V.) 3,979.32 4,015.80
Imperial Energy Project, Russia (Jarpeno Ltd.) 69,259.43 69,894.41
MRPL 2930.45 2930.45
TOTAL 109,769.68 110,742.82
( ` in million)
Decrease in For the year ended
2010-11 2009-10
Gross Revenue 248,924.30 115,543.07
Less: Value Added Tax (VAT) 6,159.47 2,760.27
Sales Revenue 242,764.83 112,782.80
Less: Statutory Levies 29,418.00 13,534.06
Profit Before Tax 213,346.83 99,248.74
( ` in million)
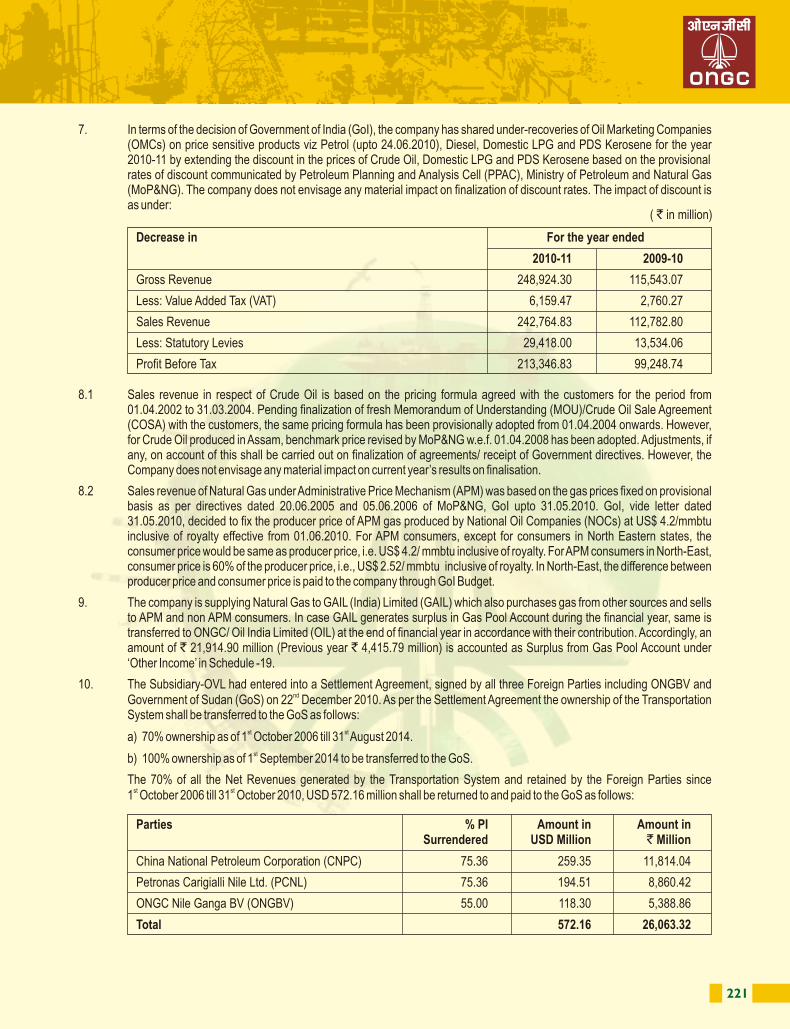
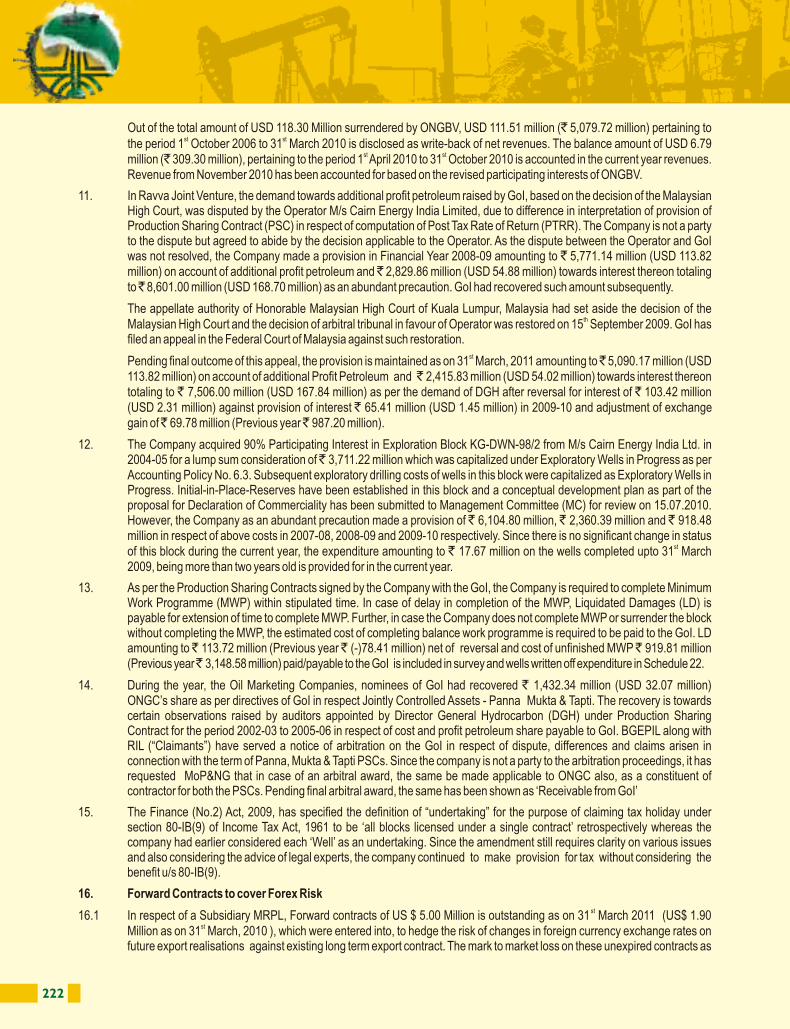
222 223
Out of the total amount of USD 118.30 Million surrendered by ONGBV, USD 111.51 million (` 5,079.72 million) pertaining to st stthe period 1 October 2006 to 31 March 2010 is disclosed as write-back of net revenues. The balance amount of USD 6.79
st stmillion (` 309.30 million), pertaining to the period 1 April 2010 to 31 October 2010 is accounted in the current year revenues. Revenue from November 2010 has been accounted for based on the revised participating interests of ONGBV.
11. In Ravva Joint Venture, the demand towards additional profit petroleum raised by GoI, based on the decision of the Malaysian High Court, was disputed by the Operator M/s Cairn Energy India Limited, due to difference in interpretation of provision of Production Sharing Contract (PSC) in respect of computation of Post Tax Rate of Return (PTRR). The Company is not a party to the dispute but agreed to abide by the decision applicable to the Operator. As the dispute between the Operator and GoI was not resolved, the Company made a provision in Financial Year 2008-09 amounting to ` 5,771.14 million (USD 113.82 million) on account of additional profit petroleum and ̀ 2,829.86 million (USD 54.88 million) towards interest thereon totaling to ̀ 8,601.00 million (USD 168.70 million) as an abundant precaution. GoI had recovered such amount subsequently.
The appellate authority of Honorable Malaysian High Court of Kuala Lumpur, Malaysia had set aside the decision of the thMalaysian High Court and the decision of arbitral tribunal in favour of Operator was restored on 15 September 2009. GoI has
filed an appeal in the Federal Court of Malaysia against such restoration.stPending final outcome of this appeal, the provision is maintained as on 31 March, 2011 amounting to ̀ 5,090.17 million (USD
113.82 million) on account of additional Profit Petroleum and ̀ 2,415.83 million (USD 54.02 million) towards interest thereon totaling to ` 7,506.00 million (USD 167.84 million) as per the demand of DGH after reversal for interest of ` 103.42 million (USD 2.31 million) against provision of interest ` 65.41 million (USD 1.45 million) in 2009-10 and adjustment of exchange gain of ̀ 69.78 million (Previous year ̀ 987.20 million).
12. The Company acquired 90% Participating Interest in Exploration Block KG-DWN-98/2 from M/s Cairn Energy India Ltd. in 2004-05 for a lump sum consideration of ̀ 3,711.22 million which was capitalized under Exploratory Wells in Progress as per Accounting Policy No. 6.3. Subsequent exploratory drilling costs of wells in this block were capitalized as Exploratory Wells in Progress. Initial-in-Place-Reserves have been established in this block and a conceptual development plan as part of the proposal for Declaration of Commerciality has been submitted to Management Committee (MC) for review on 15.07.2010. However, the Company as an abundant precaution made a provision of ̀ 6,104.80 million, ̀ 2,360.39 million and ̀ 918.48 million in respect of above costs in 2007-08, 2008-09 and 2009-10 respectively. Since there is no significant change in status
stof this block during the current year, the expenditure amounting to ` 17.67 million on the wells completed upto 31 March 2009, being more than two years old is provided for in the current year.
13. As per the Production Sharing Contracts signed by the Company with the GoI, the Company is required to complete Minimum Work Programme (MWP) within stipulated time. In case of delay in completion of the MWP, Liquidated Damages (LD) is payable for extension of time to complete MWP. Further, in case the Company does not complete MWP or surrender the block without completing the MWP, the estimated cost of completing balance work programme is required to be paid to the GoI. LD amounting to ̀ 113.72 million (Previous year ̀ (-)78.41 million) net of reversal and cost of unfinished MWP ̀ 919.81 million (Previous year ̀ 3,148.58 million) paid/payable to the GoI is included in survey and wells written off expenditure in Schedule 22.
14. During the year, the Oil Marketing Companies, nominees of GoI had recovered ` 1,432.34 million (USD 32.07 million) ONGC’s share as per directives of GoI in respect Jointly Controlled Assets - Panna Mukta & Tapti. The recovery is towards certain observations raised by auditors appointed by Director General Hydrocarbon (DGH) under Production Sharing Contract for the period 2002-03 to 2005-06 in respect of cost and profit petroleum share payable to GoI. BGEPIL along with RIL (“Claimants”) have served a notice of arbitration on the GoI in respect of dispute, differences and claims arisen in connection with the term of Panna, Mukta & Tapti PSCs. Since the company is not a party to the arbitration proceedings, it has requested MoP&NG that in case of an arbitral award, the same be made applicable to ONGC also, as a constituent of contractor for both the PSCs. Pending final arbitral award, the same has been shown as ‘Receivable from GoI’
15. The Finance (No.2) Act, 2009, has specified the definition of “undertaking” for the purpose of claiming tax holiday under section 80-IB(9) of Income Tax Act, 1961 to be ‘all blocks licensed under a single contract’ retrospectively whereas the company had earlier considered each ‘Well’ as an undertaking. Since the amendment still requires clarity on various issues and also considering the advice of legal experts, the company continued to make provision for tax without considering the benefit u/s 80-IB(9).
16. Forward Contracts to cover Forex Riskst16.1 In respect of a Subsidiary MRPL, Forward contracts of US $ 5.00 Million is outstanding as on 31 March 2011 (US$ 1.90
stMillion as on 31 March, 2010 ), which were entered into, to hedge the risk of changes in foreign currency exchange rates on future export realisations against existing long term export contract. The mark to market loss on these unexpired contracts as
ston 31 March 2011 amounting to ̀ 5.40 Million has been considered in the financial statements . The actual gain/loss could vary and be determined only on settlement of the contract on their respective expiry dates.
16.2 In respect a Joint Venture PLL, external commercial borrowing of USD 150.00 million from International Finance Corporation, stWashington D.C., USA is outstanding as on 31 March, 2011, JV entered into derivative contracts to hedge the loan including
interest. This has the effect of freezing the rupee equivalent of this liability as reflected under the Secured Loans. Thus there is no impact in the Profit & Loss account, arising out of exchange fluctuations for the duration of the loan. Consequently, there is no restatement of the loan taken in foreign currency. The interest payable in Indian Rupees on the derivative contracts is accounted for in the Profit & Loss account.
16.3 In respect of a Subsidiary OVL, the hedging loss for the year is ` 41.85 million (Previous year gain ` 19.42 million) and comprises of realized losses of ` 5.96 million and unrealized losses of ` 35.89 million (Previous year unrealized losses of ` 14.22 million and realized gains of ̀ 33.64 million) in respect of hedging of crude oil against prices by OMEL.
17. The Company has charged depreciation on all Trunk Pipelines and Onshore Flow Lines (assets below ground) at @ 100% based on technical assessment by the management.
18. Some balances of Debtors, Creditors and Loans & Advances are subject to confirmation/ reconciliation. Adjustments, if any, will be accounted for on confirmation/ reconciliation of the same, which will not have a material impact.
19. Borrowing Cost : Borrowing Cost Capitalized during the year is ̀ 1,352.03 million (Previous year ̀ 583.55 million).
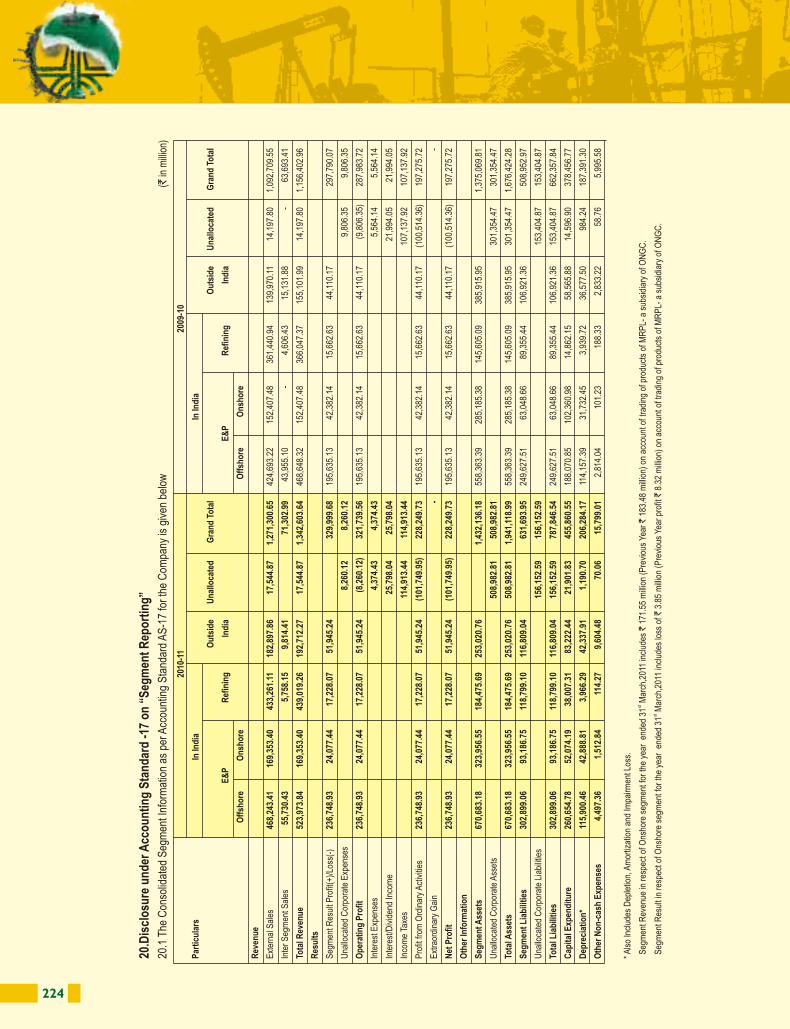
224 225
20.1
The
Con
solid
ated
Seg
men
t Inf
orm
atio
n as
per
Acc
ount
ing
Sta
ndar
d A
S-1
7 fo
r th
e C
ompa
ny is
giv
en b
elow
2010
-11
200
9-10
Par
ticu
lars
In
Ind
ia
I
n In
dia
Ou
tsid
eU
nal
loca
ted
Gra
nd
To
tal
Ou
tsid
eU
nal
loca
ted
Gra
nd
To
tal
E
&P
Ref
inin
gIn
dia
E
&P
Ref
inin
gIn
dia
Off
sho
reO
nsh
ore
Off
sho
reO
nsh
ore
Rev
enu
e
Ext
erna
l Sal
es 4
68,2
43.4
1 1
69,3
53.4
0 4
33,2
61.1
1 1
82,8
97.8
6 1
7,54
4.87
1
,271
,300
.65
424
,693
.22
152
,407
.48
361
,440
.94
139
,970
.11
14,
197.
80
1,0
92,7
09.5
5
Inte
r S
egm
ent S
ales
55,
730.
43
5,7
58.1
5 9
,814
.41
71,
302.
99
43,
955.
10
-
4,6
06.4
3 1
5,13
1.88
-
6
3,69
3.41
Tota
l Rev
enu
e 5
23,9
73.8
4 1
69,3
53.4
0 4
39,0
19.2
6 1
92,7
12.2
7 1
7,54
4.87
1
,342
,603
.64
468
,648
.32
152
,407
.48
366
,047
.37
155
,101
.99
14,
197.
80
1,1
56,4
02.9
6
Res
ult
s
Seg
men
t Res
ult P
rofit
(+)/
Loss
(-)
236
,748
.93
24,
077.
44
17,
228.
07
51,
945.
24
329
,999
.68
195
,635
.13
42,
382.
14
15,
662.
63
44,
110.
17
297
,790
.07
Una
lloca
ted
Cor
pora
te E
xpen
ses
8,2
60.1
2 8
,260
.12
9,8
06.3
5 9
,806
.35
Op
erat
ing
Pro
fit
236
,748
.93
24,
077.
44
17,
228.
07
51,
945.
24
(8,
260.
12)
321
,739
.56
195
,635
.13
42,
382.
14
15,
662.
63
44,
110.
17
(9,
806.
35)
287
,983
.72
Inte
rest
Exp
ense
s 4
,374
.43
4,3
74.4
3 5
,564
.14
5,5
64.1
4
Inte
rest
/Div
iden
d In
com
e 2
5,79
8.04
2
5,79
8.04
2
1,99
4.05
2
1,99
4.05
Inco
me
Taxe
s 1
14,9
13.4
4 1
14,9
13.4
4 1
07,1
37.9
2 1
07,1
37.9
2
Pro
fit fr
om O
rdin
ary
Act
iviti
es 2
36,7
48.9
3 2
4,07
7.44
1
7,22
8.07
5
1,94
5.24
(
101,
749.
95)
228
,249
.73
195
,635
.13
42,
382.
14
15,
662.
63
44,
110.
17
(10
0,51
4.36
) 1
97,2
75.7
2
Ext
raor
dina
ry G
ain
-
-
Net
Pro
fit
236
,748
.93
24,
077.
44
17,
228.
07
51,
945.
24
(10
1,74
9.95
) 2
28,2
49.7
3 1
95,6
35.1
3 4
2,38
2.14
1
5,66
2.63
4
4,11
0.17
(
100,
514.
36)
197
,275
.72
Oth
er In
form
atio
n
Seg
men
t Ass
ets
670
,683
.18
323
,956
.55
184
,475
.69
253
,020
.76
1,4
32,1
36.1
8 5
58,3
63.3
9 2
85,1
85.3
8 1
45,6
05.0
9 3
85,9
15.9
5 1
,375
,069
.81
Una
lloca
ted
Cor
pora
te A
sset
s 5
08,9
82.8
1 5
08,9
82.8
1 3
01,3
54.4
7 3
01,3
54.4
7
Tota
l Ass
ets
670
,683
.18
323
,956
.55
184
,475
.69
253
,020
.76
508
,982
.81
1,9
41,1
18.9
9 5
58,3
63.3
9 2
85,1
85.3
8 1
45,6
05.0
9 3
85,9
15.9
5 3
01,3
54.4
7 1
,676
,424
.28
Seg
men
t L
iab
iliti
es 3
02,8
99.0
6 9
3,18
6.75
1
18,7
99.1
0 1
16,8
09.0
4 6
31,6
93.9
5 2
49,6
27.5
1 6
3,04
8.66
8
9,35
5.44
1
06,9
21.3
6 5
08,9
52.9
7
Una
lloca
ted
Cor
pora
te L
iabi
litie
s 1
56,1
52.5
9 1
56,1
52.5
9 1
53,4
04.8
7 1
53,4
04.8
7
Tota
l Lia
bili
ties
302
,899
.06
93,
186.
75
118
,799
.10
116
,809
.04
156
,152
.59
787
,846
.54
249
,627
.51
63,
048.
66
89,
355.
44
106
,921
.36
153
,404
.87
662
,357
.84
Cap
ital
Exp
end
itu
re 2
60,6
54.7
8 5
2,07
4.19
3
8,00
7.31
8
3,22
2.44
2
1,90
1.83
4
55,8
60.5
5 1
88,0
70.8
5 1
02,3
60.9
8 1
4,86
2.15
5
8,56
5.88
1
4,59
6.90
3
78,4
56.7
7
Dep
reci
atio
n*
115
,900
.46
42,
888.
81
3,9
66.2
9 4
2,33
7.91
1
,190
.70
206
,284
.17
114
,157
.39
31,
732.
45
3,9
39.7
2 3
6,57
7.50
9
84.2
4 1
87,3
91.3
0
Oth
er N
on
-cas
h E
xpen
ses
4,4
97.3
6 1
,512
.84
114
.27
9,6
04.4
8 7
0.06
1
5,79
9.01
2
,814
.04
101
.23
188
.33
2,8
33.2
2 5
8.76
5
,995
.58
* A
lso
Incl
udes
Dep
letio
n, A
mor
tizat
ion
and
Impa
irmen
t Los
s.st
Seg
men
t Rev
enue
in r
espe
ct o
f Ons
hore
seg
men
t for
the
year
end
ed 3
1 M
arch
,201
1 in
clud
es `
171
.55
mill
ion
(Pre
viou
s Ye
ar `
183
.48
mill
ion)
on
acco
unt o
f tra
ding
of p
rodu
cts
of M
RP
L- a
sub
sidi
ary
of O
NG
C.
st S
egm
ent R
esul
t in
resp
ect o
f Ons
hore
seg
men
t for
the
year
end
ed 3
1 M
arch
,201
1 in
clud
es lo
ss o
f ` 3
.85
mill
ion
(Pre
viou
s Ye
ar p
rofit
` 8
.32
mill
ion)
on
acco
unt o
f tra
ding
of p
rodu
cts
of M
RP
L- a
sub
sidi
ary
of O
NG
C.
(` in
mill
ion)
20.D
iscl
osu
re u
nd
er A
cco
un
tin
g S
tan
dar
d -
17 o
n “
Seg
men
t R
epo
rtin
g”
20.2 Notes :
20.2.1 The annexed matrix presentation depicts the geographical segments based on assets as primary segments and business segments as secondary segments.
20.2.2 Segments have been identified and reported taking into account the differing risks and returns, the organization structure and the internal reporting systems. These have been organized into the following main geographical and business segments:
Geographical Segmentsa) In India - Offshore
- Onshore b) Outside India.
Business Segmentsa) Exploration & Productionb) Refining
20.2.3 Segment Revenue, Results, Assets and Liabilities include the respective amounts identifiable to each of the segments and amount allocated on reasonable basis. Un-allocated includes common expenditure incurred for all the segments and expenses incurred at the corporate level.
20.2.4 Inter Segment Sales have been priced at prevailing market rates.
20.2.5 Segment Assets includes ̀ 1,738.45 million of Intangible Assets (Previous year ̀ 2,168.10 million)
20.2.6 Reconciliation of the Segment Revenue with the Revenue as per Schedules 18, 19 & 25 is given below:
21. Disclosure under Accounting Standard - 18 on : "Related Party Disclosure"
21.1 Name of related parties and description of relationship:
21.1.1 Joint Ventures/Jointly Controlled Entities
( ` in million)
Particulars Schedule 2010-11 2009-10
Sales – As per P&L Account 18 1,227,685.75 1,061,688.44
Other Income 19 69,289.33 52,708.18
Prior period Sales 25 (45.36) 26.01
Prior period other Income 25 159.73 281.45
Total 1,297,089.45 1,114,704.08
Less:
Income from trade investments 19 4,367.44 2,263.74
Income from Non trade investments 19 679.98 490.63
Interest income on Deposits with banks/FIs,IT 19 20,741.38 19,240.16Refund, SRF Fund and carry Finance
Segment Revenue 1,271,300.65 1,092,709.55
Sl No. Name Relationship
A Joint Ventures in India
i Ravva Joint Venture in India
ii CY-OS-90/1( PY3) Joint Venture in India
iii Panna, Mukta & Tapti Joint Venture in India
iv CB-OS-2 Joint Venture in India
v GK-OSJ-3 Joint Venture in India
vi RJ-ON-90/1 Joint Venture in India
vii RJ-ONN-2003/1 Joint Venture in India
viii PR-OSN-2004/1 Joint Venture in India
ix RJ-ON/6 Joint Venture in India
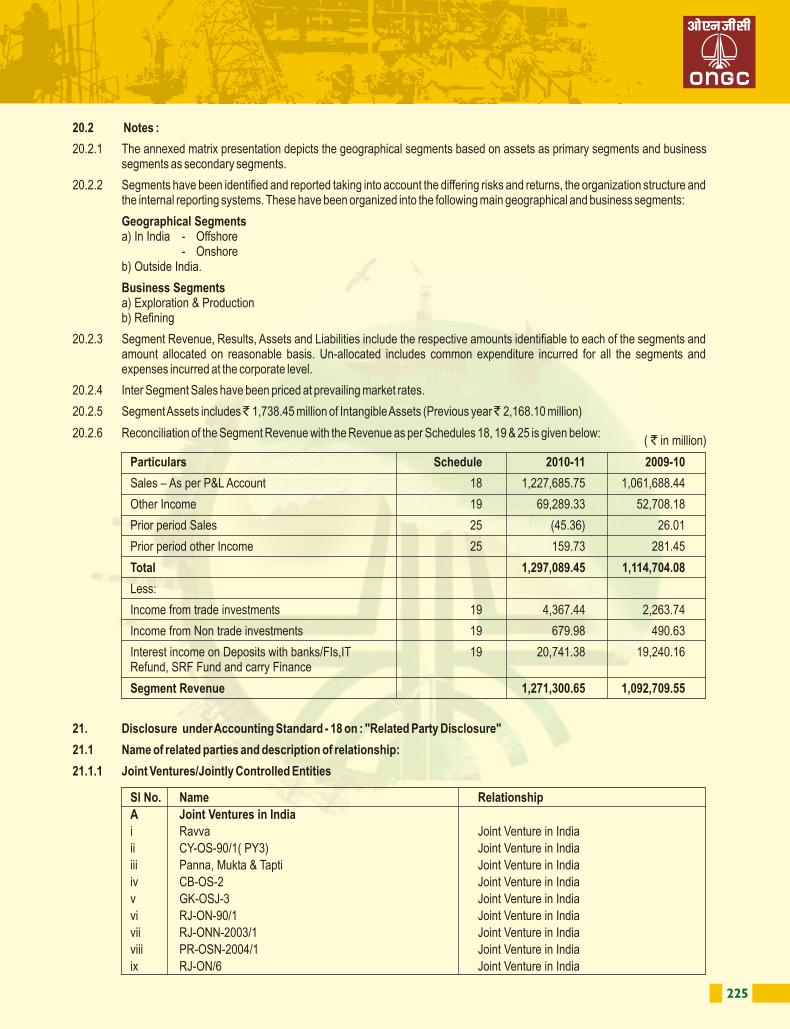
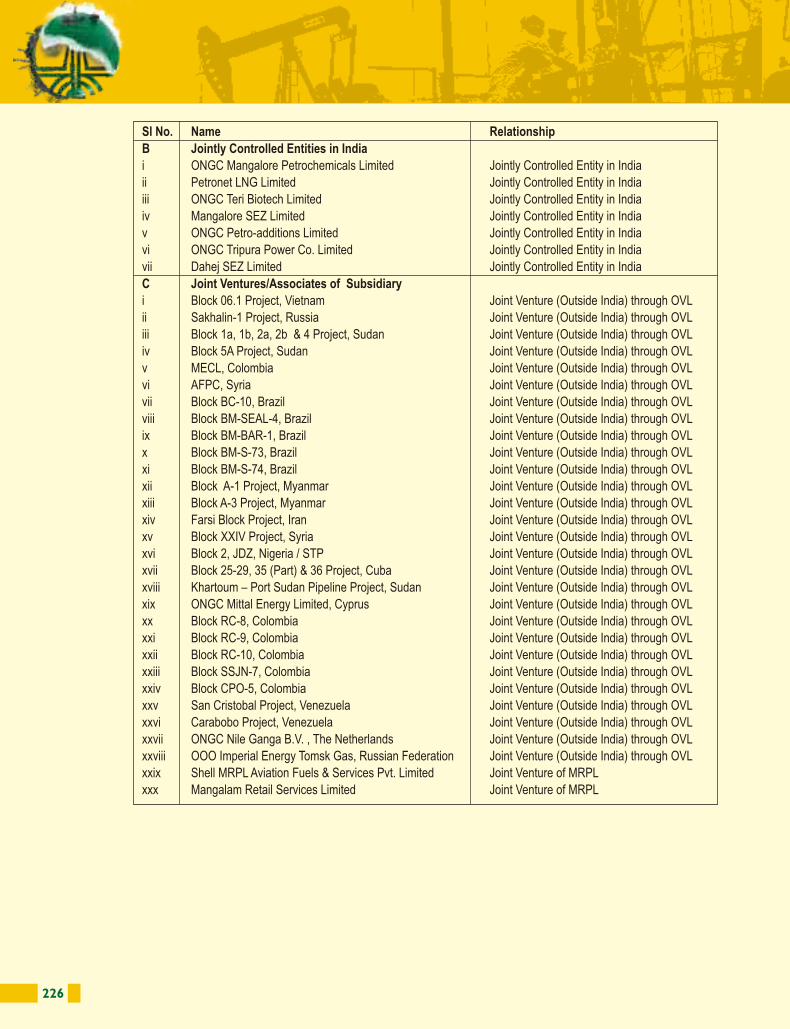
226 227
21.1.2 Key Management Personnel:
SI. No. Functional Directors:
Parent Company
i) Shri R.S. Sharma, Chairman and Managing Director up to 31.01.2011
ii) Shri A.K. Hazarika holding additional charge of Chairman and Managing Director from 01.02.2011
iii) Dr. A. K. Balyan up to 15.07.2010
iv) Shri U. N. Bose
v) Shri D.K. Pande up to 31.01.2011
vi) Shri D.K.Sarraf
vii) Shri Sudhir Vasudeva
viii) Shri S.V.Rao from 25.02.2011
Subsidiaries and Joint Venturesthi) Shri R S Butola, Managing Director, upto 28 February 2011 OVL
stii) Shri J Thomas, Managing Director, w.e.f 1 March 2011 and Director (Exploration) OVL
iii) Shri S P Garg, Director (Finance), OVLstiv) Shri S.Roychoudhary, Director (Commercial)(with effect from 1 September’2009), OVL
v) Shri Ir. A R Baron Mackay Holding B.V., Director, ONGBV
vi) Shri Costas Christoforou, Director, Jarpeno Limited
vii) Ms Arlene Nahikian, Director, Jarpeno Limited
viii) Ms. K. Antoniadou, Director, Jarpeno Limited
ix) Ms. E. Chrysanthou, Director, Jarpeno Limited
x) Shri A. Loizou, Director, Jarpeno Limited
xi) Shri Roland Göransson, Director, Carabobo One AB
xii) Shri Richard Chindt, Director, Carabobo One AB
xiii) Shri U.K. Basu, Managing Director, MRPL
xiv) Shri P P Upadhya, Director ( Technical), MRPL from 30.09.2010stxv) Shri L.K. Gupta, Director (Finance) upto 31 May 2010. MRPL
xvi) Shri Prosad Dasgupta (Managing Director & CEO), PLL till 30.06.2010
xvii) Dr. A.K. Balyan (Managing Director & CEO) PLL from 16.07.2010
xviii) Shri Amitava Sengupta (Director-Finance & Commercial), PLL
xix) Shri C S Mani (Director-Technical), PLL.stxx) Shri Rajiv Banga, Managing Director, Mangalore SEZ from 1 January 2010
xxi) Shri P.P. Nadkarni, Managing Director, PMHBLthxxii) Shri Alok Mukherjee (whole time Director & CEO), OTPCL upto 19 July 2010thxxiii) Shri Sudhindra Kumar Dube (Managing Director), OTPCL from 15 July 2010
Sl No. Name Relationship
B Jointly Controlled Entities in India
i ONGC Mangalore Petrochemicals Limited Jointly Controlled Entity in India
ii Petronet LNG Limited Jointly Controlled Entity in India
iii ONGC Teri Biotech Limited Jointly Controlled Entity in India
iv Mangalore SEZ Limited Jointly Controlled Entity in India
v ONGC Petro-additions Limited Jointly Controlled Entity in India
vi ONGC Tripura Power Co. Limited Jointly Controlled Entity in India
vii Dahej SEZ Limited Jointly Controlled Entity in India
C Joint Ventures/Associates of Subsidiary
i Block 06.1 Project, Vietnam Joint Venture (Outside India) through OVL
ii Sakhalin-1 Project, Russia Joint Venture (Outside India) through OVL
iii Block 1a, 1b, 2a, 2b & 4 Project, Sudan Joint Venture (Outside India) through OVL
iv Block 5A Project, Sudan Joint Venture (Outside India) through OVL
v MECL, Colombia Joint Venture (Outside India) through OVL
vi AFPC, Syria Joint Venture (Outside India) through OVL
vii Block BC-10, Brazil Joint Venture (Outside India) through OVL
viii Block BM-SEAL-4, Brazil Joint Venture (Outside India) through OVL
ix Block BM-BAR-1, Brazil Joint Venture (Outside India) through OVL
x Block BM-S-73, Brazil Joint Venture (Outside India) through OVL
xi Block BM-S-74, Brazil Joint Venture (Outside India) through OVL
xii Block A-1 Project, Myanmar Joint Venture (Outside India) through OVL
xiii Block A-3 Project, Myanmar Joint Venture (Outside India) through OVL
xiv Farsi Block Project, Iran Joint Venture (Outside India) through OVL
xv Block XXIV Project, Syria Joint Venture (Outside India) through OVL
xvi Block 2, JDZ, Nigeria / STP Joint Venture (Outside India) through OVL
xvii Block 25-29, 35 (Part) & 36 Project, Cuba Joint Venture (Outside India) through OVL
xviii Khartoum – Port Sudan Pipeline Project, Sudan Joint Venture (Outside India) through OVL
xix ONGC Mittal Energy Limited, Cyprus Joint Venture (Outside India) through OVL
xx Block RC-8, Colombia Joint Venture (Outside India) through OVL
xxi Block RC-9, Colombia Joint Venture (Outside India) through OVL
xxii Block RC-10, Colombia Joint Venture (Outside India) through OVL
xxiii Block SSJN-7, Colombia Joint Venture (Outside India) through OVL
xxiv Block CPO-5, Colombia Joint Venture (Outside India) through OVL
xxv San Cristobal Project, Venezuela Joint Venture (Outside India) through OVL
xxvi Carabobo Project, Venezuela Joint Venture (Outside India) through OVL
xxvii ONGC Nile Ganga B.V. , The Netherlands Joint Venture (Outside India) through OVL
xxviii OOO Imperial Energy Tomsk Gas, Russian Federation Joint Venture (Outside India) through OVL
xxix Shell MRPL Aviation Fuels & Services Pvt. Limited Joint Venture of MRPL
xxx Mangalam Retail Services Limited Joint Venture of MRPL
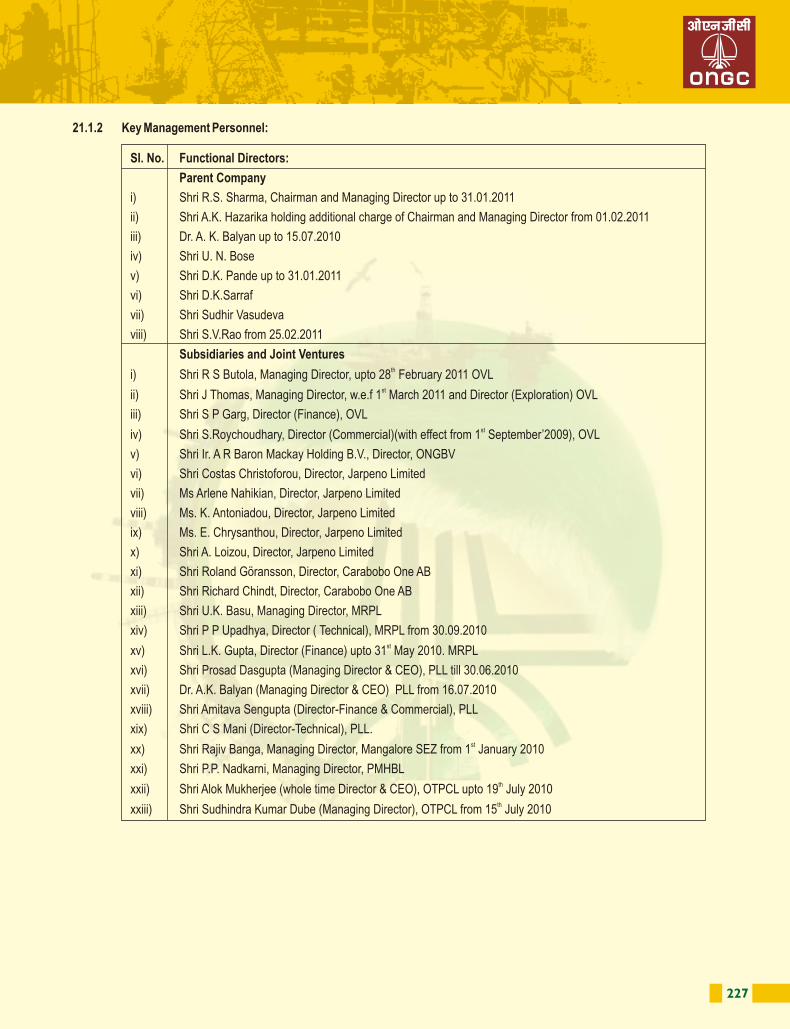
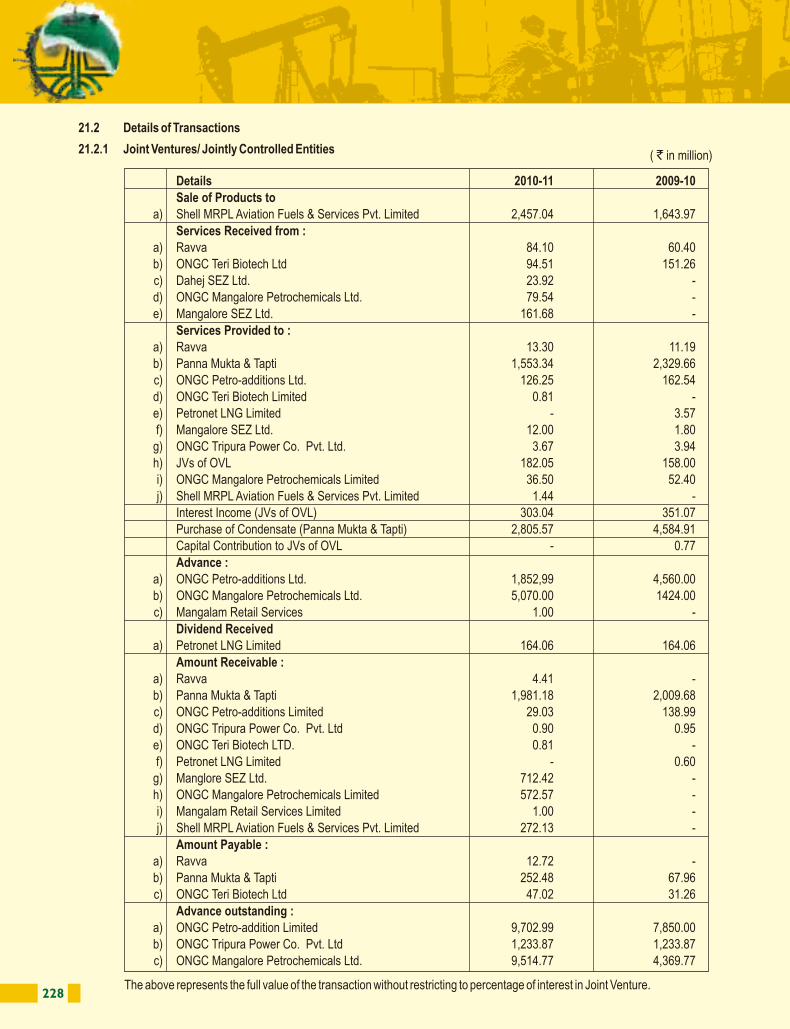
228 229
21.2 Details of Transactions
21.2.1 Joint Ventures/ Jointly Controlled Entities
21.2.2 Key Management Personnel
Remuneration Paid to Key Management Personnel ̀ 91.32 million (Previous year ̀ 78.16 million)
22. Disclosure under Accounting Standard -19 on “Leases”
22.1 Asset taken on Lease:
ONGBV owns 15% equity shares in Tamba B.V., the Netherlands; with the balance held by Shell E and P Offshore Services B.V., the Netherlands (“SEPBV”), and Petobras Netherlands B.V., the Netherlands (“PNBV”). Tamba B.V. has been established to facilitate the development and production of hydrocarbons in the BC-10 concession, Campos Basin area in Brazil. Tamba B.V. has a third party lease for major oil field equipment (FPSO) and constructed other sub-sea assets for
stonwards lease to the BC-10 Project. Both financial leases commenced on 31 December 2008.
Tamba BV leases part of its assets from a third party, the risks and rewards incidental to ownership are largely transferred to it. These assets are capitalised and recognised in the balance sheet as from the moment the lease contract is concluded, at the lower of the fair value of the asset and the discounted value of the minimum lease instalments. The lease instalments payable are broken down into repayment and interest components, based on a fixed interest rate and instalments as derived from the underlying agreement. The lease commitments are carried under long-term liabilities exclusive of interest. The interest component is recognised in the profit and loss account in accordance with the lease instalments.
Tamba BV leases part of its assets to an affiliate, the risks and rewards incidental to ownership are largely transferred to this affiliate. These assets are disposed of and recognised in the balance sheet as from the moment the lease contract is concluded, at the discounted value of the minimum lease instalments. The lease instalments receipts are broken down into repayment and interest components, based on a fixed interest rate and instalments as derived from the underlying agreement. The lease commitments are carried under long-term receivables exclusive of interest. The interest component is recognised in the profit and loss account in accordance with receipt of the lease instalments.
Revenue of finance lease contracts represents the transfer of economic ownership from Tamba BV (lessor) to the lessee of the asset, being an affiliate. Cost of sales represents the costs associated with the finance lease contracts. The Company’s share of the lease liability ( at USD 1= ̀ 44.72) are tabulated below:
The Company’s 15% share of future estimated minimum lease expenses in the year and their present values are scheduled to be as follows:
Tamba BV has entered into a 15 year lease contract for the supply of the FPSO “Espirito Santo” with a third party. The lease contract contains priced termination options for each of the 15 years and priced extension options for the 4 years following the initial 15 year term. The company can exercise a priced purchase option during the term of the lease. Certain operational elements that are priced in the contractual rates are escalated per 5 year intervals on the basis of agreed price indices.
22.2 Asset given on Lease :
The Subsidiary - OVL had completed the execution of the 12”X741 Kms multi-product pipeline from Khartoum Refinery to Port Sudan for the Ministry of Energy and Mining of the Government of Sudan (GoS) on Build, Own, Lease and Transfer (BOLT) basis and handed over the same to GoS during the financial year 2005-06. The project was implemented in consortium with Oil India Limited, Company’s share being 90%.
Lease liability ` In MillionstOpening balance as at 1 April 2010 4,517.23
Interest 388.10
Lease Payments (842.68)
Foreign Currency Translation Adjustment (41.05)stClosing balance as at 31 March 2011 4,021.60
Particulars < 1Year >5Years 1-5 Years Total
Future minimum lease payments: 715 2,707 2,529 5,951
Present value of minimum lease payments 680 2,109 1,233 4,022
(` in million)
Details 2010-11 2009-10
Sale of Products toa) Shell MRPL Aviation Fuels & Services Pvt. Limited 2,457.04 1,643.97
Services Received from :a) Ravva 84.10 60.40b) ONGC Teri Biotech Ltd 94.51 151.26c) Dahej SEZ Ltd. 23.92 -d) ONGC Mangalore Petrochemicals Ltd. 79.54 -e) Mangalore SEZ Ltd. 161.68 -
Services Provided to :a) Ravva 13.30 11.19b) Panna Mukta & Tapti 1,553.34 2,329.66c) ONGC Petro-additions Ltd. 126.25 162.54d) ONGC Teri Biotech Limited 0.81 -e) Petronet LNG Limited - 3.57f) Mangalore SEZ Ltd. 12.00 1.80g) ONGC Tripura Power Co. Pvt. Ltd. 3.67 3.94h) JVs of OVL 182.05 158.00i) ONGC Mangalore Petrochemicals Limited 36.50 52.40j) Shell MRPL Aviation Fuels & Services Pvt. Limited 1.44 -
Interest Income (JVs of OVL) 303.04 351.07Purchase of Condensate (Panna Mukta & Tapti) 2,805.57 4,584.91Capital Contribution to JVs of OVL - 0.77
Advance :a) ONGC Petro-additions Ltd. 1,852,99 4,560.00b) ONGC Mangalore Petrochemicals Ltd. 5,070.00 1424.00c) Mangalam Retail Services 1.00 -
Dividend Receiveda) Petronet LNG Limited 164.06 164.06
Amount Receivable : a) Ravva 4.41 -b) Panna Mukta & Tapti 1,981.18 2,009.68c) ONGC Petro-additions Limited 29.03 138.99d) ONGC Tripura Power Co. Pvt. Ltd 0.90 0.95e) ONGC Teri Biotech LTD. 0.81 -f) Petronet LNG Limited - 0.60g) Manglore SEZ Ltd. 712.42 -h) ONGC Mangalore Petrochemicals Limited 572.57 -i) Mangalam Retail Services Limited 1.00 -j) Shell MRPL Aviation Fuels & Services Pvt. Limited 272.13 -
Amount Payable : a) Ravva 12.72 -b) Panna Mukta & Tapti 252.48 67.96c) ONGC Teri Biotech Ltd 47.02 31.26
Advance outstanding :a) ONGC Petro-addition Limited 9,702.99 7,850.00b) ONGC Tripura Power Co. Pvt. Ltd 1,233.87 1,233.87c) ONGC Mangalore Petrochemicals Ltd. 9,514.77 4,369.77
( ` in million)
The above represents the full value of the transaction without restricting to percentage of interest in Joint Venture.
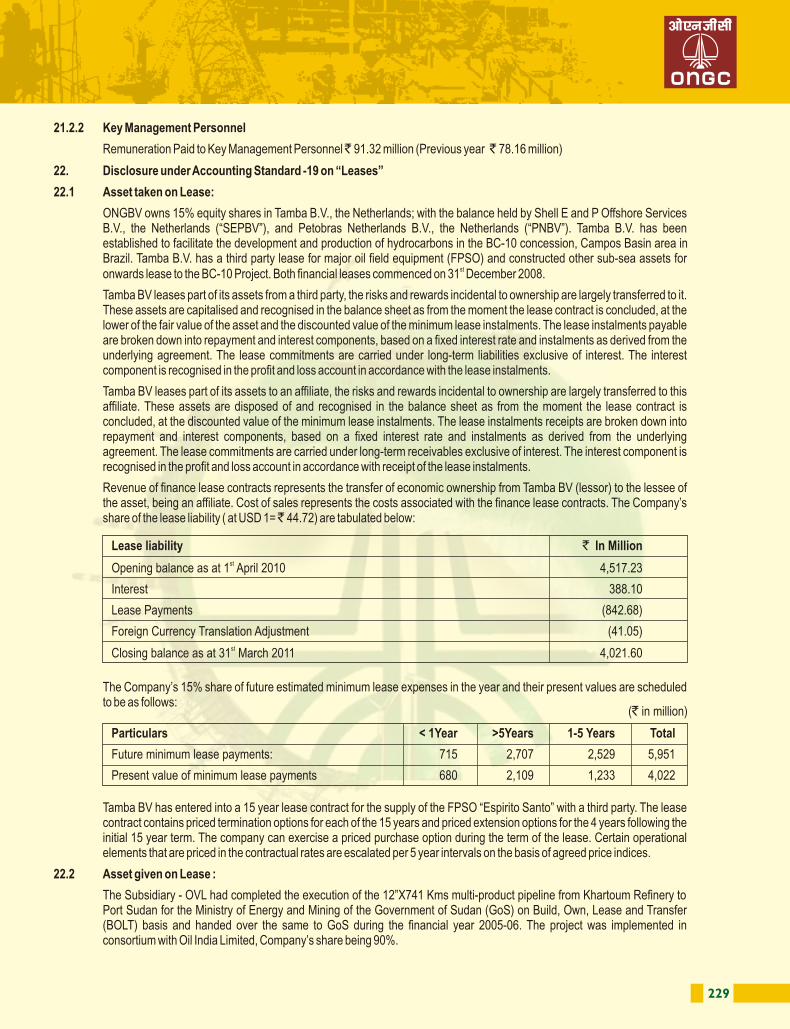
228 229
21.2 Details of Transactions
21.2.1 Joint Ventures/ Jointly Controlled Entities
21.2.2 Key Management Personnel
Remuneration Paid to Key Management Personnel ̀ 91.32 million (Previous year ̀ 78.16 million)
22. Disclosure under Accounting Standard -19 on “Leases”
22.1 Asset taken on Lease:
ONGBV owns 15% equity shares in Tamba B.V., the Netherlands; with the balance held by Shell E and P Offshore Services B.V., the Netherlands (“SEPBV”), and Petobras Netherlands B.V., the Netherlands (“PNBV”). Tamba B.V. has been established to facilitate the development and production of hydrocarbons in the BC-10 concession, Campos Basin area in Brazil. Tamba B.V. has a third party lease for major oil field equipment (FPSO) and constructed other sub-sea assets for
stonwards lease to the BC-10 Project. Both financial leases commenced on 31 December 2008.
Tamba BV leases part of its assets from a third party, the risks and rewards incidental to ownership are largely transferred to it. These assets are capitalised and recognised in the balance sheet as from the moment the lease contract is concluded, at the lower of the fair value of the asset and the discounted value of the minimum lease instalments. The lease instalments payable are broken down into repayment and interest components, based on a fixed interest rate and instalments as derived from the underlying agreement. The lease commitments are carried under long-term liabilities exclusive of interest. The interest component is recognised in the profit and loss account in accordance with the lease instalments.
Tamba BV leases part of its assets to an affiliate, the risks and rewards incidental to ownership are largely transferred to this affiliate. These assets are disposed of and recognised in the balance sheet as from the moment the lease contract is concluded, at the discounted value of the minimum lease instalments. The lease instalments receipts are broken down into repayment and interest components, based on a fixed interest rate and instalments as derived from the underlying agreement. The lease commitments are carried under long-term receivables exclusive of interest. The interest component is recognised in the profit and loss account in accordance with receipt of the lease instalments.
Revenue of finance lease contracts represents the transfer of economic ownership from Tamba BV (lessor) to the lessee of the asset, being an affiliate. Cost of sales represents the costs associated with the finance lease contracts. The Company’s share of the lease liability ( at USD 1= ̀ 44.72) are tabulated below:
The Company’s 15% share of future estimated minimum lease expenses in the year and their present values are scheduled to be as follows:
Tamba BV has entered into a 15 year lease contract for the supply of the FPSO “Espirito Santo” with a third party. The lease contract contains priced termination options for each of the 15 years and priced extension options for the 4 years following the initial 15 year term. The company can exercise a priced purchase option during the term of the lease. Certain operational elements that are priced in the contractual rates are escalated per 5 year intervals on the basis of agreed price indices.
22.2 Asset given on Lease :
The Subsidiary - OVL had completed the execution of the 12”X741 Kms multi-product pipeline from Khartoum Refinery to Port Sudan for the Ministry of Energy and Mining of the Government of Sudan (GoS) on Build, Own, Lease and Transfer (BOLT) basis and handed over the same to GoS during the financial year 2005-06. The project was implemented in consortium with Oil India Limited, Company’s share being 90%.
Lease liability ` In MillionstOpening balance as at 1 April 2010 4,517.23
Interest 388.10
Lease Payments (842.68)
Foreign Currency Translation Adjustment (41.05)stClosing balance as at 31 March 2011 4,021.60
Particulars < 1Year >5Years 1-5 Years Total
Future minimum lease payments: 715 2,707 2,529 5,951
Present value of minimum lease payments 680 2,109 1,233 4,022
(` in million)
Details 2010-11 2009-10
Sale of Products toa) Shell MRPL Aviation Fuels & Services Pvt. Limited 2,457.04 1,643.97
Services Received from :a) Ravva 84.10 60.40b) ONGC Teri Biotech Ltd 94.51 151.26c) Dahej SEZ Ltd. 23.92 -d) ONGC Mangalore Petrochemicals Ltd. 79.54 -e) Mangalore SEZ Ltd. 161.68 -
Services Provided to :a) Ravva 13.30 11.19b) Panna Mukta & Tapti 1,553.34 2,329.66c) ONGC Petro-additions Ltd. 126.25 162.54d) ONGC Teri Biotech Limited 0.81 -e) Petronet LNG Limited - 3.57f) Mangalore SEZ Ltd. 12.00 1.80
g) ONGC Tripura Power Co. Pvt. Ltd. 3.67 3.94h) JVs of OVL 182.05 158.00i) ONGC Mangalore Petrochemicals Limited 36.50 52.40j) Shell MRPL Aviation Fuels & Services Pvt. Limited 1.44 -
Interest Income (JVs of OVL) 303.04 351.07Purchase of Condensate (Panna Mukta & Tapti) 2,805.57 4,584.91Capital Contribution to JVs of OVL - 0.77
Advance :a) ONGC Petro-additions Ltd. 1,852,99 4,560.00b) ONGC Mangalore Petrochemicals Ltd. 5,070.00 1424.00c) Mangalam Retail Services 1.00 -
Dividend Receiveda) Petronet LNG Limited 164.06 164.06
Amount Receivable : a) Ravva 4.41 -b) Panna Mukta & Tapti 1,981.18 2,009.68c) ONGC Petro-additions Limited 29.03 138.99d) ONGC Tripura Power Co. Pvt. Ltd 0.90 0.95e) ONGC Teri Biotech LTD. 0.81 -f) Petronet LNG Limited - 0.60
g) Manglore SEZ Ltd. 712.42 -h) ONGC Mangalore Petrochemicals Limited 572.57 -i) Mangalam Retail Services Limited 1.00 -j) Shell MRPL Aviation Fuels & Services Pvt. Limited 272.13 -
Amount Payable : a) Ravva 12.72 -b) Panna Mukta & Tapti 252.48 67.96c) ONGC Teri Biotech Ltd 47.02 31.26
Advance outstanding :a) ONGC Petro-addition Limited 9,702.99 7,850.00b) ONGC Tripura Power Co. Pvt. Ltd 1,233.87 1,233.87c) ONGC Mangalore Petrochemicals Ltd. 9,514.77 4,369.77
( ` in million)
The above represents the full value of the transaction without restricting to percentage of interest in Joint Venture.
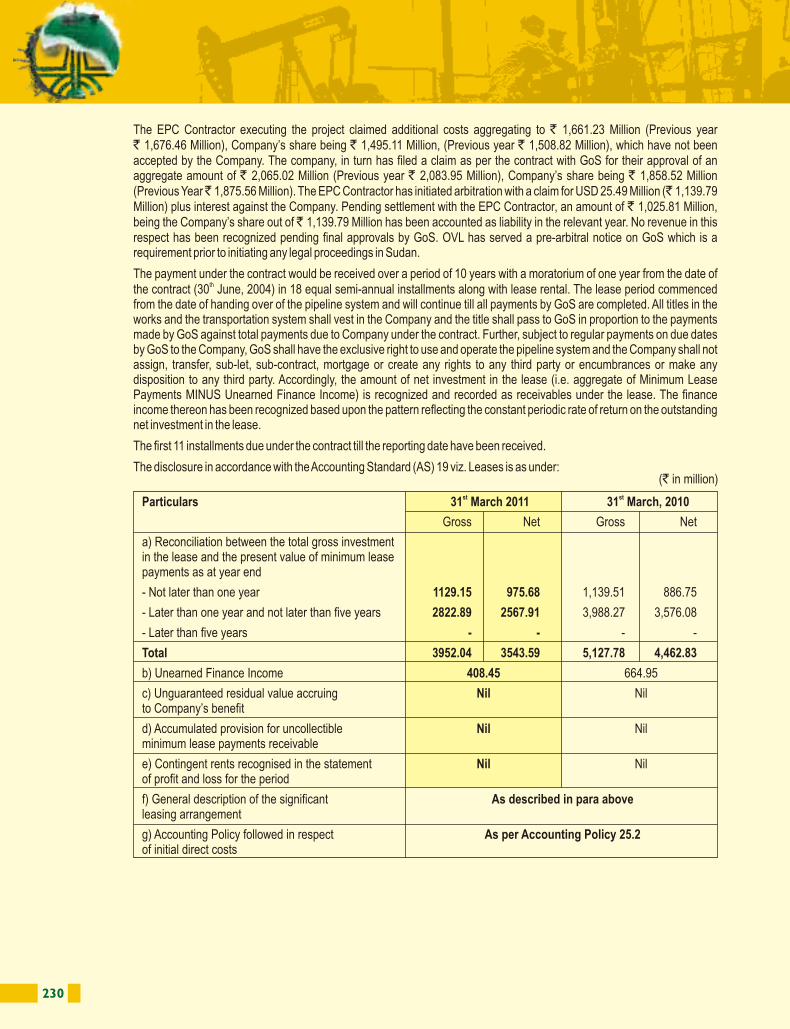
230 231
22.3 An amount of ̀ 2.27 million (previous year Nil) towards non cancellable Operating Lease for office premises was recognized in Capital work in progress. The future minimum lease payments and payment profile under the operating leases are as follows:
22.4 The Company and its subsidiary have certain office/residential premises on Operating Lease which are cancellable by giving appropriate notice as per the respective agreements. During the year ̀ 796.03 million (Previous year ̀ 756.44 million) had been paid towards cancellable Operating Lease.
23. Disclosure under Accounting Standard -22 on “Accounting for Taxes on Income”stThe Net Deferred Tax Liability of the company, its subsidiaries and joint ventures as at 31 March, 2011 comprises of the major
components of Deferred Tax Liabilities and Deferred Tax Assets as under:
st stParticulars As at 31 March, 2011 As at 31 March, 2010
Not later than one year 9.09 -
Later than one year and not later than five years 45.47 -
Later than five years 25.01 -
Total 79.57 -
( ` in million)
Particulars As at As atst st31 March, 31 March,
2011 2011
(i) Liabilities
Depletion of Producing Properties 140,955.74 133,460.20
Depreciation Allocated to Wells in Progress & expenses relating to NELP 10,264.98 7,038.26
Deferred Revenue Expenditure written off 2,582.70 2,794.64
Development wells-in Progress 6,736.28 5,908.70
Depreciation 21,742.53 20,392.46
Others 5,154.56 2,367.99
Deferred tax liability of ONGBV, OAAL- Subsidiary of OVL 5,771.82 5,394.76
Sub Total 193,208.61 177,357.01
(ii) Assets
Depreciation 6,976.17 4,677.42
Unabsorbed losses and allowances 309.26 379.43
Dry wells written off 22,297.93 22,021.71
Provision for Non Moving Inventories 1,198.44 1,285.75
Provison for Doubtful Debts/ Claims /Advances/ Interest 4,622.26 3,229.18
Provision for Abandonment 29,523.55 28,882.40
Provision for Leave Encashment 5,251.43 4,629.69
Provision toward Additional Profit Petroleum & interest 2,435.33 2,550.84
Statutory duties unpaid u/s 43B 3,241.93 543.75
Others 4,623.76 3,948.10
Deferred tax asset of ONGBV,OAAL,OMEL - Subsidiary of OVL 1,202.19 2,296.53
Sub Total 81,682.25 74,444.80
Net Liability (i-ii) 111,526.36 102,912.21
( ` in million)
The EPC Contractor executing the project claimed additional costs aggregating to ` 1,661.23 Million (Previous year ` 1,676.46 Million), Company’s share being ` 1,495.11 Million, (Previous year ` 1,508.82 Million), which have not been accepted by the Company. The company, in turn has filed a claim as per the contract with GoS for their approval of an aggregate amount of ` 2,065.02 Million (Previous year ` 2,083.95 Million), Company’s share being ` 1,858.52 Million (Previous Year ̀ 1,875.56 Million). The EPC Contractor has initiated arbitration with a claim for USD 25.49 Million (` 1,139.79 Million) plus interest against the Company. Pending settlement with the EPC Contractor, an amount of ` 1,025.81 Million, being the Company’s share out of ` 1,139.79 Million has been accounted as liability in the relevant year. No revenue in this respect has been recognized pending final approvals by GoS. OVL has served a pre-arbitral notice on GoS which is a requirement prior to initiating any legal proceedings in Sudan.
The payment under the contract would be received over a period of 10 years with a moratorium of one year from the date of ththe contract (30 June, 2004) in 18 equal semi-annual installments along with lease rental. The lease period commenced
from the date of handing over of the pipeline system and will continue till all payments by GoS are completed. All titles in the works and the transportation system shall vest in the Company and the title shall pass to GoS in proportion to the payments made by GoS against total payments due to Company under the contract. Further, subject to regular payments on due dates by GoS to the Company, GoS shall have the exclusive right to use and operate the pipeline system and the Company shall not assign, transfer, sub-let, sub-contract, mortgage or create any rights to any third party or encumbrances or make any disposition to any third party. Accordingly, the amount of net investment in the lease (i.e. aggregate of Minimum Lease Payments MINUS Unearned Finance Income) is recognized and recorded as receivables under the lease. The finance income thereon has been recognized based upon the pattern reflecting the constant periodic rate of return on the outstanding net investment in the lease.
The first 11 installments due under the contract till the reporting date have been received.
The disclosure in accordance with the Accounting Standard (AS) 19 viz. Leases is as under:
st stParticulars 31 March 2011 31 March, 2010
Gross Net Gross Net
a) Reconciliation between the total gross investmentin the lease and the present value of minimum leasepayments as at year end
- Not later than one year 1129.15 975.68 1,139.51 886.75
- Later than one year and not later than five years 2822.89 2567.91 3,988.27 3,576.08
- Later than five years - - - -
Total 3952.04 3543.59 5,127.78 4,462.83
b) Unearned Finance Income 408.45 664.95
c) Unguaranteed residual value accruing Nil Nilto Company’s benefit
d) Accumulated provision for uncollectible Nil Nilminimum lease payments receivable
e) Contingent rents recognised in the statement Nil Nilof profit and loss for the period
f) General description of the significant As described in para aboveleasing arrangement
g) Accounting Policy followed in respect As per Accounting Policy 25.2of initial direct costs
(` in million)
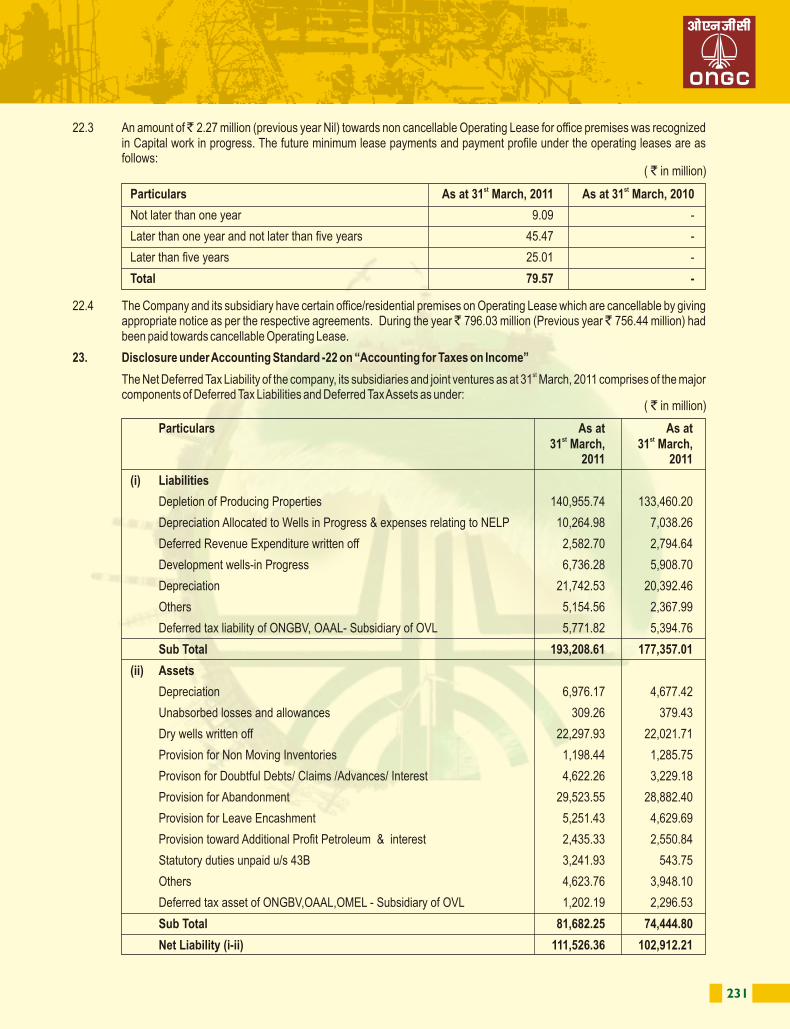
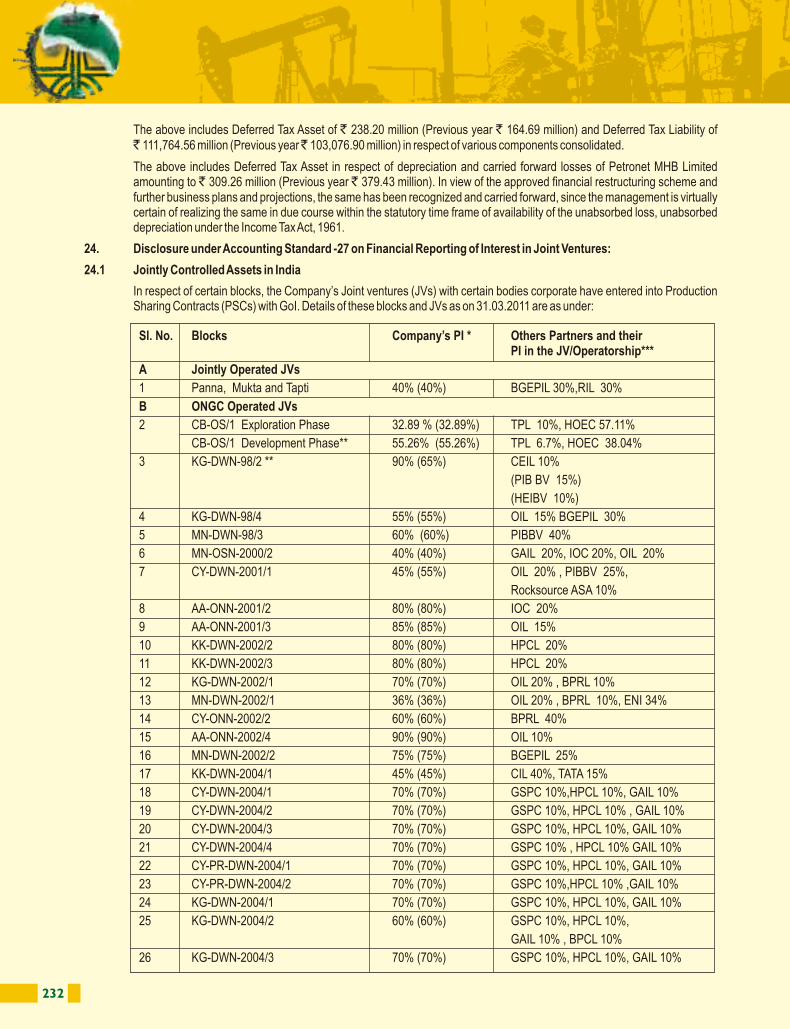
232 233
Sl. No. Blocks Company’s PI * Others Partners and theirPI in the JV/Operatorship***
27 KG-DWN-2004/5 50% (50%) GSPC 10%, HPCL 10%, GAIL 10%
OIL 10%, BPRL 10%
28 KG-DWN-2004/6 60% (60%) GSPC 10%, HPCL 10%,
GAIL 10% , OIL 10%
29 KG-OSN-2004/1 55% (55%) BGEPIL 45%
30 CB-ONN-2004/1 50% (50%) GSPC 40%, HERA-MEC LTD 10%
31 CB-ONN-2004/2** 55% (50%) GSPC 45%
32 CB-ONN-2004/3 40% (40%) GSPC 35% , ENSEARCH 25%
33 CB-ONN-2004/4 50% (50%) GSPC 40% , HERA-MEC LTD 10%
34 CY-ONN-2004/1 80% (80%) BPRL 20%
35 CY-ONN-2004/2 80% (80%) BPRL 20%
36 MB-OSN-2005-1 80% (80% ) GSPC 20%
37 MB-OSN-2005-5 70% (70% ) GSPC 30%
38 MB-OSN-2005-6 80% (80% ) GSPC 20%
39 AN-DWN-2005/1 90% (90% ) OIL 10%
40 KG-DWN-2005/1 70% (70%) IOC 20%, GSPC 10%
41 KK-DWN-2005/2 90% (90%) GSPC 10%
42 KG-OSN-2005/1 60% (60%) HMEL 20%GSPC 20%
43 KG-OSN-2005/2 80% (80%) HMEL 20%
44 Raniganj 74% (74%) CIL 26%
45 Jharia 90% (90%) CIL 10%
46 NK-CBM-2001/1 80% (80%) IOC 20%
47 BK-CBM-2001/1 80% (80%) IOC 20%
48 CB-ONN-2005/4 51% (51%) GSPC 49%
49 CB-ONN-2005/10 51% (51%) GSPC 49%
50 PR-ONN-2005/1 80% (80%) TPL 20%
51 WB-ONN-2005/4 75% (75%) OIL 25%
52 AA-ONN-2005/1 60% (60%) OIL 30% ACIL -10%
53 GV-ONN-2005/3 80% (80%) TPL 20%
54 HF-ONN-2001/1 65% (100%) BMN 35%
55 CB-ONN-2001/1** 100% (100%)
56 AN-DWN-2009/1 70% (Nil) OIL 30%
57 AN-DWN-2009/2 60% (Nil) OIL 40%
58 AN-DWN-2009/3 60% (Nil) OIL 40% (Joint Operator)
59 AN-DWN-2009/5 90% (Nil) GSPC 10%
60 AN-DWN-2009/13 70% (Nil) GAIL 10%, NTPC 10%, GSPC 10%
61 AN-DWN-2009/18 60% (Nil) OIL 30%, GAIL 10%
62 GK-OSN-2009/1 40% (Nil) AWEL 20%, GSPC 20%, IOC 20%
63 GK-OSN-2009/2 40% (Nil) AWEL 30%, IOC 30%
64 KG-OSN-2009/1 80% (Nil) APGIC 10%, NTPC 10%
65 KG-OSN-2009/2 90% (Nil) APGIC 10%
66 KG-OSN-2009/4 50% (Nil) APGIC 10%, OIL 30%, NTPC 10%
67 AA-ONN-2009/3 50% (Nil) OIL 50%
68 CB-ONN-2009/4 50% (Nil) GSPC 50%
The above includes Deferred Tax Asset of ` 238.20 million (Previous year ` 164.69 million) and Deferred Tax Liability of ` 111,764.56 million (Previous year ̀ 103,076.90 million) in respect of various components consolidated.
The above includes Deferred Tax Asset in respect of depreciation and carried forward losses of Petronet MHB Limited amounting to ` 309.26 million (Previous year ` 379.43 million). In view of the approved financial restructuring scheme and further business plans and projections, the same has been recognized and carried forward, since the management is virtually certain of realizing the same in due course within the statutory time frame of availability of the unabsorbed loss, unabsorbed depreciation under the Income Tax Act, 1961.
24. Disclosure under Accounting Standard -27 on Financial Reporting of Interest in Joint Ventures:
24.1 Jointly Controlled Assets in India
In respect of certain blocks, the Company’s Joint ventures (JVs) with certain bodies corporate have entered into Production Sharing Contracts (PSCs) with GoI. Details of these blocks and JVs as on 31.03.2011 are as under:
Sl. No. Blocks Company’s PI * Others Partners and theirPI in the JV/Operatorship***
A Jointly Operated JVs
1 Panna, Mukta and Tapti 40% (40%) BGEPIL 30%,RIL 30%
B ONGC Operated JVs
2 CB-OS/1 Exploration Phase 32.89 % (32.89%) TPL 10%, HOEC 57.11%
CB-OS/1 Development Phase** 55.26% (55.26%) TPL 6.7%, HOEC 38.04%
3 KG-DWN-98/2 ** 90% (65%) CEIL 10%
(PIB BV 15%)
(HEIBV 10%)
4 KG-DWN-98/4 55% (55%) OIL 15% BGEPIL 30%
5 MN-DWN-98/3 60% (60%) PIBBV 40%
6 MN-OSN-2000/2 40% (40%) GAIL 20%, IOC 20%, OIL 20%
7 CY-DWN-2001/1 45% (55%) OIL 20% , PIBBV 25%,
Rocksource ASA 10%
8 AA-ONN-2001/2 80% (80%) IOC 20%
9 AA-ONN-2001/3 85% (85%) OIL 15%
10 KK-DWN-2002/2 80% (80%) HPCL 20%
11 KK-DWN-2002/3 80% (80%) HPCL 20%
12 KG-DWN-2002/1 70% (70%) OIL 20% , BPRL 10%
13 MN-DWN-2002/1 36% (36%) OIL 20% , BPRL 10%, ENI 34%
14 CY-ONN-2002/2 60% (60%) BPRL 40%
15 AA-ONN-2002/4 90% (90%) OIL 10%
16 MN-DWN-2002/2 75% (75%) BGEPIL 25%
17 KK-DWN-2004/1 45% (45%) CIL 40%, TATA 15%
18 CY-DWN-2004/1 70% (70%) GSPC 10%,HPCL 10%, GAIL 10%
19 CY-DWN-2004/2 70% (70%) GSPC 10%, HPCL 10% , GAIL 10%
20 CY-DWN-2004/3 70% (70%) GSPC 10%, HPCL 10%, GAIL 10%
21 CY-DWN-2004/4 70% (70%) GSPC 10% , HPCL 10% GAIL 10%
22 CY-PR-DWN-2004/1 70% (70%) GSPC 10%, HPCL 10%, GAIL 10%
23 CY-PR-DWN-2004/2 70% (70%) GSPC 10%,HPCL 10% ,GAIL 10%
24 KG-DWN-2004/1 70% (70%) GSPC 10%, HPCL 10%, GAIL 10%
25 KG-DWN-2004/2 60% (60%) GSPC 10%, HPCL 10%,
GAIL 10% , BPCL 10%
26 KG-DWN-2004/3 70% (70%) GSPC 10%, HPCL 10%, GAIL 10%
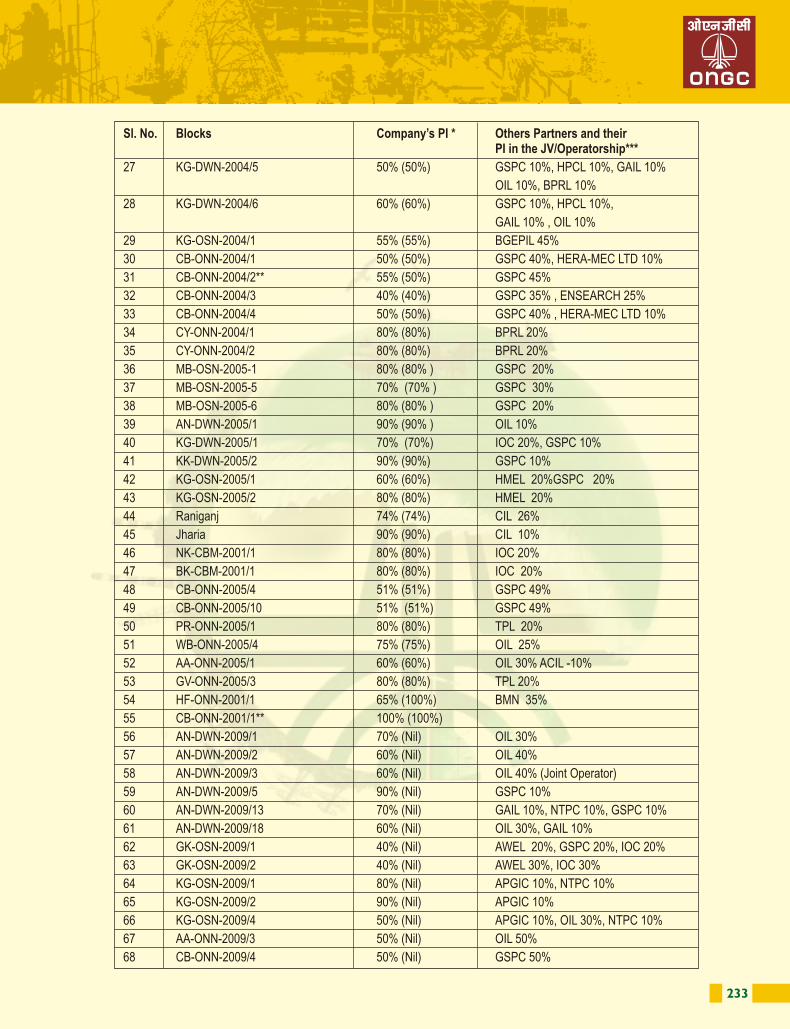
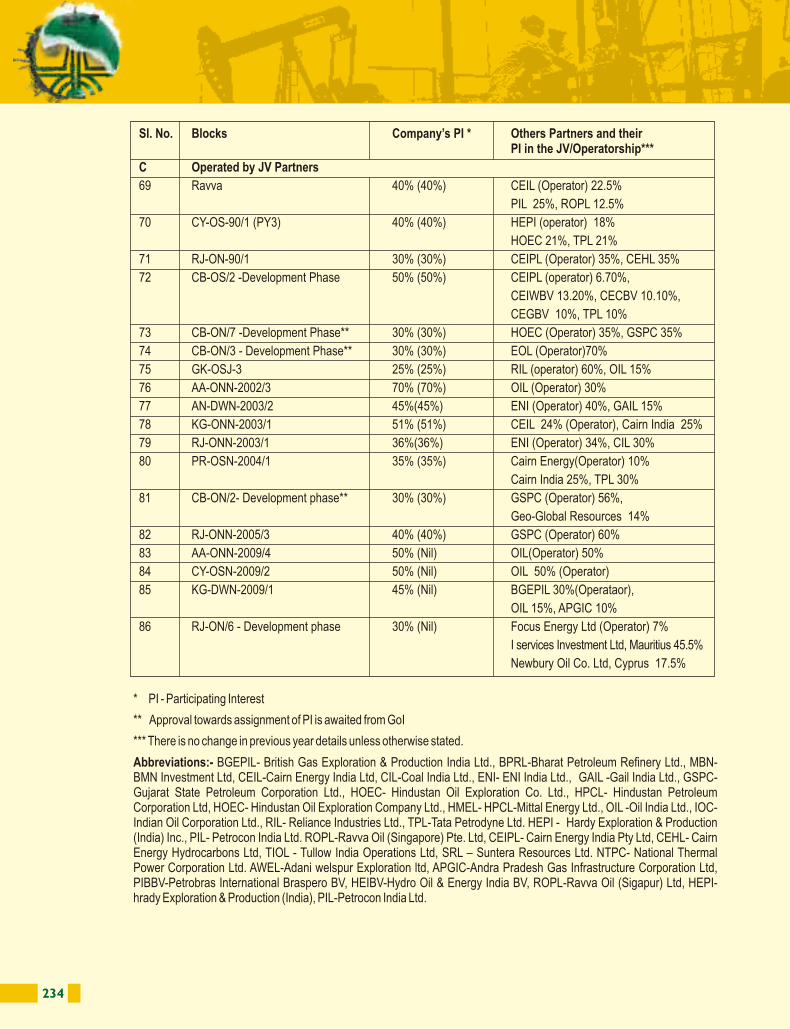
234 235
24.1.1 List of the blocks surrendered during the year are given below:-
* PI - Participating Interest
24.1.2 The Financial position of the JV/NELP blocks are as under:
24.1.3 The financial statements of 128 (Previous year 117) out of 135 (Previous year 124) JVs/NELP as per para no. 24.1.2 have been incorporated in the accounts to the extent of Company’s participating interest in assets, liabilities, income, expenditure and profit/(loss) before tax on the basis of statements certified in accordance with production sharing contract and the same has been adjusted for changes as per accounting policy No. 9.1 in Schedule-27.
24.1.4 In respect of balance 7 (Previous year 7) JVs/NELP assets, liabilities, income and expenditure amounting to ̀ 47.51 Million (Previous year ` 69.80 Million), ` 782.66 million (Previous year ` 143.98 million), ` 55.28 million (Previous year ` 152.55 million) and ̀ 943.31 million (Previous year ̀ 812.85 million) respectively have been incorporated on the basis of uncertified statements prepared under the production sharing contracts and the same has been adjusted for changes as per accounting policy No. 9.1 in Schedule-27.
24.1.5 The Company has given an undertaking to Power Finance Corporation (PFC), for an additional funding up to ` 2,234.00 million in respect of ONGC Tripura Power Co. Limited (OTPC) for cost overrun, if any.
24.2 Company’s share in Joint Ventures (Outside India) through Subsidiary - OVL:
Sl. No. Joint Ventures / PSCs Company’s PI *
1 RJ-ONN-2002/1 40%
2 GS-OSN-2003/1 51%
3 KK-DWN-2001/3 100%
No. of JVs/ Assets Liabilities Income Expenditure Profit / (-) LossNELP Blocks before tax
NELP Block- 22 5,090.88 192.90 0.72 5,345.08 -5,344.36100% IP* (19) (1,822.27) (165.89) (0.11) (7,149.44) (-7,149.33)
Blocks with 86 97,814.40 33,756.91 76,164.95 75,105.44 1,059.51other partners (74) (90,350.03) (29,287.34) (51,148.14) (39,842.90) (11,305.24)
Surrendered 27 317.59 6,942.64 46.96 3,044.76 -2,997.80(31) (219.26) (6,184.08) (0.28) (5,616.40) (-5,616.12)
Total 135 103,222.87 40,892.45 76,212.63 83,495.28 -7,282.65(124) (92,391.56) (35,637.31) (51,148.53) (52,608.74) (-1,460.21)
(` in million)
Sr. No.
1
2
3
Name of the Project and Country of Operation
Block 06.1 Project,Vietnam, Offshore
Block 1a, 1b, 2a, 2b & 4 (GNOP) Project, Sudan, Onshore (Through ONGC Nile Ganga B.V.)
Sakhalin -1 Project, Russia, Offshore
Company’s participating share (%)
45%
25%
20%
Other Consortium Members
BPEOC - 35% Petrovietnam - 20%
CNPC - 40% Petronas - 30% Sudapet - 5%
ENL - 30% SODECO - 30% SMNG - 11.5% R N Astra – 8.5%
Operator
BPEOC*
Joint Operatorship
ENL
Project Status
The project is under development and production
The project is under production.
The project is under development and production
* PI - Participating Interest
** Approval towards assignment of PI is awaited from GoI
*** There is no change in previous year details unless otherwise stated.
Abbreviations:- BGEPIL- British Gas Exploration & Production India Ltd., BPRL-Bharat Petroleum Refinery Ltd., MBN- BMN Investment Ltd, CEIL-Cairn Energy India Ltd, CIL-Coal India Ltd., ENI- ENI India Ltd., GAIL -Gail India Ltd., GSPC-Gujarat State Petroleum Corporation Ltd., HOEC- Hindustan Oil Exploration Co. Ltd., HPCL- Hindustan Petroleum Corporation Ltd, HOEC- Hindustan Oil Exploration Company Ltd., HMEL- HPCL-Mittal Energy Ltd., OIL -Oil India Ltd., IOC- Indian Oil Corporation Ltd., RIL- Reliance Industries Ltd., TPL-Tata Petrodyne Ltd. HEPI - Hardy Exploration & Production (India) Inc., PIL- Petrocon India Ltd. ROPL-Ravva Oil (Singapore) Pte. Ltd, CEIPL- Cairn Energy India Pty Ltd, CEHL- Cairn Energy Hydrocarbons Ltd, TIOL - Tullow India Operations Ltd, SRL – Suntera Resources Ltd. NTPC- National Thermal Power Corporation Ltd. AWEL-Adani welspur Exploration ltd, APGIC-Andra Pradesh Gas Infrastructure Corporation Ltd, PIBBV-Petrobras International Braspero BV, HEIBV-Hydro Oil & Energy India BV, ROPL-Ravva Oil (Sigapur) Ltd, HEPI-hrady Exploration & Production (India), PIL-Petrocon India Ltd.
Sl. No. Blocks Company’s PI * Others Partners and theirPI in the JV/Operatorship***
C Operated by JV Partners
69 Ravva 40% (40%) CEIL (Operator) 22.5%
PIL 25%, ROPL 12.5%
70 CY-OS-90/1 (PY3) 40% (40%) HEPI (operator) 18%
HOEC 21%, TPL 21%
71 RJ-ON-90/1 30% (30%) CEIPL (Operator) 35%, CEHL 35%
72 CB-OS/2 -Development Phase 50% (50%) CEIPL (operator) 6.70%,
CEIWBV 13.20%, CECBV 10.10%,
CEGBV 10%, TPL 10%
73 CB-ON/7 -Development Phase** 30% (30%) HOEC (Operator) 35%, GSPC 35%
74 CB-ON/3 - Development Phase** 30% (30%) EOL (Operator)70%
75 GK-OSJ-3 25% (25%) RIL (operator) 60%, OIL 15%
76 AA-ONN-2002/3 70% (70%) OIL (Operator) 30%
77 AN-DWN-2003/2 45%(45%) ENI (Operator) 40%, GAIL 15%
78 KG-ONN-2003/1 51% (51%) CEIL 24% (Operator), Cairn India 25%
79 RJ-ONN-2003/1 36%(36%) ENI (Operator) 34%, CIL 30%
80 PR-OSN-2004/1 35% (35%) Cairn Energy(Operator) 10%
Cairn India 25%, TPL 30%
81 CB-ON/2- Development phase** 30% (30%) GSPC (Operator) 56%,
Geo-Global Resources 14%
82 RJ-ONN-2005/3 40% (40%) GSPC (Operator) 60%
83 AA-ONN-2009/4 50% (Nil) OIL(Operator) 50%
84 CY-OSN-2009/2 50% (Nil) OIL 50% (Operator)
85 KG-DWN-2009/1 45% (Nil) BGEPIL 30%(Operataor),
OIL 15%, APGIC 10%
86 RJ-ON/6 - Development phase 30% (Nil) Focus Energy Ltd (Operator) 7%
I services Investment Ltd, Mauritius 45.5%
Newbury Oil Co. Ltd, Cyprus 17.5%
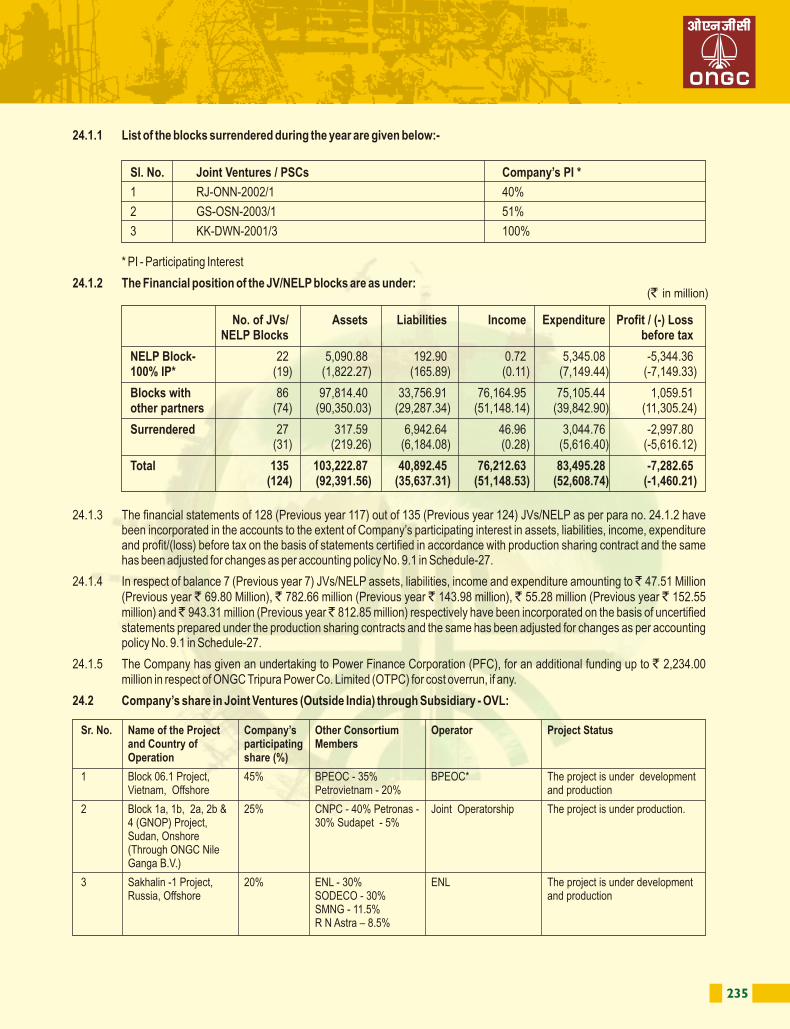
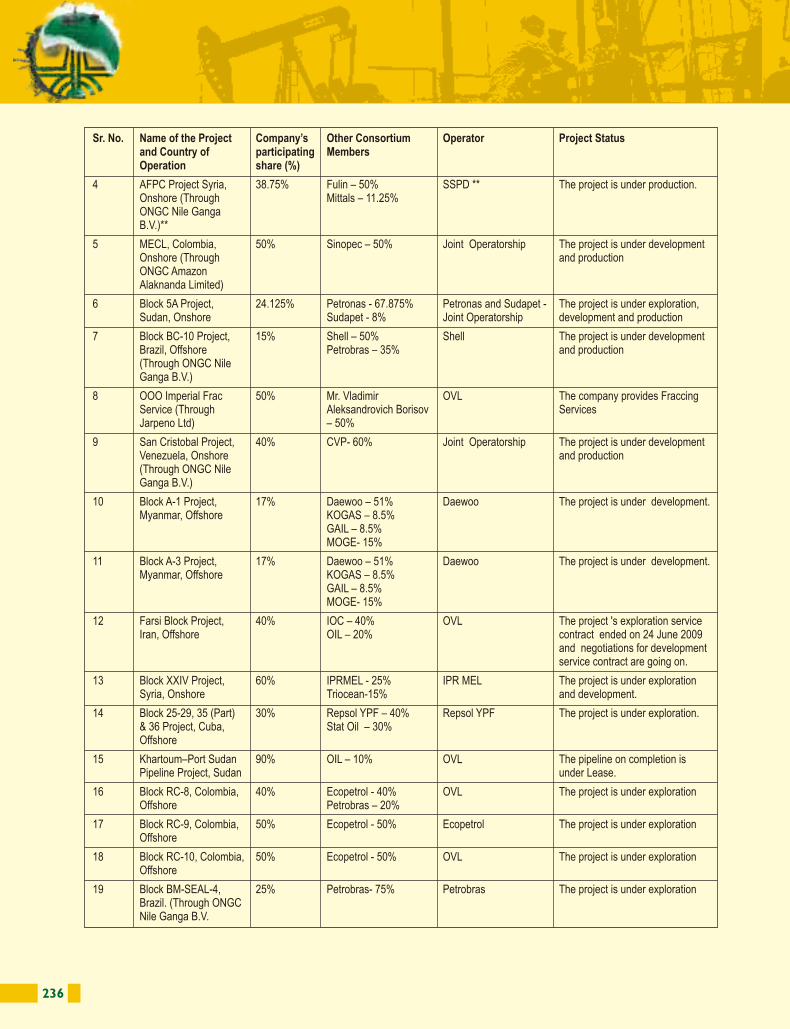
236 237
Sr. No.
20
21
22
23
24
25
26
27
28
29
Name of the Project and Country of Operation
Block BM-BAR-1, Brazil (Through ONGC Nile Ganga B.V)
Block SSJN-7, Colombia, Onshore
OPL-279, Nigeria (Through ONGC Mittal Energy Limited)
OPL-285, Nigeria (Through ONGC Mittal Energy Limited)
Block CPO-5, Colombia, Onshore
SHWE Offshore Pipeline Project, Myanmar
Myanmar Onshore Gas Pipeline Project (SEAGPCL) (Through ONGC Nile Ganga B.V.)
BM-S-73, Brazil (Through ONGC Nile Ganga B.V.)
BM-S-74, Brazil (Through ONGC Nile Ganga B.V.)
Carabobo Project, Venezuela ( Through Carabobo One AB)
Company’s participating share (%)
25%
50%
22.74% (OMEL 45.5%)
32.15% (OMEL 64.33%)
70%
17%
8.35%
43.5%
43.5%
11%
Other Consortium Members
Petrobras- 75%
Pacific - 50%
EMO- 40%Total -14.5%
EMO- 10%Total -25.67%
PetroDorado – 30%***
Daewoo – 51%, KOGAS – 8.5%, GAIL – 8.5%, MOGE – 15%
CNPC-SEAP– 50.9% Daewoo – 25.04%, KOGAS– 4.17%, GAIL – 4.17%, MOGE – 7.37%
Petrobras – 43.5%Eco Petrol – 13%
Petrobras – 43.5%Eco Petrol – 13%
CVP - 60%Repsol Exp-11%Petronas Ve-11%INDOIL-7%
Operator
Petrobras
Pacific
OMEL
OMEL
OVL
Daewoo
CNPC-SEAP
OCL
Petrobras
Joint operatorship
Project Status
The project is under exploration
The project is under exploration
The project is under exploration
The project is under exploration
The project is under exploration
The project is under construction.
The project is under construction
The project is under exploration
The project is under exploration
The project is under development
Abbreviations used: Addax – Addax Energy Nigeria Limited; BPEOC – BP Exploration Operating Company Limited; CNPC – China National Petroleum Corporation; CNPC-SEAP-CNPC South-East Asia Pipeline Co Ltd; CVP – Corporacion Venezolana Del Petroleo S.A.; Daewoo – Daewoo International Corporation; Devon – Devon Energy do Brazil Ltda ; EMO – EMO Exploration & Production Limited; Equator – Equator Exploration JDZ Block 2 Limited; ERHC – ERHC Energy Nigeria JDZ Block 2 Limited; ENL – Exxon Neftegas Limited; Foby – Foby Energy Company Limited; Fulin – Fulin Investments Sarl; GAIL – GAIL (India) Limited;; IOC – Indian Oil Corporation Limited; INDOIL- Indoil Netherlands B.V.; IPRMEL – IPR Mediterranean Exploration Limited; KOGAS – Korea Gas Corporation; B.V; Mittals – Mittal Investments Sarl; MOGE- Myanmar Oil and Gas Enterprise ; Amber – Momo Deepwater JDZ Limited; OCL – ONGC Campos Ltda.. OIL – Oil India Limited; Pacific - Pacific Stratus Energy, Colombia; Petrobras – Petroleo Brasileiro S.A.; Petro-Dorado - Petro-Dorado South America S.A.; Petronas – Petronas Carigali Overseas Sdn Bhd; Petronas Ve: PC Venezuela Ltd; Petrovietnam – Vietnam Oil and Gas Group; Repsol – Repsol YPF Cuba SA; Repsol Exp- Repsol Exploracion S.A.; SEAGPCL – South East Asia Gas Pipeline Company Ltd.; Shell – Shell Brazil Ltda; Sinopec – Sinopec Overseas Oil and Gas Limited; Sinopec JDZ– Sinopec JDZ Block 2 Limited; SMNG – Sakhalinmorneftegas Shelf; SODECO – Sakhalin Oil Development Company Limited; SSPD: Syria Shell Petroleum Development B.V.; Sudapet – Sudapet Limited; Triocean: Tri-Ocean Mediterranean
* During the year, BPEOC entered into an agreement for sale of its PI and transfer of Operatorship to TNK-Vietnam, which is awaiting approval from Vietnamese authorities.
** OVL has effectively 38.75% interest in Himalaya Energy Syria B.V.(HESBV) with Mittals and Fulin effectively holding 11.25% and 50% interest respectively. HESBV, through its subsidiaries, holds 33.33%, 37.5% and 36% interest in Ash Sham (including deep and lateral) concession, Deir-Ez Zor and Annexure-IV (including deep and lateral) concessions and a gas utilization agreement in Syria; the balance interest in the concessions being held by SSPD- the Operator.
nd st*** Farm-out of 30% participating interest effective 2 June 2010; approved by Agencia Nacional de Hidrocarburos (ANH) on 1 October 2010.
Sr. No.
4
5
6
7
8
9
10
11
12
13
14
15
16
17
18
19
Name of the Project and Country of Operation
AFPC Project Syria, Onshore (Through ONGC Nile Ganga B.V.)**
MECL, Colombia, Onshore (Through ONGC Amazon Alaknanda Limited)
Block 5A Project, Sudan, Onshore
Block BC-10 Project, Brazil, Offshore (Through ONGC Nile Ganga B.V.)
OOO Imperial Frac Service (Through Jarpeno Ltd)
San Cristobal Project, Venezuela, Onshore (Through ONGC Nile Ganga B.V.)
Block A-1 Project, Myanmar, Offshore
Block A-3 Project, Myanmar, Offshore
Farsi Block Project, Iran, Offshore
Block XXIV Project, Syria, Onshore
Block 25-29, 35 (Part) & 36 Project, Cuba, Offshore
Khartoum–Port Sudan Pipeline Project, Sudan
Block RC-8, Colombia, Offshore
Block RC-9, Colombia, Offshore
Block RC-10, Colombia, Offshore
Block BM-SEAL-4, Brazil. (Through ONGC Nile Ganga B.V.
Company’s participating share (%)
38.75%
50%
24.125%
15%
50%
40%
17%
17%
40%
60%
30%
90%
40%
50%
50%
25%
Other Consortium Members
Fulin – 50%Mittals – 11.25%
Sinopec – 50%
Petronas - 67.875% Sudapet - 8%
Shell – 50%Petrobras – 35%
Mr. Vladimir Aleksandrovich Borisov – 50%
CVP- 60%
Daewoo – 51%KOGAS – 8.5%GAIL – 8.5%MOGE- 15%
Daewoo – 51%KOGAS – 8.5%GAIL – 8.5%MOGE- 15%
IOC – 40%OIL – 20%
IPRMEL - 25% Triocean-15%
Repsol YPF – 40% Stat Oil – 30%
OIL – 10%
Ecopetrol - 40% Petrobras – 20%
Ecopetrol - 50%
Ecopetrol - 50%
Petrobras- 75%
Operator
SSPD **
Joint Operatorship
Petronas and Sudapet - Joint Operatorship
Shell
OVL
Joint Operatorship
Daewoo
Daewoo
OVL
IPR MEL
Repsol YPF
OVL
OVL
Ecopetrol
OVL
Petrobras
Project Status
The project is under production.
The project is under development and production
The project is under exploration, development and production
The project is under development and production
The company provides Fraccing Services
The project is under development and production
The project is under development.
The project is under development.
The project 's exploration service contract ended on 24 June 2009 and negotiations for development service contract are going on.
The project is under exploration and development.
The project is under exploration.
The pipeline on completion is under Lease.
The project is under exploration
The project is under exploration
The project is under exploration
The project is under exploration
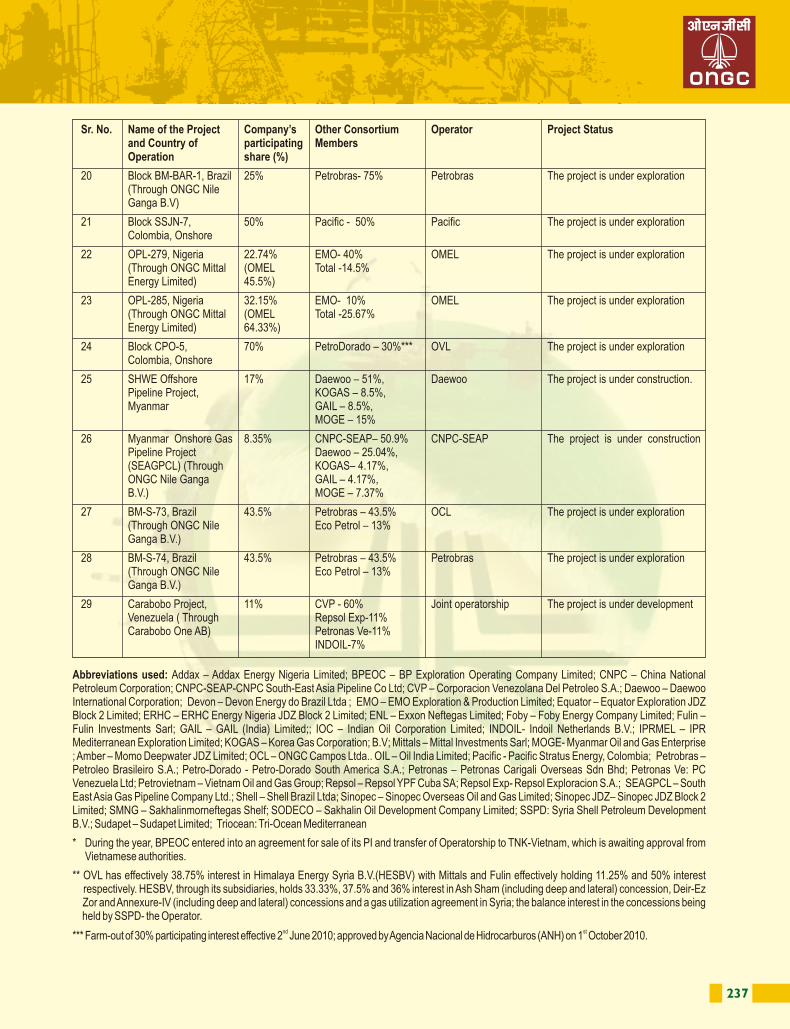
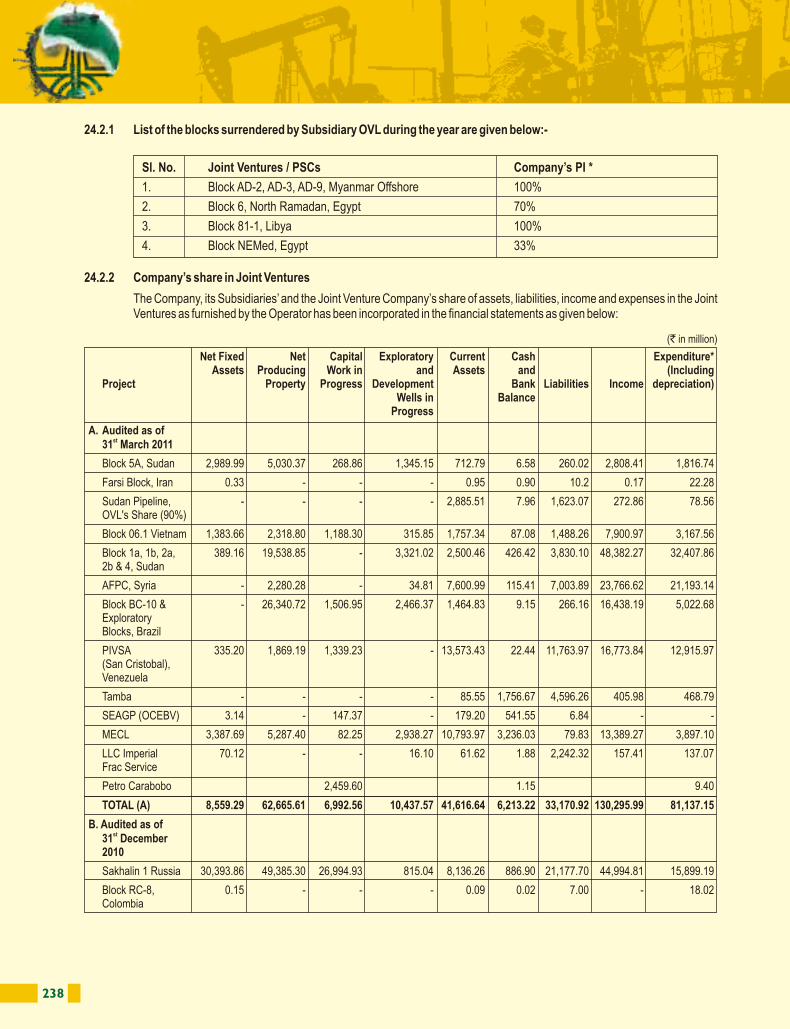
238 239
Represents expenditure as per joint venture statement. In the accounts of the Company, the amount is reflected after netting off as per the Accounting Standard (AS) 27 viz. Financial Reporting of interests in Joint Ventures.
The Company’s share of assets, liabilities have been converted into the reporting currency at the average exchange rate as on the date of balance sheet and income and expenses have been converted into the reporting currency at the average exchange rates over the period for which the details are provided by the Operators. Generally the details are provided by the Operators on monthly basis except in respect of Sakhalin-1, Russia Project, where the details are provided by the Operator on quarterly basis.
24.2.3 Title to Fixed Assets under Production Sharing Agreements
The Company, the Subsidiaries and Joint Venture Company, in consortium with other partners (Consortium) carries on its business in respect of exploration, development and production of hydrocarbons under agreements with the host governments. Several of these agreements, governing Company’s activities in the fields / projects, provide that the title to the fixed assets and other ancillary installations shall pass to host Government or its nominated entities either upon acquisition / first use of such assets or upon 100% recovery of such costs through allocation of “Cost Oil” and “Cost Gas” or upon relinquishment of the relevant contract areas or termination of the relevant agreement. However, as per the terms of the agreements, the Consortium and/ or Operator has the custody of all such assets and is entitled to use, free of charge all such assets for Petroleum Operations throughout the term of the respective agreements. The Consortium also has the custody
Net Fixed Net Capital Exploratory Current Cash Expenditure*Assets Producing Work in and Assets and (Including
Project Property Progress Development Bank Liabilities Income depreciation)Wells in Balance
Progress
Block RC-9, - - - - - - (0.07) 0.52 87.18 Colombia
Block SSJN-7, - - - - - - - 0.06 11.34 Colombia
CPO 5 Block 0.22 - - - 10.22 - 29.37 0.08 793.20
Block RC-10, 0.19 - - - 0.11 - 7.10 0.10 12.17 Colombia
Blocks 25-29, 35 1.45 - 346.91 216.77 41.24 - 42.04 - 140.47(Part) & 36, Cuba
TOTAL (B) 30,395.87 49,385.30 27,341.84 1,031.81 8,187.92 886.92 21,263.14 44,995.57 16,961.57
C. Unaudited
Block A-1, 12.16 - 700.46 2,323.10 132.37 96.93 310.48 - (184.54)Myanmar
Block A-3, 2.81 - 842.73 1,082.81 30.21 178.15 376.41 - (211.88)Myanmar
Block XXIV, Syria 32.82 (26.62) - 727.39 175.44 - 202.19 41.19 317.35
Block 6 North - - - - 67.90 - 10.52 - 1,261.71Ramadan, Egypt
Block NC-189, - - - - 22.21 2.34 0.44 0.32 81.27Libya
Block NEMED, - - - - 34.86 - 20.78 - 2,818.92 Egypt.
SHWE Offshore - - 568.78 - 11.43 54.94 117.85 - (1.32)Pipeline Myanmar
Block 279, Nigeria 2,139.17 241.39 158.42
Block 285, Nigeria 30.40 647.00 2,442.00
TOTAL (C ) 78.19 -26.62 4,898.14 4133.3 474.42 573.75 1038.67 41.51 6,681.93
GRAND TOTAL 39,033.35 112,024.29 39,232.54 15,602.68 50,278.98 7,673.89 55,472.73 175,333.07 104,780.65
(` in million)24.2.1 List of the blocks surrendered by Subsidiary OVL during the year are given below:-
24.2.2 Company’s share in Joint Ventures
The Company, its Subsidiaries’ and the Joint Venture Company’s share of assets, liabilities, income and expenses in the Joint Ventures as furnished by the Operator has been incorporated in the financial statements as given below:
Sl. No. Joint Ventures / PSCs Company’s PI *
1. Block AD-2, AD-3, AD-9, Myanmar Offshore 100%
2. Block 6, North Ramadan, Egypt 70%
3. Block 81-1, Libya 100%
4. Block NEMed, Egypt 33%
Net Fixed Net Capital Exploratory Current Cash Expenditure*Assets Producing Work in and Assets and (Including
Project Property Progress Development Bank Liabilities Income depreciation)Wells in Balance
Progress
A. Audited as ofst31 March 2011
Block 5A, Sudan 2,989.99 5,030.37 268.86 1,345.15 712.79 6.58 260.02 2,808.41 1,816.74
Farsi Block, Iran 0.33 - - - 0.95 0.90 10.2 0.17 22.28
Sudan Pipeline, - - - - 2,885.51 7.96 1,623.07 272.86 78.56OVL's Share (90%)
Block 06.1 Vietnam 1,383.66 2,318.80 1,188.30 315.85 1,757.34 87.08 1,488.26 7,900.97 3,167.56
Block 1a, 1b, 2a, 389.16 19,538.85 - 3,321.02 2,500.46 426.42 3,830.10 48,382.27 32,407.862b & 4, Sudan
AFPC, Syria - 2,280.28 - 34.81 7,600.99 115.41 7,003.89 23,766.62 21,193.14
Block BC-10 & - 26,340.72 1,506.95 2,466.37 1,464.83 9.15 266.16 16,438.19 5,022.68 ExploratoryBlocks, Brazil
PIVSA 335.20 1,869.19 1,339.23 - 13,573.43 22.44 11,763.97 16,773.84 12,915.97 (San Cristobal),Venezuela
Tamba - - - - 85.55 1,756.67 4,596.26 405.98 468.79
SEAGP (OCEBV) 3.14 - 147.37 - 179.20 541.55 6.84 - -
MECL 3,387.69 5,287.40 82.25 2,938.27 10,793.97 3,236.03 79.83 13,389.27 3,897.10
LLC Imperial 70.12 - - 16.10 61.62 1.88 2,242.32 157.41 137.07Frac Service
Petro Carabobo 2,459.60 1.15 9.40
TOTAL (A) 8,559.29 62,665.61 6,992.56 10,437.57 41,616.64 6,213.22 33,170.92 130,295.99 81,137.15
B. Audited as ofst31 December
2010
Sakhalin 1 Russia 30,393.86 49,385.30 26,994.93 815.04 8,136.26 886.90 21,177.70 44,994.81 15,899.19
Block RC-8, 0.15 - - - 0.09 0.02 7.00 - 18.02Colombia
(` in million)
*
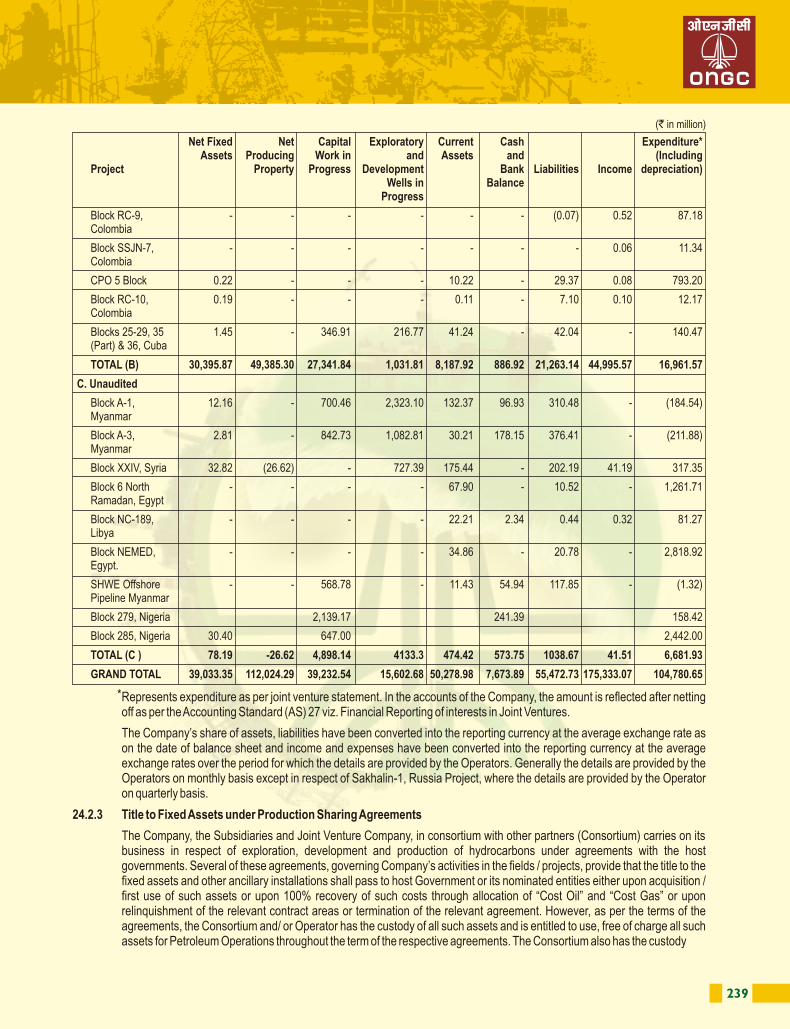
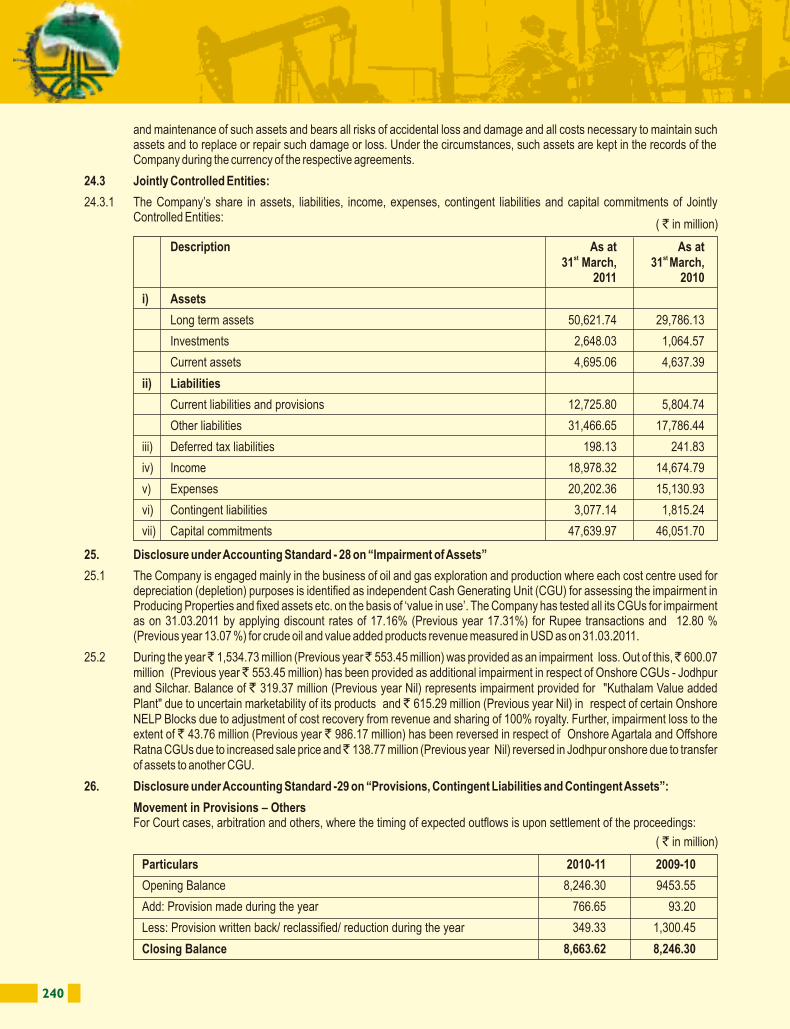
240 241
27. Disclosures under Schedule VI to the Companies Act, 1956 :-
27.1 Capital Commitment not provided for:-
27.1.1 Estimated amount of contracts remaining to be executed on capital account:-
i) In respect of the Company, its subsidiaries and Joint Venture Entities - ` 270,554.18 million (Previous year ` 333,307.98 million).
ii) In respect of Joint Ventures - ` 31,964.89 million (Previous year ` 6,450.55 million).
27.1.2 Estimated amount of Minimum Work Programme (MWP) committed under various ‘Production Sharing Contracts’:-
i) In respect of NELP blocks in which the Company has 100% participating interest – ` 22,558.90 million (Previousyear ` 33,419.14 million).
ii) In respect Nominated Blocks ` 374.04 million (Previous year ` 1,128.13 million).
iii) In respect of Joint Ventures - ` 98,441.67 million (Previous year ` 90,277.51 million).
27.2 Contingent Liabilities:
Claims against the Company/ disputed demands not acknowledged as debt:-
As at As atst st31 March, 31 March,
2011 2010
I in respect of Company :
i. Income tax matters 16,289.61 17,012.68
ii. Excise Duty matters 5,243.29 2,518.89
iii. Custom Duty matters 1,577.66 1,576.29
iv. Royalty 19,484.60 18,849.79
v. Cess 6.57 12.76
vi. Sales Tax 30,306.07 21,324.28
vii. Octroi 66.89 66.89
viii. Service Tax 1,039.92 -
ix. AP Mineral Bearing Land Tax 1,470.22 1,171.84
x. Specified Land Tax (Assam) 2,526.40 2,274.50
xi. Claims of contractors in Arbitration/Court 34,781.92 21,774.50
xii. in respect of other matters 22,297.09 20,071.51
Sub Total 135,090.24 106,653.93
II in respect of Joint Ventures :
i. Income tax matters 8.91 8.91
ii. Excise Duty matters - 322.42
iii. Custom Duty matters 3457.81 3,457.89
iv. Cess - 10.64
v. Sales Tax 2,959.04 2,959.13
vi. Claim of GoI for additional profit petroleum 3,634.77 -
vii. Claims of contractors in Arbitration/Court 9,798.45 740.73
viii. Service Tax 157.42 -
ix. in respect of other matters 907.23 4,898.72
Sub Total 20,923.63 12,398.44
TOTAL (I+II) 156,013.87 119,052.37
( ` in million)
and maintenance of such assets and bears all risks of accidental loss and damage and all costs necessary to maintain such assets and to replace or repair such damage or loss. Under the circumstances, such assets are kept in the records of the Company during the currency of the respective agreements.
24.3 Jointly Controlled Entities:
24.3.1 The Company’s share in assets, liabilities, income, expenses, contingent liabilities and capital commitments of Jointly Controlled Entities:
25. Disclosure under Accounting Standard - 28 on “Impairment of Assets”
25.1 The Company is engaged mainly in the business of oil and gas exploration and production where each cost centre used for depreciation (depletion) purposes is identified as independent Cash Generating Unit (CGU) for assessing the impairment in Producing Properties and fixed assets etc. on the basis of ‘value in use’. The Company has tested all its CGUs for impairment as on 31.03.2011 by applying discount rates of 17.16% (Previous year 17.31%) for Rupee transactions and 12.80 % (Previous year 13.07 %) for crude oil and value added products revenue measured in USD as on 31.03.2011.
25.2 During the year ̀ 1,534.73 million (Previous year ̀ 553.45 million) was provided as an impairment loss. Out of this, ̀ 600.07 million (Previous year ̀ 553.45 million) has been provided as additional impairment in respect of Onshore CGUs - Jodhpur and Silchar. Balance of ` 319.37 million (Previous year Nil) represents impairment provided for "Kuthalam Value added Plant" due to uncertain marketability of its products and ` 615.29 million (Previous year Nil) in respect of certain Onshore NELP Blocks due to adjustment of cost recovery from revenue and sharing of 100% royalty. Further, impairment loss to the extent of ` 43.76 million (Previous year ` 986.17 million) has been reversed in respect of Onshore Agartala and Offshore Ratna CGUs due to increased sale price and ̀ 138.77 million (Previous year Nil) reversed in Jodhpur onshore due to transfer of assets to another CGU.
26. Disclosure under Accounting Standard -29 on “Provisions, Contingent Liabilities and Contingent Assets”:
Movement in Provisions – OthersFor Court cases, arbitration and others, where the timing of expected outflows is upon settlement of the proceedings:
Description As at As atst st 31 March, 31 March,
2011 2010
i) Assets
Long term assets 50,621.74 29,786.13
Investments 2,648.03 1,064.57
Current assets 4,695.06 4,637.39
ii) Liabilities
Current liabilities and provisions 12,725.80 5,804.74
Other liabilities 31,466.65 17,786.44
iii) Deferred tax liabilities 198.13 241.83
iv) Income 18,978.32 14,674.79
v) Expenses 20,202.36 15,130.93
vi) Contingent liabilities 3,077.14 1,815.24
vii) Capital commitments 47,639.97 46,051.70
( ` in million)
Particulars 2010-11 2009-10
Opening Balance 8,246.30 9453.55
Add: Provision made during the year 766.65 93.20
Less: Provision written back/ reclassified/ reduction during the year 349.33 1,300.45
Closing Balance 8,663.62 8,246.30
( ` in million)
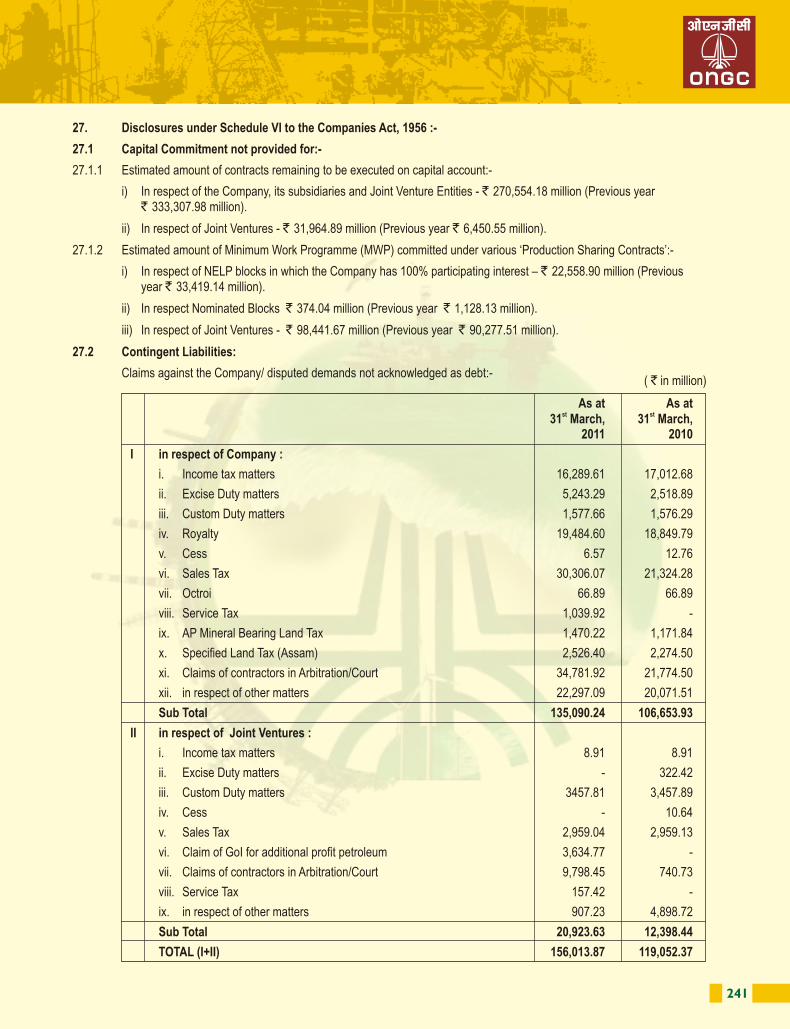
242 243
27.4 DETAILS OF EXPENDITURE
Details of expenditure incurred during the year on Production, Selling and Distribution, Operation and Maintenance of Pipelines, Exploration, Drilling and Development
Other operating expenditure above includes the expenses in respect of Sakhalin-1, Russia project, where the above details are not made available by the Operator.
( ` in million)
2010-11 2009-10
Manpower Cost:
(a) Salaries, Wages, Ex-gratia etc. 53,994.91 47,501.86(b) Contribution to Provident and other funds 3,487.19 3,397.90(c) Provision for gratuity 1,536.18 (465.80)(d) Provision for leave encashment 4,582.08 3,521.74(e) Provision for post retirement medical & terminal benefits 2,840.25 1,521.67(f) Staff welfare expenses 5,054.96 4,711.20
Sub Total 71,495.57 6,0188.57
Consumption of Raw Materials, Store and Spares 342,899.17 275,557.23Cess 56,962.72 54,547.67Natural Calamity Contingent Duty - Crude Oil 1,113.96 1,061.86Excise Duty 3,110.42 44,291.53Royalty 126,514.52 103,560.48Sales Tax 3,878.45 3,734.18Octroi/BPT 5,104.68 4,966.61Service Tax 227.48 919.14Education cess 1,828.44 1,711.65Rent 3,248.82 2,220.14Rates and taxes 2,385.67 562.28Hire charges of equipments and vehicles 111,341.13 116,683.74Power, fuel and water charges 3,397.38 2,814.94Contractual drilling, logging, workover etc. 162,219.80 115,529.46Contractual security 2,844.99 2,586.76Repairs to building 2,627.77 1,341.35Repairs to plant and machinery 2,310.41 2,355.66Other repairs 5,148.23 3,763.38Insurance 2,331.78 2,592.99Other Operating Expenditure 20,491.75 18,654.53Miscellaneous expenditure 16,499.74 11,078.00
947,982.88 830,722.15
Less:
Allocated to exploration, development drilling, capital jobs 2,60,245.18 215,054.30recoverables etc.Excise duty 3,098.80 44,142.77Prior Period Adjustment (6.29) (220.73)
Production, Transportation, Selling and Distribution Expenditure etc. 684,645.19 571,745.81
27.2.1 Contingent liabilities, if any, in respect of JVs where OVL is non-operator, is not ascertainable except where the Operator has intimated. In respect of Petronet MHB Limited, there are 135 cases (previous year 173 cases) regarding enhancement of land compensation pending with Karnataka High Court against Order of Principal Judge Bangalore Rural District Court, the amounts are not ascertainable at present.
27.2.2 The above claims / demands are at various stages of appeal and in the opinion of the Company are not tenable.
27.2.3 Bank Guarantees given by the Company ̀ 9,528.63 million (Previous year ̀ 5,079.01 million) including ̀ 1,330.82 million (Previous year ̀ 1,142.37 million) for NELP Blocks where the Company has 100% participating interest (PI)
27.2.4 Bank Guarantees in respect of Joint ventures – ̀ 5,898.85 million (Previous year ̀ 7,082.46 million).
27.3 Corporate Guarantees executed by the Company on behalf of its wholly owned subsidiary, ONGC Videsh Limited (OVL) and ONGC Nile Ganga BV (wholly owned subsidiary of OVL)
27.3.1 Guarantees executed for financial obligations:
i) Amount of Guarantee ̀ 36,371.66 million (Previous year ̀ 38,043.51 million).
ii) Amount Outstanding ̀ 33,934.69 million (Previous year ̀ 34,932.70 million).
27.3.2 Performance Guarantees executed under the contracts:
i. The Company has issued Performance Guarantee in respect of concessionary contract for Block BC-10, Brazil andBlocks BM-S-73 and BM-ES-42 on behalf of ONGC Campos Ltda (OCL). The Company is confident that OCL willbe able to honor its obligations.
ii. The Company has given a Performance Guarantee on behalf of Petro Carabobo Ganga B.V. to Government ofVenezuela in respect of Carabobo 1 Project. The total investment commitment is estimated at USD 1333 Million (` 59,611.76 Million).
27.3.3 Corporate Guarantees executed by the Company on behalf of its subsidiary, MRPL:
i) Amount of Guarantee ̀ 7,155.20 million (Previous year ̀ 16,246.80 million).
ii) Amount Outstanding ̀ 3,442.99 million (Previous year ̀ 4,828.91 million).
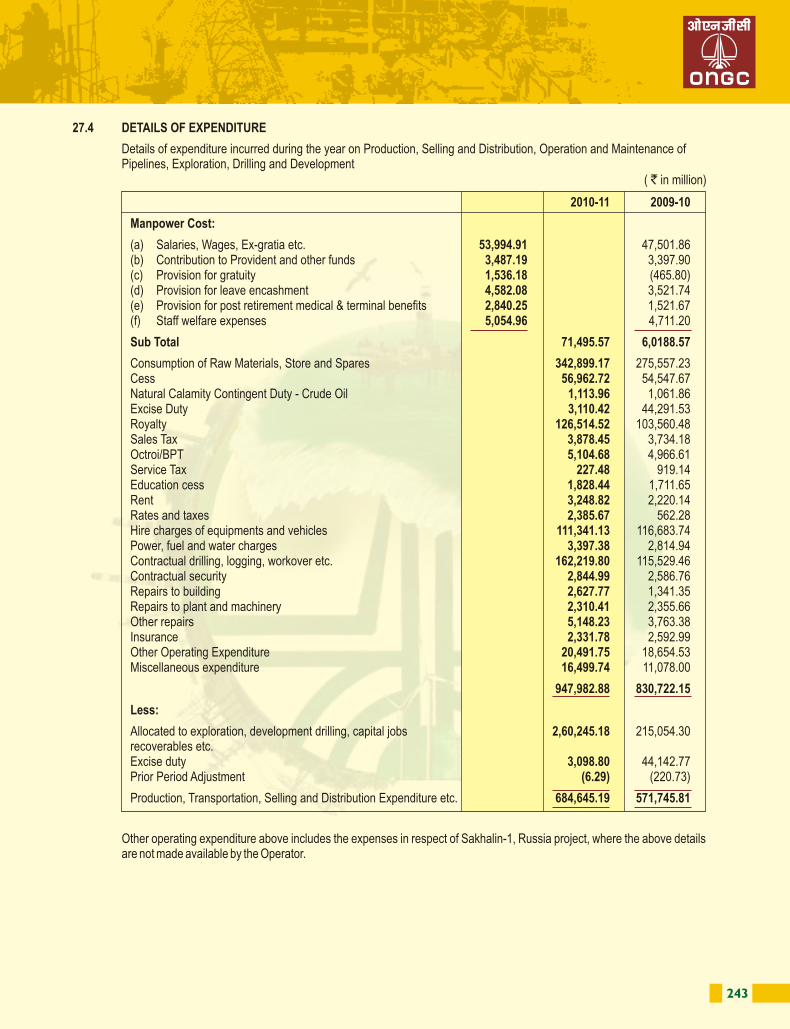
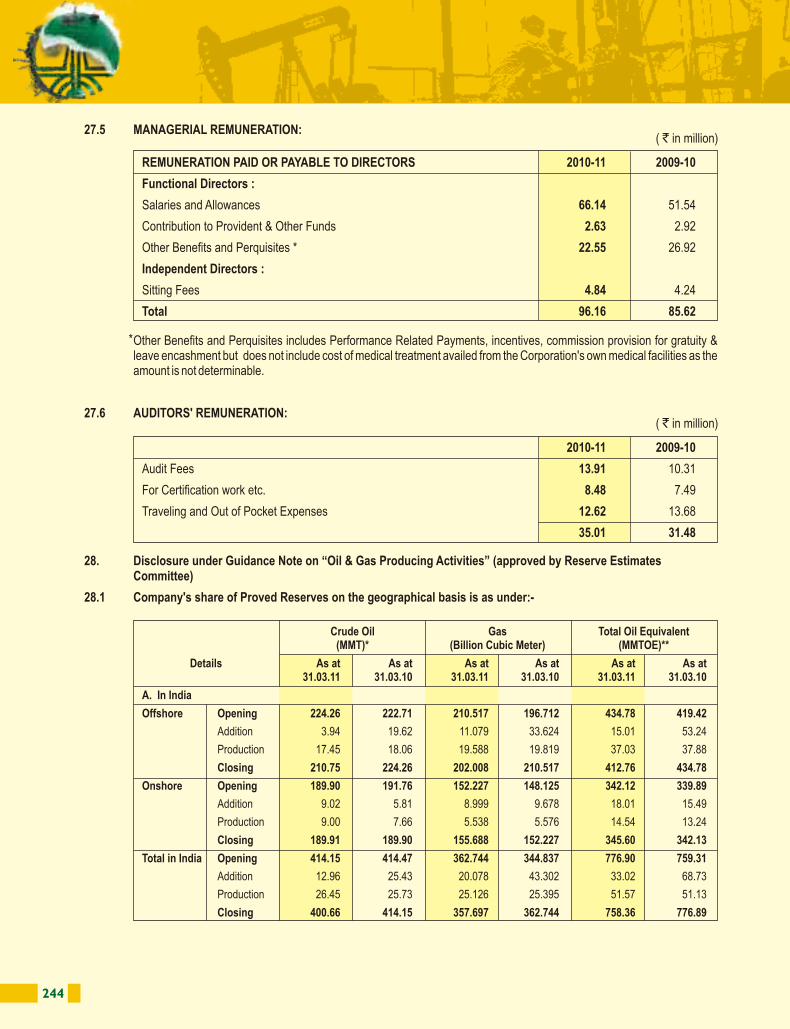
244 245
Crude Oil Gas Total Oil Equivalent(MMT)* (Billion Cubic Meter) (MMTOE)**
Details As at As at As at As at As at As at31.03.11 31.03.10 31.03.11 31.03.10 31.03.11 31.03.10
B. Outside India
Block 06.1, Opening 0.710 0.752 12.789 14.756 13.499 15.508
Vietnam Addition - - - - - -
Adjustment - - -
Production 0.038 0.042 2.249 1.967 2.287 2.009
Closing 0.672 0.71 10.540 12.789 11.212 13.499
Sakhalin-1, Opening 36.949 37.946 69.992 70.147 106.941 108.093
Russia Addition .026 0.535 1.960 0.236 1.986 0.771
Production 1.474 1.532 0.415 0.39 1.986 1.922
Closing 35.501 36.949 71.537 69.993 107.038 106.942
Block 1a, 1b, Opening 19.831 20.22 - - 19.831 20.22
2a, 2b & 4 Addition - 1.762 - - - 1.762
(GNOP), Adjustment 0.605 0.025 - - 0.605 0.025
Sudan Production 1.801 2.126 - - 1.801 2.126
Closing 17.425 19.831 - - 17.425 19.831
Block 5A, Opening 6.571 6.584 - - 6.571 6.584
Sudan Addition 0.283 0.234 - - 0.283 0.234
Adjustment 0.001 - - - 0.001 -
Production 0.226 0.247 - - 0.226 0.247
Closing 6.627 6.571 - - 6.627 6.571
AFPC Opening 2.939 2.988 - - 2.939 2.988
Syria Addition 0.933 0.669 - - 0.933 0.669
Adjustment - - - - - -
Production 0.662 0.718 - - 0.662 0.718
Closing 3.210 2.939 - - 3.210 2.939
MECL, Opening 3.381 3.729 - - 3.381 3.729
Columbia, Addition 1.218 0.062 - - 1.218 0.062
Adjustment - 0.001 - - - 0.001
Production 0.468 0.409 - - 0.468 0.409
Closing 4.131 3.381 - - 4.131 3.381
BC-10, Opening 1.605 1.946 0.563 0.601 2.168 2.547
Brazil Addition 4.285 - 0.128 - 4.413 -
Adjustment - 0.149 - 0.038 - 0.187
Production 0.573 0.192 0.032 - 0.605 0.192
Closing 5.317 1.605 0.659 0.563 5.976 2.168
Imperial Opening 16.876 18.946 4.992 3.901 21.868 22.847
Energy, Addition 1.075 - 0.318 1.091 1.393 1.091
Russia Adjustment - 1.527 - - - 1.527
Production 0.770 0.543 - - 0.770 0.543
Closing 17.181 16.876 5.309 4.992 22.490 21.868
27.5 MANAGERIAL REMUNERATION:
Other Benefits and Perquisites includes Performance Related Payments, incentives, commission provision for gratuity & leave encashment but does not include cost of medical treatment availed from the Corporation's own medical facilities as the amount is not determinable.
27.6 AUDITORS' REMUNERATION:
28. Disclosure under Guidance Note on “Oil & Gas Producing Activities” (approved by Reserve Estimates Committee)
28.1 Company's share of Proved Reserves on the geographical basis is as under:-
REMUNERATION PAID OR PAYABLE TO DIRECTORS 2010-11 2009-10
Functional Directors :
Salaries and Allowances 66.14 51.54
Contribution to Provident & Other Funds 2.63 2.92
Other Benefits and Perquisites * 22.55 26.92
Independent Directors :
Sitting Fees 4.84 4.24
Total 96.16 85.62
( ` in million)
2010-11 2009-10
Audit Fees 13.91 10.31
For Certification work etc. 8.48 7.49
Traveling and Out of Pocket Expenses 12.62 13.68
35.01 31.48
( ` in million)
Crude Oil Gas Total Oil Equivalent(MMT)* (Billion Cubic Meter) (MMTOE)**
Details As at As at As at As at As at As at31.03.11 31.03.10 31.03.11 31.03.10 31.03.11 31.03.10
A. In India
Offshore Opening 224.26 222.71 210.517 196.712 434.78 419.42
Addition 3.94 19.62 11.079 33.624 15.01 53.24
Production 17.45 18.06 19.588 19.819 37.03 37.88
Closing 210.75 224.26 202.008 210.517 412.76 434.78
Onshore Opening 189.90 191.76 152.227 148.125 342.12 339.89
Addition 9.02 5.81 8.999 9.678 18.01 15.49
Production 9.00 7.66 5.538 5.576 14.54 13.24
Closing 189.91 189.90 155.688 152.227 345.60 342.13
Total in India Opening 414.15 414.47 362.744 344.837 776.90 759.31
Addition 12.96 25.43 20.078 43.302 33.02 68.73
Production 26.45 25.73 25.126 25.395 51.57 51.13
Closing 400.66 414.15 357.697 362.744 758.36 776.89
*
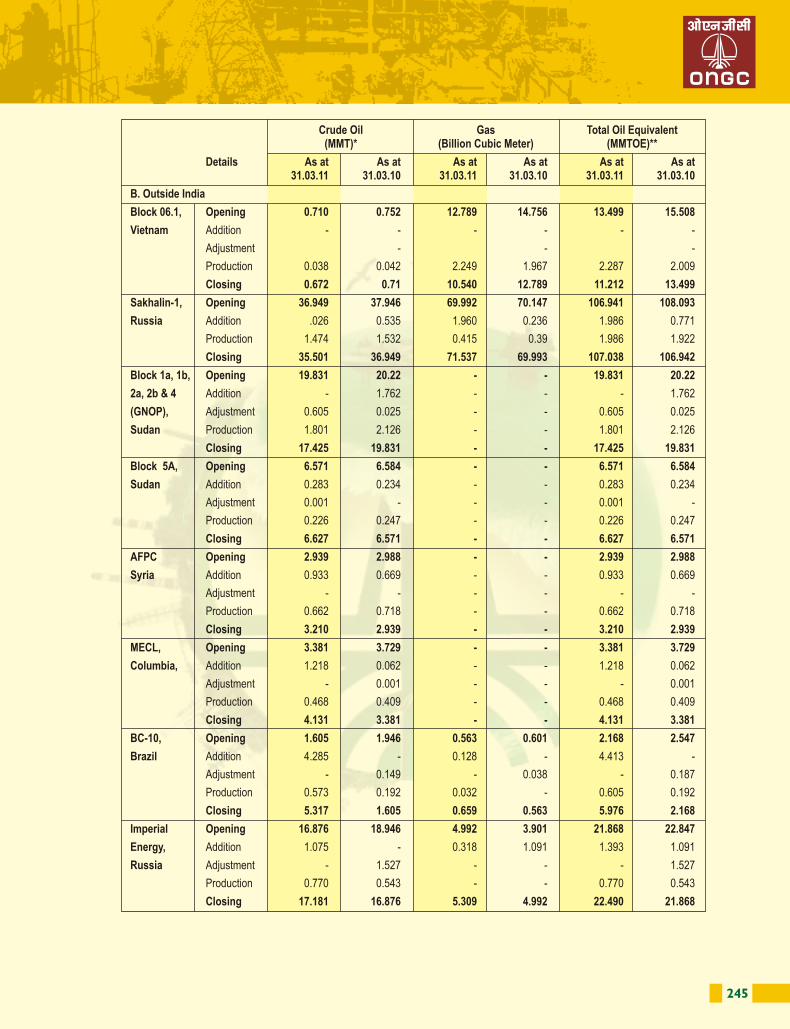
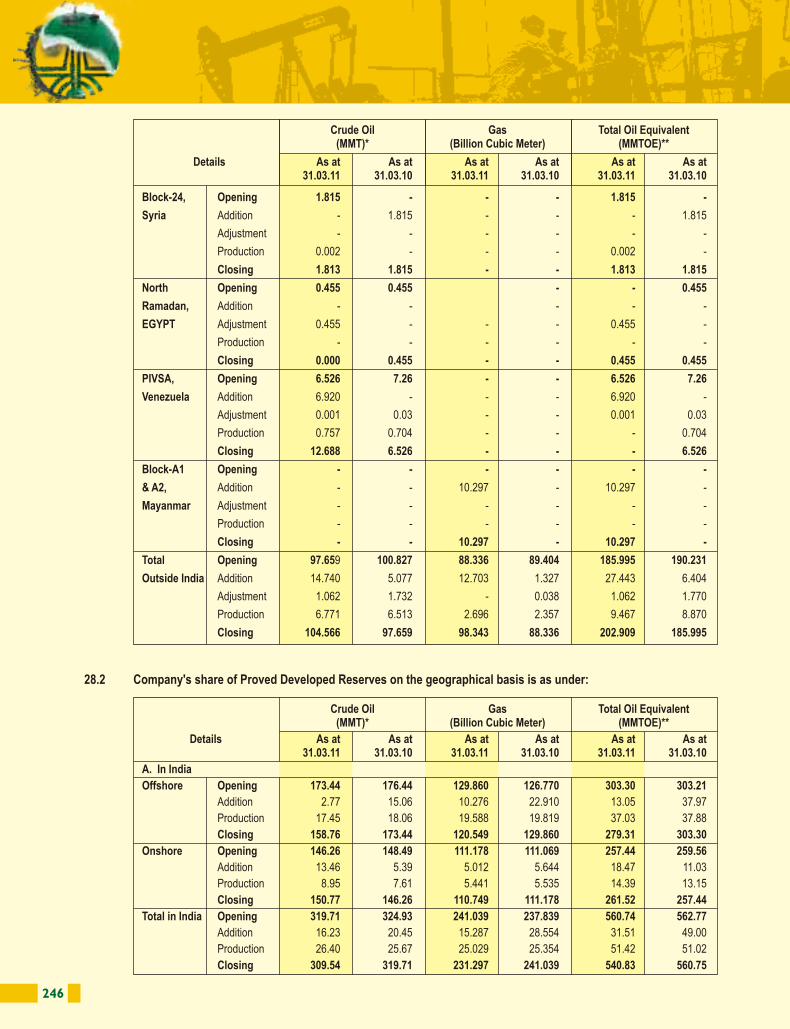
246 247
Crude Oil Gas Total Oil Equivalent(MMT)* (Billion Cubic Meter) (MMTOE)**
Details As at As at As at As at As at As at31.03.11 31.03.10 31.03.11 31.03.10 31.03.11 31.03.10
B. Outside India
Block 06.1, Opening 0.701 0.743 9.234 11.201 9.935 11.944
Vietnam Addition - - - - - -
Adjustment - - - - - -
Production 0.038 0.042 2.249 1.967 2.287 2.009
Closing 0.663 0.701 6.985 9.234 7.648 9.935
Sakhalin-1, Opening 9.614 11.146 11.704 12.093 21.318 23.239
Russia Addition 2.480 - - 0.001 2.480 0.001
Adjustment - - 0.001 - 0.001 -
Production 1.474 1.532 0.415 0.39 1.889 1.922
Closing 10.620 9.614 11.288 11.704 21.908 21.318
Block 1a, 1b, Opening 7.105 7.83 - - 7.105 7.83
2a, 2b & 4 Addition 2.527 1.426 - - 2.527 1.426
(GNOP), Adjustment - 0.025 - - - 0.025
Sudan Production 1.801 2.126 - - 1.801 2.126
Closing 7.831 7.105 - - 7.831 7.105
Block 5A, Opening 3.996 4.234 - - 3.996 4.234
Sudan Addition - 0.009 - - - 0.009
Adjustment 1.303 - - 1.303
Production 0.226 0.247 - - 0.226 0.247
Closing 2.467 3.996 - - 2.467 3.996
AFPC Opening 2.716 2.693 - - 2.716 2.693
Syria Addition 0.781 0.741 - - 0.781 0.741
Adjustment - - - -
Production 0.662 0.718 - - 0.662 0.718
Closing 2.835 2.716 - - 2.835 2.716
MECL, Opening 2.094 3.041 - - 2.094 3.041
Columbia Addition 1.614 - - - 1.614
Adjustment - 0.539 - - - 0.539
Production 0.468 0.409 - - 0.468 0.409
Closing 3.240 2.094 - - 3.240 2.094
Imperial Opening 3.997 2.648 - - 3.997 2.648
Energy, Addition 1.566 1.892 - - 1.566 1.892
Russia Adjustment - - - - - -
Production 0.770 0.543 - - 0.770 0.543
Closing 4.793 3.997 - - 4.793 3.997
BC-10,Brazil Opening 1.171 - 0.409 - 1.580 -
Addition 1.333 1.363 0.066 0.41 1.399 1.773
Adjustment - - - 0.001 - 0.001
Production 0.573 0.192 0.032 - 0.605 0.192
Closing 1.931 1.171 0.443 0.409 2.374 1.58
28.2 Company's share of Proved Developed Reserves on the geographical basis is as under:
Block-24, Opening 1.815 - - - 1.815 -
Syria Addition - 1.815 - - - 1.815
Adjustment - - - - - -
Production 0.002 - - - 0.002 -
Closing 1.813 1.815 - - 1.813 1.815
North Opening 0.455 0.455 - - 0.455
Ramadan, Addition - - - - -
EGYPT Adjustment 0.455 - - - 0.455 -
Production - - - - - -
Closing 0.000 0.455 - - 0.455 0.455
PIVSA, Opening 6.526 7.26 - - 6.526 7.26
Venezuela Addition 6.920 - - - 6.920 -
Adjustment 0.001 0.03 - - 0.001 0.03
Production 0.757 0.704 - - - 0.704
Closing 12.688 6.526 - - - 6.526
Block-A1 Opening - - - - - -
& A2, Addition - - 10.297 - 10.297 -
Mayanmar Adjustment - - - - - -
Production - - - - - -
Closing - - 10.297 - 10.297 -
Total Opening 97.659 100.827 88.336 89.404 185.995 190.231
Outside India Addition 14.740 5.077 12.703 1.327 27.443 6.404
Adjustment 1.062 1.732 - 0.038 1.062 1.770
Production 6.771 6.513 2.696 2.357 9.467 8.870
Closing 104.566 97.659 98.343 88.336 202.909 185.995
Crude Oil Gas Total Oil Equivalent(MMT)* (Billion Cubic Meter) (MMTOE)**
Details As at As at As at As at As at As at31.03.11 31.03.10 31.03.11 31.03.10 31.03.11 31.03.10
Crude Oil Gas Total Oil Equivalent(MMT)* (Billion Cubic Meter) (MMTOE)**
Details As at As at As at As at As at As at31.03.11 31.03.10 31.03.11 31.03.10 31.03.11 31.03.10
A. In India
Offshore Opening 173.44 176.44 129.860 126.770 303.30 303.21
Addition 2.77 15.06 10.276 22.910 13.05 37.97
Production 17.45 18.06 19.588 19.819 37.03 37.88
Closing 158.76 173.44 120.549 129.860 279.31 303.30
Onshore Opening 146.26 148.49 111.178 111.069 257.44 259.56
Addition 13.46 5.39 5.012 5.644 18.47 11.03
Production 8.95 7.61 5.441 5.535 14.39 13.15
Closing 150.77 146.26 110.749 111.178 261.52 257.44
Total in India Opening 319.71 324.93 241.039 237.839 560.74 562.77
Addition 16.23 20.45 15.287 28.554 31.51 49.00
Production 26.40 25.67 25.029 25.354 51.42 51.02
Closing 309.54 319.71 231.297 241.039 540.83 560.75
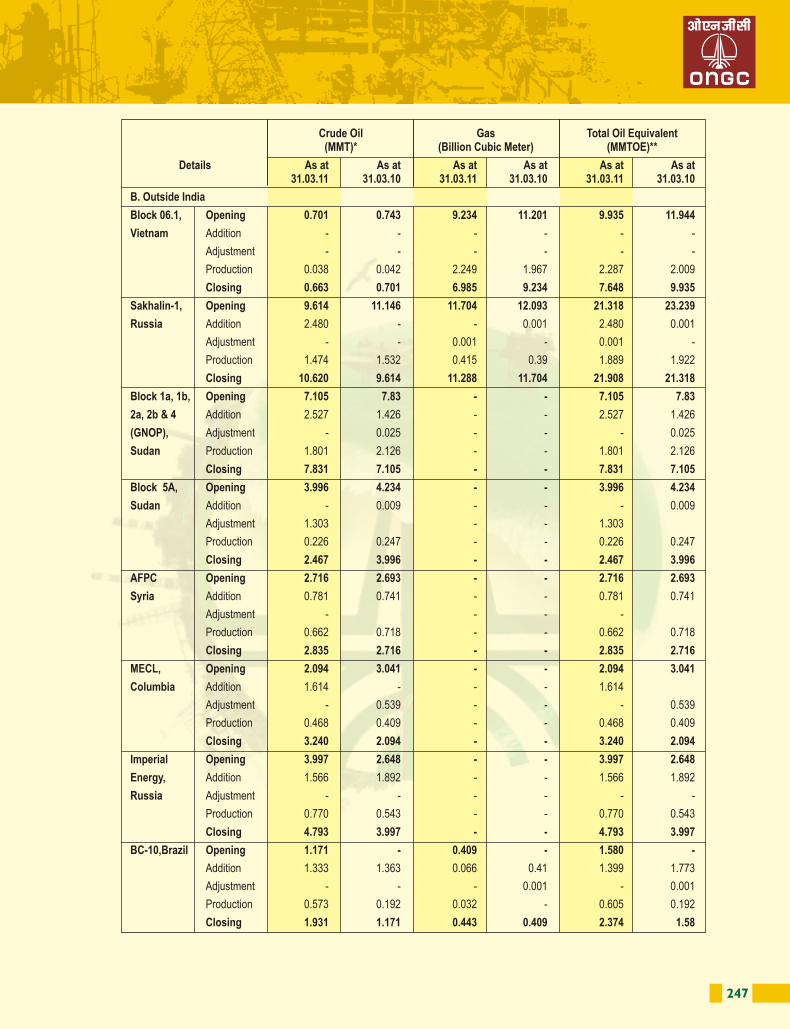
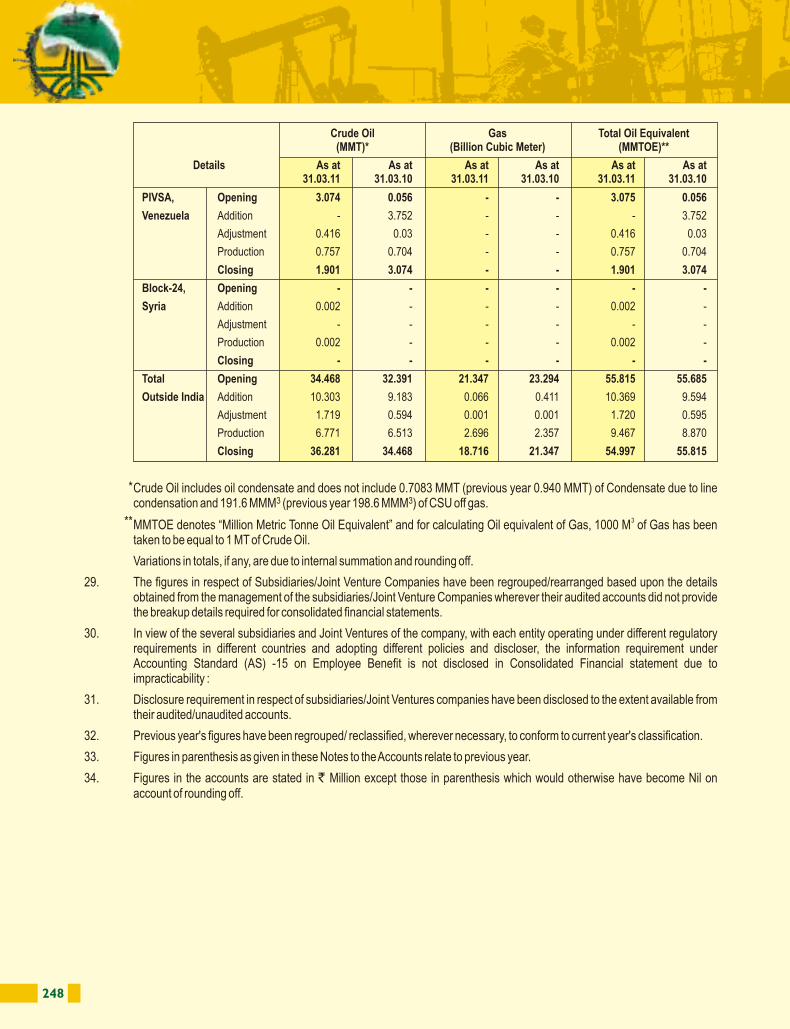
248 249
Crude Oil includes oil condensate and does not include 0.7083 MMT (previous year 0.940 MMT) of Condensate due to line 3 3condensation and 191.6 MMM (previous year 198.6 MMM ) of CSU off gas.
3MMTOE denotes “Million Metric Tonne Oil Equivalent” and for calculating Oil equivalent of Gas, 1000 M of Gas has been taken to be equal to 1 MT of Crude Oil.
Variations in totals, if any, are due to internal summation and rounding off.
29. The figures in respect of Subsidiaries/Joint Venture Companies have been regrouped/rearranged based upon the details obtained from the management of the subsidiaries/Joint Venture Companies wherever their audited accounts did not provide the breakup details required for consolidated financial statements.
30. In view of the several subsidiaries and Joint Ventures of the company, with each entity operating under different regulatory requirements in different countries and adopting different policies and discloser, the information requirement under Accounting Standard (AS) -15 on Employee Benefit is not disclosed in Consolidated Financial statement due to impracticability :
31. Disclosure requirement in respect of subsidiaries/Joint Ventures companies have been disclosed to the extent available from their audited/unaudited accounts.
32. Previous year's figures have been regrouped/ reclassified, wherever necessary, to conform to current year's classification.
33. Figures in parenthesis as given in these Notes to the Accounts relate to previous year.
34. Figures in the accounts are stated in ` Million except those in parenthesis which would otherwise have become Nil on account of rounding off.
PIVSA, Opening 3.074 0.056 - - 3.075 0.056
Venezuela Addition - 3.752 - - - 3.752
Adjustment 0.416 0.03 - - 0.416 0.03
Production 0.757 0.704 - - 0.757 0.704
Closing 1.901 3.074 - - 1.901 3.074
Block-24, Opening - - - - - -
Syria Addition 0.002 - - - 0.002 -
Adjustment - - - - - -
Production 0.002 - - - 0.002 -
Closing - - - - - -
Total Opening 34.468 32.391 21.347 23.294 55.815 55.685
Outside India Addition 10.303 9.183 0.066 0.411 10.369 9.594
Adjustment 1.719 0.594 0.001 0.001 1.720 0.595
Production 6.771 6.513 2.696 2.357 9.467 8.870
Closing 36.281 34.468 18.716 21.347 54.997 55.815
Crude Oil Gas Total Oil Equivalent(MMT)* (Billion Cubic Meter) (MMTOE)**
Details As at As at As at As at As at As at31.03.11 31.03.10 31.03.11 31.03.10 31.03.11 31.03.10
The vast expanse of Arabian Sea : Home to E&P operations of ONGC
*
**
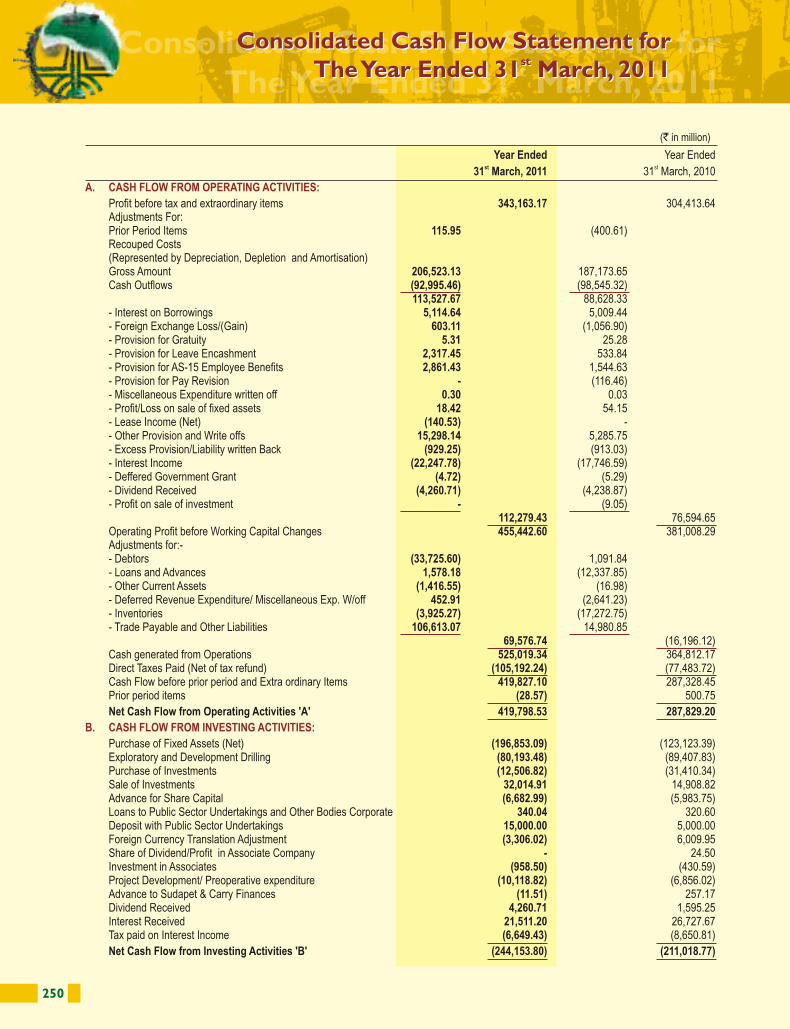
250 251
Consolidated Cash Flow Statement forstThe Year Ended 31 March, 2011
Year Ended Year Endedst st 31 March, 2011 31 March, 2010
Profit before tax and extraordinary items 343,163.17 304,413.64Adjustments For:Prior Period Items 115.95 (400.61)Recouped Costs(Represented by Depreciation, Depletion and Amortisation)Gross Amount 206,523.13 187,173.65Cash Outflows (92,995.46) (98,545.32)
113,527.67 88,628.33- Interest on Borrowings 5,114.64 5,009.44 - Foreign Exchange Loss/(Gain) 603.11 (1,056.90)- Provision for Gratuity 5.31 25.28- Provision for Leave Encashment 2,317.45 533.84- Provision for AS-15 Employee Benefits 2,861.43 1,544.63- Provision for Pay Revision - (116.46)- Miscellaneous Expenditure written off 0.30 0.03- Profit/Loss on sale of fixed assets 18.42 54.15- Lease Income (Net) (140.53) -- Other Provision and Write offs 15,298.14 5,285.75- Excess Provision/Liability written Back (929.25) (913.03)- Interest Income (22,247.78) (17,746.59)- Deffered Government Grant (4.72) (5.29)- Dividend Received (4,260.71) (4,238.87)- Profit on sale of investment - (9.05)
112,279.43 76,594.65Operating Profit before Working Capital Changes 455,442.60 381,008.29Adjustments for:-- Debtors (33,725.60) 1,091.84- Loans and Advances 1,578.18 (12,337.85)- Other Current Assets (1,416.55) (16.98)- Deferred Revenue Expenditure/ Miscellaneous Exp. W/off 452.91 (2,641.23)- Inventories (3,925.27) (17,272.75)- Trade Payable and Other Liabilities 106,613.07 14,980.85
69,576.74 (16,196.12)Cash generated from Operations 525,019.34 364,812.17 Direct Taxes Paid (Net of tax refund) (105,192.24) (77,483.72)Cash Flow before prior period and Extra ordinary Items 419,827.10 287,328.45Prior period items (28.57) 500.75
Net Cash Flow from Operating Activities 'A' 419,798.53 287,829.20
Purchase of Fixed Assets (Net) (196,853.09) (123,123.39)Exploratory and Development Drilling (80,193.48) (89,407.83)Purchase of Investments (12,506.82) (31,410.34)Sale of Investments 32,014.91 14,908.82Advance for Share Capital (6,682.99) (5,983.75)Loans to Public Sector Undertakings and Other Bodies Corporate 340.04 320.60Deposit with Public Sector Undertakings 15,000.00 5,000.00 Foreign Currency Translation Adjustment (3,306.02) 6,009.95 Share of Dividend/Profit in Associate Company - 24.50Investment in Associates (958.50) (430.59)Project Development/ Preoperative expenditure (10,118.82) (6,856.02)Advance to Sudapet & Carry Finances (11.51) 257.17 Dividend Received 4,260.71 1,595.25 Interest Received 21,511.20 26,727.67 Tax paid on Interest Income (6,649.43) (8,650.81)
Net Cash Flow from Investing Activities 'B' (244,153.80) (211,018.77)
A. CASH FLOW FROM OPERATING ACTIVITIES:
B. CASH FLOW FROM INVESTING ACTIVITIES:
Year Ended Year Endedst st 31 March, 2011 31 March, 2010
Proceeds from issue of Share Capital - 0.19Advance Against Equity 4,095.29 2,874.43 Proceeds/(Repayment) of Term Loans/Commercial Papers 400.40 (3,038.74)Dividend Paid (101,427.32) (69,377.54)Tax on Dividend (16,471.37) (11,403.91)Interest Paid (4,199.66) (1,781.63)
Net Cash Flow from Financing Activities 'C' (117,602.66) (82,727.20)Net increase/(decrease) in Cash and Cash Equivalents (A+B+C) 58,042.07 (5,916.77)
Cash and Cash Equivalents as at 1st April, 2010 (Opening Balance) 219,966.71 225,883.48Add: Other Adjustments to Cash and Cash Equivalent as at 1st April, 2010* 895.46 -
220,862.17 225,883.48
Cash and Cash Equivalents as at 31st March,2011 (Closing Balance) 278,904.24 219,966.71
58,042.07 (5,916.77)
*Cash and cash equivalent as on 01.04.2010 includes ̀ 895.46 million on account of consolidation of accounts of Dahej SEZ Ltd. for the currentperiod as it was not consolidated in the previous year.
1. The above Cash Flow Statement has been prepared under the 'Indirect Method' as set out in the Accounting Standard-3on Cash Flow Statements issued by The Institute of Chartered Accountants of India.
2. Adjustments have not been made to "Purchase of Fixed Assets" (Investing Activities), on account of increase/decrease inCapital Creditors. The impact of the above is not readily ascertainable.
3. Cash and Cash equivalents represent:-
4. Cash and Cash equivalent excludes ` 7,978.38 million (Previous year ` 3,874.16 million) in current account/depositaccount of interest warrant/refund accounts, under lien, pledge with banks/Govt. authorities in respect of MRPL.
5. Cash Balance includes ̀ 9127.38 million share of jointly controlled entity. (Previous year ̀ 2,370.84 million)
6. Bracket indicates cash outflow.
7. Previous years figures have been regrouped wherever necessary to conform to current year's classification.
C. CASH FLOW FROM FINANCING ACTIVITIES:
Notes:
(` in million) (` in million)
(` in million)
2010-11 2009-10
a) Cash and Bank Balances and Cheques in hand (Schedule 12A) 205,620.14 149,702.47
b) Deposits with Bank under Site Restoration Fund Scheme (Schedule 12B) 81,262.48 74,138.43
Total 286,882.62 223,840.90
(N. K. Sinha) (D. K. Sarraf) (A. K. Hazarika)Company Secretary Director (Finance) Chairman & Managing Director
In terms of our report of even date attached
For Kalyaniwalla & Mistry For Arun K. Agarwal & Associates For S. Bhandari & Co.Chartered Accountants Chartered Accountants Chartered AccountantsFirm Reg. No. 104607W Firm Reg. No. 003917N Firm Reg. No. 000560C
(Ermin K. Irani) (Vimal Kumar Jain) (P.P.Pareek)Partner (Mem. No. 035646) Partner (Mem. No. 086657) Partner (Mem. No. 071213 )
For Ray & Ray For M. Kuppuswamy P S G & Co. Chartered Accountants Chartered AccountantsFirm Reg. No. 301072E Firm Reg. No. 001616S
(B.K.Ghosh) (M.K.Krishnan) Partner (Mem. No. 051028) Partner (Mem. No. 020116)
New DelhithMay 30 , 2011
For and On behalf of the Board
Consolidated Cash Flow Statement forstThe Year Ended 31 March, 2011
Consolidated Cash Flow Statement forst
The Year Ended 31 March, 2011
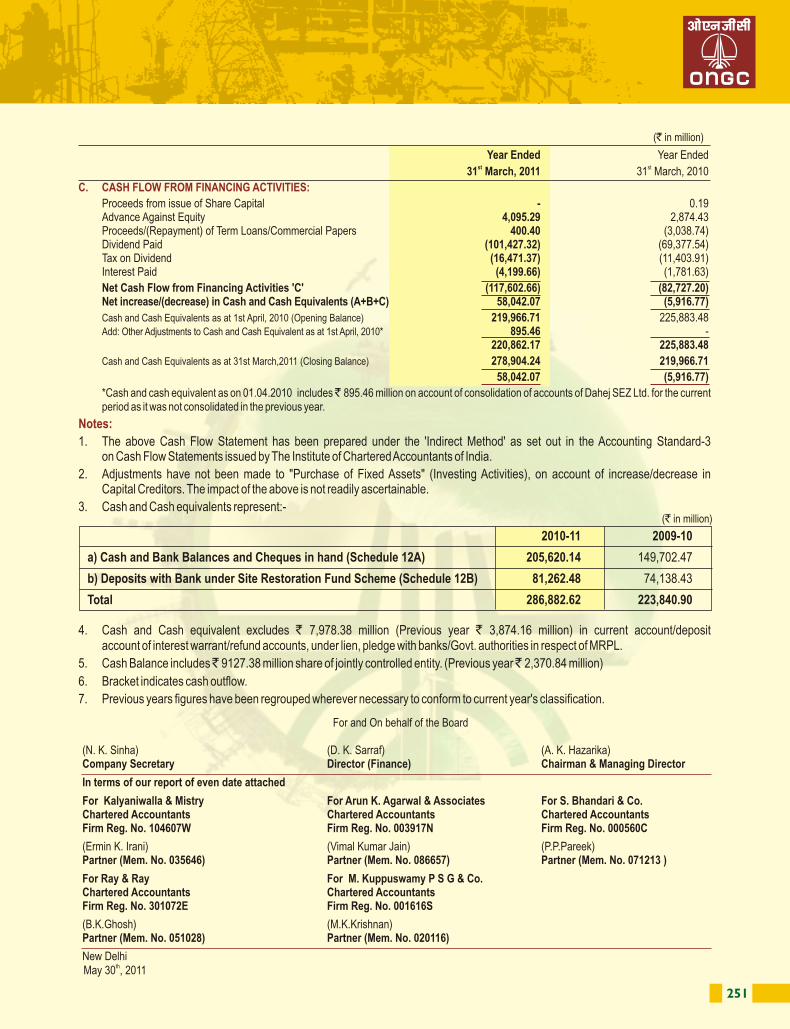
Regd. Office: Jeevan Bharati Building, Tower II,
This Annual Report is printed on 100% recycled, environment-friendly paper