wear of rock cutting tools implications for the site investigation of rock dredging projects
TRANSCRIPT
WEAROFROCKCTJTTINGTOOLSImplications for the site investigation ofrock dredging projects
PETERN.W. VERHOEFDelft University of Technology, Faculty of Applied Earth Sciences, Section ofEngineering Geology, DeW
A.A. BALKEMA / ROTTERDAM / BROOKFIELD 11997
Authorization to photocopy items for internal or personal use, or the internal or personal use ofspecific clients, is granted by A.A, Balkema, Rotterdam, provided that the base fee of US$l.50 percopy, plus US$0.10 per page is paid directly to Copyright Clearance Center, 222 Rosewood Drive,Danvers, MA 01923, USA. For those organizations that have been granted a photocopy license byCCC, a separate system of payment has been arranged. The fee code for users of the TransactionalReporting Service is: 905410434ll97 US$1.50 + US$O.10.
Published byA,A. Balkema, PO.Box 1675, 3000 BR Rotterdam, NetherlandsFax: +31.10.4135947; E-mail: [email protected]; Internet site: http://www.balkema.nl
A.A. Balkema Publishers, Old Post Road, Brookfield, VT 05036-9704, USAFax: 807.27 6.3831 : E-mail : info @ ashgate.com
rsBN 90 54t0434 |
O 1997 A.A.Balkema. RotterdamPrinted in the Netherlands
Contents
PrefaceI Introduction
1.1 Site investigation for rock dredging1.2 Outline of the research project
I.2.1 Laboratory and desk studiesL.2.2 Field studies
1.3 Presentation of results1.4 Organisation of this work1.5 Acknowledgements
PART A: PROBLEMS OF WEAR IN ROCK DREDGING
2 The problem2.1 Wear in rock dredging projects2.2 Outline of the problem of wear in rock dredging
3 Cutter suction dredging3.1 Characteristics of cutter suction dredgers3.2 Cutter suction dredging
3.2.1 Operation of a cutter suction dredger (CSD)3.2.2 Soil and rock properties during transport and disposal3.2.3 Environmental impact during cutter suction dredging
3.3 Basic mechanics of rock cutting dredging by CSD3.3.1 Cutter power3.3.2 Cutting by cutterhead3.3.3 Specific energy
4 Concepts of wear processes from tribology4.1 Basic concepts of wear mechanisms
4.1.1 Wear processes4.1.2 Fr ict ion
4.2 Wear mechanisms in dredger teeth4.2.I Studies on the wear of digger teeth and ripper tips4.2.2 Conclusions from tribological studies on cutting tool
wear
XI1)
334668
101113t4T4I61620212l212328293030343840
4I
Vil Tool Wear: Implicatiors for the site investigation of rock dredging projects
PART C: APPLICATION TO PRACTICE
15 Introduction16 Abrasiveness of Hawkesbury sandstone (Sydney Harbour tunnel
dredging)16.1 Rock excavation projects in the Sydney area16.2 Engineering properties of the hawkesbury sandstone
16.2.1 Laboratory test results16.3 Sydney harbour rock dredging16.4 Malabar outfall decline tunnel
16.4.1 Discussion16.5 Conclusion
17 Field observations of the performance of rock cutting trenchers17.1 Field observations of rock cutting trenching
l7.l.l Excavation modes during trenching17.2 Rock properties influencing trencher performance in massive
rock17 .2.1 Unconfined compressive strengthI7 .2.2Indicators of abrasiveness17.2.3 Rock ductility
17.3 Conclusions18 Assessment methods for excavation performance
18.1 Assessment methods used for tunnel boring machines18.2 Assessment methods used for rock ripping18.3 Assessment methods used for rock dredging18.4 Discussion of present assessment methods for rock excavation18.5 Assessment of trencher excavation performance using fiizzy
expert system18.5.1 First indication of trencher excavatability18.5.2 Fuzzy expert system
19 Conclusions
PART D: SITE INVESTIGATION FOR ROCK DREDGING CONTRACTS
t72
t75r76177t79183186t87189190190r93
196196r98202204206206209212216
2172I t217223
20 Introduction 22521 The construction of a geotechnical model for a rock dredging contract 226
21.1 Site investigation 2282l.l.l Geological and geomorphological investigation 2292I.1.2 Boring and sampling 23021.L.3 Data to be assembled during the main site investigation 234
21.2 Engineering geological units 23521.3 Geotechnical models 236
22 Rock mass characterisation for rock dredging projects 23822.1 Intact rock strength 23922.2 Discontinuities and block size 24122.3 Rock mass strensth 245
Contents
22.4 Weathered rock mass22.4.1Example of dredging in soils derived from weatheredgranite
22.5 Rock cementation22.5.I Cementation in carbonate rocks
23 Conclusion: Wear assessments within site investigations for rock
dredging23.1 Rock factors involved in excavation and tool consumption23.2 Monitoring of excavation and tool consumption during dredging
24 Closing remarks and recommendations
APPENDICES
A Rock identification and classification procedure for engineering pulposes
Al IntroductionA2 Terms and definitionsA3 Rock identification and classification procedure for hand
specimensB Definitions for rock mass description
B1 DescriPtion of rock material82 Discontinuity density and block size83 Description of the weathering state of the rock mass
C Intact rock strengthC1 Unconfined compressive strengthC2 Brazilian tensile strengthC3 Point load strengthC4 Effect of loading rate and moisfure
D The brittle-ductile transitionD1 Index tests and their reiationship with rock mechanics failure
theorYE Petrographic descriPtion
ReferencesNotationIndex
Author indexSubject index
24725t252
x246
254255759260
269280280281285286286288289289291
26r261263
293298
30r3163t9319323
Preface
This book is the result of a study that took place as a response to the need felt bydredging contractors to clarify problems related to the prediction of cutting toolconsumption rates during rock dredging. The project was sponsored from I989-t997by STW, the Dutch Technology Foundation. The design and the theoreticalframework of the study was my responsibility. Apart from my own work, manylaboratory tests and field observations were done by MSc students of EngineeringGeology at Delft University of Technology. The results of their work are discussedand interpreted in the chapters 11, 17, 18.3 and 18.5. One of them, Jan ReinoutDeketh, while preparing his PhD, has made an important contribution to the workby proposing to study the changes of wear processes during the penetration of achisel into rock. The result of this work has been published in the companion volumeto this book: Wear of rock cutting tools: Laboratory experiments on the abrasiviryof rock (1995). It was the intention for this book to be finished at the same time. Ittook two years more to reach the stage of publication. However, there is also anadvantage of the delay. It has been possible to discuss the results of fieldobservations of the performance of Vermeer T-850 rock cutting trenchers. Theseexcavation machines were ideal for the purpose of our investigation. [t was possibleto compare the production and the wear rates of the cutting bits with the rockparameters, that could be obtained from studying the rock within the trenchesexcavated. An ideal situation for an engineering geologist and much better than ispossible in rock dredging projects. Many people have contributed to the success ofthis project, I thank all of them and refer to the acknowledgements in chapter 1.5.
Delft, September 1997Peter N.W. Verhoef
XI
XII Tool wear: Implicatiow for the site investigation of rock dredging projeas
Etra9
o
L)E
'o\oCAc
tr
!v2cl'
(t)
otrq
€t!
0)a0
9c)
Ec
oq)
F.a=o
. JF.()BIh
(u
0
li=o0
o5F
.t*
' . .rri;ll;,l l::t li :.:!1:
-ii. : I ,
CHAPTER 1
Introduction
Rock dredging is a new development. In the sixties rock cuffer suction dredgers wereused in the United States and somewhat later the Dutch dredging contractors alsostarted with rock cutting dredging. Rock is quite a different material from the soilsthe dredging contractors are used to deal with. Dredging was very much a craft thathas to be learned by experience and this also appears to be the way one learns rockdredging nowadays. The rock cutter dredgers can handle fairly difficult ground andapart from rock they dredge also weathered rock and difficult soils.
In the past decade unpleasant surprises have occurred frequently when dredgingrock. Sometimes misjudgment can have very serious consequences. In the earlyeighties a large Dutch dredging contractor experienced excessive wear of dredgingequipment at Port Hedland, Australia. Financial losses of over 100 million Australiandollars were claimed, and the contractor stated that the site investigation reports gaveno warning of the difficult ground conditions leading to high abrasive wear of cutterteeth. Examination of the site conditions by a group of experts lead to the conclusionthat indeed ground conditions were not described adequately in the geotechnicaldocuments available to the contractor. This claim was settled for Aus $ 39 million;the largest settlement ever paid in Australia for a geotechnical project up to date(Coffey & Partners 1990 pers. comm.).
Dredging contractors are highly dependent on the site investigation reportsavailable to them when they are assessing a project at the tendering stage . Normallynot much time is available. In this short period important decisions have to be madeabout the type of dredging equipment to be used, the expected production rate andthe amount of replacement needed for equipment liable to wear, such as pumps,pipes and the cutting teeth and cutters of the dredgers.
Clearly the type of ground to be dredged has a major influence on the decisionsmade. Any misjudgment from the production estimators may have importantconsequences, in the short term on the bidding during the tendering stage, but in thelong term on the dredging operation itself, once a contract has been acquired.
Complications may arise when the information on the ground conditions is suchthat the contractor has not obtained a correct impression of the type of soils androcks present. Even site investigation reports that look exhaustive and contain all theparameters that the contractor normally uses for his estimates can be misleading.
The Port Hedland case was one of the first in which the Engineering Geology
2 TooI Wear: Impticuioru for the site investiguion of rock dredging projects
Section of the Faculty_of Applied Elrth Sciences (formerly Mining & petroleumEngineering) of Delft University of Technology was involved, as {ofessor DavidPrice was asked to_-siye his expert opinion. dother case, somewhat later in time,was at Port Laem Chabang (Thailand), where granitic soils were atJgJ. A,lso hereexcessive wear was experienced. After examination of the ground ,ofritioor, it wasalso concluded that the soils were not described adequately
Apparently practice in site investigation for dredgrng piojects is such that majormistakes can occur frequently. This silrlati.on w1s the-impetus to start this study. Theproblem of setting up an adequate site inv_estigation programme for a particularproject is the central-th€me of Engineering Geoiogy. Siie iivestigation is needed todefine-thg seoloeical factors of influence on a dredging project and to assemblegeotechnical data. The geotechnical data are used to ait"i-i"e trr" typ" or o."Ogingequipment t^o be applied and to estimate excavation production rates.
Since 1986 the Section of Engineering Geology nas been studying the problem ofwear of dredging cutting tools. It was proposed at a cEDA-(c-entrai urrcgingAssociation) meeting 1n Defft in May. tsqb { approach the probrim using cornmonengineering geological methods (verhoef 1986i.-rne alternative to solutions basedon mechanical engineering appealed to the Dutch dredging community. A result ofthis meeting was' among others, that Dutch dredging
"contractors regularly started
{t sgnd rock specimens to Delft for petrogtapnic examination. Tie Section ofEngineering Geology became involved in n *dtking group with the task of designinga useful abrasiveness test for rock. This -worki"i ir""p was funded by the csB(combinatie speurwerk Baggertechniek; Dredgi& i.esearch Associatioln) and thedevelopment of the test, a cutting test on a srraiei was carried out by the Sectionof soil Movement of_the Faculty of Mechanical and Maritime Engineeiing (van dersman 1988, Davids & Adrichem 1990, Ivliedema 1990, iissrnopiggil. i proporut
was made for a research project to S_TW (Stichting Technische Wetensctappen;Technology Foundation). The project, formulated *irco by the writer, was grantedto the section of Engineering Geology for a period of four years, starting in January1989' In 1993 a new grant for an uoaitionui roor yru.r *as giuen to th; project.
I.1 SITE INVESTIGATION FOR ROCK DREDGING
An interesting paper by stone (1991) presents a summary of the art of siteinvestigation for dredging works by someone with more than 30 years oi practicatexperience' Stone stresses that: "the most frequent criticism of any dredging projectthat has been executed over the last 30 - 4}'yrurr, is that there is insuficiew soilinformation. The second major criticism is itrat there is no generat ?o.mut ttatenables easy comparison of work by the different sampling companies or soilinvestigation contractors.." According to Stone the essentiut t.quirrrornt of tne siteinvestigation, to properly price a dredging contract, should be to assess thedredgeabiliry of the rock or soil materiai. Stone summarizes the most imporantproperties needed for his purpose: "In- the -most simple form, this requires themeasurement of the in-situ soil strength, plus u gruiing or sieve curve. If thematerial is not homogeneous, or difficult to diedge, idcitionat information is needed,
Inroduction 3
regarding hardness, abrasiveness, angularity (side slope stability), the thickness oflayers or the amount of separation of the strata, direction and trend of the interfaceof the material etc, but the prtmary interest is the soil strength and sieve curve. " Forrocks, Stone mentions a list of strength and deformation tests that could be executed.
The present work has to be seen against this background. The impulse to start thisstudy came from the excessive wear problems that sometimes faced the contractors.Part of the problem stems also from insufficient site investigation and lack ofunderstanding or coherence in site investigation reports.
1.2 OUTLINE OF THE RESEARCH PROJECT
The central purpose of the research project was to try to achieve an improvement inthe prediction of rock cutting tool wear. During the preparation of the researchprogramme two main areas that needed clarifying were identified. These were:
1. Examination of the rock cutting and tool wear process from the perspective ofthe rock properties. The main emphasis in the past had been mainly from amechanical engineering perspective, with emphasis on the improvement of the tools.
2. The need for a thorough geological component in the site investigation fordredging projects, to be carried out by a team including an engineering geologist anda professional engineer conversant with the details of dredging practice.Both aspects were to be addressed in the research. The first would be supported bylaboratory studies, literature research and observations of rock cutting operations,the second by field shrdies of actual dredging projects.
1,2.1 laboratory and desk studies
The main emphasis of the research was intended to deal with rock cutting toolconsumption and assessment of cutting tool wear. The following subjects to beaddressed in the research were defined:
- the characteristics of rock cutting equipment (rock cutting dredgers, tunnelboring machines, road headers, rippers, trenchers)
- the mechanics of rock cutting (wedge penetration)- the local heating of tool and rock during mechanical excavation- other factors (such as water pressure, cavitation, heat) of relevance to the
cutting process- the influence of rock mass structure (discontinuities) on the cutting process- rock mechanical factors (intact rock failure)- the brittle-ductile transition of rock failure and its influence on rock cutting and
tool wear- the process of abrasive wear- the abrasive capacity of rock (influence of mineralogy, microscopic structure,
abrasion process, abrasion tests, definition of "hardness")- the microstructure of rock in relation to abrasive capacity- rock microstructure classification
4 Tool Wear: Impltcaiorc for tlu site investigaion of rock dredging projecu
- the microscopic failure mechanisms of the different classes of rock; the natureof abrasion
- the implications for interpretation of abrasion index testsIn Engineering Geology practice it is customary to use simple field or laboratorytests to get an indication of engineering properties of soils or rocks. For example,to determine the abrasiveness of rock, the Cerchar scratch test is used, or-theSchimazek ,Fvalue determined. The experimental part of the study was aimed attesting the validity of this approach. It was decided to use artificial rock, consistingof mortar-mineral mixtures, to be able to test the influence of various rockproperties, such as strength, brittleness, hard mineral content, grain size of hardminerals, angularity of grains and hardness of minerals. The theoretical backgroundof wear processes from the science of tribology was consulted.
Experiments were carried out by students of the Section of Engineering Geologyof the Faculty of Mining and Petroleum Engineering as part of their MSc thesiJ.Cutting experiments were performed by Reinking (1989) and Bisschop (1991). pin-on-disc tests were carried out by Van den Bold and Vermeer (Verhoef et al. 1990)and Deketh (1991).
In 1990 a research visit was made by the author to sydney (hof. FrankRoxborough, School of Mines, University of New South lVales) which proved veryuseful. Westham Dredging Company provided information on the rock cutting donlfor the Sydney Harbour Tunnel. Borehole data and test results of the siteinvestigation reports were compared with the actual tool consumption raking place.AIso cutting and abrasion tests were performed, using steel and tungsten carbide testchisels (Verhoef 1993).
The first two years of the project were used for the constnrction of a pin-on-disctest rig. It was decided to use a special type of lathe, where the feed is coupled tothe rotation velocify, to ensure constant velocity under the pin or chisel. A varietyof test set-ups can be built for this lathe (pin-on-disc, cutting-, abrasion set-ups ormini-disc cutter). An old lathe (1960) once used by Technical University Eindliovenwas obtained for this purpose. The pin-ondisc test has been examined and used ona range of artificial and natural rocks (Deketh 1991). The results were interestingand useful for the development of theory, but the test proved not ideal for practicalpurposes. One major problem was the effect of surface roughness of the test surface,another the inability to test surfaces of strong rock. A major point was that rockcutting is a displacement-controlled process, whereas the pin-ondisc test is loadcontrolled. It was concluded that it would be better to have a test where thedevelopment of cutting forces would be a function of the rock material, instead ofbeing imposed on the rock specimen. Therefore a new test has been developed byDeketh, the scraping test. This test has proven to be of great value, and is describedin detail in the work of Deketh (1995).
1.2.2 Field stu.dies
The integration of dredging field studies with the laboratory work proved adifftculty. Although some promising statements were made, dredging contractors didnot allow observations to be made during rock cutting dredging operations. The work
Introhrction 5
done during consulting assignments was not allowed to be published. Several aspectsplay a role, which are shortly outlined here.
- Since the wear of cutting tools (or the tool consumption rate) is very diffrcultto predict (as is the production rate), such data is regarded highly confidential. Oncea contractor has experience on a site, he keeps the data in his files, to be used forfuture projects in the same area (it is not uncommon that different projects arecarried out over the years at the same harbour site).
- Despite the fact that a poor description of the geological situation can bedetrimental to the contractor, he can use this as the basis for a claim based on"unforeseen geological conditions". Experts are used to give a scientific basis for theclaim. However, when prior to a court verdict an agreement is made between clientand contractor, the contractor does not want to have his relationship with the clientspoiled by publications showing the poor quality of site investigation reportsapproved by the client, again with fufure works in mind.
The first argument is a valid one. The results of this study show that it isimpossible at this stage to make accurate predictions on tool consumption andproduction.
The second aspect shows that the contractor has conflicting interests. Firstty hewants to accomplish a work in an appropriate way, according to high technicalstandards. To do this it is necessary to perform high quality site investigations. [nfact he would prefer to do such investigations himself, because poor work performedby the clients' engineering consultants always can be used for claims. The better thesite investigation reports made by the engineering consultants working for the client,the better the contractor can prepare his work, but the less grounds for claims he haswhen his predictions prove wrong.
The reason why contractors do not reveal the methods they use to analyz.egeological data for production and tool consumption estimates is therefore based oncompetitive arguments. There is ample evidence, however, that this secrecy has keptthe average standard of site investigations for rock dredging works on a questionablelevel. Data that do give information on abrasiveness of rock, like mineralogicalcomposition, is often not gathered during site investigations. In the end there willalways be someone, either the contractor, the client, or the tax payer, who has topay for project failures.
The drawback of this situation for this research project is obvious. In this workit has not been possible to present results of site investigation work relating to rockdredging projects, other than the analysis of the Port Hedland project (Chapter 5)and the Sydney Harbour project (Chapter 16). General points that have drawnattention will be discussed, however.
In 1993, vermeer International Manufacturing Company (P. sturm, RegionalExport Office, Goes) showed interest in a study of the relationship between rockproperties and production and tool consumption of their (on-land) rock cuttingtrenchers. Since the trenchers are capable of making excavations of several metersdeep in even strong rock, these provide an excellent opportunity to compare closelythe changes in wear and production to the trench geology. On-land trenches, ofcourse, give better feed back than under-water excavations by rock cutting suctiondredgers can ever do. It is not really practical to study the geology under water atthe cutter head; normally the rocks excavated can only be monitored at the spraypipe, remote from the excavation site.
6 Tool Wear: Implicaionsfor the site invesrtgaion of rock dredging projecn
Monitoring of trenching projects has been taken place under the supervision of theauthor. A summary of the results from this work is given in Chapter 17.
It is believed that the theory and laboratory experiments developed in the courseof this project relate to rock cutting in general, not specifically to rock cuttingdredging. Especially the experimental work (Deketh 1995) is equally, or even better,related to "dry" excavations such as performed by tunnel boring machines, roadheaders and rock trenchers.
1.3 PRESENTATION OF RESULTS
The results of the research carried out is presented in two books. The present volumetreats the implications of the insights gained on wear processes for site investigationsinvolving rock dredging. The volume written by Deketh (1995) treats theexperiments performed that have given insight into the basic wear mechanismsoperating during rock cutting. The work on the performance of rock cuttingtrenchers, which is also a validation study for the concepts developed during thisproject, is still under way. The results are partly published here (Chapter I7),
1.4 ORGANISATION OF THIS WORK
The present work presents an overview of the knowledge gained during the executionof the project. It is divided into four parts.
Part A: Problems of wear in rock dredging gives the outline of the subject of thisthesis. The wear problems encountered in rock cutting dredging using suction cutterdredgers are discussed. The basic principles of suction cutter dredgers are given inChapter 3. Wear mechanisms and the principles used to study wear are discussed inChapter 4, which introduces the tribological approach followed in the research. Thet)?es of wear that are commonly encountered in dredging are also treated in thischapter. Wear of the cutting tools (pick points) on the cutterheads and wear in thepipe lines and pumps. In order to appreciate the influence of the geology, especiallythe way the geology is described in site investigation reports, in Chapter 5 the caseof excessive wear problems encountered at Port Hedland, Australia, is dealt with.
Part B: Rock properties influcncing cutting and. wear contains the availableinformation on rock cutting and tool wear that can be used in practice. Chapter 8addresses the influence of the fractured nature of the rock mass on the cuttingprocess. Fracture (or discontirwiryl density and geometry determines largely whethera rock cutting machine will excavate by rtpping (loosening of rock blocks, whoseshape and size are determined by the discontinuity geometry) or cutting (the pickpoints cut into the rock material). Chapter 9 treats the current rock cutting theoriesand explores which rock mechanical index tests relate to ths cuttability of rock. Therelation of rock cutting mechanisms with the wear mechanisms treated in Chap0er 4is discussed in this Chapter. The mode of cntting, either brittle or ductile, isimportant in this respect. This mode is related to the size of the crushed zone thatforms near the tip of the cutting tool. The nature of the crushed rock material itself
Intraduction 7
determines the wear processes that may operate. The following four chapters aredealing with the rock properties that relate to abrasive wear mechanisms. Theconcept of hardness of rocks and minerals is treated in Chapter 10. The hardnesscontrast between the abrasive (the rock surface or the crushed rock powder) and thetool (in dredging commonly hardened steel) during the cutting determines theintensity of wear. Tests that try to determine the abrasiveness of rock are treated inChapter 11. The problem with wear tests is that the results normally only relate tothe circumstances of the test itself. Correlation with practice is often fortuitous. Thewear mode theory of Deketh (1995), summarized in Chapter 12, gives a tool toapproach forecasting of wear, avoiding to rely on abrasion or cutting laboratory testsonly. A combination of rock mechanics strength tests and petrographic examinationof rocks is regarded as the best approach at present (Chapter 13).
Part C: Application of theory to practice examines the current methods that areused to assess excavation performance and tool wear. Since the information fromreal rock dredging projects is meagre, attention is given to the methods that are usedin rock tunnelling, rock ripping and rock trenching. Chapter 16 is a study where theperformance of roadheader tunnelling machines and a cutting suction dredgerexcavating in Hawkesbury sandstone is compared with site investigation data andIaboratory cutting and abrasion tests. Chapter 17 the results of field observations ofrock cutting trenchers are presented. It is shown that both rock mass properties(discontinuity density) and rock material properties (strength, mineral content andmicrostructure) influence the productron and tool consumption. These can beunderstood using the knowledge gained from the experimental and theoretical studypresented in Part B. In order to set out in what direction the performance predictionsof rock cutter dredgers can be improved, the methods currently in use for tunnelboring machines and bulldozer rippers are given in Chapter 18. In this Chapter alsothe approach adopted for the rock cutting trenchers of our project, the applicationof fuzzy logic, is presented.
Part D: Site investigation for rock dredging conffacfs presents the methods toarrive at a geotechnical model of the subsurface to be used for a rock dredgingproject. The site investigation methods that relate to cutting performance and wearare emphasized. In Chapter 27 an outline is given of the requirements of a usefulgeotechnical model and the site investigation methods needed to arrive at such amodel. In Chapter 22 the methods used to characterize a rock mass for a rockdredging project are discussed. It is shown that with help of relatively simple testsan impression on the expected cutting and abrasion behaviour can be obtained. Theway the tests are to be interpreted is a matter of concern. Current practice is mainlyinterested in estimates of unconfined compressive strength. In this work it is shownthat at least data on both compressive and tensile strength are needed (Appendix C).It is also shown that more sophisticated testing techniques (like UCS testing onservo-controlled stiff testing frames and triaxial tests) are needed to make intelligentassessment of the likelihood of ductile cutting behaviour (Appendix D). In Chapter22 aspects related to discontinuities, needed for rock mass characterisation aretreated. The rock mass to be excavated should be well described in three dimensions,based on a sound geological model. The geotechnical information on the propertiesof the rock materials and the discontinuities in the rock mass is currently processedusing simple classification systems, or by empirical correlation formulations. Newdevelopments make use of fazzy logic and expeft systenro. Chapter 23 concludes this
8 Tool wear: Implicuiorc for tln site tnvestigwion of rock drdging proJects
work with a presentation of the wear assessments to be made within siteinvestigations for rock dredging.
1.5 ACKNOWLEDGEMENTS
This study would never have been undertaken without the enthusiastic and firmsupport of Prof. David Price. As the first Professor of Engineering Geology in TheNetherlands he saw the application of Engineering Geology principles to dredgingas a good opportunity to serve a typical Dutch profession and industry. Many of nitstudents have found their vocation in dredging contracting or act as site investigationspecialist in this field. All of us have been greatly inspired by his example.
The Stichting Technische Wetenschappen (STW, Technology Foundation) hassupported this project not only financially, but also by giving the researchers enoughspace to operate. Drs. J.P. Veen, who guided the project for the sponsor alwaysfelped out when practical problems arose . The users group that followed the projectis thanked for the constructive and supportive criticism that was received over theyears: Prof. D.G.Price (1989-1994), Delft University of Technology (DLrD,Engineering Geology; Prof. D.D. Genske (1994), DUT Engineering Geolbgy; prof.J. de Koning (1989-1994), DUT, soil Movement; Dr.Ir. s.A. Miedr*u (tg9+),DLrr, soil Movemenr; Ir. A. van Hemmen (1989-1994), vosrA; R. Breken,vosrA 099a); Ir. H.J.M.G. steeghs (1989-1992), Delft Hydraulics; Ir. Joh.Pennekamp (L992>, Delft Hydraulics; Ir. J.w.M. Mens (1989), TNO-MI; Ir. F.A.verhoeven (1989-1991) Boskalis; Ir. p.D. Swart (1991), Boskalis; p. Shrrm (1994),Vermeer International.
The interest shown by many engineers involved in dredging has encouraged meto pursue this work. I have benefitted from information provided by Ir. A. vanHemmen and Klaas Wijma (vosrA, Amsterdam), Ir. Henk van Muijen and hiscolleagues from IHC-MTI (Kinderdijk) and from discussions with Ir. Paul Cools andIr. Walther van Kesteren (Delft Hydraulics). Most dredging companies in TheNetherlands regularly send rock samples for petrographic examination and strengthtesting to our laboratory. I thank Ir. Pieter Swart (Boskalis) for actively providingpossibilities to work on projects, like Sydney Harbour.
The research visit to the University of New South Wales (Sydney, Australia) hasbeen a great stimulus. The opportunity provided by Westham Dredging to study thedata of the Sydney Harbour project and the hospitality of Prof. Frank Roxborough,allowing me to perform rock cutting tests in his laboratory, is greatly appreciated.
The keen interest of the trencher manufacturing company Vermeei International(Pella, Iowa, USA) for our research, resulted in the possibility to verify our ideason rock cutting by monitoring trenching projects. Peter Sturm is thanled for hisactive role in this.
The MSc graduate students that worked on this subject under my supervisionwere: w. Jager, H.J. van den Bold, Th.w.M. vermeer, H.J.R. Deketh, M.w.Reinking, F. Bisschop, J.J. Ockeloen and the group that worked on the trencherproject, with full-time researchers Jan Reinouth Deketh and Mario Alvarez Grima:M.Giezen, M.H. den Hartog and I.M. Hergarden. A graduate student from Leuven@elgium), K. de wit, worked on dredging data from Ra's Laffan (euatar). In
Introduction g
Australia ruNSW), S. Sindhusen worked on rock abrasiveness, studying the Cercharand Schimazek test. All of them are thanked for their hard labour, interest andinvaluable contribution. Their work is referred to in the text where appropriate.
A major support has been given by Willem Verwaal and Arno Mulder, whooperate the Engineering Geology Laboratory and by the secretary, Heleen van Ussel.Their continuous effort to deliver high quality work is appreciated very much.
Duting the preparation of the manuscnpt I have benefittd from the suggestionsand help of many. I would like to mention here Dr.Ir. Jan Reinouth Deketh, Ir. Alexvan de Wall, P. Michiel Maurenbrecher MSc, Dr. Niek Rengers, Prof. David Priceand, last but not least, Prof. Wim Vlasblom, who enthusiastically discussed the insand outs of dredging. My wife Marjan lovingly made sure that I enjoyed life in thisperiod.
The encouragement and backing received over the years from my colleagues andthe management and personnel of the Faculty of Applied Earth Sciences of DelftUniversity of Technology has been heart-warming.
Finally I would like to thank those that helped me to develop the frame of mindneeded to write this work. I am grateful to Drs. Ad Stemerding @elfeld), VaidyaVivikanand (Nijmegen) and I thank my great teacher in the art of living, SwamiChidvilasananda (South Fallsburg, USA).
CHAPTER 2
The problem
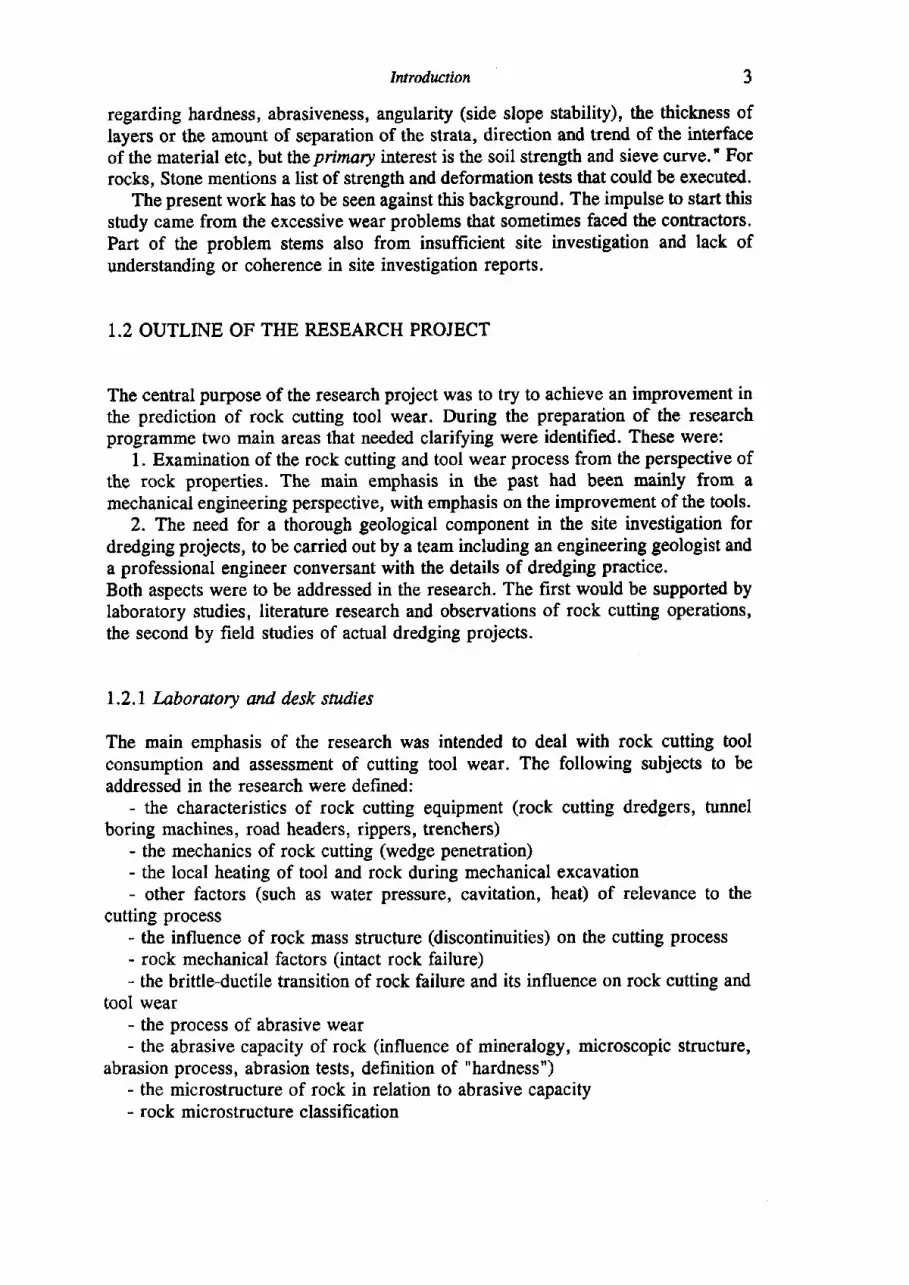
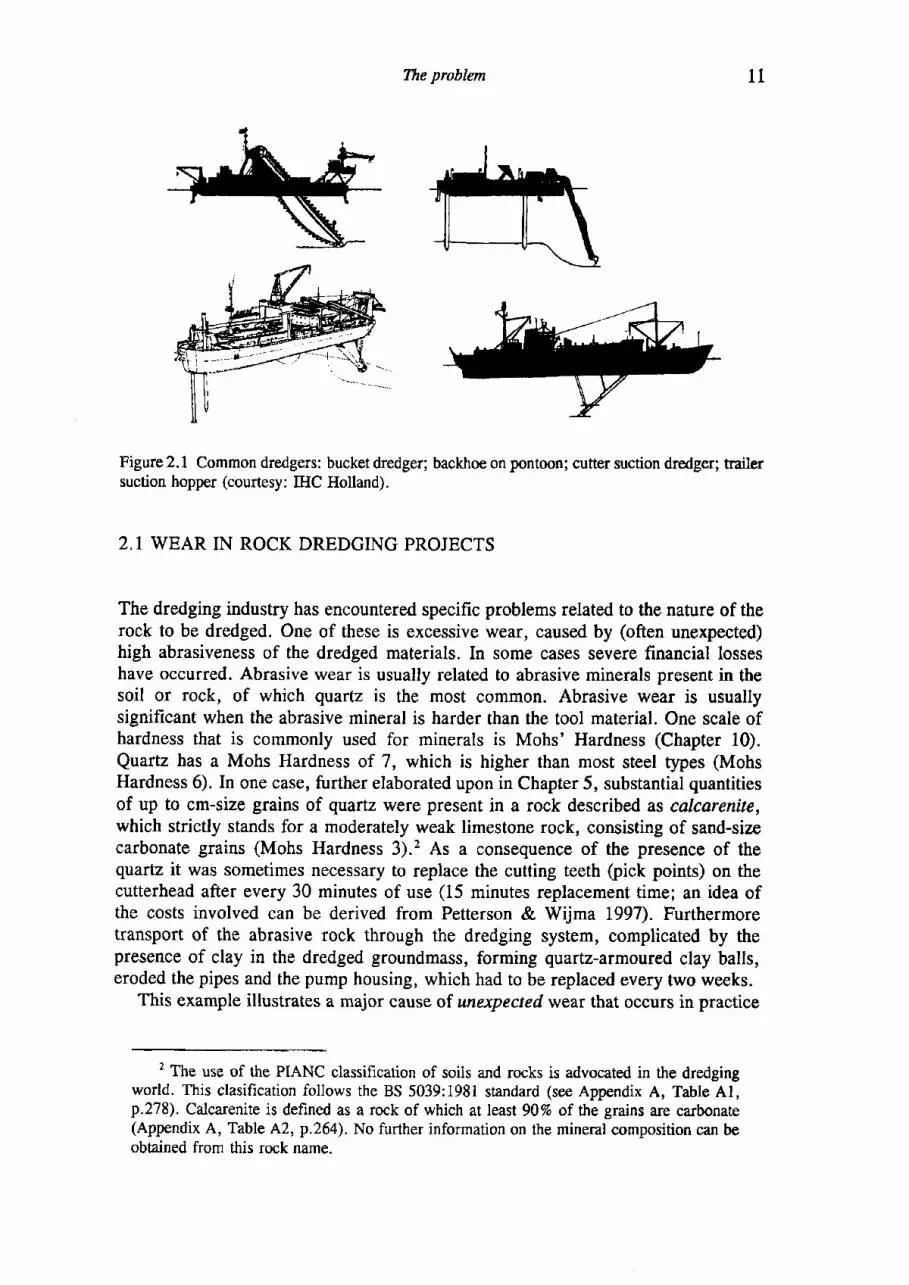
Several types of dredgers are able to dredge rock. Dredgers may be classifiedaccording to their basic method of extraction, transportation and diposition (Bray1997, De Heer 1989, Herbich lggz). present oay oreoging equipment may bLdivided into two categories, mechanic and trydraulfc. The first lmbraces vessplswhich scoop up the soil (mechanical dredgers), the second dredge by suction(hydraulic dredgers). Mechanical excavation of rock under wateioc.uts usingbackhoe, dipper (power shovel), bucket and grab dredgers, although these excavateonly the weakest rocks or rock fragmented earlier by blasting or breaking. Acombination of mechanical cutting and hydraulic suction is performed by cuttersuction dredgers, some of which were designed to be able to dridge large quantitiesof rock' Figure 2.1 shows common dredger types and Table 2.1 sum-s up tlpicalcharacteristics.
Increasingly stronger rocks can be dredged with heavy duty cuffer suctiondredgers (Chapter 3). Nowadays rocks with an unconfined-rorpt"rrive materialstrength of up to 30-50 MPa (moderately strong rocksr) may be dredged directly,without pretreatment. stronger rocks may be only dredged whJn they ir"fragmented. Fragmentation of rock, i.e. the breaking up of iocks into blocks ofmanageable size, can be present naturally due to joints or other naturaldiscontinuities in the rock. Fragmentation can be induced either by drilling andblasting, ripping, pneumatic hammering, or dropping of spud piles on the rock.
The choice of dredger depends on a number of considerations, related to the typeof project, the volume of rock to be excavated and the nature of the rock. Waves andwind conditions play an important role. Cutter suction dredgers, for example, cannotbe used during heavy wave conditions, making them less suitable for work'in openwaters. Backhoe and bucket dredgers can handle rock as well, but the backhoerequires relatively shallow depth. Other aspects relate to the dimensions of the workand the required tolerances (De Koning, 1968). When large volumes of rock haveto be excavated, nearly always a cutter suction dredger (CSD) is considered for thework.
1 For a generally used strength scale see Appendix A, Table A6, p.274.
10
The problem
Figure 2.1 Common dredgers: bucket dredger; backhoe on pontoon; cutter suction dredgerl trailersuction hopper (courtesy: IHC Holland).
2.1 WEAR IN ROCK DREDGING PROJECTS
The dredging industry has encountered specific problems related to the nature of therock to be dredged. One of these is excessive wear, caused by (often unexpected)high abrasiveness of the dredged materials. In some cases severe financial losseshave occurred. Abrasive wear is usually related to abrasive minerals present in thesoil or rock, of which quartz is the most common. Abrasive wear is usuallysignificant when the abrasive mineral is harder than the tool material. One scale ofhardness that is commonly used for minerals is Mohs' Hardness (Chapter 10).Quartz has a Mohs Hardness of 7, which is higher than most steel types (MohsHardness 6). In one case, further elaborated upon in Chapter 5, substantial quantitiesof up to cm-size grains of quartz were present in a rock described as calcarenite,which strictly stands for a moderately weak limestone rock, consisting of sand-sizecarbonate grains (Mohs Hardness 3).2 As a consequence of the presence of thequartz it was sometimes necessary to replace the cutting teeth (pick points) on thecutterhead after every 30 minutes of use (15 minutes replacement time; an idea ofthe costs involved can be derived from Petterson & Wijma 1997). Furthermoretransport of the abrasive rock through the dredging system, complicated by thepresence of clay in the dredged groundmass, forming quartz-armoured clay balls,eroded the pipes and the pump housing, which had to be replaced every two weeks.
This example illustrates a major cause of wtexpected wear that occurs in practice
2 The use of the PIANC classification of soils and rocks is advocated in the dredgingworld. This clasification follows the BS 5039:1981 standard (see Appendix A, Table Al,p.278). Calcarenite is defined as a rock of which at least 907o of the grains are carbonate(Appendix A, Table A2, p.264). No further information on the mineral composition can beobtained from this rock name.
11
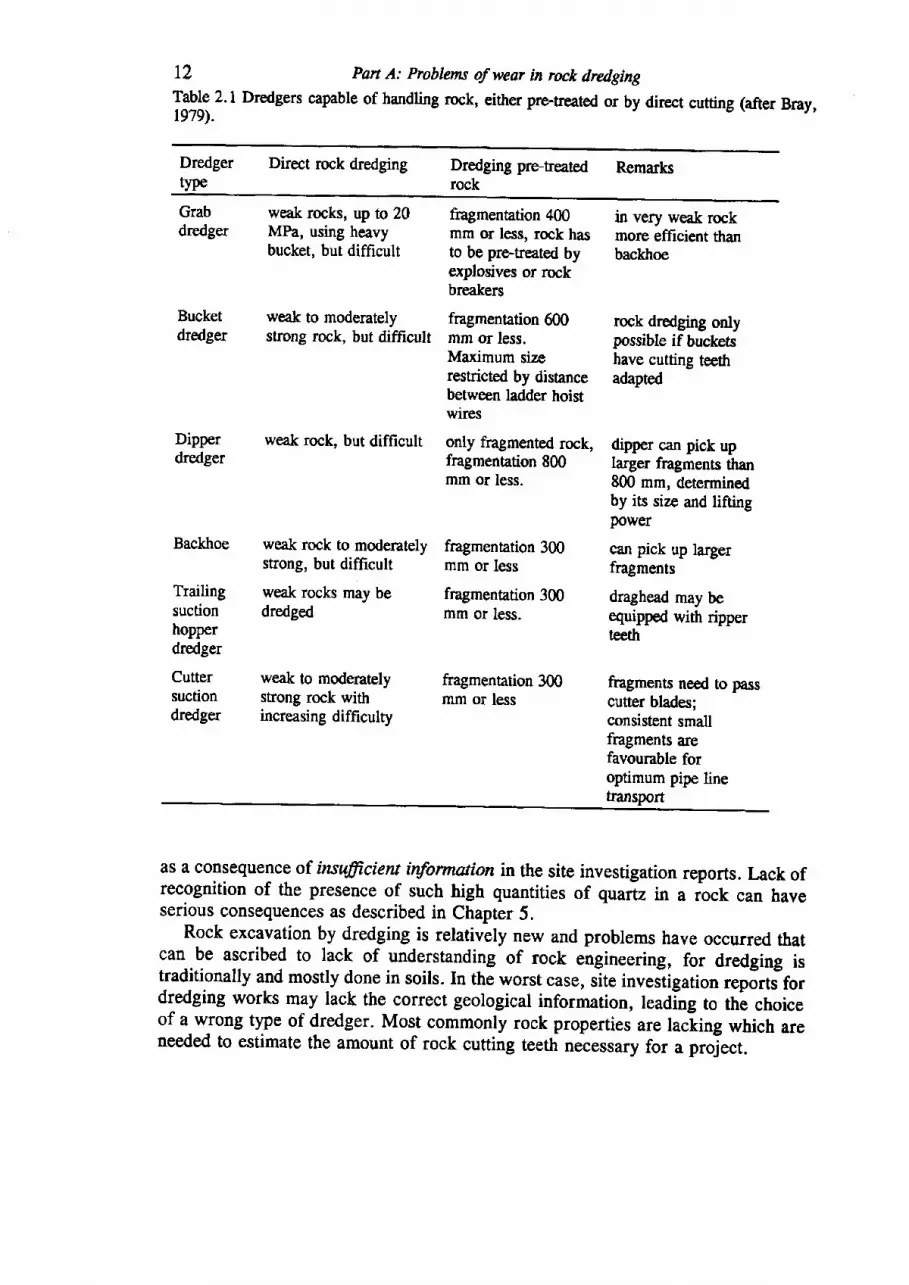
12 Pan A: Problems of wear in rock dredgingTable 2.1 Dredgers capable of handling rock, either pre.treated or by direct cutting (after Bray,l9?e).
Dredgertype
Direct rock dredging Dredging pre-fieated Remarksrock
Grabdredger
Bucketdredger
Dipperdredger
Baclhoe
Trailingsuctionhopperdredger
Cuttersuctiondredger
weak rocks, up to 20MPa, using heavybucket, but difficult
weak to moderatelystrong rock, but difEcult
weak rock, but difficult
weak rock to moderatelystrong, but diffrcult
weak rocks may bedredged
weak to moderatelystrong rock withincreasing difficulty
fragmentation 400mm or less, rock hasto be pre-treated byexplosives or rockbreakers
fragmenation 600mm or less.Maximum sizerestricted by distancebetween ladder hoistwires
only fragmented rock,fragmentation 800mm or less.
fragmentation 300mm or less
fragmentation 300mm or less.
fragmentation 300mm or less
in very weak rockmore efficient thanbaclhoe
rock dredging onlypossible if bucketshave cutting teethadapted
dipper can pick uplarger fragments than800 mm, determinedby its size and liftingpower
can pick up largerfragments
draghead may beequipped with rippert€eth
fragments need to passcutter blades;consistent smallfragments alefavourable foroptimum pipe linetransport
as a consequence of iruufficient t4fotmaion in the site investigation reports. Lack ofrecognition of the presence of such high quantities of quartz in a iock can haveserious consequences as described in Chapter 5.
Rock excavation by dredging is relatively new and problems have occurred thatcan be ascribed to lack of understaading of rock engineering, for dredging istraditionally and mostly done in soils. In the worst case, site investigation reports fordredging works may lack the correct geological information, leadi-ng to the choiceof a wrong type of dredger. Most commonly rock properties are lacting which areneeded to estimate the amount of rock cutting teeth necessary for a proJect.
The problem 13
2.2 OUTLINE OF THE PROBLEM OF WEAR IN ROCK DREDGING
The immediate reason for this study was the lack of control on the prediction of thenumber of pick points needed for dredging projects of cutter suction dredgers inrock. Especially at the excavation front, where the cutterhead mounted with pickpoints is cutting into the rock, unexpected deviations of amounts of wear arerecorded in practice (too high as well as too low estimates). Although wear occursin other parts of the dredging process as well (in pumps, in pipelines, or the tracksof bulldozers on the reclamation site), the interest is mainly on the wear experiencedat the cutting front. The focus of research into this subject had previously been verymuch concentrated on the mechanical engineering aspects and material properties ofthe pick points or cutting chisels. [t was clear that the rock malerial itself played animportant role as well. Often, when unexpected high wear rates were encountered,the reason was related to special geological circumstances or to particular featuresof the rock that had been overlooked.
After introducing basic features of cutter suction dredgers in Chapter 3, the wearprogesses that have been encountered are dsscribed in Chapter 4. Then a case historyis given, in Chapter 5, of a dredging project where excessive wear took place. Adefinition of important subjects for further elaboration is given in Chapter 6.
CHAPTER 3
Cutter suction dredging
3.1 CHARACTERISTICS OF CUTTER SUCTION DREDGERS
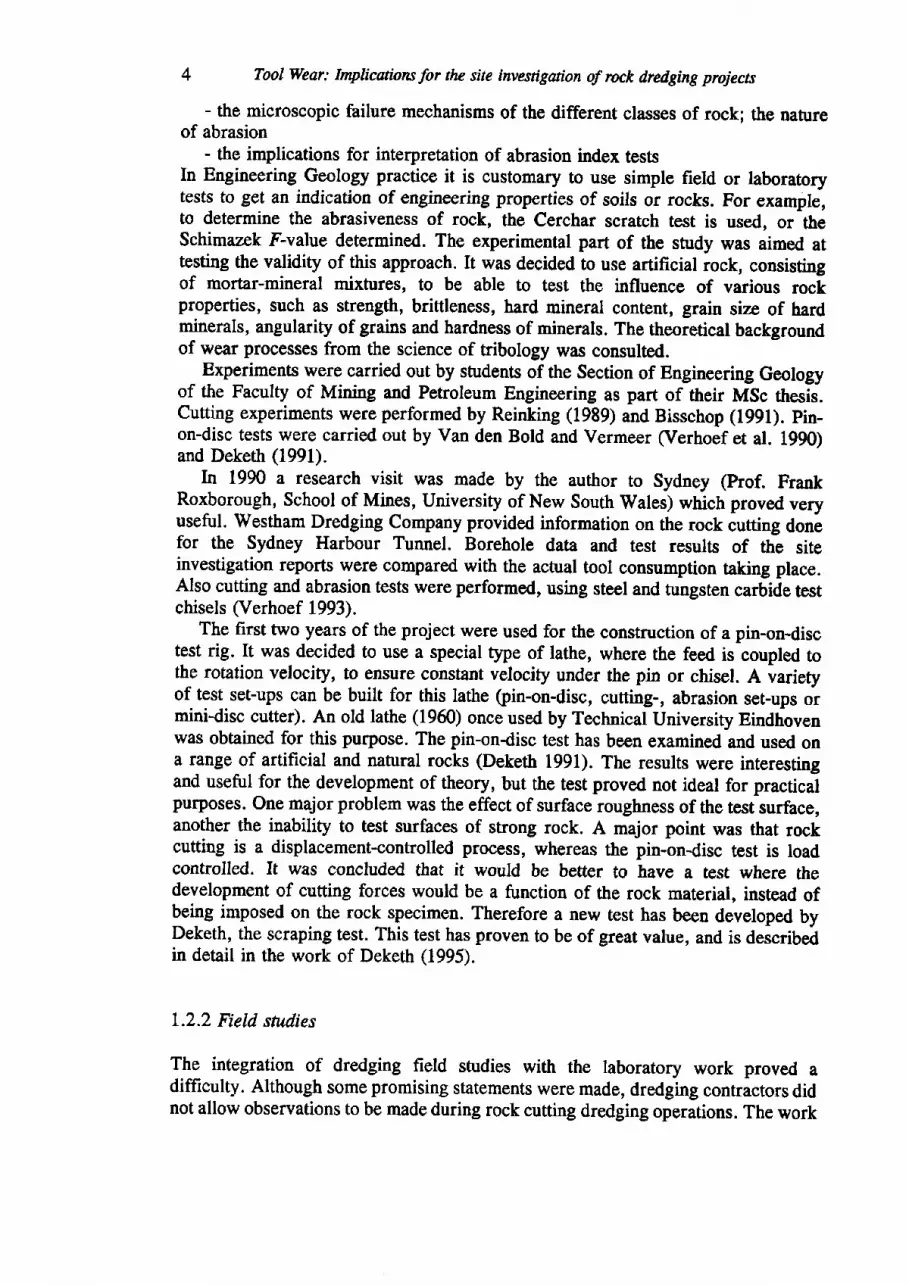
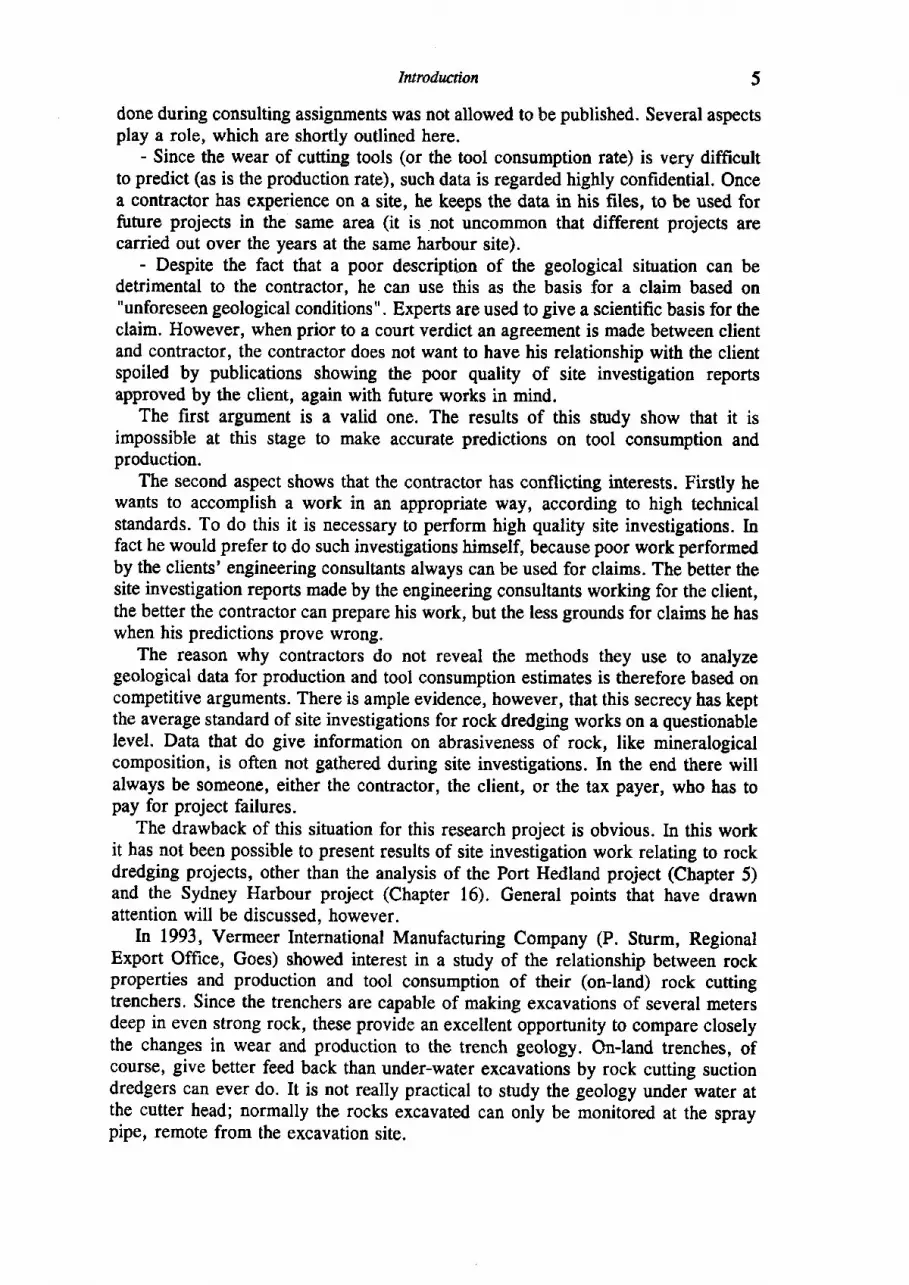
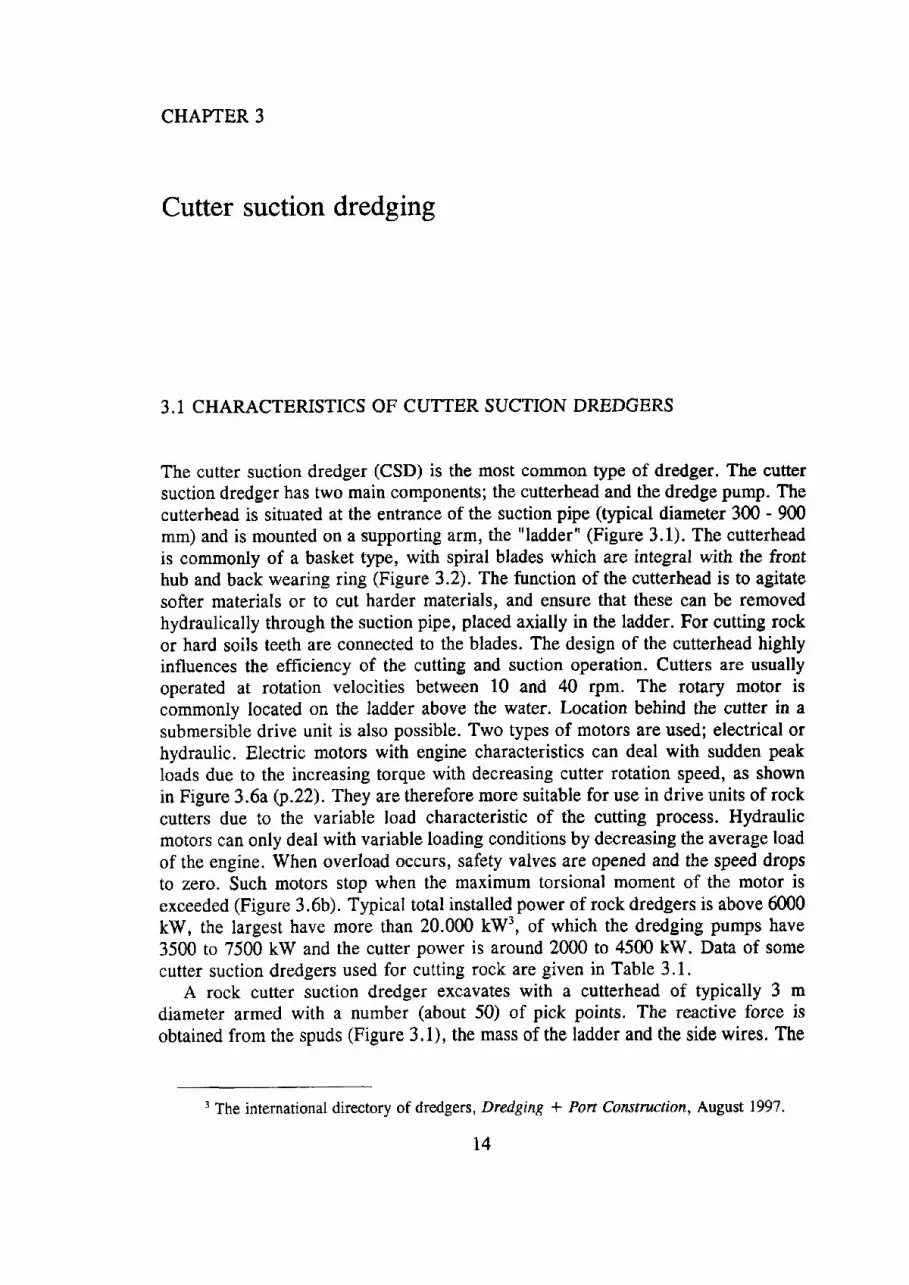
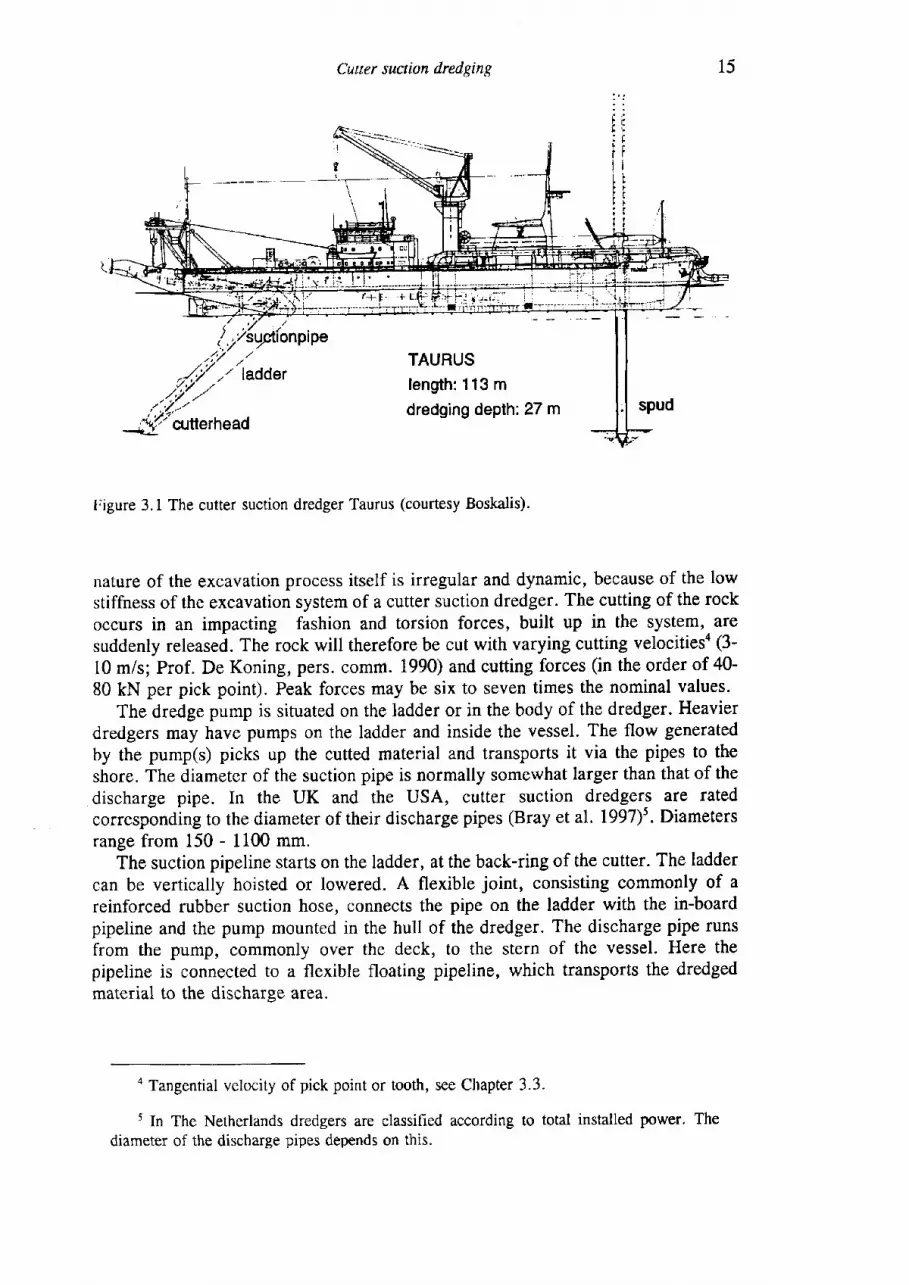
The cutter suction dredger (CSD) is the most common type of dredger. The cuttersuction dredger has two main components; the cutterhead and the dredge pump. Thecutterhead is situated at the entrance of the suction pipe (typical diameter 300 - 900mm) and is mounted on a supporting arm, the "ladder" (Figure 3.1). The cutterheadis commonly of a basket type, with spiral blades which are integral with the fronthub and back wearing ring (Figure 3.2). The function of the cutterhead is to agitatesofter materials or to cut harder materials, and ensure that these can be removedhydraulically through the suction pipe, placed axially in the ladder. For cutting rockor hard soils teeth are connected to the blades. The design of the cutterhead highlyinfluences the efficiency of the cutting and suction operation. Cutters are usuallyoperated at rotation velocities between 10 and 40 rpm. The rotary motor iscommonly located on the ladder above the water. Location behind the cutter in asubmersible drive unit is also possible. Two types of motors are used; electrical orhydraulic. Electric motors with engine characteristics can deal with sudden peakloads due to the increasing torque with decreasing cutter rotation speed, as shownin Figure 3.6a QI.ZD. They are therefore more suitable for use in drive units of rockcutters due to the variable load characteristic of the cutting process. Hydraulicmotors can only deal with variable loading conditions by decreasing the average loadof the engine. When overload occurs, safety valves are opened and the speed dropsto zero. Such motors stop when the maximum torsional moment of the motor isexceeded (Figure 3.6b). Typical total installed power of rock dredgers is above 6000kW, the largest have more than 20.000 kW3, of which the dredging pumps have3500 to 7500 kW and the cutter power is around 2000 to 4500 kW. Data of somecutter suction dredgers used for cutting rock are given in Table 3.1.
A rock cutter suction dredger excavates with a cutterhead of typically 3 mdiameter armed with a number (about 50) of pick points. The reactive force isobtained from the spuds (Figure 3.1), the mass of the ladder and the side wires. The
3 The international directory of dredgers, Dredging + Pot't Construction, August 1997.
t4
Cuuer suction dredging
ultonpipeTAURUSlength: 113 mdredging depth: 27 m
l;igure 3.1 The cutter suction dredger Taurus (courtesy Boskalis).
nature of the excavation process itself is irregular and dynamic, because of the lowstiffness of the excavation system of a cutter suction dredger. The cutting of the rockoccurs in an impacting fashion and torsion forces, built up in the system, aresuddenly released. The rock will therefore be cut with varying cutting velocities4 (3-
l0 m/s; Prof. De Koning, pers. comm. 1990) and cutting forces (in the order of 40-80 kN per pick point). Peak forces may be six to seven times the nominal values.
The dredge pump is situated on the ladder or in the body of the dredger. Heavierdredgers may have pumps on the ladder and inside the vessel. The flow generatedby the pump(s) picks up the cutted material and transports it via the pipes to theshore. The diameter of the suction pipe is normally somewhat larger than that of thedischarge pipe. In the UK and the USA, cutter suction dredger,s are ratedcorrespbnding to the diameter of their discharge pipes (Bray et al. 1997)5. Diametersrange from 150 - 1100 mm.
The suction pipeline starts on the ladder, at the back-ring of the cutter. The laddercan be vertically hoisted or lowered. A flexible joint, consisting commonly of areinforced rubber suction hose, connects the pipe on the ladder with the in-boardpipeline and the pump mounted in the hull of the dredger. The discharge pipe runsfrom the pump, commonly over the deck, to the stern of the vessel. Here thepipeline is connected to a flexible floating pipeline, which transports the dredgedmaterial to the discharse area.
15
a Tangential velocity of pick point or tooth, see Chapter 3.3.
5 In The Netherlands dredgers are classified according to total installed power.diameter of the discharge pipes depends on this.
The
16 Part A: Problems of wear in rock d,redging
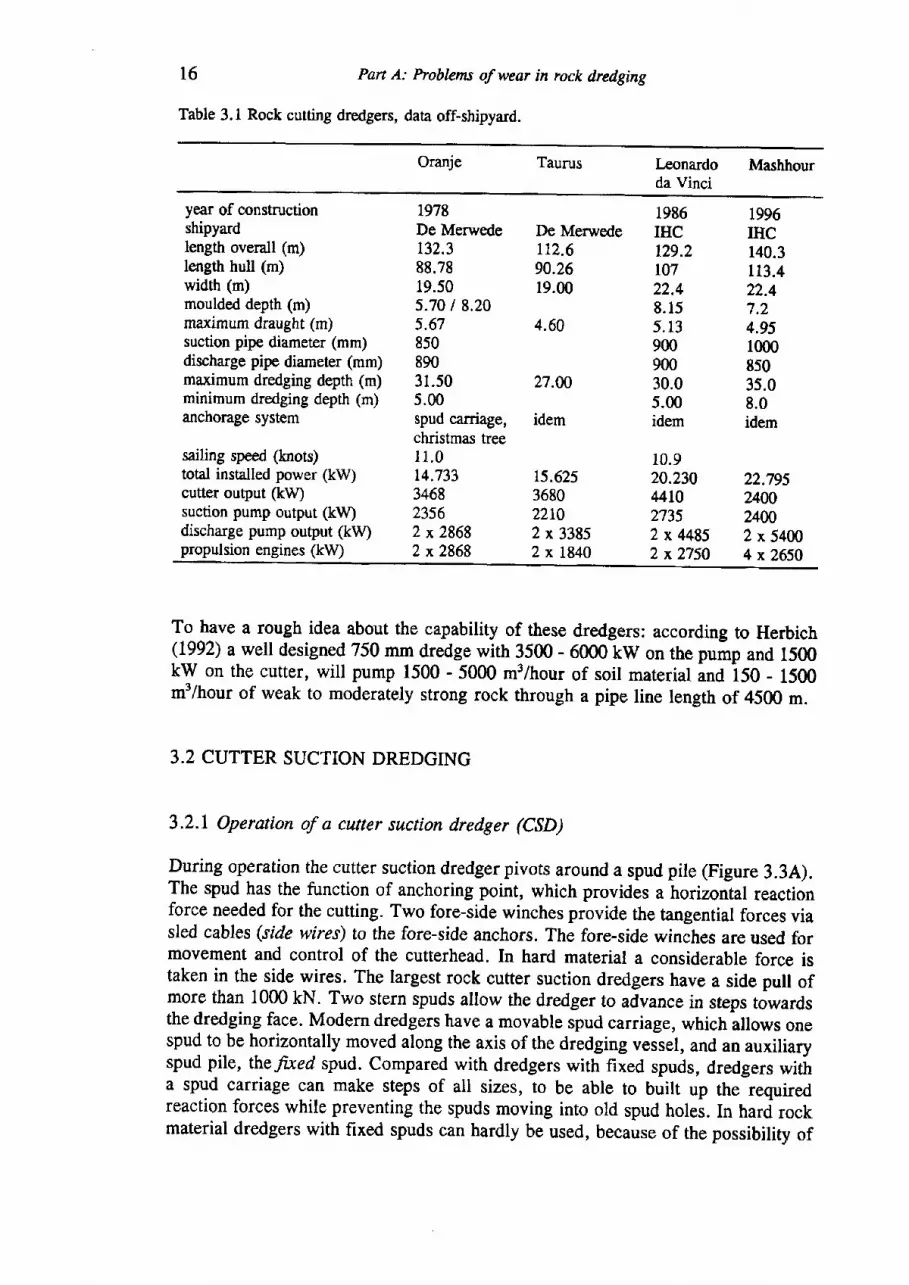
Table 3.1 Rock cutting dredgers, data off-shipyard.
Oranje Taurus I-eonardo Mashhourda Vinci
year of constructionshipyardlength overall (m)length hull (m)width (m)moulded depth (m)maximum draught (m)suction pipe diameter (mm)discharge pipe diameter (mm)maximum dredging depth (m)minimum dredging depth (m)anchorage system
sailing speed (knots)total installed power (kW)cutter ou$ut (k!V)suction pump output (k!V)discharge pump ouput (k!V)propulsion engines (kW)
1978De Merweder32.388.7819.505 .70 t8 .205.678508903r.50s.00spud carriage,christmas treeI r .014.733346823562 x28682 x2868
De Merwede1r2.690.2619.00
4.60
2t.ffi
idem
15.625368022t02 x 33852 x l84O
1986IHC129.2t0722.48.155 .1390090030.05.00idem
10.920.230uL027352 x 44852 x 2750
1996IHC140.3113.422.47.24.95100085035.08.0idem
22.795240024W2 x 54004 x2650
To have a rough idea about the capability of these dredgers: according to Herbich(1992) a well designed 750 mm dredge with 3500 - 6000 kW on the pump and 1500kW on the cutter, will pump 1500 - 5000 m3/hour of soil material and iSO - 1SOOm3/hour of weak to moderately strong rock through a pipe line length of 4500 m.
3.2 CUTTER SUCTION DREDGING
3.2.1 Operation of a ailter suction dredger (CSD)
During operation the cutter suction dredger pivots around a spud pile (Figure 3.3A).The spud has the function of anchoring point, which provides a horizontal reactionforce needed for the cutting. Two fore-side winches provide the tangential forces viasled cables (side wires) to the fore-side anchors. The fore-side winches are used formovement and control of the cutterhead. In hard material a considerable force istaken in the side wires. The largest rock cutter suction dredgers have a side pull ofmore than 1000 kN. Two stern $puds allow the dredger to advance in steps towardsthe dredging face. Modern dredgers have a movable spud carriage, which allows onespud to be horizontally moved along the axis of the dredging veslel, and an auxiliaryspud pile, rhe faed spud. Compared with dredgers with fixed spuds, dredgers witha spud carriage can make steps of all sizes, to be able to built up the requiredreaction forces while preventing the spuds moving into old spud holei. In hard rockmaterial dredgers with fixed spuds can hardly be used, because of the possibility of
Cutter suction dredging
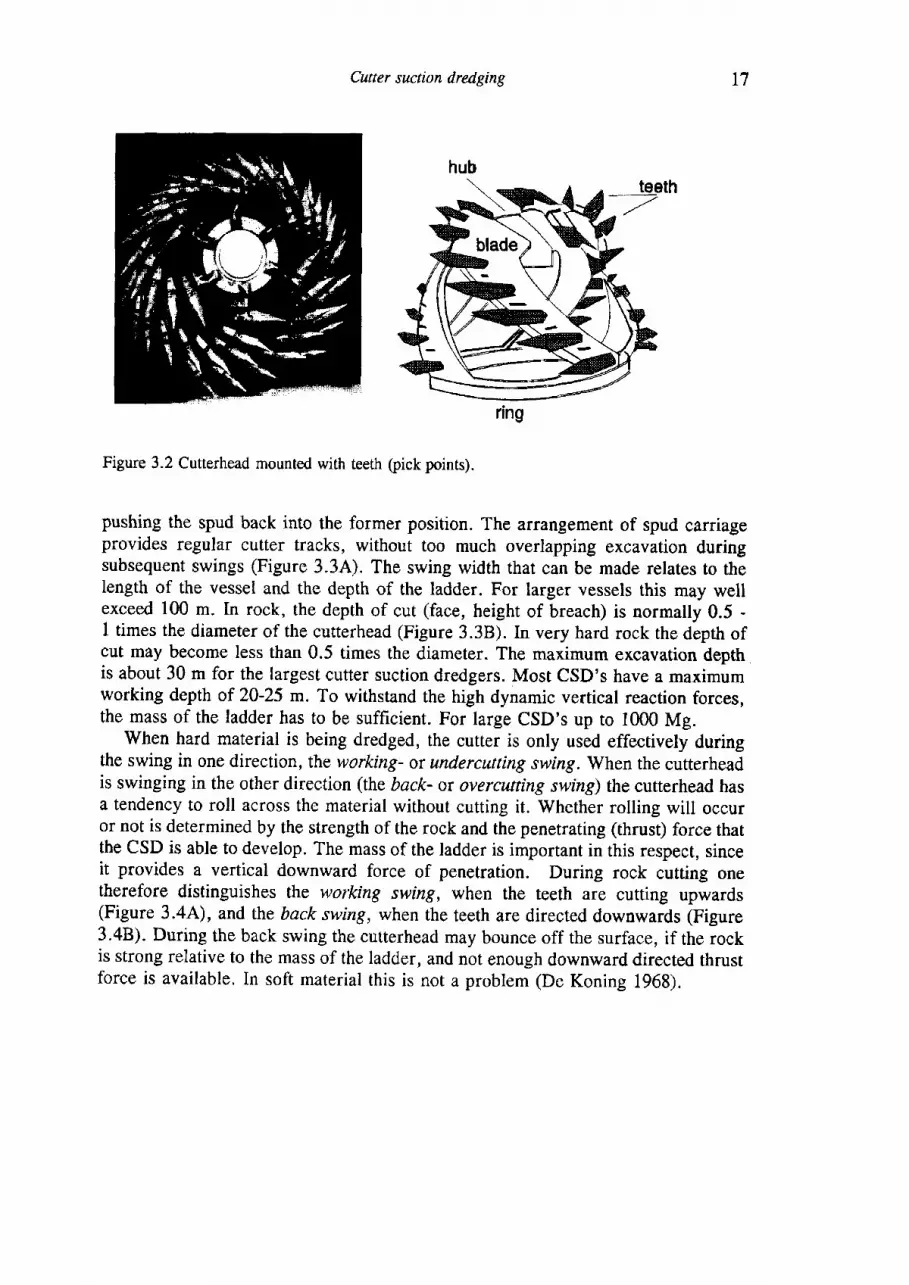
Figure 3.2 Cutterhead mounted with teeth (pick points).
pushing the spud back into the former position. The arrangement of spud carriageprovides regular cutter tracks, without too much overlapping excavation duringsubsequent swings (Figure 3.3A). The swing width that can be made relates to thelength of the vessel and the depth of the ladder. For larger vessels this may wellexceed 100 m. In rock, the depth of cut (face, height of breach) is normally 0.5 -I times the diameter of the cutterhead (Figure 3.38). In very hard rock the depth ofcut may become less than 0.5 times the diameter. The maximum excavation depthis about 30 m for the largest cutter suction dredgers. Most CSD's have a maximumworking depth of 20-25 m. To withstand the high dynamic vertical reaction forces,the mass of the ladder has to be sufficient. For large cSD's up to 1000 Mg.
When hard material is being dredged, the cutter is only used effectively duringthe swing in one direction, the working- or undercufting swing. When the cutterheadis swinging in the other direction (the back- or overcutting swing) the cutterhead hasa tendency to roll across the material without cutting it. Whether rolling will occuror not is determined by the strength of the rock and the penetrating (thrust) force thatthe CSD is able to develop. The mass of the ladder is important in this respect, sinceit provides a vertical downward force of penetration. During rock cutting onetherefore distinguishes the working swing, when the teeth are cutting upwards(Figure 3.4A), and the back swing, when the teeth are directed downwards (Figure3.4B). During the back swing the cutterhead may bounce off the surface, if the rockis strong relative to the mass of the ladder, and not enough downward directed thrustforce is available. In soft material this is nor a problem (De Koning 1968).
T7
nng
18 Part A: Problems of wear in rock dredging
ianc*ror
.side wire
fixed spud
spud caniage
3d znd 1st posih'on spud
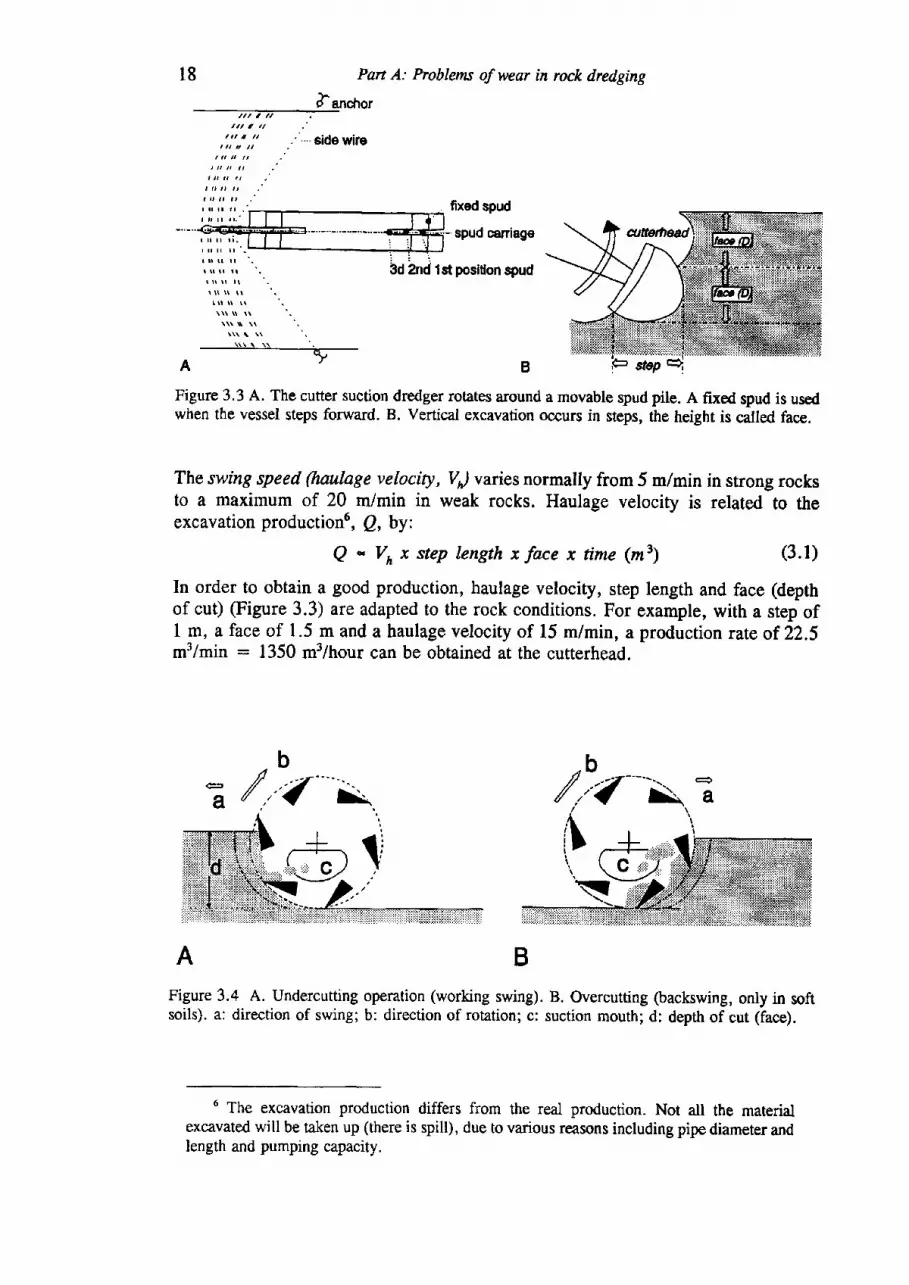
Figure 3.3 A. The cutter suction dredger rotates around a movable spud pile. A fxed spud is usedwhen the vessel steps forward. B. Vertical excavation occurs in steps, the height is catled face.
The swing speed ftaulage velocity, V) vafiesnormally from 5 m/min in strong rocksto a maximum of 20 m/min in weak rocks. Haulage velocity is related to theexcavation production6, Q., by:
Q * Vn x step length x face x time (m3) (3.1)
In order to obtain a good production, haulage velocity, step length and face (depthof cut) (Figure 3.3) are adapted to the rock conditions. For example, with a step of1 m, a face of 1.5 m and a haulage velocity of 15 m/min, a production rate of 22.5m3/min : 1350 m3/hour can be obtained at the cutterhead.
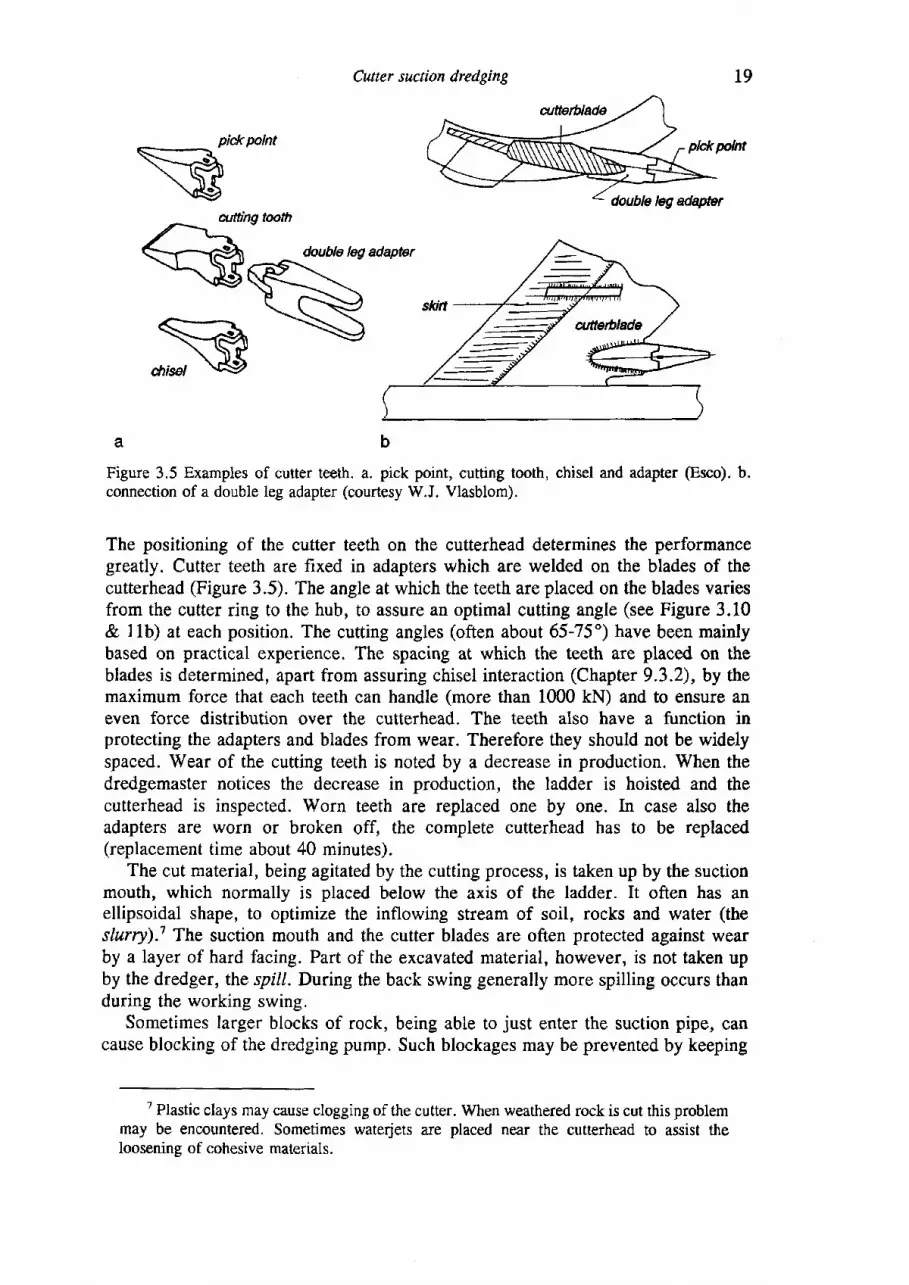
BAFigure 3.4 A. Undercutting opention (working swing).soils). a: direction of swing; b: direction of rotation; c:
B. Overcutting (backswing, only in softsuction mouth; d: depth of cut (face).
6 The excavation production differs from the real production. Not all the materialexcavated will be taken up (there is spill), due to various reasons including pipe diameter andlength and pumping capacity.
Cwter suction dredging
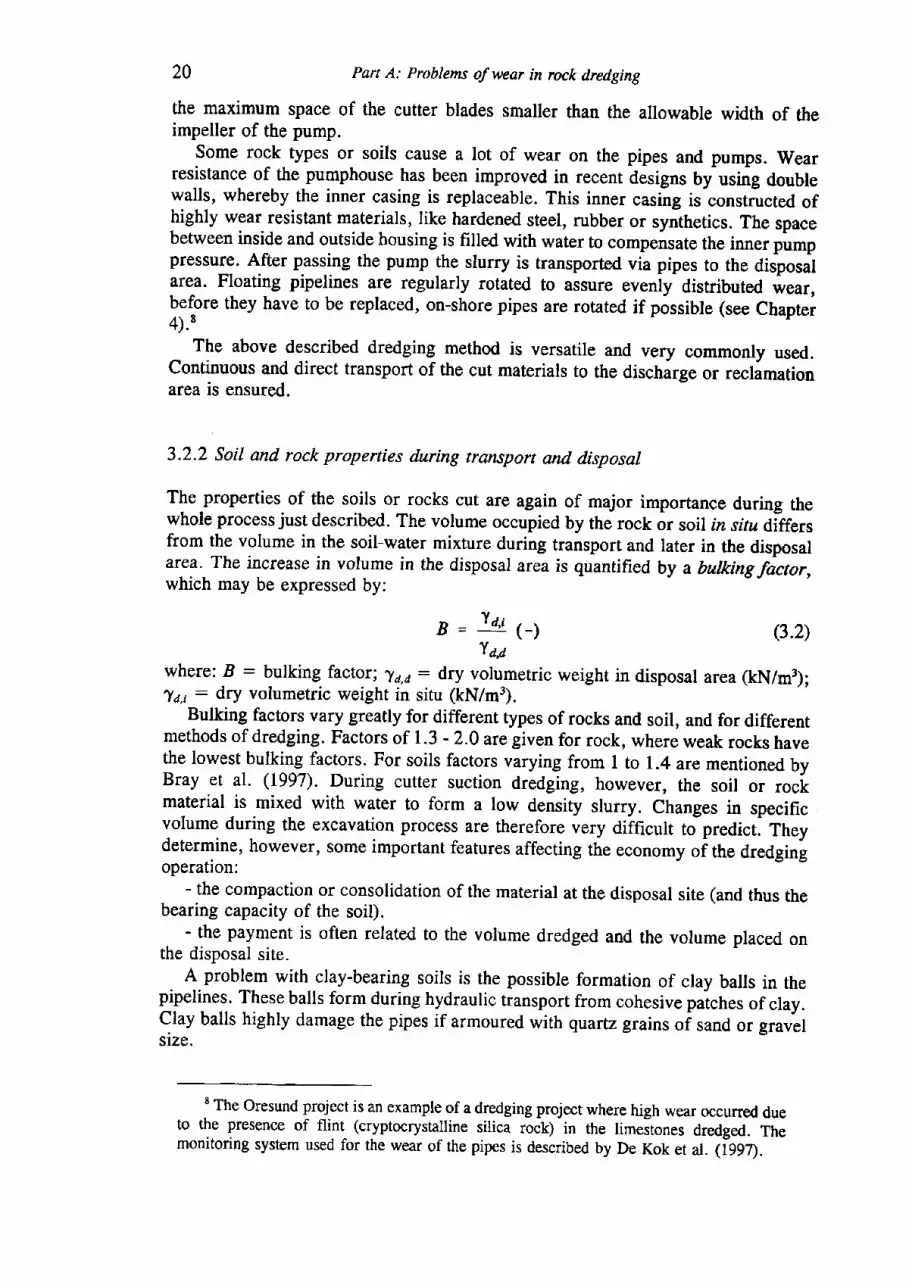
pick polnt plc*plnt
Figure 3.5 Examples of cutter teeth. a. pick point, cutting tooth, chisel and adapter @sco). b.connection of a double leg adapter (courtesy W.J. Vlasblom).
The positioning of the cutter teeth on the cutterhead determines the performancegreatly. Cutter teeth are fixed in adapters which are welded on the blades of thecutterhead (Figure 3.5). The angle at which the teeth are placed on the blades variesfrom the cutter ring to the hub, to assure an optimal cutting angle (see Figure 3.10& 1lb) at each position. The cutting angles (often about 65-75") have been mainlybased on practical experience. The spacing at which the teeth are placed on theblades is determined, apart from assuring chisel interaction (Chapter 9.3.2), by themaximum force that each teeth can handle (more than 1000 kN) and to ensure aneven force distribution over the cutterhead. The teeth also have a function inprotecting the adapters and blades from wear. Therefore they should not be widelyspaced.
'Wear of the cutting teeth is noted by a decrease in production. When the
dredgemaster notices the decrease in production, the ladder is hoisted and thecutterhead is inspected. Worn teeth are replaced one by one. In case also theadapters are worn or broken off, the complete cutterhead has to be replaced(replacement time about 40 minutes).
The cut material, being agitated by the cutting process, is taken up by the suctionrnouth, which normally is placed below the axis of the ladder. It often has anellipsoidal shape, to optimize the inflowing stream of soil, rocks and water (theslurry).1 The suction mouth and the cutter blades are often protected against wearby a layer of hard facing. Part of the excavated material, however, is not taken upby the dredger, the spill. During the back swing generally more spilling occurs thanduring the working swing.
Sometimes larger blocks of rock, being able to just enter the suction pipe, cancause blocking of the dredging pump. Such blockages may be prevented by keeping
7 Plastic clays may cause clogging of the cutter. When weathered rock is cut this problemmay be encountered. Sometimes waterjets are placed near the cutterhead to assist theloosening of cohesive materials.
19
Part A: Problew of wear in rock d,redging
the maximum space of the cutter blades smaller than the allowable width of theimpeller of the pump.
some rock types or soils cause a lot of wear on the pipes and pumps. wearresistance of the pumphouse has been improved in recent designs by using doublewalls, whereby the inner casing is replaceable. This inner casing is constructed ofhighly wear resistant materials, like hardened steel, rubber or synthetics. The spacebetween inside and outside housing is filled with water to compensate the inner pumppressure. After passing the pump the slurry is transported via pipes to the disposaiarea. Floating pipelines are regularly rotated to assure evenly distributed ir.r,before they have to be replaced, on-shore pipes are rotated if possible (see Chaptei4).t
The above described dredging method is versatile and very commonly used.Continuous and direct transport of the cut materials to the discharge or reclamationarea is ensured.
3.2.2 Soil and rock properties during transport and disposal
The properties of the soils or rocks cut are again of major importance during thewhole process just described. The volume occupied by the rock or soil rz srra differsfrom the volume in the soil-water mixture during transport and later in the disposalarea- The increase in volume in the disposal area is quantified by a buking fictor,which may be expressed by:
B = To'' (-)'( anwhere: B : bulking. factor; Ta,a: dry volumetric weight in disposal area (kN/m3);"fd,t: dry volumetric weight in situ (kN/m3).
Bulking factors vary greatly for different types of rocks and soil, and for differentmethods of dredging. Factors of 1.3 - 2.0 are given for rock, where weak rocks havethe lowest bulking factors. For soils factors varying from I to 1.4 are mentioned byBray et al- (1997). During cutter suction dredging, however, the soil or rockmaterial is mixed with water to form a low density slurry. Changes in specificvolume during the excavation process are therefore very dilficutt to predict. Theydetermine, however, some important features affecting the economy oi the dredginioperation:
- the compaction or consolidation of the material at the disposal site (and thus thebearing capacity of the soil).
- the payment is often related to the volume dredged and the volume placed onthe disposal site.
A problem with clay-bearing soils is the possible formation of clay balls in thepipelines. These balls form during hydraulic transport from cohesive paiches of clay.Clay balls highly damage the pipes if armoured with quartz grains oi sand or gravelsize.
E The Oresund project is an example of a dredging project where high wear occuned dueto the presence of flint (cryptocrystalline silica rock) in the limeitones dredged. Themonitoring system used for the wear of the pipes is described by De Kok et ar. 1ier4.
20
(3.2)
Curter sucrion dredging 2L
Larger rock blocks tend to slide along the bottom of the pipelines, causing scouringof the pipe steel.
From this short review of the dredging process follows that geotechnicalinformation of the material to be dredged is needed, since it influences the dredgingprocess in all its stages. Information is needed on:
- geology (rock and soil types and their distribution)- in situ volume and geotechnical properties of rock and soil types, including the
presence of natural fracfures (discontinuities) in rock.- bulking factor- properties during transport (density and viscosity slurry, mixing process,
abrasiveness)- properties during and after deposition (homogeneity, consolidation behaviour)
3.2.3 Environmental impact during cutter suction dredging
Environmental impact is of concern as well. The rotation of the cutterhead canproduce a sediment cloud, not only when dredging in fine sands, silts or clays, butalso when cutting rock types like weak limestones (calcarenites and calcilutites).According to Palermo & Hayes (1992) cutterhead dredges and hopper dredgeswithout overflow generate much less suspended sediment than grab dredges orhopper dredges with overflow. They stress that reduction of suspension of sedimentcan be obtained by proper selection of cutter rotation speed, ladder swing speed,depth of cut, and hydraulic suction provided at the cutter.
3.3 BASIC MECHANICS OF ROCK CUTTING DREDGING BY CSDg
3.3.I Cutter power
The mechanical description of the operation of a cutter suction dredge is extremelycomplicated. Miedema (1987) has written a simulation programme for the behaviourof a CSD, dredging sands in open waters. Miedema's model calculates the cuttingforces developing on the blades of a cutterhead while cutting in saturated sands. Forrock, such a model is being developed by Delft Hydraulics, but the results of thiswork up to now are not available. Many factors are to be considered whendeveloping such models. The cutting forces that will develop depend on the rockfailure mechanism operating. This will depend on the dynamic stress developmentin the rock, which is a function of the shape, size and mechanical properties of thecutting tool and the impact energy applied (Chapter 9). Deliac (1993) has developedgeneral rock cutting models for rock cutting heads of tunnel boring machines androad headers. To get some idea of the potential power of a CSD, some basicstatements can be made.
'Information used for this Chapter was obtained from PBNA course notes (see footnote10) and from course notes of the Training lnstitute for Dredging (TID: Cutters & Someaspects of cutter suction dredging, not dated; courtesy IHC).
elecfrlc cutter drive
22 Part A: Problems of wear in rock dredging
0 67 100 150torque (%)
Figure 3.6 Characteristic relation of cutter s@ with torque of electric and hydraulic cuttermotors (courtesy W.J. Vlasblom).
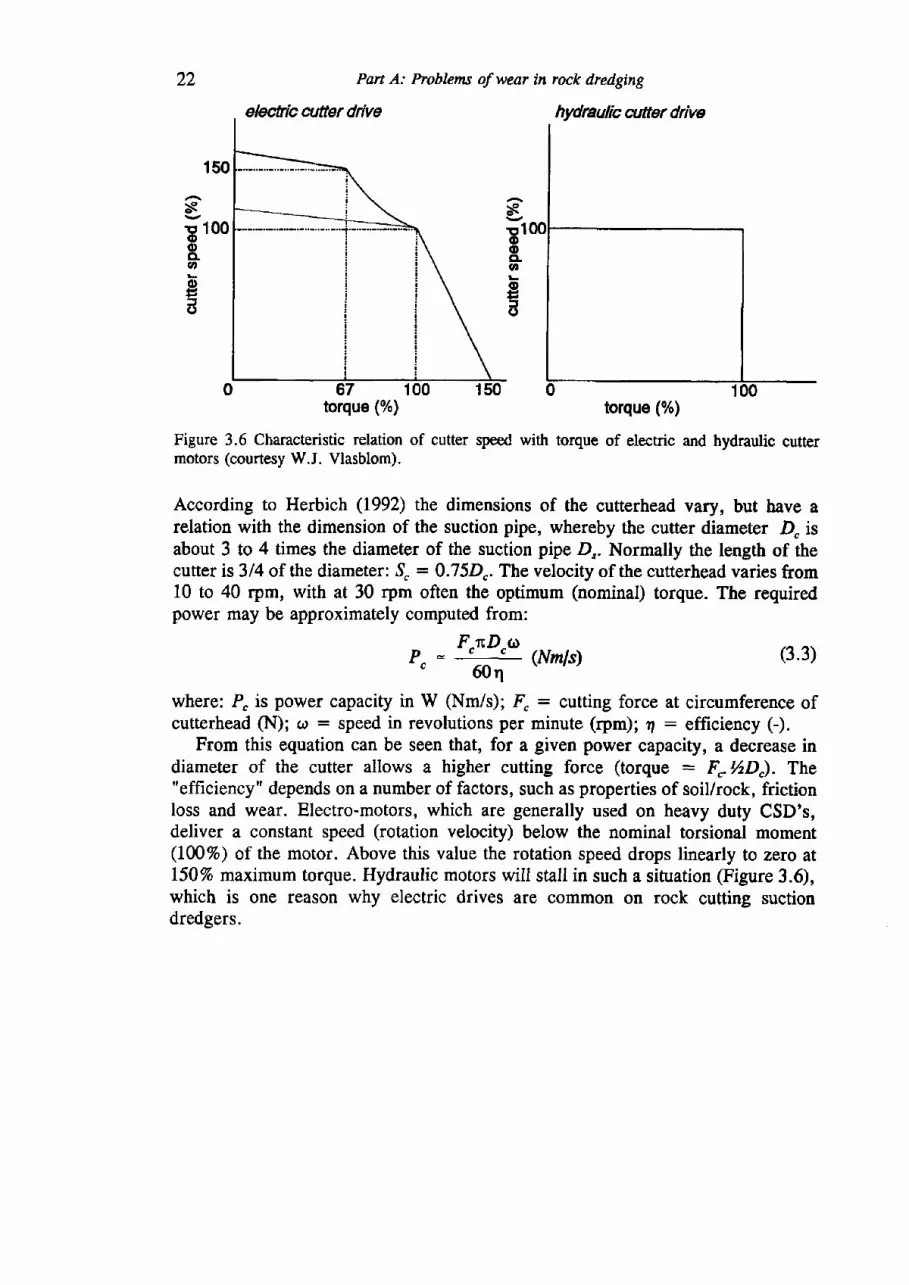
According to Herbich (1992) the dimensions of the cutterhead vary, but have arelation with the dimension of the suction pipe, whereby the cutter diameter D" isabout 3 to 4 times the diameter of the suction pipe D,. Normally the length of thecutter is 3/4 of the diameter: S" : 0.75D". The velocity of the cutterhead varies from10 to 40 rpm, with at 30 rpm often the optimum (nominal) torque. The requiredpower may be approximately computed from:
150
ss 100ooCLo
=C)
r. " ""# (rvruls) (3.3)
where: P" is power capacity in W (Nm/s); 4 : cutting force at circumference ofcutterhead (N); or : speed in revolutions per minute (rpm); 4 : efficiency (-).
From this equation can be seen that, for a given power capacity, a decrease indiameter of the cutter allows a higher cutting force (torque : F,I/zD). The"efficiency" depends on a number of factors, such as properties of soil/rock, frictionloss and wear. Electro-motors, which are generally used on heavy duty CSD's,deliver a constant speed (rotation velocity) below the nominal torsional moment(1009o) of the motor. Above this value the rotation speed drops linearly to zero at150% maximum torque. Hydraulic motors will stall in such a situation (Figure 3.6),which is one reason why electric drives are common on rock cutting suctiondredgers.
hydraulic cutter drive
torque (%)
Cutter suction dredging
V1:2rRpa/60 30 rpm
25 rpm
1 2 5 4 5 6 7 E 9 10111213 1415161718pick point position
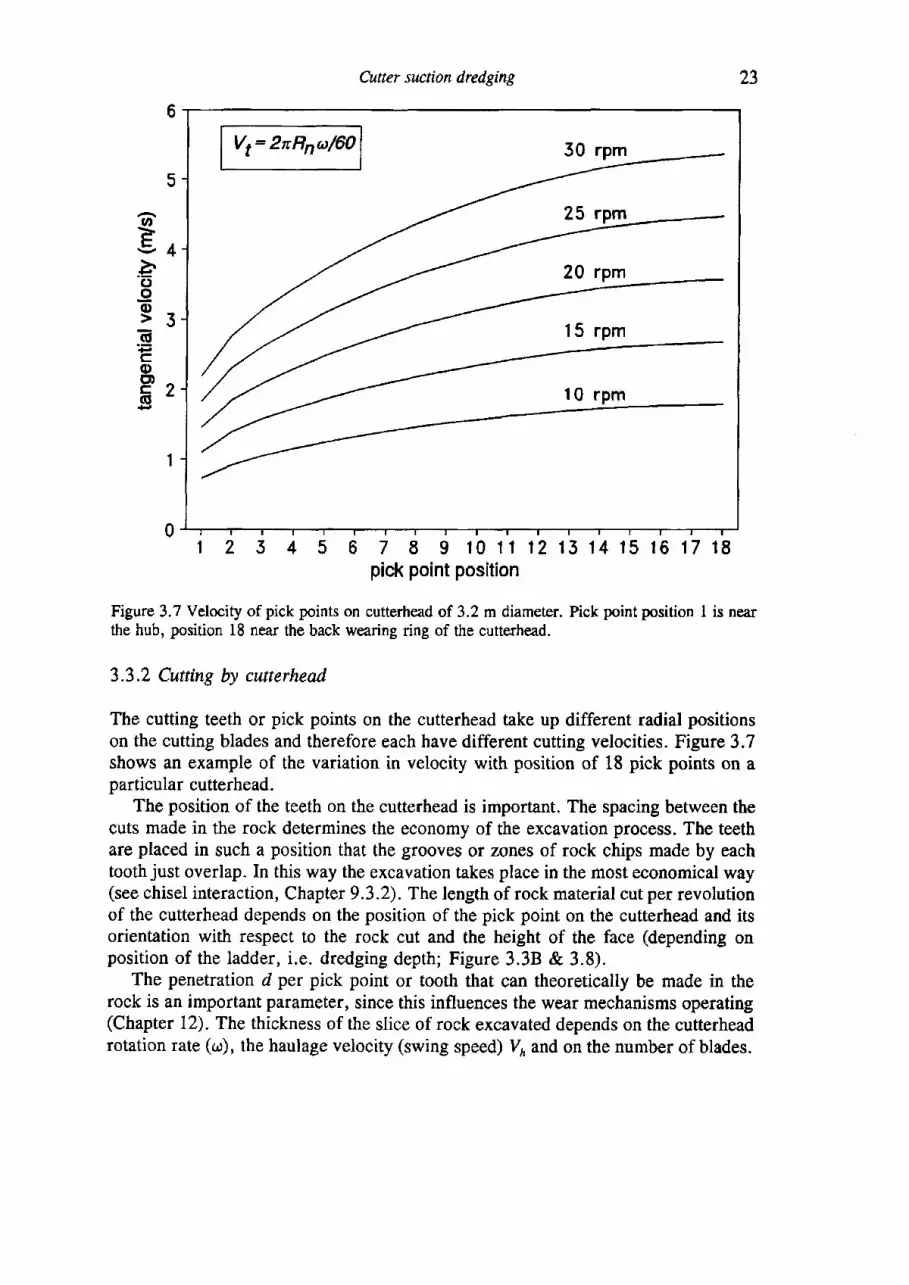
Figure 3.7 Velocity of pick points on cutterhead of 3.2 m diameter. Pick point position I is nearthe hub, position 18 near the back wearing ring of the cutterhead.
3.3.2 Cutting by cutterhead
The cutting teeth or pick points on the cutterhead take up different radial positionson the cutting blades and therefore each have different cutting velocities. Figure 3.7shows an example of the variation in velocity with position of 18 pick points on aparticular cutterhead.
The position of the teeth on the cutterhead is important. The spacing between thecuts made in the rock determines the economy of the excavation process. The teethare placed in such a position that the grooves or zones of rock chips made by eachtooth just overlap. In this way the excavation takes place in the most economical way(see chisel interaction, Chapter 9.3.2). The length of rock material cut per revolutionof the cutterhead depends on the position of the pick point on the cutterhead and itsorientation with respect to the rock cut and the height of the face (depending onposition of the ladder, i.e. dredging depth; Figure 3.3B & 3.8).
The penetration d per pick point or tooth that can theoretically be made in therock is an important parameter, since this influences the wear mechanisms operating(Chapter 12). The thickness of the slice of rock excavated depends on the cutterheadrotation rate (ar), the haulage velocity (swing speed) V, and on the number of blades.
23
o
-9+'6
I
Ecoe?cl
24 Pan A: Problems of wear in rock dredging
working swing Gycloid X(t1- Vh.t + RsinotY(t)-R(1 -cosc)t)I backward swing: Vh inopposite direction:X(9-Vh.t+RsinotY(t) - R(l + cos<,rt) l
i' Rsintot
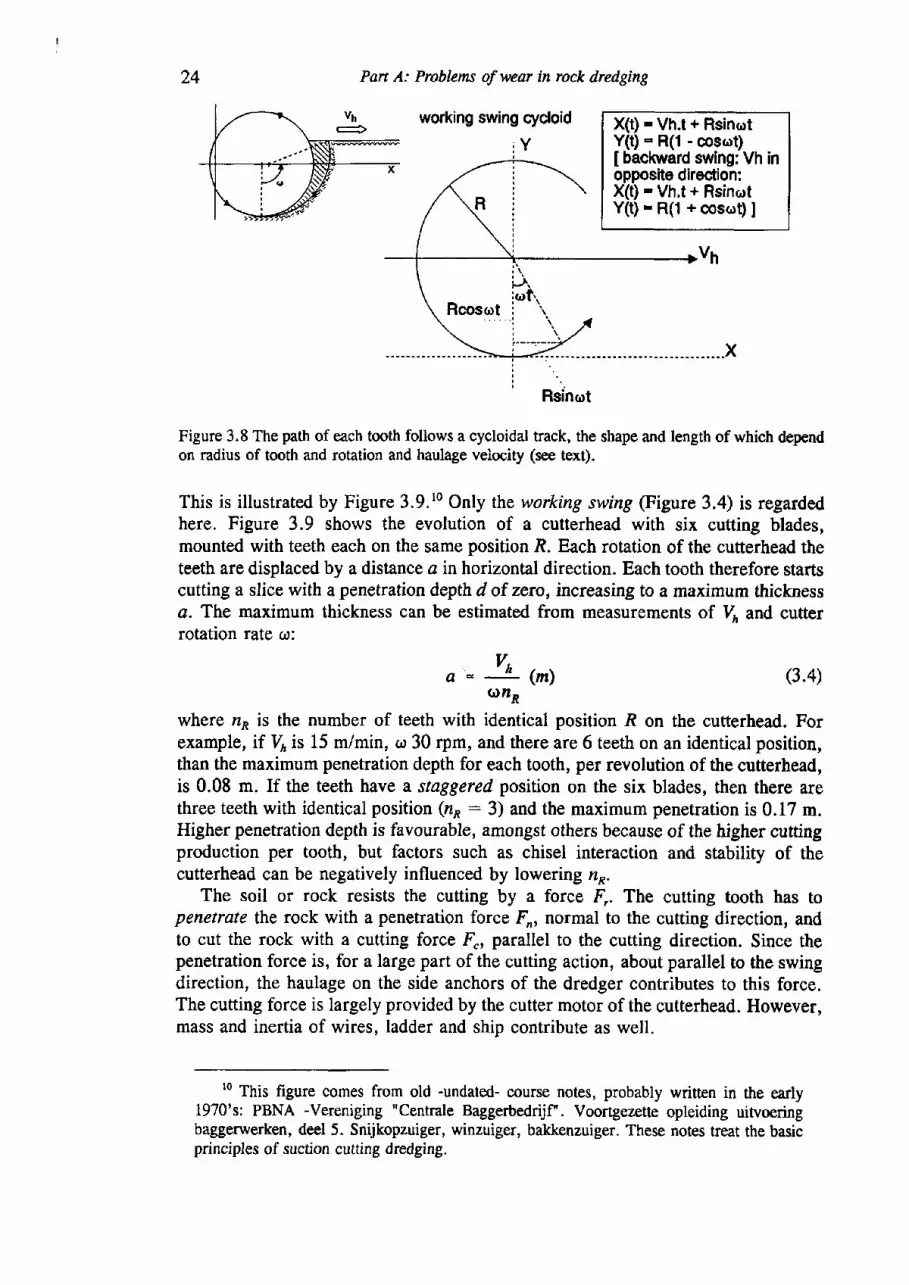
Figure 3.8 The path of each tooth follows a cycloidal track, the shape and length of which dependon radius of tooth and rotation and haulage velocity (see text).
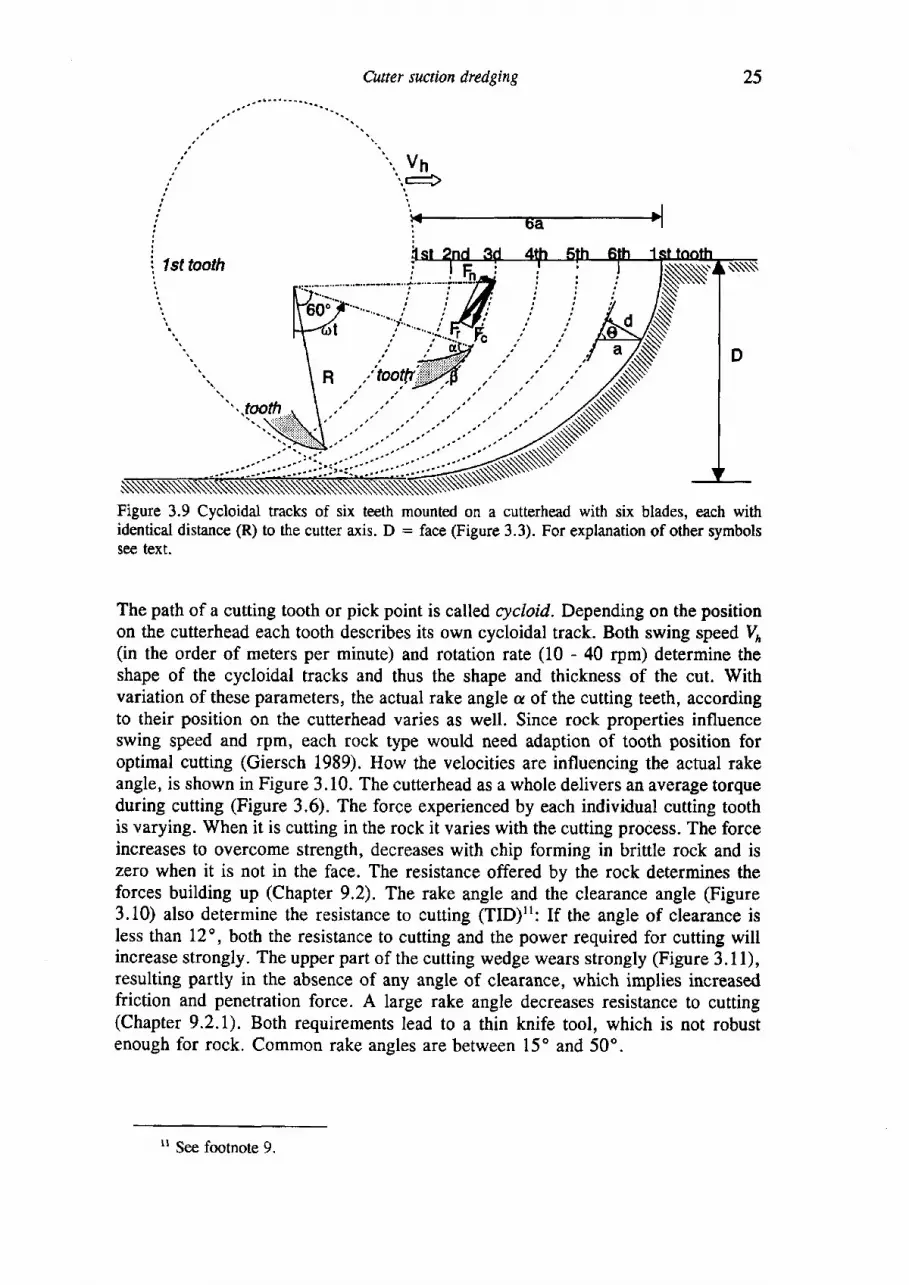
This is illustrated by Figure 3.9.10 Only the working swing (Figure 3.4) is regardedhere. Figure 3.9 shows the evolution of a cutterhead with six cutting blades,mounted with teeth each on the same position R. Each rotation of the cutterhead theteeth are displaced by a distance a in horizontal direction. Each tooth therefore startscutting a slice with a penetration depth d of zero, increasing to a maximum thicknessa. The maximum thickness can be estimated from measurements of Vo and cutterrotation rate at:
o'* n,
(^)Qf,n
where np is the number of teeth with identical position R on the cutterhead. Forexample, if V, is 15 m/min, c,r 30 rpm, and there are 6 teeth on an identical position,than the maximum penetration depth for each tooth, per revolution of the cutterhead,is 0.08 m. If the teeth have a staggered position on the six blades, then there arethree teeth with identical position (/?r : 3) and the maximum penetration is 0.17 m.Higher penetration depth is favourable, amongst others because of the higher cuttingproduction per tooth, but factors such as chisel interaction and stability of thecufferhead can be negatively influenced by lowering n*.
The soil or rock resists the cutting by a force f,. The cutting tooth has topenetrate the rock with a penetration force d, normal to the cutting direction, andto cut the rock with a cutting force .f, parallel to the cuttirrg direction. Since thepenetration force is, for a large part of the cutting action, about parallel to the swingdirection, the haulage on the side anchors of the dredger contributes to this force.The cutting force is largely provided by the cutter motor of the cutterhead. However,mass and inertia of wires, ladder and ship contribute as well.
t0 This figure comes from old -undated- course notes, probably wrinen in the early19?0's: PBNA -Vereniging "Centrale Baggerbedrijf'. Voortgezette opleiding uiwoeringbaggerwerken, deel 5. Snijkopzuiger, winzuiger, bakkenzuiger. These notes treat the basicprinciples of suction cutting dredging.
(3.4)
Cutter suction dredging
NN..
N
Figure 3.9 Cycloidal tracks of six teeth mounted on a cutterhead with six blades, each withidentical distance (R) to the cutter axis. D : face (Figure 3.3). For explanation of other symbolsse€ text.
The path of a cutting tooth or pick point is called cycloid. Depending on the positionon the cutterhead each tooth describes its own cycloidal track. Both swing speed Vn(in the order of meters per minute) and rotation rate (10 - 40 rpm) determine theshape of the cycloidal tracks and thus the shape and thickness of the cut. Withvariation of these parameters, the actual rake angle a of the cutting teeth, accordingto their position on the cutterhead varies as well. Since rock properties influenceswing speed and rpm, each rock type would need adaption of tooth position foroptimal cutting (Giersch 1989). How the velocities are influencing the actual rakeangle, is shown in Figure 3.10. The cutterhead as a whole delivers an average torqueduring cutting (Figure 3.6). The force experienced by each individual cutting toothis varying. When it is cutting in the rock it varies with the cutting process. The forceincreases to overcome strength, decreases with chip forming in brittle rock and iszero when it is not in the face. The resistance offered by the rock determines theforces building up (Chapter 9.2). The rake angle and the clearance angle (Figure3.10) also determine the resistance to cutting (TID)tt: If the angle of clearance isIess than 12o, both the resistance to cutting and the power required for cutting willincrease strongly. The upper part of the cutting wedge wears strongly (Figure 3.11),resulting partly in the absence of any angle of clearance, which implies increasedfriction and penetration force. A large rake angle decreases resistance to cutting(Chapter 9.2.I). Both requirements lead to a thin knife tool, which is not robustenough for rock. Common rake angles are between 15o and 50".
25
u See footnote 9.
26 Pan A: Problems of wear in rock dredging
cirwmferentialmoving direetion
swing movingdireciion
cutting tooth
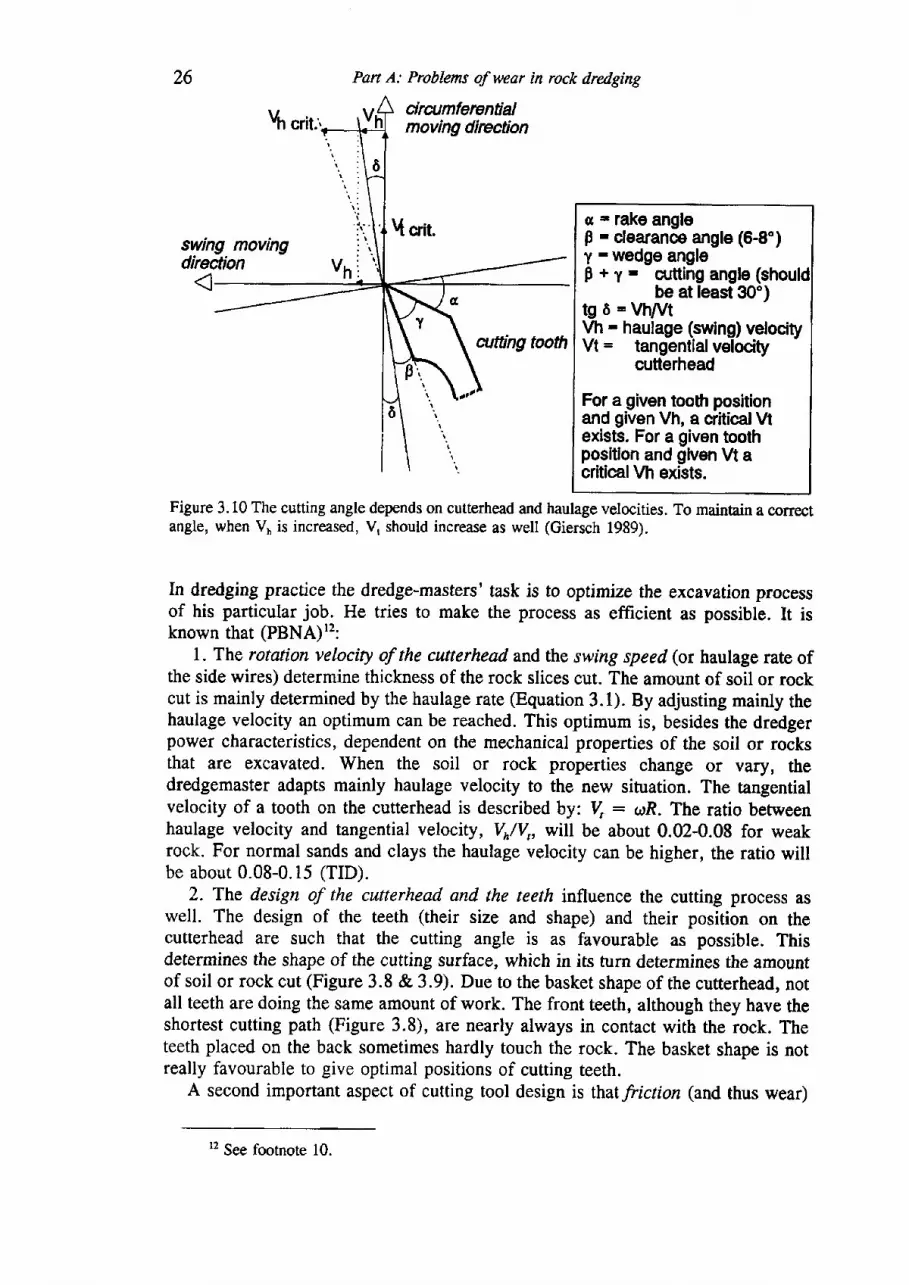
Figure 3.10 The cutting angle depends on cutterhead and haulage velocities. To mainain a correctangle, when Vu is increased, V, should increase as well (Giersch 1989).
In dredging practice the dredge-masters' task is to optimize the excavation processof his particular job. He tries to make the process as efficient as possible. It isknown that (PBNA)12:
I . The rotation velocity of the cutterhead and the swing speed (or haulage rate ofthe side wires) determine thickness of the rock slices cut. The amount of soil or rockcut is mainly determined by the haulage rate (Equation 3.1). By adjusting mainly thehaulage velocity an optimum can be reached. This optimum is, besides the dredgerpower characteristics, dependent on the mechanical properties of the soil or rocksthat are excavated. When the soil or rock properties change or vary, thedredgemaster adapts mainly haulage velocity to the new situation. The tangentialvelocity of a tooth on the cutterhead is described by: V, : crrR. The ratio betweenhaulage velocity and tangential velocity, vh/v,, will be about 0.02-0.08 for weakrock. For normal sands and clays the haulage velocity can be higher, the ratio willbe about 0.08-0.15 (TID).
2. The design of the cutterhead and the teeth influence the cutting process aswell. The design of the teeth (their size and shape) and their position on thecutterhead are such that the cutting angle is as favourable as possible. Thisdetermines the shape of the cutting surface, which in its turn determines the amountof soil or rock cut (Figure 3.8 & 3.9). Due to the basket shape of the cutterhead, notall teeth are doing the same amount of work. The front teeth, although they have theshortest cutting path (Figure 3.8), are nearly always in contact with the rock. Theteeth placed on the back sometimes hardly touch the rock. The basket shape is notreally favourable to give optimal positions of cutting teeth.
A second important aspect of cutting tool design is thatfriction (and thus wear)
s - rake angleB - clearanoe angle (6-8')1 - wedge angleF + y - antting angle (should
be at least 30")tg 6 -VhMVh - haulage (swing) velocityVt= tangentialvelocity
cutterhead
For a given tooh positionand given Vh, a critical Mexists. For a given toothposition and given Vt acriticalVh exists.
r2 See footnote 10.
Cuuer suction dredging
Change of tooth geometry due to wear
27
v t-------3-
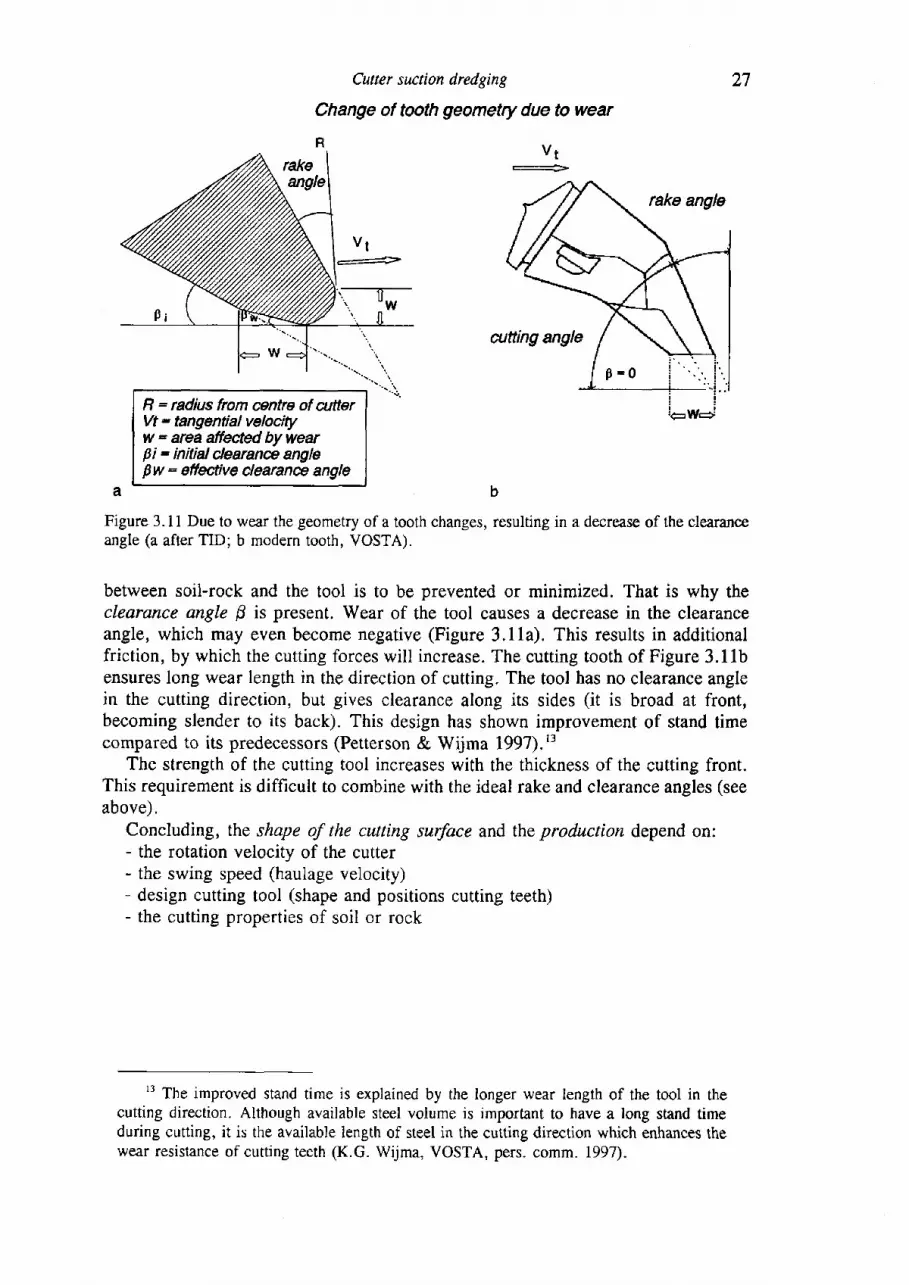
R = radius from entre of antterVt - tdng€fitial velocityw - area affeaed bywearpi- initial clearane anglepw: effective clearane angle
Figure 3. I I Due to wear the geometry of a tooth changes, resulting in a decrease of the clearanceangle (a after TID; b modern tooth, VOSTA).
between soil-rock and the tool is to be prevented or minimized. That is why theclearance angle B is present. Wear of the tool causes a decrease in the clearanceangle, which may even become negative (Figure 3.11a). This results in additionalfriction, by which the cutting forces will increase. The cutting tooth of Figure 3.1Ibensures long wear length in the direction of cutting. The tool has no clearance anglein the cutting direction, but gives clearance along its sides (it is broad at front,becoming slender to its back). This design has shown improvement of stand timecompared to its predecessors (Petterson & Wijma 1997).13
The strength of the cutting tool increases with the thickness of the cutting front.This requirement is difficult to combine with the ideal rake and clearance angles (seeabove).
Concluding, the shape of the cutting surface and the production depend on:- the rotation veiocity of the cutter- the swing speed (haulage velocity)- design cutting tool (shape and positions cutting teeth)- the cutting properties of soil or rock
t' The improved stand time is explained by the longer wear length of the tool in thecutting direction. Although available steel volume is important to have a long stand timeduring cutting, it is the available length of steel in the cutting direction which enhances thewear resistance of cutting teeth (K.G. Wijma, VOSTA, pers. comm . 1997)-
28 Part A: Problems of wear in rock d,redging
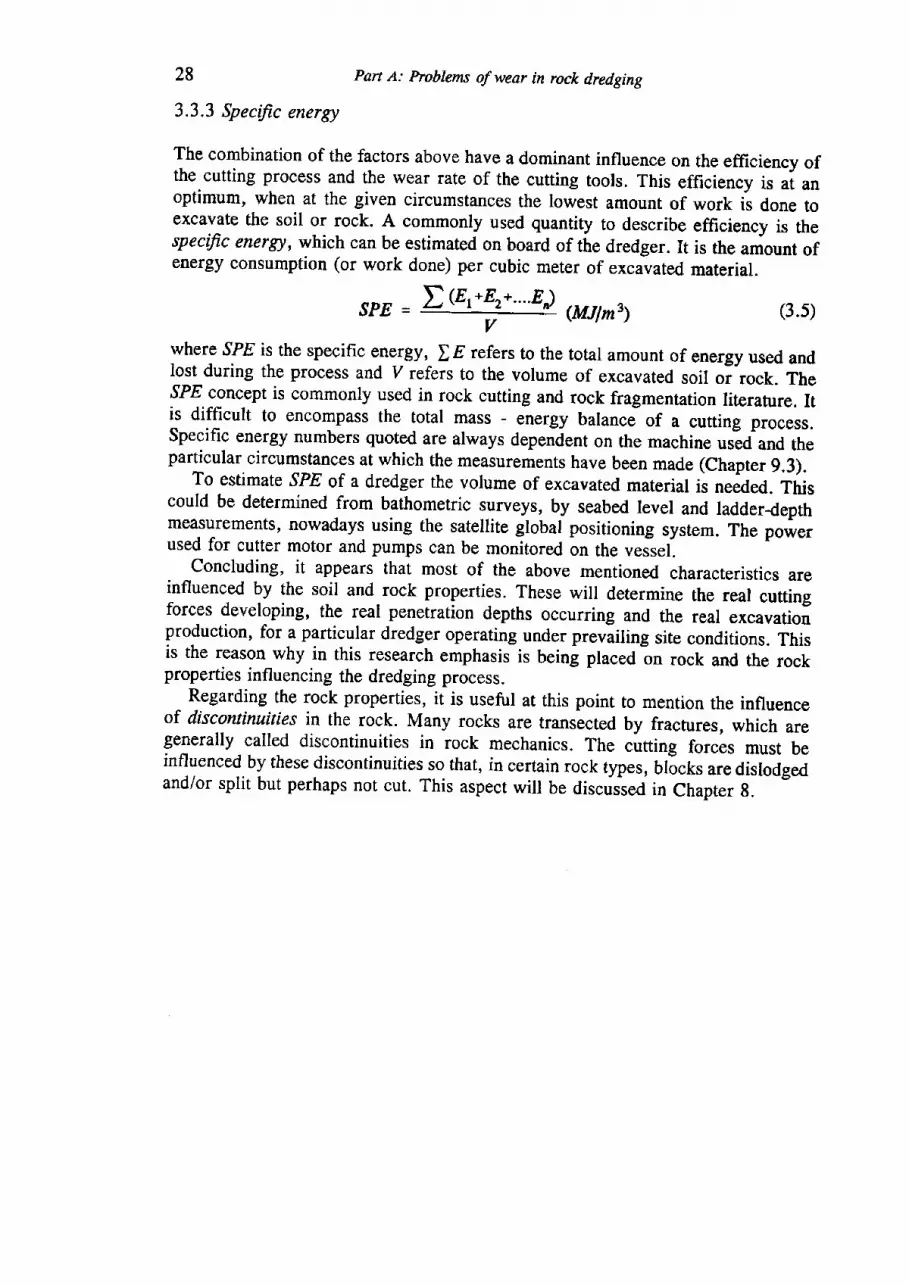
3.3.3 Specific energy
The combination of the factors above have a dominant influence on the effrciency ofthe cutting process and the wear rate of the cutting tools. This efficiency is al anoptimum, when at the given circumstances the lowest amount of work is done toexcavate the soil or rock. A commonly used quantity to describe efficiency is thespecffic energy, which can be estimated on board of the dredger. It is the amount ofenergy consumption (or work done) per cubic meter of excavated material.
SPE = E rE *Ez*-...g)(MIm3) (3.s)
where ̂ 9PE is the specific energy, f,E refers to the total amount of energy used andlost during the process and Y refers to the volume of excavated soil or rock. The^fPE concept is commonly used in rock cutting and rock fragmentation literature. Itis difficult to encompass the total mass - energy balancJ of a cutting process.Specific energy numbers quoted are always dependent on the machine used and theparticular circumstances at which the measurements have been made (Chapter 9.3).
To estimate SPE of a dredger the volume of excavated material is neeAeO. Thiscould be determined from bathometric surveys, by seabed level and ladderdepthmeasurements, nowadays using the satellite global positioning system. The powerused for cutter motor and pumps can be rnonitored in the vessel.
Concluding, it appears that most of the above mentioned characteristics areinfluenced by the soil and rock properties. These will determine the real cuttingforces developing, the real penetration depths occurring and the real excavationproduction, for a particular dredger operating under p.euiiling site conditions. Thisis the reason why in this research emphasis is being placed on rock and the rockproperties influencing the dredging process.
Regarding the rock properties, it is useful at this point to mention the influenceof discontinutties in the rock. Many rocks are transicted by fractures, which aregenerally called discontinuities in rock mechanics. The cutting forces must beinfluenced by these discontinuities so that, in certain rock types, blocks are dislodgedand/or split but perhaps not cut. This aspect will be discuJsed in chapter g.
V
CHAPTER 4
Concepts of wear processes from tribology
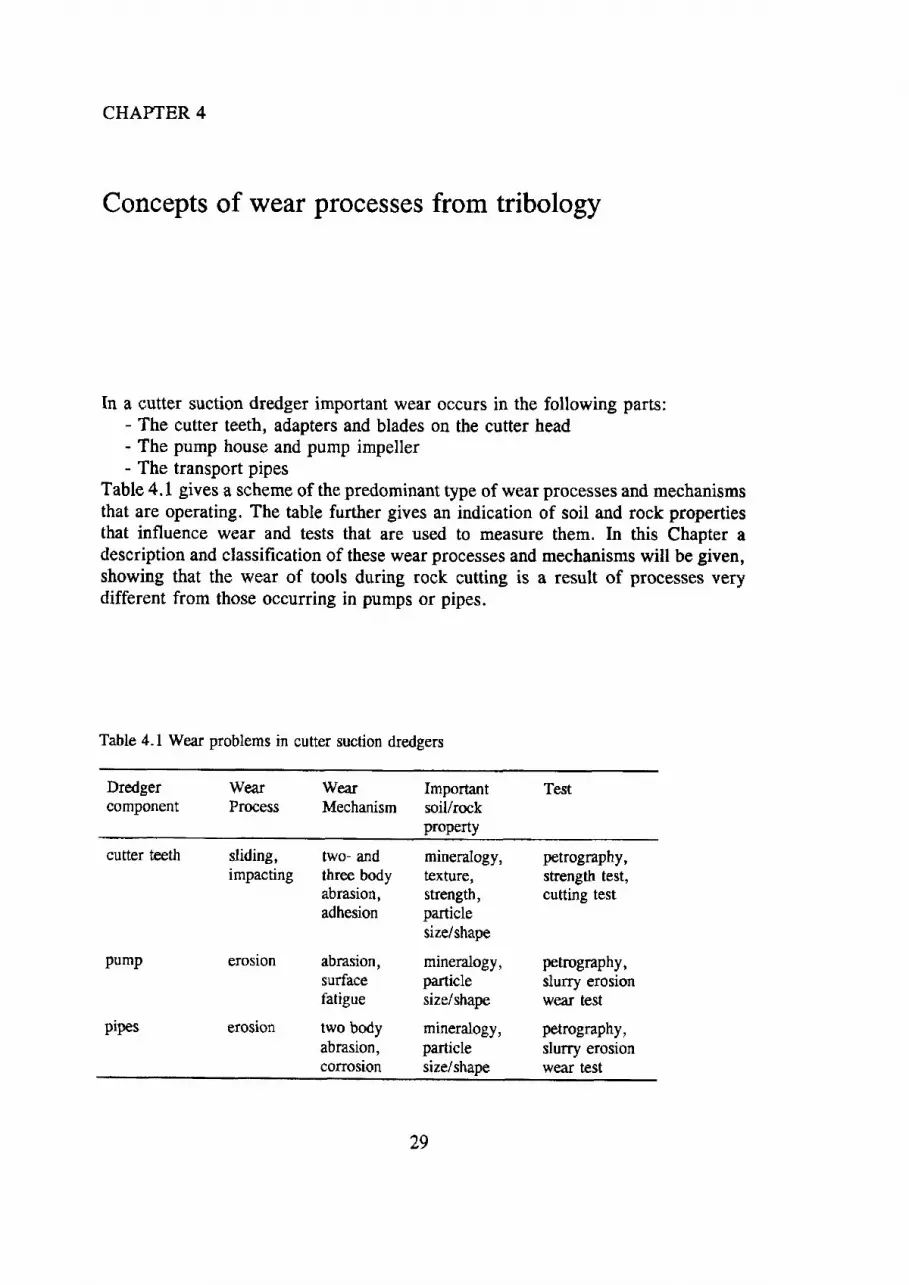
In a cutter suction dredger important wear occurs in the following parts:- The cutter teeth, adapters and blades on the cutter head- The pump house and pump impeller- The transport pipes
Table 4.1 gives a scheme of the predominant type of wear processes and mechanismsthat are operating. The table further gives an indication of soil and rock propertiesthat influence wear and tests that are used to measure them. In this Chapter adescription and classification of these wear processes aud mechanisms will be given,showing that the wear of tools during rock cutting is a result of processes verydifferent from those occurring in pumps or pipes.
Table 4.1 Wear problems in cutter suction dredgers
Dredger Wear Wear Important Testcomponent Process Mechanism soil/rock
propeny
cutter teeth sliding, two- and mineralogy, petrography,impacting three body texture, strength test,
abrasion, strength, cutting testadhesion oarticle
iize/shape
pump erosion abrasion, mineralogy, petrography,surface particle slurry erosionfatigue size/shape wear test
prpes erosion two body mineralogy, petrography,abrasion, particle slurry erosioncorrosion size/shape wear test
29
30 Pan A: Problems of unar in rrck drcdg@
neasitatte
2. ewtae!/toprlyd?€lru5E3. npffiial lrc
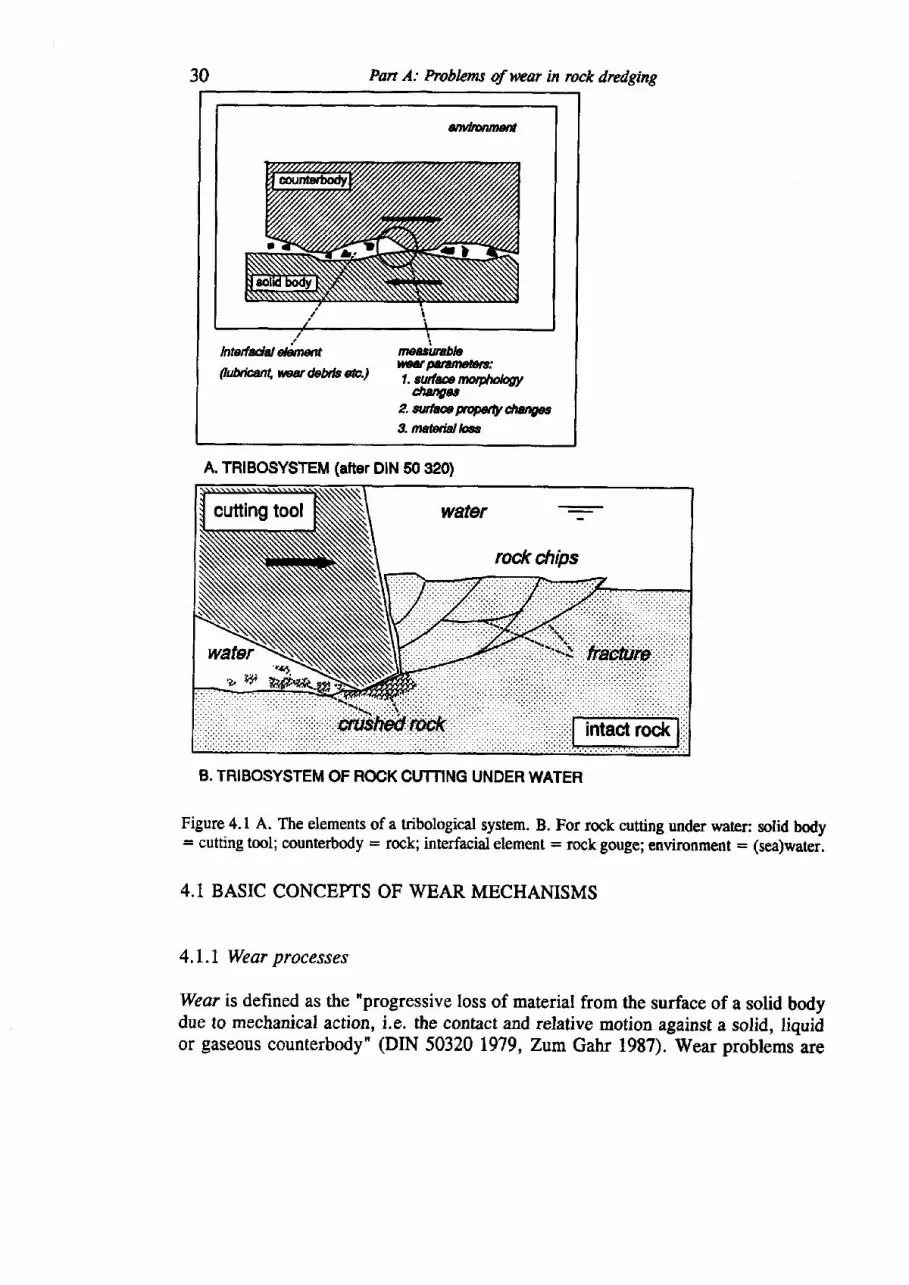
Figure 4.1 A. The elements of a tribological system. B. For rock cutting under water: solid body= cutting tml; counterbody = rock; interfacial element = rock gouge; environmenl = (sea)wat€r.
4.1 BASIE CONCEPTS OF WEAR MECHANISMS
4.I.1 Wear processes
Wear is defined as the "progressive loss of material from the surface of a solid bodydue to mechanical action, i.e. the contact and relative motioD against a solid, liquidor gaseous counterbody" (DIN 50320 t979, Zum Gahr 1987). Wear problems are
A. TRIBOSYSTEM (after DIN 50 320)
B. TRIBOSYSTEM OF ROCK CUTTING UNDER WATER
Corcepts of wear processes fum tribolagy 3l
difficult to handle. In the scienc€ of friction, lubrication and wear (tribologyra) itis long known that wear is a system dependent process. To properly describe thetribosystern, to perform relevant tests and develop appropriate models to arrive atsolutions to particular wear problems is typically the field of tribological engineering(Uetz 1986, Zum Gahr 1987 DIN 50320 1979, DIN 50321 L979).
Figure 4.1 gives an illustration of the factors which describe a tribologicalsystem. The wear problem at hand is describedusing the following terminology. Thewearing part is defined as the solid body. The object causing the wear is describedas the counterbody. In between these bodies an interfacial mediwn can be present,like wear debris or a lubricant. The whole system occurs in a certain envirownent,such as air or water. Figure 4.1B illustrates the system of a tool cutting rock underwater. The steel cutting tool is the solid body under study, the rock forms thecounterbody. In between tool and rock crushed rcck (gouge) may be present. Thecutting process occurs in (sea)water. To completely describe the process it is obviousthat data are necessary, which describe the physical and chemical circumstancesunder which the process occurs.
To describ e the wear process, which is defrned as the tlpe of action exercised onthe solid body (tool which undergoes wear), use can be made of concepts laid downin DIN 50 320 (1979), a German standard. Included with this standard is aworksheet format which can be helpful in setting up the parameters necessary todescribe a tribosystem. The elements of this worksheet are given in Figure 4.2.
A classification of wear processes is given in Figure 4.3. The classification isbased on the tlpe of motion that is occurring and the types of phases involved in theprocess (solid, liquid, gas). These actions arc: sliding, rolling, oscillation, impactingand erosion. Erosion is the wear (removal of parts of a surface) caused by a flowingmedium, like gas, water or air. The medium may be loaded with solid particles. Theprocess is an open system and involves dynamic impact of the particles or fluids. Ofcourse, a combination of actions, like sliding wear combined with impact motion isalso possible (as for example in rock cutting with a cutter suction dredger).
The DIN 50320 worksheet intends to assemble all information with regard to thecollective enorgy input in the system (Figure 4.2). Therefore, data on loads imposedand their change in time, velocities occurring and their change in time, ambienttemperafure and change in temperature are important. The characteristics of the salidbody and the counterbody (Figure 4.1 & 2) have to be described, as well as theproperties of the interfacial elements and envirownew. These are characterized bytheir dimensions, chemical compositions, structure or a1gre1ate configuration,physical properties like density, thermal expansion coefficient, thermal conductivity,volume, stress, surface properties, viscosity. Friction coefficients are determined andtheir change with time or displacement. Finally wear numbers are asked, oftenexpressed in change of dimension or change of weight per time or displacementunit.
Applications of this concept are laid down in textbooks on tribology. For thiswork mainly the books by Uetz (1986) and Zum Gahr (1987) have been consulted.
la Tribology is the science and technology of interacting surfaces in relative motion. Thename is derived from the Greek word 'tribos", meaning rubbing. Tribology embraces thescientific investigation of all tlpes of friction, lubrication and wear and the technologicalapplication of this knowledge (Zum Gahr, lgST).

32 Pert A: Prablems of wear in rock dredging
DATA TO DESCRIBE TRIBOSYSTEM (worksheet DIN s0 320)
I Technicallunction of the tribosystem
ll Collective €nergy input (load, motion, temperature; includinghistory in time)
Proctss: trsliding, tr rofling, tr impacting, trflowing,tr combinations:
Load on surface: F* record variation in time
Velocity: record the relative velocity along wearing surface
Temperature: record temperature history
lV Wear data on solid- and counter Measure totalwear,vvear rates: AUAt AUAs and reoord in time
lll Structure of the tribosysteffii s - F(A,P,R)
A: elements: (1) solid body, (2) counterbody, (3) interfacialelements, (4) environment
P: Describe properties of elementsfor (1) and (2): sizes, chemical composition and fabric,
physical properties, strength properties, surface hardness,su rface rou ghness, phys ico-chemical su rf ace properties
for (3) and (4): aggregate state, chemical composition andstructure, physical properties, viscoslty, other properties
R: Interastion of elementsTribocontact surface, ratio of real contact area and total
contact surface, state of friction, friction coetficient
Figure 4.2 Summary of the type of data that are suggasted to be recorded for a proper de.scriptionof a tribosystem (DIN 50 320, 1979).
The action leading to wear, the wear process (Figure 4.3), is comrnonly obvious.The wear mechanism taking place is deduced from the observations done. Zum Gahr(1987) explains that, although a large number of wear mechanisms are described inliterature, these can all be brought back to four basic mechanisms. These fourmechanisms are described as well in DIN 50 320: adhesive weay't, abrasion,surface fatigue and tribochemical reaction.
Adhesive wear is the formation and breaking of interfacial adhesive bonds, forexample cold welded junctions. Adhesive wear can occur when two surfaces slide
15 In the context of wear, adhesion is used to mean adhesive wear. Literally adhesion isthe attractive stress that may exist between two adjacent surfaces of different composition.

Contepts ofwear processes from tribology 33
inrpac{ wear erosive wear
ftN
lnpacling
low angleeroslon
N
,--\--.-\>----\.-/->--.---)
high angleerosion
\ \ \ \ \
%%$tean
ofllquld or gas
Figure 4.3'Classification of wear processes by the type of action on the surface of a solid body(wear mode). After Zum Gahr (1987).
along each other. High local pressure between contacting asperities results in plasticdeformation, adhesion and the formation of local junctions. These junctions willshear off during continued sliding, thus leading to wear (Zum Gahr 1987).
Abrasion is the process causing removal or displacement of material ("wear") ata solid surface due to the presence of hard particles in between or embedded in oneor both of two solid surfaces in relative sliding motion, or due to the presence ofhard protuberances on one or both of the two moving surfaces (Zum Gahr 1987). Iftwo surfaces are involved, or one surface against particles, the term wo bodyabra'sive wear is used. If particles are present between two surfaces, the abrasivemechanism is called three body ahrasive wear. The contrast in hardness of the twosolid surfaces is a fundamental factor in abrasive mechanisms. Although wearoccurs when a softer abrasive is rubbing against a harder material (low level wear),the amount of wear increases dramatically when the abrasive is harder (Figure 4.4).Hardness is the resistance against indentation of a material (see Chapter l0).
Surface fatigue. Due to repeated dynamic loading of a surface, crack formationwith resulting flaking may occur. Localized fatigue may occur on a microscopicscale due to repeated contact of asperities on the surfaces of solids in relative motion(Zum Gahr 1987).
Tribochemical reaction. Dwing the rubbing contact of two surfaces a reactionwith the environmental medium may occur, resulting in corrosive reactions (ZumGahr 1987).
Figure 4.5 shows possible mechanisms that could operate in tribological wearprocesses considered relevant to cutter suction dredging. When the cutter teeth arecutting rock, impacting and sliding motions occur. From the science of tribology isknown that certain mechanisms often happen under such circumstances (Figure 4.5).Impact loading often leads to surface fatigue. The sliding motion leads to a numberof wear mechanisms, but adhesion and tribochemical reaction are the most common.
solid particle+
llquid or gas
liquld Wide+liquid or gas
partide Erosion drop eroslon fluid Erosion
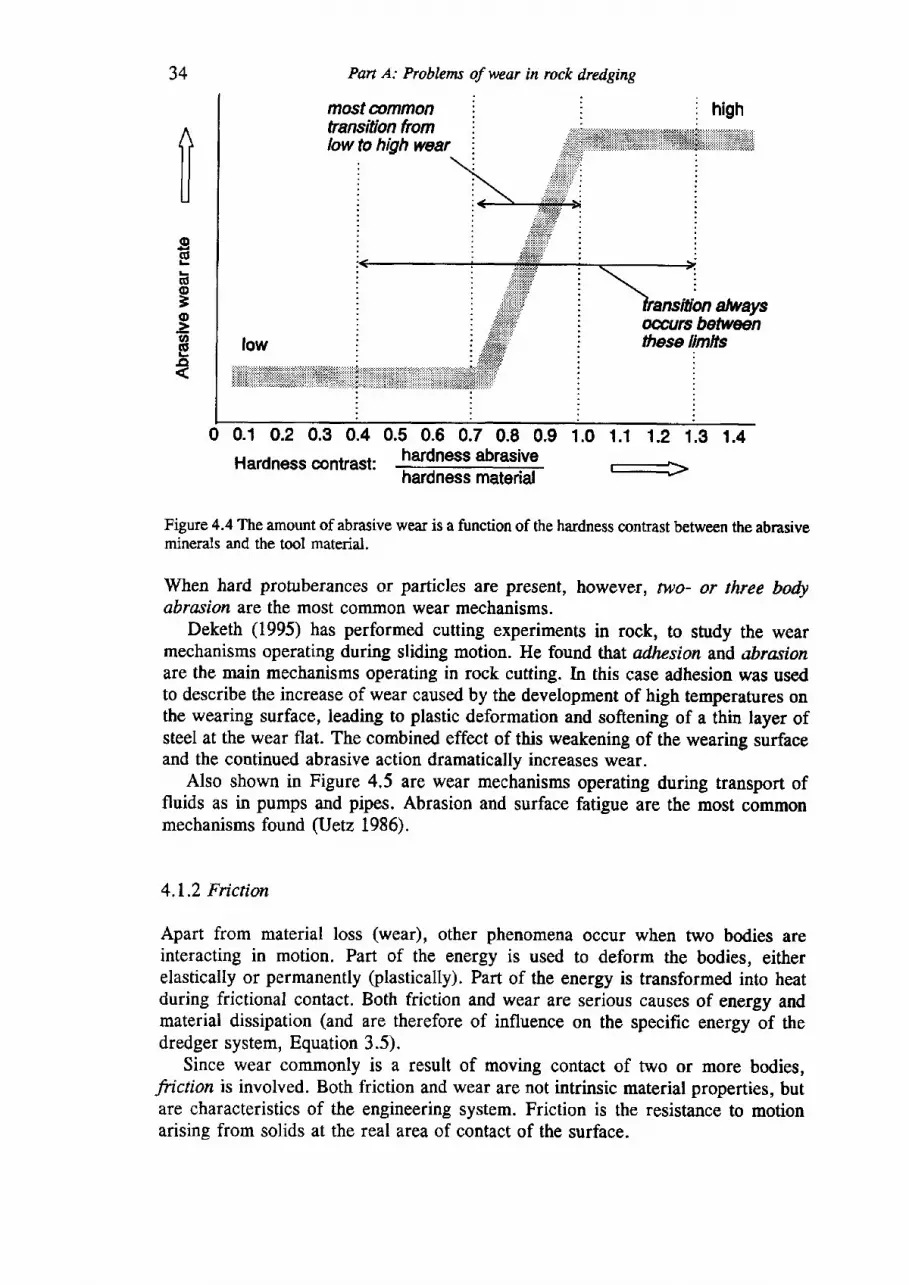
34
mostcommontransition fromIow to high wear ffi i'i''il iriiii:'':i,rrlffi ii.iiiiiiuffi
alwaysomurs betweenthese limits
---T
high
oE(do=o'6E.ct
low
,i.ifriiiiiii;i;';;iii. iiilii,,iil+ij;ji:j:i..:::l.:.:;:::i:i:.i'iii:il:i:i;li
0.1 o.2 0.3 0.4 0.5 0.6 0.7 0.8 0.9 1.0 1 .1 1 .41.31.2Hardnesscontrast: fardnessabrasive
hardness material
Figure 4.4 The amount of abrasive wear is a function of the hardness contrast between the abrasiveminerals and the tool material.
When hard protuberances or particles are present, however, two- or three bodyabrasion are the most common wear mechanisms.
Deketh (1995) has performed cutting experiments in rock, to study the wearmechanisms operating during sliding motion. He found lhat adhesion and abrasionare the main mechanisms operating in rock cutting. In this case adhesion was usedto describe the increase of wear caused by the development of high temperatures onthe wearing surface, leading to plastic deformation and softening of a thin layer ofsteel at the wear flat. The combined effect of this weakening of the wearing surfaceand the continued abrasive action dramatically increases wear.
Also shown in Figure 4.5 are wear mechanisms operating during transport offluids as in pumps and pipes. Abrasion and surface fatigue are the most commonmechanisms found (Uetz 1986).
4.I.2 Friction
Apart from material loss (wear), other phenomena occur when two bodies areinteracting in motion. Part of the energy is used to deform the bodies, eitherelastically or permanently (plastically). Part of the energy is transformed into heatduring frictional contact. Both friction and wear are serious causes of energy andmaterial dissipation (and are therefore of influence on the specific energy of thedredger system, Equation 3.5).
Since wear commonly is a result of moving contact of two or more bodies,fiiction is involved. Both friction and wear are not intrinsic material properties, butare characteristics of the engineering system. Friction is the resistance to motionarising from solids at the real area of contact of the surface.
Pan A: Problems of wear in rock dredging
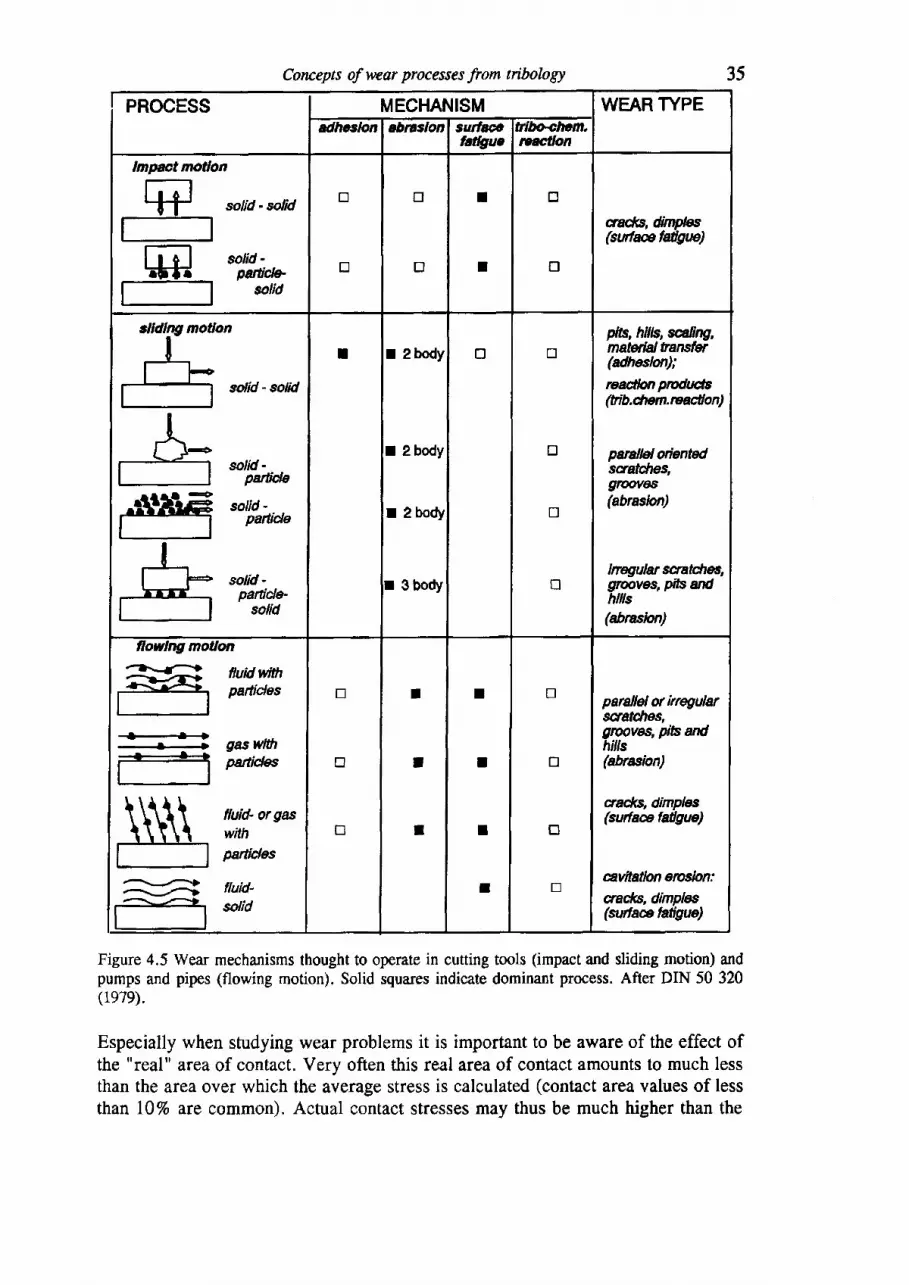
Concepts of wear processes from tribology
PROCESS MECHANISM WEAR TYPEdhcslon ebf'',slon swtw,
IatlgueTTMhCM.rcacflon
lmBct motlon
Ll-t' sotid - sottd
solid -panicb
&lid
tr
tr
B
tr
I
t
tr
0
crad(s. dinp@(surfwfadgta)
solid - soM
solid -pailide
solid -partide
solid -partida-
solicl
: a2 body
I 2 body
. 2 body
r Sbody
tr tr
tr
D
tr
pitr, hllls, wling,materialtanstar(dhastur);
raM6t godtfrs(tib.dnnt.reacilon)
panlbl orlentedscratdles,gtwYes(abrasiut)
Inqularsuatdns,gtr@ves, pits aMhllls(abrasion)
fluidwlthpadides
*-+
panaes
tluid- or gaswithpaftides
A truid-M , . s o l i d
tr
tr
tr
I
t
I
I
I
I
I
tr
u
tr
tr
parallel ar kregularwatdtes,gr@vos, p,6Nhllls(abrasion)
da*s,dimpl*(surfae fadgue)
avitatlon ercsion:
aradcs, dimplas(afiaefatigue)
Figure 4.5 Wear mechanisms thought to operate in cutting tools (impact and sliding motion) andpumps and pipes (flowing motion). Solid squares indicate dominant process. After DIN 50 320(1979).
Especially when studying wear problems it is important to be aware of the effect ofthe "real" area of contact. Very often this real area of contact amounts to much lessthan the area over which the average stress is calculated (contact area values of lessthan I}Vo are common). Actual contact stresses may thus be much higher than the
35
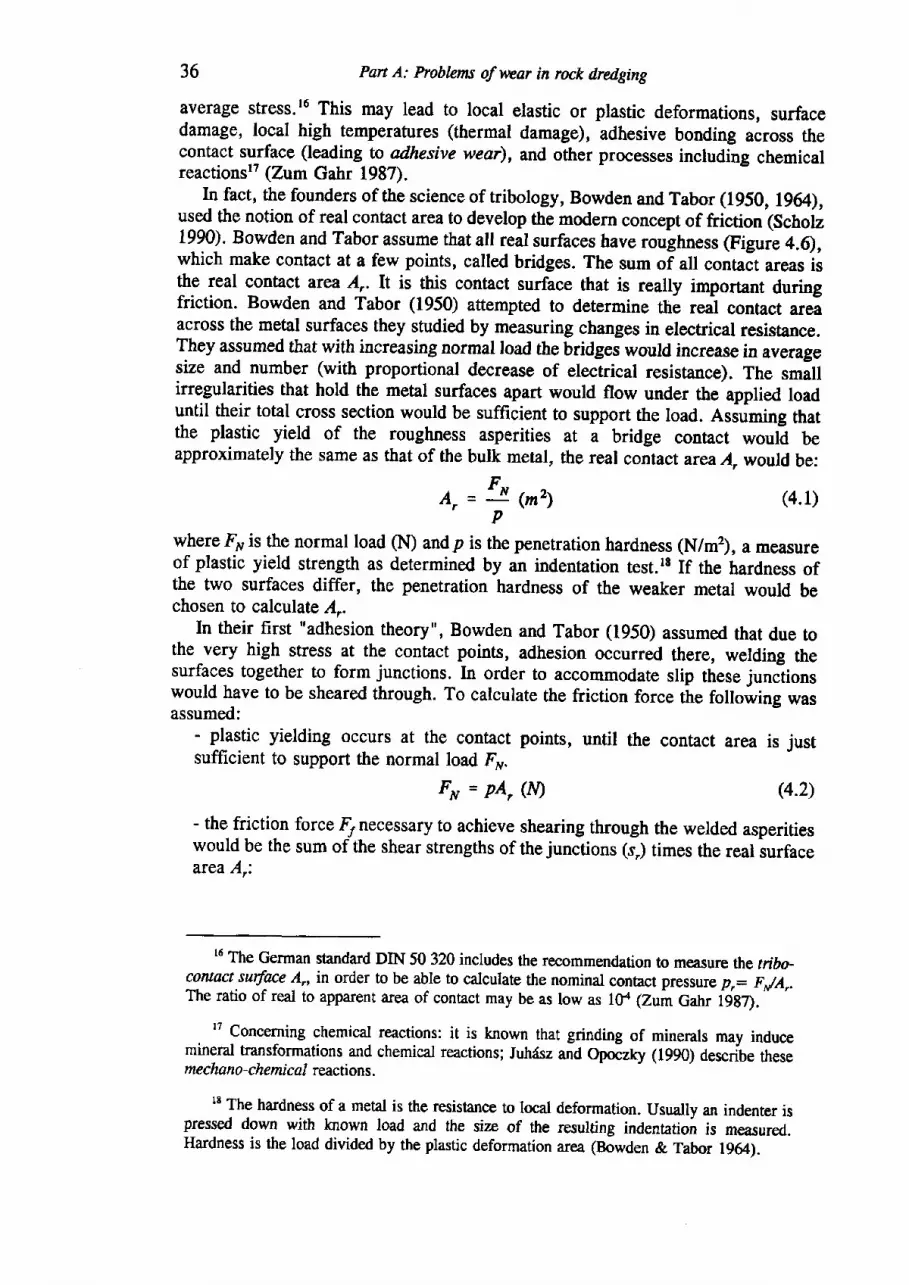
36 Part A: Problcns of v,rcar in rock dredging
average stress.r6 This may lead to local elastic or plastic deformations, surfacedamage, local high temperatures (thermal damage), adhesive bonding across thecontact surface (eading to adhesive wear), and other processes including chemicalreactionsrT (Zum Gahr 1987).
In fact, the founders of the science of tribology, Bowden and Tabor (1950, lg&),used the notion of real contact area to develop the modern concept of friction (SchoLDn). Bowden and Tabor assume that all real surfaces have roughness (Figure 4.6),which make contact at a few points, called bridges. The sum of all contadt areas isthe real contact area A,. It is this contact surface that is really important duringfriction. Bowden and Tabor (1950) attempted to determine thl real contacr areaacross the metal surfaces they studied by measuring changes in electrical resist4nce.They assumed that with increasing normal load the bridges would increase in avengesize and number (with proportional decrease of electrical resistance). The smallirregularities that hold the metal surfaces apart would flow under the applied loaduntil their total cross section would be sufficient to support the load. Asiuming thatthe plastic yield of the roughness asperities at a bridge contact would beapproximately the same as that of the bulk metal, the real contact area A, would be:
Ar= \ ,*,,P
(4.1)
where F" is the normal load (N) andp is the penetration hardness (N/m2), a measureof plastic yield strength as determined by an indentation test.rs If the hardness ofthe two surfaces differ, the penetration hardness of the weaker metal would bechosen to calculate,{,.
In their first "adhesion theory", Bowden and Tabor (1950) assumed that due tothe very high stress at the contact points, adhesion occurred there, welding thesurfaces together to form junctions. In order to accommodate slip these junctionswould have to be sheared through. To calculate the friction force the following wasassumed:
- plastic yielding occurs at the contact points, until the contact area is justsufficient to support the normal load F,y.
F" = pA, (I:tl) (4.2)- the friction force { necessary to achieve shearing through the welded asperitieswould be the sum of the shear strengths of the junctions (s) times the real surfaceatea A,:
16 The German standard DIN 50 320 includes the recommendation to measure the triho-coMact surface 24.,, in order to be able to calculate the nominal contact pressure p,= FJA,.The ratio of real to apparent area of contact may be as low as l0ra (zum catrr iggn."
. t7 Concerning chemical reactions: it is known that grinding of minerals may induce
mineral transformations and chemical reactions; Iuhdsz ana Opoczrcy (1990) describe theseme chano - chemic al reactions.
It The hardness of a metal is the resistance to local deformation. Usually an indenter ispressed down with known load and the size of the resulting indenation is measured.Hardness is the load divided by the plastic deformation area (Bowden & Tabor 1964).
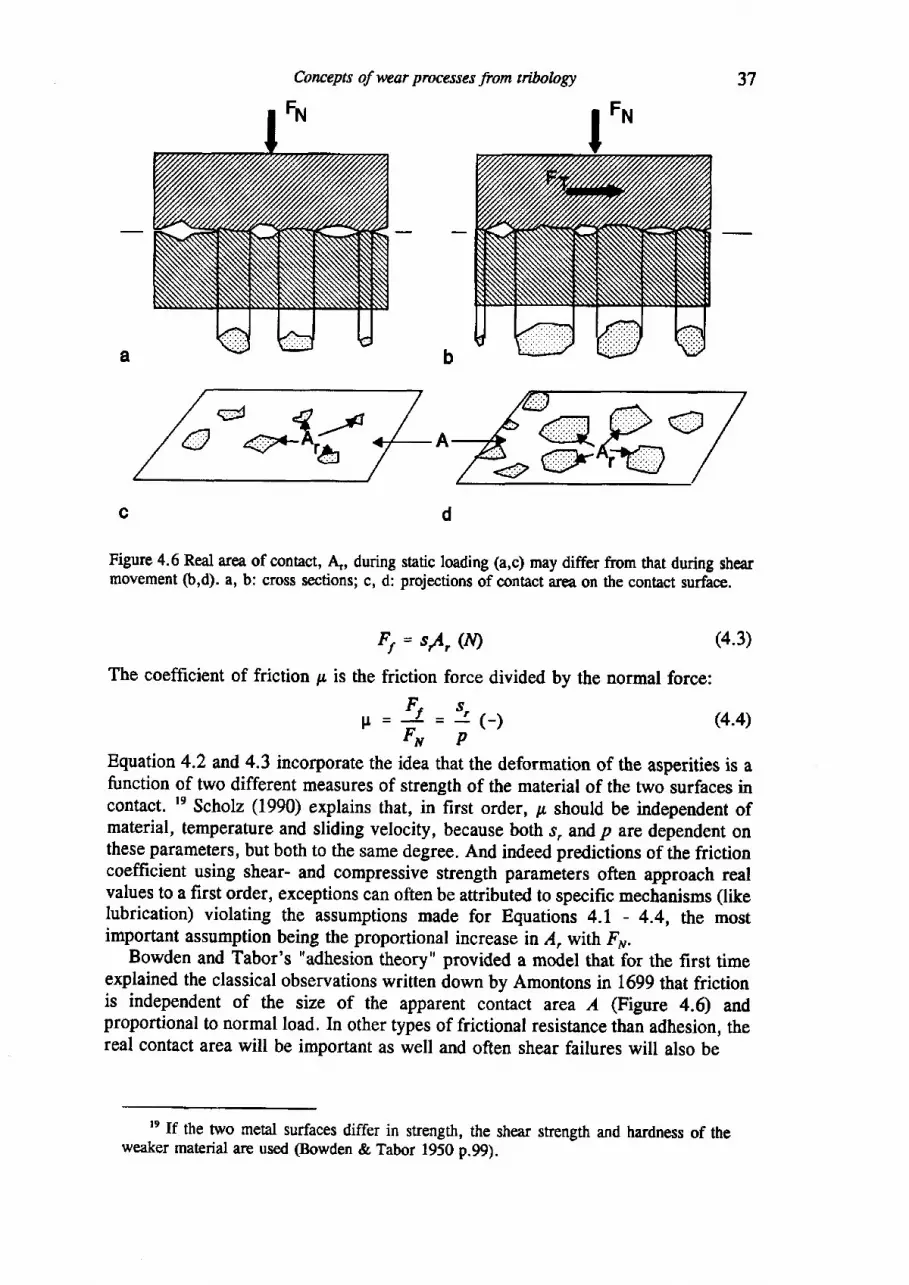
Concepts of wear processes from tribology
Figure 4.6 Real area of @ntact, A,, during static loading (a,c) may differ from that during shearmovement O,d). a, b: cross sectionsl c, d: projections of contact area on the contact surface.
37
F, = sy', (N)
The coefficient of friction p is the friction force divided by the normal force:
lr=+=1(-)rN P
(4.3)
(4.4)
Equation 4.2 and 4.3 incorporate the idea that the deformation of the asperities is afunction of two different measures of strength of the material of the two surfaces incontact. tt Scholz (1990) explains that, in first order, p, should be independent ofmaterial, temperature and sliding velocity, because both s, and p are dependent onthese parameters, but both to the same degree. And indeed predictions of the frictioncoefficient using shear- and compressive strength parameters often approach realvalues to a first order, exceptions can often be attributed to specific mechanisms (likelubrication) violating the assumptions made for Equations 4.1 - 4.4, the mostimportant assumption being the proportional increase in I, with F".
Bowden and Tabor's "adhesion theory" provided a model that for the first timeexplained the classical observations written down by Amontons in 1699 that frictionis independent of the size of the apparent contact arca A (Figure 4.6) andproportional to normal load. In other types of frictional resistance than adhesion, thereal contact area will be important as well and often shear failures will also be
te If the two metal surfaces differ in strength, the shear strength and hardness of theweaker material are used (Bowden & Tabor 1950 p.99).
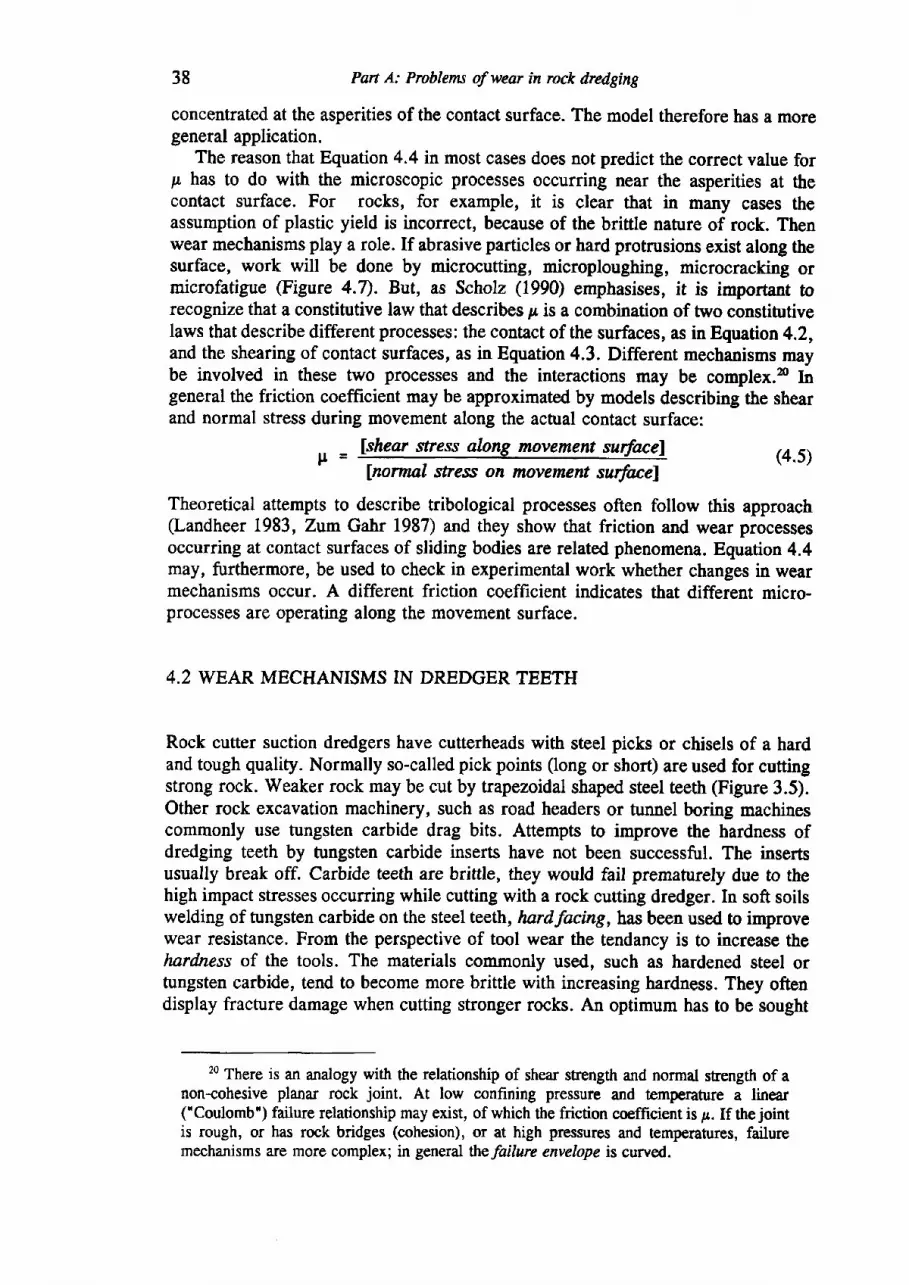
38 Pan A: Prohlems of wear in rock dredging
concentrated at the asperities of the contact surface. The model therefore has a moregeneral application.
The reason that Equation 4.4 in most cases does not predict the correct value forp has to do with the microscopic processes occurring near the asperities at theconcact surface. For rocks, for example, it is clear that in many cases theassumption of plastic yield is incorrect, because of the brittle nature of rock. Thenwear mechanisms play a role. If abrasive particles or hard protrusions exist along thesurface, work will be done by microcutting, microploughing, microcracking ormicrofatigue (Figure 4.7). But, as Scholz (1990) emphasises, it is inportant torecognize that a constitutive law that describes p is a combination of two constitutivelaws that describe different processes: the contact of the surfaces, as in Equation 4,2,and the shearing of contact surfaces, as in Equation 4.3. Different mechanisms maybe involved in these two processes and the interactions may be complex.m Ingeneral the friction coefFrcient may be approximated by models describing the shearand normal stress during movement along the actual contact surface:
,, _ lshear stress along movement surfacel* -
lnorrr*t tt ro on movemrnt ,u6*"1(4.s)
Theoretical attempts to describe tribological processes often follow this approach(Landheer 1983, Zum Gahr 1987) and they show that friction and wear processesoccurring at contact surfaces of sliding bodies are related phenomena. Equation 4.4may, furthermore, be used to check in experimental work whether changes in wearmechanisms occur. A different friction coefficient indicates that different micro-processes are operating along the movement surface.
4.2 WEAR MECHANISMS IN DREDGER TEETH
Rock cutter suction dredgers have cutterheads with steel picks or chisels of a hardand tough quality. Normally so-called pick points (long or short) are used for cuttingstrong rock. Weaker rock may be cut by trapezoidal shaped steel teeth (Figure 3.5).Other rock excavation machinery, such as road headers or tunnel boring machinescommonly use tungsten carbide drag bits. Attempts to improve the hardness ofdredging teeth by tungsten carbide inserts have not been successful, The insertsusually break off. Carbide teeth are brittle, they would fail prematurely due to thehigh impact stresses occurring while cutting with a rock cutting dredger. In soft soilswelding of tungsten carbide on the steel teeth, hardfacing, has been used to improvewear resistance. From the perspective of tool wear the tendancy is to increase thehardness of the tools. The materials commonly used, such as hardened steel ortungsten carbide, tend to become more brittle with increasing hardness. They oftendisplay fracture damage when cutting stronger rocks. An optimum has to be sought
20 There is an analogy with the relationship of shear strength and normal sfrength of anon-cohesive planar rock joint. At low confining pressure and temperature a linear("Coulomb") failure relationship may exist, of which the friction coefficient is p. If the jointis rough, or has rock bridges (cohesion), or at high pressures and temperatures, failuremechanisms are more complex; in general thefailure envelope is curved.
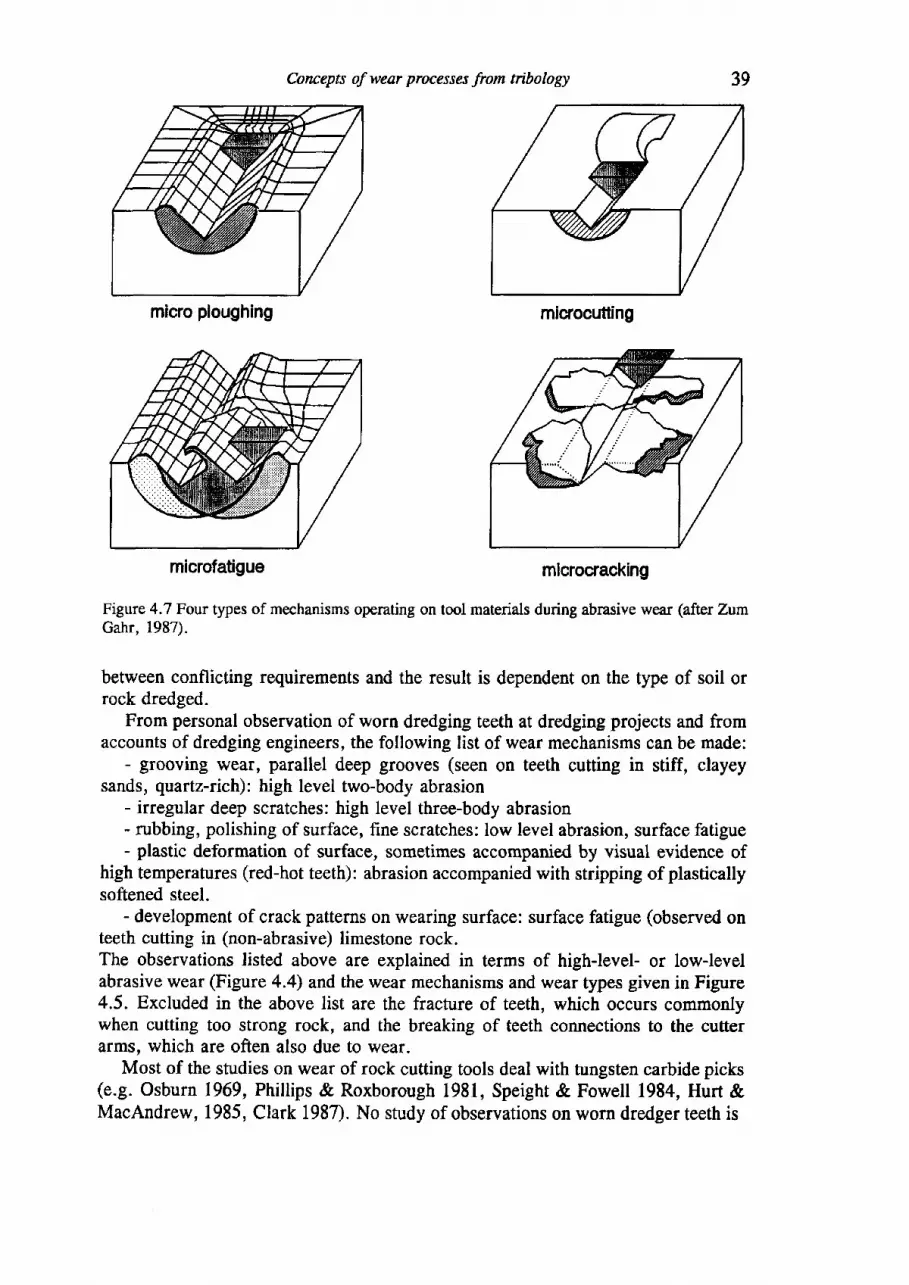
Concepts of wear processes from nibology
mlcrolatlgue microoacking
Figure 4.7 Four types of mechanisms operating on tool materials during abrasive wear (after ZumGahr, 1987).
between conflicting requirements and the result is dependent on the type of soil orrock dredged.
From personal observation of worn dredging teeth at dredging projects and fromaccounts of dredging engineers, the following list of wear mechanisms can be made:
- grooving wear, parallel deep grooves (seen on teeth cutting in stiff, clayeysands, quartz-rich): high level two-body abrasion
- irregular deep scratches: high level three-body abrasion- rubbing, polishing of surface, fine scratches: low level abrasion, surface fatigue- plastic deformation of surface, sometimes accompanied by visual evidence of
high temperatures (red-hot teeth): abrasion accompanied with stripping of plasticallysoftened steel.
- development of crack patterns on wearing surface: surface fatigue (observed onteeth cutting in (non-abrasive) limestone rock.The observations listed above are explained in terms of high-level- or low-levelabrasive wear (Figure 4.4) and the wear mechanisms and wear types given in Figure4.5. Excluded in the above list are the fracture of teeth, which occurs commonlywhen cutting too strong rock, and the breaking of teeth connectiom to the cutterarms, which are often also due to wear.
Most of the studies on wear of rock cutting tools deal with tungsten carbide picks(e.g. Osburn 1969, Phillips & Roxborough 1981, Speight & Fowell 1984, Hurt &MacAndrew, 1985, Clark 1987). No study of observations on worn dredger teeth is
micro ploughing microcutling
microfatigue
40 Part A: Problems of toear in rock dredging
known, but work has been published on ripper tips (Muro 1985) and digger teeth(Mashloosh & Eyre 1985, Schweins 1986).
4.2.1 Studies on the wear of digger teeth and ripper tips
Mashloosh & Eyre (1985) studied the wear of digger teeth placed on a bucket dragline, working in a gravel pit, excavating under water. Such teeth are comparable tothe teeth used for dredging. The digger teeth were made from low alloy carbon steel,heat treated to a Vickers hardness of 510 H" (5000 MPa)zr, with high loughnessz.The digger was excavating an aggregate of quartz gravel particles. Using Figure 4.5a first guess of possible wear mechanisms may be made. Although some impactforces can occur using the drag line, the main motion operating will be sliding. Theteeth will slide against an aggregate of particles. The surrounding medium is water.Two body abrasive wear and tribo-chemical reactions are common mechanisms undersuch circumstances. Mashloosh & Eyre (1985) made an extensive microscopicexamination of the worn surface, using the scanning electronmicroscope to stgdy areplica of the worn surface and a reflection microscope to study a polished sectioncut normal to the worn surface. The surface showed parallel grooves, produced byploughing (Figure 4.7). The scanning electron microscope gave more detail on thlploughing mechanism and additional plastic deformation. The microscopic structuresobserved with the reflection microscope showed evidence for intense rubbingbetween the gravel particles and the teeth, leading to high contact temperatures at thesurface. These high temperatures caused phase transformations in the steel up to adepth of 0.1 mm below the contact surface, with resulting changes in hardness (seeChapter 9.4). No indications of corrosion reactions were found, the water with pHof 7 apparently did not affect the wear. Abrasion was clearly the dominatingmechanism, with besides ploughing and cutting a considerable amount of rubbingcausing plastic deformation of the surface and frictional heating. In the particulaicase studied, the teeth lasted about 200 working hours, and their better performanceagainst other steel types was attributed to their hardening ability during the wearprocess. However, Mashloosh & Eyre note that the same teeth would last only 2Ahours in a pit where gravel was dug dry.
Muro (1985) describes extensive tests carried out on ripper tips coated withdifferent metals or composites, to increase wear resistance. Usually ripper tips aremade of wear resistant forging or cast steel with a Vickers hardness of 3900 - 4900MPa, with high enough toughness to resist the large excavation forces. But, whenstrong rocks are being npped, high temperatures develop leading to plastic softeningof the steel. In addition, rocks with abundant quartz cause abrasive gouging wear.Muro studied 7 different types of metal; I untreated ripper tip, 4 coated with hardfacing by thermal spraying and2 welded faced tips. A laboratory abrasion test (pin-on-disc type; Chapter 11) was carried out, whereby the test specimens were testedagainst a granite rock surface. The tests had some relevance to the dredging problem
2t The units commonly used for Vickers hardness are kg/mm2, 510 H" corresponds to5000 MPa. Quartz has a rl of 1000 to 1200 (9900 - 11260 Mpa; see chapter l0).
22 Toughness is defined as resistance to brittle failure at impact loading.
Contepn of wear procases from tribology 4l
for they were carried out both dry and wet, weffing being done by jetting water intothe contact between the steel test pins and the rock. It appeared that the amount ofwear was greater in the dry stale than in the wet state. The latter could be explainedby the cooling effect of the water jetting. At higher contact pressures (5 - 25 MPa),terqperatures from 550 - 1200 'C were measured at the steel contact in the dry tests,1200 "C being the temperature at which the steel starts to melt. During the wet testsno temperature higher than 300 oC was recorded on untreated ripper tip steel. Alsoa field test was carried out, showing that both the untreated ttp and the tips weldedwith a coating behaved well against granitic rock, but that the tips which were hardfaced using thermal spraying showed increased wear, due to the softening of thehard, heat-treated material by the fusion process.
4.2.2 Conclwiow frorn tribotogical stndies on cutting tool wear
From the two studies on wear of steel cutting tools referred to, some impression ofthe complexity of the problem can be gained. [t appears that the composition of thesteel is important, whether or not water is present, and contact pressures have a largeinfluence on wear, because high temperatures may develop. Much of this informationcomes from laboratory tests (both investigations involved pin-ondisc type tests).Only Muro pays much attention to the rock types being excavated (Muro 1985, Haa& Muro 1978). Examining the damage on the wear surfaces of the teeth, aided bymicroscopic techniques as was done by Mashloosh & Eyre (1985), can give areasonable impression of the type of wear mechanisms operating. Both papers werewritten by specialists in tribology. Both mention abrasion and high temperaturoplastic deformation of the steel as the dominant merhanisms. Characteristic ally forstudies in tribology, both performed tests on different tool materials in order to selectthe type best suited for the problem at hand. Apart from this, both studies showedthat the slnpe of the cutting tool is important (self sharpenlng dunng wear is aimedat). Mashloosh & Eyre made the important observation that, when the circumstanceschanged (the type of gravel and dry instead of wet excavation) the amount of weardiffered considerably.
When considering rock cutting as a tribological system (Figure 4.1), it is obviousthat a large part of the problem of tool wear lies in the variable nature of the rockor soil cowfierbody and -perhaps to a lesser extent- the envirownent of (sea)water.Commonly rocks have a variable structure and composition, which makes rockcutting a type of tribo-system ihat is hard !o study in the laboratory. In Chapter 1lit is shown that tests commonly used in tribology, like pin-ondisc, are probably lesssuitable to show the influence of. the rock rype on wear. Note that the tests used intribology are mostly directed to the solid body -or tool- material. Very commonlyfor convenience sandpaper is used as a counterbody in pin-ondisc tests to testdifferent types of steel; the rock or soil counterbody is then not even considered.
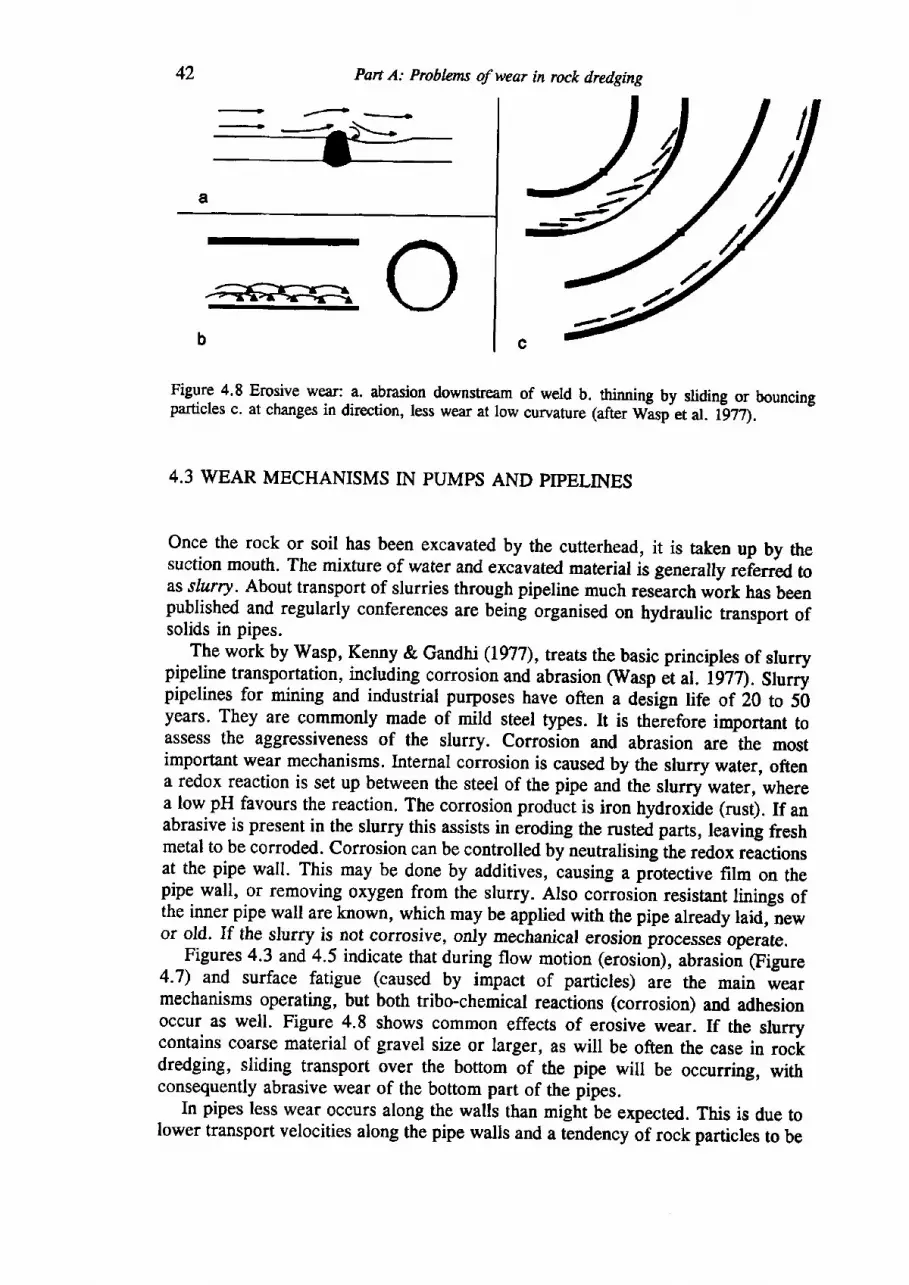
42 Pan A: Problems of wear in rock dredging
Figure 4.8 Erosive wear: a. abrasion downstream of weld b. thinning by sliding or bouncingparticles c. at changes in direction, less wear at low curvature (after Wisp et al- ig7),
4.3 WEAR MECHANISMS IN PUMPS AND PIPELINES
Once the rock or soil has been excavated by the cutterhead, it is taken up by thesuction mouth. The mixture of water and excavated material is generally relerred toas slurry' About transport of slurries through pipeline much resiarch work has beenpublished and regularly conferences are being organised on hydraulic transport ofsolids in pipes.
The work by Wasp, Kenny & Gandhi (L977), treats the basic principles of slurrypipeline transportation, including corrosion and abrasion (Wasp it ^t. igl1. Sfurrypipelines for mining and industrial purposes have often a deiign life of ZO to Sbyears. They are commonly made of mild steel types. It is therefore important toassess the aggressiveness of the slurry. Corrosion and abrasion are the mostimportant wear mechanisms. Internal corrosion is caused by the slurry water, oftena redox reaction is set up between the steel of the pipe and the slurry water, wherea low pH favours the reaction. The corrosion product is iron hydroxide (rust). If anabrasive is present in the slurry this assists in eroding the nrsted parts, leaving freshmetal to be corroded. Corrosion can be controlled by neutralising the redox reactionsat the pipe wall. This may be done by additives, causing a protective film on thepipe wall, or removing oxygen from the slurry. Also corrosion resistant linings ofthe inner pipe wall are known, which may be applied with the pipe already laid,-newor old. If the slurry is not corrosive, only mechanical erosion p.ocrr."r operate.
Figures 4.3 and 4.5 indicate that during flow motion (erosion), abrasion (Figure4-7) and surface fatigue (caused by impact of particles) are the main wearmechanisms operating, but both tribo-chemical reactions (corrosion) and adhesionoccur as well. Figure 4.8 shows common effects of erosive wear. If the slurrycontains coarse material of gravel size or larger, as will be often the case in rockdredging, sliding transport over the bottom of the pipe will be occurring, withconsequently abrasive wear of the bottom part of the pipes.
In pipes less wear occurs along the walls than might be expected. This is due tolower transport velocities along the pipe walls and a tendency of rock particles to be
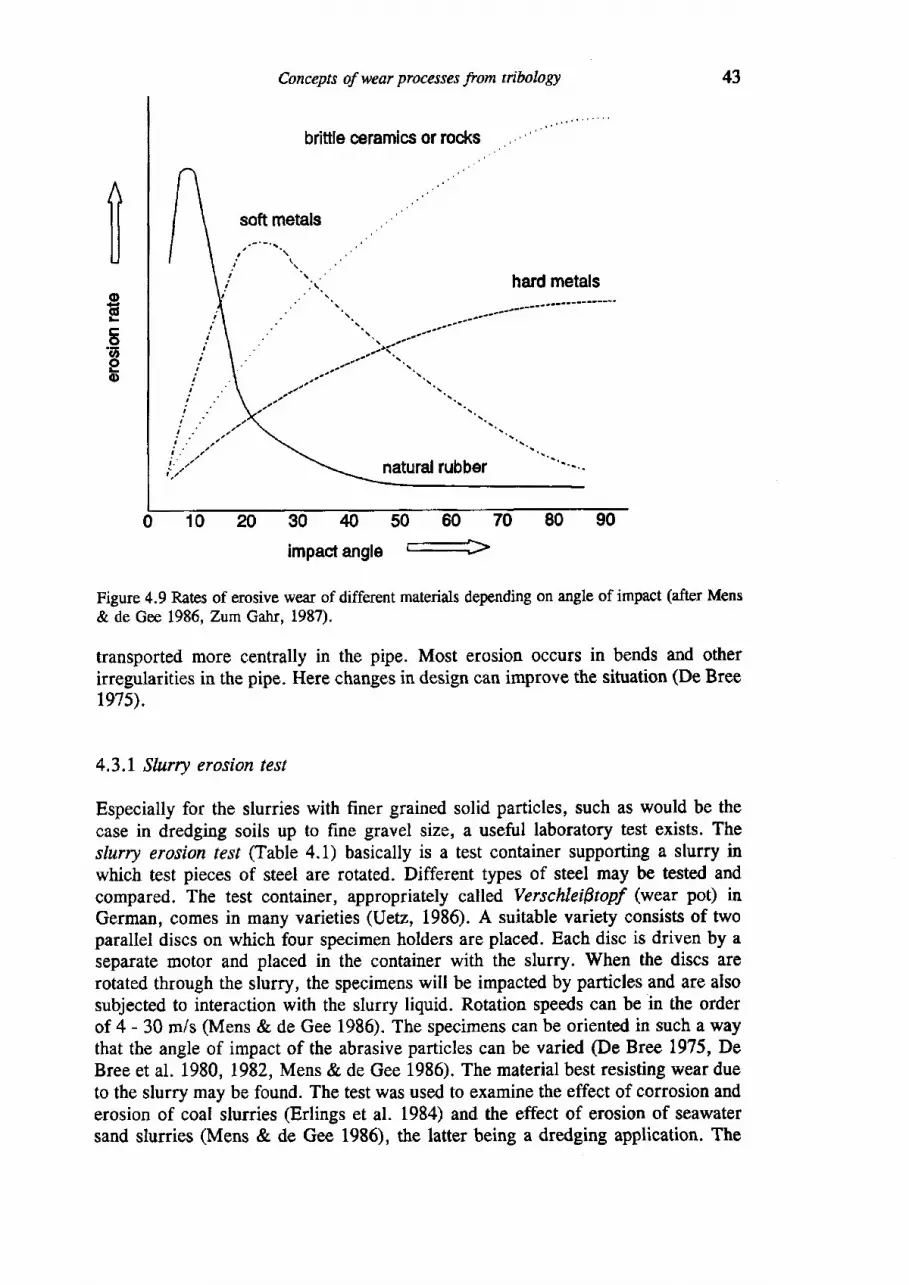
Concepts ofwear processes from tribology
briftle ceramics or rocks
43
od
:ov,go
30405060
impact angle =-->80 90
Figure 4.9 Rates of erosive wear of different materials depending on angle of impact (after Mens& de Gee 1986, Zum Gahr, 1987).
transported more centrally in the pipe. Most erosion occurs in bends and otherirregularities in the pipe. Here changes in design can improve the situation (De Breer97s).
4.3.L Slurry erosion test
Especially for the slurries with finer grained solid particles, such as would be thecase in dredging soils up to fine gravel size, a useful laboratory test exists. Theslurry erosion /esr (Table 4.1) basically is a test container supporting a slurry inwhich test pieces of steel are rotated. Different types of steel may be tested andcompared. The test container, appropriately called Verschleiptopf (wear pot) inGerman, comes in many varieties (Uetz, 1986). A suitable variety consists of twoparallel discs on which four specimen holders are placed. Each disc is driven by aseparate motor and placed in the container with the slurry. When the discs arerotated through the slurry, the specimens will be impacted by particles and are alsosubjected to interaction with the slurry liquid. Rotation speeds can be in the orderof 4 - 30 m/s (Mens & de Gee 1986). The specimens can be oriented in such a waythat the angle of impact of the abrasive particles can be varied (De Bree 1975, DeBree et at. 1980, 1982, Mens & de Gee 1986). The material best resisting wear dueto the slurry may be found. The test was used to examine the effect of corrosion anderosion of coal slurries (Erlings et al. 1984) and the effect of erosion of seawatersand slurries (Mens & de Gee 1986), the latter being a dredging application. The
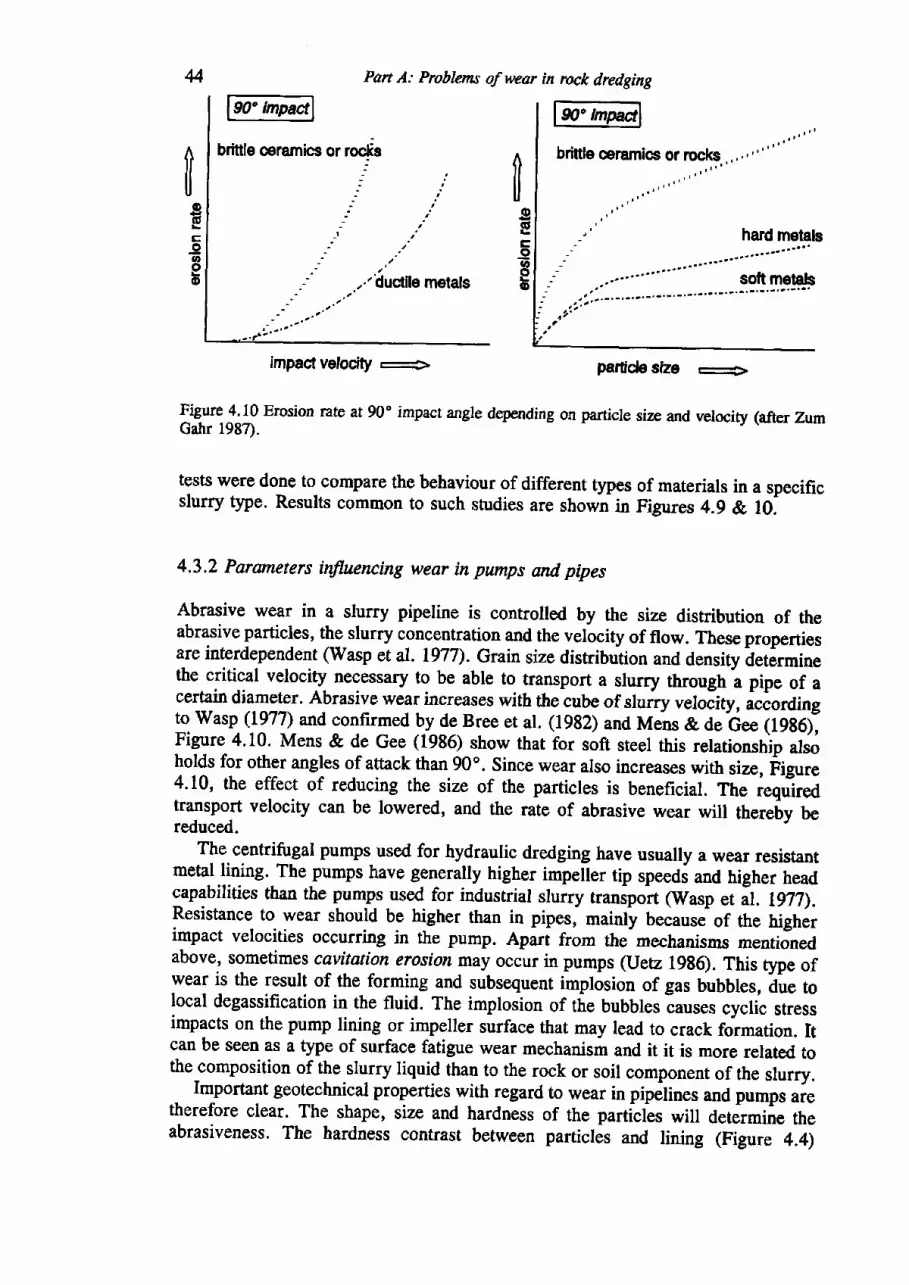
t l
llgEEG}oeo
4
I I
UoECo
eo
Part A: Problems of weer in rock dredgtng
bdttle ceramics or rocks
impact velocity - padide size '-
Figure 4.10 Erosion lla:ta at 90o impact angle depending on particle sizs, and velocity (aftet ZumGahr 1987).
tests were done to compare the behaviour of different types of materials in a specificslurry type. Results common to such studies are shown in Figures 4.g & I0:
4.3.2 Pararneters influcncing wear in pumps and pipes
Abrasive wear in a slurry pipeline is controlled by the size distribution of theabrasive particles, the slurry concentration and the velocity of flow. These propertiesare interdependent (Wasp et al. 1977). Grain size distribution and density i.tr.*io.the critical velocity necessary to be able to transport a slurry through a pipe of acertain diameter. Abrasive wear increases with the cube of slurry veloiity, accordingto lvasp (1977) and confirmed by de Bree et al. (1992) and Mens & de-Gee (l9s6tFigure 4.10. Mens & de Gee (1986) show that for soft steel this relationship alsoh.ol{t for other angles of attack than 90o. Since wear also increases with size, figu.e4.10, the effect of reducing the size of the particles is beneficial. The requiredtransport velocity can be lowered, and the rate of abrasive wear will thereby bereduced.
The centrifugal pumps used for hydraulic dredging have usually a wear resistantmetal lining. The pumps have generally higher impeier tip speedi and higher headcapabilities than the pumps used for industrial slurry transport (Wasp et ;1. lnT.Resistance to wear should be higher than in pipes, mainly because of the higherimpact velocities occurring in the pump. Aparf from the- mechanisms mentionedabove, sometimes cavitation erosion may occur in pumps (uetz 19gO. This type ofwear is the result of the forming and subsequent implosion of gas bubbles, due tolocal degassification in the fluid. The implosion of tle bubbler iu.rr., cyclic stressimpacts on the pump lining or impeller surface that may lead to crack formation. ttcan be seen as a fype of surface fatigue wear mechanism and it it is more related tothe composition of the slurry liquid than to the rock or soil component of the slurry.
Important geotechnical properties with regard to wear in pipelines and pumps aretherefore clear. The shape, size and hardness of the particles will determine theabrasiveness. The hardness contrast between particlis and lining (Figure 4.4)
hard mstals
soft metals
1 t a '
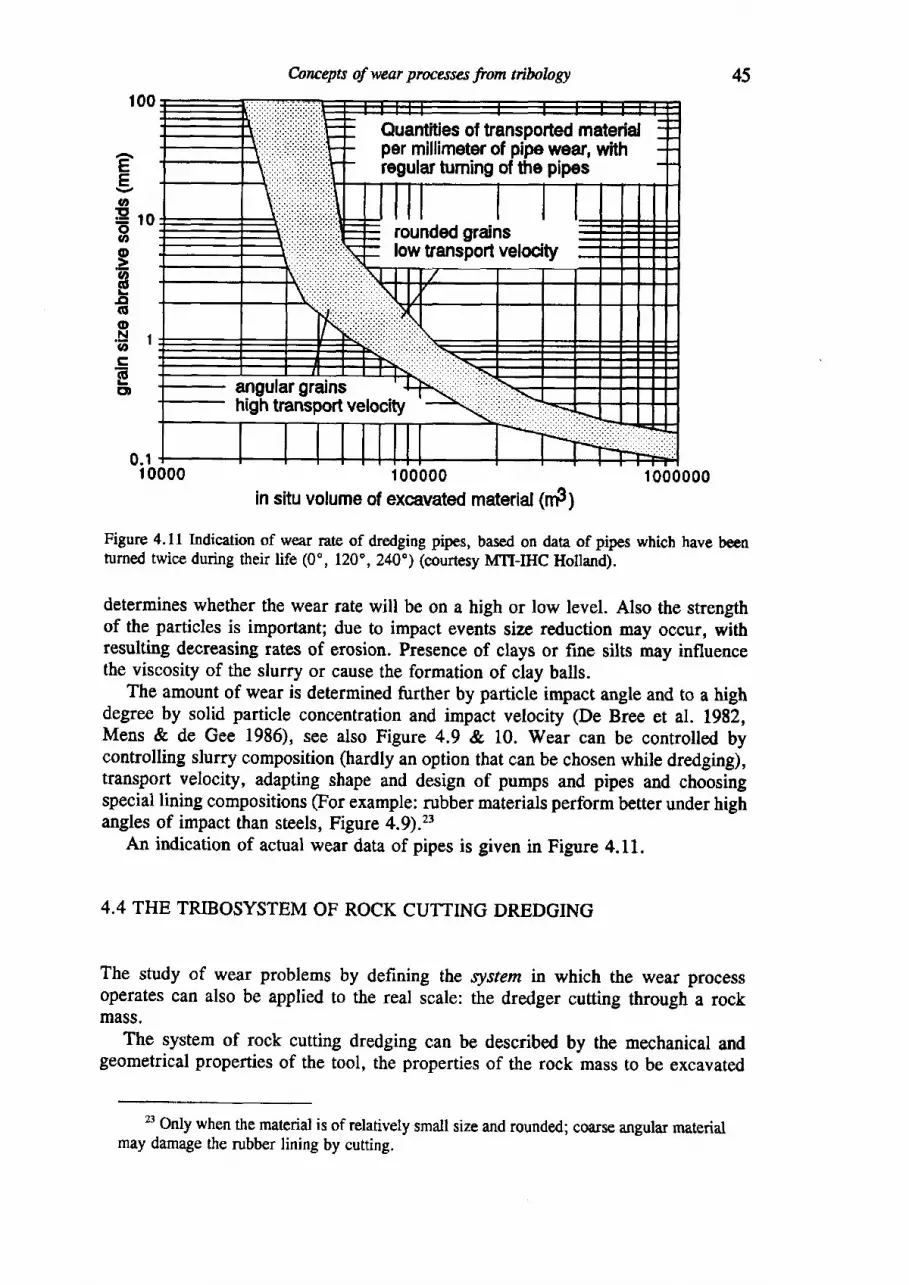
(;ancepts ofwear processcs from trihology
1000000in situ volume of excavated material(nf )
Figure 4.ll Indication of wear rat€ of dredging pipes, based on data of pipes which have beenturned twice during their life (0", 120o, 240') (courtesy MTI-IHC Holland).
determines whether the wear rate will be on a high or low level. Also the strengthof the particles is important; due to impact events size reduction may occur, withresulting decreasing rates of erosion. Presence of clays or fine silts may influencethe viscosity of the slurry or cause the formation of clay balls.
The amount of wear is determined further by particle impact angle and to a hrghdegree by solid particle concentration and impact velocity (De Bree et al. 1982,Mens & de Gee 1986), see also Figure 4.9 & 10. Wear can be controlled bycontrolling slurry composition (hardly an option that can be chosen while dredging),transport velocity, adapting shape and design of pumps and pipes and choosingspecial lining compositions (For example: rubber materials perform better under highangles of impact than steels, Figure 4.9).,t
An indication of actual wear data of pipes is given in Figure 4.11.
4.4 THE TRIBOSYSTEM OF ROCK CUTTING DREDGING
The study of wear problems by defining the system in which the wear processoperates can also be applied to the real scale: the dredger cutting through a rockmass.
The system of rock cutting dredging can be described by the mechanical andgeometrical properties of the tool, the properties of the rock mass to be excavated
23 Only when the material is of relatively small size and rounded; coarse urgular materialmay damage the rubber lining by cutting.
45
EEo
EroU'o6E.cIGoH1E
EED
I 00000
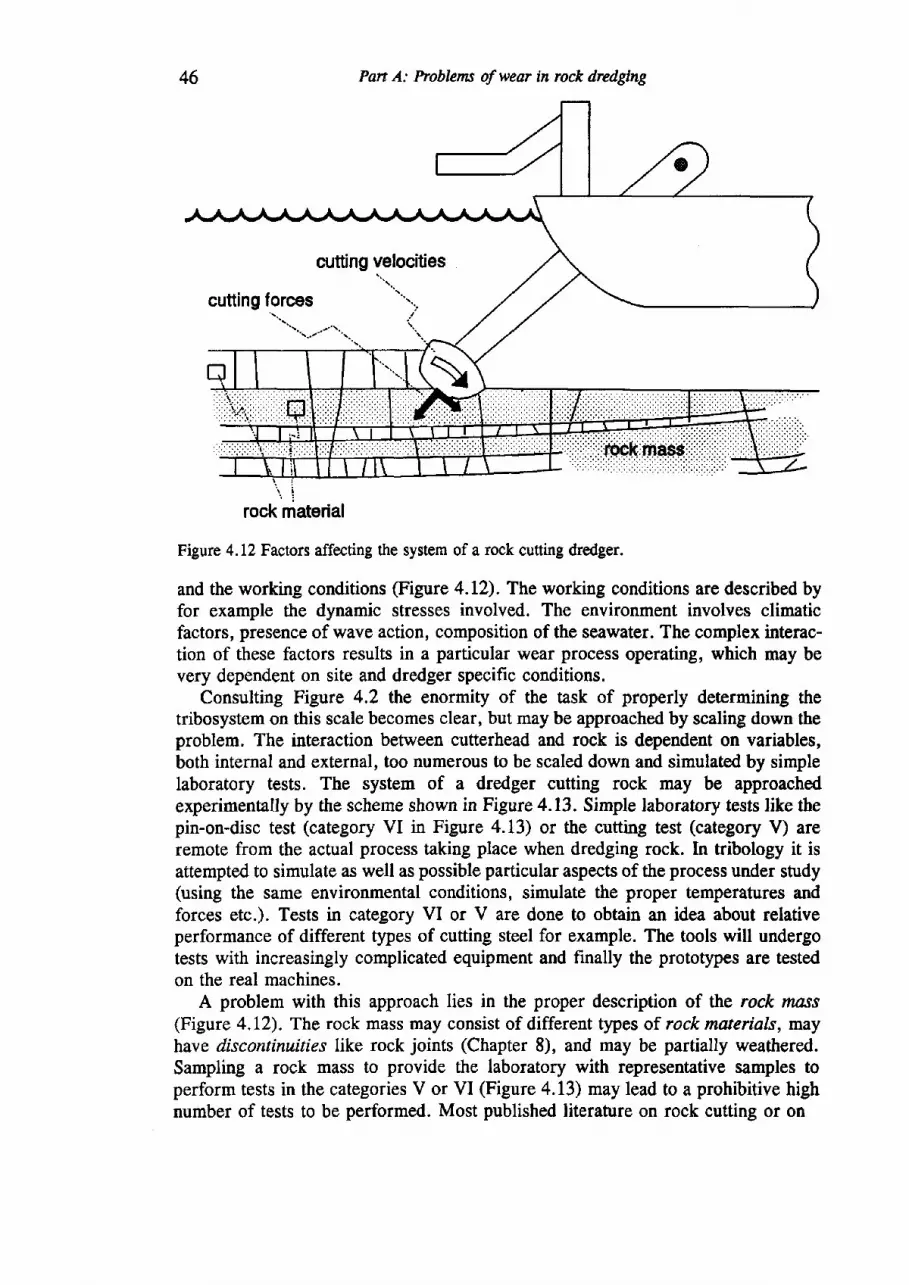
46 Pan A: Problems of wear in rock dredging
cutting forces
cutting velocities\
t . ,
I'.l
i.
Figure 4.12 Factors affecting the system of a rock cutting dredger.
and the working conditions (Figure 4.12). The working conditions are described byfor example the dynamic stresses involved. The environment involves climaticfactors, presence of wave action, composition of the seawater. The complex interac-tion of these factors results in a particular wear process operating, which may bevery dependent on site and dredger specific conditions.
Consulting Figure 4.2 the enormity of the task of properly determining thetribosystem on this scale becomes clear, but may be approached by scaling down theproblem. The interaction between cufterhead and rock is dependent on variables,both internal and external, too numerous to be scaled down and simulated by simplelaboratory tests. The system of a dredger cutting rock may be approachedexperimentally by the scheme shown in Figure 4.13. Simple laboratory tests like thepin-on-disc test (category VI in Figure 4.13) or the cutting test (category V) areremote from the actual process taking place when dredging rock. In tribology it isattempted to simulate as well as possible particular aspects of the process under study(using the same environmental conditions, simulate the proper temperatures andforces etc.). Tests in category VI or V are done to obtain an idea about relativeperformance of different types of cutting steel for example. The tools will undergotests with increasingly complicated equipment and finally the prototypes are testedon the real machines.
A problem with this approach lies in the proper description of the rock mnss(Figure 4.12). The rock mass may consist of different bpes of rock marcrtals, mayhave discontinuities like rock joints (Chapter 8), and may be partially weathsrcd.Sampling a rock mass to provide the laboratory with representative samples toperform tests in the categories V or VI (Figure 4.13) may lead to a prohibitive highnumber of tests to be performed. Most published literature on rock cutting or on
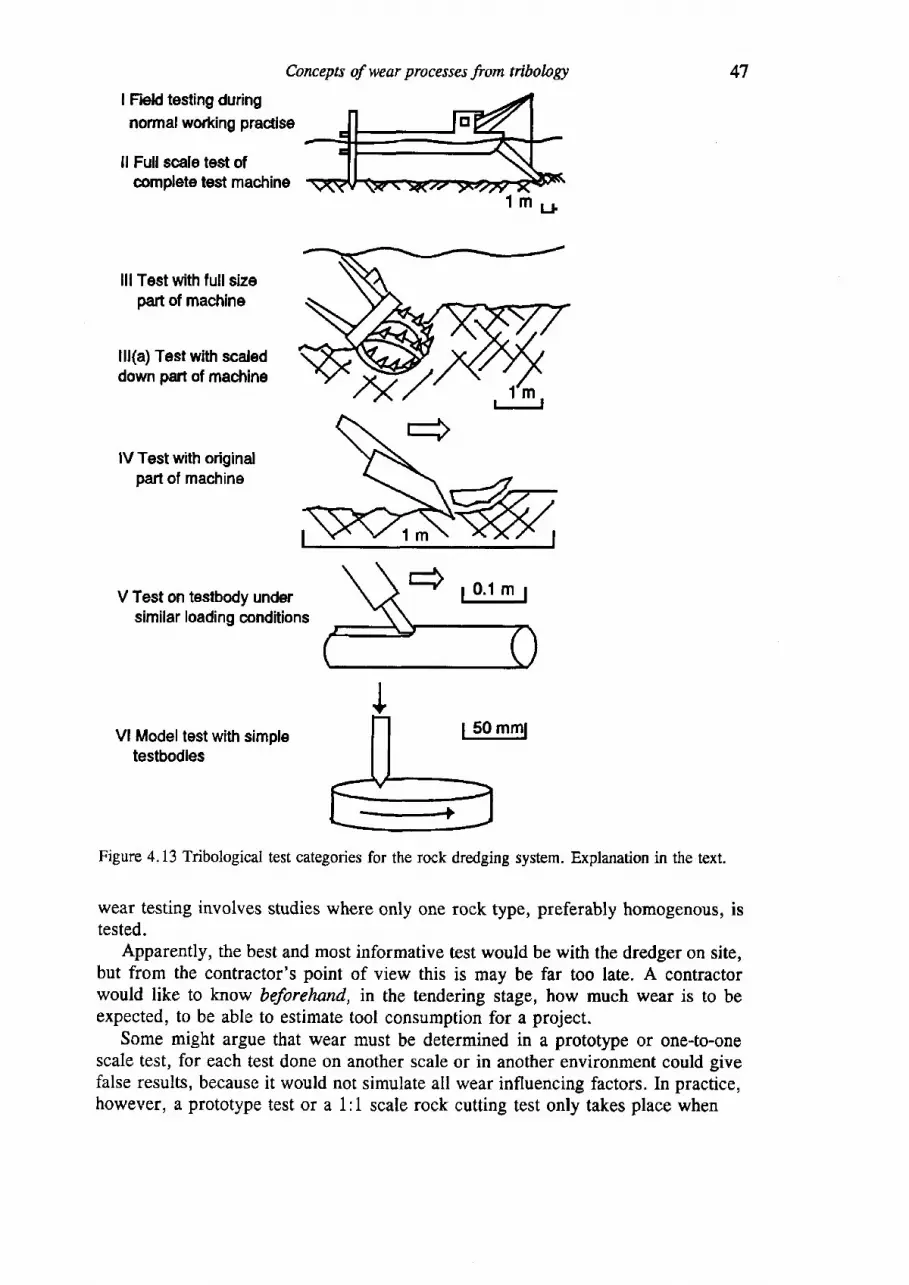
Concepts of wear processes from tribology
I Field testing duringnormal working practise
ll Fullscale test ofcomplete test machine
lllTest with full sizepart of machine
lll(a) Test with scaleddown part of madrine
lVTestwith originalpart of machine
V Test on testbody undersimilar loading conditions
Vl Model test with simpleteslbodies
Figure 4.13 Tribological test categories for the rock dredging system. Explanation in the text.
wear testing involves studies where only one roek type, preferably homogenous, istested.
Apparently, the best and most informative test would be with the dredger on site,but from the contractor's point of view this is may be far too late. A contractorwould like to know beforehand, in the tendering stage, how much wear is to beexpected, to be able to estimate tool consumption for a project.
Some might argue that wear must be determined in a prototype or one-to-onescale test, for each test done on another scale or in another environment could givefalse results, because it would not simulate all wear influencing factors. In practice,however, a prototype test or a 1:1 scale rock cutting test only takes place when
47

48 Pan A: Problems of wear in rock dredging
dredging has started, after the site investigation and tendering stages. Often the l:lscale test turns out to be the real excavation process itself.
Another point to note concerns the location where a 1:1 scale test is carried out.In linear projects, like trench excavation or harbour channel deepening, prototypetests carried out on a lacal spot could give very misleading resultJif some variationof properties or environmental circumscances were present along the excavationroute.
One solution could be that l:1 scale tests are to be used as means of calibration ofwear test data obtained at lower categories of wear testing. It is obvious that manytests could be performed for low cost on many samples on the laboratory scale. Bycalibrating the results of these data with a trial dredging operation on thireal scale,contractors may be able to estimate to a much higher level of accuracy the toolreplacement rate to be expected for a project. How this could be done is tie subjectof this work.

CHAPTER 5
Influence of site geology on wear problems
Many dredging contractors have gained experience with rock dredging in the MiddleEast area during the 1970's. Large dredging projects took place along the shores ofthe Gulf States and in the Suez canal. Especially in the Gulf area frequently acaprocl*o of strongly cemented rock was encountered within otherwise non- orslightly cemented sand deposits. This rock type required large rock cutting suctiondredgers, which were specially built for this purpose (De Koning 1993). Manycontractors became familiar with problems of rock cutting and high consumption ofpick points. Somewhere in the area of Jubail Pick Point Island is located, which issaid to be covered completely by used pick points. Much experimenting took place.Special designs of cutterheads were tried out, as were different types of cutting tools,like pick points with tungsten carbide inserts. The data gathered by the contractorsduring such projects were regarded as highly confidential, for competitive reasons(see Chapter L.2.2). Considering the concept of the tribosystem of a cutting suctiondredger, as described in Chapter 4.4. this is not surprising. Although accurate dataon production rates and tool consumptions for these projects do exist, very oftendescriptions of the rock and soil materials on which these data apply are lacking. Thereason is that monitoring of the material excavated is cumbersome on rock cuttingsuction dredgers. Samples should be taken at the disposal sites of the slurry, orunderwater inspections should be performed. Another problem is that at that time,as even today, the importance of the exact nature of the rock or soil materials beingdredged was not recognized.
During the author's research into wear problems of cutter suction dredging inrock, which started eady 1986, close contact with dredging contractors, also in aspecial working group on tooth wear, hardly ever resulted in the disclosure of toolconsumption rates for particular projects and if so it appeared that factual data on therock involved was lacking or of poor character. The involvement of engineeringgeologists or geotechnical engineers familiar with geology in these projects wasnegligible. As mentioned in Chapter 1, this has to do with the unfamiliarity with
2a Caprock (hard-pan, duricrust) is a layer of strongly cemented material of variablethickness (cm to m scale) occurring in otherwise unlithified sediments, often found close toa (paleo) ground surface. The cementing agent (calcareous, siliceous or femrginous) is oftenprecipitated from percolating groundwater.
49
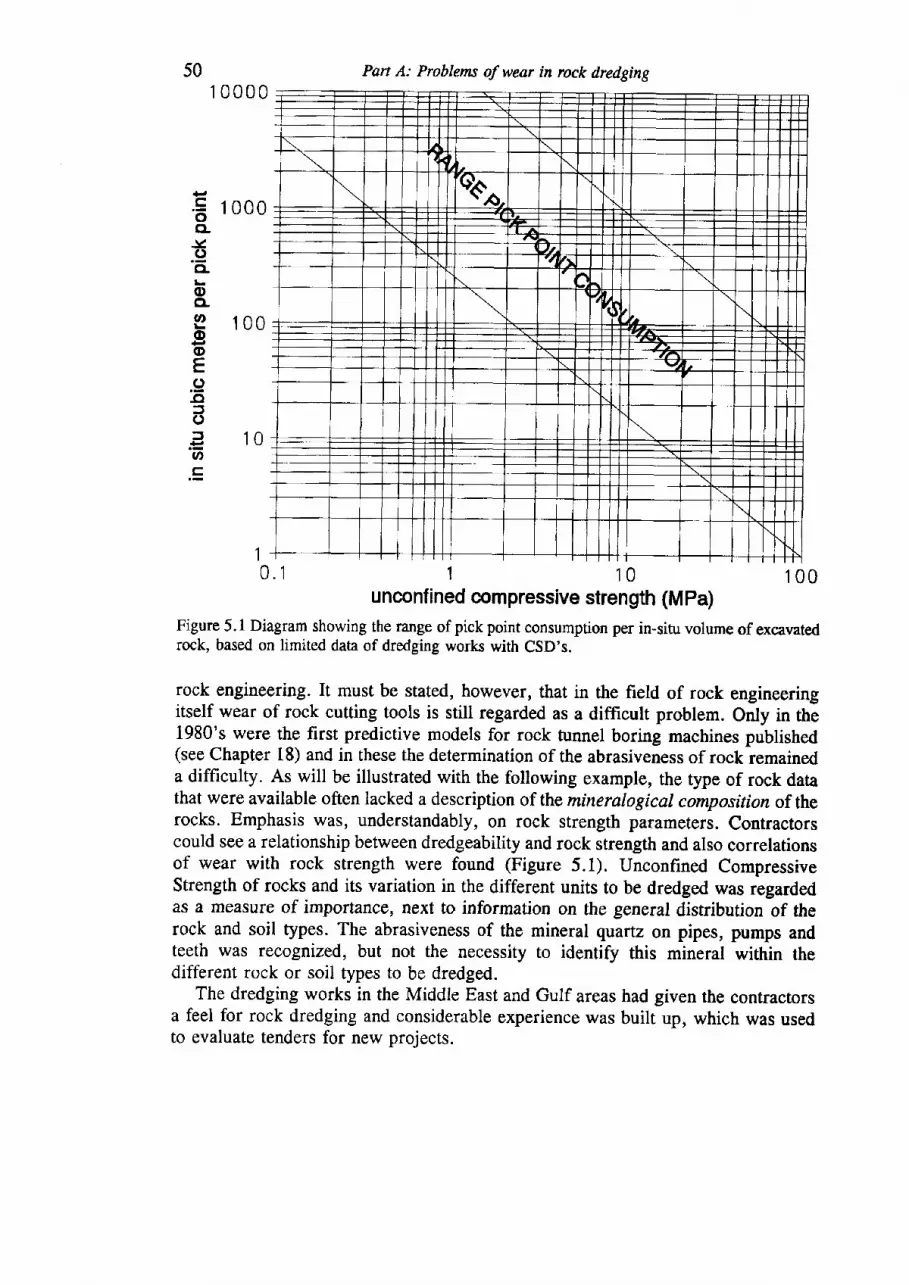
501 0000
Pan A: Problems of wear in rock dredging
t---
t...L_) &^
---\tfl l_
a
-tT ==+
1 000
100
10 100unconfined compressive strength (MPa)
Figure 5.1 Diagram showing the range of pick point consumption per in-situ volume of excavatedrock, based on limited data of dredging works with CSD's.
rock engineering. It must be stated, however, that in the field of rock engineeringitself wear of rock cutting tools is still regarded as a difficult problem. Only in the1980's were the first predictive models for rock tunnel boring machines published(see Chapter 18) and in these the determination of the abrasiveness of rock remaineda difficulty. As will be illustrated with the following example, the type of rock datathat were available often lacked a description of the mineralogicat composition of therocks. Emphasis was, understandably, on rock strength parameters. Contractorscould see a relationship between dredgeability and rock strength and also correlationsof wear with rock strength were found (Figure 5.1). Unconfined CompressiveStrength of rocks and its variation in the different units to be dredged was regardedas a measure of importance, next to information on the general distribution of therock and soil types. The abrasiveness of the mineral quartz on pipes, pumps andteeth was recognized, but not the necessity to identify this mineral within thedifferent rock or soil types to be dredged.
The dredging works in the Middle East and Gulf areas had given the contractorsa feel for rock dredging and considerable experience was built up, which was usedto evaluate tenders for new projects.
.EoCL
J()CL
oCLo(DoE.9-oJOf.=o
10
0.1
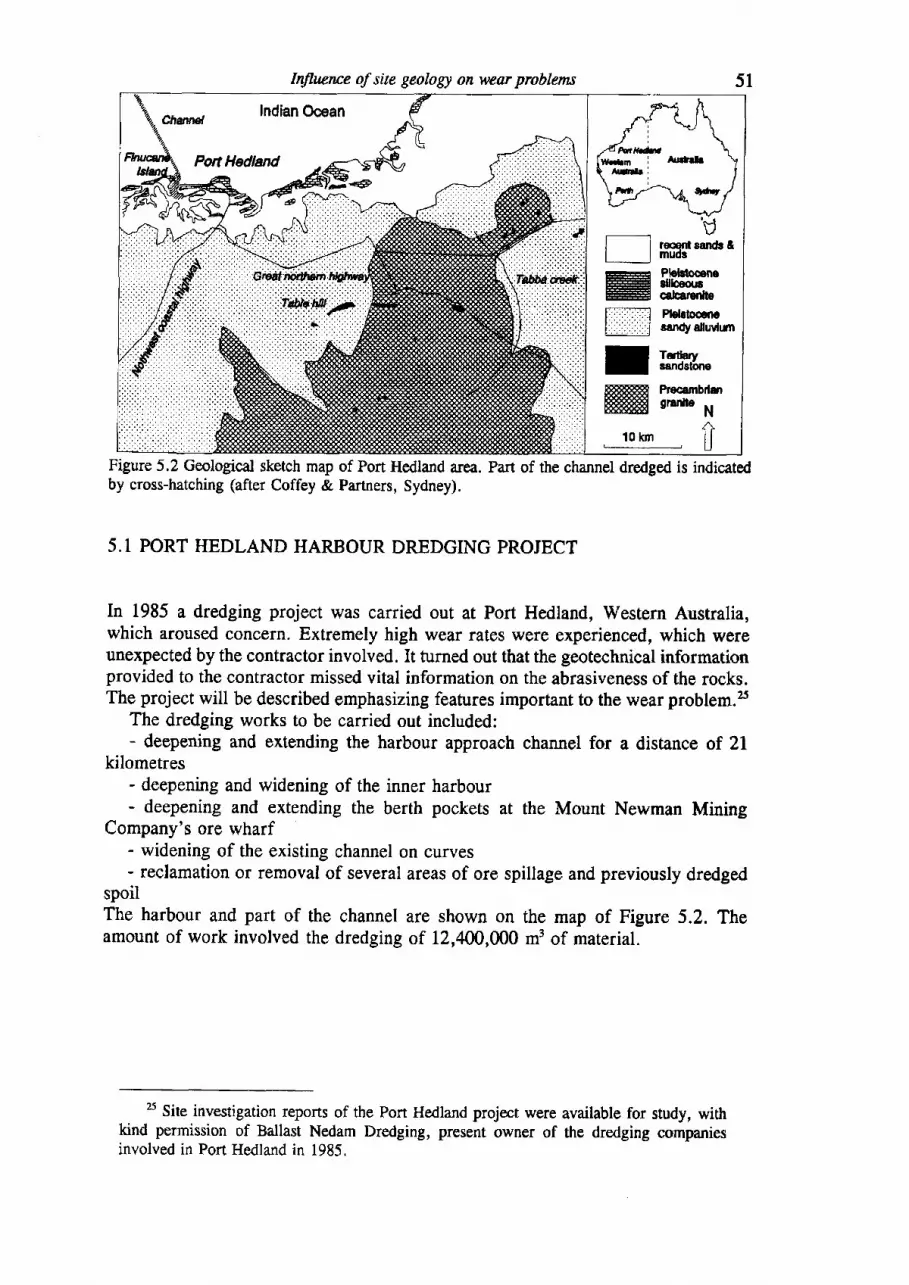
InJhterce of site geology on wear problems
Figure 5.2 Geological sketch map of Port Hedland area. Part of the channel dredged is indicatedby cross-hatching (after Coffey & Partners, Sydney).
5.1 PORT HEDLAND HARBOUR DREDGING PROJECT
In 1985 a dredging project was carried out at Port Hedland, Western Australia,which aroused concern. Extremely high wear rates were experienced, which wereunexpected by the contractor involved. It turned out that the geotechnical informationprovided to the contractor missed vital information on the abrasiveness of the rocks.The project will be described emphasizing features important to the wear problem.2s
The dredging works to be carried out included:- deepening and extending the harbour approach channel for a distance of 2l
kilometres- deepening and widening of the inner harbour- deepening and extending the berth pockets at the Mount Newman Mining
Company's ore wharf- widening of the existing channel on curves- reclamation or removal of several areas of ore spillage and previously dredged
spoilThe harbour and part of the channel are shown on the map of Figure 5.2. Theamount of work involved the dredging of L2,400,000 m3 of material,
E Site investigation reports of the Port Hedland project were available for study, withkind permission of Ballast Nedam Dredging, present owner of the dredging companiesinvolved in Port Hedland in 1985,
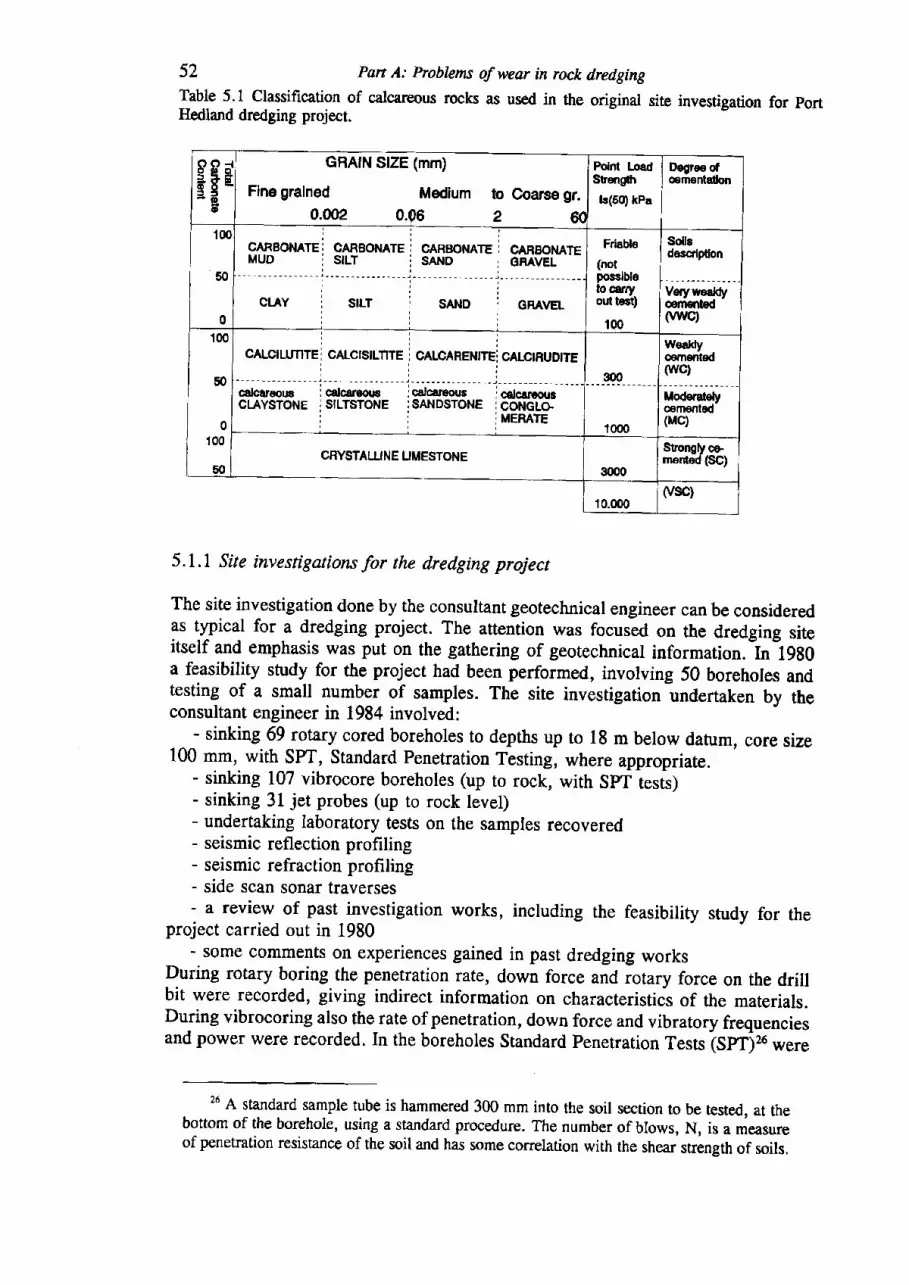
52 Pan A: Problems of wear in rock dredgingTable 5.1 Classification of calcareous rocks as used in the original site investigation for portHedland dredging project.
O O -9 P 96gP= d l
o
GHAIN SIZE (mm)
Fine gralned Medlum to coarse gr.4.ffiz 0.96 2 6(
Folnt LoadSEsrgth
ls(50) kPa
Degree dcemenldon
1tr
50
0
CARBONATEMUD
CARBONATESILT
CARBONATESANO
CAFBOMTEGRAVEL
Friable
(nolposslbletoc€rryoul test)
100
Soflsdescflpthn
Verywealdy€m€nl€d(vwc)
CIJY SILT sAlto GRAVEL
100
50
0100
50
CALc|LUNTE
calctrsousCI.AYSTONE
CATCISILTITE
calcareousSILTSTONE
CALCAFENITE
a;;;; '.SANDSTONE
CALCIRUDITE
calcarsogsCONGLGMERATE
flx)
Waaldy€ment€d(wc)
10(x)
iloderately@fii€nted(Mc)
CFYSTALUNEIMESTONE3m0
Sfongiyemsnted (SC)
10.000(vsc)
5.1.I Site investigations for the dredging project
The site investigation done by the consultant geotechnical engineer can be coosideredas typical for a dredging project. The attention was focusld on the dredging siteitself and emphasis was put on the gathering of geotechnical information.-tn 19gOa feasibility study for the project had been performed, involving 50 boreholes andtesting of a small numlgr of samples. The site investigation lndertaken by theconsultant engineer in 1984 involved:
- sinking 69 rotary cored boreholes to depths up to 18 m below datum, core sizo100 mm, with sPT, standard Penetration Testing, where appropriate.
- sinking 107 vibrocore boreholes (up to rock, with spr rests)- sinking 31 jet probes (up to rock level)- undertaking laboratory tests on the samples recovered- seismic reflection profiling- seismic refraction profiling- side scan sonar traverses- a review of past investigation works, including the feasibility study for the
project carried out in 1980- some comments on experiences gained in past dredging works
During rotary boring the penetration rate, down force and rotary force on the drillbit were recorded, giving indirect information on characteristics of the materials.During vibrocoring also the rate of penetration, down force and vibratory frequenciesand power were recorded. In the boreholes Standard Penetration Tests isptjro *rp
. 2' A standard sample tube is hammered 300 mm into the soil section to be tested, at the
bottom of the borehole, using a standard procedure. The number of blows, N, is a measureof penetration resistance of the soil and has some correlation with the shear strength of soils.
Influence of site geology on wear problems 53
performed. Pocket penetrometer tests2? were performed on solne tube samples ofclayey materials and on samples from the vibrocored boreholes. The boreholes of the1980 feasibility study were relogged, in order to adapt the descriptions to theclassification adopted in 1984. All soils were described using the PIANCclassification (Appendix A). For the rocks, which are of calcareous and siliceousnature, an adapted version of the Clark & Walker (L977) classification system wasused (Iable 5.1). Table 5.2 gives the Clark & Walker classification for comparison.The essential features of the site investigation were reported in the form of drillinglogs, laboratory test results and track plots ofgeophysical researches. A series of 85cross sections and a longirudinal section down the centre line of the channel formedthe geotechnical rnodel (Table 5.3).
To have an idea of the extent of the work, including the boreholes of 1980, theborehole density was one borehole per 175 m length of channel (see Figure 5.4).Since the structure of the rocks was relatively simple (subhorizontal layering), thiswas regarded as normal for dredging projects (Verbeek 1984). The purpose of thegeophysical work was to provide information on the subsurface between boreholes.This purpose was, however, not well met and the geophysical work was difficult tointerpret. The combination of low borehole density with poor geophysics led to arelatively high uncertainty about the ground conditions. However, the geotechnicalmodel was also based on an interpretation of the local geology.
5.1.2 Interpretation of the regional geology in the site investigation report
The regional geology was described by concentrating on the coastal area itself. Thegeology of the area was well known and several geological maps have beenpublished. A regional geological map 1:250.000 (sheet SF504 Port Hedland-BedoutIsland 1982, and a 1:50.000 urban geology map sheet 2657 (III) (Archer 1983). Asketch map based on these maps, such as Figure 5.2, was not given in the originalsite investigation report. The site investigation report mainly discusses the geologyof the area of immediate interest, concentrating on the most recent geologicalhistory.
The framework of the geology of Port Hedland was described by the geotechnicalconsultant as "... made up of several parallel strongly cemented calcarenite beachrock and former dune ridges trending east north east. lnland of this skeleton to thesouth there is a large area of tidal creeks and estuaries, partially infilled withMangrove mud. Red dunal sands of the Pindan Sand Association are encountered onthe north side of the North West Coastal Highway, and the thickness of thesesuperficial sands decreases southwards until Archaean granites appear, some 15 kmto the south.
Port Hedland has always been a natural position for a port because the calcareniteridges are gapped between the townsite and Finucane Island, and at the time that thesand ridges and beach sands were being lithified, the tidal influx kept a majorchannel open to fhe sea."
27 With the pocket penetrometer an estimate of the unconfined compressive strength ofcohesive soils can be made. Can be used on small samples.
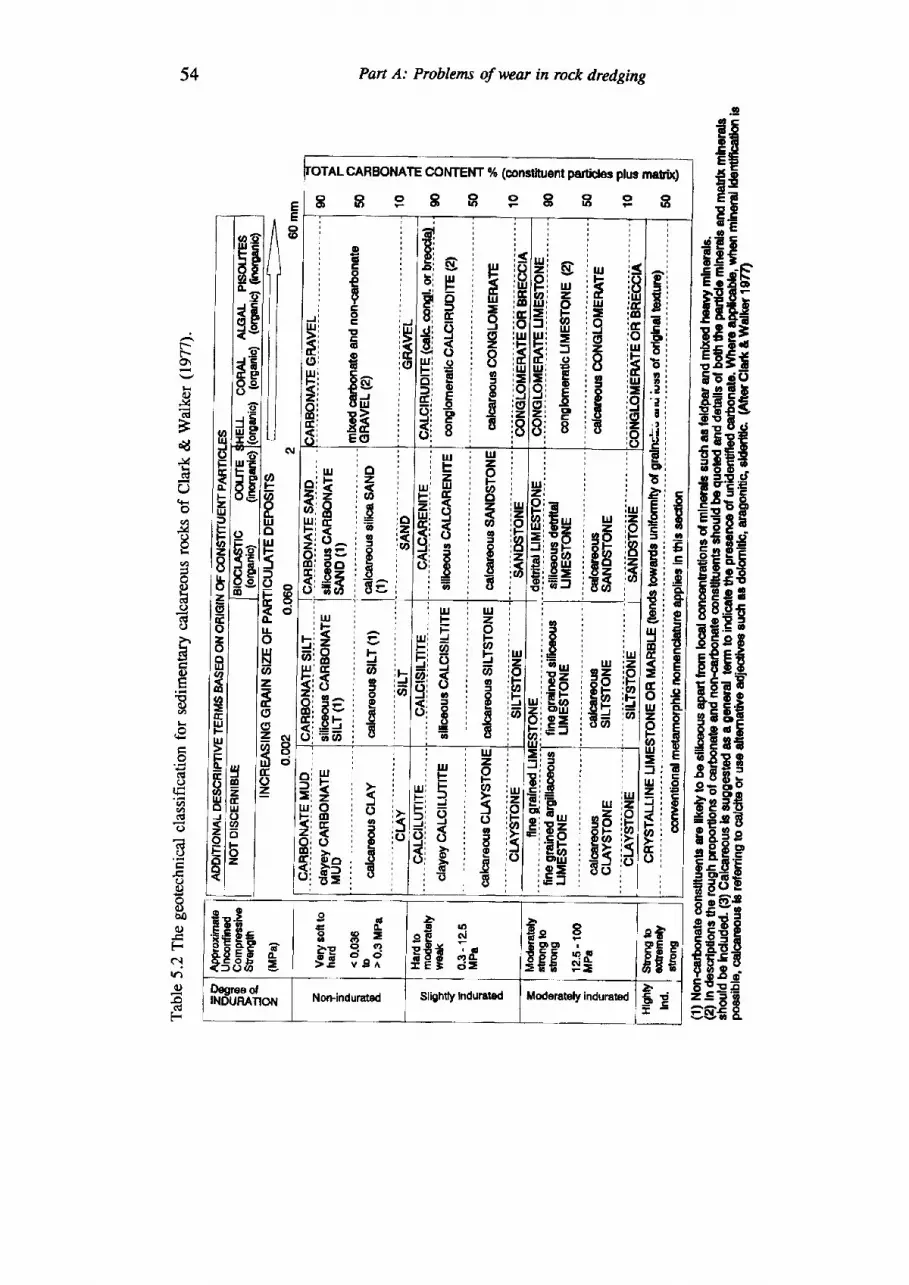
Pan A: Problems of wear in rock dredSW54
.9
E€iEE
lE*IE€
lff$sEE:EgE€fEgEF
EffffEiFgggEEEEg
gffiEer-s t:n8 g -> E q qgE ?s?
.b
EEs ;u €'" gh r togEg Eg
pB
FFgDegree ofINDURANON Nonindurded Sl'Bhdy Induratod Modentely indurated E r '
- 9 E
F-t'-.o\
l'r4)
J(cl
B€J4
(Jttsoaa
+(tra
l)G'()()
co
rr
or{i64)c,(J
atotr€a
Ubo0)
FcJu-)q)
,
l ol l -Iu )t ol o -IU Il ol u t
tkl 9I FI t r
l fll-oIJJNoz
F(,g2ofiEoz.
ahl u lt ( )I t rt$l 1I Fl 2I llJl : tI FI Fl ot z
l8I=gE0zoflq,
6rQ I= lr E lu J IF lt r l> l
EIE I
8lHlJ ]< lz lo lF I
6 lo l< l
Hg$sEE
Influence of site geology on wear problems 55
The geological history was described as follows: "In late Pleistocene time when thesea level was not very different from the present one, erosion of the granitichinterland to the south of Pt Hedland released large quantities of alluvial sands andkaolinitic type clays into local river systems, that discharged into the sea in deltaicdeposits. This material was later reworked off an extensive sea beach, andcalcarenite and capstone gravels and cobbles eroded from an exposed outcrop on thebeach were added to the alluvial materials.
Sea level then fell, and a beach was formed in the vicinity of 16 and 17 km ofthe present channel and at right angles to it.28 Sand dunes of shell grit and limesand were blown inland from the shore forming primary and secondary dunes whichwere lithified in place from the solution and deposition activity of weak carbonic acidderived from CO2 and dissolved in rain or sea water.
Sea level then fell and a new series of sand dunes were formed on the edge of thebeach in the viciniry of 20.5 krn. lVhile these dunes were lithifying in place the oldsandy clay landscape was being modified in river and terrace areas. Weathering andleaching processes became active with kaolin clay being changed into palygorskite.
A rise in sea level formed another sand beach in the vicinity of 5 to 7 km but nodunes were formed before the sea rose again this time to near its presenf day level.This sea beach became lithified.
Dune ridges were blown up on the beaches, and while the dunes were beinglithified, tidal flows down Stingray and North West Creeks kept the gap between PtHedland and Finucane Island open, and a well formed tidal discharge stream wasformed. During this period the leaching of the red sandy clays proceeded withenrichment and leaching processes continuing with variable palygorskite cementation.
Finally, sea level rose a few meters creating the flooded mangrove hintedand andestuarine muds were deposited in the areas clear of tidal flux. The two main uppercalcarenite ridges resulting from the dune cementation ran from near Hunt Point,then down either side of the present main road to the vicinity of the Leslie Saltpans. "
The emphasis was clearly on the distribution of the geological units to beencountered by the dredging work, although older rock formations, undedying theQuaternary deposits (mainly weathered sandstones) were not described in thegeological overview.
5.1.3 Geotechnical interpretation in the site investigation report
The following tests were performed during the site investigation of L984:- On soils in the field: particle size distribution, in situ bulk density (wet & dry),
moisture content, Atterberg plasticity index- On soil samples in the laboratory: shear strength, unconfined compressive
strength, carbonate content, organic content- On rocks in the field: Point Load index (number of tests: 94), Protodyakonov
number
28 The chainage of the channel has been described by km distance from the harbour tothe north. A chainage of 17 km, implies 17 km along tlie "hannel axis to the northwest,Figure 5.2.
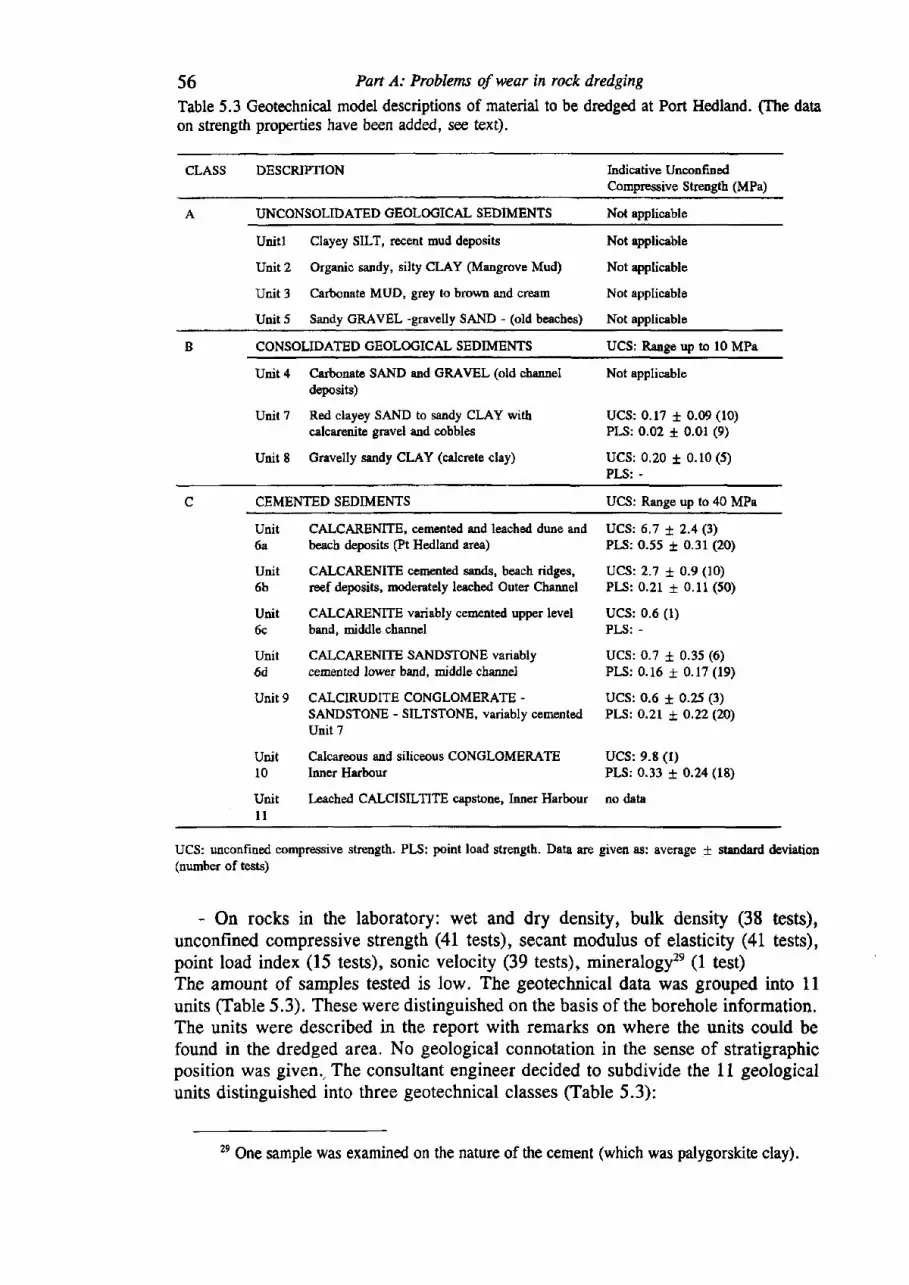
56 Part A: Problems of wear in rock dredging
Table 5.3 Geotechnicd model descriptions of material to be dredged at Port Hedland. (Ihe daaon strength properties have been addel, see text).
CLASS DESCRIPTION Indicative UnconfinedCrmpressive Strength (MPa)
UNCONSOLIDATED GEOLOGICAL SEDIMENTS Not applicable
Unitl Clayey SILT, rccent mud deposits
Unit 2 Organic sandy, silty CLAY (Mangrove Mud)
Unit 3 Carbonate MUD, grey to brown and cream
Unit 5 Sandy GRAVEL -gravelly SAND - (old beachas)
Not applicable
Not applicable
Not applicable
Not applicable
CONSOLIDATED GEOLOGICAL SEDIMENTS UCSI Range up to 10 MPa
Unit 4 Ca$onate SAND and GRAVEL (old chrnneldeposits)
Unit 7 Red clayey SAND to sandy CLAY withcalcarenite gravel aud cobbles
Unit 8 Gravelly sandy CLAY (calcrete clay)
Not applicable
UCS: 0.17 + 0.09 (10)PLS: 0.02 * 0.01 (9)
UCS:0 ,20 t 0 .10(5)PLS: -
CEMBNTED SEDIMENTS UCS: Range up to,l0 MPa
Uuit CALCARENITE, cemenled and leached dune and6a beach deposits @t Hedland area)
Unit CALCARENITE cenrented sands, beach ridges,6b reefdeposits, moderately leacbed Outer Channel
Udit CALCARENITE variably cemeoted upper level6c band, middle channel
unit CALCARENITESANDSTONEvaTiably6d cemented lower band, middle channel
Unit9 CALCIRUDITE CONGLOMERATE -SANDSTONE - SILTSTONE, variably cementedUnit 7
Unit Calcareous and siliceous CONGLOMERATEl0 lnner Harbow
Unit trached CALCISILTITE capstone, Inner Harbourl l
UCS: 6.7 t 2.4 Q')PIJ: 0.55 t 0.31 (20)
UCS: 2.7 t 0.9 (10)PLS:0.21 t 0 .11 (50)
UCS: 0.6 (l)PLS: -
UCS: 0.7 t 0.35 (6)PLS: 0.16 t 0.17 (19)
ucs: 0.6 t 0.25 (3)PLS: 0.21 t O.22 (2O)
UCS: 9.8 (l)PLS: 0.33 t 0.24 (18)
no data
UCS: unconfined compressive stre,ngth. PLS; point load strength. Data are given as: average t stsndard deviation(number of tests)
- On rocks in the laboratory: wet and dry density, bulk density (38 tests),unconfined compressive strength (41 tests), secant modulus of elasticity (41 tests),point load index (15 tests), sonic velocity (39 tests), mineralogyze (1 test)The amount of samples tested is low. The geotechnical data was grouped into 1lunits (Table 5.3). These were distinguished on the basis of the borehole information.The units were described in the report with remarks on where the units could befound in the dredged area. No geological connotation in the sense of stratigraphicposition was given., The consultant engineer decided to subdivide the 11 geologicalunits distinguished into three geotechnical classes (Table 5.3):
2e One sample was examined on the nature of the cement (which was palygorskite clay).
I4fluerce of site geology on wear problems 57
A Unconsolidated geological sediments (implying non-lithified soils)B Consolidated geological sediments (implying cemented soils/rocks)C Cemented sediments (implying rocks)
As can be seen from Table 5.3 the division distinguishes soils (A) from weak tomoderately weak @) and moderately strong (C) rocks. Using the classification theconsultant estimated the amount of materials of the A, B & C classes to be dredged.
5.1.4 Tendering for the dredging project
In the few weeks that were available for tendering, the competing contractors, on thebasis of the site investigation report (and additional information provided by theconsultant engineer on weather and water conditions, legal aspects etc.) had toprepare their bids. As can be deduced from the description given of the siteinvestigation, the geotechnical model was not completely clear and the geophysicalsurvey had not been successful in delineating the different units distinguished basedon the borehole records. The contractors could, however, inspect the cores and theborehole records, which included also information on discontinuities, like RQD'o.The bidding contractors, if not stating otherwise, accepted the report as containingsufficient information to prepare and execute their work. As stated earlier, the siteinvestigation report was of a quality considered normal for dredging contracts. Asusual the contract had the provision included in claase -llt, stating that whenphysical conditions would occur that could not be foreseen by an experiencedcontractor, the extra costs would be paid by the employer, if the consulting engineeragrees with the claim of the contractor. This provision protects the contractor fromsurprises or gross errors in the interpretation of the ground conditions.
30 Rock Quality Designation attempts to quantify the degree of natural fracturing of coredboreholes. It is the total length of intact cores with axial length > 100 mm divided by thetotal length of the section considered (%).
3r Most contracts follow the Conditions of Contract (tnternational) for works of CivilEngineering Construction, prepared by the FIDIC (Fdd€ration Internationale des Ingdnieurs-Conseils) and FIEC (Fdddration Europeenne de la Construction) approved by manyinternational construction associations. Sub-clause I of Clause 12 runs as follows: "If duringthe execution of the Site Operations the Contractor shall encounter physicat conditions (otherthan weather conditions or conditions due to weather conditions) or artifrcial obstructionswhich conditions or obstructions he considers could not reasonably have been foreseen byan experienced contractor and the Contractor is of the opinion that additional cost will beincurred which would not have been incurred if the physical conditions or artificialobstrustions had not been encnuntered he shall if he intends to make any claim for additionalpayment give notice to the Engineer pursuant to Clause 52$) nd shall specify in such noticethe physical conditiorts and/or artificial obstructions encountered and with the notice ifpracticable or as soon as possible thereafter give details of the anticipated effects thereof themeasures he is taking or proposing to take and the extend of the anticipated delay in orinterference with the execution of the Investigation.' (From the ICE -Institution of CivilEngineers, London- Conditions of Contract for Ground Investigation, Cottington & Akenhead1984, p.97,129). The remaining sub-clauses 34 provide for arrangements to be taken bythe Engineer and the Contractor and, if the grounds for the claim are accepted, it states thatthe contractor is entitled to a reasonable compensation for the costs of overcoming theproblems, and also the delay and disruption costs.
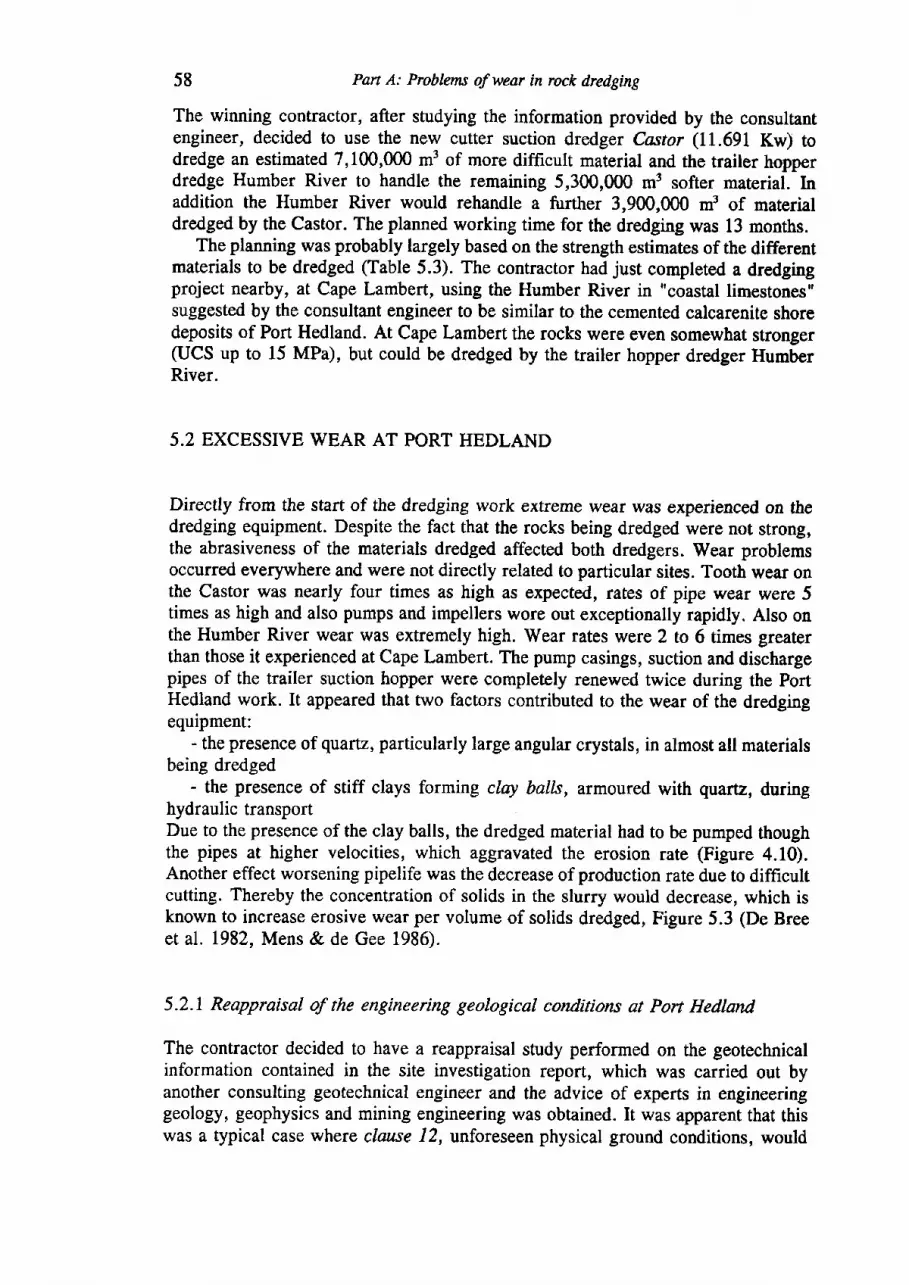
58 Part A: Problems of wear in rock dredging
The winning contractor, after studying the information provided by the consultantengineer, decided to use the new cutter suction dredger Castor (11.691 Kw) todredge an estimated 7,100,000 m3 of more diffrcult material and the trailer hopperdredge Humber River to handle the remaining 5,300,000 m3 softer material. Inaddition the Humber River would rehandle a further 3,900,000 m3 of materialdredged by the Castor. The planned working time for the dredging was 13 months.
The planning was probably largely based on the strength estimates of the differentmaterials to be dredged (Table 5.3). The contractor had just completed a dredgingproject nearby, at Cape Lambert, using the Humber River in "coastal limestones"suggested by the consultant engineer to be similar to the cemented calcarenite shoredeposits of Port Hedland. At Cape Lambert the rocks were even somewhat stronger(UCS up to 15 MPa), but could be dredged by the trailer hopper dredger HumberRiver.
5.2 EXCESSIVE WEAR AT PORT HEDLAND
Directly from the start of the dredging work extreme wear was experienced on thedredging equipment. Despite the fact that the rocks being dredged were not strong,the abrasiveness of the materials dredged affected both dredgers. Wear problemsoccurred everywhere and were not directly related to particular sites. Tooth wear onthe Castor was nearly four times as high as expected, rates of pipe wear were 5times as high and also pumps and impellers wore out exceptionally rapidly. Also onthe Humber River wear was extremely high. Wear rates were 2 to 6 times greaterthan those it experienced at Cape Lambert. The pump casings, suction and dischargepipes of the trailer suction hopper were completely renewed twice during the PortHedland work. It appeared that two factors contributed to the wear of the dredgingequipment:
- the presence of quartz, particularly large angular crystals, in almost all materialsbeing dredged
- the presence of stiff clays forming clay balls, armoured with quartz, duringhydraulic transportDue to the presence of the clay balls, the dredged material had to be pumped thoughthe pipes at higher velocities, which aggravated the erosion rate (Figure 4.10).Another effect worsening pipelife was the decrease of production rate due to difficultcutting. Thereby the concentration of solids in the slurry would decrease, which isknown to increase erosive wear per volume of solids dredged, Figure 5.3 (De Breeet al. L982, Mens & de Gee 1986).
5.2.1 Reappraisal of the engtneering geological conditions at Port Hedland
The contractor decided to have a reappraisal study performed on the geotechnicalinformation contained in the site investigation report, which was carried out byanother consulting geotechnical engineer and the advice of experts in engineeringgeology, geophysics and mining engineering was obtained. It was apparent that thiswas a typical case where claase 12, unforeseen physical ground conditions, would
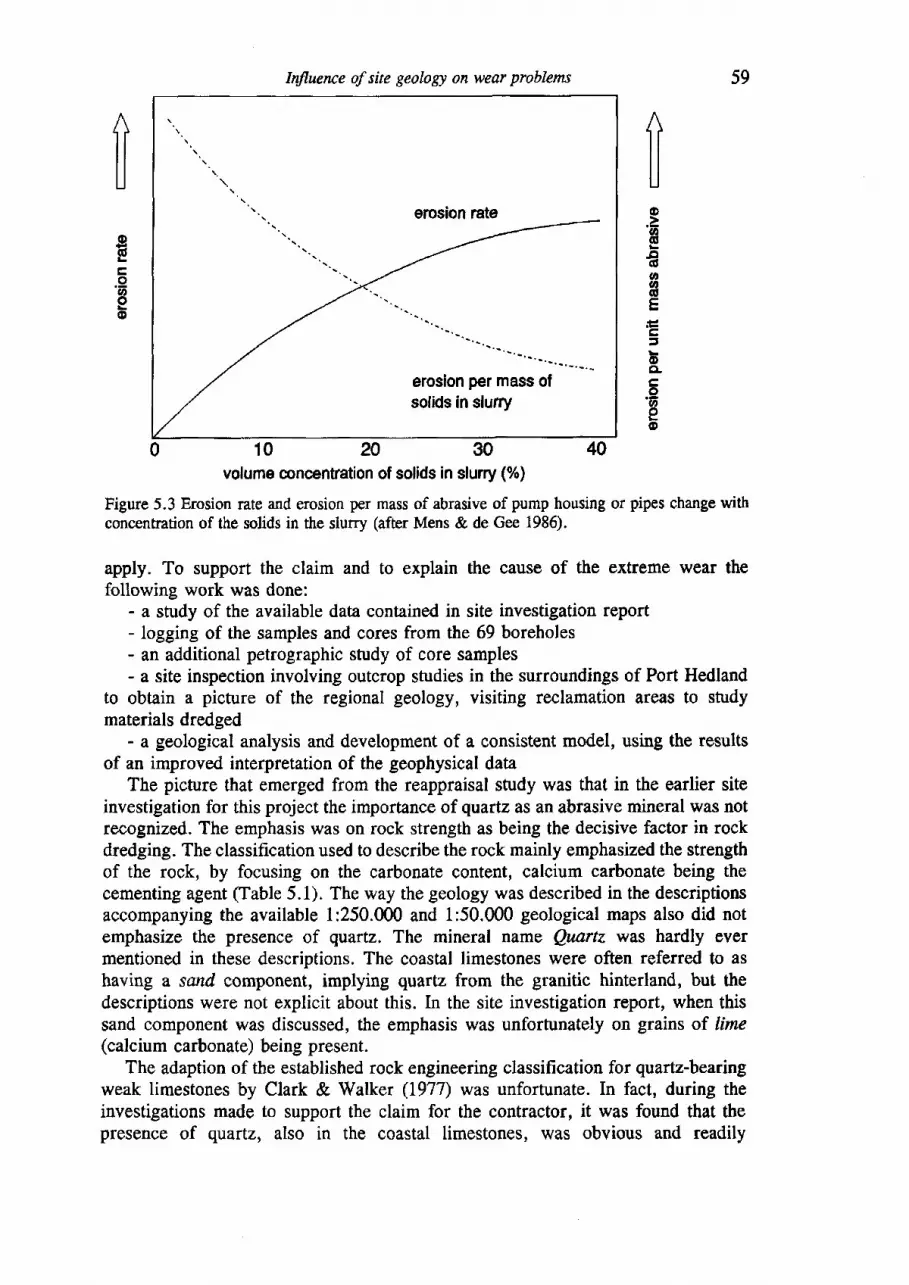
59
1filt lt l
Uoth
E-o6ood
EcuocLc,o'6eo
oE.9oIo
Irfluence of site geology on wear problems
erosion rate
erosion per mass ofsolids in slurry
010203040volume concenUation of solids in slurry (%)
Figure 5.3 Erosion rate and erosion per mass of abrasive of pump housing or pipes change withconcentration of the solids in the slurry (after Mens & de Gee 1985).
apply. To support the claim and to explain the cause of the extreme wear thefollowing work was done:
- a study of the available data contained in site investigation report- logging of the samples and cores from the 69 boreholes- an additional petrographic study of core samples- a site inspection involving outcrop studies in the surroundings of Port Hedland
to obtain a picture of the regional geology, visiting reclamation areas to studymaterials dredged
- a geological analysis and development of a consistent model, using the resultsof an improved interpretation of the geophysical data
The picture that emerged from the reappraisal study was that in the earlier siteinvestigation for this project the impor0ance of quartz as an abrasive mineral was notrecognized. The emphasis was on rock strength as being the decisive factor in rockdredging. The classification used to describe the rock mainly emphasized the strengthof the rock, by focusing on the carbonate content, calcium carbonate being thecementing agent (Table 5.1). The way the geology was described in the descriptionsaccompanying the available 1:250.000 and 1:50.000 geological maps also did notemphasize the presence of quartz. The mineral name Quartz was hardly evermentioned in these descriptions. The coastal limestones were often referred to ashaving a sand component, implying quartz from the granitic hinterland, but thedescriptions were not explicit about this. In the site investigation report, when thissand component was discussed, the emphasis was unfortunately on grains of lime(calcium carbonate) being present.
The adaption of the established rock engineering classification for quartz-bearingweak limestones by Clark & Walker (1977) was unfortunate. In fact, during theinvestigations made to support the claim for the contractor, it was found that thepresence of quartz, also in the coastal limestones, was obvious and readily
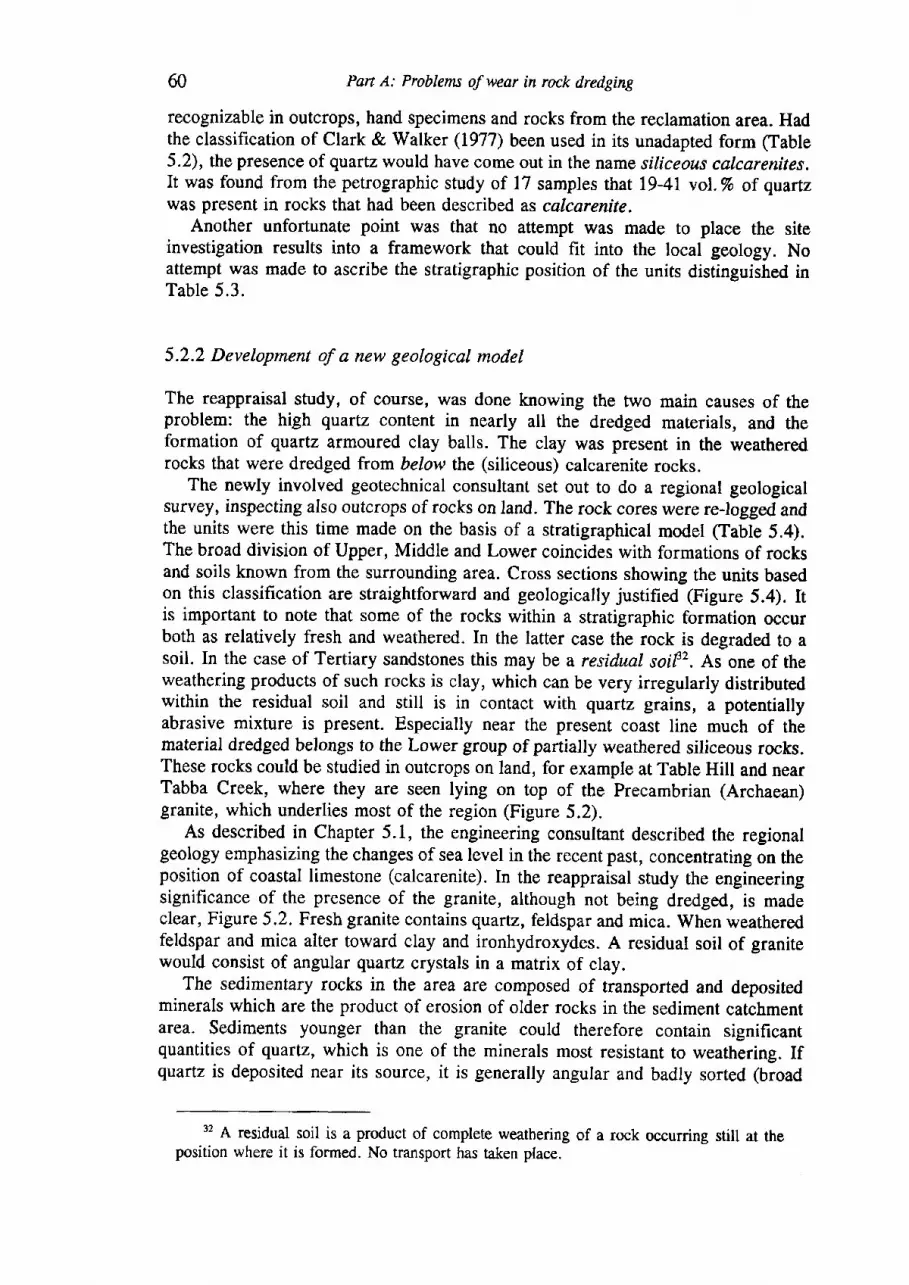
60 Part A: Problems of wear in rock dredging
recognizable in outcrops, hand specimens and rocks from the reclamation area. Hadthe classification of Clark & Walker (1977) been used in its unadapted form (Table5.2), the presence of quartz would have come out in the name siliceous calcarenites.It was found from the petrographic study of 17 samples that 79-41 vol.% of quartzwas present in rocks that had been described as calcarenite.
Another unfortunate point was that no attempt was made to place the siteinvestigation results into a framework that could fit into the local geology. Noattempt was made to ascribe the stratigraphic position of the units distinguished inTable 5.3.
5.2.2 Development of a new geological model
The reappraisal study, of course, was done knowing the two main causes of theproblem: the high quartz content in nearly all the dredged materials, and theformation of quartz armoured clay balls. The clay was present in the weatheredrocks that were dredged from below the (siliceous) calcarenite rocks.
The newly involved geotechnical consultant set out to do a regional geologicalsurvey, inspecting also outcrops of rocks on land. The rock cores were re-logged andthe units were this time made on the basis of a stratigraphical model Clable 5.4).The broad division of Upper, Middle and Lower coincides with formations of rocksand soils known from the surrounding area. Cross sections showing the units basedon this classification are straightforward and geologically justified (Figure 5.4). Itis important to note that some of the rocks within a stratigraphic formation occurboth as relatively fresh and weathered. In the latter case the rock is degraded to asoil. In the case of Tertiary sandstones this may be a residual soifz. As one of theweathering products of such rocks is clay, which can be very irregularly distributedwithin the residual soil and still is in contact with quartz grains, a potentiallyabrasive mixture is present. Especially near the present coast line much of thematerial dredged belongs to the Lower group of partially weathered siliceous rocks.These rocks could be studied in outcrops on land, for example at Table Hill and nearTabba Creek, where they are seen lying on top of the Precambrian (Archaean)granite, which underlies most of the region (Figure 5.2).
As described in Chapter 5.1, the engineering consultant described the regionalgeology emphasizing the changes of sea level in the recent past, concentrating on theposition of coastal limestone (calcarenite). In the reappraisal study the engineeringsignificance of the presence of the granite, although not being dredged, is madeclear, Figure 5.2. Fresh granite contains quartz, feldspar and mica. When weatheredfeldspar and mica alter toward clay and ironhydroxydes. A residual soil of granitewould consist of angular quartz crystals in a matrix of clay.
The sedimentary rocks in the area are composed of transported and depositedminerals which are the product of erosion of older rocks in the sediment catchmentarea. Sediments younger than the granite could therefore contain significantquantities of quartz, which is one of the minerals most resistant to weathering. Ifquartz is deposited near its source, it is generally angular and badly sorted (broad
32 A residual soil is a product of complete weathering of a rock occurring still at theposition where it is formed. No transport has taken place.
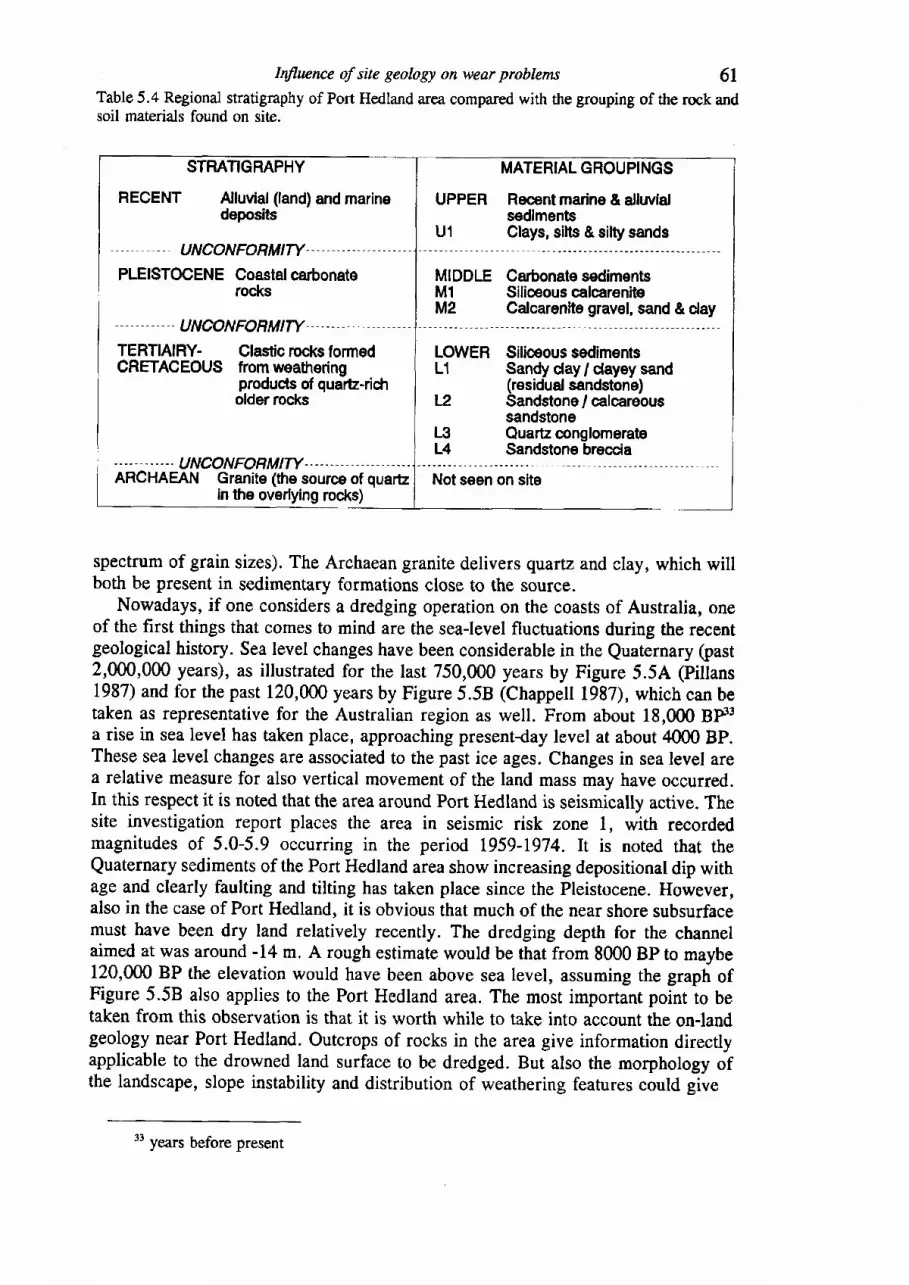
Inflaence of site geology an wear problems 61Table 5.4 Regional stratigraphy of Port Hedland area compared with the grouplng of the rock andsoil materials found on site.
STMTIGRAPHY
RECENT Alluvial (land) and marinedeposits
MATERIAL GROUPINGS
UPPER Recentmarine & alluvialsedlments
U1 Glays, silts & silty sands
PLEISTOCENE Coastal carbonaterocks
UNCONFORMITY
UNCONFORMITY
MIDDLE Carbonate sedimentsMl Silioeous calcareniteM2 Calcarenite gravel, sand & day
TERTIAIRY- Glastic roc*s formedCRETACEOUS from weatrering
producls of quart-ridrolder roc*s
LOWERL1
Siliceous sedimentsSandy day/ dayey sand(residual sandstone)Sandstone/ calcareoussandstoneQuartz conglomerateSandstone breccia
t2
L3L4
UNCONFORMITYARCHAEAN Granite (the source of quarts | ttot seen on site
in the overlying rocJrs)
spectrum of grain sizes). The Archaean granite delivers quartz and clay, which willboth be present in sedimentary formations close to the source,
Nowadays, if one considers a dredging operation on the coasts of Australia, oneof the first things that comes to mind are the sea-level fluctuations during the recentgeological history. Sea level changes have been considerable in the Quaternary (past2,000,000 years), as illustrated for the lasr 750,000 years by Figure 5.5A (pillans1987) and for the past 120,000 years by Figure 5.58 (Chappell 1987), which can betaken as representative for the Australian region as well. From about 18,000 BF3a rise in sea level has taken place, approaching present-day level at about 4m0 BP.These sea level changes are associated to the past ice ages. Changes in sea level area relative measure for also vertical movement of the land mass may have occurred.In this respect it is noted that the area around Port Hedland is seismically active. Thesite investigation report places the area in seismic risk zone 1, with recordedmagnitudes of 5.0-5.9 occurring in the period 1959-1974. It is noted that theQuaternary sediments of the Port Hedland area show increasing depositional dip withage and clearly faulting and tilting has taken place since the Pleistocene. However,also in the case of Port Hedland, it is obvious that much of the near shore subsurfacemust have been dry land relatively recently. The dredging depth for the channelaimed at was around -14 m. A rough estimate would be that from 8000 BP to maybe120,000 BP the elevation would have been above sea level, assuming the graph ofFigure 5.5B also applies to the Port Hedland area. The most important point to betaken from this observation is that it is worth while to take into account the on-landgeology near Port Hedland. Outcrops of rocks in the area give information directlyapplicable to the drowned land surface to be dredged. But also the morphology ofthe landscape, slope instability and distribution of weathering features could give
33 years before present
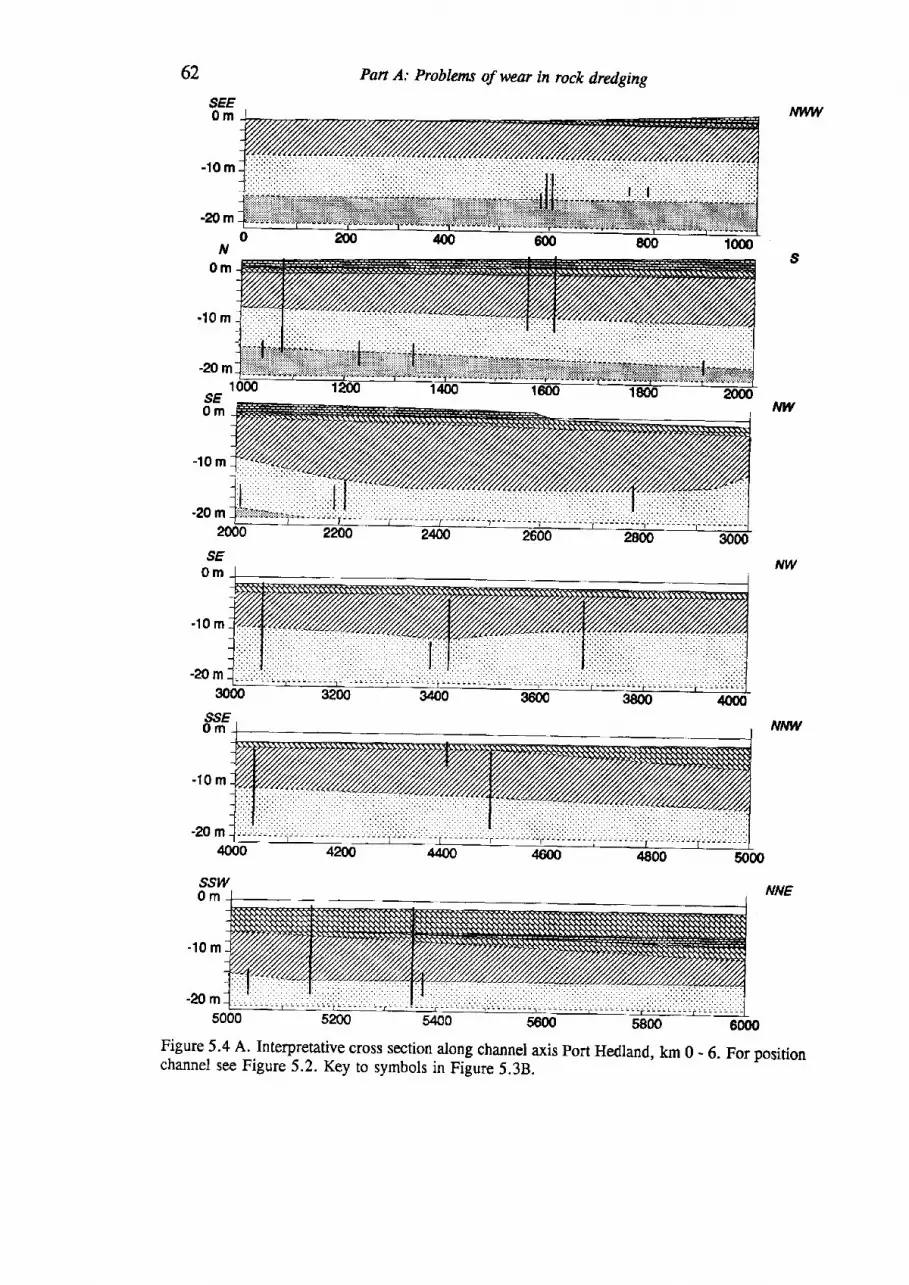
62 Pan A: Problems of wear in rock dredging
5400 5600 5800
-'10 m
-10 m
-20 m
SE0 m
-10 m
-20 m3000
-10 m
-2om4000
ss14/0 m
-10 m
-20 m5000
s
ssE0 m
NW
NNE
5200 60(x)Figure 5.4 A. Interpretative cross section along channel axis port Hedland, km 0 - 6. For positionchannel see Figure 5.2. Key to symbols in Figure 5.3B.
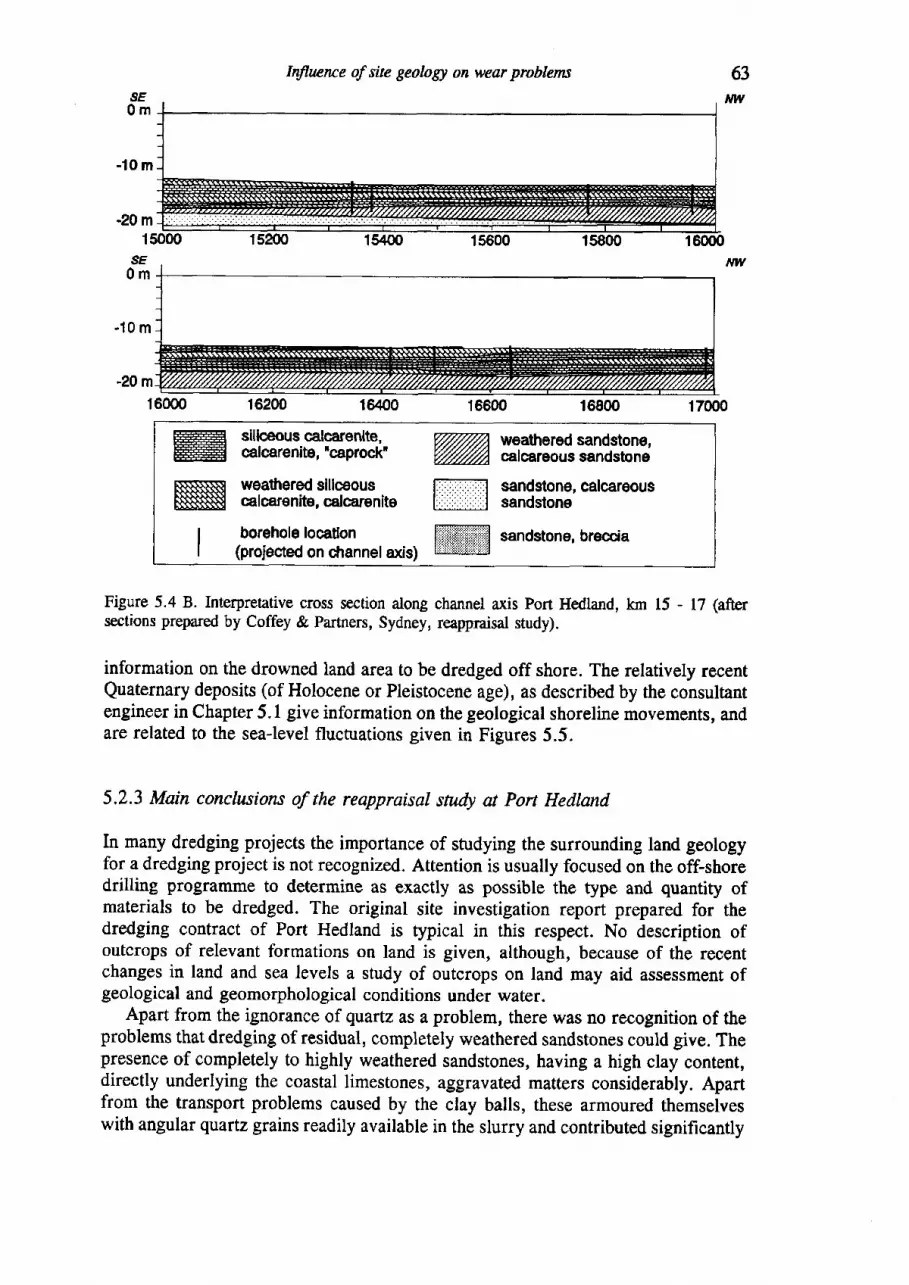
Influcnte of site geology on wear problems
SE0m
-1Om
-20 m15000
SE0m
w@@
NI,I
silieous calcarenlte,cal@renitg, 'caprock'
weathered slllceouscalcarenite, calcare n ite
weathered sandstone,calcareous sandstone
sandstone, calcareoussandstone
mffi
borehole loca$on |,ffi,,r-Efil sandstone, breccia(proiected on drannel o<is) f.':ri:iriiiiirii:i::i.jl
Figure 5.4 B. Interpretative cross section along channel axis Port Hedland, km t5 - 17 (aftersections prepared by Coffey & Partners, Sydney, reappraisal study).
information on the drowned land area to be dredged off shore. The relatively recentQuaternary deposits (of Holocene or Pleistocene age), as described by the consultantengineer in Chapter 5.1 give information on the geological shoreline movements, andare related to the sea-level fluctuations given in Figures 5.5.
5.2.3 Main conclusions of the reappraisal sndy at Port Hedtand
In mauy dredging projects the importance of studying the surrounding land geologyfor a dredging project is not recognized. Attention is usually focused on the off-shoredrilling programme to determine as exactly as possible the type and quantity ofmaterials to be dredged. The original site investigation report prepared for thedredging contract of Port Hedland is typical in this respect. No descriprion ofoutcrops of relevant formations on land is given, although, because of the recentchanges in land and sea levels a study of outcrops on land may aid assessment ofgeological and geomorphological conditions under water.
Apart from the ignorance of quartz as a problem, there was no recognition of theproblems that dredging of residual, completely weathered sandstones could give. Thepresence of completely to highly weathered sandstones, having a high clay content,directly underlying the coastal limestones, aggravated matters considerably. Apartfrom the transport problems caused by the clay balls, these armoured themselveswith angular quartz grains readily available in the slurry and contributed significantly
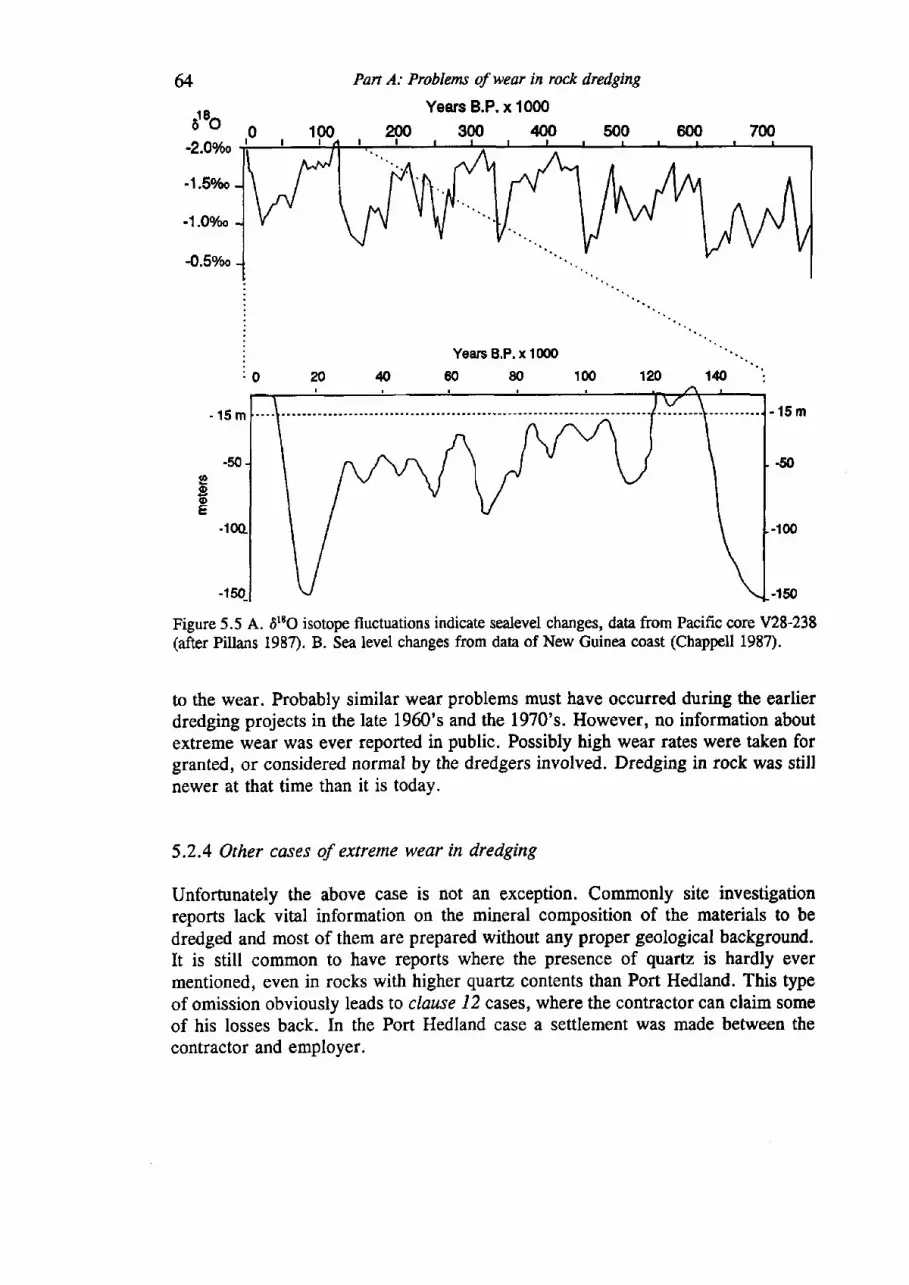
&
Jto
Pan A: Probletns of wear in rock dredging
Years B.P. x 1000
-2.00ttu
-1.5%o
-1.090o
4.5V@
Figure 5.5 A. 61EO isotope fluctuations indicate sealevel changes, data from Pacific core V28-238(after Pillans 1987). B. Sea level changes from daa of New Guinea coast (Chappell 1987).
to the wear. Probably similar wear problems must have occurred during the earlierdredging projects in the late 1960's and the 1970's. However, no information aboutextreme wear was ever reported in public. Possibly high wear rates were taken forgranted, or considered normal by the dredgers involved. Dredging in rock was stillnewer at that time than it is todaY.
5.2.4 Other coses of extreme wear in dredging
Unfortunately the above case is not an exception. Commonly site investigationreports lack vital information on the mineral composition of the materials to bedredged and most of them are prepared without any proper geological background.It is still common to have reports where the presence of quartz is hardly evermentioned, even in rocks with higher quartz contents than Port Hedland. This typeof omission obviously leads to clause,l2 cases, where the contractor can claim someof his losses back. In the Port Hedland case a settlement was made between thecontractor and employer.
CHAPTER 6
Conclusions
The following conclusions can be drawn from the survey of problems of wear inrock dredging in the preceding chapters:
1. Wear problems in rock dredging have commonly been approached from amechanical engineering point of view, through the design of better performingexcavation tools and the use of improved wear resistant materials. The science oftribology has made clear that wear processes in general are a result of the particularconditions that are operating. Intensive study of the tribological system, involvingmicroscopic examination of the worn parts, may reveal the wear mechanisms thathave operated on the tool. The tribological approach can be of help in the case ofdredging, but is hampered by the varying nafure of the rock masses being dredged.Even when the rock properties identified as having influence on wear (such asstrength, mineral composition (hardness of the abrasive minerals), grain size andshape, rock mass structure) are properly described and measured in a siteinvestigation, it remains problematic to predict the amount of wear on the dredgingequipment. A trial excavation would always be needed.
2. Looking at the practice of rock dredging, it becomes clear that even basicinformation is sometimes lacking in site investigation reports. Often the mostcommon abrasive mineral, quafiz, has been ignored. This is probably the mostimportant cause of unexpected wear problems. The resolution of these problems, ofcourse, must be found in improved site investigation practice. For example, justcomplying with the classification of soils an"d rocks to be dredged of the PIANC(198a; see Appendix A), is not enough.
3. Site investigations should preferably be carried out with the involvement ofengineering geologists, which are especially trained to translate geologicalinformation to the engineering project at hand. The engineering geologist studyingdredging projects should consult geologists familiar with the geology of the sitesurroundings. The engineering geologist should be aware of the requirements of adredging operation.
Table 6.1 lists the factors that influence the performance of a cutter suctiondredger. The first are geological factors. The intact rock properties and rock massproperties that have influence on the cuttability or excavatability of the rock aremainly the rock mass structure and composition (Figure 4.I2) and the rnaterialstrength. The petrography (mineralogical composition) does not only influence the
65
66 Part A: Problems of wear in rock d.redging
Table 6.1 Factors influencing cutter suction dredger performance in rock.
Factor Influence on:
GEOLOGY & SUBMARINE 3D distribution of rock and choice of dredging methodGEOMORPHOLOGY soil units and equipment
INTACT ROCK Strength CuttabilityPROPERTIES Tool wear
Petrography (abrasive Tool wearcapacity)
Petrography (clays & other Sluny contentsecondary minerals)
ROCK MASS PROPERTIES Discontinuities (Volumetric Cuttability, cut fragmentdensity; Orientation; Shear size, productionstrength)
Degree of variation in rock Cuttability(layering, weathering) Tool wear
Slurry content
ENVIRONMENT Water Tool wear
Cut slope stability Production
Weather; Wave action Working conditions
CUT:|ERHEAD Number of tools
Type of tool
Tool orientation
Pick point, chiselTool geometryComposition of steel
CAPACITY Haulage force & speed
Cutterhead power & speed
Rigidity of ladder & vessel
OPERATIONALCHARACTERISTICS
cutting behaviour and potential abrasiveness, but also the composition and behaviourof the slurry, for example, when weathered rocks containing clay minerals arepresent. The geological factors are the subject for further study in this work; therock properties influencing cutting and wear will be examined in part B (Chapter 7 -14).
The remaining factors influencing the performance of a cutter suction dredgermentioned in Table 6.1, the environment of operation and the specifications of theCSD itself (cutterhead, capacity and operational characteristics) will not be addressedin this study.
CHAPTER 7
lntroduction to part B: Rock properties influencingcutting and wear
This chapter introduces Part B: Rock properties influenctng cuning and wear. Theaim of this study is the improvement of the prediction of the tool consumption ofcutter suction dredgers. In Part B the influence of the properties of the rocks on thecutting process are examined. Wear plays a role in this respect, since wearing of thetools causes a reduction in performance.
The rock cutting takes place in an often heterogeneous rock mass, which not onlyconsists of intact rock materials, but also contains fractures (see Figure 4.12).Fractures are known to have a profound influence on excavation production. Thiseffect is examined in Chapter 8. Depending on the fracture density and geometry inthe rock mass and the specifications of the mechanical excavation machine, the toolwill act either by loosening of rock blocks, or by cutting into intact rock, or amixture of these processes will occur. Both production and tool consumption will beaffected by the way the rock is excavated. The information available on mechanicalexcavation of rock mass is examined in more detail in Part C: Application of theoryto practice, Chapter L7 & 18. Chapter 8 is mainly concerned with principles.
Most wear of the tools is expected to occur when the tool is cutting into intactrock. In Chapter 9 existing rock cutting theories are studied, to see what rockparameters are of importance in the cutting of intact rock. Rock cutting is, from themechanical point of view, an extremely complicated process. It has been found thatnear the tip of a cutting tool very high confining pressures are present, which leadto compressive failure and the formation of a crushed zone. The extent of thiscrushed zone depends, among others, on the brittleness of the rock. Chip formationoccurs by the generation of a shear crack from the crushed zone, that bifurcates intoa tensile crack which grows towards the free surface. This complex process mayonly be described using numerical modelling, but important rock engineeringparameters can be derived from the model. The more familiar cutting theories arediscussed as well. These are based on simplifying assumptions on the cutting processand have limited value, but again illustrate the importance of rock mechanicalparameters. Laboratory rock cutting tests have shown the influence of rock strength,geometry of the cutting tool and cutting velocity.
During rock cutting the development of high contact temperatures between tooland rock may lead to a sudden increase in wear of the tools. When examining the
67
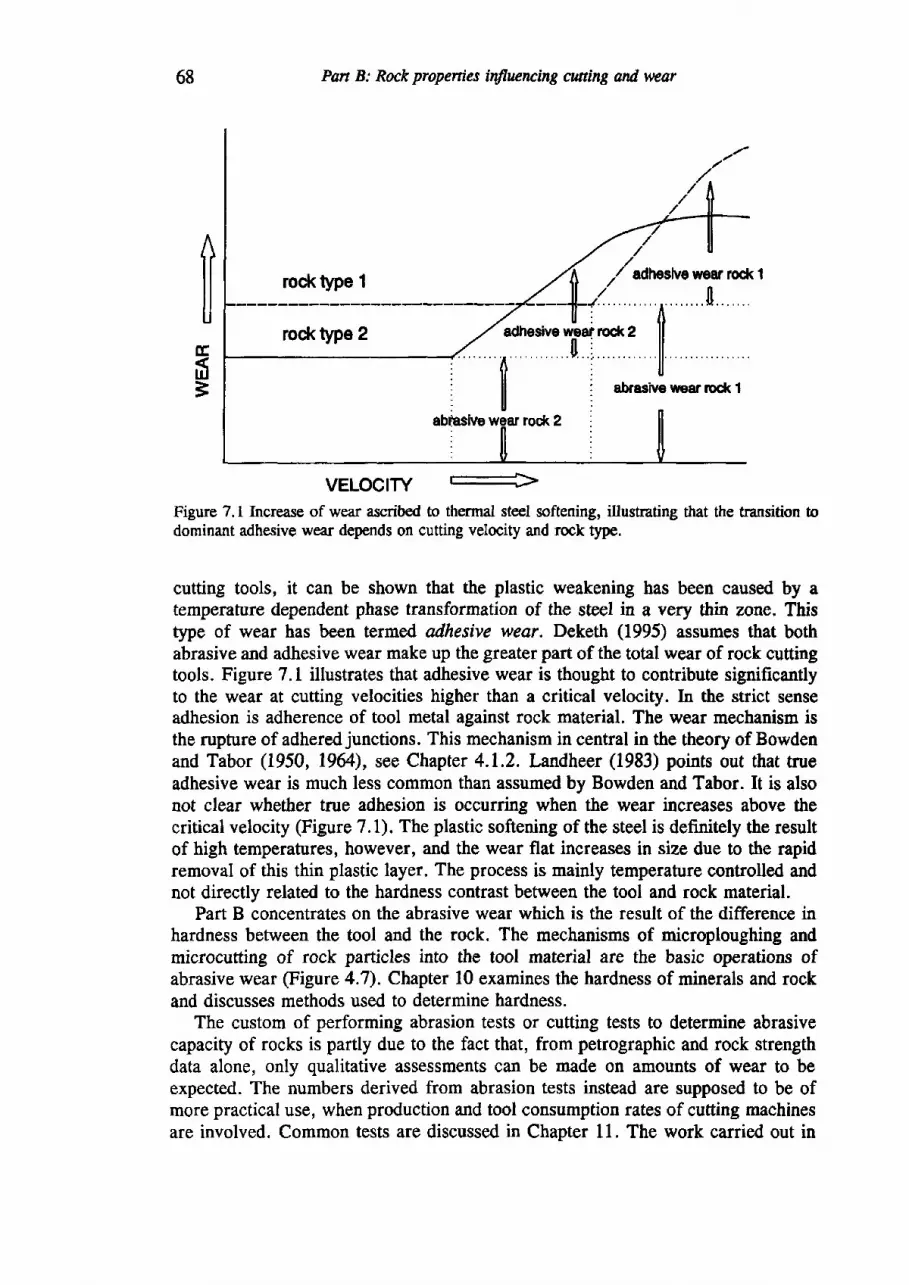
68 Part B: Rock propenies influcncing cutt@ and wer
rocktype 1
VELOCITY -_
Figure 7.1 Increase of wear ascribed to thermal steel softening, illustrating that the transition todominant adhesive wear depends on cutting velocity and rock type.
cutting tools, it can be shown that the plastic weakening has been caused by atemperafure dependent phase transformation of the steel in a very thin zone. Thistype of wear has been termed adhesive wear. Deketh (1995) assumes that bothabrasive and adhesive wear make up the greater part of the total wear of rock cuttingtools. Figure 7.1 illustrates that adhesive wear is thought to contribute significantlyto the wear at cutting velocities higher than a critical velocity. In the strict senseadhesion is adherence of tool metal against rock material. The wear mechanism isthe rupture of adhered junctions. This mechanism in central in the theory of Bowdenand Tabor (1950, l9&), see Chapter 4.1.2. Landheer (1983) points out that trueadhesive wear is much less common than assumed by Bowden and Tabor. It is alsonot clear whether true adhesion is occurring when the wear increases above thecritical velocity (Figure 7.1). The plastic softening of the steel is definitely the resultof high temperatures, however, and the wear flat increases in size due to the rapidremoval of this thin plastic layer. The process is mainly temperature controlled andnot directly related to the hardness contrast between the tool and rock material.
Part B concentrates on the abrasive wear which is the result of the difference inhardness between the tool and the rock. The mechanisms of microploughing andmicrocutting of rock particles into the tool material are the basic operations ofabrasive wear (Figure 4.1). Chapter 10 examines the hardness of minerals and rockand discusses methods used to determine hardness.
The custom of performing abrasion tests or cutting tests to determine abrasivecapacity of rocks is partly due to the fact that, from petrographic and rock strengthdata alone, only qualitative assessments can be made on amounts of wear to beexpected. The numbers derived from abrasion tests instead are supposed to be ofmore practical use, when production and tool consumption rates of cutting machinesare involved. Common tests are discussed in Chapter 11. The work carried out in
Eltl3
rock type 2
htrodaction 69
the context of this study has shown that single test results of standard type abrasiontests are insufficient to describe or predict wear of cutting tools. The wear modetheory, treated in Chapter 12, emphasizes that in rocks with abrasive minerals, suchas sandstones, mo$t of the wear takes place during the initial penetratioo of the toolinto the rock. Wear is in the high wear mode, two-body abrasive grooving andadhesive wear are common. When the chisel is at depth and cutting, commonlythree-body wear takes place at lower wear rates. The transition of the unfavourableto the more favourable wear modes takes place at a certaitr cutting depth, whichdepends on the rock properties strength, hardness of the constituent minerals andgrain size of the minerals.
The laboratory abrasion tests discussed in Chapter 11 and 1,2 make clear that wearis a function of both rock strength properties and the mineral composition of therock. The few correlation equations that exist to date which give information onabrasiveness of rock are treated in Chapter 13. In stead of relying on laboratory testsalone, it is concluded that a combination of rock strength tests and petrographicinformation should be the basis of an assessment of the potential tool wear that arock may cause (Chapter 14).
CHAPTER 8
The influence of discontinuities in the rock mass
The larger rock excavating machines, like cutter suction dredgers, will excavate ina rock rrass (Figurc 4.12 & 8.1). In rock mechanics the distinction between rockmaterial (German: Gestein, Dutch: gesteente) and rock nass (German: Fels , Dutch:rars) is made to emphasize an effect of scale that is quite common in rock. With roclcmaterial, the intact and coherent rock is meant. Larger volumes of rock usuallycontain fractures, which are termed discorxinuities in rock mechanics. Adiscontinuity is a surface in a rock, such as a fracture, joint, fault, shear, weakbedding plane or contact that has zero or relatively low tensile strength. Due to thepresence of fractures and other surfaces with low or negligible tensile strength,generally a larger volume of rock has lower strength and stiffrress than a smallervolume of the same rock without such discontinuities (e.g. Hoek & Brown 1980,Brady & Brown 1985, Goodman 1989). The frequency of discontinuities in a rockmass can vary, depending on the rock type and its geological history. ln some casesrocks can be extremely fragmented, even on hand specimen scale. Althoughsometimes done, it is not customary to speak of a rock mass in such a case; the /ocftmaterial is then described as being fragmented. In most cases the laboratory samplesfor strength testing have a diameter of about 55 mm and a length of 110 mm, thesize of a hand sample. When studying rock on this scale the term material is used.A distinction between intact and broken material can be made.
If more than one or two sets of discontinuities3{ are present, these tend to dividethe rock mass into a system of blocks. The problem of excavation is then examinedfrom the perspective of size and shape of these rock blocks. Figure 8.1 gives adiagram showing the interaction of the rock mass with a cutter suction dredger.Apart from the properties of the intact rock material, the properties of the rock massare determined by fracture frequency and fracture orientation. If fracture spacing islarge and the rock mass forms huge blocks, the strength of the mass is relativelyhigh and one tends to speak of a high ryality rock mass. If the frequency of frachrresis high, normally the quality is considered low. Such rock masses commonly giveproblems in construction, like slope instability or tunnel face instability. From the
s A set is a series of parallel discontinuities within a rock mass.
70
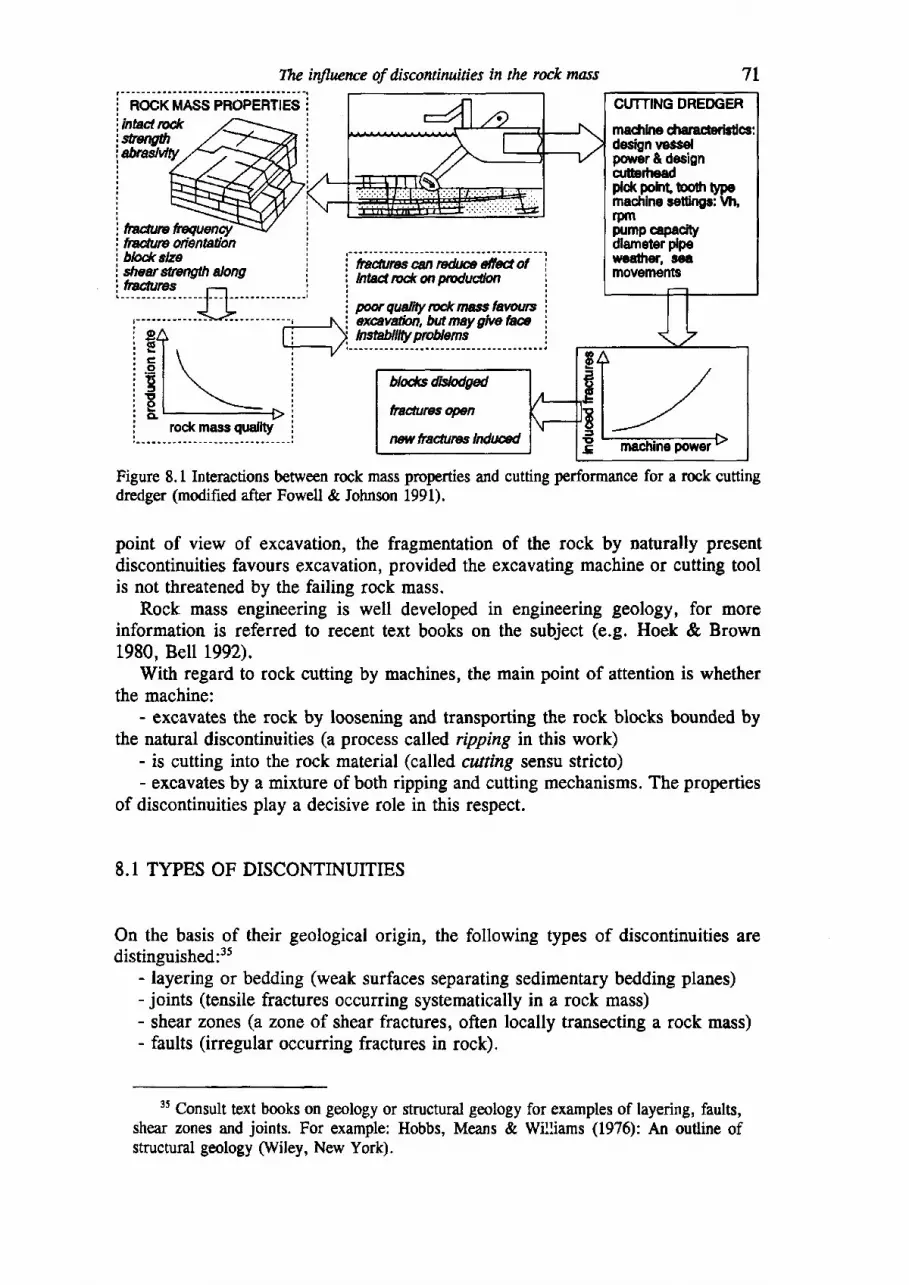
TIrc intluence of discontinuities in the rock mass
Figure 8.1 Interactions between rock mass properties and cutting performance for a rock cuttingdredger (modified after Fowell & Iohnson 1991).
point of view of excavation, the fragmentation of the rock by naturally presentdiscontinuities favours excavation, provided the excavating machine or cutting toolis not threatened by the failing rock mass.
Rock mass engineering is well developed in engineering geologyn for moreinformation is referred to recent text books on the subject (e.g. Hoek & Brown1980, Bell 1992).
With regard to rock cutting by machines, the main point of attention is whetherthe machine:
- excavates the rock by loosening and transporting the rock blocks bounded bythe natural discontinuities (a process called ripping in this work)
- is cutting into the rock material (called cutting sensu stricto)- excavates by a mixture of both ripping and cutting mechanisms. The properties
of discontinuities play a decisive role in this respect.
8.I TYPES OF DISCONTINUITIES
On the basis of their geological origin, the following types of discontinuities aredistinguished:3s
- layering or bedding (weak surfaces separating sedimentary bedding planes)- joints (tensile fractures occurring systematically in a rock mass)- shear zones (a zone of shear fractures, often locally transecting a rock mass)- faults (irregular occurring fractures in rock).
3s Consult text books on geology or structural geology for examples of layering, faults,shear zones and joints. For example: Hobbs, Means & Williams (1976): An outline ofstructural geology (Wiley, New York).
7L
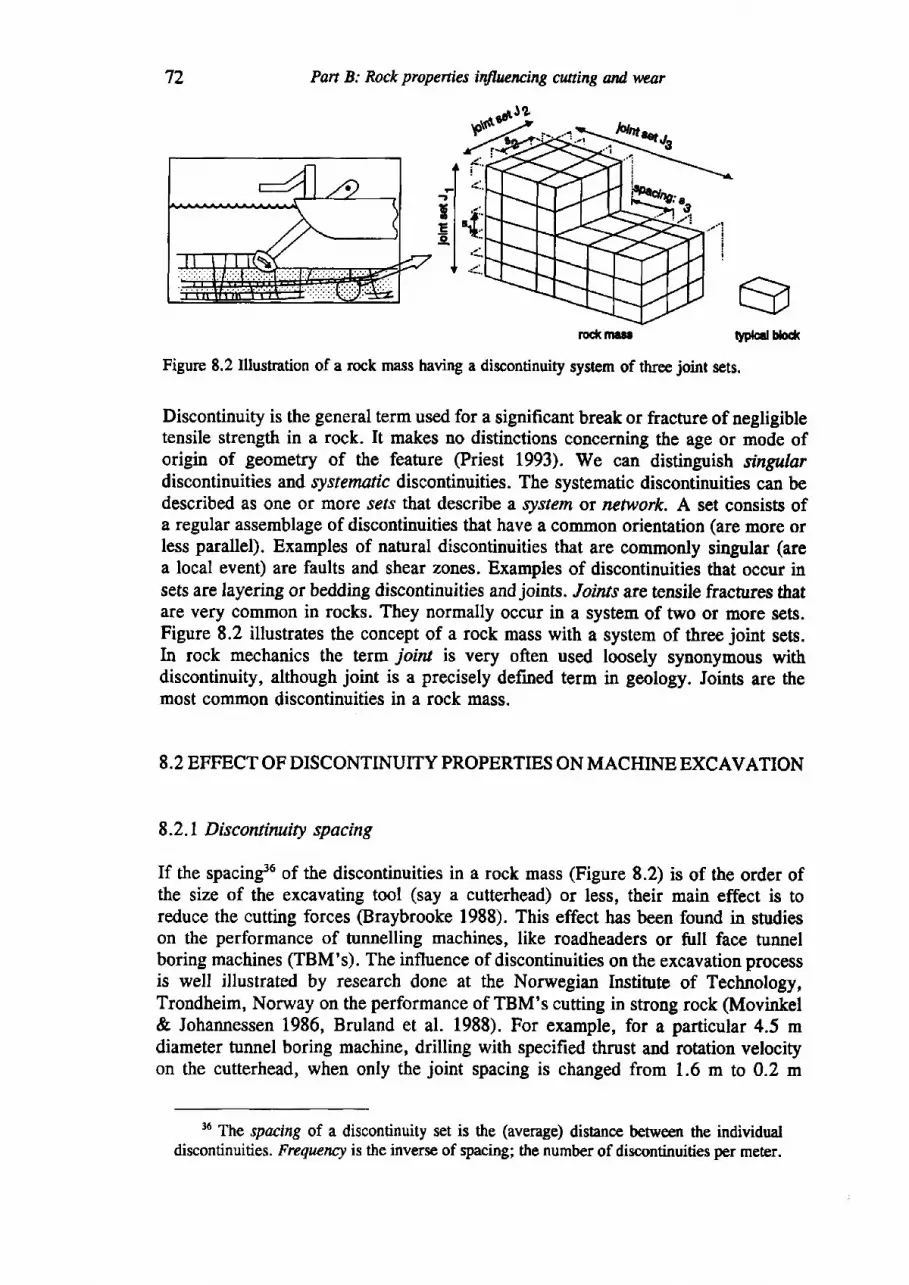
72 Pan B: Rock propenies i$luencing cutting and we,ar
Figure 8.2 Illushation of a rock mass having a discontinuity system of three joint sets.
Discontinuity is the general term used for a significant break or fracture of negligibletensile strength in a rock. It makes no distinctions concerning the age or mode oforigin of geometry of the feature (Priest 1993r. Tire can distinguish singalardiscontinuities and systetutic discontinuities. The systematic discontinuities can bedescribed as one or more sets that describe a system ot nctwork A set consists ofa regular assemblage of discontinuities that have a coilrmon orientation (are nore orless parallel). Examples of nahrral discontinuities that are commonly singular (area local event) are faults and shear zones. Examples of discontinuities that occur insets are layering or bedding discontinuities and joints. foints are tensile fractures thatare very common in rocks. They normally occur in a system of tvvo or more sets.Figure 8.2 illustrates the concept of a rock mass with a system of three joint sets.In rock mechanics the term ioirt is very often used loosely synonymous withdiscontinuity, although joint is a precisely defined term in geotogy. Joints are themost common discontinuities in a rock mass.
8.2 EFFECT OF DISCONTINUITY PROPERTIES ON MACHINE EXCAVATION
8.2.1 Discontirutity spacing
If the spacingl6 of the discontinuities in a rock mass (Figure 8.2) is of the order ofthe size of the excavating tool (say a cutterheaQ or less, their main effect is toreduce the cutting forces @raybrooke 1988). This effect has been found in studieson the performance of tunnelling machines, like roadheaders or fult face tunnelboring machines (TBM's). The influence of discontinuities on the excavation processis well illustrated by research done at the Norwegian Institute of Technology,Trondheim, Norway on the performance of TBM's cutting in strong rock (Movinkel& Johannessen 1986, Bruland et al. 1988). For example, for a particular 4.5 mdiameter tunnel boring machine, drilling with specified thrust and rotation velocityon the cutterhead, when only the joint spacing is changed from 1.6 m to 0.2 m
36 The spacing of a discontirtuity set is the (average) distance between the individualdiscontinuities. Frequency is the inverse of spacing; the number of discontinuities per meter.
aqplcrl blod(rcd(masr
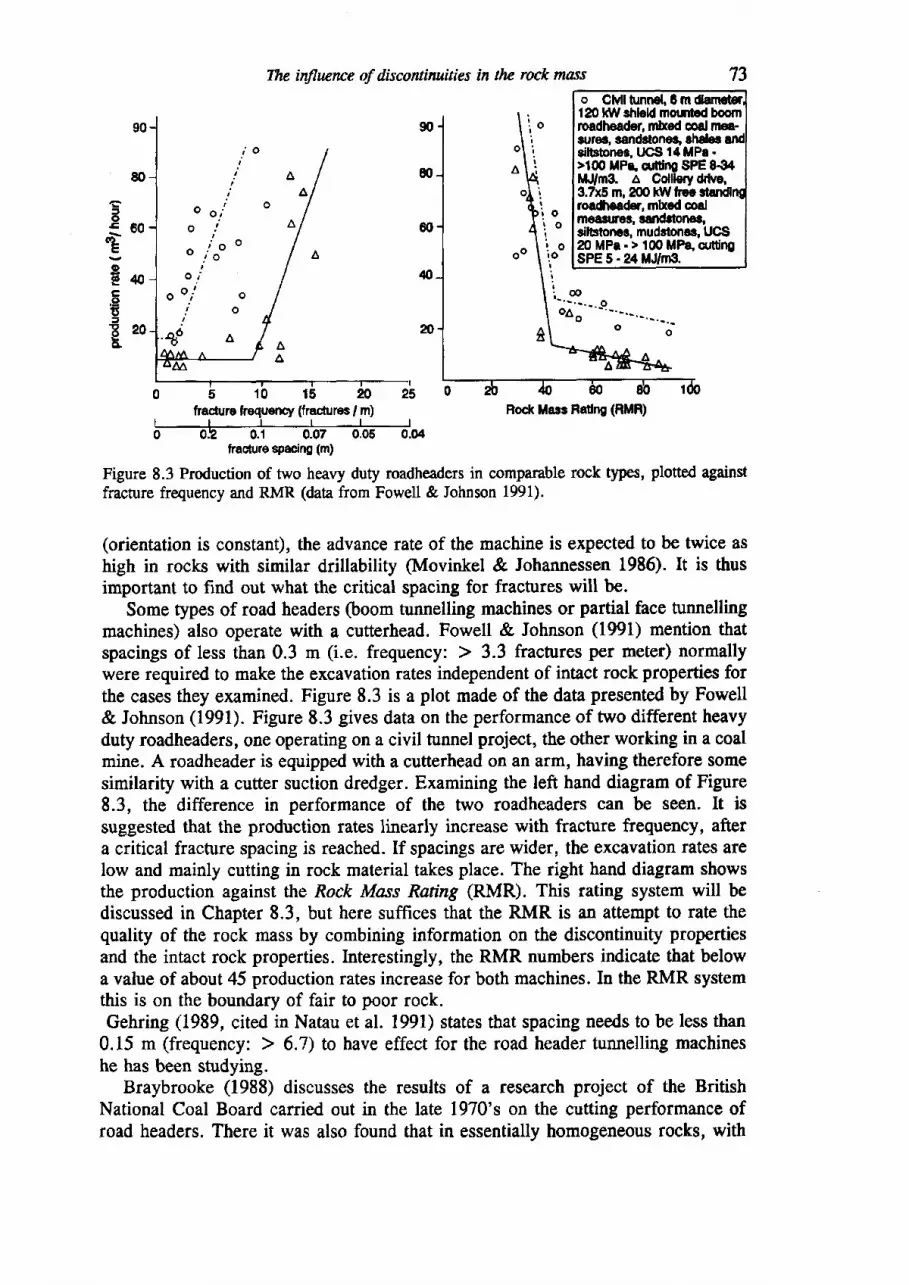
The intluerrce of discontiruities in thc rock mass
fiaclure ftequency (fractures, m) Bod( Matt Faung (HMn)l l r r l l0 0.2 0.1 0-07 0.05 0.04
tradwe spacting (m)
Figure 8.3 Production of two heavy duty roadheaders in comparable rock types, plotted againstfracture frequency and RMR (data from Fowell & Johnson 1991).
(orientation is constant), the advance rate of the machine is expected to be twice ashigh in rocks with similar drillability (Movinkel & Johannessen 1986). It is thusimportant to find out what the critical spacing for fractures will be.
Some types of road headers Ooom tunnelling machines or partial face tunnellingmachines) also operate with a cutterhead. Fowell & Johnson (1991) mention thatspacings of less than 0.3 m (i.e. frequency: > 3.3 fractures per meter) normallywere required to make the excavation rates independent of intract rock properties forthe cases they examined. Figure 8.3 is a plot made of the data presented by Fowell& Johnson (1991). Figure 8.3 gives data on the performance of two different heavyduty roadheaders, one operating on a civil tunnel project, the other working in a coalmine. A roadheader is equipped with a cutterhead on an arm, having therefore somesimilarity with a cutter suction dredger. Examining the left hand diagram of Figure8-3, the difference in performance of the two roadheaders can be seen. It issuggested that the production rates linearly increase with fracture frequency, aftera critical fracture spacing is reached. If spacings are wider, the excavation rates arelow and mainly cutting in rock material takes place. The right hand diagram showsthe production against the Rock Mass Rating (RMR). This rating system will bediscussed in Chapter 8.3, but here suffrces that the RMR is an attempt to rate thequality of the rock mass by combining information on the discontinuity propertiesand the intact rock properties. Interestingly, the RMR numbers indicate that belowa value of about 45 production rates increase for both machines. In the RMR systemthis is on the boundary of fair to poor rock.Gehring (1989, cited in Natau et al. 1991) states that spacing needs to be less than
0.15 m (frequency: > 6.7) to have effect for the road header tunnelling machineshe has been studying.
Braybrooke (1988) discusses the results of a research project of the BritishNational Coal Board carried out in the late 1970's on the cutting performance ofroad headers. There it was also found that in essentially homogeneous rocks, with
73
cof 6 0E
E*c.96J
820a
o CMI tunnel. 6 m120 kW rttl€ld mounlcd boomroadlpad€r, mbred coal mea-ouroq lend$onar, rhalalciftstones, l,rcs 14 MPs ->100 MP.,ct|tttm sPE 034llJrma A Colll€ry &ive,3.7x5 m, 200 kWfr"rrcdh€ad€r, mhcd coalm6a!r!18!r land$ons,cilBtorrs, mudstones, UCS20 MPs. > 100 MPe, cuningsPE 5 .24
Rod< Uasr Fa0ng (RMR)
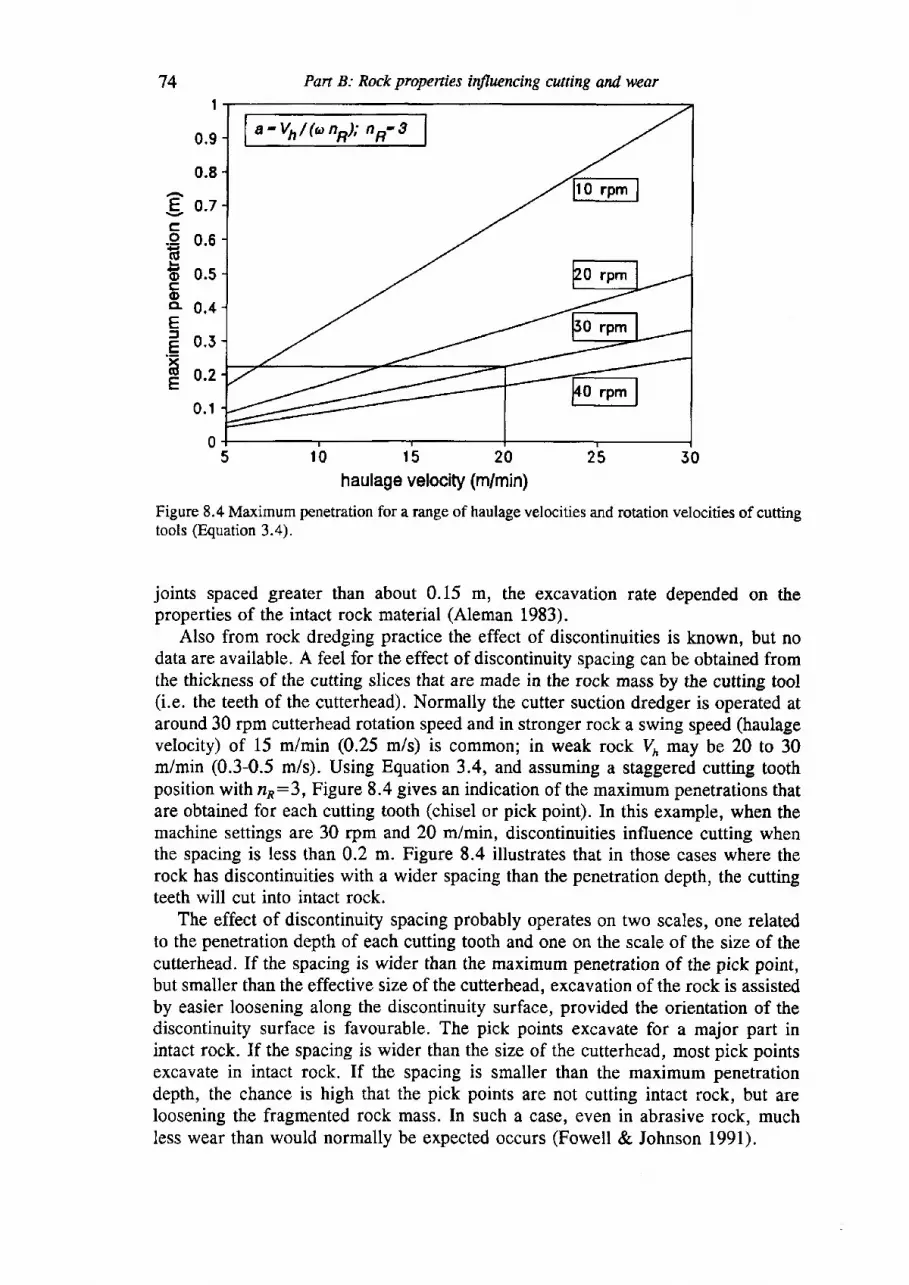
74I
0.9
0.8
g 0-7cg 0.6(d
E o.scoa 0 .4E
.E o'5XE o.zE
0 .1
05r015202530
haulage veloci$ (m/min)
Figure 8.4 Maximum penetration for a range of haulage velocities and rotation velocities of cuttingtools (Equation 3.4).
joints spaced greater than about 0.15 m, the excavation rate depended on theproperties of the intact rock material (Aleman 1983).
Also from rock dredging practice the effect of discontinuities is known, but nodata are available. A feel for the effect of discontinuity spacing can be obtained fromthe thickness of the cutting slices that are made in the rock mass by the cutting tool(i.e. the teeth of the cutterhead). Normally the cutter suction dredger is operated ataround 30 rpm cutterhead rotation speed and in stronger rock a swing speed (haulagevelocity) of 15 m/min (0.25 m/s) is common; in weak rock Vn may be 20 to 30m/min (0.3-0.5 m/s). Using Equation 3.4, and assuming a staggered cutting toothposition with n*:J, Figure 8.4 gives an indication of the maximum penetrations thatare obtained for each cutting tooth (chisel or pick point). In this example, when themachine settings are 30 rpm and 20 m/min, discontinuities influence cutting whenthe spacing is less than 0.2 m. Figure 8.4 illustrates that in those cases where therock has discontinuities with a wider spacing than the penetration depth, the cuttingteeth will cut into intact rock.
The effect of discontinuity spacing probably operates on two scales, one relatedto the penetration depth of each cutting tooth and one on the scale of the size of thecutterhead. If the spacing is wider than the maximum penetration of the pick point,but smaller than the effective size of the cutterhead, excavation of the rock is assistedby easier loosening along the discontinuity surface, provided the orientation of thediscontinuity surface is favourable. The pick points excavate for a major part inintact rock. If the spacing is wider than the size of the cutterhead, most pick pointsexcavate in intact rock. If the spacing is smaller than the maximum penetrationdepth, the chance is high that the pick points are not cutting intact rock, but areloosening the fragmented rock mass. In such a case, even in abrasive rock, muchless wear than would normally be expected occurs (Fowell & Johnson 1991).
Pan B: Rock propenies influencing cutting and wear
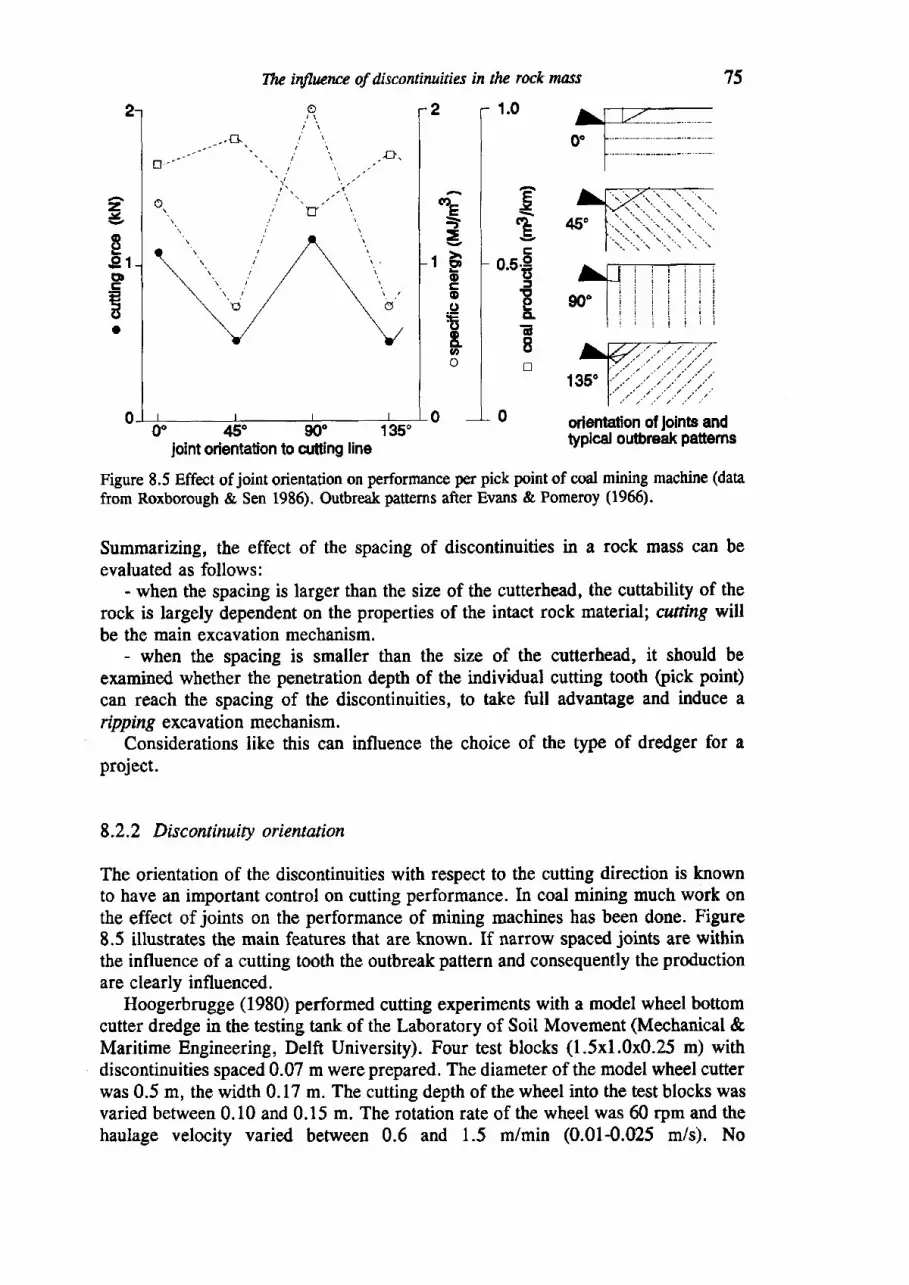
TIu influence of discontiruitiu in thc rock mass 75
00 450 900 135"joint orientation to ctrtting line
Figure 8.5 Effect of joint orientation on performance per pick point of coal mining machine (daafrom Roxborough & Sen 1986). Outbreak pattems after Evans & Pomeroy (1966).
Summarizing, the effect of the spacing of discontinuities in a rock mass can beevaluated as follows:
- when the spacing is larger than the size of the cutterhead, the cuttability of therock is largely dependent on the properties of the intact rock material; cutting willbe the main excavation mechanism.
- when the spacing is smaller than the size of the cutterhead, it should beexamined whether the penetration depth of the individual cutting tooth (pick point)can reach the spacing of the discontinuities, to take full advantage and induce artpping excavation mechanism.
Considerations like this can influence the choice of the type of dredger for aproject.
8.2.2 Discontinuity orientation
The orientation of the discontinuities with respect to the cutting direction is knownto have atr important cotrtrol on cutting performance. In coal mining much work onthe effect of joints on the performance of mining machines has been done. Figure8.5 illustrates the main features that are known. If narrow spaced joints are withinthe influence of a cutting tooth the outbreak pattern and consequently the productionare clearly influenced.
Hoogerbrugge (1980) performed cuttitrg experiments with a model wheel bottomcutter dredge in the testing tank of the Laboratory of Soil Movement (Mechanical &Maritime Engineering, Delft University). Four test blocks (1.5x1.0x0.25 m) withdiscontinuities spaced 0.07 m wereprepared. The diameter of the model wheel cutterwas 0.5 m, the width 0.17 m. The cutting depth of the wheel into the test blocks wasvaried between 0.10 and 0.15 m. The rotation rate of the wheel was 60 rpm and thehaulage velocity varied between 0.6 and 1.5 mimin (0.014.025 m/s). No
1.0
tE
=3goEo.9E8.o
zv
geCDEEII
tr-E(?.E
0.5€5
EoCl.
d
Io
0 orientafion of loine andtypical outbreak Pattems
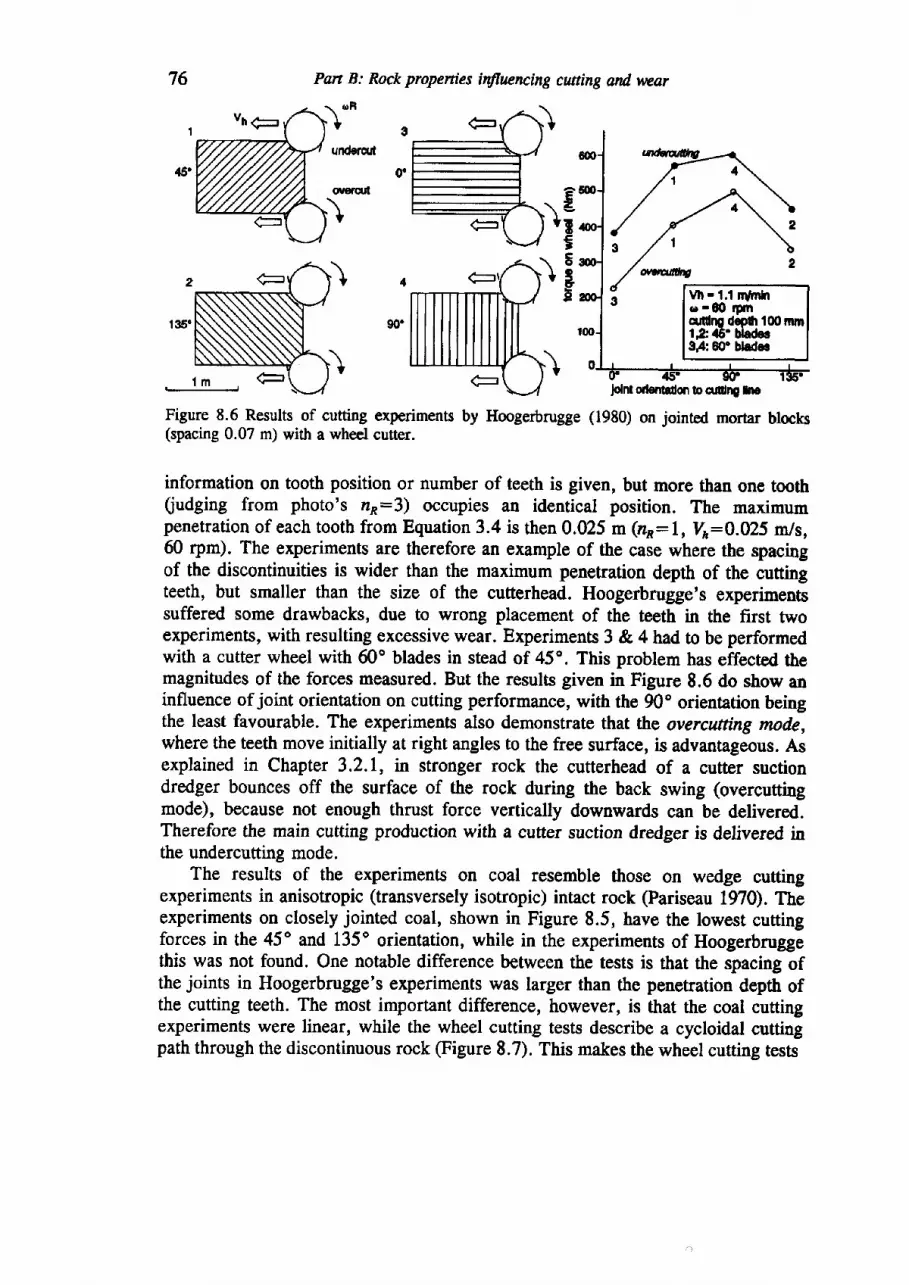
76 Pan B: Rock properties i$hrcncing cutting end, wear
Vh - 1.1 rnrlir{nor-dl nmcututp depth lAl1"e45'bladec34:60P blads
Figure 8.6 Results of cutting experiments by Hoogerbrugge (1980) on jointed mortar blocts(spacing 0.07 m) with a wheel cutter.
information on tooth position or number of teeth is given, but more than one tooth(udging from photo's nn:3) occupies an identical position. The maximumpenetration of each tooth from Equation 3.4 is then 0.025 m (zn: L, Vy:0.025 m/s,60 rpm). The experiments are therefore an example of the case where the spacingof the discontinuities is wider than the maximum penetration depth of the cuttingteeth, but smaller than the size of the cutterhead. Hoogerbrugge's experimentssuffered some drawbacks, due to wrong placement of the teeth in the first twoexperiments, with resulting excessive wear. Experiments 3 & 4 had to be performedwith a cutter wheel with 60o blades in stead of 45o. This problem has effected themagnihrdes of the forces measured. But the results given in Figure 8.6 do show aninfluence of joint orientation on cutting performance, with the 90o orientation beingthe least favourable. The experiments also demonstra0e that the overafiting made,where the teeth move initially at right angles to the free surface, is advantageous. Asexplained in Chapter 3,2.1, in stronger rock the cufferhead of a cutter suctiondredger bounces off the surface of the rock during the back swing (overcuttingmode), because not enough thrust force vertically downwards can be delivered.Therefore the main cutting production with a cutter suction dredger is delivered inthe undercutting mode.
The results of the experiments on coal resemble those on wedge cuttingexperiments in anisotropic (transversely isotropic) intact rock (Pariseau 1970). Theexperiments on closely jointed coal, shown in Figure 8.5, have the lowest cuttingforces in the 45o and 135o orientation, while in the experiments of Hoogerbruggethis was not found. One notable difference between the tests is that the spacing ofthe joints in Hoogerbrugge's experiments was larger than the penetration depth ofthe cutting teeth. The most important difference, however, is that the coal cuffingexperiments were linear, while the wheel cutting tests describe a cycloidal cuttingpath through the discontinuous rock (Figure 8.7). This makes the wheel cutting tests
E=EE5eg
folntodenudfibq.ililne lle
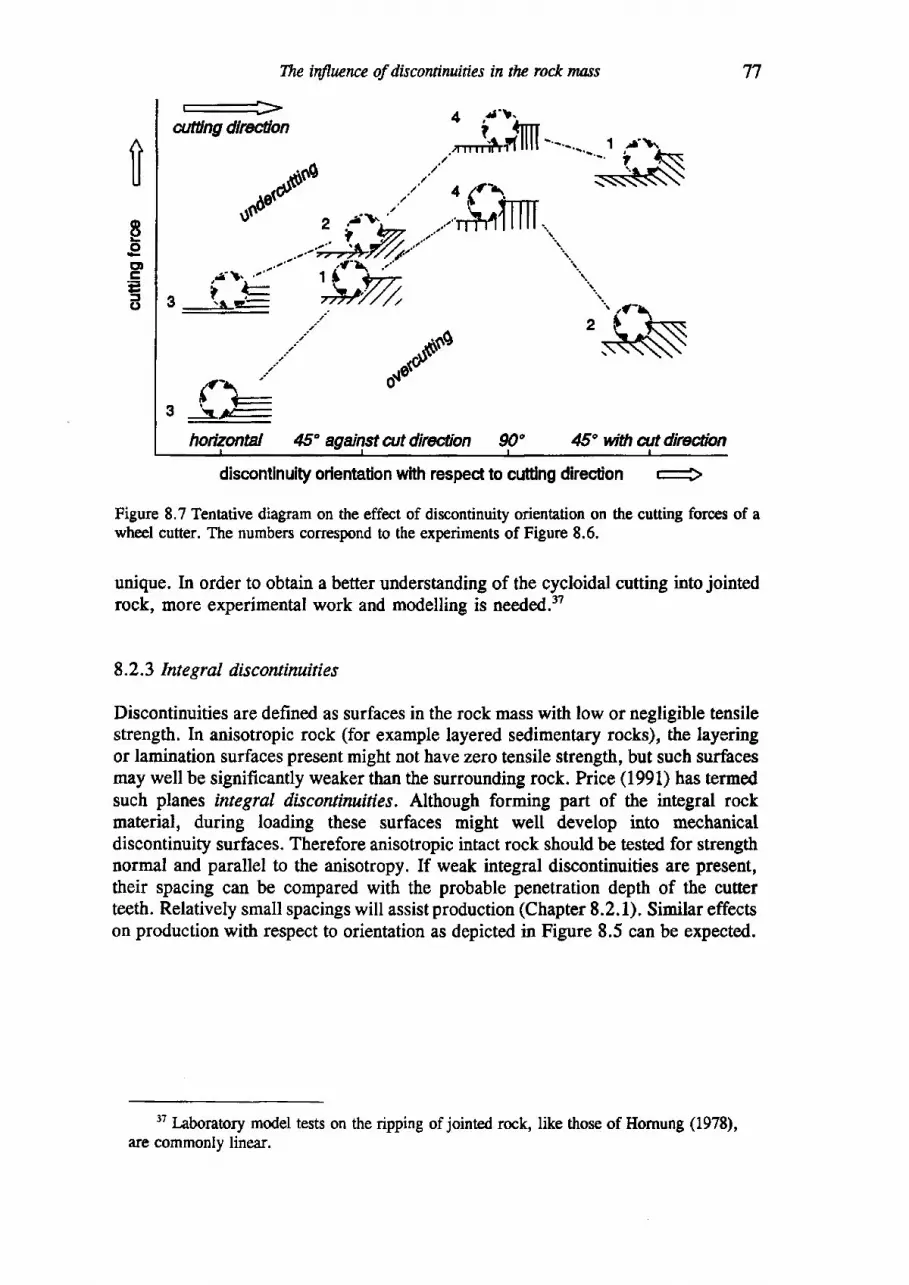
The tnJhrcnce of discontinaities in thc rock mass
ffi* 4 i'''i*.,rrrrrih{rt lll[ -.-.-._.-.- t
f-\:o'roo ,.''' : "r
pr.\-*{$)" .r.r' lr ',-\
:lSra(dD- /./' 4
,r"dt /' .Ltmfz Ttob= ....'."'rTlfr'l I I ll '.
-..-"'Q./4t'' \,r-1.. ''' 1 l ir=-? \l '- #///, \3 ---:s- 7777't 'r ,/ z . z{-\
i' 2 f- -*-=
'" '$\$g s\s\s;rt' -o$l'
zt\ o'-P-it !r-
77
ilgeocE=to
hodzontal 45" against att direction qO" 45' wrh antdiredion
discontlnuity orientation with respect to cuttlng direction -
Figure 8.7 Tenative diagram on the effect of discontinuity orientation on the cutting forces of awheel cutter. The numbers correspond to the experiments of Figure 8.6.
unique. In order to obtain a better understanding of the cycloidal cutting into jointedrock, more experimental work and modelling is needed.3?
8.2.3 Inte gral discontinuities
Discontinuities are defined as surfaces in the rock mass with low or negligible tensilestrength. In anisotropic rock (for example layered sedimentary rocks), the layeringor lamination surfaces present might not have zero tensile strength, but such surfacesmay well be significantly weaker than the surrounding rock. Price (1991) has termedsuch planes integral discowirufaes. Although forming part of the integral rockmaterial, during loading these surfaces might well develop into mechanicaldiscontinuity surfaces. Therefore anisotropic intact rock should be tested for strengthnorrnal and parallel to the anisotropy. If weak integral discontinuities are present,their spacing can be compared with the probable penetration depth of the cutterteeth. Relatively small spacings will assistproduction (Chapter 8.2.1). Similar effectson production with respect to orientation as depicted in Figure 8.5 can be expected.
37 Iaboratory model tests on the ripping of jointed rock,are commonly linear.
like those of llornung (1978),
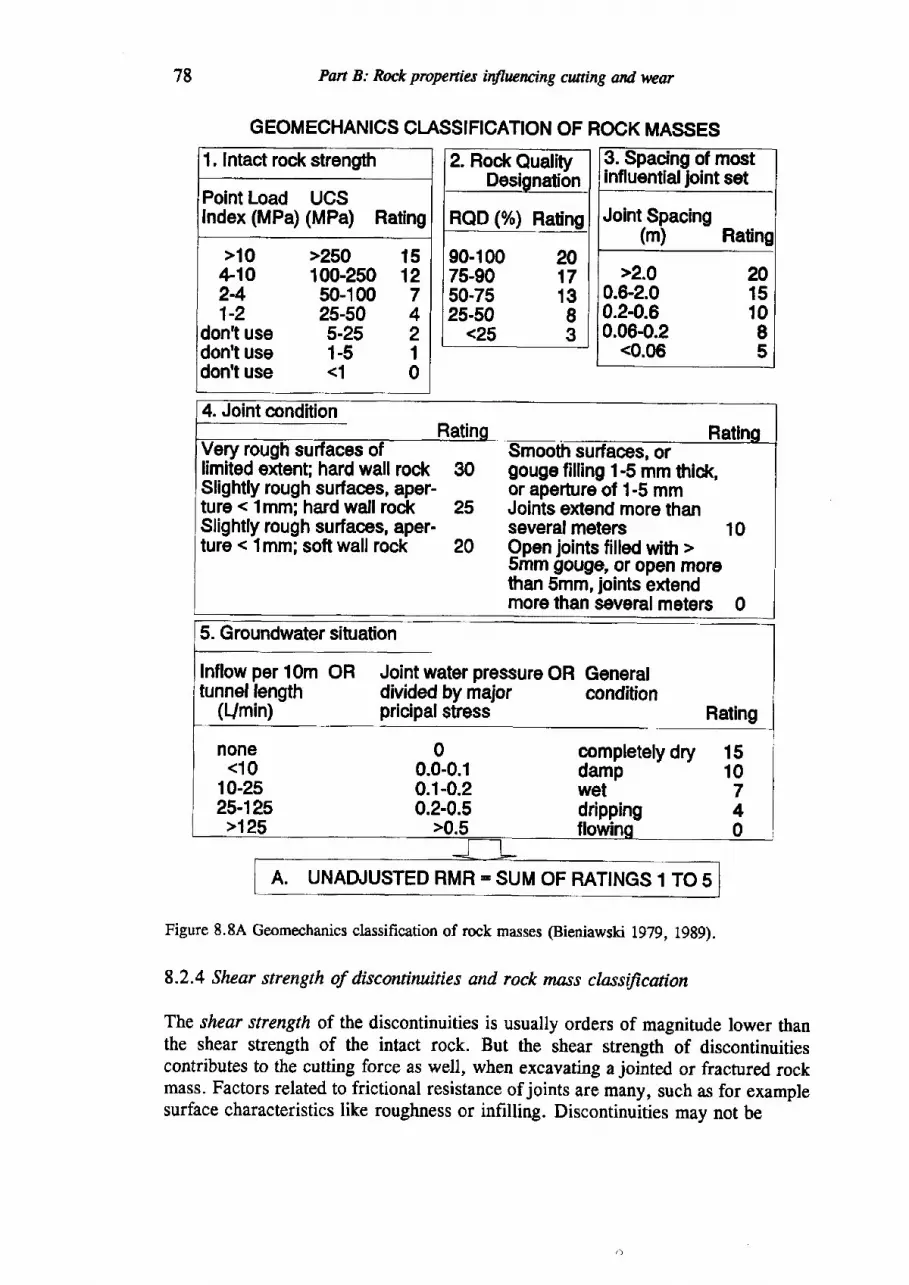
1, Intact rock strength
Point Load UCSIndex (MPa) (MPa) Rating
>10 >250 15+10 100-250 122-4 s0-100 71-2 25-50 4
don't use 5-25 2don't use 1-5 1don't use <1 0
78 Pan B: Rock propenies influcncing cwting and war
GEOMECHANICS CI.ASSIFICATION OF ROCK MASSES
2. Rock Quality
RQD (%) Ratinr
90-100 2075-90 1750-75 1325.s0 I
<25 3
5. G roundwater situation
Inflow per 10m OR Joint water pressure ORtunnel lengrth divided by major
(L/min) pricipalstress
Generalcondition
Raling
oompletely drydampwetdrippingflowins
none<10
10-2525-125>125
00.0-0.10.1-0.20.2-0.5
>0.5
1510740
A. UNAA,USTED RMR - SUM OF RATINGS 1 TO s
Figure 8.8A Geomechanics classification of rock masses (Bieniawski 1979, L989\.
8.2.4 Shear strength of discontinuities and rock mass classificaion
The shear strength of the discontinuities is usually orders of magnitude lower thanthe shear strength of the intact rock. But the shear strength of discontinuitiescontributes to the cutting force as well, when excavating a jointed or fractured rockmass. Factors related to frictional resistance of joints are many, such as for examplesurface characteristics like roughness or infilling. Discontinuities may not be
3. Spacins of mostinfluential loint set
Joint Spacing(m)
>2.0 200.6-2.0 150.2-0.6 100.06-0.2 I
<0.06 5
Slightly rough surfaces, aper-ture < lmm; hard wallrockSlightly rough surfaces, aper.ture < 1mm; soft wall roc*
gouge filling 1-5 mm thick,or aperture of 1-5 mmJoints e)il€nd more thanseveralmeterc 109p"n joints filled witr >5mm gouge, or open morethan Smm, joints extendmore than several meters 0
30
25
20
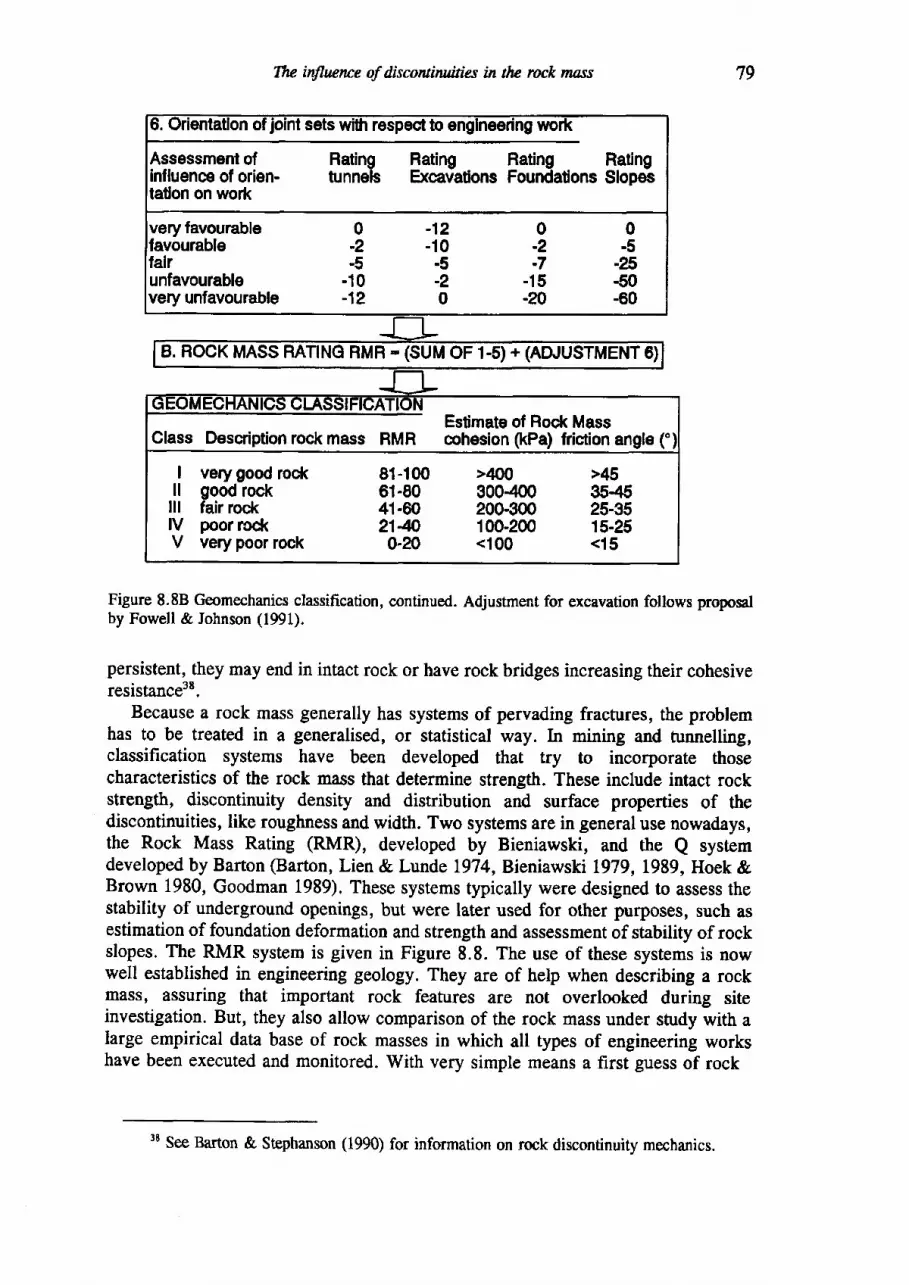
Tlu itflncnce of discowinuities in tlu rock mass
6. Qrientauon of joint sets with rsspec:t b engineering wod(
Assessment ofinfluence of orien-tation on work
Rating Rating Rating Ratingtunnels Excavations Foundations Slopes
veryfavourablefavourablelalrunfavourablevery unfavourable
0-5
.?5€0-60
0-2.7
-15-20
-12-10.5-20
0-2-5
-10-12
B. ROCK MASS RATTNG RMR - (SUM OF 1-5) + (ADJUSTMENT 6)
G EUM tsGI.IAN ICS GI-ASSIFICATIONEstimate of Rock Mass
Glass Descriptiorr rock mass RMR cohesion ftPa) friaion angle ("
I very good roc*ll good rocklll fair rocklV poor rockV verypoorrock
81-10061-8041.6021-4o0-20
>400300-40020G300100-200<100
>45354525-3515-25<15
Figure 8.88 Geomechanics classification, continued. Adjustment for excavation follows proposalby Fowell & Iohnson (1991).
persistent, they may end in intact rock or have rock bridges increasing their cohesiveresistance3E.
Because a rock mass generally has systems of pervading fractures, the problemhas to be treated in a generalised, or sktistical way. In mining and nrnnelling,classification systems have been developed that try to incorporate thosecharacteristics of the rock mass that determine strength. These include intact rockstrength, discontinuity density and distribution and surface properties of thediscontinuities, like roughness and width. Two systems are in general use nowadays,the Rock Mass Rating (RMR), developed by Bieniawski, and the Q systemdeveloped by Barton @arton, Lien & Lunde 1974, Bieniawski 1979,1989, Hoek &Brown 1980, Goodman 1989). These systems typically were designed to assess thestability of underground openings, but were later used for other pu{poses, such asestimation of foundation deformation and strength and assessment of stability of rockslopes. The RMR system is given in Figure 8.8. The use of these systems is nowwell established in engineering geology. They are of help when describing a rockmass, assuring that important rock features are not overlooked during siteinvestigation. But, they also allow comparison of the rock mass under study with aIarge empirical data base of rock masses in which all types of engineering workshave been executed and monitored. With very simple means a first guess of rock
,T9
38 See Barton & Stephanson (1990) for information on rock discontinuity mechanics.
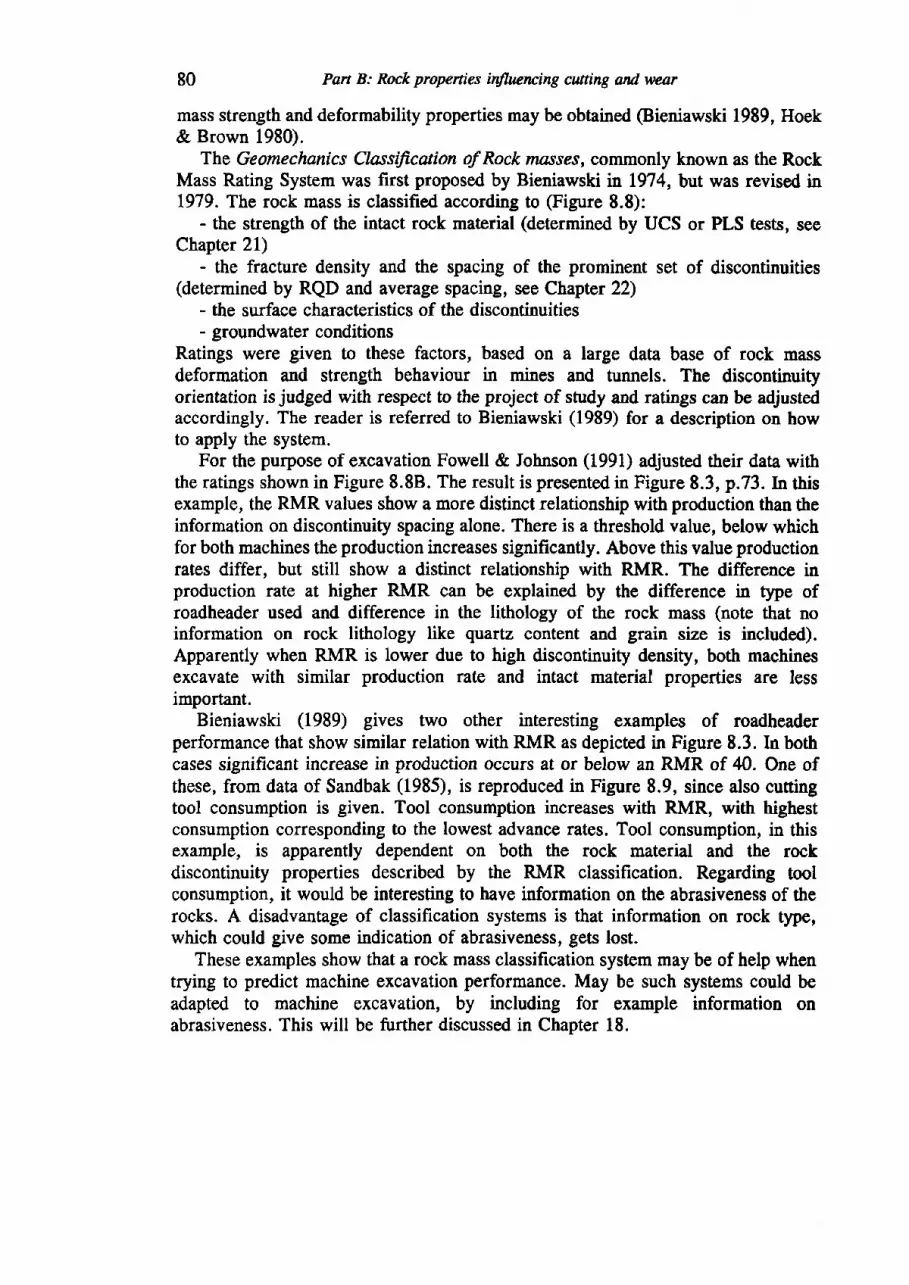
80 Part B: Rock properties itfiucrcing cutting and wear
mass strength and deformability properties may be obtained @ieniawski 1989, Hoek& Brown 1980).
The Geomechanics Classificaion of Rock masses, commonly known as the RockMass Rating System was first proposed by Bieniawski in 1974, but was revised in1979. The rock mass is classified according to (Figure 8.8):
- the strength of the intact rock material (determined by UCS or PLS tests, seeChapter 21)
- the fracture density and the spacing of the prominent set of discontinuities(determined by RQD and average spacing, see Chapter 22)
- the surface characteristics of the discontinuities- groundwater conditions
Ratings were given to these factors, based on a large data base of rock massdeformation and strength behaviour in mines and tunnels. The discontinuityorientation is judged with respect to the project of study and ratings can be adustedaccordingly. The reader is referred to Bieniawski (1989) for a description on howto apply the system.
For the purpose of excavation Fowell & Johnson (1991) adjusted their data withthe ratings shown in Figure 8.88. The result is presented in Figure 8.3, p.73.In thisexample, the RMR values show a more distinct relationship with production than theinformation on discontinuity spacing alone. There is a threshold value, below whichfor both machines the production increases significantly. Above this value productionrates differ, but still show a distinct relationship with RMR. The difference inproduction rate at higher RMR can be explained by the difference in type ofroadheader used and difference in the lithology of the rock mass (note that noinformation on rock lithology like quartz content and grain size is included).Apparently when RMR is lower due to high discontinuity density, both machinesexcavate with similar production rate and intact material properties are lessimportant.
Bieniawski (1989) gives two other interesting examples of roadheaderperformance that show similar relation with RMR as depicted in Figure 8.3. In bothcases significant increase in production occurs at or below an RMR of 40. One ofthese, from data of Sandbak (1985), is reproduced in Figure 8.9, since also cuttingtool consumption is given. Tool consumption increases with RMR, with highestconsumption corresponding to the lowest advance rates. Tool consumption, in thisexample, is apparently dependent on both the rock material and the rockdiscontinuity properties described by the RMR classification. Regarding toolconsumption, it would be interesting to have information on the abrasiveness of therocks. A disadvantage of classification systems is that information on rock type,which could give some indication of abrasiveness, gets lost.
These examples show that a rock mass classification system may be of help whentrying to predict machine excavation performance. May be such syslems could beadapted to machine excavation, by including for example information onabrasiveness. This will be further discussed in Chapter 18.
Tlu itfluence of discontiruities in tlu rock moss 81
8c(E->5qt
6ob4CLC.eELE3JthE
E.cl zctlE
:t
I
iA
" ial_\ A\i
l r. / \vl
\- !
a \ . ^ ^ \ - l l
. ?tr" '.A r'[AJ ,rx1+r
6 . - Ai .n l J
/ \ l -
\A AA4-\'..
l_\
A O
w t z
r\o oP,
0 1020 3040 506070 8090 r00Rod< Mass Rating (RMH)
Figure 8.9 Roadheader @osco SL-120) performance daa in variable rock conditions, San ManuelCopper mine, Arizona. Data from Sandbak (1985), after Bieniawski (1989).
8.2.5 Summary of the influence of discontiruities
Spacing and orientation of discontinuities influence the rock cutting process. Spacingshould be regarded with respect to the penetration depth of a cutting machine (whichis dependent on the thrust the machine is able to provide). If the spacing is near to,or smaller than, the cutting depth of the cuttitrg tooth, the cutting process witt belargely influenced by the discontinuity properties, like shear strength and orientation.
If the spacing is larger than the penetration depth of the cutting tooth, but smallerthan the size of the cutterhead, discontinuities provide for an anisotropy in the rock.They facilitate the cutting process when the angle is lower than 90o with respect tothe excavation direction. The most favourable orientation is when the haulage(direction of movement of the cutterhead) is parallel to the discontinuity orientation(Fisure 8.6 & 8.7).
Rock mass classification may be of use when studying the excavatability of a rockmass. This topic will be further examined in Chapter L8.
In many cases penetration depth of the individual cutting teeth will be smallerthan average discontinuity spacing. Cutting will be largely through intact rock,examined in the following Chapter 9.
CHAPTER 9
The cutting of intact rock material
Two questions may be asked in relation to the cutting of rock material:l. What intact rock properties that relate to cutting should be assembled in the
site investigation for a rock dredging project?2. How can these properties be used to predict the production of a cut0er suction
dredger?In this chapter a $ummary of knowledge on the cutting of intact rock is given,
from which can be deduced what mechanical properties of intact rock relate tocutting. For the site investigation is important to know which rock mechanics testsshould be performed and what laboratory cutting tests would give valuableinformation. Experimental work on rock cutting is mainly done on samples ofintact rock, using linear cutting tests. Most of the present day knowledge on rockcuttability comes from these laboratory tests.
In Chapter 9.1 a phenomenological model of rock cutting is given, based on workcarried out by Delft Hydraulics Laboratory. This model is based on rock cuttingexperiments on weak rocks, specially carried out in relation to rock cutting dredging.It illustrates the relation of rock cutting with rock failure theory and gives anindication of the type of rock mechanics tests that can provide information oncuttability.
Chapter 9.2 gives a discussion of the best known analytical cutting equations fordrag cutting tools. Apart from a rock strength factor, these equations take intoaccount changes in tool geometry (rake angle a). Since tool geometry is ghenging
due to wear (see Figure 3.11), an indication of cutting stress changes due to wearis given, by decreasing rake angle a.
In Chapter 9.3 the results of linear cutting tests, examining the effect of cuttingdepth, spacing of cutting tools and the specific energy of cutting are discussed. Theeffects of cutting velocity and heat development (Chapter 9.4), cutting under water(Chapter 9.5) and wear of the tools (Chapter 9.6) are reviewed. In these chapters theapproach to the problem of rock excavation by machines developed by Roxboroughis followed, which is based on the results of numerous rock cutting tests in thelaboratory (Roxborough 1973, Roxborough & Phillips 1981, Roxborough & Sen1986). Results of tests carried out on rocks from the Sydney Harbour Tunnel project(described in Chapter 16) are given in Chapter 9.7. How the test results may beapplied to practice is indicated in Chapter 9.8. Conclusions are given in Chapter 9.9.
82
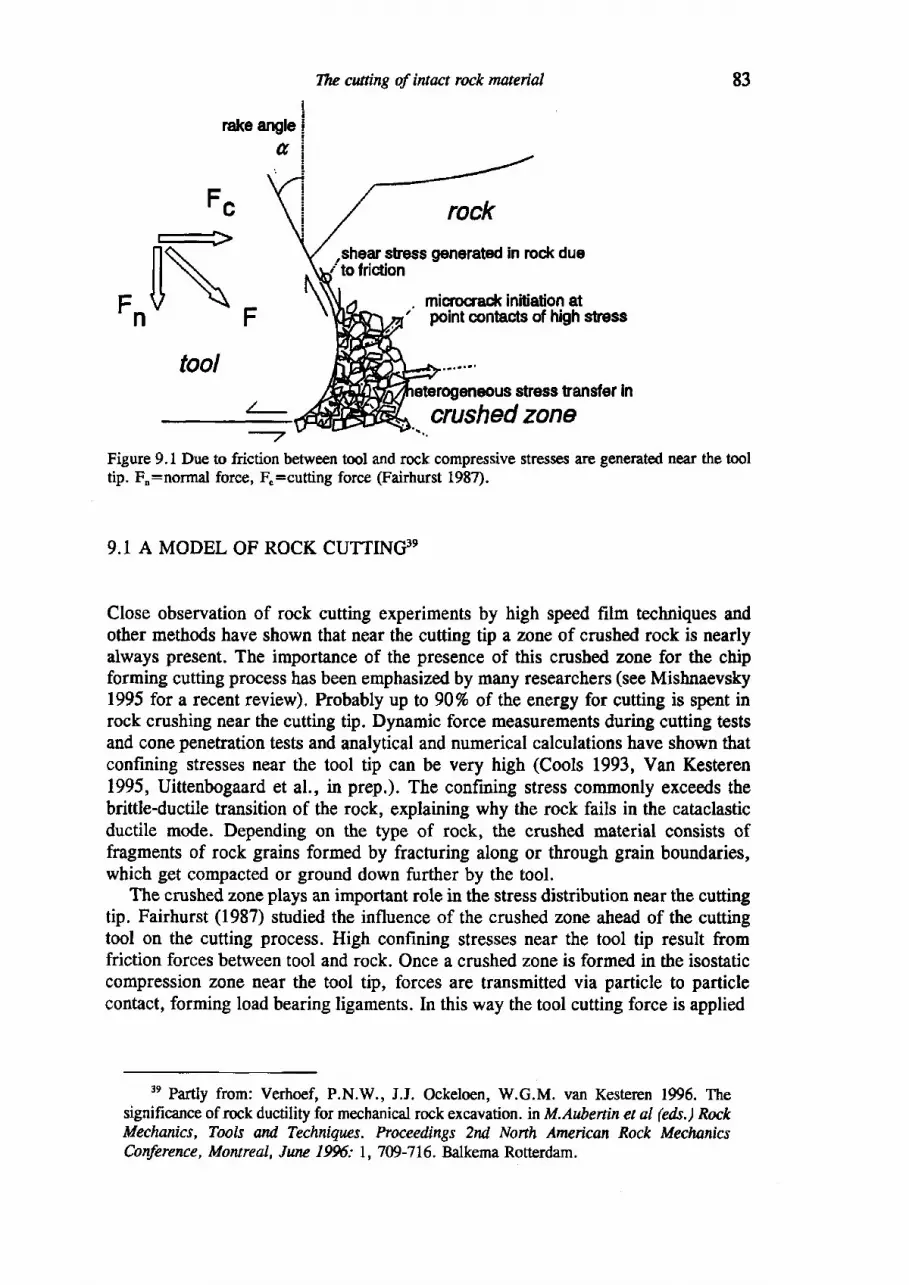
83
Fc rockshear stress genoraFd in rock dueto friction
FnN . mierocrad< iniliation at' point contacts of high sfsss
toolstress fransf€r in
crushed zoneFigure 9.1 Due to friction between tool and rock compressive stresses are generated near the tooltip- F":n661al force, F"=cutting force (Fairhurst 1987).
9.1 A MODEL OF ROCK CUTTING3g
Close observation of rock cutting experiments by high speed film techniques andother methods have shown that near the cutting tip a zone of crushed rock is nearlyalways present. The importance of the presence of this crushed zone for the chipforming cutting process has been emphasized by many researchers (see Mishnaevsky1995 for a recent review). Probably up to 90% of the energy for cutting is spent inrock crushing near the cutting tip. Dynamic force measurements during cutting testsand cone penetration tests and analytical and numerical calculations have shown thatconfining stresses near the tool tip can be very high (Cools 1993, Van Kesteren1995, Uittenbogaard et al., in prep.). The coufining stress comnonly exceeds thebrittle-ductile transition of the rock, explaining why the rock fails in the cataclasticductile mode. Depending on the type of rock, the crushed material consists offragments of rock grains formed by fracturing along or through grain boundaries,which get compacted or ground down further by the tool.
The crushed zone plays an important role in the stress distribution near the cuttingtip. Fairhurst (1987) studied the influence of the crushed zone ahead of the cuttingtool on the cutting process. High confining stresses near the tool tip result fromfriction forces between tool and rock. Once a crushed zone is formed in the isostaticcompression zone near the tool tip, forces are transmitted via particle to particlecontact, forming load bearing ligaments. In this way the tool cutting force is applied
3e Partly from: Verhoef, P.N.W., J.J. Ockeloen, W.G.M. van Kesteren 1995. Thesignificance of rock ductility for mechanical rock excavation. in M.Aubertin et al (eds.) RockMechanics, Took and TecltniErcs. Praceedings 2rtd Nonh American Rock MeclwnicsConference, Montreal, Jnru 1996: l, 709-716. Balkema Rotterdam.
TItc ctttting of intact rock maerial
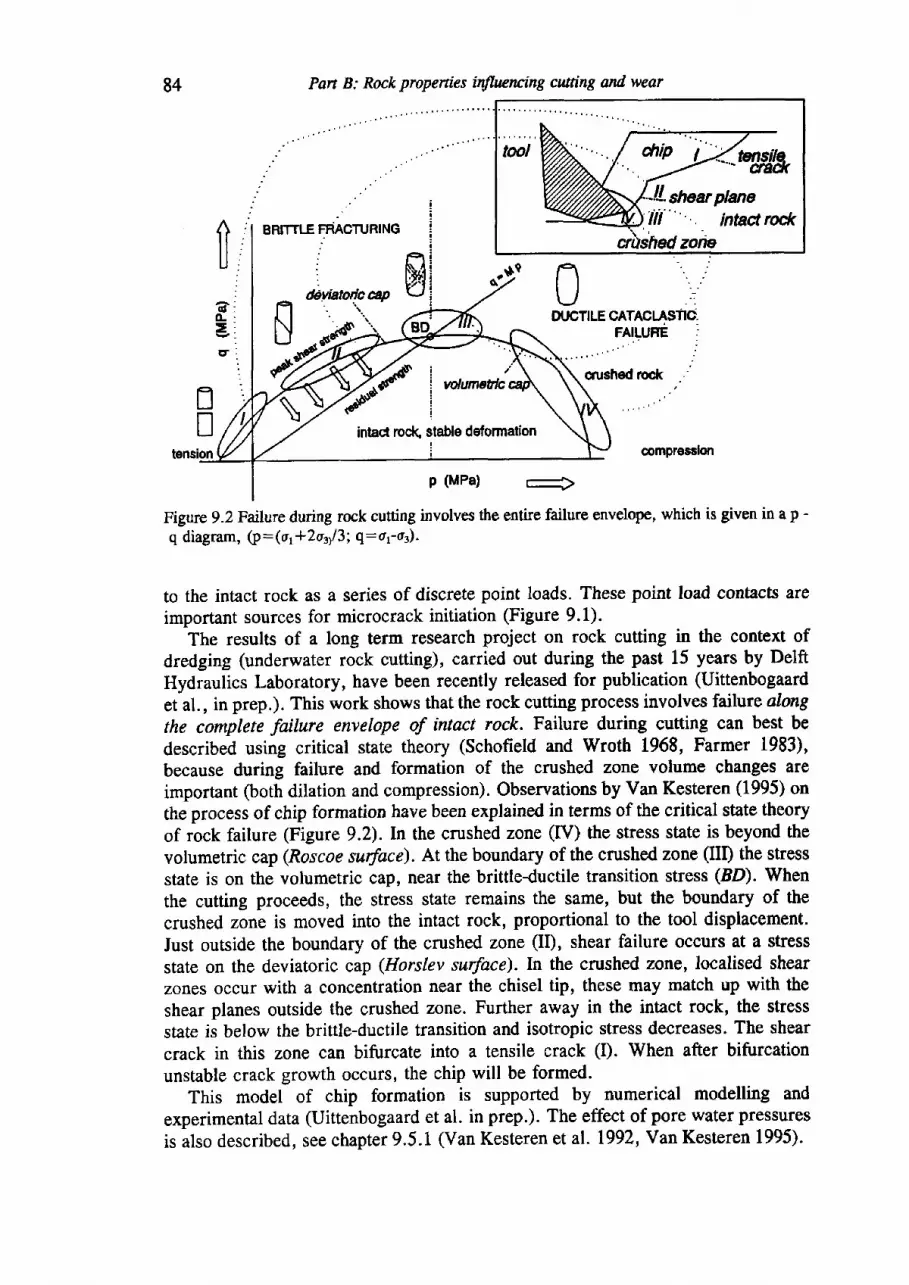
84 Part B: Rock propenins inthnncing cwting and wear
0Dt,CTILE
il BRITTLE TNICTUNHE
.:cATACIAST|C.FAILUFE :
compreeslon
p (MPa)
Figure g.2Rutureduring rock cutting involves the entire failure envelope, which is given in a p -q diagram, (p:(o1*2q/3; q:ot-ot).
to the intact rock as a series of discrete point loads, These point load contacts areimportant sources for microcrack initiation (Figure 9.1).
The results of a long term research project on rock cutting in the context ofdredging (underwater rock cutting), carried out during the past 15 years by DelftHydraulics Laboratory, have been recently released for publication (Uittenbogaard
et al., in prep.). This work shows that the rock cutting process involves failure alongthe complete failure envelope of intact rock. Failure during cutting can best bedescribed using critical state theory (Schofield and Wroth 1968, Farmer 1983)'because during failure and formation of the crushed zone volume changes areimportant Ooth dilation and compression). Observations by Van Kesteren (1995) onthe process of chip formation have been explained in terms of the critical state theoryof rock failure (Figure 9.2).In the cnrshed zone (IV) the stress state is beyond thevolumetric cap (Rosco e surface). At the boundary of the crushed zone (II! the stressstate is on the volumetric cap, near the brittleductile transition stress (BD).When
the cutting proceeds, the stress state remains the same, but the boundary of thecrushed zone is moved into the intact rock, proportional to the tool displacement.Just outside the boundary of the crushed zone (II), shear failure occurs at a stressstate on the deviatoric cap (Horslev surface). In the crushed zone,localised shearzones occur with a concentration near the chisel tip, these may match up with theshear planes outside the crushed zone. Further away in the intact rock, the stressstate is below the brittle-ductile transition and isotropic stress decreases. The shear
crack in this zone can bifurcate into a tensile crack (D. When after bifurcationunstable crack growth occurs, the chip will be formed.
This model of chip formation is supported by numerical modelling andexperimental data (Uittenbogaard et al. in prep.). The effect of pore water pressures
is also described, see chapter 9.5.1 (Van Kesteren et al. L992, Van Kesteren 1995).
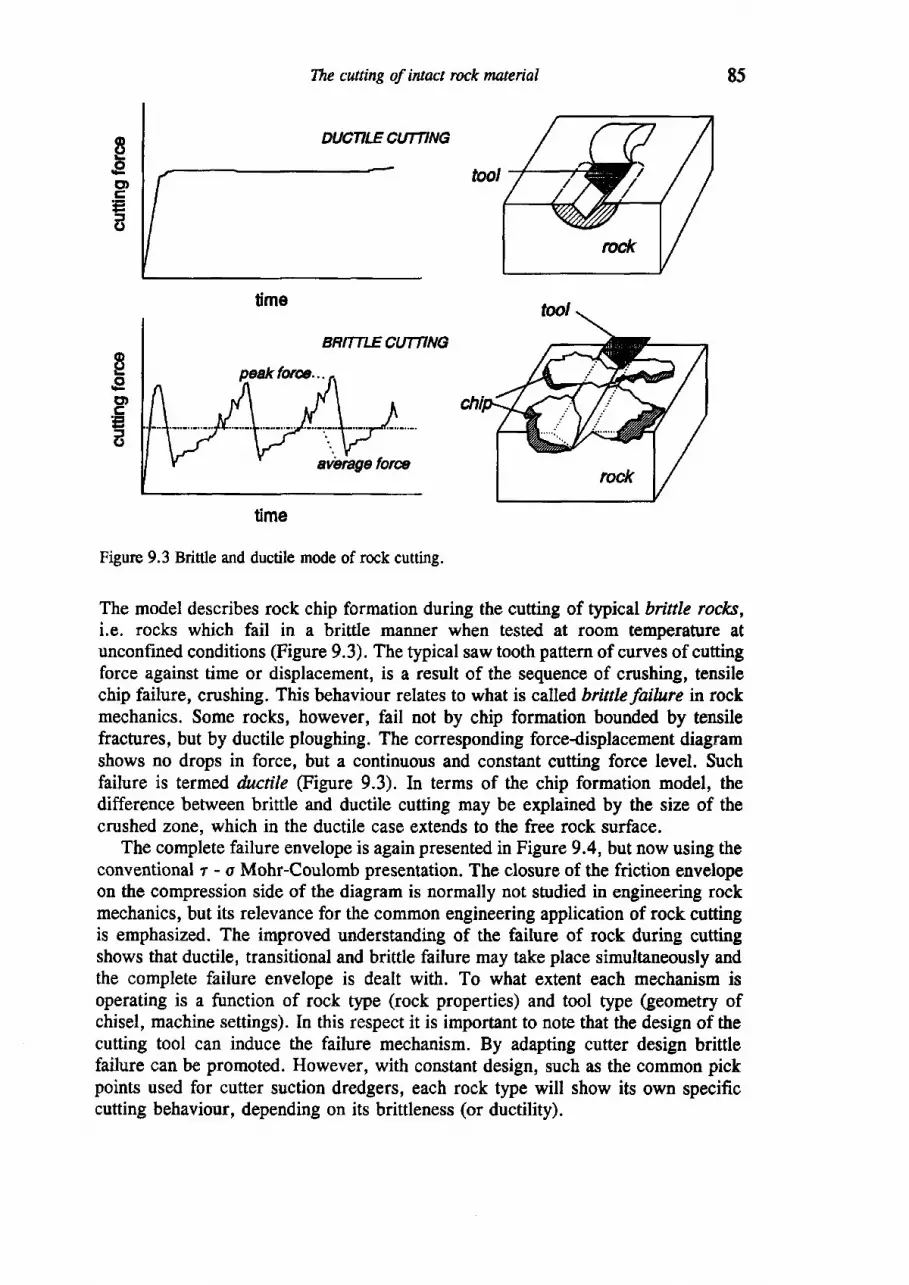
The cutting of intact rock muerial
Figure 9.3 Brittle and ductile mode of rock cutting.
The model describes rock chip formation during the cutting of 6pical brittle rocl<s,i.e. rocks which fail in a brittle manner when tested at room temperature atunconfined conditions (Figure 9.3). The typical saw tooth pattern of curves of cuttingforce against time or displacement, is a result of the sequence of crushing, tensilechip failure, crushing. This behaviour relates to what is called brittle failure in rockmechanics. Some rocks, however, fail not by chip formation bounded by tensilefractures, but by ductile ploughing. The corresponding forcedisplacement diagramshows no drops in force, but a continuous and constant cutting force level. Suchfailure is termed &tctile (Figure 9.3). In terms of the chip formation model, thedifference between brittle and ductile cutting may be explained by the size of thecrushed zone, which in the ductile case extends to the free rock surface.
The complete failure envelope is again presented in Figure 9.4, but now using theconventional r - o Mohr-Coulomb presentation. The closure of the friction envelopeon the compression side of the diagram is normally not studied in engineering rockmechanics, but its relevance for the common engineering application of rock cuffingis emphasized. The improved understanding of the failure of rock during cuttingshows that ductile, transitional and brittle failure may take place simultaneously andthe complete failure envelope is dealt with. To what extent each mechanism isoperating is a function of rock type (rock properties) and tool type (geometry ofchisel, machine settings). In this respect it is important to note that the design of thecutting tool can induce the failure mechanism. By adapting cutter design brittlefailure can be promoted. However, with constant design, such as the common pickpoints used for cutter suction dredgers, each rock type will show its own specificcutting behaviour, depending on its brittleness (or ductility).
85
Eect)EF=o
geo,c:tC)
time
time
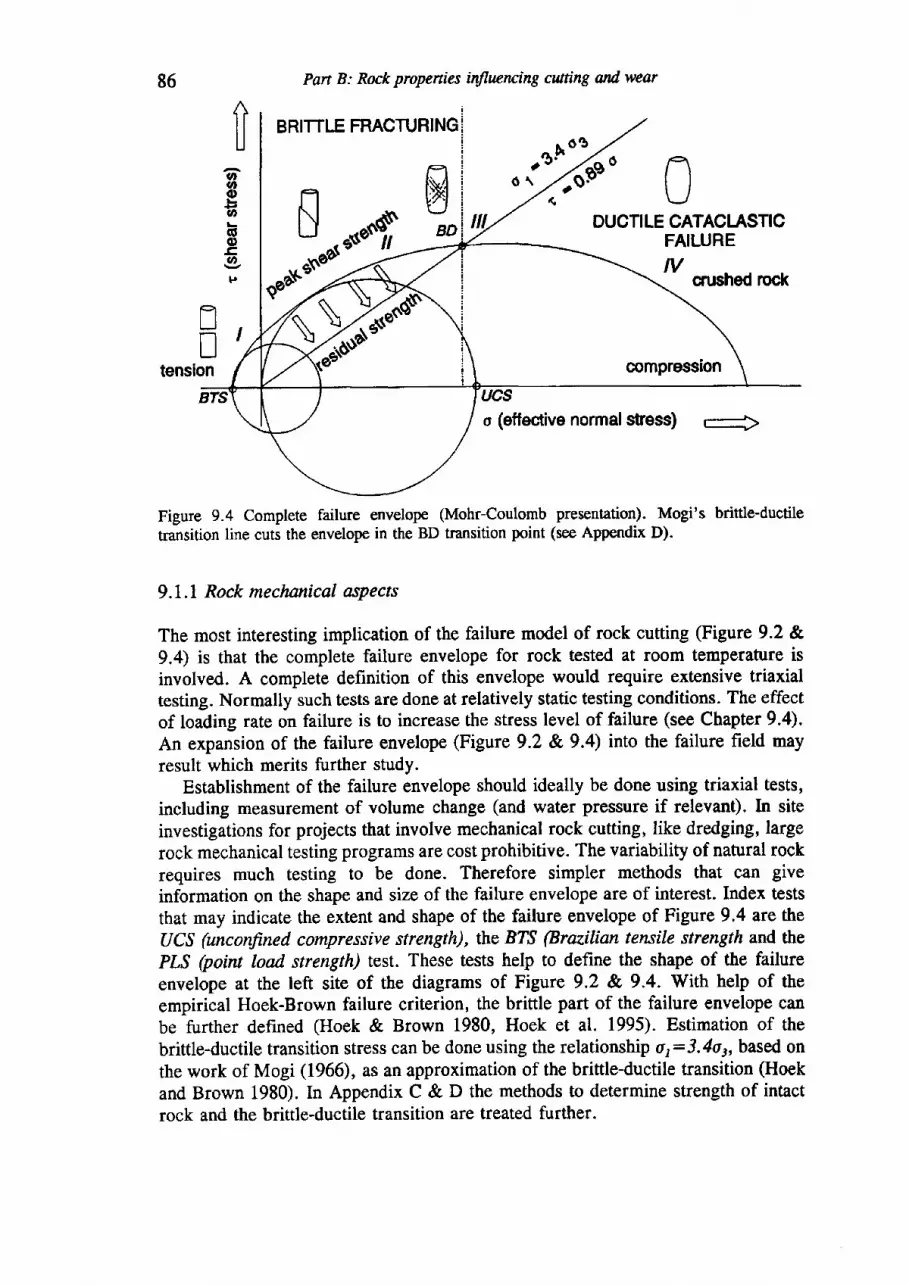
86 Part B: Rock propenies influcrcing cutting and wear
BRITTLE FMCTURING
IBDs
,r*9
At lI I
U
oa,oo
6oEol,
*ft{oO f ,,Za$:
DUCTILE CATACI.ASTICFAILURE/v
cn,stred roor
EU
tension
Figure 9.4 Complete failure envelope (Mohr-Coulomb presentation). Mogi's brittle-ductiletransition line cuts the envelope in the BD transition point (see Appendix D).
9.1.1 Rock mechanical aspects
The most interesting implication of the failure model of rock cutting (Figure 9.2 &9.4) is that the complete failure envelope for rock tested at room temperature isinvolved. A complete definition of this envelope would require extensive triaxialtesting. Normally such tests are done at relatively static testing conditions. The effectof loading rate on failure is to increase the stress level of failute (see Chapter 9.4).An expansion of the failure envelope (Figure 9.2 & 9.4) into the failure field mayresult which merits further study.
Establishment of the failure envelope should ideally be done using triaxial tests,including measurement of volume change (and water pressure if relevant). In siteinvestigations for projects that involve mechanical rock cutting, like dredgirtg, largerock mechanical testing programs are cost prohibitive. The variability of natural rockrequires much testing to be done. Therefore simpler methods that can giveinformation on the shape and size of the failure envelope are of interest. Index teststhat may indicate the extent and shape of the failure envelope of Figure 9.4 are theUCS (unconfined compressive strength), the B?S (Brazilian tensile strength and thePLS (point load strength) test. These tests help to define the shape of the failureenvelope at the teft site of the diagrams of Figure 9.2 & 9.4. With help of theempirical Hoek-Brown failure criterion, the brittle part of the failure envelope canbe further defined (Hoek & Brown 1980, Hoek et al. 1995). Estimation of thebrittle-ductile transition stress can be done using the relationship or:3.4o3, based onthe work of Mogi (1966), as an approximation of the brittle-ductile transition (Hoekand Brown 1980). In Appendix C & D the methods to determine strength of intactrock and the brittle-ductile transition are treated further.
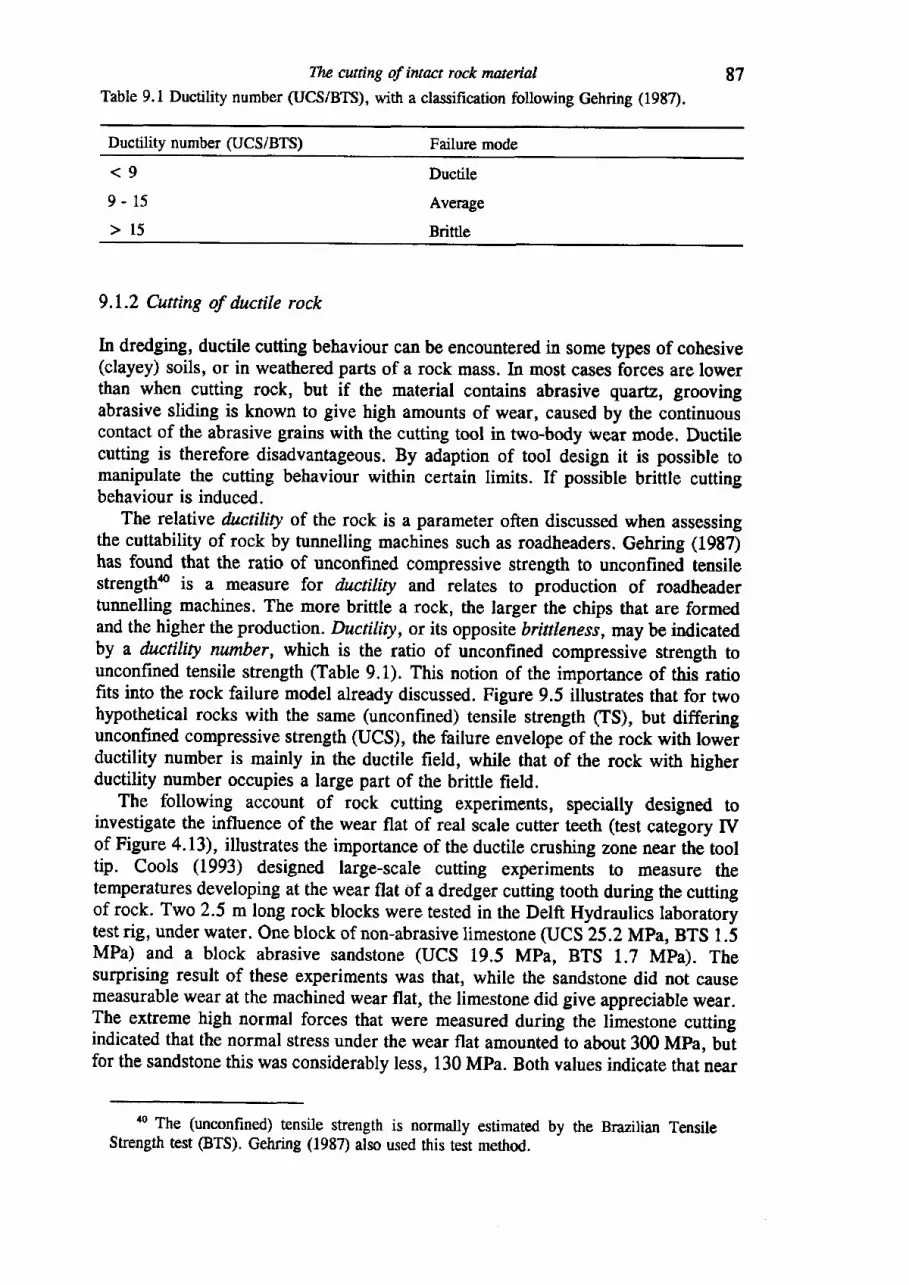
Tlu cuning of intact rock mateia, 8lTable 9.1 Ductility number (UCS/BTS), with a classification following Gehring (19S7).
Ductility number (UCS/BTS) Failure mode
<9
9- 15
>15
Ductile
Average
Brittle
9.1.2 Cuning of ductile rock
In dredging, ductile cutting behaviour can be encountered in some types of cohesive(clayey) soils, or in weathered parts of a rock mass. In most cases forces are lowerthan when cutting rock, but if the material contains abrasive quartz, groovingabrasive sliding is known to give high amounts of wear, caused by the continuouscontact of the abrasive grains with the cutting tool in trvo-body wear mode. Ductilecutting is therefore disadvantageous. By adaption of tool design it is possible tomanipulate the cutting behaviour within certain limits. If possible brittle cuttingbehaviour is induced.
The relative dactility of the rock is a parameter often discussed when assessingthe cuttability of rock by tunnelling machines such as roadheaders. Gehring (1987)has found that the ratio of unconfined compressive strength to unconfined tensilestrength& is a measure for ductility and relates to production of roadheadertunnelling machines. The more brittle a rock, the larger the chips that are formedand the higher the production. Ductility, or its opposite brittleness, Dty be indicatedby a ductility number, which is the ratio of unconfined compressive strength tounconfined tensile strength (Table 9.1). This notion of the importance of this ratiofits into the rock failure model already discussed. Figure 9.5 illustrates that for twohypothetical rocks with the same (unconfined) tensile strength (TS), but differingunconfined compressive strength (UCS), the failure envelope of the rock with lowerductility number is mainly in the ductile field, while that of the rock with higherductility number occupies a large part of the brittle field.
The following account of rock cutting experiments, specially designed toinvestigate the influence of the wear flat of real scale cutter teeth (test category IVof Figure 4.13), illustrates the importance of the ductile crushing zone near the tooltip. Cools (1993) designed large-scale cutting experiments to measure thetemperatures developing at the wear flat of a dredger cutting tooth during the cuttingof rock. Two 2.5 m long rock blocks were tested in the Delft Hydraulics laboratorytest rig, under water. One block of non-abrasive limestone (UCS 25.2MPa, BTS 1.5MPa) and a block abrasive sandstone (ucs 19.5 Mpa, BTs 1.7 Mpa). Thesurprising result of these experiments was that, while the sandstone did not causemeasurable wear at the machined wear flat, the limestone did give appreciable wear.The extreme high normal forces that were measured during the limestone cuttingindicated that the normal stress under the wear flat amounted to about 300 MPa, butfor the sandstone this was considerably less, 130 MPa. Both values indicate that near
a0 The (unconfined) tensile strength is normally estimated by the Brazilian TensileStrength t€st (BTS). Gehring (1987) also used this test method.
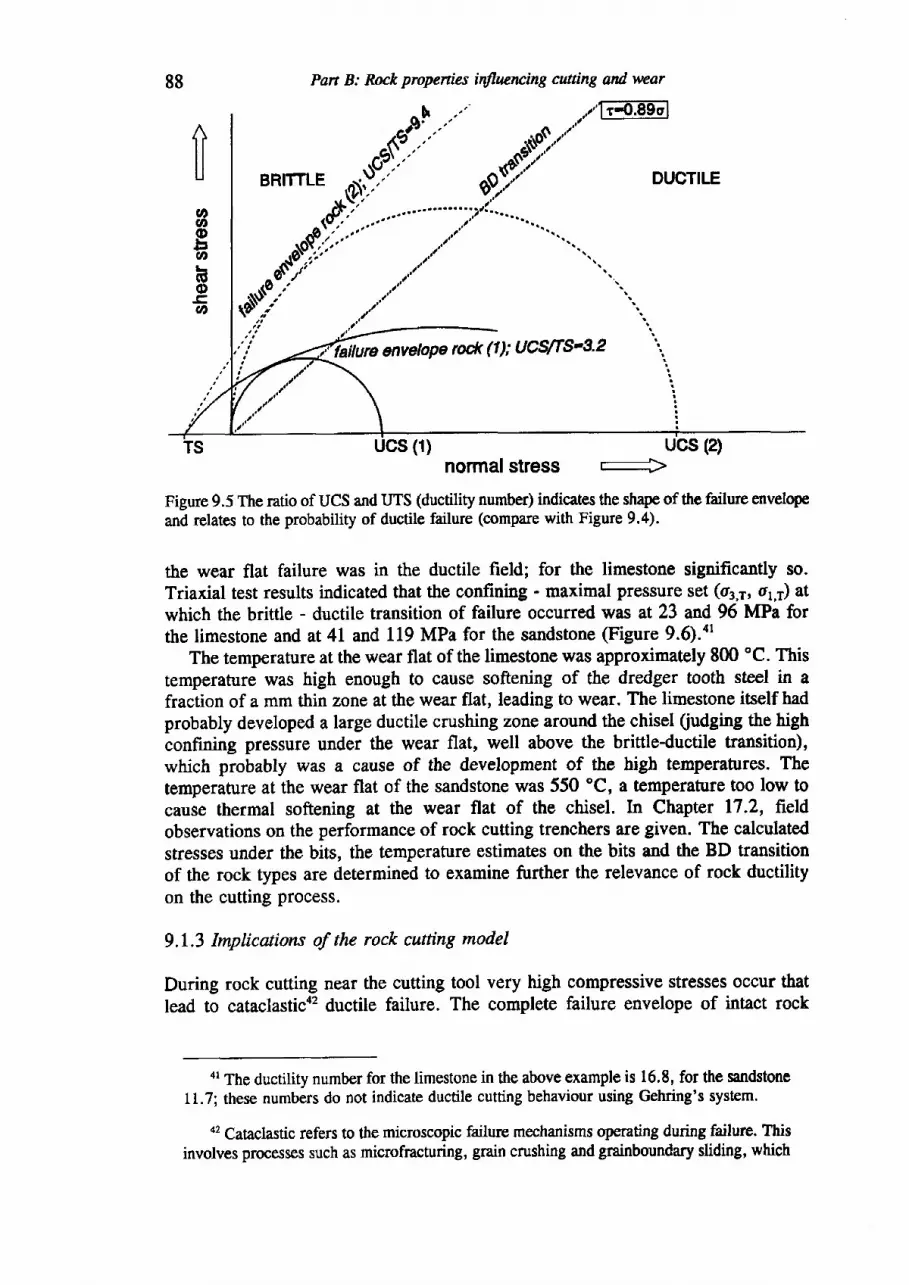
88 Pan B: Rock propenies indluencing cutting and wear
iloo@t3U'L16oo
.'yrt9BRITTLE DUCTILE
17ailure envelope ro* fl; UCflTS-3.Z
normal stressucs (2)
F------------A\
4
Figure 9.5 fire ratio of UCS and UTS (ductility number) indicates the shape of the failurc envelopeand relates to the probability of ductile failure (compare with Figure 9.4).
the wear flat failure was in the ductile field; for the limestone significantly so.Triaxial test fesults indicated that the confining - maximal pressure sot (o3,1, or,1) atwhich the brittle - ductile transition of failure occurred was at 23 ad 96 MPa forthe limestone and at 41 and 119 MPa for the sandstone (Figure 9.6).ot
The temperature at the wear flat of the limestone was approximately 8fi) 'C. Thistemperature was high enough to causo softening of the dredger tooth steel in afraction of a mm thin zone at the wear flat, leading to wear. The limestone itself hadprobably developed a large ductile crushing zone around the chisel (iudging the highconfining pressure under the wear flat, well above the brittleductile transition),which probably was a cause of the development of the high ternperatures. Thetemperature at the wear flat of the sandstone was 550 oC, o temperature too low tocause thermal softening at the wear flat of the chisel. In Chapter 17.2, fieldobservations on the performance of rock cutting trenchers are given. The calculatedstresses under the bits, the temperature estimates on the bits and the BD transitionof the rock types are determined to examine further the relevance of rock ductilityon the cutting process.
9.1.3 Implications of the rock cutting model
During rock cutting near the cutting tool very high compressive stresses occur thatlead to cataclastica2 ductile failure. The complete failure envelope of intact rock
ar The ductility number for the limestone in ttre above example is 16.8, for the sandstonell.7; these numbers do not indicate ductile cutting behaviour using Gehring's system.
a2 Cataclastic refers to the microscopic failure mechanisms operating during failure. Thisinvolves processes such as microfracturing, grain crushing and grainboundary sliding, which
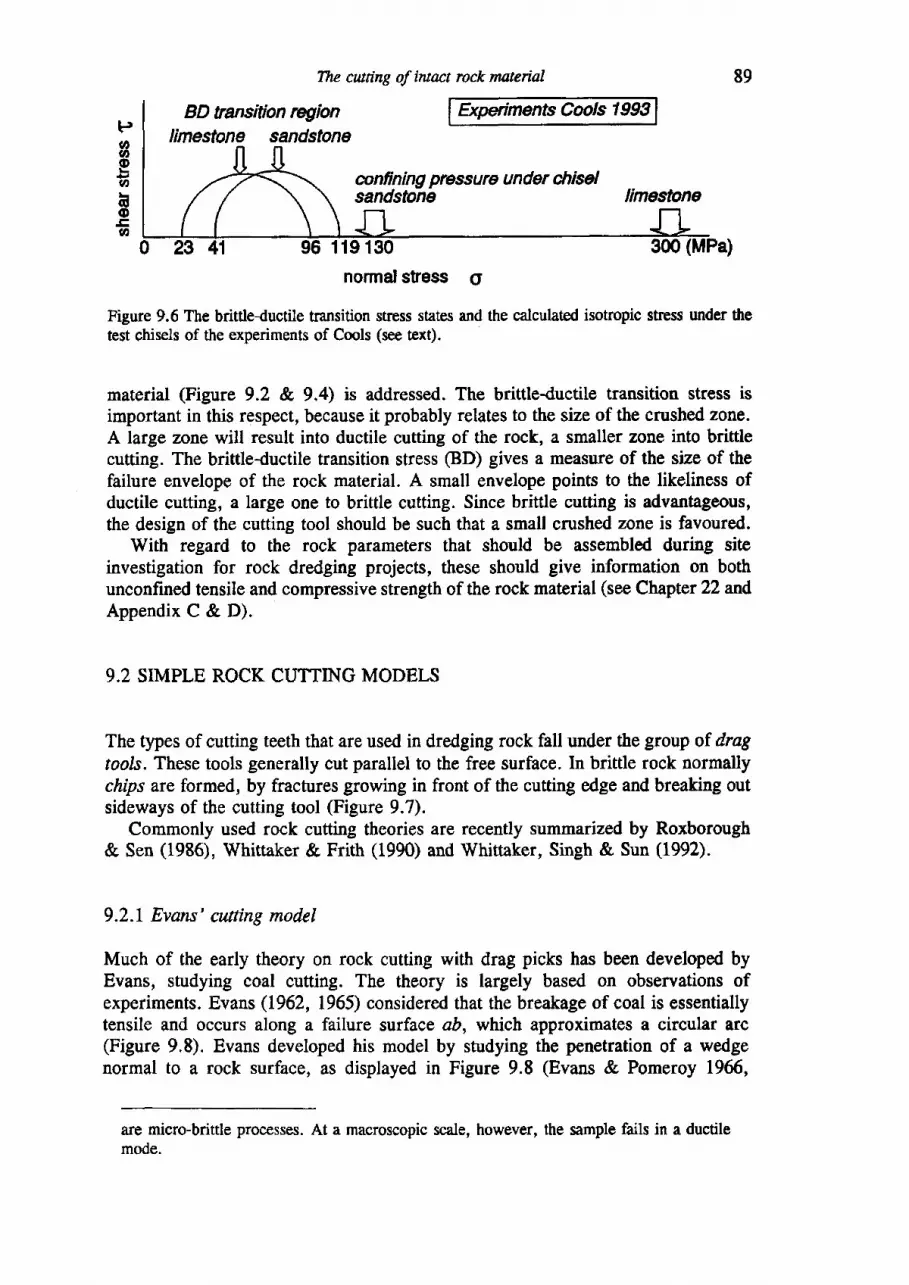
The cutting of iwact rock muerial
BD transition rqionlimestone sandstone
Expiments Cools 1993
mnfrning pressure under chiselsandstone limestone
1 19 130
normal sfress O
Figure 9.6 The brittle{uctile transition $tress stat€s and the calculated isotropic stress under thetest chisels of the experiments of Cools (see text).
material (Figure 9.2 & 9.4) is addressed. The brittleductile transition stress isimportant in this respect, because it probably relates to the size of the crushed zone.A large zone will result into ductile cutting of the rock, a smaller zone into brittlecutting. The brittleductile transition stress @D) gives a measure of the size of thefailure envelope of the rock material. A small envelope points to the likeliness ofductile cutting, a large one to brittle cutting. Since brittle cutting is advantageous,the design of the cutting tool should be such that a small crushed zone is favoured.
With regard to the rock parameters that should be assembled during siteinvestigation for rock dredging projects, these should give information on bothunconfined tensile and compressive strength of the rock malerial (see Chapter 22 andAppendix C & D).
9.2 SIMPLE ROCK CUTTING MODELS
The types of cutting teeth that are used in dredging rock fall under the group of dragtools. These tools generally cut parallel to the free surface. In brittle rock norrnallychips are formed, by fractures growing in front of the cutting edge and breaking outsideways of the cutting tool (Figure 9.7).
Commonly used rock cutting theories are recently summarized by Roxborough& Sen (1986), Whittaker & Frith (1990) and Whittaker, Singh & Sun (1992).
9.2.1 Evans' cutting model
Much of the early theory on rock cutting with drag picks has been developed byEvans, studying coal cutting. The theory is largely based on observations ofexperiments. Evans (1962, 1965) considered that the breakage of coal is essentiallytensile and occurs along a failure surface ab, which approximates a circular arc(Figure 9.8). Evans developed his model by studying the penetration of a wedgenormal to a rock surface, as displayed in Figure 9.8 (Evans & Pomeroy 1966,
are micro-brittle processes. At a macroscopic scale, however, the sample fails in a ductilemode.
89
PooEv,
G'o-co
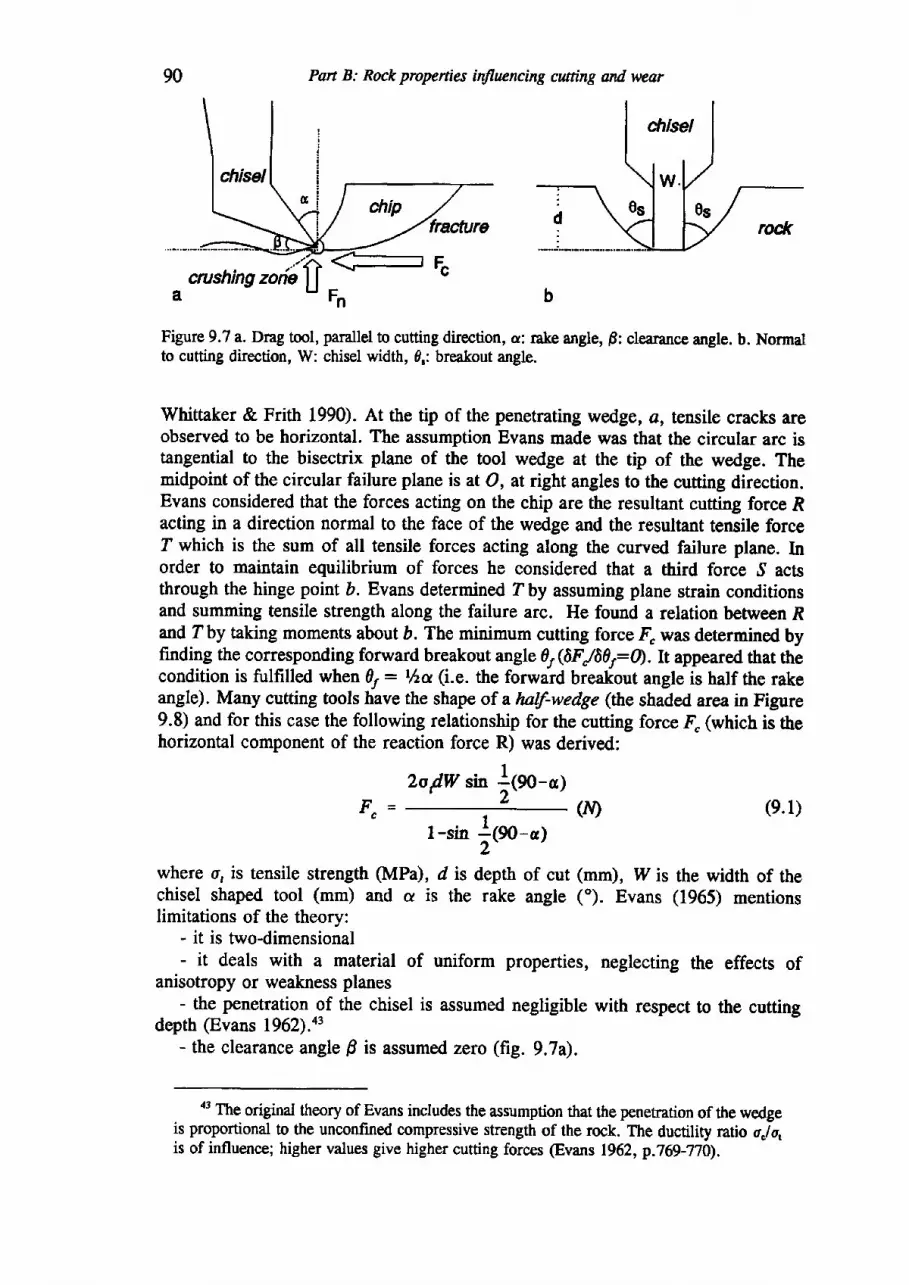
Pan B: Rock properties ttfluencing cutting atrd wear
Figure 9.7 a. Dng tool, parallel to cutting direction, c: rake angle, p: clearance angle. b. Normalto cutting direction, W: chisel width, d,: breakout angle.
Whittaker & Frith 1990). At the tip of the penetrating wedge, a, tensile cracks areobserved to be horizontal. The assumption Evans made was that the circular arc istangential to the bisectrix plane of the tool wedge at the tip of the wedge. Themidpoint of the circular failure plane is at O, at right angles to the cutting direction.Evans considered that the forces acting on the chip are the resultant cutting force Racting in a direction normal to the face of the wedge and the resultant tensile force7 which is the sum of all tensile forces acting along the curved failure plane. Inorder to maintain equilibrium of forces he considered that a third force ,9 actsthrough the hinge point D. Evans determined ?by assuming plane strain conditionsand summing tensile strength along the failure arc. He found a relation between Rand lby taking moments about D. The minimum cutting force ̂ Q was determined byfinding the corresponding forward breakout angle $(6F/607:A. happeared that thecondition is fulfilled when 01: tha (i.e. the forward brealiout angle is half the rakeangle). Many cutting tools have the shape of a lwlf-wedge (the shaded area in Figure9.8) and for this case the following relationship for the cutting force d (which is thehorizontal component of the reaction force R) was derived:
Fr=zoy'wti" fteo-ol
r -sin jfeo-"1(tf) (e.l)
where q is tensile strength (MPa), d is depth of cut (mm), IV is the width of thechisel shaped tool (mm) and cu is the rake angle ("). Evans (1965) menrionslimitations of the theory:
- it is two-dimensional- it deals with a material of uniform properties, neglecting the effects of
anisotropy or weakness planes- the penetration of the chisel is assumed negligible with respect to the cutting
depth @vans 1962).43- the clearance angle p is assumed zero (fig. 9.7a).
a3 The original theory of Evans includes the assumption that the penetration of the wedgeis proportional to the unconfined compressive strength of the rock. The ductility ratio oJo,is of influence; higher values give higher cutting forces @vans 1962, p.769-770).
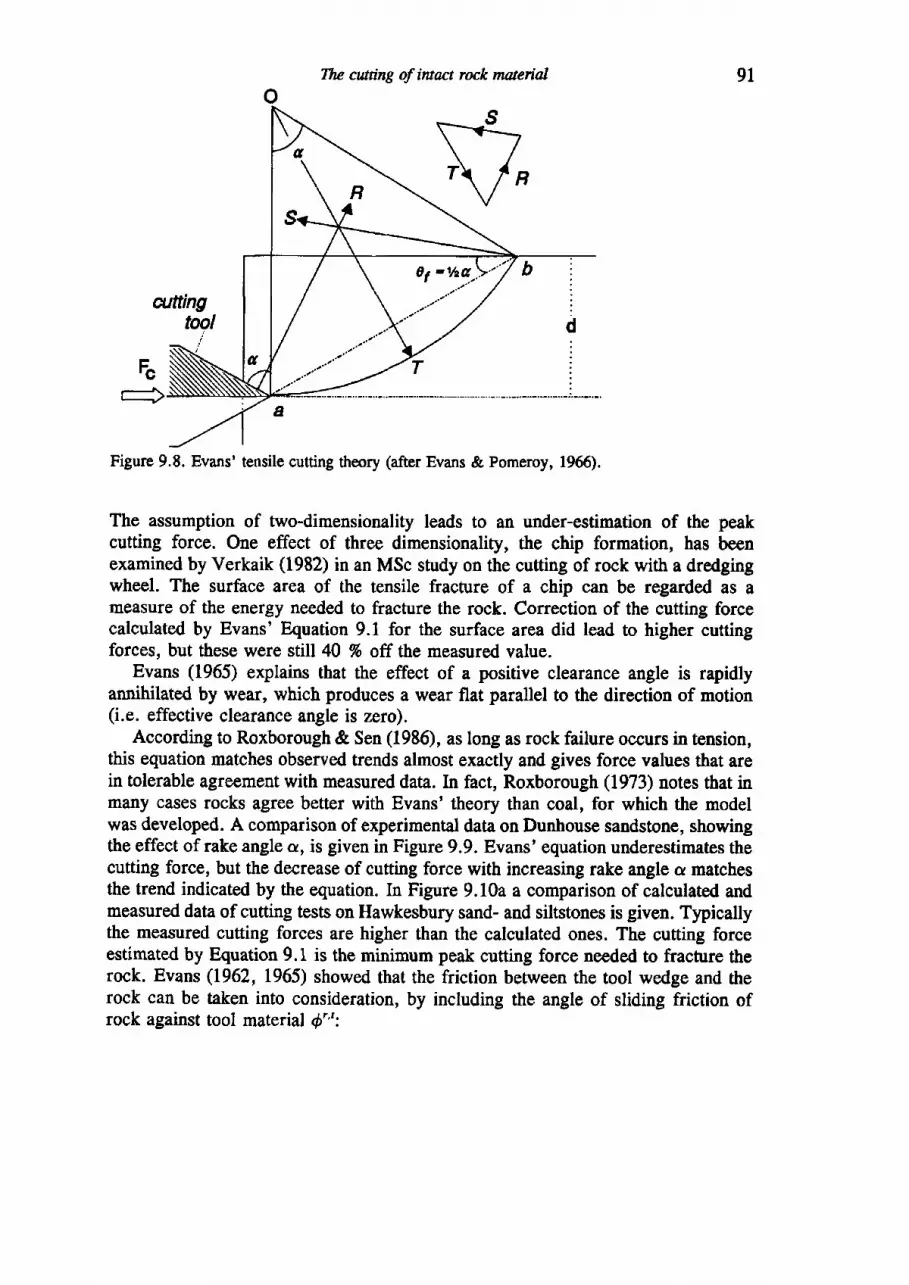
Tlu cntting of intact rock maertol
The assumption of two-dimensionality leads to an under-estimation of the peakcutting force. One effect of three dimensionality, the chip formation, has beenexamined by Verkaik (1982) in an MSc study on the cutting of rock with a dredgingwheel. The surface area of the tensile fracture of a chip can be regarded as ameasure of the energy needed to fracture the rock. Correction of the cutting forcecalculated by Evans' Equation 9.1 for the surface area did lead to higher cuttingforces, but these were still 40 % off the measured value.
Evans (1965) explains that the effect of a positive clearance angle is rapidlyannihilated by wear, which produces a wear flat parallel to the direction of motion(i.e. effective clearance angle is zero).
According to Roxborough & Sen (1986), as long as rock failure occurs in tension,this equation matches observed trends almost exactly and gives force values that arein tolerable agreement with measured data. In fact, Roxborough (1973) notes that inmany cases rocks agree better with Evans' theory than coa[, for which the modelwas developed. A comparison of experimental data on Dunhouse sandstone, showingthe effect of rake angle a, is given in Figure 9.9. Evans' equation underestimates thecutting force, but the decrease of cutting force with increasing rake angle a matchesthe trend indicated by the equation. In Figure 9.10a a comparison of calculated andmeasured data of cutting tests on Hawkesbury sand- and siltstones is given. Typicallythe measured cutting forces are higher than the calculated ones. The cuffing forceestimated by Equation 9.1 is the minimum peak cutting force needed to fracture therock. Evans (1962, 1965) showed that the friction between the tool wedge and therock can be taken into consideration, by including the angle of sliding friction ofrock against tool material ga':
91
Figure 9.8. Evans' tensile cutting theory (after Evans & Pomeroy, 1966).
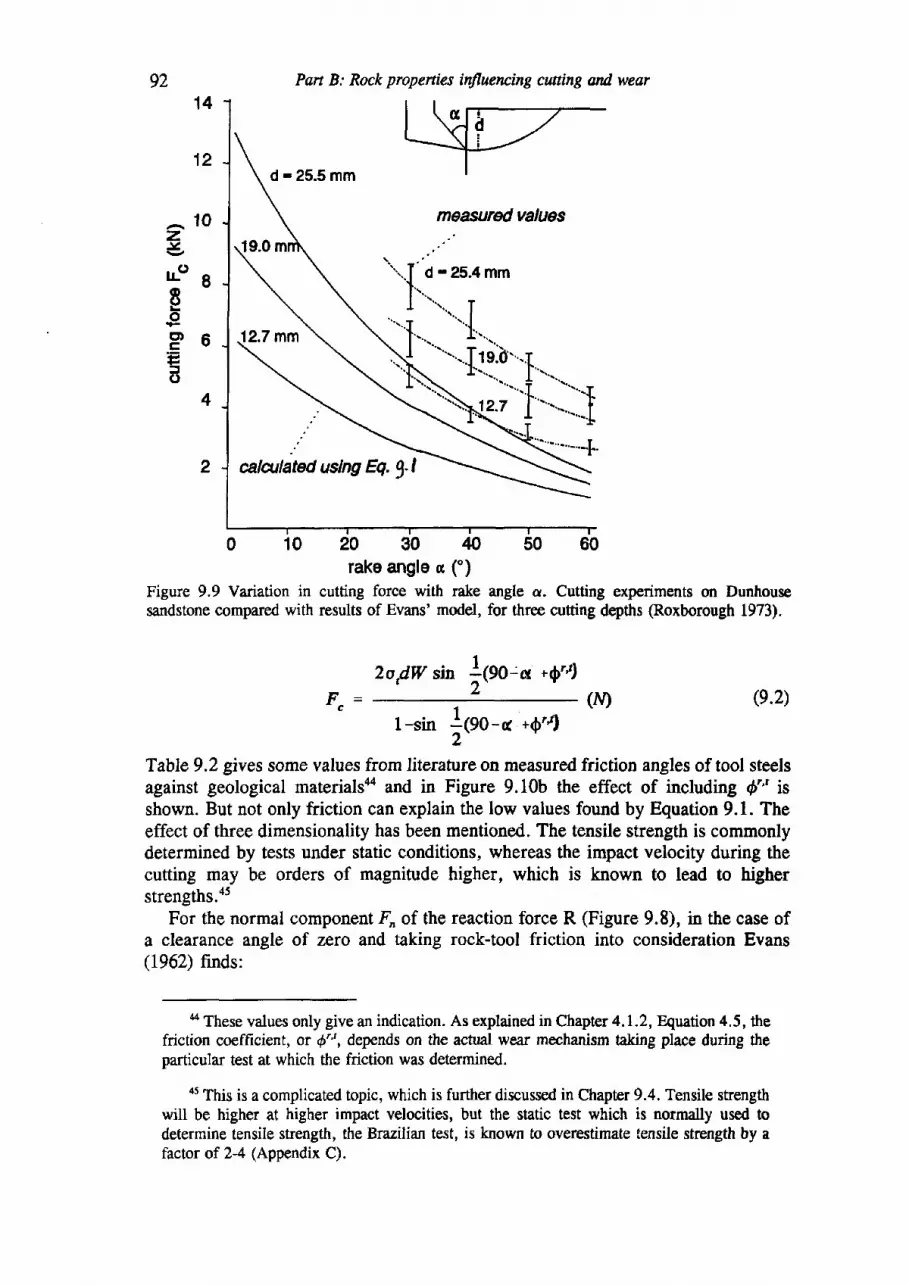
92 Pan B: Rock propenies i4fluencing cutting and wear
0102030405060rake angle c (')
Figure 9.9 Variation in cutting force with rake angle o. Cutting experiments on Dunhousesandstone compared with results of Evans' model, for three cutting de,pths (Roxborough 1973).
14
12
^10z.Y
- ou - 8
EeP6=o
4
F"= ($ (e.2)ZordW sn l1OO'cu *4'4
l-sin jfm-n .O"t
Table 9.2 gives some values from literature on measured friction angles of tool steelsagainst geological materialsaa and in Figure 9.10b the effect of including d'" isshown. But not only friction can explain the low values found by Equation 9.1. Theeffect of three dimensionality has been mentioned. The tensile strength is commonlydetermined by tests under static conditions, whereas the impact velocity during thecutting may be orders of magnitude higher, which is known to lead to higherstrengths.a5
For the normal component 4 of the reaction force R (Figure 9.8), in the case ofa clearance angle of zero and taking rock-tool friction into consideration Evans(1962) finds:
4 These values only give an indication. As explained in Chapter 4.1.2, Equation 4.5, thefriction coefficient, ot 6''', depends on the actual wear mechanism taking place during theparticular test at which the friction was determined.
a5 This is a complicated topic, which is further discussed in Chapter 9.4. Tensile strengthwill be higher at higher impact velocities, but the static trest which is normally used todetermine tensile strength, the Brazilian test, is known to overestimate tensile strength by afactor of 2-4 (Appendix C).
alatlitea using Eq.g-l
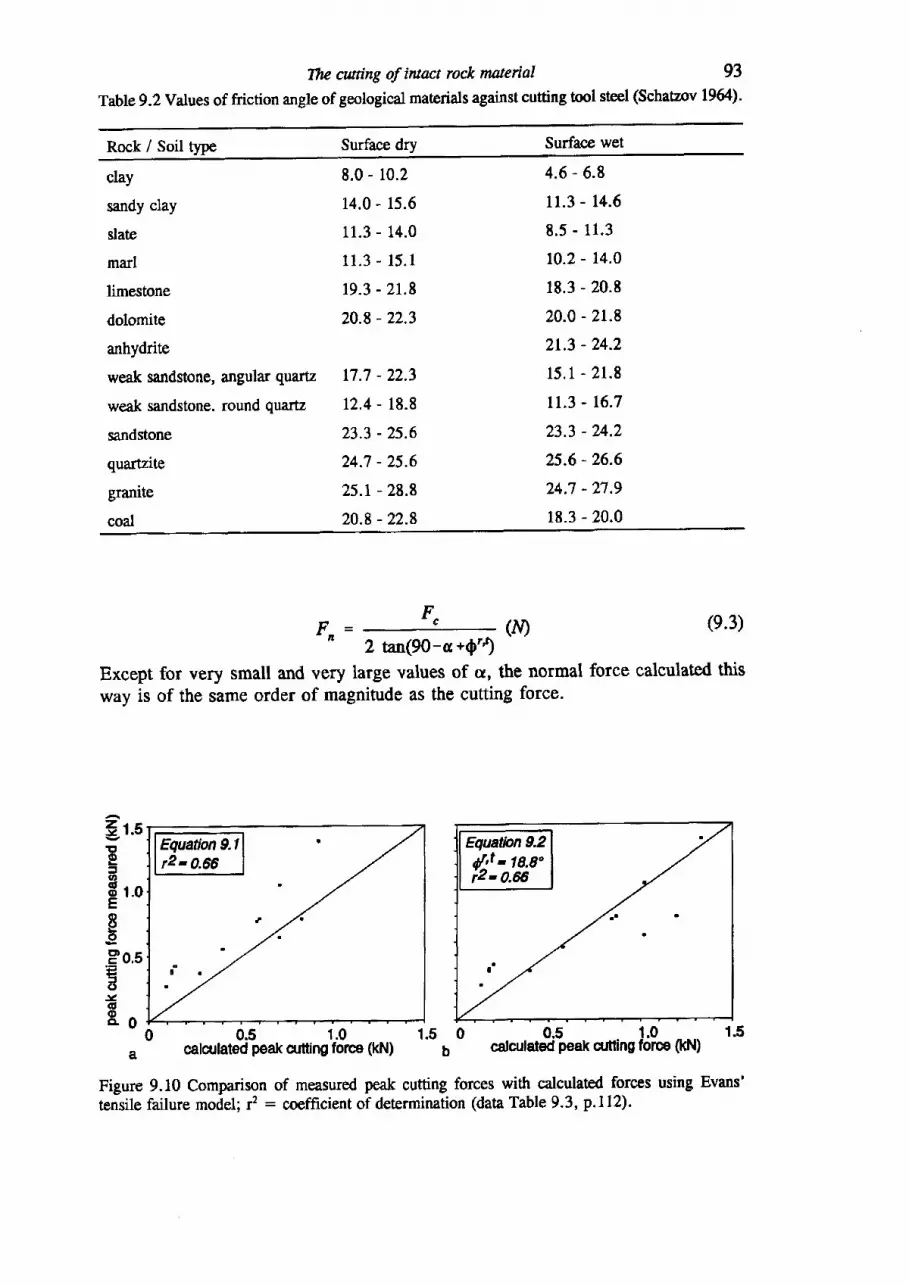
The cwing of intact rock material 93
Tab1eg.2Values of friction angle of geological materials against cutting tool steel (Schatzov Lg6/.')-
Rock / Soil type Surface dry Surface wet
clay
sandy clay
slate
marl
limestone
dolomite
anhydrite
weak sarrdstone, angular quartz
weak sandstone. round quartz
sandstone
quartzite
granite
coal
8.0 - 10.2
14.0 - 15.6
11.3 - 14.0
11 .3 - 15 .1
r9.3 - 2r.8
20.8 - 22.3
17.'t - 22.3
12.4 - 18.8
23.3 - 25.6
24;7 - 25.6
25.1 - 28.8
20.8 - 22.8
4.6 - 6.8
tt.3 - t4.5
8 .5 - 11 .3
10.2 - 14.0
18.3 - 20.8
20.0 - 21.8
2r.3 - 24.2
15.1 - 21 .8
rr.3 - 16.l
23.3 - 24,2
25.6 - 26.6
24.7 -n.9
18.3 - 20.0
F-=F,
(ff)o 2 tan(9O-c +Qrr)
Except for very small and very large values of a, the normal force calculated thisway is of the same order of magnitude as the cutting force.
(e.3)
3r.tItE=H t.oEgPo.sEt8e
l .
Eguatbn 9.2{,t - lg.g"i2 - 0.6
o 0.5 1.0 1.5 o 0,5 t.o 1.5- calcillatet peak aningib-rca (kN) b calculated pealc artling force (kN)
Figure 9.10 Comparison of measured peak cutting forces with calculated forces using Evans'tensile failure model; f : coefficient of determination (data Table 9.3, p.112).
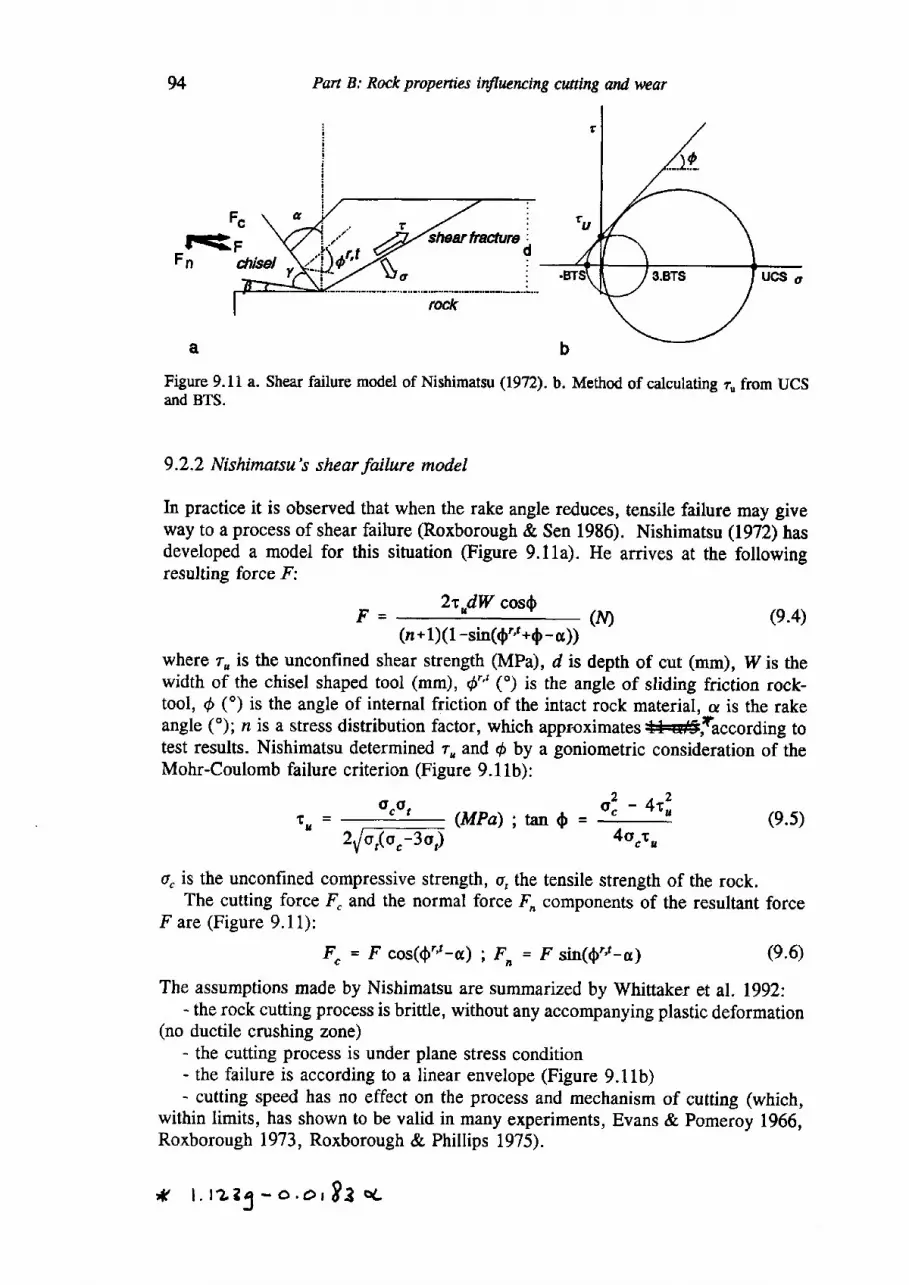
94 Pan B: Rock propenia irfluercing cwfing and wear
Figure 9.11 a. Shear failure model of Nishimatsu (1972). b. Method of calculating ru from UCSand BTS.
9.2.2 Nishimatsu's shear failure model
In practice it is observed that when the rake angle reduces, tensile failure may giveway to a process of shear failure (Roxborough & Sen 1986). Nishimatsu (1972) hasdeveloped a model for this situation (Figure 9.11a). He arrives at the followingresulting force F:
F2tp|lr cos$
(tf) (e.4)(n + 1)(1 -sin(0"'*0 - a))
where r, is the unconfined shear strength (MPa), d is depth of cut (mm), I4r is thewidth of the chisel shaped tool (mm), d"' (") is the angle of sliding friction rock-tool, S (") is the angle of internal friction of the intact rock material, a is the rakeangle ('); n is a stress distribution factor, which approximagss tr#,raccording totest results. Nishimatsu determined rn and d by a goniometric consideration of theMohr-Coulomb failure criterion (Figure 9.1 1b):
o r0,t u =2rf o,(o r-3o)
o" is the unconfined compressive strength, o, the tensile strength of the rock.The cutting force { and the normal force -Q components of the resultant force
F are (Figure 9.11):
F"=F cos($ ' r -c ) iFo= Fs i46a t -o ; (e.6)
The assumptions made by Nishimatsu are summarized by Whittaker et al. 1992:- the rock cutting process is brittle, without any accompanying plastic deformation
(no ductile crushing zone)- the cutting process is under plane stress condition- the failure is according to a linear envelope (Figure 9.1lb)- cutting speed has no effect on the process and mechanism of cutting (which,
within limits, has shown to be valid in many experiments, Evans & Pomeroy 1966,Roxborough 1973, Roxborough & Phillips 1975).
* l . rz33-o.o,8t "c
(MPa); tanO -o1.-+"14o rao
(e.5)
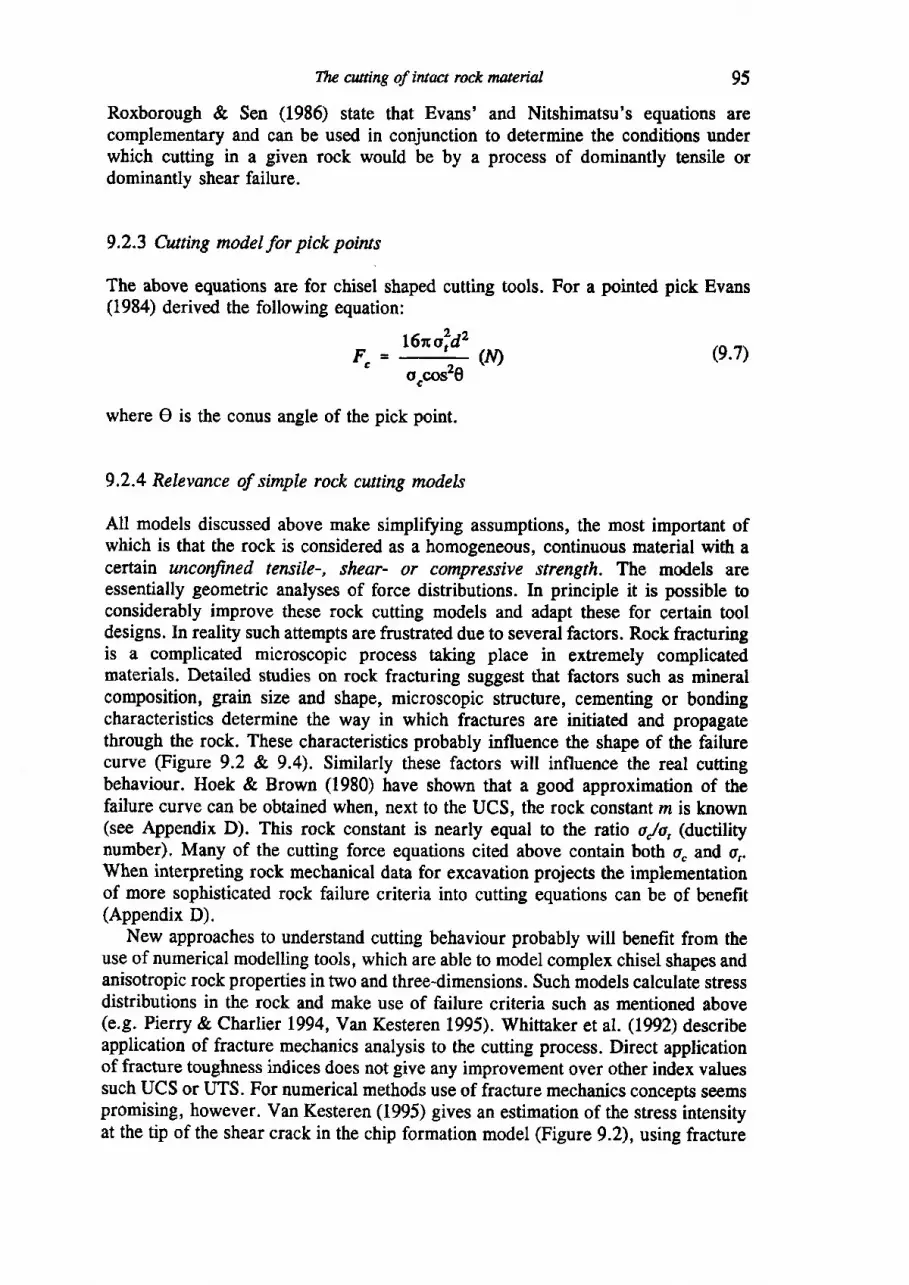
Tlrc cwting of iwact rock nuterial 95
Roxborough & Sen (1986) state that Evans' and Nitshimatsu's equations arecomplementary and can be used in conjunction to determine the conditions underwhich cutting in a given rock would be by a process of dominantly tensile ordominantly shear failure.
9.2.3 Cutting modelfor pick points
The above equations are for chisel shaped cutting tools. For a pointed pick Evans(1984) derived the following equation:
L6no?dz4=-(rV)
o.cos'0
where O is the couus angle of the pick point.
(e.7)
9,2.4 Relevance of simple rock cutting models
All models discussed above make simplifying assumptions, the most important ofwhich is that the rock is considered as a homogeneous, continuous material with acertain unconfined tensile-, shear- or compressive strength. The models areessentially geometric analyses of force distributions. In principle it is possible toconsiderably improve these rock cutting models and adapt these for certain tooldesigns. In reality such attempts are frustrated due to several factors. Rock fracturingis a complicated microscopic process taking place in extremely complicatedmaterials. Detailed shrdies on rock fracturing suggest that factors such as mineralcomposition, grain size and shape, microscopic structure, cementing or bondingcharacteristics determine the way in which fractures are initiated and propagatethrough the rock. These characteristics probably influence the shape of the failurecurve @igure 9.2 & 9.4). Similarly these factors will influence the real cuttingbehaviour. Hoek & Brown (1980) have shown that a good approximation of thefailure curve can be obtained when, next to the UCS, the rock constant n is known(see Appendix D). This rock constant is nearly equal to the ratio o"/o, (ductilitynumber). Many of the cutting force equations cited above contain both o" and 4.When interpteting rock mechanical data for excavation projects the implementationof more sophisticated rock failure criteria into cutting equations can be of benefit(Appendix D).
New approaches to understand cutting behaviour probably will benefit from theuse of numerical modelling tools, which are able to model complex chisel shapes andanisotropic rock properties in two and threedimensions. Such models calculate stressdistributions in the rock and make use of failure criteria such as mentioned above(e.g. Pierry & Charlier 1994, Van Kesteren 1995). Whittaker et al. (1992) describeapplication of fracture mechanics analysis to the cutting process. Direct applicationof fracture toughness indices does not give any improvement over other index valuessuch UCS or UTS. For numerical methods use of fracture mechanics concepts seemspromising, however. Van Kesteren (1995) gives an estimation of the stress intensityat the tip of the shear crack in the chip formation model (Figure 9.2), using fracture
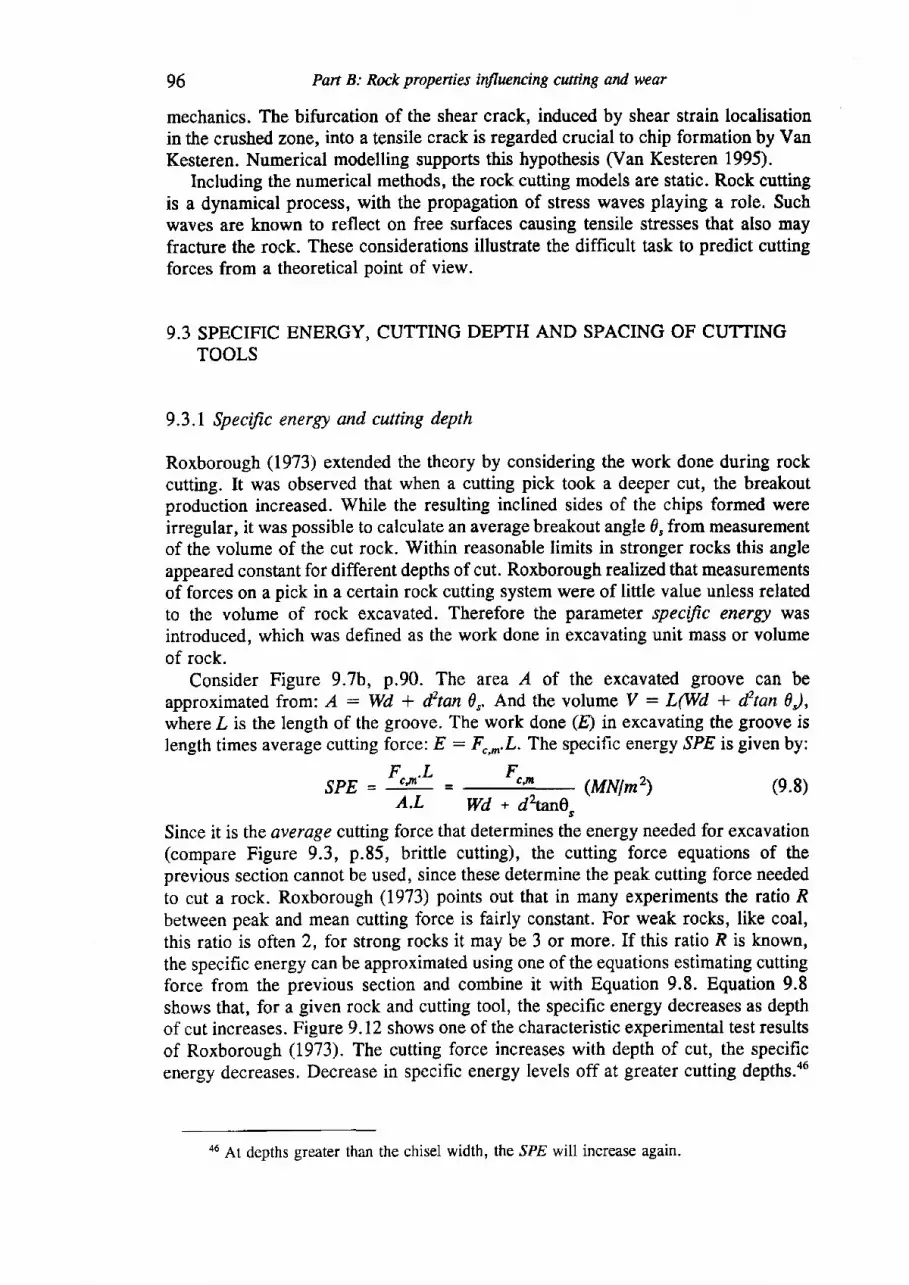
96 Pan B: Rock properties infiuencing cmrtng and wear
mechanics. The bifurcation of the shear crack, induced by shear strain localisationin the crushed zone, into a tensile crack is regarded crucial to chip formation by VanKesteren. Numerical modelling supports this hypothesis (Van Kesteren 1995).
Including the numerical methods, the rock cutting models are static. Rock cuttingis a dynamical process, with the propagation of stress waves playing a role. Suchwaves are known to reflect on free surfaces causing tensile stresses that also mayfracture the rock. These considerations illustrate the difficult task to predict cuttingforces from a theoretical point of view.
9.3 SPECIFIC ENERGY, CUTTING DEPTH AND SPACING OF CUTTINGTOOLS
9.3.1 Specific energy and cutttng depth
Roxborough (1973) extended the theory by considering the work done during rockcutting. It was observed that when a cutting pick took a deeper cut, the breakoutproduction increased. While the resulting inclined sides of the chips formed wereirregular, it was possible to calculate an average breakout angle 0, from measurementof the volume of the cut rock. Within reasonable limits in stronger rocks this angleappeared constant for different depths of cut. Roxborough realized that measurementsof forces on a pick in a certain rock cutting system were of little value unless relatedto the volume of rock excavated. Therefore the parameter specific energy wasintroduced, which was defined as the work done in excavating unit mass or volumeof rock.
Consider Figure 9.7b, p.90. The arca A of the excavated groove can beapproximated from: A : Wd. + dztan 0,. And the volume V : L(Wd + d2tan 0),where Z is the length of the groove. The work done (E) in excavating the groove islength times avorage cutting force: E : F,,^.L The specific energy SPE is given by:
SPE = F" 'L
=A.L
Fr^(MNlmz) (e.8)
Wd * d2wr0,
Since it is the average cutting force that determines the energy needed for excavation(compare Figure 9.3, p.85, brittle cutting), the cutting force equations of theprevious section canno[ be used, since these determine the peak cutting force neededto cut a rock. Roxborough (1973) points out that in many experiments the ratio Rbetween peak and mean cutting force is fairly constant. For weak rocks, like coal,this ratio is often 2, for strong rocks it may be 3 or more, If this ratio R is known,the specific energy can be approximated using one of the equations estimating cuttingforce from the previous section and combine it with Equation 9.8. Equation 9.8shows that, for a given rock and cutting tool, the specific energy decreases as depthof cut increases. Figure 9.12 shows one of the characteristic experimental test resultsof Roxborough (1973). The cutting force increases with depth of cut, the specificenergy decreases. Decrease in specific energy levels off at greater cutting depths.a6
46 At depths greater than the chisel width, the SPE will increase again.
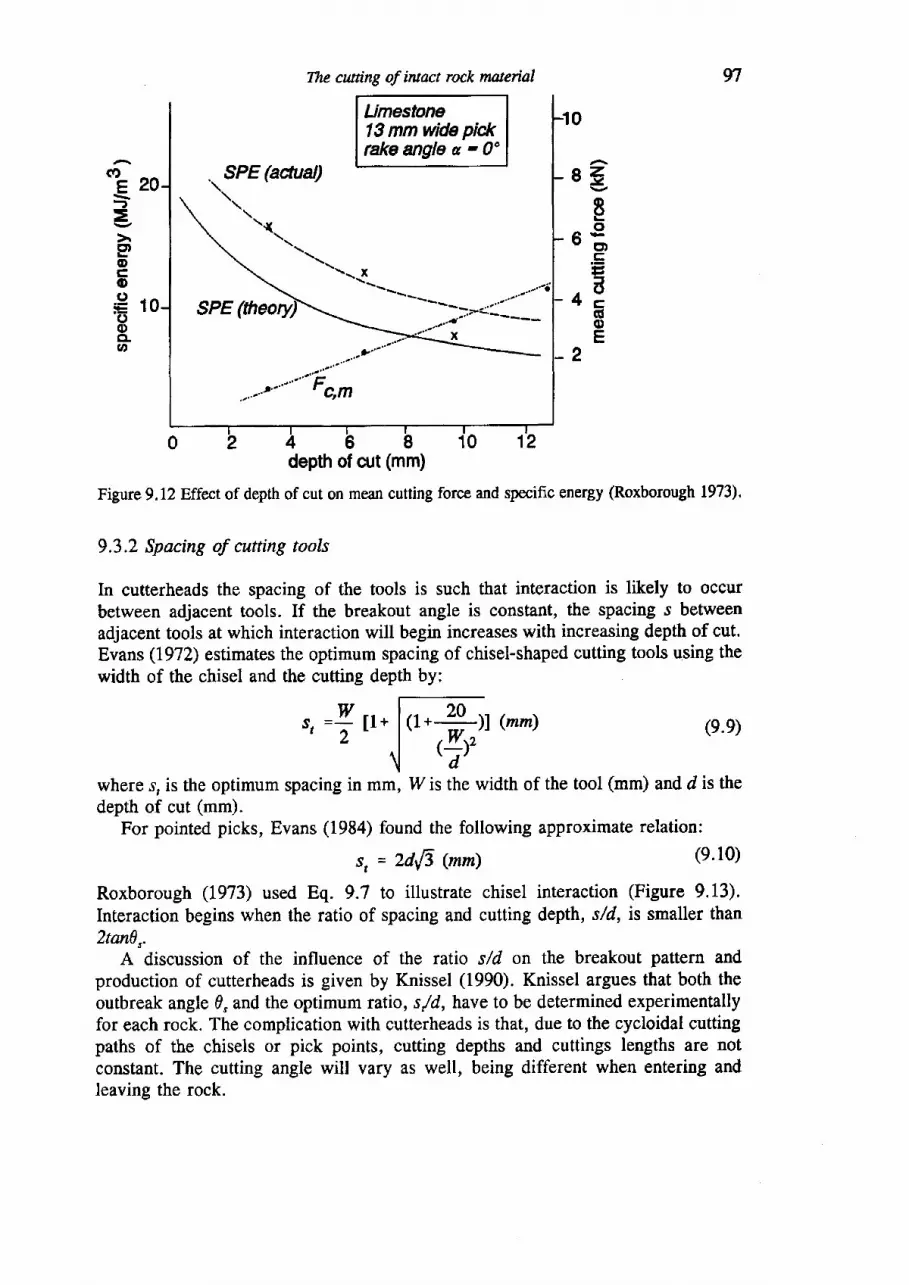
Thz ctuting of iruact rock material
Limestonel3 mm wide pic*rakeanglea-0o
depth of o.lt (mm)
Figure 9.12 Effect of depth of cut on mean cutting force and specific energy (Roxborough 1973).
9.3.2 Spacing of cutting tools
In cutterheads the spacing of the tools is such that interaction is likely to occurbetween adjacent tools. If the breakout angle is constant, tlre spacing s betweenadjacent tools at which interaction will begin increases with increasing depth of cut.Evans (1972) estimates the optimum spacing of chisel-shaped cutting tools using thewidth of the chisel and the cutting depth by:
97
eZv . Y
goE t'==
. ( ,- E
(Eo
wt, =Z l l * (mrn) (e.e)(r.+)l,d ,
where s, is the optimum spacing in mm, Wis the width of the tool (mm) and d is thedepth of cut (mm).
For pointed picks, Evans (1984) found the following approximate relation:
s, = 2dtf! (nm) (e.10)
Roxborough (1973) used Eq. 9.'l to illustrate chisel interaction (Figure 9.13).Interaction begins when the ratio of spacing and cutting depth, s/d, is smaller than2tanA,.
A discussion of the influence of the ratio s/d on the breakout pattern andproduction of cutterheads is given by Knissel (1990). Knissel argues that both theoutbreak angle 0" and the optimum ratio, s/d, have to be determined experimentallyfor each rock. The complication with cutterheads is that, due to the cycloidal cuttingpaths of the chisels or pick points, cutting depths and cuttings lengths are notconstant. The cutting angle will vary as well, being different when entering andleaving the rock.
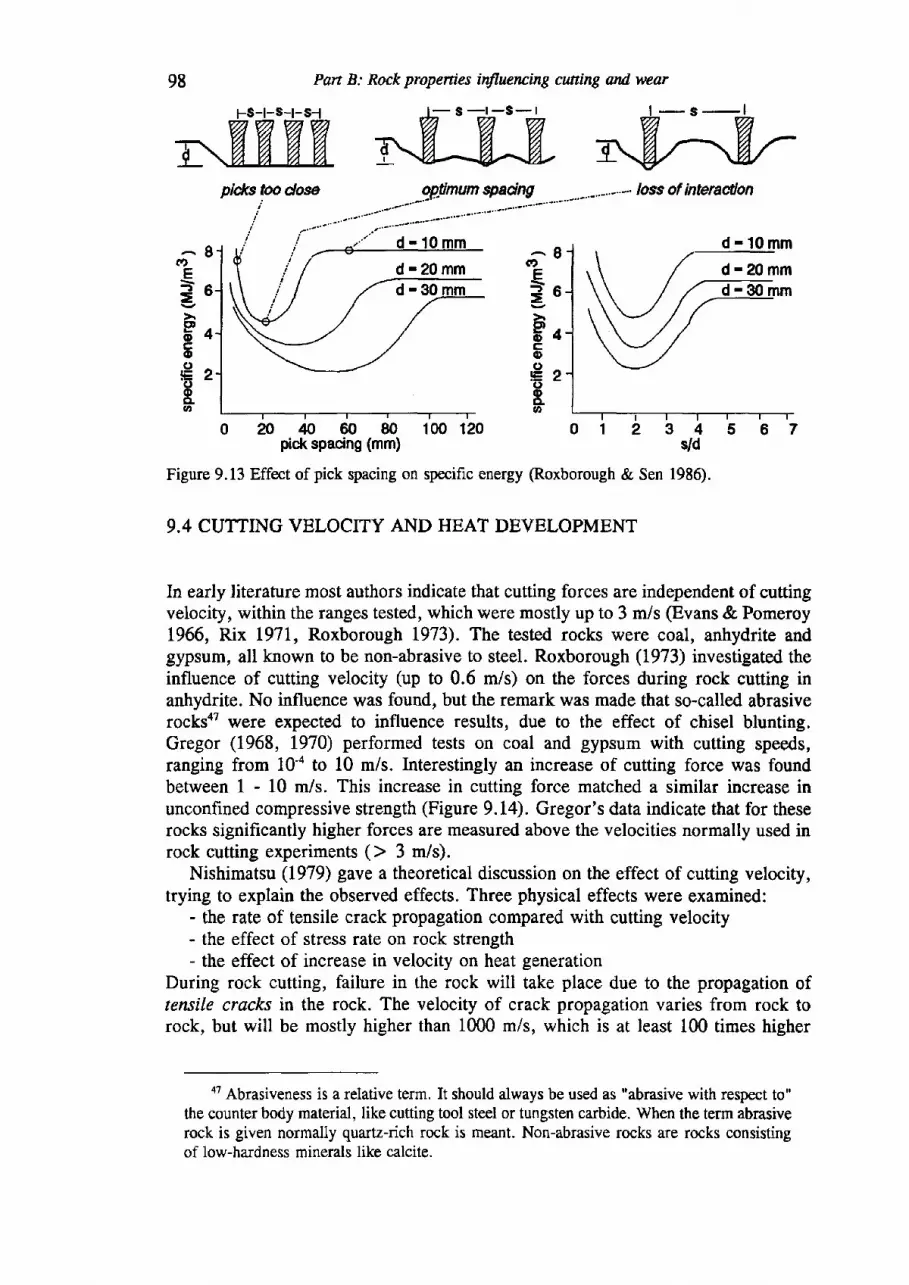
98 Part B: Rock propenies it{Iuercing cwting and, wear
pld<s too dose optimum spacingoplmum spacirrg _ -.- loss of interadon. . . . . . ' ' . " . . - . . . -
^ $c)
F
= 6;6cco
EzooCLo
^ $(t,
E]eCD64co. 9 ^C'oELo
d-20mmd -30
0 n & 60 80 100120 0 1 2 3 4 5 6pick spacing (mm) Vd
Figure 9.13 Effect ofpick spacing on specific energy (Roxborough & Sen 1986).
9.4 CUTTING VELOCITY AND HEAT DEVELOPMENT
In early literature most authors indicate that cutting forces are independent of cuttingvelocity, within the ranges tested, which were mostly up to 3 m/s (Evans & PomeroyL966, Rix 1971, Roxborough 1973). The tested rocks were coal, anhydrite andgypsum, all known to be non-abrasive to steel. Roxborough (1973) investigated theinfluence of cutting velocity (up to 0.6 m/s) on the forces during rock cutting inanhydrite. No influence was found, but the remark was made that so-called abrasiverocksaT were expected to influence results, due to the effect of chisel blunting.Gregor (1968, 1970) performed tests on coal and gypsum with cutting speeds,ranging from 10-a to 10 m/s. Interestingly an increase of cutting force was foundbetween I - 10 m/s. This increase in cutting force matched a similar increase inunconfined compressive strength (Figure 9.14). Gregor's data indicate that for theserocks significantly higher forces are measured above the velocities normally used inrock cutting experiments () 3 m/s).
Nishimatsu (1979) gave a theoretical discussion on the effect of cutting velocity,trying to explain the observed effects. Three physical effects were examined:
- the rate of tensile crack propagation compared with cutting velocity- the effect of stress rate on rock strength- the effect of increase in velocity on heat generation
During rock cutting, failure in the rock will take place due to the propagation oftensile cracks in the rock. The velocity of crack propagation varies from rock torock, but will be mostly higher than 1000 mis, which is at least 100 times higher
a7 Abrasiveness is a relative term, It should always be used as "abrasive with respect to"the counter body material, like cutting tool steel or tungsten carbide. When the term abrasiverock is given normally quartz-rich rock is meant. Non-abrasive rocks are rocks consistingof low-hardness minerals like calcite.
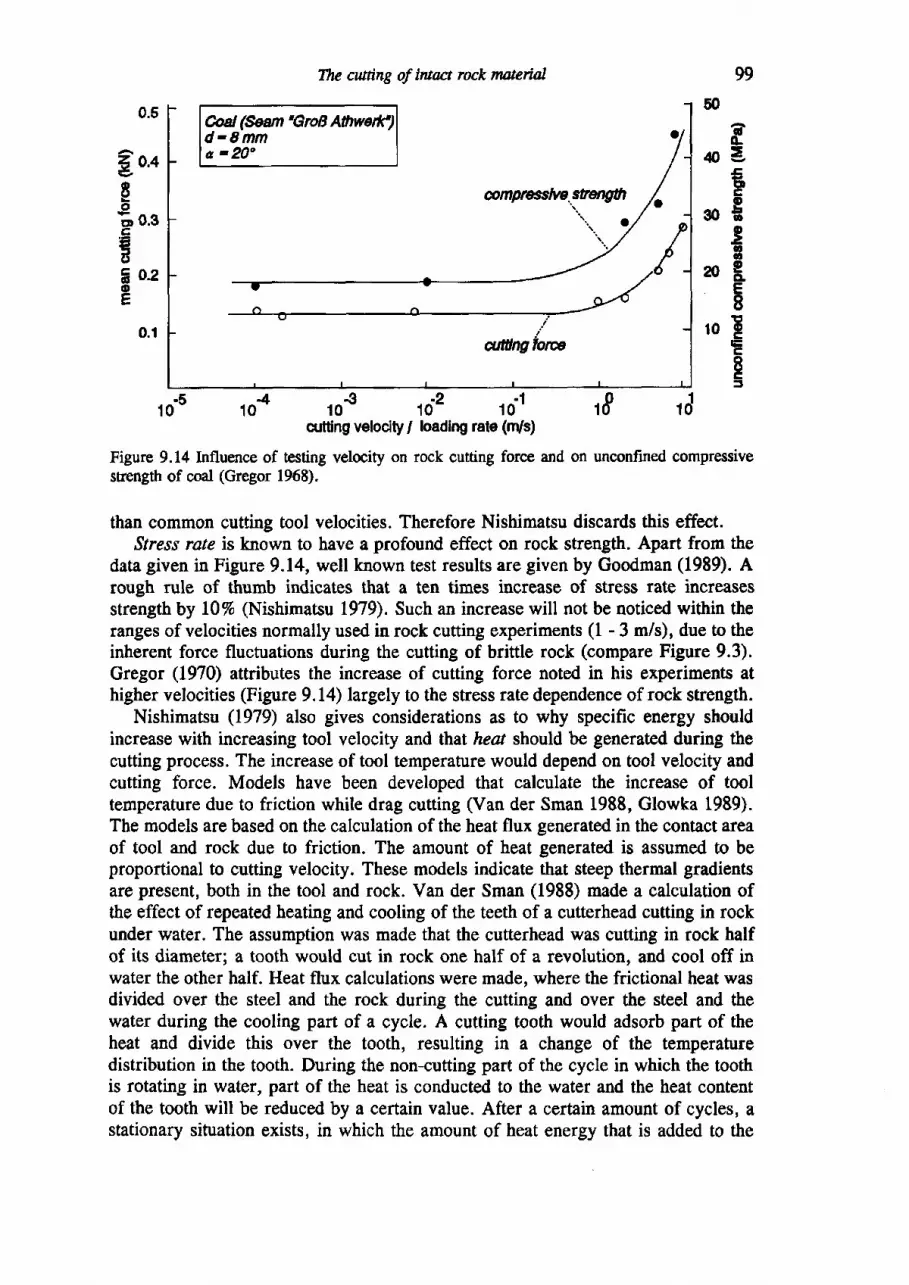
The cuning of lntrct rockrutefial 99
aG
4eEttt
3ogEa6
NEE8
loEEIc,=
?o.ogoE o.gc
Ea o.2oE
0.1
@al (9ean'GroB Ailwadfld -8mmu -20"
105 to4 . to€ t,iz 10 I rf totcutling velodry/ loadlng rate (m/s)
Figure 9.14 Influence of testing velocity on rock cutting force and on unconfined compressivesrength of coal (Gregor 1968).
than common cutting tool velocities. Therefore Nishimatsu discards this effect.,Stress rate is known to have a profound effect on rock strength. Apart from the
data given iu Figure 9.14, well known test results are given by Goodman (1989). Arough rule of thumb indicates that a ten times increase of stress rate increasesstrength by l0% (Nishimatsu 1979). Such an increase will not be noticed within theranges of velocities normally used in rock cutting experiments (1 - 3 m/s), due to theinherent force fluctuations during the cutting of brittle rock (compare Figure 9.3).Gregor (1970) attributes the increase of cutting force noted in his experiments athigher velocities (Figure 9.14) largely to the stress rate dependence of rock strength.
Nishimatsu (1979) also gives considerations as to why specific energy shouldincrease with increasing tool velocity and thal heat should be generated during thecutting process. The increase of tool temperature would depend on tool velocity andcutting force. Models have been developed that calculate the increase of tooltemperature due to friction while drag cutting (Van der Sman 1988, Glowka 1989).The models are based on the calculation of the heat flux generated in the contact areaof tool and rock due to friction. The amount of heat generated is assumed to beproportional to cutting velocity. These models indicate that steep thermal gradientsare present, both in the tool and rock. Van der Sman (1988) made a calculation ofthe effect of repeated heating and cooling of the teeth of a cutterhead cutting in rockunder water. The assumption was made that the cutterhead was cutting in rock halfof its diameter; a tooth would cut in rock one half of a revolution, and cool off inwater the other half. Heat flux calculations were made, where the frictional heat wasdivided over the steel and the rock during the cutting and over the steel and thewater during the cooling part of a cycle. A cutting tooth would adsorb part of theheat and divide this over the tooth, resulting in a change of the temperaturedistribution in the tooth. During the non-cutting part of the cycle in which the toothis rotating in water, part of the heat is conducted to the water and the heat contentof the tooth will be reduced by a certain value. After a certain amount of cycles, astationary situation exists, in which the amount of heat energy that is added to the
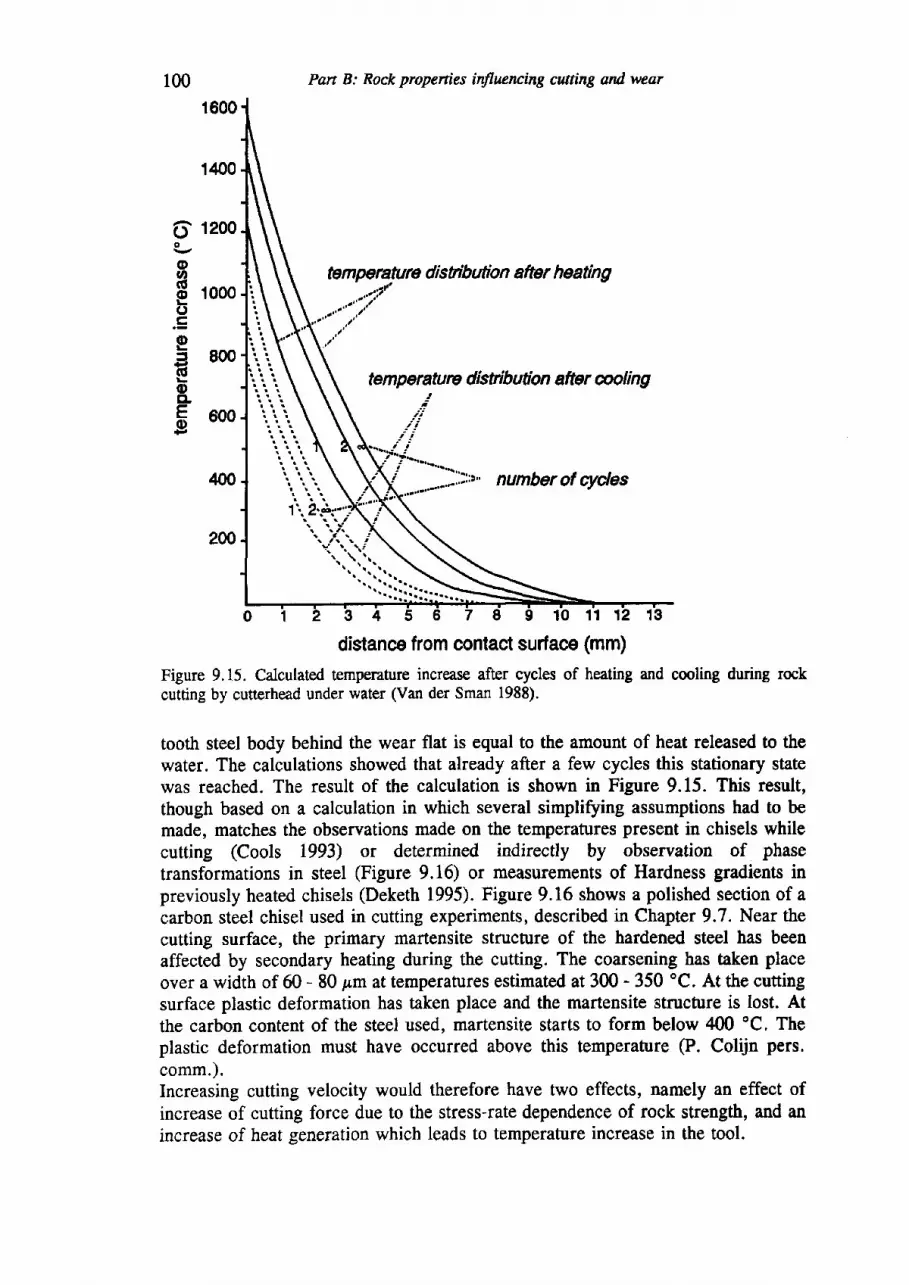
100
fJo
(Do(!
Eo.=E3artLoCLEo
1600
1400
1200
1000
800
600
ro0
200
distance from contact surface (mm)Figure 9.15. Calculated temperature increase after cycles of heating and cooling during rockcutting by cutterhead under water (Van der Sman 1988).
tooth steel body behind the wear flat is equal to the amount of heat released to thewater. The calculations showed that already after a few cycles this stationary statewas reached. The result of the calculation is shown in Figure 9.15. This result,though based on a calculation in which several simpliffing assumptions had to bemade, matches the observations made on the temperatures present in chisels whilecutting (Cools 1993) or determined indirectly by observation of phasetransformations in steel (Figure 9.16) or measurements of Hardness gradients inpreviously heated chisels (Deketh 1995). Figure 9.16 shows a polished section of acarbon steel chisel used in cutting experiments, described in Chapter 9.7. Near thecutting surface, the primary martensite structure of the hardened steel has beenaffected by secondary heating during the cutting. The coarsening has taken placeover a width of 60 - 80 pm at temperatures estimated at 300 - 350 "C. At the cuttingsurface plastic deformation has taken place and the martensite structure is lost. Atthe carbon content of the steel used, martensite starts to form below 400 "C. Theplastic deformation must have occurred above this temperature (P. Colijn pers.comm.).Increasing cutting velocity would therefore have two effects, namely an effect ofincrease of cutting force due to the stress-rate dependence of rock strength, and anincrease of heat generation which leads to temperature increase in the tool.
Pan B: Rock propenies inflwncing cutting and wear
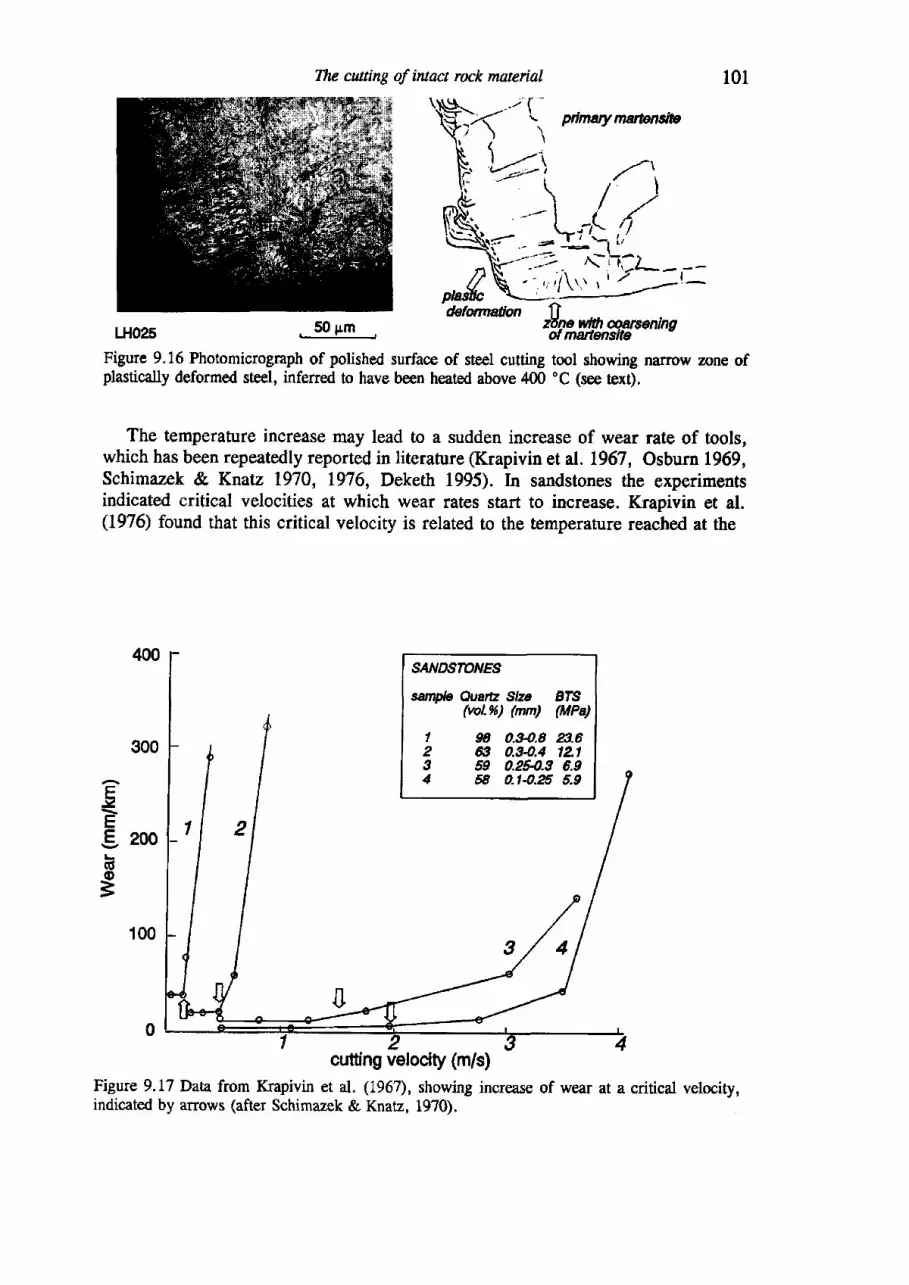
The cwting of intact rock material 101
. 50pm
Figure 9.16 Photomicrograph of polished surface of steel cutting tool showing ndrow zone ofplastically deformed steel, infened to have been heated above 400 "C (see tex$.
The temperature increase may lead to a sudden increase of wear rate of tools,which has been repeatedly reported in literature (Krapivin etal. 1967, Osburn 1969,Schimazek & Ytnatz 1970, 1976, Deketh 1995). In sandstones the experimentsindicated critical velocities at which wear rates start to increase. Krapivin et al.(1976) found that this critical velocity is related to the temperature reached at the
Figure 9.L7 Data from Krapivin et al. (1967), showing increase of wear at a critical velocity,indicated by arrows (after Schimaz,ek & Knatz, 1970).
300
E.Y
E$, eoo(so3
S4/'/DSTOirES
suttfu Quard Slza BfS(wL%) (nun) (MPa)
9 0.fr.8 H.663 0.3-0.4 '2159 0,2fr.9 6.958 o.t-o.fi 5.9
I234
cutting velocity (m/s)
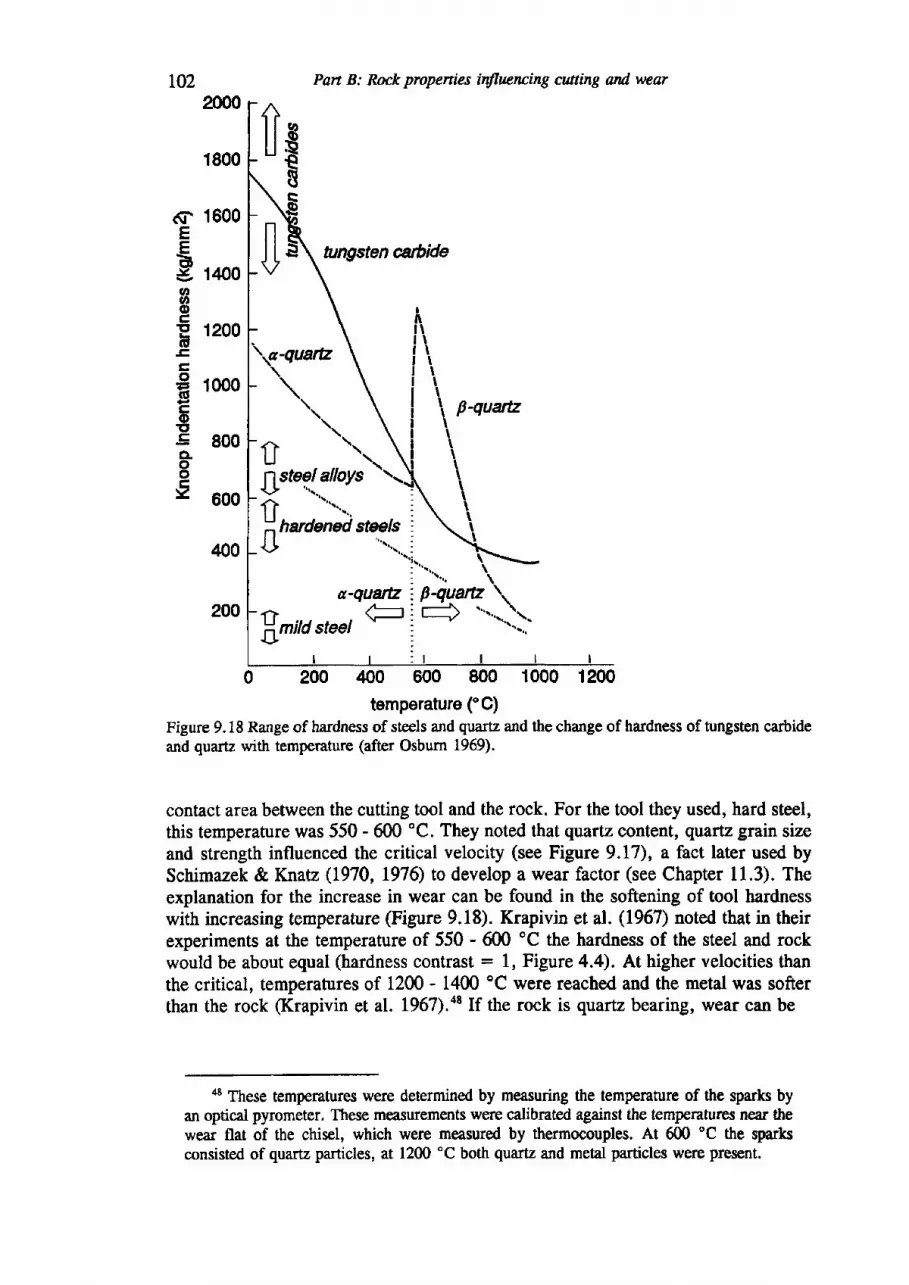
$I
LOz Pan B: Rock properties intlucncing cutting and wear
2000
1800
1600
1400
1200
1000
800
600
lm0
200
0 200 400 600 800 1000 1200temperature ("G)
Figure 9.18 Range of hardness of steels and quartz and the change of hardness of tungsten carbideand quartz with temperature (after Osburn 1969).
contact area between the cutting tool and the rock. For the tool they used, hard steel,this temperature was 550 - 600 'C. They noted that quartz content, quartz grain sizeand strength influenced the critical velocity (see Figure 9.17), a fact later used bySchimazek & Ituatz (1970, 1976) to develop a wear factor (see Chapter 11.3). Theexplanation for the increase in wear can be found in the softening of tool hardnesswith increasing temperature (Figure 9.18). Krapivin et al. (1967) noted that in theirexperiments at the temperature of 550 - 600 oC the hardness of the steel and rockwould be about equal (hardness contrast : 1, Figure 4.4). At higher velocities thanthe critical, temperatures of 1200 - 1400 "C were reached and the metal was softerthan the rock (Krapivin et al. 1967).48 If the rock is quartz bearing, wear can be
48 These temperatures were determined by measuring the temperature of the qparts byan optical pyrometer. These measurements were calibrated against the temperatures near thewear flat of the chisel, which were measured by thermocouples. At 600 'C the sparlcsconsisted of quartz particles, at l2OO "C both quartz and metal particles were present.
6EtrB.Y
v,oocEIUEEo6Eott-gooocY
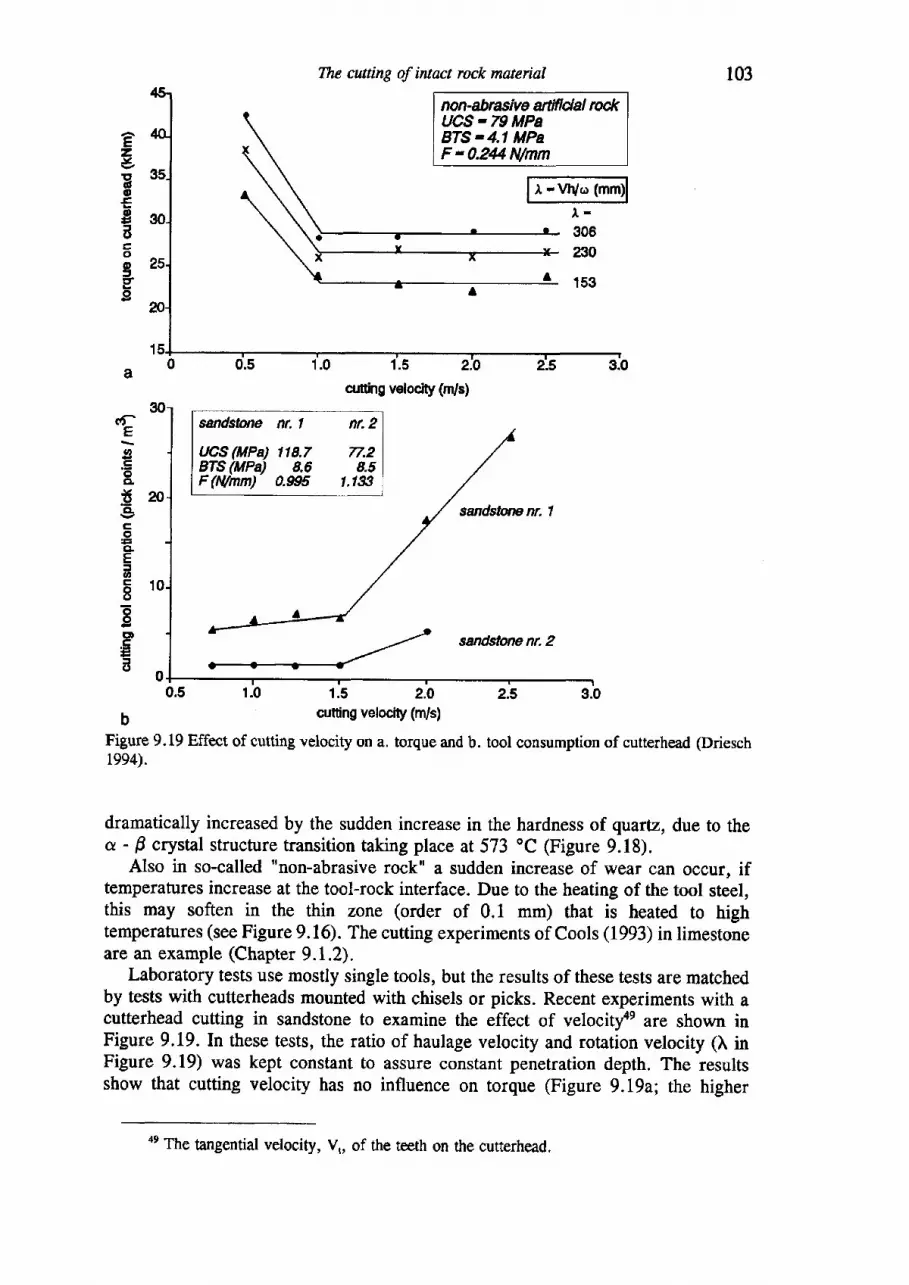
103
e2.v
Eo
E
IEo
EgI
6flE
I.goCL
!nCL
c0CLE5g,
F 1 0oEIGDEE=- 0
n on -abrutt ive attlf I ci a I M<UCS -79 MPaBTS - 4.1 MPaF - 0.244 Mmm
sandstone nn I nr.2
BTS (MPa) 8.6 8.5F (tl/nn) 0.9# t.tst
sandstotp nr. I
0.5 1.0 1.5 2.0 2.5 3.0
b cutring velociry (m/s)
Figure9.19Effectof cuttingvelocityona. torqueandb. toolconsumptionof cutterhead (Driesch1994).
dramatically increased by the sudden increase in the hardness of quartz, due to thea - F crystal structure transition taking place at 573 oC (Figure 9.18).
Also in so-called "non-abrasive rock" a sudden increase of wear can occur, iftemperatures increase at the tool-rock interface. Due to the heating of the tool steel,this may soften in the thin zone (order of 0.1 mm) that is heated to hightemperatures (see Figure 9.16). The cutting experiments of Cools (1993) in limestoneare an example (Chapter 9.1.2).
Laboratory tests use mostly single tools, but the results of these tests are matchedby tests with cutterheads mounted with chisels or picks. Recent experiments with acutterhead cutting in sandstone to examine the effect of velocit/e are shown inFigure 9.19. In these tests, the ratio of haulage velocity and rotation velocity (\ inFigure 9.19) was kept const"ant to assure constant penetration depth. The resultsshow that cutting velocity has no influence on torque (Figure 9.I9a; the higher
Ir -vw" t''llt -
The cutting of intact rock material
oruing velodty (n/s)
4e The tangential velocity, V,, of the teeth on the cutterhead.
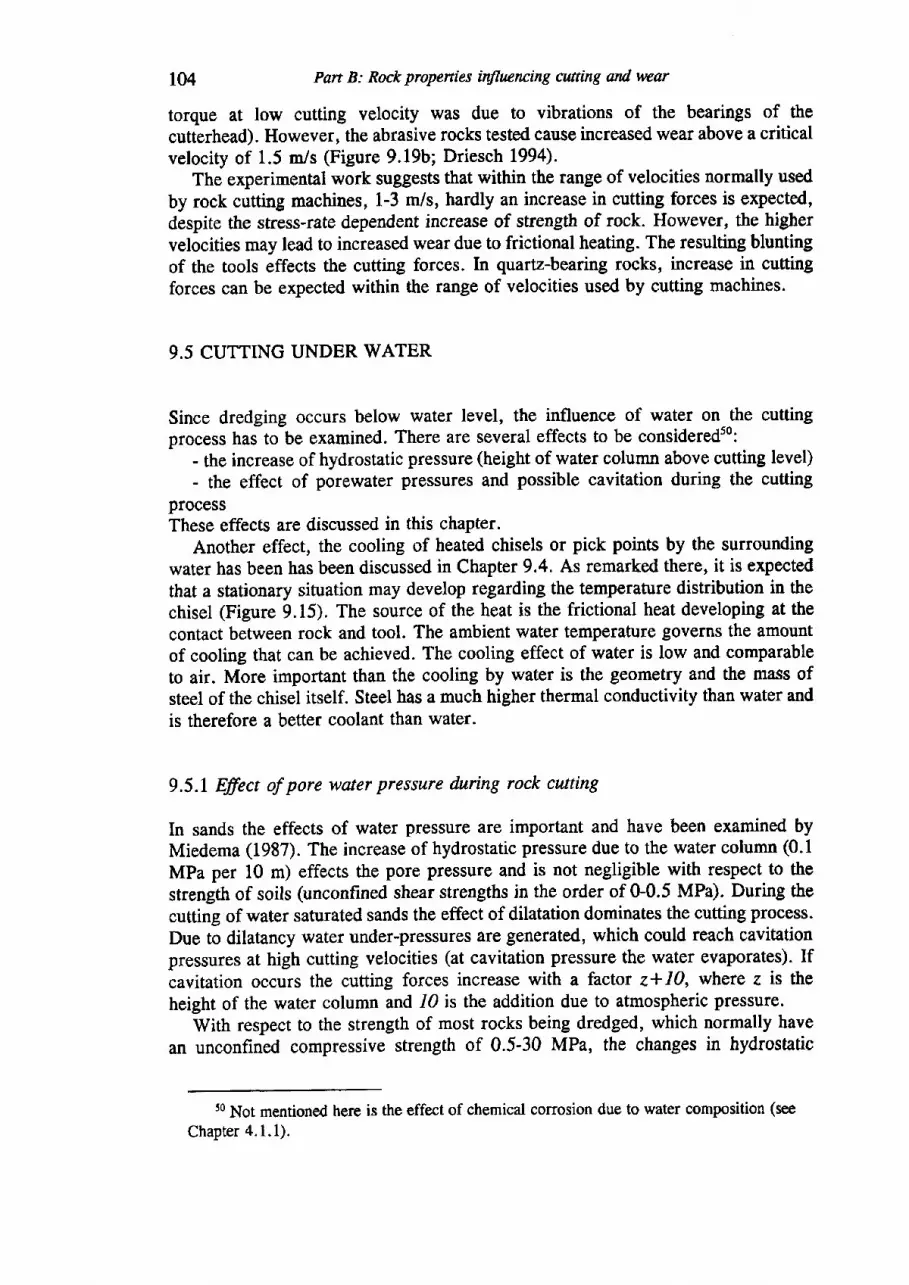
104 Pan B: Rock properties it{Iwrcing cwting and wear
torque at low cutting velocify was due to vibrations of the bearings of thecutterhead). However, the abrasive rocks tested cause increased wear above a criticalvelocity of 1.5 m/s (Figure 9.19b; Driesch 1994).
The experimental work suggests that within the range of velocities normally usedby rock cutting machines, 1-3 m/s, hardly an increase in cutting forces is expected,despite the stress-rate dependent increase of strength of rock. However, the highervelocities may lead to increased wear due to frictional heating. The resulting bluntingof the tools effects the cutting forces. In quartz-bearing rocks, increase in cuttingforces can be expected within the range of velocities used by cutting machines.
9.5 CUTTING UNDER WATER
Since dredging occurs below water level, the influence of water on the cuttingprocess has to be examined. There are several effects to be considered5o:
- the increase of hydrostatic pressure (height of water column above cutting level)- the effect of porewater pressures and possible cavitation during the cutting
processThese effects are discussed in this chapter.
Another effect, the cooling of heated chisels or pick points by the surroundingwater has been has been discussed in Chapter 9.4. As remarked there, it is expectedthat a stationary situation may develop regarding the temperature distribution in thechisel (Figure 9.15). The source of the heat is the frictional heat developing at thecontact between rock and tool. The ambient water temperature governs the amountof cooling that can be achieved. The cooling effect of water is low and comparableto air. More important than the cooling by water is the geometry and the mass ofsteel of the chisel itself. Steel has a much higher thermal conductivity than water andis therefore a better coolant than water-
9.5.1 Effect of pore water pressure during rock cutting
In sands the effects of water pressure are important and have been examined byMiedema (1987). The increase of hydrostatic pressure due to the water column (0.1
MPa per 10 rn) effects the pore pressure and is not negligible with respect to thestrength of soils (unconfined shear strengths in the order of 0-0.5 MPa). During thecutting of water saturated sands the effect of dilatation dominates the cutting process.Due to dilatancy water under-pressures are generated, which could reach cavitationpressures at high cutting velocities (at cavitation pressure the water evaporates). Ifcavitation occurs the cutting forces increase with a factor z* 10, where z is theheight of the water column and I0 is the addition due to atmospheric pressure.
With respect to the strength of most rocks being dredged, which normally havean unconfined compressive strength of 0.5-30 MPa, the changes in hydrostatic
50 Not mentioned here is the effect of chemical corrosion due to water comPosition (see
chapter 4.1.1).
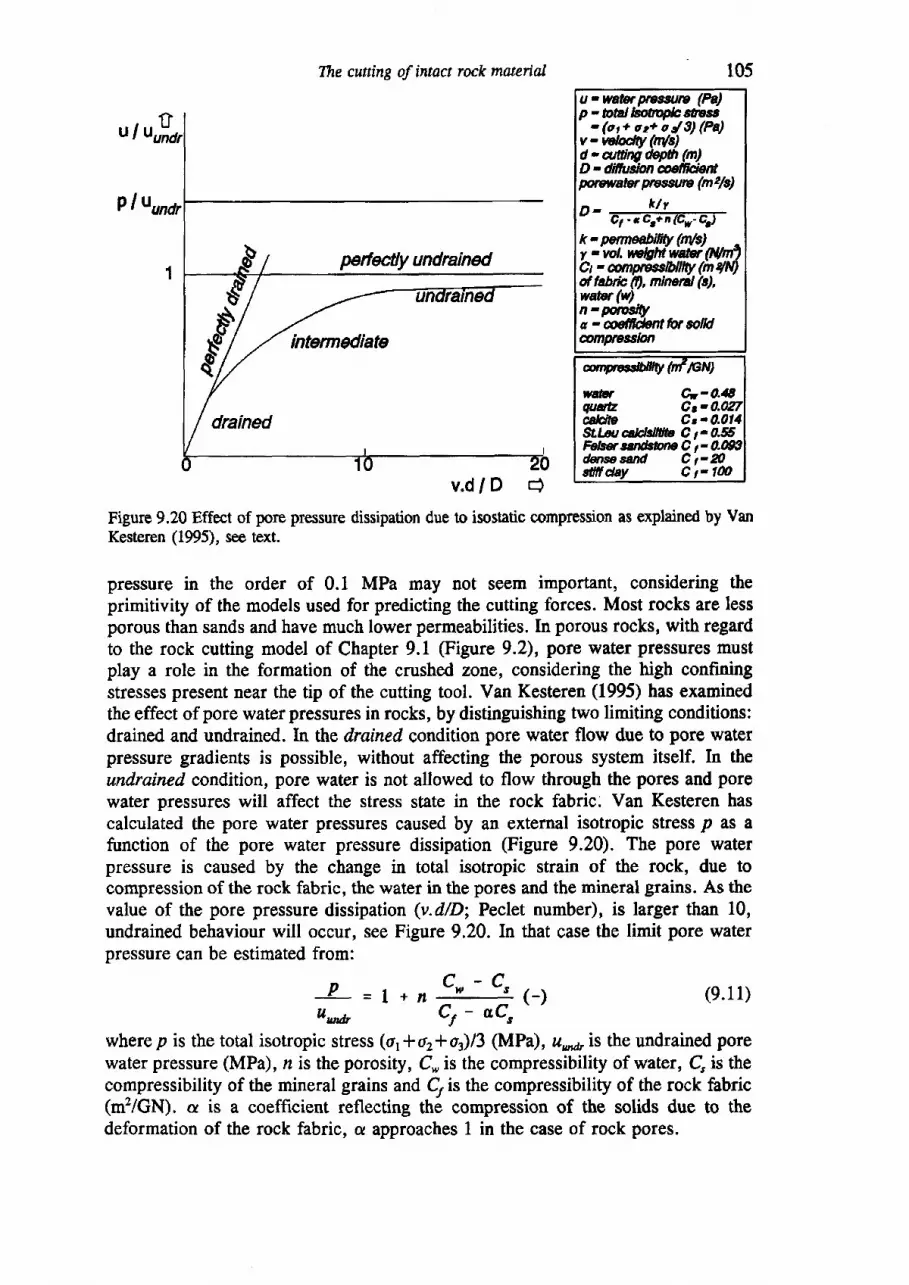
u/u
P luora,
The cutting af intau rock muerial
prfecily undrained
intermdiate
drained
@ry(nfrcN)vM Cr-O.ttECudE Cs-cdcita Ce -StLanccidffib C r-StLatc5idslfrb Cr-0.$Fe8rrrrrl&wpC rO.(F,&tesand C r-20sil ltdeY Ct-l@
Figure 9.20 Effect of pore presswe dissipation due to isostatic compression as explained by VanKesteren (1995), see text.
pressure in the order of 0.1 MPa may not seem important, considering theprimitivity of the models used for predicting the cutting forces. Most rocks are lessporous than sands and have much lower permeabilities. In porous rocks, with regardto the rock cutting model of Chapter 9.1 (Figure 9.2), porc water pressures mustplay a role in the formation of the crushed zone, considering the high confiningstresses present near the trp of the cutting tool. Van Kesteren (1995) has examinedthe effect of pore waterpressures in rocks, by distinguishing two limiting conditions:drained and undrained. In the drained condition pore water flow due to pore waterpressure gradients is possible, without affecting the porous system itself. In theundrained condition, pore water is not allowed to flow through the pores and porewater pressures will affect the stress state in the rock fabric: Van Kesteren hascalculated the pore water pressures caused by an external isotropic stress p as afunction of the pore water pressure dissipation (Figure 9.20). The pore waterpressure is caused by the change in total isotropic strain of the rock, due tocompression of the rock fabric, the water in the pores and the mineral grains. As thevalue of the pore pressure dissipation (v.d/D; Peclet number), is larger than 10,undrained behaviour will occur, see Figure 9.20. In that case the limit pore waterpressure can be estimated from:
P =L+n 'n - ' r r - ,ilrr* C, - uC,
(e.11)
wherep is the total isotropic stress (o1*or*or)/3 (MPa), un*is the undrained porewater pressure (MPa), n is the porosity, C* is the compressibility of water, C" is thecompressibility of the mineral grains and Cris the compressibility of the rock fabric(m'zlcN), cu is a coefficient reflecting th6 compression of the solids due to thedeformation of the rock fabric, cu approaches 1 in the case of rock pores.
105u-wa|orptcwn (Pa)p - /p,|dll Bouopb*ps
'(ot+ oz+ o d3) (Pa)v-wldty(rn/s)cl-afiirtgWt(n)D- difiutsluroelfuientaoleffiIerpn;cltre (nz/s)
o-#* - penwbifrty (r'n/s)r -'wl wlght-id#Mt)Q-amprwlffi(nWdtatuict), mlnenl (s),waar(w)n-Nosltys -oeflHgrlttormilU@nry$ldl
$'
v.d/D c l
106 Part B: Rock propenies influencing cuning and wear
An example is given by Van Kesteren: For St. Leu limestone, the followingparameters are known: n : 0.39, k : 1O7 m/s, C, : 0.55 m2lGN, C. : 0.014mzlcN, a : 1. Therefore D (see the Diffrrsion coefficient equation in Figure 9.20)is about 0.014 m2ls. During the cutting, the behaviour of the crushed zone will bedrained when v.d, the cutting velocity times the cutting depth, is smaller than 0.014m2ls and undrained when v.d ) 0.14 m2ls (see Figure 9.20). From Equation 9.11can be calculated that the generated pore prcssure is about 75% of the total isotropicstress in this case.
In Van Kesteren's paper cone penetration tests in St.Leu limestone are discussedwhich confirm the effect of pore water pressure on the cutting mechanism. At lowpenetration velocity (0.01 m/s) pore water can drain from the deformatiot mnearound the cone. Pore compaction balances the indented volume in the rock. Atintermediate velocity the size of the crushed zone is reduced due to the resistance ofthe pore water flow. The cone volume cannot be balanced any more by porecompaction and shearing occurs towards the free surface with chip formation. At avelocity of I m/s the undrained condition around the cone occurs. Due to the highpore water pressures, liquified crushed rock is squeezed to the free surface along thecone face. Similar transitions were obseryed during cutting tests of the St. Leu rock.A decrease of the friction angle between the chisel and the rock is noted when v.d> 0.02 m2ls. This decrease can be explained by the high contribution of the porewater pressure to the total stress in the crushed zone around the chisel.
Van Kesteren also explains that pore water pressure is of influence on crackinitiation and propagation. He argues that at the strain rates occurring duringdredging (order of ld s-r), the pore water is able to flow towards crack tips (drainedcase; the transition towards undrained occurs at strain rates > lff s-1). This impliesthat crack initiation is not impeded by resistance of the pore water. During crackpropagation away from the crushed zone, the pore water pressure is in balance withthe hydrostatic head (height of the water column). The maximum pressure differenceis determined by the water depth and the possible occurrence of cavitation in thecrack and is in the order of 0.2 - 0.4 MPa (10 - 30 m below sea level). This is inthe order of the tensile strength of weak rocks (0.5 - 2 MPa). The effect ofcavitation on the crack initiation just outside the crushed zone can therefore beneglected, but it will be of influence when the crack propagates towards the freesurface: cavitation may then inhibit unstable crack growth.
9.5.2 Effect of water saturation on the stength of roclcs
It is known that the presence of water in rock has a weakening effect. Comparedwith dry rocks, water bearing or saturated rocks may have strengths which are 30 -90 7o of. the dry strength rneasured. This reduction in strength occurs independently
of stress- or loading rate and is not a mechanical effect (due to pore pressures), butan electrochemical effect, as explained by Vutukuri (1974), who tested limestonesimmersed in different types of fluids. Water has a pronounced weakening effectcompared to other fluids with lower dielectric constants and weakening may occuralready at low degrees of water saturation. The conditions of testing of rocks shouldtherefore always be specified (see Appendix C). For rock dredging saturated rockstrengths should be used in rock excavatability assessments. [n Figure 9.21 the effect
Tlw cwting of intact rock material 107
of water wetting is illustrated by cutting tests in Bunter sandstone, where mechanicalweakening due to water resulted in lower wear (tests with CH chisels).
9.6 EFFECT OF WEAR OF TOOL ON CUTTING PERFORMANCE
Much research has been done, especially in the mining and tunnelling industry, onthe wear of rock cutting tools (e.g. Kenny & Johnson 1976a &. 1976b, Phillips &Roxborough 1981, Yardley et al. 1981, Clark 1987). Commonly these studiesemphasize the abrasive wear of the tool (catastrophic failure or breakage of the toolis disregarded). In most studies different types of tool material have been testedagainst a limited amount of rock tn)es, often classified as abrasive and non-abrasive.st The wear of rock-cutting tools has a definite influence on their cuttingefficiency. Most tools, including drag picks, have the shape of a wedge. Wearresults in the removal of a prism of tool material from the cutting edge of the bit(Figure 9.22). The resulting wear flat forms an area of z.ero or negative clearance,and crushing of rock beneath the wear flat increases the tool forces. A wear flat ofa few millimetres increases the tool forces by several times their initial values(Figure 9.23).
It is important to note here that it is the clnnge in shape of the tool thatdetermines the rise in forces (Yardley et al. 1981), see Figure 3.11. If a tool couldkeep its shape during the wearing process, no change in forces would result. Withthe design of disc cutters, commonly used on full-face tunnel boring machines, useis made of self sharpening during wear @iichi 1984). The robust design necessaryfor drag cutting tools with pick- or chisel shape always results in wear flatdevelopment. Figure 9.21 shows that already after a few hundred meters of distancecut a considerable wear flat may be present. This distance is reached within a fewminutes of operation of a cutterhead. The effect of change of shape during wear isalso illustrated by the experiments of Kenny & Johnson (L976a & 1976b), whichshow that large clearance angles reduce the effects of wear, even when the rakeangle is small or even negative.
In general pick wear has no influence on optimum pick spacing or production, ifcutting depth can be maintained (Roxborough & Sen 1986). It is noted that wear hasa much more deleterious effect on normal force than it has on cutting force @hillips& Roxborough 1981, Roxborough & Sen 1986). For a sharp pick the ratio of normalto cutting force is typically 0.5 - 0.7. This ratio increases to a value more than twiceas high at even a moderate amount of wear (Figure 9.23). This general effect, whichoccurs at a fairly early stage in the pick wear process, results in the cutting machinesbeing thrust rather than torque limited.
It has been found that depth of cut is an important factor. With increasing depthof cut less wear occurs and also the effect on cutting forces decreases (Yardley etal. 1981). This effect has been explained by Deketh (1995) and is discussed inChapter 12.
The effect of blunting of the tools due to wear on the cutting forces could, apartfrom experimental measurement, also be estimated using an empirical-theoretical
tr see footnote 47.
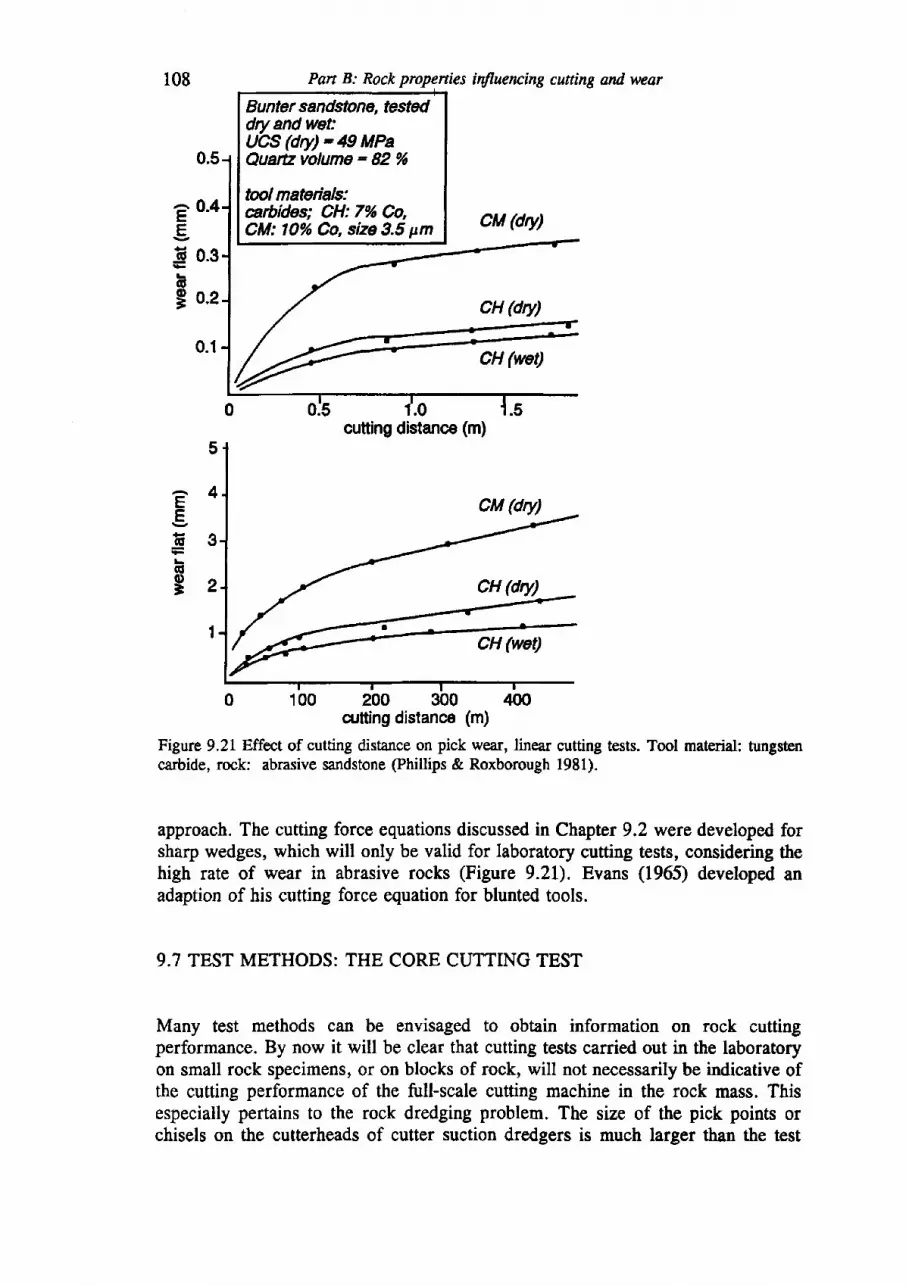
108 Pan B: Rock propenies influencing cutting and wear
Bunter sandstone, testddry and wet:UCS (drY) *49 MPaQuatE volume - 82 %
tool mateials:arbides; CH:7% Co,CM: t0% Co, size 3.5 pm
0 100 200 300 qocutting distance (m)
Figure 9.21 Effect of cutting distance on pick wear, linear cutting tests. Tool material tungstencarbide, rock: abrasive sandstone (Phillips & Roxborough 1981).
approach. The cutting force equations discussed in Chapter 9.2 werc developed forsharp wedges, which will only be valid for laboratory cutting tests, considering thehigh rate of wear in abrasive rocks (Figure 9.21). Evans (1965) developed anadaption of his cutting force equation for blunted tools.
9.7 TEST METHODS: THE CORE CUTTING TEST
Many test methods can be envisaged to obtain information on rock cuttingperformance. By now it will be clear that cutting tests carried out in the laboratoryon small rock specimens, or on blocks of rock, will not necessarily be indicative ofthe cutting performance of the full-scale cutting machine in the rock mass. Thisespecially pertains to the rock dredging problem. The sizs of the pick points orchisels on the cutterheads of cutter suction dredgers is much larger than the test
e 0.4gE 0.36
I o.z
0.1
.0
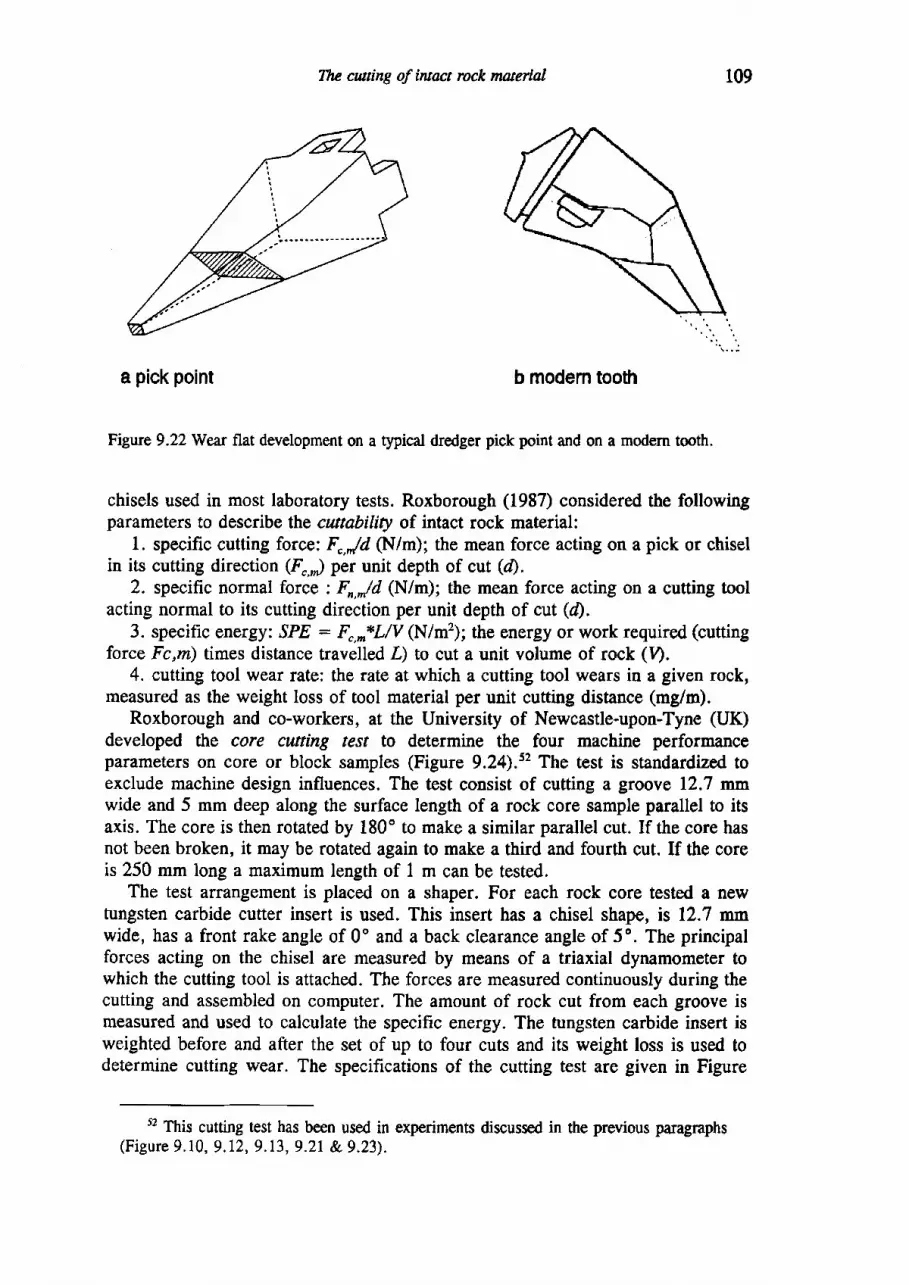
Tlu cutting of iwact rock muerial
a pick point b modem tootl
Figure 9.22Wear flat development on a typical dredger pick point and on a modern tooth.
chisels used in most laboratory tests. Roxborough (1987) considered the followingparameters to describe the cuttability of intact rock material:
l. specific cutting force: F",Jd (N/m); the mean force acting on a pick or chiselin its cutting direction (F",,) per unit depth of cut (d).
2. specific normal force : F,,Jd (N/m); the mean force acting on a cutting toolacting normal to its cutting direction per unit depth of cut (d).
3. specific energy: SPE : F",-*L/V (N/m'?); the energy or work required (cuttingforce Fc,rn) times distance travelled Z) to cut a unit volume of rock (V).
4. cutting tool wear rate: the rate at which a cutting tool wears in a given rock,measured as the weight loss of tool material per unit cutting distance (mg/m).
Roxborough and co-workers, at the University of Newcastle-upon-Tyne (uK)developed the core cutting test to determine the four machine performanceparameters on core or block samples (Figure 9.24).s2 The test is standardizeA toexclude machine design influences. The test consist of cutting a groove 12.7 mmwide and 5 mm deep along the surface length of a rock core sample parallel to itsaxis. The core is then rotated by 180" to make a similar parallel cut. If the core hasnot been broken, it may be rotated again to make a third and fourth cut. If the coreis 250 mm long a maximum length of 1 m can be tested.
The test arrangement is placed on a shaper. For each rock core tes0ed a newtungsten carbide cutter insert is used. This insert has a chisel shape, is 12.7 mmwide, has a front rake angle of 0" and a back clearance angle of 5o. The principalforces acting on the chisel are measured by means of a triaxial dynamometer towhich the cutting tool is attached. The forces are measured continuously during thecutting and assembled on computer. The amount of rock cut from each groove ismeasured and used to calculate the specific energy. The tungsten carbide insert isweighted before and after the set of up to four cuts and its weight loss is used todetermine cutting wear. The specifications of the cuffing test are given in Figure
52 This cutting test has been used in experiments discussed in the previous paragraphs(Figure 9.10, 9.12, 9.13,9.2I & 9.23).
109
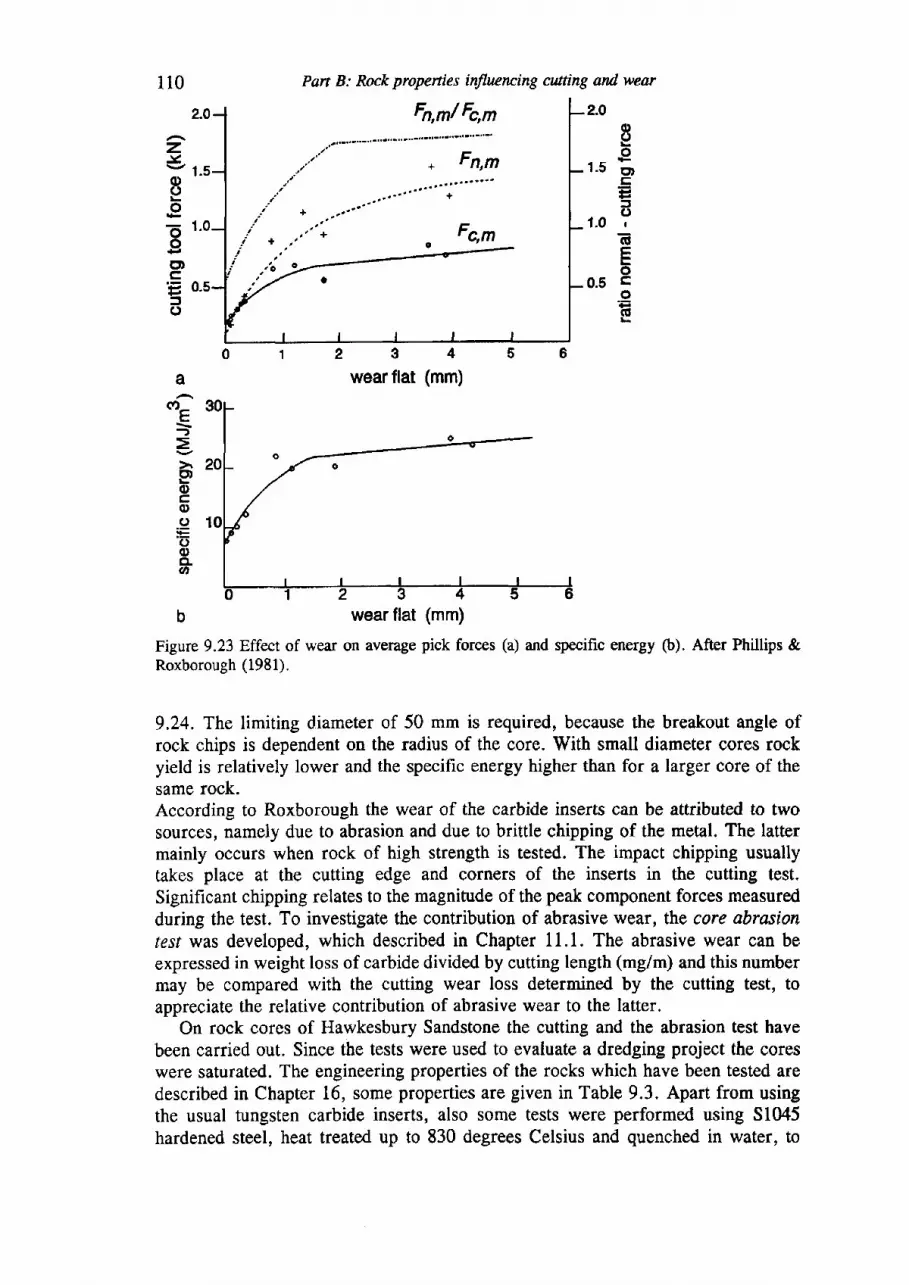
110 Pan B: Rock properties influencing cwting and wear
Fn,m/ Fc,mooo
1 - 5 E tE
3o1.O I
Etro
0.5 qo(g
1.5
1 . 0
zl<
oooEootc
:to
a
E-
goq,
o'6oCLo
b wear flat (mm)
Figure 9.23 Effect of wear on average pick forces (a) and specific energy (b). After Phillips &Roxborough (1981).
9.24. The limiting diameter of 50 mm is required, because the breakout angle ofrock chips is dependent on the radius of the core. With small diameter cores rockyield is relatively lower and the specific energy higher than for a larger core of thesame rock.According to Roxborough the wear of the carbide inserts can be attributed to twosources, namely due to abrasion and due to brittle chipping of the metal. The lattermainly occurs when rock of high strength is tested. The impact chipping usuallytakes place at the cutting edge and corners of the inserts in the cutting test.Significant chipping relates to the magnitude of the peak component forces measuredduring the test. To investigate the contribution of abrasive wear, the core abrasionterr was developed, which described in Chapter 11.1. The abrasive wear can beexpressed in weight loss of carbide divided by cutting length (mg/m) and this numbermay be compared with the cutting wear loss determined by the cutting test, toappreciate the relative contribution of abrasive wear to the latter.
On rock cores of Hawkesbury Sandstone the cutting and the abrasion test havebeen carried out. Since the tests were used to evaluate a dredging project the coreswere saturated. The engineering properties of the rocks which have been tested aredescribed in Chapter 16, some properties are given in Table 9.3. Apart from usingthe usual tungsten carbide inserts, also some tests were performed using 51045hardened steel, heat treated up to 830 degrees Celsius and quenched in water, to
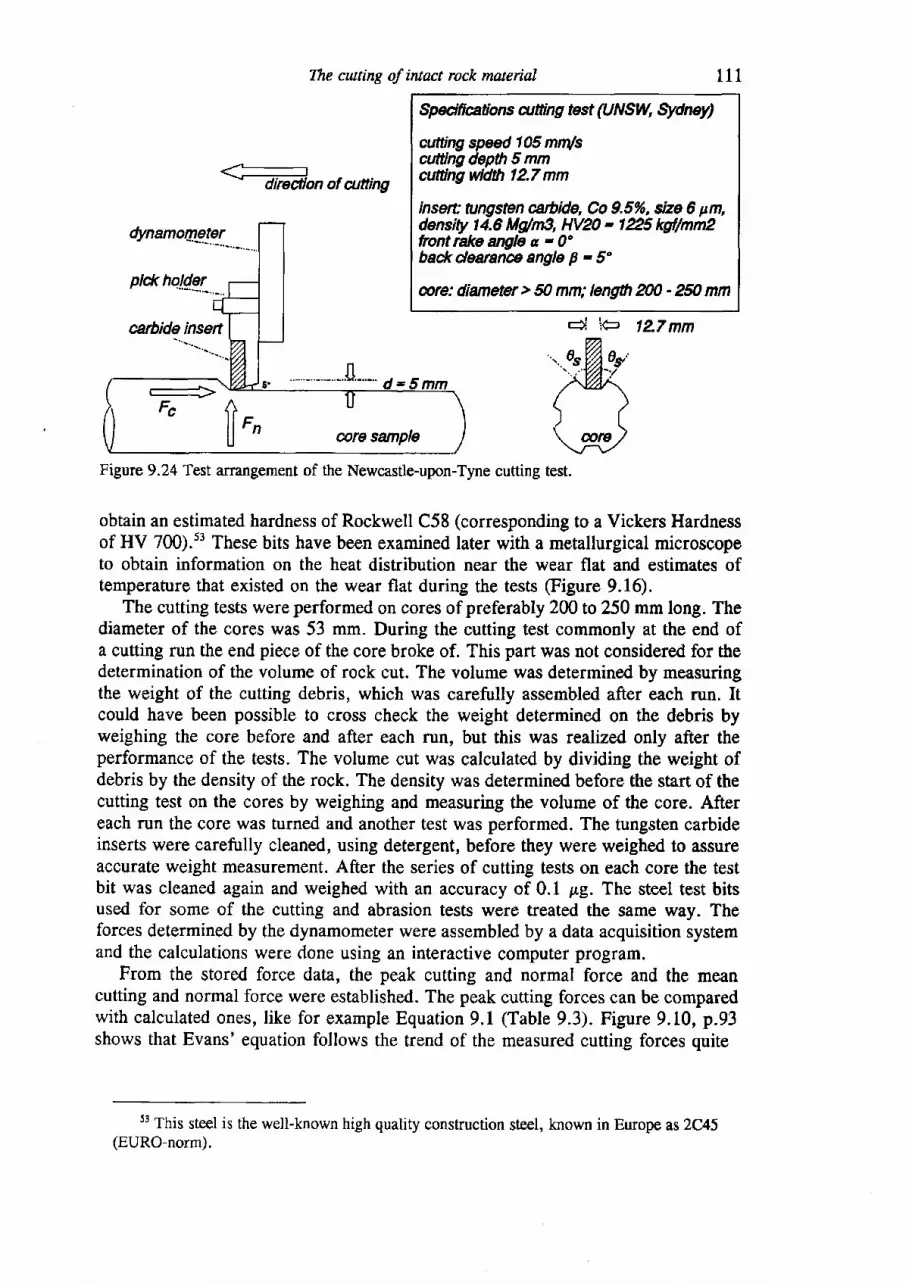
The cutting of intact rock material
spddfic€fions drfiing test (uNSfi Edney)
cuttit g speed 105 mdscutting depth 5 mmcutfrng wldth 12.7 mm
insert tungsten utbide, Co 9.5/0, size 6 pm,density 14.6 Mg/n3, HV20 - 125 kgf/mm?front rake angle a, - 0obad<deuaneangleF-5"
@re: diameter > 50 mm; length ffiO - 250 mm
di i,(= 127 mm
Figure 9.24 Test arrangement of ttre Newcastle-upon-Tyne cutting test.
obtain an estimated hardness of Rockwell C58 (corresponding to a Vickers Hardnessof HV 700).tt These bits have been examined later with a metallurgical microscopeto obtain information on the heat distribution near the wear flat and estimates oftemperature that existed on the wear flat during the tests (Figure 9.16).
The cutting tests wereperformed on cores of preferably 200 to 250 mm long. Thediameter of the cores was 53 mm. During the cutting test commonly at the end ofa cutting run the end piece of the core broke of. This part was not considered for thedetermination of the volume of rock cut. The volume was determined by measuringthe weight of the cutting debris, which was carefully assembled after each run. Itcould have been possible to cross check the weight determined on the debris byweighing the core before and after each run, but this was realized only after theperformance of the tests. The volume cut was calculated by dividing the weight ofdebris by the density of the rock. The density was determined before the start of thecutting test on the cores by weighing and measuring the volume of the core. Aftereach run the core was turned and another test was performed. The tungsten carbideinserts were carefully cleaned, using detergent, before they were weighed to assureaccurate weight measurement. After the series of cutting tests on each core the testbit was cleaned again and weighed with an accuracy of 0.1 pg. The steel test bitsused for some of the cutting and abrasion tests were treated the same way. Theforces determined by the dynamometer were assembled by a data acquisition systemand the calculations were done using an interactive computer program.
From the stored force data, the peak cutting and normal force and the meancutting and normal force were established. The peak cutting forces can be comparedwith calculated ones, like for example Equation 9.1 (Table 9.3). Figure 9.10, p.93shows that Evans' equation follows the trend of the measured cutting forces quite
53 This steel is the well-known high quality construction steel, known in Europe as 2C45(EURO-norm).
1il
\ -diredion of attting
Fc { i - u
lJ t'
ure sarnpte
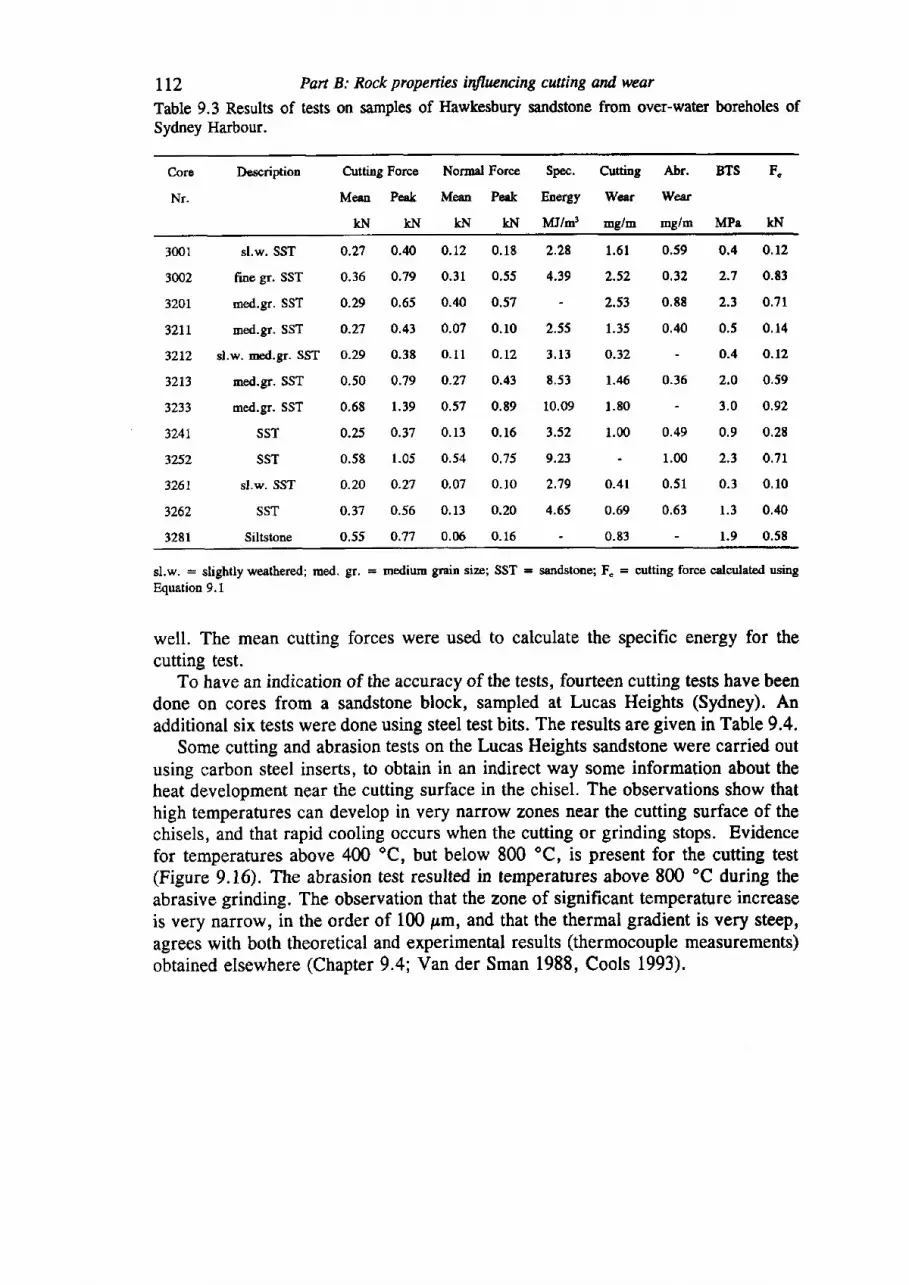
t12Table 9.3 ResultsSydney Harbour.
Pan B: Rock propenies it{hrcrcing cutting and, wear
of tests on samples of Hawkesbury sandstone from over-water boreholes of
Core
Nr.
Description Ortting Force Normal Force
Mean Peak Mesn Pesk
KN KN KN KN
Spec. Cuttirg Abr.
Energy Wear Weer
MJ/m3 mg/m mg/m
F.BTS
KN
3001 sl.w. SST
3Cf,.2 fine gr. SST
32OL med.gr. SST
SZ|L med.gr. SST
3212 sl.w. med.gr. SST
3213 med.gr. SST
3233 med.gr. SST
324t SST
3252 SST
3261 sl.w. SST
3262 SST
1281 Siltstone
o.27 0.40 0.r2 0.1E
0.36 0.79 0.31 0.55
o.z9 0.65 0.40 0.57
o.n 0.43 0.07 0.r0
o.29 0.38 0.11 o. l2
0.50 0.79 0.27 0.43
0.68 r.39 0.57 0.89
o.25 0.37 0. 13 0.16
0.58 r.05 0.54 0.75
0.20 0-n 0.07 0.10
o.37 0.56 0.13 0.20
0.55 0.77 0.06 0.16
2.28
4.39
2.5s
3 , t 3
8.53
10.09
3.52
9.23
2.19
4.65
l . 6 l
2.52
2.53
1.35
o.32
t.46
l.Eo
1.00
0.59
0,32
0.88
0.,+0
0.36
0.49
1.00
0.51
0.63
0.4r
0.69
0.83
0.4 0.r2
2.7 0.83
2.3 0.71
0.5 0.14
0.4 0.t2
2.O 0.59
3.0 0.92
0.9 0.2E
2.3 0.71
0.3 0,10
r .3 0,40
r.9 0.58
sl,w. = slightly weathered; med, gr, = medium grain size; SST = sandstone; F. = cutting force calculated using
Equation 9.1
well. The mean cutting forces were used to calculate the specific energy for thecutting test.
To have an indication of the accuracy of the tests, fourteen cutting tests have beendone on cores from a sandstone block, sampled at Lucas Heights (Sydney). Anadditional six tests were done using steel test bits. The results are given in Table 9.4.
Some cutting and abrasion tests on the Lucas Heights sandstone were carried outusing carbon steel inserts, to obtain in an indirect way some information about theheat development near the cutting surface in the chisel. The observations show thathigh temperahlres can develop in very naffow zones near the cutting surface of thechisels, and that rapid cooling occurs when the cutting or grinding stops. Evidencefor temperatures above 400 oC, but below 800 oC, is present for the cutting test(Figure 9.16). The abrasion test resulted in temperafures above 800 'C during theabrasive grinding. The observation that the zone of significant temperature increaseis very narrow, in the order of 100 pm, and that the thermal gradient is very steep,agrees with both theoretical and experimental results (thermocouple measurements)obtained elsewhere (Chapter 9.4; Van der Sman 1988, Cools 1993).
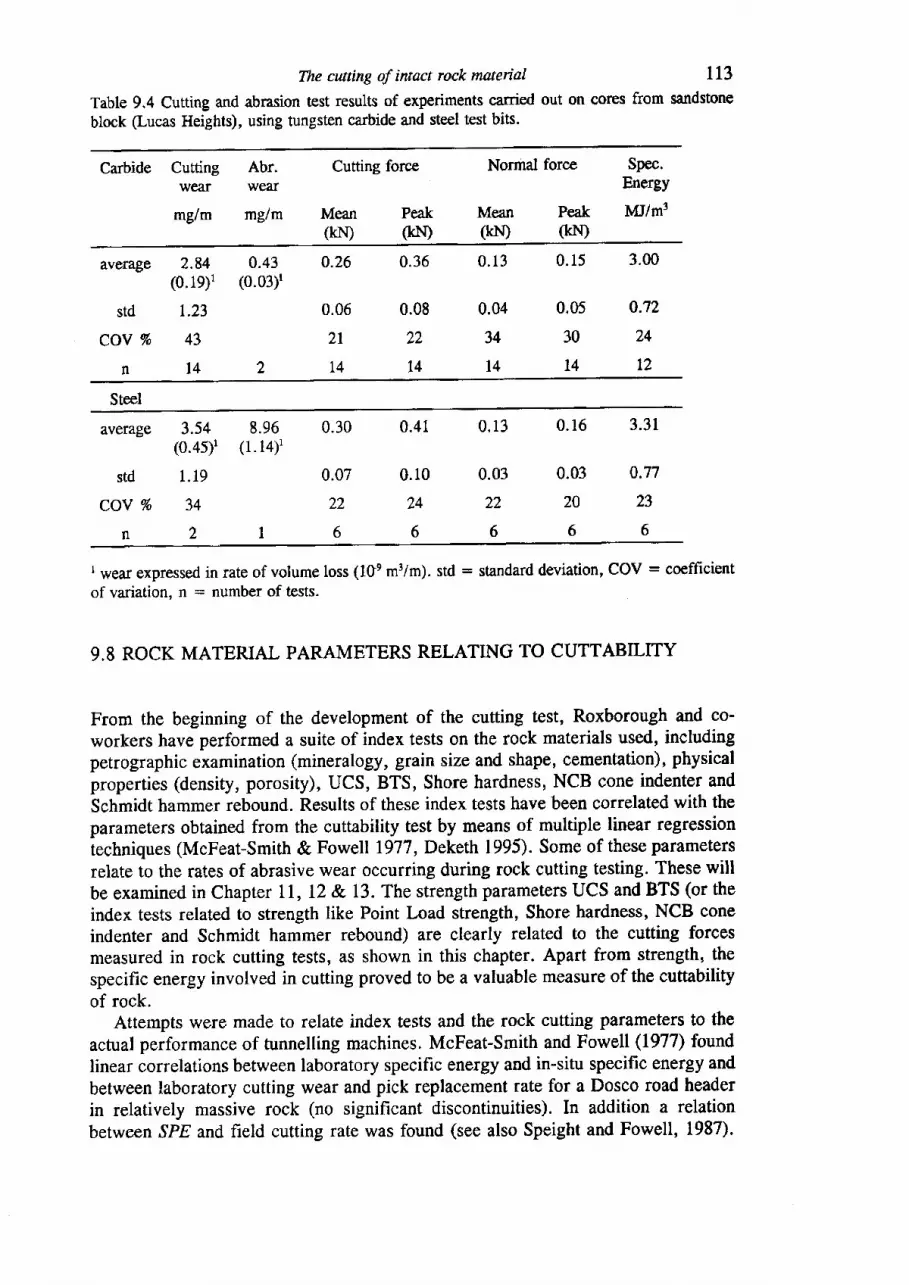
The cutting of intact rock mateial
Tabte 9.4 Cutting and abrasion test results of experiments canied out on coresblock (Lucas Heights), using tungsten carbide and steel test bits.
113from sandstone
Carbide Cuttingwear
mg/m
Abr.wear
mg/m
Cutting force Normal force Spec.Energy
MI/m3Mean Peak Mean Peak(klQ GID GI.I) (kI'[)
average
std
COY To
n
2.84 0.43(0.19)1 (0.03)r
1 .23
43
0.26
0.06
2 l1 Al +
0.36
0.08) )
l4
0.13
0.04
34
t4
0 .15
0.05
30
t4
3.00
0.72
24
t2l 4
Steel
average
std
COY To
n
3.54 8.96(o.4sl (1.14)1
1 .19
0.30
0.07
22
6
0.41
0.10
24
6
0.13
0.03
22
6
0.16
0.03
20
6
3.31
0.77
23
634
2
I wear expressed in rate of volume loss (l0e m3/m). std : standard deviation, COV = coefficientof variation, n = number of tests.
9.8 ROCK MATERIAL PARAMETERS RELATING TO CUTTABILITY
From the beginning of the development of the cutting test, Roxborough and co-workers have performed a suite of index tests on the rock materials used, includingpetrographic examination (mineralogy, grain size and shape, cementation), physicalproperties (density, porosity), UCS, BTS, Shore hardness, NCB cone indenter andSchmidt hammer rebound. Results of these index tests have been corrslated with theparameters obtained from the cuttability test by means of multiple linear regressiontechniques (McFeat-Smith & Fowell 7977, Deketh 1995). Some of these parametersrelate to the rates of abrasive wear occurring during rock cutting testing. These willbe examined in Chapter 1l , 12 & 13. The strength parameters UCS and BTS (or theindex tests related to strength like Point Load strength, Shore hardness, NCB coneinderrter and Schmidt hammer rebound) are clearly related to the cutting forcesmeasured in rock cutting tests, as shown in this chapter. Apart from strength, thespecific energy involved in cutting proved to be a valuable measure of the cuttabilityof rock.
Attempts were made to relate index tests and the rock cutting parameters to theactual performance of tunnelling machines. McFeat-Smith and Fowell (1977> foundlinear correlations between laboratory specific energy and in-situ specific energy andbetween laboratory cutting wear and pick replacement rate for a Dosco road hcaderin relatively massive rock (no significant discontinuities). In addition a relationbetween.gPE and field cutting rate was found (see also Speight and Fowell, 1987).
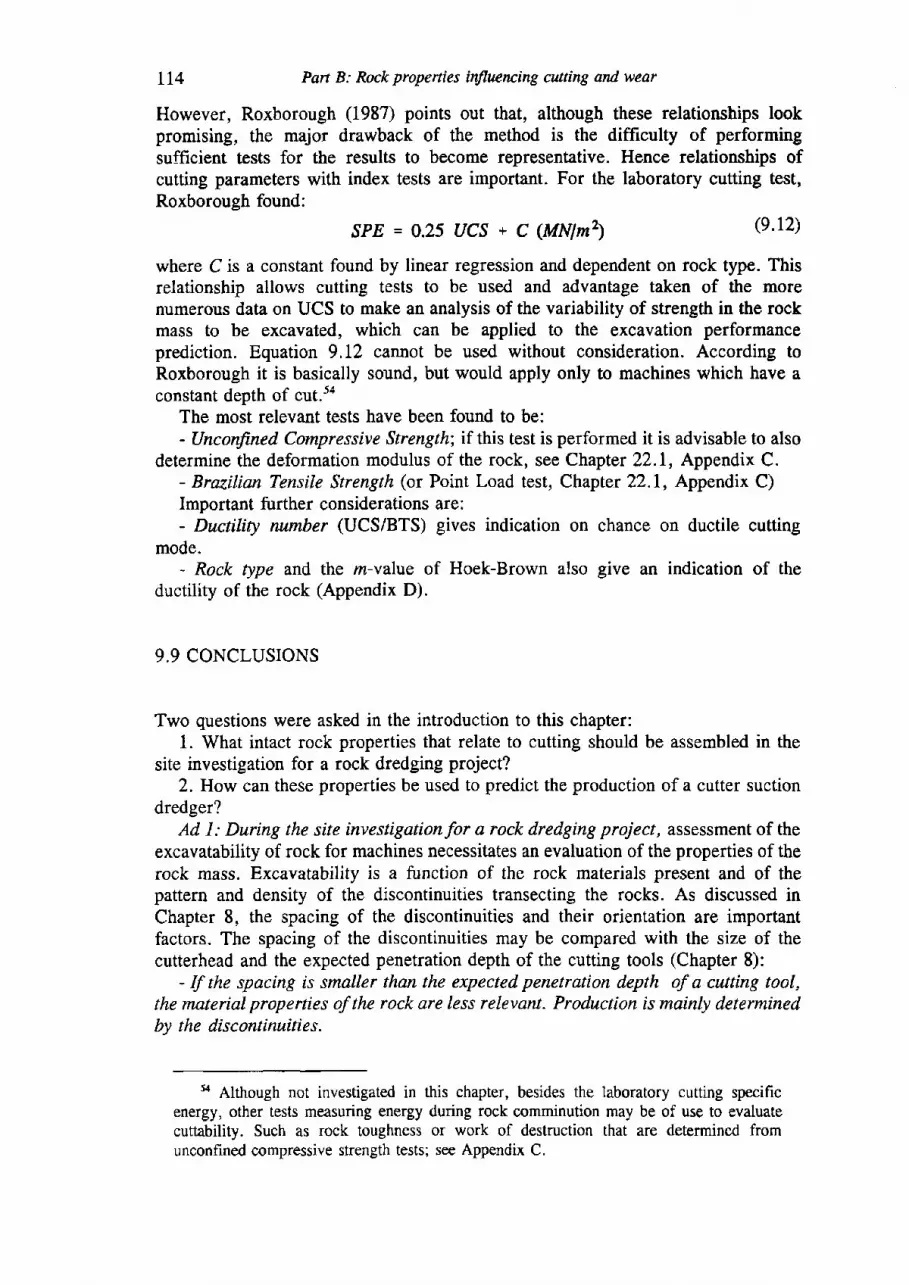
IT4 Pan B: Rock propenies influcncing cutting and wear
However, Roxborough (1987) points out that, although these relationships lookpromising, the major drawback of the method is the difFrculty of performingsufficient tests for the results to become representative. Hence relationships ofcutting parameters with index tests are important. For the laboratory cutting test,Roxborough found:
SPE=O.25UCS*C(MNIwz) (e.r2)
where C is a constant found by linear regression and dependent on rock type. Thisrelationship allows cutting tests to be used and advantage taken of the motenumerous data on UCS to make an analysis of the variability of strength in the rockmass to be excavated, which can be applied to the excavation performanceprediction. Equation 9.12 cannot be used without consideration. According toRoxborough it is basically sound, but would apply only to machines which have aconstant depth of cut.sa
The most relevant tests have been found to be:- Unconfined Compressive Strength; if this test is performed it is advisable to also
determine the deformation modulus of the rock, see Chapter 22.1, Appendix C.- Brazilian Tensile Strength (or Point Load test, Chapter 22.1, Appendix C)Important further considerations are:- Ductility number (UCS/BTS) gives indication on chance on ductile cutting
mode.- Rock type and the n-value of Hoek-Brown also give an indication of the
ductility of the rock (Appendix D).
9.9 CONCLUSIONS
Two questions were asked in the introduction to this chapter:1. What intact rock properties that relate to cutting should be assembled in the
site investigation for a rock dredging project?2. How can these properties be used to predict the production of a cutter suction
dredger?Ad I: During the site investigation for a rock dredging project, assessment of the
excavatability of rock for machines necessitates an evaluation of the properties of therock mass. Excavatability is a function of the rock materials present and of thepattern and density of the discontinuities transecting the rocks. As discussed inChapter 8, the spacing of the discontinuities and their orientation are importantfactors. The spacing of the discontinuities may be compared with the size of thecutterhead and the expected penetration depth of the cutting tools (Chapter 8):
- If the spacing is smaller than the expected penetration depth of a cutting tool,the material properties of the rock are less relevant. Production is mainly determinedbv the discontinuities.
s Although not investigated in this chapter, besides the laboratory cutting specificenergy, other tests measuring energy during rock comminution may be of use to evaluatecuttability. Such as rock toughness or work of destruction that are determined fromunconfined compressive strength tests; see Appendix C.
The cutting of intact rock material 115
- If the spacing is of the size (diwneter) of the cutterhead. or snnller, theproduction will be afunction of the properties of the disconlitwities (shear strengthand orientation) and part of the cuning will be in intact rock.
- If the spacing is Inrger tlwn the size of the cutterhead, the cutting wiII be maintydetermined by the intact rock.
The cuttability of rock is describing the facility of intact rock material to be cutby mechanical tools. This property is partly dependent on the characteristics of themaehine and the conditions under which the cutting takes place. Important rockproperties are the strength of the rocks and tests measuring the unconfinedcompressive and tensile strength are highly relevant. Very high normal pressuresmay occur near the cutting tool wear flat. Some rocks will behave in a ductile wayduring cutting, which can lead to high temperatures at the wear flat, with resultingincreased wear. The ductility of rock can be guessed at, by using the ductilitynumber (UCS/BTS), or the m value of the Hoek-Brown failure criterion for intactrock and estimate the brittle-ductile transition stress (Appendix D).
Apart from the intact rock parameters just mentioned, those that relate to adhesiveand abrasive wear, discussed in the Chapters 10-13, should be assembled during thesite investigation.
Ad 2: The prediction of the performance of a cutter suction dredger will need theproperties describing the excavatability and cuttability of rock just discussed.Machine settings and tool geometry and design can influence the rock cuttingprocess. Higher penetration depths are favourable as indicated by the lower specificenergy measured in cutting tests. Cutting velocities higher than 3 m/s tend to leadto higher cutting forces and high temperatures developing at the wear flat of the tool.Blunting of the tools, either by high temperature adhesive wear, or by abrasive wear,leads to higher cutting forces and higher energy consumption. In Chaprr 18prediction methods for mechanical rock excavation are considered.
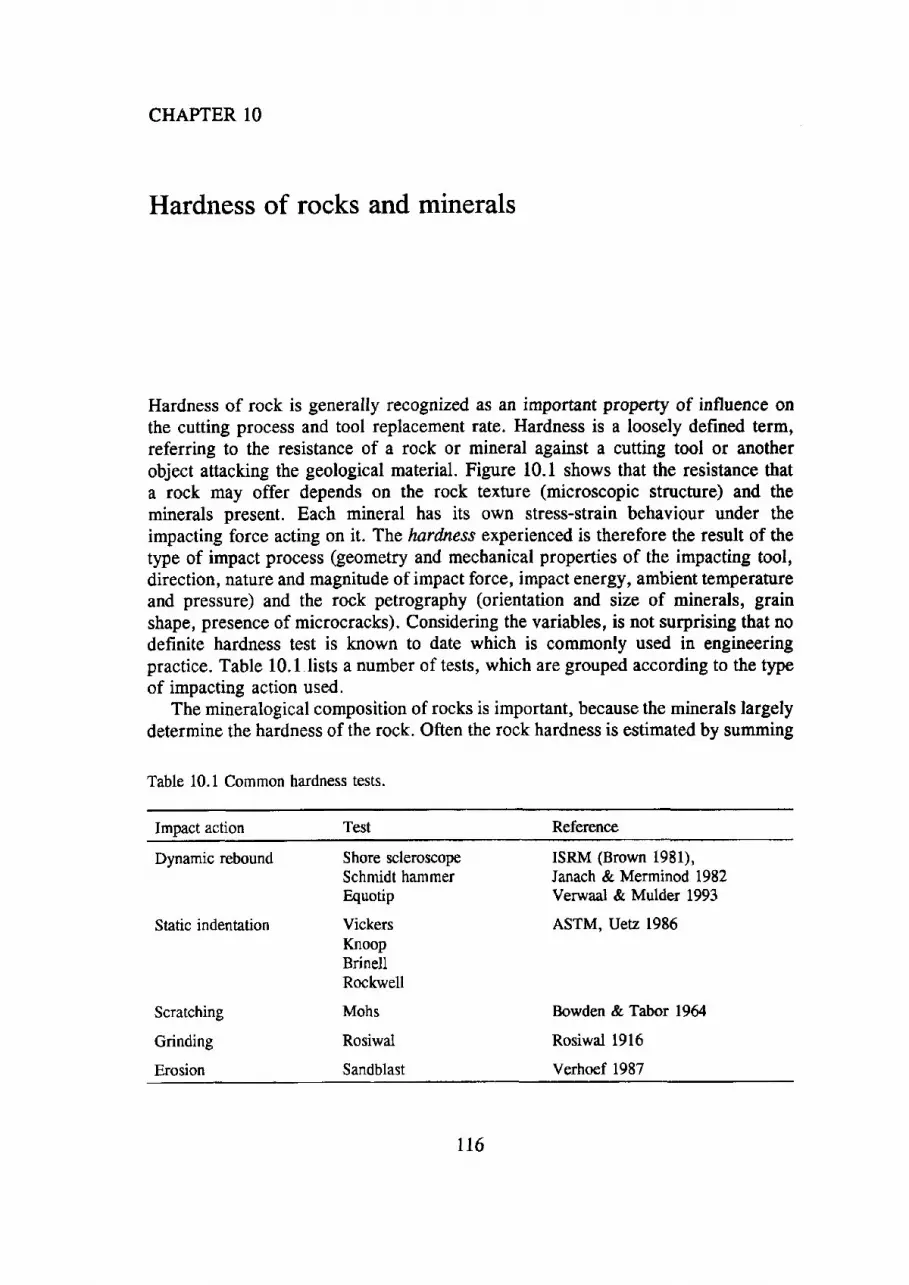
CHAPTER 10
Hardness of rocks and minerals
Hardness of rock is generally rccognaed as an important propefly of influence onthe cutting process and tool replacement rate. Hardness is a loosely defined term,referring to the resistance of a rock or mineral against a cutting tool or anotherobject attacking the geological material. Figure 10.1 shows that the resistance thata rock may offer depends on the rock texture (microscopic structure) and theminerals present. Each mineral has its own stress-strain behaviour under theimpacting force acting on it. The hardness experienced is therefore the result of thetype of impact process (geometry and mechanical properties of the impacting tool,direction, nature and magnitude of impact force, impact energy, ambient temperatureand pressure) and the rock petrography (orientation and size of minerals, grainshape, presence of microcracks). Considering the variables, is not surprising that nodefinite hardness test is known to date which is commonly used in engineeringpractice. Table 10.1 lists a number of tests, which are grouped according to the typeof impacting action used.
The mineralogical composition of rocks is important, because the minerals largelydetermine the hardness of the rock. Often the rock hardness is estimated by summing
Table 10.1 Common hardness tests.
Impact action Reference
Dynamic rebound
Static indentation
Scratching
Grinding
Erosion
Shore scleroscopeSchmidt hammerEquotip
VickersKnoopBrinellRockwell
Mohs
Rosiwai
Sandblast
ISRM (Brown 1981),Janach & Merminod 1982Verwaal & Mulder 1993
ASTM, Uetz 1986
Bowden & Tabor 1964
Rosiwal l9l6
Verhoef 1987
116
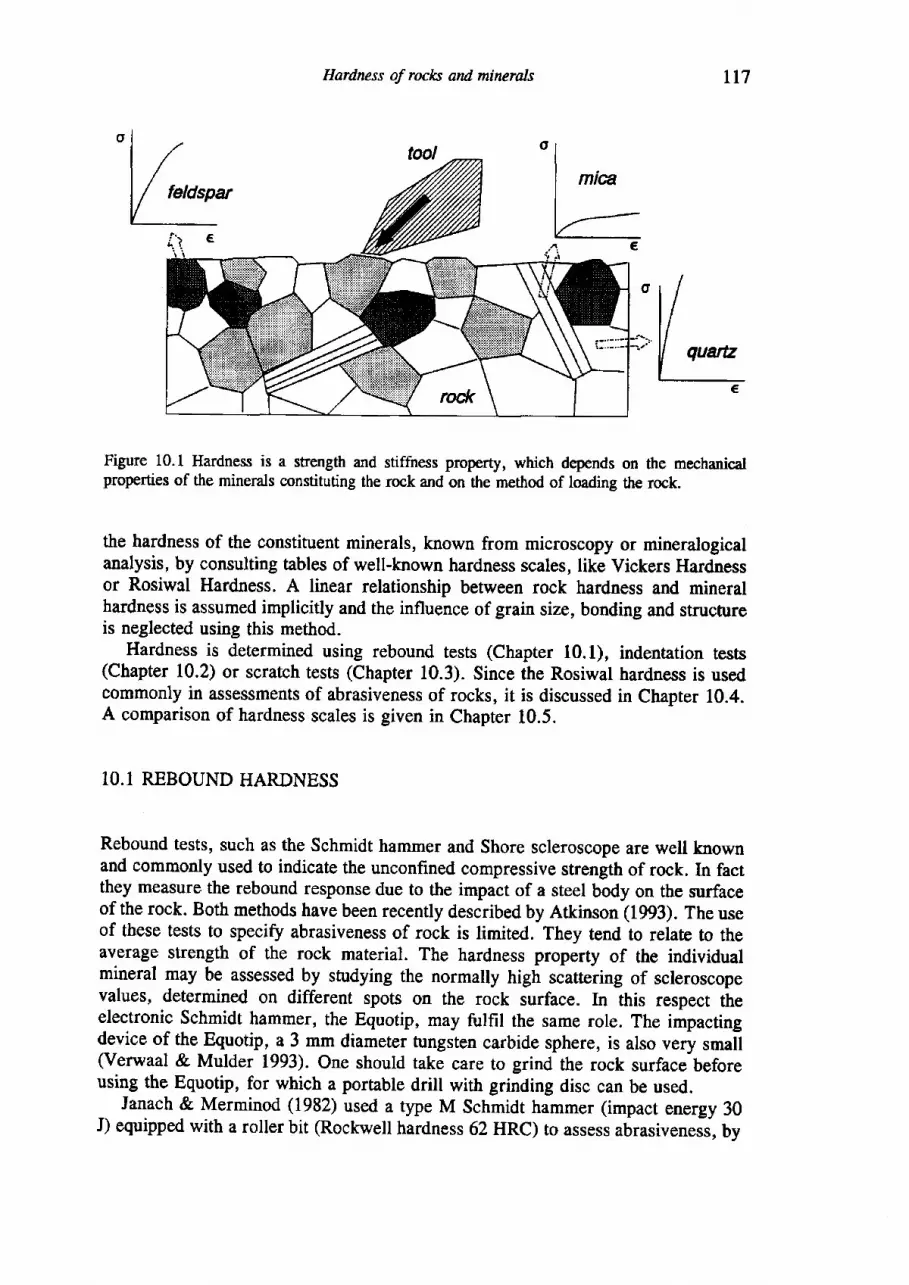
Hardness of rocks and minerals rt7
Figure 10.1 Hardness is a strength and stiffness property, which depends on the mechanicalproperties of the minerals constituting the rock and on the method of loading the rock.
the hardness of the constituent minerals, known from microscopy or mineralogicalanalysis, by consulting tables of well-known hardness scales, like Vickers Hardnessor Rosiwal Hardness. A linear relationship between rock hardness and mineralhardness is assumed implicitly and the influence of grain size, bonding and structureis neglected using this method.
Hardness is determined using rebound tests (Chapter 10.1), indentation tes6(Chapter 10.2) or scratch tests (Chapter 10.3). Since the Rosiwal hardness is usedcommonly in assessments of abrasiveness of rocks, it is discussed in Chapter 10.4.A comparison of hardness scales is given in Chapter 10.5.
10.1 REBOUND HARDNESS
Rebound tests, such as the Schmidt hammer and Shore scleroscope are well knownand eommonly used to indicate the unconfined compressive strength of rock. In factthey measure the rebound response due to the impact of a steel body on the surfaceof the rock. Both methods have been recently described by Atkinson (1993). The useof these tests to specify abrasiveness of rock is limited. They tend to relate to theaverage strength of the rock material. The hardness property of the individualmineral may be assessed by studying the normally high scattering of scleroscopevalues, determined on different spots on the rock surface. In this respect theelectronic Schmidt hammer, the Equotip, may fulfil the same role. The impactingd_elice of the Equotip, a 3 mm diameter tungsten carbide sphere, is also nery r-ull(Verwaal & Mulder 1993). One should take care to grind the rock surface beforeusing the Equotip, for which a portable drill with grinding disc can be used.
Janach & Merminod (1982) used a type M Schmidt hammer (impact energy 30J) equipped with a roller bit (Rockwell hardness 62 HRC) to assess abrasivenes, by
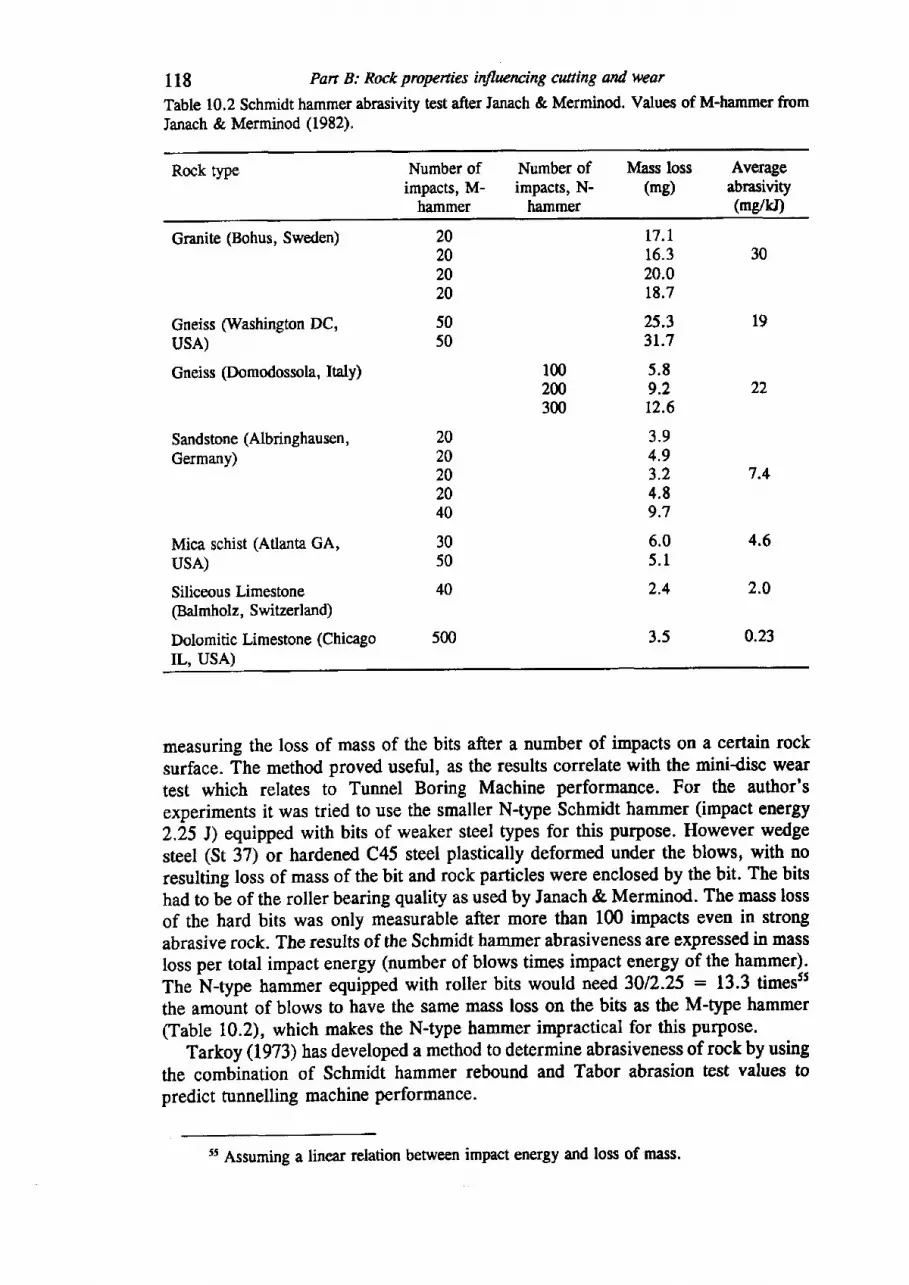
118 Pan B: Rock properties influencing cutting and war
Table 10.2 Schmidt hammer abrasivity test after Janach & Merminod. Values of M-hammer fromIanach & Merminod (1982),
Rock type Number ofimpacts, M-
hammer
Number ofimpacts, N-
hammer
Mass loss Average(mg) abrasivity
(netkI)
Granite (Bohus, Sweden)
Gneiss (Washington DC,usA)Gneiss (Domodossola, Ialy)
Sandstone (Albringhausen,Germany)
19
20202020
5050
22
7.4
1002W300
L7. l16.320.018.7
25.331.7
5.89.212.6
3 .94 .93 .24.89.7
6.05 .1
2.4
3.5
2.0
0.23
2020202040
3050
40
4.6Mica schist (Atlanta GA,usA)Siliceous Limestone(Balmholz, Switzerland)
Dolomitic Limestone (ChicagoIL, USA)
measuring the loss of mass of the bits after a number of impacts on a certain rocksurface. The method proved useful, as the results correlate with the minidisc weartest which relates to Tunnel Boring Machine performance. For the author'sexperiments it was tried to use the smaller N-type Schmidt hammer (impact energy2.25 J) equipped with bits of weaker steel types for this purpose. However wedge
steel (St 37) or hardened C45 steel plastically deformed under the blows, with noresulting loss of mass of the bit and rock particles were enclosed by the bit. The bitshad to be of the roller bearing quality as used by lanach & Merminod. The mass lossof the hard bits was only measurable after more than 100 impacts even in strongabrasive rock. The results of the Schmidt hammer abrasiveness are expressed in massloss per total impact energy (number of blows times impact energy of the hammer).
The N+ype hammer equipped with roller bits would need 3012.25 : 13.3 timesstthe amount of blows to have the same mass loss on the bits as the M-type hammer(Table 10.2), which makes the N-type hammer impractical for this purpose.
Tarkoy (1973) has developed a method to determine abrasiveness of rock by using
the combination of Schmidt hammer rebound and Tabor abrasion test values topredict tunnelling machine performance.
55 Assuming a linear relation between impact energy and loss of mass.
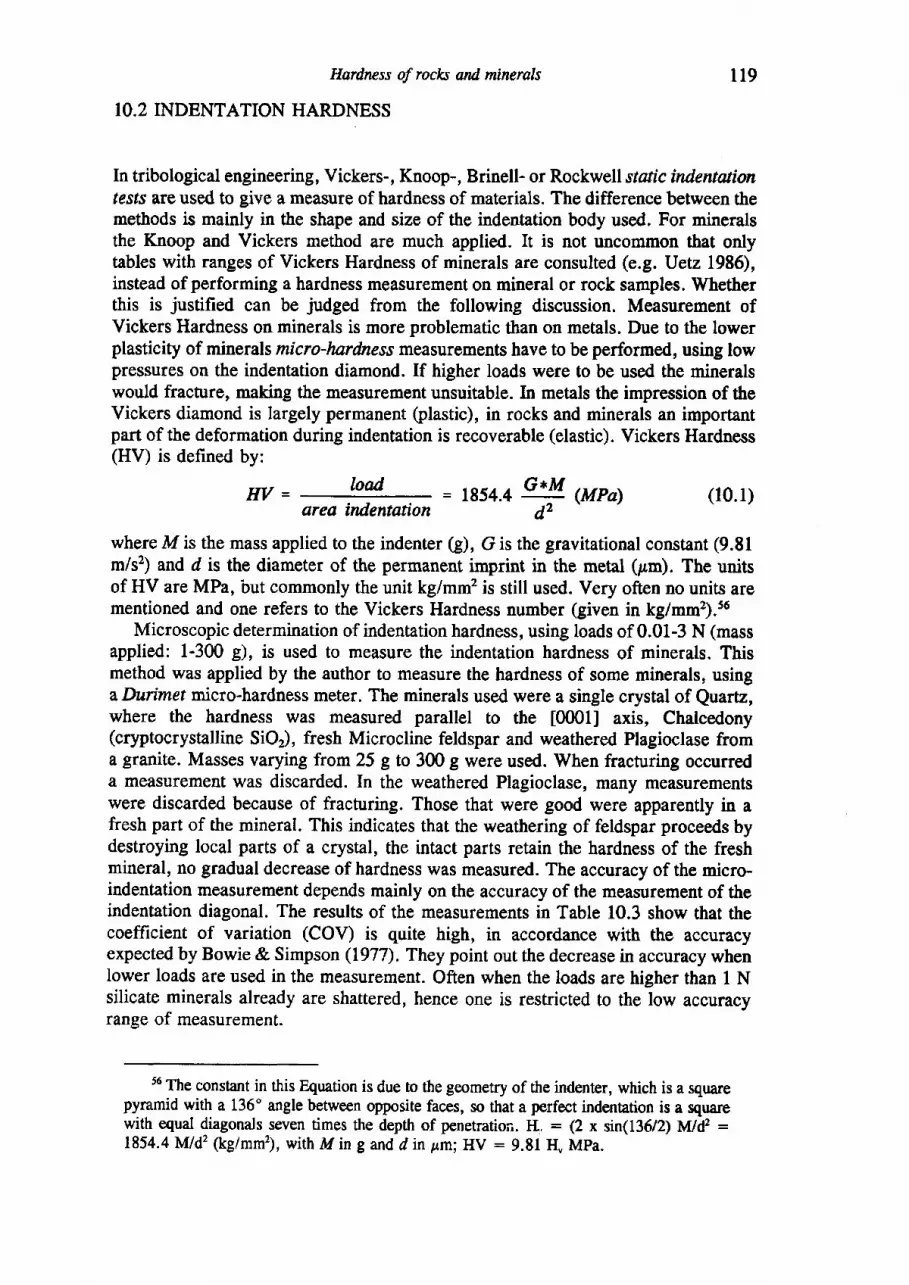
Hardncss of rocla and minerals
IO.2 INDENTATION HARDNESS
l19
In tribological engineering, Vickers-, Knoop-, Brinell- or Rockwell static in"dentationfestr are used to give a measure of hardness of materials. The difference between themethods is mainly in the shape and size of the indentation body used. For mineralsthe Knoop and Vickers method are much applied. It is not uncommon that onlytables with ranges of Vickers Hardness of minerals are consulted (e.g. Uetz 1986),instead of performing a hardness measurement on mineral or rock samples. Whetherthis is justified can be judged from the following discussion. Measurement ofVickers Hardness on minerals is more problematic than on metals. Due to the lowerplasticity of minerals micro-lnrdness measurements have to be performed, using lowpressures on the indentation diamond. If higher loads were to be used the mineralswould fracture, making the measurement unsuitable. In metals the impression of theVickers diamond is largely permanent (plastic), in rocks and minerals an importantpart of the deformation during indentation is recoverable (elastic). Vickers Hardness(HV) is defined by:
HV= load (10.1)area indentation
= 1854.4 ry
(Mpa)
where M is the mass applied to the indenter G), G is the gravitational eonstant (9.81m/s2) and d is the diameter of the permanent imprint in the metal (pm). The unitsof HV are MPa, but commonly the unit kg/mm2 is still used. Very often no units arementioned and one refers to the Vickers Hardness number (given in kg/mm2).56
Microscopic determination of indentation hardnessn using loads of 0.01-3 N (massapplied: 1-300 g), is used to measure the indentation hardness of minerals. Thismethod was applied by the author to measure the hardness of some minerals, usingaDurimet micro-hardness meter. The minerals used were a single crystal of Quartz,where the hardness was measured parallel to the t00011 axis, Chatcedony(cryptocrystalline SiOr, fresh Microcline feldspar and weathered Plagioclase froma granite. Masses varying from 25 g to 300 g were used. When fracturing occurreda measurement was discarded. In the weathered Plagioclase, many measurementswere discarded because of fracturing. Those that were good were apparently in afresh part of the mineral. This indicates that the weathering of feldspat proceeds bydestroying local parts of a crystal, the intact parts retain the hardness of the freshmineral, no gradual decrease of hardness was measured. The accuracy of the micro-indentation measurement depends mainly on the accuracy of the measurement of theindentation diagonal. The results of the measurements in Table 10.3 show that thecoeffrcient of variation (COV) is quite high, in accordance with the accuracyexpected by Bowie & Simpson (1977). They point out the decrease in accuracy whenlower loads are used in the measurernent. Often when the loads are higher than I Nsilicate minerals already are shattered, hence one is restricted to the low accuracyrange of measurement.
t6 The constant in this Equation is due to the geometry of the indenter, which is a squarepyramid with a 136" angle between opposite faces, so that a perfect indentation is a squarewith equal diagonals seven times the depth of penetration. IL = (2 x sin(136/2) Mldz =1854.4 M/dz (kg/mm2;, with M in g and d in ;rm; HV : 9.Bl H, Mpa.
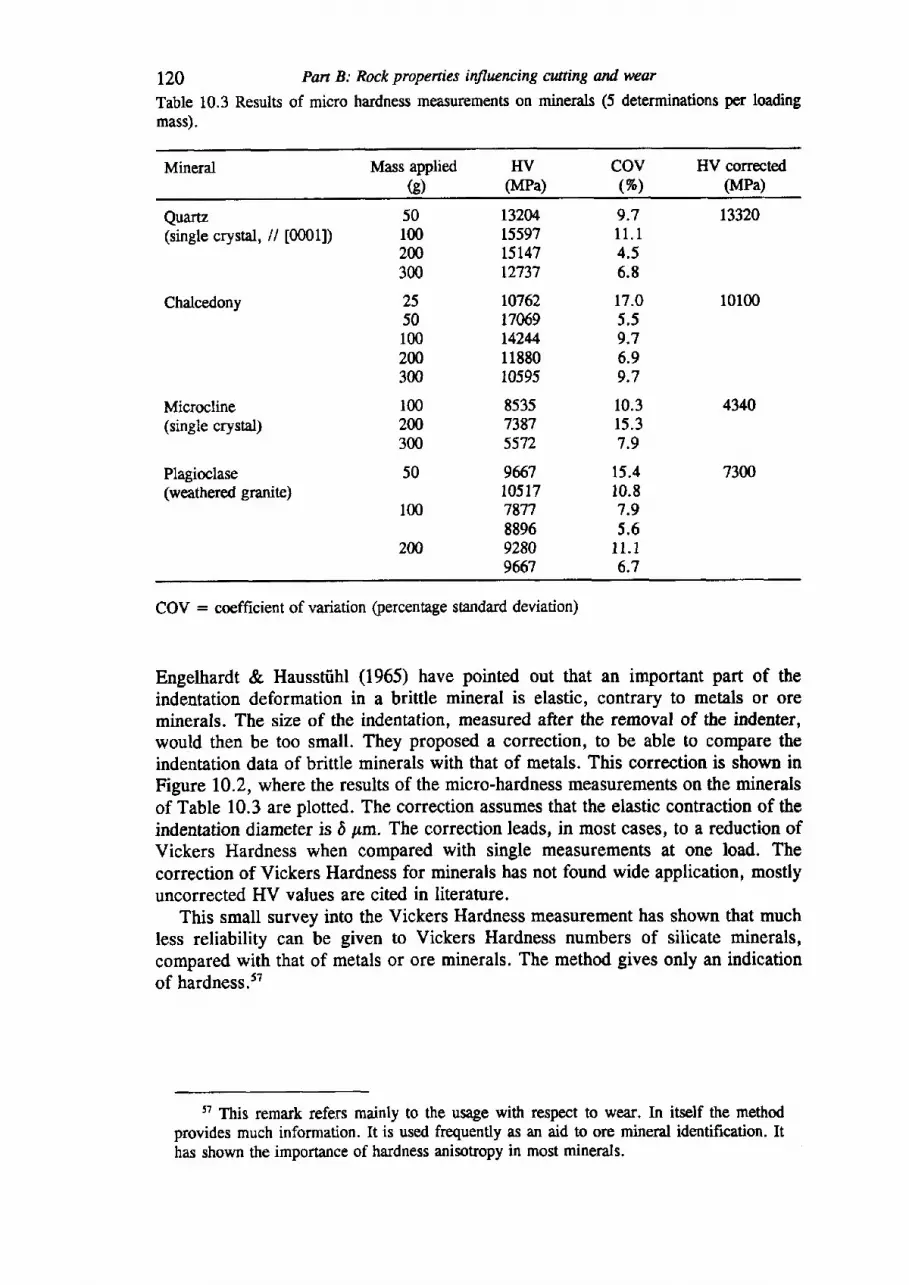
r20 Pan B: Rock properties inflrcncing cutting and wear
Table 10.3 Results of micro hardness measurements on minerals (5 determinations per loadingmass).
Mineral Mass appliedG)
HV(MPa)
cov(%)
HV corrected(MPa)
Quartz(single crystal, // t00011)
Chalcedony
Microcline(single crystal)
Plagioclase(weathered granite)
50100zffi300
2550100200300
100200300
50
lm
2N
132041559715T47t2737
r076217069T42M1188010595
853s73875572
9ffi7105177877889692809667
9.7l t . 14.56.8
17.05.59.76.99.7
10.315.37.9
15.410.87.95.6
11 .16.7
13320
10100
4340
73m
COV : coefficient of variation (percentage standard deviation)
Engelhardt & Hausstiihl (1965) have pointed out that an important part of theindentation deformation in a brittle mineral is elastic, contrary to metals or oreminerals. The size of the indentation, measured after the removal of the indenter,would then be too small. They proposed a correction, to be able to compare theindentation data of brittle minerals with that of metals. This correction is shown inFigure 10.2, where the results of the micro-hardness measurements on the mineralsof Table 10.3 are plotted. The correction assumes that the elastic contraction of theindentation diameter is D pm. The correction leads, in most cases, to a reduction ofVickers Hardness when compared with single measurements at one load. Thecorrection of Vickers Hardness for minerals has not found wide application, mostlyuncorrected Hv values are cited in literature.
This small survey into the Vickers Hardness measurement has shown that muchless reliability can be given to Vickers Hardness numbers of silicate minerals,compared with that of metals or ore minerals. The method gives only an indicationof hardness.sT
5? This remark refers mainly to the usage with respect to wear. In itself the methodprovides much information. It is used frequently as an aid to ore mineral identification. Ithas shown the importance of hardness anisotropy in most minerals.
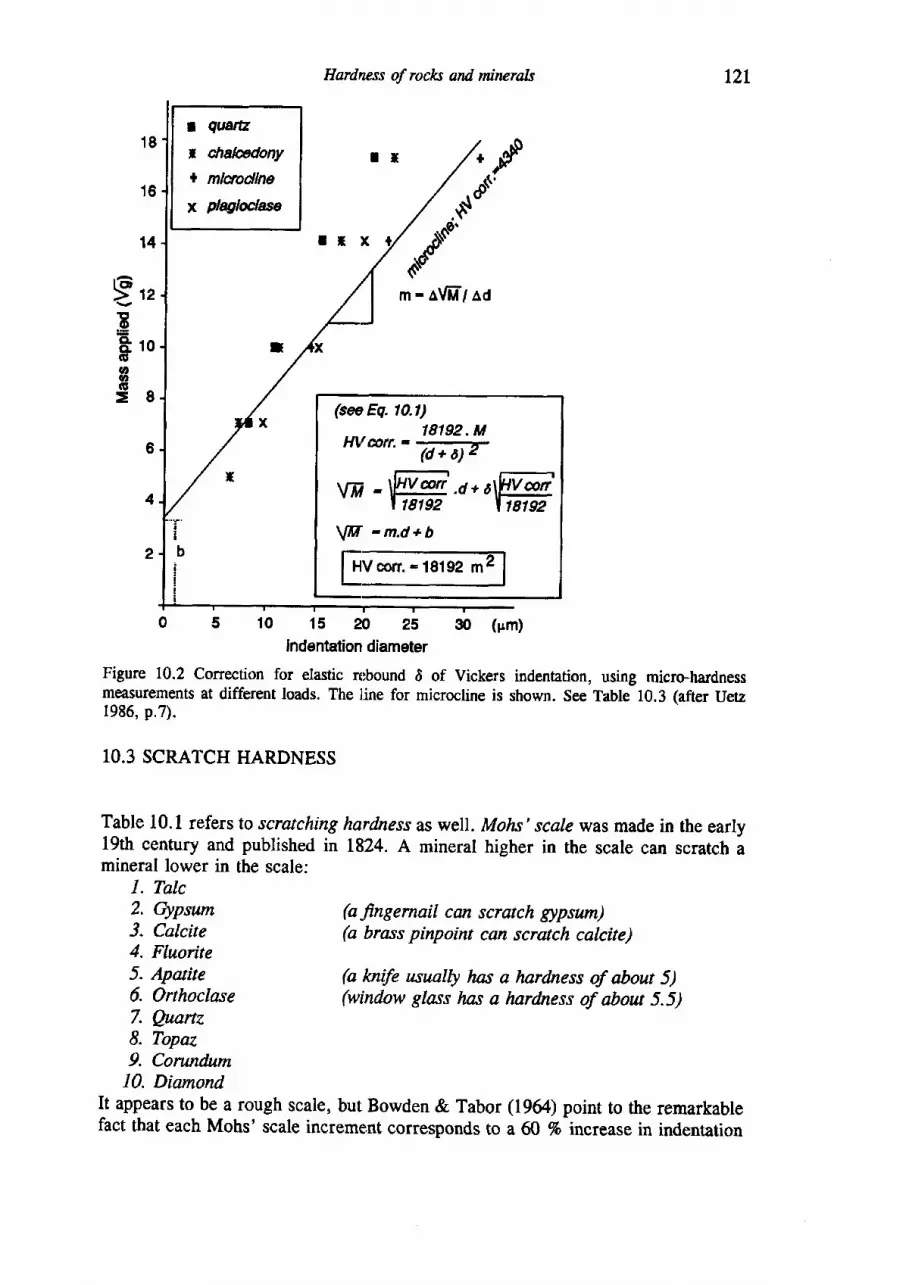
Hardness of roclcs and minerals
(a "ftngernail can scrotch gypswn)(a brass pinpoint can scratch calcite)
(a ,knife usualty lns a hardness of about 5)(window glass has a harfutess of about 5.5)
tzt
14
>12
ERro6oa
(see Eq. t0.t)t8192. M
Hltarr.- --( d + 6 ) 4
\mi -\W.d*4@| 18192 | 18t92
YM -m.d+b
HVcon -18192 m
0 5 10 15 20 2s 30 (pm)Indentation diameter
Figure 10.2 Correction for elastic nsound d of Vickers indentation, using micro.hardnessmeasurements at different loads. The l.ine for microcline is shown. See Table 10.3 (after Uetz1986, p.7).
10.3 SCRATCH HARDNESS
Table 10.1 refers to scratching harfutess as well. Motn'scale was made in the eady19th century and published in 1824. A mineral higher in the scale can scratch amineral lower in the scale:
I. Talc2. Gypsum3. Calcite4. Fluorite5. Apaite6. Orthoclase7. Quanz8. Topaz9. Corundum10. Diarnond
It appears to be a rough scale, but Bowden & Tabor 09(/l) point to the remarkablefact that each Mohs' scale increment corresponds to a ffi % increase in indentation
I quatu
;, draladonyI mlaodlne
x plqlodas
m - aV[['/ ao
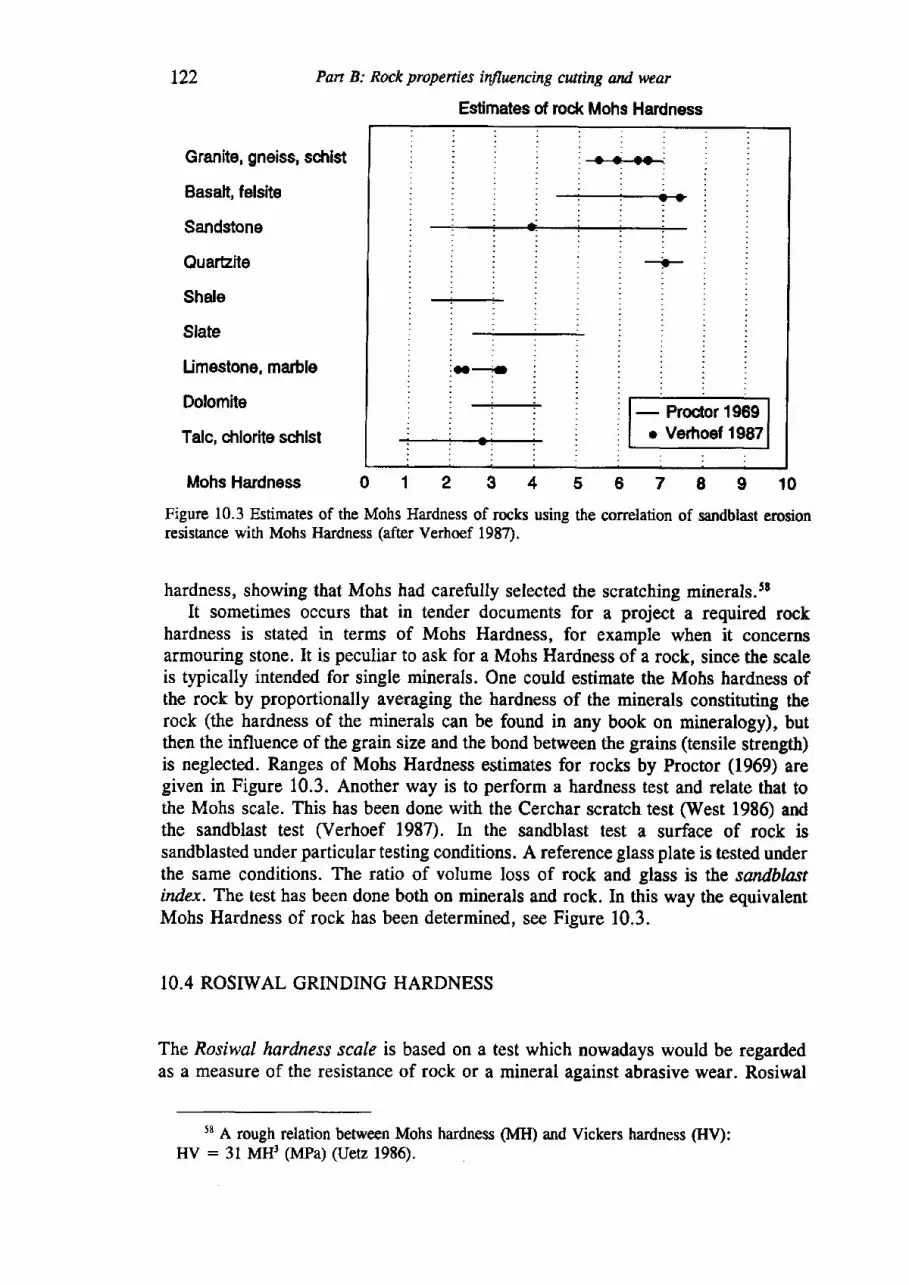
122 Pan B: Rock propeniu inflaencing cutting and wear
Estimates of rock Mohs Hardness
-{f.-.tH(li
-o-
:
-l'
- Proctor 1969r Verhoef 1987
MohsHardness 0 1 2 3 4 5 6 7 8 9 i0
Figure 10.3 Estimates of the Mohs Hardness of rocks using the correlation of sandblast erosionresistance with Mohs Hardness (after Verhoef 1987).
hardness, showing that Mohs had carefully selected the scratching minerals.sEIt sometimes occurs that in tender documents for a project a required rock
hardness is stated in terms of Mohs Hardness, for example when it concernsarmouring stone. It is peculiar to ask for a Mohs Hardness of a rock, since the scaleis typically intended for single minerals. One could estimate the Mohs hardness ofthe rock by proportionally averaging the hardness of the minerals constituting therock (the hardness of the minerals can be found in any book on mineralogy), butthen the influence of the grain size and the bond between the grains (tensile strength)is neglected. Ranges of Mohs Hardness estimates for rocks by Proctor (1969) aregiven in Figure 10.3. Another way is to perform a hardness test and relate that tothe Mohs scale. This has been done with the Cerchar scratch test (West 1986) andthe sandblast test (Verhoef 1987). In the sandblast test a surface of rock issandblasted under particular testing conditions. A reference glass plate is tested underthe same conditions. The ratio of volume loss of rock and glass is the sandblastindex. The test has been done both on minerals and rock. In this way the equivalentMohs Hardness of rock has been determined, see Figure 10.3.
10.4 ROSTWAL GRINDING HARDNESS
The Rosiwal hardness scale is based on a test which nowadays would be regardedas a measure of the resistance of rock or a mineral against abrasive wear. Rosiwal
58 A rough relation betrveen Mohs hardness (MH) and Vickers hardness (HV):HV : 3l MH3 (MPa) (Uetz 1986).
Granite, gneiss, scfrist
Basalt, felsite
Sandstone
QuarEite
Shale
Slate
Limestone, marble
Dolomite
Talc, chloritE scfilst
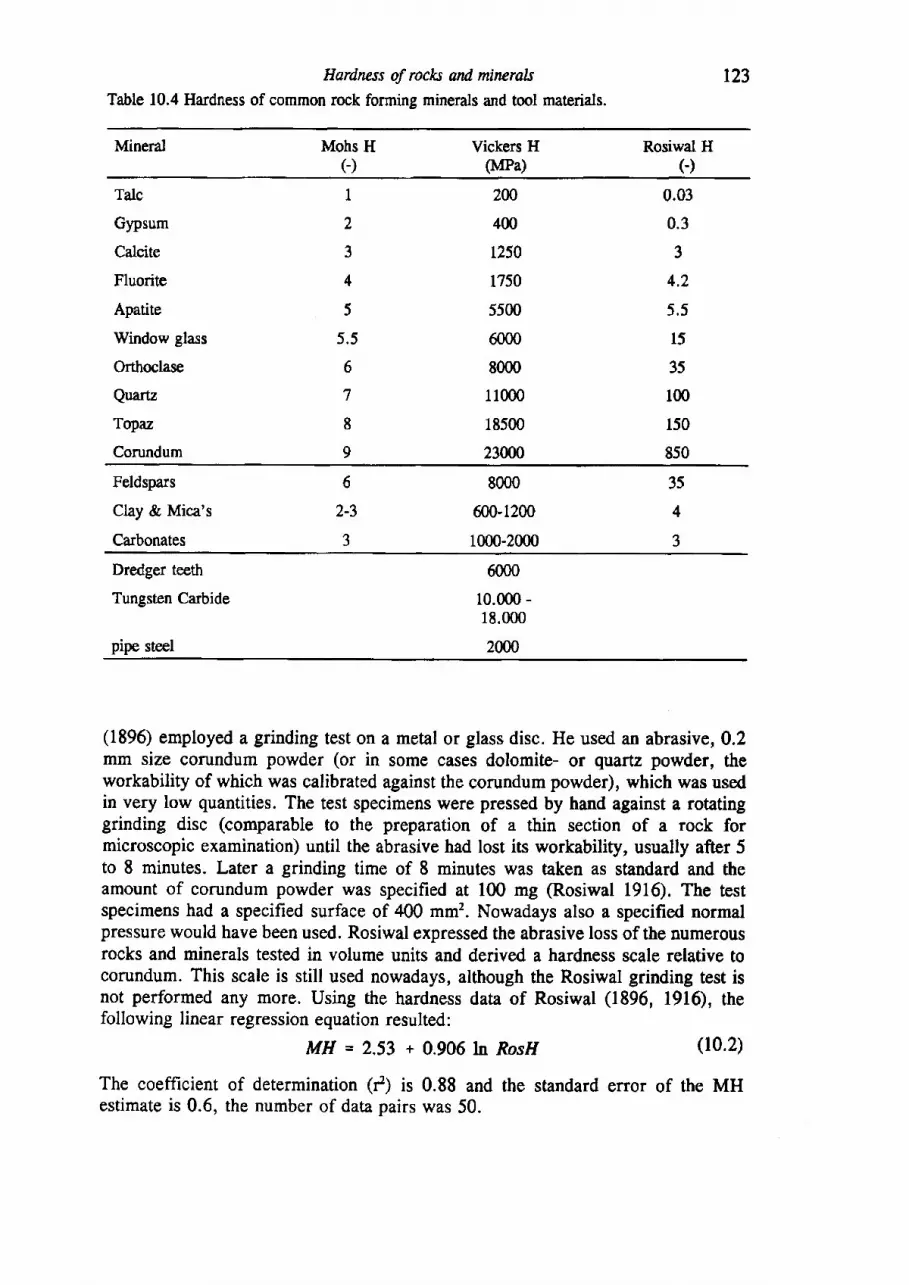
Ilardrwss of rocks and mincralsTable 10.4 Hardness of common rock forming minerals and tool mat€rids.
r23
Mineral Mohs Hc)
Vickers H(MPa)
Rosiwal HG)
Talc
6ypsum
Calcite
Fluorite
Apatite
Window glass
Orthoctase
Quartz
Topaz
Conrndum
I
2
3
4
5
5.5
6
7
8
9
240
400
1250
1750
5500
6000
8000
11000
18500
23000
0.03
0.3
3
4.2
5 .5
l5
35
100
150
8s0
Feldspars
Clay & Mica's
Carbonates
6
2-3
3
8000
600-1200
1000-2000
3s4
3
Dredger teeth
Tungsten Carbide
pipe steel
6000
10.000 -18.000
2W0
(1896) employed a grinding test on a metal or glass disc. He used an abrasive, 0.2mm size corundum powder (or in some cases dolomite- or quartz powder, theworkability of which was calibrated against the corundum powder), which was usedin very low quantities. The test specimens were pressed by hand against a rotatinggrinding disc (comparable to the preparation of a thin section of a rock formicroscopic examination) until the abrasive had lost its workability, usually after 5to 8 minutes. Later a grinding time of I minutes was taken as skndard and theamount of corundum powder was specified at 100 mg (Rosiwal 1916). The testspecimens had a specified surface of 400 mm2. Nowadays also a specified normalpressure would have been used. Rosiwal expressed the abrasive loss of the numerousrocks and minerals tested in volume units and derived a hardness scale relative tocorundum. This scale is still used nowadays, although the Rosiwal grinding test isnot performed any more. Using the hardness data of Rosiwal (1896, 1916), thefollowing linear regression equation resulted:
MH = 2.53 + 0.906 ln r1osl/ (10.2)
The coefficient of determination (t') is 0.88 and the standard error of the MHestimate is 0.6, the number of data pairs was 50.
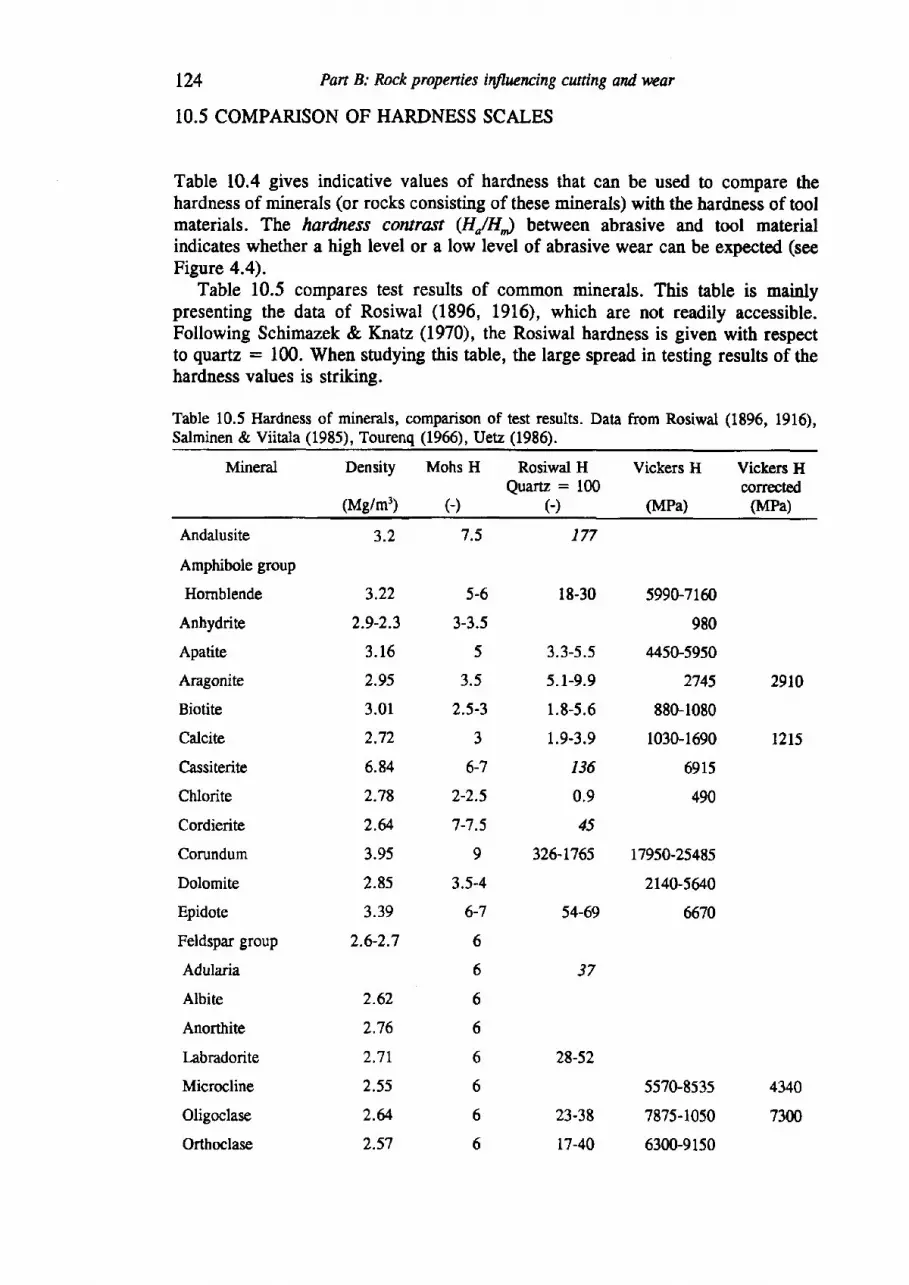
I24 Pan B: Rock propenies intluencing cutting and wear
10.5 COMPARISON OF HARDNESS SCALES
Table 10.4 gives indicative values of hardness that can be used to compare thehardness of minerals (or rocks consisting of these minerals) with the hardness of toolmaterials. The hardness contrcnt (H/H) between abrasive and tool materialindicates whether a high level or a low level of abrasive wear can be expected (seeFigure 4.4).
Table 10.5 compares test results of common minerals. This table is mainlypresenting the data of Rosiwal (1896, 1916), which are not readily accessible.Following Schimazek & Knatz (1970), the Rosiwal hardness is given with respectto quartz : 100. When studying this kble, the large spread in testing results of thehardness values is striking.
Table 10.5 Hardness of minerals, comparison of test results. Data from Rosiwal (1896, 1916),Salminen & Viitala (1985), Tourenq (1966), Uetz (1986).
Mineral Density Mohs H Rosiwal H Vickers H Vickers HQuartz : 100 corrected
(Mg/m3) C) G) (MPa) MPa)
Andalusite
Amphibole group
Hornblende
Anhydrite
Apatite
Aragonite
Biotite
Calcite
Cassiterite
Chlorite
Cordierite
Conrndum
Dolomite
Epidote
Feldspar group
Adularia
Albite
Anorthite
labradorite
Microcline
Oligoclase
Orthoclase
177
r8-30
3.3-5.55.1-9.9
1.8-5.6
1.9-3.9
r36
0.9
45
326-1765
54-69
37
5990-7160
980
4450-5950
2745
88G1080
1030-r690
6915
490
r7950-25485
2140-5640
6670
3.2
3.22
2.9-2.3
3 .16
2.95
3.0r
2.72
6.84
2.78
2.64
3.95
2.8s
3.39
2.G2.7
2.62
2.76
2.71
2.5s
2.64
2.57
7.5
5-6
3-3.5
5
3.5
2.5-3
3
6-7
2-2.5
7-7.5
9
3.5-4
6-7
6
6
6
6
6
6
6
6
28-52
23-38
17-40
557G,853s
7875-1050
630G9150
2910
1215
4340
7300
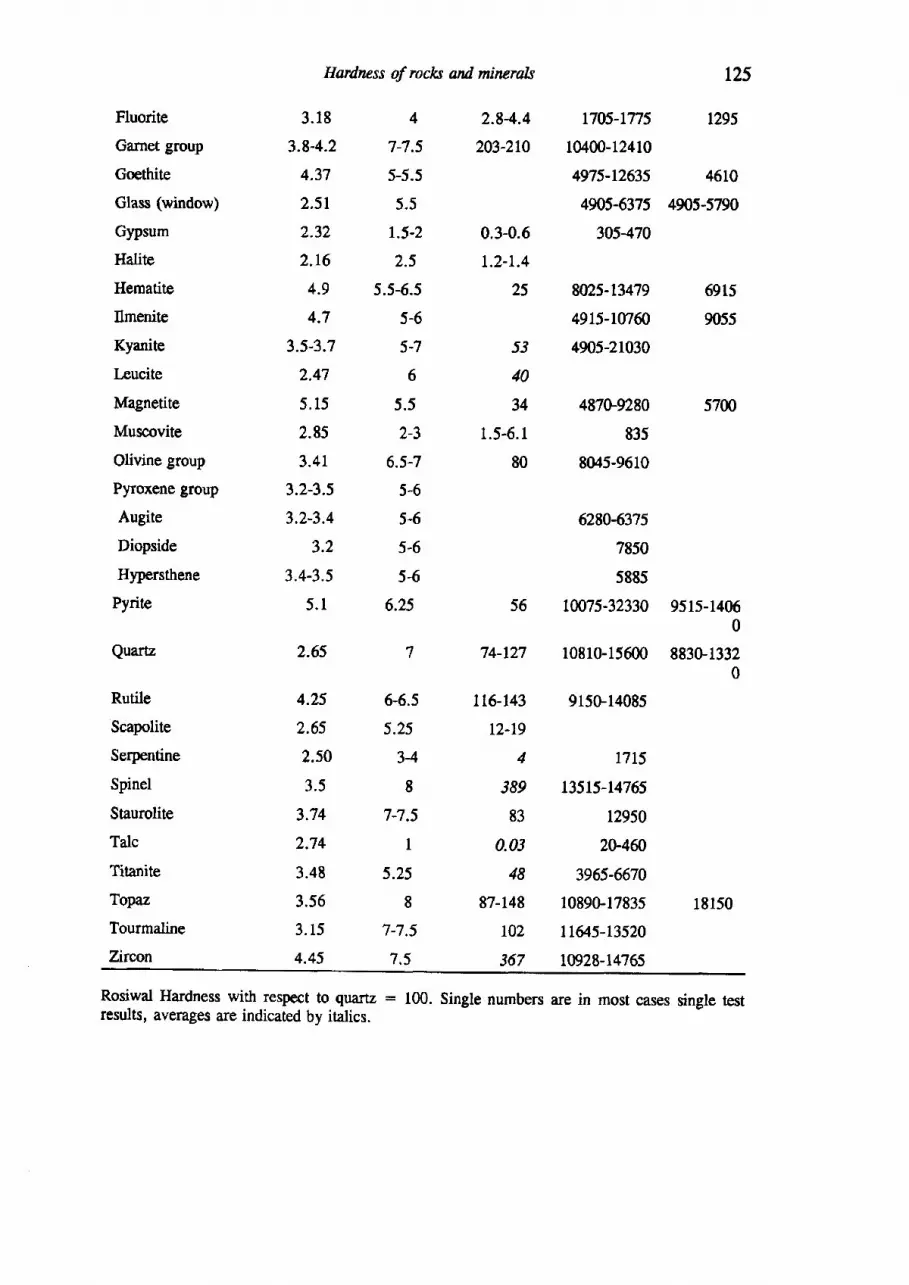
Fluorite
Garnet group
Goethite
Glass (window)
Gypsum
Halite
Hematite
Ilmenite
Kyanite
Leucite
Magnetite
Muscovite
Olivine group
Pyroxene group
Augite
Diopside
Hypersthene
Pyrite
Quartz
Rutile
Scapolite
Serpentine
Spinel
Staurolite
TaIc
Titanite
Topaz
Tourmaline
Zircan
4
7-7.5
5-5.5
5.5
r.5-2
2.55.5-6.5
5-6
5-7
6
5.5
2-3
6.5-7
5-6
5-6
5-6
5-6
6.25
7
4.25 6-6.5
2.55 5.2s2.s0 343.5 I
3.74 7-7.5
2.74 I
3.4E 5.25
3.56 8
3.15 7-7.5
4.45 7.5
1705-tn5
10400-12410
4n5-12635
4905-6375
305470
8025-134?9
49r5-rutffi
4905-21030
487V9?,80
835
8045-9610
6280-6375
7850
5885
tffi75-32330
t25
t295
4610
4905-5790
6915
9055
Hardrcss of rocles and mircrals
3 .18
3.8-4.2
4.37
2.51
2.32
2 .16
4.9
4.7
3.5-3.7
2.47
5 ,15
2.85
3.41
1.2-3.5
3.2-3.4
3.2
3.4-3.5
5 .1
2.65
2.84.4
203-210
0.3-0.6
t.2-1.4
25
53
40
34
1.5-6.1
80
56
74-127
ttGl43
12-19
4
389
83
0.03
48
87-148
102
367
5700
9515-14060
10810-15600 883G13320
915G.14085
1715
13515-14765
12950
20-4ffi
3965-6670
1089G17835 18150
tL&5-13570
10928-14?65
Rosiwal Hardness with respect to quar:tz : 100. Single numbers are in most cases single testresults, averages are indicated by italics.
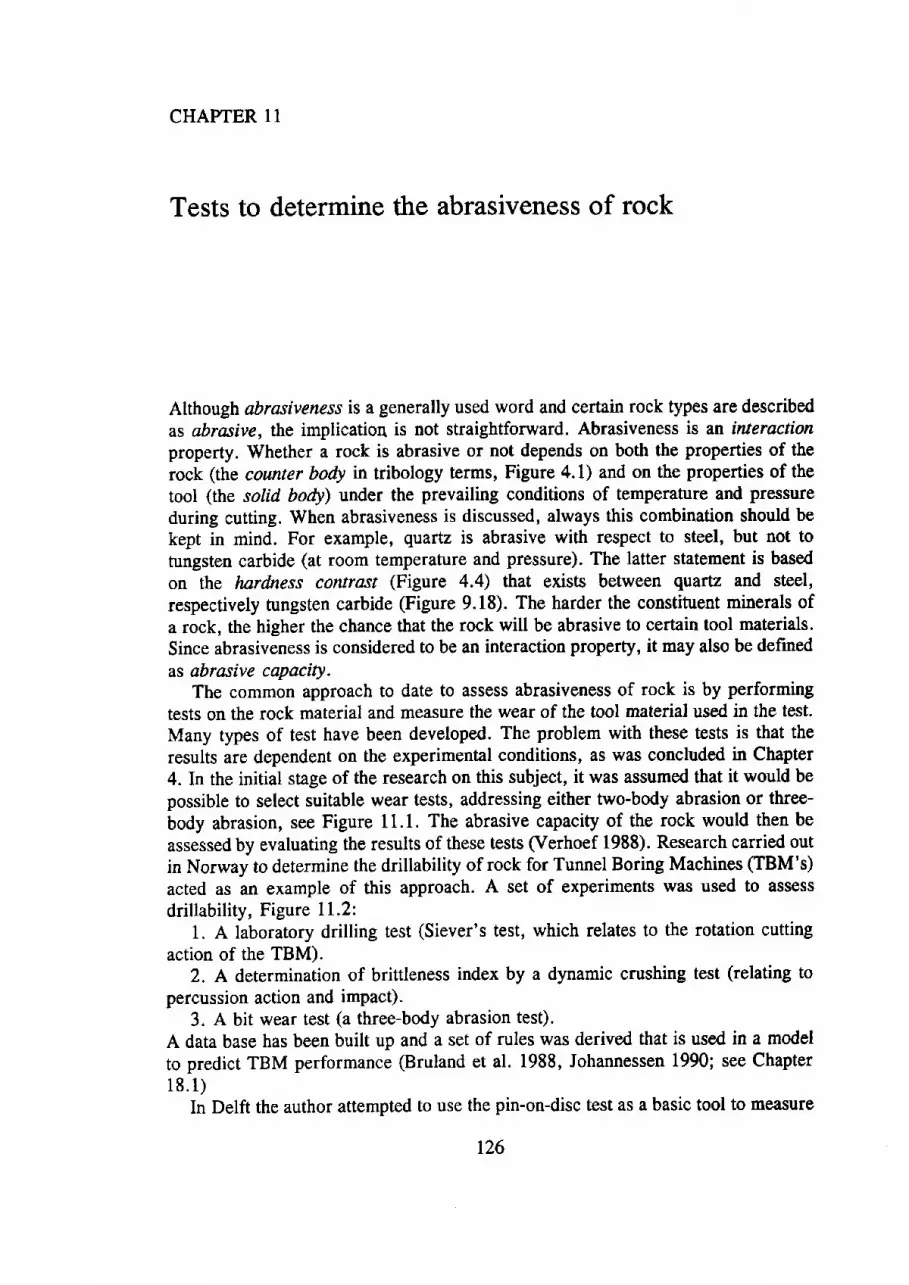
CHAPTER 11
Tests to determine the abrasiveness of rock
Although abrasiveness is a generally used word and certain rock types are describedas abrasive, the implicatioq is not straightforward. Abrasiveness is an interactionproperfy. Whether a rock is abrasive or not depends on both the properties of therock (the cowter body in tribology terms, Figure 4.1) and on the properties of thetool (the soltd body) under the prevailing conditions of temperature and pressureduring cutting. When abrasiveness is discussed, always this combination should bekept in mind. For example, quartz is abrasive with respect to steel, but not totungsten carbide (at room temperature and pressure). The latter statement is basedon the hardness controst (Figure 4.4) that exists between quartz and steel,respectively tungsten carbide (Figure 9.18). The harder the constituent minerals ofa rock, the higher the chance that the rock will be abrasive to certain tool malerials.Since abrasiveness is considered to be an interaction property, it may also be definedas abrasive capacity.
The common approach to date to assess abrasiveness of rock is by performingtests on the rock material and measure the wear of the tool material used in the test.Many rypes of test have been developed. The problem with these tests is that theresults are dependent on the experimental conditions, as was concluded in Chapter4. In the initial stage of the research on this subject, it was assumed that it would bepossible to select suitable wear tests, addressing either two-body abrasion or three-body abrasion, see Figure 11.1. The abrasive capacity of the rock would then beassessed by evaluating the results of these tests (Verhoef 1988). Research carried outin Norway to determine the drillability of rock for Tunnel Boring Machines (IBM's)
acted as an example of this approach. A set of experiments was used to assessdrillability, Figure 1 1.2:
1. A laboratory drilling test (Siever's test, which relates to the rotation cuttingaction of the TBM).
2. A determination of brittleness index by a dynamic crushing test (relating topercussion action and impact).
3. A bit wear test (a three-body abrasion test).A data base has been built up and a set of rules was derived that is used in a modelto predict TBM performance (Bruland et al. 1988, Johannessen 1990; see Chapter18 .1 )
In Delft the author attempted to use the pin-on-disc test as a basic tool to measure
126
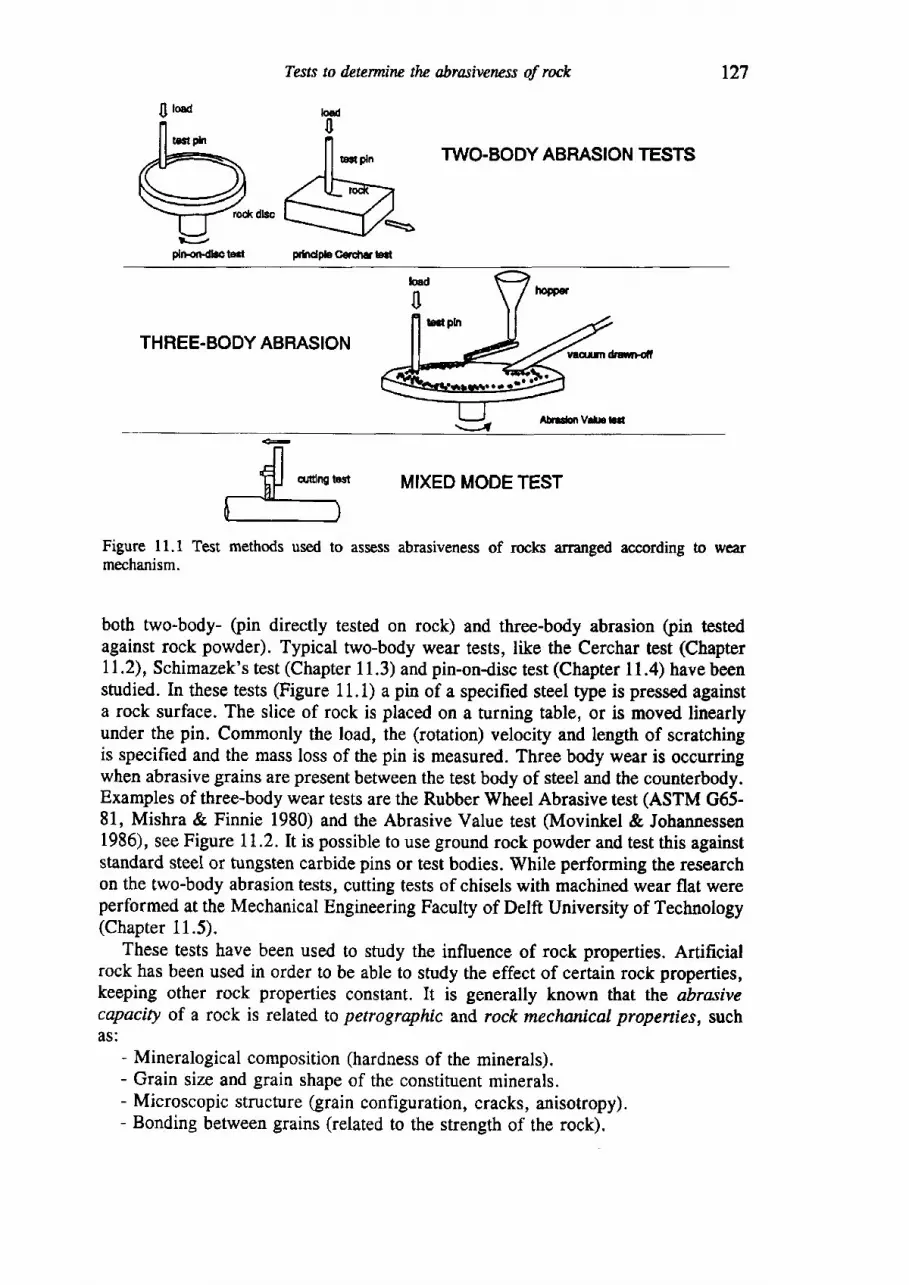
0loud
pfu}on-daotEat
Tests to determinc tlrc abrasivetuss of rock
TWO-BODY ABRASION TESTS
127
pdndpbC€rdlfBil
THREE.BODY ABRASION
MIXED MODE TEST
Figure 11.1 Test methods used to assess abrasiveness of rocls arranged according to wearmechanism.
both two-body- (pin directly tested on rock) and three-body abrasion (pin testedagainst rock powder). Typical two-body wear tests, like the Cerchar test (Chapter11.2), Schimazek's test (Chapter 1 1.3) and pin-ondisc test (Chapter 11 .4) have beenstudied. In these tests (Figure 11.1) a pin of a specified steel type is pressed againsta rock surface. The slice of rock is placed on a turning table, or is moved linearlyunder the pin. Commonly the load, the (rotation) velocity and length of scratchingis specified and the mass loss of the pin is measured. Three body wear is occurringwhen abrasive grains are present between the test body of steel and the counterbody.Examples of three-body wear tests are the Rubber Wheel Abrasive test (ASTM G65-81, Mishra & Finnie 1980) and the Abrasive Value test (Movinkel & Johannessen1986), see Figure 11.2. It is possible to use ground rock powder and test this againststandard steel or tungsten carbide pins or test bodies. While performing the researchon the two-body abrasion tests, cutting tests of chisels with machined wear flat wereperformed at the Mechanical Engineering Faculty of Delft University of Technology(Chapter 11.5).
These tests have been used to study the influence of rock properties. Artificialrock has been used in order to be able to study the effect of certain rock properties,keeping other rock properties constant. It is generally known that the abrasivecapacity of a rock is related to petrographic and rock mechanical properfies, suchas:
- Mineralogical composition (hardness of the minerals).- Grain size and grain shape of the constituent minerals.- Microscopic structure (grain configuration, cracks, anisotropy).- Bonding between grains (related to the strength of the rock).
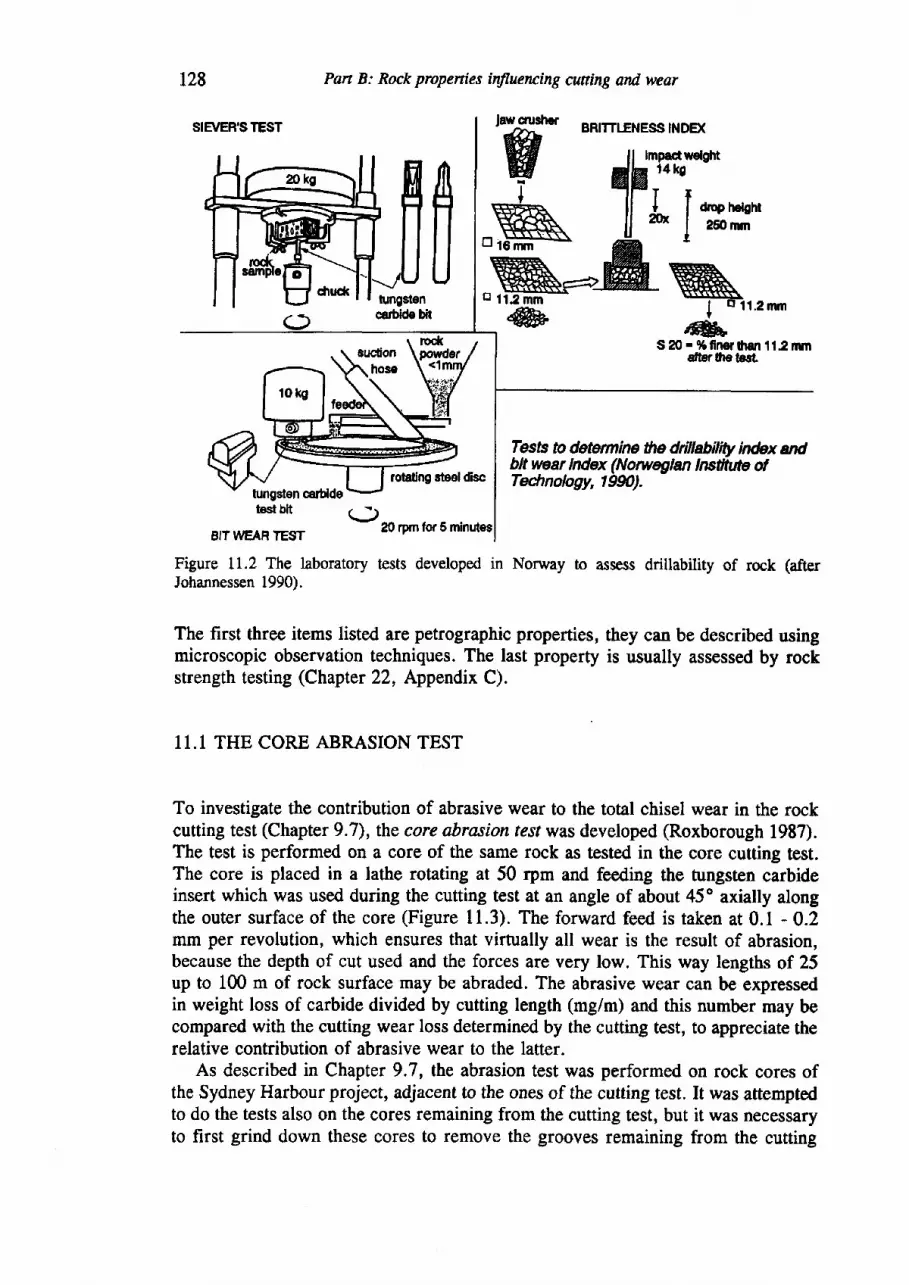
t28
SIE\/ER'STEST
Pan B: Rock propenies ffiuencing cutting and wear
BRITTLENESS INDD(
'@S 20. %fimrfian 1t2 nnt
dtsr0|€ to.rl.
tungsten carbldetost bit
Iesfs to determine the drillability in&x andbltwear lndex (Norueglan lnstlMe ofTedrnologty, tgW).
BIT WEAR TESTOrorprnforE
Figure 11.2 The laboratory tests developed in Norway to assess drillability of rock (afterJohannessen 1990).
The first three items listed are petrographic properties, they can be described usingmicroscopic observation techniques. The last property is usually assessed by rockstrength testing (Chapter 22, Appendix C).
11.1 THE CORE ABRASION TEST
To investigate the contribution of abrasive wear to the total chisel wear in the rockcutting test (Chapter 9.7), the core abrasion te,rt was developed (Roxborough 1987).The test is performed on a core of the same rock as tested in the core cutting test.The core is placed in a lathe rotating at 50 rpm and feeding the tungsten carbideinsert which was used during the cutting test at an angle of about 45o axially alongthe outer surface of the core (Figure 11.3). The forward feed is taken at 0.1 - 0.2mm per revolution, which ensures that virtually all wear is the result of abrasion,because the depth of cut used and the forces are very low. This way lengtbs of 25up to 100 m of rock surface may be abraded. The abrasive wear can be expressedin weight loss of carbide divided by cutting length (mgim) and this number may becompared with the cutting wear loss determined by the cutting test, to appreciate therelative contribution of abrasive wear to the latter.
As described in Chapter 9.7, the abrasion test was performed on rock cores ofthe Sydney Harbour project, adjacent to the ones of the cutting test. It was attemptedto do the tests also on the cores remaining from the cutting test, but it was necessaryto first grind down these cores to remove the grooves remaining from the cutting
tool holder
Figure 11.3 Test arrangement of the core abrasion test.
Tests to determinc the obrasivencss of rock t29
test. Generally the cores did not survive this procedure. Carbide test bits used forthe cutting test were taken for the abrasion test. The minor wear that resulted fromthe cutting test compared to that of the abrasion test made this allowable. The resultsof the tests are summarized in Table 9.3 & 9.4. In examining the cutting andabrasive wear values, one should rcalize that the density of tungsten carbide is abouttwice as high as that of steel (14.59 versus 7.85 Mglm3). The difference in wear dueto the use of another tool material can be seen if volume loss per cutting length iscompared for the steel and carbide bits. Therefore in Table 9.4 the rates of volumeloss are also given. The wear rate of the steel bits that occurred during the cuttingtest was about 2.4 times higher and during the abrasion test about 38 times highercompared to the tungsten carbide bits. This clearly illustrates the role of the toolmaterial and the actual wear mechanism operating. Table 9.4 also shows that themagnitude of the forces and specific energy measured on the same rock is aboutidentical when different tool materials are used, despite the difference in wear rate.The cutting forces measured using the steel inserts are somewhat higher, which canbe attributed to an increased size of the wear flat of the chisel (blunting of the tool).
During the execution of the core abrasion test, the feeding was carried out byhand. This is an unsatisfactory procedure, as the experiments reported by Deketh(1995) show that at low values of feed changes of wear mechanism (from adhesiveto abrasive) may rapidly occur (Chapter 12).
11.2 THE CERCHAR SCRATCH TEST
The Cerchar test was developed by the French coal mining research instituteCERCHAR (Centre d'6tudes et recherches des charbonnages de France). It wasmeant to give a measure of the abrasiveness of rock. The test was not meant todetermine rock hardness (in the sense of strength), for this purpose another testdetermining the penetration rate of an indenter in rock was used.se The test hasbeen used extensively both in the coal mining industry and in the tunnelling industry.
5e The hardness test and the abrasiveness test were used to examine the workabiliry of therocks with respect to machine excavation (CERCHAR brochure, l9B0).
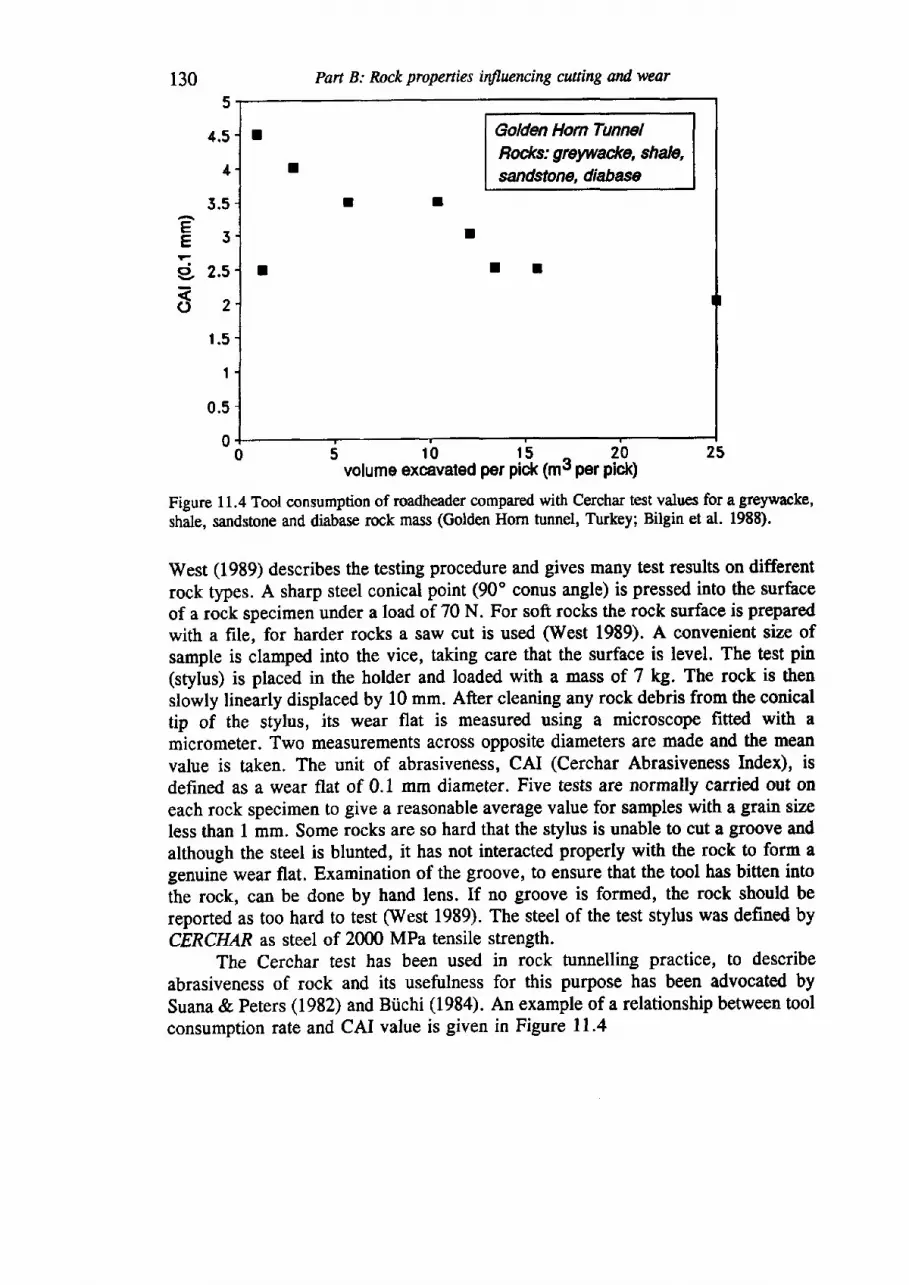
r30
3.5
Part B: Rock propenies influencing cutting and wear
I Golden Hom TunnelRodcs: grewade, shale,sandstone, diabaseI
I I
I
I T I
eE J
I 2.s=o2
r .5
1
0.5
0- 0 5 10 15 ^ 20 25
volume excavated per pic* (mo per pick)
Figure 11.4 Tool consumption of roadheader compared with Cerchar test values for a greywacke,shale, sandstone and diabase rock mass (Golden Horn tunnel, Turkey; Bilgin et at. 1988).
West (1989) describes the testing procedure and gives many test results on differentrock types. A sharp steel conical point (90o conus angle) is pressed into the surfaceof a rock specimen under a load of 70 N. For soft rocks the rock surface is preparedwith a file, for harder rocks a saw cut is used (West 1989). A convenient size ofsample is clamped into the vice, taking care that the surface is level. The test pin(stylus) is placed in the holder and loaded with a mass of
'l ke.The rock is thenslowly linearly displaced by 10 mm. After cleaning any rock debris from the conicaltip of the stylus, its wear flat is measured using a microscope fitted with amicrometer. Two measurements across opposite diameters are made and the meanvalue is taken. The unit of abrasiveness, CAI (Cerchar Abrasiveuess Index), isdefined as a wear flat of 0.1 mm diameter. Five tests ar€ normally carried out oneach rock specimen to give a reasonable average value for samples with a grain sizeless than L mm. Some rocks are so hard that the stylus is unable to cut a groove andalthough the steel is blunted, it has not interacted properly with the rock to form agenuine wear flat. Examination of the groove, to ensure that the tool has bitten intothe rock, can be done by hand lens. If no groove is formed, the rock should bereported as too hard to test (West 1989). The steel of the test stylus was defined byCERCHAR as steel of 2000 MPa tensile strength.
The Cerchar test has been used in rock tunnelling practice, to describeabrasiveness of rock and its usefulness for this purpose has been advocated bySuana & Peters (1982) and Bi,ichi (1984). An example of a relationship between toolconsumption rate and CAI value is given in Figure 11.4
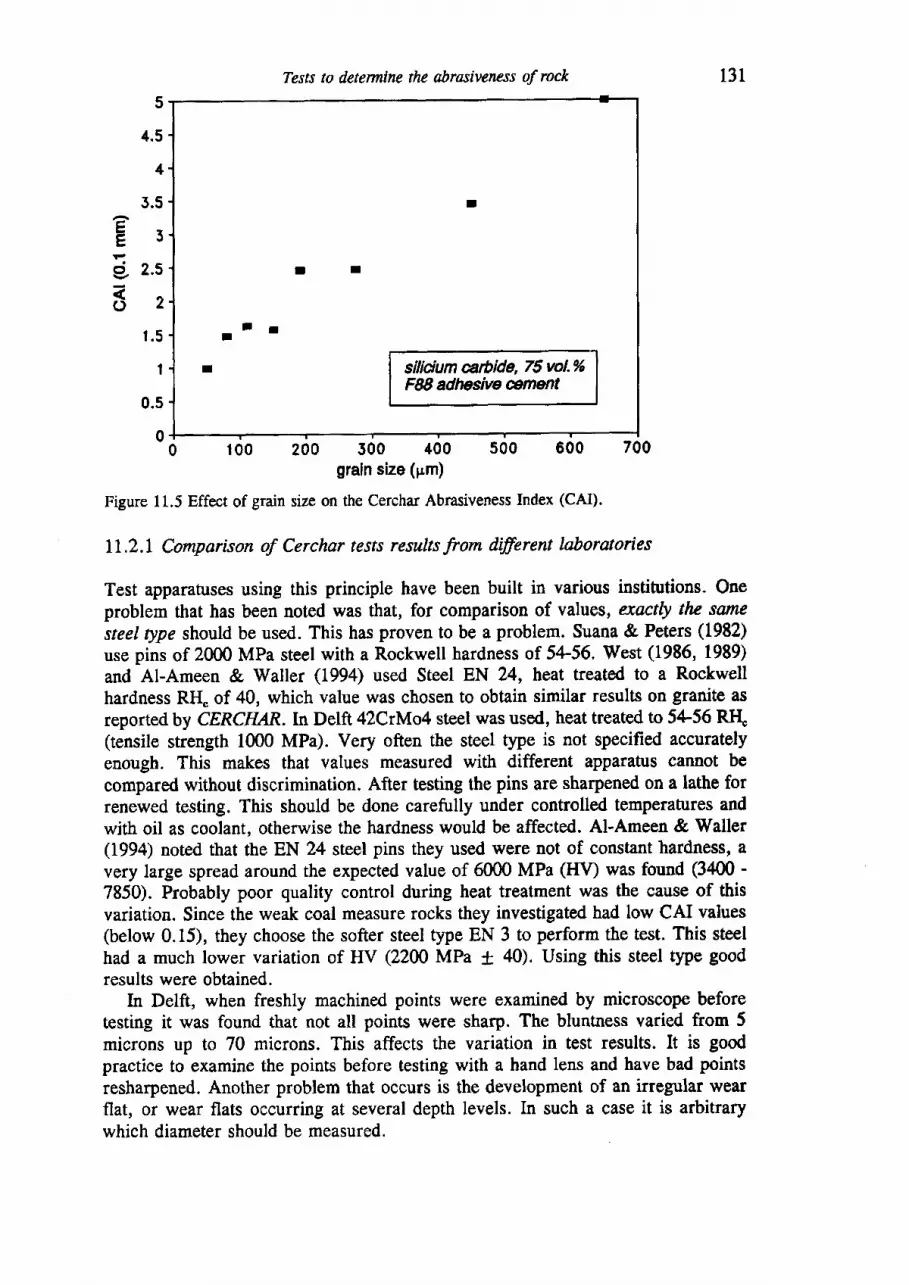
4.5
5.5
EJEi 2.5
( J ) z
r .5
I
0.5
0
Tests to determinc the abrasiveness of rock
t t I
silicium arbide, 75 wl.%FN adhesive @ment
131
- o loo 200 500 400 500 600 700
grain size (pm)
Figure 11.5 Effect of grain size on the Cerchar Abrasiveness Index (CAI).
11.2.L Comparison of Cerchar tests results Iro* dffirent laboratories
Test apparatuses using this principle have been built in various institutions. Oneproblem that has been noted was that, for comparison of values, exactly the sarnesteel type should be used. This has proven to be a problem. Suana & Peters (1982)use pins of 2000 MPa steel with a Rockwell hardness of 54-56. West (1986, 1989)and Al,Ameen & Waller (1994) used Steel EN 24, heat treated to a Rockwellhardness RH" of 40, which value was chosen to obtain similar results on granite asreported by CERCHAR In Detft 42CrMo4 steel was used, heat treated to 5456 RH"(tensile strength 1000 MPa). Very often the steel type is not specified accuratelyenough. This makes that values measured with different apparatus cannot becompared without discrimination. After testing the pins are sharpened on a lathe forrenewed testing. This should be done carefully under controlled temperatures andwith oil as coolant, otherwise the hardness would be affected. Al-Ameen & Waller(1994) noted that the EN 24 steel pins they used were not of constant hardness, avery large spread around the expected value of 6000 MPa (HV) was found (3400 -
7850). Probably poor quality control during heat treatment was the cause of thisvariation. Since the weak coal measure rocks they investigated had low CAI values(below 0.15), they choose the softer steel type EN 3 to perform the test. This steelhad a much lower variation of HV (22W MPa * 40). Using this steel type goodresults were obtained.
In Delft, when freshly machined points were examined by microscope beforetesting it was found that not all points were sharp. The bluntness varied from 5microns up to 70 microns. This affects the variation in test results. It is goodpractice to examine the points before testing with a hand lens and have bad pointsresharpened. Another problem that occurs is the development of an irregular wearflat, or wear flats occurring at several depth levels. In such a case it is arbitrarywhich diameter should be measured.
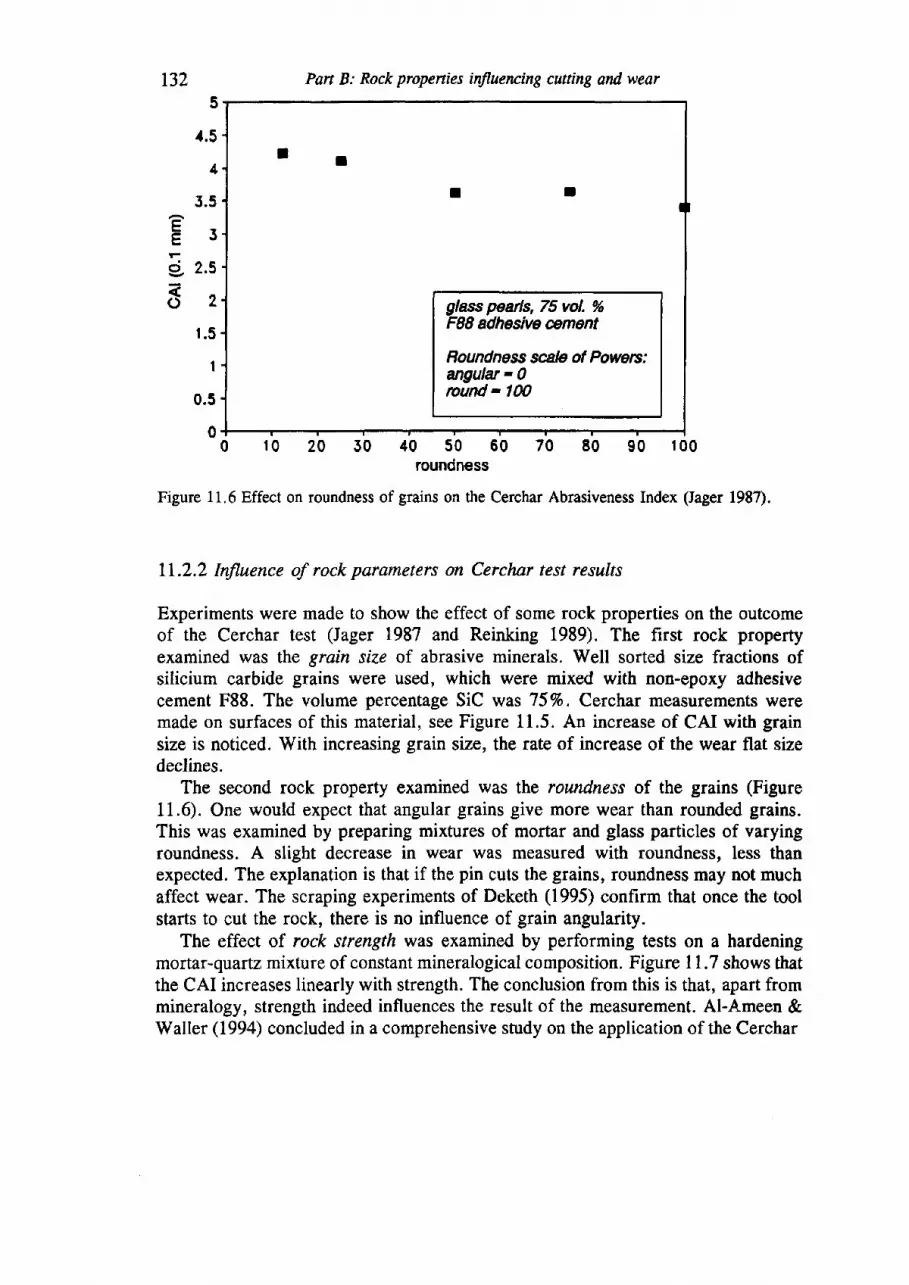
r32 Part B: Rock properties influencing cutting and wear
I I
I I
glass pearls,75 vol. o/oF88 adhesive oement
Boundness scale of Powerc:angulat - 0round - 100
0 10 20 50 40 50 60 70 E0 90 100roundness
Figure 11.6 Effect on roundness of grains on the Cerchar Abrasiveness Index (Jager 1984.
11.2.2 InJluence of rock paranTeters on Cerchar test results
Experiments were made to show the effect of some rock properties on the outcomeof the Cerchar test (Jager 1987 and Reinking 1989). The first rock propertyexamined was the grain size of abrasive minerals. Well sorted size fractions ofsilicium carbide grains were used, which were mixed with non-epoxy adhesivecement F88. The volume percentage SiC was 75Vo. Cerchar measurements weremade on surfaces of this material, see Figure 11.5. An increase of CAI with grainsize is noticed. With increasing grain size, the rate of increase of the wear flat sizedeclines.
The second rock property examined was the roundness of the grains (Figure11.6). One would expect that angular grains give more wear than rounded grains.This was examined by preparing mixtures of mortar and glass particles of varyingroundness. A slight decrease in wear was measured with roundness, less thanexpected. The explanation is that if the pin cuts the grains, roundness may not muchaffect wear. The scraping experiments of Deketh (1995) confirm that once the toolstarts to cut the rock, there is no influence of grain angularity.
The effect of. rock strength was examined by performing tests on a hardeningmortar-quartz mixfure of constant mineralogical composition. Figure ll.7 shows thatthe CAI increases linearly with strength. The conclusion from this is that, apart frommineralogy, strength indeed influences the result of the measurement. Al-Ameen &Waller (1994) concluded in a comprehensive study on the application of the Cerchar
4.5
3.5eE3
E r.td2
1 .5
1
0.5
0
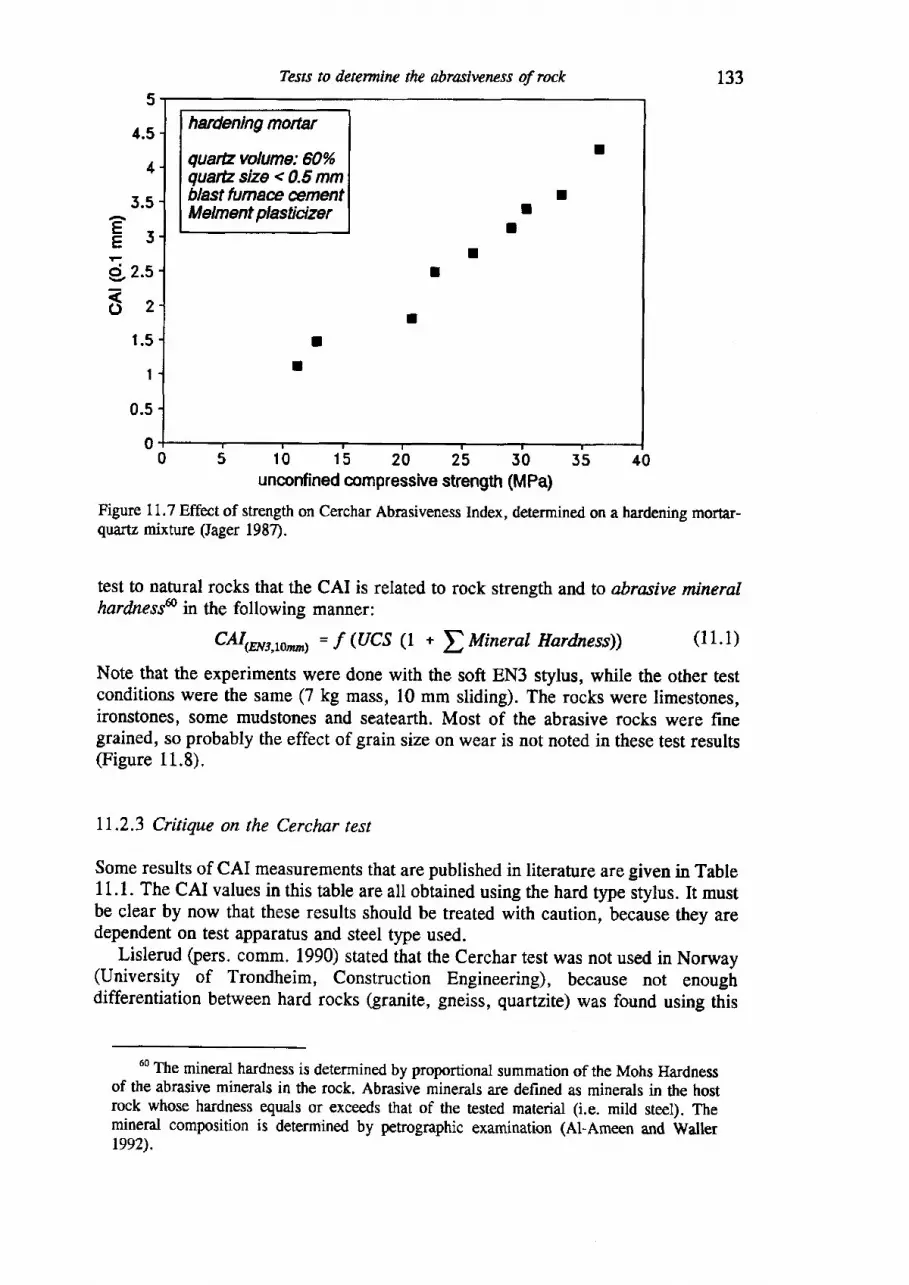
133Tests to dctermiw the abrasivencss of rock
hardening mortar
quat?volume:60%quarE size < 0.5 mmblals,t fumae ementMelment plasticizer
t
II
I
tT
I
!
I
0 5 10 15 20 25 50 35 40unconfined compressive strength (MPa)
Figure 11.7 Effect of strength on Cerchar Abrasiveness Index, determined on a hardening mortar-quartz mixture (Iager 1987).
test to natural rocks that the CAI is related to rock strength and to abrasive mineralhardttess& in the following manner:
Cilr*r,ro,*r1 =f (lCS (1 *tMineralHardness)) (1 1 .1)
Note that the experiments were done with the soft EN3 stylus, while the other testconditions were the same (7 kg mass, 10 mm sliding). The rocks were limestones,ironstones, some mudstones and seatearth. Most of the abrasive rocks were finegrained, so probably the effect of grain size on wear is not noted in these test results(Figure 11.8).
1I.2.3 Critique on the Cerchar test
Some results of CAI measurements that are published in literature are given in TableI 1.1. The CAI values in this table are all obtained using the hard tlpe stylus. It mustbe clear by now that these results should be treated with caution, because they aredependent on test apparatus and steel type used.
Lislerud (pers. comm. 1990) stated that the Cerchar test was not used in Norway(University of Trondheim, Construction Engineering), because not enoughdifferentiation between hard rocks (granite, gneiss, quartzite) was found using this
o0 The mineral hardness is determined by proportional summation of the Mohs Hardnessof the abrasive minerals in the rock. Abrasive minerals are defined as minerals in the hostrock whose hardness equals or exceeds that of the tested material (i.e. mild steel). Themineral composition is determined by petrographic examination (Al-Ameen and Waller1992).
,1.5
4
3.5
Essi 2.s
8zt .5
I
0.5
0
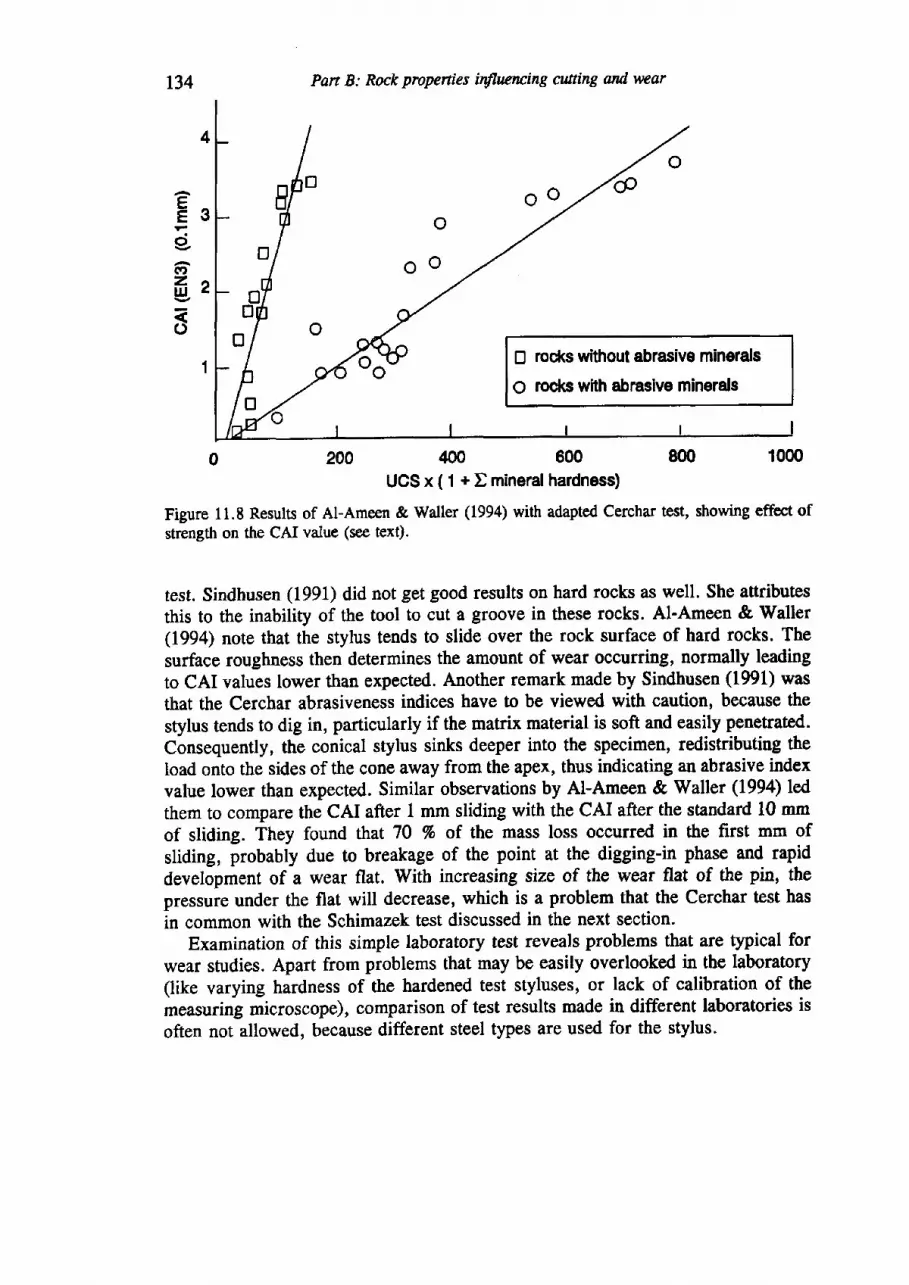
Part B: Rock properties itflucncing cwting and wear
E rocks without abrasive minorals
O rccks with abrasive minerals
200 600 800 1000UCS x ( 1 + E mineral hardness)
Figure 11.8 Results of AI-Ameen & Waller (1994) with adapted Cerchar test, showing effect ofstrength on the CAI value (see tex$.
test. Sindhusen (1991) did not get good results on hard rocks as well. She attributesthis to the inability of the tool to cut a groove in these rocks. Al-Ameen & Slaller(1994) note that the stylus tends to slide over the rock surface of hard rocks. Thesurface roughness then determines the amount of wear occurring, normally leadingto CAI values lower than expected. Another remark made by Sindhusen (1991) wasthat the Cerchar abrasiveness indices have to be viewed with caution, because the
stylus tends to dig in, particularly if the matrix material is soft and easily penetrated.
Consequently, the conical stylus sinks deeper into the specimen, redistributing theload onto the sides of the cone away from the apex, thus indicating an abrasive indexvalue lower than expected. Similar observations by Al-Ameen & Waller (1994) ledthem to compare the CAI after 1 mm sliding with the CAI after the standard l0 mmof sliding. They found that 70 % of the mass loss occurred in the first mm of
sliding, probably due to breakage of the point at the digging-in phase and rapiddevelopment of a wear flat. With increasing size of the wear flat of the pin, thepressure under the flat will decrease, which is a problem that the Cerchar test hasin common with the Schimazek test discussed in the next section.
Examination of this simple laboratory test reveals problems that are typical forwear studies. Apart from problems that may be easily overlooked in the laboratory(like varying hardness of the hardened test styluses, or lack of calibration of the
measuring microscope), comparison of test results made in different laboratories is
often not allowed, because different steel types are used for the stylus.
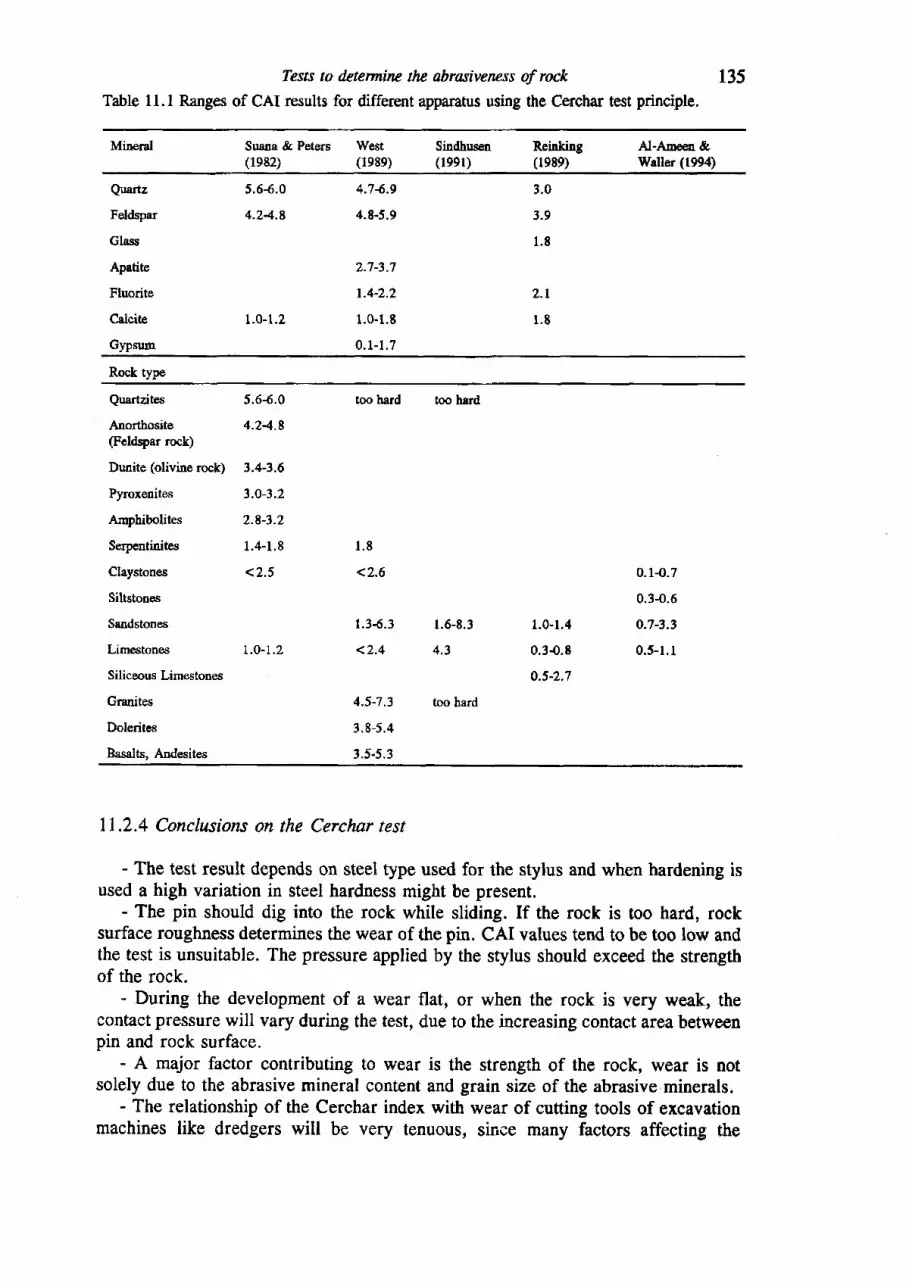
Tests to dcterminz the abrasivercss of rock 135Table 11.1 Ranges of CAI results for different apparatus using the Cerchar test principle.
Mineral Suana & Peters West Sindhusen R6inkinS Al-Arnoen &(1982) (1e89) (1991) (1989) rffailer (1994)
auartz 5.6{.0 4.74.9 3.0
Fefdspar 4-24-8 4.8-5.9 3.9
class 1.8
Apatite 2.7-3-7
Fluorite 1.4-2.2 2-I
Calcite 1.0-1.2 1.G1.8 l.E
Gypzum 0.1-1.7
Rock type
Quartzites 5.6{.0 too hard too herd
Anorthosite 4.24.8(Fetdspar rock)
Dunite (olivine rock) 3.4-3.6
Pyroxouites 3.0-3.2
Arnphibolites 2.8-3.2
Serpentinites 1.4-1.8 1.8
Claystones <2.5 <2.6 0.14.7
Siltstones 0.34.6
Sandstones 1.34.3 1.6-8.3 1.0-1,4 0-7-3.3
Limestones LO-L.2 <2.4 4.3 0.3{.8 0.5-1.1
Siliceous Limestones 0.5-2.7
Granites 4.5-7.3 too hard
Dolerites 3.8-5.4
Basalts, Andesites 3.5-5.3
L1.2.4 Conclusions on the Cerchar test
- The test result depends on steel type used for the stylus and when hardening isused a high variation in steel hardness might be present.
- The pin should dig into the rock while sliding. If the rock is too hard, rocksurface roughness determines the wear of the pin. CAI values tend to be too low andthe test is unsuitable. The pressure applied by the stylus should exceed the strengthof the rock.
- During the development of a wear flat, or when the rock is very weak, thecontact pressure will vary during the test, due to the increasing contact area betweetrpin and rock surface.
- A major factor contributing to wear is the strength of the rock, wear is notsolely due to the abrasive mineral content and grain size of the abrasive.minerals.
- The relationship of the Cerchar index with wear of cutting tools of excavationmachines like dredgers will be very tenuous, since many factors affecting the
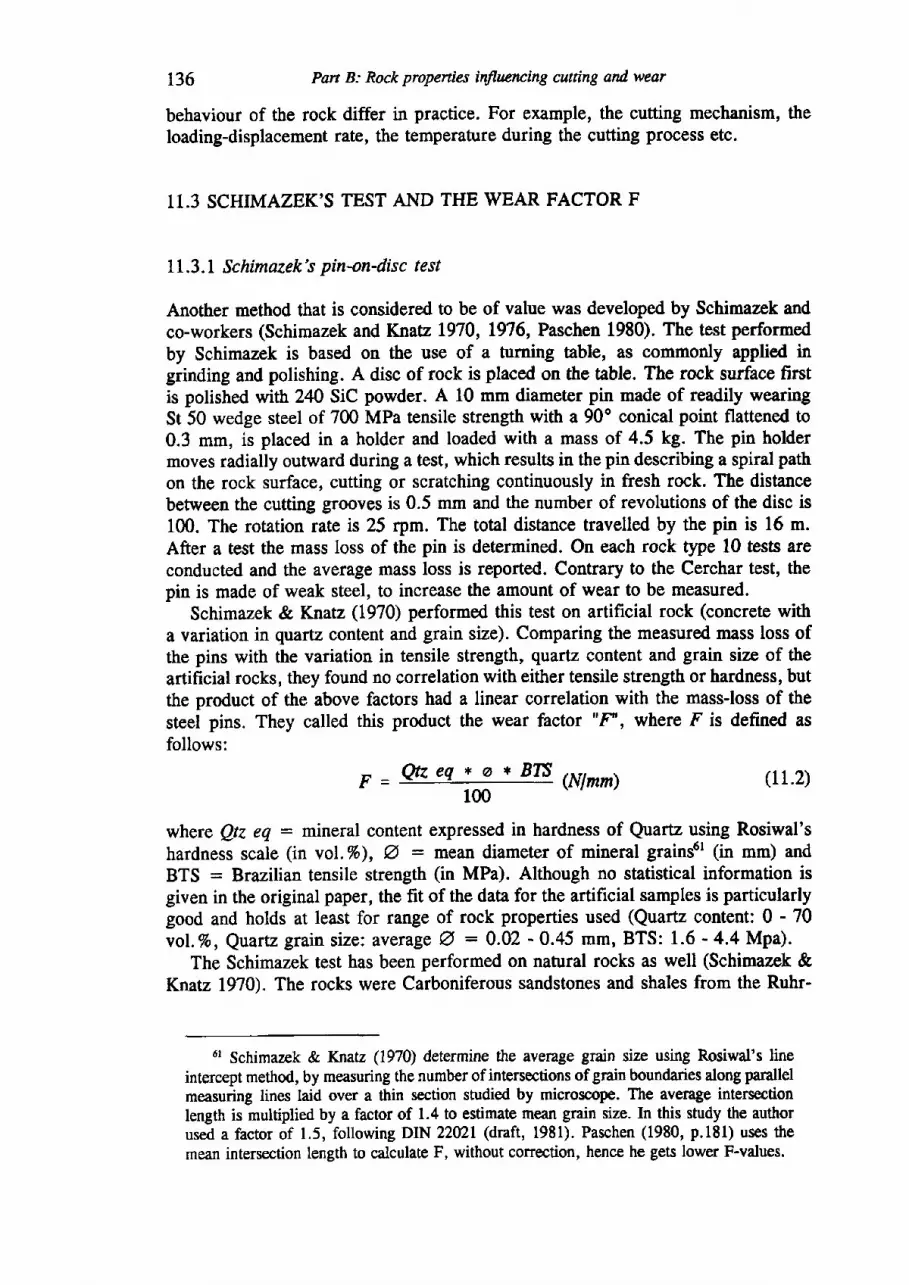
t36 Pan B: Rock properties inflwncing cutting and wear
behaviour of the rock differ in practice. For example, the cutting mechanism, theloading-displacement rate, the temperature during the cutting process etc.
11.3 SCHIMAZEK'S TEST AND THE WEAR FACTOR F
11.3.1 Schimazek's pinon-disc test
Another method that is considered to be of value was developed by Schimazek andco-workers (Schimazek and Yrnalu,1970, 19'16, Paschen 1980). The test performedby Schimazek is based on the use of a turning table, as commonly applied ingrinding and polishing. A disc of rock is placed on the table. The rock surface firstis polished with 240 SiC powder. A 10 mm diameter pin made of readily wearingSt 50 wedge steel of 700 MPa tensile strength with a 90o conical point flattened to0.3 mm, is placed in a holder and loaded with a mass of 4.5 kg. The pin holdermoves radially outward during a test, which results in the pin describing a spiral pathon the rock surface, cutting or scratching continuously in fresh rock. The distancebetween the cutting grooves is 0.5 mm and the number of revolutions of the disc is100. The rotation rate is 25 rpm. The total distance travelled by the pin is 16 m.After a test the mass loss of the pin is determined. On each rock tpe l0 tests areconducted and the average mass loss is reported. Contrary to the Cerchar test, thepin is made of weak steel, to increase the amount of wear to be measured.
Schimazek & Knatz (1970) performed this test on artificial rock (concrete witha variation in quartz content and grain size). Comparing the measured mass loss ofthe pins with the variation in tensile strength, quartz content and grain size of theartificial rocks, they found no correlation with either tensile strength or hardness, butthe product of the above factors had a linear correlation with the mass-loss of thesteel pins. They called this product the wear factof "F', where F is defined asfollows:
F_ Qdeq * a + B?t (Nlmm) (1r.2)
where Qtz eq : mineral content expressed in hardness of Quartz using Rosiwal'shardness scale (in vol.%), @ : mean diameter of mineral grains6r (in mm) andBTS : Brazilian tensile strength (in MPa). Although no statistical information isgiven in the original paper, the fit of the data for the artificial samples is particularlygood and holds at least for range of rock properties used (Quartz content: 0 - 70vol.Vo, Quartz grain size: avera5e 6 : 0.02 - 0.45 mm, BTS: 1.6 - 4.4 Mpa).
The Schimazek test has been performed on natural rocks as well (Schimazek &Knatz 1970). The rocks were Carboniferous sandstones and shales from the Ruhr-
6r Schirnazek & Knatz (1970) determine the average grain size using Rosiwal's lineintercept method, by measuring the number of intersections of grain boundaries along parallelmeasuring lines laid over a thin section studied by microscope. The average intersectionlength is multiplied by a factor of 1.4 to estimate mean grain size. In this study the authorused a factor of 1.5, following DIN 2202L (draft, 1981). Paschen (1980, p.181) uses themean intersection length to calculate F, without correction, hence he gets lower F-values.
100
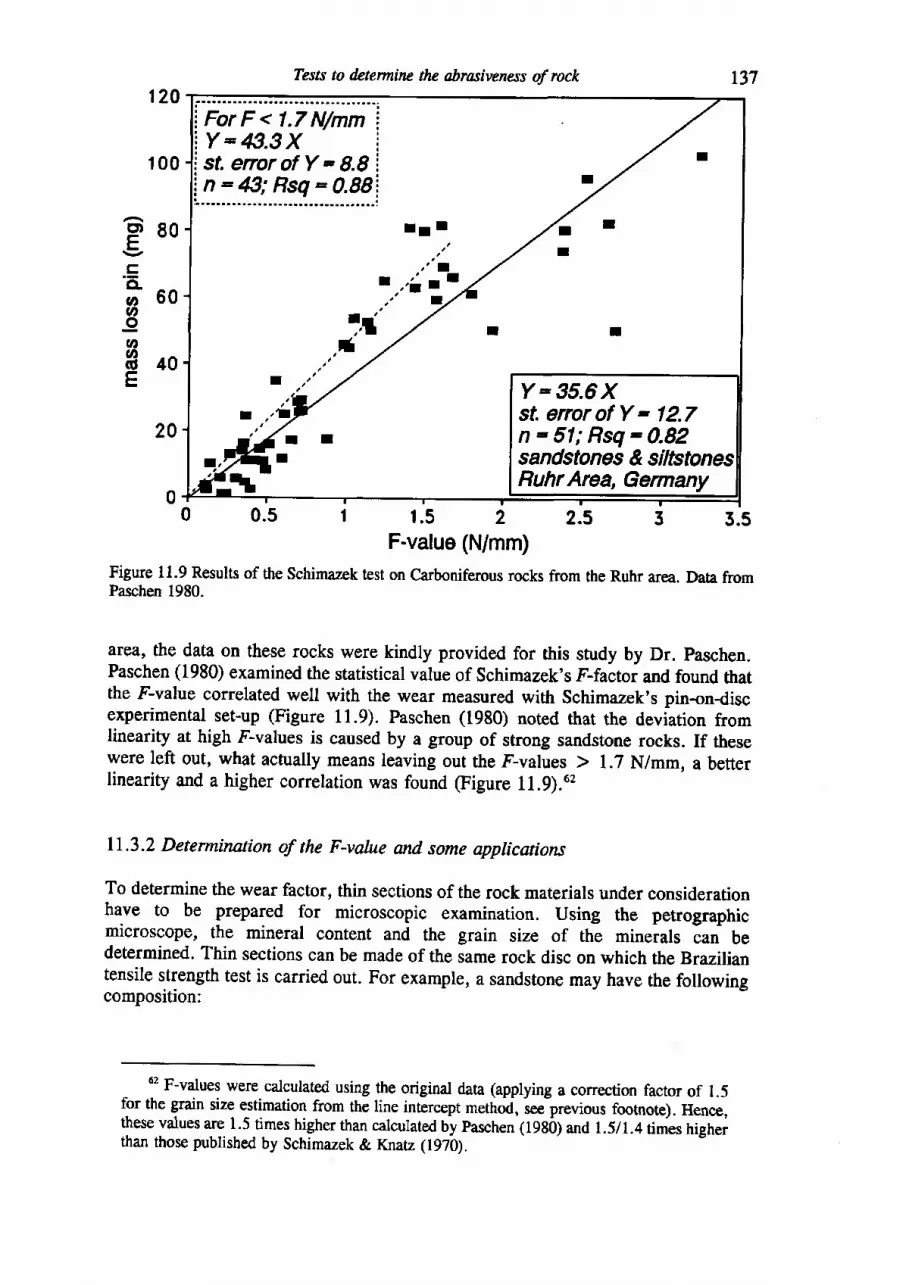
Tests to dcterminc the abrasiveness of rock 137
ForF<1.7N/mmY-43.3Xst. enor of Y = 8.8n: #; Rsq = 0.88
T
I
r - I
a ' I
7rI
| ,r i t_1.
1t'' 1 , / r r
]L
I , , ,i , / lY-35.6Xr ,.ty I st. enor of Y - 12.7
r r ln-51;Rsq-0.82r I sandstones &'i7\'
I Ruhr Area, Germany0.5 2 2.5 3 3.5
F-value (N/mm)Figure 11.9 Results of the Schimazek test on Carboniferous rocks from the Ruhr area. Data fromPaschen 1980.
area, the data on these rocks were kindly provided for this study by Dr. Paschen.Paschen (1980) examined the statistical value of Schimazek's F-factor and found thatthe Fvalue correlated well with the wear measured with Schimazek's pin-ondiscexperimental set-up (Figure 11.9). Paschen (1980) noted that the deviation fromlinearity at high F-values is caused by a group of strong sandstone rocks. If thesewere left out, what actually meaos leaving out the F-values > 1.7 N/mm, a betterlinearity and a higher correlation was found (Figure 11.9).62
11.3.2 Determination of the F-value and some applications
To determine the wear factor, thin sections of the rock materials under considerationhale to be prepared for microscopic examination. Using the petrographicmicroscope, the mineral content and the grain size of the minerals can bedetermined. Thin sections can be made of the same rock disc on which the Braziliantensile strength test is carried out. For example, a sandstone may have the followingcomposition:
120
100
PEOtrtr
l o60cnov,E40E
20
0 1 t .5
62 F-values were calculated using the original data (applying a correction factor of 1.5for the grain size estimation from the line intercept method, see-previous footnote). Hence,these values are 1.5 times higher than calculated by Paschen (1980) and 1.5/1.4 times higherthan those published by Schimazek & Knatz (1970).
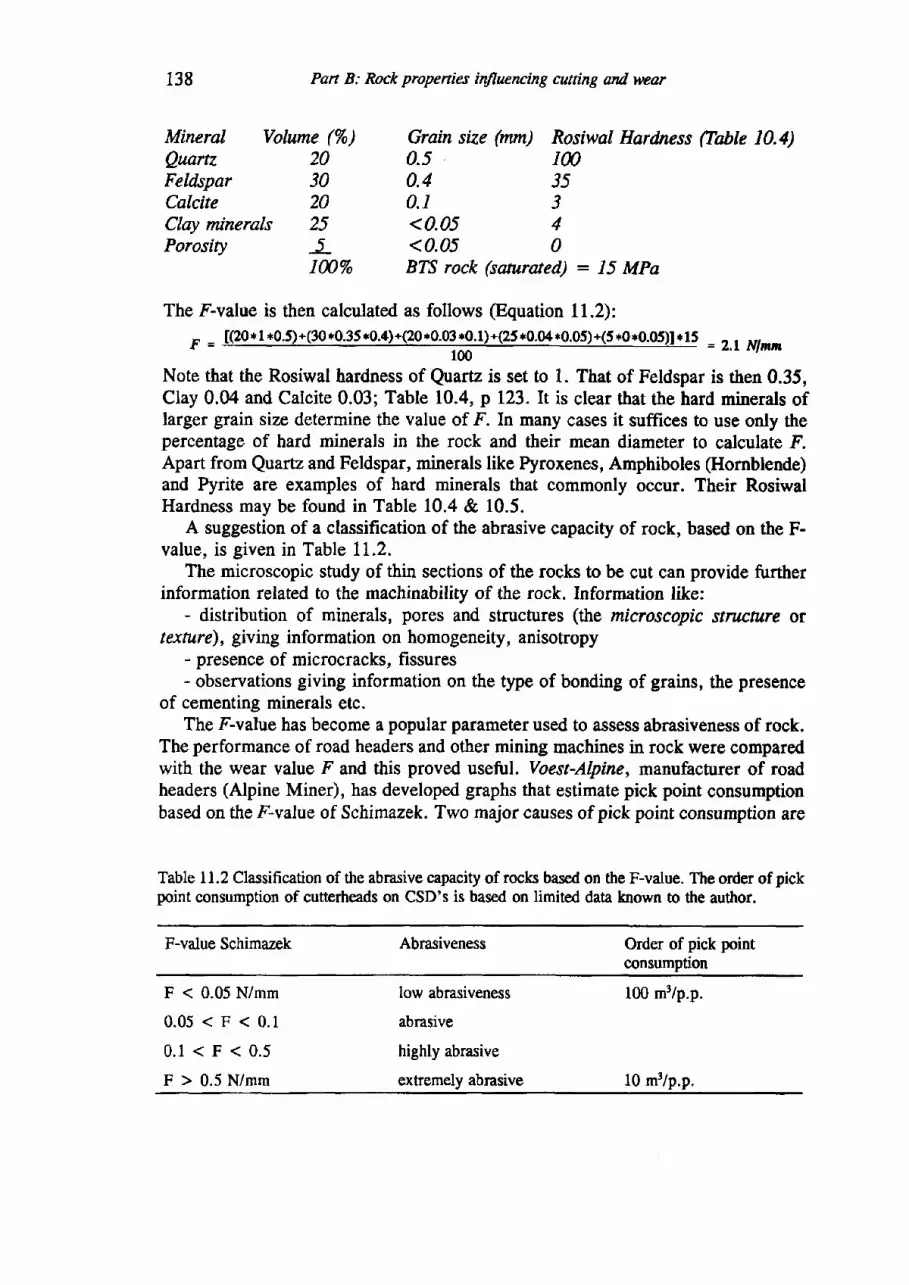
138
MineralQuartzFeldsparCalciteClay mineralsPorosity
Pan B: Rock propenies influencing cwting and wear
Volume (7o) Grain size (mm) Rosiwal Hardness (Table 10.4)20 0.5 Iffi30 0.4 3s20 0.1 325 <0.05 4l- <0.05 0Iffi% BTS rock (sanrarcd) : 15 MPa
The F-value is then calculated as follows (Equation ll.2):
-' _ [(20*1*0.5)+(30*0.35*0.4)+(20*0.03*0.1)+(25*0.04+Q.QJ)+(J+0*0.05)l*15 _,," =
= z , r N l m m
Note that the Rosiwal hardness of Quartz is set to 1. That of Feldspar is then 0.35,Clay 0.04 and Calcite 0.03; Table 10.4, p 123.lt is clear that the hard minerals oflarger grain size determine the value of F. In many cases it suffices to use only thepercentage of hard minerals in the rock and their mean diameter to calculate F.Apart from Quartz and Feldspar, minerals like Pyroxenes, Amphiboles (Hornblende)and Pyrite are examples of hard minerals that commonly occur. Their RosiwalHardness may be found in Table 10.4 & 10.5.
A suggestion of a classification of the abrasive capacity of rock, based on the F-value, is given in Table 11.2.
The microscopic study of thin sections of the rocks to be cut can provide furtherinformation related to the machinability of the rock. Information like:
- distribution of minerals, pores and structures (the microscopic stracture ortexture), giving information on homogeneity, anisotropy
- presencs of microcracks, fissures- observations giving information on the Ope of bonding of grains, the presence
of cementing minerals etc.The F-value has become a popular parameter used to assess abrasiveness of rock.
The performance of road headers and other mining machines in rock were comparedwith the wear value F and this proved useful. Voest-Alpine, manufacturer of roadheaders (Alpine Miner), has developed graphs that estimate pick point consumptionbased on the Fvalue of Schimazek. Two major causes of pick point consumption are
Table I 1.2 Classification of ttre abrasive capacity of rocks based on the F-value. The order of picklnint consumption of cutterheads on CSD's is based on limited data known to the author.
F-value Schimazek Abrasiveness Order of pick pointconsumption
F < 0.05 N/mm
0.05<F<0.1
0 .1 <F<0.5
F > 0.5 N/mm
low abrasiveness
abrasive
highly abrasive
extremely abrasive
100 m3/p.p.
l0 m3/p.p.
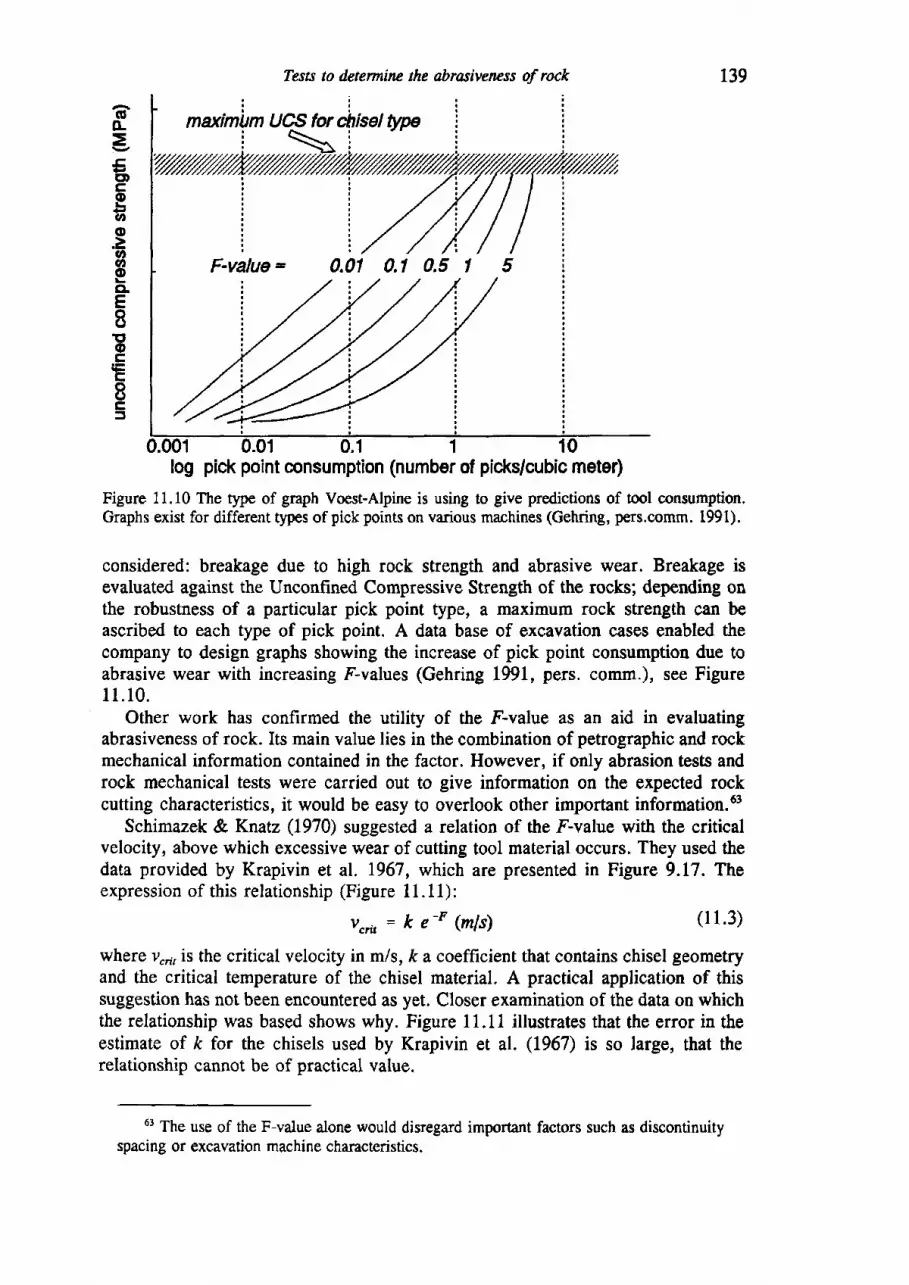
(Eo-=.CEDtrEoooaoCLE8EoctrIc=
Tests to dctermirc the abrasivencss of rock r39
F-value - 0.01 0.1 0,5
0.001log pic'k point consumption (number of picks/cubic meter)
Figure 11.10 The type of graph Voest-Alpine is using to give predictions of tool consumption.Graphs exist for different types of pick points on various machines (Gehring, pers.comm. 1,991).
considered: breakage due to high rock strength and abrasive wear. Breakage isevaluated against the Unconfined Compressive Strength of the rocks; depending onthe robustness of a particular pick point type, a maximum rock strength can beascribed to each type of pick point. A data base of excavation cases enabled thecompany to design graphs showing the increase of pick point consumption due toabrasive wear with increasing F-values (Gehring L991, pers. comm.), see Figure11 ,10 .
Other work has confirmed the utility of the F-value as an aid in evaluatingabrasiveness of rock. Its main value lies in the combination of petrographic and rockmechanical information contained in the factor. However, if only abrasion tests androck mechanical tests wete carried out to give information on the expected rockcutting characteristics, it would be easy to overlook other important information.63
Schimazek & Knatz (1970) suggested a relation of the F-value with the criticalvelocity, above which excessive wear of cutting tool material occurs. They used thedata provided by Krapivin et al. 1967, which are presented in Figure 9.17. Theexpression of this relationship (Figure 11.11):
vc r i r=ke -F (m ls \ (11.3)
where v"n, is the critical velocity in m/s, /< a coefficient that contains chisel geometryand the critical temperature of the chisel material. A practical application of thissuggestion has not been encountered as yet. Closer examination of the data on whichthe relationship was based shows why. Figure 11.11 illustrates that the error in theestimate of fr for the chisels used by Krapivin et al. (1967) is so large, that therelationship cannot be of practical value.
63 The use of the F-value alone would disregard important factors such as discontinuityspacing or excavation machine characteristics.
0.01
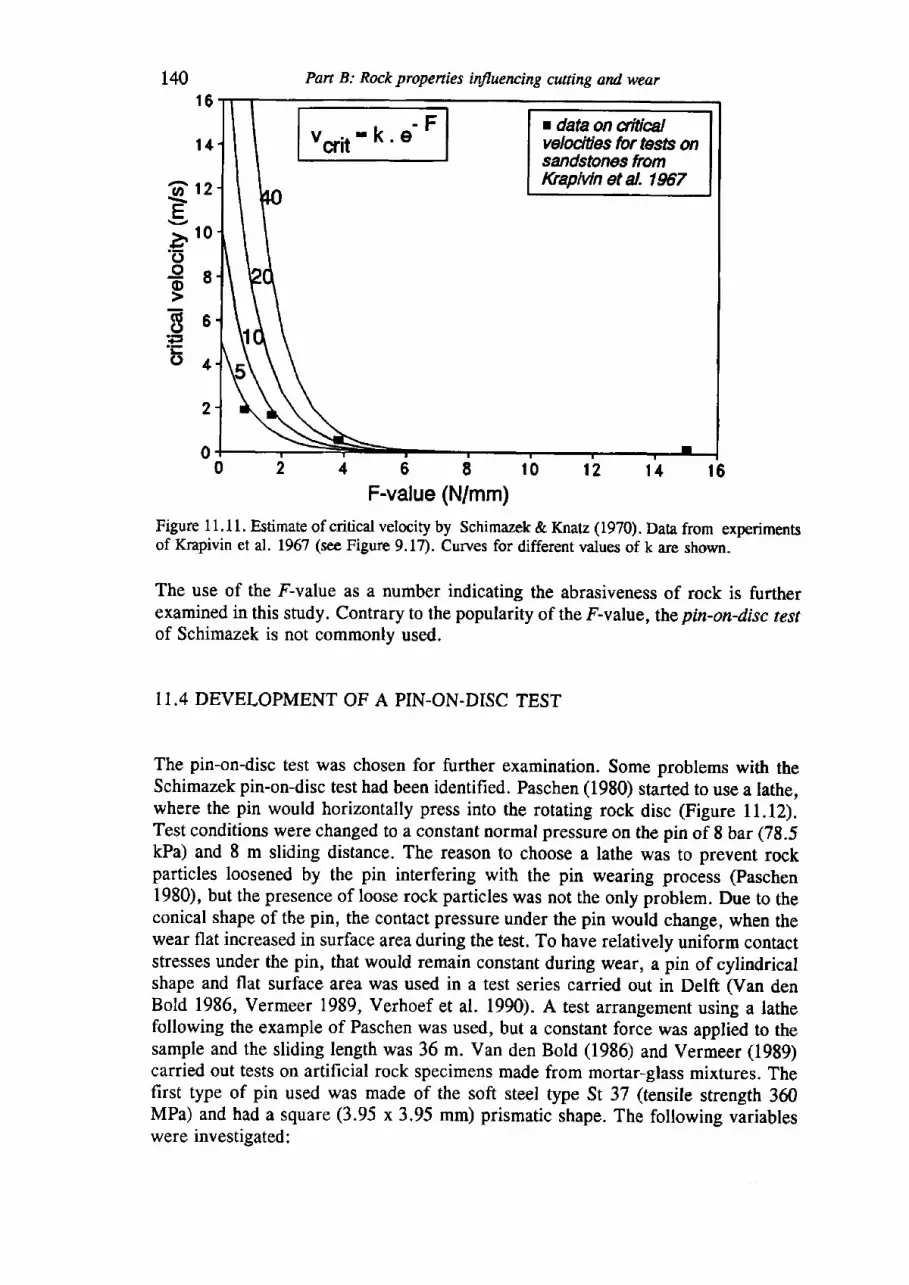
14016
l 1
6rzEr 10
P -'5
€B
E6o1
F-value (N/mm)Figure 11.11. Estimate of critical velocity by Schimazek & Knae (1970). Data from experimentsof Krapivin et aL. 1967 (see Figure 9.17). Curves for different values of k are shown.
The use of the F-value as a number indicating the abrasiveness of rock is furtherexamined in this study. Contrary to the popularity of the F-value, the pin-on-disc testof Schimazek is not commonly used.
11.4 DEVELOPMENT OF A PIN-ON-DISC TEST
The pin-on-disc test was chosen for further examination. Some problems with theSchimazek pin-on-disc test had been identified. Paschen (1980) started to use a lathe,where the pin would horizontally press into the rotating rock disc (Figure 11.12).Test conditions were changed to a constant normal pressure on the pin of 8 bar (78.5kPa) and 8 m sliding distance. The reason to choose a lathe was to prevent rockparticles loosened by the pin interfering with the pin wearing process (Paschen1980), but the presence of loose rock particles was not the only problem. Due to theconical shape of the pin, the contact pressure under the pin would change, when thewear flat increased in surface area during the test. To have relatively uniform contactstresses under the pin, that would remain constant during wear, a pin of cylindricalshape and flat surface area was used in a test series carried out in Delft (Van denBold 1986, Vermeer 1989, Verhoef et al. 1990). A test arrangement using a lathefollowing the example of Paschen was used, but a constant force was applied to thesample and the sliding length was 36 m. Van den Bold (1986) and Vermeer (1989)carried out tests on artificial rock specimens made from mortar-glass mixtures. Thefirst type of pin used was made of the soft steel type St 37 (tensile strength 360MPa) and had a square (3.95 x 3.95 mm) prismatic shape. The following variableswere investigated:
Pan B: Rock propenies inJluencing cutting and wear
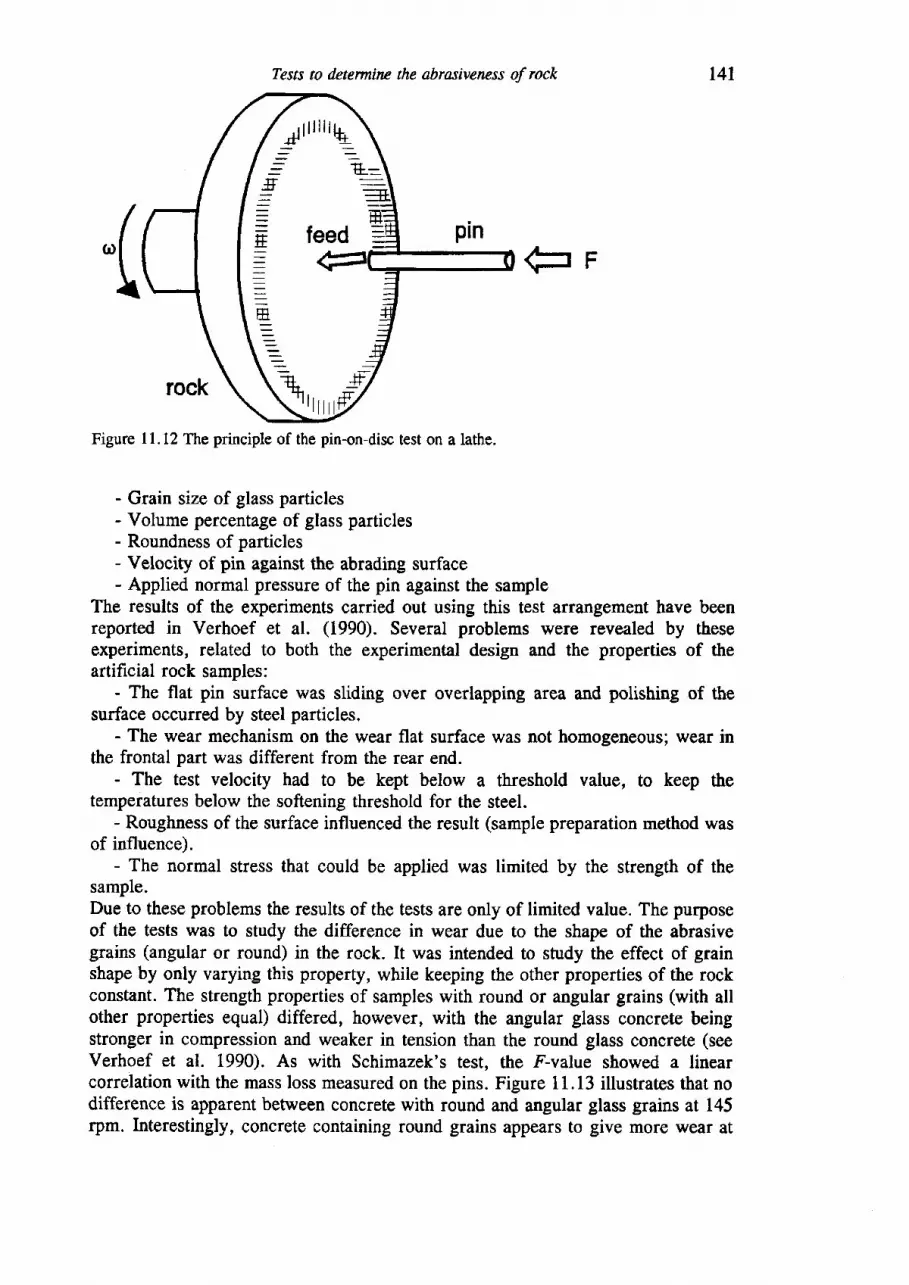
t t t i l t 6 \
=*-]
=t+f-H :
feed =<=e
:I:
sF7
t t l t tV
/:=t'=
E==;EET
=
E
Tests to dttermine the abrasiveruss of rock
C=F
Figure ll.12 The principle of the pin-on-disc test on a lathe.
- Grain size of glass particles- Volume percentage of glass particles- Roundness of particles- Velocity of pin against the abrading surface- Applied normal pressure of the pin against the sample
The results of the experiments carried out using this test arrangement have beenreported in Verhoef et al. (1990). Several problems were revealed by theseexperiments, related to both the experimental design and the properties of theartificial rock samples:
- The flat pin surface was sliding over overlapping area and polishing of thesurface occurred by s0eel particles.
- The wear mechanism on the wear flat surface was not homogeneous; wear inthe frontal part was different from the rear end.
- The test velocity had to be kept below a threshold value, to keep thetemperatures below the softening threshold for the steel.
- Roughness of the surface influenced the result (sample preparation method wasof influence).
- The normal stress that could be applied was limited by the strength of thesample.Due to these problems the results of the tests are only of limited value. The purposeof the tests was to study the difference in wear due to the shape of the abrasivegrains (angular or round) in the rock. It was intended to study the effect of grainshape by only varying this property, while keeping the other properties of the rockconstant. The strength properties of samples with round or angular grains (with allother properties equal) differed, however, with the angular glass concrete beingstronger in compression and weaker in tension than the round glass concrete (seeVerhoef et al. 1990). As with Sehimazek's test, the Fvalue showed a linearcorrelation with the mass loss measured on the pins. Figure 11.13 illustrates that nodifference is apparent between concrete with round and angular glass grains at 145rpm. Interestingly, concrete containing round grains appears to give more wear at
141
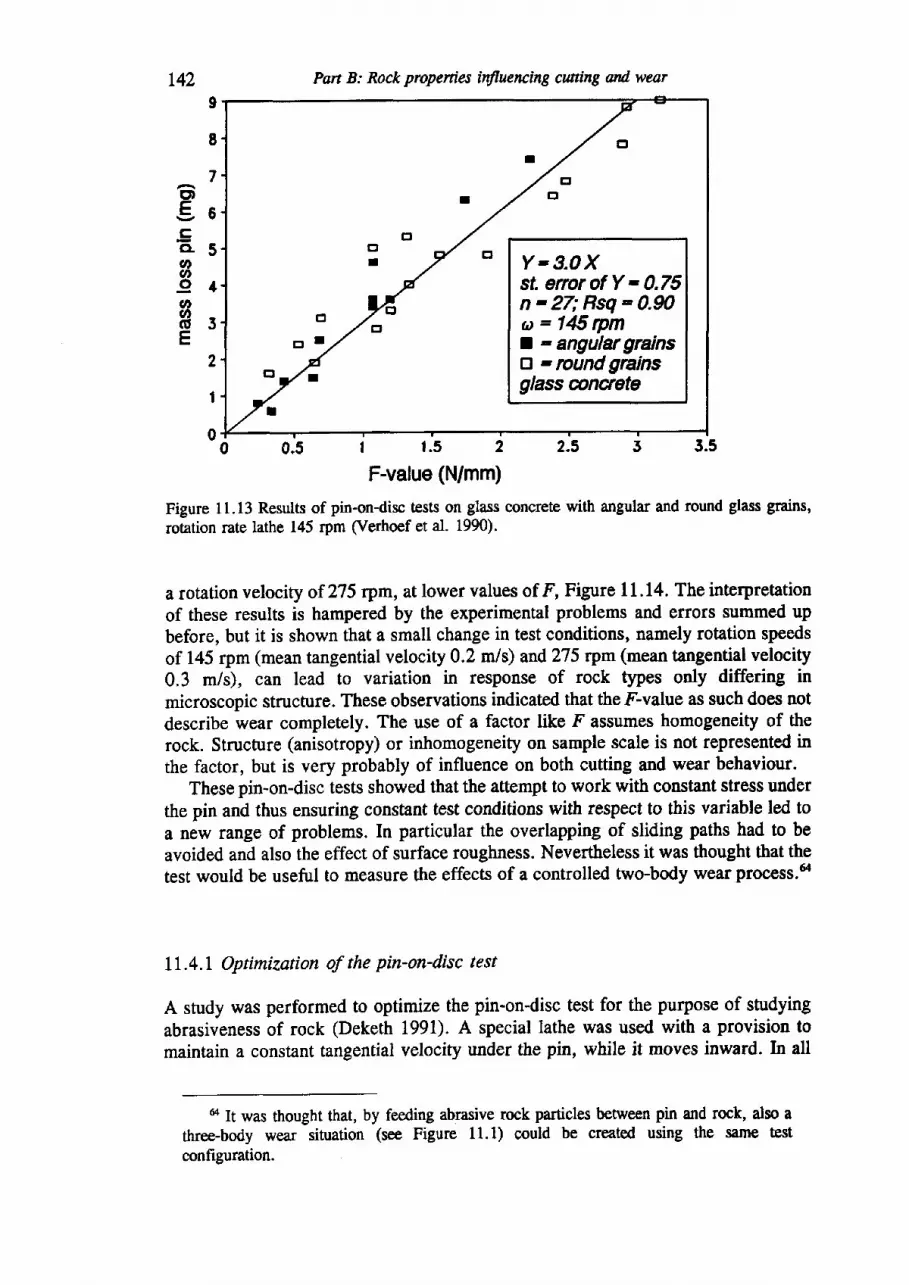
6go.EcL5og,o1oEJE
142 Part B: Rock properties tnJluencing cutting end. wear
trlI
trl Y-3.0Xst. enor of Y - 0.75n - 27; Rsq - g.got = 145 rpma - anguler grainsE - routrd grainsglass ansete
o
o l
d J t
I
F-value (N/mm)
Figure 11.13 Results of pin-on-disc tests on glass concrete with angular and round glass grains,rotation rate lathe 145 rpm (Verhoef et d. 1990).
a rotation velocity of 275 rpm, at lower values of F, Figure 11.14. The interpretationof these results is hampered by the experimental problems and errots summed upbefore, but it is shown that a small change in test conditions, namely rotation speedsof 145 rpm (mean tangential velocity 0.2 m/s) and275 rpm (mean tangential velocity0.3 m/s), can lead to variation in response of rock types only differing inmicroscopic structure. These observations indicated that the F-value as such does notdescribe wear completely. The use of a factor like F assumes homogeneity of therock. Structure (anisotropy) or inhomogeneity on sample scale is not represented inthe factor, but is very probably of influence on both cutting and wear behaviour.
These pin-on-disc tests showed that the attempt to work with constant stress underthe pin and thus ensuring constant test conditions with respect to this variable led toa new range of problems. In particular the overlapping of sliding paths had to beavoided and also the effect of surface roughness. Nevertheless it was thought that thetest would be useful to measure the effects of a controlled two-body wear process.s
11.4.1 Optimization of the pin-on-disc test
A study was performed to optimize the pin-on-disc test for the purpose of studyingabrasiveness of rock (Deketh 1991). A special lathe was used with a provision tomaintain a constant tangential velocity under the pin, while it moves inward. In all
n It was thought that, by feeding abrasive rock particles between pin and rock, also athree-body wear situation (see Figure 11.1) could be created using the s:rme testconfiguration.
I
00.5 2.3r .5
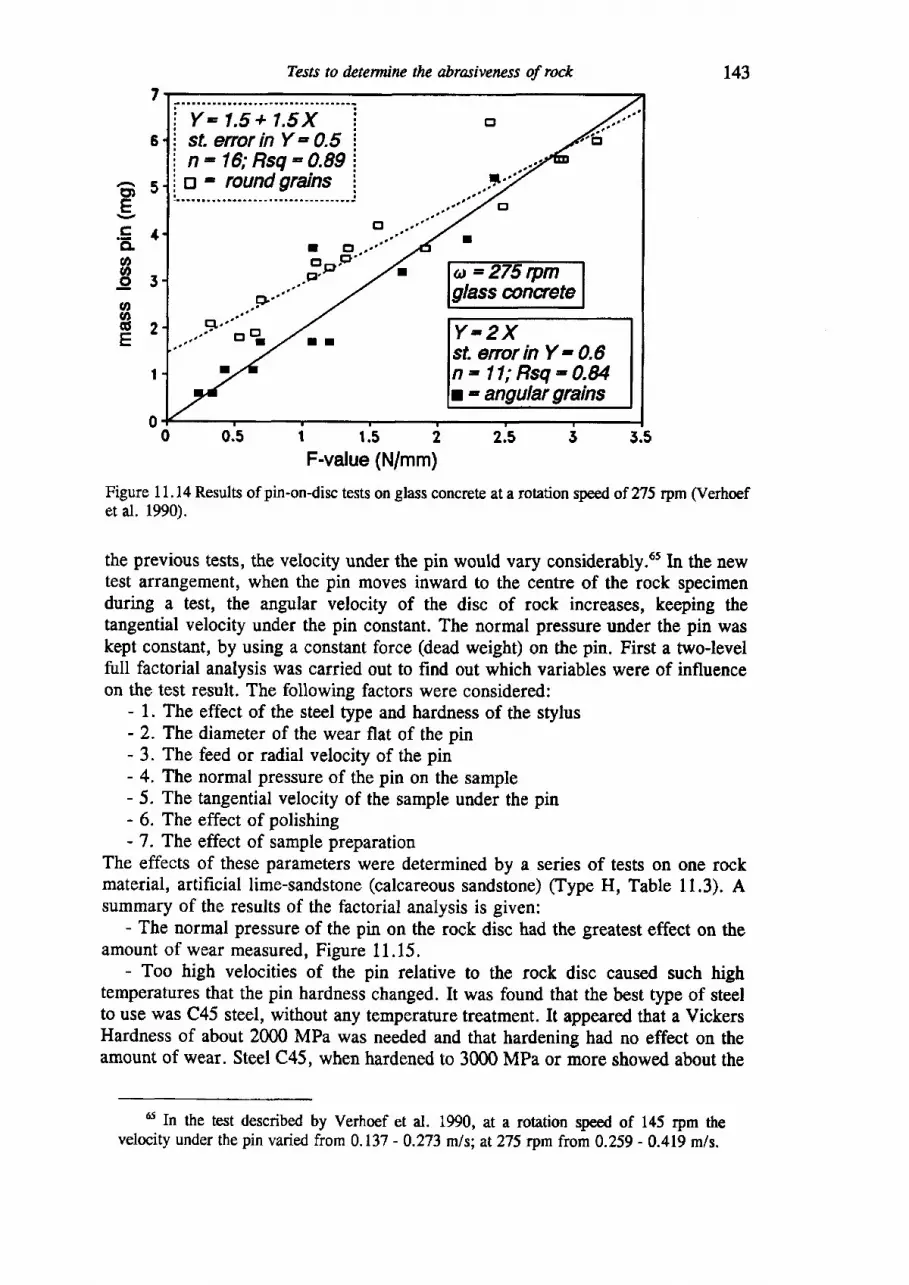
143Tests to dctermine the abrasiveness of rock
. l a - - - - P a a lfr"'Y= 1.5+ 1.5X ; trtst. enor in Y = 0.5 i
i n:16; Rsq:0.89 ai o - round grains I: . . . , . . . . . . - . . . . . - - - - - . . . . - - - - - - . . . . !
+.1"",'70
oo . . " ' I
I
.8,F."
+"'a... '
a = ZlJ fPtTlglass anqete
Y-2Xst. enor in Y - 0.6n- l l ;Rsq-0.84
: angrlar grainsI
0 0.5 r r.5 2 2.5 5 5.5F-value (N/mm)
Figure I 1 . 14 Results of pin-on-disc tests on glass concrete at a rotation speed of 275 rpm (Verhoefet al. 1990).
the previous tests, the velocity under the pin would vary considerably.6s ln the newtest arrangement, when the pin moyes inward to the centre of the rock specimenduring a test, the angular velocity of the disc of rock increases, keeping thetangential velocity under the pin constant. The normal pressure under the pin waskept constant, by using a constant force (dead weight) on the pin. First a two-levelfull factorial analysis was carried out to find out which variables were of influenceon the test result. The following factors were considered:
- 1. The effect of the steel type and hardness of the stylus- 2. The diameter of the wear flat of the pin- 3. The feed or radial velocity of the pin- 4. The normal pressure of the pin on the sample- 5. The tangential velocity of the sample under the pin- 6. The effect of polishing- 7. The effect of sample preparation
The effects of these parameters were determined by a series of tests on one rockmaterial, artificial lime-sandstone (calcareous sandstone) (Type H, Table 11.3). Asummary of the results of the factorial analysis is given:
- The normal pressure of the pin on the rock disc had the greatest effect on theamount of wear measured, Figure 11.15.
- Too high velocities of the pin relative to the rock disc caused such hightemperatures that the pin hardness changed. It was found that the best type of steelto use was C45 steel, without any temperature treatment. It appeared that a VickersHardness of about 2000 MPa was needed and that hardening had no effect on theamount of wear. Steel C45, when hardened to 3000 MPa or more showed about the
tr In the test described by Verhoef et al. 1990, at a rotation s@ of 145 rpm thevelocity under the pin varied from 0. 137 - 0.273 m/s; ar 275 rpm from 0.259 - 0.419 m/s.
t D . ,g.9 1ctv,o3v,6E2E
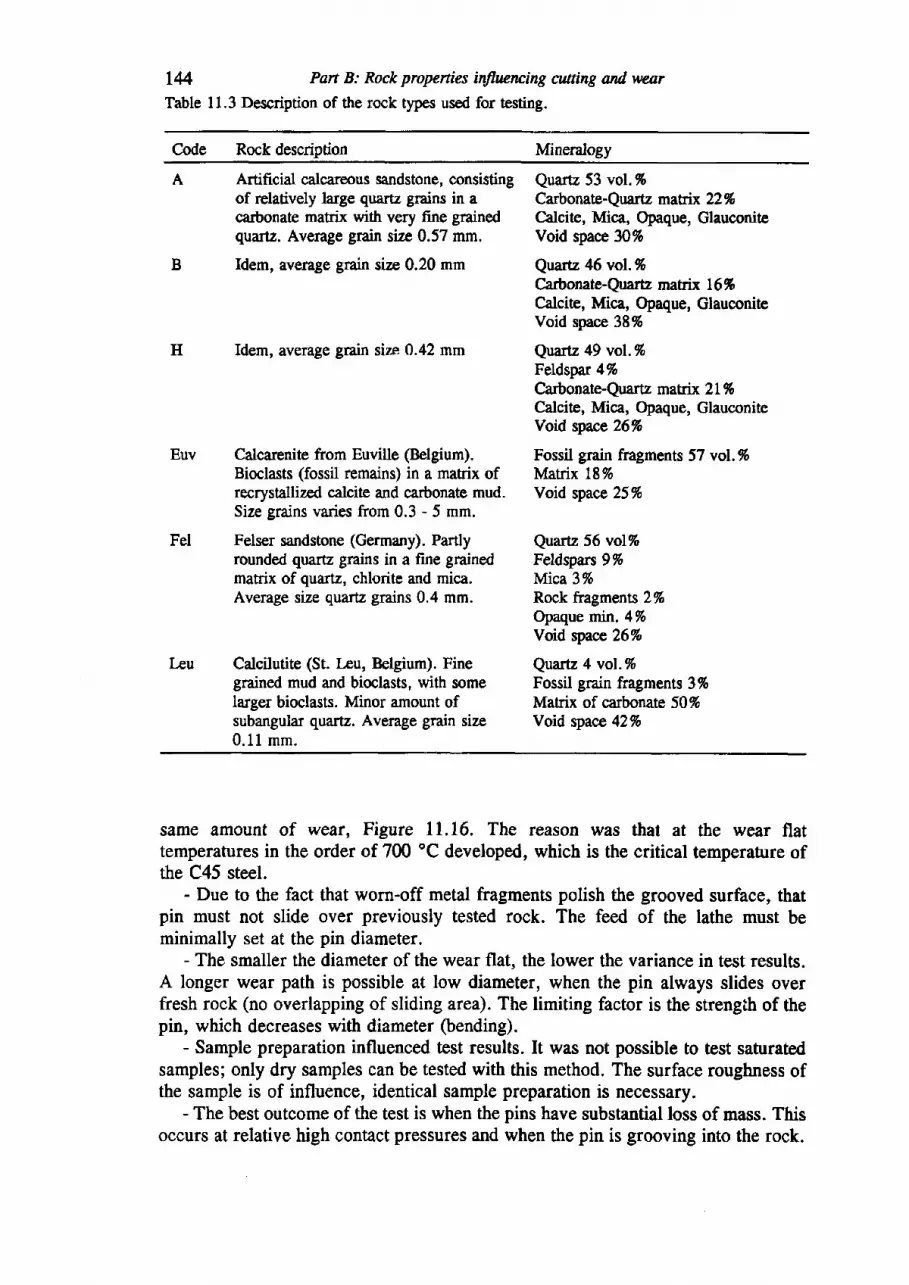
I4 Pan B: Rock properties inthrcncing cuaing and wearTable 11.3 Description of the rock types used for te.sting.
Code Rock description Mineralogy
A Artifrcial calcareous sandstone, consisting Quartz 53 vol. %of relatively large quartz grains in a Carbonate-Qvartz marfix 22%carbonate matrix with very fine grained Calcite, Mica, Opaque, Glauconitequartz. Average grain size 0.57 mm. Void space 30%
B Idem, average grain size 0.20 mm Quarte 46 vol.%Carbonate-Quartz matrlx 16%Calcite, Mica, Opaque, GlauconiteVoid space 38%
H Idem, average grain size 0.42 mm Quartz 49 vol.%Feldspar 4%Carbonate-Quartz maElx 2I %Calcite, Mica, Opaque, GlauconiteYoid spacn 26%
Euv Calcarenite from Euville (Belgium). Fossil grain fragments 57 vol.%Bioclasts (fossil remains) in a manix of Matrix 18%recrystallized calcite and carbonate mud. Void space 25%Size grains varies from 0.3 - 5 mm.
Fel Felser sandstone (Germany). Partly Quartz 56 vol%rounded quartz grains in a fine grained Feldspars 9%matrix of quartz, chlorite and mica. Mica 3%Average size quartz grains 0.4 mm. Rock fragments2%
Opaque mn.4VoVoid qpace 26%
Leu Calcilutite (St. Leu, Belgium). Fine Quartz 4 vol.%grained mud and bioclasts, with some Fossil grain fragments 3%Iarger bioclasts. Minor amount of Matrix of carbonate 50%subangular quartz. Average grain size Yoid space 42Vo0.11 mm.
same amount of wear, Figure ll.16. The reason was that at the wear flattemperatures in the order of 700 oC developed, which is the critical temFerature ofthe C45 steel.
- Due to the fact that worn-off metal fragments polish the grooved surface, thatpin must not slide over previously tested rock. The feed of the lathe must beminimally set at the pin diameter.
- The smaller the diameter of the wear flat, the lower the variance in test results.A longer wear path is possible at low diameter, when the pin always slides overfresh rock (no overlapping of sliding area). The limiting factor is the strengih of thepin, which decreases with diameter (bending).
- Sample preparation influenced test results. It was not possible to test saturatedsamples; only dry samples can be tested with this method. The surface roughness ofthe sample is of influence, identical sample preparation is necessary.
- The best outcome of the test is when the pins have substantial loss of mass. Thisoccurs at relative high contact pressures and when the pin is grooving into the rock.
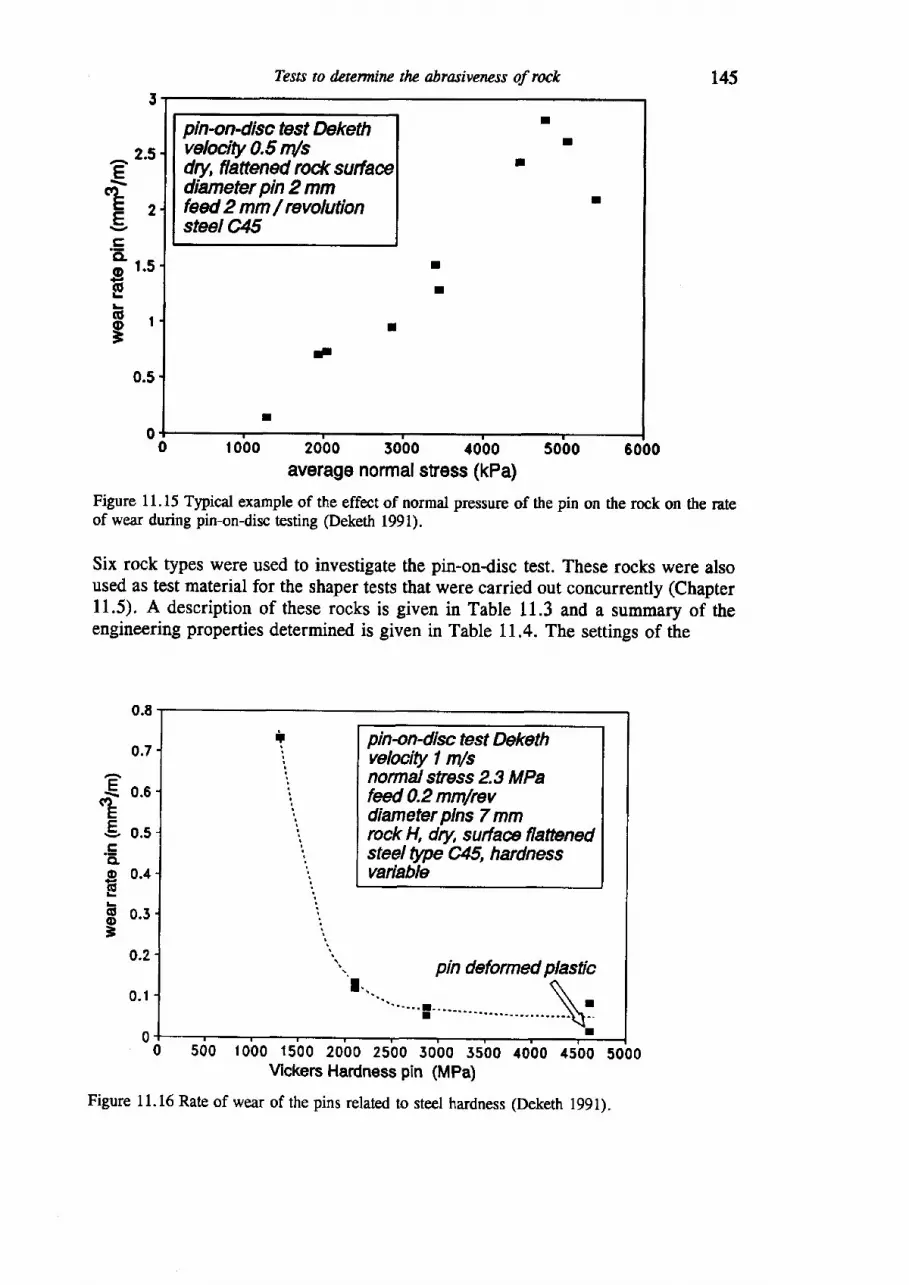
145Tests to dcterminc thc abrasiveness of rock
pinon-disc fesf Dekethvelacity 0.5 m/sdry, flattened rod< surfaediameter pin 2 mmfed2mm/revolutionsteel C45
I
I
fl
0 t000 2000 5000 1000 5000 6000average normal sfess (kPa)
Figure 11,15 Typical example of the effect of normal pressure of the pin on the rock on the rateof wear during pin-on-disc testing (Deketh 1991).
Six rock types were used to investigate the pin-on-disc test. These rocks were alsoused as test material for the shaper tests that were carried out concurrently (Chapter11.5). A description of these rocks is given in Table 11.3 and a summary of theengineering properties determined is given in Table 11.4. The settings of the
p i n -on -d i sc test Dekethvelocity I rn/snormalstress 2.3 MPafeed 0.2 mmlrevdiameter pins 7 mmrock H, dry, surfae flattenedsteel type C45, hardnessvaiable
pin deformed plasticr... \
""""!"-- \ :
I
1000 1500 2000 2500 5000 5500 /t000 4s00 S0OOVickers Hardness pin (MPa)
^2 .5E
cLE . ,-;
o 1 .5
EEl=
0.5
0.E
0.7
€ o.scLE
€ o.sco-g 0-4E
F o.JB
0,2
0.1
Figure 11.16 Rate of wear of the pins related to steel hardness (Deketh l99l).
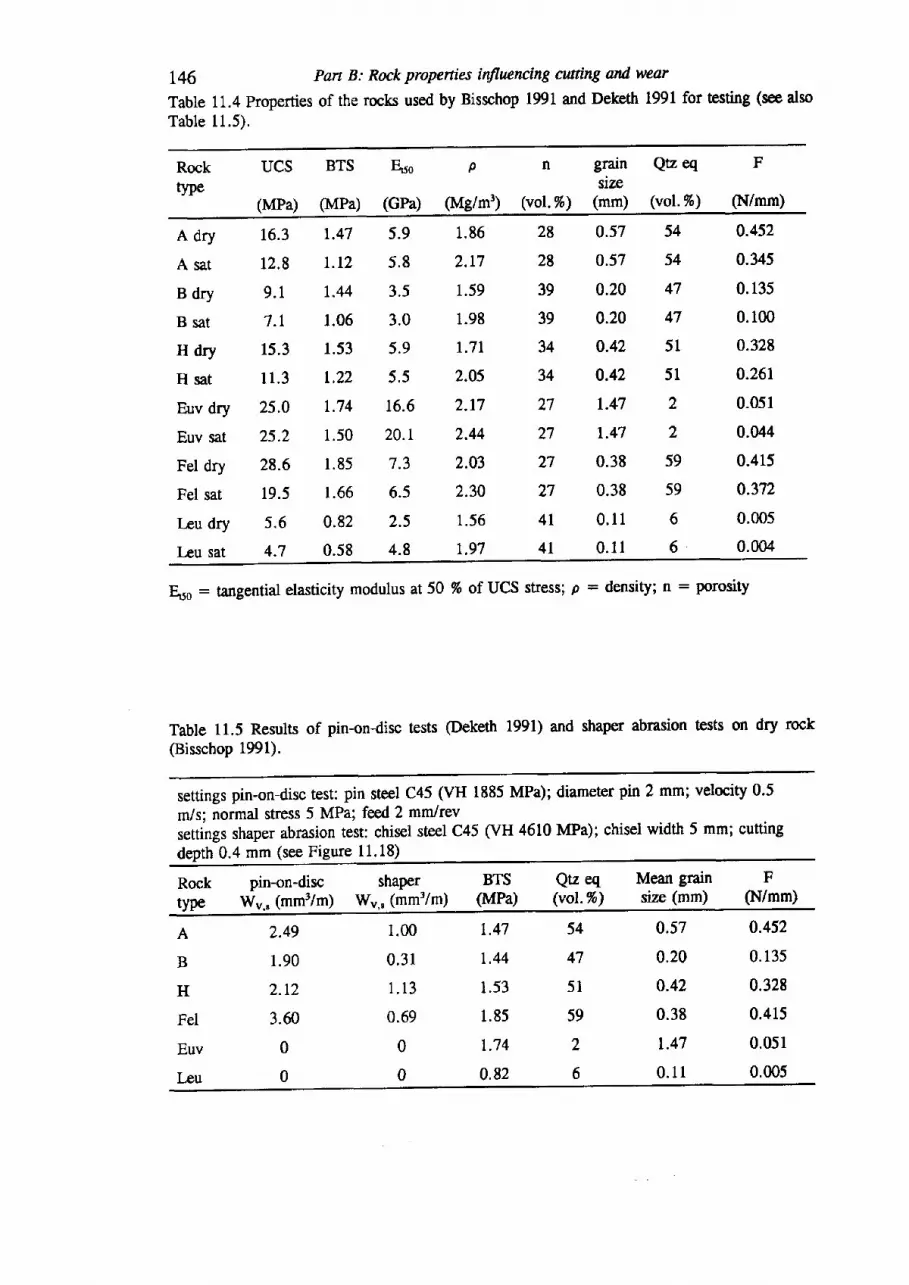
t46 Pan B: Rock properties influcncing cutrtng and wear
Table 11.4 properties of the rocks used by Bisschop 1991 and Deketh 1991 for testing (see alsoTable 11.5).
Rocktype
UCS BTS
(MPa) (MPa) (Mg/m')
Eso
(GPa)
n grain Qtz eqsirn
(vol.%) (mm) (voI.Vo)
F
(N/mm)
A dry
A Sat
Bdry
B sat
Hdry
H sat
Euv dry
Euv sat
Fel dry
Fel sat
I-eu dry
Iru sat
16.3
12.8
9 .1'1.r
15.3
11 .3
25.0
25.2
28.6
19.5
s.64.7
1.47
t . l 2
1.44
1.06
1.53
1.22
r .741 .50
1 .85
l.66
0.82
0.58
5.9
5 .8
3 .5
3 .0
5 .9
5 .5
16.6
20.r7 .3
6.5
2.5
4.8
1.86
2 .17
1.59
1.98
r .7L
2.05
2 .17
2.44
2.03
2.30
1.56
1.97
28
28
39
39
34
34
27
27
27
27
4 l
4 l
0.57
0.57
0.29
0.20
0.42
0.42
1.47
1.47
0.38
0.38
0 .1 I
0 .1 I
0.452
0.345
0.135
0.100
0.328
0.261
0.051
0.044
0.415
0.372
0.005
0.004
54
54
47
47
51
51
22
59
59
6
6
Euo : tangential elasticity modulus at 50 % of UCS stressl p = density; n : porosity
Table 11.5 Results of pin-ondisc tests @eketh 1991) and shaper abrasion tests on dry rock
@isschop 1991).
settings pin-on-disc test: pin steel C45 (VH 1885 MPa); diameter pin 2 mm; velocity 0.5
m/s; normal stress 5 MPa; feed 2 mmlrevsettings shaper abrasion test: chisel steel C45 (VH 4610 MPa); chisel width 5 mm; cutting
depth 0.4 mm (see Figure 11.18)
Rock pin-on-disc shaPertype Wu," (mm3/m) Wu,, (mm3/m)
BTS(MPa)
Qtz eq Mean grain(vol.To) size (mm)
F(N/mm)
A 7.49
B 1.90
H 2 .12
Fel 3.60
Euv 0
1.00
0 .31
1 . 13
0.69
0
0
L47
1 .44
1.53
1 .85
1 .74
0.82
0.57
0.20
0.42
0.38
1.47
0 .11
0.452
0.135
0.328
0.415
0.051
0.005
54
47
51
59
2
6
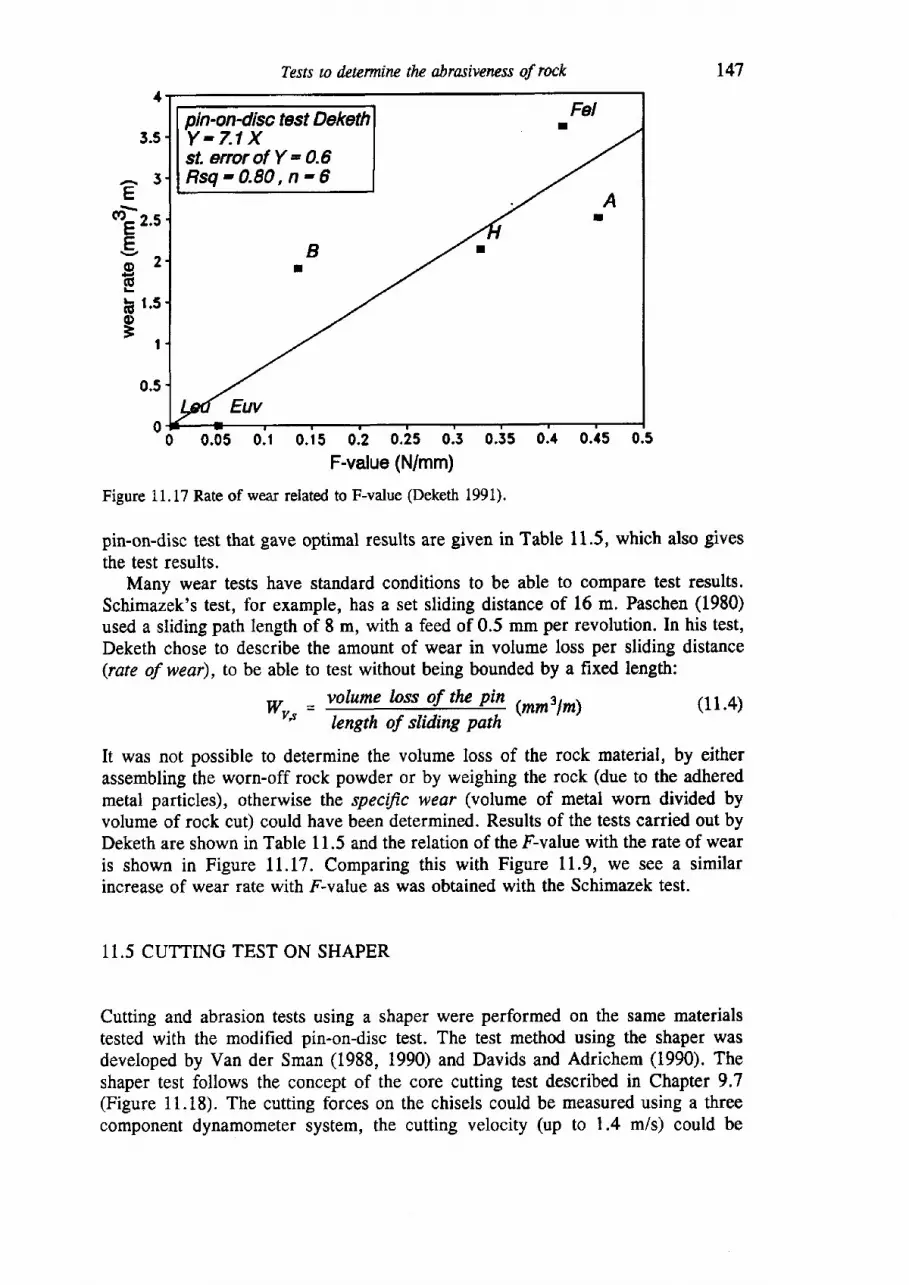
Tests to denrminc the abrasiveness of rock
pin-on4isctest DekethY-7.1 Xst. enor of Y - 0.6Rsq'0.80,n-6
Fel
A!
B
Euv
t47
0 0.05 0.1 0.t 5 0.2 0.25 0.5 0.35 0.4 0.15 0.5
F-value (N/mm)
Figure i 1. 17 Rate of wear related to F-value (Deketh 1991).
pin-on-disc testthatgave optimal results are given inTable 11.5, which also givesthe test results.
Many wear tests have standard conditions to be able to compare test results.Schimazek's test, for example, has a set sliding distance of 16 m. Paschen (1980)used a sliding path length of 8 m, with a feed of 0.5 mm per revolution. In his test,Deketh chose to describe the amount of wear in volume loss per sliding distance(rate of wear), to be able to test without being bounded by a fixed length:
3.5
A 3E
o)z.sEE;2(U
F t.uq)=
I
0.5
wu- = YIury ln:s=,o{ the Pi! (mm3lm)r's bngth of sliding path
(11.4)
It was not possible to determine the volume loss of the rock material, by eitherassembling the worn-off rock powder or by weighing the rock (due to the adheredmetal particles), otherwise the specific wear (volume of metal worn divided byvolume of rock cut) could have been determined. Results of the tests carried out byDeketh are shown in Table 11.5 and the relation of the F-value with the rate of wearis shown in Figure tI.I7. Comparing this with Figure 11.9, we see a similarincrease of wear rate with F-value as was obtained with the Schimazek test.
11.5 CUTTING TEST ON SHAPER
Cutting and abrasion tests using a shaper were performed on the same materialstested with the modified pin-ondisc test. The test method using the shaper wasdeveloped by Van der Sman (1988, 1990) and Davids and Adrichem (1990). Theshaper test follows the concept of the core cutting test described in Chapter 9.7(Figure 11.i8). The cutting forces on the chisels could be measured using a threecomponent dynamometer system, the cutting velocity (up to 1.4 m/s) could be

148 Pan B: Rock properties influencing cuning and wear
SHAPER TEST Man derSman et al.) dilselln abraslon m&
ffiB,.SION TEST
spedftafons tests (Bissdnp | 991 ) :rrc* spedmeff satuftted, air dry surtaasaidirg velm'ty 0.6 mlsdlselshape: rake angle G - 4Oo, negative dearaneangle p - - 5", wear flat length cira 4 mm,_chbelwidh 5 mm. &isF/l steel: U5, HV610 MPaanfring tests: depth 5 mm; abrasion tesh:0.4 mm.
Figure 11.18 Characteristics of the shaper cutting and abrasion tess.
measured as well. Bisschop (1991) reported test results on the same six rock typesas were tested by Deketh. Both cutting tests and abrasion tests were performed withspecially designed chisels with wear flats (Figure 11.18). The cuttlng tests werecarried out with a cutting depth of 5 mm. The abrasion tests were well controlled,by keeping the cutting depth constant at 0.4 mm.55 The test results of the abrasiontest, expressed as W"" (Equation [1.4) are shown in Table 11.5.
For the purpose of comparison, the relation of F-value with the wear rate in thistest is shown in Figure 11.19. Apart from abrasion tests on dry rock, that can becompared with Figure II.l7, Bisschop also tested the rocks saturated with water.Normally strength of wet rocks is lower, and the F-values of the wet rocks aretherefore lower as well (Table 11.4), but the wear rate obtained was considerablehigher for the saturated rocks. Another wear mechanism must be the cause of this.Bisschop (1991) assumed that crushed particles more readily break away when therock is dry and thus less abrasive grains are attacking the tool. Also from practiceis known that wet rocks, although weaker, can give more wear. Roxborough (1973)mentions that the development of a wet abrasive paste is the cause of much wear inweak sandstones: "Becatue the forces involved in cutting weak rock are low, sffainenergy at failare is also low and the debris tends not to be propelled away ftom thecufting area in large fragments, but small sandy material clings together in thepresence of water to forrn a highly abrasive paste near the cutting edge. Pick wearunder these conditions wtll be excessive".
6 The core abrasion test (Chapter 11.1) is less accurate, because the test chisel is fed byhand.
CUTTINGTEST
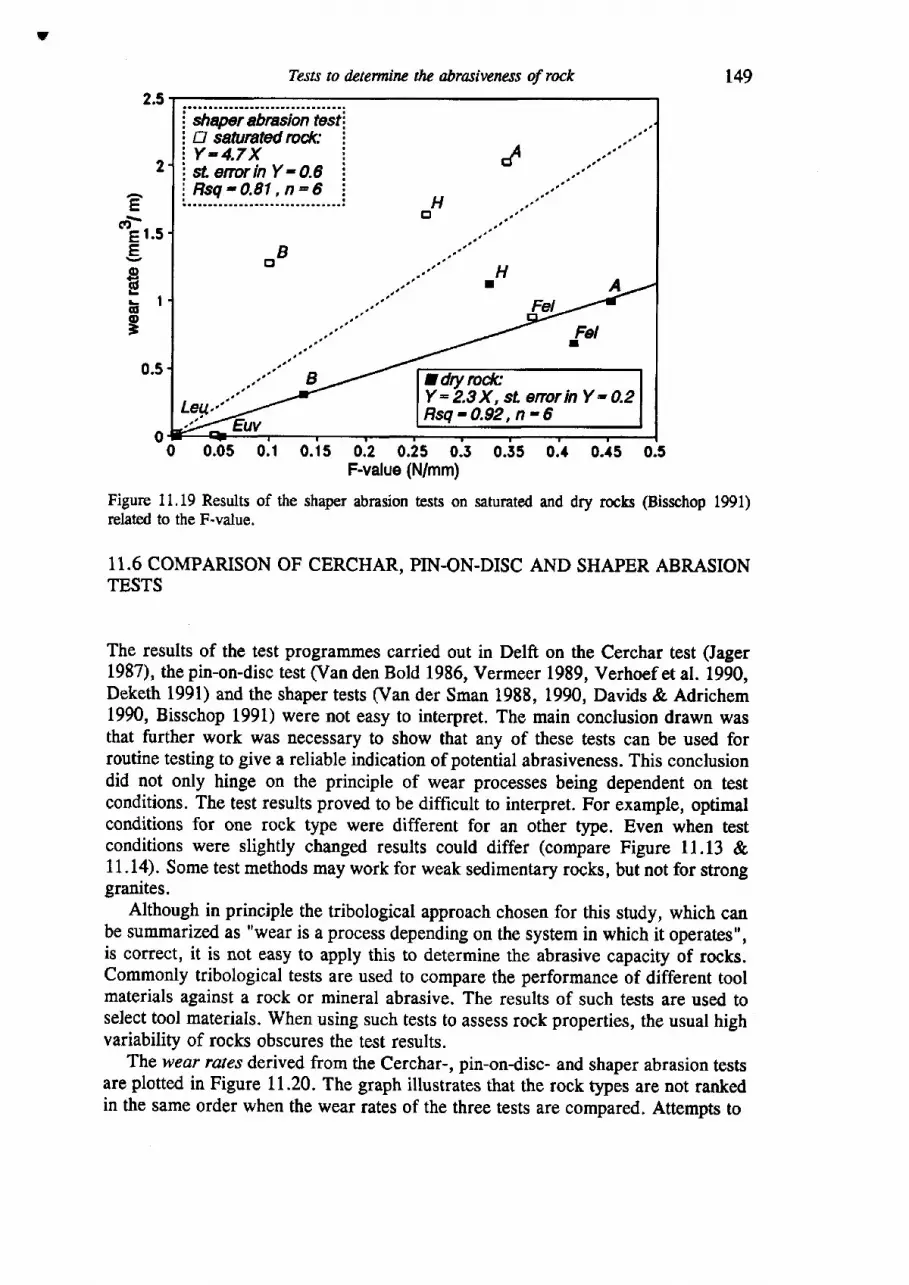
?
Tests to dztemfuu the abrasiveness of rock
i" ' ; "" '-"-1"""." " '." " ::i shapef abnsion testiI EI saturated rod<: ii Y-4.7X :i s tenor inY-0 .6 !i Rsd-0 .81 .n -6 :: - ' ' r
- : H
BH
A
Fel
B Jdry rodcY = 2.3 X, sL enor in Y - 0.2Rsq-0 .92 ,n -$Leq.t
0 0.05 0.1 0.15 0.2 0.25 0.3 0.35 0.4 0.45F-value (N/mm)
Figure 11,19 Results of the shaper abrasion bsts on saturated and dry rocksrelated to the F-value.
2.5r49
0"5
@isschop 1991)
2
E
€t. tg
fikrg
0.5
0
11.6 COMPARISON OF CERCHAR, PIN.ON.DISC AND SHAPER ABRASIONTESTS
The results of the test programmes carried out in Delft on the Cerchar test (Jager1987), the pin-on-disc test (Van den Bold 1986, Vermeer 1989, Verhoef et al. 1990,Deketh 1991) and the shaper tests (Van der Sman 1988, 1990, Davids & Adrichem1990, Bisschop 1991) were not easy to interpret. The main conclusion drawn wasthat further work was necessary to show that any of these tests can be used forroutine testing to give a reliable indication of potential abrasiveness. This conclusiondid not only hinge on the principle of wear processes being dependent on testconditions. The test results proved to be difficult to interpret. For example, optimalconditions for one rock type were different for an other type. Even when testconditions were slightly changed results could differ (compare Figure 11.13 &11.14). Some test methods may work for weak sedimentary rocks, but not for stronggranites.
Although in principle the tribological approach chosen for this study, which canbe summarized as "wear is a process depending on the system in which it operates",is correct, it is not easy to apply this to determine the abrasive capaciry of rocks.Commonly tribological tests are used to compare the performance of different toolmaterials against a rock or mineral abrasive. The results of such tests are used toselect tool materials. When using such tests to assess rock properties, the usual highvariability of rocks obscures the test results.
The wear rates derived from the Cerchar-, pin-ondisc- and shaper abrasion testsare plotted in Figure n.z0. The graph illustrates that the rock types are not rankedin the same order when the wear rates of the three tests are compared. Attempts to
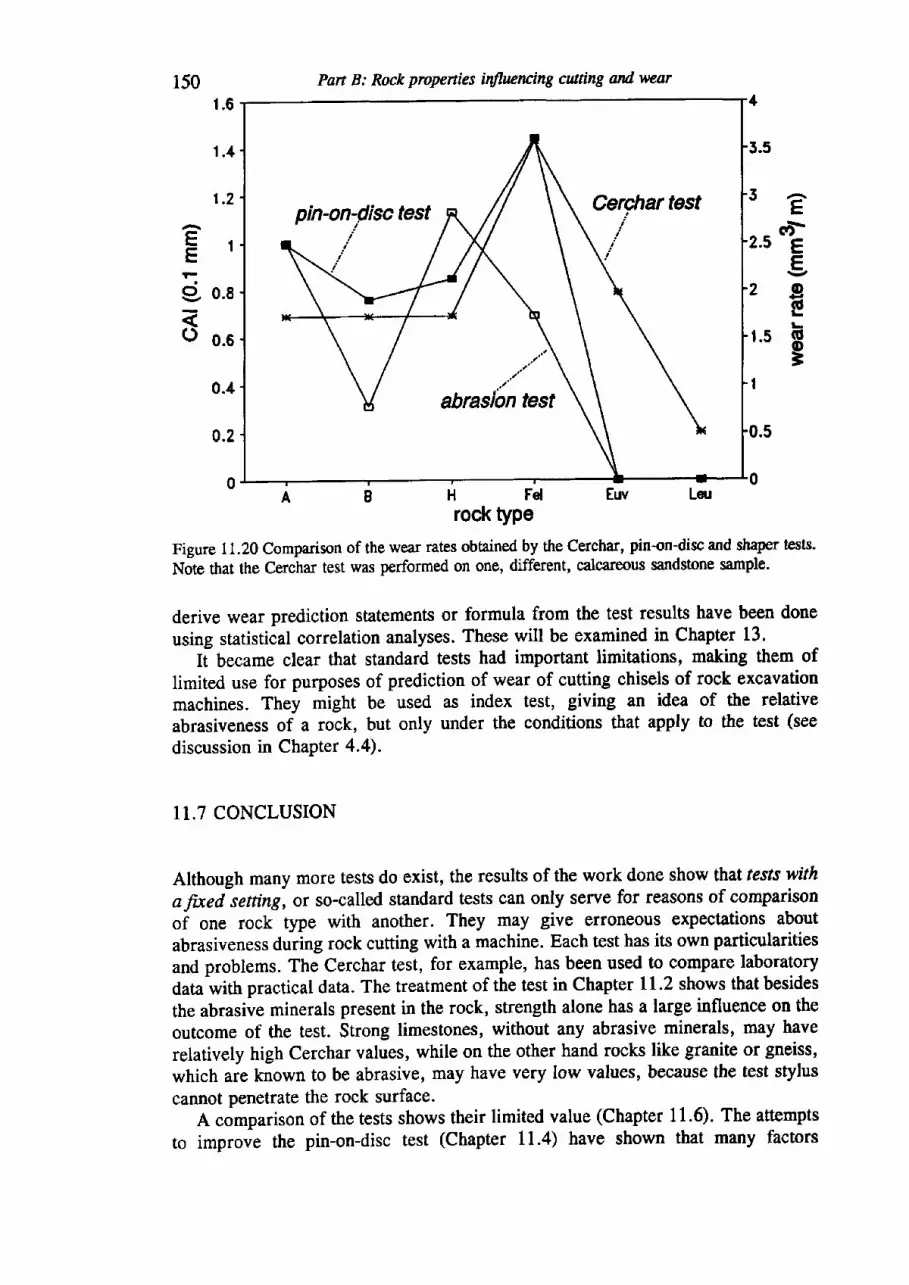
E{E I
si o.a
o 0.6
150
rock type
Figure 11.20 Comparison of the wear rates obtained by the Cerchar, pin-on-disc and shaper tests-UJte ttrat the Cerchar test was performed on one, different, calcareous sandstone sample.
derive wear prediction statements or formula from the test results have been done
using statistical correlation analyses. These will be examined in Chapter 13.Ii became clear that standard tests had important limitations, making them of
limited use for purposes of prediction of wear of cutting chisels of rock excavationmachines. They might be used as index test, giving an idea of the relative
abrasiveness of a rock, but only under the conditions that apply to the test (see
discussion in Chapter 4.4).
11.7 CONCLUSION
Although many more tests do exist, the results of the work done show that tests with
afued setting, or so-called standard tests can only serve for reasons of comparison
oi one rock type with another. They may give erroneous expectations about
abrasiveness duiing rock cuffing with a machine. Each test has its own particularities
and problems. The Cerchar test, for example, has been used to compare laboratory
data with practical data. The treatment of the test in Chapter 11.2 shows that besides
the abrasive minerals present in the rock, strength alone has a large influence on the
outcome of the test. Strong limestones, without any abrasive minerals, may have
relatively high Cerchar values, while on the other hand rocks like granite or gneiss,
which are known to be abrasive, may have very low values, because the test stylus
cannot penetrate the rock surface.A comparison of the tests shows their limited value (Chapter 11.6). The attempts
to improve the pin-on-disc test (Chapter 11.4) have shown that many factors
r .6
1 .4
t .2
0.4
0.2
eGa-Eggl:
bg
Part B: Rock propenies inffuencing cuning and. wear

Tests to determine the abrasivencss of rock
influence test results. No real improvement compared to the Schimazek pin-ondisctest with fixed settings has been obtained. The test showed, however, that withincreasing normal pressure on the pin, a change in wear mechanism occurred. Thisobservation led to the development of the scraper test, which was specificallyintended to study changes in wear mechanisms with increasing depth of cut into therock. The theory developed from these tests is summarized in Chapter 12.
It became clear that the approach of using several laboratory tests to establishabrasiveness of rock would not be helpful, without a proper understanding of theprocesses operating during laboratory tests and during real scale rock cutting.
151
CHAPTER 12
Wear mode theory
12.1 DEKETH'S SCRAPING TEST
While the usage of laboratory tests for determining abrasiveness of rocks is oflimited value, they might be helpful inunderstanding the wear mechanisms operatingduring rock cutting. One of the findings of the experiments with the pin-ondisc testwas that with increasing normal pressure the rate of wear increases up to a maximumvalue, after which a decrease in wear rate is noted (Figure l1 .15). At higher normalpressures crushing of rock occurs below the pin. Apparently when crushed rockmaterial is present between pin and rock, less wear occurs. This led to thedevelopment of a hypothesis of different wear mechanisms, or wear modcs,occurring. The decrease in wear rate at higher normal pressures could be explainedby a transition from a two-body abrasion, or an adhesion wear type of mechanism,to a three-body abrasion mechanism.
Deketh (1995) developed the shaper test to study the transition of wear modeswhile testing rocks under different conditions. The principle of the test is shown inFigure 12.1. At shallow cutting depth only scraping of the rock will occur and thetest resembles abrasion tests like the shaper abrasion test or the core abrasion test.With increasingfeed (radial displacement of the support of the lathe per revolutionof the nrrning head of the lathe) the transition to cutting can be studied.6? Thesamples have a diameter of 140 mm and a thickness of about 80 mm. At both sidesof the cutting path grooves are sawn into the rock discs before testing, to allowcracks to propagate to free surfaces. The grooves simulate the free surfaces thatwould be created in rock cutting practice by other chisels, travelling at either sideof the chisel. The fundamental difference between a pin-on-disc type of experimentand a rock cutting type of experiment is that the former is force controlled (the forceon the pin remains constant) while during a laboratory cuffing experiment the
67 The cutting depth is defined as the thickness of the rock cut per revolution of thetuming head of the lathe. Thickness is determined by measuring the mass loss of the testrock disc and calculating volume 1oss. The cutting depth can be compared with the feed. Theratio of depth of cut to the feed (cutting nade raio) indicates whether the chisel cuts (valuenear to 1) or scrapes (value near to 0) the rock.
t52
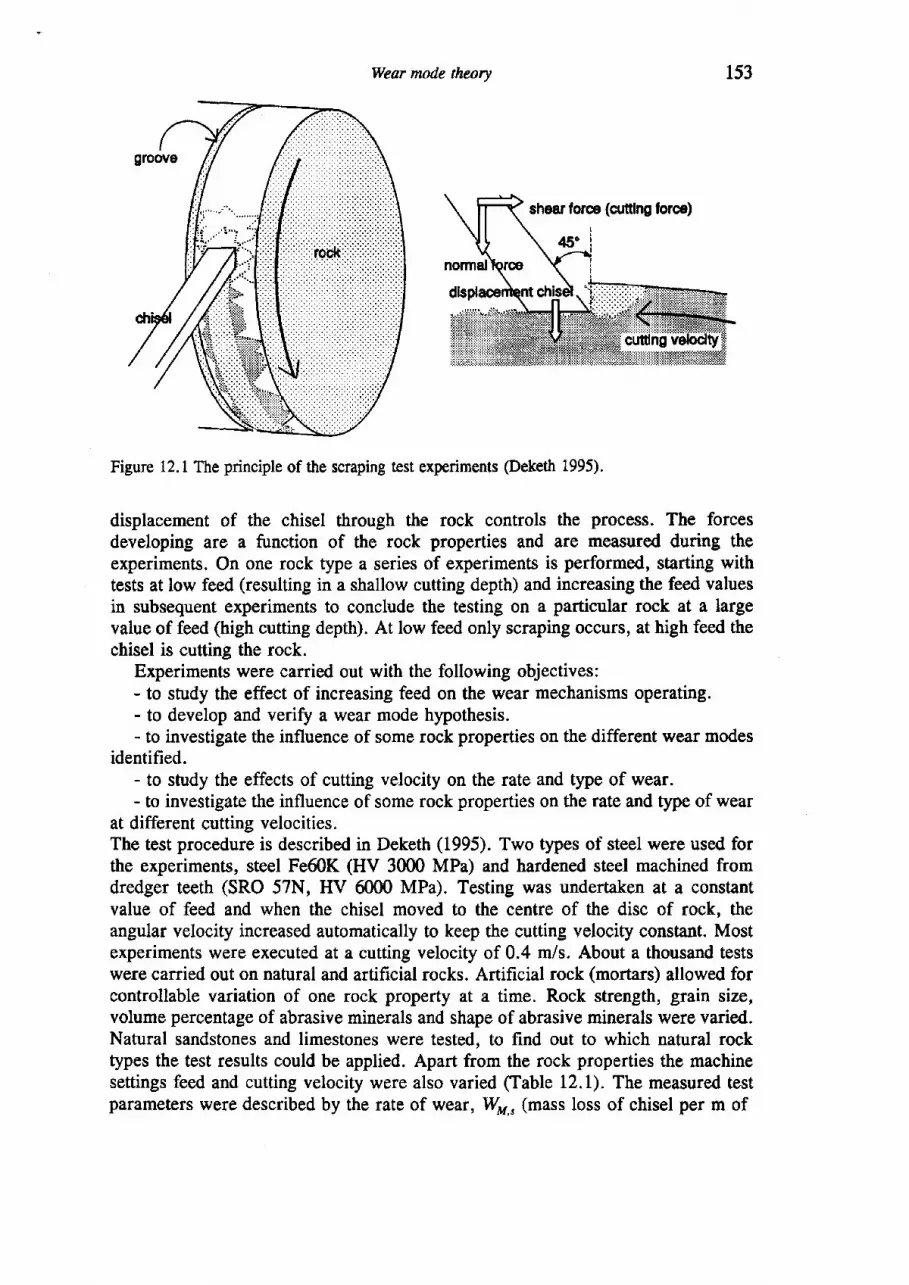
Wear mode theory 153
Figure 12.1 The principle of the scraping test experiments (Deketh 1995).
displacement of the chisel through the rock controls the process. The forcesdeveloping are a function of the rock properties and are measured during theexperiments. On one rock type a series of experiments is performed, starting withtests at low feed (resulting in a shallow cutting depth) and increasing the feed valuesin subsequent experiments to conclude the testing on a particular rock at a largevalue of feed (high cutting depth). At low feed only scraping occurs, at high feed thechisel is cutting the rock.
Experiments were carried out with the following objectives:- to study the effect of increasing feed on the wear mechanisms operating.- to develop and veriff a wear mode hypothesis.- to investigate the influence of some rock properties on the different wear modes
identified.- to study the effects of cutting velocity on the rate and type of wear.- to investigate the influence of some rock properties on the rate and type of wear
at different cutting velocities.The test procedure is described in Deketh (1995). Two types of steel were used forthe experiments, steel Fe60K (HV 3000 MPa) and hardened steel machined fromdredger teeth (SRO 57N, HV 6000 MPa). Testing was undertaken at a constantvalue of feed and when the chisel moved to the centre of the disc of rock, theangular velocity increased automatically to keep the cutting velocity constant. Mostexperiments were executed at a cutting velocity of 0.4 m/s. About a thousand testswere carried out on natural and artificial rocks. Artificial rock (mortars) allowed forcontrollable variation of one rock property at a time. Rock strength, grain size,volume percentage of abrasive minerals and shape of abrasive minerals were varied.Natural sandstones and limestones were tested, to find out to which natural rocktypes the test results could be applied. Apart from the rock properties the machinesettings feed and cutting velocity were also varied (Table l2.l). The measured testparameters were described by the rate of wear, ft, (mass loss of chisel per m of
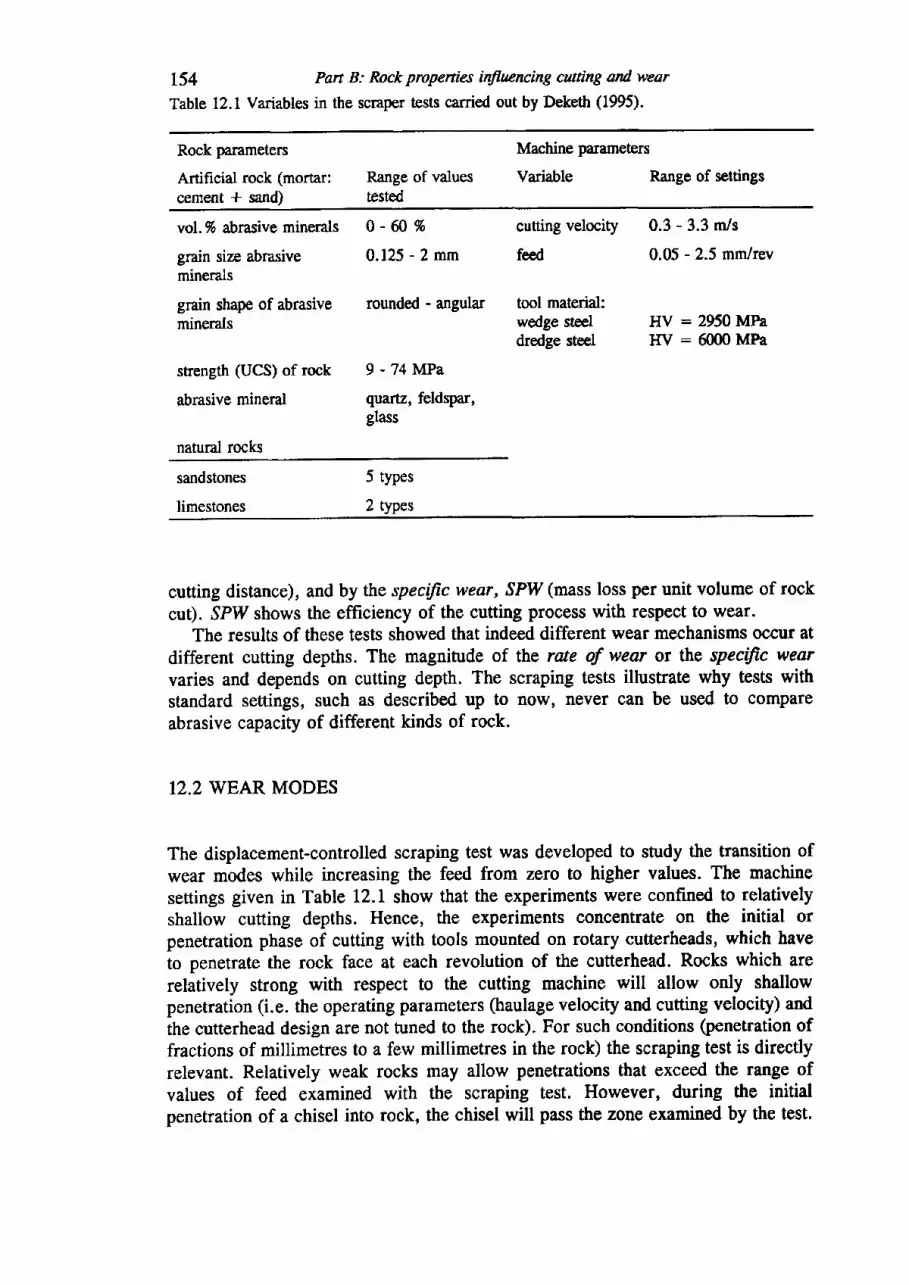
154 Pan B: Rock propenies inflrcncing cafing and wear
Tabte 12.1 Variables in the scraper tests canied out by Deketh (1995).
Rock parameters
Artificial rock (mortar:cement + sand)
Machine parameters
Variable Range of settingsRange of valuestested
vol. % abrasive minerals
grain size abrasiveminerals
grain shape of abrasiveminerals
strength (UCS) of rock
abrasive mineral
natural rocks
O- f f i To
0.125 - 2 mm
rounded - angular
9 - 74lvlPa
quartz, feldspar,glass
cutting velocity
feed
tool material:wedge steeldredge steel
0.3 - 3.3 m/s
0.05 - 2.5 mm/rev
IfV : 2950MPaHV : 6000 MPa
sandstones
limestones
5 types
2 types
cutting distance), and by the specific wear, SPIV (mass loss per unit volume of rockcut). SPIV shows the effrciency of the cutting process with respect to wear.
The results of these tests showed that indeed different wear mechanisms occrr atdifferent cutting depths. The magnitude of the rate of wear or the specific wearvaries and depends on cutting depth. The scraping tests illustrate why tests withstandard settings, such as described up to now, never can be used to compareabrasive capacity of different kinds of rock.
12.2 WEAR MODES
The displacement-controlled scraping test was developed to study the transition ofwear modes while increasing the feed from zero to higher values. The machinesettings given in Table 12.1 show that the experiments were confined to relativelyshallow cutting depths. Hence, the experiments concentrate on the initial orpenetration phase of cutting with tools mounted on rotary cutterheads, which haveto penetrate the rock face at each revolution of the cutterhead. Rocks which arerelatively strong with respect to the cutting machine will allow only shallowpenetration (i.e. the operating parameters (haulage velocity and cutting velocity) andthe cutterhead design are not tuned to the rock). For such conditions (penetration offractions of millimetres to a few millimetres in the rock) the scraping test is directlyrelevant. Relatively weak rocks may allow penetrations that exceed the range ofvalues of feed examined with the scraping test. However, during the initialpenetration of a chisel into rock, the chisel will pass the zone examined by the test.
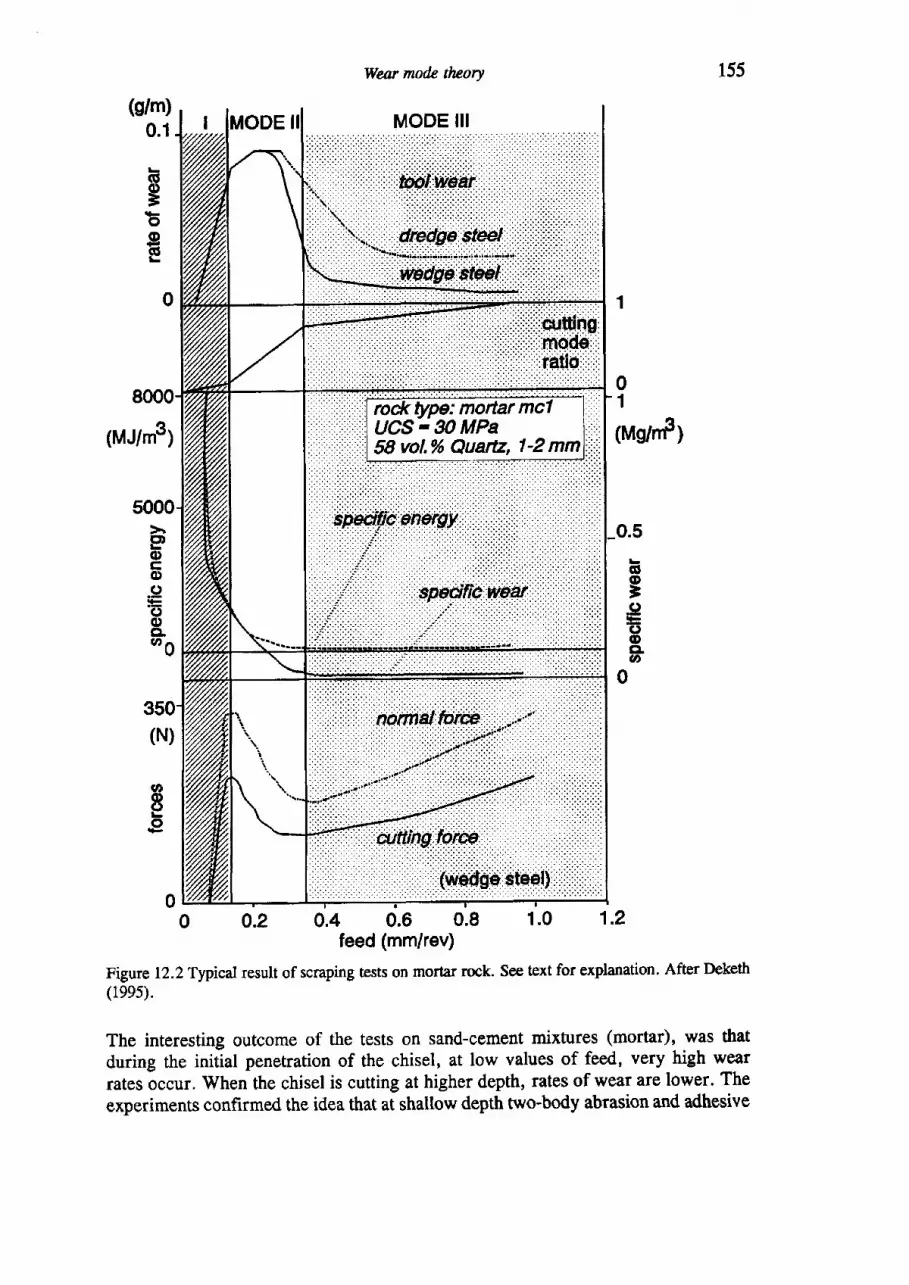
Wear mode tluory 155
(g/m)0.1
FgogE
1ut.t/mg) (MdrnP)
(N)
ogo
o 0.2 0.4 0.6 0.8 1.0 1-2feed (mm/rev)
Figure I2.2Typicalresult of scraping t€sts on mortar rock. See lext for explanation. After Deketh(1ee5).
The interesting outcome of the tests on sand-cement mixtures (mortar), was that
during the initial penetration of the chisel, at low values of feed, very high wearrates occur. When the chisel is cutting at higher depth, rates of wear are lower. The
experiments confirmed the idea that at shaltow depth two-body abrasion and adhesive
r56 Part B: Rock properties inflrcrcing cwting and wear
wear processes are dominant, while at greater depth three-body wear is the majorprocess. The artificial mortar rock models sondstones, i.e. rocks with abrasive grainsembedded in a finer grained matrix, or in grain-to-grain contact with each other.
In this chapter the results of the experiments will be examined. The implicationsfor the practice of rock cutting dredging are discussed.
12.2.1 Wear processes a shallow cutting depth
To examine the events that occur when a chisel enters the mortar rock, a simplifiedset of graphs is prepared. These are shown in Figure 12.2 & l2.3.It should be clearthat the graphs show lines drawn along trends indicated by point data representingthe results of many experiments, each carried out at one particular value of feed.
Figure 12.2 is a compilation of the experiments done on a mortar rock, consistingof 58 vol. % of l-Z mm sized quartz grains embedded in cement, that had a UCS of30 MPa. The top graph shows the rate of wear (loss of mass per unit of slidingdistance), which is negligible when the chisel barely touches the rock, increases toa maximum and then drops to a level that remains constant in the test range of feed.Interestingly, the dredge steel, with higher initial hardness, has higher wear ratesthan the wedge steel.
The graph below gives the cutting mode ratio, which is the ratio of the depth ofcut and the feed. A value of 1 indicates cutting, a value of 0 indicates that scraping,without formation of rock fragments, is taken place. A cutting mode ratio of 0 meansthat the chisel wears at the same rate as it is displaced into the rock, resulting in anet cutting depth of 0 mm/rev. A cutting mode ratio of 1 indicates that no wear istaking place, the feed equals the cutting depth. In this case at a feed of 1 mm fullrock cutting starts.
The graphs of specific energy and specific wear versus feed are of particularimportance, because they indicate the oconomy of the cutting process. Both valuessignificantly drop when the chisel starts to produce rock fragments and cuttings.
The lowest graph displays the measured averaged normal and cutting forces forthe wedge steel chisels. The forces increase to a high value at shallow depth,decrease and then increase again with cutting depth.
Deketh (1995) describes that the chisel temperatures in the initial shallow cuttingstages are very high and rise above 600 "C in a narrow, 300 pm wide, zone at thewear flat of the chisels. The wear flat surfaces of the chisels showed parallel grooves(indicating microcutting) and sometimes a 2 pm thin band of steel has plasticallyflown into the direction of movement of the chisel. (Deketh, t995, Figures 36 &43). These observations indicate that the wear mechanisms involved were two-bodyabrasion and adhesion.
Temperatures near the wear flat of chisels cutting at higher feeds reach amaximum of 400 oC. The wear flats of these chisels have irregular, abruptly ending,grooves and have much rock gouge embedded in the steel of the wear flat.
These observations led to the model of three modes of wear taking place duringthe penetration of a chisel into this type of rock. These three wear modes relate tothree cutting mechanisms:
- Wear mode /: The scraping process occurring at low feed is associated withtwo-body grooving abrasion. Clean, parallel continuous grooves on the wear flats of
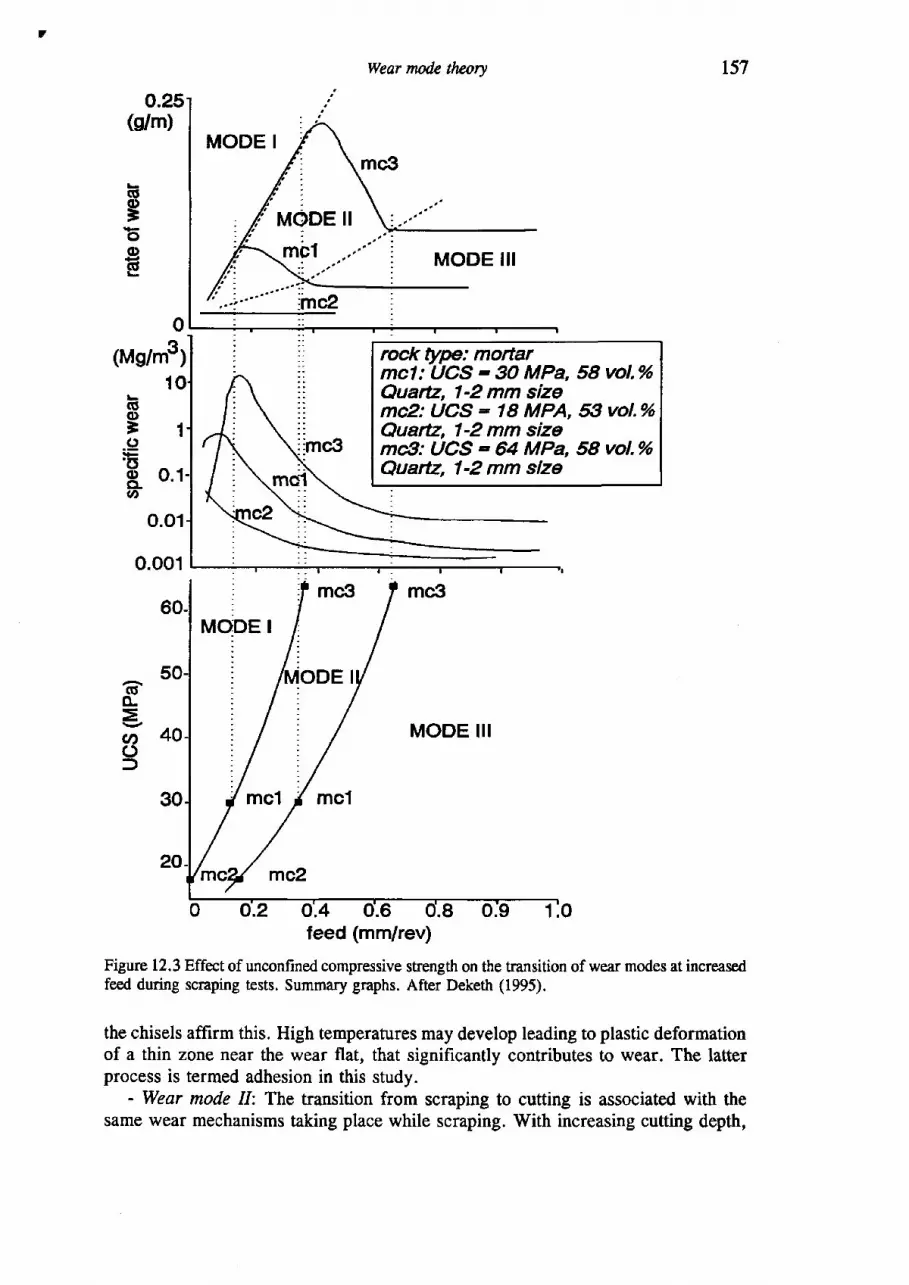
lVear modc tlwory r57
0.25(g/m)
(tutg/m3) rock type: mortarmcl: UCS - 3O MPa, 58 vol,ot6Cluartz, 1-2 mm sizemcZ: UCS : 78 MPA, 53 vol.%Quartz, 1-2 mm sizemc9: UCS - 64 MPa, 58 vol.%Quaftz, 1-2 mm size
o.01
0.001
feed (mm/rev)
Figure 12.3 Effect of unconfined compressive strength on the transition of wear modes at increasedfeed during scraping lests. Summary graphs. After Deketh (1995).
the chisels affirm this. High temperatures may develop leading to plastic deformationof a thin zone near the wear flat, that significantly contributes to wear. The latterprocess is termed adhesion in this study.
- Wear mode /l The transition from scraping to cutting is associated with thesame wear mechanisms taking place while scraping. With increasing cutting depth,
$gE(D(E
(Ito)=1.9( td-t al {o_(t,
(sTL=cn():)
: :i,mc3\
rncl
158 Pan B: Rock propenia influencing cutt@ end twar
a change towards mode III takes place, associated with a fall of the wear-flattempefature and the rate of wear.
- Wear mode //t The chisels are cutting into and crushing the mortar rock.Observations of the chisels indicate that three-body abrasive wear is dominant,cnrshed rock gouge is present between wear flat and intact rock. Temperatures ofthe wear flat are relatively low.
Referring to Figure 10.2, some additional remarks can be made:- In these experiments, the wear rate of the dredge steel is about 75% hrgher than
that of the softer wedge steel in wear mode III. Deketh (1995) notes that thisdifference also holds for tests carried out on a stronger mortar. The explanation mustbe found in a different reaction of the two steel types on the wear process imposed.
- The rise in cutting forces with increasing feed, or cutting depth, will probablylead to a rise in the specific energy and specific wear. In the shallow depthsinvestigated, however, this is not occurring as yet.
12.3 ROCK PROPERTIES INFLUENCING WEAR
Figure 12.3 is a compilation of the test results of mortars which have an almostidentical mineralogical composition and differ only in strength. The top graph showsthat for the strongest mortar rock the feed range at which the unfavourable wearmode I is occurring is larger. Correspondingly the depth of cut at which relativelyhigh wear rates are present increases as well. The transition to wear mode III alsooccurs over a wider feed range. Contrasting with this is the behaviour of the weakestrock. No transitions in wear rate are indicated, but observations of the worn chiselsurfaces indicated that at a feed of 0.18 mm/rev probably two-body groovingabrasion was still occurring, while at higher feed mode III prevailed. The lowestgraph in the figure indicates the trend of shifting transition zones with rock strength.
The graph in the middle shows the data on the specific wear (note the logarithmicscale; specific energy follows a similar trend).
The rock parameters average grain size and vol.% Qwrtz had an importantinfluence on the rate of wear. The transition zone (mode II) that separates the fieldswhere mode I and mode III wear occurs is given in Figure 12.4. These graphs canbe used to guess the likely wear mode that would operate at a certain feed in amortar of a composition different from that tested.
The rock parameters sfiength, quartz cantent and grain size influence, as shownby these tests, the rate of wear. Increase of the value of these parameters causes anincrease of the rate of wear and a shift of the transition towards the more favourablewear mode III to a larger cutting depth.
Deketh also investigated the effect of grain shape. Only at very small feeds, whilescraping, did sharper grains result in more wear. When the transition to cutting tookplace, in wear mode III, no difference in wear rate was found. The crushing processoccurring in wear mode III explains why initial shape of grains has no influence onthe wear of the chisels at greater cutting depth.
Finally, samples of mortar rock were prepared with Feldspar and Iused silicaglass. Silica glass has a hardness lower or equal to that of hard steel (HV 7500MPa), Feldspar has a hardness of about HV 8000 MPa. It was expected that the
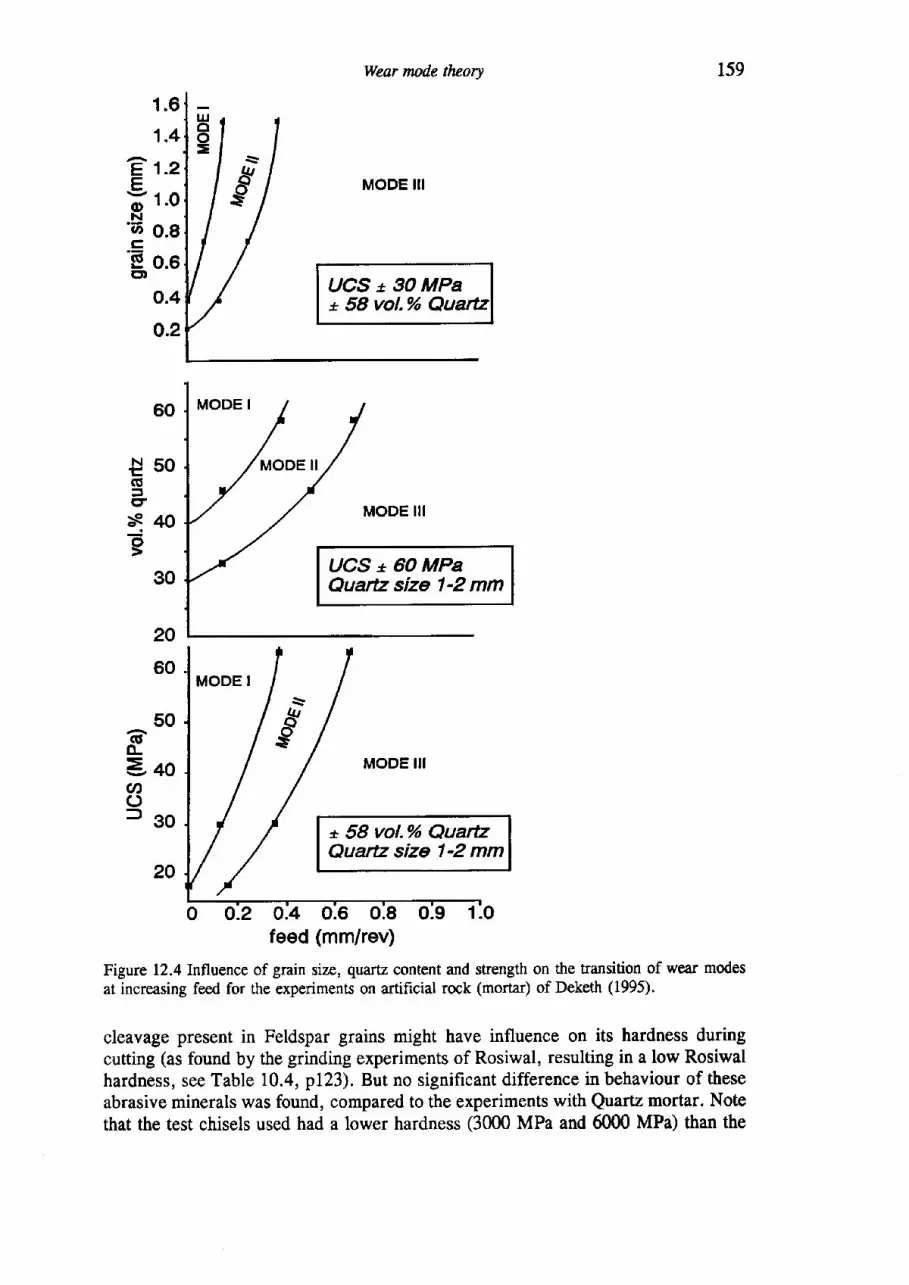
Wear mode theory 159
1.6
1.4
UCS x 3O MPax 58 vol.%
o.2
UCS * 6O MPaQuartz size 1-2 mm
20
60
* 58 vol.% QuarEQuaru size 1-2 mm
20
o o-2 0.4 0.6 0.8 0.9 1.ofeed (mm/rev)
Figure 12.4 Influence of grain size, quartz content and strength on the transition of wear modesat increasing feed for the experiments on artificial rock (mortar) of Deketh (1995).
cleavage present in Feldspar grains might have influence on its hardness duringcutting (as found by the grinding experiments of Rosiwal, resulting in a low Rosiwalhardness, see Table I0.4, pI23). But no significant difference in behaviour of theseabrasive minerals was found, compared to the experiments with Quatz mortar. Notethat the test chisels used had a lower hardness (3000 MPa and 6000 MPa) than the
E t-zF
E r.oN'aa o.Bc'E
o.eE l
o.4
850C5
cr{40o
30
50(Uo-E+oCN()=go
-\
s8
0:6 0:8 0:9 1:O
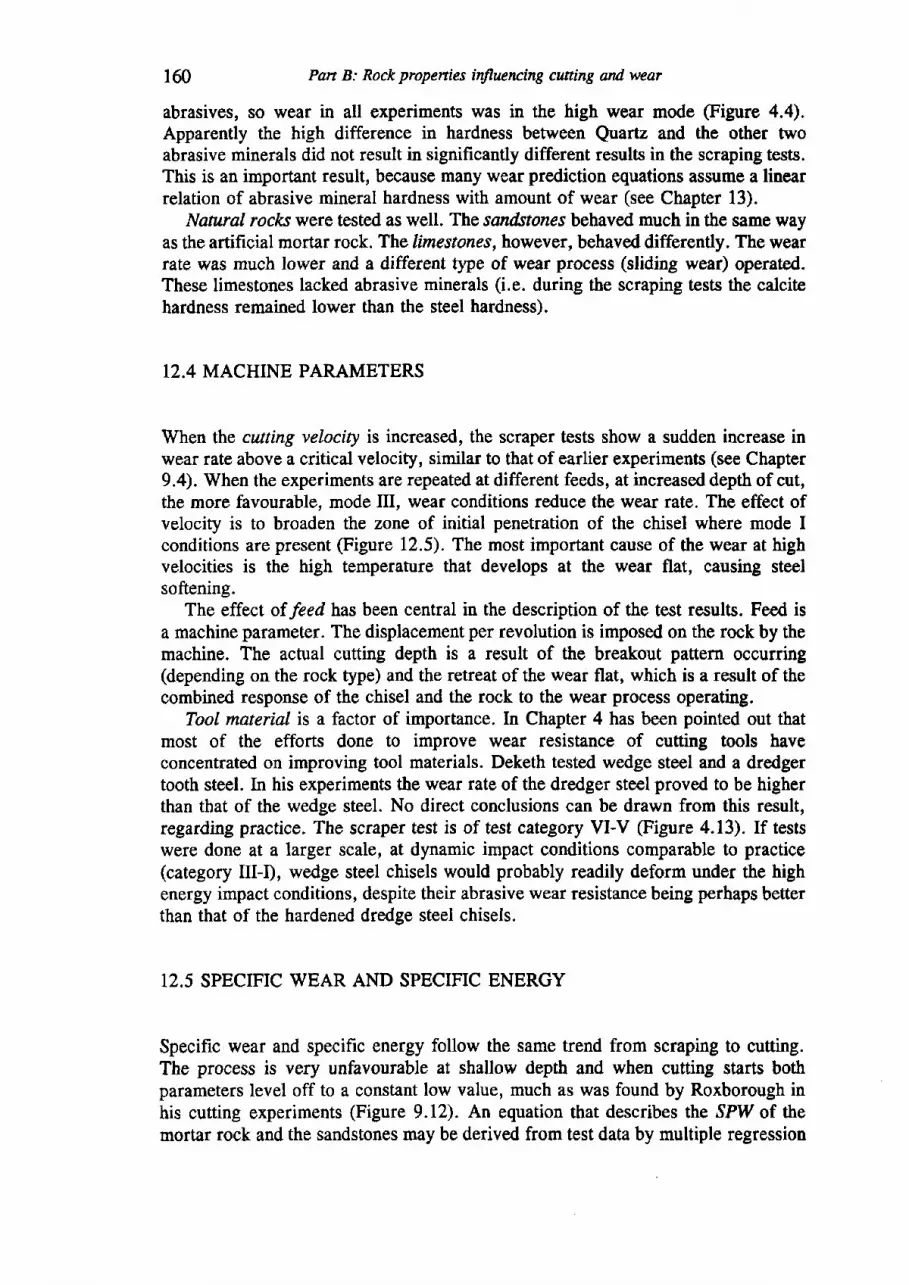
160 Pan B: Rock propenies inJluencing cutting and wear
abrasives, so wear in all experiments was in the high wear mode (Figure 4.4).Apparently the high difference in hardness between Quartz and the other twoabrasive minerals did not result in significantly different results in the scraping tests.This is an important result, because many wear prediction equations assume a linearrelation of abrasive mineral hardness with amount of wear (see Chapter l3).
Natural rocks were tested as well. The sandstones behaved much in the same wayas the artificial mortar rock. The limestones, however, behaved differently. The wearrate was much lower and a different type of wear process (sliding wear) operated.These limestones lacked abrasive minerals (i.e. during the scraping tests the calcitehardness remained lower than the steel hardness).
12.4 MACHINE PARAMETERS
When the attting velocity is increased, the scraper tests show a sudden increase inwear rate above a critical velocity, similar to that of earlier experiments (see Chapter9.4). When the experiments are repeated at different feeds, at increased depth of cut,the more favourable, mode III, wear conditions reduce the wear rate. The effect ofvelocity is to broaden the zone of initial penetration of the chisel where mode Iconditions are present (Figure I2.5). The most important cause of the wear at highvelocities is the high temperature that develops at the wear flat, causing steelsoftening.
The effect of feed has been central in the description of the test results. Feed isa machine parameter. The displacement per revolution is imposed on the rock by themachine. The actual cutting depth is a result of the breakout pattern occurring(depending on the rock type) and the retreat of the wear flat, which is a result of thecombined response of the chisel and the rock to the wear process operating.
TooI material is a factor of importance. In Chapter 4 has been pointed out thatmost of the efforts done to improve wear resistance of cutting tools haveconcentrated on improving tool materials. Deketh tested wedge steel and a dredgertooth steel. In his experiments the wear rate of the dredger steel proved to be higherthan that of the wedge steel. No direct conclusions can be drawn from this result,regarding practice. The scraper test is of test category VI-V (Frgure 4.13). If testswere done at a larger scale, at dynamic impact conditions comparable to practice(category III-D, wedge steel chisels would probably readily deform under the highenergy impact conditions, despite their abrasive wear resistance being perhaps betterthan that of the hardened dredge steel chisels.
12.5 SPECIFIC WEAR AND SPECIFIC ENERGY
Specific wear and specific energy follow the same trend from scraping to cutting.The process is very unfavourable at shallow depth and when cutting starts bothparameters level off to a constant low value, much as was found by Roxborough inhis cutting experiments (Figure 9.12). An equation that describes the ̂ SPIV of themortar rock and the sandstones may be derived from test data by multiple regression
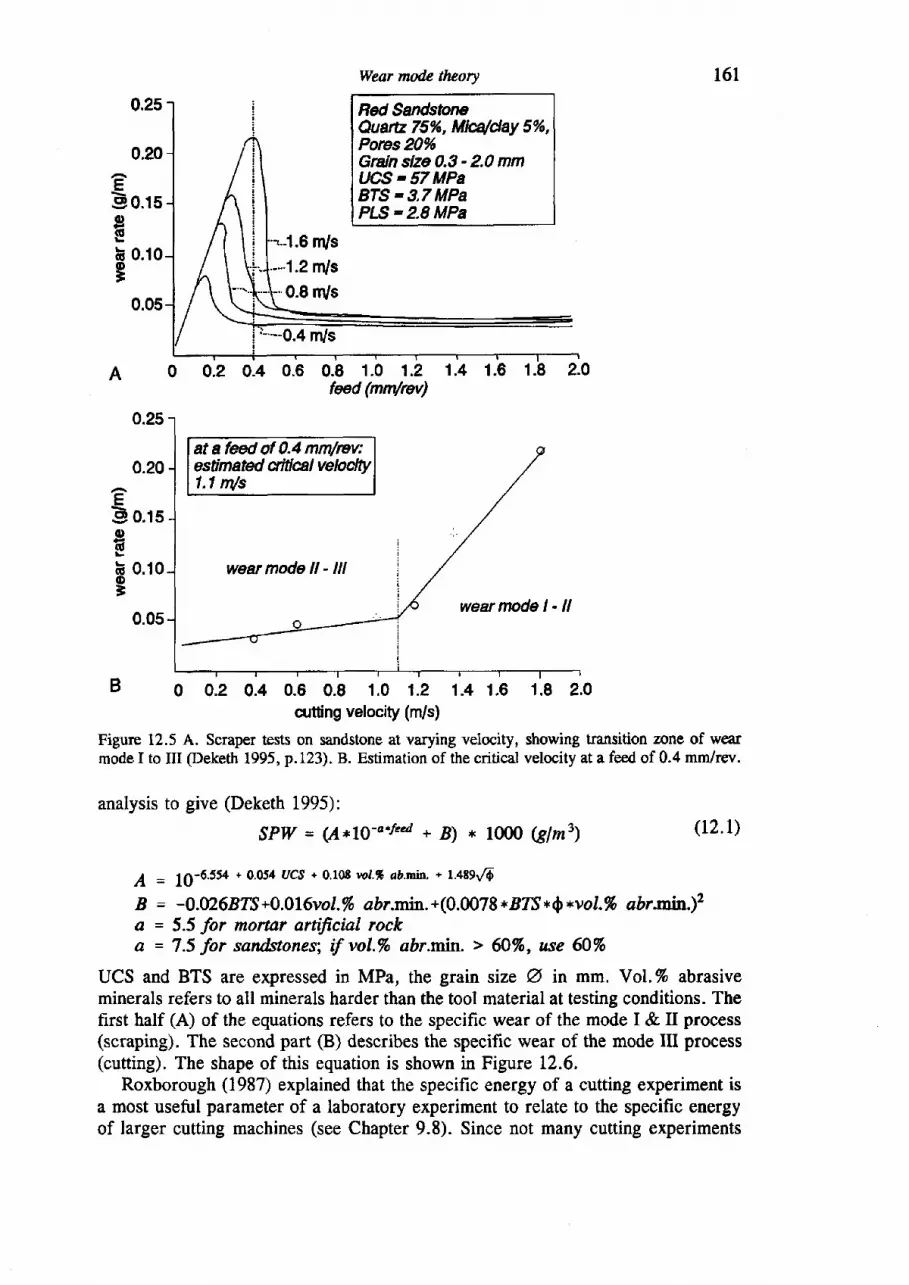
Wear nwdc tluory
Red SandstoneQudm 75%, Miu/day 5%,Pores 20%Gnin slze 0.3 - 2.0 mmLlCS - 57 MPa8IS - 3.7 MPaPLS = 2.8 MPa
EE o.tsoEF 0.10o,
161
0.25
0.20
0.05
0.6 0.8 1.0 1.2 1.4 1.6 1 .8feed (mm/rev)
at a feed of 0.4 mm/reuestimatd clittical veloclty1'l Ns
0.05
B o o.z 0.4 0.6 o.g 1.0 1.2 1.4 r.6 t.g z.ocutting velocity (m/s)
Figure 12.5 A. Scraper tests on sandstone at varying velocity, showing transition zone of wearmode I to III (Deketh 1995, p.123). B. Estimation of the critical velocity at a feed of 0.4 mm/rev.
A
eE o.tsqt
EF 0 .10oB
analysis to give (Deketh 1995):
SPW = (A*l}-a*'a * B) * lOf,l0 (glml) (12.1)
/ = 19-6.554 + 0.054 UC$ + 0.10t wl% ab.mil- * r-489J0
B = -O.V26BTS +0.01 6vot.% abr.mtr^. + (0.0078 *BIS * 0,*vol.% abr.ntn.)2a = 5.5 for monar artificial rocka = 7.5 for sandstones; if vol.% abr.min > 60%, use ffiTo
UCS and BTS are expressed in MPa, the grain size 6 in mm. YoI.% abrasiveminerals refers to all minerals harder than the tool material at testing conditions. Thefirst half (A) of the equations refers to the specific wear of the mode I & II process(scraping). The second part (B) describes the specific wear of the mode III process(cutting), The shape of this equation is shown in Figure 12.6.
Roxborough (1987) explained that the specific energy of a cutting experiment isa most useful parameter of a laboratory experiment to relate to the specific energyof larger cutting machines (see Chapter 9.8). Since not many cutting experiments
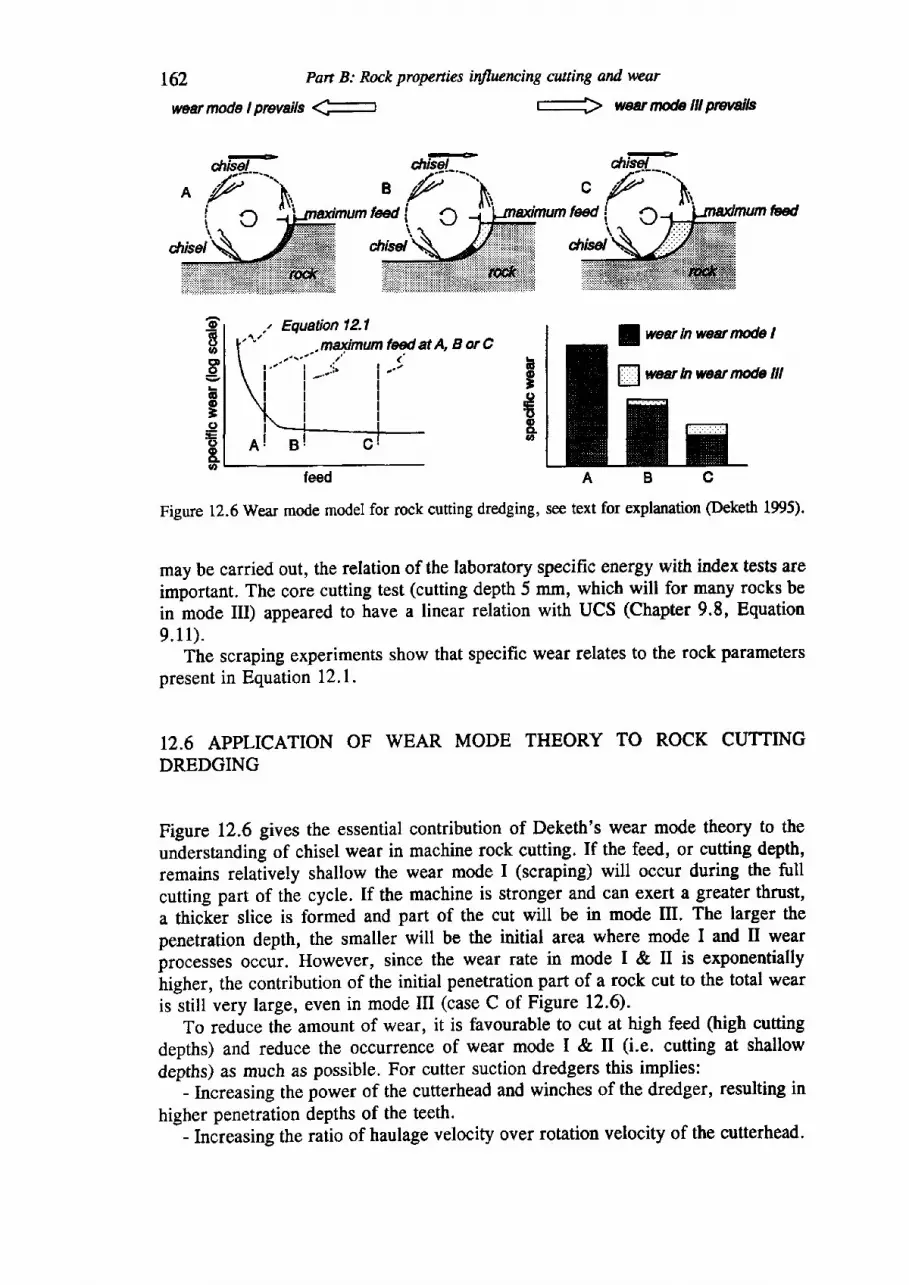
162 Part B: Rock propenies i4lhnncing cutting and wear
- wearnffilllpwatlswearmode t prevails.(-
, Equation 12.1
bgtEoCLo
6-soooI
6o3.9()g.v,
,,-:,'.:r^\'y^^ Borc
f eedABC
Figure 12.6 Wear mode model for rock cutting dredging, see text for explanation (Deketh 1995).
may be carried out, the relation of the laboratory specific energy with index tests areimportant. The core cutting test (cutting depth 5 mm, which will for many rocks bein mode III) appeared to have a linear relation with UCS (Chapter 9.8, Equation9 .11) .
The scraping experiments show that specific wear relates to the rock parameterspresent in Equation 12.1.
12.6 APPLICATION OF WEAR MODE THEORY TO ROCK CUTTINGDREDGING
Figure 12.6 gives the essential contribution of Deketh's wear mode theory to theunderstanding of chisel wear in machine rock cutting. If the feed, or cutting depth,remains relatively shallow the wear mode I (scraping) will occur during the fuIl
cutting part of the cycle. If the machine is stronger and can exeft a greater thrust,
a thicker slice is formed and part of the cut will be in mode III. The larger thepenetration depth, the smaller will be the initial area where mode I and II wearpror"sses occur. However, since the wear rate in mode I & II is exponentiallyhigher, the contribution of the initial penetration part of a rock cut to the total wearis still very large, even in mode III (case C of Figure 12.6\.
To reduce the amount of wear, it is favourable to cut at high feed (high cutting
depths) and reduce the occurrence of wear mode I & II (i.e. cutting at shallow
depths) as much as possible, For cutter suction dredgers this implies:- Increasing the power of the cutterhead and winches of the dredger, resulting in
higher penetration depths of the teeth.- Increasing the ratio of haulage velocity over rotation velocity of the cutterhead.
lwear tn wear nde t
fiwr n wear npda tlt
Wear modc thcory 163
This results in higher penetration depth of the teeth (Figure 8.4). A lower rotationvelocity of the cutterhead also will keep the contact temperatures of the tool-rockcontact lower.
- Adaption of cutterhead design to rock type, to ensure maximum feed for eachtooth. A reduction of the number of pick points in an identical position @quation3.4) results in higher penetration depths of the individual pick points.
The above listed measures should be regarded with judgement. For example,Roxborough & Sen (1986) comment with respect to the deep cutting principle inmechanised rock cutting: "Deeper cuts with more widely spaced picks mean tlwt
fewer picks are cutting ot any one time and so the associated higher traffitorycutting forces are being applied at fewer points in the array. In the extreme, thisgives rise to cutterhead vibruions. There should always be enough picks in an arayto enable the cutting sequence to be balanced suficiently well to avoid wide
fluctuations in the magnitude and locaion of the resultant force acting on thecutterhead. " Moreover, a reduction of the number of pick points is associated withincrease of pick point spacing. The interaction of the pick points stops. This leadsto an unfavourable cutting mode, accompanied by the use of more energy per unitof rock cut.
The above practical considerations have been taken into account by Deliac (1993),who has developed models that simulate the cutting action of cutterheads in rock.
CHAPTER 13
Assessment of the abrasiveness of rock
The development of the research into wear processes during rock cutting leads awayfrom relying entirely on the results of laboratory abrasion tests on rock samples.Although many remain positive about using abrasion tests for the assessment of
abrasiveness of rocks (Biichi et al. 1995), most would probably agree withRoxborough (1987) who states that correlation of laboratory test results with real
scale machine cutting is fortuitous. An overall assessment involving rock mechanical
and petrographic properties of the intact rock and considerations on the type ofmachine used, the expected depth of penetration and the type of cutting process, willplay an important part in future discussions. Almost all the tests described in thepreceding chapters have been conducted on inlact rock materials; each rock cuttingmachine, or each cutter suction dredger, will have its own wear characteristics in a
certain rock mass.The conclusion drawn is that laboratory tests are helpful in assessing the
abrasiveness of rock, but that the hope to be able to predict the amount of wear
during rock cutting from tests is not justified by the results.The Norwegian "Hard rock tunnel boring" programme that has been used as an
example for this research, also found that the drillability indices DRI and BWI,which are based on laboratory tests (Frgure ll.2), did not correlate better with the
wear data (cutter disc life) than the Vickers Hardness number of the rock (VHNR)(Johannessen at al. 1990). The VHNR is determined by proportional summation of
the Vickers Hardness of the constituent minerals (Table 10.4 & 5). To determine the
VHNR only the petrography of the rock is needed. The Norwegian programme
shows that in retrospect, simple petrographic indices may perform just as well, or
even better, as laboratory tests.However, the laboratory testing has helped to understand what rock parameters
definitely relate to abrasiveness. These are:- Strength- Mineral content- Grain size of (abrasive) minerals
To assemble the information needed, strength tests on rock samples can be carried
out (tests: Unconfined Compressive Strength, Brazilian Tensile Strength, Point Load
Strength). Grain size and mineral content can be established by microscopicexamination. The hardness of the minerals is important in this respect. This is
t&
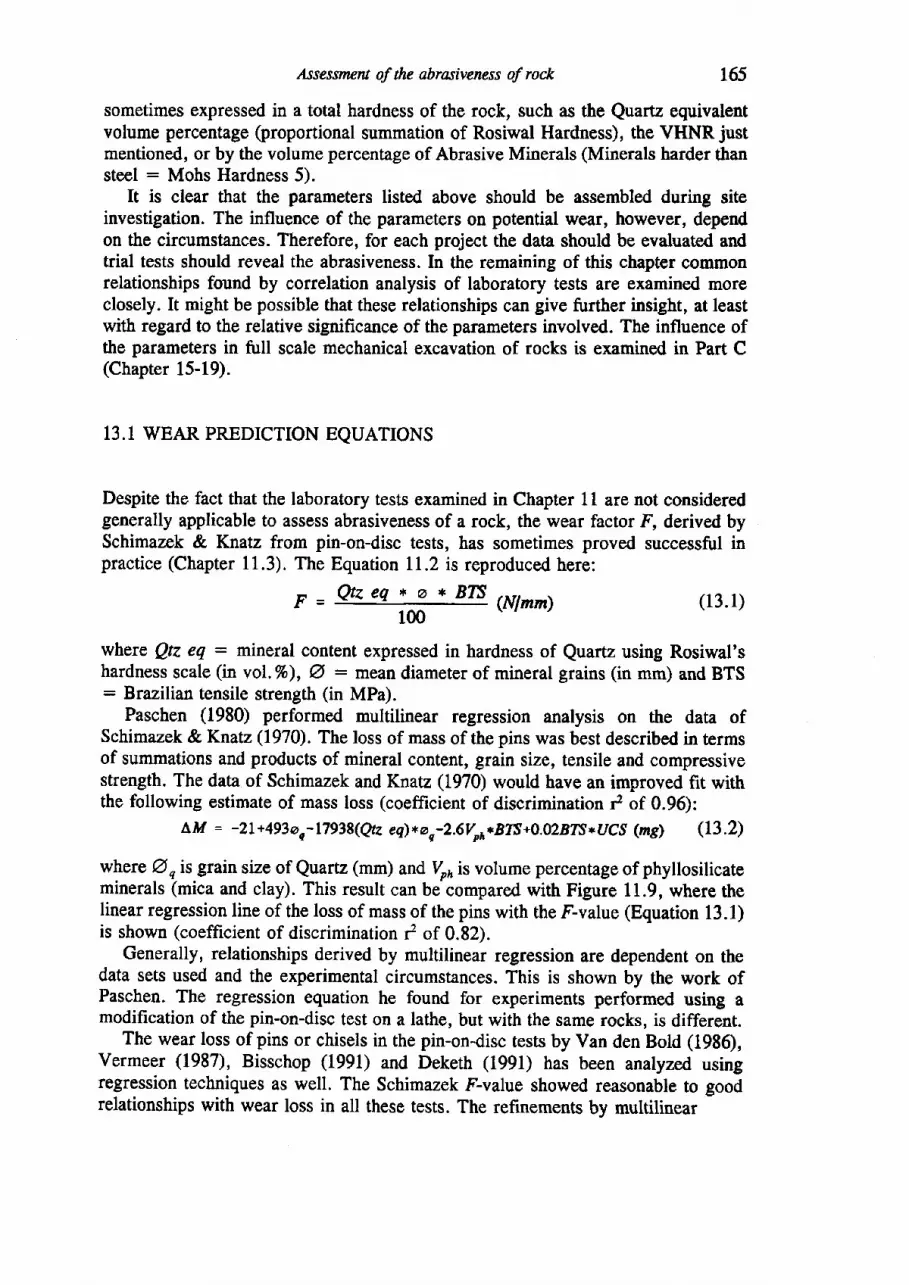
Assessmew of the abrasiveness of rock 165
sometimes expressed in a total hardnsss of the rock, such as the Quartz equivalentvolume percentage (proportional summation of Rosiwal Hardness), the VHNR justmentioned, or by the volume percentage of Abrasive Minerals (Minerals harder thansteel : Mohs Hardness 5).
It is clear that the parameters listed above should be assembled during siteinvestigation. The influence of the parameters on potential wear, however, dependon the circumstances. Therefore, for each project the data should be evaluated andtrial tests should reveal the abrasiveness. In the remaining of this chapter commonrelationships found by correlation analysis of laboratory tests are examined moreclosely. It might be possible that these relationships can give further insight, at leastwith regard to the relative significance of the parameters involved. The influence ofthe parameters in full scale mechanical excavation of rocks is examined in Part C(Chapter 15-19).
13.1 WEAR PREDTCTTON EQUATTONS
Despite the fact that the laboratory tests examined in Chapter 11 are not consideredgenerally applicable to assess abrasiveness of a rock, the wear factor fl derived bySchimazek & Knatz from pin-on-disc tests, has sometimes proved successful inpractice (Chapter 11.3). The Equation 11.2 is reproduced here:
Qtzeq * a * B7S100
(13.1)F_ (Nlmn)
where Qtz eq : mineral content expressed in hardness of Quartz using Rosiwal'shardness scale (in voL.%), @ : mean diameter of mineral grains (in mm) and BTS: Brazilian tensile strength (in MPa).
Paschen (1980) performed multilinear regression analysis on the data ofSchimazek &Knatz (1970). The loss of mass of the pins was best described in termsof summations and products of mineral content, grain size, tensile and compressivestrength. The data of Schimazek and Knatz (1970) would have an improved fit withthe following estimate of mass loss (coefficient of discrimination I of 0.96):
LM = -21 + 493 o q- 17938(Qtz eq) * o q-2.6Vpr,* BTS +0.A2rtT r, UCS (ng) (13 .2)
where Q ois grain size of Quartz (mm) and Vrnis volume percentage of phyllosilicateminerals (mica and clay). This result can be-compared with Figure 11.9, where thelinear regression line of the loss of mass of the pins with the F-value (Equation 13.1)is shown (coefficient of discrimination f of 0.82).
Generally, relationships derived by multilinear regression are dependent on thedata sets used and the experimental circumstances. This is shown by the work ofPaschen. The regression equation he found for experiments performed using amodification of the pin-on-disc test on a lathe, but with the same rocks, is different.
The wear loss of pins or chisels in the pin-ondisc tests by Van den Bold (1986),Vermeer (1987), Bisschop (1991) and Deketh (1991) has been analyzed usingregression techniques as well. The Schimazek F-value showed reasonable to goodrelationships with wear loss in all these tests. The refinements by multilinear
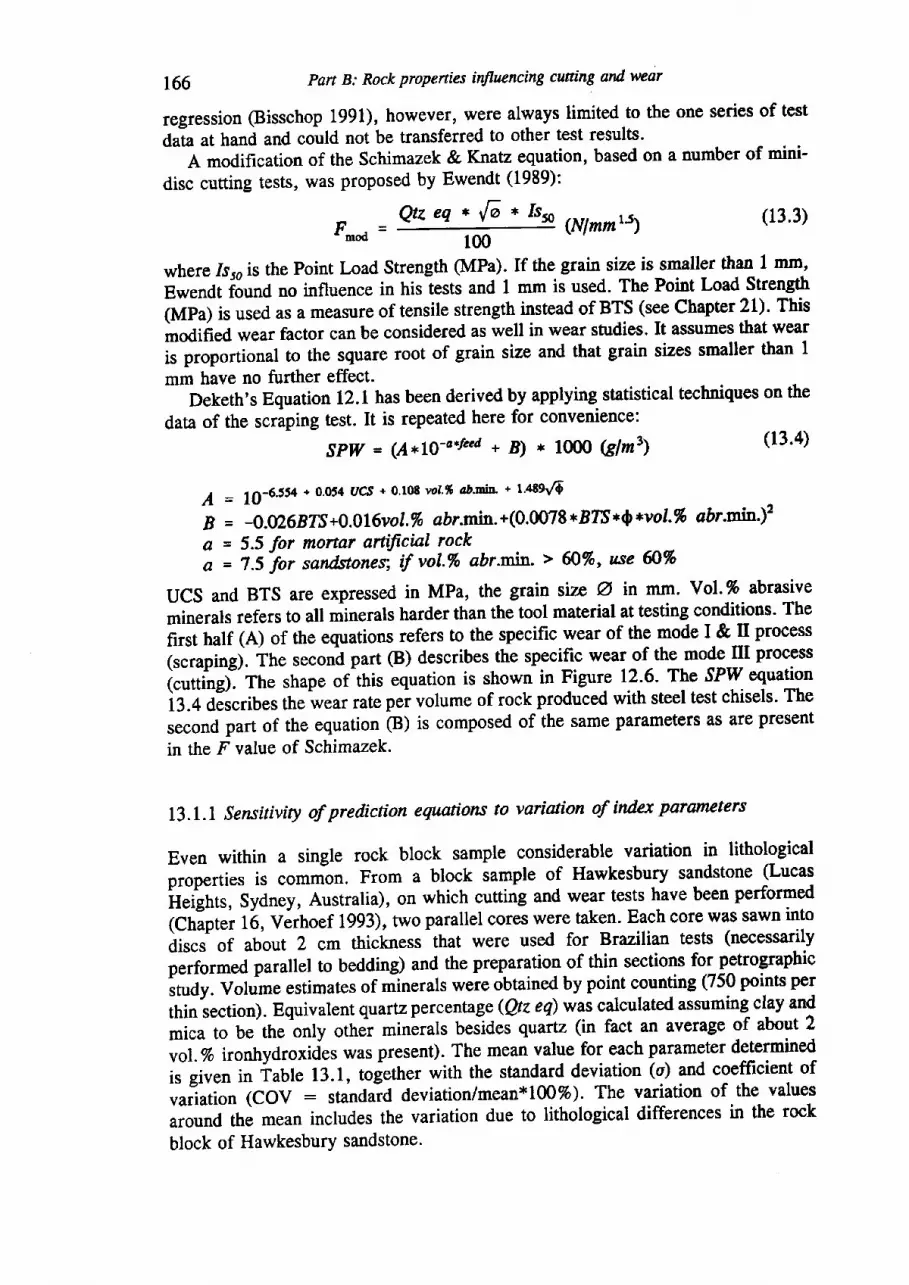
166 Pan B: Rock propenies intluencing cuning and wear
regression @isschop 1991), however, were always limited to the one series of test
daL at hand and could not be transferred to other test results.
A modification of the Schimazek & Knatz equation, based on a number of mini-
disc cutting tests, was proposed by Ewendt (1989):
Qtz eq * ,/6 * Isy,(NImmr's) (13.3)
E =' m o d100
where.Isro is the Point Load Strength (MPa), If the grain size is smaller than I mm,
Ewendt iounO no influence in his tests and I mm is used. The Point Load Streng0
(Mpa) is used as a measure of tensile strength instead of BTS (see Chapter 21). This
modified wear factor can be corrsidered as well in wear studies. It assumes that wear
is proportional to the square root of grain size and that grain sizes smaller than 1
mm have no further effect-Deketh's Equation 12.1 has been derived by applying statistical techniques on the
data of the scriping test. It is repeated here for convenience:
SPW = (r{*10-s*fecd a B) * 1000 Glms) (13'4)
= 10-6.554 + 0.054 UC,f + 0.10E wl'% &'tu' * l'aS9fi
= -O.V26BZS +0.0 16vo l.% abr.rnn +(0.0078 *BTS * 0 *vo l -% abr.min)2= 5.5 for monar arti,ficial rock= 7.5-for sandstonesJ t7 vol.% abr'min' > ffi%, use ffi%
UCS and BTS are expressed in MPa, the grain size @ in mm. Yol.% abrasive
minerals refers to all minerals harder than the tool material at testing conditions- The
first half (A) of the equations refers to the specific wear of the mode I & II process
(scraping). The second part (B) describes the specific wear of the mode III process
iruttioglr-The shape ofinis equation is shown in Figure 12.6. The 5PlV equation
ir.+ aErrribes the wear rate pei volume of rock produced with steel test chisels. The
second part of the equation (B) is composed of the same parameters as are present
in the ̂ F' value of Schimazek.
13.1.1 Sensitiviry of prediction equations to variation of index parofneters
Even within a single rock block sample considerable variation in lithological
properties is comm-on. From a block sample of Hawkesbury sandstone (Lucas
itrigttr, Sydney, Australia), on which cutting and wear tests have been performed
tCtriptei 16, Virhoef 1993), two parallel cores were taken. Each core was sawn into
air". of about Z cm thickness that were used for Brazilian tests (necessarily
performed parallel to bedding) and the preparation-of thin sections for petrographic
il;t. t"fie estimates of minerals wer€ obtained by point counting (750 points per
thin section). Equivalent quartz percentage (Qtz eq) was calculated assuming clay and
mica to be the only other minerals besides quartz (in fact an average of about 2
vol.To ironhydroxides was present). The mean value for each parameter determined
is given in iable 13.1, toiether with the standard deviation (o) and coefficient of
vaiation (COV : standaid deviation/mean*100%). The variation of the values
around the mean includes the variation due to lithological differences in the rock
block of Hawkesbury sandstone.
ABa.a
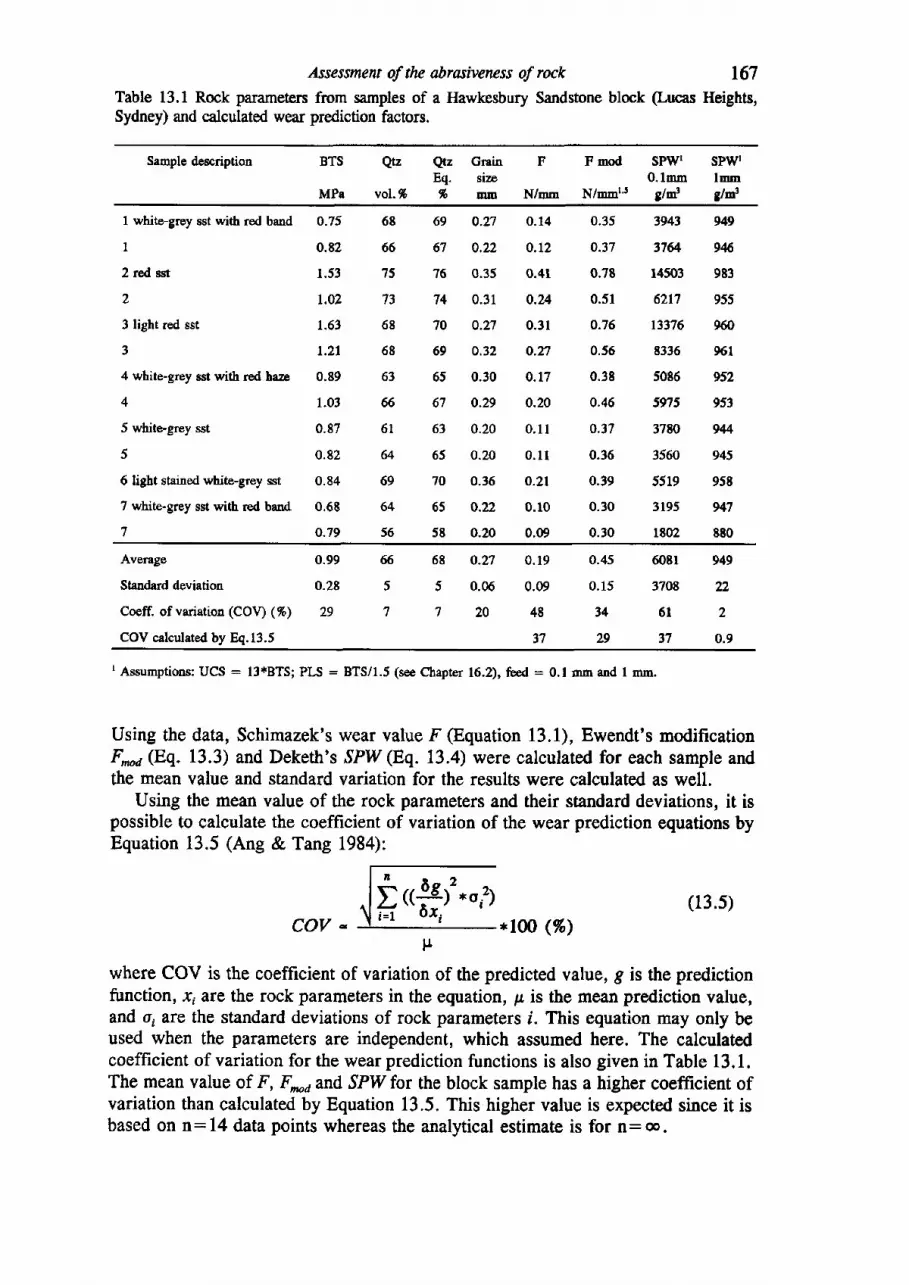
Assessment of the abrasivencss of rock 167Table 13.1 Rock parameters from samples of a Hawkesbury Sandstone block (Lucas Heights,Sydney) and calculated wear prediction factors.
Sample description BTS
MPa
atz
vol. 96
F
N/mn
Qtz GrainEq. sizn% utrl
F mod SPW' SPW0.1mm lmm
N/--t.s g/d Slrt
1 white-grey sst with red band
I
2 red sst
2
3 light red sst
3
4 white-grey sst with red haze
4
5 white-grey sst
5
6 light stained white-grey sst
7 white-grey sst with red band
7
0.35 3943
0.37 1764
0.78 14503
0.51 6217
0.76 t3376
0.56 8336
0.38 5086
0.46 5n5
0.t7 37to
0.36 3560
0.39 5519
0.30 3195
0.30 1802
0.75
o.E2
1.53
t.o2
1.63
t .2 l
0.89
L.O3
0.87
0.82
0.84
0,68
o.79
68
66
15
73
68
68
63
66
6l
64
69
64
56
0.14
0.L2
0.41
o.z4
0.31
o.27
0.17
o.20
0 . 1 l
0 .11
o.zl
0.r0
0.09
69 0.27
67 0.22
76 0.35
74 0.31
70 0.n
69 0.32
65 0.30
67 0.29
61 0.20
65 0.20
70 0.36
65 0.22
58 0.20
949
94
983
955
960
94;l
952
953
94
945
958
wl
880
Average
Stand{rd deviation
Coeff. of variation (COV) (%)
COV calculated by Eq.13.5
6081
3708
6l
37
0.99 ffi
0.28 5
29 'l
68 0.27
5 0.06
7 2 0
0. 19
0.09
4E
37
0.45
0.15
34
29
949
22
2
0.9
rAssumptions: UCS : I3*BTS; PI-S : BTS/f.S (see Chaptet 16.2), feed : 0.1rnm and I mm.
Using the data, Schimazek's wear value F @quation 13.1), Ewendt's modificationF^,a(Eq,. 13.3) and Deketh's .TPW(Eq. 13.4) were calculated for each sample andthe mean value and standard variation for the results were calculated as well.
Using the mean value of the rock parameters and their standard deviations, it i$possible to calculate the coefficient of variation of the wear prediction equations byEquation 13.5 (Ang & Tang 1984):
(r3.5)COV - *lAO (7o)
where COV is the coefficient of variation of the predicted value, g is the predictionfunction, Jci are the rock parameters in the equation, p is the mean prediction value,and or are the standard deviations of rock parameters i. This equation may only beused when the parameters are independent, which assumed here. The calculatedcoefficient of variation for the wear prediction functions is also given in Table 13.1.The mean value of. F, F,*dand SPW for the block sample has a higher coefficient ofvariation than calculated by Equation 13.5. This higher value is expected since it isbased on n:14 data points whereas the analytical estimate is for n:@.
E('fr,'
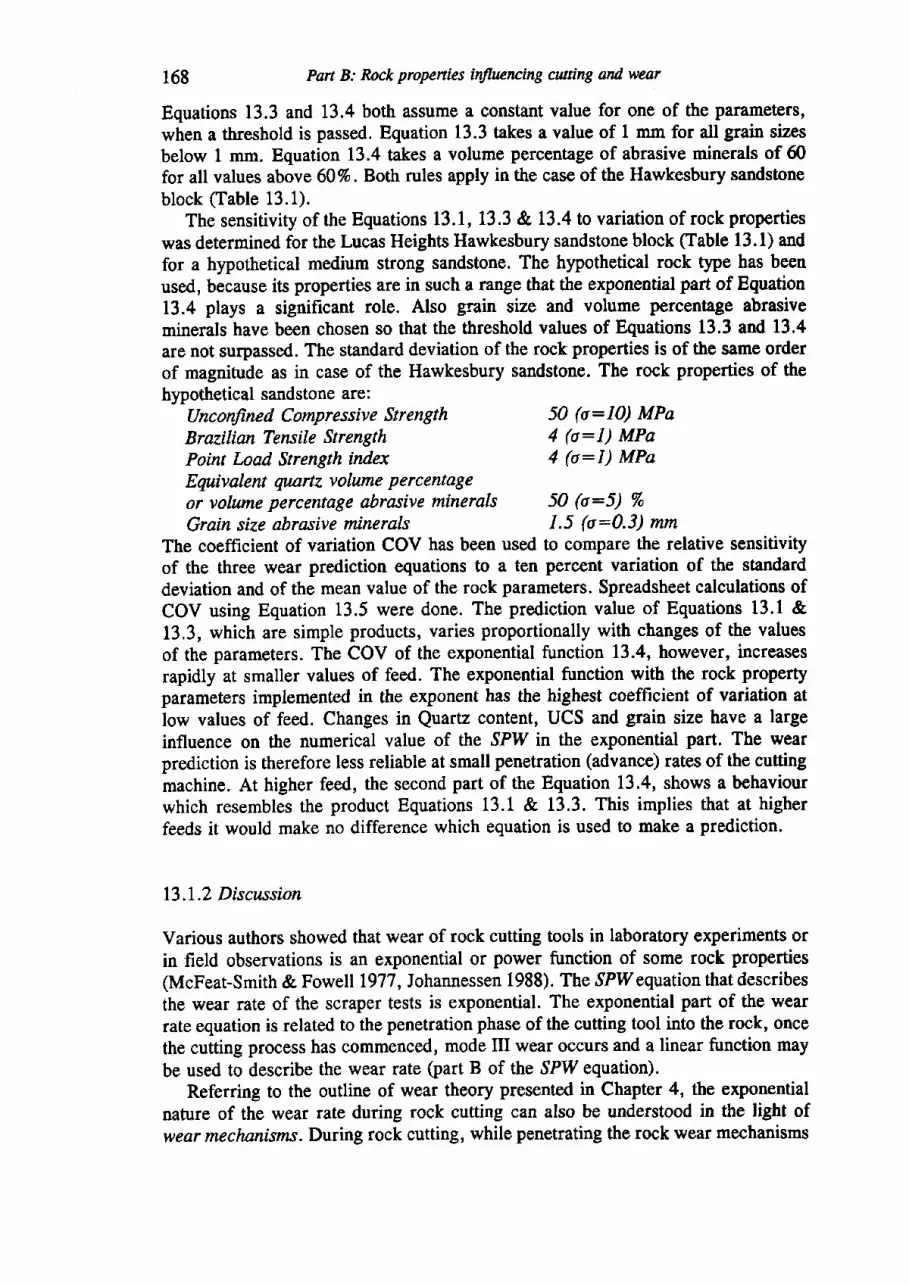
168 Part B: Rock propenies inflwncing cuning and wear
Equations 13.3 and 13.4 both assume a constant value for one of the parameters,when a threshold is passed. Equation 13.3 takes a value of 1 mm for all grain sizesbelow L mm. Equation 13.4 takes a volume percentage of abrasive minerals of 60for all values above 60To. Both rules apply in the case of the Hawkesbury sandstoneblock (fable 13.1).
The sensitivity of the Equations 13.1, 13.3 & t3.4 to variation of rock propertieswas determined for the Lucas Heights Hawkesbury sandstone block (Iable 13.1) andfor a hypothetical medium strong sandstone. The hypothetical rock 6pe has beenused, because its properties are in such a range that the exponential part of Equation13.4 plays a significant role. Also grain size and volume percentage abrasiveminerals have been chosen so that the threshold values of Equations 13.3 and 13.4are not surpassed. The standard deviation of the rock properties is of the same orderof magnitude as in case of the Hawkesbury sandstone. The rock properties of thehypothetical sandstone are:
Unconfined Compressive StengthBrazilian Tercile StengthPoint Inad Strength index
50 (o:10) MPa4 (o:I) MPa4 (o:I) MPa
Equivalent qnrtz volume percentageor volwne percentage abrasive minerals 50 (o:5) %Gratn size abrasive minerals 1.5 (o:0.3) mm
The coefficient of variation COV has been used to compare the relative sensitivityof the three wear prediction equations to a ten percent variation of the standarddeviation and of the mean value of the rock parameters. Spreadsheet calculations ofCOV using Equation 13.5 were done. The prediction value of Equations 13.1 &13.3, which are simple products, varies proportionally with changes of the valuesof the parameters. The COV of the exponential function 13.4, however, increasesrapidly at smaller values of feed. The exponential function with the rock propertyparameters implemented in the exponent has the highest coefficient of variation atlow values of feed. Changes in Quartz content, UCS and grain size have a largeinfluence on the numerical value of the SPIT in the exponential part. The wearprediction is therefore less reliable at small penetration (advance) rates of the cuttingmachine. At higher feed, the second part of the Equation 13.4, shows a behaviourwhich resembles the product Equations 13.1 & L3.3. This implies that at higherfeeds it would make no difference which equation is used to make a prediction.
13,L.2 Discussion
Various authors showed that wear of rock cutting tools in laboratory experiments orin field observations is an exponential or power function of some rock properties(McFear-Smith & Fowell 1977 , Johannessen 1988). The ,SPl{equation that describesthe wear rate of the scraper tests is exponential. The exponential part of the wearrate equation is related to the penetration phase of the cutting tool into the rock, oncethe cutting process has commenced, mode III wear occurs and a linear function maybe used to describe the wear rate (part B of the ,SPW equation).
Referring to the outline of wear theory presented in Chapter 4, the exponentialnature of the wear rate during rock cutting can also be understood in the light ofwear mechanrsrns. During rock cutting, while penetrating the rock wear mechanisms
Assessment of the abrasiveruss of rock 169
are changhg continuously from mode I towards mode UI. With each change ofmechanism, the rate of wear would differ. If a steady state position would bereached, then the wear rate possibly could be described by a linear, Archard-typeequation:
(13.6)
where V', is the volume loss of the tool material along the contact surface, s is thesliding distance in m, Fn is the normal force on the surface (N), H is the hardnessof the tool material (Nlm). The constant K is the wear coefficient, which dependson the actual wear process operating. The equation states that a linear relation existsbetween volume loss and sliding distance, which depends on the normal force on thecontact surface and the hardness of the tool material. The constant K depends on therelative contribution of two-body grooving abrasion, adhesion and three-bodyabrasion at steady state. When test conditions are changed, it is known that K isoften related to V* in a non-linear fashion (Landheer 1983). This shows that it isnecessary to perform many wear tests, carried out under different physicalconditions, to map out the variation in rate of wear.
13.2 CONCLUSTON
The examination of the laboratory test methods in Chapter 1l has shown that eachtest has its own complex relation of rock properties with test results. The wearfactors derived from these tests indicate that a combination of rock strength, rockhardness and mineral grain size describes the wear rate reasonably well. Wear rateis a nonlinear process, as illustrated by the SPI{ equation of Deketh, developed forthe scraper test. The non-linear part is related to the peneffation phase of the tool,where changes in modes of wear processes occur. When cutting in the wear modeIII, the wear rate may become constant. In that case the simpler F-value maycorrelate just as well with wear rate.
The assessment of abrasiveness of rock can be based on a combination of rockstrength testing and petrographic examination. Rock hardness is expressed either asa proportional volumetric summation of the hardness of the constituent minerals orby the volume percentage of abrasive minerals (i.e. the minerals harder than cuttingtool steel at the testing conditions). In each project, the rock parameters, or the wearprediction equations, must be related to the actual wear occurring.
v* = x.Ff @')
CHAPTER 14
Conclusions of Part B: Rock properties influencingcutting and wear
In Part B the influence of rock properties on cutting and wear of tools is examined.It has been pointed out that the nature of the rock mass influences excavation. Thefrequency and geometry of fractures (discontinuities) in the rock mass determineswhether the cutterhead is able to act as a ripper, by loosening the rock blocks, orwill have to partially or completely cut into the rock material. In order to predictwhether ripping or cutting will occur, the size and geometry of the rock blocksbuilding the rock mass should be compared with the size and design of the cutterheadof the cutter suction dredger.
The rock material properties relevant during cutting have been established mainlyby tests carried out in the laboratory. Simple rock cutting theories use only theunconfined tensile or compressive strength, or a combination of these two, to predictcutting forces.
Work by the Delft Hydraulics Laboratory has shown that the complete failureenvelope of the rock is addressed. Near the cutting tip of the tool, extremely highconfining pressures exist, causing compressive crushing of the rock. In brittle rock,away from the crushing zone, shear failure and tensile failure occur during chipformation. This implies that, to properly describe rock failure during cutting,attempts should be made to predict thr complete rock failure envelope. One possibleway to do this, is to follow the approach taken by Hoek and Brown (1980) and tryto predict the failure envelope from values of the UCS and BTS test. The transitionstress from brittie to ductile failure is an important parameter in this respect. Frommechanical excavation practice there are indications that rocks, which are ductileduring cutting (large crushed zone; no chip formation), f,dy cause extreme heatingof the cutting tool resulting in adhesive wear of the tool surface. Whether this tlpeof wear will occur depends on the strength of the rock with respect to the power anddesign of the cutting tool.
The scraper test of Deketh has shown that during the penetration of the cuttingtool into the rock, the tool at first scrapes over the rock surface and experiences atransition towards real cutting. In the initial slage, very high wear rates occur andchisels are heated to such a degree that apart from abrasive wear, a high amount ofthe total wear can be attributed to high temperature adhesive wear (wear mode I).
r70
Conclusioru of Part B: Rock properties itffuencing cutting and' war l7l
After a threshold cutting depth chip formation occurs and the wear rate is lower and
is dominated by abrasive wear (mode IID.If adhesive wear occurs, the tool surface is weakened due to temperature
dependent phase transformations in the tool material. Also tungsten carbide
,rod.tgor* weakening at elevated temperatures. The contfast of hardness between the
tool rnaterial and the,rock mineral grains may diminish, or even reverse, causing the
high rates of wear.High temperatures can also occur at increased cutting velocity. Many experiments
show a distinct critical velocity, above which a sudden increase in wear rate occuts.
At temperatures below the tool material weakening threshold, wear will be mainly
by abrasion. Abrasive wear is mainly due to the contrast in hardness between the
mineral grains and the tool material.At the start of this study, in 1989, it was thought that tool wear might be
predicted by a combination of rock strength parameters and some suitable wear tests.
these wear tests should address two-body and three-body abrasive wear. Based on
our examination of pin-on-disc type tests (Cerchar, Schimazek, flat pins), however,
it appeared that the wear rates obtained by these tests were dependent on a large
tto*b.r of factors, the most important being rock strength, hardness of the
constituent minerals and grain size of the minerals of the rock. This dependency is
such, that tests carried out at standard conditions may not induce identical wear
mechanisms on different rock types. It is concluded that the tests themselves may trot
be so valuable in a site investigation fot a rock dredging project. The main reason
for this statement is that the tests should simulate a wear process identical as that
which would occur in practice, with preferably real size tools. The rock parame0ers
that relate to abrasive wear in the laboratory are important, however. It is suggested
that these parameters should be evaluated against the performance of real cuttingmachines. The performance of the machines might be calibrated against these rockparameters.
The laboratory tests examined illustrate the importance of several rock properties,
that can be determined by index tests. It is also clear that no complete picture of
wear during rock cutting can be given. This research has been restricted to ahrasive
wear processes and most results appty to rocks that contain abrasive minerals set in
a mairix of weaker material (the sandstone rock type). The parameters strength(measured by the index tests UCS, BTS and PLS), volume percentage abrasiveminerals and grain size are important. Abrasive wear is sensitive to the following
rock index parameters:1. At shallow rock cutting (scraping), or during initial penetration of the cutting
tools, the unconfined compressive strength (UCS), the volume percentage abrasiveminerals and the grain size.
2. During rock cutting at higher cutting depths the Brazilian tensile strength(BTS), the volume percentage abrasive minerals and the grain size.These parameters should be measured in sufficient quantity during a siteinvestigation. Part C examines whether the approach of relating basic rockparameters to mechanical rock excavation projects is promising or not.
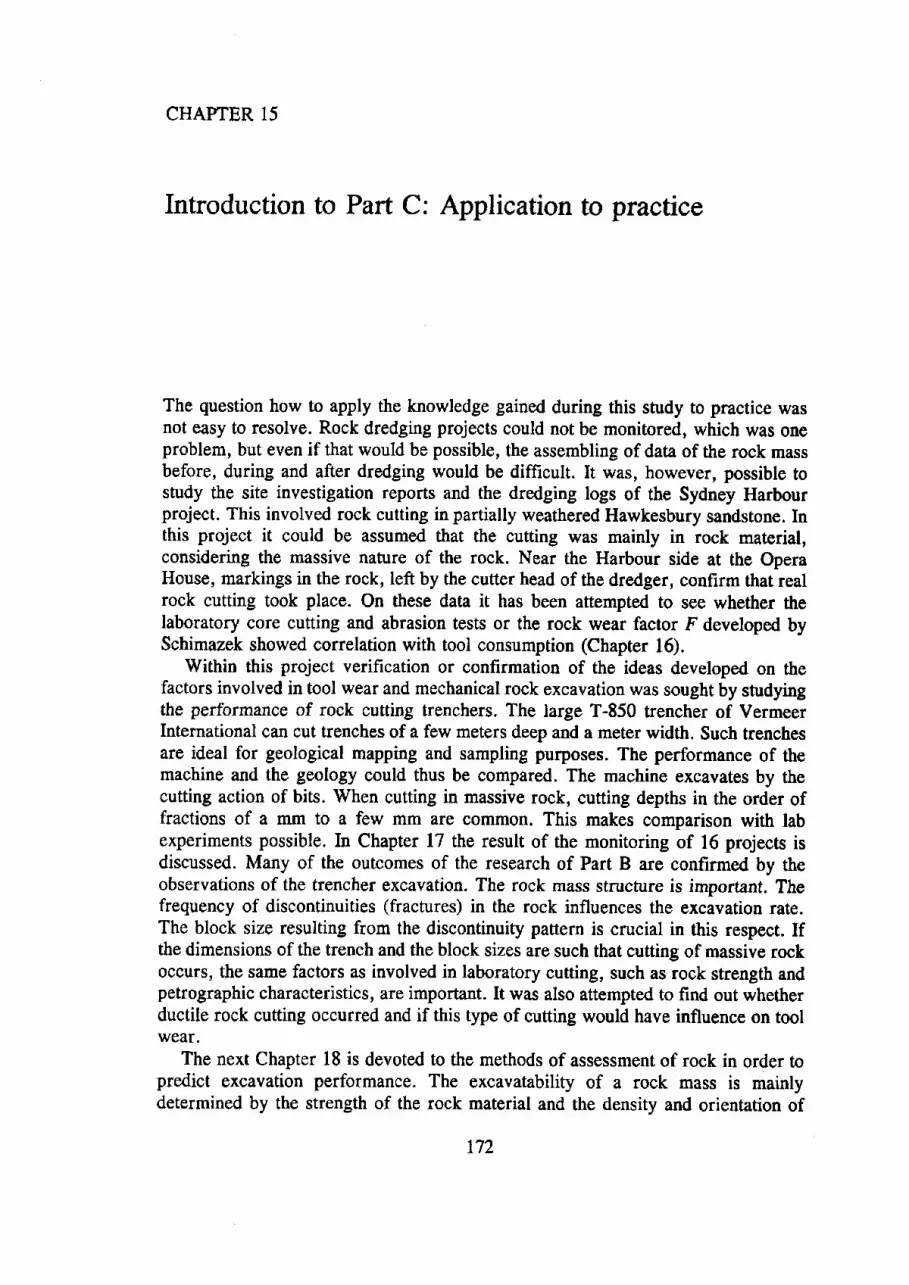
EHAPTER 15
Introduction to Part C: Application to practice
The question how to apply the knowledge gained during this study to practice wasnot easy to resolve. Rock dredging projects could not be monitored, which was oneproblem, but even if that would be possible, the assembling of data of the rock massbefore, during and after dredging would be difficult. It was, however, possible tostudy the site investigation reports and the dredging logs of the Sydney Harbourproject. This involved rock cutting in partially weathered Hawkesbury sandstone. Inthis project it could be assumed that the cutting was mainly in rock material,considering the massive nature of the rock. Near the Harbour side at the OperaHouse, markings in the rock, left by the cutter head of the dredger, confirm that realrock cutting took place. On these data it has been attempted to see whether theIaboratory core cutting and abrasion tests or the rock wear factor F developed bySchimazek showed correlation with tool consumption (Chapter 16).
Within this project verification or confirmation of the ideas developed on thefactors involved in tool wear and mechanical rock excavation was sought by studyingthe performance of rock cutting trenchers. The large T-850 trencher of VermeerInternational can cut trenches of a few meters deep and a meter width. Such trenchesare ideal for geological mapping and sampling purposes. The performance of themachine and the geology could thus be compared. The machine excavates by thecutting action of bits. When cutting in massive rock, cutting depths in the order offractions of a mm to a few mm are common. This makes comparison with labexperiments possible. In Chapter 17 the result of the monitoring of 16 projects isdiscussed. Many of the outcomes of the research of Part B are confirmed by theobservations of the trencher excavation. The rock mass structure is important. Thefrequency of discontinuities (fractures) in the rock influences the excavatiou rate.The block size resulting from the discontinuity pattern is crucial in this respect. Ifthe dimensions of the trench and the block sizes are such that cutting of massive rockoccurs, the same factors as involved in laboratory cutting, such as rock strength andpetrographic characteristics, are important. It was also attempted to find out whetherductile rock cutting occurred and if this type of cutting would have influence on toolwear.
The next Chapter 18 is devoted to the methods of assessment of rock in order topredict excavation performance. The excavatability of a rock mass is maintydetermined by the strength of the rock material and the density and orientation of
172
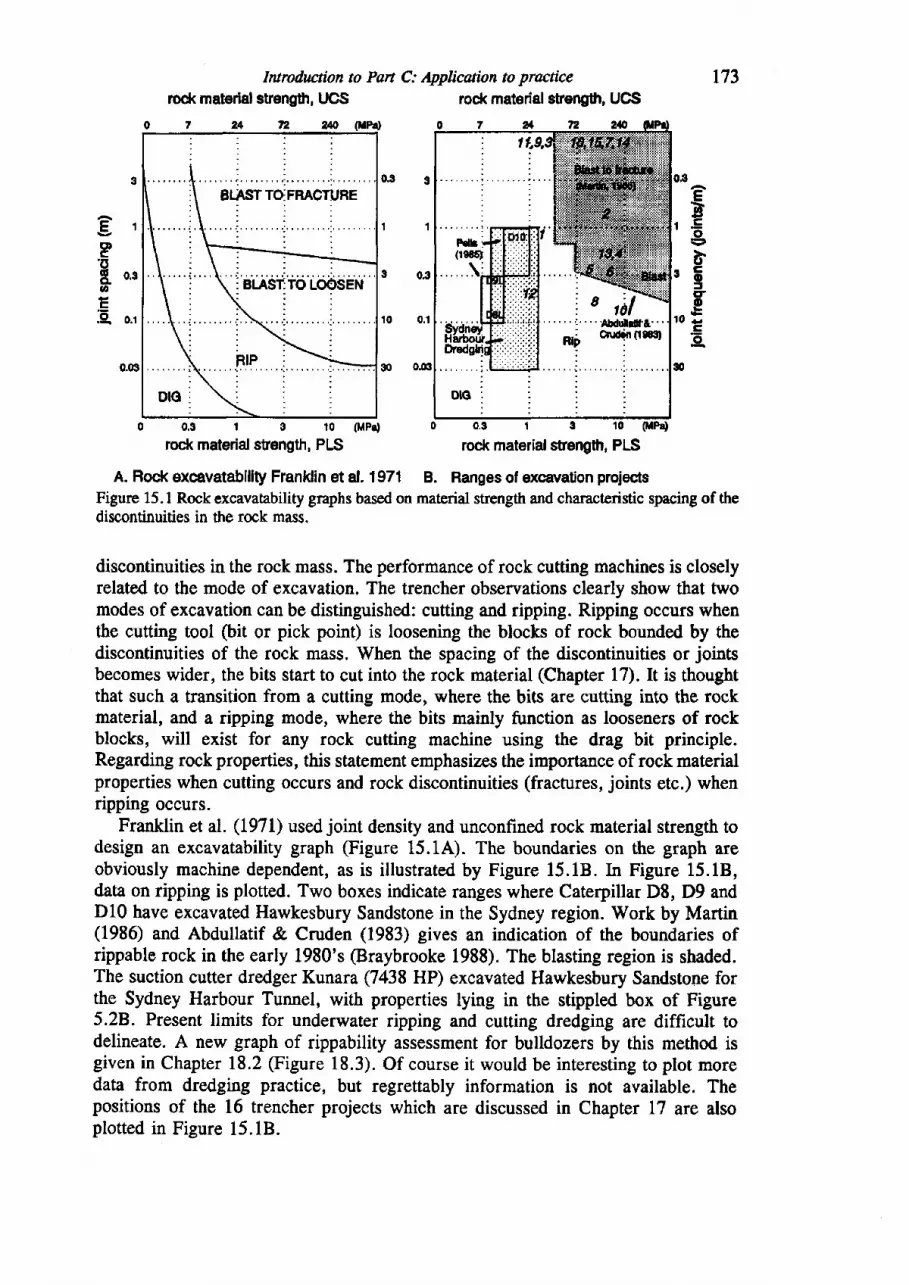
rock material suength, UCSIntrohrction to Part C: Applicaion to practice
0 0.9 t I t0 (MPC 0 0.3 t 3 10 (MPs)
roc* material stength, PLS rock mat€rial sfrength, PLS
A. Rock excavatability Franklin et al. 1971 B. Ranges of exca\ration projec.tsFigure 15.1 Rock excavatability graphs based on material strength and characteristic spacing of thediscontinuities in the rock mass.
discontinuities in the rock mass. The performance of rock cutting machines is closelyrelated to the mode of excavation. The trencher observations clearly show that twomodes of excavation can be distinguished: cutting and ripping. Ripping occurs whenthe cutting tool (bit or pick point) is loosening the blocks of rock bounded by thediscontinuities of the rock mass. When the spacing of the discontinuities or jointsbecomes wider, the bits start to cut into the rock material (Chapter 17). It is thoughtthat such a transition from a cutting mode, where the bits are cutting into the rockmaterial, and a ripping mode, where the bits mainly function as looseners of rockblocks, will exist for any rock cutting machine using the drag bit principle.Regarding rock properties, this statement emphasizes the importance of rock materialproperties when cutting occurs and rock discontinuities (fractures, joints etc.) whenripping occurs.
Franklin et al. (L971) used joint density and unconfined rock material strength todesign an excavatability graph (Figure 15.1A). The boundaries on the graph areobviously machine dependent, as is illustrated by Figure 15.18. In Figure 15.18,data on ripping is plotted. Two boxes indicate ranges where Caterpillar D8, D9 andD10 have excavated Hawkesbury Sandstone in the Sydney region. Work by Martin(1986) and Abdullatif & Cruden (1983) gives an indication of the boundaries ofrippable rock in the early 1980's @raybrooke 1988). The blasting region is shaded.The suction cutter dredger Kunara Q438 HP) excavated Hawkesbury Sandstone forthe Sydney Harbour Tunnel, with properties lying in the stippled box of Figure5.28. Present limits for underwater ripping and cutting dredging are difficult todelineate. A new graph of rippability assessment for bulldozers by this method isgiven in Chapter 18.2 (Figure 18.3). Of course it would be interesting to plot moredata from dredging practice, but regrettably information is not available. Thepositions of the 16 trencher projects which are discussed in Chapter 17 are alsoplotted in Figure 15.18.
173
gP'o6o.aEo
rock matarial strength, UCS

r74 Pan C: Application to practice
The Franklin method and also the rock mass classification systems currently used inEngineering Geology site investigation are intended to give an indication of the waya rock can be excavated. It was examined whether these methods can be directlyused to predict rippability (Chapter 18.2), or could be of use in dredging (Chapter18.3). But it was found that the analysis of many data is necessary to come to someform of prediction. The example of the tunnel boring machine model of theNorwegian Technology Institute is discussed in Chapter 18.1, the example of rippingin Chapter 18.2. In Chapter 18.4 is outlined how we think the data of the trencherproject can be used for prediction puqposes by using fuzzy expert modelling.
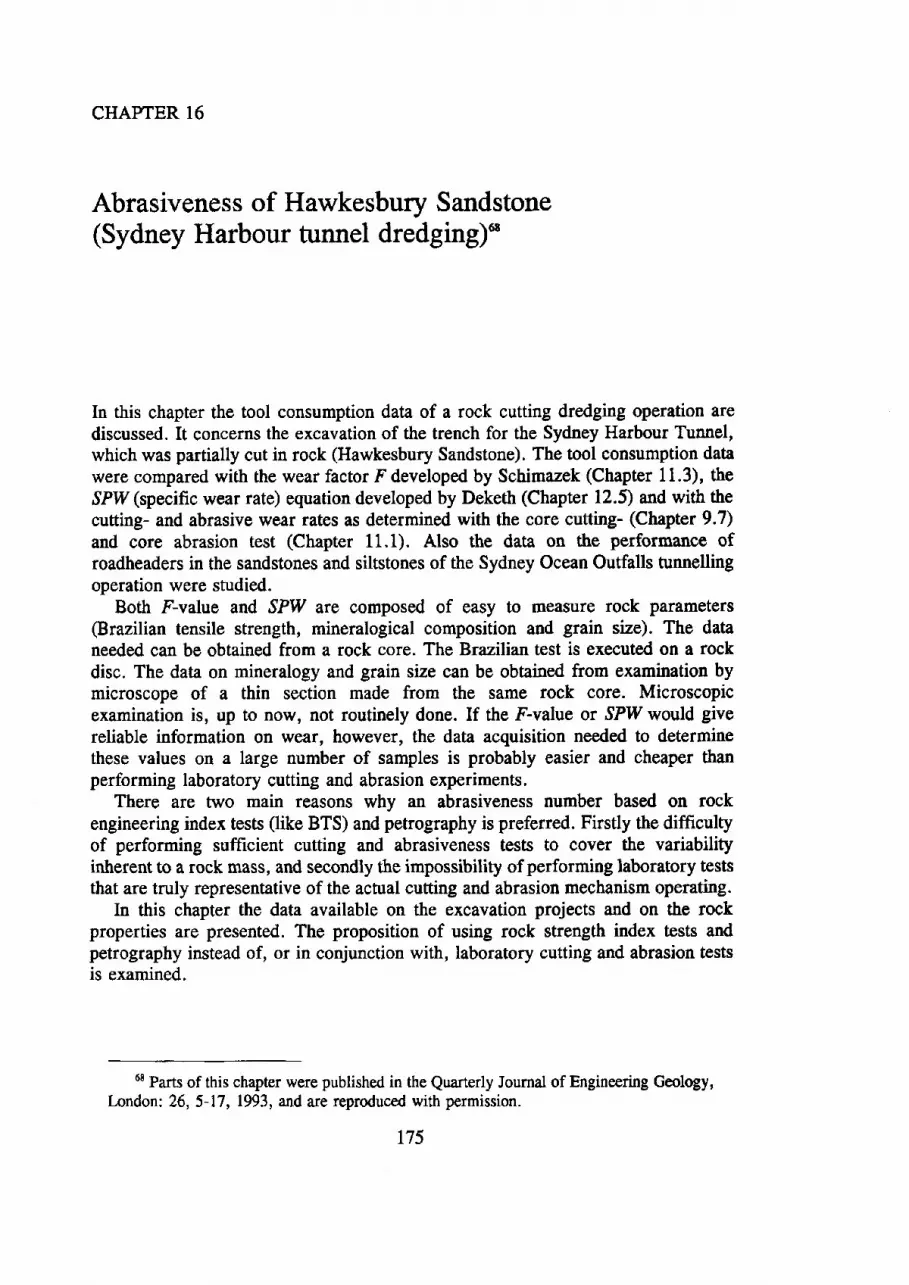
CHAPTER 16
Abrasiveness of Hawkesbury Sandstone(Sydney Harbour tunnel dredging)*
In this chapter the tool consumption data of a rock cutting dredging operation arediscussed. It concerns the excavation of the trench for the Sydney Harbour Tunnel,which was partially cut in rock (Hawkesbury Sandstone). The tool consumption datawere compared with the wear factor F developed by Schimazek (Chapter 11.3), the,IPIV (specific wear rate) equation developed by Deketh (Chapter 12.5) and with thecutting- and abrasive wear rates as determined with the core cutting- (Chapter 9.7)and core abrasion test (Chapter 11.1). Also the data on the performance ofroadheaders in the sandstones and siltstones of the Sydney Ocean Outfalls tunnellingoperation were studied.
Both F-value and SPIV are composed of easy to measure rock parameters
@razilian tensile strength, mineralogical composition and grain size). The dataneeded can be obtained from a rock core. The Brazilian test is executed on a rockdisc. The data on mineralogy and grain size can be obtained from examination bymicroscope of a thin section made from the same rock core. Microscopicexamination is, up to now, not routinely done. If the F-value or ,SPW would givereliable information on wear, however, the data acquisition needed to determinethese values on a Iarge number of samples is probably easier and cheaper thanperforming laboratory cutting and abrasion experiments.
There are two main reasons why an abrasiveness number based on rockengineering index tests (like BTS) and petrography is preferred. Firstly the difficultyof performing sufficient cutting and abrasiveness tests to cover the variabilityinherent to a rock mass, and secondly the impossibility of perforrning laboratory teststhat are truly representative of the actual cutting and abrasion mechanism operating.
In this chapter the data available on the excavation projects and on the rockproperties are presented. The proposition of using rock strength index tests andpetrography instead of, or in conjunction with, laboratory cutting and abrasion testsis examined.
68 Parts of this chapter were published in the Quarterly Journal of Engineering Geology,lnndon: 26,5-L7,1993, and are reproduced with permission.
t75
t76 Part C: Applicaion to practice
SUBURBAN SYDNEY
LTJCAS }IEIOHTS
16.1 ROCK EXCAVATION PROJECTS IN THE SYDNEY AREA
Large parts of the Sydney area are underlain by the Hawkesbury Sandstone, a weakto moderately strong quartz-rich rock. The Hawkesbury Sandstone is of Triassic ageand up to 290 m thick. Major tunnelling projects have been carried out in this rockand increasingly use has been made of mechanical excavation methods. For tworecent projects carried out in the Sydney region, the Sydney Harbour Tunnel and theSydney Ocean Outfall tunnels (Figure 16.1), considerable attention has been paid tothe abrasiveness of the Hawkesbury Sandstone. On two of the Outfall tunnels reportshave been published with data on the cuttability and abrasiveness of the rocksexcavated (Lowe and McQueen 1988 and 1990). The Malabar Ocean Outfall Declinepasses through Hawkesbury Sandstone and was partially excavated by mechanicalmeans. Lowe and McQueen (1988) give data on rock properties and toolconsumption rate and an analysis of roadheader performance.
For the Sydney Harbour Tunnel, consisting partly of land tunnels and partly ofimmersed reinforced concrete tube elements in the harbour, the trench dredged fotthe tunnel elements was partially excavated in rock, using a rock cutter suctiondredger. Unusually the contractor, Westham Dredging Company Pfy Ltd Sydney,made the excavation data available for analysis. In the following a comparison ismade between the site investigation and laboratory data available and the excavationperformance of the dredger.
For both projects results of the core cutting and abrasion test developedRoxborough (1987) were available. Some additional tests have been performed.examine whether wear factors derived from laboratory tests relate to
byTo
tool
Figure 16.1 l-ocation map Sydney area.
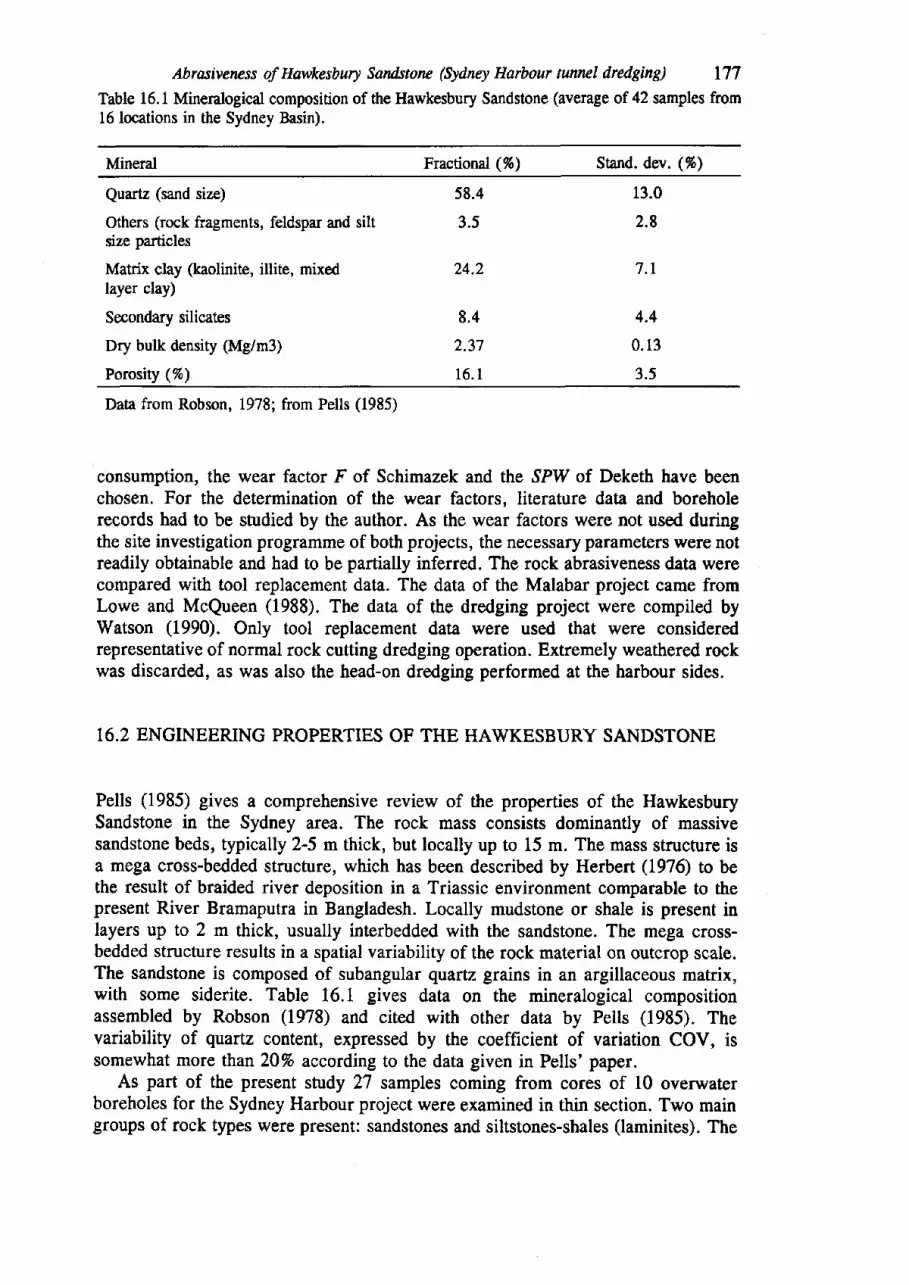
Abrasiveness of Hawkesbury Sandstonc ($dney Harbour tmrcI dredging) 177
Table 16.l Mineralogical composition of the Hawkesbury Sandstone (average of 42 samples fromlS locations in the Sydney Basin).
Mineral Fractional (%) Stand. dev. (%)
Quartz (sand size)
Others (rock fragments, feldspar and siltsize particles
Matrix clay (kaolinite, illite, mixedlayer clay)
Secondary silicates
Dry bulk density (Mg/m3)
Porosity (%)
58.4
3.5
24.2
8 .4
2.37
16. I
13.0
2.8
7 .1
4.4
0 .13
3.5
Data from Robson, 1978; from Pells (1985)
consumption, the wear factor F of Schimazek and the ,SPIV of Deketh have beenchosen. For the determination of the wear factors, literature data and boreholerecords had to be studied by the author. As the wear factors were not used duringthe site investigation programme of both projects, the necessary parameters were notreadily obtainable and had to be partially inferred. The rock abrasiveness data werecompared with tool replacement data. The data of the Malabar project came fromLowe and McQueen (1988). The data of the dredging project were compiled byWatson (1990). Only tool replacement data were used that were consideredrepresentative of normal rock cutting dredging operation. Extremely weathered rockwas discarded, as was also the head-on dredging performed at the harbour sides.
16.2 ENGINEERING PROPERTIES OF THE HAWKESBURY SANDSTONE
Pells (1985) gives a comprehensive review of the properties of the HawkesburySandstone in the Sydney area. The rock mass consists dominantly of massivesandstone beds, typically 2-5 m thick, but locally up to 15 m. The mass structure isa mega cross-bedded structure, which has been described by Herbert (L976) to bethe result of braided river deposition in a Triassic environment comparable to thepresent River Bramaputra in Bangladesh. Locally mudstone or shale is present inlayers up to 2 m thick, usually interbedded with the sandstone. The mega cross-bedded structure results in a spatial variability of the rock material on outcrop scale.The sandstone is composed of subangular quartz grains in an argillaceous matrix,with some siderite. Table 16.1 gives data on the mineralogical compositionassembled by Robson (1978) and cited with other data by Pells (1985). Thevariability of quartz content, expressed by the coefficient of variation COV, issomewhat more than 2O% according to the data given in Pells' paper.
As part of the present study 27 samples coming from cores of 10 overwaterboreholes for the Sydney Harbour project were examined in thin section. Two maingroups of rock types were present: sandstones and siltstones-shales (laminites). The
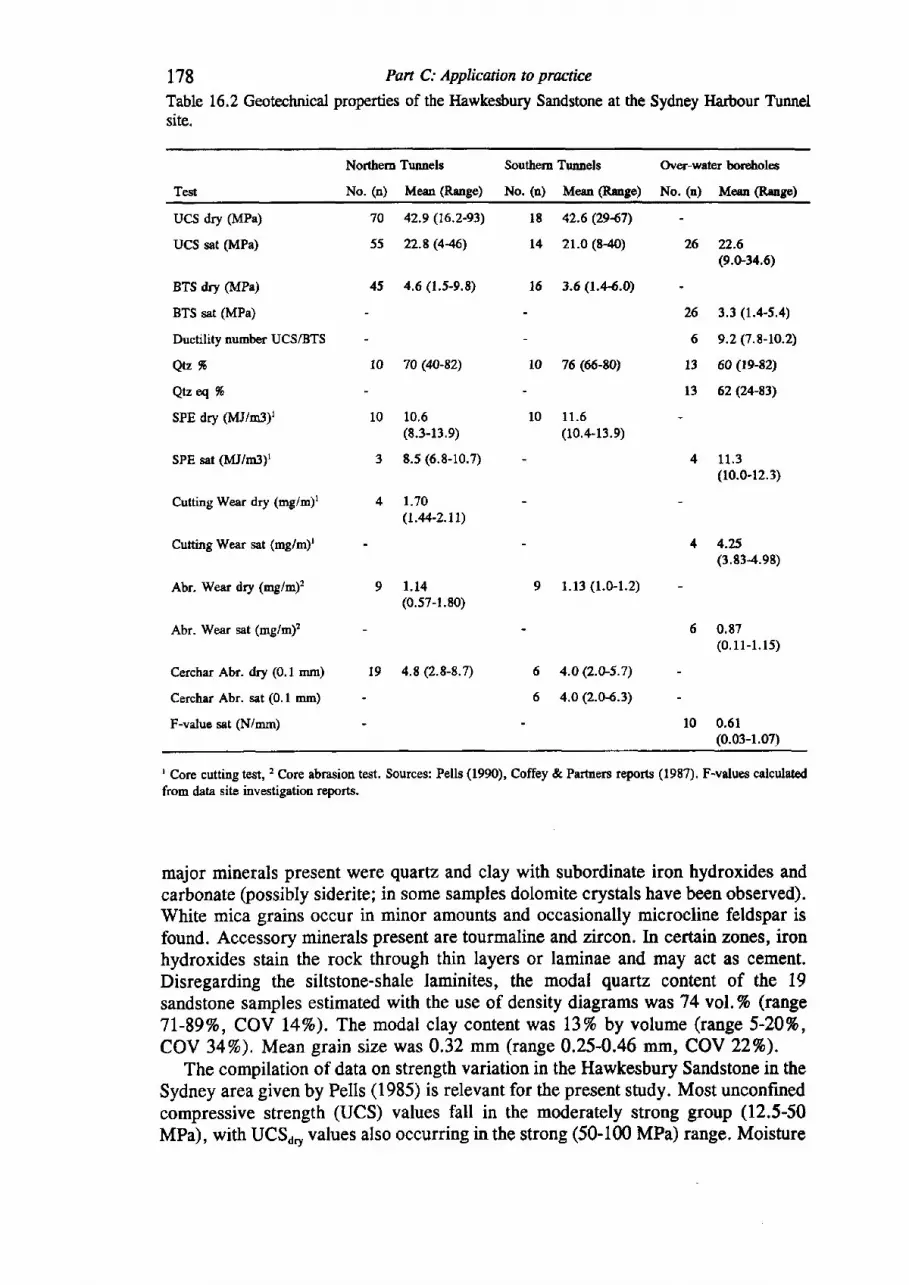
178Tablesite.
Part C: Application to practice
16.2 Geotrechnical properties of the llawkesbury Sandstone at the Sydney l{artour T\rnnel
Northem Tunnels
No. (n) Mean (Range)
Southem Tunnels
No. (u) Meen (Range)
Over-water boreholes
No. (n) Mean (Rs!ge)
UCS dry (MPa)
UCS sat (MPa)
BTS dry (MPa)
BTS sat (MPa)
Ductility numtrer UCS/BTS
Q.z %
Qtzq %
SPE dry (l{J/d)'
SPE sat (MI/m3)'
Cutting Wear dry (mg/m)'
Cutting Wear sat (mg/m)l
Abr. Wear dry (ag/m)2
Abr. Wear sat (mg/m)2
Cerchar Abr. dry (0.1 mm)
Cerchar Abr. sat (0.1 mm)
F-value sat (N/mm)
70 42.9 (16.2-93)
5s 22.8 (4.{6)
45 4.6 (r.5-e.E)
10 70 (40-82)
10.6(8.3-r3.e)
8.5 (6.8-10.7)
r.70(r.44-2.rr)
1.14(0.57-1.80)
r8 42.6 (2947\
14 21.0 (840)
16 3.6 (r-4tr.O)
10 76 (66-tO)
10 11.5(10.+13.e)
9 1.13 (1.0-1.2)
6 4.0 (2.0-5.7)
6 4.O (2.0{.3)
26 22.6(e.G34.6)
26 3.3 (1.4-5.4)
6 9.2(7.8-10.2)
13 60 (re-82)
13 62 Q4-83)
11 .3(10.0-r2.3)
4.25(3,834.e8)
6 0.87(0.11-1.15)
t9 4.8 (2.8-8.7)
l0 0.61(0.03-1.07)
I Core cutting test, 2 Core abrasion test. Sources: Pells (1990), Coffey & Partners reports (1987). F-vdues calculatedfrom data site investigation reports.
major minerals present were quartz and clay with subordinate iron hydroxides andcarbonate (possibly siderite; in some samples dolomite crystals have been observed).White mica grains occur in minor amounts and occasionally microcline feldspar isfound. Accessory minerals present are tourmaline and zircon.In certain zones, ironhydroxides stain the rock through thin layers or laminae and may act as cement.Disregarding the siltstone-shale laminites, the modal quartz content of the 19sandstone samples estimated with the use of density diagrams was 74 vol % (range7l-89%, COV t4%). The modal clay content was 13 % by volume (range 5-20%,COV 34%). Mean grain size was 0.32 mm (range 0.25-0.46 mm, COV 22%).
The compilation of data on strength variation in the Hawkesbury Sandstone in theSydney area given by Pells (1985) is relevant for the present study. Most unconfinedcompressive strength (UCS) values fall in the moderately strong group (12.5-50MPa), with UCSdry values also occurring in the strong (50-100 MPa) range. Moisture
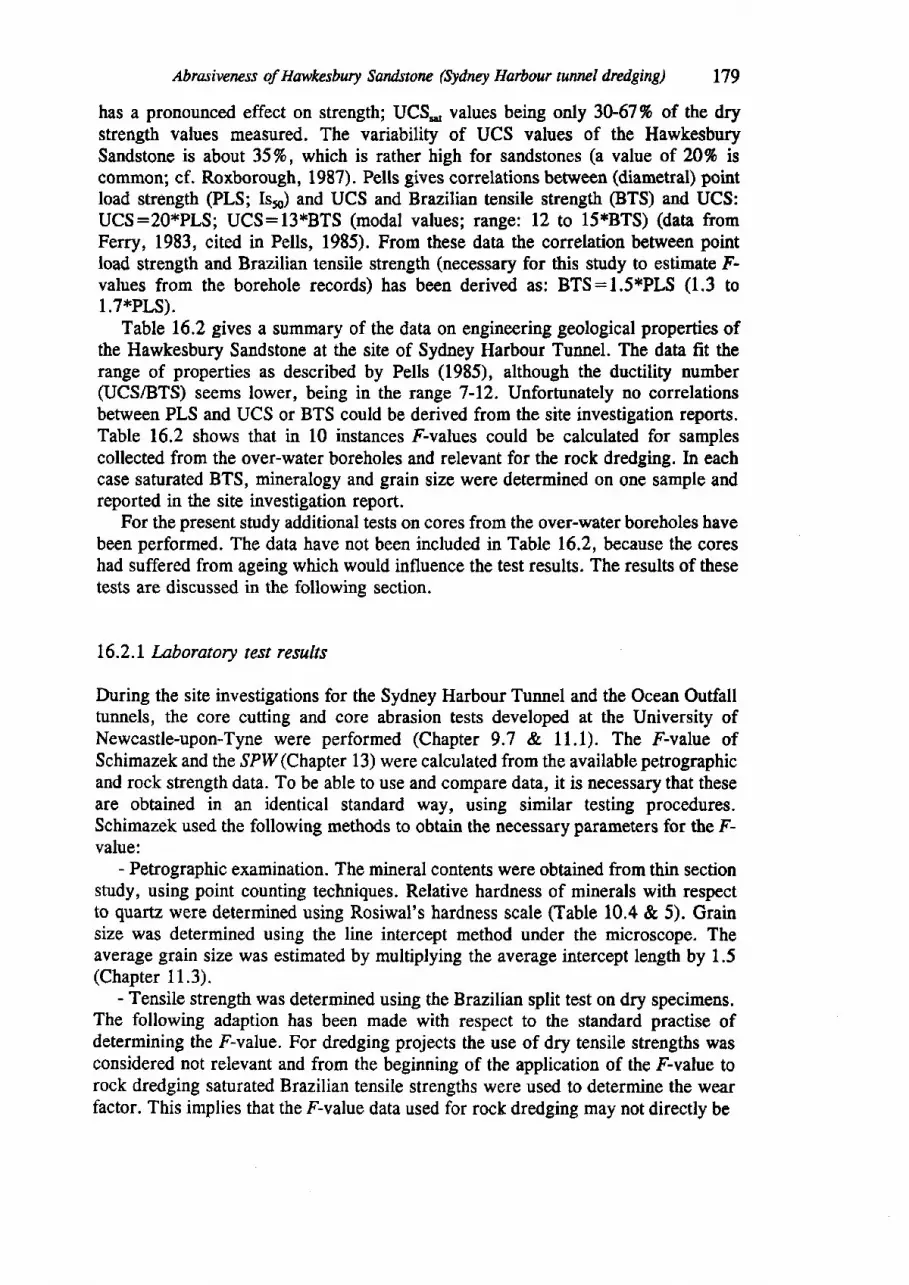
Abrasiveness of Hawkcsbury Sandstoru (Edney Harbour runrcl dredging) 179
has a pronounced effect on strength; UCS* values being only 30-67% of the drystrength values measured. The variability of UCS values of the HawkesburySandstone is about 35Vo, which is rather high for sandstones (a value of ?.0% iscommon; cf. Roxborough, 1987). Pells gives correlations between (diametral) pointload strength (PLS; Is5o) and UCS and Brazilian tensile strength (BTS) and UCS:UCS:20*PLS; UCS:13*BTS (modal values; range: 12 to 15*BTS) (data fromFerry, 1983, cited in Pells, 1985). From these data the correlation between pointload strength and Brazilian tensile strength (necessary for this study to estimate F-values from the borehole records) has been derived as: BTS:I.S*PLS (1.3 to1.7*PLS).
Table 16.2 gives a summary of the data on engineering geological properties ofthe Hawkesbury Sandstone at the site of Sydney Harbour Tunnel. The data fit therange of properties as described by Pells (1985), although the ductility number(UCS/BTS) seems lower, being in the range 7-12. Unforhrnately no correlationsbetween PLS and UCS or BTS could be derived from the site investigation reports.Table 16.2 shows that in 10 instances F-values could be calculated for samplescollected from the over-water boreholes and relevant for the rock dredging. In eachcase saturated BTS, mineralogy and grain size were determined on one sample andreported in the site investigation report.
For the present study additional tests on cores from the over-water boreholes havebeen performed. The data have not been included in Table 16.2, because the coreshad suffered from ageing which would influence the test results. The results of thesetests are discussed in the followine section.
t6.2.I Laboratory test results
During the site investigations for the Sydney Harbour Tunnel and the Ocean Outfalltunnels, the core cutting and core abrasion tests developed at the University ofNewcastle-upon-Tyne were performed (Chapter 9.7 & 11.1). The F-value ofSchimazek and the SPlT(Chapter 13) were calculated from the available petrographicand rock strength data. To be able to use and compare data, it is necessary that theseare obtained in an identical standard wry, using similar testing procedures.Schimazek used the following methods to obtain the necessary parameters for the F-value:
- Petrographic examination. The mineral contents were obtained from thin sectionstudy, using point counting techniques. Relative hardness of minerals with respectto quartz were determined using Rosiwal's hardness scale (fable 10.4 & 5). Grainsize was determined using the line intercept method under the microscope. Theaverage grain size was estimated by multiplying the average intercept length by 1.5(Chapter 11.3).
- Tensile strength was determined using the Brazilian split test on dry specimens.The following adaption has been made with respect to the standard practise ofdetermining the F-value. For dredging projects the use of dry tensile strengths wasconsidered not relevant and from the beginning of the application of the F-value torock dredging saturated Brazilian tensile strengths were used to determine the wearfactor. This implies that the F-value data used for rock dredging may not directly be
180':l
0
cBEo6
6o=
Pan C: Application to practice
I
anttng wear
O OO E
afuadt/ewer
0,2 0,.r 0.c 0,t i t.2
estimated F-vaiue (l{mm)
Figure 16.2 Results of the cufting and abrasion tests on samples of the overwater boreholes (Iable16.2) compared with estimates of the F-value and the SPW (feed 5 mm).
compared with F-values cited elsewhere; they should be corrected for type ofstrength testing (wet or dry).
Table 1.6.2 shows the mean results of the cutting and abrasion tests carried outon the over-water boreholes. For the rocks tested mineralogical and strength datawere available, and F- and ,SPl4/ values could be calculated. In Figure 16.2 lheresults are given. The figure shows no apparent relationship between either the F-or the ,SPIV value and the cutting wear rates (wear of the chisels during the cuttingtest) and abrasive wear rates (wear of the test chisels due to the abrasion test).
Additional tests were carried out in October and November 1990 on old rockcores from the Sydney Harbour tunnel project by the author. The tests wereperformed in the Laboratory of the Department of Mining Engineering of theUniversity of New South Wales, where Professor Roxborough has set up theapparatus for the cuttability assessment tests.
The samples were provided by the Geotechnical Consultant to the SydneyHarbour Tunnel project, Coffey Partners Pty Ltd. They were taken from the over-water boreholes in the Harbour, to assemble additional data relevant to the rockcutting dredging. It should be emphasized that these cores have been stored in metalboxes in the open air for more than two years. This must have had detrimentalinfluence on their quality and weakened them.
On the rock cores both the cutting test and the abrasion test have been performed.Since the cuttability of the rock was studied in relation to the rock cutting dredgingdone for the Sydney Harbour tunnel, all cores have been tested in a water saturatedcondition. Water saturation was obtained by immersion in water for 24 hours. Fromeach core tested, slices were taken to perform the Brazilian tensile strength test(sanrrated). From the slices tested thin sections were made for microscopic study,with the purpose of determining the wear factor F of Schimazek.
The results of the laboratory tests are given in Table 16.3 & 16.4 and Figure16.3. The values of cutting forces, strength and cutting wear are generally lowerthan those measured during the site investigation on fresh cores (compare Figure16.3 with Figure 16.2). This reflects the deterioration of the quality of the coresduring storage. Again, the conclusion can be drawn that there is no clear relationshipbetween F-value and laboratory wear rates as measured with the cutting and abrasiontest. Plots of ,SPW against wear rate give a similar result.
c00500
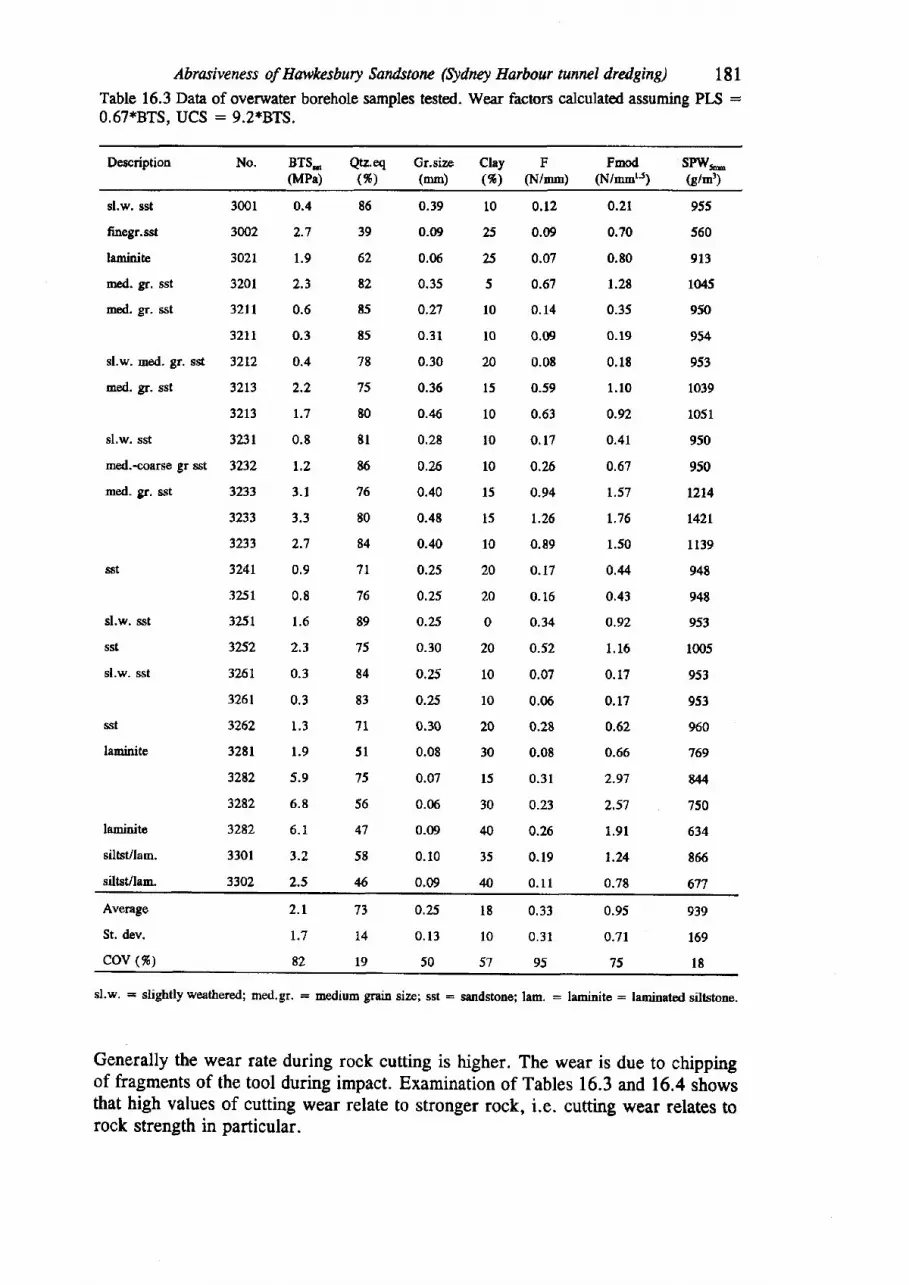
Abrasiveness of Hawlcesbury Sandstone (Syfuey Harbour tunnel dredging) 181Table 16.3 Data of overwater borehole samplas tested. Wear factors calculated assuming PLS =0.67*BT5, UCS : 9.2*BTS.
Description No. BTS*(MPa)
Qtz.eS(%)
Gr.size, Clay F Fnod(mn) (%) (N/'n'n) (N/mmrr;
sPwr^Grm)
sl.w. sst
finegr.sst
lsminit€
med. gr. sst
med. gr. sst
sl.w. med. gr. sst
med. gr. sst
sl.w. sst
med.-coarse gr sst
med. gr. sst
sst
sl.w. sst
sst
sl.w. sst
sst
laminite
laminite
siltst/lam.
siltsVlam.
3001
3002
302L
3201
32tl
32tr
3212
3213
3213
3231
3232
3233
3233
3233
3241
325r
3251
3252
3261
3261
3262
J28l
3282
3282
3282
3301
3302
0.4
2.7
1 .9
2.3
0.6
0.3
0.4
z . L
1 .7
0 .8
t ,z3 . 1
3.3
2.7
0,9
0 ,8
1.6
2.3
0.3
0.3
1 . 3
1 .9
5.9
6 .8
6 . 1
3.2
2.5
86
39
62
82
85
85
78
75
80
81
86't6
EO
84
7l
76
89
75
84
83
7 l
5 1
75
56
47
58
46
o.r9
0.09
0.06
0.35
0.27
0 .31
0.30
0.36
0.46
0.28
0,?5
0.40
0.48
0.40
o.25
0.25
0.25
0.30
o.25
o.25
0.30
0.08
0.07
0.06
0.09
0. t0
0.09
10
u25
5
l0
l0
20
l5
10
l0
l0
l5
l5
10
20
20
0
20
10
l0
20
30
l5
30
'+0
35
40
0.rz0.09
0.07
0.67
0.14
0.09
0.08
0.59
0.63
a.n0J5
o.94
1.26
0.89
o. l7
0.16
o.34
0.52
0.07
0.06
0.28
0.08
0.31
0.23
0.26
0 .19
0 . 1 I
o.2l
0.70
0.80
1.28
0.35
0.19
0. t8
1 .10
0.92
0.41
0.67
1.57
L.76
1.s0
0.,f4
0,43
o.92
t .16
0.L1
0.17
0.62
0.66
2.97
2.57
l .9 l
r.24
0.78
955
560
9t3
1045
950
954
953
1039
1051
950
950
r2l4
L42L
Lt39
94t
948
953
1005
953
953
960
769
E44
750
634
866
67?
Average
St. dev.
cov (%)
0.95
0.'t l
75
2.L 73 0.25 18
1.7 14 0.13 10
82 19 50 57
0,33
0.31
95
939
169
l8
sl.w. = slightly weathered; med.gr, : medium grain size; sst : sandstone; lam. : laminite : laminated siltstone.
Generally the wear rate during rock cutting is higher. The wear is due to chippingof fragments of the tool during impact. Examination of Tables 16.3 and 16.4 showsthat high values of cutting wear relate to stronger rock, i.e. cutting wear relates torock strength in particular.
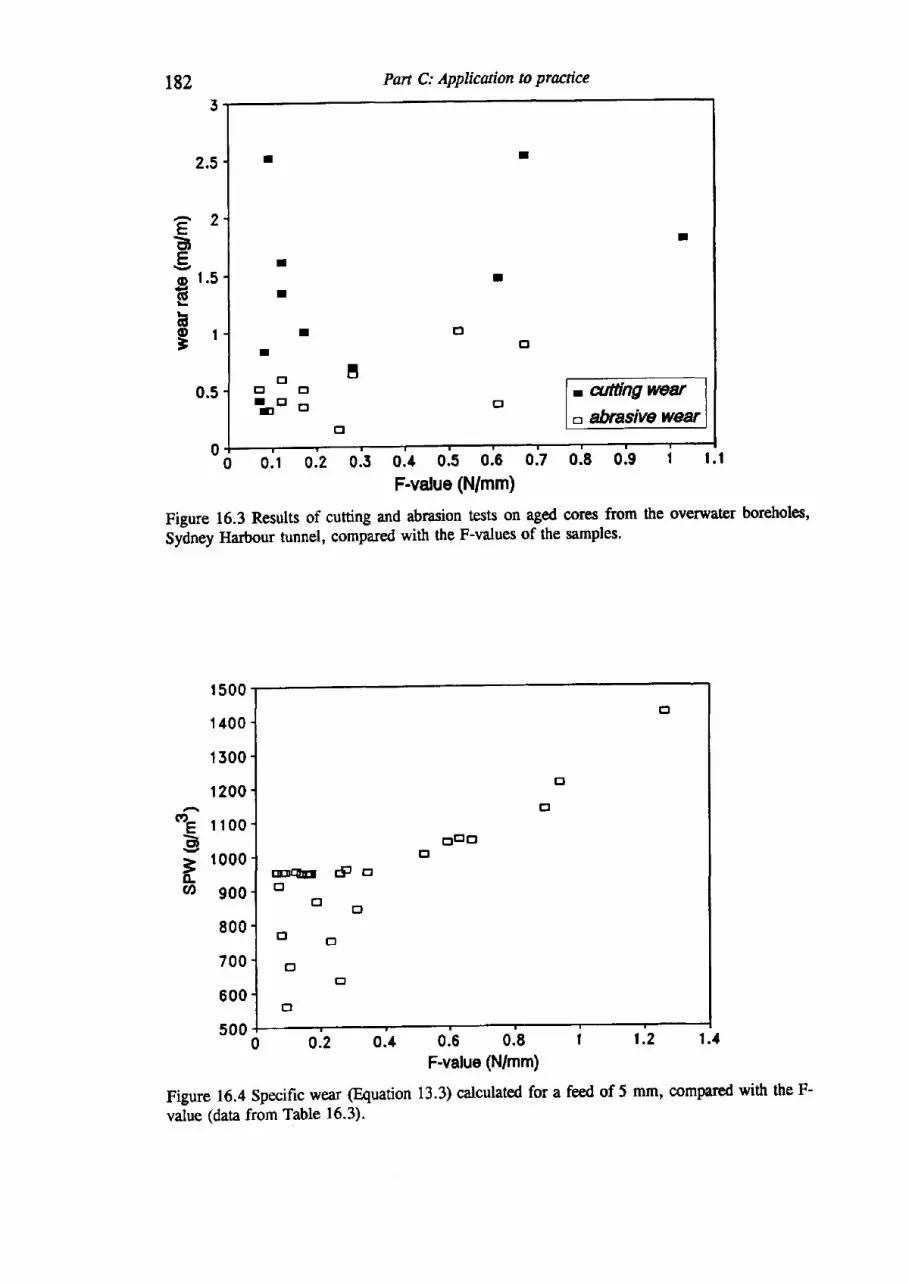
r82 Part C: Applicaion to practice
I
I
I
ttrt
trl trlr t r l -t t t U
trt
- antting vwaro abrasive wear
0.5
ri o.r 0.2 0.3 0.4 o.s 0.6 0.7 o.E 0.9 l . l
F-value (N/mm)
Figure 16.3 Results of cutting and abrasion tests on aged cores from the overwat€r boreholes,
sydney Harbour tunnel, compared with the F-values of the samples.
E
otrlo
EDflr 4 0o
E c l
0.2 0.4 0.6 0.6 |F value (N/mm)
Figure 16.4 Specific wear @quation 13.3) calculated for a feed of 5 mm, compared with the F-
value (data from Table 16-3).
2.5
E
o 1 .5E6O l=
tE
ED
Io
| 500
I 400
1 500
r 200
r 100
1000
900
800
700
600
s00 1 .2 1 .1
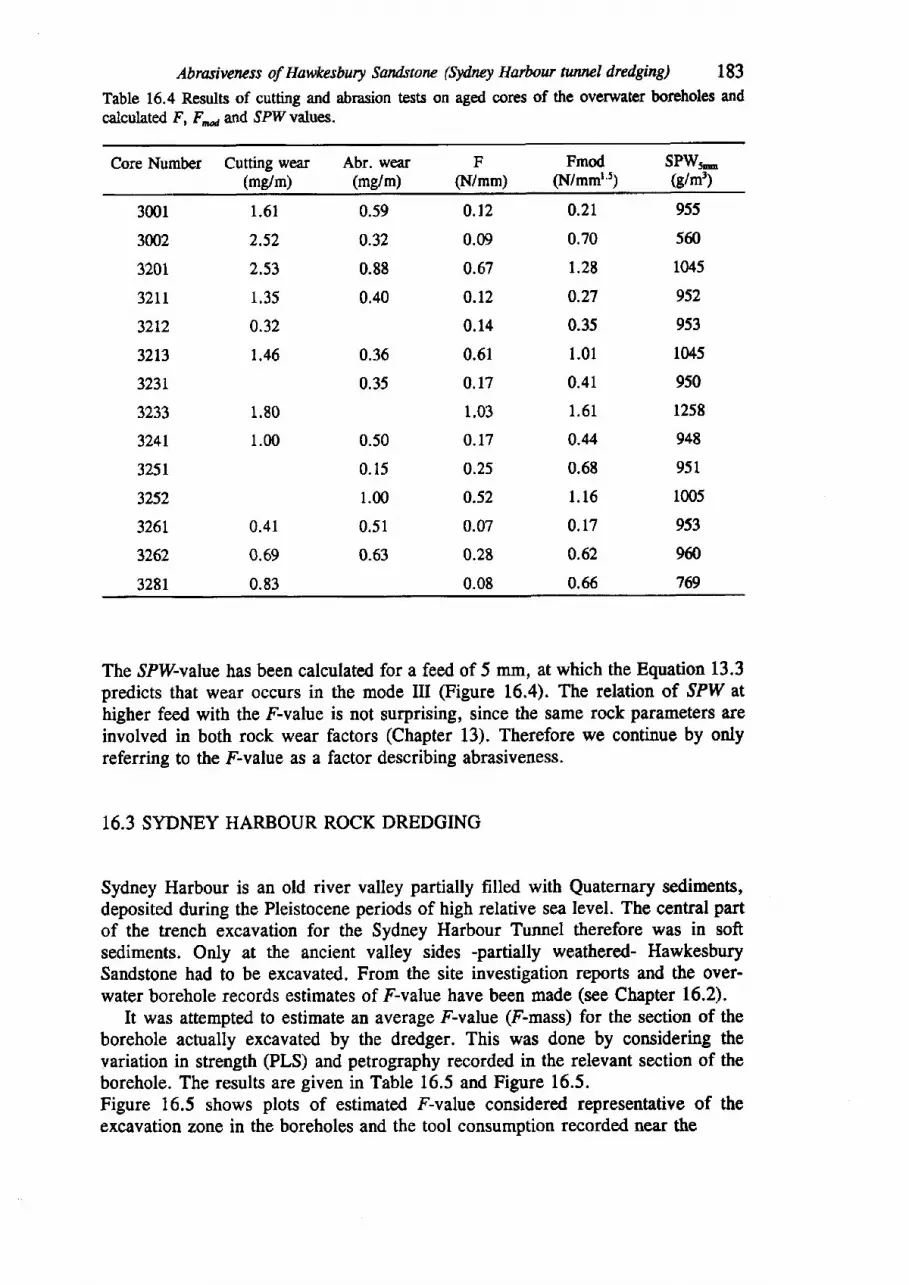
Abrasiveness of Hawkesbury Sandstoru (Syfusy Harbour tunrcl dredging) 183
Table 16.4 Results of cutting and abrasion tests on aged cores of the overwat€r boreholes andcalculated F, F,,,a and ,9PWvalues.
Core Number Cutting wear(me/m)
Abr. wear(mg/m)
F(N/mm)
Fmod(N/mmr'5)
sPw5-(s/m)
3001
3002
3201
32rr3212
32t3
323t
3233
3241
325r
3252
3261
1262
328r
1.61
2.52
2.53
1.35
0.32
r.46
1.80
1.00
0.41
0.69
0.83
0.59
0.32
0.88
0.40
0.36
0.35
0.50
0.15
1.00
0.51
0.63
0 .12
0.09
0.67
0 .12
0.14
0.61
0.17
1.03
0. t7
0.25
0.52
0.07
0.28
0.08
0.21
0.70
r.28
Q.27
0.35
1.01
0.41
1.61
0.44
0.6E
t .L6
0.17
0.62
0.66
955
560
1045
952
953
1045
950
1258
948
951
1005
953
960
769
The SPIV-value has been calculated for a feed of 5 mm, at which the Equation 13.3predicts that wear occurs in the mode Itr (Figure 16.4). The relation of ,9PW athigher feed with the F-value is not surprising, since the same rock parameters areinvolved in both rock wear factors (Chapter 13). Therefore we continue by onlyreferring to the F-value as a factor describing abrasiveness.
16.3 SYDNEY HARBOUR ROCK DREDGING
Sydney Harbour is an old river valley partially filled with Quaternary sediments,deposited during the Pleistocene periods of high relative sea level. The central partof the trench excavation for the Sydney Harbour Tunnel therefore was in softsediments. Only at the ancient valley sides -partially weathered- HawkesburySandstone had to be excavated. Frorn the site investigation reports and the over-water borehole records estimates of .Fvalue have been made (see Chapter 16.2).
It was attempted to estimate an average F-value (F-mass) for the section of theborehole actually excavated by the dredger. This was done by considering thevariation in strength (PLS) and petrography recorded in the relevant section of theborehole. The results are given in Table 16.5 and Figure 16.5.Figure 16.5 shows plots of estimated F-value considered representative of theexcavation zone in the boreholes and the tool consumption recorded near the
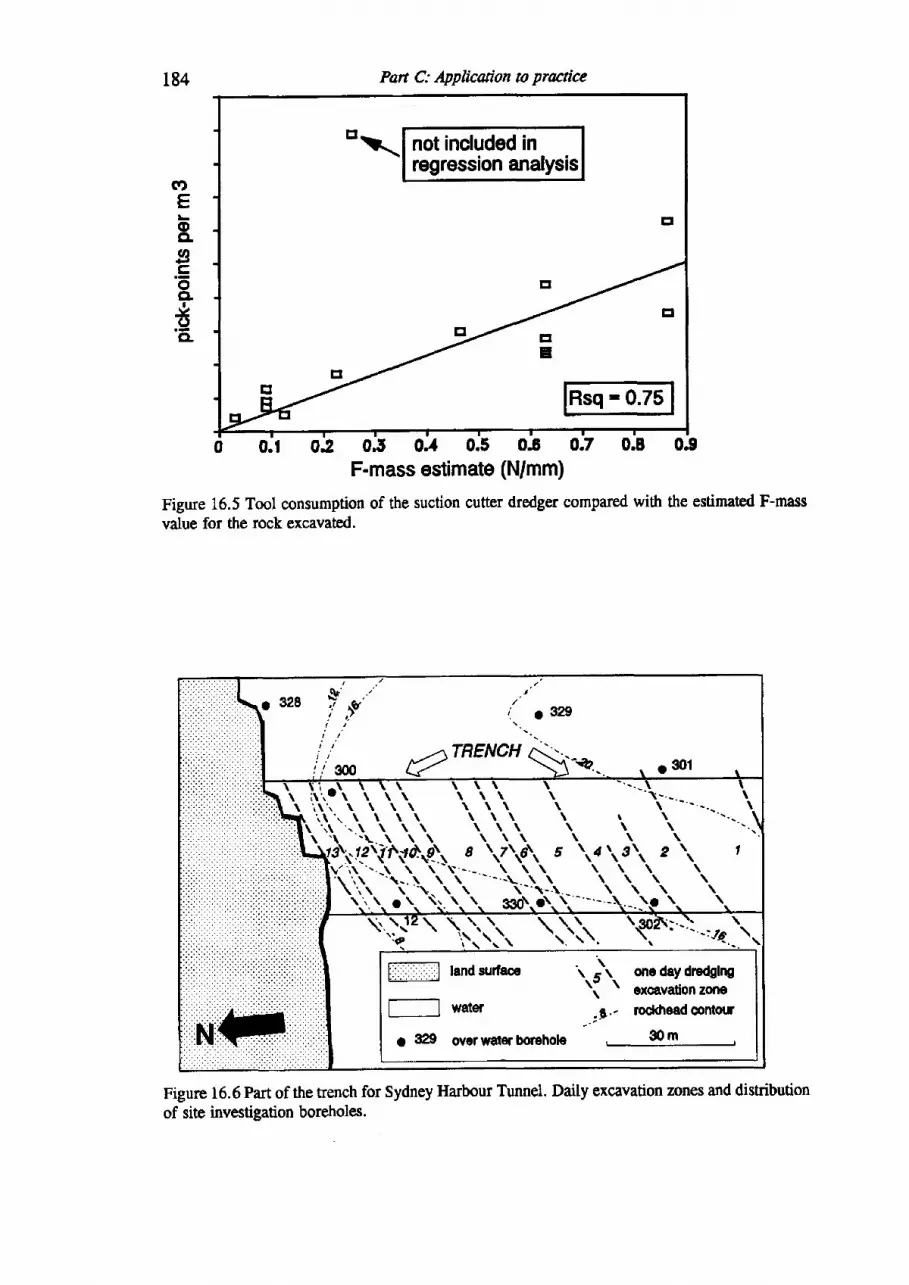
not included inregression analysis
Rsq - 0.75
Patt C: Applicaion n praaice
02 0.t 0A 0.5 0.0 0.7 0.8
a)EoCLocoCL
I
.Y(t'a
F-mass €stamate (N/mm)
Figure 16.5 Tool consumption of the suction cutter dredger compared with the estimated F-massvalue for the rock excavated.
Figure 16.6 Part of the trench for Sydney Harbour Tunnel. Daily excavation zones and distributionof site investigadon boreholes.
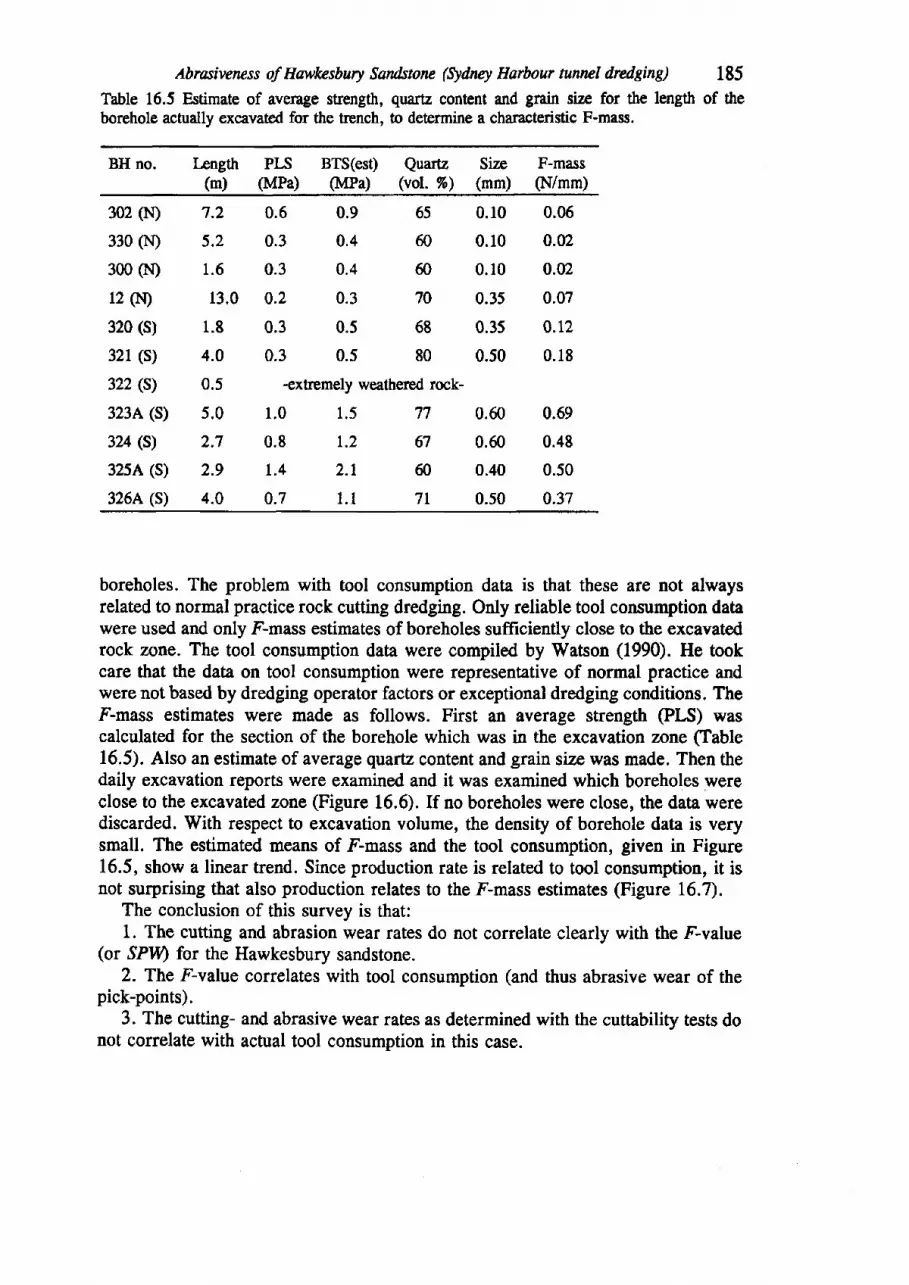
Abrasivencss of Hawlesbury Eandstone (Edney Harboar nmel dredging) 185Table 16.5 Estimate of average strength, quartz content and grain size for the lengtlt of theborehole actually excavated for the trrench, to determine a characteristic F-mass.
BH no. hngth PIJ(m) (MPa)
Quartz Size F-mass(vol. %) (mm) (N/mm)
BTS(est)(MPa)
302 (N)
330 (N)
300 (to
12 (l.I)
320 (s)
321 (s)
322 (s)
3234. (S)
324 (S)
325A (S)
326A (s)
7.2
5 .2
1 .5
13.0
1.8
4.0
0.5
5.0
2.7
2.9
4.0
0.6
0.3
0.3
Q.2
0.3
0.9
0.4
0.4
0.3
0.5
65
@
60
70
68
0.10 0.06
0.10 0.u
0.10 0.02
0.35 0.07
0.35 0.12
0.50 0.18
0.60 0.69
0.60 0.48
0.40 0.50
0.50 0.37
0.3 0.5 80-extremely weathered rock-
1.0 1.5 77
0.8
1 .4
4.7
r .22. tl . t
67
@
7L
boreholes. The problem with tool consumption data is that these are not alwaysrelated to normal practice rock cutting dredging. Only reliable tool consumption datawere used and only F-mass estimates of boreholes sufficiently close to the excavatedrock zone. The tool consumption data were compiled by V/atson (1990). He tookcare that the data on tool consumption were representative of normal practice andwere not based by dredging operator factors or exceptional dredging conditions. TheF-mass estimates were made as follows. First an average strength (PLS) wascalculated for the section of the borehole which was in the excavation zone Cfable16.5). Also an estimate of average quartz content and grain size was made. Then thedaily excavation reports were examined and it was examined which boreholes wereclose to the excavated zote (Frgure 16.6). If no boreholes were close, the data werediscarded. With respect to excavation volume, the density of borehole data is verysmall. The estimated means of F-mass and the tool consumption, given in Figure16.5, show a linear trend. Since production rate is related to tool consumption, it isnot surprising that also production relates to the F-mass estimates (Figure 16.7).
The conclusion of this survey is that:1. The cutting and abrasion wear rates do not correlate clearly with the F-value
(or.9PlV) for the Hawkesbury sandstone.2. The F-value correlates with tool consumption (and thus abrasive wear of the
pick-points).3. The cutting- and abrasive wear rates as determined with the cuttability tests do
not correlate with actual tool consumption in this case.
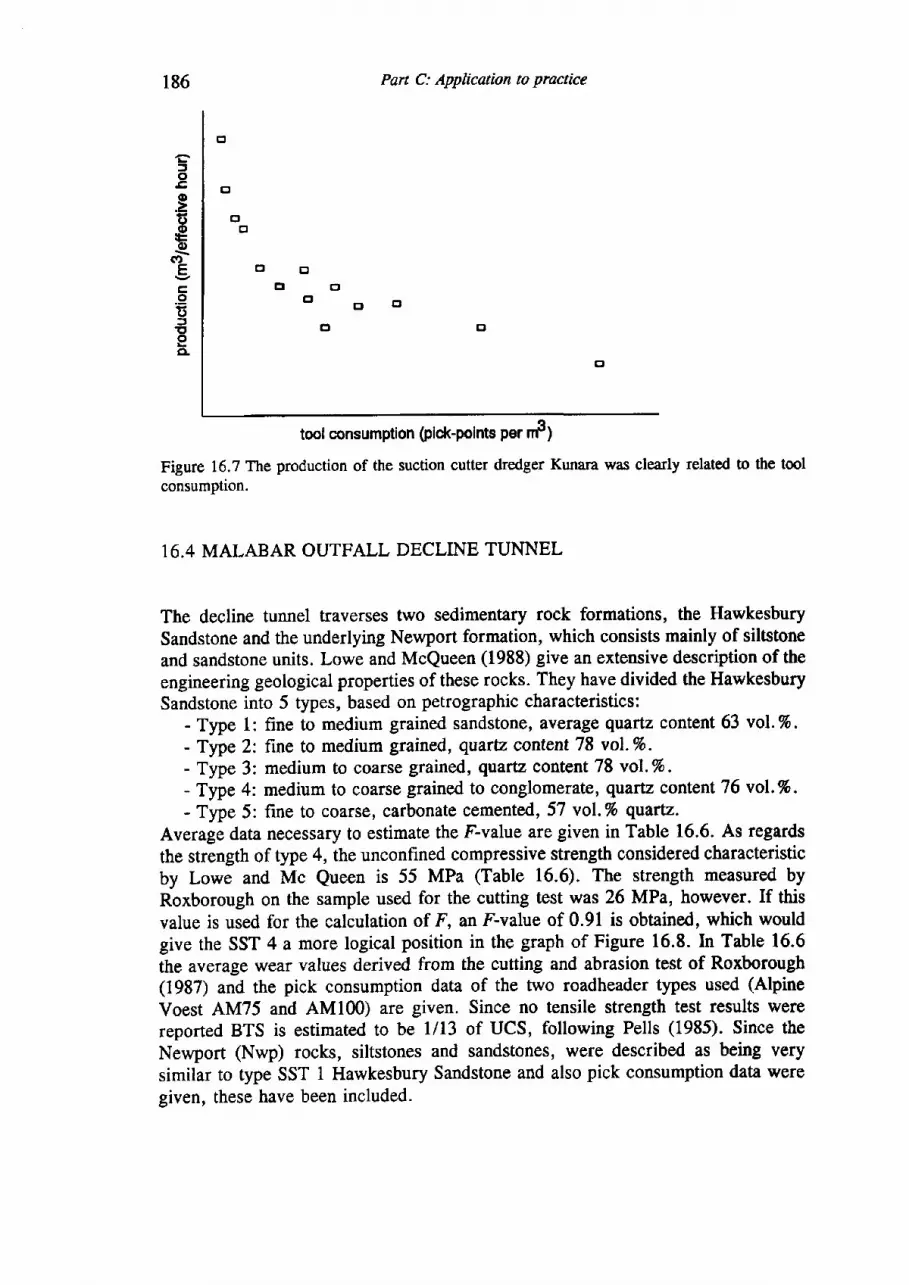
186
cJo
o
E€o)
(.,E
oE:tEeCL
Part C: Application to practice
Figure 16.7 The production of the suction cutter dredger Kunara was clearly related to the toolconsumption.
16.4 MALABAR OUTFALL DECLINE TUNNEL
The decline tunnel traverses two sedimentary rock formations, the HawkesburySandstone and the underlying Newport formation, which consists mainly of siltstoneand sandstone units. Lowe and McQueen (1988) give an extensive description of theengineering geological properties of these rocks. They have divided the HawkesburySandstone into 5 types, based on petrographic characteristics:
- Type 1: fine to medium grained sandstone, average quartz content 63 vol.%.- Type 2: fine to medium grained, qaartz content 78 vol.Vo.- Type 3: medium to coarse grained, quartz content 78 vol.%.- Type 4: medium to coarse grained to conglomerate, quartz content 76 vol.%.- Type 5: fine to coarse, carbonate cemented, 57 vol. To $artz.
Average data necessary to estimate the F-value are given in Table 16.6. As regardsthe strength of type 4, the unconfined compressive strength considered characteristicby Lowe and Mc Queen is 55 MPa (Table 16.6). The strength measured byRoxborough on the sample used for the cutting test was 26 MPa, however. If thisvalue is used for the calculation of 4 an F-value of 0.91 is obtained, which wouldgive the SST 4 a more logical position in the graph of Figure 16.8. In Table 16.6the average wear values derived from the cutting and abrasion test of Roxborough(1987) and the pick consumption data of the two roadheader types used (Alpine
Voest AM75 and AMl00) are given. Since no tensile strength test results werereported BTS is estimated to be l/13 of UCS, following Pells (1985). Since theNewport (Nwp) rocks, siltstones and sandstones, were described as being verysimilar to type SST 1 Hawkesbury Sandstone and also pick consumption data weregiven, these have been included.
tool consumption (pick-points per #;
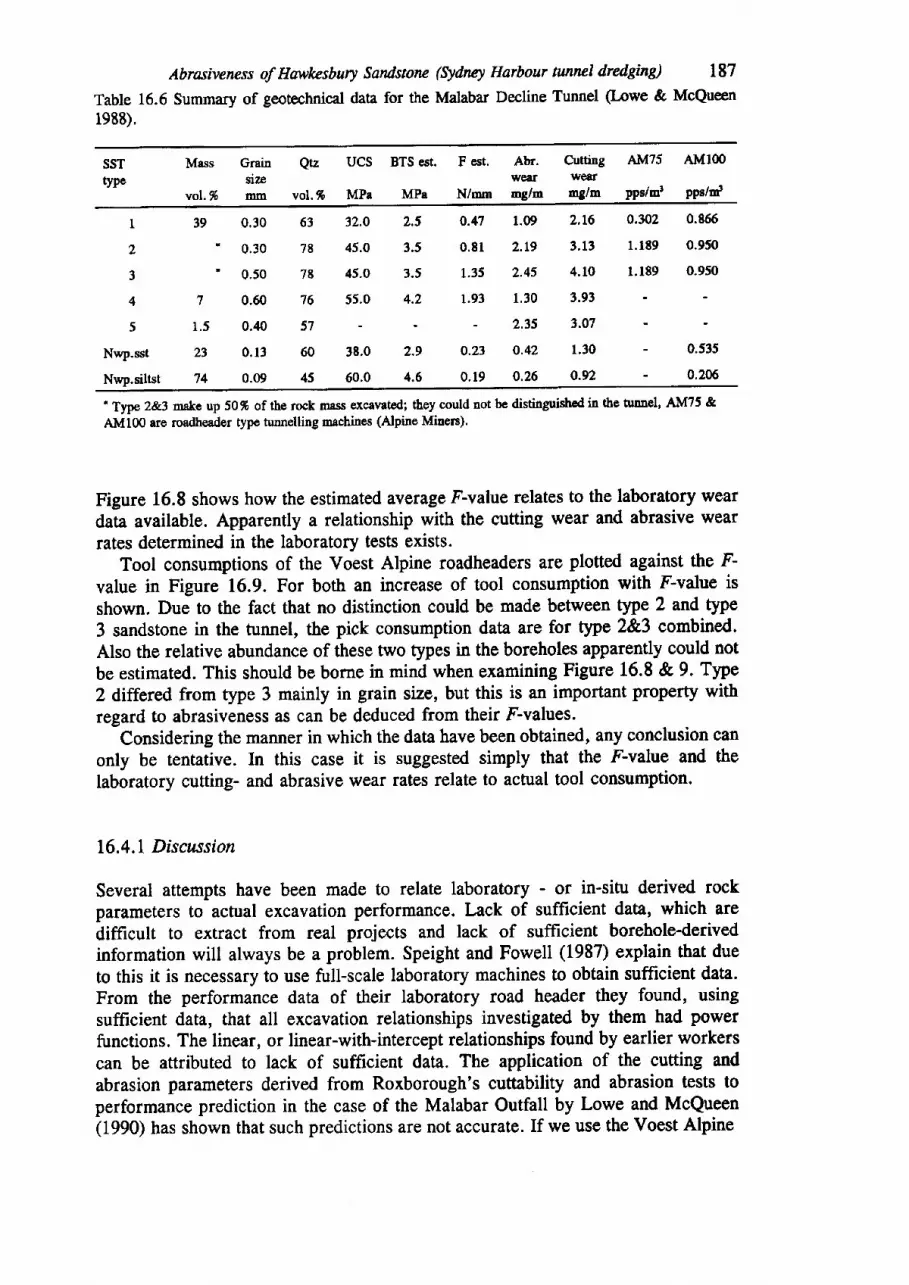
Abrasivencss of Hawkesbury Sandstoru (Ednq Harbour runrul dredginil 187
Table 16.6 Summary of geotechnical data for the Malabar Decline Tunnel (Lowe & McQueen19EE).
ucs
MPa
Grainsizpfitm
ssTt)"e
Mass
vol. %
atz
vol.%
BTS est. F est.
MPa N/mm
Abr. Cutting AM?s AMl00Wetf weif
mg/m mg/m pps/mr Pps/d
I
2
!
4
5
Nwp.sst
N*p.siltst
0.30
0.30
0.50
0.60
0.40
0.13
0.09
63
7E
7E
76
57
32.O
45.0
45.O
55.0
2.5
3.5
3.5
4.2
0.{l
0 ,81
1.35
1.93
1.09
2.19
2.45
1 .30
2.35
z.L6
3.13
4.10
3.93
?.07
0.302 0.866
1.1t9 0.950
l.r89 0.950
7
1 .5
23't4
60 38.0 2.9 0.23 0.42 1.30 - 0.535
45 60.0 4.6 0.19 0.?5 0.92 - 0.206
' Typ 2&3 make up 50% of the rock mass excgveted; they could not be distinguishd itr the hrnnel' AM75 &
AM100 are roadheader type tunnelling machines (Alpine Miuers).
Figure 16.8 shows how the estimated average F-value relates to the laboratory weardata available. Apparently a relationship with the cutting wear and abrasive wearrates determined in the laboratory tests exists.
Tool consumptions of the Voest Alpine roadheaders are plotted against the F-
value in Figure 16.9. For both an increase of tool consumption with F-value is
shown. Due to the fact that no distinction could be made between We 2 and type3 sandstone in the tunnel, the pick consumption data are for type 2&3 combined.Also the relative abundance of these two types in the boreholes apparently could notbe estimated. This should be borne in mind when examining Figure 16.8 & 9. Tlpe2 differed from type 3 mainly in grain size, but this is an important property withregard to abrasiveness as can be deduced from their F-values.
Considering the manner in which the data have been obtained, any conclusion canonly be tentative. In this case it is suggested simply that the F-value and thelaboratory cutting- and abrasive wear rates relate to actual tool consumption.
16.4.1 Disctusion
Several attempts have been made to relate laboratory - or in-situ derived rockparameters to actual excavation performance. Lack of sufficient data, which aredifficult to extract from real projects and lack of sufficient borehole-derivedinformation will always be a problem. Speight and Fowell (1987) explain that dueto this it is necessary to use full-scale laboratory machines to obtain suffrcient data.From the performance data of their laboratory road header they found, usingsuffrcient data, that all excavation relationships investigated by them had powerfunctions. The linear, or linear-with-intercept relationships found by earlier workerscan be attributed to lack of suf,frcient data. The application of the cutting andabrasion parameters derived from Roxborough's cuttability and abrasion tests toperformance prediction in the case of the Malabar Outfall by Lowe and McQueen(1990) has shown that such predictions are not accurate. If we use the Voest Alpine
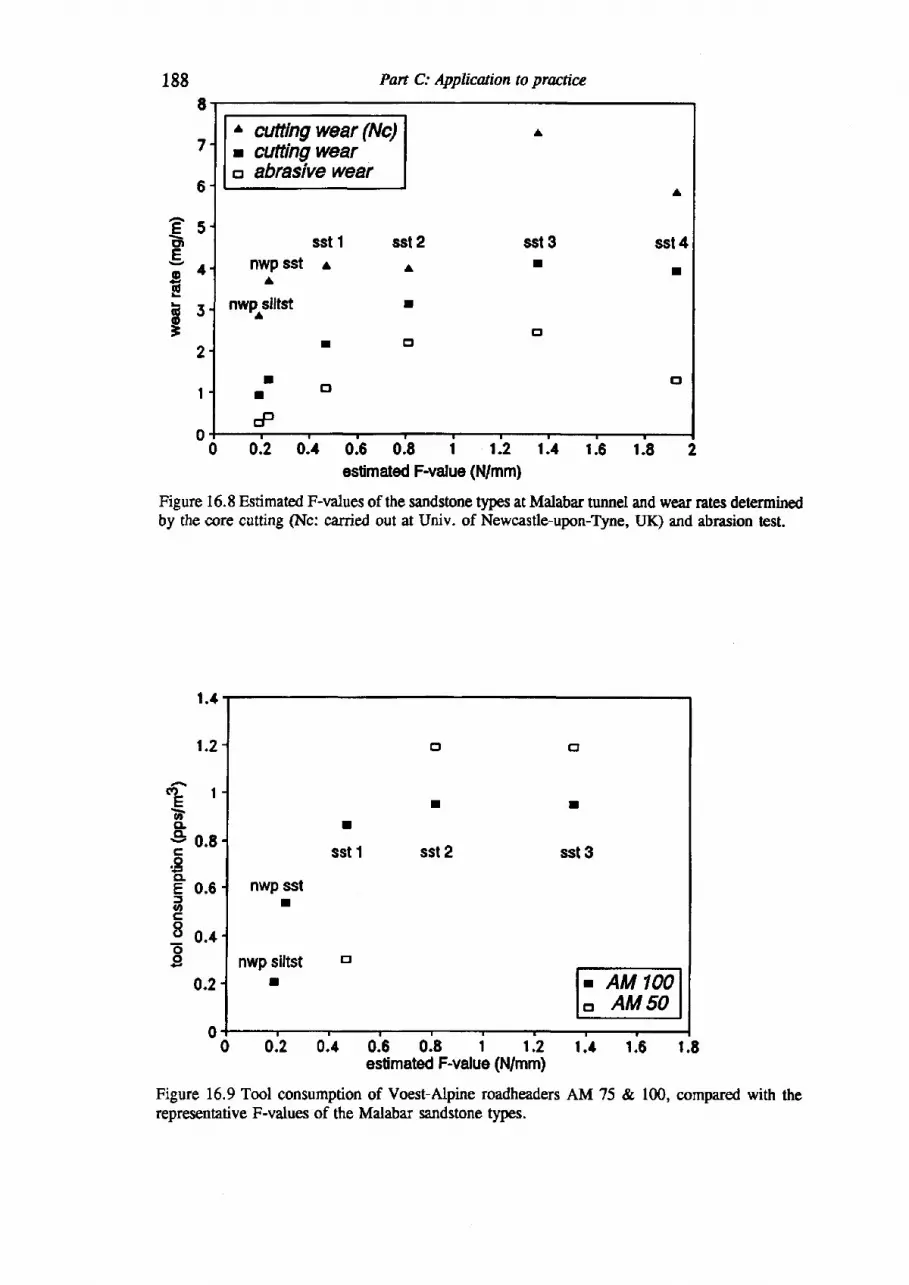
E
7
6
esctlEl rE
E5i
2
I
0
188 Pan C: Applicaion to practice
t anttinq wear (Nc): cufting weara abrasive wear
sst 1nwp sst a
A
nwp slltst- A
I
sst 2A
I
trt
sst 3I
sst 4
I
cl
r t . ,
#0.,3 0.6 0.8 | r.2 1.4 t.6 1.8 2
estim ated F-value (t'Umm)
Figure 16.8 Estimated F-values of the sandstone types at Malabar tunnel ud wear rates determinedby the core cutting (Nc: carried out at Univ. of Newcastle-upon-Tyne, UK) and abrasion test.
s)EbCLCL
c.9CLE5oc8oo
0 0.2 0.4 0.6 0.8 1 1.2 t .4 1.6 t .Eestimated F-value (N/mm)
Figure 16.9 Tool consumption of Voest-Alpine roadheaders AM 75 & 100, compared with therepresentative F-values of the Malabar sandstone types.
t .4
1 ,2
I
0.8
0.6
0.4
0.2
0
I
sst 1
o
I
sst 2
cl
t
sst 3
nwp sstT
nwp siltstI
Abrasiveness of Hawkesbury Sandstone (Edttst Harfuur ttnncl dredging) 189
graphs (Gehring 1991, pers. comm.; Braybrooke L988), which are based on F-valueand UCS, only in one case out of four is a proper estimate of pick consumption isobtained. The others fall outside the LU30% accuracy boundaries mentioned byGehring (1987). In the case of Malabar, the data show that the F-value and thecutting- and abrasive wear rates derived from the cuttability tests are related. Bothmethods also relate to pick consumption. ln the case of the rock cutting dredgingoperation it is striking that the estimated F-mass value shows an apparently linearcorrelation with actual pick consumption, but that the cutting- and abrasion wearrates are not related to both F-value and pick consumption.
16.5 CONCLUSTON
For the first time relatively accurate tool consumption data of a rock cutter suctiondredger could be studied. In this case the wear factor F, derived by Schimazek,related reasonably well with tool consumption. The SPIV relation of Deketh, alsoderived from laboratory tests gives comparable results. Another method commonlyapplied in rock tunnelling, the cutting wear and abrasive wear rates derived from thecore cutting and core abrasion tests, did not correlate with the tool consumption ofthe rock cutting dredger. Both Fvalue and the cutting- and abrasion wear rates wererelated to the tool consumption of the roadheaders used to excavate the MalabarOutfall Decline in Sydney.
The amount of cutting or abrasion tests which can be performed on rock coreswill always be limited. Therefore in site investigation practice use should be madeof rock index tests which do relate to cutting performance and abrasive wear. Suchtests include UCS, BTS, PLS, thin section examination (mineralogy, microscopicstructure, grain shape, grain size), E-modulus and so on. For wear prediction it isnecessary to calibrate the results of such tests against a trial-excavation with a realcutting machine at the site.
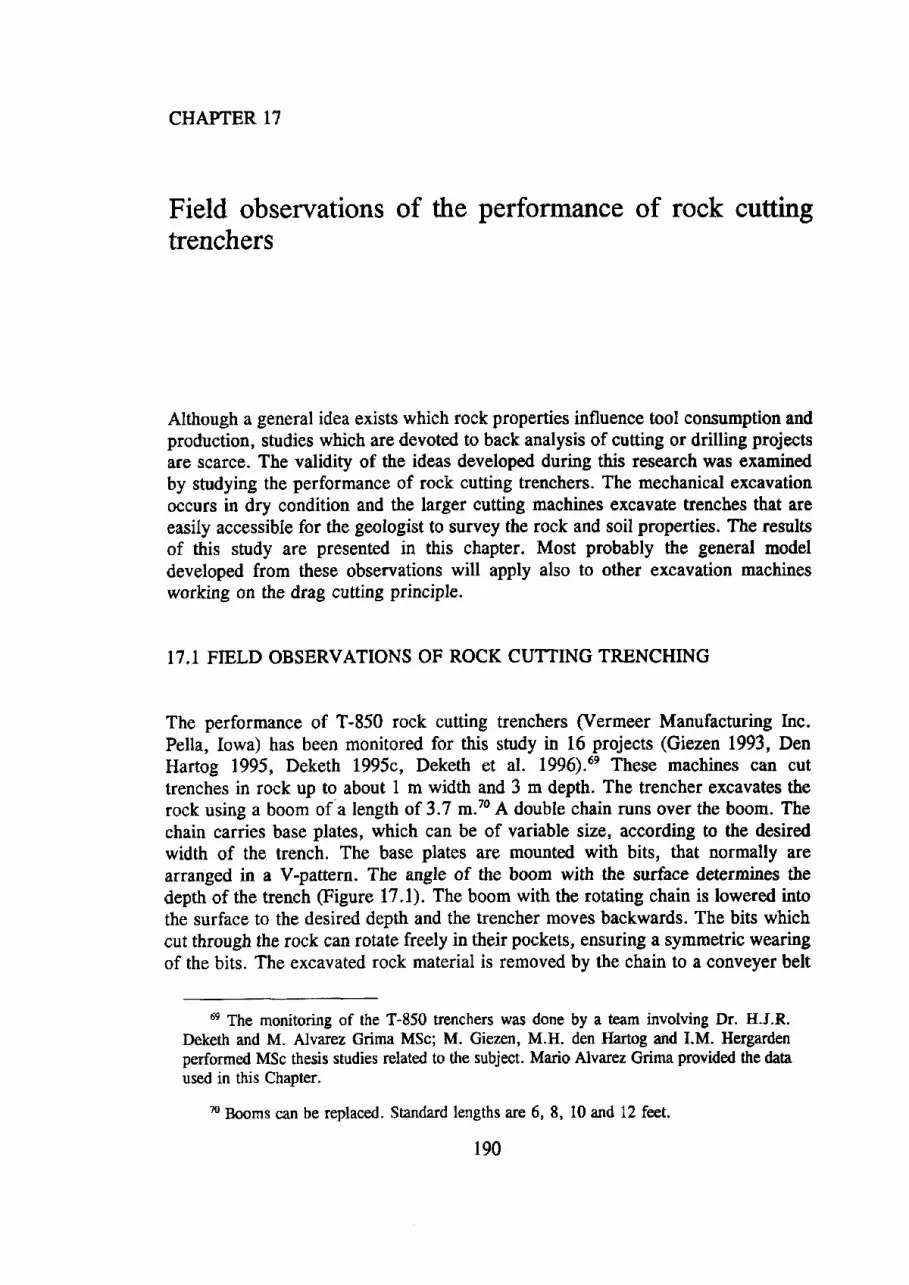
CHAPTER 17
Field observations of the performance of rock cuttingtrenchers
Although a general idea exists which rock properties influence tool consumption andproduction, studies which are devoted to back analysis of cutting or drilling projectsare scarce. The validity of the ideas developed during this research was examinedby studying the performance of rock cutting trenchers. The mechanical excavationoccurs in dry condition and the larger cutting machines excavate trenches that areeasily accessible for the geologist to survey the rock and soil properties. The resultsof this study are presented in this chapter. Most probably the general modeldeveloped from these observations will apply also to other excavation machinesworking on the drag cutting principle.
17.1 FIELD OBSERVATIONS OF ROCK CUTTING TRENCHING
The performance of T-850 rock cutting trenchers (Vermeer Manufacturing Inc.Pella, Iowa) has been monitored for this study in 16 projects (Giezen 1993, DenHartog 1995, Deketh I995c, Deketh et al. 1996).6e These machines can cuttrenches in rock up to about 1 m width and 3 m depth. The trencher excavates therock using a boom of a length of 3.7 m.70 A double chain runs over the boom. Thechain carries base plates, which can be of variable size, according to the desiredwidth of the trench. The base plates are mounted with bits, that normally arearranged in a V-pattern. The angle of the boom with the surface determines thedepth of the trench (Figure l7.l). The boom with the rotating chain is lowered intothe surface to the desired depth and the trencher moves backwards. The bits whichcut through the rock can rotate freely in their pockets, ensuring a symmetric wearingof the bits. The excavated rock material is removed by the chain to a conveyer belt
6e The monitoring of the T-850 trenchers was done by a team involving Dr. H.J.R.Deketh and M. Alvarez Grima MSc; M. Giezen, M.H. den Hartog and I.M. Hergardenperformed MSc thesis studies related to ttre subject. Mario Alvarez Grima provided the dataused in this Chapter.
70 Booms can be replaced. Standard lengths are 6, 8, 10 and 12 fent.
190
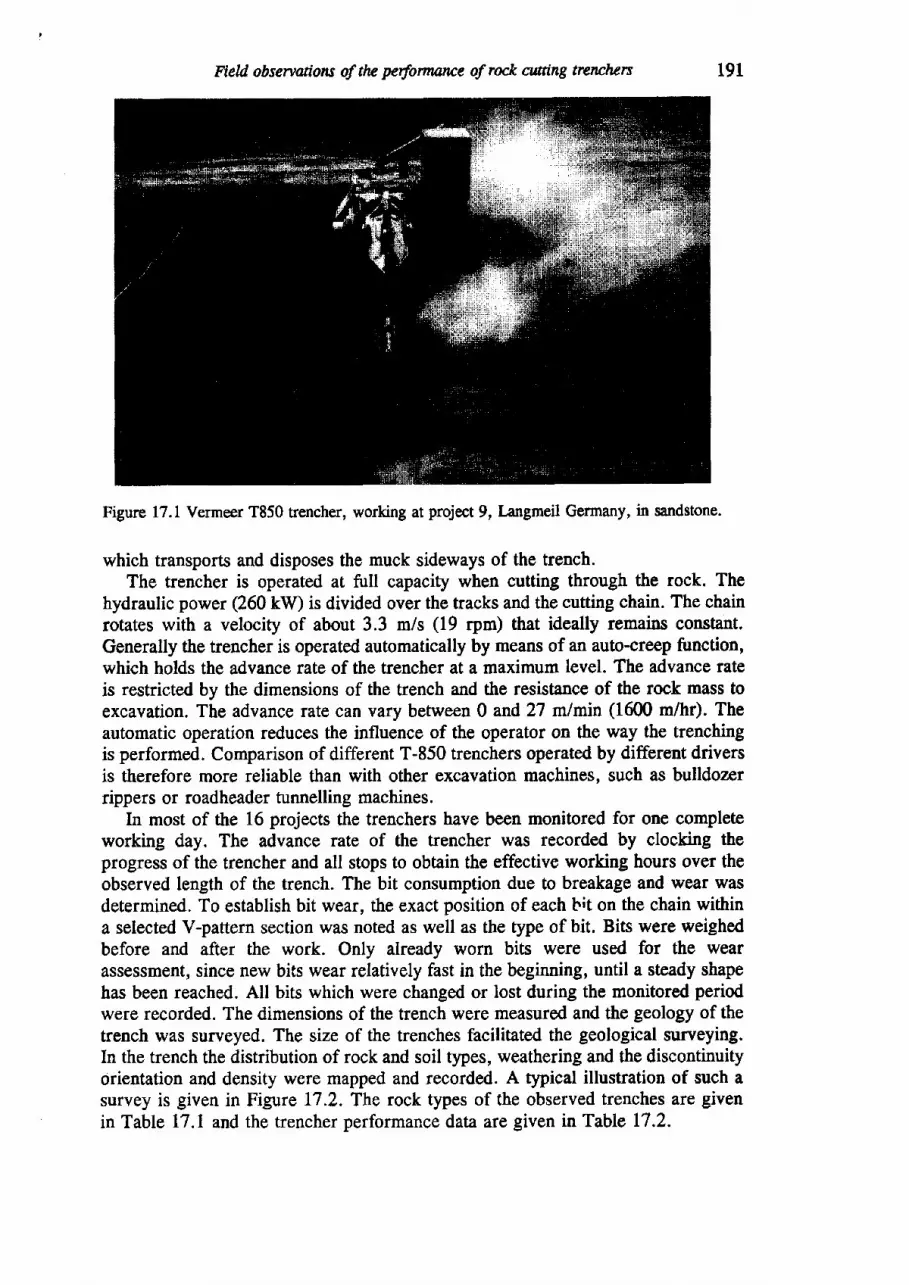
Fleld obsewwions of the perfomance of rock ctnting tetulurs
Figurc 17.1 Vermeer T850 trencher, working at project 9, Ianrgmeil Germany, in sandstone.
which transports and disposes the muck sideways of the trench.The trencher is operated at full capacity when cutting through the rock. The
hydraulic power (260 kW) is divided over the tracks and the cutting chain. The chainrotatos with a velocity of about 3.3 m/s (19 rpm) that ideally remains constant.Generally the trencher is operated automatically by means of an auto-creep function,which holds the advance rate of the trencher at a maximum level. The advance rateis restricted by the dimensions of the trench and the resistance of the rock mass toexcavation. The advance rate can vary between 0 and 27 mlmin (1600 m/hr). Theautomatic operation reduces the influence of the operator on the way the trenchingis performed. Comparison of different T-850 trenchers operated by different driversis therefore more reliable than with other excavation machines, such as bulldozerrippers or roadheader tunnelling machines.
In most of the 16 projects the trenchers have been monitored for one completeworking day. The advance rate of the trencher was recorded by clocking theprogress of the trencher and all stops to obtain the effective working hours over theobserved length of the trench. The bit consumption due to breakage and tvear wasdetermined. To establish bit wear, the exact position of each t it on the chain withina selected V-pattern section was noted as well as the type of bit. Bits were weighedbefore and after the work. Only already worn bits were used for the wearassessment, since new bits wear relatively fast in the beginning, until a steady shapehas been reached. All bits which were changed or lost during the monitored periodwere recorded. The dimensions of the trench were measured and the geology of thetrench was surveyed. The size of the trenches facilitated the geological surveying.In the trench the distribution of rock and soil types, weathering and the discontinuityorientation and density were mapped and recorded. A typical illustration of such asurvey is given in Figure 17.2. The rock types of the observed trenches are givenin Table 17.1 and the trencher performance data are given in Table 17.2.
r92 Pan C: Applicwion rc pracrtce
adranoe rate (ffir) MILIAU, FNANCE
s+ch rtflrW
?o30Direstlon of trencfilng -
f overburden Effiil Unit I massive
Figure 77.2 Example of the relationship of excavation mechanism (scraping & cutting and ripping)wittr rock type and advance rate of the trencher.
In Table l7.l data on the trench dimensions and the rock characteristics aregiven. The trench dimensions varied for each project. This has a bearing on theinterpretation of the rock mass data. The block size of the rock mass excavatedshould be compared with the cross section of the trench, to be able to judge whethera block could be easily dislodged. Dislodging will be easy when the dimension ofthe rock blocks is smaller than the cross section of the trench face. In the Able thecolumn block size gives the indication rnansive (m.) when the block size is largerthan the trench dimension and dislodging cannot occur. To be able to study the rockcutting performance, the assumption was made that soil overburden or highly tocompletely weathered rock would not contribute significantly to the wear of thecutting bits, as compared with the contribution of massive rock.
The volume of rock cut in each trench was estimated and is given as a percentageof the trench dimensions in Table 17.2. The excavation rate in rock was establishedby multiplying the advance rate of the trencher (m/hour) by the width of the trenchand the thickness of the rock unit. The total excavation rate was obtained bymultiplying the advance rate by the width and the total depth of the trench. The bitconsumption rate was calculated by dividing the total number of bits replaced or lostby the rock volume excavated.
Breakage mainly occurred due to high impact forces exceeding the strength of thebits or the tungsten carbide insert. Loss of the insert led to very rapid wear of thesteel body of the bit. Failure of the steel body of the bit occurred mostly at theposition where the shaft of the bit is not supported by the bit pocket. The specificwear for all bits on the chain was calculated by extrapolating the mass loss of the
0.000.10
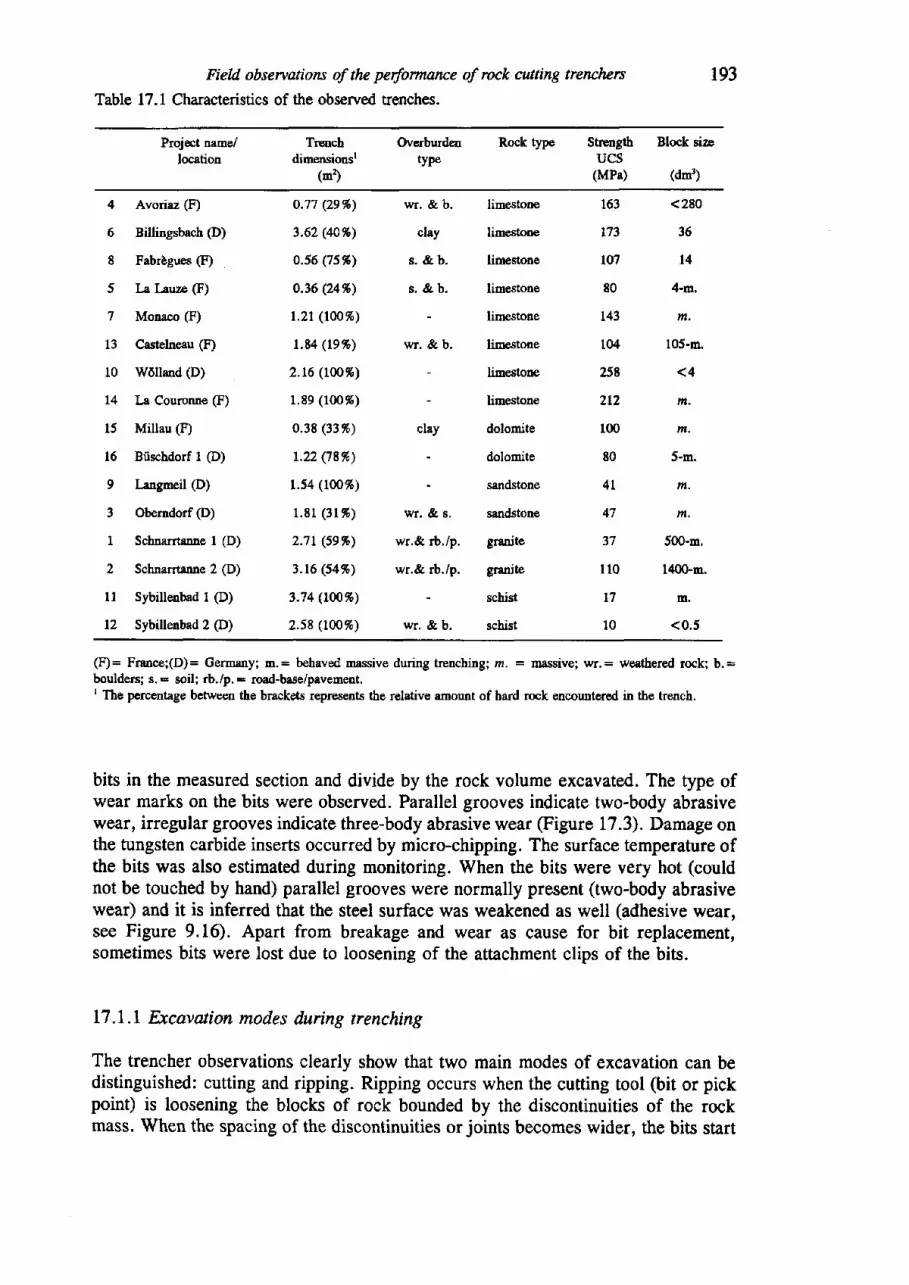
Field obsewaions of thc performarce of rock cutting trenchcrs
Table 17.1 Characteristics of the observed trenches.
193
Project name/locatiou
Trenchdimensionsl
(m')
Overburdentyw
Shength Block sizEucs(MPr) (dm)
Rock type
4 Avoriaz (F)
6 Billingsbach @)
8 Fabrl.gues (F)
5 Ir f-euze (F)
7 Monaco (F)
13 Castelneau (F)
10 w6lland (D)
L4 Ia Couronne (F)
15 Millau (F)
16 Bfischdorf I @)
9 langmeil (D)
3 Oberndorf (D)
1 Schnarrtanne I (D)
2 Schnarrtanne 2 (D)
ll Sybillenbad I @)
12 Sybillenbad 2 @)
o.77 (2e%)
3.62 (40%)
0.s6 (7s%>
0.36 (U%)
r.n $ao%)r.84 (r97o)
2.16 (L0Or)
1.89 (100'6)
0.38 (33%)
r.22 Q8%)
1.s4 (100%)
1.E1 (31%)
2.71(se%)
3.16 (s4%)
3.74 (Iffi*)
2.58 (100%)
wr. & b.
clay
s. &b.
s . &b .
wr. & b.
wr. & s.
wr,& rb,/p.
wr.& rb./p.
wr. & b.
limestone
limestone
limestone
limestone
lime.stone
limstone
limestone
limestone
dolomite
dolomite
sandstone
sandstone
granite
granite
schist
schist
<280
36
l4
4-m.
m,
105-m.
< 4
m.
m.
5-m.
m.
m,
5@-m,
1400-m.
m.
<0.5
clay
163
L73
ro7
80
143
104
258
2t2
100
80
4L
47
37
110
l7
10
(F)= France;(D)= Germa[y; m.= behaved massive during trenchingi m. - massive; wr,= weathered rock; b.=boulders; s. : soil; rb./p. : road-base/pavemeot.I The percentage between the brackets represents the relative amount of hand rock encountered in the trench.
bits in the measured section and divide by the rock volume excavated. The type ofwear marks on the bits were observed. Parallel grooves indicate two-body abrasivewear, irregular grooves indicate three-body abrasive wear (Figure L7.3). Damage onthe tungsten carbide inserts occurred by micro-chipping. The surface temperature ofthe bits was also estimated during monitoring. When the bits were very hot (couldnot be touched by hand) parallel grooves were normally present (two'body abrasivewear) and it is inferred that the steel surface was weakened as well (adhesive wear,see Figure 9.16). Apart from breakage and wear as cause for bit replacement,sometimes bits were lost due to loosening of the attachment clips of the bits.
17 .l.t Excavation modes &.tring trenching
The trencher observations clearly show that two main modes of excavation can bedistinguished: cutting and ripping. Ripping occurs when the cutting tool Oit or pickpoint) is loosening the blocks of rock bounded by the discontinuities of the rockmass. When the spacing of the discontinuities or joints becomes wider, the bits start
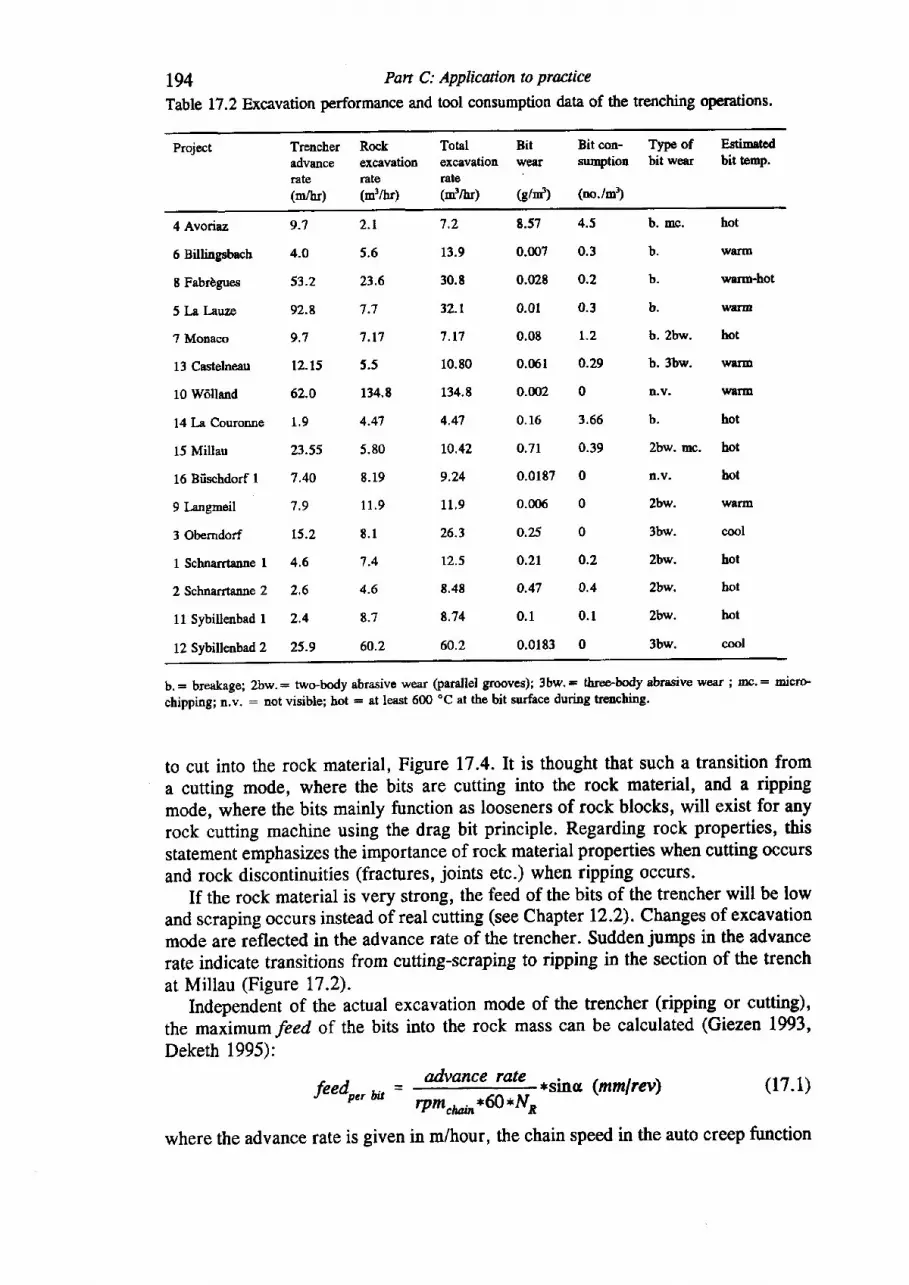
194 Pan C: Applicuion to practice
Table L7.2 Excavation performance and tool consumption data of the trenching operations'
ProJect Trencher Rockadvcnc€ excavationrate rate(m/hr) (d/h)
Total Bitexcavation wesrrate(d/}I) (e/d)
Bit con- Tyrye of Estinatedsunption bit wear bit temp.
(no./m)
4 Avoriaz
6 Billingsbech
8 Fabrbgues
5 I-a Iauze
? Monaco
13 Castelneau
10 W6llend
14 La Couronne
15 Millau
16 Biischdorf I
9I-angmeil
3 Obemdorf
1 Schnarrtanne I
2 Schnarrtanne 2
11 Sybillenbad I
12 Sybillenbad 2
8.57 4.5
0.007 0.3
0.028 0.2
0.01 0.3
0.0E r.2
0.061 a-29
0.002 0
0.16 3,66
0.7r 0.39
0.0187 0
0.006 0
o.25 0
o.2l o.2
a.47 0.4
0.1 0.1
0.0183 0
b. mp.
b.
b.
b.
b. 2bw.
b.3bw.
n.v-
b.
2bw. mc.
n.v.
2bw.
3bw.
2bw.
2bw,
zbllt.
3bw.
hot
warm
wrrm-hot
wrrtr|
hot
wstD
wNrm
hot
bot
hot
wantr
cool
hot
bot
hot
cool
9-',|
4.0
53.2
92.E
9.7
n.15
6?,.0
1 .9
23.55
7,40
7 .9
L5.2
4.6
2,6
2,4
25.9
2 .1
5.6
2r.6
7 ; l
7 .17
5.5
134.8
4.47
5.80
8.19
r 1 . 9
E . l
7.4
4.6
E.'l
60.2
7 ,2
13.9
30.8
32-r
7 . t 7
10.80
134.8
4.47
LO.42
9.24
I 1.,9
26.3
12.5
8,4t
8.74
60.2
b.= breakage; 2bw.= two-body abrasive wear (parallel grooves); 3bw,= tbree'body abrasive wear ; mc.: micro-
chipping; n.v. : not visible; hot = at least 600 oC at the bit surface during trenching.
to cut into the rock material, Figure 17.4.lt is thought that such a transition froma cutting mode, where the bits are cutting into the rock material, and a ripping
mode, where the bits mainly function as looseners of rock blocks, will exist for anyrock cutting machine using the drag bit principle. Regarding rock properties' this
statement emphasizes the importance of rock material properties when cutting occurs
and rock discontinuities (fractures, joints etc.) when ripping occurs.If the rock material is very strong, the feed of the bits of the trencher will be low
and scraping occurs instead of real cutting (see Chapter lZ.2). Changes of excavationmode are reflected in the advance rate of the treneher. Sudden jumps in the advancerate indicate transitions from cutting-scraping to ripping in the section of the trench
at Millau (Figure 17.2).Independent of the actual excavation mode of the trencher (npping or cutting),
the maiimumfeed of the bits into the rock mass can be calculated (Giezen 1993,
Deketh 1995):
leedo* ut = advance rate *sina (mmlrat) (17.1)rPmrun+60*JVn
where the advance rate is given in m/hour, the chain speed in the auto creep function
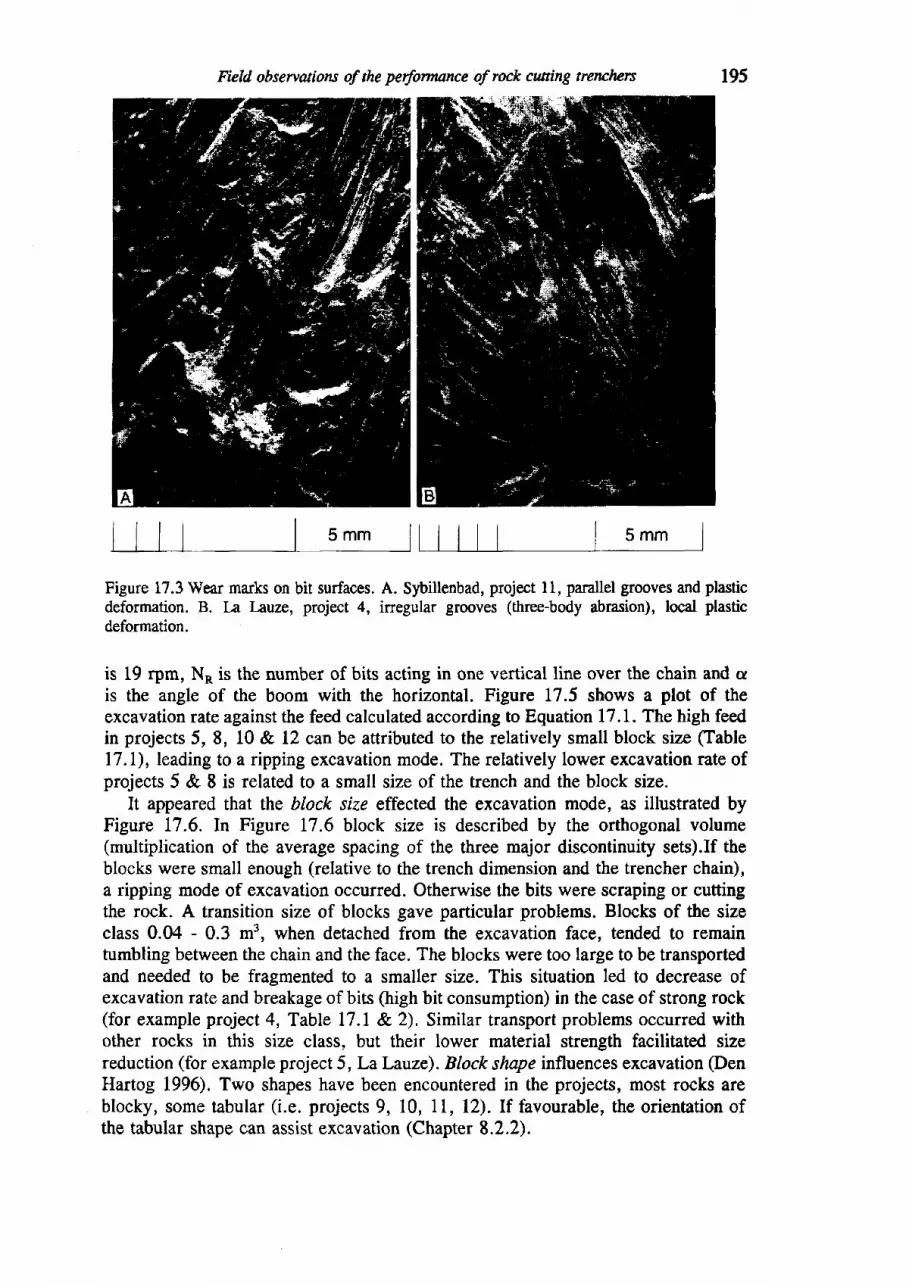
Field observaions of the perfonnance of rock cuning trerrclwrc
Figure 17.3 Wear marks on bit surfaces.deformation. B. I^a l;ruza, project 4,deformation.
__Jl llll lsmm IA. Sybillenbad, project 11, parallel grooves and plasticinegular grooves (three-body abrasion), local plastic
is 19 rpm, N* is the number of bits acting in one vertical line over the chain and cris the angle of the boom with the horizontal. Figure 17.5 shows a plot of theexcavation rate against the feed calculated according to Equation 17.1. The high feedin projects 5, 8, 10 & 12 can be attributed to the relatively small block size (fable77.1),leading to a ripping excavation mode. The relatively lower excavation rate ofprojects 5 & I is related to a small size of the trench and the block size.
It appeared that the btock size effected the excavation mode, as illustrated byFigure 17.6. In Figure 17.6 block size is described by the orthogonal volume(multiplication of the average spacing of the three major discontinuity sets).If theblocks were small enough (relative to the trench dimension and the trencher chain),a ripping mode of excavation occurred. Otherwise the bits were scraping or cuttingthe rock. A transition size of blocks gave particular problems. Blocks of the sizeclass 0.04 - 0.3 m3, when detached from the excavation face, tended to remaintumbling between the chain and the face. The blocks were too large to be transportedand needed to be fragmented to a smaller size. This situation led to decrease ofexcavation rate and breakage of bits (high bit consumption) in the case of strong rock(for example project 4, Table 17 .1 & 2). Similar transport problems occurred withother rocks in this size class, but their lower material strength facilitated sizereduction (for example project 5 , LaLaaze). Block shape influences excavation (DenHartog 1996). Two shapes have been encountered in the projects, most rocks areblocky, some tabular (i.e. projects 9, 10, II, l2). If favourable, the orientation ofthe tabular shape can assist excavation (Chapter 8.2.2).
I I I I I s.' t
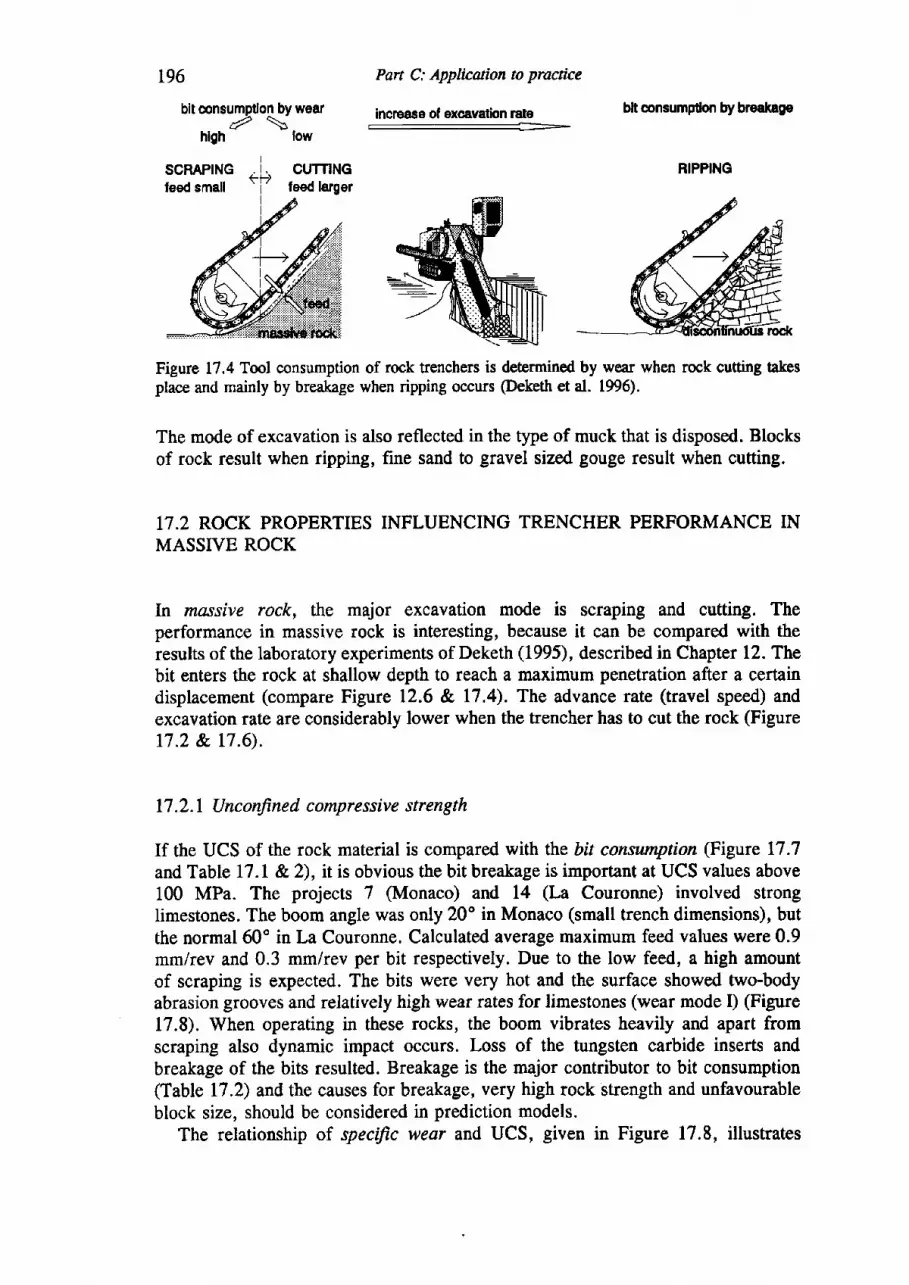
196
bit consumption by wear
Par-t C: Applicaion to practice
increase of excavation rate: >
blt consumpdon by breakage
high\
low
SCRAFINGfeed small
CUTTINGfeed larger
BIPPING
Figure 17.4 Tml consumption of rock trenchers is determined by wear when rock cutting takesplace and mainly by breakage when ripping occurs @eketh et al. 1996).
The mode of excavation is also reflected in the type of muck that is disposed. Blocksof rock result when ripping, fine sand to gravel sized gouge result when cutting.
17.2 ROCK PROPERTIES INFLUENCING TRENCHER PERFORMANCE INMASSTVE ROCK
In mnssive rock, the major excavation mode is scraping and cutting. Theperformance in massive rock is interesting, because it can be compared with theresults of the laboratory experiments of Deketh (1995), described in Chapter 12. Thebit enters the rock at shallow depth to reach a maximum penetration after a certaindisplacement (compare Figure L2.6 & 17.4). The advance rate (travel speed) andexcavation rate aro considerably lower when the trencher has to cut the rock (Figure17.2 & 17.6).
17 .2.1 Unconfined compressive strength
If the UCS of the rock material is compared with the bit conswnpfion (Figure 17.7and Table I7.I & 2), it is obvious the bit breakage is important at UCS values above100 MPa. The projects 7 (Monaco) and 14 (La Couronne) involved stronglimestones. The boom angle was only 20" in Monaco (small trench dimensions), butthe normal 60o in La Couronne. Calculated average maximurn feed values were 0.9mm/rev and 0.3 rnm/rev per bit respectively. Due to the low feed, a high amountof scraping is expected. The bits were very hot and the surface showed two-bodyabrasion grooves and relatively high wear rates for limestones (wear mode I) (Figure17.8). When operating in these rocks, the boom vibrates heavily and apart fromscraping also dynamic impact occurs. Loss of the tungsten carbide inserts andbreakage of the bits resulted. Breakage is the major contributor to bit consumption(Table t7.2) and the causes for breakage, very high rock strength and unfavourableblock size, should be considered in prediction models.
The relationship of specific wear and UCS, given in Figure 17.8, illustrates
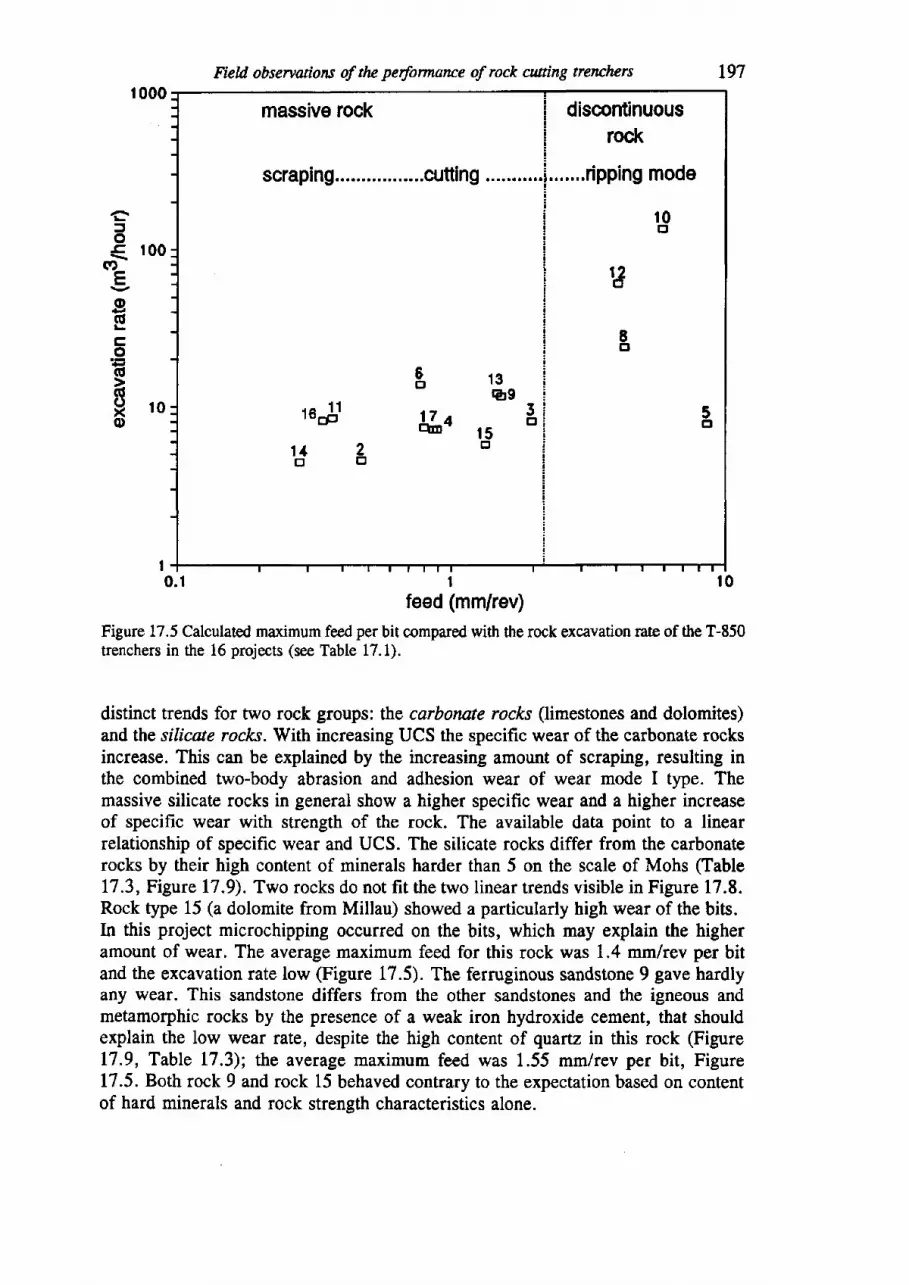
massivs rock
scraping.................cutting . r.....,..
c3o.c,
g)
E.9Ecocl
Ixo
Field observaions of tlw performance of rock cutting terrchers
t00
feed (mm/rev)Figure 17.5 Calculated maximum feed per bit compared with the rock excavation rate of the T-850trenchers in the 16 projects (see Table 17.1).
distinct trends for two rock groups: the carbonnte roclcs (limestones and dolomites)and the silicue roclcs. With increasing UCS the specific wear of the carbonate rocksincrease. This can be explained by the increasing amount of scraping, resulting inthe combined two-body abrasion and adhesion wear of wear mode I type. Themassive silicate rocks in general show a higher specific wear and a higher increaseof specific wear with strength of the rock. The available data point to a linearrelationship of specific wear and UCS. The silicate rocks differ from the carbonaterocks by their high content of minerals harder than 5 on the scale of Mohs (Table17.3, Figurc17.9). TworocksdonotfitthetwolineartrendsvisibleinFigure 17.8.Rock type 15 (a dolomite from Millau) showed a particularly high wear of the bits.In this project microchipping occurred on the bits, which may explain the higheramount of wear. The average maximum feed for this rock was 1.4 mm/rev per bitand the excavation rate low (Figure 17.5). The ferruginous sandstone 9 gave hardlyany wear. This sandstone differs from the other sandstones and the igneous andmetamorphic rocks by the presence of a weak iron hydroxide cement, that shouldexplain the low wear rate, despite the high content of quartz in this rock (Figure17.9, Table L7.3); the average maximum feed was 1.55 mm/rev per bit, Figure17.5. Both rock 9 and rock 15 behaved contrary to the expectation based on contentof hard minerals and rock strength characteristics alone.
t 0
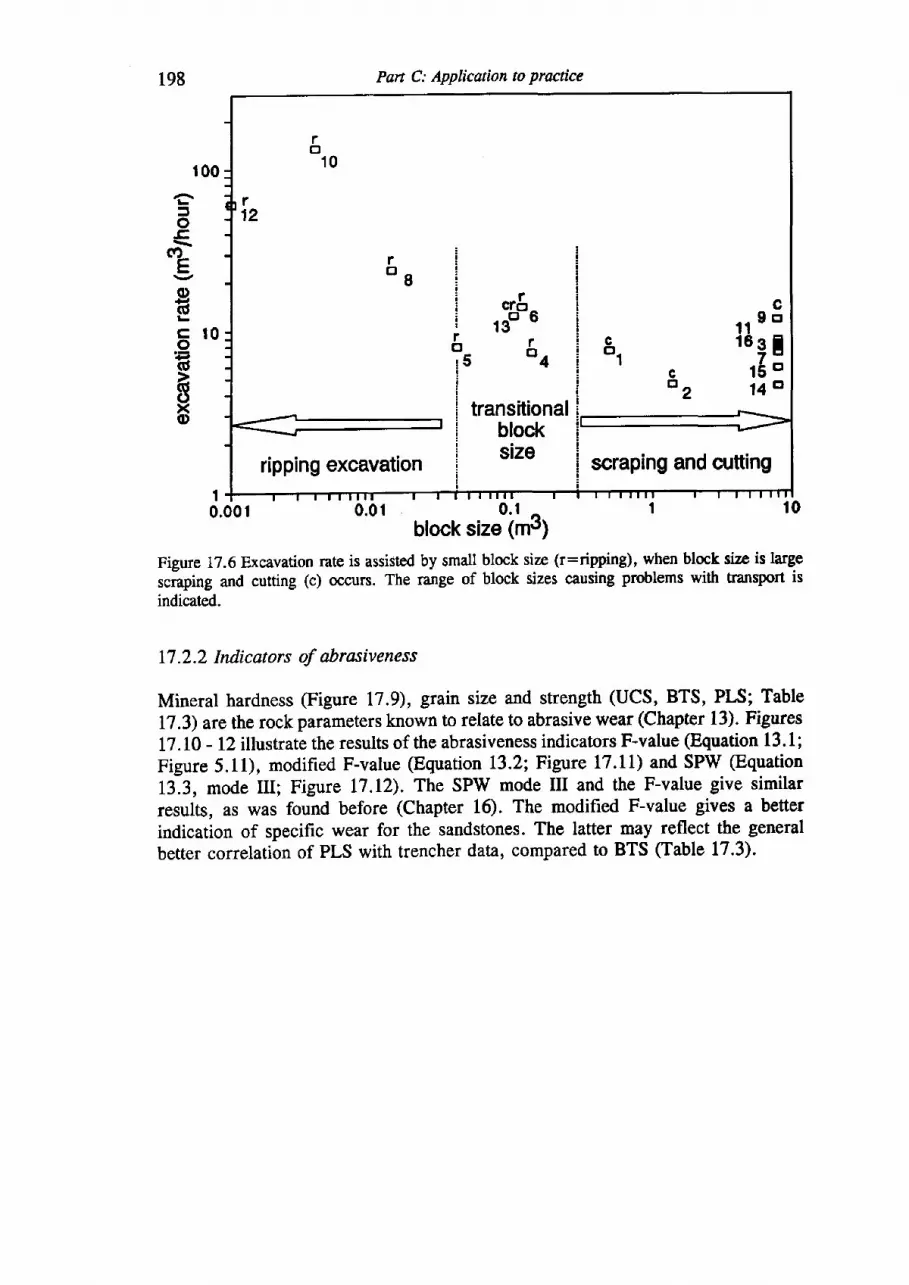
Pan C: Applicuion to practice
scraping and o.rtting
198
c=o-tr-
E;6:oG'
(s(Jxo
1F0.00 |
block siza(m3;Figure 17.6 Excavation rate is assisted by smdl block size (r:ripping), when block size is largesciaping and cutting (c) occurs. The range of block sizes causing problems with fansport isindicated.
17.2.2 Indicators of abrasiveness
Mineral hardness (Figure L7.9), grain size and strength (UCS, BTS, PLS; Table
17.3) arcthe rock parameters known to relate to abrasive wear (Chapter 13). Figures
17.lO - 12 illustrate the results of the abrasiveness indicators Fvalue (Equation 13.1;Figure 5.11), modified F-value (Equation 13.2; Figure 17.11) and SPW @quation13.3, mode III; Figure 17.12). The SPW mode III and the F-value give similar
results, as was found before (Chapter 16). The modified F-value gives a better
irrdication of specific wear for the sandstones. The latter may reflect the general
better correlation of PLS with trencher data, compared to BTS (Table 17.3\.
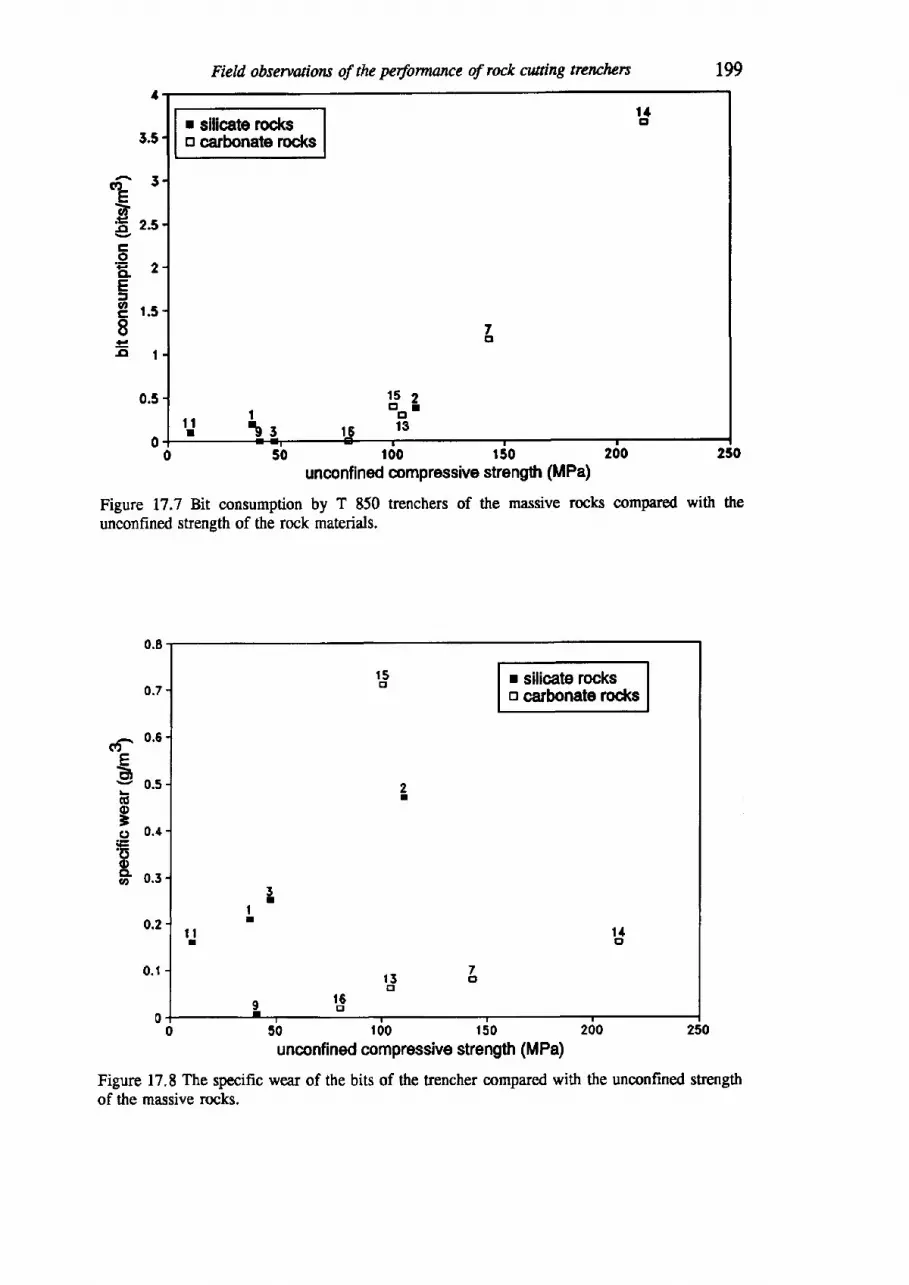
art
b'Ec.9CLE=oc8-cl
Field obsewuioru of the perfonnance of rock atning terrclwrc
I
3.5
5
2.5
2
r.5
I
0.5
00 50 100 150 200 250
unconf ined cornpressive strength (M Pa)
Figure 17,7 Bit consumption by T 850 trenchers of the massive rocks compared with theunconfined strength of the rock materials.
r 5o I silicate rocks
o carbonate rocks
5rIt
t lI
l 4c'
r 5o
7c'
t 6EI
50 t00 t50 200 250unconfined compressive strength (MPa)
Figure 17.8 The specific wear of the bits of the trencher compared with the unconfined strengthof the massive rocks.
0.8
0.7
^ 0,6F
I o-s(6o=cr 0.4
iE'6oB o.s
0.2
0.1
0
r sllicate rockso carbonale rod<s
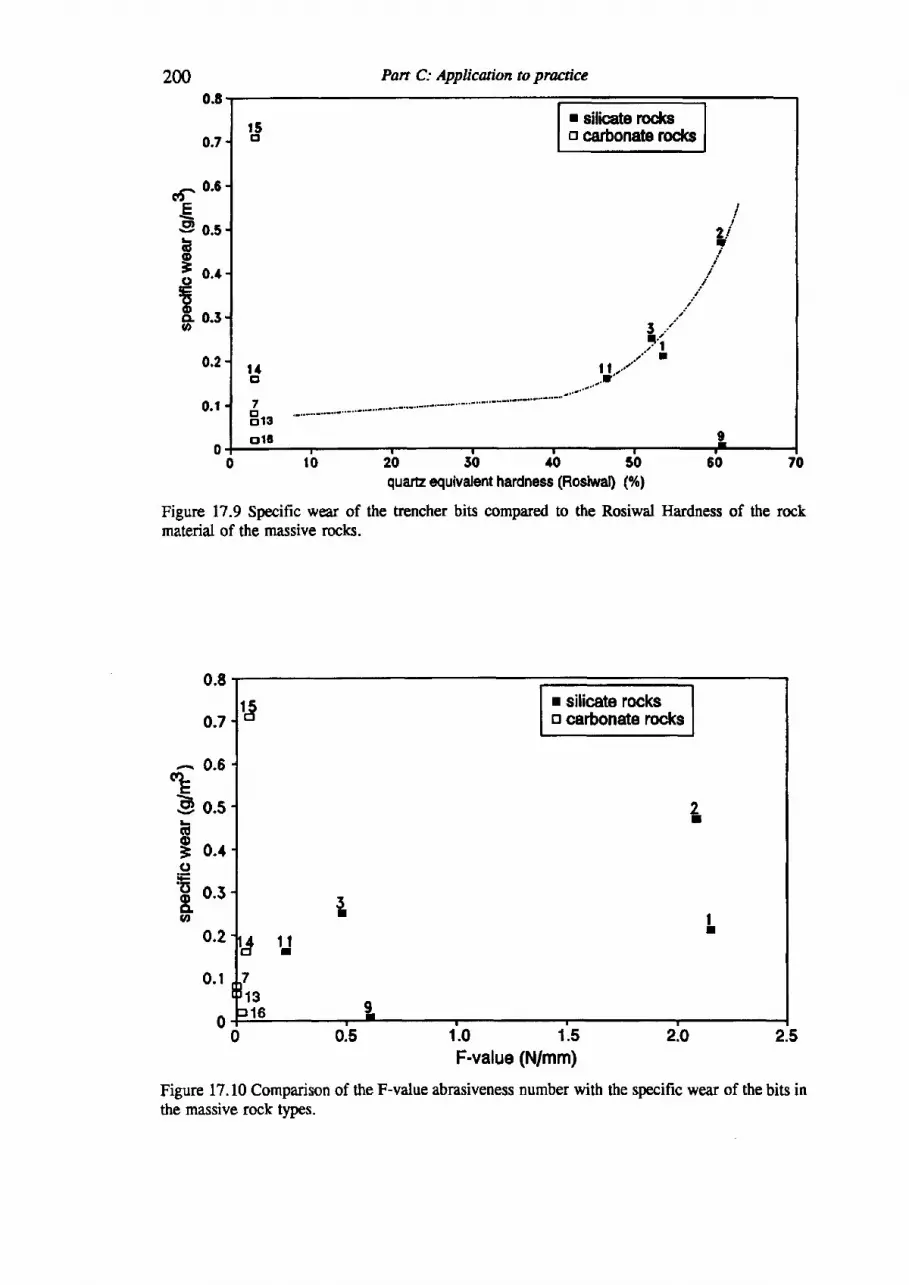
C'fEo
6o3-915oCLo
2000.8
0.7
0.6
0.5
0.a
0.3
0.2
0.1
0
quartr equivalent hardne$ (RoslwaD (%)
Figure 17.9 Specific wear of the trencher bits compared to the Rosiwal Hardness of the rockmaterial of the massive rocfts.
c?-E0)
(6o3(,(t
Ia
1.5 2.O 2.5F-value (N/mm)
Figure 17.10 Comparison of the F-value abrasiveness number with the specific wear of the bits inthe massive rock types.
0.E
0.7
0.0
0.5
0.4
0.3
0.2
0.r
0
15 r silicate rockstr carbonate rocks
2t
5T I
I
1 lr
13
1.00.5
Pan C: Applicaion to practice
r silicate rockss carbonate rcd(s
t 4El
7
Erso l8
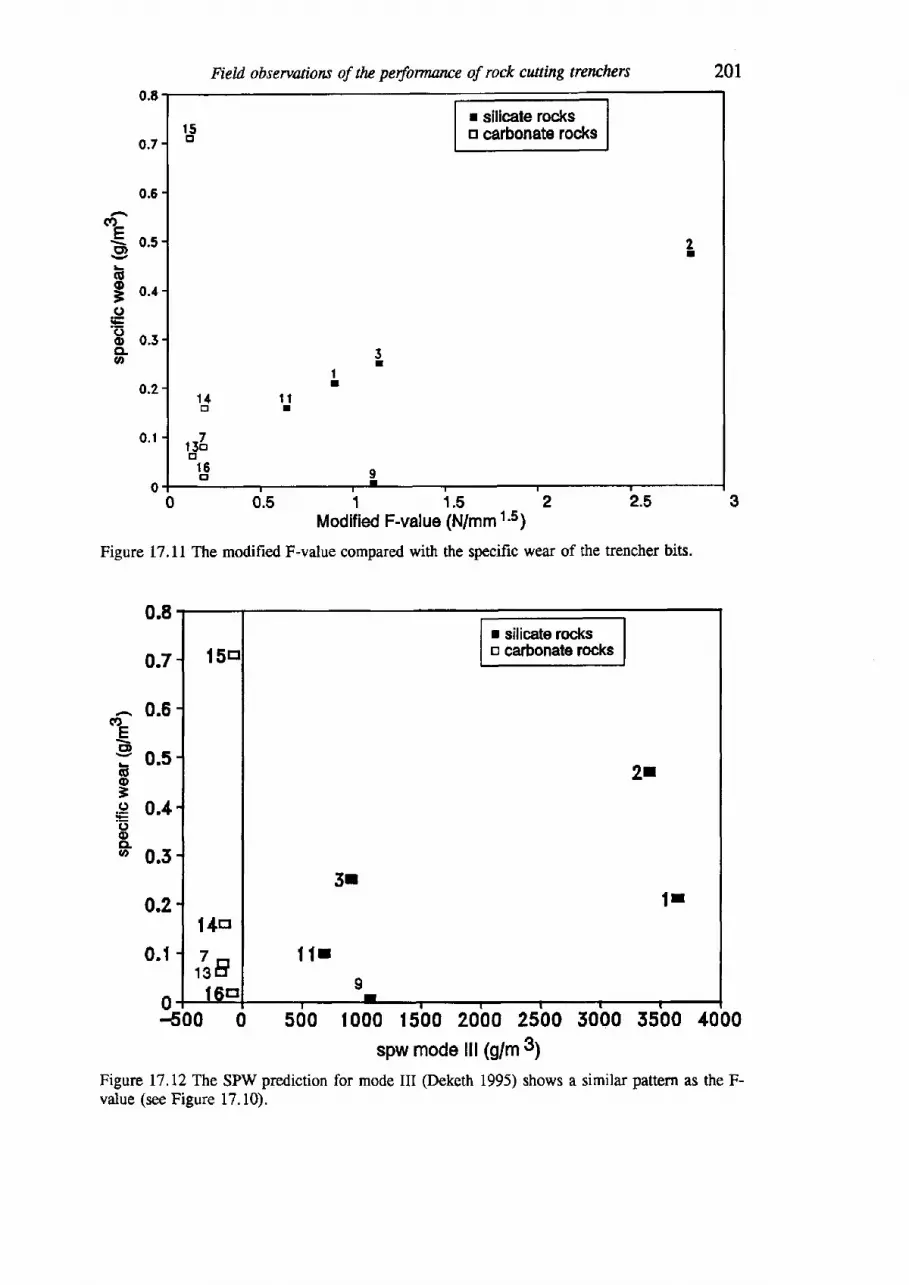
Field obsewaions of tlu pedonnnrrce of rock cutting tenchers
t 5or silicate rockstr carbonat€ rocks
3I
l /+o
rsIor6ct
t tI
201
(D
g'
(U
3.9()oCLq
0.6
0.7
0.6
0.5
0.4
0.5
0.2
0.r
0
(t,
ECD
(do=o'6oCLo
0 0.5 1 1.5 2 2.5Modified F-value (N/mm 1's)
Figure 17.11 The modified F-value compared with the specific wear of the trencher bits.
0.8
0.7
0.6
0.5
0,4
0.5
0.2
0.1
0-500 0 s00 1000 t500 2000 2500 5000 5500 4000spw mode lll (g/m 3)
Figure 17 .12 The SPW prediction for mode III (Deketh 1995) shows a similar pattern as the F-value (see Figure 17.10).
I silicate rockss carbonate rocks
l4r:
1?3 E
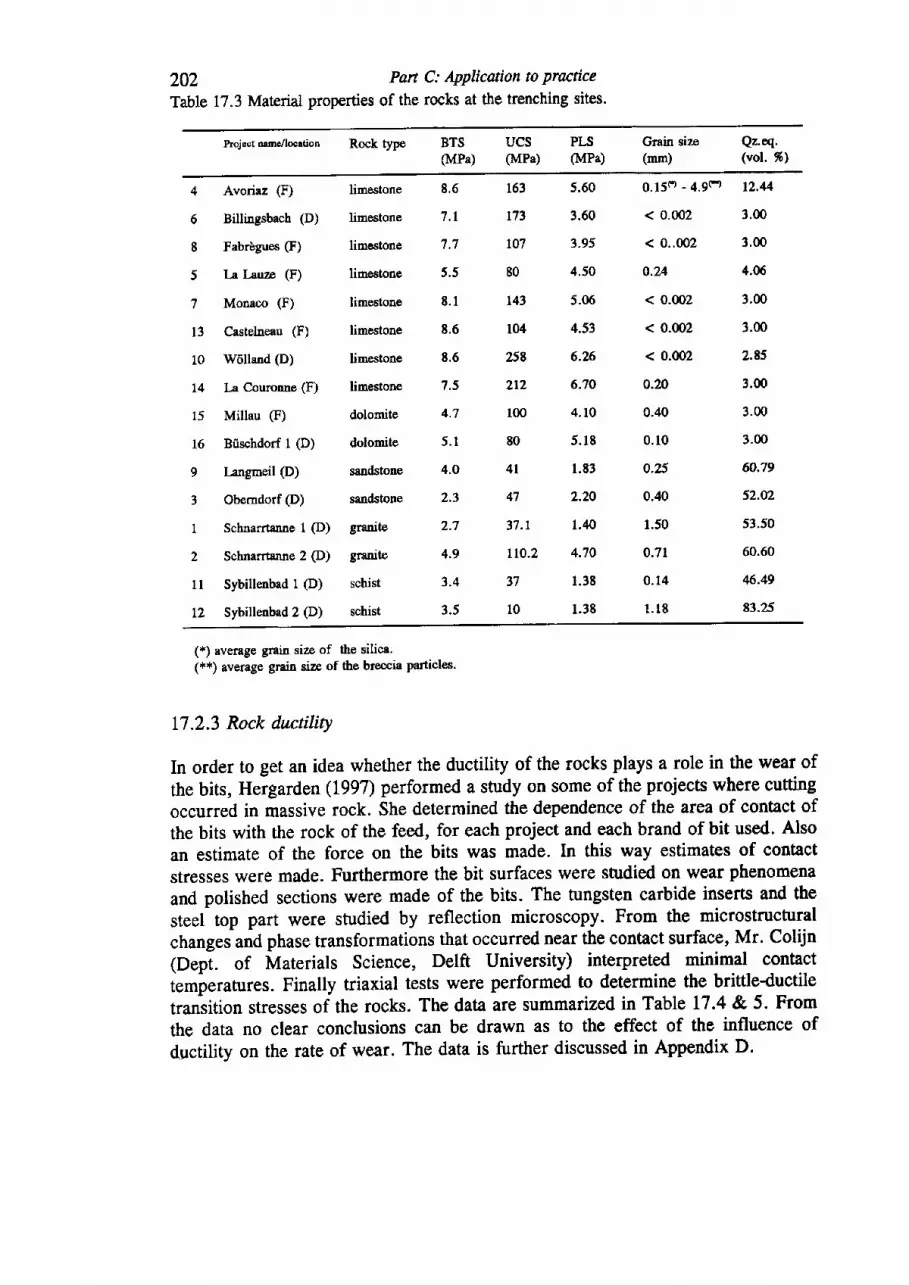
202 Pan C: ApPlicaion to PracticeTable 17.3 Materiat properties of the rocks at the trenching sites.
hojecl n me/locltion Rock type BTS(MPa)
UCS PLS(MPa) (MPa)
Grain size(mn)
Qz.eq.(vol. %)
4 Avoriaz (F)
6 Billingsbach (D)
8 Fabrbgues (F)
5 h I-auze (F)
7 Monaco (F)
13 Cestelneau (F)
10 W6llaad (D)
t4 I-a Couronne (F)
15 Millau (F)
16 Bfischdorf 1 (D)
t hngmeil (D)
3 Oberndorf @)
1 Schnarrtanne I (D)
2 Schnarrenne 2 (D)
1l Sybillenbad 1 (D)
LZ Sybillenbad 2 (D)
0.150 - 4.9Ff 12,44
< 0.002 3.00
< 0..002 3.00
0.24 4.06
< 0.002 3.m
< 0.002 3.00
< 0.002 2.85
0.20 3.00
0.40 3.00
0.10 3.00
0.25 60.79
0.40 52.s2
r.50 53,50
0.71 60.60
0.14 6.49
r.18 83.25
limestone
limestone
limestone
limestone
limestone
limestone
limestone
limestone
dolomile
dolomite
ssodstone
sandstone
gnnite
granite
schist
schist
8 ,6
7 . 1
7.7
5.5
8 . 1
8.6
8,6
7.5
4.7
5 . 1
4.0
2.3
2.7
4.9
3.4
3.5
163
r73
r07
80
143
104
258
2r2
100
80
4 l
47
37.1
110.2
37
l0
5.60
3.60
3.95
4.50
5.06
4.53
6.26
6.70
4.r0
5.18
1.83
2.20
1.,10
4.70
l . 38
1.38
(*) average grain size of the silica.(i'*') avemge grain size of the breccia particles.
17.2.3 Rock ductility
In order to get an idea whether the ductility of the rocks plays a role in the wear of
the bits, Hergarden (L997) performed a study on some of the projects where cutting
occurred in massive rock. She determined the dependence of the area of contact of
the bits with the rock of the feed, for each project and each brand of bit used. Also
an estimate of the force on the bits was made. In this way estimates of contact
stresses were made. Furthermore the bit surfaces were studied on wear phenomena
and polished sections were made of the bits. The tungsten carbide inserts and the
steef top part were studied by reflection microscopy. From the microstructural
changeJand phase transformations that occurred near the contact surface' Mr. Colijn(Dept. of Materials Science, Delft University) interpreted minimal contact
temperatures. Finally triaxial tests were performed to determine the brittleductile
transition stresses of the rocks. The data are summarized in Table 17.4 & 5. From
the data no clear conclusions can be drawn as to the effect of the influence of
ductility on the rate of wear. The data is further discussed in Appendix D.
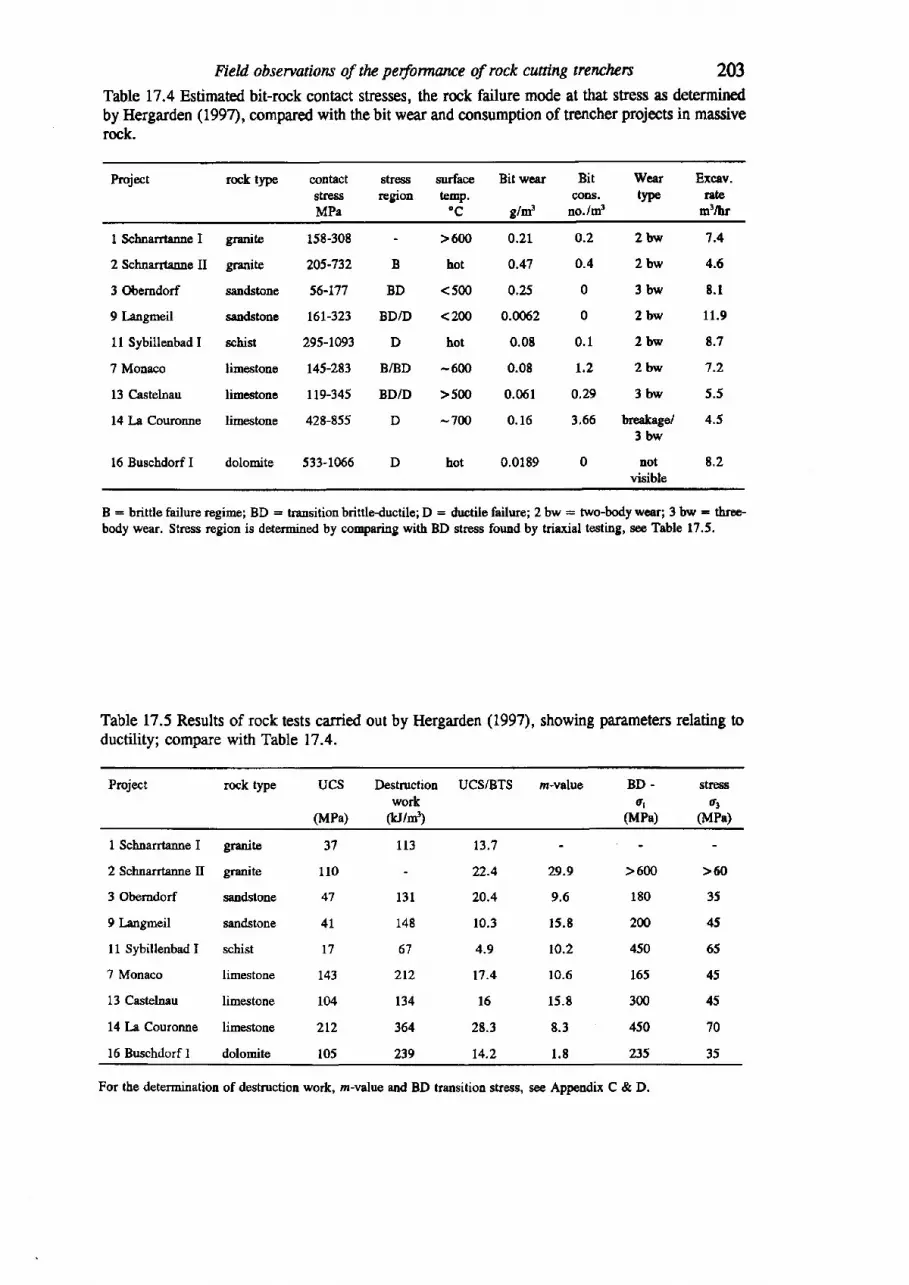
Field obseryations of the performance of rock cutting tencherc 203
Table 17.4 Estimated bit-rock contact stresses, the rock failure mode at that strsss as determinedby Hergarden (L997), compared with the bit wear and consumption of trencher projects in massiverock.
Project rock tlpe contactstressMPa
strees zurfaceregion temp.
"c
Bit wear Bitcolls.
8/m' uo./d
Wear Excav.type r8te
m3/hr
I Scbnarrteone I
2 Schnarrtanne II
3 Obemdorf
9 t "ngmeil
ll Sybillenbad I
7 Monaco
13 Castelnau
14 La Couronne
16 Buschdorf I
0.2 2 tnr 7.4
0.4 2 bw 4.6
0 3 b w E . l
0 2 bw 11.9
0.1 2 btil 8.7
1.2 zbw 7.2
0,29 3 bw 5.5
3.66 breakago/ 4.53 b w
0 not 8.2visible
granite
granite
sandstone
sandstooe
schis
linestone
limestone
limestone
dolomite
158-308
205-"t32
56-177
L6L-323
295-1093
r45-283
l l9-345
428-855
533-1066
B
BD
BD/D
D
BAD
BD/D
D
D
>600
hot
<500
<2W
hot
-600
>500
-7W
hot
0.21
0.47
0.25
0.0062
0.08
0.08
0.061
0. 16
0.0189
B: brittlefailureregime; BD: transitionbrittleductile;D: ductilefailure;2bw = two-bodywear;3trw = tbroe-body wear. Stress region is determined by comparing with BD stress found by triaxial testing, see Table 17.5.
Table 17.5 Results of rock tests carried out by Hergarden (1997), showing parameters relating toductility; compare with Table 17.4.
Project rock type m-valueUCS Destruction UCS/BTSwork
(MPa) (kJ/d)
BD - streeso1 o1
(MPa) (MPc)
I Scbnarrtanne I
2 Schnarrtanne II
3 Obemdorf
9 L:ngrneil
l1 Sybillenbad I
7 Monaco
13 Castelnau
14 [-a Couronne
16 Buschdorf I
grani!e
granite
mndstone
sandstone
schist
limestone
limestone
limestone
dolomite
113
13 l
148
67
212
134
364
239
37
110
47
4L
r7
143
104
2t2
105
t3.7
22.4
20,4
10.3
4.9
t7.4
l6
28.3
t4.2
29.9
9.6
r5 .8
r0.2
10.6
15.8
8.3
1 . 8
>600 >60
180 35
2@ 45
450 65
165 45
300 45
450 '10
235 35
For the determination of destruction work, rz-value and BD transition stress, see Appendix C & D.
2M
17.3 CONCLUSTONS
Part C: ApplicAion to practice
The 16 projects that are studied up to now do not give sufficient data to makedefinite conclusions. Some important general points can be derived from thediscussion in the previous section.
l. Dimension of the trench and block size and shape determine whether ripping(dislodging and transport of blocks) occurs. This is favourable for production.Production rates above 10 m3/trour indicate ripping. Calculated maximum feeds(Equation 17.1) in the order of several mm/rev also indicate ripping (Figure 17.5,p.L97). A certain size range of blocks may give problems with transport. When rockstrength is high, breakage of bits may occur.
2. Massive rocks are being scraped or cut by the bits. Excavation rates are below10 m3/hour. Calculated maximum feed values below 2 mmhev indicate massivecutting, but some rocks that were ripped (projects 4,5,6,1.3) had low feeds due totransport problems with blocks (Figure 17.5 & 6). A definite relationship of feedwith rock strength exists. Above a UCS of 150 MPa excessive bit breakage can beexpected. Very strong rocks have a low feed and scraping with resulting mode Iwear (hot bits, two-body abrasive wear and adhesive wear) occurs.
3. Massive silicate rocks and carbonate rocks (with no quartz) have clearlydifferent relations of specific wear with rock strength (Figure 17.8, p.199).
To estimate trencher performance for new projects, first an evaluation of thelikelihood of ripping can be made. If massive rocks are present an estimate of feedmay be made based on rock strength. Deketh (1995) gives a formula to estimate themaximum feed on the basis of trench dimension, based on only three projects(project 1,2,3). Using the data of the massive rocks, two prediction equations, onefor silicate rocks and one for carbonate rocks (without quartz) can be derived:
feedpcrott =PIS * trench width * mrnsive rock thiclcness
(mmlrev) (J7.2)
where the units of Point Load Strength are MPa, the thicknesses are in m. Theconstant C : 3.8 MNmm/rev for silicate rocks (based on projects 1.,2,3,9,11; linearregression, 12 : 0.89). C : 2.L MNmm/rev for carbonate rocks without quartz(based on projects 7,14,15,16; linear regression, P : 0.79). The feed calculatedusing this equation may compared with the data base of excavation rate of massiverocks (Figure 17.5), to estimate the production.
A guess of SPW in massive rock can be obtained using rock material strength andagain differentiate between silicate and carbonate rock types (Figure 17.8). Aspointed out in the previous section, bit consumption increases exponentially aboveUCS values of 80 - 100 MPa (Figure 17.7), due to breakage.
The rock properties that influence trencherperformance are summarized in Figure17.13. For a trencher, the boundary between a broken rock mass and a massive rockmass is determined by the trench dimensions. If rock blocks cannot be removed, therock will be massive for the trencher and cutting will occur, even in rocks that arejointed or fractured. In the rare occasion that ductile cutting occurs in strong rock(perhaps this occurred in project 14, a dolomite), high temperatures may lead toadhesive wear. Adhesive wear may also occur in all rocks at low feed values, whichis more likely when the rock becomes stronger (Equation 17.2).
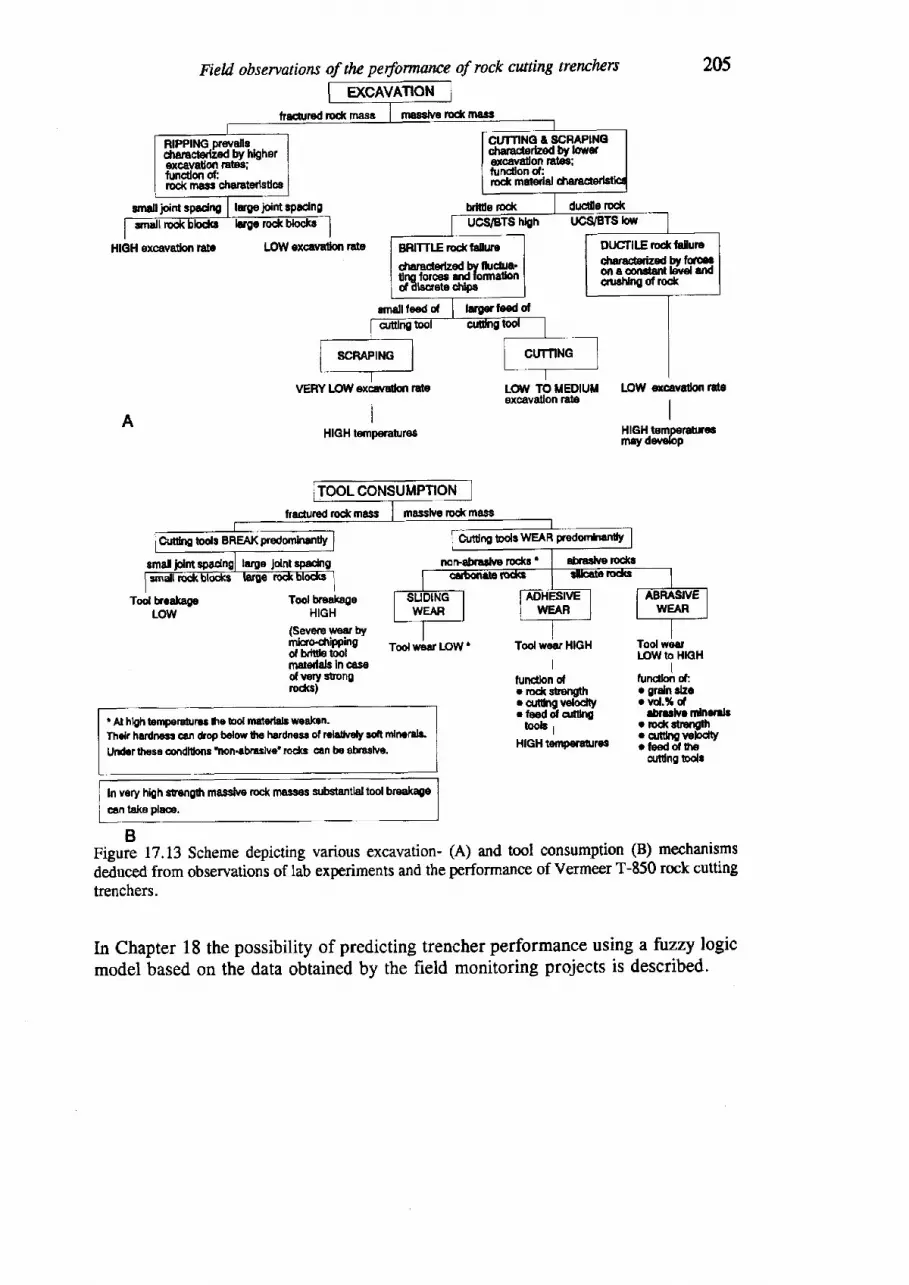
Fiel.d, obsematiorts of tln performance of rock cutting trenchers 205
mdlitnl spldne hrlp jcint $!dno
HIGH €xcavathn rate LOflexc*atlon rcte
lrmtrred rcdt rnass misslv€ rcd( mals
brl$s rcck
rmall leed ol largriced of
VERYLOWexcavdon raleIII
HIGH ternp€raturesA
LOv TO UEDIUM LOW *cavadon rdsexcavallon rate
IHIGH temperol*ruYderrolop
dLrcilg tod(
Tool wear HIGH
Ilun€lhn dr mdrstenglh. crrt[ng velodtyr ieed of cunL[
b o b ,
HIGH teflporatrroo
Tool wsarM)Wto HIGH
Ifuncdon dr graln rlzcr ud.9l d
sflslvc nlnentr. rod( ltranglh. cutilngv€hdty. t€ed cf lhs
andng toolr
frldured .ock mrss masslvo rc€kmass
smal jolm nonabnshp tockr' abrarhp tod<r
Tool breakageHIGH
(Seve{€ vvsat by
lfl,Hinit tootwiaruow'mdodals In cassolwry stongrocl(s)
I Af hbh bmp€rdlrlr tte bol nstodals w98kan.Thelr hardnos! oai drop bolow lh€ hardnesr of roladvcly soft nTncralr.
Und.rttF3e co|tdltons lrcn-eb|aslve'rodtr can be abrarlv€'
tn y€ry hhh stengh masshn rcck masos substantlal r,ool bmak{e
can traka place.
BFigure 17.13 Scheme depicting various excavation- (A) and tool consumption (B) mechanismsdeduced from observations of lab experiments and the performance of Vermeer T-850 rock cuttingtrenchers.
In Chapter 18 the possibility of predicting trencher performance using a fazzy logicmodel based on the data obtained by the field monitoring projects is described.
Tool breakagnLOW
CU'rNNG E SCRAP]NocharacterEed by lowetdcavdon raloo:
DUG"fllErccktuIutedEraddzed bryfcron e oonEtent kivc lndmsHngof tod<
BRITTIE rocftft0uro
duraclelzed byfiuctue.0m forcer rnd lomalbnof ilscrete dfpr
CHAPTER 18
Assessment methods for excavation perfonnance
This chapter examines methods that have been developed to predict rock excavationby machines. First a summary of the method developed in Norway to predict full-face tunnel machine performance is given. Then the work on prediction of rippability
by bulldozers. Also for rock dredging approaches of prediction, using conventionalrock mass classification, have been used. A recent dredging project in Quatar (Ra's
Laffan) has been analyzed this way. It appears that a general approach to excavationprediction, valuable for a broad group of excavation machines, is too simple to be
useful. The rock trencher projects discussed in Chapter 17 have shown that theperformance of the machine relates with rock properties. For the trencher projects,
the performance of one type of excavation machine is examined. To develop validprediction models for this machine requires more data. Instead of the classical rock
mass classification approach, the potential of fuzzy model expert systems has been
examined to develop better predictions of excavation rates and bit consumption.
18.1 ASSESSMENT METHODS USED FOR TUNNEL BORING MACHINES
The Norwegian Institute of Technology (University of Trondheim) has developed a
system to predict drilling rate which is well published and widely known (Movinkel
& Johannessen 1986, Bruland et al. 1988, Johannessen 1990). The Drilling Rate
Index (DRD was originally developed by Reidar Lien in the late 1950's to estimatepenetration rates of light percussive drifters. The method is still used in rock drilling,tamrock and Atlas Copco are two manufacturers known to use the system to
estimate the dritlabiliry of rocks for percussive rock drilling. For this purpose theDrilling Rate Index (DRI) and the Bit Wear Index (BWD are determined on rock
material in the laboratory, see Chapter 11, Figure 11.2. The influence of
discontinuities or fractures in the rock mass is ignored (Iamrock 1983).Since 1975 systematic collection of data and rock samples from Tunnel Boring
Machine (TBM) projects in Norway and abroad has taken place in order to find a
correlation between the DRI value and TBM advance rates. The last publication of
the prediction model for Tunnel Boring Machines is the project report Hard Rock
Tunnel Boring (Bruland et al. 1988). A large data base with test results exists
206
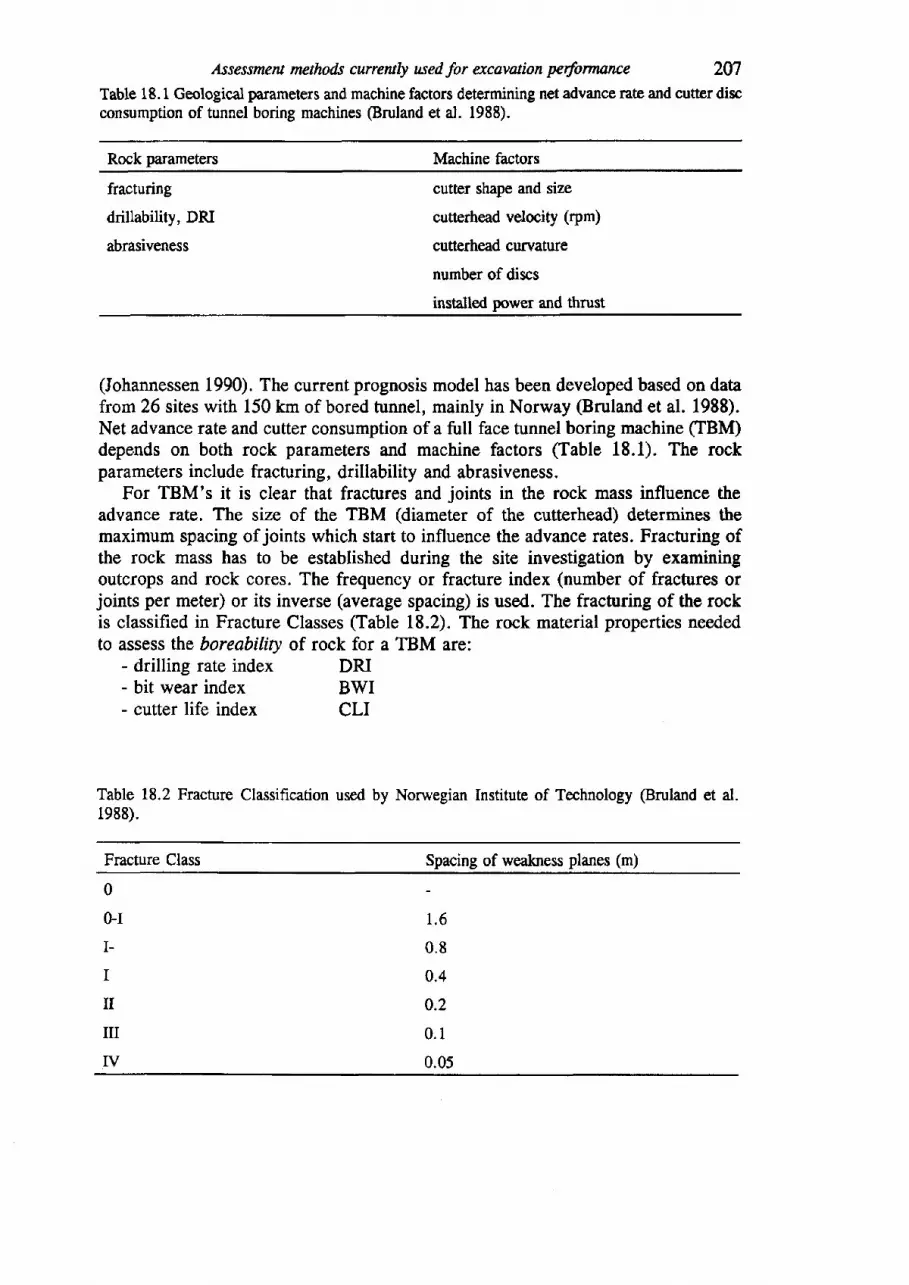
Assessmet methad"s currently used for excavation pedormance 207
Table 18.1 Geological Imrameters and machine factors determining net advance rate and cutter discconsumption of tunnel boring machines @ruland et al. 1988).
Rock parameters Machine faclors
fracturing
drillability, DRI
abrasiveness
cutter shape and size
cutterhead velocity (rpm)
cutt€rhead curvature
number of discs
installed po!\'er and thrust
(Johannessen 1990). The currentprognosis model has been developed based on dataftom26 sites with 150 km of bored tunnel, mainly in Norway @ruland et al. 1988).Net advance rate and cutter consumption of a full face tunnel boring machine (TBM)depends on both rock parameters and machine factors (Table l8.l). The rockparameters include fracturing, drillability and abrasiveness.
For TBM's it is clear that fractures and joints in the rock mass influence theadvance rate. The size of the TBM (diameter of the cutterhead) determines themaximum spacing of joints which start to influence the advance rates. Fracnrring ofthe rock mass has to be established during the site investigation by examiningoutcrops and rock cores. The frequency or fracture index (number of fractures orjoints per meter) or its inverse (average spacing) is used. The fracturing of the rockis classified in Fracture Classes (Table 18.2). The rock material properties neededto assess the boreabilin of rock for a TBM are:
- drilling rate index- bit wear index
DRIBWI
- cutter life index CLI
Table 18.2 Fracture Classification used by Norwegian Institute of Technology (Bruland et al.1988).
Fracture Class Spacing of wealaress planes (m)
0
0-rI-
I
II
mIV
1 .6
0.8
0.4
0.2
0 .1
0.05
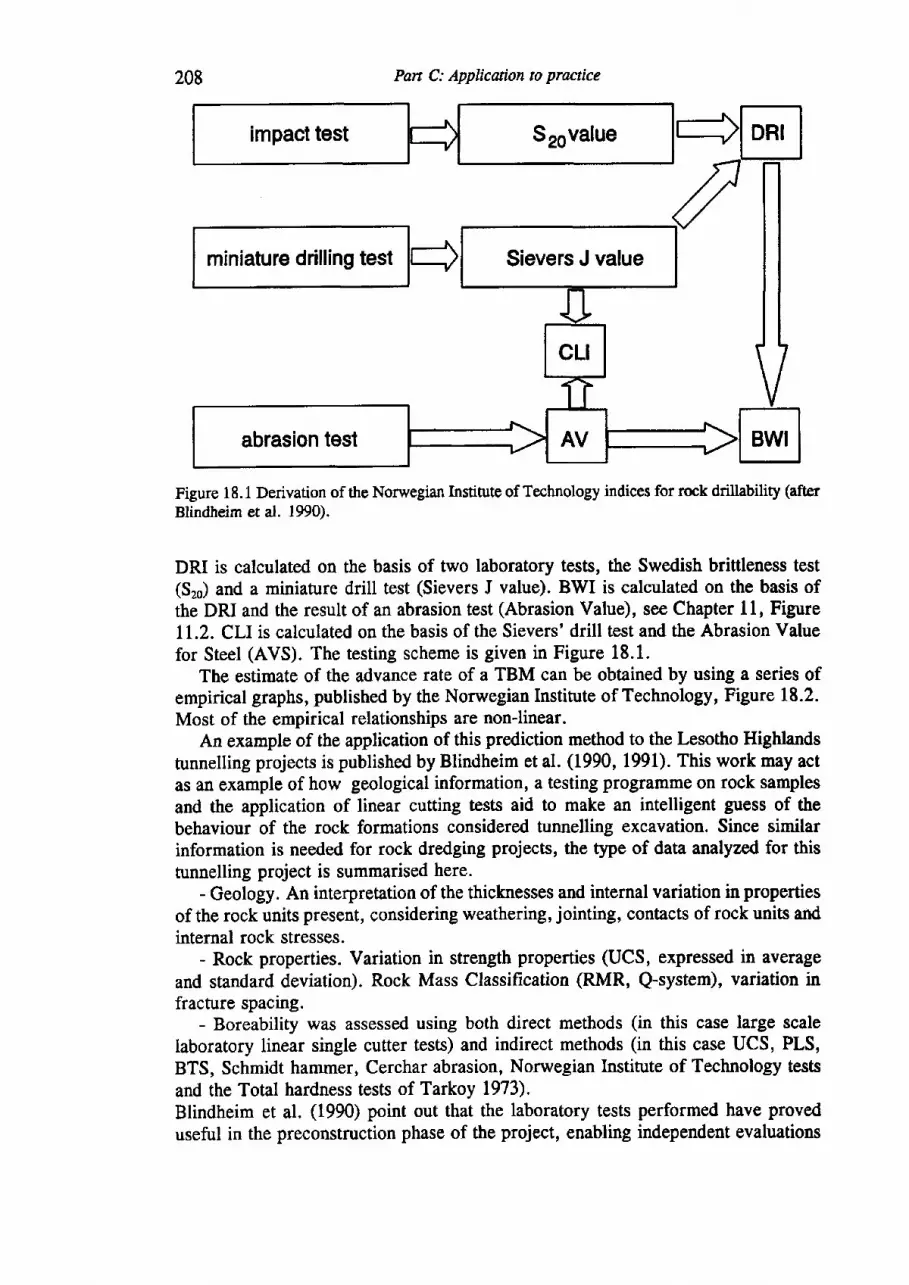
impact test Srovalue
Sievers J value
abrasion test
Pan C: Applicaion to practice
Figure 1 8. 1 Derivation of the Norwegian Institute of Technology indices for rock drillability (afterBlindheim et al. 1990).
DRI is calculated on the basis of two laboratory tests, the Swedish brittleness test(S2J and a miniature drill test (Sievers J value). BWI is calculated on the basis ofthe DRI and the result of an abrasion test (Abrasion Value), see Chapter 11, FigureLL.2. CLI is calculated on the basis of the Sievers' drill test and the Abrasion Valuefor Steel (AVS). The testing scheme is given in Figure 18.1.
The estimate of the advance rate of a TBM can be obtained by using a series ofempirical graphs, published by the Norwegian Institute of Technology, Figure 18.2.Most of the empirical relationships are non-linear.
An example of the application of this prediction method to the Lesotho Highlandstunnelling projects is published by Blindheim et al. (1990, l99l). This work may actas an example of how geological information, a testing programme on rock samplesand the application of linear cutting tests aid to make an intelligent guess of thebehaviour of the rock formations considered tunnelling excavation. Since similarinformation is needed for rock dredging projects, the type of data analyzed for thistunnelling project is summarised here.
- Geology. An interpretation of the thicknesses and internal variation in propertiesof the rock units present, considering weathering, jointing, contacts of rock units andinternal rock stresses.
- Rock properties. Variation in strength properties (UCS, expressed in averageand standard deviation). Rock Mass Classification (RMR, Q-system), variation infracture spacing.
- Boreability was assessed using both direct methods (in this case large scalelaboratory linear single cutter tests) and indirect methods (in this case UCS, PLS,BTS, Schmidt hammer, Cerchar abrasion, Norwegian Institute of Technology testsand the Total hardness tests of Tarkoy 1973).Blindheim et al. (1990) point out that the laboratory tests performed have proveduseful in the preconstruction phase of the project, enabling independent evaluations
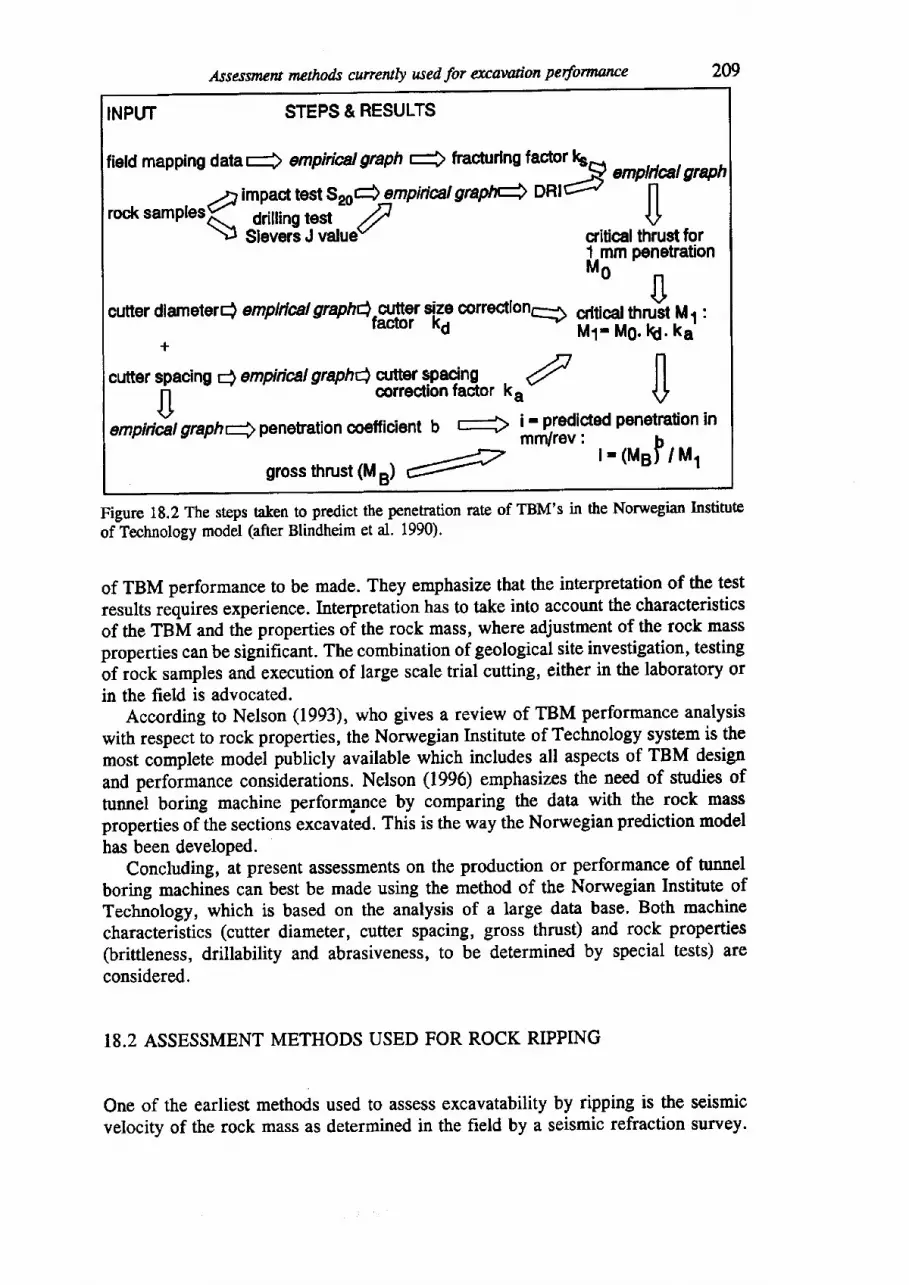
Assessment nethods currenlty used for qcantion perfornwrce 2W
INPUT STEPS & RESULTS
field mapping dataQ empitiel gnph E+ fracturing factor \ "rr,no,graph-4impad,testSro+ empirial gnile DAnc-" |l
rock sampl"rK- drilting test ,4 +\r sievers J varue" f1$ffi,Jll[iljf;l,,Mon
cutter dfameterQ emptrlat graph4r#?, siz; conectionr- ffi,Sr31#:U
t+
cutter spacing Q empirtcal graphdcutter gpagnq A [|
0 corrocllon lactor Ka V
enpiri&t graphepeneration coefficient b + fiit3g,f* Fenetration in
gross thrust oad c4 l- rueI / Mt
Figure 18.2 The steps taken to predict the penetration rate of TBM's in the Norwegian Instituteof Technology model (after Blindheim et al' 1990).
of TBM performance to be made. They emphasize that the intelpretation of the test
results requires experience. Interpretation has to take into account the characteristicsof the TBM and the properties of the rock mass, where adjustment of the rock rnassproperties can be significant. The combination of geological site investigation, testing
of ioct samples and execution of large scale trial cutting, either in the laboratory or
in the field is advocated.According to Nelson (1993), who gives a review of TBM performance analysis
with respect to rock properties, the Norwegian Institute of Technology system is themost complete model publicly available which includes all aspects of TBM design
and perfoimance considerations. Nelson (1996) emphasizes the need of studies of
tunnit boring machine performpnce by comparing the data with the rock mass
properties of the sections excavated. This is the way the Norwegianprediction modelhas been developed.
Concluding, at present assessments on the production or performance of tunnelboring machines can best be made using the method of the Norwegian Institute ofTechnology, which is based on the analysis of a large data base. Both machinecharacteristics (cutter diameter, cutter spacing, gross thrust) and rock properties(brittleness, drillability and abrasiveness, to be determined by special tests) areconsidered.
18.2 ASSESSMENT METHODS USED FOR ROCK RIPPING
One of the earliest methods used to asse$s excavatability by ripping is the seismicvelocity of the rock mass as determined in the field by a seismic refraction survey.
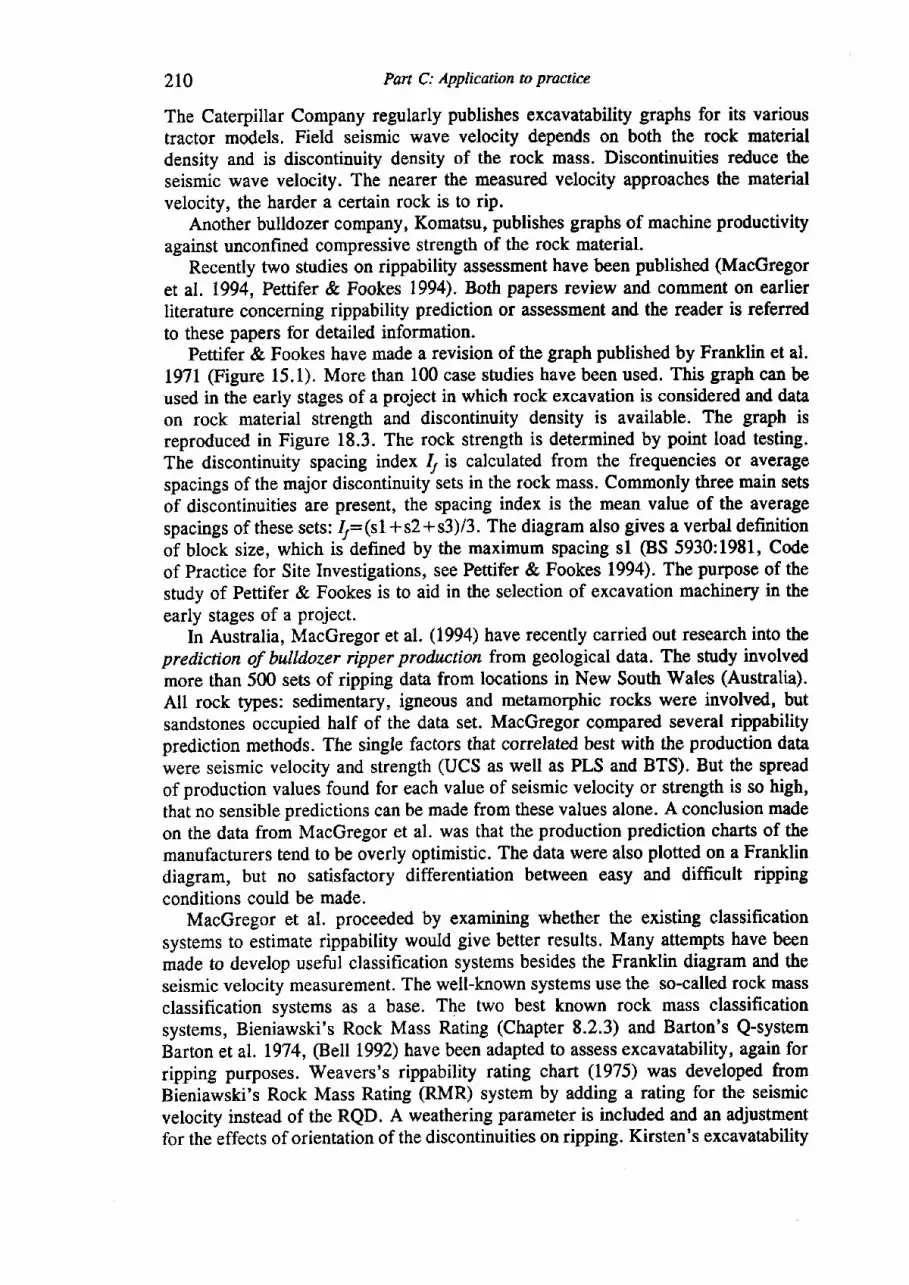
210 Pan C: APPlication to Practice
The Caterpillar Company regularly publishes excavatability graphs for its varioustractor models. Field seismic wave velocity depends on both the rock materialdensity and is discontinuity density of the rock mass. Discontinuities reduee theseismic wave velocity. The nearer the measured velocity approaches the materialvelocity, the harder a certain rock is to rip.
Another bulldozer company, Komatsu, publishes graphs of machine productivityagainst unconfined compressive strength of the rock material.
Recently two studies on rippability assessment have been published (MacGregoret al. 1994, Pettifer & Fookes 1994r. Both papers review and comment on earlierliterature concerning rippability prediction or assessment and the reader is referredto these papers for detailed iuformation.
Pettifer & Fookes have made a revision of the graph published by Franklin et al.1971 (Figure 15.1). More than 100 case studies have been used. This graph can beused in the early stages of a project in which rock excavation is considered and dataon rock material strength and discontinuity density is available. The graph isreproduced in Figure 18.3. The rock strength is determined by point load testing.The discontinuity spacing index /, is calculated from the frequencies or averagespacings of the major discontinuity sets in the rock mass. Commonly three main setsof discontinuities are present, the spacing index is the mean value of the averagespacings of these sets: Iy:(s1+s2+s3)/3. The diagram also gives a verbal definitionof block size, which isdefined by the maximum spacing sl (BS 5930:1981, Codeof Practice for Site Investigations, see Pettifer & Fookes 1994). The purpose of thestudy of Pettifer & Fookes is to aid in the selection of excavation machinery in theearly stages of a project.
In Australia, MacGregor et al. (1994) have recently carried out research into theprediction of bulldozer ripper production from geological data. The study involvedmore than 500 sets of ripping data from locations in New South Wales (Australia).All rock types: sedimentary, igneous and metamorphic rocks were involved, butsandstones occupied half of the data set. MacGregor compared several rippabilityprediction methods. The single factors that correlated best with the production datawere seismic velocity and strength (UCS as well as PLS and BTS). But the spreadof production values found for each value of seismic velocity or strength is so high,that no sensible predictions can be made from these values alone. A conclusion madeon the data from MacGregor et al. was that the production prediction charts of themanufacturers tend to be ovedy optimistic. The data were also plotted on a Franklindiagram, but no satisfactory differentiation between easy and difficult nppingconditions could be made.
MacGregor et al. proceeded by examining whether the existing classificationsystems to estimate rippability would give better results. Many attempts have beenmade to develop useful classification systems besides the Franklin diagram and theseismic velocity measurement. The well-known systems use the so-called rock massclassification systems as a base. The two best known rock mass classificationsystems, Bieniawski's Rock Mass Rating (Chapter 8.2.3) and Barton's Q-systemBarton et al. L974, (Bell 1992) have been adapted to assess excavatability, again forripping purposes. Weavers's rippability rating chart (1975) was developed fromBieniawski's Rock Mass Rating (RMR) system by adding a rating for the seismicvelocity instead of the RQD. A weathering parameter is included and an adjustmentfor the effects of orientation of the discontinuities on ripping. Kirsten's excavatability
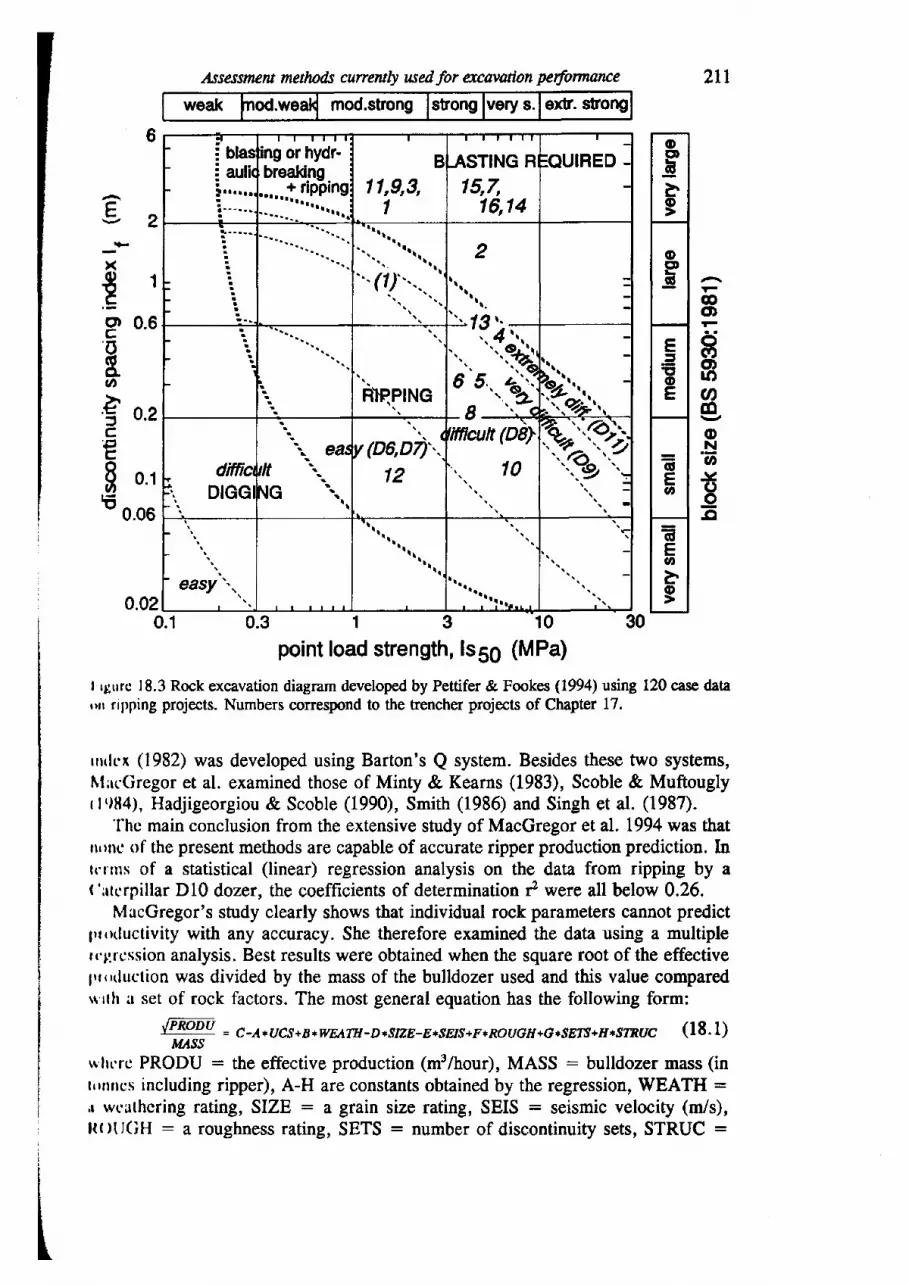
2tl
6 ;,i blas! aulil ' a r r r r
ing or hydr-breaking.
:::::':.11?l::| 1,9,3,1
ASTING R15,7,
16,14
:OUIRED .
2r t t t l t .
h \ B h r l r Arrrqrilr$l
lt..t - t -1 4 - 4 ,
..'..%j.t,*
diffic?
:.. DIGG
\ eatrll
{G\t
I
r (D6,D4'-I ':t, z
\ -rffrcult (D8|
., 10
t t r t l \ t t t t l
t t ] t t r . . .
- . . . . - .
€o)
og)o)lOv)6oN3h-vooE
g2
x91c'P
0.,o(Uo.o
E o,2c'Itr
I 0.1E o.ou
0.020.3 1310
point load strength, lsSO (MPa)
I rgrrrc 18.3 Rock excavation diagram developed by Pettifer & Fookes (1994) using 120 case dataun ripping projects. Numbers correspond to the hencher projects of Chapter 17.
rrrtlcx (1982) was developed using Barton's Q system. Besides these two systems,NllcGregor et al. examined those of Minty & Kearns (1983), Scoble & Muftouglyr lt)ll4), Hadjigeorgiou & Scoble (1990), Smith (1986) and Singh et al. (1987),
'l'hc main conclusion from the extensive study of MacGregor et al. 1994 was thatrr,rrrc uf the present rnethods are capable of accurate ripper production prediction. Intcnns of a statistical (linear) regression analysis on the data from ripping by a('ltcrpillar D10 dozer, the coefficients of determination f were all below 0.26.
MucGregor's study clearly shows that individual rock parameters cannot predictgrrrxluctivity with any accuracy. She therefore examined the data using a multiplerr'lircssion analysis. Best results were obtained when the square root of the effectivefrrotluction was divided by the mass of the bulldozer used and this value comparedrt rth l set of rock factors. The most general equation has the following form:
'[FnoD-u = e-/*leg+B+wEAM-D+sIitrE-E+sErs+F+Ror]GH+G+ilEN+II*rqRUC (18.1)MASS
rr'lrt'rc PRODU : the effective production (m3/hour), MASS : bulldozer mass (int,rfrncs including ripper), A-H are constants obtained by the regression, WEATH :,r rvcathcring rating, SIZE : a grain size rating, SEIS : seismic velocity (mis),Itot,(;H : a roughness rating, SETS : number of discontinuity sets, STRUC :
0.1 30
,4ssasnew metlpds currently used for excavotion performance
weak nod.weal mod.strongstrongvery s- e)ff. sfrong
oEDFEI
oEst
E-=EoE
=6Eo
G'Eabo
2r2 Pan C: Applicaion to practice
a structure rating related to block size (see MacGregor et al. L994). Apart fron thegeneral equation, other regression equations are given which can be used for specificrock 6pes, such as igneous rocks, or when data is lacking, such as for exampleseismic velocity.
The conclusion that can be drawn from MacGregor's study is that productionassessment from rock data cannot be reliably made using single rock factors, suchas seismic velocity or rock strength. Also rock classification systems or ratingsystems specially made for rippability assessment prove unreliable. Allowing formachine characteristics (in this case bulldozer mass), reasonable assessments can bemade using the regression equations of MacGregor et al. (1994), which are derivedfrom a large data base.
18.3 ASSESSMENT METHODS USED FOR ROCK DREDGING
Dredging contractors are known to have developed in-house methods to estimateproduction and tool consumption from rock data. Probably the most common factorsused are UCS and a measure of discontinuity density, like RQD and FI?t. BothUCS and RQD and/or fracture index are used to derive a factor related to thespecific energy required to excavate the rock mass. This is used to estimateproduction and tool consumption for the various cutter suction dredgers available.It is not known how reliable and evolved these systems are, but similar problems aswith the tunnel boring machines and bulldozer rippers exist. The aim of this workis to come up with a list of rock parameters that ought to participate in a databaseof rock dredging excavation, in order that the contractors may improve their in-houseassessment methods.
Also for dredging a rating system has been proposed in literature. Weaver's(1,975) method has been modified by Smith (1987) to an underutater rippability ratingchart, by leaving out seismic velocity (Iable 18.3). The information on rock strengthhas been expanded to include weathering grade. The information on joints alsoincludes orientation. Joint spacing is considered with respect to ripping depth or thesize of the cutting tool. Smith considered his Rippability Rating (RR) moreappropriate to dredging. According to Smith (1987) seismic refraction data areseldom availableT2, but also the observations on joint continuity and joint gouge,that can easily be made in on-land excavations or tunnels, are often not available fordredging. Smith omitted this information, stating that his index would giveinformation on relative ripping difficulty, but not on productivity. Joint orientationis most adverse for vertical or horizontal bedding and favourable near 45 degrees.The rating number for orientation can therefore be expressed by I c-a5 l/3, wherea is the angle of the joint with the horizontal into the direction of ripping. The mostadvantageous direction of ripping is normal to the strike, in which case cu is equalto the dip of joint or layer. The usefulness of the RR method has to be proven in
7t FI = fracture index = number of fracturqs per meter (identical to joint frequency).
?2 Nowadays overwater seismic surveys (reflection measurements) are routinely carriedout, velocities may be derived with some extra effort (refraction measurements).
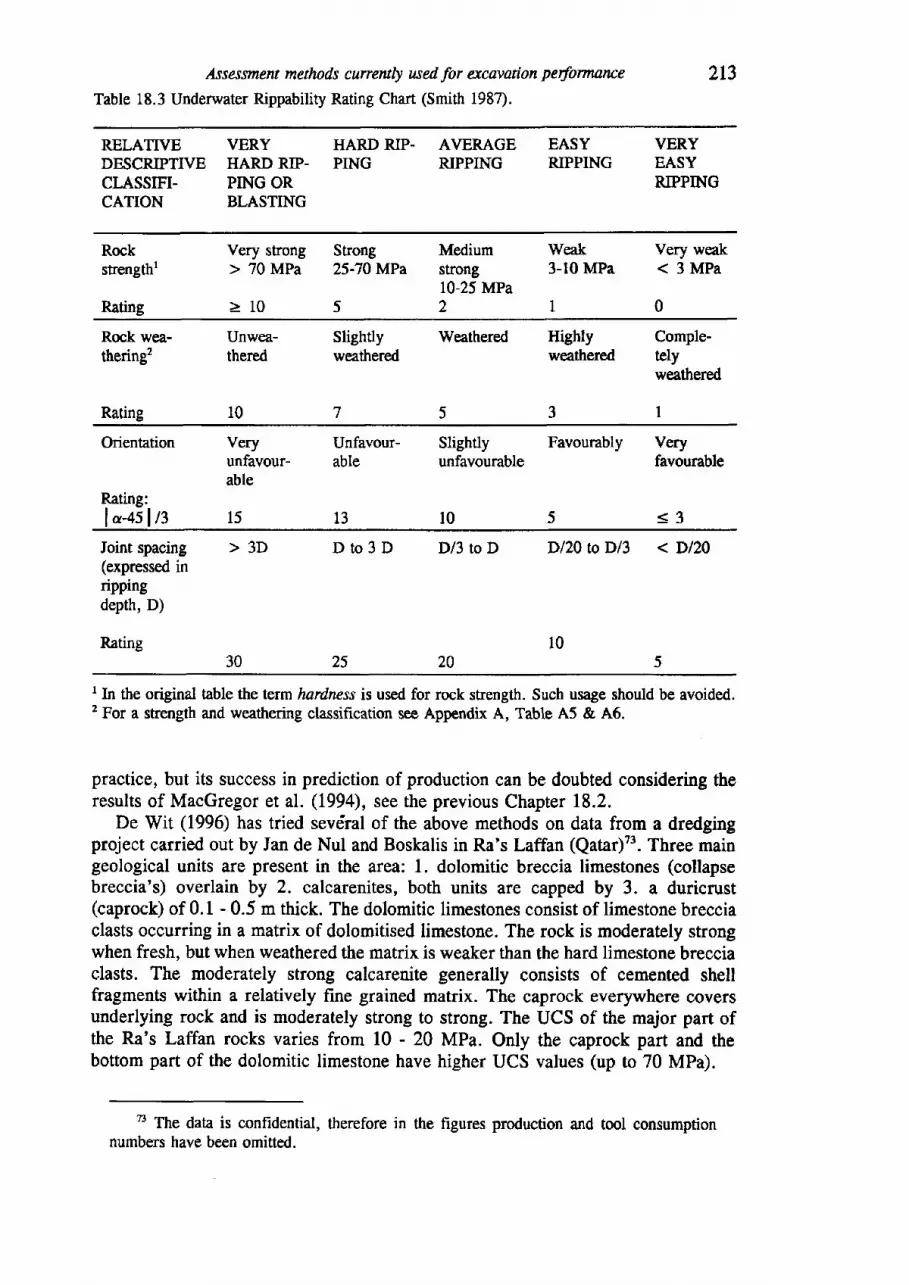
Assessmetu methods currmrty wed for excavarton peformarce
Table 18.3 Underwater Rippability Rating Chart (Smith 1987).2t3
RELATTVE VERYDESCRIPTIVE HARD RIP-CI-ASSIFI- PING ORCATION BLASTING
HARD RIP. AVERAGEPING RIPPING
EASYRIPPING
VERYEASYRIPPING
Rockstrengthr
Rating
Very strong Strong> 70 MPa 25-7AMPa
>10
Mediumstrong10-25 MPa,
Weak3-10 MPa
1
Very wak( 3 M P a
0
Rock wea-thering2
Rating
Unwea-thered
l0
Slightlyweathered
7
Weathered Highlyweathered
3
Comple-telyweathered
I
Orientation
Rating:I u-+sl t3
Veryunfavour-able
15
Unfavour-able
13
Slightly Favourably Veryunfavourable favourable
<3l0
Ioint spacing > 3D(expressed inrippingdepth, D)
Rating30
Dto3D D/3 to D D/20 toDl3 < Dl20
t020
I In the original table the term hardness is used for rock strength. Such usage should be avoided.2 For a strength and weathering classification see Appendix A, Table A5 & A6.
practice, but its success in prediction of production can be doubted considering theresults of MacGregor et aL. (1994), see the previous Chapter 18.2.
De Wit (1996) has tried sevdral of the above methods on data from a dredgingproject carried out by Jan de Nul and Boskalis in Ra's Laffan (Qatar)?3. Three maingeological units are present in the area: 1. dolomitic breccia limestones (collapsebreccia's) overlain by 2. calcarenites, both units are capped by 3. a duricrust(caprock) of 0.1 - 0.5 m thick. The dolomitic limestones consist of limestone brecciaclasts occurring in a matrix of dolomitised limestone. The rock is moderately strongwhen fresh, but when weathered the matrix is weaker than the hard limestone brecciaclasts. The moderately strong calcarenite generally consists of cemented shellfragments within a relatively fine grained matrix. The caprock everywhere coversunderlying rock and is moderately strong to strong. The UCS of the major part ofthe Ra's Laffan rocks varies from l0 - 20 MPa. Only the caprock part and thebottom part of the dolomitic limestone have higher UCS values (up to 70 MPa).
73 The data is conhdential, therefore in the figures production and tool consumptionnumbers have been omitted.
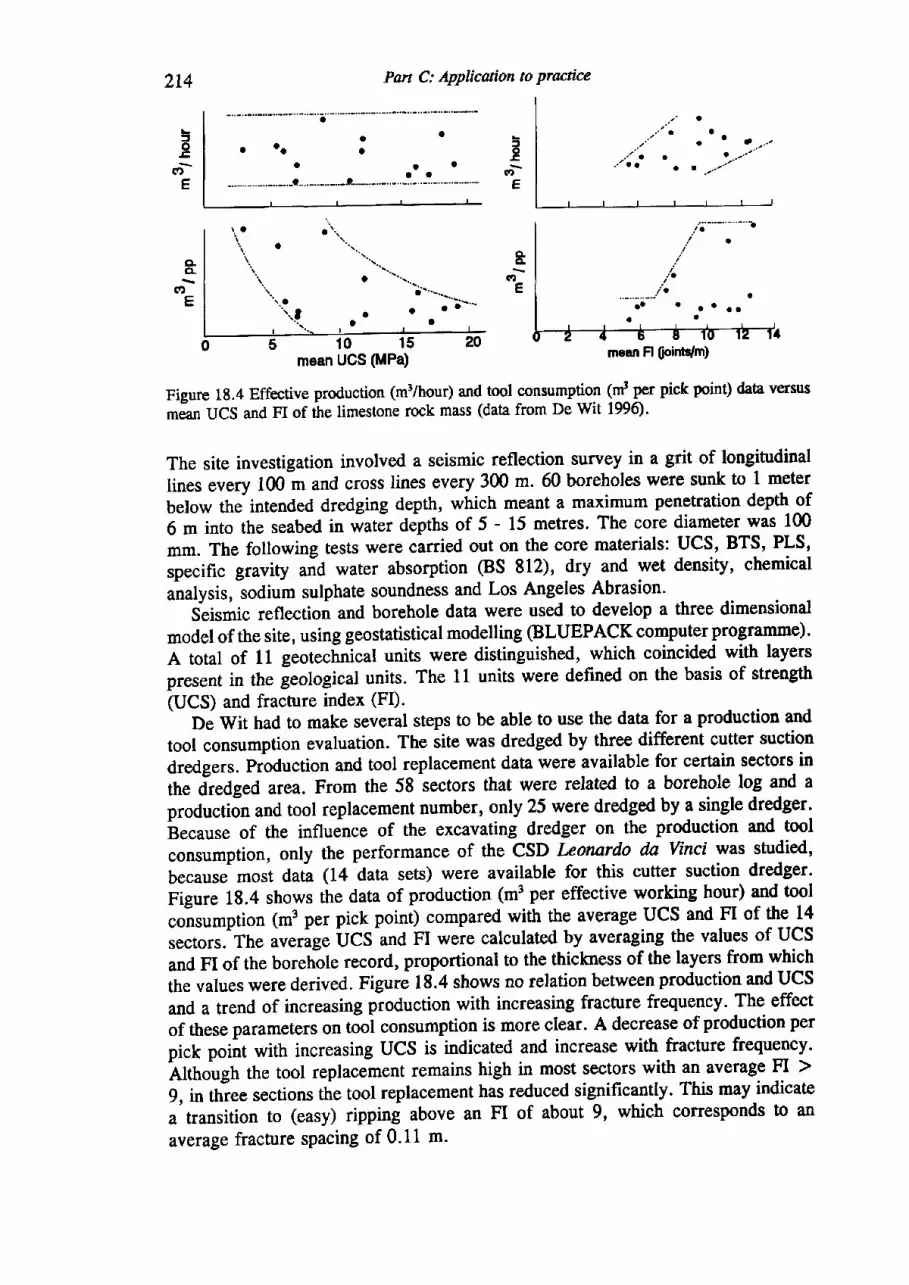
2t4 Part C: Applicuion to practice
:tc(t)
E
CICL
clE
\ .t o
"\..
:toE
aoE
&G'
E
l '..
o '".,
510mean UCS (MPa)
Figure 1g.4 Effective production (m3/hour) and tool consumption (# pet pick pornt) data versus
tnJrr UCS and FI of the limestone rock mass (data from De Wit 1996).
The site investigation involved a seismic reflection survey in a grit of longitudinal
lines every 100; and cross lines every 300 m. 60 boreholes were sunk to 1 meter
below thq intended dredging depth, which meant a maximum penetration depth of
6 m into the seabed in watJr depths of 5 - 15 metres. The core diameter was 100
mm. The following tests were carried out on the core materials: UCS, BTS, PLS,
sfecific gravity aid water absorption (BS 812), dry and wet density, chemical
a-nalysis, iodium sulphate soundness and Los Angeles Abrasion.
Seismic reflection and borehole data were used to develop a three dimensional
model of the site, using geostatistical modelling (BLUEPACK computer programme).
A total of 11 geotechnical units were distinguished, which coincided with layers
present in the geological units. The 11 units were defined on the basis of strength
(UCS) and fracture index (FD.De Wit had to make several steps to be able to use the data for a production and
tool consumption evaluation. The site was dredged by three different cutter suction
dredgers. production and tool replacement data were available for certain sectors in
the d-redged area. From the 58 iectors that were related to a borehole log and a
productiJn and tool replacement number, only 25 were dredged by a single dredger.^Brr.u*,
of the influence of the excavating dredger on the production and tool
consumption, only the performance of the CSD Leorurdo da Vinci was studied,
beeause most data (14 data sets) were available for this cutter suction dredger.
Figure 18.4 shows tie data of production (m3 per effective working hour) and tool
coisumption (m3 per pick point) compared with the average UCS and FI of the 14
sectors. The averagr iJCS--d FI were calculated by averaging the values of UCS
and FI of the borehole record, proportional to the thickness of the layers from which
the values were derived. Figure 18.4 shows no relation between production and UCS
and a trend of increasing pioduction with increasing fracture frequency. The effect
of these parameters on tool consumption is more clear. A decrease of production per
pick point with increasing UCS is iniicated and increase with fracture frequency.
ittttougtt the tool replacernent remains high in most sectors with an average FI >
9, in ttrree sections the tool replacement has reduced significantly. This may indicate
a transition to (easy) ripping above an FI of about 9, which corresponds to an
average fracture spacing of 0.11 m-
mean Fl $ointtlm)
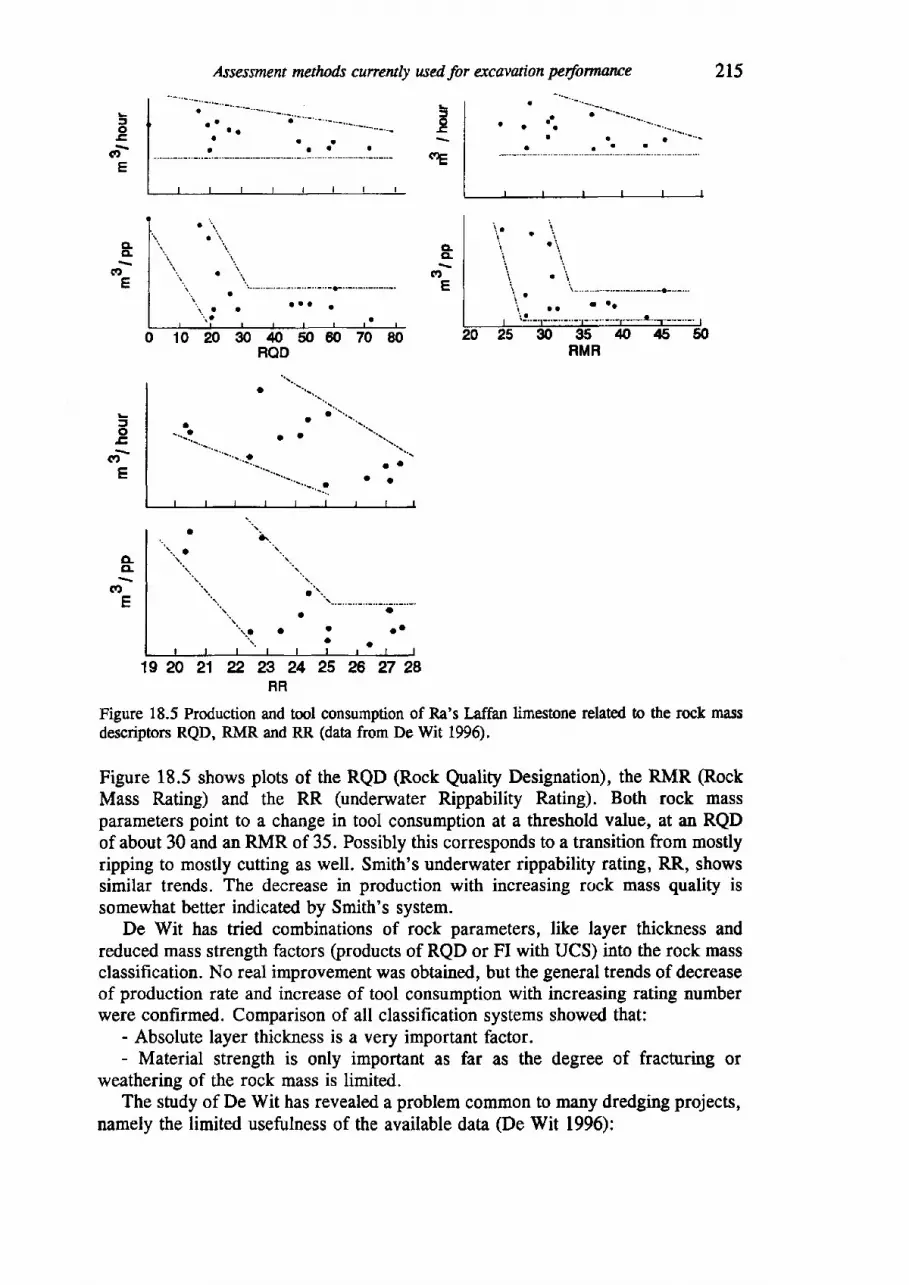
Assessment metlwds cunenly used for excavation perfonnarue
:'I
a)E
GLGL
ctE
Jo
fi,E
ELEL
fitE
Jo
(l,
E
CLCL
(aE
a
\ .\ Q ' r
a i .1
r \\ - - . - - - - - - - . - - - - - . . - . . - . . -G. . - , .
r a I l o
0 1 0 2 0 3 0 4 0 5 0 6 0 7 0 8 0RQD
\-:'-.._....!
o '
\a \ . . \ r , \
I | 'r\rr\.r\r.\
a a
^ t a
t9 20 21 2, 27 28
Figure 18.5 Production and tool consumption of Ra's Laffan limestone related to the rockdescriptors RQD, RMR and RR (data from De Wit 1996).
Figure 18.5 shows plots of the RQD (Rock Quality Designation), the RMR (RockMass Rating) and the RR (underwater Rippability Rating). Both rock massparameters point to a change in tool consumption at a threshold value, at an RQDof about 30 and an RMR of 35. Possibly this corresponds to a transition from mostlyripping to mostly cutting as well. Smith's underwater rippability rating, RR, showssimilar trends. The decrease in production with increasing rock mass quality issomewhat better indicated by Smith's system.
De Wit has tried combinations of rock parameters, like layer thickness andreduced mass strength factors (products of RQD or FI with UCS) into the rock massclassification. No real improvement was obtained, but the general trends of decreaseof production rate and increase of tool consumption with increasing rating numberwere confirmed. Comparison of all classification systems showed that:
- Absolute layer thickness is a very important factor.- Material strength is only important as far as the degree of fractunng or
weathering of the rock mass is limited.The study of De Wit has revealed a problem common to many dredging projects,
namely the limited usefulness of the available data (De Wit 1996):
23242526RR
RMR
216 Part C: Applicaion to practice
"Examining the data of Quatar could give no decisive answer to many interestingquestions: Does the compressive strength (UCS) describe the mechanical resistanceof the intact rock material better than the tensile strength (BTS, PLS)? Is the FI moreappropriate to measure the degree of fracturing of the rock mass than the RQD?What is the influence on dredgeability of mineralogy, Young's modulus, joint
orientation and joint condition? All these questions remain unanswered because ofvarious reasons:
- Imponmt dua is lacWng. From only seven rock samples the mineralogy andYoung's modulus have been determined. During core logging, the FI was notregistered as regularly as the RQD. Detailed information on joint orientation andcondition is always hard to get during marine site investigations. Seismic surveysonly give a general view on the main geological structures.
- The wefulness of the available data is limited. Since for a whole section onlyone wear and production figure is available, it is very difficult to assess the specificcontribution of each individual layer, let alone to evaluate the importance of itsdifferent properties. One could relate the (properties of one) type of rock much betterto the obtained production, if during each swing made by the cutter suction dredger(CSD), the following data would be collected:
-cutting depth (d) and face (D) of the cut;-momentary position of the CSD and the step taken;-production made during that swing
- There is little variation in the geology of the dredged area. ln Ra's Laffanmainly dolomitic limestone and calcarenites occur. The variety in properties (e.g.ductility, strength, mineralogy) of the encountered layers is therefore limited."
Two main points follow from the above:1. Rock mass classification systems can only give a general indication of
excavatability of rock.2. A laryer variety of relevant rock data should be assembled both in the site
investigation and during dredging.
I8.4 DISCUSSION OF PRESENT ASSESSMENT METHODS FOR ROCKEXCAVATION
From the previous Sections in this chapter may be deduced that modelling of themechanical excavation process may only be done with a reasonable chance of successwhen a large data base exists of rock excavation projects carried out with a cefiainmachine. The Norwegian model for Tunnel Boring Machines in hard rock (Chapter18.1) may act as example. This prediction model is mainly based on regressionanalysis of the data from which relationships between performance and rockproperties could be established (Figure I8.1 &2).Much less successful appear therock mass classification systems in this respect. The study of bulldozer ripper databy MacGregor et al. (1994) illustrates this. Rock Mass Ratings give only a generalidea of production and tool consumption and are too crude to act as real predictors.This was also found when the data assembled on the performance of the T-850trencher werc examined (Giezen 1993). Probably the description of the rock massby the current classification systems is not accurate enough. They do not give a good

Assessmcnt methods currentty used for excavatton performance 2I7
idea of the spreading of properties within the rock mass, even when the range ofrating values is taken into consideration. The character of geological information isoften vague. Therefore the possibility of applylng fuzzy logic to process thegeological data was examined, as described in the next chapter.
18.5 ASSESSMENT OF TRENCHER EXCAVATION PERFORMANCE USINGWZZY EXPERT SYSTEM
18.5.1 First indication of trencher excavatabiliry
Two rock factors of importance are the discontinuity density and the materialproperties of the rock. Trenching has shown to be sensitive to this. Excavationoccurs by ripping or cufting. tn the rippability diagram of Figure 18.3 the 16trencher projects have been plotted, using point load strength and block size. Theposition of the projects indicates that the Pettifer diagram is useful. Trencher projectsin which ripping occurred fatl in the field of rippable rock. Project 13, in which bothripping and cutting occurred falls in the field of extremely hard npping. Project 4,in which ripping occurred and very high bit breakage, plots also in this area. Theprojects within the blasting field, all involve cutting action during trench excavation.For trencher projects, however, the dimensions of the trench should be comparedwith the block size. If the trench dimensions are smaller than the block size, thetrencher excavates in effectively massive rock (see Table l7.l). The projects 1, 2,11, 16 that have been plotted in the top of the diagram, above the 2 m discontinuityspacing line belong to this category. The projects3,7,9, L4,15 above the 2 m linehave joint spacings wider than 2 m. Project 1, which has a bock size of 0.5 m3 anda discontinuity spacing index of 1 m, is an example of effectively massive rock.Projects Ll & 12, in Sybillenbad were both in the same rock, a schist. In the caseof project 12 this rock was weathered and ripping took place along the discontinuitiesin the rock. In unweathered schist (project 11), cutting took place.
L8.5.2 Fuzry expeft system74
Den Hartoe (1996) made a study of the trencher data of the first 11 projects. Fuz,zylogic has been used to model the trencher performance for three reasons:
- The limited number of data does not allow the use of conventional statisticalmethods to predict trencher performance.
- Most of the factors involved in the excavation process do not have well definedboundaries.
- Fuzzy logic allows to use subjective (non-numerical) information in models ofprediction performance.
The application of fuzzy logic to this problem is described by Den Hartog et al.L991 . Den Hartog (1996) developed a preliminary scheme for the data on production
7a For the dwelopment of the fuzzy system, the support of Dr. R.Babuska, TUD, Facultyof Electrical Engineering is acknowledged.
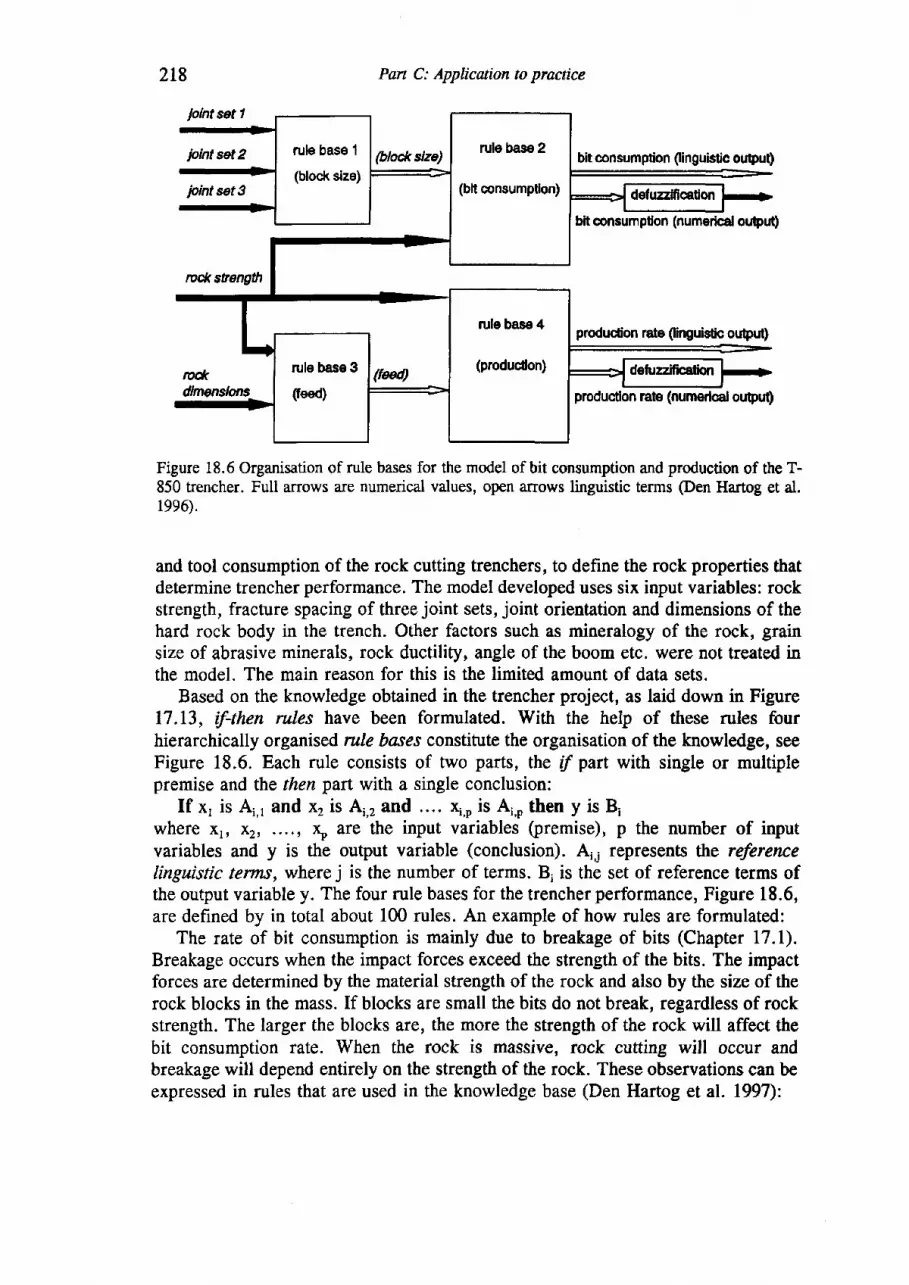
218
lolnt set 1
Pan C: ApplicAion to prauice
joint set 2 (blod< slze) bit consumption (inguistic ouput)
bint set9
bit oonsumpUon (numerical outsttt)
rcd( stength
produciion rate (linguidic outsut)
producdon rate (numedcal output)
Figure 18.6 Organisation of rule bases for the model of bit consumption and production of the T-850 trencher. Full arrows are numerical values, open arrows linguistic terms (Den Hartog et al.1996).
and tool consumption of the rock cutting trenchers, to define the rock properties thatdetermine trencher performance. The model developed uses six input variables: rockstrength, fracture spacing of three joint sets, joint orientation and dimensions of thehard rock body in the trench. Other factors such as mineralogy of the rock, grainsize of abrasive minerals, rock ductility, angle of the boom etc. were not treated inthe model. The main reason for this is the limited amount of data sets.
Based on the knowledge obtained in the trencher project, as laid down in Figure17.13, if+hen rules have been formulated. With the help of these des fourhierarchically organised rule bases constitute the organisation of the knowledge, seeFigure 18.6. Each rule consists of two parts, the if part with single or multiplepremise and the then part with a single conclusion:
If x, is A,,, and xr is A,,, and .... \,p is At,o then y is B,where X1' x2, ...., \ are the input variables (premise), p the number of inputvariables and y is the output variable (conclusion). Ai; represents the referencelingaistic term$, where j is the number of terms. B, is the set of reference terms ofthe output variable y. The four rule bases for the trencher performance, Figure 18.6,are defined by in total about 100 rules. An example of how rules are formulated:
The rate of bit consumption is mainly due to breakage of bits (Chapter ll.D.Breakage occurs when the impact forces exceed the strength of the bits. The impactforces are determined by the material strength of the rock and also by the size of therock blocks in the mass. If blocks are small the bits do not break, regardless of rockstrength. The larger the blocks are, the more the strength of the rock will affect thebit consumption rate. When the rock is rnassive, rock cutting will occur andbreakage will depend entirely on the strength of the rock. These observations can beexpressed in rules that are used in the knowledge base (Den Hartog et al. 1997):
rule base 2
(blt consumptlon)
rule base 4
(producdon)
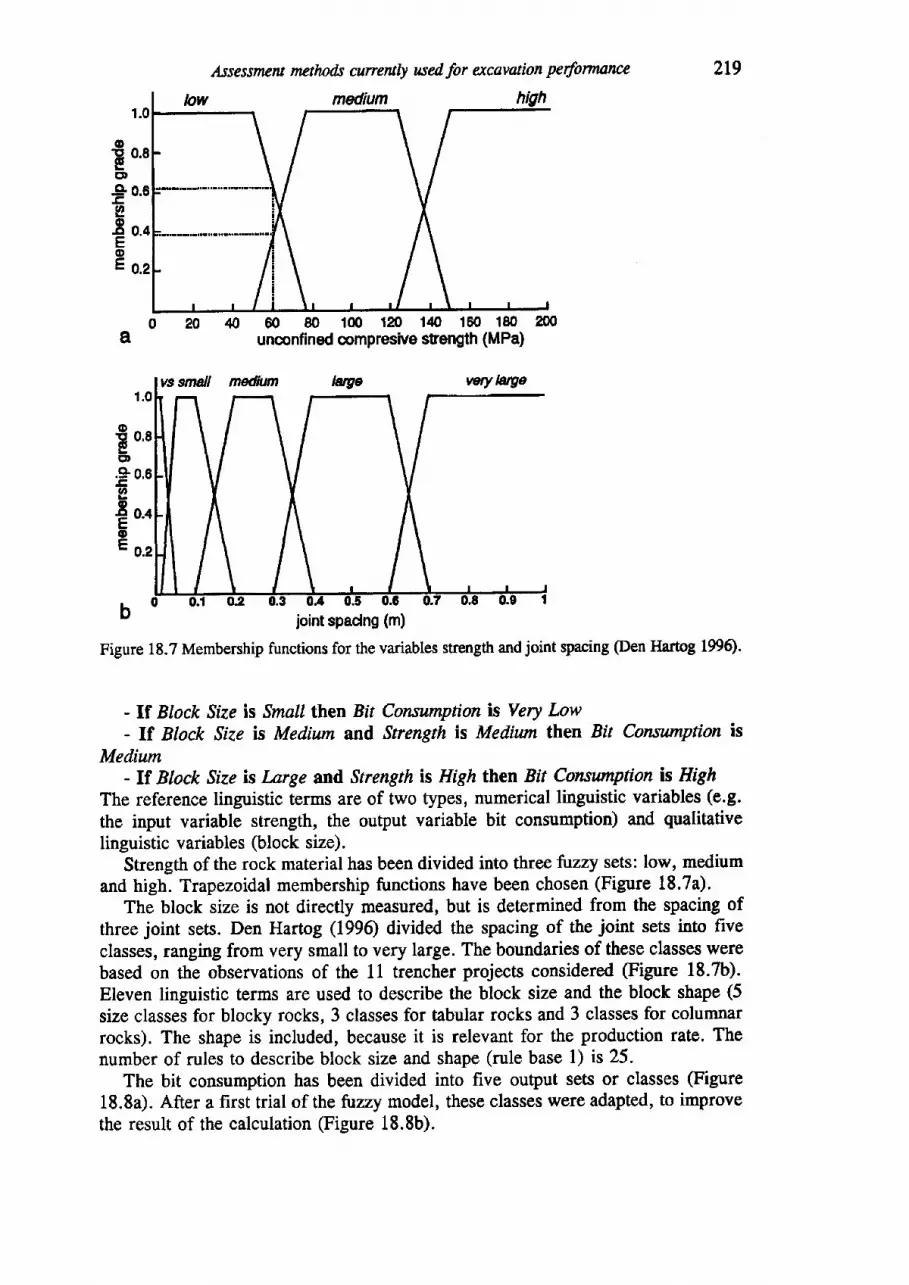
oECD
.ELg,ottEoE
,Lssessment methods cunentty used. for excavafion perfonnance 2r9
40 60 80 100 1n 14 160 180 n0unconfi ned compresive srength (MPa)
b joint spadng (m)
Figure 18.? Membership functions for the variables strength and joint spacing @en llartog 1990.
- lf Block Stze is Small then Bir Consumption is Very Low- lf Block Size is Medium and Strength is Mediwn then Bit Cortswnption is
Medium- lf Btock ^9ize is Inrge md Strength is High then Bff Conswnption is High
The reference linguistic terms are of two types, numerical linguistic variables (e.9.
the input variable strength, the output variable bit consumption) and qualitativelinguistic variables (block size).
Strength of the rock material has been divided into thre,efuzzy sets: low, mediumand high. Trapezoidal membership functions have been chosen (Figure 18.7a).
The block size is not directly measured, but is determined from the spacing ofthree joint sets. Den Hartog (1996) divided the spacing of the joint sets into fiveclasses, ranging from very small to very large. The boundaries of these classes werebased on the observations of the 11 trencher projects considered (Figure 18.7b).Eleven linguistic terms are used to describe the block size and the block shape (5size classes for blocky rocks, 3 classes for tabular rocks and 3 classes for columnarrocks). The shape is included, because it is relevant for the production rate. Thenumber of rules to describe block size and shape (rule base 1) is 25.
The bit consumption has been divided into five output sets or classes (Figure18.8a). After a first trial of the fuzzy model, these classes were adapted, to improvethe result of the calculation (Figure 18.8b).
€ o.acCD
.g 0,6E9.S o.oEoE- 0.2
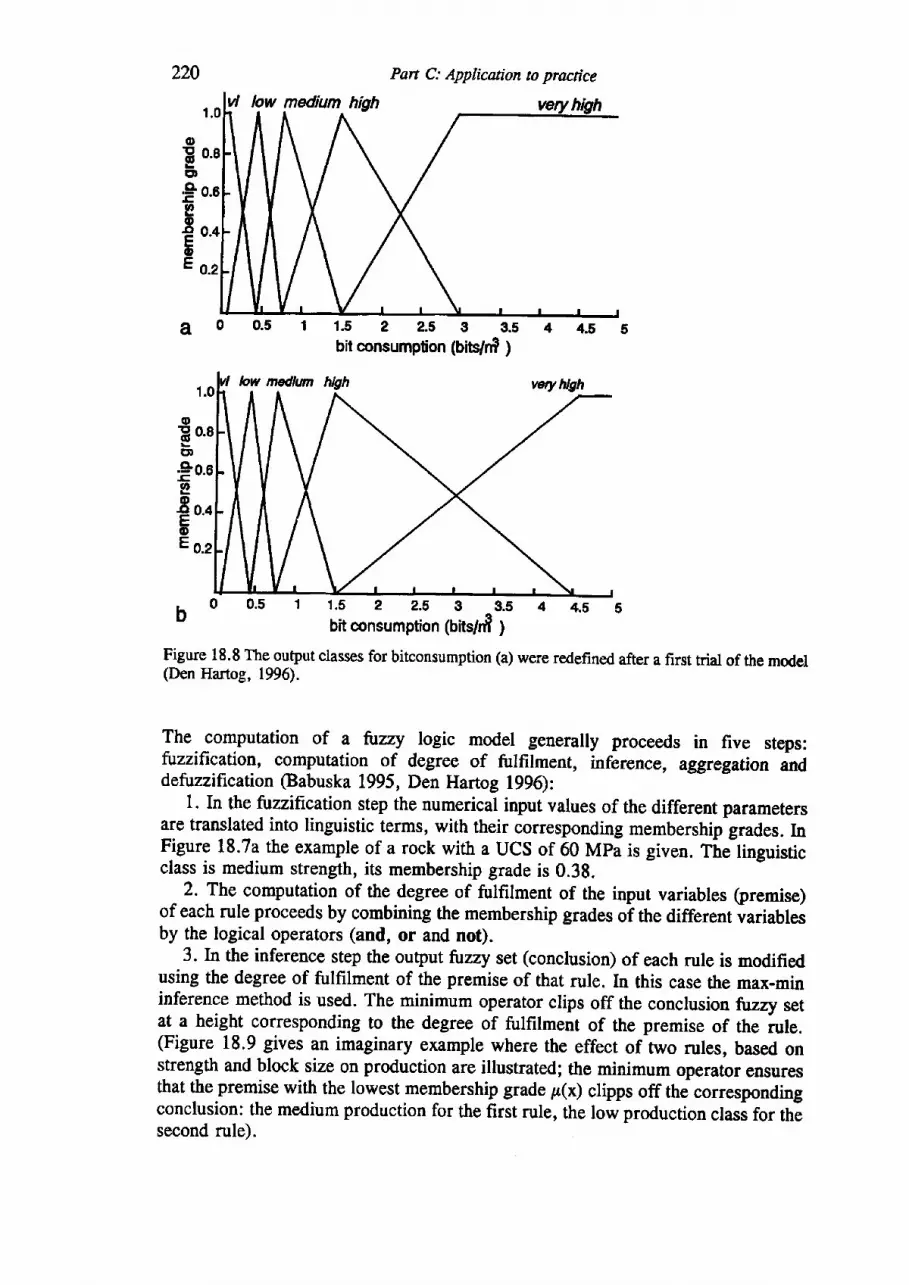
Pan C: Applicaion to practice
1.0
0.8
0.6
0.4
Io-21
1 1 . 5 2 2 . 5 3 3 . s 4bit consumption (bitgn? )
4.5 5
low nedtun l{gh
oE o.tCD
Eo0.6E@
I 0 . 4oE o.z
0 0 . 5 1 1 . 5 2 2 . 5 3 S . 5 4 4 . 5 5b :':
' '. '. ' .. '_ . ? o
bit consurnption (bits/rf{ }
Figure 18.8 The output ciasses for bitconsumption (a) were redefined after a first trial of the model(Den Hartog, 1996).
The computation of a tazzy logic model generally proceeds in five steps:fuzzifrcation, computation of degree of fulfilment, inference, aggregation anddefuzzifrcation @abuska 1995, Den Hartog 1996):
1. In the fuzzification step the numerical input values of the different parametersare translated into linguistic terms, with their corresponding membership grades. InFigure 18.7a the example of a rock with a UCS of 60 MPa is given. TnJtinguisticclass is medium strength, its membership grade is 0.38.
2. The computation of the degree of fulfilment of the input variables (premise)of each rule proceeds by combining the membership grades of the different iariablesby the logical operators (and, or and not).
3. In the inference step the output fuzzy set (conclusion) of each rule is modifiedusing the degree of fulfilment of the premise of that rule. In this case the max-mininference method is used. The minimum operator clips off the conclusion fuzzy setat a height corresponding to the degree of fulfilment of the premise of the rule.(Figure 18.9 gives an imaginary example where the effect of two rules, based onstrength and block size on production are illustrated; the minimum operator ensuresthat the premise with the lowest membership grade p(x) clipps off thJ correspondingconclusion: the medium production for the first rule, the low production class for thisecond rule).
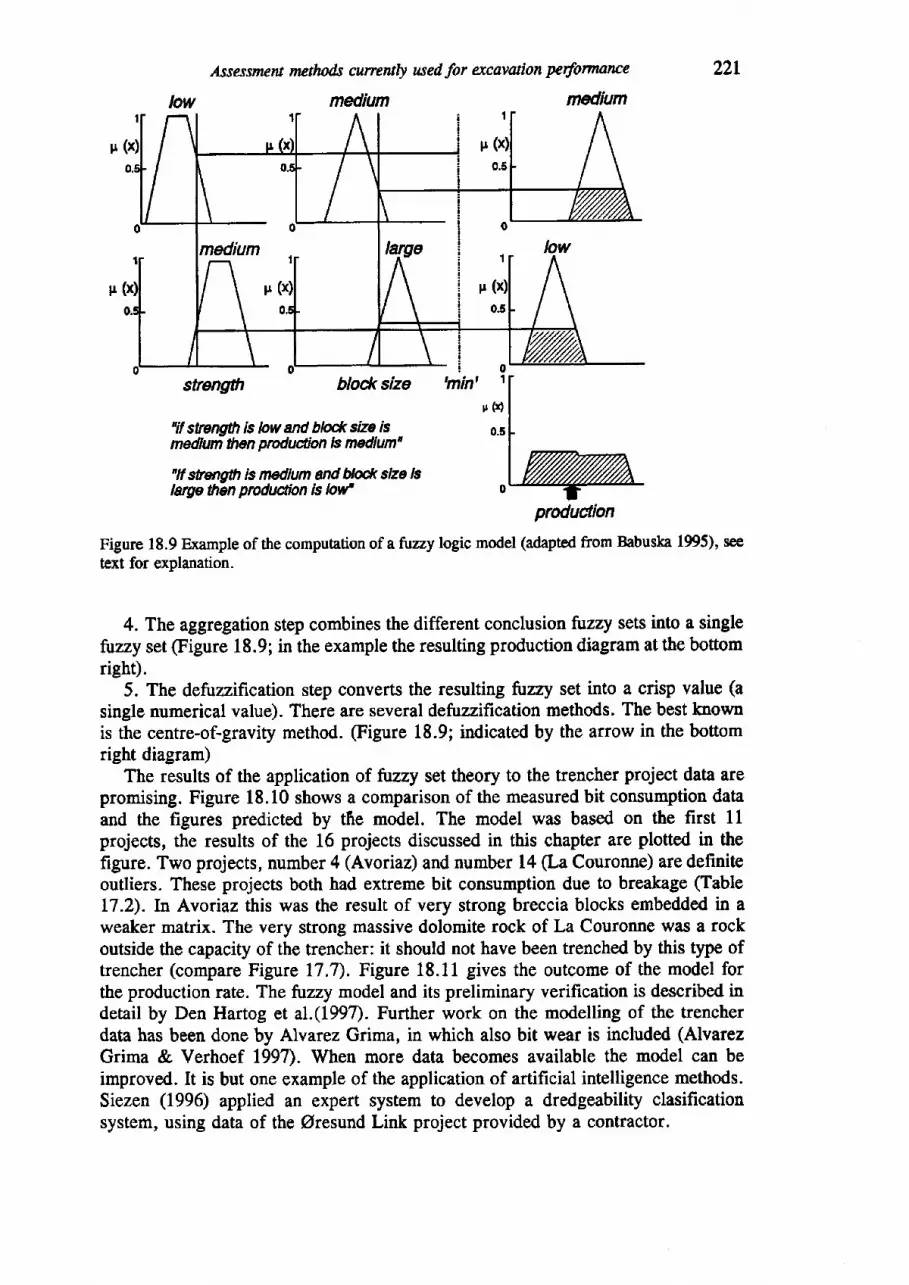
Assessmcnt methds currewty wed for excavafion performance
mdium22r
medium
strengfri blod< size 'min'
'it strength is low and bld< size ismedumthan produaion is mdium"
'lf sf,engfr, is medium and blod< size lslarge then produaion E lolirt'
ProductionFigure 18.9 Example of the compulation of a fuzzy logic model (adapted ftom Babuska 195)' seelext for explanation.
4. The aggregation step combines the different conclusionfuzzy sets into a singlefuzzy set (Figure 18.9; in the example the resulting production diagram at the bottomright).
5. The defuzzification step converts the resulting fuuy set into a crisp value (asingle numerical value). There are several defuzzification methods. The best knownis the centre-of-gravity method. (Figure 18.9; indicated by the arrow in the bottomright diagram)
The results of the application of. fwzy set theory to the trencher project data arepromising. Figure 18.10 shows a comparison of the measured bit consumption dataand the figures predicted by the model. The model was based on the first 11projects, the results of the 16 projects discussed in this chapter are plotted in thefigure. Two projects, number 4 (Avoriaz) and number L4 (I-aCouronne) are definiteoutliers. These projects both had extreme bit consumption due to breakage (TableL7.2). In Avoriaz this was the result of very strong breccia blocks embedded in aweaker matrix. The very strong massive dolomite rock of La Couronne was a rockoutside the capacity of the trencher; it should not have been trenched by this type oftrencher (compare Figure 17.7). Figure 18.11 gives the outcome of the model forthe production rate. The fazzy model and its preliminary verification is described indetail by Den Hartog et aL.(I997). Further work on the modelling of the trencherdata has been done by Alvarez Grima, in which also bit wear is included (AlvarezGrima & Verhoef 1997). When more data becomes available the model can beimproved. It is but one example of the application of artificial intelligence methods.Siezen (1996) applied an expert system to develop a dredgeability clasificationsystem, using data of the Oresund Link project provided by a contractor.
p (r)
0.5
0
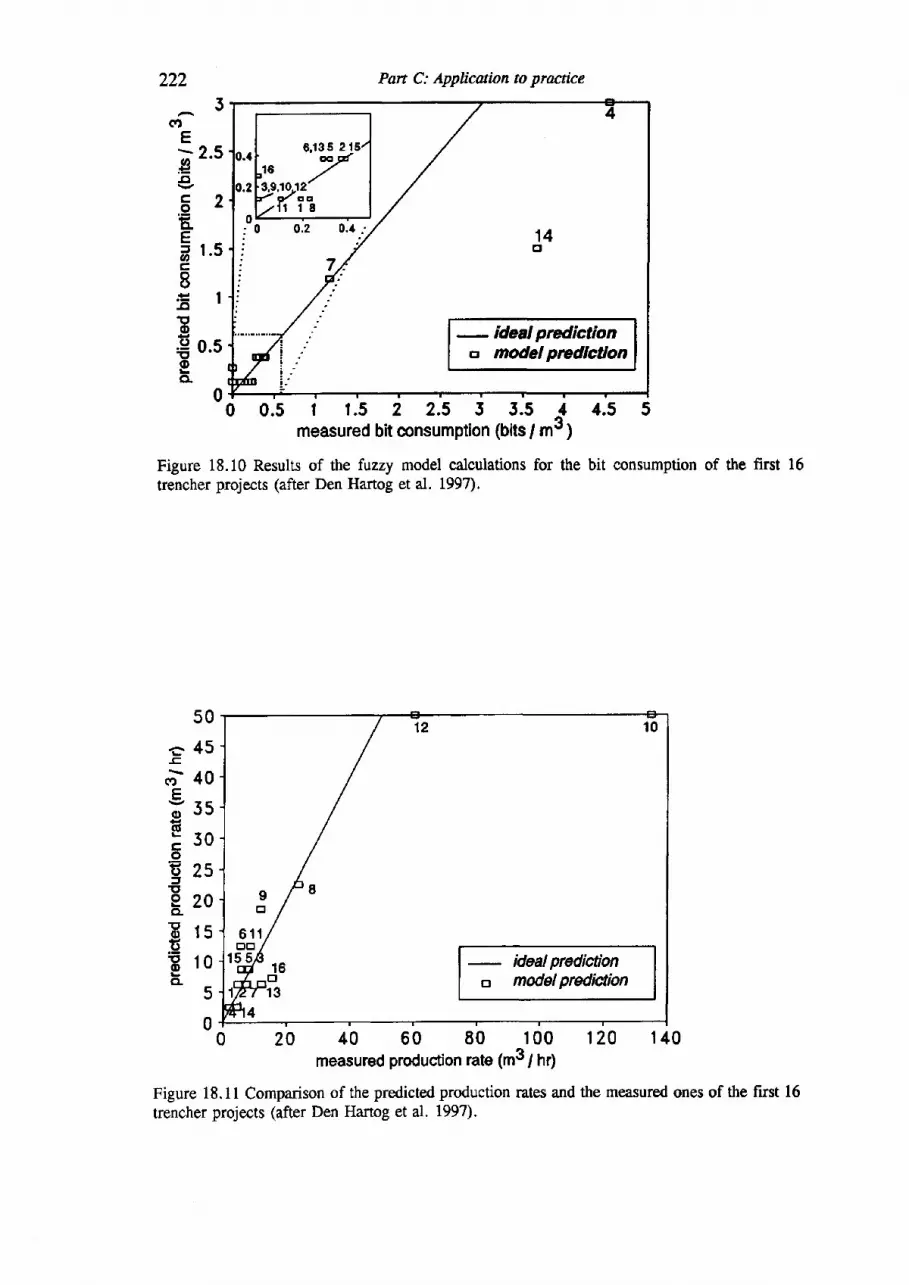
222 Part C: Applicuion to practice
2
G.13 s 2e F
16 ./!,9,1O,12'/ { o a/ 1 1 1 8
0 E. 0 0.2 0.4 .. 14El
I- ideal pdiction
cr mdel prcdlctlon
0 0 .5 | 1 .5 22.5 5 3 .5 4 4 .5 5measured bit consumption (bits / m3 )
Figure 18.10 Results of the fuzzy model calculations for the bit consumption of the first 16trencher projects (after Den Hartog et al. 1997).
12 1 0
IE
6 1 1 ,tr,a/
15 58
I
- idealpredictionE modelPrediction
0 20 40 60 E0 100 120 140measured production rate 1m31 trr;
Figure 18.11 Comparison of the predicted production rates and the measured ones of the frrst 16trencher projects (after Den Hanog et al. 1997).
5a)
E> 2.5vg52CLF
a r.scI= i rEo
€ o.sEo.
0
50
F4s.i- +o
F
Yss6
:30og2sE
t20E rsE
E 10o-
5
0
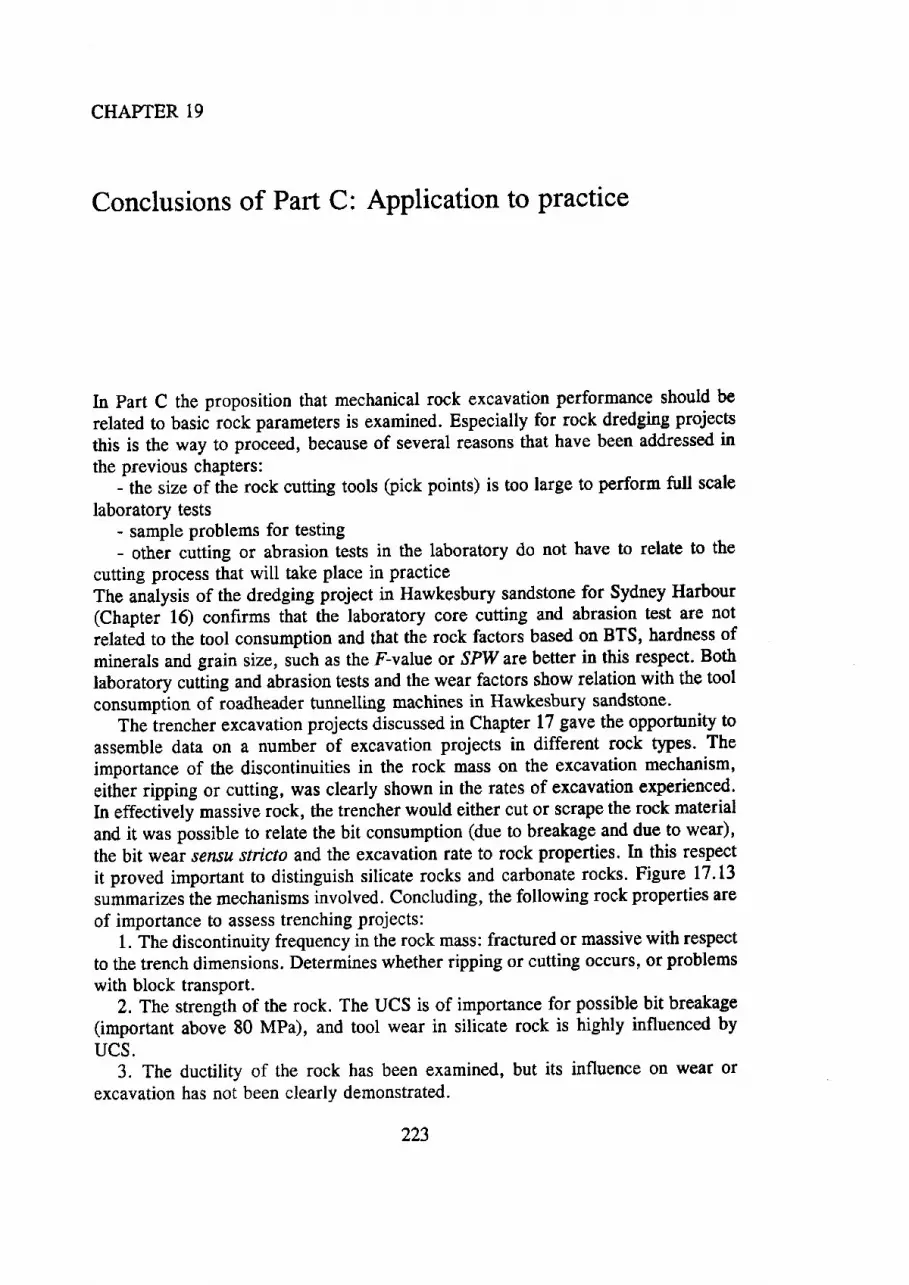
CHAPTER 19
Conclusions of Part C: Application to practice
In Part C the proposition that mechanical rock excavation performance should be
related to basic rock parameters is examined. Especially for rock dredging projects
this is the way to proceed, because of several reasons that have been addressed in
the previous chapters:- the size of the rock cutting tools (pick points) is too large to perform full scale
laboratory tests- sample problems for testing- othe] cutting or abrasion tests in the laboratory do not have to relate to the
cutting process that will take place in practiceThe analysis of the dredging project in Hawkesbury sandstone for Sydney Harbour(Chapter 16) confirms that the laboratory core cutting and abrasion test are not
related to the tool consumption and that the rock factors based on BTS, hardness of
minerals and grain size, such as the F-value or SPIT are better in this respect. Both
laboratory cutiing and abrasion tests and the wear factors show relation with the tool
consumption of roadheader tunnelling machines in Hawkesbury sandstone-The trencher excavation projects discussed in Chapter 17 gave the opportunity to
assemble data on a number of excavation projects in different rock types. The
importance of the discontinuities in the rock mass on the excavation mechanism,
either ripping or cutting, was clearly shown in the rates of excavation experienced.In effectively massive rock, the trencher would either cut or scrape the rock materialand it was possible to relate the bit consumption (due to breakage and due to wear),the bit wear sensu stricto and the excavation rate to rock properties. In this respectit proved important to distinguish silicate rocks and carbonate rocks. Figure I7.L3summarizes the mechanisms involved. Concluding, the following rock properties are
of importance to assess trenching projects:1. The discontinuity frequency in the rock mass: fractured or massive with respect
to the trench dimensions. Determines whether ripping or cutting occurs, or problemswith block transport.
2. The strength of the rock. The UCS is of importance for possible bit breakage(important above 80 MPa), and tool wear in silicate rock is highly influenced by
UCS.3. The ductility of the rock has been examined, but its influence on wear or
excavation has not been clearly demonstrated.
223
224 Pan C: Application to practice
4. The abrasiveness indicators F-value, F,*r, and SPWril are very comparable andrelate to bit wear.
Considering the prediction of excavation performance, a method using an expertsystem based onfitzzy modelling is considered useful for this problem. A model forthe T-850 Vermeer trencher has been developed and predicts excavation rate, bitconsumption and bit wear, using information on the discontinuity system of the rockmass, the rock material strength and the minemlsgy and grain size.
One of the goals of this research project was how to improve the prediction oftool consumption for rock cutting dredgers. For the development of predictionmodels a similar approach as used with the trenchers, using expert systems, isthought useful. For each cutter suction dredger a data base and a performance modelshould be developed. This implies that it is important that rock properties such asstrength (UCS and BTS), petrographic composition (mineralogy and grain size) ofthe rocks dredged by a CSD should be constantly monitored and compared with theproduction and tool replacement data. If a good geotechnical model of theunderground exists before the dredging starts, this model can be used during thedredging operation.
CHAPTER 20
Introduction to Part D: Site investigation for rockdredging contracts
O1e of the aims of this work was to outline how the site investigation for a rock
dredging contract should be performed, bearing in mind the factors that are involvedin thi wiar of the rock cutting tools. In Part D therefore the general outline of such
a site investigation is given, by focusing on the goal of the site investigation, the
development of a geoteclrtical model of the subsurface.It ii emphasized that the consulting engineer should aim at the development of a
three-dimensional model of the subsurface, based on a good understanding of thegeology. Nowadays 3D geoscience modelling is supported by computer assistedinformation systems and imaging methods. To have all information available in
digitized form can be of great help during the execution of a project. Thc generalprocedure to come to such a model and the type of data that is needed for a rock
dredging project is discussed in Chapter 21. The subsurface is divided intoengineering geological wnits, which are soil- and rock mass volumes that havedistinguishable ranges of geotechnical properties that relate to the dredgingexcavation process. These units are distinguished based on both lithological andgeotechnical information.
In Chapter 22 emphasis is made on the characterisation of the rock mass forengineering purposes. Rock mass is described in terms of rock material properties
and the presence and propertigs of the rock discontinuities in the mass. Somerelevant features of the existing methods are discussed, mainly to point to the typeof information to be gathered during the site investigation. Therefore also some shortremarks are made on weathered rock mass and the presence of cementation. Bothsoils and weathered rock can become cemented by precipitation of cementingmaterial from saturated water. Since in many potential dredging locations in coastalareas conditions for weathering and cementation are presetrt or have occurred in therecent past, during the site investigation attention should be given to these features.
In Chapter 23 the conclusion of the work is given. Based on the review of rockabrasiveness and testing methods and mainly on the laboratory tests and observationsof the rock cutting trencher operations models of the excavation mechanisms of rockmass and the factors of that determine tool consumption are given. These models arethe point of departure for further work on this subject (Chapter 24)'
225
CHAPTER 21
The construction of a geotechnical model for a rockdredging contract
The objective of the site investigation for a rock dredging contract is the production
of a geotechnical model. This geotechnical model of the subsurface consists ofengineering geological units1s, which are volumes of soil or rock that have welldefined ranges of geotechnical properties related to dredging. Within eachengineering geological unit the properties relevant to dredging are, within establishedlimits, approximately equal. The model should be such that the contractor can designan excavation plan and choose the appropriate dredging method. The geotechnicalmodel should give information related to excavatability (for production estimation)and wear (tool consumption). Other aspects related to the dredging operation, suchas estimates of the bulking factor, hydraulic transport of the slurry, slope stabilityof a trench should be retrievable from the model or its data base.
Figure 21.1 illustrates the concept of the geotechnical model. The engineerlnggeological units are described following the definitions given in Appendix B, Table81. From the verbal descriptions a clear picture of the geotechnical properties of theengineering geological unit can be obtained. The following information is used tocharacterise an engineering geological unit:
1. Description of the rock material:colour, fabric, grain size, important minerals, ROCK NAME, ductility, strength,abrasiveness, weathering state. For example:yellow - thickly laminated - medium grained - quartZ bearing - DOLOMITE 'ductile-moderately strong ' low obrasiveness - fresh
2. Description of the rock mass:layer thickness, discontinuity spacing in three dimensions, block shape, number ofdiscontinuity setsmediwn bedded - mediwn block size - tabular block slnpe ' some dissolwion alongthe two joint sets, with clay ffill; three discontinuiry se*: bedding artd twosubvertical joint sets
75 In this text the term engineering geological unit is used, to stress the geological(lithological) basis of the concept. The term geotechnical unit is commonly used and issynonymous (see for example Hack 1996).
226
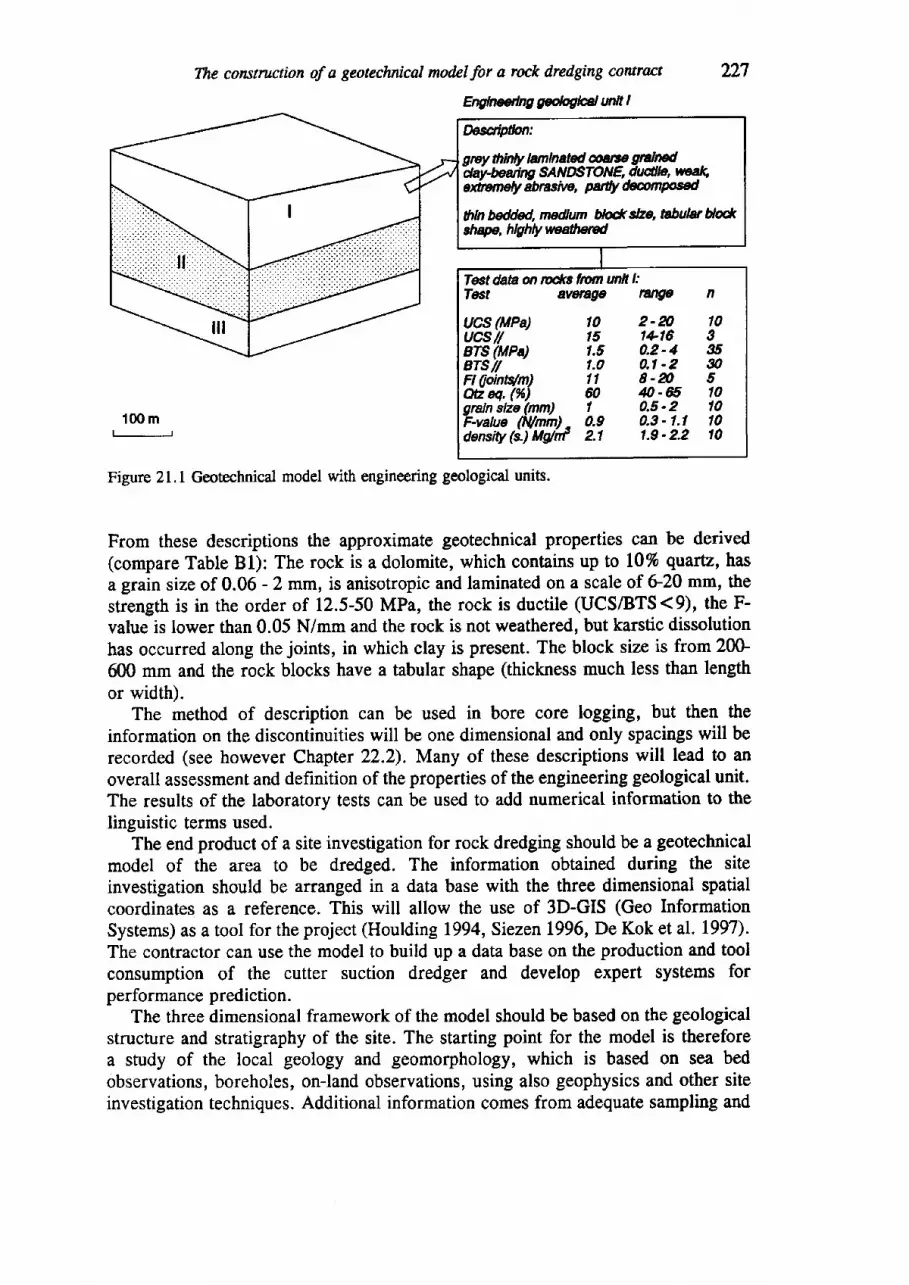
Erylrwdngg@@l mltl
Figure 21,1 Geotechnical model with engineering geological units.
The cowtruction of a geotechnical modcl for a rock dredging contract
From these descriptions the approximate geotechnical properties can be derived(compare Table Bl): The rock is a dolomite, which contains up to 10% quartz, hasa grain size of 0.06 - 2 mm, is anisotropic and laminated on a scale of G2A mm, thestrength is in the order of 12.5-50 MPa, the rock is ductile (UCS/BTS<9), the F-value is lower than 0.05 N/mm and the rock is not weathered, but karstic dissolutionhas occurred along the joints, in which clay is present. The block size is from 20G600 mm and the rock blocks have a tabular shape (thickness much less than lengthor width).
The method of description can be used in bore core logging, but then theinformation on the discontinuities will be one dimensional and only spacings will berecorded (see however Chapter 22.2). Many of these descriptions will lead to anoverall assessment and definition of the properties of the engineering geological unit.The results of the laboratory tests can be used to add numerical information to thelinguistic terms used.
The end product of a site investigation for rock dredging should be a geotechnicalmodel of the area to be dredged. The information obtained during the siteinvestigation should be arranged in a data base with the three dimensional spatialcoordinates as a reference. This will allow the use of 3D-GIS (Geo InformationSystems) as a tool for theproject (Houlding 1994, Siezen 1996, De Kok etaI.1997).The contractor can use the model to build up a data base on the production and toolconsumption of the cutter suction dredger and develop expert systems forperformance prediction.
The three dimensional framework of the model should be based on the geologicalstructure and stratigraphy of the site. The starting point for the model is thereforea study of the local geology and geomorphology, which is based on sea bedobservations, boreholes, on-land observations, using also geophysics and other siteinvestigation techniques. Additional information comes from adequate sampling and
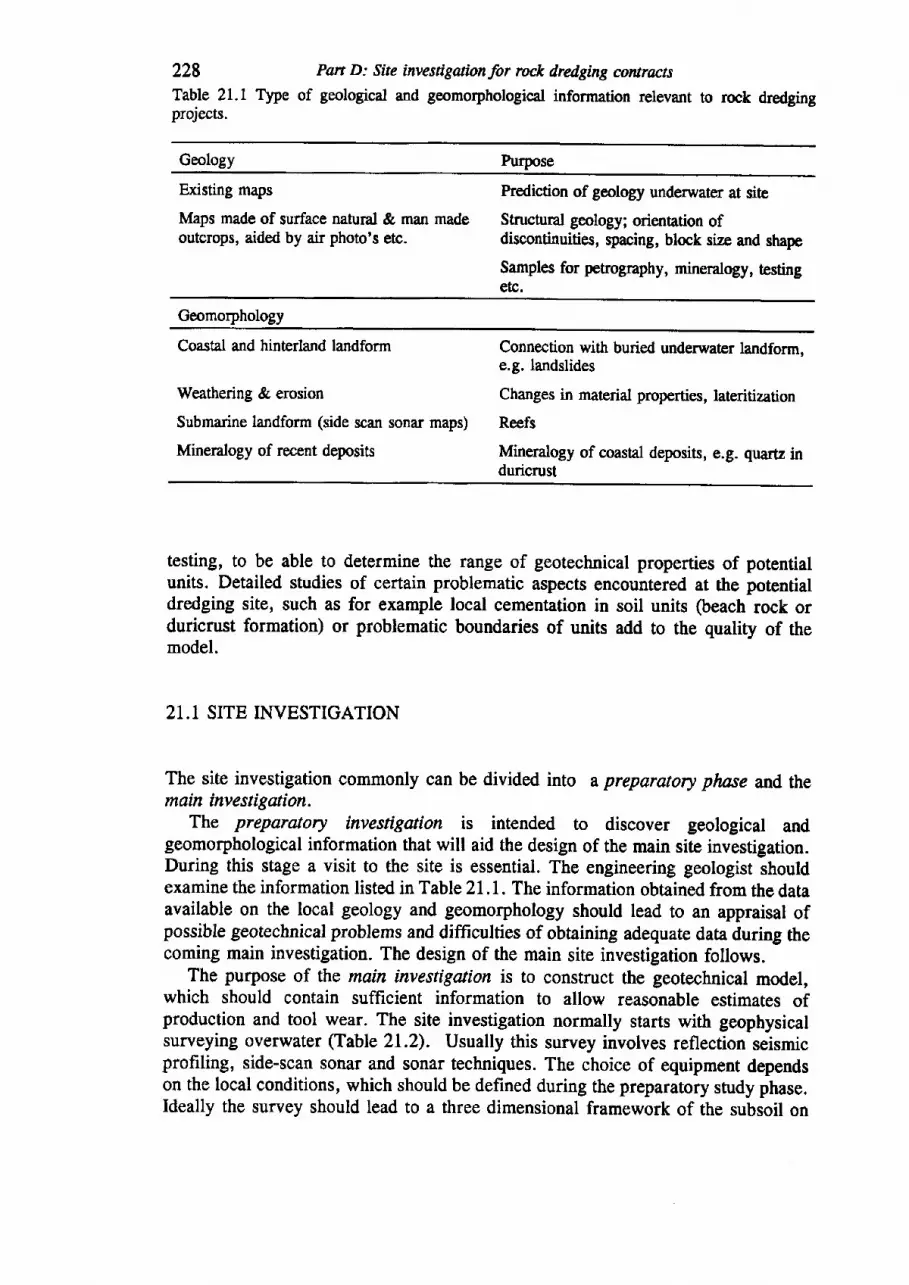
228Table 21.1 Tlpeprojects.
Pan D: Site inve*iguionfor ro& dredging contractsof geological and geomorphological information relevant to rock dredging
Geology Purpose
Existing maps
Maps made of surface natural & man madeoutcrops, aided by air photo's etc.
Prediction of geology underwater at site
Structural geology; orienadon ofdiscontinuities, qracing, block size and shape
Samples for petrography, mineralogy, testingetc.
Geomorphology
Coastal and hinterland landform
Weathering & erosion
Submarine landform (side scan sonar maps)
Mineralogy of recent deposits
Connection with buried underwater landform,e.g. landslides
Changes in material properties, lateritization
Reefs
Mineralogy of coastal deposis, e.g- quartz induricrust
testing, to be able to determine the range of geotechnical properties of potentialunits. Detailed studies of certain problematic aspects encouutered at the potentialdredging site, such as for example local cementation in soil units Oeach rock orduricrust formation) or problematic boundaries of units add to the quality of themodel.
21.1 SITE INVESTIGATION
The site investigation commonly can be divided into a preparatory phose and themain invesligation.
The preparalory investiguion is intended to discover geological andgeomorphological information that will aid the design of the main site investigation.During this stage a visit to the site is essential. The engineering geologist shouldexamine the information listed in Table 21.1. The information obtained from the dataavailable on the local geology and geomorphology should lead to an appraisal ofpossible geotechnical problems and difficulties of obtaining adequate data during thecoming main investigation. The design of the main site investigation follows.
The purpose of the main investigaion is to construct the geotechnical model,which should contain sufficient information to allow reasonable estimates ofproduction and tool wear. The site investigation normally starts with geophysicalsurveying overwater (Table 21.2). Usually this survey involves reflection seismicprofiling, side-scan sonar and sonar techniques. The choice of equipment dependson the local conditions, which should be defined during the preparatory study phase.Ideally the survey should lead to a three dimensional framework of the subsoil on
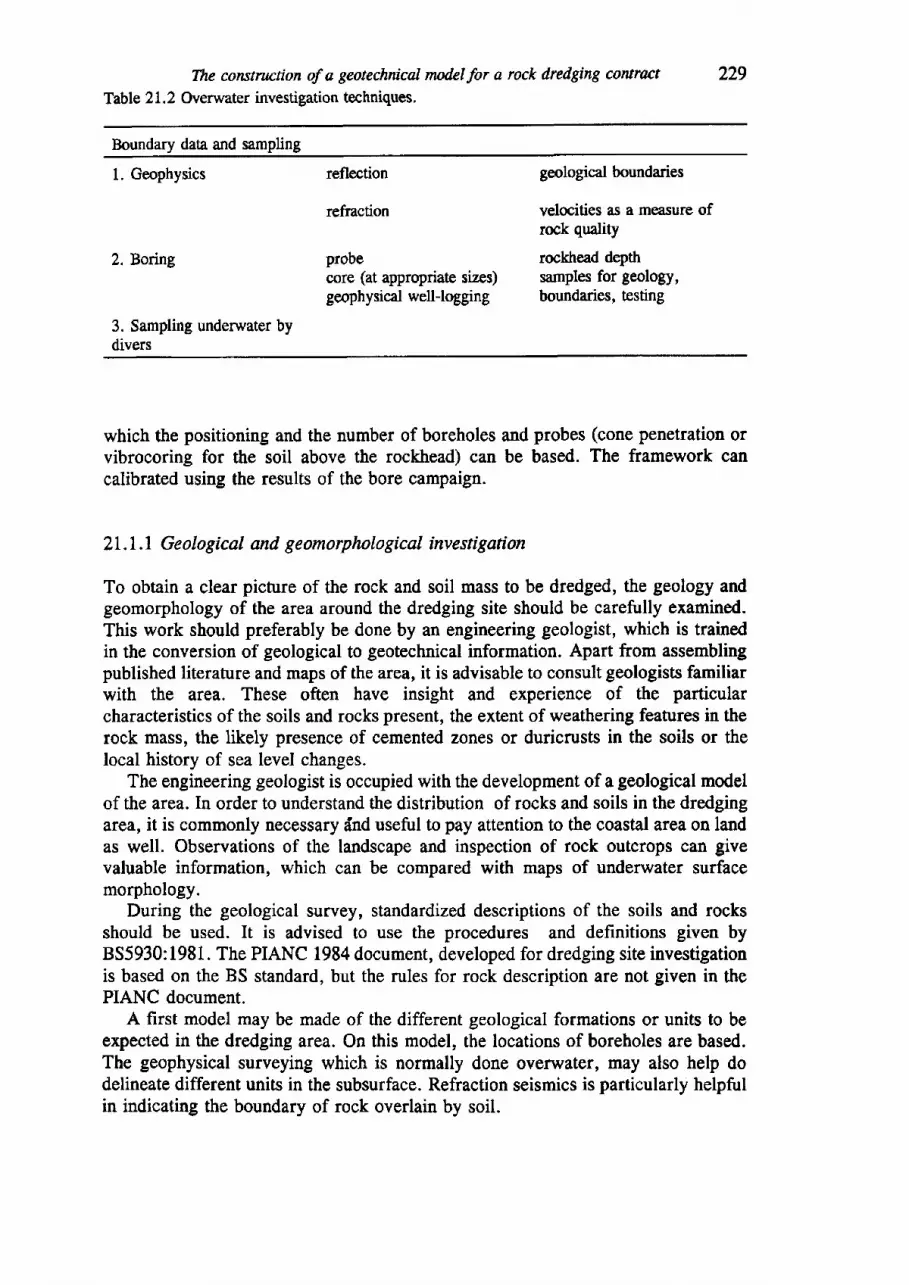
The corctrucrton of a geotechnical mdcl for a rock dredging cowract
Table 2t,2 Overwater investigation techniques,229
Boundary data and sampling
1. Geophysics
2. Boring
3. Sampling underwater bydivers
which the positioning and the number of boreholes and probes (cone penetration orvibrocoring for the soil above the rockhead) can be based. The framework cancalibrated using the results of the bore campaign.
21.1,.1 Geological and geomorphological investigation
To obkin a clear picture of the rock and soil mass to be dredged, the geology andgeomorphology of the area around the dredging site should be carefirlly examined.This work should preferably be done by an engineering geologist, which is trainedin the conversion of geological to geotechnical information. Apart from assemblingpublished literature and maps of the area, it is advisable to consult geologists familiarwith the area. These often have insight and experience of the particularcharacteristics of the soils and rocks present, the extent of weathering features in therock mass, the likely presence of cemented zones or duricrusts in the soils or thelocal history of sea level changes.
The engineering geologist is occupied with the development of a geological modelof the area. In order to understand the distribution of rocks and soils in the dredgingarea, it is commonly necessary dnd useful to pay attention to the coastal area on landas well. Observations of the landscape and inspection of rock outcrops can givevaluable information, which can be compared with maps of underwater surfacemorphology.
During the geological survey, standardized descriptions of the soils and rocksshould be used. It is advised to use the procedures and definitions given by855930:1981. The PIANC 1984 document, developed for dredging site investigationis based on the BS standard, but the rules for rock description are not given in thePIANC document.
A first model may be made of the different geological formations or units to beexpected in the dredging area. On this model, the locations of boreholes are based.The geophysical surveying which is normally done overwater, may also help dodelineate different units in the subsurface. Refraction seismics is particularly helpfulin indicating the boundary of rock overlain by soil.
reflection
refraction
probecore (at appropriate sizes)geophysicd well-logging
geological boundaries
velocities as a measure ofrock quality
rockhead depthsamples for geology,boundaries, testing
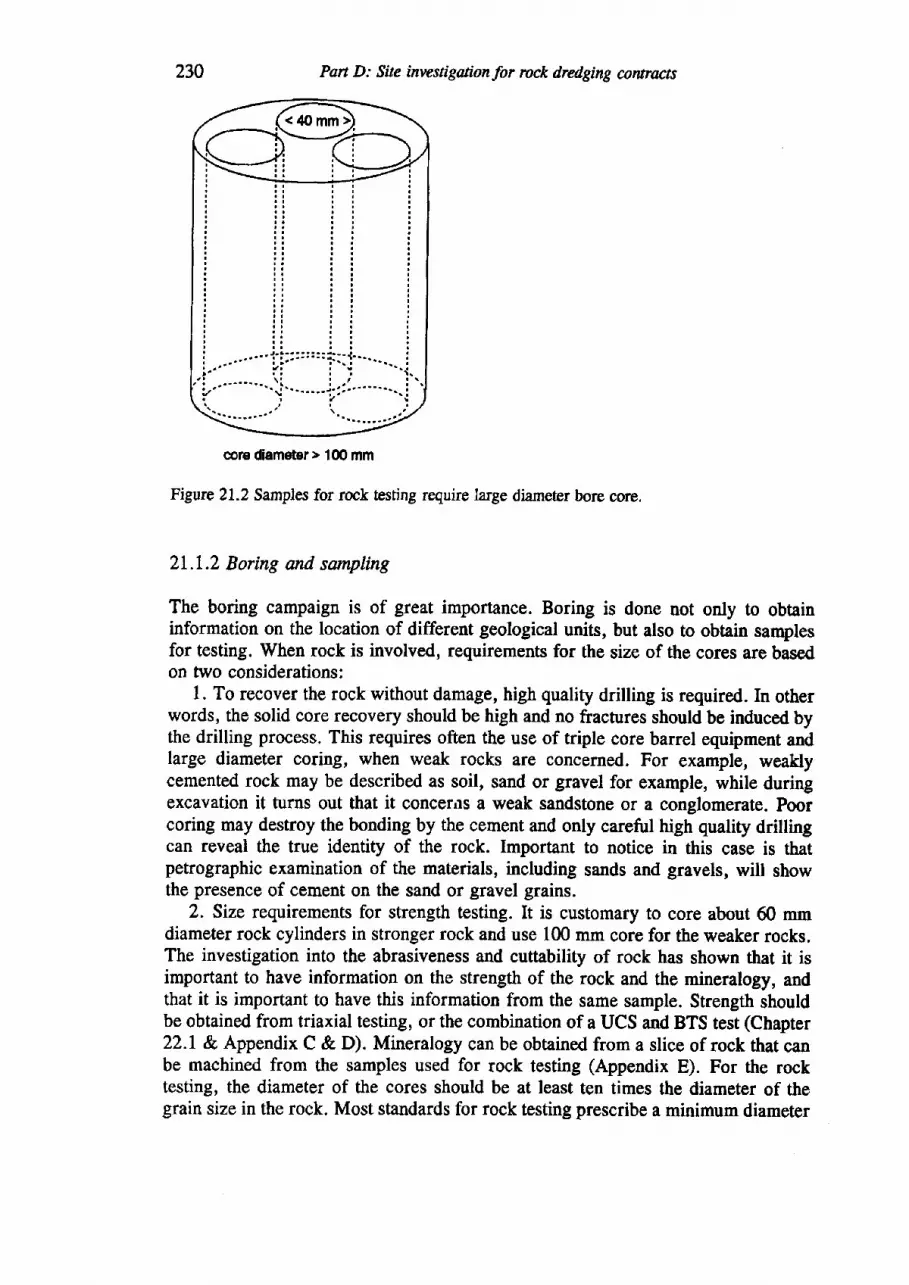
Part D: Site inwstigaionfor rcck dredging eowracts
Figure 21.2 Samples for rock testing require large diameter bore core.
2I.1.2 Boring and sampling
The boring campaign is of great importance. Boring is done not only to obtaininformation on the location of different geological units, but also to obtain samplesfor testing. When rock is involved, requirements for the size of the cores are basedon two considerations:
1. To rccover the rock without damage, high quality drilling is required. In otherwords, the solid core recovery should be high and no fractures should be induced bythe drilling process. This requires often the use of triple core barrel equipment andlarge diameter coring, when weak rocks are concerned. For example, weaklycemented rock may be described as soil, sand or gravel for example, while duringexcavation it turns out that it concerns a weak sandstone or a conglomerate. Poorcoring may destroy the bonding by the cement and only careful high quality drillingcan reveal the true identity of the rock. Important to notice in this case is thatpetrographic examination of the materials, including sands and gravels, will showthe presence of cement on the sand or gravel grains.
2. Size requirements for strength testing. It is customary to core about 60 mmdiameter rock cylinders in stronger rock and use 100 mm core for the weaker rocks.The investigation into the abrasiveness and cuttability of rock has shown that it isimportant to have information on the strength of the rock and the mineralogy, andthat it is important to have this information from the same sample. Strength shouldbe obtained from triaxial testing, or the combinarion of a UCS and BTS test (Chapter22.1 & Appendix C & D). Mineralogy can be obtained from a slice of rock that canbe machined from the samples used for rock testing (Appendix E). For the rocktesting, the diameter of the cores should be at least ten times the diameter of thegrain size in the rock. Most standards for rock testing prescribe a minimum diameter
core diameter> 1(X) mm
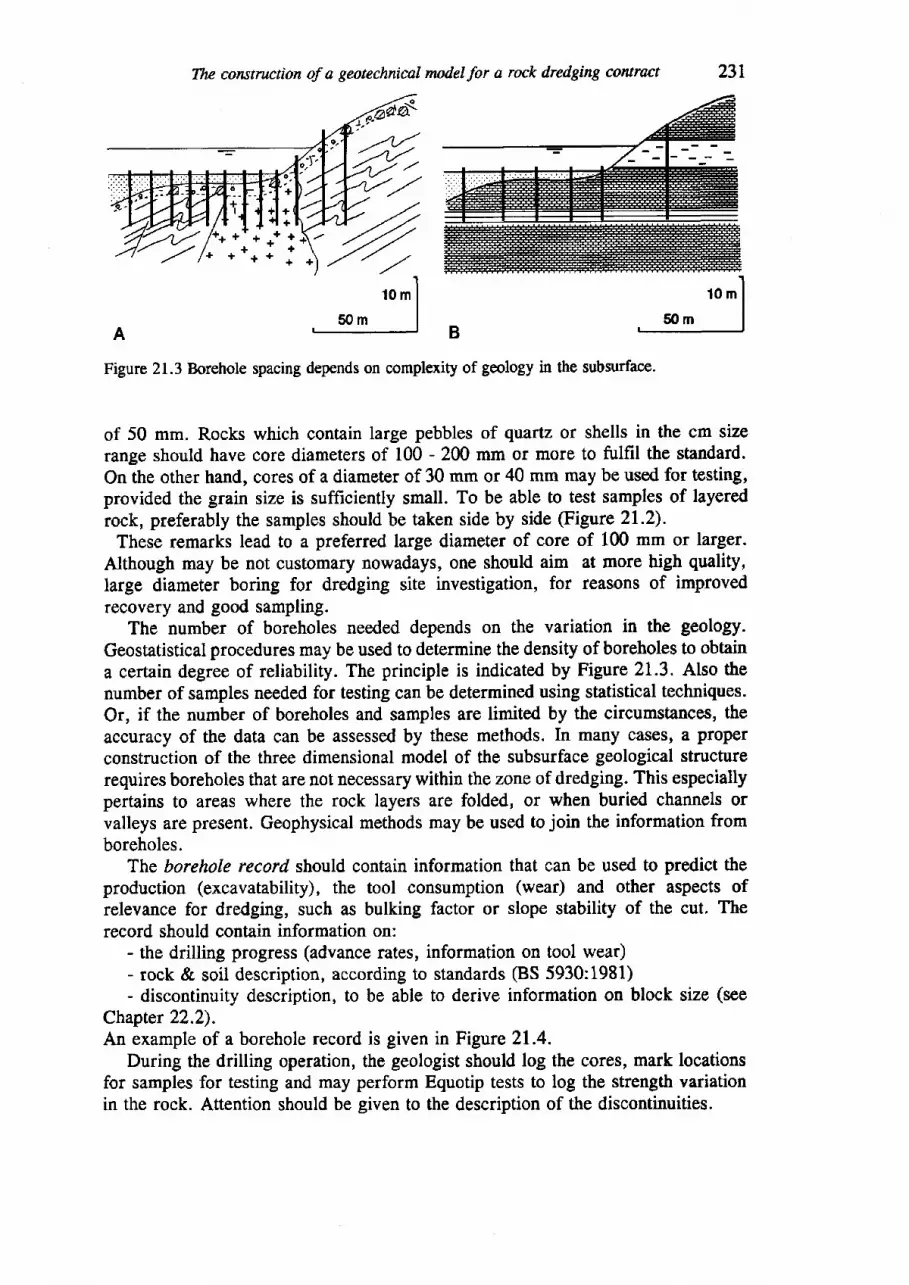
10 mlI
50m IA
Thc construction of a geotechnical model for a rock dredging contact
Figure 21.3 Borehole spacing depends on complexity of geology in the subsurface.
of 50 mm. Rocks which contain large pebbles of quartz or shells in the cm sizerange should have core diameters of 100 - zffi mm or more to fulfil the standard.On the other hand, cores of a diameter of 30 mm or 40 mm may be used for testing,provided the grain size is sufficiently small. To be able to test samples of layeredrock, preferably the samples should be taken side by side (Figure 21.2).
These remarks lead to a preferred large diameter of core of 100 mm or larger.Although may be not customary nowadays, one should aim at more high quality,large diameter boring for dredging site investigation, for reasons of improvedrecovery and good sampling.
The number of boreholes needed depends on the variation in the geology.Geostatistical procedures may be used to determine the density of boreholes to obtaina certain degree of reliability. The principle is indicated by Figure 21.3. Also thenumber of samples needed for testing can be determined using statistical techniques.Or, if the number of boreholes and samples are limited by the circumstances, theaccuracy of the data can be assessed by these methods. In many cases, a properconstruction of the three dimensional model of the subsurface geological structurerequires boreholes that are not necessary within the zone of dredging. This especiallypertains to areas where the rock layers are folded, or when buried channels orvalleys are present. Geophysical methods may be used to join the information fromboreholes.
The borehole record should contain information that can be used to predict theproduction (excavatability), the tool consumption (wear) and other aspects ofrelevance for dredging, such as bulking factor or slope stability of the cut. Therecord should contain information on:
- the drilling progress (advance rates, information on tool wear)- rock & soil description, according to standards (BS 5930:1981)- discontinuity description, to be able to derive information on block size (see
Chapter 22.2).An example of a borehole record is given in Figure 21.4.
During the drilling operation, the geologist should log the cores, mark locationsfor samples for testing and may perform Equotip tests to log the strength variationin the rock. Attention should be given to the description of the discontinuities.
+ t++
?
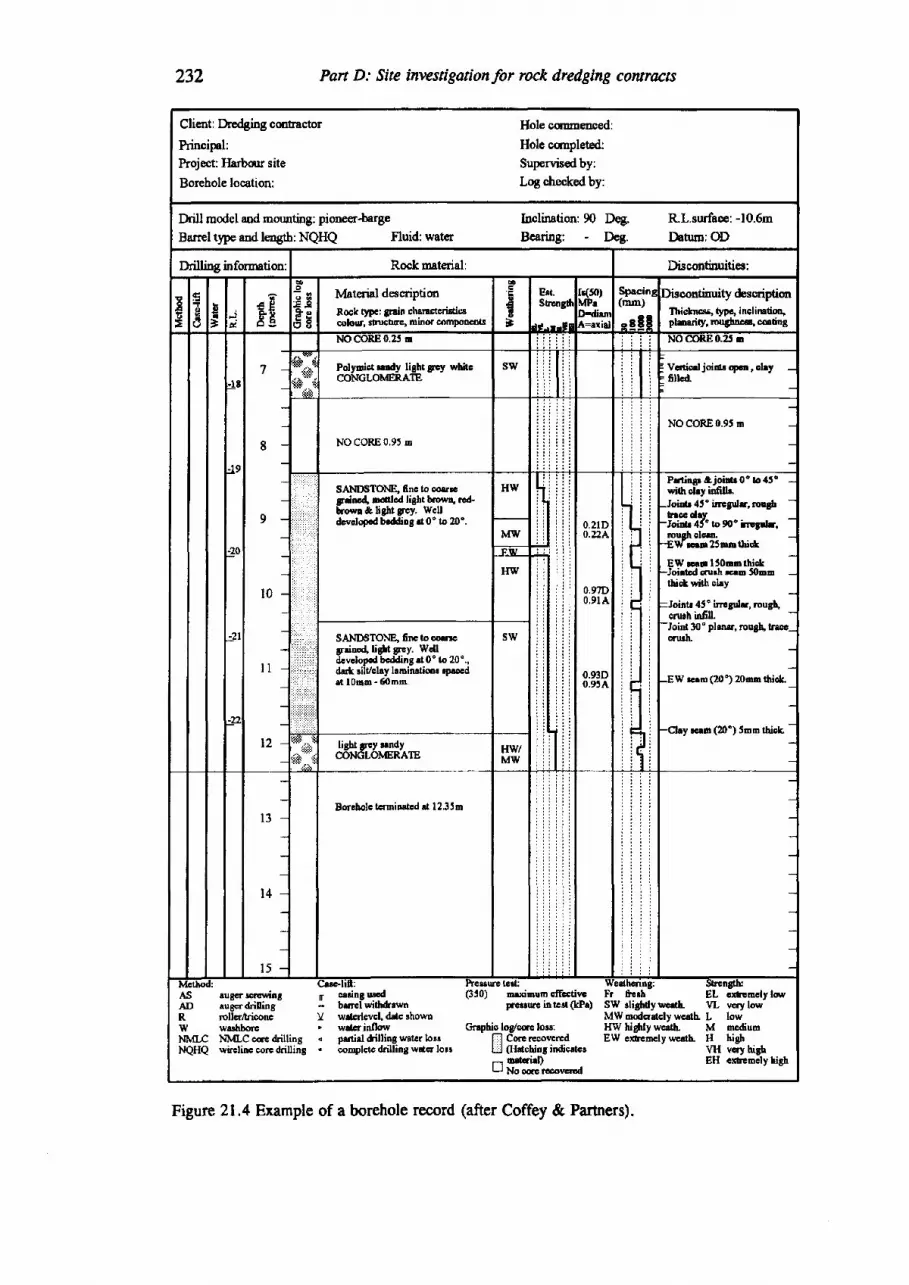
232 Part D: Site investigaionfor rock dredging cowracts
Client : Dredging contractor
kincipal:
hoject llarbanr site
Borehole looation:
Hole csnmensed:Hole c.mpleted:Supervised by:Log checked by:
Drill model aod mounting: pioneer-barge trnolination: 90 D€9. Rl.surfaoe: -10.6m
Barreltypeandlength: NQHQ Fluid:water Bearing: - Deg. Datum; OD
Drilling information: Rock material: Discsrlrnuitics:
E€
/toa' x FE
o
t 5
F e5 E
Msterial descriptiut
Aock tnc: Snin chafftddi.solour, srucn-rc' ninor coromcors
FtE
B
Era.SEtrtg0
I - - I !
450)v|Pr
Spa.cinl(mm)
, r t t
Discontinuity &scriptionThictnc*s, typq inclirelioo,plmriry, ro.ryhrcrr, coting
'18
le
?o
=21
7
I
9
l0
t 1
t2
NO COIUJ 0.Zr r NO(X.)ltl10.25 0
s . .4trt
t+ 'tPolyoiot !.dy light grey whleCONGLOMERATE
sw Vatict joidr qar, olryf,tlea
NO CORE 0,95 o
NO CORE0.95 n
SAIIDSTOI{E,6rc io g$rcfrdnc4 nalcd lieht bowrt.€d'brorm & lig[t ft€y. Wetl&rclopod beddiog d 0 " to 20".
HW
0,0,
2tD22A
0.97D0.91A
0.93D0.954
Liil
Priingr &joiilr 0" !o 45c -withohyidlh
-Joidr 41" inegulr, mgh -
broc ohy-Joidr 45" to 90' ingolr.mdrcln
-EWsn25nnthi*
EW rcao l50norhioh-Joioicd mrh ru 50outhi*wiih alry
=Jointr 45' irrogdr, mugt,onuh infill-Joint
30'pluur, rough lrroc-crurL
-EW rcrm(20') 20m thioh
-Ctay rcro (Z)") Snn thich
M\[/
HW
SAIIDSTOM, fnctoorrcgrrinc4 ti$t gtEy. Wdl&wlopcd bcdding d 0" ao 20'.,drrk rilt/elay lamirotior tpsdrt lOmn - 6omm.
sw
i{f Itlr::l
ft;,,liglt grcy undyCONGLOMERAIE Hw/
MW
l 3
l 4
t 5
Borshol. trmimt€d at 1235m
Method:AS eugnmingAD eugadrillingR rollcririconeW wshborcNMLC NMLC ccc drillingNQHQ wirclim corc&illing
(lFhtt:
6 ering urcd- bmlwilhdr|mV u'rtcrlevcl,dalclhown' wrlerinllow< perriel dilliag wrtrr lo!!. mnplctc drilling rvdcr lort
rr€$urc tel|:(3J0) nuinum sffetiw
F€.rurs in tcc (lPr)
Cinphio log/ccc lors:fi CorcrtrmdLJ (Hatchingindiqles- nrlrrid)u Nooqtrccovmd
wca!,rcntrg:Fr f:rl
$rcn$D:EL ortcrulylw
SW llighdyurcrth- VL vrylwMW oodcrdcly wcalh. L lowHW highlywcrth. M mcdiunEW crd€trly wEdL H hiCh
VH vcry highEH cxrenclyhigfi
Figure 21.4 Example of a borehole record (after Coffey & Partners).

The cowtruction of a gmtechnical modclfor a rock dredging coftroct 233
Table 21.3 Main site investigation prognmme for rock dredging contracts.
1. Field investigation Engineering geological mapping Geology and geomorphology ofon land and, ifpossible, under area, structuf,al geologywater
Determination of inhomogeneityBorehole dri[ing campaign, in- and anisotropy of rock and soilsitu testing
Geophysical survey
umts
Weathering features (presence ofclay, rock core stones in
Rock & soil description and weathered soil)classification
Discontinuity frequencY;
Quantitative description of orientation, sPacinB, RQD,discontinuities
(following ISRM suggestedmethods)
block size and shape estimation
2. Rock material Sampling from drilling cores or Unconfined Compessiveproperties outcrops on land Shength (UCS)' Triaxiat testing
Deformation modulusUnconfined Tensile Strength(BTS, PLS)Ratio of UCS/BTSDensityPorosityInfluence of anisotroPY orinhomogeneity on mechanicalproperties
3. Petrographic Mineral composition Equivalent qualtz contentdescription Microscopic structure (mineral hardness)
Grain size and shapeCementationmicro+racksanisotropy, homogeneity
4. Geotechnical Two- or three dimensional Estimation of quantitiesmodelling geological-geotechnical modelling (volumes) of engineering
geologicd units to dredge
5. Performance Excavation model Choice of dredgerprediction Estimate of production and tool
consumption
Sometimes the orientation of discontinuities with respect to the core axis should belogged, in order to be able to obtain information on block size and shape and joint
set orientations (see Chapter 22.2). When the laboratory tests are done, spreadsheetdatabases may be set up with the most important information can be compiled inborehole description forms. The combination of all data available may be used todelineate the engineering geological units at the site.

234 Pan D: Site investigationfor rock dredging contratts
Units:
I sandsllweathered granitelll granite
I sandsl lshalelllsandstone
I sandsll schists with dolerite
Figure 21.5 Examples of geotechnical units in different geological situations.
21.1.3 Data to be assembled during the main site investigaion
Table 21.3 summarises the information to be gathered on the rock masscharacteristics during the main site investigation.
In many current site investigation reports for rock dredging projects emphasis ison borehole record listings and summation tables of test results. In the case of rocksthis pertains to Point Load tests and UCS tests. Commonly no effort is made to basethe geotechnical model, when present, on a geological model. Petrography is oftenlimited to visual descriptions and name giving. Mineralogical examinations andmicroscopic studies are seldom performed. Discontinuities are commonly describedin the borehole reports in the form of RQD and FI (fracture index) numbers. Thispractice needs to be improved, because a sound geological model is a necessaryprerequisite for a sound geotechnical model. It is necessary to delineate lithologicalboundaries of both rock and soil units and the discontinuity patterns to describe thecomplete mass to be excavated. Focus should be on the proper presentation of thedata, by distinguishing lithological units that also have geotechnical significance. Part
C. complex metamorphic rock mass
The corstruction of a geotechnicat modztfor a rock dredging controct 235
of the mass may be satisfactorily described using mechanical properties of thematerials present. Insight into the geological history of the site can help tounderstand the structure of the rock mass and the effect of weathering processes on
the rock properties (Chapter 22).The material properties needed for a proper analysis should consist of information
on the density, porosity and mechanical strength of the rocks present. The variationof these properties should be recorded as well. The tests on strength shouldpreferably be performed on saturated samples. As is obvious from the trend of thisiesearch,-a petrographic study of the nature of the rock types is essential to establishthe presence and nature of potentially abrasive minerals (Iable 21.3).
21.2 ENGINEERING GEOLOGICAL UNITS
The subsurface will be divided into units that are defined on the basis of trvocharacteristics related to the type of soil or rock: the lithology (geology) and thegeotechnical properties. Therefore these units are termed engineering geological
units. Each unit will be defined by a characteristic range of properties. Figure 21.5gives some examples, which show that the local circumstances dictate the division.The division should be such that the units are meaningful with respect !o dredgingexcavation. Not only the geology, but also the dredging requirements are used tomake the subdivision in units. The last remark refers to the scale of the units. Fora cutter suction dredger, layers with a thickness of 30 cm or more can be consideredas separate units.
It is advisable to maintain the geological subdivision as a basis throughout theproject, to avoid confusion, such as for example existed in the Port Hedland project(Chapter 5, compare Table 5.3, p.56 with Table 5.4, p.61).
In Figure 21.5B , for example, on the basis of the stratigraphy the layers A, B, C,D & E are a normal succession. Layers B & D have the same range of geotechnicalproperties, as have layers A, C & E. Now it would be unwise to distinguish onlytwo engineering geological units (this was done in Table 5.3). Better is to divide therock mass into the engineering geological units AII, BIII, Cil, DIII & EII.
Geological and geotechnical properties that would be used to define theengineering geological units are:
- layering/anisotropy (layer thickness)- material strength properties: strength and ductility- block size and shape; discontinuity patterns and spacings- abrasiveness, as determined by strength and petrography/mineralogy
The description of the units should follow standards, as outlined in Chapter 22 &Appendix B. In fact, any information that relates to engineering properties of rockmass can be used to define the units (Table 2L.4).
The units themselves can be chosen in such a way that they relate todredgeability. Each layer or unit should behave in a characteristic way with respectto excavation. The contractor should be able to earmark the engineering geologicalunits as rippable, ar massive, or mixed, based on block size estimation. If massive,
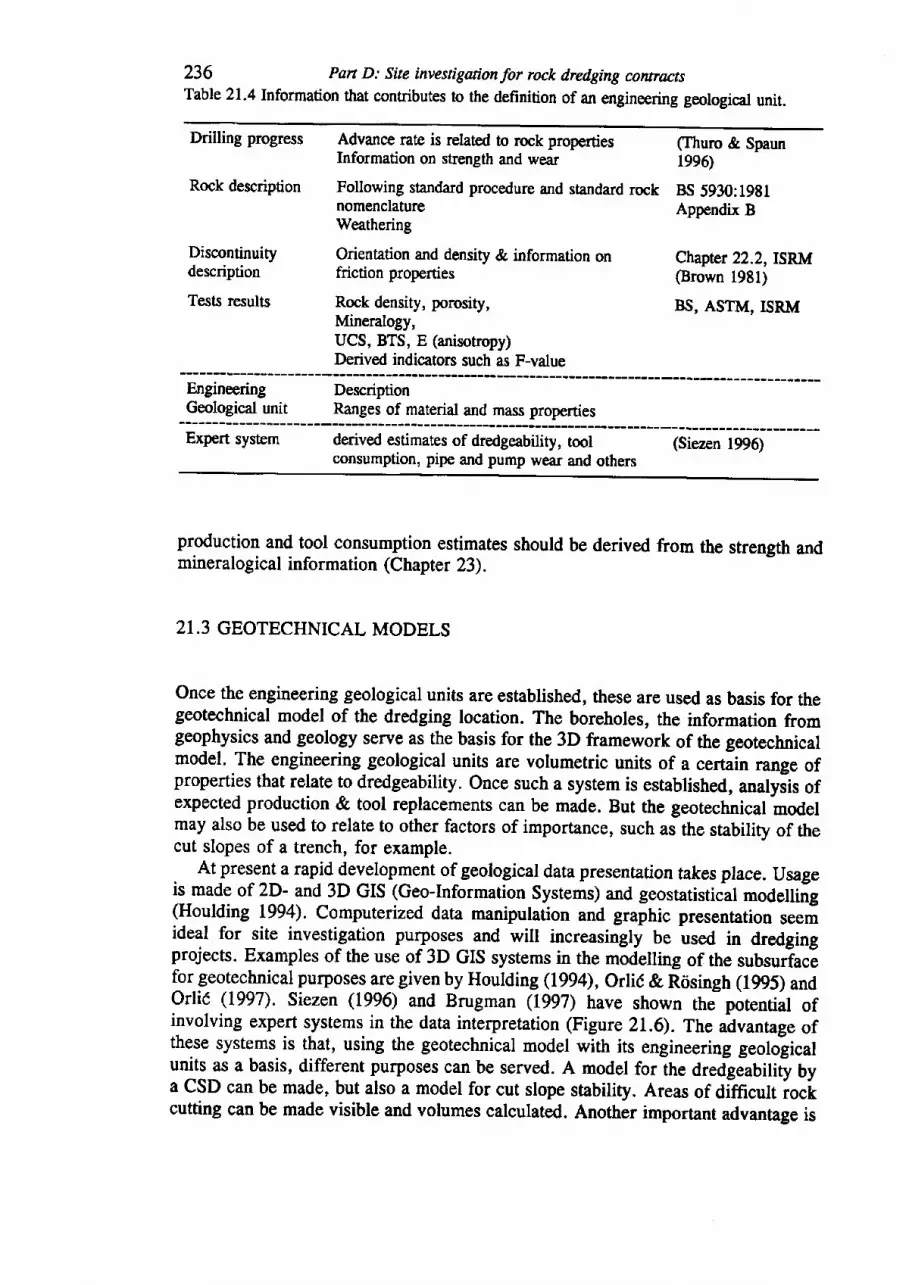
236 Pan D: Site investigwionfor rock dred,ging contractsTable 2l.4lnformation that contributes to the definition of an engineering geological unit.
Drilling progress
Rock description
Discontinuitydescription
Tests results
Advance rate is related to rock propertiesInformation on strength and wear
Following standard procedure and standard rocknomenclatureWeathering
Orientation and density & information onfriction properties
Rock density, porosity,Minenlogy,UCS, BTS, E (anisotropy)Derived indicators such as F-value
(Thuro & Spaun1996)
BS 5930:1981Appendix B
Chapter 22.2, ISRM(Brown 1981)
BS, ASTM, ISRM
EngineeringGeological unit
DescriptionRanges of material and mass properties
Expert system derived estimates of dredgeability, tool (Siezen 1996)consumption, pipe and pump wear and others
production and tool consumption estimates should be derived from the strength andmineralogical information (Chapter 23).
21.3 GEOTECHNICAL MODELS
Once the engineering geological units are established, these are used as basis for thegeotechnical model of the dredging location. The boreholes, the information fromgeophysics and geology serve as the basis for the 3D framework of the geotechnicalmodel. The engineering geological units are volumetric units of a cettuin range ofproperties that relate to dredgeability. Once such a system is established, analyJis ofexpected production & tool replacements can be made. But the geotechnical modelmay also be used to relate to other factors of importance, such as the stabilitv of thecut slopes of a trench, for example.
At present a rapid development of geological data presentation takes place. Usageis made of 2D- and 3D GIS (Geo-Information Systems) and geostatisticll modelling(Houlding L994). Computerized data manipulation and graphic presentation seemideal for site investigation purposes and will increasingly be used in dredgingprojects. Examples of the use of 3D GIS systems in the modeling of the subsurfacefor geotechnical purposes are given by Houlding(1994), OrliC & Rrisingh (1995) andOrlic (1997). Siezen (1996) and Brugman (1997) have shown the porenrial ofinvolving expert systems in the data interpretation (Figure 2L.6). The advantage ofthese systems is that, using the geotechnical model with its engineering geololicalunits as a basis, different pu{poses can be served. A model for ihe Ore3geaUitity UVa CSD can be made, but also a model for cut slope stability. Areas of dfficult rockcutting can be made visible and volumes calculated. Another important advantage is
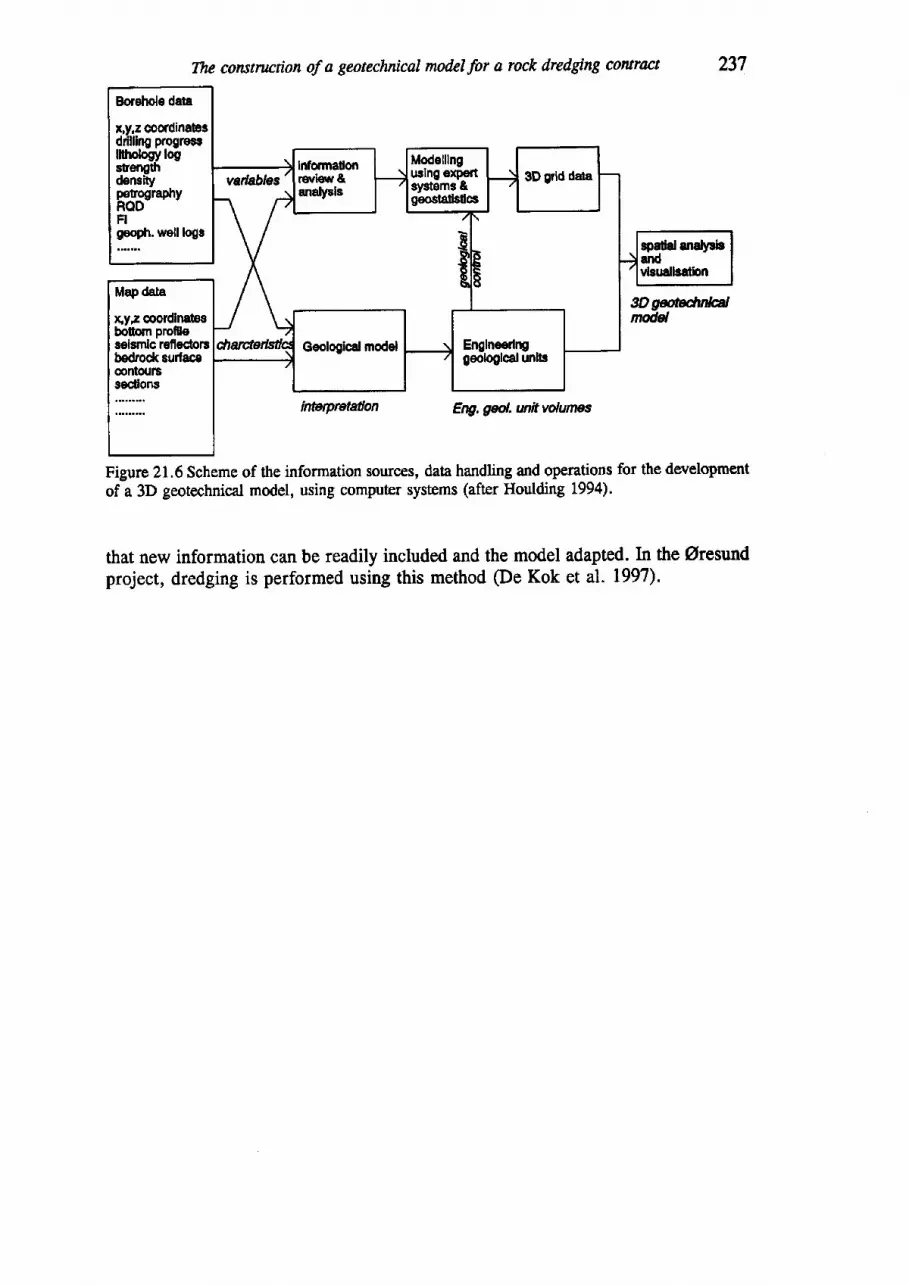
BolEhole dm
r,y,z coordinabsdrilllng progreorllttrologylogstr€noil|d€mrtyp€rographyRODFIgeoph. well logs
Modelllngwlng e:gertsystoms &gpodsJsdcs
spadal enal$lisandvbualbatlon
Map dala
x,y.z coofdlngbsbotom profrleseismlc reile<ionbedrod< sudaceaontours
Y-:*
The corutnrction of a geotechnical model for a rock dredging contract
Figure 21.6 Scheme of the information sources, datia handling and operation$ for the developmentof a 3D geotechnical model, using computer systems (after Houlding 1994).
that new information can be readily included and the model adapted. In the Oresundproject, dredging is performed using this method (De Kok et al. 1997).
CHAPTER 22
Rock mass characterisation for rock dredging projects
In this chapter general aspects of the characterisation of rock for dredging projectsare treated. Each project will have its own special geological situation and meritscareful investigation by the engineering geologist. The information that is needed toarrive at meaningful engineering geological units for a project relates to usefuldescription methods of the rock mass. The advise is to follow the procedures laiddown in professional standards. These have been developed for site investigation assuch, but also for the rock mass characterisation and the description of weatheredrock mass standard or suggested methods exist.
Concerning the production and tool consumption, it has become clear from thiswork that intact rock strength and the density of fractures in the rock mass areimportant parameters. The rock types, the extent of weathering, the possiblepresence of cemented horizons in the soils to be dredged in an area are typicalaspects that differ from project to project. Many rock dredging projects occur inareas that have been transgressed by the sea, during the most recent sea-level rise.In such cases dredging occurs in areas previously exposed on land, where rocks mayhave undergone weathering processes, or soils may have been partly or completelycemented by cementation processes that are common in certain coastal areas. Manydredging projects take place on the boundary of weathered rock and overlying soil.In this chapter therefore attention is given to weathering and also to the cementationthat may be present in the soils of a coastal zone (beach rock and duricrusts).Sometimes these cemented rocks have strength higher than the cutter suctiondredging limit of 30-50 MPa.
The following subjects are treated: intact rock strength (Chapter 22,1),discontinuities and block size (Chapter 22.2), rock mass strength (Chapter 22.3),weathered rock mass (Chapter 22.4) and rock cementation (Chapter 22.5). Thetreatment will be concise, but is regarded relevant for this work. The aim is toconvince the consultant and contractor of the importance of a thorough engineeringgeological site investigation for dredging contracts involving rock.
238
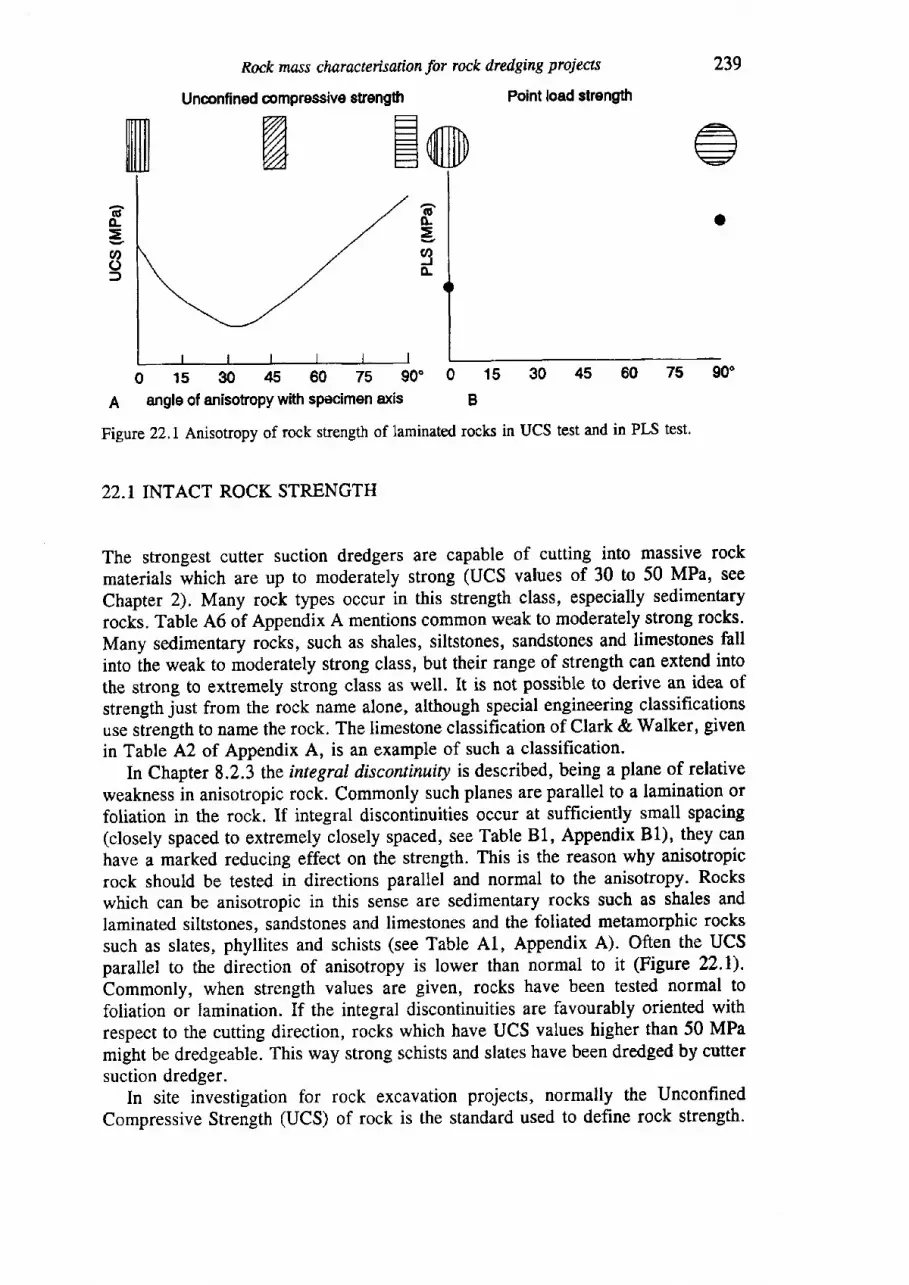
Rock msss ch.aractertswion for rack dredging proiects 239
Unconfined strength Point load strengrilt
Em
o 15 30 45 60 75 90" 0 15 30 45 60 75 90'
A angte of anisotropy with specimen axis B
Figure 22.1 Anisotropy of rock strength of laminated rocks in UCS test and in PLS test.
22.1 INTACT ROCK STRENGTH
The strongest cutter suction dredgers are capable of cutting into massive rockmaterials which are up to moderately strong (UCS values of 30 to 50 MPa, see
Chapter 2). Many rock types occur in this strength class, especially sedimentaryrockl. Table 46 of Appendix A mentions common weak to moderately strong rocks.
Many sedimentary rocks, such as shales, siltstones, sandstones and limestones fall
into lhe weak to moderately strong class, but their range of strength can extend into
the strong to extremely strong class as well. It is not possible to derive an idea of
strength just from the rock name alone, although special engineering classificationsuse strength to name the rock. The limestone classification of Clark & Walker, given
in Table A2 of Appendix A, is an example of such a classification.In Chapter 8.2.3 the integral discontinuiry is described, being a plane of relative
weakness in anisotropic rock. Commonly such planes are parallel to a lamination orfoliation in the rock. If integral discontinuities occur at sufficiently small spacing(closely spaced to extremely closely spaced, see Table 81, Appendix B1), they canhave a marked reducing effect on the strength. This is the reason why anisotropicrock should be tested in directions parallel and normal to the anisotropy. Rockswhich can be anisotropic in this senso are sedimentary rocks such as shales andlaminated siltstones, sandstones and limestones and the foliated metamorphic rockssuch as slates, phyllites and schists (see Table A1, Appendix A). Often the UCSparallel to the direction of anisotropy is lower than normal to it (Figure 22.1).Commonly, when strength values are given, rocks have been tested normal tofoliation or lamination. If the integral discontinuities are favourably oriented withrespect to the cutting direction, rocks which have UCS values higher than 50 MPamight be dredgeable. This way strong schists and slates have been dredged by cuttersuction dredger.
In site investigation for rock excavation projects, normally the UnconfinedCompressive Strength (UCS) of rock is the standard used to define rock strength.
@mpressv€fTZtv// t
14
(EL
E9o-
6o-=a,of
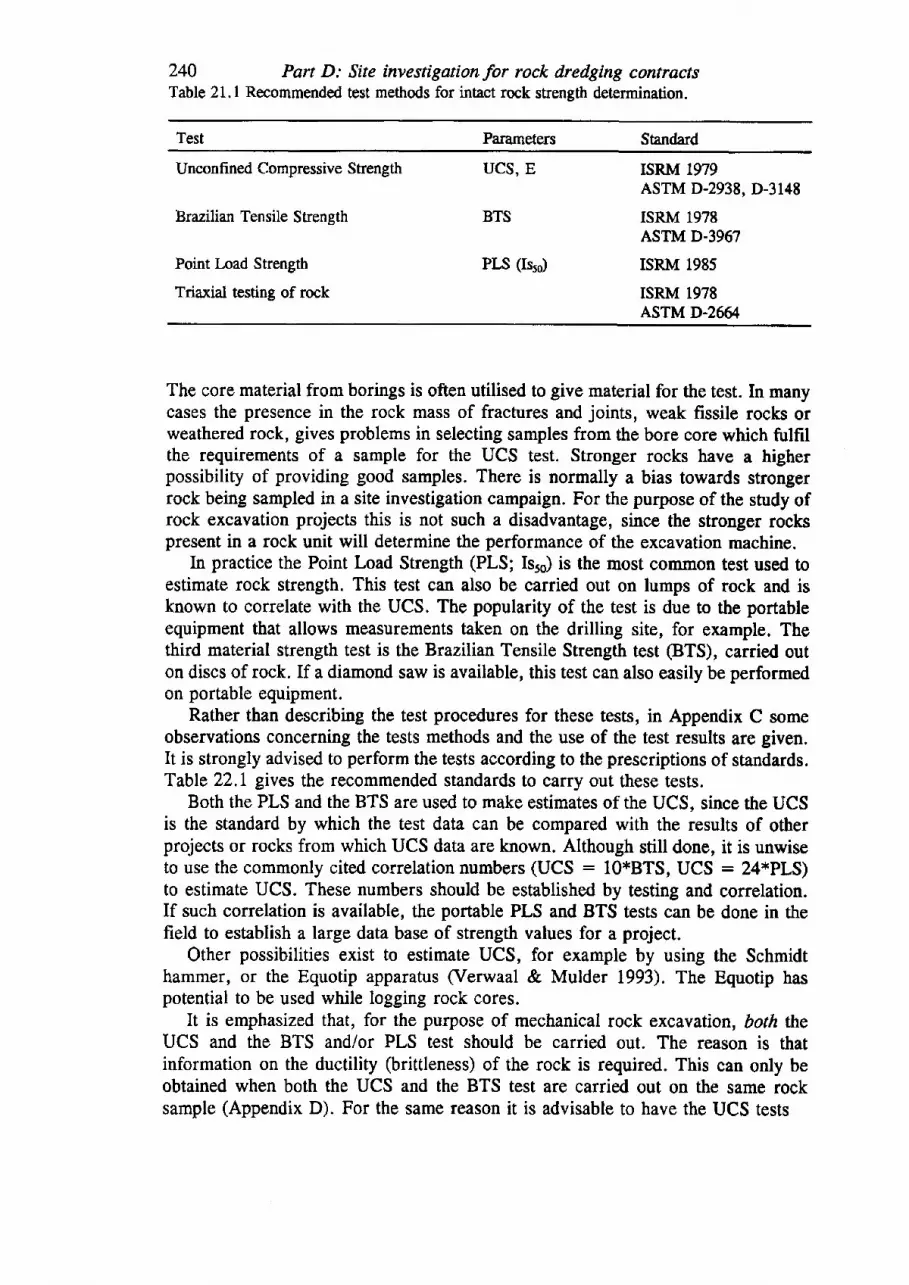
244 Part D: Site investigation for rock dredging contractsTable 21.1 Recommended test methods for intact rock strength determination.
Test Parameters Standard
Unconfi ned Compressive Strength
Brazilian Tensile Streneth
Point Load Strength
Triaxial testing of rock
rsRM 1979ASTM D-2938, D-3149
rsRM 1978ASTM D-3967
rsRM 1985
rsRM 1978ASTM D-2664
The core material from borings is often utilised to give material for the test. In manycases the presence in the rock mass of fractures and joints, weak fissile rocks orweathered rock, gives problems in selecting samples from the bore core which fulfrlthe requirements of a sample for the UCS test. Stronger rocks have a higherpossibility of providing good samples. There is normally a bias towards strongerrock being sampled in a site investigation campaign. For the purpose of the study ofrock excavation projects this is not such a disadvantage, since the stronger rockspresent in a rock unit will determine the perforrnance of the excavation machine.
In practice the Point Load Strength (PLS; Isro) is the most common test used toestimate rock strength. This test can also be carried out on lumps of rock and isknown to correlate with the UCS. The popularity of the test is due to the portableequipment that allows measurements taken on the drilling site, for example. Thethird material strength test is the Brazilian Tensile Strength test @TS), carried outon discs of rock. If a diamond saw is available, this test can also easily be performedon portable equipment.
Rather than describing the test procedures for these tests, in Appendix C someobservations concerning the tests methods and the use of the test results are given.It is strongly advised to perform the tests according to the prescriptions of standards.Table 22.L gives the recommended standards to carry out these tests.
Both the PLS and the BTS are used to make estimates of the UCS, since the UCSis the standard by which the test data can be compared with the results of otherprojects or rocks from which UCS data are known. Although still done, it is unwiseto use the commonly cited correlation numbers (UCS : 10*BTS, UCS : 24*PLS)to estimate UCS. These numbers should be established by testing and correlation.If such correlation is available, the portable PLS and BTS tests can be done in thefield to establish a large data base of strength values for a project.
Other possibilities exist to estimate UCS, for example by using the Schmidthammer, or the Equotip apparatus (Verwaal & Mulder 1993). The Equotip haspotential to be used while logging rock cores.
It is emphasized that, for the purpose of mechanical rock excavation, both theUCS and the BTS and/or PLS test should be carried out. The reason is thatinformation on the ductility (brittleness) of the rock is required. This can only beobtained when both the UCS and the BTS test are carried out on the same rocksample (Appendix D). For the same reason it is advisable to have the UCS tests
UCS, E
BTS
PLS (Isr)
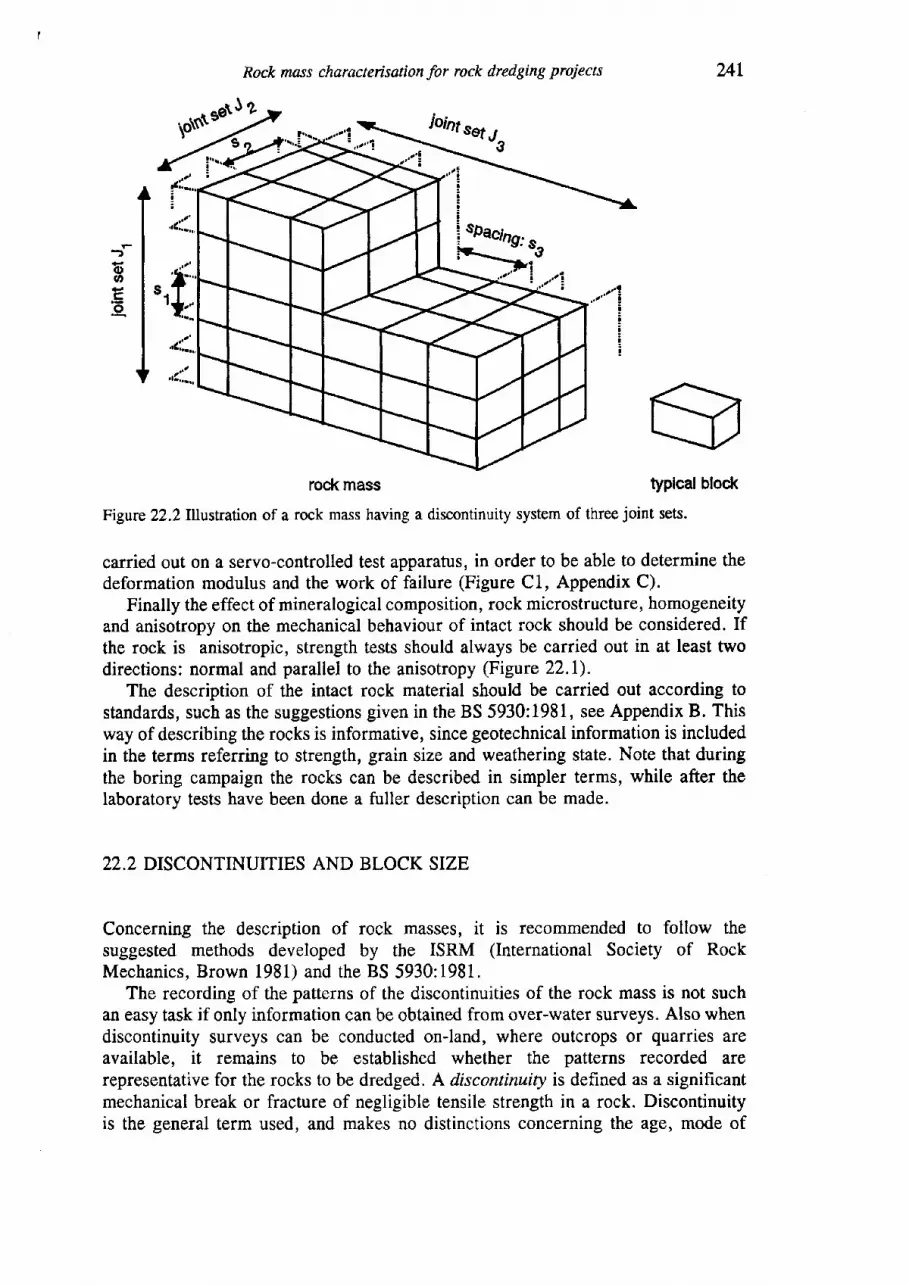
',"*"*
Rock mass characterisationfor rock dredging proiects 241
_lEIE IS=j
rock mass tYPlcal blocJ<
Figure 22.2lllvstratron of a rock mass having a discontinuity system of three joint sets.
carried out on a servo-controlled test apparatus, in order to be able to determine thedeformation modulus and the work of failure (Figure C1, Appendix C).
Finally the effect of mineralogical composition, rock microstructure, homogeneityand anisotropy on the mechanical behaviour of intact rock should be considered. Ifthe rock is anisotropic, strength tests should always be carried out in at least twodirections: normal and parallei to the anisotropy (Figure 22.1).
The description of the intact rock material should be carried out according tostandards, such as the suggestions given in the BS 5930:1981, see Appendix B. Thisway of describing the rocks is informative, since geotechnical information is includedin the terms referring to strength, grain size and weathering state. Note that duringthe boring campaign the rocks can be described in simpler terms, while after thelaboratory tests have been done a fuller description can be made.
22.2 DISCONTINUITIES AND BLOCK SIZE
Concerning the description of rock masses, it is recommended to follow thesuggested methods developed by the ISRM (International Society of RockMechanics, Brown 1981) and the BS 5930:1981.
The recording of the patterns of the discontinuities of the rock mass is not suchan easy task if only information can be obtained from over-water surveys. Also whendiscontinuity surveys can be conducted on-land, where outcrops or quarries areavailable, it remains to be established whether the patterns recorded arerepresentative for the rocks to be dredged. A discontinuiry is defined as a significantmechanical break or fracture of negligible tensile strength in a rock. Discontinuityis the general term used, and makes no distinctions concerning the age, mode of
sFaciao.
rock mass
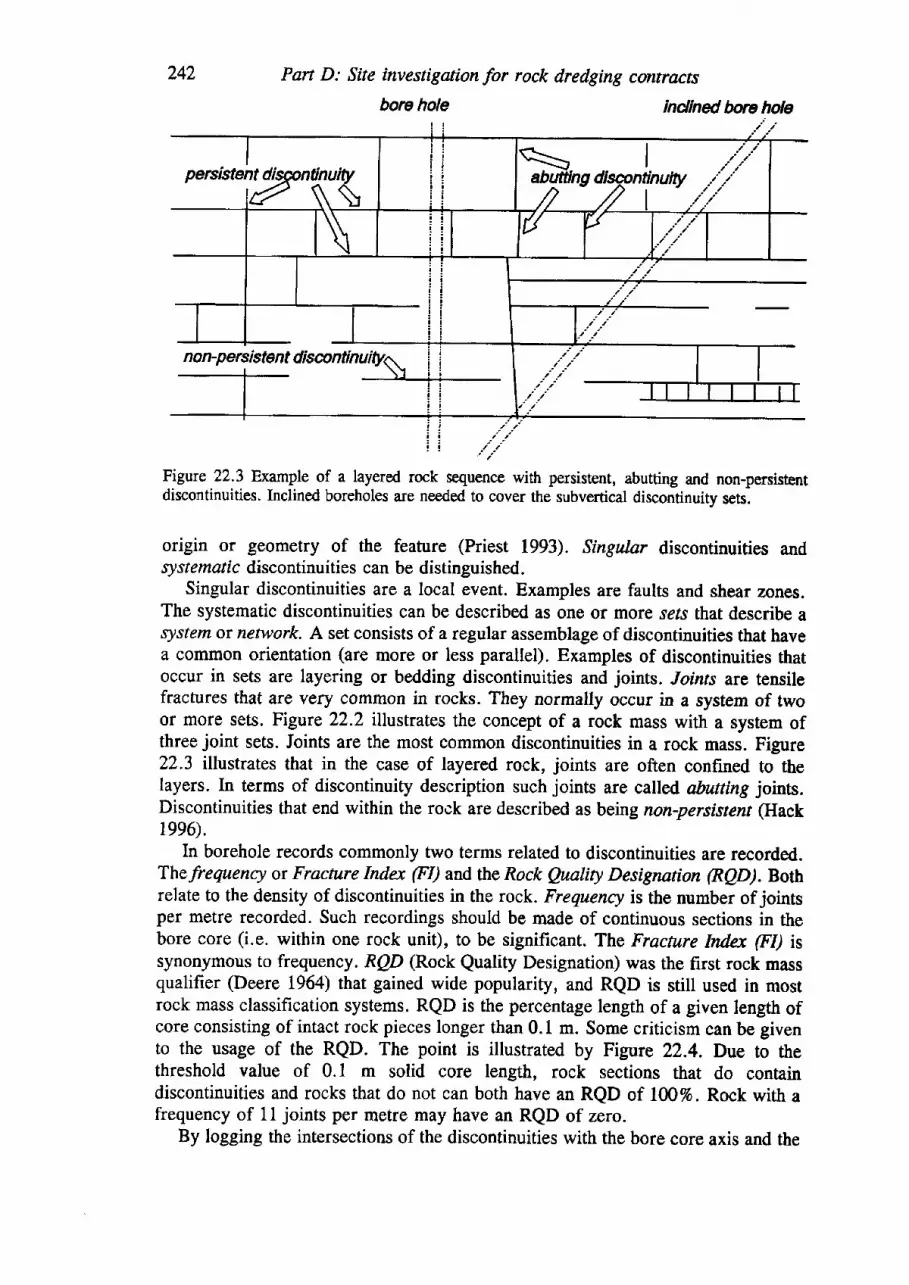
242 Pan D: Site investigation for rock dredging contracts
bore hole indined bore hde
persistent
non-persistent
Figure 22.3 Example of a layered rock sequence with persistent, abutting and non-persistentdiscontinuities. Inclined boreholes are needed to cover the subvertical discontinuitv sets.
origin or geometry of the feature (Priest 1993). Singular discontinuities andsy stematic discontinuities can be distinguished.
Singular discontinuities are a local event. Examples are faults and shear zones.The systematic discontinuities can be described as one or more .rets that describe asystem or network A set consists of a regular assemblage of discontinuities that havea common orientation (are more or less parallel). Examples of discontinuities thatoccur in sets are layering or bedding discontinuities and joints. Joints are tensilefractures that are very common in rocks. They normally occur in a system of twoor more sets. Figure 22.2 illustrates the concept of a rock mass with a system ofthree joint sets. Ioints are the most common discontinuities in a rock mass. Figure22.3 itlustrates that in the case of layered rock, joints are often confined to ttrelayers. In terms of discontinuity description such joints are called abuning joints.Discontinuities that end within the rock are described as being non-persistent (Hack1996).
In borehole records commonly two terms related to discontinuities are recorded.Thefrequency or Fracture Index (FI) and the Rock Quality Designation (RQD). Bothrelate to the density of discontinuities in the rock. Freqaency is the number ofjointsper metre recorded. Such recordings should be made of continuous sections in thebore core (i.e. within one rock unit), to be significant. The Frqcture Indcx (FI) issynonymous to frequency, RQD (Rock Quality Designation) was the first rock massqualifier (Deere t964) that gained wide popularity, and RQD is still used in mostrock mass classification systems. RQD is the percentage length of a given leng*r ofcore consisting of intact rock pieces longer than 0.1 m. Some criticism can be givento the usage of the RQD. The point is illustrated by Figure 22.4. Due to thethreshold value of 0.1 m solid core length, rock sections that do containdiscontinuities and rocks that do not can both have an RQD of 100%. Rock with afrequency of 1l joints per metre may have an RQD of zero.
By logging the intersections of the discontinuities with the bore core axis and the
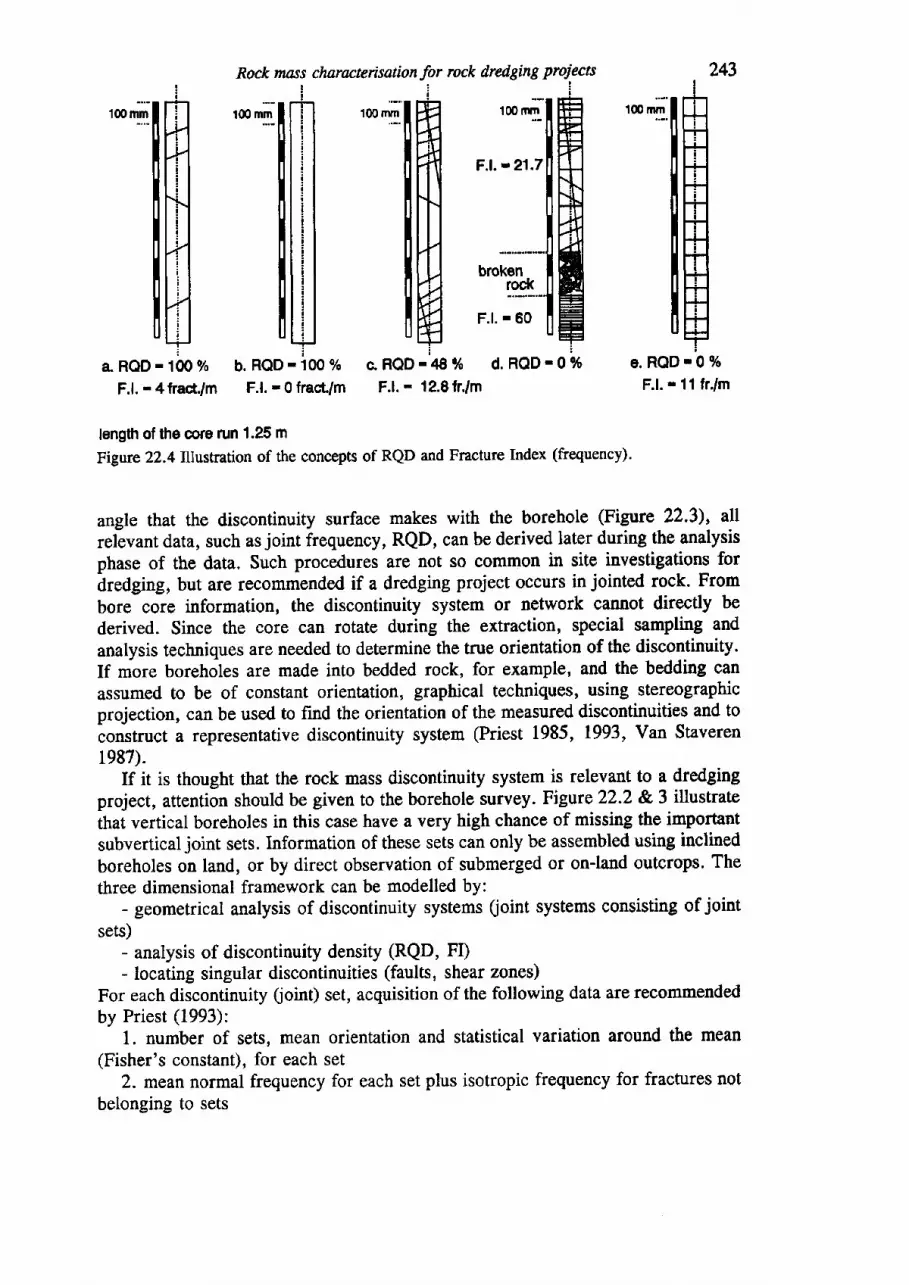
Rock mass charrcterisation for rock dredging proiecn
loo,n'- too"g'
F . l . - 21 .7
brokenrod(
F.l. - 60
a RQD - 100 % b. RQD 'lffi o/o c. RQD '48 % d. RQD - 0 %
F.l. - 4fract./m F.l. - 0 frast/m F.l. - 12.8fr./m
e. RQD'0 7oF.l. - 11 frlm
length of the core run 1.25 mFigure 22.4 Illustration of the concepts of RQD and Fracture Index (frequency).
angle that the discontinuity surface makes with the borehole (Figure 22.3), allrelevant data, such as joint frequency, RQD, can be derived later during the analysisphase of the data. Such procedures are not so common in site investigations for
dredging, but are recommended if a dredging project occurs in jointed rock. From
bore core information, the discontinuity system or network cannot directly bederived. Since the core can rotate during the extraction, special sampling and
analysis techniques are needed to determine the true orientation of the discontinuity.If more boreholes are made into bedded rock, for example, and the bedding canassumed to be of constant orientation, graphical techniques, using stereographicprojectiorr, can be used to find the orientation of the measured discontinuities and toconstruct a representative discontinuity system (Priest 1985, 1993, Van Staveren1987).
If it is thought that the rock mass discontinuity system is relevant to a dredgingproject, attention should be given to the borehole survey. Figure 22.2 & 3 illustrate
that vertical boreholes in this case have a very high chance of missing the importantsubvertical joint sets. Information of these sots can only be assembled using inclinedboreholes on land, or by direct observation of submerged or on-land outcrops. Thethree dimensional framework can be modelled by:
- geometrical analysis of discontinuity systems (oint systems consisting of joint
sets)- analysis of discontinuity density (RQD, FI)- locating singular discontinuities (faults, shear zones)
For each discontinuity (oint) set, acquisition of the following data are recommendedby Priest (1993):
1. number of sets, mean orientation and statistical variation around the mean(Fisher's constant), for each set
2. mean normal frequency for each set plus isotropic frequency for fractures notbelonging to sets
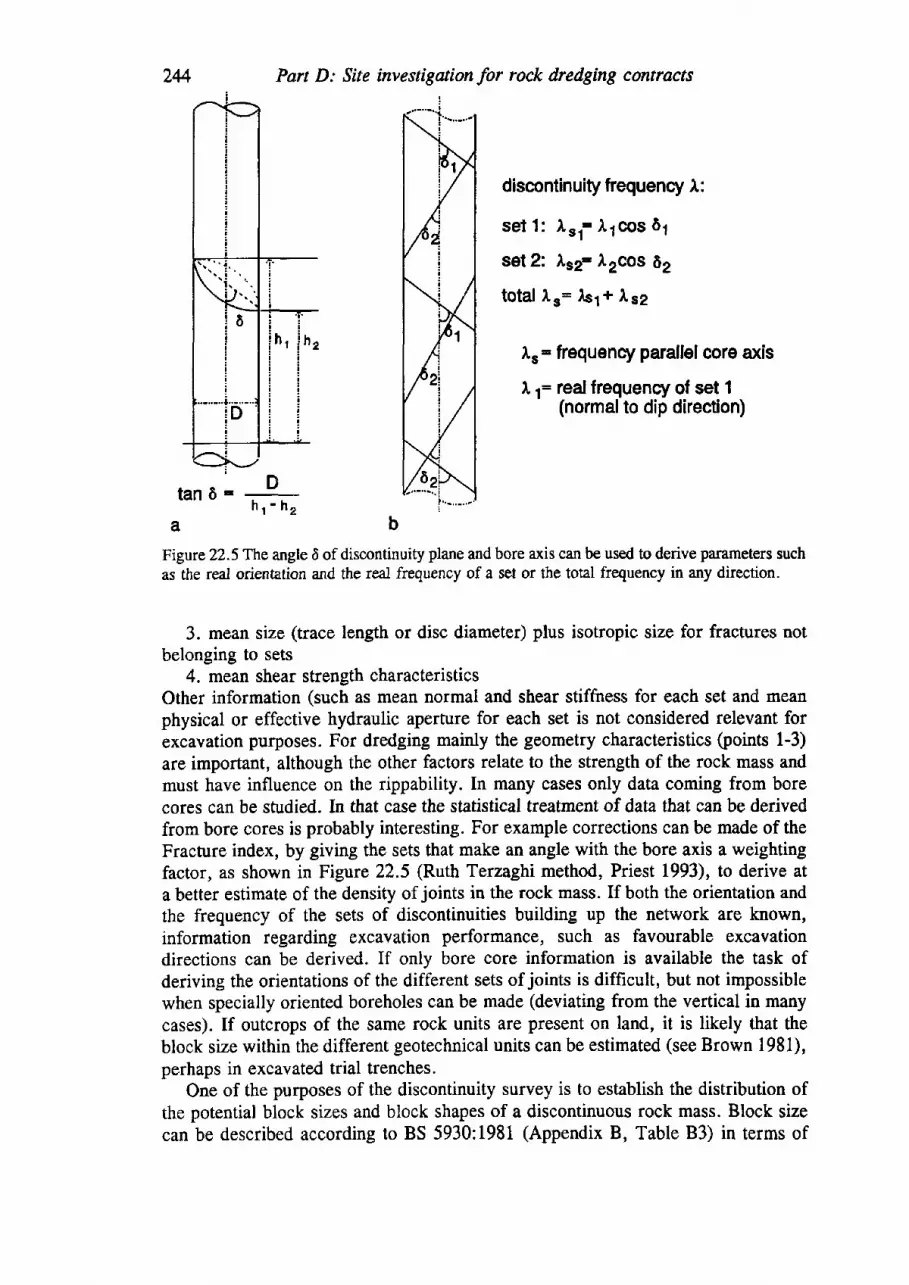
\t \
6
I
I
h l h 2
D
z4 Part D: Site investigation for rock dredging contracts
discontinuity frequency I :
sel 1: l11- l1cos 61
set 2: .1.r2- l2coS 62
total lr= lsr+ lsz
lr= frequency parallel core axis
l1= red lrequenry of set 1(normal to dip direction)
tan6= ,D,h r
- h z
Figure 22.5The angte 6 of discontinuity plane and bore axis can be used to derive parameters suchas the real orientation and the real frequency of a set or the total frequency in any direction.
3. mean size (trace length or disc diameter) plus isotropic size for fractures notbelonging to sets
4. mean shear strength characteristicsOther information (such as mean normal and shear stifftress for each set and meanphysical or effective hydraulic aperture for each set is not considered relevant forexcavation purposes. For dredging mainly the geometry characteristics (points l-3)are important, although the other factors relate to the strength of the rock mass andmust have influence on the rippability. In many cases only data coming from borecores can be studied. In that case the statistical treatment of data that can be derivedfrom bore cores is probably interesting. For example corrections can be made of theFracture index, by giving the sets that make an angle with the bore axis a weightingfactor, as shown in Figure 22.5 (Ruth Terzaghi method, Priest t993), to derive ata better estimate of the density of joints in the rock mass. If both the orientation andthe frequency of the sets of discontinuities building up the network are known,information regarding excavation performance, such as favourable excavationdirections can be derived. If only bore core information is available the task ofderiving the orientations of the different sets of joints is difficult, but not impossiblewhen specially oriented boreholes can be made (deviating from the vertical in manycases). If outcrops of the same rock units are present on land, it is likely that theblock size within the different geotechnical units can be estimated (see Brown 1981),perhaps in excavated trial trenches.
One of the purposes of the discontinuity survey is to establish the distribution ofthe potential block sizes and block shapes of a discontinuous rock mass. Block sizecan be described according to BS 5930:1981 (Appendix B, Table 83) in terms of
Rock mass chnracterisation for rock dred'ging projects 245
being very large, Large, medium, Small or very smnll. The dimension of thediscontinuity set with the largest spacing is chosen for the block size classificationand the second term used (bloclq, tabular, colutnnar) gives an indication of theshape (and the dimensions) of the other discontinuity sets involved. Pettifer &Fookes (1994) used the discontinuity spacing Irto give the block size (the mean valueof the average spacings of the three major discontinuity sets), see Chapter 18.2.Price has developed a ratings system to indicate the relative size and shape of rockblocks. This system might be of use in excavation projects and is therefore describedin Appendix B. The ratings system gives high values to large, cubic blocks. Theratings diminish as the blocks become smaller and change in shape from cubic totabular and then columnar (Figure B2).
22.3 ROCK MASS STRENGTH
It is clear by now that the presence of discontinuities in the rock mass effectivelyreduces the strength of stronger rocks. Strength reduction by discontinuities, possiblyin combination with weathering, flay be such that the rock may become dredgeable.
In Chapter 8 & 18, the rock mass classification systems that are used inengineering geology have been discussed. In has been shown that these systemsindicate the rock mass quality. The RMR system, for example, has shown to relateto excavation performance (Chapter 8.2.4; 18.3). From this information it appearsthat rock with a RMR below 45 can probably be excavated by mechanical means.In Chapter 18.4 it is concluded, however, that the systems are too crude to be usedin production estimation. During the site investigation, the systems can be used toevaluate the rock mass.
In rock engineering RMR values are used to make estimates of the strength of therock mass, among others by using the rock failure criterion of Hoek & Brown (seeHoek & Brown 1988;.76 Estimates of the rock mass strength by this method,however, give unrealistically low strength values. Probably the constants have beenchosen on the conservative side, since the estimations are commonly used forunderground construction in rock masses or for slope stability calculations. Thevalues of rock mass strength calculated with this method would give an unjustifiedoptimism with regard to machine excavation.
In the site investigation stage, it is helpful to use Figure 18.3 (Rippability chart)in considerations of excavatability.
For improved predictions and usage during dredging projects, however, manymore case studies should be assembled to improve the knowledge of dredgeable rockmasses (see Chapter 23).
76See Equation C3, Appendix C. Parameter m can be estimated from: m:ff\ exp {(RMR-100)/28)), where m, is the m-value for intact rock. Parameter s can be estimated from s=exp
{(RMR-100)/9)}. The UCS of the rock mass (d3:0) is solely depending on the factor forfracture density s: UCS*,: so'.IJCS*,"',,.
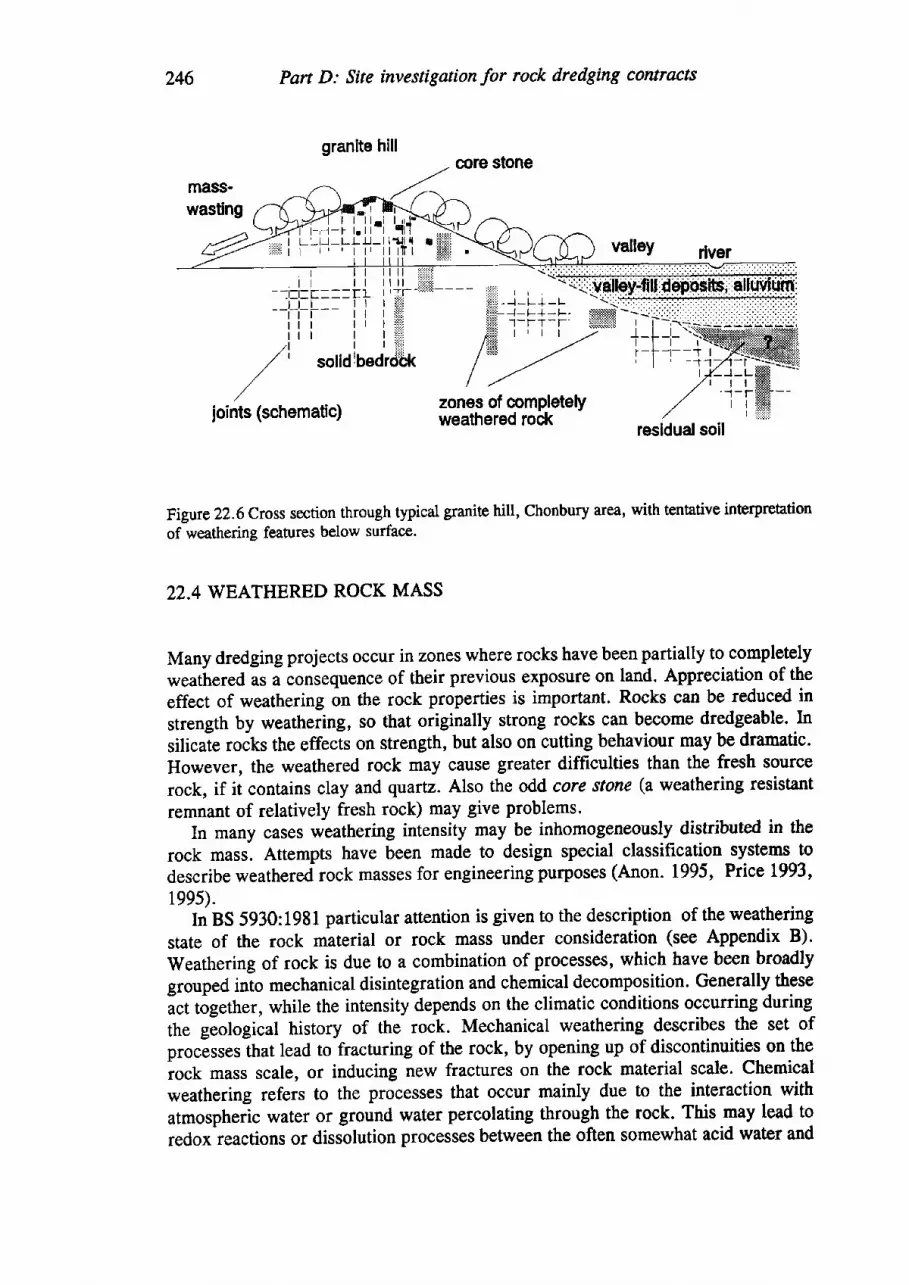
246 Part D: Srte investigation for rock dredging contracts
granlte hillcore stone
Figure 22.6 Cross section through typical granite hill, Chonbu{I tr€, with tentative interpretation
of weathering features below surface.
22.4 WEATHERED ROCK MASS
Many dre.dging projects occur in zones where rocks have been partially to completely
weathered as a consequence of their previous exposure on [and. Appreciation of the
effect of weathering on the rock properties is important. Rocks can be reduced in
strength by weathering, so that originally strong rocks can become dredgeable. In
silicate roiks the effects on strength, but also on cutting behaviour may be dramatic.
However, the weathered rock may cause greater difficulties than the fresh source
rock, if it contains clay and quartz. Also the odd core stone (a weathering resistant
remnant of relatively fresh rock) may give problems.In many cases weathering intensity may be inhomogeneously distributed in the
rock mass. Attempts have been made to design special classification systems to
describe weathered rock masses for engineering purposes (Anon. 1995, Price L993,
1995).In BS 5930:1981 particular attention is given to the description of the weathering
state of the rock material or rock mass under consideration (see Appendix B).
Weathering of rock is due to a combination of processes, which have been broadly
grouped inio mechanical disintegration and chemical decomposition. Generally these
act together, while the intensity depends on the climatic conditions occurring during
the geological history of the rock. Mechanical weathering describes the set of
pror6gs6 that lead to fracturing of the rock, by opening up of discontinlities on the
iock mass scale, or inducing new fractures on the rock material scale. Chemical
weathering refers to the processes that occur mainly due to the interaction with
atmospheric water or ground water percolating through the rock. This may lead to
redoxleactions or dissolution processes between the often somewhat acid water and
Wfi;'l.fI l - - l - f b l l IL : - l - t - L L I J - l lG i I'i-r-+|-i iil ",#ii --
I I l l l l l , i i i i l! | __l_l l1_!L-ii1:',i{____- -Ft-r - - - r '1 | r t ' t - - '
l l i | | | i : : : i : i
\ ':i:::::::l-l-tr:-:ff l;f-'-"' i i::,:, l l -.-'.ril:I{-jiI:IL--fi-i--- il ll+ iirr-l:Ei:i *[t-t:-fl,,i;,,;:,,,,,,,,i i r r r r i i : , i . : i i r _ r r _ r i i i l $ i l i t i _ i { : ;l l l I l l ; i : E l r r | - . / + - l - - l - - ' q
7t I rli: /ilti -,.- l._L_l I
,/' soildlbedrdbk /t!!! --' f -i-l- -1
' / / . . t 1, / t ' t r /
/ -^-^o af amalalahr , /
ioinrs (schematic) fir|T,f;r?t fil$Pdt
Rock mass characterisation for rock dredging proiects 247
some or all of the minerals constituting the rock. Silicate minerals tend to reacttowards clay minerals and Fe- or Al-oxides. The end product of chemical weatheringof silicate rock is the well-known lateritic or bauxitic soil, consisting solely of claysand iron or aluminium oxides. Complete weathering, however, is only known tooccur under wet tropical conditions. In most situations, not all minerals aredecomposed by weathering reactions. Quartz is known to be resistant to chemicalweathering. It has been found that biological processes often assist weathering.Mechanical weathering may be assisted by the action of plant or tree roots, chemicalweathering by the catalytic action of specializndbacterla,
Chemical weathering reactions involve changes in volume of primary andsecondary minerals. In silicate rocks the effects on the strength, and also on cuttingbehaviour, may be dramatic. Weathering reactions involve the transformation ofminerals like feldspar to clay minerals. Many of such reactions involve volumechanges that may result in high internal stresses in the rock. Some weathered graniterocks have internally completely cnrshed minerals, including quartz, which becomevery angular in the process. Weathered granite soils may therefore be very abrasive(see Chapter 22.4.1).
Whereas the silicate rocks weather due to a combination of chemical reactions(including dissolution), the limestone rocks and evaporitic rocks mainly dissolveduring weathering. If no other minerals, like clay, are present in limestone, thematerial properties, such as strength, will not be affected by weathering. Such a rockwill mainty have dissolution holes or widening of discontinuities, for example alongthe bedding or joint planes.
For the general description of weathered rock, the tables in Appendix B may beconsulted. Rock material can be described as fresh, discoloured, decomposed ordisintegrated. Normally the major strength reduction occurs in decomposed rock anddisintegrated rock. Completely decomposed or disintegrated rocks have thecharacteristics of an engineering soil. In many cases such soils have voids bothwithin and between mineral grains, may be partly filled up with weathering productssuch as clay or Fe-hydroxides, but these products may also have been removed byleaching. Locally the bonding between mineral grains may be still very strong(Anon. 1995).
Rock mass weathering is described with respect to the weathering state of therock materials in it and the effect of weathering on the discontinuities. BS 5930:1981distinguishes six grades, that are commonly used (Appendix B).
22.4.1 Example of dredging in soils derived from weathered granite.
Some dredging works have been carried out in soils that were derived fromweathered granite bedrock. One example is the Port Hedland project (Chapter 5).Another is the Chonbury coast of Thailand, where dredging works are regularlycarried out in an area underlain by granite bedrock. The recent sea-level rise wassuch that dredging off today's shore-line occurs in a drowned granite hill landscape.Shallow depth seismic reflection profiles show this hilly landscape covered by morerecent horizontal sediment deposits. On land this landscape can still be observed(Figure 22.6).
In some cases the soils to be dredged were recognized to be derived from granite ,
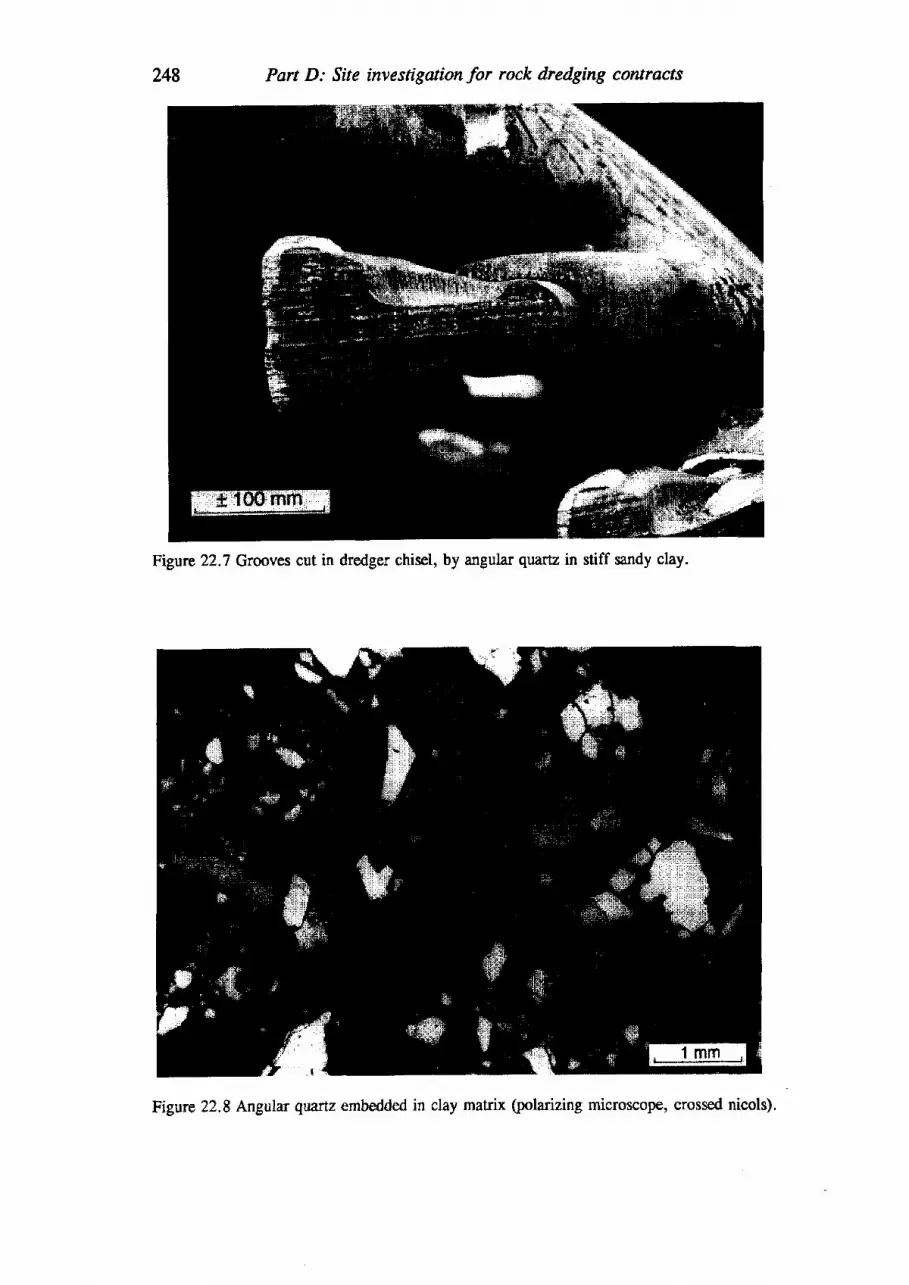
Part D: Site investigation for rock dredging contracts
Figurc 22.7 Grooves cut in dredger chisel, by angular quartz in stiff sandy clay.
Figure 22.8 Anguln qnrtz embedded in clay matrix (polarizing microscope, crossed nicols).
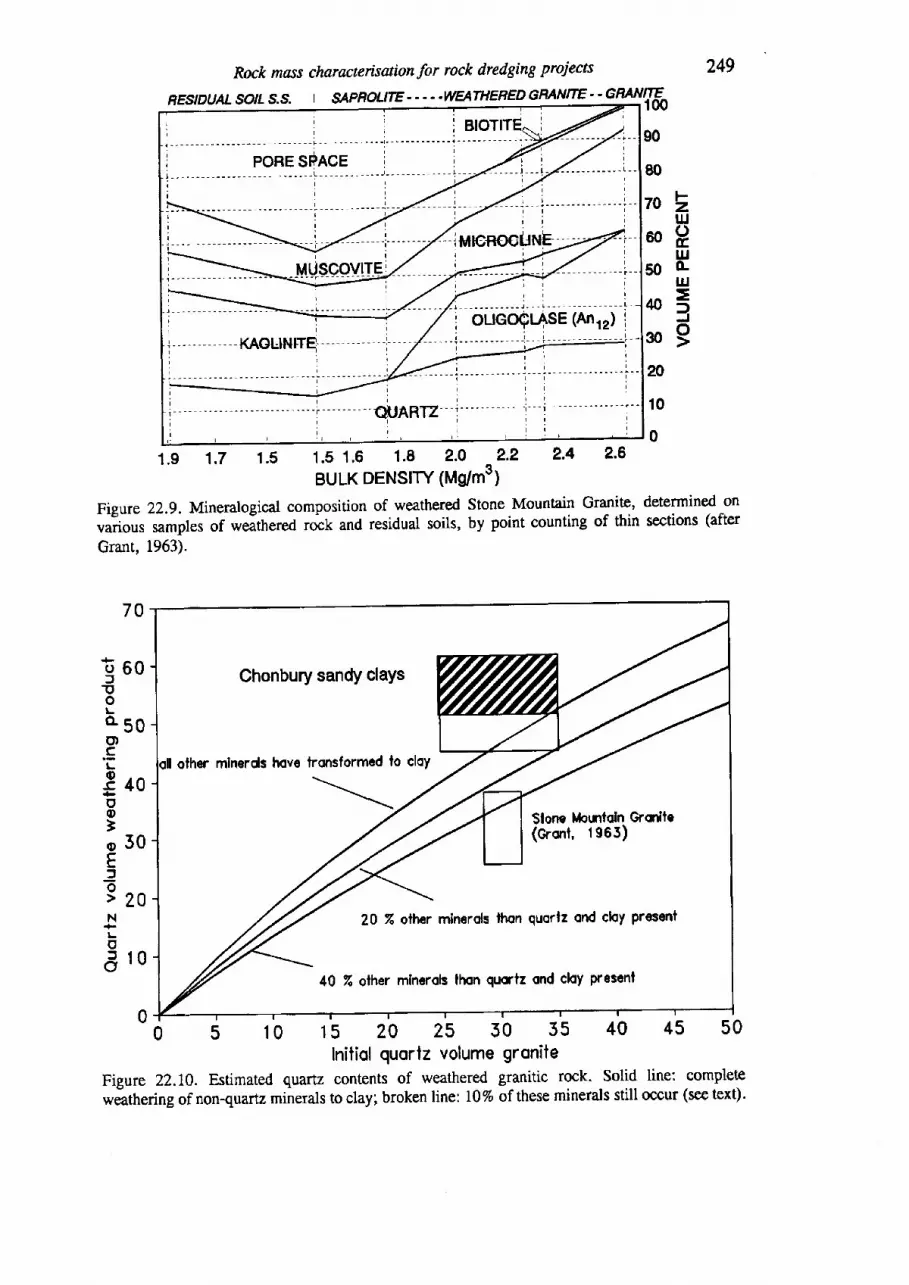
249
n
10
01.9 1.7 1.s 1.s 1,6 1.8 2.0 2.2 2.4 2 '6
BULK DENSITY (Mg/m3)
Figure 22.9. Mineralogical composition of weathered Stone Mountain Granite, determined on
u#.ou, samples of wefthereO rock and residual soils, by point counting of thin sections (after
Grant, 1963).
Initiol quortz volume groniteFigure 22.10. Estimated quartz contents of weathered granitic rock. Solid line: complete
*Jath*ting of non-quartz minerals to clay; broken line: 10% of these minerals still occur (see texQ.
Rock mass characrcrisaion for rock d'redging proiects
BESIDIJALSO/T. S..S. I S,/'PROLITE.....WEATHERED GNANTE " GRANITEffi100
70,TU
60HLll
50 0-lrJ
40=
309
70
i60JEoLosoo).gL
840oo3o30EfE>20IoE r0
Slone )lorrttqln Grmite(Gront, I 965)
20 % oltpr minerols lhon quorlz ond chy present
40 % other mlnerols lhon qurtz ond cloy prescnf
15 20 25 50
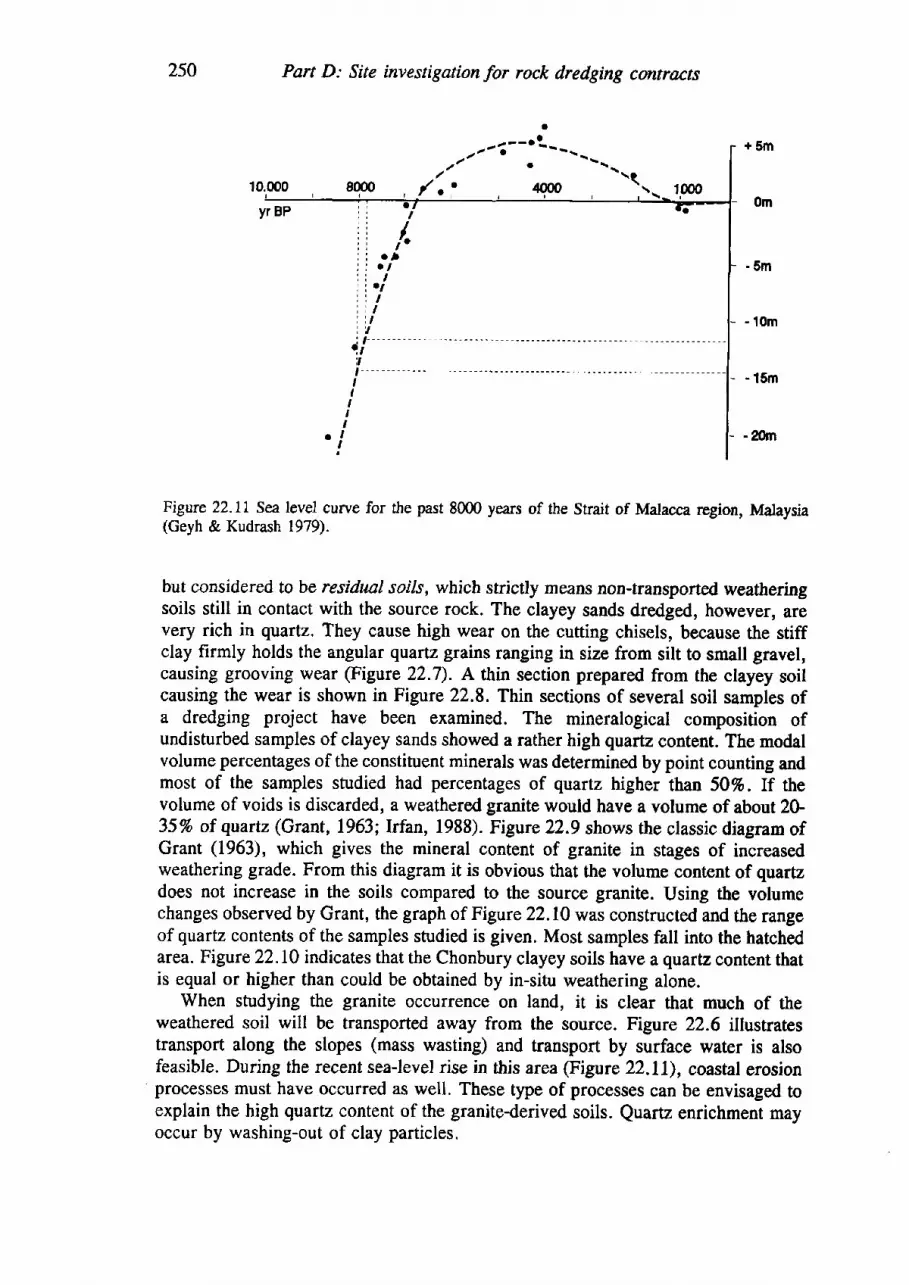
250 Part D: Site investigation for rock dredging contracts
^ a
- . t 7 - " r \ r \ -
/ / a - - t
4000-.R
+ 5 m
0mr000
. 5 m
-' l0m
- 15m
-frm
Figure 22.LI Sea level curve for the past 8000 years of the Strait of Malacca region, Malaysia(Geyh & Kudrash 1979).
but considered to be residunl soik, which strictly means non-transported weathet'lurgsoils still in contact with the source rock. The clayey sands dredged, however, arevery rich in quartz. They cause high wear on the cutting chisels, because the stiffclay firmly holds the angular quartz grains ranging in size from silt to small gravel,causing grooving wear (Figurc 22.7). A thin section prepared from the clayey soilcausing the wear is shown in Figure 22.8. Thin sections of several soil samples ofa dredging project have been examined. The mineralogical composition ofundisturbed samples of clayey sands showed a rather high quartz content. The modalvolume percentages of the constituent minerals was determined by point counting andmost of the samples studied had percentages of quartz higher than 50%. If thevolume of voids is discarded, a weathered granite would have a volume of about 2G35% of quartz (Grant, 1963; Irfan, 1988). Figure 22.9 shows the classic diagram ofGrant (1963), which gives the mineral content of granite in stages of increasedweathering grade. From this diagram it is obvious that the volume content of quartzdoes not increase in the soils compared to the source granite. Using the volumechanges observed by Grant, the graph of Figure 22.10 was constructed and the rangeof quartz contents of the samples studied is given. Most samples fall into the hatchedarea. FigureZ?.l0 indicates that the Chonbury clayey soils have a quartz content thatis equal or higher than could be obtained by in-situ weathering alone.
When studying the granite occurrence on land, it is clear that much of theweathered soil will be transported away from the source. Figure 22.6 illustratestransport along the slopes (mass wasting) and transport by surface water is alsofeasible. During the recent sea-level rise in this area (Figure 22.11), coastal erosionprocesses must have occurred as well. These type of processes can be envisaged toexplain the high quartz content of the granite-derived soils. Quartz enrichment mayoccur by washing-out of clay particles.
i /ItII
t lr't,IIIIT
1 I ,
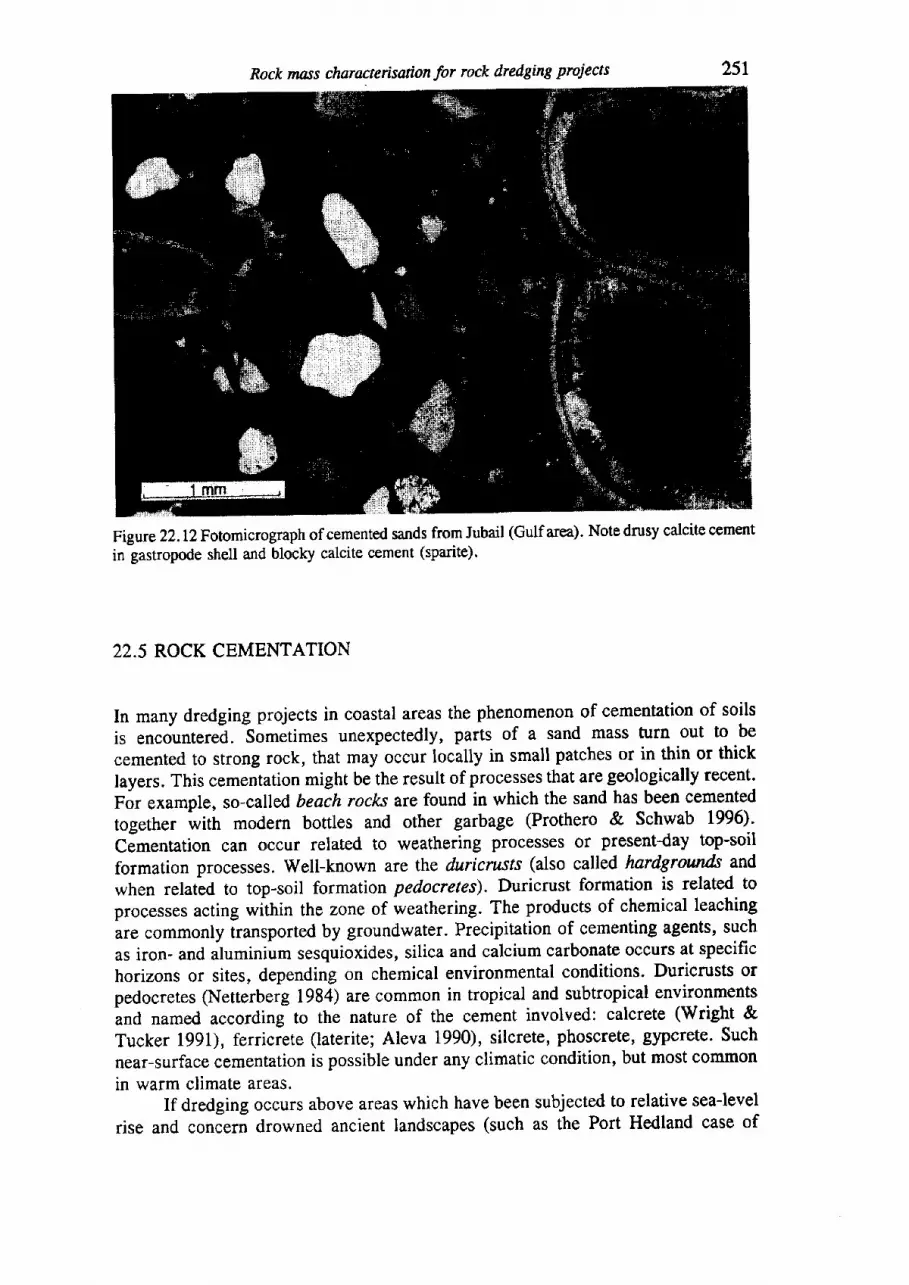
Rock mass charanerisaion for rock dredging proiects
Figure Z1.L2Fotomicrograph of cemented sands from Jubail (Gulf area). Note dmsy calcite cement
in gastropode shell and blocky calcite cement (sparite).
22.5 ROCK CEMENTATION
In many dredging projects in coastal areas the phenomenon of cementation of soils
is encounter.d. Sornetimes unexpectedly, parts of a sand mass turn out to be
cernented to strong rock, that may occur locally in small patches or in thin or thick
layers. This cementation might be the result of processes that are geologically recent.
For example, so-called beach rocks are found in which the sand has been cemented
together with modern bottles and other garbage (Prothero & Schwab 1996).
Cementation can occur related to weathering processes or presentday top-soil
formation processes. Well-known are the duricrusfs (also called hardgrowds and
when related to top-soil formation pedocretes). Duricrust formation is related to
processes acting wittrin the zone of weathering. The products of chemical leaching
ur, .o**only iransported by groundwater. Precipitation of cementing agents, such
as iron- and aluminium sesquioxides, silica and calcium carbonate occurs at specific
horizons or sites, depending on chemical environmental conditions. Duricrusts orpedocretes (Netterberg 1984) are common in tropical and subtropical environmentsand named according to the nature of the cement involved: calcrete (Wright &
Tucker 1991), ferriciete (laterite; Aleva 1990), silcrete, phoscrete, gypcrete' Such
near-surface cementation is possible under any climatic condition, but most common
in warm climate areas.If dredging occurs above areas which have been subjected to relative sea-level
rise and concern drowned ancient landscapes (such as the Port Hedland case of
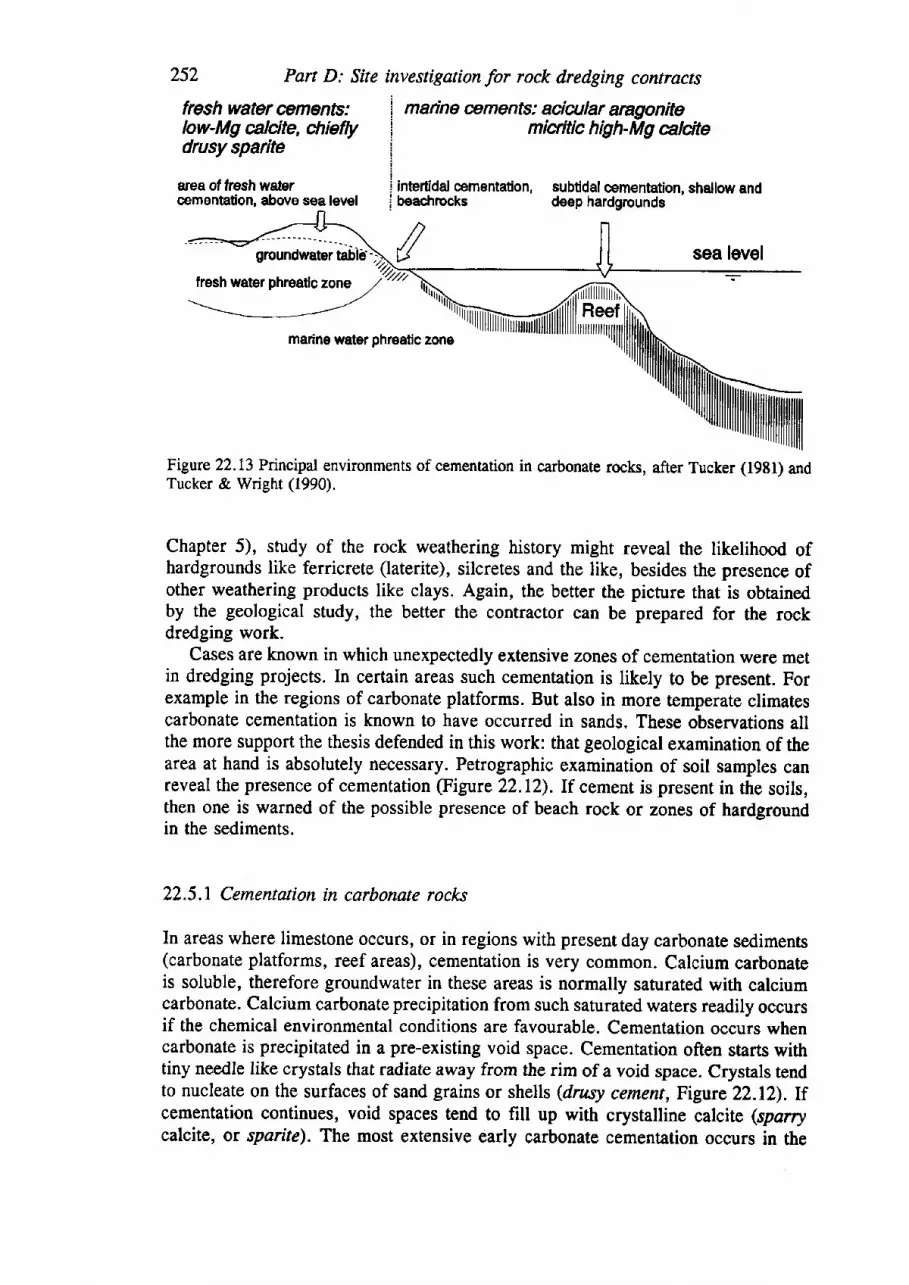
252
fresh water @ments:law-Mg alcite, chieflydrusy sparite
area of lresh wateroemsntation, above soa level
marine oements: aciwlar angonitemicritic high- Mg alcite
inteilidal cementation, subtidal cem€ntation, shallow andbeachrocks deep hardgrounds
Part D: Site investigation for rock dredging contracts
nrr"i-";;t"bl}
marine watar phreatic zone
Figure 22.13 Pincipal environments of cementation in carbonate rocks, after Tucker (1981) andTucker & Wright (1990),
Chapter 5), srudy of the rock weathering history might reveal the likelihood ofhardgrounds like ferricrete (laterite), silcretes and the like, besides the presence ofother weathering products like clays. Again, the better the picture that is obtainedby the geological study, the better the contractor can be prepared for the rockdredging work.
Cases are known in which unexpectedly extensive zones of cementation were metin dredging projects. In certain areas such cementation is likely to be present. Forexample in the regions of carbonate platforms. But also in more temperate climatescarbonate cementation is known to have occurred in sands. These observations allthe more support the thesis defended in this work: that geological examination of thearea at hand is absolutely necessary. Petrographic examination of soil samples canreveal the presence of cementation (Figure 22.12). If cement is present in the soils,then one is warned of the possible presence of beach rock or zones of hardgroundin the sediments.
22.5.1 Cementation in carbonate roclcs
In areas where limestone occurs, or in regions with present day carbonate sediments(carbonate platforms, reef areas), cementation is very common. Calcium carbonateis soluble, therefore groundwater in these areas is normally saturated with calciumcarbonate. Calcium carbonate precipitation from such saturated waters readily occursif the chemical environmental conditions are favourable. Cementation occurs whencarbonate is precipitated in a pre-existing void space. Cementation often starts withtiny needle like crystals that radiate away from the rim of a void space. Crystals tendto nucleate on the surfaces of sand grains or shells (drusy cement, Figure 22.12).Ifcementation continues, void spaces tend to fill up with crystalline calcite (sparrycalcite, or sparite). The most extensive early carbonate cementation occurs in the
Rock mass characterisation for rock dredging proiecn 253
areas above sea level, in zones where fresh rainwater or run-off surface water
penetrates the ground above the groundwater level. The area around the groundwater
ievet (the phriatic zone) is also prone to cementation (Figure 22.13). The tlryical
cement is low Mg-calcite, which can be distinguished by mineralogical methods from
the high Mg-calclte variety that precipitates typically from marine pore water. In the
shallow subtidal zone often a crusty surface known as a hardground is present. Such
hardgrounds are usually cemented mostly at the interface of sediment and seawater,
and the cementation degree decreases within centimetres from the surface. The tlpe
of cement is commonly nrry fine grained (muddy cement: micrite). Seawater is
supersaturated with caicium carbonate and it takes just a slight change in water
chimistry, or impurities and sites of nucleation for marine cementation to occur. In
the intertidal zone usually such fluctuation of water chemistry occurs, which results
tn beach rock, which can form in a matter of years under the right conditions. The
cements are composed of drusy needles of aragonite and high-Mg calcite- The
cement is apparently precipitated when sea water evaporates (Prothero & Schwab
1996).
CHAPTER 23
Conclusion: Wear assessments within site investigationsfor rock dredging
This research started with the aim of improving the prediction of tool consumptionfor rock dredging contracts (Verhoef 1988). The approach taken was to view theproblem this time from the perspective of the rock mass to be excavated. Earlier,most attention was given to the improvement of the cutting machines and cuttingtools. Two aspects can be distinguished: The proper geological and geotechnicaldescription of the rock mass and determination of rock parameters (to be done at thesite investigation) and the prediction of the tool consumption and production of therock cutting dredger.
It has been found that the site investigation should aim at a well developed 3Dmodel of the subsurface, with different engineering geological units delineated. Goodunderstanding of the geological history of the area around the site is necessary andthe geotechnical interpretation should be done by professionals able to communicatethe geological information to the dredging engineers. The special requirements ofdredging should be understood by the professionals involved in the site investigation.
To improve tool consumption prediction, the methods of laboratory testing ofrock samples for this purpose were examined. It was attempted to use tests thatexamined fundamental wear mechanisms, such as two-body wearor three-bodywear.However, the laboratory testing program learnt us that 0est results aimed at wear arenot easily transferred to other scales. Cutting and wear tests with tools that are muchsmaller in size than the real tools are not likely to be relevant. However, insight intothe mechanisms operating have been obtained and the tests indicate that acombination of rock strength, mineral hardness and mineral grain size describe thewear rate reasonably well. Wear rate is a non-linear process, and the scraper testsof Deketh have revealed that the non-linear part is related to the penetration phaseof the tool, where changes in modes of wear process occur. When the tool is ableto reach a cuffing depth sufficiently deep to reach wear mode III (three-body abrasivewear), the wear rate may become constant.
The conclusion drawn is that, even more important than special cutting or weartests, the more fundamental rock parameters strength and mineralogy should be usedin assessments of potential wear. These fundamental parameters can be comparedwith the performance of, for example, the exploration drilling equipment (drilling
254
Conchnion: wear (Nsessmentrs within site investigaions for rock dredging 255
progress, information on bit wear), the observations during sample prelaration in the
iaboratory, the performance in laboratory cutting or wear tests and - of course -
during tle actual excavation with the excavation machine/dredger. All this
information helps to obtain a picture of the abrasiveness of the rock concerned.
Regarding the interpretation of the site investigation results, the conclusion is
drawrithat the generaliock classification systems known in Engineering Geology,
can only give a hrst indication of the excavatability of rock. Instead of proposing yet
anothei classification system, it is thought that another type of modelling should be
applied. The factors involved in rock cutting performance and tool consumption can
be formulated into rules that may be used in expert systems using fazzy logic, as
already applied on the data assembled of the rock trencher projects (Chapter 17 &
18.4).In Chapter 23.1, based on both the laboratory work and the observations on tle
trencher performance, the rock factors of importance are outlined. These rock
parameters are discussed with respect to site investigations for rock dredging-contracts. This information is mainly relevant for the consultants that are responsible
for the site investigation.In Chapter 23.2 suggestions are made how contractors can improve the production
and tool consumption prediction by improving their in-house data base on dredgerperformance in rock dredging projects.
23.1 ROCK FACTORS INVOLVED IN EXCAVATION AND TOOLCONSUMPTION
Dredging works normally comprise a complexity of operations consisting of soil
excavation and movement and in some cases rock excavation and transportation. The
client, usually a Port Authority, carries out the site investigation, ideally through a
firm of coniulting engineers who act on their behalf. The consulting engineerprepares the site investigation contract document and selects, through a tenderingproiedure, a firm of specialist site investigation contractors to carry out the site
investigations. The client should be aware of the peculiarities of dredging. The
contractor that is going to carry out the work will base the type of dredging
equipment to be used on the data obtained by the site investigation contractor. If
inadequate, may be the wrong equipment is applied and contrary to on-land
engineering woiks it will be often impossible to bring in other better suited
equipment- Such instances usually result in claims and associated extra work and
costs if such claims are disputed, despite clauses in the main works contract statingthe dredging contractor has to verify or supplement any geotechnical informationcontained in the tender document. The client will find little sympathy in court with
such clauses especially when the main works tendering period is too short to carry
out an adequate site investigation to supplement or verify previous investigations.Several working party reports have summed up the techniques involved in
geotechnical site investigation. The PIANC document (1984) is applied specificallyto dredging. Another useful document is the Report of the IAEG commission on siteinvestigations (Price, 1981), which gives an outline of most methods, procedures and
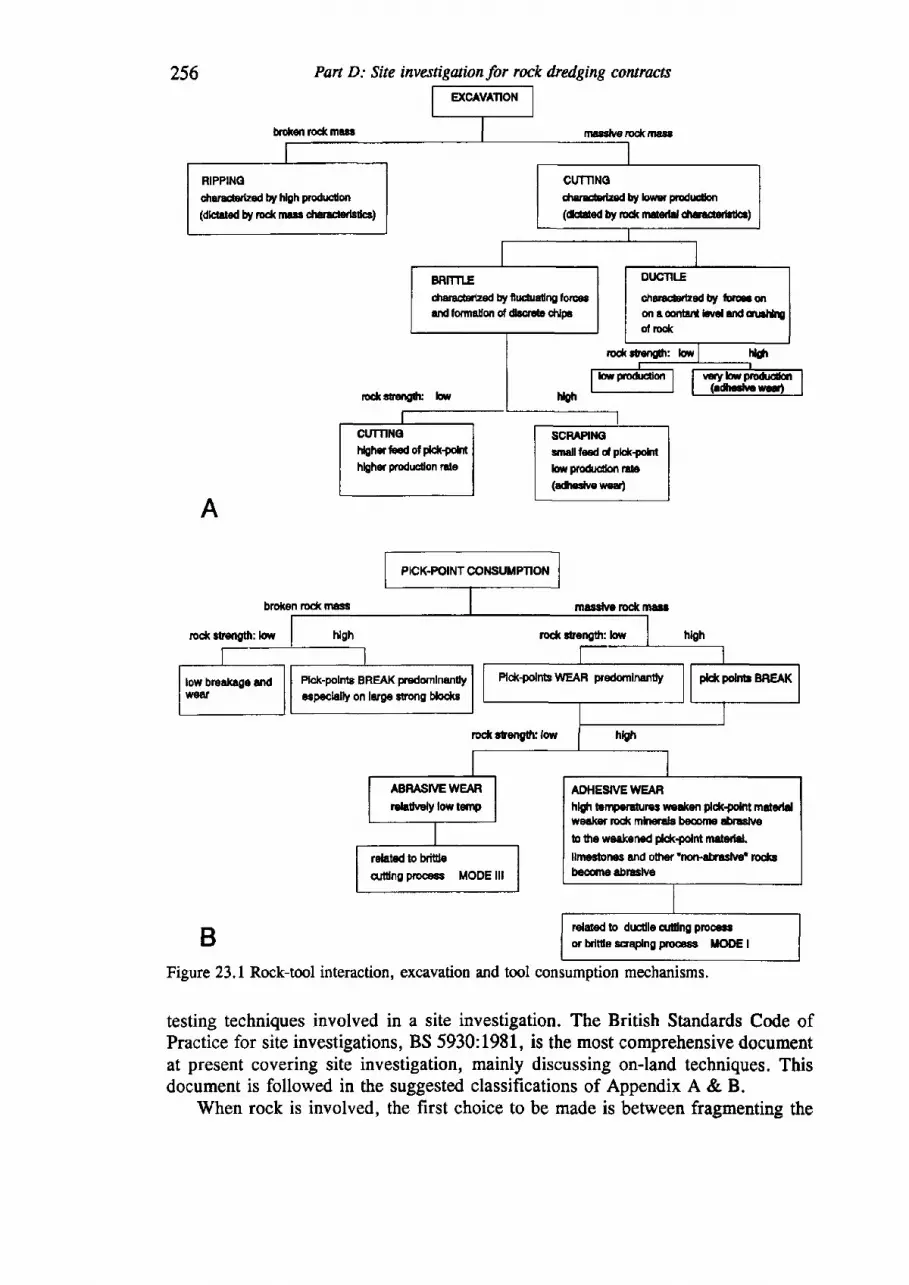
256 Part D: Site investigaionfor rock dredging couracts
brcften rod( masr
CUTNNOhleh€rb€d otpkN(+of*hlgher producdon rale
m!3sh€,!d(mass
nrd( roarigth: low
scR^,Ptl{ovnallfeed cf pldraohhwpr€drcdffire(adh6hrew€d)
A
brokon md( mast masshn rcdr mag
rock rf€ngth: lotfl Hgh rod< rtength: low
rod rt€ngth: lou,
Figure 23.1 Rock-tool interaction, excavation and tool consumption mechanisms.
testing techniques involved in a site investigation. The British Standards Code ofPractice for site investigations, BS 5930:1981, is the most comprehensive documentat present covering site investigation, mainly discussing onland techniques. Thisdocument is followed in the suggested classifications of Appendix A & B.
When rock is involved, the first choice to be made is between fragmenting the
B
RIPPINOdencrdzed by hlgh producrdm(dkrded by rod( m!!.dnr!.$rlsdc!)
CUTNNGdurd:ed by lou,sr Fodn Jort(d6ted by rod( mde.ld dro.€iotffic.)
BR]TTIEdtsradlzad by fr rrctutung f orcoalndfomadon d dscrs chlps
DUCNl.E
draracbrEed by foraqlon a coflbrl bval Jxl cnlfaroqf rock
Pld(-polnts WE R p|edornlnantlyFlck-polnts BREAK pradornlnantly*pechlly on large stong bhdc
ADHEgVEWEARhhh lempcrdJr3r wed(en dd(?oht mde.lCwesker rod( mherals becorne abraslw
b the week n6d plck+olnt meledd.
llnte6i0nes and oi|ref 'non.rbrrslvar rcck3becom€ abraslv€
related lo brideqrdng p|lccecs MODE lll
relaled to ducdle qldng pmcffor Mtilo eaaplng gooeca IIODE I
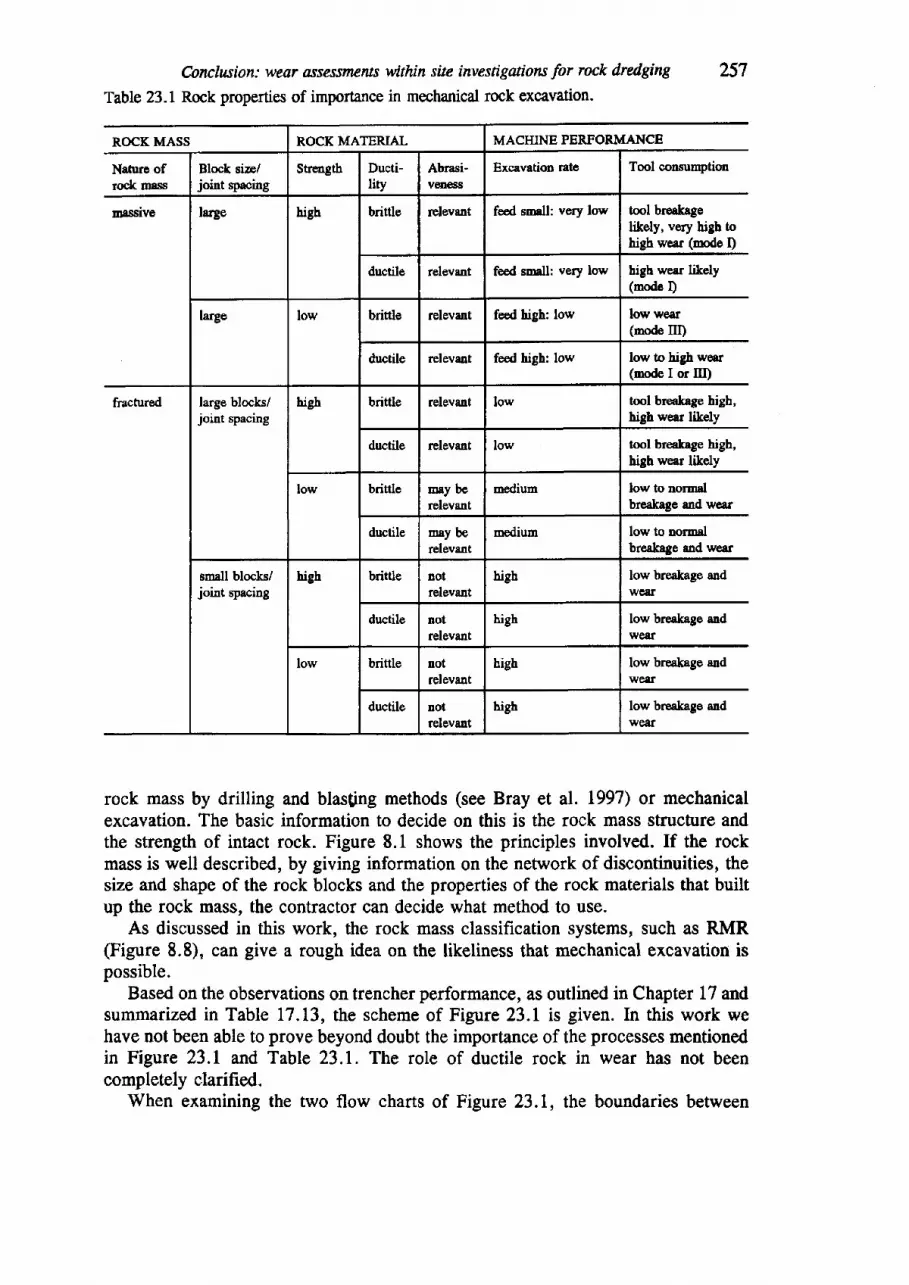
Conclwion: wear assessnzrxs within site investigations for rock dredging 257
Table 23.1 Rock properties of importance in mechanical rock excavation.
ROCK MASS ROCK MATERJAL MACHINE PEMORMANCE
Nanre ofrock mass
Block sireljoint qpacing
Strengtb Ducti-lity
Abrasi-veness
Excrvation rato Tool conzumption
Elllflve large high brittle rplevant feed emdl: very low tool breakagelikely, very high tohigh wear (node I)
drctile relevant feed small: very low high wear likely(node D
l".gu low brifrle relevant feed high: low low wesr(node III)
ductile relevaot feed high: low 1o1x, 1s high weor(node I or III)
fractured large blocks/joint spacing
hieh brittle relevent low tool breakage high,high werr likely
ductile rclevgnt low tool breakage high,high wear likely
low brittle Esy berelevant
medium low to no,rmalbreakage and wcar
rluctile Eay berelevant
Eeotum low to normalbreekage and weer
small blocks/joint spaciug
high brittle !ot
relevanthigh low breakage and
wear
ductile notrelevant
high low breakago andwear
low brittle notrelevant
high low breakage andwegf
ductile notrelevant
high low breakage andweaf,
rock mass by drilling and blas[ing methods (see Bray et al. 1997) or mechanicalexcavation. The basic information to decide on this is the rock mass structure andthe strength of intact rock. Figure 8.1 shows the principles involved. If the rockmass is well described, by giving information on the network of discontinuities, thesize and shape of the rock blocks and the properties of the rock materials that builtup the rock mass, the contractor can decide what method to use.
As discussed in this work, the rock mass classification systems, such as RMR(Figure 8.8), can give a rough idea on the likeliness that mechanical excavation ispossible.
Based on the observations on trencher performance, as outlined in Chapter 17 andsummarized in Table L7.L3, the scheme of Figure 23.1 is given. In this work wehave not been able to prove beyond doubt the importance of the processes mentionedin Figure 23.1 and Table 23.1. The role of ductile rock in wear has not beencompletely clarified.
When examining the two flow charts of Figure 23.1, the boundaries between
258 Part D: Site invatigwionfor rock dredging cawlocts
massive and fractured rock, high and low strength of rock material and high/lowproduction are relative, because these depend on the Epe of rock excavation machine(dredger) involved. The scheme intends to point to the type of information that needsto be gathered:
Rock mass properties. Most relevant are the discontinuity patterns and estimationsof block sizes (see Chapter 8 &22). The cutting forces will also relate to the interblock shear strength.
Rock material properties. With regard to rock cutting, tbe rock type is important.Carbonate rocks differ in behaviour from silicate rocks (Chapter 17). The strengthof the roeks is very important. It has been shown that both the UCS test and BTStest (or PLS test) have to be performed on the samples. Not only to be able tocorrelate the simpler Point Load or Brazilian split tests to the standard UCS, but alsobecause the ratio UCS/BTS relates to the dilctiw of rock during failure and cutting(Chapter 9 & Appendix D). It is thought that rrore extensive rock mechanical testingwould benefit the understanding of the mechanical behaviour of the rock. Carryingout UCS tests, with information on the deformation behaviour (cyclic loading,determination of deformation modulus) and registration of the complete failure curve,gives an indication of the work of destruction. Triaxial tests are helpful to determinethe brittleductile transition stress and give a determination of the rn-value. Low m-values also point to ductility of the rock (Appendix D). Unfornrnately the datagathered up to now are insufficient to really prove this statement (Iable 17.4).Cutting tests are considered less relevant for the dredging application. Calibrationwith practice is cumbersome.TT Petrography becomes relevant when real rockcutting takes place (Iable 23.Lr. The abrasiveness of the rock can be assessed by thecombination of rock strength, mineral hardness and grain size (Chapter lG13).When rock scraping occurs, or when ductile cutting occurs in relatively strongerrocks, the tool-rock contact surface can reach high temperatures due to frictionalheating, the adhesive wear mechanism operates and the steel or carbide is muchweakened, such that even soft rock as limestones become abrasive. Limestones can,sometimes unexpectedly, contain quartz. Also for this reason petrographicexamination is really needed (Chapter 5). In fractured rock, when ripping occurs,the relevance of abrasiveness is lower, depending of the amount of cutting orscraping that still occurs.
In reality the characterisation of the groundmass to be dredged can be complicatedby many geological factors. The mass can be heterogeneous, consisting of layers ofhighly different nature. It can be attempted in that case to distinguish units of rockor soil that have rock properties within a certain geotechnical range. In many casesrocks are weathered or weathering zones are present. Often clay is formed, whichcan give a ductile component to the mix of rnaterial dredged. This is known toinfluence the arnount and types of wear occurring (Chapter 5 & 22.5).
Concluding, to make better assessment of potential wear, the site investigation ofrock that is considered to be dredged should not be confined to the execution ofPoint Load tests and Unconfined Compression tests, but also triaxial tests are advisedto be carried out, and petrographic examination is needed as well. The variation in
7 For rock drilling putposes this is different. In this case the bits that are used in alaboratory cutting test are similar to the ones used in the real drilling tool (same scale).
Corchtsion: wear assessments within site investigaioru for rock dredging 259
the groundmass needs to be well documented and a sound geological model of the
subsurface is needed.
23.2 MONITORING OF EXCAVATION AND TOOL CONSUMPTION DURING
DREDGING
In the ideal situation, the contractor has at his disposal a model of the ground to be
dredged. In this model, the distribution of different layers with defined properties are
given. In recent years many projects have already been executed with ground models
iresented in computer aided graph format and supported by geostatistics programs
(Chapter t7.3).' T; improve the present sinration in prediction of production and tool
consumptiin, it is strongly advised to develop performance rnonitoring programmes
during rock dredging projects. These should aim at checking the geotechnical model
of thelsubsurface-duiing ift" dredging operation and, by regular sampling of the rock
dredged, control the basic rock parameters. It is important to check regUlarly the
*"rr-puitrrns on the dredging teith or pick point surfaces and advisable is to have
the tooth steel examineO micioscopically, to derive an estimate of the tool surface
temperature (Chapter 9.4). The data base thus built up for each cutter suction
dredger in different projects, can be used in models that will predict the performance
in future projects.This can be done in the way that is used for the rock trencher projects studied in
this project (Chapter 17, Table 17.4 & 5)' The modelling could be done by using
expert systems andfiizzy systems. This approach appears promising for-this pu{pose
lsee Chapter 18.5). Once-developed, theie systems may be used on board of the
CSD vessels during an operation and give direct information to the operator.probably in the near future the three-dimensional geotechnical model, with built-
in fuzzy e*prtt models that describe production and wear, can be compared directly
on boaid of the vessel with data on specific energy. In this way the information
needed on the tribological wear systern-is generated and can be used to make much
more reliable predicti-ons about pioduction and tool consumption for the remainder
of the dredging contract.
CHAPTER 24
Closing remarks and recommendations
This research, which has taken part of the time of the author over a period of morethan ten years, has been rewarding in the sense that insight has been gained in whatturned out to be a complex problem. It is hoped that this work can be of assistanceto the dredging contractors and consulting engineers involved in rock dredgingcontracts. Being aware of the geological factors involved in the mechanicalexcavation of rock is the most important notion that can benefit and improve thequality of site investigation reports.
Many aspects have not been resolved that certainly can be clarified in futureresearch. For example, the role of ductility of rock in cutting and wear could bestudied in a laboratory testing program involving a selection of rock qrpes, a triaxialtesting program and a series of cutting experiments. This would be a major researchprogram on its own.
A task of the Engineering Geologist is to make structure and composition of thegroundmass to be dredged transparent to the dredging engineers and provide usefulgeotechnical data. Three dimensional imaging of the shallow subsurface is importantin this respect, and is improving continuously these years, through the improvementof geophysical sounding tools and the rapid development of data processing andimaging techniques. In Engineering Geology, much effort should be directed to thedevelopment of more reliable geotechnical models qf soil and rock masses. It isthought that the rock mass classification systems, which have been a major aid sincethe early 1970's in rock mass mechanics, sholllld be replaced by models based onexpert systems andfuzry systems, that are able to combine expert opinion, hard dataand fazzy information. Apart from representations of the spatial distribution ofgeotechnical parameters, the accuracy of the knowledge should also be indicated.This type of systems can only be developed with any reliability, if sufficient data isavailable. The assemblage of data of production and tool consumption duringexcavation projects is thereforo very important. Such data are only valuable if therock mass parameters that relate to excavation and tool consumption are gathered atthe same time.
2ffi
APPENDIX A
Rock identification and classification procedure forengineering pu{po sestt
A1 INTRODUCTION
In rock engineering practice, engineers are often confronted with the task to estimate
or determine the engineering properties of rock. The first step needed is to recognize
the type of rock one is dealing with. Often this is not an easy task. It is not without
reason that within the science of Geology special branches have developed that study
the different types of rock (sedimentary rocks by 'sedimentologtsts', metamorphic and
igneous rocks by 'pefiologists'). The classification discussed here was specially
developed for the use of engineers and is an evolvement from the classification given
in BS 5930:1981, which is also used by PIANC (1984), It is evident that for dredgingprojects specialists should be consulted concerning rock identification.
The engineering behaviour of rock is recognized to be intimately related to its
constitution, which is reflected in its name78. The classif,rcation procedure presented
here aids persons with limited geotogicat knowledge to allocate a rock name to a hand
specimen of rock or a fresh outcrop surface. Several flowcharts are presented which
foltow a logical path and are easy to use. The names of the most common rock typesare given in Table A1. In Section A2 terms and defirutions of mineral and rockdescriptors are listed. The user is expected to take notice of these terms anddefinitions before starting to classi$r. In section ,A.3 the classifrcation procedure is
explained (Flowchart A,p.275). ,Before starting to classify a rock it is necessary to identiff the rock-forming
minerals. Descriptions of minerals, of which there are many hundreds, can be found in
any mineralogy- book, but fortunately the list of the most common rock-formingminerals is rather short, about 10-20. The common rock-forming minerals belong tothe groups of the silicates, carbonates and the evaporites (salt, sulphates andchlorides). Some silicate minerals are for example qtartz, feldspar (alkali feldspar and
tt By Mario Nvarez Grima and Peter N.W. Verhoef. An Expen System of this classification is
available on request.78 It should be appreciated that the rock classification presented here is not intended to group rocks
with simitar engineering properties. Its main objective is to group rocks of similar origin. However, a
rock name with a short description of the origin, texture and structure of particles and minerals, canindicate much that is of practical value for engineering geological purposes.
261
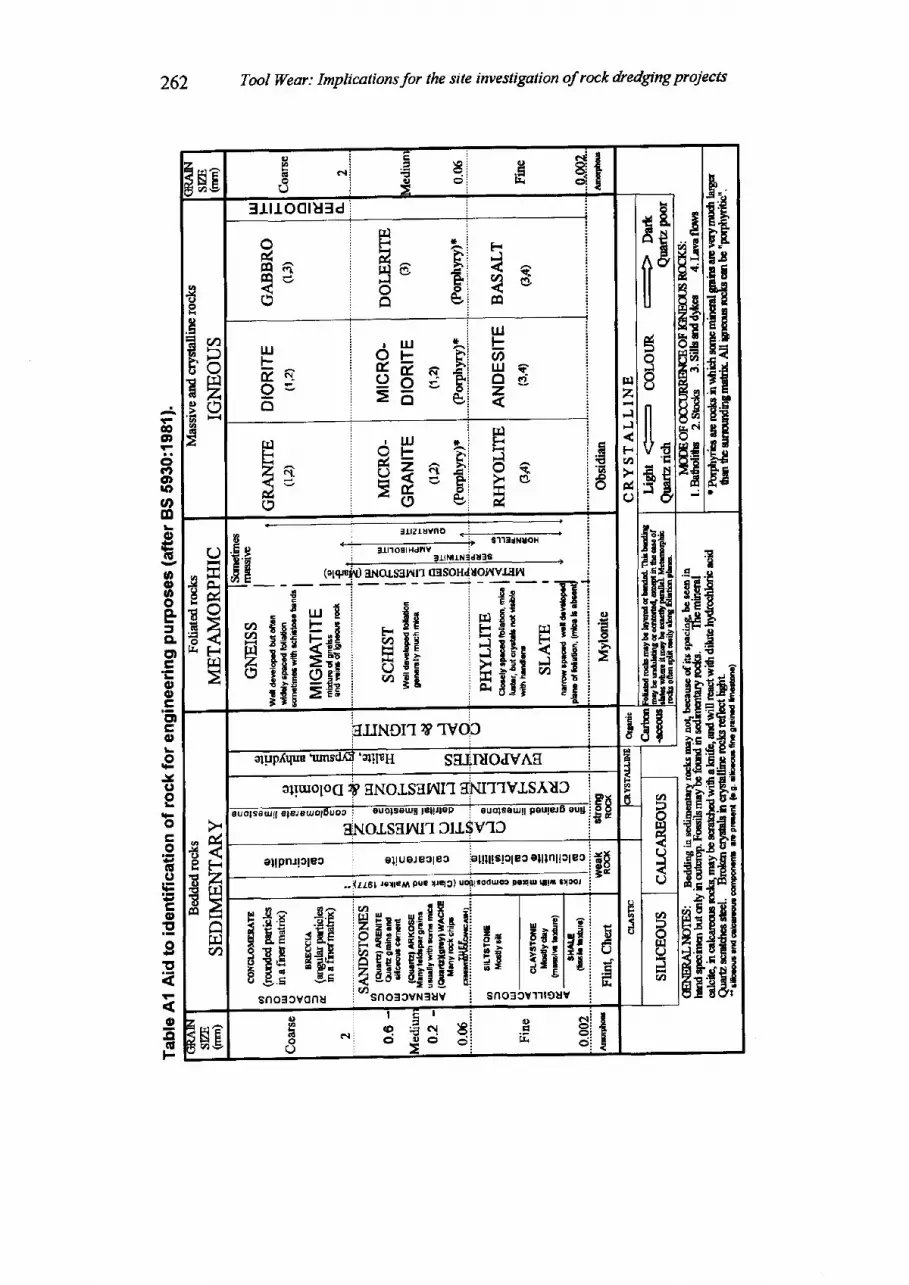
E, . Ip3p+v)
Hgx?t r tO s
HE&
fisr r - N
sg = - .
EFF.EP T
AIEEE Jt .s, 1
EE{ €BEqTF3
4'
lro{ i
p
egq
€'tr
tA
ilEqoL)
I6J
trlzJF]
Fv))r
&O
SItroolu3d i
rr.(}
!t
rt
s^
F
U)
trl
uttalrJoz
14F5o
I
* i
> r !
> ' :t l iH :o i
_ji
* i>r!h i
H io i
A ;i
i
r i> r i
>' l
B Io l
ultta9eo
TUFzato
FrF
&tso
IoE()=
I
4
odn9
ut( rqo3o
tuFz f f<e&()
a
Hzo
,-i$Es$iEati: gEis Q ! ! l r
E-aE Fg
iafalflgr* EHiiEiHgggi
fie
iiiE{€
TT;EE€E!
h l
Flv)
€. lu rE
a ta. .E F ;E i E * f t * gU E : - a - :
Z, $EE >:Eo En! oe;i9E =ee
,6<g t-{eZE14sE
rqv)
elluroloo ry gNorsgnll frNIT'IVrSlUf, i- -, i g xouolseul lg laJoulolDuoe' - f f i :EP
i 6 *itrNOTSflITI'I3IISVlC :
:i
^ i! : g
E i Bt i Ft i { .gi d
i I &i:
E$arejiIii#sE$E Hff
262 Tool Wear: Implicationsfor the site irwestigation of rock dredging projects
c,o
c)f?o,rootroG
o€toogfCLotroo=E lgooJ(Jo
o
otg(J
5
opott
gll([F
A p p e n d i x A : R o c k i d e n t i f i c a t i o n a n d c l a s s i f i c a t i o n p r o c e d u r e 2 6 S
plagioctase), mica (biotite and muscovite), chlorite, amphibole (e.g. hornblende),
pyri*.tt" (e,g. augrie), and olivine. Calcite and dolomite belong to the carbonate
mineral $oup.fne minerats are identified and classified ttuough the use of Flowchart B (p-276) After
identification of the minerals, the rock identification can be carried out (Flowchart C'
D, and E). Finally the rock name is retrieved. The rock name is based on the rock
classification for engineering purposes, Table Al.It is important to point outhere ttrat the rocks that are most difficult to identiff are
those without visibli gains or minerals. For example, rocks composed uniformly of
very fine grains like baialts, shales, some slates, and some fine-grained limestones and
doltmites can provide difficulties when the hardness and sffucture are overlooked.
Associated rocks and stnrctures which can be studied in the field usually make rock
identification easier.
A2 TERMS A}ID DEFINITIONS
There are coflrmon terms frequently used in any rock identification procedure- These
terms are related to minerals and rocks respectively. It is necessary to become familiar
with these terms before starting to classiff any type of rock'
M1 Minerals
A mineral can be defined as a natural inorganic solid substance having a particular
chemical composition or range of composition and a regular atomic structure to which
its crystalline form is related.
A2.I.1 Physical properties of the mineralsProperties
-included in the classification are: colour, lustre, crystal form, hardness,
clearrage, fiacture, strength, and specific gravity. It is not necessary to know all these
p.oprtti"r to identiff a mineral; two or three of them taken together may be enough. In
i f.* cases the taste (for example rock - salt) and touch (for example talc, and
serpentine, feels soapy) give useful indications.
A,2.1.1.1 HardnessHardness is measured relative to a standard scale of ten minerals, known as Mohs'
Scale of Hardness (Table A3, A4). These minerals are chosen so that their hardness
increases from I to 10. Hardness is tested by attempting to scratch the minerals of the
scale with the sample under examination. Hardness should be tested on a crystal face
or a cleavage plane. For rapid identification relative hardness can be determined as
shown in flowchart B (p.2?6). For example talc, gypsum, chlorite, and serpentine can
be scratched by the fingernail, a steel knife will scratch calcite, dolomite, biotite and
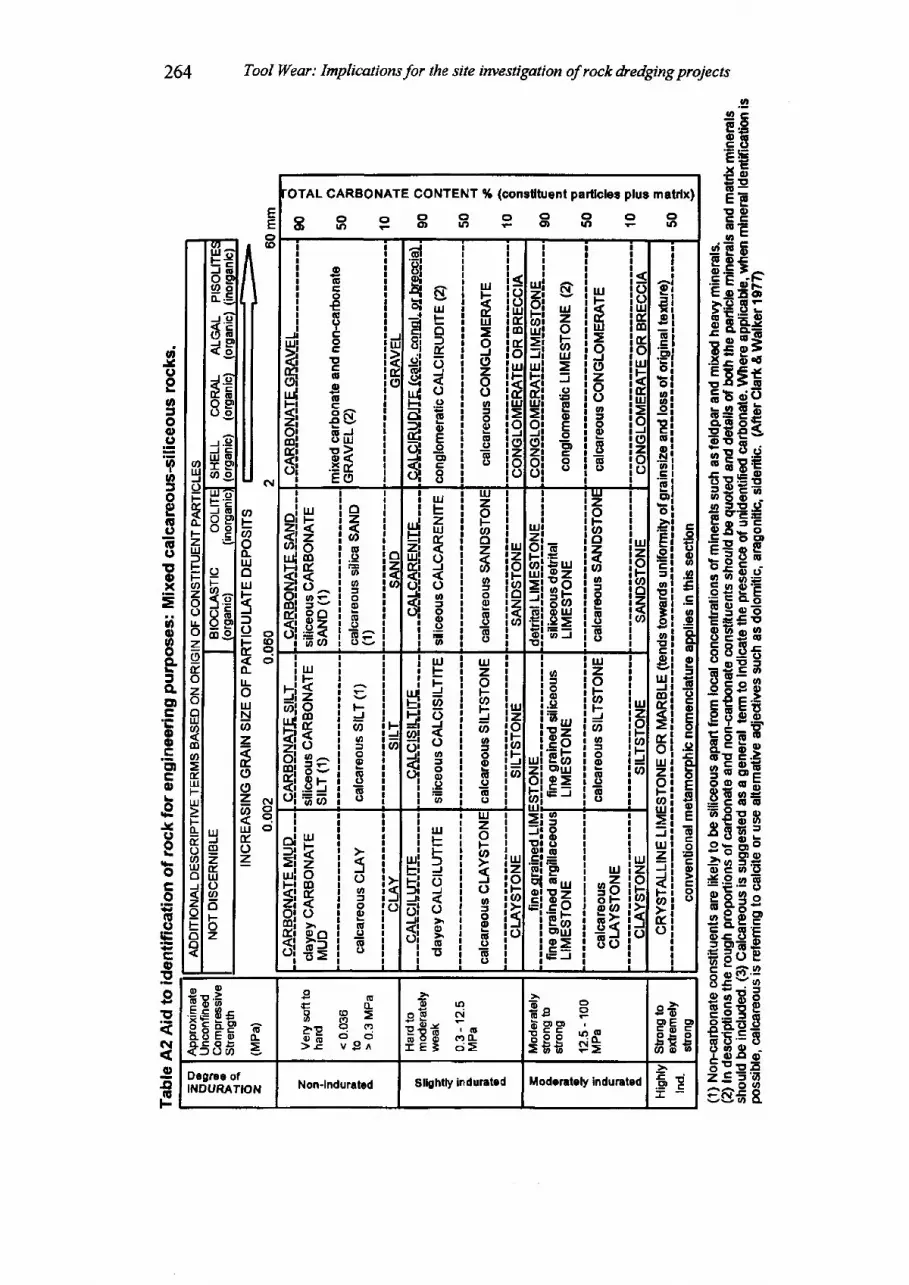
264 Tool Wear: Implicationsfor the site irwestigation of roek &edging projects
EEg ! E
.5E- ! t. ! ' -
E El, c)C CE Et a E
t 4 E d
ErEsi g 8 :
: FFf;€Eissfi EggEEq* *Eg
EgE IEEgEg EE;EE: gE FEEE:EEgFsEf i*sg
Eetgi3 Ygo c o o
EeBgC - o ' E
#sfitEso;
EFEE#a
'OTAL CARBONATE CONTENT % (cons0tuenl partlcler plue matrlx)
o{toouto
CDtrlo
uitcto,oort)o
or
!€iEr a !I I J
iEHEv ! og J Eg. EsHi E*E i u )
5! :g
ii
!lg
sulEo:)troJ
o()ooE-9ogoo
ru
trltl=oozooo=oIdl2ag()
oultr.DtoUJ
truJ=oJ(92oo
UJzo6IIJ
J
uJtEIIJ
oJozoo
oIJJzoFau
=(,G
oEoocoo
IU
trl!=9ozooo=oE6()Eo
.9GEoo io iatt I. h l-9 ip lc iE io l
6EE:.EDio ii>l
EIe ic if io !E i5io lo i= t i
.9 1ur iJ Io lc i<r> lt r io lIJJ Iz iO !F Iu ) iu t i> lJ iu J lz iJ IJ I< iF to )> lE io l
E.9(,oo.9E
E
o.9oooEtG(,Eotrotr.9ECloEoo
oo
o
o(,
oiszl 4
fr6tJ-u oFntr.= i o^O : = -
5! #3
ozu,o.9oo
ot ^O i /
czu
utu0(
C
tutzulK
9()oJoo.9o
utzoFU'oz6o
IoC)6o
IJJzoF.J'ozo
ltzoFCNUJ=)(!
o
(U
E9:6= F
Efre=o J
zooozU'o=oEoll(!()
ItzoFuczu
trJ
kzof,tEo3ao vO r -O ' r
f r6
FJooooooo(J
F
U.
utF
Ic
u,F
56oJ
(JU':loo).co
uJzoFo!oo=oo(Eo6o
|I.zoFqF
u
!to'6
0loC
ooo.g.t u)E ZE O' t Ft r agruJ9 =' E f
TooIJ-gE6urE=c\.,' = Fs (/,E rllj
9 E
uJzoaFJ@ooooso(J
u2cuF
u
ir.r l.U=kz ) zu l OH O< ! (z i <o t o6i >h
olr! Eqo1 *i
J
oooo,olloO
a
uEF
;
aC
utF-FlJO
o
o.j
u,lzoFa
J(JoJoodo.EI
Izou
o
IU
E6O Fou tskEd
uzcFU,
{c
siJ()eo=o0,.9qo:'oEo(J
|EIJIto.IEooooCLL3q.E ,coo.EEll
oL.eIteoEoG(t.Stropgtt
(\
g€GF
acessS t u€ ( LBE> E C a ?9e ?e?
.bO r t )
o l g O l
EEg:gB O
f rp I^ O t O
i 55 ' ' , .F= ;B S=
.lr 6
HEEDegree ofIfi|DURATION Nonjndufal€d SllghtU indurated Moderately indurated
-G q '
. 9 EE _
oEct)o(LUJoulFJfot-
Ill-olrJNa=TToozautEoz
oI!Jctro-FzuJtsFg,
zool!ozoEozoIJJth
(Ila=Eul-UJ
F(LEooluo
o-
J
6J
dE.oo
JJuJIo
uJJ(D
2truloU'oFoz
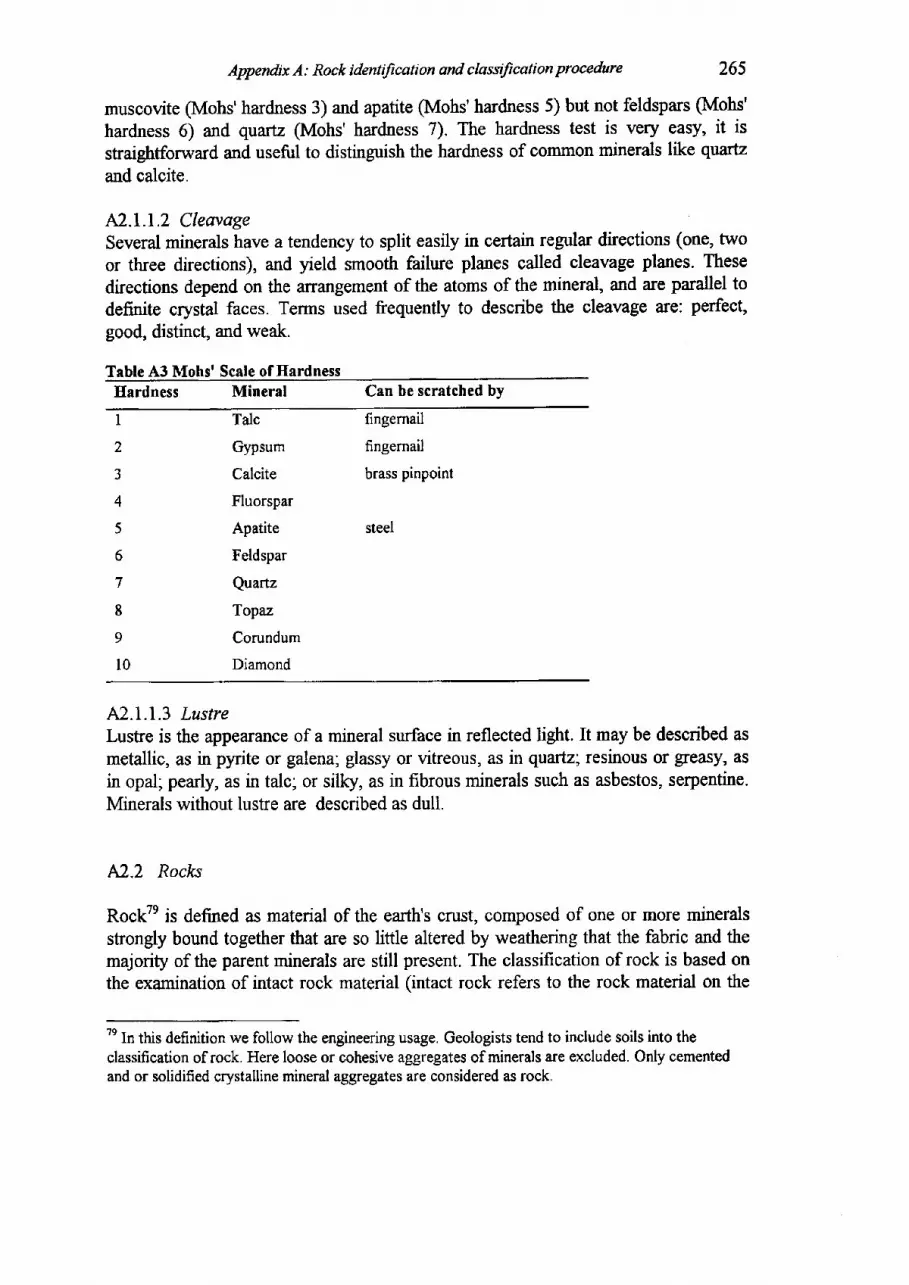
Appendix A: Rock identification and classification procedure 265
muscovite (Mohs'hardness 3) and apatite (Mohs'hardness 5) but not feldspars (Mohs'
hardness 6) and quartz (Mohs' hardness 7). The hardness test is very easy, it is
shaightforward and useful to distinguish the hardness of common minerals like quartz
and calcite.
42.1.1 .2 CleavageSeveral minerals have a tendency to split easily in certain regular directions (one, two
or three directions), and yield smooth failure planes called cleavage planes. Thesedirections depend on the arrangement of the atoms of the mineral, and are parallel todefinite crystal faces. Terms used frequently to describe the cleavage are: perfect,good, distinct, and weak.
Teble A3 Mohs' Scale of HardnessEardness Mineral Can be scratched by
I
2
3
4
5
6
7
8
9
l 0
Talc
Gypsum
Calcite
Fluorspar
Apatite
Feldspar
Quartz
Topaz
Corundum
Diamond
fingernail
fingernail
brass pinpoint
steel
A2.1.1.3 LustreLusfie is the apperuance of a mineral surface in reflected light. It may be described asmetallic, as in pyrite or galena; glassy or vitreous, as in quartz; resinous or greasy, asin opal; pearly, as in talc; or silky, as in fibrous minerals such as asbestos, serpentine.Minerals without lustre are described as dull.
A2.2 Rocl<s
RockTe is defined as material of the earth's crust, composed of one or more mineralsstrongly bound together that are so little altered by weathering that the fabric and themajority of the parent minerals are still present. The classification of rock is based onthe examination of intact rock material (intact rock refers to the rock material on the
Te In this definition we follow the engineering usage. Geologists tend to include soils into theclassification of rock. Here loose or cohesive aggregates of minerals are excluded. Only cementedand or solidified crystalline mineral aggregates are considered as rock
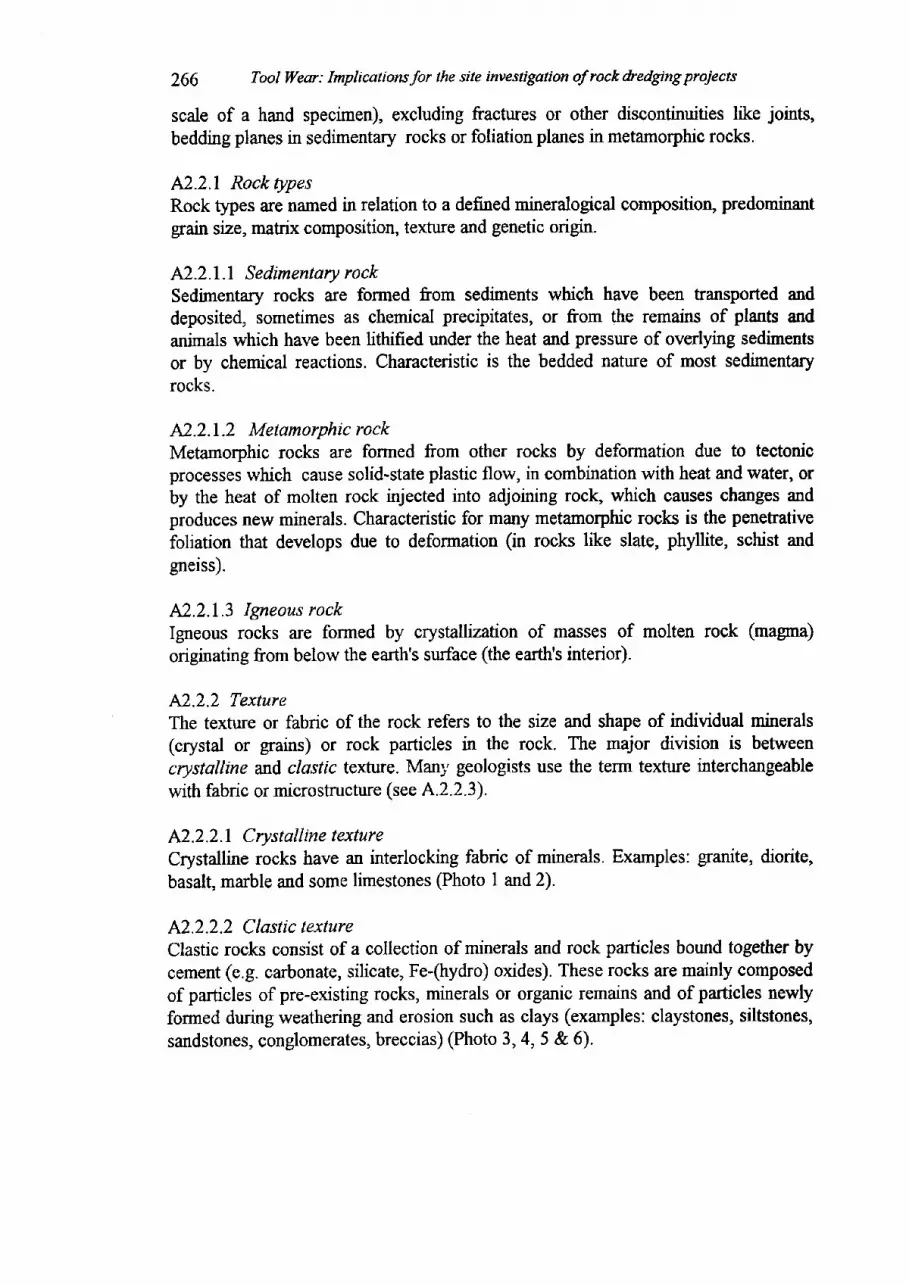
266 Tool Wesr: Implications Jor the site investigation of rock dredging projects
scale of a hand specimen), excluding frachues or other discontinuities like joints,
bedding planes in sedimentary rocks or foliation planes in metamorphic rocks,
A2.2.1 Rock typesRock types are named in relation to a defined mineralogical composition, predominantgrain size, matix composition, texture and genetic origrn.
M.z.l.l Sedimentary rockSedimentary rocks are formed from sediments which have been fansported anddeposited, sometimes as chemical precipitates, or from the remains of plants andanimals which have been lithified under the heat and pressure of overlying sedimentsor by chemical reactions. Characteristic is the bedded nature of most sedimentaryrocks.
A2.2.1.2 Metamorphic rockMetamorphic rocks are formed from other rocks by deformation due to tectonicprocesses which cause solid-state plastic flow, in combination with heat and water, orby the heat of molten rock injected into adjoining rock, which causes changes andproduces new minerals. Characteristic for many metamorphic rocks is the penetrativefoliation that develops due to deformation (in rocks like slate, phyllite, schist andgneiss).
M.2.1.3 lgneous rockIgneous rocks are formed by crystallization of masses of molten rock (magma)originating from below the earth's surface (the earth's interior).
A2.2.2 TextureThe texture or fabric of the rock refers to the size and shape of individual minerals(crystal or grains) or rock particles in the rock. The major division is betweencrystalline and clastic texture. Many geologists use the term texhrre interchangeablewith fabric or microstructure (see A.2.2.3).
A2.2.2.1 Crystalline textureCrystalline rocks have an interlocking fabric of minerals. Examples: granite, diorite,basalt, marble and some limestones (Photo I and 2).
A2.2.2.2 Clastic textureClastic rocks consist of a collection of minerals and rock particles bound together bycement (e.g. carbonate, silicate, Fe-(hydro) oxides). These rocks are mainly composedof particles of pre-existing rocks, minerals or organic remains and of particles newlyformed during weathering and erosion such as clays (examples: claystones, siltstones,sandstones, conglomerates, breccias) (Photo 3,4,5 & 6).
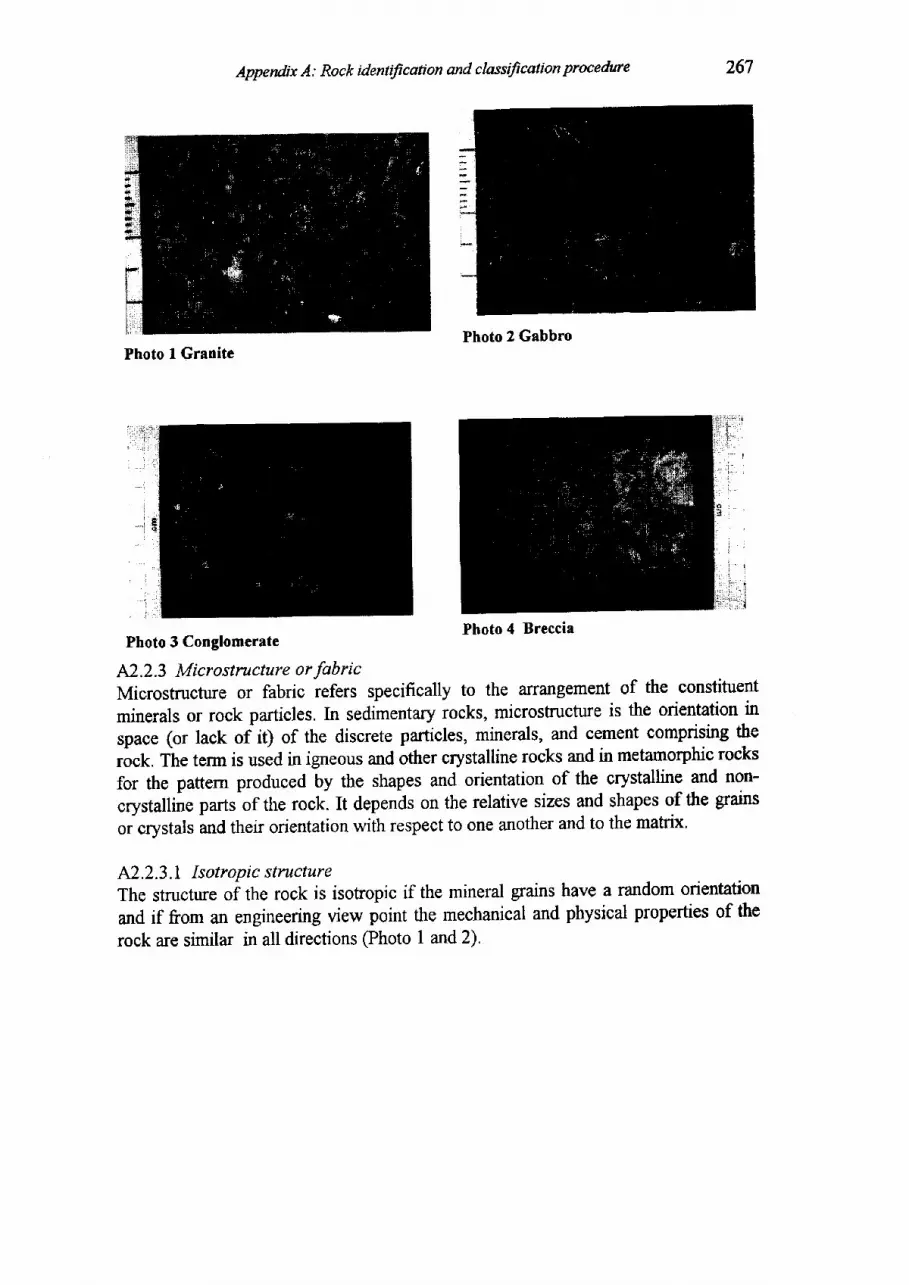
Appendix A: Rock identification and classification procedure 267
Photo 3 Conglomerate
A2.2.3 Microstructure or fabricMicrostructure or fabric refers specifically to the Eurangement of the constituent
minerals or rock particles. In sedimentary rocks, microsffucture is the orientation in
space (or lack of it; of the discrete particles, minerals, and cement comprising the
rock. The term is used in igneous and other crystalline rocks and in metamorphic rocks
for the pattern produced by the shapes and orientation of the crystalline and non-
crystalline parts of the rock It depends on the relative sizes and shapes of the gfains
oicrystals and their orientation with respect to one another and to the matrix.
A2.2.3.1 Isotropic structureThe structure of the rock is isotropic if the mineral grains have a random orientation
and if from an engineering view point the mechanical and physical properties of the
rock are similar in all directions (Photo I and 2).
Photo 2 GabbroPhoto I Granite
Photo 4 Brcccia
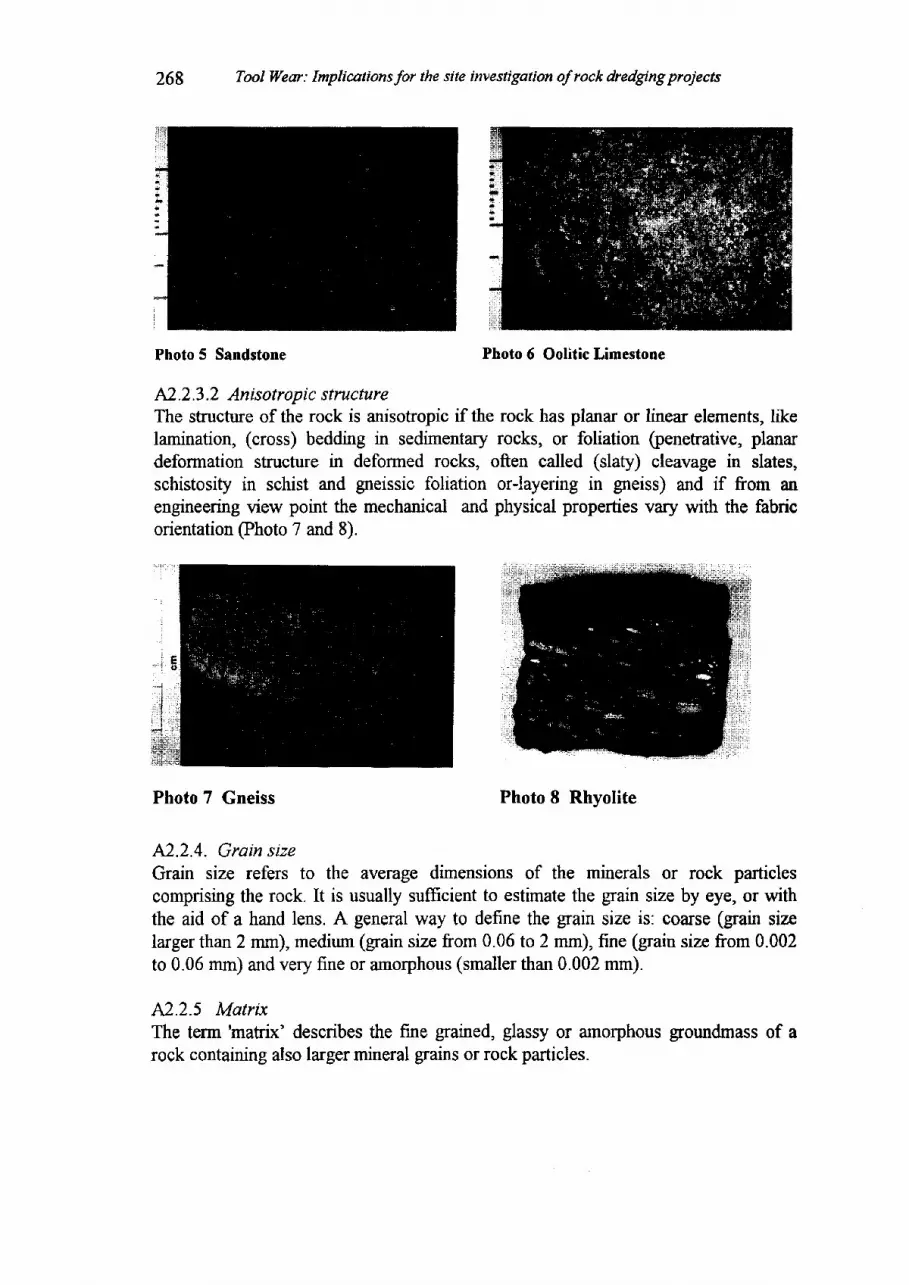
268 Tool Wear: ImplicationsJor the site investigation of rock &edging projects
Photo 5 Sandstone
A2.2.3.2 Anisotropic structureThe struchue of the rock is anisotropic if the rock has planar or linear elements, likelamination, (cross) bedding in sedimentary rocks, or foliation (penehative, planardeformation structure in deformed rocks, often called (slaty) cleavage in slates,schistosity in schist and gneissic foliation or-layering in gneiss) and if from anengineering view point the mechanical and physical properties vary with the fabricorientation @hoto 7 and 8).
Photo 7 Gneiss Photo 8 Rhyolite
A2.2.4. Grain sizeGrain size refers to the average dimensions of the minerals or rock particlescomprising the rock. It is usually sufficient to estimate the grain size by eye, or withthe aid of a hand lens. A general way to defrne the grain size is: coarse (grain sizelarger than 2 mm), medium (grain size from 0.06 to 2 mm), fine (grain size from 0.002to 0.06 mm) and very fine or amorphous (smaller than 0.002 mm).
M.25 MatrixThe term 'matrix' describes the fine grained, glassy or amorphous groundmass of arock containing also larger mineral grains or rock particles.
Photo 6 Oolitic Limestone
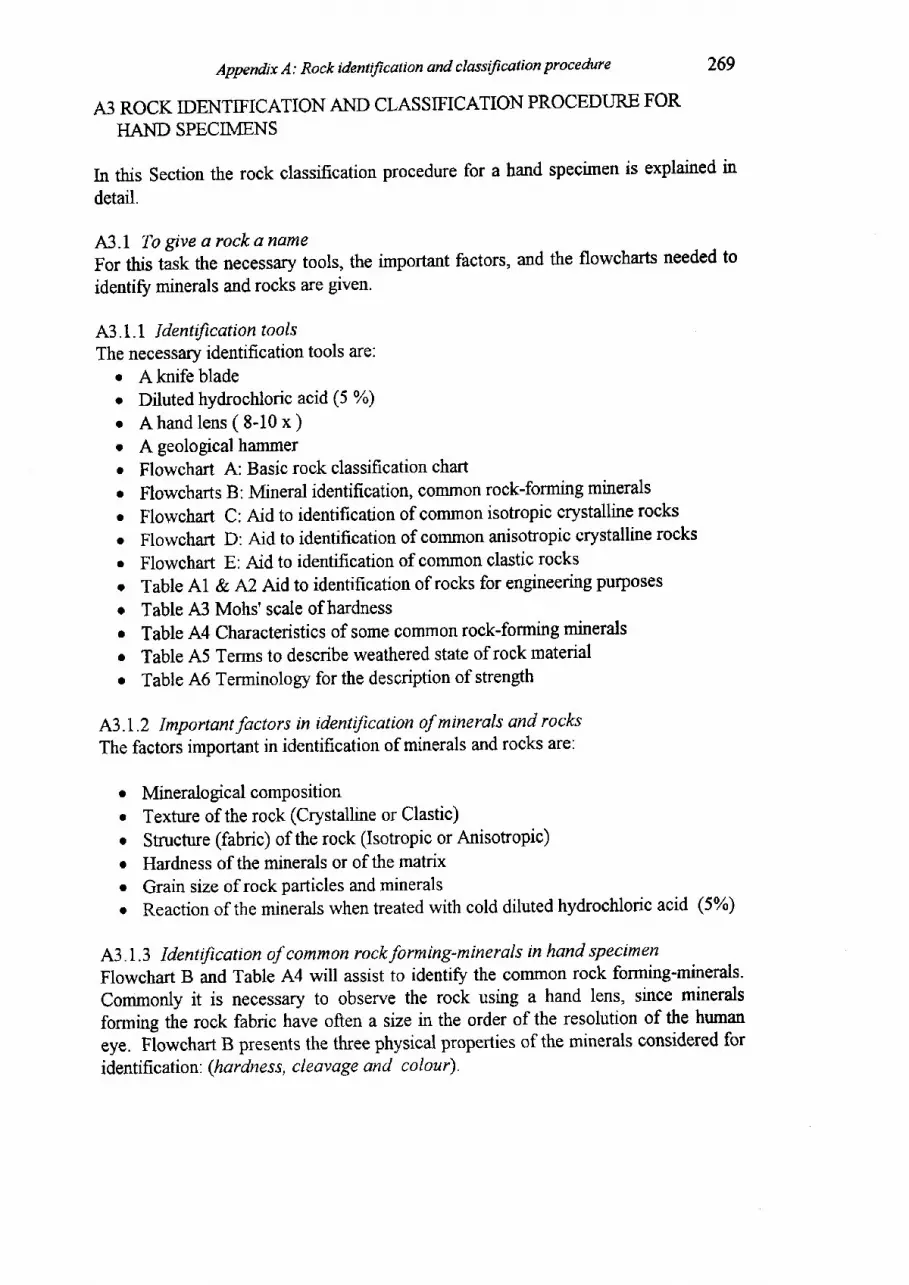
Appendix A: Rock identification and classification procedure 269
43 ROCK IDENTIFICATION AND CLASSIFICATION PROCEDURE FOR
HAND SPECIMENS
In this Section the rock classification procedure for a hand specimen is explained in
detail.
A3J To give a rock onameFor this task the necessary tools, the important factors, and the flowcharts needed to
identiff minerals and rocks are given.
A3.1.1 Identification toolsThe necessary identification tools are:
o A knife bladeo Diluted hydrochloric acid (5 %)o A hand lens ( 8-10 x )o A geological hammerr Flowchart A: Basic rock classification chart. Flowcharts B: Mineral identification, common rock-forming minerals
. Flowchart C: Aid to identification of common isotropic crystalline rocks
o Flowchart D: Aid to identification of common anisotropic crystalline rocks
. Flowchart E: Aid to identification of common clastic rockso Table Al & 1r2 Aid to identification of rocks for engineering purposes
o Table A'3 Mohs'scale of hardnessr Table A4 Characteristics of some common rock-forming mineralso Table 45 Terms to describe weathered state of rock materialr Table ,4.6 Terminology for the description of strength
A3.1.2 Importantfactors in identification of minerals and rocks
The factors important in identification of minerals and rocks are:
o Mineralogical compositiono Texture of the rock (Crystalline or Clastic)o Sffucture (fabric) of the rock (Isotropic or Anisotropic)r Hardness of the minerals or of the matrixo Grain size of rock particles and mineralsr Reaction of the minerals when treated with cold diluted hydrochloric acid (5%)
43.1.3 ldenttfication of common rock forming-minerals in hand specimen
Flowchart B and Table A4 will assist to identify the common rock forming-minerals-
Commonly it is necessary to observe the rock using a hand lens, since minerals
forming the rock fabric have often a size in the order of the resolution of the human
eye. Fiowchart B presents the three physical properties of the minerals considered for
identificati on'. (hardness, cleavage and colour).

270 Tool Wear: Implicationsfor the site iwestigation of rock dredging projects
First the hardness of the mineral(s) is determined. Rocks are divided into thosecontaining minerals which can be scratched by a fingernail, those containing mineralswhich can be scratched by a knife blade and those containing minerals which cannotbe scratched by a knife blade. On Mohs' scale of relative hardness, Table ,A'3, a fingernail usualty has a hardness between 2 and 2.5, while the average knife blade has ahardness between 5 and 5.5. More information about physical properties ofindividual minerals is given in Table A4.
The second division is based on mineral cleavage. The presence or absence ofcleavage is one of the diagnostic features of minerals. Cleavage surfaces are smoothand uniform and reflect incident light unifonnly at one orientation. When the size ofthe mineral is very small (less than about I mm), as in some fine grained crystallinerock (e.g. basalt, rhyolite and andesite), it is diffrcult to note the cleavage even withthe aid of a hand lens. In this case other methods, like microscopic examination of thinsections is suggested. The third division is based on the colour of the mineral,(Flowchart B),
A3.1.4 ldentrfication of common rocks in hand specimensIn Table Al the nalnes of common rock types found in engineering projects arepresent. Using this table the first step is to decide whether the rock is igneous,sedimentary or metamorphic. For someone with limited geological knowledge usingTable Al is rather difficult. Therefore to facilitate the rock classification severalflowcharts were created (Flowcharts B, C, D and E).
Four of the many attributes presented by a rock specimen are singled outdominantly in this classification texture, structure, hardness and grain srze. The firstdivision given is between crystalline and clastic texhre (Flowcharts C, D and E).The crystalline rocks like granite present an interlocking structure of minerals withvery little or no pore space. There may be grain boundary cracks and other fisswesthat can weaken the rock, and minerals themselves may be deformable (e.g. calcite inmarble) but the structure is generally a sffong one.
Contrary, the clastic rocks (Flowchart E) consist of a collection of minerals androcks particles with pore space filled with cement. Some clastic rocks are so finegrained that the grain particles or minerals cannot be seen with the naked eye (e.g.
Example 1: As illustration of how the flowchart B works, you can compare calcite,feldspar and quartz, three conrmon minerals that are frequently confirsed when theyare present in a rock specimen. Quartz has no cleavage and will not be scratched by aknife blade, but will scratch the blade itself. Quartz does not react with dilutedhydrochlonc acid (5%). Feldspar is harder than a knife blade, although sometimes itcan be scratched, It presents two good directions of cleavage. Calcite has three goodcleavage directions, and can be scratched by a knife blade. It also shows vigorouseffervesce when treated with diluted hydrochloric acid. Moreover, calcite presentsrhombohedral angles between the cleavage surfaces (75" and 105'), whereas feldsparcleavage faces have a imately 90" angles between them.
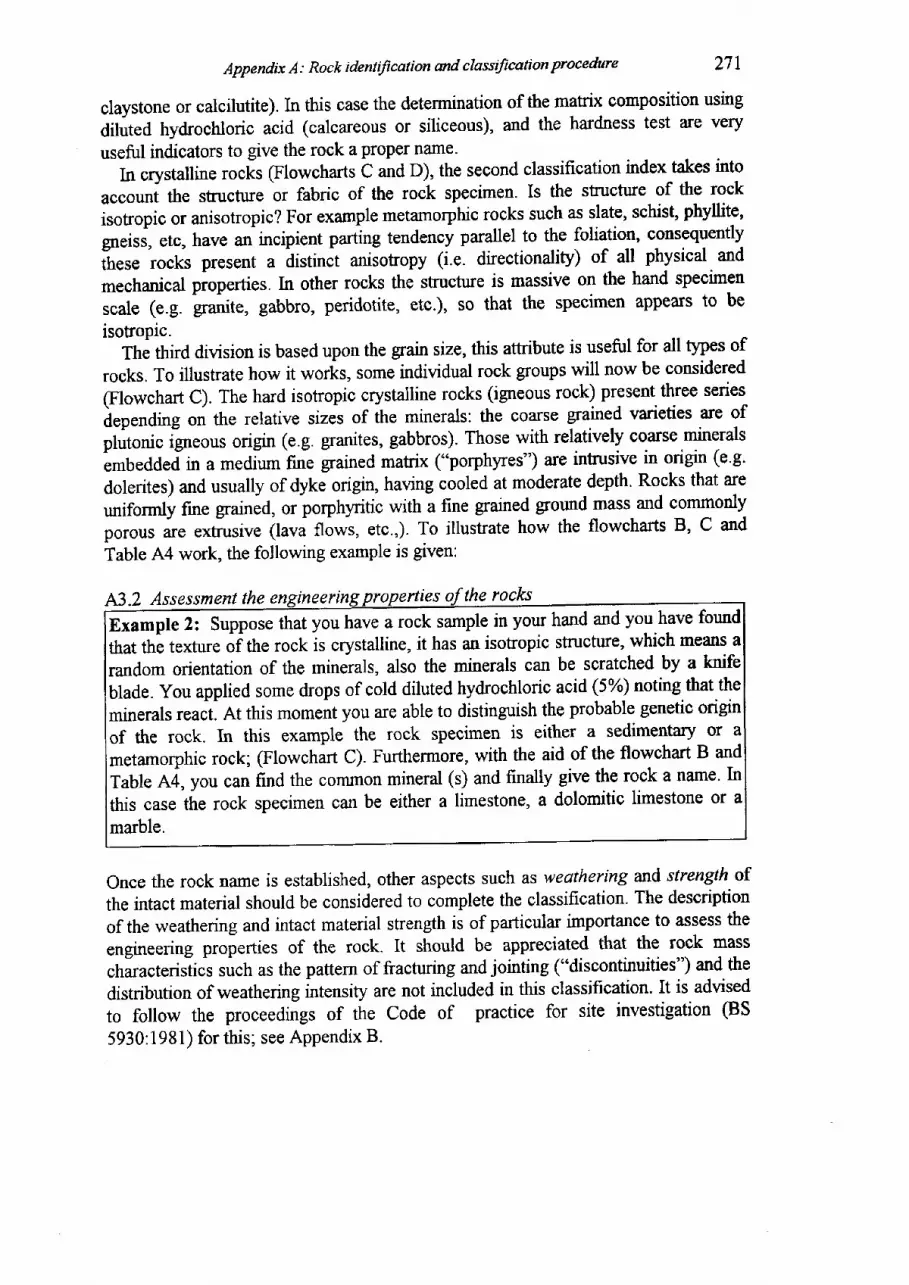
Appendix A: Rock identification md classification procedure
ies of the rocks
271
claystone or calcilutite). In this case the determination of the matrix composition using
diluted hydrochloric acid (calcareous or siliceous), and the haldness test are very
useful indicators to give the rock a proper name.
In crystallin, 1.o.f, (Flowcharts C and D), the second classifi.cation index takes into
account the structure or fabric of the rock specimen. Is the structure of the rock
isoffopic or anisotropic? For example metamorphic rocks such as slate, schist, phyllite,
gneiss, etc, have a1incipient parting tendency parallel to the foliation, consequently
these rocks present u airtinrt aniiotropy (i.e. directionality) of all physical and
mechanical pioperties. In other rocks the structure is massive on the hand specimen
scale (e.g. gr*it*, gabbro, peridotite, etc.), so that the specimen appeafs to be
isotropic.The third division is based upon the grain size, this attribute is useful for all types of
rocks, To illustrate how it works, some individual rock $oups will now be considered
(Flowchart C). The hard isotropic crystalline rocks (igneous rock) present,three series
depending on the relative sizei of the minerals: the coarse grained varieties are of
plutonic ign.our origur (e.g. granites, gabbros). Those with relatively coarse minerals
embedded in a medium fine grained matix ("porphyres") are intrusive in origin (e.g.
dolerites) and usually of dykJ origin, having cooled at moderate depth' Rocks that are
uniformly fine grained, oriorphyritic with a fine grained gpund mass and commonly
porous are e*trusive (lava flows, etc.,). To illustrate how the flowcharts B, C and
Table A4 work, the following exampie is given:
A3.2 Assessment the
E*"tpl- 2t Sopp*thut you have a rock sample in your hand and you have found
that thi texture of the rock is crystalline, it has an isotropic structure, which means a
random orientation of the minerals, also the minerals can be scratched by a lnife
blade. you applied some drops of cold diluted hydrochloric acid (5%) noting that the
minerals react. At this moment you are able to distinguish the probable genetic origtn
of the rock. In this example the rock specimen is either a sedimentary or a
metamorphic rock; (Flowchart C). Furthermore, with the aid of the flowchart B and
Table A4, you can find the common mineral (s) and finally give the rock a name' In
this case the rock specimen can be either a limestone, a dolomitic limestone or
marble.
Once the rock name is established, other aspects such as weathering artd strength of
the intact material should be considered to complete the classification- The description
of the weathering and intact material strength is of particular importance to assess the
engineering properties of the rock. It should be appreciated that the rock mass
characteristics such as the pattern of fracturing and jointing ("discontinuities") and the
distribution of weathering intensity are not included in this classification. It is advised
to follow the proceedings of the Code of practice for site investigation (BS
5930:1981) for this; see Appendix B.
272 Tool Wear: Implicationsfor the site investigation of rock &edging projects
A3.2.1 illeathering @S 5930:1981)Weathering results in an alteration of the original rock. There are two importantaspects of weathering: one dominated by mechanical disintegration and the other bychemical decomposition, including solution. Generally, mechanical and chemicaleffects act together and depending on climate regimes a certain weathering processprevails.
Mechanical weathering results in the opening of microcracks, the formation of newmicrocracks by rock frachre, the opening of grain boundaries, ild the fracture orcleavage of individual mineral grains. Chemical weathering leads to the eventualdecomposition of silicate minerals to clay or other secondary minerals. Some minerals,notably quartz, resist this action and may remain unchanged. It should be pointed outthat early stages of chemical weathering result in discolouration of the affected rock.Solution is an aspect of chemical weathering which is particularly important tocarbonate minerals, rock salt, gypsum and anhydrite.
On the basis of these changes, a descriptive scheme for weathering of rock materialis presented in Table A5. This table does not present a weathering scale. The stages ofweathering described in Table 45 may be subdivided by using quali$ing terms, forexample, partially discoloured, wholly discoloured and slightly discoloured, which willaid the description of the material being examined. These descriptive qualifying termsmay be quantified if necessary.
A3.2.2 StrengthThe strength of the intact material refers to the maximum stress level which can becarried by a specimen in a specific test. The strength of the rock material can besubdivided, based on for example the unconfined compression test, the point load testor by geological hammer blows, as presented in Table ,4,6.
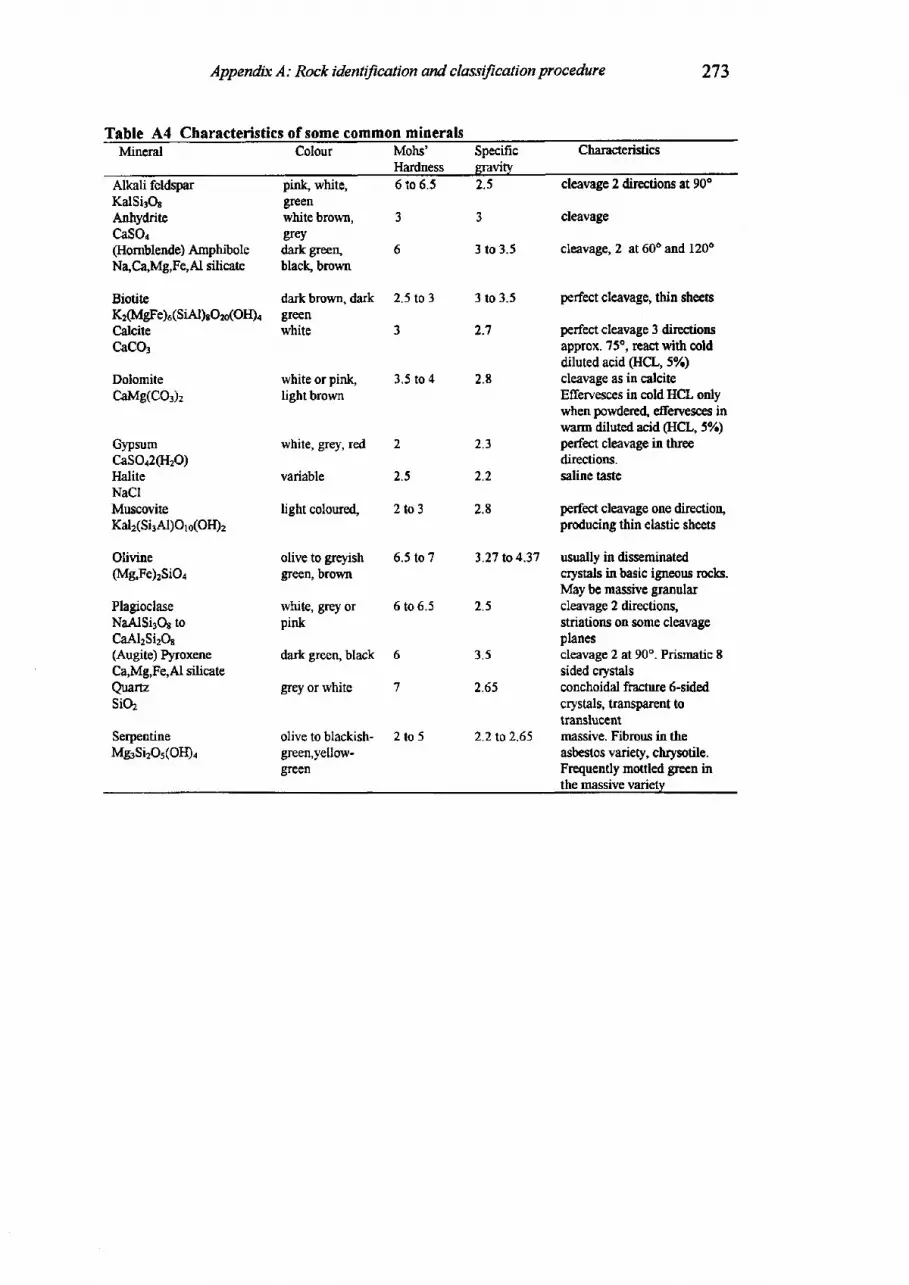
Appendix A: Rock identiJication and classiJication procedure
Characteristics of some common minerals
273
Table A4Mineral Mohs'
HardnessSpecificsravity
Characteristics
Alkali feldsparKalSLOrAnhydriteCaSOr(Homblende) AmphiboleN4C4Mg,Fe,Al silicate
BiotiteK:(MgFe)e ( SiAl)sO:o(OtDoCalciteCaC03
DolomiteCaMe(Cq)z
GypzumCaSOr2(IIzO)HaliteNaClMuscoviteKal2(Si3Al)Oro(OII)2
Olivine(Mg,Fe)2SiOa
PlagoclaseNaAlSirOr toCaAl2Si2os(Augite) P5noxeneCa,Mg,Fe,Al silicateauartzsio2
SerpentineMgSizOs(OII)a
pink, white,greenwhite brovm,crsydark gree4black, brovm
dark brovm, darkgreenwhite
white or pink"lightbrown
white, grey, red
variable
light coloured,
olive to greyishgreen, brown
white, grey orpink
dark green, black
grey or white
6 to 6-5
J
6
2.5 to 3
J
3.5 to 4
2
t <
2lo3
5.5 to 7
6 to 6,5
3 to 3.5
3 to 3.5
2.7
2.8
3.27 to4.37
2.5
3 .5
2.65
2.2 to 2.65
2.5 cleavage 2 directions at 90
cleavage
cleavage, 2 at 600 and 1200
perfect cleavage, thin sheets
perfect cleavage 3 directionsapprox. 75o, rcact with colddiluted acid (HCx,, SVScleavage as in calciteEffervesces in coldHCL onlywhen powdered, efrervesces inwarm diluted acid (HCL, 5ol")perfect cleavage in threedirections.saline taste
perfect cleavage one direction,producing thin elastic sheets
usually in disseminatedcrystals in basic igneous rocks.May be massive granularcleavage 2 directions,striations on some cleavageplanescleavage 2 at 90". Prismatic 8sided crystalsconchoidal fracture 6-sidedcrystals, transparent totranslucentmassive. Fibrous in theasbestos variety, chrysotile.Frequently mottlcd grcn inthe massive varietv
2 .3
,, 1
2.8
o
1
olive to blackish- 2 to 5green,yellow-green
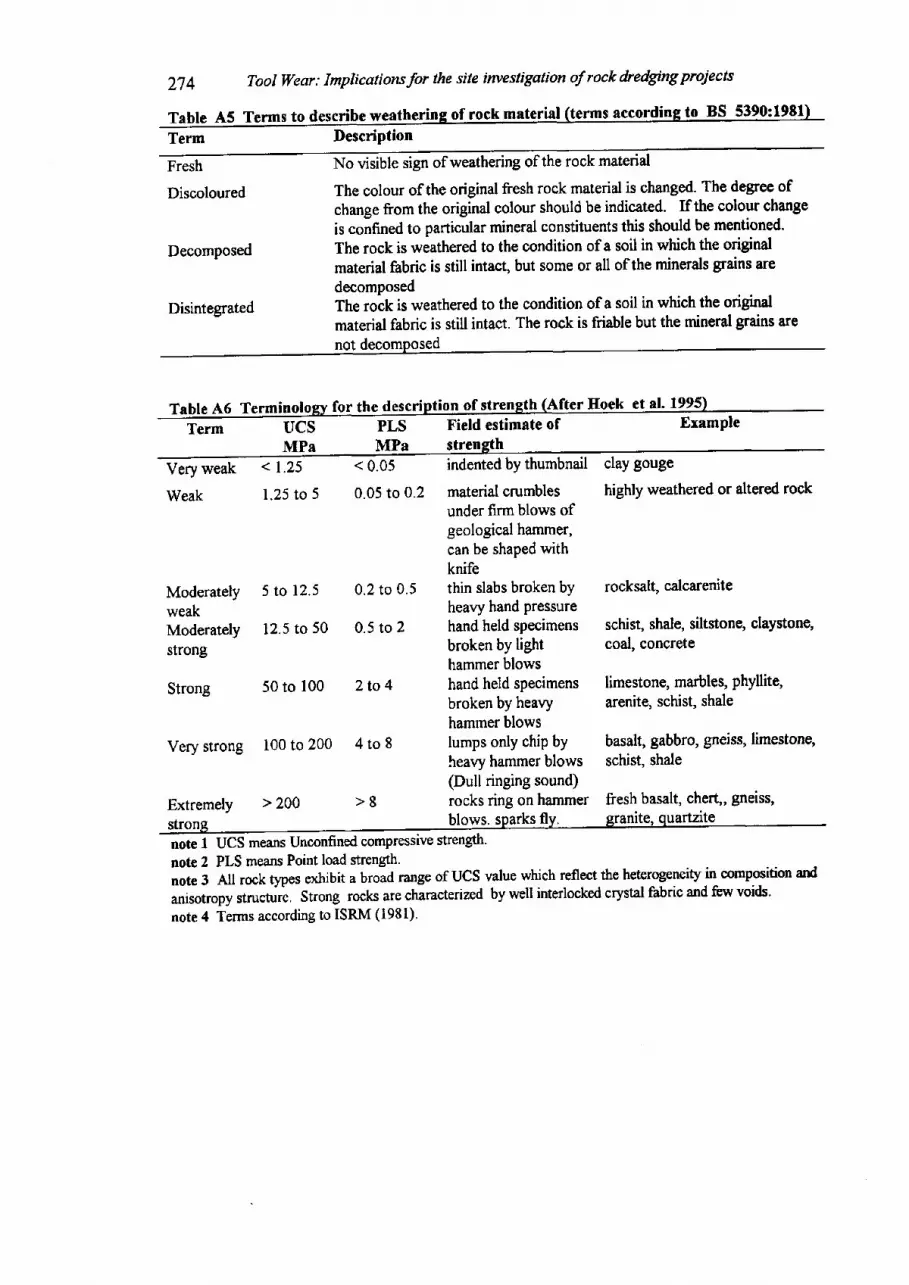
274 Tool wear: Implicationsfor the site investigation of rock dredging proiects
Table A5 Terms to describe wea of rock material (terms
Term DescriPtionto BS 5390:198
Fresh
Discoloured
Decomposed
Disintegrated
No visible sign ofweathering of the rock material
The colour of the original fresh rock material is changed. The degree of
changefromthe original colour should be indicated. Ifthe colourchange
is confined to particular mineral constituents this should be mentioned.
The rock is weathered to the condition of a soil in which the original
material fabric is still intact, but some or all ofthe minerals grains are
decomposedThe rotk is weathered to the condition of a soil in which the original
material fabric is still intact. The rock is friable but the mineral grains are
Table A6 Term for the ducsMPa
of strensth (After Hoek et al. I
Field estimate ofTerm PLSMPa
Example
Very weak l .25 < 0.05
Weak 1.25 to 5 0.05 to 0.2
indented by thumbnail
material crumblesunder firm blows ofgeological hammer,can be shaped withknifethin slabs broken byheavy hand pressurehand held specimensbroken by lighthammer blowshand held specimensbroken by heavyhammer blowslumps only chip byheavy hammer blows(Dull ringing sound)rocks ring on hammer
clay gouge
highly weathered or altered rock
rocksalt, calcarenite
schist, shale, siltstong claystongcoal, concrete
limestone, marbles, Phyllite,arenite, schist, shale
basalt, gabbro, gneiss, limestongschist, shale
Moderately 5 to 12.5weakModerately 12.5 to 50strong
Strong 50 to 100
0.2 to 0.5
0.5 to 2
2to 4
Very strong 100 to 200 4 to 8
Extremely > 200 > 8 fresh basalt, cheIt,, gneiss,
blows. ite. ouartzite
rote 1 UCS means Unconfined compressive strength'
note 2 PLS means Point load strength.note 3 All rock types exhibit a broad range of UCS value which reflect the heterogeneity in composition and
anisotropy structurl. Strong rocks are characterized by well interlocked crystal fabric and few voids.
note 4 Terms according to ISRM (1981)'
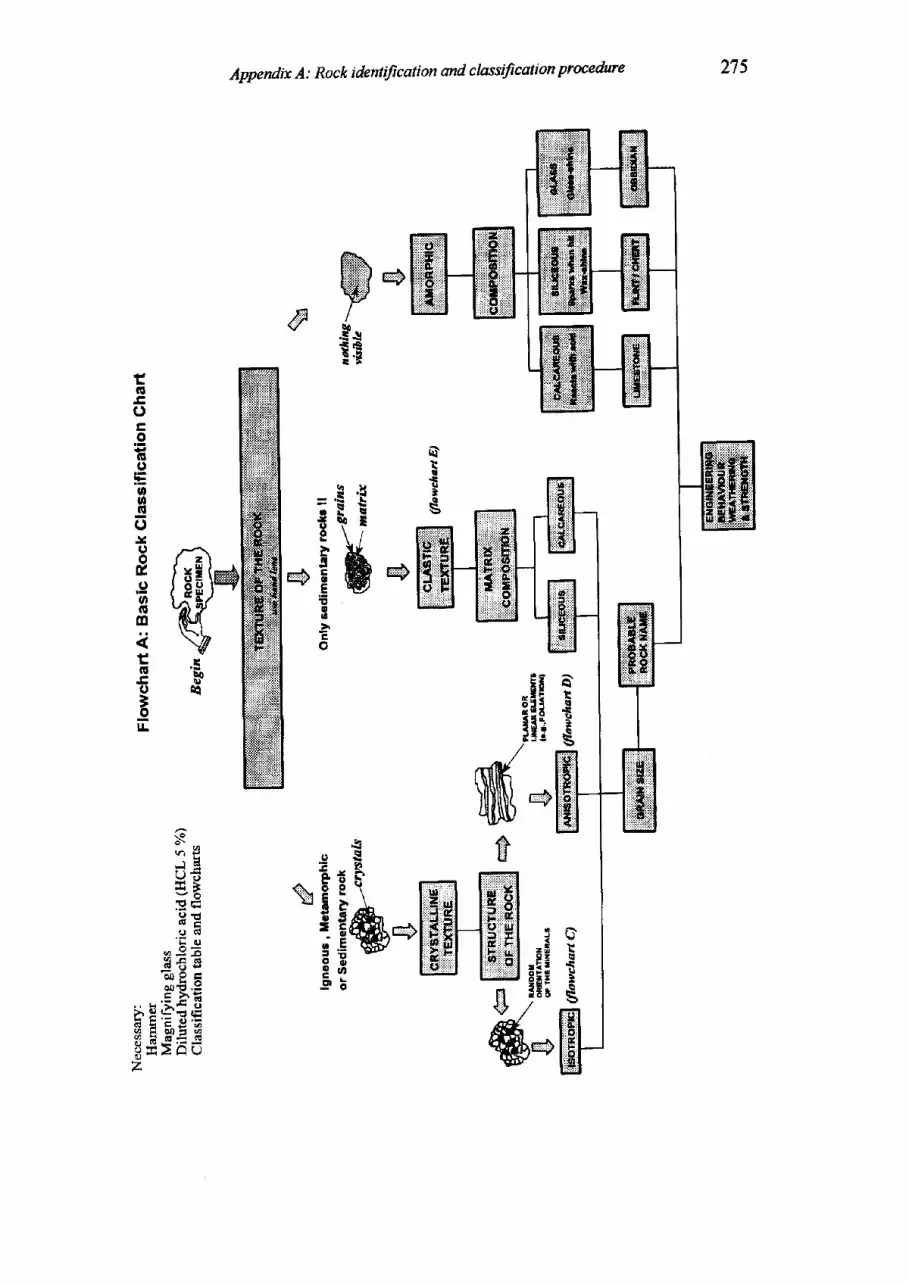
2',75Appendir A: Rock identification and classification proce&re
atq€atg
PE6E- t
EE
t;b
=sJa,o
cr+FA -.cg l v . E
toIt>zo
tfil-co
.9(Eo'6oItoJuouOoGo<ttu(,3otr
,Iqili
M"fr
t\E*tgrfii ,;ltu:
snBi :t \ -v orBE EHEEo 6 !' Fe
a J E
H*s-xs ec h ? i
xE.bE€
H89fisz
"EErt
iEe
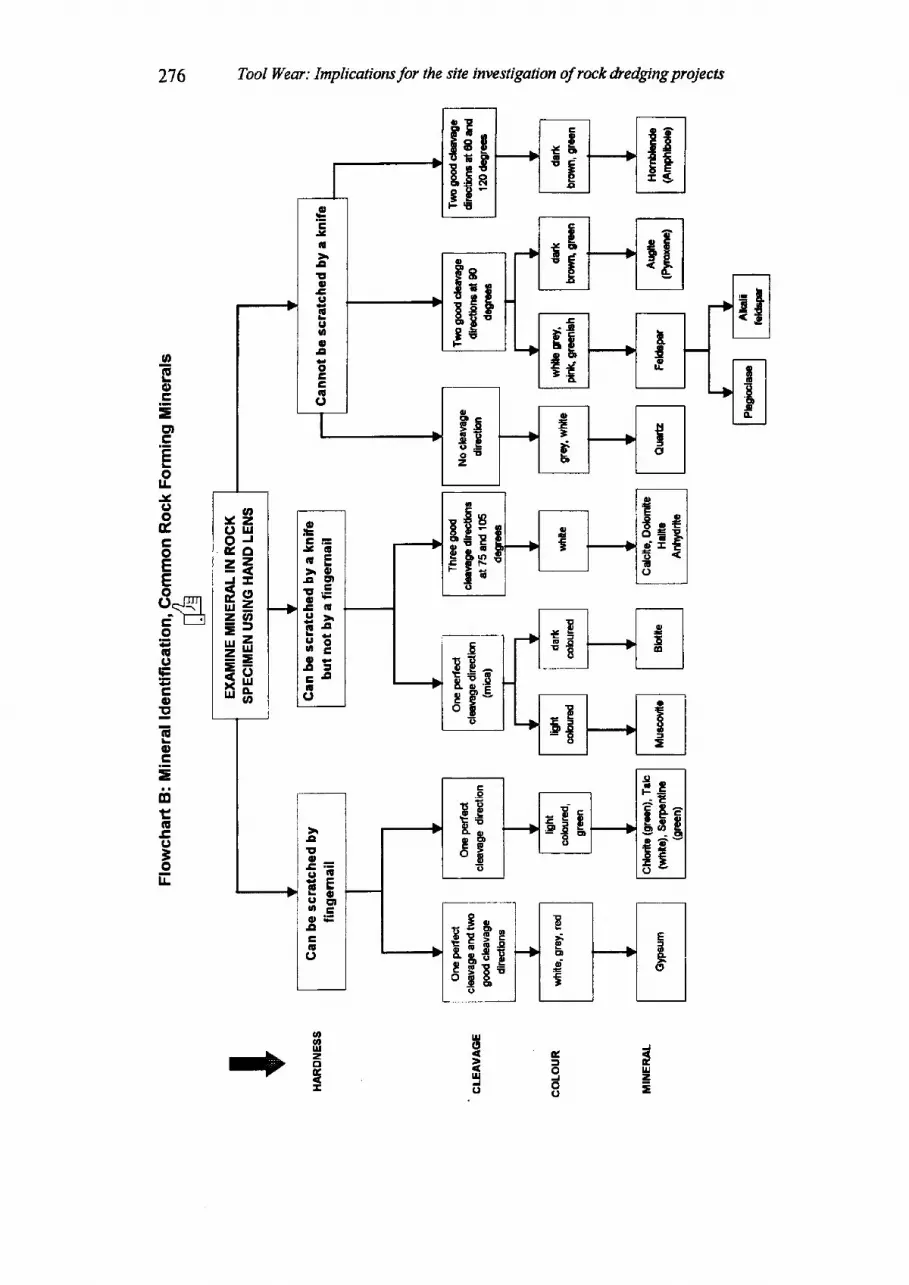
HEu;TSgtr Re,E-
F Eo'E.t.!
5ttoaIJ
E|Joo
5
oEcqt(,
Fe.E tn
ef$.3€
ogc
* . €:-E FtIo
oY 2(t lllo JE O=7J -
frz= t 4= J
Efr= =SEri a.
oIE
J 6cE> o- a E 'r . ET G1 4 >6 - sEE5 1o :l t =E l loC'
276 TooI Wear: Implications for the site investigation of rock dredging projects
L.Eq,
.EEctt.E=olrJoodcoEE
,.r Tfmv* { l
i I =oIE(,EtrogG
otr=
diEGto3olr
cfoo()
uJo
ui(,
t1!==
aul
de-uI
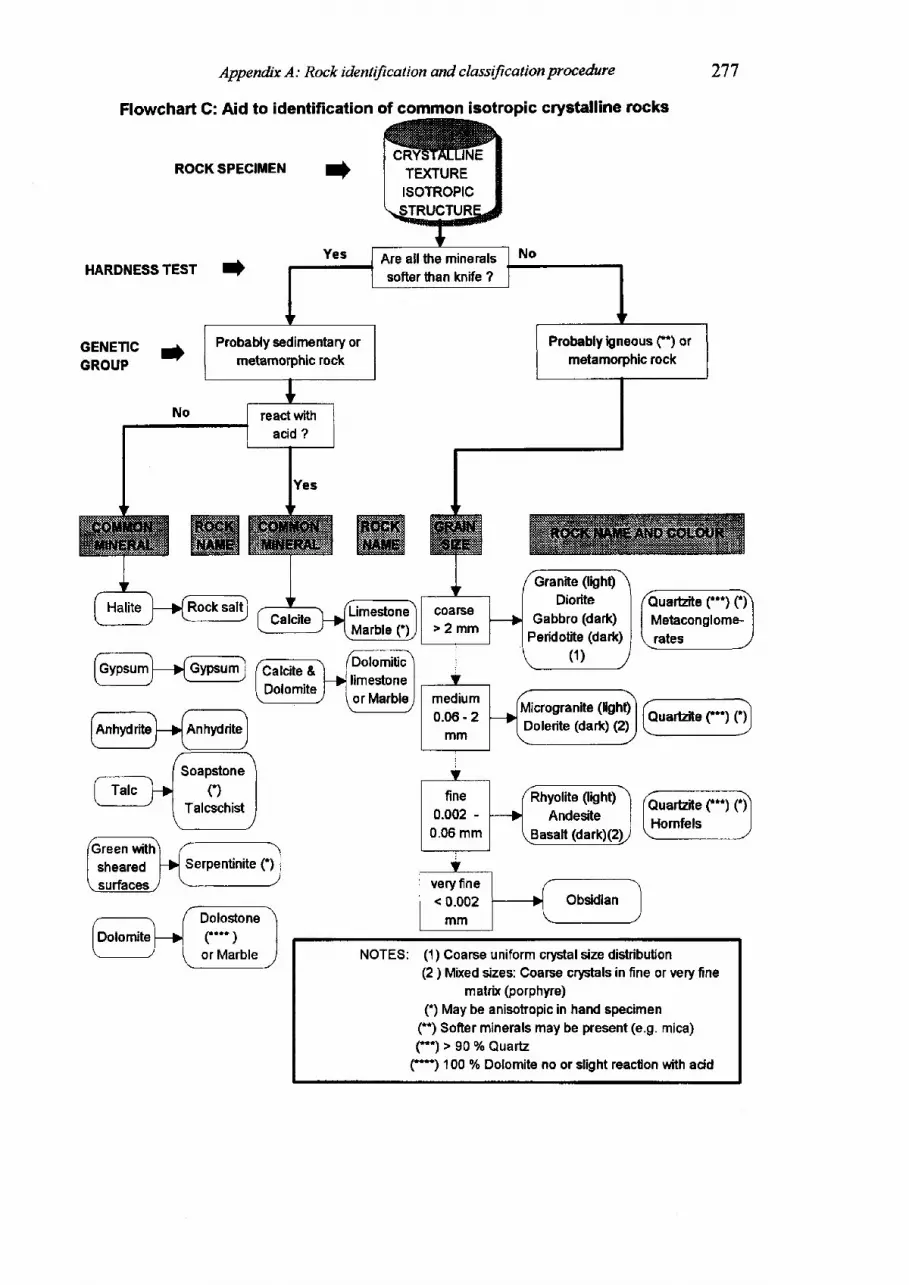
Appendix A: Rock identifcation and classifcation procedure
Flowchart G: Aid to identification of common isotropic crystalline nocks
ROCKSPECIITIEN
HARDNESSTEST T}
GENETIC -GROUP
t
277
QuarEite ('1C)Metaconglome-rates
Y
I medium I f.- l\
l;:*:f{Tnr:ufr,:t)@I mm | \ _ _____
NOTES: (1 ) Coarse uniform crlstal size distribuUon(2 ) Mixed sizes: Coarse crptals in fine or very fine
matrix (porphyre)(') May be anisotropic in hand specimen
fl Softer minerals may be present (e.9. mica)( " ' )>90%Quar tz
(*) 100 7o Dolomite no or slight reaction with acid
Are all the mineralssofter than knife ?
LimestoneMarble (')
Rhyolite (light)Andesite
Basalt (dark)(2)
Dolo$one("" )or Marble

278 Tool Wear: Implications for the site irwestigation of rack dredging projects
oJ(,goE
Eo
ooCLe0.2g|g
EoEEo(,otoIE|,
tropo!
ciE.E(,!.9l.L
.^.I
zttJ=oUJo.oY(,ot
r L Fo s 1uJ 0ao . lFbF ]< Er F= o
a(,o
> o
o o .- o =o =o - F
c,E
pcE y ,- c osEEro r g
o.o
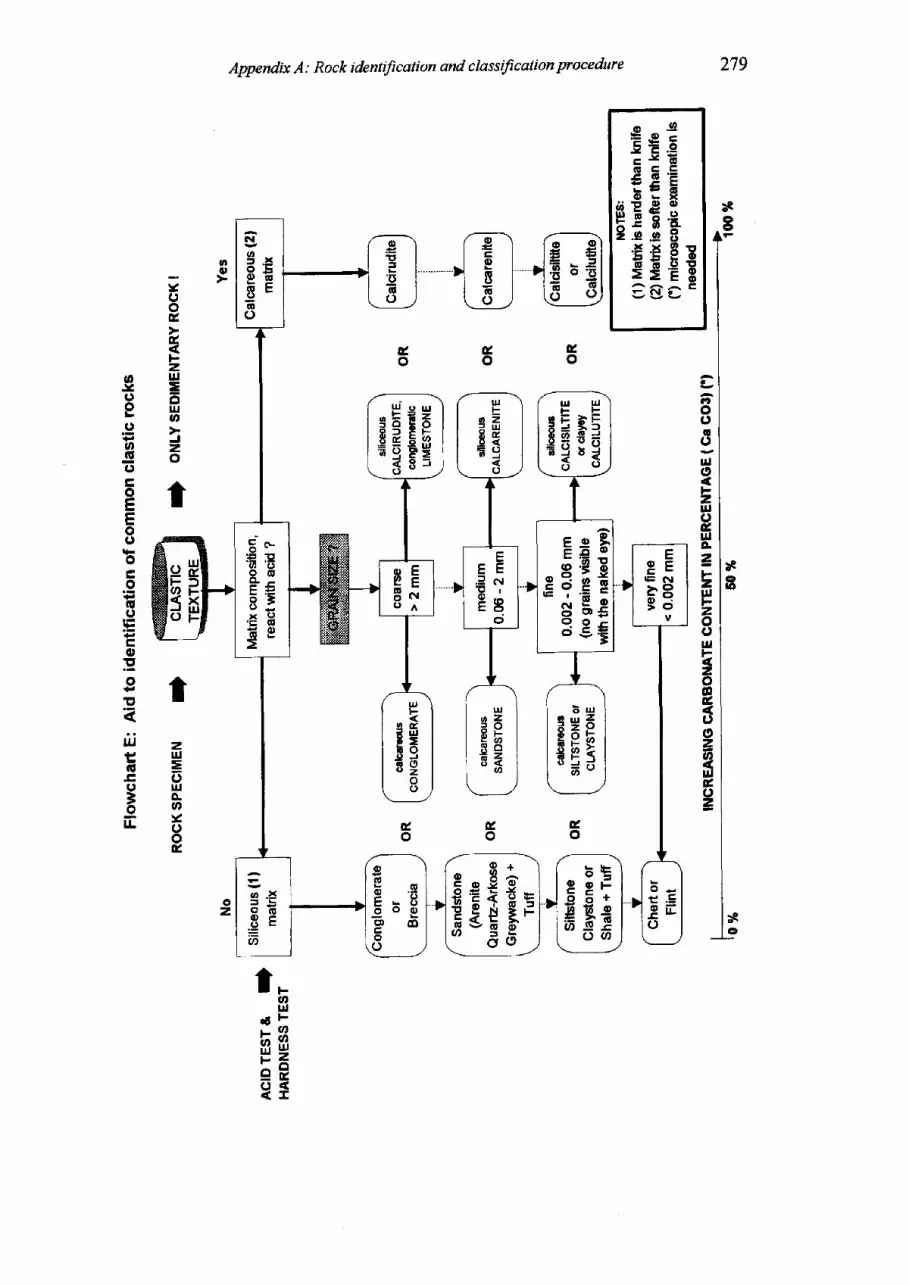
279Appendix A: Rock identification and classificalion procedure
YootrE
zIu=otuoJzo
.4.I
o.vIJe.go.EIJgoEtrooo
oo(J
.E
oPot
iiEG-c|JBoIl.
t..g,ul
. 6 F
nfr9 Z
be?f
a
eoo6o;o
,uloEulA
=1-zlrJFzoouJ
kzooG
o(,464UJto2
oob . g
EaE? C Doo
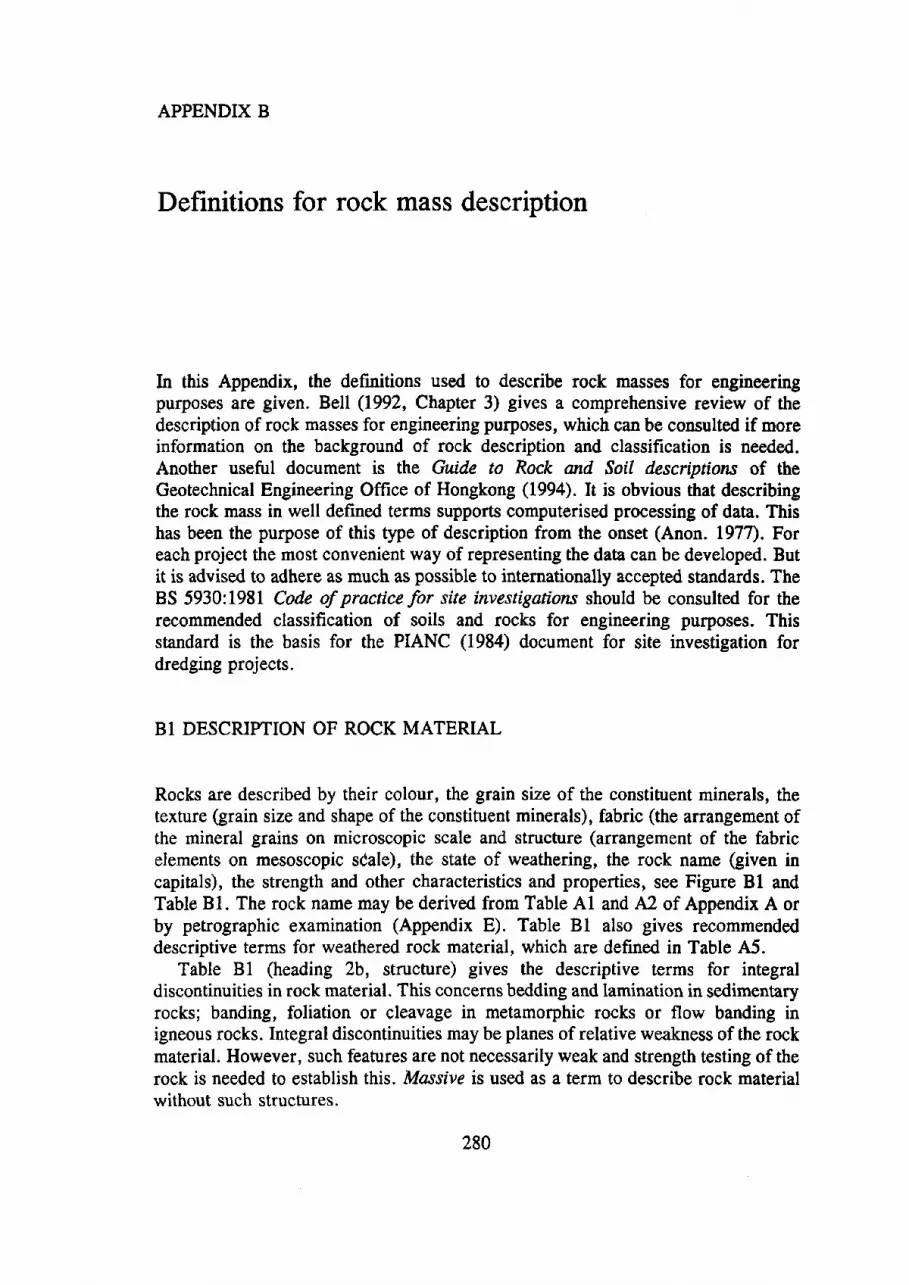
APPENDIX B
Definitions for rock mass description
In this Appendix, the definitions used to describe rock masses for engineeringpu{poses are given. BelI (1992, Chapter 3) gives a comprehensive review of thedescription of rock massos for engineering purposes, which can be consulted if moreinformation on the background of rock description and classification is needed.Another useful document is the Guidc to Rock and SoiI dcscriptiotts of theGeotechnical Engineering Office of Hongkong (199a). It is obvious that describingthe rock mass in well defined terms supports computerised processing of data. Thishas been the purpose of this type of description from the onset (Anon. L977). Foreach project the most converrient way of representing the data can be developed. Butit is advised to adhere as much as possible to internationally accepted standards. TheBS 5930:1981 Code of practice for site investigatiorzs should be consulted for therecommended classification of soils and rocks for engineering purposes. Thisstandard is the basis for the PIANC (1984) document for site investigation fordredging projects.
B1 DESCRIPTION OF ROCK MATERIAL
Rocks are described by their colour, the grain size of the constituent minerals, thetexture (grain size and shape of the constituent minerals), fabric (the arrangement ofthe mineral grains on microscopic scale and structure (arrangement of the fabricelements on mesoscopic sdale), the state of weathering, the rock name (given incapitals), the strength and other characteristics and properties, see Figure 81 andTable Bl. The rock name may be derived from Table Al and A2 of Appendix A orby petrographic examination (Appendix E). Table 81 also gives recommendeddescriptive terms for weathered rock material, which are defined in Table A5.
Table 81 (heading 2b, structure) gives the descriptive terms for integraldiscontinuities in rock rnaterial. This concerns bedding and lamination in sedimentaryrocks; banding, foliation or cleavage in metamorphic rocks or flow banding inigneous rocks. Integral discontinuities may be planes of relative weakness of the rockmaterial. However, such features are not necessarily weak and strength testing of therock is needed to establish this. Massive is used as a term to describe rock materialwithout such structures.
280
Append.ix B: Definitions for rock nass description
DescripUon d sook maledal ltom Englneedng Geologlcal Unlt
28t
Fod< malerlal:
llm:'*l**'g*:m5l,'#ll,'"ff iioameo,dastlc/ grajn shaPe -...3. qraln slzen. iiinJrat content (quartz' day.-'J5. ROCK NAME6. ducfrlltyZ.qftnqft TABIE Bl8. abraslr€n$s9, r,roafiering state
Rockmms:t.larcrthidmess Cl'able B1' 2b)i:fi'"&:ffi-;,"fi;ttrr"bti ed), ot tf not posslbb spadnsof dlscon$nuldec (Iable BZ)3. block shaPe Oable B{f)4. descriptioh of discominuitv sets;: ffi&i;iltil *earrlrtng itite ol the mass (Iable 84)
Figure B1 Description of engineering geological units for rock dredging pulposes'
82 DISCONTINUITY DENSTTY AND BLOCK SIZE
Discontinuities are fractures in the rock mass (oints, fissures, faults, shear planes'
bedding). Borehole cores provide one dimensional information on the presence of
discontinuities. To describe spacing of discontinuities in cores' or in special scanline
studies in a rock mass with *"u"*t discontinuity sets, the terms of Table 92 are
used. If the rock mass can be observed, the termi of Table 83 are used to describe
the block size and shape of the Inass' using the spacing of the largest discontinuity
set as an indicator of iize and the second t-erm iJused to describe the shape of the
blocks.Price has developed a ratings system that might be applied to estimates of
excavatability of rock. In this system the three major discontinuity sets are used and
the dimensions plotted on the graph of Figure B2. Examples how to l9e the graph
are also given in the figure. The idea of itris system is that cubic and lalge blocks
compose the most stable discontinuous rock mass and are the most difficult to
excavate. suctr roct< rnasses will get the highest rating number. The ratings diminish
as the blocks become smaller and changJin shape from cubic to tabular and then
columnar.
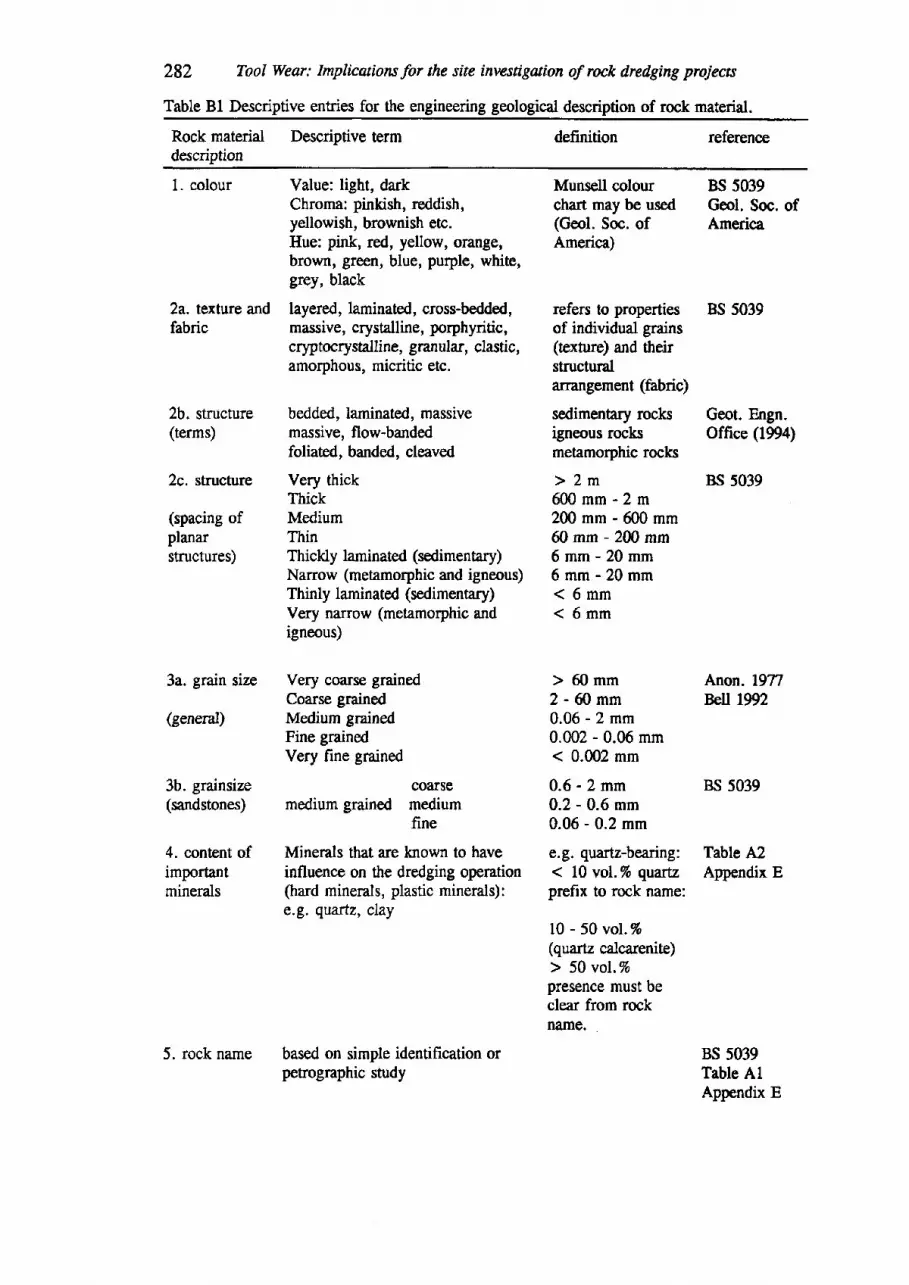
282 TooI Wear: Implicuioru for the site investiguion of rock dredging projects
Table Bl Descriptive entries for the engineering geological description of rock material.
Rock material Descriptive termdescription
definition reference
1- colour
2a. texture andfabric
2b. structure(terms)
2c. structure
(spacing ofplanarstructures)
3a. grain size
(general)
3b. grainsize(sandstonas)
4. content ofimportantminerals
Value: light, darkChroma: pinkish, reddish,yellowish, brownish etc.Hue: pink, red, yellow, orange,brown, green, blue, purple, white,grey, black
layered, laminated, cross-bedded,massive, crystalline, porphyritic,cryptocrystalline, granular, clastic,amorphous, micritic etc.
bedded, laminated, massivemassive, flow-bandedfoliated, banded, cleaved
Very thickThickMediumThinThickly laminated (sedimentary)Narrow (metamorphic and igneous)Thinly laminated (sedimenary)Very narrow (metamorphic andigneous)
Very coarse grainedCoarse grainedMedium grainedFine grainedVery frne grained
coarsemedium grained medium
fine
Minerals that are known to haveinfluence on the dredging operation(hard minerals, plastic minerals):e.g. quartz, clay
Munsell colourchart may be used(Geol. Sos. ofAmerica)
refers to propertiesof individual grains(texture) and theirstructuralarrangement (fabric)
sedimentary rocksigneous roctsmetamorphic rocks
) 2mS0mm-2m200 mm - 600 mm@mm-200mm6mm-20mm6mm-20mm(6mm( 6mm
) 60mm2-60mm0.06 - 2 mm0.002 - 0.06 mm( 0.002 mm
0.6 -2mm0.2 - 0.6 mm0.06 - 0.2 mm
e.g. quartz-bearing:( 10 vol.Vo euartzprefix to rock name:
10 - 50 vol.%(quartz calcarenite)) 50vol.Vopresence must beclear from rockname.
BS 5039Geol. Soc. ofAmerica
BS 5039
Geot. Engn.Office (1994)
BS s039
Anon. 1977BeU 1992
BS 5039
Table A2Appendix E
BS 5039Table AlAppendix E
based on simple identifrcation orpetrographic study
5. rock name

Appendix B: Definitions for rock tnass description 283
6. ductility
7. strength
8. abrasiveness
9. weatheringstrate
ductileaveragebrittle
very weakweakmoderately weakmoderately strongstrongvery strongextremely stfong
low abrasivenessabrasivehighly abrasiveextremely abrasive
freshdiscoloureddecomposeddisintegrated
ucsiBTs < 99 -15>15
UCS < 1.25 MPa1.25 - 55 - r2.512.5 - 5050 - 100100 - 200> 20O MPa
F < 0.05 Nimm0.05 - 0.10.1 - 0.5> 0.5 N/mm
see Table A5
Table 9.1
Table t0r6
Table 11.2
Table A5
Table 82 Spacing of discontinuities in one dimension (rock core or scan line) (BS 5039:1981).
Spacing
Very widely spaced
Widely spaced
Medium spaced
Closely spaced
Very closely spaced
Bxtremely closely spaced
> 2m
600mm-2m
200 mm - 600 mm
60 mm - 200 mm
20- 60mm
< 20mm
Table 83 Spacing of discontinuities in three dimensions (rock mass) @S 5039:1981).
First term Maximum dimension
Very large
Large
Medium
Small
Very small
) 2m
600mm-2m
200 mm - 600 mm
60 rnm - 200 mm
( 60mm
Secondary term Nature of block
Blocky
Tabular
Columnar
Equidimensional
Thickness much less than length or width
Height much greater than cross section
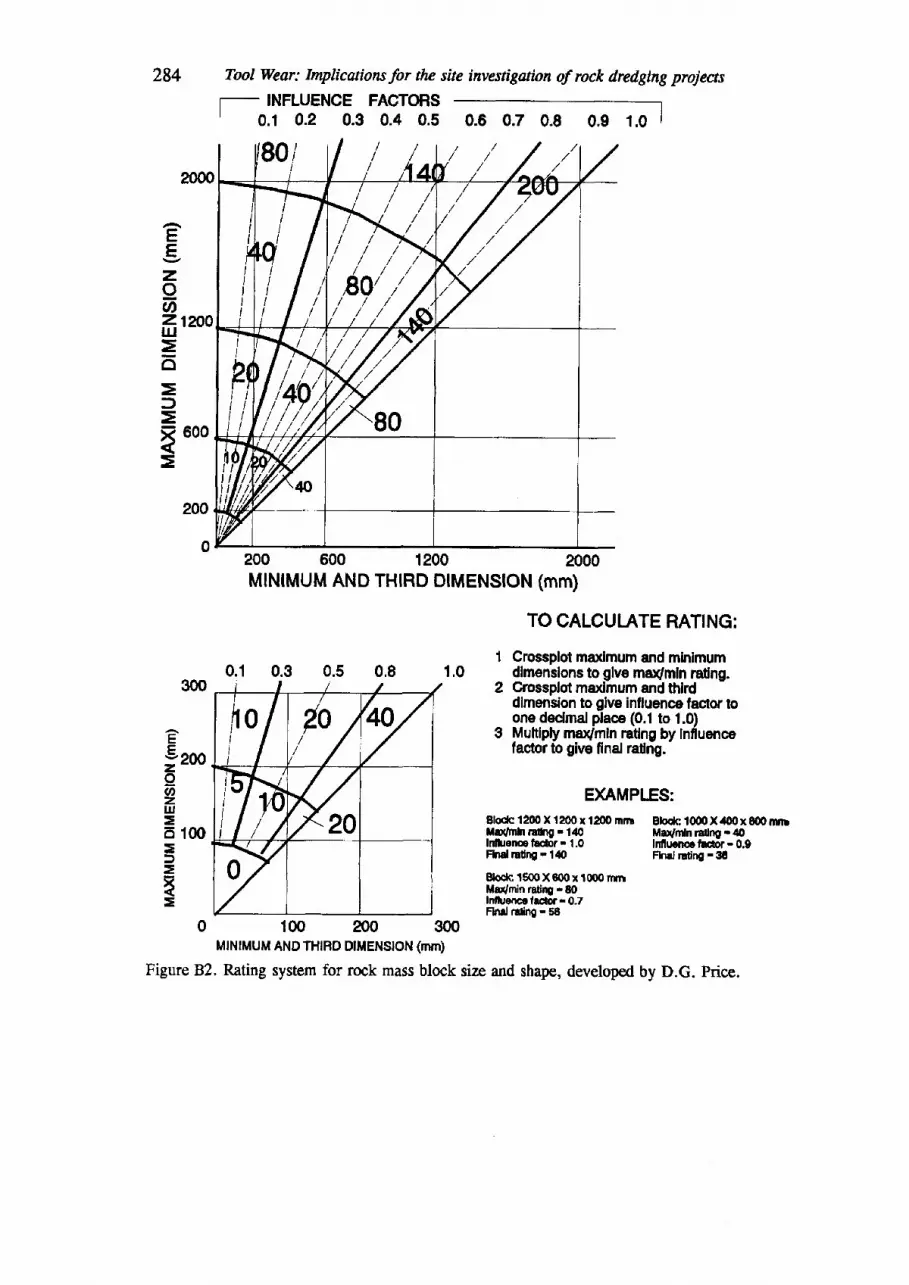
284 Tool Wear: Implicaiors for the site investigation of rock dred,ging projeasINFLUENCE FACTORS
0.1 0.2 0.3 0.4 0.5 0.6 0.7 0.8 0.9 1.0 |
2000
200
200 600 1200MINIMUM AND THIRD DIMENSION
EgzIozl?f/(ll-l
=6=:)
x 600=
2000(mm)
0.50.30.11
1 ,02
0.8
TO CALCUI.ATE RATTNG:
Crossplot maximum and minimumdlmenslons to glve ma{mln ratlng.Grossplot maximum and thirddlmension to glve influence faaor rc91e dedmal place (0.1 to 1.0)Muttlply max/mln ratlng by lnfluencefac,tor to give final ratng.
300
eE
Y200zIozUJ=6 100=f
x=
D(AMPI.ES:Bloafc 12m X 1200x 1200 mm Btodc 1000X400x800rrnllot/nh rtrE - 140ldluenolbcior.l.0Fhd retry - 149
Bbdc rsOOX8{nx 1€Xl0 rmMar/min ratittg - 36IntluetHl|frr-0-7Fhd rutnC - 58
Max/rnln railry - aglnllucnoc llmr . 0.9Fkul ntirP - 35
0 100 200 300MINIMUM ANDTHIRO DIMENSION (mm)
Figure 82. Rating system for rock mass block size and shape, developed by D.G. Price.
80/ /
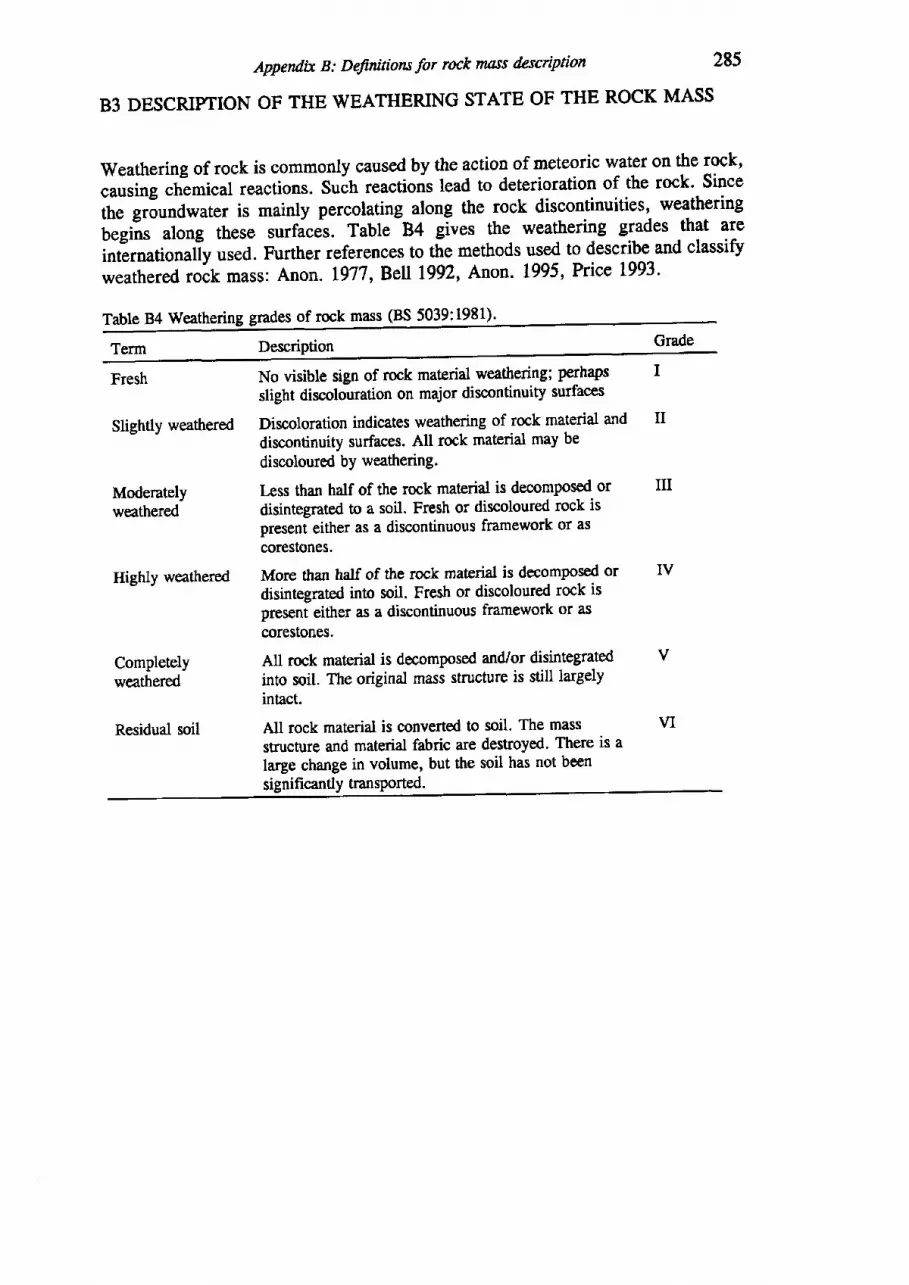
Appendix B: Definitioru for rock mass description 285
83 DESCRIPTION OF THE WEATHERING STATE OF THE ROCK MASS
Weathering of rock is commonly caused by the actioD of meteoric watef on the rock,
causing chemical reactions. Such reactions lead to deterioration of the rock' Since
tne gr6uoawater is mainly percolating along the rock discontinuities, weathering
begiis along these surfaces. Table 84 gives the weathering grades that are
iniernationaliy used. Further references to the methods used to describe and classify
weathered rock mass: Anon. 1977, Bell 19p/, Anon. 1995, Price 1993'
Table 84 Weathering grades of rock mass (BS 5039:1981)'
Description GradeTerm
Fresh
Slightly weathered
Moderatelyweathered
Highly weathered
Completelyweathered
Residual soil
No visible sign of rock material weathering; perhapsslight discolouration on major discontinuity surfaces
Discoloration indicates weathering of rock material anddiscontinuity surfaces. All rock material may bediscoloured by weathering.
Less than half of the rock material is decomposed ordisintegrated to a soil. Fresh or discoloured rock ispresent either as a discontinuous framework or ascorestones,
More than half of the rock matedal is decomposed ordisintegrated into soil. Fresh or discoloured rock ispresent either as a discontinuous framework or ascorestones.
Atl rock material is decomposed and/or disintegratedinto soil. The original mass structure is still largelyintact.
All rock materiat is converted to soil. The massstructure and material fabric are destroyed. There is alarge change in volume, but the soil has not been
II
ilI
Iv
VI
significantly transported.
APPENDIX C
Intact rock strength
The most common index tests that are used to estimate the material strength of rockare the Unconfined Compressive Strength (UCS) test, The Brazilian Tensile Strengthtest (BTS) and the Point Load Strength test (PLS). These tests are carried out understandard conditions, because the results depend on various factors, such as testspecimen shape and size, loading rates and other test conditions. Current proceduresfollow commonly the recommendations given by the ISRM (International Society forRock Mechanics; Brown 1981). Further background information on these tests canbe found in Brook (1993) and Pells (1993).
Cl UNCONFINED COMPRESSIVE STRENGTH
The Unconfined Compressive Strength test is the general accepted standard ofengineering strength for intact rock. The test is carried out on cylinders of rock.Apart from the requirements mentioned in the ISRM 1979 standard, some commentsare made on this test. To perform the test according to the standards accurate samplepreparation is required. The length/diameter ratio should preferably be larger than2 (the ISRM suggests 2.5), to avoid friction at the end platens affecting the stresscondition in the centre of the specimen. The specimen ends should be flat, parallel
and at 90o to the long axis of the core. Tests are normally carried out in a specialrock mechanics laboratory, which has the facilities of specimen preparation.Relatively simple testing frames exist to perform the test. Nowadays manylaboratories have stiff servo-controlled testing machines that provide the possibility
of accurate deformation monitoring during the test, also after failure. If available,with little extra effort, the tests could be performed on such a testing frame. Thecomplete stress-strain curve that is obtained this way gives additional informationbesides the unconfined strength, namely the deformation modulus and the specificwork of failure. The latter is larger in ductile rock and has successfully been relatedto rock drillability by Thuro (fhuro 1996, Thuro & Spaun 1996). Figure C1illustrates the concept.
Thuro (1996) calculates the specific work of failure (specific destruction work)using the complete stress-strain curve:
286
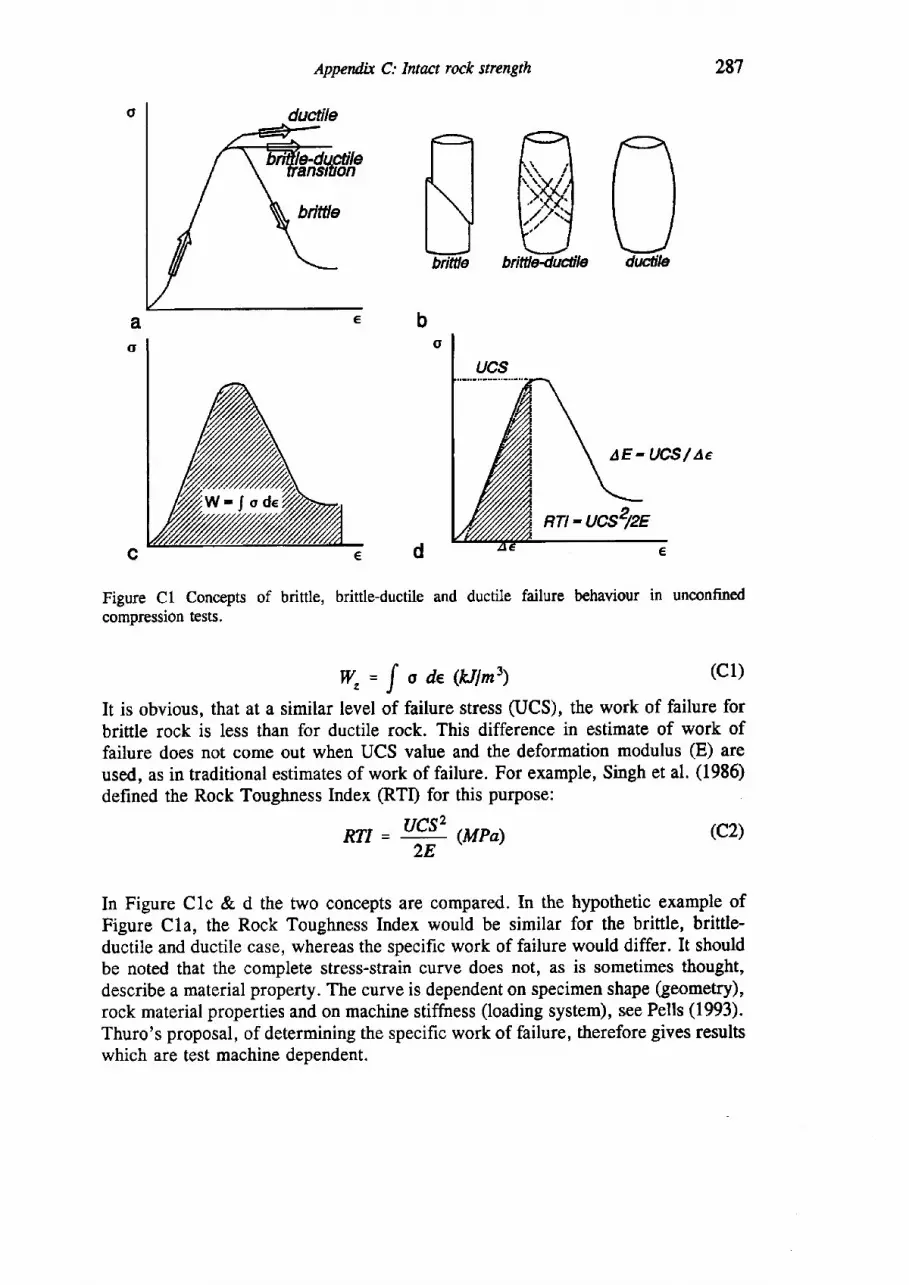
Appendit C: Iwact rock stength
Figure Cl Concepts of brittle, brittle-ductile and ductile failure behaviour in unconfinedcompression tests.
W"={ode(k lm i ) (c1)
It is obvious, that at a similar level of failure stress (UCS), the work of failure forbrittle rock is less than for ductile rock. This difference in estimate of work offailure does not come out when UCS value and the deformation modulus (E) areused, as in traditional estimates of work of failure. For example, Singh et al. (1986)defined the Rock Toughness Index (RTD for this purpose:
287
Idwtile
b
Rrr = ry (Mpa) (c2)
In Figure Clc & d the two concepts are compared. In the hypothetic example ofFigure Cla, the Rock Toughness Index would be similar for the brittle, brittle-ductile and ductile case, wheroas the specific work of failure would differ. It shouldbe noted that the complete stress-strain curvg does not, as is sometimes thought,describe a material property. The curve is dependent on specirnen shape (geometry),rock material properties and on machine stiffness (loading system), see Pells (1993).Thuro's proposal, of determining the specific work of failure, therefore gives resultswhich are test machine dependent.
aE - UCS/ Ae
141- J o de
288 Tool Wmr: Implicaions for the site investigaion of rock dredging projects
C2 BRAZILIAN TENSILE STRENGTH
The second relevant rock parameter is the Unconfined Tensile Strength (UTS).Direct tensile tests are not commonly performed, because these require much effortin sample preparation and testing procedures. The Brazilian split test is by far themost common test used to estimate tensile strength. The test is easy to perform andcan be used in the field as well, if a small diamond saw is available to cut parallelslices frour rock core. The test can be done on short length of core (less than 25mm) and no strict requirements regarding test disc preparation are needed. The smallsize of the samples makes it an excellent test to perform on many samples and toassess any anisotropy in strength of the rock. The diameter of the disc shouldpreferably be 50 mm, the grain size of the rock is important in this respect (10 timesthe grain size is the minimum requirement). Very coarse rock (like limestonescontaining quartz pebbles or large shells) may preclude valid testing, since the tensilecrack growth should start from the centre of the specimen. According to Pells(1993), the BTS test is generally valid for rocks which have a UCS > 5 MPa.
Once for each rock type within a project site the ratio UCS/BTS is established(which is important with regard to rock cutting), the test may be used as an estimateof UCS as well.
There is much discussion about the validity of the Brazilian test with regard tothe estimation of the direct Unconfined Tensile Strength (UTS) value. The discussionon the validity of the BTS test as estimate of the direct UTS stems from severalconcerns:
- Often crack growth starts directly below the platens of the compression jig instead of the centre of the specimen. This can be prevented by using cardboard stripsbetween the platens, which cause some circumferential confinement.
- The equation used to calculate BTS (ISRM suggested method 1978, in Brown1981) assumes the rock to be homogeneous, isotropic and elastic. Most rocks areanisotropic and this is known to affect the test result. Chen & Stimpson (1993) haveexamined the effect of the modulus of deformation (E) being unequal in tension andcompression. For most rocks the ratio Q/E" is smaller than I and the UTS isoverestimated. For example for a ratio of 0.5, the BTS overestimates the UTS byL5%.
- In a study of the comparison of the BTS test, the direct UTS test and the Hooptest (a promising new test to estimate UTS) Shulin Xu et al. (1988) found that theBTS of Penrith sandstone was four times higher than the direct UTS. Anothersandstone gave a BTS three times higher than UTS! (The Hoop test gave nearly thesame result as the direct UTS test). These observations suggest that the data inliterature on tensile strengths of rocks could have a bias towards too high values.Pells (1993) states that for most applications in practice this discussion is largelyacademic.
t0 Direct tensile tests apparently give more variation in test results due to this. Comparethe results of Shulin Xu et al. (1988) on Penrith sandstone: Coefficient of variation (COV)of BTS test: 157o, COV of Hoop test: I5%, COV of direct ItrIS: 25To.
Appendix C: Intact rock strength
C3 POINT LOAD STRENGTH
289
In rock dredging up to present the Unconfined Compressive Strength is used as themeasure of strength of intact rock and the main parameter to assess dredgeability.Often the portable Point Load test is used to determine the strength of a largenumber of samples. Originally the PLS test was a development from the Braziliantest and used to determine the tensile strength of brittle rocks (Hoek 1977). But in(very) weak rocks the test becomes inaccurate. The conical points penetrate into therock before failure and the failure itself may occur by a diffirse zone of multiplefractures and not by a vertical tensile fracture. Hoek (1977) suggests that, for thisreason, the test may not be valid for rocks which have a UCS/BTS ratio of less than5. Rocks with such low ratios are common in dredging projects (weak limestones,claystones etc.). But for more brittle rocks, when the test is carried out in diametricloading, the Point Load test might give a value reasonably close to the BTS value.A value of PLS=0.8*BTS (or BTS:1.25*PLS) is suggested by ISRM (1985), butit is advised to establish a correlation by comparing test results on samples of rock.Point loading resembles the wedge penetration of a cutting tool and although the testoccurs in a static mode, sometimes it correlates better with cutting tool performancethan either the UCS or the BTS test. If the point load test is carried out on rockcylinders (diametrical test), the coefficient of variation (COV), which gives anindication of the spreading of test results, is commonly somewhat lower than that ofthe BTS test (Piepers 1995).
The Point Load test can also be carried out on irregular lumps of rock. In fact,the test was originally meant as an aid in rock strength classification (Franklin et al.1971). The results of PLS index tests are commonly used to estimate UCS. The testcan be used on site, which is an advantage. It is well established that each rock typehas its own correlation of PLS with UCS. In other words for each projectcalibrations should be made8r. Normally a certain spreading of data points aroundthe calibration line is common. The standardized procedures for this test are givenby the ISRM suggested method (1985). As described there, the test can be used todetermine the strength anisotropy of the rock, which is significant for the cuttingprocess.
C4 EFFECT OF LOADING RATE AND MOISTURE
Loading rate influences the result of strength tests. This effect is discussed in relationto the stress rate dependence of cutting forces in Chapter 9.4 (see Figure 9.14). Athigh toading rates strength tends to increase exponentially, The reason for thestrength increase is not clear yet (see Goodman 1989).
8r Note that in the Franklin diagrams (Figure 15.1) the factor 24 is used (UCS : 24PLS), Pettifer & Fookes (1994) used the factor 20, which was the average for the rocls intheir data base (Figure 18.3).
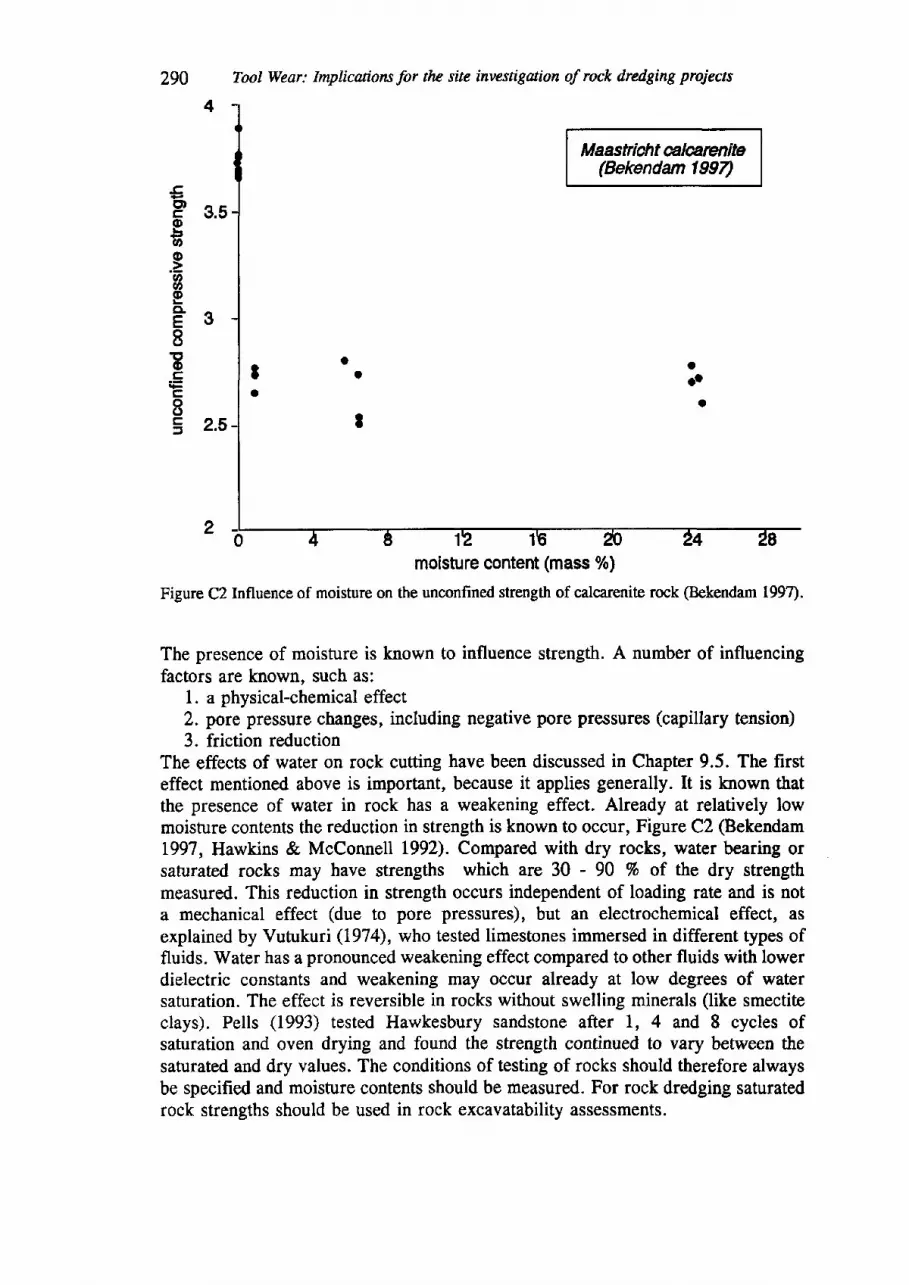
EP s.Eoba,o'6chEF38
!occoo5 2.5
290 Tool Wear: Implications for the site investigation of rock dredging projects
Maastricht alarenite(Bekendam 199n
moisture content (mass %)
Figure C2 Influence of moisture on the unconfined strength of calcarenite rock (Bekendam 1997).
The presence of moisture is known to influence strength. A number of influencingfactors are known, such as:
1. a physical-chemical effect2, pore pressure changes, including negative pore pressures (capillary tension)3. friction reduction
The effects of water on rock cutting have been discussed in Chapter 9.5. The firsteffect mentioned above is important, because it applies generally. It is known thatthe presence of water in rock has a weakening effect. Already at relatively lowmoisture contents the reduction in strength is known to occur, Figure C2 (Bekendam1997, Hawkins & McConnell 1992). Compared with dry rocks, water bearing orsaturated rocks may have strengths which are 30 - 90 Vo of the dry strengthmeasured. This reduction in strength occurs independent of loading rate and is nota mechanical effect (due to pore pressures), but an electrochemical effect, asexplained by Vutukuri (7974), who tested limestones immersed in different types offluids. Water has a pronounced weakening effect compared to other fluids with lowerdielectric constants and weakening may occur already at low degrees of watersaturation. The effect is reversible in rocks without swelling minerals (like smectiteclays). Pells (1993) tested Hawkesbury sandstone after 1, 4 and 8 cycles ofsaturation and oven drying and found the strength continued to vary between thesaturated and dry values. The conditions of testing of rocks should therefore alwaysbe specified and moisture contents should be measured. For rock dredging saturatedrock strengths should be used in rock excavatability assessments.
APPENDIX D
The brittle-ductile transition
The importance of the brittle-ductile transition for rock cutting is discussed in
Chapteig.l and by Verhoef er al. (1996). In the rock cutting model developed by
uittenbogaard et ui. 1it pfep.), see Figure 9.2, it is emphasized that a crushed zone
is presenl below the tip of tit" cutting tool. This implies that the stress field near the
tij is in the ductile cataclastic failure field. During rock cutting therefore the
complete failure envelope for intact rock is addressed'The stress level at whicn the transition from brittle to ductile failure occurs is of
interest. It occurs at the apex of the failure envelope, as illustrated by the results of
three series of triaxial tests carried out by Ockeloen (1997). Figure Dl shows typical
stress-strain curves for tests done with increasing confining pfessure on Felser
sandstone. The surface area below the failure envelopes relates to the amount of
work involved in the failure process, in analogue with the stress-strain diagram of
an unconfined test (Figure Ct A Dl). The failure stresses are plotted in a p-q
diagram in Figure D2,-together with the results of tests on mortar and calcarenite
,ork. Th. failure stresses of ttte triaxial tests define the failure envelope of the three
rocks (compare with Figur e 9.2). The diagram of Figure D2 indicates that the briffle-
ductile tranlition of thJ Felser sandstone is at a relatively higher normalized stress
level than that of the mortar and calcarenite. The two lines shown in the figure are
the brittleductile transition stress lines found by Mogi (1966). The line or:3.4o3
approximates the BD (brittle-ductile) transition stress for silicate rocks, the line
ir:4.Zotwas the best fit for the BD transition stress of carbonate (limestone) rocks.
These lines separate the diagram in a brittle failure area (left of the lines) and a
ductile failure area (right of the lines), see also Figure 9.2 & 4.
Apart from triaxiaitess to establish the failure envelope aod the brittle-ductile
transition stress, other methods have been mentioned that may indicate ductile or
brittle rock:l. The ratio UCS/BTS (ductility number). Gehring (1987) proposed boundaries
(Chapter g.L.2, Table 9.1). A ratio ( 9 indicates ductile rock; ) 15 brittle rock.' 2. .qssessing the complete stress-strain path of a UCS test and estimate the
specific work of failure (Figure C1).3. Estimare the failure invelope using BTS (or PLS) and UCS test and the
empirical Hoek-Brown failure criterion.Thise three possibilities have been examined and are discussed in the next section.
29r
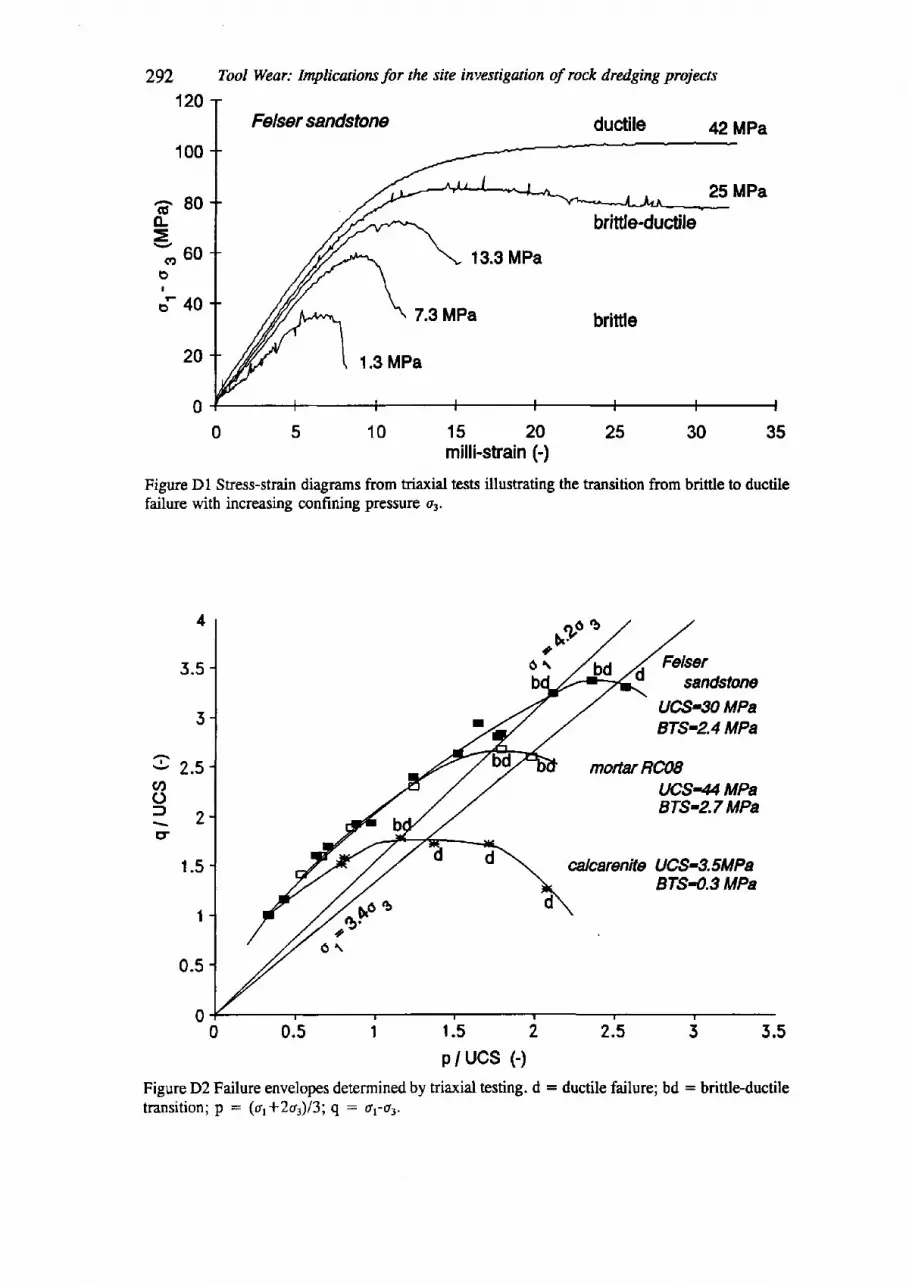
120
100
6800-=-r
6ooI
o- 40
20
0
4
5.5
5
e z.sCNC)f , 7
r
1 .5
1
0.5
0
292 Tool Wear: Inplicatiors for the site invesrigation of rock dredging projecn
Felser sandstone ductile 42MPa
25 MPa
brittle-ductile
13.3 MPa
7.3 MPa
1.3 MPa
15 20 25 30 35milli-strain (-)
Figure Dl Stress-strain diagrams from triaxial tests illustrating the transition from brittle to ductilefailure with increasing confining pressure 03.
Felsersandstone
UCS-30 MPaBTS-2.4 MPa
mortar RCMUCS-44 MPaBTS-2.7 MPa
alcarenite UCS-3.fiMPaBTS4.3 MPa
6lo "
f .5 2 2 .5 5 5 .5p / ucs (-)
Figure D2 Failure envelopes determined by triaxial testing. d = ductile failure; bd = brittle-ductiletransit ion; p = (or*2q)13;q: ot-ot.
10
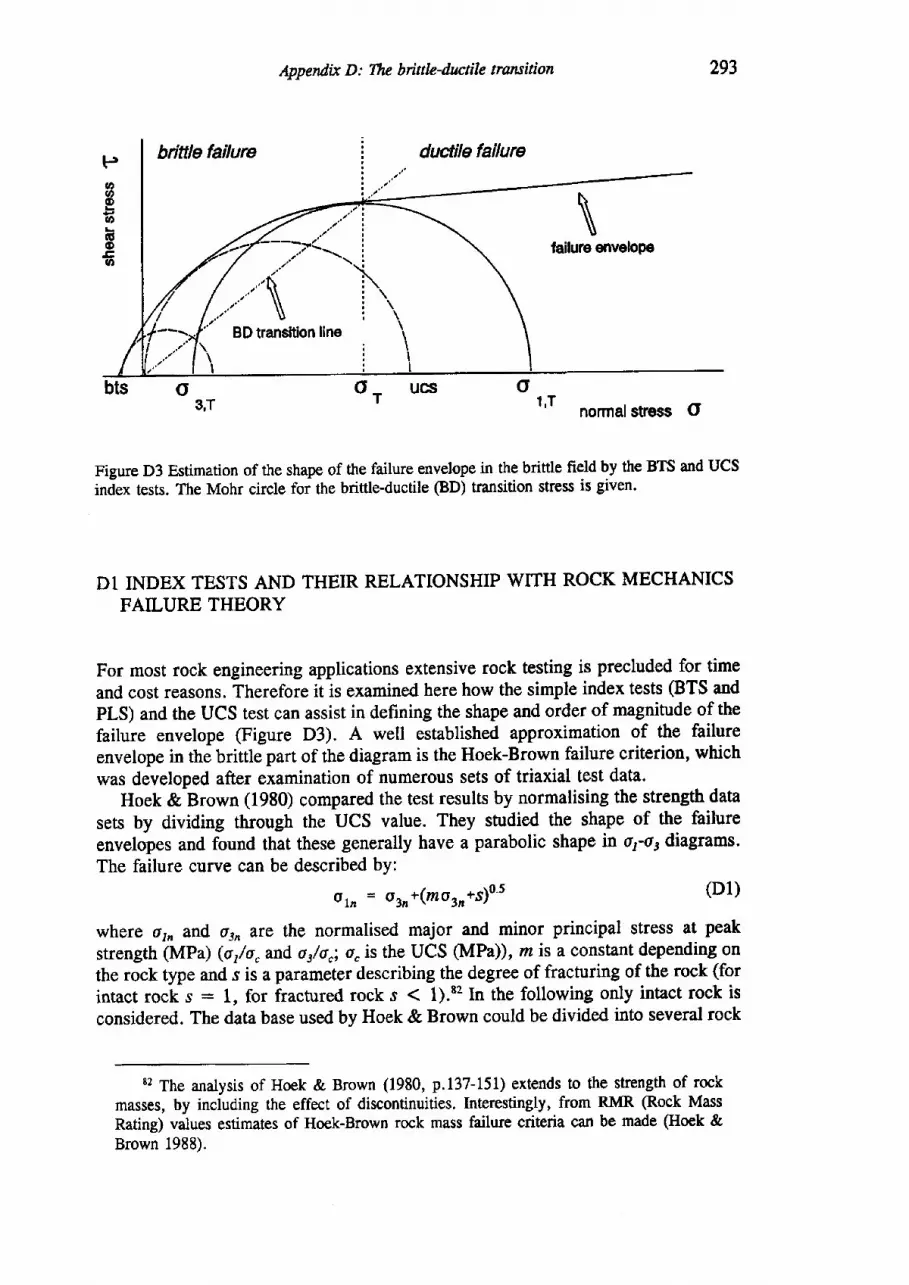
Append.ix D: Tlw bittle-furcrt|e transition
brtftle failure ductile failure
s2 The analysis of Hoek & Brown (1980, p.137-151) extends !o the strength of rockmasses, by including the effect of discontinuities. Interestingly, from RMR (Rock MassRating) values estimates of Hoek-Brown rock mass failure criteria can be made (Hoek &Brown 1988).
293
Pa.l)oth
t5oEQ
\failure envelope
1'T normalstress o
Figure D3 Estimation of the shape of the failure envelope in the brittle field by the BTS and UCSindex tests. The Mohr circle for the brittle-ductile @D) transition stress is given.
Dl INDEX TESTS AND THEIR RELATIONSHIP WITH ROCK MECHANICSFAILURE THEORY
For most rock engineering applications extensive rock testing is precluded for time
and cost reasons. Therefore it is examined here how the simple index tests @TS andPLS) and the UCS test can assist in defining the shape and order of magnitude of the
failure envelope (Figure D3). A well established approximation of the failure
envelope in the brittle part of the diagram is the Hoek-Brown failure criterion, which
was developed after examination of numerous sets of triaxial test data.Hoek & Brown (1980) comparcd the test results by normalising the strength data
sets by dividing through the UCS value. They studied the shape of the failure
envelopes and found that these generally have a parabolic shape in oso3 diagrams.The failure curve can be described by:
oLn = oro+(rzoro+s)o'5 (D1)
where orn and ojn xto the normalised major and minor principal stress at peak
strength (MPa) (o,/o"and or/o,; o" is the UCS (MPa)), m is a constant depending onthe rock type and s is a parameter describing the degree of fracturing of the rock (for
intact rock s : 1, for fractured rock s < l).tt In the following only intact rock is
considered. The data base used by Hoek & Brown could be divided into several rock
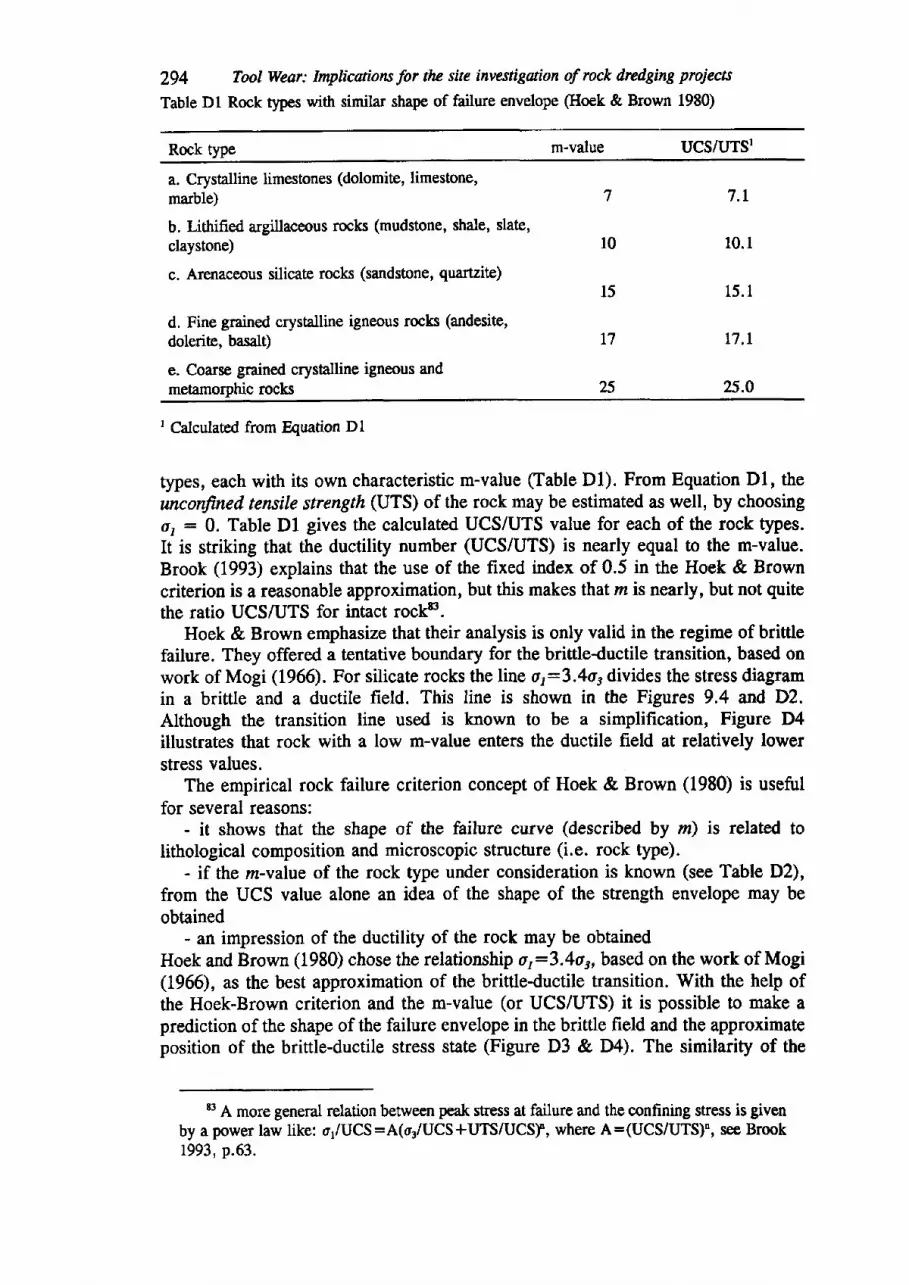
294 Tool Wear: Implicaions for tlu site investigaion of rock dredging proiecu
Table Dl. Rock tlpes with similar shape of failure envelope (Hoek & Brown 1980)
Rock type m-value ucs/ursta. Crystalline limestones (dolomite, limestone,marble)
b, Lithified argillaceous rocks (mudstone, shale, slate,claystone)
c. Arenaceous silicate rocks (sandstone, quartzite)
d. Fine grained crystalline igneous rocls (andesite,dolerite, basalQ
e. Coarse grained crystalline igneous andmetamorphic rocls
l0
l5
T7
7.r
l0 . l
15 .1
t7. l
25.0
t Calculated from Equation Dl
types, each with its own characteristic m-value Clable Dl). From Equation Dl, theunconrtned tensile strength (UTS) of the rock may be estimated as well, by choosingot : 0.Table Dl gives the calculated UCS/UTS value for each of the rock types.It is striking that the ductility number (UCS/UTS) is nearly equal to the m-value.Brook (1993) explains that the use of the fixed index of 0.5 in the Hoek & Brswncriterion is a reasonable approximation, but this makes that m is nearly, but not quitethe ratio UCS/UTS for intact rockf.
Hoek & Brown emphasize that their analysis is only valid in the regime of brittlefailure. They offered a tentative boundary for the brittleductile transition, based onwork of Mogi (1966). For silicate rocks the line o1:3.4o, divides the stress diagramin a brittle and a ductile field. This line is shown in the Figures 9.4 and D2.Although the transition line used is known to be a simplification, Figure Dlillustrates that rock with a low m-value enters the ductile field at relatively lowerstress values.
The empirical rock failure criterion concept of Hoek & Brown (1980) is usefulfor several reasons:
- it shows that the shape of the failure curve (described by m) is related totithological composition and microscopic structure (i.e. rock type).
- if the ru-value of the rock type under consideration is known (see Table D2),from the UCS value alone an idea of the shape of the strength envelope may beobtained
- an impression of the ductility of the rock may be obtainedHoek and Brown (1980) chose the relationship or:J.4or, based on the work of Mogi(1966), as the best approximation of the brittle-ductile transition. With the help ofthe Hoek-Brown criterion and the m-value (or UCS/LJTS) it is possible to make aprediction of the shape of the failure envelope in the brittle field and the approximateposition of the brittle-ductile stress state (Figure D3 & D4). The similarity of the
t3 A more general relation between peak stress at failure and the confining stress is givenby a power law like: o1lUCS=A(o3lUCS*UTS/UCSL where a=IUCS/UTS)', see Brook1993, p.63.
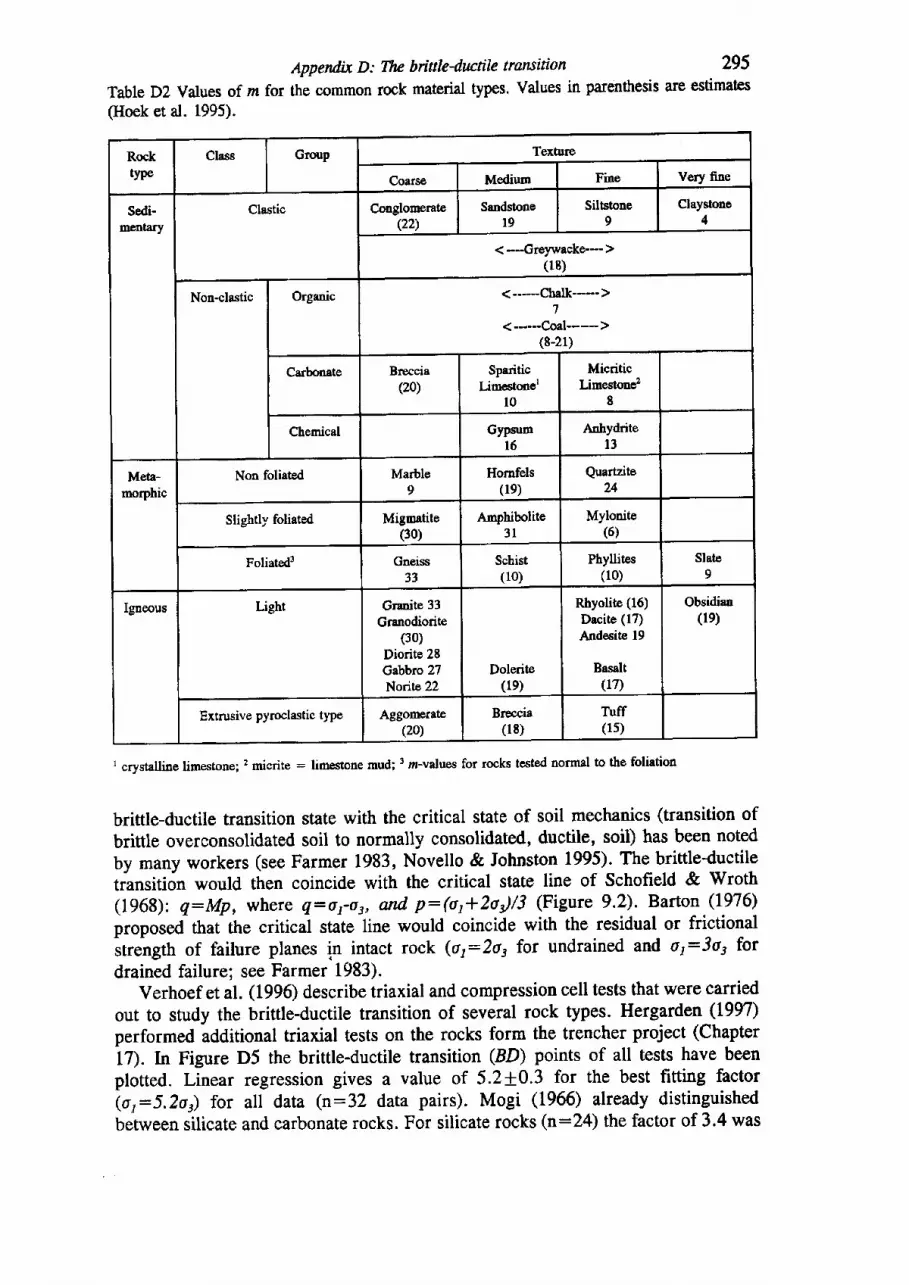
Rocktype
Class Group Texhrre
Coarso Medium Fine Vory fine
Sedi-mentary
Clastic Conglomerate(22)
Sands{ooer9
Siltstone9
Claysione4
< -*Greywacke--)(18)
Non-clastic Organic <---chdk---->7
<----Coel---->(8-21)
Carbonate Breccia(20)
SpariticLimestoner
l0
MicriticLimestone2
I
Chemical Gypsmr6
Anhydritel3
Meta-rnorphic
Non foliated Marble9
Homfels(le)
Quartzite24
slighrly foliated Migmatite(30)
Amphibolite3 l
Mylonite(6)
Foliated3 Gneiss31
Schist(10)
Phyllites(10)
Slate9
lgneous Ught Granite 33Granodiorite
(30)Diorite 28Gabbro 27Norite 22
Dolerito(le)
Rhyolite (16)Dacite (17)Andesite 19
Basalt(r7>
Obsidian(le)
Extrusive pyroclastic type Aggomerste(20)
Breccia(l 8)
Tuff(1s)
I crystalline limestone; 2 micrite : limestone mud; I m-values for rocks test'ed normal O the foliation
Appendix D: The brinle4ttctile tansition 295
Table D2 Values of m for the common rock material types. Values in parenthesis are estimates
(Hoek et al. 1995).
brittle-ductile transition skte with the critical state of soil mechanics (transition of
brittle overconsolidated soil to normally consolidated, ductile, soil) has been noted
by many workers (see Farmer 1983, Novello & Johnston 1995). The brittleductiletransiti;n would then coincide with the critical state line of Schofield & Wroth(1968): e:Mp, where q:o;ojt and p:(or+2o)/3 (Figure 9.2). Barton (1976)
proposed thai the critical state line would coincide with the residual or frictional
strength of failure planes in intact rock (or:2o, for undrained and or:3os for
drained failure; see Farmer 1983).Verhoef et al. (1996) describe triaxial and compression cell tests that were carried
out to study the brittle-ductile transition of several rock types. Hergarden (1997)
performed additional triaxial tests on the rocks form the trencher project (Chapter
17). In Figure D5 the brittle-ductile transition (BD) points of all tests have beenplotted. Linear regression gives a value of 5.2*0.3 for the best fitting factor(o,:5.2or) for all data (n:32 data pairs). Mogi (1966) already distinguishedbetween silicate and carbonate rocks. For silicate rocks (n:24) the factor of 3.4 was
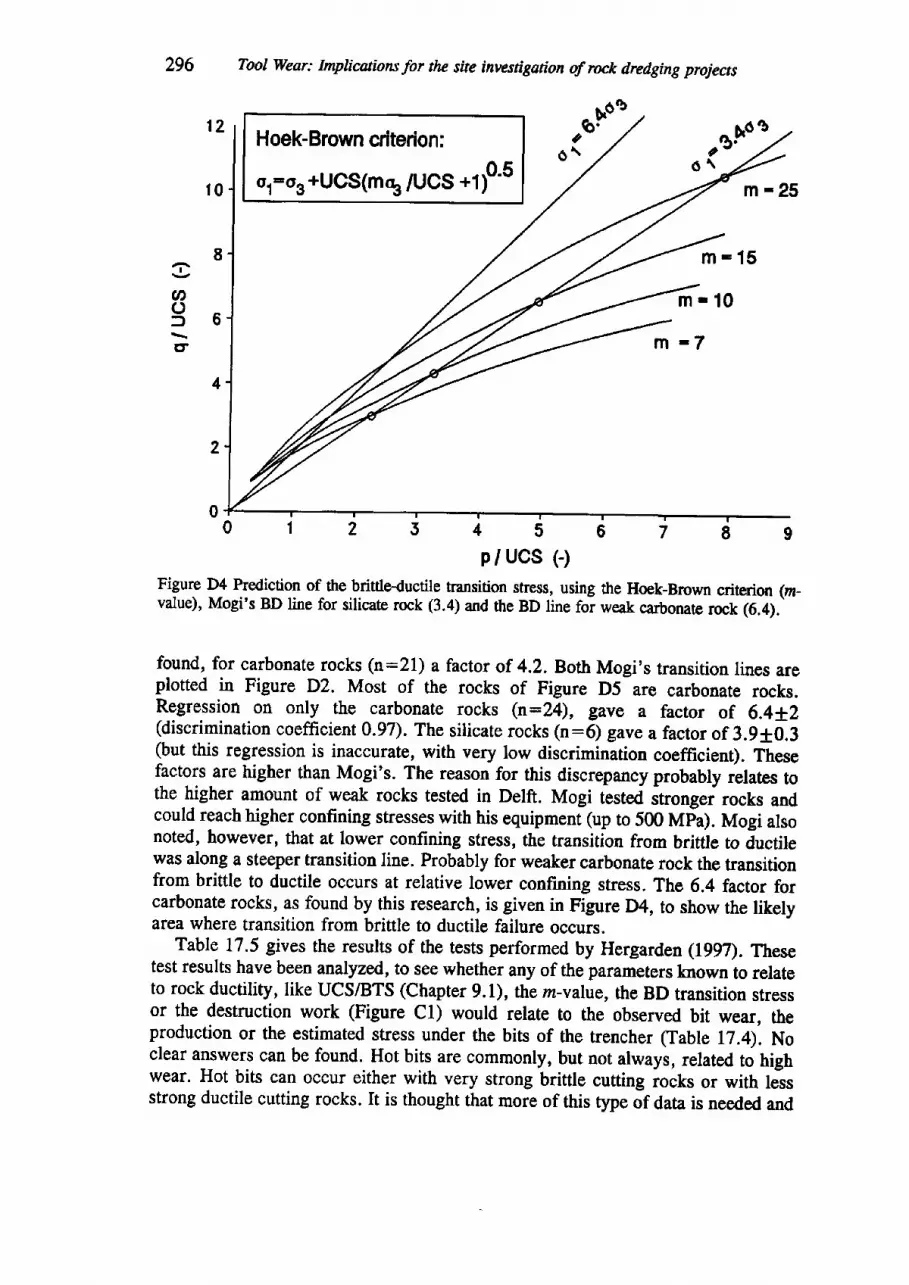
296 Tool wear: Implicuiorts for tlu site inwstigation of rock dredging projects
Hoek-Brown criterion:
o,=o. +!lQS(m% /UCS *1f'5
6F0".c6 \ o9l
m-25
m-15
m-10
l n -7
P / UCS 1-1Figure D4 Prediction of the brittle{uctile transition stress, using the Hoek-Brown criterion (rn-value), Mogi's BD line for silicate rock (3.4) and the BD line for weak carbonate rock (6.4).
found, for carbonate rocks (n:21) a factor of 4.2. Both Mogi's transition lines areplotted in Figure D2. Most of the rocks of Figure D5 are carbonate rocks.Regression on only the carbonate rocks (n:24), gave a factor of 6.4t2(discrimination coeffrcient 0.97). The silicate rocks (n:6) gave a factor of 3.910.3(but this regression is inaccurate, with very low discriminition coeffrcient). Thesefactors are higher than Mogi's. The reason for this discrepancy probably relates tothe higher amount of weak rocks tested in Delft. Mogi tested it.oogri rocks andcould reach higher confining stresses with his equipment (up to 500 Mpa). Mogi alsonoted, however, that at lower confining stress, the transition from brittle to ductilewas along a steeper transition line. Probably for weaker carbonate rock the transitionfrom brittle to ductile occurs at relative lower confining stress. The 6.4 factor forcarbonate rocks, as found by this research, is given in Figure Dr[, to show the likelyarea where transition from brittle to ductile failure occurs.
Table 17.5 gives the results of the tests performed by Hergarden (lgg7). Thesetest results have been anaIyzd,, to see whether any of the parameters known to relateto rock ductility, Iike UCS/BTS (Chapter 9.1), the z-value, the BD transition srressor the destruction work (Figure Cl) would relate to the observed bit wear, theproduction or the estimated stress under the bits of the trencher flable 17.4). Noclear answers can be found. Hot bits are commonly, but not always, related to highwear. Hot bits can occur either with very strong brittle cutting iocks or with lessstrong ductile cutting rocks. It is thought that more of this type of data is needed and
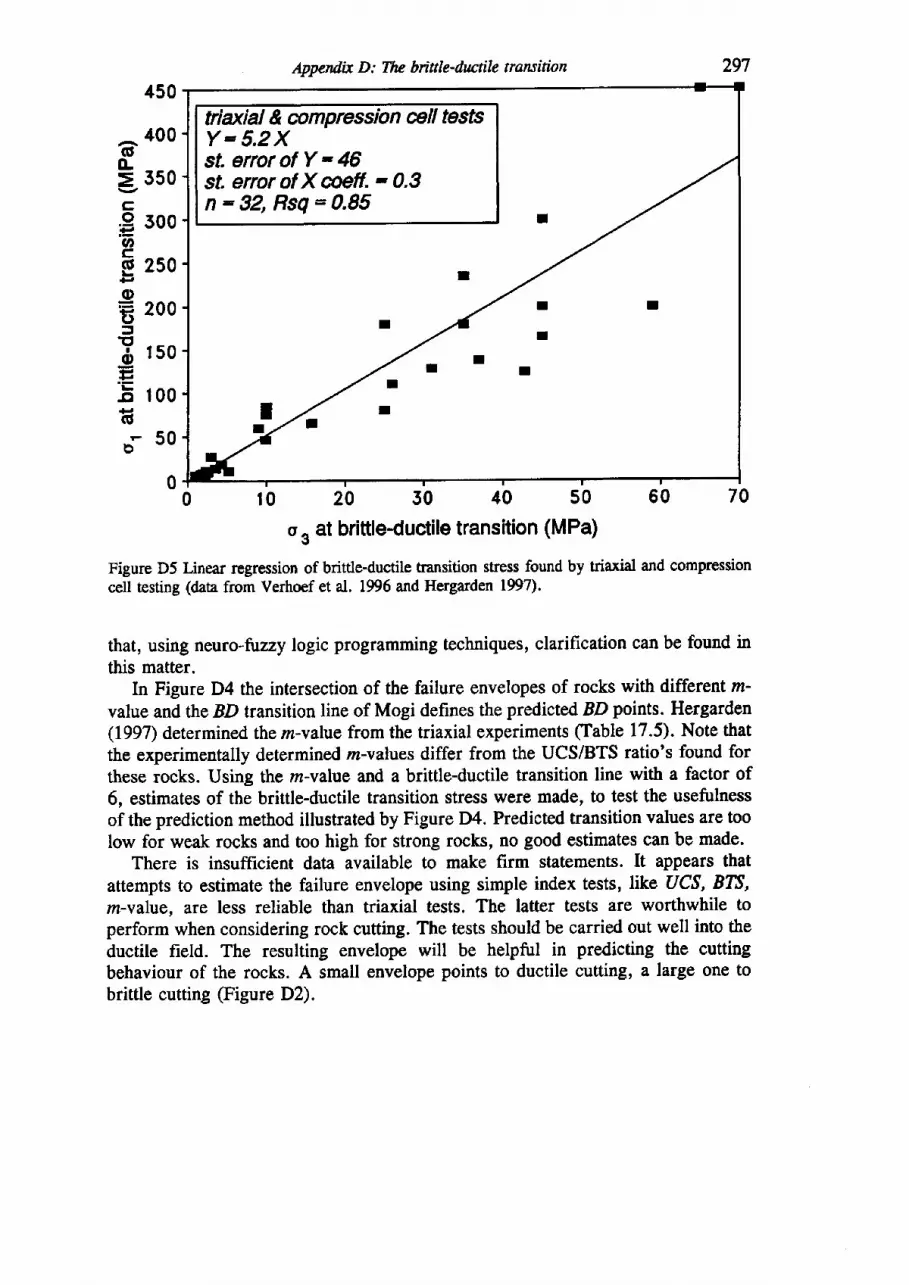
(tro-=
Co'6c(s
ofJ
rE,I
ofr.E.cI.H(tr
b
450
400
350
300
250
200
150
r00
50
0
Appendix D: Tlu briale-hrctile transition 297
fia)dal & compression ellfesfsY: 5.2 Xst. error of Y - 46st. error of X wff. - 0,3n - 32, Rsq = 0.85
t
I
I
I
I
Ia .
I
II
0r02050l l
40 50 60 70
o. ot brittle-ductile transition (MPa)
Figure D5 Linear regression of brittle-ductile fansition stress found by triaxial and compressioncell testing (data from Verhoef et al. 1996 and Hergarden lD7).
that, using neuro-fuzzy logic programming techniques, clarification can be found inthis matter.
In Figure D4 the intersection of the failure envelopes of rocks with different m-value and the BD transition line of Mogi defines the predicted BD points. Hergarden(1997) determined the m-vabte from the triaxial experiments (Table 17.5). Note thatthe experimentatly determined rz-values differ from the UCS/BTS ratio's found forthese rocks. Using the m-value and a brittle-ductile transition line with a factor of6, estimates of the brittle-ductile transition stress were made, to test the usefulnessof the prediction method illustrated by Figure D4. Predicted transition values are toolow for weak rocks and too high for strong rocks, no good estimates can be made.
There is insuffrcient data available to make firm statements. It appears thatattempts to estimate the failure envelope using simple index tests, like ACS, B75,m-vaIve, are less reliable than triaxial tests. The latter tests are worthwhile toperform when considering rock cutting. The tests should be carried out well into theductile field. The resulting envelope will be helpful in predicting the cuttingbehaviour of the rocks. A small envelope points to ductile cutting, a large one tobrittle cutting (Figure D2).
APPENDIX E
Petrographic description
The microscopic composition and strucfure of intact rocks have a profound influenceon their mechanical behaviour. This is well established and in the context of thiswork, illustrated by the study of abrasiveness (Chapter 11) and the clearly distinctbehaviour of carbonate and silicate rocks during rock trenching (Chapter l7).Therefore it is important that the rocks that are considered in a dredging project areadequately described. It is important that the composition and the texture of the rocksare well known. This implies that a petrographic study of the rock tnles should beundertaken. Important to know are:
- mineralogical composition- rock microstructure (texture)- homogeneity- anisotropy
During the drilling campaign the rock should be described by a professionalengineering geologist, by methods of visual examination. Very commonly thisdescription occurs using standard codes. This practice is encouraged and descriptionswhich are not done using an established code of practice should not be acceptedwithout confirmation of their quality. The Code of practice for Site investigations@ritish Standard Institute, BS 5930:1981) is an example of a good standard. ThePIANC (1984) classification of soils and rocks to be dredged follows and refers tothe BS code.sa
Besides the visual examination, however, microscopic investigation of tpicalsamples from a site should be undertaken to obtain information vital for theinterpretation of potential abrasiveness of rock. Petrographic examination should becarried out by specialists. From the rock a thin section should be prepared, bycutting a slice of rock, atkch this to a glass plate and grinding and polishing thisdown to 0.3 mm thickness. Also from porous sandy soils such thin sections can beprepared. The soil sample should be immersed with epoxy resin before preparation.
s For the interested contractor and consulting engineer, a simple scheme to recognizeminerals and rock is presented in Appendix A. Ttris resembles the scheme of BS 5930:1981and the classification of PIANC. Apart from the general classification, a classification ofcarbonate rocks is included.
298
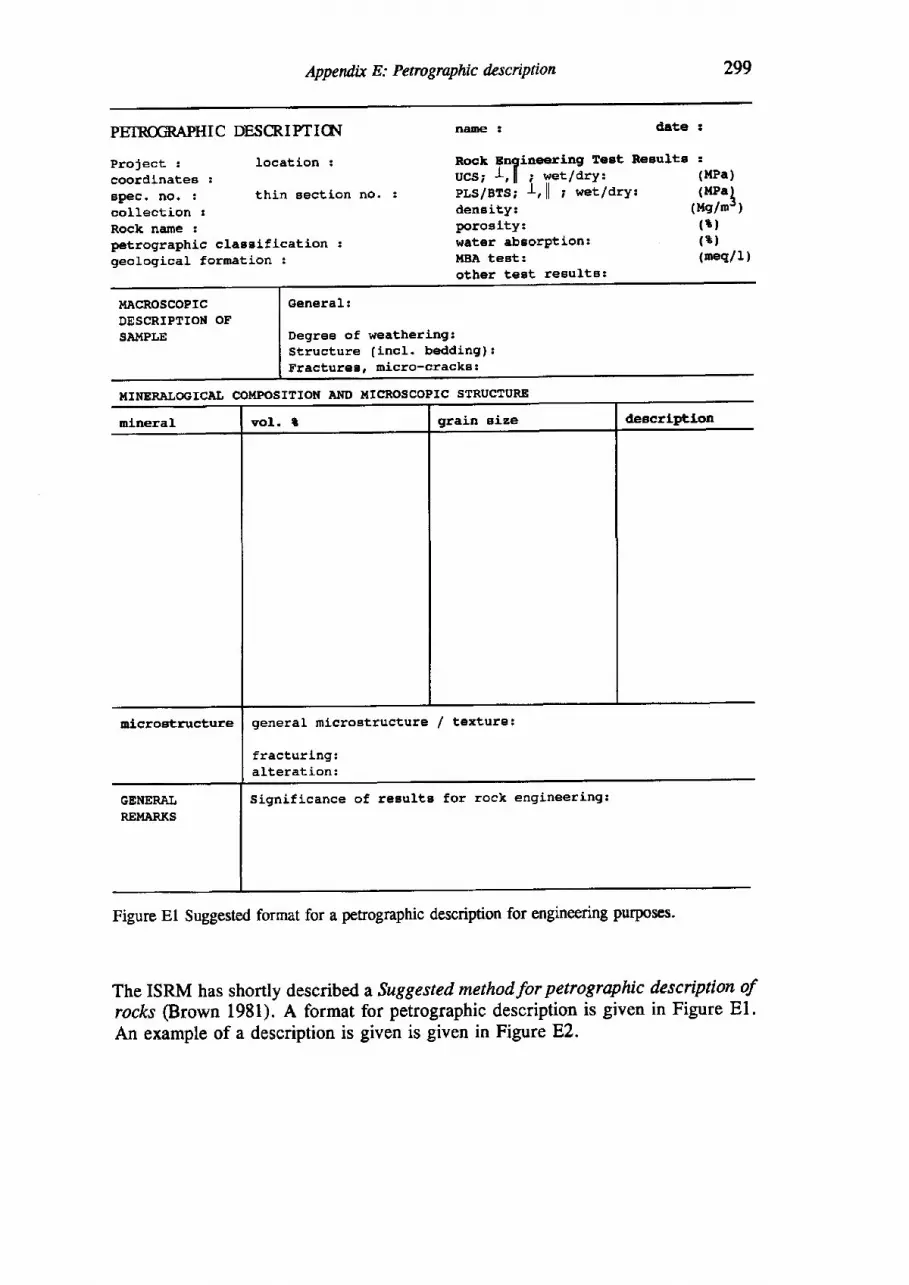
Appendix E: Petrogrqhic dcscrtption 299
PEIRtrMPHI C DESCR.I PTICN nare : date !
Rock Bngiaeering Teet ReEultsUCS; I r l ; wet , /d rY lPLS/BTS; f , l l ; wet/dry:deneity:porosity!rrater abeorption:l,lBA test:other test reeulte:
Project :coordlnatee :
Fpec. no. :col lect ion :Rock name :petrographic classifLcation :geological. formation :
location :
thin eectLon no. :
3
(MPa)(uPal
(Mslmr)( t )( t )(meq/1 )
uAcRoscoPrcDESCRIPTION OFSA!.{PLE
General:
Degree of weathering:Structure ( incl. bedding) !
FracturEB, micro-cracks:
MINERALOGICAL COI.IPOSTrION AND UTCROSCOPIC STRUCIURE
nineral vol. t grain eize deecrLptlon
oicrostructure
GENER.AI.REMARKS
general mlcrostructure
f ractur lng:a l terat ion:
signj.f icance of reEuItE
texture 3
for rock engineering:
Figure El Suggested format for a petrogmphic description for engineenng Pulposes.
The ISRM has shortly described a Suggested methodfor petrographic description ofrocks @rown 1981). A format for petrographic description is given in Figure El.An example of a description is given is given in Figure E2.
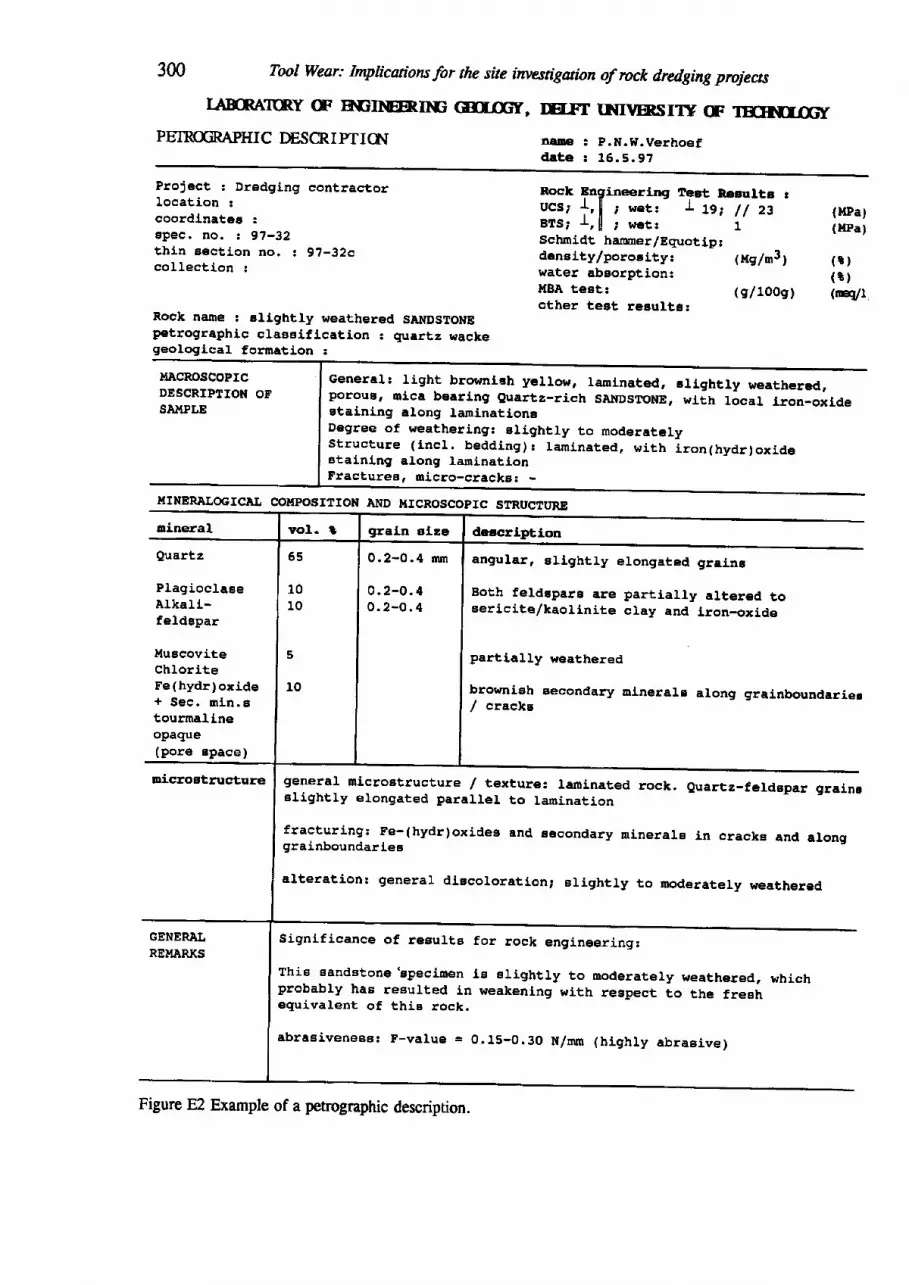
300 Tool Wear: Implicaions for the site invesrtgaion of rock dredging projeas
IjffiAI(RY tr EIGIIIGERII$] rffirmr, IELF'r (NIvRsITv ff TEIIL(ErPEIRMRAPIIIC TSCR I PTIChI neE 3 P.N.w.verhoef
d a t e : 1 6 . 5 . 9 7
ProJect : Dredging contractorIocation :coordlnatee :spec. no. t 97-32thin Boctlon no. : 9?-32ccol lect ion :
Rock nane : elightly weathered SANDSTONEp€trographic claeeification . quartz wackegeologlcal formatl-on :
MACROSCOPICDESCRIPITON OFSAMPLE
aineral
Quartz
P lag ioc laEeAIkaIi-feldapar
Mueeovitechlori teFe (hydr) oxide+ S e c . m i n . stourmalineopa{Jue(pore Bpace)
uicrostrusture
Rock Enpineering Teet Reaults :ucs ; { , [ I , . t t I S ; 11 zsBTS; r , [ ; wet , 1Schnidt harnner/Equotlp:dans lty/poroa lty :rdater abeorption:UBA t€st:other teet regultg:
(uPaf(llPal
(nsln3) (r)( r )
(s/100s) (q/l
General: light brownrah yerrow, rarnrnated, errghtr.y neathered,poroug, mtca bearlng guartz-rich sANDSrloNE, wLth local iron-oxrcleetaining along larninationgDegree of weathering: elLghtly to moderatelyStructure ( incl. bedding) I larninated, with iron(hydr)oxideetalnLng along larninatl_onFracturee, micro-cracke: -
deecrlption
anEular, et ightly elongated graina
Both feldepars are partlally altered toserici te/kaol inite clay and iron-oxide
partl,ally weathered
brownieh eecondary mLnerale along grelnboundarier/ cracks
general nicroetructure / texture: laminated rock. Quartz-feldepar grain!elightly elongated parallel to lamination
fraeturing: Fe- (hydr) oxidee and gecondary ninerals Ln cracke and aloaggrainboundarles
alterat ion: general dLEsoloratlon; alJ.ghtly to moderately weathered
GENERALREUARKS
Signlf icance of reEults for rock engineering:
Thie eandatone'specinen re erightly to moderately weathered,probably has resurted ln weakening with respect to the freshequivalent of this rock.
abraeivenees: F-value = 0.1s-0.30 N/rnm (hlghry abraeive)
which
Ii{INERALO€ICAIJ COUPOSIAION AND ItI CROSCOPIC STRUC1URE
65
1010
5
10
0 .2 -0 .4 nm
0 . 2 - 0 . 40 . 2 - 0 . 4
Figure E2 Example of a pehographic description.
References
Abdullatif, O.M. & D.M. Cruden 1983. The relationship between rock mass quality
and ease of excavation. Bull Int. Assoc. EnT. Geol.:28, 183-187.
Al-Ameen, S.I. & M.D. Waller L992. Petrographic analysis for assessing the
abrasiveness of Coal Measures rocks. Dep. Min. Resour. Eng' Mag.: 44,29'34'
Al-Ameen, S.I. & M.D. Waller 1994. The influence of rock strength and abrasive
mineral content on the Cerchar Abrasive Index. Engineering Geologyt 36,293'
301.Aleman, V.P. 1983. Prediction of cutting rates for boom type roadheaders. Ttnnels
& Tttmelltng lan 1983: 23-25.Aleva, G.J.J. tdqO. Laterites. Concepts, geology, morphology and chemistry' ISRIC
(Iniernational Soil Reference and Information Centre.pp. 169. Wageningen, The
Netherlands.Alvarez Grima, M., M.H. den Hartog, H.J.R. Deketh, P.N.W. Verhoef & R.
Babuska L996. Uncertainty handling of mechanical excavation processes with
tuz.zy logic (Geotechnics Congress, Havana, September 1996)'Alvarez Grima, M. & P.N.W. Verhoef t997. Forecasting of rock trencher
performance using a fuzzy logic approach. Int. J. Rock Mech. & Min. Sci.:34,
34, puprt no. 325 (36th US Rock Mechanics symposium, NYRocks'97).
Ang, A.H--S & W.H.Tang 1988. Probability Concepts in Engineering Planning ond
besign, volume ll-Decision, Risk, and Reliability. Ioln wiley & sons.Anon. lgll fnedescription of rock masses for engineering purposes. Working party
report. Q. J. Engng. Geol.: 10, 355-388'Anon. 1995 The deiciiption and classification of weathered rocks for engineering
pulposes. Working party report. Q- J. Engng. Geol-: 28,207'242'Archei R. 1983. Port Hedland. Western Australia 1:50.000 Urban Geology Sertes:
Sheet 2657 trI. Geological Survey of Western Australia 66 Adelaide Tce., Perth.
Atkinson, R.H. 1993. Hardness tests for rock characterization. In: J.A. Hudson (ed.)
Comprehensive Rock Engineering, vol. 3, Rock testing and site clnracterizationi105 - 117. Permagon Press, Oxford.
Babuska, R. 1995 Fuzzy logic in modelling and control. Proceedings SymposiwnComputational btelligence, May l0 1995, Delft, The Netherlands.
301
302 Tool Wear: Implications for thc site investigaion of rock dredging projects
Barron, N. 1976. The shear strength of rock and rock joints. Int. I. Rock Mech. &Min. Sci.: 13,255-279.
Barton, N., R.Lien & J.Lunde I974. Engineering classification of rock masses forthe design of tunnel support. Rock Mechanics: 6, 189-236.
Barton, N. & O. Stephanson (eds.) 1990. Rock Joints. Proceedings InternationalSymposium, 4-6 June, Loen, Norway:814 pp. Balkema, Rotterdam.
Bekendam, R. 1997. The assessment of stabiliry of the calcarenite room and pillarmtnes of South Limburg. PhD thesis Faculty of Applied Earth Sciences, inpreparation.
Bell, F.G. 1992. Engineering in rock mc$ses. Butterworth, Oxford. 580 pp.Bieniawski, Z.T. 1974. Geomechanics classification of rock masses and its
application in tunnelling. Proceedings 3rd Congress ISRM, Denver: vol.2A,p.27Bieniawski, Z.T. 1989. Engineering rock mass classifications. John Wiley & Sons,
New York. 251' pp.Bilgin, N., T. Seyreck & K. Shahriar 1988. Golden Horn clean-up contributes
valuable data. Tunnels & Tfunnelling: 20, no.6, 4l-44.Bisschop, F. 1991. The analysis of a laboratory cutting and abrasion test to be
applied in rock cutting dredging. Classified internal report, Memoirs of theCentre for Engineering Geology in the Netherlands 81 105 pp. Delft Universityof Technology.
Blindheim, O.T., A. Boniface & J.A. Richards 1990. Boreability assessments for theLesotho Highlands water project. In: R. Brummer (ed.) Static and dynamicconsideralions in rock engineering. ISRM Symposium, Swaziland: 29-39.Balkema, Rotterdam.
Blindheim, O.T., A. Boniface & J.A. Richards 1991. Boreability assessments for theLesotho Highlands water project. Tunnels & Ttamellt'ng: June, 55-58.
Bold, H.J. van den 1986. De abrasieve slijtage van snijwerktuigen door gesteente(The abrasive wear of cutting tools by rock). Memoirs of the Centre forEngineering Geology in the Netherlands; 38, 98 pp. Delft University ofTechnology.
Bowden, F.P. & D. Tabor 1950. The frictionClarenden Press. Oxford. 337 pp.
Bowden, F.P. & D. Tabor 19&. The frictionClarenden Press. Oxford. 544 pp.
and lubrication of solids. Part L
and lubrication of solids. Pan II.
Bowie, S.H.U. & P.R. Simpson 1977. Microscopy: reflected light. In J. Zussman(ed.): Plrysical methods tn determinative mineralogy:109-165. Academic Press,London.
Brady, B.H.G. & E.T. Brown (1985). Rock mechanics for un^derground mining.George Allen & Unwin, London. 527 pp.
Bray, R.N. 1979. Dredging, a handbook for engineers. Edward Arnold, London.276 pp.
Bray, R.N., A.D. Bates & J.M.Land 1997. Dredging, a handbookfor engineers(2nd ed). Edward Arnold, London. 434 pp.
Braybrooke, J.C. 1988. The state of the art of rock cuttability and rippabilityprediction. Proc. Sth Australian-New fualand Conf. on Geomechanics, August1988, Sydney: 13-42.
References 303
Bree, S.E.M. de 1975. The abrasion behaviour of materials for dredger components,due to sand/water mixtures. First Intemational Symposiurn on Dredging
Technology, Canterbury. BHRA Fluid Engineering, Cranfield, Bedford, England:35-51.
Bree, S.E.M. de, A. Begelinger & A.W.J. de Gee 1980. A study on the wearbehaviour of materials for dredge parts in water sand mixnrres. ThirdInternational Symposiwn on Dredging Teclvtology, Bordeaux. BHM FluidEngineering, Cranfield, BeQford, England: 299'314.
Bree, S.E.M. de, W.F. Rosenbrand & A.W.J. de Gee 1982. On the erosionresistance in water-sand mixtures of steels for application in slurry pipelines.Hydrotransport 8, Intemational Conference on the hydraulic trutsport of solidsin pipes, Johannesburg, South Africa: 161-180.
Brook, N. 1993. The measurement and estimation of basic rock strength. In: J.A.Hudson (ed.) Comprehensive Rock Engineering, vol. 3, Rock testing a'nd sitecharacterizatton: 4L-66. Permagon Press, Oxford.
Brouwer, J. 1984. Gesteentemechanica in de baggertechniek (Rock mechanics indredging technology) . Nieuwsbrtef Ing e okring : inli, 35 -44 -
Brown, E.T. 1981 . Rock charactertzafion, testing and monitoring. ISRM suggestedmethods. Permagon Press, Oxford. 2Il pp.
Brugman, M.H.A. 1.919|.. A threedimensional production estimation system.Geotechnical aspects of dredging production estimation in the context of theOresund Link Tunnel Trench dredging project. Memoirs of the Centre ofEngineering Geology in The Netherlands: I57, 111 pp. Delft University ofTechnology.
Bruland, A., B.E. Johannessetr, A. Lislerud, T. Movinkel, K. Myrvold & O.Johannessen 1988. Hard rock tunnel boring. Project report 1-88: 183 pp.Norwegian Institute of Technology, Trondheim.
BS 5930:1981. Code of practicefor site tnvestigations. British Standards Institution,London. 147 pp.
Biichi, E. 1984. Einflufi geologischer parometer atf, die Vortriebsleistung einerfttmetbohrmachine. (Influence of geological parameters on the performance ofa tunnel boring machine). PhD thesis University of Bern, Switzerland, 136 pp.
Btichi, 8., J.-F. Mathier & Ch. Wyss 1995. Rock abrasivity - a significant costfactor for mechanical tunnelling in loose and hard rock. Tunnel:5, 3844.
Chappell, J. 1987. Late Quaternary sea-level changes in the Australasian region".In Tooley, M.J. & I. Shennan (eds.) Sea-tevel chnnges. Blackwell, Oxford.
Chen, R. & B. Stimpson 1993. Interpretation of indirect tensile strength tests whenmoduli of deformation in compression and tension are different. Rock Meclnnicsand Rock Engineering: 26, 183-189.
Clark, A.R. & B.F. Walker 7977. A proposed scheme for the classification andnomenclature for use in the engineering description of Middle Easternsedimentary rocks. Technical Note. Geotechnique: 27, 93-99,
Clark, G.B. 1987. Principles of rockfragmentation. John Wiley & Sons, New York.610 pp.
Cools,P.M.C.B.M. Igg3.Temperaturemeasurementsuponthechiselsurfaceduringrock cutting. Int. J. Rock Mech. Mtn. Sci. & Geomech. Abstr.: 30, 25-35.
Cottington , J. &, R. Akenhead 1984. Stte investigation and the law. Thomas TelfordLtd, London. 184 pp.
3M Tool Wear: Implicuiotu for the site investigaion of rock dredging projects
Davids, S.W. & P. Adrichem 1990. The testing of a classification apparatus for thewear of cutter heads during cutting of rock (in Dutch) . Classified irternal repoft,Faculty of Mechanical andMarine Engineering. no. 90.3.GV.2671: 100 pp. DelftUniversity of Technology.
Deere, D.U. 1964. Technical description of rock cores for engineering purposes.Rock Mechanics and Rock Engtneering: l, 17-22.
Degen, B.T.A.I., L. LeBlanc & P.M. Maurenbrecher 1995. Formations andgeotechnical parameters from reflection surveys. Proceedings IIth EuropeanConf. Soil mech. & Foundarton Engng., Kopenhagen, DGF Bulletin: 11, 1.85-1.90. Danish Geotechnical Society, Kopenhagen.
Deketh, H.J.R. 1991. Determination of optimum conditions for the modified pin-on-disc test. Memoirs of the Cente for Engineering Geology in the Netherlands: 85,27 pp. & appendices. Delft University of Technology.
Deketh, H.J.R. L993. Rock properties relevant for the assessment of abrasivenessand excavatability of rock, applied to dredging. Proceedings CEDA DredgingDrys, November 18-19, Amsterdam: E4, 14pp.
Deketh, H.J.R. 1995. Wear of rock curting tools. Laboratory experiments on theabrasivity of rock. Balkema. Rotterdam. 144 pp.
Deketh, H.J.R. 1995b. The wear sensitive cutting principle of a cutter suctiondredger. Terra et Aqun: 60, 3-7.
Deketh H.J.R. 1995c. Wear of the cutting tools of rock excavation machines.Proceedings of the 35th US Symposiwn of Rock Meclnnics, 5-7 Jwte, Reno, USA:342-347 . Balkema, Rotterdam.
Deketh, H.J.R. & P.N.W. Verhoef 1993. Fundamental aspects of abrasive wear ofcutting tools by rock. Proceedings XIV ,4wtual Meeting Westem DredgingAssociation, May 25-28, Texas A&M University Centre for Dredging SndiesRepon: 327,281-294.
Deketh, H.J.R., D.D. Genske & P.N.W. Verhoef 1995. Rock properties affectingthe sensitivity of prediction equations for rock cutting tool wear. Proceedings ofthe &th Internationel Congress on Rock Mechanics, Tolcyo, fapan: l, L9-2L.Balkema, Rotterdam.
Deketh, H.J.R., M. Giezen, M. Alvarez Grima & M. den Hartog 1996,Performance of rock cutting trenchers at different sites. Proceedings 2nd Not"thArnerican Rock Mechanics Conference, Montreal: 2, 669-675. BalkemaRotterdam.
Deliac, E.P. 1986. Optimization des machines d'abbatage a pics. PhD thesis,University of Paris VI, 501 pp.
Deliac, E.P. 1993. Theoretical and practical rules for mechanical rock excavation.In: J.A. Hudson (ed.) Comprehensive Rock Engineering, vol. 4, Excavation,support and monitoring: t78-22'1. Permagon Press, Oxford.
Den Hartog, M.H. 1996. T-850 Rock cutting trencher performance and fuzzy logic.Memoirs of the Centrefor Engineering Geology in the Netherlands: L32, pp.162.Delft University of Technology.
Den Hartog, M.H., R. Babuska, H.J.R. Deketh, M. Alvarez Grima, P.N.W.Verhoef & H.B. Verbruggen 1997. Knowledge-based fuzry model forperformance prediction of a rock cutting trencher. .lzr. I. of ApproximateReasoning: 16,43-66.
References 305
DIN 50 320 1979: VerschleiR. Begriffe, Systemanalyse von VerschleiBvorgengen.Gliederung des VerschleiRgebietes. (Wear. Definitions, system analysis of wearoccurrences. Classification of the wear field). Deutsches Institut fir Normwtge.V., Berlin: 8 pp.
DIN 50 32I 1979. VerschleiB - MefigroBen. (Wear - quantification). DeutschesInstitur fir Normung e.V., Berlin: 6 pp.
Driesch, S. von den 1994. Schneidtechnische und verfahrentechnischeWeiterentwicklungen fiir den maschinellen Vortrieb. (Operational and cuttingtechnical developments for tunnelling machines). Gliickauf'Forschwtgshefie: 55,15G160.
Engelhardt, W. von & S. Haussiihl 1965. Festigkeit und Hiirte von Kristallen.(Strength and hardness of crystals). Forrschritte der Mineralogie: 42,549.
Ersoy, A. & M.D. rffaller 1995. Textural charcterisation of rocks. EngineeringGeology:39, 123-136
Evans, I. 1962. A theory on the basic mechanics of coal ploughing. In G.B. Clark(ed): International Symposiurn on Mining Research, February 1961, Missouri;vol . 2,761-798.
Evans, I. 1965. The force required to cut coal with blunt wedges. Int.I. Rock Mech.Mining Sci.:2, l-12.
Evans, l. 1972. Line spacing of picks for efficient cutting. Int.J. Rock Mech. MiningSc i . :9 ,355-361 .
Evans, I. 1984. A theory of the cutting force for pointed attack picks. Int. J. Min.Engng. :2 ,63-71.
Evans, I. & C.D. Porneroy 1966. The strength, fracture and workabiliry of coal.Permagon Press, Oxford. 277 pp.
Ewendt,G. 1989. ErfaBung der Gesteinsabrasivit?it und Prognose desWerkzeugversleiBes beim maschinellen Tunnelvortrieb mit Diskenmeiseln.(Determination of rock abrasivity and prediction of tool wear of disc cuttertunnelting machines). Bochumer geologische und geotechnische Arbeiten: Hefi 33.Institiit fiir Geologie, Ruhr -Universitdt, Bochum.
Fairhurst C.R. 1987 . Theory and practice of enhanced rock cutting picks: the water'jet assisted tool and the vibrating tool. Thesis L'Ecole nationale supd.rieure desmines de Paris.
Farmer, I. 1983. Engineertng behaviour of roclcs. Chaprnan and Hall. London. 208pp.
Fell, R. 1990. Engineering geophysics- a civilGeophysics: 2\,25-3I.
engineer's viewpoint. Exploraion
Fowell, R.J. & S.T. Johnson 1991. Cuttability assessmenttunnelling machines. Proc.ISRM International CongressAachen, Germarry, VoI. 2:985-990. Balkema, Rotterdam
Franklin, J.A., E.Broch & G. Walton 1971. Logging the mechanical character ofrock. Trans. Inst. Min. Metall.:80, Section A- Mining Industry, A1-9.
Gehring, K. 1987. Rock testing procedures at VA's geotechnical laboratory inZeltweg. Internal report TZU 41. Voest Alpine Zeltweg, Austria. 11 pp.
Geyh, M.A., H.R. Kudrass & H. Streif t979. Sealevel changes during the latePleistocene and Holocene in the Strait of Malacca. Nature: 278, 4L-'43.
applied to drag toolon Rock Mechanics,
306 TooI Wear: Implicaions for the site investigaion of rock dredging projects
Giersch, D. 1989. Dredge teeth, design and economy. Wilson, J.R. & V.L. vanDam (eds.) Proceedings XllthWorldDredging Congress, Orlando, Flortda, USA:870-889.
Giezen, M. 1993. Rock properties relevant to tool wear and production of rockcutting trenchers. A pilot study. Memoirs of the Centre of Engineering Geologyin The Netherlands: 110, 75 pp. + App. Delft University of Technology.
Goodman, R.E. (1989). Introduction to rock mechanfcs. 2nd ed., John Wiley &Sons, New York. 562 pp.
Grant, W.H. 1963. Weathering of Stone Mountain granite. [n: Clays and cloyminerals. Proceedings llth national conference, Ontario, August 1!M2: 65-73.
Gregor, M. 1968. F.xperimentelle und theoretische Untersuclwngenliber den EinfluSder Sclvtittgeschwindigkeit auf den krspanungswiderstand von Kohle.(Experimental and theoretical investigations into the influence of cutting velocityon the cutting forces of coal). Thesis RrWTH Aachen. 88 pp.
Gregor, M. 1970. Der EinfluB der Schnittgeschwindigkeit auf Schnitt- undAndnickkraft beim Zerspanen von Kohle. flnfluence of cutting velocity on thecutting- and thrust forces of coal). Glackauf Forschungsherte: 29, 179-188.
Habig, K.H. 1980. Verschleif und Hrirte von Werlcstoffen. (Wear and hardness ofmaterials). Carl Hanser Verlag, Mtinchen. 303 pp.
Hack H.R.G.K. 1996. Slope stabiliry probability classification SSPC. PhD thesis.ITC publication number 43. pp. 258. Delft, The Netherlands.
Hadjigeorgiou, J. & M.J. Scoble 1990. Ground characterization for assessment ofease of excavation. In: Singhal, R.K. & M. Varva (eds.): Proceedings of the 4thInt. Symposiwn on Mine Planning and Equipment Selection, Calgary:323-33LBalkema, Rotterdam
Hata, S. & T. Muro 1978. Relations between wear life of rippertip and rock massproperties. Proc. of the 6th Int. Conf. Int .Soc. Teruain Vehicle Soc., Vienna:951-981.
Hawkins, A.B. & B.J. McConnell 1992. Sensitivity of sandstone strength anddeformability to changes in moisture content. Quarterly Journal of EngineeringGeology, London: 25, 115-130.
Heer, R.J. de & Rochmanhadi 1989. Dredging and dredging equipment. Part 2,dredging equipment. Lecture notes International Institute for HydraulicEngineering, Delrt: 353 pp.
Herbert, C. I976. The depositional development of the basin. In: Branagan, D.F.et.al.. An outline of the geology and geomorphology of the Sydney Basin. SciencePress, Sldney: 5-38,
Herbich, John B. L992. Handbook of dredging engineering. McGraw-Hill, NewYork, 600 pp.
Hergarden, I.M. 1997 . The influence of the ductility of rock on the performance ofrock cutting trenchers. Memoirs of the Centre of Engineering Geology in TheNetherlands: 143, 130 pp. Delft University of Technology.
Hoek, E. 1983. Strength of jointed rock masses. Gdotechnique: 33, 187-223,Hoek, E. & E.T. Brown 1980. Underground excavations in rock Institution of
Mining and Metallurgy, London. 527 pp,Hoek, E. & E.T. Brown 1988. Determination of shear failure envelope in rock
masses. Journ. Geotechn. Engng.: II4, 37L-373.
References 307
Hoek, E., P.K. Kaiser & W.F. Bawden 1995. Support of undergrowtd excavationsin hard rock. Balkema, Rotterdam. 215 pp.
Holland, R. 1991. Too much or too little?". In: "Capital Dredging". Proceedingsof conference, Institution of Civil Engineers, Edinburgh, 15-16 Mayz 1-13.Thomas Telford Ltd, London.
Hoogerbrugge, W.J. 1980. The influence of discontinuities on the excavation of rockby disc bottom cutter dredging. Memoirs of the Centre of Engineering Geologyin The Netherlands: 3, 109 pp. Delft University of Technology.
Hornung, I. 1978. Modelluntersuchungen iiber die Vorgiinge beim maschinellenReissen von Fels (Model tests on the mechanical ripping of rock). Baurnachineund Bautecltnik: 25, 167-173.
Houlding, S.W. 1994. 3D Geoscience modeling. Computenechniques forge olo gi calcharact e rization. 309 pp. Springer-Verlag, Berlin
Hurt, K.G. & K.M. MacAndrew 1985. Cutting efficiency and life of rock-cuttingpicks. Mining Science and Technology:2, 139-t5I.
IHC 1994. How to select stationary dredging equipment. Ports and Dredging: 142,18 -21 .
Irfan, T.Y. 1988. Fabric variability and testing of a granitic saprolite. In:Geomechanics in topical soils. Proc. Znd int. conf. on geomech- in trop. soils,Singapore: l, 25-35. Balkema, Rotterdam
ISRM 1978. Suggested methods for determining the strength of rock in triaxialcompression. Int. J. of Rock Mech. and Mining Sciences & Geomech. Absffacts:15 ,47-51.
ISRM 1978. Suggested methods for determining tensile strength of rock materials.Int. J. of Rock Mech. and Mining Sciences & Geomech. Abstacrs: 15, 99-103.
ISRM 1979. Suggested methods for determining the uniaxial compressive strengthand deformability of rock materials. Int. l. of Rock Mech. and Mining Sciences& Geomech. Abstracrs: 16. 135-140.
ISRM 1981. Basic geotechnical description of rock masses. Int. J. Rock Mech. Min.Sci. & Geomech. Abst.: 18, 85-100.
ISRM 1985. Suggested method for determining point load strength. Int. J. RockMech. Min, Sci. & Geomech. Abst.:22,61-70.
Iager W. 1988. An investigation into the abrasive capacity of rock. Memoirs of theCentre of Engineering Geology in The Netherlands: 52, 99 pp. Delft Universityof Technology.
Janach, W, & A. Merminod 1982. Rock abrasivity test with a modified Schmidthammer. Int. J. Rock Mech. Min. Sci. & Geomech. Abst.: 19,43-45.
Johannessen, O. 1990. Drillabiliry, drilling rate indcx catalogue. Report 13-90. TheUniversity of Trondheim, The Norwegian Geotechnical Institute of Technology,Division of Construction Engineering & Department of Geology. 170 pp.
Johnston, I.W. 1985. Strength of intact geomechanical materials. Journnl ofgeotecltnical engineering: llt, 730-7 43.
Juhiisz, A.Z. & L. Opoczky 1990. Mechanical aaivaion of minerals by grinding.Pulverizing and morphology of particles. Akaddmiai Kiad6, Budapest. 234 pp.
Kenny, P. & S.N. Johnson 1976a. An investigation of the abrasive wear of mineralcutting tools. Wear: 36,337-367.
Kenny, P. & S.N. Johnson 1976b. The effect of wear on the performance ofmineral-cutting tools. Colliery Guardian: June, 2t6-252.
308 TooI Wear: Implicatiors for the site investigation of rock dredging projeas
Kearey P. & M. Brooks 1984. An introduction to geophysical exploraiorl. BlaclnilellScientific Publications, Oxford. pp. 296.
Kesteren, W.G.M. van, H.J.M.G. Steeghs, D.R. Mastbergen 1992. Pore waterbehaviour in dredging processes, proc. XIIIth World Dredgtng CongressWODCON, Bornbay India: 597-615.
Kesteren, W.G.M. van 1995. Numerical simulations of crack bifurcation in the chipforming cutting process in rock. In G. Baker &8.L. Karihaloo Fracture of brinledisordered materlals: concrete, rock and cerarnics: paper 33, 505-524. E & FNSpon, London.
Kirsten, H.A.D. 1982. A classification system for excavation in natural materials.The Civil Engineer in Soath Africa: 24,293-306.
Koerr, J.P. 1981. Trillend snijdenvan gesteente. $librational cutting of rock). MScthesis. Faculty of Mechanical and Marine Engineering, Delft University ofTechnology, CO/81/126, 88 pp.
Kok, M. de, W. Dirks & R. Hessels 1997. The Oresung fixed link: dredging andreclamation. Terua et Aqua: 66, 16-24.
Koning, J. de 1968. Boundary conditions for the use of dredging equipment. PaperCourse of dredging engineering in coastal waters and estuaries, May I%8.Delft/The Hague.
Koning, J. de 1993. Terugblik naar de toekomst (Looking back at the future)Lecture Delft University of Technology. 40 pp.
Krapivin, M.G., V.M. Manakov & V.G. Michajlov t967. Untersuchungen derTemperaturen und ihres Einflusses auf den VerschleiB der Schneidwerkzeuge vonVortriebsmachinen beim schneiden in Sandstein (translated from Russian intoGerman). Izvest VUZ, Gorn: 10, 84-89.
Landheer, D. 1983. Adhesie, wrijving, slijtage. (Adhesion, friction and wear). In:Tribotecltniek en aandrijvingen, Lecture notes Meclnnical Engineering 4BSl.0.Eindhoven University of Technology.
Lowe, P.T. & L.B. McQueen 1988. Ground conditions and construction methodsin the Malabar Ocean Outfall Decline and observations on rock cuttability. Proc.Awtralian Underground Construction and Tunnelling ,4ssociation Seminar onCost Effective Twtnelling in the Sydney Basin. IE Aust., Canberra: 165-203.
Lowe, P.T. & L.B. McQueen 1990. Construction of the North Head Ocean OutfallTunnel. Proc. VII Austalian Tunnelling Conference, Tlte Underground Domain.IE Aust., National Conf. Publ:9018, 159-172.
MacGregor, F., R. Fell, G.R. Mostyn, G. Hocking & G. McNally 1994. Theestimation of rock rippability. Quarterly Journal of Engineering Geology,London: 21, 123-144.
Martin, J.M. 1986. Predicting the rippability of sandstone in SE Queensland. I3thARRB/SIh REAAA Conf-: II9-132.
Mashloosh, K.M. & T.S. Eyre 1985. Abrasive wear and its application to diggerteeth. Tribology international: L8, 259'266.
Maurenbrecher, P.M., B.T.J.A. Degen, D.G. Price & P.N.W. Verhoef 1992.Marine investigation for dredging works. Course notes. Memoirs of the Centre
for Engineering Geology in the Netherlands: 99, 90 pp.McFeat-Smith, I. & R.J. Fowell 1977 . Correlation of rock properties and the cutting
performance of tunnelling machines. Proc. Conf. on Rock Engineering,Universiry Newcastle upon T\tne: 587'602.
Refererres 309
Mens, J.W.M. & A.W.J. de Gee 1986. Erosion in seawater sand slurries. Tribology
international: 19, 59-64.Miedema, S.A. 1987. Berekening van de snijkrachten bii het sniiden van volledig
met water verzadigd zand (Citculation of the cuttingforces during the cutting of
completely toturitd sand). PhD thesis, Delft University of Technology, Faculty
of Mechanical and Maritime Engineering, 268 pp.
Miedema, S.A. 1990 . The developmcnt of an apparatusfor the classitfication of wear
while dredging solid rock (in Dutch). Classified internal report, Faculty of
Mechanical and Marine Engineering, Delft University of Technology, no.
90.3.GV.2749,30 pP.Minty, E.J. & C.f. f"arns 1983. Rock mass workability. Geological Society of
Australia, Special Publication' 11, 59-81.Mishnaevsky Ji, L.L. lgg5. Physical mechanisms of hard rock fragmentation under
mechanical loading: a review. Int. J. Rock Mech. Min. Sci. & Geomech. Abstr.:
32,763-766.Mishra, A. & I. Finnie 1980. A classification of three-body abrasive wear and
design of a new tester. Wear: 60, 1l I-121.Mogi, k.. tgOO. pressure dependence of rock strength and transition from brittle
fracture to ductile flow. Butt. Earthquake Res. htst., Japan: 44, 2L5'232'
Movinkel, T. & O. Johanrressen 1986. Geological parameters for hard rock tunnel
boring. Tunnels & Turmelling April 1986: 45-48.Muro, T-atsuro 1985. Abrasive wear resistance of surface coatings on an excavating
tip against a rock mass. Journal of Terrunechanics: 22, 87-109.Natau, O., ttt. Mutschler & Ch. Lempp lggL Estimation of the cutting rate and the
bit wear of partial-face tunnelling machines. Proc.ISKM International Congress
on Rock Meihanics, Aachen, Germany, Vol. 3:1591-1595. Balkema, Rotterdam'
Nelson, p.p. 1993. TBM performance analysis with reference to rock properties. In:
J.A. Hudson (ed.) Comprehensive Rock Engineering, vol. 4, F-xcavalion, support
and monitoring: 26l-291. Permagon Press, Oxford.Nelson, p.p. 1f1ge- Rock engineering for underground civil construction. In:
M.Aubertin et al (eds.) Rock Mechanics, Tools and Techniques. Proceedings 2nd.
North American Rock Mechanics Conference, Montreal, June 1996: L, 3'12.
Balkema Rotterdam.Netterberg, F. L9g4. Engineering geology of pedocretes and other residual soils.
proceidings 7th International IAEG Congress: p. XIX-XXXVm. Balkema,
Roterdam. )Nishimatsu ,Y. Ig72. The mechanics of rock cutting.Int.J. Rock Mech. Mining Sci.:
9,26L-270.Nishimatsu , Y. lg7g. On the effect of tool velocity in the rock cutting. International
conference on Mining and Machinery, Brisbane, 2 - 6 July:3I4-3L9.
Novello, E.A. & I.W. Johnston 1995. Geotechnical materials and the critical state.
Gilote chnique : 45, 223-235 .Ockeloen, l.f. Dn. Experiments to determine the transition of brittle to ductile
rock failure at room tempefarure. MSc thesis, Memoirs of the centre forEngineertng Geology in The Netherlands.' 94, pp. 43 + App'
Orlii -B.
lgg7. Prediiting subsurface conditiow for geotechnical modelling- PhD
thesis. ITC publication: 55, Delft.
310 Tool Wear: Implications for the site investigotion of rock dredging projects
Orlii B. & J.W. Rtisingh 1995. Three-dimensional geomodelling for offshoreaggregate resources assessment. Q. J. of Engineering Geology: 28, 385-391.
Osburn, H.J. 1969. Wear of rock cutting tools. Powder Metallurgy: 12, 471-502.Ottmann, F.G. & G. Lahuec 1976. Dredging and geology. Terra et Aqua: I1,26-
34.Palermo, M.R. & D.F. Hayes 1992. Environmental effects of dredging. In: J.B.
Herbich (ed) Handbook of oceen engineering, vol.3, Harbors, navigationalchanne ls, e stuari e s, e nvironmental ffi cts : 1169 -ll7 5 .
Pariseau, W.G. 197A, Wedge indentation of anisotropic media. Dynamic rockmechanics. Proceedings l2th Symposium on rock ntechanics, Rolla, Missouri,USA:529-546.
Pariseau, W.G. 1994. On the significance of dimensionless failure criterea. Int. J.Rock Mech. Min. Sci. & Geomech. Abst.:31, 555-560.
Paschen, D. 1980. Petrographtsche und geomechanische Clnrakterisierung vonRuhrkarbongesteinen zur Bestimmung ihres Verschleit3verhaltens (Petographicand geomechanical charactertsation of Ruhr area Carboniferous rocks for thedetermination of their wear behaviour). PhD dissertation, Technische UniversiriitClaustahl. pp.202.
PBNA. Voortgezette opleiding uinoering baggerwerken, deel 5. Snijkopzuiger,winzuiger, bakkenzuiger (Advanced course execution of dredging works, part 5.Cutter suction dredger, suction dredger). Vereniging "Centrale Baggerbedrijf".Undated lecture notes, probably early 1970's.
Pells, P.J.N. 1985. Engineering properties of the Hawkesbury Sandstone. In Pells,P.J.N. (ed.). Engineering Geology of the Sydney Region: 179-197. Balkema,Rotterdam.
Pells, P.J.N. 1993. Uniaxial strength testing. In: J.A. Hudson (ed.) ComprehensiveRock Engineering, vol. 3, Rock testing and site characterization: 67-85.Permagon Press, Oxford.
Petterson, D. & K.G. Wijma 1997. Lowering the overall costs for the use of rockcutterhead systems. Proceedings CEDA Dredging Dayt, 20-21 November 1997,Amsterdam. CEDA, Delft, The Netherlands.
Pettifer, G.S. & P.G. Fookes 1994. A revision of the graphical method for assessingthe excavatability of rock. Quarterly lournal of Engineering Geology, London:27, t45-164.
Phillips H.R & F.F. Roxborough 1981. The influence of tool material on the wearrate of rock cutting picks. Proceedings 34th annual conference, Brtsbane,Queensland. Awtalian Institute of Metals: 52-56.
PIANC 1984. Classification of soils and rocks to be dredged. Supplement to BulletinNo. 47, Permanent International Association of Navigation Congresses, Brussels.16 pp.
Piepers, T.P.H. 1995. The significance of rock strength index tests applied to rockdredging. Memoirs of the Cente for Engineering Geology in the Netherlands:125, pp.93. Delft, The Netherlands.
Pierry, J. & R. Charlier 1994. Finite element modelling of shear band localisationand application to rock cutting by a PCD tool. In: Rock Mechanics in PetroleumEngineering. Proceedings Eurock'94 SPE/ISRM Conference, Delrt, 29-31 August:199-204. Balkema. Rotterdam.

References 311
pillans, B. 1987. Quaternary sea-level changes: Southern Hemisphere data. [n
Devoy, R.J.N. (ed.) ,9ea suffice studies: Chapter 9.price, O.C. tg$t. Report of the IAEG commission on site investigations. Bull. Int.
Ass. of Engineering Geology: 24, 185'226.price, p.C. fqgO. Panel r"pott: Erosion and sedimentation in harbour projects -
dredging and hydraulic filling. Proceedings 5th Int. Congress Int. Ass. of Eng.
Geol., Buenos Aires: 8, 2699-2705. Balkema, Rotterdam'price, n.C. tqqt . Engineering Geology: Site Investigation. Lecture notes, Delft
University of technology. pp. 209.price, D.G. i993. A suggested method for the classification of rock mass weathering
by a ratirrgs system. Q. J. of Engng. Geology: 26, 69-'16.Prici, D.G. i995. Weathering and weathering processes. Q. J. of Engng. Geology"
28,243-252.Priest, S.D. 1985. Hemispherical projection methods in rock
Allen and Unwin, London.Priest, s.D. 1993 . Discontinuiry analysis for rock engineering.
mechanics. George
Chapman & Hall,
London.Prudhomme, R.J., M.L. Rizzone, T.H. Schmieman & J.E. Miller L974.
Reciprocating pumps for long distance slurry pipelines. Hydrotransport 1,
International Conference on the trydraulic transport of solids in pipes, Coventry,
England: F.4, 49-59.Prothelro, D.R., & F. Schwab 1996. Sedimentary geology. W-H. Freeman and
Company.Reinking, M.W. 1989. Unpublished Cerchar test results. Section of Engineering
Geology, Delft University of Technology.Reinking,-M.W. 1989. Linear cutting tests in artificial sand-clay mixtures to study
the influence of brittleness on abrasive wear of cutting tools. Memoirs of the
Centre for Engineering Geotogy in the Netherlands: 75, pp.95'
Reinking, M.W. tqqO. Linear cutting tests in artificial sand-clay mixtures to study
the influence of brittleness on abrasive wear of cutting tools. Proc. 6th htt-
Congress IAEG, Amsterdnm: 29L3-29I8. Balkema, Rotterdam'Rix, P.F. Ig7L. (Jntersuchtmgen tiber den Spannwiderstand von sprAd elastischen
Gesteinen in Abhtingigkeit von der MeilSelbreite und, der Spantiefe urlter
besonderer Beritcksichtigung des Bruchvorganges. (Investigations into the cutting
resistance of brittle elastic rocks, depending on chisel width and cutting depth'
with special emphasis on fracture propagation). Thesis RWTH Aachen.Rosiwal, A. 1896. Neue Untersuchungsergebnisse tiber die Hiirte von Mineralien
und Gesteinen. (New research findings on the hardness of minerals and rocks).
Verhandlungen der kdnigt. geol. Reicluanstalt, Wien: 17 & 18, 475'491.
Rosiwal, A. 1t16. Neuere Ergebnisse der Hartebestimmung von Mineralien undGesteinen -Ein Absolutes MaB fiir die Hiirte sprtider Korper. (New findings on
the hardness determination of minerals and rocks - an absolute measure for the
hardness of brittle materials). Verhandlungen der khnigl. geol. Reichsanstalt,Wien :5 &6 , 117-147 .
Rossen, H.P.H. van 1987. Ananlyse van snij- en slijtage processen van beitels bii
het snijden von vaste gesteenten (Analysis of cutting and wear processes of
chisels cutting in solid rock). MSc thesis. Faculty of Mechanical and Marine
Engineering, Delft University of Technology, 87.3 .GV -2232, 80 pp.
312 Tool Wear: Impltcaions for tlte sirc investigarton of rock dredging projecn
Roxborough, F.F. 1973. Cutting rock with picks. The mining engineer: Iune 1973.Roxborough, F.F. 1982. An assessment of the cuttability of rock formations
associated with the Sydnq MWS & DB Submarine Outfall Ttumels. UnisearchLimited Report for The Metropolitan Water Sewerage and Drainage Board. fune1982.81 pp.
Roxborough, F.F. 1987. The role of some basic rock properties in assessingcuttability. Proceedings Seminar "Tfunnels - Wolly Engineered Stntcrures". IEAwt. April.
Roxborough, F.F. & H.W. Phillips 1974. Experimental studies on the excavationon the rock using picks. International Society of Rock Mecltanics, Advances inRoclcmechanics, Vol. II, part B. Proc. of the ld Congress, Denver.
Roxborough, F.F. & G.C. Sen 1986. Breaking coal and rock. In C.H. Martin (ed.)Australian coal mining practice, AIMM Manograph Series: 12, l3A-147.
Sandbak, L.A. 1985. Roadheader drift excavation and geomechanics rockclassification. Proc, Rapid Excav. Turmelling Conf , AIME, New York: vol.2,902-916.
Schatzov, N.I. 1964. Bohren auf Erddl und Erdgas, Band /. VEB Deutscher Verlagfiir Grundstoffindustrie, Leipzig. 295 pp.
Schimazek J. & H. Knatz 1970. Der EinfluB des Gesteinsaufbaus auf dieSchnittgeschwindigkeit und den MeiBelverschleiB von Streckenvortriebs-machinen. (The influence of rock composition on cutting velocity and chisel wearof tunnelling machines). Gltkkauf: 106, 274-278.
Schimazek J. & H. Knatz 1976. Die Beurteiling der Bearbeitbarkeit von Gesteinendurch Schneid- und Rollenbohrwerkzeuge. (The assessment of the cuttability ofrocks by drag- and roller bits). Ertzmetall:29,113-119.
Scholz, C.H. 1990. The mechanics of earthquakes and faulting. CambridgeUniversity Press. 439 pp.
Schweins, B. 1986. VerschleiB im Braunkohlentagebau. (Wear in browncoalmining). In H. Uetz, Abrasion und Erosion: 598-637. Carl Hauser Verlag,Miinchen.
Schofield, A. & P. Wroth 1968. Critical state soil mechanics. McGraw-HilI,London. pp. 310.
Scoble, M.J. & Y.V. Muftuoglu 1984. Derivation of a diggability index for surfacemine equipment selection. Mining Science and Technology, 1,305-322.
Shulin Xu, De Freitas, M.H. & B.A. Clark 1988. The measurement of tensilestrength of rock. In Romana (ed.) Rock Mechanics and Power Plants.Proceedings ISRM Symposiwn, Madrid: 125-132. Balkema, Rotterdam.
Siezen, M.R. 1996. A threedimensional dredgeability classification system. A casestudy for the Oresund Link Tunnel dredging project. Memoirs of the Centre forEngineering Geology in the Netherlands: 1.40, pp. 118. Delft, The Netherlands.
Sindhusen, S. 1991 . Rock abrasivity. MSc thesis University of New South Wales,Department of Applied Sciences. pp. 97. Sidney, Australia.
Singh, R.N., B. Denby, I. Egretly & A.G. Pathan 1986. Assessment of groundrippability in open cast mining operations. University of Nottinglwm, MiningDepartment Magazine.' XXXVIII, 2t-34.
Singh, R.N., B. Denby & l. Egtetly 1987. Development of a new rippability indexfor coal measures excavations. 27th US Symposiwn on Rock Mechanics: 935-943.Balkema, Rotterdam.
References 3L3
Sman, R.M. van der 1988. Investigation into the concept of a test apparalus forchisel wear (in Dutch). Classified internal report, Faculty of Mechanical andMarine Engineering, Delft University of Technology, 38 pp.
Sman, R.M. van der 1988. Resubs of afirst series of wear tests an chisels with theshaper (in Dutch). Classified internal report, Faculty of Mechanical and MarineEngineering, Delft University of Technology, 89.3.GV.2667, 6l pp.
Smith, H.J. 1986. Estimating rippability by rock mass classlftcation, 27th aSSymposium on Rock Mechanics: 443448. Balkema, Rotterdam.
Smith, H.J. 1987. Estimating the mechanical dredgeability of rock. 28th USSmposium on Rock Meclwnicsz 945-952. Balkema, Rotterdam.
Speight, H.E. & R.J. Fowell 1987. The influence of operational parameters ofroadheader productivity and efficiency with particular reference to cutting pickwear. Conference on ftibology in mineral extraction, wear on wear, NottinghamUniversity : 17 5-182. I.Mech.E., London.
Speight, H.E. & R.J. Fowell 1987. Roadheader performance studies using a fullscale laboratory research facility. Proceedings 28th US $mposium on RockMechanics, Tuscon: 973-980. Balkema, Rotterdam.
Staveren, M.T. van 1987. Discontinuity studies for the OPAC project. Memoirs ofthe Centre for Engineering Geology in the Netherlands: 41..
Stone, M. 1991. Soil investigation. In: CapitalDredging. Proceedings of conference,Instifirtion of Civil Engineers, Edinburgh. 15-16 May 1991: 47-62. ThomasTelford Ltd. London.
Suana, M. & Ti. Peters L982. The CERCHAR abrasivity index and its relation torock mineralogy and petrography. Rock Mechanics:51, 1-8.
Swart, P.D. & T.M. McGee 1993. Marine seismic single-channel investigationtechniques to improve dredging performance - a case sfudy. Proceedings CEDAdredging days, Amsterdam. Central Dredging Association, Delrt: paper F2, pp.2t.
Tamrock 1983. Handbook of underground drilling. Tamrock Oy, Tampere, Finland.Tarkoy, P.l. L973. A study of rock properties and tunnel machine advance rates in
two mica schists formations. 15th Symp. Rock Mech, Custer State Park, SowhDakota: 415-47.
Tarkoy, P.I. 1973. Predicting tunnel boring machine (TBM) penetration rates andcutter costs in selected rock types. In: Proceedings of the 9th Canado Rockmechanics Symposium, Montreal: 263-27 4.
Tucker, M.E. 1981. Sedtmentary petrology, an introduction. Blackwell ScientificPublishers. Oxford. 252 pp.
Tucker, M.E. & V.P.Wright 1990. Carbonate sedimentology. Blackwell ScientificPublishers. Oxford. 482 pp.
Thuro, K. & G. Spaun 1996. Drillability in hard rock drill and blast tunnelling,Felsbau: 14, 103-109.
TID (Training Institute for Dredging). Course notes: Cutters & Some aspects ofcutter suction dredging. IHC. Kinderdijk, Holland.
Tourenq, C 1966. La duretd Vickers des mindraux e[ des roches, quelquesapplications (Vickers hardness of minerals and rocks, some applications). Bul.Liaison Laboratoires des Ponts et Chauss€es: 19, r€f 332
Uetz, H. 1986. Abrasion und Erosion Carl Hauser Verlag, Mtinchen. 829 pp.
314 Tool Wear: Implicatiors for rhe sile investigation of rock dredging pro1ects
Uittenbogaard, R., J. Cornelisse, P.M.C.B.M. Cools & D. Luger, in prep. Reporton laboratory research on rock cutting in the context of dredging. Submitted toInt. J. Rock Mech. Min. Sci. & Geomech- Abstr.
Verbeek, P.R.H. 1984. Soil analysis and dredging. Terra et Aqwr 28, ll-2l.Verhoef, P.N.W. 1986. The assessment of the abra"sive capacity of roclcs for
dredging works (in Dutch). Abstract. Lecture lngeokringicEDA, 12 May 1986.Verhoef, P.N.W. 1987. Sandblast testing of rock. Int. I. Rock Mech. Min. Sci. &
Geomech. Abst.: 24, L85-192.Verhoef, P.N.W. 1988. Towards a prediction of the abrasive wear of cutting tools
in rock dredging. Delfi Progress Report: 13, 307-320-Verhoef, P.N.W. 1993. Abrasivity of Hawkesbury Sandstone (Sydney, Australia)
in relation to rock dredging. Quarterly Journal af Engineering Geology, London:26, 5-r7.
Verhoef, P.N.W. 1994. Wear testing categories for rock dredging projects. 6rft.International IAEG Congress, Amsterdnm, 19fl: 5, 3289-3292. Balkema,Rotterdam.
Verhoef, P.N.W., H.J.van den Bold & Th.W.M. Vermeer 1990. Influence ofmicroscopic structure on the abrasivity of rock as determined by the pin-on-disctest. Proc. 6th Int. Congress IAEG, Amsterdam: 495-504. Balkema, Rotterdam.
Verhoef, P.N.W. & H.J.R. Deketh 1992. Factors determining abrasivity of rock,experience from rock dredging. First International Symposium on TurutelConstruction and ()nderground Stuctures, Ljubljana, Sloventa, September 1992.pp . : 10 ,
Verhoef, P.N.W. & H.J.R. Deketh 1994. Rock characterisation for dredgingpurposes. Terra et Aquai 55, 4-13.
Verhoef, P.N.W., J.J. Ockeloen, W.G.M. vanKesteren 1996. The significance ofrock ductility for mechanical rock excavation. In M,Aubertin et al (eds.) RockMechanics, Tools and Techniques. Proceedings 2nd North American RockMechanics Conference, Montreal, June 1996: 1,709-716. Balkema Rotterdam.
Verkaik C.J. 1982. Snijden van gesteente met een baggerwiel. (Cutting of rock witha dredging wheel). MSc thesis. Faculty of Mechanical and Marine Engineering,Delft University of Technology, CO/821I26, 130 pp.
Vermeer, T.W.M. 1989. Investigation of the abrasive- and erosive wear capacity ofrock related to rock cutting tools. Memoirs of the Centefor Engineering Geologyin the Netherlands:71, pp.71. Delft, The Netherlands.
Verwaal, W. & A. Mulder 1993. Estimating rock strength with the Equotip hardnesstester. Int.J. Rock Mech. Mining,lcf.: 30, 659-662.
Vutukuri, V.S. 1974. The effect of liquids on the tensile strength of limestone. Int.J.Rock Mech. Mining Sci.: 11, 27-29.
wasp, E.J., J.P. Kenny & R.L. Gandhi t977. solidJiquidflow. slurry pipelinetransportatlon. Trans Tech Publications. Clausthal.
Watson, J. 1990. Internal report Westham Dredging Company Pty. Ltd.Weaver, J.M. 1975. Geological factors significant in the assessment of rippability.
The Civil Engineer in South Africa: 17,313-316.Whittaker, B.N. R.N. Singh & G. Sun 1992. Rock fracture mechanics. Elsevier,
Amsterdam.

References 315
Wit, K. de 1996. Correlation between rockmechanical properties urd dredgeability.MSc thesis Faculty of Applied Sciences, Mining Engineering Department,Catholic University of Leuven. 113 pp. Leuven, Belgium.
West, G. 1986. An observation on Mohs' scale of Hardness. Quaterly Journal ofEngineering Geology: 19, 203-205.
Yardley, E.D., S.N. Johnson & P. Kenny 1981. The wear of tools used for cuttingcoal and rock. Proc. Int. conf. on wear of metals, San Fransisco: 468477,
Zum Gahr, K.H. 1,987. Microstrucrure andwear of materfals. Elsevier, Amsterdam.5@ pp.
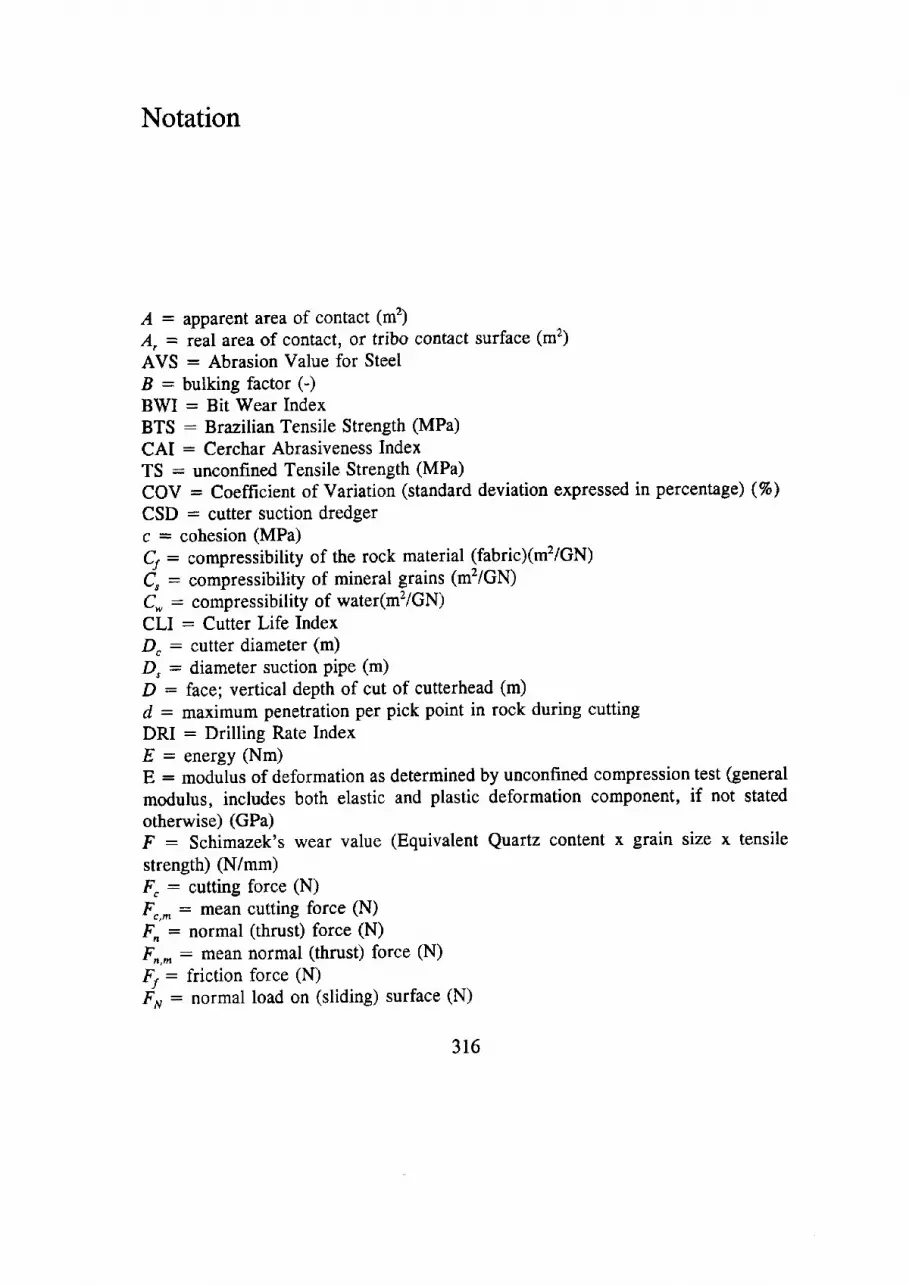
Notation
A : apparent area of contact (m2)A, = ieal area of contact, or tribo contact surface (m2)AVS : Abrasion Value for SteelB : bulking factor (-)BWI : Bit Wear IndexBTS : Brazilian Tensile Strength (MPa)CAI : Cerchar Abrasiveness IndexTS : unconfined Tensile Strength (MPa)COV : Coefficient of Variation (standard deviation expressed in percentage) (Vo)
CSD : cutter suction dredgerc = cohesion (MPa)Cy : compressibility of the rock material (fabric)(m2lcN)C, : to.pressibitity of mineral grains (m?GN)Cn : compressibility of water(mzlGN)CLI : Cutter Life IndexD, : cutter diameter (m)D, : diameter suction pipe (m)D : face; vertical depth of cut of cutterhead (m)d : maximum penetration per pick point in rock during cuttingDRI : Drilling Rate IndexE : energy (Nm)E : modulus of deformation as determined by unconfined cornpression test (general
modulus, includes both elastic and plastic deformation component, if not statedotherwise) (GPa)F : Schimazek's wear value (Equivalent Quartz content x grain size x tensilestrength) (N/mm)
4 : cutting force (N)Fr,^: mean cutting force (N)
4 : normal (thrust) force (N)Fr,^ : mean normal (thrust) force (N)
4 : friction force (N)
F" : normal load on (sliding) surface (N)
316
Notuion 317
4 : resultant forceF, : tangential load on (sliding) surface (N)FI : Fracture Index (: fracture frequency; number of fractures per meter)Ho : Hardness of abrasiveH^ : Hardness of tool materialHR : Rockwell HardnessHV : Vickers indentation hardness (MPa), often expressed in "[I," units (kg/mm2)(HV:9 .8xH" )Hu : Vickers Hardness (kg/mm2)
4 : discontinuity spacing index, calculated from three major discontinuity sets:(sl*s2*s3)/3 (m)Isso : diametral Point Load Strength normalised to core diameter of 50 mm7 : joint volume number (volumetric joint count). Sum of the number of joints permeter of each joint set in a rock mass (oints/mJI : length (m)nr : Hoek-Brown constant describing curvature of failure envelope (-)n : porosity (volume of voids divided by total volume) (-)r* is the number of teeth with identical position R on the cutterheadP" is power capacity (kW) of cutterp : penetration hardness of metal (plastic yield strength) (N/m2)p : total isotropic stress (ot*or*ot)/3 (MPa),PLS : Point Load Strength (MPa)
E; : production (m3)
Qtz eq : total mineral hardness, where hardness of minerals is expressed relativeto quartz, using Rosiwal's hardness scale (vol. %)4 : position vector of tooth on cutterhead& : radius of n+h tooth on cutterheadRsq - coefficient of discrimination12 : coefficient of discriminationr : regression coefficientRMR : Rock Mass RatingRTI : Rock Toughness Index (MPa)RQD : Rock Quality Designation. Length of intact rock core > 100 mm dividedby total length drilled in section of interest (%)S" : length of cutter (m),s : cut tength (m)s : degree of fracturing of rock masss, : total shear strength of asperities on sliding surface (N/m2),SPE : specific energy (MN/m2), (MJ/m3)SPT : Standard Penetration Testt : timeu : pore water pressure (MPa)UCS : Unconfined Compressive Strength (MPa)(U)TS : Unconfined Tensile Strength (MPa)TBM : Tunnel Boring MachineV : volume of excavated soil or rock, in-situ (m3)V, : haul velocity (swing speed) (m/min)V, : tangential velocity tooth on cutterhead (m/s)
318 TooI wear: Implications for the site investigation of rock dredging proiects
v : velocity (m/s)VHNR : Vicke.s Hardness Number of Rock; proportional summation of HV of
minerals constituting the rock (MPa)W, = Work of failure, specific work of destruction (MPa)
a : rake augle (o) cutting tool
6 : clearance angle (") cutting tool
T : wedge angle cutting tool (")^la,a = dry volumetric weight in disposal area (kN/m3)^ya,, : dry volumetric weight in situ (kN/m3)
O : conus angle pick point (')dr : forward breakout angle of chip (")
4 : sideways breakout angle of chip (")o : standard deviationo : normal stress (MPa)oc : unconfined compressive strength (UCS) (MPa)
o,, : normalized normal stress (o/o") (-)or : tensile strength (MPa)dr : unconfined compressive strength (MPa)o, : major PrinciPal stress (MPa)d, : minor principal stress (MPa)A = diameter grain, grain size (mm)p = friction coefficientp : average or mean value
4 : efficiency; delivered power / used power (-)
r : shear stress (MPa)rn : normalized shear stress (r/o") (-)r,. : unconfined shear stress (cohesion) (MPa)
d : angle of internal friction (o)
6''' : angle of friction between rock and tool (o)
co : angular velocity (revolutions per minute, rpm)
Index
AUTHOR INDEX
Abdullatif, O.M. 173,301 Bray, R.N. 10, 15, 2A,256,302Adrichem, P. 2, 147,149, 304 Braybrooke, l,C. 72,73, L73,188, 302Akenhead, R. 57,303 Bree, S.E.M. de 43-45,58,303Al-Ameen, S.I. 131-134, 301 Broch, E. 305Aleman, V.P. 74, 301 Brook, N. 286, 293,303Aleva, G.J.J. 251, 301 Brooks, M. 308Alvarez Grima, M. 8, 190, 22I,26I, Brouwer, J. 303
301, 304 Brown, E.T. 49, 70,71,79, 80, 86, 95,Ang, A.H-S 16?, 301 ll4-115, 170,241,244,245,282,Archer, R. 53, 301 286,288, 291-294,29E,302,303,Atkinson, R.H. 117, 301 306
Brugman, M.H.A. 236, 303Babuska, R- 217, 220, 301, 3M Bruland, A. 72, L26,206, 207, 303Barton, N. 79, 210,211,294,302 Bichi, E. 107, 130, 164, 303Bates, A.D. 302Bawden, W.F. 307 Chappell, J. 61, 64, 303Begelinger, A. 303 Charlier, R. 95, 310Bekendam, R. 286, 290,302 Chen, R. 288,303Bell, F.G. 71,2I0,280,282,285, 302 Clark, A.R. 53, 54, 59,239,279, 303Bieniawski, Z.T. 79,80, 81, 210,302 Clark, B.A. 305,3L2Bilgin, N. 130, 302 Clark, G.B. 39, 107, 303Bisschop, F. 2,4,8,147-149,165, 166, Cools, P.M.C.B.M. 8, 83, 87, 100,
302 103,112,303,314Blindheim, O.T. 208,302 Cornelisse, J. 3I4Bold, H.J. van den 4, 8, 140, 1,49,165, Cottington, J. 57, 303
3Q2,314 Cruden, D.M. 173, 301Boniface, A. 302Bowden, F.P. 36,37,68,116, I2 I ,302 Davids, S.W. 2, L47, I49,304Bowie, S.H.U. L19,302 De Freitas, M.H. 312Brady, B.H.G. 70,302 Deere, D.V. 242,3M
Degen, B.T.J.A. 304, 308
319
320 TooI wear: Implicuions for the site investigaion of rock dredging proiects
Deketh, H.J.R. 4, 6-9, 34, 68, 100,101, 107, ll2, 129, 132, L42,146, 147, I49, I52, 153, 156,158, 160-162, 165-167, L69, 170,175, 177, 189, 190, 194, 196,204, 254,301, 304, 314
Deliac, E.P. 22,163, 304Den Hartog, M.H. 8, 190, 195,
217-221,,301, 304Denby, B. 312Dirks, W. 308Driesch, S. von den 103, 104, 305
Egretly, I. 3I2Engelhardt, W. von 119, 305Ersoy, A. 305Evans, I. 75, 89-92, 94, 95, 97, 98,
108 , 111 ,305Ewendt, G. 166, 167,3Q5Eyre, T.S. 40, 41, 308
Fairhurst C.R. 83, 305Farmer, I. 84,294,305Fell, R. 54, 55, 305, 308Fowell, R.J. 74, 305Finnie, I . I27,3Q9Fookes, P.G. 210, 245,289,3I0Fowell, R.J. 39, 70, 73, 74,80, 112,
113, 168, 187, 305,308, 313Franklin, J.A. 173,174,210, 289, 305
Gandhi, R.L. 42,314Gee, A.W.J. de 43-45,49,58,303, 309Gehring, K. 73, 82,87, 88, 139, 188,
291,305Genske, D.D. 8, 304Geyh, M.A. 250, 305Giersch, D. 25,26,306Giezen, M. 8, 190, 194,2.16,304, 306Goodman, R.E. 70, 79, 99, 289, 306Grant, W.H. 250, 306Gregor, M. 98, 99, 306
Habig, K.H. 306Hack H.R.G .K. 226, 242, 306Hadjigeorgiou, J, 7ll, 306Hata, S, 41, 306Haussiihl, S. 305Hawkins, A.B. 290,306Hayes, D.F. 21, 310Heer, R.J. de 10, 306Herbert, C. 177,306Herbich, J.B. 10, 16, 22,306,3L0Hergarden, I.M, 8, 190, 202, 29I, 294,
296.306
Hessels, R. 308Hocking, G. 308Hoek, E. 70,7I ,79, 80,86, 95, 114,
1[5, 170, 245,288,291, 293,294,306,307
Holland, R. 307Hoogerbrugge, W.J. 75,76, 3WHornung, J. 77,307Houlding, S.W. 227, 236, 307Hurt, K.G. 37,307
Irfan, T.Y. 250,307
Jager W. 8, 132, 149,307Janach, W. 116-118, 307Johannessen, A. 303Johannessen, O. 72,73, L26, l2l, L&,
168, 206, 207, 303, 307, 3WJohnson, S.N. 71, 73,74,80, 107, 305,
307. 315Johnston, I.W. 294, 307, 309Juhdsz, A.Z. 36,307
Kaiser, P.K, 307Kearey, P. 308Kearns, G.K. 211,309Kenny, P. 42, 107, 307, 3I4, 3I5Kesteren, W.G.M. van 8, 84, 95,96,
105, 106, 308,314Kirsten, H.A.D. 210, 308Knatz, H, 101, 102,124, 136, I37, I39,
165, 166,312Koert, J.P. 1981. 308Kok, M. de 20,227,236, 308Koning, J. de 8, 10, 15, 17,49,308Krapivin, M.G. 101, 102, 139, 308Kudrass, H.R. 305
lahuec, G. 310Land J.M. 302Landheer, D. 38,68, 169, 308IrBlanc, L. 304kmpp, Ch. 309Lien, R. 79,206,302Lislerud, A. 133, 303Lowe, P.T. 176, 177, 186, 187, 308Luger, D. 314Lunde, J. 79,302
MacAndrew, K.M. 39,3O7MacGregor, F. 210-213,216, 308Manakov, V.M. 308Martin, J.M. I73, 308, lLzMashloosh, K.M. 40,41, 308Mastbergen, D.R. 308
Mathier, I.F- 303Maurenbrecher, P.M. 9, 304, 308McConnell, B.J. 290, 306McFeat-Smith, I. 112, 113, 168,308McGee, T.M. 313McNally, G. 308McQueen, L.B. 176, L77,186,187, 308Mens, J.W.M. 8,43-45,58, 59, 309Merminod, A. 116-118, 307Michajlov, V.G. 308Miedema, S.A. 2, 8,21,104, 309Miller, J.E. 311Minty, E.J. 2lI,3WMishnaevsky Jr, L.L. 83, 309Mishra, A. 127,3Q9Mogi, K. 82, 86, 291,293,294,296,
3WMostyn, G. 308Movinkel, T. '72, 73, L27,206, 303,
309Muftuoglu, Y.V. 312Mulder, A. 9, 116, 117,240, 314Muro, T. 40, 41, 306, 309Mutschler, Th. 309Myrvold, K. 303
Natau, O. 73,3A9Nelson, P.P. 209,309Netterberg, F. 251, 309Nishimatsu, Y, 94,98,99, 309Novello, E.A. 294,309
Ockeloen, J.J. 8, 83, 291,309, 314Opoczky, L. 36,307Orlid B. 236,3W,3L0Osburn, H.I. 39, 101 , 102,310Ottmann, F.G. 310
Palermo, M.R. 21, 310Pariseau, W.G. 76, 310Paschen, D. 136, 137, 140, 146, 165,
310Pathan, A.G. 312Pells, P.J.N. L77-179, 1E6, 28G28E,
290,3L0Peters, Tj. 130, 131, 313Petterson, D. Il, 27, 310Pettifer, G.S. 210, 217, 245, 289, 310Philtips H.R 39, 82, 94, 107, 310, 312Piepers, T.P.H. 289, 3lOPierry, J. 95, 310Pillans, B. 49, 6l,3IlPomeroy, C.D. 75, 89, 91, 94, 98, 305Price, D.G. 2, 8, 9, 77,245,246,255,
280,281,285, 309, 311
321
Priest, S.D. 72, 242-244,3LlProthero, D.R. 251, 253, 3lLPrudhomme, R.J. 311
Reinking, M.W. 4,8, 132, ?llRichards, J.A. 302Rix, P.F. 98, 311Rizzone, M.L. 311Rochmanhadi 306Rosenbrand, W.F. 303R<isingh, J.W. 236, 310Rosiwal, A. 116, ll7, 122-125, 136,
138, 159, 165, ll9, 200, 311Rossen, H.P.H. van 311Roxborough, F.F. 4,8,39,75, A, U,
E9, 91, 94-96,98, 107, l(8, 110,ll3, rl4, 128, 148, 160, 161,163, lg, 176, r78, 180, 186,187,310, 312
Sandbak, L.A. 80, 81, 312Schatzov, N.I. 82, 312Schimazek J. 4,9, 82, l0l, lA2, 124,
127 ,134,136-141, 146, 147 , l5l,165, 166, 167, L7L, L72, 175,rl7, r '19,180, 189, 312
Schmieman, T.H. 3l lSchofield, A. U, 294, 3LzScholz, C.H. 36-38, 312.Schwab, F. 251,253,311Schweins, B, 40,312Scoble, M.J. 211, 306,312Sen, G.C. 75,82,89, 91, 94,95, I07,
163,312Seyreck, T. 302Shahriar, K. 302Shulin Xu 288, 312Siezen, M.R. 221, 227, 236, 3I2Simpson, P.R. 119,302Sindhusen, S. 9, 134, 312Singh, R.N. 89, 211, 286, 312, 3I4Sman, R.M. van der 2, 82,99, ll2,
147, 149, 3r3Smith, H.J. LIz, ll3, 168,21L,2I2,
215, 308, 313Spaun, G. 286,313Speight, H.E. 39, l I3,187,313Staveren, M.T. van 243,313Steeghs, H.J.M.G. 8, 308Stephanson, O. 79,302Stimpson, B. 288, 303Stone, M. 1991. 2,3,3L3Streif, H. 305Suana, M. 130, 13l, 313Sun, G. 89, 314
322 TooI wear: Implicaions for the site investigotion of rock dredging projects
Swart, P.D. 8, 313
Tabor, D. 36,37,68, 116, Ll9, l2l,302
Tang, A.H-S. 167, 301Tarkoy, P.J. 118, 208, 313Thuro, K. 286, 287, 313Tourenq, C L24,3LjTucker, M.E. 251, 313
Uetz, H. 3I, 34, 43, 44, Lt6, Il9, 122,I24,312,3r3
Uittenbogaard, R. 83, 84,291,3I4
Verbeek, P-R.H. 53, 314Verbruggen, H.B. 304Verhoef, P.N.W. 2, 4, 83, 116, 122,
126, 140, l4l, 143, I49, 766,221, 254,291, 294,299, 301,304, 308, 314
Verkaik C,J. 90, 314Vermeer, T.W.M. 4,8, 140,I49, L65,
314Verwaal, W. 9, 116, 117,240,3L4Vlasblom, W.J. 9, 19,22Vutukuri, V.S. lA6, 290, 314
Walker, B.F. 49, 53, 59, 239, 279, 303Waller, M.D. 131-134, 301, 305Walton, G. 305W*p, E.I. 29, 42,44,3I4Watson, J. L77, 185, 3L4Weaver, I.M. 212,3L4West, G. 53, 55, 122, L30,131, 315Whittaker, B.N. 89, 94, 95, 3L4W{ima, K.G. 8, 11,27,310Wit, K. de 8,213-215, 315Wright, V.P. 251, 313Wroth, P. 84, 294,312Wyss, Ch. 303
Yardley, E.D. 107, 315
Zum Gahr, K,H, 29-33, 36, 38, 44,3L5
Index 323
SI.]BJECT INDEX
abrasion 3, 4, 7, 29, 32-34, 39-42, 68,59, 82, 110-112, lL9, 126-129,139, 147, 148, 149, 152, 155,156, 158, 169, l7l, L72, 176,179, 180, 185-187, 189, 196,208,2r4,223
abrasive grinding LLzAbrasive Value test, AV 127, 208abrasive wear I, 3,7, 11,29,33,39,
40, 42, 44, 68, 107, 110, 113,Ll5, 122, r24, 128, 129, 139,158, 160, 170, 171, 175, 180,1E5, 187, 189, 193, 197,204,254
abrasiveness 2-5,'7, 9, ll, 2I, 44, 50,51 ,59 , 65 ,69 ,80 ,98 , 117 , 118 ,126, r29, 130, 134, 138-140, 142,149-152, L&, t65, 169, 175-177,183, 187, 197, 198, 207, 2W,224-226, 230, 235, 255, 258, 283,298, 300
adhesion theory 36,37adhesive wear 32, 36,67-69,115, l?0,
r7l, L93,2Q4,258aggregation 220,221aggressiveness 42angle of internal friction 94angle of sJiding friction 9I,94angularity 3,4, 132anisotropic 76, 7'7, 95, 227, 239, 241,
268,269,211,288artificial rock 4, L27, 136, 140, L4I,
153
back- or overcutting swing 17beach rock 53, 228, 238, 252, 253bedding 70-72, 166, 212, 226, 242, 243,
247, 266, 268, 280, 281, 298, 300bifurcation 84,96bit consumption L9l, 192, 195, 196,
2M, 206, 218, 219, 221, 223, 224bonding 36, 95, LI7, 127, L38, l3Q, 247breakage 89, 107, 134, 139, 191-193,
195, 196, 204, 217, 218, 221, 223brittle cutting 87, 89, 96, 295, 296brittle failure 40, 85, 291,293brittle-ductile transition 3, 83-84, 86, 88,
89, 1 15, 202, 258, 291, 293, 294,296
brittleness 4, ffi,85, 87, 208, 2W,240
Brazilian tensile strength, BTS 86,8't, tr2-r15, 136,138, 161,t&-Lffi, l7O, 177, 175,179,186, 189, 197, 198,208,210,214, 216, 223, 224, 226, 227,230, 2240, 258, 283, 286,288, 289, 291, 295, 296, 298,299
bulking factor 20, 21,226,23L
calcarenite 11,53, 55, 58, ff i ,2L3,274,282,286,29L,3U2
calcrete 49,251cataclastic ductile failure 83, 88, 291cement 56, I32, 155, 156, 178, L97,
230, 25r-253, 266, 267, 270cementation 55, 113, 225, 226, 228,
238,25t-253Cerchar scratch test 4, I22, 127, 129,
r30, L32-r36, 149, 150chip formation 67, 84, 85, 90, 95, 96,
106, 170, 171chisel 4, 19,23,24, 65, 69,74,84, 85,
88, 90, 94-98, 100, 102, 104,106, 107, lw, ll2, r28, L29,139, 148, 152-156,158, Lffi, L62,250
clause 12 57,58, 64clay LL,20,45, 55, 56, 58, 60, 61, 63,
82, L16,138, 165, L66,177, r78,226, 227, 238, 246, 24',1, 250,258, 272, 27 4, 282, 300, 306, 3 I I
c lay bal ts 11,20,45,58, 60,63clearance angle 25, 27,90-92, lWcoefficient of friction 3?coefficient of variation, COV 116, 119,
166-168, 177, 178, 288, 289compressibility 105confining pressures 67, I70core abrasion test 110, 128, 129, I48,
L52, L75core cutting test 108, 109, L28, t47,
162, L75corrosion 29, 40, 42, 43, lMcounter body 98, 126crisp value 221critical state theory 84critical velocity 44, 68, 101, 102, 139,
152, rffi, r71crushed rock 6, 7 , 3I, 83 , 106, 152, 158
324 TooI wear: Implications for the site invesrtguion of rock dredging projects
crushed mne 6,67,83-85,89, 96, 105,106, 170,291
cuttability 6, 65, 75, 87 , 109, 1 12-115,176, 180, 185, 197, 189,230
cutter suction dredger, CSD 10, 14-16,27 ,29 ,31 , 59 , 65 , 66 ,70 ,73 ,74,76, 714, 175, 170, 176, L89,214, 215, 224, 227, 235, 239, 259
cutt ing l-8, 1O.17, 19,21-29,31, 33,34, 3841, 45-47, 49, 50, 58,55-78, 80, 81, 82-92, 94-100,t02-rt6, 126-129, 135, 136, 139,142, 147, 148, 150, Lst, L52-164,L66, 168-173, 175-177, 179-181,185-187, 189-196, 202, 204, 209,209, 2r2,2t5-218, 223-225, 236,239, 246,247, 250,254, 255,257, 258, 260, 288-29 L, 295, 296,298
cutting force 22, 24, 25, 78, 83, 85,90-92, 94-96, 98-100, 107-109
cutting performance 7,70,73, 75, 76,107, 108, r89,192,255
cutt ing test 2, 29, 46, 47,82, 108-113,128, 129, 147, 162, 175, 180,186, 258
cutting tip 83, 170cutting tool 3, 6, 22, 27, 29, 31, 41, 67,
7L, 74, 80, 83, 95, g7-89, 96, 99,99, r02, 105, 109, 114, 116, 139,168-170, 173, r93, 212, 289, 291.
cutting tooth 14, 24, 25, 74, 75, 81, 87,99
cycloid 25
defuzzification 220, 22Idegree of fulfilment 220deviatoric cap 84dilation 84discontinuity 3, 6,7, 10,21,28, 46,57 ,
65, 70-81, 113, 114, r39, 170,r72, 173, 191, 193- 195, 2r0-?t2,2t7, 223, 224-227, 231-233, 235,238, 239 , Z4l-247 , 257 , 266, 27 I ,28A, 281, 283, 295, 293
drag tools 89dredgeability 2, 50, 216,221, 226,235,
236,288
dredgers L, 3, 5-7, 10, 13-17, 22, 29,38 , 49 ,58 , 64 , 67 ,70 ,85 , l og ,135, 162, 212, 2r4, 224, 239
drusy cement 252
ductile cutting 7, 85,87-89, II4,2M,258,295,296
ductile failure 88, 170, 202, 286,291,294
ductile ploughing 85ductility 83, 85, 87, 88, 90, 95, 114,
ll5, l7g, lgo, 202, 216, 219,223, 226, 235, 240, 259, 2fi,283,291,293, 294
ductility number 87, 88, 95, 114, 115,l 7g ,zgL ,2g3
duricrust 49, 2L3, 226, 228, 251
elastically 34Equotip 116, L17,231, ?40, 299erosion 29, 31, 4245, 49, 54,58, 60,
Lr6, 226, 250,266excavatability index 210expert systems 7, 206, 224,, 221, 236,
255,259,2ff i
F-value 4, I36-L42, 147, L48,165, i69,175, I7g, lg0, lg2, 193, lg5,186, 187-190, l9g, 223, 224, 226,227,3ff i
failure envelope 38, 84-89, I70, 29L,294,296
faults 71, 72, 242, 243, 281feed 4, 5, I28, I29, 143, I44, 146,
152-156, 159, 160, 162, t63, 16g,r82, 190, 194, 196, lg7, 202,204,254
feldspar 60, ll9, 124, L38, 152, I58,l5g, I7g, 247, 262, 269, 272, 300
fracture 6, 38, 39, 67, 70, 72,73, 80,90, 91, 95, 96, llg, 206-209,zl2, 214, 2lg, 233, 239, 24L,242, 244, 245, 263, 272, 273, 2gg
fracture index, FI (see frequency) 212,2L4-2r6, 233, 242, 243
fracture orientation 70fracture spacing 70, 73, 208, 2l4,2LBfragmentation of rock l0frequency (see fracture index) 70, 72,
73, 170, 172, 2Q7, 212, 2I4, 223,226,238,242-244
fr ic t ion 22,25-27,30, 31, 34, 36-38,83, 85, 9I, 92,94, gg, 106,226,286,290
friction fore, 36,37frictional heating 40, 104, 258fuzzification 220fuzzy expert modelling 174,259fuzzy logic 7, 205, 206, 217, 220, 255,
296
geostatistical modelling 214, 236Geo Information System, GIS 227,236glass 116, l2I-L23, 125, L32,140, 141,
r52, 158,298gouge 29,31, 156, 158, L95,2I2,274grain shape 116, 127, I4l, L52, L58,
189grain size 4, 44, 65, 69, 80, 95, 102,
lLz, lI7, L22, 127, 130, 132,133, 135-138, r4 l ,152,153, 158,161, 165, 166, 168, 169, l7r,175, L78, 179, 185, 187, 189,190, 197, 2r r ,2L8, 223,224,226,227, 230, 24I, 254,258,264, 266, 768, 270, 27L, 280,282,288,298,300
granite 40, 60, 61, 116, i19, 131, 133,150, 190, 238,247, 250, 266,270,271,274,291, 3Q6
groundwater 49, 80, 251-253,285
hard facing 19,38, 40hardground 252,253hardness 3, 4, '1, LL, 29, 33, 36-38, 40,
44,65,68, 69, 98, 100, 102,1.03,110, 112, l13, 116-127,r29,131,133-136, r38, 143, 156, 158-160,165, 169, r71, 179, l9o, 197,208, 223,226, 254,258, 263,269,270,271
hardness contrast 7, 29,44, 68, 102,r24, 126
haulage velocity 18,23, 26,27,74, 75,la3, 154, 162
Horslev surface 84
impact 21, 29, 31, 33, 38, 40, 42-45,92, l t } ,116-118, 126, 160, l8 l ,192, 196,2r8
impact angle 29,45impact velocity 45,92impacting 15,29,31, 33, 716, 117indentation 33, 36, I 16-121indentation tests 117, 118inference 220infilling 78intact rock 3, 65, 67,70,73-82,84, 86,
88, 94, 109, 114, 115, 158, 164,216, 238,239, 241, 242, 245,256, 265, 786, 288, 29 r, 293, 294
interfacial medium 31
joints 10, 46, '7I, J2, 74-76, 78, 173,793, 194, 207, 212, 227, 240,242,244,266,281
32s
layering 268limestone 11, 39, 60,87,88, 103, 106,
116, 190, 2r3, 216,239, 247,252, 27r, 274, 291,3L4
Iinguistic terms 218-220, 227logical operators 220lubricant 3ilubrication 30,37
m-value 114, 190, 245, 258, 29I,293-296
main investigation 228massive lI3, L72, I77, lg0, L92, 196,
202, 204, 217, 218, 271, 223,235, 239, 254, 257, 27L, 274,280,282
membership grades 220micrite 253,291.micro-chipping 190, 193microcracking 38microcutting 38, 68, 156microfatigue 38microploughing 38, 68microscopic structure 3, 95, lL6, I27,
138, r42, L89, 226, 294, 298, 3oOmineralogical composition 5, 50, 65,
116, 127, 132, 158, I75, 177,238, 24r, 250, 266,298, 300
mode of cutting 6Mohs Hardness 11, 116, 122,I33, L65moisture 55, 178, 286,289,290,306monitoring 6, 8, 20, 49, 172, 190, 193,
205, 258, 259, 286, 303, 304, 309
NCB cone indenter II2, Ll3normal force 3?, 87 , 92,94, 107, 109,
i 11 , 169
oscillation 31outbreak ar;.gle 97overcutting I7,76
penetration hardness 36petrographic examination 2, 7, 8, Llz,
133, 169, 179,23Q, 252, 258,280,298
phreatic zone 253pick point 15, 23, 25, 49, 65, '70,74,
75,95, 138, 139, 163, r73, 193,2 r4 ,259
pin-on-disc test 4, 46, 126, 127, 136,140, 142, I44, 146, L47, I49-I52,165
pipe wear 58plagioclase 116, 119, 263, 300
326 Tool wear: Implicatiorc for the site investigation of rock dredging projects
plastic deformation 33, 34, 36, 39-4L,94,100, 157, 190
plastic yield strength 36plastic yielding 36point load strength, PIJ 55, 56, 80, 86,
lu, l7l, 175, 179, 183, 185,189, 190, 197, 198, 208,210,2L4, 216, 226, 238, 240, 258,274, 286, 288, 289, 291, 298
point load index 55pore pressure dissipation 105pore water pressure 104-106preparatory investigation 228Protodyakonov number 55
quartz lI, 12, 21, 39, 40, 50, 58-61,63, &,80, 87, 98, 102-104, 116,ll9, l2L, L23-126,132, 136, 138,152,156,158-160, 165, 166, 168,175-179, 185, 186, t97, 2M, 226,227, 230, 238, 246, 247, 250,258, 26L, 265, 270, 272, 282,299,299,300
Q system 79,211
rake angle 25,82,90, 91, 94, tA7, LWrate of wear 108, 147, 152-154, 156,
158, 168, 169,202ratio of spacing and cutting depth 97ratio R 96rebound tests ll7residual soil 60, 285Rippability Rating 210, 212, 214, 215ripping 6, 7, I0, 71, 75, 77, 170, 173,
r74, r90, 193-195, 204, 2W-212,214, 215, 211 ,223,258
rock mass 3, 6, 7, 45, 46, 65, 67,?0-75,77-81,87, 108, 113, 114,164, 170, L72-175, 1,77, l9L-194,2M, 207-2t0, 212, 214-216,223-226, 229, 232, 234, 235, 238,240-247, 254, 256, 257, 260, 27 r,290,291,283, 285,293
Rock Mass Rating, RMR 73, 79, 80,207, 2Q8, 210, 2r4, 215, 245,257,293
rock material 4, 6,7, 13, 16, 2Q,23,68, 70, 7r,73-75,'1',7,80,82, 88,89,94, 109, 112, l I4, l l7, L43,L47, L52, L70, L72, r73, 177,190, 193, 194, 196,204, 207,zl0, 216, 219, 223-226, 241, 246,247, 254, 257, 258, 265, 269,272, 274, 280, 282, 285, 287, 291
rock strength 50, 59, 67-69, 79, 82,98-100, r28, 132,133, 139, 153,158, 169, Lll, 172, 175, 179,181, 196, 197, 20l.,2210, 212,218, 238, 239, 240, 254, 258,286,289
Rock Toughness Index, RTI 286,287rock tlpe 25, 41, 47, 49, 67,70, 80,
85, 113, 114, 1[6, 136, l4g, 150,153, 160, 163, 168, 171, 190,197, 258, 26L, 27Q, 274, 288,289,291,293,294
rolling 17, 3LRoscoe surface 84Rosiwal Hardness II7, L22, 124, L25,
138, 159,165, 190rotation rrite 23-25, 75, 136rotiation velocity 4, 22,26,27,72, I03,
142,162, L63roughness 36roundness 132, l4lRTI 286Rubber Wheel Abrasive test 127
sandblast test 122sandstone 7, 87,88, 91, 103, 107, ll0,
Llz, 116, 137, 143, 152, 166,168, L7t-L73, r75-I79, 183,1 85-l 87, 190, 197, 223, 230, 288,290, 29L,299, 300, 306, 309,310, 314
Schimazek's pin-on-disc test 136Schimazek's test I27,136, L4L, L46Schmidt hammer LLz, 113, 116-118,
208,240,299scraper test 151, 160, 169, 170scratch tests IL1shaper 2, lW, 144, I47, L49, 152shear strength 37, 38, 52, 55, 65, 78,
81,94, r14,244,258shear zones 77,72, 84,242,243shore hardness 112, l13shore scleroscope 116, 117silcrete 251sliding 29, 3L, 33, 34, 37, 38, 40, 42,
87, 88, 91, 94, 133-135, 140-142,r44,146,156, 160, 169
sliding wear 31, 160slurry 15, 19-21, 29,42-45,58, 63, 65,
226solid body 29-31,41, 126solid particle concentration 45sparite 238,252specific cutting force 109
specifrc energy 28, 34, 96, 99, 109,111, 113-115, r29, 156, 158,160-L62,212
specifrc normal force 109specific wear (SPW) L47, 154, 156, 158,
lffi-162, 166, r75, 190, r92,196-198, 204
specific work of failure 286, 287, 29Lspill 18, 19stress distribution factor 94stress rate 98, 99, 289surface fatigue 29,32-34,39, 42, 44swing speed 18, 2I, 23, 25-27, 74
tangential velocity 15, 26, 103, 142, 143temperature 3L, 37, 38, 4I, 68, 85, 86,
88, 99-102, 104, 111, 112, 115,116, 135, 139, 143, 144, 158,160, 170, r71,r93,259
tensile chip failure 85tensile strength (see unconfined tensile
strength) 7, 70, 72, 77, 86, 87,9A, 92, 94, 106, rr4, Lls, 122,130, l3l, 136, L37, 140, 164-166,168, 171, 115, 179, 180, 186,216, 226, 238, 240, 241, 286,288, 293, 303, 307 , 312, 314
three body abrasive wear 29,33, L27thrust 17,72, '76,81, 107, L62,209tool consumption 3-5, 7, 47 , 50, 67 , 68,
80, 130, 172, 175-177, 183, 185,187, 189, r90,212-217 ,223-22'7,231, 236,238, 254,255, 258,259,260
tool material 11, 68, 91,107,I09,124,r29, 139, 152, 160, 161, 166,169, L7l
tool temperature 99tool velocity 99torque 14,22,25, 103, lWtoughness 40, 95, I14,286,287transversely isotropic 76trenches 5, L72, I90, 191,244tribochemical reaction 32, 33tribology 4,29-31,33, 36, 41, 46, 65,
126tribosystem 29,31,, 45,46, 49tungsten carbide 4, 38, 39, 49, 98,
109-111, 116, Lr7,126-129, t7t,Lgz, Lg3, tg6,2A
two body abrasive wear 33, 40
327
unconfined compressive strength, UCS7, 50, 53,55, 56, 58, 80, 86, 87,90, 94, 95, 98, lM, rr2-1r5,lr7, 139, r52, 156, L6l, 162,164, 166, 168, 170, l7t, 175,178, L79, 186, 188-190, 196, 197,2M, 208, 210, 212-215, 220, 223,224, 226, 227, 230, 233, 238-24Q,245, 25E, 274, 283, 286, 288,289, 291, 293-296, 298, 299
unconfined shear strength 94unconfined tensile strength, UTS (see
tensile strength) 87, 95, 226,288,293,294
undercutting 17,76undrained condition 105, 106
V-pattern 190, 191Vickers Hardness 40, ll0, 116, ll9,
170, r22,143, l&volumetric cap 84
water saturation 106, 180, 290wear debris 31weaf factor "F" 136wear flat 34, 68, 87-89, 91, 100, 107,
111, 115, 127,129-132,134, r35,140, l4L, 143, 144, 147, 156-158,160
wear mechanism 29, 32, 44, 68, 92,r29, r41,148, 151, 258
wear mode 7, 69, 87, 152-154, 15G158,160, 162, t69, 170, 196,254
wear process 3,29,3I,32, 40,45, 46,107, 142, 158, 160, 169, L7L, 254
working- or undercutting swing I7
hdex