weak population genetic differentiation in the most numerous arctic seabird, the little auk
TRANSCRIPT
ORIGINAL PAPER
Weak population genetic differentiation in the most numerousArctic seabird, the little auk
Katarzyna Wojczulanis-Jakubas • Adrianna Kilikowska • Ann M. A. Harding •
Dariusz Jakubas • Nina J. Karnovsky • Harald Steen • Hallvard Strøm •
Jorg Welcker • Maria Gavrilo • Jan T. Lifjeld • Arild Johnsen
Received: 22 April 2013 / Revised: 19 October 2013 / Accepted: 20 January 2014
� The Author(s) 2014. This article is published with open access at Springerlink.com
Abstract Quantifying patterns of genetic diversity and
differentiation among populations of Arctic birds is funda-
mental for understanding past and ongoing population pro-
cesses in the Arctic. However, the genetic differentiation of
many important Arctic species remains uninvestigated. Here,
phylogeography and population genetics were examined in
the worldwide population of a small seabird, the little auk
(dovekie, Alle alle)—the most numerous avian species of the
Arctic ecosystem. Blood samples or feathers were collected
from 328 little auks (325 from the nominate subspecies and 3
from the A. a. polaris) in nine main breeding aggregations in
the northern Atlantic and one location from the Pacific Ocean.
The mtDNA haplotypes of the two subspecies were not seg-
regated into separate groups. Also, no genetic structure was
found within the nominate race based on microsatellite
markers. The level of genetic differentiation among popula-
tions was low yet significant (mean FST = 0.005). Some
pairwise FST comparisons revealed significant differences,
including those involving the most distant Pacific colony as
well as among some Atlantic populations. Weak population
differentiation following the model of isolation by distance in
the little auk is similar to the patterns reported in other high-
Arctic bird species, indicating that a lack of distinct genetic
structure is a common phenomenon in the Arctic avifauna.
Keywords Alle alle � Dovekie � Microsatellites � Gene
flow � Genetic population differentiation � Population
structure
Introduction
The genetic diversity and divergence of avian populations
inhabiting the Arctic generally seems to be low compared with
those breeding at lower latitudes (Hewitt 2000; 2004; Weider
and Hobæk 2000). This is usually attributed to historical
changes in the geographic ranges of the species, associated
with the cycles of glaciations during the Quaternary (Hewitt
Electronic supplementary material The online version of thisarticle (doi:10.1007/s00300-014-1462-5) contains supplementarymaterial, which is available to authorized users.
K. Wojczulanis-Jakubas (&) � D. Jakubas
Department of Vertebrate Ecology and Zoology, University
of Gdansk, ul. Wita Stwosza 59, 80-308 Gdansk, Poland
e-mail: [email protected]
A. Kilikowska
Department of Genetics, University of Gdansk,
ul. Wita Stwosza 59, 80-308 Gdansk, Poland
A. M. A. Harding
Environmental Science Department, Alaska Pacific University,
4101 University Drive, Anchorage, AK 99508, USA
N. J. Karnovsky
Department of Biology, Pomona College, 175 W Sixth Street,
Claremont, CA 91711, USA
H. Steen � H. Strøm � J. Welcker
Fram Centre, Norwegian Polar Institute, 9296 Tromso, Norway
M. Gavrilo
Arctic and Antarctic Research Institute (AARI), 38 Bering
Street, 199397 Saint Petersburg, Russia
J. T. Lifjeld � A. Johnsen
Natural History Museum, University of Oslo, PO Box 1172,
Blindern, 0318 Oslo, Norway
123
Polar Biol
DOI 10.1007/s00300-014-1462-5

2000; 2004; Martin and McKay 2004; Adams and Hadley
2013). The shifting of species ranges could reduce the genetic
diversity and/or divergence of populations through several
mechanisms, such as reduction in population size (Hewitt
2000, 2004) and/or population mixing, particularly in com-
bination with possible selection for increased dispersal during
the recolonization periods (Martin and McKay 2004 and ref-
erences therein). At present, limited availability of habitat
suitable for breeding in the Arctic causes disjunctive breeding
locations, which together with intrinsic barriers, such as site
fidelity and philopatry, can reduce the birds’ dispersal and lead
to genetic structuring of populations (Friesen et al. 2007). In
consequence of all these processes, the extent of genetic pat-
terns of Arctic bird populations is quite variable. Identifying
and quantifying the patterns of genetic diversity and differ-
entiation of Arctic bird species may help to understand the
evolutionary paths and ongoing population processes in this
ecosystem (Avise 2000; Crandall et al. 2000).
Arctic species at remote locations continue to be a chal-
lenge to investigate and are thus underrepresented in the lit-
erature. This is particularly visible in meta-analytical studies of
biogeographic patterns of genetic variability, where high-lat-
itude birds are scarce (e.g., Martin and McKay 2004; Weir and
Schluter 2007). Therefore, the investigations of truly Arctic
species are highly valuable. In this study, the phylogeography
and population genetics were examined in a small, colonial
seabird, the little auk (dovekie) Alle alle, the breeding range of
which is entirely restricted to the high-Arctic.
The little auk is believed to be one of the most numerous
seabirds of the world ([37 million pairs, Kampp et al. 1987;
Mehlum and Bakken 1994; Isaksen and Bakken 1996; Bo-
ertmann and Mosbech 1998; Stempniewicz 2001; Egevang
et al. 2003). The majority of the global population is con-
centrated in the Atlantic sector of the Arctic, with the largest
colonies located in Greenland and the Svalbard archipelago
(Stempniewicz 2001; Fig. 1). Much smaller colonies are
located on the southern (Jan Mayen and Bjørnøya) and
eastern borders (Novaya Zemlya and Severnaya Zemlya) of
the breeding range, while only small numbers have been
reported to breed in the Pacific sector of the Arctic, namely
the Bering Strait (Diomede Island, and possibly on St
Lawrence Is. and King Is.) and the Bering Sea (St Matthew
Is. and Pribilof Is.; Day et al. 1988; Montevecchi and
Stenhouse 2002). Two subspecies have been recognized: the
nominate Alle a. alle and A. a. polaris. The latter is larger
(Stempniewicz et al. 1996; Wojczulanis-Jakubas et al. 2011)
and inhabits Franz Josef Land and possibly Novaya Zemlya,
whereas the nominate race occurs over the rest of the
breeding range (Fig. 1). Although the little auk is considered
a keystone species of the Arctic ecosystems (Stempniewicz
Fig. 1 Distribution and relative size of little auk breeding populations (indicated by black circles) sampled in the study. The maps were
produced with Ocean Data View; relative population sizes are based on Stempniewicz (2001). See Table 1 for colony abbreviations
Polar Biol
123

2005; Stempniewiecz et al. 2007), the population genetics of
this species has never been studied.
Some genetic differentiation of the little auk populations
might be expected, given the insular pattern of distribution
of the little auk colonies (Fig. 1) in combination with
presumably high rate of nest-site fidelity (K. Wojczulanis-
Jakubas, unpublished data and per analogiae to related
species of similar life-history traits, reviewed in Divoky
and Horton 1995). Moreover, intraspecific differentiation
in body size (Stempniewicz et al. 1996), including some
differentiation within the nominate subspecies (Wojczul-
anis-Jakubas et al. 2011), suggests that breeding colonies
may constitute isolated populations.
Materials and methods
Sampling and laboratory procedure
Blood, feathers, or tissues were collected from 328 little
auks from ten breeding locations in the Atlantic and Pacific
oceans (Table 1; Fig. 1). Blood samples (25 lL) were
taken from birds captured in the colony during the breeding
season in the years 2001–2010. The blood was preserved in
96 % ethanol until DNA extraction. Feathers were col-
lected from birds found dead in the colony in Franz Josef
Land. Tissue samples were collected in the Alaska
Museum from skins and two frozen specimens (voucher
catalog numbers: UAM 1000, UAM 3399, UAM 4883,
UAM 5263, UAM 5384, UAM 13203, and UAM 27041).
All sampled birds were adults (at age [2 years, distin-
guished from subadults by the appearance of wing covers
and flight feathers, Stempniewicz 2001) and presumably
unrelated to each other.
DNA was extracted from blood samples using kits
designed for blood samples (Blood Mini, A&A Biotech-
nology, and EZNA, Omega Bio-tek). For feathers and
frozen tissue, DNeasy Tissue kits (Quiagen) were used.
Three DNA samples from four distant locations, and
comprising the two little auk subspecies, were selected for
sequencing the mitochondrial control region (A. a. alle: the
Atlantic area—MH_SVA, IS_SVA; and the Pacific area—
DI_ALA; A. alle polaris: the Atlantic area—FJ_RUS; see
abbreviation codes in Table 1). The primers were designed
based on the sequences of the mtDNA control region
available in GenBank for the little auk and the closely
related common and Brunnich’s guillemots and razorbill
(Alca torda) (AaCRF1: 50cctgaattttcacattcccttt and
AaCRR1: 50ttatgcccaacaagcattca). The following protocol
was used for the sequencing reaction: PCR reaction volume
was 15 lL, containing 0.6 mM dNTPs, 0.03 U/lL Dyna-
zyme II DNA Polymerase (Finnzymes), 19 buffer (10 mM
Tris–HCl, 1.5 mM MgCl2, 50 mM KD, and 0.1 % Triton
X-100; Finnzymes), 0.5 mM primer, and 3 lL DNA
extract. The conditions of the reaction were as follows:
5 min at 94 �C; 30 cycles of 30 s at 94 �C, 30 s at the
annealing temperature, and 30 s at 72 �C; and final
extension period of 10 min at 72 �C. Cycle-sequencing
reactions were carried out using an ABI PRISM BigDye
Terminator v1.1 Cycle-Sequencing Kit, with reaction vol-
ume of 10, 1 lL primer, and 5 lL PCR product. Cycle-
sequencing products were run on an ABI PRISM 3100
Genetic Analyzer following the manufacturer’s instructions
(Applied Biosystems).
Table 1 Numbers of little auks analyzed for microsatellite (Msats) and mitochondrial markers (mtDNA) for ten breeding colonies, ordered
according to longitude and latitude
Abbreviation Breeding colony geographic
location
DNA source
(N samples)
Subsp. Coordinates Year Msats mtDNA
DI_ALA Diomede Island, Alaska skin (5), alle 65�450N, 168�550W 1958–2000a 7 3
frozen tissue (2)
HI_GRE Hakluyt Island, Greenland blood (8) alle 77�420N, 72�680W 2006 8 0
KH_GRE Kap Hoegh, Greenland blood (30) alle 70�430N, 22�380W 2007 30 0
MH_SVA Magdalenefjorden, Høystakken slope,
Spitsbergen, Svalbard
blood (65) alle 79�350N, 10�590E 2007 65 3
MA_SVA Magdalenefjorden, Alkekongen slope,
Spitsbergen, Svalbard
blood (40) alle 79�350N, 11�050E 2008 40 0
KF_SVA Kongsfjorden, Spitsbergen, Svalbard blood (33) alle 79�010N, 12�250E 2007 33 0
IS_SVA Isfjorden, Spitsbergen Svalbard, blood (29) alle 78�140N, 15�190E 2007 29 3
HO_SVA Hornsund, Spitsbergen, Svalbard blood (33 ? 40) alle 77�000N, 15�330E 2001, 2008 73 0
BI_SVA Bjørnøya, Svalbard blood (40) alle 74�150N, 19�030E 2008 40 0
FJ_RUS Hooker Island, Franz Josef Land, Russia feathers (3) polaris 80�190N 52�460E 2010 0 3
a Each individual sampled in different years: 1958, 1968, 1975, 1982, 1985, 1986, and 2000
Polar Biol
123
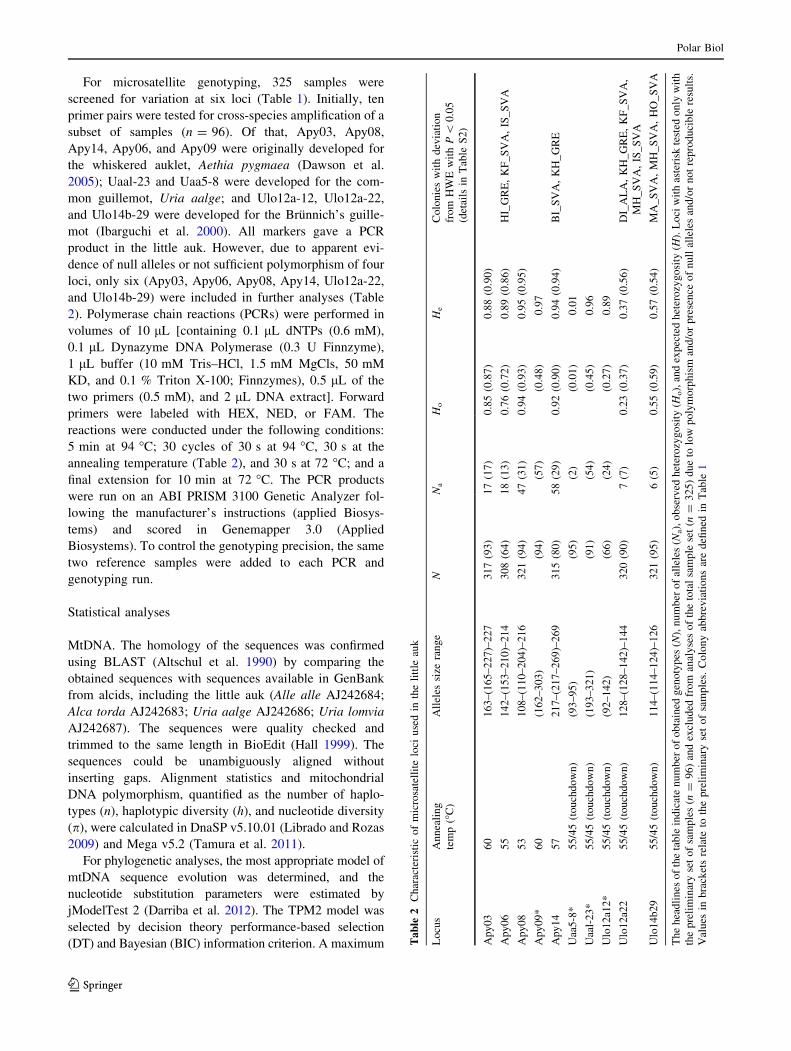
For microsatellite genotyping, 325 samples were
screened for variation at six loci (Table 1). Initially, ten
primer pairs were tested for cross-species amplification of a
subset of samples (n = 96). Of that, Apy03, Apy08,
Apy14, Apy06, and Apy09 were originally developed for
the whiskered auklet, Aethia pygmaea (Dawson et al.
2005); Uaal-23 and Uaa5-8 were developed for the com-
mon guillemot, Uria aalge; and Ulo12a-12, Ulo12a-22,
and Ulo14b-29 were developed for the Brunnich’s guille-
mot (Ibarguchi et al. 2000). All markers gave a PCR
product in the little auk. However, due to apparent evi-
dence of null alleles or not sufficient polymorphism of four
loci, only six (Apy03, Apy06, Apy08, Apy14, Ulo12a-22,
and Ulo14b-29) were included in further analyses (Table
2). Polymerase chain reactions (PCRs) were performed in
volumes of 10 lL [containing 0.1 lL dNTPs (0.6 mM),
0.1 lL Dynazyme DNA Polymerase (0.3 U Finnzyme),
1 lL buffer (10 mM Tris–HCl, 1.5 mM MgCls, 50 mM
KD, and 0.1 % Triton X-100; Finnzymes), 0.5 lL of the
two primers (0.5 mM), and 2 lL DNA extract]. Forward
primers were labeled with HEX, NED, or FAM. The
reactions were conducted under the following conditions:
5 min at 94 �C; 30 cycles of 30 s at 94 �C, 30 s at the
annealing temperature (Table 2), and 30 s at 72 �C; and a
final extension for 10 min at 72 �C. The PCR products
were run on an ABI PRISM 3100 Genetic Analyzer fol-
lowing the manufacturer’s instructions (applied Biosys-
tems) and scored in Genemapper 3.0 (Applied
Biosystems). To control the genotyping precision, the same
two reference samples were added to each PCR and
genotyping run.
Statistical analyses
MtDNA. The homology of the sequences was confirmed
using BLAST (Altschul et al. 1990) by comparing the
obtained sequences with sequences available in GenBank
from alcids, including the little auk (Alle alle AJ242684;
Alca torda AJ242683; Uria aalge AJ242686; Uria lomvia
AJ242687). The sequences were quality checked and
trimmed to the same length in BioEdit (Hall 1999). The
sequences could be unambiguously aligned without
inserting gaps. Alignment statistics and mitochondrial
DNA polymorphism, quantified as the number of haplo-
types (n), haplotypic diversity (h), and nucleotide diversity
(p), were calculated in DnaSP v5.10.01 (Librado and Rozas
2009) and Mega v5.2 (Tamura et al. 2011).
For phylogenetic analyses, the most appropriate model of
mtDNA sequence evolution was determined, and the
nucleotide substitution parameters were estimated by
jModelTest 2 (Darriba et al. 2012). The TPM2 model was
selected by decision theory performance-based selection
(DT) and Bayesian (BIC) information criterion. A maximum Ta
ble
2C
har
acte
rist
ico
fm
icro
sate
llit
elo
ciu
sed
inth
eli
ttle
auk
Lo
cus
An
nea
lin
g
tem
p(�
C)
All
eles
size
ran
ge
NN
aH
oH
eC
olo
nie
sw
ith
dev
iati
on
fro
mH
WE
wit
hP
\0
.05
(det
ails
inT
able
S2
)
Ap
y0
36
01
63
–(1
65
–2
27
)–2
27
31
7(9
3)
17
(17
)0
.85
(0.8
7)
0.8
8(0
.90
)
Ap
y0
65
51
42
–(1
53
–2
10
)–2
14
30
8(6
4)
18
(13
)0
.76
(0.7
2)
0.8
9(0
.86
)H
I_G
RE
,K
F_
SV
A,
IS_
SV
A
Ap
y0
85
31
08
–(1
10
–2
04
)–2
16
32
1(9
4)
47
(31
)0
.94
(0.9
3)
0.9
5(0
.95
)
Ap
y0
9*
60
(16
2–
30
3)
(94
)(5
7)
(0.4
8)
0.9
7
Ap
y1
45
72
17
–(2
17
–2
69
)–2
69
31
5(8
0)
58
(29
)0
.92
(0.9
0)
0.9
4(0
.94
)B
I_S
VA
,K
H_
GR
E
Uaa
5-8
*5
5/4
5(t
ou
chd
ow
n)
(93
–9
5)
(95
)(2
)(0
.01
)0
.01
Uaa
l-2
3*
55
/45
(to
uch
do
wn
)(1
93
–3
21
)(9
1)
(54
)(0
.45
)0
.96
Ulo
12
a12
*5
5/4
5(t
ou
chd
ow
n)
(92
–1
42
)(6
6)
(24
)(0
.27
)0
.89
Ulo
12
a22
55
/45
(to
uch
do
wn
)1
28
–(1
28
–1
42
)–1
44
32
0(9
0)
7(7
)0
.23
(0.3
7)
0.3
7(0
.56
)D
I_A
LA
,K
H_
GR
E,
KF
_S
VA
,
MH
_S
VA
,IS
_S
VA
Ulo
14
b2
95
5/4
5(t
ou
chd
ow
n)
11
4–
(11
4–
12
4)–
12
63
21
(95
)6
(5)
0.5
5(0
.59
)0
.57
(0.5
4)
MA
_S
VA
,M
H_
SV
A,
HO
_S
VA
Th
eh
ead
lin
eso
fth
eta
ble
ind
icat
en
um
ber
of
ob
tain
edg
eno
typ
es(N
),n
um
ber
of
alle
les
(Na),
ob
serv
edh
eter
ozy
go
sity
(Ho),
and
exp
ecte
dh
eter
ozy
go
sity
(H).
Lo
ciw
ith
aste
risk
test
edo
nly
wit
h
the
pre
lim
inar
yse
to
fsa
mp
les
(n=
96
)an
dex
clu
ded
fro
man
aly
ses
of
the
tota
lsa
mp
lese
t(n
=3
25
)d
ue
tolo
wp
oly
mo
rph
ism
and
/or
pre
sen
ceo
fn
ull
alle
les
and
/or
no
tre
pro
du
cib
lere
sult
s.
Val
ues
inb
rack
ets
rela
teto
the
pre
lim
inar
yse
to
fsa
mp
les.
Co
lon
yab
bre
via
tio
ns
are
defi
ned
inT
able
1
Polar Biol
123
likelihood consensus tree was calculated in the PhyML v.
3.0 software (Guindon and Gascuel 2003), under the general
settings of the selected models with 500 bootstrap iterations.
An Alca torda control region sequence (GenBank
AJ242683) was used as out-group to root the tree. However,
in case of mitochondrial markers with high intrapopulation
polymorphism, construction of classic phylogenetic trees is
often not appropriate, resulting in uncertainties of the rela-
tionships between haplotypes. In such cases, estimating a
network of haplotypes connected by a minimal number of
mutational steps may be a better solution. Therefore, rela-
tionships between control region haplotypes were recon-
structed using the median-joining algorithm (Bandelt et al.
1999) in Network v4. 6.1.0 (http://www.fluxus-technology.
com). This method groups related haplotypes through
median vectors into a tree or network. Different settings for
the homoplasy level parameter, e, were tested, and e = 20
was eventually used. To account for differences in substi-
tution rates, weight of 1 for transitions and 2 for transver-
sions was applied. Ambiguous relationships were resolved
with a maximum parsimony (MP) heuristic algorithm.
Microsatellites. The presence of null alleles at micro-
satellite loci was tested with MICRO-CHECKER 2.2.3
(van Oosterhout et al. 2004). To determine the extent of
distortion from independent segregation of loci, Arlequin
3.11 (Excoffier et al. 2006) was used. The Arlequin 3.11
was also used to test deviations from Hardy–Weinberg
equilibrium (HWE), with exact P values being estimated
using the Markov chain Monte Carlo (MCMC) procedure
with 100,000 dememorization steps.
The genetic diversity of each colony was described by the
mean number of alleles per locus, observed and expected
heterozygosity, and the inbreeding coefficient FIS, all calcu-
lated in FSTAT 2.9.3.2 (Goudet 2002). Allelic richness
(R) and private allelic richness (RPA) across the colonies were
calculated using HP-RARE (Kalinowski 2005). Genetic var-
iation existing among and within colonies was analyzed with
an analysis of molecular variance (AMOVA), using ARLE-
QUIN 3.11. The genetic differentiation among the colonies
was estimated based on the F-statistics of Weir and Cocker-
ham (1984) using pairwise comparison tests in ARLEQUIN
3.11. Significance level of multiple pairwise comparisons was
adjusted using Benjamimi–Yekutieli correction (Narum
2006). As FST strongly depends on within-population heter-
ozygosity (Meirmans and Hedrick 2011), the standardized
measure of genetic differentiation FST
0(Hedrick 2005) was
calculated, using RecodeData v.0.1 (Meirmans 2006) to
transform the data set.
To infer population structure (i.e., the number of distinct
genetic groups or clusters), Bayesian clustering analyses
were performed in STRUCTURE 2.3.4 (Pritchard et al.
2000) using both ‘‘admixed’’ and ‘‘not admixed’’ models
for ancestry. The first model is recommended as a starting
point for analyses, while the second may be better to detect
a subtle structure (Pritchard and Wen 2004). The correlated
allele frequency model, which is supposed to improve
clustering for closely related populations (Pritchard and
Wen 2004), was applied. Sampling locations as prior
information were used to assist clustering, since this
approach is recommended for data sets where a signal for
structure is expected to be weak (Hubisz et al. 2009). The
burn-in length was set to 100,000 followed by 1,000,000
iterations of the MCMC estimation procedure. The analy-
ses were run for each value of K (number of clusters) from
1 to 9. The interpretation of the true value of K was based
on the size of the mean log likelihood of K (Pritchard and
Wen 2004). Additionally, to estimate contemporary levels
of gene flow, probability of individual-based assignment to
the origin and other colonies was estimated using Gene-
Class 2.0 (Piry et al. 2004).
The relationship between genetic (matrix of pairwise FST)
and geographical distance was analyzed to test an isolation
by distance pattern. Since the most distant colony (DI_ALA)
was also poorly represented in terms of sample number and
quality, and span of the sampling period (7 museum samples
collected over 42 years), the analysis was performed both
with and without this colony. Both analyses were performed
using Mantel tests with Euclidean similarity measure and
5,000 permutations (Legendre 2000) in PAST 1.87 (Ham-
mer et al. 2008). The analysis evaluates the statistical sig-
nificance of the correlation between two or more distance
matrices, using permutation tests (Telles and Diniz-Filho
2005). The matrix of geographical distances was built from
the shortest distances between colonies, calculated using the
measurement tool in Google Earth 6.2.1.
Results
MtDNA. The alignment of the mitochondrial control
region sequences of A. alle produced 537 sites covering
Domain I and CSB regions, 13 of which were variable.
Although nuclear copies of mitochondrial genes have been
reported in other seabirds, little auk sequences did not
differ from models expected for true mtDNA (Baker and
Marshall 1997; Friesen et al. 2005). The observed pattern
of sequence evolution corresponded to higher variation in
the region of Domain I and to slower rate of substitution in
conserved sequence blocks (CSBs; Baker and Marshall
1997). Ten control region haplotypes (h = 0.955,
p = 0.005) were found among 12 individuals of both little
auk subspecies (deposited in GenBank, KC899681–
KC899692). The haplotypes differ by one to two substi-
tutions with no insertions/deletions.
The constructed ML phylogenetic mtDNA tree indicated
very shallow, recent phylogeny. Most of the subdivisions had
Polar Biol
123
low support (data not shown). Haplotypes of individuals
assigned to different subspecies from different localities were
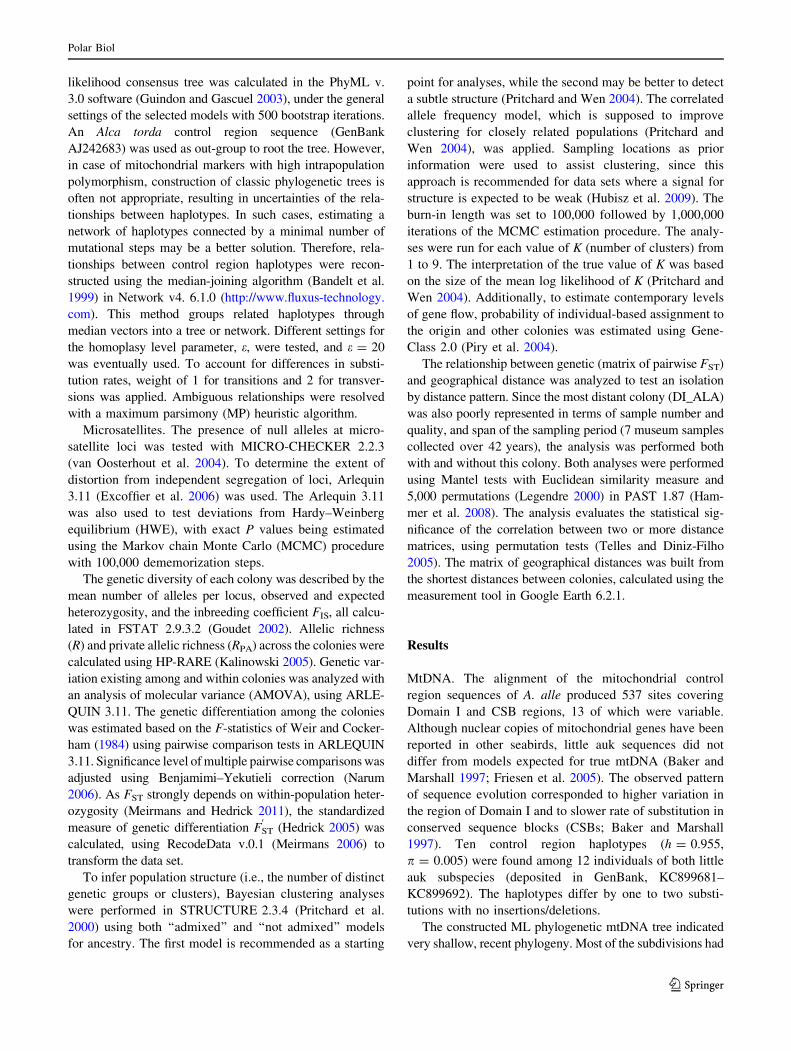
mixed in the tree. In the median-joining network, the total
number of identified haplotypes was 10 (Fig. 2). The most
frequent haplotype was represented by three individuals [two
individuals of A. a. polaris (FJ-RUS1 and FJRUS4) and one
of A. a. alle (MH-SVA100)], while nine other haplotypes
occurred in single individuals. No reciprocal monophyly was
observed for samples representing the two subspecies, and no
clear phylogeographical pattern was revealed.
Microsatellites. Results of the basic analyses of the six
loci suggested the presence of linkage disequilibrium in the
data set. However, the overall pattern of linkage disequi-
librium was not consistent with that observed in separate
colonies (Table S1). There was some evidence of departure
from HWE in four loci, but the pattern of deviation was
again not consistent across colonies (Table 2 and Table
S2). Given the inconsistencies in the patterns of both
linkage disequilibrium and deviation from HWE, all loci
were considered appropriate for the population genetic
analyses and used in the further investigation (Table 2).
Analyses based on smaller subsets of loci [with 5 loci
(excluding Apy 03 that seemed to be in linkage disequi-
librium with two other loci in the pooled data set) and with
3 loci (excluding Apy 06, Ulo 12a_22, and Ulo 14b_29 that
showed deviation from HWE in some colonies)] gave
qualitatively similar results in comparison with the analysis
of all loci.
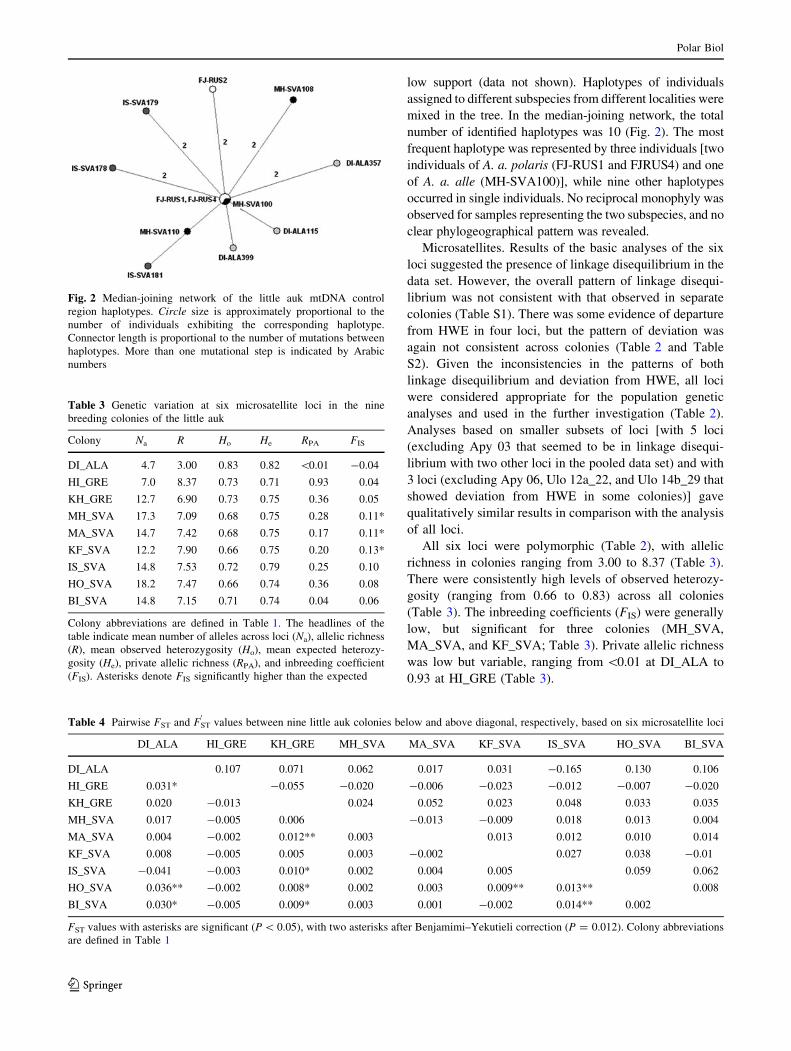
All six loci were polymorphic (Table 2), with allelic
richness in colonies ranging from 3.00 to 8.37 (Table 3).
There were consistently high levels of observed heterozy-
gosity (ranging from 0.66 to 0.83) across all colonies
(Table 3). The inbreeding coefficients (FIS) were generally
low, but significant for three colonies (MH_SVA,
MA_SVA, and KF_SVA; Table 3). Private allelic richness
was low but variable, ranging from \0.01 at DI_ALA to
0.93 at HI_GRE (Table 3).
Fig. 2 Median-joining network of the little auk mtDNA control
region haplotypes. Circle size is approximately proportional to the
number of individuals exhibiting the corresponding haplotype.
Connector length is proportional to the number of mutations between
haplotypes. More than one mutational step is indicated by Arabic
numbers
Table 3 Genetic variation at six microsatellite loci in the nine
breeding colonies of the little auk
Colony Na R Ho He RPA FIS
DI_ALA 4.7 3.00 0.83 0.82 \0.01 -0.04
HI_GRE 7.0 8.37 0.73 0.71 0.93 0.04
KH_GRE 12.7 6.90 0.73 0.75 0.36 0.05
MH_SVA 17.3 7.09 0.68 0.75 0.28 0.11*
MA_SVA 14.7 7.42 0.68 0.75 0.17 0.11*
KF_SVA 12.2 7.90 0.66 0.75 0.20 0.13*
IS_SVA 14.8 7.53 0.72 0.79 0.25 0.10
HO_SVA 18.2 7.47 0.66 0.74 0.36 0.08
BI_SVA 14.8 7.15 0.71 0.74 0.04 0.06
Colony abbreviations are defined in Table 1. The headlines of the
table indicate mean number of alleles across loci (Na), allelic richness
(R), mean observed heterozygosity (Ho), mean expected heterozy-
gosity (He), private allelic richness (RPA), and inbreeding coefficient
(FIS). Asterisks denote FIS significantly higher than the expected
Table 4 Pairwise FST and FST
0values between nine little auk colonies below and above diagonal, respectively, based on six microsatellite loci
DI_ALA HI_GRE KH_GRE MH_SVA MA_SVA KF_SVA IS_SVA HO_SVA BI_SVA
DI_ALA 0.107 0.071 0.062 0.017 0.031 -0.165 0.130 0.106
HI_GRE 0.031* -0.055 -0.020 -0.006 -0.023 -0.012 -0.007 -0.020
KH_GRE 0.020 -0.013 0.024 0.052 0.023 0.048 0.033 0.035
MH_SVA 0.017 -0.005 0.006 -0.013 -0.009 0.018 0.013 0.004
MA_SVA 0.004 -0.002 0.012** 0.003 0.013 0.012 0.010 0.014
KF_SVA 0.008 -0.005 0.005 0.003 -0.002 0.027 0.038 -0.01
IS_SVA -0.041 -0.003 0.010* 0.002 0.004 0.005 0.059 0.062
HO_SVA 0.036** -0.002 0.008* 0.002 0.003 0.009** 0.013** 0.008
BI_SVA 0.030* -0.005 0.009* 0.003 0.001 -0.002 0.014** 0.002
FST values with asterisks are significant (P \ 0.05), with two asterisks after Benjamimi–Yekutieli correction (P = 0.012). Colony abbreviations
are defined in Table 1
Polar Biol
123

Global AMOVA revealed low, but significant genetic
differentiation, with average FST = 0.005 over all loci
(P = 0.03), even when excluding DI_ALA from the ana-
lysis (mean FST = 0.003, P = 0.02). However, it should
be noted that most of the variance resided within popula-
tions (99.55 %). Pairwise FST values ranged from -0.014
to 0.036, with significant differences (P \ 0.05) between
ten colony-pairs (Table 4). When Benjamimi–Yekutieli
correction (critical P = 0.012) was applied, only half of
these differences were significant (Table 4). Pairwise
standardized FST
0ranged from -0.165 to 0.130 (Table 4).
Clustering analyses revealed no genetic structure.
Regardless of the model used, one cluster (K = 1) had the
highest value of posterior probability (P & 1). The proba-
bility of the correct assignment of individual genotypes to
their colony of origin was low, ranging from 0.162 to 0.430,
and generally similar to that of the adjacent colony, ranging
from 0.001 to 0.496 (Table 5). The only exception was the
DI_ALA colony, where the probability of assignment to other
colonies was generally much lower (0.001–0.014) than the
probability to assignment to colony of origin (0.22) (Table 5).
A significant positive correlation was found between
genetic (FST) and geographic distance matrices (Mantel
test, r = 0.43, P = 0.04, Fig. 3), however, that was not
significant when DI_ALA was excluded from the analysis
(r = 0.44, P = 0.15).
Discussion
High genetic diversity was found in the little auk. Almost
all individuals had a unique haplotype, and also the level of
heterozygosity in microsatellites markers was consistently
high in all colonies. However, the overall level of genetic
differentiation of the populations was very low, with an
average fixation index (FST) of 0.005 and low probability
of the individual assignment to its origin colony. Conse-
quently, one genetic cluster was proposed for all colonies.
These features place the little auk in the middle of a con-
tinuum of genetic variation in the Arctic avifauna. At one
end of this continuum, there are species such as dunlin
Calidris canutus that has been found to harbor considerable
genetic diversity, with a very pronounced phylogeographic
structure (Wennerberg and Bensch 2001). On the other
extreme, there is red knot C. canutus, for instance, that
exhibits very low genetic diversity and shows no genetic
structure, despite wide range of breeding distribution
(Buehler and Baker 2005).
Even though some genetic structuring could be expected
given the disjunctive distribution of the breeding colonies
and high nest-site fidelity in the little auk, the weak dif-
ferentiation found in this study is similar to results from
other seabird species with similar breeding range and
biology. In particular, little or no genetic differentiation
between populations has been reported for other alcids
inhabiting the Arctic, e.g., Atlantic puffin (Fratercula
arctica, Moen 1991), Atlantic subspecies of Brunnich’s
guillemot (Birt-Friesen et al. 1992; Morris-Pocock et al.
2008), common guillemot (Moum et al. 1991; Friesen et al.
Table 5 Average assignment probability of individuals to origin or adjacent colony
Origin/adjacent DI_ALA HI_GRE KH_GRE MH_SVA MA_SVA KF_SVA IS_SVA HO_SVA BI_SVA
DI_ALA 0.222 0.043 0.171 0.151 0.223 0.232 0.331 0.207 0.306
HI_GRE 0.001 0.162 0.277 0.503 0.351 0.250 0.523 0.405 0.304
KH_GRE 0.004 0.234 0.377 0.300 0.365 0.427 0.426 0.496 0.331
MH_SVA 0.003 0.226 0.377 0.430 0.428 0.380 0.358 0.431 0.425
MA_SVA 0.014 0.226 0.288 0.327 0.402 0.340 0.365 0.370 0.360
KF_SVA 0.008 0.156 0.355 0.213 0.385 0.337 0.324 0.326 0.322
IS_SVA 0.006 0.172 0.323 0.253 0.333 0.343 0.404 0.386 0.305
HO_SVA 0.005 0.195 0.388 0.300 0.364 0.363 0.395 0.415 0.419
BI_SVA 0.012 0.300 0.393 0.253 0.388 0.371 0.323 0.453 0.418
Colony abbreviations are defined in Table 1
Fig. 3 Pairwise FST values plotted against geographic distance
between the studied colonies of the little auk. White circles denote
pairwise relationships for the most distant colony at Diomede Island
(DI_ALA)
Polar Biol
123

1996; Moum and Arnason 2001; Riffaut et al. 2005), and
marbled murrelet (Brachyramphus marmoratus, Congdon
et al. 2000; Friesen et al. 2005).
Various demographic and historical factors may con-
tribute to the lack of genetic structure in the little auk. First,
following the periods of changes in range and size, popula-
tions require time to establish equilibrium between mutation,
migration, and genetic drift (Whitlock and McCauley 1999).
The global little auk population is believed to have expanded
significantly only recently, after extermination of the main
food competitor, the bowhead whale (Balena mysticetus), in
the eighteenth century (Wesławski et al. 2000). Given this,
along with the relatively recent origin of Arctic habitats
(reviewed in Hewitt 2000), the population of the little auk
may be in a nonequilibrium state. This argument was put
forward to explain the weak population structure in the
common guillemot (Friesen et al. 1996) and the razorbills
(Moum and Arnason 2001).
Second, the weak level of differentiation of the little auk
population may be the consequence of the evolutionary
history of the species, including the pattern of the northward
expansion of the population after the deglaciation. A long-
term isolation into different refugia during the Pleistocene
ice ages is usually invoked to explain genetic divergence of
populations of Arctic birds (e.g., dunlin, Wennerberg and
Bensch 2001). In contrast, species that do not exhibit genetic
structuring, such as Atlantic Brunnich’s guillemot and
razorbill, are believed to have expanded north from a single,
southern refugium (Friesen et al. 1996; Moum and Arnason
2001). This latter scenario seems to apply equally well to the
little auk. Also, given the current geographic distribution of
little auk colonies, concentrated mainly in a relatively nar-
row sector of the North Atlantic (Stempniewicz 2001), the
populations appear to have arisen through expansion of a
single homogeneous refugia population.
Finally, high current intercolony dispersal would be
enough to prevent genetic structuring of the population, as
dispersal tends to oppose the effect of genetic drift and
homogenize populations (Slatkin 1989). Nest-site fidelity is
presumed to be high in the little auk (K. Wojczulanis-
Jakubas, unpublished data), but natal dispersal (movement
between the natal and recruitment site) may efficiently
prevent genetic structuring. There is no information about
philopatry and the extent of natal dispersal in the little auk,
but it has been shown that in other alcids some young may
breed away from their natal colony (e.g., Halley and Harris
1993; Harris et al. 1996; Olsson et al. 1999; Harris and
Swann 2002). In particular at wintering grounds, there is
high potential for mixing between birds from different
breeding sites during the nonbreeding season. Some winter
recoveries of little auks ringed in the breeding colonies in
western Spitsbergen and northwestern Greenland indicate
that waters off southwestern Greenland are an important
wintering area for both of these populations (Isaksen and
Bakken 1996). Also, a recent study on birds equipped with
geolocator tags showed substantial overlap of the wintering
areas among birds from breeding grounds on east and west
Greenland and the Svalbard archipelago including Bear
Island (Fort et al. 2013).
Despite apparently low genetic differentiation of the
global population of the little auk, some pairwise FST com-
parisons of the breeding colonies showed significant differ-
ences (Table 4). The significant correlation of the FST values
with geographic distance suggests a pattern of isolation by
distance (Avise 2000). Accordingly, the most distant colony
at Diomede Island (DI_ALA) presented the highest values of
pairwise FST and FST
0(although not always significant,
possibly due to the low number of individuals sampled at
Diomede Island). The distance between the Diomede colony
and the nearest neighboring colony on NW Greenland is
about 3,000 km, and it makes intuitive sense that the most
distant population is also most differentiated from the others.
The low quantity and inferior quality of the samples from
Diomede Island may cast doubt on the validity of these
results. Most of the samples from this site were collected
from the museum specimen (possible effect on DNA qual-
ity), and the sampling period spanned about 40 years (pos-
sible effect of time on the population differentiation,
reviewed in Balloux and Lugon-Moulin 2002). However,
there are several lines of evidence suggesting that samples
from Diomede Island yielded valid results. First, the samples
from this site were successfully sequenced for the control
region of mtDNA, 537 bp long, indicating sufficient quality
of DNA. Also, the size of microsatellite alleles from Dio-
mede Island fitted well within the overall range of all loci,
and the number of unique alleles for that colony was rather
low compared with the others, giving no indication of false
alleles. Moreover, given the long life span of the little auk (at
least 15 years, K. Wojczulanis-Jakubas unpublished data),
and associated long generation time, the long period of
sampling should not affect the frequency of alleles in the
population. Nevertheless, further examination of the little
auk population from Diomede Island would be recom-
mended, especially given the interesting genetic differenti-
ation found in the present study and the small size of the
population (Day et al. 1988; Montevecchi and Stenhouse
2002).
Departure from HWE was found in all colonies but only
in four cases was apparent in more than one locus (Isf-
jorden, Kongsfjorden and one colony from Magdalenef-
jorden on Svalbard, and Kap Hoegh on Greenland). Of
these, linkage disequilibrium between two different pairs of
loci was found for Isfjorden and Kongsfjorden colonies.
Although deviations from HWE or distortion from linkage
equilibrium might be a random effect associated with the
sample size and/or level of marker polymorphism, these
Polar Biol
123
two features combined may indicate some population dis-
tortion. In general, the high levels of linkage disequilibrium
and deviation from HWE in populations are associated
with small effective population size, significant intrapop-
ulation genetic structure, and occurrence of inbreeding (Li
and Merila 2010). Given the fact that the Isfjorden and
Kongsfjorden colonies are among the smallest in the
Svalbard area, it is possible that the observed deviations
reflect ongoing demographic processes in these two
populations.
There was no indication of a segregation of mtDNA
haplotypes according to the two described subspecies of
little auks, despite their apparent morphological differences
(Stempniewicz et al. 1996; Wojczulanis-Jakubas et al.
2011). This may be due to recent divergence of the two
subspecies and/or high degree of current gene flow between
them. Whether the morphological differences have a
genetic basis and are sufficient to merit subspecific status
cannot be assessed with our data. Clearly, there is a need
for a more comprehensive molecular analysis to further
explore the validity of little auk subspecies.
Acknowledgments The study was supported by a grant from the
Polish Ministry of Science and Higher Education (KBN 8173/P01/
2011/40) and grant from the University of Gdansk (BW/1440-5-0393-
8), and by ‘‘Smaforsk’’ funding from the Natural History Museum of
Oslo. Data collection at Kap Hoegh (E Greenland) was funded by the
French Polar Institute Paul-Emile Victor (Grant 388) and the National
Science Foundation (Grant 0612504), and sampling on Svalbard
(Kongsfjorden, Isfjorden, and Bear Island) was funded by the Nor-
wegian Research Council (MariClim, 165112/S30) and the Norwe-
gian Polar Institute. All samples were collected under appropriate
permissions of the Governor of Svalbard, Greenland Home Rule
Government, Ministry of Domestic Affairs, Nature and Environment,
Norwegian Animal Research Authority, and the Ethics Committee of
the French Polar Institute. Authors are grateful to sample providers
Knud Falk (Hyklut Island, NW Greenland) and Kevin Winkler
(Museum of Alaska), and for help in the field from Kurt Jerstad
(Bjørnøya, Svalbard). Thanks also go to Silje Hogner and Seble-
wengel Bekele Talle for their excellent laboratory assistance, as well
as to Vicki Friesen and David Boertmann for their valuable comments
on the first draft of the manuscript.
Open Access This article is distributed under the terms of the
Creative Commons Attribution License which permits any use, dis-
tribution, and reproduction in any medium, provided the original
author(s) and the source are credited.
References
Adams RI, Hadley EA (2013) Genetic diversity within vertebrate
species is greater at lower latitudes. Evol Ecol 27:133–143
Altschul SF, Gish W, Miller W, Myers EW, Lipman DJ (1990) Basic
local alignment search tool. J Mol Biol 215:403–410
Avise JC (2000) Phylogeography, the history and formation of
species. Harvard University Press, Cambridge
Baker AJ, Marshall HD (1997) Mitochondrial control-region
sequences as tools for understanding evolution of avian taxa.
In: Mindell DP (ed) Avian molecular systematics and evolution.
Academic Press, New York, pp 49–80
Balloux F, Lugon-Moulin N (2002) The estimation of population
differentiation with microsatellite markers. Mol Ecol 11:155–165
Bandelt HJ, Forster P, Rohl A (1999) Median-joining networks for
intraspecific phylogenies. Mol Biol Evol 16:37–48
Birt-Friesen VL, Montevecchi WA, Gaston AJ, Davidson WS (1992)
Genetic structure of thick-billed murre (Uria lomvia) populations
examined using direct sequence analysis of amplified DNA.
Evolution 46:267–272
Boertmann D, Mosbech A (1998) Distribution of little auk (Alle alle)
breeding colonies in Thule District, Northwest Greenland. Polar
Biol 19:206–210
Buehler DM, Baker AJ (2005) Population divergence times and historical
demography in red knots and dunlins. Condor 107:497–513
Congdon BC, Piatt JF, Martin K, Friesen VL (2000) Mechanism of
population differentiation in marbled murrelets: historical versus
contemporary processes. Evolution 54:974–986
Crandall KA, Bininda-Emonds ORP, Mace GM, Wayne RK (2000)
Considering evolutionary processes in conservation biology.
Trends Ecol Evol 15:290–295
Darriba D, Taboada GL, Doallo R, Posada D (2012) jModelTest 2:
more models, new heuristics and parallel computing. Nat
Methods 9:772
Dawson DA, Hunter FM, Pandhal J, Buckland R, Parham A, Jones IL,
Bradshaw M, Jehle R, Burke T (2005) Assessment of 17 new
whiskered auklet (Aethia pygmaea) microsatellite loci in 42
seabirds identifies 5-15 polymorphic markers for each of nine
Alcinae species. Mol Ecol Not 5:289–297
Day RH, DeGange AR, Divoky GJ, Troy DM (1988) Distribution and
subspecies of the dovekie in Alaska. Condor 90:712–714
Divoky GJ, Horton M (1995) Breeding and natal dispersal, nest
habitat loss and implications for marbled murrelet populations.
In: Ralph CJ, Hunt GL Jr, Raphael MG, Piatt JF (eds) Ecology
and conservation of the Marbled Murrelet. Gen Tech Rep PSW-
GTR-152. Pacific Southwest Research Station, Forest Service,
US Department of Agriculture, Albany, pp 83–88
Egevang C, Boertmann D, Mosbech A, Tamstorf MP (2003) Estimat-
ing colony area and population size of little auks Alle alle, at
Northumberland Island using aerial images. Polar Biol 26:8–13
Excoffier L, Laval G, Schneider S (2006) Arlequin ver 3.01. An
integrated software package for population genetics data
analysis. Switzerland
Fort J, Moe B, Strøm H, Gremillet D, Welcker J, Schultner J, Jerstad
K, Johansen KL, Phillips RA, Mosbech A (2013) Multicolony
tracking reveals potential threats to little auks wintering in the
North Atlantic from marine pollution and shrinking sea ice
cover. Divers Distrib 19:1322–1332
Friesen VL, Montevecchi WA, Baker AJ, Barrett RT, Davidson WS
(1996) Population differentiation and evolution in the common
guillemot Uria aalge. Mol Ecol 5:793–805
Friesen VL, Birt TP, Piatt JF, Golightly RT, Newman SH, Hebert PN,
Congdon BC, Gissing G (2005) Population genetic structure and
conservation of marbled murrelets (Brachyramphus marmora-
tus). Conserv Genet 6:607–614
Friesen VL, Burg TM, McCoy KD (2007) Mechanisms of population
differentiation in seabirds. Mol Ecol 16:1765–1785
Goudet J (2002) FSTAT, a program to estimate and test gene
diversities and fixation indices (version 2.9.3.2). Available at
http://www.unil.ch/izea/softwares/fstat.html
Guindon S, Gascuel O (2003) A simple, fast, and accurate algorithm
to estimate large phylogenies by maximum likelihood. Syst Biol
52:696–704
Polar Biol
123
Hall TA (1999) BioEdit: a user-friendly biological sequence align-
ment editor and analysis program for Windows 95/98/NT. In:
Nucleic acids symposium series, vol 41, pp 95–98
Halley DJ, Harris MP (1993) Intercolony movements and behaviour
of immature Guillemots Uria aalge. Ibis 135:264–270
Hammer Ø, Harper DAT, Ryan D (2008) PAST—PAlaeontological
STatistics, ver. 1.87, http://folk.uio.no/ohammer/past
Harris MP, Swann B (2002) Common guillemot. In: Wernham CV,
Toms MP, Marchant JH, Clark JA, Siriwardena GM, Baillie SR
(eds) The migration atlas: movements of birds of Britain and
Ireland. T & AD Poyser, London, pp 397–400
Harris MP, Halley DJ, Wanless S (1996) Philopatry in the common
guillemot Uria aalge. Bird Study 43:134–137
Hedrick PW (2005) A standardized genetic differentiation measure.
Evolution 59:1633–1638
Hewitt GM (2000) The genetic legacy of the Quaternary ice ages.
Nature 45:907–913
Hewitt GM (2004) Genetic consequences of climatic oscillations in
the Quaternary. Philos Trans R Soc Lond B 359:183–195
Hubisz M, Falush D, Stephens M, Pritchard J (2009) Inferring weak
population structure with the assistance of sample group
information. Mol Ecol Res 9:1322–1332
Ibarguchi G, Birt TP, Warheit KI, Boag PT, Friesen VL (2000)
Microsatellite loci from common and thick-billed guillemots,
Uria aalge and U. lomvia. Mol Ecol 9:638–639
Isaksen K, Bakken V (1996) Migration routes and wintering area of
little auks Alle alle ringed in Svalbard. Sula 10:229–238
Kalinowski ST (2005) HP-RARE. A computer program for perform-
ing refraction on measures of allelic diversity. Mol Ecol Notes
5:187–189
Kampp K, Meltofte H, Mortensen CE (1987) Population size of the
little auk Alle alle in East Greenland. Dan Ornithol Foren Tidsskr
81:129–136
Legendre P (2000) Comparison of permutation methods for the partial
correlation and partial Mantel tests. J Stat Comput Simul 67:37–73
Li MH, Merila J (2010) Sex-specific population structure, natural
selection, and linkage disequilibrium in a wild bird population as
revealed by genome-wide microsatellite analyses. BMC Evol
Biol 10:66
Librado P, Rozas J (2009) DnaSP v5: a software for comprehensive
analysis of DNA polymorphism data. Bioinformatics 25:1451–1452
Martin PR, McKay JK (2004) Latitudinal variation in genetic
divergence of populations and the potential for future speciation.
Evolution 58:938–945
Mehlum F, Bakken V (1994) Seabirds in Svalbard (Norway): status,
recent changes and management. In: Nettleship DN, Burger J,
Gochweld M (eds) Seabirds on Islands: threats, case studies and
action plans. Birdlife conservation series No. 1. Birdlife Interna-
tional, Cambridge, pp 155–171
Meirmans PG (2006) Using the AMOVA framework to estimate a
standardised genetic differentiation measure. Evolution 60:2399–2402
Meirmans PG, Hedrick PW (2011) Assessing population structure:
FST and related measures. Mol Ecol Res 11:5–11
Moen SM (1991) Morphologic and genetic variation among breeding
colonies of the Atlantic puffin (Fratercula arctica). Auk
108:755–763
Montevecchi WA, Stenhouse IJ (2002) Dovekie (Alle alle). In: Poole
A, Gill F (eds) The Birds of North America 701. The Birds of
North America Inc, Philadelphia
Morris-Pocock JA, Taylor SA, Birt TP, Damus M, Piatt JF, Warheit KI,
Friesen VL (2008) Population genetic structure in Atlantic and
Pacific Ocean common murres (Uria aalge): natural replicate tests
of post-Pleistocene evolution. Mol Ecol 17:4859–4873
Moum T, Arnason E (2001) Genetic diversity and population history
of two related seabird species based on mitochondrial DNA
control region sequences. Mol Ecol 10:2463–2478
Moum T, Erikstad KE, Bjorkild E (1991) Restriction fragment
analysis of mitochondrial DNA in common guillemots, Uria
aalge, from four Norwegian seabird colonies. Can J Zool
69:1577–1584
Narum SR (2006) Beyond Bonferroni: less conservative analyses for
conservation genetics. Conserv Genet 7:783–787
Olsson O, Fransson T, Larsso K (1999) Post fledging migration of
common murres Uria aalge in the Baltic Sea: management
implications. Ecography 22:233–239
Piry S, Alapetite A, Cornuet JM, Paetkau D, Baudouin L, Estoup A
(2004) GeneClass2: a software for genetic assignment and first-
generation migrant detection. J Hered 95:536–539
Pritchard JK, Stephens M, Donnelly P (2000) Inference of population
structure using multilocus genotype data. Genetics 155:945–959
Pritchard JK, Wen W (2004) Documentation in STRUCTURE 2.0.
Available from http://pritch.bsd.uchicago.edu
Riffaut L, McCoy KD, Tirard C, Friesen VL, Boulinier T (2005)
Population genetics of the common guillemot Uria aalge in the
North Atlantic: geographic impact of oil spills. Mar Ecol Prog
Ser 291:263–273
Slatkin M (1989) Detecting small amounts of gene flow from
phylogenies of alleles. Genetics 121:609–612
Stempniewicz L (2001) Alle alle. Little Auk. The Journal of the Birds
of the Western Palearctic. Oxford University Press. BWP Update
3:175–201
Stempniewicz L (2005) Keystone species and ecosystem functioning.
Seabirds in polar ecosystem. Ecol Quest 6:129–134
Stempniewicz L, Skakuj M, Iliszko L (1996) The Little Auk Alle alle
polaris of Franz Josef Land: a comparison with Svalbard Alle a.
alle populations. Polar Res 15:1–10
Stempniewiecz L, Błachowiak-Samołyk K, Wesławski JM (2007)
Impact of climate change on zooplankton communities, seabird
populations and arctic terrestrial ecosystem—a scenario. Deep
Sea Res II 54:2934–2945
Tamura K, Peterson D, Peterson N, Stecher G, Nei M, Kumar S
(2011) MEGA5: molecular evolutionary genetics analysis using
maximum likelihood, evolutionary distance, and maximum
parsimony methods. Mol Biol Evol 28:2731–2739
Telles MPC, Diniz-Filho JAF (2005) Multiple Mantle tests and
isolation-by-distance, taking into account long-term historical
divergence. Genet Mol Res 4:742–748
van Oosterhout C, Hutchinson WF, Wills DPM, Shipley P (2004)
Micro-checker: software for identifying and correcting genotyp-
ing errors in microsatellite data. Mol Ecol Not 4:535–538
Weider LJ, Hobæk A (2000) Latitudinal variation in genetic
divergence of populations and the potential for future speciation.
Ann Zool Fenn 37:217–231
Weir BS, Cockerham CC (1984) Estimating F-statistics for the
analysis of population structure. Evolution 38:1358–1370
Weir JT, Schluter D (2007) The latitudinal gradient in recent
speciation and extinction rates of birds and mammals. Science
315:1574
Wennerberg L, Bensch S (2001) Geographic variation in the dunlin
Calidris alpina as revealed by morphology, mtDNA and
microsatellites genetic variation and migration of waders. PhD
Thesis. University of Lund
Wesławski JM, Hacquebord L, Stempniewicz L, Malinga M (2000)
Greenland whales and walruses in the Svalbard food web before
and after exploitation. Oceanologia 42:37–56
Whitlock MC, McCauley DE (1999) Indirect measures of gene flow
and migration: FST = 1/(4Nm ? 1). Heredity 82:117–125
Wojczulanis-Jakubas K, Jakubas D, Welcker J, Harding AMA,
Karnovsky NJ, Kidawa D, Steen H, Stempniewicz L, Camphuy-
sen CJ (2011) Body size variation of a high-Arctic seabird: the
dovekie (Alle alle). Pol Biol 34:847–854
Polar Biol
123