scaling down the analysis of seabird-fishery interactions
TRANSCRIPT

MARINE ECOLOGY PROGRESS SERIESMar Ecol Prog Ser
Vol. 473: 275–289, 2013doi: 10.3354/meps10071
Published January 21
INTRODUCTION
Fishing activities are pervasive in the currentocean landscape, and marine megafauna such asseabirds, sharks and dolphins frequently encounterfishing vessels and gear. These interactions betweenfisheries and animals can benefit or harm the animalsin volved. Many seabirds have responded to theglobal proliferation of commercial fishing fleets byexploiting fisheries waste, including offal (Thompson& Riddy 1995, Grémillet et al. 2008), bait (Pierre &Norden 2006) and discarded non-target catch (Bartle
1991, Rindorf et al. 2000). Demonstrated impacts ofseabird-fishery associations include direct negativeeffects on adult survival rates (Brothers 1991, Rollandet al. 2010, Anderson et al. 2011), indirect negativeeffects on breeding success (Frederiksen et al. 2004),and positive effects on population sizes (Garthe et al.1996, Furness 2003). The impacts of these interac-tions on seabird populations and ecology havebecome high-profile and common conservation andmanagement issues (Lewison et al. 2004, Croxall2008). A result of this focus on seabird-fisheries inter-actions is a proliferation of studies attempting to
© Inter-Research 2013 · www.int-res.com*Email: [email protected]
Scaling down the analysis of seabird-fishery interactions
Leigh G. Torres1,*, Paul M. Sagar2, David R. Thompson1, Richard A. Phillips3
1National Institute of Water and Atmospheric Research, Hataitai, Wellington 6021, New Zealand2National Institute of Water and Atmospheric Research, Riccarton, Christchurch 8011, New Zealand
3British Antarctic Survey, Natural Environment Research Council, High Cross, Madingley Road, Cambridge CB3 0ET, UK
ABSTRACT: Seabird-fishery interactions are currently a major issue in marine conservation man-agement. A common approach to quantifying the extent of interactions is to overlay density mapsof seabird and fishing activities derived from point locations. Such large-scale evaluations of over-lap can be misleading due to the static representation of birds and vessels that in reality are spa-tially and temporally dynamic. Additionally, overlap at large scales does not necessarily indicateinteraction; overlapping distributions of seabirds and fisheries could reflect coincident use of habi-tat. Using 4 yr of distribution data, we conducted a fine-scale analysis of overlap between alba-trosses and fishing vessels. Results were compared to those derived from large-scale density com-parisons. Additionally, we compared overlap versus interaction rates by calculating the proportionof time that birds foraged in close association with a fishing vessel versus independently whilewithin 10 km of a vessel. Results of our fine-scale analysis indicated generally low rates of overlapwhile foraging and high variability among sexes, years and types of fishery. Changes in overlaprates were attributed to shifts in both albatross and vessel distributions. Albatrosses foraged inde-pendently of fishing vessels half the time they were within 10 km of a vessel, indicating that 50%of overlap is due to coincident habitat use rather than vessel interaction. Overlaying of large-scaledistribution maps failed to distinguish annual variation in the degree of bird-fishery overlap, andsuggested overlap where none was identified at the finer scale. This study illustrates the increasedinsight derived from fine-scale analyses of seabird-fisheries interactions.
KEY WORDS: Foraging behavior · Scale · Seabird · Distribution · Overlap · Fisheries interaction ·GPS tracking · Buller’s albatross
Resale or republication not permitted without written consent of the publisher
This authors' personal copy may not be publicly or systematically copied or distributed, or posted on the Open Web, except with written permission of the copyright holder(s). It may be distributed to interested individuals on request.
Mar Ecol Prog Ser 473: 275–289, 2013
define the extent of overlap between seabirds andcommercial fishing vessels at various scales includ-ing large (Hyrenbach & Dotson 2003, Phillips et al.2006), meso (Xavier et al. 2004, Waugh et al. 2005,Pichegru et al. 2009), and fine (Votier et al. 2010,Granadeiro et al. 2011, Torres et al. 2011).
A common method of identifying areas of overlapbetween seabirds and fishing activities is to createdensity maps of birds and boats from point locationsand overlay these outputs (Phillips et al. 2006,Petersen et al. 2008, Fischer et al. 2009, Okes et al.2009). The resulting density maps are produced in avariety of ways and include kernel density plots, uti-lization distributions, density grids, or animal home-ranges. Essentially all density maps provide a proba-bility index, either as contours or grids, and indicatethe relative proportion of the distribution of seabirdsor fishing activities within a particular area. Thesedensity plots are created by converting distributionpoints that had associated timing information intostatic illustrations of distribution patterns that nolonger reflect the temporal component (other thanseason or year). However, neither the seabirds northe fishing activities are static. Rather, both are spa-tially and temporally dynamic and respond to a mul-titude of factors including environmental variability,short-term climatic conditions, prey/target speciesavailability, market demand (fisheries), and life his-tory stage (seabirds). Therefore, an overlay of densitymaps typically only provides a coarse-scale evalua-tion of overlap; broad spatial areas are subsequentlyoutlined as static boundaries of overlap between sea-bird and fisheries over wide temporal periods. How-ever, effective conservation strategies, that simulta-neously minimize burden on the fishing industry,should be dynamic enough to recognize and incorpo-rate the high spatial and temporal variation in over-lap between fishing vessels and marine predators.
Moreover, areas in which high densities of birdsand boats coincide are frequently considered to beareas where rates of interaction or association be -tween seabirds and fishing vessels are particularlyhigh, and therefore where there is greatest suscepti-bility of birds to bycatch (Tuck et al. 2003, Cuthbertet al. 2005, Petersen et al. 2008, Copello & Quintana2009, Fischer et al. 2009, Delord et al. 2010). How-ever, static spatial overlap, as identified by densitiesalone, does not necessarily indicate interaction. Atlarge (>100 km) and meso (10−100 km) scales, it islikely that seabirds and fisheries target similar pro-ductive areas with abundant prey (Freeman et al.2001, Karpouzi et al. 2007). Furthermore, some birdsand fishing vessels compete for the same prey/target
species (Montevecchi & Myers 1995, Furness 2002,Okes et al. 2009). Therefore, overlap between sea-birds and fisheries could reflect the coincident use ofthe same habitat or resources, rather than a dedi-cated foraging strategy to interact with fishing activ-ities. Teasing these behavior patterns apart requiresthe examination of overlap at very fine scales(<10 km).
The scale adopted in overlap analyses is typicallydetermined by the scale of bird distribution and fish-eries data. Recently, fine-scale studies of overlapbetween seabirds and fishing vessels have utilizeddistribution data that were highly resolved both spa-tially and temporally (Votier et al. 2010, Granadeiroet al. 2011, Torres et al. 2011). All 3 studies foundhigh individual variability in overlap rates with fish-ing vessels, including many birds that rarely or neveroverlapped with fishing vessels. Each of these stud-ies used GPS data from tracked seabirds and vesselmonitoring system (VMS) data. Although the tempo-ral resolution of seabird tracks was high (<14 min),the 3 studies adopted different methods and defini-tions of overlap to compensate for the less resolvedtemporal scale of the VMS data (positions every 1 to3 h). Votier et al. (2010) assessed overlap using2 methods: (1) aggregated VMS data across 4 yearsin 5 km2 cells and assumed minimal spatial variation,(2) assessed the presence/absence of fishing vesselswithin 2 h and 5 km for each bird GPS location.Granadeiro et al. (2011) interpolated points betweenVMS locations linearly and defined overlap to bewithin 3.5 km at a temporal scale of 3 s. Torres et al.(2011) generated scaled buffers around VMS dataand linearly interpolated points; the GPS location of abird was defined as overlapping when within thesespatial buffers and 3 min. These studies demonstratethe advantage of fine-scale analysis of seabird-vesseloverlap compared to broad scale methods. However,they did not assess inter-annual variability in over-lap, which limits interpretation of results, and, likeprevious studies, failed to distinguish overlap frominteraction.
In this study, we use 4 years of data to assess varia-tion in fine-scale foraging behavior of the Buller’salbatross Thalassarche bulleri relative to inter-annual variability of fishing activities, and addresswhether coincident use of the same area by birds andboats is due to the presence of vessels or is independ-ent, reflecting a natural foraging strategy. TheBuller’s albatross is an annual breeder, endemic toNew Zealand. The main breeding site is The Snares,lying within the sub-tropical frontal zone. Colonieson The Snares have been studied irregularly since
276A
utho
r cop
y

Torres et al.: Scaling down seabird-fishery interactions
1948, and annually since 1992. Demographic datacollected during this long-term project allow us toassign sex and minimum age to tracked birds. Duringtheir breeding season (January-September), Buller’salbatrosses forage along the continental shelf andslope of New Zealand and Tasmania (Stahl & Sagar2000) and are known to interact with fishing vessels(Bartle 1991). Squid are an important natural preyitem of many albatrosses including the Buller’s alba-tross (Croxall & Prince 1996, James & Stahl 2000) andare also targeted by local fisheries. We tracked alba-tross distribution during a time of year (brood-guard)when their energy demands are relatively high andadults are spatially constrained because of the needto return to the colony to feed the chick. We use fine-scale tracking of Buller’s albatross foraging trips andfisheries data to assess overlap at a scale of <10 kmand <2 min. We examine variation in overlap whileforaging by sex, age, year, and fishery, and we com-pare our results to those derived from overlayinglarge-scale density maps. Finally, we attempt to dis-tinguish overlap from interaction by assessing theproportion of time an albatross foraged in associationwith a fishing vessel when given the opportunity todo so.
MATERIALS AND METHODS
Field methods
This study was conducted in April of 4 consecutiveyears (2008 to 2011) on breeding adult Buller’s alba-trosses from 2 colonies at The Snares, New Zealand(48.02° S, 166.61° E). In all years, tracking occurredduring the guard stage of the breeding cycle (whenparents brood the chick in alternate shifts while theother feeds at sea) (Table 1), to eliminate differencesin foraging patterns among years due to breedingphase.
We captured banded birds at the nest by hand, andattached GPS loggers to dorsal feathers using water-proof Tesa® tape. Each deployment took ~5 min tocomplete, and all birds were returned to their nestpedestal where they continued to brood their chick.The sex of each bird was determined from measure-ments of minimum bill depth (B) and tarsus width (T)(both in mm) using the discriminant function (DF):
DF = 0.981 × B + 1.556 × T − 50.648
with negative values of DF indicating females andpositive values males. This equation is estimated toclassify 99% of birds correctly (Sagar et al. 1998).
The minimum age of birds not banded as chicks wasestimated using the time elapsed since their bandingas a breeding bird plus 10 yr, the average age of firstbreeding (Francis & Sagar 2012).
‘GPSlog’ loggers (Earth & Ocean Technologies)weighing 65 g, or ~2% of body mass, were deployedin 2008, and the second generation of these tags, the‘miniGPSlog’, weighing 34 g and ~1% of the bird’sbody mass, were deployed in 2009 to 2011. All GPStags were programmed to acquire a GPS point every2 min; 90% of fixes were estimated to be within 19 mof the true location (Earth & Ocean Technologiesunpubl. data).
In 2010, archival loggers equipped with light andimmersion sensors (3.65 g, Mk17 tags, British Antarc-tic Survey) were simultaneously deployed on the legsof 20 of the 23 birds with GPS loggers. The loggersrecorded the time of every change between a wetand dry state that lasted ≥6 s. Before deployment,clocks on immersion and GPS loggers were synchro-nized, allowing us to determine whether the bird wasflying or on the water at the time of each GPS fix.
GPS track analysis and fine-scale overlap analysis
This study examined the annual variation in over-lap between foraging Buller’s albatrosses and fishingvessels. Therefore, the first step in GPS track analysiswas to identify foraging. First, flight characteristics —speed, path straightness and residence — were de -rived for each point along each track. Speed was cal-culated as the ratio of distance travelled to the timeelapsed since the previous point (km h−1). Pathstraightness was determined for each point over a20 min window (±5 GPS points) as the ratio of thestraight-line distance between the points and thealong-path distance. Residence is a measure of arearestricted search and was calculated by consideringall track segments within a virtual circle of a constantradius (Barraquand & Benhamou 2008, Torres et al.2011). We applied a 1 km radius using spatial seg-ments of 100 m and a threshold of 5 steps. The use ofthese parameters was arbitrary but maintained afine-scale level of analysis. These 3 flight metricswere used successfully in previous studies to charac-terize albatross behavior (Weimerskirch et al. 2002,Torres et al. 2011). GPS points with residence valuesgreater than 2× the standard deviation for that partic-ular track were considered to be outliers. Thesepoints and points at the start and end of gaps intracks from 2010 (see ‘Results’) were excluded fromanalyses.
277A
utho
r cop
y
Mar Ecol Prog Ser 473: 275–289, 2013
Based on these flight characteristics, GPS pointswere classified into one of 3 behavior states: drift,transit, and foraging. Drift characterizes points whenthe bird was likely resting on the water for a period of1 h or more. Drift points were defined based on a 1 hwindow (±15 points) as having high mean pathstraightness values (≥0.9), low mean speeds(≤4.25 km h−1), and short mean distances travelled(≤0.15 km). While these cut-off values may be sub-jective, they were applied successfully to classifydrift points from GPS tracks of white-capped alba-trosses Thalassarche steadi (Torres et al. 2011). Weare confident that this methodology correctly identi-fied drift behavior in this study because immersionloggers deployed in 2010 recorded a ‘wet’ state dur-ing 98% of GPS points identified as drift. Weassumed that drift and foraging states were mutuallyexclusive. Therefore, all points identified as driftwere excluded from further analyses because theywere not considered to denote foraging behavior.Additionally, all points within 5 km of the colonywere removed because albatrosses are known to‘bathe’ in nearby areas before or after foraging trips.
All remaining points within each track weredefined as transit or foraging based on residence,speed and path straightness values over a 20 minwindow (±5 points). Residence and straightness hadhighly skewed distributions. Therefore, percentilesof residence and path straightness for each trackwere calculated and used to classify behavioral state.Transit points were identified as having low resi-dence (in the lower 50th percentile), high pathstraightness values (in the upper 50th percentile),and high speed (>20 km h−1). Foraging points wereidentified as having high residence (in the upper50th percentile) and low speed (<20 km h−1). Pathstraightness was not used to define foraging pointsbecause the birds frequently travel in a relativelystraight line when they forage behind vessels, follow-ing the path of the vessel (Torres et al. 2011).Although points labeled transit and forage are mutu-ally exclusive, there were some unclassified pointsthat were neither transit nor forage. Therefore, thismethod of identifying transit and forage points wasconservative.
Methods developed by Torres et al. (2011) todetect GPS track points that overlapped a fishingvessel were applied here. Vessel monitoring system(VMS) data were supplied by the New ZealandMinistry of Fisheries, and included records of themovements of every fishing vessel over 28 m, andall foreign vessels in New Zealand waters. Vesselmonitoring systems on each vessel accurately
recorded location every 1 to 2 h. Vessel monitoringsystem data analyzed for overlap with albatrosstracks were limited to points within the same tem-poral period as the tracking data for each year, anda consistent spatial area that covered the maximumextent of all 4 yr of tracking data. This large spatialextent was assumed to be the region in which thebirds can exploit prey at this time of year, and sowas applied for between-year comparisons through-out the analysis. Circular spatial buffers were gen-erated along each VMS track between points at2 min intervals, the same interval as the bird GPSlocations. These circular buffers had increasingradii size with increasing distance from each VMSpoint to account for increased uncertainty in vessellocation (see Torres et al. 2011). Any albatross GPSpoint that fell within the spatial buffers and within a2 min window of each vessel location was consid-ered to indicate overlap. These methods allowed usto identify possible vessel-bird associations at a finescale. Any albatross GPS point beyond a bufferradius of 10 km from a vessel location was consid-ered non-overlapping. Due to the difference in sam-ple size between years and sexes, and gaps inrecorded tracks (see ‘Results’), overlap and foragingcharacteristics were quantified as rates. The overlaprate was calculated as the ratio of track points iden-tified as foraging and overlapping a VMS track tothe total number of points identified as foraging.Therefore, the rate of foraging while overlapping afishing vessel was calculated.
GPS track points identified as foraging and over-lapping a vessel were then cross-referenced to acatch effort dataset also provided by the NewZealand Ministry of Fisheries (Ministry of Fisheries2006). The catch effort dataset includes all start loca-tions and times of fishing events by all commercialfishing vessels in New Zealand (regardless of size),and the target species, fishing method and catchweight of each event. Overlap points were cross- referenced with this dataset based on a unique vesselidentification code that was constant between theVMS and catch effort datasets. This approach identi-fied the target species and fishing method used bythe vessel of interest. With this information, the ratesof foraging while overlapping particular fisheries(e.g. squid trawl) were quantified as the ratio of thenumber of points identified as foraging and overlap-ping a fishery to the total number of foraging points.ANOVA was used to test for difference in overlaprates among sexes and years. Correlation tests wereused to detect possible relationships between alba-tross age and overlap rate.
278A
utho
r cop
y

Torres et al.: Scaling down seabird-fishery interactions
Seabird attraction to fishing vessels occurs at scales<10 km (Skov & Durinck 2001). Therefore, it isassumed that an albatross can perceive fishing ves-sels within 10 km and subsequently chooses to forageindependently of the vessel (no defined overlap) or inassociation with the vessel (overlap defined). Thenumber of bird locations within 10 km of a fishingvessel that were previously identified as foragingand/or overlapping a vessel while foraging were tal-lied for each track. The percentage of foraging pointswithin 10 km of a vessel that overlapped a fishingvessel was calculated for each track as the ratio of thenumber of overlapping foraging points (alwayswithin 10 km of a vessel) to the total number of forag-ing points within 10 km of a fishing vessel (whetheroverlapping or not). This reflects the proportion oftime that a bird forages in association with a vesselwhen the opportunity is available (within 10 km of afishing vessel).
Circular statistics and rose diagrams were used tocompare the distribution patterns of male and femalealbatrosses, and fishing vessels (based on VMS data)within and among years. The bearing from thecolony at The Snares was calculated for all foragingpoints of each tracked bird, and for VMS pointswithin the spatial extent of the tracked birds in allyears. Rose diagrams were generated to illustrate theangular distribution patterns of foraging activity rel-ative to the colony. Next, the circular statistics pack-age (Lund & Agostinelli 2007) was implemented in R(www.r-project.org/) to perform Watson’s 2-sampletest, a non-parametric procedure to test the nullhypothesis of no difference between 2 circular distri-butions (Zar 1999). We used this test to assesswhether males and females foraged in similar direc-tions from the colony, and for comparison of foragingactivity by sex and year relative to the distribution ofvessels (VMS dataset).
Large-scale overlap analysis
For comparison with results from the fine-scaleoverlap analysis, albatross tracking and fisheriesdata were analyzed at a large scale. Kernel densitieswere created (ArcGIS version 10, Spatial Analysttools) from albatross GPS points and from the startlocations of all fishing events in each year (from thecatch effort datasets). Each density plot was classi-fied into 5 equal interval groups of density, ranked(1 = <20% through to 5 = >80%), and converted topolygons. The intersect tool in ArcGIS was used tocoalesce yearly polygons of bird and boat density
into one layer. For each resulting polygon, the prod-uct of bird and boat density rank was calculated.Polygon layers were symbolized by this product,which could range from 1 to 25.
Characterizing yearly fishing activity
Using the catch effort dataset, the number of fish-ing events by target species and fishing method wascounted for each year. Additionally, the catch perunit effort (CPUE) for all trawl events (bottom andmid-water) was calculated as the total catch (kg) perminute of each tow. CPUE for squid jiggers was cal-culated as the total catch weight (kg) per number ofsquid jig events.
To compare the fisheries distributions and catchesamong years, density plots were generated (ArcGISversion 10, Spatial Analyst tools) using start locationsand associated catch weights provided for each fish-ing event in the catch effort dataset. Fishing eventswere grouped by fishery and year. A density plot,weighted by catch weight (kg), was made for eachgroup using 1000 m cell size and 50 km searchradius.
RESULTS
Foraging trips were tracked at high resolution for77 birds. The youngest bird tracked was 10 and theoldest bird was at least 29 yr old. Forty-three tripswere performed by males and 34 trips by females(Table 1). The fewest foraging trips were recorded in2008 (n = 11); more tracks were recorded in 2009 (n =23), 2010 (n = 25), and 2011 (n = 18). The duration offoraging trips was 0.5 to 4 d, with a mean of 41.5 h.All but 3 tracks from 2010 included periods whenno GPS data were acquired, typically of 1 h, and
279
Year Date Number of recorded trips Age range Male Female Total rangea (yr)
2008 4−8 April 5 6 11 12−282009 6−11 April 13 10 23 11−282010 8−14 April 13 12 25 12−292011 8−13 April 12 6 18 10−24Total 43 34 77 10−29
aUpper bound of age range is a minimum estimate (see‘Materials and methods’)
Table 1. Thalassarche bulleri. Details of GPS logger deploy-ment on Buller’s albatrosses
Aut
hor c
opy

Mar Ecol Prog Ser 473: 275–289, 2013
occasionally longer (maximum 8 h). These gapsaccounted for 19.4% of time spent at sea by trackedbirds in 2010, and restricted our ability to comparetrip length among years, sexes and ages. Over allyears, the tracks covered 759 000 km2, extendingfrom 42.3° S to 51.1° S (Fig. 1). In all years, the birdsdispersed from the colony in all directions exceptsouthwest. The tracks overlapped a variety of habi-tats, but there was a concentrated use in all years ofwaters over the 200 m shelf break to the east andsoutheast of the colony (Fig. 1).
During the 4 yr of tracking, 93 fishing vessels wereactive within the area used by the albatrosses. Ves-
sels targeted 31 different species, using 7 differentfishing methods, yet squid trawls (targeting arrowsquid Nototodarus gouldi and N. sloani) dominatedfishing effort in all years (73% of all fishing events),followed by hoki (Macruronus novaezelandiae)trawls, barracouta (Thyrsites atun) trawls, and squidjiggings (targeting arrow squid Nototodarus gouldiand N. sloani). Fishing methods included bottomtrawls (n = 1556), mid-water trawls (n = 226), squidjiggings (n = 49), set nets (n = 50), bottom longline(n = 29), and surface longline (n = 1). Although squidtrawls dominated effort in all years, fishing effort andcatch per unit effort (CPUE) was variable among
280
Fig. 1. Thalassarche bulleri. Tracks of Buller’s albatross fitted with GPS loggers in 2008 to 2011, south of New Zealand. All birds were tagged at The Snares (q). Note that the map scales vary
Aut
hor c
opy

Torres et al.: Scaling down seabird-fishery interactions
years (Fig. 2). Both fewest fishing events and lowestCPUE occurred in 2010, caused mainly by the sharpdecline in squid trawl CPUE. There was minimalhoki trawl effort in 2008, but effort and CPUE werehigher in 2009 and 2010. Trawls for barracouta (BAR)increased in 2010, with increased CPUE. Therewas only one event targeting silver warehou Seri-olella punc tata (SWA) and jack mackerel Trachurusde clivis (JMA) in 2009, and no targeting of these spe-cies in 2010. CPUE for SWA and JMA was highest in2011. Squid jigging effort and CPUE were relativelyconstant across all years. Note that individual fishingvessels can rapidly switch fishing methods and targets.
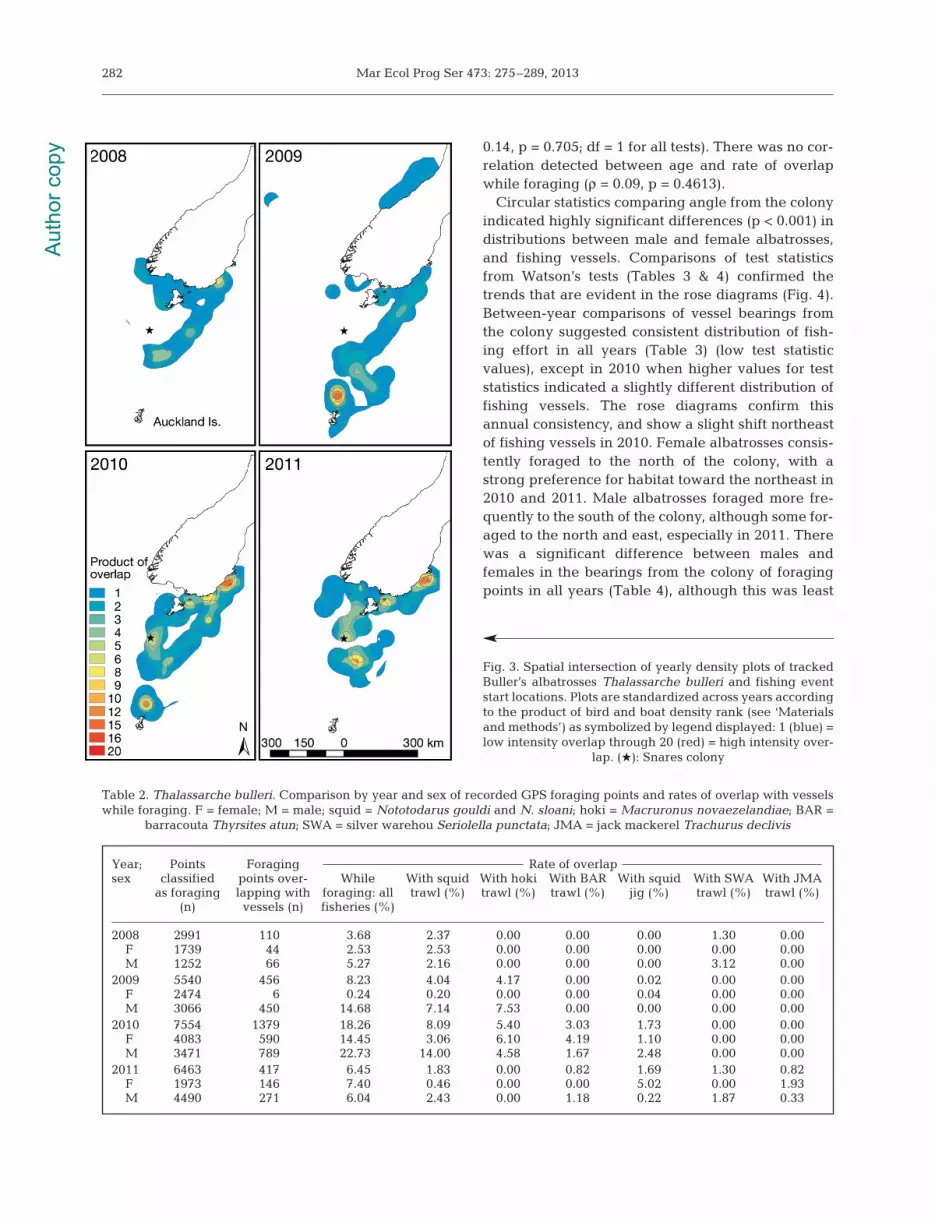
The large-scale analysis of overlap between yearlykernel densities of fishing event start locations andalbatross track GPS points indicated potential inter-action between seabirds and fishing activities atnumerous locations (Fig. 3). In all years, medium tohigh levels of overlap were identified along the shelfbreak, particularly along the southern portion of theshelf break. Additionally, in all years, overlap that
varied in intensity from low to high was identifiedalong the southeast coast of mainland New Zealand.High levels of overlap were indicated just north ofthe Auckland Islands in 2009 and 2010, and near thecolony in 2010 and 2011. Medium to low levels ofoverlap were identified along the entire south coastof mainland New Zealand in 2008 and 2011. Thesespatial comparisons of yearly fishing effort and alba-tross distributions illustrate overlap over a broadrange at variable intensities.
The fine-scale analysis of overlap revealed that inall years, several birds never overlapped a fishingvessel while foraging (2008: 55%; 2009: 57%; 2010:20%; 2011: 56%). The rates of foraging while over-lapping a fishing vessel were highest in 2010, withdouble the rate of overlap for females and both sexescombined compared to other years (Table 2). In 2010,22.7% of foraging effort by males overlapped a fish-ing vessel, including 14.0% of foraging effort withsquid trawl vessel and 4.6% with hoki trawls. Theoverall rate of overlap by females while foraging in2010 was 14.5%, with 6.1% attributed to hoki trawls
and 4.2% attributed to barracouta trawls.No overlap between female albatrossesand these fisheries was determined in anyother year. The lowest overall rate of over-lap while foraging was in 2008, althoughminimal overlap by females while forag-ing was detected in 2009. Males spent7.1% and 7.5% of their foraging effort in2009 overlapping squid and hoki trawls,respectively. The elevated rate of foragingby females while overlapping in 2011 ismainly attributed to overlap with squid jigevents (5.0% of foraging effort).
In a multi-way ANOVA, there was a sig-nificant effect of year (F = 4.18, p = 0.009,df = 3) on the rate of overlap while forag-ing. The mean rate of overlap while forag-ing was higher in 2010 (x = 17%, SD =14.5%) than 2008 (x = 6%, SD = 11%),2009 (x = 6%, SD = 13%), and 2011 (x =7%, SD = 11%). Rates of overlap while for-aging were not significantly affected bysex (F = 2.45, p = 0.122, df = 1), and therewas no interaction between year and sex(F = 1.06, p = 0.371, df = 3). Moreover,there were no significant differencesbetween sexes in the rates of overlapwhile foraging in the different fisheries(squid trawl: F = 2.14, p = 0.148; hokitrawl: F = 1.64, p = 0.204; barracoutatrawls: F = 0.03, p = 0.863; squid jig: F =
281
Fig. 2. Variation in fishing effort (stacked bars) and catch per unit effort(CPUE; lines) among years in the area used by Buller’s albatross Thalas-sarche bulleri during the tracking periods. CPUE for trawl fisheries calcu-lated as the sum of the ratio of catch weight per duration of tow for eachevent. CPUE for squid jig in each year calculated as the sum of the ratio ofcatch weight per fishing event. Squid = Nototodarus gouldi and N. sloani;hoki = Macruronus novaezelandiae; BAR = barracouta Thyrsites atun;SWA = silver warehou Seriolella punctata; JMA = jack mackerel Trachu-
rus declivis
Aut
hor c
opy
Mar Ecol Prog Ser 473: 275–289, 2013
0.14, p = 0.705; df = 1 for all tests). There was no cor-relation detected between age and rate of overlapwhile foraging (ρ = 0.09, p = 0.4613).
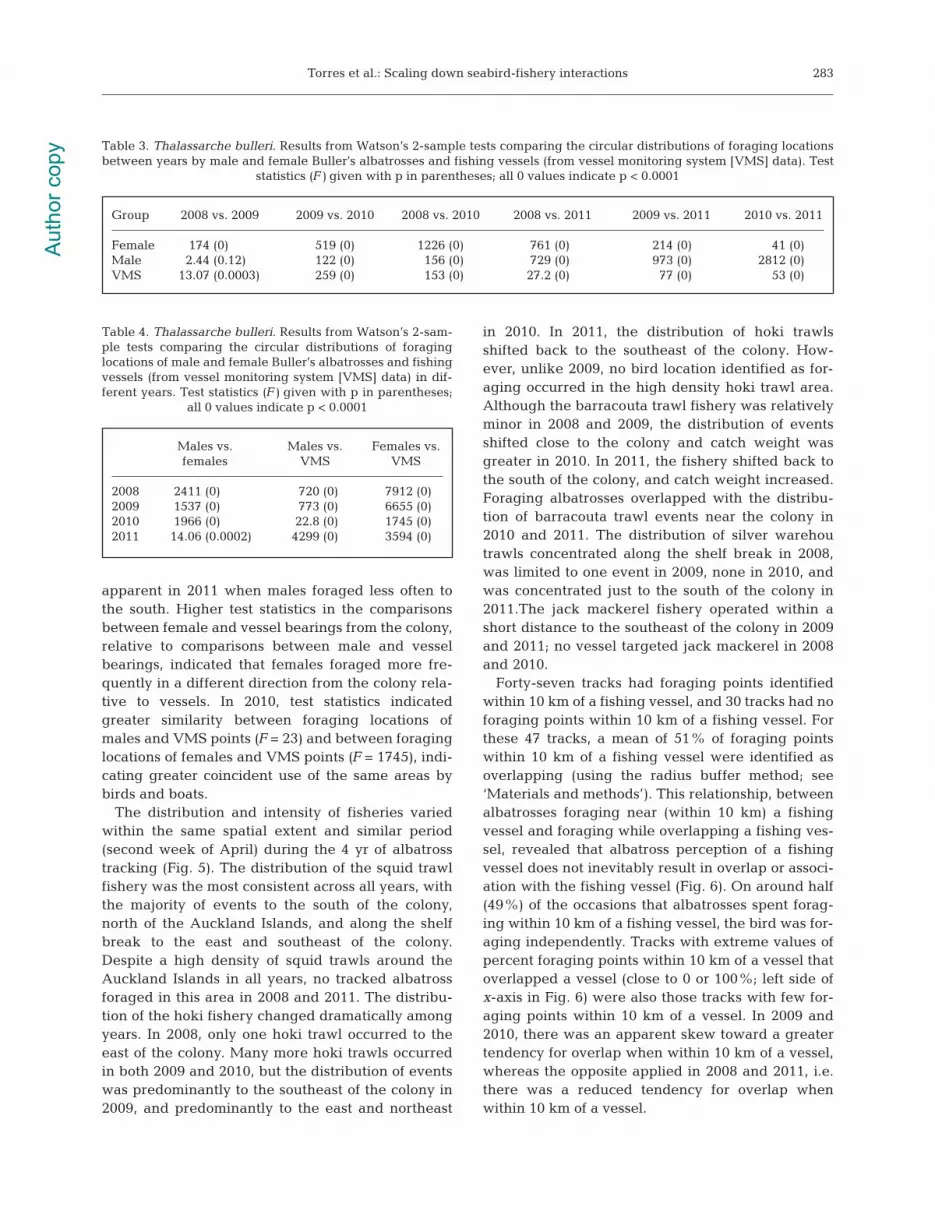
Circular statistics comparing angle from the colonyindicated highly significant differences (p < 0.001) indistributions between male and female albatrosses,and fishing vessels. Comparisons of test statisticsfrom Watson’s tests (Tables 3 & 4) confirmed thetrends that are evident in the rose diagrams (Fig. 4).Between-year comparisons of vessel bearings fromthe colony suggested consistent distribution of fish-ing effort in all years (Table 3) (low test statistic values), except in 2010 when higher values for teststatistics indicated a slightly different distribution offishing vessels. The rose diagrams confirm thisannual consistency, and show a slight shift northeastof fishing vessels in 2010. Female albatrosses consis-tently foraged to the north of the colony, with astrong preference for habitat toward the northeast in2010 and 2011. Male albatrosses foraged more fre-quently to the south of the colony, although some for-aged to the north and east, especially in 2011. Therewas a significant difference between males andfemales in the bearings from the colony of foragingpoints in all years (Table 4), although this was least
282
Year; Points Foraging Rate of overlapsex classified points over- While With squid With hoki With BAR With squid With SWA With JMA
as foraging lapping with foraging: all trawl (%) trawl (%) trawl (%) jig (%) trawl (%) trawl (%)(n) vessels (n) fisheries (%)
2008 2991 110 3.68 2.37 0.00 0.00 0.00 1.30 0.00F 1739 44 2.53 2.53 0.00 0.00 0.00 0.00 0.00M 1252 66 5.27 2.16 0.00 0.00 0.00 3.12 0.00
2009 5540 456 8.23 4.04 4.17 0.00 0.02 0.00 0.00F 2474 6 0.24 0.20 0.00 0.00 0.04 0.00 0.00M 3066 450 14.68 7.14 7.53 0.00 0.00 0.00 0.00
2010 7554 1379 18.26 8.09 5.40 3.03 1.73 0.00 0.00F 4083 590 14.45 3.06 6.10 4.19 1.10 0.00 0.00M 3471 789 22.73 14.00 4.58 1.67 2.48 0.00 0.00
2011 6463 417 6.45 1.83 0.00 0.82 1.69 1.30 0.82F 1973 146 7.40 0.46 0.00 0.00 5.02 0.00 1.93M 4490 271 6.04 2.43 0.00 1.18 0.22 1.87 0.33
Table 2. Thalassarche bulleri. Comparison by year and sex of recorded GPS foraging points and rates of overlap with vesselswhile foraging. F = female; M = male; squid = Nototodarus gouldi and N. sloani; hoki = Macruronus novaezelandiae; BAR =
barracouta Thyrsites atun; SWA = silver warehou Seriolella punctata; JMA = jack mackerel Trachurus declivis
Fig. 3. Spatial intersection of yearly density plots of trackedBuller’s albatrosses Thalassarche bulleri and fishing eventstart locations. Plots are standardized across years accordingto the product of bird and boat density rank (see ‘Materialsand methods’) as symbolized by legend displayed: 1 (blue) =low intensity overlap through 20 (red) = high intensity over-
lap. (Q): Snares colony
Aut
hor c
opy
Torres et al.: Scaling down seabird-fishery interactions
apparent in 2011 when males foraged less often tothe south. Higher test statistics in the comparisonsbetween female and vessel bearings from the colony,relative to comparisons between male and vesselbearings, indicated that females foraged more fre-quently in a different direction from the colony rela-tive to vessels. In 2010, test statistics indicatedgreater similarity between foraging locations ofmales and VMS points (F = 23) and between foraginglocations of females and VMS points (F = 1745), indi-cating greater coincident use of the same areas bybirds and boats.
The distribution and intensity of fisheries variedwithin the same spatial extent and similar period(second week of April) during the 4 yr of albatrosstracking (Fig. 5). The distribution of the squid trawlfishery was the most consistent across all years, withthe majority of events to the south of the colony,north of the Auckland Islands, and along the shelfbreak to the east and southeast of the colony.Despite a high density of squid trawls around theAuck land Islands in all years, no tracked albatrossforaged in this area in 2008 and 2011. The distribu-tion of the hoki fishery changed dramatically amongyears. In 2008, only one hoki trawl occurred to theeast of the colony. Many more hoki trawls occurredin both 2009 and 2010, but the distribution of eventswas predominantly to the southeast of the colony in2009, and predominantly to the east and northeast
in 2010. In 2011, the distribution of hoki trawlsshifted back to the southeast of the colony. How-ever, unlike 2009, no bird location identified as for-aging occurred in the high density hoki trawl area.Although the barracouta trawl fishery was relativelyminor in 2008 and 2009, the distribution of eventsshifted close to the colony and catch weight wasgreater in 2010. In 2011, the fishery shifted back tothe south of the colony, and catch weight increased.Foraging albatrosses overlapped with the distribu-tion of barracouta trawl events near the colony in2010 and 2011. The distribution of silver warehoutrawls concentrated along the shelf break in 2008,was limited to one event in 2009, none in 2010, andwas concentrated just to the south of the colony in2011.The jack mackerel fishery operated within ashort distance to the southeast of the colony in 2009and 2011; no vessel targeted jack mackerel in 2008and 2010.
Forty-seven tracks had foraging points identifiedwithin 10 km of a fishing vessel, and 30 tracks had noforaging points within 10 km of a fishing vessel. Forthese 47 tracks, a mean of 51% of foraging pointswithin 10 km of a fishing vessel were identified asoverlapping (using the radius buffer method; see‘Materials and methods’). This relationship, betweenalbatrosses foraging near (within 10 km) a fishingvessel and foraging while overlapping a fishing ves-sel, revealed that albatross perception of a fishingvessel does not inevitably result in overlap or associ-ation with the fishing vessel (Fig. 6). On around half(49%) of the occasions that albatrosses spent forag-ing within 10 km of a fishing vessel, the bird was for-aging independently. Tracks with extreme values ofpercent foraging points within 10 km of a vessel thatoverlapped a vessel (close to 0 or 100%; left side of x-axis in Fig. 6) were also those tracks with few for-aging points within 10 km of a vessel. In 2009 and2010, there was an apparent skew toward a greatertendency for overlap when within 10 km of a vessel,whereas the opposite applied in 2008 and 2011, i.e.there was a reduced tendency for overlap whenwithin 10 km of a vessel.
283
Group 2008 vs. 2009 2009 vs. 2010 2008 vs. 2010 2008 vs. 2011 2009 vs. 2011 2010 vs. 2011
Female 174 (0) 519 (0) 1226 (0) 761 (0) 214 (0) 41 (0)Male 2.44 (0.12) 122 (0) 156 (0) 729 (0) 973 (0) 2812 (0)VMS 13.07 (0.0003) 259 (0) 153 (0) 27.2 (0) 77 (0) 53 (0)
Table 3. Thalassarche bulleri. Results from Watson’s 2-sample tests comparing the circular distributions of foraging locationsbetween years by male and female Buller’s albatrosses and fishing vessels (from vessel monitoring system [VMS] data). Test
statistics (F) given with p in parentheses; all 0 values indicate p < 0.0001
Males vs. Males vs. Females vs. females VMS VMS
2008 2411 (0) 720 (0) 7912 (0)2009 1537 (0) 773 (0) 6655 (0)2010 1966 (0) 22.8 (0) 1745 (0)2011 14.06 (0.0002) 4299 (0) 3594 (0)
Table 4. Thalassarche bulleri. Results from Watson’s 2-sam-ple tests comparing the circular distributions of foraginglocations of male and female Buller’s albatrosses and fishingvessels (from vessel monitoring system [VMS] data) in dif-ferent years. Test statistics (F) given with p in parentheses;
all 0 values indicate p < 0.0001
Aut
hor c
opy

Mar Ecol Prog Ser 473: 275–289, 2013284
Fig. 4. Thalassarche bulleri. Rose diagrams indicating the angular distribution from the colony of foraging locations of trackedmale and female Buller’s albatrosses and vessel locations (VMS points) within the same spatial extent and time period. Thecenter of each rose diagram represents the colony location, and length of each wedge reflects the number of points in that
direction. All rose diagrams have a consistent scale that extends to 40%, with each ring representing 10% of points
Aut
hor c
opy

Torres et al.: Scaling down seabird-fishery interactions 285
Fig. 5. Thalassarche bulleri. Variation in the distribution of fisheries among years with Buller’s albatross foraging locationsoverlaid (male = blue dots; female = red dots). ( ) The Snares. Density plots for each fishery created from start locations of fish-ing events, weighted by catch weight (tons) of the event. The scale of plots for each fishery is standardized across all years, sothat each fishery color bar reflects the relative weight of catch (t) in to every year. The bottom row of plots includes density plotsof 3 fisheries. Squid = Nototodarus gouldi and N. sloani; hoki = Macruronus novaezelandiae; barracouta = Thyrsites atun;
SWA = silver warehou Seriolella punctata; JMA = jack mackerel Trachurus declivis; SquJig = squid jig
Aut
hor c
opy

Mar Ecol Prog Ser 473: 275–289, 2013
DISCUSSION
Seabird interactions with fishing vessels are gener-ally considered in the context of seabirds beingattracted to boats in order to scavenge on fisheriesdiscards and catch (Arcos & Oro 1996, Skov & Dur-inck 2001). However, our study demonstrates thatthis is not always the default foraging strategy, evenwhen birds and vessels occur in the same area. Wefound that Buller’s albatrosses forage independentlyabout half of the time they are within 10 km of a fish-ing vessel. Thus, use of the same area by albatrossesand vessels is due, at least half the time, to coinci-dence rather than the deliberate tactic of targetingvessels for feeding opportunities. Additionally, wedemonstrate temporal and spatial variability in alba-tross foraging locations across 4 yr. Despite the rela-tively static distribution of the squid trawl fishery,overlap rates while foraging by tracked birds wererelatively low in 2008 and 2011, indicating flexibleforaging patterns and use of areas irrespective of thepresence of squid trawl vessels. Moreover, it appearsthat the dramatic increase in rates of vessel overlapwhile foraging by females in 2010 was due to shifts infishing effort rather than changes in bird distribution.In 2010 the hoki trawl fishery moved north into theareas used by females, and the barracouta trawl fish-ery was very active in close proximity to the colony.
Correspondingly, as the hoki fishery moved north in2010, away from the southern areas used by males,rates of overlap while foraging by male albatrossesand hoki trawls declined.
The fine-scale overlap analysis revealed thatacross all 4 yr of tracking, the mean rate of overlapwith a fishing vessel while foraging was relativelylow (10%). This result indicates that the trackedalbatrosses foraged independently of fishing vesselsfor the majority of the time. Even in 2010, when therate of overlap while foraging increased, the birdsstill foraged away from vessels for the majority of thetime. This result is in contrast to other studies thathave documented high rates of albatross bycatch infisheries (Croxall 2008, Anderson et al. 2011). Weconsider 3 non-exclusive hypotheses for this incon-gruity. (1) As a medium-sized albatross species,Buller’s albatrosses are outcompeted by larger alba-trosses (i.e. white-capped (Thalassarche steadi) orSalvin’s (Thalassarche salvini) albatrosses) for accessto foraging opportunities behind fishing vessels. (2)Buller’s albatrosses were not particularly attracted toavailable fishing activities during the temporalperiod of our tracking work. (3) Fisheries mitigationmethods such as Tori lines and offal mincing are pro -perly implemented and effectively deterring inter -actions with Buller’s albatrosses.
Additionally, our results illustrate how overlaprates are subject to the variability in both bird andfishing vessel distributions at fine scales. Both groupssearch for prey within a highly dynamic ecosystem,which occasionally results in overlapping distribu-tions. The high rate (14%) of overlap while foragingof males and squid trawls in 2010 was likely due to ashift in the distribution of male foraging effort to theeast and south (Fig. 4) compared with other years;this distribution over the shelf break and north of theAuckland Islands coincided with a dense concen -tration of squid trawlers. The explanation for thischange in foraging distribution is difficult to ascer-tain, but further tracking and comparisons with fish-eries distributions as well as an assessment of the roleof environmental variability may reveal the drivingfactor(s).
Our results demonstrate the increased precisionand value of quantifying seabird-fishery overlap witha fine-scale approach, rather than relying on conven-tional large-scale analysis typically done throughoverlays of density plots (Fig. 3). Comparison ofresults derived from fine and large-scale analysesillustrate that conclusions drawn from overlaid ker-nel density plots can be misleading. For instance, thekernel density plot in 2010 looks little different from
286
Fig. 6. Thalassarche bulleri. Relationship between Buller’salbatrosses foraging near (within 10 km) a fishing vessel andforaging while overlapping a fishing vessel (identified usingradius buffer method; see ‘Materials and methods’). Thenumber of foraging points from 47 Buller’s albatross tracksthat foraged within 10 km of a fishing vessel (x-axis) is plot-ted relative to the percent of foraging points within 10 km ofa vessel that were identified as overlapping a vessel (y-axis).The 30 tracks with no identified foraging points within 10 km
of a fishing vessel are not included in this figure
Aut
hor c
opy

Torres et al.: Scaling down seabird-fishery interactions
any other year, yet the fine-scale analysis revealeddramatically higher rates of overlap while foraging.Additionally, in all years, spatial overlap was indi-cated in areas where no or little foraging behaviorwas identified through the fine-scale track analysis,including along the south coast of mainland NewZealand. This large-scale overlap approach is alsohighly susceptible to sampling bias; density plotcomparisons do not account for the variable numberof tracks recorded in each year, which certainly influ-ences areas identified as overlap. These exampleshighlight the deficiencies of a simple spatial overlay.Moreover, overlays are often assessed qualitativelythrough visual evaluations rather than objectivelyquantified (BirdLife International 2004, Phillips et al.2006, Copello & Quintana 2009). Spatial comparisonsof density plots of birds and boats are an effectivebroad-scale approach to assessing seabird-fisheriesoverlap. However, we suggest it would be prudent toresist over-interpreting results and simultaneouslyrecognize that observed patterns are not absolute butrather the starting point for investigations at finerspatial and temporal scales.
Furthermore, access to fine-scale data utilized tocreate the kernel density plots in Fig. 3 (start loca-tions from fishing events) is typically not available toscientists. Previous studies that compared seabirdand fisheries distributions through density overlayshave used catch effort datasets at meso-scales(18.6 km2 or 1° grid cells) with variable temporalscales (Petersen et al. 2008, Copello & Quintana2009, Pichegru et al. 2009) or data provided byregional fisheries management organizations in5° grid cells at yearly temporal scales (Weimerskirchet al. 1997, Tuck et al. 2003, Cuthbert et al. 2005,Phillips et al. 2006, Walker & Elliott 2006). Therefore,our attempt at a large-scale comparison of seabird-fisheries overlap can still be considered relativelyfine in scale compared to other studies.
The value of multiple years of tracking and analysisis illustrated by the increased overlap rate in 2010compared with other years. With 4 yr of data andanalysis, we demonstrated the temporal variability inrate of vessel overlap while foraging. Single-yearanalyses would have limited and skewed our under-standing of relationships between Buller’s alba-trosses and fisheries. Additionally, our results high-light the relatively large variability in fishing effortand activity within a comparatively small spatial areaand short temporal period.
GPS tracking of Buller’s albatrosses during thebrood-guard stage revealed a general pattern of sex-ual segregation. In all years but 2011, males foraged
to the south and east of the colony, whereas femalesconsistently foraged to the north and northeast of thecolony in all years. There are a number of non-exclu-sive explanations for sexual segregation in foragingdistributions of albatrosses, including size-mediateddominance and competitive exclusion, reproductiverole specialization, and niche divergence (Shaffer etal. 2001, Phillips et al. 2004). Although the driver ofthe different distribution patterns of male and femaleBuller’s albatrosses is unknown, males spent moretime foraging near the large squid and hoki trawlfisheries (except in 2010 when the hoki trawl fisherymoved north), which were also mainly to the southand east of the colony. However, the lack of a signifi-cant difference in rates of vessel overlap while forag-ing between sexes indicates that males are no morelikely to interact closely with fishing vessels thanfemales. The shift to the north and east of the colonyof male foraging locations in 2011 illustrates the flex-ibility in albatross foraging behavior and also high-lights the importance of multiple years of trackingdata to better understand distribution patterns.
Fishing vessels have become part of the environ-ment of many marine megafauna. Individuals utilizethis resource (fisheries discards or target species) ifand when it is advantageous, but according to ourresults, it would be incorrect to assume that this for-aging tactic is common for all species (see alsoGranadeiro et al. 2011). Our results indicate thatBuller’s albatrosses maintain natural foraging pat-terns for the majority of the time, despite relativelywidespread fishing activity within their at-sea range.Moreover, variable albatross overlap rates with fish-eries are not solely a function of seabird and vesseldistribution patterns, but also of the distribution andoperational characteristics of vessels. To the best ofour knowledge, this study represents the first timethat more than 2 yr of fine-scale seabird tracking andfisheries distribution data have been assessed atsmall spatial (<10 km) and temporal (2 min) scales.Our datasets and analyses enabled us to quantifyoverlap rates by behavior state (limited to foraging),sex, age, year, and fishery, allowing meaningful com-parisons among groups and insightful results.
Historically, national and international fisheriesbodies have been reluctant to distribute fine-scaledata on fishing vessel distribution, and until recently,GPS loggers were too large to deploy on seabirds.Hence, most studies of seabird-fisheries overlapwere at relatively large scales (Phillips et al. 2006,Petersen et al. 2008, Fischer et al. 2009). However,access to fine-scale fishing vessel distribution andcatch data is increasing, and biologging devices are
287A
utho
r cop
y

Mar Ecol Prog Ser 473: 275–289, 2013
now much smaller, which allows much finer-scaleanalyses of overlap (Votier et al. 2010, Granadeiro etal. 2011, Torres et al. 2011). Therefore, we believegreater insight into fisheries association can be generated by scaling down analyses and examiningindividual behavior, as demonstrated in our study.This knowledge will also improve our understandingof sea bird foraging strategies and help to gene -rate effec tive conservation management solutionswhile minimizing regulatory burdens on fisheriesoperators.
Acknowledgements. Funding for this study was provided bythe Conservation Services Programme of the New ZealandDepartment of Conservation and NIWA. We are grateful tothe New Zealand Ministry of Fisheries for supplying fishingvessel and CPUE data. This paper represents a contributionto the British Antarctic Survey Ecosystems Programme. Wethank H. Haazen and the crew of the RV ‘Tiama’ for safelytransporting our field crews to and from The Snares, and theDepartment of Conservation, Southland Conservancy forlogistic support.
LITERATURE CITED
Anderson ORJ, Small CJ, Croxall JP, Dunn EK, Sullivan BJ,Yates O, Black A (2011) Global seabird bycatch in long-line fisheries. Endang Species Res 14: 91−106
Arcos J, Oro D (1996) Changes in foraging ranges ofAudouin’s gulls Larus audouinii in relation to a trawlermoratorium in the western Mediterranean. Colon Water-birds 19: 128−131
Barraquand F, Benhamou S (2008) Animal movements inheterogeneous landscapes: identifying profitable placesand homogeneous movement bouts. Ecology 89: 3336−3348
Bartle JA (1991) Incidental capture of seabirds in the NewZealand subantarctic squid trawl fishery, 1990. Bird Conserv Int 1: 351−359
BirdLife International (2004) Tracking ocean wanderers: theglobal distribution of albatrosses and petrels. ProcResults from the Global Procellariform Tracking Work-shop, 1−5 September, 2003. BirdLife International, Cam-bridge
Brothers N (1991) Albatross mortality and associated baitloss in the Japanese longline fishery in the SouthernOcean. Biol Conserv 55: 255−268
Copello S, Quintana F (2009) Spatio-temporal overlap be -tween the at-sea distribution of southern giant petrelsand fisheries at the Patagonian Shelf. Polar Biol 32: 1211−1220
Croxall JP (2008) Seabird mortality and trawl fisheries.Anim Conserv 11: 255−256
Croxall JP, Prince PA (1996) Cephalopods as prey. I. Sea-birds. Philos T Roy Soc B 351: 1023−1043
Cuthbert R, Hilton G, Ryan P, Tuck GN (2005) At-sea distri-bution of breeding Tristan albatrosses Diomedea dabbe-nena and potential interactions with pelagic longlinefishing in the South Atlantic Ocean. Biol Conserv 121: 345−355
Delord K, Cotte C, Peron C, Marteau C and others (2010) At-sea distribution and diet of an endangered top predator: relationship between white-chinned petrels and com-mercial longline fisheries. Endang Species Res 13: 1−16
Fischer KN, Suryan RM, Roby DD, Balogh GR (2009) Post-breeding season distribution of black-footed and Laysanalbatrosses satellite-tagged in Alaska: inter-specific dif-ferences in spatial overlap with North Pacific fisheries.Biol Conserv 142: 751−760
Francis RICC, Sagar PM (2012) Modelling the effect of fish-ing on southern Buller’s albatross using a 60-year dataset.NZ J Zool 39: 3−17
Frederiksen M, Wanless S, Harris MP, Rothery P, Wilson LJ(2004) The role of industrial fisheries and oceanographicchange in the decline of North Sea black-legged kitti-wakes. J Appl Ecol 41: 1129−1139
Freeman AND, Wilson KJ, Nicholls DG (2001) Westlandpetrels and the hoki fishery: determining co-occurrenceusing satellite telemetry. Emu 101: 47−56
Furness RW (2002) Management implications of interactionsbetween fisheries and sandeel-dependent seabirds andseals in the North Sea. ICES J Mar Sci 59: 261−269
Furness RW (2003) Impacts of fisheries on seabird communi-ties. Sci Mar 67: 33−45
Garthe S, Camphuysen K, Furness RW (1996) Amounts ofdiscards by commercial fisheries and their significance asfood for seabirds in the North Sea. Mar Ecol Prog Ser 136: 1−11
Granadeiro JP, Phillips RA, Brickle P, Catry P (2011) Alba-trosses following fishing vessels: How badly hooked arethey on an easy meal? PLoS ONE 6: e17467
Grémillet D, Pichegru L, Kuntz G, Woakes AG, Wilkinson S,Crawford RJM, Ryan PG (2008) A junk-food hypothesisfor gannets feeding on fishery waste. Philos Trans R SocLond B 275: 1149−1156
Hyrenbach KD, Dotson RC (2003) Assessing the susceptibilityof female black-footed albatross (Phoebastria nigri pes) tolongline fisheries during their post-breeding dispersal: anintegrated approach. Biol Conserv 112: 391−404
James GD, Stahl JC (2000) Diet of southern Buller’s alba-tross (Diomedea bulleri bulleri) and the importance offishery discards during chick rearing. N Z J Mar FreshwRes 34: 435−454
Karpouzi VS, Watson R, Pauly D (2007) Modelling and map-ping resource overlap between seabirds and fisheries ona global scale: a preliminary assessment. Mar Ecol ProgSer 343: 87−99
Lewison RL, Crowder LB, Read AJ, Freeman SA (2004)Understanding impacts of fisheries bycatch on marinemegafauna. Trends Ecol Evol 19: 598−604
Lund U, Agostinelli C (2007) Circular statistics. Version 0.3–8,CRAN
Ministry of Fisheries (2006) Catch effort reference library.Ministry of Fisheries, Wellington
Montevecchi WA, Myers RA (1995) Prey harvests of seabirdsreflect pelagic fish and squid abundance on multiplespatial and temporal scales. Mar Ecol Prog Ser 117: 1−9
Okes NC, Hockey PAR, Pichegru L, van der Lingen CD,Crawford RJM, Grémillet D (2009) Competition for shift-ing resources in the southern Benguela upwelling: sea-birds versus purse-seine fisheries. Biol Conserv 142: 2361−2368
Petersen SL, Phillips RA, Ryan PG, Underhill LG (2008)Albatross overlap with fisheries in the Benguela up -welling system: implications for conservation and man-
288A
utho
r cop
y

Torres et al.: Scaling down seabird-fishery interactions 289
agement. Endang Species Res 5: 117−127Phillips RA, Silk JRD, Phalan B, Catry P, Croxall JP (2004)
Seasonal sexual segregation in two Thalassarche alba-tross species: competitive exclusion, reproductive rolespecialization or trophic niche divergence? Philos TransR Soc Lond B 271: 1283−1291
Phillips RA, Silk JRD, Croxall JP, Afanasyev V (2006) Year-round distribution of white-chinned petrels from SouthGeorgia: relationships with oceanography and fisheries.Biol Conserv 129: 336−347
Pichegru L, Ryan PG, Le Bohec C, van Der Lingen CD andothers (2009) Overlap between vulnerable top predatorsand fisheries in the Benguela upwelling system: implica-tions for marine protected areas. Mar Ecol Prog Ser 391: 199−208
Pierre JP, Norden WS (2006) Reducing seabird bycatch inlongline fisheries using a natural olfactory deterrent. BiolConserv 130: 406−415
Rindorf A, Wanless S, Harris MP (2000) Effects of changes insandeel availability on the reproductive output of sea-birds. Mar Ecol Prog Ser 202: 241−252
Rolland V, Weimerskirch H, Barbraud C (2010) Relativeinfluence of fisheries and climate on the demography offour albatross species. Glob Change Biol 16: 1910−1922
Sagar PM, Stahl JC, Molloy J (1998) Sex determination andnatal philopatry of southern Buller’s mollymawk (Dio -medega bulleri bulleri). Notornis 45: 271−278
Shaffer SA, Weimerskirch H, Costa DP (2001) Functionalsignificance of sexual dimorphism in wandering alba-trosses, Diomedea exulans. Funct Ecol 15: 203−210
Skov H, Durinck J (2001) Seabird attraction to fishing ves-sels is a local process. Mar Ecol Prog Ser 214: 289−298
Stahl JC, Sagar PM (2000) Foraging strategies of southernBuller’s albatrosses Diomedea b. bulleri breeding on TheSnares, New Zealand. J R Soc NZ 30: 299−318
Thompson KR, Riddy MD (1995) Utilization of offal and dis-cards from ‘finfish’ trawlers around the Falkland Islands
by the black-browed albatross Diomedea melanophris.Ibis 137: 198−206
Torres LG, Thompson DR, Bearhop S, Votier SC, Taylor GA,Sagar PM, Robertson BC (2011) White-capped alba-trosses alter fine-scale foraging behavior patterns whenassociated with fishing vessels. Mar Ecol Prog Ser 428: 289−301
Tuck GN, Polacheck T, Bulman CM (2003) Spatio-temporaltrends of longline fishing effort in the Southern Ocean andimplications for seabird bycatch. Biol Conserv 114: 1−27
Votier SC, Bearhop S, Witt MJ, Inger R, Thompson DR,Newton J (2010) Individual responses of seabirds to com-mercial fisheries revealed using GPS tracking, stable iso-topes and vessel monitoring systems. J Appl Ecol 47: 487−497
Walker K, Elliott G (2006) At-sea distribution of Gibson’s andAntipodean wandering albatrosses, and relationshipswith longline fisheries. Notornis 53: 265−290
Waugh S, Filippi D, Fukuda A, Suzuki M, Higuchi H, Seti-awan A, Davis L (2005) Foraging of royal albatrosses,Dio medea epomophora, from the Otago Peninsula andits relationships to fisheries. Can J Fish Aquat Sci 62: 1410−1421
Weimerskirch H, Brothers N, Jouventin P (1997) Populationdynamics of wandering albatross Diomedea exulans andAmsterdam albatross D. amsterdamensis in the Indianocean and their relationships with long-line fisheries: conservation implications. Biol Conserv 79: 257−270
Weimerskirch H, Bonadonna F, Bailleul F, Mabille G, Del-l’Omo G, Lipp HP (2002) GPS tracking of foraging alba-trosses. Science 295: 1259
Xavier JC, Trathan PN, Croxall JP, Wood AG, Podesta G, Rod-house PG (2004) Foraging ecology and interactions withfisheries of wandering albatrosses (Diomedea exulans)breeding at South Georgia. Fish Oceanogr 13: 324−344
Zar JH (1999) Biostatistical analysis. Prentice Hall, UpperSaddle River, NJ
Editorial responsibility: John Piatt, Anchorage, Alaska, USA
Submitted: August 29, 2011; Accepted: September 24, 2012Proofs received from author(s): January 11, 2013
Aut
hor c
opy