seabird guano fertilizes baltic sea littoral food webs
TRANSCRIPT
Seabird Guano Fertilizes Baltic Sea Littoral Food WebsKarine Gagnon*, Eva Rothausler, Anneli Syrjanen, Maria Yli-Renko, Veijo Jormalainen
Section of Ecology, Department of Biology, University of Turku, Turku, Finland
Abstract
Nutrient enrichment in coastal marine systems can have profound impacts on trophic networks. In the Baltic Sea, thepopulation of Great Cormorant (Phalacrocorax carbo sinensis) has increased nearly exponentially since the mid-1990s, andcolonies of these seabirds can be important sources of nitrogen enrichment for nearby benthic communities due to guanorunoff. In this study we used stable isotope analyses and diet mixing models to determine the extent of nitrogenenrichment from cormorant colonies, as well as to examine any possible changes in herbivore diet preferences due toenrichment. We found significantly higher levels of d15N in samples from colony islands than control islands for producers(the dominant macroalga Fucus vesiculosus, filamentous algae, and periphyton) and herbivores, as well as a positivecorrelation between enrichment and nest density in colony sites. We also found that enrichment increased over thebreeding season of the cormorants, with higher enrichment in late summer than early summer. While the amount of totalnitrogen did not differ between colony and control sites, the amount of guano-based nitrogen in algae was .50% in mostsites, indicating high nitrogen enrichment from colonies. Herbivores (the isopod Idotea balthica and the gastropodTheodoxus fluviatilis) preferred feeding upon the dominant macroalga Fucus vesiculosus rather than on filamentous algae orperiphyton in both control and colony, and there was a significant increase in periphyton consumption near colony sites.Overall, guano from cormorant colonies seems to have effects on both producers and herbivores, as well as the potential tomodify algae-herbivore interactions.
Citation: Gagnon K, Rothausler E, Syrjanen A, Yli-Renko M, Jormalainen V (2013) Seabird Guano Fertilizes Baltic Sea Littoral Food Webs. PLoS ONE 8(4): e61284.doi:10.1371/journal.pone.0061284
Editor: Candida Savage, University of Otago, New Zealand
Received January 15, 2013; Accepted March 6, 2013; Published April 11, 2013
Copyright: � 2013 Gagnon et al. This is an open-access article distributed under the terms of the Creative Commons Attribution License, which permitsunrestricted use, distribution, and reproduction in any medium, provided the original author and source are credited.
Funding: This study was funded by the Academy of Finland (project # 251102). The funding agency had no role in study design, data collection and analysis,decision to publish, or preparation of the manuscript.
Competing Interests: The authors have declared that no competing interests exist.
* E-mail: [email protected]
Introduction
Coastal seas are facing numerous threats to biodiversity and
ecosystem functioning, such as eutrophication, overfishing, and the
introduction of non-native species [1,2,3,4,5]. Traditionally,
studies have focused on the impacts of a single stressor on a
target species; however, recent studies have shown that examining
multiple disturbances on the entire ecosystem is necessary to
determine the full impacts of anthropogenic stressors. Trophic
links between species can be very strong, such that changes in the
abundance of one species can affect the whole trophic network
through either top-down or bottom-up effects, with unexpected
and far reaching impacts on the entire community [6,7].
In the Baltic Sea, multiple disturbances [8], have already led to
shifts in marine communities, e.g. [9,10]. Among the more recent
developments is the return of the Great Cormorant (Phalacrocorax
carbo sinensis), which disappeared from northern Europe in the 19th
century [11], and returned to the Baltic Sea in the mid-1990s [12].
While the initial population growth was extremely rapid, the Great
Cormorant population on the Finnish coast is starting to stabilise
at approximately 17 000 breeding pairs (unpublished monitoring
data from the Finnish Environmental Institute in 2012).
Cormorants form dense colonies (up to 2000 pairs) on islands
and it has been suggested that these islands can be considered as
small-scale models of highly eutrophicated, and depleted commu-
nities for several reasons [13,14]. Due to their position at the top of
the marine food chain, cormorants, like other seabirds, excrete
guano which contains 15–20% nitrogen [15], as well as
phosphorus [16,17,14]. Guano accumulates on colony islands
during the breeding season (May-August in the Baltic Sea), and if
washed into the sea can cause nitrogen (N) enrichment in the
surrounding areas [14]. The extent of enrichment may also vary
depending on the amount of runoff due to e.g. seasonal changes in
guano accumulation and rainfall.
Cormorants are effective predators and consume large amounts
of fish during the breeding season [18,19,20,21] thus not just
producing guano on colony islands but also generating top-down
cascading effects. While top-down effects are often strong in
marine littoral benthic systems [22,23,24], cormorant colonies also
have the potential to considerably affect trophic interactions
through bottom-up effects. Seabird colonies have been shown to
lead to increased N concentrations in terrestrial plants and marine
organisms [17,25,26]. N enrichment in benthic systems can
generally increase the productivity of these ecosystems by
stimulating the growth of algae [27], though not all algal species
are equally affected. Fast-growing ephemeral filamentous algae
benefit the most from N enrichment, while slower-growing
perennial macroalgae are disadvantaged due to overgrowth of
the filamentous algae and periphyton [27,28]. Herbivory, at least
at moderate levels, may counteract these effects, by reducing the
coverage of filamentous algae [27]. Consequently, if N enrichment
(i.e. eutrophication) is accompanied by trophic cascades (i.e. from
overfishing or cormorant predation), which lead to higher
herbivore densities, the top-down effects could balance the
bottom-up effects. Therefore, islands inhabited by cormorants
offer an important opportunity to explore the relationship and role
PLOS ONE | www.plosone.org 1 April 2013 | Volume 8 | Issue 4 | e61284
of both bottom-up and top-down processes in regulating trophic
interactions.
Prior to determining the interactions between processes, the
magnitude and characteristics of cormorant impacts must be
studied. N enrichment does occur in benthic communities near
cormorant colonies on the Swedish coast of the Baltic Sea [14],
however little work has been done in determining the factors
controlling the spatial and temporal variability of guano enrich-
ment. In this study, we determined the extent of N enrichment at
producer and herbivore trophic levels near cormorant colonies on
the Finnish coast, and the role of nest density and fetch in
influencing enrichment. We predicted that high nest densities and
high wave exposure (i.e. fetch) would have a positive effect on N
enrichment around colonies. We also tested how enrichment
varied seasonally, as well as whether guano-based N affected
control islands, with the hypothesis that enrichment is a solely local
scale phenomenon which increases over the summer (along with
higher guano production and increasing rainfall). In addition, we
applied diet mixing models to estimate the contribution of guano-
based N to N uptake of algae and periphyton, and to determine
the diet preferences of herbivores and their possible shifts due to N
enrichment from guano. We predicted that the consumption of
periphyton and/or filamentous algae would increase in colonies as
compared to control islands due to positive impacts of nitrogen
enrichment on algal growth.
Materials and Methods
Ethics statementAll sampling complied with relevant regulations. No permits
were required as sampling occurred outside the cormorant
breeding season and no protected species were sampled.
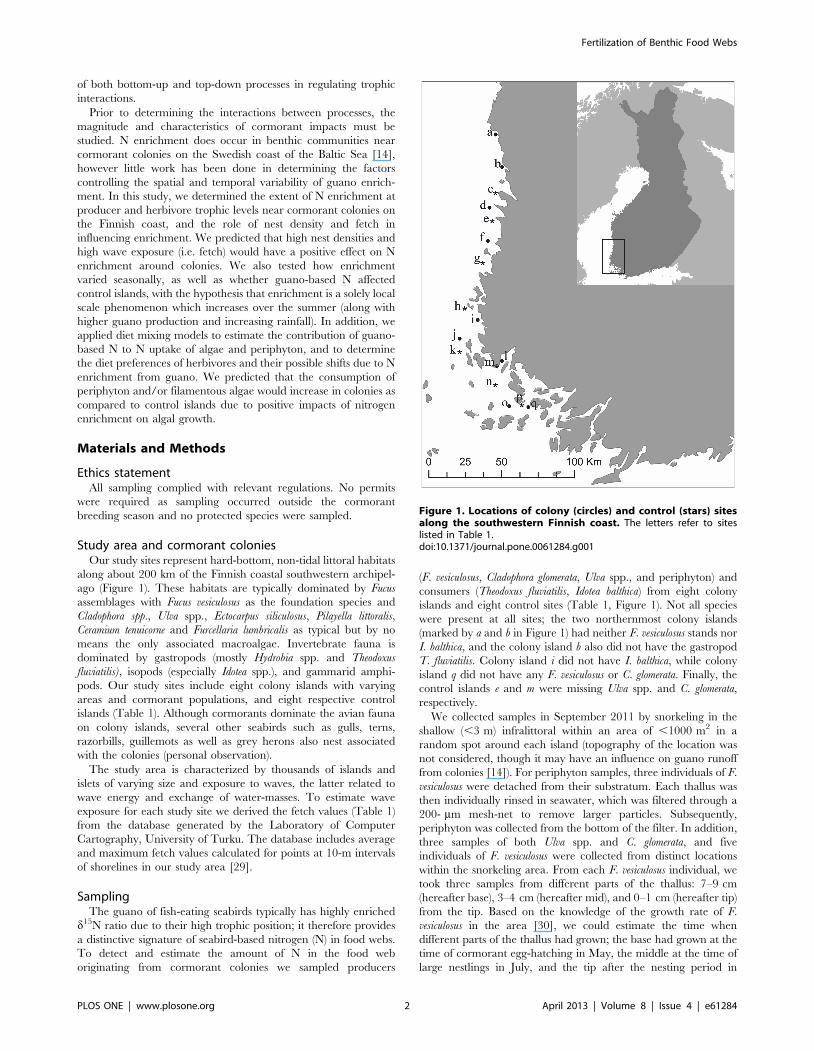
Study area and cormorant coloniesOur study sites represent hard-bottom, non-tidal littoral habitats
along about 200 km of the Finnish coastal southwestern archipel-
ago (Figure 1). These habitats are typically dominated by Fucus
assemblages with Fucus vesiculosus as the foundation species and
Cladophora spp., Ulva spp., Ectocarpus siliculosus, Pilayella littoralis,
Ceramium tenuicorne and Furcellaria lumbricalis as typical but by no
means the only associated macroalgae. Invertebrate fauna is
dominated by gastropods (mostly Hydrobia spp. and Theodoxus
fluviatilis), isopods (especially Idotea spp.), and gammarid amphi-
pods. Our study sites include eight colony islands with varying
areas and cormorant populations, and eight respective control
islands (Table 1). Although cormorants dominate the avian fauna
on colony islands, several other seabirds such as gulls, terns,
razorbills, guillemots as well as grey herons also nest associated
with the colonies (personal observation).
The study area is characterized by thousands of islands and
islets of varying size and exposure to waves, the latter related to
wave energy and exchange of water-masses. To estimate wave
exposure for each study site we derived the fetch values (Table 1)
from the database generated by the Laboratory of Computer
Cartography, University of Turku. The database includes average
and maximum fetch values calculated for points at 10-m intervals
of shorelines in our study area [29].
SamplingThe guano of fish-eating seabirds typically has highly enriched
d15N ratio due to their high trophic position; it therefore provides
a distinctive signature of seabird-based nitrogen (N) in food webs.
To detect and estimate the amount of N in the food web
originating from cormorant colonies we sampled producers
(F. vesiculosus, Cladophora glomerata, Ulva spp., and periphyton) and
consumers (Theodoxus fluviatilis, Idotea balthica) from eight colony
islands and eight control sites (Table 1, Figure 1). Not all species
were present at all sites; the two northernmost colony islands
(marked by a and b in Figure 1) had neither F. vesiculosus stands nor
I. balthica, and the colony island b also did not have the gastropod
T. fluviatilis. Colony island i did not have I. balthica, while colony
island q did not have any F. vesiculosus or C. glomerata. Finally, the
control islands e and m were missing Ulva spp. and C. glomerata,
respectively.
We collected samples in September 2011 by snorkeling in the
shallow (,3 m) infralittoral within an area of ,1000 m2 in a
random spot around each island (topography of the location was
not considered, though it may have an influence on guano runoff
from colonies [14]). For periphyton samples, three individuals of F.
vesiculosus were detached from their substratum. Each thallus was
then individually rinsed in seawater, which was filtered through a
200- mm mesh-net to remove larger particles. Subsequently,
periphyton was collected from the bottom of the filter. In addition,
three samples of both Ulva spp. and C. glomerata, and five
individuals of F. vesiculosus were collected from distinct locations
within the snorkeling area. From each F. vesiculosus individual, we
took three samples from different parts of the thallus: 7–9 cm
(hereafter base), 3–4 cm (hereafter mid), and 0–1 cm (hereafter tip)
from the tip. Based on the knowledge of the growth rate of F.
vesiculosus in the area [30], we could estimate the time when
different parts of the thallus had grown; the base had grown at the
time of cormorant egg-hatching in May, the middle at the time of
large nestlings in July, and the tip after the nesting period in
Figure 1. Locations of colony (circles) and control (stars) sitesalong the southwestern Finnish coast. The letters refer to siteslisted in Table 1.doi:10.1371/journal.pone.0061284.g001
Fertilization of Benthic Food Webs
PLOS ONE | www.plosone.org 2 April 2013 | Volume 8 | Issue 4 | e61284
August-early September. All algal samples were cleaned to remove
epibionts before they were blotted dry and preserved in silica gel
until oven-drying in the laboratory at 55uC for 24 h.
Samples of T. fluviatilis and I. balthica were collected from F.
vesiculosus or other macrophytes when F. vesiculosus was not present.
At least 12 individuals of both species were sampled. The animals
were kept in water without food for about 24 h to empty their gut
contents and then preserved on ice until freezing within 1 to 4
days. In the laboratory, animals were oven-dried (as above) and
ground to a fine powder. Four individuals were ground to form
one composite sample and three composite samples of both species
from each site were prepared. For the gastropod T. fluviatilis we
only used the soft parts, detached from the shell, so that the isotope
signal would only indicate accumulation during the present year.
To estimate the contributions of colony-based and other water-
borne stable isotope signals to the food web, we took three samples
of guano from each colony and three samples of surface water
particulate organic matter (POM) from a distance of approxi-
mately 200 m from each control island. The d15N in POM was
assumed to represent the N available for producers in the water
column without terrestrial runoff from seabird guano. The POM
sample was taken by filtering 1 L of seawater through a 50- mm
filter into a bottle that was kept on ice until vacuum-filtration of
POM through GF/F Whatmann glass-fibre filters.
Stable isotope analysisThe stable isotope analyses of 13C and 15N were conducted
from dried samples (prepared as indicated above) in the UC Davis
Stable Isotope Facility (University of California) using PDZ
Europa ANCA-GSL elemental analyzer interfaced to a PDZ
Europa 20-20 isotope ratio mass spectrometer (Sercon Ltd.,
Cheshire, UK). Analyses of the samples were run along with
calibrated laboratory standards (nylon, bovine liver, glutamic acid
and peach leaves) that were chosen to be compositionally similar
to the samples being analyzed. The isotope values presented here
are expressed as standard delta values relative to international
standards of Vienna PeeDee Belemnite for carbon and atmo-
spheric N for nitrogen as follows:
d13C ~13Cs
�12Cs
13Cst=12Cst-1
� �| 1000
d15N ~15Ns
�14Ns
15Nst=14Nst
-1
� �| 1000
where s refers to sample and st to standard.
The total amount of N content including all isotopes was also
measured to determine whether it varied between colony and
control islands.
Values of d13C were corrected for variation in lipid content,
which would otherwise generate unwanted variation for the
carbon signal, by using the normalization technique suggested by
Post et al. [31]. The correction for aquatic invertebrates uses the
relative abundance of C to N as follows:
d13Ccorrected~ d13C-3:32z0:99|C : N
The correction for plants with less than 40% C (as algae and
periphyton in our samples) uses the percentage of C as follows:
Table 1. Summary of colony and control site characteristics, including fetch, breeding pairs, area, and year of colonyestablishment (for colony islands).
Code SiteColony/Control
Average Fetch(km)
Maximum Fetch(km)
Breeding Pairs(2011) Area (ha)
Year of colonyestablishment
a Lankoslahti Colony 0.31 0.58 1619 1.06 2002
b Jarvikari Colony 19.23 57.68 1252 0.69 2005
d Marjakari Colony 22.81 64.19 1084 1.93 2003
f Puskakarta Colony 23.32 70.42 2342 3.64 2005
i Urpoinen Colony 0.81 1.66 190 4.18 2010
j Kluppi Colony 1.79 4.99 417 5.18 2003
l Kalmanhohde Colony 1.52 3.27 241 0.18 2009
o Aggskar Colony 1.37 2.67 2000 2.42 2003
q Masgrund Colony 1.59 3.09 520 0.3 2009
c Outoori Control 9.91 30.81
e Matinkari Control 6.92 21.06
g Kuuskajaskari Control 5.72 16.25
h Paivakarit Control 5.72 17.12
k Korra Control 6.71 20.75
m Raumharju Control 0.47 1.08
n Mustaluoto Control 0.68 1.23
p Orhisaari Control 1.65 3.74
The average and maximum fetch are given for the actual sampling point from each island. Data from the colony islands were provided by the Finnish EnvironmentInstitute, which monitors cormorant colonies.doi:10.1371/journal.pone.0061284.t001
Fertilization of Benthic Food Webs
PLOS ONE | www.plosone.org 3 April 2013 | Volume 8 | Issue 4 | e61284

d13Ccorrected~ d13C-3:02z0:09|%C
Statistical analysesFor analysis of d15N and d13C signatures, as well as total N
content, we used linear mixed models implemented by SAS 9.3
[32]. In separate analyses for both the signatures and all sample
types, we used the treatment (colony/control) as the fixed factor
and the site, nested within the treatment, as the random factor. We
checked whether there was spatial autocorrelation between sites,
and found no evidence of this, so location was not considered in
the analysis. Due to heteroscedasticity of variances between the
treatment levels (i.e. variances were higher within colony than
control sites), we used a likelihood-based (REML estimation)
statistical model which allowed us to fit different variance levels for
each treatment level [32]. Thus, the model weighed data
differently depending on the variance. We used the Akaike
information criterion to judge that the model fitted the data better
than a homogenous variance model. To determine whether the
d15N signature (i.e. enrichment) varied between different sections
of the F. vesiculosus thallus, we used a model in which the sections
were treated as repeated measures within the individual alga.
Univariate linear regression analyses were used to determine the
relationship between enrichment and abundance/density of
breeding pairs within the colony sites, as well as to determine
whether the fetch or wave exposure of the colony site affected
enrichment.
Applying diet mixing modelsWe applied diet mixing models for two purposes: 1) to perform a
source analysis on producers and estimate the amount of N
originating from the terrestrial runoff from colonies, and 2) to
determine any possible differences in diet composition of
consumers between colony and control islands. To carry out the
diet mixing analyses, we used the SIAR V4 package for R, which
uses Bayesian inference (see [33] for more details).
We used d15N values from two sources for the producer source
analysis: guano and POM alone. For each colony site we used the
POM values from the nearest control site, and for each control site
we likewise used the guano values from the nearest colony site.
Only d15N was used, as the carbon from the terrestrial runoff is
unlikely to compete for intake by the producers. We also assumed
no fractionation was taking place (i.e. trophic enrichment factor
(TEF) = 0). The median value of guano uptake was taken to
represent each site (see [33] for more details) and the mean of
these medians was calculated for each species. We then used
univariate linear regression analyses to determine whether nest
density and fetch of colony islands affected the amount of guano-
based N absorbed by producers.
Both d15N and d13C were used for the herbivore diet analysis,
with three sources: F. vesiculosus, filamentous algae, and periphyton.
Ulva spp. and C. glomerata were pooled as filamentous algae due to
the similarity of their stable isotope signatures. We calculated the
diet-dependent TEF separately for each source as recommended
by Caut et al. [34]:
TEF for d15Ni~ -0:311|d15Niz4:065
TEF for d13Ci~ -0:113|d13Ci{1:916
where i refers to the diet (source).
TEFs were calculated using data from the control islands only,
as we assumed these were more representative of the ‘‘natural’’
enrichment factors in this system. Since diet mixing models are
especially sensitive to different enrichment factors, we also ran the
same models using fractionation factors derived from a review
involving several different systems [35], as well as those from two
recent studies on pelagic marine ecosystems [36] and lake
ecosystems [37]. Using these values, the patterns were similar
and we only show the analyses based on enrichment factors
calculated following Caut et al. [34]. Trophic fractionation factors
used for the models are shown in Table 2.
Since stable isotope signatures varied by site, each site was
analysed separately with site-specific source values. Only sites in
which all four source species were present were used. The median
for each site was then estimated using SIAR and the mean of these
medians calculated for each species and source. These means were
then subsequently explored in linear mixed models [see [33]) to
determine if there were significant differences between sources,
within sites, and between colony and control sites. To account for
interdependency between the sources, they were treated as
repeated measures within each site.
Results
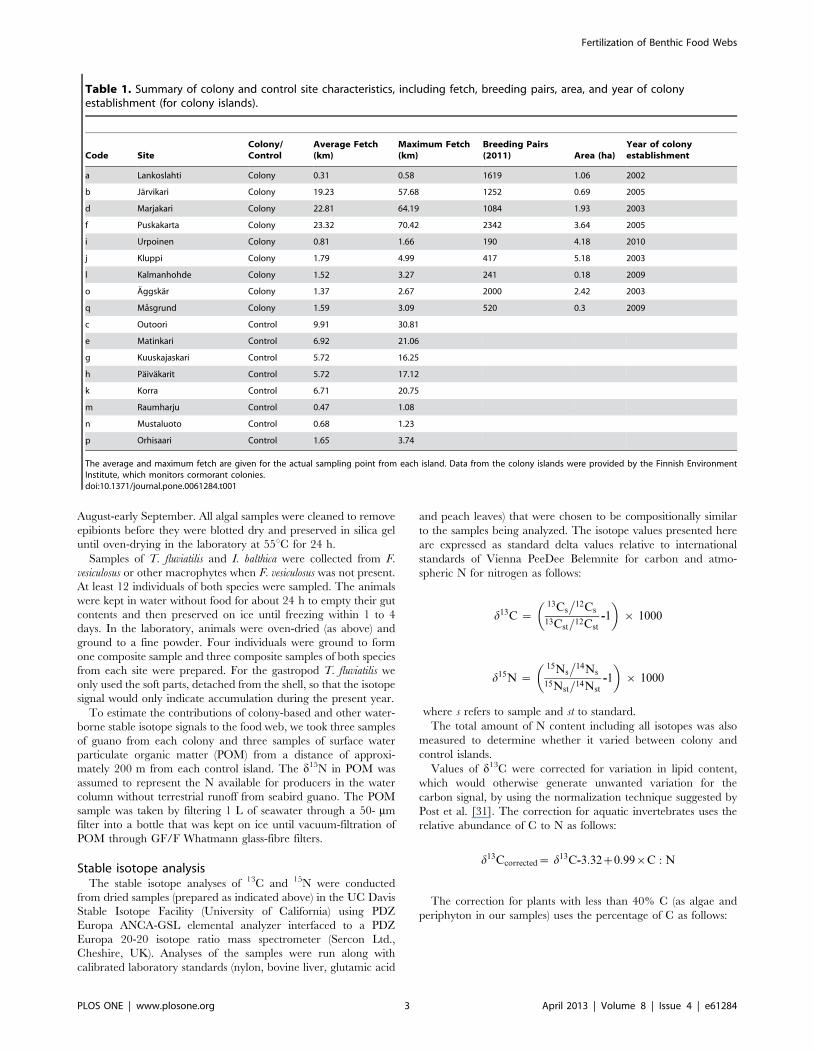
Stable isotope analysisThe d15N values were significantly higher in colony sites than in
control sites for all species (Figure 2, Table 3). The mean, as well as
the variance, in d15N was much higher among the colony sites (F.
vesiculosus: s2 = 36.64, C. glomerata: s2 = 52.73, Ulva spp.:
s2 = 85.60, periphyton: s2 = 10.52, I. balthica: s2 = 11.96, T.
fluviatilis: s2 = 8.92) than among the control sites (F. vesiculosus:
s2 = 1.78, C. glomerata: s2 = 3.22, Ulva spp.: s2 = 3.93, periphyton:
s2 = 1.50, I. balthica: s2 = 2.66, T. fluviatilis: s2 = 0.41). The total N
content did not differ between colony and controls sites in any of
the species. However, the d15N increased significantly with total N
content in F. vesiculosus (bcontrol = 1.2760.36, r2control = 0.22,
Pcontrol = 0.001; bcolony = 9.7562.75, r2colony = 0.28, Pcolony = 0.001)
and Ulva spp. (bcontrol = 1.0860.38, r2control = 0.26, Pcontrol = 0.01;
bcolony = 4.0260.99, r2colony = 0.35, Pcolony,0.001), particularly in
Table 2. Trophic enrichment factors (mean 6 standarddeviation) of d15N and d13C from three diet sources used inthe diet mixing analyses.
Source TEF for d15N TEF for d13C
Filamentous algae 2.1560.62 0.2660.33
Periphyton 2.3660.38 0.3460.23
Fucus vesiculosus 2.0560.45 20.460.29
McCutchan et al. [35] 2.360.28 0.460.17
Aita et al. [36] 3.560.2 0.960.39
Syvaranta et al. [37] 3.060.5 0.560.2
These factors were calculated using the equations suggested for invertebrateconsumers in Caut et al. [34]. Average from colony sites and standard deviationare shown. Also shown are trophic enrichment factors from three previousstudies which were also used to compare model results. In these cases, thesame enrichment factors were used for the three source species.doi:10.1371/journal.pone.0061284.t002
Fertilization of Benthic Food Webs
PLOS ONE | www.plosone.org 4 April 2013 | Volume 8 | Issue 4 | e61284
the colony sites. We found no differences in the d13C values between
the colony sites and control sites in any of the species (Figure 2,
Table 3).
There were significant differences between species within the
colony sites for both d15N (F6, 159 = 18.52, P,0.001), and d13C (F6,
159 = 31.81, P,0.001). The d15N value was highest in guano
samples, followed by the filamentous algae, F. vesiculosus, herbi-
vores, and finally periphyton, which had the lowest d15N values.
The d13C values separated into two groups: F. vesiculosus, I. balthica,
and T. fluviatilis were similar, and higher than those of C. glomerata,
Ulva spp., and periphyton, while the d13C values of guano
resembled those of filamentous algae. Within the control sites,
there was also some variation between the species for d15N (F6,
160 = 14.13, P,0.001), though the differences were much smaller,
and the pattern was different than in the colony sites: the d15N
value was highest in the herbivores and F. vesiculosus, followed by
the filamentous algae and periphyton, and lowest values were
found in the POM samples. The d13C values also varied
significantly between species in the control sites (F6, 162 = 161.01,
P,0.001), along the same pattern as seen within the control sites
with the addition of POM, which had a d13C value that was
clearly lower than that of all other samples.
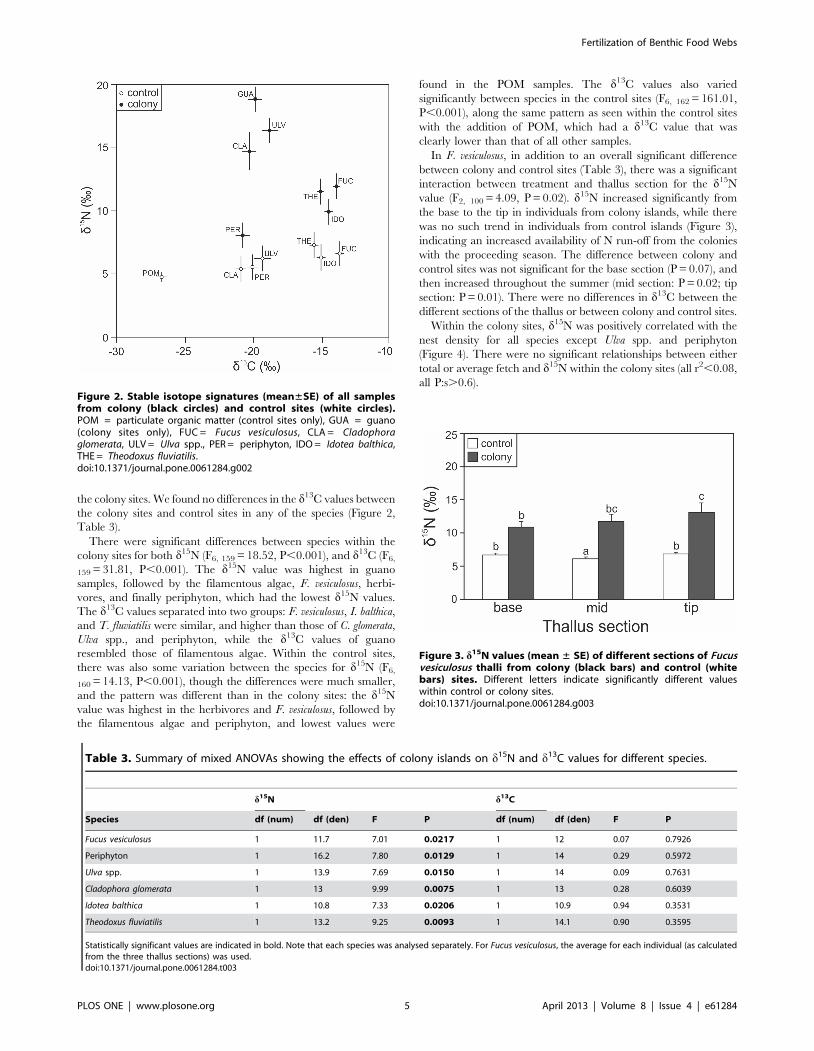
In F. vesiculosus, in addition to an overall significant difference
between colony and control sites (Table 3), there was a significant
interaction between treatment and thallus section for the d15N
value (F2, 100 = 4.09, P = 0.02). d15N increased significantly from
the base to the tip in individuals from colony islands, while there
was no such trend in individuals from control islands (Figure 3),
indicating an increased availability of N run-off from the colonies
with the proceeding season. The difference between colony and
control sites was not significant for the base section (P = 0.07), and
then increased throughout the summer (mid section: P = 0.02; tip
section: P = 0.01). There were no differences in d13C between the
different sections of the thallus or between colony and control sites.
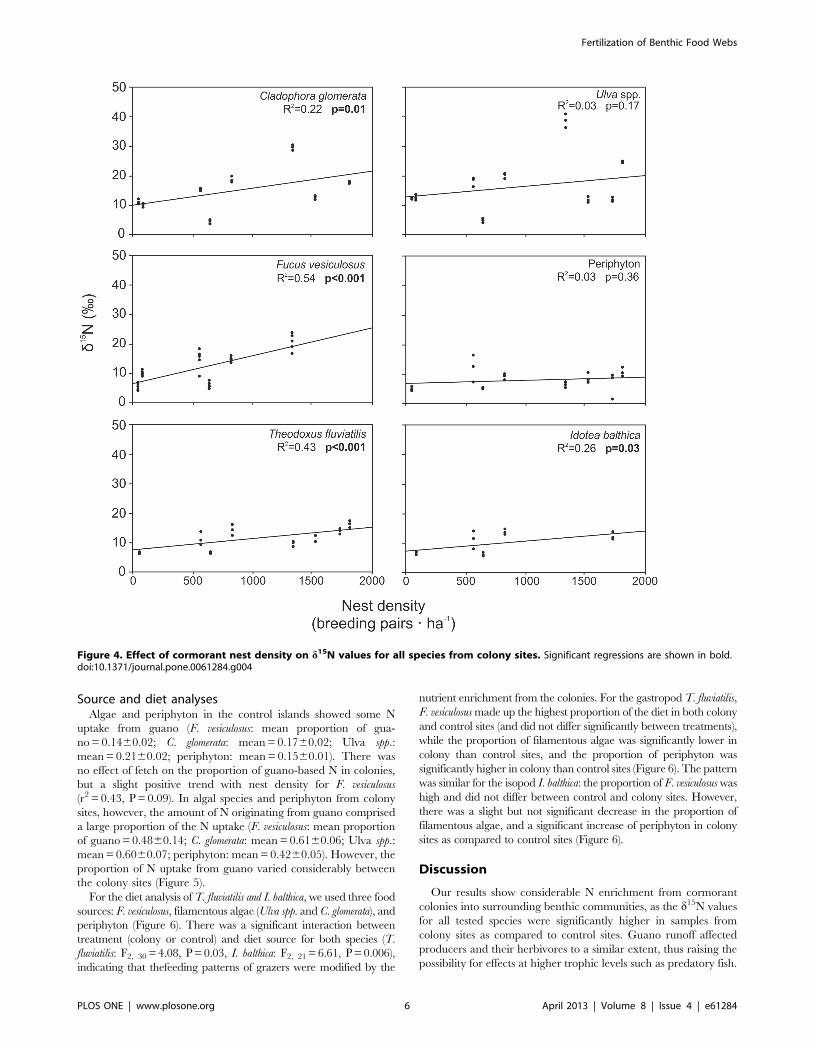
Within the colony sites, d15N was positively correlated with the
nest density for all species except Ulva spp. and periphyton
(Figure 4). There were no significant relationships between either
total or average fetch and d15N within the colony sites (all r2,0.08,
all P:s.0.6).
Figure 2. Stable isotope signatures (mean±SE) of all samplesfrom colony (black circles) and control sites (white circles).POM = particulate organic matter (control sites only), GUA = guano(colony sites only), FUC = Fucus vesiculosus, CLA = Cladophoraglomerata, ULV = Ulva spp., PER = periphyton, IDO = Idotea balthica,THE = Theodoxus fluviatilis.doi:10.1371/journal.pone.0061284.g002
Table 3. Summary of mixed ANOVAs showing the effects of colony islands on d15N and d13C values for different species.
d15N d13C
Species df (num) df (den) F P df (num) df (den) F P
Fucus vesiculosus 1 11.7 7.01 0.0217 1 12 0.07 0.7926
Periphyton 1 16.2 7.80 0.0129 1 14 0.29 0.5972
Ulva spp. 1 13.9 7.69 0.0150 1 14 0.09 0.7631
Cladophora glomerata 1 13 9.99 0.0075 1 13 0.28 0.6039
Idotea balthica 1 10.8 7.33 0.0206 1 10.9 0.94 0.3531
Theodoxus fluviatilis 1 13.2 9.25 0.0093 1 14.1 0.90 0.3595
Statistically significant values are indicated in bold. Note that each species was analysed separately. For Fucus vesiculosus, the average for each individual (as calculatedfrom the three thallus sections) was used.doi:10.1371/journal.pone.0061284.t003
Figure 3. d15N values (mean ± SE) of different sections of Fucusvesiculosus thalli from colony (black bars) and control (whitebars) sites. Different letters indicate significantly different valueswithin control or colony sites.doi:10.1371/journal.pone.0061284.g003
Fertilization of Benthic Food Webs
PLOS ONE | www.plosone.org 5 April 2013 | Volume 8 | Issue 4 | e61284
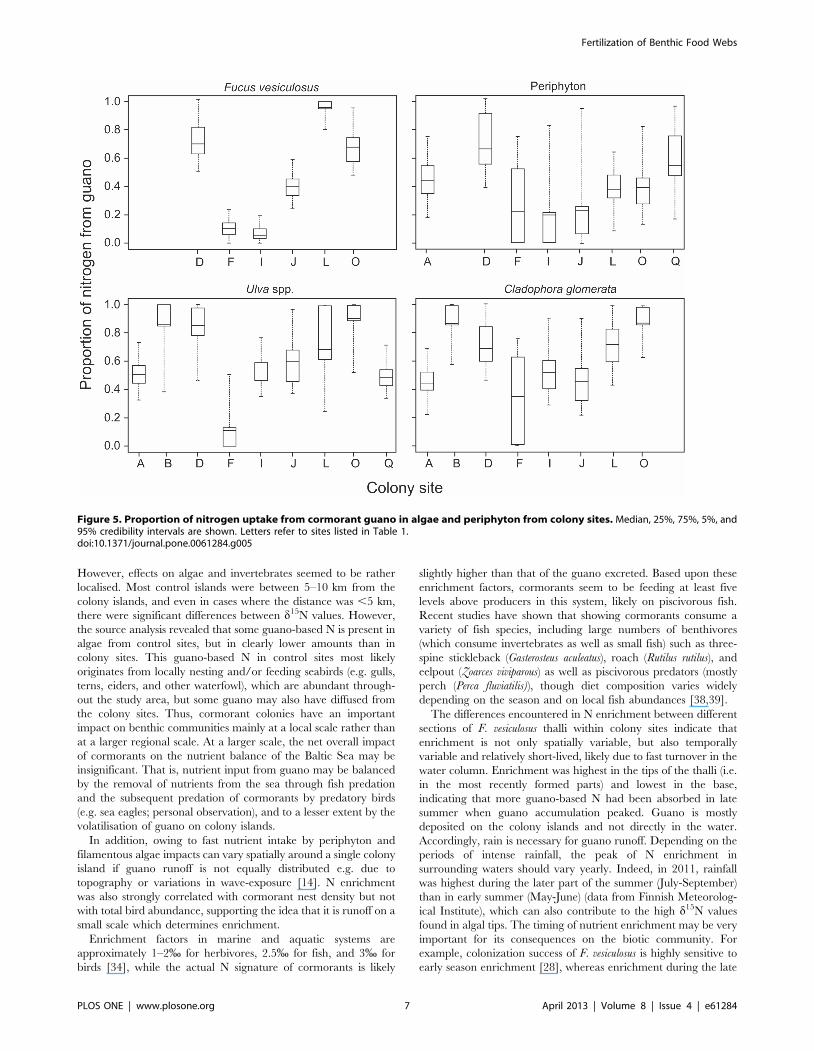
Source and diet analysesAlgae and periphyton in the control islands showed some N
uptake from guano (F. vesiculosus: mean proportion of gua-
no = 0.1460.02; C. glomerata: mean = 0.1760.02; Ulva spp.:
mean = 0.2160.02; periphyton: mean = 0.1560.01). There was
no effect of fetch on the proportion of guano-based N in colonies,
but a slight positive trend with nest density for F. vesiculosus
(r2 = 0.43, P = 0.09). In algal species and periphyton from colony
sites, however, the amount of N originating from guano comprised
a large proportion of the N uptake (F. vesiculosus: mean proportion
of guano = 0.4860.14; C. glomerata: mean = 0.6160.06; Ulva spp.:
mean = 0.6060.07; periphyton: mean = 0.4260.05). However, the
proportion of N uptake from guano varied considerably between
the colony sites (Figure 5).
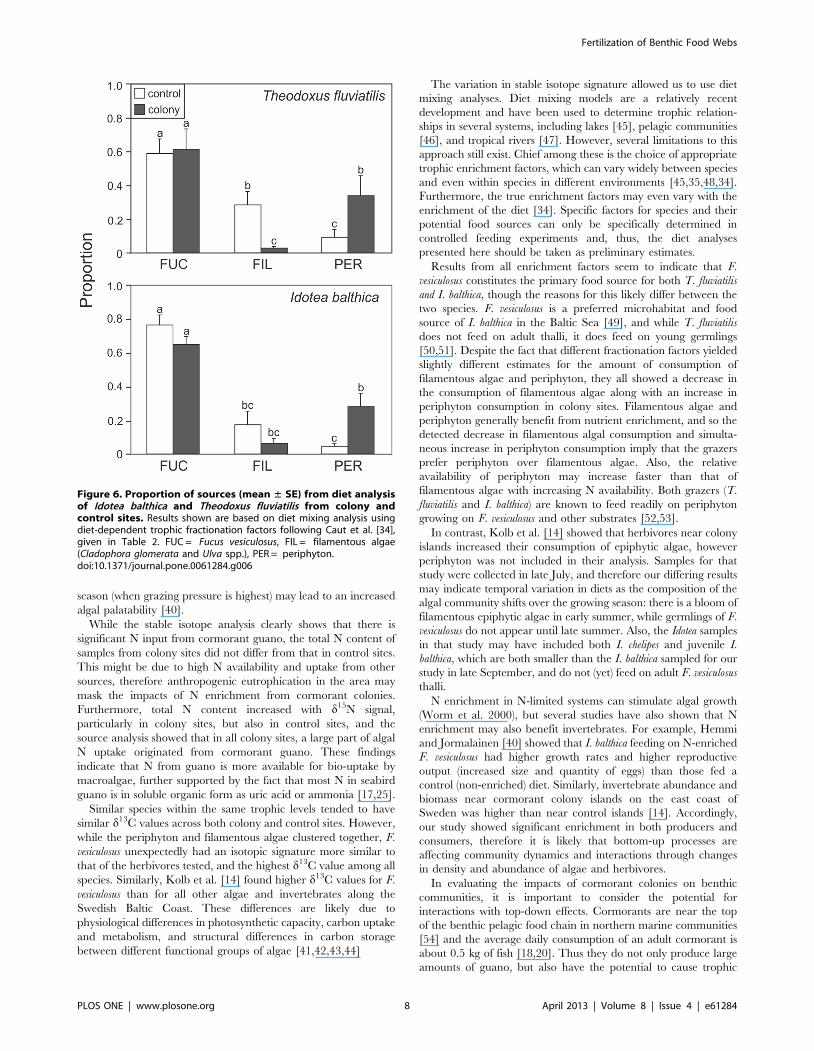
For the diet analysis of T. fluviatilis and I. balthica, we used three food
sources: F. vesiculosus, filamentous algae (Ulva spp. and C. glomerata), and
periphyton (Figure 6). There was a significant interaction between
treatment (colony or control) and diet source for both species (T.
fluviatilis: F2, 30 = 4.08, P = 0.03, I. balthica: F2, 21 = 6.61, P = 0.006),
indicating that thefeeding patterns of grazers were modified by the
nutrient enrichment from the colonies. For the gastropod T. fluviatilis,
F. vesiculosus made up the highest proportion of the diet in both colony
and control sites (and did not differ significantly between treatments),
while the proportion of filamentous algae was significantly lower in
colony than control sites, and the proportion of periphyton was
significantly higher in colony than control sites (Figure 6). The pattern
was similar for the isopod I. balthica: the proportion of F. vesiculosus was
high and did not differ between control and colony sites. However,
there was a slight but not significant decrease in the proportion of
filamentous algae, and a significant increase of periphyton in colony
sites as compared to control sites (Figure 6).
Discussion
Our results show considerable N enrichment from cormorant
colonies into surrounding benthic communities, as the d15N values
for all tested species were significantly higher in samples from
colony sites as compared to control sites. Guano runoff affected
producers and their herbivores to a similar extent, thus raising the
possibility for effects at higher trophic levels such as predatory fish.
Figure 4. Effect of cormorant nest density on d15N values for all species from colony sites. Significant regressions are shown in bold.doi:10.1371/journal.pone.0061284.g004
Fertilization of Benthic Food Webs
PLOS ONE | www.plosone.org 6 April 2013 | Volume 8 | Issue 4 | e61284
However, effects on algae and invertebrates seemed to be rather
localised. Most control islands were between 5–10 km from the
colony islands, and even in cases where the distance was ,5 km,
there were significant differences between d15N values. However,
the source analysis revealed that some guano-based N is present in
algae from control sites, but in clearly lower amounts than in
colony sites. This guano-based N in control sites most likely
originates from locally nesting and/or feeding seabirds (e.g. gulls,
terns, eiders, and other waterfowl), which are abundant through-
out the study area, but some guano may also have diffused from
the colony sites. Thus, cormorant colonies have an important
impact on benthic communities mainly at a local scale rather than
at a larger regional scale. At a larger scale, the net overall impact
of cormorants on the nutrient balance of the Baltic Sea may be
insignificant. That is, nutrient input from guano may be balanced
by the removal of nutrients from the sea through fish predation
and the subsequent predation of cormorants by predatory birds
(e.g. sea eagles; personal observation), and to a lesser extent by the
volatilisation of guano on colony islands.
In addition, owing to fast nutrient intake by periphyton and
filamentous algae impacts can vary spatially around a single colony
island if guano runoff is not equally distributed e.g. due to
topography or variations in wave-exposure [14]. N enrichment
was also strongly correlated with cormorant nest density but not
with total bird abundance, supporting the idea that it is runoff on a
small scale which determines enrichment.
Enrichment factors in marine and aquatic systems are
approximately 1–2% for herbivores, 2.5% for fish, and 3% for
birds [34], while the actual N signature of cormorants is likely
slightly higher than that of the guano excreted. Based upon these
enrichment factors, cormorants seem to be feeding at least five
levels above producers in this system, likely on piscivorous fish.
Recent studies have shown that showing cormorants consume a
variety of fish species, including large numbers of benthivores
(which consume invertebrates as well as small fish) such as three-
spine stickleback (Gasterosteus aculeatus), roach (Rutilus rutilus), and
eelpout (Zoarces viviparous) as well as piscivorous predators (mostly
perch (Perca fluviatilis)), though diet composition varies widely
depending on the season and on local fish abundances [38,39].
The differences encountered in N enrichment between different
sections of F. vesiculosus thalli within colony sites indicate that
enrichment is not only spatially variable, but also temporally
variable and relatively short-lived, likely due to fast turnover in the
water column. Enrichment was highest in the tips of the thalli (i.e.
in the most recently formed parts) and lowest in the base,
indicating that more guano-based N had been absorbed in late
summer when guano accumulation peaked. Guano is mostly
deposited on the colony islands and not directly in the water.
Accordingly, rain is necessary for guano runoff. Depending on the
periods of intense rainfall, the peak of N enrichment in
surrounding waters should vary yearly. Indeed, in 2011, rainfall
was highest during the later part of the summer (July-September)
than in early summer (May-June) (data from Finnish Meteorolog-
ical Institute), which can also contribute to the high d15N values
found in algal tips. The timing of nutrient enrichment may be very
important for its consequences on the biotic community. For
example, colonization success of F. vesiculosus is highly sensitive to
early season enrichment [28], whereas enrichment during the late
Figure 5. Proportion of nitrogen uptake from cormorant guano in algae and periphyton from colony sites. Median, 25%, 75%, 5%, and95% credibility intervals are shown. Letters refer to sites listed in Table 1.doi:10.1371/journal.pone.0061284.g005
Fertilization of Benthic Food Webs
PLOS ONE | www.plosone.org 7 April 2013 | Volume 8 | Issue 4 | e61284
season (when grazing pressure is highest) may lead to an increased
algal palatability [40].
While the stable isotope analysis clearly shows that there is
significant N input from cormorant guano, the total N content of
samples from colony sites did not differ from that in control sites.
This might be due to high N availability and uptake from other
sources, therefore anthropogenic eutrophication in the area may
mask the impacts of N enrichment from cormorant colonies.
Furthermore, total N content increased with d15N signal,
particularly in colony sites, but also in control sites, and the
source analysis showed that in all colony sites, a large part of algal
N uptake originated from cormorant guano. These findings
indicate that N from guano is more available for bio-uptake by
macroalgae, further supported by the fact that most N in seabird
guano is in soluble organic form as uric acid or ammonia [17,25].
Similar species within the same trophic levels tended to have
similar d13C values across both colony and control sites. However,
while the periphyton and filamentous algae clustered together, F.
vesiculosus unexpectedly had an isotopic signature more similar to
that of the herbivores tested, and the highest d13C value among all
species. Similarly, Kolb et al. [14] found higher d13C values for F.
vesiculosus than for all other algae and invertebrates along the
Swedish Baltic Coast. These differences are likely due to
physiological differences in photosynthetic capacity, carbon uptake
and metabolism, and structural differences in carbon storage
between different functional groups of algae [41,42,43,44]
The variation in stable isotope signature allowed us to use diet
mixing analyses. Diet mixing models are a relatively recent
development and have been used to determine trophic relation-
ships in several systems, including lakes [45], pelagic communities
[46], and tropical rivers [47]. However, several limitations to this
approach still exist. Chief among these is the choice of appropriate
trophic enrichment factors, which can vary widely between species
and even within species in different environments [45,35,48,34].
Furthermore, the true enrichment factors may even vary with the
enrichment of the diet [34]. Specific factors for species and their
potential food sources can only be specifically determined in
controlled feeding experiments and, thus, the diet analyses
presented here should be taken as preliminary estimates.
Results from all enrichment factors seem to indicate that F.
vesiculosus constitutes the primary food source for both T. fluviatilis
and I. balthica, though the reasons for this likely differ between the
two species. F. vesiculosus is a preferred microhabitat and food
source of I. balthica in the Baltic Sea [49], and while T. fluviatilis
does not feed on adult thalli, it does feed on young germlings
[50,51]. Despite the fact that different fractionation factors yielded
slightly different estimates for the amount of consumption of
filamentous algae and periphyton, they all showed a decrease in
the consumption of filamentous algae along with an increase in
periphyton consumption in colony sites. Filamentous algae and
periphyton generally benefit from nutrient enrichment, and so the
detected decrease in filamentous algal consumption and simulta-
neous increase in periphyton consumption imply that the grazers
prefer periphyton over filamentous algae. Also, the relative
availability of periphyton may increase faster than that of
filamentous algae with increasing N availability. Both grazers (T.
fluviatilis and I. balthica) are known to feed readily on periphyton
growing on F. vesiculosus and other substrates [52,53].
In contrast, Kolb et al. [14] showed that herbivores near colony
islands increased their consumption of epiphytic algae, however
periphyton was not included in their analysis. Samples for that
study were collected in late July, and therefore our differing results
may indicate temporal variation in diets as the composition of the
algal community shifts over the growing season: there is a bloom of
filamentous epiphytic algae in early summer, while germlings of F.
vesiculosus do not appear until late summer. Also, the Idotea samples
in that study may have included both I. chelipes and juvenile I.
balthica, which are both smaller than the I. balthica sampled for our
study in late September, and do not (yet) feed on adult F. vesiculosus
thalli.
N enrichment in N-limited systems can stimulate algal growth
(Worm et al. 2000), but several studies have also shown that N
enrichment may also benefit invertebrates. For example, Hemmi
and Jormalainen [40] showed that I. balthica feeding on N-enriched
F. vesiculosus had higher growth rates and higher reproductive
output (increased size and quantity of eggs) than those fed a
control (non-enriched) diet. Similarly, invertebrate abundance and
biomass near cormorant colony islands on the east coast of
Sweden was higher than near control islands [14]. Accordingly,
our study showed significant enrichment in both producers and
consumers, therefore it is likely that bottom-up processes are
affecting community dynamics and interactions through changes
in density and abundance of algae and herbivores.
In evaluating the impacts of cormorant colonies on benthic
communities, it is important to consider the potential for
interactions with top-down effects. Cormorants are near the top
of the benthic pelagic food chain in northern marine communities
[54] and the average daily consumption of an adult cormorant is
about 0.5 kg of fish [18,20]. Thus they do not only produce large
amounts of guano, but also have the potential to cause trophic
Figure 6. Proportion of sources (mean ± SE) from diet analysisof Idotea balthica and Theodoxus fluviatilis from colony andcontrol sites. Results shown are based on diet mixing analysis usingdiet-dependent trophic fractionation factors following Caut et al. [34],given in Table 2. FUC = Fucus vesiculosus, FIL = filamentous algae(Cladophora glomerata and Ulva spp.), PER = periphyton.doi:10.1371/journal.pone.0061284.g006
Fertilization of Benthic Food Webs
PLOS ONE | www.plosone.org 8 April 2013 | Volume 8 | Issue 4 | e61284
cascades through the removal of fish. In general, top-down effects
(e.g. trophic cascades) may be of equal or greater importance than
bottom-up effects (e.g. nutrient enrichment) on coastal benthic
producer communities (reviewed in [23]), demonstrating that
trophic networks are complex systems regulated at the same time
by both the top-down and bottom-up influences.
Overall, results on N enrichment near cormorant colonies
across lower trophic levels shown herein represent an assessment
of the bottom-up impacts of cormorant colonies on benthic
communities. The top-down effects through trophic cascades may
be equally or more important and remain to be studied.
Understanding of both bottom-up and top-down processes and
their potential interactions in community regulation will be of
critical importance in predicting the responses of communities to
multiple anthropogenic stressors such as eutrophication and
overfishing.
Acknowledgments
We are grateful for the logistic support provided by the Archipelago
Research Institute of the University of Turku, and to Mikael Kilpi for
discussions and Pekka Rusanen from the Finnish Environment Institute for
permission to use the cormorant monitoring data. We greatly appreciate
the comments by Mark Ridgway and an anonymous reviewer on an earlier
draft of this paper.
Author Contributions
Conceived and designed the experiments: VJ. Performed the experiments:
AS MYR VJ. Analyzed the data: KG ER VJ. Wrote the paper: KG ER VJ.
Analysed and calculated fetch data: AS.
References
1. Myers RA, Worm B (2003) Rapid worldwide depletion of predatory fish
communities. Nature 423: 280–283. doi:10.1038/nature01610.
2. Syvitski JPM (2005) Impact of humans on the flux of terrestrial sediment to the
global coastal ocean. Science 308: 376–380. doi:10.1126/science.1109454.
3. Lotze HK (2006) Depletion, degradation, and recovery potential of estuaries andcoastal seas. Science 312: 1806–1809. doi:10.1126/science.1128035.
4. Halpern BS, Selkoe KA, Micheli F, Kappel CV (2007) Evaluating and ranking
the vulnerability of global marine ecosystems to anthropogenic threats. ConservBio 21: 1301–1315. doi:10.1111/j.1523–1739.2007.00752.x.
5. Halpern BS, Walbridge S, Selkoe KA, Kappel CV, Micheli F, et al. (2008) A
global map of human impact on marine ecosystems. Science 319: 948–952.doi:10.1126/science.1149345.
6. Berlow EL, Neutel AM, Cohen JE, De Ruiter PC, Ebenman BO, et al. (2004)
Interaction strengths in food webs: issues and opportunities. J Anim Ecol 73:585–598. doi:10.1111/j.0021-8790.2004.00833.x.
7. Dunne JA, Williams RJ, Martinez ND (2004) Network structure and robustness
of marine food webs. Mar Ecol Prog Ser 273: 291–302. doi:10.3354/meps273291.
8. Ducrotoy J-P, Elliott M (2008) The science and management of the North Sea
and the Baltic Sea: natural history, present threats and future challenges. MarPollut Bull 57: 8–21. doi:10.1016/j.marpolbul.2008.04.030.
9. Osterblom H, Hansson S, Larsson U, Hjerne O, Wulff F, et al. (2007) Human-
induced trophic cascades and ecological regime shifts in the Baltic Sea.
Ecosystems 10: 877–889. doi:10.1007/s10021-007-9069-0.
10. Sieben K, Ljunggren L, Bergstrom U, Eriksson BK (2011) A meso-predator
release of stickleback promotes recruitment of macroalgae in the Baltic Sea. Mar
Ecol Prog Ser 397: 79–84. doi:10.1016/j.jembe.2010.11.020.
11. Van Eerden MR, Gregersen J (1995) Long-term changes in the northwest
European population of cormorants Phalacrocorax carbo sinensis. ARDEA 83: 61–
79.
12. Lehikoinen A (2006) Cormorants in the Finnish archipelago. Ornis Fennica 83:
34–46.
13. Wootton JT (1991) Direct and indirect effects of nutrients on intertidalcommunity structure: variable consequences of seabird guano. J Exp Mar Biol
Ecol 151: 139–153. doi:10.1016/0022–0981(91)90121-C.
14. Kolb G, Ekholm J, Hamback P (2010) Effects of seabird nesting colonies onalgae and aquatic invertebrates in coastal waters. Mar Ecol Prog Ser 417: 287–
300. doi:10.3354/meps08791.
15. Mizota C, Noborio K, Mori Y (2012) The Great Cormorant (Phalacrocorax carbo)colony as a ‘‘hot spot’’ of nitrous oxide (N2O) emission in central Japan. Atmos
Environ 57: 29–34. doi:10.1016/j.atmosenv.2012.02.007.
16. Zelickman EA, Golovkin AN (1972) Composition, structure and productivity ofneritic plankton communities near the bird colonies of the northern shores of
Novaya Zemlya. Mar Biol 17: 265–274. doi:10.1007/BF00366302.
17. Smith JS, Johnson CR (1995) Nutrient inputs from seabirds and humans on a
populated coral cay. Mar Ecol Prog Ser 124: 189–200. doi:10.3354/meps124189.
18. Glahn JF, Brugger KE (1995) The impact of double-crested cormorants on the
Mississippi Delta catfish industry: a bioenergetics model. Colon Waterbird 18:168–175. doi:10.2307/1521537.
19. Gremillet D, Schmid D, Culik B (1995) Energy requirements of breeding great
cormorants Phalacrocorax carbo sinensis. Mar Ecol Prog Ser 121: 1–9. doi:10.3354/meps121001.
20. Engstrom H (2001) Long term effects of cormorant predation on fish
communities and fishery in a freshwater lake. Ecography 24: 127–138.doi:10.1034/j.1600-0587.2001.240203.x.
21. Ridgway MS (2010) A review of estimates of daily energy expenditure and food
intake in cormorants Phalacrocorax spp.). J Great Lakes Res 36: 93–99.doi:10.1016/j.jglr.2009.10.002.
22. Shurin JB, Borer ET, Seabloom EW, Anderson K, Blanchette CA, et al. (2002)
A cross-ecosystem comparison of the strength of trophic cascades. Ecol Lett 5:
785–791. doi:10.1046/j.1461-0248.2002.00381.x.
23. Heck KL, Valentine JF (2007) The primacy of top-down effects in shallow
benthic ecosystems. Estuar Coast 30: 371–381. doi:10.1007/BF02819384.
24. Gruner DS, Smith JE, Seabloom EW, Sandin SA, Ngai JT, et al. (2008) A cross-
system synthesis of consumer and nutrient resource control on producer
biomass. Ecol Lett 11: 740–755. doi:10.1111/j.1461-0248.2008.01192.x.
25. Wainright SC, Haney JC, Kerr C, Golovkin AN, Flint MV (1998) Utilization of
nitrogen derived from seabird guano by terrestrial and marine plants at St. Paul,
Pribilof Islands, Bering Sea, Alaska. Mar Biol 131: 63–71. doi:10.1007/
s00227005029.
26. Kolb GS, Jerling L, Hamback PA (2010) The impact of cormorants on plant–
arthropod food webs on their nesting islands. Ecosystems 13: 353–366.
doi:10.1007/s10021-010-9323-8.
27. Worm B, Lotze HK, Sommer U (2000) Coastal food web structure, carbon
storage, and nitrogen retention regulated by consumer pressure and nutrient
loading. Limnol Oceanogr 45: 339–349. doi:10.4319/lo.2000.45.2.0339.
28. Korpinen S, Jormalainen V (2008) Grazing and nutrients reduce recruitment
success of Fucus vesiculosus L. (Fucales: Phaeophyceae). Estuar Coast Mar Sci 78:
437–444. doi:10.1016/j.ecss.2008.01.005.
29. Suominen T, Kalliola R, Tolvanen H (2007) Exposure of the Finnish coasts -
UTU fetch data. Spatial modelling in coastal areas. Turku,University of
Turku:UTU-LCC Publications 13. pp. 7–16.
30. Hemmi A, Makinen A, Jormalainen V, Honkanen T (2005) Responses of growth
and phlorotannins in Fucus vesiculosus to nutrient enrichment and herbivory.
Aquat Ecol 39: 201–211. doi:10.1007/s10452-004-3526-z.
31. Post DM, Layman CA, Arrington DA, Takimoto G, Quattrochi J, et al. (2007)
Getting to the fat of the matter: models, methods and assumptions for dealing
with lipids in stable isotope analyses. Oecologia 152: 179–189. doi:10.1007/
s00442-006-0630-x.
32. Littell RC, Milliken GA, Stroup WW, Wolfinger RD, Schabenberger O (2006)
SAS for mixed models. 2nd ed.Cary,NC :SAS Institute Inc.
33. Parnell AC, Inger R, Bearhop S, Jackson AL (2010) Source partitioning using
stable isotopes: coping with too much variation. PLoS ONE 5: e9672.
doi:10.1371/journal.pone.0009672.
34. Caut S, Angulo E, Courchamp F (2009) Variation in discrimination factors
(d15N and d13C): the effect of diet isotopic values and applications for diet
reconstruction. J Appl Ecol 46: 443–453. doi:10.1111/j.1365–
2664.2009.01620.x.
35. McCutchan JH, Lewis WM, Kendall C, McGrath CC (2003) Variation in
trophic shift for stable isotope ratios of carbon, nitrogen, and sulfur. Oikos 102:
378–390. doi:10.1034/j.1600-0706.2003.12098.x.
36. Aita MN, Tadokoro K, Ogawa NO, Hyodo F, Ishii R, et al. (2011) Linear
relationship between carbon and nitrogen isotope ratios along simple food chains
in marine environments. J Plankton Res 33: 1629–1642. doi:10.1093/plankt/
fbr070.
37. Syvaranta J, Hogmander P, Keskinen T, Karjalainen J, Jones RI (2010) Altered
energy flow pathways in a lake ecosystem following manipulation of fish
community structure. Aquat Sci 73: 79–89. doi:10.1007/s00027-010-0161-8.
38. Lehikoinen A, Heikinheimo O, Lappalainen A (2011) Temporal changes in the
diet of great cormorant (Phalacrocorax carbo sinensis) on the southern coast of
Finland - comparison with available fish data. Boreal Environ Res 16: 61–70.
39. Bostrom MK, Ostman O, Bergenius MAJ, Lunneryd S-G (2012) Cormorant
diet in relation to temporal changes in fish communities. ICES J Mar Sci 69:
175–183. doi:10.1093/icesjms/fss002.
40. Hemmi A, Jormalainen V (2002) Nutrient enhancement increases performance
of a marine herbivore via quality of its food alga. Ecology 83: 1052–1064.
doi:10.2307/3071913.
Fertilization of Benthic Food Webs
PLOS ONE | www.plosone.org 9 April 2013 | Volume 8 | Issue 4 | e61284
41. O9Leary MH, Madhavan S, Paneth P (2006) Physical and chemical basis of
carbon isotope fractionation in plants. Plant Cell Environ 15: 1099–1104.doi:10.1111/j.1365–3040.1992.tb01660.x.
42. Axelsson L, Mercado J, Figueroa F (2000) Utilization of HCO3- at high pH by
the brown macroalga Laminaria saccharina. Eur J Phycol 35: 53–59. doi:10.1017/S096702629900253X.
43. Mercado JM, de los Santos CB, Lucas Perez-Llorens J, Vergara JJ (2009)Carbon isotopic fractionation in macroalgae from Cadiz Bay (southern Spain):
comparison with other bio-geographic regions. Est Coast Shelf Sci 85: 449–458.
doi:10.1016/j.ecss.2009.09.005.44. Hanson CE, Hyndes GA, Wang SF (2010) Differentiation of benthic marine
primary producers using stable isotopes and fatty acids: implications to food webstudies. Aquat Bot 93: 114–122. doi:10.1016/j.aquabot.2010.04.004.
45. Vander Zanden MJ, Rasmussen JB (2001) Variation in d15N and d13C trophicfractionation: implications for aquatic food web studies. Limnol Oceanogr 46:
2061–2066. doi:10.4319/lo.2001.46.8.2061.
46. Gillies CL, Stark JS, Johnstone GJ, Smith SDA (2012) Carbon flow and trophicstructure of an Antarctic coastal benthic community as determined by d13C and
d15N. Estuar Coast Mar Sci 97: 44–57. doi:10.1016/j.ecss.2011.11.003.47. Davis AM, Blanchette ML, Pusey BJ, Jardine TD, Pearson RG (2012) Gut
content and stable isotope analyses provide complementary understanding of
ontogenetic dietary shifts and trophic relationships among fishes in a tropicalriver. Freshwat Biol 57: 2156–2172. doi:10.1111/j.1365–2427.2012.02858.x.
48. Vanderklift MA, Ponsard S (2003) Sources of variation in consumer-diet d15N
enrichment: a meta-analysis. Oecologia 136: 169–182. doi:10.1007/s00442-003-
1270-z.
49. Jormalainen V, Honkanen T, Heikkila N (2001) Feeding preferences and
performance of a marine isopod on seaweed hosts: cost of habitat specialization.
Mar Ecol Prog Ser 220: 219–230. doi:10.3354/meps220219.
50. Malm T, Engkvist R, Kautsky L (1999) Grazing effects of two freshwater snails
on juvenile Fucus vesiculosus in the Baltic Sea. Mar Ecol Prog Ser 188: 63–71.
doi:10.3354/meps188063.
51. Korpinen S, Jormalainen V, Honkanen T (2007) Bottom–up and cascading top–
down control of macroalgae along a depth gradient. J Exp Mar Biol Ecol 343:
52–63. doi:10.1016/j.jembe.2006.11.012.
52. Honkanen T, Jormalainen V (2005) Genotypic variation in tolerance and
resistance to fouling in the brown alga Fucus vesiculosus. Oecologia 144: 196–205.
doi:10.1007/s00442-005-0053-0.
53. Jormalainen V, Wikstrom SA, Honkanen T (2008) Fouling mediates grazing:
intertwining of resistances to multiple enemies in the brown alga Fucus vesiculosus.
Oecologia 155: 559–569. doi:10.1007/s00442-007-0939-0.
54. Doucette JL, Wissel B, Somers CM (2011) Cormorant-fisheries conflicts: stable
isotopes reveal a consistent niche for avian piscivores in diverse food webs. Ecol
Appl 21: 2987–3001. doi:10.1890/10–2384.1.
Fertilization of Benthic Food Webs
PLOS ONE | www.plosone.org 10 April 2013 | Volume 8 | Issue 4 | e61284