wave power for la isla bonita
TRANSCRIPT
lable at ScienceDirect
Energy 35 (2010) 5013e5021
Contents lists avai
Energy
journal homepage: www.elsevier .com/locate/energy
Wave power for La Isla Bonita
G. Iglesias*, R. CarballoUniv. of Santiago de Compostela, Hydraulic Eng., EPS, Campus Univ. s/n, 27002 Lugo, Spain
a r t i c l e i n f o
Article history:Received 31 March 2010Received in revised form12 August 2010Accepted 14 August 2010
Keywords:Wave energyWave powerWave modelAtmospheric modelNumerical modelLa Palma
* Corresponding author. Tel.: þ34 982 285900; faxE-mail address: [email protected] (G. Iglesia
0360-5442/$ e see front matter � 2010 Elsevier Ltd.doi:10.1016/j.energy.2010.08.020
a b s t r a c t
The island of La Palma (Spain), dubbed La Isla Bonita for its beauty, is a UNESCO Biosphere Reserve in theAtlantic Ocean. The island’s authorities are aiming for energy self-sufficiency based on wave energy andother renewables. In this research its wave resource is investigated using a 44-years hindcast datasetobtained through numerical modelling and validated with wave buoy records. First, its distributionaround La Palma is studied. Significant variations are found, with the largest resource occurring off thenorth and northwest coasts; the northwest presents operational advantages (proximity to a port).Second, the seasonal variations in this area are studied. Wave energy is provided essentially by powerfulNNW-NW swells in winter and autumn, by less energetic NNE-N waves in summer and spring. Finally,the resource is characterised in terms of sea states; it is found that the bulk of the energy is provided bywaves between 9.5 s and 13.5 s of energy period and 1.5 m and 3.5 m of significant wave height, so theselection of the Wave Energy Converters to be installed should guarantee maximum efficiency in theseranges.
� 2010 Elsevier Ltd. All rights reserved.
1. Introduction
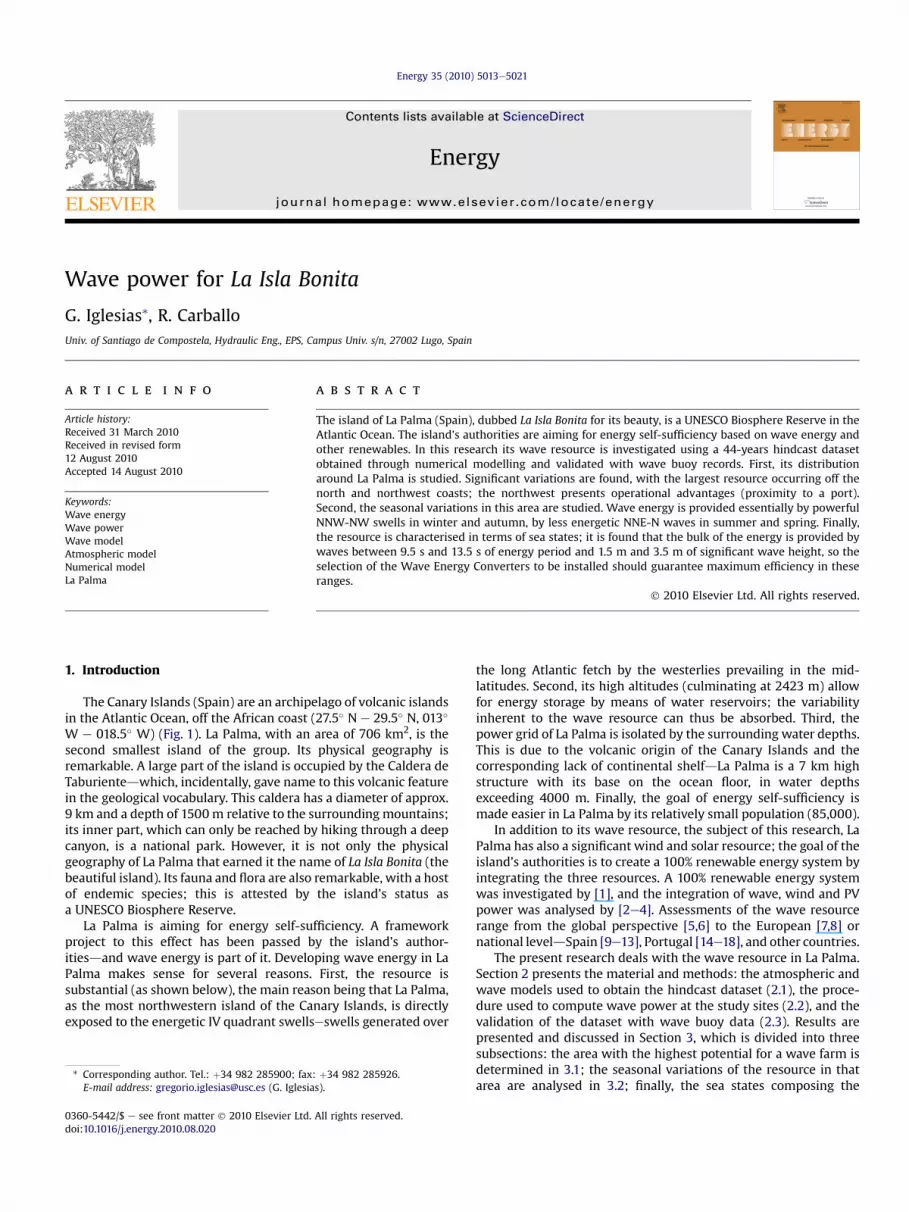
The Canary Islands (Spain) are an archipelago of volcanic islandsin the Atlantic Ocean, off the African coast (27.5� N e 29.5� N, 013�
W e 018.5� W) (Fig. 1). La Palma, with an area of 706 km2, is thesecond smallest island of the group. Its physical geography isremarkable. A large part of the island is occupied by the Caldera deTaburientedwhich, incidentally, gave name to this volcanic featurein the geological vocabulary. This caldera has a diameter of approx.9 km and a depth of 1500m relative to the surrounding mountains;its inner part, which can only be reached by hiking through a deepcanyon, is a national park. However, it is not only the physicalgeography of La Palma that earned it the name of La Isla Bonita (thebeautiful island). Its fauna and flora are also remarkable, with a hostof endemic species; this is attested by the island’s status asa UNESCO Biosphere Reserve.
La Palma is aiming for energy self-sufficiency. A frameworkproject to this effect has been passed by the island’s author-itiesdand wave energy is part of it. Developing wave energy in LaPalma makes sense for several reasons. First, the resource issubstantial (as shown below), the main reason being that La Palma,as the most northwestern island of the Canary Islands, is directlyexposed to the energetic IV quadrant swellseswells generated over
: þ34 982 285926.s).
All rights reserved.
the long Atlantic fetch by the westerlies prevailing in the mid-latitudes. Second, its high altitudes (culminating at 2423 m) allowfor energy storage by means of water reservoirs; the variabilityinherent to the wave resource can thus be absorbed. Third, thepower grid of La Palma is isolated by the surrounding water depths.This is due to the volcanic origin of the Canary Islands and thecorresponding lack of continental shelfdLa Palma is a 7 km highstructure with its base on the ocean floor, in water depthsexceeding 4000 m. Finally, the goal of energy self-sufficiency ismade easier in La Palma by its relatively small population (85,000).
In addition to its wave resource, the subject of this research, LaPalma has also a significant wind and solar resource; the goal of theisland’s authorities is to create a 100% renewable energy system byintegrating the three resources. A 100% renewable energy systemwas investigated by [1], and the integration of wave, wind and PVpower was analysed by [2e4]. Assessments of the wave resourcerange from the global perspective [5,6] to the European [7,8] ornational leveldSpain [9e13], Portugal [14e18], and other countries.
The present research deals with the wave resource in La Palma.Section 2 presents the material and methods: the atmospheric andwave models used to obtain the hindcast dataset (2.1), the proce-dure used to compute wave power at the study sites (2.2), and thevalidation of the dataset with wave buoy data (2.3). Results arepresented and discussed in Section 3, which is divided into threesubsections: the area with the highest potential for a wave farm isdetermined in 3.1; the seasonal variations of the resource in thatarea are analysed in 3.2; finally, the sea states composing the
-19 -18 -17 -16 -15 -14 -13
27.5
28
28.5
29
29.5
Longitude (º)
Latit
ude
(º)
Morocco
WesternSahara
Lanzarote
Tenerife Fuerteventura
El Hierro La Gomera
Gran Canaria
LA PALMA
WB
CGP
Fig. 1. Map of the Canary Islands showing the location of the seven study sites around La Palma, the wave buoy (WB) and closest grid point (CGP) used for validating the hindcastdataset.
G. Iglesias, R. Carballo / Energy 35 (2010) 5013e50215014
resource, their different contributions to the total annual energy,and how this should be taken into account in the selection of WaveEnergy Converters (WECs) for La Palma is discussed in 3.3. Thearticle is closed by Section 4, Conclusions.
2. Material and methods
2.1. Atmospheric and wave models
Given that there are no wave buoys in the vicinity of La Palma,thewave resource assessment was based on hindcast data obtainedthrough numerical modelling, integrating a high-resolution atmo-spheric model and a wave model. Both models were run on a gridthat covered the North Atlantic with a resolution of 0.5� � 0.5�,enhanced near the coastlines to 0.25� � 0.25�. The atmosphericmodel, REMO, solved not only the large-scale flow but also thesmaller-scale effects associated with the topography of landmassesusing a spectral nudging technique [19]; it was forced with datafrom the global atmospheric reanalysis carried out by the U.S.National Center for Environmental Prediction, Washington, D.C.,USA (NCEP) and the National Center for Atmospheric Research,Boulder, Colorado, USA (NCAR) integrating satellite and instru-mental data [20]. The result was a high-resolution atmosphericdataset which was in turn used to force the spectral wave modelWAM cycle 4 [21,22]. WAM is a third-generationwavemodel, i.e. noparticular shape is assumed for the wave spectrum, which is free toevolve according to the energy sources and sinks. For convenience,a brief description of WAM is given here; further details may befound in [23e26]. The model is based on spectral action densitybecause, unlike energy density, action density is conserved in thepresence of currents [27]. Action density is defined as
Nðs; qÞ ¼ Eðs; qÞs
; (1)
E¼ E(s,q) is the energy density, with q the propagation directionand s the relative radian frequency (i.e. the radian frequency in
Table 1Wave height, power and energy statistics at the study sites [Hm0, significant wave heighfront].
Site No. Latitude, Longitude (Hm0)mean � std. dev.(m) (Hm
S1 28.5�N, 18.0�W 1.50 � 0.76 10.1S2 28.25�N, 17.75�W 1.71 � 0.65 9.4S3 28.5�N, 17.5�W 1.80 � 0.71 7.8N1 28.75�N, 18.25�W 2.07 � 0.85 10.3N2 29.0�N, 18.0�W 2.14 � 0.87 10.0N3 29.0�N, 17.75�W 2.11 � 0.87 9.3N4 28.75�N, 17.5�W 1.99 � 0.79 8.5
a system moving with the current). The WAM model solves thespectral action balance equation:
v
vtðNÞ þ v
vxðcxNÞ þ v
vy�cyN
�þ v
vqðcqNÞ þ
v
vsðcsNÞ ¼ S
s; (2)
where cx and cy are the propagation velocity components in the x-and y-space, respectively; cq is the propagation velocity in theq-space; cs is the propagation velocity in the s-space; and S¼S(s,q)represents sources or sinks of wave energy. The physical meaningof the terms on the left-hand side of Equation (2) is straightfor-ward: the first term represents the local rate of change of actiondensity in time, the second and third terms represent propagationof action in geographic space, the fourth term represents depth-induced and current-induced refraction, and the fifth term repre-sents shifting of the relative frequency due to variations in depthand currents.
2.2. Computation of wave power
As a result of the volcanic origin of La Palma, the seven studysites (Fig. 1) are located in deepwater, so wave fields are unaffectedby refraction or shoaling [26,28]. It follows that wave power may becomputed directly from the results of the WAM model (withoutrunning a coastal wave model). Wave power is given [29] by:
J ¼ rg2
64pTeH2
m0; (3)
where Te is energy period, Hm0 is significant wave height, r isseawater density, and g is gravitational acceleration. The (spectral)significant wave height is defined as
Hm0 ¼ 4ðm0Þ12; (4)
where m0 is the zeroth moment (the variance) of the wave spec-trum. In general, the nth spectral moment is given by
t; J, power per metre of wave front; (E)annual, total annual energy per metre of wave
0)max(m) Jmean(kW/m) Jmax(kW/m) (E)annual(MWh/m)
15.92 671.1 139.615.99 589.1 140.218.76 437.9 164.527.36 698.0 239.928.46 677.2 249.527.84 672.8 244.024.04 573.3 210.7

−18.3 −18.2 −18.1 −18 −17.9 −17.8 −17.7 −17.6 −17.5 −17.4
28.2
28.3
28.4
28.5
28.6
28.7
28.8
28.9
29
29.1
Longitude (º)
Latit
ude
(º) LA PALMA
Pt. Salinas
Pt. delAserradero
2000m
Pt. delMundo
Pt. deFuencaliente
Pt. Cumplida
Puerto deTazacorte
1000m500m
3000m
2000m
S3
N4
N3N2
N1
S1
S2
Fig. 2. Map of La Palma with the annual wave roses for the study sites.
G. Iglesias, R. Carballo / Energy 35 (2010) 5013e5021 5015
mn ¼Z2pZN
f nEðf ; qÞdf dq; (5)
0 0
where f is wave frequency and E¼ E(f,q) is energy density (e.g. [26]).As regards the energy period, it represents the period of a sinu-soidal wave with the same energy as the sea state and is defined asa function of the spectral moments:
Fig. 3. Hindcast data (..) vs. wave buoy measurements (dd) from 1 January to 30
Te ¼ m�1
m0; (6)
Among the various characteristic values of the wave period ofa sea state (peak period, significant period, mean period, etc.), theenergy period is normally used for energy studies because itweights waves according to their spectral energy content.
December 2001. [Hm0, significant wave height; J, power per metre of wave front].
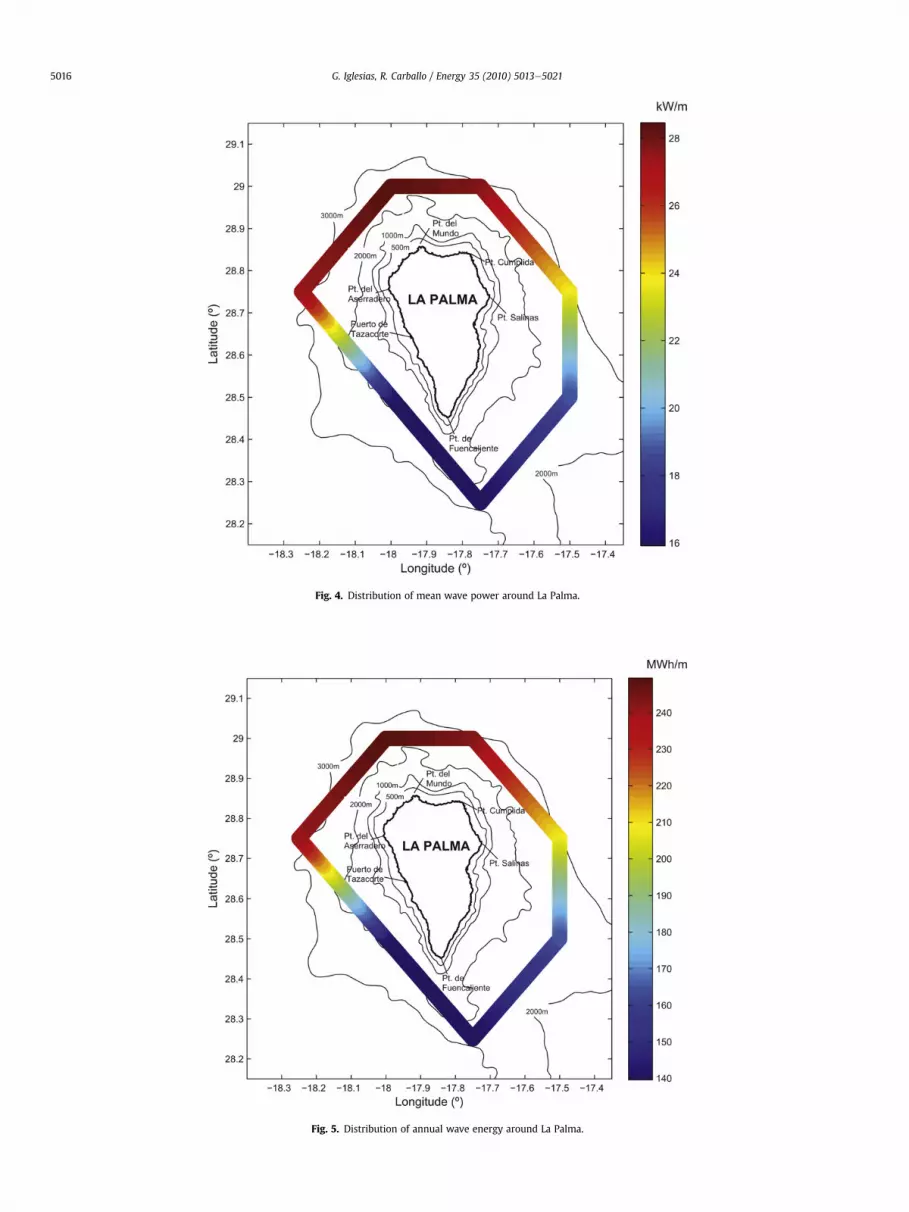
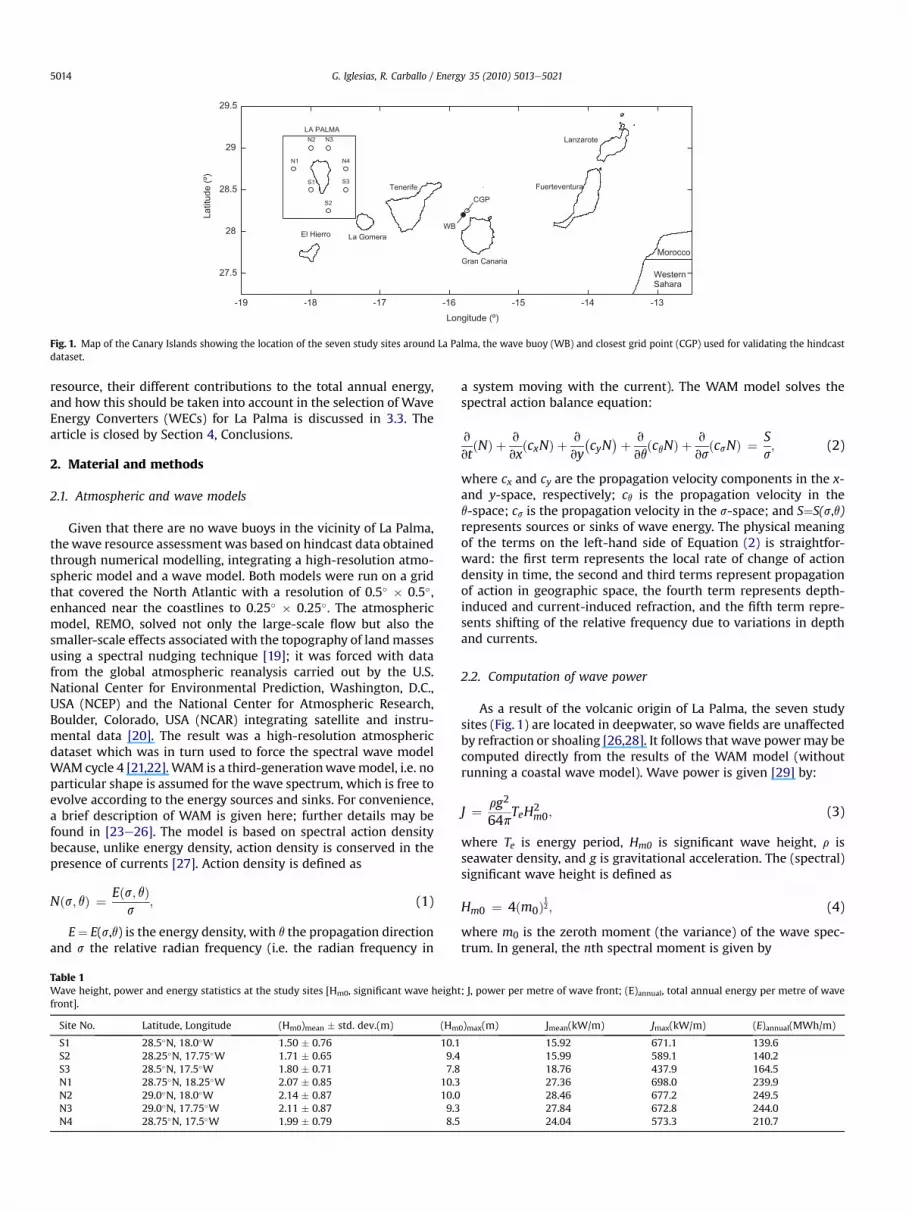
Fig. 4. Distribution of mean wave power around La Palma.
Fig. 5. Distribution of annual wave energy around La Palma.
G. Iglesias, R. Carballo / Energy 35 (2010) 5013e50215016
Fig. 6. Annual wave power roses at sites N1 e N4 (high-energy area) [J, power per metre of wave front].
G. Iglesias, R. Carballo / Energy 35 (2010) 5013e5021 5017
2.3. Validation of hindcast data with wave buoy measurements
The hindcast dataset thus obtained covers a 44-year period,from 1 January 1958 to 30 December 2001. As there are no wavebuoys in the vicinity of La Palma, the wave buoy near Gran Canariawas used for validation; its measurements were compared with thehindcast data corresponding to the closest grid point (Fig. 1). Thevalidation period included 54 months of data, from 20 June 1997 at21:00 UTC to 30 December 2001 at 12:00 UTC. Very good agree-ment was found (Fig. 3), with correlation coefficients of RH¼ 0.8243(significant wave height) and RJ ¼ 0.8121 (wave power) over thewhole period. The last 12 months, from 1 January 2001 to 30December 2001, are shown in Fig. 3 (the whole validation period isnot depicted for the sake of clarity).
3. Results
3.1. Area with the largest wave resource
Apart from the data used in the previous section for validatingthe hindcast dataset, the data used in the present research corre-spond to the seven grid points closest to La Palma (Fig. 1). Their
mainwave height, power and energy statistics are shown in Table 1.The last column, total annual energy, is referred to an average year(the average of the 44 years in the dataset). It is apparent from thefigures in the table that the study sites can be classified into twogroups or areas: a high-energy area to the north (N1 to N4) anda low-energy area to the south (S1 to S3). The explanation for thedifference between the two areas is straightforward: northerlywaves (fromNW toNE) prevail in the Canary Islands region, and thenorth of La Palma is fully exposed to them; in contrast, the south issheltered by the island itself (Fig. 2). As for the differences withineach area, they are clearly related to the position of each site rela-tive to the island. Within the low-energy area the most shelteredare S1 and S2, hence they are also the least energetic. Within thehigh-energy area the most exposed are N2 and N3; in any case,their differences with N1 are minor (less than 2% in terms of annualenergy), so the areawith the largest wave resource is the north andnorthwest of the island. These geographical variations around theisland are represented in Fig. 4 (meanwave power) and Fig. 5 (totalannual energy).
The wave roses in Figs. 6 and 7, for the high-energy and low-energy areas, respectively, have a colour scale graded according towave power. Focusing on the high-energy area (Fig. 6) it is clear that

Fig. 7. Annual wave power roses at sites S1 e S3 (low-energy area) [J, power per metre of wave front].
G. Iglesias, R. Carballo / Energy 35 (2010) 5013e50215018
the largest wave power values correspond to IV quadrant direc-tions, in particular NNW, followed by NW and N (strictly speaking,N waves are 50% IV quadrant, 50% I quadrant); certain directionsfrom the I quadrant (NNE) also have large probabilities of occur-rence, but are associated with less energetic waves. This isexplained by the Canary Islands’ location near the easternboundary of the Atlantic Ocean, which results in longer fetchdistances along IV quadrant directions, and by the northwesterlywinds prevailing in the Atlantic north of the Canary Islands (wherethe IV quadrant swells in Fig. 6 are generated). The lower wavepower values of I quadrant waves relative to IV quadrant wavesaccount for the lower energy levels of the northeast of La Palma(site N4) relative to the northwest (site N1).
For all its importance, the wave resource is not the only issue toconsider when selecting the area for awave power installation. Twoother major issues, the construction and operational costs, areinfluenced by various factors: technological options, financing,public subsidies, taxation, etc. These factors are outside the scope ofthis work; there is, however, one factor that can be weighed here:proximity to a port. Its importance is obvious if the technologicaloptions are centred around offshore Wave Energy Converters. Buteven if an onshore wave power plant were envisageddwhich is
unlikely given La Palma’s status as a UNESCO Biosphere Reser-vedthe construction and operational costs would increase withroad distance to the nearest port, not least in view of the windingroads of La Palma. While there are no ports along the north of theisland, there is one on its west coast: Tazacorte (Fig. 2). On thesegrounds, the northwest (the area around site N1) has the highestpotential for the installation of a wave farm.
3.2. Seasonality of the wave resource
Having established the area with the highest potential fora wave farm, the seasonal variations of the resource in this area areconsidered next. Seasonal wave roses for study site N1 (Fig. 8)indicate that the prevailing wave direction veers from NW-NNW inwinter to NNE in summer; the prevailing directions in the inter-mediate seasons are also intermediate: N in spring, NNW inautumn. Two more facts may be observed in Fig. 8. First, the largestwaves occur in winter, followed by autumn; significant waveheights are clearly smaller in spring and summer. Second, there isa correlation between wave height and directiondthe larger waveheights are associated with NW and NNWwaves. As indicated, thisis a direct result of the long (oceanic) fetch along these directions.
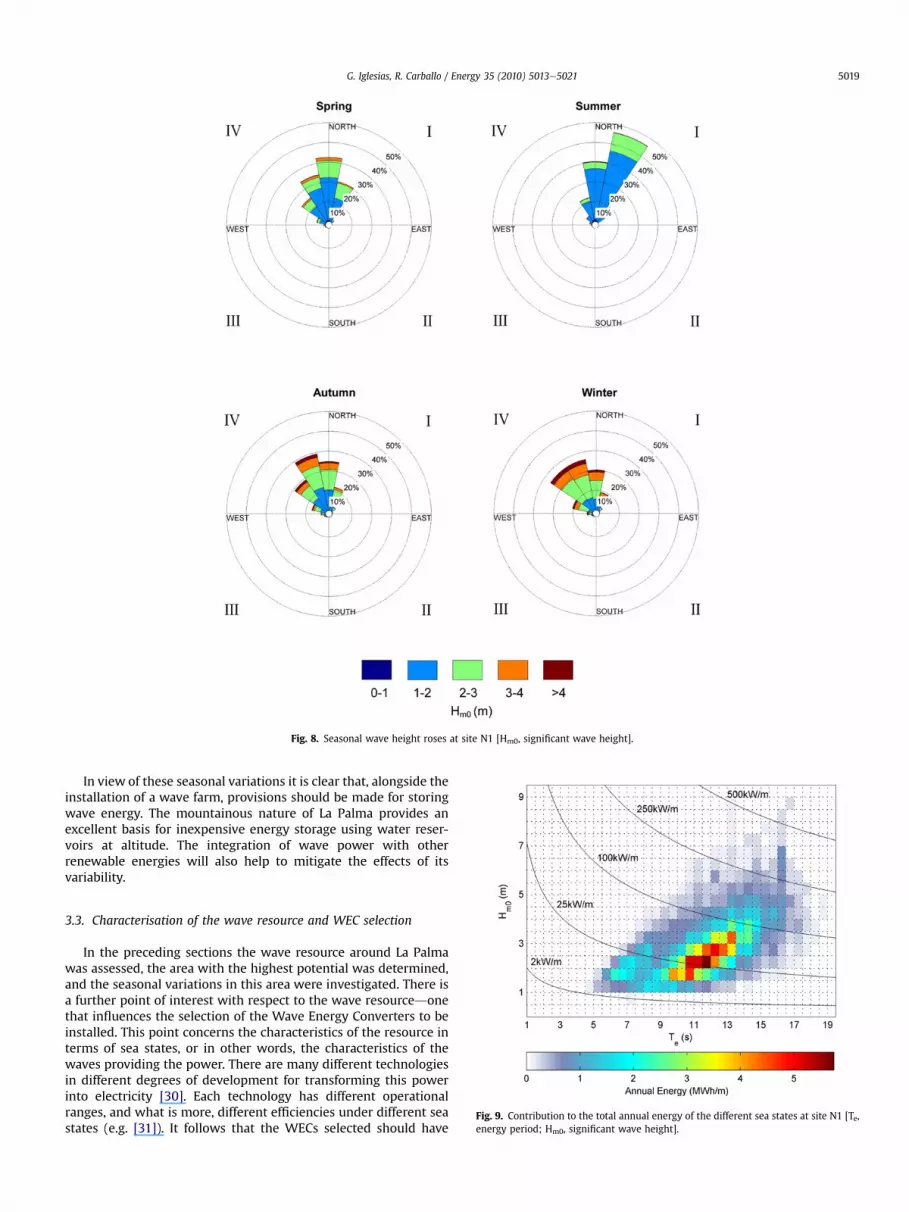
Fig. 8. Seasonal wave height roses at site N1 [Hm0, significant wave height].
G. Iglesias, R. Carballo / Energy 35 (2010) 5013e5021 5019
In view of these seasonal variations it is clear that, alongside theinstallation of a wave farm, provisions should be made for storingwave energy. The mountainous nature of La Palma provides anexcellent basis for inexpensive energy storage using water reser-voirs at altitude. The integration of wave power with otherrenewable energies will also help to mitigate the effects of itsvariability.
Fig. 9. Contribution to the total annual energy of the different sea states at site N1 [Te,energy period; Hm0, significant wave height].
3.3. Characterisation of the wave resource and WEC selection
In the preceding sections the wave resource around La Palmawas assessed, the area with the highest potential was determined,and the seasonal variations in this area were investigated. There isa further point of interest with respect to the wave resourcedonethat influences the selection of the Wave Energy Converters to beinstalled. This point concerns the characteristics of the resource interms of sea states, or in other words, the characteristics of thewaves providing the power. There are many different technologiesin different degrees of development for transforming this powerinto electricity [30]. Each technology has different operationalranges, and what is more, different efficiencies under different seastates (e.g. [31]). It follows that the WECs selected should have
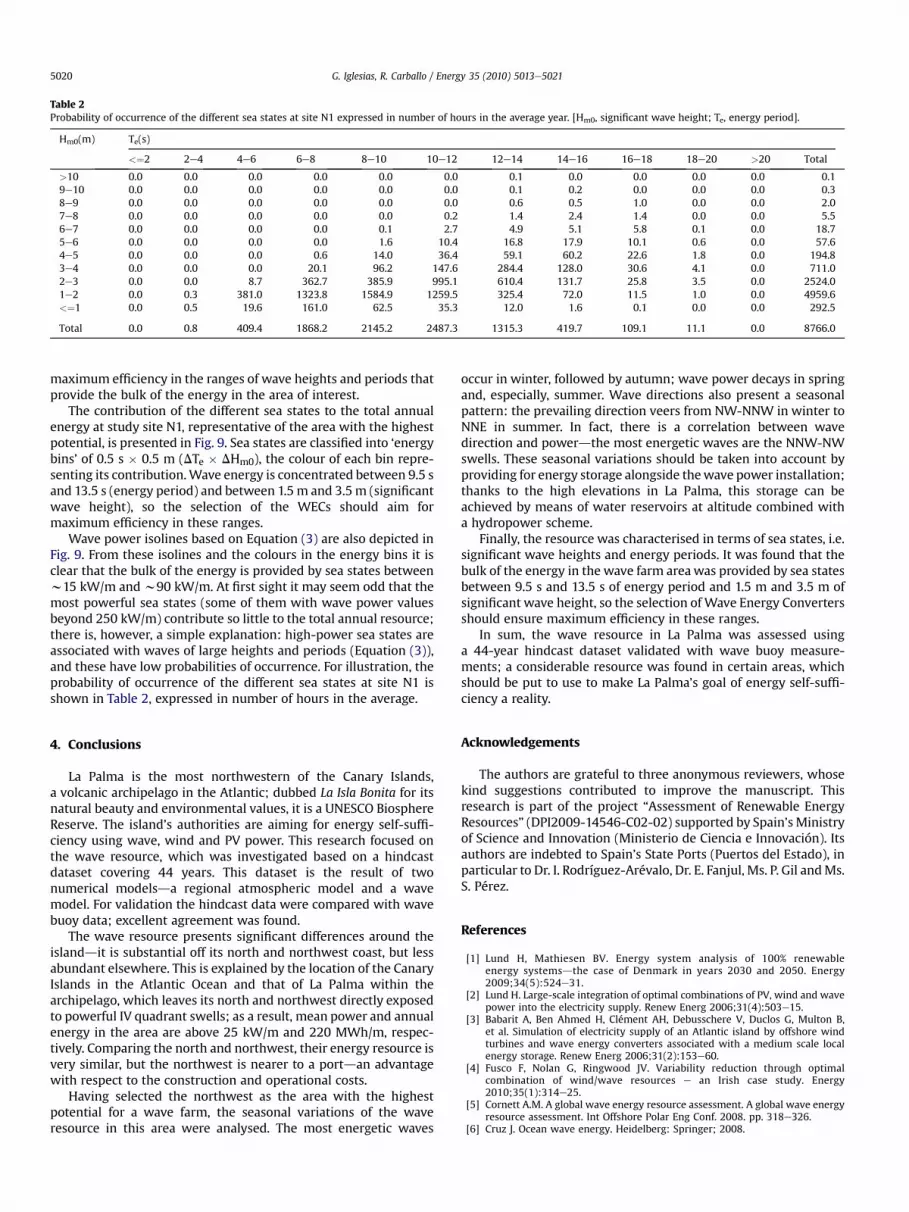
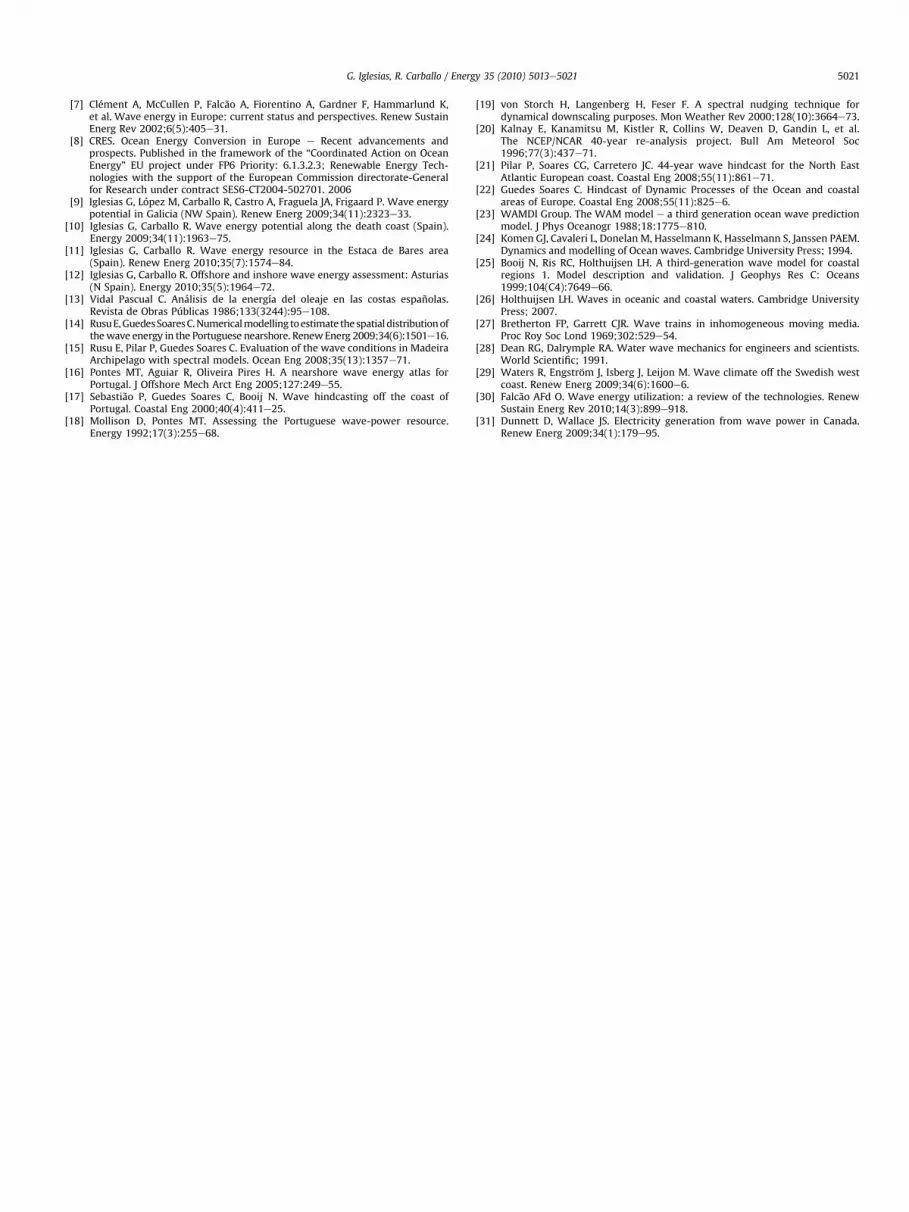
Table 2Probability of occurrence of the different sea states at site N1 expressed in number of hours in the average year. [Hm0, significant wave height; Te, energy period].
Hm0(m) Te(s)
<¼2 2e4 4e6 6e8 8e10 10e12 12e14 14e16 16e18 18e20 >20 Total
>10 0.0 0.0 0.0 0.0 0.0 0.0 0.1 0.0 0.0 0.0 0.0 0.19e10 0.0 0.0 0.0 0.0 0.0 0.0 0.1 0.2 0.0 0.0 0.0 0.38e9 0.0 0.0 0.0 0.0 0.0 0.0 0.6 0.5 1.0 0.0 0.0 2.07e8 0.0 0.0 0.0 0.0 0.0 0.2 1.4 2.4 1.4 0.0 0.0 5.56e7 0.0 0.0 0.0 0.0 0.1 2.7 4.9 5.1 5.8 0.1 0.0 18.75e6 0.0 0.0 0.0 0.0 1.6 10.4 16.8 17.9 10.1 0.6 0.0 57.64e5 0.0 0.0 0.0 0.6 14.0 36.4 59.1 60.2 22.6 1.8 0.0 194.83e4 0.0 0.0 0.0 20.1 96.2 147.6 284.4 128.0 30.6 4.1 0.0 711.02e3 0.0 0.0 8.7 362.7 385.9 995.1 610.4 131.7 25.8 3.5 0.0 2524.01e2 0.0 0.3 381.0 1323.8 1584.9 1259.5 325.4 72.0 11.5 1.0 0.0 4959.6<¼1 0.0 0.5 19.6 161.0 62.5 35.3 12.0 1.6 0.1 0.0 0.0 292.5
Total 0.0 0.8 409.4 1868.2 2145.2 2487.3 1315.3 419.7 109.1 11.1 0.0 8766.0
G. Iglesias, R. Carballo / Energy 35 (2010) 5013e50215020
maximum efficiency in the ranges of wave heights and periods thatprovide the bulk of the energy in the area of interest.
The contribution of the different sea states to the total annualenergy at study site N1, representative of the area with the highestpotential, is presented in Fig. 9. Sea states are classified into ‘energybins’ of 0.5 s � 0.5 m (DTe � DHm0), the colour of each bin repre-senting its contribution.Wave energy is concentrated between 9.5 sand 13.5 s (energy period) and between 1.5 m and 3.5m (significantwave height), so the selection of the WECs should aim formaximum efficiency in these ranges.
Wave power isolines based on Equation (3) are also depicted inFig. 9. From these isolines and the colours in the energy bins it isclear that the bulk of the energy is provided by sea states betweenw15 kW/m andw90 kW/m. At first sight it may seem odd that themost powerful sea states (some of them with wave power valuesbeyond 250 kW/m) contribute so little to the total annual resource;there is, however, a simple explanation: high-power sea states areassociated with waves of large heights and periods (Equation (3)),and these have low probabilities of occurrence. For illustration, theprobability of occurrence of the different sea states at site N1 isshown in Table 2, expressed in number of hours in the average.
4. Conclusions
La Palma is the most northwestern of the Canary Islands,a volcanic archipelago in the Atlantic; dubbed La Isla Bonita for itsnatural beauty and environmental values, it is a UNESCO BiosphereReserve. The island’s authorities are aiming for energy self-suffi-ciency using wave, wind and PV power. This research focused onthe wave resource, which was investigated based on a hindcastdataset covering 44 years. This dataset is the result of twonumerical modelsda regional atmospheric model and a wavemodel. For validation the hindcast data were compared with wavebuoy data; excellent agreement was found.
The wave resource presents significant differences around theislanddit is substantial off its north and northwest coast, but lessabundant elsewhere. This is explained by the location of the CanaryIslands in the Atlantic Ocean and that of La Palma within thearchipelago, which leaves its north and northwest directly exposedto powerful IV quadrant swells; as a result, mean power and annualenergy in the area are above 25 kW/m and 220 MWh/m, respec-tively. Comparing the north and northwest, their energy resource isvery similar, but the northwest is nearer to a portdan advantagewith respect to the construction and operational costs.
Having selected the northwest as the area with the highestpotential for a wave farm, the seasonal variations of the waveresource in this area were analysed. The most energetic waves
occur in winter, followed by autumn; wave power decays in springand, especially, summer. Wave directions also present a seasonalpattern: the prevailing direction veers from NW-NNW in winter toNNE in summer. In fact, there is a correlation between wavedirection and powerdthe most energetic waves are the NNW-NWswells. These seasonal variations should be taken into account byproviding for energy storage alongside thewave power installation;thanks to the high elevations in La Palma, this storage can beachieved by means of water reservoirs at altitude combined witha hydropower scheme.
Finally, the resource was characterised in terms of sea states, i.e.significant wave heights and energy periods. It was found that thebulk of the energy in the wave farm areawas provided by sea statesbetween 9.5 s and 13.5 s of energy period and 1.5 m and 3.5 m ofsignificant wave height, so the selection of Wave Energy Convertersshould ensure maximum efficiency in these ranges.
In sum, the wave resource in La Palma was assessed usinga 44-year hindcast dataset validated with wave buoy measure-ments; a considerable resource was found in certain areas, whichshould be put to use to make La Palma’s goal of energy self-suffi-ciency a reality.
Acknowledgements
The authors are grateful to three anonymous reviewers, whosekind suggestions contributed to improve the manuscript. Thisresearch is part of the project “Assessment of Renewable EnergyResources” (DPI2009-14546-C02-02) supported by Spain’s Ministryof Science and Innovation (Ministerio de Ciencia e Innovación). Itsauthors are indebted to Spain’s State Ports (Puertos del Estado), inparticular to Dr. I. Rodríguez-Arévalo, Dr. E. Fanjul, Ms. P. Gil andMs.S. Pérez.
References
[1] Lund H, Mathiesen BV. Energy system analysis of 100% renewableenergy systemsdthe case of Denmark in years 2030 and 2050. Energy2009;34(5):524e31.
[2] Lund H. Large-scale integration of optimal combinations of PV, wind and wavepower into the electricity supply. Renew Energ 2006;31(4):503e15.
[3] Babarit A, Ben Ahmed H, Clément AH, Debusschere V, Duclos G, Multon B,et al. Simulation of electricity supply of an Atlantic island by offshore windturbines and wave energy converters associated with a medium scale localenergy storage. Renew Energ 2006;31(2):153e60.
[4] Fusco F, Nolan G, Ringwood JV. Variability reduction through optimalcombination of wind/wave resources e an Irish case study. Energy2010;35(1):314e25.
[5] Cornett A.M. A global wave energy resource assessment. A global wave energyresource assessment. Int Offshore Polar Eng Conf. 2008. pp. 318e326.
[6] Cruz J. Ocean wave energy. Heidelberg: Springer; 2008.
G. Iglesias, R. Carballo / Energy 35 (2010) 5013e5021 5021
[7] Clément A, McCullen P, Falcão A, Fiorentino A, Gardner F, Hammarlund K,et al. Wave energy in Europe: current status and perspectives. Renew SustainEnerg Rev 2002;6(5):405e31.
[8] CRES. Ocean Energy Conversion in Europe e Recent advancements andprospects. Published in the framework of the “Coordinated Action on OceanEnergy” EU project under FP6 Priority: 6.1.3.2.3; Renewable Energy Tech-nologies with the support of the European Commission directorate-Generalfor Research under contract SES6-CT2004-502701. 2006
[9] Iglesias G, López M, Carballo R, Castro A, Fraguela JA, Frigaard P. Wave energypotential in Galicia (NW Spain). Renew Energ 2009;34(11):2323e33.
[10] Iglesias G, Carballo R. Wave energy potential along the death coast (Spain).Energy 2009;34(11):1963e75.
[11] Iglesias G, Carballo R. Wave energy resource in the Estaca de Bares area(Spain). Renew Energ 2010;35(7):1574e84.
[12] Iglesias G, Carballo R. Offshore and inshore wave energy assessment: Asturias(N Spain). Energy 2010;35(5):1964e72.
[13] Vidal Pascual C. Análisis de la energía del oleaje en las costas españolas.Revista de Obras Públicas 1986;133(3244):95e108.
[14] RusuE,GuedesSoaresC.Numericalmodelling toestimate thespatialdistributionofthewave energy in the Portuguese nearshore. RenewEnerg 2009;34(6):1501e16.
[15] Rusu E, Pilar P, Guedes Soares C. Evaluation of the wave conditions in MadeiraArchipelago with spectral models. Ocean Eng 2008;35(13):1357e71.
[16] Pontes MT, Aguiar R, Oliveira Pires H. A nearshore wave energy atlas forPortugal. J Offshore Mech Arct Eng 2005;127:249e55.
[17] Sebastião P, Guedes Soares C, Booij N. Wave hindcasting off the coast ofPortugal. Coastal Eng 2000;40(4):411e25.
[18] Mollison D, Pontes MT. Assessing the Portuguese wave-power resource.Energy 1992;17(3):255e68.
[19] von Storch H, Langenberg H, Feser F. A spectral nudging technique fordynamical downscaling purposes. Mon Weather Rev 2000;128(10):3664e73.
[20] Kalnay E, Kanamitsu M, Kistler R, Collins W, Deaven D, Gandin L, et al.The NCEP/NCAR 40-year re-analysis project. Bull Am Meteorol Soc1996;77(3):437e71.
[21] Pilar P, Soares CG, Carretero JC. 44-year wave hindcast for the North EastAtlantic European coast. Coastal Eng 2008;55(11):861e71.
[22] Guedes Soares C. Hindcast of Dynamic Processes of the Ocean and coastalareas of Europe. Coastal Eng 2008;55(11):825e6.
[23] WAMDI Group. The WAM model e a third generation ocean wave predictionmodel. J Phys Oceanogr 1988;18:1775e810.
[24] Komen GJ, Cavaleri L, Donelan M, Hasselmann K, Hasselmann S, Janssen PAEM.Dynamics and modelling of Ocean waves. Cambridge University Press; 1994.
[25] Booij N, Ris RC, Holthuijsen LH. A third-generation wave model for coastalregions 1. Model description and validation. J Geophys Res C: Oceans1999;104(C4):7649e66.
[26] Holthuijsen LH. Waves in oceanic and coastal waters. Cambridge UniversityPress; 2007.
[27] Bretherton FP, Garrett CJR. Wave trains in inhomogeneous moving media.Proc Roy Soc Lond 1969;302:529e54.
[28] Dean RG, Dalrymple RA. Water wave mechanics for engineers and scientists.World Scientific; 1991.
[29] Waters R, Engström J, Isberg J, Leijon M. Wave climate off the Swedish westcoast. Renew Energ 2009;34(6):1600e6.
[30] Falcão AFd O. Wave energy utilization: a review of the technologies. RenewSustain Energ Rev 2010;14(3):899e918.
[31] Dunnett D, Wallace JS. Electricity generation from wave power in Canada.Renew Energ 2009;34(1):179e95.