volume 94 (2), july to december, 2019 - the indian
TRANSCRIPT
Governing Council of the Indian Geographical Society
President: Dr. K. Devarajan
Vice Presidents: Dr. P. Ilangovan
Dr. B. HemaMalini
Dr. H.N. Misra
Dr. R.B. Singh
Dr. R. Vaidyanadhan
General Secretary: Dr. R. Jaganathan
Joint Secretaries: Dr. R. Bhavani
Dr. R. Shyamala
Dr. J. Uma
Dr. R. Jegankumar
Treasurer: Dr. V. Madha Suresh
Council Members:
Ms. R. Valli
Dr. S.R. Nagarathinam
Dr. S. Balaselvakumar
Dr. P.H. Anand
Mr. G. Jagadeesan
Dr. N. Subramanian
Mr. C. Subramaniam
Member Nominated to the Executive Committee from the Council:
Dr. S.R. Nagarathinam
Editor: Prof. K. Kumaraswamy
Authors, who wish to submit their papers for publication in the Indian Geographical Journal, are most welcome to send their papers to the Editor only through e-mail: [email protected]
Authors of the research articles in the journal are responsible for the views expressed in their articles and for obtaining permission for copyright materials.
For details and downloads visit: geography.unom.ac.in/igs | www.igschennai.org
Information to Authors
The Indian Geographical Journal is peer-reviewed published half-yearly in June and December by The Indian Geographical Society, Chennai. It invites manuscripts of original research on any geographical subject providing information of importance to geography and related disciplines with an analytical approach. The article should be submitted only through the Editor’s e-mail: [email protected]
The manuscript should be strictly ordered as follows: Title page, author (s) name, designation, e-mail ID, and telephone number, abstract, keywords, text (Introduction, Study Area, Methodology, Results and Discussion, Conclusion), Acknowledgements, References, Tables, Figures. You may refer IGS website (geography.unom.ac.in/igs | www.igschennai.org) for reference.
The title should be brief, specific and amenable to indexing. Not more than five keywords should be indicated separately; these should be chosen carefully and must not be phrases of several words. Abstract and summary should be limited to 100 words and convey the main points of the manuscript, outline the results and conclusions and explain the significance of the results.
Maps and charts should be submitted in the final or near-final form. The authors should however agree to revise the maps and charts for reproduction after the article is accepted for publication. Each figure should have a concise caption describing accurately what the figure depicts.
If you include figures that have already been published elsewhere, you must obtain permission from the copyright owner(s) for both the print and online format. Please be aware that some publishers do not grant electronic rights for free and that IGS will not be able to refund any costs that may have occurred to receive these permissions.
Acknowledgements of people, grants, funds etc. should be placed in a separate section before the reference list. The names of funding organisations should be written in full.
References should be listed in alphabetical order, serially numbered at the end of the manuscript as per MLA format. The list of references should only include works that are cited in the text and that have been published or accepted for publication.
The manuscripts should be accompanied with a letter stating that the article has not been published or sent for publication to any other journal and that it will not be submitted elsewhere for publication. Further, the authors could also send name and address with e-mail ids and phone number of four referees to review the article.
For details and downloads visit: geography.unom.ac.in/igs | www.igschennai.org
The Indian Geographical Journal
Contents
Volume - 94 Number - 2 December, 2019 Page No.
Assessment of Petrol Filing Stations Compliance with Planning Standards in Benin City, Edo State, Nigeria - Daniel Nosakhare Onaiwu
139-153
Quantitativeanalysis of Crop Combinations in Cyclone Prone Nellore District, Andhra Pradesh - Bala Ankanna N. and Krishna Kumari A.
154-160
A Spatio-Temporal Study of the Surface Water-Spread in Rurban Zone of Hyderabad Metropolis - Biswabandan Satpathy, Pratigna T. and Padmaja S.
161-171
A Critical Analysis on the Commercialisation of the Forest Ecosystem that Affects the Existence of Tribal Culture and Challenges the Sustainability of Forests of Chitteri Hills, Eastern Ghats - Narmada K. and Bhaskaran G.
172-184
Spatio-Temporal Variation of Population Density in Baitarani Basin in Odisha - Siva Prasad Panda and Kabir Mohan Sethy
185-193
Impact of Urbanization in Gradual Increase in Land Surface Temperature of Patna Municipal Corporation in New Millennium (2000-2018) Using Satellite Data - Ashraf M.
194-207
Fuzzy Logic Based Site Suitability Assessment for Cold Storage Construction at Western Villages of Loktak Lake, Manipur - Irom Luckychand Meitei and Abujam Manglem Singh
208-217
Trends of Urbanization in Rajasthan: Applicability of Rank Size Distribution and Primate City - Bharat Ratnu and Anjana Ratnu
218-227
Changing the Trend of Functional Classification in Jaipur Region, Rajasthan - Poonam Devi Verma and Mini Mathur
228-235
Assessment of Rainfall Variability in Different Taluks of Arkavathy Watershed Using Geographic Information System, Karnataka, India - Shahnin Irfan, Surendra P. and Ashok D. Hanjagi
236-244
Mapping of Flood Hazard Zones of Tuthapuzha Sub-Basin, Kerala, India - A Geo-Spatial Approach - Dipjyoti G., Dhanusree M. and Bhaskaran G.
245-254
Challenge of Providing Clean Air in Urban Areas in India - Kalpana Markandey
255-261
News and Notes
Conduct of 10th IGS Talent Test
Award of ICSSR Senior Fellowship - Dr. K. Kumaraswamy
IGU Secretary-General and Treasurer - Prof. R.B. Singh
NRDMS-DST - Winter School on Geospatial Technologies - Dr. R. Jaganathan
262-269
The Indian Geographical Journal Volume 94 (2) December - 2019, pp 139-153
ISSN 0019-4824
139
ASSESSMENT OF PETROL FILING STATIONS COMPLIANCE
WITH PLANNING STANDARDS IN BENIN CITY, EDO STATE,
NIGERIA
Daniel Nosakhare Onaiwu
Department of Geography and Regional Planning, University of Benin, Benin City, Nigeria
E-mail: [email protected]
Abstract
Petroleum is a major energy source that propels an economy and the distribution of filling
stations is a measurement of its use. The study is on the assessment of filling station’s.
compliance with planning standards in Benin City, Edo State, Nigeria. 852 respondents
were used in the interview survey. The study area was divided into core, intermediate, and
sub-urban zones where 287 filling stations are sited. A radius of 100m was circumscribed
around each filling station where three respondents were randomly picked at every 5th
house in a street around a station. The trained interviewers estimated distances and areas
of plots the stations were sited. The global position system readings of co-ordinates and
distances between stations were determined. Descriptive analysis of percentages and
frequencies were used to analyze data; inferential techniques of paired sample t-test was
used to compare observed standards with planning standards; and nearest neighbor
analysis was used to establish the pattern in the distribution of filling stations. The results
showed non-compliance with the planning standards; the paired sample t-test on standards
of plot size, sight distance and set-backs were significant. Also, the patterns of distributions
at the core, intermediate and sub-urban were not regular. The study recommends that
space standards for plot size, sight distance, and set-backs should be strictly enforced by
the Ministry of Physical Planning and Urban Development; environmental monitoring of
impacts should be carried out by responsible agencies, and that every filling station should
have a fire-hydrant.
Key words: compliance, development control, petrol filling stations, set-backs, standards
Introduction
The place where premium motor spirit is sold is usually referred to in Nigeria as a
petrol filling station. Although many different types of fuels are sold and services are
rendered, the service stations are commonly known as petrol filling stations because
premium motor spirit or petrol is the most common product demanded by consumers.
According to Chinambu (2011), petroleum products constitute a critical energy requirement
for transportation and industrialization in many countries. This assertion is also supported
by Taylor, Sichinsambwe and Chonsa (2016) as constituting a prime moral of the present
140
Daniel Nosakhare Onaiwu The Indian Geographical Journal, 94 (2) December – 2019
movement of persons and goods world-wide. Thus filling stations are a visible part of the
urban landscapes where economic and social activities gravitate (Taylor, et al. 2016).
Petroleum products are highly volatile and have serious environmental consequences, and
their locations require a guided selection to reduce their negative impacts (Ogundahunsi,
2014; Mshelia, Abdullahi and Dawha, 2015). The hazards involved in dispensing petroleum
products demand intervention to shield urban residents from their negative environmental
impacts. This task has been placed on some bodies such as the physical planning
departments and agencies giving the approval of siting of filling station. Tah (2017)
emphasized that the existence of regulatory bodies is a necessity, which must be,
entrenched in a structure development plans. In Nigeria, the statutory bodies that are
vested with the approval and siting of filling stations rest mainly on physical planning
ministries and the Department of Petroleum Resources (DPR).
The standards that are used for the location and operations of filling stations
involve location, plot size, set-backs requirements which the operators of petrol filling
stations must comply with. In Edo State of Nigeria where the study area Benin City.is, the
operators of filling station are to comply with the space standard of 33 x 33 square metres,
a front set-back of 15 metres of the pump to the edge of the road, a 400m of distance
separating two filling stations, a buffer of 50 metres separating filling stations from
residential plots, and a filling station should share common boundaries with schools and
hospital and so on (Edo State Government, 2014). these standards generally form the basis
for the siting of petrol filling stations in urban environment of Edo State of Nigeria. In
addition, the operators of the filling stations are expected to show their site plans and
environmental impact reports of the operation of their proposal before obtaining approval for
siting filling stations (Edo State Government, 2014).
The compliance by the operators of filling stations with planning standards has
been observed in the literature. Taylor et al (2016) evaluated public opinion on the location
of filling stations in the Zambian City of Kitwe found that 77.39 percent of the filling stations
did not meet location standards. Also, Tah (2017) employed Geographic Information
System (GIS) and remote sensing techniques in the locational analysis of filling stations in
Kaduna metropolis revealed an over-concentration of filling stations on higher hierarchy
roads thereby violating the minimum distance of 400 metres between two fillings in a road.
Arokoyou, Ogoro and Aman-oritsewo (2015) also used GIS and remote sensing
approaches in Obio-Akpo Local Government Area of River States and found that the
minimum safe distance requirement of 400 metres between two stations and 15 metres
front set-backs of pimps to the roads were grossly violated. Olusola (2017) observed the
distribution pattern of petrol filling stations at Ilesha using Nearest Neighbour Analysis
(NNA) and he found that the distribution pattern tended towards clustering (i.e. 0.36). The
author suggested a more proactive approach by the planning authorities in striving at a
better, regular distribution pattern. Olugenga (2017) remarked that there is a general
phenomenon of non-compliance with many aspects of development control standards by
developer and operators of development control regulations in Nigeria. The author
attributed some reasons for these, which are: political influence on the location of filling
141
Daniel Nosakhare Onaiwu The Indian Geographical Journal, 94 (2) December – 2019
stations and corruption on the part of approving officials. Inter-agencies conflicts, especially
between planning authorities and Department of Petroleum and Resources can hamper
compliance to standards (Okafor, 2011).
The appraisal of PFSs compliance to planning laws and standards in Benin City will
be assessed with these research questions:
1. What is the spatial pattern of location of petrol filling stations (PFSs) in Benin City?
2. To what extent do PFSs in the study area comply with planning standards specified by Edo State Urban Physical Planning Ministry?
3. What are the factors that promote PFSs non-compliance with planning standards in the study area?
4. How can the problem of non-compliance be addressed in Benin City?
Study Area
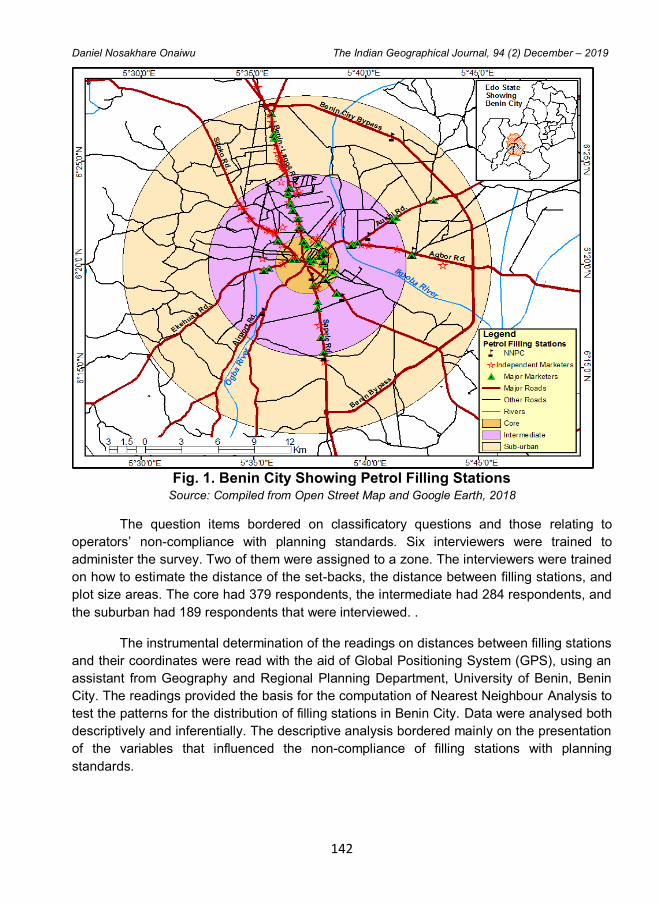
Benin City is located between latitudes 6O 10’ 39.161’’ and 6
O 29’ 52.153’’N, and
longitudes 5O 26’ 38.45’’ and 5
O 49’ 39.299’’E as shown in Figure 1. City has a land mass of
10,956km2.
Research Methodology
The approaches adopted include descriptive cross-sectional survey, geographical
information systems (GIS), and field measurements. The study employed primary and
secondary data. Primary data comprise PFSs geographic coordinates, setbacks to roads
and linear distance from one PFS to another. Secondary data were collected from literature
review and the standards operationalized in development control by the Edo State Ministry
Physical Planning and Urban Development. The population of Benin is 1,634,501 (projected
from 1991 to 2018). Using a sample size calculator, the estimated sample size is 384.
(David Van Amburg cited in Mitchel and Jolley, 2007). However, 861 respondents were
used for the survey because of the 100m, radius around each station in which three
respondents were picked.
The sample size of 861 was distributed around 100m radius of a filling station, and
the number of filling stations that was investigated is 287.The sampling technique is
systematic random technique of every 5th house in a street that falls within 100m around a
filling station was chosen. A sampling ratio of 4:3:2 was applied to select the streets in the
core, intermediate and sub-urban zones of Benin City in that order respectively. This
translates to a total of 861 respondents, but 852 was retrieved. A structured questionnaire
with Likert-type format was used for the interview survey. The responses were a five-option
type with the lowest value option as 1, 3 as neutral, and the highest anchor value for the
scale as 5.
142
Daniel Nosakhare Onaiwu The Indian Geographical Journal, 94 (2) December – 2019
Fig. 1. Benin City Showing Petrol Filling Stations
Source: Compiled from Open Street Map and Google Earth, 2018
The question items bordered on classificatory questions and those relating to
operators’ non-compliance with planning standards. Six interviewers were trained to
administer the survey. Two of them were assigned to a zone. The interviewers were trained
on how to estimate the distance of the set-backs, the distance between filling stations, and
plot size areas. The core had 379 respondents, the intermediate had 284 respondents, and
the suburban had 189 respondents that were interviewed. .
The instrumental determination of the readings on distances between filling stations
and their coordinates were read with the aid of Global Positioning System (GPS), using an
assistant from Geography and Regional Planning Department, University of Benin, Benin
City. The readings provided the basis for the computation of Nearest Neighbour Analysis to
test the patterns for the distribution of filling stations in Benin City. Data were analysed both
descriptively and inferentially. The descriptive analysis bordered mainly on the presentation
of the variables that influenced the non-compliance of filling stations with planning
standards.
143
Daniel Nosakhare Onaiwu The Indian Geographical Journal, 94 (2) December – 2019
The inferential analyses employed the Nearest Neighbour Analysis to test the
distribution pattern of the filling stations in Benin City; and paired sample t-test was used to
test the statistical significance of the difference between planning standards and the
observed standards in the field survey. Eta squared was used to measure the magnitude of
the significance difference of the observed standards with the standards operationalized by
Edo State Ministry of Physical Planning and Urban Development.
Results and Discussion
Filling Stations’ Compliance with Standards
There are different operators of filling stations found in Benin City and these range
from small independent marketers, Nigeria National Petroleum Corporation (NNPC) to
major marketers. All these one expected to meet the same standards in terms of siting, size
and other standards as operationalized by the various supervisory authorities. The
distribution of these filling stations are indicated in Table 1. The distribution among the
operators shows that the independent marketers operate about 70.0 percent of the filling
stations and NNPC operates 1.2 percent, which is the least.
Table 1. Ownership/Operator of Filling Station
S/N Frequency Percent
1.
2.
3.
4.
Independent Marketer
Major Marketer
NNPC Retail Outlet
Don’t know
Total
201
68
10
8
287
70.0
23.7
3.5
2.8
100.0
Source: Author’s Field Survey, 2019.
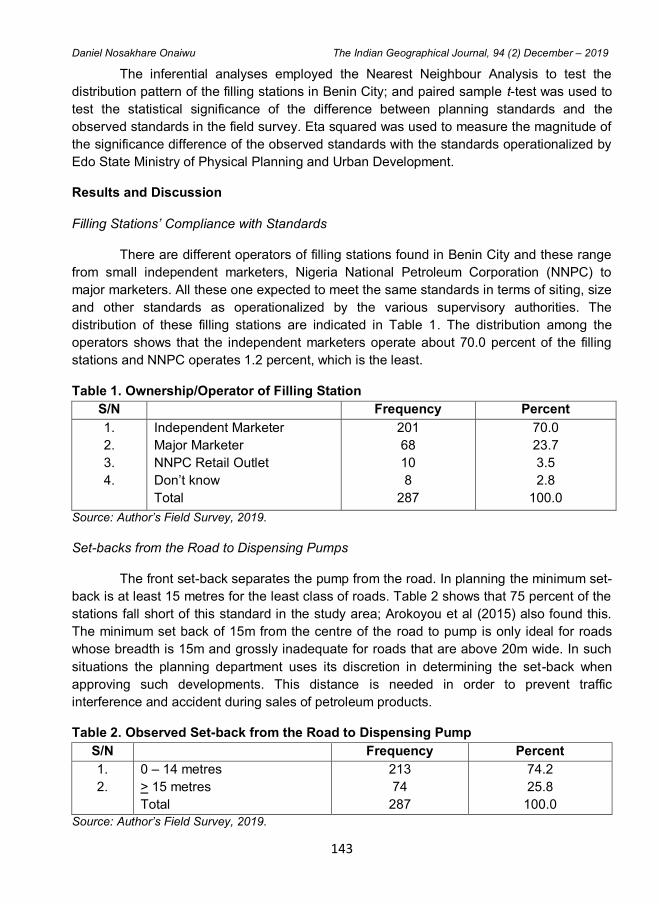
Set-backs from the Road to Dispensing Pumps
The front set-back separates the pump from the road. In planning the minimum set-
back is at least 15 metres for the least class of roads. Table 2 shows that 75 percent of the
stations fall short of this standard in the study area; Arokoyou et al (2015) also found this.
The minimum set back of 15m from the centre of the road to pump is only ideal for roads
whose breadth is 15m and grossly inadequate for roads that are above 20m wide. In such
situations the planning department uses its discretion in determining the set-back when
approving such developments. This distance is needed in order to prevent traffic
interference and accident during sales of petroleum products.
Table 2. Observed Set-back from the Road to Dispensing Pump
S/N Frequency Percent
1.
2.
0 – 14 metres
> 15 metres
Total
213
74
287
74.2
25.8
100.0
Source: Author’s Field Survey, 2019.
144
Daniel Nosakhare Onaiwu The Indian Geographical Journal, 94 (2) December – 2019
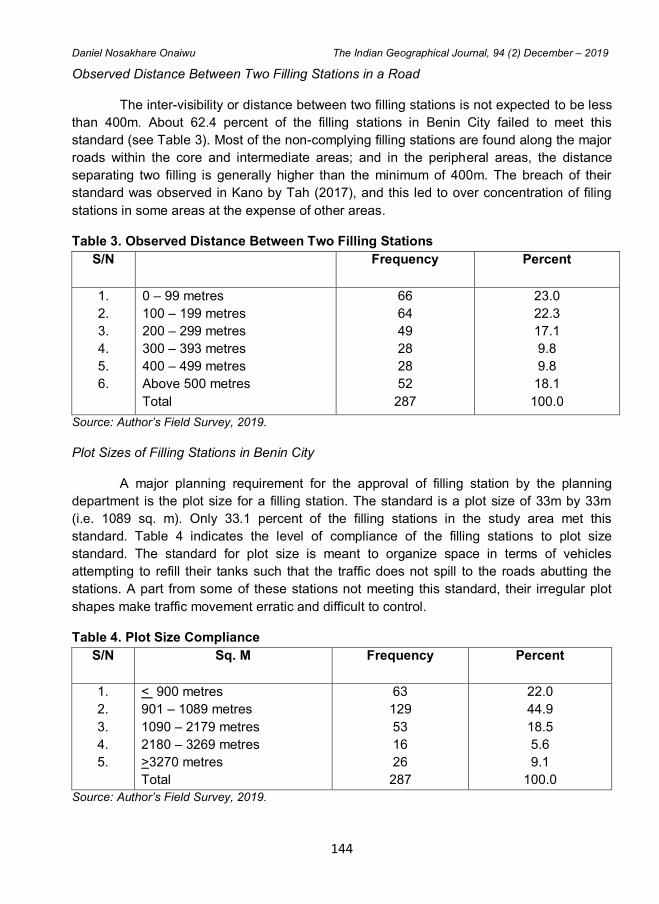
Observed Distance Between Two Filling Stations in a Road
The inter-visibility or distance between two filling stations is not expected to be less
than 400m. About 62.4 percent of the filling stations in Benin City failed to meet this
standard (see Table 3). Most of the non-complying filling stations are found along the major
roads within the core and intermediate areas; and in the peripheral areas, the distance
separating two filling is generally higher than the minimum of 400m. The breach of their
standard was observed in Kano by Tah (2017), and this led to over concentration of filing
stations in some areas at the expense of other areas.
Table 3. Observed Distance Between Two Filling Stations
S/N Frequency Percent
1.
2.
3.
4.
5.
6.
0 – 99 metres
100 – 199 metres
200 – 299 metres
300 – 393 metres
400 – 499 metres
Above 500 metres
Total
66
64
49
28
28
52
287
23.0
22.3
17.1
9.8
9.8
18.1
100.0
Source: Author’s Field Survey, 2019.
Plot Sizes of Filling Stations in Benin City
A major planning requirement for the approval of filling station by the planning
department is the plot size for a filling station. The standard is a plot size of 33m by 33m
(i.e. 1089 sq. m). Only 33.1 percent of the filling stations in the study area met this
standard. Table 4 indicates the level of compliance of the filling stations to plot size
standard. The standard for plot size is meant to organize space in terms of vehicles
attempting to refill their tanks such that the traffic does not spill to the roads abutting the
stations. A part from some of these stations not meeting this standard, their irregular plot
shapes make traffic movement erratic and difficult to control.
Table 4. Plot Size Compliance
S/N Sq. M Frequency Percent
1.
2.
3.
4.
5.
< 900 metres
901 – 1089 metres
1090 – 2179 metres
2180 – 3269 metres
>3270 metres
Total
63
129
53
16
26
287
22.0
44.9
18.5
5.6
9.1
100.0
Source: Author’s Field Survey, 2019.
145
Daniel Nosakhare Onaiwu The Indian Geographical Journal, 94 (2) December – 2019
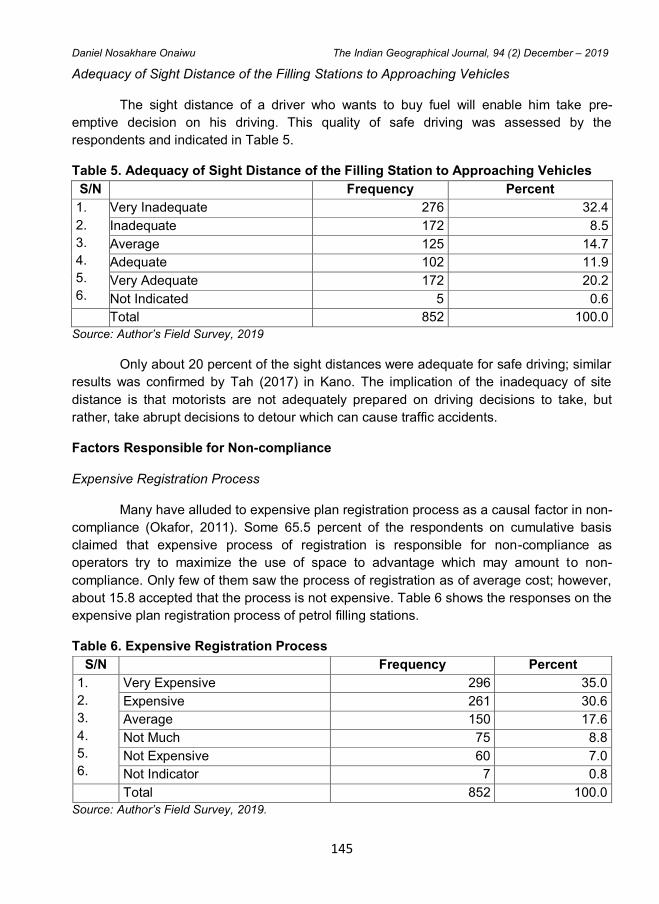
Adequacy of Sight Distance of the Filling Stations to Approaching Vehicles
The sight distance of a driver who wants to buy fuel will enable him take pre-
emptive decision on his driving. This quality of safe driving was assessed by the
respondents and indicated in Table 5.
Table 5. Adequacy of Sight Distance of the Filling Station to Approaching Vehicles
S/N Frequency Percent
1.
2.
3.
4.
5.
6.
Very Inadequate 276 32.4
Inadequate 172 8.5
Average 125 14.7
Adequate 102 11.9
Very Adequate 172 20.2
Not Indicated 5 0.6
Total 852 100.0
Source: Author’s Field Survey, 2019
Only about 20 percent of the sight distances were adequate for safe driving; similar
results was confirmed by Tah (2017) in Kano. The implication of the inadequacy of site
distance is that motorists are not adequately prepared on driving decisions to take, but
rather, take abrupt decisions to detour which can cause traffic accidents.
Factors Responsible for Non-compliance
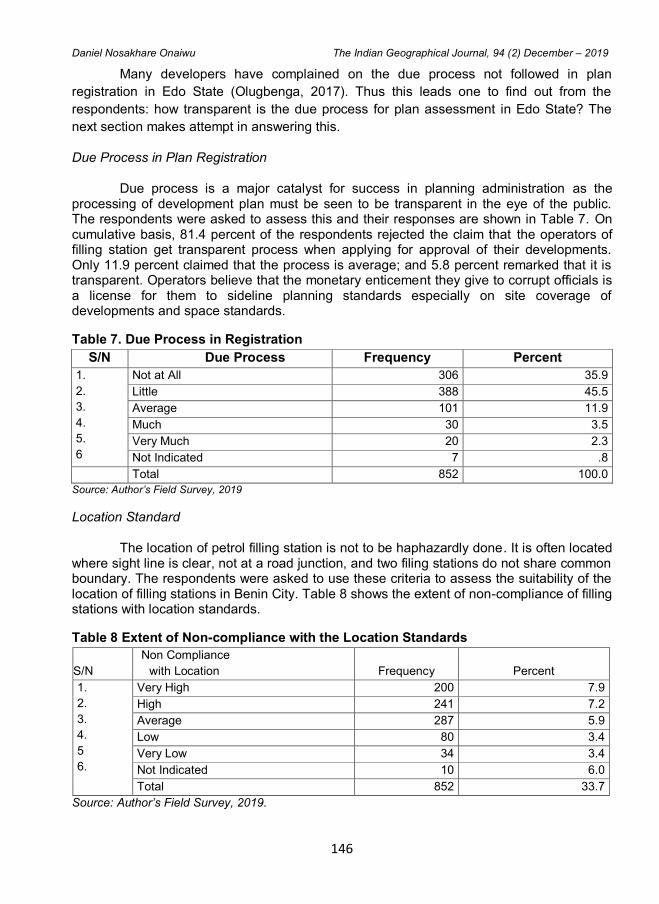
Expensive Registration Process
Many have alluded to expensive plan registration process as a causal factor in non-
compliance (Okafor, 2011). Some 65.5 percent of the respondents on cumulative basis
claimed that expensive process of registration is responsible for non-compliance as
operators try to maximize the use of space to advantage which may amount to non-
compliance. Only few of them saw the process of registration as of average cost; however,
about 15.8 accepted that the process is not expensive. Table 6 shows the responses on the
expensive plan registration process of petrol filling stations.
Table 6. Expensive Registration Process
S/N Frequency Percent
1.
2.
3.
4.
5.
6.
Very Expensive 296 35.0
Expensive 261 30.6
Average 150 17.6
Not Much 75 8.8
Not Expensive 60 7.0
Not Indicator 7 0.8
Total 852 100.0
Source: Author’s Field Survey, 2019.
146
Daniel Nosakhare Onaiwu The Indian Geographical Journal, 94 (2) December – 2019
Many developers have complained on the due process not followed in plan
registration in Edo State (Olugbenga, 2017). Thus this leads one to find out from the
respondents: how transparent is the due process for plan assessment in Edo State? The
next section makes attempt in answering this.
Due Process in Plan Registration
Due process is a major catalyst for success in planning administration as the processing of development plan must be seen to be transparent in the eye of the public. The respondents were asked to assess this and their responses are shown in Table 7. On cumulative basis, 81.4 percent of the respondents rejected the claim that the operators of filling station get transparent process when applying for approval of their developments. Only 11.9 percent claimed that the process is average; and 5.8 percent remarked that it is transparent. Operators believe that the monetary enticement they give to corrupt officials is a license for them to sideline planning standards especially on site coverage of developments and space standards.
Table 7. Due Process in Registration
S/N Due Process Frequency Percent
1.
2.
3.
4.
5.
6
Not at All 306 35.9
Little 388 45.5
Average 101 11.9
Much 30 3.5
Very Much 20 2.3
Not Indicated 7 .8
Total 852 100.0
Source: Author’s Field Survey, 2019
Location Standard
The location of petrol filling station is not to be haphazardly done. It is often located where sight line is clear, not at a road junction, and two filing stations do not share common boundary. The respondents were asked to use these criteria to assess the suitability of the location of filling stations in Benin City. Table 8 shows the extent of non-compliance of filling stations with location standards.
Table 8 Extent of Non-compliance with the Location Standards
S/N
Non Compliance
with Location Frequency Percent
1.
2.
3.
4.
5
6.
Very High 200 7.9
High 241 7.2
Average 287 5.9
Low 80 3.4
Very Low 34 3.4
Not Indicated 10 6.0
Total 852 33.7
Source: Author’s Field Survey, 2019.
147
Daniel Nosakhare Onaiwu The Indian Geographical Journal, 94 (2) December – 2019
About 71.4 percent of the filling stations did not comply with the criteria set for
locating them; average level of noncompliance was 33.7 percent; low level of non-
compliance was 15.6 percent. Thus the rate of non-compliance with location standards is
very high (Edo State Government, 2014).
Spatial Pattern of Location
One of the most widely used techniques in evaluating the distributional pattern of phenomena in space is the nearest neighbour analysis (NNA) developed by Clark and Evans (1954). This framework was used to evaluate the locational pattern of PFSs in Benin City. The NNA, although computed using it algorithm in Arc GIS 10.1 is computed using the formula in Equation 1:
where, Rn = nearest neighbour index n
A = land area of the study area
d = total mean distance between the fuel stations
n = number of fuel stations
The Rn values ranges from 0 to 2.15 interpreted as follows:
Rn = 0: the distribution is clustered
Rn = 1: the distribution is random
Rn = 2.15: the distribution is regular
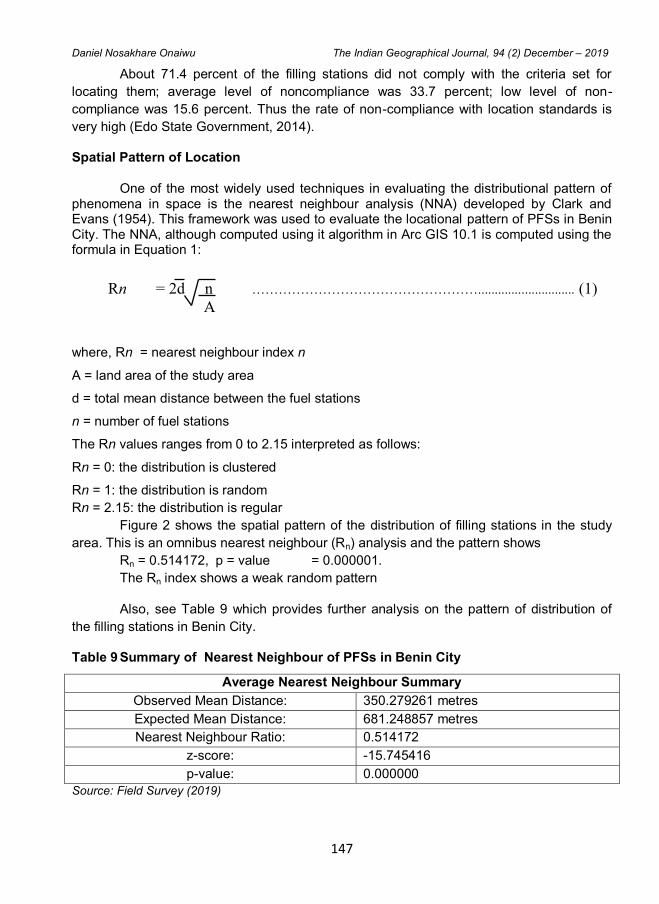
Figure 2 shows the spatial pattern of the distribution of filling stations in the study
area. This is an omnibus nearest neighbour (Rn) analysis and the pattern shows
Rn = 0.514172, p = value = 0.000001.
The Rn index shows a weak random pattern
Also, see Table 9 which provides further analysis on the pattern of distribution of
the filling stations in Benin City.
Table 9 Summary of Nearest Neighbour of PFSs in Benin City
Average Nearest Neighbour Summary
Observed Mean Distance: 350.279261 metres
Expected Mean Distance: 681.248857 metres
Nearest Neighbour Ratio: 0.514172
z-score: -15.745416
p-value: 0.000000
Source: Field Survey (2019)
Rn = 2d n ……………………………………………............................. (1)
A
148
Daniel Nosakhare Onaiwu The Indian Geographical Journal, 94 (2) December – 2019
The Rn which is 0.514172 is close to random in terms of the pattern of distribution;
and also, this is significant at 0.000001.
Fig. 2. Average Nearest Neighbour Summary of PFSs in Benin City
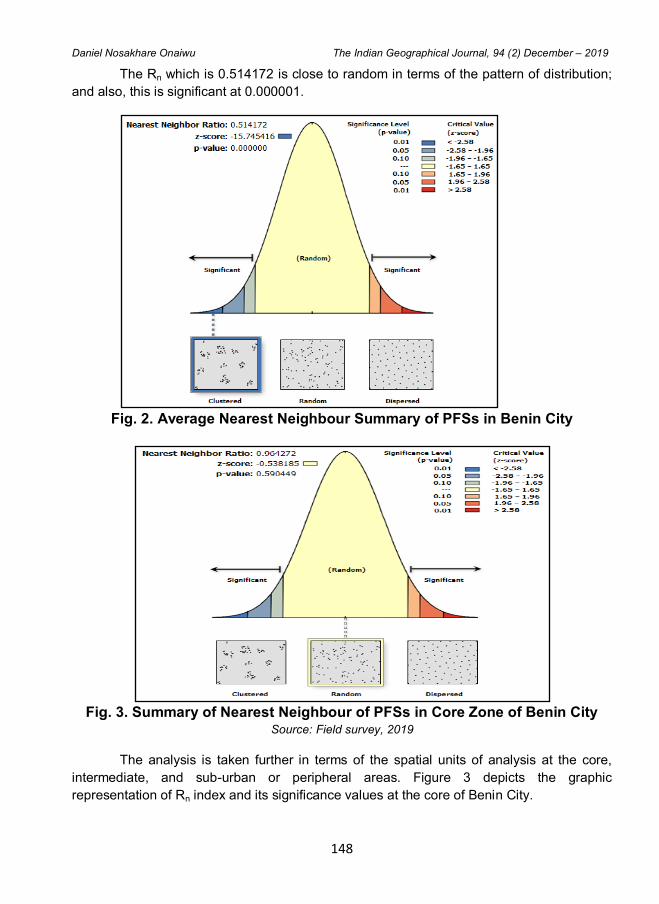
Fig. 3. Summary of Nearest Neighbour of PFSs in Core Zone of Benin City
Source: Field survey, 2019
The analysis is taken further in terms of the spatial units of analysis at the core,
intermediate, and sub-urban or peripheral areas. Figure 3 depicts the graphic
representation of Rn index and its significance values at the core of Benin City.
149
Daniel Nosakhare Onaiwu The Indian Geographical Journal, 94 (2) December – 2019
The Rn is 0.964272, which is close to 1, a value for random pattern. This is,
therefore, a case of random pattern. However, the p-value of 0.590449 is not significant
(See Figure 2 and Table 10).
Table 10. Summary of Nearest Neighbour of PFSs in Core Zone of Benin City
Average Nearest Neighbour Summary
Observed Mean Distance 262.300538 metres
Expected Mean Distance 272.019153 metres
Nearest Neighbour Ratio 0.964272
z-score -0.538185
p-value 0.590449
Source: Field Survey (2019)
Given the P=0.590449, the Rn = 0.964272 though close to random is not
significant.
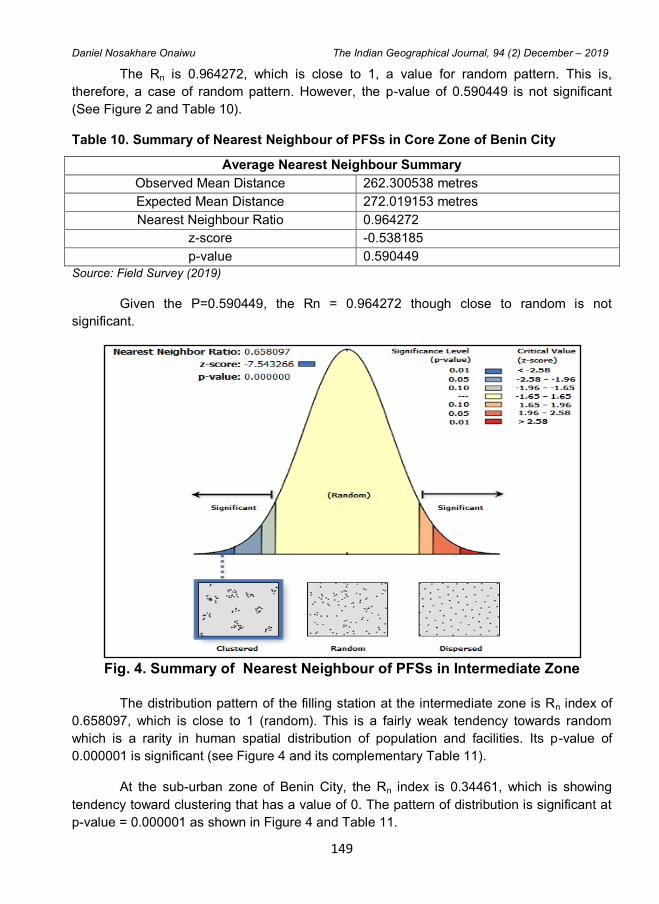
Fig. 4. Summary of Nearest Neighbour of PFSs in Intermediate Zone
The distribution pattern of the filling station at the intermediate zone is Rn index of
0.658097, which is close to 1 (random). This is a fairly weak tendency towards random
which is a rarity in human spatial distribution of population and facilities. Its p-value of
0.000001 is significant (see Figure 4 and its complementary Table 11).
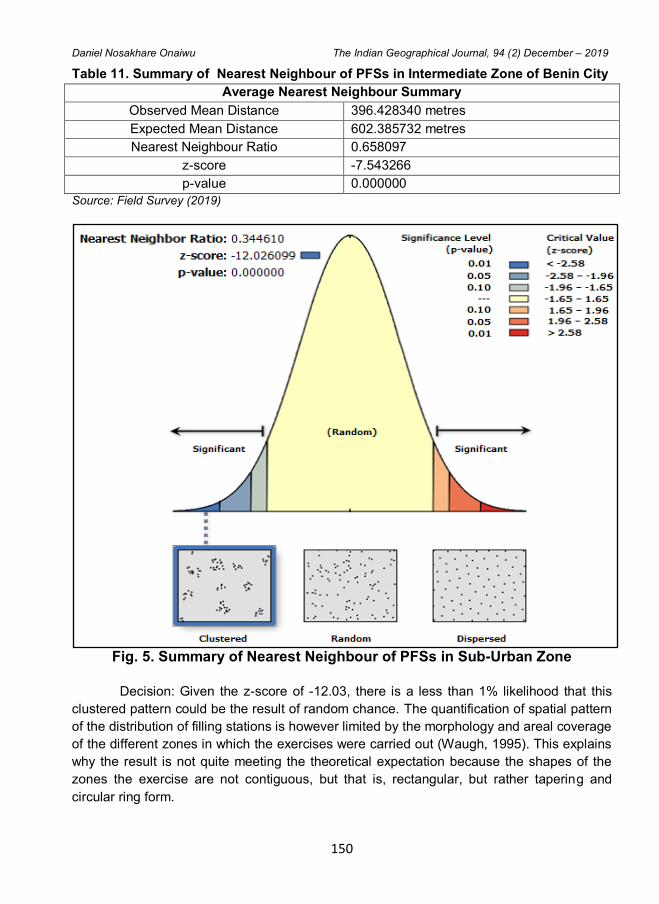
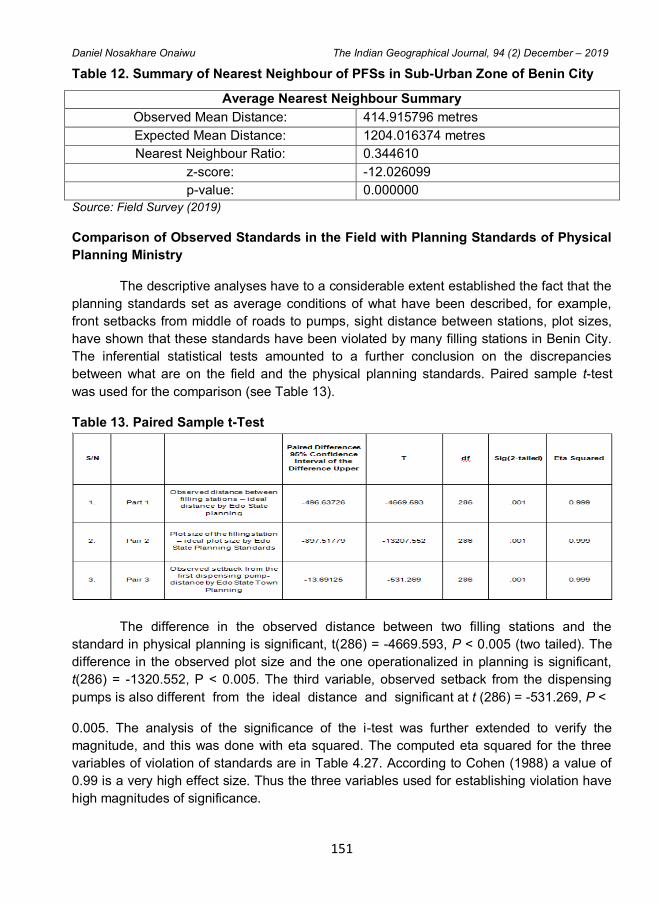
At the sub-urban zone of Benin City, the Rn index is 0.34461, which is showing
tendency toward clustering that has a value of 0. The pattern of distribution is significant at
p-value = 0.000001 as shown in Figure 4 and Table 11.
150
Daniel Nosakhare Onaiwu The Indian Geographical Journal, 94 (2) December – 2019
Table 11. Summary of Nearest Neighbour of PFSs in Intermediate Zone of Benin City
Average Nearest Neighbour Summary
Observed Mean Distance 396.428340 metres
Expected Mean Distance 602.385732 metres
Nearest Neighbour Ratio 0.658097
z-score -7.543266
p-value 0.000000
Source: Field Survey (2019)
Fig. 5. Summary of Nearest Neighbour of PFSs in Sub-Urban Zone
Decision: Given the z-score of -12.03, there is a less than 1% likelihood that this
clustered pattern could be the result of random chance. The quantification of spatial pattern
of the distribution of filling stations is however limited by the morphology and areal coverage
of the different zones in which the exercises were carried out (Waugh, 1995). This explains
why the result is not quite meeting the theoretical expectation because the shapes of the
zones the exercise are not contiguous, but that is, rectangular, but rather tapering and
circular ring form.
151
Daniel Nosakhare Onaiwu The Indian Geographical Journal, 94 (2) December – 2019
Table 12. Summary of Nearest Neighbour of PFSs in Sub-Urban Zone of Benin City
Average Nearest Neighbour Summary
Observed Mean Distance: 414.915796 metres
Expected Mean Distance: 1204.016374 metres
Nearest Neighbour Ratio: 0.344610
z-score: -12.026099
p-value: 0.000000
Source: Field Survey (2019)
Comparison of Observed Standards in the Field with Planning Standards of Physical
Planning Ministry
The descriptive analyses have to a considerable extent established the fact that the
planning standards set as average conditions of what have been described, for example,
front setbacks from middle of roads to pumps, sight distance between stations, plot sizes,
have shown that these standards have been violated by many filling stations in Benin City.
The inferential statistical tests amounted to a further conclusion on the discrepancies
between what are on the field and the physical planning standards. Paired sample t-test
was used for the comparison (see Table 13).
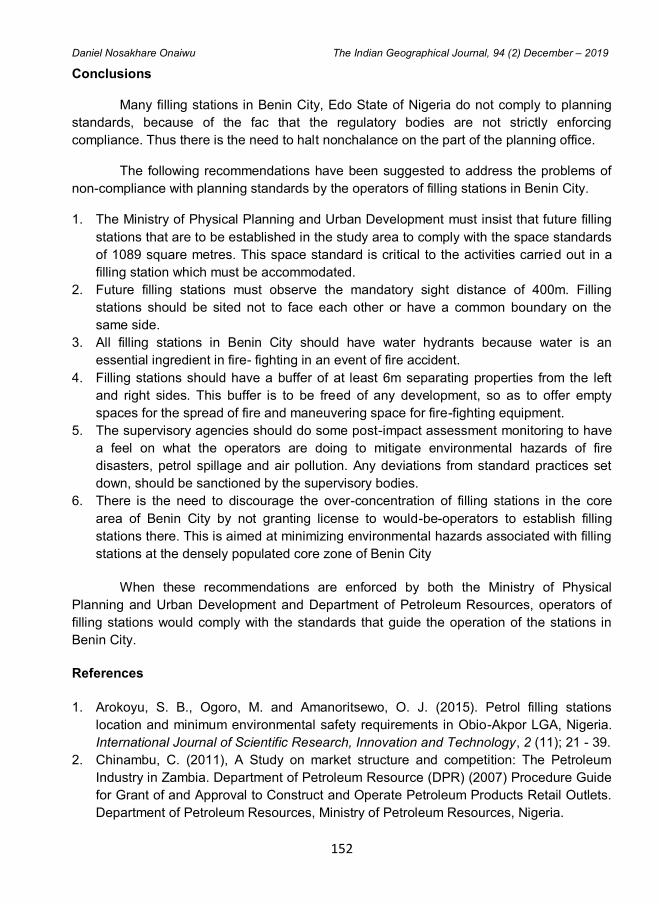
Table 13. Paired Sample t-Test
The difference in the observed distance between two filling stations and the
standard in physical planning is significant, t(286) = -4669.593, P < 0.005 (two tailed). The
difference in the observed plot size and the one operationalized in planning is significant,
t(286) = -1320.552, P < 0.005. The third variable, observed setback from the dispensing
pumps is also different from the ideal distance and significant at t (286) = -531.269, P <
0.005. The analysis of the significance of the i-test was further extended to verify the
magnitude, and this was done with eta squared. The computed eta squared for the three
variables of violation of standards are in Table 4.27. According to Cohen (1988) a value of
0.99 is a very high effect size. Thus the three variables used for establishing violation have
high magnitudes of significance.
152
Daniel Nosakhare Onaiwu The Indian Geographical Journal, 94 (2) December – 2019
Conclusions
Many filling stations in Benin City, Edo State of Nigeria do not comply to planning
standards, because of the fac that the regulatory bodies are not strictly enforcing
compliance. Thus there is the need to halt nonchalance on the part of the planning office.
The following recommendations have been suggested to address the problems of
non-compliance with planning standards by the operators of filling stations in Benin City.
1. The Ministry of Physical Planning and Urban Development must insist that future filling
stations that are to be established in the study area to comply with the space standards
of 1089 square metres. This space standard is critical to the activities carried out in a
filling station which must be accommodated.
2. Future filling stations must observe the mandatory sight distance of 400m. Filling
stations should be sited not to face each other or have a common boundary on the
same side.
3. All filling stations in Benin City should have water hydrants because water is an
essential ingredient in fire- fighting in an event of fire accident.
4. Filling stations should have a buffer of at least 6m separating properties from the left
and right sides. This buffer is to be freed of any development, so as to offer empty
spaces for the spread of fire and maneuvering space for fire-fighting equipment.
5. The supervisory agencies should do some post-impact assessment monitoring to have
a feel on what the operators are doing to mitigate environmental hazards of fire
disasters, petrol spillage and air pollution. Any deviations from standard practices set
down, should be sanctioned by the supervisory bodies.
6. There is the need to discourage the over-concentration of filling stations in the core
area of Benin City by not granting license to would-be-operators to establish filling
stations there. This is aimed at minimizing environmental hazards associated with filling
stations at the densely populated core zone of Benin City
When these recommendations are enforced by both the Ministry of Physical
Planning and Urban Development and Department of Petroleum Resources, operators of
filling stations would comply with the standards that guide the operation of the stations in
Benin City.
References
1. Arokoyu, S. B., Ogoro, M. and Amanoritsewo, O. J. (2015). Petrol filling stations
location and minimum environmental safety requirements in Obio-Akpor LGA, Nigeria.
International Journal of Scientific Research, Innovation and Technology, 2 (11); 21 - 39.
2. Chinambu, C. (2011), A Study on market structure and competition: The Petroleum
Industry in Zambia. Department of Petroleum Resource (DPR) (2007) Procedure Guide
for Grant of and Approval to Construct and Operate Petroleum Products Retail Outlets.
Department of Petroleum Resources, Ministry of Petroleum Resources, Nigeria.
153
Daniel Nosakhare Onaiwu The Indian Geographical Journal, 94 (2) December – 2019
3. Cohen, J.W. (1988) Statistical power analysis for the behavioural sciences (2nd
ed).
Hillsdale, N.J: Lawrence Erlbaum Associates.
4. Department of Petroleum Resources (DPR, 2007). Guidelines for approval to construct
and operate petroleum products filling station. Accessed on 25th August, 2018.
https://www.dpr.gov.ng/wp-content/uploads/2018/08/Filling-Station-Guidelines.pdf
5. Edo State Government of Nigeria (2014). Edo State urban development and physical
planning regulations 2014. Edo State Government.
6. Mitchell, M.L., and Jolley, J.M., (2007). Research design explained. United Kingdom:
Thomson Wadsworth.
7. Mshelia, A.M, Abdullahi, J. and Dawha, E. D. (2015). Environmental effects of petrol
stations at close proximities to residential buildings in Maiduguri and Jere, Borno State,
Nigeria. IOSR Journal of Humanities and Social Science, 20, 1 – 08.
8. National Population Commission (NPC, 2015). Projected Population Figures. Abuja,
National Population Commission.
9. Ogundahunsi, D. S. (2014). Locational Analysis of Fuel Stations, in Ilesa, Osun State,
Nigeria.International Journal of Development Strategies In Humanities, Management
And Social Sciences, 4 (2): 245 – 258.
10. Okafor, O. (2011). The State of Environmental Monitoring in Nigeria and Ways to
Improve It: Case Study of Niger Delta. Accessed on 24th July, 2016.
https://www.academia.edu/909562/The_State_of_Environmental_Monitoring_in_Nigeri
a_and_Ways_to_Improve_It_Case_Study_of_Niger_Delta.
11. Olugbenga, A. (2017). Nigeria: Owners flood residential areas with gas stations.
Accessed on 27th August, 2018. https://www.caracalreports.com/nigeria-owners-flood-
residential-areas-gas-stations/
12. Olusola, O. O. (2017). Resolving potential chaos associated with spatial distribution of
gas filling stations in urban centres for sustainable planning. Journal of Advanced
Research Design, 39 (1), 9 – 18.
13. Tah, D. S. (2017). GIS-Based locational analysis of petrol filling stations in Kaduna
metropolis. Science World Journal, 12 (2): 8 – 13.
14. Taylor, T. K., Sichinsambwe, C. and Chansa, B. (2016). Public perceptions on location
of filling stations in the City of Kitwe in Zambia. Developing Country Studies, 6 (6),133 –
151.
The Indian Geographical Journal Volume 94 (2) December - 2019, pp 154-160
ISSN 0019-4824
154
QUANTITATIVE ANALYSIS OF CROP COMBINATIONS IN
CYCLONE PRONE NELLORE DISTRICT, ANDHRA PRADESH
Bala Ankanna N. and Krishna Kumari A.
Department of Geography, Sri Krishnadevaraya University, Anantapuramu - 515 003 E-mail: [email protected]
Abstract
In India, Agriculture plays a vital role in the economy. It is an important sector as it
contributes about 17% to the total GDP and provides employment to over 60% of the
population. The agricultural sector includes field crops, Horticultural crops, agro-forestry
plants, livestock and fisheries. Cyclones in Coastalareas severely affect all these
components of agricultural sector through direct damage by high speed winds, torrential
rains and extensive flooding. Proper cropping system and cropping pattern promotes Food
security in any region especially in the disaster prone areas. India, being a second most
populous country, there is a need for the optimum utilization of every piece of land, as land
is fixed and limited compared to the population. Though the Green revolution enhanced the
food grain production, the sustainability of land quality, its environment and recurring
disasters posed a problem to the farmers, Policy makers and Planners. Cropping system
comprises all components required for the production of a particular crop and the
interrelationships between them and environment. In the cropping systems, sometimes a
number of crops are grown together or they are grown separately at short intervals in the
same field. To understand the cropping systems the study of Crop Combinations brings out
a comprehensive scenario of any area. Hence in the present endeavour an attempt is made
to study the Crop Combinations in the Cyclone prone Nellore District of Andhra Pradesh
using Doi’s Method.
Introduction
Crop Combination is a process of cultivating multiple crops in the same field. This
practice helps farmers to harvest more than one crop in different seasons. Crop
Combination also nurtures the soil and increases its fertility. The concept is an integral and
important part of agricultural geography as it provides a good basis for agricultural
regionalization. The crops are generally grown in combinations and it is rarely that a
particular crop occupies a position of total isolation with other crops in a given areal unit at a
given point of time. The mapping of the integrated assemblage of various crops grown in an
aerial unit in the form of crop combinations is more important and comprehensive than the
depiction of individual crops in a map . For example, the demarcation of India into the Rice
region or Wheat region does not explain the agriculturally significant fact that very often the
Wheat region also has a Rice crop and vice versa, or wheat is often grown with gram,
barley or some other crops.
155
Bala Ankanna N. and Krishna Kumari A. The Indian Geographical Journal, 94 (2) December – 2019
For a comprehensive and clear understanding of the agricultural mosaic of an
agro-climatic region and for the planning and development of its agriculture, a systematic
study of crop combinations is of great significance. In recent years the concept of crop
combination has engaged the attention of geographers and agricultural land use planners.
Hence, in the present article, an endeavour is made to study the quantitative analysis of
crop combinations in Cyclone prone Nellore District. The district being frequently prone to
Cyclones, planning of crop land use matters a lot. The study throws a light in this direction.
Study Area
Nellore District the southern most coastal district of Andhra Pradesh lies between
130 30
1 and 15
0 6
1 of the Northern latitude and 70
0 5
1 and 15
0 6
1 of the Eastern longitude. It
is bounded on the north by Prakasam district, on the east by Bay of Bengal, on the South
by Chittor district and Thiruvallur district of Tamil Nadu and on the west by Veligonda hills
which separate it from Cuddapah District. The principal rivers which drain the district are the
Pennar river and other streams of occasional and torrential in character are Kandleru and
Boggeru. The district spreads over an area of 13,07,000 hectares and accounts for 4.75 per
cent of the total geographical area of the state. The Net area sown is reported as 3,33,451
hectares in the district. According to 2011 census the total population of the district
accounts to 29.64 lakhs and the density of population is 227 Persons/sq.km. The main
objective of the present study is to identify the crop combinations in two time periods i.e.
between the trienniums 1987-90 and 2012-15 in Nellore District and to bring out the
changes in the combinations during 25 years period.
Database and Methodology
In the present study, secondary data pertaining to General cropping pattern for two
trienniums i.e., 1987-90 and 2012-15 have been collected from the Government records
and reports from Chief planning officer, Hand book of Statistics, Agricultural office of Nellore
District taking ‘Mandal’ as Unit. Simple statistical techniques such as percentages and
averages have been used to analyse the data. Doi’s method has been employed to find out
various crop combinations in the district.
Results and Discussions
Crop Combinations (1987-90)
By employing Doi's method, the crop combinations are identified in the district for
the triennium 1987-90. Broadly speaking, the following crops namely, Paddy, Jowar, Bajra,
Ragi, Pulses, Groundnut, Spices and condiments, Tobacco, Fruit crops are found at least
in one of the crop combinations and hence these crops are considered very significant. The
distributional pattern of the combinations revealed seven major combinations in the district.
Both in area and number, mono crop combination namely Paddy is more prevalent in the
district.
156
Bala Ankanna N. and Krishna Kumari A. The Indian Geographical Journal, 94 (2) December – 2019
Mono Crop Combination
Monoculture is found in 43 per cent of mandals of the district (Fig.1). Paddy is in
monopolistic position in terms of areal extent of monoculture. All the coastal mandals
except a few in extreme south are confined to this combination.
Double Crop Combination
This is the second largest combination in this district and account 19 per cent of the
mandals. In all the two crop combinations Paddy is cultivated as first crop in combination
with groundnut. The two crop combinations are found in Kota, Ozile, Tada, Vakadu,
Naidupet, Dakkili, Pellakur, Venkatagiri and Balayapalli mandals which are generally
confined to the southern part of the district.
Triple Crop Combination
Only 11 per cent of mandals in the district exhibits three crop combinations. Of the
total three crop combinations, Paddy + Jowar + Tobacco combination is found in two
mandals such as Kondapuram and Atmakur, Paddy+Jowar +Bajra combination is noticed in
Ananthasagaram mandal, Paddy + Fruit crops +Groundnut is observed in Gudur mandal
and the last combination of Jowar + Groundnut 4 paddy belongs to varikuntapadu mandal.
All the three crop combinations except one are found in north-western part of the district
(Fig.1).
Four Crop Combination
This is the third most important combination regarding to areal extent occupying 15
per cent of mandals in the district. Groundnut + Paddy + Bajra + Ragi is observed in 2
mandals such as Seetharampuram and Udayagiri. Jowar + Paddy + Pulses + Fruit crops
combination is seen in Chegerla, Jowar + Paddy + Fruit crops + Pulses in Podalkur, Paddy
+ Groundnut + Spices and condiments + Tobacco combination in A.S.Peta, Jowar + Spices
and Condiments + Paddy + Pulses noticed in Kaluvoya and the last sub combination
composed of Fruit crops + Paddy + Groundnut + Jowar is found in Sydapuram mandal.
Four crop combinations are spatially belongs to western part of the district especially in the
southern bank of the river Pennar.
Five Crop Combination
Spatial pattern of this combination is very tiny occupying only one mandal such as
Rapur. The crops involved in the combination are Paddy + Groundnut + Fruit crops + Jowar
+ Pulses.
Six Crop Combination
Nearly about 4 per cent of mandals in the district have this type of combination. The
crops involved in this combination are Tobacco, Paddy, Jowar, Groundnut, Bajra, Ragi,
157
Bala Ankanna N. and Krishna Kumari A. The Indian Geographical Journal, 94 (2) December – 2019
spices and Condiments and Pulses in the two sub group of six crop combination. The
combination with Tobacco as first rank crop is found in Marripadu and the other one is with
Paddy noticed in Kaligiri mandal. These two mandals are located in north-western corner
(Fig.1), as it is stated earlier it Is the driest part of the district where generally diversified
cropping pattern is observed.
Seven Crop Combination
Like in the case of six crop combination, the areal extent of this combination is too
small which belongs to north-western corner where crop diversification is more. There are
two Kinds of 7 crop combinations with crops such as Jowar, Bajra, Ragi, Groundnut,
Tobacco, Paddy and spices and condiments. The combination with Jowar as first crop is
noticed in Duttalur and the other combination is reported in Vinjamur with Paddy as first
rank crop (Figure 1).
The crop combinations of Nellore District showed 7 major combinations during
2012-15. The crops involved in these combinations are Paddy, Jowar, Bajra, Tobacco,
Spices and Condiments, cotton, Sugarcane, Fruit crops, Pulses and Grams, Vegetable
crops and Groundnut in various combinations with different positions. These 9- crops are
found at least in one of the crop combinations during the study period.
Crop Combinations (2012-15)
During 2012-15 about 11 crops such as Paddy, Jowar, Bajra, Tobacco, Cotton,
sugarcane, Groundnut, Fruit crops, Vegetable crops, Spices and Condiments and Pulses
and Grams which as found in at least one of the crop combinations of the study period. It is
analysed that there are 7 major combinations starting from mono crop to 8 crop
combinations excluding 6 crop combinations noticed in Nellore District during the triennium
2012-15. Aerially Mono crop combination dominated by Paddy crop is the most significant
combination confined to 26 mandals of the district.
Mono Crop Combination
Monocrop or one crop combination is observed in 26 mandals of the district during
2012-15 (Figure 1). In all these one crop combination regions Paddy is having monopoly
which shows its dominance. Most of the mandals located in coastal lowlands belong to
Paddy crop combination zone.
Double Crop Combination
In about 6 mandals of the district, 2 – crop combinations are been observed during
the study period. They are Paddy + Fruit crops combination is noticed in Kavali, Balayapalli,
Chillakur and Ojili mandals, whereas Fruit crops + Paddy combination is found in Podalakur
and Sydapuram mandals (Figure 1).
158
Bala Ankanna N. and Krishna Kumari A. The Indian Geographical Journal, 94 (2) December – 2019
Triple Crop Combination
Triple crop combinations is reported in 4 mandals in Nellore District during 2012-15
Paddy + Pulses and Grams + Fruit crops combination is noticed the Chejerla mandal, Fruit
crops + Paddy + Pulses and Grams is observed in Rapur mandal, Fruit crops + Pulses and
Grams + Paddy combination in Varikuntapadu mandal and Pulses and Grams + Paddy +
Tobacco combination is reported in Kondapuram mandal.
Four Crop Combination
About 6 mandals have been reported under 4 - crops combination with various
crops in various positions in the study region during 2012-15. They are Kaligiri (Pulses +
Grams + Tobacco + Paddy + Fruit crops), Duttalur (Pulses and Grams + Tobacco + Fruit
crops +Paddy), Gudur (Fruit crops + Paddy + Pulses and Grams + Sugarcane), Vinjamur
(Pulses and Grams + Paddy + Sugarcane + Fruit crops), Kaluvoya (Paddy + Pulses and
Grams + Fruit crops + Jowar) and Atmakur (Paddy + Tobacco + Pulses and Grams +
Cotton) mandals.
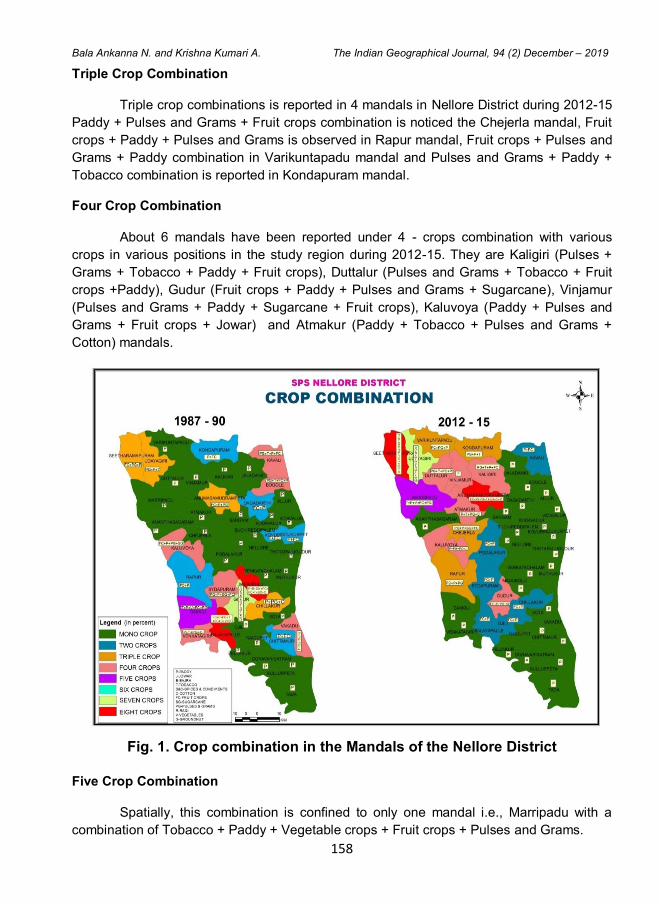
Fig. 1. Crop combination in the Mandals of the Nellore District
Five Crop Combination
Spatially, this combination is confined to only one mandal i.e., Marripadu with a
combination of Tobacco + Paddy + Vegetable crops + Fruit crops + Pulses and Grams.
159
Bala Ankanna N. and Krishna Kumari A. The Indian Geographical Journal, 94 (2) December – 2019
Six Crop Combination
This combination is completely absent in Nellore District during the 2012-15.
Seven Crop Combination
This combination is also restricted to only one mandal such as Udayagiri with the
combination (Fruit crops + Paddy + Bajra + Groundnut + Pulses and Grams + Jowar +
Sugarcane).
Eight Crop Combination
About 2 mandal have been found under 8 crop combination, such as
Sitaramapuram mandal (Paddy + Bajra + Groundnut + Pulses and Grams + Fruit crops +
Tobacco + Spices and condiments + Cotton) and Anumasamudrampeta mandal (Fruit
crops+ Paddy + Pulsesand Grams + Tobacco + Sugarcane + Cotton + vegetable crops +
Spices and Condiments) (Figure 1).
Changes in Crop Combinations (1987-90 to 2012-15)
The advent of Green revolution influenced food grain crops especially, Paddy in the
coastal and irrigated districts of Andhra Pradesh. During 25 years of period (1987-90 to
2012-15) the spatial expansion of monoculture or monocrop cultivated area is reported in
Nellore district. This expansion is spread over to 26 mandals (2012-15) from 20 mandals
(1987-90) in the district. Paddy is the only crop dominated in the entire mono crop
combination regions. The spread has been extended to southern mandals of the Nellore
District apart from the original coastal mandals of the district. In all the other combinations
spatial shrinkage is observed apart from the newly emerged 8- crop combination zone
(Table 1). This shows dominance of mono crop combination with Paddy at one end and
newly emerged diversified combination (8 – crop combination ) the other end during 25
years period. Spatial decrease of 3 mandals has been reported in 2 – crop combination,
one mandal in 3- crop combination and 4 crop combination. The number of mandals
remained unchanged under 5 crop combination during the study period. Six crop
combinations has been completely disappeared in the district. There is a shrinkage from 2
to 1 mandal in 7 – crop combination. The newly emerged 8 – crop combination has been
seeing in 2 mandals (2012-15) which was completely absent in 1987-90. Change is also
observed in the number of crops involved in the various crop combinations during 1987-90
and 2012-15 in Nellore district. About 9 – crops such as Paddy, Jowar, Bajra, Groundnut,
Tobacco, Spices and condiments, Fruit crops, Pulses and Grams and Ragi have been
reported in various combinations in different positions during 1987-90. In 2012-15 except
Ragi crop the other 8 – crops have been observed in various combinations along with 3
more new crops namely Cotton, Sugarcane and Vegetable crops in Nellore District. Ragi
crop, which is considered as an inferior millet crop, lost its ground in the crop combinations
in Nellore District (Table 1).
160
Bala Ankanna N. and Krishna Kumari A. The Indian Geographical Journal, 94 (2) December – 2019
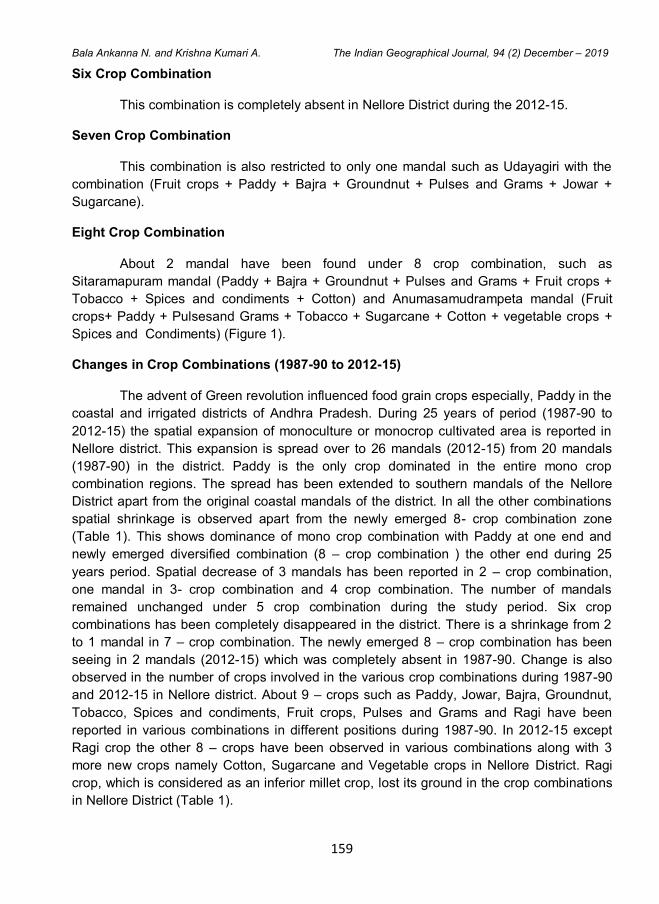
Table-1 Crop Combinations for Nellore District: 1987-1990 and 2012-2015
S No Crop combination Number of Mandals Decrease/Increase in
25 years period 1987-90 2012-15
1 Mono crop 20 26 +6
2 Two crop 9 6 -3
3 Triple crop 5 4 -1
4 Four crop 7 6 -1
5 Five crop 1 1 No change
6 Six crop 2 - -2
7 Seven crop 2 1 -1
8 Eight crop - 2 +2
Conclusions
The analysis of crop combinations in Nellore District revealed that the crop
combination with one or two crops are more significant than multiple crop combinations
both in 1987-90 to 2012-15. About 60-70 % of the mandals fall in these two combinations
only. Crop combinations with the lesser number of crops are found in Coastal lowlands and
Southern part of the district. Paddy dominates in most of the Mono crop combinations. In
contrast the combinations with more number of crops are mostly prevalent in the Western
and North Western part of the district due to dry climatic conditions.
References
1. Bala Ankanna N. (2019): Geographical Analysis of Land use and Cropping Pattern in the Cyclone prone SPS Nellore District, Andhra Pradesh, an unpublished Ph.D. Thesis, Department of Geography, Sri Krishnadevaraya University, Anantapuramu, Andhra Pradesh.
2. Gopal Das (2013): The study of Crop Combination Regions in Jalpaiguri District, West Bengal, Acme International Journal of Multidisciplinary Research, 1(9), pp. 27-33.
3. J. Murugesan, P. Gangai and K. Selvam (2018): Patterns of Crop Concentration, Crop Diversification and Crop Combination in Tiruchirappalli District, Tamil Nadu, International Journal for Innovative Research in Science and Technology, 4, pp. 32-41.
4. Kadam M.D and Shinde S.D (2018): crop Combination Regions in Sina River basin: Maharashtra, International Journal of Research in Humanities, Arts and Literature, 6, pp. 343-350.
5. Ogale S.B (2014): A study of Crop Combination Region, International Journal of Innovation and Research, pp. 329-334.
6. Sanjay Parihar (2018): An Analysis of Crop Combination and Crop Diversification in North-western India, Int, Arch, App, Sci, Techno; 9(1), pp. 06-12.
7. Vipin Kumar (2017): Study of Cropping pattern, Crop Ranking and Crop Combination in Somb River basin at lower Shiwalik Hills, International Journal of advanced Remote Sensing and GIS, 6, pp. 2297-2305.
The Indian Geographical Journal Volume 94 (2) December - 2019, pp 161-171
ISSN 0019-4824
161
A SPATIO-TEMPORAL STUDY OF THE SURFACE WATER-
SPREAD IN RURBAN ZONE OF HYDERABAD METROPOLIS
Biswabandan Satpathy1, Pratigna T.
2 and Padmaja S.
1
1 Department of Geography, UCS, Osmania University, Hyderabad - 500 007
2 Department of Geoinformatics, Telangana University, Nizamabad - 503 322
E-mail: [email protected], [email protected], [email protected]
Abstract
At no other time in the annals of human history, there has been so much of concern for
Water Resources as at present, due to gross mismanagement of available surface fresh
waterbodies, further impacted by global warming phenomena. Hyderabad, located in a
semiarid/ sub humid tract of Indian Subcontinent, is not only witnessing climatic aberrations
but also the anthropogenic impact on its waterbodies. This makes it essential to monitor its
Water Resources for better prospective Regional Planning. In this paper, an attempt is
made to evaluate the Surface Waterbodies in the Rurban Zone of Hyderabad through
spatial technological inferences.
Keywords: Surface waterbodies, Spatial Technology, Rurban Zone, Evaluation, Global
Warming,
Introduction
Fresh Water, a natural resource, is an elixir of life which is scantily available on the
Land surface. Unfortunately, this limited resource is tending to be increasingly being termed
as an economic resource, merely due to gross mismanagement and a steady decline in the
availability of this resource. It is a well-known fact that this resource is over dependent on
natural rainfall for its repletion which is unevenly distributed, making the proper
augmentation, a tough task. At no point of time in the history of mankind, there has been
such a debate on Water Resources and their management as is evidenced now. There has
been a steady increase of the climate change impact on the existing availability of water,
adding to these woes is also the deteriorating water quality.
Hyderabad was known as a city of the thousand lakes during Nizam‟s period. There
were thousands of waterbodies which fulfilled the irrigational, domestic and edible water
needs at that point of time. As the times progressed, it has been observed that there are
only countable numbers of fresh water bodies left over. Many waterbodies all around
Hyderabad have disappeared. The foresighted vision, during Nizam‟s time, was responsible
for creating a linked pond chain, so that the excess water would not be wasted, in case of
overfilling of one tank and ultimately joining a river system.
162
Biswabandan Satpathy et al. The Indian Geographical Journal, 94 (2) December – 2019
Due to warranted built up activity, majority of these ponds have been filled up and
the catchment areas of these ponds have become concrete jungles, leading to high
intensive overland flows. The recent Chennai floods are a testimony to this fact. The 2000
flood in Hyderabad, is also attributed to the same reason. Urban floods in a way are
manmade floods. Reviewing the earlier studies, few notable ones are to be addressed here:
Ritu Singh and Manu Bhatnagar (2012), in a case study of Delhi, have identified
because of land alteration and encroachment in the process of urbanization there is a sharp
decrease in surface storage of storm water resulting in increasing surface runoff and
sediment input to the streamlines and water catchments. Decreased groundwater recharge
results in decreasing groundwater flow, which reduces base flow and may eliminate dry
season flow. Altering the convexity of slopes and terrain concavity affects water gathering
and water disseminating properties.
Siddhartha Koduru and Swati Dutta (2013) in a case study of Hyderabad Urban
Development Authority region, have examined the impact of urbanization, over exploitation,
encroachment to the lakeshores and altering the catchments for cultural and religious
purposes which led in shrinking and even diminish most of the waterbodies during last 50
years. Swati Bansal (2015) studied the very similar phenomena occurring in Shri Nagar,
Jammu and Kashmir. As per her study more than 50% waterbodies have disappeared over
last century in Kashmir because of human interference and rapid urbanisation which is
taking a heavy toll on Kashmir's waterbodies. Lakes in the region get silted due to massive
erosion in the catchment area and thereby turn into land masses. Even Dal Lake, a major
tourists‟ attraction has shrunk 37% in last 36 years.
Laloo and Ranjan (2017) in an overall study of Indian urban lakes, found the major
loopholes in urban waterbody conservation are Lack of proper information, Lack of
systematic strategies and coordination, Lack of Ecosystem approach, Lack of capacity
building, Lack of balance of interest in management approaches. He also emphasized the
Spatial growth of the cities, Encroachment, Illegal mining, Eutrophication and Socio-cultural
misuse have been the catalytic drivers for shrinking or disappearing the urban waterbodies.
Similarly, several other studies have been conducted by many researchers which in
fact reveals the truth of negative impact of urbanization on its waterbodies. Keeping these
observations in view, an attempt is made in this paper to study surface fresh water bodies
in 15 - 50km radius, bounding the Rurban Zone of Hyderabad. This area is exclusive of city
water with many waterbodies like Ellamma Lake, Red lake, Devils Pond, Ali Lake,
Bhagiratha Patel Lake, Kula Lake and Mondikunta Lake, which already have shrunk to
a greater extent. Within the city region, Government is proceeding with reclamation and
rejuvenation policy of these waterbodies as waterbodies revival programme. However, a lot
more is needed to be done for the waterbodies falling within the peri-urban region of the
city. The role of spatio-temporal technology, in this type of study, is highly significant as this
can enhance the reliable data generation that further could help for a better decision
making.
163
Biswabandan Satpathy et al. The Indian Geographical Journal, 94 (2) December – 2019
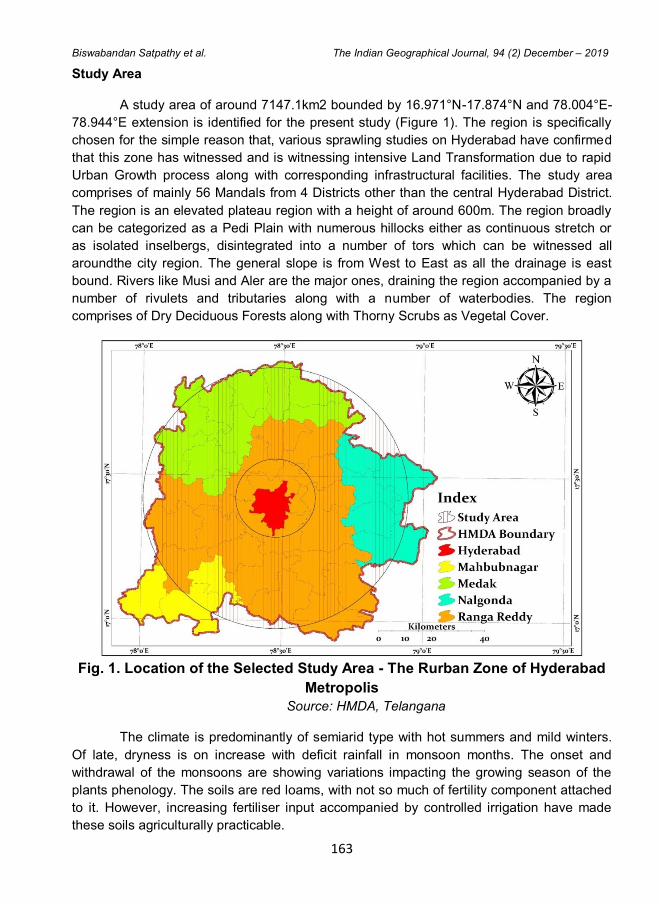
Study Area
A study area of around 7147.1km2 bounded by 16.971°N-17.874°N and 78.004°E-
78.944°E extension is identified for the present study (Figure 1). The region is specifically
chosen for the simple reason that, various sprawling studies on Hyderabad have confirmed
that this zone has witnessed and is witnessing intensive Land Transformation due to rapid
Urban Growth process along with corresponding infrastructural facilities. The study area
comprises of mainly 56 Mandals from 4 Districts other than the central Hyderabad District.
The region is an elevated plateau region with a height of around 600m. The region broadly
can be categorized as a Pedi Plain with numerous hillocks either as continuous stretch or
as isolated inselbergs, disintegrated into a number of tors which can be witnessed all
aroundthe city region. The general slope is from West to East as all the drainage is east
bound. Rivers like Musi and Aler are the major ones, draining the region accompanied by a
number of rivulets and tributaries along with a number of waterbodies. The region
comprises of Dry Deciduous Forests along with Thorny Scrubs as Vegetal Cover.
Fig. 1. Location of the Selected Study Area - The Rurban Zone of Hyderabad
Metropolis
Source: HMDA, Telangana
The climate is predominantly of semiarid type with hot summers and mild winters.
Of late, dryness is on increase with deficit rainfall in monsoon months. The onset and
withdrawal of the monsoons are showing variations impacting the growing season of the
plants phenology. The soils are red loams, with not so much of fertility component attached
to it. However, increasing fertiliser input accompanied by controlled irrigation have made
these soils agriculturally practicable.
164
Biswabandan Satpathy et al. The Indian Geographical Journal, 94 (2) December – 2019
Being “Rurban (Rural-Urban)”, the region, predominantly, is an agrarian belt. The
livelihood of the majority of the people are associated with agriculture, subordinated by
service sectors. The demand for water is enormous, not only for irrigational schemes, but
also for domestic and industrial needs, which are likely to increase in the near future. The
'Telangana Drinking Water Supply Grid' or „Mission Bhagirathi‟ is an attempt by the
Government to provide 100 litres of safe drinking water per person in rural areas, 135
LPCD for Municipalities and 150 LPCD for municipal corporations. With population
projections of 30 lakhs in another couple of years, the total water requirement would be
around 43 TMC per annum. Further, the need would be increased to around 63 TMC by
2050. In this context, the need for water resource evaluation becomes more apt and more
pertinent.
Database and Methodology
Multi Seasonal and Multi Temporal Scenes of Landsat-5 Thematic Mapper and
Landsat-8 Operational Land Imager having 30m of Spatial Resolution (WRS-2, Path-144 &
Row-48) along with 70‟s & 80‟s SOI Toposheets of 56K series on 1:50000 scale, are
selected for the Identification and comparison of the area of the Surface Waterbodies
populated within the Study Area for the years 1990 and 2015 respectively. Similarly,
multiple post monsoon 2016 Satellite Scenes of Sentinel-2 MSI of 10m spatial resolution
are taken for the identification of the plenitude of the Surface Waterbodies, which got
refilled after an abundant rainfall for the said year. The satellite scenes are classified in a
hybrid process (both Supervised and Unsupervised) using ERDAS Imagine 2015 for
accurate mapping. Vector maps are extracted from the classified images and are further
post processed using Minimum Mapping Unit (MMU) Technique in ArcGIS 10.3 for
selecting the major water catchment areas instead of the smaller negligible ones. The Area
differentiation is calculated using MS Excel. A standard parameter of 25% interval in the
shrinkage of the net catchment area of any waterbodies from 1990 to 2015, is considered
for the evaluation of the degree of shrinkage intensity.
Assuming the climate factor to have a greater impact on the water cycle, the
historical meteorological data within 0.25o interval viz. rainfall, is collected for a period of 36
years (Jan-1980 to Nov-2016), on seasonal and monthly basis, from the Web Server of
“Precipitation Measurement Mission” (Global PMM) by NASA. Thus, the database is
prepared and the analysis proceeded.
Results and Discussion
The Scenario of Waterbodies in 1990:
The scenario of waterbodies in 1990 clearly reflects the bountifulness of the nature.
Dividing the entire Study Area into 8 Zones, one can easily perceive that the West-Central
region was dotted with numerous numbers of waterbodies mostly small and few big ones.
One can come across a number of tiny dots of waterbodies, along with major rivers draining
from West to East. On the other hand, numerous waterbodies were seen dispersed
165
Biswabandan Satpathy et al. The Indian Geographical Journal, 94 (2) December – 2019
throughout the North-West, North and North-East Zones along with few rivers and rivulets
out there, covering from one hectare to few square kilometres of catchment area. Exactly
the East and the South-East region also can‟t be slurred over, as the regions also were
witnessing the major source of surface water flow through the river Musi and many other
waterbodies embodied within the agricultural lands and tableland topography of the region.
The South and South-West regions were found not to be so rich of water resources as
compared to the other 6 zones of the Study Area. These two zones seemed to be more
scorched. Mapping the total number of surface waterbodies within the Study Area during
90‟s counted up to 1147 numbers of waterbodies ranging from 1Ha - 2162.413Ha of
catchment area. Out of which 20, major known and other 15 minor unnamed waterbodies
are selected for the study of change in areal spread (Table 1). The two major water bodies
i.e. Himayat Sagar and Osman Sagar, approximately covering around 1646.70Ha and
2162.41Ha respectively, were in fact the major source of water supply to the twin cities of
Hyderabad and Secunderabad. The other major waterbodies viz. Shahmirpet Lake,
Malkapur Cheruvu, Ibrahimpatnam Lake, Rawiral Cheruvu, Bibinagar Lake, Mahbub Sagar,
Maisamma Cheruvu, Cherlaguda Tank and Tangaliapalli Lake etc. covered the area above
100 hectares. Waterbodies viz.Isnapuram Tank, Dabilpur Tank, Masab Tank, Bhima Tank,
Kalwakol Tank, Pedda Cheruvu, Timmapur Cheruvu, Kachva Tank and Pata Cheruvu were
having the area ranging from nearly 50 to 60 hectares. 15 other unnamed waterbodies were
also clearly identified for the study which were sum together covering approximately an
area of 983.297Ha within the Study Area. Overall, the waterbodies inclusive of major rivers,
approximately covered 208.742km2 of area. Out of these, the major waterbodies covering
more than one hectare of catchment area are taken into account for the present study
which covered 81.40% (169.927km2) of the total coverage by the Surface waterbodies.
Contrastingly, East of 78o30'E longitude, more open spaces were observed.
The Scenario of Waterbodies in 2015:
During 2015 it was observed that the total area under waterbodies covered only
93.84km2 which is nearly 1/3
rd of the total area as compared to 1990. Most of the smaller
unnamed waterbodies, mainly ponds seem to have disappeared. However, the major
waterbodies, witnessed earlier, continue to exist but with a shrunken area. Osman Sagar
and Himayat Sagar shrunk to 786.307Ha and 1087.377Ha area approximately, reducing by
63.637% and 33.966% when compared to earlier numbers. Waterbodies like Shamirpet
Lake, Ibrahimpatnam Lake, Bibinagar Lake, Tangaliapali Lake and Bhima Tank occupied
less than 100 hectares, i.e. 52.886, 84.161, 7.571, 14.917 and 12.791 hectares, reducing
by approximately 87.067%, 74.096%, 95.66%, 85.95% and 79.897% respectively. This is
one of the rapid areal shrinkage in recent times. RawiralCheruvu, Dabilpur Tank, Kalwakol
Tank, TimmapurCheruvu and Kachva Tank along with other 15 unnamed waterbodies
seemed to be disappeared totally in course of a 25 years of period. MalkapurCheruvu,
Mahbub Sagar, MaisammaCheruvu, Cherlaguda Tank, Isnapuram Tank, Masab Tank,
PeddaCheruvu and PataCheruvu also witnessed a remarkable shrinkage of area ranging
from 7.43% to 53.09% from 90‟sto 2015 (Table 2).
166
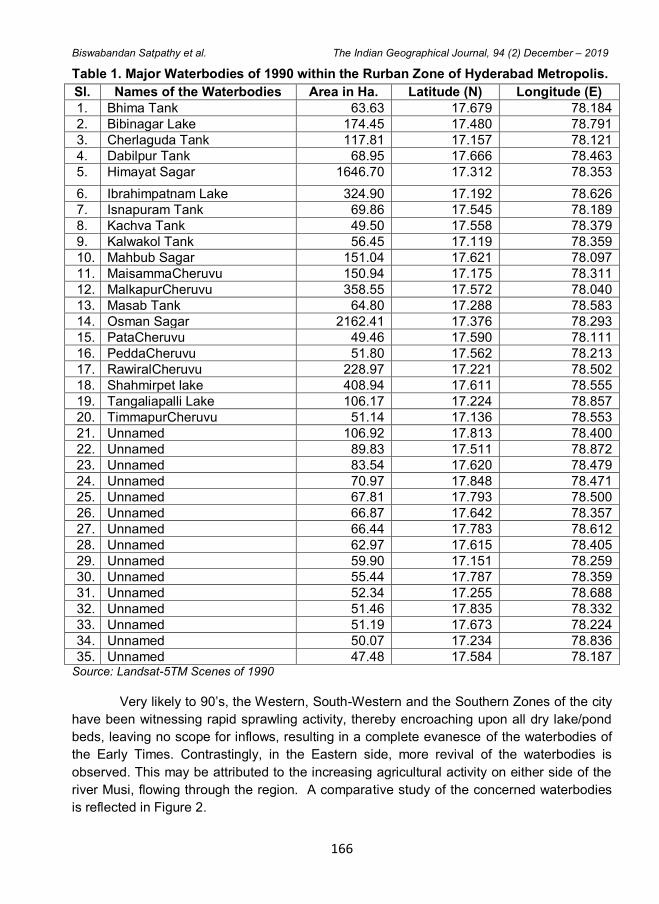
Biswabandan Satpathy et al. The Indian Geographical Journal, 94 (2) December – 2019
Table 1. Major Waterbodies of 1990 within the Rurban Zone of Hyderabad Metropolis.
Sl. Names of the Waterbodies Area in Ha. Latitude (N) Longitude (E)
1. Bhima Tank 63.63 17.679 78.184
2. Bibinagar Lake 174.45 17.480 78.791
3. Cherlaguda Tank 117.81 17.157 78.121
4. Dabilpur Tank 68.95 17.666 78.463
5. Himayat Sagar 1646.70 17.312 78.353
6. Ibrahimpatnam Lake 324.90 17.192 78.626
7. Isnapuram Tank 69.86 17.545 78.189
8. Kachva Tank 49.50 17.558 78.379
9. Kalwakol Tank 56.45 17.119 78.359
10. Mahbub Sagar 151.04 17.621 78.097
11. MaisammaCheruvu 150.94 17.175 78.311
12. MalkapurCheruvu 358.55 17.572 78.040
13. Masab Tank 64.80 17.288 78.583
14. Osman Sagar 2162.41 17.376 78.293
15. PataCheruvu 49.46 17.590 78.111
16. PeddaCheruvu 51.80 17.562 78.213
17. RawiralCheruvu 228.97 17.221 78.502
18. Shahmirpet lake 408.94 17.611 78.555
19. Tangaliapalli Lake 106.17 17.224 78.857
20. TimmapurCheruvu 51.14 17.136 78.553
21. Unnamed 106.92 17.813 78.400
22. Unnamed 89.83 17.511 78.872
23. Unnamed 83.54 17.620 78.479
24. Unnamed 70.97 17.848 78.471
25. Unnamed 67.81 17.793 78.500
26. Unnamed 66.87 17.642 78.357
27. Unnamed 66.44 17.783 78.612
28. Unnamed 62.97 17.615 78.405
29. Unnamed 59.90 17.151 78.259
30. Unnamed 55.44 17.787 78.359
31. Unnamed 52.34 17.255 78.688
32. Unnamed 51.46 17.835 78.332
33. Unnamed 51.19 17.673 78.224
34. Unnamed 50.07 17.234 78.836
35. Unnamed 47.48 17.584 78.187 Source: Landsat-5TM Scenes of 1990
Very likely to 90‟s, the Western, South-Western and the Southern Zones of the city
have been witnessing rapid sprawling activity, thereby encroaching upon all dry lake/pond
beds, leaving no scope for inflows, resulting in a complete evanesce of the waterbodies of
the Early Times. Contrastingly, in the Eastern side, more revival of the waterbodies is
observed. This may be attributed to the increasing agricultural activity on either side of the
river Musi, flowing through the region. A comparative study of the concerned waterbodies
is reflected in Figure 2.
167
Biswabandan Satpathy et al. The Indian Geographical Journal, 94 (2) December – 2019
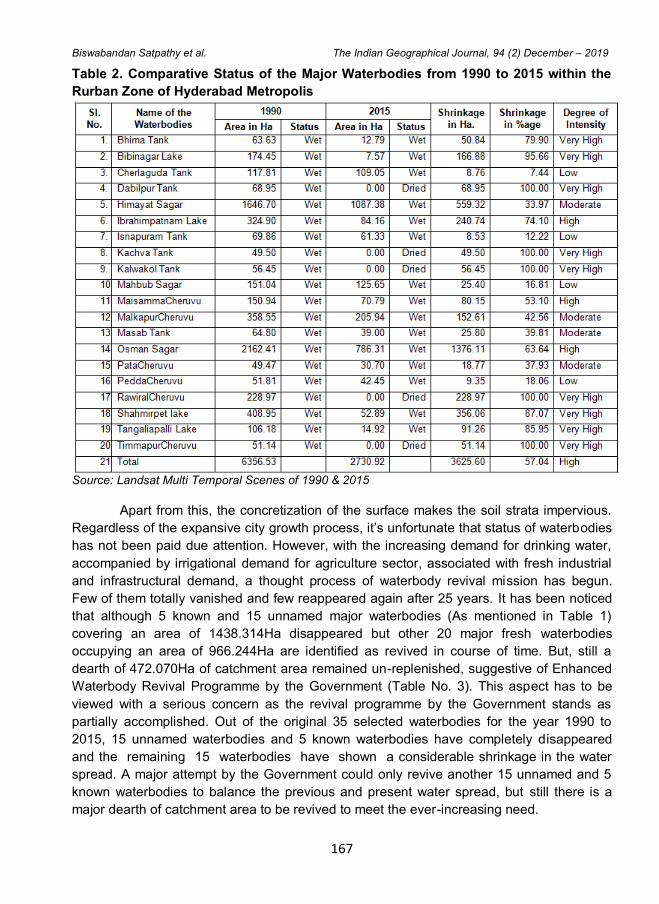
Table 2. Comparative Status of the Major Waterbodies from 1990 to 2015 within the
Rurban Zone of Hyderabad Metropolis
Source: Landsat Multi Temporal Scenes of 1990 & 2015
Apart from this, the concretization of the surface makes the soil strata impervious.
Regardless of the expansive city growth process, it‟s unfortunate that status of waterbodies
has not been paid due attention. However, with the increasing demand for drinking water,
accompanied by irrigational demand for agriculture sector, associated with fresh industrial
and infrastructural demand, a thought process of waterbody revival mission has begun.
Few of them totally vanished and few reappeared again after 25 years. It has been noticed
that although 5 known and 15 unnamed major waterbodies (As mentioned in Table 1)
covering an area of 1438.314Ha disappeared but other 20 major fresh waterbodies
occupying an area of 966.244Ha are identified as revived in course of time. But, still a
dearth of 472.070Ha of catchment area remained un-replenished, suggestive of Enhanced
Waterbody Revival Programme by the Government (Table No. 3). This aspect has to be
viewed with a serious concern as the revival programme by the Government stands as
partially accomplished. Out of the original 35 selected waterbodies for the year 1990 to
2015, 15 unnamed waterbodies and 5 known waterbodies have completely disappeared
and the remaining 15 waterbodies have shown a considerable shrinkage in the water
spread. A major attempt by the Government could only revive another 15 unnamed and 5
known waterbodies to balance the previous and present water spread, but still there is a
major dearth of catchment area to be revived to meet the ever-increasing need.
168
Biswabandan Satpathy et al. The Indian Geographical Journal, 94 (2) December – 2019
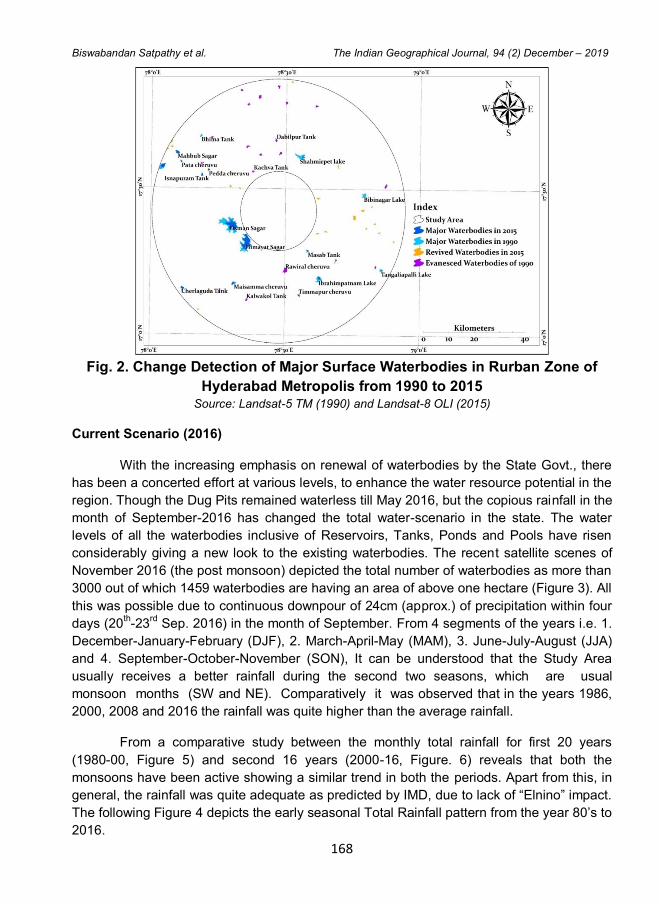
Fig. 2. Change Detection of Major Surface Waterbodies in Rurban Zone of
Hyderabad Metropolis from 1990 to 2015 Source: Landsat-5 TM (1990) and Landsat-8 OLI (2015)
Current Scenario (2016)
With the increasing emphasis on renewal of waterbodies by the State Govt., there
has been a concerted effort at various levels, to enhance the water resource potential in the
region. Though the Dug Pits remained waterless till May 2016, but the copious rainfall in the
month of September-2016 has changed the total water-scenario in the state. The water
levels of all the waterbodies inclusive of Reservoirs, Tanks, Ponds and Pools have risen
considerably giving a new look to the existing waterbodies. The recent satellite scenes of
November 2016 (the post monsoon) depicted the total number of waterbodies as more than
3000 out of which 1459 waterbodies are having an area of above one hectare (Figure 3). All
this was possible due to continuous downpour of 24cm (approx.) of precipitation within four
days (20th-23
rd Sep. 2016) in the month of September. From 4 segments of the years i.e. 1.
December-January-February (DJF), 2. March-April-May (MAM), 3. June-July-August (JJA)
and 4. September-October-November (SON), It can be understood that the Study Area
usually receives a better rainfall during the second two seasons, which are usual
monsoon months (SW and NE). Comparatively it was observed that in the years 1986,
2000, 2008 and 2016 the rainfall was quite higher than the average rainfall.
From a comparative study between the monthly total rainfall for first 20 years
(1980-00, Figure 5) and second 16 years (2000-16, Figure. 6) reveals that both the
monsoons have been active showing a similar trend in both the periods. Apart from this, in
general, the rainfall was quite adequate as predicted by IMD, due to lack of “Elnino” impact.
The following Figure 4 depicts the early seasonal Total Rainfall pattern from the year 80‟s to
2016.
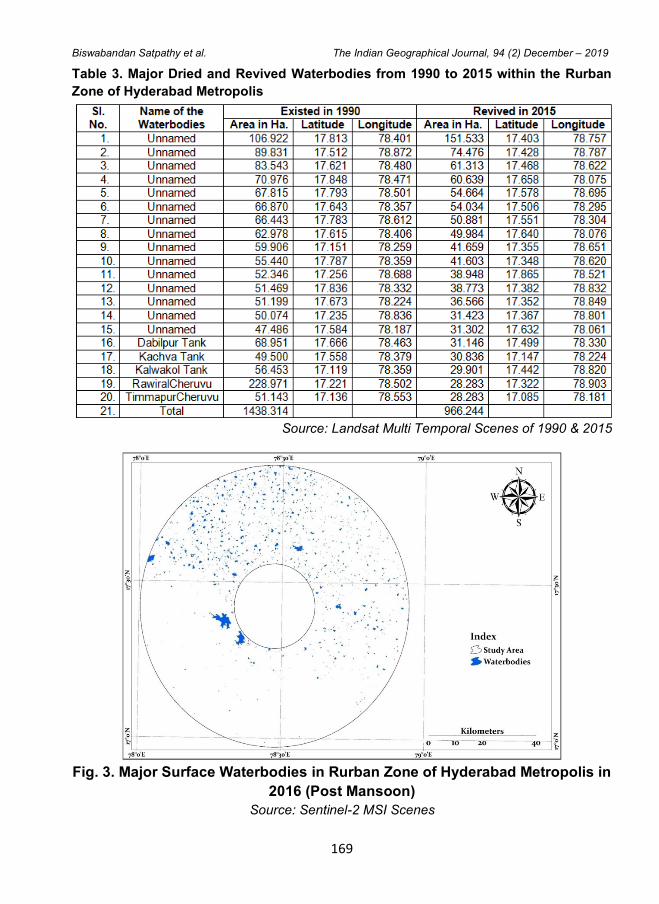
169
Biswabandan Satpathy et al. The Indian Geographical Journal, 94 (2) December – 2019
Table 3. Major Dried and Revived Waterbodies from 1990 to 2015 within the Rurban
Zone of Hyderabad Metropolis
Source: Landsat Multi Temporal Scenes of 1990 & 2015
Fig. 3. Major Surface Waterbodies in Rurban Zone of Hyderabad Metropolis in
2016 (Post Mansoon)
Source: Sentinel-2 MSI Scenes
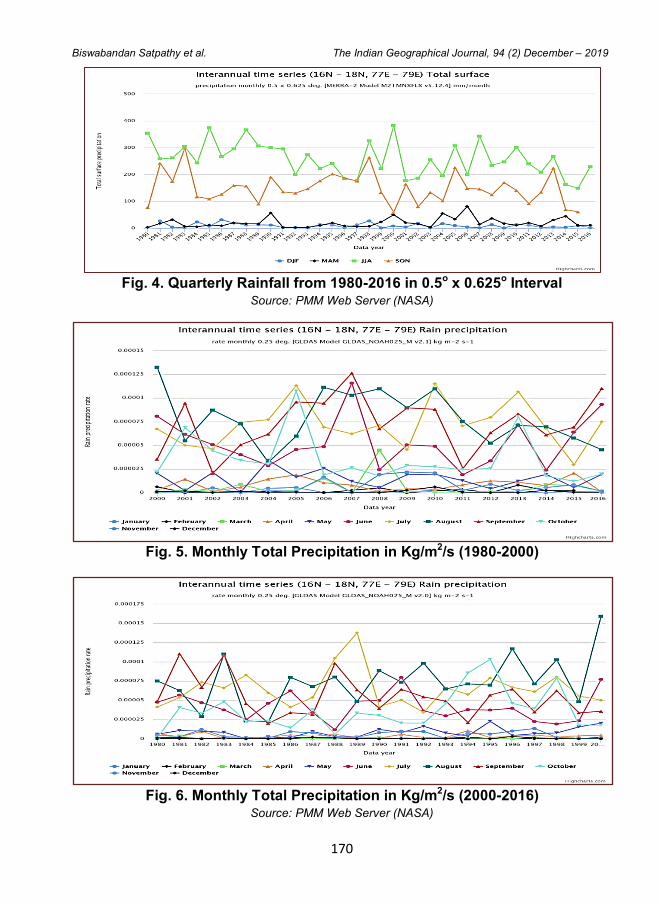
170
Biswabandan Satpathy et al. The Indian Geographical Journal, 94 (2) December – 2019
Fig. 4. Quarterly Rainfall from 1980-2016 in 0.5o x 0.625o Interval
Source: PMM Web Server (NASA)
Fig. 5. Monthly Total Precipitation in Kg/m2/s (1980-2000)
Fig. 6. Monthly Total Precipitation in Kg/m2/s (2000-2016)
Source: PMM Web Server (NASA)
171
Biswabandan Satpathy et al. The Indian Geographical Journal, 94 (2) December – 2019
Conclusion
From the preceding analysis, it can be inferred that the spatio-temporal nature of a
water spread in a region is closely linked to not only natural rainfall but also to the
manmade activities. The wisdom executed in the historical past of Hyderabad Region have
been neglected in the successive times leading to not only the water scarcity but also
manmade hazards. Revival of the waterbodies has been a successful venture in the Study
Region aided by good rainfall input as has been depicted in the said paper.
References
1. Bansal Swati (2015):“Srinagar's Dal Lake Shrinks by 36% in the Last 37 Years”, India
Water Portal.
2. Central Public Health and Environmental Engineering Organization (Cpheeo, Aug
2013): “Advisory on Conservation and Restoration of Water Bodies in Urban Areas”,
Ministry of Urban Development, Government of India, http://moud.gov.in.
3. “Churning Still Water” (2012): Centre for Science and Environment, Tughlakabad
Institutional Area, New Delhi.
4. Ramachandraiah C. and Sheela Prasad (2004): “Impact of Urban Growth on Water
Bodies: the Case of Hyderabad”, Working Paper No. 60, Centre for Economic and
Social Studies, Begumpet, Hyderabad.
5. Fazal Shahab and Amin Arshad (2011): “Impact of Urban Land Transformation on
Water Bodies in Srinagar City, India”, Journal of Environmental Protection, Scientific
Research Publication, 2011, 2, Pp142-153. Jamwal Nidhi (Oct 13 2015): “Disappearing
Lakes”, Deccan Herald.
6. Khan Kunta Hamid:“Adopt A Lake”, Hyderabad.
7. Koduru Siddhartha and Dutta Swati (2013): “Urban Ecosystems: Preservation and
Management of Urban Water Bodies”, Creative Space (Cs) Publication, Chitkara
University, Vol. 1 No. 1, Pp. 19–37.
8. National River Conservation Directorate (Nrcd, July 28 2010): “Conservation and
Management of Lakes – An Indian Perspective”, Moef, Government of India, New
Delhi.
9. Ramesh N. and Krishnaiah S. (2013): “Scenario of Water Bodies (Lakes) in Urban
Areas- A Case Study on Bellandur Lake of Bangalore Metropolitan City”, Iosr Journal of
Mechanical and Civil Engineering (Iosr-Jmce), Volume 7, Issue 3 (Jul. - Aug. 2013), pp
06-14.
10. Rustogi Paridhi and Singh S. K. (2017): “Ecological Benefits of Reviving Urban Water
Bodies Using Rainwater Harvesting”, International Journal of Advance Research and
Innovation, Volume 5 Issue 2 (2017) Pp283-285.
11. Sauni Wan Lenar Laloo and Alok Ranjan (2017): “Urban Development Impacts on
Water Bodies: A Review in India”, International Journal on Emerging Technologies 8(1):
pp363-370.
12. Sikdar Prabeerkumar (2016): “Shrinking Lakes Cause of Alarm”, the Times of India.
The Indian Geographical Journal
Volume 94 (2) December - 2019, pp 172-184
ISSN 0019-4824
172
A CRITICAL ANALYSIS ON THE COMMERCIALISATION OF
THE FOREST ECOSYSTEM THAT AFFECTS THE EXISTENCE
OF TRIBAL CULTURE AND CHALLENGES THE
SUSTAINABILITY OF FORESTS OF CHITTERI HILLS,
EASTERN GHATS
Narmada K. and Bhaskaran G.
Centre for Water Resources Management, University of Madras, Guindy, Chennai - 600 025
E-mail: [email protected], [email protected]
Abstract
Commercial opportunities for tribal communities as a result of decentralisation and
democratisation have a deeper impact on tribal culture. The present study is based on the
Malayali Tribe of the Chitteri Hills of the Eastern Ghats located at the Tamil Nadu state of
South India. Research findings indicate that the biological properties of many tropical
species face the stage of extinction. The transition of tribal culture from subsistence
agriculture to commercial exploitation has higher risk on forest ecosystem sustainability. No
longer has the younger tribal population depended on forest for their livelihood but they
have experienced opportunities outside the forest. It is difficult to objectively measure the
degree of commercialisation on tribal culture and ecosystem sustainability, because of the
complex linkage between commercialisation and change in tribal culture and ecosystem
sustainability.
Keywords: Tribal Culture, Forest Ecosystem, Commercialisation, Ecosystem, Sustainability
Introduction
The forest dwelling scheduled tribes in India are residing on their ancestral lands
from ancient times. They are integral to their very survival and sustainability of the forest
ecosystems. The most interesting aspect of tribal economy is that though a majority of the
tribal population depends on agriculture, yet they do not depend on it exclusively. Their
economy is also based on the collection of forests and it is considered as a significant
occupation among the tribal people. Collection the forest products like the fruits and nuts,
honey and even dried leaves is a common practice in these areas. These inexpensive
materials can be collected almost throughout the year and has become a dependable
source of income for the tribal people in this region.
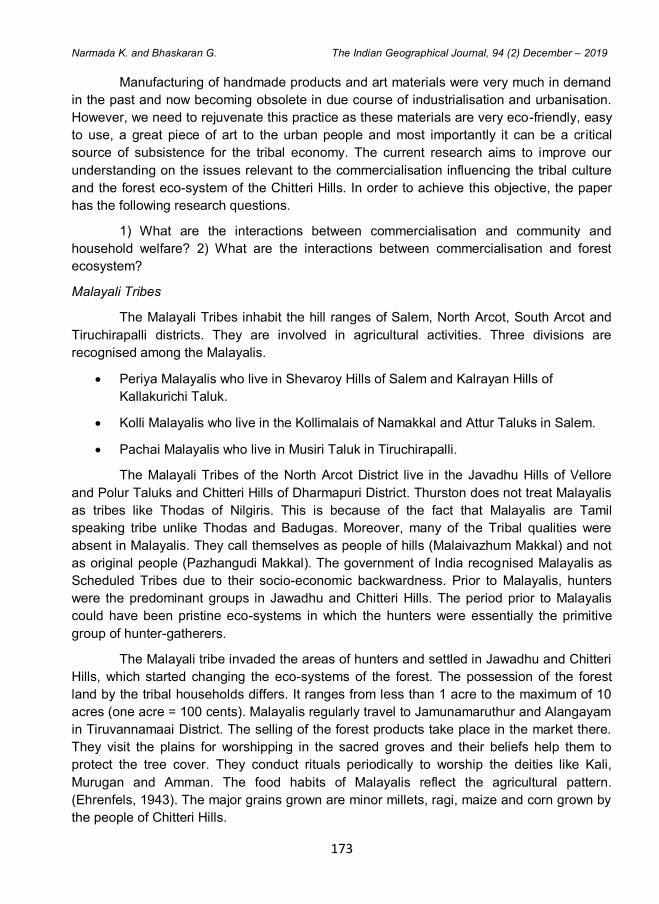
173
Narmada K. and Bhaskaran G. The Indian Geographical Journal, 94 (2) December – 2019
Manufacturing of handmade products and art materials were very much in demand
in the past and now becoming obsolete in due course of industrialisation and urbanisation.
However, we need to rejuvenate this practice as these materials are very eco-friendly, easy
to use, a great piece of art to the urban people and most importantly it can be a critical
source of subsistence for the tribal economy. The current research aims to improve our
understanding on the issues relevant to the commercialisation influencing the tribal culture
and the forest eco-system of the Chitteri Hills. In order to achieve this objective, the paper
has the following research questions.
1) What are the interactions between commercialisation and community and
household welfare? 2) What are the interactions between commercialisation and forest
ecosystem?
Malayali Tribes
The Malayali Tribes inhabit the hill ranges of Salem, North Arcot, South Arcot and
Tiruchirapalli districts. They are involved in agricultural activities. Three divisions are
recognised among the Malayalis.
Periya Malayalis who live in Shevaroy Hills of Salem and Kalrayan Hills of
Kallakurichi Taluk.
Kolli Malayalis who live in the Kollimalais of Namakkal and Attur Taluks in Salem.
Pachai Malayalis who live in Musiri Taluk in Tiruchirapalli.
The Malayali Tribes of the North Arcot District live in the Javadhu Hills of Vellore
and Polur Taluks and Chitteri Hills of Dharmapuri District. Thurston does not treat Malayalis
as tribes like Thodas of Nilgiris. This is because of the fact that Malayalis are Tamil
speaking tribe unlike Thodas and Badugas. Moreover, many of the Tribal qualities were
absent in Malayalis. They call themselves as people of hills (Malaivazhum Makkal) and not
as original people (Pazhangudi Makkal). The government of India recognised Malayalis as
Scheduled Tribes due to their socio-economic backwardness. Prior to Malayalis, hunters
were the predominant groups in Jawadhu and Chitteri Hills. The period prior to Malayalis
could have been pristine eco-systems in which the hunters were essentially the primitive
group of hunter-gatherers.
The Malayali tribe invaded the areas of hunters and settled in Jawadhu and Chitteri
Hills, which started changing the eco-systems of the forest. The possession of the forest
land by the tribal households differs. It ranges from less than 1 acre to the maximum of 10
acres (one acre = 100 cents). Malayalis regularly travel to Jamunamaruthur and Alangayam
in Tiruvannamaai District. The selling of the forest products take place in the market there.
They visit the plains for worshipping in the sacred groves and their beliefs help them to
protect the tree cover. They conduct rituals periodically to worship the deities like Kali,
Murugan and Amman. The food habits of Malayalis reflect the agricultural pattern.
(Ehrenfels, 1943). The major grains grown are minor millets, ragi, maize and corn grown by
the people of Chitteri Hills.
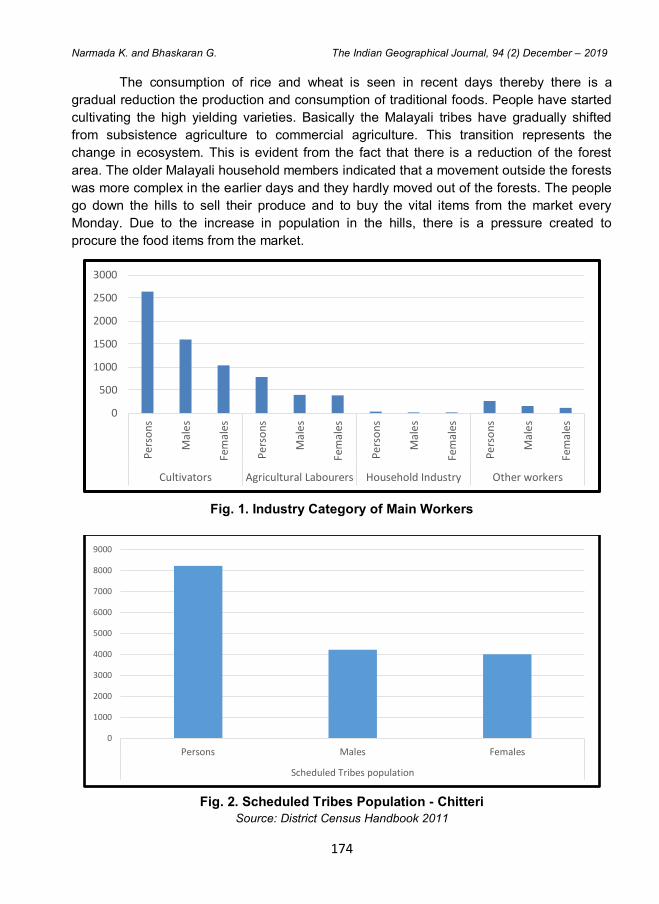
174
Narmada K. and Bhaskaran G. The Indian Geographical Journal, 94 (2) December – 2019
The consumption of rice and wheat is seen in recent days thereby there is a
gradual reduction the production and consumption of traditional foods. People have started
cultivating the high yielding varieties. Basically the Malayali tribes have gradually shifted
from subsistence agriculture to commercial agriculture. This transition represents the
change in ecosystem. This is evident from the fact that there is a reduction of the forest
area. The older Malayali household members indicated that a movement outside the forests
was more complex in the earlier days and they hardly moved out of the forests. The people
go down the hills to sell their produce and to buy the vital items from the market every
Monday. Due to the increase in population in the hills, there is a pressure created to
procure the food items from the market.
Fig. 1. Industry Category of Main Workers
Fig. 2. Scheduled Tribes Population - Chitteri
Source: District Census Handbook 2011
0
500
1000
1500
2000
2500
3000
Pe
rso
ns
Mal
es
Fem
ales
Pe
rso
ns
Mal
es
Fem
ales
Pe
rso
ns
Mal
es
Fem
ales
Pe
rso
ns
Mal
es
Fem
ales
Cultivators Agricultural Labourers Household Industry Other workers
0
1000
2000
3000
4000
5000
6000
7000
8000
9000
Persons Males Females
Scheduled Tribes population
175
Narmada K. and Bhaskaran G. The Indian Geographical Journal, 94 (2) December – 2019
Study Area
The study area Chitteri hills, a part of Southern Eastern Ghats is situated in Harur
Taluk, Dharmapuri in Tamil Nadu. It is situated towards North East of Salem district within
the geographical limit of 78°51’10” - 78°32’40” E, longitude and 11°55’14” – 12 °4’48” N
latitude and occupies an area of about 654 km2.
Database and Methodology
The research was conducted after adopting various analytical techniques, so as to
understand the impact of commercialisation of the forest ecosystem in Chitteri Hills. The
total population of the Tribes in the Chitteri Hills is 9647 living in around 1604 households
(Census of India, 2011). 10 percent of the number of the households were considered for
the study. Simple random sampling was adopted and selection was done to accommodate
the families in and around the hills. The present study is based on primary data collected
from each household to understand the socio-economic status and occupation structure
and the change in working population with the help of a well-structured questionnaire and
face to face interview. Both qualitative and quantitative aspects has been considered for the
study.
The hills form a compact block consisting of several hill ranges and contain tangled
ridges and ravines running in the North East and South West directions, enclosing many
narrow valleys, rivers viz., Kallar, Varattar, Kambalai and Anaimaduvu (Harur Forest office
Report, 2007). In the western region, Thottilmadu rivulet join with Varattar rivulet and reach
Varattar dam or Vallimadurai dam located in the foot hills of Chitteri near Vallimadurai
village. Kalmaduvu rivulet flows towards southern region and reach Puluthikuttai dam of
Salem district. The Kottar rivulet flows towards Eastern region and joins with Kottapatti
rivulet and reach Sattnur dam of Tiruvannamalai District.
Non-Timber Forest Products
A NTFP literally means every natural resource from the forest except timber. The
hunter gathering tribes and the settled agriculture tribes totally depend on the forest for their
livelihood and their way of life is no way harm the sustainability of the forest. However, their
property rights, harvesting practices and management strategies largely decide the
sustainability of forest eco-system.
Forests feature predominantly in tribal development because they depend on a
wide variety of plants, animals for their own use and for sale. Forest products have
commercial markets and generate substantial revenues. In the search for development,
forests provide a flow of valuable products. If people’s life is to be improved in an
environment friendly way, it should be without being subject to the destructive way of
harvesting. Commercialisation culture of tribal helps to understand the relationship between
forest products, poverty reduction and sustainable forests.
176
Narmada K. and Bhaskaran G. The Indian Geographical Journal, 94 (2) December – 2019
The degree of relationship between the contributions of forest products to the
household economy measured in terms of the ratio of total cash and in kind income and the
degree to which tribal households are integrated into the cash economy. In subsistence
oriented tribal households, more than half of the cash income comes from selling forest
products. They tend to be located in relatively remote areas with abundant forests and
limited transportation infrastructure. The land which they cultivate is licensed land; ensure
the rights of sales only to a tribal and access to other forest resources is open. They
supplement their agricultural income with gathering or extracting NTFPs. Off-farm activities
help make ends meet the return often find insufficient to lift tribal households out of poverty.
In the Chitteri Hills range, these tribal households tend to invest very little effort in cultivation
and rely on NTFPs which has been declining as a result of overexploitation, inefficient
management and loss of habitat.
Malayali tribe generally extract NTFPs in times of the year in which income from
cultivation or from other sources is low. The labour requirements for extracting for NTFPs is
relatively high when compared to agriculture or off-farm labour. They do the job when
labour requirements for agriculture are low. NTFPs are more important to the low income
tribal people. But poverty alleviation requires increased trade of NTFPs results in an
increase in income. Change in the tribal culture induced by commercialisation cause
resource depletion. Tenure security need not necessarily lead to sustainable harvest of
NTFPs but it may change the attitude for conservation. Moreover, people do not necessarily
prioritise long-term availability of resource for their future economic security.
Table1. Important Non-Timber Forest Product of Chitteri Hills
Local Name Botanical Name
Tamarind Tamarindus Indica Nellikai Phylinthus emblica Yettikottai Strychnos mix-vomica Avaram bark Cassia auriculata Konnai bark Cassia siamea Kadukkai Terminali chebula Pungan Pongamia glabra Tagarai Cassia siamia Mani Pungan Sapindus emarginata Seekai Acacia sinuta Woodapple Feronia elephantum Elandai Zizyphus maurtiana Kilakkai Carissa carandas Setha Anona squamosa Thuringimaramn Alibizzia amara Alingimaram Alangium lamarckii Arasamaram Ficus religiosa Veppalaimaram Wrightia tomentasa Kattu elumichai Atalantia monophylla Sundakai Solanum trilobatum
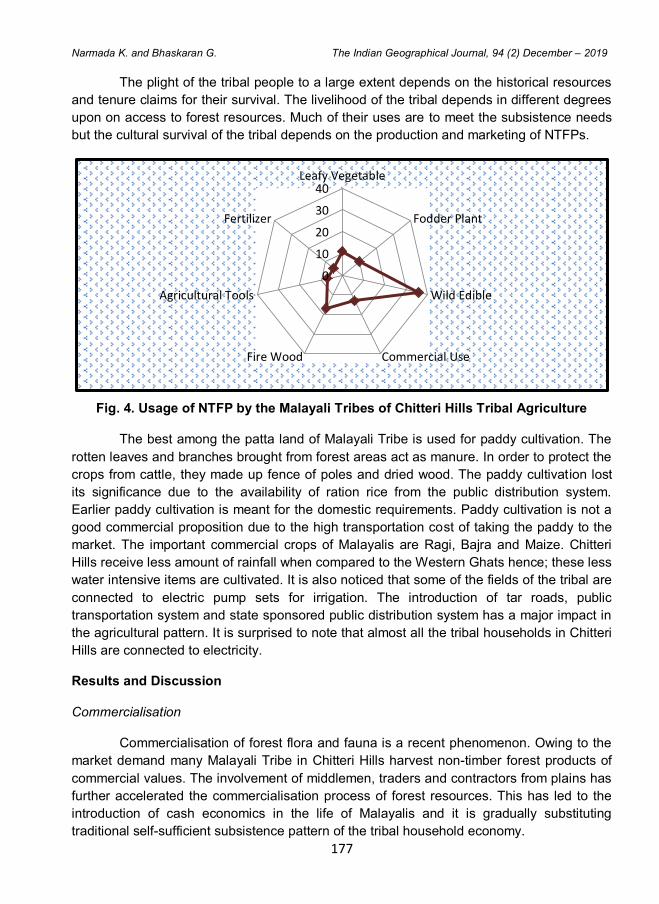
177
Narmada K. and Bhaskaran G. The Indian Geographical Journal, 94 (2) December – 2019
The plight of the tribal people to a large extent depends on the historical resources
and tenure claims for their survival. The livelihood of the tribal depends in different degrees
upon on access to forest resources. Much of their uses are to meet the subsistence needs
but the cultural survival of the tribal depends on the production and marketing of NTFPs.
Fig. 4. Usage of NTFP by the Malayali Tribes of Chitteri Hills Tribal Agriculture
The best among the patta land of Malayali Tribe is used for paddy cultivation. The
rotten leaves and branches brought from forest areas act as manure. In order to protect the
crops from cattle, they made up fence of poles and dried wood. The paddy cultivation lost
its significance due to the availability of ration rice from the public distribution system.
Earlier paddy cultivation is meant for the domestic requirements. Paddy cultivation is not a
good commercial proposition due to the high transportation cost of taking the paddy to the
market. The important commercial crops of Malayalis are Ragi, Bajra and Maize. Chitteri
Hills receive less amount of rainfall when compared to the Western Ghats hence; these less
water intensive items are cultivated. It is also noticed that some of the fields of the tribal are
connected to electric pump sets for irrigation. The introduction of tar roads, public
transportation system and state sponsored public distribution system has a major impact in
the agricultural pattern. It is surprised to note that almost all the tribal households in Chitteri
Hills are connected to electricity.
Results and Discussion
Commercialisation
Commercialisation of forest flora and fauna is a recent phenomenon. Owing to the
market demand many Malayali Tribe in Chitteri Hills harvest non-timber forest products of
commercial values. The involvement of middlemen, traders and contractors from plains has
further accelerated the commercialisation process of forest resources. This has led to the
introduction of cash economics in the life of Malayalis and it is gradually substituting
traditional self-sufficient subsistence pattern of the tribal household economy.
0
10
20
30
40Leafy Vegetable
Fodder Plant
Wild Edible
Commercial UseFire Wood
Agricultural Tools
Fertilizer
178
Narmada K. and Bhaskaran G. The Indian Geographical Journal, 94 (2) December – 2019
The modern tribal people get more than 50 per cent of their cash income from off-
farm activities. Owing to modernization and the thirst of consumerism modern tribal people
make relatively large trade in mature markets yield higher income. The size of tribal
household income depends on property rights, size of land, accessibility to markets and the
opportunity costs of labour. Modern tribal enjoy better transportation facilities and other
physical infrastructure such as communication and electricity. There is a tendency among
them to overexploit forest products. In this situation forestry is generally the default option.
The areas located nearer to the market, definite tenure rights for land, less
requirement of labour for cultivation and by using labour readily available at low periods in
the agricultural cycle tended to have higher incomes. Trade in many of the NTFPs has
developed only recently. It has proportionately increased with the availability of new
products in the market. The gathering of the forest products from the wild is associated with
subsistence oriented livelihood strategies. Gathering from wild does not always mean
gathering from an undisturbed natural forest. Sustainable forests naturally regenerate
resources in order to improve the quality of life of the tribal people.
Commercialisation is an effort of tribal households for socio-economic and political
empowerment. The question of ownership of land and control of access to NTFPs
determine the extent of poverty and wealth distribution among them. The issues of
ownership and control of resources form the central to socio-political studies of
commercialisation. Women play an important role in the harvesting, processing of the
NTFPs, while men do the job of marketing. The examination of land tenure reflects
commercialisation. The major challenge of the tribes for the economic empowerment is the
difficulty of getting their goods to the market and to receive fair prices for their products. In
Chitteri Hills, the Malayali Tribe has two forms of access rights. They enjoy the benefits of
both private property resources where they cultivate and being the member of the village
forest council they enjoy the benefits of non-timber forest products. Individual tribal
households have private rights to specific land surrounding their dwellings. The NTFPs on
forest land are common property which are protected and harvested jointly by the tribal
households.
Medicinal Plants
The tribal knowledge of medicinal use of plants is still an unexploited area. In the
1780s an employee of the British East India Company convinced botanists in England to
establish a network of naturalists in India reporting to the Kew Garden (British Imperial
Institute), (Grove 1995). A majority of NTFPs in Chitteri Hills is for medicinal use. The
genesis of Indian native medicines of Ayurveda and Sidha can be traced to what called
ethno medicines is practiced by the tribal communities. It is observed that the tribal
knowledge of medicine is either on the verge of extinction or being destroyed. At present
tribal depend more on trained doctors of town which give them immediate relief from pain. It
is reported that forest herbs and leaves are the best medicines for immunity, fertility,
abortion, asthma etc.
179
Narmada K. and Bhaskaran G. The Indian Geographical Journal, 94 (2) December – 2019
Market
Tribes are considered to be the most economically impoverished community of
India. The net income contributed by Malayali Tribe showed an inverse relationship
between percentage of income derived from NTFPs and total household income. The poor
tribal households of interior forest relatively depend on economic support from NTFPs
collection. The poor tribal households engage in NTFPs extraction in the absence of
alternative income sources. The poor households with surplus labour and low opportunity
cost accept less paid wage employment. Some of the tribal households undertake intensive
forest agriculture. The output per unit of land is higher than non-forest agriculture but the
income per hectare of land in forest is lower than that in non-forest areas depending on the
distance of the land from the market. Some of the tribal households in Chitteri Hills hire ass
to transport their agricultural products to the market. The transportation cost accounts for a
substantial portion of the revenue from the sales.
Most of the people interviewed highlighted a fixed life based on agriculture. At
present in the list of necessities many more items are included. The number of items
included in the consumption basket persuades them to find alternative income earning
sources. Some of the tribal households sell their labour outside the forest even at a long
distance. It indicates that tribal no longer depend forest for improving their livelihood but
search for opportunities that give better opportunity cost. It indicates that the dependence of
tribal on the forest decreases with the percentage of educated members in the family and
income from other vocations. The interviews highlighted the preference of the tribal for
vocations rather than the forest dependence. The tribal people who have greater
dependence on the forest did not improve their living standards significantly. In a situation
of rising commercial values, the tribal people can be subject to exploitation. There are some
tribal households complained that some of them were the victims of theft cases even if they
are innocent.
In the areas where communication and transportation facilities are poor, the costs
of transportation to the market are high. The trading of NTFPs reflects the prevailing social,
economic and geographical considerations of tribal people. In some household’s producers
themselves act as traders and in other cases middlemen visit their dwellings to procure the
NTFPs produced by the tribal households. But in majority of the cases, middlemen are
accused of exploiting producers and their excessive profit share leaving the producers a
paltry sum. Certainly the middleman or traders have the advantage of the weak bargaining
power of the producers. The tribal people sell the same NTFPs of the same quality at
different prices in different locations of the forest. The tribal households are exploited while
selling their forest produces and labour. They sell their agricultural products to the Chitteri
market every Friday. The traders come to the market from outside who act uniquely to
procure these products at a lesser price. For some of the NTFPs, the price difference
between the local forest market and the main market is more than 10 times. The tribal
population sell their labour for various construction activities in the forest areas.
180
Narmada K. and Bhaskaran G. The Indian Geographical Journal, 94 (2) December – 2019
The contractors get full wages from the forest department but pay them only a
fraction. This results in entering a relationship between money lenders and poor people.
This has implications for commercialisation because once the produces consumed by the
tribal households sold in the market in order to pay the debts. The role of middleman is
blamed an important reason for the poverty of tribal in Chitteri Hills.
It is noted that the profit margins of the middlemen can be over emphasised
because of the reasons that they bear high transportation costs, financial risks and
unpredictable market. The middlemen therefore try to shift the burden on the tribe who are
ignorant about the outward market. The tribal also face uncertain market for their NTFP
because local trader come to the market only when the agricultural products of the tribal are
very cheap when compared to the other markets. The monopoly control of the traders
acting under a cartel makes producers powerless to capture good returns for their
producers.
The village forest council is a step towards reducing the control of the middlemen in
order to get a greater share of benefit to the tribal households. But it is reported that the
tribal people receive a little as 10 to 40 percentages of the sale price as a return to the
forest council which will be circulated among the tribal households (village forest council
members).
Village Forest Council
In Chitteri Hills, Village Forest council is the popular strategy to harvest NTFPs from
State Forest reserves. The very objective of the council is to integrate local tribal community
NTFPs. Chitteri Hills witness participatory forest management with focus on NTFPs. The
village forest council is an alternative management strategy to solve the problems of
degradation of forests and growing conflict between forest dependent tribal communities
and the forest staff. Many of the villages of tribal households in Chitteri Hills come under the
control of the Panchayat administration. Despite the situation where official management of
forest use lay outside village control, they did create the village forest council to manage
and protect their legally designated Panchayat forest. Through management in the village
forest council, the tribal households participate in forest protection in return for NTFPs,
employment and net cash benefits from rotation of sales. It is noted that some tribal
households are not members of village forest council, because they don’t have time to
participate in the council at the cost of their agriculture. Therefore, relatively rich and interior
tribal households are found less as members in village forest council.
Tenure system provides the rules and regulations to harvest forest resources,
including ownership and corresponding rights. The defining characteristic of extractive
reserves is a specialised tenure arrangement between the state and the tribal. Extractive
reserves are forest areas inhabited by tribal population granted long term rights to forest
resources which they collectively manage (Joint Forest Council). The extractive reserves
are state owned where the rights of forest are allocated only to the tribal people.
181
Narmada K. and Bhaskaran G. The Indian Geographical Journal, 94 (2) December – 2019
This arrangement is viewed attractive because it appears socially just form of forest
land use for promoting socio-economic development of tribal and environmental
conservation. The basic principle of this exercise is the sustained extraction of renewable
commercial forest products by traditional resident population or indigenous or tribal
population. There is socioeconomic and conservation implications of tenure arrangement.
Tribal Culture
Perceptions of modern lifestyle make forest based activities less attractive.
Regional development changes the culture of tribal people. New roads alternative sources
of wage income, government policies protecting the interests of tribal make forests less
attractive. The Malayali Tribe fast shift from natural resources based activities of forestry to
wage employment in the secondary and tertiary sectors. Perceptions of modernity make
such possibilities highly attractive especially for younger generations. The introduction of 35
kgs of free rice per tribal household per month, 1 per cent reservation of educational and
job opportunities in government sector and the efforts of tribal welfare societies in Chitteri
Hills transform agriculture and harvesting of NTFPs less remunerative. Moreover, the
younger and educated tribal people consider these productions as backwards. The Malayali
Tribe of Chitteri Hills shows mass migration of younger generation to different metropolitan
cities such as Bangalore, Chennai and Pune. They look forward new ways to make a living
comparable to their brothers in other parts of the country. This change made ageing labour
force in tribal agriculture in forests.
The younger generation of the Malayali is in the transitional stage of tribal culture
while the old generation feels a mysterious bond between man and other animals and a
symbiotic relationship with the cattle. The tribal ethics of forest sprang among the
fundamental facts of their existence. The tribal dependent on the fertility of the forest areas
are basically to meet their agricultural needs. They use the edibles among the wild fruits,
leaves and roots besides honey. Majority of the forest depending tribal in Chitteri Hills build
their houses with bamboos, forest leaves and hay. Majority of these are substituted by
concrete houses at present. The younger generation of Malayali Tribes of Chiiteri hills has
been forced to discard the traditional way of life and they started adapting to the changing
situations. The important consequence of the high degree of commercialisation leads to
ultimate destruction of tribal life and their culture. With a disappearance of the important
tribal culture, practical understanding of ecological relationship between the society and the
environment is disturbed.
The loss of ecological knowledge among these ecosystem people of the Chitteri
Hills area is one of the serious issues of concern. The tribal superstitions like worshipping
trees for happy life could enforce or at least support ecological considerations though they
do not fully realise the significance. It is superior to the value system compared to what we
see in the present times. The unsustainable harvesting of forest was considered as a taboo
for the fear of antagonising the rules of deities represented by various aspects of nature.
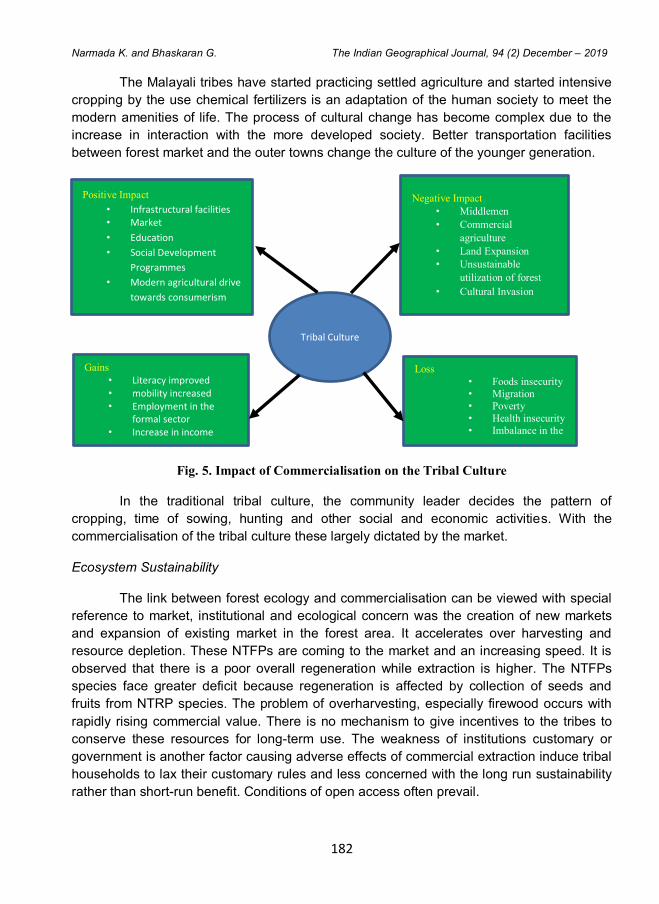
182
Narmada K. and Bhaskaran G. The Indian Geographical Journal, 94 (2) December – 2019
The Malayali tribes have started practicing settled agriculture and started intensive
cropping by the use chemical fertilizers is an adaptation of the human society to meet the
modern amenities of life. The process of cultural change has become complex due to the
increase in interaction with the more developed society. Better transportation facilities
between forest market and the outer towns change the culture of the younger generation.
Fig. 5. Impact of Commercialisation on the Tribal Culture
In the traditional tribal culture, the community leader decides the pattern of
cropping, time of sowing, hunting and other social and economic activities. With the
commercialisation of the tribal culture these largely dictated by the market.
Ecosystem Sustainability
The link between forest ecology and commercialisation can be viewed with special
reference to market, institutional and ecological concern was the creation of new markets
and expansion of existing market in the forest area. It accelerates over harvesting and
resource depletion. These NTFPs are coming to the market and an increasing speed. It is
observed that there is a poor overall regeneration while extraction is higher. The NTFPs
species face greater deficit because regeneration is affected by collection of seeds and
fruits from NTRP species. The problem of overharvesting, especially firewood occurs with
rapidly rising commercial value. There is no mechanism to give incentives to the tribes to
conserve these resources for long-term use. The weakness of institutions customary or
government is another factor causing adverse effects of commercial extraction induce tribal
households to lax their customary rules and less concerned with the long run sustainability
rather than short-run benefit. Conditions of open access often prevail.
Positive Impact
• Infrastructural facilities • Market
• Education
• Social Development
Programmes
• Modern agricultural drive
towards consumerism
Negative Impact
• Middlemen
• Commercial
agriculture
• Land Expansion
• Unsustainable
utilization of forest
• Cultural Invasion
Gains
• Literacy improved • mobility increased • Employment in the
formal sector • Increase in income
Loss
• Foods insecurity
• Migration
• Poverty
• Health insecurity
• Imbalance in the
ecosystem
Tribal Culture
183
Narmada K. and Bhaskaran G. The Indian Geographical Journal, 94 (2) December – 2019
The hunting and trapping often exceeds sustainable forest rates. Hunting is often
not meant for domestic consumption but for commercial exploitation. Some senior tribal
people accepted a drastic disappearance of many animals in the Chitteri Hills in the past
ten years. Development activities instead of assimilating have alienated tribal communities.
Development of road facilities in Chitteri Hills accelerated commercialisation and the
dependence of Malayalis outside the forest for income generation disrupted the traditional
tribal production techniques and they have been deprived of the forest and forest produce.
The assimilation and integration of tribal communities with the rest of the society does not
take place due to the feelings of insecurity and absence of freedom, quality and mutual
respects. In Chitteri Hills the species richness of tropical forest eco-system is in the brink of
extinction and the forest eco-system is warned of the perils of deforestation.
Some argued that the extraction of non-timber forest resources by the tribes may
lead to biotic impoverishment (Nepstad et al., 1992). It may be due to over harvesting,
reduced populations of dispersal agents through hunting, low germination rates,
dependence on large openings and burning beneath adult trees. But it is felt that extractors
are the beneficiaries of forest resources hence they have in incentive to maintain the
resources. The biotic impoverishment will continue within extractive reserves as long as
cattle are viewed as the main investment of surplus income. But the extractive model based
on village forest council is appreciated because of its economic viability, environmental
conservation and social equity.
The Chitteri Hills also face the problem of significant amount of timber and non-
timber forest products illegal commercial extraction. The Tribes claim that illegal extraction
often coincides with a breakdown of authorities without replacing them with effective
authorities. The survivals of effective and honest foresters have to face problems from co-
workers and illegal fellers. In India under state ownership, the conditions of the forests
deteriorated and tribal communities and other forest dwellers had no interest in
conservation without management rights or ownership (Pachauri, 1990).
The growing market demand for certain forest products can lead to an increase in
natural resource crime and associated phenomena of violence and corruption. Sandalwood
is the costly timber used for the manufacture of medicine, cosmetic products and costly
furniture which often subject to the category of natural resource crime leading to negative
ecological and economic outcomes. In Chitteri Hills, the high price of super quality sandal
wood was the prime reason for the change of the resource base over time.
Rising prices do lead to increase in harvesting through illegal sandalwood
harvesting. If the returns from the extraction are lesser than the marginal cost of illegal
harvesting, this precludes botanical extinction. Forest management is essential to promote
economic development by maintaining and even increasing production while maintaining or
improving ecological conditions. The way of life of Malayali Tribe involves the management
of forest. The practices are founded on acquiring flora and fauna sustainably for
generations living in forest.
184
Narmada K. and Bhaskaran G. The Indian Geographical Journal, 94 (2) December – 2019
Conclusions
The results of the present study reveal the ecological effects of commercialisation
of forest products and the constraints of sustainable extraction due to the change in the
tribal culture. Research findings indicate that the biological properties of many tropical
species face the stage of extinction. The transaction of tribal culture from substance
agriculture to commercial exploitation has higher risk on forest ecosystem sustainability.
High biodiversity forest inhibits commercial exploitation if tribal culture remains static. The
change in tribal culture with limited biodiversity, high population densities and clustered
distribution of tribal dwellings make commercial exploitation of forest simple. No longer has
the younger tribal population depended on forest for their livelihood but they tasted
opportunities outside the forest. It is difficult to objectively measure the degree of
commercialisation on tribal culture and ecosystem sustainability, because of the complex
linkage between commercialisation and change in tribal culture and ecosystem
sustainability.
Acknowledgement
I would like to thank ICSSR (Indian Council for Social Science Research) for
funding this research, which is helping me to carry on with my work in an effective way.
References
1. Bulletin of the Madras Government Museum, 2006, The Tamil Nadu Tribes, Directorate of Museum, Government of Tamil Nadu.
2. District Census Handbook, Dharmapuri. Vilage and Town wise Primary Census Abstract (PCA), District Census Operations, Tamil Nadu, 2011
3. Edwards, D.M. 1996, Non-timber Forest Products from Nepal: Aspects of the Trade in Medicinal and Automatic Plants, FORESC Monograph 1/96. Ministry of Forest and survey Centre, Babar Mahal, Kathmandu, Nepal.
4. Ehrenfels O.R.B. 1943, Traces of a Matricuchial cwilization among the killi Malayalis, Journal of the Royal Asiatic society of Bengal, Vol. IX, 29-82.
5. Grove, R. 1995, Green Imperialism: Colonial Expansion, Tropical Island Edens and the Origins of Environmentalism, 1600-1860, Cambridge University Press, Cambridge.
6. Nepstad, D.C., Brown, I.F., Luz, L., Alechandre, A and Viana, V. 1992, ‘Biotic Impoverishment of Amazonian Forest by Rubber Tappers, Loggers and Cattle Ranchers, In:
7. Nepstad, D.C and Schwartzman, S. (eds.), Nontimber Products from Tropical Forest: Evaluation of Conservation and Development Strategy, 1-14. The New York Botanical Garden, Bronx, New York.
8. Pachauri, R. 1990, Sal Plate Processing and Marketing in West Bengal, Sustainable management, Working Paper, 12, Ford Foundation, New Delhi, India.
9. Pillai K.K, A Social Life of the Tamils, Vol. I, Chennai, 2008, p.210 10. Thurston E 1909, Caste and Tribes of South Indian, Vol IV, Government Press,
Madras.
The Indian Geographical Journal
Volume 94 (2) December - 2019, pp 185-193
ISSN 0019-4824
185
SPATIO-TEMPORAL VARIATION OF POPULATION DENSITY
IN BAITARANI BASIN IN ODISHA
Siva Prasad Panda and Kabir Mohan Sethy
Department of Geography, Utkal University, Bhubaneswar - 751 004
E-mail: [email protected]
Abstract
Population, environment and human health have become the burning issues for social
science researchers, planners, policy makers and administrators. The size and structure of
population provides a basic idea to planners on the basis of which specific development
programmes can be formulated and implemented. Growth indicates the successive positive
trend of population increase in an area. Growth of population assumes special importance
in the economic and social planning of a state as any planning is for the people. In
population geography, the term growth of population is used in its broadest connotation to
cover change in population numbers inhabiting a territory during a specific period of time,
irrespective of the fact that change is positive or negative. An attempt has been made to
identify the factors responsible for this unequal distribution and high growth of population
where natural increase and migration induces population growth which has been
highlighted by taking into consideration the vital statistics. The paper also deals with the
consequences of population growth not only on the demographic characteristics of the
region but also the socio-economic and physical environment of the region.
Keywords: Population geography, Population density, Population growth, Demographic
characteristics, Environment, Human health, Baitarani basin, Peninsular India
Introduction
Population, environment and human health have become the burning issues for
social science researchers, planners, policy makers and administrators. The size and
structure of population provides a basic idea to planners on the basis of which specific
development programmes can be formulated and implemented. There are various attributes
studied within human population. Fertility, mortality and migration are the three
demographic processes which affecting population changes in a region or community. Of
these three, fertility has become a major concern for demographers. It is a major
determinant of high population growth in developing countries. The birth rate (CBR) in
developed countries as a whole 11 persons per 1,000 where as it is 26 in developing
countries. The death rates in both of the regions are similar. They are 9 per 1000 in each
case (PRB, 1998). Thus, high fertility and low mortality are encouraging rapid population
growth in developing countries. The same situation exists in the developing community.
186
Siva Prasad Panda and Kabir Mohan Sethy The Indian Geographical Journal, 94 (2) December – 2019
Another notable feature of demographic phenomena in developing countries is that
the proportion of young population is very high. It is above 40 percent in most of the cases.
When this population enters into reproductive process, the population increases fast.
There are various attributes studied within human population. Fertility, mortality and
migration are the three demographic processes which affect population changes in a region
or community. Of these three, fertility has become a major concern for demographers. It is a
major determinant of high population growth in developing countries. Population density
and distribution have been discussed at the block and district level. The urban population
figure has been taken from 1991-2011 Census data. To show a variation in the density of
population within the basin, the estimation is done at the block level.
Study Area
The Baitarani River is one of the important rivers of north Odisha in the peninsular
India. It originates from the Gonasika of the Gupta Ganga hill range of the Eastern Ghats
located at an elevation of about 981 mt. above the mean sea level. It flows in north to
south-easterly direction for about 365 km before meeting the River Brahmani at Bajarpur
village of Rajnagar block of Kendrapara district about 8 km from the Dhamra river mouth of
the Bay of Bengal near Chandabali. It initially flows in the N-E direction being a boundary
line between Odisha and Jharkhand near Champua, and then flows as a boundary line
between Kendujhar district and Mayurbhanj district. In the lower reaches it makes boundary
lines between Jajpur district and Bhadrak district and Kendrapara district and Bhadrak
districts.
The Baitarani is distinguished from its surrounding basins like the Budhabalanga
basin on the north and the Brahmani basin on the south-west. The combined river of the
Baitarani and the Brahmani drains into the Bay of Bengal as Dhamra River. The Baitarani
and Brahmani drain into the Bay of Bengal as Dhamra river. Its main tributaries are Matai,
Deo, Indrani, Aradei, Sim-Salandi, Kusei, Sita nadi, Kani, Masala, Kukrakata, Tel, Kanjhari
and Remal. The Baitarani basin is a compact elongated shaped basin. It flows through the
districts of Kendujhar, Mayurbhanj, Bhadrak, Baleswar, and Jajpur. The basin covers
partially nine districts-one district of Jharkhand state i.e. W. Singhbhum and eight district of
Odisha. The basin is situated approximately between of 850 10’ and 870 03’ East longitude
and between of 200 35’ and 220 15’ North latitudes. The Baitarani river basin has an area
of 10, 246 sq km. Out of this about 10,982 sq km. lies in Odisha and about 736 sq km lies in
Jharkhand. Total area of the delta is 1713 sq. km and joins with the combined delta the
Mahanadi and Brahmani rivers. The river is flashy in nature having a total length of 365 km.
The present effort solely aims to study the density and distribution of population and
their variations in study area The main objective of this study is to understand arithmetic
density of population in the study region during 1991-2011.The other objective of this paper
is to study the block wise decadal population density distribution in Baitarani basin of
Odisha.
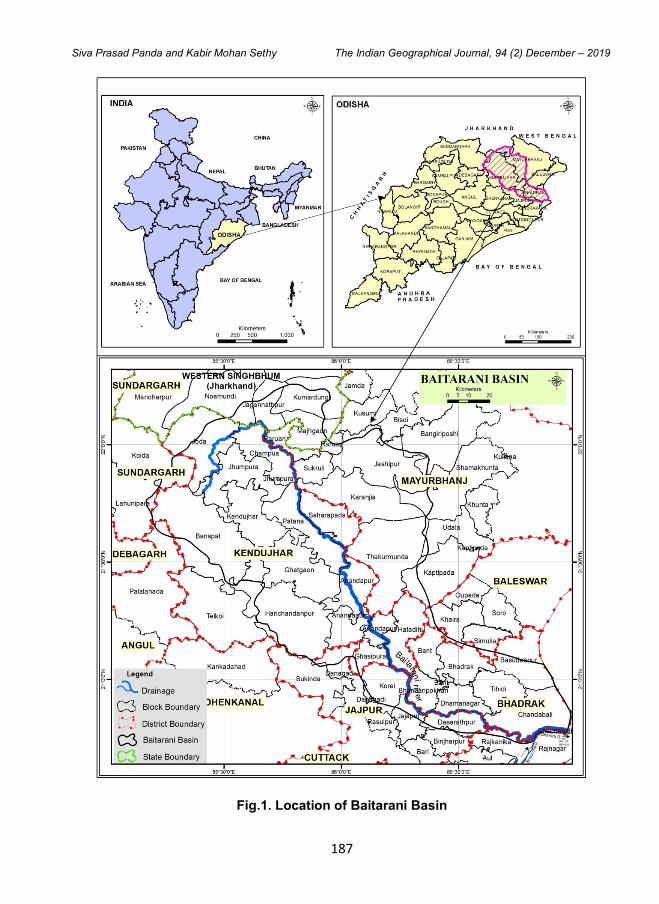
187
Siva Prasad Panda and Kabir Mohan Sethy The Indian Geographical Journal, 94 (2) December – 2019
Fig.1. Location of Baitarani Basin
188
Siva Prasad Panda and Kabir Mohan Sethy The Indian Geographical Journal, 94 (2) December – 2019
Database and Methodology
The present investigation is based on secondary data. Block wise population data
has been collected from census records for the year 1991, 2001, and 2011 from District
census Handbook of Odisha have gathered for the basin for 43 blocks. The spatial
distribution of population for study region has shown by maps and graphs.
To find out the Very High, High, medium and low population density following
formula is adopted.
Very High Population Density - (> 600)
High Population Density - (400-600)
Medium Population Density - (200-400)
Low Population Density - (< 200)
Results and Discussion
The concept of growth of population is often used to connote the change in the
number of inhabitants of a territory during a specific period of time, irrespective of the fact
whether change is negative or positive (Chandna 2008). It is controlled by the relative
balance of fertility, mortality and migration which are generally influenced by six groups of
factors: biological, environmental, economic, social, political and technological (Sauvy,
1969). Population growth rate calculated with the help of actual population counts is known
as natural increase of population growth.
This Natural rate of growth of population is obtained by dividing the difference
between the birth and deaths of population at the beginning of the period and
multiplying it with hundred it implies that while in case natural growth rate only the births
and deaths are taken into account ,in case of actual growth rate, the factor of migration is
also taken into consideration both actual and natural rates of population growth have been
subjected to spatial portrayal and interpretation. The factors which are responsible for
population growth consists of progressive character of population , greater transport and
communication facilities urbanization development in agriculture and infrastructure as
well as deterioration in death rate. These factors transform the traditional rural settlement
i.e. village into a town/city.
Population growth of Baitarani basin can be analysed with the help of census data
available from 1991 onwards. As it is well known that India’s population remained stationary
around 100-200 million through most part of its demographic history as both fertility and
mortality remained high and cancelled out each other leaving very little scope for its
population grow in numbers. The density of population is very uneven of the basin; due to
unfavorable relief features, human activities and natural resources. Density of population
has been changes because of natural birth rate, death rate and migration.
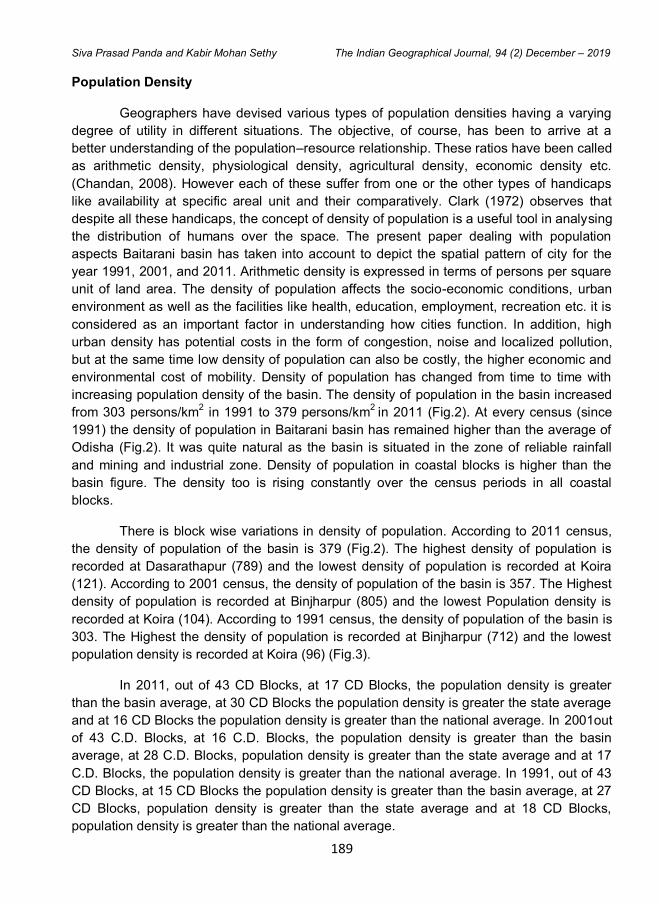
189
Siva Prasad Panda and Kabir Mohan Sethy The Indian Geographical Journal, 94 (2) December – 2019
Population Density
Geographers have devised various types of population densities having a varying
degree of utility in different situations. The objective, of course, has been to arrive at a
better understanding of the population–resource relationship. These ratios have been called
as arithmetic density, physiological density, agricultural density, economic density etc.
(Chandan, 2008). However each of these suffer from one or the other types of handicaps
like availability at specific areal unit and their comparatively. Clark (1972) observes that
despite all these handicaps, the concept of density of population is a useful tool in analysing
the distribution of humans over the space. The present paper dealing with population
aspects Baitarani basin has taken into account to depict the spatial pattern of city for the
year 1991, 2001, and 2011. Arithmetic density is expressed in terms of persons per square
unit of land area. The density of population affects the socio-economic conditions, urban
environment as well as the facilities like health, education, employment, recreation etc. it is
considered as an important factor in understanding how cities function. In addition, high
urban density has potential costs in the form of congestion, noise and localized pollution,
but at the same time low density of population can also be costly, the higher economic and
environmental cost of mobility. Density of population has changed from time to time with
increasing population density of the basin. The density of population in the basin increased
from 303 persons/km2 in 1991 to 379 persons/km
2 in 2011 (Fig.2). At every census (since
1991) the density of population in Baitarani basin has remained higher than the average of
Odisha (Fig.2). It was quite natural as the basin is situated in the zone of reliable rainfall
and mining and industrial zone. Density of population in coastal blocks is higher than the
basin figure. The density too is rising constantly over the census periods in all coastal
blocks.
There is block wise variations in density of population. According to 2011 census,
the density of population of the basin is 379 (Fig.2). The highest density of population is
recorded at Dasarathapur (789) and the lowest density of population is recorded at Koira
(121). According to 2001 census, the density of population of the basin is 357. The Highest
density of population is recorded at Binjharpur (805) and the lowest Population density is
recorded at Koira (104). According to 1991 census, the density of population of the basin is
303. The Highest the density of population is recorded at Binjharpur (712) and the lowest
population density is recorded at Koira (96) (Fig.3).
In 2011, out of 43 CD Blocks, at 17 CD Blocks, the population density is greater
than the basin average, at 30 CD Blocks the population density is greater the state average
and at 16 CD Blocks the population density is greater than the national average. In 2001out
of 43 C.D. Blocks, at 16 C.D. Blocks, the population density is greater than the basin
average, at 28 C.D. Blocks, population density is greater than the state average and at 17
C.D. Blocks, the population density is greater than the national average. In 1991, out of 43
CD Blocks, at 15 CD Blocks the population density is greater than the basin average, at 27
CD Blocks, population density is greater than the state average and at 18 CD Blocks,
population density is greater than the national average.
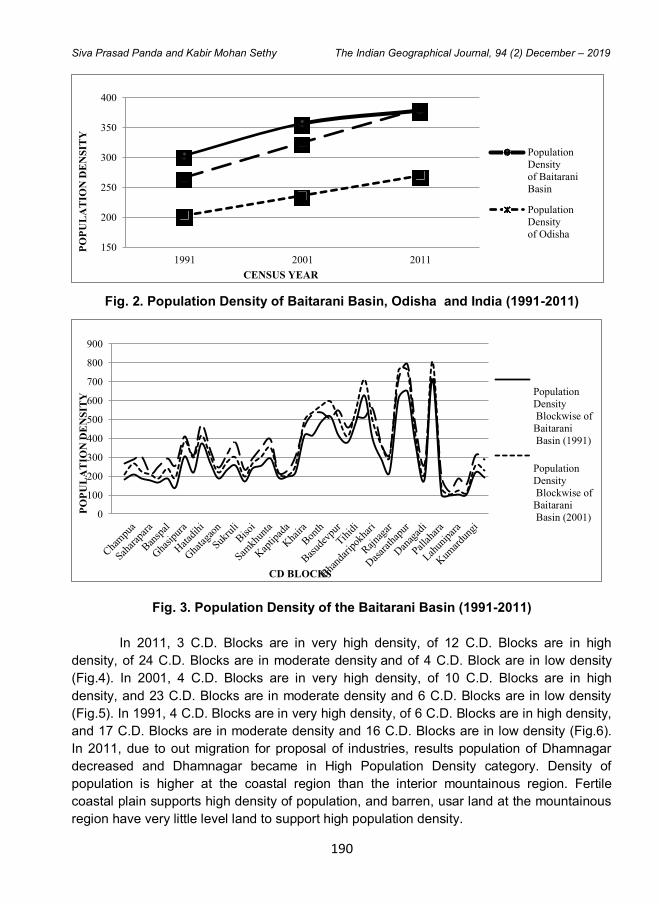
190
Siva Prasad Panda and Kabir Mohan Sethy The Indian Geographical Journal, 94 (2) December – 2019
Fig. 2. Population Density of Baitarani Basin, Odisha and India (1991-2011)
Fig. 3. Population Density of the Baitarani Basin (1991-2011)
In 2011, 3 C.D. Blocks are in very high density, of 12 C.D. Blocks are in high
density, of 24 C.D. Blocks are in moderate density and of 4 C.D. Block are in low density
(Fig.4). In 2001, 4 C.D. Blocks are in very high density, of 10 C.D. Blocks are in high
density, and 23 C.D. Blocks are in moderate density and 6 C.D. Blocks are in low density
(Fig.5). In 1991, 4 C.D. Blocks are in very high density, of 6 C.D. Blocks are in high density,
and 17 C.D. Blocks are in moderate density and 16 C.D. Blocks are in low density (Fig.6).
In 2011, due to out migration for proposal of industries, results population of Dhamnagar
decreased and Dhamnagar became in High Population Density category. Density of
population is higher at the coastal region than the interior mountainous region. Fertile
coastal plain supports high density of population, and barren, usar land at the mountainous
region have very little level land to support high population density.
150
200
250
300
350
400
1991 2001 2011
PO
PU
LA
TIO
N D
EN
SIT
Y
CENSUS YEAR
Population
Density
of Baitarani
Basin
Population
Density
of Odisha
0
100
200
300
400
500
600
700
800
900
PO
PU
LA
TIO
N D
EN
SIT
Y
CD BLOCKS
Population
Density
Blockwise of
Baitarani
Basin (1991)
Population
Density
Blockwise of
Baitarani
Basin (2001)
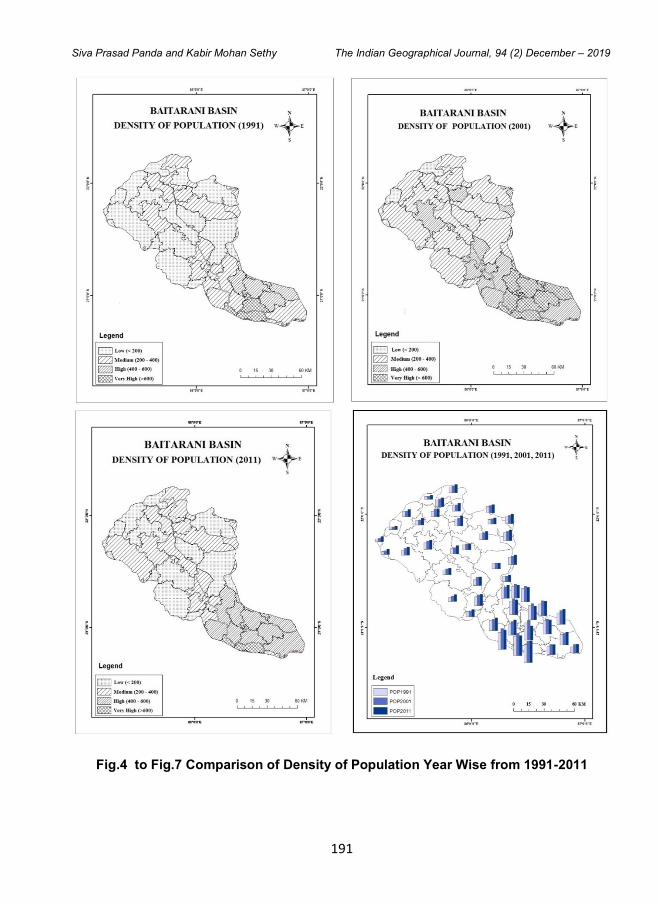
191
Siva Prasad Panda and Kabir Mohan Sethy The Indian Geographical Journal, 94 (2) December – 2019
Fig.4 to Fig.7 Comparison of Density of Population Year Wise from 1991-2011
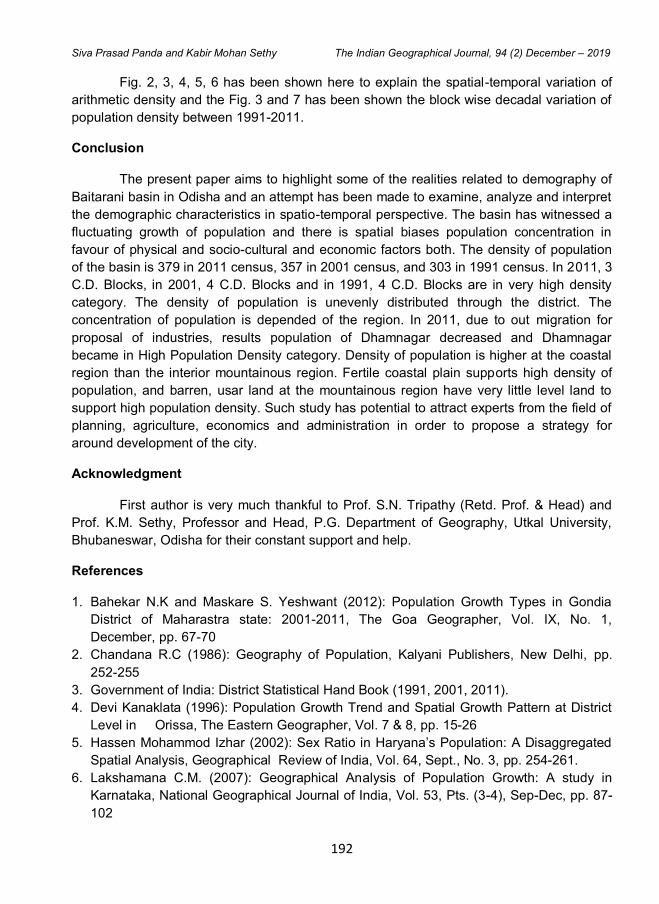
192
Siva Prasad Panda and Kabir Mohan Sethy The Indian Geographical Journal, 94 (2) December – 2019
Fig. 2, 3, 4, 5, 6 has been shown here to explain the spatial-temporal variation of
arithmetic density and the Fig. 3 and 7 has been shown the block wise decadal variation of
population density between 1991-2011.
Conclusion
The present paper aims to highlight some of the realities related to demography of
Baitarani basin in Odisha and an attempt has been made to examine, analyze and interpret
the demographic characteristics in spatio-temporal perspective. The basin has witnessed a
fluctuating growth of population and there is spatial biases population concentration in
favour of physical and socio-cultural and economic factors both. The density of population
of the basin is 379 in 2011 census, 357 in 2001 census, and 303 in 1991 census. In 2011, 3
C.D. Blocks, in 2001, 4 C.D. Blocks and in 1991, 4 C.D. Blocks are in very high density
category. The density of population is unevenly distributed through the district. The
concentration of population is depended of the region. In 2011, due to out migration for
proposal of industries, results population of Dhamnagar decreased and Dhamnagar
became in High Population Density category. Density of population is higher at the coastal
region than the interior mountainous region. Fertile coastal plain supports high density of
population, and barren, usar land at the mountainous region have very little level land to
support high population density. Such study has potential to attract experts from the field of
planning, agriculture, economics and administration in order to propose a strategy for
around development of the city.
Acknowledgment
First author is very much thankful to Prof. S.N. Tripathy (Retd. Prof. & Head) and
Prof. K.M. Sethy, Professor and Head, P.G. Department of Geography, Utkal University,
Bhubaneswar, Odisha for their constant support and help.
References
1. Bahekar N.K and Maskare S. Yeshwant (2012): Population Growth Types in Gondia
District of Maharastra state: 2001-2011, The Goa Geographer, Vol. IX, No. 1,
December, pp. 67-70
2. Chandana R.C (1986): Geography of Population, Kalyani Publishers, New Delhi, pp.
252-255
3. Government of India: District Statistical Hand Book (1991, 2001, 2011).
4. Devi Kanaklata (1996): Population Growth Trend and Spatial Growth Pattern at District
Level in Orissa, The Eastern Geographer, Vol. 7 & 8, pp. 15-26
5. Hassen Mohammod Izhar (2002): Sex Ratio in Haryana’s Population: A Disaggregated
Spatial Analysis, Geographical Review of India, Vol. 64, Sept., No. 3, pp. 254-261.
6. Lakshamana C.M. (2007): Geographical Analysis of Population Growth: A study in
Karnataka, National Geographical Journal of India, Vol. 53, Pts. (3-4), Sep-Dec, pp. 87-
102
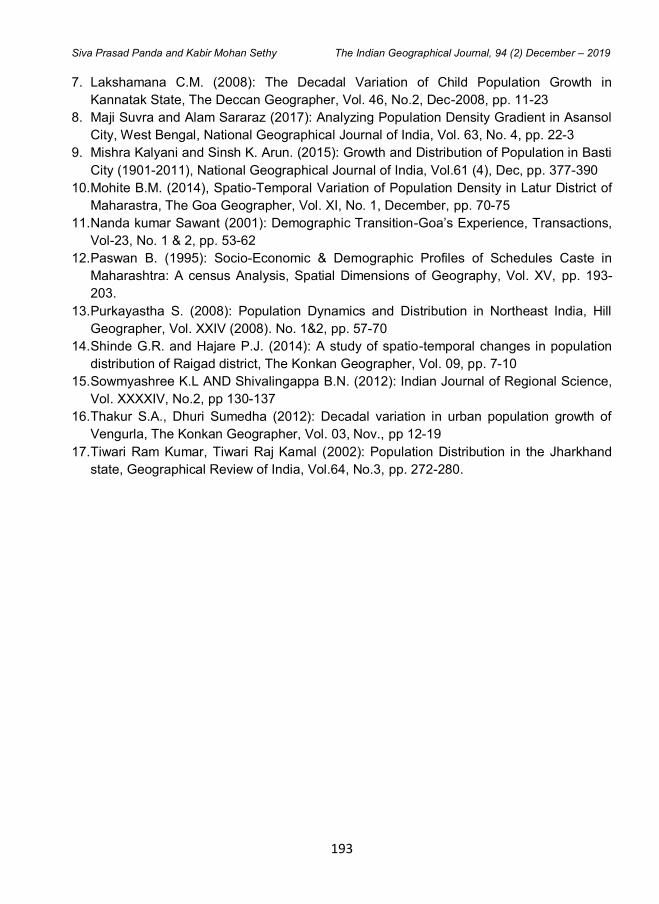
193
Siva Prasad Panda and Kabir Mohan Sethy The Indian Geographical Journal, 94 (2) December – 2019
7. Lakshamana C.M. (2008): The Decadal Variation of Child Population Growth in
Kannatak State, The Deccan Geographer, Vol. 46, No.2, Dec-2008, pp. 11-23
8. Maji Suvra and Alam Sararaz (2017): Analyzing Population Density Gradient in Asansol
City, West Bengal, National Geographical Journal of India, Vol. 63, No. 4, pp. 22-3
9. Mishra Kalyani and Sinsh K. Arun. (2015): Growth and Distribution of Population in Basti
City (1901-2011), National Geographical Journal of India, Vol.61 (4), Dec, pp. 377-390
10. Mohite B.M. (2014), Spatio-Temporal Variation of Population Density in Latur District of
Maharastra, The Goa Geographer, Vol. XI, No. 1, December, pp. 70-75
11. Nanda kumar Sawant (2001): Demographic Transition-Goa’s Experience, Transactions,
Vol-23, No. 1 & 2, pp. 53-62
12. Paswan B. (1995): Socio-Economic & Demographic Profiles of Schedules Caste in
Maharashtra: A census Analysis, Spatial Dimensions of Geography, Vol. XV, pp. 193-
203.
13. Purkayastha S. (2008): Population Dynamics and Distribution in Northeast India, Hill
Geographer, Vol. XXIV (2008). No. 1&2, pp. 57-70
14. Shinde G.R. and Hajare P.J. (2014): A study of spatio-temporal changes in population
distribution of Raigad district, The Konkan Geographer, Vol. 09, pp. 7-10
15. Sowmyashree K.L AND Shivalingappa B.N. (2012): Indian Journal of Regional Science,
Vol. XXXXIV, No.2, pp 130-137
16. Thakur S.A., Dhuri Sumedha (2012): Decadal variation in urban population growth of
Vengurla, The Konkan Geographer, Vol. 03, Nov., pp 12-19
17. Tiwari Ram Kumar, Tiwari Raj Kamal (2002): Population Distribution in the Jharkhand
state, Geographical Review of India, Vol.64, No.3, pp. 272-280.
The Indian Geographical Journal
Volume 94 (2) December - 2019, pp 194-207
ISSN 0019-4824
194
IMPACT OF URBANIZATION IN GRADUAL INCREASE IN
LAND SURFACE TEMPERATURE OF PATNA MUNICIPAL
CORPORATION IN NEW MILLENNIUM (2000-2018) USING
SATELLITE DATA
Ashraf M.
Department of Geography, Patna University, Patna - 800 005
E-mail: [email protected]
Abstract
The increase in urbanization negatively affects the natural environment resulting in change
in the micro climate of the urban centers and related municipal area. The variations in Land
Surface Temperature (LST) with in a Municipal area are of highest concern to study the
urban climate and human-environment interactions. For this purpose the increase (change)
in level of urbanization is calculated using Normalized Difference Built up Area Index
(NDBI). The present study investigates the interrelation between the increase in built up
area and simultaneously temporal change in land surface temperature of Patna Municipal
Corporation (PMC) using Remote sensing data. The estimation of surface temperature was
done using the required Band math for different Satellite sensors and finally spatiotemporal
model and statistical techniques were used to determine the variations in Urban Heat Island
(UHI) effect in Patna Municipal Corporation (PMC). The results were proportional to the
assumptions, with the increase in built up area over the years, the land surface temperature
has increased considerably and the dense built up and commercial / Residential areas
show higher surface temperature in comparison with adjoining areas while the Urban
Greens (vegetations) were the cooler part of the Municipal area.
Keywords – Urbanization, Micro Climate, Land Surface Temperature (LST), Normalized
Difference Built up Index (NDBI), Urban Heat Island (UHI)
Introduction
The Municipal areas are dynamic in nature and because of anthropogenic activities,
population growth and urbanization they change time to time altering the Land use Land
cover (LULC). Zhanq and Wang (2008) studied the inter relationship between these issues
and found that there is a correlation between the formation of the heat island, population
density and concentration of built (Zhang, and Wang, 2008). With the increase in
urbanization the vegetated surface of an area is converted into impervious surface resulting
in change pattern in absorption of solar radiation, storage of heat, surface temperature,
evaporation rate, and wind turbulence thus negatively affecting the micro climate of the area
(Mallik et al., 2008).
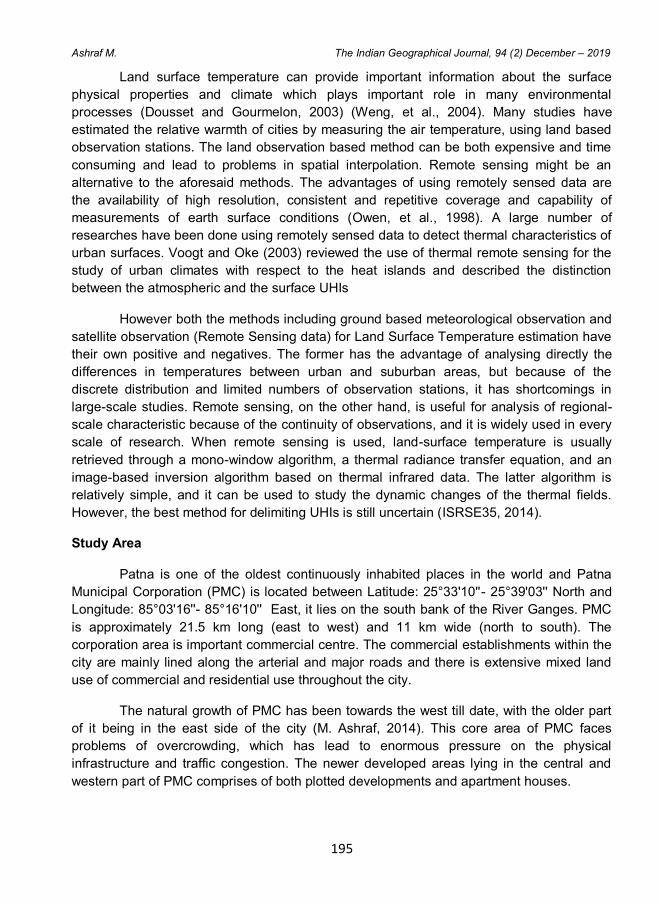
195
Ashraf M. The Indian Geographical Journal, 94 (2) December – 2019
Land surface temperature can provide important information about the surface
physical properties and climate which plays important role in many environmental
processes (Dousset and Gourmelon, 2003) (Weng, et al., 2004). Many studies have
estimated the relative warmth of cities by measuring the air temperature, using land based
observation stations. The land observation based method can be both expensive and time
consuming and lead to problems in spatial interpolation. Remote sensing might be an
alternative to the aforesaid methods. The advantages of using remotely sensed data are
the availability of high resolution, consistent and repetitive coverage and capability of
measurements of earth surface conditions (Owen, et al., 1998). A large number of
researches have been done using remotely sensed data to detect thermal characteristics of
urban surfaces. Voogt and Oke (2003) reviewed the use of thermal remote sensing for the
study of urban climates with respect to the heat islands and described the distinction
between the atmospheric and the surface UHIs
However both the methods including ground based meteorological observation and
satellite observation (Remote Sensing data) for Land Surface Temperature estimation have
their own positive and negatives. The former has the advantage of analysing directly the
differences in temperatures between urban and suburban areas, but because of the
discrete distribution and limited numbers of observation stations, it has shortcomings in
large-scale studies. Remote sensing, on the other hand, is useful for analysis of regional-
scale characteristic because of the continuity of observations, and it is widely used in every
scale of research. When remote sensing is used, land-surface temperature is usually
retrieved through a mono-window algorithm, a thermal radiance transfer equation, and an
image-based inversion algorithm based on thermal infrared data. The latter algorithm is
relatively simple, and it can be used to study the dynamic changes of the thermal fields.
However, the best method for delimiting UHIs is still uncertain (ISRSE35, 2014).
Study Area
Patna is one of the oldest continuously inhabited places in the world and Patna
Municipal Corporation (PMC) is located between Latitude: 25°33'10''- 25°39'03'' North and
Longitude: 85°03'16''- 85°16'10'' East, it lies on the south bank of the River Ganges. PMC
is approximately 21.5 km long (east to west) and 11 km wide (north to south). The
corporation area is important commercial centre. The commercial establishments within the
city are mainly lined along the arterial and major roads and there is extensive mixed land
use of commercial and residential use throughout the city.
The natural growth of PMC has been towards the west till date, with the older part
of it being in the east side of the city (M. Ashraf, 2014). This core area of PMC faces
problems of overcrowding, which has lead to enormous pressure on the physical
infrastructure and traffic congestion. The newer developed areas lying in the central and
western part of PMC comprises of both plotted developments and apartment houses.
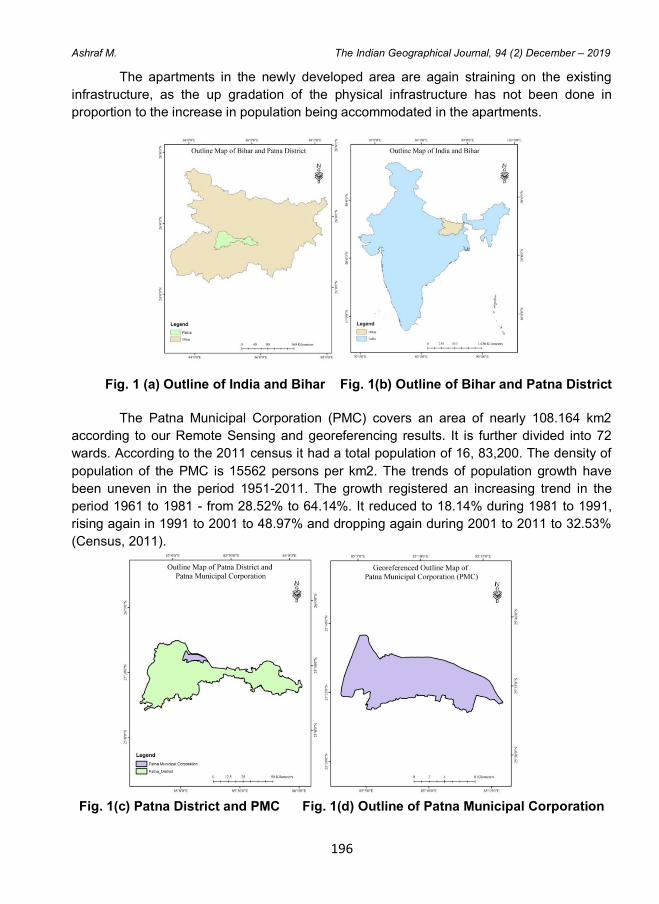
196
Ashraf M. The Indian Geographical Journal, 94 (2) December – 2019
The apartments in the newly developed area are again straining on the existing
infrastructure, as the up gradation of the physical infrastructure has not been done in
proportion to the increase in population being accommodated in the apartments.
Fig. 1 (a) Outline of India and Bihar Fig. 1(b) Outline of Bihar and Patna District
The Patna Municipal Corporation (PMC) covers an area of nearly 108.164 km2
according to our Remote Sensing and georeferencing results. It is further divided into 72
wards. According to the 2011 census it had a total population of 16, 83,200. The density of
population of the PMC is 15562 persons per km2. The trends of population growth have
been uneven in the period 1951-2011. The growth registered an increasing trend in the
period 1961 to 1981 - from 28.52% to 64.14%. It reduced to 18.14% during 1981 to 1991,
rising again in 1991 to 2001 to 48.97% and dropping again during 2001 to 2011 to 32.53%
(Census, 2011).
Fig. 1(c) Patna District and PMC Fig. 1(d) Outline of Patna Municipal Corporation
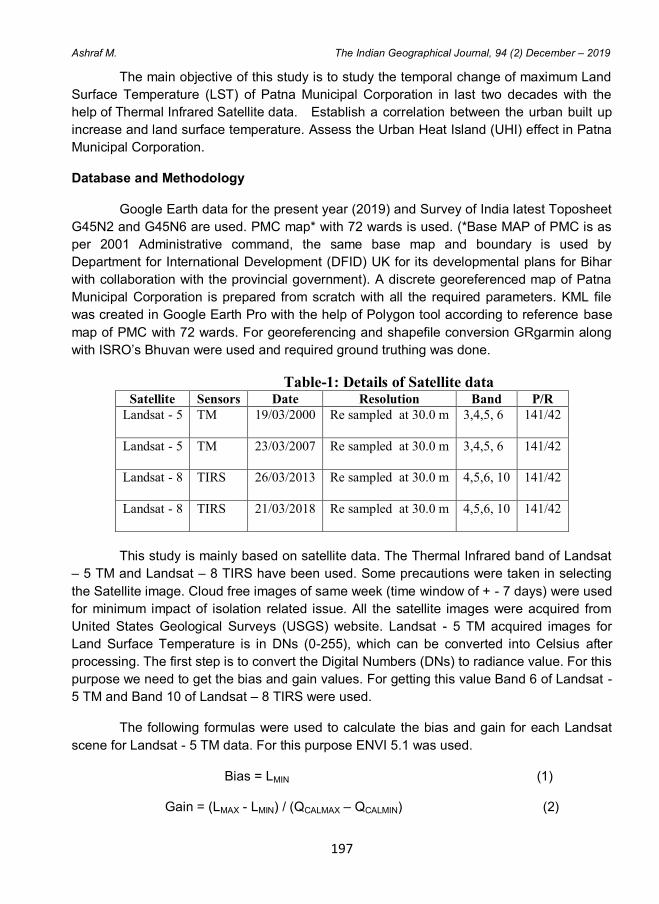
197
Ashraf M. The Indian Geographical Journal, 94 (2) December – 2019
The main objective of this study is to study the temporal change of maximum Land
Surface Temperature (LST) of Patna Municipal Corporation in last two decades with the
help of Thermal Infrared Satellite data. Establish a correlation between the urban built up
increase and land surface temperature. Assess the Urban Heat Island (UHI) effect in Patna
Municipal Corporation.
Database and Methodology
Google Earth data for the present year (2019) and Survey of India latest Toposheet
G45N2 and G45N6 are used. PMC map* with 72 wards is used. (*Base MAP of PMC is as
per 2001 Administrative command, the same base map and boundary is used by
Department for International Development (DFID) UK for its developmental plans for Bihar
with collaboration with the provincial government). A discrete georeferenced map of Patna
Municipal Corporation is prepared from scratch with all the required parameters. KML file
was created in Google Earth Pro with the help of Polygon tool according to reference base
map of PMC with 72 wards. For georeferencing and shapefile conversion GRgarmin along
with ISRO‟s Bhuvan were used and required ground truthing was done.
Table-1: Details of Satellite data Satellite Sensors Date Resolution Band P/R
Landsat - 5 TM 19/03/2000 Re sampled at 30.0 m
3,4,5, 6 141/42
Landsat - 5 TM 23/03/2007 Re sampled at 30.0 m
3,4,5, 6 141/42
Landsat - 8 TIRS 26/03/2013 Re sampled at 30.0 m
4,5,6, 10 141/42
Landsat - 8 TIRS 21/03/2018 Re sampled at 30.0 m
4,5,6, 10 141/42
This study is mainly based on satellite data. The Thermal Infrared band of Landsat
– 5 TM and Landsat – 8 TIRS have been used. Some precautions were taken in selecting
the Satellite image. Cloud free images of same week (time window of + - 7 days) were used
for minimum impact of isolation related issue. All the satellite images were acquired from
United States Geological Surveys (USGS) website. Landsat - 5 TM acquired images for
Land Surface Temperature is in DNs (0-255), which can be converted into Celsius after
processing. The first step is to convert the Digital Numbers (DNs) to radiance value. For this
purpose we need to get the bias and gain values. For getting this value Band 6 of Landsat -
5 TM and Band 10 of Landsat – 8 TIRS were used.
The following formulas were used to calculate the bias and gain for each Landsat
scene for Landsat - 5 TM data. For this purpose ENVI 5.1 was used.
Bias = LMIN (1)
Gain = (LMAX - LMIN) / (QCALMAX – QCALMIN) (2)
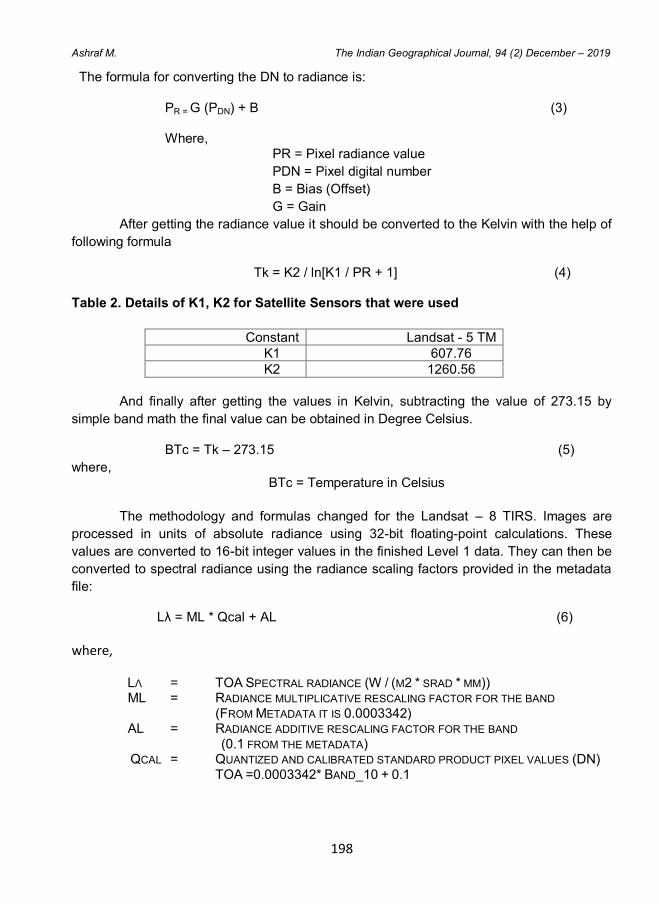
198
Ashraf M. The Indian Geographical Journal, 94 (2) December – 2019
The formula for converting the DN to radiance is:
PR = G (PDN) + B (3)
Where, PR = Pixel radiance value
PDN = Pixel digital number
B = Bias (Offset)
G = Gain
After getting the radiance value it should be converted to the Kelvin with the help of
following formula
Tk = K2 / ln[K1 / PR + 1] (4)
Table 2. Details of K1, K2 for Satellite Sensors that were used
Constant Landsat - 5 TM
K1 607.76
K2 1260.56
And finally after getting the values in Kelvin, subtracting the value of 273.15 by
simple band math the final value can be obtained in Degree Celsius.
BTc = Tk – 273.15 (5)
where, BTc = Temperature in Celsius
The methodology and formulas changed for the Landsat – 8 TIRS. Images are
processed in units of absolute radiance using 32-bit floating-point calculations. These
values are converted to 16-bit integer values in the finished Level 1 data. They can then be
converted to spectral radiance using the radiance scaling factors provided in the metadata
file:
Lλ = ML * Qcal + AL (6)
where,
LΛ = TOA SPECTRAL RADIANCE (W / (M2 * SRAD * ΜM)) ML = RADIANCE MULTIPLICATIVE RESCALING FACTOR FOR THE BAND (FROM METADATA IT IS 0.0003342) AL = RADIANCE ADDITIVE RESCALING FACTOR FOR THE BAND (0.1 FROM THE METADATA) QCAL = QUANTIZED AND CALIBRATED STANDARD PRODUCT PIXEL VALUES (DN)
TOA =0.0003342* BAND_10 + 0.1
199
Ashraf M. The Indian Geographical Journal, 94 (2) December – 2019
Similar to the conversion to radiance, the 16-bit integer values in the Level 1
product can also be converted to TOA reflectance. The foll╗owing equation is used to
convert Level 1 DN values to TOA reflectance:
ρλ = Mρ * Qcal + Aρ (7)
Where:
ρλ = TOA Planetary Spectral Reflectance, without correction for solar angle. (Unit less)
Mρ = Reflectance multiplicative scaling factor for the band
(REFLECTANCEW_MULT_BAND_n from the metadata).
Aρ = Reflectance additive scaling factor for the band
(REFLECTANCE_ADD_BAND_N from the metadata)
Qcal = Level 1 pixel value in DN
Note that ρλ is not true TOA Reflectance, because it does not contain a correction
for the solar elevation angle. Once a solar elevation angle is chosen, the conversion to true
TOA Reflectance is as follows:
ρλ = ρλ / cos (θSZ) = ρλ / sin (θSE) (8)
where, ρλ = TOA planetary reflectance
θSZ = Local solar zenith angle; θSZ = 90° - θSE
θSE = Local sun elevation angle; the scene center sun elevation angle in degrees is
provided in the metadata
TIRS data can also be converted from spectral radiance (as described above) to
brightness temperature, which is the effective temperature viewed by the satellite under an
assumption of unity emissivity. The conversion formula is as follows
BT = K2 / ln[K1 / Lλ + 1] – 273.15 (9)
where,
BT = Top of atmosphere brightness temperature (°C) where:
Lλ = TOA spectral radiance (Watts/(m2 * srad * μm))
K1 = Band-specific thermal conversion constant from the metadata
(K1_CONSTANT_BAND_x, where x is the thermal band number)
K2 = Band-specific thermal conversion constant from the metadata
(K2_CONSTANT_BAND_x, where x is the thermal band number)
200
Ashraf M. The Indian Geographical Journal, 94 (2) December – 2019
Table 3. Details of K1, K2 for Satellite Sensors that were used from the Metadata
Constant Landsat - 8 TIRS
K1 774.89
K2 1321.08
BT = (1321.08 / Ln((774.89 / “TOA”) +1)) – 273.15 (10)
Now from this stage the similar calculations were done for both Landsat 5 and
Landsat 8. After getting the brightness temperature for both satellites the NDVI was
calculated using the following formula.
NDVI = Near Infrared (NIR) – Red / Near Infrared (NIR) + Red (11)
Table 4. Details of Satellite and Sensors
Satellite Bands NDVI Formula
Landsat 5 TM Band 3 (Red), Band 4 (NIR) Band (4) – Band (3) / Band (4) + Band (3)
Landsat 8 TIRS Band 4 (Red), Band 5 (NIR) Band (5) – Band (4) / Band (5) + Band (4)
The importance of estimating the NDVI is essential since the amount of vegetation
present is an important factor and NDVI can be used to infer general vegetation condition
(Q. H. Weng, D. S. Lu, and J. Schubring, 2004). The calculation of the NDVI is important because,
afterward, the proportion of the vegetation (PV) should be calculated, and they are highly
related with the NDVI, and emissivity (ε) should be calculated, which is related to the Pv:
Calculating the Proportion of Vegetation (Pv): Pv is calculated according to the
following equation. A method for calculating Pv suggests using the NDVI values for
vegetation and soil (NDVImax = 0.5 and NDVImin = 0.2) to apply in global conditions (J.A.
Sobrino, J. C. Jimenez-Munoz, and L. Paolini, 2004). However here in the present condition
the maximum and minimum NDVI value has been taken as input and the following equation
was applied in raster calculator.
Pv = (NDVI – NDVImin / NDVImax – NDVImin) 2 (12)
However, since the NDVI values differ for every area, the value for vegetated
surfaces, 0.5, may be too low. Global values from NDVI can be calculated from at – surface
reflectivities, but it would not be possible to establish global values in the case of an NDVI
computed from TOA reflectivities, since NDVIV and NDVI𝑠 will depend on the atmospheric
conditions (J. C. Jimenez-Munoz, J. A. Sobrino, A. Plaza, L. Guanter, J. Moreno, and P.
Martinez, 2009).
201
Ashraf M. The Indian Geographical Journal, 94 (2) December – 2019
Calculating Land Surface Emissivity: The land surface emissivity [LSE (ε)] must be
known in order to estimate LST, since the LSE is a proportionality factor that scales
blackbody radiance (Planck‟s law) to predict emitted radiance, and it is the efficiency of
transmitting thermal energy across the surface into the atmosphere (J. C. Jimenez-Munoz,
J. A. Sobrino, A. Gillespie, D. Sabol and W. T. Gustafson, 2006). The determination of the
ground emissivity is calculated conditionally as suggested in (J.A. Sobrino, J. C. Jimenez-
Munoz, and L. Paolini, 2004).
ελ = εvλPv + εsλ (1 – Pv) + Cλ (13)
The error correction equation for emissivity (ελ) is = 0.004* Pv + 0.986
The last step of retrieving the LST or the emissivity corrected land surface
temperature Ts is computed as follows (M. Stathopoulou and C. Cartalis, 2007):
Ts = BT / [1 + ( λBT / ρ) * ln (eλ)] (14)
where,
Ts is the LST in Celsius, BT is at sensor Brightness Temperature (°C), λ is the
wavelength of emitted radiance (for which the peak response and the average of the limiting
wavelength (𝜆=10.895, Band 10 of Landsat 8 will be used), ελ is the emissivity calculated
and
ρ = h * C / s = 1.438 * 10−2
m K (15)
where,
s = Boltzmann constant (1.38 ×10⁻²³
J/K)
h = Planck‟s constant (6.626×10⁻³⁴
Js)
c = velocity of light (2.998×10⁸ m/s)
After finishing the above mentioned calculation in raster calculator of ArcMap and
getting the final result in degree Celsius the Landsat tile for each base year was clipped as
per the area of interest (AOI). The AOI (PMC) was classified into five classes according to
the manual breaks in different thermal regions of the area. And lastly Maximum Likelihood
Classification was done for all the base years for getting the required LST data for the
statistical analysis.
The next step was to calculate change (increase) in Built up area over the years
using Normalized Difference Built up Area (NDBI) formula under the raster calculator in
ArcMap.
NDBI formula for Landsat 5 TM = Band 5 – Band 4 / Band 5 + Band 4 (16)
NDBI formula for Landsat 8 TIRS = Band 6 – Band 5 / Band 6 + Band 5 (17)
202
Ashraf M. The Indian Geographical Journal, 94 (2) December – 2019
The built up and none built up area were classified using maximum likelihood
classifier under ArcMap. None built areas come under the urban greens. Urban greens are
the temporary or permanent green (vegetative) spaces under a urban locality which
includes urban farming, gardens, parks, open spaces, avenue trees, institutional fields, golf
course, cemeteries, green corridors along road, rail, rivers or canals (M. Ashraf, 2015). The
famous French urban architect, Le Corbusier rightly considered parks and gardens as the
lungs of cities. It is now strongly believed that the quality of life of a city, to a great extent,
depends on the share of urban greens.
The present paper investigates the declining „green infrastructure‟ and the
expansion of „grey infrastructure‟ or urban built up and its correlation on the land surface
temperature that corresponds to urban heat island effect of a city or municipal area.
Table 5. Details of Software used in Study
Software Used Functions Google Earth Professional 7.1.1
For overlaying RAW map and creating Polygon generated outline KML file
DNR Garmin 5.04 Converting KML file to Shape file , Ground Truthing and Georeferencing
ISRO Bhuvan Evaluation of shapefile and georeferenced data
ENVI 5.1 Processing of Landsat 5 TM Thermal band to degree Celsius
ArcMap 10.1 AOI clipping, Thermal band processing using Raster calculator, ML Classification and LST/UHI Model Creation, NDBI Calculation
MS Excel 2007 Correlation calculation, Graphs and Charts
Results and Discussions
The main objective of this study was to determine the impact of increase in Built up
area and its correlation with Land Surface Temperature (LST) after year 2000 A.D. in Patna
Municipal Corporation. Four base years were selected depending on the availabili ty of
Satellite data with minimum cloud coverage for the maximum accuracy. All the data were of
the same period (plus minus one weak) for minimizing the effect of seasonal change on
Land Surface. The processed satellite data showed some considerable results regarding
increase in maximum land surface temperature and built up area. The results of increase in
maximum Land Surface Temperature and Built up area are shown below in table and graph
Table 6. Growth in Built up area and LST from 2000 – 2018
Year Maximum Land Surface Temperature (LST) in ° C Built Up (in sq. km)
2000 35.11 62.14
2007 36.80 64.18
2013 39.05 70.05
2018 40.00 76.44
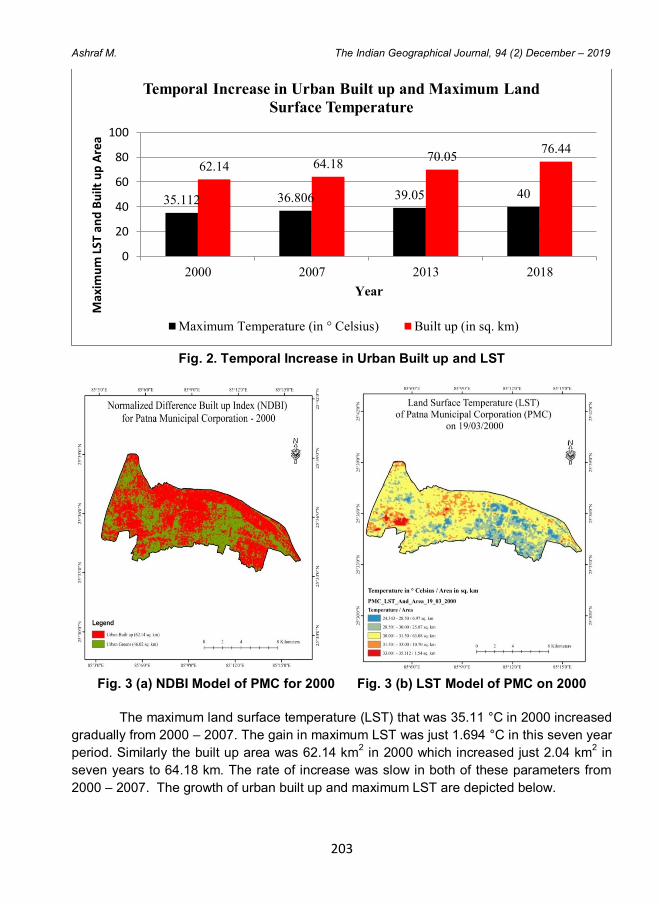
203
Ashraf M. The Indian Geographical Journal, 94 (2) December – 2019
Fig. 2. Temporal Increase in Urban Built up and LST
Fig. 3 (a) NDBI Model of PMC for 2000 Fig. 3 (b) LST Model of PMC on 2000
The maximum land surface temperature (LST) that was 35.11 °C in 2000 increased
gradually from 2000 – 2007. The gain in maximum LST was just 1.694 °C in this seven year
period. Similarly the built up area was 62.14 km2 in 2000 which increased just 2.04 km
2 in
seven years to 64.18 km. The rate of increase was slow in both of these parameters from
2000 – 2007. The growth of urban built up and maximum LST are depicted below.
35.112 36.806 39.05 40
62.14 64.18 70.05
76.44
0
20
40
60
80
100
2000 2007 2013 2018
Max
imu
m L
ST a
nd
Bu
ilt u
p A
rea
Year
Temporal Increase in Urban Built up and Maximum Land
Surface Temperature
Maximum Temperature (in ° Celsius) Built up (in sq. km)
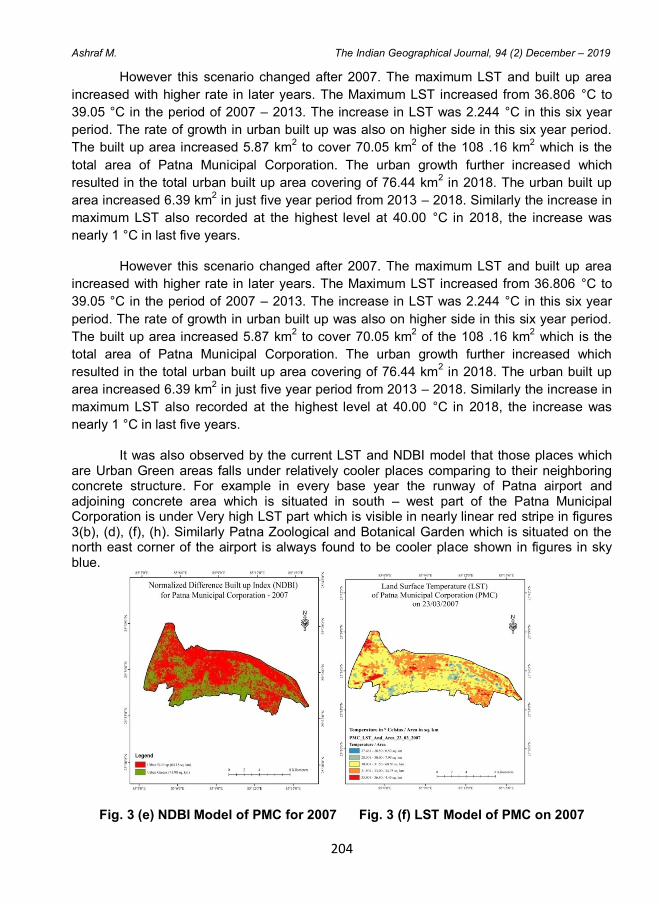
204
Ashraf M. The Indian Geographical Journal, 94 (2) December – 2019
However this scenario changed after 2007. The maximum LST and built up area
increased with higher rate in later years. The Maximum LST increased from 36.806 °C to
39.05 °C in the period of 2007 – 2013. The increase in LST was 2.244 °C in this six year
period. The rate of growth in urban built up was also on higher side in this six year period.
The built up area increased 5.87 km2 to cover 70.05 km
2 of the 108 .16 km
2 which is the
total area of Patna Municipal Corporation. The urban growth further increased which
resulted in the total urban built up area covering of 76.44 km2 in 2018. The urban built up
area increased 6.39 km2 in just five year period from 2013 – 2018. Similarly the increase in
maximum LST also recorded at the highest level at 40.00 °C in 2018, the increase was
nearly 1 °C in last five years.
It was also observed by the current LST and NDBI model that those places which are Urban Green areas falls under relatively cooler places comparing to their neighboring concrete structure. For example in every base year the runway of Patna airport and adjoining concrete area which is situated in south – west part of the Patna Municipal Corporation is under Very high LST part which is visible in nearly linear red stripe in figures 3(b), (d), (f), (h). Similarly Patna Zoological and Botanical Garden which is situated on the north east corner of the airport is always found to be cooler place shown in figures in sky blue.
Fig. 3 (e) NDBI Model of PMC for 2007 Fig. 3 (f) LST Model of PMC on 2007
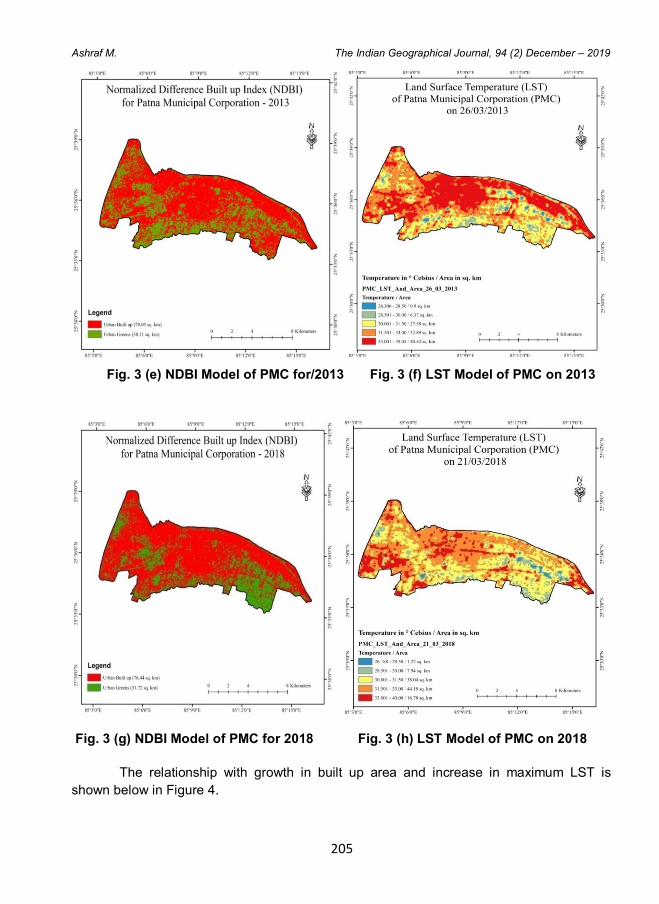
205
Ashraf M. The Indian Geographical Journal, 94 (2) December – 2019
Fig. 3 (e) NDBI Model of PMC for/2013 Fig. 3 (f) LST Model of PMC on 2013
Fig. 3 (g) NDBI Model of PMC for 2018 Fig. 3 (h) LST Model of PMC on 2018
The relationship with growth in built up area and increase in maximum LST is
shown below in Figure 4.
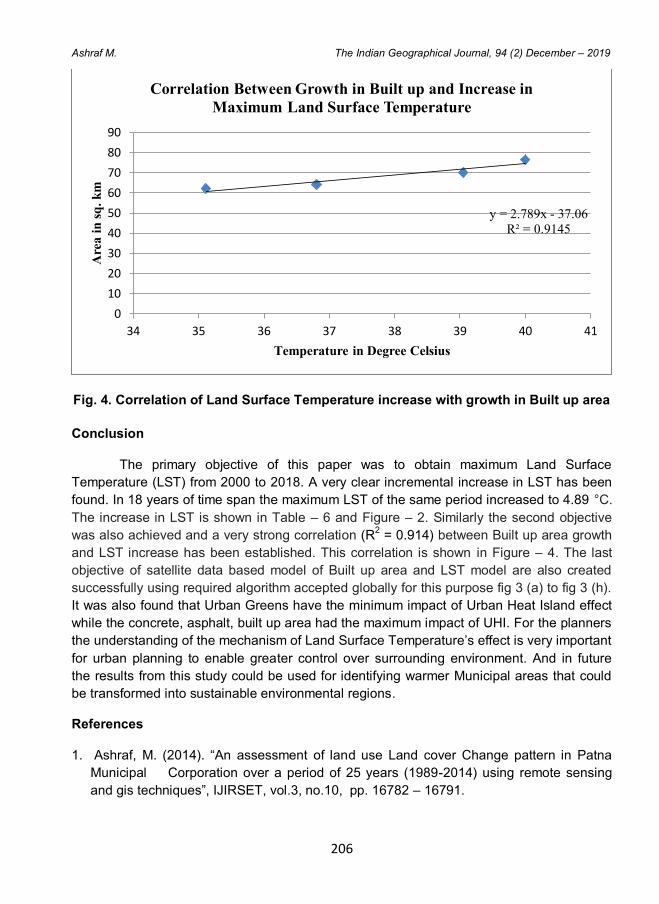
206
Ashraf M. The Indian Geographical Journal, 94 (2) December – 2019
Fig. 4. Correlation of Land Surface Temperature increase with growth in Built up area
Conclusion
The primary objective of this paper was to obtain maximum Land Surface
Temperature (LST) from 2000 to 2018. A very clear incremental increase in LST has been
found. In 18 years of time span the maximum LST of the same period increased to 4.89 °C.
The increase in LST is shown in Table – 6 and Figure – 2. Similarly the second objective
was also achieved and a very strong correlation (R2 = 0.914) between Built up area growth
and LST increase has been established. This correlation is shown in Figure – 4. The last
objective of satellite data based model of Built up area and LST model are also created
successfully using required algorithm accepted globally for this purpose fig 3 (a) to fig 3 (h).
It was also found that Urban Greens have the minimum impact of Urban Heat Island effect
while the concrete, asphalt, built up area had the maximum impact of UHI. For the planners
the understanding of the mechanism of Land Surface Temperature‟s effect is very important
for urban planning to enable greater control over surrounding environment. And in future
the results from this study could be used for identifying warmer Municipal areas that could
be transformed into sustainable environmental regions.
References
1. Ashraf, M. (2014). “An assessment of land use Land cover Change pattern in Patna
Municipal Corporation over a period of 25 years (1989-2014) using remote sensing
and gis techniques”, IJIRSET, vol.3, no.10, pp. 16782 – 16791.
y = 2.789x - 37.06
R² = 0.9145
0
10
20
30
40
50
60
70
80
90
34 35 36 37 38 39 40 41
Are
a i
n s
q. k
m
Temperature in Degree Celsius
Correlation Between Growth in Built up and Increase in
Maximum Land Surface Temperature
207
Ashraf M. The Indian Geographical Journal, 94 (2) December – 2019
2. Ashraf, M. (2015). “An Assessment of Declining Urban Greens under Patna Municipal
Corporation Based on Normalized Difference Vegetation Index”. UJERT, vol.5, no.5, pp.
220 – 232.
3. Dousset, B., and Gourmelon, F, (2003), “Satellite multi – sensor data analysis of urban
surface temperatures and land cover, ISPRS Journal of Photogrammetry and Remote
Sensing”, pp.43 – 54.
4. Jimenez-Munoz, J. C., Sobrino, J.A.., Gillespie, A., and Gustafson, T., (2006) “Improved
land surface emissivities over agricultural areas using ASTER NDVI,” Remote Sensing
of Environment, vol.103, no.4, pp.474–487.
5. Jimenez-Munoz, J. C., Sobrino, J.A.., Plaza, A., Gaunter, L., Moreno, J., and Martinez,
P. (2009), “Comparison between fractional vegetation cover retrievals from vegetation
indices and spectral mixture analysis: case study of PROBA/CHRIS data over an
agricultural area”, Sensors, vol.9, no.2, pp.768–793.
6. Mallik, J., Kant, Y., and Bharth, D, (2008), “Estimation of land surface temperature over
Delhi using landsat-7 ETM+”, J.Ind.Geophysics Union, vol.12, no.3, pp.131-140.
7. Owen, T. W., Carlson, T. N., Gillies, R. R. (1998), “Remotely sensed surface
parameters governing urban climate change”, International Journal of Remote Sensing,
19, pp. 1663-1681.
8. Sobrino, J.A., Jimenez-Munoz, J. C., and Paolini, L. (2004), “Land surface temperature
retrieval from LANDSAT - 5 TM,” Remote Sensing of Environment, vol. 90, no. 4, pp.
434–440.
9. Stathopoulou, M., and Cartalis, C. (2007), “Daytime urban heat islands from Landsat
ETM+ and Corine land cover data: an application to major cities in Greece”, Solar
Energy, vol.81, no.3, pp. 358 – 368.
10. Voogt, J. A., and Oke, T. R. (2003), “Thermal remote sensing of urban climates”,
Remote Sensing of Environment, vol. 86, no.3, pp. 370 – 384.
11. Weng, Q., Lu, D., and Schubring, J. (2004), “Estimation of land surface temperature,
vegetation abundance relationship for urban heat island studies”, Remote Sensing of
Environment, vol. 89, no. 4, pp. 467-483.
The Indian Geographical Journal
Volume 94 (2) December - 2019, pp 208-217
ISSN 0019-4824
208
FUZZY LOGIC BASED SITE SUITABILITY ASSESSMENT FOR
COLD STORAGE CONSTRUCTION AT WESTERN VILLAGES
OF LOKTAK LAKE, MANIPUR
Irom Luckychand Meitei and Abujam Manglem Singh
Department of Geography, Utkal University, Bhubaneswar - 751 004
E-mail: [email protected]
Abstract
Agriculture in India is plagued by a multitude of problems at every stages of the practice.
Absence of cold storage limits farmer’s ability to solve post harvest problems. This study
attempts to find suitable sites for cold storage location in western lakeshore villages of
Loktak Lake, Manipur by using fuzzy logic overlay and linear membership analysis in GIS
environment. Four suitability zones were obtained, of which, the western part Toubul Village
was found to be the most suitable zone.
Keywords: Cold storage, Suitability assessment, GIS, Fuzzy logic, Western Loktak villages
Introduction
Agriculture in India is plagued by a multitude of problems at every stages of the practice.
While some farmers lack appropriate inputs in pre harvest phase, others face the vagaries
of weather events during sowing seasons (Kannan, 2014). Even in situations where a
farmer is able to overcome all such hardships and have a bumper crop, post-harvest
problem awaits a typical farmer in India (Maheshwar et al, 2006). Lack of access to market,
production of the same crop at the same time having dampening effects on the prices, large
gap in crop price between farm and market among others areas some of the important post-
harvest problems. For commercial farmers, storing their produce to sell in lean season
could make them fetch remunerative price but due to absence of cold storage in suitable
numbers and places preclude them from using this option. Manipur, one of the seven sister
states of north eastern India, has an agrarian economy with employment structure
characterized by dominance of people employed in agriculture sector (S.S Roy et al, 2018).
Agriculture in the state has varying level of technological adoptions. While hill areas of the
state continue to practice predominantly primitive subsistence agriculture, agriculture in the
Imphal valley is of intensive nature with higher levels of technological inputs. There are
areas in the valley where commercial agriculture is practice year round with more emphasis
on horticulture crops. Toubul, Ngaikhong, Khoijuman and Kwasiphai villages of Manipur
and also the case study areas for this research, situated in western lakeshore of Loktak
represent one of the most agriculturally advanced regions of Manipur.
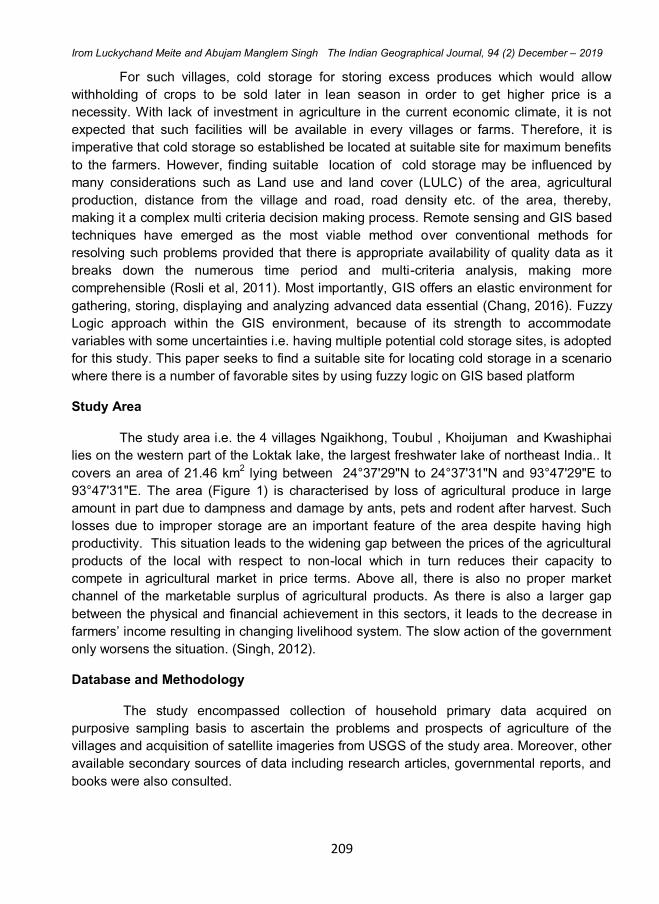
209
Irom Luckychand Meite and Abujam Manglem Singh The Indian Geographical Journal, 94 (2) December – 2019
For such villages, cold storage for storing excess produces which would allow
withholding of crops to be sold later in lean season in order to get higher price is a
necessity. With lack of investment in agriculture in the current economic climate, it is not
expected that such facilities will be available in every villages or farms. Therefore, it is
imperative that cold storage so established be located at suitable site for maximum benefits
to the farmers. However, finding suitable location of cold storage may be influenced by
many considerations such as Land use and land cover (LULC) of the area, agricultural
production, distance from the village and road, road density etc. of the area, thereby,
making it a complex multi criteria decision making process. Remote sensing and GIS based
techniques have emerged as the most viable method over conventional methods for
resolving such problems provided that there is appropriate availability of quality data as it
breaks down the numerous time period and multi-criteria analysis, making more
comprehensible (Rosli et al, 2011). Most importantly, GIS offers an elastic environment for
gathering, storing, displaying and analyzing advanced data essential (Chang, 2016). Fuzzy
Logic approach within the GIS environment, because of its strength to accommodate
variables with some uncertainties i.e. having multiple potential cold storage sites, is adopted
for this study. This paper seeks to find a suitable site for locating cold storage in a scenario
where there is a number of favorable sites by using fuzzy logic on GIS based platform
Study Area
The study area i.e. the 4 villages Ngaikhong, Toubul , Khoijuman and Kwashiphai
lies on the western part of the Loktak lake, the largest freshwater lake of northeast India.. It
covers an area of 21.46 km2 lying between 24°37'29"N to 24°37'31"N and 93°47'29"E to
93°47'31"E. The area (Figure 1) is characterised by loss of agricultural produce in large
amount in part due to dampness and damage by ants, pets and rodent after harvest. Such
losses due to improper storage are an important feature of the area despite having high
productivity. This situation leads to the widening gap between the prices of the agricultural
products of the local with respect to non-local which in turn reduces their capacity to
compete in agricultural market in price terms. Above all, there is also no proper market
channel of the marketable surplus of agricultural products. As there is also a larger gap
between the physical and financial achievement in this sectors, it leads to the decrease in
farmers’ income resulting in changing livelihood system. The slow action of the government
only worsens the situation. (Singh, 2012).
Database and Methodology
The study encompassed collection of household primary data acquired on
purposive sampling basis to ascertain the problems and prospects of agriculture of the
villages and acquisition of satellite imageries from USGS of the study area. Moreover, other
available secondary sources of data including research articles, governmental reports, and
books were also consulted.
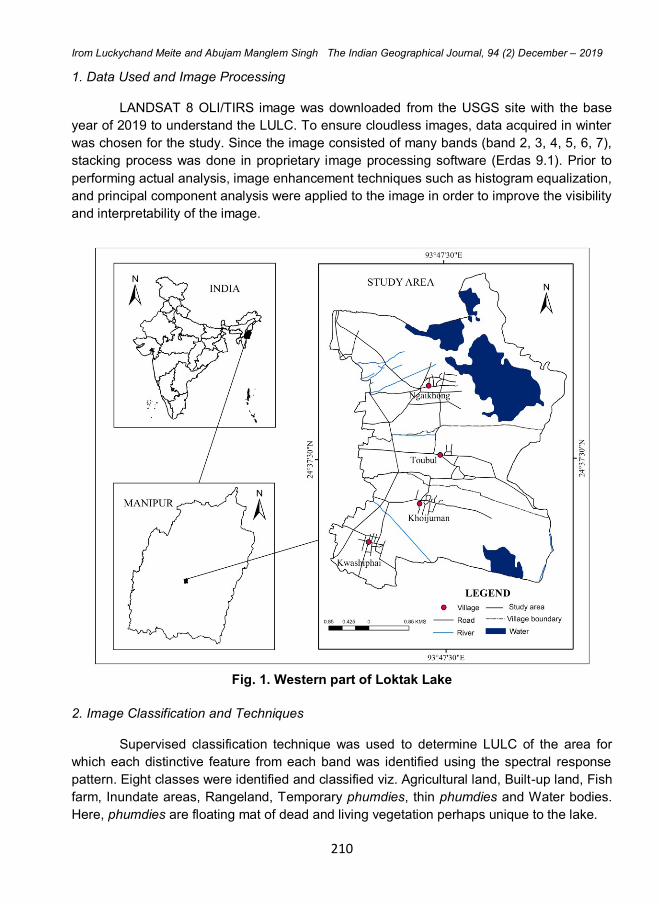
210
Irom Luckychand Meite and Abujam Manglem Singh The Indian Geographical Journal, 94 (2) December – 2019
1. Data Used and Image Processing
LANDSAT 8 OLI/TIRS image was downloaded from the USGS site with the base
year of 2019 to understand the LULC. To ensure cloudless images, data acquired in winter
was chosen for the study. Since the image consisted of many bands (band 2, 3, 4, 5, 6, 7),
stacking process was done in proprietary image processing software (Erdas 9.1). Prior to
performing actual analysis, image enhancement techniques such as histogram equalization,
and principal component analysis were applied to the image in order to improve the visibility
and interpretability of the image.
Fig. 1. Western part of Loktak Lake
2. Image Classification and Techniques
Supervised classification technique was used to determine LULC of the area for
which each distinctive feature from each band was identified using the spectral response
pattern. Eight classes were identified and classified viz. Agricultural land, Built-up land, Fish
farm, Inundate areas, Rangeland, Temporary phumdies, thin phumdies and Water bodies.
Here, phumdies are floating mat of dead and living vegetation perhaps unique to the lake.
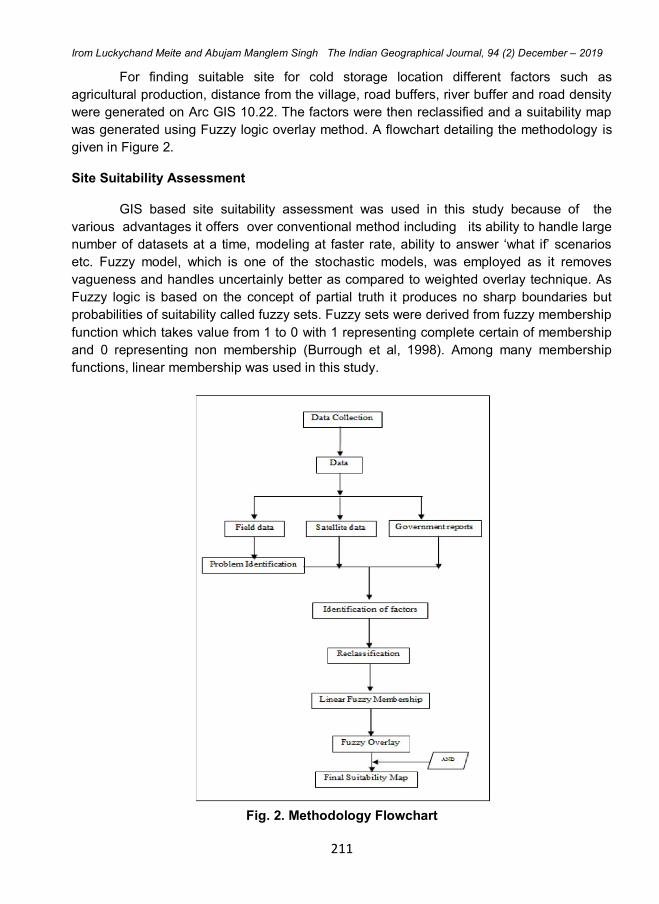
211
Irom Luckychand Meite and Abujam Manglem Singh The Indian Geographical Journal, 94 (2) December – 2019
For finding suitable site for cold storage location different factors such as
agricultural production, distance from the village, road buffers, river buffer and road density
were generated on Arc GIS 10.22. The factors were then reclassified and a suitability map
was generated using Fuzzy logic overlay method. A flowchart detailing the methodology is
given in Figure 2.
Site Suitability Assessment
GIS based site suitability assessment was used in this study because of the
various advantages it offers over conventional method including its ability to handle large
number of datasets at a time, modeling at faster rate, ability to answer ‘what if’ scenarios
etc. Fuzzy model, which is one of the stochastic models, was employed as it removes
vagueness and handles uncertainly better as compared to weighted overlay technique. As
Fuzzy logic is based on the concept of partial truth it produces no sharp boundaries but
probabilities of suitability called fuzzy sets. Fuzzy sets were derived from fuzzy membership
function which takes value from 1 to 0 with 1 representing complete certain of membership
and 0 representing non membership (Burrough et al, 1998). Among many membership
functions, linear membership was used in this study.
Fig. 2. Methodology Flowchart
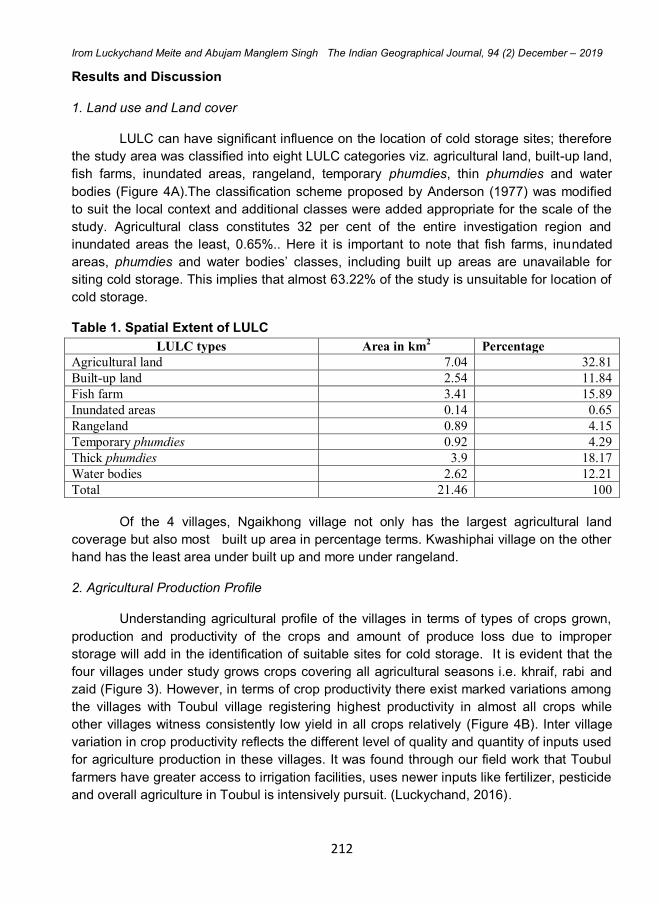
212
Irom Luckychand Meite and Abujam Manglem Singh The Indian Geographical Journal, 94 (2) December – 2019
Results and Discussion
1. Land use and Land cover
LULC can have significant influence on the location of cold storage sites; therefore
the study area was classified into eight LULC categories viz. agricultural land, built-up land,
fish farms, inundated areas, rangeland, temporary phumdies, thin phumdies and water
bodies (Figure 4A).The classification scheme proposed by Anderson (1977) was modified
to suit the local context and additional classes were added appropriate for the scale of the
study. Agricultural class constitutes 32 per cent of the entire investigation region and
inundated areas the least, 0.65%.. Here it is important to note that fish farms, inundated
areas, phumdies and water bodies’ classes, including built up areas are unavailable for
siting cold storage. This implies that almost 63.22% of the study is unsuitable for location of
cold storage.
Table 1. Spatial Extent of LULC
LULC types Area in km2 Percentage
Agricultural land 7.04 32.81
Built-up land 2.54 11.84
Fish farm 3.41 15.89
Inundated areas 0.14 0.65
Rangeland 0.89 4.15
Temporary phumdies 0.92 4.29
Thick phumdies 3.9 18.17
Water bodies 2.62 12.21
Total 21.46 100
Of the 4 villages, Ngaikhong village not only has the largest agricultural land
coverage but also most built up area in percentage terms. Kwashiphai village on the other
hand has the least area under built up and more under rangeland.
2. Agricultural Production Profile
Understanding agricultural profile of the villages in terms of types of crops grown,
production and productivity of the crops and amount of produce loss due to improper
storage will add in the identification of suitable sites for cold storage. It is evident that the
four villages under study grows crops covering all agricultural seasons i.e. khraif, rabi and
zaid (Figure 3). However, in terms of crop productivity there exist marked variations among
the villages with Toubul village registering highest productivity in almost all crops while
other villages witness consistently low yield in all crops relatively (Figure 4B). Inter village
variation in crop productivity reflects the different level of quality and quantity of inputs used
for agriculture production in these villages. It was found through our field work that Toubul
farmers have greater access to irrigation facilities, uses newer inputs like fertilizer, pesticide
and overall agriculture in Toubul is intensively pursuit. (Luckychand, 2016).
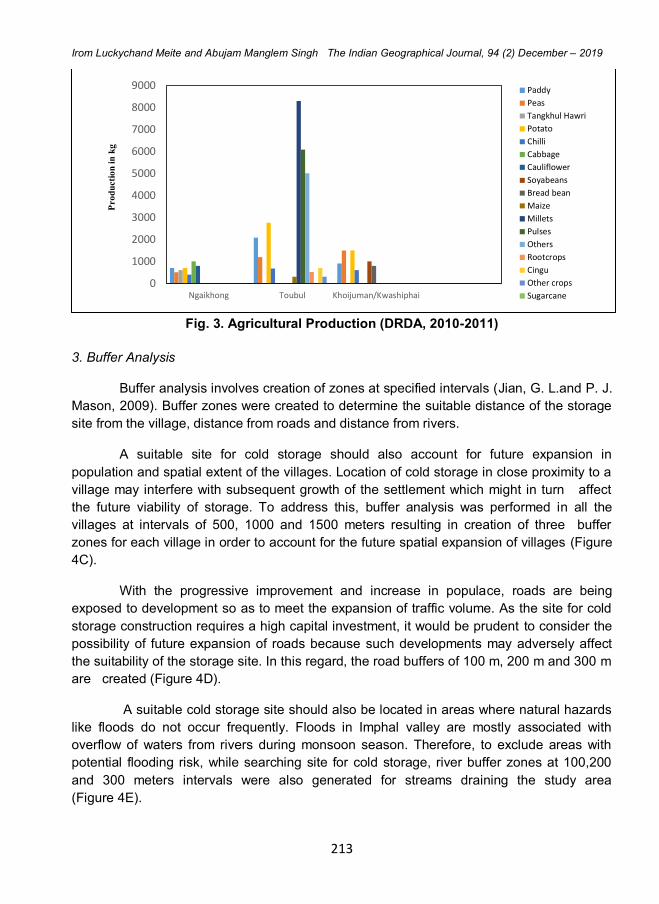
213
Irom Luckychand Meite and Abujam Manglem Singh The Indian Geographical Journal, 94 (2) December – 2019
Fig. 3. Agricultural Production (DRDA, 2010-2011)
3. Buffer Analysis
Buffer analysis involves creation of zones at specified intervals (Jian, G. L.and P. J.
Mason, 2009). Buffer zones were created to determine the suitable distance of the storage
site from the village, distance from roads and distance from rivers.
A suitable site for cold storage should also account for future expansion in
population and spatial extent of the villages. Location of cold storage in close proximity to a
village may interfere with subsequent growth of the settlement which might in turn affect
the future viability of storage. To address this, buffer analysis was performed in all the
villages at intervals of 500, 1000 and 1500 meters resulting in creation of three buffer
zones for each village in order to account for the future spatial expansion of villages (Figure
4C).
With the progressive improvement and increase in populace, roads are being
exposed to development so as to meet the expansion of traffic volume. As the site for cold
storage construction requires a high capital investment, it would be prudent to consider the
possibility of future expansion of roads because such developments may adversely affect
the suitability of the storage site. In this regard, the road buffers of 100 m, 200 m and 300 m
are created (Figure 4D).
A suitable cold storage site should also be located in areas where natural hazards
like floods do not occur frequently. Floods in Imphal valley are mostly associated with
overflow of waters from rivers during monsoon season. Therefore, to exclude areas with
potential flooding risk, while searching site for cold storage, river buffer zones at 100,200
and 300 meters intervals were also generated for streams draining the study area
(Figure 4E).
0
1000
2000
3000
4000
5000
6000
7000
8000
9000
Ngaikhong Toubul Khoijuman/Kwashiphai
Pro
du
cti
on
in
kg
Paddy
Peas
Tangkhul Hawri
Potato
Chilli
Cabbage
Cauliflower
Soyabeans
Bread bean
Maize
Millets
Pulses
Others
Rootcrops
Cingu
Other crops
Sugarcane
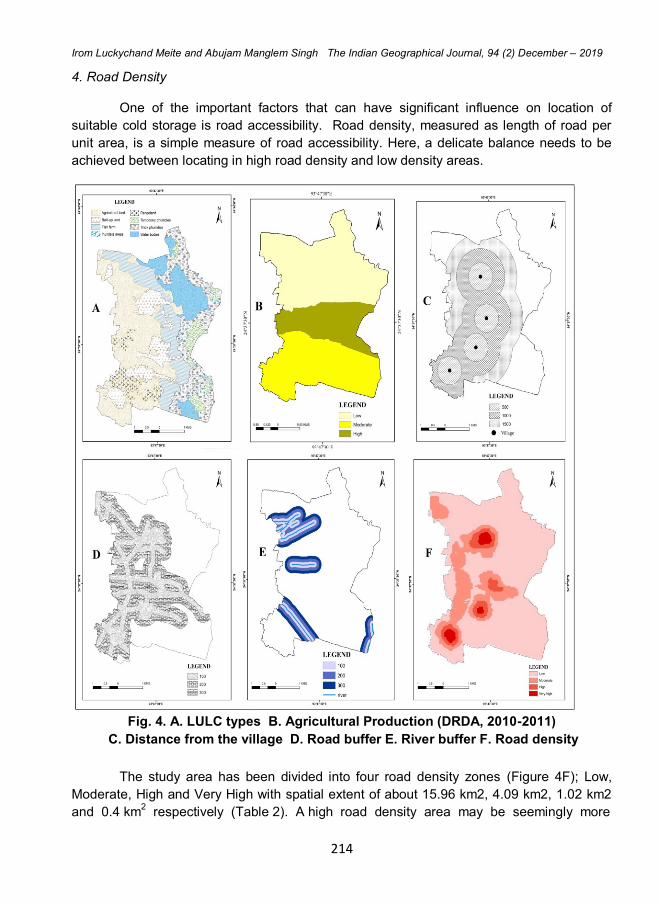
214
Irom Luckychand Meite and Abujam Manglem Singh The Indian Geographical Journal, 94 (2) December – 2019
4. Road Density
One of the important factors that can have significant influence on location of
suitable cold storage is road accessibility. Road density, measured as length of road per
unit area, is a simple measure of road accessibility. Here, a delicate balance needs to be
achieved between locating in high road density and low density areas.
Fig. 4. A. LULC types B. Agricultural Production (DRDA, 2010-2011)
C. Distance from the village D. Road buffer E. River buffer F. Road density
The study area has been divided into four road density zones (Figure 4F); Low,
Moderate, High and Very High with spatial extent of about 15.96 km2, 4.09 km2, 1.02 km2
and 0.4 km2 respectively (Table 2). A high road density area may be seemingly more
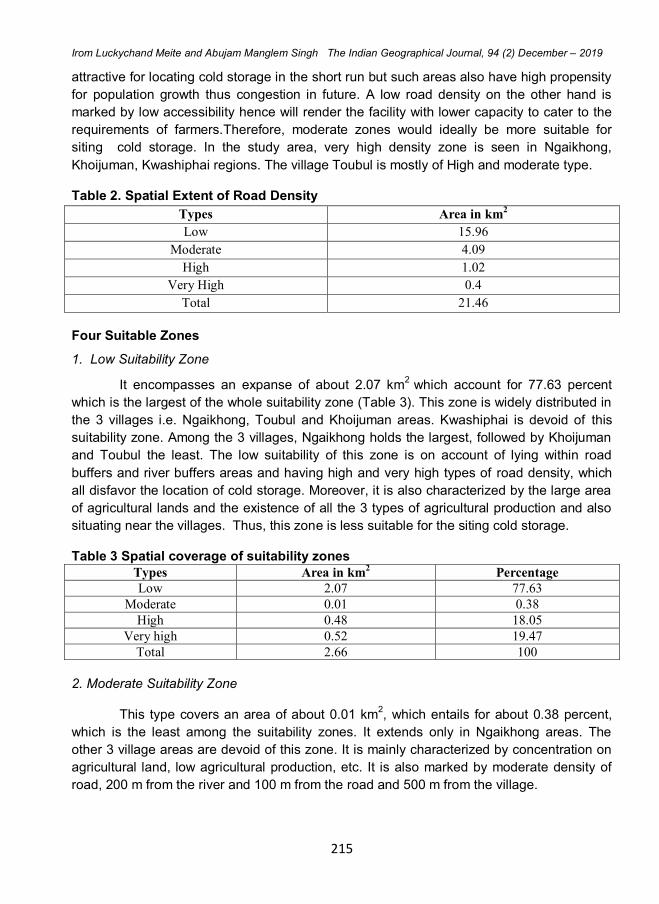
215
Irom Luckychand Meite and Abujam Manglem Singh The Indian Geographical Journal, 94 (2) December – 2019
attractive for locating cold storage in the short run but such areas also have high propensity
for population growth thus congestion in future. A low road density on the other hand is
marked by low accessibility hence will render the facility with lower capacity to cater to the
requirements of farmers.Therefore, moderate zones would ideally be more suitable for
siting cold storage. In the study area, very high density zone is seen in Ngaikhong,
Khoijuman, Kwashiphai regions. The village Toubul is mostly of High and moderate type.
Table 2. Spatial Extent of Road Density
Types Area in km2
Low 15.96
Moderate 4.09
High 1.02
Very High 0.4
Total 21.46
Four Suitable Zones
1. Low Suitability Zone
It encompasses an expanse of about 2.07 km2
which account for 77.63 percent
which is the largest of the whole suitability zone (Table 3). This zone is widely distributed in
the 3 villages i.e. Ngaikhong, Toubul and Khoijuman areas. Kwashiphai is devoid of this
suitability zone. Among the 3 villages, Ngaikhong holds the largest, followed by Khoijuman
and Toubul the least. The low suitability of this zone is on account of lying within road
buffers and river buffers areas and having high and very high types of road density, which
all disfavor the location of cold storage. Moreover, it is also characterized by the large area
of agricultural lands and the existence of all the 3 types of agricultural production and also
situating near the villages. Thus, this zone is less suitable for the siting cold storage.
Table 3 Spatial coverage of suitability zones
Types Area in km2 Percentage
Low 2.07 77.63
Moderate 0.01 0.38
High 0.48 18.05
Very high 0.52 19.47
Total 2.66 100
2. Moderate Suitability Zone
This type covers an area of about 0.01 km2, which entails for about 0.38 percent,
which is the least among the suitability zones. It extends only in Ngaikhong areas. The
other 3 village areas are devoid of this zone. It is mainly characterized by concentration on
agricultural land, low agricultural production, etc. It is also marked by moderate density of
road, 200 m from the river and 100 m from the road and 500 m from the village.
216
Irom Luckychand Meite and Abujam Manglem Singh The Indian Geographical Journal, 94 (2) December – 2019
As this zone falls in all the places that will affect the expansion of built-up and prone
to flooding, it is not suitable for the construction of cold storage.
Fig. 5. Suitability Zones
3. High Suitability Zone
Among the suitability types, this type holds a third position in terms of spatial extent.
It covers an area of about 0.48 km2, which accounts for 18.05 percent of the whole
suitability zone. When analyzed, it is mainly concentrated at the western part of the Toubul
village trailed by Ngaikhong village on southwestern part. The villages of Kwashiphai and
Khoijuman is devoid of this category. High Suitability Zone falls in the region of high
agricultural and low agricultural production and it covers less agricultural land and contains
100 m and 200 m type of road buffer and 300 m and 400 m type of river buffers. It is also
characterized by moderate type of road density. This zone is also suitable and can be
considered for locating cold storage in contingency situations.
4. High Suitability Zone
This zone covers an area of about 0.56 km2 accounting for 19.47 percent of the
whole suitability zone. Lower coverage of agricultural land when compared with other
suitability zones is its main feature. High Suitability Zone is found only in the western side of
the Toubul village. Being farthermost from the village (1500 m) and situating near high
agricultural production, i.e. Toubul, makes this zone very suitable for the future cold storage
construction. It also fulfills the criterion of not being affected by the future built-up
expansions (300 m from the road) and flood risk (300 m from the river) and also
characterized by moderate density of connectivity.
217
Irom Luckychand Meite and Abujam Manglem Singh The Indian Geographical Journal, 94 (2) December – 2019
Conclusion
Post-harvest problem in Indian agriculture is a real and serious issue compounded
by absence of cold storages. This study of villages surrounding western sides of Loktak
Lake showed that there can be four levels of suitability zones for cold storage locations but
only Toubul village area emerged as the most suitable site. The study also points to the
urgent need for cold storage construction in the area. The continuing absence of cold
storage in one of the most agriculturally forward regions of Manipur may not only have local
effects, but in fact, deter other farmers of the state from pursuing commercial oriented
advanced agriculture.
References
1. Anderson, J.R.(1977). Land Use and Land Cover Changes: A Framework for
Monitoring. Journal of Research by the Geological Survey, 5, pp.143-153.
2. Burrough, P.A. & Macdonell, R. A. (1998). Principles of Geographical Information
Systems. Fuzzy Set And Fuzzy Geographical Objects Oxford University Press, New
York
3. Chang, Kang. Tsung. (2016). Introduction to Geographical Information Iystem, 4th
Edition, McGraw Hill Education (India) Private Limited, New Delhi
4. DRDA.( 2010-11).Detailed project report (IWMP-I). Bishnupur, pp.68-112.
5. Jian, G. L. & P. J. Mason, (2009). Essential Image Processing and GIS for Remote
Sensing,1st Edition , John Wiley & Sons Ltd, West Sussex.
6. Kannan, Elumala.(2014). Assessment of pre and post harvest losses of important crops
in India. Agricultural Development and Rural Transformation Centre Institute for Social
and Economic Change, Bangalore.
7. Maheshwar, C. & Chanakwa, T.S. (2006). Post Harvest Losses Due to Gaps in Cold
Chain in India: A Solution. Acta Hort. International Society for Horticultural Science,
712, pp.777-784.
8. Meitei, Luckychand. I. (2016). Socio-Economic Survey on the Western Side of the
Loktak Lake. Unpublished Master 2nd semester dissertation, Manipur University,
Imphal, Manipur, India.
9. Rosli, A. Z,, Reba, M. N. M., Roslan, N. & Room, M. H. M.( 2014). Sustainable Urban
Forestry Potential Based Quantitative and Qualitative Measurement using Geospatial
Technique, IOP Conference Series, Earth and Environmental Science, 18, 1.
10. Roy, S.S. M.I. Ansari, Sharma, S.K Saito, B. Basuda Devi ,Ch. Singh, I.M. Das, Anup.
D. Chakarbarty, A. Arunchslam, N. Prakash & Ngachan, S.V. (2018) .Climate Resilient
Agriculture In Manipur: Status and Strategies for Sustainable Development, Current
Science, 108(7), pp.13-43
11. Singh, N.R. (2012).Agricultural Policy of Manipur State, Part 1. The Sangai Express,
Sangai.
12. http://www.e-pao.net/epSubPageExtractor.asp?src=education.Science_and
Technology. Agricultural_policy_of_Manipur_state_part_1 (Accessed on 12 January
2019)
The Indian Geographical Journal
Volume 94 (2) December - 2019, pp 218-227
ISSN 0019-4824
218
TRENDS OF URBANIZATION IN RAJASTHAN:
APPLICABILITY OF RANK SIZE DISTRIBUTION AND
PRIMATE CITY
Bharat Ratnu1 and Anjana Ratnu
2
1 Department of Geography, Shivaji College, University of Delhi - 110 027
2 CSRD, Jawaharlal Nehru University, New Delhi - 110 067
E-mail: [email protected]
Abstract
Urbanization is a process of transformation in a society, transformation from rural lifestyle
and stagnant economy to urban lifestyle and dynamic economy. Urbanization is not a very
recent process but it started even before industrialization and the process of urbanization in
Rajasthan starts from since ancient period of history. The level of urbanization in India is
comparatively lower than the developed countries and Rajasthan is also comparatively less
urbanized than other states of India. The present study is focused on analyzing the trends
and patterns of urbanization in Rajasthan from 1901 to 2011 and to study how far the rank
rule in Rajasthan is followed. Urbanization in Rajasthan has increased and the rate of
increase is fastest in the last decades. But the process of urbanization in Rajasthan has
disparity among the districts. The paper also deals with the concept of primate city in
Rajasthan.
Keywords: Urbanization, Primate city, Rank size rule, Disparity
Introduction
Urbanization is the new reality of modern world. Urban areas have been considered
as engines of inclusive economic growth. Tremendous urban growth in terms of urban
population, density of urban population and number of towns has been registered after the
post- Independence period in India. About 32% population of the India from 121 crore of
total population lives in urban areas. Census of India characterize urban settlement as, all
the places which have municipality, corporation, and cantonment board or notified town
area committee. Many historians have been debating on urbanization in the early medieval
India. Mark Jefferson, a renowned geographer, put forward the concept of primate cities.
According to his definition, a primate city has to be twice as large in size as the next biggest
city. A primate city is the largest city within a region or nation that dominates not only in
size, but also with regards to area of influence. It often serves as the political and financial
hub of a country. It must also be twice as important, socially and economically. Moreover, a
primate city needs to be on top in most aspects, including politics, universities, media and
culture etc.
219
Bharat Ratnu and Anjana Ratnu The Indian Geographical Journal, 94 (2) December – 2019
A city size distribution, in which the largest city is several times larger than the
second largest is known as the primate city. Primate city expresses the national disposition
more completely than any other city. Different urban geographers in use the concept of rank
size rule world over to investigation of the ranking of cities. Stewart (1958), has applied this
concept for analysing for the nature of 72 counties of the different continents. Mark
Jefferson (1939), was the first geographer introduced the „Law of Primate city‟. The central
place theory of Christaller is also associated with this concept. Vining (1955), Isard (1956),
Allen (1954), Madden (1954), Garrison (1958), Beckmann (1958), Hagget (1965), Smailes
(1967) also checked the relevance of the rank size rule in their work. Rank size rule concept
is suitable for the investigation of the urban process of U. S. A., and Russia. In India,
different urban geographers and administrators for examining the relationships of
population and ranking of cities apply this concept. Reddy (1969), examined the rank-size
relationship and effect of the primate city on the urban centers in Krishna-Godavari delta of
Andhra Pradesh. Barai (1974), investigate the spatial distribution and rank-size relationship
of the urban centres of settlements in Tamil Nadu State.
The rank-size rule (or rank-size distribution) of city populations, is a commonly
observed statistical relationship between the population sizes and population ranks of a
nation‟s cities. According to the rank-size rule, a rank 3 city would have ⅓ the population of
a country's largest city, a rank four city would have ¼ the population of the largest city, and
so on.
Study Area
The study area is Rajasthan, which is located at the western border of the country
and is the largest state in terms of area (342.24 thousand km2) but ranks only eighth in
terms of population. More than half part of state is covered of Thar desert and hence the
population distribution is very unequal. The population density of the state is one of the
lowest at 165 persons per sq. km compared to 325 for India as a whole. The geographical
location of Rajasthan and its topography and climatic condition plays an important role to
determining the land use pattern. Rajasthan extends between 23 0 3' north to 30 0 12' north
latitudes and 69 0 30'E to 78 0 17' east longitudes. The state displays a wide variation of
physical features, which includes hills, plateau, plain, desert with a variable and extreme
climatic conditions, and population distribution. It is bounded by Pakistan in the west and
international border with Pakistan runs for about 1,070 kilometres. Its adjoining states also
present a wide range of disparity in their level of development. Therefore, Rajasthan
present a typical case of Indian urbanization system, where extreme socio economic
characteristics exist and planned development has now visible to completed is more than
sixty years under peaceful democratic set up. As Rajasthan is a largest state of India,
accounting for 10.41 percent of geographical area. In the state of proportion of urban
population (23.39%) is below the national average (27.78%). The adjoining state like
Gujarat (37.4%), Punjab (34%), Haryana (29%). And Madhya Pradesh (27%) are more
urbanized than Rajasthan.
220
Bharat Ratnu and Anjana Ratnu The Indian Geographical Journal, 94 (2) December – 2019
Database and Methodology
The study is based on secondary source of data and source of data is Census of
India 1991, 2001 and 2011.
To analyse the patterns and levels of urbanization, simple statistical methods has
been used with the help of bars and graphs by arranging them with their rank of both the
time period of 2001 and 2011 respectively. The rank size and expected population of the
town or city is calculated by using the simple formula of Zipf‟s
Estimated population of rank city (Pn) = ∑ Pi † ∑ (1/r) Estimated population of first rank city (P1) = ∑ Pi † ∑ (1/r)
where, Pn= estimated population of X
th urban centre
Pi= the population of the largest city or urban centre n= rank of urban centre
Then as stated by the rank-size rule, the estimated first rank city‟s population is
divided by the rank for each city, which gives the estimated population for each city. This
estimated population is the population estimated on the basis of rank-size rule. Now a log
graph is plotted for the both actual population and estimate population of each city of two
time period with a decadal a variation.
Analysis
History of Urbanization in Rajasthan
Ancient Period: The history of Rajasthan is as old as the Harappan Civilization and
dates back to 1000 BC. Some excavated sites bring forth the records of this period. Several
ruins and relics found in the region suggest that it was inhabited by Pre-Aryan race. This
part of Indian sub continent was also influenced by the Jains and Buddhists and the faiths
were spread at large here. In the bygone era Rajasthan has been ruled by different rulers at
different periods of time. Some great dynasties that left behind their impressions here
include the dynasties of Magadha, Kushana, Maurya (321-184BC) and Gupta (400 AD).
From 6th century onwards Rajputs established their supreme power over this area and
under them the region attained its present glory. Rajput rulers established several kingdoms
throughout and the area came to be known as Rajputana or the state of Rajputs.
Medieval Period: Under the Muslim rule in 12th century, some part of Rajasthan
came under the Muslim rulers but some who the Rajputs were able to resist their
supremacy over Mughals. During 13th century, there were some of the powerful regions of
Rajasthan were Nagaur, Ajmer and Mewar region.
Modern Period: During the 16th century under the Akbar supremacy, every
province of Rajasthan was unified. But in the 18th century, with the decline of Mughal
power, the political breakdown of Rajasthan started and some part of Rajasthan came
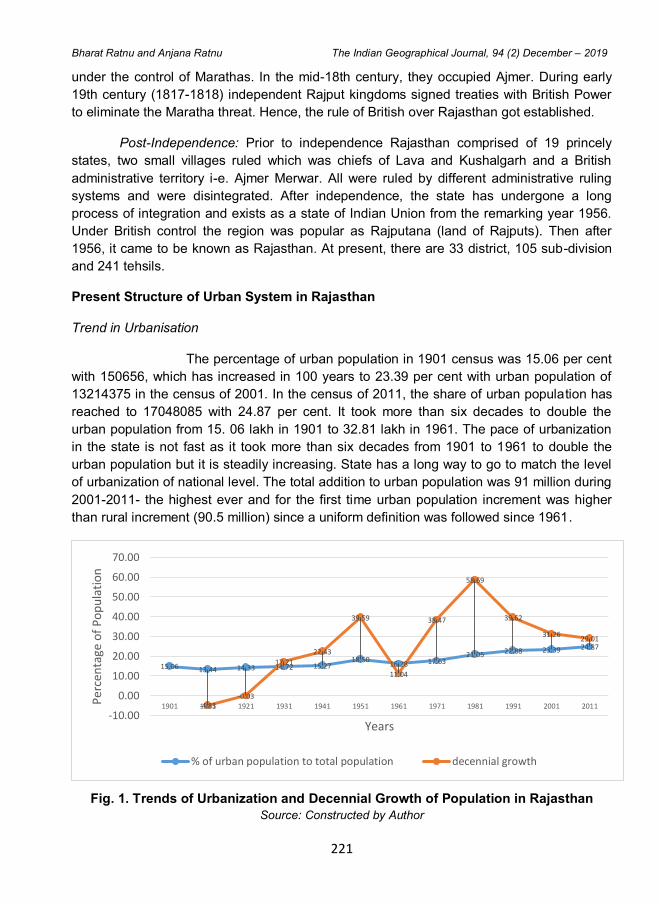
221
Bharat Ratnu and Anjana Ratnu The Indian Geographical Journal, 94 (2) December – 2019
under the control of Marathas. In the mid-18th century, they occupied Ajmer. During early
19th century (1817-1818) independent Rajput kingdoms signed treaties with British Power
to eliminate the Maratha threat. Hence, the rule of British over Rajasthan got established.
Post-Independence: Prior to independence Rajasthan comprised of 19 princely
states, two small villages ruled which was chiefs of Lava and Kushalgarh and a British
administrative territory i-e. Ajmer Merwar. All were ruled by different administrative ruling
systems and were disintegrated. After independence, the state has undergone a long
process of integration and exists as a state of Indian Union from the remarking year 1956.
Under British control the region was popular as Rajputana (land of Rajputs). Then after
1956, it came to be known as Rajasthan. At present, there are 33 district, 105 sub-division
and 241 tehsils.
Present Structure of Urban System in Rajasthan
Trend in Urbanisation
The percentage of urban population in 1901 census was 15.06 per cent
with 150656, which has increased in 100 years to 23.39 per cent with urban population of
13214375 in the census of 2001. In the census of 2011, the share of urban population has
reached to 17048085 with 24.87 per cent. It took more than six decades to double the
urban population from 15. 06 lakh in 1901 to 32.81 lakh in 1961. The pace of urbanization
in the state is not fast as it took more than six decades from 1901 to 1961 to double the
urban population but it is steadily increasing. State has a long way to go to match the level
of urbanization of national level. The total addition to urban population was 91 million during
2001-2011- the highest ever and for the first time urban population increment was higher
than rural increment (90.5 million) since a uniform definition was followed since 1961.
Fig. 1. Trends of Urbanization and Decennial Growth of Population in Rajasthan
Source: Constructed by Author
15.06 13.44 14.33 14.72 15.27 18.50
16.28 17.63 21.05 22.88 23.39 24.87
-4.83 -0.03
17.21
22.43
39.59
11.04
38.47
58.69
39.62
31.26 29.01
-10.00
0.00
10.00
20.00
30.00
40.00
50.00
60.00
70.00
1901 1911 1921 1931 1941 1951 1961 1971 1981 1991 2001 2011Pe
rcen
tage
of
Po
pu
lati
on
Years
% of urban population to total population decennial growth
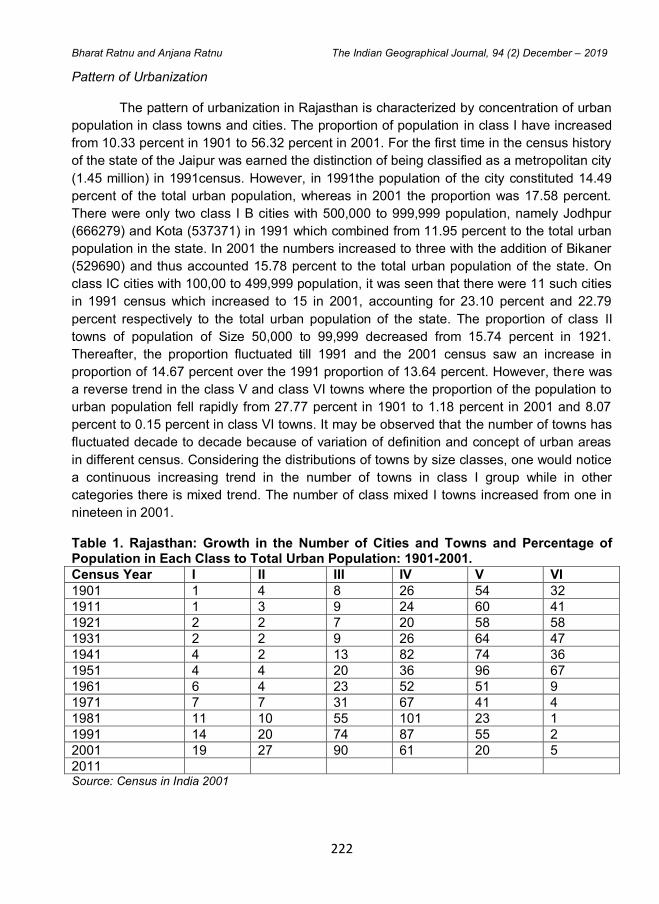
222
Bharat Ratnu and Anjana Ratnu The Indian Geographical Journal, 94 (2) December – 2019
Pattern of Urbanization
The pattern of urbanization in Rajasthan is characterized by concentration of urban
population in class towns and cities. The proportion of population in class I have increased
from 10.33 percent in 1901 to 56.32 percent in 2001. For the first time in the census history
of the state of the Jaipur was earned the distinction of being classified as a metropolitan city
(1.45 million) in 1991census. However, in 1991the population of the city constituted 14.49
percent of the total urban population, whereas in 2001 the proportion was 17.58 percent.
There were only two class I B cities with 500,000 to 999,999 population, namely Jodhpur
(666279) and Kota (537371) in 1991 which combined from 11.95 percent to the total urban
population in the state. In 2001 the numbers increased to three with the addition of Bikaner
(529690) and thus accounted 15.78 percent to the total urban population of the state. On
class IC cities with 100,00 to 499,999 population, it was seen that there were 11 such cities
in 1991 census which increased to 15 in 2001, accounting for 23.10 percent and 22.79
percent respectively to the total urban population of the state. The proportion of class II
towns of population of Size 50,000 to 99,999 decreased from 15.74 percent in 1921.
Thereafter, the proportion fluctuated till 1991 and the 2001 census saw an increase in
proportion of 14.67 percent over the 1991 proportion of 13.64 percent. However, there was
a reverse trend in the class V and class VI towns where the proportion of the population to
urban population fell rapidly from 27.77 percent in 1901 to 1.18 percent in 2001 and 8.07
percent to 0.15 percent in class VI towns. It may be observed that the number of towns has
fluctuated decade to decade because of variation of definition and concept of urban areas
in different census. Considering the distributions of towns by size classes, one would notice
a continuous increasing trend in the number of towns in class I group while in other
categories there is mixed trend. The number of class mixed I towns increased from one in
nineteen in 2001.
Table 1. Rajasthan: Growth in the Number of Cities and Towns and Percentage of Population in Each Class to Total Urban Population: 1901-2001.
Census Year I II III IV V VI
1901 1 4 8 26 54 32
1911 1 3 9 24 60 41
1921 2 2 7 20 58 58
1931 2 2 9 26 64 47
1941 4 2 13 82 74 36
1951 4 4 20 36 96 67
1961 6 4 23 52 51 9
1971 7 7 31 67 41 4
1981 11 10 55 101 23 1
1991 14 20 74 87 55 2
2001 19 27 90 61 20 5
2011 Source: Census in India 2001
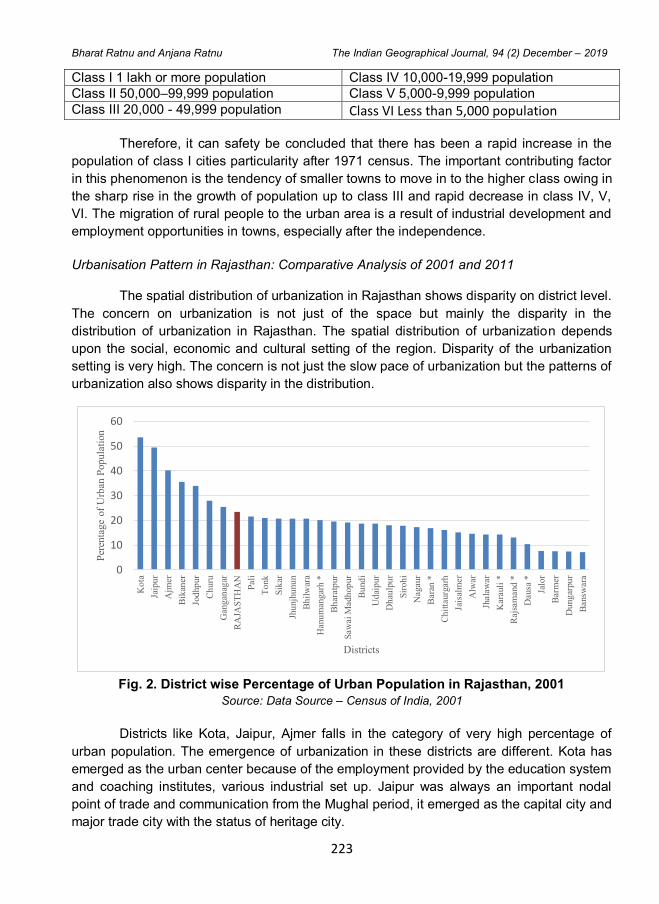
223
Bharat Ratnu and Anjana Ratnu The Indian Geographical Journal, 94 (2) December – 2019
Class I 1 lakh or more population Class IV 10,000-19,999 population
Class II 50,000–99,999 population Class V 5,000-9,999 population
Class III 20,000 - 49,999 population Class VI Less than 5,000 population
Therefore, it can safety be concluded that there has been a rapid increase in the
population of class I cities particularity after 1971 census. The important contributing factor
in this phenomenon is the tendency of smaller towns to move in to the higher class owing in
the sharp rise in the growth of population up to class III and rapid decrease in class IV, V,
VI. The migration of rural people to the urban area is a result of industrial development and
employment opportunities in towns, especially after the independence.
Urbanisation Pattern in Rajasthan: Comparative Analysis of 2001 and 2011
The spatial distribution of urbanization in Rajasthan shows disparity on district level.
The concern on urbanization is not just of the space but mainly the disparity in the
distribution of urbanization in Rajasthan. The spatial distribution of urbanization depends
upon the social, economic and cultural setting of the region. Disparity of the urbanization
setting is very high. The concern is not just the slow pace of urbanization but the patterns of
urbanization also shows disparity in the distribution.
Fig. 2. District wise Percentage of Urban Population in Rajasthan, 2001
Source: Data Source – Census of India, 2001
Districts like Kota, Jaipur, Ajmer falls in the category of very high percentage of
urban population. The emergence of urbanization in these districts are different. Kota has
emerged as the urban center because of the employment provided by the education system
and coaching institutes, various industrial set up. Jaipur was always an important nodal
point of trade and communication from the Mughal period, it emerged as the capital city and
major trade city with the status of heritage city.
0
10
20
30
40
50
60
Ko
ta
Jaip
ur
Ajm
er
Bik
aner
Jod
hp
ur
Ch
uru
Gang
anag
ar
RA
JAS
TH
AN
Pali
To
nk
Sik
ar
Jhu
njh
unu
n
Bh
ilw
ara
Hanu
mang
arh *
Bh
aratp
ur
Saw
ai
Madh
op
ur
Bu
nd
i
Ud
aip
ur
Dh
aulp
ur
Sir
oh
i
Nagaur
Bara
n *
Ch
itta
urg
arh
Jais
alm
er
Alw
ar
Jhala
war
Kara
uli
*
Rajs
am
and
*
Dausa
*
Jalo
r
Barm
er
Du
ng
arpu
r
Bansw
ara
Per
enta
ge
of
Urb
an P
opula
tion
Districts
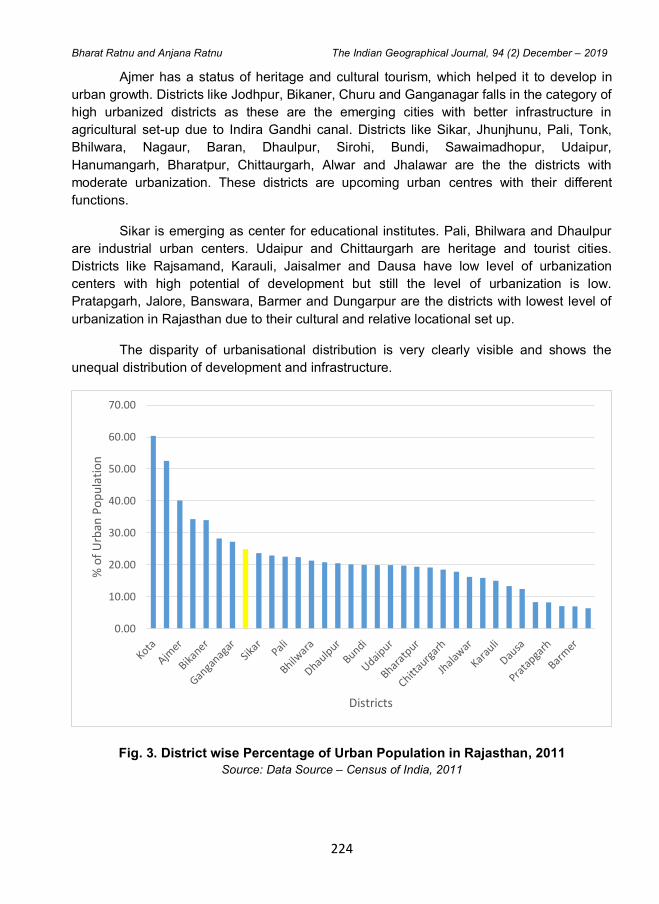
224
Bharat Ratnu and Anjana Ratnu The Indian Geographical Journal, 94 (2) December – 2019
Ajmer has a status of heritage and cultural tourism, which helped it to develop in
urban growth. Districts like Jodhpur, Bikaner, Churu and Ganganagar falls in the category of
high urbanized districts as these are the emerging cities with better infrastructure in
agricultural set-up due to Indira Gandhi canal. Districts like Sikar, Jhunjhunu, Pali, Tonk,
Bhilwara, Nagaur, Baran, Dhaulpur, Sirohi, Bundi, Sawaimadhopur, Udaipur,
Hanumangarh, Bharatpur, Chittaurgarh, Alwar and Jhalawar are the the districts with
moderate urbanization. These districts are upcoming urban centres with their different
functions.
Sikar is emerging as center for educational institutes. Pali, Bhilwara and Dhaulpur
are industrial urban centers. Udaipur and Chittaurgarh are heritage and tourist cities.
Districts like Rajsamand, Karauli, Jaisalmer and Dausa have low level of urbanization
centers with high potential of development but still the level of urbanization is low.
Pratapgarh, Jalore, Banswara, Barmer and Dungarpur are the districts with lowest level of
urbanization in Rajasthan due to their cultural and relative locational set up.
The disparity of urbanisational distribution is very clearly visible and shows the
unequal distribution of development and infrastructure.
Fig. 3. District wise Percentage of Urban Population in Rajasthan, 2011
Source: Data Source – Census of India, 2011
0.00
10.00
20.00
30.00
40.00
50.00
60.00
70.00
% o
f U
rban
Po
pu
lati
on
Districts
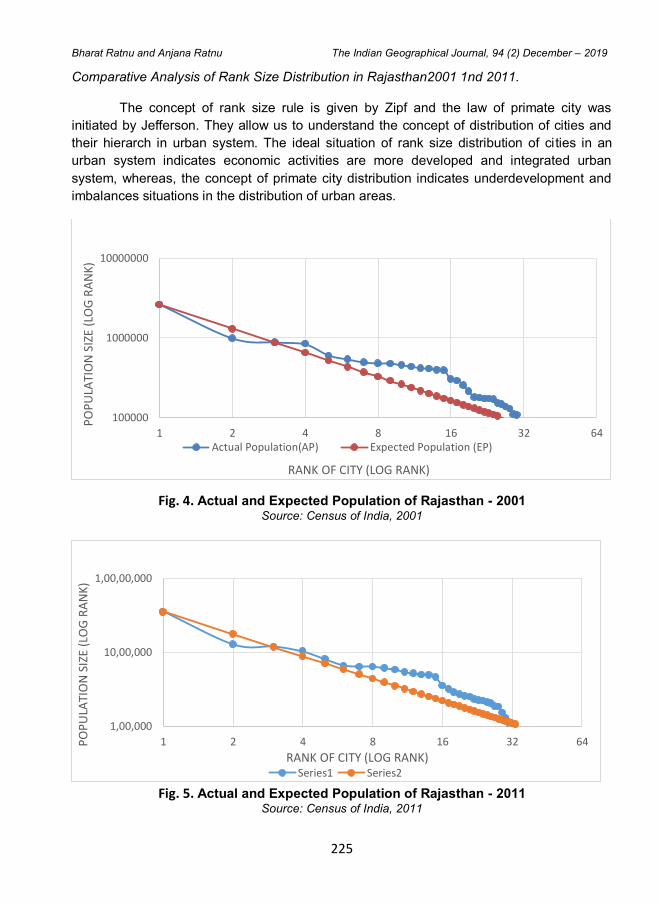
225
Bharat Ratnu and Anjana Ratnu The Indian Geographical Journal, 94 (2) December – 2019
Comparative Analysis of Rank Size Distribution in Rajasthan2001 1nd 2011.
The concept of rank size rule is given by Zipf and the law of primate city was
initiated by Jefferson. They allow us to understand the concept of distribution of cities and
their hierarch in urban system. The ideal situation of rank size distribution of cities in an
urban system indicates economic activities are more developed and integrated urban
system, whereas, the concept of primate city distribution indicates underdevelopment and
imbalances situations in the distribution of urban areas.
Fig. 4. Actual and Expected Population of Rajasthan - 2001 Source: Census of India, 2001
Fig. 5. Actual and Expected Population of Rajasthan - 2011
Source: Census of India, 2011
100000
1000000
10000000
1 2 4 8 16 32 64
PO
PU
LATI
ON
SIZ
E (L
OG
RA
NK
)
RANK OF CITY (LOG RANK)
Actual Population(AP) Expected Population (EP)
1,00,000
10,00,000
1,00,00,000
1 2 4 8 16 32 64PO
PU
LATI
ON
SIZ
E (L
OG
RA
NK
)
RANK OF CITY (LOG RANK) Series1 Series2
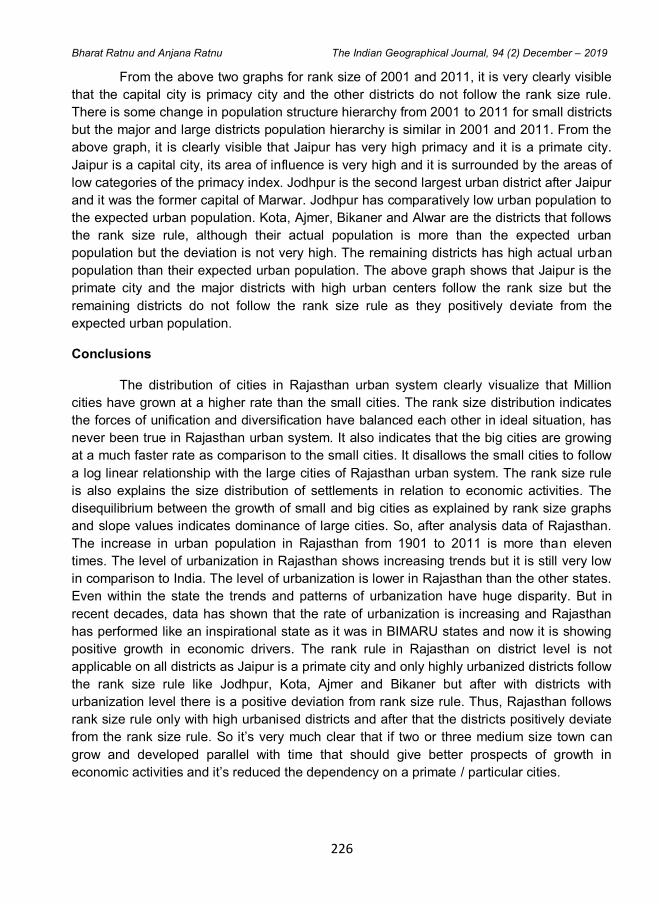
226
Bharat Ratnu and Anjana Ratnu The Indian Geographical Journal, 94 (2) December – 2019
From the above two graphs for rank size of 2001 and 2011, it is very clearly visible
that the capital city is primacy city and the other districts do not follow the rank size rule.
There is some change in population structure hierarchy from 2001 to 2011 for small districts
but the major and large districts population hierarchy is similar in 2001 and 2011. From the
above graph, it is clearly visible that Jaipur has very high primacy and it is a primate city.
Jaipur is a capital city, its area of influence is very high and it is surrounded by the areas of
low categories of the primacy index. Jodhpur is the second largest urban district after Jaipur
and it was the former capital of Marwar. Jodhpur has comparatively low urban population to
the expected urban population. Kota, Ajmer, Bikaner and Alwar are the districts that follows
the rank size rule, although their actual population is more than the expected urban
population but the deviation is not very high. The remaining districts has high actual urban
population than their expected urban population. The above graph shows that Jaipur is the
primate city and the major districts with high urban centers follow the rank size but the
remaining districts do not follow the rank size rule as they positively deviate from the
expected urban population.
Conclusions
The distribution of cities in Rajasthan urban system clearly visualize that Million
cities have grown at a higher rate than the small cities. The rank size distribution indicates
the forces of unification and diversification have balanced each other in ideal situation, has
never been true in Rajasthan urban system. It also indicates that the big cities are growing
at a much faster rate as comparison to the small cities. It disallows the small cities to follow
a log linear relationship with the large cities of Rajasthan urban system. The rank size rule
is also explains the size distribution of settlements in relation to economic activities. The
disequilibrium between the growth of small and big cities as explained by rank size graphs
and slope values indicates dominance of large cities. So, after analysis data of Rajasthan.
The increase in urban population in Rajasthan from 1901 to 2011 is more than eleven
times. The level of urbanization in Rajasthan shows increasing trends but it is still very low
in comparison to India. The level of urbanization is lower in Rajasthan than the other states.
Even within the state the trends and patterns of urbanization have huge disparity. But in
recent decades, data has shown that the rate of urbanization is increasing and Rajasthan
has performed like an inspirational state as it was in BIMARU states and now it is showing
positive growth in economic drivers. The rank rule in Rajasthan on district level is not
applicable on all districts as Jaipur is a primate city and only highly urbanized districts follow
the rank size rule like Jodhpur, Kota, Ajmer and Bikaner but after with districts with
urbanization level there is a positive deviation from rank size rule. Thus, Rajasthan follows
rank size rule only with high urbanised districts and after that the districts positively deviate
from the rank size rule. So it‟s very much clear that if two or three medium size town can
grow and developed parallel with time that should give better prospects of growth in
economic activities and it‟s reduced the dependency on a primate / particular cities.
227
Bharat Ratnu and Anjana Ratnu The Indian Geographical Journal, 94 (2) December – 2019
References
1. Ansary, Rabiul (2013) Pattern of Urbanization Migration and Economic Development in Rajasthan: A District Level Analysis, Indian Streams Research Journals, Vol: II, Issue : XII, January – 2013.
2. Barai Daksha, C. (1974): “Rank-size Relationship and Spatial Distribution of Urban Centres in Tamil Nadu”, National Geographical Journal of India, Vamasi, Vol. 20, pp. 246-56.
3. Beckmann, Martin J. (1958) "City Hierarchies and the Distribution of City Size”. Economic Development and Cultural Change 6.3 pp.243-48.
4. Henderson. V (2002) “Urbanization in Developing Countries” The World Bank Research Observer, Vol. 17, No. 1, pp. 89-112
5. IDS (2008), Human Development Report Rajasthan (An Update - 2008), Jaipur: Institute of Development Studies and Government of Rajasthan.
6. Jefferson, M. (1939): “The Law of the Primate city”, The Journal of Geographical Review, Vol.29, pp. 226-232.
7. Joshi, K.N.: State Level Background Paper on Rajasthan, Institute of Development Studies, 8-B, Jhanlana Institutional Area, Jaipur.
8. Reddy, N.B.K. (1969): “A Comparative Study of Urban Rank Size Relationship in the Krishna, Godavari Deltas and South Indian States”, The National Geographical Journal of Indian, Varanasi, Vol. 25(2) pp. 63-89.
9. Richardson, H. (1987). "The Costs of Urbanization: A Four Country Comparison." Economic Development and Cultural Change 33, pp.561-80
10. Stewart, C. T. (1958): “The Size and Spacing of Cities”, The Journal of Geographical Review, Vol. 48, pp. 222-245.
11. Vapnarsky, Cesar A. (1969) "On Rank-Size Distributions of Cities: An Ecological Approach." Economic Development and Cultural Change 17.4 pp.584-95.
12. Williamson, J. 1965. "Regional Inequality and the Process of National Development." Economic Development and Cultural Change 13, pp.3-45.
The Indian Geographical Journal
Volume 94 (2) December - 2019, pp 228-235
ISSN 0019-4824
228
CHANGING THE TREND OF FUNCTIONAL CLASSIFICATION
IN JAIPUR REGION, RAJASTHAN
Poonam Devi Verma and Mini Mathur
Department of Geography, Shivaji College, University of Delhi - 110 027
E-mail: [email protected]
Abstract
In the present study the changing pattern of occupational structure and economic activity is
analysed in this study that is an essential to observe the economic development. A
significant consequential relationship between the establishment of Industrial andService
activities and the Employment trend is also analyzed here. In modern times there are
different ways to classify towns. Classification can be based on geographical location, stage
and the size o population. But in many ways the most meaningful basis of classification is
that of function determined principally by occupational structure. A Ternary diagram was,
however found the most suitable device for classification of large number of Indian towns in
1961 census. In the present area, Ternary diagram is use ie. Primary, secondary and
tertiary activities under which particularly cultivators, agricultural laborers, workers involved
in household industries and others area examined. Along “A” apex shows primary activity
“B” apex of triangle shows secondary and „C‟ apex of triangle shows tertiary activity. The
percentage of activities are then plotted on a ternary diagram, along with categories on sub
triangle and this position in the triangle was taken as the main determinant of this functional
classification. Functional classification of six tehsils of Jaipur district is done on the basis of
dominance of economic activity preventing in each tehsils. Future depending on the
categorized of workers involved in each economic activity, six sub divisions ie. I, II, III,IV,
V,VI are categorised.
Keywords: Occupational structure, Ternary diagram, Functional classification
Introduction
In recent period the economic development has been major concern in the
economic process. With the rapid development, the economic activities structure is also
changing. Eerier it was primary activity, which was dominantly activity, but over the years it
has been found that other activities are growing and developing in the regions thus
reducing the work participation of primary workers and primary activities. The high degree
of specialization and high levels of labour wages of other sector are the driving force behind
this change, on the basis of Census 1971, it is found that the study area had out of total
workers population 57% and7% agriculture labour and cultivators respectively. But in year
2011 the work participation of workers involved in agricultural and cultivators has reduced to
- and - respectively with increased participation of 36 % in others.
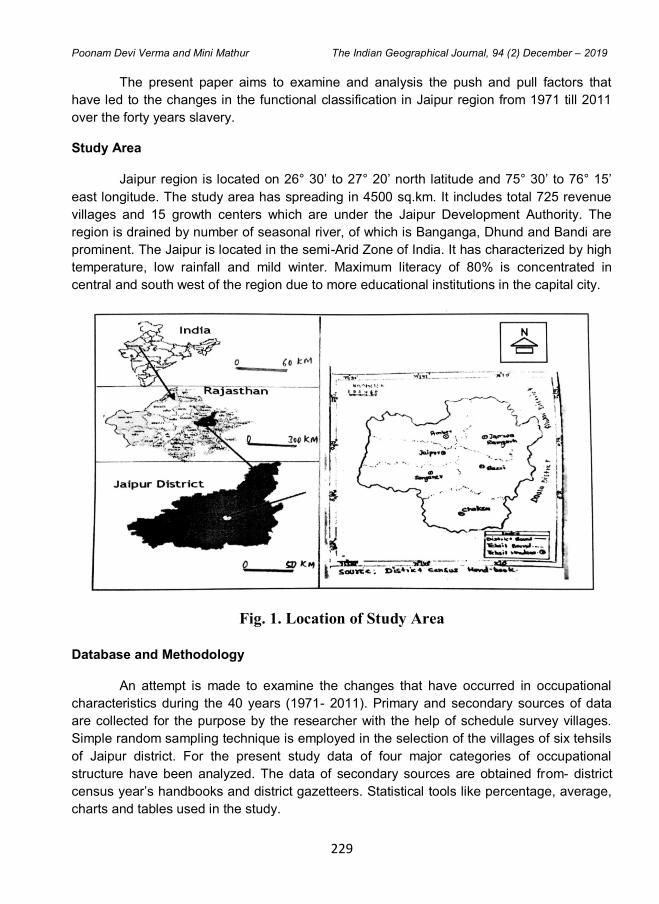
229
Poonam Devi Verma and Mini Mathur The Indian Geographical Journal, 94 (2) December – 2019
The present paper aims to examine and analysis the push and pull factors that
have led to the changes in the functional classification in Jaipur region from 1971 till 2011
over the forty years slavery.
Study Area
Jaipur region is located on 26° 30’ to 27° 20’ north latitude and 75° 30’ to 76° 15’
east longitude. The study area has spreading in 4500 sq.km. It includes total 725 revenue
villages and 15 growth centers which are under the Jaipur Development Authority. The
region is drained by number of seasonal river, of which is Banganga, Dhund and Bandi are
prominent. The Jaipur is located in the semi-Arid Zone of India. It has characterized by high
temperature, low rainfall and mild winter. Maximum literacy of 80% is concentrated in
central and south west of the region due to more educational institutions in the capital city.
Fig. 1. Location of Study Area
Database and Methodology
An attempt is made to examine the changes that have occurred in occupational
characteristics during the 40 years (1971- 2011). Primary and secondary sources of data
are collected for the purpose by the researcher with the help of schedule survey villages.
Simple random sampling technique is employed in the selection of the villages of six tehsils
of Jaipur district. For the present study data of four major categories of occupational
structure have been analyzed. The data of secondary sources are obtained from- district
census year’s handbooks and district gazetteers. Statistical tools like percentage, average,
charts and tables used in the study.
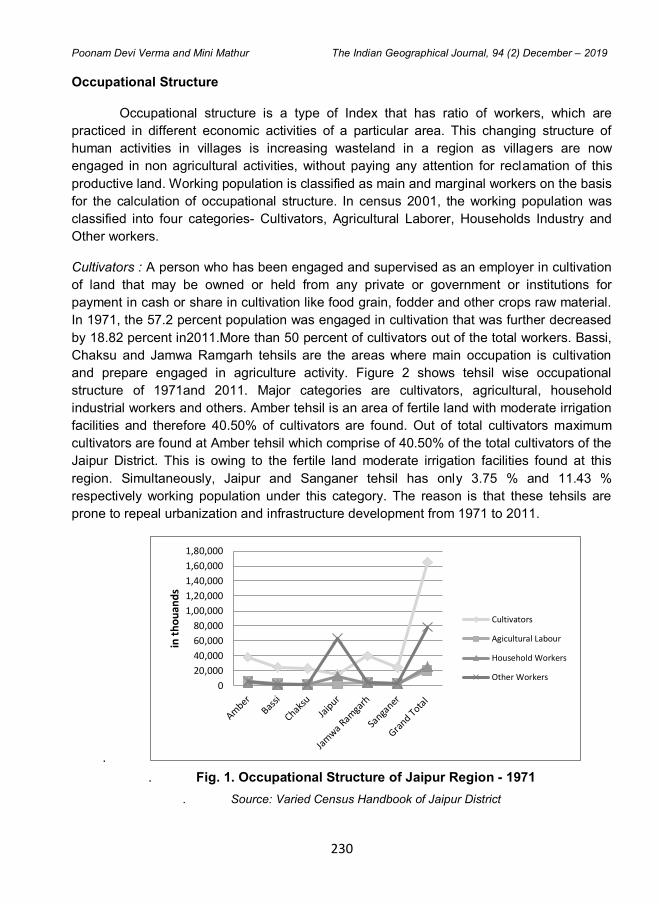
230
Poonam Devi Verma and Mini Mathur The Indian Geographical Journal, 94 (2) December – 2019
Occupational Structure
Occupational structure is a type of Index that has ratio of workers, which are
practiced in different economic activities of a particular area. This changing structure of
human activities in villages is increasing wasteland in a region as villagers are now
engaged in non agricultural activities, without paying any attention for reclamation of this
productive land. Working population is classified as main and marginal workers on the basis
for the calculation of occupational structure. In census 2001, the working population was
classified into four categories- Cultivators, Agricultural Laborer, Households Industry and
Other workers.
Cultivators : A person who has been engaged and supervised as an employer in cultivation
of land that may be owned or held from any private or government or institutions for
payment in cash or share in cultivation like food grain, fodder and other crops raw material.
In 1971, the 57.2 percent population was engaged in cultivation that was further decreased
by 18.82 percent in2011.More than 50 percent of cultivators out of the total workers. Bassi,
Chaksu and Jamwa Ramgarh tehsils are the areas where main occupation is cultivation
and prepare engaged in agriculture activity. Figure 2 shows tehsil wise occupational
structure of 1971and 2011. Major categories are cultivators, agricultural, household
industrial workers and others. Amber tehsil is an area of fertile land with moderate irrigation
facilities and therefore 40.50% of cultivators are found. Out of total cultivators maximum
cultivators are found at Amber tehsil which comprise of 40.50% of the total cultivators of the
Jaipur District. This is owing to the fertile land moderate irrigation facilities found at this
region. Simultaneously, Jaipur and Sanganer tehsil has only 3.75 % and 11.43 %
respectively working population under this category. The reason is that these tehsils are
prone to repeal urbanization and infrastructure development from 1971 to 2011.
.
. Fig. 1. Occupational Structure of Jaipur Region - 1971
. Source: Varied Census Handbook of Jaipur District
0
20,000
40,000
60,000
80,000
1,00,000
1,20,000
1,40,000
1,60,000
1,80,000
in t
ho
uan
ds
Cultivators
Agicultural Labour
Household Workers
Other Workers
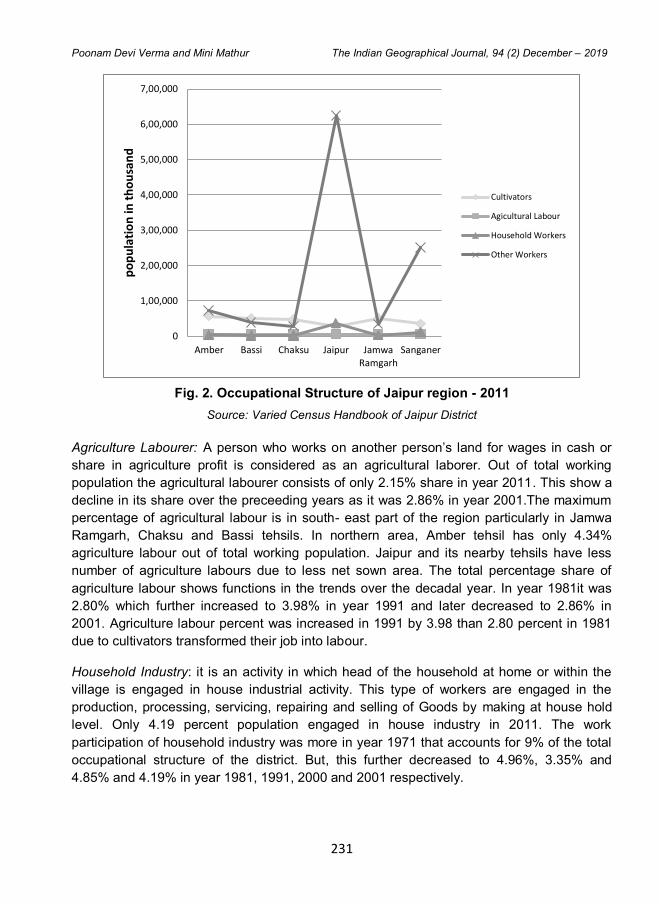
231
Poonam Devi Verma and Mini Mathur The Indian Geographical Journal, 94 (2) December – 2019
Fig. 2. Occupational Structure of Jaipur region - 2011
Source: Varied Census Handbook of Jaipur District
Agriculture Labourer: A person who works on another person’s land for wages in cash or
share in agriculture profit is considered as an agricultural laborer. Out of total working
population the agricultural labourer consists of only 2.15% share in year 2011. This show a
decline in its share over the preceeding years as it was 2.86% in year 2001.The maximum
percentage of agricultural labour is in south- east part of the region particularly in Jamwa
Ramgarh, Chaksu and Bassi tehsils. In northern area, Amber tehsil has only 4.34%
agriculture labour out of total working population. Jaipur and its nearby tehsils have less
number of agriculture labours due to less net sown area. The total percentage share of
agriculture labour shows functions in the trends over the decadal year. In year 1981it was
2.80% which further increased to 3.98% in year 1991 and later decreased to 2.86% in
2001. Agriculture labour percent was increased in 1991 by 3.98 than 2.80 percent in 1981
due to cultivators transformed their job into labour.
Household Industry: it is an activity in which head of the household at home or within the
village is engaged in house industrial activity. This type of workers are engaged in the
production, processing, servicing, repairing and selling of Goods by making at house hold
level. Only 4.19 percent population engaged in house industry in 2011. The work
participation of household industry was more in year 1971 that accounts for 9% of the total
occupational structure of the district. But, this further decreased to 4.96%, 3.35% and
4.85% and 4.19% in year 1981, 1991, 2000 and 2001 respectively.
0
1,00,000
2,00,000
3,00,000
4,00,000
5,00,000
6,00,000
7,00,000
Amber Bassi Chaksu Jaipur JamwaRamgarh
Sanganer
po
pu
lati
on
in t
ho
usa
nd
Cultivators
Agicultural Labour
Household Workers
Other Workers
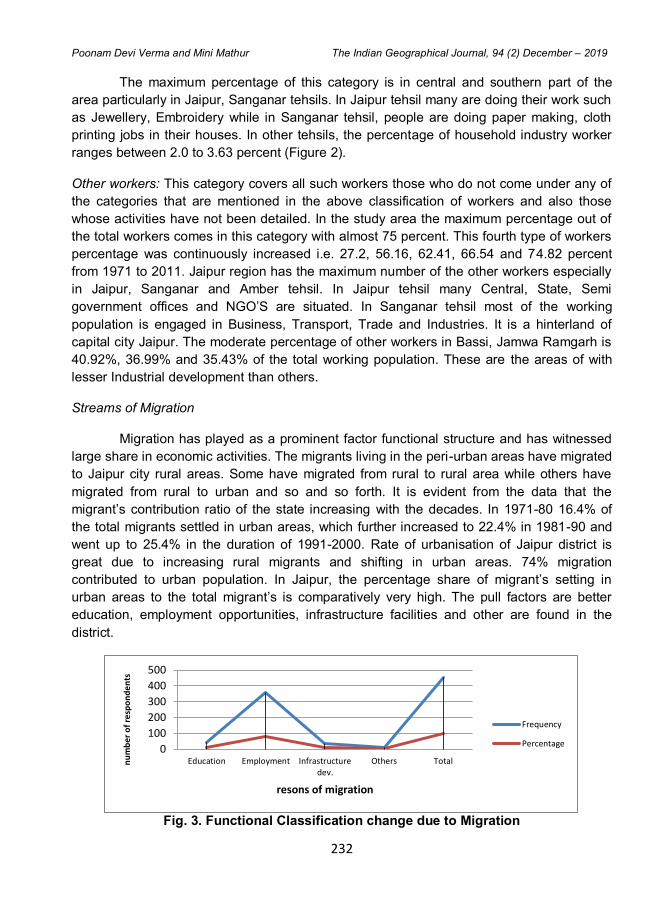
232
Poonam Devi Verma and Mini Mathur The Indian Geographical Journal, 94 (2) December – 2019
The maximum percentage of this category is in central and southern part of the
area particularly in Jaipur, Sanganar tehsils. In Jaipur tehsil many are doing their work such
as Jewellery, Embroidery while in Sanganar tehsil, people are doing paper making, cloth
printing jobs in their houses. In other tehsils, the percentage of household industry worker
ranges between 2.0 to 3.63 percent (Figure 2).
Other workers: This category covers all such workers those who do not come under any of
the categories that are mentioned in the above classification of workers and also those
whose activities have not been detailed. In the study area the maximum percentage out of
the total workers comes in this category with almost 75 percent. This fourth type of workers
percentage was continuously increased i.e. 27.2, 56.16, 62.41, 66.54 and 74.82 percent
from 1971 to 2011. Jaipur region has the maximum number of the other workers especially
in Jaipur, Sanganar and Amber tehsil. In Jaipur tehsil many Central, State, Semi
government offices and NGO’S are situated. In Sanganar tehsil most of the working
population is engaged in Business, Transport, Trade and Industries. It is a hinterland of
capital city Jaipur. The moderate percentage of other workers in Bassi, Jamwa Ramgarh is
40.92%, 36.99% and 35.43% of the total working population. These are the areas of with
lesser Industrial development than others.
Streams of Migration
Migration has played as a prominent factor functional structure and has witnessed
large share in economic activities. The migrants living in the peri-urban areas have migrated
to Jaipur city rural areas. Some have migrated from rural to rural area while others have
migrated from rural to urban and so and so forth. It is evident from the data that the
migrant’s contribution ratio of the state increasing with the decades. In 1971-80 16.4% of
the total migrants settled in urban areas, which further increased to 22.4% in 1981-90 and
went up to 25.4% in the duration of 1991-2000. Rate of urbanisation of Jaipur district is
great due to increasing rural migrants and shifting in urban areas. 74% migration
contributed to urban population. In Jaipur, the percentage share of migrant’s setting in
urban areas to the total migrant’s is comparatively very high. The pull factors are better
education, employment opportunities, infrastructure facilities and other are found in the
district.
Fig. 3. Functional Classification change due to Migration
0
100
200
300
400
500
Education Employment Infrastructuredev.
Others Totalnu
mb
er
of
resp
on
de
nts
resons of migration
Frequency
Percentage
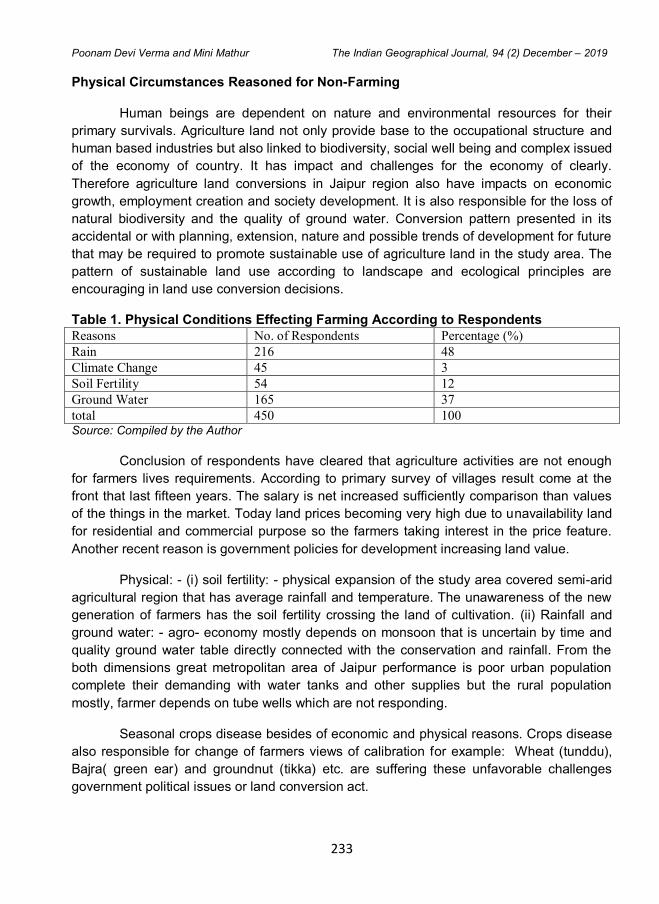
233
Poonam Devi Verma and Mini Mathur The Indian Geographical Journal, 94 (2) December – 2019
Physical Circumstances Reasoned for Non-Farming
Human beings are dependent on nature and environmental resources for their
primary survivals. Agriculture land not only provide base to the occupational structure and
human based industries but also linked to biodiversity, social well being and complex issued
of the economy of country. It has impact and challenges for the economy of clearly.
Therefore agriculture land conversions in Jaipur region also have impacts on economic
growth, employment creation and society development. It is also responsible for the loss of
natural biodiversity and the quality of ground water. Conversion pattern presented in its
accidental or with planning, extension, nature and possible trends of development for future
that may be required to promote sustainable use of agriculture land in the study area. The
pattern of sustainable land use according to landscape and ecological principles are
encouraging in land use conversion decisions.
Table 1. Physical Conditions Effecting Farming According to Respondents
Reasons No. of Respondents Percentage (%)
Rain 216 48
Climate Change 45 3
Soil Fertility 54 12
Ground Water 165 37
total 450 100 Source: Compiled by the Author
Conclusion of respondents have cleared that agriculture activities are not enough
for farmers lives requirements. According to primary survey of villages result come at the
front that last fifteen years. The salary is net increased sufficiently comparison than values
of the things in the market. Today land prices becoming very high due to unavailability land
for residential and commercial purpose so the farmers taking interest in the price feature.
Another recent reason is government policies for development increasing land value.
Physical: - (i) soil fertility: - physical expansion of the study area covered semi-arid
agricultural region that has average rainfall and temperature. The unawareness of the new
generation of farmers has the soil fertility crossing the land of cultivation. (ii) Rainfall and
ground water: - agro- economy mostly depends on monsoon that is uncertain by time and
quality ground water table directly connected with the conservation and rainfall. From the
both dimensions great metropolitan area of Jaipur performance is poor urban population
complete their demanding with water tanks and other supplies but the rural population
mostly, farmer depends on tube wells which are not responding.
Seasonal crops disease besides of economic and physical reasons. Crops disease
also responsible for change of farmers views of calibration for example: Wheat (tunddu),
Bajra( green ear) and groundnut (tikka) etc. are suffering these unfavorable challenges
government political issues or land conversion act.
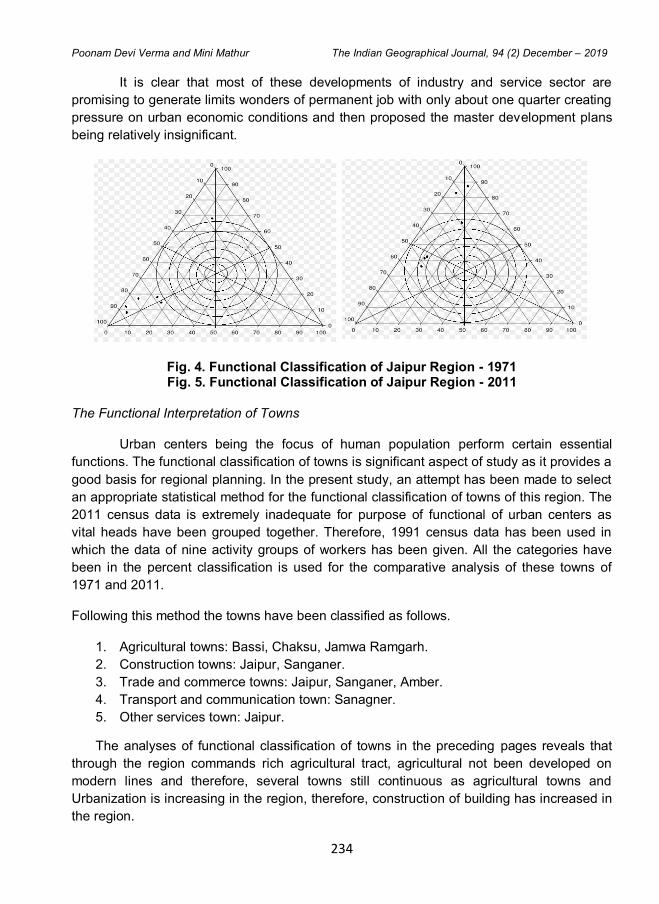
234
Poonam Devi Verma and Mini Mathur The Indian Geographical Journal, 94 (2) December – 2019
It is clear that most of these developments of industry and service sector are
promising to generate limits wonders of permanent job with only about one quarter creating
pressure on urban economic conditions and then proposed the master development plans
being relatively insignificant.
Fig. 4. Functional Classification of Jaipur Region - 1971 Fig. 5. Functional Classification of Jaipur Region - 2011
The Functional Interpretation of Towns
Urban centers being the focus of human population perform certain essential
functions. The functional classification of towns is significant aspect of study as it provides a
good basis for regional planning. In the present study, an attempt has been made to select
an appropriate statistical method for the functional classification of towns of this region. The
2011 census data is extremely inadequate for purpose of functional of urban centers as
vital heads have been grouped together. Therefore, 1991 census data has been used in
which the data of nine activity groups of workers has been given. All the categories have
been in the percent classification is used for the comparative analysis of these towns of
1971 and 2011.
Following this method the towns have been classified as follows.
1. Agricultural towns: Bassi, Chaksu, Jamwa Ramgarh.
2. Construction towns: Jaipur, Sanganer.
3. Trade and commerce towns: Jaipur, Sanganer, Amber.
4. Transport and communication town: Sanagner.
5. Other services town: Jaipur.
The analyses of functional classification of towns in the preceding pages reveals that
through the region commands rich agricultural tract, agricultural not been developed on
modern lines and therefore, several towns still continuous as agricultural towns and
Urbanization is increasing in the region, therefore, construction of building has increased in
the region.
235
Poonam Devi Verma and Mini Mathur The Indian Geographical Journal, 94 (2) December – 2019
Conclusion
Change of functional classification has answered about the rapid urbanization that
cultivator and agriculture labour have adopted new source of income. Maximum number of
workers are in tertiary group because of primary activities are based on physical conditions.
It is examined that Bassi, Chaksu and Jamwa Ramgarh tehsils have low house hold
workers, moderate other workers and high predominant workers though Jaipur, Sanganer
and amber tehsil has low household workers, moderate predominant workers and high
other workers due to rapid Industrialization. The functional classification represents the
regional disparities due to urban development. There is a linkage between urbanization and
functional classification it is observed that those towns have came in urban class I they
changed working structure for good standard of life as like to urban people.
Due to rapid urbanization and unfavorable physical conditions, people going to
abundant their primary work for good standard of life. There is observed a great danger for
agriculture sector for continue reducing percent of workers. Jaipur tehsil has maximum
pressure of land due to people migrants here for different purpose. It is observed that
Sanganer is also on the way that is pressurized by the rapid industrialization and
urbanization. Farmers near the urban area utilize their land for construction purposes
because they want to earn stable income as farming is nothing but gamble cultivable waste
land is used for the ware houses in the village. Therefore the cultivators have joined to
another economic activity due to land is acquired for income to small scale industries and
favourable hydro conditions. It is observed that the number of cultivators and agricultural
laborers’ has rapidly decreased during four decades by 18.82 and 2.15 percent
respectively.
References
1. Gregory, S. (1963): "Statistical Methods and the Geographers", Longman, London, pp. 213 - 224.
2. Clarke, J.I. (1972): "Population Geography", Pergamon Press, Oxford, pp 87-94. 3. Census of India (1971) Jaipur District Census Handbook, Government of India, New
Delhi. 4. Chandana, R. C. (2001): “Geography of Population”, Kalyani Publication, New Delhi. 5. Bhattacharya, A. ( 2006): “ Labour Market Regulation and Industrial Performance in
India, A Critical Review of Empirical Evidence, The Indian Journal of labour Economics.” 49, (2).
6. Pravinchandra B. (2010), "Spatio-Temporal Changes in Population Structure of Pune Division of Maharashtra", Unpublished Ph.D. Thesis, Shivaji University, Kolhapur, pp. 221.
7. Census of India (2011) Jaipur District Census Handbook, Government of India, New Delhi.
The Indian Geographical Journal Volume 94 (2) December - 2019, pp 236-244
ISSN 0019-4824
236
ASSESSMENT OF RAINFALL VARIABILITY IN DIFFERENT
TALUKS OF ARKAVATHY WATERSHED USING
GEOGRAPHIC INFORMATION SYSTEM, KARNATAKA, INDIA
Shahnin Irfan, Surendra P. and Ashok D. Hanjagi
Department of Geography, Faculty of Science, Bangalore University, Bengaluru - 560 056
E-mail: [email protected]
Abstract
There are many elements that make up both the weather and the climate of a geographical
location. Out of the various climatic elements, Rainfall is in the first index. It is the most
important single factor which determines the cropping patterns of an area, the type of crop
to be cultivated and its success and failure in particular. As a result, careful observation and
analysis of meteorological data is very essential. Therefore, the present study deals with
the rainfall characteristics of Arkavathy Watershed of Karnataka which include the spatial
distribution, rainfall, pattern and variability through different seasons. The present study is
based on 30 years of monthly rainfall data. Therefore, a throughout study of long-term
record is made to evaluate the relations between amount and duration of rainfall that strikes
the surface. Daily Rainfall Data for the years (1988-2018) has been collected for Bangalore
North, Devanahalli, Doddaballapur, Nelamangala and Madadi taluk from the Rain Gauge
Stations of the Indian Meteorological Department and Directorate of Economics and
Statistics; Govt. of Karnataka Govt. of India
Keywords: Rainfall Variability, Watershed, Seasonal and Annual Rainfall
Introduction
The study of rainfall pattern helps drought and flood risk assessment, relief and
rehabilitation during extreme events and also local level contingency planning. The
distribution pattern of rainfall in the state of Karnataka is most uneven and varies
considerably from year to year and from region to region. Rainfall is the only input source of
the hydrological system in the Arkavathy Watershed. The situation of the Arkavathy basin,
especially the upper Arkavathy or Thippagondana Halli reservoir provides rich insights into
the complex problem of water management in urbanising basins (Ashoka Trust for
Research in Ecology and the Environment (ATREE)), Bengaluru. Furthermost, the rainfall in
the Arkavathy watershed is also still vague and uncertain according to the available data
sources. Therefore, a throughout study of long-term record is essential to evaluate the
relations between the amount and duration of rainfall that strikes the surface. The main
objective of this study is to assess the rainfall distribution (seasonal and annual), pattern
and variabilities of the study area.
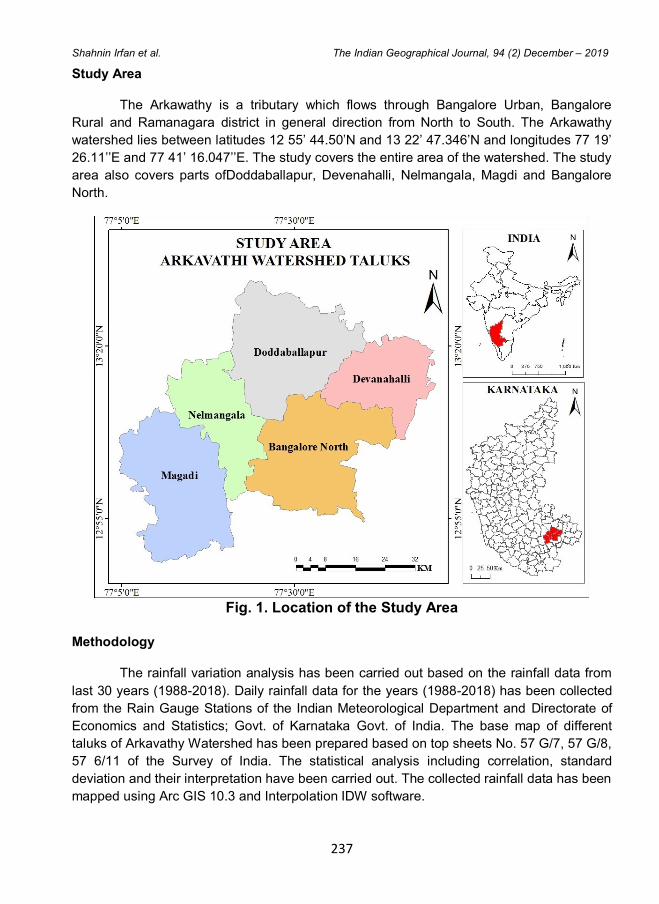
237
Shahnin Irfan et al. The Indian Geographical Journal, 94 (2) December – 2019
Study Area
The Arkawathy is a tributary which flows through Bangalore Urban, Bangalore
Rural and Ramanagara district in general direction from North to South. The Arkawathy
watershed lies between latitudes 12 55’ 44.50’N and 13 22’ 47.346’N and longitudes 77 19’
26.11’’E and 77 41’ 16.047’’E. The study covers the entire area of the watershed. The study
area also covers parts ofDoddaballapur, Devenahalli, Nelmangala, Magdi and Bangalore
North.
Fig. 1. Location of the Study Area
Methodology
The rainfall variation analysis has been carried out based on the rainfall data from
last 30 years (1988-2018). Daily rainfall data for the years (1988-2018) has been collected
from the Rain Gauge Stations of the Indian Meteorological Department and Directorate of
Economics and Statistics; Govt. of Karnataka Govt. of India. The base map of different
taluks of Arkavathy Watershed has been prepared based on top sheets No. 57 G/7, 57 G/8,
57 6/11 of the Survey of India. The statistical analysis including correlation, standard
deviation and their interpretation have been carried out. The collected rainfall data has been
mapped using Arc GIS 10.3 and Interpolation IDW software.
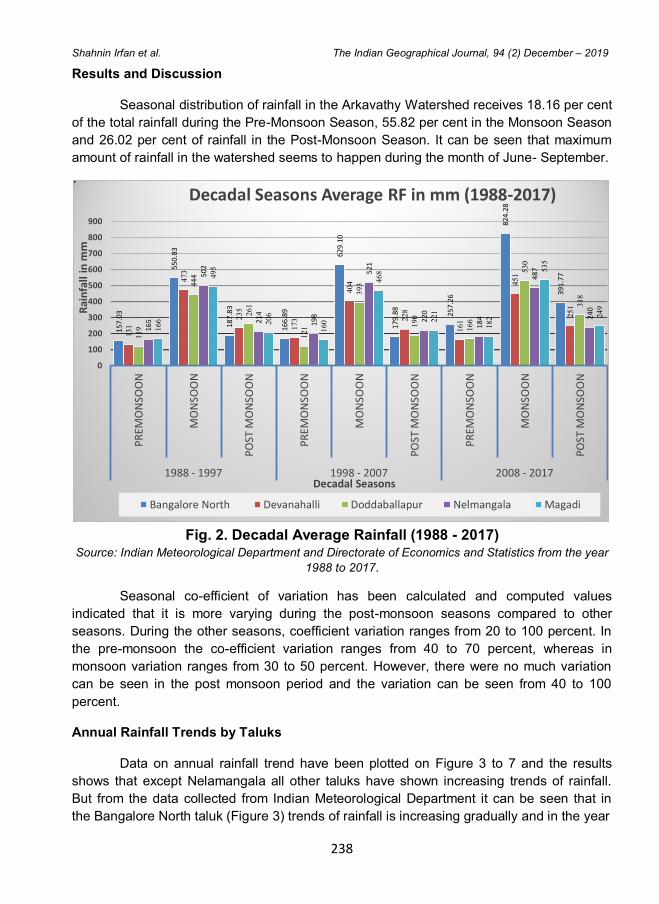
238
Shahnin Irfan et al. The Indian Geographical Journal, 94 (2) December – 2019
Results and Discussion
Seasonal distribution of rainfall in the Arkavathy Watershed receives 18.16 per cent
of the total rainfall during the Pre-Monsoon Season, 55.82 per cent in the Monsoon Season
and 26.02 per cent of rainfall in the Post-Monsoon Season. It can be seen that maximum
amount of rainfall in the watershed seems to happen during the month of June- September.
Fig. 2. Decadal Average Rainfall (1988 - 2017)
Source: Indian Meteorological Department and Directorate of Economics and Statistics from the year
1988 to 2017.
Seasonal co-efficient of variation has been calculated and computed values
indicated that it is more varying during the post-monsoon seasons compared to other
seasons. During the other seasons, coefficient variation ranges from 20 to 100 percent. In
the pre-monsoon the co-efficient variation ranges from 40 to 70 percent, whereas in
monsoon variation ranges from 30 to 50 percent. However, there were no much variation
can be seen in the post monsoon period and the variation can be seen from 40 to 100
percent.
Annual Rainfall Trends by Taluks
Data on annual rainfall trend have been plotted on Figure 3 to 7 and the results
shows that except Nelamangala all other taluks have shown increasing trends of rainfall.
But from the data collected from Indian Meteorological Department it can be seen that in
the Bangalore North taluk (Figure 3) trends of rainfall is increasing gradually and in the year
157.
03
550.
83
187.
83
166.
89
629.
10
179.
88
257.
26
824.
28
391.
77
131
473
235
173
404
228
161
451
251
119
444
261
121
393
190
166
530
318
165
502
214
198
521
220
184
487
240
16
6
495
206
160
468
221
182
535
249
0
100
200
300
400
500
600
700
800
900
PR
EMO
NSO
ON
MO
NSO
ON
PO
ST M
ON
SOO
N
PR
EMO
NSO
ON
MO
NSO
ON
PO
ST M
ON
SOO
N
PR
EMO
NSO
ON
MO
NSO
ON
PO
ST M
ON
SOO
N
1988 - 1997 1998 - 2007 2008 - 2017
Rai
nfa
ll in
mm
Decadal Seasons
Decadal Seasons Average RF in mm (1988-2017)
Bangalore North Devanahalli Doddaballapur Nelmangala Magadi
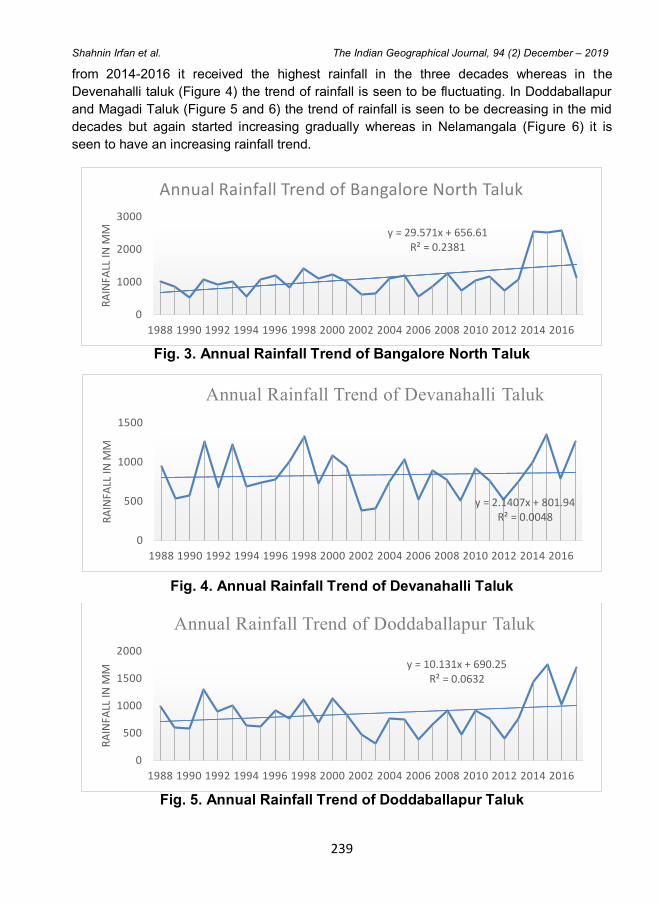
239
Shahnin Irfan et al. The Indian Geographical Journal, 94 (2) December – 2019
from 2014-2016 it received the highest rainfall in the three decades whereas in the
Devenahalli taluk (Figure 4) the trend of rainfall is seen to be fluctuating. In Doddaballapur
and Magadi Taluk (Figure 5 and 6) the trend of rainfall is seen to be decreasing in the mid
decades but again started increasing gradually whereas in Nelamangala (Figure 6) it is
seen to have an increasing rainfall trend.
Fig. 3. Annual Rainfall Trend of Bangalore North Taluk
Fig. 4. Annual Rainfall Trend of Devanahalli Taluk
Fig. 5. Annual Rainfall Trend of Doddaballapur Taluk
y = 29.571x + 656.61 R² = 0.2381
0
1000
2000
3000
1988 1990 1992 1994 1996 1998 2000 2002 2004 2006 2008 2010 2012 2014 2016
RA
INFA
LL IN
MM
Annual Rainfall Trend of Bangalore North Taluk
y = 2.1407x + 801.94 R² = 0.0048
0
500
1000
1500
1988 1990 1992 1994 1996 1998 2000 2002 2004 2006 2008 2010 2012 2014 2016
RA
INFA
LL IN
MM
Annual Rainfall Trend of Devanahalli Taluk
y = 10.131x + 690.25 R² = 0.0632
0
500
1000
1500
2000
1988 1990 1992 1994 1996 1998 2000 2002 2004 2006 2008 2010 2012 2014 2016
RA
INFA
LL IN
MM
Annual Rainfall Trend of Doddaballapur Taluk
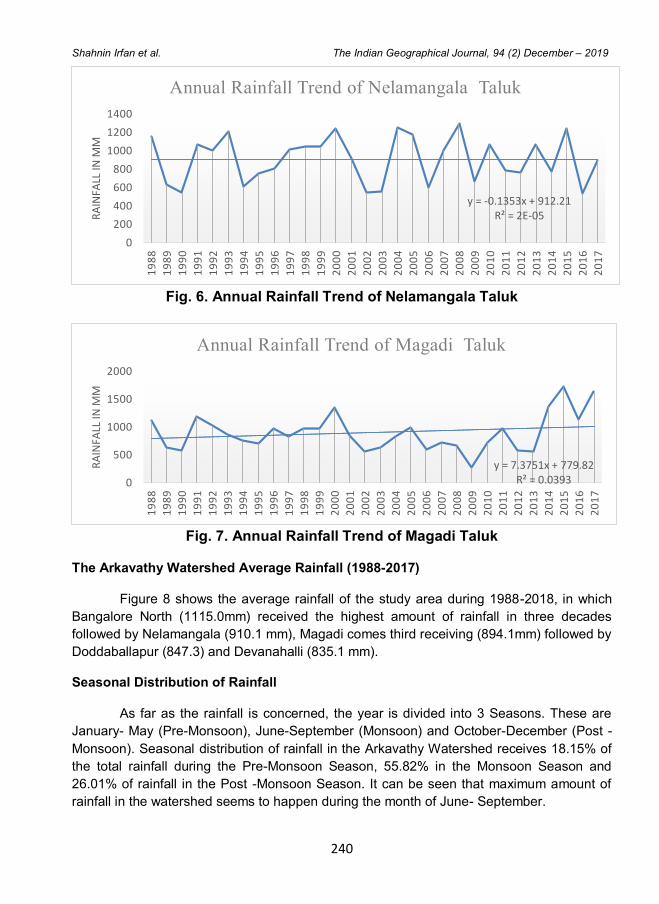
240
Shahnin Irfan et al. The Indian Geographical Journal, 94 (2) December – 2019
Fig. 6. Annual Rainfall Trend of Nelamangala Taluk
Fig. 7. Annual Rainfall Trend of Magadi Taluk
The Arkavathy Watershed Average Rainfall (1988-2017)
Figure 8 shows the average rainfall of the study area during 1988-2018, in which
Bangalore North (1115.0mm) received the highest amount of rainfall in three decades
followed by Nelamangala (910.1 mm), Magadi comes third receiving (894.1mm) followed by
Doddaballapur (847.3) and Devanahalli (835.1 mm).
Seasonal Distribution of Rainfall
As far as the rainfall is concerned, the year is divided into 3 Seasons. These are
January- May (Pre-Monsoon), June-September (Monsoon) and October-December (Post -
Monsoon). Seasonal distribution of rainfall in the Arkavathy Watershed receives 18.15% of
the total rainfall during the Pre-Monsoon Season, 55.82% in the Monsoon Season and
26.01% of rainfall in the Post -Monsoon Season. It can be seen that maximum amount of
rainfall in the watershed seems to happen during the month of June- September.
y = -0.1353x + 912.21 R² = 2E-05
0
200
400
600
800
1000
1200
1400
19
88
19
89
19
90
19
91
19
92
19
93
19
94
19
95
19
96
19
97
19
98
19
99
20
00
20
01
20
02
20
03
20
04
20
05
20
06
20
07
20
08
20
09
20
10
20
11
20
12
20
13
20
14
20
15
20
16
20
17
RA
INFA
LL IN
MM
Annual Rainfall Trend of Nelamangala Taluk
y = 7.3751x + 779.82 R² = 0.0393 0
500
1000
1500
2000
19
88
19
89
19
90
19
91
19
92
19
93
19
94
19
95
19
96
19
97
19
98
19
99
20
00
20
01
20
02
20
03
20
04
20
05
20
06
20
07
20
08
20
09
20
10
20
11
20
12
20
13
20
14
20
15
20
16
20
17
RA
INFA
LL IN
MM
Annual Rainfall Trend of Magadi Taluk
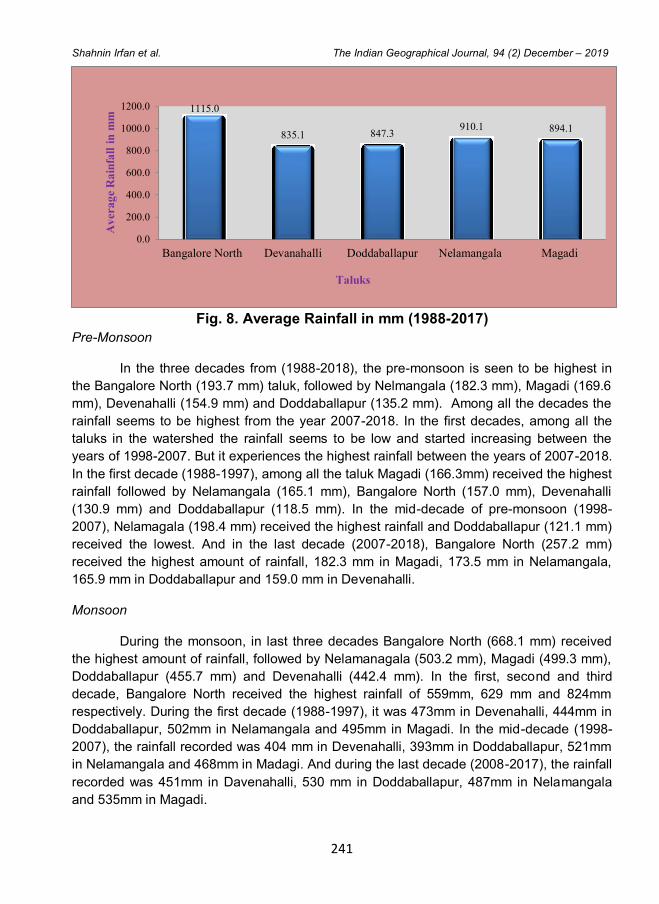
241
Shahnin Irfan et al. The Indian Geographical Journal, 94 (2) December – 2019
Fig. 8. Average Rainfall in mm (1988-2017)
Pre-Monsoon
In the three decades from (1988-2018), the pre-monsoon is seen to be highest in
the Bangalore North (193.7 mm) taluk, followed by Nelmangala (182.3 mm), Magadi (169.6
mm), Devenahalli (154.9 mm) and Doddaballapur (135.2 mm). Among all the decades the
rainfall seems to be highest from the year 2007-2018. In the first decades, among all the
taluks in the watershed the rainfall seems to be low and started increasing between the
years of 1998-2007. But it experiences the highest rainfall between the years of 2007-2018.
In the first decade (1988-1997), among all the taluk Magadi (166.3mm) received the highest
rainfall followed by Nelamangala (165.1 mm), Bangalore North (157.0 mm), Devenahalli
(130.9 mm) and Doddaballapur (118.5 mm). In the mid-decade of pre-monsoon (1998-
2007), Nelamagala (198.4 mm) received the highest rainfall and Doddaballapur (121.1 mm)
received the lowest. And in the last decade (2007-2018), Bangalore North (257.2 mm)
received the highest amount of rainfall, 182.3 mm in Magadi, 173.5 mm in Nelamangala,
165.9 mm in Doddaballapur and 159.0 mm in Devenahalli.
Monsoon
During the monsoon, in last three decades Bangalore North (668.1 mm) received
the highest amount of rainfall, followed by Nelamanagala (503.2 mm), Magadi (499.3 mm),
Doddaballapur (455.7 mm) and Devenahalli (442.4 mm). In the first, second and third
decade, Bangalore North received the highest rainfall of 559mm, 629 mm and 824mm
respectively. During the first decade (1988-1997), it was 473mm in Devenahalli, 444mm in
Doddaballapur, 502mm in Nelamangala and 495mm in Magadi. In the mid-decade (1998-
2007), the rainfall recorded was 404 mm in Devenahalli, 393mm in Doddaballapur, 521mm
in Nelamangala and 468mm in Madagi. And during the last decade (2008-2017), the rainfall
recorded was 451mm in Davenahalli, 530 mm in Doddaballapur, 487mm in Nelamangala
and 535mm in Magadi.
1115.0
835.1 847.3 910.1 894.1
0.0
200.0
400.0
600.0
800.0
1000.0
1200.0
Bangalore North Devanahalli Doddaballapur Nelamangala Magadi
Av
era
ge
Ra
infa
ll i
n m
m
Taluks
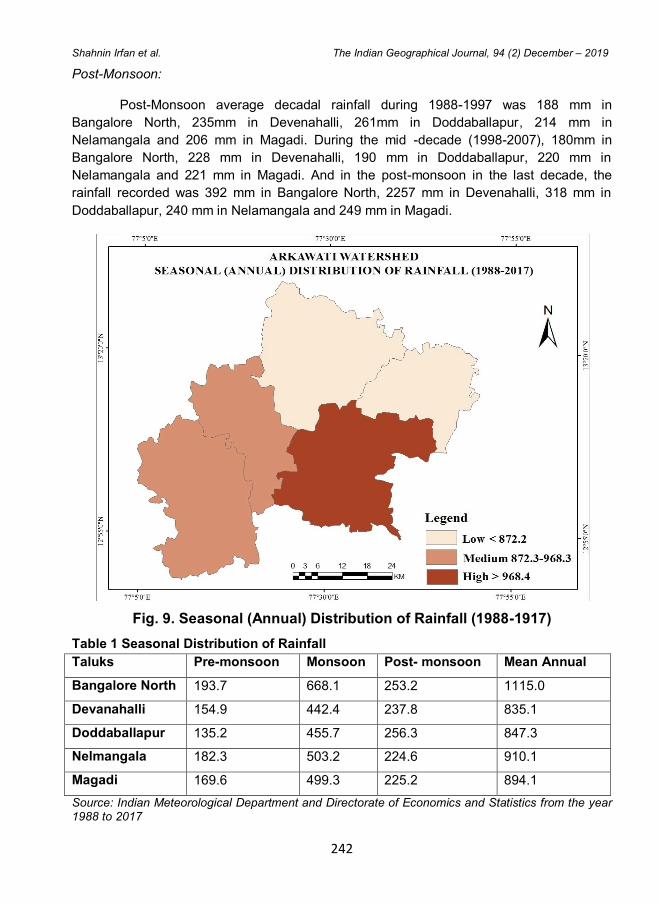
242
Shahnin Irfan et al. The Indian Geographical Journal, 94 (2) December – 2019
Post-Monsoon:
Post-Monsoon average decadal rainfall during 1988-1997 was 188 mm in
Bangalore North, 235mm in Devenahalli, 261mm in Doddaballapur, 214 mm in
Nelamangala and 206 mm in Magadi. During the mid -decade (1998-2007), 180mm in
Bangalore North, 228 mm in Devenahalli, 190 mm in Doddaballapur, 220 mm in
Nelamangala and 221 mm in Magadi. And in the post-monsoon in the last decade, the
rainfall recorded was 392 mm in Bangalore North, 2257 mm in Devenahalli, 318 mm in
Doddaballapur, 240 mm in Nelamangala and 249 mm in Magadi.
Fig. 9. Seasonal (Annual) Distribution of Rainfall (1988-1917)
Table 1 Seasonal Distribution of Rainfall
Taluks Pre-monsoon Monsoon Post- monsoon Mean Annual
Bangalore North 193.7 668.1 253.2 1115.0
Devanahalli 154.9 442.4 237.8 835.1
Doddaballapur 135.2 455.7 256.3 847.3
Nelmangala 182.3 503.2 224.6 910.1
Magadi 169.6 499.3 225.2 894.1
Source: Indian Meteorological Department and Directorate of Economics and Statistics from the year 1988 to 2017
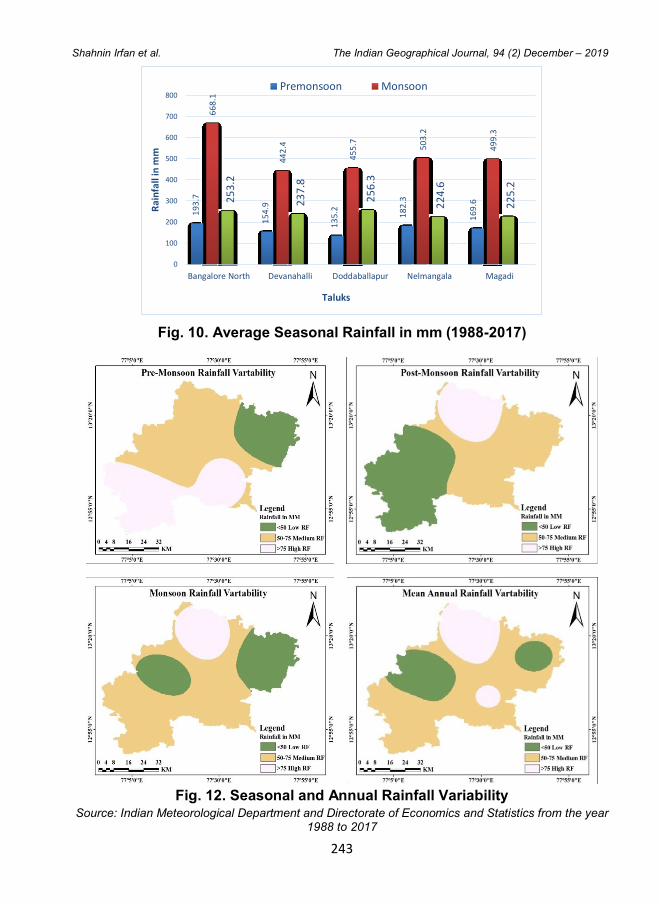
243
Shahnin Irfan et al. The Indian Geographical Journal, 94 (2) December – 2019
Fig. 10. Average Seasonal Rainfall in mm (1988-2017)
Fig. 12. Seasonal and Annual Rainfall Variability
Source: Indian Meteorological Department and Directorate of Economics and Statistics from the year 1988 to 2017
19
3.7
15
4.9
13
5.2
18
2.3
16
9.6
66
8.1
44
2.4
45
5.7
50
3.2
49
9.3
25
3.2
23
7.8
25
6.3
22
4.6
22
5.2
0
100
200
300
400
500
600
700
800
Bangalore North Devanahalli Doddaballapur Nelmangala Magadi
Rai
nfa
ll in
mm
Taluks
Premonsoon Monsoon
244
Shahnin Irfan et al. The Indian Geographical Journal, 94 (2) December – 2019
Rainfall Class Range
Excess (E) > +20%
Normal (N) minus 20% to plus 20%
Below Normal (B) < -20% Source: Indian Meteorological Department, year 2000
Based on the mean rainfall, Northern part of Doddaballapur and some inner parts
of Bangalore North taluks of the watershed experiences heavy rainfall. The northern part of
Magaditaluk, north-western part of Nelamangala and north-eastern part of Devanahallitaluk
receives rainfall below average whereas other parts of the taluks received medium rainfall.
with reference to average rainfall of each station and the percentage of deviation has been
calculated and the result has been classified into three ranges as shown above.
Conclusion
The study concludes that in all the Taluks of the Arkavathy Watershed receiveshigh
rainfall during the monsoon and the rain tends to decrease by post monsoon and then pre-
monsoon. Among all the taluks in the study area, Bangalore North experiences highest
rainfall, followed by Nelamngala, Magadi, Doddaballapur and Devenahalli.It is
recommended that the analysis of rainfall pattern and increase the natural storage in
Arkavathy Watershed is significant to manage the water shortage problem in the Bangalore
city particularly during the drought season.
References
1. Alaka Gadagil, 1986. Annual and Weekly Analysis of Rainfall and Temperature for
Pune: A Multiple Time Series Approach. Indian Geographers, vol.8 no.1.
2. Bibi U.M., Kaduk J and Balzter H. 2014. Spatio-Temporal variation and prediction of
rainfall in North Eastern Nigeria, ISSN 2225-1154, pp. 206-222.
3. Directorate of Economics and Statistics, Government of Karnataka, Bengaluru.
4. Hassan S.M. 2009. Recent rainfall trends in the FCT, Abuja. Trans. Inst. Indain
Geographers. vol.31. no.1.
5. India Meteorological Department, 1875, Government of India. New Delhi.
6. Vennila. G, 2007. Rainfall Variation Analysis of Vattamalaikarai Sub-basin, Tamil Nadu.
Journal of Applied Hydrology. vol.XX. no. 3. pp.50-59.
7. Water Management in Arkavathi Basin, 2013, Ashoka Trust for Research in Ecology
and the Environment, pp. 1-40.
The Indian Geographical Journal
Volume 94 (2) December - 2019, pp 245-254
ISSN 0019-4824
245
MAPPING OF FLOOD HAZARD ZONES OF TUTHAPUZHA
SUB-BASIN, KERALA, INDIA - A GEO-SPATIAL APPROACH
Dipjyoti G., Dhanusree M. and Bhaskaran G.
Centre for Water Resources Management, University of Madras, Guindy, Chennai - 600 025
E-mail: [email protected], [email protected]
Abstract
Flood is one of the major disasters among the all-natural hazards. It is an overflow of water
over the dry areas within a short period of time and create lots of damages over the
catchment areas. The present study aims to identify the flood hazard zones to create
awareness to those who reside in the nearby areas of the river. The Tuthapuzha sub-basin
has been selected for the current study for flood hazard mapping which covers two districts
of Kerala called Palakkad and Malappuram. The GIS and Remote Sensing techniques have
been used to delineate the flood hazard zones of the Tuthapuzha sub-basin area. The flood
zones can be identified with the help of different thematic layers like geomorphology,
geology, slope, aspect, soil, LULC, drainage density, rainfall intensity, flow accumulation
etc., with help of Remote Sensing and GIS. The normalized weights of the individual
themes and their different features were obtained through the Saaty’s Analytical Hierarchy
Process (AHP). This study is carried out to highlight the scenario of the flood hazard zones
over the basin area which will help to reduce the damages that occur during the flood.
Keywords: Flood Hazards, Analytical Hierarchy Process (AHP), Remote Sensing and GIS,
Hazard Zonation
Introduction
Flood became the common major natural disaster over the world at present.
Studies on vulnerabilities related to natural hazards have been conducted by many
researchers (Blaikie, 2004). The flood vulnerability assessment is very necessary action for
the prevention of this natural disaster. India is one of the worst flood-affected countries,
being second in the world after Bangladesh and accounts for one fifth of global death count
due to floods (Bapalu, 2005). Many studies have been carried out on flood vulnerability
assessment on different parts of Kerala. Prevention and reduction are appropriate
strategies in disaster management for reducing the effects of flood disasters. Through the
spatial information system regarding the vulnerability on infrastructure and areas, the level
of vulnerability and the factors liable for vulnerability is necessary to proceeds toward the
flood mitigation programs.
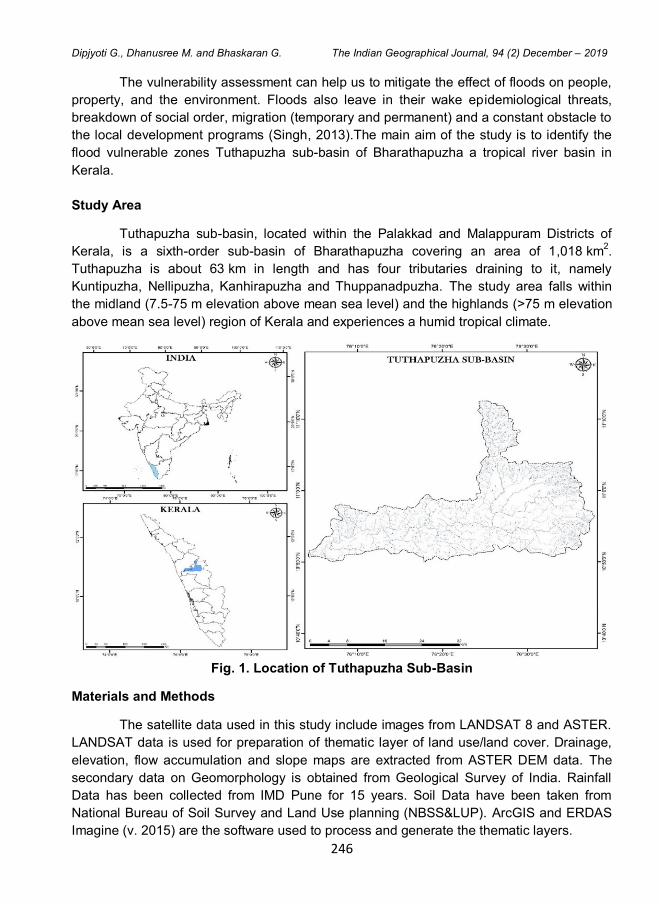
246
Dipjyoti G., Dhanusree M. and Bhaskaran G. The Indian Geographical Journal, 94 (2) December – 2019
The vulnerability assessment can help us to mitigate the effect of floods on people,
property, and the environment. Floods also leave in their wake epidemiological threats,
breakdown of social order, migration (temporary and permanent) and a constant obstacle to
the local development programs (Singh, 2013).The main aim of the study is to identify the
flood vulnerable zones Tuthapuzha sub-basin of Bharathapuzha a tropical river basin in
Kerala.
Study Area
Tuthapuzha sub-basin, located within the Palakkad and Malappuram Districts of
Kerala, is a sixth-order sub-basin of Bharathapuzha covering an area of 1,018 km2.
Tuthapuzha is about 63 km in length and has four tributaries draining to it, namely
Kuntipuzha, Nellipuzha, Kanhirapuzha and Thuppanadpuzha. The study area falls within
the midland (7.5-75 m elevation above mean sea level) and the highlands (>75 m elevation
above mean sea level) region of Kerala and experiences a humid tropical climate.
Fig. 1. Location of Tuthapuzha Sub-Basin
Materials and Methods
The satellite data used in this study include images from LANDSAT 8 and ASTER.
LANDSAT data is used for preparation of thematic layer of land use/land cover. Drainage,
elevation, flow accumulation and slope maps are extracted from ASTER DEM data. The
secondary data on Geomorphology is obtained from Geological Survey of India. Rainfall
Data has been collected from IMD Pune for 15 years. Soil Data have been taken from
National Bureau of Soil Survey and Land Use planning (NBSS&LUP). ArcGIS and ERDAS
Imagine (v. 2015) are the software used to process and generate the thematic layers.
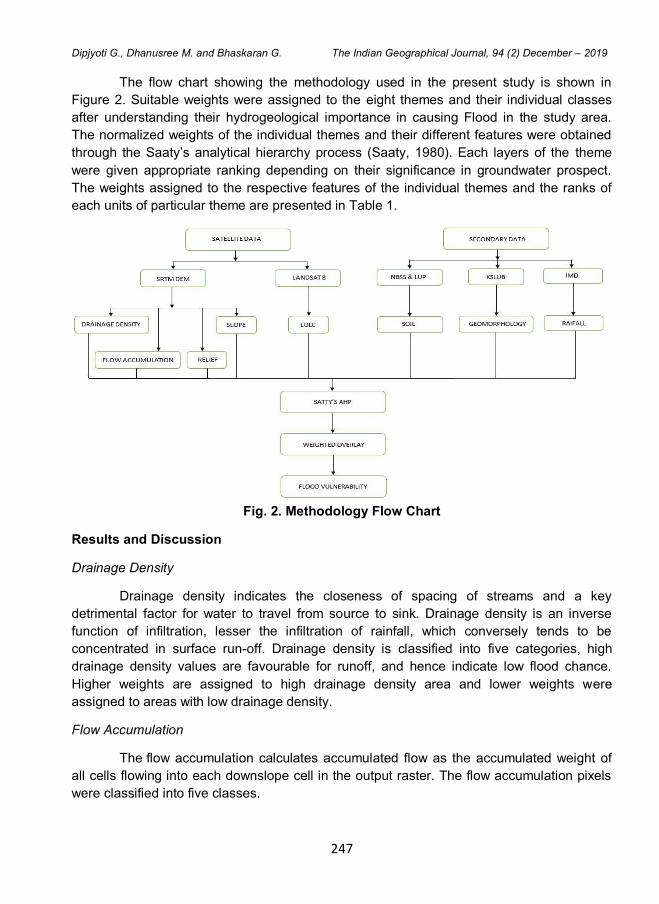
247
Dipjyoti G., Dhanusree M. and Bhaskaran G. The Indian Geographical Journal, 94 (2) December – 2019
The flow chart showing the methodology used in the present study is shown in
Figure 2. Suitable weights were assigned to the eight themes and their individual classes
after understanding their hydrogeological importance in causing Flood in the study area.
The normalized weights of the individual themes and their different features were obtained
through the Saaty‟s analytical hierarchy process (Saaty, 1980). Each layers of the theme
were given appropriate ranking depending on their significance in groundwater prospect.
The weights assigned to the respective features of the individual themes and the ranks of
each units of particular theme are presented in Table 1.
Fig. 2. Methodology Flow Chart
Results and Discussion
Drainage Density
Drainage density indicates the closeness of spacing of streams and a key
detrimental factor for water to travel from source to sink. Drainage density is an inverse
function of infiltration, lesser the infiltration of rainfall, which conversely tends to be
concentrated in surface run-off. Drainage density is classified into five categories, high
drainage density values are favourable for runoff, and hence indicate low flood chance.
Higher weights are assigned to high drainage density area and lower weights were
assigned to areas with low drainage density.
Flow Accumulation
The flow accumulation calculates accumulated flow as the accumulated weight of
all cells flowing into each downslope cell in the output raster. The flow accumulation pixels
were classified into five classes.
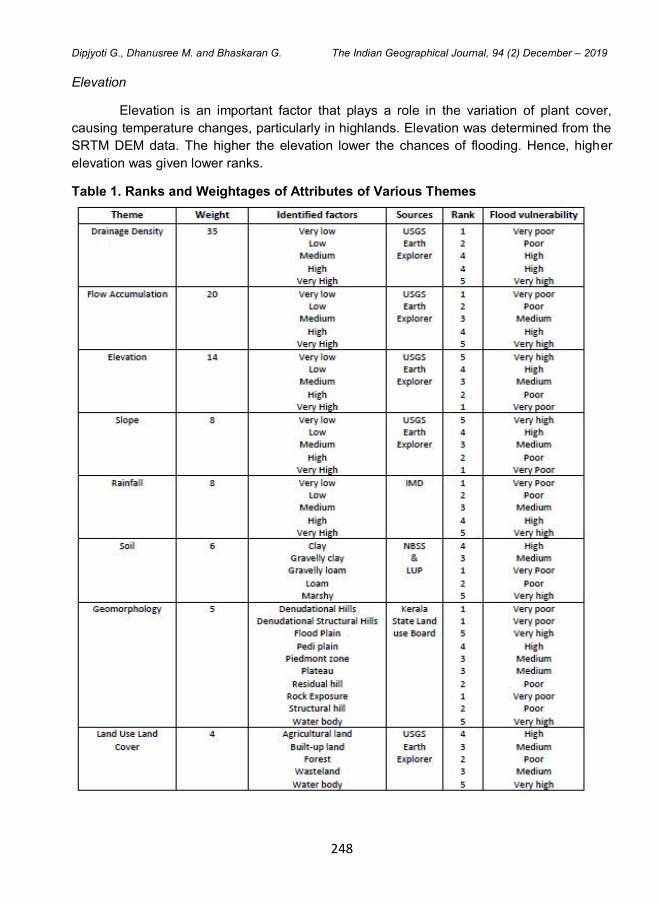
248
Dipjyoti G., Dhanusree M. and Bhaskaran G. The Indian Geographical Journal, 94 (2) December – 2019
Elevation
Elevation is an important factor that plays a role in the variation of plant cover,
causing temperature changes, particularly in highlands. Elevation was determined from the
SRTM DEM data. The higher the elevation lower the chances of flooding. Hence, higher
elevation was given lower ranks.
Table 1. Ranks and Weightages of Attributes of Various Themes
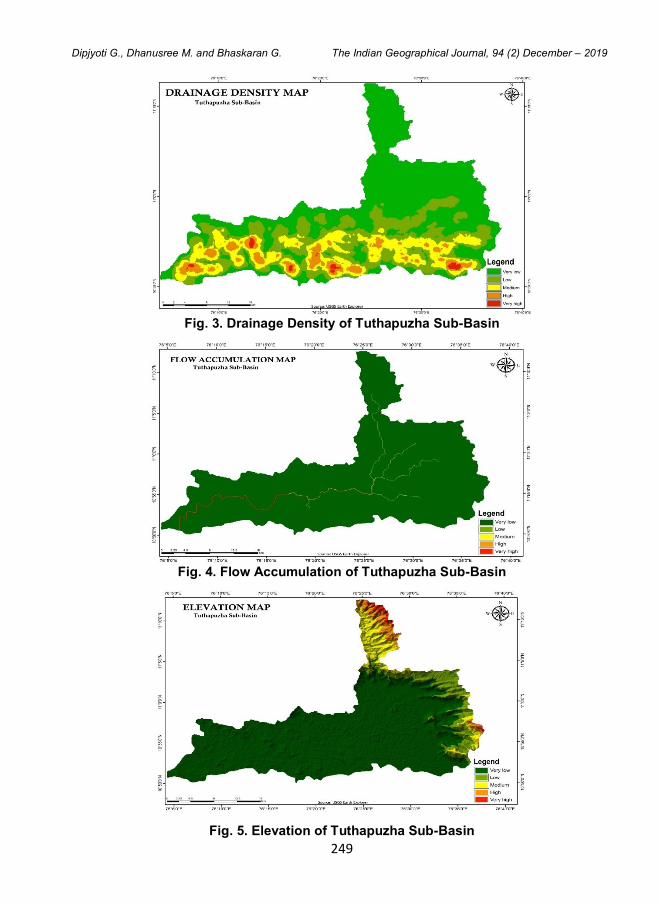
249
Dipjyoti G., Dhanusree M. and Bhaskaran G. The Indian Geographical Journal, 94 (2) December – 2019
Fig. 3. Drainage Density of Tuthapuzha Sub-Basin
Fig. 4. Flow Accumulation of Tuthapuzha Sub-Basin
Fig. 5. Elevation of Tuthapuzha Sub-Basin
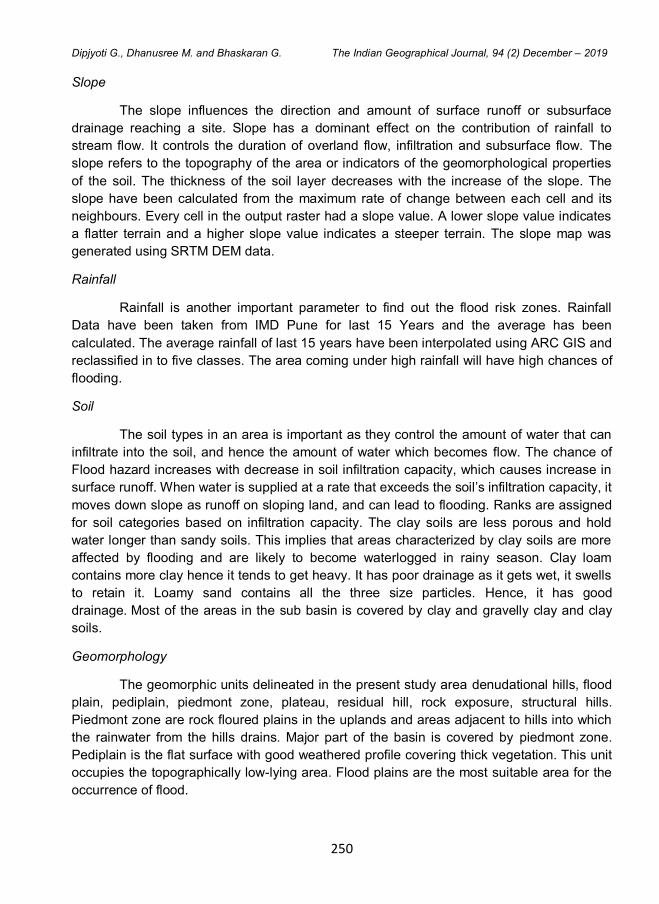
250
Dipjyoti G., Dhanusree M. and Bhaskaran G. The Indian Geographical Journal, 94 (2) December – 2019
Slope
The slope influences the direction and amount of surface runoff or subsurface
drainage reaching a site. Slope has a dominant effect on the contribution of rainfall to
stream flow. It controls the duration of overland flow, infiltration and subsurface flow. The
slope refers to the topography of the area or indicators of the geomorphological properties
of the soil. The thickness of the soil layer decreases with the increase of the slope. The
slope have been calculated from the maximum rate of change between each cell and its
neighbours. Every cell in the output raster had a slope value. A lower slope value indicates
a flatter terrain and a higher slope value indicates a steeper terrain. The slope map was
generated using SRTM DEM data.
Rainfall
Rainfall is another important parameter to find out the flood risk zones. Rainfall
Data have been taken from IMD Pune for last 15 Years and the average has been
calculated. The average rainfall of last 15 years have been interpolated using ARC GIS and
reclassified in to five classes. The area coming under high rainfall will have high chances of
flooding.
Soil
The soil types in an area is important as they control the amount of water that can
infiltrate into the soil, and hence the amount of water which becomes flow. The chance of
Flood hazard increases with decrease in soil infiltration capacity, which causes increase in
surface runoff. When water is supplied at a rate that exceeds the soil‟s infiltration capacity, it
moves down slope as runoff on sloping land, and can lead to flooding. Ranks are assigned
for soil categories based on infiltration capacity. The clay soils are less porous and hold
water longer than sandy soils. This implies that areas characterized by clay soils are more
affected by flooding and are likely to become waterlogged in rainy season. Clay loam
contains more clay hence it tends to get heavy. It has poor drainage as it gets wet, it swells
to retain it. Loamy sand contains all the three size particles. Hence, it has good
drainage. Most of the areas in the sub basin is covered by clay and gravelly clay and clay
soils.
Geomorphology
The geomorphic units delineated in the present study area denudational hills, flood
plain, pediplain, piedmont zone, plateau, residual hill, rock exposure, structural hills.
Piedmont zone are rock floured plains in the uplands and areas adjacent to hills into which
the rainwater from the hills drains. Major part of the basin is covered by piedmont zone.
Pediplain is the flat surface with good weathered profile covering thick vegetation. This unit
occupies the topographically low-lying area. Flood plains are the most suitable area for the
occurrence of flood.
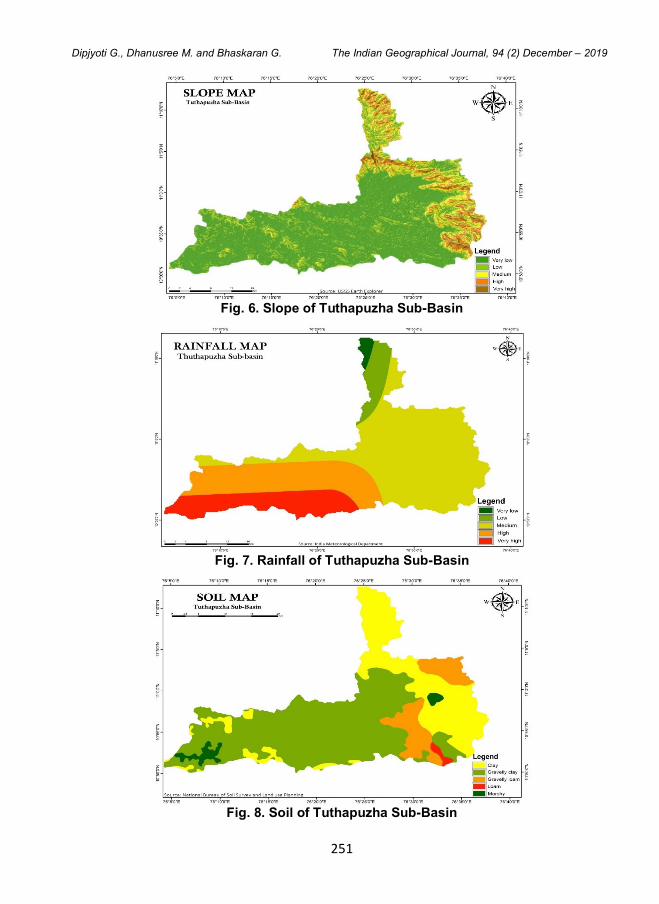
251
Dipjyoti G., Dhanusree M. and Bhaskaran G. The Indian Geographical Journal, 94 (2) December – 2019
Fig. 6. Slope of Tuthapuzha Sub-Basin
Fig. 7. Rainfall of Tuthapuzha Sub-Basin
Fig. 8. Soil of Tuthapuzha Sub-Basin
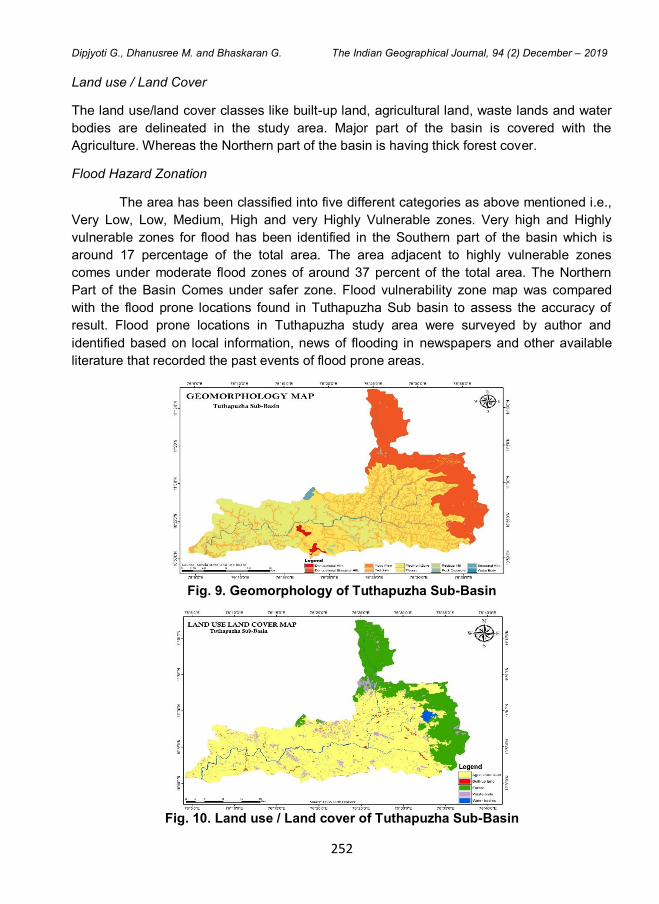
252
Dipjyoti G., Dhanusree M. and Bhaskaran G. The Indian Geographical Journal, 94 (2) December – 2019
Land use / Land Cover
The land use/land cover classes like built-up land, agricultural land, waste lands and water
bodies are delineated in the study area. Major part of the basin is covered with the
Agriculture. Whereas the Northern part of the basin is having thick forest cover.
Flood Hazard Zonation
The area has been classified into five different categories as above mentioned i.e.,
Very Low, Low, Medium, High and very Highly Vulnerable zones. Very high and Highly
vulnerable zones for flood has been identified in the Southern part of the basin which is
around 17 percentage of the total area. The area adjacent to highly vulnerable zones
comes under moderate flood zones of around 37 percent of the total area. The Northern
Part of the Basin Comes under safer zone. Flood vulnerability zone map was compared
with the flood prone locations found in Tuthapuzha Sub basin to assess the accuracy of
result. Flood prone locations in Tuthapuzha study area were surveyed by author and
identified based on local information, news of flooding in newspapers and other available
literature that recorded the past events of flood prone areas.
Fig. 9. Geomorphology of Tuthapuzha Sub-Basin
Fig. 10. Land use / Land cover of Tuthapuzha Sub-Basin
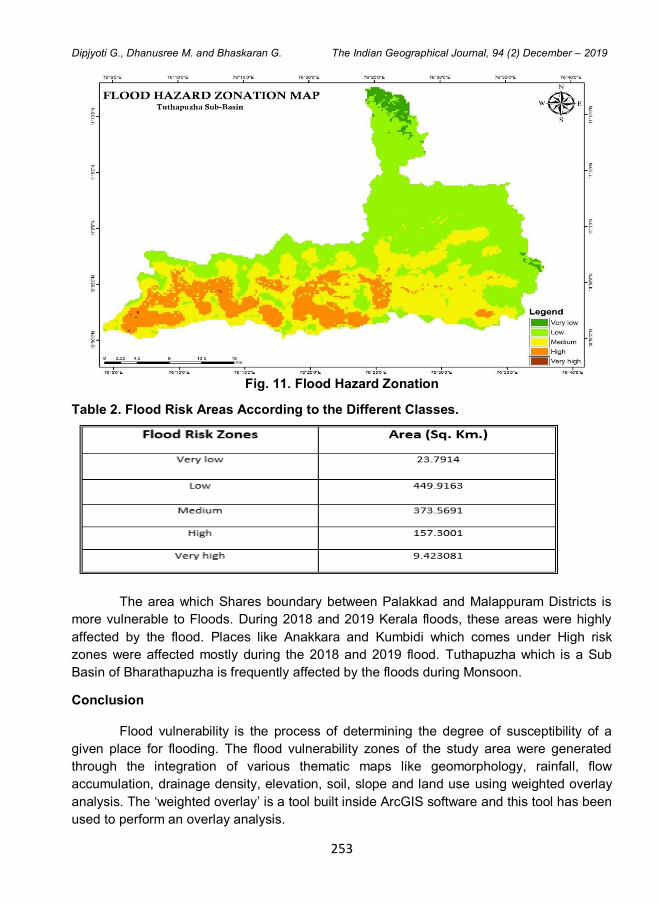
253
Dipjyoti G., Dhanusree M. and Bhaskaran G. The Indian Geographical Journal, 94 (2) December – 2019
Fig. 11. Flood Hazard Zonation
Table 2. Flood Risk Areas According to the Different Classes.
The area which Shares boundary between Palakkad and Malappuram Districts is
more vulnerable to Floods. During 2018 and 2019 Kerala floods, these areas were highly
affected by the flood. Places like Anakkara and Kumbidi which comes under High risk
zones were affected mostly during the 2018 and 2019 flood. Tuthapuzha which is a Sub
Basin of Bharathapuzha is frequently affected by the floods during Monsoon.
Conclusion
Flood vulnerability is the process of determining the degree of susceptibility of a
given place for flooding. The flood vulnerability zones of the study area were generated
through the integration of various thematic maps like geomorphology, rainfall, flow
accumulation, drainage density, elevation, soil, slope and land use using weighted overlay
analysis. The „weighted overlay‟ is a tool built inside ArcGIS software and this tool has been
used to perform an overlay analysis.
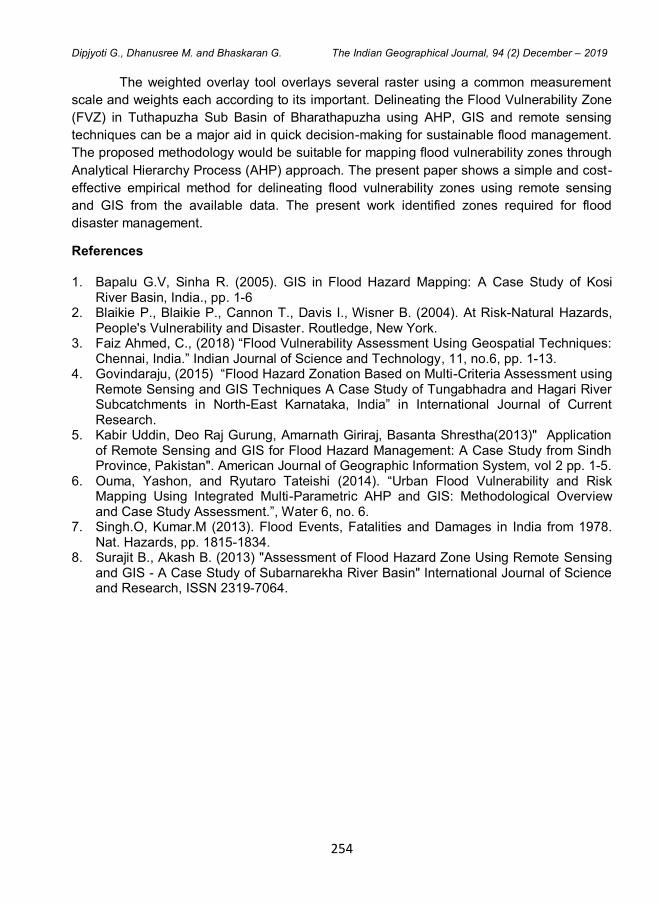
254
Dipjyoti G., Dhanusree M. and Bhaskaran G. The Indian Geographical Journal, 94 (2) December – 2019
The weighted overlay tool overlays several raster using a common measurement
scale and weights each according to its important. Delineating the Flood Vulnerability Zone
(FVZ) in Tuthapuzha Sub Basin of Bharathapuzha using AHP, GIS and remote sensing
techniques can be a major aid in quick decision-making for sustainable flood management.
The proposed methodology would be suitable for mapping flood vulnerability zones through
Analytical Hierarchy Process (AHP) approach. The present paper shows a simple and cost-
effective empirical method for delineating flood vulnerability zones using remote sensing
and GIS from the available data. The present work identified zones required for flood
disaster management.
References
1. Bapalu G.V, Sinha R. (2005). GIS in Flood Hazard Mapping: A Case Study of Kosi River Basin, India., pp. 1-6
2. Blaikie P., Blaikie P., Cannon T., Davis I., Wisner B. (2004). At Risk-Natural Hazards, People's Vulnerability and Disaster. Routledge, New York.
3. Faiz Ahmed, C., (2018) “Flood Vulnerability Assessment Using Geospatial Techniques: Chennai, India.” Indian Journal of Science and Technology, 11, no.6, pp. 1-13.
4. Govindaraju, (2015) “Flood Hazard Zonation Based on Multi-Criteria Assessment using Remote Sensing and GIS Techniques A Case Study of Tungabhadra and Hagari River Subcatchments in North-East Karnataka, India” in International Journal of Current Research.
5. Kabir Uddin, Deo Raj Gurung, Amarnath Giriraj, Basanta Shrestha(2013)" Application of Remote Sensing and GIS for Flood Hazard Management: A Case Study from Sindh Province, Pakistan". American Journal of Geographic Information System, vol 2 pp. 1-5.
6. Ouma, Yashon, and Ryutaro Tateishi (2014). “Urban Flood Vulnerability and Risk Mapping Using Integrated Multi-Parametric AHP and GIS: Methodological Overview and Case Study Assessment.”, Water 6, no. 6.
7. Singh.O, Kumar.M (2013). Flood Events, Fatalities and Damages in India from 1978. Nat. Hazards, pp. 1815-1834.
8. Surajit B., Akash B. (2013) "Assessment of Flood Hazard Zone Using Remote Sensing and GIS - A Case Study of Subarnarekha River Basin" International Journal of Science and Research, ISSN 2319-7064.
The Indian Geographical Journal
Volume 94 (2) December - 2019, pp 255-261
ISSN 0019-4824
255
CHALLENGE OF PROVIDING CLEAN AIR IN URBAN AREAS IN INDIA
Kalpana Markandey
Department of Geography, Osmania University, Hyderabad - 500 007
E-mail: [email protected]
Abstract
This paper examines the increasing levels of air pollution in Indian cities. Indian cities are
compared to the world scenario and it is found that industries, unregulated transport by
sometimes highly polluting diesel fueled vehicles, construction activity, indiscriminate
burning of garbage, smoke from the crematoria, besides other factors are responsible for
this. The impact of poor air quality on the elderly and child population besides the sick is
quite appalling. While awareness, precaution and regulatory protocols are definitely
required to address this issue, yet an alternative approach like purifying the air in addition
will go a long way in tacking the issue. This requires technological intervention for a human
welfare issue.
Keywords: Air quality index, Air pollution, Poor air quality, Unrestrained industrialization,
Health and well-being, High population density.
Introduction
India and many developing countries of the world are witnessing huge streams of
rural to urban migration owing to the pangs of finding employment in a rural setting. The
mélange of poor prospects in rural areas, the magnetism of urban areas and migration lead
to huge population densities. This become perilous to the health and welfare of people
when the urban areas are also engaged in unrestrained industrialization where the
industries spew out fumes besides toxic fluids and now also where the urban areas are
engaged with the IT sector. The vehicles which transport the IT workers have an endless
run five days a week and are a major cause of unhealthy air along the roads, at road
intersections and even in the residential areas that they traverse in the course of picking up
the employees of the IT sector and dropping them back home. Not to be left out from the
equation is the increasing number of private vehicles hitting the road in most cities and
cutting down of trees to facilitate construction activity besides burning of garbage and other
factors.
Health and well-being of people in urban areas which not only have a high
population density but also more of new construction, renovation, demolition, and emissions
are likely to be impacted. Elevated levels of formaldehyde, PM2.5 (Particulate Matter which
is 2.5 micrometers or smaller) and asbestos lead to poor air quality. All of them can lead to
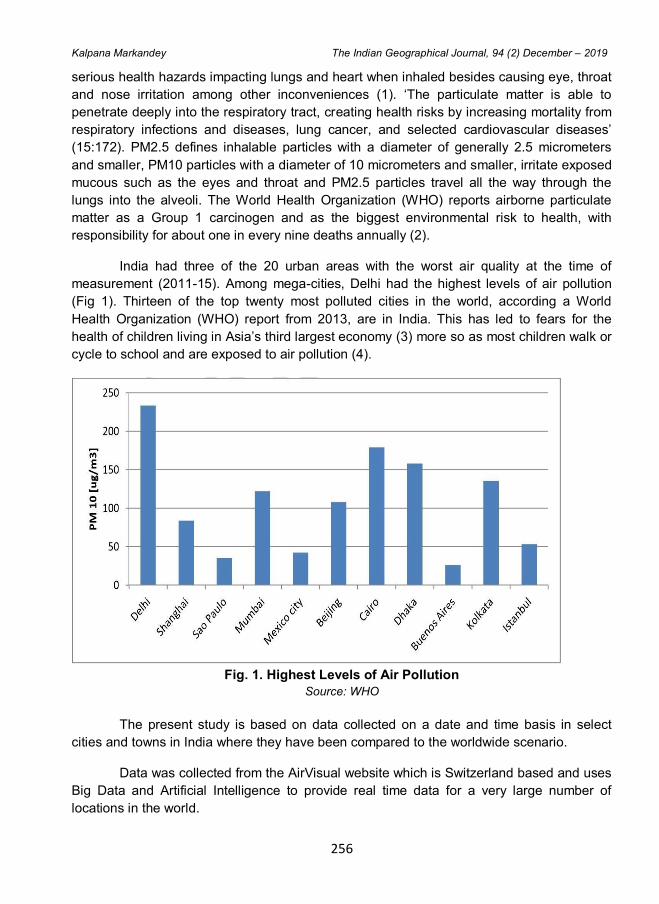
256
Kalpana Markandey The Indian Geographical Journal, 94 (2) December – 2019
serious health hazards impacting lungs and heart when inhaled besides causing eye, throat
and nose irritation among other inconveniences (1). „The particulate matter is able to
penetrate deeply into the respiratory tract, creating health risks by increasing mortality from
respiratory infections and diseases, lung cancer, and selected cardiovascular diseases‟
(15:172). PM2.5 defines inhalable particles with a diameter of generally 2.5 micrometers
and smaller, PM10 particles with a diameter of 10 micrometers and smaller, irritate exposed
mucous such as the eyes and throat and PM2.5 particles travel all the way through the
lungs into the alveoli. The World Health Organization (WHO) reports airborne particulate
matter as a Group 1 carcinogen and as the biggest environmental risk to health, with
responsibility for about one in every nine deaths annually (2).
India had three of the 20 urban areas with the worst air quality at the time of
measurement (2011-15). Among mega-cities, Delhi had the highest levels of air pollution
(Fig 1). Thirteen of the top twenty most polluted cities in the world, according a World
Health Organization (WHO) report from 2013, are in India. This has led to fears for the
health of children living in Asia‟s third largest economy (3) more so as most children walk or
cycle to school and are exposed to air pollution (4).
Fig. 1. Highest Levels of Air Pollution
Source: WHO
The present study is based on data collected on a date and time basis in select
cities and towns in India where they have been compared to the worldwide scenario.
Data was collected from the AirVisual website which is Switzerland based and uses
Big Data and Artificial Intelligence to provide real time data for a very large number of
locations in the world.
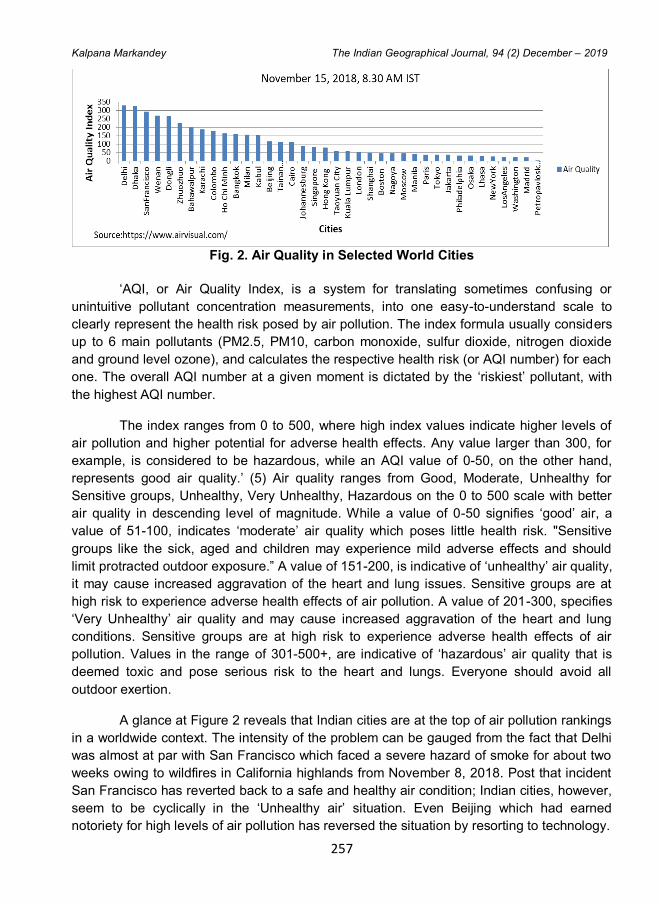
257
Kalpana Markandey The Indian Geographical Journal, 94 (2) December – 2019
Fig. 2. Air Quality in Selected World Cities
„AQI, or Air Quality Index, is a system for translating sometimes confusing or
unintuitive pollutant concentration measurements, into one easy-to-understand scale to
clearly represent the health risk posed by air pollution. The index formula usually considers
up to 6 main pollutants (PM2.5, PM10, carbon monoxide, sulfur dioxide, nitrogen dioxide
and ground level ozone), and calculates the respective health risk (or AQI number) for each
one. The overall AQI number at a given moment is dictated by the „riskiest‟ pollutant, with
the highest AQI number.
The index ranges from 0 to 500, where high index values indicate higher levels of
air pollution and higher potential for adverse health effects. Any value larger than 300, for
example, is considered to be hazardous, while an AQI value of 0-50, on the other hand,
represents good air quality.‟ (5) Air quality ranges from Good, Moderate, Unhealthy for
Sensitive groups, Unhealthy, Very Unhealthy, Hazardous on the 0 to 500 scale with better
air quality in descending level of magnitude. While a value of 0-50 signifies „good‟ air, a
value of 51-100, indicates „moderate‟ air quality which poses little health risk. "Sensitive
groups like the sick, aged and children may experience mild adverse effects and should
limit protracted outdoor exposure.” A value of 151-200, is indicative of „unhealthy‟ air quality,
it may cause increased aggravation of the heart and lung issues. Sensitive groups are at
high risk to experience adverse health effects of air pollution. A value of 201-300, specifies
„Very Unhealthy‟ air quality and may cause increased aggravation of the heart and lung
conditions. Sensitive groups are at high risk to experience adverse health effects of air
pollution. Values in the range of 301-500+, are indicative of „hazardous‟ air quality that is
deemed toxic and pose serious risk to the heart and lungs. Everyone should avoid all
outdoor exertion.
A glance at Figure 2 reveals that Indian cities are at the top of air pollution rankings
in a worldwide context. The intensity of the problem can be gauged from the fact that Delhi
was almost at par with San Francisco which faced a severe hazard of smoke for about two
weeks owing to wildfires in California highlands from November 8, 2018. Post that incident
San Francisco has reverted back to a safe and healthy air condition; Indian cities, however,
seem to be cyclically in the „Unhealthy air‟ situation. Even Beijing which had earned
notoriety for high levels of air pollution has reversed the situation by resorting to technology.
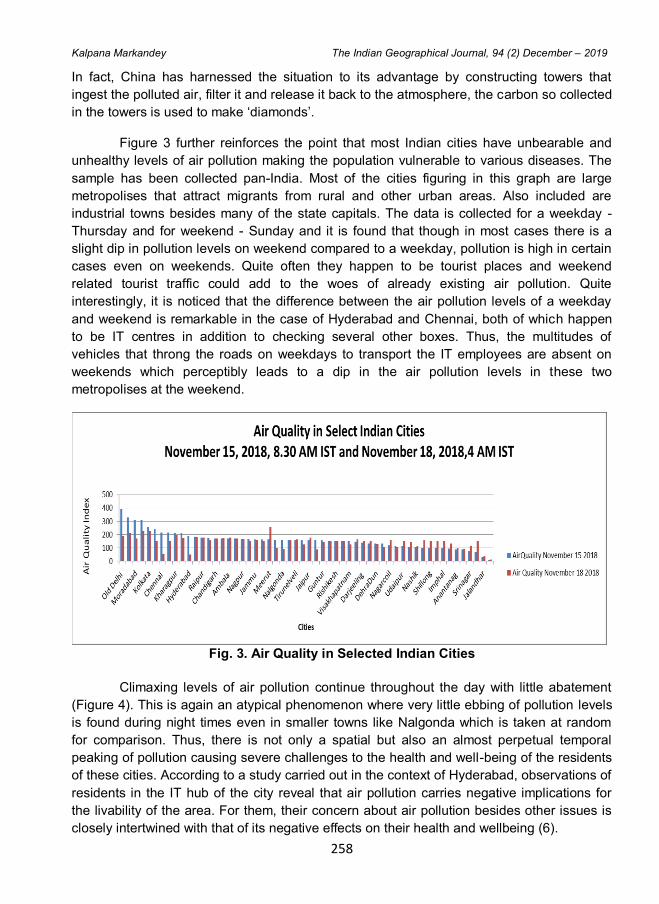
258
Kalpana Markandey The Indian Geographical Journal, 94 (2) December – 2019
In fact, China has harnessed the situation to its advantage by constructing towers that
ingest the polluted air, filter it and release it back to the atmosphere, the carbon so collected
in the towers is used to make „diamonds‟.
Figure 3 further reinforces the point that most Indian cities have unbearable and
unhealthy levels of air pollution making the population vulnerable to various diseases. The
sample has been collected pan-India. Most of the cities figuring in this graph are large
metropolises that attract migrants from rural and other urban areas. Also included are
industrial towns besides many of the state capitals. The data is collected for a weekday -
Thursday and for weekend - Sunday and it is found that though in most cases there is a
slight dip in pollution levels on weekend compared to a weekday, pollution is high in certain
cases even on weekends. Quite often they happen to be tourist places and weekend
related tourist traffic could add to the woes of already existing air pollution. Quite
interestingly, it is noticed that the difference between the air pollution levels of a weekday
and weekend is remarkable in the case of Hyderabad and Chennai, both of which happen
to be IT centres in addition to checking several other boxes. Thus, the multitudes of
vehicles that throng the roads on weekdays to transport the IT employees are absent on
weekends which perceptibly leads to a dip in the air pollution levels in these two
metropolises at the weekend.
Fig. 3. Air Quality in Selected Indian Cities
Climaxing levels of air pollution continue throughout the day with little abatement
(Figure 4). This is again an atypical phenomenon where very little ebbing of pollution levels
is found during night times even in smaller towns like Nalgonda which is taken at random
for comparison. Thus, there is not only a spatial but also an almost perpetual temporal
peaking of pollution causing severe challenges to the health and well-being of the residents
of these cities. According to a study carried out in the context of Hyderabad, observations of
residents in the IT hub of the city reveal that air pollution carries negative implications for
the livability of the area. For them, their concern about air pollution besides other issues is
closely intertwined with that of its negative effects on their health and wellbeing (6).
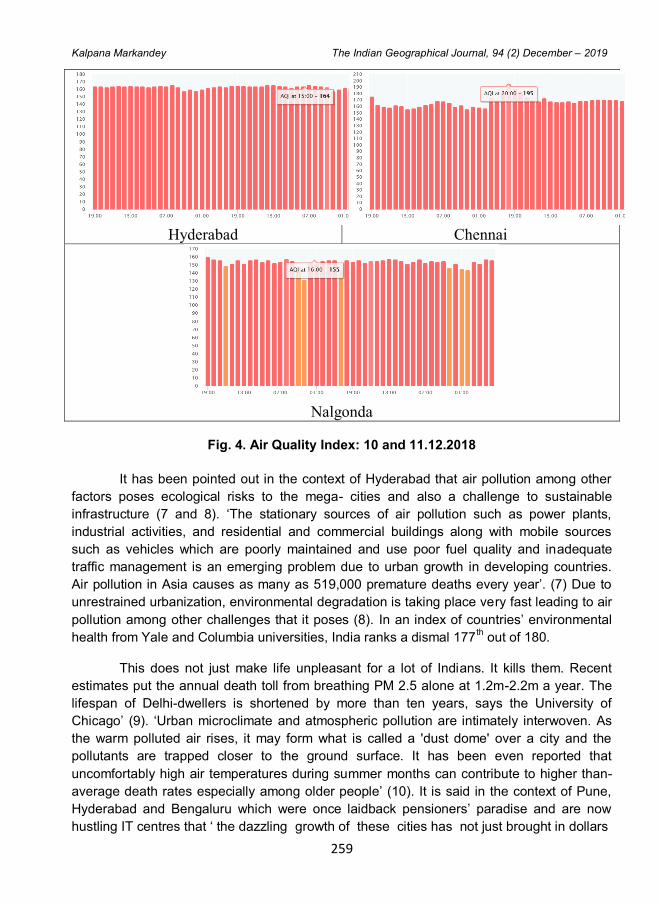
259
Kalpana Markandey The Indian Geographical Journal, 94 (2) December – 2019
Hyderabad
Chennai
Nalgonda
Fig. 4. Air Quality Index: 10 and 11.12.2018
It has been pointed out in the context of Hyderabad that air pollution among other
factors poses ecological risks to the mega- cities and also a challenge to sustainable
infrastructure (7 and 8). „The stationary sources of air pollution such as power plants,
industrial activities, and residential and commercial buildings along with mobile sources
such as vehicles which are poorly maintained and use poor fuel quality and inadequate
traffic management is an emerging problem due to urban growth in developing countries.
Air pollution in Asia causes as many as 519,000 premature deaths every year‟. (7) Due to
unrestrained urbanization, environmental degradation is taking place very fast leading to air
pollution among other challenges that it poses (8). In an index of countries‟ environmental
health from Yale and Columbia universities, India ranks a dismal 177th out of 180.
This does not just make life unpleasant for a lot of Indians. It kills them. Recent
estimates put the annual death toll from breathing PM 2.5 alone at 1.2m-2.2m a year. The
lifespan of Delhi-dwellers is shortened by more than ten years, says the University of
Chicago‟ (9). „Urban microclimate and atmospheric pollution are intimately interwoven. As
the warm polluted air rises, it may form what is called a 'dust dome' over a city and the
pollutants are trapped closer to the ground surface. It has been even reported that
uncomfortably high air temperatures during summer months can contribute to higher than-
average death rates especially among older people‟ (10). It is said in the context of Pune,
Hyderabad and Bengaluru which were once laidback pensioners‟ paradise and are now
hustling IT centres that „ the dazzling growth of these cities has not just brought in dollars
260
Kalpana Markandey The Indian Geographical Journal, 94 (2) December – 2019
and malls, but also large-scale migration, traffic jams, pollution, creaking infrastructure and
discontent‟ (11) The main culprit cited here is auto pollution. Vehicular pollution levels are
rising above the permissible limits at all major traffic junctions (12) in Hyderabad. „Further
lack of adequate road infrastructure and massive increase in number of vehicles has
resulted in massive traffic congestion at major traffic points along with increasing vehicular
pollution within the city‟ (13).
„The spatial expansion of cities renders increase in the average trip length, and
excessive dependence on automobiles leads to traffic congestion, air pollution, rising
greenhouse gas emissions, and poor public health. There is an increase in the incidence of
urban health related issues because of the poor quality of air, drinking water, improper
sanitation facilities, open defecation and inadequate solid waste management‟ (15:172).
Most of the cities of the developing countries are going through a phase of severe
air pollution. Industries, unregulated transport by sometimes highly polluting diesel-fueled
vehicles, construction activity, indiscriminate burning of garbage, smoke from the
crematoria, besides other factors are responsible for this. While awareness, precaution and
regulatory protocols are definitely required to address this issue, yet an alternative
approach like purifying the air in addition will go a long way in tacking the issue in its
incipient stages, thus improving the overall situation.
Thoughtful action has to go into improving this situation, which impacts the vast
majority of the Indian population which is increasingly living in towns and cities. It is not an
unsurmountable problem as is seen from cases of other countries. The initiative has to
come at an early date to subvert the ongoing damage to the most important asset of the
people – which is their health.
Some of the measures suggested at the BRICS summit are „renewable/biofuels
energy, energy efficiency, mobility and sustainable urban transport, reduction of the effects
of climate change and pollution, sustainable production (clean technologies, eco-design)
waste recycling and environmental sanitation, construction and sustainable urban
infrastructure, social technologies, biodiversity and biomes, socio-biodiversity networks, and
electric vehicles and/or hybrids‟ (14: 314). Policy-makers at international, national and city
level are advised to promote cleaner transport, more efficient energy production and waste
management (15). Awareness, precaution and proactive measures can help ameliorate the
problematic situation.
References
1. Ramachandraiah C., (2007) Public Transport Options in Hyderabad, Economic and
Political Weekly, Vol. 42, No. 23 pp. 2153. URL: http://www.jstor.org/stable/4419683
Accessed: 20-02-2018
2. Ramachandraiah C., (1997). Weather and Water in Urban Areas, Economic and
Political Weekly, Vol. 32, No. 43 p. 2799. URL: http://www.jstor.org/stable/4406004
Accessed: 21-02-2018 10:51 UTC
261
Kalpana Markandey The Indian Geographical Journal, 94 (2) December – 2019
3. Diganta Das Tracey Skelton A. Nageswara Rao G. Nagasubbarao (2014) City and
Neighbouhood Report: Hyderabad, India, A Report from the „Asian Cities: Liveability,
Sustainability, Diversity and Spaces of Encounter‟ Research Project, National
University of Singapore, pp 18-19
4. Diganta Das, Hyderabad: Visioning, restructuring and making of a high-tech city,
www.elsevier.com/locate/cities
5. Mahalingam T.V. (2007), Growth Pangs in Techie Land, Business Today.
6. Renato Coelho Baumann das Neves and Tamara Gregol de Faria (2014) VI BRICS
Academic Forum, Rio de Janeiro.
7. Shailaja Tetali, P. Edwards, G. V. S. Murthy and I. Roberts (2016) How do children
travel to school in urban India? A cross-sectional study of 5,842 children in Hyderabad,
BMC Public Health 16:1099 p. 1. DOI 10.1186/s12889-016-3750-1
8. Wakode H. B. (2016), “Analysis of Urban Growth and Assessment of Impact of
Urbanization on Water Resources- A Case Study of Hyderabad, India” Ph. D Thesis,
Faculty of Georesources and Materials Engineering of The Rwth Aachen University,
Aachen.
9. Wakode H B, Klaus Baier, Ramakar Jha and Raffig Azzam (2013), Analysis of Urban
Growth Using Landsat TM/ETM Data and GIS - A Case Study of Hyderabad, India,
Arabian Journal of Geosciences, pp. 110-111
10. https://www.airvisual.com/
11. https://www.airvisual.com/air-pollution-information/blog/summer-related-air-pollution-
may-be-affecting-your-health-without-you-knowing
12. https://www.economist.com/leaders/2018/12/08/even-by-the-standards-of-poor-
countries-india-is-alarmingly-filthy
13. https://www.sensorsmag.com/components/particulate-matter-sensing-for-air-quality-
measurements
14. https://www.weforum.org/agenda/2016/02/which-country-has-the-worst-air-pollution/
15. https://www.weforum.org/agenda/2016/05/which-are-the-world-s-most-polluted-cities/
The Indian Geographical Journal Volume 94 (2) December - 2019, pp 262-263
ISSN 0019-4824
262
News and Notes
THE INDIAN GEOGRAPHICAL SOCIETY Department of Geography, University of Madras, Chennai - 600 025
Announcement of 10th Talent Test - 2020 for Geography Students
on 22th February, 2020 ******************
The Indian Geographical Society is organizing the state wide Tenth Talent Test -
2020 for final year UG and PG students of the Geography Departments in Tamil Nadu on
Wednesday, the 22th
Feburary, 2020. The Executive Committee of the Society has
identified the following coordinators to organise this event successfully with the support of
Principals of the respective colleges and Heads of Geography Departments.
Regional Coordinators
1. Dr. G. Bhaskaran (Chennai Region), Assistant Professor, Department of Geography, University of Madras, Chennai - 600 005, Mobile: 94444 14688, E-mail: [email protected]
2. Dr. R. Jegankumar (Central and Western Tamil Nadu)
Head, Department of Geography, Bharathidasan University, Tiruchirappalli - 620 024, Mobile: 98947 48564, E-mail: [email protected]
3. Dr. K. Balasubramani (Eastern Tamil Nadu) Assistant Professor, Department of Geography, Central University of Tamil Nadu, Thiruvarur - 610 005, Mobile: 99440 60319, E-mail: [email protected]
The Heads of the Geography Departments to contact the coordinator / regional coordinators and conduct the Talent Test successfully.
General Information
1. Talent Test will be conducted in English language only for PG students and in English and Tamil for UG students for 1.30 hours consisting of 100 questions without
any choice. 2. Syllabi for UG and PG talent tests are UGC NET Paper II & III respectively. 3. Final year UG and PG students of Geography are eligible for Talent Test. 4. The students should enroll their names with the concerned Head of the Geography
Department on or before 22th Feburary, 2020.
5. The co-ordinators would contact the Heads of nearby Geography Departments and send the representatives for conducting Talent Test.
6. The Head of the Geography Departments would collect the registration fee from the students of their Department and inform the coordinators accordingly.
7. Talent Test is scheduled on 22th Feburary, 2020 (Wednesday) between 11.00 a.m.
and 12.30 p.m. 8. Registration fee for UG Students is Rs.50/- and for PG Students it is Rs.75/-. Only Cash
should be collected from the interested candidates.
263
Details of Awards and Prizes
Prize
Award and Prize Amount
UG The IGS Founder Prof. N. Subrahmanyam
Award
PG Prof. A. Ramesh
Award
I Rs. 5,000/- Rs. 7,000/-
II Rs. 3,000/- Rs. 5,000/-
III Rs. 2,000/- Rs. 3,000/-
Prizes will be awarded to the winners of Talent Tests during IGS Annual
Conference to be held at Department of Geography, University of Madras, Guindy Campus,
Chennai on Sunday, the 8th March, 2020. All other participants will be given Certificate of
Participation. Please visit IGS website for registration forms and further information:
http://www.igschennai.org/
Dates to Remember
Last Date for the Enrolment: 20-01-2020 (Monday)
Date of the Talent Test: 22-01-2020 (Wednesday)
Award of ICSSR - Senior Fellowship
Dr. K. Kumaraswamy, UGC BSR Faculty Fellow, Department of Geography,
Bharathidasan University, Tiruchirappalli and the present Editor of The Indian Geographical Journal is awarded with the ICSSR - Senior Fellowship to conduct research on ‘Water Quality and Human Health’ in the Department of Geography, Bharathidasan University, Tiruchirappalli for two years (December, 2019 - December, 2021).
The Indian Geographical Journal Volume 94 (2) December - 2019, pp 264-265
ISSN 0019-4824
264
News and Notes
THE INDIAN GEOGRAPHICAL SOCIETY CONGRATULATES
THE FIRST INDIAN AND THE SECOND ASIAN BEING ELECTED AS
THE SECRETARY GENERAL AND TREASURER OF
THE INTERNATIONAL GEOGRAPHICAL UNION (IGU)
“PROFESSOR R.B. SINGH”
(Mobile: 9971950226; E-mail: [email protected])
Dr. R.B. Singh is Professor of Geography since 2002 and presently Head in the Department of Geography, Delhi School of Economics, University of Delhi, India. Earlier he served as UGC Research Scientist-C / Professor (1996-2002), UGC Research Scientist-B/Reader (1988-1996) and Lecturer (1985-1988); Coordinator UGC-SAP-DRS III and Head, Department of Geography during 2013-2016. Recently, Prof. Singh got elected as the first Indian and the second Asian Secretary General and Treasurer of the International Geographical Union for 2018-2022. Dr. Singh is presently Chair, Research Council, CSIR-Central Food Technological Research Institute, Mysuru; Member-Research Council of CSIR - Central Institute of Medicinal and Aromatic Plants, Lucknow; Member of International Science Council (earlier ICSU) Prestigious Scientific Committee of Health and Wellbeing in Changing Urban Environment - System Analysis Approach.
Prof. Singh was Vice-President, International Geographical Union (IGU) since 2012 and is elected again for second consecutive term (2016-2018) of the highest world geographical body. He is invited by IAP-Global Network of Science Academies to join Working Group for statement on Science and Technology for Disaster Risk Reduction. He was unanimously elected as President of the Earth System Science Section of the Indian Science Congress Association for 2019-2020. The NITI Aayog, Government of India has invited him as Member of the prestigious committee for preparing Vision India - 2035.
He is the First Indian Geographer bearing dual distinction of the IGU Secretary General and ISC Scientific Committee Member. Under his Headship during 2013-2016 the Department of Geography has received two prestigious recognitions: i) Second position among all the Departments of the University of Delhi in showcasing good practices at Antardhwani-2014 and ii) Under QS World University Ranking the Department featured Rank 1 as the Best Institution in India for Geography discipline. He is the Springer Series Editor of Advances in Geographical
265
and Environmental Sciences; and Sustainable Development Goals (SDGs), IAP–Global Network of Science Academies representative on Disaster Risk Reduction. Invited by UN to Moderate a Working Group on Exposure and Vulnerability at UNISDR Science and Technology Conference on DRR, 2015-2030, Geneva during January, 2016 and IAP also invited him as Panelist on Science Advise in Times of Disaster Emergencies in South Africa during 28 February – 2 March, 2016; Science Council of Japan together with UNISDR invited him for Tokyo Global Forum on Disaster Resilience during November 23-25, 2017 for contributing towards Disaster Risk Mapping. He is also associated with prestigious programme such as Chair - ISC-CODATA-PASTED and Member Earth System Governance.
He was awarded the prestigious Japan Society for Promotion of Science (JSPS)’s Research Fellowship at Hiroshima in 2013 and Several Travel Fellowships / Support from UNEP, UNITAR, UNISDR, IAP, UNU, UNCRD, WCRP, IAHS, IGU, NASDA, INSA, UGC, SICI, MAIRS and University of Delhi etc. for participating and presenting papers, Chairing sessions and discussing research projects in about 40 countries like USA, Canada, Mexico, Japan, Australia, France, Finland, Denmark, Spain, U.K., the Netherlands, Norway, Germany, Switzerland, Russia, Georgia, Armenia, Poland, Czech Republic, Mongolia, Malaysia, Thailand, Egypt, China, Taiwan, Tunisia, Sweden, Israel, South Korea, Ireland, South Africa, Brazil, Singapore, Italy, Luxembourg, Sri Lanka, Indonesia, Turkey, Nepal and Bhutan. Prof. Singh is specialised in Landuse, Water and Environmental Studies, Climate Change, Urban and Regional Development, Disaster Management, Remote Sensing and GIS.
To his credit, he has contributed 15 books, 35 edited research volumes and more than 235 research papers in national and international journals (i.e. Climate Dynamics, Current Science, Singapore Journal of Tropical Geography, Energies, Theoretical and Applied Climatology, Environmental Science and Policy, Physical Geography, Advances in Meteorology, Physics and Chemistry of the Earth, Agriculture, Ecosystem and Environment, Hydrological Processes, Mountain Research and Development, Journal of Mountain Science, Climate, Advances in Earth Science, Advances in Limnology, Asian Geographer, Environmental Economics, Tourism Recreation Research etc.). He was Special Series Editor of the prestigious journals like Sustainability, Advances in Meteorology, Physics and Chemistry of the Earth and NAM Today. He is Editorial Committee Member of Journal of Mountain Science. In 1988, the UNESCO / ISSC (Paris) awarded him Research and Study Grants Award in Social and Human Sciences. He was also associated with some of the prestigious international collaborative research programs such as ICSSR-IDPAD, CIDA-SICI, DFID and Ministry of Agriculture. He has supervised 35 Ph.D. and 81 M.Phil Scholars. He was also associated with Nordic Institute of Asian Studies, Copenhagen (Denmark) in 1998 and Visiting Professor for delivering invited Lectures at the University of Turku (Finland). He was one of the contributors in the famous ‘The World Atlas - Earth Concise’, Millennium House Ltd., Douglas IM2 4RW, Isle of Man, Australia. He was invited by UGC for preparing National Level CBCS Syllabus for Undergraduate Geography Programme in 2015. He is also Chair of the UGC’s prestigious committee for preparing Learning Outcome based Curriculum Framework since July 2018. Recently UGC-Consortium for Educational Communication invited him as Academic Advisory Council for CEC MOOCS on SWAYAM. He has been expert in the prestigious Committees of the Government of India- Ministry of Environment and Forests, Department of Science and Technology, National Disaster Management Authority (NDMA), ICSSR, CSIR etc.
The Indian Geographical Society congratulates the Vice-President, Dr. R.B. Singh for
his sustained and multi-faced activities for the development of Science and Technology in general and Geography in particular. Prof. Singh will lead us for the Centenary Celebrations of the Indian Geographical Society in 2024-2025.
******************************
NRDMS-DST Sponsored – Summer School – 17th February 2020 – 08th March 2020
NRDMS-DST - Winter School on
GEOSPATIAL TECHNOLOGIES (Equivalent to Refresher Course)
NRDMS-DST, Government of India, New Delhi Sponsored
21 days Winter School on Geospatial Technologies
(17th February 2020 – 08th March 2020)
Organized by
Department of Geography
University of Madras
Guindy Campus, Guindy
Chennai – 600 025

NRDMS-DST Sponsored – Summer School – 17th February 2020 – 08th March 2020
Introduction
Geospatial Technologies are integrated approaches of exploration,
analysis and problem solving methodologies applicable to Earth,
Atmospheric, Social and other integrated sciences. The application
needs knowledge in cartography, GIS, Remote Sensing, GPS, Geo
computation areas and sound understanding of the respective subject
domains (like Geography, Service provision, Disaster Management,
Criminology, etc.,) OOP, Database Management and Web Technologies
are other interest areas of Geospatial technologies.
There are Copyright, Proprietary software, Open Source initiatives, and
Community based developments competing each other in the fields of
training, development and applications of Geospatial Technologies.
Open source and community based tools provide scope for research
activities apart from zero cost investment and maintenance free resource
setup for learning and applications. The winter school proposes to use
QGIS, SAGA, PAST3, GeoDA and other Open Source tools for hands-
on experience as part of the programme.
The candidates are expected to fairly versed with usage of computer
software. There is need for open mind learning open source software
tools and practicing them.
Programme
The Programme is studded with special lectures from key note speakers,
theoretical presentations from subject experts and intensive practical
hands-on experience of geospatial technology tools. This Winter School
can be a great training experience for the participants. Preferably all
afternoon sessions are practical sessions; morning sessions are
theoretical perspective and software startup programmes. There is also
field visit and mini project completion schedule.
Who can Apply?
This Winter School is open for faculty members of Universities, Colleges,
Research Organizations, Urban Planners and practicing geospatial
initiators in Municipal Corporation, Central and State Government
Organizations.
NRDMS-DST Sponsored – Summer School – 17th February 2020 – 08th March 2020
The Outline of the Programme
(a) Introduction to geospatial technologies – Geomatics, Geoinformation
and Geospatial analysis – Modelling
(b) Cartography, Projections, UTM System, Types of Maps, Number of
Classes and Class Interval Selection
(c) QGIS – Basics, Analysis and Applications
(d) Remote Sensing – Satellites, Sensors, Data Products, Resolutions
and Applications
(e) SAGA – Basics, Display, Ratioing, Classification, Visualization and
Modelling
(f) Socio-economic GIS and GeoDA
(g) Understanding Statistics, Statistical Diagrams, Analysis and
Applications – PAST3
(h) Introduction to DBMS – OORDBMS – use of PostGreSQL and
SpatialLITE
(i) Project Management – Mini Project Organization
(j) Participants interaction and observations
The Institution and the Department
University of Madras is historical and well-known institution all over the
world. It had won several laurels and produced eminent personalities in
academic, industrial, political, social and public welfare fields.
Historically, it is known as Mother of many Universities in the South. The
University of Madras is spread over in six campuses. The Physical,
Chemical and Earth & Atmospheric Sciences Departments are housed
in Guindy Campus – surrounded by Anna University, IIT Madras, Central
Leather Research Institute (CLRI), and MGR Medical University and also
the states prestigious Centenary Library. Opportunities are available for
training and research in several branches of Arts, Science, Technology,
Paramedical and Languages.
The Department of Geography, is one of the oldest Geography
Departments in the country. First of its kind, it introduced courses in
M.Sc. Applied Geography, M.Sc. Spatial Information Technology,
M.Tech. Geoinformatics and PG Diploma in GIS Management. In recent
years, It also offers courses on M.Sc. Geoinformatics (Private Study),
M.Sc. Geography under Distance Education. Department is the house

NRDMS-DST Sponsored – Summer School – 17th February 2020 – 08th March 2020
of the prestigious Indian Geographical Society (IGS). The Department is
fortunate to get funding from DST-FIST, UGC-SAP, UGC-CPEPA for its
infrastructural development and strengthening teaching programmes.
The Department has state of the art lab for GIS and Remote Sensing
Applications. To train 40 – 50 candidates at the same time, it has lab
facilities with necessary software installed and internet connectivity.
The Application Process
Link to the Website: http://www.dst-iget.in/
Application form Page: http://dst-iget.in/index.php/applicationform
Accommodation
Accommodation shall be provided only to the outstation participants on
sharing basis. Request for family accommodation may be arranged with
extra charges depending upon the availability / outside hotel or guest
house.
Travel
For travel allowance a maximum of AC three-tire fare or travel by Duranto
(whichever is shortest between the origin and destination) shall be
reimbursed on production of original travel documents (Tickets). Those
who are travelling by bus the expenses shall be reimbursed on
production of tickets.
NO TRAVEL FARE by Taxi, Car or Private Luxury van shall be entertained.
Contact
Department Office: 044 22202891
HOD Office : 044 22202286
Coordinator
Dr. R. Jaganathan
Professor and Head
Department of Geography
University of Madras
Email: [email protected],
Cell: +91 9444917006
Statement about ownership and other particulars about
THE INDIAN GEOGRAPHICAL JOURNAL Department of Geography, University of Madras, Chennai - 600 025
Form IV
1. Place of Publication University of Madras, Chennai
2. Periodicity of its Publication Bi-annual
3. Printer’s Name Nationality Address
A. Paghyaselvam Indian J.J. Printers, 4/726, P.S.K., Nager Hussain Colony Pallapatti - P.O., Sivakasi - 626 189
4. Publisher’s Name Nationality Address
Dr. K. Kumaraswamy Indian ICSSR - Senior Fellow Department of Geography Bharathidasan University Tiruchirappalli - 620 024
5. Editor’s Name Nationality Address
Dr. K. Kumaraswamy Indian ICSSR - Senior Fellow Department of Geography Bharathidasan University Tiruchirappalli - 620 024
6. Names and Address of Individuals who own the journal and society
The Indian Geographical Society Department of Geography University of Madras, Guindy Campus Chennai - 600 025
I, K. Kumaraswamy, hereby declare that the particulars given above are true to the best of my knowledge and belief.
Dr. K. Kumaraswamy
Editor, The Indian Geographical Journal