vision-based musical notes recognition of string instruments
TRANSCRIPT

The Interdisciplinary Center, HerzliaEfi Arazi School of Computer Science
M.Sc. program
Vision-Based Musical NotesRecognition of String Instruments
byShir Goldstein
Thesis Supervisor: Prof. Yael Moses
Final project, submitted in partial fulfillment of the
requirements for the M.Sc. degree, School of Computer
Science The Interdisciplinary Center, Herzliya
September, 2017

Vision-Based Musical Notes Recognition of String Instruments
This work was carried out under the supervision of Prof. Yael Moses as part ofthe M.Sc. program of Efi Arazi School of Computer Science, The InterdisciplinaryCenter, Herzliya.
2 Shir Goldstein

Abstract
Music Information Retrieval (MIR) is an important research field in music, combin-ing computer science, signal processing, physics, psychology and more. One of themost important subtasks of MIR is Automatic Music Transcription (AMT), whichinvolves notating an unnotated musical piece. This task is of great value in themusic discipline, but it is also complex and, for polyphonic musical pieces, is stillbelow human performance. We present a novel approach for a specific AMT task,Note Tracking (NT) for guitars (AMT limited to only the pitch of the note andits occurrence in time), using only a silent video of a guitar, captured by a cameramounted on it. We use the vibration of the strings as a visual signal and analyze itusing various signal processing and computer vision methods. We process each stingseparately which practically allows reducing the complexity of a polyphonic NT tomultiple monophonic NT. We also use the physical characteristics of the guitar, likethe possible notes that can be played on a specific string, in order to limit our searchspace which is inapplicable in audio methods. We analyze the expected errors of ourmethod, given the instrument, the string, and the frame rate of the camera. Theperformance of our method were tested on four different guitars, and it is shown thatour algorithm can play an important role in solving the NT problem. Additionalinformation is required to obtain perfect results.
3

Acknowledgements
First I wish to express my deep gratitude to my supervisor Prof. Yael Moses. Ihave been fortunate to work with a professional and a knowledgeable person, thatprovided me with support and guidance. It has been an inspiriting journey.I would like to thank my parents and my brother and sister that encouraged andsupported me.Finally I’d like to thank Moty, my husband, for his love, support and understanding.
4
Contents
1 Introduction 10
2 Theoretical Background 152.1 A Musical Note . . . . . . . . . . . . . . . . . . . . . . . . . . . . . . 15
2.1.1 The Physicality of the Musical Note . . . . . . . . . . . . . . . 152.2 Fourier Transform and Analysis . . . . . . . . . . . . . . . . . . . . . 17
2.2.1 Sampling and Aliasing . . . . . . . . . . . . . . . . . . . . . . 172.2.2 Temporal Information . . . . . . . . . . . . . . . . . . . . . . 18
2.3 The Guitar . . . . . . . . . . . . . . . . . . . . . . . . . . . . . . . . 192.4 Musical Notation . . . . . . . . . . . . . . . . . . . . . . . . . . . . . 20
3 Related Work 23
4 The Note Tracking System 254.1 Temporal Information . . . . . . . . . . . . . . . . . . . . . . . . . . 26
4.1.1 Spectrograms Generation . . . . . . . . . . . . . . . . . . . . . 264.1.2 Note Temporal Segmentation . . . . . . . . . . . . . . . . . . 26
4.2 Pitch Detection . . . . . . . . . . . . . . . . . . . . . . . . . . . . . . 284.2.1 Expected Failures . . . . . . . . . . . . . . . . . . . . . . . . . 32
4.3 Strings Detection . . . . . . . . . . . . . . . . . . . . . . . . . . . . . 324.3.1 A Geometric-Based Algorithm . . . . . . . . . . . . . . . . . . 344.3.2 A Temporal-Spectral Based Approach . . . . . . . . . . . . . 34
5 Experimental Results 365.1 Experiments . . . . . . . . . . . . . . . . . . . . . . . . . . . . . . . . 365.2 Data . . . . . . . . . . . . . . . . . . . . . . . . . . . . . . . . . . . . 365.3 Calibration . . . . . . . . . . . . . . . . . . . . . . . . . . . . . . . . 37
6 Discussion and Future Work 50
A 53
B 55
5
List of Figures
1.1 The signals captured from both audio and video data of a guitarplaying the note E2 (82.41 Hz) by plucking the open lowest string areshown on the left column. The signals’ representation in the frequencydomain are shown on the right column. For the video signal, there isan obvious peak in 82.28 Hz, and for the audio one there is an obviouspeak in 82.24 Hz. . . . . . . . . . . . . . . . . . . . . . . . . . . . . . 12
1.2 Illustration of the automatic music transcription process, for bothaudio and video data. First, the signals are obtained from either audioof visual data, then anaylzed using signal processing methods, thenrepresented in a time-frequency representation, and finally arrangedto a complete musical score or tablature. . . . . . . . . . . . . . . . 14
2.1 Middle C harmonics and spectrum up to the 10th harmonic, producedby a plucked guitar string. . . . . . . . . . . . . . . . . . . . . . . . . 16
2.2 (a): The spectrum of the note A4 (f0 = 440 Hz), with a sample rateof over 20 kHz. (b): The spectrum of the note A4 (440 Hz), witha sample rate of 2756 Hz. Frequencies above 1378 Hz, such as thefourth, fifth and sixth harmonics are aliased. For example, the aliasof fourth harmonic h4 = 4f0 = 1760 is 996 = |1760− 2756|. . . . . . . 18
2.3 The key components and structure of a guitar. . . . . . . . . . . . . 192.4 The short-term Fourier transform process. . . . . . . . . . . . . . . . 212.5 Different representations of the ”Happy Birthday” song. . . . . . . . . 22
4.1 Our system setup. . . . . . . . . . . . . . . . . . . . . . . . . . . . . . 254.2 Spectrograms that were applied with bounding boxes. (a) Applying
the bounding boxes on the entire spectrogram. Some bounding boxescan be falsely merged to include two notes, as in the red boundingbox. (b) Applying bounding boxes on horizontal stripes of the spec-trogram, which resulted in individually detection of the notes, in thered bounding boxes. . . . . . . . . . . . . . . . . . . . . . . . . . . . 27
4.3 (a) The spectrogram computed for a chromatic scale played on Estring of the bass guitar. (b) The initial bounding boxes placedaround the thresholded spectrogram (c) The horizontal sectioning anddiscarding of noise.(d) The discarding of time-overlapped boundingboxes, before discarding of the bounding boxes with no meaningfulsignal. (e) The final temporal segments. . . . . . . . . . . . . . . . . 28
4.4 Several string-pixels’ temporal note segmentation. Each row repre-sents the temporal segmentation of the signal computed using a singlestring-pixel. The upper row (blue) is the ground truth. . . . . . . . . 29
6
Vision-Based Musical Notes Recognition of String Instruments
4.5 The visible fundamentals of each string for the standard guitars. Notethat the visible fundamentals on string E are relatively dense whilethe ones of A string are sparse. . . . . . . . . . . . . . . . . . . . . . 30
4.6 The fundamental frequencies of the standard guitars. The pairs ofred and green dots mark a pair of indistinguishable notes. Markedwith white dots are notes whose fundamental frequency is within thenoise range. Frequencies 233.1 and 246.9 are marked as indistinguish-able although both their f0 and h2 are within the noise range, whichpractically makes the undetectable. . . . . . . . . . . . . . . . . . . 33
4.7 The process of locating the string-pixels. (a) The edge map of the gui-tar image (without dilation). (b) The energy map of 53.7 Hz (whichis the aliased frequency of 293 Hz, note D4 on string G). (c) The pix-els with highest energy for the computed frequency. (d) The randomchosen subset of string-pixels from the set presented in (c). . . . . . . 34
4.8 The proposed algorithm’s pipeline. . . . . . . . . . . . . . . . . . . . 35
5.1 A visualisation example of the different tests results. The blue seg-ments are the GT, the yellow ones are the pitch detected on the givenGT intervals (as in Test 2),and the red ones are the automaticallytemporally segmented notes (as in Test 1), and their detected pitch(as in Test3 - evaluation of pitch detection). The frame-by-frameevaluation (as in Test3 - frame-by-frame evaluation) is calculated bycounting only frames where the blue segments and the red ones arepresent and show the same frequency. . . . . . . . . . . . . . . . . . 37
5.2 The errors using GT temporal intervals (blue), and the errors in im-perfectly seen notes (orange), on each fret. The peaks (diamonds)correspond to frets that have indistinguishable notes, in which errorsare certain. . . . . . . . . . . . . . . . . . . . . . . . . . . . . . . . . 43
5.3 The errors using automatically obtained temporal intervals (blue),and the errors in imperfectly seen notes (orange), on each fret. Thepeaks (diamonds) correspond to frets that have indistinguishable notes,in which errors are certain. . . . . . . . . . . . . . . . . . . . . . . . 46
5.4 Errors examples obtained by testing our method on real-data. (1) Asplit note, where the first detected note is detected with the wrongpitch and the second with the correct one. (2) A split note, whereboth detected notes are detected with the correct pitch. (3),(4) Acase where the detected onset is not within the tested threshold, eithertoo late (3) or too early (4). . . . . . . . . . . . . . . . . . . . . . . . 47
5.5 The string-pixels obtained using three different methods: (a) String-pixels obtained by using the temporal-spectral algorithm with a high-fret note (6, 7 or 8). (b) String-pixels obtained by using the temporal-spectral algorithm with an open string note. (c) String-pixels thatwere marked manually upon the string. . . . . . . . . . . . . . . . . . 48
Shir Goldstein 7

Vision-Based Musical Notes Recognition of String Instruments
5.6 The method’s output in ”chord mode”, for a video capturing the play-ing of the chords Cmaj - Gmaj - Fmaj - Dmaj - Gmaj, as explained inSection 5.3. The X’s mark notes that were detected with the wrongpitch. The rectangles around the detected notes indicate the typeof error, if applicable. In this case the offsets are disregarded, sincegenerally in chords notation no offsets are mentioned. . . . . . . . . 49
A.1 Classic, acoustic and electric guitars fundamental frequencies. Yel-low markings indicate notes that their h2 are in the noise range, redmarkings indicates notes that their f0 are in the noise range, mixedred and yellow markings indicates notes that both their f0 and h2 arein the noise range. . . . . . . . . . . . . . . . . . . . . . . . . . . . . 53
A.2 Bass Guitar fundamental frequencies. Yellow markings indicate notesthat their h2 are in the noise range, and red markings indicated notesthat their f0 are in the noise range. . . . . . . . . . . . . . . . . . . . 54
8 Shir Goldstein

Abbreviations
AMT Automatic Music Transcription
DFT Discrete Fourier Transform
FFT Fast Fourier Transform
FPS Frames Per Second
GT Ground Truth
Hz Hertz
MIDI Musical Instrument Digital Interface
MIR Music Information Retrieval
MIREX Music Information Retrieval Evaluation eXchange
NT Note Tracking
STFT Short Term Fourier Transform
9

Chapter 1
Introduction
Sheet music is a form of musical notation that indicates instruments players how toplay a certain musical piece. The most important elements in a musical sheet arethe notes’ pitches, onsets (the notes’ beginning) and offsets (the notes’ end), but acomplete musical sheet may also consists of other elements, such as key, tempo andother rhythmic information, fingering and dynamics (e.g., loudness and intonation).
The task of music transcription is a key task in Music Information Retrieval(MIR). This task entails the translation of an audio recoding or performance of amusical piece to some kind of written form. Only limited number of the musicalpieces are notated by the composer or performer, while others need to be manuallyextracted based on listening alone. Manually transcribing music is a non trivialtask even for skilled musicians and can be time consuming and inaccurate, thus anautomatic mechanism is required.
Automatic Music Transcription (AMT) is generally considered as the task ofautomatically constructing a musical sheet from an auditory musical data. Althoughaudio data is a natural source of information for AMT, our goal is to use computervision to generate a coherent musical sheet of music played by a string instrument,given only a visual data of the instrument (see Figure 1.2). As most audio-basedAMT applications restrict themselves to the detection of the notes’ pitch, onset,and duration or offset, which is usually referred to as Note Tracking (NT), we willrestrict our system to those components as well. Our focus is on various guitars,but our method is mostly not instrument-specific and can be easily generalised towork on other string instruments.
Note tracking for monophonic music (only one voice playing at a given time) isconsidered to be solved by auditory applications. The main challenge for auditoryapplication is to separate different notes in polyphonic music (two or more notes areplayed simultaneously), in particular, when there are several instruments playingtogether, some of which are of the same type (e.g., a string quartet that includestwo violins). Another challenge is to determine the fingering configuration which isan important aspect of the transcription. However, it is often ambiguous in audiodata since the same note (with the same pitch) can be produce by several strings(e.g., the note A2 in a classic guitar can be produced by pressing the 5th segmentof the lowest string (E) and the second string (A) open).
A small number of audio applications addressed the issue of identifying whatstring and fret is being played, but those are limited; either by a pre-set of knownchords to identify, or by analyzing an individual string played in isolation. Most of
10
Vision-Based Musical Notes Recognition of String Instruments
those methods work merely on a guitar and rely on its specifications, and cannot besimply generalised to work on other string instruments.
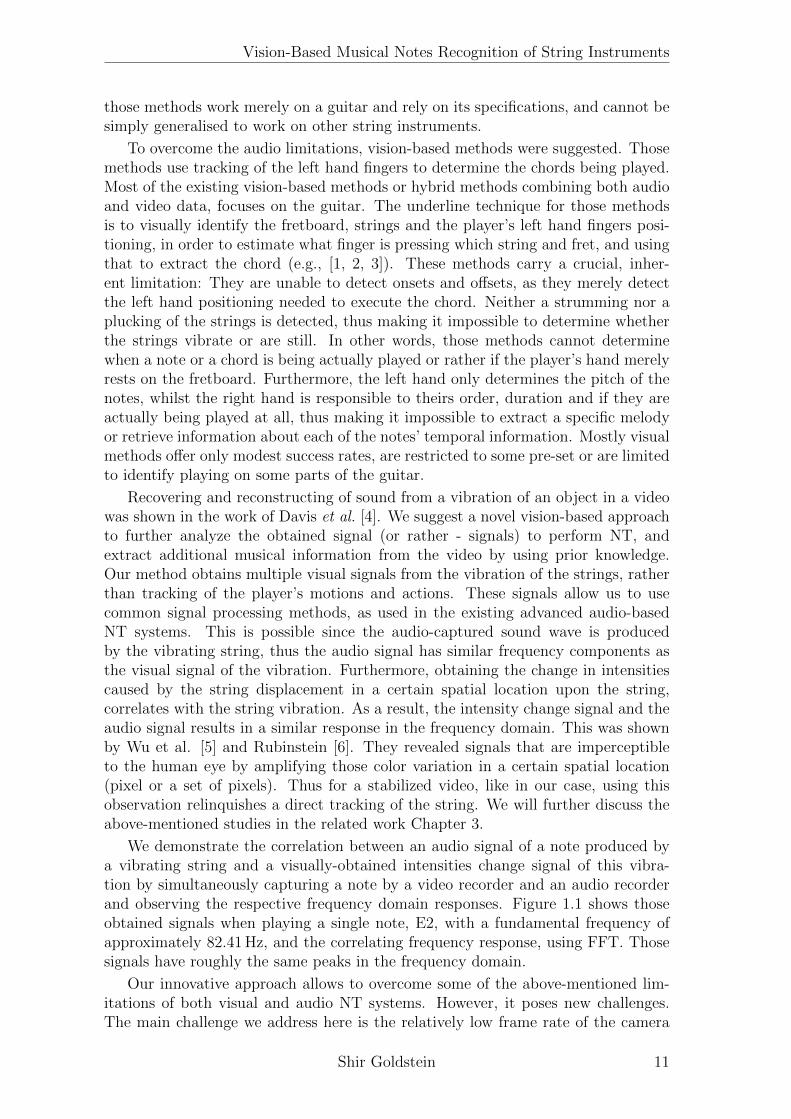
To overcome the audio limitations, vision-based methods were suggested. Thosemethods use tracking of the left hand fingers to determine the chords being played.Most of the existing vision-based methods or hybrid methods combining both audioand video data, focuses on the guitar. The underline technique for those methodsis to visually identify the fretboard, strings and the player’s left hand fingers posi-tioning, in order to estimate what finger is pressing which string and fret, and usingthat to extract the chord (e.g., [1, 2, 3]). These methods carry a crucial, inher-ent limitation: They are unable to detect onsets and offsets, as they merely detectthe left hand positioning needed to execute the chord. Neither a strumming nor aplucking of the strings is detected, thus making it impossible to determine whetherthe strings vibrate or are still. In other words, those methods cannot determinewhen a note or a chord is being actually played or rather if the player’s hand merelyrests on the fretboard. Furthermore, the left hand only determines the pitch of thenotes, whilst the right hand is responsible to theirs order, duration and if they areactually being played at all, thus making it impossible to extract a specific melodyor retrieve information about each of the notes’ temporal information. Mostly visualmethods offer only modest success rates, are restricted to some pre-set or are limitedto identify playing on some parts of the guitar.
Recovering and reconstructing of sound from a vibration of an object in a videowas shown in the work of Davis et al. [4]. We suggest a novel vision-based approachto further analyze the obtained signal (or rather - signals) to perform NT, andextract additional musical information from the video by using prior knowledge.Our method obtains multiple visual signals from the vibration of the strings, ratherthan tracking of the player’s motions and actions. These signals allow us to usecommon signal processing methods, as used in the existing advanced audio-basedNT systems. This is possible since the audio-captured sound wave is producedby the vibrating string, thus the audio signal has similar frequency components asthe visual signal of the vibration. Furthermore, obtaining the change in intensitiescaused by the string displacement in a certain spatial location upon the string,correlates with the string vibration. As a result, the intensity change signal and theaudio signal results in a similar response in the frequency domain. This was shownby Wu et al. [5] and Rubinstein [6]. They revealed signals that are imperceptibleto the human eye by amplifying those color variation in a certain spatial location(pixel or a set of pixels). Thus for a stabilized video, like in our case, using thisobservation relinquishes a direct tracking of the string. We will further discuss theabove-mentioned studies in the related work Chapter 3.
We demonstrate the correlation between an audio signal of a note produced bya vibrating string and a visually-obtained intensities change signal of this vibra-tion by simultaneously capturing a note by a video recorder and an audio recorderand observing the respective frequency domain responses. Figure 1.1 shows thoseobtained signals when playing a single note, E2, with a fundamental frequency ofapproximately 82.41 Hz, and the correlating frequency response, using FFT. Thosesignals have roughly the same peaks in the frequency domain.
Our innovative approach allows to overcome some of the above-mentioned lim-itations of both visual and audio NT systems. However, it poses new challenges.The main challenge we address here is the relatively low frame rate of the camera
Shir Goldstein 11

Vision-Based Musical Notes Recognition of String Instruments
Figure 1.1: The signals captured from both audio and video data of a guitar playingthe note E2 (82.41 Hz) by plucking the open lowest string are shown on the leftcolumn. The signals’ representation in the frequency domain are shown on the rightcolumn. For the video signal, there is an obvious peak in 82.28 Hz, and for the audioone there is an obvious peak in 82.24 Hz.
(240 fps in our case) with respect to a typical audio sampling rate (44.1 kHz). Lowframe rate causes the detection of the note’s pitch to become substantially morechallenging. In particular, the Nyquist-Shannon sample rate theorem [7, 8] guaran-tees perfect reconstruction (or reliable analysis) only for a signal with a bandlimitsmaller than half the frame rate (see Section 2.2.1). For detection of higher fre-quencies, the aliasing phenomenon must be considered. Moreover, the sensitivity tonoise is more substantial for a low frame rate.
An additional challenge for a fully automatic system, is to detect in all framesthe key pixel we call a string-pixel (or pixels) on which the vibration is measured.For simplicity, we assume that the camera is mounted on the instrument, hence nostabilization of the video is required. This setup is a first step toward more generalsetups that include using an unmounted camera, using two cameras, etc. Althoughsome obfuscation of the strings by the player’s hand or body is allowed, we assumethat some parts between the left (fretting) hand and the right (strumming) handare visible throughout the entire video.
We explored two different approaches for strings detection, which is necessaryfor obtaining the string-pixels. The first approach is geometric, is based on theguitar physical structure and obtained from a single frame. The second, which ismore effective, is a spatial-temporal approach that considers the strings vibrationthroughout multiple frame.
The rest of the thesis is organized as follows: In Chapter 2 we will provide ashort theoretical background of both musical terms and mathematical ones. Webriefly review the theory of string oscillation and explain about harmonics and thefundamental frequency of a note. We also review the time-frequency analysis for
12 Shir Goldstein

Vision-Based Musical Notes Recognition of String Instruments
MIR applications, which is a basic components to a vast majority of NT systems.In Chapter 3 we review the related work of both auditory methods and visual ones.In Chapter 4 we present our method. We explain the flow of the method and itsexpected limitations. We review the aliasing problem and the effect it has on ourmethod. In Chapter 5 we present the testing of our algorithm, and also each of itscomponents. Several measurements were used for evaluating the performance of ourmethod. Finally, in Chapter 6 we conclude our work and discuss optional futurework.
Shir Goldstein 13

Vision-Based Musical Notes Recognition of String Instruments
Figure 1.2: Illustration of the automatic music transcription process, for both audioand video data. First, the signals are obtained from either audio of visual data,then anaylzed using signal processing methods, then represented in a time-frequencyrepresentation, and finally arranged to a complete musical score or tablature.
14 Shir Goldstein

Chapter 2
Theoretical Background
In this chapter we introduce the technical terms relevant to this work. Those includemusic related terminology as well as signal processing and frequency domain analysisterms.
2.1 A Musical Note
The musical note has many meanings, amongst a musical entity, a notation sign, apitch and more. The basic components of a played musical note are threefold:
• Height - How high or low does a note sounds.
• Timbre - The sound of the note that differentiate two notes with the sameheight played on different instruments.
• Temporal information – Note’s duration, and in a context of a musical piece -when is a note played.
We hereby define the meaning of a musical note to be used throughout thiswork; a musical note (or simply: note) is a musical entity, produced by a pitchedinstrument, that consists of a tone (also: pitch), and in the context of a musical piececarries additional temporal information (e.g., when a note is played). Timbre willnot be addressed throughout this thesis. We will only address string instruments,and not other pitched instruments as brass instruments.
2.1.1 The Physicality of the Musical Note
When an ideal string that is fixed in both ends vibrates, it produces different waves,each with a particular frequency, amplitude and phase. The lowest frequency inwhich it vibrates is called the fundamental frequency (or simply: fundamental, andabbreviated as f0). The entire set of frequencies in which the string vibrates arean integer multiple of the fundamental frequency and are called harmonics. Eachharmonic is a member of the harmonic series defined by the fundamental. Formally,let f0 be a fundamental frequency, then the harmonic series is defined as
Hn = {hi | hi = i · f0, i ∈ N+}.
15

Vision-Based Musical Notes Recognition of String Instruments
It follows that f0 is the first harmonic and is equal to h1, the second harmonic is h2and so on.
When a string vibrates in a certain frequency, it causes pressure fluctuations inthe air around it in the same frequency. These fluctuations eventually vibrates ourear drum and produce a sound. But in practice, especially when a string is plucked orstruck by a hammer (as in a guitar and a piano respectively) as opposed to bowed forexample, the string vibrates in slightly different set of frequencies. This causes theinstrument to produce a complex tone, that is constructed from pure (also: musicalor simple) tones. Those tones are periodic and have a single sinusoidal waveform,i.e., contains a single frequency. Those tones, called partials, mainly include theharmonics. Any partials which are not harmonics are called inharmonic partials.Throughout this work we will address the instruments as producing only harmonicpartials, as the partials it actually produces are very close to the harmonics and theinharmonic partials tend to decay rapidly.
The pitch of a note is a perceptual term that is used to describe how high or low atone is. Pitch is closely related to the fundamental frequency, because generally theperceived pitch correlates with the fundamental – a high pitch sound correspondsto a tone with a high fundamental and a low pitch sound corresponds to a tonewith a low fundamental. Throughout this thesis we will use fundamental frequency,fundamental, and pitch interchangeably, as is customary among musicians.
It follows that each musical note has a specific, distinct set of frequency com-ponents. This allows the human ear as well as computerized programs to identifyand differentiate between notes with different fundamentals or pitch. For example,the middle C, C4, has a fundamental frequency of 261.63 Hz, and has harmonicsof 523.26 Hz, 784.89 Hz and so on (see Figure 2.1). The amplitude of each partialdetermines the timbre of the note. For that reason different instruments that playsthe same note (with the same tone) sound different, e.g., the different sound pro-duced by playing C4 on a guitar and a flute. In this work we will assume that eachof the guitars produces at most the first, second and third harmonics with someamplitude. This, since the higher a harmonic is the lower is its amplitude and inpractice we found that amplitudes of harmonics higher than the third are as low asthe noise.
(a) Middle C harmonics (b) Middle C spectrum
Figure 2.1: Middle C harmonics and spectrum up to the 10th harmonic, producedby a plucked guitar string.
16 Shir Goldstein

Vision-Based Musical Notes Recognition of String Instruments
2.2 Fourier Transform and Analysis
Fourier Transform is a method to convert a signal, which is in the time domain,into the frequency domain, by decomposing it to its frequency constituent parts.
The Fourier transform can operate on continuous-time signals (which are oftenperiodic, or constructs of periodic components) in order to create a continuous fre-quency spectrum. However, in practice, signals are discrete and finite, since theyare reduced from real-world, continuous-time signals by sampling (see Section 2.2.1).For these signals, a discrete version of the Fourier transform, the Discrete FourierTransform (DFT) is used. Many applications in digital signal processing use thistransform, or rather its fast implementation Fast Fourier Transform (FFT), and itis presumed to be the most important discrete transform.
Formally, DFT transforms a sequence of samples x1, x2, ..., xn−1 to the sequenceX1, X2, ..., Xn−1 which is defined by
Xk =N−1∑n=0
xn · e−i2πkn/N
2.2.1 Sampling and Aliasing
The process of reducing a continuous-time (analog) signal to a discrete-time signalis called sampling. The capturing of a sound wave by a microphone is an exampleof sampling, as well as capturing a scene by a video camera.
When a signal is sampled, it is inherently band-limited in frequency. That is,sampling a signal with a finite number of points, clearly cannot represent an infiniterange of frequencies. Thus, every signal obtained by a sampling process is limited toa specific frequency range that is determined by the sampling rate, defined by thenumber of samples per second. Figure 2.4 in part illustrates the sampling process.
The Nyquist-Shannon sampling theorem [7, 8] establishes a sufficient conditionfor a sample rate that permits a discrete-time signal to entirely capture the informa-tion from a continuous-time signal. According to the theorem, the sufficient framerate for a signal that has a maximum frequency of fMAX should be at least 2fMAX
samples per second. In other words, the sampled signal must contain no sinusoidalcomponent that is higher than half the sample rate. It follows that the frequencyspectrum of a time-to-frequency transform will be limited to half the sample rate.This defines the typical audio sampling frequency to be 44.1 kHz which is slightlyhigher than double the maximal frequency of the human hearing range (20 kHz).
However, when a signal that does contain frequency components higher than fs/2is sampled with a sample rate of fs, a phenomenon called aliasing occurs. Aliasingis an effect that causes different signals to become indistinguishable when sampled.Equivalently, such a signal will not correctly show its frequency components, assome can exceed the maximum frequency of the frequency spectrum. Any frequencycomponent above fs/2 is indistinguishable from a lower-frequency component, andis called an alias. In the case of an insufficient sample rate fs, for a frequencyabove fs/2, fhigh, there exists m ∈ N+ such that fa = |fhigh − mfs| < fs/2 thatit aliases to. For example, when sampling with 240 Hz, two sinusoidal signals withfrequencies of 110 Hz and 130 Hz are aliases of one another, as both will have afrequency component of 110 Hz. The 110 Hz sinusoidal will show a signal componentin 110 Hz, since it is lower than half the sample rate. However, 130 Hz is above fs/2,
Shir Goldstein 17

Vision-Based Musical Notes Recognition of String Instruments
thus aliases to 110 Hz, since 110 = |130− (1)240|. Although usually an anti-aliasingfilter is used to suppress these high frequencies, in this work we will use these aliasedfrequencies to obtain additional information, since our sample rate is limited withrespect to the notes played on the guitars. Figure 2.2 illustrates the phenomenon ofaliasing.
(a) (b)
Figure 2.2: (a): The spectrum of the note A4 (f0 = 440 Hz), with a sample rateof over 20 kHz. (b): The spectrum of the note A4 (440 Hz), with a sample rate of2756 Hz. Frequencies above 1378 Hz, such as the fourth, fifth and sixth harmonicsare aliased. For example, the alias of fourth harmonic h4 = 4f0 = 1760 is 996 =|1760− 2756|.
2.2.2 Temporal Information
As mentioned above, the musical tone is a complex signal that contains several fre-quencies. Thus, Fourier analysis is well-suited for the task of identifying a note, bybraking it to its frequency components. Although this simple transform is sufficientfor several music applications (such as a tuner), it does not give any temporal in-formation. That is, when performed on a long signal, it will reveal the frequencycomponents throughout the entire signal. In musical-analysis cases, if a signal rep-resents an entire musical piece, this analysis might be practically meaningless, asthe frequencies throughout a musical piece are many and vary frequently. Thus,a time–frequency analysis is the main practice in music related signal processing.Mainly, it involves braking the signal into small, usually overlapping signals andapplying a Fourier transform (or other time-to-frequency transforms) to each one,to create a time-frequency representation.
Short-Term Fourier Transform
The most basic and well-used transform is Short Term Fourier Transform (STFT),which breaks the discrete samples of the signal x[t] of length M to equal-lengthsegments (with length N), and computes FFT on each one to reveal the frequencycomponents in a given time.
Each of those segments is first multiplied by a window function, w[t] of sizeN 1, and then applied with FFT. To reduce artifacts, those windows are usually
1we take the number of DFT points in each segments to equal to N
18 Shir Goldstein

Vision-Based Musical Notes Recognition of String Instruments
applied with some overlap, r. Figure 2.4 shows the STFT applied on an analogsignal following the sampling process.
The Spectrogram
A general spectrogram is a visual representation of a signal that shows its fre-quencies information variation over time (or some other variable). A spectrogramrepresentation of the STFT applied to a signal correspond to taking the squaredmagnitude of the STFT. In this case, the spectrogram is a 2D map, T × f , whereeach column of the map is the power spectral function of each segment. More specif-ically, the spectrogram is a m × k matrix, α. The number of columns is given byk = (b(M–r)/(N–r)c). The frequency bin size fBS is given by fBS = fs/N . Itfollows that the number of spectrogram rows is given by m = (n/2 + 1) for an evenN and (N + 1)/2 for an odd N , since the applicable frequencies ranges from zeroto fs/2. Finally, the value at an entry α(ti, fj) is the magnitude of the frequencyfj computed for the interval with size N of the signal starting from (ti − 1)(M − r)(see Figures 2.4 and 4.3a).
2.3 The Guitar
The guitar is a string instrument, usually fretted, that is played by strummingthe strings or plucking them. For a standard guitar, the right hand is the strum-ming/plucking hand whilst the finger of the left are fretting it. Typically, all guitarstrings have the same length. However, their thickness varies; higher strings are thin-ner, which causes the string to produce a higher set of frequencies. Additionally,Shortening a string using the left hand makes a string produce higher frequencies.See guitar structure and components in Figure 2.3
Figure 2.3: The key components and structure of a guitar.
The guitar’s frets are metallic straight strips that divide the fretboard into seg-ments. The ratio of the spacing of two consecutive frets is 12
√2 . This ratio makes
the difference in notes produced by playing consecutive segments to be a semitone.Pressing the string against a higher segment will shorten the string to the nextclosest fret and make it produce a higher pitched note. We will use the term fretto address the segment that is behind it, as is customary among musicians. For
Shir Goldstein 19

Vision-Based Musical Notes Recognition of String Instruments
example, when naming the second fret we mean the segment between the first fretand the second one.
2.4 Musical Notation
Musical notation is a representation of a played (or sung) music by instruments(or human voice) using some form of musical symbols. Musical notation includevarious properties of the musical piece. The most important ones include the notestemporal information and pitch information. Other properties may include tempo,key, dynamics, etc. Modern staff notation is the most known form of musical nota-tion, which usually include the majority of these properties, and are usually used forclassical instruments (like brass and bowed string instruments), instruments withcomplex polyphony (such as a piano) or for multiple instruments (like an orchestraor a quartet). An example of a modern staff is shown in Figure 2.5a. However,some instruments or different methods of playing require little understanding ofthese complex musical notation or some note properties are redundant. Guitar’scommon musical notation is the tablature. This notation includes merely the pitchinformation by notating the number of string and fret needed to be pressed in orderto produce it. Temporally, the notes’ orders is given, and usually some additionaltemporal information regarding the notes’ onsets and offsets is added, either by thespace between the these numbers (where a small space between notes indicated toplay them closer together and vice versa), or by other simple temporal notation asin modern staff notation. This notation can be sufficient to describe a large majorityof music for guitars. See example of a tablature in Figure 2.5c.
Music being computerized formed a new way of interfacing and communicatingbetween electronic music instruments and computers. This formed MIDI (MusicalInstrument Digital Interface) which is a technical standard that carries informationabout events of musical notes. For example, a MIDI keyboard controller can beconnected to a computer and a software will identify each key press. MIDI mainlycarries event messages that correspond to temporal and pitch information. MIDIrepresentation will usually consist of a matrix, where the columns (x-axis) representsthe time sequence and the rows (y-axis) represent the pitch. Every note in thisrepresentation is an horizontal bar. The bar’s y-axis coordinates corresponds to thepitch of the note. The bar’s x-axis coordinates corresponds its occurrence in time,where the left edge indicates the start of the note and the right one indicates its end(and accordingly its length corresponds to the note’s duration).
In this work, we will use MIDI-like representation as it is closely related to thetime-frequency representation obtained using the STFT and since it is suitable forguitar playing (especially for bass and for melody playing in guitars). Furthermore,this representation describes best the features obtained by NT. Since we analyzeeach string separately, the transition to a tablature is trivial. An example of a MIDIrepresentation is presented in Figure 2.5b.
20 Shir Goldstein

Vision-Based Musical Notes Recognition of String Instruments
Figure 2.4: The short-term Fourier transform process.
Shir Goldstein 21

Vision-Based Musical Notes Recognition of String Instruments
(a) Modern staff notation of ”Happy Birthday”.
(b) MIDI representation of ”Happy Birthday”.
(c) Tablature representation of ”Happy Birthday”.
Figure 2.5: Different representations of the ”Happy Birthday” song.
22 Shir Goldstein

Chapter 3
Related Work
Our work was inspired by the innovative study by Davis et al. [4], where sounds wererecovered from silent videos. In their study, they showed that when sound hits anobject, its surface vibrates subtly, and those vibrations can be visually detected by acamera. Furthermore, it is possible to reconstruct the original sound by processingthe signals obtained from those vibrations. However, NT was beyond the scope oftheir study, since they did not focus specifically on music signals or attempted toanalyze them. Wu et al. [9] suggested to look at a certain location in the image andextract the temporal color changes, in order to amplify it to make it visible to thenaked eye. Rubinstein [10] demonstrates that a temporal color change obtainedin a certain location on a vibrating string, can reveal its vibration frequency solelyfrom the video. These studies used an extremely high frame rate camera or madeuse of the rolling shutter properties to effectively increase the frame rate, which isinapplicable in our work, as our signal must be captured in a single pixel. Anothernotable study is that of Owens et al. [11], where supervised learning is used topredict the sound of an object being hit or scratched in a scene from a silent video.It demonstrates that audio information could be retrieved by visual data alone, butwithout any attempt to analyze the physics of the scene.
Naturally, most applications use auditory means to solve the AMT problem (seesurveys [12, 13, 14, 15, 16]). These applications use signal processing methods toanalyze the audio signal. But although AMT is a fundamental field in music infor-mation retrieval, only monophonic AMT is considered solved. AMT for polyphonicmusic is a more complicated problem and the state-of-the-art AMT systems stillperform well-below the level of humans, or is restricted to the degree of polyphonyor instruments type [12]. Furthermore, audio signals can partially obfuscate someessential information that can be observed almost only visually, such as fingeringor even what string is used to play a certain note (as a note can be played onseveral strings). Although several works did address those issues, they are limitedin several aspects, e.g., by the set of pre-defined structured chords or by the levelof polyphony [17, 18], an isolated single note [19], or a single instrument playingsolely [18, 20].
Visual and hybrid (visual combined with audio-based) approaches were attemptedto solve the AMT problem, due to the limitations of the audio-based methods. Asthe visual information obtained usually consist of the physical manner the player isoperating the instrument, visual methods are mainly instrument specific. Methodsthat focus of the guitar mostly follow the same technique of detecting the guitar’s
23

Vision-Based Musical Notes Recognition of String Instruments
strings and frets and then locating the guitarist’s left hand. Most methods ignorethe player’s right hand (the plucking / strumming hand).
A key component of methods that use visual infomration is to locate the guitarin the video or frame. Straight forward approaches use the common structure ofthe guitar to locate it in the frame. For example, Pelari et al. [21, 22] and Questedet al. [23] detected the straight lines of the of frets. Common trackers were usedto track some guitar-specific structural elements, such as the constant ratio of thedistance between frets. In both these hybrid systems a rough location of the left handwas obtained to retrive the fingering information (string and fret) for each detectednote by the audio analysis system. Similar but more comprehensive systems werepresented by Cheung and Lee [24] and Scarr and Green [25]. These solely vision-based systems use similar characteristics of the guitar to locate the fretboard andmore specifically the exact location of each string and fret. Locating of the fretboardis executed on each frame separately and no tracking is used. Zhang et al. [26] usedthe similar structural elements of a violin for an AMT application.
Applications that bypassed the challenge of tracking the fretboard or to relocateit in each frame used, as we do, a mounted camera [3, 27, 28]. In this case, thestrings and the frets need to be detected only once, as they stay static in relationto the camera throughout the entire video. Others [2, 29, 30, 31, 32] used markerson the guitar in order to track it. Our method use a mounted camera, and thestrings need to be only once detected. The detection is based on their vibration ina video rather than using the geometric structure of the guitar from a single image(see Section 4.3).
Given the location of the guitar, the frets, and the strings, the next challengeis to identify the left hand and/or fingers of the player. In this task as well, somemethod used marking on the fingers [2, 31]. Most method that avoid markingsusually use either detecting of the skin color [1, 21, 23, 25, 22, 24, 26] and/orsearch for the circular shape of the finger tips by using circular hough transform[1, 3, 24, 26, 27, 28]. Hrybyk and Kim [29] trained a set of rectified images of thefretboard to identify a specific voicing of a chord.
Although visual and hybrid methods can diminish some limitations derived fromsolely audio-based applications, these methods are not without their shortcomings;first, since the detection of the frets is executed by measuring the distance from thenut, it is required to have a sufficiently large view of the fretboard that includesthe frets that are played on, starting from the 1st fret. Some methods are limitedeither by the number of frets considered (e.g., [3]) or by a pre-known set of possiblechords or voicing options (e.g., [29]). Our method requires only a small portion ofthe strings to be visible.
Another main limitation of visual-based method is the detection of when a notewas played, if at all, as discussed earlier. Zhang et al. [26] attempt to overcome thislimitation by measuring the distance between the strings to its closest finger, in anattempt to determine the finger that is pressing the string. However, they concludedthat, due to poor results, a single 2D camera is insufficient to obtain this kind ofinformation. Another notable exception is the work of Wang and Ohya [1] thatdetects ”key frames” in which the player’s hand is moving toward a new chord, thusmaking it possible to roughly determine when a chord is not being played and whenit is. However, this approach does not solve the problem of a specific strumming orpicking and is irrelevant if the player is playing a melody rather than chords.
24 Shir Goldstein

Chapter 4
The Note Tracking System
In this chapter, we present our note tracking method. The input is a video taken bya camera mounted on the guitar, as shown in Figure 4.1. The output is the NT thatconsists of the temporal segmentation of the played notes as well as their pitch.
(a) A camera mounted on the guitar(b) A frame captured by the mountedcamera
Figure 4.1: Our system setup.
In Section 4.3 we present our method to detect a set of string-pixels for eachstring. A string-pixel qs of string s is roughly located on the projection of s. Thestring-pixels should be located only once, because their locations are fixed with re-spect to the camera; the change in the strings locations is only due to their vibration.The intensity of qs as a function of time, qs(t), is correlated with the frequency ofthe string vibrations (see Figure 1.1). For each string s, we compute the NT ofthe music played using a set of its string-pixels signals, {qsi (t)}, as an input. Thetemporal segmentation algorithm is described in Section 4.1.2. Then, for each seg-mented note, the algorithm for computing the fundamental frequency (the note’spitch) is described in Section 4.2. Robustness of the NT is obtained by voting fromseveral string-pixels of the specific string. The pitch and temporal information ofnotes from all the strings can then be rearranged to form a coherent musical sheet(MIDI or tablature-like).
A full diagram of the proposed method is given in Figure 4.8.
25

Vision-Based Musical Notes Recognition of String Instruments
4.1 Temporal Information
In this section we present our method to compute the temporal information of theplayed music on a given string. It consists of the onset and offset of each note.Our goal is to divide the set of input signals, {qsi (t)}, into a set of segments, eachcorresponding to a single note played on the string s. We represent each of the inputsignals in a time-frequency representation, a spectrogram, to achieve both temporaland pitch information. However, since temporal resolution and frequency resolutionare complementary, we favor the temporal information and largely ignore the pitchinformation obtained by this representation. The computed temporal informationis then used to compute the frequency of each played note (see Section 4.2).
4.1.1 Spectrograms Generation
We calculate the short-term Fourier transform of each of the signals separately andrepresent it as a spectrogram (see Section 2.2.2). That is, an FFT is applied to timeintervals of length N of the original signal. The size N should be sufficiently largefor obtaining high energy at the fundamental frequency of the played note as well asfor improving resolution of the computed frequencies. On the other hand, small Nimproves the time resolution, and it is more likely that only a single note is playedduring a short time interval. To improve the time resolution, overlapping intervalscan be considered. In our implementation, we use overlapping time intervals andtrade frequency resolution for temporal resolution, since the temporal informationis more imperative in this stage. Thus, we use a rectangular window with N = 20,and the maximal overlap between the signal’s time intervals (r = 19).
4.1.2 Note Temporal Segmentation
Since each qsi (t) is a signal obtained from a single string, only a single note is playedat a given time. Moreover, for a sufficiently small time interval N , only a singlenote is present. Hence, at the time interval during which a note is played, thespectrogram is expected to have a region with high energy roughly centered aroundthe played frequency. High energy of the spectrogram at the same temporal intervalis also expected at the visible frequencies that correspond to the note’s harmonics,and the aliased frequencies of both the note and its harmonics (see Section 4.2).Other regions of the spectrogram are expected to have low energy, except for noisyregions, typically at low frequencies. In our case, we consider the noise range tobe ≤ 20 Hz. To avoid the detection of noise, the region of the spectrogram thatcontains frequencies equal to or below 20 Hz is discarded.
We use a naive segmentation method – applying a threshold to the spectrogramenergy. A bounding box is set around each region above the threshold. The boundingbox coordinates in the temporal axis correspond to a temporal segment, denoted byτj = (tj, tj + δtj).
The large frequency bins, the spectral leakage phenomenon, and the fact thatsome harmonics can appear as aliases and might overlap unaliased harmonics, cancause the high energies to smear across the frequency axis. This, in addition to noisyareas in the spectrogram, can result in temporally adjacent segments to be falselymerged to be included in a single bounding box.
26 Shir Goldstein

Vision-Based Musical Notes Recognition of String Instruments
(a) (b)
Figure 4.2: Spectrograms that were applied with bounding boxes. (a) Applying thebounding boxes on the entire spectrogram. Some bounding boxes can be falselymerged to include two notes, as in the red bounding box. (b) Applying bound-ing boxes on horizontal stripes of the spectrogram, which resulted in individuallydetection of the notes, in the red bounding boxes.
Hence, the segmentation is performed separately on each frequency bin of thespectrogram. That is, the spectrogram image is divided to horizontal stripes accord-ing to the frequency bins size, and each is set with the bounding boxes. This causeslarge energy areas representing a note to be divided to several, roughly temporallyequal bounding boxes. Since we merely wish to extract temporal information in thisstage, we can ignore the height of the bounding box which eventually be selected torepresent the temporal segmentation of the note. An example of this sectioning ifshowed in Figure 4.2.
As a post-processing step, we discard overlapping temporal segments, by choos-ing the more dominant regions, as at each given time only one note can be played.Additionally, small segments are also discarded. The threshold is chosen to be theranked 80% of the energy values in the spectrogram, since we assume that the playednotes take roughly 20% of the spectrum at each given time (See Figure 4.3).
This algorithm is applied to each qsi (t). As expected, the set of temporal segmentsobtained from the set {qis(t)} (for a gives string s) varies due to the quality eachof the signals. This, since different locations along the string captures its vibrationdifferently (see example in Figure 4.4). We use the results obtained from the signalsof all string-pixels of a given string to vote for its temporal segmentation; the set offrames that appear in at least 65% of the signals are chosen.
Clearly, a more sophisticated segmentation algorithm can be used for this stageof our algorithm. It is left for future research to study how advanced segmentationmethods can improve our results.
Shir Goldstein 27

Vision-Based Musical Notes Recognition of String Instruments
(a) (b) (c) (d)
(e)
Figure 4.3: (a) The spectrogram computed for a chromatic scale played on E stringof the bass guitar. (b) The initial bounding boxes placed around the thresholdedspectrogram (c) The horizontal sectioning and discarding of noise.(d) The discardingof time-overlapped bounding boxes, before discarding of the bounding boxes withno meaningful signal. (e) The final temporal segments.
4.2 Pitch Detection
Computing the note’s fundamental frequency is a main goal of NT. Many audio-based methods compute the note’s pitch by selecting frequencies with high energyin the spectrogram of the audio signal and matching it to the known structure of thenotes’ frequency components (the corresponding harmonic series). In our case, thesefrequency components are largely above the spectrogram frequency range due to thelow frame rate. More importantly, the frequency resolution of the spectrogram ispoor thus frequency bins are too coarse to allow distinction between close frequencies(e.g., a frequency bin of 1 hertz will not allow distinction between frequencies of81.4 Hz and 82 Hz assuming the fall in the same bin). The poor frequency resolutionis caused by our choice of a small time interval size, N , which guarantees hightemporal resolution at the cost of low frequency resolution.
To improve the frequency resolution, FFT can be applied to a longer time in-terval that consists of a single note computed by the temporal note segmentation(Section 4.1.2). Indeed, the temporal note segments are typically longer than thechosen N .
Our goal is to compute the fundamental frequency, f0, for each pre-calculatednote temporal segmentation. This, by applying FFT on each of those segments,which results in obtaining the power spectra function, S(f), for each string-pixel.Finally, a majority voting is computed on all string-pixels for each note to determine
28 Shir Goldstein

Vision-Based Musical Notes Recognition of String Instruments
Figure 4.4: Several string-pixels’ temporal note segmentation. Each row representsthe temporal segmentation of the signal computed using a single string-pixel. Theupper row (blue) is the ground truth.
each note’s pitch.The main challenge is the low sampling rate of the video (240fps) with respect
to the fundamentals we wish to recover (up to 392 Hz), let alone for their secondand third harmonics (up to 1176 Hz). According to the Nyquist-Shannon samplerate theorem [7, 8], a perfect reconstruction is guaranteed for frequencies withina bandwidth limit B < fs/2, which we refer to as the visible range of the powerspectrum (see Section 2.2.1).
Peaks of S(f): A peak of S(f) is expected at the note’s fundamental frequency,f0, if it is in the visible range (f0 < fs/2). Otherwise, it is theoretically guaranteedthat one of its aliased frequencies, denoted by fA(f0), is visible (see definition inSection 2.2.1). That is, there exists k ∈ N+ such that fA(f0) = |f − kfs| < fs/2.We define the visible frequency of f (given fs) to be
fv(f) =
{f f ≤ fs/2
fA(f) f > fs/2
Hence, if S(f) has a single peak at f ′, we could infer that it is either at f0 orthat it is an aliased frequency of f0 given by the set {|f0 ± k · fps|}k∈N (as long asfv(f0) is not in the noise range).
Additional peaks are expected at the note’s harmonics (or their visible aliasedfrequencies). Formally, let the harmonic series set of f0 be given by {hi|hi = if0}i∈N+
(f0 is the first harmonic of itself). A peak of S(f) is expected at each fv(f), wheref = if0. In practice, the energy of a harmonic usually decreases as i increases (seeFigure 2.1b); hence we consider only the fundamental frequencies and two lowestadditional harmonics of f0. We expect S(f) to have peaks at :
FV (f0) = {fv(f0), fv(2f0), fv(3f0)}.
Thus, the structure of the music harmonics and our limited bandwidth of visiblefrequencies can cause ambiguities, since one needs to discriminate between f0, itsaliased frequency, and its harmonics. That is, a peak of S(f) at a frequency fmay be obtained for f = f0, f = fA(f0) or f ∈ {fv(2f0), fv(3f0)}. For example,observing a frequency of 110 Hz can be either because a note has a fundamental
Shir Goldstein 29

Vision-Based Musical Notes Recognition of String Instruments
frequency of 110 Hz, because it is a (second) harmonic of a note with fundamentalfrequency of 55 Hz (as 2 ∗ 55 = 110), or because it is an aliased frequency of 130 Hz(as 240 − 130 = 110). Moreover, our limited bandwidth could cause peaks to bevery close together and thus harder to distinguish. For example, there is only 0.8Hz difference between the peak of the note A2, where f0 = fv(f0) = 110hz, andthe peak of C3, where f0 = 130.8 and fv(f0) = 109.2hz. Also, a slight out of tuneguitar or a hard picking of the string can cause some variation of the note’s pitch.Figure 4.5 illustrated this property.
In addition to the above-mentioned expected peaks, some peaks will not bevisible because they are within the noise range (≤ 20 Hz), and peaks may be shifteddue to S(f) resolution.
Using Prior Knowledge: Our goal is to compute f0 despite the expected above-mentioned ambiguities. The most significant information we have is that S(f) con-sists of only a single note. Moreover, the set of possible fundamental frequenciesthat can be played on a given string s, Fstring(s), is also known (as long as the
Figure 4.5: The visible fundamentals of each string for the standard guitars. Notethat the visible fundamentals on string E are relatively dense while the ones of Astring are sparse.
30 Shir Goldstein

Vision-Based Musical Notes Recognition of String Instruments
instrument is tuned). As a result, if f0 ∈ Fstring(s) is played, we expect the peaks ofS(f) to be the set FV (f0). We define a score for each possible f ∈ Fstrings(s), andthe computed set of peaks, and we choose the note with the highest score.
Observe that in audio analysis, no aliasing exists since the bandwidth is suffi-ciently large or an anti-aliasing filter can be used. However, harmonics frequenciesare visible, and it might be hard to discriminate, for example, whether a single noteis played or both the note and its harmonics are played. We do not have to handlethese challenges that arise from such ambiguity, since only a single note is played ata given temporal segment on a given string.
Score Definition: Let Fpeaks(S(f)) be the set of the highest six peaks of S(f).The score of f0 ∈ Fstring(s) is computed as the weighted sum of the distances ofeach fh ∈ FV (f0) from its nearest peak in Fpeaks(S(f)). We normalize the distancesbetween fh and fp ∈ Fpeaks(S(f)), since the results of the discrete FFT are equallyspaced while the distances between semitones are larger for high frequencies andsmaller for lower ones. Formally, let f < f ′ be two successive semitones, and letf < fp ∈ Fpeaks(S(f)) be the peak frequency. The distance between f and fp isgiven by d(f, fp) = |(f − fp)|/|(f − f ′)|. In a similar manner we define the distanced(f, fp) where f > f p, using f ′ < f . The frequency of the nearest peak to f is givenby
f = argminfp∈P (S(f))d(f, fp).
The contribution of the ith harmonic of f0, f = if0, to the score of f0 is given by
ei = e−d(f,f))S(f).
Then the score is defined by the weighted sum:
score(f0) =3∑i=1
wiei,
where wi is a weight of the ith harmonic. In our implementation the weights are setto be w1 = 0.6, w2 = 0.25, w3 = 0.15, if all expected frequencies are above the noiserange. Otherwise the weights are set to 0 for an invisible frequency, and the rest areset accordingly.
High energy frequencies at FV (f0) are used as evidence to support that f0 wasplayed. However, special attention should be paid to two notes that are likely to beconfused. These include a pair of notes such that one of them has a fundamentalthat is the second harmonic of the other, that is, f0, 2f0 ∈ Fstring(s). In this case,score(2f0) may be larger than score(f0) but f0 is the correct fundamental frequencyof the played note, or vice versa. To avoid such errors, we reexamine which one ofthem is the fundamental frequency. We expect e1(f0) to be low if 2f0 is the correctone. We test this according to the rank of e1(f0) in the set of e1(f),∀f ∈ Fstring(s).In our implementation we choose 2f0 if the rank is below 70%.
Post-Processing After obtaining the score of each string-pixel for a specific tem-poral note we use a majority vote to determine the note’s fundamental. Further-more, some temporal segments can show no meaningful frequency information (i.e.,no peaks are visible in the corresponding S(f), see Section 4.2). This means that
Shir Goldstein 31

Vision-Based Musical Notes Recognition of String Instruments
no pitch was detected in the temporal segment. Thus, if the majority of the string-pixels indicated that no pitch was detected, the temporal segment is assumed to bea false-positive and is discarded.
4.2.1 Expected Failures
Given the limited frame rate used, it is possible to predict the failures of the pitchdetection for each instrument.
Let us consider two notes played on the same string of a given instrument. Thesenotes are defined to be indistinguishable if their corresponding harmonic series areobserved identically. Strictly, let f ′ and f ′′ be two notes with fundamentals of f ′0, f
′′0
such that f ′0 6= f ′′0 (and accordingly Hf ′0n 6= H
f ′′0n ), then f ′ and f ′′ are indistinguishable
if Fv(f′0) = Fv(f
′′0 ).
For example, the fundamentals of the notes B[2 and B2 are 116.5 Hz and 123.5 Hz,respectively. For B[2: fv(116.5) = 116.5, h2 = 233 Hz⇒ fv(h2) = |233−1 ·240| = 7,h3 = 349.5 Hz ⇒ fv(h3) = |349.5 − 1 · 240| = 109.5, and or B2: fv(123.5) =|123.5 − 1 · 240| = 116.5, h2 = 247 Hz ⇒ fv(h2) = |247 − 1 · 240| = 7, h3 =370.5 Hz⇒ fv(h3) = |370.5−2 ·240| = 109.5 (See 4.2 for computation explanation).Example of such notes on the classic guitar is given in Figure 4.6.
We clearly cannot recover a frequency below the defined noise range. Hence,notes that both f0 and h2 are in the noise range their pitch cannot be detected.Moreover, neither their temporal information can be detected. Theoretically, h3 canbe detected but in practice the peak of the high harmonic is too weak for detectingsuch notes.
Specifically, there are two pairs of indistinguishable notes. The first pair, B[2and B2 (116.5 Hz and 123.5 Hz) can be produced in the bass guitar in strings Dand G and, and by all other guitars in strings E and A. The second pair, B[3 andB3 (f0 = 233.1 Hz, 246.9 Hz), which are played on all guitars but the bass guitar,are also indistinguishable but more importantly, both the fundamental and secondharmonic are within the noise range. This make them practically impossible todetect since, as mentioned above, the peak in h3 is usually insignificant. Figure 4.6illustrates the indistinguishable notes in the standard guitar.
The note A3 (f0 =220 Hz, fv(220) = 20) has its fundamental in the noise range,but its second harmonic, fv(2f0) = 40, is detectable. Some notes has some of theirharmonics in the noise range, which might cause some detection issues, mainly inthe pitch detection phase. Tables 4.1 and 4.2 summarize the visibility properties ofthe notes per string and fret, respectively. Tables A.2 and A.1 show the visibility ofeach note and its string and fret location on each of the instruments.
Since the frequency resolution is relatively low, we also expect ambiguities forsimilar frequencies rather than identical ones. For example, A2 (f 1
0 = 110 Hz) andC3 (f 2
0 = 130.8 Hz) have very close visible frequencies of the fundamental, thatis fv(f
10 ) = 110, fv(f
20 ) = 109.2. These notes second and third harmonics are also
relatively close (fv(h11) = 20 and fv(h
21) = 21.6. Also fv(h
12) = 90 and fv(h
22) = 87.6).
4.3 Strings Detection
We present two algorithms for locating the string-pixels. The first is a classic,geometric approach for string detection which is based on a single frame. The
32 Shir Goldstein

Vision-Based Musical Notes Recognition of String Instruments
String % f0(only) in
noiserange
% f1(only) inthe noise
range
% both f0and f1 in thenoise range
E(1) 0 17 0A(2) 6 20 0D(3) 6 6 12G(4) 6 12 12
Table 4.1: Notes visibility properties, per string, up to the 12th fret.
Fret % f0(only) in
noiserange
% f1(only) inthe noise
range
% both f0and f1 inthe noise
range0 0 16.67 01 0 16.67 02 16.67 25 03 0 8.34 16.674 0 8.34 16.675 0 16.67 06 0 16.67 07 16.67 25 08 0 8.34 16.679 0 8.34 16.6710 0 0 011 0 16.67 012 16.67 8.34 0
Table 4.2: Notes visibility properties, per fret.
second is a temporal-spectral approach, using the temporal data from the video.Note, that we assume that the string-pixels obtained are not obfuscated throughoutthe entire video. However, if only few of the string-pixels are partially invisible, thisshould not effect our results, as multiple string-pixels are processed and a majority
Figure 4.6: The fundamental frequencies of the standard guitars. The pairs of redand green dots mark a pair of indistinguishable notes. Marked with white dots arenotes whose fundamental frequency is within the noise range. Frequencies 233.1 and246.9 are marked as indistinguishable although both their f0 and h2 are within thenoise range, which practically makes the undetectable.
Shir Goldstein 33

Vision-Based Musical Notes Recognition of String Instruments
(a) (b) (c) (d)
Figure 4.7: The process of locating the string-pixels. (a) The edge map of theguitar image (without dilation). (b) The energy map of 53.7 Hz (which is the aliasedfrequency of 293 Hz, note D4 on string G). (c) The pixels with highest energy forthe computed frequency. (d) The random chosen subset of string-pixels from theset presented in (c).
voting is used, thus making our method more robust. Moreover, a small adjustmentof our method can assure that the number of visible string-pixels at a given time ofthe video is sufficient, for example by using more string-pixels.
4.3.1 A Geometric-Based Algorithm
The guitar’s strings and frets are approximately straight lines. It follows that thestrings should be selected from a set of image lines. We assume that a region in thevideo frame contains the guitar neck, although part of it can be obfuscated by theplayers hand. The guitar’s neck consists of frets and strings, which form a grid-likestructure that can point us to the location of the strings. Multiple methods whereattempted: Hough transform was used to detect straight lines the image, than onlyroughly perpendicular lines where chosen; Harris corner detector was attempted tofind the corners created in the intersection between a fret and a string; and more.However, these methods offered only limited success and are not applicable unlessstrong assumptions regarding the scene and the visible part of the guitar are made.
4.3.2 A Temporal-Spectral Based Approach
We propose to use frequency information available from the video, and detect eachstring according to expected frequency (e.g., by an initialization video that capturespre-known visible notes). When a string vibrates in a known frequency, some pixelsaround or along the string are expected to have high energy in their frequencyspectrum at that known frequency. Thus, those pixels capture the string vibration,and can be detected by searching high energy pixels after filtering the frequencyspectrum to the desired frequency. Practically, an FFT is computed on the dilatededge image (Figure 4.7a) to reduce the computation time, and the string-pixels aredetected by a filter on the expected frequency (see example Figure 4.7b). The string-pixels with the highest energy are chosen (Figure 4.7c) and then selected randomlyto for a set of 31 string-pixels (Figure 4.7d) .
Real-data experiment revealed that even a manual locating of the strings yieldsinferior results to using our temporal-spectral algorithm. Thus, a geometric ap-proach will be inferior as well (see Section 5.3). As a result, the geometric approachwas abandoned and was not used for the experiments.
34 Shir Goldstein

Vision-Based Musical Notes Recognition of String Instruments
Figure 4.8: The proposed algorithm’s pipeline.
Shir Goldstein 35

Chapter 5
Experimental Results
5.1 Experiments
We tested our method on data generated by us. Existing data available on the Webis insufficient for our method since it is either captured with a low frame rate or by acamera that is not mounted on the instrument. The algorithm was implemented inMatlab, and run on a standard PC. We evaluate the performance of each componentof our algorithm separately, as well as the performance from start to end of the entiresystem.
Since this problem has not been addressed before, there are no existing solutionswith which to compare our results. Existing methods that use audio signals facechallenges due to polyphonic music, which is trivial in our data, but they avoid thechallenges of the low sampling rate of a camera. On the other hand, visual-basedmethods are not comparable to ours, since they detect only the pose of the left hand.The left hand pose is used to detect a chord that can be played, but no onset andoffset are computed.
An visualization of the tests results for pitch detection and frame-by-frame eval-uation is shown in Figure 5.1.
5.2 Data
We applied our method to all data described below. The videos were capturedby a camera mounted to several guitars - an electric bass guitar, a classic guitar,an electric guitar, and an acoustic guitar. These guitars have strings made fromdifferent materials, and consists of a representative sample of all common stringsavailable for guitars. We use a GoPro (model: HERO3+) camera and SJCam(similar to GoPro, with similar specifications), with 240 FPS in WVGA resolution(see Figure 4.1).
The instrument was tuned using a simple electronic tuner before data collection.The music was played by a guitar player. The videos were captured in a well-lit room, without flickering lighting (such as fluorescent). In addition, all stringswere visible in the video with high enough contrast to the background, althoughsometimes the string shadow can also be used to obtain the same signal with highercontrast. The strumming was strong enough for obtaining a large amplitude of thestring’s vibration.
36

Vision-Based Musical Notes Recognition of String Instruments
Figure 5.1: A visualisation example of the different tests results. The blue segmentsare the GT, the yellow ones are the pitch detected on the given GT intervals (as inTest 2),and the red ones are the automatically temporally segmented notes (as inTest 1), and their detected pitch (as in Test3 - evaluation of pitch detection). Theframe-by-frame evaluation (as in Test3 - frame-by-frame evaluation) is calculatedby counting only frames where the blue segments and the red ones are present andshow the same frequency.
For the bass guitar we consider notes played up to the 14th fret (including, outof 20), that is, 15 notes played on each string. Higher fret notes are rarely used inpractice. For the other guitars, we considered only the first 13 notes on each string,that is up to the 12th fret (out of 20), since the strings are shorter than those ofthe bass and thus the amplitude when strumming is smaller. Unfortunately, theresolution of our cameras does not allow to reliably capture the signal of the twohighest strings of these guitars, which are very thin and/or made of a partiallytransparent material (i.e, nylon). Hence, we tested our method only on the lower 4strings of these instruments out of total of six. Note that the bass guitar has onlyfour strings. It remains to be seen whether a camera with higher resolution mayallow to deal with all strings.
On each of the strings (E,A,D,G) of each of the guitars, we played four times thechromatic scale (consecutive semitones on all the considered frets) up to the 14thfret in the bass guitar and up to the 12th fret in all other three guitars. All togetherwe played 864 = 15× 4× 4× 1 + 13× 4× 4× 3 notes. We made no assumption onthe music played, hence, this data represents well all musical pieces played in theconsidered range. Additionally, we demonstrate a polyphony example of a chordplaying in a guitar.
5.3 Calibration
The temporal-spectral algorithm was used to detect the string-pixels in each ofthe videos (see Section 4.3.2). For calibration, for each video, we used a knowntemporal interval with a known played note. In practice, a calibration video can
Shir Goldstein 37

Vision-Based Musical Notes Recognition of String Instruments
also be processed separately, by providing a video that captures the strumming ofall strings with predefined notes (e.g., open string or a chord).
In the next experiments we will use the temporal-spectral string detection algo-rithm with a calibration performed using notes that where played on a high (6th,7th,or 8th) fret. In general, we found that calibrating using notes played on a higher fretgives more reliable results than that obtained on an open string or with manuallychosen string-pixels (see Test 4. The geometric approach was abandoned since ityielded inferior results in the detection of the string.
Example of the manually detected pixels, the low-fret and the high-fret detectedpixels are shown in Figure 5.5.
Test 1: Temporal Note Segmentation
Here we test the temporal segmentation of the notes. The input is a set {qsi (t)}, fora given string, and the output is a set of temporal intervals {τi(s)}.
The ground truth is computed manually for each string s, by manually markingthe starts and ends around the high-energies areas of a spectrogram. The spectro-gram is computed for a single pixel of each string, qsi (t). The known number of notesvisible in the spectrogram and their frequencies are used for the manual marking.This process yields temporal intervals (start and end frames) for each played note.It is important to note that this manual extraction of the ground truth is consider-ably inaccurate, as the exact frame a note is starting and ending is often unclear.In particular, notes tend to fade out. We do not use existing audio methods forground truth extraction since they often use priors on the played music, which doesnot reflect the actual signal. Such priors could also be used in our method as apost-processing. However, our goal here is to study the information that can beextracted directly from the visual signal.
For quantitative evaluation of the onsets, we use the same methodology as inMIREX [33]. That is, an onset is considered if it is within a tolerance time windowaround the ground truth defined by a threshold. Note, that this test merely requiresa general note to be detected regardless of the correctness of the pitch. Given adetected onset, we consider its offset to be correct if it is within a tolerance timewindow around the ground truth. When more than a single onset is detected fora given note, we use the one which is closest to the ground truth for the offsetevaluation. The others are considered as false positives for the onset detection.Note that errors in the offset values may be due to the choice of the matched intervalbased on the onset.
The temporal interval detection may miss a note with low energy or with fre-quency components in the noise range. It may also split a note into two or moreintervals, which causes false positive onset detection and an offset error. Noisy datamay cause false positive detection of a note. Finally, fading out of a note may causeoffset errors.
Four different thresholds are considered, 12, 24, 36 and 80. The 12 frames thresh-old corresponds to 50ms. The 50ms threshold is typically used in the MIREX onsetsdetection [33]. It corresponds to 2205 samples in audio recorded at 44.1 kHz. An 80frames threshold (which is 0.03 of 2205) corresponds to 1/3 of a second. Althoughslightly slow for professional guitarists, it is a reasonable pace for educational pur-poses and chords playing. Hence, a threshold of 80 frames is acceptable in the data
38 Shir Goldstein

Vision-Based Musical Notes Recognition of String Instruments
resolution available by the considered camera.
The recall of the onset detection, using 80 as a threshold, is 0.88 (true-positive).The precision with the same threshold is given by 0.74. This results in F-measure of0.8. In addition, 70% of the notes which onsets were detected were also successfullymatched with offsets. The detailed results for onset and offset for the bass guitar arepresented in Table 5.2 and for each of the other guitars in Table 5.1. In addition wepresent the sum of onset errors (false-negatives) per fret and string over all guitars inTable 5.3. Note that in this table, only the first 13 notes (out of 15) for each stringof the bass are considered, for compatibility with the tests on the other guitars.These results are computed using 80 as a threshold. For completeness the results ofthe other thresholds for the onset detection are presented in Appendix B.
The results of our method cannot be compared to those obtained by the state-of-the-art MIREX 2016 [34], since the data reported consists of different musicalinstruments (including unpitched ones), different musical pieces, and a differentannotation technique. Most importantly, the signal’s sources are different (audiovs. video). However, it is interesting to note that the F-measure reported by theMIREX (2016) is 0.87 which only 0.07% better than our results which are obtainedusing naive segmentation.
Generally lower strings and lower frets yield better results (see Table 5.3). Thetwo lower strings achieved around 4% errors (of played notes on both strings), whilethe higher two yielded around 19%. Frets under the 9th fret had less than 8% errorsand 9-12 frets had more than double that, with close to 20% errors. Lower stringshas several advantages for notes extraction over higher ones. First, lower strings arethicker, which makes the visual signal clearer and stronger. In particular, the classicguitar G string is made from nylon which has some transparency. Additionally, noteswith f0 in the noise range are less likely to be detected, since the first harmonic istypically the one with the highest energy. Moreover, some notes have both their f0and h2 in the noise range, which make them almost impossible to detect, as the thirdharmonic alone is unlikely to have a high energy. These imperfectly seen notes aremore present in the two higher strings. Table 4.1 summarize the imperfectly seennotes for each string of the instruments. As can be seen, the two higher strings have17% of the notes with (at least) f0 in the noise range, as opposed to 3% in the twolower ones. Note that notes with merely h2 in the noise range should be detected bythe onset detector, as their f0 is not within the noise range and is ordinarily visible.
The extracted signal from high fret notes are inferior to the one extracted fromlower frets. This is due to the fact that higher frets corresponds with shorter strings,thus vibration amplitude is smaller (assuming same force is applied for the displace-ment (strumming or picking) of the string).
Test 2: Pitch Detection with GT Temporal Inter-
vals
We evaluate the pitch detection part of our method, given the temporal intervals ofthe notes. The input is the set of string-pixel signals, {qsi (t)} for each string s, theset of possible frequencies of s, Fstring(s), and a set of temporal note segmentations{τ sj }. In this test we wish to focus merely on the pitch detection, hence we used GTtemporal segmentation as input. For evaluation, we used the ground truth pitch
Shir Goldstein 39

Vision-Based Musical Notes Recognition of String Instruments
Acoustic Classic Electric
OnsetOffset (%)
OnsetOffset (%)
OnsetOffset (%)
String TP (%) FP TP (%) FP TP (%) FPE(1) 51 (98%) 12 37 (73%) 47 (90%) 25 28 (60%) 52 (100%) 2 42 (81%)A(2) 49 (94%) 12 35 (71%) 45 (87%) 27 21 (46%) 52 (100%) 2 49 (94%)D(3) 37 (71%) 21 15 (41%) 30 (58%) 19 18 (55%) 48 (92%) 7 39 (81%)G(4) 39 (75%) 43 13 (33%) 39 (75%) 33 28 (72%) 50 (96%) 17 26 (52%)
Table 5.1: Classic, acoustic and electric guitars onset and offset detection resultsout of 52 notes played per string on each instrument. True-positive (TP) detectionsand their respective percent out of the played notes, false-positive (FP) detectionsand offsets detection and the respective percent of the TP detection.
BassOnset
Offset (%)String TP(%) FPE(1) 60 (100%) 2 58 (97%)A(2) 57 (95%) 3 45 (79%)D(3) 57 (95%) 27 45 (79%)G(4) 51 (85%) 20 39 (76%)
Table 5.2: Bass guitar onset and offset detection results out of 60 notes playedper string. True-positive (TP) detections and their respective percent of the playednotes, false-positive (FP) detections and offsets detection and the respective percentof the TP detection.
according to the known played notes.Overall, 66% of the notes’ pitches were detected correctly. We present the percent
of incorrectly detected pitches. The errors per string and per fret are summarized inTables 5.5 and 5.6, respectively. The results per instruments are shown in Table 5.7.
We classify these the errors into the following seven categories:
• Indistinguishable Notes (IN): The detected note is indistinguishable from theGT note (see Section 4.2.1 and Figure 4.6).
• Notes with f0 in Noise Range (Nf0):
• Notes with h2 in noise Range (Nh2):
• Notes with both f0 and h2 in Noise Range (Nh2):
• Semitone Error (SE): The detected note is one semitone away up or down fromGT.
• Harmonic Error (HE): The detected note is a harmonic of the GT one, or theGT is harmonic of the detected note.
• Others: all other errors.
40 Shir Goldstein

Vision-Based Musical Notes Recognition of String Instruments
Fret Err. St. 1 Err. St. 2 Err. St. 3 Err. St. 4 Total Err. % Total Err.
0 0 1 4 1 6 9%1 0 0 0 1 1 2%2 0 0 0 5 5 8%3 0 0 0 7 7 11%4 0 1 1 2 4 6%5 0 0 1 5 6 9%6 0 0 2 1 3 5%7 0 0 4 2 6 9%8 0 2 6 0 8 12.5%9 0 1 11 2 14 22%10 3 0 6 1 10 16%11 1 2 4 4 11 17%12 2 4 5 2 13 20%
Total Err. 6 11 44 33 94 11%
% Total Err. 3% 5% 21% 16% 11%
Table 5.3: Summary of the errors of the temporal note segmentation (true-positive)per string and fret. The last two columns and rows show the total error per eachfret and string respectively and the corresponding percent from the notes played perfret / string.
String Onset TP(%) Offset (%)
E(1) 210 (97%) 165 (79%)A(2) 203 (94%) 150 (74%)D(3) 172 (80%) 117 (68%)G(4) 179 (83%) 105 (59%)
Table 5.4: Summary of all instruments temporal segmentation results, per string.The correctly detected notes (TP) are shown with their respective percent of theplayed notes. The correctly detected offsets are shown with their respective percentof the notes that their onsets were correctly.
We divide the first six error types to two sets. The first, Sexpected = HE ∪ SE ∪IN of expected errors caused by several reasons: notes that are a semitone apartfrom one another and thus very close in frequency components(SE), notes that areoctave apart thus share frequency components (HE) and indistinguishable notes(IN). The second, Snoise range = Nf0 , Nh2 , (Nf0 & Nh2), which are notes that areimperfectly seen by our method, as one of their fv(f0), fv(h2) or both are in the noiserange. Note that HE,SE, IN are pairwise disjoint, as are Nf0 , Nh2 , (Nf0 & Nh2).However, Sexpected and Snoiserange are not disjoint. For example, B2 has a fundamentalfrequency of (123.5 Hz), which is indistinguishable from B[2 (f0 = (116.5 Hz)) andalso a note with h2 in the noise range.
Tables 5.5 and 5.6 summarize the results per string and fret, respectively. Notethat 13% of the 34% errors was in notes that has at least one harmonic (out of thefirst two) in the noise range. Harmonic errors account for only 2% of the 34%. Thisis expected, as those errors are applicable only for 2 (out of 13) frets for the classic,
Shir Goldstein 41

Vision-Based Musical Notes Recognition of String Instruments
Str.Err.
Total Err.Sexpected Snoise range
HE SE IN Nf0 Nh2 Nf0 & Nh2
E(1) 70 (32%) 10 (7%) 0 12 (6%) 0 13 (6%) 0A(2) 54 (25%) 0 6 (3%) 15 (7%) 5 (2%) 19 (9%) 0D(3) 86 (40%) 4 (2%) 17 (8%) 4 (2%) 12 (6%) 4 (2%) 24(11%)G(4) 82 (38%) 0 27 (12.5%) 4 (2%) 11 (5%) 4 (2%) 24 (11%)
Total 292 (34%) 14 (2%) 50 (6%) 35 (4%) 28(3%) 40 (5%) 48 (6%)
Table 5.5: Pitch detection errors given GT temporal intervals, per string. The firstcolumn summarize the total errors of each string and the respective percent fromthe total number of played notes, 216 (per string). The other columns present thenumber of errors for each type and set defined above, and the respective percentfrom the total played notes.
FretErr.
Total Err.Sexpected Snoise range
HE SE IN Nf0 Nh2 Nf0 & Nh2
0 4 (6%) 1 (2%) 0 0 0 3 (5%) 01 0 0 0 0 0 0 02 23 (36%) 0 0 12 (19%) 8 (12.5%) 12 (19%) 03 23 (36%) 0 0 0 0 0 12 (19%)4 21 (33%) 0 7 (11%) 4 (6%) 0 4 (6%) 12 (19%)5 11 (17%) 0 2 (3%) 0 0 1 (2%) 06 11 (17%) 0 3 (5%) 0 0 0 07 28 (44%) 0 2 (3%) 12 (19%) 12 (19%) 12 (19%) 08 27 (42%) 0 1 (2%) 0 0 0 12 (19%)9 34 (53%) 0 10 (16%) 4 (6%) 0 4 (6%) 12 (19%)10 34 (53%) 0 14 (22%) 0 0 0 011 27 (42%) 0 6 (9%) 0 0 0 012 37 (58%) 13 (20%) 1 (2%) 0 5 (8%) 0 013* 2(12.5%) 0 1 (6%) 0 0 0 014* 10 (62.5%) 0 3 (19%) 3 (19%) 3 (19%) 4 (25%) 0Total 292 (34%) 14 (2%) 50 (6%) 35 (4%) 28(3%) 40 (5%) 48 (6%)
Table 5.6: Pitch detection errors given GT temporal intervals, per fret. Note, *frets13 and 14 are only applicable for the bass guitar. The first column summarize thetotal errors of each fret and the respective percent from the total number of playednotes, 64 for frets 0-12 and 16 for frets 13-14. The other columns present the numberof errors for each type and set defined above, and the respective percent from thetotal played notes.
acoustic and electric guitar (0, 12) and for 6 (out of 15) frets for the bass guitar(0,1,2,12,13,14). 6% of the 34% are notes that were identified as a semitone aboveof below the GT pitch.
Analyzing the results per fret uncovers the relation between the errors causedin frets with imperfectly seen notes and the total amount of errors, as is shown inFigure 5.2. Up to the 8th fret, a steady ratio between the total errors and those ofthe imperfectly seen frets is kept. Starting from the 8th fret, the number of errorsincreases in frets with no noise issues. This is expected since, as explained above,higher frets notes are harder to detect and analyze. Moreover, this is consistentwith the findings in Test 1, where the higher frets showed inferior results. Failure totemporally segment a note will usually cause failures in the pitch detection as well,
42 Shir Goldstein

Vision-Based Musical Notes Recognition of String Instruments
since occasionally a temporal segmentation errors is a result of an undetected noteand not merely failure in detecting the onset within the desired threshold.
Figure 5.2: The errors using GT temporal intervals (blue), and the errors in imper-fectly seen notes (orange), on each fret. The peaks (diamonds) correspond to fretsthat have indistinguishable notes, in which errors are certain.
Observing the results per string shows that the two lower strings are again per-forming better than the two higher ones. However, the best results was listed forthe second lowest string (A), rather than the lowest one (E). This can be explainedby the sparse fundamentals of the notes on the A string, as opposed to the relativelydense fundamentals of the E string (see Figure 4.5). Clearly, this property affectsthe pitch detection and not the temporal segmentation, thus the E string presentedthe best results in the temporal note segmentation stage.
The results per instrument are presented in Table 5.7. As expected, the bassguitar results are superior to all other guitar, due to the strings thickness and length,and since less notes are imperfectly seen.
Instrument % Success
Bass 86Acoustic 64Classic 56Electric 55Total 66
Table 5.7: The pitch detection success percentage using GT temporal intervals, perinstrument, counting the number of correctly detected pitches of the total notesplayed on each instrument - 240 for the bass guitar and 208 for all other guitars.
Shir Goldstein 43

Vision-Based Musical Notes Recognition of String Instruments
StringErr.
Matched Total Err.Sexpected Snoise range
HE SE IN Nf0 Nh2 Nf0 & Nh2
E(1) 210 (97%) 68 (32%) 10 (5%) 0 12 (6%) 0 13 (6%) 0A(2) 206 (95%) 55 (27%) 0 5 (2%) 13 (6%) 6 (3%) 18 (9%) 0D(3) 196 (91%) 74 (38%) 5 (3%) 5 (3%) 4 (2%) 12 (6%) 4 (2%) 13 (7%)G(4) 197 (91%) 74 (38%) 0 24 (12%) 4 (2%) 7 (4%) 5 (3%) 17 (10%)Total 809 (94%) 271 (33%) 15 (2%) 33 (4%) 33 (4%) 25 (3%) 40 (5%) 30 (4%)
Table 5.8: Pitch detection errors given automatically segmented temporal intervals,per string. The first column is the number of intervals that were matched with a GTinterval and corresponding percent of the total number of the GT notes, 216 (perstring). The second column presents the errors per string in pitch detection only forthe matched detected notes. The other columns present the number of errors foreach type and set defined above, and the respective percent from the total playednotes.
Test 3: End-to-end
In this test we apply our algorithm to compute the pitch of all temporal intervalssegmented by our method. This allows evaluation of the entire system. We firstevaluate only the pitch detection, and then frame-by-frame errors.
Evaluation of Pitch Detection We now evaluate the pitch detection given thetemporal intervals calculated by our method. The pitch errors are computed only fordetected temporal segments that overlap the GT. Results per string and per fret aregiven in Tables 5.8 and 5.9 respectively. The first column is the number of intervalsthat where matched with a GT interval and corresponding percent of the totalnumber of the GT notes. The second column presents the errors in pitch detectiononly for the matched detected notes. We also present, as in Tables 5.5 and 5.6, theclassification of the errors, and the overall results per instrument, similarly to theTable 5.7.
Since notes are matched by choosing the note with largest interval overlap to GTinterval, notes that are not matched suggest that no note (nor noise) was detectedin the GT temporal interval. The better results of matching in the two lower stringsin consistent with the results in Test 1.
Roughly, the pitch detection results are consistent with the results of Test 2.This suggests that the note with closest temporally onset is usually also the onewith the most temporal overlap to GT.
Similarly to the results in the previous section, more errors occur in higher frets,and from the 8th fret an on, less of these errors occur due to noise issues. Again,better pitch detection is obtained the string (A) showing better results than thelowest one (E) as previously in Test 2.
The results per instrument are presented in Table 5.10. Again we see the bassguitar superiority.
Frame-by-frame Evalutation We use frame-by-frame evaluation of the resultscompared to ground truth. We compare the output data and the ground truth ineach frame. The algorithm output is assumed to be correct if in a given frame theGT and the output shows the same frequency (or no frequency, e.g. no note is played
44 Shir Goldstein

Vision-Based Musical Notes Recognition of String Instruments
FretErr.
Matched Total Err.Sexpected Snoise range
HE SE IN Nf0 Nh2 Nf0 & Nh2
0 64 (100%) 4 (6%) 1 (2%) 0 0 0 3 (5%) 01 64 (100%) 1 (2%) 0 0 0 0 0 02 62 (97%) 21 (34%) 0 1 (2%) 11 (18%) 6 (10%) 12 (19%) 03 59 (92%) 18 (31%) 0 1(2%) 0 0 0 7 (12%))4 62 (97%) 17 (27%) 0 6 (10%) 4 (6%) 0 4 (6%) 10 (16%)5 61 (95%) 9 (15%) 0 1 (2%) 0 0 1 (2%) 06 64 (100%) 12 (19%) 0 1 (2%) 0 0 0 07 64 (100%) 27 (42%) 0 1 (2%) 12 (19%) 12 (19%) 12 (19%) 0)8 60 (94%) 23 (39%) 0 0 0 0 0 8 (13%)9 57 (89%) 30 (53%) 0 3 (5%) 4 (7%) 0 4 (7%) 5 (9%)10 59 (92%) 39 (66%) 0 17 (29%) 0 0 0 011 54 (84%) 22 (41%) 0 0 0 0 1(2%) 012 53 (83%) 38 (72%) 14 (26%) 1 (2%) 0 6 (11%) 1(2%) 013* 15 (94%) 3(20%) 0 1 (7%) 0 0 0 014* 11 (69%) 7 (64%) 0 1 (9%) 2 (18%) 1 (9%) 2 (18%) 0Total 809 (94%) 271 (33%) 15 (2%) 34 (4%) 33 (4%) 25 (3%) 40 (5%) 30 (4%)
Table 5.9: Pitch detection errors given automatically segmented temporal intervals,per fret. Note, *frets 13 and 14 are only applicable for the bass guitar. The firstcolumn is the number of intervals that where matched with a GT interval andcorresponding percent of the total number of the GT notes (64 for frets 0-12 and 16for frets 13-14). The second column presents the errors per fret in pitch detectiononly for the matched detected notes. The other columns present the number oferrors for each type and set defined above, and the respective percent from the totalplayed notes.
Instrument % Matched % Success
Bass 96 88Acoustic 88 65Classic 93 55Electric 98 55
Total 94 67
Table 5.10: Total pitch detection success percentage using automatically obtainedtemporal intervals, per instrument. The first column is the percent of matchedintervals from the notes played - 240 for the bass guitar and 208 for all other guitars.The second column is the percent of the successful pitch detection from the totalnotes matched.
in the frame). This allows us to evaluate the system for both frequency and temporalinformation combined. Using this evaluation allows us to largely ignore cases thatare counted as errors in previous test, but reflect some success of the methods insome aspects. Figure 5.4 shows some of those errors. The first error (1) is a casewere a note is split, where the first, temporally closer to GT, detected note wasdetected with the wrong pitch, and the second was detected with the correct pitch.In this case the first detected note will be accounted for in the temporal segmentationdetection and the other will be considered a false-positive. In the auto-computedpitch detection, the same detected note will be considered and since its pitch was
Shir Goldstein 45

Vision-Based Musical Notes Recognition of String Instruments
Figure 5.3: The errors using automatically obtained temporal intervals (blue), andthe errors in imperfectly seen notes (orange), on each fret. The peaks (diamonds)correspond to frets that have indistinguishable notes, in which errors are certain.
detected wrongly, the pitch test will record an error. However, using the frame-by-frame evaluation, the overlapping frame of the second detected notes and the groundtruth will be considered as success. In the second error (2), a splitting occurred andboth detected notes was detected with the right pitch. For the temporal intervaltest, the second detected note will be considered as false-positive. For the pitchdetection using automatic intervals, the first detected note will be considered andthe other ignored, and the offset detection is a failure. Frame-by-frame evaluationwill consider the entire note as successfully obtained, except from the gap betweento detected notes. The third and fourth errors (3,4) are cases where the detectedonset is not within the tested threshold, either too late (3) or too early (4). For thetemporal segmentation test, the detected notes in both cases will be considered falsepositives. For the auto-segmented pitch detection test, the detected notes will bematched and considered true-positive since the pitch detected is correct. The frame-by-frame evaluation will consider all area that overlaps both the GT and detectednote as success and any other area as error.
This evaluations is roughly similar to f0-estimation problem (see MIREX 2016 [35])that involves detecting all active fundamentals in a given time frame. In our case,the problem diminishes to a single f0-estimation, as we consider a single string eachtime, that can only produce a single note simultaneously. This evaluation is ex-tremely robust, does not make any assumptions on the data (such as thresholds),it is not dependant of sequential steps and provides good estimation of the systemperformance. Note that we do not allow tolerance in the note onsets and offsetshere. Furthermore, this evaluation disregards the nature on an error. For example,undetecting a note temporally and a correctly temporally detected note with anincorrectly detected pitch will both be considered as a frame with an error. This ex-
46 Shir Goldstein

Vision-Based Musical Notes Recognition of String Instruments
Figure 5.4: Errors examples obtained by testing our method on real-data. (1) Asplit note, where the first detected note is detected with the wrong pitch and thesecond with the correct one. (2) A split note, where both detected notes are detectedwith the correct pitch. (3),(4) A case where the detected onset is not within thetested threshold, either too late (3) or too early (4).
plains the slight variation is results per string and instrument comparing to previoustests.
Table 5.11 summarizes this evaluation method. Overall, 68% of the frames werecorrectly detected. As was observes before, when considering the entire data on allguitars, lower strings yield better results. However, this observation does not holdwhen considering each instrument separately, which encourage us to collect moredata to get more conclusive results. In this test, as in was shown in the other tests,the bass guitar outperforms other guitars.
String Bass Acoustic Classic Electric AllE(1) 93 64 66 64 72A(2) 83 71 62 70 71D(3) 71 67 64 67 67G(4) 68 55 60 69 63Total 79 64 63 68 68
Table 5.11: A frame-by-frame evaluation presenting the percent of frames that weresuccessfully detected from the total frames in the video, calculated per string andinstrument.
Test 4: String-pixels Selection
Here we test the string-pixels that yields the best results. Three sets of string-pixelswere considered; string-pixels that were extracted using high fret (6th, 7th or 8th)note calibration, open string note calibration, and manual marked pixels on thestring. Our method was then applied on each video of the bass guitar. Several of
Shir Goldstein 47

Vision-Based Musical Notes Recognition of String Instruments
(a) High-fret string-pixels (b) Open string string-pixels (c) Manual string-pixels
Figure 5.5: The string-pixels obtained using three different methods: (a) String-pixels obtained by using the temporal-spectral algorithm with a high-fret note (6, 7or 8). (b) String-pixels obtained by using the temporal-spectral algorithm with anopen string note. (c) String-pixels that were marked manually upon the string.
the mentioned above measurements were used to determine the best selection ofstring pixels. Those include frame-by-frame evaluation (as in Test 3 - frame-by-frame evaluation), onsets f-measure (as in Test 1) and pitch detection using GTtemporal intervals (as in Test 2). Results are summarized in Table 5.12. Theset of string-pixels obtained by our automatic string detection using high fret notecalibration surpassed other methods (our performed equally well) in each of thetested measurements.
Frame-by-Frame Onsets F-measure PD with GT int.Manual 79 % 0.85 85 %
Auto. Open-String 73 % 0.85 84 %Auto. High Fret 79 % 0.87 86 %
Table 5.12: Different string-pixels detection methods and their performances, eval-uated by the different evaluation methods.
Test 5: Polyphony Demonstration (Chords Play-
ing)
In this section we present a demonstration of a possible application of our method.In this demonstration we show a polyphony example of an acoustic guitar playing 5chords: Cmaj (open) - Gmaj (open) - Fmaj (Barred) - Dmaj (open) - Gmaj (open).This means that at the same time, 5 or 6 strings are playing together. In this case,we assume that the guitarist is playing in ”chord mode”, meaning only chords areplayed and considered. Appropriately, we add some post-processing to the outputof our algorithm:
• Only temporal intervals that overlap in at least 3 strings are kept.
• Temporal intervals lasting less than 48 frames (200 ms.) are discarded.
The results are shown in Figure 5.6. Note, that in this case the offset is withoutsignificance. The time-overlapping temporal segments where shortened to the short-est interval in the chord to provide better visualisation. In practice, when playing
48 Shir Goldstein

Vision-Based Musical Notes Recognition of String Instruments
chords, a letter representing the chord will appear in the musical sheet (for example,Am7), and no offset notation is used.
This demonstration points out two important strengths of our method. First,polyphony does not affect the signal extracted from each string separately. Thisvalidates our approach and tests. Secondly, since every string is analyzed separately,an error on one or more strings may not affect the correctness in identifying a chord.It remains for future work to develop a chord-oriented system that could analyzethe played notes as chords.
Figure 5.6: The method’s output in ”chord mode”, for a video capturing the playingof the chords Cmaj - Gmaj - Fmaj - Dmaj - Gmaj, as explained in Section 5.3. TheX’s mark notes that were detected with the wrong pitch. The rectangles around thedetected notes indicate the type of error, if applicable. In this case the offsets aredisregarded, since generally in chords notation no offsets are mentioned.
Shir Goldstein 49

Chapter 6
Discussion and Future Work
In this thesis we present the first steps toward solving Note Tracking for variousguitars, using a video capturing the vibration of the strings. We clarify the challengesinvolved and suggest algorithms for handling them. We present our algorithm whichincludes thee main steps – string-pixels detection, temporal note segmentation, andpitch detection. Our method for detecting string-pixels is based on the stringsvibrations rather than using classic detection techniques that are based on geometry.The pitch detection algorithm uses priors on the possible notes played on each stringas well as their expected visible aliasing and harmonics. The temporal segmentationuses multiple signals obtained from a single video to attain robustness. In addition,we present a set of methods for evaluating these algorithms. We next discuss ourresults, and suggest how our method can be further extended in a future work.
Discussion
As a rule, a successful capturing of signals of the played note depends on two mainfactors. The first is the camera’s frame rate. The frame rate makes some notespartially or completely obscured by noise, which induces errors. Additionally, somenotes are ambiguous in relation to others. For the standard guitars other than thebass guitar, the method of harmonics scoring had limited success in detecting notesthat their fundamental frequency was in the noise range. In particular, the notesB[3 and B3 that both their 1st and 2nd harmonics are in the noise range wereundetectable by our method.
Second, the physical characteristics of the string can also influence the successrate of our method. Notes that are produced by playing a lower fret, are usuallyeasier to detect, since the longer the string is, the bigger its vibrating amplitude.Additionally, lower strings are thicker, which seldom makes the intensity changesignal captured stronger and less noisy.
The bass guitar results are better than the other guitars throughout all tests.This is expected, due to the instrument characteristics as mentioned above: thebass guitar has longer strings and thicker strings and the bass guitar produces lowerfrequencies notes, thus a note’s fundamental frequency is always in not in the noiserange.
Since our method is unique and incomparable to other NT methods, we presenteda diverse variety of testing techniques to evaluate our method. Most results areroughly in the same scale as audio, and although our method is limited in some
50

Vision-Based Musical Notes Recognition of String Instruments
aspects such as frets higher than the 12th (in standard guitars) and the invisibilityof the two highest strings, it offers an innovative approach - analyzing a complexpolyphonic signal by transforming it to multiple monophonic signals.
Future Work
Extracting notes from a vibrating string for the task of note tracking or other musicinformation retrieval tasks, is a brand new field. Thus, the options for future workare innumerous.
As commercial cameras keep improving, higher frame rates and higher resolutionare expected to be available at reasonable price. We expect that an increase inframe rate will massively improve our performances. Not only will a higher framerate solve ambiguities and remove notes from noisy range, it will provide a bettertime resolution. Additionally, errors that are unaffected by the noise range arealso expected to be reduces, as a higher frame rate expands the unaliased frequencyrange, thus making notes more distinguishable from one another. Moreover, a betterresolution camera or one with zooming abilities can also contribute to better results,since the extracted signal can be stronger and clearer.
A clear aspiration of future work is to relinquish the need of a mounted camera.The vision is to capture a musician playing his instrument from a far, non-intrusivecamera, and to be able to extract the played notes. Simple tacking of the instrumentsor strings might not suffice, as our method extracts the signal by measuring thechange in intensities a string generates when vibrating, and a large-scale movementsof the guitar may interfere with this signal. Nonetheless, preliminary tests show thata video of a guitar player sitting fairy still in front of a stationary camera, can beused to extract such signal and the note played. Furthermore, there are additionalchanges when using an unmounted camera; the distance from the instrument maycause the signal to be fairly weak, and it may be harder to distinguish betweenadjacent strings. This could be partially solved by using a more advanced camera.
As our retrieved signal is very similar to an audio retrieved signal, future workcan also include implementing the great work done on audio signals, on our visuallyobtained signal. Time domain, as well as frequency domain methods for audiosignals such as filter banks and cepstrum, can yield improvements if operated on thevisual signal.
Moreover, a hybrid approach, combining both visual signal and audio signal,should be attempted. Some methods combining both audio and video were previ-ously addressed, but only for left hand tracking methods that doesn’t obtain thesignal from the vibrating string. As our visual signal and the audio signal representthe same physical event, more information could be gathered on the played note, asopposed to a visual signal describing the movement of the instrument or the player.Each of the signals has its own strengths and weaknesses, e.g., audio has a higherresolution that evades low frame rate ambiguities but captures a polyphonic sig-nal that presents other ambiguities and that is harder to process. Infusion of bothsignals can create a clearer, easier to process signal.
Future work should also include some knowledge on the instrument and themanner it is played. For example, tracking of the left hand and positioning it onthe guitar, can eliminate ambiguities for the currently played note, as the handshould be placed roughly around the pressed fret. Another way to use instruments
Shir Goldstein 51

Vision-Based Musical Notes Recognition of String Instruments
or musical information is to estimate a likely trajectory of the left hand, which canalso eliminate unlikely played notes and improve pitch detection accuracy. Althoughone of our method strengths (compared to other visual methods) is the ability todetect all kinds of melodies and non-trivial chords, providing a pre-set of chords,even a vast one, could eliminate ambiguities in pitch detection and also overcomethe invisibility of some notes, as a chord with some detected notes could suffice toidentify it.
More string instruments should be tested our method, mainly bowed string in-struments, as the string vibration is slightly different.
To conclude, we believe that the proposed solution to the note tracking problem,can be a first step toward a more reliable NT with better results, as we presenta novel approach to obtain the musical information. Combining our method withother existing audio or vision based method may be present a big leap in the NTresults and other MIR applications.
52 Shir Goldstein

Appendix A
Figure A.1: Classic, acoustic and electric guitars fundamental frequencies. Yellowmarkings indicate notes that their h2 are in the noise range, red markings indicatesnotes that their f0 are in the noise range, mixed red and yellow markings indicatesnotes that both their f0 and h2 are in the noise range.
53

Vision-Based Musical Notes Recognition of String Instruments
Figure A.2: Bass Guitar fundamental frequencies. Yellow markings indicate notesthat their h2 are in the noise range, and red markings indicated notes that their f0are in the noise range.
54 Shir Goldstein

Appendix B
Threshold = 12 Threshold = 24 Threshold = 36
Precision Recall F-measure Precision Recall F-measure Precision Recall F-measure
0.36 0.43 0.39 0.56 0.68 0.61 0.64 0.79 0.71
Table B.1: Precision, recall and F-measure evaluations for onset detection for allinstruments, using different thresholds.
55

Vision-Based Musical Notes Recognition of String Instruments
Bass guitar
Threshold = 12 Threshold = 24 Threshold = 36String TP (%) FP TP (%) FP TP (%) FPE (1) 37 (62%) 25 49 (82%) 13 59 (98%) 3A (2) 48 (80%) 12 55 (92%) 5 56 (93%) 4D (3) 20 (33%) 64 38 (63%) 46 48 (80%) 36G (4) 20 (33%) 51 33 (55%) 38 41 (68%) 30
Total 125 (52%) 152 175 (73%) 102 204 (85%) 73
Electric guitar
Threshold = 12 Threshold = 24 Threshold = 36String TP (%) FP TP (%) FP TP (%) FPE (1) 25 (48%) 29 46 (88%) 8 50 (96%) 4A (2) 25 (48%) 29 43 (83%) 11 49 (94%) 5D (3) 25 (48%) 30 44 (85%) 11 48 (92%) 7G (4) 29 (56%) 38 41 (79%) 26 47 (90%) 20
Total 104 (50%) 126 174 (84%) 56 194 (93%) 36
Acoustic guitar
Threshold = 12 Threshold = 24 Threshold = 36String TP (%) FP TP (%) FP TP (%) FPE (1) 26 (50%) 37 47 (71%) 16 50 (96%) 13A (2) 26 (50%) 35 39 (75%) 22 43 (83%) 18D (3) 15 (29%) 43 25 (48%) 33 30 (58%) 28G (4) 11 (21%) 71 21 (40%) 61 24 (46%) 58
Total 78 (37.5%) 186 132 (63%) 132 147 (71%) 117
Classic guitar
Threshold = 12 Threshold = 24 Threshold = 36String TP (%) FP TP (%) FP TP (%) FPE (1) 15 (29%) 57 28 (54%) 44 38 (73%) 34A (2) 20 (38%) 52 30 (58%) 42 33 (63%) 39D (3) 14 (27%) 35 19 (37%) 30 24 (46%) 25G (4) 13 (25%) 59 18 (35%) 54 26 (50%) 46
Total 62 (30%) 203 95 (46%) 170 121 (58%) 144
Table B.2: Onset detection results for all instruments, using different thresholds. Atotal of 240 notes are played on the bass guitar (60 per string) and 208 on each ofthe other guitars (52 per string).
56 Shir Goldstein

Bibliography
[1] Z. Wang and J. Ohya, “Tracking the guitarist’s fingers as well as recognizingpressed chords from a video sequence,” Electronic Imaging, vol. 2016, no. 15,pp. 1–6, 2016.
[2] C. Kerdvibulvech and H. Saito, “Vision-based guitarist fingering tracking usinga bayesian classifier and particle filters,” in Pacific-Rim Symposium on Imageand Video Technology. Springer, 2007, pp. 625–638.
[3] A.-M. Burns and M. M. Wanderley, “Visual methods for the retrieval of gui-tarist fingering,” in Proceedings of the 2006 conference on New interfaces formusical expression. IRCAM—Centre Pompidou, 2006, pp. 196–199.
[4] A. Davis, M. Rubinstein, N. Wadhwa, G. J. Mysore, F. Durand, and W. T.Freeman, “The visual microphone: Passive recovery of sound from video,” ACMTransactions on Graphics, 2014.
[5] H.-Y. Wu, M. Rubinstein, E. Shih, J. Guttag, F. Durand, and W. T. Freeman,“Eulerian video magnification for revealing subtle changes in the world,” ACMTrans. Graph. (Proceedings SIGGRAPH 2012), vol. 31, no. 4, 2012.
[6] M. Rubinstein, “Analysis and visualization of temporal variations in video,”Ph.D. dissertation, Massachusetts Institute of Technology, Feb 2014.
[7] H. Nyquist, “Certain topics in telegraph transmission theory,” Transactions ofthe American Institute of Electrical Engineers, vol. 47, no. 2, pp. 617–644, 1928.
[8] C. E. Shannon, “A mathematical theory of communication, part i, part ii,” BellSyst. Tech. J., vol. 27, pp. 623–656, 1948.
[9] H.-Y. Wu, M. Rubinstein, E. Shih, J. Guttag, F. Durand, and W. Freeman,“Eulerian video magnification for revealing subtle changes in the world,” ACMTransactions on Graphics, 2012.
[10] M. Rubinstein et al., “Analysis and visualization of temporal variations invideo,” Ph.D. dissertation, Massachusetts Institute of Technology, 2014.
[11] A. Owens, P. Isola, J. McDermott, A. Torralba, E. H. Adelson, and W. T.Freeman, “Visually indicated sounds,” in Proceedings of the IEEE Conferenceon Computer Vision and Pattern Recognition, 2016, pp. 2405–2413.
[12] E. Benetos, S. Dixon, D. Giannoulis, H. Kirchhoff, and A. Klapuri, “Automaticmusic transcription: challenges and future directions,” Journal of IntelligentInformation Systems, vol. 41, no. 3, pp. 407–434, 2013.
57

Vision-Based Musical Notes Recognition of String Instruments
[13] F. Argenti, P. Nesi, and G. Pantaleo, “Automatic music transcription: frommonophonic to polyphonic,” Musical Robots and Interactive Multimodal Sys-tems, vol. 74, p. 27, 2011.
[14] B. Gowrishankar and N. U. Bhajantri, “An exhaustive review of automaticmusic transcription techniques: Survey of music transcription techniques,” inSignal Processing, Communication, Power and Embedded System (SCOPES),2016 International Conference on. IEEE, 2016, pp. 140–152.
[15] T. F. Tavares, J. G. A. Barbedo, R. Attux, and A. Lopes, “Survey on automatictranscription of music,” Journal of the Brazilian Computer Society, vol. 19,no. 4, pp. 589–604, 2013.
[16] A. P. Klapuri, “Automatic music transcription as we know it today,” Journalof New Music Research, vol. 33, no. 3, pp. 269–282, 2004.
[17] A. M. Barbancho, A. Klapuri, L. J. Tardon, and I. Barbancho, “Automatictranscription of guitar chords and fingering from audio,” IEEE Transactionson Audio, Speech, and Language Processing, vol. 20, no. 3, pp. 915–921, 2012.
[18] C. Dittmar, A. Mannchen, and J. Abeber, “Real-time guitar string detectionfor music education software,” in Image Analysis for Multimedia InteractiveServices (WIAMIS), 2013 14th International Workshop on. IEEE, 2013, pp.1–4.
[19] J. Abeßer, “Automatic string detection for bass guitar and electric gui-tar,” in International Symposium on Computer Music Modeling and Retrieval.Springer, 2012, pp. 333–352.
[20] C. Kehling, J. Abeßer, C. Dittmar, and G. Schuller, “Automatic tablaturetranscription of electric guitar recordings by estimation of score-and instrument-related parameters.” in DAFx, 2014, pp. 219–226.
[21] M. Paleari, B. Huet, A. Schutz, and D. Slock, “A multimodal approach to musictranscription,” in Image Processing, 2008. ICIP 2008. 15th IEEE InternationalConference on. IEEE, 2008, pp. 93–96.
[22] M. Paleari, B. Huet, A. Schutz, D. Slock, N. J. Kern, G. Guarascio, andB. Merialdo, “Audio-visual guitar transcription,” in Jamboree 2008: WorkshopBy and For KSpace PhD Students, July, 25 2008, Paris, France, 2008.
[23] G. Quested, R. Boyle, and K. Ng, “Polyphonic note tracking using multimodalretrieval of musical events.” in ICMC, 2008.
[24] M. Cheung and K. M. B. Lee, “A vision based autonomous music transcriptionsoftware for guitarists,” University of Sydney, 2006.
[25] J. Scarr and R. Green, “Retrieval of guitarist fingering information using com-puter vision,” in Image and Vision Computing New Zealand (IVCNZ), 201025th International Conference of. IEEE, 2010, pp. 1–7.
58 Shir Goldstein

Vision-Based Musical Notes Recognition of String Instruments
[26] B. Zhang, J. Zhu, Y. Wang, and W. K. Leow, “Visual analysis of fingering forpedagogical violin transcription,” in Proceedings of the 15th ACM internationalconference on Multimedia. ACM, 2007, pp. 521–524.
[27] A.-M. Burns and M. Wanderley, “Computer vision method for guitarist finger-ing retrieval,” in Proceedings of the Sound and Music Computing Conference,2006.
[28] A.-M. Burns, “Computer vision methods for guitarist left-hand fingering recog-nition,” Ph.D. dissertation, McGill University, 2006.
[29] A. Hrybyk, “Combined audio and video analysis for guitar chord identification,”Ph.D. dissertation, Drexel University, 2010.
[30] M. Cicconet, “The guitar as a human-computer interface,” Ph.D. dissertation,D. Sc. Thesis. National Institute of Pure and Applied Mathematics. Rio deJaneiro, 2010.
[31] C. Kerdvibulvech and H. Saito, “Real-time guitar chord estimation by stereocameras for supporting guitarists,” in Proceeding of 10th International Work-shop on Advanced Image Technology (IWAIT 07), 2007, pp. 256–261.
[32] ——, “Vision-based detection of guitar players’ fingertips without markers,” inComputer Graphics, Imaging and Visualisation, 2007. CGIV’07. IEEE, 2007,pp. 419–428.
[33] “Music Information Retrieval Evaluation eXchange: audio onset detection,”http://www.music-ir.org/mirex/wiki/2016:Audio Onset Detection.
[34] “Music Information Retrieval Evaluation eXchange 2016: audio onsetdetection results,” http://nema.lis.illinois.edu/nema out/mirex2016/results/aod/summary.html.
[35] “Music Information Retrieval Evaluation eXchange 2016: multiple fundamen-tal frequency estimation and tracking,” http://www.music-ir.org/mirex/wiki/2016:Multiple Fundamental Frequency Estimation %26 Tracking.
Shir Goldstein 59

תקציר
חשובמחקר מהווה תחום (Music Information retrieval)מידע מוזיקלי אחזור
, פיסיקה, פסיכולוגיה ועוד. אחת תבמוזיקה, ומשלב את תחומי מדעי המחשב, עיבוד אותו
Automatic) מוזיקלים תוויםשל אוטומטי תעתיקא החשובות ביותר תחום זה הי בעיותה
Music Transcription קיימים עבור יצירות מוזיקליות להן לא (, אשר כוללת כתיבת תוים
ותה גדולה ועבור מוזיקה אך מורכבזו חשיבות רבה בתחום מחקר המוזיקה, בעיהל תווים.
אנו ביצועיהם של אנשי מקצוע עולים על ביצועיהן של מערכות אוטומטיות. פוליפונית
המוגבלת ,מוזיקלים תוויםשל אוטומטי תעתיקשל בעיה חלקית פתרוןל חדשהגישה מציגים
Note), הנקראת מעקב אחר תווים הכוללים את גובה הצליל ותזמונולמספר מרכיבים
Tracking) כאשר הקלט הוא , צלילים המנוגנים על גיטרותבעבודה זו ב מתמקדים. אנו
נשתמש בתנודת הנגינה. צלמה המורכבת על גבי כלי מ ידיוידאו המצולם ללא קול על
וראיה ממוחשבת. תשל עיבוד אותווננתח אותו בעזרת שיטות חזותי בתור אותהמיתרים
של הבעיה כיותיבואת צמצום הס ררד מאפשפהניתוח של האינפורמציה מכל מיתר בנ
בנוסף, ניתן ר בעיות של מוזיקה מונופונית. והפיכתה מבעיה של מוזיקה פוליפונית למספ
דגימההוג כלי הנגינה, המיתר, וקצב בהנתן סבפתרון המוצע, תאת השגיאות הצפויו לנתח
המעקב יכול לתרום רבות לתחוםגיטרות שונות, 4על נבדקש ,הפתרון שלנו. המצלמהשל
תווים. אחר

מבי"ס אפי ארזי למדעי המחשב, המרכז יעל מוזסשל פרופ' ה עבודה זו בוצעה בהדרכת
הבינתחומי, הרצליה.

המרכז הבינתחומי בהרצליהספר אפי ארזי למדעי המחשב-בית
(.M.Scהתכנית לתואר שני )
םיזיקליזיהוי אוטומטי של תוים מו
על ידי ראיה ממוחשבת לכלי מיתר
מאת
שיר גולדשטיין
בהדרכתה של פרופ' יעל מוזס
,.M.Scק מהדרישות לשם קבלת תואר מוסמך כחל פרויקט גמר, מוגש
הרצליה זי למדעי המחשב, המרכז הבינתחומיבית ספר אפי אר
2017 ספטמבר