vegetation and seed bank dynamics in a tidal freshwater marsh
TRANSCRIPT

Vegetation and seed bank dynamics in a tidal freshwater marsh
Hopfensperger, K.N.1,2; Engelhardt, K.A.M.
1,3& Lookingbill, T.R.
1,4
1University of Maryland Center for Environmental Science, Appalachian Laboratory, 301 Braddock Road, Frostburg,
MD 21532, USA;2Current address: Colgate University, Hamilton, NY 13346, USA;
3E-mail [email protected]; 4E-mail [email protected];
Corresponding author; E-mail [email protected]
Abstract
Questions: What are the feedbacks among the seed bank,parent vegetation, and landscape structure that controlplant species turnover in space and time in a tidal fresh-water marsh? How can these feedbacks be used to betterunderstand marsh community dynamics and to establishrestoration practices that seek to restore vegetation diver-sity of this important and widely distributed ecosystem?
Location: Potomac River, Virginia, United States (15 kmsouth of Washington, DC).
Methods: We sampled the seed bank and standing vegeta-tion in a tidal freshwater marsh and explored similaritiesbetween seed bank and vegetation composition throughspace and time. We then investigated marsh surfaceelevation, distance to nearest tidal channels, and lifehistory of component species as potential explanationsfor the observed vegetation patterns.
Results: The composition of individual plots changedconsiderably from year to year; however, the compositionat broader spatial (whole marsh) and temporal (4 years)scales was relatively stable. Species composition of theseed bank was dissimilar to both the previous and currentyear’s standing vegetation, and similarity to standingvegetation was particularly low in plots dominated byannual species. Landscape structure and life history char-acteristics of individual species best explained thespatiotemporal variability in marsh vegetation.
Conclusions: Restoration designs should be landscape-dependent and explicitly incorporate spatially structuredelements such as elevation gradients tomaximize communitydiversity in reconstructed tidal freshwater marshes. Optimaldesigns include areas of high seed input, areas of high speciesturnover, as well as other areas of greater stability.
Keywords: Annuals and perennials; Elevation; Plant com-munity; Restoration; Species turnover; Tidal channels;Water level.
Nomenclature: USDA NCRS (2009).
Introduction
Vegetation communities are rarely stable; theychange directionally through time or randomlyfluctuate depending on the temporal and spatialscale of inference. In tidal freshwater marshes, spe-cies turnover in time and space depends onsuccessful recruitment from local and regional spe-cies pools, and the strength of interactions amongthe parent vegetation, the seed bank, and propertiesof the marsh landscape. Wetland restoration projectmanagers must understand these feedbacks whendesigning a self-sustaining ecosystem that offersreasonably predictable communities.
The distribution of species in space and time islimited by a variety of factors (Huston 1994; Ro-senzweig 1995; Hubbell 2001). In tidal freshwatermarshes, propagules disperse close to the parentplant (Leck & Simpson 1993) and are either in-corporated into the seed bank or are washed away bytidal flushing. However, whether and how seed banksinfluence the composition of standing vegetation and,reciprocally, how standing vegetation affects the seedbank in space and time are not well understood forthese ecosystems. Seedling composition may mirrorthe species composition of the seed rain (Leck &Simpson 1994), persistent seed banks may rapidlycolonize a restored area, or no relationship may existbetween above- and belowground composition,leading to large variation in community compositionthrough time (Leck 2003).
Seed dispersal processes should be broadlymanifested in the spatial distribution patterns ofspecies in tidal marshes. Tidal channels offer a directinflux of seeds to the marsh substrate. As tidal watermoves from tidal channels inland over the channel
Journal of Vegetation Science 20: 767–778, 2009& 2009 International Association for Vegetation Science

banks and then recedes, sediments and propagulesare filtered out; thus, areas closer to tidal channelsshould trap more propagules than areas further fromchannels (Leck & Graveline 1979; Leck & Simpson1993). Species turnover should be higher near tidalchannels as greater propagule pressure and a higherfrequency of disturbance from ice scouring offermore opportunities for immigration and emigration.
In addition to dispersal processes, another majordeterminant of species distributions is their specificadaptations to different environmental conditions(Whittaker 1967; Stephenson 1990). One importantenvironmental gradient in tidal freshwater marshes iselevation (Simpson et al. 1983; Odum et al. 1984),which determines the frequency and length of waterinundation of a marsh with tides. Climatic variationsthat influence the inundation regime of the marshduring key times of the growing season (e.g., duringthe spring and early summer when new seedlingsemerge) would also be an important driver of speciesturnover through time and space.
Marsh elevation and species-specific life historycharacteristics are likely to interact in affecting plantdistribution patterns (Parker & Leck 1985). For ex-ample, perennial species should be more tolerant offluctuating water levels as they can draw from energyreserves stored in belowground structures. However,annual species depend on recruitment from seeds andmay not germinate or survive during wet years, or theymay be washed away through tides and germinateelsewhere. Thus, turnover in community compositionin tidal freshwater marshes is likely to be driven moreby changes in the abundance of annual species thanperennial species, and this turnover of annual speciesshould be higher at lower elevations, which experiencemore flooding events than higher elevations.
These interactions have important implicationsfor restoration, for example, by informing decisionson whether to plant vegetation or to allow the sys-tem to self-design through natural recruitment fromseeds. Results from planting newly created or re-stored areas have been mixed (Campbell et al. 2002;Kellogg & Bridgham 2002; Mulhouse & Galato-witsch 2003; Mitsch et al. 2005), highlighting theneed to better understand what limits the establish-
ment, growth, and survival of species within theseinternationally significant ecosystems. Given thismanagement dilemma, we examined the temporalvariability in community structure in a tidal fresh-water marsh in Virginia, USA (Fig. 1, path 1). Wepredicted that variability in community structurewould be driven more by annual than perennialspecies. We then tested whether aboveground vegeta-tion composition determines seed bank compositionfor the following year (Fig. 1, path 2); and whetherseed bank composition drives that year’s standingvegetation (path 3). Finally, we explored drivers ofthese relationships by testing whether the observedrelationships are influenced by landscape structure, inparticular distance to nearest tidal channels, andmarsh surface elevation.
Methods
Study area
Field sampling was completed from 2004 to 2007at Dyke Marsh Wildlife Preserve (DMP, 38.771N,77.051W), an 80-ha tidal freshwater marsh on the Po-tomac River, just south of Alexandria, Virginia(Fig. 2). The marsh is owned by the National ParkService, which seeks to recreate parts of the marshthat were lost to sand and gravel dredging in the 1930-1970s. The climate of the region is temperate withJuly mean daily maximum temperature of 311C andJanuary mean minimum temperature of � 21C(Johnston 2000). Average annual precipitation is101.6 cm, of which up to 30.4 cm may be snowfall(Johnston 2000). The marsh receives two tide cyclesper day of varying heights, which have a mean tidalrange of 0.5-0.9m and an average daily fluctuation of0.91m (Carter et al. 1994). Flow rates upstream of thesite on the PotomacRiver average 312m3 s� 1 and canrange from 3.5 to 14 000m3 s� 1 (National Park Ser-vice 1977). The highest flows occur in March andApril after significant upstream snowmelt. The floweffect of the Potomac River on the marsh is usuallyminimal owing to the long distance from the mainchannel of the river to the marsh, although the entire
12004 Vegetation 2005 Vegetation 2006 Vegetation
2006 Seed bank
2
1
3
2007 Vegetation1
Fig. 1. Conceptual flow diagram of pathways studied between the tidal freshwater marsh seed bank and abovegroundvegetation.
768 Hopfensperger, K.N. et al.

marsh is within the flood plain of the Potomac River(NPS 1977).
DMP is located in the coastal plain of Virginia,which is underlain by stratified, oceanic deposits ofmud, sand, clay, and gravel atop older crystallinerocks (NPS 1977; Johnston 2000). The alluvium de-posits covering the marsh are approximately 15-mthick, comprised of sand and gravel with lenticularinterlayered units of silt and clay (NPS 1977). Thehydric surface soils provide an ideal habitat for adiverse plant community typical of Atlantic coasttidal freshwater marshes (Simpson et al. 1983;Odum et al. 1984; Leck & Simpson 1995). Vegeta-tion in the marsh is comprised of various sizedpatches of dominant annual species within a het-erogeneous mix of perennial species.
Plant community structure
Using a Trimble GeoExplorer II Global Posi-tioning System (GPS), plots were located along agradient of annual species abundance by delineatingten various sized patches of Impatiens capensisMeerb. (ranging from 150 to 6000m2), a commonannual in tidal freshwater marshes (Simpson et al.
1985) and the dominant annual species at DMP.Thirty-eight 1-m2 plots were blindly located inside(N5 18), outside (N5 10), or on the edge (N5 10)of the I. capensis patches during summer of 2004,using ArcView (version 3.2, ESRI 1999; Fig. 2). By2007, the end of the study period, patch boundarieshad moved, but the gradient in annual speciesabundances was still preserved. We recordedpercentage cover (Braun-Blanquet 1964) of all spe-cies for every plot during peak biomass in late July/early August 2004, 2005, 2006, and 2007 to assessthe composition of the standing vegetation of themarsh. Dominant species associations (from here onreferred to as plant communities) were defined byclassifying aboveground vegetation data from allyears using hierarchical agglomerative clusteringwith Ward’s linkage method and relative Euclideandistance measure using PC-ORD software (McCune& Grace 2002).
The seed bank of each plot was sampled withthree soil cores, 10-cm long�3.81-cm diameter, perplot in March 2006. The seedling emergence techni-que was then used to determine species compositionof the seed bank (Poiani & Johnson 1988; Gross1990). The soil cores were pooled, homogenized,spread over vermiculite in bedding trays (soil layero1 cm thick), and placed in a greenhouse mistingroom for germination at two water depths (satu-rated and flooded 2 cm above surface) to assure thatspecies that prefer low and high water inundationhad an opportunity to germinate. Coarse materialincluding leaves, sticks, and trash were removedfrom the samples, rinsed with water over the tray toremove any seeds, and then discarded. In late fall ofeach year, all trays were stored at approximately 41Cover winter to cold stratify any remaining seeds, andthen placed back into the greenhouse to continuegermination in the spring. Seedlings emerging fromeach sample were identified as young as possible andremoved from the tray when identified. Seedlings ofunknown species were transplanted and allowed tomature before identification. Seed bank abundancewas recorded as the number of emerged seedlingsper species per plot.
Landscape and environmental variables
Distances from each plot to the nearest tidalchannel were determined in ArcView using a digi-tized channel map for Dyke Marsh built from aSeptember 2005 QuickBird image, a May 2004MrSID image, and field verification data (Elmore2008). Marsh elevation was measured in the centerof every plot in July 2004, using a Topcon Precision
Fig. 2. Delineated patches of Impatiens capensis and 38,1-m2 plots dominated by annuals (�), perennials (}), anda mixture of annuals and perennials (&) at Dyke MarshPreserve, Virginia.
- Marsh seed bank and vegetation dynamics - 769
GPS HiPer Lite Pro with an accuracy of � 2 cm. Alocal benchmark (NAD83 VA North) at a marinaadjacent to the marsh was used to georeference allplot locations and elevations.
Temporal variability in community composition
We first quantified changes in marsh vegetationcommunity structure through time (2004 to 2007)using multivariate and univariate approaches (Fig. 1;path 1). Parallel ordinations of aboveground commu-nity composition for all years were done using non-metric multidimensional scaling (NMS) in PC-ORD(McCune &Grace 2002): dimensionality5 3; distancemeasure5S�rensen’s; and detrended correspondenceanalysis (DCA (Hill 1979) with standard options withdetrending by segments and nonlinear rescaling (seeØkland 1996). We used the NMS solution that mini-mized ordination stress the most (two-dimensionsolution5 24.4, three-dimension solution5 19.2).When analyzing all axes together (the entire ordina-tion solution), the DCA axes corresponded withthe NMS axes (Spearman correlation, n5 304,r5 � 0.25, Po0.001); therefore all further analysesused only the NMS data. NMS axis 1 explained mostof the distribution of community composition(n5 152, R25 0.34) and was related to our primaryenvironmental variable, elevation (n5 152, r5 0.43);therefore, axis 1 was used for all further analyses(NMS axis 2: R25 0.31, axis 3 R25 0.20). Year-to-year compositional change was measured by calculat-ing plot displacement along the dominant ordinationaxis for each plot for each of the three 1-year periods(see Økland & Eilersten 1996 and Rydgren et al.2004). Plot displacement was then averaged for eachyear. The 4-year change in vegetation was measuredby calculating plot displacement for each plot between2004 and 2007. A general linear model (GLM) wasused to compare interannual variability in communitycomposition (sum of the 1-year plot displacementvariances) to the 4-year change in community com-position (variance of 4-year plot displacement).
Seed bank-vegetation relationships
To clarify why some communities change whileothers do not, we identified the relationship betweenthe spring seed bank and either the previous year’sstanding vegetation (Fig. 1; path 2) or the currentyear vegetation (Fig. 1; path 3). The ordination ma-trices used binary, or presence/absence species data.Similar to above, collectively the three axes fromparallel ordinations (NMS and DCA) includingseed bank 2006, vegetation 2005, and vegetation
2006 data corresponded weakly (n5 342,r5 � 0.15, P5 0.01); so further analyses used onlythe NMS ordination. Axes 1 and 2 explained mostplot community composition (n5 114, R2 5 0.41and 0.32, respectively; axis 3 R2 5 0.21). Axis 1 wasrelated to both elevation (n5 114, r5 0.35) and dis-tance to tidal channel (n5 114, r5 0.34), while axis2 was related to elevation (n5 114, r5 0.29) and re-lative percentage annual species (n5 114, r5 0.22).Plot displacement was calculated along each axisbetween the vegetation 2005 and the seed bank 2006and between the seed bank 2006 and the vegetation2006 for each plot. GLMs were then used to de-termine if plot displacement differed between thevegetation 2005 to seed bank 2006 and seed bank2006 to vegetation 2006 for all three ordination axes.
This multivariate approach to discerning simi-larity in composition between the seed bank andstanding vegetation was followed up with Spearmanrank correlations between the relative percentage ofa species in the belowground seed bank and the re-lative percentage of a species in the standingvegetation (previous year and current year). Re-lative percentage annual species per plot wascalculated for the seed bank data using number ofseeds emerged from the seed bank sample, and forthe aboveground vegetation using total percentagecover. These analyses could only be performed forthose species (Typha angustifolia L., I. capensis, andBidens laevis (L.) B.S.P.) that were present in boththe standing vegetation and the seed bank in suffi-cient quantities (420% of all plots).
Vegetation-environment relationships
We hypothesized that changes in communitycomposition through time are driven by marsh sur-face elevation and distance to tidal channels. Wetested this hypothesis using GLMs with both aver-age year-to-year plot displacement and 4-year plotdisplacement as the class variables. We also usedGLMs to determine how plot displacement betweenthe seed bank (2006) and standing vegetation (2005and 2006) is affected by environmental and land-scape drivers (elevation and distance to channel)when accounting for potential covariates. Distancefrom plot to nearest channel was square-root trans-formed to conform to normality assumptions.
We also explored how the cover of individualdominant species changed with environmentalgradients. A coefficient of variation (cv) was calcu-lated for each plot across years (2004-2007) fordominant annual species I. capensis, B. laevis, andPolygonum arifolium L. and dominant perennial
770 Hopfensperger, K.N. et al.

species T. angustifolia, Peltandra virginica (L.)Schott, and Nuphar lutea (L.) Sm. The cv for B. lae-vis was square-root transformed, cv for I. capensisand T. angustifolia was log11 transformed, and cvfor P. virginica and N. lutea was natural log trans-formed to conform to normality assumptions.Statistical analyses were performed in SAS forWindows (SAS Institute 2000). Significance was de-termined at a5 0.05.
Life history effects
By selecting plots along an abundance gradientof I. capensis, the dominant annual species of thestudy system, we designed the study specifically toaddress whether communities dominated by annualspecies fluctuate more in species composition thancommunities dominated by perennial species. Dif-ferent species associations, identified throughclassification, were labeled as dominated by annualspecies, dominated by perennial species, or co-dominated by a mix of annual and perennial species.We used GLMs to determine if one classified com-munity type changed through time more than othersusing each year-to-year plot displacement and4-year plot displacement. We also tested this ideausing data from individual species. A GLM wasused to test whether annual species were more vari-able than perennial species through time using cv asthe quantitative variable. Here, cover of 13 domi-nant annual and perennial species were individuallysummed for all plots and then cv calculated acrossyears (2004-2007). In addition, we used GLMs todetermine if seed bank-vegetation plot displacementdiffered among annual, perennial, or mixed com-munities. Lastly, we used GLMs to test if specificcommunities on their own had relationships be-tween environmental variables (elevation anddistance to channel) and 4-year plot displacement orseed bank-vegetation plot displacement.
Results
A total of 25 species were identified in theaboveground vegetation and the seed bank of DMP(App. 1). Twenty-two species germinated from theseed bank; dominant species included T. angustifo-lia, I. capensis, Amaranthus cannabinus (L.) Sauer,and Cuscuta gronovii Willd. ex J.A. Schultes. Seven-teen species were identified in the abovegroundvegetation; dominant species included I. capensis,P. virginica, T. angustifolia, P. arifolium, B. laevis,and N. lutea. Sixteen of the 25 species were presentin both the seed bank and the vegetation. Speciesfound in the seed bank, but not in the vegetation,included Ranunculus cymbalaria Pursh, Ludwigiapalustris L. (Ell.), Juncus effusus L., Mikania scan-dens L. Willd., Carex frankii Kunth, and Pulcheafoetida (L.). Species found in the vegetation and notin the seed bank included Onoclea sensibilis L.,Acorus calamus L., and Zizania aquatica L. Thecluster analysis resulted in a three-class solution thatgrouped the vegetation (2004-2007) composition atDMP (1.5% chaining; Table 1) into communitiesdominated by annuals, perennials, or a mixture ofthe two (Fig. 3).
The three vegetation groups of the classificationwere: perennial communities dominated by N. lutea,P. virginica, and T. angustifolia; annual commu-nities comprised mostly of I. capensis, along withB. laevis and P. arifolium; and the mixed communitywhere dominant annuals and perennials co-occur.
Temporal variability in community composition
Composition change through time was quanti-fied by calculating plot displacement alongthe dominant ordination axes. These analyses re-vealed that interannual variability in compositionwas higher than 4-year composition change(F5 5.061, 74, P5 0.03). When we separated theplots into the three classified community types, the
Table 1. Class descriptions represented in the standing vegetation classification from Dyke Marsh, and the number of plotsrepresenting each class for all 4 study years. For the class description, the species are listed in order of most dominant to leastdominant.
Class number Community type Description # plots 2004 # plots 2005 # plots 2006 # plots 2007
1 Annual Impatiens capensis w/Peltandra virginica& annuals
7 9 8 7
2 Mixed I. capensis, P. virginica, Typha angustifolia,& Polygonum arifolium
23 19 21 22
3 Perennial I. capensis & Nuphar lutea w/T. angustifolia,& P. virginica
8 10 9 9
- Marsh seed bank and vegetation dynamics - 771
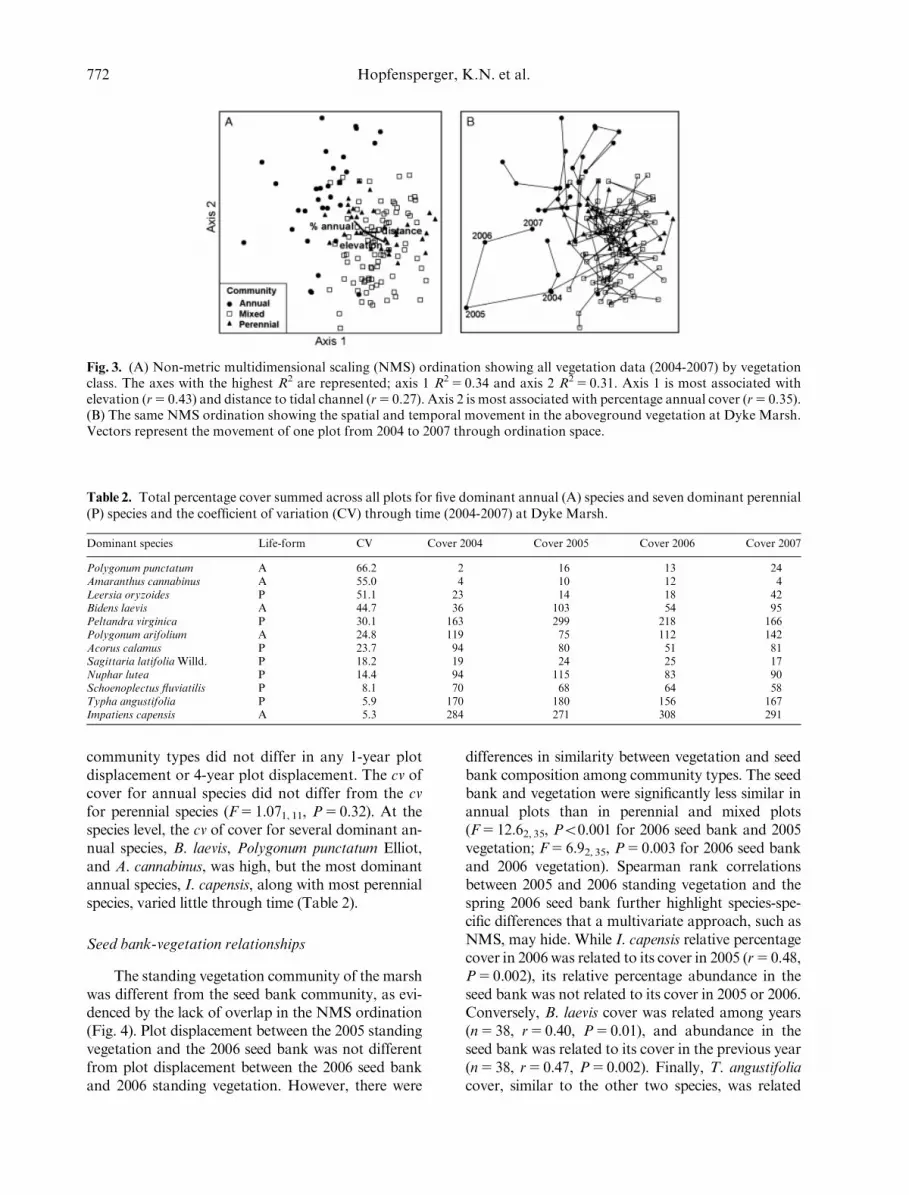
community types did not differ in any 1-year plotdisplacement or 4-year plot displacement. The cv ofcover for annual species did not differ from the cvfor perennial species (F5 1.071, 11, P5 0.32). At thespecies level, the cv of cover for several dominant an-nual species, B. laevis, Polygonum punctatum Elliot,and A. cannabinus, was high, but the most dominantannual species, I. capensis, along with most perennialspecies, varied little through time (Table 2).
Seed bank-vegetation relationships
The standing vegetation community of the marshwas different from the seed bank community, as evi-denced by the lack of overlap in the NMS ordination(Fig. 4). Plot displacement between the 2005 standingvegetation and the 2006 seed bank was not differentfrom plot displacement between the 2006 seed bankand 2006 standing vegetation. However, there were
differences in similarity between vegetation and seedbank composition among community types. The seedbank and vegetation were significantly less similar inannual plots than in perennial and mixed plots(F5 12.62, 35, Po0.001 for 2006 seed bank and 2005vegetation; F5 6.92, 35, P5 0.003 for 2006 seed bankand 2006 vegetation). Spearman rank correlationsbetween 2005 and 2006 standing vegetation and thespring 2006 seed bank further highlight species-spe-cific differences that a multivariate approach, such asNMS, may hide. While I. capensis relative percentagecover in 2006 was related to its cover in 2005 (r5 0.48,P5 0.002), its relative percentage abundance in theseed bank was not related to its cover in 2005 or 2006.Conversely, B. laevis cover was related among years(n5 38, r5 0.40, P5 0.01), and abundance in theseed bank was related to its cover in the previous year(n5 38, r5 0.47, P5 0.002). Finally, T. angustifoliacover, similar to the other two species, was related
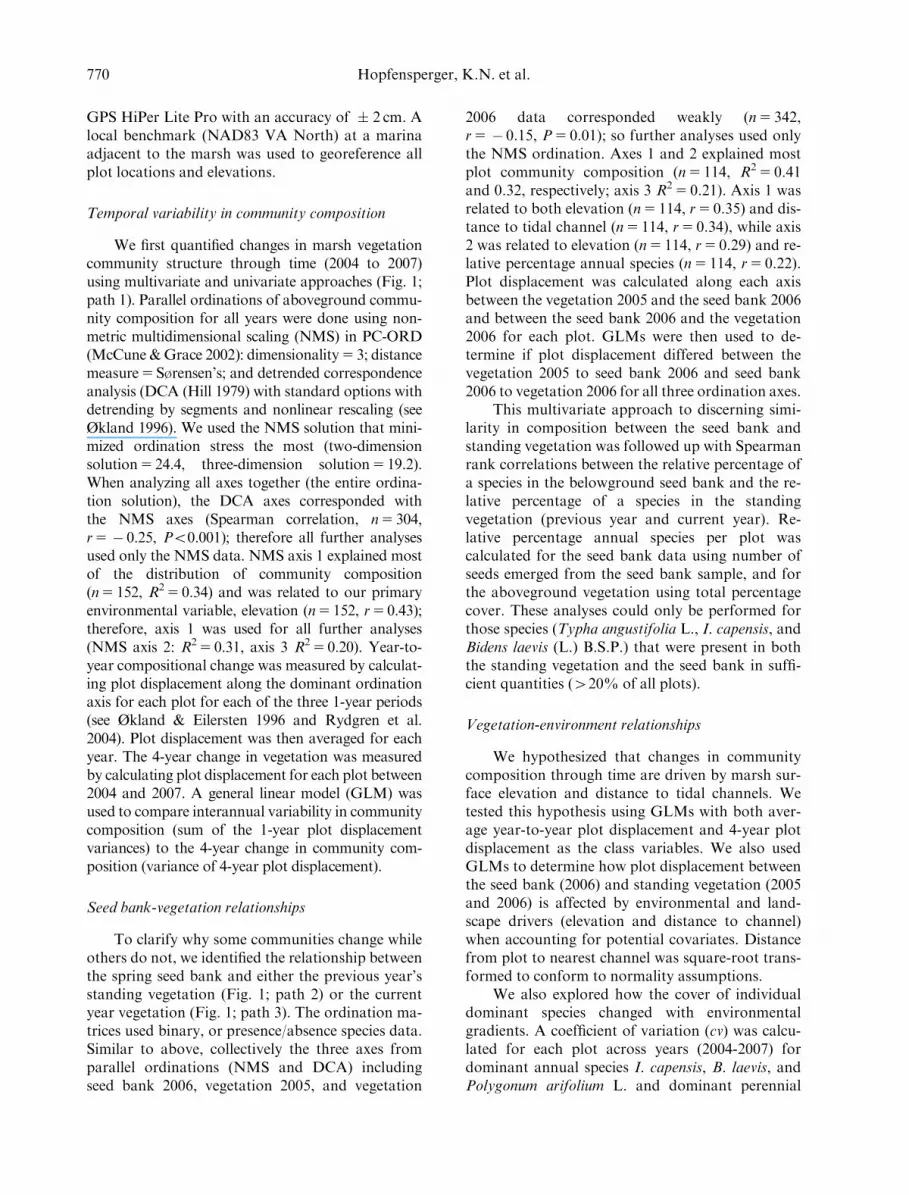
Fig. 3. (A) Non-metric multidimensional scaling (NMS) ordination showing all vegetation data (2004-2007) by vegetationclass. The axes with the highest R2 are represented; axis 1 R2 5 0.34 and axis 2 R2 5 0.31. Axis 1 is most associated withelevation (r5 0.43) and distance to tidal channel (r5 0.27). Axis 2 is most associated with percentage annual cover (r5 0.35).(B) The same NMS ordination showing the spatial and temporal movement in the aboveground vegetation at Dyke Marsh.Vectors represent the movement of one plot from 2004 to 2007 through ordination space.
Table 2. Total percentage cover summed across all plots for five dominant annual (A) species and seven dominant perennial(P) species and the coefficient of variation (CV) through time (2004-2007) at Dyke Marsh.
Dominant species Life-form CV Cover 2004 Cover 2005 Cover 2006 Cover 2007
Polygonum punctatum A 66.2 2 16 13 24Amaranthus cannabinus A 55.0 4 10 12 4Leersia oryzoides P 51.1 23 14 18 42Bidens laevis A 44.7 36 103 54 95Peltandra virginica P 30.1 163 299 218 166Polygonum arifolium A 24.8 119 75 112 142Acorus calamus P 23.7 94 80 51 81Sagittaria latifolia Willd. P 18.2 19 24 25 17Nuphar lutea P 14.4 94 115 83 90Schoenoplectus fluviatilis P 8.1 70 68 64 58Typha angustifolia P 5.9 170 180 156 167Impatiens capensis A 5.3 284 271 308 291
772 Hopfensperger, K.N. et al.

among years (n5 38, r5 0.91, Po0.001), and abun-dance in the seed bank was related to its cover in 2006(n5 38, r5 0.34, P5 0.04). Furthermore, the relativepercentage cover of standing vegetation of these threespecies was correlated. In both years (2005 and 2006),I. capensis and T. angustifolia were positively corre-lated (n5 38, r5 0.37, P5 0.02, n5 38, r5 0.54,P5 0.001, respectively), and B. laevis was negati-vely correlated with both I. capensis (n5 38,r5 � 0.42, P5 0.01, n5 38, r5 � 0.38, P5 0.02)and T. angustifolia (n5 38, r5 � 0.38, P5 0.02,n5 38, r5 � 0.55, P5 0.001).
Vegetation-environment relationships
Elevations of the plots were in the range of0.17-0.64m. Distances from plot to nearest channelranged from 0 to 45.6m. Neither elevation (n5 38,R2 5 0.07, P5 0.12) nor distance to tidal channel(n5 38, R2 5 0.01, P5 0.61) was associated with4-year composition change. However, plot displace-ment over the 4 years for communities dominated byperennial species was associated with elevation(n5 8,R2 5 0.73, P5 0.01), with the greatest changein composition observed at lower elevations. Noother significant associations were observed between4-year composition change of specific communitytypes and environmental variables.
Only very weak relationships were found be-tween plot displacement in the seed bank-vegetationordination (Fig. 4) and environmental variableswhen studying the marsh as a whole. The similaritybetween seed bank and vegetation was better ex-plained by environmental variables when examiningindividual community types. Similarity between theprevious year’s vegetation (2005) and the following
year’s seed bank (2006) decreased in annual com-munities with an increase in elevation (n5 9,R2 5 0.58, P5 0.02). Similarity between the seedbank (2006) and the current year vegetation (2006)also decreased with elevation in mixed (n5 21,R2 5 0.26, P5 0.02) but increased with elevation inperennial (n5 9,R2 5 0.45, P5 0.048) communities.At the individual species level, dominant annualspecies differed in their relationships with environ-mental gradients. The cv of I. capensis coverdecreased as elevation increased (n5 37, R2 5 0.38,P5 0.01), while the cv of B. laevis cover increasedwith elevation (n5 23, R2 5 0.18, P5 0.04). Simi-larly, cv of B. laevis cover increased with distancefrom the nearest channel (n5 23, R2 5 0.29,P5 0.01), while cv of P. arifolium cover decreasedwith increased distance to a tidal channel (n5 30,R2 5 0.14, P5 0.04). Dominant perennial species,T. angustifolia, P. virginica, or N. lutea, were notcorrelated with any of the environmental variables.
Discussion
The vegetation communities at DMP exhibitedgreater year-to-year change (path 1; Fig. 1) thanover the entire 4-year term of the study. This inter-annual variability was not as evident when examin-ing the classified communities separately. Ourobservations of annual variability at DMP reflectresults of similar studies conducted in tidal fresh-water marshes; Perry & Hershner (1999; 14-yearstudy) and Leck & Simpson (1995; 10-year study)both observed significant year-to-year fluctuationsof dominant species (changes in community com-position were not reported). Our results show that
Fig. 4. (A) NMS analysis comparing the seed bank composition of 2006 with the vegetation composition of 2005 and 2006.The axes with the highest R2 are represented; axis 1 R2 5 0.41 and axis 2 R2 5 0.32. (B) The same NMS ordination withvectors representing the spatial and temporal movement in ordination space of a plot from aboveground to the seed bankand back to aboveground at Dyke Marsh.
- Marsh seed bank and vegetation dynamics - 773

community structure at DMP is driven both by sto-chastic processes, such as regional dispersal events,and deterministic processes, such as species adapta-tions to different hydroperiods. These processesshould be manifested in the relationship between theseed bank and standing vegetation and in the re-lationship between community composition andlandscape structure.
Variability and directional trends in the com-position of the standing vegetation at DMP could bea function of survival and recruitment from the localand regional species pool, which should be reflectedin the similarity between the seed bank and standingvegetation. High similarity (low plot displacement)between seed bank and vegetation compositionwould indicate strong local influences, whereas lowsimilarity (high plot displacement) would be in-dicative of regional processes affecting localcommunity structure. The species composition ofthe 2005 standing vegetation was not similar to the2006 seed bank composition (path 2), suggestingthat sediments and associated seeds tend to becomemixed during the dormant season (Novemberthrough April) and that seeds may immigrate fromregional sources. Similarly, the composition of the2006 standing vegetation was also different fromthat year’s spring seed bank (path 3). Thus, speciescomposition in this tidal freshwater marsh is pri-marily driven by recruitment from regional sourcesrather than local short-distance dispersal events.The relative importance of these local and regionalseed inputs into local seed reserves (Grelsson &Nilsson 1991; Jutila 2003) affect the variability ofmarsh vegetation communities, which is, most like-ly, dependent on where the community is locatedwithin the marsh landscape.
Recruitment is not homogeneous across the en-tire marsh, but depends on landscape structure,which affects movement of sediments and associatedseeds, as well as the germination of seeds. The 4-yearchange in community composition of the wholemarsh did not vary with elevation or distance to ti-dal channel, but change in composition was greatestat low elevations for perennial communities. Fur-thermore, seed bank-vegetation similarity wasaffected by these physical variables. Plots domi-nated by perennial species had high seed bank-vegetation similarity in areas of higher elevation.The extensive network of tidal channels allows forflow to scour and deposit sediments and seedsthroughout the marsh, thereby creating areas oftemporally shifting vegetation where tidal flushing isstrong, and areas that are relatively stable where ti-dal flushing is weak. Areas at higher elevations are
rarely inundated by tides. Thus, seeds do not travelfar from the parent plant and may be incorporatedinto the seed bank without tidal contributions ofnew seeds (Middleton 2000; Leyer 2006). In addi-tion, plots at farther distances from tidal channelsare less likely to receive seed inputs from the regionbecause vegetation closer to the channels will haveintercepted them (Gurnell et al. 2006a, b).
Fluctuating resources and disturbances such asannual and inter-annual variability in surface waterlevel may also facilitate changes in community ve-getation composition. Elevation and spring waterinundation are tightly linked in tidal freshwatermarshes (K. Hopfensperger unpublished data).While a reliable seed bank is essential for recruit-ment into the aboveground vegetation, localelevations and subsequent water levels that existduring spring germination may dictate the maturestanding vegetation community each year in a tidalfreshwater marsh. We find that individual annualspecies are more variable in marsh areas at lowerelevations. Indeed, many dominant tidal freshwatermarsh species germinate more readily at higher ele-vations where conditions are drier (Baldwin et al.2001; Peterson & Baldwin 2004). In addition, springwater inundation may influence the composition ofthe seed bank at a site through scouring and de-position events. Potentially important disturbanceevents include ice scouring (Belanger & Bedard1994), large storms (Nyman et al. 1995), and wrack-burial (Brewer et al. 1998), all of which may play animportant role in determining community dy-namics; however, these disturbance mechanismshave rarely been studied in tidal freshwater marshes.
The dominance of annual and perennial speciesmay also affect how variable a community isthrough time. Indeed, seed bank-vegetation similar-ity was lowest in communities dominated by annualspecies, illustrating the dependence of annual specieson regional seed sources. This gains further supportfrom annual species as a group being more variableacross years than perennial species. However, thedominant annual species, I. capensis, was relativelystable through time (similar to perennials), suggest-ing that stability of a community may be driven byindividual species rather than by life histories. Alldominant perennial species, with the exception ofL. oryzoides, varied little in total percentage coverduring the study (Table 2), probably because per-ennial structures were reliably available forregeneration. For example, T. angustifolia reliablyoccurred in the same quantities in the same placesthroughout the study (cv5 5.9). Its cover appearednot to be related to its abundance in the seed bank
774 Hopfensperger, K.N. et al.

suggesting that T. angustifolia is not dependent onthe seed bank for regeneration. On the other hand,some annual species differed in their variabilityacross the 4 years. For example, B. laevis had highvariation in cover (cv5 45). Bidens laevis was not asabundant in the seed bank (20% of all plots), yetseed bank abundance in 2006 was related to 2005vegetation cover. This suggests that B. laevis is lim-ited by the availability of seeds in the seed bank andis dependent on immigration from both the parentvegetation and the region. Impatiens capensis covervaried little (cv5 5.3) and the species was prevalentin the seed bank, yet I. capensis seed bank abun-dance was not related to its cover. These resultssuggest that the seed bank of I. capensis is relativelysaturated and that this species is not limited bythe availability of seeds, but by environmentalconditions that affect germination and survival. In-terestingly, high percentage cover of I. capensis wasdirectly related to high percentage cover of T. angu-stifolia, but B. laevis cover decreased with anincrease in I. capensis suggesting competition be-tween these two annual species. Similarly, Leck &Simpson (1995) found that over a 10-year period theabundance of several dominant species fluctuatedrelative to each other.
We offer several recommendations on restoringand creating tidal freshwater marsh habitat. Restora-tion managers should attempt landscape-dependentrestoration designs, meaning that decisions aboutself-design need to be made with environmental gra-dients in mind. For example, managers could allowfor self-design in areas that experience tidal flushingwhere diverse seed banks or seed rain is present, andplant areas further from tidal channels and at higherelevations. Regardless of initial planting or self-design, monitoring to track and respond to spatio-temporal changes in vegetation composition isnecessary for reaching restoration goals. In addition,creating a physical habitat template that allows theestablishment, survival and reproduction of a varietyof wetland species is crucial. An extensive networkof channels throughout a tidal freshwater marsh isnecessary to allow dispersal of seeds and flow ofnutrients to all marsh areas. In a salt marsh restora-tion in New Jersey, Weishar et al. (2005) found thatbreaching dikes and allowing high velocity sheet flowacross the marsh plain produced braided streamchannels throughout the marsh that were favorablefor rapid recolonization and restoration. In combi-nation, tidal channel networks and a variety ofelevations are necessary to ensure successful germi-nation of a variety of species with differing life historycharacteristics.
In conclusion, following the vegetation dy-namics of 38 plots in Dyke Marsh Wildlife Preservefor 4 years reveals substantial year-to-year varia-bility in the marsh vegetation but rather stablecomposition over the entire marsh and the entirestudy period. These dynamics depend on the domi-nant life histories of species within definablecommunities. The aboveground vegetation of plotsdominated by annuals and plots dominated by per-ennials appeared relatively stable through time, andperennial plots were more similar to the seed bankthan annual plots. We found elevation and in-dividual species to be dominant drivers of thesespatial and temporal community dynamics. Thus,composition changes result from both stochastic re-gional and local dispersal events that affect localseed banks and deterministic recruitment of specificspecies that differ in habitat requirements.
Acknowledgements. We thank the National Park Service
through the Chesapeake Bay Cooperative Ecosystems
Study Unit and the University of Maryland for funding
the project. In addition, we thank the George Washington
Memorial Parkway for access to the study site. Most spe-
cial thanks to Lauren McChesney, Annie Elmore, and
Sherry Adams for their hard work in the field. Additional
thanks to Annie Elmore for sharing her digitized channel
map with us.
References
Baldwin, A.H., Egnotovich, M.S. & Clarke, E. 2001.
Hydrologic change and vegetation of tidal fresh-
water marshes: field, greenhouse, and seed bank
experiments. Wetlands 21: 519–531.
Belanger, L. & Bedard, J. 1994. Role of ice scouring and
goose grubbing in marsh plant-dynamics. Journal of
Ecology 82: 437–455.
Braun-Blanquet, J. 1964. Pflanzensoziologie. Springer-
Verlag, Berlin.
Brewer, J.S., Levine, J.M. & Bertness, M.D. 1998.
Interactive effects of elevation and burial with wrack
on plant community structure in some Rhode Island
salt marshes. Journal of Ecology 86: 125–136.
Campbell, D.A., Cole, C.A. & Brooks, R.P. 2002. A
comparison of created and natural wetlands in
Pennsylvania, USA. Wetlands Ecology and
Management 10: 41–49.
Carter, V., Rybicki, N.B., Landwehr, J.M. & Turtora, M.
1994. Role of weather and water quality in population
dynamics of submersed macrophytes in the tidal
Potomac River. Estuaries 17: 417–426.
Elmore, A.H. 2008. Mapping the biotic and physical
structure of a tidal freshwater marsh: a combined
- Marsh seed bank and vegetation dynamics - 775

community ecology and remote sensing approach. MS
thesis, University of Maryland.
Grelsson, G. & Nilsson, C. 1991. Vegetation and seed-
bank relationships on a lakeshore. Freshwater Biology
26: 199–207.
Gross, K.L. 1990. A comparison of methods for estimating
seed numbers in the soil. Journal of Ecology 78: 1079–
1093.
Gurnell, A.M., Boitsidis, A.J. & Thompson, K., et al.
2006a. Seed bank, seed dispersal and vegetation cover:
colonization along a newly-created river channel.
Journal of Vegetation Science 17: 665–674.
Gurnell, A.M., Morrissey, I.P. & Boitsidis, A.J., et al.
2006b. Initial adjustments within a new river channel:
interactions between fluvial processes, colonizing
vegetation, and bank profile development. Environ-
mental Management 38: 580–596.
Hill, M.O. 1979. DECORANA – A Fortran program for
detrended correspondence analysis and reciprocal
averaging. Cornell University, Ithaca, NY.
Hubbell, S.P. 2001. The unified neutral theory of
biodiversity and biogeography. Princeton University
Press, Princeton, NJ, US.
Huston, M. 1994. Biological diversity: the coexistence of
species on changing landscapes. Cambridge University
Press, Cambridge, UK.
Johnston, D.W. 2000. The Dyke Marsh Preserve
ecosystem. Virginia Journal of Science 51: 223–271.
Jutila, H.M. 2003. Germination in Baltic coastal wet-
land meadows: similarities and differences between
vegetation and seed bank. Plant Ecology 166:
275–293.
Kellogg, C.H. & Bridgham, S.D. 2002. Colonization
during early succession of restored freshwater
marshes. Canadian Journal of Botany 80: 176–185.
Leck, M.A. 2003. Seed-bank and vegetation development
in a created tidal freshwater wetland on the Delaware
River, Trenton, New Jersey, USA. Wetlands 23:
310–343.
Leck, M.A. & Graveline, K.J. 1979. Seed bank of a
freshwater tidal marsh. American Journal of Botany
66: 1006–1015.
Leck, M.A. & Simpson, R.L. 1993. Seeds and seedlings of
the Hamilton Marshes, a Delaware River tidal
freshwater wetland. Proceedings of the Academy of
Natural Sciences Philadelphia 144: 267–281.
Leck, M.A. & Simpson, R.L. 1994. Tidal freshwater
wetland zonation: seed and seedling dynamics.
Aquatic Botany 47: 61–75.
Leck, M.A. & Simpson, R.L. 1995. Ten-year seed bank
and vegetation dynamics of a tidal freshwater marsh.
American Journal of Botany 82: 1547–1557.
Leyer, I. 2006. Dispersal, diversity and distribution
patterns in pioneer vegetation: the role of river–
floodplain connectivity. Journal of Vegetation Science
17: 407–416.
McCune, B. & Grace, J.B. 2002. Analysis of Ecological
Communities. MjM Software Design, Gleneden Beach.
Middleton, B. 2000. Hydrochory, seed banks, and
regeneration dynamics along the landscape boundaries
of a forested wetland. Plant Ecology 146: 169–184.
Mitsch, W.J., Zhang, L., Anderson, C.J., Altor, A.E.
& Hernandez, M.E. 2005. Creating riverine wetlands:
ecological succession, nutrient retention, and pulsing
effects. Ecological Engineering 25: 510–527.
Mulhouse, J.M. & Galatowitsch, S.M. 2003. Revegetation
of prairie pothole wetlands in the mid-continental
US: twelve years post-reflooding. Plant Ecology 169:
143–159.
National Park Service. 1977. Environmental assessment of
Dyke Marsh. National Capital Region, National Park
Service, U.S. Department of Interior, Washington,
DC.
Nyman, J.A., Crozier, C.R. & Delaune, R.D. 1995. Roles
and patterns of hurricane sedimentation in an
estuarine marsh landscape. Estuarine Coastal and
Shelf Science 40: 665–679.
Odum, W.E., Smith III, T.J., Hoover, J.K. & McIvor,
C.C. 1984. The ecology of tidal freshwater marshes
of the United States east coast: a community profile.
U.S. Fish and Wildlife Service Report FWS/OBS-83/
17.
Økland, R.H. 1996. Are ordination and constrained
ordination alternative or complementary strategies in
general ecological studies? Journal of Vegetation
Science 7: 289–292.
Økland, R.H. & Eilersten, O. 1996. Dynamics of
understory vegetation in an old-growth boreal
coniferous forest, 1988–1993. Journal of Vegetation
Science 7: 747–762.
Parker, V.T. & Leck, M.A. 1985. Relationship of seed
banks to plant distribution patterns in a freshwater
tidal wetland. American Journal of Botany 72:
161–174.
Perry, J.E. & Hershner, C.H. 1999. Temporal changes in
the vegetation patterns in a tidal freshwater marsh.
Wetlands 19: 90–99.
Peterson, J.E. & Baldwin, A.H. 2004. Seedling emergence
from seed banks of tidal freshwater wetlands: response
to inundation and sedimentation. Aquatic Botany 78:
243–254.
Poiani, K.A. & Johnson, W.C. 1988. Evaluation of the
emergence method in estimating seed bank composition
of prairie wetlands. Aquatic Botany 32: 91–97.
Rosenzweig, M.L. 1995. Species diversity in space and
time. Cambridge University Press, Cambridge, UK.
Rydgren, K., Økland, R.H. & Hestmark, G. 2004.
Disturbance severity and community resilience in a
boreal forest. Ecology 85: 1906–1915.
Simpson, R.L., Good, R.E., Leck, M.A. & Whigham,
D.F. 1983. The ecology of freshwater tidal wetlands.
BioScience 33: 255–259.
Simpson, R.L., Leck, M.A. & Parker, V.T. 1985. The
comparative ecology of Impatiens capensis Meerb.
(Balsaminaceae) in Central New Jersey. Bulletin of the
Torrey Botanical Club 112: 295–311.
776 Hopfensperger, K.N. et al.

Stephenson, N.L. 1990. Climatic control of vegetation
distribution – the role of the water-balance. American
Naturalist 135: 649–670.
USDA NCRS. 2009. The PLANTS Database. National
Plant Data Center, Baton Rouge, LA, US. http://
plants.usda.gov. (Accessed 15 April 2009).
Weishar, L.L., Teal, J.M. & Hinkle, R. 2005. Designing
large-scale restoration for Delaware Bay. Ecological
Engineering 25: 231–239.
Whittaker, R.H. 1967. Gradient analysis of vegetation.
Biological Review 42: 207–264.
Table A1. Average percentage cover � standard deviation (SD) and average emerged seedling abundance � SD for allspecies found in 38 plots at Dyke Marsh Wildlife Preserve along the Potomac River, Virginia, USA. Percentage cover wasrecorded using Braun-Blanquet (1964) cover classes; therefore maximum (max) observed cover is a range and not an exactvalue. Plots were located either on the inside (I), outside (O), or edge (E) of dominant patches of Impatiens capensis. Specieslife history is either annual (A) or perennial (P). Total number of plots5 38.
# plots found inseed bank &vegetation
2004 %cover � SD(max)
2005 %cover � SD(max)
2006 %cover � SD(max)
2007 %cover � SD(max)
Seed bank meanabundan-ce � SE 2006
Plot locationspecies foundin
Lifehistory
Acorus calamus 018
1 � 1 (75–95) 1 � 1 (10–25) 0.5 � 0.5 (25–50) 1 � 1 (10–25) 0 � 0 IOE P
Amaranthuscannabinus
242
Trace (2–5) Trace (10–25) Trace (10–25) Trace (2–5) 2.7 � 3.3 OE A
Bidens laevis 723
Trace (10–25) 1 � 1 (75–95) 0.5 � 1 (10–25) 1 � 2 (75–95) 0.3 � 0.6 IOE A
Carex frankii 10
0 � 0 (0) 0 � 0 (0) 0 � 0 (0) 0 � 0 (0) 0.1 � 0.3 O P
Cuscuta gronovii 2032
0.5 � 1 (75–95) Trace (0–1) 0.5 � 1 (50–75) 1 � 1 (75–95) 1.9 � 3.1 IOE P
Hibiscusmoscheutos
11
Trace (10–25) Trace (25–50) Trace (10–25) Trace (50–75) 0.3 � 0.2 I P
Impatiens capensis 2331
35 � 1 (100) 25 � 2 (100) 50 � 1 (100) 40 � 1 (100) 2.9 � 4.2 IOE A
Juncus effusus 10
0 � 0 (0) 0 � 0 (0) 0 � 0 (0) 0 � 0 (0) 0.1 � 0.7 I P
Leersia oryzoides 212
Trace (5–10) Trace (10–25) Trace (10–25) 0.5 � 0.5 (25–50) 0.3 � 1.8 IOE P
Ludwigia palustris 70
0 � 0 (0) 0 � 0 (0) 0 � 0 (0) 0 � 0 (0) 0.8 � 2.8 IOE P
Mikania scandens 10
0 � 0 (0) 0 � 0 (0) 0 � 0 (0) 0 � 0 (0) 0.1 � 0.5 O P
Nuphar lutea 416
1 � 1 (75–95) 1 � 2 (100) 1 � 1 (50–75) 1 � 1 (50–75) 0.1 � 0.4 IOE P
Onoclea sensibilis 021
Trace (50–75) Trace (75–95) Trace (50–75) Trace (50–75) 0 � 0 I P
Peltandra virginica 438
3 � 1 (75–95) 45 � 1 (100) 8 � 1 (50–75) 3 � 1 (25–50) 0.2 � 0.6 IOE P
Pilea pumila 11
Trace (10–25) 0 � 0 (0) 0 � 0 (0) 0 � 0 (0) 0.1 � 0.3 E P
Pluchea foetida 10
0 � 0 (0) 0 � 0 (0) 0 � 0 (0) 0 � 0 (0) o0.1 � 0.2 O P
Polygonumarifolium
130
1 � 1 (50–75) 0.5 � 1 (25–50) 1 � 1 (75–95) 2 � 1 (50–75) o0.1 � 0.2 IOE A
Polygonumpersicaria
54
Trace (10–25) Trace (10–25) Trace (0–1) 0 � 0 (0–1) 0.2 � 0.6 IO A
Polygonumpunctatum
16
Trace (0–1) Trace (10–25) Trace (5–10) Trace (10–25) o0.1 � 0.2 IOE A
Ranunculuscymbalaria
30
0 � 0 (0) 0 � 0 (0) 0 � 0 (0) 0 � 0 (0) 0.1 � 0.4 IOE P
Rorippa palustris 10
0 � 0 (0) 0 � 0 (0) 0 � 0 (0) 0 � 0 (0) o0.1 � 0.2 O A
Sagittaria latifolia 47
Trace (25–50) Trace (25–50) Trace (10–25) Trace (5–10) 0.2 � 0.7 IOE P
- Marsh seed bank and vegetation dynamics - 777

Received 15 March 2009;
Accepted 11 April 2009.
Co-ordinating editor – R. Halvorsen.
Table A1. (Continued).
# plots found inseed bank &vegetation
2004 %cover � SD(max)
2005 %cover � SD(max)
2006 %cover � SD(max)
2007 %cover � SD(max)
Seed bank meanabundan-ce � SE 2006
Plot locationspecies foundin
Lifehistory
Schoenoplectusfluviatilis
217
0.5 � 1 (75–95) 1 � 1 (50–75) 0.5 � 1 (25–50) 0.5 � 1 (50–75) 0.1 � 0.5 IOE P
Typha angustifolia 3432
3 � 1 (50–75) 3 � 1 (75–95) 2 � 1 (50–75) 3 � (50–75) 58 � 85 IOE P
Zizania aquatica 01
0 � 0 (0) Trace (10–25) Trace (5–10) Trace (10–25) 0 � 0 O A
778 Hopfensperger, K.N. et al.