accelerated microbial organic matter mineralization following salt-water intrusion into tidal...
TRANSCRIPT
1 23
BiogeochemistryAn International Journal ISSN 0168-2563Volume 102Combined 1-3 Biogeochemistry (2010)102:135-151DOI 10.1007/s10533-010-9427-4
Accelerated microbial organic mattermineralization following salt-waterintrusion into tidal freshwater marsh soils

1 23
Your article is protected by copyright and
all rights are held exclusively by Springer
Science+Business Media B.V.. This e-offprint
is for personal use only and shall not be self-
archived in electronic repositories. If you
wish to self-archive your work, please use the
accepted author’s version for posting to your
own website or your institution’s repository.
You may further deposit the accepted author’s
version on a funder’s repository at a funder’s
request, provided it is not made publicly
available until 12 months after publication.
Accelerated microbial organic matter mineralizationfollowing salt-water intrusion into tidal freshwatermarsh soils
Nathaniel B. Weston • Melanie A. Vile •
Scott C. Neubauer • David J. Velinsky
Received: 10 September 2009 / Accepted: 4 March 2010 / Published online: 25 June 2010
� Springer Science+Business Media B.V. 2010
Abstract The impact of salt-water intrusion on
microbial organic carbon (C) mineralization in tidal
freshwater marsh (TFM) soils was investigated in a
year-long laboratory experiment in which intact soils
were exposed to a simulated tidal cycle of freshwater or
dilute salt-water. Gas fluxes [carbon dioxide (CO2) and
methane (CH4)], rates of microbial processes (sulfate
reduction and methanogenesis), and porewater and
solid phase biogeochemistry were measured through-
out the experiment. Flux rates of CO2 and, surprisingly,
CH4 increased significantly following salt-water intru-
sion, and remained elevated relative to freshwater
cores for 6 and 5 months, respectively. Following salt-
water intrusion, rates of sulfate reduction increased
significantly and remained higher than rates in the
freshwater controls throughout the experiment. Rates
of acetoclastic methanogenesis were higher than rates
of hydrogenotrophic methanogenesis, but the rates did
not differ by salinity treatment. Soil organic C content
decreased significantly in soils experiencing salt-water
intrusion. Estimates of total organic C mineralized in
freshwater and salt-water amended soils over the
1-year experiment using gas flux measurements (18.2
and 24.9 mol C m-2, respectively) were similar to
estimates obtained from microbial rates (37.8 and
56.2 mol C m-2, respectively), and to losses in soil
organic C content (0 and 44.1 mol C m-2, respec-
tively). These findings indicate that salt-water intru-
sion stimulates microbial decomposition, accelerates
the loss of organic C from TFM soils, and may put
TFMs at risk of permanent inundation.
Keywords Tidal freshwater marshes � Carbon �Organic matter mineralization � Sulfate reduction �Methanogenesis � Carbon dioxide � Methane �Delaware River
Introduction
Tidal marshes have existed for at least the past
4000 years, when rates of sea level rise slowed
enough to allow for their development (Redfield
1965). Sea level exerts an especially powerful
influence on tidal marshes (Morris et al. 2002; Mudd
et al. 2009). Tidal marshes are found at or near
N. B. Weston (&)
Department of Geography and the Environment,
Villanova University, Villanova, PA 19085, USA
e-mail: [email protected]
M. A. Vile
Department of Biology, Villanova University, Villanova,
PA 19085, USA
S. C. Neubauer
Baruch Marine Field Laboratory, University of South
Carolina, Georgetown, SC 29442, USA
D. J. Velinsky
Patrick Center for Environmental Research, The Academy
of Natural Sciences, Philadelphia, PA 19103, USA
123
Biogeochemistry (2011) 102:135–151
DOI 10.1007/s10533-010-9427-4
Author's personal copy
current mean local sea level, and maintain their
elevation relative to rising sea levels through net
accretion and vertical growth. Accretion in tidal
marshes is largely driven by deposition of watershed-
derived sediments and autochthonous organic matter
produced by marsh macrophytes and the subsequent
storage of these materials in marsh soils (Reed 1995;
Morris et al. 2002). The rate of sea level rise has
increased in the past century due to anthropogenic
climate change, and future acceleration of sea level
rise is predicted (Nakada and Inoue 2005; Church and
White 2006). Increased rates of sea level rise may
exceed the ability of some marshes to accrete
vertically, resulting in permanent inundation and loss
of marsh area (Reed 1995; Morris et al. 2002).
Tidal marshes provide many critical ecosystem
services, and the response of these ecosystems to
climate change and sea level rise has received
considerable attention from the scientific community
(e.g., Morris et al. 2002; Mudd et al. 2009). Much of
the attention has been on salt marshes, however, and
relatively less is known about the impacts of climate
change on tidal freshwater marshes (TFMs; see
Neubauer and Craft 2009). TFMs are found in the
tidally influenced freshwater portions of many estu-
aries, and approximately 20% of total tidal marsh
area along the Atlantic and Gulf Coasts of the United
States is TFM (Odum 1988; Mitsch and Gosselink
1993). Both TFMs and salt marshes are highly
productive ecosystems (Odum 1988), serve as key
habitats for many organisms (Mitsch and Gosselink
1993), and are efficient filters that can reduce the
loading of nutrients from watersheds to coastal waters
(Neubauer et al. 2005a; Gribsholt et al. 2005).
Additionally, tidal marshes absorb storm surge and
wave energy (Yang 1998), minimizing flooding and
damage to adjacent upland areas during coastal storm
events (Barbier et al. 2008). Although TFMs and salt
marshes are functionally similar in many ways,
differences in salinity and solute concentrations
[especially sulfate (SO42-) and hydrogen sulfide
(H2S)] lead to significant differences in microbial
biogeochemical processes and dominant plant com-
munities between these wetland types.
Climate change is predicted to alter future patterns
and rates of precipitation, evaporation, and evapo-
transpiration (Smith et al. 2005; Milly et al. 2005).
The combination of rising sea-levels and decreased
river (freshwater) discharge will result in the upriver
migration of the freshwater-saltwater mixing zone
(i.e., salt-water intrusion) in some estuaries (Hamil-
ton 1990; Knowles 2002), with potentially significant
impacts on ecosystems in the tidal freshwater zone,
including TFMs. Salinity-induced stress on freshwa-
ter plant communities is projected to decrease
primary production and organic matter accumulation
rates (Willis and Hester 2004; McKee and Mendels-
sohn 1989; Spalding and Hester 2007). In addition,
rates and pathways of microbial organic matter
mineralization can shift in response to changing
salinities (Rysgaard et al. 1999; Canavan et al. 2006;
Weston et al. 2006). Due to low SO42- availability in
freshwater (\0.1 mmol L-1), methanogenesis (MG)
is often a major pathway of anaerobic organic matter
mineralization (Capone and Kiene 1988; Kelley et al.
1990), although microbial iron reduction and denitri-
fication can also be important processes in freshwater
wetlands (Roden and Wetzel 1996; Neubauer et al.
2005b; Gribsholt et al. 2005). Microbially-mediated
SO42- reduction (SR) replaces MG as a dominant
anaerobic terminal C mineralization process in
marine sediments and salt marsh soils (Jørgensen
1982; Capone and Kiene 1988) due to the greater
availability of SO42- in seawater (*28 mmol L-1)
and the higher energy yield of organic C degradation
coupled to SR as compared to MG (Capone and
Kiene 1988; Mishra et al. 2003). Therefore, salt-
water intrusion into TFMs will likely alter pathways
and rates of elemental cycling and drive shifts in
overall ecosystem structure and function.
Previous studies have documented a positive rela-
tionship between salinity and decomposition in marsh
soils (Craft 2007), and a shift from MG to SR following
salt-water intrusion into tidal freshwater estuarine
sediments (Weston et al. 2006). While these studies
have suggested that salt-water intrusion may increase
overall rates of organic matter decomposition, the
impact of climate change on microbial C cycling in
TFM soils remains unclear. Increased organic matter
decomposition in response to salt-water intrusion has
profound implications for the persistence of TFMs in
coastal landscapes. In this study, we incubated TFM
cores in the laboratory under freshwater and dilute salt-
water conditions and measured emissions of carbon
dioxide (CO2) and methane (CH4), rates of SR and MG,
and soil biogeochemistry throughout the 1-year exper-
iment. We specifically excluded plants from the
experimental design to minimize confounding factors,
136 Biogeochemistry (2011) 102:135–151
123
Author's personal copy
such as changes in C inputs as plants grow and senesce,
and salinity-related deaths of freshwater plants, to
focus on how salt-water intrusion impacts rates and
pathways of microbial organic matter mineralization.
Methods
Study site
The Delaware River is tidal as far north as Trenton,
New Jersey, although saline water seldom reaches
north of the Delaware–Pennsylvania border. Exten-
sive TFMs are found along the main channel and in
tributaries to the Delaware River between approxi-
mately Wilmington, Delaware and Trenton, New
Jersey (Patrick et al. 1973; Field and Philipp 2000).
We collected soils from the Woodbury Creek TFM
(39� 510 33.0500 N, 75� 100 23.3300 W), approximately
2 km from the confluence of this small tributary and
the Delaware River. This site is towards the lower
end of the freshwater tidal portion of the Delaware
River; just upriver of the highest reach of saline water
in recent years. Vegetation at this site includes
freshwater Peltandra virginica (arrow arum), Pont-
ederia cordata (pickerelweed) and Nuphar lutea
(yellow pond lily).
Experimental design
We collected 40 intact soil cores from the marsh
platform at the Woodbury Creek study site at low tide
in early spring (17 April 2006), before plants
emerged. Soils were collected in 10 cm (i.d.) poly-
vinylchloride tubes to a depth of approximately
25 cm, sealed at the bottom with gas- and water-
tight end caps, and transported to the laboratory. Two
cores were sectioned the following day for initial
porewater biogeochemical measurements (see Soil
Biogeochemistry below). Holes were drilled in the
core barrel just above the soil surface. Subsequently,
cores were randomly assigned to two separate tidal
tanks which were housed in an environmental
chamber at 20�C in the dark. The tidal tanks (100 L
each) allowed the core surface to be exposed to air for
a period of 6 h (low tide) followed by 6 h of
inundation (high tide). Both tidal tanks were initially
filled with artificial freshwater (AFW; Table 1),
which was changed several times a week to maintain
constant water chemistry. AFW chemistry was cho-
sen to represent average ion and nutrient concentra-
tions in the freshwater Delaware River.
After a 2 week pre-incubation period (days -14 to
0), the water in one tidal tank was replaced with
dilute artificial seawater (ASW; Table 1). The ASW
had a salinity of approximately 5 (about 14% of full
strength seawater), which was attained through
increasing major ion concentrations in proportion to
seawater while maintaining nutrient and inorganic C
concentrations as in the AFW (Table 1). Cores were
exposed to simulated tidal flooding and drainage with
AFW or ASW for 1-year (days 0–365). The water in
both tanks was changed at least once weekly (more
often during the first months of the experiments). We
measured concentrations of dissolved inorganic C
(DIC), chloride (Cl-), SO42-, ammonium (NH4
?),
nitrate ? nitrite (NOx), and phosphate (PO43-) in the
tidal tanks several times per week to ensure relatively
constant chemistry (see Soil Biogeochemistry for
analytical methods).
Gas flux rates
We measured rates of CO2 and CH4 gas emission
from the soil cores 2 to 3 times per week during the
initial 6 months of the experiment and once weekly
in the last 6 months. Gas fluxes were measured
during the low-tide portion of the tidal cycle when the
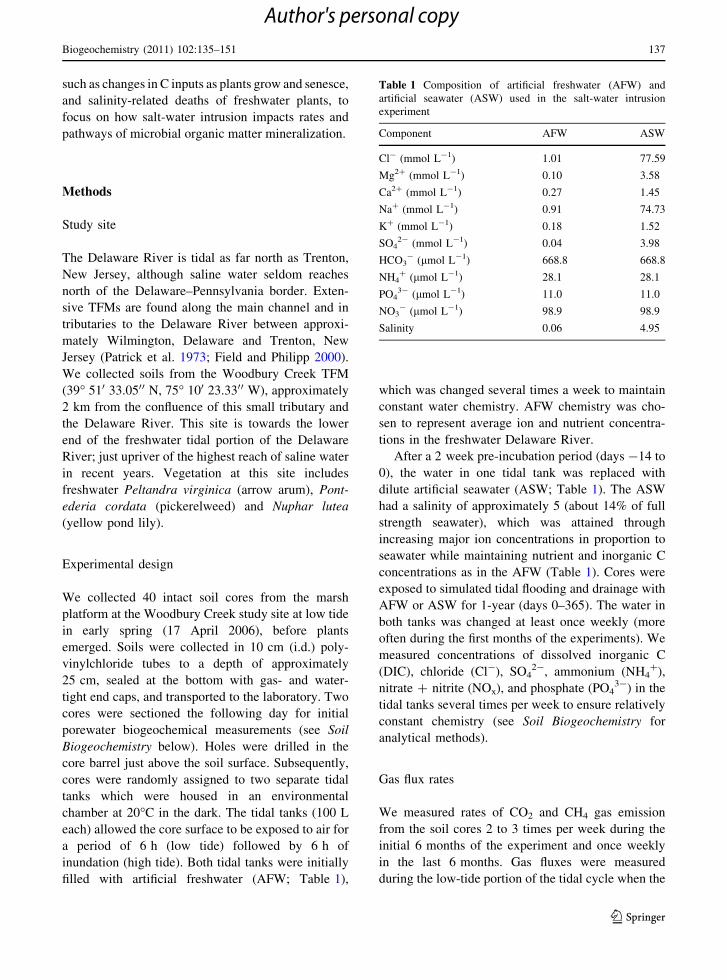
Table 1 Composition of artificial freshwater (AFW) and
artificial seawater (ASW) used in the salt-water intrusion
experiment
Component AFW ASW
Cl- (mmol L-1) 1.01 77.59
Mg2? (mmol L-1) 0.10 3.58
Ca2? (mmol L-1) 0.27 1.45
Na? (mmol L-1) 0.91 74.73
K? (mmol L-1) 0.18 1.52
SO42- (mmol L-1) 0.04 3.98
HCO3- (lmol L-1) 668.8 668.8
NH4? (lmol L-1) 28.1 28.1
PO43- (lmol L-1) 11.0 11.0
NO3- (lmol L-1) 98.9 98.9
Salinity 0.06 4.95
Biogeochemistry (2011) 102:135–151 137
123
Author's personal copy
soil surface was exposed. Cores were fitted with a
gas-tight cap, providing approximately 1.2 L of
headspace that was circulated with a small fan. An
infra-red gas analyzer (PP Systems EGM-4) was
connected to the cap in a flow-through configuration,
and CO2 concentration was measured in the head-
space every 1 min for 10 min. When CO2 measure-
ments were complete, an initial headspace sample
(3 mL) for CH4 was obtained with a gas-tight
syringe. Final CH4 samples were obtained after
approximately 1 h. CH4 samples were analyzed
immediately by flame ionization detection gas chro-
matography (Agilent 6890 N with Porapak Q col-
umn). Changes in CO2 and CH4 gas concentrations
over time in the headspace were used to determine
gas flux rates.
CO2 gas flux rates were measured on all cores
during each of 85 sampling dates for a total of 1453
CO2 flux measurements. Due to logistical constraints,
CH4 flux was measured on a subset of 4 AFW and 4
ASW cores during each sampling (72 dates for a total
of 618 CH4 flux measurements). Equipment failure
resulted in no CH4 measurements from days 200 to
270.
To assess whether CO2 and CH4 flux rates differed
between periods of core inundation and core expo-
sure, we compared gaseous flux rates as described
above with aqueous flux measurements. Aqueous flux
rates were measured on duplicate cores from each
treatment on 6 different dates (day 0, 5, 12, 27, 47
and 82; on day 0 only duplicate freshwater cores were
incubated). Cores were capped without a gas head-
space and incubated for approximately 8 h with
continuous mixing of the overlying water. Water
samples were obtained about every 2 h. For DIC
measurements, 8 mL of headspace water was
removed and placed into a glass vial, 50 lL of
HgCl2 was added to halt microbial activity, and the
vial was capped without headspace. DIC concentra-
tions were determined on a Shimadzu TOC-VCSH
instrument. For dissolved CH4, 5 mL of sample was
injected into a 12 mL headspace vial and preserved
with 2 mL of 1 N HCl. Following equilibration, the
concentration of CH4 in the gas headspace of these
vials was determined by gas chromatography. DIC
and CH4 flux rates under inundated conditions were
then calculated from the changes in DIC and CH4
concentrations in the flooded core headspace over
time.
Rates of microbial sulfate reduction
and methanogenesis
We sectioned soil cores periodically throughout the
experiment to determine depth-specific rates of both
microbial SR and MG and porewater and solid-phase
biogeochemistry (see Soil Biogeochemistry below).
Duplicate cores were sectioned after field collection
(on day -14) and just prior to salt-water amendment
(day 0). Duplicate cores were removed from the ASW
tank and sectioned on days 5, 12, 27, 47, 82, 160 and
364, with sampling from the AFW tank occurring the
following day. Due to the destructive nature of the
sampling, the number of cores in each tidal tank
decreased by two following each sampling timepoint.
Soil cores were sectioned in 2 cm depth increments
to a depth of 20 cm in an O2-free (N2) atmosphere.
Depth-specific rates of microbial SR, hydrogeno-
trophic MG (HMG) and acetoclastic MG (AMG) were
determined on duplicate 2 cm3 sub-samples from the
0–2, 2–4, 4–6, 8–10, 12–14 and 18–20 cm depths. Six
intact sub-samples from each section were taken using
5 mL cut-off syringes that were immediately capped
with silicon stoppers. Approximately 0.2 lCi of35SO4
2-, 1 lCi of H14CO3-, and 0.2 lCi of
14CH3COOH were injected into separate sub-cores
(2 each) and the samples were incubated at 20�C for
12-16 h. Sub-samples containing 35S were then fixed
in 10 mL of 20% zinc acetate and immediately frozen.
Sub-samples containing 14C were injected into a
12 mL headspace vial and immediately fixed with
2 mL of 6 N HCl to stop metabolic activity and
convert DIC into CO2. Activity of the total reduced
sulfur (TRS) pool was quantified by liquid scintillation
counting following cold distillation (Kallmeyer et al.
2004), and rates of SR were calculated as
SR ¼ TR35S� 35SO42�� ��1� SO4
2�� �
� u� aSR� t�1 ð1Þ
where 35SO42- is the activity of the initial SO4
2-
added, [SO42-] is the concentration of SO4
2- in the
soil porewater, u is the porosity of the soil (cm3 water
cm-3 soil), aSR is the isotope fractionation factor of
SR (1.06; Jørgensen 1978) and t is incubation time.
The 14C activities of CH4 and CO2 in MG samples
were determined by gas chromatography. The gas
headspace from acidified soil slurries was purged for
10 min with helium and trapped onto a 5 cm length
138 Biogeochemistry (2011) 102:135–151
123
Author's personal copy
of Porapak Q column under liquid nitrogen. The
trapped gases were then injected into a gas chro-
matograph (Agilent 6890 N) with a 1 m Porapak Q
column for separation and quantification of CH4 (by
flame ionization detection) and CO2 (by thermal
conductivity detection), and quantification of 14CH4
and 14CO2 activities by gas counting (Raytest Raga
Star). Purging and trapping efficiency was [99% for
CH4 and[95% for CO2. The activity of samples was
determined relative to the activity of 14CO2 standards,
after determining that the counting efficiency of14CH4 and 14CO2 was equivalent. Rates of hydro-
genotrophic HMG and AMG were quantified in a
similar manner to SR rates (Eq. 1):
HMG ¼ 14CH4 � DI14C� ��1� DIC½ �
� u� aHM� t�1 ð2Þ
AMG ¼ 14CH4 � 14CH3COOH� ��1� CH3COOH½ �
� u� aAM� t�1 ð3Þ
where 14CH4 is the activity of the measured CH4,
(DI14C) and (14CH3COOH) are the activities of the
DIC and acetate additions, respectively, [DIC] and
[CH3COOH] are the porewater concentrations of
DIC and acetate, respectively, and aHM and aAM
are the isotope fractionation factors for HMG and
AMG, respectively (both 1.06, Orcutt et al. 2005).
Total organic C (CH2O) mineralized through each
anaerobic microbial pathway was estimated assuming
the following stoichiometries:
SR : 2CH2Oþ SO42� þ 2Hþ
! 2CO2 þ H2Sþ 2H2O ð4Þ
AMG : 2CH2O! CH4 þ CO2 ð5ÞHMG : CO2 þ 4H2 ! CH4 þ 2H2O ð6Þ
The amount of SO42- reduced (for SR; Eq. 1) or CH4
produced (for MG; Eqs. 2 and 3) via each process
was used to determine the total amount of organic C
mineralized to CO2 and CH4. For SR and AMG,
2 mol C are mineralized per SO42- reduced (Eq. 4)
or CH4 produced (Eq. 5), while there is no net C
mineralization for HMG (Eq. 6). The rates of CO2
and CH4 production and total organic C (TC)
mineralization are then:
CO2 ¼ 2 � SRþ AMG ð7Þ
CH4 ¼ AMGþ HMG ð8ÞTC ¼ 2 � SRþ 2 � AMG ð9Þ
Soil biogeochemistry
Porewater and solid-phase biogeochemistry was deter-
mined on the same soil cores used for microbial SR and
MG rates on each 2 cm soil section between the surface
and 20 cm depth. Two cm3 of soil was placed into an
aluminum weigh dish for determination of bulk density,
porosity, and elemental analysis after drying at 90�C.
C and N content was determined on dried, ground soil
using a Leco TruSpec CN analyzer. Carbonates did not
contribute to the C content of these soils [unacidi-
fied = 0.997 (acidified) ? 0.18; R2 = 0.88; n = 87
samples from throughout the experiment and from both
treatments] and the CN content reported here is for
unacidified samples. For determination of porewater
CH4 concentrations, 2 cm3 of soil was placed into
duplicate 12 mL headspace vials which were immedi-
ately sealed. Four mL of 1 N HCl was injected into the
vial, and the contents shaken vigorously to stop
microbial activity and equilibrate the porewater gases
with the vial headspace. CH4 concentration was deter-
mined on the headspace of these vials by gas
chromatography.
We placed 50 cm3 of soil into centrifuge tubes
under an N2 atmosphere, centrifuged the soil at
4000 rpm for 15 min, and split aliquots of porewater
into several vials for various analyses. One mL of
unfiltered porewater was preserved with 50 lL of a
saturated HgCl2 solution for DIC analysis on a
Shimadzu TOC-VCSH. One mL of unfiltered porewater
was pipetted into a 20% zinc acetate solution for later
determination of reduced sulfide concentrations (Cline
1969). Four mL of 0.7 lm nominal filtered (GF/F)
porewater was preserved with 50 lL of 6 N HNO3,
2 mL of filtered sample was immediately frozen, and
the remaining sample (1–5 mL) was filtered and
refrigerated.
Porewater Cl- and SO42- (Dionex DX 500 ion
chromatograph) and PO43- (phosphomolybdate
method; Murphy and Riley 1962) concentrations were
determined on nitric acid acidified samples. Dissolved
organic carbon (DOC) concentrations were deter-
mined by high-temperature combustion following
sparging of acidified samples on a Shimadzu TOC-
VCSH. NH4? (phenolhypochlorite method; Solorzano
Biogeochemistry (2011) 102:135–151 139
123
Author's personal copy
1969) and NOx (flow injection autoanalyzer following
cadmium reduction) concentrations were measured on
un-acidified, refrigerated samples. Acetate was deter-
mined on frozen samples by high-pressure liquid
chromatography (Agilent 1200 series) following sam-
ple derivitization (Albert and Martens 1997).
Data analysis
Porewater and solid phase biogeochemical variables
and microbial rates were integrated over a 20 cm
depth, with linear interpolations between data points
when data were missing (e.g., rates were measured on
only 6 of 10 depths). Porewater and solid phase
measurements were converted to volumetric units
(i.e., mmol cm-3) using measured soil porosity and
bulk density, respectively. Statistical analyses of the
data were conducted using linear regressions and
univariate analysis of variance (ANOVA) with least
squares difference corrections of confidence intervals
for main effects using SPSS (v16.0). Additional pair-
wise comparisons of means were made using T tests
for independent samples.
Results
Gas flux
Gaseous CO2 flux rates were significantly higher for
cores undergoing salt-water intrusion (Fig. 1,
p \ 0.001, F1,1452 = 95.38). The CO2 flux from the
salt-water amended marsh soils increased above flux
rates from freshwater controls rapidly (\1 week)
following salt-water intrusion and remained
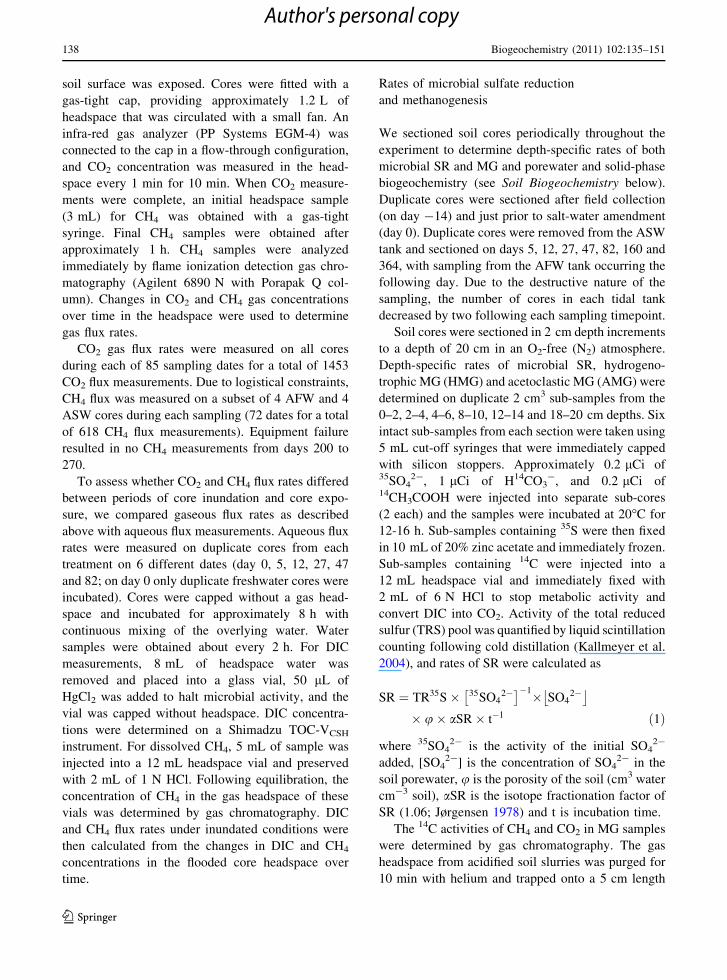
Fig. 1 Daily and monthly carbon dioxide (CO2; top), methane
(CH4; middle) and total C (bottom) gas fluxes (mmol m-2 h-1;
mean ± SE) from freshwater soil cores and soil cores exposed
to dilute salt-water. The percent increase in flux from salt-water
amended soils versus freshwater controls for monthly averages
are shown, and shading indicates months for which differences
between treatments are significant (p \ 0.05; months 1–6 for
CO2, 1–5 for CH4 and 1–5 for total C). No CH4 (and therefore
total C) data are available from day 200 to day 270 due to
equipment failure
140 Biogeochemistry (2011) 102:135–151
123
Author's personal copy
significantly higher for the first 6 months of the
experiment (Fig. 1, p \ 0.05). Maximum flux rates in
both treatments were measured during months 1
through 3 averaging *2.7 mmol m-2 h-1 in the
salt-water amended cores and *2.2 mmol m-2 h-1
in the freshwater cores (Fig. 1). The relative difference
in CO2 flux from salt-water amended soils increased to
20% in the first several months following salt-water
intrusion, with a peak of 45% in the 5th month
(Fig. 1). There was a significant decline in CO2 gas flux
over time in both the freshwater (CO2 flux =
-0.0037 9 day ? 2.19, t = -18.02, p \ 0.001, R2 =
0.32, F1,696 = 324.61) and salt-water amended soils
(CO2 flux = -0.0040 9 day ? 2.61, t = -12.61,
p \ 0.001, R2 = 0.17, F1,756 = 159.08).
CH4 fluxes (Fig. 1) were significantly higher for
cores undergoing salt-water intrusion (p \ 0.001,
F1,617 = 44.04) and this difference persisted for
5 months (p \ 0.05, Fig. 1). CH4 flux from salt-water
amended cores peaked in month 3 with an average rate
of about 3.3 mmol m-2 h-1 (Fig. 1). The flux of CH4
from salt-water amended soils was 70% (in month 1) to
1200% (month 5) higher than flux rates from freshwater
soils (Fig. 1). Note that CH4 flux rates were not
significantly different for 2 months (months 6 and 7)
prior to data loss during months 8 and 9 (Fig. 1). As
was observed for CO2 flux, the flux of CH4 declined
significantly over time from the freshwater
(CH4 flux = -0.0021 9 day ? 0.84, t = -3.26, p =
0.001, R2 = 0.03, F1,313 = 10.65) and salt-water
amended soils (CH4 flux = -0.0050 9 day ? 2.15,
t = -3.75, p \ 0.001, R2 = 0.04, F1,305 = 14.05).
Overall, total gaseous C fluxes (CO2 ? CH4) were
significantly higher from salt-water amended marsh
soils for 5 months following salt-water intrusion
(p \ 0.001, F1 = 52.46), and C emissions ranged
from 40% (in month 1) to 175% (in month 5) higher
from the cores undergoing salt-water exposure than
from freshwater cores (Fig. 1). Total C flux from salt-
water impacted marsh soils peaked in month 3 at a
rate of about 6 mmol C m-2 h-1 (Fig. 1).
During the first 90 days of the experiment (when
inundated flux measurements were conducted) the
average DIC flux rates when the soils were flooded
were not significantly different than CO2 gas fluxes
when soils were exposed (Table 2; p = 0.84,
F1,865 = 0.66). In contrast, there was a significant
difference between exposed and inundated CH4
fluxes (Table 2; p = 0.02; F1,379 = 5.79). The ratio
of CH4 emissions in inundated versus exposed cores
(R(Ind/Exp)) was 0.46 and 0.22 in freshwater and salt-
water amended cores, respectively (Table 2).
Total CO2 and CH4 emissions over the 1-year
experiment were calculated. As there was no signif-
icant difference between inundated and exposed CO2/
DIC flux (Table 2), the measured CO2 gas fluxes
(Fig. 1) were integrated over 1-year for 24 h per day.
14.2 mol CO2 m-2 was emitted from freshwater soils
compared with 17.3 mol CO2 m-2 from soils exposed
to salt-water. Because of the lower CH4 emissions
when soils were flooded (Table 2), the CH4 gas flux
measurements (Fig. 1) were assumed to represent
CH4 emissions for 12 h per day when soils were
exposed. To determine CH4 emissions for the
remaining 12 h per day when soils were flooded,
the CH4 gas flux measurements (Fig. 1) were multi-
plied by the appropriate R(Ind/Exp) (Table 2). The total
CH4 flux over the 1-year experiment was calculated
Table 2 Average (±standard deviation; SD) carbon dioxide (CO2) and methane (CH4) flux rates (mmol m-2 h-1) from freshwater
and salt-water amended soil cores under exposed and inundated conditions, and the ratio of inundated to exposed flux (R(Ind/Exp)) rates
during the initial 90 days of the experiment
CO2 CH4
Freshwater Salt-amended Freshwater Salt-amended
Mean SD n Mean SD n Mean SD n Mean SD n
Exposed 2.17 0.54 396 2.54 0.91 449 0.86 1.37 182 2.12 2.68 177
Inundated 2.36 2.00 14 2.28 1.72 10 0.40 0.36 14 0.46 0.48 10
R(Ind/Exp) 1.09 0.90 0.46 0.22
The number of measurements (n) is shown. Note that the difference between exposed and inundated measurements is significantly
different for CH4 (p = 0.02; F1,379 = 5.79) but not for CO2 (p = 0.84, F1,865 = 0.66)
Biogeochemistry (2011) 102:135–151 141
123
Author's personal copy
to be 3.9 and 7.5 mol m-2 from freshwater and salt-
water amended cores, respectively. The total C gas
flux over the 1-year experiment from freshwater cores
was 18.2 mol m-2, compared with 24.9 mol m-2
from salt-water amended soils.
Rates of microbial sulfate reduction
and methanogenesis
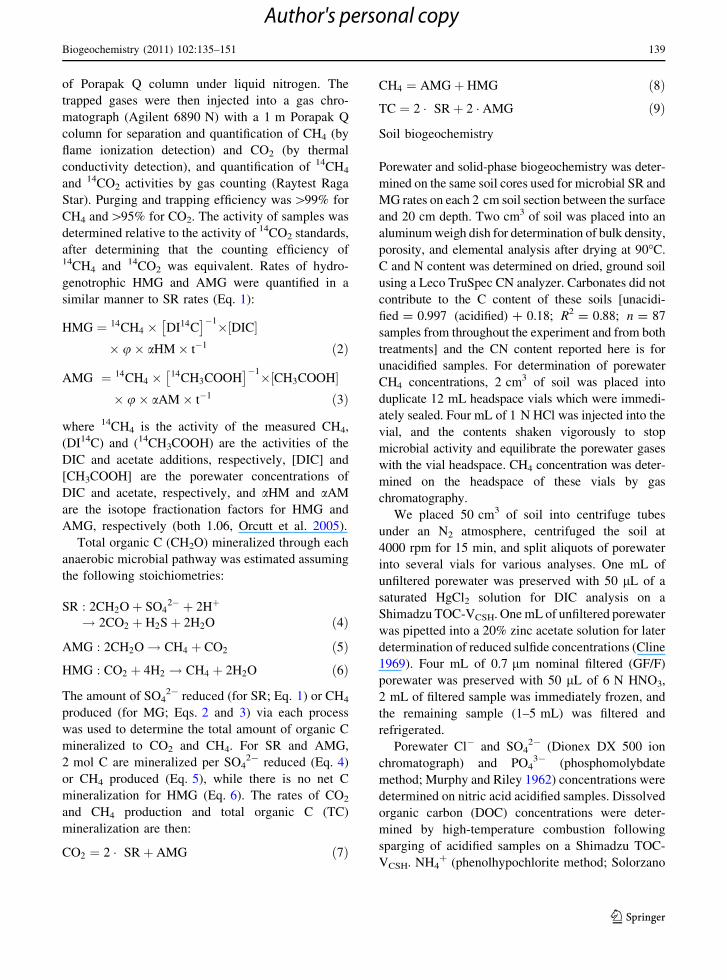
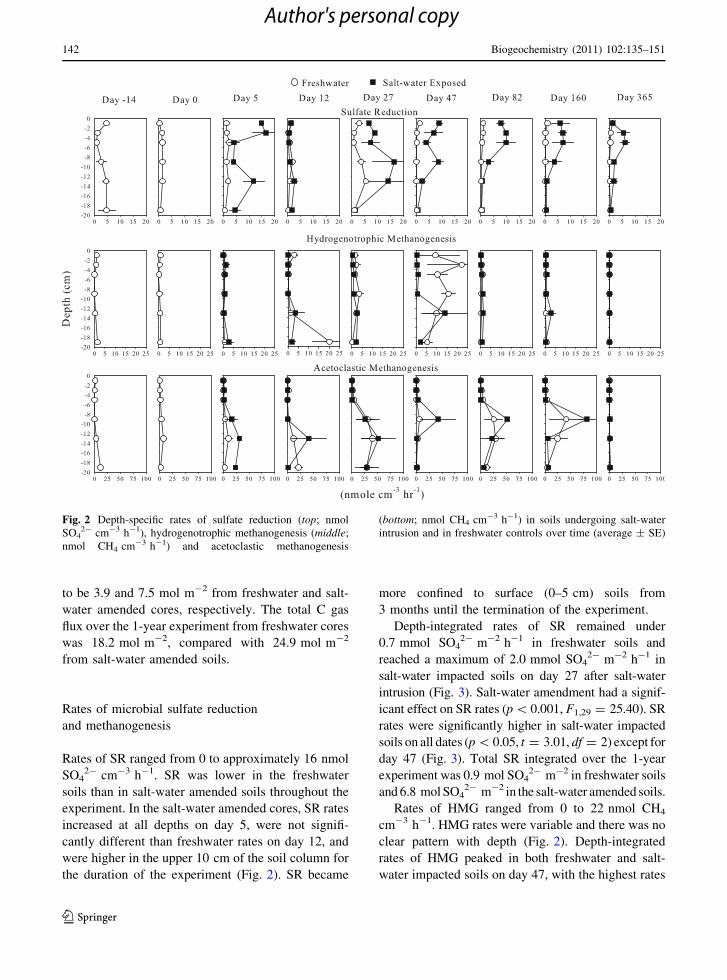
Rates of SR ranged from 0 to approximately 16 nmol
SO42- cm-3 h-1. SR was lower in the freshwater
soils than in salt-water amended soils throughout the
experiment. In the salt-water amended cores, SR rates
increased at all depths on day 5, were not signifi-
cantly different than freshwater rates on day 12, and
were higher in the upper 10 cm of the soil column for
the duration of the experiment (Fig. 2). SR became
more confined to surface (0–5 cm) soils from
3 months until the termination of the experiment.
Depth-integrated rates of SR remained under
0.7 mmol SO42- m-2 h-1 in freshwater soils and
reached a maximum of 2.0 mmol SO42- m-2 h-1 in
salt-water impacted soils on day 27 after salt-water
intrusion (Fig. 3). Salt-water amendment had a signif-
icant effect on SR rates (p \ 0.001, F1,29 = 25.40). SR
rates were significantly higher in salt-water impacted
soils on all dates (p \ 0.05, t = 3.01, df = 2) except for
day 47 (Fig. 3). Total SR integrated over the 1-year
experiment was 0.9 mol SO42- m-2 in freshwater soils
and 6.8 mol SO42- m-2 in the salt-water amended soils.
Rates of HMG ranged from 0 to 22 nmol CH4
cm-3 h-1. HMG rates were variable and there was no
clear pattern with depth (Fig. 2). Depth-integrated
rates of HMG peaked in both freshwater and salt-
water impacted soils on day 47, with the highest rates
Fig. 2 Depth-specific rates of sulfate reduction (top; nmol
SO42- cm-3 h-1), hydrogenotrophic methanogenesis (middle;
nmol CH4 cm-3 h-1) and acetoclastic methanogenesis
(bottom; nmol CH4 cm-3 h-1) in soils undergoing salt-water
intrusion and in freshwater controls over time (average ± SE)
142 Biogeochemistry (2011) 102:135–151
123
Author's personal copy
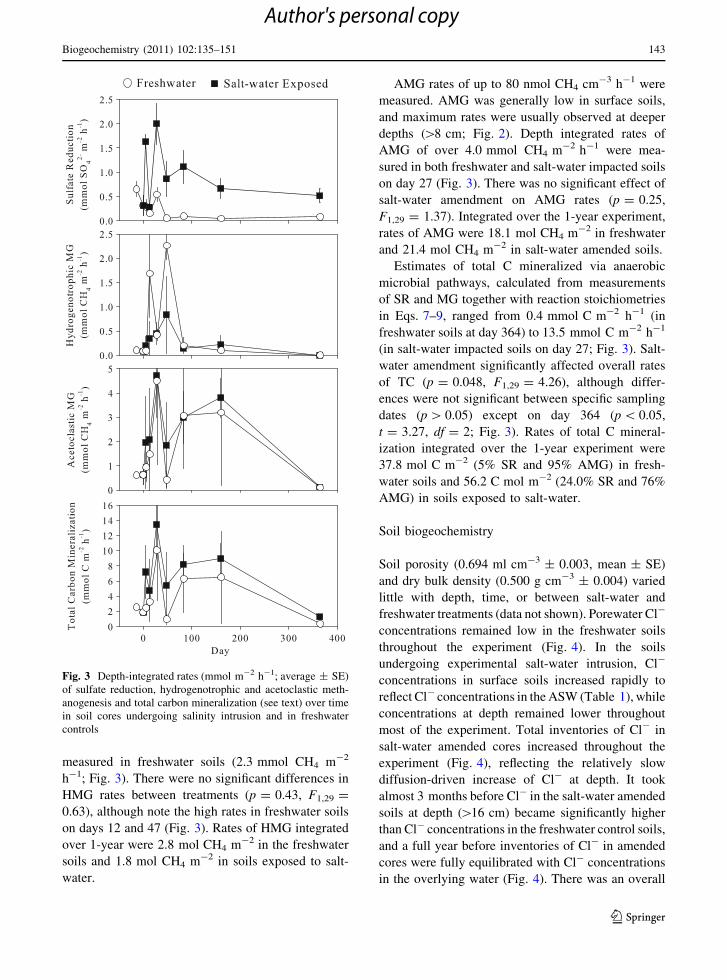
measured in freshwater soils (2.3 mmol CH4 m-2
h-1; Fig. 3). There were no significant differences in
HMG rates between treatments (p = 0.43, F1,29 =
0.63), although note the high rates in freshwater soils
on days 12 and 47 (Fig. 3). Rates of HMG integrated
over 1-year were 2.8 mol CH4 m-2 in the freshwater
soils and 1.8 mol CH4 m-2 in soils exposed to salt-
water.
AMG rates of up to 80 nmol CH4 cm-3 h-1 were
measured. AMG was generally low in surface soils,
and maximum rates were usually observed at deeper
depths ([8 cm; Fig. 2). Depth integrated rates of
AMG of over 4.0 mmol CH4 m-2 h-1 were mea-
sured in both freshwater and salt-water impacted soils
on day 27 (Fig. 3). There was no significant effect of
salt-water amendment on AMG rates (p = 0.25,
F1,29 = 1.37). Integrated over the 1-year experiment,
rates of AMG were 18.1 mol CH4 m-2 in freshwater
and 21.4 mol CH4 m-2 in salt-water amended soils.
Estimates of total C mineralized via anaerobic
microbial pathways, calculated from measurements
of SR and MG together with reaction stoichiometries
in Eqs. 7–9, ranged from 0.4 mmol C m-2 h-1 (in
freshwater soils at day 364) to 13.5 mmol C m-2 h-1
(in salt-water impacted soils on day 27; Fig. 3). Salt-
water amendment significantly affected overall rates
of TC (p = 0.048, F1,29 = 4.26), although differ-
ences were not significant between specific sampling
dates (p [ 0.05) except on day 364 (p \ 0.05,
t = 3.27, df = 2; Fig. 3). Rates of total C mineral-
ization integrated over the 1-year experiment were
37.8 mol C m-2 (5% SR and 95% AMG) in fresh-
water soils and 56.2 C mol m-2 (24.0% SR and 76%
AMG) in soils exposed to salt-water.
Soil biogeochemistry
Soil porosity (0.694 ml cm-3 ± 0.003, mean ± SE)
and dry bulk density (0.500 g cm-3 ± 0.004) varied
little with depth, time, or between salt-water and
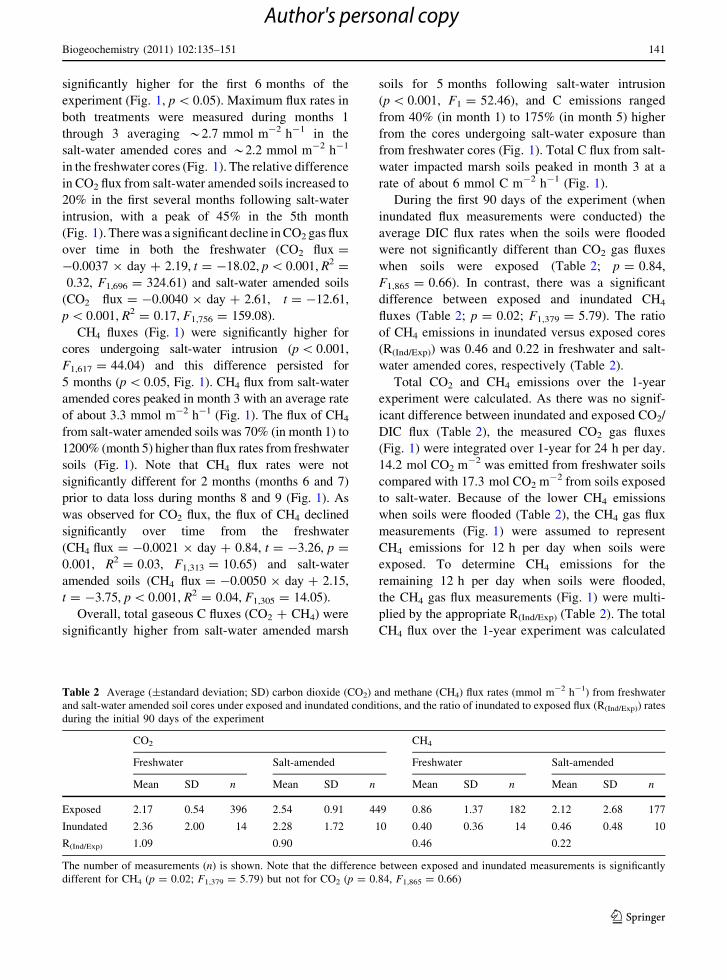
freshwater treatments (data not shown). Porewater Cl-
concentrations remained low in the freshwater soils
throughout the experiment (Fig. 4). In the soils
undergoing experimental salt-water intrusion, Cl-
concentrations in surface soils increased rapidly to
reflect Cl- concentrations in the ASW (Table 1), while
concentrations at depth remained lower throughout
most of the experiment. Total inventories of Cl- in
salt-water amended cores increased throughout the
experiment (Fig. 4), reflecting the relatively slow
diffusion-driven increase of Cl- at depth. It took
almost 3 months before Cl- in the salt-water amended
soils at depth ([16 cm) became significantly higher
than Cl- concentrations in the freshwater control soils,
and a full year before inventories of Cl- in amended
cores were fully equilibrated with Cl- concentrations
in the overlying water (Fig. 4). There was an overall
Fig. 3 Depth-integrated rates (mmol m-2 h-1; average ± SE)
of sulfate reduction, hydrogenotrophic and acetoclastic meth-
anogenesis and total carbon mineralization (see text) over time
in soil cores undergoing salinity intrusion and in freshwater
controls
Biogeochemistry (2011) 102:135–151 143
123
Author's personal copy
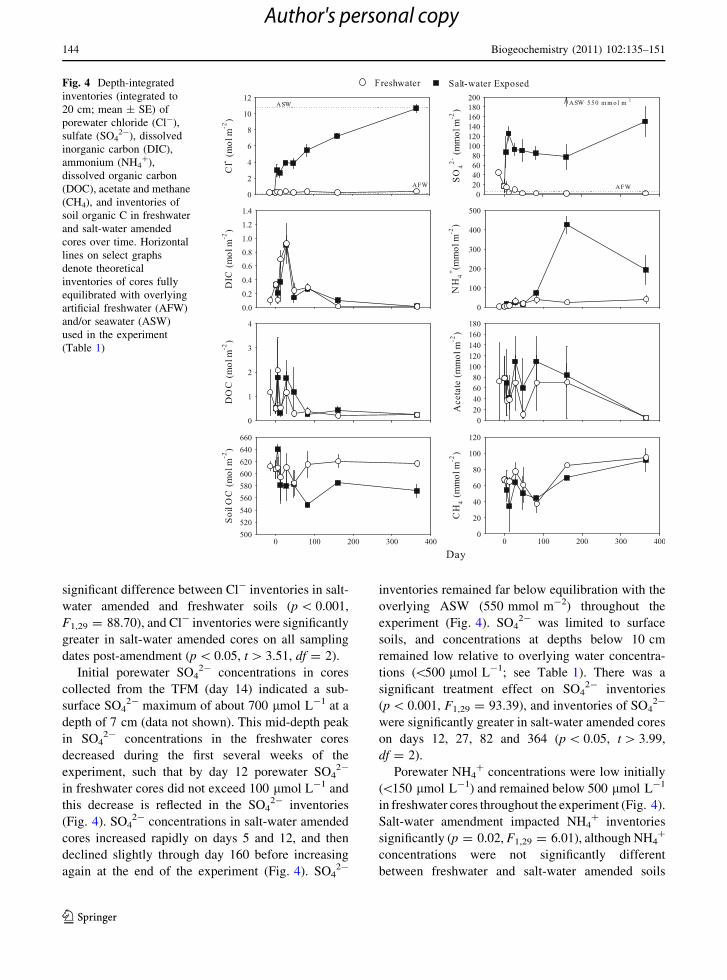
significant difference between Cl- inventories in salt-
water amended and freshwater soils (p \ 0.001,
F1,29 = 88.70), and Cl- inventories were significantly
greater in salt-water amended cores on all sampling
dates post-amendment (p \ 0.05, t [ 3.51, df = 2).
Initial porewater SO42- concentrations in cores
collected from the TFM (day 14) indicated a sub-
surface SO42- maximum of about 700 lmol L-1 at a
depth of 7 cm (data not shown). This mid-depth peak
in SO42- concentrations in the freshwater cores
decreased during the first several weeks of the
experiment, such that by day 12 porewater SO42-
in freshwater cores did not exceed 100 lmol L-1 and
this decrease is reflected in the SO42- inventories
(Fig. 4). SO42- concentrations in salt-water amended
cores increased rapidly on days 5 and 12, and then
declined slightly through day 160 before increasing
again at the end of the experiment (Fig. 4). SO42-
inventories remained far below equilibration with the
overlying ASW (550 mmol m-2) throughout the
experiment (Fig. 4). SO42- was limited to surface
soils, and concentrations at depths below 10 cm
remained low relative to overlying water concentra-
tions (\500 lmol L-1; see Table 1). There was a
significant treatment effect on SO42- inventories
(p \ 0.001, F1,29 = 93.39), and inventories of SO42-
were significantly greater in salt-water amended cores
on days 12, 27, 82 and 364 (p \ 0.05, t [ 3.99,
df = 2).
Porewater NH4? concentrations were low initially
(\150 lmol L-1) and remained below 500 lmol L-1
in freshwater cores throughout the experiment (Fig. 4).
Salt-water amendment impacted NH4? inventories
significantly (p = 0.02, F1,29 = 6.01), although NH4?
concentrations were not significantly different
between freshwater and salt-water amended soils
Fig. 4 Depth-integrated
inventories (integrated to
20 cm; mean ± SE) of
porewater chloride (Cl-),
sulfate (SO42-), dissolved
inorganic carbon (DIC),
ammonium (NH4?),
dissolved organic carbon
(DOC), acetate and methane
(CH4), and inventories of
soil organic C in freshwater
and salt-water amended
cores over time. Horizontal
lines on select graphs
denote theoretical
inventories of cores fully
equilibrated with overlying
artificial freshwater (AFW)
and/or seawater (ASW)
used in the experiment
(Table 1)
144 Biogeochemistry (2011) 102:135–151
123
Author's personal copy
except on day 160 when NH4? inventories in salt-water
amended soils peaked at over 400 mmol m-2 (Fig. 4,
p \ 0.05, t = 9.06, df = 2). DIC concentrations were
variable between replicate cores, and there were no
significant differences between treatments for whole
core inventories (p = 0.90, F1,29 = 0.02, Fig. 4).
There was a consistent pattern over time for both
treatments, in which inventories increased in both
freshwater and salt-water amended soils until day 27
and then decreased. Porewater DIC inventories were
quite low by the termination of the experiment (Fig. 4).
Porewater acetate concentrations were consistently
higher at depth than in surface soils. Acetate
concentrations in the top 4 cm remained below
400 lmol L-1, while maximum concentrations
exceeded 1 mmol L-1 at depths below 8 cm. Acetate
concentrations were variable and there were no
significant differences between treatments for whole
core inventories (p = 0.27, F1,29 = 1.27), although
acetate inventories were consistently larger in salt-
water amended soils (Fig. 4). Inventories of pore-
water DOC were highly variable and there were no
significant differences between salt-water amended
and freshwater control soils (Fig. 4, p = 0.57,
F1,29 = 0.34). DOC concentrations were consistently
low by day 82, however, and remained low for the
duration of the experiment (Fig. 4).
Whole core CH4 inventories were not significantly
different between freshwater and salt-water amended
soils (Fig. 4, p = 0.10, F1,29 = 2.96), although inven-
tories in both treatments increased over time
(p = 0.002, F1,29 = 12.18). Soil inventories of PO43-
and NOx were consistently low (\10 mmol m-2), were
not significantly different between treatments
(p [ 0.05) and did not exhibit patterns over time (data
not shown). Porewater sulfide concentrations were
below detection (*1 lmol L-1) in all cores at all
depths (data not shown).
Soil solid phase organic C ranged between 5.0 and
9.5% by weight, and total N ranged from 0.3 and
0.8% by weight. There was no significant change in N
over time or between treatments (p [ 0.05, data not
shown). Inventories of organic C were significantly
different between salt-water amended and freshwater
soils (p = 0.043, F1,29 = 4.50), and organic C was
significantly lower in salt-water amended soils on
days 82, 160 and 364 compared to freshwater soils
and to initial organic C values (Fig. 4, p \ 0.05,
t \ -2.98, df = 2). The average soil inventory of
organic C on these 3 sampling dates (n = 6 cores per
treatment) was 568.2 (±7.7 SE) mol m-2 for salt-
water amended cores versus 617.3 (± 7.5 SE)
mol m-2 for freshwater cores and 612.2 (±8.3 SE)
mol m-2 for the initial organic C inventory on day 14
(Fig. 4).
Discussion
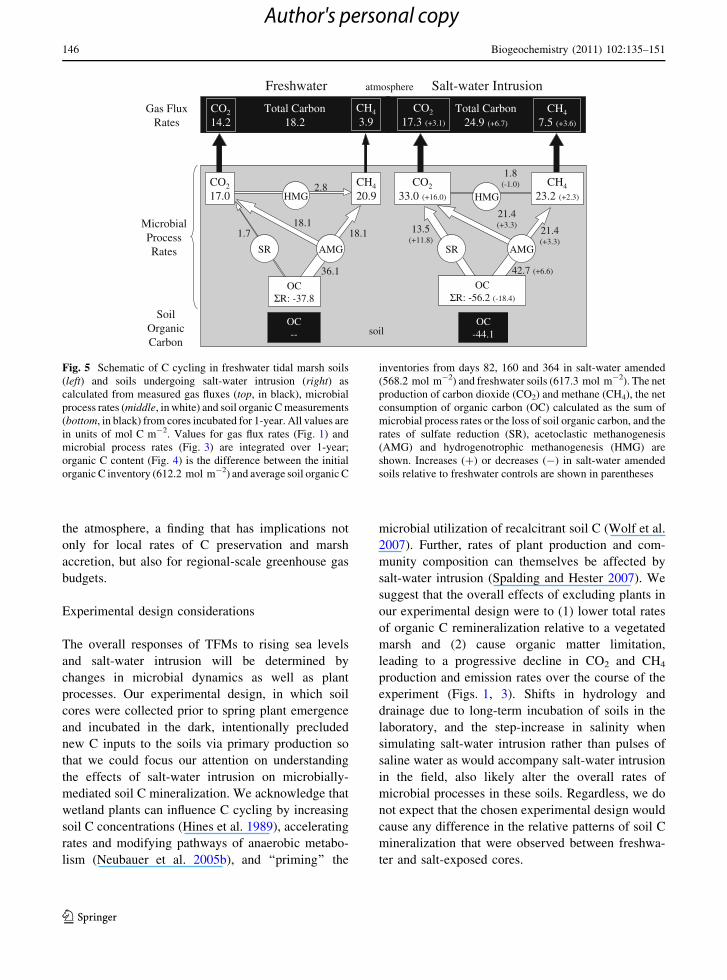
Our research has documented that salt-water intrusion
into TFM soils can significantly increase rates of
microbial C mineralization (Fig. 5). We used three
independent approaches to assess C mineralization,
including (1) changes in soil organic C, (2) microbial
sulfate reduction and methanogenesis rate measure-
ments, and (3) C gas fluxes from soils following
simulated salt-water intrusion and in freshwater
controls. The lack of measurable decrease in the
organic C in freshwater controls (Figs. 4, 5), coupled
with the differences between rates of CO2 and CH4
production by microbial mineralization and the flux
of these gases from the soils (Fig. 5), suggests these
three measures of soil C dynamics were prone to
some uncertainties. That these three independent
approaches agree on the relative impact of salt-water
intrusion on microbial C cycling in TFM soils,
however, clearly indicates that the mineralization of
organic C accelerates following salt-water intrusion
into tidal freshwater marshes.
The total amount of CO2 and CH4 released from
salt-water amended cores (24.9 mol m-2) was 36.9%
greater than the total inorganic C flux from freshwa-
ter cores (18.2 mol m-2) over the 1-year experiment.
Similarly, the amount of organic matter mineralized
via SR and MG within soils experiencing salt-water
intrusion (56.2 mol m-2) was greater than mineral-
ization in freshwater soils (37.8 mol m-2) by 49%.
Finally, the higher rates of organic matter decompo-
sition in salt-water amended soils were reflected in a
loss of soil organic C (44.1 mol m-2) from these
soils (Fig. 5). These results reinforce earlier work
about the effects of salinity on C turnover in a short-
term (30 d) experiment with freshwater riverine
sediments (Weston et al. 2006) and in a year-long
root decomposition study along an estuarine salinity
gradient (Craft 2007). However, unlike these earlier
studies, our research has shown that salt-water
intrusion can accelerate rates of CH4 emission to
Biogeochemistry (2011) 102:135–151 145
123
Author's personal copy
the atmosphere, a finding that has implications not
only for local rates of C preservation and marsh
accretion, but also for regional-scale greenhouse gas
budgets.
Experimental design considerations
The overall responses of TFMs to rising sea levels
and salt-water intrusion will be determined by
changes in microbial dynamics as well as plant
processes. Our experimental design, in which soil
cores were collected prior to spring plant emergence
and incubated in the dark, intentionally precluded
new C inputs to the soils via primary production so
that we could focus our attention on understanding
the effects of salt-water intrusion on microbially-
mediated soil C mineralization. We acknowledge that
wetland plants can influence C cycling by increasing
soil C concentrations (Hines et al. 1989), accelerating
rates and modifying pathways of anaerobic metabo-
lism (Neubauer et al. 2005b), and ‘‘priming’’ the
microbial utilization of recalcitrant soil C (Wolf et al.
2007). Further, rates of plant production and com-
munity composition can themselves be affected by
salt-water intrusion (Spalding and Hester 2007). We
suggest that the overall effects of excluding plants in
our experimental design were to (1) lower total rates
of organic C remineralization relative to a vegetated
marsh and (2) cause organic matter limitation,
leading to a progressive decline in CO2 and CH4
production and emission rates over the course of the
experiment (Figs. 1, 3). Shifts in hydrology and
drainage due to long-term incubation of soils in the
laboratory, and the step-increase in salinity when
simulating salt-water intrusion rather than pulses of
saline water as would accompany salt-water intrusion
in the field, also likely alter the overall rates of
microbial processes in these soils. Regardless, we do
not expect that the chosen experimental design would
cause any difference in the relative patterns of soil C
mineralization that were observed between freshwa-
ter and salt-exposed cores.
Total Carbon18.2
AMGSR
OCΣR: -37.8
HMG
1.7
CH4
20.9
36.1
18.118.1
2.8CO2
17.0
AMGSR
OCΣR: -56.2 (-18.4)
HMG
13.5(+11.8)
42.7 (+6.6)
21.4(+3.3)
21.4(+3.3)
1.8(-1.0)
Freshwater Salt-water Intrusion
soil
atmosphere
CH4
23.2 (+2.3)
CO2
33.0 (+16.0)
CO2
14.2CH4
3.9Total Carbon
24.9 (+6.7)
CO2
17.3 (+3.1)
CH4
7.5 (+3.6)
Gas FluxRates
Microbial Process Rates
Soil Organic Carbon
OC--
OC-44.1
Fig. 5 Schematic of C cycling in freshwater tidal marsh soils
(left) and soils undergoing salt-water intrusion (right) as
calculated from measured gas fluxes (top, in black), microbial
process rates (middle, in white) and soil organic C measurements
(bottom, in black) from cores incubated for 1-year. All values are
in units of mol C m-2. Values for gas flux rates (Fig. 1) and
microbial process rates (Fig. 3) are integrated over 1-year;
organic C content (Fig. 4) is the difference between the initial
organic C inventory (612.2 mol m-2) and average soil organic C
inventories from days 82, 160 and 364 in salt-water amended
(568.2 mol m-2) and freshwater soils (617.3 mol m-2). The net
production of carbon dioxide (CO2) and methane (CH4), the net
consumption of organic carbon (OC) calculated as the sum of
microbial process rates or the loss of soil organic carbon, and the
rates of sulfate reduction (SR), acetoclastic methanogenesis
(AMG) and hydrogenotrophic methanogenesis (HMG) are
shown. Increases (?) or decreases (-) in salt-water amended
soils relative to freshwater controls are shown in parentheses
146 Biogeochemistry (2011) 102:135–151
123
Author's personal copy
Salt-water effects on anaerobic C mineralization
rates
Salt-water inundation of TFM soils resulted in shifts in
microbial pathways and increases in the overall rate of
organic matter decomposition. Higher concentrations
of SO42- following salt-water intrusion fueled
increased rates of SR (Figs. 2, 3) and likely contributed
to higher CO2 emissions from the cores (Fig. 1).
Surprisingly, rates of MG did not decrease with salt-
water intrusion (Figs. 2, 3) and CH4 emissions from the
salt-exposed cores increased by 70–1200% for
5 months relative to freshwater cores (Fig. 1). The
overall gaseous C loss (Fig. 1) was significantly
greater in TFM soils following salt-water intrusion
relative to freshwater controls. Similarly, the inventory
of organic C was significantly lower in salt-water
amended soils 3, 6 and 12 months after exposure than
in freshwater soils (Fig. 4), reflecting the increased
mineralization of organic matter in these soils under
higher salinity regimes. Weston et al. (2006) found a
similar increase in organic matter decomposition in
freshwater sediments following salt-water intrusion in
a short-term experiment. In addition, Craft (2007)
documented a negative relationship between both soil
organic content and accumulation and the salinity of
the overlying water in a survey of tidal freshwater and
salt marshes, which he attributed to the availability of
SO42- and thus higher rates of SR in the more saline
sites. Our results support these findings, and suggest
that salt-water intrusion will stimulate decomposition
in TFM soils.
SR and MG are terminal steps in the breakdown of
organic matter, and are limited to relatively small
organic compounds such as acetate (Weiss et al.
1991). These terminal metabolic processes therefore
depend on the generation of low molecular weight
DOC substrates by other processes. A microbial
consortium converts particulate organic matter into
low molecular weight DOC through hydrolysis and
fermentation reactions (Arnosti et al. 1994; Fenchel
and Findlay 1995). Greater inorganic C fluxes
from TFM soils amended with salt-water (Fig. 1),
which can be attributed to increased rates of SR and
MG (Fig. 3), require either; (1) the utilization of a
previously unused pool of low molecular weight
DOC in the soils or (2) an increased supply of
low molecular weight DOC via hydrolysis and
fermentation.
Low molecular weight dissolved organic matter
can adsorb onto mineral particles, and ion exchange
plays an important role in the sorption of some
compounds such as amino acids (Wang and Lee
1993; Liu and Lee 2007). Therefore, the intrusion of
saline water with greater concentrations of dissolved
ions into previously freshwater soils may desorb
organic compounds from exchange sites making them
available for terminal metabolism (e.g., Liu and Lee
2007) and may alter the availability of larger
dissolved and particulate organic C, perhaps promot-
ing hydrolytic and fermentative production of labile,
low molecular weight, dissolved organic compounds.
Similarly, NH4? is a surface reactive ion that can also
be desorbed upon addition of other cations (Rosen-
feld 1979); evidence of NH4? desorption in our study
is reflected by the increase in porewater inventories
of NH4? in the salt-water amended soils from about
3 months until the termination of the experiment
(Fig. 4). The increasing ionic strength of the pore-
water in the salt-water amended soils therefore
clearly altered the soil sorption dynamics. There
was no evidence of DOC or acetate desorption,
however (Fig. 4), and other potential substrates for
these terminal metabolic processes were not mea-
sured. Further investigation of the mechanisms influ-
encing organic matter availability upon salt-water
intrusion is required.
The amount of both CO2 and CH4 produced by the
measured microbial processes in marsh soils in both
freshwater and salt-water amended soils exceeded the
flux of these gases from the soils (Fig. 5). While
processes other than SR and MG, such as iron
reduction and denitrification (Roden and Wetzel
1996; Neubauer et al. 2005b; Gribsholt et al. 2005),
may have contributed to the mineralization of organic
matter, the measured rates of SR and MG were more
than enough to support the measured inorganic C
fluxes from these soils.) There was an increase in
CH4 production in soils following salt-water intrusion
(Fig. 5; 2.3 mol CH4 m-2), which was lower than the
increase in measured CH4 flux (Fig. 5; 3.6 mol CH4
m-2). The difference between CH4 production and
flux (D = 17.0 and 15.7 mol CH4 m-2 for freshwater
and salt-water amended soils, respectively; Fig. 5)
suggests a difference between production and flux
from the soils and/or errors in the rate measurements.
Porewater acetate concentrations measured in both
freshwater and salt-water amended soils were
Biogeochemistry (2011) 102:135–151 147
123
Author's personal copy
relatively high (exceeding 1 mmol L-1 in some
cases; data not shown), which may reflect increased
acetate following centrifugation of soils (Shaw and
McIntosh 1990; Hines et al. 1994). Artificially
increased concentrations of porewater acetate would
result in higher rates of AMG (Eq. 3), and lead to
elevated estimates of CH4 and CO2 production
(Fig. 5). CH4 oxidation may also have played an
important role in mitigating CH4 emission from these
TFM soils (Megonigal and Schlesinger 2002). The
oxidation of CH4 produces CO2, but as with CH4,
the measured CO2 gas fluxes could not account for the
CO2 produced via sulfate reduction and methanogen-
esis (D = 2.7 and 15.7 mol CO2 m-2 for freshwater
and salt-water amended soils, respectively; Fig. 5). A
total of 19.7 and 31.4 mol C m-2 was therefore
apparently mineralized but not accounted for in gas
fluxes from freshwater and salt-water soils, respec-
tively (Fig. 5). The fate of this ‘missing’ carbon is
unclear, though we suspect that estimates of CH4 and
CO2 production were elevated due to artificially high
porewater acetate concentrations. Some amount of the
organic carbon substrate used during SR and MG
would be assimilated by the microbes mediating these
reactions, though growth yields do not typically
exceed 10% and are often much lower (Widdel and
Bak 1992; Maillacheruvu and Parkin 1996; Reeve
et al. 1997; Habicht et al. 2005). Chemoautotrophic
fixation and assimilation of CO2 and CH4 via
methanotrophy, nitrification, reduced sulfur oxidation
and other reactions may also reduce fluxes of these
gasses from soils (e.g., Howarth 1984; Hadas et al.
2001). Fixation of carbon and an increase in microbial
biomass and/or subsequent release of fixed C as DOC
(DOC fluxes were not measured in this study, though
soil inventories of DOC were substantial: Fig. 4) may
account for some of this missing C. Alternatively,
ebullition, which can be patchy both in space and
time, could be responsible for some loss of CO2 and
CH4 from soil that was not captured by the exposed or
inundated core incubations. For example, ebullition
accounted for *50% of the total CH4 flux (diffu-
sion ? ebullition) from subtidal freshwater river
sediments (Chanton et al. 1989).
Pathways of anaerobic C mineralization
The energy yield of SR is greater than that of MG,
and when SO42- is available, sulfate reducers are
expected to outcompete methanogens for organic
matter substrates (Capone and Kiene 1988; Mishra
et al. 2003). Increased rates of SR upon salt-water
intrusion were therefore expected, and these findings
support previous studies. For instance, Weston et al.
(2006) found that the sulfate reducing microbial
community in freshwater sediments of the Altamaha
River, GA was able to adjust rapidly (\2 weeks) to
higher SO42- availability since sulfate reducers can
multiply quickly upon the onset of positive growth
conditions (e.g., Raskin et al. 1996). Although
rates of SR increased in the current experiment, as
hypothesized, the apparent stimulation (or at a
minimum the lack of suppression) of methanogens
was unexpected.
Depth-integrated rates of HMG in general were
less than rates of AMG (Fig. 3). Although the
differences were not significant, rates of HMG tended
to be greater in freshwater soils than in salt-exposed
soils, while rates of AMG tended to be higher in salt-
water-impacted soils (Fig. 3). The two pathways of
MG measured here are usually the major pathways of
CH4 production, but the utilization of other low
molecular weight organic substrates, such as metha-
nol and methyl amines, were not directly measured
and could therefore account for a portion of the CH4
generation (Oremland and Polcin 1982). Regardless
of the specific substrate, however, results indicate that
the increased CH4 flux from TFM soils experiencing
salt-water intrusion was due to the response of the
methanogens utilizing organic matter substrates
rather than hydrogen as the reductant.
MG was largely limited to deeper soils ([8 cm)
while rates of SR were generally greater in surface
soils (Fig. 2). SO42- concentrations below about
10 cm remained relatively low in the salt-water
amended cores, due to consumption of SO42- via
SR in surface soils and the slow diffusion of SO42- at
depth (see also Cl- profiles; Fig. 4). The diffusion of
Cl- deeper into the soils relative to SO42- may have
desorbed organic matter and stimulated AMG at
depth below the zone of active SR. However, rates of
AMG were highest in the mid-depth soils, and there
was substantial overlap in the zones of active SR and
MG (Fig. 2). In the salt-water-impacted soils, there
was actually a very weak but statistically significant
positive relationship between AMG and SR
[AM = 0.91 9 SR, R2 = 0.05, p = 0.04]. Salt-water
intrusion therefore stimulated both SR and MG
148 Biogeochemistry (2011) 102:135–151
123
Author's personal copy
(Fig. 5), and the apparent mechanism is enhanced
availability of SO42- (for SR) and organic matter (for
both processes). While SR and MG often compete for
substrates, contemporaneous SR and MG can occur
when noncompetitive substrates are available (such
as methanol and methylamines, which are not
available to sulfate reducers; Oremland and Polcin
1982), when organic substrates are in abundance
(e.g., Yoda et al. 1987) or due to fine scale
heterogeneity in the distribution of electron acceptors
and electron donors (Højberg et al. 1994). The
increased CH4 flux from soils experiencing salt-water
intrusion was unexpected and conflicts with mea-
surements along estuarine salinity gradients (e.g.,
Bartlett et al. 1987), and with prior experimental
results using tidal freshwater river sediments (Weston
et al. 2006). Further work is needed to determine the
mechanism leading to enhanced CH4 emissions
following salt-water intrusion.
Implications for TFMs
Marsh accretion, which is necessary if marshes are to
keep pace with rising sea levels, occurs through the
accumulation of both organic matter and mineral
sediments (Reed 1995; Morris et al. 2002). Across a
diversity of TFMs, the accumulation of organic
matter from both autochthonous and allochthonous
sources contributes an average of 62% to vertical
marsh growth (Neubauer 2008). Based on the loss of
44.1 mol soil C m-2 over 1-year due to salt-water
intrusion (Fig. 5), we estimate that the increased rate
of decomposition will lead to the loss of 5.8 mm of
marsh elevation (assuming the % organic matter is
twice the % organic C and a volumetric leverage of
5.5 cm3 g-1 for organic matter in TFM soils;
Neubauer 2008). For Delaware River TFMs, which
have vertical accretion rates averaging 10 mm yr-1
(based on 137Cs, 210Pb, and pollen horizons; Orson
et al. 1992; Church et al. 2006) and are exposed to a
relative sea level rise rate of about 4 mm yr-1, the
loss of 5.8 mm of soil elevation is the difference
between a site that is accreting considerably faster
than sea level is rising and one that is growing at
roughly the rate of today’s sea level rise. While it is
likely that the response of soil C mineralization to salt
water intrusion will moderate after long-term
exposure (e.g., Fig. 1), decreases in plant production
also are likely and may hinder the vertical growth
response of TFMs.
The tidal marsh plant community plays a key role
in marsh accretion by supplying organic matter and
by trapping allochthonous sediments and associated
organic matter from tidal waters as water velocity
slows due to friction within the plant canopy (Reed
1995; Pasternack and Brush 2001). In TFMs, salt-
water intrusion associated with sea-level rise will
adversely affect plant productivity (Willis and Hester
2004; Spalding and Hester 2007), and declines in
plant production will limit the accretion potential of
these marshes. Shifts in the dominant marsh macro-
phyte (from freshwater to salt-tolerant species) may
play an important role in determining the fate of
TFMs experiencing salt-water intrusion, and the rate
of both sea-level rise and salinity increases relative to
plant community shifts will likely determine the
resilience of these ecosystems to climate change.
Declines in plant productivity, coupled with
increased organic matter decomposition rates as
described here, create a scenario in which organic
matter sequestration is severely limited in TFMs
following salt-water intrusion. Future work involving
experimental mesocosms, field transplants, or in situ
manipulations that expose both TFM soils and plants
to elevated salinities will be necessary since the
overall response of TFMs to climate change and salt-
water intrusion will be a complex interaction of the
processes that drive plant production, microbial
decomposition, sediment deposition and, ultimately,
marsh accretion. Our work highlights that salt-water
intrusion will increase microbial decomposition rates
in TFM soils, can change the importance of metabolic
pathways in unexpected ways (e.g., increases in CH4
emissions), and may put TFMs at risk of permanent
inundation as rates of sea level rise continue to
accelerate.
Acknowledgements We thank P. Costello, A. Foskett,
O. Gibb, P. Kiry, D. Lammey, C. McLaughlin, T. Prsa,
J. Quinn, D. Russo, M. Santini, K. Scott, A. Smith, R. Thomas,
and P. Weibel, for assistance in the field and laboratory. We are
grateful to S. Joye and two anonymous reviewers for their
comments on the manuscript. This research was supported by
EPA-STAR grant RD 83222202 and the Department of
Biology at Villanova University. This is contribution #1605
from the University of South Carolina’s Belle W. Baruch
Institute for Marine and Coastal Sciences.
Biogeochemistry (2011) 102:135–151 149
123
Author's personal copy
References
Albert DB, Martens CS (1997) Determination of low-molec-
ular-weight organic acid concentrations in seawater and
pore-water samples via HPLC. Mar Chem 56:27–37
Arnosti C, Repeta DJ, Blough NV (1994) Rapid bacterial-
degradation of polysaccharides in anoxic marine sedi-
ments. Geochim Cosmochim Acta 58:2639–2652
Barbier EB, Koch EW, Silliman BR, Hacker SD, Wolanski E,
Primavera J, Granek EF, Polasky S, Aswani S, Cramer
LA, Stoms DM, Kennedy CJ, Bael D, Kappel CV, Perillo
GME, Reed DJ (2008) Coastal ecosystem-based man-
agement with nonlinear ecological functions and values.
Science 309:323
Bartlett KB, Bartlett DS, Harriss RC, Sebacher DI (1987)
Methane emissions along a salt-marsh salinity gradient.
Biogeochemistry 4:183–202
Canavan RW, Slomp CP, Jourabchi P, Van Cappellen P,
Laverman AM, van der Berg GA (2006) Organic matter
mineralization in sediment of a coastal freshwater lake
and response to salinization. Geochim Cosmochim Acta
70:2836–2855
Capone DG, Kiene RP (1988) Comparison of microbial
dynamics in marine and fresh-water sediments—contrasts
in anaerobic carbon catabolism. Limnol Oceanogr 33:
725–749
Chanton JP, Martens CS, Kelley CA (1989) Gas transport from
methane-saturated, tidal freshwater and wetland sedi-
ments. Limnol Oceanogr 34:807–819
Church JA, White NJ (2006) A 20th century acceleration in
global sea-level rise. Geophys Res Lett 33:L01602
Church TM, Sommerfield CK, Velinsky DJ, Point D, Benoit C,
Amouroux D, Plaa D, Donard OFX (2006) Marsh sedi-
ments as records of sedimentation, eutrophication and
metal pollution in the urban Delaware Estuary. Mar Chem
102:72–95
Cline JD (1969) Spectrophotometric determination of hydrogen
sulfide in natural waters. Limnol Oceanogr 14:454–458
Craft C (2007) Freshwater input structures soil properties,
vertical accretion, and nutrient accumulation of Georgia
and U.S. tidal marshes. Limnol Oceanogr 52:1220–1230
Fenchel TM, Findlay BJ (1995) Ecology and evolution of
anoxic worlds. Oxford University Press, London
Field RT, Philipp KR (2000) Vegetation changes in the
freshwater tidal marsh of the Delaware estuary. Wetlands
Ecol Manage 8:79–88
Gribsholt B, Boschker HTS, Andersson M, Tramper A, De
Brabandere L, van Damme S, Brion N, Meire P, Dehairs
F, Middelburg JJ, Heip CHR (2005) Nitrogen processing
in a tidal freshwater marsh: a whole ecosystem 15 N
labeling study. Limnol Oceanogr 50:1945–1959
Habicht KS, Salling L, Thamdrup B, Canfield DE (2005)
Effect of low sulfate concentrations on lactate oxidation
and isotope fractionation during sulfate reduction by Ar-cheoglobus fulgidus strain Z. Appl Environ Microbiol
71:3770–3777
Hadas O, Pinkas R, Erez J (2001) High chemoautotrophic
primary production in Lake Kinneret, Israel: a neglected
link in the carbon cycle of the lake. Limnol Oceanogr
46:1968–1976
Hamilton P (1990) Modeling salinity and circulation for the
Columbia River Estuary. Prog Oceanogr 25:113–156
Hines ME, Knollmeyer SL, Tugel JB (1989) Sulfate reduction
and other sedimentary biogeochemistry in a northern New
England salt marsh. Limnol Oceanogr 34:578–590
Hines ME, Banta GT, Giblin AE, Hobbie JE, Tugel JB (1994)
Acetate concentrations and oxidation in salt-marsh sedi-
ments. Limnol Oceanogr 39:140–148
Højberg O, Revsbech NP, Tiedje JM (1994) Denitrification in
soil aggregates analyzed with microsensors for nitrous
oxide and oxygen. Soil Sci Soc Am J 58:1691–1698
Howarth RW (1984) The ecological significance of sulfur in
the energy dynamics of salt marsh and coastal marine
sediments. Biogeochemistry 1:5–27
Jørgensen BB (1978) A comparison of methods for quantifi-
cation of bacterial sulfate reduction in coastal marine
sediments. I. Measurements with radiotracer techniques.
Geomicrobiol J 1:11–28
Jørgensen BB (1982) Mineralization of organic-matter in the
sea bed—the role of sulfate reduction. Nature 296:
643–645
Kallmeyer J, Ferdelman TG, Weber A, Fossing H, Jørgensen
BB (2004) A cold chromium distillation procedure for
radiolabeled sulfide applied to sulfate reduction mea-
surements. Limnol Oceanogr: Methods 2:171–180
Kelley CA, Martens CS, Chanton JP (1990) Variations in
sedimentary carbon remineralization rates in the White
Oak River estuary, North Carolina. Limnol Oceanogr
35:372–383
Knowles N (2002) Natural and management influences on
freshwater inflows and salinity in the San Francisco
Estuary at monthly to interannual scales. Water Resour
Res 38:1289
Liu Z, Lee C (2007) The role of organic matter in the sorption
capacity of marine sediments. Mar Chem 105:240–257
Maillacheruvu KY, Parkin GF (1996) Kinetics of growth,
substrate utilization and sulfide toxicity for proprionate,
acetate, and hydrogen utilizers in anaerobic systems.
Water Environ Res 68:1099–1106
McKee KL, Mendelssohn IA (1989) Response of freshwater
marsh plant community to increased salinity and
increased water level. Aquat Bot 34:301–316
Megonigal JP, Schlesinger WH (2002) Methane-limited met-
hanotrophy in tidal freshwater swamps. Global Biogeo-
chem Cycles 16:1062
Milly PCD, Dunne KA, Vecchia AV (2005) Global pattern of
trends in streamflow and water availability in a changing
climate. Nature 438:347–350
Mishra SR, Pattnaik P, Sethenathan N, Adhya TK (2003)
Anion-mediated salinity affecting methane production in
a flooded alluvial soil. Geomicrobiol J 20:579–586
Mitsch WJ, Gosselink JG (1993) Wetlands, 2nd edn. Van
Nostrand Reinhold, New York
Morris JT, Sundareshwar PV, Nietch CT, Kjerfve B, Cahoon
DR (2002) Responses of coastal wetlands to rising sea
level. Ecology 83:2869–2877
Mudd SM, Howell SM, Morris JT (2009) Impact of dynamic
feedbacks between sedimentation, sea-level rise, and bio-
mass production on near-surface marsh stratigraphy and
carbon accumulation. Estuar Coast Shelf Sci 82:377–389
150 Biogeochemistry (2011) 102:135–151
123
Author's personal copy
Murphy J, Riley JP (1962) A modified single solution method
for the determination of phosphate in natural systems.
Anal Chim Acta 27:31–36
Nakada M, Inoue H (2005) Rates and causes of recent global
sea-level rise inferred from long tide gauge data records.
Quat Sci Rev 24:1217–1222
Neubauer SC (2008) Contributions of mineral and organic
components to tidal freshwater marsh accretion. Estuar
Coast Shelf Sci 78:78–88
Neubauer SC, Craft CB (2009) Global change and tidal
freshwater wetlands: scenarios and impacts. In: Barend-
regt A, Whigham DF, Baldwin AH (eds) Tidal freshwater
wetlands. Backhuys, Leiden, The Netherlands
Neubauer SC, Anderson IC, Neikirk BB (2005a) Nitrogen
cycling and ecosystem exchanges in a Virginia tidal
freshwater marsh. Estuaries 28:909–922
Neubauer SC, Givler K, Valentine S, Megonigal JP (2005b)
Seasonal patterns and plant-mediated controls of subsur-
face wetland biogeochemistry. Ecology 86:3334–3344
Odum WE (1988) Comparative ecology of tidal freshwater and
salt marshes. Annu Rev Ecol Syst 19:147–176
Orcutt B, Boetius A, Elvert M, Samarkin V, Joye SB (2005)
Molecular biogeochemistry of sulfate reduction, metha-
nogenesis and the anaerobic oxidation of methane at Gulf
of Mexico cold seeps. Geochim Cosmochim Acta 69:
4267–4281
Oremland RS, Polcin S (1982) Methanogenesis and sulfate
reduction: competitive and noncompetitive substrates in
estuarine sediments. Appl Environ Microbiol 44:1270–
1276
Orson RA, Simpson RL, Good RE (1992) A mechanism for the
accumulation and retention of heavy metals in tidal
freshwater marshes of the upper Delaware River estuary.
Estuar Coast Shelf Sci 34:171–186
Pasternack GB, Brush GS (2001) Seasonal variations in sedi-
mentation and organic content in five plant associations
on a Chesapeake Bay tidal freshwater delta. Estuar Coast
Shelf Sci 53:93–106
Patrick R, Gaither WS, Whipple W Jr (1973) Delaware River
estuarine marsh survey. In: Walton T E III, Patrick R (eds)
The Delaware Estuary system, environmental impacts,
and socio-economic effects. Academy of Natural Sciences
of Philadelphia, Philadelphia, PA
Raskin L, Rittmann BE, Stahl DA (1996) Competition and
coexistence of sulfate-reducing and methanogenic popu-
lations in anaerobic biofilms. Appl Environ Microbiol
62:3847–3857
Redfield AC (1965) Ontogeny of a salt marsh estuary. Science
147:50–55
Reed DJ (1995) The response of coastal marshes to sea-level
rise: survival or submergence. Earth Surf Process Landf
20:39–48
Reeve JN, Morgan RM, Nolling J (1997) Environmental and
molecular regulation of methanogenesis. Water Sci
Technol 36:1–6
Roden EE, Wetzel RG (1996) Organic carbon oxidation and
suppression of methane production by microbial Fe(III)
oxide reduction in vegetated and unvegetated freshwater
wetland sediments. Limnol Oceanogr 41:1733–1748
Rosenfeld JK (1979) Ammonium absorption in nearshore
anoxic sediments. Limnol Oceanogr 24:356–364
Rysgaard S, Thastum P, Dalsgaard T, Christensen PB, Sloth
NP (1999) Effects of salinity on NH4? adsorption
capacity, nitrification, and denitrification in Danish estu-
arine sediments. Estuaries 22:21–30
Shaw DG, McIntosh DJ (1990) Acetate in recent anoxic sed-
iments: direct and indirect measurements of concentration
and turnover rates. Estuar Coast Shelf Sci 31:775–788
Smith SJ, Thomson AM, Rosenberg NJ, Izaurralde RC, Brown
RA, Wigley TML (2005) Climate change impacts for the
conterminous USA: an integrated assessment: 1. Scenar-
ios and context. Clim Change 69:7–25
Solorzano L (1969) Determination of ammonia in natural
waters by the phenolhypochlorite method. Limnol Ocea-
nogr 14:799–801
Spalding EA, Hester MW (2007) Interactive effects of
hydrology and salinity on oligohaline plant species pro-
ductivity: implications of relative sea-level rise. Estuar
Coast 30:214–225
Wang XC, Lee C (1993) Adsorption and desorption of ali-
phatic-amines, amino-acids and acetate by clay-minerals
and marine-sediments. Mar Chem 44:1–23
Weiss MS, Abele U, Weckesser J, Welte W, Schiltz E, Shultz
GE (1991) Molecular architecture and electrostatic prop-
erties of a bacterial porin. Science 254:1627–1630
Weston NB, Dixon RE, Joye SB (2006) Ramifications of
increased salinity in tidal freshwater sediments: geo-
chemistry and microbial pathways of organic matter
mineralization. J Geophys Res Biogeosci 111:G01009.
doi:10.1029/2005JG000071
Widdel F, Bak F (1992) Gram-negative mesophilic sulfate-
reducing bacteria. In: Balows A, Truper HG, Dworkin M,
Harder W, Schleifer KH (eds) The prokaryotes. Springer,
New York, NY
Willis JM, Hester MW (2004) Interactive effects of salinity,
flooding, and soil type on Panicum hemitomon. Wetlands
24:43–50
Wolf AA, Drake BG, Erickson JE, Megonigal JP (2007) An
oxygen-mediated positive feedback between elevated
carbon dioxide and soil organic matter decomposition in a
simulated anaerobic wetland. Glob Change Biol 13:2036–
2044
Yang SL (1998) The role of Scirpus marsh in attenuation of
hydrodynamics and retention of fine sediment in the
Yangtze Estuary. Estuar Coast Shelf Sci 47:227–233
Yoda M, Kitagawa M, Miyaji Y (1987) Long term competition
between sulfate-reducing and methane-producing bacteria
for acetate in anaerobic biofilm. Water Res 21:1547–1556
Biogeochemistry (2011) 102:135–151 151
123
Author's personal copy