organic matter sources supporting lower food web production in the tidal freshwater portion of the...
TRANSCRIPT

Organic Matter Sources Supporting Lower Food WebProduction in the Tidal Freshwater Portion of the YorkRiver Estuary, Virginia
Joel C. Hoffman & Deborah A. Bronk & John E. Olney
Received: 27 November 2007 /Revised: 9 July 2008 /Accepted: 10 July 2008 /Published online: 1 August 2008# Coastal and Estuarine Research Federation 2008
Abstract The Mattaponi River is part of the York Riverestuary in Chesapeake Bay. Our objective was to identifythe organic matter (OM) sources fueling the lower foodweb in the tidal freshwater and oligohaline portions of theMattaponi using the stable isotopes of carbon (C) andnitrogen (N). Over 3 years (2002–2004), we measuredzooplankton densities and C and N stable isotope ratiosduring the spring zooplankton bloom. The river wascharacterized by a May–June zooplankton bloom numeri-cally dominated by the calanoid copepod Eurytemoraaffinis and cladocera Bosmina freyi. Cluster analysis ofthe stable isotope data identified four distinct signatureswithin the lower food web: freshwater riverine, brackishwater, benthic, and terrestrial. The stable isotope signaturesof pelagic zooplankton, including E. affinis and B. freyi,were consistent with reliance on a mix of autochthonousand allochthonous OM, including OM derived fromvascular plants and humic-rich sediments, whereas macro-invertebrates consistently utilized allochthonous OM.Based on a dual-isotope mixing model, reliance onautochthonous OM by pelagic zooplankton ranged from20% to 95% of production, declining exponentially withincreasing river discharge. The results imply that dischargeplays an important role in regulating the energy sources
utilized by pelagic zooplankton in the upper estuary. Wehypothesize that this is so because during high discharge,particulate organic C loading to the upper estuary increasedand phytoplankton biomass decreased, thereby decreasingphytoplankton availability to the food web.
Keywords Allochthonous . Zooplankton . Eurytemora .
Bosmina . Chesapeake Bay
Introduction
River–estuary complexes are highly heterogeneous systemscharacterized by variable salinity, residence time, lightattenuation, and tidal energy; diverse riparian and uplandplant communities; and temporally and spatially variablezooplankton and fish assemblages. This heterogeneitypresents formidable challenges for developing generalitiesabout their food webs. Both autochthonous carbon (C),from local photosynthetic autotrophic production, andallochthonous C, from riparian and upland vegetation,may be utilized by aquatic metazoan grazers such aszooplankton and benthic macroinvertebrates. Terrestrial Csubsidies can fuel aquatic ecosystem metabolism (Cole andCaraco 2001), increase production of upper trophic levels(Carpenter et al. 2005), and stabilize predator–prey inter-actions (Huxel et al. 2002). In higher-order streams andlakes, invertebrate consumers utilize allochthonous organicmatter (OM) transported from terrestrial and riparianecosystems, thereby enhancing ecosystem productivity(Jones 1992; Wallace et al. 1997). The current consensusfor river–estuary complexes, however, is that their metazo-an food webs are endogenously fueled by photosyntheticautotrophs (phytoplankton) even though phytoplanktongenerally comprise <10% of the particulate OM (POM)
Estuaries and Coasts (2008) 31:898–911DOI 10.1007/s12237-008-9073-4
J. C. Hoffman :D. A. Bronk : J. E. OlneyVirginia Institute of Marine Science,P.O. Box 1346, Gloucester Point, VA 23062, USA
J. C. Hoffman (*)Mid-Continent Ecology Division,National Health and Ecological Effects Research Laboratory,U. S. Environmental Protection Agency,6201 Congdon Blvd,Duluth, MN 55804, USAe-mail: [email protected]

available to consumers (Deegan and Garritt 1997; Hugheset al. 2000; Chanton and Lewis 2002; Sobczak et al. 2005).This is because allochthonous matter has lower nutritionalvalue than phytoplankton, thus bioavailability of POM toupper trophic levels is largely determined by its phyto-plankton content.
The factors that influence the relative importance ofautochthonous and allochthonous C to aquatic food webs inriver–estuary complexes are poorly understood. Vannote etal. (1980) hypothesize that a phytoplankton-based food webcould arise in large rivers due to their semi-lentic nature,consistent with findings that river–estuary food webs areendogenously fueled. Along the southeastern coast of NorthAmerica, coastal tributaries generally have extensive tidalfreshwater regions—many of these tributaries have highconcentrations of terrestrially derived chromophoric dis-solved OM (CDOM), resulting in characteristic tea to blackcolors. The metabolism of coastal plain, blackwatertributaries, however, has increased reliance on allochtho-nous C with increasing size (Meyer and Edwards 1990).Further, CDOM can account for a large portion of lightattenuation in estuaries (Branco and Kremer 2005), result-ing in reduced productivity. It, therefore, seems plausiblethat allochthonous C could be important to the lower foodweb in blackwater, turbid estuaries. These contrastingperspectives are particularly applicable to those tidalblackwater systems characterized by both rapid lightattenuation and long water residence times.
We used the C and nitrogen (N) stable isotope ratios ofpotential OM sources, zooplankton, and macroinvertebratesto identify those sources utilized by the lower food web.The C and N stable isotope ratios (δ13C, δ15N) among
upland plants, marsh vegetation, freshwater phytoplankton,and estuarine phytoplankton differ with respect to C or Nsource and method of C fixation (Table 1). Consumersreflect these differences in their diet, demonstrating anaverage trophic discrimination (i.e., the difference betweenthe consumer and its diet) of +0.4‰ δ13C and +3.4‰ δ15Nper trophic level (Vander Zanden and Rasmussen 2001).The stable C isotope composition (δ13C) of upland vs.aquatic vegetation differs because these plants utilizedifferent C pools with distinct isotopic ratios. Riparianplants utilizing the C3 pathway have a δ13C of about −28‰because there is an uptake fractionation of about −21‰over atmospheric CO2 (δ13C −7‰). In contrast, Spartinaspp. are enriched (δ13C −13‰) owing to reduced discrim-ination associated with the C4 pathway (Mook and Tan1991). Freshwater and estuarine phytoplankton can beseparated where they utilize isotopically distinct pools ofdissolved inorganic carbon (DIC); their 13C discrimination,though generally −21‰, can vary with DIC concentration,phytoplankton growth rate, and nutrient availability (Mookand Tan 1991). In general, periphytons are more enrichedthan phytoplankton due to boundary layer effects thatreduce isotopic discrimination (France 1995). The N stableisotope composition (δ15N) can help separate terrestrialsources (depleted) from aquatic (enriched; Table 1). Partic-ulate δ15N source values should be interpreted cautiously,however, because they can be altered indirectly (e.g.,preferential uptake of isotopically light N by phytoplank-ton; Cifuentes et al. 1988) and directly (e.g., microbialactivity; Altabet 1988).
Our objective was to characterize the contribution ofautochthonous phytoplankton and allochthonous OM, both
Table 1 Stable isotope ratios of organic matter sources to the York River estuary based on published data from other estuaries (References) andthe York River (typical ranges or means±1 standard deviation)
Organic matter source References York river estuary
δ13C δ15N δ13C δ15N
Woody vegetation (C3)a,b,c −26 to −30 −4 to 4
Emergent vascular plants (C3)c,d −28 to −30 6 to 10 −28.7 (±1.3) 8.4 (±1.3)
Humic-rich soilsb,d −26 0 to 4 −25.9 (±0.6) 4.2 (±1.1)Benthic diatoms (salinity <5)c,e,f −18 to −22 6 to 7Tidal freshwater marsh sedimentc,g −26 4 to 7 −26.4 (±0.1)Freshwater phytoplanktonb,c,d Variable 0 to 8 −32.1 to −38.3 4.7 (±0.5)Estuarine phytoplanktonc,d,h −18 to −26 5 to 10 −23.5 (±1.2) 9.9 (±1.3)Spartina spp. (C4)
h −10 to −14 2 to 6
a Peterson and Fry 1987b Fry 1991c Cloern et al. 2002d Hoffman and Bronk 2006e Deegan and Garritt 1997f Hughes et al. 2000g Raymond and Bauer 2001h Fry and Sherr 1984
Estuaries and Coasts (2008) 31:898–911 899899

terrestrial (i.e., humic-rich soils) and riparian-derived (i.e.,vascular plants), to zooplankton and macroinvertebrateproduction in the Mattaponi River, Virginia—a large, tea-colored tributary in the York River estuary. Specifically, weexamined whether phytoplankton were the primary Csource fueling the lower food web under naturally varyingdischarge rates. We contrasted spring (May–June) condi-tions among years (2002–2004) and spring and summer(July–September) conditions in 2003. Concurrently, wecharacterized the concentration, stable isotope ratios, andsources of DIC (ΣCO2) and particulate organic C (POC)and N (Hoffman and Bronk 2006), as well as stable isotoperatios of the dominant pelagic fish, young American shad(Alosa sapidissima; Hoffman et al. 2007a).
Materials and Methods
Study Site The Mattaponi River is one of two majortributaries to the York River, a brackish, coastal plaintributary located in the southern end of Chesapeake Bay.The Mattaponi River is approximately 85 km long andalmost entirely fresh (mouth at 76°47′12″ W, 37°31′40″ N).The river has one of the few largely forested watersheds leftin Chesapeake Bay (upper river watershed 73.6% forest,0.2% developed; Bilkovic et al. 2002). The head of tide isnear river km 115 (km 0 is the York River mouth, km 52the Mattaponi River mouth), the salt wedge is typicallybetween km 67–76 (during the study, it ranged from km 52at extreme low discharge to km 85 at extreme highdischarge), and the tide range is approximately 1 m. Springdischarge is generally >35 m3 s−1 and the turnover andresidence times are short (14 and 45 days, respectively),whereas average discharge is 14.4 m3 s−1 and turnover andresidence times are long (29 and 88 days, respectively;Shen and Haas 2004).
Environmental Data Temperature and salinity profiles weremeasured at each zooplankton station with a YSI model600 QS sonde. Freshwater stations were always well mixed.River discharge data were obtained from the U.S. Geolog-ical Survey gage located near Beaulahville, Virginia(#01674500), approximately 20 river km above the headof tide. No major tributaries enter the Mattaponi Riverbetween the gage and the river mouth so we treated the dataas representative of the whole river.
Chlorophyll α and POC data were obtained from river-wide cruise data (Hoffman and Bronk 2006), though neitherdata were available for 2002. We estimated May–June POCloading to the upper estuary by multiplying each averagedaily discharge (1 May to 30 June) by the seasonal averagePOC concentration measured biweekly at the head of tide(km 115; n=4) and summing the daily values. Because
POC data were not available for 2002, a potential rangewas estimated using 2003 and 2004 data. We report heremonthly, river-wide Chl α means, which are the average ofsamples taken along the river axis (taken every 5–6 kmfrom km 52 to 101). Finally, we estimated the portion ofPOC that was from phytoplankton using a C to Chl αconversion of 35:1, calculated from the regression pub-lished by Cloern et al. 1995 (Eq. 2; variables aretemperature, irradiance, and phytoplankton growth rate).We used published light attenuation coefficient and phyto-plankton growth rates from the upper York River estuary(Sin et al. 1999) and irradiance data from a buoy at theYork River mouth (Virginia Institute of Marine Scienceunpublished data [P.O. Box 1346, Gloucester Point,Virginia 23062. Metadata and data are located at http://www.vims.edu/resources/databases.html#pier]).
Zooplankton Samples We sampled zooplankton and macro-invertebrates biweekly with a neuston net equipped with aflow meter (diurnally; 1.0×0.5 m net, 180 μm mesh). Thetiming and duration of samples varied in accordance withthe timing and duration of peak discharge. We sampledfrom April through July 2002 (only monthly nonvolumetricsamples), May through September 2003 (biweekly samplesthrough August), and May through June 2004. Sampleswere taken along the river axis from km 115 to the limit ofsalt intrusion, randomly choosing a station from each offive (2002, 2004) or six (2003) 9.3 km strata (in 2003, sixstrata were used due to the higher discharge, resulting in alarger freshwater region). We towed the net near the surfaceover the deepest portion of the river channel (2–11 mdepth). For 2003 and 2004, at each station, a short tow(approximately 1 min; preserved in 2% formaldehyde forarchival purposes) was used for abundance estimation and along tow (approximately 3 min; preserved in 95% ethanol)was used to collect invertebrates for stable isotope analysis.Ethanol was used for preservation because the effect onstable isotope ratios is small (Feuchtmayer and Grey 2003).
We estimated zooplankton and macroinvertebrate abun-dance by counting consecutive aliquots until at least 100members of each taxon had been counted or 25% of asample searched and then corrected for subsample and towvolume. Organisms were identified to the highest taxonom-ic resolution feasible (minimum of order). Adult copepodswere tallied separate from earlier instars and nauplii. Allcladoceran instars were tallied together. To characterize thespatial and temporal patterns in plankton abundance, weused a canonical correspondence analysis (CCA) on thelog10-transformed density estimates (i.e., log(N+1)) for the22 most numerically abundant plankton. The environmentalvariables were salinity (log10-transformed), river kilometer,surface water temperature, and day of year. Data for 2003and 2004 were analyzed together.
900 Estuaries and Coasts (2008) 31:898–911

Stable Isotope Analysis Zooplankton and macroinverte-brates were picked from the sample, cleaned of detritus,and sorted by taxa. Additionally, a sample of mysids(Neomysis americana), which we did not sample byneuston net, was obtained in August 2003 (km 54; densityestimate not available). We analyzed composite samples ofsmall zooplankton. Large zooplankton and macroinverte-brates were analyzed whole or ground and subsampled. Noisotopic analysis was performed if the biomass wasinsufficient. Samples were rinsed in deionized (DI) waterand dried at 45°C for 24 h before analysis. When possible,we took replicate samples.
All stable isotope samples were combusted with anANCA GSL gas purification module and elementalanalyzer and analyzed with a Europa Hydra 20–20continuous flow isotope ratio mass spectrometer (Univer-sity of California—Davis Stable Isotope Facility, Davis,CA). Stable isotope ratios were calculated as dX : dX ¼Rsample
�Rstandard � 1
� �� 103, where X is the stable C or Nisotope, R is the ratio of heavy to light stable isotopes, andPee Dee Belmnite and air were the standards for δ13C andδ15N, respectively. The standard deviation (SD) betweenreplicate reference samples was <±0.1‰ for C and N. TheSD between replicate zooplankton samples was ±0.2‰ forC and ±0.3‰ for N. We corrected isotope ratios for mass(standardized to 100 μg N and 500 μg C based on linearstandard curve) and ethanol preservation (+0.4‰ δ13C,+0.6‰ δ15N; Feuchtmayer and Grey 2003).
Food Web Characterization We identified trophic similar-ities related to feeding mode (taxa), region (samplinglocation), or both using an unweighted pair group methodwith arithmetic mean cluster analysis (UPGMA; Euclideandistance) using the δ13C and δ15N data (pooling allsampling dates). Data from 2003 and 2004 were analyzedseparately. The analysis only included organisms sampledon at least three dates. Macroinvertebrate data frommultiple strata occasionally were pooled in order to obtainat least three samples.
We examined differences in the springtime food webamong years by estimating the proportional contribution (F)of each OM source to the most common pelagic zooplank-ton and macroinvertabrate (i.e., Eurytemora affinis, Bos-mina freyi, cyclopoid copepods, and chironomid larvae)using a dual-isotope, three-source mixing model thatincorporates OM source error (Phillips and Gregg 2001).In the freshwater portion of the Mattaponi River, theisotopic ratios of the major sources contributing to thePOM pool (particulates <125 μm)—humic-rich terrestrialsoils, vascular plant-derived matter, and endogenouslyproduced phytoplankton—are sufficiently unique to dis-criminate among sources (Table 1). The mixing modelmathematically states that the isotopic ratio of the tissue
represents the proportional contribution from each source(Fphyto, Fplant, and Fterrestrial, respectively). For each dateand freshwater region sampled, the model was applied tothe zooplankton (z) δ13C and δ15N, adjusted for trophicdiscrimination (Δl, where Δ represents the average dis-crimination per trophic level and l the trophic level).
d13Cz �Δl ¼ d13Cplant � Fplant þ d13Cterrestrial
� Fterrestrial þ d13Cphyto � Fphyto ð1Þ
d15Nz �Δl ¼ d15Nplant � Fplant þ d15Nterrestrial
� Fterrestrial þ d15Nphyto � Fphyto ð2Þ
1 ¼ Fplant þ Fterrestrial þ Fphyto ð3ÞWe used an average trophic discrimination of +0.4‰
δ13C and estimated the δ15N discrimination and the trophiclevel (methods below). The SD of the F estimates arisingfrom both OM source and consumer isotopic variation was,on average, 0.08 for Fphyto (95% of all SD <0.15), 0.10 forFterrestrial (95% of all SD <0.14), and 0.13 for Fplant (95% ofall SD <0.19).
Stable isotope ratios for the OM sources were estimatedfrom Mattaponi River POM samples that resembled a puresource (Hoffman and Bronk 2006), similar to our previousapplication of the model to American shad data (Hoffmanet al. 2007a; Table 1). The stable isotope ratios of OMsources were constants except for phytoplankton δ13C(δ13Cphyto). The δ
13Cphyto varied by date and was estimatedfrom the DIC δ13C (δ13CDIC) using a typical −21‰ uptakediscrimination (i.e., δ13Cphyto=δ
13CDIC −21‰). This ap-proach was corroborated by zooplankton data, whichindicated utilization of a C source of about −35‰ whenthe δ13CDIC was −13‰, and appeared reasonable becausethe temperature, pH, and nutrient and DIC concentrationswere similar among years (Hoffman and Bronk 2006).
Source δ15N ratios can be difficult to determine fromfield data. The δ15Nphyto (4.7‰) was estimated from alimited number of samples (n=5) but is consistent withdissolved inorganic N (DIN) ratios from unpolluted rivers(approximately 2–8‰; McClelland et al. 1997; Deegan andGarritt 1997), assuming little uptake discrimination. Theδ15Nterrestrial (0±1.0‰ SD) in the food web modelrepresents a fresh terrestrial signal because the cladoceranB. freyi often had δ15N <4‰. Mattaponi River humic-richsoil OM, however, has enriched δ15N compared toterrestrial soils (0–2‰; Martinelli et al. 1999), implyingsome microbial processing had occurred (Table 1). The C toN ratios of these POM samples were 10:12, which is typicalof rivers and likely from soils of similar C to N (Hedges etal. 1986). Vascular plant-derived OM has many potential
Estuaries and Coasts (2008) 31:898–911 901901

sources in the watershed. The signature in the MattaponiRiver, with enriched δ15N (8.3‰) and high C to N (19–33),suggests it originates from littoral emergent vegetation(Cloern et al. 2002).
We treated trophic level as a variable in the model toaccount for potential bacteria consumption or omnivory.The model was fit to the data with respect to taxa andvariable trophic level (l) with respect to region. We used aconstant δ13C trophic discrimination (+0.4‰) and estimat-ed the δ15N discrimination (Δδ15N) for each species byletting l=1.0 (grazer) and then maximizing Δδ15N (up to+3.4‰) such that F≥0 for each source. Then the upper andlower l for each species were iteratively estimated by riverstratum (each year analyzed separately), constrained by theresult that for each OM source F≥0 (if such a solution wasnot possible, the sum of all negative F values wasminimized, yielding only one trophic level estimate), andthe mid-points used for the model output. We estimatedriver-wide means by sampling date, averaging among strata(two to four per date, depending on estuarine distribution).
We then tested whether utilization of autochthonousOM varies with river discharge using the output from themixing model. We fit an exponential model using nonlin-
ear, least-squares regression (three parameters; SigmaPlot9.0) to the average Fphyto by sampling date for E. affinisand B. freyi and the average recent daily discharge, a 5-dayrunning average, for each sampling date. The analysisincluded May–June results, 2002–2004. Similarly, wetested whether there is a relationship between the differencein δ13C between either zooplankton (Eurytemora orBosmina; δ13Cz) and the bulk POM pool (δ13CPOC) andriver discharge using a nonlinear, least-squares regression.We used an exponential model with the difference δ13Cz−δ13CPOC (again estimated for each sampling location andaveraged by sampling date) as the dependent variable,which was used to test for a grazing response with regardsto river discharge. A small δ13C difference (approximately1‰) between zooplankton and the bulk particulate poolimplies nonselective grazing, whereas an increasinglydepleted zooplankton signature compared to the bulk poolimplies increasingly strong selection (or preferentialassimilation) for an isotopically depleted source (i.e.,phytoplankton).
Finally, the tidal freshwater food web for spring (May–June; 2002–2004) and the oligohaline tidal freshwater foodwebs for summer (July–September; 2003 only) were
Physical
Dis
char
ge (
m3 s
-1)
0
20
40
60
80
Chl
a ( g
L-1
)
0
2
4
6
8
10
Surf
ace
Tem
p (˚
C)
5
15
25
35
Eurytemora affinis
Den
sity
(N
L-1
)
0
10
20
30
40
50
60
Bosmina freyi
0
5
10
15
20
discharge
A M J A M J2003 2004
Chl a
J A
Cyclopoids
0.0
0.2
0.4
0.6
0.8
1.0
km 67-70km 78-82km 85-91km 95-100km 106-109
temp.
Fig. 1 Discharge, averagechlorophyll α (Chl α), averagedaily surface temperature(measured at km 98), andE. affinis, B. freyi, and cyclopoidcopepod (includes Eucyclopssp., Paracyclops sp., and A.vernalis) densities for theMattaponi River, 2003 and 2004
902 Estuaries and Coasts (2008) 31:898–911

qualitatively analyzed using stable isotope biplots tocompare the stable isotope ratios of the consumers withpotential sources. The mean δ13C and δ15N for a particulartaxon within a season was estimated by averaging amongsampling dates (freshwater stations pooled by date).
Results
Physical Environment In 2002, discharge was at or nearhistorical lows owing to a regional draught, though a smallspring freshet was observed in early May (15.3 m3 s−1). In2003, a spring freshet in late March (90.9 m3 s−1) precededunusually high discharge that was ≥95% of historical valuesthroughout June and early July, returning to base flow bylate-August (Fig. 1). In 2004, a spring freshet in mid-April(65.7 m3 s−1) was followed by typical springtime discharge,around 10 m3 s−1, and a return to base flow during summer.
Low flows during May–June of 2002 decreased spring-time POC loading to the upper estuary by an order ofmagnitude compared to 2004, whereas high flows during2003 increased allochthonous C loadings by an order ofmagnitude (Table 2). Compared to 2004, both the peak andmean Chl α concentrations were reduced in 2003, as was theproportion of POC comprised of phytoplankton (Table 2).
Zooplankton Abundance In general, the species-specificdensities of zooplankton were low, less than 10 L−1. Thedensities of aquatic macroinvertebrates were even lower,less than 1 L−1. E. affinis and B. freyi were the mostcommon of the 43 taxonomic groups identified (Table 3).The average density (±SD) of E. affinis during May andJune 2003 was higher than May and June 2004 −5.1 (4.8)compared to 1.4 (1.5) L−1, respectively. A similar resultwas obtained for B. freyi density −1.5 (0.2) compared to 1.0(0.9) L−1, respectively. In both years, the B. freyi peakfollowed the E. affinis peak (Fig. 1). The peak density of E.affinis and B. freyi was higher in 2003 than in 2004 (45 vs.8 L−1 and 16 vs. 5 L−1, respectively). In both years,
cyclopoid copepod (including Paracyclops spp., Eucyclopsspp., and Acanthocyclops vernalis) densities were low, lessthan 1 L−1, peaking in July.
The assemblage was organized along the estuary(Fig. 2), indicated by the first CCA axis (28% of thevariability). Cladocerans, cyclopoid copepods, and thecalanoid copepod Diaptomus sp. were most abundanttowards the head of tide, whereas gammarid amphipods,mud and fiddler crab zoea (Uca spp.), and the calanoidcopepod Acartia spp. were located near the oligohalineriver mouth. The second CCA axis is related to seasonality(10% of the variability): Acartia spp., amphipods, harpacti-coid copepods, Chydorus sp., and Diaptomus sp. were mostabundant during the spring when the river was cool. Thetwo most ubiquitous zooplankton, E. affinis and B. freyi,were located in the center of the CCA triplot; their peakabundance occurred during mid- to late-spring in the lowerand central portions of the tidal freshwater.
Food Web Characterization The results from the UPGMAcluster analysis indicate that organisms from differenthabitats relied on different OM sources (Fig. 3). TheUPGMA analysis clusters organisms by various habitats,including terrestrial (i.e., flying ants (Formicidae)); brackishestuary (Acartia spp., Halicyclops sp., mysids); benthic(i.e., harpacticoid copepods, gammarid amphipods, Ucaspp. zoea); and riverine (e.g., E. affinis, B. freyi, cyclo-poids). Among this latter group, they cluster into those withrelatively depleted δ15N (B. freyi, chironomid larvae) andthose with higher δ15N (E. affinis, cyclopoids), owing toeither differences in trophic level or diet (i.e., those withdepleted δ15N are more reliant on terrestrial-derived finePOM) or both. Results for 2004 were similar, though theisotopic ratios of benthic invertebrates and zooplanktonwere closer to one another, resulting in a slightly differentclustering hierarchy than in 2003.
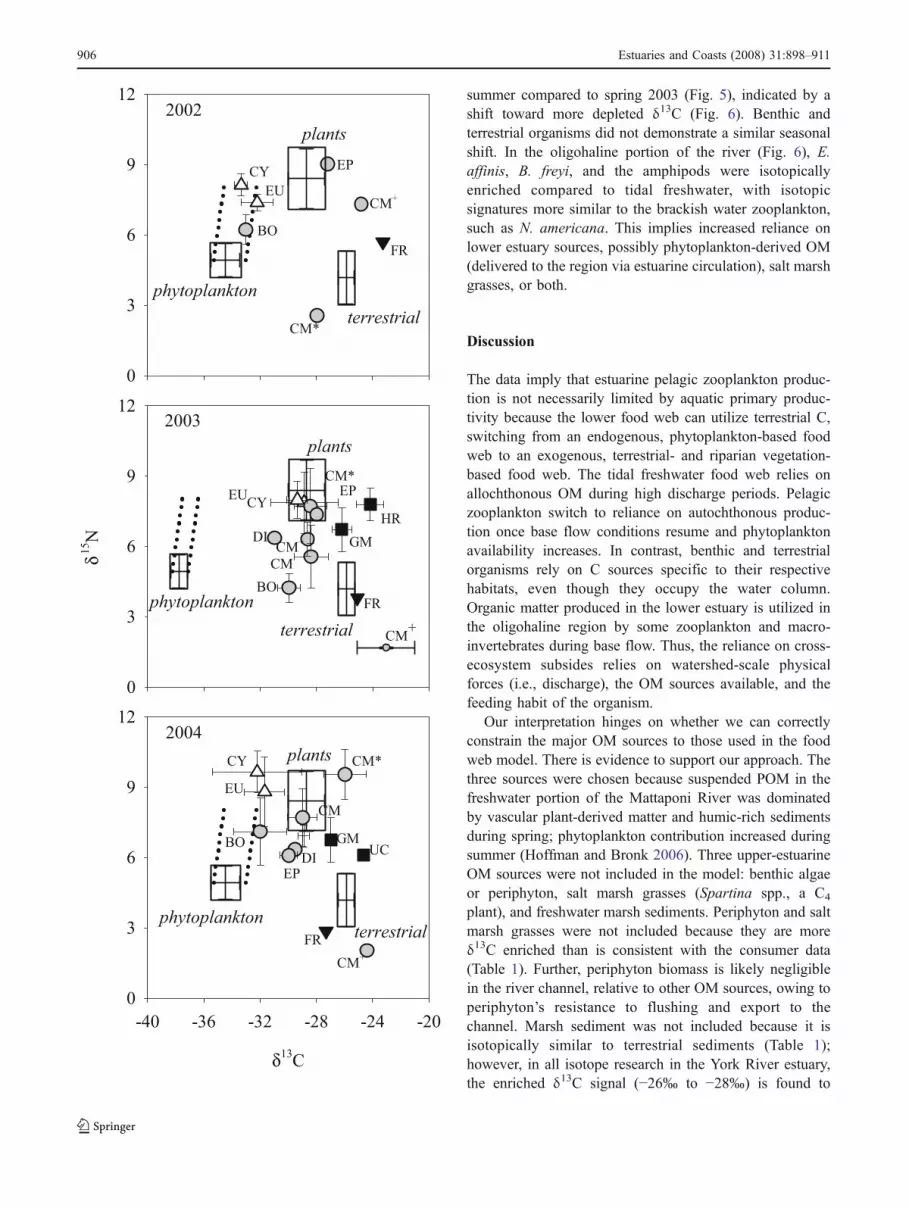
The dual-stable isotope mixing model indicates thatzooplankton utilization of the different OM sources variedby year, taxonomic group, and season (Fig. 4). The largestdifference among years was the marked shift in reliance on
Table 2 Characterization of the tidal freshwater portion of the Mattaponi River, Virginia during May and June, 2002 through 2004
Year Q (m3 s−1) POC (mg L−1) Loading (mt C) Chl α (μg L−1) Proportion phytoplankton
Range Mean (SD) Mean (SD) Max % POC (SD)
2002 0.0–0.4 0.5–1.4 0.2–0.6 n/a n/a n/a2003 11.4–68.2 1.4 (0.1) 234 1.6 (1.1) 1.0, 4.4 13 (7)2004 4.6–24.9 0.5 (0.2) 26 3.9 (2.1) 6.6, 8.0 4 (2)
See “Materials and Methods” for data sources and calculations. Discharge (Q) ranges refer to daily values, 1 May to 30 June. For Chl α, both themean and SD among monthly samples and monthly peak (max) values are shown for May and June, respectivelyn/a Data not available
Estuaries and Coasts (2008) 31:898–911 903903

autochthonous phytoplankton by the pelagic zooplanktonE. affinis, B. freyi, and cyclopoids in 2002 and 2004 toreliance on allochthonous sources in 2003. In May–June2002 and 2004, pelagic zooplankton production generallywas fueled by phytoplankton (Fphyto 0.61–0.93), whereasterrestrial and vascular plant-derived matter fueled themajority of production in May–June 2003 (Fphyto 0.14–0.32; Table 4).
In contrast, isotopic ratios of benthic (e.g., amphipods) andterrestrial (e.g., flying ants) organisms were similar amongyears, as were Diaptomus sp. and the ephemeropteran andchironomid larvae (Fig. 4). Notably, whereas chironomidpupae and adults had similar δ13C, we sampled both lifestages with either enriched (approximately 8–10‰) ordepleted (approximately 2–3‰) δ15N, implying a trophicdifference, likely owing to both ontogenetic and species
Table 3 Taxa identified from the Mattaponi River, Virginia, including the location (river kilometer, km 52 is the Mattaponi River mouth) and dayof peak density (max), as well as the number of stations where they were captured during 2003 and 2004 (stations; 71 total stations)
Group Taxon Max (N m−3) Location (km) Day Stations (n) Code
Calanoida E. affinis 45,289.3 87 4-May 69 EUAcartia spp. 5,024.7 57 21-Jul 13 ATDiaptomus sp. 22.2 108 5-May 12 DI
Cyclopoida Halicyclops sp. 1,824.2 67 5-May 19 HLEucyclops sp. 1,293.4 91 2-Sep 64 ECParacyclops sp. 50.6 67 5-May 33 PCA. vernalis 371.5 91 2-Sep 40 ACCyclops spp. 1,664.9 91 2-Sep 64 CYCopepodites 1,167.1 91 25-May 32Nauplii 25.1 54 22-Jun 35
Poecilostomatoida Ergasilus sp. 14.5 57 21-Jul 11 PSHarpacticoida Harpacticoids 429.0 56 3-Jun 44 HRCladocera B. freyi 15,516.4 78 22-Jun 71 BO
Chydorus sp. 548.8 108 4-May 38 CSChydoridae 46.7 108 5-May 54 CDCeriodaphnia sp. 323.7 109 3-Jun 45 CRScapholeberis mucronata 300.0 91 2-Sep 48 SCDiaphanosoma brachyurum 469.8 78 22-Jun 47 DADaphnia sp. 47.9 108 5-May 15Leptodora kindti 4.0 98 2-Sep 1Cladocera (unknown) 3.5 108 5-May 1
Malacostraca Uca spp. 586.7 70 17-Jun 22 UCGammaridae 74.5 56 3-Jun 12 GMDecapoda: Astacoidea 0.2 106 1-Jun 1
Ostrocoda Ostracoda 53.8 67 4-May 49 OSAchari Araneae 4.7 89 17-Jun 11 AR
Acarina 14.6 108 25-May 50 ARGastropoda Gastropoda 281.3 70 21-Jul 33 GSInsecta (larvae) Chironomidae 17.8 106 21-Jul 32 CM
Chaoboridae 3.4 106 2-Sep 1Trichoptera 4.6 108 7-Jul 8 TRPlecoptera 8.3 108 4-May 2Ephemeroptera 23.6 106 2-Sep 34 EP
Insecta (pupae) Diptera 2.3 109 3-Jun 5 PDInsecta (adults) Formicidae 1.2 108 5-May 3 FR
Thysanoptera 12.9 108 5-May 9Hemiptera 1.2 108 5-May 1Diptera 11.7 108 5-May 23 ADInsecta (unknown) 6.5 106 21-Jul 17
Other Tardigrada 0.8 95 4-May 2Oligochaete 1.9 106 21-Jul 3Collembola 31.6 108 5-May 26
Cyclops spp. is Eucyclops sp., Paracyclops sp., and A. vernalis combined
904 Estuaries and Coasts (2008) 31:898–911

differences. Still, the majority of chironomid larvae produc-tion was fueled by allochthonous OM in 2003 and 2004(Table 4). Trophic dissimilarities among the groups identifiedin the cluster analysis were apparent. Gammarid amphipods,harpacticoid copepods, and Uca spp. had enriched δ13C,consistent with a benthic OM source. Flying ants had anisotopic composition similar to soils and humic-rich sedi-ments. Diaptomus sp., ephemeropteran larvae, and chirono-mids utilized a mix of autochthonous and allochthonous OM.
The nonlinear regression of Fphyto for E. affinis and B.freyi and discharge was significant (Fig. 5). Reliance onphytoplankton by E. affinis and B. freyi significantlydeclines as river discharge increases. The relationship spansthe 3-year time series and predicts the fraction ofzooplankton production supported by phytoplankton (r2=0.72). This relationship is likely due to the decreasedphytoplankton availability during high discharge (Table 2),reducing the zooplankton’s ability to preferentially assim-ilate or selectively graze phytoplankton, indicated byincreasingly depleted zooplankton δ13C compared to POC(e.g., δ13CBosmina–δ
13CPOC) as river discharge decreases(Fig. 5).
The stable isotope biplots from summer samplingrevealed additional seasonal and spatial differences in thefood web. There was evidence for increased utilization ofautochthonous phytoplankton by the pelagic zooplankton in
CCA Axis 1
-2 -1 0 1 2
CC
A A
xis
2
-1.0
-0.5
0.0
0.5
1.0
E
ATDI
HLU
P
A
PS
HR
B
CS
CDC
SCDAR
OS
GS
CM
ET UC
GM
SAL
DAY TEM
RKM
Fig. 2 Canonical correlation analysis (CCA) of the 22 most abundantzooplankton in the Mattaponi River, Virginia; species codes generallyfollow Table 3, except E. affinis (E), B. freyi (B), Paracyclops sp. (P),A. vernalis (A), Ceriodaphnia sp. (C), Achari (spiders and mitescombined; R), and pooled ephemeroptera and trichoptera larvae (ET).Environmental variables are salinity (SAL), river kilometer (RKM),day of year (DAY), and surface temperature (TEM)
1
3
10
12
14
15
16
17
18
1920
22
24
25
26
30
32
39
02
46
AT
AH
L B
NM
AB
O B
CM
D
CM
EG
M D
GM
BO
C EP
E
BO
FD
I F
CY
CE
U C
PD
SC
ES
C F
EU
AE
U B
CY
F
EU
F
EU
EC
Y E
FR
GM
A
HR
B GM
BG
M C
HR
D
HR
C UC
HR
EH
R A
oligohaline tidal freshwater and benthic
water column benthic, terrestrial
benthicterrestrialFPOM grazers phyto/omnivores
AD
Hei
g
1
3
10
12
14
15
16
17
18
1920
22
24
25
26
30
32
39
02
46
AT
AH
L B
NM
AB
O B
CM
D
CM
EG
M D
CM
FG
M E
/FB
O C EP
BO
D
BO
BO
DI
FC
Y C
EU
CP
D
EU
AE
U B
CY
D
CY
F
EU
F
EU
EC
Y E
FR
GM
A
HR
B GM
B
HR
HR
E
oligohaline tidal freshwater and benthic
water column benthic, terrestrial
benthicterrestrialFPOM grazers phyto/omnivores
AD
AT
AH
L B
NM
AB
O B
CM
D
CM
EG
M D
CM
FG
MB
O C EP
DI
FC
Y C
EU
CP
D
EU
AE
U B
CY
D
CY
F
EU
FE
U D EU
EC
Y E
FR
GM
A
HR
B GM
B
HR
HR
E
oligohaline tidal freshwater and benthic
water column benthic, terrestrial
benthicterrestrialFPOM grazers phyto/omnivores
AD
ht
Fig. 3 Dendogram from thecluster analysis (unweighted pairgroup with arithmetic meanmethod) of zooplankton δ13Cand δ15N data from 2003. Thefirst two letters are the speciescodes, listed in Table 3; NM N.americana. The next letterdenotes the region of the river,which is defined as follows:A—km 52–65; B—km 67–74;C—km 76–83; D—km 85–93;E—km 95–102; F—km 104–111. If no region code is given,the value is a river-wideaverage. The descriptions at thebranches are interpretative,based on the biology of thevarious organisms (e.g., fineparticulate organic matter(FPOM) grazer)
Fig. 4 Stable isotope ratios of common Mattaponi River tidalfreshwater zooplankton for May–June 2002–2004. Symbols indicateaverage ±1 SD. The average (±SD) isotopic compositions offreshwater phytoplankton (phytoplankton), humic-rich sediments(terrestrial), and vascular plant-derived matter (plant) are shown bythe boxes (see “Materials and Methods” for details). The dotted lineindicates the expected stable isotope ratios of consumers utilizingphytoplankton, assuming typical trophic discrimination (+0.4‰ δ13C,+3.4‰ δ15N per trophic level). Tidal freshwater included stations abovekm 76. Zooplankton symbols were assigned based on the cluster analysis(circle—fine particulate organic matter grazer; triangle—phytoplankton/omnivorous grazer; square—benthic; upside-down triangle—terrestrial).Species codes are listed in Table 3; larvae (CM), pupae (CM*), and adult(CM+) life stages of chironomids are indicated
�
Estuaries and Coasts (2008) 31:898–911 905905
summer compared to spring 2003 (Fig. 5), indicated by ashift toward more depleted δ13C (Fig. 6). Benthic andterrestrial organisms did not demonstrate a similar seasonalshift. In the oligohaline portion of the river (Fig. 6), E.affinis, B. freyi, and the amphipods were isotopicallyenriched compared to tidal freshwater, with isotopicsignatures more similar to the brackish water zooplankton,such as N. americana. This implies increased reliance onlower estuary sources, possibly phytoplankton-derived OM(delivered to the region via estuarine circulation), salt marshgrasses, or both.
Discussion
The data imply that estuarine pelagic zooplankton produc-tion is not necessarily limited by aquatic primary produc-tivity because the lower food web can utilize terrestrial C,switching from an endogenous, phytoplankton-based foodweb to an exogenous, terrestrial- and riparian vegetation-based food web. The tidal freshwater food web relies onallochthonous OM during high discharge periods. Pelagiczooplankton switch to reliance on autochthonous produc-tion once base flow conditions resume and phytoplanktonavailability increases. In contrast, benthic and terrestrialorganisms rely on C sources specific to their respectivehabitats, even though they occupy the water column.Organic matter produced in the lower estuary is utilized inthe oligohaline region by some zooplankton and macro-invertebrates during base flow. Thus, the reliance on cross-ecosystem subsides relies on watershed-scale physicalforces (i.e., discharge), the OM sources available, and thefeeding habit of the organism.
Our interpretation hinges on whether we can correctlyconstrain the major OM sources to those used in the foodweb model. There is evidence to support our approach. Thethree sources were chosen because suspended POM in thefreshwater portion of the Mattaponi River was dominatedby vascular plant-derived matter and humic-rich sedimentsduring spring; phytoplankton contribution increased duringsummer (Hoffman and Bronk 2006). Three upper-estuarineOM sources were not included in the model: benthic algaeor periphyton, salt marsh grasses (Spartina spp., a C4
plant), and freshwater marsh sediments. Periphyton and saltmarsh grasses were not included because they are moreδ13C enriched than is consistent with the consumer data(Table 1). Further, periphyton biomass is likely negligiblein the river channel, relative to other OM sources, owing toperiphyton’s resistance to flushing and export to thechannel. Marsh sediment was not included because it isisotopically similar to terrestrial sediments (Table 1);however, in all isotope research in the York River estuary,the enriched δ13C signal (−26‰ to −28‰) is found to
2004
δ13C
-40 -36 -32 -28 -24 -20
0
3
6
9
12
phytoplankton
plants
terrestrial
2002
0
3
6
9
12
FR
CY
CM+
CM*
BO
EU
EP
2003
δ15N
0
3
6
9
12
FR
CY
CM*
BO
EP
CM
DI GM
HR
EU
CM+
CM+
FR
CY
CM+
CM*
BO
EP
CM
DI
GMUC
EU
terrestrial
phytoplankton
plants
terrestrial
phytoplankton
plants
906 Estuaries and Coasts (2008) 31:898–911

originate from terrestrial-derived C (Raymond and Bauer2001; McCallister et al. 2004; Hoffman and Bronk 2006).
Feeding Behaviors Different grazing strategies among E.affinis and B. freyi were indicated by their different δ15Nratios. E. affinis, a cosmopolitan, euryhaline calanoidcopepod, consumes microzooplankton, diatoms, detritus,and particle-attached bacteria (Hughes et al. 2000; Tackx etal. 2004; Kerner et al. 2004; Reaugh et al. 2007), consistentwith the opportunistic feeding behavior indicated by theirisotopic shift. Microzooplankton consumption by theomnivorous E. affinis is consistent with its enriched δ15Ncomposition, generally about +3‰, or a trophic level,relative to B. freyi. The enriched δ15N was likely thecombined result of greater consumption of vascular plant-derived OM that is δ15N enriched compared to humic-richsediments (Table 4), greater trophic discrimination due toincreased omnivory, and feeding at an elevated trophic level(Table 5). B. freyi is a small, cosmopolitan, filter-feedingcladoceran that feeds on detritus, unicellular algae, andbacteria (Kerner et al. 2004). The δ15N ratio of B. freyi wasgenerally equal to or less than the δ15NPN, implying eitherassimilation of a particulate fraction with similar δ13C tothe bulk pool but with depleted δ15N or else low trophicfractionation (Table 5), likely due to the high C to N ofPOM (e.g., Adams and Sterner 2000).
Cyclopoids were less numerous than calanoids, thoughincreasingly important towards the head of tide. The stableisotope ratios of Cyclops spp. and E. affinis were similar inall regions of the river, implying reliance on a similar OMsource; however, the data are difficult to interpret becausethere are multiple taxa in this group, including Paracyclopssp., Eucyclops sp., and A. vernalis. We separated these taxa
for analysis but their isotopic ratios were similar. Paracyclopssp. and Eucyclops sp. consume POM and microzooplankton(Williamson 1983; Brandl 2005), whereas A. vernalisconsumes microzooplankton (Brandl 2005). Our findingcould be due to either similar feeding behavior or contam-ination of the sample resulting from misidentification ofearly instars. The enriched δ15N of Halicyclops sp. (Fig. 6), abenthic, oligohaline cyclopoid, is consistent with preferentialgrazing on bacteria (e.g., Carman and Thistle 1985).
Chironomid larvae were the most common macroinver-tebrate sampled and are an important prey for young fishes.Their isotopic signature indicated reliance on allochthonousOM, likely a mix of terrestrial-derived fine particulates andamorphous detritus (Hall and Meyer 1998). Similarly,ephemeropteran larvae consumed a mix of allochthonousand autochthonous OM (Fig. 4).
Those organisms identified by a benthic signature(enriched δ13C, −24‰ to −26‰, and depleted δ15N, 2‰to 5‰), including harpacticoid copepods, gammaridamphipods, and Uca zoea (Fig. 3), were likely consumingallochthonous detritus, either degraded terrestrial matter orfreshwater marsh sediments (Table 1). The stable isotoperatios are equivocal owing to the isotopic similarity of theselast two OM sources. The mouthparts of these detrivoresare adapted for tearing, raking, and scraping, not filtration(Smith 2001), which likely explains the lack of a seasonalshift toward utilization of autochthonous OM, despite theirapparent ability to occupy water column habitat.
Influence of River Discharge The results suggest that riverdischarge influences energy source and trophic level. Bothphysical mixing and river discharge are important physicalprocesses that influence Mattaponi River POM composition
Table 4 Fraction (F) contributed by autochthonous phytoplankton(phyto) and allochthonous humic-rich sediments (terrestrial) andvascular plant-derived organic matter (plant) to production of E.
affinis, B. freyi, Cyclops spp. (includes Eucyclops sp., Paracyclops sp.,and A. vernalis), and chironomid larvae in the Mattaponi River, Mayand June 2002–2004
Species Year Fphyto (±SD) Fterrestrial (±SD) Fplant (±SD)
Eurytemora 2002 0.82 (0.17) 0.13 (0.13) 0.05 (0.03)2003 0.25 (0.03) 0.40 (0.08) 0.35 (0.08)2004 0.61 (0.13) 0.18 (0.21) 0.21 (0.10)
Bosmina 2002 0.92 (0.02) 0.09 (0.14) −0.01 (0.15)2003 0.32 (0.09) 0.52 (0.11) 0.16 (0.03)2004 0.74 (0.16) 0.17 (0.14) 0.09 (0.05)
Cyclops spp. 2002 0.93 (0.00) 0.06 (0.03) 0.01 (0.03)2003 0.14 (0.06) 0.49 (0.27) 0.37 (0.31)2004 0.74 (0.28) 0.09 (0.09) 0.16 (0.20)
Chironomidae 2002 n/a n/a n/a2003 0.16 (0.05) 0.55 (0.17) 0.30 (0.22)2004 0.28 (0.26) 0.53 (0.16) 0.19 (0.16)
Fractions from the dual-isotope, three-source mixing model are means among dates sampled (±SD, two to four dates per year depending onestuarine distribution) and, therefore, may not sum to 1.0 exactlyn/a Data not available
Estuaries and Coasts (2008) 31:898–911 907907

(Hoffman and Bronk 2006). During high discharge, quickresidence time and low transparency flush and suppressphytoplankton production (Sin et al. 1999), and suspendedPOC concentrations increase, dramatically increasingallochthonous C loadings to the upper estuary (Table 3). InMay–June 2003, Chl α concentration was low (<1 μg L−1),C to NPOM high (>20; Hoffman and Bronk 2006), andphytoplankton comprised less than 5% of the bulk POMpool, supporting only 14–25% of pelagic zooplanktonproduction. In contrast, during May–June 2004, phyto-plankton comprised >10% of the bulk POM pool andsupported 61–74% of pelagic zooplankton production.
Allochthonous OM, therefore, is utilized by zooplanktonduring high discharge when phytoplankton are scarce, butendogenously produced phytoplankton is disproportionate-ly utilized once available.
Summer - TFW
0
3
6
9
12
FR
CY
CM+
BO EP
CM
DI
GM
UCEU
Summer - oligohaline
13C
-40 -36 -32 -28 -24 -20
δ1
5N
0
3
6
9
12
15
18
FR
AT
GM
BO
EU
HL
NM
UC
terrestrial
phytoplankton
plants
phytoplankton(autochthonous)
phyto.(poly.)
terrestrial
SPM
δ
Fig. 6 Stable isotope biplot of common Mattaponi River zooplanktonduring 2003 for oligohaline (km 52–74) and tidal freshwater (km 76–111) regions. Symbols indicate July–September average (±1 SD). Thedotted line and the potential sources for tidal freshwater (TFW) followFig. 3. Additional sources for the oligohaline portion includeautochthonous phytoplankton (δ13Cphytoplankton estimated fromδ13CDIC—see “Materials and Methods” for details; δ15Nphytoplankton
from literature (Table 1)), phytoplankton from the polyhaline YorkRiver estuary (“phyto. (poly.)”; Table 1), and suspended particulateorganic matter (SPM) measured from this region (interpreted to be amix of all available sources, including vascular plant-derived matter;Hoffman and Bronk 2006). Symbols were assigned as in Fig. 4,including oligohaline zooplankton (diamond). Species codes are listedin Table 3; NM N. americana
0 10 20 30 40 50 60
δ13C
Z -
δ13C
PO
C
-6
-5
-4
-3
-2
-1
0
Recent daily discharge (m3 s
-1)
Fra
ctio
n f
rom
phyto
pla
nkto
n (
Fp
hyto
)
0.0
0.2
0.4
0.6
0.8
1.0 E. affinis
B. freyi
gra
zing
neu
tral
sele
ctiv
e
A)
B)
r2 = 0.72
p < 0.0001
r2 = 0.77
p < 0.001
Fig. 5 Fraction (F) of the diet obtained from endogenous phyto-plankton (a) and the isotopic difference between the availableparticulate organic carbon (POC) and either the calanoid copepod E.affinis or the cladoceran B. freyi (δ13Cz−δ13CPOC; b) in response toriver discharge. Points represent river-wide means for a sampling date(generally three stations). The lines show the best-fit exponentialmodel
908 Estuaries and Coasts (2008) 31:898–911
This finding is corroborated by the observation thatpelagic zooplankton were increasingly isotopically depletedwith respect to POC as discharge decreased (Fig. 5). Thisanalysis presumes that isotopic turnover is sufficiently rapidto respond to environmental conditions. At typical May–June temperatures, the instantaneous weight-specificgrowth rate of E. affinis would range from 0.03 to0.08 days−1 (Escaravage and Soetaert 1995) and of B. freyifrom 0.2 to 0.6 days−1 (Acharya et al. 2006). At these rates,we expect the zooplankton to reach isotopic equilibriumwithin 10–30 days (Hoffman et al. 2007b), which is likely aconservative estimate because it does not take into accountindividual metabolism or population growth.
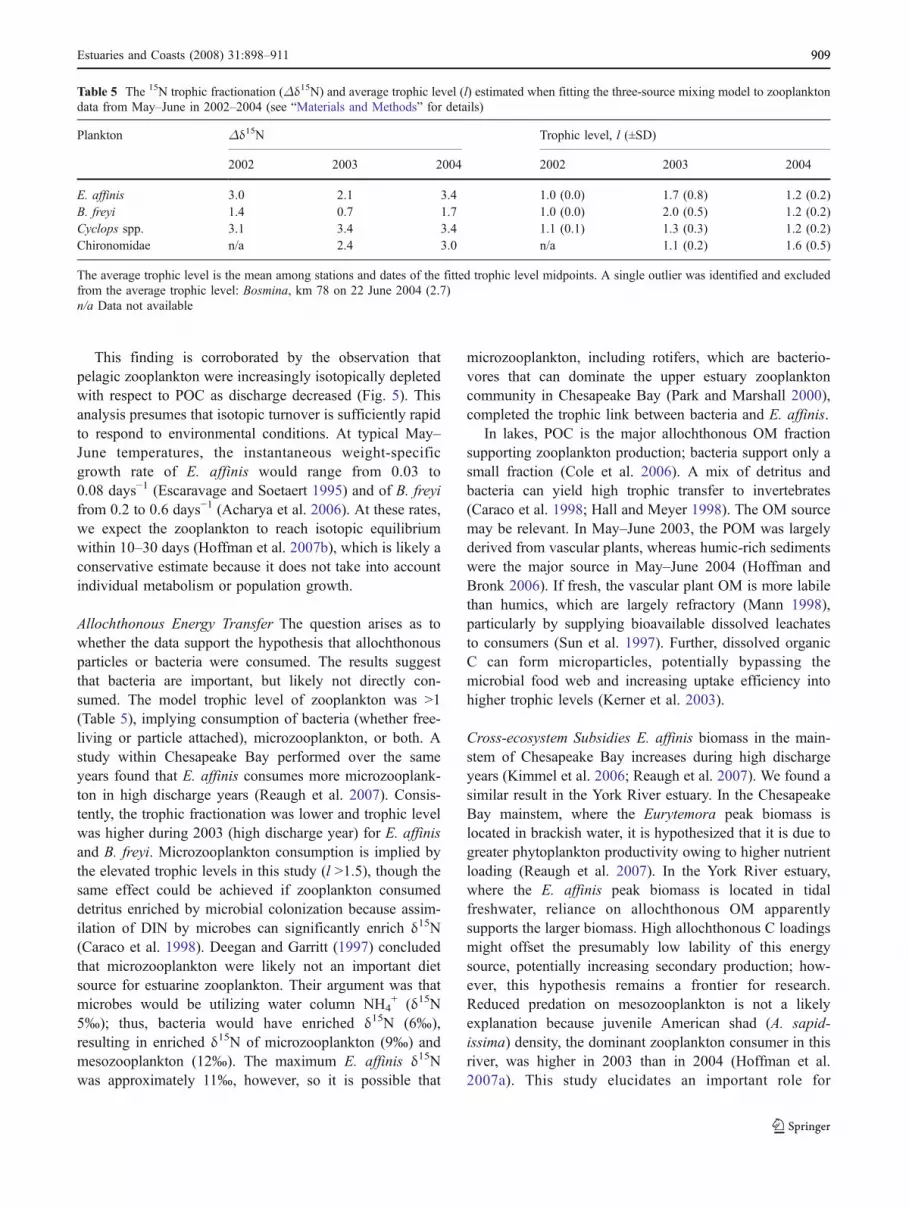
Allochthonous Energy Transfer The question arises as towhether the data support the hypothesis that allochthonousparticles or bacteria were consumed. The results suggestthat bacteria are important, but likely not directly con-sumed. The model trophic level of zooplankton was >1(Table 5), implying consumption of bacteria (whether free-living or particle attached), microzooplankton, or both. Astudy within Chesapeake Bay performed over the sameyears found that E. affinis consumes more microzooplank-ton in high discharge years (Reaugh et al. 2007). Consis-tently, the trophic fractionation was lower and trophic levelwas higher during 2003 (high discharge year) for E. affinisand B. freyi. Microzooplankton consumption is implied bythe elevated trophic levels in this study (l >1.5), though thesame effect could be achieved if zooplankton consumeddetritus enriched by microbial colonization because assim-ilation of DIN by microbes can significantly enrich δ15N(Caraco et al. 1998). Deegan and Garritt (1997) concludedthat microzooplankton were likely not an important dietsource for estuarine zooplankton. Their argument was thatmicrobes would be utilizing water column NH4
+ (δ15N5‰); thus, bacteria would have enriched δ15N (6‰),resulting in enriched δ15N of microzooplankton (9‰) andmesozooplankton (12‰). The maximum E. affinis δ15Nwas approximately 11‰, however, so it is possible that
microzooplankton, including rotifers, which are bacterio-vores that can dominate the upper estuary zooplanktoncommunity in Chesapeake Bay (Park and Marshall 2000),completed the trophic link between bacteria and E. affinis.
In lakes, POC is the major allochthonous OM fractionsupporting zooplankton production; bacteria support only asmall fraction (Cole et al. 2006). A mix of detritus andbacteria can yield high trophic transfer to invertebrates(Caraco et al. 1998; Hall and Meyer 1998). The OM sourcemay be relevant. In May–June 2003, the POM was largelyderived from vascular plants, whereas humic-rich sedimentswere the major source in May–June 2004 (Hoffman andBronk 2006). If fresh, the vascular plant OM is more labilethan humics, which are largely refractory (Mann 1998),particularly by supplying bioavailable dissolved leachatesto consumers (Sun et al. 1997). Further, dissolved organicC can form microparticles, potentially bypassing themicrobial food web and increasing uptake efficiency intohigher trophic levels (Kerner et al. 2003).
Cross-ecosystem Subsidies E. affinis biomass in the main-stem of Chesapeake Bay increases during high dischargeyears (Kimmel et al. 2006; Reaugh et al. 2007). We found asimilar result in the York River estuary. In the ChesapeakeBay mainstem, where the Eurytemora peak biomass islocated in brackish water, it is hypothesized that it is due togreater phytoplankton productivity owing to higher nutrientloading (Reaugh et al. 2007). In the York River estuary,where the E. affinis peak biomass is located in tidalfreshwater, reliance on allochthonous OM apparentlysupports the larger biomass. High allochthonous C loadingsmight offset the presumably low lability of this energysource, potentially increasing secondary production; how-ever, this hypothesis remains a frontier for research.Reduced predation on mesozooplankton is not a likelyexplanation because juvenile American shad (A. sapid-issima) density, the dominant zooplankton consumer in thisriver, was higher in 2003 than in 2004 (Hoffman et al.2007a). This study elucidates an important role for
Table 5 The 15N trophic fractionation (Δδ15N) and average trophic level (l) estimated when fitting the three-source mixing model to zooplanktondata from May–June in 2002–2004 (see “Materials and Methods” for details)
Plankton Δδ15N Trophic level, l (±SD)
2002 2003 2004 2002 2003 2004
E. affinis 3.0 2.1 3.4 1.0 (0.0) 1.7 (0.8) 1.2 (0.2)B. freyi 1.4 0.7 1.7 1.0 (0.0) 2.0 (0.5) 1.2 (0.2)Cyclops spp. 3.1 3.4 3.4 1.1 (0.1) 1.3 (0.3) 1.2 (0.2)Chironomidae n/a 2.4 3.0 n/a 1.1 (0.2) 1.6 (0.5)
The average trophic level is the mean among stations and dates of the fitted trophic level midpoints. A single outlier was identified and excludedfrom the average trophic level: Bosmina, km 78 on 22 June 2004 (2.7)n/a Data not available
Estuaries and Coasts (2008) 31:898–911 909909

allochthonous OM in the estuarine food web. The Ches-apeake Bay watershed has been and continues to bedramatically transformed by urbanization (Jantz et al.2005). Disconnecting the estuary from its floodplainthrough the construction of dams and the filling of wetlandscould profoundly impact the food web.
Acknowledgements We thank Deborah Steinberg, Michael Sierszen,John Morrice, and two anonymous reviewers for helpful comments onthe manuscript; Brian Watkins, Patricia Crewe, Kristen Delano,Ashleigh Rhea, and Demetria Christo for field assistance; andDemetria Christo, Melanie Chattin, and David Harris for preparationand analysis of stable isotope samples. This work was supported by aNational Science Foundation Graduate Research Fellowship to J. C.Hoffman and sponsored in part by NOAA Office of Sea Grant, USDepartment of Commerce, under Grant NA03OAR4170084 to theVirginia Graduate Marine Science Consortium and Virginia Sea GrantCollege Program, with additional support from the Wallop–Breauxprogram of the US Fish and Wildlife Service through the MarineRecreational Fishing Advisory Board of the Virginia Marine Resour-ces Commission (Grants F-116-R-6 and 7). This is contribution of theVirginia Institute of Marine Science, The College of William andMary.
References
Acharya, K., P.A. Bukaveckas, J.D. Jack, M. Kyle, and J.J. Elser.2006. Consumer growth linked to diet and RNA-P stoichiometry:response of Bosmina to variation in riverine food resources.Limnology and Oceanography 51: 1859–1869.
Adams, T.S., and R.W. Sterner. 2000. The effect of dietary nitrogencontent on trophic level 15N enrichment. Limnology andOceanography 45: 601–607.
Altabet, M.A. 1988. Variations in nitrogen isotopic compositionbetween sinking and suspended particles: implications fornitrogen cycling and particle transformation in the open ocean.Deep Sea Research 35: 535–554.
Bilkovic, D.M., C.H. Hershner, and J.E. Olney. 2002. Macroscaleassessment of American shad spawning and nursery habitats inthe Mattaponi and Pamunkey rivers. North American Journal ofFisheries Management 22: 1176–1192.
Branco, A.B., and J.N. Kremer. 2005. The relative importance ofchlorophyll and colored dissolved organic matter (CDOM) to theprediction of the diffuse attenuation coefficient in shallowestuaries. Estuaries 28: 643–652.
Brandl, Z. 2005. Copepods and rotifers: predators and their prey.Hydrobiologia 546: 475–489.
Caraco, N.F., G. Lampman, J.J. Cole, K.E. Limburg, M.L. Pace, andD. Fischer. 1998. Microbial assimilation of DIN in a nitrogenrich estuary: implications for food quality and isotope studies.Marine Ecology Progress Series 167: 59–71.
Carman, K.R., and D. Thistle. 1985. Microbial food partitioning bythree species of benthic copepods. Marine Biology 88: 143–148.
Carpenter, S.R., J.J. Cole, M.L. Pace, M. Van de Bogert, D.L. Bade,D. Bastviken, C.M. Gille, J.R. Hodgson, J.F. Kitchell, and E.S.Kritzberg. 2005. Ecosystem subsidies: terrestrial support ofaquatic food web from 13C addition to contrasting lakes. Ecology86: 2737–2750.
Chanton, J., and F.G. Lewis. 2002. Examination of coupling betweenprimary and secondary production in a river-dominated estuary:
Apalachicola Bay, Florida, USA. Limnology and Oceanography47: 683–697.
Cifuentes, L.A., J.H. Sharp, and M.L. Fogel. 1988. Stable carbon andnitrogen isotope biogeochemistry in the Delaware estuary.Limnology and Oceanography 33: 1102–1115.
Cloern, J.E., C. Grenz, and L. Vidergar-Lucas. 1995. An empiricalmodel of the phytoplankton chlorophyll:carbon ratio—the con-version factor between productivity and growth rate. Limnologyand Oceanography 40: 1313–1321.
Cloern, J.E., E.A. Canuel, and D. Harris. 2002. Stable carbon andnitrogen isotope composition of aquatic and terrestrial plants ofthe San Francisco Bay estuarine system. Limnology andOceanography 47: 713–729.
Cole, J.J., and N.F. Caraco. 2001. Carbon in catchments: connectingterrestrial carbon losses with aquatic metabolism. Marine andFreshwater Research 52: 101–110.
Cole, J.J., S.R. Carpenter, M.L. Pace, M.C. Van de Bogert, J.L.Kitchell, and J.R. Hodgson. 2006. Differential support of lakefood webs by three types of terrestrial organic carbon. EcologyLetters 9: 558–568.
Deegan, L.A., and R.H. Garritt. 1997. Evidence for spatial variability inestuarine food webs. Marine Ecology Progress Series 147: 31–47.
Escaravage, V., and K. Soetaert. 1995. Secondary production of thebrackish copepod communities and their contribution to carbonfluxes in the Westerschelde estuary (The Netherlands). Hydro-biologia 311: 103–114.
Feuchtmayer, H., and J. Grey. 2003. Effect of preparation andpreservation procedures on carbon and nitrogen stable isotopedeterminations from zooplankton. Rapid Communications inMass Spectrometry 17: 2605–2610.
France, R.L. 1995. Differentiation between littoral and pelagic foodwebs in lakes using stable carbon isotopes. Limnology andOceanography 40: 1310–1313.
Fry, B. 1991. Stable isotope diagrams of freshwater food webs.Ecology 72: 2293–2297.
Fry, B., and E. Sherr. 1984. d13C measurements as indicators ofcarbon flow in marine and freshwater ecosystems. Contributionsin Marine Science 27: 13–47.
Hall, R.O., and J.L. Meyer. 1998. The trophic significance of bacteriain a detritus-based stream food web. Ecology 79: 1995–2012.
Hedges, J.I., W.A. Clark, P.D. Quay, J.E. Richey, A.H. Devol, U. de,and M. Santos. 1986. Compositions and fluxes of particulateorganic material in the Amazon River. Limnology and Oceanog-raphy 31: 717–738.
Hoffman, J.C., and D.A. Bronk. 2006. Inter-annual variation in stablecarbon and nitrogen isotope biogeochemistry of the MattaponiRiver, Virginia. Limnology and Oceanography 51: 2319–2332.
Hoffman, J.C., D.A. Bronk, and J.E. Olney. 2007a. Contribution ofallochthonous carbon to American shad production in theMattaponi River, Virginia using stable isotopes. Estuaries andCoasts 30: 1034–1048.
Hoffman, J.C., D.A. Bronk, and J.E. Olney. 2007b. Tracking nurseryhabitat use by young American shad in the York River estuary,Virginia using stable isotopes. Transactions of the AmericanFisheries Society 136: 1285–1297.
Hughes, J.E., L.A. Deegan, B.J. Peterson, R.M. Holmes, and B. Fry.2000. Nitrogen flow through the food web in the oligohalinezone of a New England estuary. Ecology 81: 433–452.
Huxel, G.R., K. McCann, and G.A. Polis. 2002. Effects of partitioningallochthonous and autochthonous resources on food web stabil-ity. Ecological Research 17: 419–432.
Jantz, P., S. Goetz, and C. Jantz. 2005. Urbanization and the loss ofresource lands in the Chesapeake Bay watershed. EnvironmentalManagement 36: 808–825.
Jones, R.I. 1992. The influence of humic substances on lacustrineplanktonic food chains. Hydrobiologia 229: 73–91.
910 Estuaries and Coasts (2008) 31:898–911

Kerner, M., H. Hohenberg, S. Ertl, M. Reckermann, and A. Spitzy.2003. Self-organization of dissolved organic matter to micelle-like microparticles in river water. Nature 422: 150–154.
Kerner, M., S. Ertl, and A. Spitzy. 2004. Trophic diversity within theplanktonic food web of the Elbe Estuary determined on isolatedindividual species by 13C analysis. Journal of Plankton Research26: 1039–1048.
Kimmel, D.G., W.D. Miller, and M.R. Roman. 2006. Regional scaleclimate forcing of mesozooplankton dynamics in ChesapeakeBay. Estuaries and Coasts 29: 375–387.
Mann, K.H. 1998. Production and use of detritus in variousfreshwater, estuarine, and coastal marine ecosystems. Limnologyand Oceanography 33: 910–930.
Martinelli, L.A., M.C. Piccolo, A.R. Townsend, P.M. Vitousek, E.Cuevas, W. McDowell, G.P. Robertson, O.C. Santos, and K.Treseder. 1999. Nitrogen stable isotopic composition of leaves andsoil: tropical versus temperate forests. Biogeochemistry 46: 45–65.
McCallister, L.S., J.E. Bauer, J.E. Cherrier, and H.W. Ducklow. 2004.Assessing sources and ages of organic matter supporting riverand estuarine bacterial production: a multiple isotope (D14C,d13C, and d15N) approach. Limnology and Oceanography 49:1687–1702.
McClelland, J.W., I. Valiela, and R.H. Michener. 1997. Nitrogen-stable isotope signatures in estuarine food webs: a record ofincreasing urbanization in coastal watersheds. Limnology andOceanography 42: 930–937.
Meyer, J.L., and R.T. Edwards. 1990. Ecosystem metabolism andturnover of organic carbon along a blackwater river continuum.Ecology 71: 668–677.
Mook, W.G., and F.C. Tan. 1991. Stable carbon isotopes in rivers andestuaries. In Biogeochemistry of major world rivers, eds. E.T.Degens, S. Kempe, and J.E. Richy, 245–264. New York: Wiley.
Park, G.S., and H.G. Marshall. 2000. The trophic contributions ofrotifers in tidal freshwater and estuarine habitats. Estuarine,Coastal and Shelf Science 51: 729–742.
Peterson, B.J., and B. Fry. 1987. Stable isotopes in ecosystem studies.Annual Review of Ecology and Systematics 18: 293–320.
Phillips, D.L., and J.W. Gregg. 2001. Uncertainty in source partition-ing using stable isotopes. Oecologia 127: 171–179.
Raymond, P.A., and J.E. Bauer. 2001. DOC cycling in a temperatureestuary: a mass balance approach using natural 14C and 13Cisotopes. Limnology and Oceanography 46: 655–667.
Reaugh, M.L., M.R. Roman, and D.K. Stoecker. 2007. Changes inplankton community structure and function in response tovariable freshwater flow in two tributaries of the ChesapeakeBay. Estuaries and Coasts 30: 403–417.
Shen, J., and L. Haas. 2004. Calculating age and residence time in thetidal York River using three-dimensional model experiments.Estuarine, Coastal and Shelf Science 61: 449–461.
Sin, Y., R.L. Wetzel, and I.C. Anderson. 1999. Spatial and temporalcharacteristics of nutrient and phytoplankton dynamics in theYork River estuary, Virginia: analyses of long-term data.Estuaries 22: 260–275.
Smith, D.G. 2001. Pennak’s freshwater invertebrates of the UnitedStates: Porifera to Crustacea. 4New York: Wiley.
Sobczak, W.V., J.E. Cloern, A.D. Jassby, B.E. Cole, T.S. Schraga, andA. Arnsberg. 2005. Detritus fuels ecosystem metabolism but notmetazoan food webs in San Francisco Estuary’s freshwater delta.Estuaries 28: 124–137.
Sun, L., E.M. Perdue, J.L. Meyer, and J. Weis. 1997. Use of elementalcomposition to predict bioavailability of dissolved organic matterin a Georgia river. Limnology and Oceanography 42: 714–721.
Tackx, M.L.M., N. de Pauw, R. Van Miegham, F. Azémar, A.Hannouti, S. Van Damme, F. Fiers, N. Daro, and P. Meire. 2004.Zooplankton in the Schelde estuary, Belgium and The Netherlands.Spatial and temporal patterns. Journal of Plankton Research 26:133–141.
Vander Zanden, M.J., and J.B. Rasmussen. 2001. Variation in d15Nand d13C trophic fractionation: Implications for aquatic food webstudies. Limnology and Oceanography 46: 2061–2066.
Vannote, R.L., G.W. Minshall, K.W. Cummins, J.R. Sedell, and C.E.Cushing. 1980. The river continuum concept. Canadian Journalof Fisheries and Aquatic Sciences 37: 130–137.
Wallace, J.B., S.L. Eggert, J.L. Meyer, and J.R. Webster. 1997.Multiple trophic levels of a forest stream linked to terrestrial litterinputs. Science 277: 102–104.
Williamson, C.E. 1983. Invertebrate predation on planktonic rotifers.Hydrobiologia 104: 385–39.
Estuaries and Coasts (2008) 31:898–911 911911