variations in elemental and radiometric concentrations of soils
TRANSCRIPT
EQA - International Journal of Environmental QualityISSN 2281-4485 - Vol. 39 (2020): 20-31Journal homepage: https://eqa.unibo.it/
The journal is hosted and mantained by ABIS-AlmaDL. Works are licensed under CC BY 4.0
published by
Variations in elemental and radiometric concentrations of soils around a mining site in Southwestern Nigeria
Felix S. Olise1, Olayinka O. Ajayi1, Godwin C. Ezeh*2, Oyediran K. Owoade1
1 Physics and Engineering Physics Department, Obafemi Awolowo University, Ile-Ife, Nigeria2 Centre for Energy Research and Development, Obafemi Awolowo University, Ile-Ife, Nigeria
* Corresponding author e-mail: [email protected]
Article info
Received 28/12/2019; received in revised form 5/3/2020; accepted 20/3/2020.DOI: 10.6092/issn.2281-4485/10260© 2020 The Authors.
AbstractSoil samples from a mine site in Ijero, Ekiti State South-west Nigeria, were investigated for their elemental and radionuclides (40K, 232Th and 238U) concentrations to assess the contaminations levels. Twenty (20) soil samples were randomly collected using Dutch stainless steel Auger around the mine sites but largely dictated by the miners activities and locations. Elemental and radioactivity (40K, 232Th and 238U) components of the soils were determined using particle induced X-ray emission and Gamma spectrometers respectively. To assess the level of contamination and the possible anthropogenic impact, the pollution indices and the geo-accumulation indices of some elements were calculated. Twenty-six elemental (Na, Mg, Al, Si, Cl, K, Ca, Ti, V, Cr, Fe, Cu, Zn, Ga, Rb, Zr, Nb, Cd, Sn, Ba, Nd, Bi, Pb, Pa, Th and U) concentrations were quantified. Average concentrations of these toxic elements; V (327 μg g-1), Cu (276 μg g-1), Nb (806 μg g-1), Cd (785 μg g-1), Pb (394 μg g-1), Th (473 μg g-1) and U (500 μg g-1) were particularly high, exceeding recommended values. Activity concentrations of the radionuclides ranged from 1 to 3, 4 to 10 and 415 to 15520 kBq kg-1 for 232Th, 238U, and 40K respectively with an average exceeding world limit which could lead to possible radiological consequences. Geo-accumulation and the pollution risk factor studies revealed that Pb could pose significant potential health risk to the miners and ecosystem.
Keywords Elemental, Pollution, Radiometric, Soil, Toxicity
Introduction
Artisanal mineral exploitation practices are basically the method of extraction which often leads to loss of other associated recoverable economic minerals and eventual contamination of ecosystem with mining tailings. The miners and ecosystem could be exposed to negative impacts of the more accessible. radionuclides and toxic trace metals (Olise et al. 2011, Isinkaye et al. 2013). This work is aimed at evaluating radionuclides (40K, 232Th and 238U) and elemental concentrations of mineral hosted soils from a mining area at Ijero Ekiti, South-West Nigeria using Particle Induced X-ray Emission (PIXE) and Gamma spectro-analytical techniques. The cross-analysis of elemental and radiometric data provides useful tools for better understanding of the
impacts of mining activities in the environment (Brai et al. 2006).
Materials and Methods
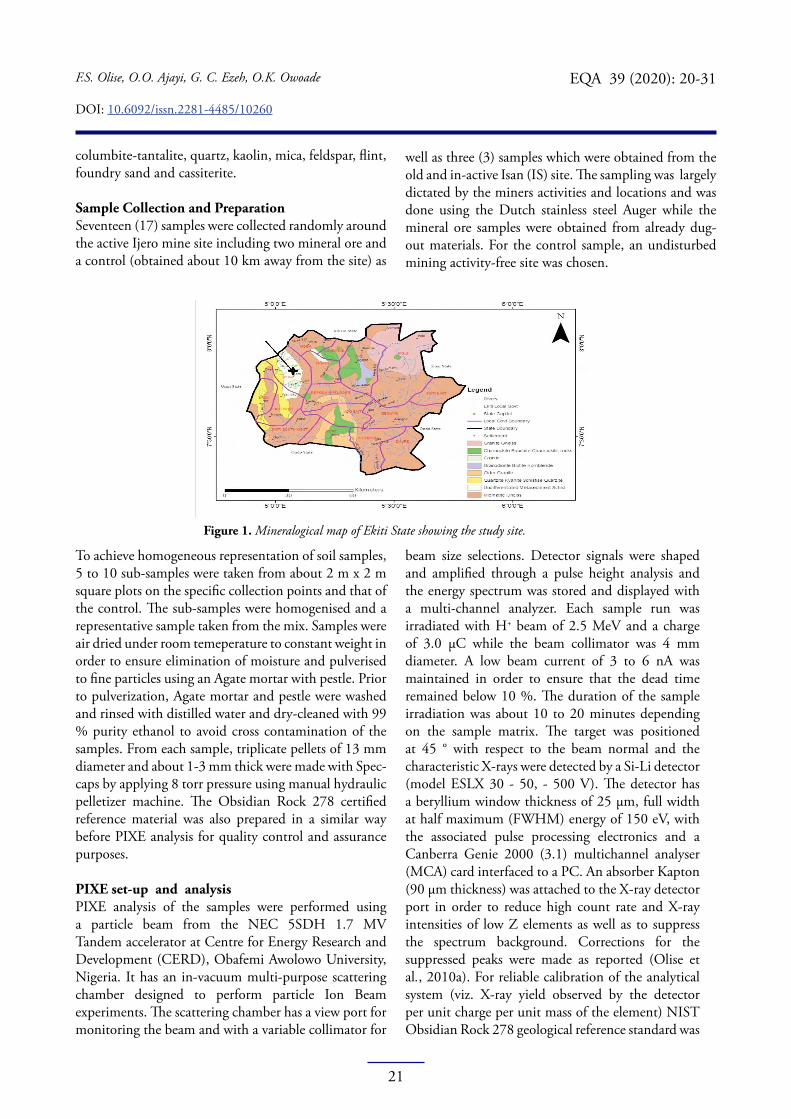
Study Area Figure 1 shows the study site which is Ijero-Ekiti (7o49’ N and 5o50’ E) in the mineralogy map of Ekiti State Nigeria Southwestern Nigeria. The area is entirely situated within the tropics and characterized with high temperature and heavy rainfall. The geological formation of the area is precambrian basement and made of rock sequence vis-a-viz pegmatites, aplites, granitic rocks, charnokitic rocks, the quartzite series, gneisses and magnetites (Olarewaju 1981;UNAD 2009. The solid minerals mined in the study area are
21
F.S. Olise, O.O. Ajayi, G. C. Ezeh, O.K. Owoade
DOI: 10.6092/issn.2281-4485/10260
EQA 39 (2020): 20-31
columbite-tantalite, quartz, kaolin, mica, feldspar, flint, foundry sand and cassiterite.
Sample Collection and PreparationSeventeen (17) samples were collected randomly around the active Ijero mine site including two mineral ore and a control (obtained about 10 km away from the site) as
well as three (3) samples which were obtained from the old and in-active Isan (IS) site. The sampling was largely dictated by the miners activities and locations and was done using the Dutch stainless steel Auger while the mineral ore samples were obtained from already dug-out materials. For the control sample, an undisturbed mining activity-free site was chosen.
Figure 1. Mineralogical map of Ekiti State showing the study site.
To achieve homogeneous representation of soil samples, 5 to 10 sub-samples were taken from about 2 m x 2 m square plots on the specific collection points and that of the control. The sub-samples were homogenised and a representative sample taken from the mix. Samples were air dried under room temeperature to constant weight in order to ensure elimination of moisture and pulverised to fine particles using an Agate mortar with pestle. Prior to pulverization, Agate mortar and pestle were washed and rinsed with distilled water and dry-cleaned with 99 % purity ethanol to avoid cross contamination of the samples. From each sample, triplicate pellets of 13 mm diameter and about 1-3 mm thick were made with Spec-caps by applying 8 torr pressure using manual hydraulic pelletizer machine. The Obsidian Rock 278 certified reference material was also prepared in a similar way before PIXE analysis for quality control and assurance purposes.
PIXE set-up and analysisPIXE analysis of the samples were performed using a particle beam from the NEC 5SDH 1.7 MV Tandem accelerator at Centre for Energy Research and Development (CERD), Obafemi Awolowo University, Nigeria. It has an in-vacuum multi-purpose scattering chamber designed to perform particle Ion Beam experiments. The scattering chamber has a view port for monitoring the beam and with a variable collimator for
beam size selections. Detector signals were shaped and amplified through a pulse height analysis and the energy spectrum was stored and displayed with a multi-channel analyzer. Each sample run was irradiated with H+ beam of 2.5 MeV and a charge of 3.0 µC while the beam collimator was 4 mm diameter. A low beam current of 3 to 6 nA was maintained in order to ensure that the dead time remained below 10 %. The duration of the sample irradiation was about 10 to 20 minutes depending on the sample matrix. The target was positioned at 45 ° with respect to the beam normal and the characteristic X-rays were detected by a Si-Li detector (model ESLX 30 - 50, - 500 V). The detector has a beryllium window thickness of 25 µm, full width at half maximum (FWHM) energy of 150 eV, with the associated pulse processing electronics and a Canberra Genie 2000 (3.1) multichannel analyser (MCA) card interfaced to a PC. An absorber Kapton (90 µm thickness) was attached to the X-ray detector port in order to reduce high count rate and X-ray intensities of low Z elements as well as to suppress the spectrum background. Corrections for the suppressed peaks were made as reported (Olise et al., 2010a). For reliable calibration of the analytical system (viz. X-ray yield observed by the detector per unit charge per unit mass of the element) NIST Obsidian Rock 278 geological reference standard was
22
F.S. Olise, O.O. Ajayi, G. C. Ezeh, O.K. Owoade
DOI: 10.6092/issn.2281-4485/10260
EQA 39 (2020): 20-31
used as quality control of the experimental procedure. X-ray spectra obtained from PIXE measurements were analyzed using thick target option of computer-coded GUPIXWIN (Campbell et al., 2010).
Gamma-ray spectroscopyThe activity concentrations of natural radioactivity in the selected samples were determined using a 7.62 cm × 7.62 cm NaI (Tl) detector surrounded with adequate lead shield that reduces background by a factor of approximately 95 %. The optimal counting of 25200 seconds were used and detection limits of the NaI (Tl) detector system were calculated as 6.77, 11.40, and 12.85 Bq kg−1 for 40K, 232Th, and 238U, respectively. The activities of various radionuclides were determined in Bq kg−1 from the count spectra obtained from each of the samples using the gamma ray photo peaks corresponding to energy of 1120.3 keV (214Bi), 911.21 keV (228Ac) and 1460.82 keV (40K) for 238U, 232Th and 40K, respectively. After spectrum analysis, the count rates under each photopeak were used to calculate the activity concentration of each nuclide (Olise et al. 2010a, Olise et al. 2013) as show:
AE =ME λE NA [1]
WE
where, ME is the fractional weight of nuclide E in the sample, WE is the atomic weight of nuclide E (kg/mol), λE is the decay constant (s–1) of the parent radioisotope and NA is the Avogadro’s number (6.023 x 10²³ atoms/mol).
The absorbed dose rate, D (nGyh–1) in air due to the radionuclides concentrations in the samples was calculated at a distance of 1 m above the ground level using (UNSCEAR 2000, Olise et al. 2011):
D = 0.042Ak + 0.666ATh + 0.429AU [2]
where, Ak, ATh and AU are the activity concentrations (Bq/kg) of 40K, 232Th and 238U, respectively. Other radionuclides like 137Cs and 90Sr decay series were conviniently neglected, since they contribute very little to the total background dose (Leung et al. 1990, Olise et al. 2016).To estimate the annual effective doses, we considered the conversion coefficient from the absorbed dose in air to effective dose and the indoor occupancy factor which their average numerical values could be a function of the age of resident population and climate change. In
some studies, 0.7 Sv Gy–1 have been used as conversion coefficient for absorbed dose in air to effective dose received by adults while 0.2 and 0.8 have been used as outdoor and indoor occupancy factors respectively. This implies that on the average, 20% of time is spent outdoors around the world (UNSCEAR 2000). In summary, the populace at the study area could spend up to 60 % of their time outdoors (Olise et al. 2016) and the local miners and farmers with a 6 am to 4 or 6 pm mining or farming activities, could spend between 10 (42%) and 12 (50%) hours outdoors. Therefore, annual effective dose were determined by taking occupancy factor to be 0.4583 while outdoor effective dose rate (OEDR) was estimated as:
OEDR (mSvy-1) = D(nGyh-1) . 24hd-1 . 365.25dy-1 . 0.4583(OCPF) . 0.7SvGy-1(CONVC) . 10-6 [3]
where, OCPF and CONVC are the occupancy factor and conversion coefficient, respectively. Since the indoor and outdoor occupancy factors need to sum up to 1.0 in accounting for 100 % of the exposure group’s time, an indoor factor of 1 - 0.4583 = 0.5417 was used to calculate the indoor effective dose rate (IEDR):
IEDR (mSvy-1) = D(nGyh-1) . 24hd-1 . 365.25dy-1 . 0.5417(OCPF) . 0.7SvGy-1(CONVC) . 10-6 [4]
Data AnalysisThe results obtained from PIXE analysis were subjected to further analysis in-order to determine the Geo-accumulation Index (Igeo) and Potential Ecological Risk Index of some selected metals in the study sites.
IgeoIgeo, was introduced by Muller, (1969) for determining the extent of metal accumulation in sediments, and has been widely used in various studies. Igeo is mathematically expressed as:
Igeo =Log2 Cn
[5]1.5 Bn
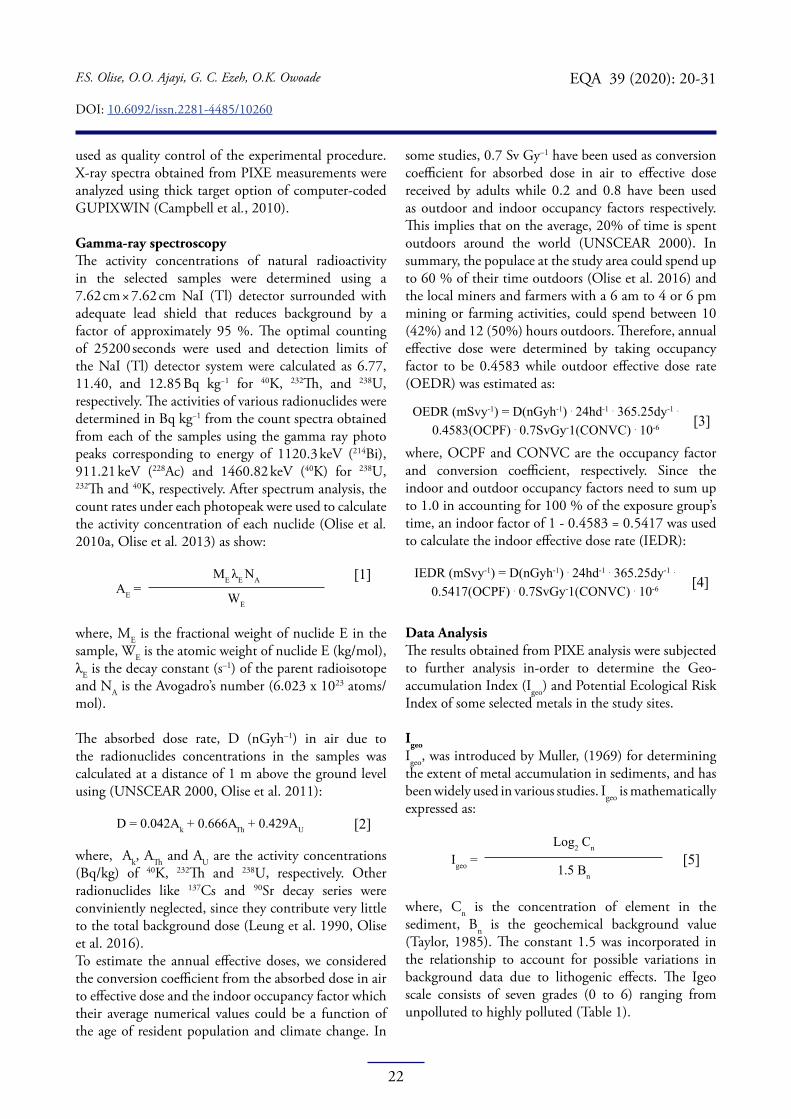
where, Cn is the concentration of element in the sediment, Bn is the geochemical background value (Taylor, 1985). The constant 1.5 was incorporated in the relationship to account for possible variations in background data due to lithogenic effects. The Igeo scale consists of seven grades (0 to 6) ranging from unpolluted to highly polluted (Table 1).
23
F.S. Olise, O.O. Ajayi, G. C. Ezeh, O.K. Owoade
DOI: 10.6092/issn.2281-4485/10260
EQA 39 (2020): 20-31
Igeoclass
Igeovalue
Igeoquality
0 Igeo ≤ 0 Uncontaminated1 0 < Igeo <1 Uncontaminated to moderately contaminated2 1 < Igeo <2 Moderately contaminated3 2 < Igeo <3 Moderately to heavily contaminated4 3 < Igeo <4 Heavily contaminated5 4 < Igeo <5 Heavily to extremely contaminated6 5 < Igeo Extremely contaminated
Table 1. Pollution grades of geo-accumulation index of metals.
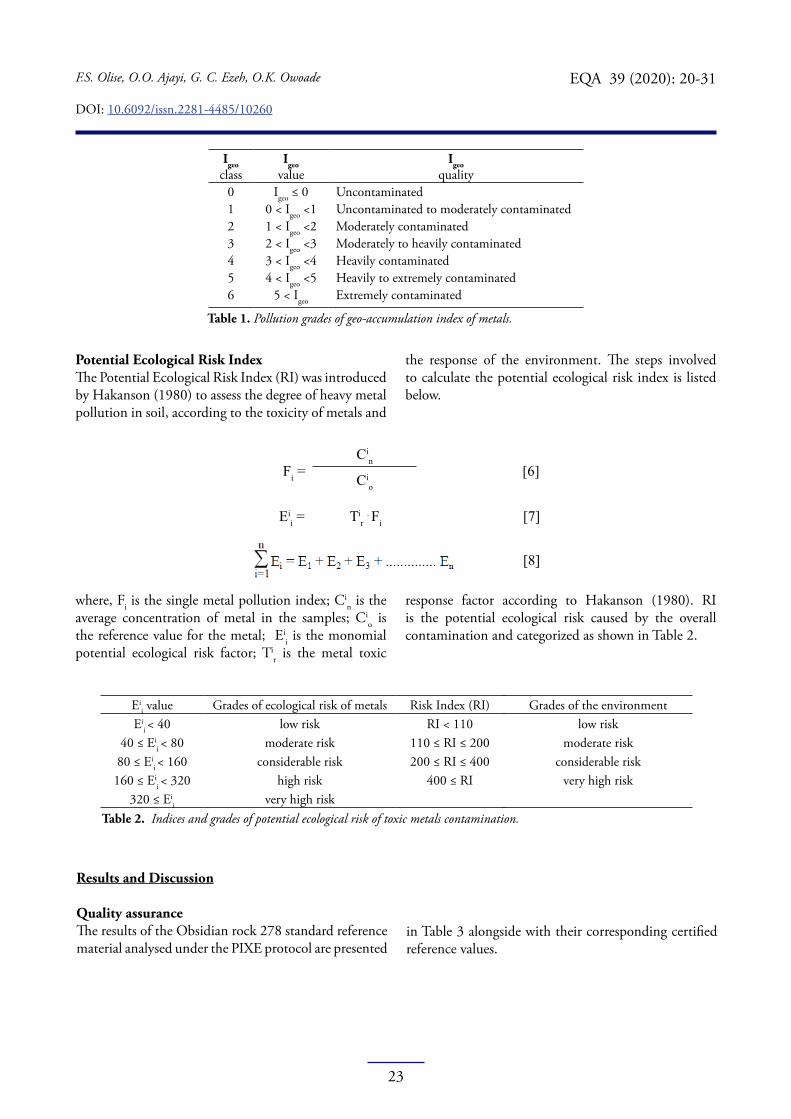
Potential Ecological Risk IndexThe Potential Ecological Risk Index (RI) was introduced by Hakanson (1980) to assess the degree of heavy metal pollution in soil, according to the toxicity of metals and
the response of the environment. The steps involved to calculate the potential ecological risk index is listed below.
Results and Discussion
Quality assuranceThe results of the Obsidian rock 278 standard reference material analysed under the PIXE protocol are presented
in Table 3 alongside with their corresponding certified reference values.
Fi =Ci
n[6]Ci
o
////Ei
i = Tir
. Fi [7]///
[8]
where, Fi is the single metal pollution index; Cin is the
average concentration of metal in the samples; Cio is
the reference value for the metal; Eii is the monomial
potential ecological risk factor; Tir is the metal toxic
Eii value Grades of ecological risk of metals Risk Index (RI) Grades of the environment
Eii < 40 low risk RI < 110 low risk
40 ≤ Eii < 80 moderate risk 110 ≤ RI ≤ 200 moderate risk
80 ≤ Eii < 160 considerable risk 200 ≤ RI ≤ 400 considerable risk
160 ≤ Eii < 320 high risk 400 ≤ RI very high risk
320 ≤ Eii very high risk
Table 2. Indices and grades of potential ecological risk of toxic metals contamination.
response factor according to Hakanson (1980). RI is the potential ecological risk caused by the overall contamination and categorized as shown in Table 2.
24
F.S. Olise, O.O. Ajayi, G. C. Ezeh, O.K. Owoade
DOI: 10.6092/issn.2281-4485/10260
EQA 39 (2020): 20-31
Elements Experimental values (µg g-1) Certified reference values (µg g-1) PIXE Efficiency (%)
Na 35810 35900 99.75Mg 1400 1390 100.72Al 74630 74900 99.64Si 341660 341436 100.07K 34430 34530 99.71Ca 7020 7025 99.93Ti 1470 1468 100.14
Mn 390 403 96.77Cu 5.9 5.9 100.00Fe 14270 14268 100.01Rb 55 55 100.00Sr 62 63.5 97.64Ba 1145 1140 100.44
Table 3. Results of NIST obsidian rock 278 standard reference material.
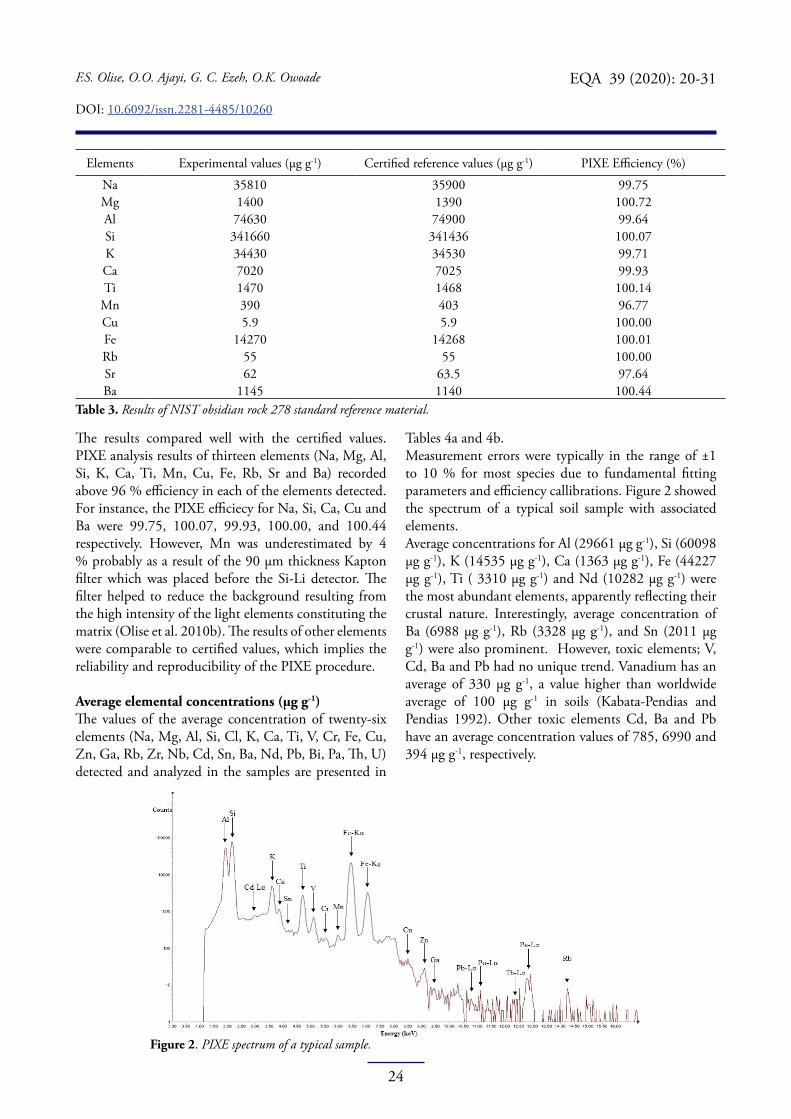
The results compared well with the certified values. PIXE analysis results of thirteen elements (Na, Mg, Al, Si, K, Ca, Ti, Mn, Cu, Fe, Rb, Sr and Ba) recorded above 96 % efficiency in each of the elements detected. For instance, the PIXE efficiecy for Na, Si, Ca, Cu and Ba were 99.75, 100.07, 99.93, 100.00, and 100.44 respectively. However, Mn was underestimated by 4 % probably as a result of the 90 µm thickness Kapton filter which was placed before the Si-Li detector. The filter helped to reduce the background resulting from the high intensity of the light elements constituting the matrix (Olise et al. 2010b). The results of other elements were comparable to certified values, which implies the reliability and reproducibility of the PIXE procedure.
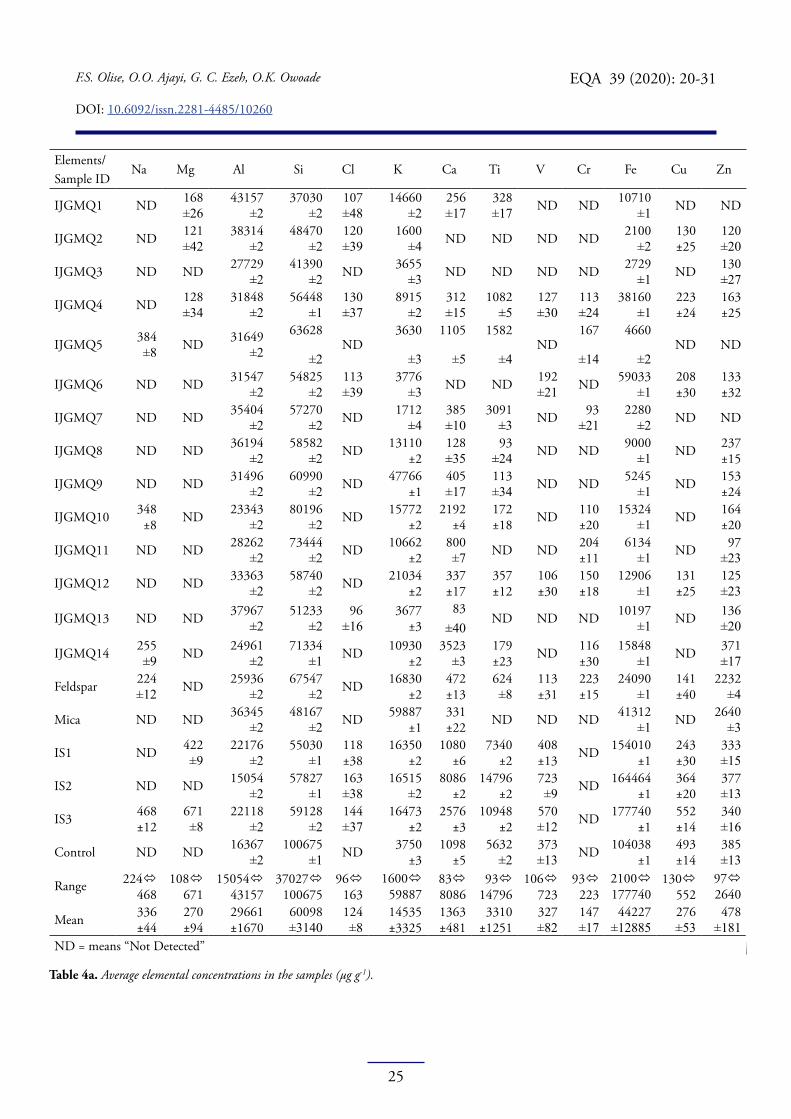
Average elemental concentrations (μg g-1)The values of the average concentration of twenty-six elements (Na, Mg, Al, Si, Cl, K, Ca, Ti, V, Cr, Fe, Cu, Zn, Ga, Rb, Zr, Nb, Cd, Sn, Ba, Nd, Pb, Bi, Pa, Th, U) detected and analyzed in the samples are presented in
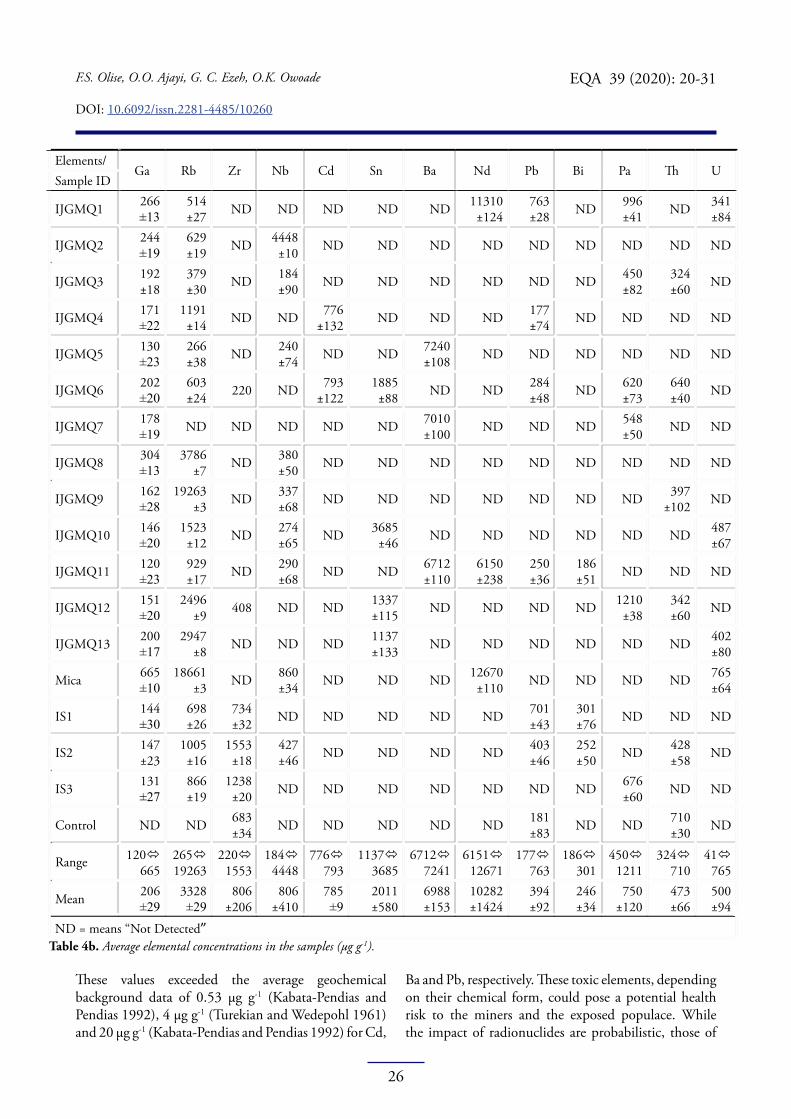
Tables 4a and 4b. Measurement errors were typically in the range of ±1 to 10 % for most species due to fundamental fitting parameters and efficiency callibrations. Figure 2 showed the spectrum of a typical soil sample with associated elements. Average concentrations for Al (29661 µg g-1), Si (60098 µg g-1), K (14535 µg g-1), Ca (1363 µg g-1), Fe (44227 µg g-1), Ti ( 3310 µg g-1) and Nd (10282 µg g-1) were the most abundant elements, apparently reflecting their crustal nature. Interestingly, average concentration of Ba (6988 µg g-1), Rb (3328 µg g-1), and Sn (2011 µg g-1) were also prominent. However, toxic elements; V, Cd, Ba and Pb had no unique trend. Vanadium has an average of 330 µg g-1, a value higher than worldwide average of 100 µg g-1 in soils (Kabata-Pendias and Pendias 1992). Other toxic elements Cd, Ba and Pb have an average concentration values of 785, 6990 and 394 µg g-1, respectively.
Figure 2. PIXE spectrum of a typical sample.
25
F.S. Olise, O.O. Ajayi, G. C. Ezeh, O.K. Owoade
DOI: 10.6092/issn.2281-4485/10260
EQA 39 (2020): 20-31
Elements/ Na Mg Al Si Cl K Ca Ti V Cr Fe Cu Zn
Sample ID
IJGMQ1 ND 168±26
43157±2
37030±2
107±48
14660±2
256±17
328±17 ND ND 10710
±1 ND ND
IJGMQ2 ND 121±42
38314±2
48470±2
120±39
1600±4 ND ND ND ND 2100
±2130±25
120±20
IJGMQ3 ND ND 27729±2
41390±2 ND 3655
±3 ND ND ND ND 2729±1 ND 130
±27
IJGMQ4 ND 128±34
31848±2
56448±1
130±37
8915±2
312±15
1082±5
127±30
113±24
38160±1
223 ±24
163 ±25
IJGMQ5 384±8 ND 31649
±2
63628
±2ND
3630
±3
1105
±5
1582
±4ND
167
±14
4660
±2ND ND
IJGMQ6 ND ND 31547±2
54825±2
113±39
3776±3 ND ND 192
±21 ND 59033±1
208 ±30
133 ±32
IJGMQ7 ND ND 35404 ±2
57270±2 ND 1712
±4385±10
3091±3 ND 93
±212280
±2 ND ND
IJGMQ8 ND ND 36194±2
58582 ±2 ND 13110
±2128±35
93±24 ND ND 9000
±1 ND 237 ±15
IJGMQ9 ND ND 31496 ±2
60990 ±2 ND 47766
±1405±17
113±34 ND ND 5245
±1 ND 153 ±24
IJGMQ10 348 ±8 ND 23343
±280196
±2 ND 15772 ±2
2192 ±4
172 ±18 ND 110
±2015324
±1 ND 164 ±20
IJGMQ11 ND ND 28262 ±2
73444 ±2 ND 10662
±2800 ±7 ND ND 204
±116134
±1 ND 97±23
IJGMQ12 ND ND 33363 ±2
58740 ±2 ND 21034
±2337 ±17
357 ±12
106 ±30
150 ±18
12906±1
131 ±25
125±23
IJGMQ13 ND ND 37967 ±2
51233 ±2
96 ±16
3677 ±3
83 ±40
ND ND ND 10197±1 ND 136
±20
IJGMQ14 255±9 ND 24961
±271334
±1 ND 10930 ±2
3523±3
179 ±23 ND 116
±3015848
±1 ND 371±17
Feldspar 224±12 ND 25936
±267547
±2 ND 16830 ±2
472 ±13
624 ±8
113 ±31
223 ±15
24090±1
141 ±40
2232±4
Mica ND ND 36345±2
48167±2 ND 59887
±1331 ±22 ND ND ND 41312
±1 ND 2640±3
IS1 ND 422 ±9
22176 ±2
55030 ±1
118 ±38
16350 ±2
1080 ±6
7340 ±2
408 ±13 ND 154010
±1243 ±30
333±15
IS2 ND ND 15054±2
57827±1
163±38
16515±2
8086 ±2
14796 ±2
723 ±9 ND 164464
±1364 ±20
377±13
IS3 468 ±12
671±8
22118±2
59128±2
144±37
16473 ±2
2576 ±3
10948 ±2
570±12 ND 177740
±1552 ±14
340±16
Control ND ND 16367±2
100675±1 ND 3750
±31098
±55632
±2373±13 ND 104038
±1493 ±14
385±13
Range 224ó468
108ó671
15054ó43157
37027ó100675
96ó163
1600ó59887
83ó8086
93ó14796
106ó723
93ó223
2100ó 177740
130ó552
97ó2640
Mean 336 ±44
270 ±94
29661±1670
60098±3140
124 ±8
14535 ±3325
1363 ±481
3310 ±1251
327±82
147±17
44227±12885
276±53
478±181
ND = means “Not Detected”
Table 4a. Average elemental concentrations in the samples (μg g-1).
26
F.S. Olise, O.O. Ajayi, G. C. Ezeh, O.K. Owoade
DOI: 10.6092/issn.2281-4485/10260
EQA 39 (2020): 20-31
Elements/ Ga Rb Zr Nb Cd Sn Ba Nd Pb Bi Pa Th U
Sample ID
IJGMQ1 266±13
514 ±27 ND ND ND ND ND 11310
±124763 ±28 ND 996
±41 ND 341 ±84
IJGMQ2 244 ±19
629 ±19 ND 4448
±10 ND ND ND ND ND ND ND ND ND
IJGMQ3 192 ±18
379 ±30 ND 184
±90 ND ND ND ND ND ND 450 ±82
324 ±60 ND
IJGMQ4 171 ±22
1191 ±14 ND ND 776
±132 ND ND ND 177 ±74 ND ND ND ND
IJGMQ5 130 ±23
266 ±38 ND 240
±74 ND ND 7240 ±108 ND ND ND ND ND ND
IJGMQ6 202 ±20
603 ±24 220 ND 793
±1221885 ±88 ND ND 284
±48 ND 620 ±73
640 ±40 ND
IJGMQ7 178 ±19 ND ND ND ND ND 7010
±100 ND ND ND 548 ±50 ND ND
IJGMQ8 304 ±13
3786 ±7 ND 380
±50 ND ND ND ND ND ND ND ND ND
IJGMQ9 162 ±28
19263 ±3 ND 337
±68 ND ND ND ND ND ND ND 397 ±102 ND
IJGMQ10 146 ±20
1523 ±12 ND 274
±65 ND 3685 ±46 ND ND ND ND ND ND 487
±67
IJGMQ11 120 ±23
929 ±17 ND 290
±68 ND ND 6712 ±110
6150 ±238
250 ±36
186 ±51 ND ND ND
IJGMQ12 151 ±20
2496 ±9 408 ND ND 1337
±115 ND ND ND ND 1210 ±38
342 ±60 ND
IJGMQ13 200 ±17
2947 ±8 ND ND ND 1137
±133 ND ND ND ND ND ND 402 ±80
Mica 665 ±10
18661 ±3 ND 860
±34 ND ND ND 12670 ±110 ND ND ND ND 765
±64
IS1 144±30
698 ±26
734 ±32 ND ND ND ND ND 701
±43301 ±76 ND ND ND
IS2 147 ±23
1005 ±16
1553 ±18
427 ±46 ND ND ND ND 403
±46252 ±50 ND 428
±58 ND
IS3 131 ±27
866 ±19
1238 ±20 ND ND ND ND ND ND ND 676
±60 ND ND
Control ND ND 683 ±34 ND ND ND ND ND 181
±83 ND ND 710 ±30 ND
Range 120ó665
265ó19263
220ó1553
184ó4448
776ó793
1137ó3685
6712ó7241
6151ó12671
177ó763
186ó301
450ó1211
324ó710
41ó765
Mean 206 ±29
3328 ±29
806 ±206
806 ±410
785 ±9
2011 ±580
6988 ±153
10282 ±1424
394 ±92
246 ±34
750 ±120
473 ±66
500 ±94
ND = means “Not Detected”Table 4b. Average elemental concentrations in the samples (μg g-1).
These values exceeded the average geochemical background data of 0.53 µg g-1 (Kabata-Pendias and Pendias 1992), 4 µg g-1 (Turekian and Wedepohl 1961) and 20 µg g-1 (Kabata-Pendias and Pendias 1992) for Cd,
Ba and Pb, respectively. These toxic elements, depending on their chemical form, could pose a potential health risk to the miners and the exposed populace. While the impact of radionuclides are probabilistic, those of
27
F.S. Olise, O.O. Ajayi, G. C. Ezeh, O.K. Owoade
DOI: 10.6092/issn.2281-4485/10260
EQA 39 (2020): 20-31
toxic metals are deterministic and attracts immediate consequences at elevated levels. Some possible health risks have been identified to include hyperkeratosis, hyperpigmentation (Tseng 1977), impairment of reproduction and lipid metabolism, extrasystoles and reduced level of blood cholesterol (Vouk 1979). High level of Pb poisoning and eventual death resulting from artisanal mining activities have been reported in two towns in Northern Nigeria (Olise et al. 2016). From the study, the identified potentially toxic elements can be used as fingerprint for immediate or near future evaluation of artisanal mining-related impacts in the study area. Such impacts could include but not limited to chronic human metal poisoning from consumption of plant and animal materials enriched in the metals. Interestingly, trace metal concentrations observed in the control samples were lower than values observed in the other samples, thus an indication of the influence of
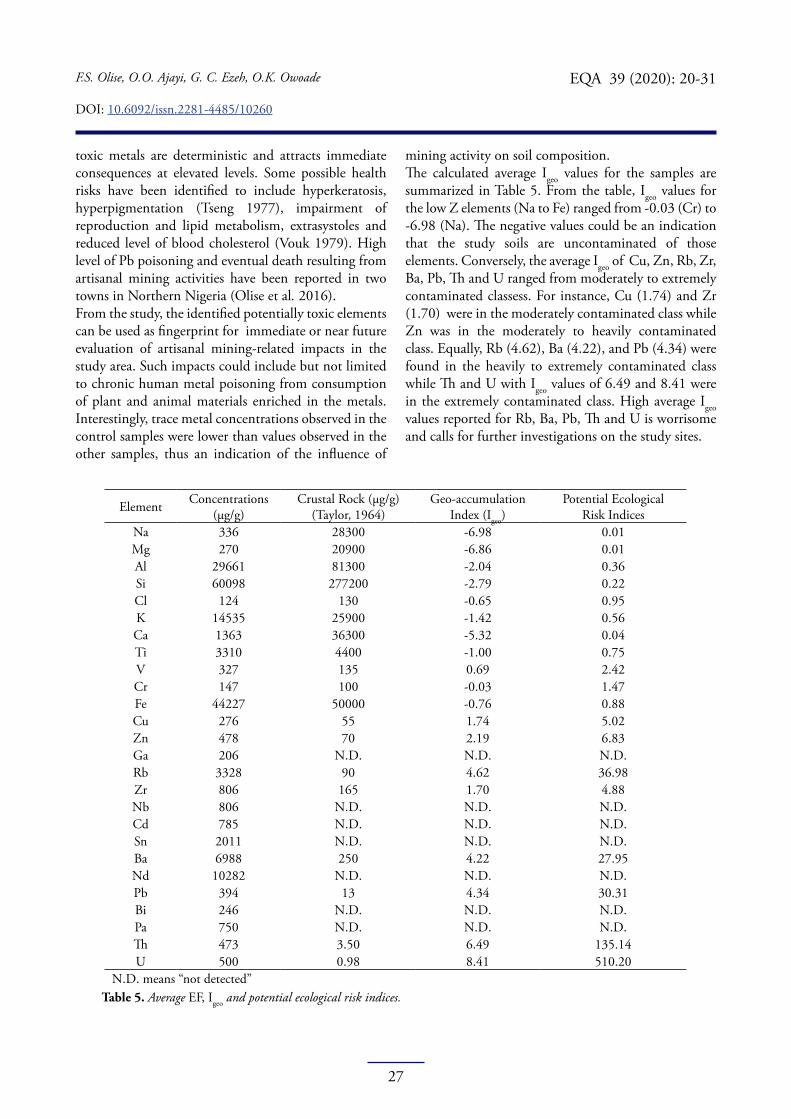
mining activity on soil composition.The calculated average Igeo values for the samples are summarized in Table 5. From the table, Igeo values for the low Z elements (Na to Fe) ranged from -0.03 (Cr) to -6.98 (Na). The negative values could be an indication that the study soils are uncontaminated of those elements. Conversely, the average Igeo of Cu, Zn, Rb, Zr, Ba, Pb, Th and U ranged from moderately to extremely contaminated classess. For instance, Cu (1.74) and Zr (1.70) were in the moderately contaminated class while Zn was in the moderately to heavily contaminated class. Equally, Rb (4.62), Ba (4.22), and Pb (4.34) were found in the heavily to extremely contaminated class while Th and U with Igeo values of 6.49 and 8.41 were in the extremely contaminated class. High average Igeo values reported for Rb, Ba, Pb, Th and U is worrisome and calls for further investigations on the study sites.
Element Concentrations(µg/g)
Crustal Rock (µg/g)(Taylor, 1964)
Geo-accumulationIndex (Igeo)
Potential EcologicalRisk Indices
Na 336 28300 -6.98 0.01Mg 270 20900 -6.86 0.01Al 29661 81300 -2.04 0.36Si 60098 277200 -2.79 0.22Cl 124 130 -0.65 0.95K 14535 25900 -1.42 0.56Ca 1363 36300 -5.32 0.04Ti 3310 4400 -1.00 0.75V 327 135 0.69 2.42Cr 147 100 -0.03 1.47Fe 44227 50000 -0.76 0.88Cu 276 55 1.74 5.02Zn 478 70 2.19 6.83Ga 206 N.D. N.D. N.D.Rb 3328 90 4.62 36.98Zr 806 165 1.70 4.88Nb 806 N.D. N.D. N.D.Cd 785 N.D. N.D. N.D.Sn 2011 N.D. N.D. N.D.Ba 6988 250 4.22 27.95Nd 10282 N.D. N.D. N.D.Pb 394 13 4.34 30.31Bi 246 N.D. N.D. N.D.Pa 750 N.D. N.D. N.D.Th 473 3.50 6.49 135.14U 500 0.98 8.41 510.20
N.D. means “not detected”Table 5. Average EF, Igeo and potential ecological risk indices.
28
F.S. Olise, O.O. Ajayi, G. C. Ezeh, O.K. Owoade
DOI: 10.6092/issn.2281-4485/10260
EQA 39 (2020): 20-31
Table 5 also depicts the average ecological risk assessment of toxic metals in the study area. It was found that the average Fi ranged from 0.01 to 510 while the average monomial risk factor (Ei
r) of the toxic metals; Cr (2.94), Cu (25.09) and Zn (6.83) were below 40 indicating that these metals posed low risk to environment. There was only one monomial ecological risk above 100, which is Pb (Ei
r = 151.54) indicating moderate risk. In order to quantify the overall potential ecologicak risk of observed metals, RI was calculated as the sum of all the six risk factors. RI could provide information regarding sensitivity of local ecosystem to the toxic metals and also represent ecological risk that resulted from the overall contamination. The RI values for the calculated metals were in the order Pb (81.3 %) > Cu (13.5 %) > Zn (3.7 %) > Cr (1.7 %). Overall, Pb contributed 81.3 % of the total potential ecological risk.
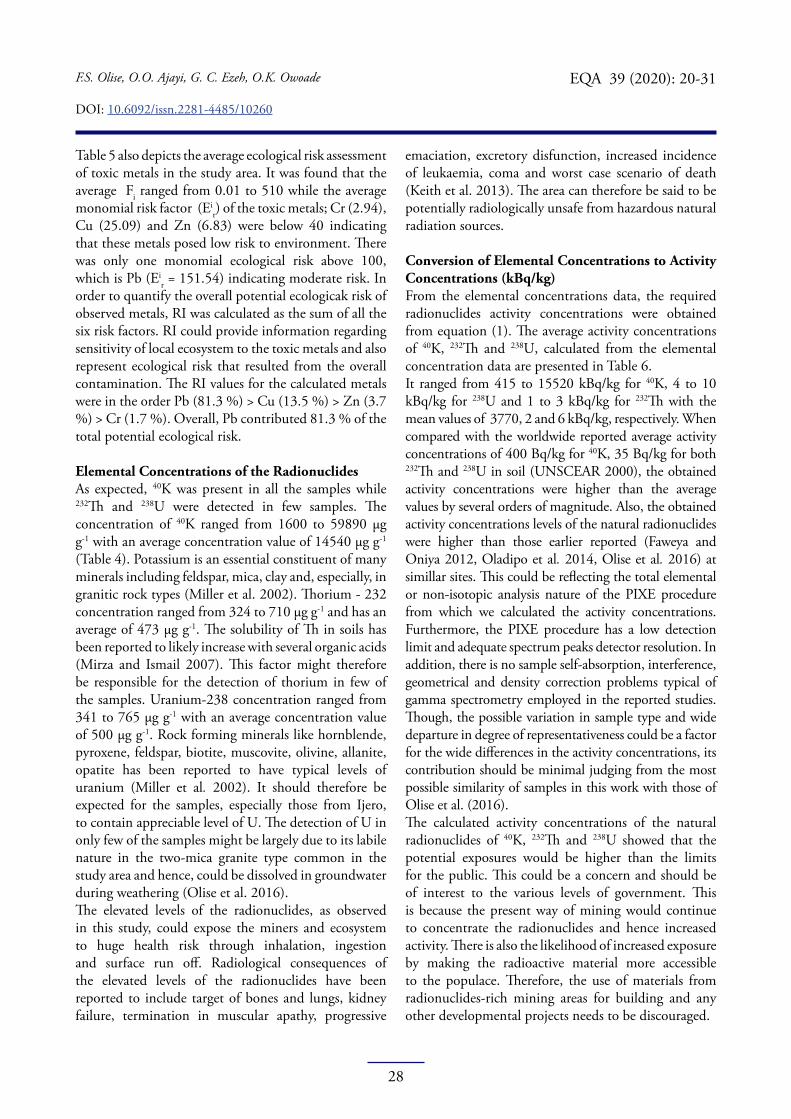
Elemental Concentrations of the RadionuclidesAs expected, 40K was present in all the samples while 232Th and 238U were detected in few samples. The concentration of 40K ranged from 1600 to 59890 µg g-1 with an average concentration value of 14540 µg g-1 (Table 4). Potassium is an essential constituent of many minerals including feldspar, mica, clay and, especially, in granitic rock types (Miller et al. 2002). Thorium - 232 concentration ranged from 324 to 710 µg g-1 and has an average of 473 µg g-1. The solubility of Th in soils has been reported to likely increase with several organic acids (Mirza and Ismail 2007). This factor might therefore be responsible for the detection of thorium in few of the samples. Uranium-238 concentration ranged from 341 to 765 µg g-1 with an average concentration value of 500 µg g-1. Rock forming minerals like hornblende, pyroxene, feldspar, biotite, muscovite, olivine, allanite, opatite has been reported to have typical levels of uranium (Miller et al. 2002). It should therefore be expected for the samples, especially those from Ijero, to contain appreciable level of U. The detection of U in only few of the samples might be largely due to its labile nature in the two-mica granite type common in the study area and hence, could be dissolved in groundwater during weathering (Olise et al. 2016).The elevated levels of the radionuclides, as observed in this study, could expose the miners and ecosystem to huge health risk through inhalation, ingestion and surface run off. Radiological consequences of the elevated levels of the radionuclides have been reported to include target of bones and lungs, kidney failure, termination in muscular apathy, progressive
emaciation, excretory disfunction, increased incidence of leukaemia, coma and worst case scenario of death (Keith et al. 2013). The area can therefore be said to be potentially radiologically unsafe from hazardous natural radiation sources.
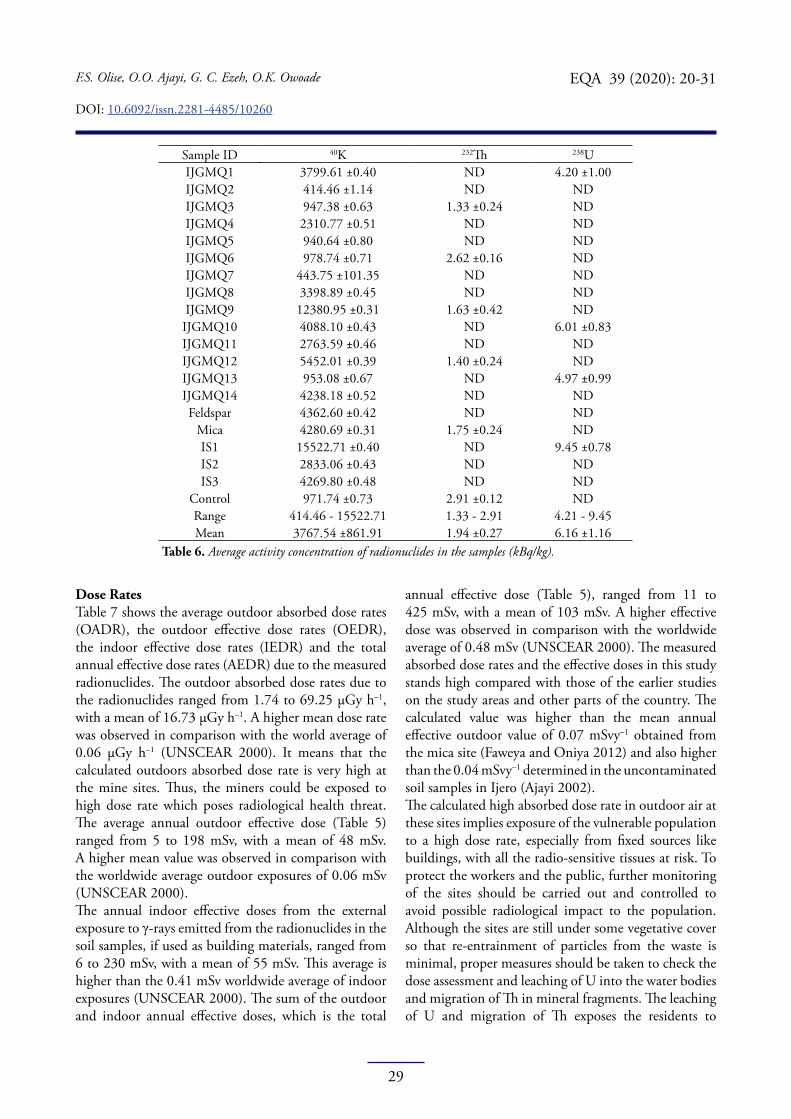
Conversion of Elemental Concentrations to Activity Concentrations (kBq/kg) From the elemental concentrations data, the required radionuclides activity concentrations were obtained from equation (1). The average activity concentrations of 40K, 232Th and 238U, calculated from the elemental concentration data are presented in Table 6. It ranged from 415 to 15520 kBq/kg for 40K, 4 to 10 kBq/kg for 238U and 1 to 3 kBq/kg for 232Th with the mean values of 3770, 2 and 6 kBq/kg, respectively. When compared with the worldwide reported average activity concentrations of 400 Bq/kg for 40K, 35 Bq/kg for both 232Th and 238U in soil (UNSCEAR 2000), the obtained activity concentrations were higher than the average values by several orders of magnitude. Also, the obtained activity concentrations levels of the natural radionuclides were higher than those earlier reported (Faweya and Oniya 2012, Oladipo et al. 2014, Olise et al. 2016) at simillar sites. This could be reflecting the total elemental or non-isotopic analysis nature of the PIXE procedure from which we calculated the activity concentrations. Furthermore, the PIXE procedure has a low detection limit and adequate spectrum peaks detector resolution. In addition, there is no sample self-absorption, interference, geometrical and density correction problems typical of gamma spectrometry employed in the reported studies. Though, the possible variation in sample type and wide departure in degree of representativeness could be a factor for the wide differences in the activity concentrations, its contribution should be minimal judging from the most possible similarity of samples in this work with those of Olise et al. (2016).The calculated activity concentrations of the natural radionuclides of 40K, 232Th and 238U showed that the potential exposures would be higher than the limits for the public. This could be a concern and should be of interest to the various levels of government. This is because the present way of mining would continue to concentrate the radionuclides and hence increased activity. There is also the likelihood of increased exposure by making the radioactive material more accessible to the populace. Therefore, the use of materials from radionuclides-rich mining areas for building and any other developmental projects needs to be discouraged.
29
F.S. Olise, O.O. Ajayi, G. C. Ezeh, O.K. Owoade
DOI: 10.6092/issn.2281-4485/10260
EQA 39 (2020): 20-31
Sample ID 40K 232Th 238UIJGMQ1 3799.61 ±0.40 ND 4.20 ±1.00IJGMQ2 414.46 ±1.14 ND NDIJGMQ3 947.38 ±0.63 1.33 ±0.24 NDIJGMQ4 2310.77 ±0.51 ND NDIJGMQ5 940.64 ±0.80 ND NDIJGMQ6 978.74 ±0.71 2.62 ±0.16 NDIJGMQ7 443.75 ±101.35 ND NDIJGMQ8 3398.89 ±0.45 ND NDIJGMQ9 12380.95 ±0.31 1.63 ±0.42 NDIJGMQ10 4088.10 ±0.43 ND 6.01 ±0.83IJGMQ11 2763.59 ±0.46 ND NDIJGMQ12 5452.01 ±0.39 1.40 ±0.24 NDIJGMQ13 953.08 ±0.67 ND 4.97 ±0.99IJGMQ14 4238.18 ±0.52 ND NDFeldspar 4362.60 ±0.42 ND ND
Mica 4280.69 ±0.31 1.75 ±0.24 NDIS1 15522.71 ±0.40 ND 9.45 ±0.78IS2 2833.06 ±0.43 ND NDIS3 4269.80 ±0.48 ND ND
Control 971.74 ±0.73 2.91 ±0.12 NDRange 414.46 - 15522.71 1.33 - 2.91 4.21 - 9.45Mean 3767.54 ±861.91 1.94 ±0.27 6.16 ±1.16
Table 6. Average activity concentration of radionuclides in the samples (kBq/kg).
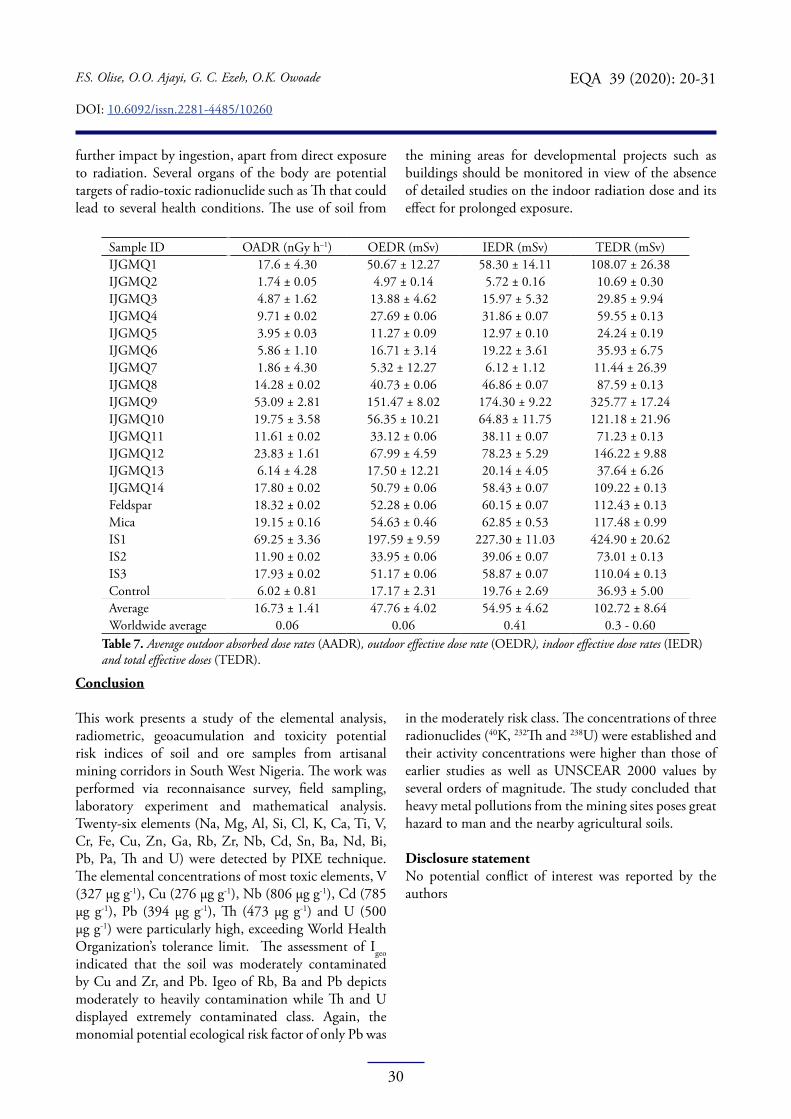
Dose RatesTable 7 shows the average outdoor absorbed dose rates (OADR), the outdoor effective dose rates (OEDR), the indoor effective dose rates (IEDR) and the total annual effective dose rates (AEDR) due to the measured radionuclides. The outdoor absorbed dose rates due to the radionuclides ranged from 1.74 to 69.25 µGy h–1, with a mean of 16.73 µGy h–1. A higher mean dose rate was observed in comparison with the world average of 0.06 µGy h–1 (UNSCEAR 2000). It means that the calculated outdoors absorbed dose rate is very high at the mine sites. Thus, the miners could be exposed to high dose rate which poses radiological health threat. The average annual outdoor effective dose (Table 5) ranged from 5 to 198 mSv, with a mean of 48 mSv. A higher mean value was observed in comparison with the worldwide average outdoor exposures of 0.06 mSv (UNSCEAR 2000). The annual indoor effective doses from the external exposure to γ-rays emitted from the radionuclides in the soil samples, if used as building materials, ranged from 6 to 230 mSv, with a mean of 55 mSv. This average is higher than the 0.41 mSv worldwide average of indoor exposures (UNSCEAR 2000). The sum of the outdoor and indoor annual effective doses, which is the total
annual effective dose (Table 5), ranged from 11 to 425 mSv, with a mean of 103 mSv. A higher effective dose was observed in comparison with the worldwide average of 0.48 mSv (UNSCEAR 2000). The measured absorbed dose rates and the effective doses in this study stands high compared with those of the earlier studies on the study areas and other parts of the country. The calculated value was higher than the mean annual effective outdoor value of 0.07 mSvy–1 obtained from the mica site (Faweya and Oniya 2012) and also higher than the 0.04 mSvy–1 determined in the uncontaminated soil samples in Ijero (Ajayi 2002).The calculated high absorbed dose rate in outdoor air at these sites implies exposure of the vulnerable population to a high dose rate, especially from fixed sources like buildings, with all the radio-sensitive tissues at risk. To protect the workers and the public, further monitoring of the sites should be carried out and controlled to avoid possible radiological impact to the population. Although the sites are still under some vegetative cover so that re-entrainment of particles from the waste is minimal, proper measures should be taken to check the dose assessment and leaching of U into the water bodies and migration of Th in mineral fragments. The leaching of U and migration of Th exposes the residents to
30
F.S. Olise, O.O. Ajayi, G. C. Ezeh, O.K. Owoade
DOI: 10.6092/issn.2281-4485/10260
EQA 39 (2020): 20-31
further impact by ingestion, apart from direct exposure to radiation. Several organs of the body are potential targets of radio-toxic radionuclide such as Th that could lead to several health conditions. The use of soil from
the mining areas for developmental projects such as buildings should be monitored in view of the absence of detailed studies on the indoor radiation dose and its effect for prolonged exposure.
Sample ID OADR (nGy h–1) OEDR (mSv) IEDR (mSv) TEDR (mSv)IJGMQ1 17.6 ± 4.30 50.67 ± 12.27 58.30 ± 14.11 108.07 ± 26.38IJGMQ2 1.74 ± 0.05 4.97 ± 0.14 5.72 ± 0.16 10.69 ± 0.30IJGMQ3 4.87 ± 1.62 13.88 ± 4.62 15.97 ± 5.32 29.85 ± 9.94IJGMQ4 9.71 ± 0.02 27.69 ± 0.06 31.86 ± 0.07 59.55 ± 0.13IJGMQ5 3.95 ± 0.03 11.27 ± 0.09 12.97 ± 0.10 24.24 ± 0.19IJGMQ6 5.86 ± 1.10 16.71 ± 3.14 19.22 ± 3.61 35.93 ± 6.75IJGMQ7 1.86 ± 4.30 5.32 ± 12.27 6.12 ± 1.12 11.44 ± 26.39IJGMQ8 14.28 ± 0.02 40.73 ± 0.06 46.86 ± 0.07 87.59 ± 0.13IJGMQ9 53.09 ± 2.81 151.47 ± 8.02 174.30 ± 9.22 325.77 ± 17.24IJGMQ10 19.75 ± 3.58 56.35 ± 10.21 64.83 ± 11.75 121.18 ± 21.96IJGMQ11 11.61 ± 0.02 33.12 ± 0.06 38.11 ± 0.07 71.23 ± 0.13IJGMQ12 23.83 ± 1.61 67.99 ± 4.59 78.23 ± 5.29 146.22 ± 9.88IJGMQ13 6.14 ± 4.28 17.50 ± 12.21 20.14 ± 4.05 37.64 ± 6.26IJGMQ14 17.80 ± 0.02 50.79 ± 0.06 58.43 ± 0.07 109.22 ± 0.13Feldspar 18.32 ± 0.02 52.28 ± 0.06 60.15 ± 0.07 112.43 ± 0.13Mica 19.15 ± 0.16 54.63 ± 0.46 62.85 ± 0.53 117.48 ± 0.99IS1 69.25 ± 3.36 197.59 ± 9.59 227.30 ± 11.03 424.90 ± 20.62IS2 11.90 ± 0.02 33.95 ± 0.06 39.06 ± 0.07 73.01 ± 0.13IS3 17.93 ± 0.02 51.17 ± 0.06 58.87 ± 0.07 110.04 ± 0.13Control 6.02 ± 0.81 17.17 ± 2.31 19.76 ± 2.69 36.93 ± 5.00Average 16.73 ± 1.41 47.76 ± 4.02 54.95 ± 4.62 102.72 ± 8.64Worldwide average 0.06 0.06 0.41 0.3 - 0.60
Table 7. Average outdoor absorbed dose rates (AADR), outdoor effective dose rate (OEDR), indoor effective dose rates (IEDR)and total effective doses (TEDR).
Conclusion
This work presents a study of the elemental analysis, radiometric, geoacumulation and toxicity potential risk indices of soil and ore samples from artisanal mining corridors in South West Nigeria. The work was performed via reconnaisance survey, field sampling, laboratory experiment and mathematical analysis. Twenty-six elements (Na, Mg, Al, Si, Cl, K, Ca, Ti, V, Cr, Fe, Cu, Zn, Ga, Rb, Zr, Nb, Cd, Sn, Ba, Nd, Bi, Pb, Pa, Th and U) were detected by PIXE technique. The elemental concentrations of most toxic elements, V (327 µg g-1), Cu (276 µg g-1), Nb (806 µg g-1), Cd (785 µg g-1), Pb (394 µg g-1), Th (473 µg g-1) and U (500 µg g-1) were particularly high, exceeding World Health Organization’s tolerance limit. The assessment of Igeo indicated that the soil was moderately contaminated by Cu and Zr, and Pb. Igeo of Rb, Ba and Pb depicts moderately to heavily contamination while Th and U displayed extremely contaminated class. Again, the monomial potential ecological risk factor of only Pb was
in the moderately risk class. The concentrations of three radionuclides (40K, 232Th and 238U) were established and their activity concentrations were higher than those of earlier studies as well as UNSCEAR 2000 values by several orders of magnitude. The study concluded that heavy metal pollutions from the mining sites poses great hazard to man and the nearby agricultural soils.
Disclosure statement No potential conflict of interest was reported by the authors
31
F.S. Olise, O.O. Ajayi, G. C. Ezeh, O.K. Owoade
DOI: 10.6092/issn.2281-4485/10260
EQA 39 (2020): 20-31
References
AJAYI I.R. (2002) Radiological dose implications of the natural radioactivity in surface soils in Ekiti state, Nigeria. Pure and Applied Science 8(3):357–360.
BRAI M., BELLI S., HAUSER S., PUCCIO P., RIZZO S., BASILE S., MARRALE M. (2006) Correlation of radioactivity measurements, air kerma rates and geological features of Sicily. Radiation Measurement 41:461–470.
CAMPBELL J.L., BOYD N.I., GRASSI N., BONNICK P., MAXWELL J.A. (2010) The Guelph PIXE software package IV. Nucl Instr Meth Phys Res B 268:3356–3363.
FAWEYA E.B., ONIYA E.O. (2012) Radiological safety assessment and physico-chemical characterization of soil mixed with mine tailings used as building materials from Oke-Kusa mining sites in Ijero, Nigeria. Nature and Science 10(5):64–71.
HAKANSON L. (1980) An ecological risk index for aquatic pollution control, a sedimentological approach. Water Resources 14(8):975–1001.KABATA-PENDIAS A., PENDIAS H. (1992) Trace elements in soils and plants. 2nd ed., CRC Press, Boca Raton, 365.
KEITH S., FAROON O., RONEY N., SCINICARIELLO F., WILBUR S., INGERMAN L., LLADOS F., PLEWAK D., WOHLERS D., DIAMOND G. (2013) Toxicological profile for Uranium. Agency for Toxic Substances and Disease Registry (US), Atlanta, GA, Bookshelf ID: NBK158809.
LEUNG K.C., LAU S.Y., POON C.B. (1990) Gamma radiation dose from radionuclides in Hong Kong soils. Environmemtal Radioactivity 11:279–290.
MILLER B., LIND A., SAVAGE D., MAUL P., ROBINSON P. (2002) Natural elemental concentrations and fluxes: their use as indicators of repository safety, Statens Kärnkraftinspektion (SKI) report 02:3 and Statens Strålskyddinstitut (SSI) Report:02, Sweden.
MIRZA T.A., ISMAIL S.A. (2007) Origin of Plagiogranites in the Mawat Ophidite complex, Kurdistan region Iraq. Kirkuk University Scientific Studies 2(1):1–20.
OLADIPO G.O., OLAYINKA A., AWOTOYE O.O. (2014) Ecological impact of mining on soils of southwestern Nigeria. Environment and Experimental Biology 12:179–186.
OLAREWAJU V.O. (1981) Geochemistry of the Charnockitic and Granitic rocks of the basement complex around Ado-Ekiti, Southwestern Nigeria. Ph.D Thesis, University of London, UK.
OLISE F.S., OWOADE O.K., OLANIYI H.B., OBIAJUNWA E.I. (2010a) A complimentary tool in the determination of activity concentrations of naturally occurring radionuclides. Environmental Radioactivity 101:910–914.
OLISE F.S., OWOADE O.K, OLANIYI H.B. (2010b) An optimization of PIXE procedure for high-Z species in a lower Z matrix. Applied Radiation and Isotopes 68:1030–1034.
OLISE F.S., OWOADE O.K., OLANIYI H.B. (2011) Radiological indices of technologically enhanced naturally occurring radionuclides: A PIXE Approach. Radiological Protection 31:255–264.
OLISE F.S., ONUMEJOR A.C., AKINLUA A., OWOADE O.K. (2013) Geochemistry and health burden of radionuclide and trace metals in shale samples from North Western Niger Delta. Radioanalytical and Nuclear Chemistry 295(2):871–881.
OLISE F.S., AKINNAGBE D.M., OLASOGBA O.S. (2016) Radionuclides and radon levels in soil and ground water from solid minerals hosted area, South-Western Nigeria. Cogent Environmental Science 2: 1142344.
ISINKAYE M.O., SHITTA M.B.O., ODERINDE M.O. (2013) Determination of radionuclides and elemental composition of clay soils by Gamma and X-ray spectrometry. Springer Plus 2 (74):1–11.
TAYLOR S.R., MCLENNAN S.M. (1985) The continental crust: its composition and evolution. Blackwell Scientific Publication Carlton: 312.
TSENG W.P. (1977) Effects and dose-response relationships of skin cancer and blackfoot disease with Arsenic. Environmental Health Perspectives 19:109–119.
TUREKIAN K.K., WEDEPOHL K.H. (1961) Distribution of the elements in some of the earth’s crust. Geological Society of America Bullettin 72(2):175–192.
UNAD (2009) Department of geography and planning Science, cartographic unit, University of Ado-Ekiti.
UNSCEAR (2000) Sources and effects of ionizing radiation. United Nations Scientific Committee on Effects of Atomic Radiation, Annex AB, New York.
VOUK V. (1979) Vanadium: Handbook on the Toxicology of Metals. Elsevier -North Holland Biomedical Press:659–667.