determination of the elemental distribution and chemical
TRANSCRIPT
Available online at www.sciencedirect.com
7 (2007) 1473–1482
Cement and Concrete Research 3Determination of the elemental distribution and chemical speciationin highly heterogeneous cementitious materials usingsynchrotron-based micro-spectroscopic techniques
M. Vespa a,b,⁎,1, E. Wieland a, R. Dähn a, D. Grolimund a, A.M. Scheidegger a,b
a Paul Scherrer Institute, Laboratory for Waste Management, 5232 Villigen PSI, Switzerlandb Department of Environmental Sciences, Swiss Federal Institute of Technology (ETH), Zürich, Switzerland
Received 27 December 2006; accepted 13 August 2007
Abstract
Synchrotron-based micro-X-ray fluorescence (XRF) combined with scanning electron microscopy-based energy dispersive micro-analysis(EDS) has been used to determine the elemental distribution of contaminants (e.g., Ni) and of chemical elements inherent to the cement matrix(e.g., Si, Ca, Al, S) in hardened cement paste. Detailed information on the cement microstructure was gained by using backscattered electron(BSE) imaging. The results obtained from the complementary use of micro-XRF, EDS and BSE reveal that Ni is primarily distributed around innercalcium silicate hydrates (inner-C-S-H) and that Ni is preferentially associated with Al. This suggests the formation of a Ni–Al phase and its directassociation with inner-C-S-H. Further information on the chemical speciation of Ni in relation to Al and S was obtained at selected regions ofinterests in the cement matrix using synchrotron-based micro-X-ray absorption spectroscopy (XAS). Data analysis shows that Ni is predominantlyimmobilized in layered double hydroxides, while predominant formation of ettringite was indicated from the Al and S XAS data.
The present study demonstrates that the combined use of micro-XRF, BSE, EDS and micro-XAS, opens up a powerful analytical approach todetermine the distribution and the speciation of chemical elements in complex heterogeneous cementitious materials on the same region of interestwith micro-scale resolution.© 2007 Elsevier Ltd. All rights reserved.
Keywords: Synchrotron-based micro-XRF; micro-XAS; SEM-based BSE; SEM-based EDS; Cement
1. Introduction
Cement-based materials are commonly used in multi-barrierconcepts developed worldwide for the safe disposal ofhazardous and radioactive waste [e.g., 1,2]. In the case of thelatter waste form, cement is used to condition and stabilize thewaste materials and to construct the engineered barrier systems(container, backfill and liner materials) of repositories forradioactive waste. Thus, hardened cement paste (HCP) is an
⁎ Corresponding author. Department of Environmental Sciences, Swiss FederalInstitute of Technology (ETH), Zürich, Switzerland. Tel.: +41 56 310 2966;fax: +41 56 310 4595.
E-mail address: [email protected] (M. Vespa).1 Current address. Environmental Geochemistry Group L.G.I.T. — Maison
des Géosciences Université J. Fourier B.P. 53, 38041 Grenoble Cedex 9, France.Tel.: +33 4 76 828016.
0008-8846/$ - see front matter © 2007 Elsevier Ltd. All rights reserved.doi:10.1016/j.cemconres.2007.08.007
important component of the engineered barrier and plays animportant role in the immobilization of waste ions in the ce-mentitious near field of a repository. The immobilization po-tential of HCP originates from the selective binding propertiesfor different chemical elements [e.g., 3], indicating that retentionin cement systems is highly specific with respect to the mineralcomponents and processes involved [e.g., 4–7]. HCP iscomposed of a very heterogeneous mineral assemblage withdiscrete particles in the nano- to micrometer size range.Therefore, any further attempt to link the immobilization ofselected elements with the inherent heterogeneity of the cementmatrix requires techniques well suited to address the appropriatelength scale. Neglecting the micro-heterogeneity of such acomplex matrix could result in misleading interpretations ofimmobilization mechanisms deduced frommacroscopic studies,e.g., wet chemistry experiments. Thus, it is thought that spatially-resolved elemental, chemical and structural information could
1474 M. Vespa et al. / Cement and Concrete Research 37 (2007) 1473–1482
often be the crucial key to decipher binding mechanisms in thecementmatrix and offer novel insights into the chemical reactivityof cementitious systems.
Highly heterogeneous cementitious materials can be ana-lyzed by a variety of analytical techniques, such as X-raydiffraction (XRD), transmission electron microscopy (TEM)and scanning electron microscopy (SEM). These methods arewell suited to identify different mineral phases and to gainspatially-resolved information on the mineralogical composi-tion, the morphology of the cementitious material and elementaldistributions. For example, SEM provides spatially-resolvedinformation on the microstructure and phase association as wellas semi-quantitative information on the chemical compositionof the different mineral phases by using a combination ofbackscattered electron (BSE) imaging with energy dispersivemicro-analysis (EDS) [e.g., 8–11]. SEM-based BSE and EDShave proven to be suitable tools for investigating themicrostructure of cement, the spatial distribution and thecorrelations among elements present in the cement matrix[e.g., 10,12]. Nevertheless, the main drawback of the abovetechniques is that they cannot provide information on the che-mical speciation.
Only few analytical techniques allow the chemical speciationof elements in heterogeneous materials to be determined on themicro-scale. Synchrotron-based Fourier-transformed-infrared(FTIR)-spectro-microscopy and laser Raman microanalysis(LRMA) offer molecular information with a spatial resolutionbelow 10 μm. However, the sensitivity of the above techniquesis limited. Electron beam-based techniques, on the other hand,provide the best spatial resolution (nanometer range) that ispresently achievable. For example, electron energy lossspectroscopy (EELS) allows the investigation of the chemicalspeciation of an element on a sub-micrometer-scale (e.g., redoxstate in a given matrix) based on the fine structure in the energy-loss spectrum [13]. Nevertheless, laborious sample preparation,sample exposure to ultra-high vacuum and possible radiationdamages, especially in the case of cementitious materials, canlimit its application [14].
The most promising technique for investigating the chemicalspeciation of elements in heterogeneous cementitious materialsis synchrotron-based X-ray absorption spectroscopy (XAS).The method allows the speciation of chemical entities incomplex matrices to be determined, even at low concentrations(concentration of X-ray absorber down to a few tens of ppm).Unknown species can be identified as precipitates in crystallineas well as in amorphous chemical environments, as surface-sorbed species or even in solution. XAS is a local probingtechnique which provides information on the coordinationenvironment of an X-ray absorbing atom of interest within adistance up to ∼5 Å. Most frequently used XAS techniques are:X-ray absorption near edge structure (XANES) and extendedX-ray absorption fine structure (EXAFS) [e.g., 15]. XANES ismainly used to discern the oxidation state of the X-ray absorber,based on the edge position, and for fingerprinting by comparingexperimental spectra of unknown species with referencecompounds. EXAFS, on the other hand, is employed todetermine the coordination sphere of the X-ray absorber, i.e.,
type of neighboring atoms, bond length and coordination number[15–18].
In general, XAS does not yield spatially-resolved structuraldata, since the dimension of the X-ray beam is at most beam-lines N100×100 μm2. In the past, much of the understanding ofthe coordination environment of contaminants bound incementitious materials has been obtained by applying XAS onpowder materials (bulk-XAS) [e.g., 4–7,19–22]. The studiesfocused on the use of bulk-XAS to determine the coordinationenvironment of the element of interest in the bulk matrix.Furthermore, an increasing number of bulk-XAS studies havebeen carried out at the Ca and Al K-edge to examine thestructure of hydrating calcium aluminates and poorly crystal-lized calcium-silicate-hydrate phases (C-S-H) [e.g., 23–26]. Inbulk-XAS measurements the chemical speciation of an X-rayabsorber of interest is determined by the averaged XAS signalgenerated from all individual species within the matrix of theinvestigated element (area typically probed ∼0.5 mm×7 mm).In many cases, bulk-XAS is entirely sufficient to answerpertinent questions regarding the coordination environment ofthe element of interest in complex matrices, but the approachbreaks down when mechanisms operative on the micro-scalehave larger consequences on the chemical speciation. Inparticular, cementitious materials exhibiting micro-structuralheterogeneities may provide different chemical environmentswithin the matrix. Thus, it has been realized in the past yearsthat solutions for large scale problems, such as metalcontaminants in the environment, remediation and the storageof radioactive waste, should also be based on detailedinformation on the micro-scale. In view of the importance ofsmall-scale processes and molecular-level mechanisms incomplex heterogeneous systems, there has been a considerableeffort to develop high resolution analytical synchrotron-basedX-ray probes with which the wealth of structural informationprovided by XAS can be obtained on the micro-scale [27–38].A key advantage of synchrotron-based X-ray analyticalfacilities is the combination of high photon flux, high brillianceand high wavelength tuneability with focused micro-beams.For in-depth reviews on micro-probe beamlines and applica-tions of micro-spectroscopy on non-cementitious materials thereader is referred to Bertsch and Hunter [39], Manceau et al.[40] and Sutton et al. [41]. For micro-scale studies on cemen-titious materials the reader is referred to more recent publi-cations [42–44].
In the present paper, a few case studies will be presented withthe aim of illustrating the potential of the combined use of SEM-based BSE imaging and EDS micro-analyses with synchrotron-based micro-X-ray fluorescence (XRF) and micro-XAS. Micro-XRF is essential, in a first stage, to map the distribution of thechemical elements in the cement matrix. Subsequently, micro-XAS opens up the possibility of identifying the coordinationenvironment of the element of interest on the molecular level.This multi-technique approach together with several methods ofdata analysis will be demonstrated using examples of thedetermination of the speciation of Ni, Al and S within a Nienriched cement matrix and of Cr in a Cr rich cement matrix.The examples will be illustrated on the same region of interest in
1475M. Vespa et al. / Cement and Concrete Research 37 (2007) 1473–1482
the given sample. In the ideal case, the approach could even beapplied on the same micron spot size.
2. Experimental
2.1. Sample preparation
The cement samples were prepared from a commercialsulfate-resisting Portland cement (CEM I 52.5 N HTS, Lafarge,France). Metal-enriched hydrated cement pastes were preparedby mixing a Ni(NO3)2 or K2CrO4 solution with unhydratedcement. The metal salts were dissolved in deionized water toobtain stock solutions with concentrations of 0.3 mol/L(pH∼4.5 and ∼3). The solutions were mixed with theunhydrated cement at a water/cement (w/c) ratio of 0.4 ac-cording to the European Norm EN-196-3. The final metalconcentrations ofNi(II) andCr(VI) in the pasteswere 5000mg/kg.The cement pastes were filled into Plexiglas moulds, which wereclosed with a polyethylene lid, and hydrated for 30 days. Thesamples were stored in closed containers at 100% relativehumidity. The cylinders were cut into several slices of ∼1 cmthickness and dried in the glovebox (dry N2 atmosphere, CO2 andO2b2 ppm, T=20±3 °C). Some slices were crushed to obtainsize fractions b100 μm using a tungsten/carbide pebble mill. Forbulk-XAS measurements the powder material was filled intoPlexiglas holders and sealed with Kapton tape. Other slices wereimpregnated and polished for the preparation of thin sections. Thepolished thin sections, prepared by Spectrum Petrographics, Inc.(USA), were employed for both SEM-based BSE/EDS in-vestigations and synchrotron-based micro-focused XRF/XASmeasurements.
2.2. Scanning electron microscopy
The SEM investigations were conducted at the Laboratoryfor Construction Materials (IMX), Ecole Polytechnique Fédéralde Lausanne (EPFL) using a FEI Quanta 200 microscope. TheFEI microscope was operated at an accelerating voltage of15 kV and a beam current of 100 μA. The FEI microscope isequipped with a solid state detector for BSE imaging and with aSi(Li) detector for EDS analysis. The sample volume probedwas ∼1 μm3.
2.3. Synchrotron-based investigations
2.3.1. Micro-XRF and micro-XAS data collectionMicro-XRF maps are based on the fluorescence signal
detected from the sample under investigation. Elemental mapsare generated by scanning the sample under the X-ray beam at aselected energy and correspond to qualitative elementaldistribution. The proper choice of the beamline used formicro-focused investigations is crucial. Every beamline has anoptimized (excitation) energy range, which depends, amongothers, on the X-ray source (e.g., bending magnet, insertiondevice), the crystals of the monochromator and the X-rayabsorbing materials in the beam path (e.g., X-ray windows).Furthermore, micro-beam facilities offer specific experimental
setups, allowing experiments to be either conducted in air or invacuum.
For the present study, micro-XRF maps of Ca, Si, Al and Swere performed on the LUCIA beamline at the Swiss LightSource (SLS), Switzerland [35,36]. The micro-XRF maps wereobtained by scanning the sample in a tender vacuum under themonochromatic beam with a beam size of 10×10 μm2. For Ca,Si and Al the micro-XRF maps were recorded at the energy of4.1 keV. For the S map the beam energy was set to 3.9 keV(below the Ca K-edge) in order to avoid saturation of thefluorescence detector by the Ca signal. The fluorescence signalwas detected using a single element silicon drift diode. Themicro-XRF map of Ni was collected at the Advanced LightSource (ALS) on beamline 10.3.2 in Berkeley, USA [37]. Themicro-XRF map was obtained at the energy of 10 keV with abeam size of 5×5 μm2 using a 7 element Ge-solid state detectorand was carried out in air at room temperature.
Micro-XAS spectra at the K-edge of Ni (8.333 keV) and Cr(5.989 keV) were collected on beamline 10.3.2 (ALS) with a Si(111) crystal monochromator. The XAS spectra of Cr(III) andCr(VI) reference solutions (Cr(NO3)3 and K2CrO4 solutions)were also collected on beamline 10.3.2 (ALS). The bulk-XASspectra of Ni reference compounds were collected on the SwissNorwegian Beam Line (SNBL) at the European SynchrotronRadiation Facility (ESRF) in Grenoble, France.
Micro-XAS spectra at the Al K-edge (1.559 keV) and S K-edge (2.470 keV) were recorded on the LUCIA beamline (SLS).The Al K-edge measurements were performed with a YB66
(yttrium 66 boride crystal), whereas for the S K-edgemeasurements a Si(111) crystal monochromator was applied[35,36]. The beam size used was 10×10 μm2. The XAS spectraof several reference compounds, i.e. ettringite (Ca6Al2(SO4)3(OH)12·26H2O) [45], anhydrite (CaSO4), Ca-monosulfoalumi-nate (3CaO·Al2O3·CaSO4·12H2O), Ca-monocarboaluminate(3CaO·Al2O3 CaCO3·11H2O), aluminate (C3A, Ca3Al2O6)and tetra calcium aluminate hydrated (C4AH13, 4CaO·Al2O3
13H2O) [the latter four compounds from 46] were collectedduring the same measuring campaign and used to identify the Aland S speciation in the cement matrix. It should be noted thatmeasurements of reference compounds are essential to identifythe species in the cement matrix.
2.3.2. Micro-XAS data reductionData reduction was performed using the WinXAS 3.1
software package [e.g., 47]. All spectra were normalized byfitting a first-degree polynomial to the pre-edge and a third-degree polynomial to the post-edge regions. The Ni EXAFSspectra (k3-weighted χ(k) functions) were generated byconverting the energy to photoelectron wave vector units(Å−1) using the origin E0 of the first inflection point of theabsorption edge. Radial Structure Functions were obtained byFourier transforming the k3-weighted χ(k) functions between3.2 and 10.9 Å−1 using a Bessel window function with asmoothing parameter of 4. Multi-shell fits were performed inreal space across the range of the first two shells (ΔR=0.8–3.5 Å). Theoretical phase and amplitude functions for the fitwere calculated using FEFF 8.20 [48] and the structure of
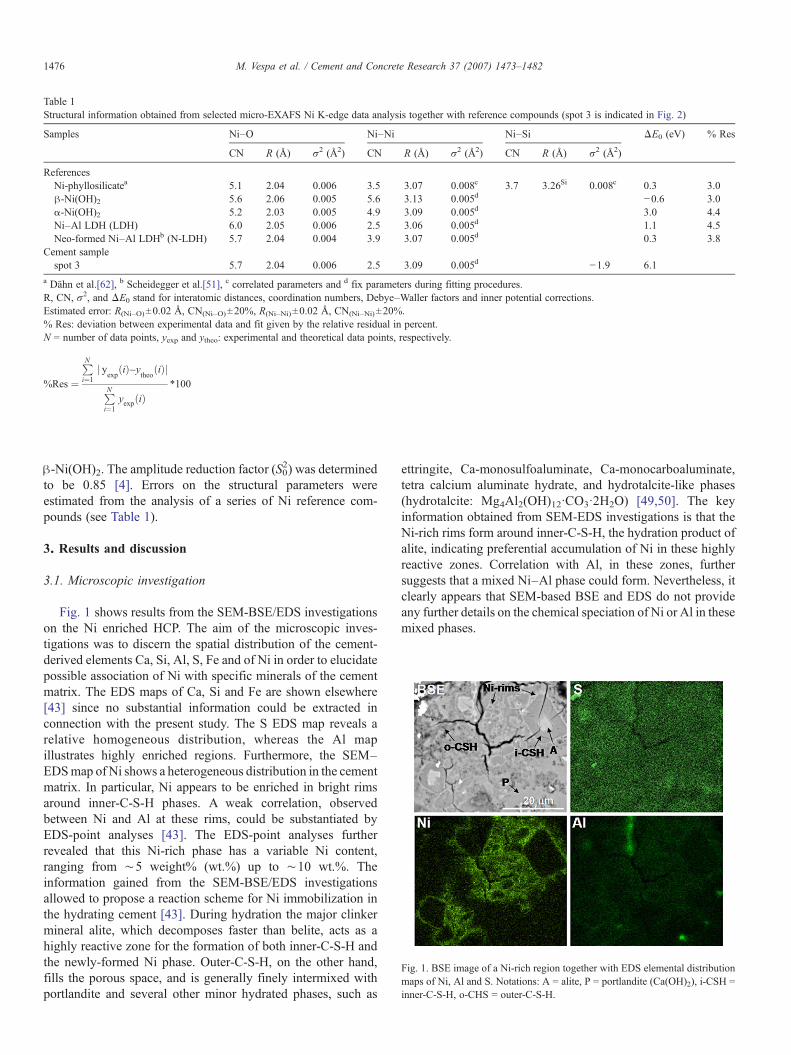
Table 1Structural information obtained from selected micro-EXAFS Ni K-edge data analysis together with reference compounds (spot 3 is indicated in Fig. 2)
Samples Ni–O Ni–Ni Ni–Si ΔE0 (eV) % Res
CN R (Å) σ2 (Å2) CN R (Å) σ2 (Å2) CN R (Å) σ2 (Å2)
ReferencesNi-phyllosilicatea 5.1 2.04 0.006 3.5 3.07 0.008c 3.7 3.26Si 0.008c 0.3 3.0β-Ni(OH)2 5.6 2.06 0.005 5.6 3.13 0.005d −0.6 3.0α-Ni(OH)2 5.2 2.03 0.005 4.9 3.09 0.005d 3.0 4.4Ni–Al LDH (LDH) 6.0 2.05 0.006 2.5 3.06 0.005d 1.1 4.5Neo-formed Ni–Al LDHb (N-LDH) 5.7 2.04 0.004 3.9 3.07 0.005d 0.3 3.8
Cement samplespot 3 5.7 2.04 0.006 2.5 3.09 0.005d −1.9 6.1
a Dähn et al.[62], b Scheidegger et al.[51], c correlated parameters and d fix parameters during fitting procedures.R, CN, σ2, and ΔE0 stand for interatomic distances, coordination numbers, Debye–Waller factors and inner potential corrections.Estimated error: R(Ni–O)±0.02 Å, CN(Ni–O)±20%, R(Ni–Ni)±0.02 Å, CN(Ni–Ni)±20%.% Res: deviation between experimental data and fit given by the relative residual in percent.N = number of data points, yexp and ytheo: experimental and theoretical data points, respectively.
kRes ¼PN
i¼1j y
expið Þ−ytheo ið Þj
PN
i¼1yexp ið Þ
⁎100
Fig. 1. BSE image of a Ni-rich region together with EDS elemental distributionmaps of Ni, Al and S. Notations: A = alite, P = portlandite (Ca(OH)2), i-CSH =inner-C-S-H, o-CHS = outer-C-S-H.
1476 M. Vespa et al. / Cement and Concrete Research 37 (2007) 1473–1482
β-Ni(OH)2. The amplitude reduction factor (S02) was determined
to be 0.85 [4]. Errors on the structural parameters wereestimated from the analysis of a series of Ni reference com-pounds (see Table 1).
3. Results and discussion
3.1. Microscopic investigation
Fig. 1 shows results from the SEM-BSE/EDS investigationson the Ni enriched HCP. The aim of the microscopic inves-tigations was to discern the spatial distribution of the cement-derived elements Ca, Si, Al, S, Fe and of Ni in order to elucidatepossible association of Ni with specific minerals of the cementmatrix. The EDS maps of Ca, Si and Fe are shown elsewhere[43] since no substantial information could be extracted inconnection with the present study. The S EDS map reveals arelative homogeneous distribution, whereas the Al mapillustrates highly enriched regions. Furthermore, the SEM–EDSmap of Ni shows a heterogeneous distribution in the cementmatrix. In particular, Ni appears to be enriched in bright rimsaround inner-C-S-H phases. A weak correlation, observedbetween Ni and Al at these rims, could be substantiated byEDS-point analyses [43]. The EDS-point analyses furtherrevealed that this Ni-rich phase has a variable Ni content,ranging from ∼5 weight% (wt.%) up to ∼10 wt.%. Theinformation gained from the SEM-BSE/EDS investigationsallowed to propose a reaction scheme for Ni immobilization inthe hydrating cement [43]. During hydration the major clinkermineral alite, which decomposes faster than belite, acts as ahighly reactive zone for the formation of both inner-C-S-H andthe newly-formed Ni phase. Outer-C-S-H, on the other hand,fills the porous space, and is generally finely intermixed withportlandite and several other minor hydrated phases, such as
ettringite, Ca-monosulfoaluminate, Ca-monocarboaluminate,tetra calcium aluminate hydrate, and hydrotalcite-like phases(hydrotalcite: Mg4Al2(OH)12·CO3·2H2O) [49,50]. The keyinformation obtained from SEM-EDS investigations is that theNi-rich rims form around inner-C-S-H, the hydration product ofalite, indicating preferential accumulation of Ni in these highlyreactive zones. Correlation with Al, in these zones, furthersuggests that a mixed Ni–Al phase could form. Nevertheless, itclearly appears that SEM-based BSE and EDS do not provideany further details on the chemical speciation of Ni or Al in thesemixed phases.
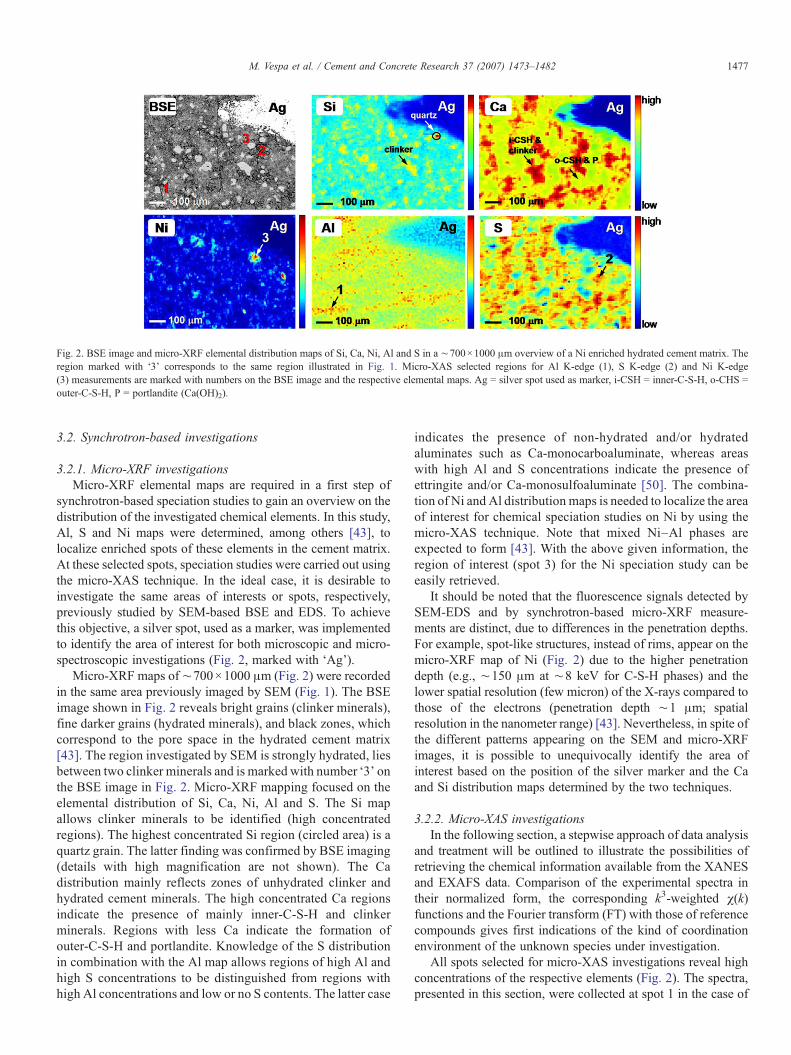
Fig. 2. BSE image and micro-XRF elemental distribution maps of Si, Ca, Ni, Al and S in a ∼700×1000 μm overview of a Ni enriched hydrated cement matrix. Theregion marked with ‘3’ corresponds to the same region illustrated in Fig. 1. Micro-XAS selected regions for Al K-edge (1), S K-edge (2) and Ni K-edge(3) measurements are marked with numbers on the BSE image and the respective elemental maps. Ag = silver spot used as marker, i-CSH = inner-C-S-H, o-CHS =outer-C-S-H, P = portlandite (Ca(OH)2).
1477M. Vespa et al. / Cement and Concrete Research 37 (2007) 1473–1482
3.2. Synchrotron-based investigations
3.2.1. Micro-XRF investigationsMicro-XRF elemental maps are required in a first step of
synchrotron-based speciation studies to gain an overview on thedistribution of the investigated chemical elements. In this study,Al, S and Ni maps were determined, among others [43], tolocalize enriched spots of these elements in the cement matrix.At these selected spots, speciation studies were carried out usingthe micro-XAS technique. In the ideal case, it is desirable toinvestigate the same areas of interests or spots, respectively,previously studied by SEM-based BSE and EDS. To achievethis objective, a silver spot, used as a marker, was implementedto identify the area of interest for both microscopic and micro-spectroscopic investigations (Fig. 2, marked with ‘Ag’).
Micro-XRF maps of ∼700×1000 μm (Fig. 2) were recordedin the same area previously imaged by SEM (Fig. 1). The BSEimage shown in Fig. 2 reveals bright grains (clinker minerals),fine darker grains (hydrated minerals), and black zones, whichcorrespond to the pore space in the hydrated cement matrix[43]. The region investigated by SEM is strongly hydrated, liesbetween two clinker minerals and is marked with number ‘3’ onthe BSE image in Fig. 2. Micro-XRF mapping focused on theelemental distribution of Si, Ca, Ni, Al and S. The Si mapallows clinker minerals to be identified (high concentratedregions). The highest concentrated Si region (circled area) is aquartz grain. The latter finding was confirmed by BSE imaging(details with high magnification are not shown). The Cadistribution mainly reflects zones of unhydrated clinker andhydrated cement minerals. The high concentrated Ca regionsindicate the presence of mainly inner-C-S-H and clinkerminerals. Regions with less Ca indicate the formation ofouter-C-S-H and portlandite. Knowledge of the S distributionin combination with the Al map allows regions of high Al andhigh S concentrations to be distinguished from regions withhigh Al concentrations and low or no S contents. The latter case
indicates the presence of non-hydrated and/or hydratedaluminates such as Ca-monocarboaluminate, whereas areaswith high Al and S concentrations indicate the presence ofettringite and/or Ca-monosulfoaluminate [50]. The combina-tion of Ni and Al distribution maps is needed to localize the areaof interest for chemical speciation studies on Ni by using themicro-XAS technique. Note that mixed Ni–Al phases areexpected to form [43]. With the above given information, theregion of interest (spot 3) for the Ni speciation study can beeasily retrieved.
It should be noted that the fluorescence signals detected bySEM-EDS and by synchrotron-based micro-XRF measure-ments are distinct, due to differences in the penetration depths.For example, spot-like structures, instead of rims, appear on themicro-XRF map of Ni (Fig. 2) due to the higher penetrationdepth (e.g., ∼150 μm at ∼8 keV for C-S-H phases) and thelower spatial resolution (few micron) of the X-rays compared tothose of the electrons (penetration depth ∼1 μm; spatialresolution in the nanometer range) [43]. Nevertheless, in spite ofthe different patterns appearing on the SEM and micro-XRFimages, it is possible to unequivocally identify the area ofinterest based on the position of the silver marker and the Caand Si distribution maps determined by the two techniques.
3.2.2. Micro-XAS investigationsIn the following section, a stepwise approach of data analysis
and treatment will be outlined to illustrate the possibilities ofretrieving the chemical information available from the XANESand EXAFS data. Comparison of the experimental spectra intheir normalized form, the corresponding k3-weighted χ(k)functions and the Fourier transform (FT) with those of referencecompounds gives first indications of the kind of coordinationenvironment of the unknown species under investigation.
All spots selected for micro-XAS investigations reveal highconcentrations of the respective elements (Fig. 2). The spectra,presented in this section, were collected at spot 1 in the case of
1478 M. Vespa et al. / Cement and Concrete Research 37 (2007) 1473–1482
Al, at spot 2 in the case of S and at spot 3 in the case of Ni(Fig. 2). Note that the Ni spot 3, outlined in Fig. 2, was analyzedby SEM,micro-XRF and micro-XAS and corresponds to the areadisplayed in Fig. 1.
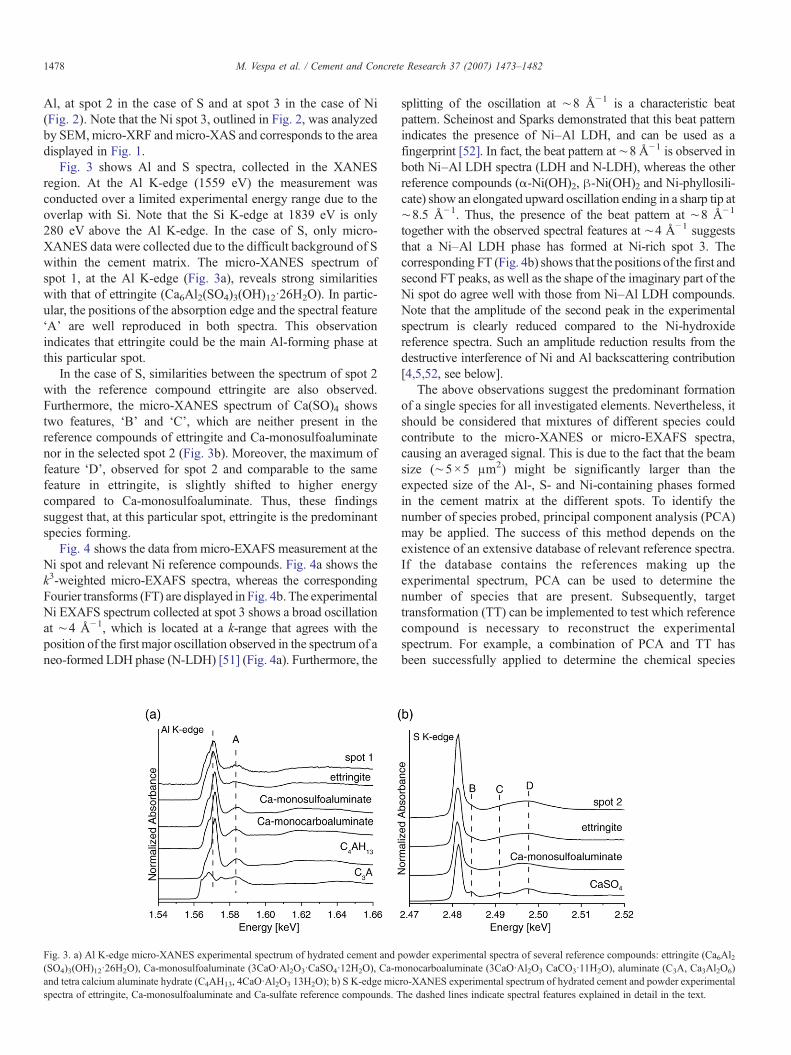
Fig. 3 shows Al and S spectra, collected in the XANESregion. At the Al K-edge (1559 eV) the measurement wasconducted over a limited experimental energy range due to theoverlap with Si. Note that the Si K-edge at 1839 eV is only280 eV above the Al K-edge. In the case of S, only micro-XANES data were collected due to the difficult background of Swithin the cement matrix. The micro-XANES spectrum ofspot 1, at the Al K-edge (Fig. 3a), reveals strong similaritieswith that of ettringite (Ca6Al2(SO4)3(OH)12·26H2O). In partic-ular, the positions of the absorption edge and the spectral feature‘A’ are well reproduced in both spectra. This observationindicates that ettringite could be the main Al-forming phase atthis particular spot.
In the case of S, similarities between the spectrum of spot 2with the reference compound ettringite are also observed.Furthermore, the micro-XANES spectrum of Ca(SO)4 showstwo features, ‘B’ and ‘C’, which are neither present in thereference compounds of ettringite and Ca-monosulfoaluminatenor in the selected spot 2 (Fig. 3b). Moreover, the maximum offeature ‘D’, observed for spot 2 and comparable to the samefeature in ettringite, is slightly shifted to higher energycompared to Ca-monosulfoaluminate. Thus, these findingssuggest that, at this particular spot, ettringite is the predominantspecies forming.
Fig. 4 shows the data from micro-EXAFS measurement at theNi spot and relevant Ni reference compounds. Fig. 4a shows thek3-weighted micro-EXAFS spectra, whereas the correspondingFourier transforms (FT) are displayed in Fig. 4b. The experimentalNi EXAFS spectrum collected at spot 3 shows a broad oscillationat ∼4 Å−1, which is located at a k-range that agrees with theposition of the first major oscillation observed in the spectrum of aneo-formed LDH phase (N-LDH) [51] (Fig. 4a). Furthermore, the
Fig. 3. a) Al K-edge micro-XANES experimental spectrum of hydrated cement and p(SO4)3(OH)12·26H2O), Ca-monosulfoaluminate (3CaO·Al2O3·CaSO4·12H2O), Ca-mand tetra calcium aluminate hydrate (C4AH13, 4CaO·Al2O3 13H2O); b) S K-edge micspectra of ettringite, Ca-monosulfoaluminate and Ca-sulfate reference compounds. T
splitting of the oscillation at ∼8 Å−1 is a characteristic beatpattern. Scheinost and Sparks demonstrated that this beat patternindicates the presence of Ni–Al LDH, and can be used as afingerprint [52]. In fact, the beat pattern at∼8 Å−1 is observed inboth Ni–Al LDH spectra (LDH and N-LDH), whereas the otherreference compounds (α-Ni(OH)2, β-Ni(OH)2 and Ni-phyllosili-cate) show an elongated upward oscillation ending in a sharp tip at∼8.5 Å−1. Thus, the presence of the beat pattern at ∼8 Å−1
together with the observed spectral features at ∼4 Å−1 suggeststhat a Ni–Al LDH phase has formed at Ni-rich spot 3. Thecorresponding FT (Fig. 4b) shows that the positions of the first andsecond FT peaks, as well as the shape of the imaginary part of theNi spot do agree well with those from Ni–Al LDH compounds.Note that the amplitude of the second peak in the experimentalspectrum is clearly reduced compared to the Ni-hydroxidereference spectra. Such an amplitude reduction results from thedestructive interference of Ni and Al backscattering contribution[4,5,52, see below].
The above observations suggest the predominant formationof a single species for all investigated elements. Nevertheless, itshould be considered that mixtures of different species couldcontribute to the micro-XANES or micro-EXAFS spectra,causing an averaged signal. This is due to the fact that the beamsize (∼5×5 μm2) might be significantly larger than theexpected size of the Al-, S- and Ni-containing phases formedin the cement matrix at the different spots. To identify thenumber of species probed, principal component analysis (PCA)may be applied. The success of this method depends on theexistence of an extensive database of relevant reference spectra.If the database contains the references making up theexperimental spectrum, PCA can be used to determine thenumber of species that are present. Subsequently, targettransformation (TT) can be implemented to test which referencecompound is necessary to reconstruct the experimentalspectrum. For example, a combination of PCA and TT hasbeen successfully applied to determine the chemical species
owder experimental spectra of several reference compounds: ettringite (Ca6Al2onocarboaluminate (3CaO·Al2O3 CaCO3·11H2O), aluminate (C3A, Ca3Al2O6)ro-XANES experimental spectrum of hydrated cement and powder experimentalhe dashed lines indicate spectral features explained in detail in the text.
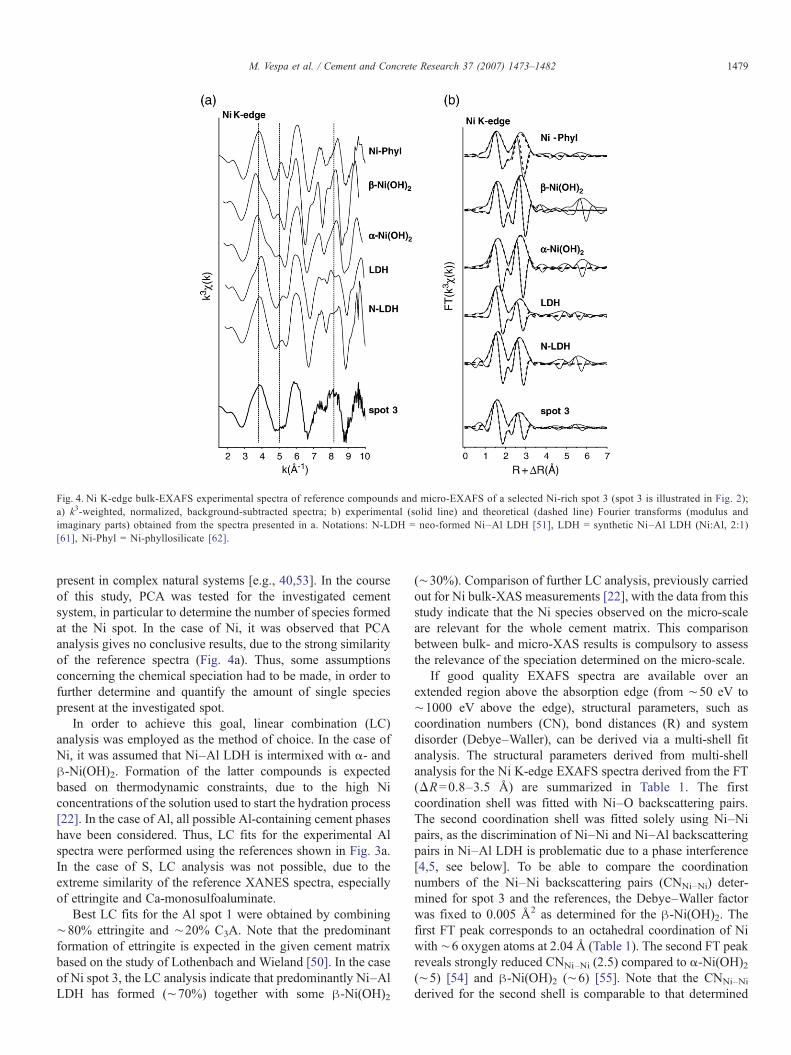
Fig. 4. Ni K-edge bulk-EXAFS experimental spectra of reference compounds and micro-EXAFS of a selected Ni-rich spot 3 (spot 3 is illustrated in Fig. 2);a) k3-weighted, normalized, background-subtracted spectra; b) experimental (solid line) and theoretical (dashed line) Fourier transforms (modulus andimaginary parts) obtained from the spectra presented in a. Notations: N-LDH = neo-formed Ni–Al LDH [51], LDH = synthetic Ni–Al LDH (Ni:Al, 2:1)[61], Ni-Phyl = Ni-phyllosilicate [62].
1479M. Vespa et al. / Cement and Concrete Research 37 (2007) 1473–1482
present in complex natural systems [e.g., 40,53]. In the courseof this study, PCA was tested for the investigated cementsystem, in particular to determine the number of species formedat the Ni spot. In the case of Ni, it was observed that PCAanalysis gives no conclusive results, due to the strong similarityof the reference spectra (Fig. 4a). Thus, some assumptionsconcerning the chemical speciation had to be made, in order tofurther determine and quantify the amount of single speciespresent at the investigated spot.
In order to achieve this goal, linear combination (LC)analysis was employed as the method of choice. In the case ofNi, it was assumed that Ni–Al LDH is intermixed with α- andβ-Ni(OH)2. Formation of the latter compounds is expectedbased on thermodynamic constraints, due to the high Niconcentrations of the solution used to start the hydration process[22]. In the case of Al, all possible Al-containing cement phaseshave been considered. Thus, LC fits for the experimental Alspectra were performed using the references shown in Fig. 3a.In the case of S, LC analysis was not possible, due to theextreme similarity of the reference XANES spectra, especiallyof ettringite and Ca-monosulfoaluminate.
Best LC fits for the Al spot 1 were obtained by combining∼80% ettringite and ∼20% C3A. Note that the predominantformation of ettringite is expected in the given cement matrixbased on the study of Lothenbach and Wieland [50]. In the caseof Ni spot 3, the LC analysis indicate that predominantly Ni–AlLDH has formed (∼70%) together with some β-Ni(OH)2
(∼30%). Comparison of further LC analysis, previously carriedout for Ni bulk-XAS measurements [22], with the data from thisstudy indicate that the Ni species observed on the micro-scaleare relevant for the whole cement matrix. This comparisonbetween bulk- and micro-XAS results is compulsory to assessthe relevance of the speciation determined on the micro-scale.
If good quality EXAFS spectra are available over anextended region above the absorption edge (from ∼50 eV to∼1000 eV above the edge), structural parameters, such ascoordination numbers (CN), bond distances (R) and systemdisorder (Debye–Waller), can be derived via a multi-shell fitanalysis. The structural parameters derived from multi-shellanalysis for the Ni K-edge EXAFS spectra derived from the FT(ΔR=0.8–3.5 Å) are summarized in Table 1. The firstcoordination shell was fitted with Ni–O backscattering pairs.The second coordination shell was fitted solely using Ni–Nipairs, as the discrimination of Ni–Ni and Ni–Al backscatteringpairs in Ni–Al LDH is problematic due to a phase interference[4,5, see below]. To be able to compare the coordinationnumbers of the Ni–Ni backscattering pairs (CNNi–Ni) deter-mined for spot 3 and the references, the Debye–Waller factorwas fixed to 0.005 Å2 as determined for the β-Ni(OH)2. Thefirst FT peak corresponds to an octahedral coordination of Niwith ∼6 oxygen atoms at 2.04 Å (Table 1). The second FT peakreveals strongly reduced CNNi–Ni (2.5) compared to α-Ni(OH)2(∼5) [54] and β-Ni(OH)2 (∼6) [55]. Note that the CNNi–Ni
derived for the second shell is comparable to that determined
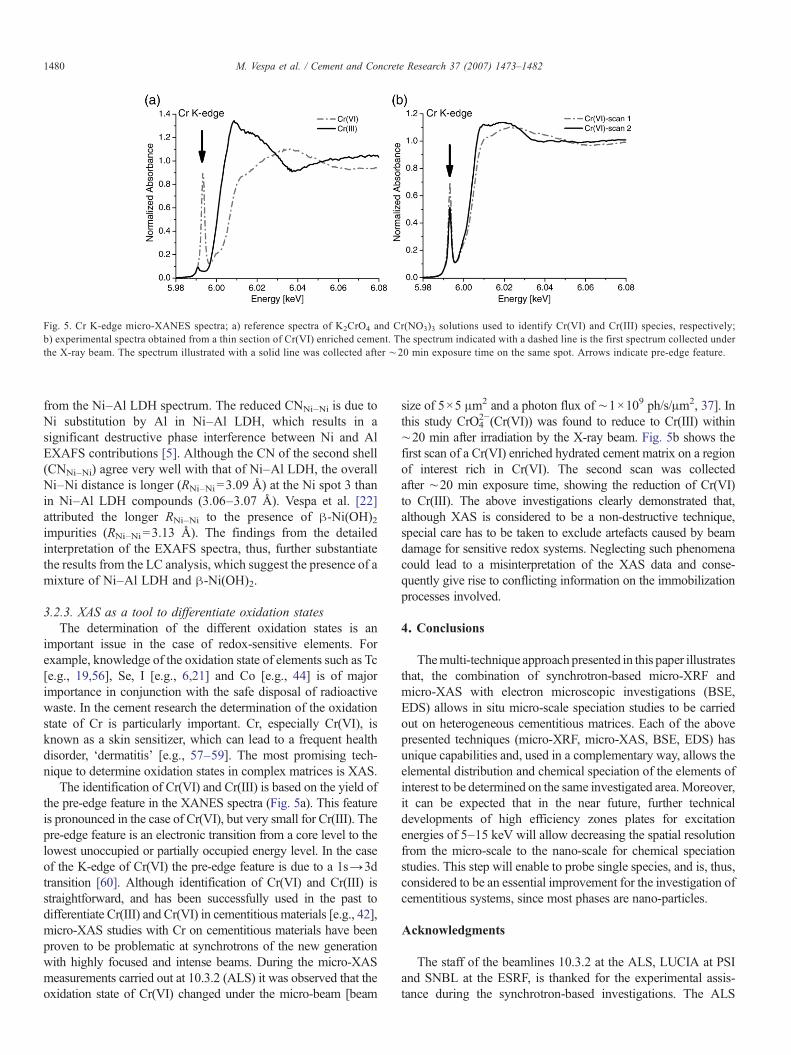
Fig. 5. Cr K-edge micro-XANES spectra; a) reference spectra of K2CrO4 and Cr(NO3)3 solutions used to identify Cr(VI) and Cr(III) species, respectively;b) experimental spectra obtained from a thin section of Cr(VI) enriched cement. The spectrum indicated with a dashed line is the first spectrum collected underthe X-ray beam. The spectrum illustrated with a solid line was collected after ∼20 min exposure time on the same spot. Arrows indicate pre-edge feature.
1480 M. Vespa et al. / Cement and Concrete Research 37 (2007) 1473–1482
from the Ni–Al LDH spectrum. The reduced CNNi–Ni is due toNi substitution by Al in Ni–Al LDH, which results in asignificant destructive phase interference between Ni and AlEXAFS contributions [5]. Although the CN of the second shell(CNNi–Ni) agree very well with that of Ni–Al LDH, the overallNi–Ni distance is longer (RNi–Ni=3.09 Å) at the Ni spot 3 thanin Ni–Al LDH compounds (3.06–3.07 Å). Vespa et al. [22]attributed the longer RNi–Ni to the presence of β-Ni(OH)2impurities (RNi–Ni=3.13 Å). The findings from the detailedinterpretation of the EXAFS spectra, thus, further substantiatethe results from the LC analysis, which suggest the presence of amixture of Ni–Al LDH and β-Ni(OH)2.
3.2.3. XAS as a tool to differentiate oxidation statesThe determination of the different oxidation states is an
important issue in the case of redox-sensitive elements. Forexample, knowledge of the oxidation state of elements such as Tc[e.g., 19,56], Se, I [e.g., 6,21] and Co [e.g., 44] is of majorimportance in conjunction with the safe disposal of radioactivewaste. In the cement research the determination of the oxidationstate of Cr is particularly important. Cr, especially Cr(VI), isknown as a skin sensitizer, which can lead to a frequent healthdisorder, ‘dermatitis’ [e.g., 57–59]. The most promising tech-nique to determine oxidation states in complex matrices is XAS.
The identification of Cr(VI) and Cr(III) is based on the yield ofthe pre-edge feature in the XANES spectra (Fig. 5a). This featureis pronounced in the case of Cr(VI), but very small for Cr(III). Thepre-edge feature is an electronic transition from a core level to thelowest unoccupied or partially occupied energy level. In the caseof the K-edge of Cr(VI) the pre-edge feature is due to a 1s→3dtransition [60]. Although identification of Cr(VI) and Cr(III) isstraightforward, and has been successfully used in the past todifferentiate Cr(III) and Cr(VI) in cementitious materials [e.g., 42],micro-XAS studies with Cr on cementitious materials have beenproven to be problematic at synchrotrons of the new generationwith highly focused and intense beams. During the micro-XASmeasurements carried out at 10.3.2 (ALS) it was observed that theoxidation state of Cr(VI) changed under the micro-beam [beam
size of 5×5 μm2 and a photon flux of ∼1×10⁹ ph/s/μm2, 37]. Inthis study CrO4
2−(Cr(VI)) was found to reduce to Cr(III) within∼20 min after irradiation by the X-ray beam. Fig. 5b shows thefirst scan of a Cr(VI) enriched hydrated cement matrix on a regionof interest rich in Cr(VI). The second scan was collectedafter ∼20 min exposure time, showing the reduction of Cr(VI)to Cr(III). The above investigations clearly demonstrated that,although XAS is considered to be a non-destructive technique,special care has to be taken to exclude artefacts caused by beamdamage for sensitive redox systems. Neglecting such phenomenacould lead to a misinterpretation of the XAS data and conse-quently give rise to conflicting information on the immobilizationprocesses involved.
4. Conclusions
Themulti-technique approachpresented in this paper illustratesthat, the combination of synchrotron-based micro-XRF andmicro-XAS with electron microscopic investigations (BSE,EDS) allows in situ micro-scale speciation studies to be carriedout on heterogeneous cementitious matrices. Each of the abovepresented techniques (micro-XRF, micro-XAS, BSE, EDS) hasunique capabilities and, used in a complementary way, allows theelemental distribution and chemical speciation of the elements ofinterest to be determined on the same investigated area.Moreover,it can be expected that in the near future, further technicaldevelopments of high efficiency zones plates for excitationenergies of 5–15 keV will allow decreasing the spatial resolutionfrom the micro-scale to the nano-scale for chemical speciationstudies. This step will enable to probe single species, and is, thus,considered to be an essential improvement for the investigation ofcementitious systems, since most phases are nano-particles.
Acknowledgments
The staff of the beamlines 10.3.2 at the ALS, LUCIA at PSIand SNBL at the ESRF, is thanked for the experimental assis-tance during the synchrotron-based investigations. The ALS
1481M. Vespa et al. / Cement and Concrete Research 37 (2007) 1473–1482
(Berkeley, CA) is acknowledged for providing beamtime at themicro-focused beamline 10.3.2. The ALS is supported by theDirector, Office of Science, Office of Basic Energy Sciences,Materials Sciences Division of the U.S. Department of Energyunder Contract DE-AC03-76SF00098 at the Lawrence Berke-ley National Laboratory. Thanks are extended to Dr. E. Curti,D. Kunz (LES-PSI) for assistance during the measuringcampaigns. Prof. K. L. Scrivener, Dr. E. Gallucci and Dr. A.Jenni (IMX-EPFL) and R. Brütsch (LWV-PSI) providedmeasuring time and experimental assistance with the SEMinvestigations and their contribution to this project is gratefullyacknowledged. Dr. C.A. Johnson (EAWAG, Switzerland), Dr.B. Lothenbach (EMPA, Switzerland) and Dr. T. Matschei(University of Aberdeen, UK) are warmly thanked for thesupply of Ni and Al reference compounds. Prof. B. Wehrli(EAWAG, Switzerland) is thanked for useful discussion andcontinuous support of this work. Partial financial support wasprovided by the National Cooperative for the Disposal ofRadioactive Waste (Nagra), Switzerland.
References
[1] M. Schmidt, P. Beckefeld, R. Götz, S. Kamsties, C. Kretz, N. Molitor, U.Neck, P. Vogel, Reststoff-und Abfallverfestigung, Immobilisierung vonSchadstoffen-Recycling-Verbesserung der Deponiefähigkeit, Expert Ver-lag, Renningen-Malmheim, 1995.
[2] N. Chapman, C. McCombie, Principles and Standards for the Disposal ofLong-Lived RadioactiveWastes, 1st ed.Elsevier Science, Ltd., Oxford, 2003.
[3] F.P. Glasser, Chemistry of cement-solidified waste forms, in: R.D. Spence(Ed.), Chemistry and Microstructure of Solidified Waste Forms, LewisPublishers, Boca Raton, 1993, pp. 1–39.
[4] A.M. Scheidegger, E. Wieland, R. Dähn, P. Spieler, Spectroscopic evi-dence for the formation of layered Ni–Al double hydroxides in cement,Environmental Science and Technology 34 (2000) 4545–4548.
[5] A.M. Scheidegger, E. Wieland, A.C. Scheinost, R. Dähn, J. Tits, P. Spieler, Niphases formed in cement and cement systems under highly alkaline conditions:an XAFS study, Journal of Synchrotron Radiation 8 (2001) 916–918.
[6] I. Bonhoure, A.M. Scheidegger, E. Wieland, R. Dähn, Iodine speciesuptake by cement and CSH studied by K-edge X-ray absorptionspectroscopy, Radiochimica Acta 90 (2002) 647–651.
[7] I. Bonhoure, E. Wieland, A.M. Scheidegger, M. Ochs, D. Kunz, EXAFS stu-dy of Sn (IV) immobilization by hardened cement paste and calcium sili-cate hydrates, Environmental Science and Technology 37 (2003) 2184–2191.
[8] J.G. Catalano, J.P. McKinley, J.M. Zachara, S.M. Heald, S.C. Smith, G.E.Brown Jr., Changes in uranium speciation through a depth sequence ofcontaminated Hanford sediments, Environmental Science and Technology40 (8) (2006) 2517–2524.
[9] C. Famy, K.L. Scrivener, A.K. Crumbie, What causes differences of C-S-Hgel grey levels in backscattered electron images? Cement and ConcreteResearch 32 (9) (2002) 1465–1471.
[10] K.L. Scrivener, Backscatter electron imaging of cementitious microstruc-tures: understanding and quantification, Cement and Concrete Composites26 (2004) 935–945.
[11] T. Kirpichtchikova, A. Manceau, L. Spadini, F. Panfili, M. Marcus, T.Jacquet, Speciation and solubility of heavy metals in contaminated soilusing X-ray microfluorescence, EXAFS spectroscopy, chemical extrac-tion, and thermodynamic modelling, Geochimica et Cosmochimica Acta70 (2006) 2163–2190.
[12] C. Famy, K.L. Scrivener, A. Atkinson, A.R. Brough, Effects of an early ora late heat treatment on the microstructure and composition of inner C-S-Hproducts of Portland cement mortars, Cement and Concrete Research 32(2) (2002) 269–278.
[13] R.F. Egerton, M. Malac, EELS in the TEM, Journal of Electron Spec-troscopy and Related Phenomena 143 (2005) 43–50.
[14] R.F. Egerton, P. Li, M. Malac, Radiation damage in the TEM and SEM,Micron 35 (2004) 399–409.
[15] D.C. Koningsberger, R. Prins, X-ray Absorption, John Wiley & Sons, NewYork, 1987.
[16] G.E. Brown Jr., Spectroscopic studies of chemisorption reaction mechan-isms at oxide–water interfaces, in: M.F. Hochella, A.F. White (Eds.),Mineral–Water Interface Geochemistry, The Mineralogical Society ofAmerica, Washington DC, 1990, pp. 309–353.
[17] L. Charlet, A. Manceau, Structure, formation, and reactivity of hydrousoxide particles: insights from X-ray absorption spectroscopy, in: P.J.Buffle, H.P. van Leeuwen (Eds.), Environmental Particles, LewisPublishers, Boca Raton, 1993, pp. 117–164.
[18] P.A. Fenter, M.L. Rivers, N.C. Sturchio, S.R. Sutton, Applications ofSynchrotron Radiation in Low-Temperature Geochemistry and Environmen-tal Science, The Mineralogical Society of America, Washington DC, 2002.
[19] P.G. Allen, G.S. Siemering, D.K. Shuh, J.J. Bucher, N.M. Edelstein, C.A.Langton, Technetium speciation in cement waste forms determined by X-rayabsorption fine structure spectroscopy, Radiochimica Acta 76 (1997) 77–86.
[20] P. Zhao, P.G. Allen, E.R. Sylvester, B.E. Viani, The partitioning of uraniumand neptunium onto hydrothermally altered concrete, Radiochimica Acta88 (2000) 729–736.
[21] I. Bonhoure, I. Baur, E. Wieland, C.A. Johnson, A.M. Scheidegger, Uptakeof Se(IV/VI) oxyanions by hardened cement paste and cement minerals: anX-ray absorption spectroscopy study, Cement and Concrete Research 36(2006) 91–98.
[22] M. Vespa, R. Dähn, D. Grolimund, E. Wieland, A.M. Scheidegger,Spectroscopic investigation of Ni speciation in hardened cement paste,Environmental Science and Technology 40 (2006) 2275–2282.
[23] N. Richard, N. Lequeux, P. Boch, An X-ray absorption study of phasesformed in high-alumina cements, Advances in Cement Research 7 (28)(1995) 159–169.
[24] N. Lequeux, A. Moreau, S. Philippot, P. Boch, Extended X-ray absorptionfine structure investigation of calcium silicate hydration, Journal of theAmerican Ceramic Society 82–5 (1999) 1299–1306.
[25] R.J. Kirkpatrick, G.E. Brown, N. Xu, X. Cong, X-ray absorptionspectroscopy of C-S-H and some model compounds, Advances in CementResearch 9 (33) (1997) 31–36.
[26] N. Richard, N. Lequeux, P. Florian, Changes in the structure ofCaAl2O14H2O during heat treatments: an X-ray absorption spectroscopyand 27Al NMR studies, in: P. Colombet, A.R. Grimmer, H. Zanni, P.Sozanni (Eds.), Nuclear Magnetic Resonance Spectroscopy of Cement-Based Materials, Springer-Verlag, Berlin, 1998, pp. 321–329.
[27] M.L. Rivers, S.R. Sutton, J.V. Smith, A synchrotron X-ray-fluorescencemicroprobe, Chemical Geology 70 (1988) 179.
[28] F. Vanlangevelde, G.H.J. Tros, D.K. Bowen, R.D. Vis, The synchrotronradiation microprobe at the SRS, Daresbury (UK) and its applications,Nuclear Instruments & Methods in Physics Research. Section B, BeamInteractions with Materials and Atoms 49 (1990) 544–550.
[29] R. Devoti, F. Zontone, C. Tuniz, F. Zanini, A synchrotron radiationmicroprobe for X-ray-fluorescence and microtomography at Elettra —focusing with bent crystals, Nuclear Instruments & Methods in PhysicsResearch. Section B, Beam Interactions with Materials and Atoms 54(1991) 424–428.
[30] K. Janssens, L. Vincze, F. Adams, K.W. Jones, Synchrotron radiation-induced X-ray-microanalysis, Analytica Chimica Acta 283 (1993) 98–110.
[31] S. Hayakawa, S. Goto, T. Shoji, E. Yamada, Y. Gohshi, X-ray microprobesystem for XRF analysis and spectroscopy at SPring-8 BL39XU, Journalof Synchrotron Radiation 5 (1998) 1114–1116.
[32] M. Newville, S. Sutton, M. Rivers, P. Eng, Micro-beam X-ray absorptionand fluorescence spectroscopies at GSECARS: APS beamline 131D,Journal of Synchrotron Radiation 6 (1999) 353–355.
[33] S. Bohic, A. Simionovici, A. Snigirev, R. Ortega, G. Deves, D. Heymann,C.G. Schroer, Synchrotron hard X-ray microprobe: fluorescence imagingof single cells, Applied Physical Letters 78 (2001) 3544–3546.
[34] A. Somogyi, M. Drakopoulos, L. Vincze, B. Vekemans, C. Camerani, K.Janssens, A. Snigirev, F. Adams, ID18F: a new micro-X ray fluorescenceend-station at the European Synchrotron Radiation Facility (ESRF):preliminary results, X-ray Spectrometry 30 (2001) 242–252.
1482 M. Vespa et al. / Cement and Concrete Research 37 (2007) 1473–1482
[35] M. Janousch, A.-M. Flank, P. Lagarde, G. Cauchon, S. Bac, J.M. Dubuisson,T. Schmidt, R. Wetter, D. Grolimund, A.M. Scheidegger, LUCIA — a new1–7 keV μ-XAS beamline, AIP Conference Proceedings (2004) 312.
[36] P. Lagarde, A.-M. Flank, D. Vantelon, M. Janousch, Micro-soft X-rayspectroscopy with the LUCIA beamline, X-Ray Absorption FineStructure-XAFS13, 2007, pp. 852–857.
[37] M. Marcus, A.A. MacDowell, R. Celestre, A. Manceau, T. Miller, H.A.Padmore, R.E. Sublett, Beamline 10.3.2 at ALS: a hard X-ray microprobefor environmental and material sciences, Journal of Synchrotron Radiation11 (2004) 239–247.
[38] A.M. Scheidegger, D. Grolimund, M. Harfouche, M. Willimann, B.Meyer, R. Dähn, D. Gavillet, M. Nicolet, P. Heimgartner, The micro-XASbeamline at the Swiss Light source (SLS): a new analytical facility suitedfor X-ray micro-beam investigations with radioactive samples, SpeciationTechniques and Facilities for Radioactive Materials at Synchrotron LightSources, 2006, pp. 81–86.
[39] P.M. Bertsch, D.B. Hunter, Applications of synchrotron-based X-raymicroprobes, Chemical Reviews 101 (6) (2001) 1809–1842.
[40] A. Manceau, M. Marcus, N. Tamura, Quantitative speciation of heavymetals in soils and sediments by synchrotron X-ray techniques, in: P.A.Fenter, M.L. Rivers, N.C. Sturchio, S.R. Sutton (Eds.), Application ofSynchrotron Radiation in Low-Temperature Geochemistry and Environ-mental Science, Mineralogical Society of America, Washington, DC, 2002,pp. 341–428.
[41] S.R. Sutton, P.M. Bertsch, M. Newville, M. Rivers, A. Lanzirotti,Microfluorescence and microtomography analyses of heterogeneous earthand environmental materials, Applications of Synchrotron Radiation inLow-Temperature Geochemistry and Environmental Science, AmericanMineralogical Society, 2002, pp. 429–483.
[42] J. Rose, A. Bénard, J.S., D. Borschneck, J.-L. Hazemann, P. Cheylan, A.Vichot, J.-Y. Bottero, First insights of Cr speciation in leached Portlandcement using X-ray spectromicroscopy, Environmental Science andTechnology 37 (2003) 4864–4870.
[43] M. Vespa, R. Dähn, E. Gallucci, D. Grolimund, E. Wieland, A.M.Scheidegger, Micro-scale investigation of Ni uptake by cement using acombination of scanning electron microscopy and synchrotron-basedtechniques, Environmental Science and Technology 40 (2006)7702–7709.
[44] M. Vespa, R. Dähn, D. Grolimund, E. Wieland, A.M. Scheidegger, Cospeciation in hardened cement paste: a macro- and micro-spectroscopicinvestigation, Environmental Science and Technology 41 (2007)1902–1908.
[45] M. Ochs, B. Lothenbach, E. Giffaut, Uptake of oxo-anions by cementsthrough solid-solution formation: experimental evidence and modelling,Radiochimica Acta 90 (2002) 639–646.
[46] T. Matschei, B. Lothenbach, F.P. Glasser, The AFm-phase in Portlandcement, Cement and Concrete Research 37 (2007) 118–130.
[47] T. Ressler, WinXAS: a program for X-ray absorption spectroscopydata analysis under MS-Windows, Journal of Synchrotron Radiation5 (2) (1998) 118–122.
[48] J.J. Rehr, R.C. Albers, Theoretical approaches to X-ray absorption finestructure, Reviews of Modern Physics 72 (3) (2000) 621–653.
[49] B. Lothenbach, F. Winnefeld, Thermodynamic modelling of the hydrationof Portland cement, Cement and Concrete Research 36 (2006) 209–226.
[50] B. Lothenbach, E. Wieland, A thermodynamic approach to the hydrationof sulphate-resisting Portland cement, Waste Management 26 (2006)706–719.
[51] A.M. Scheidegger, G.M. Lamble, D.L. Sparks, The kinetics of nickelsorption on phyrophyllite as monitored by X-ray absorption fine structure(XAFS) spectroscopy, Journal de Physique IV France 7 (C2) (1997)773–775.
[52] A.C. Scheinost, D.L. Sparks, Formation of layered single- and double-metal hydroxide precipitates at the mineral/water interface: a multiple-scattering XAFS analysis, Journal of Colloid and Interface Science 223(2000) 1–12.
[53] A. Voegelin, S. Pfister, A.C. Scheinost, M. Marcus, R. Kretzschmar,Changes in zinc speciation in field soil after contamination with zinc oxide,Environmental Science and Technology 39 (2005) 6616–6623.
[54] H. Bode, K. Dehmelt, J. Witte, Zur Kenntnis der Nickelhydroxidelektrode-I. Über das Nickel (II)-Hydroxidehydrat, Electrochimica Acta 11 (1966)1079–1087.
[55] A.N. Mansour, C.A. Melendres, Analysis of X-ray absorption spectra ofsome nickel oxycompounds using theoretical standards, Journal ofPhysical Chemistry A 102 (1998) 65–81.
[56] J.W. Lukens, J.J. Bucher, D.K. Shuh, N.M. Edelstein, Evolution oftechnetium speciation in reducing grout, Environmental Science andTechnology 39 (2005) 8064–8070.
[57] A.R. Halbert, K.A. Gebauer, L.M. Wall, Prognosis of occupationalchromate dermatitis, Contact Dermatitis 27 (1992) 214–219.
[58] Y.L. Guo, B.J. Wang, K.C. Yek, J.C. Wang, H.H. Kao, M.T. Wang, H.C.Shih, C.J. Chen, Dermatoses in cement workers in Southern Taiwan,Contact Dermatitis 40 (1999) 1–7.
[59] J. Geier, A. Schnuch, A comparison of contact allergies amongconstruction and non-construction workers attending contact dermatitisclinics in Germany. Results of the IVDK from November 1989 until July1993, American Journal of Contact Dermatitis 6 (1995) 86–94.
[60] M.L. Peterson, G.E. Brown Jr., G.A. Parks, C.L. Stein, Differential redoxand sorption of Cr(III/VI) on natural silicate and oxide minerals: EXAFSand XANES results, Geochimica et Cosmochimica Acta 61 (16) (1997)3399–3412.
[61] C.A. Johnson, F.P. Glasser, Hydrotalcite-like minerals (M2Al(OH)6(CO3)0.5·XH2O, where M=Mg, Zn, Co, Ni) in the environment: synthesis,characterization and thermodynamic stability, Clays and Clay Minerals 51(2003) 1–8.
[62] R. Dähn, A.M. Scheidegger, A. Manceau, M.L. Schlegel, B. Baeyens,M.H. Bradbury, M. Morales, Neoformation of Ni phyllosilicate upon Niuptake on montmorillonite: a kinetics study by powder and polarizedextended X-ray absorption fine structure spectroscopy, Geochimica etCosmochimica Acta 66 (13) (2002) 2335–2347.