determination of chemical-structural changes in vitrinite accompanying luminescence alteration using...
TRANSCRIPT
Determination of chemical-structural changes in vitrinite
accompanying luminescence alteration using C-NEXAFS analysis
G. D. CODY1*, H. ADE2, S. WIRICK3, G. D. MITCHELL4 and A. DAVIS4
1Carnegie Institution of Washington, Geophysical Laboratory, Washington, DC 20015, U.S.A., 2TheDepartment of Physics, North Carolina State University, Raleigh, NC, U.S.A., 3The Department ofPhysics, SUNY, Stony Brook, NY, U.S.A. and 4Coal and Organic Petrology Labs, The Pennsylvania
State University, University Park, PA 16802, U.S.A.
(Received 28 August 1997; returned to author for revision 5 November 1997; accepted 7 January 1998)
AbstractÐThe phenomenon of luminescence alteration has been shown to correlate with the thermalmaturity of Type III kerogens (vitrinites). In order to establish a chemical structural basis for this cor-relation, carbon near edge X-ray absorption ®ne structure (C-NEXAFS) spectroscopy is used to moni-tor the gain and loss of organic functionality in ultra-thin sections of vitrinite following timeincremental exposure to blue light (390±490 nm) irradiation in air. These data are compared with lumi-nescence alteration behavior measured at 600 nm. Three samples are studied; low maturity (%R0=0.29), medium maturity (% R0=0.73), and high maturity (% R0=1.35) vitrinite. These exhibit``positive'', ``dual'', and ``negative'' luminescence alteration, respectively. It has been previously estab-lished that the luminescence alteration of vitrinites is the result of photo±oxidation. C-NEXAFS dataare used to identify the types of reactions and correlate the chemical structural changes with lumines-cence alteration behavior. The unaltered C-NEXAFS spectrum of each vitrinite is signi®cantly di�erent,re¯ecting the broad range in vitrinite maturity. The dominant reaction is the formation of COOHgroups, through the attack of singlet oxygen on, predominantly, benzylic carbon. Carbonyl substitutedaromatics are the dominant photo±oxidation product of the most mature vitrinite. The photo±chemicaloxidation pathways and kinetics vary signi®cantly between the three samples. Virtually all of the majorspectral trends (excluding the formation of COOH groups) reverse, moving from low to high maturity,i.e. gains in absorption at a given energy at one maturity level are observed to be losses at a di�erentmaturity level. The spectral changes reveal that in the lower maturity samples aromatic acids, aliphaticketones, and hydroxylated aromatic compounds are formed; aliphatic and aldehydic carbon are lost. Inthe more mature vitrinite, aryl±ketones and aromatic acids are formed, whereas polycyclic aromaticcompounds are lost. Strong correlations exist between the development of ``positive'' alteration and theformation of COOH functionality. No obvious correlation could be made between the C-NEXAFSdata and the ``negative'' luminescence alteration, suggesting that the lumophor participating in thisreaction is below the detection limit of C-NEXAFS spectroscopy. The maturity of a given vitrinitesample, hence its molecular structure, strongly controls the speci®c reaction pathways as well as thetotal extent of reaction. # 1998 Elsevier Science Ltd. All rights reserved
Key wordsÐvitrinite, luminescence, photochemical oxidation, C-NEXAFS, thermal maturity
INTRODUCTION
Assessment of the molecular evolution of type III
kerogens (vitrinites) with diagenesis provides a
measure of the thermal history of associated rock.
Vitrinite, a macromolecular material recognized as
being derived from the biomacromolecular constitu-
ents of vascular plants, undergoes substantial
chemical structural modi®cation with the extent of
diagenetic alteration (maturation); including sub-
stantial losses in oxygen containing functionality
(carboxylic acids, ketones, and hydroxylated aro-
matics), increases in the fraction of aromatic car-
bon, as well as increases in the concentrations of
polycyclic aromatic hydrocarbons. The ability to
accurately assess the degree of maturation of vitri-
nite; hence the thermal history of the associated
lithology is crucial in oil exploration (Hunt, 1979;
Tissot and Welte, 1978) as well as providing im-
portant constraints on paleoheat ¯ow and burial/
uplift histories in geodynamic studies of sedimen-
tary basins (e.g. Beaumont et al., 1987; Furlong,
1989; Zhang and Davis, 1993).
The most commonly measured maturity par-
ameter is vitrinite re¯ectance, % R0. There are oc-
casions where the use of % R0 underestimates the
true maturity of vitrinite; for example, in the case
of so-called perhydrous vitrinite (e.g. Price and
Barker, 1985). It is worthwhile, therefore, to have a
second parameter, independent of % R0, to sup-
plement maturity assessment. Ideally, such a par-
Org. Geochem. Vol. 28, No. 7-8, pp. 441±455, 1998# 1998 Elsevier Science Ltd. All rights reserved
Printed in Great Britain0146-6380/98 $19.00+0.00PII: S0146-6380(98)00010-2
*To whom correspondence should be addressed.
441
ameter would be more closely tied to the chemical
structural state of the kerogen. Recently, Wilkins et
al. (1995) have proposed that the phenomenon
of luminescence alteration be used in addition to
%R0 for the determination of thermal maturity in
oil exploration.
Blue and ultraviolet luminescence analysis of
vitrinites and other kerogens is a well established
tool in organic petrography. The analytical method
involves irradiation of vitrinite with blue (390±
490 nm) or ultraviolet (340±380 nm) light using a
petrographic microscope. The luminescence is
measured using a calibrated photometric system in
a narrow band or across a spectral range using a
grating monochromator. Absorption of light energy
induces photoexcitation of valance electrons within
certain organic functional groups to various excited
states; this energy is lost through the thermal exci-
tation of vibrational modes and the emittance of
light at longer wavelengths. The emitted light may
be broadly de®ned as luminescence, avoiding the
need to di�erentiate between ¯uorescence and phos-
phorescence de-excitation pathways. It is likely that
both pathways contribute to the luminescence of
vitrinites.
TeichmuÈ ller (1974) ®rst observed that when ana-
lyzed in air vitrinites exhibit luminescence intensity
variations with irradiation exposure time. Ottenjann
et al. (1982) described three distinct classes of
alteration behavior; positive, ambivalent (or dual),
and negative. Positive alteration refers to the pro-
gressive increase in luminescence intensity with time
during continuous exposure to blue or UV light,
negative alteration is the opposite trend, and dual
describes an initial decrease in luminescence inten-
sity followed by a later increase. These classes were
shown to correlate well with the thermal maturity
level of vitrinite; immature vitrinites (% R0<0.60)
exhibit exclusively positive alteration, vitrinites in
the range, % R0=0.60±1.0, exhibit dual alteration,
and mature vitrinites (% R0>1.0) exhibit negative
alteration. Wilkins et al., 1995 established that these
alteration trends persist even in kerogens exhibiting
``suppressed'' values of % R0, implying that the two
parameters are largely independent, hence the po-
tential utility for vitrinite maturation assessment in
oil exploration.
By monitoring the e�ects of atmosphere on the
time dependent luminescence intensity, Davis et al.
(1990) established that the alteration is the result of
photo±oxidation chemistry. There have since been a
number of studies aimed at determining the chem-
istry of luminescence alteration employing FTIR
(e.g. Pradier et al., 1990; Mitchell et al., 1996).
These studies have clearly de®ned losses in the ali-
phatic region and gains in the carboxyl C.Ostretching region that appear to correlate with lumi-
nescence alteration. Other subtle changes across the
FTIR spectrum were also recognized but have not
been described in detail. FTIR is a powerful tech-nique, however, spectral complexity and base line
artifacts related to scattering often complicate in-terpretation.In the present study, carbon near edge X-ray
absorption ®ne structure (C-NEXAFS) spec-troscopy was employed to systematically monitorthe change in concentration of various organic
functional groups following progressive photoche-mical alteration. Soft X-rays (l140 AÊ ) are used topromote carbon core level (1s) electrons into var-
ious bound and virtual excited states consisting, lar-gely, of anti-bonding molecular orbitals. Localvariations in electron density surrounding thephotoexcited cores impart di�erences in the energy
gaps between the core and excited states leading torelatively well resolved spectra of absorption bandscorresponding to carbon in di�erent organic func-
tional groups. C-NEXAFS spectroscopy is particu-larly appropriate for the present study in that theinner shell spectrum reveals the manifold of excited
states available for the photoexcited electrons. Inmany regards these excited states are well describedby the lowest unoccupied molecular orbitals
(LUMOs) of organic functional groups; thus, C-NEXAFS is complementary to UV-visible absorp-tion and luminescence spectroscopy.C-NEXAFS has been previously applied to probe
the electronic structure of organic carbon withinmicroheterogeneous kerogeneous materials (Cody etal., 1995a,b, 1996) and has been shown to provide
fairly well resolved functional group information.An experimental requirement for C-NEXAFS isextremely thin samples (150±300 nm), due to the
very large absorption cross section of carbon for X-rays in the 280±300 eV range (Henke, 1986). Thisrequirement is ideal for the present experiment inthat the samples are essentially ``surfaces''. In this
regard, C-NEXAFS should be extremely sensitiveto changes in chemical structure of vitrinites occur-ring at the sample surface.
EXPERIMENTAL
Samples
Vitrinite samples used in this study were selectedfrom blocks of coal collected from freshly exposed
mine working face during sampling for the PennState Sample Bank collection supported by theDepartment of Energy. These samples were sealedin foil multi-laminate bags under argon gas at the
mine and were stored under refrigeration until used.Three vitrinite samples were selected to representdi�erent luminescence alteration behaviors, i.e.,
positive, dual and negative. Analytical dataobtained from the nearby channel samples areshown in Table 1 to denote the approximate matur-
ity of the vitrinites used in this study.
G. D. Cody et al.442
Sample preparation
Ultra-thin sections of vitrinite were preparedusing an ultra-microtome with a diamond knife.Sample thickness were estimated to on the order of
100±200 nm based on their characteristic interfer-ence colors. Details on the sample preparation havebeen published previously (Cody et al., 1995a).
Blue-light irradiation and luminescence measurements
A Leitz Orthoplan MPV-II microscope photo-
meter system was used for both photo±oxidationand luminescence measurements. This system gener-ates excitation energy from a 100 watt mercury±arclamp which is then passed through a series of inter-
ference ®lters to give an excitation wavelengthbetween 390±490 nm. This light is re¯ected by a510 nm re¯ection short-pass dichromatic beam split-
ter and condensed onto the sample through a 50XNPL FLUOTAR air objective. Part of the absorbedexcitation energy is released as a longer wavelength
emission that is passed back through a 515 nm bar-rier ®lter to remove any re¯ected excitation lightand then through a 600 nm measurement ®lter. Thelight energy is transformed into an electronic signal
and ampli®ed by an EMI 9558 photomultiplier.System calibration is achieved using a ®ltered ura-nyl glass standard.
Measurement of the change in luminescenceintensity were made at 6 s intervals during thephoto±oxidation sequence in the following manner.
Circular irradiation areas of 40 mm were used foreach sample; this region being con®ned within the50 mm grid spacing of the thin section support.
Using white-light, a grid area was selected that con-tained the maximum amount of recognizable vitri-nite. Individual areas were photo-oxidized for 1, 5,10 or 15 min and a record of the change in lumines-
cence was recorded.
Carbon micro-NEXAFS measurements
Carbon NEXAFS data was acquired using thescanning transmission X-ray microscope (STXM)and microspectrometer located at the X1A beamline at the National Synchrotron Light Source at
Brookhaven National Laboratory. The X-raysource is an undulator on the 2.5 GeV electron sto-rage ring. In its current con®guration the STXMs
monochromator is capable of 0.3 eV energy resol-ution. Adjustable entrance and exit slits ensure thespectral purity of the monochromatic beam.
Focusing the monochromatic X-ray beam is accom-
plished with a Fresnell phase-zone plate objective
and an order-sorting aperture yielding a spatial res-olution of 55 nm. Micro-spectroscopy using theSTXM necessitates scanning the monochromatorwhile simultaneously moving the sample along the
optical axis to maintain focus using a stepper motordrive. The actual analysis area is consequently100�100 nm due to small positioning errors.
Additional details regarding the design and speci®-cations of the STXM at X1A are available else-where (e.g. Jacobsen et al., 1991).
Measurement protocol involved acquiring anabsorption spectrum spanning the energy range of280±300 eV, this was then corrected for background
absorption by subtraction of a spectrum obtainedwithout the sample. The data are presented as inabsorption mode as the ÿlog(T/T0), where T and T0
are the transmittance of the sample and back-
ground, respectively. Reproducibility from scan toscan is excellent, provided that background spectraare obtained just before or following each sample
spectrum. The inevitable decay in intensity of I0,the synchrotron generated X-ray beam intensity, issu�ciently slow as not to compromise the spectral
quality given total acquisition times on the order of60 s. A typical spectrum spans a wavelength rangeof 3 AÊ ; 512 points are acquired across the spectrumwith a dwell time of 100 ms. Energy calibration is
a�orded through comparison of the position of the1s±p* and Rydberg transitions of CO2 (Ma et al.,1991) bled into the irradiated volume.
RESULTS
Luminescence alteration
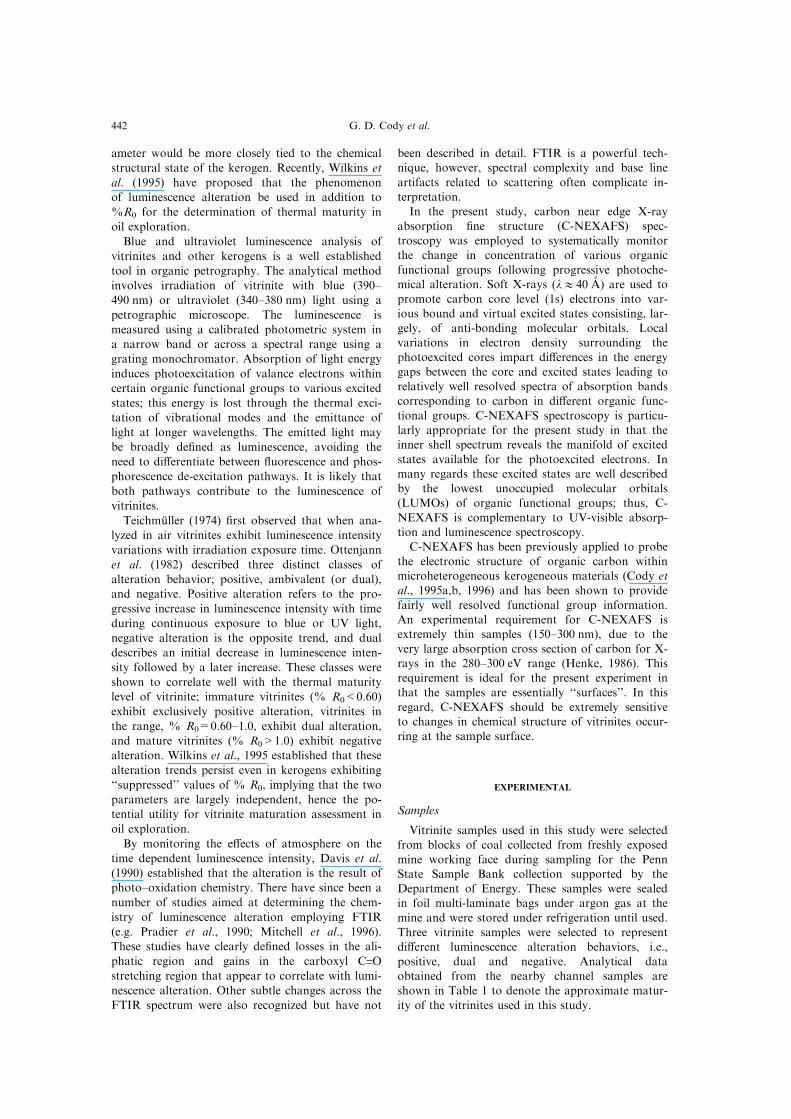
Figures 1±3 show typical alteration patterns forthe three di�erent maturity vitrinites. The least
mature vitrinite (DECS-26, Fig. 1) exhibits strong``positive'' alteration with nearly a factor of 6increase in luminescence intensity in 15 min. The
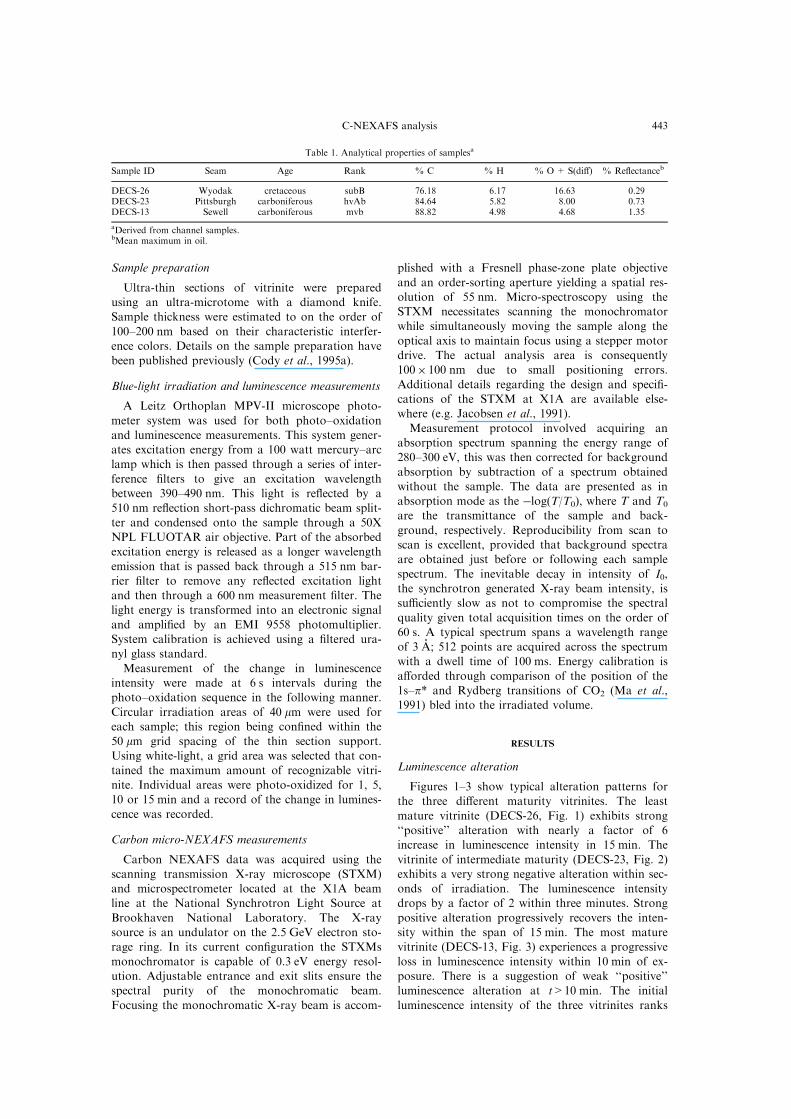
vitrinite of intermediate maturity (DECS-23, Fig. 2)exhibits a very strong negative alteration within sec-onds of irradiation. The luminescence intensitydrops by a factor of 2 within three minutes. Strong
positive alteration progressively recovers the inten-sity within the span of 15 min. The most maturevitrinite (DECS-13, Fig. 3) experiences a progressive
loss in luminescence intensity within 10 min of ex-posure. There is a suggestion of weak ``positive''luminescence alteration at t>10 min. The initial
luminescence intensity of the three vitrinites ranks
Table 1. Analytical properties of samplesa
Sample ID Seam Age Rank % C % H % O + S(di�) % Re¯ectanceb
DECS-26 Wyodak cretaceous subB 76.18 6.17 16.63 0.29DECS-23 Pittsburgh carboniferous hvAb 84.64 5.82 8.00 0.73DECS-13 Sewell carboniferous mvb 88.82 4.98 4.68 1.35
aDerived from channel samples.bMean maximum in oil.
C-NEXAFS analysis 443
Fig. 1. Change in the luminescence intensity during irradiation (390±490 nm) in air measured at 600 nmfrom low maturity vitrinite (% R= 0.29) (DECS-26).
Fig. 2. Change in the luminescence intensity during irradiation (390±490 nm) in air measured at 600 nmfrom intermediate maturity vitrinite (% R= 0.73) (DECS-23).
G. D. Cody et al.444
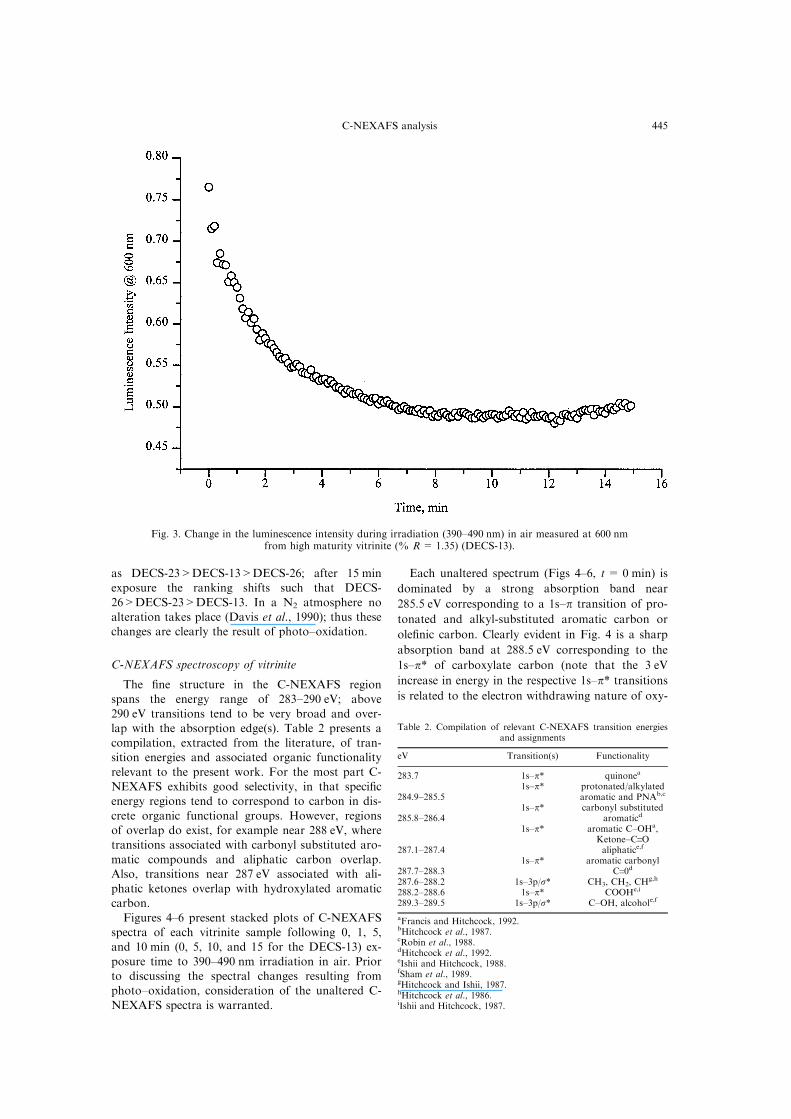
as DECS-23>DECS-13>DECS-26; after 15 minexposure the ranking shifts such that DECS-
26>DECS-23>DECS-13. In a N2 atmosphere noalteration takes place (Davis et al., 1990); thus thesechanges are clearly the result of photo±oxidation.
C-NEXAFS spectroscopy of vitrinite
The ®ne structure in the C-NEXAFS regionspans the energy range of 283±290 eV; above
290 eV transitions tend to be very broad and over-lap with the absorption edge(s). Table 2 presents acompilation, extracted from the literature, of tran-sition energies and associated organic functionality
relevant to the present work. For the most part C-NEXAFS exhibits good selectivity, in that speci®cenergy regions tend to correspond to carbon in dis-
crete organic functional groups. However, regionsof overlap do exist, for example near 288 eV, wheretransitions associated with carbonyl substituted aro-
matic compounds and aliphatic carbon overlap.Also, transitions near 287 eV associated with ali-phatic ketones overlap with hydroxylated aromaticcarbon.
Figures 4±6 present stacked plots of C-NEXAFSspectra of each vitrinite sample following 0, 1, 5,and 10 min (0, 5, 10, and 15 for the DECS-13) ex-
posure time to 390±490 nm irradiation in air. Priorto discussing the spectral changes resulting fromphoto±oxidation, consideration of the unaltered C-
NEXAFS spectra is warranted.
Each unaltered spectrum (Figs 4±6, t= 0 min) is
dominated by a strong absorption band near
285.5 eV corresponding to a 1s±p transition of pro-
tonated and alkyl-substituted aromatic carbon or
ole®nic carbon. Clearly evident in Fig. 4 is a sharp
absorption band at 288.5 eV corresponding to the
1s±p* of carboxylate carbon (note that the 3 eV
increase in energy in the respective 1s±p* transitions
is related to the electron withdrawing nature of oxy-
Fig. 3. Change in the luminescence intensity during irradiation (390±490 nm) in air measured at 600 nmfrom high maturity vitrinite (% R= 1.35) (DECS-13).
Table 2. Compilation of relevant C-NEXAFS transition energiesand assignments
eV Transition(s) Functionality
283.7 1s±p* quinonea
284.9±285.51s±p* protonated/alkylated
aromatic and PNAb,c
285.8±286.41s±p* carbonyl substituted
aromaticd
287.1±287.4
1s±p* aromatic C±OHa,Ketone±C.Oaliphatice,f
287.7±288.31s±p* aromatic carbonyl
C.0d
287.6±288.2 1s±3p/s* CH3, CH2, CHg,h
288.2±288.6 1s±p* COOHe,i
289.3±289.5 1s±3p/s* C±OH, alcohole,f
aFrancis and Hitchcock, 1992.bHitchcock et al., 1987.cRobin et al., 1988.dHitchcock et al., 1992.eIshii and Hitchcock, 1988.fSham et al., 1989.gHitchcock and Ishii, 1987.hHitchcock et al., 1986.iIshii and Hitchcock, 1987.
C-NEXAFS analysis 445
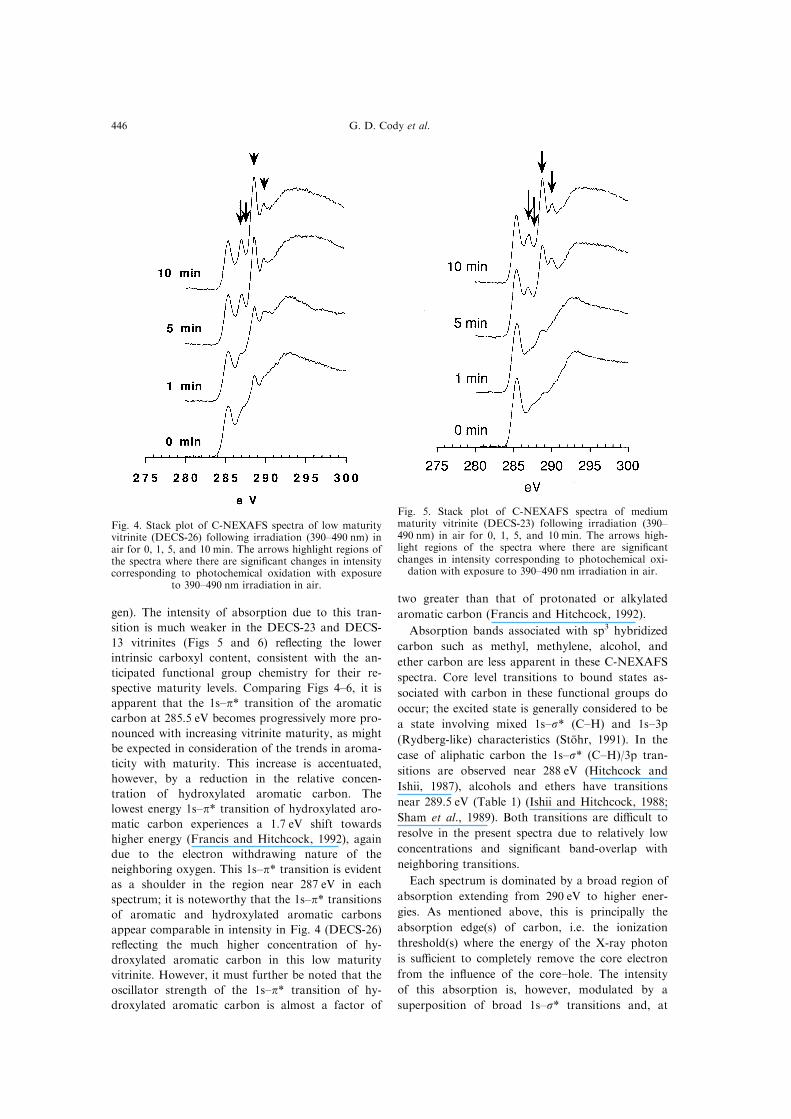
gen). The intensity of absorption due to this tran-
sition is much weaker in the DECS-23 and DECS-
13 vitrinites (Figs 5 and 6) re¯ecting the lower
intrinsic carboxyl content, consistent with the an-
ticipated functional group chemistry for their re-
spective maturity levels. Comparing Figs 4±6, it is
apparent that the 1s±p* transition of the aromatic
carbon at 285.5 eV becomes progressively more pro-
nounced with increasing vitrinite maturity, as might
be expected in consideration of the trends in aroma-
ticity with maturity. This increase is accentuated,
however, by a reduction in the relative concen-
tration of hydroxylated aromatic carbon. The
lowest energy 1s±p* transition of hydroxylated aro-
matic carbon experiences a 1.7 eV shift towards
higher energy (Francis and Hitchcock, 1992), again
due to the electron withdrawing nature of the
neighboring oxygen. This 1s±p* transition is evident
as a shoulder in the region near 287 eV in each
spectrum; it is noteworthy that the 1s±p* transitions
of aromatic and hydroxylated aromatic carbons
appear comparable in intensity in Fig. 4 (DECS-26)
re¯ecting the much higher concentration of hy-
droxylated aromatic carbon in this low maturity
vitrinite. However, it must further be noted that the
oscillator strength of the 1s±p* transition of hy-
droxylated aromatic carbon is almost a factor of
two greater than that of protonated or alkylated
aromatic carbon (Francis and Hitchcock, 1992).
Absorption bands associated with sp3 hybridized
carbon such as methyl, methylene, alcohol, and
ether carbon are less apparent in these C-NEXAFS
spectra. Core level transitions to bound states as-
sociated with carbon in these functional groups do
occur; the excited state is generally considered to be
a state involving mixed 1s±s* (C±H) and 1s±3p
(Rydberg-like) characteristics (StoÈ hr, 1991). In the
case of aliphatic carbon the 1s±s* (C±H)/3p tran-
sitions are observed near 288 eV (Hitchcock and
Ishii, 1987), alcohols and ethers have transitions
near 289.5 eV (Table 1) (Ishii and Hitchcock, 1988;
Sham et al., 1989). Both transitions are di�cult to
resolve in the present spectra due to relatively low
concentrations and signi®cant band-overlap with
neighboring transitions.
Each spectrum is dominated by a broad region of
absorption extending from 290 eV to higher ener-
gies. As mentioned above, this is principally the
absorption edge(s) of carbon, i.e. the ionization
threshold(s) where the energy of the X-ray photon
is su�cient to completely remove the core electron
from the in¯uence of the core±hole. The intensity
of this absorption is, however, modulated by a
superposition of broad 1s±s* transitions and, at
Fig. 4. Stack plot of C-NEXAFS spectra of low maturityvitrinite (DECS-26) following irradiation (390±490 nm) inair for 0, 1, 5, and 10 min. The arrows highlight regions ofthe spectra where there are signi®cant changes in intensitycorresponding to photochemical oxidation with exposure
to 390±490 nm irradiation in air.
Fig. 5. Stack plot of C-NEXAFS spectra of mediummaturity vitrinite (DECS-23) following irradiation (390±490 nm) in air for 0, 1, 5, and 10 min. The arrows high-light regions of the spectra where there are signi®cantchanges in intensity corresponding to photochemical oxi-dation with exposure to 390±490 nm irradiation in air.
G. D. Cody et al.446
higher energies (>320 eV), photo±electron scatter-
ing (e.g. EXAFS).
The unaltered spectra (Figs 4±6, t= 0 min), exhi-
bit clear maturity dependent trends, i.e. in aromati-
city and losses in organic oxygen containing
functionality. As will be described below, maturity
dependent di�erences also exist in the photochemi-
cal oxidation behavior with progressive reaction
time as detected in the time resolved C-NEXAFS
spectra of each sample.
Beginning with the least mature vitrinite (DECS-
26), the following salient features are noted. The
most prominent change in the C-NEXAFS spectra
is growth in intensity of at 288.5 eV. There are also
clear increases in intensity at 287.1 eV and 290 eV.
These increases are o�set by a large decrease in
intensity at 288 eV and a slight decrease at
286.3 eV. The intermediate maturity vitrinite
(DECS-23) exhibits similar trends (Fig. 5); most
prominent, again, being the increases at 288.5 eV
and 290 eV, and 287.1 eV and a decrease intensity
in the region around 288 eV. However, there is also
a subtle increase in intensity in the region around
286.3 eV.
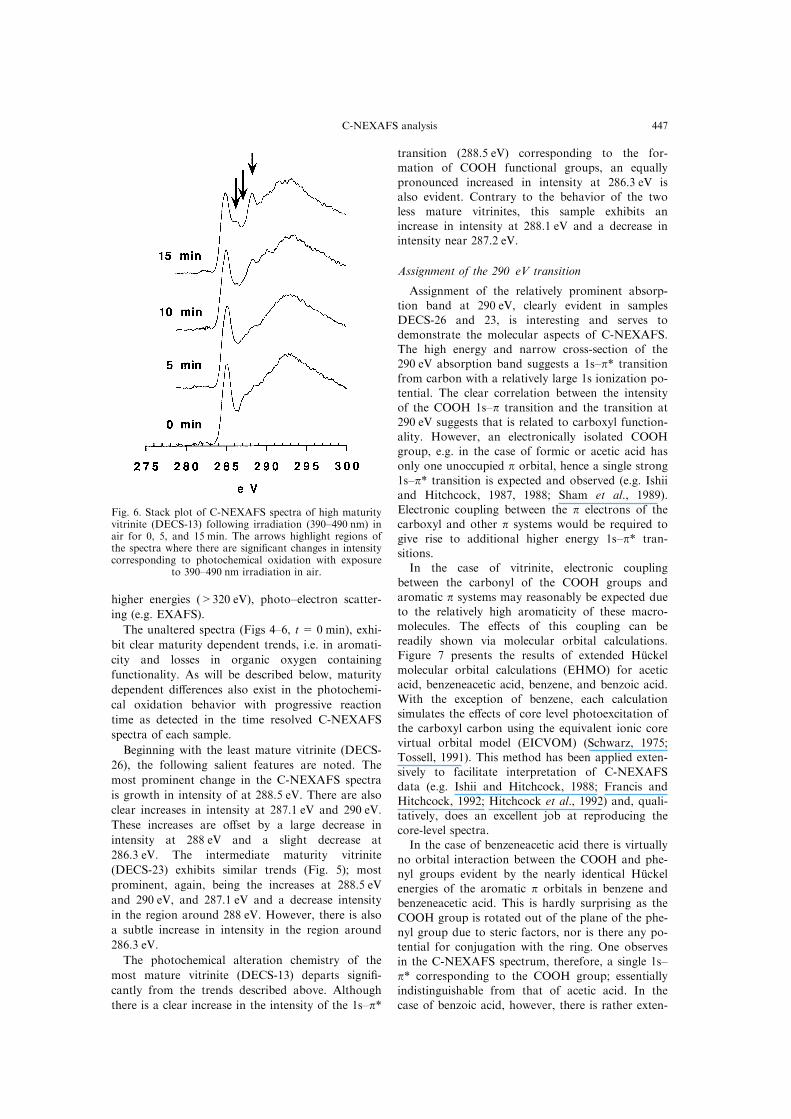
The photochemical alteration chemistry of the
most mature vitrinite (DECS-13) departs signi®-
cantly from the trends described above. Although
there is a clear increase in the intensity of the 1s±p*
transition (288.5 eV) corresponding to the for-mation of COOH functional groups, an equally
pronounced increased in intensity at 286.3 eV isalso evident. Contrary to the behavior of the twoless mature vitrinites, this sample exhibits an
increase in intensity at 288.1 eV and a decrease inintensity near 287.2 eV.
Assignment of the 290 eV transition
Assignment of the relatively prominent absorp-tion band at 290 eV, clearly evident in samplesDECS-26 and 23, is interesting and serves to
demonstrate the molecular aspects of C-NEXAFS.The high energy and narrow cross-section of the290 eV absorption band suggests a 1s±p* transition
from carbon with a relatively large 1s ionization po-tential. The clear correlation between the intensityof the COOH 1s±p transition and the transition at290 eV suggests that is related to carboxyl function-
ality. However, an electronically isolated COOHgroup, e.g. in the case of formic or acetic acid hasonly one unoccupied p orbital, hence a single strong
1s±p* transition is expected and observed (e.g. Ishiiand Hitchcock, 1987, 1988; Sham et al., 1989).Electronic coupling between the p electrons of the
carboxyl and other p systems would be required togive rise to additional higher energy 1s±p* tran-sitions.In the case of vitrinite, electronic coupling
between the carbonyl of the COOH groups andaromatic p systems may reasonably be expected dueto the relatively high aromaticity of these macro-
molecules. The e�ects of this coupling can bereadily shown via molecular orbital calculations.Figure 7 presents the results of extended HuÈ ckel
molecular orbital calculations (EHMO) for aceticacid, benzeneacetic acid, benzene, and benzoic acid.With the exception of benzene, each calculation
simulates the e�ects of core level photoexcitation ofthe carboxyl carbon using the equivalent ionic corevirtual orbital model (EICVOM) (Schwarz, 1975;Tossell, 1991). This method has been applied exten-
sively to facilitate interpretation of C-NEXAFSdata (e.g. Ishii and Hitchcock, 1988; Francis andHitchcock, 1992; Hitchcock et al., 1992) and, quali-
tatively, does an excellent job at reproducing thecore-level spectra.In the case of benzeneacetic acid there is virtually
no orbital interaction between the COOH and phe-nyl groups evident by the nearly identical HuÈ ckelenergies of the aromatic p orbitals in benzene andbenzeneacetic acid. This is hardly surprising as the
COOH group is rotated out of the plane of the phe-nyl group due to steric factors, nor is there any po-tential for conjugation with the ring. One observes
in the C-NEXAFS spectrum, therefore, a single 1s±p* corresponding to the COOH group; essentiallyindistinguishable from that of acetic acid. In the
case of benzoic acid, however, there is rather exten-
Fig. 6. Stack plot of C-NEXAFS spectra of high maturityvitrinite (DECS-13) following irradiation (390±490 nm) inair for 0, 5, and 15 min. The arrows highlight regions ofthe spectra where there are signi®cant changes in intensitycorresponding to photochemical oxidation with exposure
to 390±490 nm irradiation in air.
C-NEXAFS analysis 447
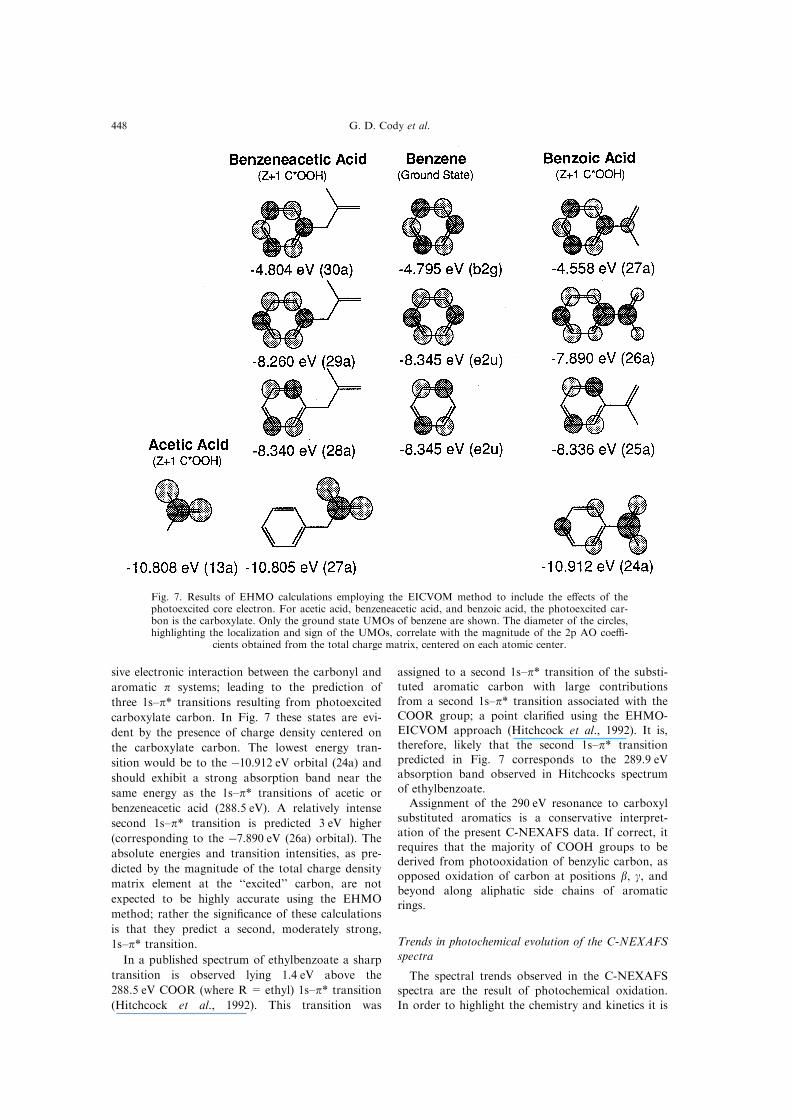
sive electronic interaction between the carbonyl and
aromatic p systems; leading to the prediction of
three 1s±p* transitions resulting from photoexcited
carboxylate carbon. In Fig. 7 these states are evi-
dent by the presence of charge density centered on
the carboxylate carbon. The lowest energy tran-
sition would be to the ÿ10.912 eV orbital (24a) and
should exhibit a strong absorption band near the
same energy as the 1s±p* transitions of acetic or
benzeneacetic acid (288.5 eV). A relatively intense
second 1s±p* transition is predicted 3 eV higher
(corresponding to the ÿ7.890 eV (26a) orbital). The
absolute energies and transition intensities, as pre-
dicted by the magnitude of the total charge density
matrix element at the ``excited'' carbon, are not
expected to be highly accurate using the EHMO
method; rather the signi®cance of these calculations
is that they predict a second, moderately strong,
1s±p* transition.
In a published spectrum of ethylbenzoate a sharp
transition is observed lying 1.4 eV above the
288.5 eV COOR (where R = ethyl) 1s±p* transition
(Hitchcock et al., 1992). This transition was
assigned to a second 1s±p* transition of the substi-tuted aromatic carbon with large contributions
from a second 1s±p* transition associated with theCOOR group; a point clari®ed using the EHMO-EICVOM approach (Hitchcock et al., 1992). It is,
therefore, likely that the second 1s±p* transitionpredicted in Fig. 7 corresponds to the 289.9 eVabsorption band observed in Hitchcocks spectrum
of ethylbenzoate.Assignment of the 290 eV resonance to carboxyl
substituted aromatics is a conservative interpret-
ation of the present C-NEXAFS data. If correct, itrequires that the majority of COOH groups to bederived from photooxidation of benzylic carbon, asopposed oxidation of carbon at positions b, g, andbeyond along aliphatic side chains of aromaticrings.
Trends in photochemical evolution of the C-NEXAFSspectra
The spectral trends observed in the C-NEXAFSspectra are the result of photochemical oxidation.
In order to highlight the chemistry and kinetics it is
Fig. 7. Results of EHMO calculations employing the EICVOM method to include the e�ects of thephotoexcited core electron. For acetic acid, benzeneacetic acid, and benzoic acid, the photoexcited car-bon is the carboxylate. Only the ground state UMOs of benzene are shown. The diameter of the circles,highlighting the localization and sign of the UMOs, correlate with the magnitude of the 2p AO coe�-
cients obtained from the total charge matrix, centered on each atomic center.
G. D. Cody et al.448
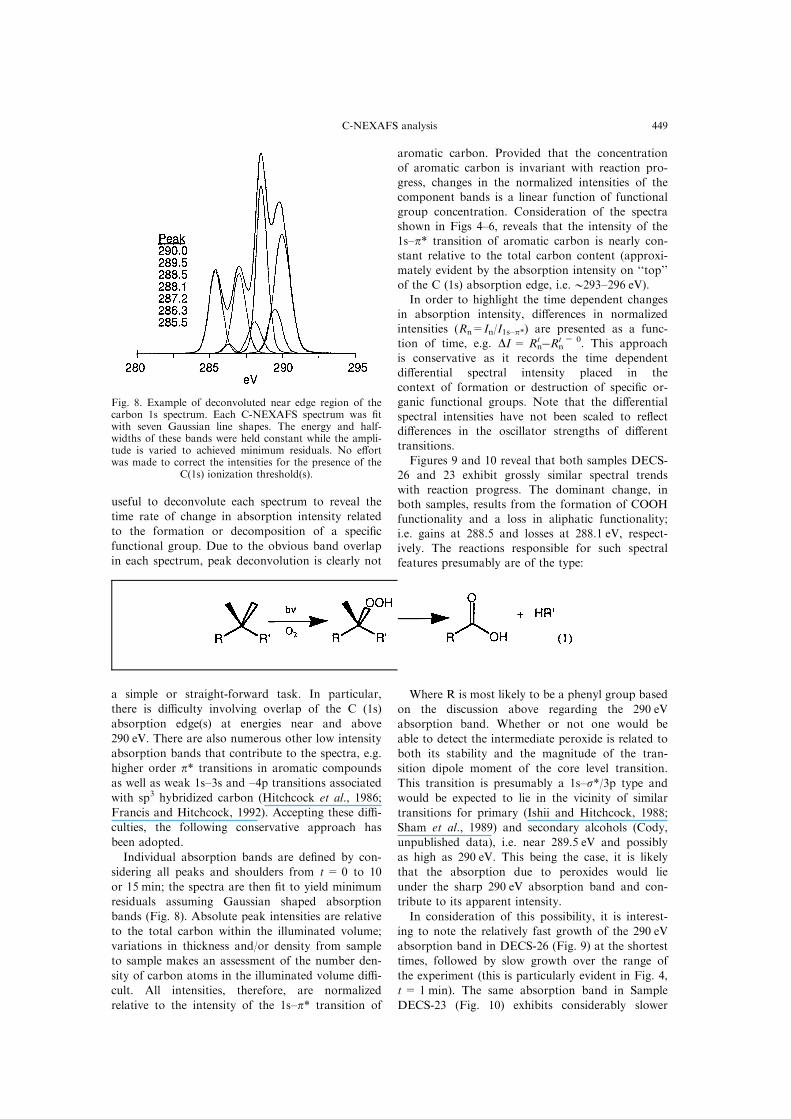
useful to deconvolute each spectrum to reveal the
time rate of change in absorption intensity related
to the formation or decomposition of a speci®c
functional group. Due to the obvious band overlap
in each spectrum, peak deconvolution is clearly not
a simple or straight-forward task. In particular,
there is di�culty involving overlap of the C (1s)
absorption edge(s) at energies near and above
290 eV. There are also numerous other low intensity
absorption bands that contribute to the spectra, e.g.
higher order p* transitions in aromatic compounds
as well as weak 1s±3s and ±4p transitions associated
with sp3 hybridized carbon (Hitchcock et al., 1986;
Francis and Hitchcock, 1992). Accepting these di�-
culties, the following conservative approach has
been adopted.
Individual absorption bands are de®ned by con-
sidering all peaks and shoulders from t = 0 to 10
or 15 min; the spectra are then ®t to yield minimum
residuals assuming Gaussian shaped absorption
bands (Fig. 8). Absolute peak intensities are relative
to the total carbon within the illuminated volume;
variations in thickness and/or density from sample
to sample makes an assessment of the number den-
sity of carbon atoms in the illuminated volume di�-
cult. All intensities, therefore, are normalized
relative to the intensity of the 1s±p* transition of
aromatic carbon. Provided that the concentration
of aromatic carbon is invariant with reaction pro-
gress, changes in the normalized intensities of the
component bands is a linear function of functional
group concentration. Consideration of the spectra
shown in Figs 4±6, reveals that the intensity of the
1s±p* transition of aromatic carbon is nearly con-
stant relative to the total carbon content (approxi-
mately evident by the absorption intensity on ``top''
of the C (1s) absorption edge, i.e.0293±296 eV).
In order to highlight the time dependent changes
in absorption intensity, di�erences in normalized
intensities (Rn=In/I1s±p*) are presented as a func-
tion of time, e.g. DI = RntÿRn
t = 0. This approach
is conservative as it records the time dependent
di�erential spectral intensity placed in the
context of formation or destruction of speci®c or-
ganic functional groups. Note that the di�erential
spectral intensities have not been scaled to re¯ectdi�erences in the oscillator strengths of di�erent
transitions.
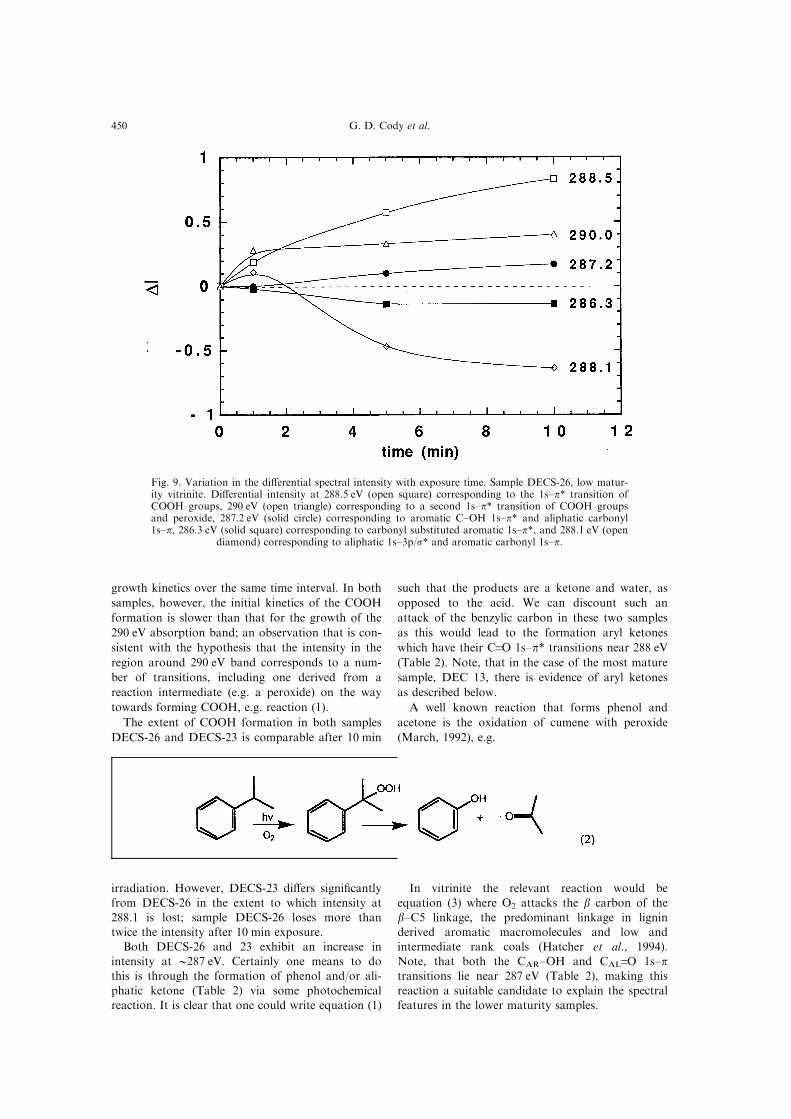
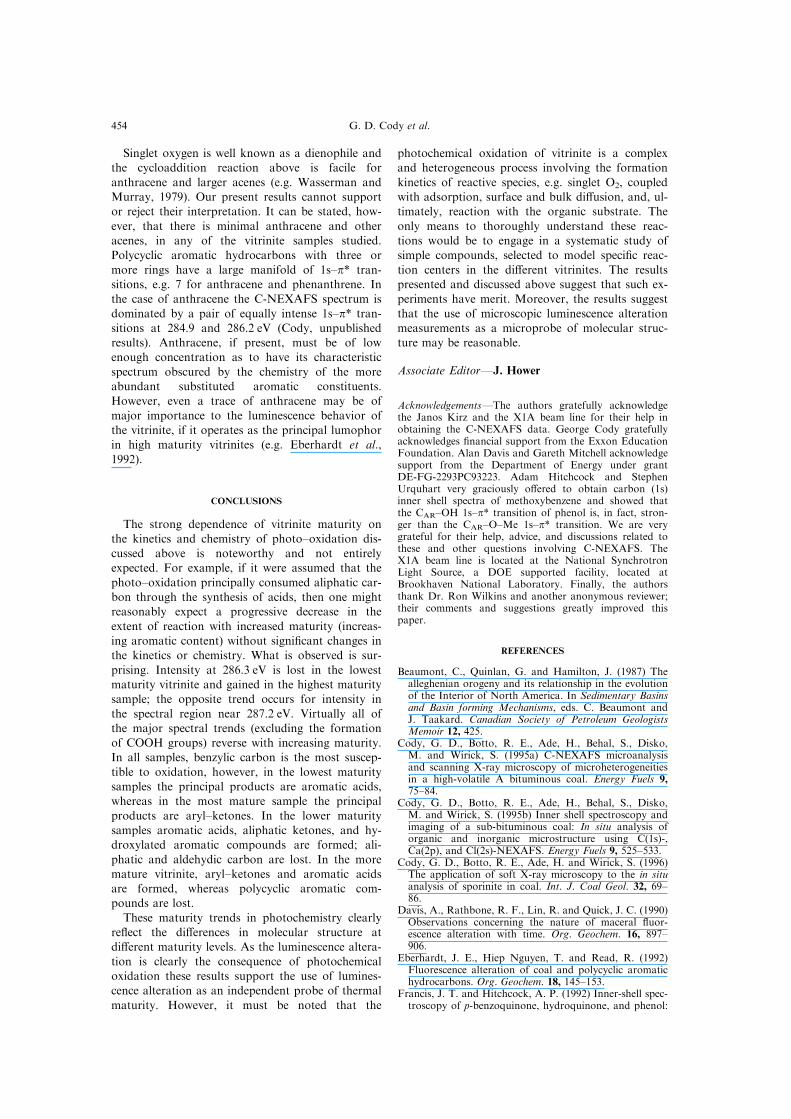
Figures 9 and 10 reveal that both samples DECS-
26 and 23 exhibit grossly similar spectral trends
with reaction progress. The dominant change, in
both samples, results from the formation of COOH
functionality and a loss in aliphatic functionality;
i.e. gains at 288.5 and losses at 288.1 eV, respect-
ively. The reactions responsible for such spectral
features presumably are of the type:
Where R is most likely to be a phenyl group based
on the discussion above regarding the 290 eV
absorption band. Whether or not one would be
able to detect the intermediate peroxide is related to
both its stability and the magnitude of the tran-
sition dipole moment of the core level transition.
This transition is presumably a 1s±s*/3p type and
would be expected to lie in the vicinity of similar
transitions for primary (Ishii and Hitchcock, 1988;
Sham et al., 1989) and secondary alcohols (Cody,
unpublished data), i.e. near 289.5 eV and possibly
as high as 290 eV. This being the case, it is likely
that the absorption due to peroxides would lie
under the sharp 290 eV absorption band and con-
tribute to its apparent intensity.
In consideration of this possibility, it is interest-
ing to note the relatively fast growth of the 290 eV
absorption band in DECS-26 (Fig. 9) at the shortest
times, followed by slow growth over the range of
the experiment (this is particularly evident in Fig. 4,
t= 1 min). The same absorption band in Sample
DECS-23 (Fig. 10) exhibits considerably slower
Fig. 8. Example of deconvoluted near edge region of thecarbon 1s spectrum. Each C-NEXAFS spectrum was ®twith seven Gaussian line shapes. The energy and half-widths of these bands were held constant while the ampli-tude is varied to achieved minimum residuals. No e�ortwas made to correct the intensities for the presence of the
C(1s) ionization threshold(s).
C-NEXAFS analysis 449
growth kinetics over the same time interval. In both
samples, however, the initial kinetics of the COOH
formation is slower than that for the growth of the
290 eV absorption band; an observation that is con-
sistent with the hypothesis that the intensity in the
region around 290 eV band corresponds to a num-
ber of transitions, including one derived from a
reaction intermediate (e.g. a peroxide) on the way
towards forming COOH, e.g. reaction (1).
The extent of COOH formation in both samples
DECS-26 and DECS-23 is comparable after 10 min
irradiation. However, DECS-23 di�ers signi®cantly
from DECS-26 in the extent to which intensity at
288.1 is lost; sample DECS-26 loses more than
twice the intensity after 10 min exposure.
Both DECS-26 and 23 exhibit an increase in
intensity at 0287 eV. Certainly one means to do
this is through the formation of phenol and/or ali-
phatic ketone (Table 2) via some photochemical
reaction. It is clear that one could write equation (1)
such that the products are a ketone and water, as
opposed to the acid. We can discount such an
attack of the benzylic carbon in these two samples
as this would lead to the formation aryl ketones
which have their C.O 1s±p* transitions near 288 eV
(Table 2). Note, that in the case of the most mature
sample, DEC 13, there is evidence of aryl ketones
as described below.
A well known reaction that forms phenol and
acetone is the oxidation of cumene with peroxide
(March, 1992), e.g.
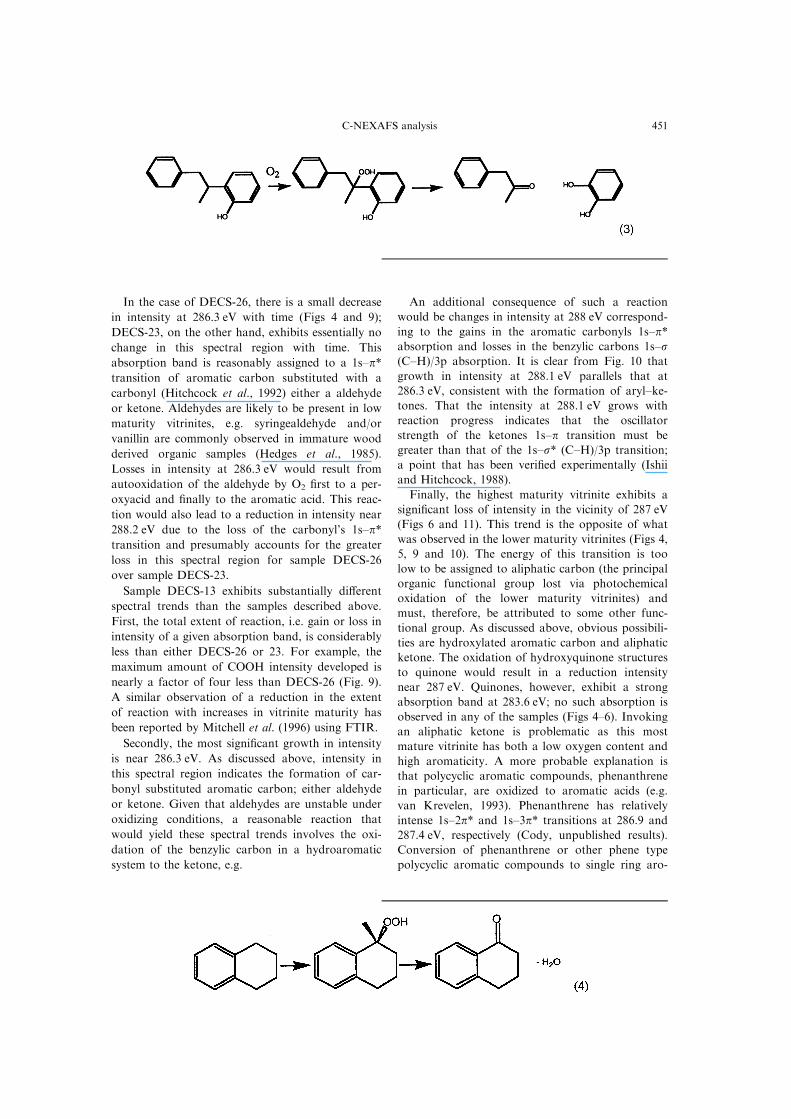
In vitrinite the relevant reaction would be
equation (3) where O2 attacks the b carbon of the
b±C5 linkage, the predominant linkage in lignin
derived aromatic macromolecules and low and
intermediate rank coals (Hatcher et al., 1994).
Note, that both the CAR±OH and CAL.O 1s±ptransitions lie near 287 eV (Table 2), making this
reaction a suitable candidate to explain the spectral
features in the lower maturity samples.
Fig. 9. Variation in the di�erential spectral intensity with exposure time. Sample DECS-26, low matur-ity vitrinite. Di�erential intensity at 288.5 eV (open square) corresponding to the 1s±p* transition ofCOOH groups, 290 eV (open triangle) corresponding to a second 1s±p* transition of COOH groupsand peroxide, 287.2 eV (solid circle) corresponding to aromatic C±OH 1s±p* and aliphatic carbonyl1s±p, 286.3 eV (solid square) corresponding to carbonyl substituted aromatic 1s±p*, and 288.1 eV (open
diamond) corresponding to aliphatic 1s±3p/s* and aromatic carbonyl 1s±p.
G. D. Cody et al.450
In the case of DECS-26, there is a small decrease
in intensity at 286.3 eV with time (Figs 4 and 9);
DECS-23, on the other hand, exhibits essentially no
change in this spectral region with time. This
absorption band is reasonably assigned to a 1s±p*transition of aromatic carbon substituted with a
carbonyl (Hitchcock et al., 1992) either a aldehyde
or ketone. Aldehydes are likely to be present in low
maturity vitrinites, e.g. syringealdehyde and/or
vanillin are commonly observed in immature wood
derived organic samples (Hedges et al., 1985).
Losses in intensity at 286.3 eV would result from
autooxidation of the aldehyde by O2 ®rst to a per-
oxyacid and ®nally to the aromatic acid. This reac-
tion would also lead to a reduction in intensity near
288.2 eV due to the loss of the carbonyl's 1s±p*transition and presumably accounts for the greater
loss in this spectral region for sample DECS-26
over sample DECS-23.
Sample DECS-13 exhibits substantially di�erent
spectral trends than the samples described above.
First, the total extent of reaction, i.e. gain or loss in
intensity of a given absorption band, is considerably
less than either DECS-26 or 23. For example, the
maximum amount of COOH intensity developed is
nearly a factor of four less than DECS-26 (Fig. 9).
A similar observation of a reduction in the extent
of reaction with increases in vitrinite maturity has
been reported by Mitchell et al. (1996) using FTIR.
Secondly, the most signi®cant growth in intensity
is near 286.3 eV. As discussed above, intensity in
this spectral region indicates the formation of car-
bonyl substituted aromatic carbon; either aldehyde
or ketone. Given that aldehydes are unstable under
oxidizing conditions, a reasonable reaction that
would yield these spectral trends involves the oxi-
dation of the benzylic carbon in a hydroaromatic
system to the ketone, e.g.
An additional consequence of such a reaction
would be changes in intensity at 288 eV correspond-
ing to the gains in the aromatic carbonyls 1s±p*absorption and losses in the benzylic carbons 1s±s(C±H)/3p absorption. It is clear from Fig. 10 that
growth in intensity at 288.1 eV parallels that at
286.3 eV, consistent with the formation of aryl±ke-
tones. That the intensity at 288.1 eV grows with
reaction progress indicates that the oscillator
strength of the ketones 1s±p transition must be
greater than that of the 1s±s* (C±H)/3p transition;
a point that has been veri®ed experimentally (Ishii
and Hitchcock, 1988).
Finally, the highest maturity vitrinite exhibits a
signi®cant loss of intensity in the vicinity of 287 eV
(Figs 6 and 11). This trend is the opposite of what
was observed in the lower maturity vitrinites (Figs 4,
5, 9 and 10). The energy of this transition is too
low to be assigned to aliphatic carbon (the principal
organic functional group lost via photochemical
oxidation of the lower maturity vitrinites) and
must, therefore, be attributed to some other func-
tional group. As discussed above, obvious possibili-
ties are hydroxylated aromatic carbon and aliphatic
ketone. The oxidation of hydroxyquinone structures
to quinone would result in a reduction intensity
near 287 eV. Quinones, however, exhibit a strong
absorption band at 283.6 eV; no such absorption is
observed in any of the samples (Figs 4±6). Invoking
an aliphatic ketone is problematic as this most
mature vitrinite has both a low oxygen content and
high aromaticity. A more probable explanation is
that polycyclic aromatic compounds, phenanthrene
in particular, are oxidized to aromatic acids (e.g.
van Krevelen, 1993). Phenanthrene has relatively
intense 1s±2p* and 1s±3p* transitions at 286.9 and
287.4 eV, respectively (Cody, unpublished results).
Conversion of phenanthrene or other phene type
polycyclic aromatic compounds to single ring aro-
C-NEXAFS analysis 451
matic acid compounds would result in a reductionof the size of the p orbital manifold leading to a re-
duction in absorption intensity in spectral regionaround 287 eV.
Chemical correlations with luminescence alterationbehavior
It is reasonable to assume that the di�erences inluminescence alteration behavior exhibited by thesethree vitrinites would correlate with the di�erencesin photochemical oxidation behavior as detected
via C-NEXAFS; however, such a correlation is byno means necessary. The luminescence of vitrinitesmay very well be controlled by the presence of di-
lute lumophors, whereas the photochemical oxi-dation detected using C-NEXAFS in this studyand FTIR in other studies probes the chemical
structural changes a�ecting the majority of organicfunctional groups. Nevertheless, the strong positiveluminescence alteration of samples DECS-26 andDECS-23 appears to correlate well with the
growth of carboxylic acid functionality upon ex-posure. The simplest explanation for this corre-lation is that some of the COOH bearing products
are lumophors; however, this explanation is notsupported by molecular spectroscopy. The additionof COOH groups to aromatic or aliphatic mol-
ecules does not signi®cantly alter their lumines-cence at these excitation wavelengths. Interactionbetween the COOH group and the aromatic pelectrons (e.g. Fig. 7) does lead to a shift inabsorption and ¯uorescence maxima to longerwavelengths. However, in the case of single ringaromatics this shift is small and is accompanied by
a pronounce decrease in luminescence intensity(Ja�e and Orchin, 1962).A more plausible explanation is that the increase
in luminescence intensity with time results from aparallel reaction involving a considerably more di-lute species. Such a compound would, evidently, be
undetectable via C-NEXAFS, but with photochemi-cal oxidation would yield a lumophor in su�cientquantities as to manifest signi®cant changes in the
luminescence intensity at 600 nm. For example, intheir study of the luminescence alteration of modelcompounds, Eberhardt et al. (1992) observed thatanthracene and pentacene both exhibited positive
alteration in the region near 600 nm upon exposureto 410 nm light in O2. The most probable expla-nation for this alteration is the formation of
quinones through the breakdown of trans-annular(epi-) peroxides. Trace quantities of anthraquinone
were detected by Hayatsu et al. (1978) in their
study of UV irradiation of solutions containing coal
particles. The extent to which such chemistry isoperating in the present samples must be very
minor, however, as there is no evidence of growth
in absorption intensity corresponding to quinones
(Table 2) in Figs 4±6. Furthermore, if such reac-tions were primarily responsible for positive altera-
tion, then one would reasonably expect a greater
extent of reaction in the most mature vitrinite
(DECS-13), which clearly contains a higher concen-tration of polycyclic aromatic hydrocarbons.
Alternatively, there may be a more subtle connec-tion between the formation of COOH groups and
positive luminescence alteration. For example, an
increase in the molar volume of the macromolecular
system due to an increase in concentration ofCOOH groups is likely. Such an increase would
result from reactions such as equation (3), which
leads to cleavage of network linkages in the vitrinite
macromolecule, hence dilation of the macromolecu-lar network. An increase the luminescence intensity
would, therefore, result from a reduction in ``con-
centration quenching''. The anticipated e�ect would
be a blue shift in the emission peak maximum withreaction progress; a trend observed by Eberhardt et
al. (1992) for two di�erent vitrinites exhibiting
``dual'' alteration. It is noteworthy that all of the
blue-light exposed regions of the ultra-thin sectionsexhibited some degree of warping, suggesting
volume expansion, perhaps the result of the for-
mation of COOH groups.
Identifying a spectral correlation with ``negative''
alteration is surprisingly di�cult. For example, the
most pronounced change in negative luminescencealteration behavior is observed in DECS-23 (Fig. 2)
where the intensity drops by nearly a factor of 2
in one minute. A study of the C-NEXAFS data
presented in Figs 5 and 10; however, reveals noobvious changes in the bulk carbon chemistry that
might account for such a large and rapid change in
the luminescence yield. It is probable, therefore,
that the negative alteration involves a photo±oxida-tion reaction of a dilute lumophor, not detectable
amidst the bulk carbon chemical signature recorded
in the C-NEXAFS spectrum.
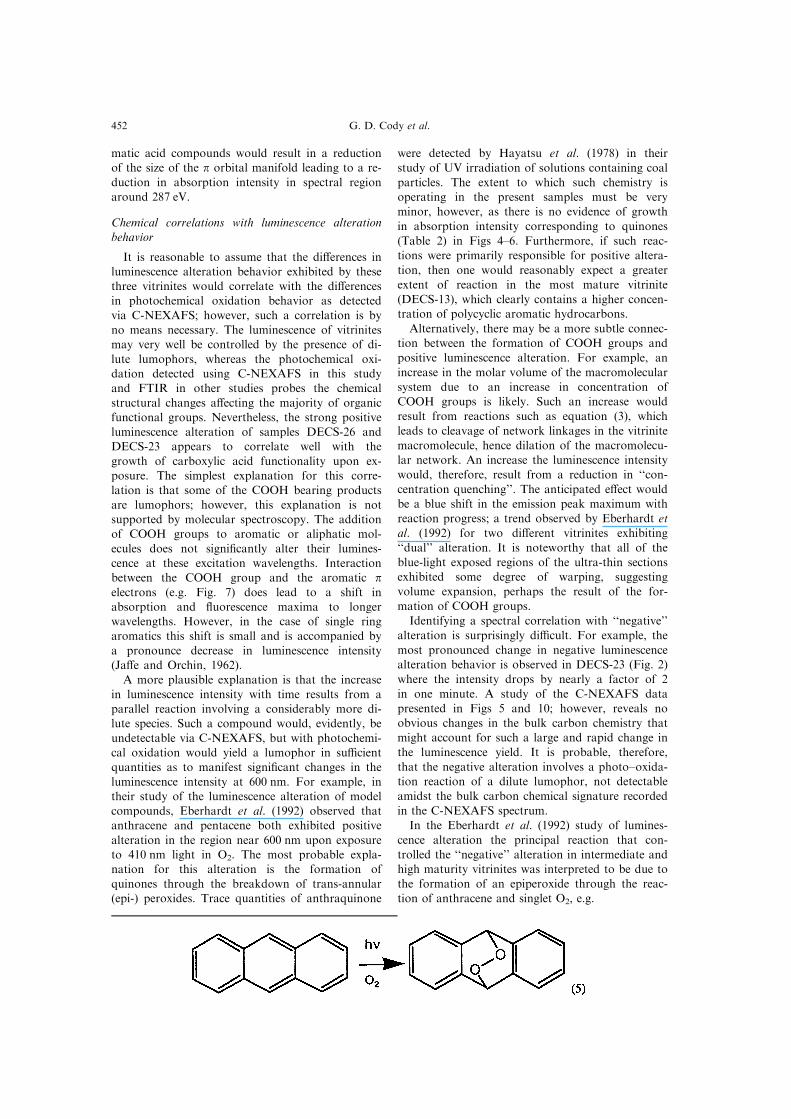
In the Eberhardt et al. (1992) study of lumines-
cence alteration the principal reaction that con-
trolled the ``negative'' alteration in intermediate andhigh maturity vitrinites was interpreted to be due to
the formation of an epiperoxide through the reac-
tion of anthracene and singlet O2, e.g.
G. D. Cody et al.452
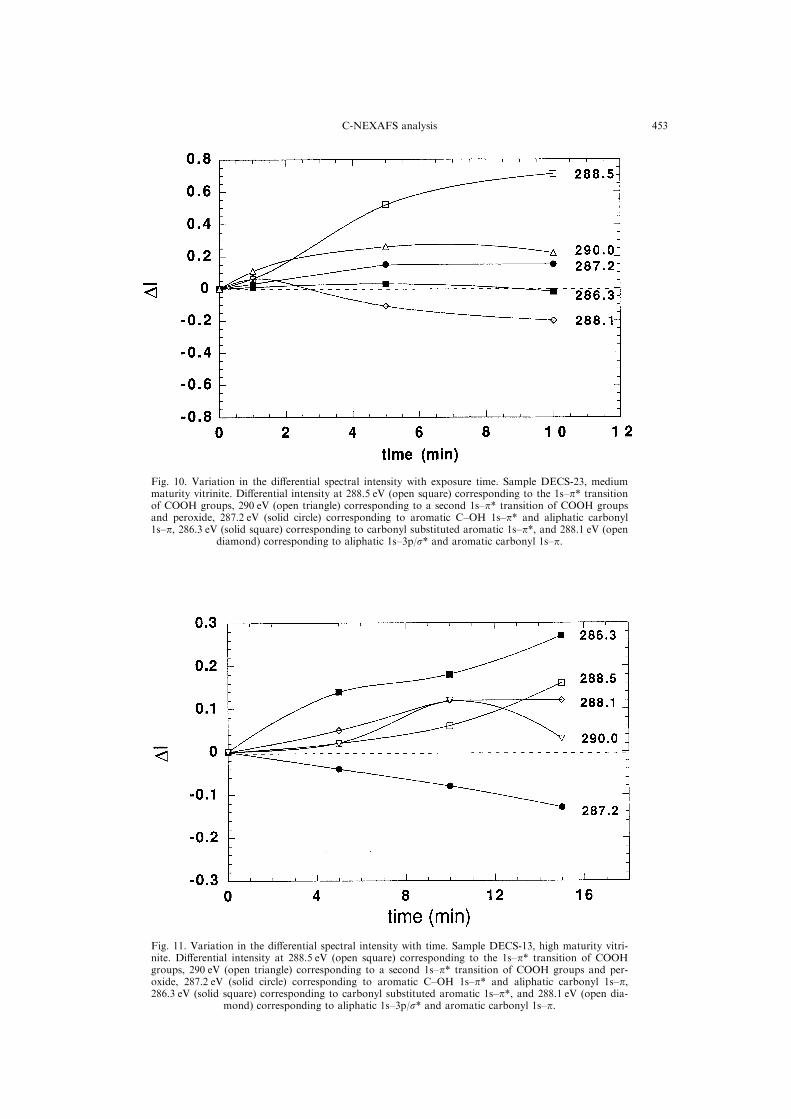
Fig. 10. Variation in the di�erential spectral intensity with exposure time. Sample DECS-23, mediummaturity vitrinite. Di�erential intensity at 288.5 eV (open square) corresponding to the 1s±p* transitionof COOH groups, 290 eV (open triangle) corresponding to a second 1s±p* transition of COOH groupsand peroxide, 287.2 eV (solid circle) corresponding to aromatic C±OH 1s±p* and aliphatic carbonyl1s±p, 286.3 eV (solid square) corresponding to carbonyl substituted aromatic 1s±p*, and 288.1 eV (open
diamond) corresponding to aliphatic 1s±3p/s* and aromatic carbonyl 1s±p.
Fig. 11. Variation in the di�erential spectral intensity with time. Sample DECS-13, high maturity vitri-nite. Di�erential intensity at 288.5 eV (open square) corresponding to the 1s±p* transition of COOHgroups, 290 eV (open triangle) corresponding to a second 1s±p* transition of COOH groups and per-oxide, 287.2 eV (solid circle) corresponding to aromatic C±OH 1s±p* and aliphatic carbonyl 1s±p,286.3 eV (solid square) corresponding to carbonyl substituted aromatic 1s±p*, and 288.1 eV (open dia-
mond) corresponding to aliphatic 1s±3p/s* and aromatic carbonyl 1s±p.
C-NEXAFS analysis 453
Singlet oxygen is well known as a dienophile andthe cycloaddition reaction above is facile for
anthracene and larger acenes (e.g. Wasserman andMurray, 1979). Our present results cannot supportor reject their interpretation. It can be stated, how-
ever, that there is minimal anthracene and otheracenes, in any of the vitrinite samples studied.Polycyclic aromatic hydrocarbons with three or
more rings have a large manifold of 1s±p* tran-sitions, e.g. 7 for anthracene and phenanthrene. Inthe case of anthracene the C-NEXAFS spectrum is
dominated by a pair of equally intense 1s±p* tran-sitions at 284.9 and 286.2 eV (Cody, unpublishedresults). Anthracene, if present, must be of lowenough concentration as to have its characteristic
spectrum obscured by the chemistry of the moreabundant substituted aromatic constituents.However, even a trace of anthracene may be of
major importance to the luminescence behavior ofthe vitrinite, if it operates as the principal lumophorin high maturity vitrinites (e.g. Eberhardt et al.,
1992).
CONCLUSIONS
The strong dependence of vitrinite maturity onthe kinetics and chemistry of photo±oxidation dis-cussed above is noteworthy and not entirelyexpected. For example, if it were assumed that the
photo±oxidation principally consumed aliphatic car-bon through the synthesis of acids, then one mightreasonably expect a progressive decrease in the
extent of reaction with increased maturity (increas-ing aromatic content) without signi®cant changes inthe kinetics or chemistry. What is observed is sur-
prising. Intensity at 286.3 eV is lost in the lowestmaturity vitrinite and gained in the highest maturitysample; the opposite trend occurs for intensity in
the spectral region near 287.2 eV. Virtually all ofthe major spectral trends (excluding the formationof COOH groups) reverse with increasing maturity.In all samples, benzylic carbon is the most suscep-
tible to oxidation, however, in the lowest maturitysamples the principal products are aromatic acids,whereas in the most mature sample the principal
products are aryl±ketones. In the lower maturitysamples aromatic acids, aliphatic ketones, and hy-droxylated aromatic compounds are formed; ali-
phatic and aldehydic carbon are lost. In the moremature vitrinite, aryl±ketones and aromatic acidsare formed, whereas polycyclic aromatic com-pounds are lost.
These maturity trends in photochemistry clearlyre¯ect the di�erences in molecular structure atdi�erent maturity levels. As the luminescence altera-
tion is clearly the consequence of photochemicaloxidation these results support the use of lumines-cence alteration as an independent probe of thermal
maturity. However, it must be noted that the
photochemical oxidation of vitrinite is a complexand heterogeneous process involving the formation
kinetics of reactive species, e.g. singlet O2, coupledwith adsorption, surface and bulk di�usion, and, ul-timately, reaction with the organic substrate. The
only means to thoroughly understand these reac-tions would be to engage in a systematic study ofsimple compounds, selected to model speci®c reac-
tion centers in the di�erent vitrinites. The resultspresented and discussed above suggest that such ex-periments have merit. Moreover, the results suggest
that the use of microscopic luminescence alterationmeasurements as a microprobe of molecular struc-ture may be reasonable.
Associate EditorÐJ. Hower
AcknowledgementsÐThe authors gratefully acknowledgethe Janos Kirz and the X1A beam line for their help inobtaining the C-NEXAFS data. George Cody gratefullyacknowledges ®nancial support from the Exxon EducationFoundation. Alan Davis and Gareth Mitchell acknowledgesupport from the Department of Energy under grantDE-FG-2293PC93223. Adam Hitchcock and StephenUrquhart very graciously o�ered to obtain carbon (1s)inner shell spectra of methoxybenzene and showed thatthe CAR±OH 1s±p* transition of phenol is, in fact, stron-ger than the CAR±O±Me 1s±p* transition. We are verygrateful for their help, advice, and discussions related tothese and other questions involving C-NEXAFS. TheX1A beam line is located at the National SynchrotronLight Source, a DOE supported facility, located atBrookhaven National Laboratory. Finally, the authorsthank Dr. Ron Wilkins and another anonymous reviewer;their comments and suggestions greatly improved thispaper.
REFERENCES
Beaumont, C., Quinlan, G. and Hamilton, J. (1987) Thealleghenian orogeny and its relationship in the evolutionof the Interior of North America. In Sedimentary Basinsand Basin forming Mechanisms, eds. C. Beaumont andJ. Taakard. Canadian Society of Petroleum GeologistsMemoir 12, 425.
Cody, G. D., Botto, R. E., Ade, H., Behal, S., Disko,M. and Wirick, S. (1995a) C-NEXAFS microanalysisand scanning X-ray microscopy of microheterogeneitiesin a high-volatile A bituminous coal. Energy Fuels 9,75±84.
Cody, G. D., Botto, R. E., Ade, H., Behal, S., Disko,M. and Wirick, S. (1995b) Inner shell spectroscopy andimaging of a sub-bituminous coal: In situ analysis oforganic and inorganic microstructure using C(1s)-,Ca(2p), and Cl(2s)-NEXAFS. Energy Fuels 9, 525±533.
Cody, G. D., Botto, R. E., Ade, H. and Wirick, S. (1996)The application of soft X-ray microscopy to the in situanalysis of sporinite in coal. Int. J. Coal Geol. 32, 69±86.
Davis, A., Rathbone, R. F., Lin, R. and Quick, J. C. (1990)Observations concerning the nature of maceral ¯uor-escence alteration with time. Org. Geochem. 16, 897±906.
Eberhardt, J. E., Hiep Nguyen, T. and Read, R. (1992)Fluorescence alteration of coal and polycyclic aromatichydrocarbons. Org. Geochem. 18, 145±153.
Francis, J. T. and Hitchcock, A. P. (1992) Inner-shell spec-troscopy of p-benzoquinone, hydroquinone, and phenol:
G. D. Cody et al.454
Distinguishing quinoid and benzenoid structures.J. Phys. Chem. 96, 6598.
Furlong, K. F. (1989) Origin and Evolution ofSedimentary Basins and Their Energy and MineralResources. In American Geophysical Union Monograph48, ed. A. Raymond, Vol. 3, 331 pp.
Hatcher, P. G., Wenzel, K. A. and Cody, G. D. (1994)Coali®cation reactions of vitrinite derived from coali®edwood: transformations to rank of bituminous coal. InVitrinite Re¯ectance as a Maturity Indicator, eds. P. K.Mukhopadhyay and W. G. Dow. ACS Symp. Series570, 112±135.
Hayatsu, R., Winans, R. E., Scott, R. G., Moore, L. P.and Studier, M. H. (1978) Oxidation studies of coalstructure. In Organic Geochemistry of Coal, ed. John W.Larsen. ACS Symp. Series 71, 108±121.
Hedges, J. I., Cowie, G. L., Ertel, J. R., Barbour, R. J. andHatcher, P. G. (1985) Degradation of carbohydratesand lignins in buried woods. Geochim. Cosmochim. Acta49, 701±711.
Henke, B. L. (1986) Scattering factors and mass absorp-tion coe�cients. In X-ray Data Booklet, ed. D. Vaughn,pp. 28±43. Lawrence Berkeley Laboratory, University ofCalifornia Berkeley, CA.
Hitchcock, A. P., Fischer, P., Gedanken, A. and Robin,M. B. (1987) Antibonding s* valence MOs in the innershell and outer shell spectra of the ¯uorobenzenes.J. Phys. Chem. 91, 531±540.
Hitchcock, A. P. and Ishii, I. (1987) Carbon K-shellexcitation spectra of linear and branched alkanes.J. Electron. Spectroscopy Related Phenomena 42, 11±26.
Hitchcock, A., Newbury, D. C., Ishii, I., Stohr, J.,Horsley, J. A., Redwing, R. D., Johnson, A. L. andSette, F. (1986) Carbon K-shell excitation of gaseousand condensed cyclic hydrocarbons: C3H6, C4H8, C5H8,C5H10, C6H10, C6H12, and C8H8. J. Chem. Phys. 85,4849±4862.
Hitchcock, A. P., Urquhart, S. G. and Rightor, E.G. (1992) Inner shell spectroscopy of benzaldehyde, ter-ephthalaldehyde, ethyl benzoate, terephthaloyl chloride,and phosgene: Models for core excitation of poly (ethyl-ene terephthalate). J. Phys. Chem. 96, 8736±8750.
Hunt, J. M. (1979) Petroleum Geochemistry and Geology.W. H. Freeman and Co., San Francisco, 617 pp.
Ishii, I. and Hitchcock, A. P. (1987) A quantitative exper-imental study of the core excited electronic states of for-amide, formic acid, and formyl ¯uoride. J. Chem. Phys.87, 830±839.
Ishii, I. and Hitchcock, A. P. (1988) The oscillatorstrengths for C1s and O1s excitation of some saturatedand unsaturated organic alcohols, acids, and esters.J. Electron. Spectroscopy Related Phenomena 46, 55±84.
Jacobsen, C., Williams, S., Anderson, E., Browne, M. T.,Buckley, C. J., Kern, D., Kirz, J., Rivers, M. andZhang, X. (1991) Di�raction-limited imaging in a scan-ning transmission X-ray microscope. Optics Commun.86, 351±364.
Ja�e, H. H. and Orchin, M. (1962) Theory andApplications of Ultraviolet Spectroscopy. John Wiley andSons, New York, 624 pp.
Ma, Y., Chen, C. T., Meigs, G., Randall, K. and Sette,F. (1991) High resolution K-shell photoabsorptionmeasurements of simple molecules. Phys. Rev. A 44,1848±1859.
March, J. (1992) Advanced Organic Chemistry. John Wileyand Sons, New York, 1495 pp.
Mitchell, G. D., Davis, A., Polat, H. and Chander,S. (1996) The in¯uence of photo±oxidation on the wett-ability of vitrinite from bituminous rank coals. Proc.Pitts. Coal Conf. 2, 885±890.
Ottenjann, K., Wolf, M. and Wol�-Fischer, E. (1982) DasFluoreszenzverhalten der vitriniten zur Kennzeichnungder Kohlungseigenschaften von Steinkohlen. GluÈckaufForsch. 43(4), 173±179.
Pradier, B., Largeau, C., Derenne, E., Martinez, L.,Bertrand, P. and Pouet, Y. (1990) Chemical basis of¯uorescence alteration of crude oils and kerogensÐI.Micro¯uorimetry of an oil and its isolated fractions;relationships with chemical structure. Org. Geochem. 16,451±460.
Price, L. C. and Barker, C. E. (1985) Suppression of vitri-nite re¯ection in amorphous rich kerogenÐa majorunrecognized problem. J. Pet. Geol. 8, 59±84.
Robin, M. B., Ishii, I., McLaren, R. and Hitchcock, A.P. (1988) Fluorination e�ects on the inner shell spectraof unsaturated molecules. J. Electron. SpectroscopyRelated Phenomena 47, 53±92.
Schwarz, W. H. E. (1975) Interpretation of the core elec-tron excitation spectra of hydride molecules and theproperties of hydride radicals. Chem. Phys. 11, 217±228.
Sham, T. K., Yang, B. X., Kirz, J. and Tse, J. S. (1989)K-Edge near-edge X-ray absorption ®ne structure ofoxygen and carbon-containing molecules in the gasphase. Phys. Rev. A 40, 652±669.
StoÈ hr, J. (1991) NEXAFS Spectroscopy. Springer Verlag,Berlin, 305 pp.
TeichmuÈ ller, M. (1974) Entstehung und VeraÈ nderungBituminoÈ ser Substanzen in Kohlen in Beziehung zurEntstehung und Umwandlung des ErdoÈ ls. Fortschr.Geol. Rheinld. Westf. 24, 65±112.
Tissot, B. P. and Welte, D. H. (1978) Petroleum Formationand Occurrence. Springer-Verlag, New York, 538 pp.
Tossell, J. A. (1991) Calculation of the inner shell exci-tation spectra and estimation of the electron scatteringand dissociative attachment resonance energies of SF6,SO2, SF2O, SF4, SF4O, and S2F10. Chem. Phys. 154,211±219.
van Krevelen (1993) Coal. Elsevier, New York, 979 pp.Wasserman, A. and Murray, R. W. (1979) Singlet Oxygen.Academic Press, New York, 415 pp.
Wilkins, R. W. T., Wilmhurst, J. R., Hladky, G., Ellacott,M. V. and Buckingham, C. P. (1995) Should ¯uor-escence alteration replace vitrinite re¯ectance as a majortool for thermal maturity determination in oil explora-tion? Org. Geochem. 22, 191±209.
Zhang, E. and Davis, A. (1993) Coali®cation patterns ofthe Pennsylvanian coal measures in the AppalachianForeland Basin, Western and South-CentralPennsylvania. Geol. Soc. Am. Bull. 105, 162±173.
C-NEXAFS analysis 455