variability of tropospheric hydroperoxides at a coastal surface site in antarctica
TRANSCRIPT

*Corresponding author. Tel.: #49-471-4831-1253; fax:#49-471-4831-1425.
E-mail address: [email protected] (R. Weller).
Atmospheric Environment 34 (2000) 5225}5234
Variability of tropospheric hydroperoxides at a coastalsurface site in Antarctica
Katja Riedel, Rolf Weller*, Otto Schrems, Gert KoK nig-Langlo
Alfred Wegener Institute for Polar and Marine Research, Am Handelshafen 12, D-27570 Bremerhaven, Germany
Received 13 December 1999; received in revised form 13 March 2000; accepted 13 June 2000
Abstract
The annual cycles of hydrogen peroxide (H2O
2) and methylhydroperoxide (MHP) have been investigated at a remote
site in Antarctica in order to study seasonal variations as well as chemical processes in the troposphere. Themeasurements have been performed from March 1997 to January 1998 and in February 1999 at the German Antarcticresearch station Neumayer which is located at 70339@S, 8315@W. The obtained time series for hydrogen peroxide andmethylhydroperoxide in near-surface air represents the "rst all-year measurements in Antarctica and indicates clearly theoccurrence of seasonal variations. During polar night mean values of 0.054$0.046 ppbv (range(0.03}0.11 ppbv) forhydrogen peroxide and 0.089$0.052 ppbv (range(0.05}0.14ppbv) for methylhydroperoxide were detected. At thesunlit period higher Mixing ratios were found, 0.20$0.13 ppbv (range(0.03}0.91 ppbv) for hydrogen peroxide and0.19$0.10ppbv (range(0.05}0.89ppbv) for methylhydroperoxide. Occasional long-range transport of air masses frommid-latitudes caused enhanced peroxide concentrations at polar night. During the period of stratospheric ozonedepletion we observed peroxide mixing ratios comparable to typical winter levels. ( 2000 Elsevier Science Ltd. Allrights reserved.
Keywords: Hydrogen peroxide; Methylhydroperoxide; Seasonal variation; Photooxidants; Ozone depletion
1. Introduction
Photooxidation is the most dominant sink for many ofthe environmentally important natural and anthropo-genic atmospheric trace gases such as CH
4, CO, SO
2,
and DMS (dimethyl sul"de). Besides hydroxyl radicals(OH) and ozone (O
3), hydroperoxides are the main
oxidising compounds in the troposphere (see review arti-cle by: Jackson and Hewitt, 1999, and literature therein).Hydroperoxides in#uence the oxidising capacity of theatmosphere and represent a major reservoir for OHradicals. The whole complexity of the atmospheric chem-istry of peroxides was described by numerous formerpublications (see review article by: Gunz and Ho!mann,1990, and literature therein). In the Antarctic troposphere
the peroxide chemistry is characterised by a limitation tosome important sources and sinks on which we want toconcentrate in the following. At remote polar sites hy-droperoxides are mainly produced by recombination ofHO
2and RO
2radicals
HO2#HO
2PH
2O
2#O
2, (1)
RO2#HO
2PROOH#O
2. (2)
Peroxy radicals on their part are mostly formed byphotooxidation of hydrocarbons and CO initiated byOH radical attack (Lightfoot et al., 1992). The dominantsource of OH radicals is photolysis of O
3followed by
reaction of the formed O(1D) atoms with water vapour.Hydroperoxides are also involved in the odd-hydrogen(H, OH, HO
2) and odd-oxygen (OH, HO
2, CH
3OO)
chemistry of the troposphere. They can be used as a diag-nostic tool for the extent of HO
xfree radical chemistry
occurring in the troposphere (Kleinmann, 1994). Themain sinks for hydrogen peroxide are dry and wet
1352-2310/00/$ - see front matter ( 2000 Elsevier Science Ltd. All rights reserved.PII: S 1 3 5 2 - 2 3 1 0 ( 0 0 ) 0 0 3 2 2 - 8

Fig. 1. Map of local area around Neumayer station on theEkstroK m Ice shelf. Continental areas are in black, ice shelf areasin grey.
deposition, reaction with OH radicals (3) and photolysis(4) (Logan et al., 1981):
H2O
2#OHPH
2O#HO
2, (3)
H2O
2#hlP2 OH(j(350nm). (4)
In contrast to the short living radicals (OH, HO2),
H2O
2itself is rather stable in the atmosphere. At mid-
latitudes, the overall lifetime within the planetary bound-ary layer is presumed to be around q"30 h (Kleinmann,1986). In polar regions the in#uence of the local photo-chemistry on the production of photooxidants is verysmall, especially during the polar night when temper-atures and solar radiation are low or absent, respectively.Dry deposition to ice and snow surfaces is not signi"canteven for water-soluble species (Bales et al., 1987). Thus,longer lifetimes for hydrogen peroxide could be expectedin polar regions (q'2}3 d). Consequently, e!ects due tolong-range transport have to be included in thediscussion of peroxide mixing ratios in Antarctica.
Whereas in polluted air various organic hydroperox-ides such as methylhydroperoxide (MHP, CH
3OOH),
ethylhydroperoxide (EHP, CH3CH
2OOH), hy-
droxyethylhydroperoxide (HEHP, CH3CH(OH)OOH)
and hydroperoxides of other hydrocarbons can be detec-ted (Hewitt and Kok, 1991), at remote marine and polarregions methane is the only signi"cant organic peroxyradical precursor. Reaction of methane with hydroxylradicals produce methylperoxy radicals:
CH4#OHPH
2O#CH
3, (5)
CH3#O
2#MPCH
3O
2#M. (6)
Ship-based HPLC investigations indicated that noother organic hydroperoxides than methylhydroperoxidecould be detected in remote marine areas (Weller et al.,2000). In comparison to hydrogen peroxide the organichydroperoxides have lower Henry law constants, forexample K
MHP"304M atm~1 and K
H2O2"1.02]105
M atm~1 at 298K (Lind and Kok, 1994). Thus, wetdeposition of organic hydroperoxides is less important,which is supported by higher gaseous organic perox-ide/hydrogen peroxide ratios during or after rainfalls(Weller and Schrems, 1993) and an enrichment of H
2O
2in rainwater (Hellpointer and GaK b, 1989).
Since hydrogen peroxide seems to be preserved formillenia (Neftel et al., 1984) in glacial ice and snow,investigations of hydroperoxides in polar regions havereceived special attention due to the importance of polarice caps as inexhaustible climate archives. Atmospherichydrogen peroxide washed out by precipitation and de-posited in snow and ice may potentially provide valuableinformation concerning the oxidative capacity of theancient troposphere (Thompson et al., 1993). However,there is still a vital lack of information for troposphericphotochemistry transport mechanisms of hydroperox-
ides in polar regions, about peroxide deposition, post-depositional air}snow exchange and possible chemicalreactions in buried snow. Hence, one aim of our inves-tigations was to obtain basic experimental data which areneeded to understand peroxide photochemistry in thepristine polar and marine troposphere free of any anthro-pogenic in#uence. The crucial point of our investigationswas to measure for the "rst time the seasonal variationsof tropospheric H
2O
2and MHP mixing ratios in Ant-
arctica. Analysis of the obtained data and interpretationof the results have been performed along with parameterscharacterising the photochemical activity, transport anddeposition processes.
2. Experimental
The measurements were carried out at the GermanAntarctic station Neumayer (70339@S/08315@W) duringthe overwintering season 1997/98 and during a summercampaign which was performed from January to March1999. The station is located on the EkstroK m Ice Shelf ata distance of 7 km from the southeast part of Atka Bay,42m above sea level (see Fig. 1). The instruments wereinstalled in the Air Chemistry Observatory of theNeumayer station which is located 1500m south ofthe main base. Since northerly winds are hardly everobserved there, no serious contamination problem dueto the main station existed. The mean annual temper-ature at Neumayer is !153C. The maximum solar inci-dence angle is 42.83. The sun stays permanently above the
5226 K. Riedel et al. / Atmospheric Environment 34 (2000) 5225}5234

horizon from 19 November to 24 January and perma-nently below the horizon from 19 May to 27 July(KoK nig-Langlo et al., 1998).
A #uorometric two-channel technique, described indetail by Lazrus et al. (1985), was applied for continuousquanti"cation of hydroperoxides in ambient air. An airstream of 1000 cm3min~1, was sucked through thesampling line, a 2.5m long Te#on hose with an innerdiameter of 4mm. This leads to a residence time of 1.9 sfor the air sample in the tube. In the instrument (Aero-laser H
2O
2analyser, Model AL2002) the incoming air-
#ow was led into a coil where H2O
2was stripped from
the air by a bu!er solution (pH"5.8}6.0). The strippingcoil was an approximately 53 cm long spiral glass tubewith an inner diameter of 2mm. The #ow rate of thestripping solution was regulated by a peristaltic pump at0.42 cm3 min~1. In the "rst channel, the #uorimetric re-agent (para-hydroxyphenylacetic acid, POPHA) andhorseradish peroxidase was added to determine the totalamount of hydroperoxides. POPHA forms a dimer whenit reacts with peroxidase and organic hydroperoxides orH
2O
2. This dimer can be excited with a cadmium vapour
lamp at 320nm. The #uorescence signal at 415 nm islinearly dependent on the peroxide concentration.
A distinction between hydrogen peroxide and organichydroperoxides was achieved by selective destruction ofH
2O
2with the enzyme catalase in the second parallel
channel. Weller et al. (2000) showed by HPLC analysisthat no other organic peroxide than methylhydroperox-ide (MHP, CH
3OOH) could be detected in remote mar-
ine areas. In this paper, we assume that the signal fromthe catalase channel corresponds to MHP. Thus, a con-tinuous quantitative determination of MHP mixing ra-tios with the Lazrus method was feasible. However,a fraction of the methylhydroperoxide is inherently de-stroyed by catalase, making a correction necessary. Theevaluation of the raw data were carried out similarly asdescribed in literature (Claiborn and Aneja, 1991; Ayerset al., 1996; Sta!elbach et al., 1996; Weller et al., 2000).The raw data from the peroxidase channel S
1and the
signal of the catalase channel S#
were processed by thefollowing expression:
[H2O
2]"
ak0S1!S
#ak0!a
0
[CH3OOH]"
S#!a
0S1
e(ak0!a
0),
where e is the collection e$ciency for MHP and a0
is theresidual fraction of H
2O
2remaining in the catalase
channel (ratio of response in the catalase channel to thatof the total hydroperoxides channel to span solutions ofH
2O
2). The destruction e$ciency of the catalase solution
was determined twice a day and adjusted to be between70 and 90%, corresponding to a
0"0.1}0.3. Our laborat-
ory experiments showed that at catalase e$ciencies be-tween 90 and 95% the MHP decay was around 5}7%.Lower destruction e$ciencies (70}75%) lead to MHPlosses of 2}3% (Tolu, 1993). The ratio between pseudo
"rst-order reaction rate coe$cients for the reaction ofcatalase with a mixture of hydroperoxides and for thereaction with pure hydrogen peroxide is given byk"k
i/k
0. Based on laboratory investigations with pure
MHP we presumed a value of k"0.017. This ratio wasalso used for all calculations in this work. Another crucialfactor is the collection e$ciency e of the stripping coil,which must be carefully determined since Henry's lawcoe$cients for MHP and H
2O
2show a strong temper-
ature dependence (Lind and Kok, 1994). For hydro-gen peroxide and MHP the Henry's law constant K isgiven by
KH2O2
"e(6338@T~9.74) KMHP
"e(5322@T~12.14).
In Neumayer's Air Chemistry Observatory the temper-atures varied during the whole year over the range of18}263C (minimum and maximum temperatures of 13and 363C were also observed). Calculations according toLazrus et al. (1986) showed that under the given condi-tions, viz., 1000 cm3 min~1 air#ow and 0.42 cm3min~1
stripping solution #ow, equilibrium is reached in thestripping coil. The sampling e$ciency for hydrogen per-oxide was always better than 99% independent oftemperature, whereas the sampling e$ciency e of methyl-hydroperoxide showed strong temperature dependence.It was calculated to be 0.82 at 183C and 0.75 at 263C.Uncertainty in the collection e$ciency accounted for thelargest contribution of estimated uncertainty in thereported mixing ratios of MHP.
Measurements of hydroperoxides in air require aperiodic determination of the systems sensitivity by usinga calibration source. Thus, an automatic gas calibrationwas performed every 12 h. Signals of zero air and of aninternal hydrogen peroxide standard were compared andused to determine the sensitivity of the instrument. Zeroair was generated internally by passing ambient airthrough a zero trap with manganese-dioxide-coatedcharcoal. The internal gas phase H
2O
2source consisted
of a short piece of polyethylene tube in a small bottle"lled with 30% H
2O
2. The temperature of the device was
stabilised to approximately 253C. The permeation sourceitself was calibrated every week by standard solutions of10~6mol l~1 H
2O
2, freshly prepared from a stock solu-
tion of 10~2 mol l~1 H2O
2. The absolute permeation
rate is calculated by comparing the permeation signalwith the signal of the prepared liquid standards. Theconcentration of the 10~2M hydrogen peroxide stocksolution was determined every three months by titrationwith KMnO
4. MHP calibration was performed in our
home laboratory with aqueous solutions of di!erentMHP concentrations before the over-wintering period.Due to the explosive nature of MHP, calibration was notrepeated during the expedition. Unfortunately no suit-able permeation sources are available for MHP. Espe-cially during winter season, H
2O
2and MHP values were
sometimes extremely low and thus close to the detection
K. Riedel et al. / Atmospheric Environment 34 (2000) 5225}5234 5227

Fig. 2. Annual variation of hydrogen peroxide (drawn blackline) and methylhydroperoxide (drawn grey line): Five day run-ning means of hydroperoxides gas-phase concentrations (inppbv) are plotted against day of the year (1"1 January and365"31 December). The presented time series is a result of twodi!erent campaigns: March 1997 to January 1998 and February1999. The thin line shows annual variations in UV solar radi-ation.
Fig. 3. Frequency distribution of measured peroxide concentra-tions. Frequency (in %) is depicted versus concentration inter-vals of 0.05 ppbv: (a) distribution of hydrogen peroxide, and (b)methylhydroperoxide, grey columns represent winter values (1April to 15 September, 91}258 day of the year, total number ofmeasurements N+11000), black columns represent summervalues (15 September to 1 April, total number of measurementsN+7800).
limit of the instrument. Therefore, regular zero measure-ments were carried out. An external zero trap "lled withmanganese-dioxide-coated charcoal was used to deter-mine the daily zero value. The trap was mounted betweenthe instrument and inlet tube for 30min each day.
The main air inlet was installed on top of the AirChemistry Observatory 8m above the ground. The inletwas protected against drifting snow with a specially de-signed tumbler. The sampling e$ciency of the Te#oninlet system was determined to be in the range of0.85}0.95 by comparing measurements of indoor air(contaminated with hydroperoxides). For some minutesindoor air was directly sucked into the instrument andthe results were compared with the peroxide concentra-tions obtained with the te#on tube.
All solutions were prepared with ultra pure water(milliQ-water) and reagent grade chemicals. Under theseconditions a detection limit of 50 pptv is achievable. Thiscorresponds with 3p of the standard deviation of thenoise level. The accuracy of the instrument has beencalculated to be in the order of 15}20% at [H
2O
2])
500pptv and 12}15% at [H2O
2]"500}1000pptv. The
time constant for a change from 10 to 90% signal is 30 swith a delay time of 300 s.
Further supporting data were provided by thelong-term measuring programme established at theAir Chemistry and Meteorological Observatory atNeumayer station. UV solar radiation measurementswere carried out with an UV radiometer (seleniumphotocell pyranometer, Eppley, USA, 300}370nm). Rela-tive humidity was measured with two pernix hair hy-grometers (Lambrecht 800L100) (KoK nig-Langlo andHerber, 1996). Ozone column density data were obtainedby ozonesondes launched weekly at Neumayer station.Additionally data from satellite-based total ozone map-ping spectrometer (TOMS) were used, available in theworld wide web: http://jwocky.gsfc.nasa.gov/. Daily 5-day-back trajectories have been made available by theGerman Weather Service (DWD).
3. Results
Fig. 2 presents our results of the "rst all-year-roundinvestigations of hydroperoxides in the Antarctic tropo-sphere. The seasonal variations of hydrogen peroxideand methylhydroperoxide gas-phase mixing ratios atNeumayer station are compared with UV solar radiationfor the same time period. A clear seasonal variationis evident. During the polar night we observed mixingratios of 0.054$0.046 ppbv (range 0.03}0.40 ppbv) forhydrogen peroxide and 0.089$0.052 ppbv (range0.05}0.35ppbv) for methylhydroperoxide. Most values(97% of the measured H
2O
2and 86% of the measured
MHP values) are in the range from below 0.05 to0.150ppbv. Fig. 3 illustrates the frequency distribution of
5228 K. Riedel et al. / Atmospheric Environment 34 (2000) 5225}5234

measured peroxide mixing ratios during winter (1 Aprilto 15 September, 91}258 day of the year) and summerseason (15 September to 1 April, 259}90 day of thefollowing year). As depicted in Fig. 3 of the winter dataare close to, respectively, below the detection limit of0.05ppbv. An increase of peroxide mixing ratios could beobserved in the middle of polar night (H
2O
2"0.15ppbv
and MHP"0.11 ppbv (see Fig. 2). Due to that the wintermean values are slightly shifted to higher levels. Calcu-lation of the winter means without these values leads to0.048$0.046ppbv for hydrogen peroxide and0.084$0.055ppbv for methylhydroperoxide.
During summer, higher peroxide mixing ratios werefound, i.e. 0.20$0.13 ppbv (range(0.03}0.91ppbv) foratmospheric hydrogen peroxide and 0.19$0.10ppbv(range(0.05}0.89ppbv) for methylhydroperoxide.
4. Discussion
4.1. Seasonal variations
Since production of hydroperoxides is closely linkedwith the HO
xchemistry, variation in the solar radiation
should entail changes in atmospheric peroxide concen-trations. Fig. 2 illustrates the relation between UV solarradiation and observed peroxide mixing ratios. As ex-pected, the decline of atmospheric peroxide concentra-tions coincide with the drop of solar radiation to0.0W/m2 during polar night (139}208th day of the year)since photochemical oxidation is the only relevant sourceof atmospheric hydroperoxides. Nevertheless surprising-ly high atmospheric concentrations could be observedduring polar night when the sun stays permanently belowthe horizon with a minimum solar incidence angle of!433 at 26 June (177th day of the year). Obviously inthis case local photochemistry could not contribute tothe peroxide production. The South Pole photochemicalmodels (McConnell et al., 1997a) predict mixing ratios ofaround 1 pptv for hydrogen peroxide during polar night.A reasonable explanation for these signi"cant di!erencesmight be an underestimation of transport processes(Bales and Choi, 1996).
Previous investigations of hydrogen peroxide in polarregions were carried out almost exclusively during sum-mer season (Table 1). Generally the values for hydrogenperoxide mixing ratios are in the same order of magni-tude. However, in our time series concentration levels upto 1 ppbv are only reached sporadically. In comparisonwith "ndings of Jacob and Klockow (1993), we observedlower H
2O
2concentrations around 0.24$0.12 ppbv in
December and 0.16$0.09 ppbv in January. The onlymeasurements performed at polar night so far were car-ried out by de Serves (1994) at Alert, Canada. FromJanuary to February 1992 he observed total peroxideconcentrations from below detection limit (0.01 to
0.04ppbv. Our measurements of total hydroperoxidesindicate higher values between (0.05 and 0.26ppbvwith a mean of 0.13$0.07 ppbv during winter. Severalapproaches from di!erent groups were made to estimateatmospheric hydrogen peroxide mixing ratios from themeasured concentration values in snow pits and ice cores(van Ommen and Morgan, 1996; McConnell et al.,1997b). This method provides a suitable possibility toreconstruct atmospheric concentration signals: For LawDome, Antarctica van Ommen and Morgan (1996) pre-dict hydrogen peroxide mixing ratios of 0.01 ppbv atwinter and between 0.12 and 0.80 ppbv at summer. Obvi-ously the derived winter values are signi"cantly lowerthan our measurements. Most probably uncertaintiesconcerning post deposition processes and air}snowtransfer coe$cients are responsible for this discrepancy.
In comparison to H2O
2, there are only very few "eld
measurements of organic hydroperoxides reported inliterature. In polar regions, as far as we know, our in-vestigations represent the "rst measurements at all. Aspointed out in the experimental section, we attribute thecatalase channel signal to methylhydroperoxide (MHP).Mean concentrations of 0.19$0.10 ppbv MHP at sum-mer and 0.09$0.05 ppbv at winter were observed. Incomparison with the measurements conducted in thecontinental troposphere by other groups (Heikes et al.,1987; Barth et al., 1989, Jackson and Hewitt, 1996), ourinvestigations exhibit a higher MHP/(H
2O
2#MHP)
ratio of 0.57$0.26 (range 0.1}1.0). Ship-based investiga-tions across the Atlantic from northern mid-latitudes tosouthern mid-latitudes revealed ratios between 0.1 and0.6 (mean: 0.32$0.12) (Weller et al., 2000) and between0.17 and 0.98 (mean: 0.48$0.14) (Slemr and Tremmel,1994). Airborne measurements over the western NorthPaci"c report about ratios of 0.58 (Heikes et al., 1996)while in the continental boundary over the United Statesmuch lower ratios of 0.1 have been found (Heikes et al.,1987; Barth et al., 1989). Investigations at the Europeancontinent show slightly higher MHP/(H
2O
2#MHP)
ratios. Fels and Junkermann (1994) observed ratios of0.35}0.58 at a mountain site in southern Germany andJackson and Hewitt (1996) report on ratios of 0.05}0.37in central Portugal. Airborne measurements over theSouth Atlantic, Brazil and southern Africa duringTRACE-A (Lee et al., 1997, 1998) exhibit distinct di!er-ences according to air mass origin. MHP/(H
2O
2#
MHP) ratios of 0.2 were found over continents while inmarine air masses the ratio was typically twice as high.Obviously, the highest MHP/(H
2O
2#MHP) ratios
were found at Neumayer station and in remote marineregions. The overall deposition rates for MHP andH
2O
2, including dry and wet deposition should be very
di!erent over land, ocean, snow and ice and within theplanetary boundary layer compared to the free tropo-sphere. Especially dry deposition on the ocean surface,which is an important removal process of water soluble
K. Riedel et al. / Atmospheric Environment 34 (2000) 5225}5234 5229

Table 1Comparison of previous measurements of tropospheric hydroperoxides concentrations in polar regions with our recent results
Measuring site Reference Measuring period Atmospheric H2O
2concentrations(ppbv)
Atmospheric MHPconcentrations(ppbv)
East Greenland sea Weller and Schrems (1996) July}August 1994 Mean: 0.42$0.26(703}803N) Range: (0.1}1.0Alert de Serves (1994) Feb.}April 1992 Total peroxides(Canada, 82.53N, 62.33W) Dark period:
(0.01}0.04Sunlit period:0.10}0.40
Summit Sigg et al. (1992) June}July 1990 0.3}3.5(Greenland, 72.23N, 37.83W)Summit Bales et al. (1995) May}July 1993 Mean: 1.0$0.4(Greenland, 72.23N, 37.83W) Range: 0.4}2.0Summit McConnell et al. (1997b) April}July 1995 0.50}1.75(Greenland, 72.23N, 37.83W)Cape Grim Ayers et al. (1996) Feb. 1991}March 1992 Total peroxides(Tasmania, 413S, 1453E) Summer: 0}2 (mean
Dec.: 1.4)Winter: 0}1.2 (meanJuly: 0.16)
Northwest Weddell Sea,Brans"eld Street,
Weller and Schrems (1993) Jan. 1992 0.47}0.86
(61}633S, 51}593W)South Pole McConnell et al. (1997a) Nov.}Dec. 1994 0.20}0.25(Antarctica, 903S) Jan. 1996 0.90}1.00Dronning Maud Land Fuhrer et al. (1996) Dec. 1993}Jan. 1994 ( 0.5(Antarctica, 73}763S, 12}93W)Neumayer Jacob and Klockow (1993) Dec. 1989}Jan. 1990 Mean: 0.394(Antarctica, 70.13S, 8.03W) Range:(0.10}1.05Neumayer This work April}Sept. 1997 Mean: 0.054$0.046 Range:( 0.05}0.35(Antarctica, 70.13S, 8.03W) Sept. 1997}March 1998 Range:( 0.03}0.40 Mean: 0.089$0.052
and Feb. 1999 Mean: 0.197$0.130 Mean: 0.191$0.103Range:(0.03}0.90 Range:(0.05}0.89
trace gases in the marine boundary layer, leads to a pref-erential depletion of H
2O
2(Weller and Schrems, 1993).
Di!erent air mass histories may explain the depictedvariations measured at Neumayer station. Unfortunate-ly, literature data even for dry deposition rates of MHPand H
2O
2over di!erent surfaces are disturbingly incon-
sistent (Hauglustaine et al., 1994; Hough, 1991). Our dataindicate that deposition of H
2O
2is favoured relative to
MHP over the ocean: Air masses passing the sea beforereaching Neumayer station showed a signi"cantly higherMHP/(H
2O
2#MHP) ratio. On 7 September when
a MHP/(H2O
2#MHP) ratio between 0.3 and 0.7 was
found, the corresponding trajectory indicates advectionof marine air masses, passing a frontal system of a de-pression over the southern Atlantic masses (Fig. 4:6 (circles), 7 (squares) and 8 September (triangles)). Mostprobably, wet deposition occurred along the trajectory.
In contrast, continental air masses caused lowerMHP/(H
2O
2#MHP) ratios during the day before and
after this event.
4.2. Long-range transport ewects and troposphericlifetimes of hydroperoxides
A striking increase of peroxide mixing ratios was foundin the middle of the polar night (177th day of the year, of26 June). Local photochemistry could not contribute tothe production of photooxidants, because of missing so-lar radiation. Thus, long-range transport of hydroperox-ides from sunlit areas to Antarctica seems to be the mostplausible explanation. Analysis of the 5-day-back trajec-tories con"rms this assumption. Fig. 5 shows trajectoriesfrom 25 (circles), 26 (squares) and 27 June (triangles).While air parcels reaching Neumayer station on 25 and
5230 K. Riedel et al. / Atmospheric Environment 34 (2000) 5225}5234

Fig. 4. 5-day-back trajectories reaching Neumayer station atsurface level on September the 6th (circles), 7th (squares) and 8th(triangles). All trajectories showed only marginal vertical move-ments within the planetary boundary layer.
Fig. 5. 5-day-back trajectories reaching Neumayer station atsurface level on the 25 (circles), 26 (squares) and 27 June (tri-angles). Origin of the air parcel arriving on 26 is a sunlit area eastof South America (533S, 433W). Again, trajectories showed onlymarginal vertical movements within the planetary boundarylayer.
27 June originated from inner Antarctica, the sourceregion on June 26 was a marine area east of SouthAmerica (533S, 433W). The corresponding local sunshineduration in this region was around 7.5 h with a maximumsolar incidence angle of 13.73. Photochemical productionof hydrogen peroxide and methylhydroperoxide mayhave occurred enhancing the atmospheric peroxide con-centrations at Neumayer station "ve days later. Regard-
ing such long-range transport, atmospheric lifetimes haveto be considered. Former estimations of hydrogen perox-ide lifetimes vary between q"1 d in polluted atmosphere(Kleinmann, 1986), 10 d as e!ective tropospheric lifetime(Logan et al., 1981) and a `rainouta lifetime of q"50 d,calculated with a simple box model and observed me-teorological conditions at Summit, Greenland (Sigg et al.,1992). All these calculations assume three main H
2O
2removing processes: Reaction with OH radicals (3),photolysis (4) and deposition. First of all, we will estimateand compare the H
2O
2lifetime over ice for polar day
and night. During polar day the H2O
2lifetime
q10-!3 $!:
(H2O
2) can be calculated by the expression
q10-!3 $!:
(H2O
2)"(k
$%1#k
3[OH]#J
4)~1.
The H2O
2deposition rate over ice (k
$%1) was esti-
mated with the following considerations: Depositionshould occur inside the mixed layer which is then identi-cal with the Ekman layer. This layer extends to a heightof from 300 to 500m depending on the surface roughnessof the terrain (Seinfeld and Pandis, 1998). In the case ofice the surface roughness is typically small. Therefore,a mixing height of 300m was assumed. With k~1
$%1"h
v~1$
, an adopted dry deposition velocity v*#%$
for hydrogenperoxide over ice of 0.05 cm s~1 (Hough, 1991), anda mixing height h"300m, a peroxide lifetime k
$%1of
1.6]10~6 s~1 results. J4
is the photolysis frequency ofH
2O
2, estimated according to Tremmel (1992) to
be around 2]10~6 s~1, and k3"1.6]10~12 cm~3s~1
(DeMore et al., 1994), is the rate coe$cient of reaction (3)at !103C. With a mean 24 h OH concentration of1.1]105 cm~3 (Je!erson et al., 1998), q
10-!3 $!:(H
2O
2) is
roughly 3 d. During polar night, we can neglect J4
and k3
[OH], but take into account the reactionH
2O
2#NO
3PHO
2#HNO
3(5), thus
q10-!3 /*')5
(H2O
2)"(k
$%1#k
5[NO
3])~1.
The steady-state NO3
concentration was derived con-sidering the main source and loss reactionsNO
2#O
3PNO
3#O
2(6) and NO
3#NO
2PN
2O
5(7), respectively, to be [NO
3]"k
6[O
3]/k
7+
2.7]106 cm~3 (k6"6]10~18 cm~3 s~1 and k
7"
1.7]10~12 cm~3 s~1 at !253C (DeMore et al., 1994),measured O
3mixing ratio: 32 ppbv). Unfortunately, to
our knowledge there exists no data for the rate coe$cientof the reaction H
2O
2#NO
3, but typically hydrogen
abstraction reactions by NO3
are 3}4 orders of magni-tude lower compared to the corresponding OH reaction(DeMore et al., 1994). As a consequence, also the reactionH
2O
2#NO
3can be neglected, yielding q
10-!3 /*')5(H
2O
2)+
7 d. Concerning the situation at 26 June, polar nightpredominated in the region south of 66330@S and depos-ition should be the dominant sink for atmospherichydrogen peroxide, indicating that e!ective H
2O
2advection by long-range transport could occur.
K. Riedel et al. / Atmospheric Environment 34 (2000) 5225}5234 5231
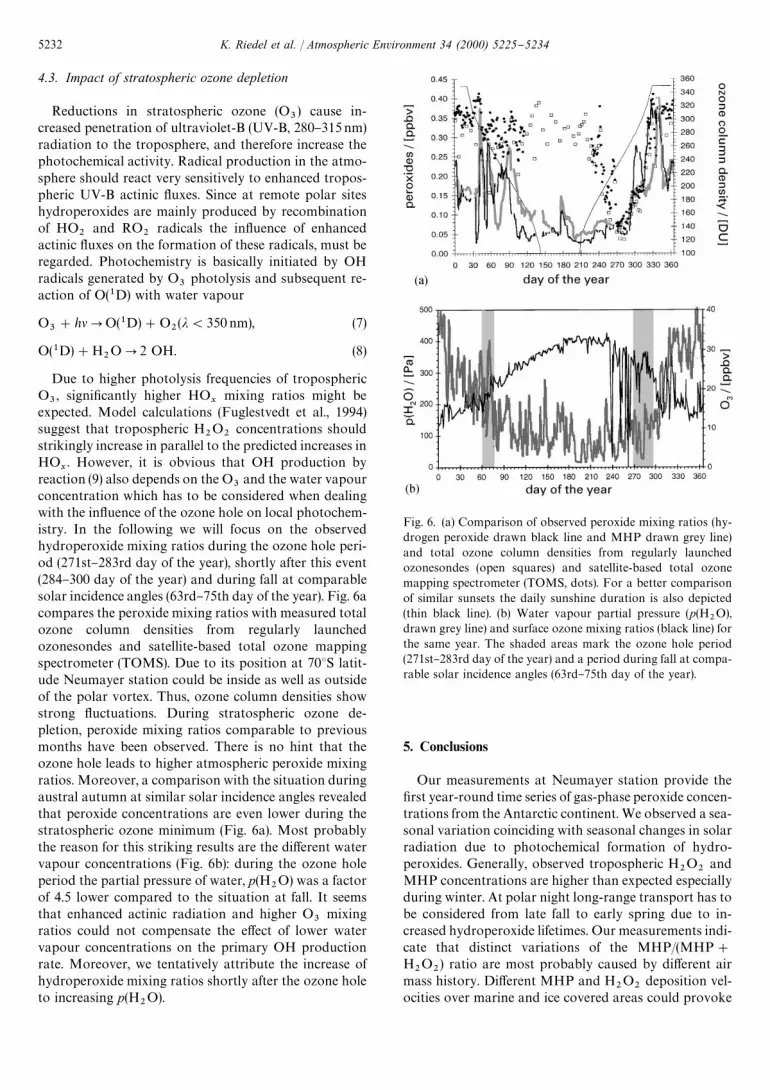
Fig. 6. (a) Comparison of observed peroxide mixing ratios (hy-drogen peroxide drawn black line and MHP drawn grey line)and total ozone column densities from regularly launchedozonesondes (open squares) and satellite-based total ozonemapping spectrometer (TOMS, dots). For a better comparisonof similar sunsets the daily sunshine duration is also depicted(thin black line). (b) Water vapour partial pressure (p(H
2O),
drawn grey line) and surface ozone mixing ratios (black line) forthe same year. The shaded areas mark the ozone hole period(271st}283rd day of the year) and a period during fall at compa-rable solar incidence angles (63rd}75th day of the year).
4.3. Impact of stratospheric ozone depletion
Reductions in stratospheric ozone (O3) cause in-
creased penetration of ultraviolet-B (UV-B, 280}315nm)radiation to the troposphere, and therefore increase thephotochemical activity. Radical production in the atmo-sphere should react very sensitively to enhanced tropos-pheric UV-B actinic #uxes. Since at remote polar siteshydroperoxides are mainly produced by recombinationof HO
2and RO
2radicals the in#uence of enhanced
actinic #uxes on the formation of these radicals, must beregarded. Photochemistry is basically initiated by OHradicals generated by O
3photolysis and subsequent re-
action of O(1D) with water vapour
O3#hlPO(1D)#O
2(j(350nm), (7)
O(1D)#H2OP2 OH. (8)
Due to higher photolysis frequencies of troposphericO
3, signi"cantly higher HO
xmixing ratios might be
expected. Model calculations (Fuglestvedt et al., 1994)suggest that tropospheric H
2O
2concentrations should
strikingly increase in parallel to the predicted increases inHO
x. However, it is obvious that OH production by
reaction (9) also depends on the O3
and the water vapourconcentration which has to be considered when dealingwith the in#uence of the ozone hole on local photochem-istry. In the following we will focus on the observedhydroperoxide mixing ratios during the ozone hole peri-od (271st}283rd day of the year), shortly after this event(284}300 day of the year) and during fall at comparablesolar incidence angles (63rd}75th day of the year). Fig. 6acompares the peroxide mixing ratios with measured totalozone column densities from regularly launchedozonesondes and satellite-based total ozone mappingspectrometer (TOMS). Due to its position at 703S latit-ude Neumayer station could be inside as well as outsideof the polar vortex. Thus, ozone column densities showstrong #uctuations. During stratospheric ozone de-pletion, peroxide mixing ratios comparable to previousmonths have been observed. There is no hint that theozone hole leads to higher atmospheric peroxide mixingratios. Moreover, a comparison with the situation duringaustral autumn at similar solar incidence angles revealedthat peroxide concentrations are even lower during thestratospheric ozone minimum (Fig. 6a). Most probablythe reason for this striking results are the di!erent watervapour concentrations (Fig. 6b): during the ozone holeperiod the partial pressure of water, p(H
2O) was a factor
of 4.5 lower compared to the situation at fall. It seemsthat enhanced actinic radiation and higher O
3mixing
ratios could not compensate the e!ect of lower watervapour concentrations on the primary OH productionrate. Moreover, we tentatively attribute the increase ofhydroperoxide mixing ratios shortly after the ozone holeto increasing p(H
2O).
5. Conclusions
Our measurements at Neumayer station provide the"rst year-round time series of gas-phase peroxide concen-trations from the Antarctic continent. We observed a sea-sonal variation coinciding with seasonal changes in solarradiation due to photochemical formation of hydro-peroxides. Generally, observed tropospheric H
2O
2and
MHP concentrations are higher than expected especiallyduring winter. At polar night long-range transport has tobe considered from late fall to early spring due to in-creased hydroperoxide lifetimes. Our measurements indi-cate that distinct variations of the MHP/(MHP#
H2O
2) ratio are most probably caused by di!erent air
mass history. Di!erent MHP and H2O
2deposition vel-
ocities over marine and ice covered areas could provoke
5232 K. Riedel et al. / Atmospheric Environment 34 (2000) 5225}5234

fractional depletion of hydrogen peroxide. Instead ofincreasing hydrogen peroxide levels due to higher UV-Bactinic #uxes during the stratospheric ozone depletion,we observed values comparable to typical winter levels.Most surprisingly, hydroperoxides during the ozone holeperiod are strikingly lower compared to typical mixingratios in austral fall at similar solar incidence angles.However, in our case the partial pressure of water duringthe ozone hole period was a factor of 4.5 lower comparedto the situation at fall. Clearly, for a more detailed inter-pretation and a meaningful analysis of the processesdetermining the observed hydroperoxide time series,photochemical model calculations paying attention tospecial Antarctic conditions are indispensable and will betopic of our further investigations.
Acknowledgements
The authors would like to thank A. Minikin, B. MuK llerand all technicians and scientists of the over-winteringcrews and summer campaigns at Neumayer station fortheir help and technical and logistical support. K.R.thanks the Studienstiftung des deutschen Volkes for a re-search stipend and M. Hutterli for a helpful evaluationprogram. The trajectories have been provided by theGerman Weather Service (DWD). This paper is contribu-tion No. 1728 of the Alfred-Wegener Institute for Polarand Marine Research, Bremerhaven.
References
Ayers, G.P., Penkett, S.A., Gillett, R.W., Bandy, B., Galbally,I.E., Meyer, C.P., Elsworth, C.M., Bentley, S.T., Forgan,B.W., 1996. The annual cycle of peroxides and ozone inmarine air at Cape Grim, Tasmania. Journal of AtmosphericChemistry 23, 221}252.
Bales, R.C., Valdez, M.P., Dawson, G.A., 1987. Gaseous depo-sition to snow, 2. Physical-chemical model for SO
2de-
position. Journal of Geophysical Research 92, 9789}9799.Bales, R.C., McConnell, J.R., Losleben, M.V., Conklin, M.H.,
Fuhrer, K., Neftel, A., Dibb, J.E., Kahl, J.D.W., Stearns, C.R.,1995. Diel variations of H
2O
2in Greenland: a discussion of
the cause and e!ect relationship. Journal of GeophysicalResearch 100, 18661}18668.
Bales, R.C., Choi, J., 1996. Conceptual framework for interpreta-tion of exchange processes. In: Wolf, E.W., Bales, R.C. (Eds.),Chemical Exchange Between the Atmosphere and PolarSnow. NATO-ASI Series 143, Springer, Berlin.
Barth, M.C., Hegg, D.A., Hobbs, P.V., Walega, J.G., Kok, G.L.,Heikes, B.G., Lazrus, A.L., 1989. Measurements of atmo-spheric gas-phase hydrogen peroxide concentrations in win-ter on the east coast of the United States. Tellus 41B, 61}69.
Claiborn, C.S., Aneja, V.P., 1991. Measurements of atmospherichydrogen peroxide in the gas phase and in cloud waterat Mt. Mitchell, North Carolina. Journal of GeophysicalResearch 96, 18771}18787.
DeMore, W.B., Sander, S.P., Golden, D.M., Hampson, R.F.,Kurylo, M.J., Howard, C.J., Ravishankara, A.R., Kolb, C.E.,Molina, M.J., 1994. Chemical kinetics and photochemicaldata for use in stratospheric modeling. Evaluation no.11,JPL Publ. 94-26, 1, Pasadena, CA.
De Serves, C., 1994. Gas phase formaldehyde and peroxidemeasurements in the Arctic atmosphere. Journal of Geo-physical Research 99, 25391}25398.
Fels, M., Junkermann, W., 1994. The occurrence of organichydroperoxides in air at a mountain site. Geophysical Re-search Letters 21 (5), 341}344.
Fuglestvedt, J.S., Jonson, J.E., Isaksen, I.D.A., 1994. E!ects ofreductions in stratospheric ozone on tropospheric chemistrythrough changes in photolysis rates. Tellus 46B, 172}192.
Fuhrer, K., Hutterli, M., McConnell, J.R., 1996. Overview ofrecent "eld experiments for the study of the air snow transferof H
2O
2and HCHO. In: Wolf, E.W., Bales, R.C. (Eds.),
Chemical Exchange Between the Atmosphere and PolarSnow. NATO-ASI Series 143, Springer, Berlin.
Gunz, D.W., Ho!mann, M.R., 1990. Atmospheric chemistry ofhydroperoxides: a review. Atmospheric Environment 24,1601}1633.
Hauglustaine, D.A., Granier, C., Brasseur, G.P., Megie, G., 1994.The importance of atmospheric chemistry in the calculationof radiative forcing on the climate system. Journal of Geo-physical Research 99, 1173}1186.
Heikes, B.G., Kok, G.L., Walega, J.G., Lazrus, A.L., 1987.H
2O
2, O
3and SO
2measurements in the lower troposphere
over the eastern United States during fall. Journal of Geo-physical Research 97, 915}931.
Heikes, B.G., Lee, M., Bradshaw, J., Sandholm, S., Davis, D.D.,Crawford, J., Rodriguez, J., Liu, S., McKeen, S., Thronton,D., Bandy, A., Gregory, G., Talbot, R., Blake, D., 1996.Hydrogen peroxide and methylhydroperoxide distributionsrelated to ozone and odd hydrogen over the North Paci"c inthe fall of 1991. Journal of Geophysical Research 101,1891}1905.
Hellpointer, E., GaK b, S., 1989. Detection of methyl, hydroxy-methyl and hydroxyethyl hydroperoxides in air and precipi-tation. Nature 337, 631}634.
Hewitt, C.N., Kok, G.L., 1991. Formation and occurrence of or-ganic hydroperoxides in the troposphere: laboratory and "eldobservations. Journal of Atmospheric Chemistry 12, 181}194.
Hough, A.M., 1991. Development of a two-dimensional globaltropospheric model: model chemistry. Journal of Geophysi-cal Research 96, 7325}7362.
Jackson, A.V., Hewitt, C.N., 1996. Hydrogen peroxide and or-ganic hydroperoxide concentrations in air in a eucalyptusforest in central Portugal. Atmospheric Environment 30 (6),819}830.
Jackson, A.V., Hewitt, C.N., 1999. Atmosphere hydrogen perox-ide and organic hydroperoxides: a review. Critical Reviewsin Environmental Science and Technology 29 (2), 175}228.
Jacob, P., Klockow, D., 1993. Measurements of hydrogen perox-ide in Antarctic ambient air, snow and "rn cores. FreseniusJournal of Analytical Chemistry 346, 429}434.
Je!erson, A., Tanner, D.J., Eisele, F.L., Davis, D.D., Chen, G.,Crawford, J., Huey, J.W., Torres, A.L., Berresheim, H., 1998.OH photochemistry and methane sulfonic acid formation inthe coastal Antarctic boundary layer. Journal of Geophysi-cal Reseasrch 103, 1647}1656.
K. Riedel et al. / Atmospheric Environment 34 (2000) 5225}5234 5233

Kleinmann, L.I., 1986. Photochemical formation of peroxides inthe boundary layer. Journal of Geophysical Research 91,10889}10904.
Kleinmann, L.I., 1994. Low and high NOx
troposphericphotochemistry. Journal of Geophysical Research 99,16831}16838.
KoK nig-Langlo, G., Herber, A., 1996. The meteorological data ofthe Neumayer station (Antarctica) for 1992, 1993, and 1994.Reports on Polar Research 187, 1}101.
KoK nig-Langlo, G., King, J.C., PettreH , P., 1998. Climatology ofthe three coastal Antarctic stations Dumont d'Urville,Neumayer, and Halley. Journal of Geophysical Research103, 10935}10946.
Lazrus, A.L., Kok, G.L., Gitlin, S.N., Lind, J.A., 1985. Auto-mated #uorometric method for hydrogen peroxide in atmo-spheric precipitation. Analytical Chemistry 57, 917}922.
Lazrus, A.L., Kok, G.L., Lind, J.A., Gitlin, S.N., Heikes, B.G.,Shetter, R.E., 1986. Automated #uorometric method for hy-drogen peroxide in air. Analytical Chemistry 58, 594}597.
Lee, M., Heikes, B.G., Jacob, D.J., Sachse, G., Anderson, B.,1997. Hydrogenperoxide, organic hydroperoxide, and for-maldehyde as primary pollutants from biomass burning.Journal of Geophysical Research 102, 1301}1309.
Lee, M., Heikes, B.G., Jacob, D.J., 1998. Enhancements of hy-droperoxides and formaldehyde in biamass burning impac-ted air and their e!ect on atmospheric oxidant cycles.Journal of Geophysical Research 103, 13201}13212.
Lightfoot, P.D., Cox, R.A., Crowley, J.N., Destriau, M., Hay-man, G.D., Jenkin, M.E., Moortgat, G.K., Zabel, F., 1992.Organic peroxy radicals: kinetics, spectroscopy and tropos-pheric chemistry. Atmospheric Environment 26, 1805}1961.
Lind, J.A., Kok, G.L., 1994. Correction to Henry's law deter-minations for aqueous solutions of hydrogen peroxide,methylhydroperoxide, and peroxyacetic acid. Journal ofGeophysical Research 99, 21}119.
Logan, J.A., Prather, M.J., Wofsy, S.C., McElroy, M.B., 1981.Tropospheric chemistry: a global perspective. Journal ofGeophysical Research 86, 7210}7254.
McConnell, J.R., Winterle, J.R., Bales, R.C., Thompson, A.M.,Steward, R.W., 1997a. Physically based inversion of surfacesnow concentrations of H
2O
2to atmospheric concentra-
tions at South Pole. Geophysical Research Letters 24 (4),441}444.
McConnell, J.R., Bales, J.C., Winterle, J.R., Kuhns, H., Stearns,C.R., 1997b. A lumped parameter model for atmosphere-
to-snow transfer function for hydrogen peroxide. Journal ofGeophysical Research 102, 26809}26818.
Neftel, A., Jacob, P., Klockow, D., 1984. Measurements of hy-drogen peroxide in polar ice samples. Nature 311, 43}45.
Seinfeld, J.H., Pandis, S.N., 1998. Atmospheric Chemistry andPhysics: From Air Pollution to Climate Change, 1st Edition.Wiley, New York.
Sigg, A., Sta!elbach, T., Neftel, A., 1992. Gas phase measure-ments of hydrogen peroxide in Greenland and their meaningfor the interpretation of H
2O
2records in ice cores. Journal
of Atmospheric Chemistry 14, 223}232.Slemr, F., Tremmel, H.G., 1994. Hydroperoxides in the marine
troposphere over the Atlantic Ocean. Journal of Atmo-spheric Chemistry 19, 371}404.
Sta!elbach, T.A., Kok, G.L., Heikes, B.G., McCully, B., Mackay,G.I., Karecki, D.R., Schi!, H.I., 1996. Comparison of hy-droperoxide measurements made during the Mauna Loaobservatory photochemistry experiment 2. Journal of Geo-physical Research 101, 14729}14739.
Thompson, A.M., Chappellaz, J.A., Fung, I.Y., Kucsera, T.L.,1993. The atmospheric CH
4increase since the last glacial
maximum, 2, Interactions with oxidants. Tellus 45B,242}357.
Tolu, K., 1993. Untersuchung am enzymatisch-#uorometris-chen Me{geraK t fuK r Peroxide (Investigations at an enzymatic#uorometric instrument for peroxides). Diploma Thesis,Fachhochschule Isny, Germany.
Tremmel, H.G., 1992. Die Verteilung von Peroxiden in derunteren TroposphaK re. Ph.D. Thesis, Fraunhofer Institut fuK rAtmosphaK rische Umweltforschung, Garmisch-Partenkir-chen.
Van Ommen, T.D., Morgan, V., 1996. Peroxide concentrationsin the Dome Summit south ice core, Law Dome, Antarctica.Journal of Geophysical Research 101, 9139}9147.
Weller, R., Schrems, O., 1993. H2O
2in the marine troposphere
and seawater of the Atlantic Ocean. Geophysical ResearchLetters 20 (2), 125}128.
Weller, R., Schrems, O., 1996. Photooxidants in the marineArctic troposphere in summer. Journal of Geophysical Re-search 101, 9139}9147.
Weller, R., Schrems, O., Boddenberg, A., GaK b, Gautrois, M.,2000. Meridional distribution of hydroperoxides and formal-dehyde in the marine boundary layer of the Atlantic(483N}353S) measured during the ALBATROSS campaign.Journal of Geophysical Research, 105, 14401}14412.
5234 K. Riedel et al. / Atmospheric Environment 34 (2000) 5225}5234