emission sources contributing to tropospheric ozone over
TRANSCRIPT
Atmos. Chem. Phys., 11, 13395–13419, 2011www.atmos-chem-phys.net/11/13395/2011/doi:10.5194/acp-11-13395-2011© Author(s) 2011. CC Attribution 3.0 License.
AtmosphericChemistry
and Physics
Emission sources contributing to tropospheric ozone overEquatorial Africa during the summer monsoon
I. Bouarar 1, K. S. Law1, M. Pham1, C. Liousse2, H. Schlager3, T. Hamburger3, C. E.Reeves4, J.-P. Cammas2,P. Nedelec2, S. Szopa5, F. Ravegnani6, S. Viciani7, F. D’Amato7, A. Ulanovsky8, and A. Richter9
1UPMC Universite Paris 06: Universite Versailles Saint-Quentin: CNRS/INSU; UMR8190, LATMOS/IPSL, Paris, France2Universite de Toulouse, UPS, LA (Laboratoire d’Aerologie), CNRS UMR5560, Toulouse, France3DLR Institut fur Physik der Atmosphare, Oberpfaffenhofen, Germay4School of Environmental Sciences, University of East Anglia, Norwich, UK5Laboratoire des Sciences du Climat et de l’Environnement, LSCE/IPSL, Saclay, France6Instituto di Scienze dell’Atmosfera e del Clima, Consiglio Nazionale delle Ricerche (ISAC-CNR), Italy7Consiglio Nazionale dell Ricerche-Istituto Nazionale di Ottica (CNR-INO), Firenze, Italy8Central Aerological Observatory, Moscow, Russia8Institute of Environmental Physics, University of Bremen, Bremen, Germany
Received: 27 December 2010 – Published in Atmos. Chem. Phys. Discuss.: 5 May 2011Revised: 11 November 2011 – Accepted: 15 November 2011 – Published: 22 December 2011
Abstract. A global chemistry-climate model LMDzINCAis used to investigate the contribution of African and Asianemissions to tropospheric ozone over Central and WestAfrica during the summer monsoon. The model results showthat ozone in this region is most sensitive to lightning NOxand to Central African biomass burning emissions. However,other emission categories also contribute significantly to re-gional ozone. The maximum ozone changes due to lightningNOx occur in the upper troposphere between 400 hPa and200 hPa over West Africa and downwind over the AtlanticOcean. Biomass burning emissions mainly influence ozonein the lower and middle troposphere over Central Africa, anddownwind due to westward transport. Biogenic emissionsof volatile organic compounds, which can be uplifted fromthe lower troposphere to higher altitudes by the deep convec-tion that occurs over West Africa during the monsoon season,lead to maximum ozone changes in the lower stratosphereregion. Soil NOx emissions over the Sahel region make asignificant contribution to ozone in the lower troposphere. Inaddition, convective uplift of these emissions and subsequentozone production are also an important source of ozone inthe upper troposphere over West Africa. Concerning African
Correspondence to:I. Bouarar([email protected])
anthropogenic emissions, they only make a small contribu-tion to ozone compared to the other emission categories.The model results indicate that most ozone changes due toAfrican emissions occur downwind, especially over the At-lantic Ocean, far from the emission regions. The import ofAsian emissions also makes a considerable contribution toozone concentrations above 150 hPa and has to be taken intoaccount in studies of the ozone budget over Africa. UsingIPCC AR5 (Intergovernmental Panel on Climate Change;Fifth Assessment Report) estimates of anthropogenic emis-sions for 2030 over Africa and Asia, model calculations showlarger changes in ozone over Africa due to growth in Asianemissions compared to African emissions over the next 20 yr.
1 Introduction
Tropospheric ozone (O3) plays an important role in theglobal climate and chemical composition of the atmosphere.Indeed, the greenhouse forcing of tropospheric ozone affectsthe radiation budget of the atmosphere (Forster et al., 2007).Moreover, ozone is an important source of hydroxyl (OH)radicals which determine to a large extent the removal andatmospheric lifetime of many trace gases (Brasseur et al.,1999; Jacob, 1999). Ozone production in the troposphereis controlled by transport from the O3-rich stratosphere(Olsen et al., 2002) and by photochemical oxidation of
Published by Copernicus Publications on behalf of the European Geosciences Union.
13396 I. Bouarar et al.: Emission sources contributing to tropospheric ozone
carbon monoxide (CO), methane (CH4) and other volatile or-ganic compounds (VOCs) in the presence of nitrogen oxides(NOx=NO + NO2) (Crutzen, 1974; Atkinson, 2000). It is re-moved by photochemical loss and dry deposition.
Africa is an important source region for O3 precursors(Marufu et al., 2000; Jaegle et al., 2004, 2005; Sauvage et al.,2005, 2007a; Stewart et al., 2008). It emits a large amountof biomass burning (BB) emissions (CO, NOx, VOCs) asso-ciated with savanna and forest fires, which take place duringdry (December to February, DJF) and monsoon (June to Au-gust, JJA) periods over West and Central Africa respectively,as well as with agricultural waste and domestic biofuel com-bustion (Crutzen and Andreae, 1990; Sauvage et al., 2005;Jonquieres et al., 1998). Furthermore, vegetation and soilsare also considered to be important sources of O3 precur-sors over Africa (Aghedo et al., 2007; Jaegle et al., 2004).Forests and savanna near African Equatorial regions releaselarge amounts of VOCs (Murphy et al., 2010; Ferreira et al.,2010), particularly isoprene, terpenes and methanol whichare the dominant VOC emissions from vegetation. Impor-tant amounts of nitric oxide (NO) are emitted by soils af-ter rainfall events over the Sahel region during the summermonsoon (Stewart et al., 2008). Analysis of satellite NO2data by Jaegle et al. (2005) showed enhancements in NO2columns over this region during the monsoon season also at-tributed to rain-induced emissions of NOx from soils. Usingsurface NO2 data collected over Banizoumbou (Niger) be-tween 1998 and 2004, Galy-Lacaux et al. (2009) also showedincreased NO2 concentrations during the monsoon season.African cities along the southern coast and industrializedcountries (e.g. Nigeria) release important amounts of anthro-pogenic emissions (Hopkins et al., 2009), related to oil gasexploration, which can influence O3 regionally (Minga et al.,2010).
Dynamical processes strongly influence ozone and pre-cursor distributions in the African troposphere. During theNorthern Hemisphere summer monsoon season, West Africais marked by intense convective activity that occurs aroundthe Inter Tropical Convergence Zone (ITCZ) around 10◦ N.The resulting mesoscale convective systems (MCSs) lead tovertical transport of air masses, more or less influenced by lo-cal emissions, into the upper troposphere (UT) where chem-ical species have longer lifetimes and can be redistributedglobally by prevailing westward winds. Using aircraft mea-surements performed in the framework of the African Mon-soon Multidisciplinary Analyses (AMMA) project, Law etal. (2010) showed clear signatures of convective uplift of COand aerosols into the tropical tropopause layer (TTL). Re-sults from Bechara et al. (2010) also pointed to convectionas an explanation for observed enhancements of VOCs inthe UT over West Africa. Moreover, Sauvage et al. (2007b,c) and Barret et al. (2010) demonstrated that convectionleads to production of important amounts of NOx from light-ning in the UT which subsequently leads to O3 productiondownwind.
During the summer monsoon, BB emissions occur mostlysouth of the Equator over Central Africa. Nevertheless,cross-hemispheric transport of these emissions into WestAfrica has been shown to occur particularly during phaseswhen the southern branch of the African Easterly Jet (AEJ) isactive (Mari et al., 2008). This allows transport of BB pollu-tants towards the southern coast of West Africa (Williams etal., 2010b; Reeves et al., 2010) in the lower/mid troposphere.BB pollution can also be transported northwards into activeconvective regions over Chad/Sudan where they can be up-lifted into the UT and transported westwards. Evidence forthis pathway was found in analysis of aircraft data collectedin the UT over West Africa (Real et al., 2010; Law et al.,2010). Recent studies have suggested an important role forimport of Asian emissions on the chemical composition ofthe African UT during boreal summer (Sudo and Akimodo,2007; Barret et al., 2008; Liu et al., 2009; Law et al., 2010).As shown for example by Park et al. (2009), convection as-sociated with the Indian monsoon leads to injection of Asiantrace gases into the UT. The Tropical Easterly Jet (TEJ) at200 hPa that extends into the Atlantic Ocean (Janicot et al.,2008) allows rapid westward transport of Asian pollution toWest Africa. Sudo and Akimodo (2007) and Liu et al. (2009)analysed transport of tagged Asian O3 tracers in their globalmodels. Both studies showed O3 outflow in the UT fromAsia towards Africa. Analysis of pathways of intercontinen-tal transport in summer performed within the HTAP (Hemi-spheric Transport of Air Pollution; seehttp://www.htap.org)project using passive CO tracers released over the northernhemisphere continents also confirmed that Asian pollutioncan reach the African UT (HTAP, 2010).
In this study, we examine the influence of different emis-sions on the distribution of tropospheric O3 over West andCentral Africa as well as downwind over the Central AtlanticOcean during the summer monsoon in 2006. For this pur-pose, we use the three-dimensional global chemistry modelLMDz INCA. Previous global modeling studies attempted toinvestigate the sensitivity of African tropospheric O3 to dif-ferent emission sources at different times of year. For exam-ple, Marufu et al. (2000) calculated an annual average contri-bution of 16 % from global BB emissions to tropospheric O3over Africa for the year 1993. In a more recent study, Aghedoet al. (2007) examined the sensitivity of surface O3 and tro-pospheric O3 burden over Africa to different emissions. BBprovided the largest impact on surface O3 concentrations dur-ing the monsoon season in their study. They also concludedthat, in all seasons, African and global tropospheric O3 bur-dens are more sensitive to biogenic emissions than to BB,lightning NOx (LiNOx hereafter) and anthropogenic emis-sions. Williams et al. (2009) applied different biogenic emis-sion inventories in a global model to assess the impact ofsuch emissions from Africa on tropical tropospheric ozonein 2006. They found that differences in the seasonality andtemporal distribution of the biogenic emissions used inducedifferences in the regional and global ozone simulated by
Atmos. Chem. Phys., 11, 13395–13419, 2011 www.atmos-chem-phys.net/11/13395/2011/
I. Bouarar et al.: Emission sources contributing to tropospheric ozone 13397
their model. Recently, Barret et al. (2010) focused on theimpact of LiNOx emissions on O3 in the UT over WestAfrica during the monsoon season. Based on results fromseveral global chemical models, they showed the importantimpact of LiNOx on O3 (more than 10 ppbv production) oc-curring over the tropical Atlantic in agreement with Sauvageet al. (2007b).
Most previous modeling studies on the influence ofAfrican emissions were conducted either by focusing on aspecific emission category or by switching off emissions oneat a time. However, when turning off an emission source it isdifficult to estimate its contribution to O3 due to non-lineareffects (Wu et al., 2009; Grewe et al., 2010). In order to takeinto account such effects, our approach is based on the es-timation of the influence of percentage reductions (20 %) indifferent African emissions on O3 within Equatorial Africa.In this study we also examine the impact of Asian emissions(20 % reduction) on O3 over Africa which has largely beenignored in previous studies. Using emission estimates for2030, we also estimate O3 changes due to growth in Africanand Asian anthropogenic emissions in the future. Resultspresented here are also compared to previous studies, whereappropriate.
A brief description of the LMDzINCA model is givenin Sect. 2. Section 3 presents the model experiments anddata used in this study. An evaluation of model performanceagainst in-situ data from the AMMA and MOZAIC (Mea-surement of OZone and water vapour by Airbus In-serviceaircraft) programs as well as satellite measurements is pre-sented in Sect. 4 with the aim of assessing the model’s abil-ity to model general features seen in the observations duringthe monsoon season. The results of the sensitivity studies todifferent emission reductions on O3 over Equatorial Africaare discussed in Sect. 5. In Sect. 6, we examine the possibleimpact of future emissions on West African chemical com-position using anthropogenic emissions estimates for 2030over Africa and Asia. Conclusions are given in Sect. 7.
2 Model description
The global chemistry-climate model LMDzINCA cou-ples the general circulation model LMDz (Laboratoire deMeteorologie Dynamique, zoom) version 4 and version 3of the INCA (Interactive Chemistry and Aerosols) chem-istry module (Hauglustaine et al., 2004; Folberth et al., 2006;Szopa et al., 2007). The model simulations were performedwith horizontal resolution of 3.75◦ in longitude and 2.5◦
in latitude (96× 72 grid cells) and 19 hybrid (σ , p) verti-cal levels extending from the surface to 3 hPa. The verticalresolution is 300–500 m in the boundary layer and around2 km at the tropopause with 7–9 levels located in the strato-sphere and 2–3 levels in the TTL. In LMDz, large-scale ad-vection of tracers is described according to a second orderfinite volume scheme (Van Leer, 1977; Hourdin and Armen-gaud, 1999). The surface boundary layer is treated according
to Louis (1979). In this study, both the Tiedtke (1989) andKerry Emanuel (1991, 1993) schemes were used for the pa-rameterization of deep convection. The Emanuel scheme waschosen for the baseline simulation and Tiedtke scheme wasused in a sensitivity run (see Sect. 3.2). Hourdin et al. (2006)provides a detailed description of the parameterizations in thedynamical part of the model.
The chemistry module INCA simulates troposphericchemistry, wet scavenging and dry deposition of a num-ber of chemical species (Folberth et al., 2006). It in-cludes a comprehensive chemistry scheme including morethan 80 species and 250 chemical reactions. When cou-pled to LMDz, the model can be used to calculate thedistribution of tropospheric ozone and precursors consider-ing emissions, transport, photochemical reactions, deposi-tion and scavenging. The standard INCA chemical schemeis based on the CH4-NOx-CO-O3 photochemistry repre-sentative of the background chemistry of the troposphere(Hauglustaine et al., 2004). For the present study we haveused the INCANMHC version (Folberth et al. 2006) whichalso includes an oxidation scheme for volatile organic com-pounds (VOCs) (e.g. ethane, propane, isoprene, terpenes)and their products. Dry deposition of chemical species (e.g.O3, HNO3, HNO4, CO, HCHO) at the surface is based onthe resistance-in-series approach (Wesely, 1989; Walmsleyand Wesely, 1996; Wesely and Hicks, 2000). Wet scaveng-ing of soluble species (e.g. HNO3, H2O2, HCHO and HNO4)
is parameterized with a first-order loss process as originallyproposed by Giorgi and Chameides (1985). Folberth et al.(2006) provide a more detailed description of dry depositionand wet scavenging parameterizations in LMDzINCA.
Concerning surface emissions, the RETRO anthropogenicemissions of CO, NOx and VOCs for the year 2000 wereused with emissions provided for different source sectors(e.g. residential and industrial combustion, road transport,solvent use and agriculture and land use change). Detailsabout the chemical compounds emitted as well as catego-rization of source sectors can be found on the RETRO web-site (http://retro.enes.org). Monthly average biomass burningemissions for 2006 were taken from the GFEDv2 (GlobalFire Emissions Database, version 2) inventory (Van der Werfet al., 2006). In addition, recent biomass burning and anthro-pogenic emissions estimates developed in the framework ofthe AMMA project (Liousse et al., 2008, 2010), were alsoused over Africa (hereafter referred to as L3JRC inventory).Table 3 shows integrated biomass burning emissions totalsfor CO and NOx over Africa in the L3JRC and GFEDv2 in-ventories. These emissions are higher in the L3JRC inven-tory by around 47 % and 61 % respectively in 2006 (and 70 %and 75 % respectively during the summer (JJA) period) com-pared to GFEDv2. Biomass burning emissions were emittedat the surface in the model simulations presented in this study(see Table 1).
www.atmos-chem-phys.net/11/13395/2011/ Atmos. Chem. Phys., 11, 13395–13419, 2011
13398 I. Bouarar et al.: Emission sources contributing to tropospheric ozone
NO emissions from lightning, fixed to a total globalamount of 5 Tg N yr−1 are calculated interactively inLMDz INCA on the basis of the occurrence of convectionand cloud top heights (Jourdain and Hauglustaine, 2001).Biogenic emissions of isoprene, terpenes, methanol, ace-tone and NO were prepared using the inventory derived fromthe dynamical vegetation model ORCHIDEE (Lathiere etal., 2006). Other biogenic emissions (e.g. oceanic emis-sions) and other VOC emissions were taken from the GEIA(Global Emissions Inventory Activity) database (http://www.geiacenter.org).
3 Evaluation data and model simulations
In this section, we present the data used to evaluate modelperformance (Sect. 4) and a description of the model simu-lations and sensitivity studies. Data from the satellite instru-ments MOPITT (Measurement Of Pollution In The Tropo-sphere) and SCIAMACHY (Scanning Imaging Absorptionspectrometer for Atmospheric CHartographY), and aircraftmeasurements from the AMMA and MOZAIC programs arepresented in the first section. Model simulations and sensi-tivity studies are presented in Sect. 3.2.
3.1 Satellite and in-situ data
3.1.1 MOPITT and SCIAMACHY observations
The MOPITT instrument is flying on board the NASA Terrasatellite and has been operational since March 2000 (Drum-mond and Mand, 1996; Deeter et al., 2004). It measures up-welling radiation in the thermal infrared spectral range usinggas-filter correlation radiometry. At nadir view, MOPITT of-fers a horizontal resolution of 22× 22 km2 and allows globalcoverage in two to three days. MOPITT data used in thisstudy corresponds to the daytime CO total columns observedduring August 2006, and the Level 2 Version 3 product (Em-mons et al., 2007, 2009).
SCIAMACHY was launched in March 2002 on board theENVISAT satellite and allows global measurements of anumber of trace gases in the troposphere and stratospherewith 30× 60 km2 resolution (Bovensmann et al., 1999). Weuse the NO2 tropospheric columns for August 2006 basedon the DOAS (Differential Optical Absorption Spectroscopy)retrieval algorithm (Richter et al, 2005).
In order to compare LMDzINCA results to MOPITTand SCIAMACHY observations, the modelled CO and NO2columns in each grid cell were calculated at the local over-pass time of each instrument (10 h:30 min and 10 h respec-tively). This calculation is essential knowing the impor-tant diurnal variation of NO2 concentrations in the tropo-sphere. Moreover, for a proper comparison with MOPITT,the model CO total columns were calculated by applying theMOPITT Averaging Kernels. Details about the calculation
and method are given in Rodgers and Connor (2003) andDeeter et al. (2004).
3.1.2 AMMA measurements
The in-situ measurements performed during AMMA andconsidered in this study were made aboard five research air-craft: the M55 Geophysica and DLR Falcon (DF20) werebased in Ouagadougou (Burkina Faso); the French Falcon(FF20), ATR42, and United Kingdom FAAM (Facility forAirborne Atmospheric Measurements) BAe-146 were basedin Niamey (Niger). The measurements presented here weremade during the special observation period in July and Au-gust 2006. Chemical measurements of ozone and precur-sors (e.g. CO, NOx, HCHO, isoprene etc.) and also aerosolswere made over West Africa in the boundary layer and upto the lower stratosphere allowing a comprehensive charac-terization of the chemical composition of the troposphereduring the monsoon season. A detailed description of thefield campaign and aircraft payloads is given in Reeves etal. (2010). In order to compare LMDzINCA simulationsto the AMMA measurements, the model results were inter-polated along flight tracks and compared to 1 min averagedobservations.
3.1.3 MOZAIC observations
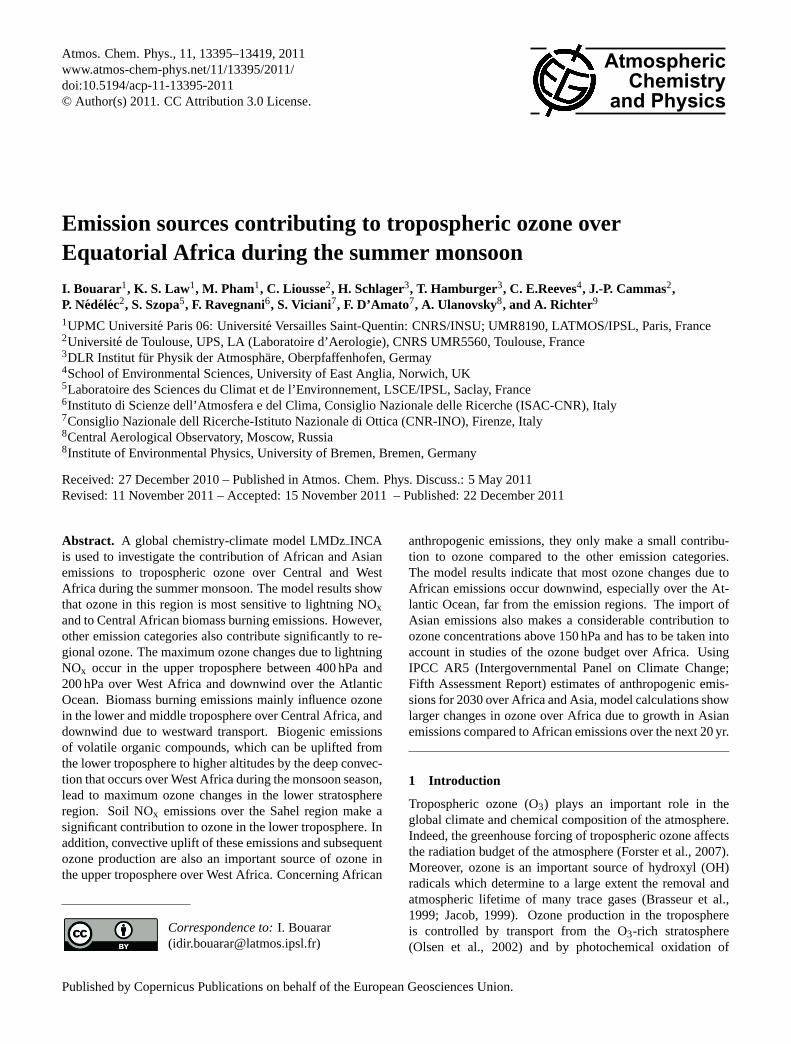
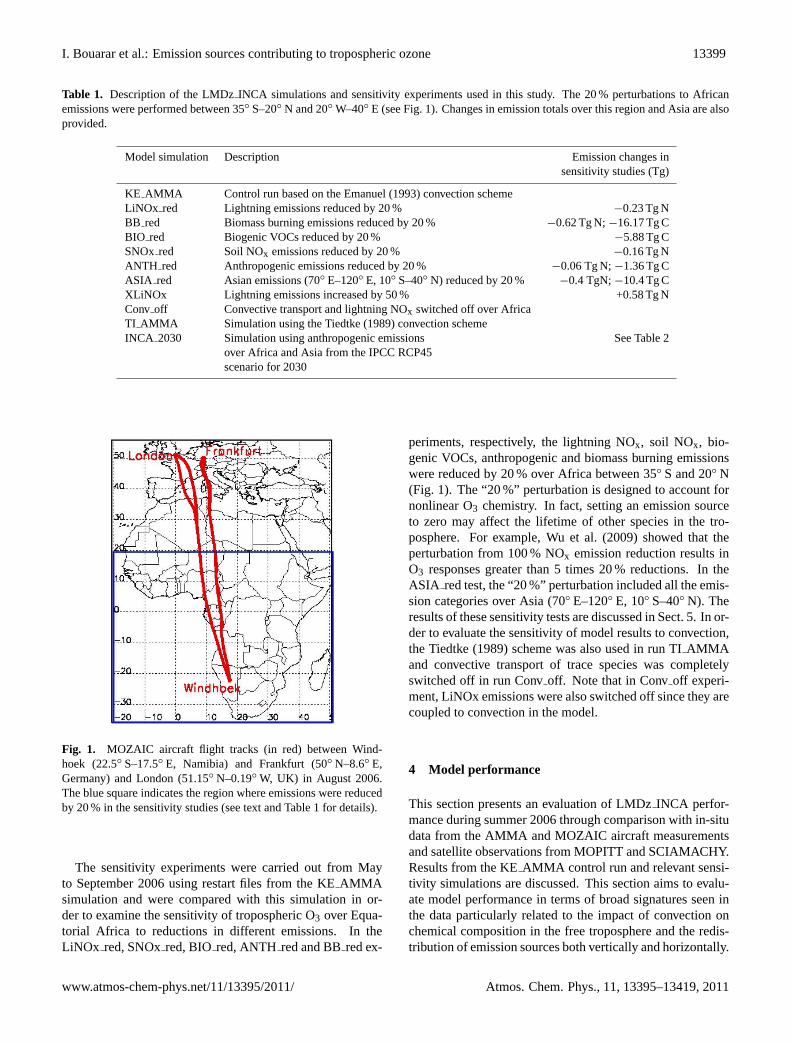
Daily in-situ measurements of CO and O3 were collectedin the framework of MOZAIC (Marenco et al., 1998) us-ing commercial aircraft in August 2006. Figure 1 showsaircraft flight routes between Windhoek (22.5◦ S, 17.5◦ E,Namibia) and Frankfurt (50◦ N, 8.6◦ E, Germany) and Lon-don (51.15◦ N–0.19◦ W, UK). In order to have sufficientdata for statistical comparisons we selected data recordedat flight altitudes above 250 hPa. At cruise altitudes, theMOZAIC data are interesting insofar as they were mea-sured over the biomass burning regions of Central Africaand over West Africa. These data provide complementaryinformation about the distribution of CO and O3 in the up-per troposphere. The same interpolation method used for theLMDz INCA versus AMMA data comparison (interpolationto a 1 minute averaged observation times and locations) wasalso performed.
3.2 Model simulations
LMDz INCA was used to perform different simulations for2006 in order to investigate the impact of emissions on tro-pospheric O3 over Equatorial Africa. The simulations (seeTable 1) consisted of a control simulation (KEAMMA) anda set of sensitivity experiments. For a better comparison withsatellite and in-situ data, the model was nudged with windfields from the ECMWF (European Centre for Medium-Range Weather Forecasts) analyses for 2006. The control runKE AMMA was performed using the Kerry Emanuel (KE)convection scheme. A one year spin-up was conducted fromJanuary to December 2005 before the 2006 run.
Atmos. Chem. Phys., 11, 13395–13419, 2011 www.atmos-chem-phys.net/11/13395/2011/
I. Bouarar et al.: Emission sources contributing to tropospheric ozone 13399
Table 1. Description of the LMDzINCA simulations and sensitivity experiments used in this study. The 20 % perturbations to Africanemissions were performed between 35◦ S–20◦ N and 20◦ W–40◦ E (see Fig. 1). Changes in emission totals over this region and Asia are alsoprovided.
Model simulation Description Emission changes insensitivity studies (Tg)
KE AMMA Control run based on the Emanuel (1993) convection schemeLiNOx red Lightning emissions reduced by 20 % −0.23 Tg NBB red Biomass burning emissions reduced by 20 % −0.62 Tg N;−16.17 Tg CBIO red Biogenic VOCs reduced by 20 % −5.88 Tg CSNOx red Soil NOx emissions reduced by 20 % −0.16 Tg NANTH red Anthropogenic emissions reduced by 20 % −0.06 Tg N;−1.36 Tg CASIA red Asian emissions (70◦ E–120◦ E, 10◦ S–40◦ N) reduced by 20 % −0.4 TgN;−10.4 Tg CXLiNOx Lightning emissions increased by 50 % +0.58 Tg NConv off Convective transport and lightning NOx switched off over AfricaTI AMMA Simulation using the Tiedtke (1989) convection schemeINCA 2030 Simulation using anthropogenic emissions See Table 2
over Africa and Asia from the IPCC RCP45scenario for 2030
Fig. 1. MOZAIC aircraft flight tracks (in red) between Wind-hoek (22.5◦ S–17.5◦ E, Namibia) and Frankfurt (50◦ N–8.6◦ E,Germany) and London (51.15◦ N–0.19◦ W, UK) in August 2006.The blue square indicates the region where emissions were reducedby 20 % in the sensitivity studies (see text and Table 1 for details).
The sensitivity experiments were carried out from Mayto September 2006 using restart files from the KEAMMAsimulation and were compared with this simulation in or-der to examine the sensitivity of tropospheric O3 over Equa-torial Africa to reductions in different emissions. In theLiNOx red, SNOxred, BIO red, ANTH red and BBred ex-
periments, respectively, the lightning NOx, soil NOx, bio-genic VOCs, anthropogenic and biomass burning emissionswere reduced by 20 % over Africa between 35◦ S and 20◦ N(Fig. 1). The “20 %” perturbation is designed to account fornonlinear O3 chemistry. In fact, setting an emission sourceto zero may affect the lifetime of other species in the tro-posphere. For example, Wu et al. (2009) showed that theperturbation from 100 % NOx emission reduction results inO3 responses greater than 5 times 20 % reductions. In theASIA red test, the “20 %” perturbation included all the emis-sion categories over Asia (70◦ E–120◦ E, 10◦ S–40◦ N). Theresults of these sensitivity tests are discussed in Sect. 5. In or-der to evaluate the sensitivity of model results to convection,the Tiedtke (1989) scheme was also used in run TIAMMAand convective transport of trace species was completelyswitched off in run Convoff. Note that in Convoff experi-ment, LiNOx emissions were also switched off since they arecoupled to convection in the model.
4 Model performance
This section presents an evaluation of LMDzINCA perfor-mance during summer 2006 through comparison with in-situdata from the AMMA and MOZAIC aircraft measurementsand satellite observations from MOPITT and SCIAMACHY.Results from the KEAMMA control run and relevant sensi-tivity simulations are discussed. This section aims to evalu-ate model performance in terms of broad signatures seen inthe data particularly related to the impact of convection onchemical composition in the free troposphere and the redis-tribution of emission sources both vertically and horizontally.
www.atmos-chem-phys.net/11/13395/2011/ Atmos. Chem. Phys., 11, 13395–13419, 2011
13400 I. Bouarar et al.: Emission sources contributing to tropospheric ozone
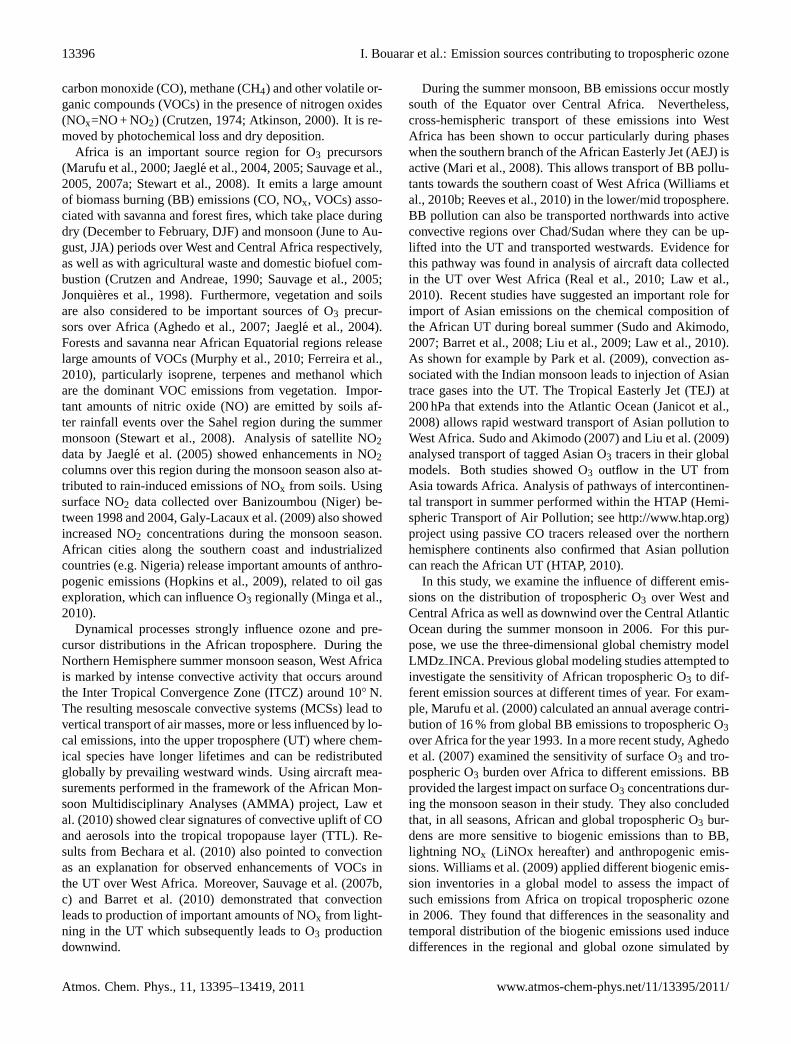
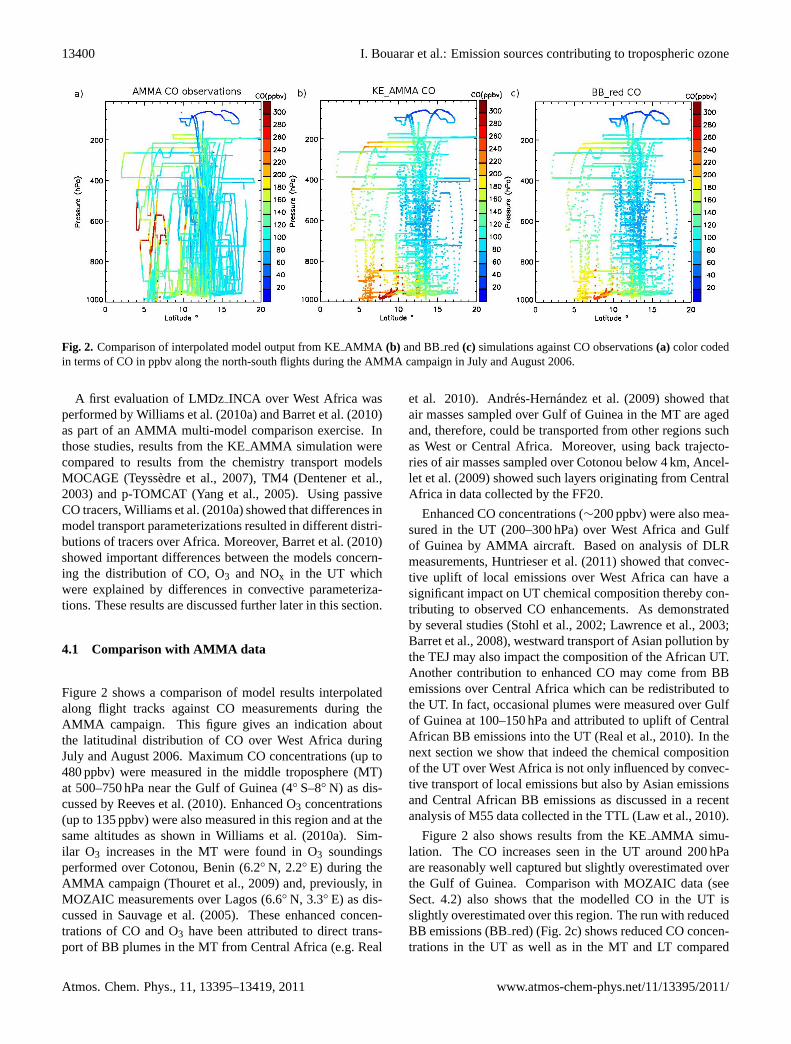
Fig. 2. Comparison of interpolated model output from KEAMMA (b) and BBred(c) simulations against CO observations(a) color codedin terms of CO in ppbv along the north-south flights during the AMMA campaign in July and August 2006.
A first evaluation of LMDzINCA over West Africa wasperformed by Williams et al. (2010a) and Barret et al. (2010)as part of an AMMA multi-model comparison exercise. Inthose studies, results from the KEAMMA simulation werecompared to results from the chemistry transport modelsMOCAGE (Teyssedre et al., 2007), TM4 (Dentener et al.,2003) and p-TOMCAT (Yang et al., 2005). Using passiveCO tracers, Williams et al. (2010a) showed that differences inmodel transport parameterizations resulted in different distri-butions of tracers over Africa. Moreover, Barret et al. (2010)showed important differences between the models concern-ing the distribution of CO, O3 and NOx in the UT whichwere explained by differences in convective parameteriza-tions. These results are discussed further later in this section.
4.1 Comparison with AMMA data
Figure 2 shows a comparison of model results interpolatedalong flight tracks against CO measurements during theAMMA campaign. This figure gives an indication aboutthe latitudinal distribution of CO over West Africa duringJuly and August 2006. Maximum CO concentrations (up to480 ppbv) were measured in the middle troposphere (MT)at 500–750 hPa near the Gulf of Guinea (4◦ S–8◦ N) as dis-cussed by Reeves et al. (2010). Enhanced O3 concentrations(up to 135 ppbv) were also measured in this region and at thesame altitudes as shown in Williams et al. (2010a). Sim-ilar O3 increases in the MT were found in O3 soundingsperformed over Cotonou, Benin (6.2◦ N, 2.2◦ E) during theAMMA campaign (Thouret et al., 2009) and, previously, inMOZAIC measurements over Lagos (6.6◦ N, 3.3◦ E) as dis-cussed in Sauvage et al. (2005). These enhanced concen-trations of CO and O3 have been attributed to direct trans-port of BB plumes in the MT from Central Africa (e.g. Real
et al. 2010). Andres-Hernandez et al. (2009) showed thatair masses sampled over Gulf of Guinea in the MT are agedand, therefore, could be transported from other regions suchas West or Central Africa. Moreover, using back trajecto-ries of air masses sampled over Cotonou below 4 km, Ancel-let et al. (2009) showed such layers originating from CentralAfrica in data collected by the FF20.
Enhanced CO concentrations (∼200 ppbv) were also mea-sured in the UT (200–300 hPa) over West Africa and Gulfof Guinea by AMMA aircraft. Based on analysis of DLRmeasurements, Huntrieser et al. (2011) showed that convec-tive uplift of local emissions over West Africa can have asignificant impact on UT chemical composition thereby con-tributing to observed CO enhancements. As demonstratedby several studies (Stohl et al., 2002; Lawrence et al., 2003;Barret et al., 2008), westward transport of Asian pollution bythe TEJ may also impact the composition of the African UT.Another contribution to enhanced CO may come from BBemissions over Central Africa which can be redistributed tothe UT. In fact, occasional plumes were measured over Gulfof Guinea at 100–150 hPa and attributed to uplift of CentralAfrican BB emissions into the UT (Real et al., 2010). In thenext section we show that indeed the chemical compositionof the UT over West Africa is not only influenced by convec-tive transport of local emissions but also by Asian emissionsand Central African BB emissions as discussed in a recentanalysis of M55 data collected in the TTL (Law et al., 2010).
Figure 2 also shows results from the KEAMMA simu-lation. The CO increases seen in the UT around 200 hPaare reasonably well captured but slightly overestimated overthe Gulf of Guinea. Comparison with MOZAIC data (seeSect. 4.2) also shows that the modelled CO in the UT isslightly overestimated over this region. The run with reducedBB emissions (BBred) (Fig. 2c) shows reduced CO concen-trations in the UT as well as in the MT and LT compared
Atmos. Chem. Phys., 11, 13395–13419, 2011 www.atmos-chem-phys.net/11/13395/2011/
I. Bouarar et al.: Emission sources contributing to tropospheric ozone 13401
to KE AMMA. This indicates that, in the model, CentralAfrican BB emissions influence not only the MT but alsothe LT and UT over the Gulf of Guinea in agreement withfindings in Real et al. (2010).
Williams et al. (2010b) also demonstrated, using the TM4model, that the influence of BB emissions from CentralAfrica extends into West Africa and that the largest impactoccurs over the southern coast of West Africa and the Gulfof Guinea below 500 hPa. In the LT, the KEAMMA resultsgive high CO concentrations south of 10◦ N but observedconcentrations over the Gulf of Guinea are overestimated.The CO enhancements seen in the MT around 5◦ N are how-ever underestimated by the model. Williams et al. (2010a)showed that LMDzINCA, as well as other global models,simulate a maximum in CO and O3 in the MT around 0–5◦ S, further south over Gulf of Guinea compared to the ob-servations. Using an inert tracer defined over Central Africa,they demonstrated that transport in the models was too zonalextending into the Atlantic Ocean in the MT and not extend-ing far enough northward over the Equator. In the case ofLMDz INCA, the simulated horizontal wind fields in the MTover the Gulf of Guinea are much more zonal compared toECMWF analyses. Moreover, Williams et al. (2010b) alsoshowed no direct transport of air in the MT from CentralAfrica to the Gulf of Guinea when ECMWF meteorologicalanalyses were used to drive the TM4 model. They showedthat using ECMWF analyses with additional assimilated ra-diosonde data taken during the AMMA campaign improvedthis direct transport of air to West Africa in the MT. There-fore, the weak northward transport of Central African air inthe ECMWF meteorological analyses can partly explain thediscrepancy between LMDzINCA and the observations inthe MT. Model results are also sensitive to treatments of in-jection of BB emissions (e.g. Labonne et al., 2007; Williamset al., 2010b). In fact, CO increases of up to 30 ppbv werecalculated in the MT over the Atlantic Ocean when AfricanBB emissions were injected up to 3 km in LMDzINCA.Williams et al. (2010b) also showed increases in CO con-centrations over the Atlantic Ocean when BB emissions areinjected from the surface to 4 km in TM4. This indicates anincrease in westward export of such emissions out of Cen-tral Africa when emissions injection is included. Therefore,model performance could be improved through inclusion ofmore realistic schemes for BB emissions (e.g. Freitas et al.,2007; Rio et al., 2010) and using the ECMWF analyses as-similating the AMMA soundings.
In order to evaluate the influence of convection on thechemical composition of the troposphere over West Africa,aircraft CO, O3 and NO data from the DLR, FF20 and M55observations were separated into air masses recently im-pacted by convection (CONV) and those less impacted by re-cent local convection (NOCONV). The purpose of this analy-sis is, firstly, to examine the observations in terms of convec-tive influence to see whether there are signatures in the chem-ical data of convective influence in air uplifted over the last
3–4 days compared to more aged air masses, and secondly, toasses the performance of LMDzINCA over a region stronglyinfluenced by deep convection on a daily basis. The aim isnot to quantify the impact of individual MCS, which cannotbe reproduced by a global model run at coarse resolution, butto examine whether such a model run with current convectiveparameterizations is capable of capturing broad features ob-served in air masses influenced by deep convection.
The FF20 data were separated according to flight typebased on the analysis of Ancellet et al. (2009) who examinedeach flight in terms of proximity to MCS. The approach usedto distinguish the two categories for the M55 data was basedon analysis of ECMWF back-trajectories from the flightsand METEOSAT cloud images (see Law et al., 2010 for de-tails). Coincidences between back-trajectories and convec-tive cloud tops (identified when cloud top radiance temper-atures were below 200 K) were used to identify whether thesampled air masses were recently in contact with an MCSor region of convective uplift over the previous few days.Law et al. (2010) estimated the percentage of air masses en-countering an MCS and showed that at 200 hPa large regionsover Africa were constantly influenced by recent local con-vection during the campaign period in August 2006. The ap-proach used for the DLR data was also based on analysis ofMETEOSAT cloud images and Lagrangian backward trajec-tories calculated using the LAGRANTO model (Wernli andDavies, 1997) during transport up to 10 h before each flight.For air mass ages of less than 10 h, satellite imagery was usedto examine the time since passage of recent MCS relative tothe DLR position to identify air masses of the CONV cat-egory. These approaches serve to give an indication aboutwhich flights were more or less influenced by convection.Further detailed analysis based, for example on mesoscalemodel results can provide more detailed information. In thecase of the M55 flights, Fierli et al. (2011) followed such anapproach. Whilst they showed larger convective impact interms of percentage contributions, their results were broadlyconsistent with the analysis of Law et al. (2010) using themethodology outlined above.
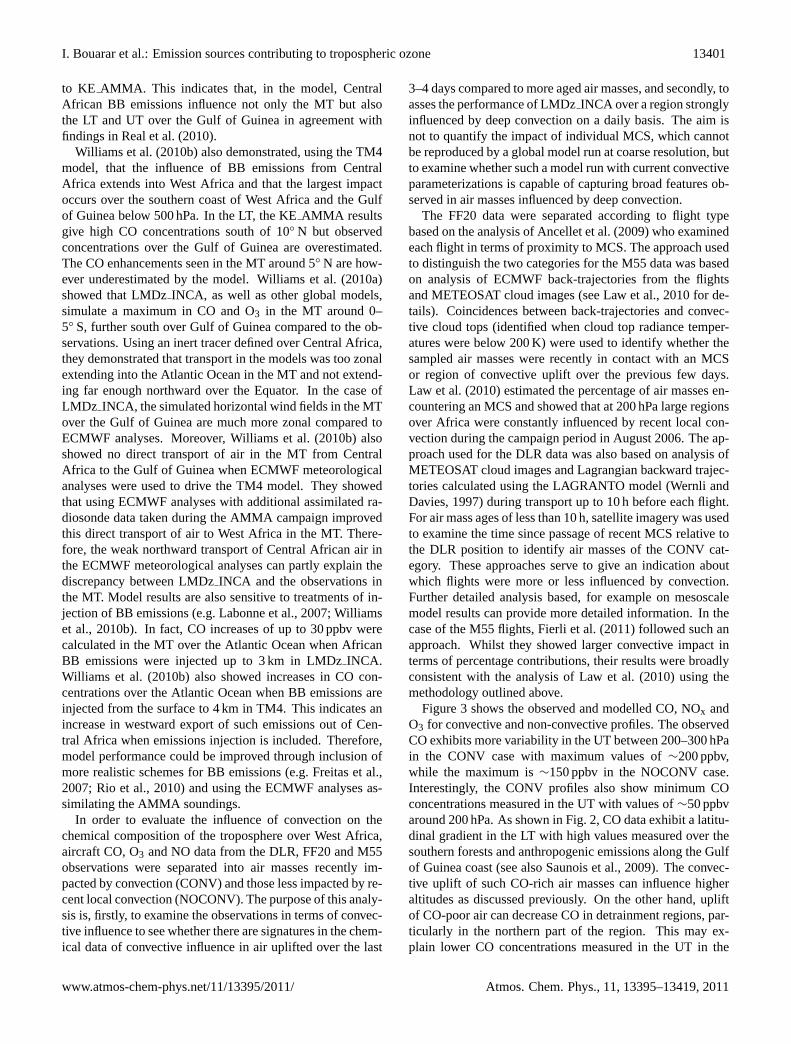
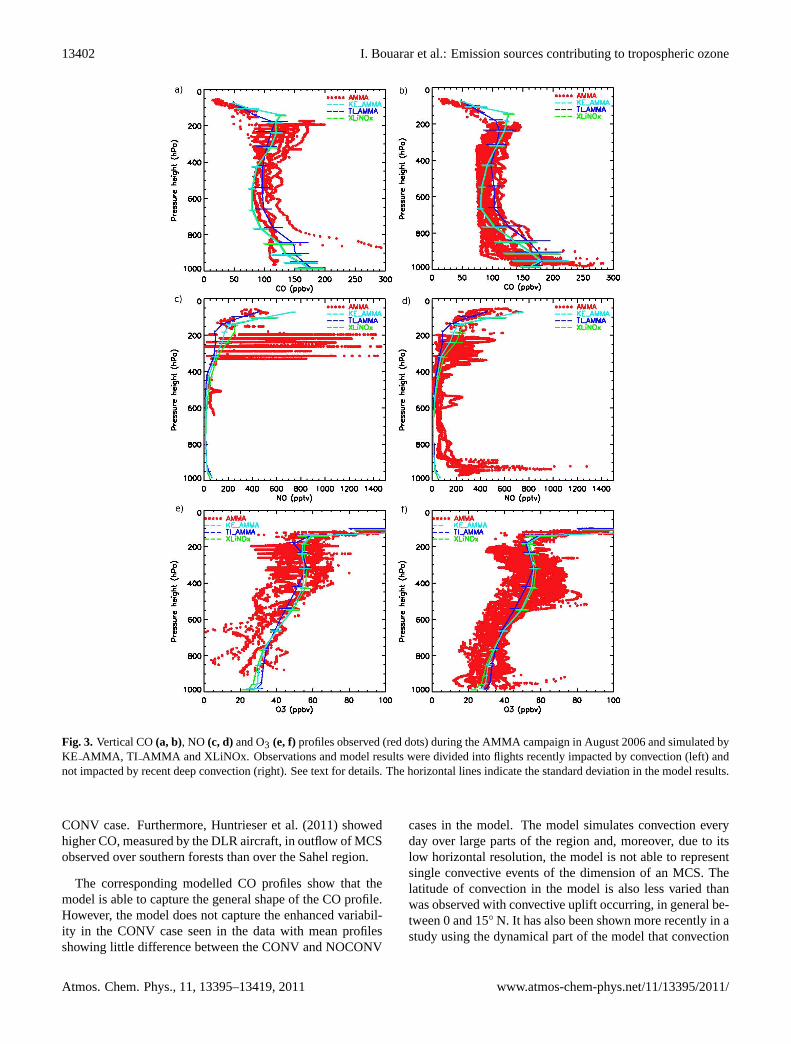
Figure 3 shows the observed and modelled CO, NOx andO3 for convective and non-convective profiles. The observedCO exhibits more variability in the UT between 200–300 hPain the CONV case with maximum values of∼200 ppbv,while the maximum is∼150 ppbv in the NOCONV case.Interestingly, the CONV profiles also show minimum COconcentrations measured in the UT with values of∼50 ppbvaround 200 hPa. As shown in Fig. 2, CO data exhibit a latitu-dinal gradient in the LT with high values measured over thesouthern forests and anthropogenic emissions along the Gulfof Guinea coast (see also Saunois et al., 2009). The convec-tive uplift of such CO-rich air masses can influence higheraltitudes as discussed previously. On the other hand, upliftof CO-poor air can decrease CO in detrainment regions, par-ticularly in the northern part of the region. This may ex-plain lower CO concentrations measured in the UT in the
www.atmos-chem-phys.net/11/13395/2011/ Atmos. Chem. Phys., 11, 13395–13419, 2011
13402 I. Bouarar et al.: Emission sources contributing to tropospheric ozone
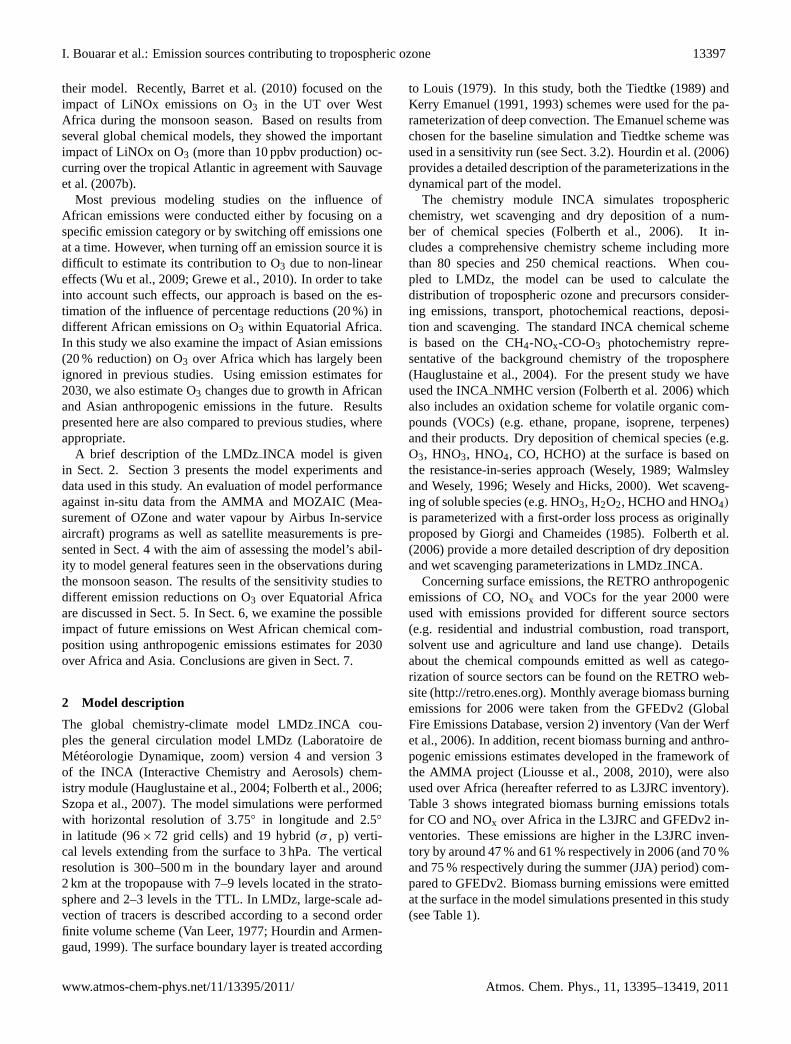
Fig. 3. Vertical CO(a, b), NO (c, d) and O3 (e, f) profiles observed (red dots) during the AMMA campaign in August 2006 and simulated byKE AMMA, TI AMMA and XLiNOx. Observations and model results were divided into flights recently impacted by convection (left) andnot impacted by recent deep convection (right). See text for details. The horizontal lines indicate the standard deviation in the model results.
CONV case. Furthermore, Huntrieser et al. (2011) showedhigher CO, measured by the DLR aircraft, in outflow of MCSobserved over southern forests than over the Sahel region.
The corresponding modelled CO profiles show that themodel is able to capture the general shape of the CO profile.However, the model does not capture the enhanced variabil-ity in the CONV case seen in the data with mean profilesshowing little difference between the CONV and NOCONV
cases in the model. The model simulates convection everyday over large parts of the region and, moreover, due to itslow horizontal resolution, the model is not able to representsingle convective events of the dimension of an MCS. Thelatitude of convection in the model is also less varied thanwas observed with convective uplift occurring, in general be-tween 0 and 15◦ N. It has also been shown more recently in astudy using the dynamical part of the model that convection
Atmos. Chem. Phys., 11, 13395–13419, 2011 www.atmos-chem-phys.net/11/13395/2011/
I. Bouarar et al.: Emission sources contributing to tropospheric ozone 13403
was occurring at midday rather than in the late afternoon seenin the observations (Grandpeix et al., 2010) and this mayalso help to explain the lack of variability in the CONV airmasses.
Differences between the KEAMMA and TI AMMA sim-ulations provide an indication of model sensitivity to dif-ferent convection schemes. KEAMMA is in better agree-ment with the observations in the UT and exhibits higher COconcentrations than TIAMMA although TI AMMA doesshow larger differences between the CONV and NOCONVcases. On the other hand, TIAMMA shows higher CO val-ues in the MT and LT. The Emanuel scheme transports moreCO to the UT indicating deeper convection. However, thisscheme leads to lower CO in the MT due to higher down-drafts of CO-poor air masses from the UT. Using inert CO-like tracer simulations defined over West Africa, Williams etal. (2010a) showed higher tracer concentrations simulated inthe UT in KE AMMA than in models based on Tiedtke (e.g.TM4). In agreement with these results, Hourdin et al. (2010)demonstrated, using an idealized tracer defined over Africain LMDz, that the tracer is injected higher by the Emanuelscheme than by Tiedtke. Furthermore, Barret et al. (2010)also showed that convective uplift into the UT is weaker inmodels based on the Tiedtke scheme.
The NO measurements (see Fig. 3c and d) show increasedvalues (up to 1700 pptv) in the CONV profiles around 200–350 hPa, while lowest values (< 800 pptv) are observed in theNOCONV case. Law et al. (2010) and Barret et al. (2010),in an analysis of M55 and DLR NO data, respectively, alsoshowed clear signatures of NO increases in the UT in con-vectively influenced air masses attributed to production ofNO from lightning and uplift of air masses impacted byNOx emissions from the LT. Stewart et al. (2008) and Delonet al. (2008) showed NOx concentrations exceeding 1 ppbvmeasured by the BAe146 in the LT around 15◦ N. Such en-hancements were attributed to NOx emissions from recentlywetted soils. Uplift of such emissions may also contributeto the observed NO increases in the CONV case. Further-more, Huntrieser et al. (2011) showed that NOx measuredby the DLR in MCS outflow is a mixture of LiNOx andNOx transported upward from the LT. The modelled pro-files underestimate the maximum of NO in the UT, partic-ularly in the CONV case, although KEAMMA has higherNO (150–200 pptv) compared to TIAMMA (50–100 pptv).This difference between the two simulations is due to highercloud top heights in the Emanuel scheme leading to higherlightning NOx production in KEAMMA. It could also bedue to more intense uplift of NOx emissions from the LTin this simulation. Barret et al. (2010) showed that all theglobal models participating in their study underestimatedNO in the UT but LMDzINCA and pTOMCAT were mostable to reproduce elevated NO concentrations. They alsoshowed that the lightning NOx parameterization of Price andRind (1992), based on convective cloud top height, used inmost models including LMDzINCA, tends to underestimate
the flash activity over Central Africa in comparison to satel-lite lightning observations. Tost et al. (2007), using differ-ent convection schemes and lightning parameterizations intheir model, also showed that when using certain convectiveschemes (e.g. Tiedtke, 1989), the parameterization of Priceand Rind (1992) fails to reproduce the maximum of lightningactivity that occurs over West Africa due to the low numberof simulated convective events over this region. They con-cluded that large uncertainties still remain in the present-dayparameterizations of lightning NOx production and even ifa scaling factor is used in most parameterizations to repro-duce the globally observed flash frequency, additional tun-ing of the parameters in convective and lightning schemes isneeded. Based on analysis of LiNOx observations from dif-ferent campaigns including AMMA, Huntrieser et al. (2011)provided different recommendations in order to improve cur-rent LiNOx schemes and discussed some of the parametersthat are crucial for LiNOx estimates and should be con-sidered in LiNOx parameterizations. Weak lightning NOxproduction over Africa in LMDzINCA contributes there-fore to the discrepancy with the observations. In order toimprove model results, lightning NOx production was in-creased by 50 % (+0.58 Tg N) over Africa in sensitivity testXLiNOx (see Table 1). This simulation gives better resultsand shows up to 70 pptv NO increases in the UT in com-parison to KEAMMA. Whilst peak concentrations are stilllower than mean observed values, these results demonstratethe considerable sensitivity of global model results to LiNOxtreatments.
Concerning O3, there are only small differences betweenCONV and NOCONV compared to observed NO and to alesser extent observed CO. This shows that constant persis-tent convection over this region is perturbing on a regionalscale over West Africa making it difficult to distinguishCONV air masses in terms of their O3 concentrations. Also,as shown in the next section, O3 perturbations are higherdownwind over the Atlantic Ocean than over West Africa.In both CONV and NOCONV cases, observed O3 profilesshow increasing concentrations from the LT to around 300–400 hPa where a maximum reaching 80 ppbv was observed.These increases may be a result of either subsidence of O3-rich air masses from the UT to the lowest levels due to con-vective downdrafts, lightning production of NOx or uplift ofNOx emissions from the LT leading to ozone production.Lower concentrations (30–60 ppbv) were measured in theregion of convective outflow (∼200 hPa) as a combined ef-fect of deep convection uplift of O3-poor air masses fromthe forested regions near the Gulf of Guinea (Saunois et al.,2009; Huntrieser et al., 2011), latitudinal redistribution ofO3 precursors by the UT branches of the Hadley cells (seenext section) and import of air masses from the upwind re-gions such as Asia (Law et al., 2010). The model profilesagree reasonably well with the observed vertical distributionwith only small differences between CONV and NOCONVas also observed. Results from KEAMMA show higher O3
www.atmos-chem-phys.net/11/13395/2011/ Atmos. Chem. Phys., 11, 13395–13419, 2011
13404 I. Bouarar et al.: Emission sources contributing to tropospheric ozone
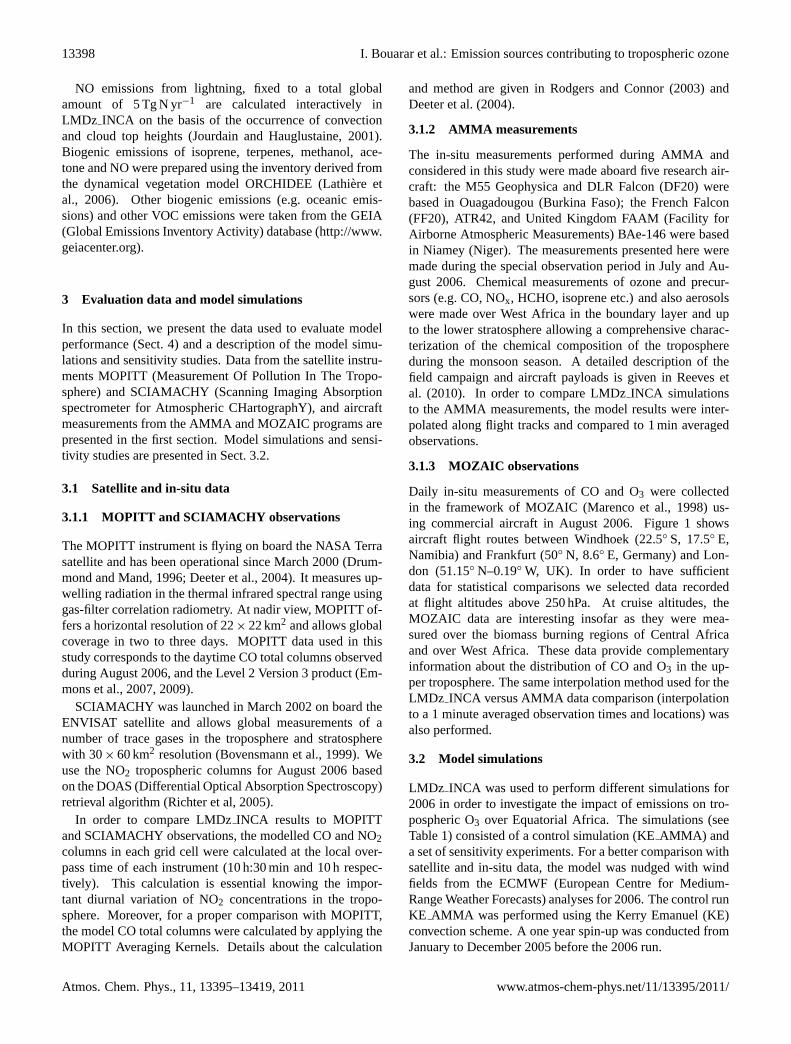
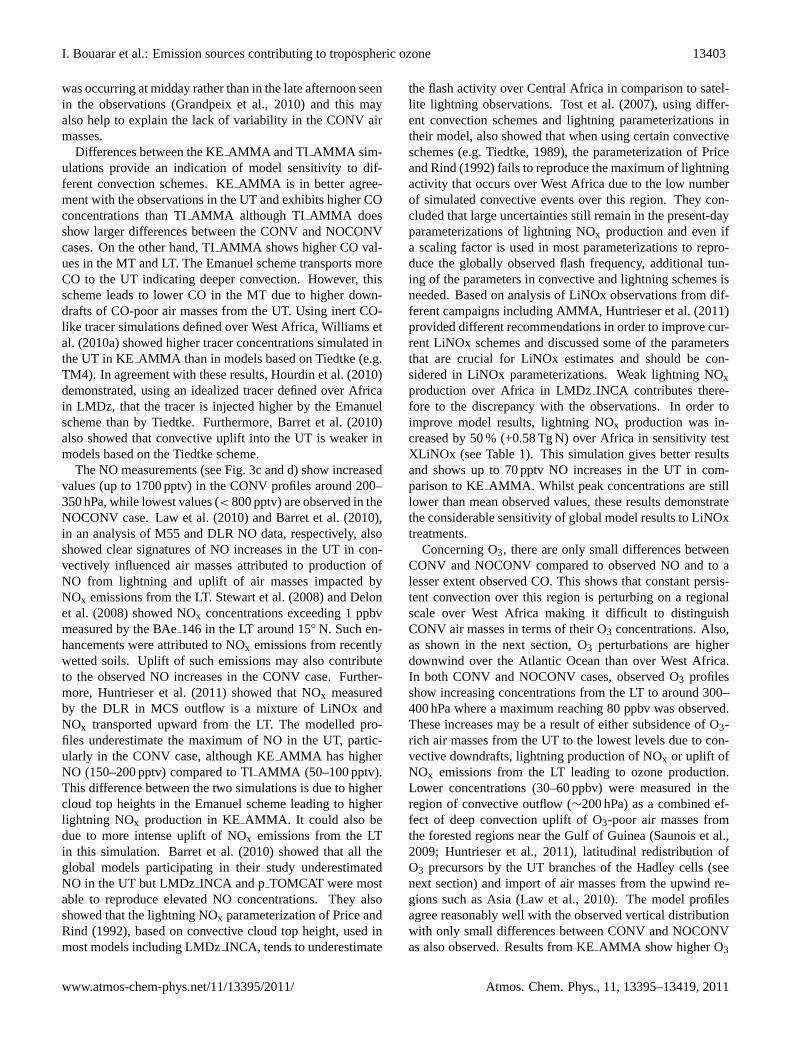
Fig. 4. CO (a) and O3 (b) concentrations (ppbv) observed as a function of latitude by MOZAIC aircraft in August 2006 and correspondingmodel output for the simulations KEAMMA, BB red, Convoff and XLiNOx. See text for details. The vertical lines indicate the standarddeviation in the model results.
concentrations (∼+5 ppbv) in the MT and UT, in particularin the CONV case, compared to TIAMMA. This is due tohigher LiNOx and higher downdrafts of O3-rich air massesfrom the UT in KEAMMA. Increased lightning NOx pro-duction in XLiNOx leads to increased O3 (∼2 ppbv) in theMT and UT.
Overall, this comparison shows that LMDZINCA is ableto reproduce broad features of the vertical profiles observedover West Africa during the summer monsoon although it isunable to capture the higher variability seen in CO data in airmasses recently influenced by convection and the high NOconcentrations observed in the mid and upper troposphere.
4.2 Comparison with MOZAIC data
A preliminary evaluation of LMDzINCA against MOZAICdata was performed by Barret et al. (2010) where resultsfrom the KEAMMA simulation were discussed. Barretet al. (2010) concluded that model performance is sensi-tive to biomass burning emission inventories and differ-ences in convection and chemical schemes may explain dif-ferences between the models. This section further evalu-ates LMDzINCA against MOZAIC data. Figure 4 showsCO and O3 measurements from MOZAIC over Africa at250 hPa during August 2006 compared to model output forthe control simulation (KEAMMA) and various sensitivityexperiments (discussed below). Enhanced CO concentra-tions were observed south of the Equator with a maximumof ∼160 ppbv observed at 8◦ S. KE AMMA captures the lat-itudinal gradient of CO but, in common with other modelsused in Barret et al. (2010), overestimates the measured max-imum. The simulated maximum is higher by about 50 ppbvand is reproduced further north around 3◦ S compared to theobservations. As shown by Barret et al. (2010), deep convec-tion and meridional transport within the upper branch of the
Hadley cell play a key role in the UT CO distribution and canexplain the observed enhancements.
Switching off the convective transport in the Convoff sim-ulation leads to a significant decrease of CO in the UT con-firming that the modelled CO distribution in the African UTis sensitive to convective uplift. BB emissions are an impor-tant source of CO in this region although they are not directlyuplifted by convection over Central Africa but are trans-ported in the LT northward to the convective region over Su-dan/Chad before being uplifted into the UT and redistributedsouthwards over Central Africa by the large-scale Hadley cir-culation. The northward shift in simulated CO maximum inthe UT compared to the observations appears to be due tothe location of convection in the model. Analysis of merid-ional wind speed and vertical velocities from ECMWF andKE AMMA in the UT (not shown) showed strongest ascend-ing winds in the model over West Africa and north of 5◦ Sover Central Africa. Moreover, Barret et al. (2010) showedthat detrainment occurs over a larger meridional region inKE AMMA simulation compared to other models. Compar-isons with results from TIAMMA are in better agreementwith MOZAIC compared to KEAMMA, due to weaker up-lift into the UT, although simulated values are still highercompared to MOZAIC. The overestimation of UT CO inKE AMMA could therefore be due to strong convective up-drafts and detrainment in the Emanuel scheme leading torapid uplift of CO from the LT and redistribution over abroad region. However, as shown by Barret et al. (2010),other global models based on the Tiedtke scheme (TM4and pTOMCAT) also tend to overestimate CO comparedto MOZAIC. Another possibility is that biomass emissionsare too high in the L3JRC dataset. Reducing the AfricanBB emissions by 20 % (i.e.−31 Tg CO in BBred) duringthe JJA period leads to better agreement with MOZAIC COdata. Therefore, the overestimation of UT CO could be due
Atmos. Chem. Phys., 11, 13395–13419, 2011 www.atmos-chem-phys.net/11/13395/2011/
I. Bouarar et al.: Emission sources contributing to tropospheric ozone 13405
to an overestimation of BB emissions. Convective uplift mayalso be too strong over Central Africa since it has only beenpossible to validate vertical profiles further north over WestAfrica where convective uplift of CO seems to be reasonablywell simulated.
Low O3 concentrations (less than 50 ppbv) were observedby MOZAIC over the convective region between 0 and15◦ N. The highest values occur north and south of this re-gion as a result of O3 formation in the upper level branches ofthe Hadley circulation as already reported in previous studies(Sauvage et al., 2007c; Barret et al., 2010). The latitudinaldistribution of O3 observed by MOZAIC is fairly well re-produced by the model simulations although the shape of O3transect south of 5◦ N is not reproduced correctly. However,KE AMMA underestimates O3 by up to 20 ppbv south ofthe Equator at around 10◦ S. Barret et al. (2010) showed thatother models (except MOCAGE) also fail to capture the ob-served maximum and that KEAMMA also underestimatesO3 relative to MLS observations at around 10◦ S. As notedin the comparisons with MOZAIC CO, these discrepanciesmay be due to a combination of factors linked to convectiveuplift and emission sources. Modelled O3 in the UT overCentral Africa is rather insensitive to surface BB emissionswith results from the BBred run showing only small changesin UT O3 relative to KEAMMA (1 ppbv decreases south ofthe Equator). Results from emission sensitivity runs (seeSect. 5.4 and Fig. 9) confirm this low model sensitivity toCentral African BB emissions, despite significant convectiveuplift of these emissions. UT O3 is also sensitive to availableNOx and so, it is possible that there is insufficient modelledphotochemical production in BB air masses or too much pro-duction of HNO3, which is then washed out during convec-tion leading to too little O3 in the UT. Modelled UT O3 is alsorather insensitive to other surface emissions (biogenic VOCs,soil NOx and anthropogenic sources<1 ppbv O3 changes).On the other hand, model results are most sensitive to light-ning NOx emissions (see Sect. 5) which, following the anal-ysis presented in the previous section, are underestimated.This direct injection of NOx leading to photochemical O3production downwind is a significant source of O3 in the UT.Increasing lightning NOx production by 50 % over Africa inthe XLiNOx simulation during JJA leads to higher O3 con-centrations (up to 6 ppbv) south of the Equator. The influenceof lightning NOx, which is mainly produced over West Africaduring the monsoon season, extends up to Central Africa dueto southward redistribution of such emissions in the UT bythe Hadley circulation (see Sect. 5.1 and Fig. 6). This is alsoconfirmed by the Convoff experiment, where both lightningNOx emissions and convection were switched off. In thisrun, the underestimation of UT O3 in LMDz INCA is morepronounced compared to KEAMMA.
Thus, while overestimation of convective uplift and BBemissions may explain the overestimation of MOZAIC COdata, a combination of weak lightning NOx emissions andweak photochemical production in uplifted (BB) air masses
may explain the underestimation of MOZAIC O3. Enhancedwashout of NOx reservoir species, linked to strong convec-tion, may also impact the amount of NOx available for O3production over downwind regions over Central Africa in themodel.
4.3 Comparison with satellite data
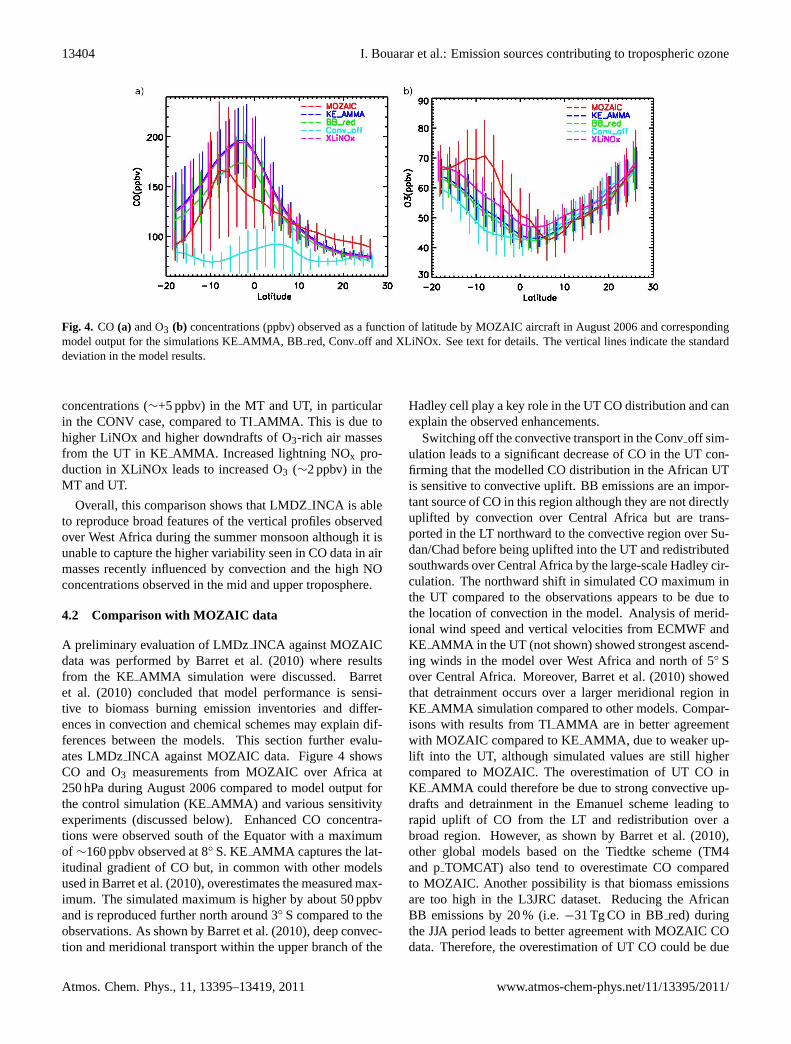
To evaluate the spatial distribution of O3 precursors, Fig-ure 5 shows average total columns of CO and troposphericcolumns of NO2 observed during August 2006 compared tomodel results from the KEAMMA and BB red simulations.Strong CO enhancements are observed over the BB region inCentral Africa and over the outflow regions in the AtlanticOcean and Gulf of Guinea. Whilst spatial distribution isreasonably well reproduced, total CO columns are overesti-mated over Central Africa and downwind as far as the Brazil-ian coast in KEAMMA (+50 %). CO columns in BBredshow lower values (∼−15 %) over Central Africa comparedto KE AMMA. Therefore, the discrepancy in KEAMMAappears to be due to an overestimation of CO from AfricanBB emissions in the L3JRC inventory as already discussedin the previous section. In another model simulation basedon the GFEDv2 inventory (not shown) total CO was too lowconfirming that Central African BB emissions are underes-timated in this inventory. Therefore, the CO BB emissionsover Africa during the monsoon season probably lie betweenthe GFEDv2 and L3JRC inventories, as already suggested byBarret et al. (2010). Another possible reason for the discrep-ancy in KEAMMA is the uncertainty in MOPITT retrievalswhich are less sensitive to CO concentrations at the lowestaltitudes (Emmons et al., 2007, 2009). Emmons et al. (2009)found that CO columns larger than 4× 10¹⁸ mol cm−2 arenot considered in the MOPITT V3 product used in this study.This may lead therefore to a negative bias in MOPITT mea-surements over regions such as Central Africa. The mod-elled NO2 tropospheric columns agree reasonably well withSCIAMACHY measurements although the simulated max-imum over Central Africa is overestimated. This discrep-ancy may be attributed to an overestimation of BB emis-sions in L3JRC or to the uncertainties in satellite measure-ments of NO2 (van Noije et al., 2006). The model capturesthe enhanced NO2 observed over the anthropogenic emis-sions sources of South Africa but underestimates the ob-served maximum. Westward export from Central Africa ismore northerly in both NO2 and CO measurements than inthe model. This could explain therefore the low NO2 valuessimulated over the Gulf of Guinea.
Another possible explanation for the discrepancy betweenKE AMMA and satellite column data is the fact that bothMOPITT and SCIAMACHY retrievals are biased to clearsky scenes. Indeed, this reduces the number of observa-tions available for comparison and thereby increases the un-certainty in the observations. Furthermore, the satellite datamay underestimate CO and NO2 from fires if there is a lot of
www.atmos-chem-phys.net/11/13395/2011/ Atmos. Chem. Phys., 11, 13395–13419, 2011
13406 I. Bouarar et al.: Emission sources contributing to tropospheric ozone
Fig. 5. Total columns of CO (1018molec cm−2) and tropospheric columns of NO2 (1015molec cm−2) observed by MOPITT(a) andSCIAMACHY (d) respectively and corresponding KEAMMA and BB red simulations(b, c, e)averaged for August 2006.
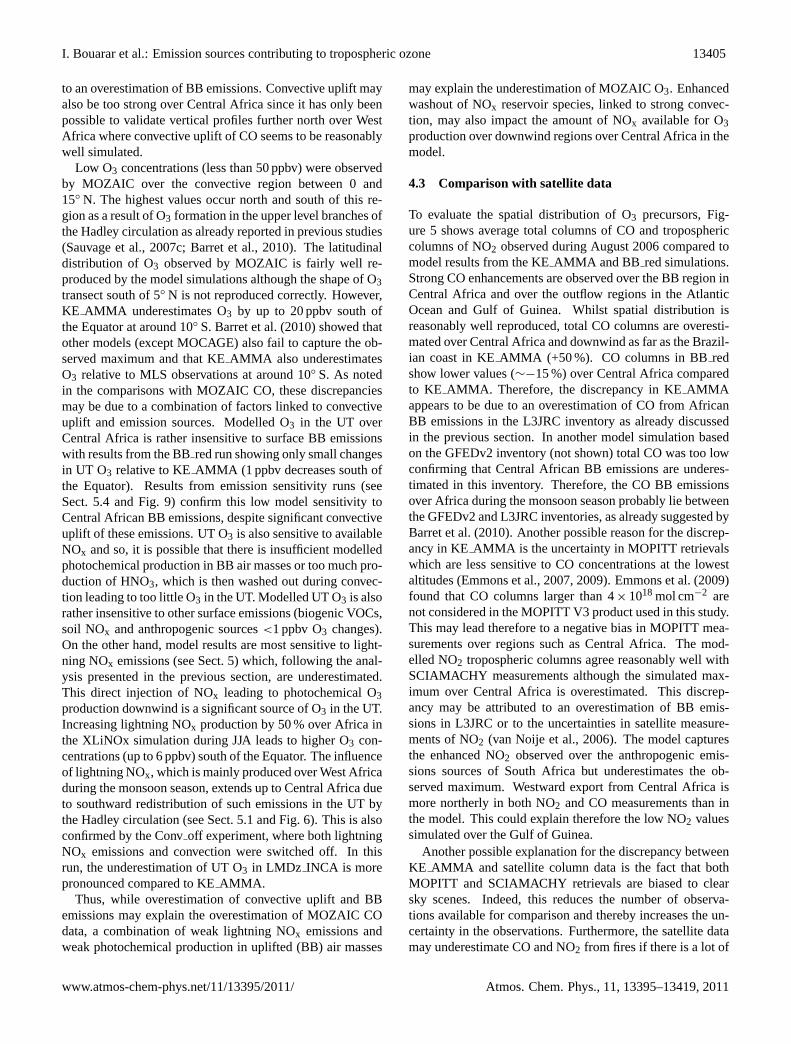
Fig. 6. KE AMMA - LiNOx red O3 differences (1O3) in ppbv at 545 hPa(a) and 240 hPa(b).
aerosol or clouds obscuring the fire regions. However, thisis difficult to account for since there is no readily availableinformation on the presence of aerosols, their distributionand type. Furthermore, the BB emissions occur over CentralAfrica far from the cloudy convective regions associated withthe summer monsoon. However, some data may be missedif aerosol or smoke is mistaken as cloud but this depends onfire type and phase during the satellite overpass.
In summary, this comparison against observations showsthat the model performs reasonably well over West Africa interms of ability to model the spatial and vertical distributionof O3 and its precursors. However, model results are im-proved in runs with higher lightning NOx and lower BBemissions. This point is taken into account in the follow-ing analysis of the emissions contributing to O3 distributionsover West Africa and downwind.
5 Influence of African and Asian emissions
In this section, we investigate the contribution of Africanemissions to O3 distributions over Equatorial Africa dur-ing the monsoon season. The impact of downwind trans-port of different emissions on O3 is also discussed. Modelruns starting in May 2006 were performed with a small per-turbation (−20 %) to the following emission categories overAfrica (see Fig. 1): lightning NOx, soil NOx, biogenic VOCs,biomass burning, or anthropogenic emissions (see Table 1).In the case of LiNOx, we also comment on the results ob-tained from the XLiNOx run when LiNOx emissions wereincreased by 50 % in the model since these results agreebetter with the observations. In the following sections, thedifference (1O3) in the simulated O3 concentrations dur-ing JJA between the control experiment and sensitivity testswhen various emissions were reduced are examined. This
Atmos. Chem. Phys., 11, 13395–13419, 2011 www.atmos-chem-phys.net/11/13395/2011/
I. Bouarar et al.: Emission sources contributing to tropospheric ozone 13407
analysis allows identification of regions where O3 is influ-enced by different emissions. In order to quantify the sensi-tivity of reducing different emissions on O3, the calculated1O3 were also normalized by dividing by the unit change inNOx (1 Tg N) and carbon (1 Tg C) emissions (see Sect. 5.7).
5.1 Influence of lightning NOx
Figure 6 depicts the impact of reducing LiNOx by 20 %over Africa (LiNOx red) on O3 concentrations. The maininfluence on O3 can be seen in the MT and UT where O3concentrations change by 1 to 2 ppbv and 2 to 3 ppbv, re-spectively. O3 changes occur principally over the convectiveregions of West Africa and downwind over the tropical At-lantic and Central Africa. Results from other models, dis-cussed in Barret et al. (2010), showed similar regions im-pacted by LiNOx during August 2006. In an analysis ofmodelled total O3 columns, Sauvage et al. (2007b) showeda large influence of LiNOx on O3 over the Central Atlanticduring JJA 2000 in their model. Differences exist however inthe maximum influence which occurred between 10◦ S and10◦ N in Sauvage et al. (2007b), but is found north of 10◦ Nin LMDz INCA. This was also the case in p-TOMCAT, asshown in Barret et al. (2010), although other models partic-ipating in that study showed lower O3 enhancements overthis region and maximum changes between 0 and 10◦ N (e.g.in TM4). This large spatial influence of LiNOx on O3 canbe explained by the advection of NOx-rich air masses fromAfrica downwind to other regions by the AEJ in the MT, andthe TEJ in the UT followed by photochemical O3 production.The large-scale Hadley circulation also redistributes UT airmasses north and south (as discussed in Sect. 4.2). Analy-sis of the XLiNOx results showed that increasing by 50 %the LiNOx in the model leads to O3 changes up to 6 ppbv inthe UT compared to KEAMMA. Excluding all the LiNOxemissions over Africa in LMDzINCA leads to O3 changesof up to 20 ppbv in the UT (as discussed in Barret et al.,2010). Maximum O3 changes in other models (MOCAGEand TM4) were lower (10 ppbv and 15 ppbv respectively) in-dicating a higher influence of LiNOx on O3 in LMDz INCA.Overall, these results show that O3 changes due to 100 %LiNOx perturbation are higher than 2 times the changes dueto a 50 % perturbation (XLiNOx) and even higher than 5times the changes due to a 20 % perturbation (LiNOxred).This suggests that the response of O3 changes to LiNOx per-turbations in LMDzINCA shows a strong nonlinearity.
5.2 Influence of soil NOx
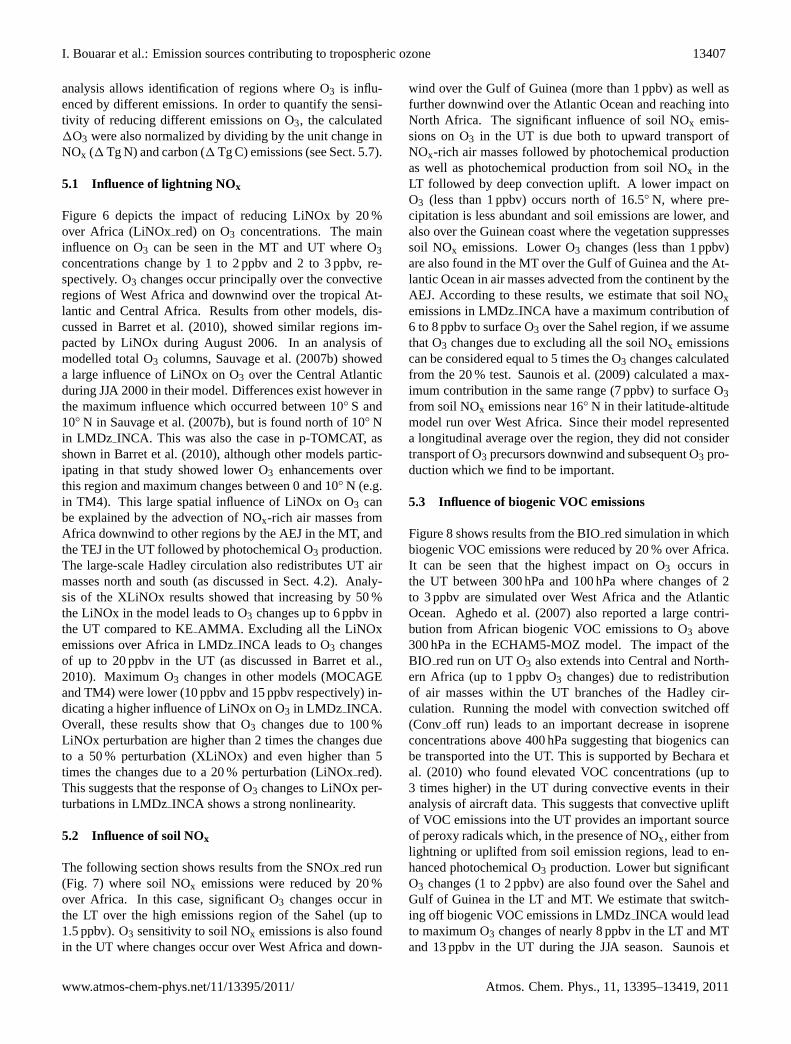
The following section shows results from the SNOxred run(Fig. 7) where soil NOx emissions were reduced by 20 %over Africa. In this case, significant O3 changes occur inthe LT over the high emissions region of the Sahel (up to1.5 ppbv). O3 sensitivity to soil NOx emissions is also foundin the UT where changes occur over West Africa and down-
wind over the Gulf of Guinea (more than 1 ppbv) as well asfurther downwind over the Atlantic Ocean and reaching intoNorth Africa. The significant influence of soil NOx emis-sions on O3 in the UT is due both to upward transport ofNOx-rich air masses followed by photochemical productionas well as photochemical production from soil NOx in theLT followed by deep convection uplift. A lower impact onO3 (less than 1 ppbv) occurs north of 16.5◦ N, where pre-cipitation is less abundant and soil emissions are lower, andalso over the Guinean coast where the vegetation suppressessoil NOx emissions. Lower O3 changes (less than 1 ppbv)are also found in the MT over the Gulf of Guinea and the At-lantic Ocean in air masses advected from the continent by theAEJ. According to these results, we estimate that soil NOxemissions in LMDzINCA have a maximum contribution of6 to 8 ppbv to surface O3 over the Sahel region, if we assumethat O3 changes due to excluding all the soil NOx emissionscan be considered equal to 5 times the O3 changes calculatedfrom the 20 % test. Saunois et al. (2009) calculated a max-imum contribution in the same range (7 ppbv) to surface O3from soil NOx emissions near 16◦ N in their latitude-altitudemodel run over West Africa. Since their model representeda longitudinal average over the region, they did not considertransport of O3 precursors downwind and subsequent O3 pro-duction which we find to be important.
5.3 Influence of biogenic VOC emissions
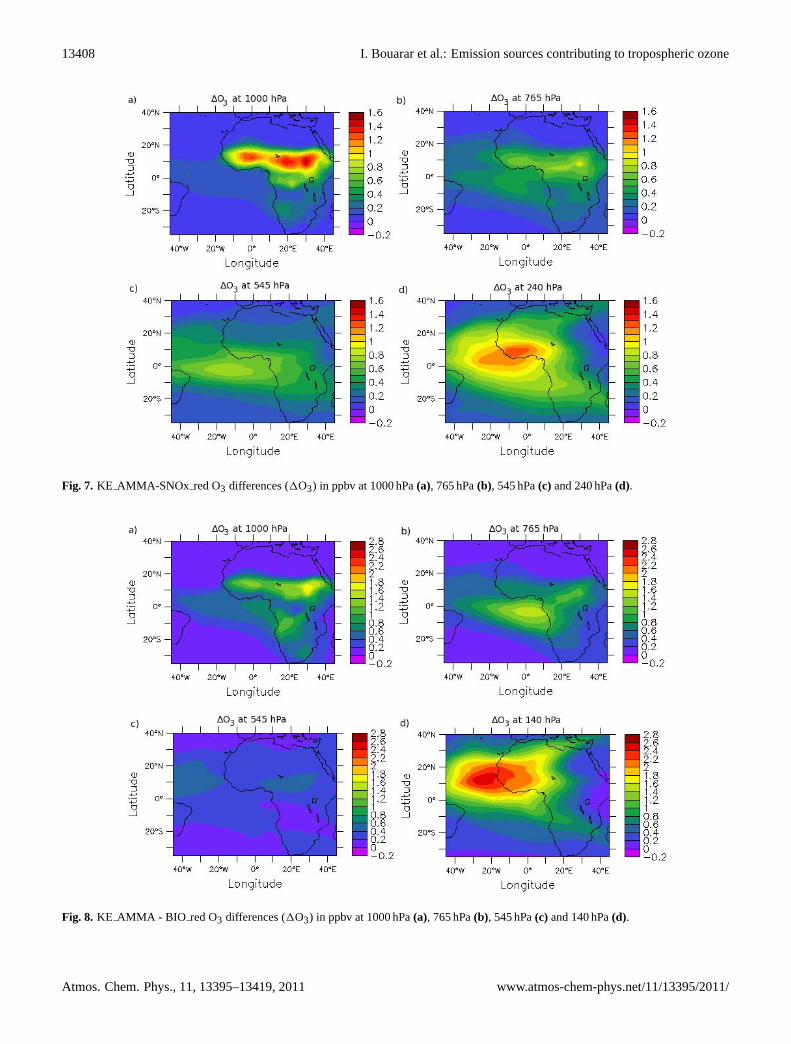
Figure 8 shows results from the BIOred simulation in whichbiogenic VOC emissions were reduced by 20 % over Africa.It can be seen that the highest impact on O3 occurs inthe UT between 300 hPa and 100 hPa where changes of 2to 3 ppbv are simulated over West Africa and the AtlanticOcean. Aghedo et al. (2007) also reported a large contri-bution from African biogenic VOC emissions to O3 above300 hPa in the ECHAM5-MOZ model. The impact of theBIO red run on UT O3 also extends into Central and North-ern Africa (up to 1 ppbv O3 changes) due to redistributionof air masses within the UT branches of the Hadley cir-culation. Running the model with convection switched off(Conv off run) leads to an important decrease in isopreneconcentrations above 400 hPa suggesting that biogenics canbe transported into the UT. This is supported by Bechara etal. (2010) who found elevated VOC concentrations (up to3 times higher) in the UT during convective events in theiranalysis of aircraft data. This suggests that convective upliftof VOC emissions into the UT provides an important sourceof peroxy radicals which, in the presence of NOx, either fromlightning or uplifted from soil emission regions, lead to en-hanced photochemical O3 production. Lower but significantO3 changes (1 to 2 ppbv) are also found over the Sahel andGulf of Guinea in the LT and MT. We estimate that switch-ing off biogenic VOC emissions in LMDzINCA would leadto maximum O3 changes of nearly 8 ppbv in the LT and MTand 13 ppbv in the UT during the JJA season. Saunois et
www.atmos-chem-phys.net/11/13395/2011/ Atmos. Chem. Phys., 11, 13395–13419, 2011
13408 I. Bouarar et al.: Emission sources contributing to tropospheric ozone
Fig. 7. KE AMMA-SNOx red O3 differences (1O3) in ppbv at 1000 hPa(a), 765 hPa(b), 545 hPa(c) and 240 hPa(d).
Fig. 8. KE AMMA - BIO red O3 differences (1O3) in ppbv at 1000 hPa(a), 765 hPa(b), 545 hPa(c) and 140 hPa(d).
Atmos. Chem. Phys., 11, 13395–13419, 2011 www.atmos-chem-phys.net/11/13395/2011/
I. Bouarar et al.: Emission sources contributing to tropospheric ozone 13409
al. (2009) calculated maximum O3 changes of 5 ppbv in theLT around 16◦ N and found no significant impact between6◦ N and 13◦ N while in LMDz INCA O3 changes can reach4 ppbv over the same region. This difference may be dueto differences in VOC and NOx emissions, and to the factthat only isoprene and terpenes emissions were switched offin Saunois et al. (2009), while other VOCs (e.g. methanol)were also switched off in BIOred. Aghedo et al. (2007) cal-culated O3 changes of 10 to 30 ppbv in the LT when bothbiogenic VOCs and soil NOx emissions were excluded fromtheir model. Since ozone changes of up to 8 ppbv were foundin the BIO red and SNOxred tests in LMDzINCA, we canexpect to see O3 changes of more than 8 ppbv if both VOCand soil NOx emissions are switched off in the model.
5.4 Influence of biomass burning emissions
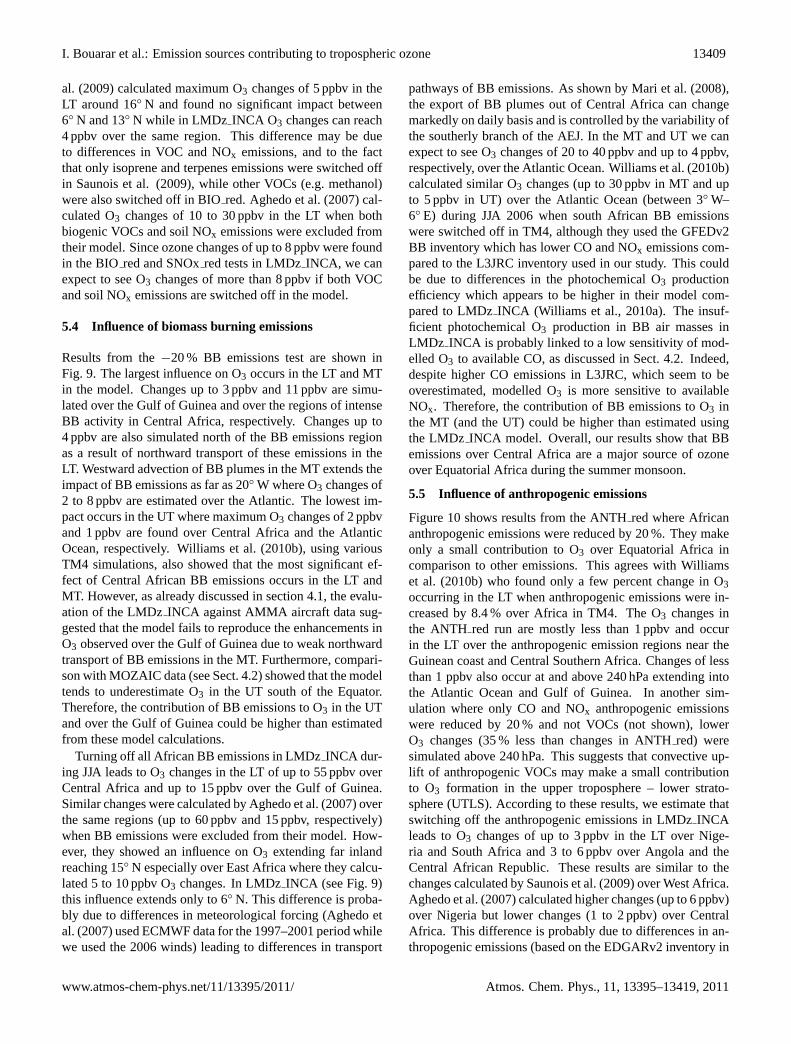
Results from the−20 % BB emissions test are shown inFig. 9. The largest influence on O3 occurs in the LT and MTin the model. Changes up to 3 ppbv and 11 ppbv are simu-lated over the Gulf of Guinea and over the regions of intenseBB activity in Central Africa, respectively. Changes up to4 ppbv are also simulated north of the BB emissions regionas a result of northward transport of these emissions in theLT. Westward advection of BB plumes in the MT extends theimpact of BB emissions as far as 20◦ W where O3 changes of2 to 8 ppbv are estimated over the Atlantic. The lowest im-pact occurs in the UT where maximum O3 changes of 2 ppbvand 1 ppbv are found over Central Africa and the AtlanticOcean, respectively. Williams et al. (2010b), using variousTM4 simulations, also showed that the most significant ef-fect of Central African BB emissions occurs in the LT andMT. However, as already discussed in section 4.1, the evalu-ation of the LMDzINCA against AMMA aircraft data sug-gested that the model fails to reproduce the enhancements inO3 observed over the Gulf of Guinea due to weak northwardtransport of BB emissions in the MT. Furthermore, compari-son with MOZAIC data (see Sect. 4.2) showed that the modeltends to underestimate O3 in the UT south of the Equator.Therefore, the contribution of BB emissions to O3 in the UTand over the Gulf of Guinea could be higher than estimatedfrom these model calculations.
Turning off all African BB emissions in LMDzINCA dur-ing JJA leads to O3 changes in the LT of up to 55 ppbv overCentral Africa and up to 15 ppbv over the Gulf of Guinea.Similar changes were calculated by Aghedo et al. (2007) overthe same regions (up to 60 ppbv and 15 ppbv, respectively)when BB emissions were excluded from their model. How-ever, they showed an influence on O3 extending far inlandreaching 15◦ N especially over East Africa where they calcu-lated 5 to 10 ppbv O3 changes. In LMDzINCA (see Fig. 9)this influence extends only to 6◦ N. This difference is proba-bly due to differences in meteorological forcing (Aghedo etal. (2007) used ECMWF data for the 1997–2001 period whilewe used the 2006 winds) leading to differences in transport
pathways of BB emissions. As shown by Mari et al. (2008),the export of BB plumes out of Central Africa can changemarkedly on daily basis and is controlled by the variability ofthe southerly branch of the AEJ. In the MT and UT we canexpect to see O3 changes of 20 to 40 ppbv and up to 4 ppbv,respectively, over the Atlantic Ocean. Williams et al. (2010b)calculated similar O3 changes (up to 30 ppbv in MT and upto 5 ppbv in UT) over the Atlantic Ocean (between 3◦ W–6◦ E) during JJA 2006 when south African BB emissionswere switched off in TM4, although they used the GFEDv2BB inventory which has lower CO and NOx emissions com-pared to the L3JRC inventory used in our study. This couldbe due to differences in the photochemical O3 productionefficiency which appears to be higher in their model com-pared to LMDzINCA (Williams et al., 2010a). The insuf-ficient photochemical O3 production in BB air masses inLMDz INCA is probably linked to a low sensitivity of mod-elled O3 to available CO, as discussed in Sect. 4.2. Indeed,despite higher CO emissions in L3JRC, which seem to beoverestimated, modelled O3 is more sensitive to availableNOx. Therefore, the contribution of BB emissions to O3 inthe MT (and the UT) could be higher than estimated usingthe LMDz INCA model. Overall, our results show that BBemissions over Central Africa are a major source of ozoneover Equatorial Africa during the summer monsoon.
5.5 Influence of anthropogenic emissions
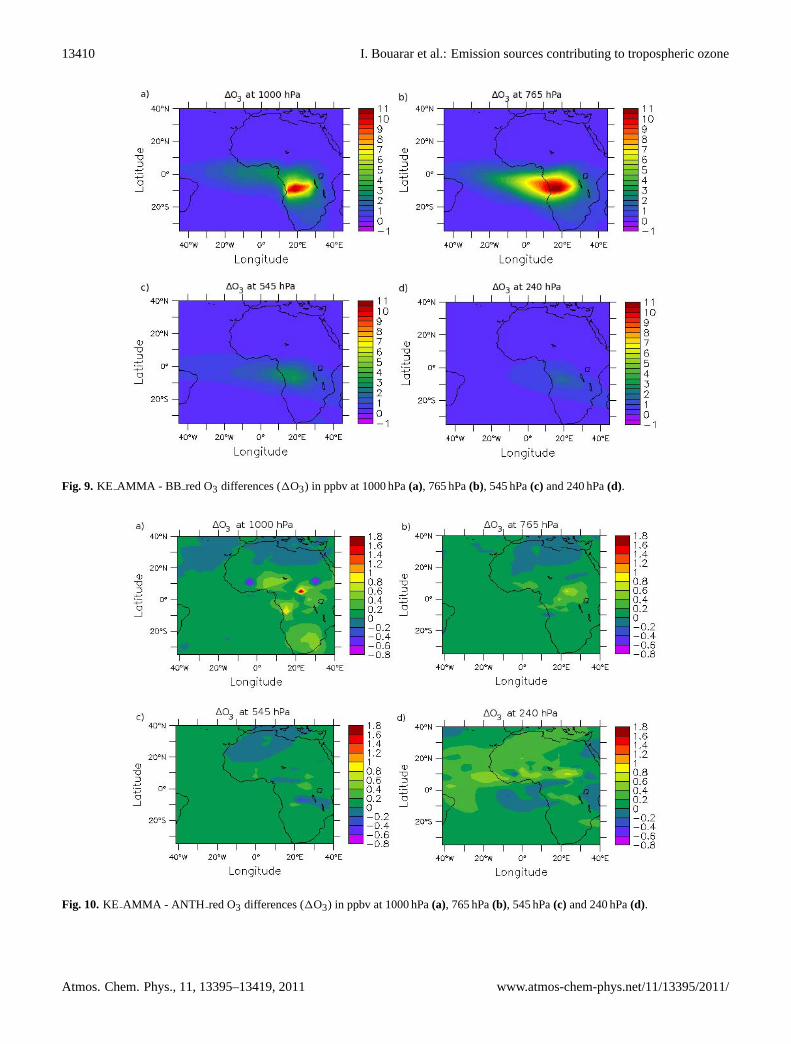
Figure 10 shows results from the ANTHred where Africananthropogenic emissions were reduced by 20 %. They makeonly a small contribution to O3 over Equatorial Africa incomparison to other emissions. This agrees with Williamset al. (2010b) who found only a few percent change in O3occurring in the LT when anthropogenic emissions were in-creased by 8.4 % over Africa in TM4. The O3 changes inthe ANTH red run are mostly less than 1 ppbv and occurin the LT over the anthropogenic emission regions near theGuinean coast and Central Southern Africa. Changes of lessthan 1 ppbv also occur at and above 240 hPa extending intothe Atlantic Ocean and Gulf of Guinea. In another sim-ulation where only CO and NOx anthropogenic emissionswere reduced by 20 % and not VOCs (not shown), lowerO3 changes (35 % less than changes in ANTHred) weresimulated above 240 hPa. This suggests that convective up-lift of anthropogenic VOCs may make a small contributionto O3 formation in the upper troposphere – lower strato-sphere (UTLS). According to these results, we estimate thatswitching off the anthropogenic emissions in LMDzINCAleads to O3 changes of up to 3 ppbv in the LT over Nige-ria and South Africa and 3 to 6 ppbv over Angola and theCentral African Republic. These results are similar to thechanges calculated by Saunois et al. (2009) over West Africa.Aghedo et al. (2007) calculated higher changes (up to 6 ppbv)over Nigeria but lower changes (1 to 2 ppbv) over CentralAfrica. This difference is probably due to differences in an-thropogenic emissions (based on the EDGARv2 inventory in
www.atmos-chem-phys.net/11/13395/2011/ Atmos. Chem. Phys., 11, 13395–13419, 2011
13410 I. Bouarar et al.: Emission sources contributing to tropospheric ozone
Fig. 9. KE AMMA - BB red O3 differences (1O3) in ppbv at 1000 hPa(a), 765 hPa(b), 545 hPa(c) and 240 hPa(d).
Fig. 10. KE AMMA - ANTH red O3 differences (1O3) in ppbv at 1000 hPa(a), 765 hPa(b), 545 hPa(c) and 240 hPa(d).
Atmos. Chem. Phys., 11, 13395–13419, 2011 www.atmos-chem-phys.net/11/13395/2011/
I. Bouarar et al.: Emission sources contributing to tropospheric ozone 13411
Table 2. Percentage and absolute differences in African andAsian anthropogenic emissions of CO, NOx and VOCs between theAMMA and IPCC RCP45 emission scenario for 2030.
Species Difference over Africa Difference over Asia
CO +150 % (85 Tg(CO) yr−1) +70 % (145 Tg(CO) yr−1)NOx +18 % (0.5 Tg(N) yr−1) +65 % (3.8 Tg(N) yr−1)VOCs −0.1 Tg(C) yr−1 +73 % (19.5 Tg(C) yr−1)
Aghedo et al., 2007) and their spatial distribution. Whilst,present-day anthropogenic emissions appear to have a smallinfluence on O3, they may increase in the near future, in par-ticular over Africa and Asia, according to IPCC AR5 emis-sions scenarios. This is examined further in Sect. 6.
5.6 Influence of Asian emissions
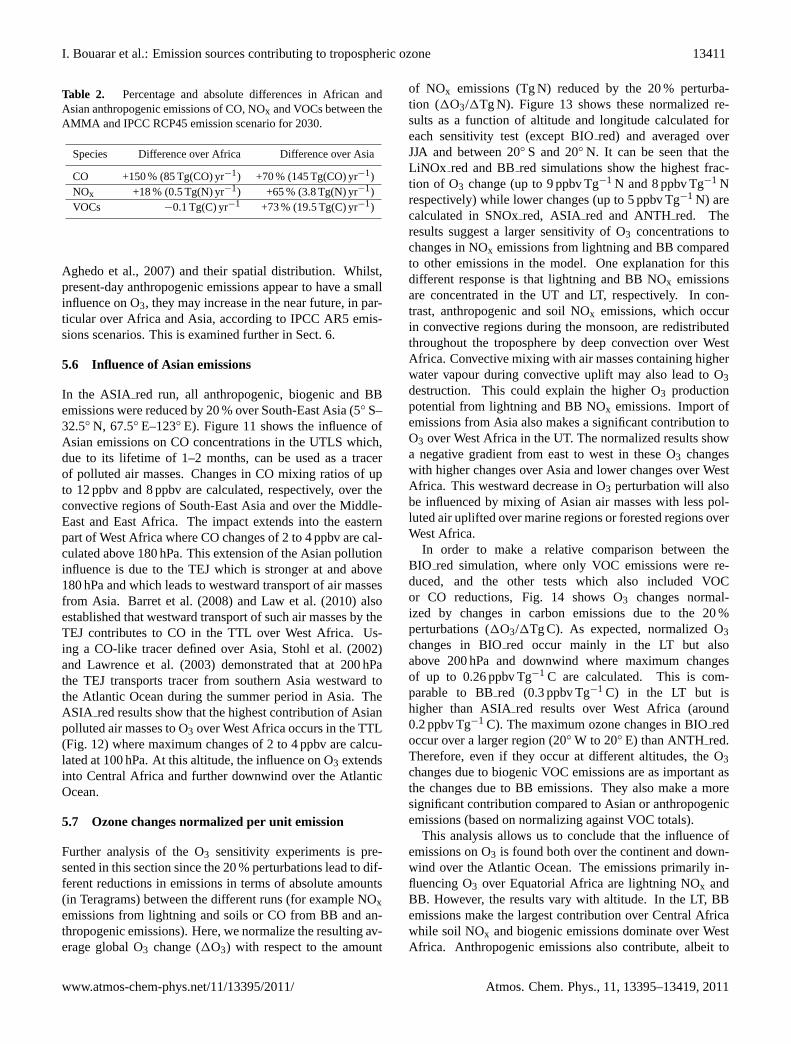
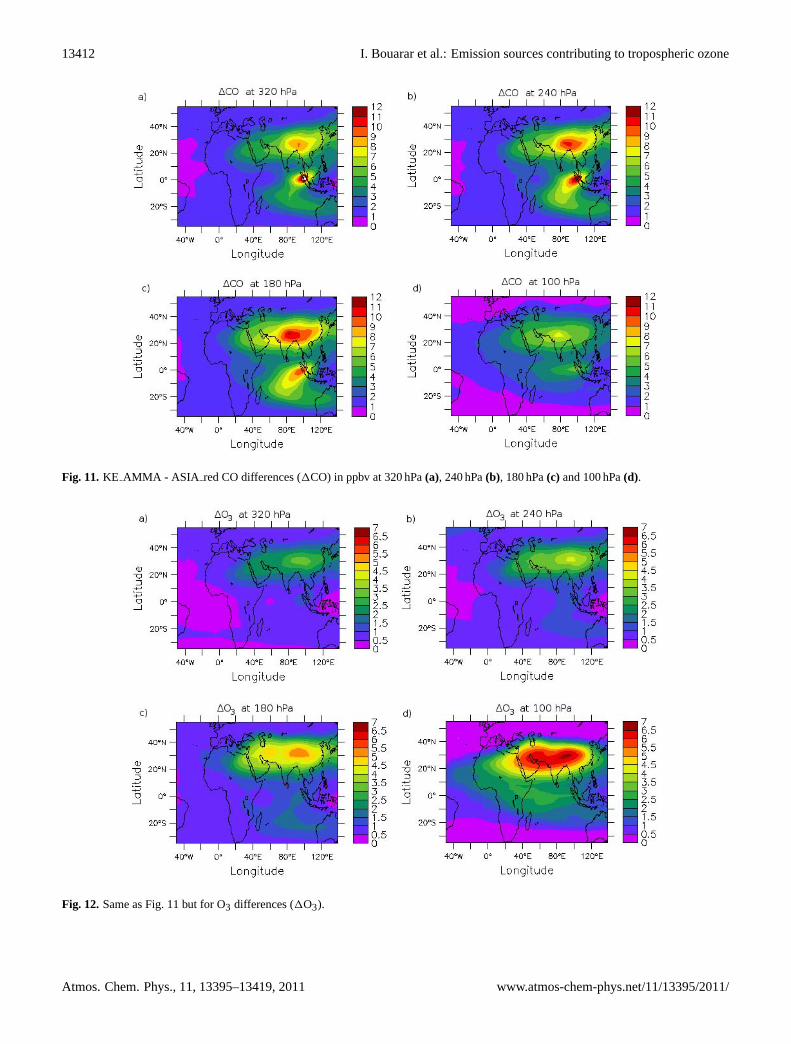
In the ASIA red run, all anthropogenic, biogenic and BBemissions were reduced by 20 % over South-East Asia (5◦ S–32.5◦ N, 67.5◦ E–123◦ E). Figure 11 shows the influence ofAsian emissions on CO concentrations in the UTLS which,due to its lifetime of 1–2 months, can be used as a tracerof polluted air masses. Changes in CO mixing ratios of upto 12 ppbv and 8 ppbv are calculated, respectively, over theconvective regions of South-East Asia and over the Middle-East and East Africa. The impact extends into the easternpart of West Africa where CO changes of 2 to 4 ppbv are cal-culated above 180 hPa. This extension of the Asian pollutioninfluence is due to the TEJ which is stronger at and above180 hPa and which leads to westward transport of air massesfrom Asia. Barret et al. (2008) and Law et al. (2010) alsoestablished that westward transport of such air masses by theTEJ contributes to CO in the TTL over West Africa. Us-ing a CO-like tracer defined over Asia, Stohl et al. (2002)and Lawrence et al. (2003) demonstrated that at 200 hPathe TEJ transports tracer from southern Asia westward tothe Atlantic Ocean during the summer period in Asia. TheASIA red results show that the highest contribution of Asianpolluted air masses to O3 over West Africa occurs in the TTL(Fig. 12) where maximum changes of 2 to 4 ppbv are calcu-lated at 100 hPa. At this altitude, the influence on O3 extendsinto Central Africa and further downwind over the AtlanticOcean.
5.7 Ozone changes normalized per unit emission
Further analysis of the O3 sensitivity experiments is pre-sented in this section since the 20 % perturbations lead to dif-ferent reductions in emissions in terms of absolute amounts(in Teragrams) between the different runs (for example NOxemissions from lightning and soils or CO from BB and an-thropogenic emissions). Here, we normalize the resulting av-erage global O3 change (1O3) with respect to the amount
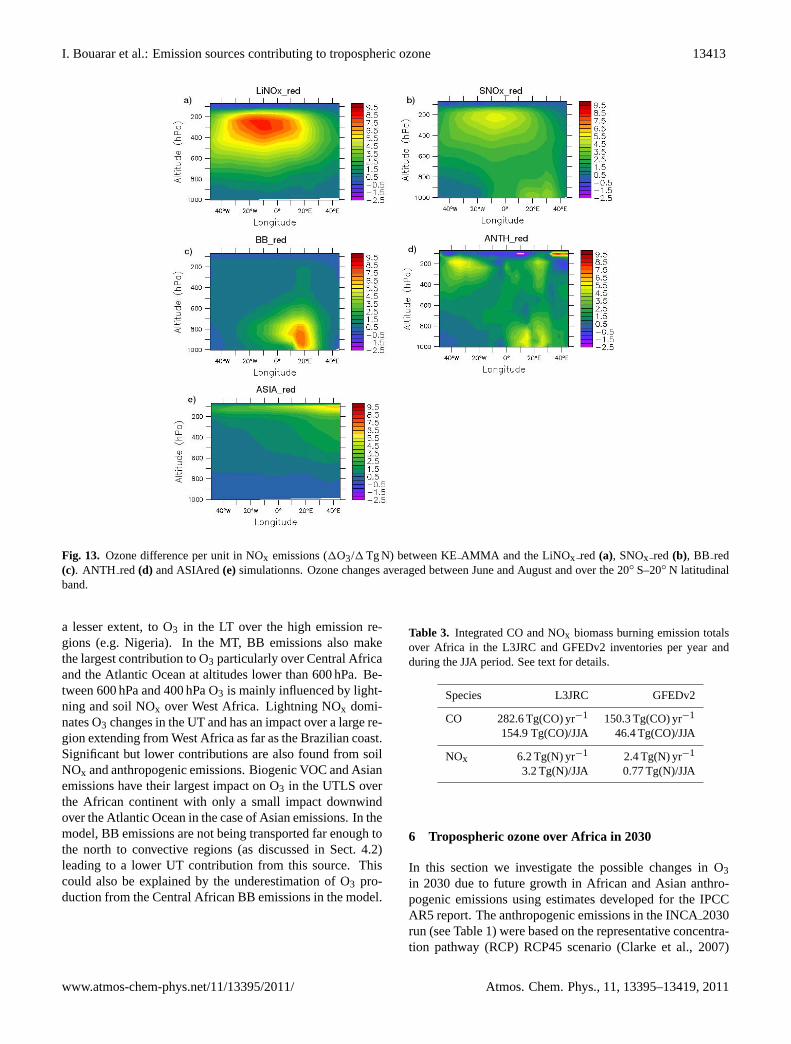
of NOx emissions (Tg N) reduced by the 20 % perturba-tion (1O3/1Tg N). Figure 13 shows these normalized re-sults as a function of altitude and longitude calculated foreach sensitivity test (except BIOred) and averaged overJJA and between 20◦ S and 20◦ N. It can be seen that theLiNOx red and BBred simulations show the highest frac-tion of O3 change (up to 9 ppbv Tg−1 N and 8 ppbv Tg−1 Nrespectively) while lower changes (up to 5 ppbv Tg−1 N) arecalculated in SNOxred, ASIA red and ANTHred. Theresults suggest a larger sensitivity of O3 concentrations tochanges in NOx emissions from lightning and BB comparedto other emissions in the model. One explanation for thisdifferent response is that lightning and BB NOx emissionsare concentrated in the UT and LT, respectively. In con-trast, anthropogenic and soil NOx emissions, which occurin convective regions during the monsoon, are redistributedthroughout the troposphere by deep convection over WestAfrica. Convective mixing with air masses containing higherwater vapour during convective uplift may also lead to O3destruction. This could explain the higher O3 productionpotential from lightning and BB NOx emissions. Import ofemissions from Asia also makes a significant contribution toO3 over West Africa in the UT. The normalized results showa negative gradient from east to west in these O3 changeswith higher changes over Asia and lower changes over WestAfrica. This westward decrease in O3 perturbation will alsobe influenced by mixing of Asian air masses with less pol-luted air uplifted over marine regions or forested regions overWest Africa.
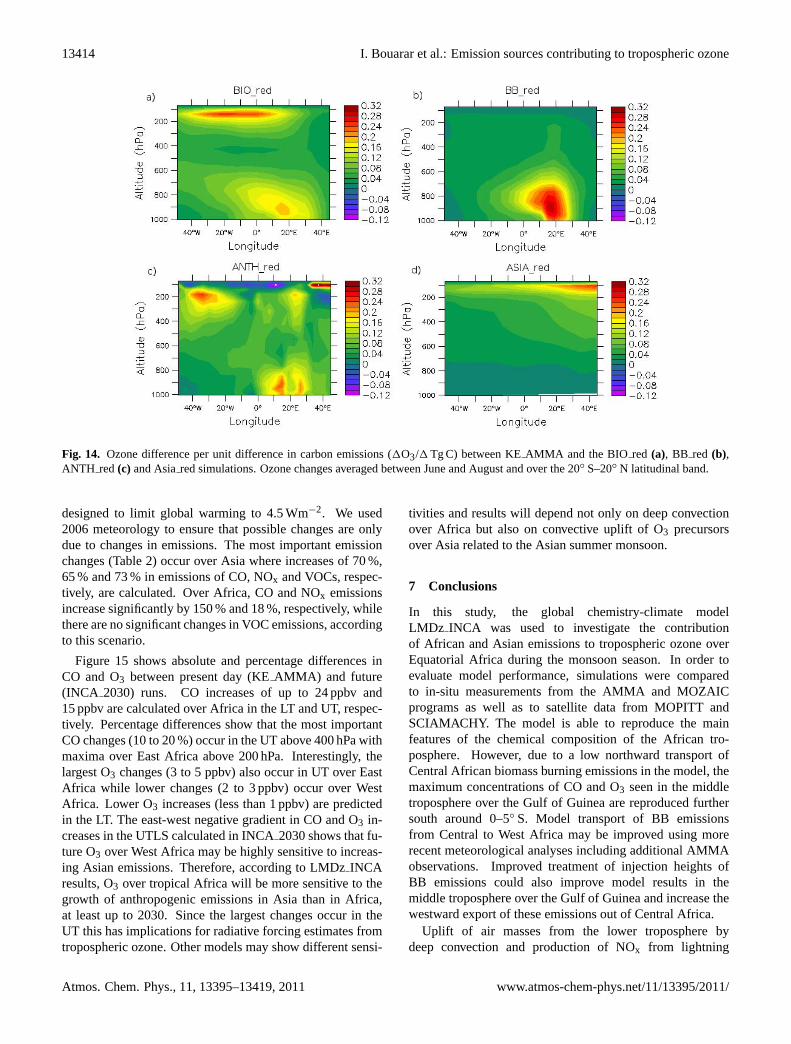
In order to make a relative comparison between theBIO red simulation, where only VOC emissions were re-duced, and the other tests which also included VOCor CO reductions, Fig. 14 shows O3 changes normal-ized by changes in carbon emissions due to the 20 %perturbations (1O3/1Tg C). As expected, normalized O3changes in BIOred occur mainly in the LT but alsoabove 200 hPa and downwind where maximum changesof up to 0.26 ppbv Tg−1 C are calculated. This is com-parable to BBred (0.3 ppbv Tg−1 C) in the LT but ishigher than ASIAred results over West Africa (around0.2 ppbv Tg−1 C). The maximum ozone changes in BIOredoccur over a larger region (20◦ W to 20◦ E) than ANTHred.Therefore, even if they occur at different altitudes, the O3changes due to biogenic VOC emissions are as important asthe changes due to BB emissions. They also make a moresignificant contribution compared to Asian or anthropogenicemissions (based on normalizing against VOC totals).
This analysis allows us to conclude that the influence ofemissions on O3 is found both over the continent and down-wind over the Atlantic Ocean. The emissions primarily in-fluencing O3 over Equatorial Africa are lightning NOx andBB. However, the results vary with altitude. In the LT, BBemissions make the largest contribution over Central Africawhile soil NOx and biogenic emissions dominate over WestAfrica. Anthropogenic emissions also contribute, albeit to
www.atmos-chem-phys.net/11/13395/2011/ Atmos. Chem. Phys., 11, 13395–13419, 2011
13412 I. Bouarar et al.: Emission sources contributing to tropospheric ozone
Fig. 11. KE AMMA - ASIA red CO differences (1CO) in ppbv at 320 hPa(a), 240 hPa(b), 180 hPa(c) and 100 hPa(d).
Fig. 12. Same as Fig. 11 but for O3 differences (1O3).
Atmos. Chem. Phys., 11, 13395–13419, 2011 www.atmos-chem-phys.net/11/13395/2011/
I. Bouarar et al.: Emission sources contributing to tropospheric ozone 13413
Fig. 13. Ozone difference per unit in NOx emissions (1O3/1 Tg N) between KEAMMA and the LiNOx red (a), SNOx red (b), BB red(c). ANTH red(d) and ASIAred(e) simulationns. Ozone changes averaged between June and August and over the 20◦ S–20◦ N latitudinalband.
a lesser extent, to O3 in the LT over the high emission re-gions (e.g. Nigeria). In the MT, BB emissions also makethe largest contribution to O3 particularly over Central Africaand the Atlantic Ocean at altitudes lower than 600 hPa. Be-tween 600 hPa and 400 hPa O3 is mainly influenced by light-ning and soil NOx over West Africa. Lightning NOx domi-nates O3 changes in the UT and has an impact over a large re-gion extending from West Africa as far as the Brazilian coast.Significant but lower contributions are also found from soilNOx and anthropogenic emissions. Biogenic VOC and Asianemissions have their largest impact on O3 in the UTLS overthe African continent with only a small impact downwindover the Atlantic Ocean in the case of Asian emissions. In themodel, BB emissions are not being transported far enough tothe north to convective regions (as discussed in Sect. 4.2)leading to a lower UT contribution from this source. Thiscould also be explained by the underestimation of O3 pro-duction from the Central African BB emissions in the model.
Table 3. Integrated CO and NOx biomass burning emission totalsover Africa in the L3JRC and GFEDv2 inventories per year andduring the JJA period. See text for details.
Species L3JRC GFEDv2
CO 282.6 Tg(CO) yr−1 150.3 Tg(CO) yr−1
154.9 Tg(CO)/JJA 46.4 Tg(CO)/JJA
NOx 6.2 Tg(N) yr−1 2.4 Tg(N) yr−1
3.2 Tg(N)/JJA 0.77 Tg(N)/JJA
6 Tropospheric ozone over Africa in 2030
In this section we investigate the possible changes in O3in 2030 due to future growth in African and Asian anthro-pogenic emissions using estimates developed for the IPCCAR5 report. The anthropogenic emissions in the INCA2030run (see Table 1) were based on the representative concentra-tion pathway (RCP) RCP45 scenario (Clarke et al., 2007)
www.atmos-chem-phys.net/11/13395/2011/ Atmos. Chem. Phys., 11, 13395–13419, 2011
13414 I. Bouarar et al.: Emission sources contributing to tropospheric ozone
Fig. 14. Ozone difference per unit difference in carbon emissions (1O3/1 Tg C) between KEAMMA and the BIO red (a), BB red (b),ANTH red(c) and Asiared simulations. Ozone changes averaged between June and August and over the 20◦ S–20◦ N latitudinal band.
designed to limit global warming to 4.5 Wm−2. We used2006 meteorology to ensure that possible changes are onlydue to changes in emissions. The most important emissionchanges (Table 2) occur over Asia where increases of 70 %,65 % and 73 % in emissions of CO, NOx and VOCs, respec-tively, are calculated. Over Africa, CO and NOx emissionsincrease significantly by 150 % and 18 %, respectively, whilethere are no significant changes in VOC emissions, accordingto this scenario.
Figure 15 shows absolute and percentage differences inCO and O3 between present day (KEAMMA) and future(INCA 2030) runs. CO increases of up to 24 ppbv and15 ppbv are calculated over Africa in the LT and UT, respec-tively. Percentage differences show that the most importantCO changes (10 to 20 %) occur in the UT above 400 hPa withmaxima over East Africa above 200 hPa. Interestingly, thelargest O3 changes (3 to 5 ppbv) also occur in UT over EastAfrica while lower changes (2 to 3 ppbv) occur over WestAfrica. Lower O3 increases (less than 1 ppbv) are predictedin the LT. The east-west negative gradient in CO and O3 in-creases in the UTLS calculated in INCA2030 shows that fu-ture O3 over West Africa may be highly sensitive to increas-ing Asian emissions. Therefore, according to LMDzINCAresults, O3 over tropical Africa will be more sensitive to thegrowth of anthropogenic emissions in Asia than in Africa,at least up to 2030. Since the largest changes occur in theUT this has implications for radiative forcing estimates fromtropospheric ozone. Other models may show different sensi-
tivities and results will depend not only on deep convectionover Africa but also on convective uplift of O3 precursorsover Asia related to the Asian summer monsoon.
7 Conclusions
In this study, the global chemistry-climate modelLMDz INCA was used to investigate the contributionof African and Asian emissions to tropospheric ozone overEquatorial Africa during the monsoon season. In order toevaluate model performance, simulations were comparedto in-situ measurements from the AMMA and MOZAICprograms as well as to satellite data from MOPITT andSCIAMACHY. The model is able to reproduce the mainfeatures of the chemical composition of the African tro-posphere. However, due to a low northward transport ofCentral African biomass burning emissions in the model, themaximum concentrations of CO and O3 seen in the middletroposphere over the Gulf of Guinea are reproduced furthersouth around 0–5◦ S. Model transport of BB emissionsfrom Central to West Africa may be improved using morerecent meteorological analyses including additional AMMAobservations. Improved treatment of injection heights ofBB emissions could also improve model results in themiddle troposphere over the Gulf of Guinea and increase thewestward export of these emissions out of Central Africa.
Uplift of air masses from the lower troposphere bydeep convection and production of NOx from lightning
Atmos. Chem. Phys., 11, 13395–13419, 2011 www.atmos-chem-phys.net/11/13395/2011/
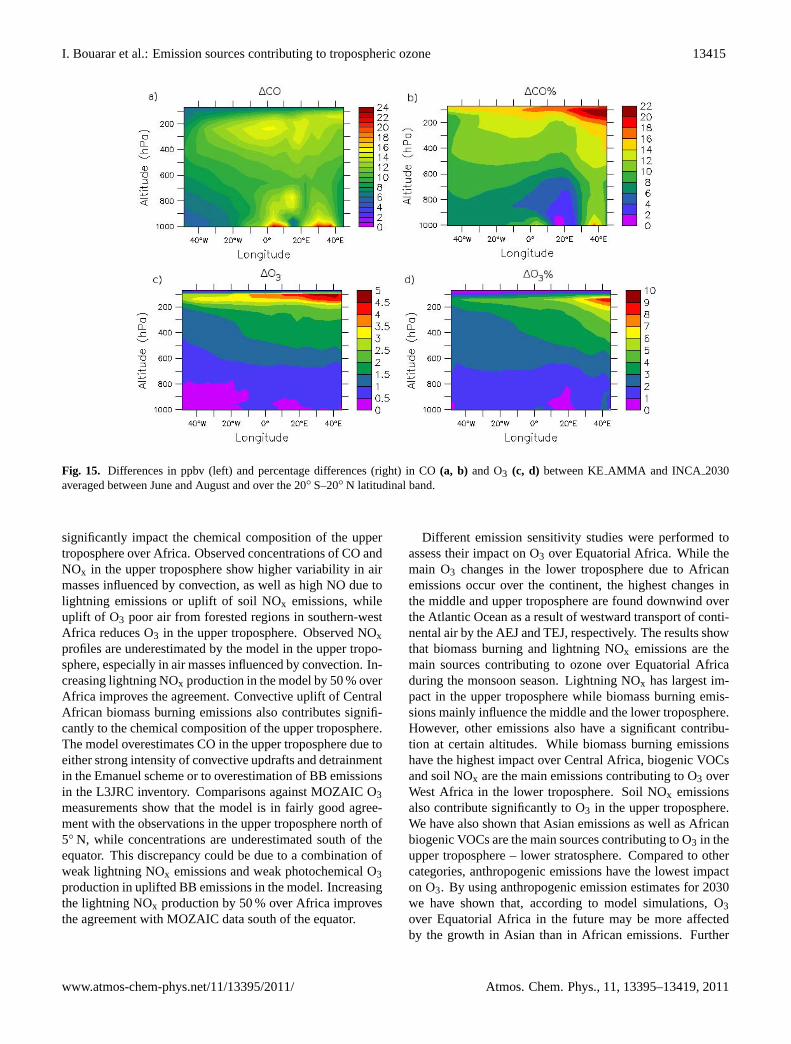
I. Bouarar et al.: Emission sources contributing to tropospheric ozone 13415
Fig. 15. Differences in ppbv (left) and percentage differences (right) in CO(a, b) and O3 (c, d) between KEAMMA and INCA 2030averaged between June and August and over the 20◦ S–20◦ N latitudinal band.
significantly impact the chemical composition of the uppertroposphere over Africa. Observed concentrations of CO andNOx in the upper troposphere show higher variability in airmasses influenced by convection, as well as high NO due tolightning emissions or uplift of soil NOx emissions, whileuplift of O3 poor air from forested regions in southern-westAfrica reduces O3 in the upper troposphere. Observed NOxprofiles are underestimated by the model in the upper tropo-sphere, especially in air masses influenced by convection. In-creasing lightning NOx production in the model by 50 % overAfrica improves the agreement. Convective uplift of CentralAfrican biomass burning emissions also contributes signifi-cantly to the chemical composition of the upper troposphere.The model overestimates CO in the upper troposphere due toeither strong intensity of convective updrafts and detrainmentin the Emanuel scheme or to overestimation of BB emissionsin the L3JRC inventory. Comparisons against MOZAIC O3measurements show that the model is in fairly good agree-ment with the observations in the upper troposphere north of5◦ N, while concentrations are underestimated south of theequator. This discrepancy could be due to a combination ofweak lightning NOx emissions and weak photochemical O3production in uplifted BB emissions in the model. Increasingthe lightning NOx production by 50 % over Africa improvesthe agreement with MOZAIC data south of the equator.
Different emission sensitivity studies were performed toassess their impact on O3 over Equatorial Africa. While themain O3 changes in the lower troposphere due to Africanemissions occur over the continent, the highest changes inthe middle and upper troposphere are found downwind overthe Atlantic Ocean as a result of westward transport of conti-nental air by the AEJ and TEJ, respectively. The results showthat biomass burning and lightning NOx emissions are themain sources contributing to ozone over Equatorial Africaduring the monsoon season. Lightning NOx has largest im-pact in the upper troposphere while biomass burning emis-sions mainly influence the middle and the lower troposphere.However, other emissions also have a significant contribu-tion at certain altitudes. While biomass burning emissionshave the highest impact over Central Africa, biogenic VOCsand soil NOx are the main emissions contributing to O3 overWest Africa in the lower troposphere. Soil NOx emissionsalso contribute significantly to O3 in the upper troposphere.We have also shown that Asian emissions as well as Africanbiogenic VOCs are the main sources contributing to O3 in theupper troposphere – lower stratosphere. Compared to othercategories, anthropogenic emissions have the lowest impacton O3. By using anthropogenic emission estimates for 2030we have shown that, according to model simulations, O3over Equatorial Africa in the future may be more affectedby the growth in Asian than in African emissions. Further
www.atmos-chem-phys.net/11/13395/2011/ Atmos. Chem. Phys., 11, 13395–13419, 2011
13416 I. Bouarar et al.: Emission sources contributing to tropospheric ozone
assessment of future emission changes is required to confirmthese results which are also sensitive to models treatmentsof chemistry and transport, particularly deep convection overmonsoon regions.
Acknowledgements.The authors acknowledge the AMMA-EUand SCOUT-O3 projects for support and funding. AMMA wasbuilt by an international scientific group and was funded by alarge number of agencies, especially from France, the UK, USand Africa. Detailed information on scientific coordination andfunding is available on the AMMA International web site atwww.amma-international.org. Computer time has been providedby the Institut du Developpement et des Ressources en Informa-tique Scientifique (IDRIS). We acknowledge FAAM for operatingthe BAe-146. We also acknowledge the RETRO EU and GEIAprojects for providing emissions used in this study. MOZAIC ispresently funded by INSU-CNRS (France), Meteo-France, andForschungszentrum (FZJ, Julich, Germany). The MOZAIC database is supported by ETHER (CNES and INSU-CNRS). We arealso grateful for F. Fierli for providing information about the airmasses impacted by convection which were sampled by the M55aircraft during the AMMA campaign. The M55 Geophysica datawere collected as part of the EU AMMA and SCOUT-O3 projects.
Edited by: M. Kanakidou
The publication of this article is financed by CNRS-INSU.
References
Aghedo, A. M., Schultz, M. G., and Rast, S.: The influence ofAfrican air pollution on regional and global tropospheric ozone,Atmos. Chem. Phys., 7, 1193–1212,doi:10.5194/acp-7-1193-2007, 2007.
Ancellet, G., Leclair de Bellevue, J., Mari, C., Nedelec, P., Kukui,A., Borbon, A., and Perros, P.: Effects of regional-scale and con-vective transports on tropospheric ozone chemistry revealed byaircraft observations during the wet season of the AMMA cam-paign, Atmos. Chem. Phys., 9, 383–411,doi:10.5194/acp-9-383-2009, 2009.
Andres-Hernandez, M. D., Kartal, D., Reichert, L., Burrows, J. P.,Meyer Arnek, J., Lichtenstern, M., Stock, P., and Schlager, H.:Peroxy radical observations over West Africa during AMMA2006: photochemical activity in the outflow of convective sys-tems, Atmos. Chem. Phys., 9, 3681–3695,doi:10.5194/acp-9-3681-2009, 2009.
Atkinson, R.: Atmoshperic chemistry of VOCs and NOx, Atmos.Environ., 34, 2063–2101, 2000.
Barret, B., Ricaud, P., Mari, C., Attie, J.-L., Bousserez, N., Josse,B., Le Flochmoen, E., Livesey, N. J., Massart, S., Peuch, V.-H., Piacentini, A., Sauvage, B., Thouret, V., and Cammas, J.-
P.: Transport pathways of CO in the African upper troposphereduring the monsoon season: a study based upon the assimilationof spaceborne observations, Atmos. Chem. Phys., 8, 3231–3246,doi:10.5194/acp-8-3231-2008, 2008.
Barret, B., Williams, J. E., Bouarar, I., Yang, X., Josse, B., Law, K.,Pham, M., Le Flochmoen, E., Liousse, C., Peuch, V. H., Carver,G. D., Pyle, J. A., Sauvage, B., van Velthoven, P., Schlager,H., Mari, C., and Cammas, J.-P.: Impact of West African Mon-soon convective transport and lightning NOx production uponthe upper tropospheric composition: a multi-model study, At-mos. Chem. Phys., 10, 5719–5738,doi:10.5194/acp-10-5719-2010, 2010.
Bechara, J., Borbon, A., Jambert, C., Colomb, A., and Perros, P. E.:Evidence of the impact of deep convection on reactive VolatileOrganic Compounds in the upper tropical troposphere during theAMMA experiment in West Africa, Atmos. Chem. Phys., 10,10321–10334,doi:10.5194/acp-10-10321-2010, 2010.
Bovensmann, H., Burrows, J. P., Buchwitz, M., Frerick, J., Noel,S., Rozanov, V. V., Chance, K. V., and Goede, A. P. H.: SCIA-MACHY: Mission objectives and measurement modes, J. Atmos.Sci., 56, 127–150, 1999.
Brasseur, G. P., Orlando, J. J., and Tyndall, G. S.: AtmosphericChemistry and global Change, Oxford Uiversity Press, NY, 1999.
Clarke, L., Edmonds, J., Jacoby, H., Pitcher, H., Reilly, J., andRichels, R.: Scenarios of Greenhouse Gas Emissions and Atmo-spheric Concentrations, Sub-report 2.1A of Synthesis and As-sessment Product 2.1 by the US Climate Change Science Pro-gram and the Subcommittee on Global Change Research, De-partment of Energy, Office of Biological und Environmental Re-search, Washington, 7 DC, USA, pp. 154, 2007.
Crutzen, P. J.: Photochemical reactions initiated by an influencingozone in the unpolluted troposphere, Tellus, 26, 47–57, 1974.
Crutzen, P. J. and Andreae, M. O.: Biomass burning in the trop-ics: Impact on atmospheric chemistry and biogeochemical cy-cles, Science, 250, 1669–1678, 1990.
Deeter M. N., Emmons, L. K., Edwards, D. P., Gille, J. C., andDrummond, J. R.: Vertical resolution and information contentof CO profiles retrieved by MOPITT, Geophys. Res. Lett., 31,L15112,doi:10.1029/2004GL020235, 2004.
Delon, C., Reeves, C. E., Stewart, D. J., Serca, D., Dupont, R.,Mari, C., Chaboureau, J.-P., and Tulet, P.: Biogenic nitrogen ox-ide emissions from soils impact on NOx and ozone over WestAfrica during AMMA (African Monsoon Multidisciplinary Ex-periment): modelling study, Atmos. Chem. Phys., 8, 2351–2363,doi:10.5194/acp-8-2351-2008, 2008.
Dentener, F., van Weele, M., Krol, M., Houweling, S., and vanVelthoven, P.: Trends and inter-annual variability of methaneemissions derived from 1979-1993 global CTM simulations, At-mos. Chem. Phys., 3, 73–88,doi:10.5194/acp-3-73-2003, 2003.
Drummond J. R. and Mand, G. S.: The measurements of pollu-tion in the troposphere (MOPITT) instrument: Overall perfor-mance and calibration requirements, J. Atmos. Ocean. Technol.,13, 314–320, 1996.
Emanuel, K. A.: A Scheme for Representing Cumulus Convectionin Large-Scale Models, J. Atmos. Sci., 48, 2313–2329, 1991.
Emanuel, K. A.: A cumulus representation based on the episodicmixing model: the importance of mixing and microphysics inpredicting humidity, AMS Meteorol. Monogr., 24, 185–192,1993.
Atmos. Chem. Phys., 11, 13395–13419, 2011 www.atmos-chem-phys.net/11/13395/2011/
I. Bouarar et al.: Emission sources contributing to tropospheric ozone 13417
Emmons L. K., Pfister, G. G., Edwards, D. P., Gille, J. C.,Sachse, G., Blake, D., Wofsy, S., Gerbig, C., Matross, D.,and Nedelec, P.: Measurements of Pollution in the Troposphere(MOPITT) validation exercises during summer 2004 field cam-paigns over North America, J. Geophys. Res., 112, D12S02,doi:10.1029/2006JD007833, 2007.
Emmons, L. K., Edwards, D. P., Deeter, M. N., Gille, J. C., Cam-pos, T., Ndlec, P., Novelli, P., and Sachse, G.: Measurementsof Pollution In The Troposphere (MOPITT) validation through2006, Atmos. Chem. Phys., 9, 1795–1803,doi:10.5194/acp-9-1795-2009, 2009.
Ferreira, J., Reeves, C. E., Murphy, J. G., Garcia-Carreras, L.,Parker, D. J., and Oram, D. E.: Isoprene emissions modelling forWest Africa: MEGAN model evaluation and sensitivity analysis,Atmos. Chem. Phys., 10, 8453–8467,doi:10.5194/acp-10-8453-2010, 2010.
Fierli, F., Orlandi, E., Law, K. S., Cagnazzo, C., Cairo, F., Schiller,C., Borrmann, S., Di Donfrancesco, G., Ravegnani, F., and Volk,C. M.: Impact of deep convection in the tropical tropopauselayer in West Africa: in-situ observations and mesoscale mod-elling, Atmos. Chem. Phys., 11, 201–214,doi:10.5194/acp-11-201-2011, 2011.
Folberth, G. A., Hauglustaine, D. A., Lathiere, J., and Brocheton,F.: Interactive chemistry in the Laboratoire de Meteorologie Dy-namique general circulation model: model description and im-pact analysis of biogenic hydrocarbons on tropospheric chem-istry, Atmos. Chem. Phys., 6, 2273–2319,doi:10.5194/acp-6-2273-2006, 2006.
Forster, P., Ramaswamy, V., Artaxo, P., Berntsen, T., Betts, R., Fa-hey, D. W., Haywood, J., Lean, J., Lowe, D. C., Myhre, G.,Nganga, J., Prinn, R., Raga, G. M. S., and Van Dorland, R.:Changes in atmospheric constituents and rediative forcing. Cli-mate change 2007: The physical Scientific Basis, CambridgeUniversity Press, Cambridge, United Kingdom and New York,NY, USA, 6pp, 2007.
Freitas, S. R., Longo, K. M., Chatfield, R., Latham, D., Silva Dias,M. A. F., Andreae, M. O., Prins, E., Santos, J. C., Gielow, R.,and Carvalho Jr., J. A.: Including the sub-grid scale plume rise ofvegetation fires in low resolution atmospheric transport models,Atmos. Chem. Phys., 7, 3385–3398,doi:10.5194/acp-7-3385-2007, 2007.
Galy-Lacaux, C., Laouali, D., Descroix, L., Gobron, N., and Li-ousse, C.: Long term precipitation chemistry and wet depositionin a remote dry savanna site in Africa (Niger), Atmos. Chem.Phys., 9, 1579–1595,doi:10.5194/acp-9-1579-2009, 2009.
Giorgi, F. and Chameides, W.: The Rainout Parameterization in aPhotochemical Model, J. Geophys. Res., 90, 7872–7880, 1985.
Grandpeix, J.-Y. and Lafore, J.-P.: A Density CurrentParameterization Coupled with Emanuel’s ConvectionScheme, Part I: The Models. J. Atmos. Sci., 67, 881–897,doi:10,1175/2009JAS3044.1, 2010.
Grewe, V., Tsati, E., and Hoor, P.: On the attribution of con-tributions of atmospheric trace gases to emissions in atmo-spheric model applications, Geosci. Model Dev., 3, 487–499,doi:10.5194/gmd-3-487-2010, 2010.
Hauglustaine, D. A., Hourdin, F., Jourdain, L., Filiberti, M.-A.,Walters, S., Lamarque, J.-F., and Holland, E. A.: Interactivechemistry in the Laboratoire de Meteorologie Dynamique gen-eral circulation model: description and background tropospheric
chemistry evaluation, J. Geophys. Res., 109, 4314–4357, 2004.Hopkins, J. R., Evans, M. J., Lee, J. D., Lewis, A. C., H Marsham,
J., McQuaid, J. B., Parker, D. J., Stewart, D. J., Reeves, C. E., andPurvis, R. M.: Direct estimates of emissions from the megacityof Lagos, Atmos. Chem. Phys., 9, 8471–8477,doi:10.5194/acp-9-8471-2009, 2009.
Hourdin, F. and Armengaud, A.: The use of finite-volume methodsfor atmospheric advection of trace species, Part I : test of variousformulations in a general circulation model, Mon. Weather. Rev.,127, 822–837, 1999.
Hourdin, F., Musat, I., Bony, S., Braconnot, P., Codron, F.,Dufresne, J. L., Fairhead, L., Filiberti, M. A., Friedlingstein, P.,Grandpeix, J. Y., Krinnerm, G., Levan, P., Li, Z. X., and Lott,F.: The LMDZ4 general circulation model: climate performanceand sensitivity to parameterized physics with emphasis on tropi-cal convection, Clim. Dynam., 27, 787–813, 2006.
Hourdin, F., Musat, I., Grandpeix, J. Y., Polcher, J., Guichard, F.,Favot, F.,, P., Boone, A., Lafore, J. P., Redelsperger, J. L., Ruti,P. M., Dell’aquila, A., Filiberti, M. A., Pham, M., Doval, T. L.,Traore, Marquet, A. K., and Gallee, H.: AMMA-Model Inter-comparison Project, B. Am. Meteorol. Soc., 91, 95–104, 2010.
HTAP, Hemispheric Transport of Air Pollution, Assessement report,Parte A: Ozone and Particulate Matter, United Nations Publica-tion, 2010.
Huntrieser, H., Schlager, H., Lichtenstern, M., Stock, P., Ham-burger, T., Holler, H., Schmidt, K., Betz, H.-D., Ulanovsky,A., and Ravegnani, F.: Mesoscale convective systems observedduring AMMA and their impact on the NOx and O3 bud-get over West Africa, Atmos. Chem. Phys., 11, 2503–2536,doi:10.5194/acp-11-2503-2011, 2011.
Jacob, D. J. J.: Introduction to Atmospheric Chemistry, PrincetonUniversity Press, Princeton, New Jersey, 1999.
Jaegle, L., Martin, R. V., Chance, K., Steinberger, L., Kurosu,T. P., Jacob, D. J., Modi, A. I., Yoboue, V., Sigha-Nkamdjou,L., and Galy-Lacaux, C.: Satellite mapping of rain-induced ni-tric oxide emissions from soils, J. Geophys. Res., 109, D21310,doi:10.1029/2004JD004787, 2004.
Jaegle, L., Steinberger, L., Martin, R. V., and Chance, K.: Globalpartitioning of NOx sources using satellite observations: Relativeroles of fossil fuel combustion, biomass burning and soil emis-sions, FARADAY Discuss., 130, 407–423, 2005.
Janicot, S., Thorncroft, C. D., Ali, A., Asencio, N., Berry, G., Bock,O., Bourles, B., Caniaux, G., Chauvin, F., Deme, A., Kergoat, L.,Lafore, J.-P., Lavaysse, C., Lebel, T., Marticorena, B., Mounier,F., Nedelec, P., Redelsperger, J.-L., Ravegnani, F., Reeves, C.E., Roca, R., de Rosnay, P., Schlager, H., Sultan, B., Tomasini,M., Ulanovsky, A., and ACMAD forecasters team: Large-scaleoverview of the summer monsoon over West Africa during theAMMA field experiment in 2006, Ann. Geophys., 26, 2569–2595,doi:10.5194/angeo-26-2569-2008, 2008.
Jonquieres, I., Marenco, A., Maalej, A., and Rohrer, F.: Study ofozone formation and transatlantic transport from biomass burn-ing emissions over West Africa during the airborne troposphericozone campaigns TROPOZ I and TROPOZ II, J. Geophys. Res.,103, 19059–19073, 1998.
Jourdain, L. and Hauglustaine, D. A.: The global distribution oflightning NOx simulated on-line in a general circulation model,Phys. Chem. Earth, 26, 585–591, 2001.
Labonne, M., Breon, F.-M., and Chevallier, F.: Injection height of
www.atmos-chem-phys.net/11/13395/2011/ Atmos. Chem. Phys., 11, 13395–13419, 2011
13418 I. Bouarar et al.: Emission sources contributing to tropospheric ozone
biomass burning aerosols as seen from a spaceborne lidar, Geo-phys. Res. Lett., 34, L11806,doi:10.1029/2007GL029311, 2007.
Lathiere, J., Hauglustaine, D. A., Friend, A. D., De Noblet-Ducoudre, N., Viovy, N., and Folberth, G. A.: Impact of climatevariability and land use changes on global biogenic volatile or-ganic compound emissions, Atmos. Chem. Phys., 6, 2129–2146,doi:10.5194/acp-6-2129-2006, 2006.
Law, K. S., Fierli, F., Cairo, F., Schlager, H., Borrmann, S., Streibel,M., Real, E., Kunkel, D., Schiller, C., Ravegnani, F., Ulanovsky,A., D’Amato, F., Viciani, S., and Volk, C. M.: Air mass originsinfluencing TTL chemical composition over West Africa during2006 summer monsoon, Atmos. Chem. Phys., 10, 10753–10770,doi:10.5194/acp-10-10753-2010, 2010.
Lawrence, M. G., Rasch, P. J., von Kuhlmann, R., Williams, J., Fis-cher, H., de Reus, M., Lelieveld, J., Crutzen, P. J., Schultz, M.,Stier, P., Huntrieser, H., Heland, J., Stohl, A., Forster, C., Elbern,H., Jakobs, H., and Dickerson, R. R.: Global chemical weatherforecasts for field campaign planning: predictions and observa-tions of large-scale features during MINOS, CONTRACE, andINDOEX, Atmos. Chem. Phys., 3, 267–289,doi:10.5194/acp-3-267-2003, 2003.
Liousse C., Guillaume B., Gregoire J. M., Konare A., Granier C.and Mieville, A.: AMMA biomass burning (AMMABB) emis-sion inventories for gases and particles from savannah and for-est fires for the period 2000–2007, D243g report, FP6 AMMAProject no. 004089, 2008.
Liousse, C., Guillaume, B., Gregoire, J. M., Mallet, M., Galy, C.,Pont, V., Akpo, A., Bedou, M., Castra, P., Dungall, L., Gardrat,E., Granier, C., Konar, A., Malavelle, F., Mariscal, A., Mieville,A., Rosset, R., Serca, D., Solmon, F., Tummon, F., Assamoi, E.,Yoboue, V., and Van Velthoven, P.: Updated African biomassburning emission inventories in the framework of the AMMA-IDAF program, with an evaluation of combustion aerosols, At-mos. Chem. Phys., 10, 9631–9646,doi:10.5194/acp-10-9631-2010, 2010.
Liu, J. J., Jones, D. B. A., Worden, J. R., Noone, D., Parrington, M.,and Kar, J.: Analysis of the summertime buildup of troposphericozone abundances over the Middle East and North Africa as ob-served by the Tropospheric Emission Spectrometer instrument, J.Geophys. Res., 114, D05304,doi:10.1029/2008JD010993, 2009.
Louis, J. F.: A parametric model of vertical eddy fluxes in the atmo-sphere, Boundary Layer Meteo., 17, 187–202, 1979.
Marenco, A., Thouret, V., Nedelec, P., Smit, H., Helten, M., Kley,D., Karcher, F., Simon, P., Law, K., Pyle, J., Poschmann, G.,Von Wrede, R., Hume, C., and Cook, T.: Measurement of ozoneand water vapor by Airbus in service aircraft: The MOZAICairborne program, an overview, J. Geophys. Res., 103, 25631–25642,doi:10.1029/98JD00977, 1998.
Mari, C. H., Cailley, G., Corre, L., Saunois, M., Attie, J.L., Thouret, V., and Stohl, A.: Tracing biomass burningplumes from the Southern Hemisphere during the AMMA 2006wet season experiment, Atmos. Chem. Phys., 8, 3951–3961,doi:10.5194/acp-8-3951-2008, 2008.
Marufu, L., Dentener, F., Lelieveld, J., Andreae, M. O., andHelas, G.: Photochemistry of the African troposphere: Influ-ence of biomass-burning emissions, J. Geophys. Res.-Atmos.,105, 14513–14530, 2000.
Minga, A., Thouret, V., Saunois, M., Delon, C., Serca, D., Mari,C., Sauvage, B., Mariscal, A., Leriche, M., and Cros, B.: What
caused extreme ozone concentrations over Cotonou in December2005?, Atmos. Chem. Phys., 10, 895–907,doi:10.5194/acp-10-895-2010, 2010.
Murphy, J. G., Oram, D. E., and Reeves, C. E.: Measurementsof volatile organic compounds over West Africa, Atmos. Chem.Phys., 10, 5281–5294,doi:10.5194/acp-10-5281-2010, 2010.
Olsen, M. A., Douglass, A. R., and Schoeberl, M. R.: Esti-mating downward cross-tropopause ozone flux using columnozone and potential vorticity, J. Geophys. Res., 107, 4636,doi:10.1029/2001JD002041, 2002.
Park, M., Randel, W. J., Emmons, L. K., and Livesey, N.J.: Transport pathways of carbon monoxide in the Asiansummer monsoon diagnosed from Model of Ozone and Re-lated Tracers (MOZART), J. Geophys. Res., 114, D08303,doi:10.1029/2008JD010621, 2009.
Price, C. and Rind, D.: A Simple Lightning Parameterization forCalculating Global Lightning Distributions, J. Geophys. Res.,97, 9919–9933, 1992.
Real, E., Orlandi, E., Law, K. S., Fierli, F., Josset, D., Cairo, F.,Schlager, H., Borrmann, S., Kunkel, D., Volk, C. M., McQuaid,J. B., Stewart, D. J., Lee, J., Lewis, A. C., Hopkins, J. R., Raveg-nani, F., Ulanovski, A., and Liousse, C.: Cross-hemispherictransport of Central African biomass burning pollutants: impli-cations for downwind ozone production, Atmos. Chem. Phys.,10, 3027–3046,doi:10.5194/acp-10-3027-2010, 2010.
Reeves, C. E., Formenti, P., Afif, C., Ancellet, G., Attie, J.-L.,Bechara, J., Borbon, A., Cairo, F., Coe, H., Crumeyrolle, S.,Fierli, F., Flamant, C., Gomes, L., Hamburger, T., Jambert, C.,Law, K. S., Mari, C., Jones, R. L., Matsuki, A., Mead, M. I.,Methven, J., Mills, G. P., Minikin, A., Murphy, J. G., Nielsen,J. K., Oram, D. E., Parker, D. J., Richter, A., Schlager, H.,Schwarzenboeck, A., and Thouret, V.: Chemical and aerosolcharacterisation of the troposphere over West Africa during themonsoon period as part of AMMA, Atmos. Chem. Phys., 10,7575–7601,doi:10.5194/acp-10-7575-2010, 2010.
Richter, A., Burrows, J. P., Nuß, H., Granier, C., and Niemeier, U.:Increase in tropospheric nitrogen dioxide over China observedfrom space, Nature, 437, 129–132,doi:10.1038/nature04092,2005.
Rio, C., Hourdin, F., and Chedin, A.: Numerical simulation of tro-pospheric injection of biomass burning products by pyro-thermalplumes, Atmos. Chem. Phys., 10, 3463–3478,doi:10.5194/acp-10-3463-2010, 2010.
Rodgers, C. D. and Connor, B. J.: Intercomparison of re-mote sounding instruments, J. Geophys. Res., 108, 4116,doi:10.1029/2002JD002299, 2003.
Saunois, M., Reeves, C. E., Mari, C. H., Murphy, J. G., Stewart, D.J., Mills, G. P., Oram, D. E., and Purvis, R. M.: Factors control-ling the distribution of ozone in the West African lower tropo-sphere during the AMMA (African Monsoon MultidisciplinaryAnalysis) wet season campaign, Atmos. Chem. Phys., 9, 6135–6155,doi:10.5194/acp-9-6135-2009, 2009.
Sauvage, B., Thouret, V., Cammas, J.-P., Gheusi, F., Athier, G., andNedelec, P.: Tropospheric ozone over Equatorial Africa: regionalaspects from the MOZAIC data, Atmos. Chem. Phys., 5, 311–335,doi:10.5194/acp-5-311-2005, 2005.
Sauvage, B., Gheusi, F., Thouret, V., Cammas, J.-P., Duron, J., Es-cobar, J., Mari, C., Mascart, P., and Pont, V.: Medium-range mid-tropospheric transport of ozone and precursors over Africa: two
Atmos. Chem. Phys., 11, 13395–13419, 2011 www.atmos-chem-phys.net/11/13395/2011/
I. Bouarar et al.: Emission sources contributing to tropospheric ozone 13419
numerical case studies in dry and wet seasons, Atmos. Chem.Phys., 7, 5357–5370,doi:10.5194/acp-7-5357-2007, 2007a.
Sauvage, B., Martin, R. V., van Donkelaar, A., and Ziemke, J.R.: Quantification of the factors controlling tropical troposphericozone and the South Atlantic maximum, J. Geophys. Res., 112,D11309,doi:10.1029/2006JD008008, 2007b.
Sauvage B., Thouret, V., Cammas, J.-P., Brioude, J., Nedelec,P., and Mari, C.: Meridional ozone gradients in theAfrican upper troposphere, Geophys. Res. Lett., 34, L03817,doi:10.1029/2006GL028542, 2007c.
Stewart, D. J., Taylor, C. M., Reeves, C. E., and McQuaid, J. B.:Biogenic nitrogen oxide emissions from soils: impact on NOxand ozone over west Africa during AMMA (African MonsoonMultidisciplinary Analysis): observational study, Atmos. Chem.Phys., 8, 2285–2297,doi:10.5194/acp-8-2285-2008, 2008.
Stohl, A., Eckhardt, S., Forster, C., James, P., and Spichtinger,N.: On the pathways and timescales of intercontinen-tal air pollution transport, J. Geophys. Res., 107, 4684,doi:10.1029/2001JD001396, 2002.
Sudo, K. and Akimoto, H.: Global source attribution oftropospheric ozone: Long-range transport from vari-ous source regions, J. Geophys. Res., 112, D12302,doi:10.1029/2006JD007992, 2007.
Szopa, S., Hauglustaine, D. A., and Ciais, P.: Relative contributionsof biomass burning emissions and atmospheric transport to car-bon monoxide interannual variability, Geophys. Res. Lett., 34,L18810,doi:10.1029/2007GL030231, 2007.
Teyssedre, H., Michou, M., Clark, H. L., Josse, B., Karcher, F.,Olivi e, D., Peuch, V.-H., Saint-Martin, D., Cariolle, D., Attie,J.-L., Nedelec, P., Ricaud, P., Thouret, V., van der A, R. J., Volz-Thomas, A., and Chroux, F.: A new tropospheric and strato-spheric Chemistry and Transport Model MOCAGE-Climat formulti-year studies: evaluation of the present-day climatology andsensitivity to surface processes, Atmos. Chem. Phys., 7, 5815–5860,doi:10.5194/acp-7-5815-2007, 2007.
Thouret, V., Saunois, M., Minga, A., Mariscal, A., Sauvage, B., So-lete, A., Agbangla, D., Nedelec, P., Mari, C., Reeves, C. E., andSchlager, H.: An overview of two years of ozone radio sound-ings over Cotonou as part of AMMA, Atmos. Chem. Phys., 9,6157–6174,doi:10.5194/acp-9-6157-2009, 2009.
Tiedtke, M.: A comprehensive mass flux scheme for cumulus pa-rameterization in large-scale models, Mon. Weather Rev., 117,1179–1180, 1989.
Tost, H., Jockel, P., and Lelieveld, J.: Lightning and convec-tion parameterisations - uncertainties in global modelling, At-mos. Chem. Phys., 7, 4553–4568,doi:10.5194/acp-7-4553-2007,2007.
van der Werf, G. R., Randerson, J. T., Giglio, L., Collatz, G. J.,Kasibhatla, P. S., and Arellano Jr., A. F.: Interannual variabil-ity in global biomass burning emissions from 1997 to 2004, At-mos. Chem. Phys., 6, 3423–3441,doi:10.5194/acp-6-3423-2006,2006.
Van Leer, B.: Towards the ultimate conservative difference scheme:IV, A new approach to numerical convection, J. Comput. Phys.,23, 276–299, 1977.
van Noije, T. P. C., Eskes, H. J., Dentener, F. J., Stevenson, D. S.,Ellingsen, K., Schultz, M. G., Wild, O., Amann, M., Atherton,C. S., Bergmann, D. J., Bey, I., Boersma, K. F., Butler, T., Co-fala, J., Drevet, J., Fiore, A. M., Gauss, M., Hauglustaine, D.A., Horowitz, L. W., Isaksen, I. S. A., Krol, M. C., Lamarque,J.-F., Lawrence, M. G., Martin, R. V., Montanaro, V., Muller, J.-F., Pitari, G., Prather, M. J., Pyle, J. A., Richter, A., Rodriguez,J. M., Savage, N. H., Strahan, S. E., Sudo, K., Szopa, S., andvan Roozendael, M.: Multi-model ensemble simulations of tro-pospheric NO2 compared with GOME retrievals for the year2000, Atmos. Chem. Phys., 6, 2943–2979,doi:10.5194/acp-6-2943-2006, 2006.
Walmsley, J. L. and Wesely, M. L.: Modification of coded param-eterizations of surface resistances to gaseous dry deposition, At-mos. Environ., 30, 1181–1188, 1996.
Wernli, B. H. and Davies, H. C.: A lagrangian-based anal-ysis of extratropical cyclones. I: The method and someapplications, Q. J. Roy. Meteorol. Soc., 123, 467–489,doi:10.1002/qj.49712353811, 1997.
Wesely, M.: Parameterization of surface resistances to gaseous drydeposition in regional-scale numerical models, Atmos. Environ.,23, 1293–1304, 1989.
Wesely, M. L. and Hicks, B. B.: A review of the current status ofknowledge on dry deposition, Atmos. Environ., 34, 2261–2282,2000.
Williams, J. E., Scheele, M. P., van Velthoven, P. F. J., Cam-mas, J.-P., Thouret, V., Galy-Lacaux, C., and Volz-Thomas, A.:The influence of biogenic emissions from Africa on tropicaltropospheric ozone during 2006: a global modeling study, At-mos. Chem. Phys., 9, 5729–5749,doi:10.5194/acp-9-5729-2009,2009.
Williams, J. E., Scheele, R., v. Velthoven, P., Bouarar, I., Law,K., Josse, B., Peuch, V. H., Yang, X., Pyle, J., Thouret, V.,Barret, B., Liousse, C., Hourdin, F., Szopa, S., and Cozic, A.:Global Chemistry Simulations in the AMMA Multimodel In-tercomparison Project, B. Am. Meteorol. Soc., 91, 611–624,doi:10.1175/2009BAMS2818.1, 2010a.
Williams, J. E., Scheele, M. P., van Velthoven, P. F. J., Thouret, V.,Saunois, M., Reeves, C. E., and Cammas, J.-P.: The influence ofbiomass burning and transport on tropospheric composition overthe tropical Atlantic Ocean and Equatorial Africa during the WestAfrican monsoon in 2006, Atmos. Chem. Phys., 10, 9797–9817,doi:10.5194/acp-10-9797-2010, 2010.
Wu, S., Duncan, B. N., Jacob, D. J., Fiore, A. M., and WildO.: Chemical nonlinearities in relating intercontinental ozonepollution to anthropogenic emissions, Geophys. Res. Lett., 36,L05806,doi:10.1029/2008GL036607, 2009.
Yang, X., Cox, R. A., Warwick, N. J., Pyle, J. A., Carver, G. D.,O’Connor, F. M., and Savage, N. H.: Tropospheric brominechemistry and its impacts on ozone: A model study, J. Geophys.Res., 110, D23311,doi:10.1029/2005JD006244, 2005.
www.atmos-chem-phys.net/11/13395/2011/ Atmos. Chem. Phys., 11, 13395–13419, 2011