variability in regional background aerosols within the mediterranean
TRANSCRIPT
Atmos. Chem. Phys., 9, 4575–4591, 2009www.atmos-chem-phys.net/9/4575/2009/© Author(s) 2009. This work is distributed underthe Creative Commons Attribution 3.0 License.
AtmosphericChemistry
and Physics
Variability in regional background aerosolswithin the Mediterranean
X. Querol1, A. Alastuey1, J. Pey1, M. Cusack1, N. Perez1, N. Mihalopoulos2, C. Theodosi2, E. Gerasopoulos3,N. Kubilay 4, and M. Kocak4
1Institute of Environmental Assessment and Water Research (IDÆA), Dept. of Geosciences CSIC, LLuis Sole i Sabarıs S/N,08028 Barcelona, Spain2Environmental Chemical Processes Laboratory, Dept. of Chemistry, University of Crete, P.O. Box 1470, 71409Heraklion, Greece3Institute for Environmental Research and Sustainable Development, National Observatory of Athens, Metaxa & V. Pavlou,15236, Athens, Greece4Institute of Marine Sciences, Middle East Technical University, P.O. Box 38, 33731, Erdemli-Mersin, Turkey
Received: 5 March 2009 – Published in Atmos. Chem. Phys. Discuss.: 23 April 2009Revised: 19 June 2009 – Accepted: 23 June 2009 – Published: 16 July 2009
Abstract. The main objective of this study is the identifi-cation of major factors controlling levels and chemical com-position of aerosols in the regional background (RB) alongthe Mediterranean Basin (MB). To this end, data on PMlevels and speciation from Montseny (MSY, NE Spain), Fi-nokalia (FKL, Southern Greece) and Erdemli (ERL, South-ern Turkey) for the period 2001 to 2008 are evaluated. Im-portant differences on PM levels and composition are evi-dent when comparing the Western and Eastern MBs. The re-sults manifest W-E and N-S PM10 and PM2.5 gradients alongthe MB, attributed to the higher frequency and intensity ofAfrican dust outbreaks in the EMB, while for PM1 very sim-ilar levels are encountered.
PM in the EMB is characterized by higher levels of crustalmaterial and sulphate as compared to WMB (and centralEuropean sites), however, RB nitrate and OC + EC levelsare relatively constant across the Mediterranean and lowerthan other European sites. Marked seasonal trends are evi-denced for PM levels, nitrate (WMB), ammonium and sul-phate. Also relatively higher levels of V and Ni (WMB) aremeasured in the Mediterranean basin, probably as a conse-quence of high emissions from fuel-oil combustion (powergeneration, industrial and shipping emissions).
Enhanced sulphate levels in EMB compared to WMBwere measured. The high levels of sulphate in the EMB maydeplete the available gas-phase NH3 so that little ammoniumnitrate can form due to the low NH3 levels.
Correspondence to:X. Querol([email protected])
This study illustrates the existence of three very impor-tant features within the Mediterranean that need to be ac-counted for when modeling climate effects of aerosols in thearea, namely: a) the increasing gradient of dust from WMBto EMB; b) the change of hygroscopic behavior of mineralaerosols (dust) via nitration and sulfation; and c) the abun-dance of highly hygroscopic aerosols during high insolation(low cloud formation) periods.
1 Introduction
Tropospheric aerosols have been the object of intensive re-search mainly because of their impact on health (Pope andDockery, 2006), the Earth’s climate (IPCC, 2007), visibil-ity, ecosystems and building materials. Air quality degrada-tion by particulate matter (PM) over polluted areas is oftencharacterized by high levels of regional background (RB)aerosols on which intense episodes of either natural or an-thropogenic origins are superimposed. Such episodes are as-sociated with synoptic and mesoscale meteorological con-ditions that favour formation and accumulation of aerosolpollutants at regional or even continental scales. The ex-clusive measurement of aerosols in highly polluted areasand at a local scale may prevent adequate interpretation ofthe origin of pollution episodes. On the contrary, measure-ments performed at RB sites, seem to optimize accuratedocumentation on both aerosol long-term trends and rele-vant synoptic features. The importance of this type of mea-surement site is highlighted by the creation of the EU-wideEUSAAR network (European Supersites for Atmospheric
Published by Copernicus Publications on behalf of the European Geosciences Union.
4576 X. Querol et al.: Variability in regional background aerosols
Aerosol Research, EU 6th framework, EUSAAR RII3-CT-2006-026140), which seeks to integrate the measurements ofatmospheric aerosol properties at 21 high quality Europeanground-based stations.
Reports from countries around the Mediterranean Basinand Eastern Europe show especially high levels of atmo-spheric PM compared to Northern and some central Euro-pean regions. Both anthropogenic (transport sector, indus-trial processes, power generation, biomass burning, amongothers) and natural (African dust, resuspension, sea spray,forest fires, primary biological particles, biogenic secondaryorganic compounds) emissions, as well as orographic and cli-matic factors contribute to those enhanced PM levels.
A number of individual studies are available on the vari-ability of RB-PM levels for Western (e.g. Querol et al., 1998;Rodriguez et al., 2002, 2004; Perez et al., 2008) and EasternMediterranean (e.g. Kocak et al., 2007a; Gerasopoulos etal., 2007), and to a lesser extent on PM speciation (e.g. Ro-driguez et al., 2003; Querol et al., 2004, 2008; Marenco etal., 2006; Viana et al., 2008; Dongarra et al., 2007; Saliba etal., 2007; Kocak et al., 2007b; Koulouri et al., 2008; Glavaset al., 2008). However, there is a lack of comparative stud-ies on the variability of PM levels and composition along theMediterranean Basin, necessary for understanding the spe-cial features that differentiate aerosol processes and aerosol-climate interactions between WMB and EMB, for instance.
This study aims to summarise the results on levels andchemical composition of RB-PM along the MediterraneanBasin, with special attention giving to the comparison be-tween WMB and EMB, in order to identify and discrimi-nate the major controlling factors. Special focus is givento the identification and interpretation of daily and seasonalpatterns and the influence of certain atmospheric transporton PM composition and levels, with emphasis on Africandust outbreaks and regional pollution episodes. Addition-ally, the Mediterranean situation will be put into context withthe corresponding situation over Central and Northern Eu-rope, by comparison with similar studies performed in otherregions in Europe. For this purpose, PM speciation datafrom the Montseny (MSY, NE Spain) and Finokalia (FKL,Crete Island, Southern Greece) sites, both EUSAAR sitesand Erdemli (ERL, Southern Turkey), obtained during theperiod 2001–2007, are evaluated in this paper.
2 Atmospheric dynamics and sources of PM alongthe Mediterranean
The WMB presents peculiar and complex atmospheric dy-namics affected by mesoscale and local meteorological pro-cesses but also regional factors, such as: 1) the considerableinfluence of the Azores high-pressure system in the meteorol-ogy of the Iberian Peninsula (IP); 2) the coastal ranges sur-rounding the Mediterranean coast (Fig. 1); 3) the influenceof the Iberian and Saharan thermal lows causing weak pres-sure gradients over the Mediterranean; 4) the intense breeze
action along the Mediterranean coast favoured by the pre-vailing low advective conditions; 5) the scarce summer pre-cipitation; and 6) the intense seasonal contrast concerningtemperature, humidity and rainfall (Millan et al., 1997; Sori-ano et al., 2001; Gangoiti et al., 2001; Rodrıguez et al., 2002,2003; Jorba et al., 2004; Perez et al., 2004).
Similarly, the EMB meteorology is controlled by the fol-lowing main factors: 1) during spring and early summer thedevelopment of Saharan depressions to the south of the At-las Mountains take place (Moulin et al., 1998). These cy-clones move eastwards, across the Mediterranean betweenLibya and Egypt and are responsible for the transport of largeamounts of desert dust over the EMB; 2) during summer theEMB is influenced by the Azores anticyclone extended tothe east and the cyclonic branch of the large South Asianthermal low. Additionally, a strong influence of the IndianMonsoon on the dry Mediterranean climate (Rodwell andHoskins, 2001), combined with the complex orographic ter-rain of regions such as Greece, result in persistent northerlywinds, called “Etesians”. As a result, the EMB is influencedby advection from Europe in the lower troposphere, favour-ing the transport of particles from urban areas of central andEastern Europe as well as from areas with intense biomassburning (Balis et al., 2003; Sciare et al., 2008).
The overall area is characterized by abrupt topography, in-fluencing the synoptic winds (Fig. 1). Although the Mediter-ranean Basin contains extensive regions of semi-arid soils,most of the ranges are mainly covered by typical Mediter-ranean and coniferous forests. The main densely populatedareas and urban conglomerations (e.g. Barcelona, Valencia,Marseille, Rome, Athens, Istanbul and Cairo), industrial set-tlements, dense road and ships traffic paths, all constitutinglarge anthropogenic emission sources, are located along thecoastal areas.
All the above factors give rise to a scenario of a partic-ularly complex aerosol phenomenology, with large anthro-pogenic and natural emissions, significant secondary aerosolformation and transformation, and intensive interaction be-tween aerosols and gaseous pollutants. It is also notice-able that the intensive meteorological contrast along the year(temperature, humidity and rainfall) causes marked seasonalpatterns for specific PM components.
3 Methodology
3.1 Monitoring sites
The MSY (41◦46′ N; 02◦21′ E, 720 m a.s.l.), FKL (35◦20′ N;25◦40′ E, 230 m a.s.l.), and ERL (36◦36′ N; 34◦18′ E,22 m a.s.l.) monitoring stations are selected due to theirrepresentative locations as typical for western and easternMediterranean RB sites and also because they have a long-term data series of PM concentrations and chemical compo-sition.
Atmos. Chem. Phys., 9, 4575–4591, 2009 www.atmos-chem-phys.net/9/4575/2009/
X. Querol et al.: Variability in regional background aerosols 4577
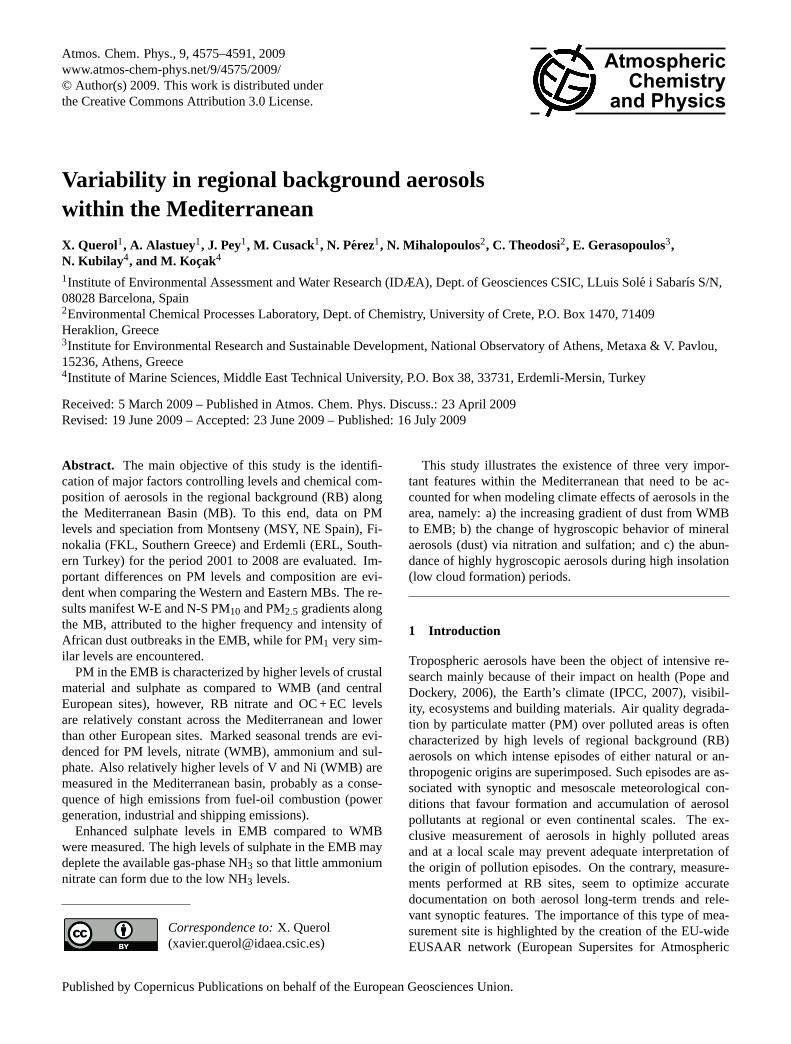
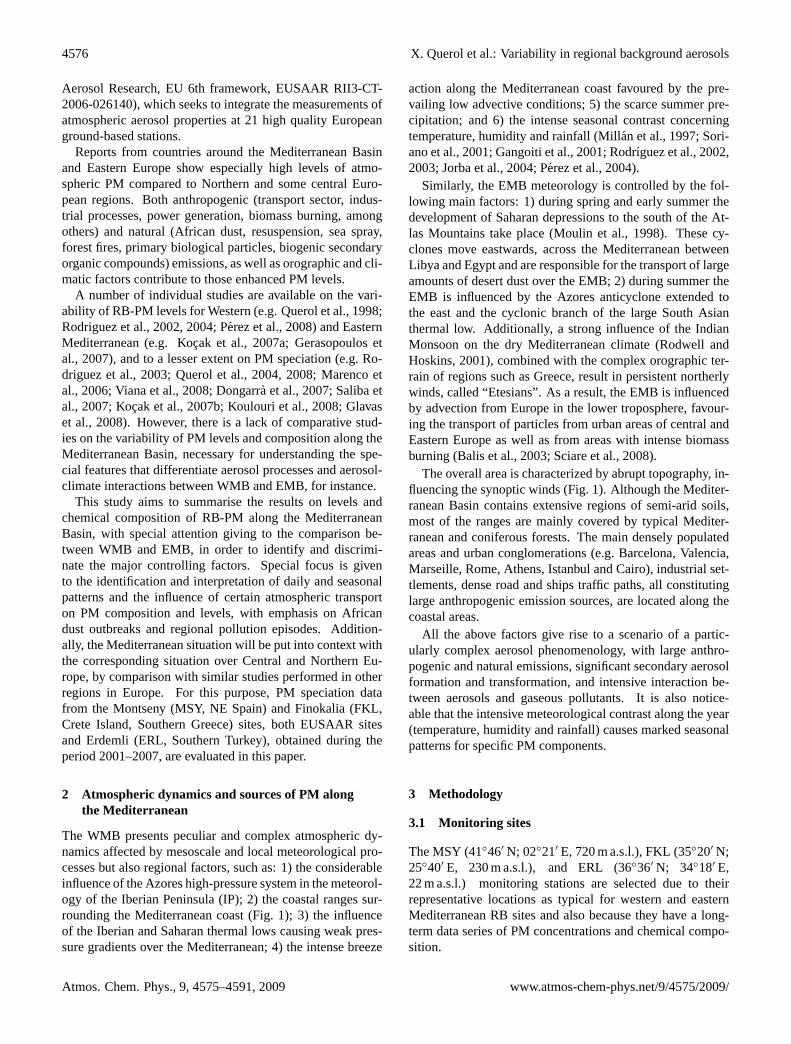
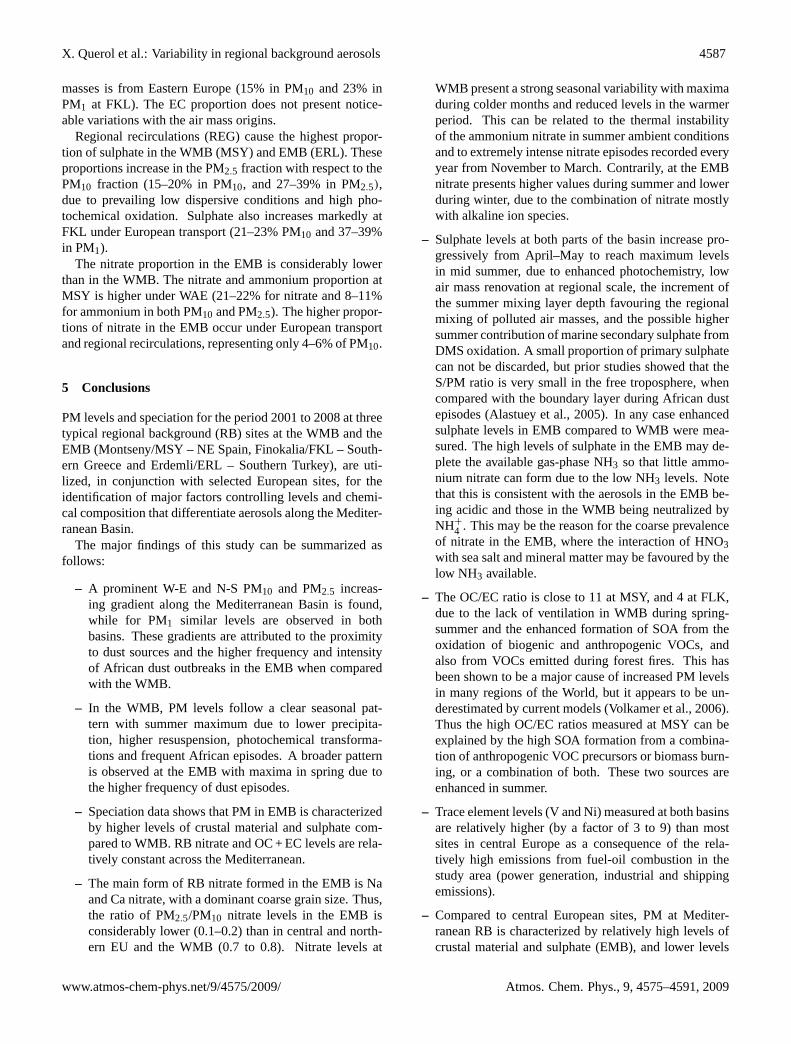
Figure 1. Location of the monitoring sites over the Mediterranean Basin. Mean annual PM1, PM1-2.5 and PM2.5-10 levels (µg/m3) at MSY, FKL and ERL. Mean annual PM10 levels at other regional background monitoring sites across the Mediterranean Basin. White circles show data from this study, shadowed circles show data from Airbase.
FKL
ERL
MSY
PM2.5-10
PM2.5-10
PM2.5
PM1-2.5
PM1-2.5
PM1
PM (µg/m3)
PM111
24
PM2.5-10
10
8
13
26
10
1020
30
40
17
21
16
19
30
2415
15
17
31
36
PM10 (µg/m3)
15
Zarra
Víznar
MonagregaEls Torms
Fontechiari
Censt1
Ayia Marina
Lazaropole
Rojen peak
FKL
ERL
MSY
PM2.5-10
PM2.5-10
PM2.5
PM1-2.5
PM1-2.5
PM1
PM (µg/m3)
PM111
24
PM2.5-10
10
8
13
26
10
1020
30
40
17
21
16
19
30
2415
15
17
31
36
PM10 (µg/m3)
15
Zarra
Víznar
MonagregaEls Torms
Fontechiari
Censt1
Ayia Marina
Lazaropole
Rojen peak
Fig. 1. Location of the monitoring sites over the Mediterranean Basin. Mean annual PM1, PM1−2.5 and PM2.5−10 levels (µg/m3) at MSY,FKL and ERL. Mean annual PM10 levels at other regional background monitoring sites across the Mediterranean Basin. White circles showdata from this study, shadowed circles show data from Airbase.
MSY is situated at the Montseny Natural Park located40 km to the NNE of Barcelona metropolitan area (around3.5 million inhabitants), 25 km from the Mediterranean coast.The station is located at La Castanya, a perpendicular valleyto the coast inside the Catalan Pre-Coastal Ranges (Fig. 1).Even though the station is relatively far from urban and in-dustrial agglomerations, it should be noted that the adjacentregions are highly populated and industrialized, and anthro-pogenic emissions may affect this site under specific meteo-rological scenarios. Atmospheric dynamics and aerosol vari-ability at MSY are described in detail by Perez et al. (2008).
FKL is situated in the northern coast of Crete Island, 70 kmeast of Heraklion, which is the nearest largest city of the is-land with 0.15 million inhabitants. The station is located atthe top of a hill and faces the sea to the north within a sec-tor of 270◦ to 90◦ (Mihalopoulos et al., 1997). According tothe criteria proposed by the European Environment Agency(Larssen et al., 1999), FKL is characterized as a “naturalbackground” station, with characteristics of a remote coastalsite, and only under specific meteorological circumstancescan be affected by anthropogenic pollution from short (Her-aklion) and medium (Athens) range transport. A recent de-scription of the prevailing winds has been reported by Gera-sopoulos et al. (2005).
ERL is located on the coastline of South Turkey in theEM (36
◦
33′54′′ N and 34◦15′18′′ E). The sampling site isrural and not under direct influence from industrial activities.The nearest city (Mersin) is located 45 km to the east of thesampling site and has a population of 0.74 million inhabitants(Kubilay et al., 2000; Kocak et al., 2004, 2007b).
3.2 Sampling methods and measurements
3.2.1 MSY station
At MSY, PM10, PM2.5 and PM1 are continuously measuredsince March 2002 using real time optical counters (GRIMM1107) which are corrected with gravimetric measurements.24-h PM10 and PM2.5 samples are collected on 150 mmquartz micro-fibre filters (Schleicher and Schuell, QF20) us-ing high volume samplers (30 m3/h) and DIGITEL cut-offinlets. Originally, TSP and PM2.5 were sampled weekly (amean of 2 samples of TSP and 1 sample of PM2.5 per week),but in 2004 TSP sampling was replaced by PM10.
Overall, 188 (March 2002–January 2004), 442 (January2004–December 2007) and 255 (March 2002–December2007) samples of TSP, PM10 and PM2.5, respectively, wereanalyzed. PM mass concentrations were determined by stan-dard gravimetric procedures. Thereafter,1/2 of each filterwas acid digested (HF:HNO3:HClO4) for the determinationof major and trace elements by ICP-AES and ICP-MS. An-other1/4 of each filter was water leached to determine solubleion concentrations by ion chromatography (sulphate, nitrateand chloride) and ion selective electrode (ammonium). Theremaining1/4 of each filter was used for the elemental anal-ysis of total carbon (TC) by elemental analyzers. Details ofthe analytical procedure are given by Querol et al. (2001).Furthermore, OC and EC (organic and elemental carbon)were analyzed by a thermal-optical transmission technique(Birch and Cary, 1996) using a Sunset Laboratory OCECAnalyzer. Moreover, SiO2 and CO2−
3 were indirectly de-termined on the basis of empirical factors (Al∗1.89 = Al2O3,3∗Al2O3 = SiO2) mass ratios; see Querol et al. (2001). Theindirect determination of CO2−
3 levels was obtained accord-ing to the output of the ion balance. To this end, for each sam-
www.atmos-chem-phys.net/9/4575/2009/ Atmos. Chem. Phys., 9, 4575–4591, 2009
4578 X. Querol et al.: Variability in regional background aerosols
ple the ammonium/sulphate excess was obtained, then am-monium nitrate was calculated. The excess sodium/chloridewas calculated and balanced with sulphate and nitrate. Theremaining sulphate and nitrate excess was then balanced withcalcium, and then the Ca excess was considered to be cal-cium carbonate. The addition of the above determinations ac-counted for 75–85% of the TSP, PM10 and PM2.5 mass. Thechemical components of the PM are grouped as (a) crustal ormineral (sum of Al2O3, SiO2, CO2−
3 , Ca, Fe, K, Mg, Mn, Tiand P); (b) marine component (sum of Cl− and Na+); (c) or-ganic matter and elemental carbon, OM + EC (OM obtainedapplying a 2.1 factor to the OC concentrations following thesuggestions from Turpin et al., 2001, and Aiken et al., 2008);and (d) secondary inorganic aerosols, SIA (sum of SO2−
4 ,NO−
3 and NH+
4 ).
3.2.2 FKL station
PM10 is routinely monitored at FKL since September 2004,with an Eberline FH 62 I-R (Eberline Instruments GmbH)particulate monitor, designed to continuously measure themass concentration of the suspended particles in ambient airbased on b-attenuation (Gerasopoulos et al., 2006). Addi-tional aerosol samples were collected using a Small-Deposit-area low-volume-Impactor “SDI” and a Virtual Impactor“VI” (Gerasopoulos et al., 2007; Koulouri et al., 2008) sinceJuly 2004. In total, 360 samples (180 PTFE and 180 Quartzfilters) have been collected and analyzed for the main anions,cations, elements, OC and EC at different aerosol fractions.The OM/OC ratio was 2.1 as before. PTFE filters were ana-lyzed for water-soluble ions and elements.1/4 of each PTFE-filter was extracted using 20 ml of pure water (18 M�). Thesolutions obtained were analyzed by ion chromatography foranions (Cl−, Br−, NO−
3 , SO2−
4 , C2O2−
4 , methyl sulfonate)and cations (Na+, NH+
4 , K+, Mg2+ and Ca2+). More detailson the IC method are given by Bardouki et al. (2003). Ele-ments (Al, Ti, V, Cr, Mn, Fe, Ni, Cu, Zn, Cd, Pb) were deter-mined using ICP-MS after acid digestion. Quartz filters wereanalyzed for organic and elemental carbon (OC and EC),with the same thermal-optical transmission method used atMSY under conditions described in Koulouri et al. (2008).
3.2.3 ERL station
At ERL, PM10−2.5 and PM2.5 concentrations were deter-mined gravimetrically from April 2001 to April 2002. Water-soluble ions were measured by ion chromatography (IC)at Environmental Chemical Processes Laboratory (ECPL),University of Crete, following the same method as for FKLfilters described in detail by Bardouki et al. (2003). Con-centration of the elements (Fe, Ti, Ca, Mn, K, Cr, V, Zn,Cl, S) were obtained using 2 cm2 of the filter sample ap-plying proton-induced X-ray emission (PIXE) at ATOMKI(Institute of Nuclear Research of the Hungarian Academy ofSciences, Debrecen, Hungary). During the experiments, the
aerosol samples were irradiated by a 2 MeV proton beam,which was supplied by the 5 MV Van de Graaff Acceleratorof ATOMKI (for more details see Borbely-Kiss et al., 1999).For the evaluation of PIXE spectra, the PIXEKLM softwarewas applied (Szabo and Borbely-Kiss, 1993). BC contentin 46 fine aerosol filter samples collected during winter andsummer was determined using a smoke stain reflectometer(SSR, Borbely-Kiss et al., 1999). For this purpose, obtainedreflectance was converted intoµg m−3 by calibrating the in-strument using EC (for more details see Kocak et al., 2007a,b). OC data was not available in this station.
3.3 Complementary analyses
To interpret the different source regions of air masses, NCEPmeteorological maps (Kalnay et al., 1996) and daily back-trajectories calculated by HYSPLIT4 model (Draxler andRolph, 2003) were used. Daily, 5-day back-trajectories werecalculated at 12:00 GMT at receptor points of 700, 1500 and2500 m a.s.l. modelling also the vertical velocity. Accordingto these tools, sampling days were classified as African dustoutbreaks and transport of marine air masses, from the At-lantic for the WMB and the Mediterranean for both basins.Additionally, in the WMB the recirculation of air masses, thewinter anticyclonic episodes, and the transport of Europeanair masses were also identified; whereas for the EMB the airmasses from the Central and Northern European continent,were recognized.
African dust outbreaks were additionally identified byaerosol maps from the Marine Meteorology Division of theNaval research Laboratory, USA (NRL) (http://www.nrlmry.navy.mil/aerosol); the SKIRON aerosol concentration mapsand simulations (http://forecast.uoa.gr, Kallos et al., 1997);the BSC-/DREAM dust maps (http://www.bsc.es/projects/earthscience/DREAM/, Perez et al., 2006); and satellite im-agery provided by NASA SeaWIFS project (McClain et al.,1998,http://seawifs.gsfc.nasa.gov/SEAWIFS.html).
4 Results
4.1 PM levels
Mean annual TSP, PM10, PM2.5 and PM1 levels recordedat MSY (2002–2008) are 26, 17, 13 and 11µg/m3 (cal-culated from daily means), whereas at FLK (2004–2008)the mean annual PM10, PM2.5 and PM1 levels reach 31,18 and 10µg/m3 (mean values from SDI 2-day in averagesamplings) and at ERL (2001–2002) PM10 and PM2.5 attainmean levels of 36 and 10µg/m3. The data shown here, cor-roborated by the intermediate levels (24µgPM10/m3) mea-sured at a sub-urban site in Palermo by Dongarra et al. (2007)and the 31µgPM10/m3 (2003–2006) measured at the EMEPsite in Cyprus (Ayia Marina, as reported in Airbase), indicatea prominent increase in the annual PM10 levels from WMBto EMB. A north-south gradient of increasing PM10 levels is
Atmos. Chem. Phys., 9, 4575–4591, 2009 www.atmos-chem-phys.net/9/4575/2009/
X. Querol et al.: Variability in regional background aerosols 4579
also observed. In the EMB, the mean annual values reportedfor Lazaropole (Macedonia) and Rojen peak (Bulgaria, air-base dataset) are close to 15µgPM10/m3. The same gradi-ent holds in the WMB when comparing PM10 levels mea-sured at MSY with those recorded at Spanish EMEP stations(Perez et al., 2008). In both cases, this N-S trend can be ex-plained by the gradual deposition of dust transported fromNorth Africa northwards, as well as the lower rainfall fromNorth to South. Mean annual PM levels at RB sites acrossthe Mediterranean may vary largely year to year mainly be-cause of the influence of the African dust (Querol et al.,2009). In order to minimize the inter-annual variability ofthis natural contribution we have included the maximum datacoverage in this study. As shown in the supplementary in-formation (Table S.1, seehttp://www.atmos-chem-phys.net/9/4575/2009/acp-9-4575-2009-supplement.pdf), most of theselected monitoring sites have 6–7 years of data.
Concerning PM2.5, 13, 18 and 10µg/m3, were measuredat MSY, FKL and ERL, respectively. This PM2.5 range isslightly higher than the one obtained at RB sites located atAtlantic and Central Spain (8–11µg/m3). As pointed outby Gerasopoulos et al. (2007) the higher values recordedat Finokalia for PM2.5 are due to Saharan dust intrusions.Very close mean annual PM1 levels are measured at MSYand FKL (11 and 10µg/m3, respectively), which is higherthan the summer levels measured at Monte Cimone in Italy(7µg/m3, Marenco et al., 2006), which is a free troposphericsite (2165 m a.s.l.).
As PM10 and PM2.5 are influenced by dust sources, promi-nent W-E and N-S gradients are also revealed for the differ-ent PM fraction ratios. Thus, PM2.5/PM10 reaches the low-est values in the EMB (0.3–0.6 at FKL and ERL), similar tothe Canary Islands and southern Iberian Peninsula (0.4 and0.5, respectively, Querol et al., 2004, 2008). In the Centraland Northern Iberian Peninsula, the average PM2.5/PM10 ra-tio ranges between 0.60 and 0.75. The same tendency is alsoseen in the mean PM1/PM2.5 ratios ranging from 0.65 at FKLto 0.8 at MSY.
4.1.1 Diurnal variability of PM levels
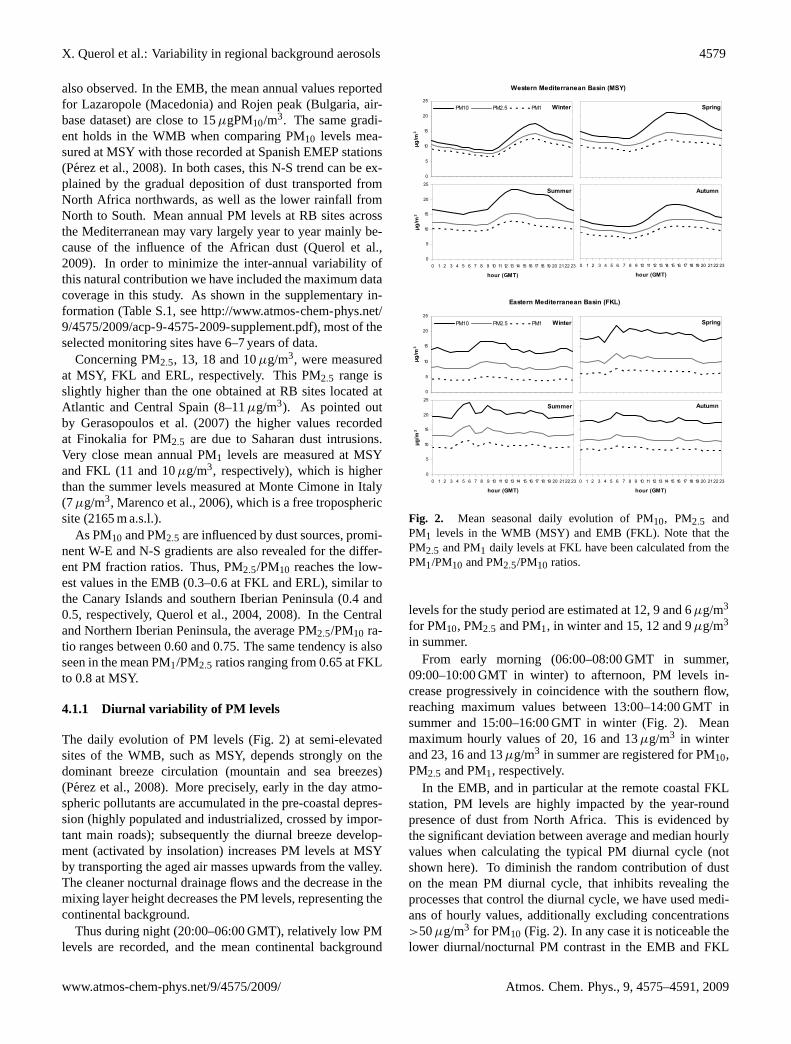
The daily evolution of PM levels (Fig. 2) at semi-elevatedsites of the WMB, such as MSY, depends strongly on thedominant breeze circulation (mountain and sea breezes)(Perez et al., 2008). More precisely, early in the day atmo-spheric pollutants are accumulated in the pre-coastal depres-sion (highly populated and industrialized, crossed by impor-tant main roads); subsequently the diurnal breeze develop-ment (activated by insolation) increases PM levels at MSYby transporting the aged air masses upwards from the valley.The cleaner nocturnal drainage flows and the decrease in themixing layer height decreases the PM levels, representing thecontinental background.
Thus during night (20:00–06:00 GMT), relatively low PMlevels are recorded, and the mean continental background
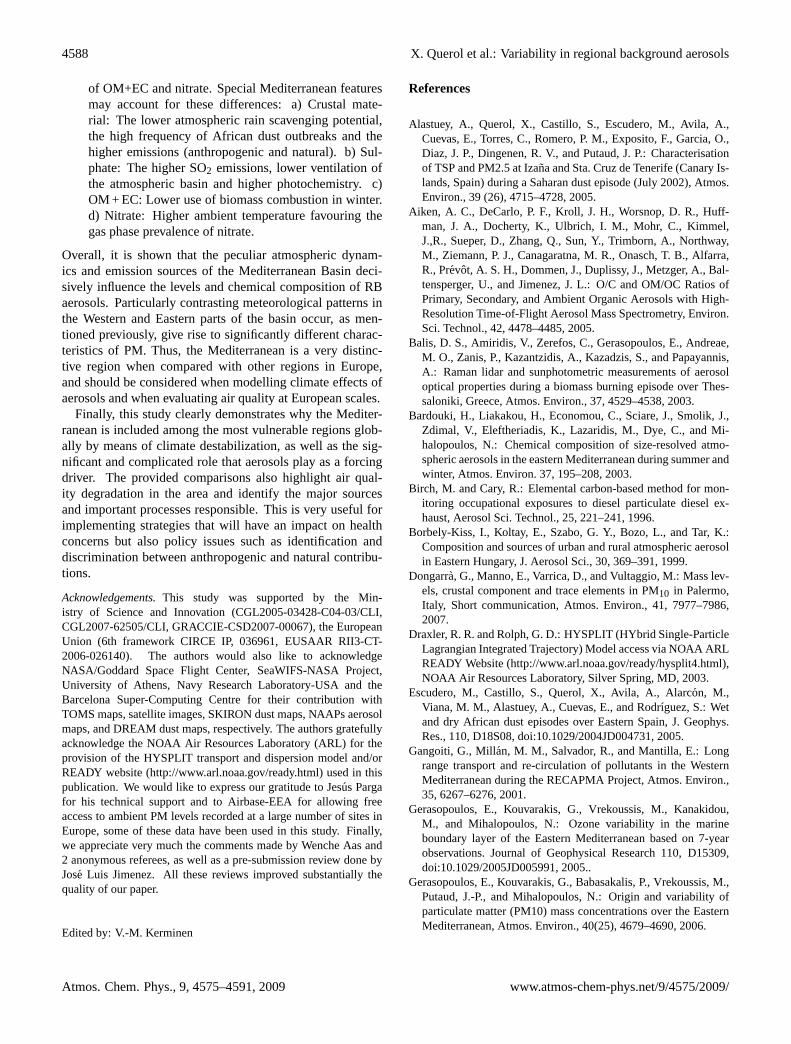
Figure 2. Mean seasonal daily evolution of PM10, PM2.5 and PM1 levels in the WMB (MSY) and EMB (FKL). Note that the PM2.5 and PM1 daily levels at FKL have been calculated from the PM1/PM10 and PM2.5/PM10 ratios.
Winter
0
5
10
15
20
25
0 1 2 3 4 5 6 7 8 9 10 11 12 13 14 15 16 17 18 19 20 21 22 23
µg/m
3
PM10 PM2.5 PM1
Summer
0
5
10
15
20
25
0 1 2 3 4 5 6 7 8 9 10 11 12 13 14 15 16 17 18 19 20 2122 23
hour (GMT)
µg/m
3
Autumn
0
5
10
15
20
25
0 1 2 3 4 5 6 7 8 9 10 11 12 13 14 15 16 17 18 19 20 2122 23
hour (GMT)
Spring
0
5
10
15
20
25
0 1 2 3 4 5 6 7 8 9 10 11 12 13 14 15 16 17 18 19 20 21 22 23
Western Mediterranean Basin (MSY)
Spring
0
5
10
15
20
25
0 1 2 3 4 5 6 7 8 9 10 11 12 13 14 15 16 17 18 19 20 21 22 23
Winter
0
5
10
15
20
25
0 1 2 3 4 5 6 7 8 9 10 11 12 13 14 15 16 17 18 19 20 21 22 23
µg/m
3
PM10 PM2.5 PM1
Summer
0
5
10
15
20
25
0 1 2 3 4 5 6 7 8 9 10 11 12 13 14 15 16 17 18 19 20 2122 23
hour (GMT)
µg/m
3
Autumn
0
5
10
15
20
25
0 1 2 3 4 5 6 7 8 9 10 11 12 13 14 15 16 17 18 19 20 2122 23
hour (GMT)
Eastern Mediterranean Basin (FKL)
Fig. 2. Mean seasonal daily evolution of PM10, PM2.5 andPM1 levels in the WMB (MSY) and EMB (FKL). Note that thePM2.5 and PM1 daily levels at FKL have been calculated from thePM1/PM10 and PM2.5/PM10 ratios.
levels for the study period are estimated at 12, 9 and 6µg/m3
for PM10, PM2.5 and PM1, in winter and 15, 12 and 9µg/m3
in summer.From early morning (06:00–08:00 GMT in summer,
09:00–10:00 GMT in winter) to afternoon, PM levels in-crease progressively in coincidence with the southern flow,reaching maximum values between 13:00–14:00 GMT insummer and 15:00–16:00 GMT in winter (Fig. 2). Meanmaximum hourly values of 20, 16 and 13µg/m3 in winterand 23, 16 and 13µg/m3 in summer are registered for PM10,PM2.5 and PM1, respectively.
In the EMB, and in particular at the remote coastal FKLstation, PM levels are highly impacted by the year-roundpresence of dust from North Africa. This is evidenced bythe significant deviation between average and median hourlyvalues when calculating the typical PM diurnal cycle (notshown here). To diminish the random contribution of duston the mean PM diurnal cycle, that inhibits revealing theprocesses that control the diurnal cycle, we have used medi-ans of hourly values, additionally excluding concentrations>50µg/m3 for PM10 (Fig. 2). In any case it is noticeable thelower diurnal/nocturnal PM contrast in the EMB and FKL
www.atmos-chem-phys.net/9/4575/2009/ Atmos. Chem. Phys., 9, 4575–4591, 2009
4580 X. Querol et al.: Variability in regional background aerosols
compared with the MSY. This may be due in our study tothe influence of large regional emissions of atmospheric pol-lutants transported to MSY by mountain and seas breezesduring daytime. In the absence of high resolution data forPM2.5 and PM1, we have used the ratios of PM1/PM10 andPM2.5/PM10 derived from the impactors for each season, toreproduce their mean diurnal cycle, keeping in mind that inthis way we force their pattern to follow the respective oneof PM10.
As in the case of WMB, relatively lower PM levels are en-countered during night (20:00–04:00 GMT). The mean con-tinental background levels for the study period are estimatedat 14, 8 and 4µg/m3 for PM10, PM2.5 and PM1, in win-ter, and 19, 13 and 9µg/m3 in summer. A progressive PMlevel enhancement is observed during daytime, however withdifferent characteristics for each season. In summer twomorning peaks are found (Fig. 2) at 04:00–6:00 GMT and08:00–10:00 GMT, the first one coinciding with an increaseof NOx, and probably attributed to anthropogenic emissions;and the second one associated to an increase in ozone, possi-bly demonstrating the effect of regional sources of pollutionunder intense photochemical activity (Gerasopoulos et al.,2005). During the transitional seasons (spring and autumn),daytime enhanced PM levels are still evident, however therole of photochemical processes appears less significant. Fi-nally, in winter, the peak narrows and is delimited between05:00 and 11:00 GMT, possibly reflecting the conjunction ofdiurnal patterns of otherwise lower levels of pollution andsolar radiation. Mean maximum hourly values of 17, 10 and5µg/m3 in winter and of 24, 16 and 11µg/m3 in summer areregistered for PM10, PM2.5 and PM1, respectively. The sim-ilarity of the mean maximum summer values between FKLand MSY and the large differences found in winter are at-tributed to the high summer atmospheric mixing, and the ef-fect of the winter anticyclonic episodes frequently developedin the WMB.
4.1.2 Seasonal variability of PM levels
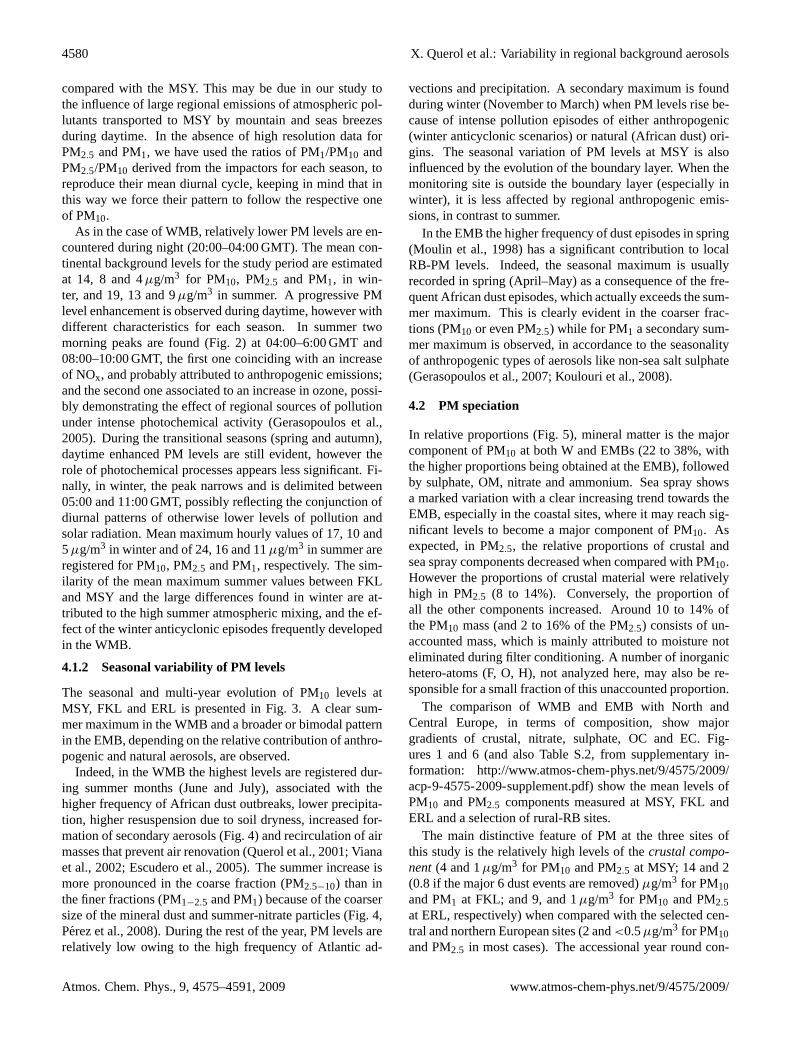
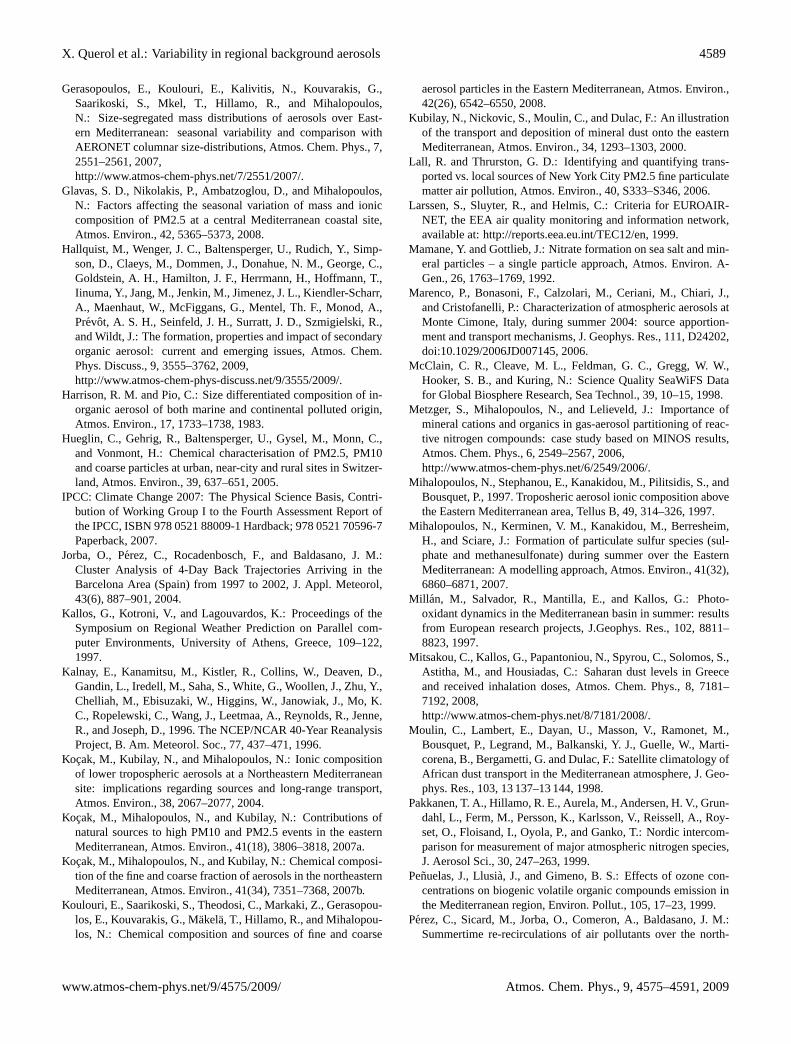
The seasonal and multi-year evolution of PM10 levels atMSY, FKL and ERL is presented in Fig. 3. A clear sum-mer maximum in the WMB and a broader or bimodal patternin the EMB, depending on the relative contribution of anthro-pogenic and natural aerosols, are observed.
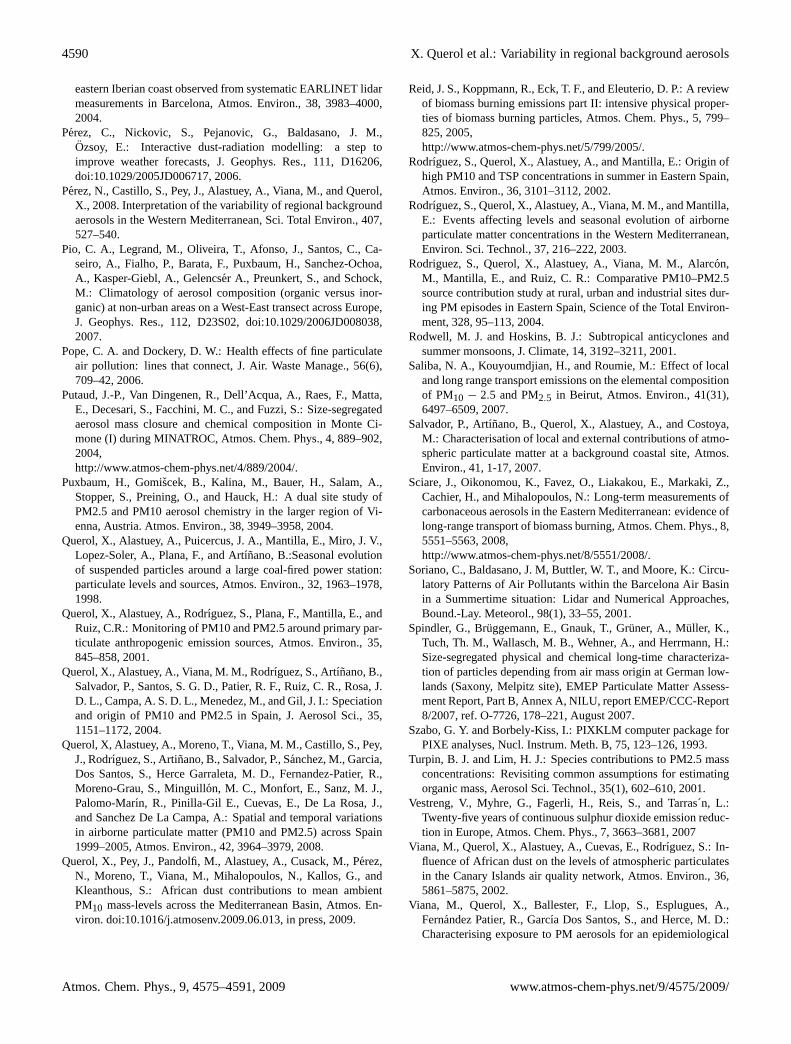
Indeed, in the WMB the highest levels are registered dur-ing summer months (June and July), associated with thehigher frequency of African dust outbreaks, lower precipita-tion, higher resuspension due to soil dryness, increased for-mation of secondary aerosols (Fig. 4) and recirculation of airmasses that prevent air renovation (Querol et al., 2001; Vianaet al., 2002; Escudero et al., 2005). The summer increase ismore pronounced in the coarse fraction (PM2.5−10) than inthe finer fractions (PM1−2.5 and PM1) because of the coarsersize of the mineral dust and summer-nitrate particles (Fig. 4,Perez et al., 2008). During the rest of the year, PM levels arerelatively low owing to the high frequency of Atlantic ad-
vections and precipitation. A secondary maximum is foundduring winter (November to March) when PM levels rise be-cause of intense pollution episodes of either anthropogenic(winter anticyclonic scenarios) or natural (African dust) ori-gins. The seasonal variation of PM levels at MSY is alsoinfluenced by the evolution of the boundary layer. When themonitoring site is outside the boundary layer (especially inwinter), it is less affected by regional anthropogenic emis-sions, in contrast to summer.
In the EMB the higher frequency of dust episodes in spring(Moulin et al., 1998) has a significant contribution to localRB-PM levels. Indeed, the seasonal maximum is usuallyrecorded in spring (April–May) as a consequence of the fre-quent African dust episodes, which actually exceeds the sum-mer maximum. This is clearly evident in the coarser frac-tions (PM10 or even PM2.5) while for PM1 a secondary sum-mer maximum is observed, in accordance to the seasonalityof anthropogenic types of aerosols like non-sea salt sulphate(Gerasopoulos et al., 2007; Koulouri et al., 2008).
4.2 PM speciation
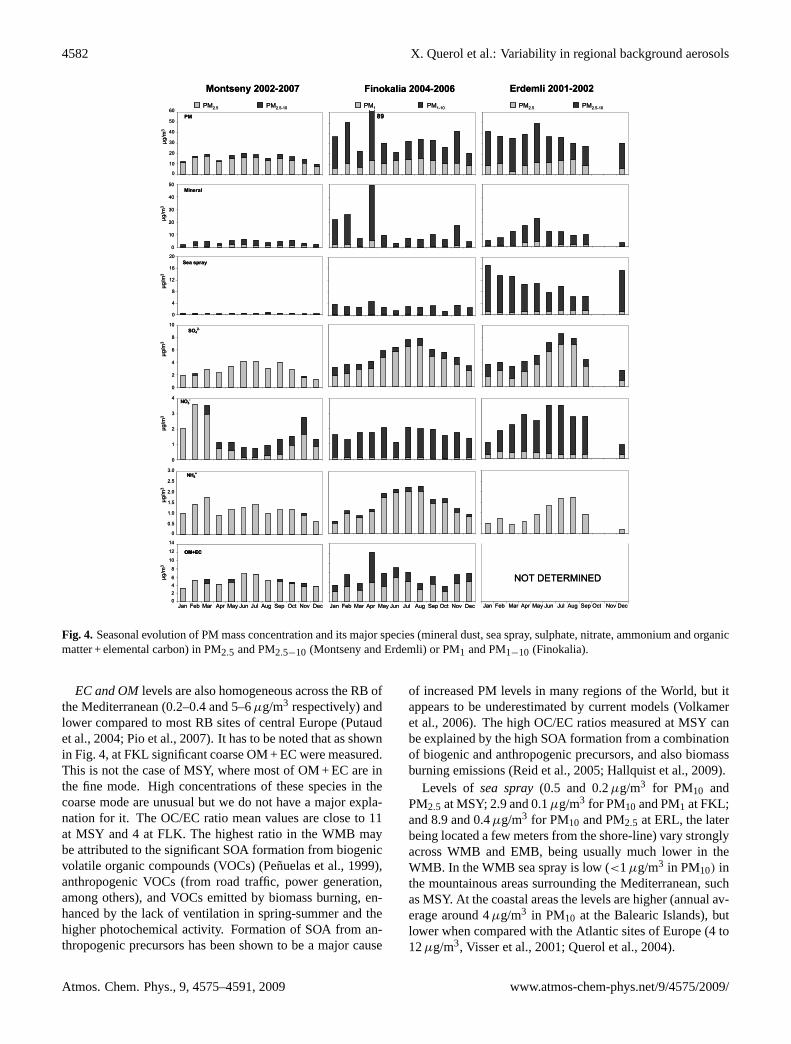
In relative proportions (Fig. 5), mineral matter is the majorcomponent of PM10 at both W and EMBs (22 to 38%, withthe higher proportions being obtained at the EMB), followedby sulphate, OM, nitrate and ammonium. Sea spray showsa marked variation with a clear increasing trend towards theEMB, especially in the coastal sites, where it may reach sig-nificant levels to become a major component of PM10. Asexpected, in PM2.5, the relative proportions of crustal andsea spray components decreased when compared with PM10.However the proportions of crustal material were relativelyhigh in PM2.5 (8 to 14%). Conversely, the proportion ofall the other components increased. Around 10 to 14% ofthe PM10 mass (and 2 to 16% of the PM2.5) consists of un-accounted mass, which is mainly attributed to moisture noteliminated during filter conditioning. A number of inorganichetero-atoms (F, O, H), not analyzed here, may also be re-sponsible for a small fraction of this unaccounted proportion.
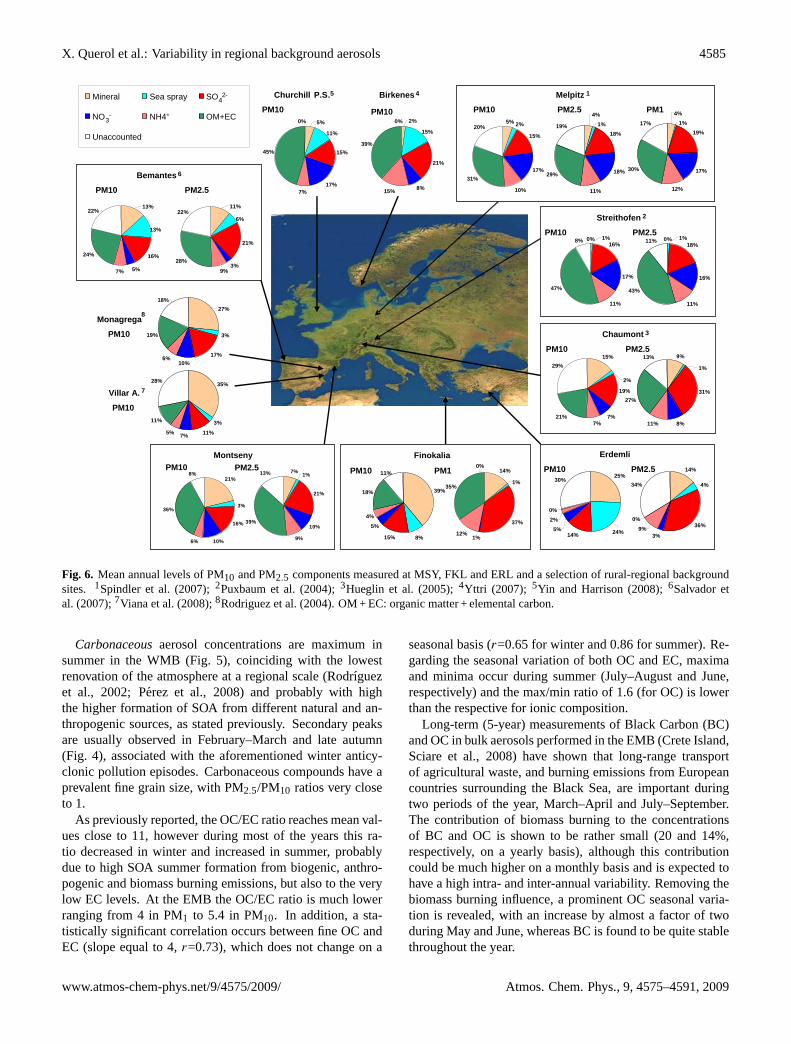
The comparison of WMB and EMB with North andCentral Europe, in terms of composition, show majorgradients of crustal, nitrate, sulphate, OC and EC. Fig-ures 1 and 6 (and also Table S.2, from supplementary in-formation: http://www.atmos-chem-phys.net/9/4575/2009/acp-9-4575-2009-supplement.pdf) show the mean levels ofPM10 and PM2.5 components measured at MSY, FKL andERL and a selection of rural-RB sites.
The main distinctive feature of PM at the three sites ofthis study is the relatively high levels of thecrustal compo-nent(4 and 1µg/m3 for PM10 and PM2.5 at MSY; 14 and 2(0.8 if the major 6 dust events are removed)µg/m3 for PM10and PM1 at FKL; and 9, and 1µg/m3 for PM10 and PM2.5at ERL, respectively) when compared with the selected cen-tral and northern European sites (2 and<0.5µg/m3 for PM10and PM2.5 in most cases). The accessional year round con-
Atmos. Chem. Phys., 9, 4575–4591, 2009 www.atmos-chem-phys.net/9/4575/2009/
X. Querol et al.: Variability in regional background aerosols 4581Figure 3. Mean daily PM10 levels from 2001 to 2008 at Montseny (WMB), and Erdemli and Finokalia (EMB). African dust episodes are indicated with unfilled rhombus.
0
20
40
60
80
100
01/01 07/01 01/02 07/02 01/03 07/03 01/04 07/04 01/05 07/05 01/06 07/06 01/07 07/07 01/08 07/08
PM10
(µg/
m3 )
PM10 NAF WESTERN MEDITERRANEAN
MONTSENY 2002-2008
PM10
2001 2002 2003 2004 2005 2006 2007 2008
0
40
80
120
160
200
01/01 07/01 01/02 07/02 01/03 07/03 01/04 07/04 01/05 07/05 01/06 07/06 01/07 07/07 01/08 07/08
PM10
(µg/
m3 )
PM10 NAF EASTERN MEDITERRANEAN
ERDEMLI 2001-2002
PM10
FINOKALIA 2004-2008
2001 2002 2003 2004 2005 2006 2007 2008
Fig. 3. Mean daily PM10 levels from 2001 to 2008 at Montseny (WMB), and Erdemli and Finokalia (EMB). African dust episodes areindicated with unfilled rhombus.
tribution of dust at FKL is estimated to be 8±5µgPM10/m3,in agreement with the range given by Mitsakou et al. (2008)(5–9µg/m3) for Heraklion, the nearest large city to FKL sta-tion. Of course, at the remote site of FKL the percentagecontribution of dust is much higher than at Heraklion reach-ing 40–50% in spring (frequent dust outbreaks) and winter(some of which are among the most intense events). In theWMB this African dust annual contribution ranges from 1–2µgPM10/m3 in the NWMB to 7µgPM10/m3 in the SWMB.
Sulphatelevels measured at WMB-MSY (3µg/m3) fall inthe usual range reported for rural-RB sites in central andsouthern Europe and the UK (2–4µg/m3), and are higherthan those measured at RB sites of Switzerland and the Scan-dinavian region (1–2µg/m3). However, at the EMB-FKL-ERL, measured levels are among the highest in Europe (5–6µg/m3). EMB is highly influenced by air masses comingfrom Eastern Europe (e.g. Ukraine, Russia) which in associ-ation with high insolation in the area favours H2SO4 produc-tion via homogeneous reactions (Mihalopoulos et al., 2007).Furthermore, SO2 emissions from coal power generation inGreece and the countries surrounding the Black Sea, the lat-ter contributing to more than one third of the total SO2 emis-sions reported over Europe in 2004 (Vestreng et al., 2007),may also contribute to enhanced sulphate levels in EMB. Fur-thermore, the high levels of sulphate in the EMB deplete theavailable gas-phase NH3 so that little ammonium nitrate canform due to the low NH3 levels. Note that this is consistentwith the aerosols in the EMB being acidic and those in theWMB being neutralized by NH+4 , as later discussed.
Nitrate and ammonium levelsat both WMB and EMB fol-low a very similar spatial distribution pattern. For instancenitrate levels range from 1.7 to 1.9µg/m3 at both basins.These values are lower than in central Europe and the UK(2–4µg/m3), slightly higher than at RB sites of Switzerlandand the Scandinavian region (0.5–1µg/m3) and similar to thelevels measured in RB sites of Italy.
Concerning SIA, the nitrate/sulphate ratio in PM10 in theWMB is in the range of 0.4–0.6 for most years, whereas inthe EMB, this ratio falls in the lowest fraction of the aboverange (0.3–0.4), close to the range of values reported for RBsites of Switzerland and Scandinavia (Birkenes) and almosthalf the values recorded in RB sites of Germany and UK (Ta-ble S.2, from supplementary information).
Finally, a very interesting difference between the size dis-tributions of nitrate was observed. In central and north-ern Europe and in the WMB the ratio of nitrate levels inPM2.5/PM10 is constantly 0.7 to 0.8, whereas in the EMB thisdecreases down to 0.1–0.2 (see also PM2.5 data measured atPatras; Table S2). This is probably due to several factors,such as: 1) the major occurrence of coarse sodium and cal-cium nitrate in the EMB (also in an important proportion inthe WMB) with respect to other areas, and 2) with a minorrelevance, the high levels of sulphate in EMB, sufficient toneutralize ammonium and consequently reduce ammoniumnitrate formation under favouring meteorological conditionsi.e. during winter.
www.atmos-chem-phys.net/9/4575/2009/ Atmos. Chem. Phys., 9, 4575–4591, 2009
4582 X. Querol et al.: Variability in regional background aerosols
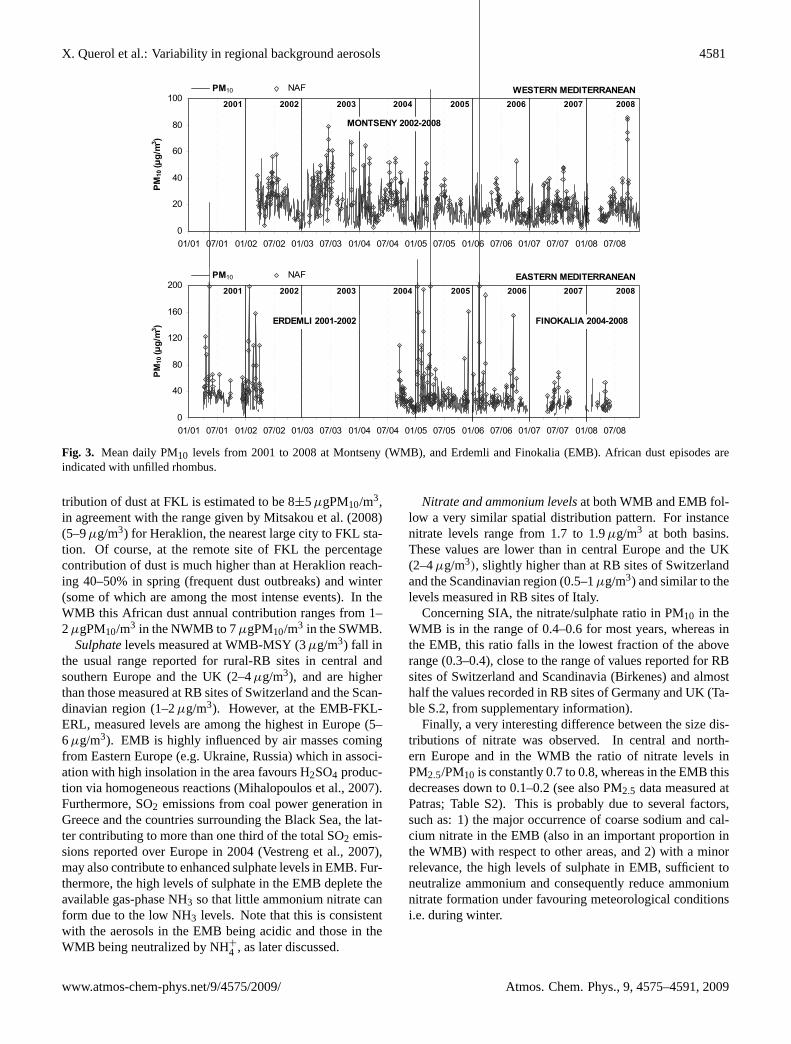
Figure 4. Seasonal evolution of PM mass concentration and its major species (mineral dust, sea spray, sulphate, nitrate, ammonium and organic matter + elemental carbon) in PM2.5 and PM2.5-10 (Montseny and Erdemli) or PM1 and PM1-10 (Finokalia).
PM
Mineral
Sea spray
NO3-
NH4+
SO42-
Jan Feb Mar Apr May Jun Jul Aug Sep Oct Nov Dec Jan Feb Mar Apr May Jun Jul Aug Sep Oct Nov Dec Jan Feb Mar Apr May Jun Jul Aug Sep Oct Nov Dec
89
Montseny 2002-2007 Finokalia 2004-2006 Erdemli 2001-2002
14
12
10
8
6420
60
50
40
30
20
10
0
3.0
2.5
2.0
1.5
1.0
0.5
0
10
8
6
4
2
0
50
40
30
20
10
0
4
3
2
1
0
20
16
12
8
4
0
µg/m
3µg
/m3
µg/m
3µg
/m3
µg/m
3µg
/m3
µg/m
3
PM2.5 PM2.5-10 PM2.5 PM2.5-10PM1 PM1-10
NOT DETERMINED
OM+EC
PM
Mineral
Sea spray
NO3-
NH4+
SO42-
Jan Feb Mar Apr May Jun Jul Aug Sep Oct Nov Dec Jan Feb Mar Apr May Jun Jul Aug Sep Oct Nov Dec Jan Feb Mar Apr May Jun Jul Aug Sep Oct Nov Dec
89
Montseny 2002-2007 Finokalia 2004-2006 Erdemli 2001-2002
14
12
10
8
6420
60
50
40
30
20
10
0
3.0
2.5
2.0
1.5
1.0
0.5
0
10
8
6
4
2
0
50
40
30
20
10
0
4
3
2
1
0
20
16
12
8
4
0
µg/m
3µg
/m3
µg/m
3µg
/m3
µg/m
3µg
/m3
µg/m
3
PM2.5 PM2.5-10 PM2.5 PM2.5-10PM1 PM1-10
NOT DETERMINED
OM+ECOM+EC
Fig. 4. Seasonal evolution of PM mass concentration and its major species (mineral dust, sea spray, sulphate, nitrate, ammonium and organicmatter + elemental carbon) in PM2.5 and PM2.5−10 (Montseny and Erdemli) or PM1 and PM1−10 (Finokalia).
EC and OMlevels are also homogeneous across the RB ofthe Mediterranean (0.2–0.4 and 5–6µg/m3 respectively) andlower compared to most RB sites of central Europe (Putaudet al., 2004; Pio et al., 2007). It has to be noted that as shownin Fig. 4, at FKL significant coarse OM + EC were measured.This is not the case of MSY, where most of OM + EC are inthe fine mode. High concentrations of these species in thecoarse mode are unusual but we do not have a major expla-nation for it. The OC/EC ratio mean values are close to 11at MSY and 4 at FLK. The highest ratio in the WMB maybe attributed to the significant SOA formation from biogenicvolatile organic compounds (VOCs) (Penuelas et al., 1999),anthropogenic VOCs (from road traffic, power generation,among others), and VOCs emitted by biomass burning, en-hanced by the lack of ventilation in spring-summer and thehigher photochemical activity. Formation of SOA from an-thropogenic precursors has been shown to be a major cause
of increased PM levels in many regions of the World, but itappears to be underestimated by current models (Volkameret al., 2006). The high OC/EC ratios measured at MSY canbe explained by the high SOA formation from a combinationof biogenic and anthropogenic precursors, and also biomassburning emissions (Reid et al., 2005; Hallquist et al., 2009).
Levels of sea spray(0.5 and 0.2µg/m3 for PM10 andPM2.5 at MSY; 2.9 and 0.1µg/m3 for PM10 and PM1 at FKL;and 8.9 and 0.4µg/m3 for PM10 and PM2.5 at ERL, the laterbeing located a few meters from the shore-line) vary stronglyacross WMB and EMB, being usually much lower in theWMB. In the WMB sea spray is low (<1µg/m3 in PM10) inthe mountainous areas surrounding the Mediterranean, suchas MSY. At the coastal areas the levels are higher (annual av-erage around 4µg/m3 in PM10 at the Balearic Islands), butlower when compared with the Atlantic sites of Europe (4 to12µg/m3, Visser et al., 2001; Querol et al., 2004).
Atmos. Chem. Phys., 9, 4575–4591, 2009 www.atmos-chem-phys.net/9/4575/2009/
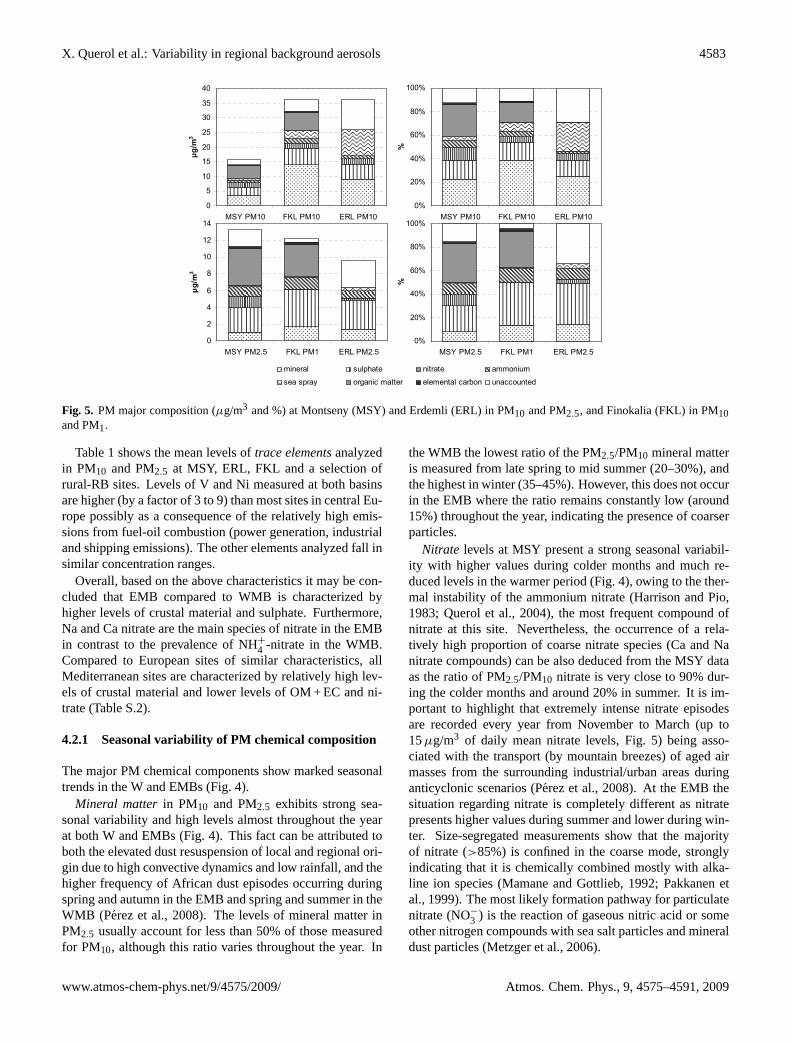
X. Querol et al.: Variability in regional background aerosols 4583 Figure 5. PM major composition (µg/m3 and %) at Montseny (MSY) and Erdemli (ERL) in PM10 and PM2.5, and Finokalia (FKL) in PM10 and PM1.
mineral sulphate nitrate ammonium
sea spray organic matter elemental carbon unaccounted
0
5
10
15
20
25
30
35
40
MSY PM10 FKL PM10 ERL PM10
µg/m
3
0%
20%
40%
60%
80%
100%
MSY PM10 FKL PM10 ERL PM10
%
0
2
4
6
8
10
12
14
MSY PM2.5 FKL PM1 ERL PM2.5
µg/m
3
0%
20%
40%
60%
80%
100%
MSY PM2.5 FKL PM1 ERL PM2.5
%Fig. 5. PM major composition (µg/m3 and %) at Montseny (MSY) and Erdemli (ERL) in PM10 and PM2.5, and Finokalia (FKL) in PM10and PM1.
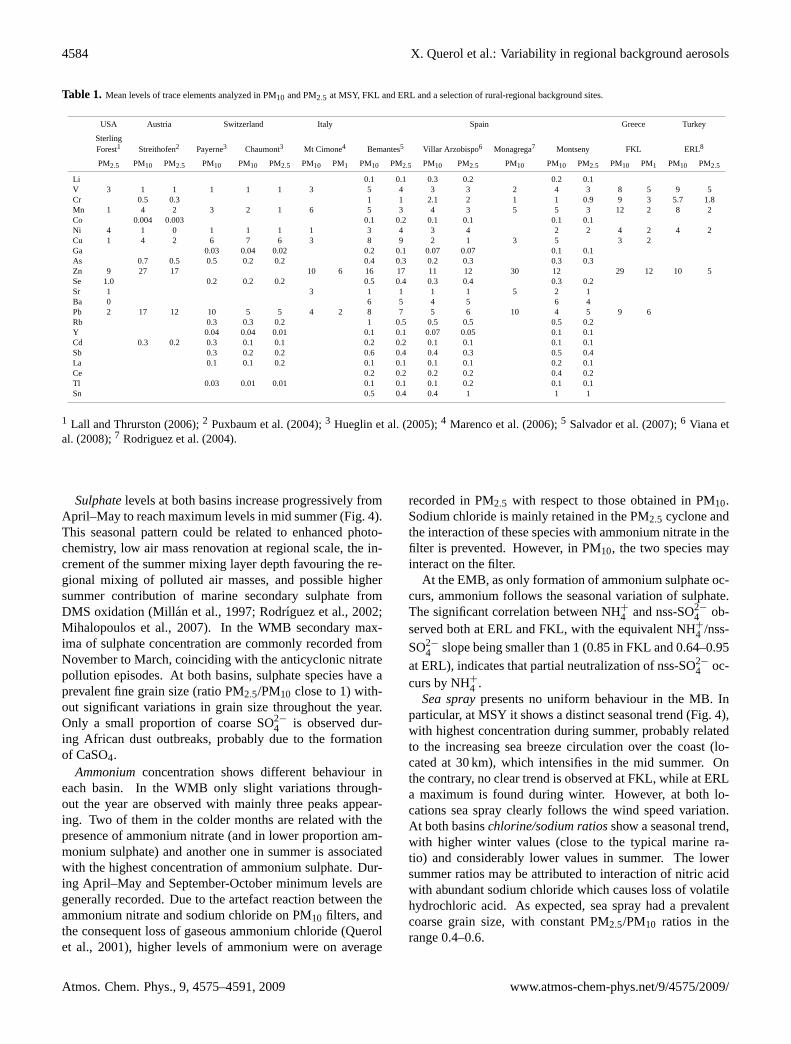
Table 1 shows the mean levels oftrace elementsanalyzedin PM10 and PM2.5 at MSY, ERL, FKL and a selection ofrural-RB sites. Levels of V and Ni measured at both basinsare higher (by a factor of 3 to 9) than most sites in central Eu-rope possibly as a consequence of the relatively high emis-sions from fuel-oil combustion (power generation, industrialand shipping emissions). The other elements analyzed fall insimilar concentration ranges.
Overall, based on the above characteristics it may be con-cluded that EMB compared to WMB is characterized byhigher levels of crustal material and sulphate. Furthermore,Na and Ca nitrate are the main species of nitrate in the EMBin contrast to the prevalence of NH+
4 -nitrate in the WMB.Compared to European sites of similar characteristics, allMediterranean sites are characterized by relatively high lev-els of crustal material and lower levels of OM + EC and ni-trate (Table S.2).
4.2.1 Seasonal variability of PM chemical composition
The major PM chemical components show marked seasonaltrends in the W and EMBs (Fig. 4).
Mineral matter in PM10 and PM2.5 exhibits strong sea-sonal variability and high levels almost throughout the yearat both W and EMBs (Fig. 4). This fact can be attributed toboth the elevated dust resuspension of local and regional ori-gin due to high convective dynamics and low rainfall, and thehigher frequency of African dust episodes occurring duringspring and autumn in the EMB and spring and summer in theWMB (Perez et al., 2008). The levels of mineral matter inPM2.5 usually account for less than 50% of those measuredfor PM10, although this ratio varies throughout the year. In
the WMB the lowest ratio of the PM2.5/PM10 mineral matteris measured from late spring to mid summer (20–30%), andthe highest in winter (35–45%). However, this does not occurin the EMB where the ratio remains constantly low (around15%) throughout the year, indicating the presence of coarserparticles.
Nitrate levels at MSY present a strong seasonal variabil-ity with higher values during colder months and much re-duced levels in the warmer period (Fig. 4), owing to the ther-mal instability of the ammonium nitrate (Harrison and Pio,1983; Querol et al., 2004), the most frequent compound ofnitrate at this site. Nevertheless, the occurrence of a rela-tively high proportion of coarse nitrate species (Ca and Nanitrate compounds) can be also deduced from the MSY dataas the ratio of PM2.5/PM10 nitrate is very close to 90% dur-ing the colder months and around 20% in summer. It is im-portant to highlight that extremely intense nitrate episodesare recorded every year from November to March (up to15µg/m3 of daily mean nitrate levels, Fig. 5) being asso-ciated with the transport (by mountain breezes) of aged airmasses from the surrounding industrial/urban areas duringanticyclonic scenarios (Perez et al., 2008). At the EMB thesituation regarding nitrate is completely different as nitratepresents higher values during summer and lower during win-ter. Size-segregated measurements show that the majorityof nitrate (>85%) is confined in the coarse mode, stronglyindicating that it is chemically combined mostly with alka-line ion species (Mamane and Gottlieb, 1992; Pakkanen etal., 1999). The most likely formation pathway for particulatenitrate (NO−
3 ) is the reaction of gaseous nitric acid or someother nitrogen compounds with sea salt particles and mineraldust particles (Metzger et al., 2006).
www.atmos-chem-phys.net/9/4575/2009/ Atmos. Chem. Phys., 9, 4575–4591, 2009
4584 X. Querol et al.: Variability in regional background aerosols
Table 1. Mean levels of trace elements analyzed in PM10 and PM2.5 at MSY, FKL and ERL and a selection of rural-regional background sites.
USA Austria Switzerland Italy Spain Greece Turkey
SterlingForest1 Streithofen2 Payerne3 Chaumont3 Mt Cimone4 Bemantes5 Villar Arzobispo6 Monagrega7 Montseny FKL ERL8
PM2.5 PM10 PM2.5 PM10 PM10 PM2.5 PM10 PM1 PM10 PM2.5 PM10 PM2.5 PM10 PM10 PM2.5 PM10 PM1 PM10 PM2.5
Li 0.1 0.1 0.3 0.2 0.2 0.1V 3 1 1 1 1 1 3 5 4 3 3 2 4 3 8 5 9 5Cr 0.5 0.3 1 1 2.1 2 1 1 0.9 9 3 5.7 1.8Mn 1 4 2 3 2 1 6 5 3 4 3 5 5 3 12 2 8 2Co 0.004 0.003 0.1 0.2 0.1 0.1 0.1 0.1Ni 4 1 0 1 1 1 1 3 4 3 4 2 2 4 2 4 2Cu 1 4 2 6 7 6 3 8 9 2 1 3 5 3 2Ga 0.03 0.04 0.02 0.2 0.1 0.07 0.07 0.1 0.1As 0.7 0.5 0.5 0.2 0.2 0.4 0.3 0.2 0.3 0.3 0.3Zn 9 27 17 10 6 16 17 11 12 30 12 29 12 10 5Se 1.0 0.2 0.2 0.2 0.5 0.4 0.3 0.4 0.3 0.2Sr 1 3 1 1 1 1 5 2 1Ba 0 6 5 4 5 6 4Pb 2 17 12 10 5 5 4 2 8 7 5 6 10 4 5 9 6Rb 0.3 0.3 0.2 1 0.5 0.5 0.5 0.5 0.2Y 0.04 0.04 0.01 0.1 0.1 0.07 0.05 0.1 0.1Cd 0.3 0.2 0.3 0.1 0.1 0.2 0.2 0.1 0.1 0.1 0.1Sb 0.3 0.2 0.2 0.6 0.4 0.4 0.3 0.5 0.4La 0.1 0.1 0.2 0.1 0.1 0.1 0.1 0.2 0.1Ce 0.2 0.2 0.2 0.2 0.4 0.2Tl 0.03 0.01 0.01 0.1 0.1 0.1 0.2 0.1 0.1Sn 0.5 0.4 0.4 1 1 1
1 Lall and Thrurston (2006);2 Puxbaum et al. (2004);3 Hueglin et al. (2005);4 Marenco et al. (2006);5 Salvador et al. (2007);6 Viana etal. (2008);7 Rodriguez et al. (2004).
Sulphatelevels at both basins increase progressively fromApril–May to reach maximum levels in mid summer (Fig. 4).This seasonal pattern could be related to enhanced photo-chemistry, low air mass renovation at regional scale, the in-crement of the summer mixing layer depth favouring the re-gional mixing of polluted air masses, and possible highersummer contribution of marine secondary sulphate fromDMS oxidation (Millan et al., 1997; Rodrıguez et al., 2002;Mihalopoulos et al., 2007). In the WMB secondary max-ima of sulphate concentration are commonly recorded fromNovember to March, coinciding with the anticyclonic nitratepollution episodes. At both basins, sulphate species have aprevalent fine grain size (ratio PM2.5/PM10 close to 1) with-out significant variations in grain size throughout the year.Only a small proportion of coarse SO2−
4 is observed dur-ing African dust outbreaks, probably due to the formationof CaSO4.
Ammoniumconcentration shows different behaviour ineach basin. In the WMB only slight variations through-out the year are observed with mainly three peaks appear-ing. Two of them in the colder months are related with thepresence of ammonium nitrate (and in lower proportion am-monium sulphate) and another one in summer is associatedwith the highest concentration of ammonium sulphate. Dur-ing April–May and September-October minimum levels aregenerally recorded. Due to the artefact reaction between theammonium nitrate and sodium chloride on PM10 filters, andthe consequent loss of gaseous ammonium chloride (Querolet al., 2001), higher levels of ammonium were on average
recorded in PM2.5 with respect to those obtained in PM10.Sodium chloride is mainly retained in the PM2.5 cyclone andthe interaction of these species with ammonium nitrate in thefilter is prevented. However, in PM10, the two species mayinteract on the filter.
At the EMB, as only formation of ammonium sulphate oc-curs, ammonium follows the seasonal variation of sulphate.The significant correlation between NH+
4 and nss-SO2−
4 ob-served both at ERL and FKL, with the equivalent NH+
4 /nss-SO2−
4 slope being smaller than 1 (0.85 in FKL and 0.64–0.95at ERL), indicates that partial neutralization of nss-SO2−
4 oc-curs by NH+
4 .Sea spraypresents no uniform behaviour in the MB. In
particular, at MSY it shows a distinct seasonal trend (Fig. 4),with highest concentration during summer, probably relatedto the increasing sea breeze circulation over the coast (lo-cated at 30 km), which intensifies in the mid summer. Onthe contrary, no clear trend is observed at FKL, while at ERLa maximum is found during winter. However, at both lo-cations sea spray clearly follows the wind speed variation.At both basinschlorine/sodium ratiosshow a seasonal trend,with higher winter values (close to the typical marine ra-tio) and considerably lower values in summer. The lowersummer ratios may be attributed to interaction of nitric acidwith abundant sodium chloride which causes loss of volatilehydrochloric acid. As expected, sea spray had a prevalentcoarse grain size, with constant PM2.5/PM10 ratios in therange 0.4–0.6.
Atmos. Chem. Phys., 9, 4575–4591, 2009 www.atmos-chem-phys.net/9/4575/2009/
X. Querol et al.: Variability in regional background aerosols 4585
16%
10%6%
36%
8%21%
3%
5% 2%
15%
17%
10%
31%
20%
PM104%
1%18%
18%
11%
29%
19%
PM2.5 4%1%
19%
17%
12%
30%
17%
PM1
Melpitz 1
0%16%
17%
11%
47%
8% 1% 0%18%
16%
11%
43%
11% 1%PM10 PM2.5
Streithofen 2
15%
19%
7%7%
21%
29%
2%
9%
31%
8%11%
27%
13%
1%
PM10 PM2.5
Chaumont 3
21%
8%15%
39%
0% 2%
15%
PM10
Birkenes 4
15%
17%7%
45%
0% 5%
11%
PM10
Churchill P.S.5
16%
5%7%
24%
22%13%
13%
21%
3%9%
28%
22%11%
6%
PM10 PM2.5
Bemantes 6
17%10%
6%
19%
18%27%
3%
PM10
Monagrega8
11%7%5%
11%
28% 35%
3%
Villar A. 7
PM10 PM2.5Montseny
15%
5%
4%
18%
11%
39%
8%
37%
1%12%
35%
0%14%
1%
PM10 PM1
Finokalia
14%5%
2%0%
30%25%
24%36%
3%9%
0%
34%
14%
4%
PM10 PM2.5
Erdemli
3.4; 17%Mineral Sea spray SO4
2-
NO3- NH4+ OM+EC
Unaccounted
21%
10%
9%
39%
13% 7% 1%
PM10
Fig. 6. Mean annual levels of PM10 and PM2.5 components measured at MSY, FKL and ERL and a selection of rural-regional backgroundsites. 1Spindler et al. (2007);2Puxbaum et al. (2004);3Hueglin et al. (2005);4Yttri (2007); 5Yin and Harrison (2008);6Salvador etal. (2007);7Viana et al. (2008);8Rodriguez et al. (2004). OM + EC: organic matter + elemental carbon.
Carbonaceousaerosol concentrations are maximum insummer in the WMB (Fig. 5), coinciding with the lowestrenovation of the atmosphere at a regional scale (Rodrıguezet al., 2002; Perez et al., 2008) and probably with highthe higher formation of SOA from different natural and an-thropogenic sources, as stated previously. Secondary peaksare usually observed in February–March and late autumn(Fig. 4), associated with the aforementioned winter anticy-clonic pollution episodes. Carbonaceous compounds have aprevalent fine grain size, with PM2.5/PM10 ratios very closeto 1.
As previously reported, the OC/EC ratio reaches mean val-ues close to 11, however during most of the years this ra-tio decreased in winter and increased in summer, probablydue to high SOA summer formation from biogenic, anthro-pogenic and biomass burning emissions, but also to the verylow EC levels. At the EMB the OC/EC ratio is much lowerranging from 4 in PM1 to 5.4 in PM10. In addition, a sta-tistically significant correlation occurs between fine OC andEC (slope equal to 4,r=0.73), which does not change on a
seasonal basis (r=0.65 for winter and 0.86 for summer). Re-garding the seasonal variation of both OC and EC, maximaand minima occur during summer (July–August and June,respectively) and the max/min ratio of 1.6 (for OC) is lowerthan the respective for ionic composition.
Long-term (5-year) measurements of Black Carbon (BC)and OC in bulk aerosols performed in the EMB (Crete Island,Sciare et al., 2008) have shown that long-range transportof agricultural waste, and burning emissions from Europeancountries surrounding the Black Sea, are important duringtwo periods of the year, March–April and July–September.The contribution of biomass burning to the concentrationsof BC and OC is shown to be rather small (20 and 14%,respectively, on a yearly basis), although this contributioncould be much higher on a monthly basis and is expected tohave a high intra- and inter-annual variability. Removing thebiomass burning influence, a prominent OC seasonal varia-tion is revealed, with an increase by almost a factor of twoduring May and June, whereas BC is found to be quite stablethroughout the year.
www.atmos-chem-phys.net/9/4575/2009/ Atmos. Chem. Phys., 9, 4575–4591, 2009
4586 X. Querol et al.: Variability in regional background aerosols
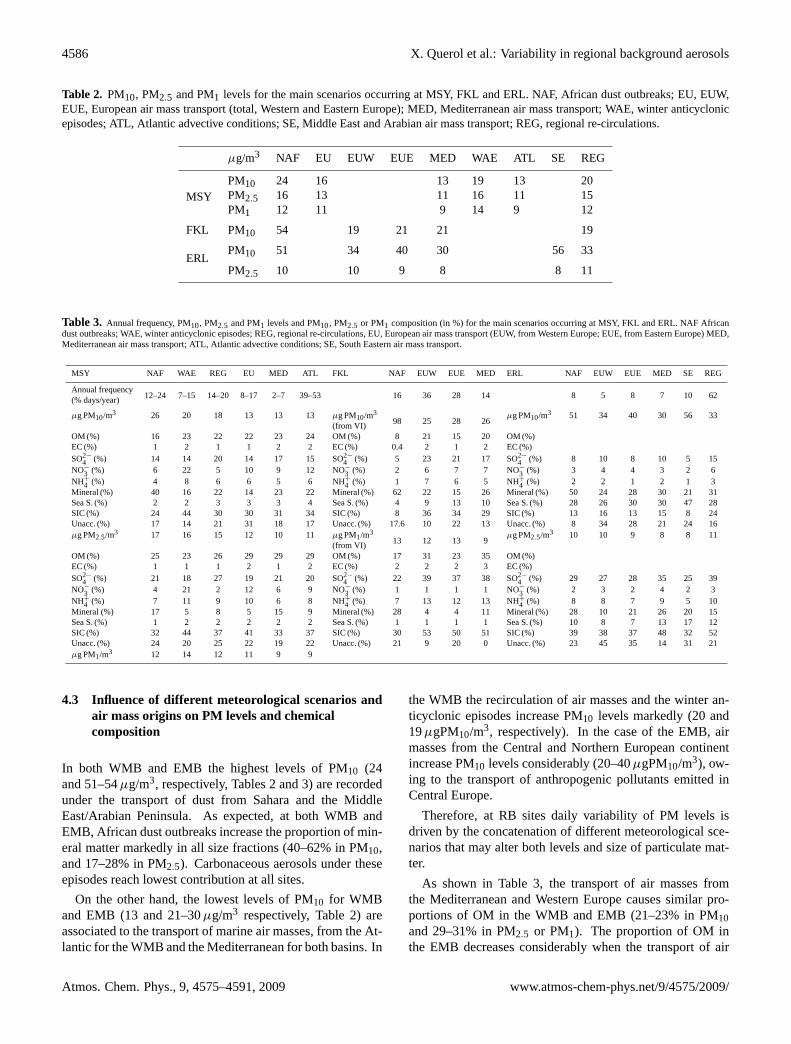
Table 2. PM10, PM2.5 and PM1 levels for the main scenarios occurring at MSY, FKL and ERL. NAF, African dust outbreaks; EU, EUW,EUE, European air mass transport (total, Western and Eastern Europe); MED, Mediterranean air mass transport; WAE, winter anticyclonicepisodes; ATL, Atlantic advective conditions; SE, Middle East and Arabian air mass transport; REG, regional re-circulations.
µg/m3 NAF EU EUW EUE MED WAE ATL SE REG
MSYPM10 24 16 13 19 13 20PM2.5 16 13 11 16 11 15PM1 12 11 9 14 9 12
FKL PM10 54 19 21 21 19
ERLPM10 51 34 40 30 56 33
PM2.5 10 10 9 8 8 11
Table 3. Annual frequency, PM10, PM2.5 and PM1 levels and PM10, PM2.5 or PM1 composition (in %) for the main scenarios occurring at MSY, FKL and ERL. NAF Africandust outbreaks; WAE, winter anticyclonic episodes; REG, regional re-circulations, EU, European air mass transport (EUW, from Western Europe; EUE, from Eastern Europe) MED,Mediterranean air mass transport; ATL, Atlantic advective conditions; SE, South Eastern air mass transport.
MSY NAF WAE REG EU MED ATL FKL NAF EUW EUE MED ERL NAF EUW EUE MED SE REG
Annual frequency12–24 7–15 14–20 8–17 2–7 39–53 16 36 28 14 8 5 8 7 10 62(% days/year)
µg PM10/m3 26 20 18 13 13 13 µg PM10/m398 25 28 26
µg PM10/m3 51 34 40 30 56 33(from VI)
OM (%) 16 23 22 22 23 24 OM (%) 8 21 15 20 OM (%)EC (%) 1 2 1 1 2 2 EC (%) 0.4 2 1 2 EC (%)SO2−
4 (%) 14 14 20 14 17 15 SO2−
4 (%) 5 23 21 17 SO2−
4 (%) 8 10 8 10 5 15NO−
3 (%) 6 22 5 10 9 12 NO−3 (%) 2 6 7 7 NO−
3 (%) 3 4 4 3 2 6NH+
4 (%) 4 8 6 6 5 6 NH+4 (%) 1 7 6 5 NH+
4 (%) 2 2 1 2 1 3Mineral (%) 40 16 22 14 23 22 Mineral (%) 62 22 15 26 Mineral (%) 50 24 28 30 21 31Sea S. (%) 2 2 3 3 3 4 Sea S. (%) 4 9 13 10 Sea S. (%) 28 26 30 30 47 28SIC (%) 24 44 30 30 31 34 SIC (%) 8 36 34 29 SIC (%) 13 16 13 15 8 24Unacc. (%) 17 14 21 31 18 17 Unacc. (%) 17.6 10 22 13 Unacc. (%) 8 34 28 21 24 16µg PM2.5/m3 17 16 15 12 10 11 µg PM1/m3
13 12 13 9µg PM2.5/m3 10 10 9 8 8 11
(from VI)OM (%) 25 23 26 29 29 29 OM (%) 17 31 23 35 OM (%)EC (%) 1 1 1 2 1 2 EC (%) 2 2 2 3 EC (%)SO2−
4 (%) 21 18 27 19 21 20 SO2−
4 (%) 22 39 37 38 SO2−
4 (%) 29 27 28 35 25 39NO−
3 (%) 4 21 2 12 6 9 NO−3 (%) 1 1 1 1 NO−
3 (%) 2 3 2 4 2 3NH+
4 (%) 7 11 9 10 6 8 NH+4 (%) 7 13 12 13 NH+4 (%) 8 8 7 9 5 10Mineral (%) 17 5 8 5 15 9 Mineral (%) 28 4 4 11 Mineral (%) 28 10 21 26 20 15Sea S. (%) 1 2 2 2 2 2 Sea S. (%) 1 1 1 1 Sea S. (%) 10 8 7 13 17 12SIC (%) 32 44 37 41 33 37 SIC (%) 30 53 50 51 SIC (%) 39 38 37 48 32 52Unacc. (%) 24 20 25 22 19 22 Unacc. (%) 21 9 20 0 Unacc. (%) 23 45 35 14 31 21µg PM1/m3 12 14 12 11 9 9
4.3 Influence of different meteorological scenarios andair mass origins on PM levels and chemicalcomposition
In both WMB and EMB the highest levels of PM10 (24and 51–54µg/m3, respectively, Tables 2 and 3) are recordedunder the transport of dust from Sahara and the MiddleEast/Arabian Peninsula. As expected, at both WMB andEMB, African dust outbreaks increase the proportion of min-eral matter markedly in all size fractions (40–62% in PM10,and 17–28% in PM2.5). Carbonaceous aerosols under theseepisodes reach lowest contribution at all sites.
On the other hand, the lowest levels of PM10 for WMBand EMB (13 and 21–30µg/m3 respectively, Table 2) areassociated to the transport of marine air masses, from the At-lantic for the WMB and the Mediterranean for both basins. In
the WMB the recirculation of air masses and the winter an-ticyclonic episodes increase PM10 levels markedly (20 and19µgPM10/m3, respectively). In the case of the EMB, airmasses from the Central and Northern European continentincrease PM10 levels considerably (20–40µgPM10/m3), ow-ing to the transport of anthropogenic pollutants emitted inCentral Europe.
Therefore, at RB sites daily variability of PM levels isdriven by the concatenation of different meteorological sce-narios that may alter both levels and size of particulate mat-ter.
As shown in Table 3, the transport of air masses fromthe Mediterranean and Western Europe causes similar pro-portions of OM in the WMB and EMB (21–23% in PM10and 29–31% in PM2.5 or PM1). The proportion of OM inthe EMB decreases considerably when the transport of air
Atmos. Chem. Phys., 9, 4575–4591, 2009 www.atmos-chem-phys.net/9/4575/2009/
X. Querol et al.: Variability in regional background aerosols 4587
masses is from Eastern Europe (15% in PM10 and 23% inPM1 at FKL). The EC proportion does not present notice-able variations with the air mass origins.
Regional recirculations (REG) cause the highest propor-tion of sulphate in the WMB (MSY) and EMB (ERL). Theseproportions increase in the PM2.5 fraction with respect to thePM10 fraction (15–20% in PM10, and 27–39% in PM2.5),due to prevailing low dispersive conditions and high pho-tochemical oxidation. Sulphate also increases markedly atFKL under European transport (21–23% PM10 and 37–39%in PM1).
The nitrate proportion in the EMB is considerably lowerthan in the WMB. The nitrate and ammonium proportion atMSY is higher under WAE (21–22% for nitrate and 8–11%for ammonium in both PM10 and PM2.5). The higher propor-tions of nitrate in the EMB occur under European transportand regional recirculations, representing only 4–6% of PM10.
5 Conclusions
PM levels and speciation for the period 2001 to 2008 at threetypical regional background (RB) sites at the WMB and theEMB (Montseny/MSY – NE Spain, Finokalia/FKL – South-ern Greece and Erdemli/ERL – Southern Turkey), are uti-lized, in conjunction with selected European sites, for theidentification of major factors controlling levels and chemi-cal composition that differentiate aerosols along the Mediter-ranean Basin.
The major findings of this study can be summarized asfollows:
– A prominent W-E and N-S PM10 and PM2.5 increas-ing gradient along the Mediterranean Basin is found,while for PM1 similar levels are observed in bothbasins. These gradients are attributed to the proximityto dust sources and the higher frequency and intensityof African dust outbreaks in the EMB when comparedwith the WMB.
– In the WMB, PM levels follow a clear seasonal pat-tern with summer maximum due to lower precipita-tion, higher resuspension, photochemical transforma-tions and frequent African episodes. A broader patternis observed at the EMB with maxima in spring due tothe higher frequency of dust episodes.
– Speciation data shows that PM in EMB is characterizedby higher levels of crustal material and sulphate com-pared to WMB. RB nitrate and OC + EC levels are rela-tively constant across the Mediterranean.
– The main form of RB nitrate formed in the EMB is Naand Ca nitrate, with a dominant coarse grain size. Thus,the ratio of PM2.5/PM10 nitrate levels in the EMB isconsiderably lower (0.1–0.2) than in central and north-ern EU and the WMB (0.7 to 0.8). Nitrate levels at
WMB present a strong seasonal variability with maximaduring colder months and reduced levels in the warmerperiod. This can be related to the thermal instabilityof the ammonium nitrate in summer ambient conditionsand to extremely intense nitrate episodes recorded everyyear from November to March. Contrarily, at the EMBnitrate presents higher values during summer and lowerduring winter, due to the combination of nitrate mostlywith alkaline ion species.
– Sulphate levels at both parts of the basin increase pro-gressively from April–May to reach maximum levelsin mid summer, due to enhanced photochemistry, lowair mass renovation at regional scale, the increment ofthe summer mixing layer depth favouring the regionalmixing of polluted air masses, and the possible highersummer contribution of marine secondary sulphate fromDMS oxidation. A small proportion of primary sulphatecan not be discarded, but prior studies showed that theS/PM ratio is very small in the free troposphere, whencompared with the boundary layer during African dustepisodes (Alastuey et al., 2005). In any case enhancedsulphate levels in EMB compared to WMB were mea-sured. The high levels of sulphate in the EMB may de-plete the available gas-phase NH3 so that little ammo-nium nitrate can form due to the low NH3 levels. Notethat this is consistent with the aerosols in the EMB be-ing acidic and those in the WMB being neutralized byNH+
4 . This may be the reason for the coarse prevalenceof nitrate in the EMB, where the interaction of HNO3with sea salt and mineral matter may be favoured by thelow NH3 available.
– The OC/EC ratio is close to 11 at MSY, and 4 at FLK,due to the lack of ventilation in WMB during spring-summer and the enhanced formation of SOA from theoxidation of biogenic and anthropogenic VOCs, andalso from VOCs emitted during forest fires. This hasbeen shown to be a major cause of increased PM levelsin many regions of the World, but it appears to be un-derestimated by current models (Volkamer et al., 2006).Thus the high OC/EC ratios measured at MSY can beexplained by the high SOA formation from a combina-tion of anthropogenic VOC precursors or biomass burn-ing, or a combination of both. These two sources areenhanced in summer.
– Trace element levels (V and Ni) measured at both basinsare relatively higher (by a factor of 3 to 9) than mostsites in central Europe as a consequence of the rela-tively high emissions from fuel-oil combustion in thestudy area (power generation, industrial and shippingemissions).
– Compared to central European sites, PM at Mediter-ranean RB is characterized by relatively high levels ofcrustal material and sulphate (EMB), and lower levels
www.atmos-chem-phys.net/9/4575/2009/ Atmos. Chem. Phys., 9, 4575–4591, 2009
4588 X. Querol et al.: Variability in regional background aerosols
of OM+EC and nitrate. Special Mediterranean featuresmay account for these differences: a) Crustal mate-rial: The lower atmospheric rain scavenging potential,the high frequency of African dust outbreaks and thehigher emissions (anthropogenic and natural). b) Sul-phate: The higher SO2 emissions, lower ventilation ofthe atmospheric basin and higher photochemistry. c)OM + EC: Lower use of biomass combustion in winter.d) Nitrate: Higher ambient temperature favouring thegas phase prevalence of nitrate.
Overall, it is shown that the peculiar atmospheric dynam-ics and emission sources of the Mediterranean Basin deci-sively influence the levels and chemical composition of RBaerosols. Particularly contrasting meteorological patterns inthe Western and Eastern parts of the basin occur, as men-tioned previously, give rise to significantly different charac-teristics of PM. Thus, the Mediterranean is a very distinc-tive region when compared with other regions in Europe,and should be considered when modelling climate effects ofaerosols and when evaluating air quality at European scales.
Finally, this study clearly demonstrates why the Mediter-ranean is included among the most vulnerable regions glob-ally by means of climate destabilization, as well as the sig-nificant and complicated role that aerosols play as a forcingdriver. The provided comparisons also highlight air qual-ity degradation in the area and identify the major sourcesand important processes responsible. This is very useful forimplementing strategies that will have an impact on healthconcerns but also policy issues such as identification anddiscrimination between anthropogenic and natural contribu-tions.
Acknowledgements.This study was supported by the Min-istry of Science and Innovation (CGL2005-03428-C04-03/CLI,CGL2007-62505/CLI, GRACCIE-CSD2007-00067), the EuropeanUnion (6th framework CIRCE IP, 036961, EUSAAR RII3-CT-2006-026140). The authors would also like to acknowledgeNASA/Goddard Space Flight Center, SeaWIFS-NASA Project,University of Athens, Navy Research Laboratory-USA and theBarcelona Super-Computing Centre for their contribution withTOMS maps, satellite images, SKIRON dust maps, NAAPs aerosolmaps, and DREAM dust maps, respectively. The authors gratefullyacknowledge the NOAA Air Resources Laboratory (ARL) for theprovision of the HYSPLIT transport and dispersion model and/orREADY website (http://www.arl.noaa.gov/ready.html) used in thispublication. We would like to express our gratitude to Jesus Pargafor his technical support and to Airbase-EEA for allowing freeaccess to ambient PM levels recorded at a large number of sites inEurope, some of these data have been used in this study. Finally,we appreciate very much the comments made by Wenche Aas and2 anonymous referees, as well as a pre-submission review done byJose Luis Jimenez. All these reviews improved substantially thequality of our paper.
Edited by: V.-M. Kerminen
References
Alastuey, A., Querol, X., Castillo, S., Escudero, M., Avila, A.,Cuevas, E., Torres, C., Romero, P. M., Exposito, F., Garcia, O.,Diaz, J. P., Dingenen, R. V., and Putaud, J. P.: Characterisationof TSP and PM2.5 at Izana and Sta. Cruz de Tenerife (Canary Is-lands, Spain) during a Saharan dust episode (July 2002), Atmos.Environ., 39 (26), 4715–4728, 2005.
Aiken, A. C., DeCarlo, P. F., Kroll, J. H., Worsnop, D. R., Huff-man, J. A., Docherty, K., Ulbrich, I. M., Mohr, C., Kimmel,J.,R., Sueper, D., Zhang, Q., Sun, Y., Trimborn, A., Northway,M., Ziemann, P. J., Canagaratna, M. R., Onasch, T. B., Alfarra,R., Prevot, A. S. H., Dommen, J., Duplissy, J., Metzger, A., Bal-tensperger, U., and Jimenez, J. L.: O/C and OM/OC Ratios ofPrimary, Secondary, and Ambient Organic Aerosols with High-Resolution Time-of-Flight Aerosol Mass Spectrometry, Environ.Sci. Technol., 42, 4478–4485, 2005.
Balis, D. S., Amiridis, V., Zerefos, C., Gerasopoulos, E., Andreae,M. O., Zanis, P., Kazantzidis, A., Kazadzis, S., and Papayannis,A.: Raman lidar and sunphotometric measurements of aerosoloptical properties during a biomass burning episode over Thes-saloniki, Greece, Atmos. Environ., 37, 4529–4538, 2003.
Bardouki, H., Liakakou, H., Economou, C., Sciare, J., Smolik, J.,Zdimal, V., Eleftheriadis, K., Lazaridis, M., Dye, C., and Mi-halopoulos, N.: Chemical composition of size-resolved atmo-spheric aerosols in the eastern Mediterranean during summer andwinter, Atmos. Environ. 37, 195–208, 2003.
Birch, M. and Cary, R.: Elemental carbon-based method for mon-itoring occupational exposures to diesel particulate diesel ex-haust, Aerosol Sci. Technol., 25, 221–241, 1996.
Borbely-Kiss, I., Koltay, E., Szabo, G. Y., Bozo, L., and Tar, K.:Composition and sources of urban and rural atmospheric aerosolin Eastern Hungary, J. Aerosol Sci., 30, 369–391, 1999.
Dongarra, G., Manno, E., Varrica, D., and Vultaggio, M.: Mass lev-els, crustal component and trace elements in PM10 in Palermo,Italy, Short communication, Atmos. Environ., 41, 7977–7986,2007.
Draxler, R. R. and Rolph, G. D.: HYSPLIT (HYbrid Single-ParticleLagrangian Integrated Trajectory) Model access via NOAA ARLREADY Website (http://www.arl.noaa.gov/ready/hysplit4.html),NOAA Air Resources Laboratory, Silver Spring, MD, 2003.
Escudero, M., Castillo, S., Querol, X., Avila, A., Alarcon, M.,Viana, M. M., Alastuey, A., Cuevas, E., and Rodrıguez, S.: Wetand dry African dust episodes over Eastern Spain, J. Geophys.Res., 110, D18S08, doi:10.1029/2004JD004731, 2005.
Gangoiti, G., Millan, M. M., Salvador, R., and Mantilla, E.: Longrange transport and re-circulation of pollutants in the WesternMediterranean during the RECAPMA Project, Atmos. Environ.,35, 6267–6276, 2001.
Gerasopoulos, E., Kouvarakis, G., Vrekoussis, M., Kanakidou,M., and Mihalopoulos, N.: Ozone variability in the marineboundary layer of the Eastern Mediterranean based on 7-yearobservations. Journal of Geophysical Research 110, D15309,doi:10.1029/2005JD005991, 2005..
Gerasopoulos, E., Kouvarakis, G., Babasakalis, P., Vrekoussis, M.,Putaud, J.-P., and Mihalopoulos, N.: Origin and variability ofparticulate matter (PM10) mass concentrations over the EasternMediterranean, Atmos. Environ., 40(25), 4679–4690, 2006.
Atmos. Chem. Phys., 9, 4575–4591, 2009 www.atmos-chem-phys.net/9/4575/2009/
X. Querol et al.: Variability in regional background aerosols 4589
Gerasopoulos, E., Koulouri, E., Kalivitis, N., Kouvarakis, G.,Saarikoski, S., Mkel, T., Hillamo, R., and Mihalopoulos,N.: Size-segregated mass distributions of aerosols over East-ern Mediterranean: seasonal variability and comparison withAERONET columnar size-distributions, Atmos. Chem. Phys., 7,2551–2561, 2007,http://www.atmos-chem-phys.net/7/2551/2007/.
Glavas, S. D., Nikolakis, P., Ambatzoglou, D., and Mihalopoulos,N.: Factors affecting the seasonal variation of mass and ioniccomposition of PM2.5 at a central Mediterranean coastal site,Atmos. Environ., 42, 5365–5373, 2008.
Hallquist, M., Wenger, J. C., Baltensperger, U., Rudich, Y., Simp-son, D., Claeys, M., Dommen, J., Donahue, N. M., George, C.,Goldstein, A. H., Hamilton, J. F., Herrmann, H., Hoffmann, T.,Iinuma, Y., Jang, M., Jenkin, M., Jimenez, J. L., Kiendler-Scharr,A., Maenhaut, W., McFiggans, G., Mentel, Th. F., Monod, A.,Prevot, A. S. H., Seinfeld, J. H., Surratt, J. D., Szmigielski, R.,and Wildt, J.: The formation, properties and impact of secondaryorganic aerosol: current and emerging issues, Atmos. Chem.Phys. Discuss., 9, 3555–3762, 2009,http://www.atmos-chem-phys-discuss.net/9/3555/2009/.
Harrison, R. M. and Pio, C.: Size differentiated composition of in-organic aerosol of both marine and continental polluted origin,Atmos. Environ., 17, 1733–1738, 1983.
Hueglin, C., Gehrig, R., Baltensperger, U., Gysel, M., Monn, C.,and Vonmont, H.: Chemical characterisation of PM2.5, PM10and coarse particles at urban, near-city and rural sites in Switzer-land, Atmos. Environ., 39, 637–651, 2005.
IPCC: Climate Change 2007: The Physical Science Basis, Contri-bution of Working Group I to the Fourth Assessment Report ofthe IPCC, ISBN 978 0521 88009-1 Hardback; 978 0521 70596-7Paperback, 2007.
Jorba, O., Perez, C., Rocadenbosch, F., and Baldasano, J. M.:Cluster Analysis of 4-Day Back Trajectories Arriving in theBarcelona Area (Spain) from 1997 to 2002, J. Appl. Meteorol,43(6), 887–901, 2004.
Kallos, G., Kotroni, V., and Lagouvardos, K.: Proceedings of theSymposium on Regional Weather Prediction on Parallel com-puter Environments, University of Athens, Greece, 109–122,1997.
Kalnay, E., Kanamitsu, M., Kistler, R., Collins, W., Deaven, D.,Gandin, L., Iredell, M., Saha, S., White, G., Woollen, J., Zhu, Y.,Chelliah, M., Ebisuzaki, W., Higgins, W., Janowiak, J., Mo, K.C., Ropelewski, C., Wang, J., Leetmaa, A., Reynolds, R., Jenne,R., and Joseph, D., 1996. The NCEP/NCAR 40-Year ReanalysisProject, B. Am. Meteorol. Soc., 77, 437–471, 1996.
Kocak, M., Kubilay, N., and Mihalopoulos, N.: Ionic compositionof lower tropospheric aerosols at a Northeastern Mediterraneansite: implications regarding sources and long-range transport,Atmos. Environ., 38, 2067–2077, 2004.
Kocak, M., Mihalopoulos, N., and Kubilay, N.: Contributions ofnatural sources to high PM10 and PM2.5 events in the easternMediterranean, Atmos. Environ., 41(18), 3806–3818, 2007a.
Kocak, M., Mihalopoulos, N., and Kubilay, N.: Chemical composi-tion of the fine and coarse fraction of aerosols in the northeasternMediterranean, Atmos. Environ., 41(34), 7351–7368, 2007b.
Koulouri, E., Saarikoski, S., Theodosi, C., Markaki, Z., Gerasopou-los, E., Kouvarakis, G., Makela, T., Hillamo, R., and Mihalopou-los, N.: Chemical composition and sources of fine and coarse
aerosol particles in the Eastern Mediterranean, Atmos. Environ.,42(26), 6542–6550, 2008.
Kubilay, N., Nickovic, S., Moulin, C., and Dulac, F.: An illustrationof the transport and deposition of mineral dust onto the easternMediterranean, Atmos. Environ., 34, 1293–1303, 2000.
Lall, R. and Thrurston, G. D.: Identifying and quantifying trans-ported vs. local sources of New York City PM2.5 fine particulatematter air pollution, Atmos. Environ., 40, S333–S346, 2006.
Larssen, S., Sluyter, R., and Helmis, C.: Criteria for EUROAIR-NET, the EEA air quality monitoring and information network,available at:http://reports.eea.eu.int/TEC12/en, 1999.
Mamane, Y. and Gottlieb, J.: Nitrate formation on sea salt and min-eral particles – a single particle approach, Atmos. Environ. A-Gen., 26, 1763–1769, 1992.
Marenco, P., Bonasoni, F., Calzolari, M., Ceriani, M., Chiari, J.,and Cristofanelli, P.: Characterization of atmospheric aerosols atMonte Cimone, Italy, during summer 2004: source apportion-ment and transport mechanisms, J. Geophys. Res., 111, D24202,doi:10.1029/2006JD007145, 2006.
McClain, C. R., Cleave, M. L., Feldman, G. C., Gregg, W. W.,Hooker, S. B., and Kuring, N.: Science Quality SeaWiFS Datafor Global Biosphere Research, Sea Technol., 39, 10–15, 1998.
Metzger, S., Mihalopoulos, N., and Lelieveld, J.: Importance ofmineral cations and organics in gas-aerosol partitioning of reac-tive nitrogen compounds: case study based on MINOS results,Atmos. Chem. Phys., 6, 2549–2567, 2006,http://www.atmos-chem-phys.net/6/2549/2006/.
Mihalopoulos, N., Stephanou, E., Kanakidou, M., Pilitsidis, S., andBousquet, P., 1997. Troposheric aerosol ionic composition abovethe Eastern Mediterranean area, Tellus B, 49, 314–326, 1997.
Mihalopoulos, N., Kerminen, V. M., Kanakidou, M., Berresheim,H., and Sciare, J.: Formation of particulate sulfur species (sul-phate and methanesulfonate) during summer over the EasternMediterranean: A modelling approach, Atmos. Environ., 41(32),6860–6871, 2007.
Mill an, M., Salvador, R., Mantilla, E., and Kallos, G.: Photo-oxidant dynamics in the Mediterranean basin in summer: resultsfrom European research projects, J.Geophys. Res., 102, 8811–8823, 1997.
Mitsakou, C., Kallos, G., Papantoniou, N., Spyrou, C., Solomos, S.,Astitha, M., and Housiadas, C.: Saharan dust levels in Greeceand received inhalation doses, Atmos. Chem. Phys., 8, 7181–7192, 2008,http://www.atmos-chem-phys.net/8/7181/2008/.
Moulin, C., Lambert, E., Dayan, U., Masson, V., Ramonet, M.,Bousquet, P., Legrand, M., Balkanski, Y. J., Guelle, W., Marti-corena, B., Bergametti, G. and Dulac, F.: Satellite climatology ofAfrican dust transport in the Mediterranean atmosphere, J. Geo-phys. Res., 103, 13 137–13 144, 1998.
Pakkanen, T. A., Hillamo, R. E., Aurela, M., Andersen, H. V., Grun-dahl, L., Ferm, M., Persson, K., Karlsson, V., Reissell, A., Roy-set, O., Floisand, I., Oyola, P., and Ganko, T.: Nordic intercom-parison for measurement of major atmospheric nitrogen species,J. Aerosol Sci., 30, 247–263, 1999.
Penuelas, J., Llusia, J., and Gimeno, B. S.: Effects of ozone con-centrations on biogenic volatile organic compounds emission inthe Mediterranean region, Environ. Pollut., 105, 17–23, 1999.
Perez, C., Sicard, M., Jorba, O., Comeron, A., Baldasano, J. M.:Summertime re-recirculations of air pollutants over the north-
www.atmos-chem-phys.net/9/4575/2009/ Atmos. Chem. Phys., 9, 4575–4591, 2009
4590 X. Querol et al.: Variability in regional background aerosols
eastern Iberian coast observed from systematic EARLINET lidarmeasurements in Barcelona, Atmos. Environ., 38, 3983–4000,2004.
Perez, C., Nickovic, S., Pejanovic, G., Baldasano, J. M.,Ozsoy, E.: Interactive dust-radiation modelling: a step toimprove weather forecasts, J. Geophys. Res., 111, D16206,doi:10.1029/2005JD006717, 2006.
Perez, N., Castillo, S., Pey, J., Alastuey, A., Viana, M., and Querol,X., 2008. Interpretation of the variability of regional backgroundaerosols in the Western Mediterranean, Sci. Total Environ., 407,527–540.
Pio, C. A., Legrand, M., Oliveira, T., Afonso, J., Santos, C., Ca-seiro, A., Fialho, P., Barata, F., Puxbaum, H., Sanchez-Ochoa,A., Kasper-Giebl, A., Gelencser A., Preunkert, S., and Schock,M.: Climatology of aerosol composition (organic versus inor-ganic) at non-urban areas on a West-East transect across Europe,J. Geophys. Res., 112, D23S02, doi:10.1029/2006JD008038,2007.
Pope, C. A. and Dockery, D. W.: Health effects of fine particulateair pollution: lines that connect, J. Air. Waste Manage., 56(6),709–42, 2006.
Putaud, J.-P., Van Dingenen, R., Dell’Acqua, A., Raes, F., Matta,E., Decesari, S., Facchini, M. C., and Fuzzi, S.: Size-segregatedaerosol mass closure and chemical composition in Monte Ci-mone (I) during MINATROC, Atmos. Chem. Phys., 4, 889–902,2004,http://www.atmos-chem-phys.net/4/889/2004/.
Puxbaum, H., Gomiscek, B., Kalina, M., Bauer, H., Salam, A.,Stopper, S., Preining, O., and Hauck, H.: A dual site study ofPM2.5 and PM10 aerosol chemistry in the larger region of Vi-enna, Austria. Atmos. Environ., 38, 3949–3958, 2004.
Querol, X., Alastuey, A., Puicercus, J. A., Mantilla, E., Miro, J. V.,Lopez-Soler, A., Plana, F., and Artınano, B.:Seasonal evolutionof suspended particles around a large coal-fired power station:particulate levels and sources, Atmos. Environ., 32, 1963–1978,1998.
Querol, X., Alastuey, A., Rodrıguez, S., Plana, F., Mantilla, E., andRuiz, C.R.: Monitoring of PM10 and PM2.5 around primary par-ticulate anthropogenic emission sources, Atmos. Environ., 35,845–858, 2001.
Querol, X., Alastuey, A., Viana, M. M., Rodrıguez, S., Artınano, B.,Salvador, P., Santos, S. G. D., Patier, R. F., Ruiz, C. R., Rosa, J.D. L., Campa, A. S. D. L., Menedez, M., and Gil, J. I.: Speciationand origin of PM10 and PM2.5 in Spain, J. Aerosol Sci., 35,1151–1172, 2004.
Querol, X, Alastuey, A., Moreno, T., Viana, M. M., Castillo, S., Pey,J., Rodrıguez, S., Artinano, B., Salvador, P., Sanchez, M., Garcia,Dos Santos, S., Herce Garraleta, M. D., Fernandez-Patier, R.,Moreno-Grau, S., Minguillon, M. C., Monfort, E., Sanz, M. J.,Palomo-Marın, R., Pinilla-Gil E., Cuevas, E., De La Rosa, J.,and Sanchez De La Campa, A.: Spatial and temporal variationsin airborne particulate matter (PM10 and PM2.5) across Spain1999–2005, Atmos. Environ., 42, 3964–3979, 2008.
Querol, X., Pey, J., Pandolfi, M., Alastuey, A., Cusack, M., Perez,N., Moreno, T., Viana, M., Mihalopoulos, N., Kallos, G., andKleanthous, S.: African dust contributions to mean ambientPM10 mass-levels across the Mediterranean Basin, Atmos. En-viron. doi:10.1016/j.atmosenv.2009.06.013, in press, 2009.
Reid, J. S., Koppmann, R., Eck, T. F., and Eleuterio, D. P.: A reviewof biomass burning emissions part II: intensive physical proper-ties of biomass burning particles, Atmos. Chem. Phys., 5, 799–825, 2005,http://www.atmos-chem-phys.net/5/799/2005/.
Rodrıguez, S., Querol, X., Alastuey, A., and Mantilla, E.: Origin ofhigh PM10 and TSP concentrations in summer in Eastern Spain,Atmos. Environ., 36, 3101–3112, 2002.
Rodrıguez, S., Querol, X., Alastuey, A., Viana, M. M., and Mantilla,E.: Events affecting levels and seasonal evolution of airborneparticulate matter concentrations in the Western Mediterranean,Environ. Sci. Technol., 37, 216–222, 2003.
Rodriguez, S., Querol, X., Alastuey, A., Viana, M. M., Alarcon,M., Mantilla, E., and Ruiz, C. R.: Comparative PM10–PM2.5source contribution study at rural, urban and industrial sites dur-ing PM episodes in Eastern Spain, Science of the Total Environ-ment, 328, 95–113, 2004.
Rodwell, M. J. and Hoskins, B. J.: Subtropical anticyclones andsummer monsoons, J. Climate, 14, 3192–3211, 2001.
Saliba, N. A., Kouyoumdjian, H., and Roumie, M.: Effect of localand long range transport emissions on the elemental compositionof PM10 − 2.5 and PM2.5 in Beirut, Atmos. Environ., 41(31),6497–6509, 2007.
Salvador, P., Artınano, B., Querol, X., Alastuey, A., and Costoya,M.: Characterisation of local and external contributions of atmo-spheric particulate matter at a background coastal site, Atmos.Environ., 41, 1-17, 2007.
Sciare, J., Oikonomou, K., Favez, O., Liakakou, E., Markaki, Z.,Cachier, H., and Mihalopoulos, N.: Long-term measurements ofcarbonaceous aerosols in the Eastern Mediterranean: evidence oflong-range transport of biomass burning, Atmos. Chem. Phys., 8,5551–5563, 2008,http://www.atmos-chem-phys.net/8/5551/2008/.
Soriano, C., Baldasano, J. M, Buttler, W. T., and Moore, K.: Circu-latory Patterns of Air Pollutants within the Barcelona Air Basinin a Summertime situation: Lidar and Numerical Approaches,Bound.-Lay. Meteorol., 98(1), 33–55, 2001.
Spindler, G., Bruggemann, E., Gnauk, T., Gruner, A., Muller, K.,Tuch, Th. M., Wallasch, M. B., Wehner, A., and Herrmann, H.:Size-segregated physical and chemical long-time characteriza-tion of particles depending from air mass origin at German low-lands (Saxony, Melpitz site), EMEP Particulate Matter Assess-ment Report, Part B, Annex A, NILU, report EMEP/CCC-Report8/2007, ref. O-7726, 178–221, August 2007.
Szabo, G. Y. and Borbely-Kiss, I.: PIXKLM computer package forPIXE analyses, Nucl. Instrum. Meth. B, 75, 123–126, 1993.
Turpin, B. J. and Lim, H. J.: Species contributions to PM2.5 massconcentrations: Revisiting common assumptions for estimatingorganic mass, Aerosol Sci. Technol., 35(1), 602–610, 2001.
Vestreng, V., Myhre, G., Fagerli, H., Reis, S., and Tarras´n, L.:Twenty-five years of continuous sulphur dioxide emission reduc-tion in Europe, Atmos. Chem. Phys., 7, 3663–3681, 2007
Viana, M., Querol, X., Alastuey, A., Cuevas, E., Rodrıguez, S.: In-fluence of African dust on the levels of atmospheric particulatesin the Canary Islands air quality network, Atmos. Environ., 36,5861–5875, 2002.
Viana, M., Querol, X., Ballester, F., Llop, S., Esplugues, A.,Fernandez Patier, R., Garcıa Dos Santos, S., and Herce, M. D.:Characterising exposure to PM aerosols for an epidemiological
Atmos. Chem. Phys., 9, 4575–4591, 2009 www.atmos-chem-phys.net/9/4575/2009/
X. Querol et al.: Variability in regional background aerosols 4591
study, Atmos. Environ., 42, 1552–1568, 2008.Visser, H., Buringh, E., and van Breugel, P. B.: Composition and
origin of airborne particulate matter in the Netherlands. NationalInstitute for Public Helath and the Environment, RIVM, TheNetherlands, Report 650010029, 104 pp., 2001.
Volkamer, R., Jimenez, J. L., San Martini, F., et al.: Secondary or-ganic aerosol formation from anthropogenic air pollution: Rapidand higher than expected, Geophys. Res. Lett., 33, L17811,doi:10.1029/2006GL026899, 2006.
Yin, J. and Harrison, R. M.: Pragmatic mass closure study forPM1.0, PM2.5 and PM10 at roadside, urban background and ru-ral sites, Atmos. Environ. 42, 980–988, 2008.
Yttri, K. E.: Concentrations of particulate matter (PM10, PM2.5)in Norway. Annual and seasonal trends and spatial variability.EMEP Particulate Matter Assessment Report, Part B, Annex A,NILU, report EMEP/CCC-Report 8/2007, ref. O-7726, 292–307,August 2007.
www.atmos-chem-phys.net/9/4575/2009/ Atmos. Chem. Phys., 9, 4575–4591, 2009