characteristics, sources, and transport of aerosols - acp
TRANSCRIPT
ACPD10, 27361–27434, 2010
Characteristics,sources, and
transport of aerosols
C. A. Brock et al.
Title Page
Abstract Introduction
Conclusions References
Tables Figures
J I
J I
Back Close
Full Screen / Esc
Printer-friendly Version
Interactive Discussion
Discussion
Paper
|D
iscussionP
aper|
Discussion
Paper
|D
iscussionP
aper|
Atmos. Chem. Phys. Discuss., 10, 27361–27434, 2010www.atmos-chem-phys-discuss.net/10/27361/2010/doi:10.5194/acpd-10-27361-2010© Author(s) 2010. CC Attribution 3.0 License.
AtmosphericChemistry
and PhysicsDiscussions
This discussion paper is/has been under review for the journal Atmospheric Chemistryand Physics (ACP). Please refer to the corresponding final paper in ACP if available.
Characteristics, sources, and transport ofaerosols measured in spring 2008 duringthe aerosol, radiation, and cloudprocesses affecting Arctic climate(ARCPAC) project
C. A. Brock1, J. Cozic1,2,*, R. Bahreini1,2, K. D. Froyd1,2, A. M. Middlebrook1,A. McComiskey1,2, J. Brioude1,2, O. R. Cooper1,2, A. Stohl3, K. C. Aikin1,2,J. A. de Gouw1,2, D. W. Fahey1,2, R. A. Ferrare4, R.-S. Gao1, W. Gore5,J. S. Holloway1,2, G. Hubler1,2, A. Jefferson1, D. A. Lack1,2, S. Lance1,2,R. H. Moore6, D. M. Murphy1, A. Nenes6,7, P. C. Novelli1, J. B. Nowak1,2,J. A. Ogren1, J. Peischl1,2, R. B. Pierce8, P. Pilewskie9, P. K. Quinn10,T. B. Ryerson1, K. S. Schmidt11, J. P. Schwarz1,2, H. Sodemann3,**,J. R. Spackman1,2, H. Stark1,2, D. S. Thomson1,2,***, T. Thornberry1,2, P. Veres1,2,L. A. Watts1,2, C. Warneke1,2, and A. G. Wollny1,2,****
27361
ACPD10, 27361–27434, 2010
Characteristics,sources, and
transport of aerosols
C. A. Brock et al.
Title Page
Abstract Introduction
Conclusions References
Tables Figures
J I
J I
Back Close
Full Screen / Esc
Printer-friendly Version
Interactive Discussion
Discussion
Paper
|D
iscussionP
aper|
Discussion
Paper
|D
iscussionP
aper|
1Earth System Research Laboratory, National Oceanic and Atmospheric Administration, Boul-der, Colorado, USA2Cooperative Institute for Research in Environmental Sciences, University of Colorado, Boul-der, Colorado, USA3Norsk Institutt for Luftforskning, Kjeller, Norway4Langley Research Center, National Aeronautics and Space Administration, Hampton, Virginia,USA5Ames Research Center, National Aeronautics and Space Administration, Moffett Field, Cali-fornia, USA6Chemical and Biomolecular Engineering, Georgia Institute of Technology, Atlanta, Georgia,USA7 Earth and Atmospheric Science, Georgia Institute of Technology, Atlanta, Georgia, USA8National Environmental Satellite, Data, and Information Service, National Oceanic and Atmo-spheric Administration, Madison, Wisconsin, USA9Atmospheric and Oceanic Sciences, University of Colorado, Boulder, Colorado, USA10Pacific Marine Environmental Laboratory, National Oceanic and Atmospheric Administration,Seattle, Washington, USA11Laboratory for Atmospheric and Space Physics, University of Colorado, Boulder, Colorado,USA∗now at: Laboratoire de Glaciologie et Geophysique de l’Environnement, Grenoble, France∗∗now at: Institute for Atmospheric and Climate Science, ETH Zurich, Zurich, Switzerland∗∗∗now at: Droplet Measurement Technologies Inc., Boulder, Colorado, USA∗∗∗∗now at: Biogeochemistry, Max Planck Institute for Chemistry, Mainz,Germany
Received: 8 October 2010 – Accepted: 20 October 2010 – Published: 11 November 2010
Correspondence to: C. A. Brock ([email protected])
27362
ACPD10, 27361–27434, 2010
Characteristics,sources, and
transport of aerosols
C. A. Brock et al.
Title Page
Abstract Introduction
Conclusions References
Tables Figures
J I
J I
Back Close
Full Screen / Esc
Printer-friendly Version
Interactive Discussion
Discussion
Paper
|D
iscussionP
aper|
Discussion
Paper
|D
iscussionP
aper|
Abstract
We present an overview of the background, scientific goals, and execution of theAerosol, Radiation, and Cloud Processes affecting Arctic Climate (ARCPAC) projectof April 2008. We then summarize airborne measurements, made in the troposphereof the Alaskan Arctic, of aerosol particle size distributions, composition, and optical5
properties and discuss the sources and transport of the aerosols. The aerosol datawere grouped into four categories based on gas-phase composition. First, the back-ground troposphere contained a relatively diffuse, sulfate-rich aerosol extending fromthe top of the sea-ice inversion layer to 7.4 km altitude. Second, a region of depleted(relative to the background) aerosol was present within the surface inversion layer over10
sea-ice. Third, layers of dense, organic-rich smoke from open biomass fires in South-ern Russia and Southeastern Siberia were frequently encountered at all altitudes fromthe top of the inversion layer to 7.1 km. Finally, some aerosol layers were dominatedby components originating from fossil fuel combustion.
Of these four categories measured during ARCPAC, the diffuse background aerosol15
was most similar to the average springtime aerosol properties observed at a long-termmonitoring site at Barrow, Alaska. The biomass burning (BB) and fossil fuel layers werepresent above the sea-ice inversion layer and did not reach the sea-ice surface duringthe course of the ARCPAC measurements. The BB aerosol layers were highly scat-tering and were moderately hygroscopic. On average, the layers produced a noontime20
net heating of ∼0.1 K day−1 between 2 and 7 km and a slight cooling at the surface.The ratios of particle mass to carbon monoxide (CO) in the BB plumes, which hadbeen transported over distances >5000 km, were comparable to the high end of litera-ture values derived from previous measurements in fresh wildfire smoke. These ratiossuggest minimal precipitation scavenging and removal of the BB particles between the25
time they were emitted and the time they were observed in dense layers above thesea-ice inversion layer.
27363
ACPD10, 27361–27434, 2010
Characteristics,sources, and
transport of aerosols
C. A. Brock et al.
Title Page
Abstract Introduction
Conclusions References
Tables Figures
J I
J I
Back Close
Full Screen / Esc
Printer-friendly Version
Interactive Discussion
Discussion
Paper
|D
iscussionP
aper|
Discussion
Paper
|D
iscussionP
aper|
1 Introduction
Global temperature records show a statistically significant warming in the last century,with most of the change attributed to anthropogenically emitted greenhouse gases andassociated feedbacks (IPCC, 2007). Temperature increases in the Arctic exceed theglobal average increase, especially in winter and spring. Coincident with the observed5
and modeled warming is an observed decrease in seasonal Arctic sea-ice coverageand thickness. The summertime extent of sea-ice has decreased significantly in recentdecades (Lindsay et al., 2009), and this reduction now clearly exceeds that expectedfrom natural short-term variability (Francis and Hunter, 2006; Johannessen et al., 2004;IPCC, 2007; Holland et al., 2010). Many climate models predict an ice-free summer-10
time Arctic Ocean within a few decades (Winton, 2006; Stroeve, 2007; Holland et al.,2010), with attendant disruptions to Arctic ecosystems, ocean circulation, weather pat-terns, and global climate. Additional effects of a warmer Arctic may include substantialexpansion of resource extraction and seasonal shipping traffic due to improved seaaccess (Corbett et al., 2010).15
Modeling of the Arctic climate system is difficult due to complex and sensitive feed-backs (Serreze and Francis, 2006) and many climate simulations struggle to replicatehistorical temperature, precipitation, cloudiness, and sea-ice properties (Walsh et al.,2002; Chapman and Walsh, 2007; Wang et al., 2007). Simulations of future climatesresult in substantial model-to-model variability in Arctic climate parameters such as20
sea-ice extent and thickness, indicating that some important processes are not beingadequately described in the simulations (Winton, 2006; Chapman and Walsh, 2007;Holland et al., 2010).
Analyses of observations and recent climate simulations suggest that, in addition tolong-lived greenhouse gas-induced warming and feedbacks, Arctic warming may also25
be caused by shorter-lived climate forcing agents (Law and Stohl, 2007; Quinn et al.,2008; Shindell et al., 2008; Shindell and Faluvegi, 2009). In particular, four processeshave been postulated to contribute significantly to observed atmospheric warming and
27364
ACPD10, 27361–27434, 2010
Characteristics,sources, and
transport of aerosols
C. A. Brock et al.
Title Page
Abstract Introduction
Conclusions References
Tables Figures
J I
J I
Back Close
Full Screen / Esc
Printer-friendly Version
Interactive Discussion
Discussion
Paper
|D
iscussionP
aper|
Discussion
Paper
|D
iscussionP
aper|
reductions in sea-ice in the Arctic. These processes include: 1) direct warming of thelower troposphere by the absorption of solar radiation and infrared (IR) emission byaerosol particles (e.g., Ritter et al., 2005; Treffeisen et al., 2007; Shindell and Faluvegi,2009); 2) changes in snow melt and surface temperature due to deposition of soot(containing light-absorbing black carbon, BC) to the surface in springtime (Hansen and5
Nazarenko, 2004; Jacobson, 2004, 2010; Flanner et al., 2007, 2009); 3) increasesin IR emissivity of wintertime and springtime clouds in the Arctic due to the effects ofanthropogenic aerosol particles on cloud properties (Garrett and Zhao, 2006; Lubinand Vogelmann, 2006; Alterskjær et al., 2010); and 4) direct radiative effects of tro-pospheric ozone in the Arctic (Mickley et al., 1999; Hansen et al., 2005; Shindell and10
Faluvegi, 2009). Recent modeling studies suggest that the Arctic climate is particularlyinfluenced by aerosol radiative forcing, and is sensitive to the composition, and henceoptical properties, of the aerosol (Shindell and Faluvegi, 2009; Jacobson, 2010).
Airborne and surface observations in the Arctic have long reported the annualoccurrence of visibility-reducing aerosol hazes in the Arctic in springtime (Shaw,15
1975; Rahn, 1981; Barrie, 1986; Garret and Verzella, 2008). An extensive lit-erature has documented the chemical and optical characteristics of these hazes(Schnell, 1984; Clarke et al., 1984; Radke, et al., 1984; Brock et al., 1990; seealso http://www.agu.org/contents/sc/ViewCollection.do?collectionCode=ARCTHZ1&journalCode=GL), and a climatology of some key parameters extending more than20
20 years has been developed for a few Arctic sites (e.g., Quinn et al., 2002, 2007,2009; Sharma et al., 2002, 2004, 2006). The springtime submicron aerosol at allremote Arctic surface sites is composed predominantly of partially neutralized sulfateand sea-salt, with lesser contributions from nitrate, BC, soil and trace elements (e.g.,Quinn et al., 2002). There are few reported measurements of organic concentration25
or composition in the deep Arctic (Li and Winchester, 1989; Kawamura et al., 1996),and residual mass unaccounted for by comparing compositional measurements withgravimetric mass concentrations has been assigned to this component (Quinn et al.,2002). Recent measurements report that both anthropogenic and biomass/biofuel
27365
ACPD10, 27361–27434, 2010
Characteristics,sources, and
transport of aerosols
C. A. Brock et al.
Title Page
Abstract Introduction
Conclusions References
Tables Figures
J I
J I
Back Close
Full Screen / Esc
Printer-friendly Version
Interactive Discussion
Discussion
Paper
|D
iscussionP
aper|
Discussion
Paper
|D
iscussionP
aper|
burning sources contribute to the organic aerosol fraction in the Arctic in spring(Shaw et al., 2010). There is a strong seasonal cycle to both intensive (e.g., type,size, composition, single scattering albedo) and extensive (e.g., mass and numberconcentration, light scattering) aerosol properties at surface sites throughout theArctic, with one or more maxima in the late winter and early spring, and a pronounced5
minimum in the summer months (Bodhaine, 1989; Delene and Ogren, 2002; Quinnet al., 2002). There is some additional evidence for a slightly different seasonal cycleto Arctic haze properties aloft, with higher concentrations occurring aloft later in thespring than at the surface (Scheuer et al., 2003; Stohl, 2006). In addition, aerosollayers associated with BB sources have been observed in the Arctic troposphere in10
summer (Brock et al., 1989; Stohl et al., 2006; Paris et al., 2009); extreme BB eventshave been observed at the surface across much of the Arctic (Stohl et al., 2006).
Because of the cold temperatures at the Arctic surface, the dominant sources con-tributing to the springtime maximum in Arctic surface aerosol concentrations lie innorthern midlatitudes (Rahn and McCaffery, 1980; Raatz and Shaw, 1984; Barrie,15
1986; Koch and Hansen, 2005; Stohl, 2006). Diabatic cooling produces large-scaledescent of air from the middle to lower Arctic free troposphere (Stohl, 2006), althoughsmall-scale mixing processes may be needed to facilitate further transport to the sea-ice inversion layer (Spackman et al., 2010). Such cooling and mixing could result intransport of aerosol from slightly warmer midlatitude sources to the Arctic free tropo-20
sphere and thence downward into the cold surface layer. However, on average, thelargest contributions to the springtime surface aerosol in the Arctic are believed tocome from Northern Europe and the Russian Arctic, where large industrial complexeshave long operated (Rahn et al., 1977; Rahn 1981; Raatz and Shaw, 1984; Barrie,1986; Koch and Hansen, 2005; Sharma et al., 2006; Stohl, 2006). Due to declines25
in emissions from the former Soviet Union and Eastern Europe, light scattering, lightabsorption, and black carbon concentrations have fallen in the Arctic in springtimesince the 1980s, with a possible leveling or slight increase in the 21st century (Sharmaet al., 2006; Quinn et al., 2007, 2009; Hirdman et al., 2010). Because most industrial
27366
ACPD10, 27361–27434, 2010
Characteristics,sources, and
transport of aerosols
C. A. Brock et al.
Title Page
Abstract Introduction
Conclusions References
Tables Figures
J I
J I
Back Close
Full Screen / Esc
Printer-friendly Version
Interactive Discussion
Discussion
Paper
|D
iscussionP
aper|
Discussion
Paper
|D
iscussionP
aper|
sources in North America lie southward of the mean position of the Arctic front, andsince advection from these sources to the Arctic involves transport through the mete-orologically active North Atlantic region, North American sources are not believed tocontribute more than occasionally to surface Arctic haze, and the North American in-fluence is likely most pronounced in the vicinity of Greenland (Stohl, 2006; McConnell5
et al., 2007). Koch and Hansen (2005) suggest a significant contribution to springtimeArctic BC loadings from Southern Asia, but Stohl (2006) and Hirdman et al. (2010)find this source region to be only a small contributor to the Arctic BC budget. A fewstudies suggest that biomass burning, primarily associated with springtime agriculturalactivities, can be a sporadic but potentially important contributor to the budgets of Arc-10
tic gas-phase and aerosol species (Lavoue, et al., 2000; Stohl et al., 2007; Warnekeet al., 2009, 2010).
In spring 2008, the United States (US) National Oceanic and Atmospheric Adminis-tration (NOAA) undertook a large airborne field campaign, the Aerosol, Radiation, andCloud Processes affecting Arctic Climate (ARCPAC) study, primarily to evaluate phe-15
nomena and processes contributing to non-greenhouse gas climate forcing in the Arctic(http://www.esrl.noaa.gov/csd/arcpac). The ARCPAC project used the heavily instru-mented NOAA WP-3D aircraft to make observations in the troposphere over NorthernAlaska and the adjacent Arctic seas. Four general topic areas were the foci of study:1) improving understanding of the chemical, optical, and microphysical characteristics20
of aerosols in the Arctic in springtime; 2) evaluating the sources and sinks of the var-ious aerosol components using observations of gas and particulate composition andtransport models; 3) examining the role of aerosol particles in modifying the microphys-ical and optical properties of Arctic clouds and the role of those clouds in modifying andremoving aerosol particles; 4) evaluating the occurrence and mechanisms of halogen25
photochemistry that leads to tropospheric ozone loss in the Arctic. Additional topicsstudied during the project included examining local emissions and cold-weather chem-istry associated with urban areas and industrial facilities encountered in the Arctic,during flights in the Denver, Colorado area, and in transit between the aircraft base
27367
ACPD10, 27361–27434, 2010
Characteristics,sources, and
transport of aerosols
C. A. Brock et al.
Title Page
Abstract Introduction
Conclusions References
Tables Figures
J I
J I
Back Close
Full Screen / Esc
Printer-friendly Version
Interactive Discussion
Discussion
Paper
|D
iscussionP
aper|
Discussion
Paper
|D
iscussionP
aper|
in Tampa, Florida and Fairbanks, Alaska. Emission, transport, and process modelingwere recognized as essential tools to interpret the observations given the distance andtransport time from likely sources. Further details of specific science questions andapproaches employed in planning, executing, and analyzing the data from ARCPACare listed in Supplementary Material in Table S1.5
The ARCPAC project was one of several complementary activities associated withthe International Polar Year (IPY) and coordinated through the Polar Study using Air-craft, Remote Sensing, Surface Measurements and Models, of Climate, Chemistry,Aerosols, and Transport (POLARCAT) program (http://www.polarcat.no/). The ARC-PAC project overlapped in space and time with the springtime deployment of the US10
National Aeronautics and Space Administration (NASA)-sponsored Arctic Researchof the Composition of the Troposphere from Aircraft and Satellites (ARCTAS) project(http://www.espo.nasa.gov/arctas/), which had many similar goals as ARCPAC butwhich covered a larger area of the Arctic (Jacob et al., 2010). Coordination betweenARCPAC and ARCTAS included wingtip-to-wingtip comparisons with the NASA DC-15
8 and P-3B aircraft and simultaneous vertically stacked flight segments combiningthe NOAA WP-3D with the NASA P-3B and the lidar-equipped NASA B-200 aircraft(Bierwirth et al., 2010). The ARCPAC project also coordinated one flight segment inclear and cloudy air with the Convair 580 aircraft operated as part of the US Depart-ment of Energy/Canadian National Research Council-sponsored Indirect and Semi-20
Direct Aerosol Campaign (ISDAC), which focused on the meteorology, microphysics,radiation, and interaction with aerosols of near-surface clouds in the Alaskan Arc-tic (http://acrf-campaign.arm.gov/isdac/). The ARCPAC program was also linked withship-borne observations made in the North Atlantic and European Arctic as part of theNOAA-sponsored International Chemistry Experiment in the Arctic LOwer Troposphere25
(ICEALOT) campaign (http://saga.pmel.noaa.gov/Field/icealot/).The purpose of this paper is 1) to provide information on the scientific background
and objectives, methods, and execution of the ARCPAC project, and 2) to summarizethe aerosol chemical, microphysical, cloud-nucleating, and optical properties observed
27368
ACPD10, 27361–27434, 2010
Characteristics,sources, and
transport of aerosols
C. A. Brock et al.
Title Page
Abstract Introduction
Conclusions References
Tables Figures
J I
J I
Back Close
Full Screen / Esc
Printer-friendly Version
Interactive Discussion
Discussion
Paper
|D
iscussionP
aper|
Discussion
Paper
|D
iscussionP
aper|
during the project. More detailed work on aerosol composition, aerosol radiative ef-fects, cloud-aerosol interactions, long-range transport, aerosol deposition, gas-phasechemistry, the Arctic radiative environment, and Arctic emissions from the ARCPACproject can be found in Warneke et al. (2009, 2010), Bierwirth et al. (2010), Fisheret al. (2010), Lance et al. (2010a,b), Neuman et al. (2010), and Spackman et al. (2010),5
and will be published in other contributions. A summary of NASA’s ARCTAS project(Jacob et al., 2010) has been published, as has an overview of the Arctic meteorologyoccurring during the time frame of the ARCTAS and ARCPAC projects (Fuelberg et al.,2010). Many papers related to the above programs and others associated with PO-LARCAT may be found in a special issue of Atmos. Chem. Phys. (http://www.atmos-10
chem-phys.net/special issue182.html).
2 Methods
2.1 Airborne instrumentation
Fast-response, airborne measurements were made of trace gases, of aerosol compo-sitional, microphysical, cloud nucleating and optical properties, of hydrometeor concen-15
tration, size, and shape, of atmospheric state parameters and winds, of ultraviolet, visi-ble, and infrared radiation, and of location (Table 1). These measurements were madeaboard a NOAA WP-3D aircraft, a four-engine turboprop airplane capable of flight du-rations in excess of 8 h at true airspeeds of ∼100 m s−1 (http://www.aoc.noaa.gov/).Characteristics and sampling details for most of the instruments may be found in prior20
publications (Ryerson et al., 1998, 2000; Holloway et al., 2000; Brock et al., 2008). Allbut one cabin-mounted aerosol instruments operated downstream of a low turbulenceinlet (LTI, Wilson et al., 2004) and a multi-orifice impactor with greased substrate anda 1 µm aerodynamic diameter (∼0.7 µm physical diameter) cut-point. Our analysis willfocus on measurements made in the cabin with a compact time-of-flight aerosol mass25
spectrometer (AMS), a single particle soot photometer (SP2), a particle soot absorption
27369
ACPD10, 27361–27434, 2010
Characteristics,sources, and
transport of aerosols
C. A. Brock et al.
Title Page
Abstract Introduction
Conclusions References
Tables Figures
J I
J I
Back Close
Full Screen / Esc
Printer-friendly Version
Interactive Discussion
Discussion
Paper
|D
iscussionP
aper|
Discussion
Paper
|D
iscussionP
aper|
photometer (PSAP), a cloud condensation nucleus (CCN) counter, an ultra high sen-sitivity aerosol spectrometer (UHSAS), a white light optical particle counter (WLOPC,which sampled upstream of the 1 µm impactor) and an aerosol cavity ringdown spec-trometer (CRDS). In addition to these instruments that operated downstream of theLTI, a five-channel condensation particle counter (Brock et al., 2000) was mounted in5
an unpressurized underwing pod and sampled from a separate inlet with known parti-cle transmission characteristics (Jonsson et al., 1995). A single-particle aerosol massspectrometer (PALMS), also mounted in the pod, alternately sampled from either a for-ward facing aerosol inlet or a redesigned version of a counterflow virtual impactor (CVI)inlet (Cziczo et al., 2004). In addition to the aerosol observations, measurements of10
CO, acetonitrile (CH3CN), O3, SO2, and the halogen species HOBr+Br2, BrO, and BrClare key to the analysis presented here.
Accuracy and precision for many of the instruments were determined by in-flightcalibration and zeroing. Instrument comparisons were performed during separate co-ordinated flights with the NASA DC-8 and P-3B aircraft in which the NOAA WP-3D15
flew at the same altitude with a typical horizontal separation of 0.25(±0.10) km. Re-sults from this comparison (http://www-air.larc.nasa.gov/TAbMEP2 polarcat.htmlhttp://www-air.larc.nasa.gov/TAbMEP2 polarcat.html) show that submicron particle compo-sition, number, surface area, and volume largely agreed within experimental uncertain-ties. In contrast, supermicron particle size distributions and quantities derived from20
those measurements compared poorly, with differences often exceeding the stated ex-perimental uncertainties. These supermicron data are not central to this paper. Allquality-controlled and processed airborne data from the ARCPAC project are availableat http://www.esrl.noaa.gov/csd/tropchem/2008ARCPAC/P3/DataDownload/.
Measurements were made during 10 flights, 4 of which involved transit to Alaska or25
measurements in the Denver, Colorado area (Fig. 1, Table 2). The aircraft was based inFairbanks, Alaska from 3 to 23 April 2008. The 6 flights entirely within the Alaskan Arc-tic, from 11–21 April 2008 (in addition to arrival and departure profiles on 3 and 23 April,respectively), encompassed a region bounded by the western edge of Alaska near the
27370
ACPD10, 27361–27434, 2010
Characteristics,sources, and
transport of aerosols
C. A. Brock et al.
Title Page
Abstract Introduction
Conclusions References
Tables Figures
J I
J I
Back Close
Full Screen / Esc
Printer-friendly Version
Interactive Discussion
Discussion
Paper
|D
iscussionP
aper|
Discussion
Paper
|D
iscussionP
aper|
Bering Strait to the Chukchi and Beaufort Seas northwest and northeast of Barrow,Alaska, respectively. Aircraft flight tracks (Fig. 2) included vertical profiles to altitudesas high as 7.4 km, level flight legs sampling airmasses of interest, and transects atlow altitude (<500 m) over the sea-ice surface, often within the surface inversion layer,with brief descents to ∼70 m. The aircraft flight path was planned to sample specific5
regions based upon predictions by transport and coupled transport-chemistry models,notably FLEXPART (http://transport.nilu.no/flexpart) and the Regional Air Quality Mon-itoring System (http://raqms-ops.ssec.wisc.edu/index.php). As a result, the statistics ofaircraft sampling are biased toward forecast transport events. Furthermore, early andwidespread seasonal BB in Russia occurred during the ARCPAC measurement pe-10
riod, strongly affecting aerosol properties and dominating observed transport events.Despite these biases, the NOAA WP-3D aircraft sampled airmasses containing diffuseanthropogenic Arctic haze, some denser aerosol layers with evident anthropogenic in-fluences, and air within the sea-ice surface layer with distinctive gas-phase and aerosolcharacteristics.15
2.2 Transport models
To assist the flight planning during the ARCPAC project, the FLEXPART model(Stohl et al., 2005) was used in forward mode to predict the spatial distribution ofa few emission tracers in the study domain using meteorological forecast data. Af-ter the campaign, FLEXPART version 8.0 was used in backward mode to evalu-20
ate the sources and transport paths that contributed to concentrations of gas-phasecompounds sampled by the WP-3D aircraft (http://zardoz.nilu.no/∼andreas/ARCPAC/http://zardoz.nilu.no/∼andreas/ARCPAC/). Every time the aircraft changed horizontallocation by 0.2 degrees of latitude or longitude, or when aircraft static pressure changedby more than 10 hPa, 6×10⁴ parcel backtrajectories of 20-day duration were calculated25
from a grid box surrounding the location of the aircraft. The trajectories were calcu-lated using the ECMWF gridded hemispheric meteorological fields with turbulence andconvection parameterizations (Stohl et al., 2005). The FLEXPART emission sensitivity
27371
ACPD10, 27361–27434, 2010
Characteristics,sources, and
transport of aerosols
C. A. Brock et al.
Title Page
Abstract Introduction
Conclusions References
Tables Figures
J I
J I
Back Close
Full Screen / Esc
Printer-friendly Version
Interactive Discussion
Discussion
Paper
|D
iscussionP
aper|
Discussion
Paper
|D
iscussionP
aper|
output for the lowest 100 m of the atmosphere was convolved with emission invento-ries to predict the distribution and mixing of specific trace species. For ARCPAC, theEDGAR anthropogenic emissions inventory (Olivier and Berdowski, 2001) was usedoutside of North America and Europe for NO2, SO2, and CO, while the inventoriesof Frost et al. (2006) for North America and EMEP 2005 for Europe were used for5
these species. The inventory from Bond et al. (2004) was used to describe anthro-pogenic BC emissions. Emissions of CO and BC from BB were modeled as describedby Stohl et al. (2007) using fire locations detected by the moderate-resolution imagingspectrometer (MODIS) on the Aqua and Terra satellites and a land-cover vegetationclassification. Smoke was injected within the lowest 100 m above the surface; it quickly10
mixed vertically to fill the planetary boundary layer. No chemistry was incorporatedinto the model as used in this analysis; all emitted species were assumed to be pas-sive tracers. The resulting model products included estimates of CO, BC, and totalnitrogen and sulfur (as NO2 and SO2, respectively) at the location of the aircraft, thetransport pathway of the air to the aircraft, and maps and numerical data regarding15
the predicted contribution of different anthropogenic and BB sources to the sampledair. Emission sources were tagged as anthropogenic or BB, and by region as Euro-pean, North American, or Asian, or as originating from two specific fire-prone regionsin Russia.
Chemical and aerosol forecasts from RAQMS were also used for flight planning ac-20
tivities during ARCPAC. RAQMS is a unified (stratosphere/troposphere), online (me-teorological, chemical, and aerosol) modeling system which has been developed forassimilating satellite observations of atmospheric chemical composition and provid-ing real-time predictions of trace gas and aerosol distributions (Pierce et al., 2007).The RAQMS aerosol model incorporates online aerosol modules from GOCART (Chin25
et al., 2003). Six aerosol species (SO2−4 , hydrophobic organic carbon (OC), hydrophilic
OC, BC, dust, and sea-salt) are transported. Biomass burning emissions in RAQMSare produced from twice daily ecosystem/severity based emission estimates coupledwith MODIS Rapid Response fire detections (Al-Saadi et al., 2008). Movies showing
27372
ACPD10, 27361–27434, 2010
Characteristics,sources, and
transport of aerosols
C. A. Brock et al.
Title Page
Abstract Introduction
Conclusions References
Tables Figures
J I
J I
Back Close
Full Screen / Esc
Printer-friendly Version
Interactive Discussion
Discussion
Paper
|D
iscussionP
aper|
Discussion
Paper
|D
iscussionP
aper|
RAQMS-simulated sulfate, OC+BC, and dust transport are provided in the Supplemen-tal Material.
3 Results
The remainder of this manuscript focuses on observations made in four differentregimes:5
1) background haze – regions above the top of the surface boundary layer, over bothland and sea-ice, to 7.2 km that did not contain layers of locally enhanced aerosolor gas-phase species directly transported within the last 20 days from identifiablesources. Mixing ratios of CO were <170 ppbv (see below for exact screeningmethods), and acetonitrile was <100 pptv. Air with stratospheric influence was10
not removed from this category.
2) biomass burning (BB) plumes – regions containing elevated mixing ratios of COand acetonitrile. Samples in this category had CO>170 ppbv and acetonitrile>100 pptv. Often CO2, methanol, NOy (the sum of NO+NO2 (=NOx), HNO3, acylperoxynitrates (PANs), alkyl nitrates, and other reactive nitrogen species) were15
enhanced compared to surrounding air.
3) anthropogenic plumes – regions containing elevated mixing ratios of CO(>170 ppbv) while acetonitrile remained <100 pptv. Often CO2, NOy, and/or SO2,were also enhanced. These cases were infrequently observed, and were adja-cent to BB plumes.20
4) Arctic boundary layer over sea-ice (ABL) – regions within the Arctic surface in-version layer over sea-ice and containing O3 mixing ratios <20 ppbv and/or sig-nificant enhancements in photochemically active bromine. Air within this regionis assumed to have been in chemical contact with the sea-ice surface (Neuman
27373
ACPD10, 27361–27434, 2010
Characteristics,sources, and
transport of aerosols
C. A. Brock et al.
Title Page
Abstract Introduction
Conclusions References
Tables Figures
J I
J I
Back Close
Full Screen / Esc
Printer-friendly Version
Interactive Discussion
Discussion
Paper
|D
iscussionP
aper|
Discussion
Paper
|D
iscussionP
aper|
et al., 2010), which included open and thinly ice-covered leads. Data between thetop of the inversion layer and the ABL as defined above are excluded.
Data were placed into these categories by screening according to aircraft positionand the gas-phase conditions indicated above. However, if the aircraft was flying pre-dominantly in one airmass type and briefly (<10 s) passed into a different airmass type,5
the airmass classification was not changed for the short interval. This strategy wasused because of differing sampling intervals and response times for various measure-ments, and to allow sufficient dynamic range for regression analyses. Thus there are,for example, some brief periods of data included in the “BB” category when acetonitrileand CO mixing ratios were appropriate for the “background haze” category. In addition10
to the four airmass categories listed above, measurements were made in air influencedby local emissions from the city of Fairbanks, Alaska (population ∼100 000), from theoil extraction, handling, and transport facilities in the vicinity of Prudhoe Bay, Alaska,and from the exhaust of the WP-3D itself. These data, clearly identifiable by geographiclocation and enhanced concentrations of NO, NO2, CO, CO2, and/or aerosol number,15
have been excluded from the categories above. Periods when the aircraft was in cloudor precipitation have also been excluded, due to potential aerosol sampling artifactsfrom droplet and ice crystal shattering.
A vertical profile of several gas-phase and aerosol parameters (Fig. 3) illustratesthe separation of the data into three of the four categories, as well as the complex20
vertical structure. Layers of enhanced CO, acetonitrile, organic aerosol mass, BC, andaerosol optical extinction and absorption are evident, and are identified as being of BBorigin. Note that the region from 3 to 3.5 km is identified as BB, despite the lack ofacetonitrile data (instrument zeroing), due to the similarity in other constituents withnearby BB layers. This figure illustrates the difficulty in separating observations into25
different classifications, and also emphasizes that the Arctic troposphere is composedof superimposed layers with differing characteristics, origins, and transport histories,rather than being a homogeneous airmass of static properties.
27374
ACPD10, 27361–27434, 2010
Characteristics,sources, and
transport of aerosols
C. A. Brock et al.
Title Page
Abstract Introduction
Conclusions References
Tables Figures
J I
J I
Back Close
Full Screen / Esc
Printer-friendly Version
Interactive Discussion
Discussion
Paper
|D
iscussionP
aper|
Discussion
Paper
|D
iscussionP
aper|
3.1 Consistency among aerosol measurements
Aerosol compositional, microphysical, and optical properties were measured by diversetechniques, including mass spectrometry, cavity ringdown spectrometry, light attenua-tion, incandescence, Kelvin diameter measurement, and light scattering amplitude (Ta-ble 1). In this analysis, we primarily use submicron particle composition measurements5
(from the AMS and SP2), single particle composition measurements from the PALMS,particle size distributions, aerosol light extinction from the CRDS, aerosol light absorp-tion from the PSAP, and CCN concentrations. Here we assess the level of consistencyamong the different aerosol instruments that quantitatively measure the dry submicronaerosol.10
The primary instrument measuring the accumulation mode aerosol size distribution,the UHSAS optical particle size spectrometer, had substantial pressure-dependentconcentration biases caused by the sample flow control system (see SupplementalMaterial). These biases were corrected, and uncertainty estimates (Table 1) accountfor potential errors caused by the correction.15
The dry particle volume calculated from the measured size distributions agreeswithin stated uncertainty with volume calculated from the particle composition mea-surements (Table 1), assuming densities of 1.30×10³, 1.75×10³, and 1.80×10³ kg m−3
for the organic (Turpin and Lim, 2001), inorganic, and BC (Bond and Bergstrom, 2006)constituents, respectively (Fig. 4). Although the measurements are highly correlated20
(r2>0.84) and agree within stated uncertainties, there is a systematic bias of up to 22%in which the volume derived from the compositional measurements (primarily the AMS)is less than that derived from the size measurements for all the analyzed data. Thisapparent bias changes signs, with AMS higher than size distribution measurements by14% when considering only those data with a molar ratio, Fmr, of ammonium to the sum25
of the inorganic anionic species <1.5 (Fig. 4), or when the organic fraction is <0.7 (notshown). This composition-dependent variation suggests biases introduced by particlephase-dependent AMS collection efficiency (Matthew et al., 2008), for which the cor-
27375
ACPD10, 27361–27434, 2010
Characteristics,sources, and
transport of aerosols
C. A. Brock et al.
Title Page
Abstract Introduction
Conclusions References
Tables Figures
J I
J I
Back Close
Full Screen / Esc
Printer-friendly Version
Interactive Discussion
Discussion
Paper
|D
iscussionP
aper|
Discussion
Paper
|D
iscussionP
aper|
rection applied in data processing may not be accurate. Part of the discrepancy mayalso be due to lens transmission of the AMS, since 5 to 8% of the mass resides inparticles large enough to be sampled with <100% transmission efficiency. Refractiveindex variations, which would affect particle sizing from the UHSAS (Cai et al., 2008),could also contribute to the evident bias, especially since volume is calculated from5
the 3rd moment of particle diameter. Since the refractive index of organic compoundsis poorly constrained (Kanakidou et al., 2005; Dick et al., 2007), a constant refractiveindex of 1.52-0i, appropriate for the ammonium sulfate particles used for calibration(Toon et al., 1976) and near the center of the estimated range for oxidized organic mat-ter, was used to relate scattered light intensity to particle size. A final cause of the bias10
may be due to refractory material (sea-salt and dust) that is measured by the UHSASbut not volatilized in the aerosol impactor/heater in the AMS. However, dust is a minorcontributor to the sub-0.5 µm aerosol mass, while sea-salt is likely to be significant onlynear the Arctic surface, where it can comprise ∼20% of the submicron mass (Quinnet al., 2002).15
The integrated light scattering at a wavelength of 532 nm, σscat,532, was calculatedusing Mie theory (Bohren and Huffman, 1983) from the measured dry size distribu-tions, assuming a refractive index of 1.52-0i. The calculated scattering was comparedwith that derived from the extinction at 532 nm, σext,532, measured by the CRDS andabsorption at 530 nm, σabs,530, measured by the PSAP. The scattering derived from20
these two approaches was highly correlated (r2=0.98) and the slope was within statedexperimental uncertainty (Fig. 5). However, a bias of 26% is evident, with the moredirectly measured extinction-absorption value higher than that calculated by Mie the-ory from the size distributions. In summary, the extinction data are higher than thesize distribution data, which in turn are higher than the AMS data. While the AMS,25
size distribution, and optical measurements are consistent within stated uncertainties,remaining biases are substantial and should be considered when interpreting the data.
27376
ACPD10, 27361–27434, 2010
Characteristics,sources, and
transport of aerosols
C. A. Brock et al.
Title Page
Abstract Introduction
Conclusions References
Tables Figures
J I
J I
Back Close
Full Screen / Esc
Printer-friendly Version
Interactive Discussion
Discussion
Paper
|D
iscussionP
aper|
Discussion
Paper
|D
iscussionP
aper|
3.2 Background Arctic haze
The free troposphere over Northern Alaska and adjacent waters was strongly influ-enced by anthropogenic and biomass emissions, even in the absence of discreteplumes from identifiable sources. This influence was most obvious in the mixing ra-tio of CO, which in winter is produced primarily from combustion (Fisher et al., 2010).5
Mean CO mixing ratios were 160±3 ppbv (Fig. 6c, Table 3). This relatively high COmixing ratio is characteristic of the polluted Northern Hemisphere in early spring andis caused by a decrease in the photochemical loss of CO in the winter months as wellas a seasonal increase in anthropogenic and biomass/biofuel emissions, especially inEurope and Northern Asia (e.g., Novelli et al., 1992, 1998; Petron et al., 2002; Fisher10
et al., 2010; Kopacz et al., 2010).
3.2.1 Aerosol composition and microphysical properties
The concentrations of submicron aerosol constituents in background haze conditionswere also enhanced relative to remote, unpolluted areas in the springtime midlatitudefree troposphere (e.g., Brock et al, 2004; Peltier et al., 2008; Dunlea et al., 2009).15
Histograms of concentrations of extensive aerosol parameters were lognormally dis-tributed. For all lognormally distributed data we use geometric means and standarddeviations to describe their statistics of occurrence; otherwise Gaussian statistics areapplied (Table 3). We also use medians and quartiles to graphically summarize sev-eral parameters (Fig. 6). Geometric mean aerosol sulfate concentrations in back-20
ground haze were 1.1(×÷2.01) µg m−3, and organic concentrations were highly variableat 0.71(×÷3.15) µg m−3 (values with ×
÷ are geometric standard deviations). Nitrate andammonium were ∼1% and ∼10%, respectively, of the non-refractory submicron aerosolmass, and nitrate was often below the detection limit of 0.02 µg m−3 for 10-s measure-ments. The mean ionic ratio of ammonium to the sum of measured anions was 0.6,25
indicating that the inorganic constituents of the aerosol were only partially neutralized.Black carbon was ∼3% of the total submicron mass.
27377
ACPD10, 27361–27434, 2010
Characteristics,sources, and
transport of aerosols
C. A. Brock et al.
Title Page
Abstract Introduction
Conclusions References
Tables Figures
J I
J I
Back Close
Full Screen / Esc
Printer-friendly Version
Interactive Discussion
Discussion
Paper
|D
iscussionP
aper|
Discussion
Paper
|D
iscussionP
aper|
Particle size distributions in these polluted background conditions were varied, at-testing to the diverse sources and ages of the layers found within this airmass clas-sification. Typical size distributions included an accumulation mode with a numbergeometric mean diameter, Dg,n, of ∼0.17 µm. A mode of coarse particles was presentbetween 1 and 5 µm in the volume distribution (Fig. 7). The total volume within this5
mode was ∼60% of that found in the accumulation mode (Table 3). An Aitken modecontributing 10% or more of the total particle number was present 58% of the time inthe background haze; this mode had a variable Dg,n ranging from 0.008 to 0.05 µm.
Mean particle number and mass concentrations were 371 cm−3 and 2.1 µg m−3, re-spectively (Fig. 6a,b; Table 3), with a composition that was 35% organic with sulfate10
comprising the large majority of the remaining mass (Figs. 6i–k, 7, Table 3). At a su-persaturation (SS) of 0.10(±0.04)%, 36(±12)% of the particles were active CCN. Thisfraction of CCN increased to 88(±15)% for SS between 0.15 and 0.42%.
Particles with diameters in two size classes (fine, 0.15 to 0.7 µm and coarse, 0.7 to3 µm) were placed into one of six compositional categories based upon the positive15
or negative mass spectrum from individual particles as measured by the PALMS in-strument (Froyd et al., 2009). The categories include particles with a biomass/biofuelcomponent (Hudson et al. 2004), sulfate/organic internal mixtures with no biomassmaterial, elemental carbon, mineral dust, sea-salt, and unclassified. Note that the par-ticles are classified according to their dominant spectral characteristics; many particles20
are likely to be a mixture of types, yet are placed in the category with the most dom-inant spectral signature. Within the “background” category, 64% of fine particles hada biomass/biofuel compositional signature, while particles with sulfate/organic signa-tures comprised 18% of the fine particle number (Fig. 7). In contrast, in the coarsemode, 49% of the particles were mineral dust, followed in number contribution by sea-25
salt, particles with a biomass/biofuel signature, unclassified particles and particles withsulfate/organic signatures. In both the fine and coarse mode, elemental carbon parti-cles contributed 1% or less of the particle number.
The reader’s attention may be drawn to the difference in particle composition as re-
27378
ACPD10, 27361–27434, 2010
Characteristics,sources, and
transport of aerosols
C. A. Brock et al.
Title Page
Abstract Introduction
Conclusions References
Tables Figures
J I
J I
Back Close
Full Screen / Esc
Printer-friendly Version
Interactive Discussion
Discussion
Paper
|D
iscussionP
aper|
Discussion
Paper
|D
iscussionP
aper|
ported by the AMS and the PALMS instruments (Fig. 7). Due to transmission losseswithin its aerodynamic lens, the AMS did not efficiently sample particles with physicaldiameters >0.5 µm (Bahreini et al., 2008). Furthermore, the AMS composition is mass-based while the PALMS apportionment is based on number frequency of occurrence.The PALMS categorization is based on the presence of marker species, and does not5
necessarily represent the only important contributor to that particle’s mass. Thus thefact that the AMS shows that 52% of the non-refractory fine particle mass measured inthe Arctic background aerosol was composed of sulfate does not contradict the PALMSmeasurements showing that only 18% by number of the fine mode particles were clas-sified as predominantly sulfate/organic internal mixtures, since particles classified as10
BB by the PALMS can also contain substantial non-refractory sulfate material (Hudsonet al., 2004).
3.2.2 Aerosol optical properties
In the polluted background airmass, dry aerosol extinction was <10 Mm−1 and theaerosol was highly scattering, with a single scattering albedo of ∼0.96. The asymme-15
try parameter (the cosine-weighted integral of the scattering phase function, used inradiative transfer calculations) was ∼0.6, similar to values of ∼0.7 reported for spring-time at the surface at Barrow, Alaska (McComiskey et al., 2008). The term γ, which isa key parameter in understanding the variation in light extinction due to changing atmo-spheric relative humidity, f (RH), was determined from continuously operating, parallel,20
humidified extinction measurements and is defined such that (Doherty et al., 2005)
f (RH)=σext,532,RH
σext,532,RH0
=(
100−RH0
100−RH
)γ
, (1)
where RH0 and RH are the dry (<10%) and humidified (∼60% and ∼85%) instrumentalrelative humidity conditions, respectively. The value of γ was determined by fittingthe extinction data at the three measurement humidities. For the background haze25
category, the geometric mean value of γ was 0.63 (Fig. 6h, Table 3).27379
ACPD10, 27361–27434, 2010
Characteristics,sources, and
transport of aerosols
C. A. Brock et al.
Title Page
Abstract Introduction
Conclusions References
Tables Figures
J I
J I
Back Close
Full Screen / Esc
Printer-friendly Version
Interactive Discussion
Discussion
Paper
|D
iscussionP
aper|
Discussion
Paper
|D
iscussionP
aper|
3.2.3 Origins and transport
Simulations of the origins of the background aerosol are difficult because of the longtime scales of transport involved. FLEXPART simulations during background condi-tions do not show substantial direct transport from known sources. Analysis with anEulerian atmospheric transport and chemistry model shows an increase in CO during5
the winter and spring months due to transport of anthropogenic emissions from Europe,Northwestern Asia, and China (Fisher et al., 2010). The observed background concen-trations of CO are consistent with this model of enhanced emission and transport, andreduced wintertime photochemical loss. The aerosol composition and size distribu-tion measurements are also consistent with an aged, predominantly fossil fuel-derived10
aerosol with a significant contribution from biomass and/or biofuel burning sources.
3.3 Biomass burning plumes
3.3.1 Aerosol composition and microphysical properties
The striking feature dominating the measurements made aboard the NOAA WP-3Daircraft from 12 to 23 April 2008 was the unexpected, frequent occurrence of layers of15
enhanced aerosol and gas-phase species that were attributable to BB (Warneke et al.,2009, 2010). These layers were identified by enhancements in CO from backgroundvalues of ∼160 ppbv to a 95th-percentile value of 273 ppbv (Fig. 6c) and a maximumvalue of 419 ppbv, and by correlated enhancements in acetonitrile, a specific tracerof biomass/biofuel combustion (de Gouw et al., 2003b). Single-particle compositional20
measurements (Fig. 7) showed that on average 83% of the 0.15 to 0.7 µm diameterparticles in these plumes had a substantial biomass/biofuel signature (Hudson et al.,2004). Geometric mean fine aerosol mass concentrations were 9.0 µg m−3 with a ge-ometric standard deviation of 2.30 and a 95th percentile value of 27 µg m−3. Aerosolcomposition within the BB plumes was dominated by organic compounds which com-25
prised 60% of the non-refractory submicron mass. Sulfate was present within the BB
27380
ACPD10, 27361–27434, 2010
Characteristics,sources, and
transport of aerosols
C. A. Brock et al.
Title Page
Abstract Introduction
Conclusions References
Tables Figures
J I
J I
Back Close
Full Screen / Esc
Printer-friendly Version
Interactive Discussion
Discussion
Paper
|D
iscussionP
aper|
Discussion
Paper
|D
iscussionP
aper|
layers at a higher concentration than in the background haze (Fig. 7, Table 3). Whileagricultural and wild fires are not thought to be large sources of sulfur compounds(Hegg et al., 1987; Andreae and Merlet, 2001), the presence of enhanced particulatesulfate concentrations in these plumes, in the absence of obvious fossil fuel combustionsources co-located or immediately upwind of the fires, may call that assumption into5
question. Nitrate (NO−3 ) and ammonium (NH+
4 ) were significantly higher within the BBplumes compared with the background haze, probably originating from fire emissionsof NOx and NH3, respectively (e.g., Andreae and Merlet, 2001). Black carbon concen-trations were enhanced within the BB plumes, but generally increased proportionally tothe total aerosol mass concentrations. The BC mass fraction of the quantified submi-10
cron aerosol composition was 3.8±1.1% for the BB plumes, similar to the backgroundBC fraction.
Submicron particles were present as a single mode with Dg,n=0.19 µm and a geo-metric standard deviation σg=1.5 (Fig. 7, Table 3). Values of Dg,n varied systematicallywith CO within the BB plumes (Fig. 8), probably because mixing of concentrated BB15
smoke with background air resulted in partitioning of semivolatile organic matter fromthe condensed to the gas phase (e.g., Donahue et al., 2009), thereby decreasing par-ticle size in diluted BB smoke. Submicron particle concentrations within the BB modevaried from 470 to 2000 cm−3 (5th and 95th percentiles), with a geometric mean of910 cm−3. Submicron volume concentration ranged from 2.4 to 25 µm3 cm−3 (5th and20
95th percentiles) with a geometric mean of 5.6 µm3 cm−3. Submicron particle sur-face area ranged from 56 to 464 µm2 cm−3 (5th and 95th percentiles) with a geometricmean of 122 µm2 cm−3. Coarse particle geometric mean volume was 1.7 µm3 cm−3,with a mass median diameter of ∼4 µm. At a supersaturation (SS) of 0.10(±0.04)%,40(±9)% of the particles were active CCN. The fraction of activated CCN increased to25
88(±11)% for SS between 0.15 and 0.42% (Table 3).
27381
ACPD10, 27361–27434, 2010
Characteristics,sources, and
transport of aerosols
C. A. Brock et al.
Title Page
Abstract Introduction
Conclusions References
Tables Figures
J I
J I
Back Close
Full Screen / Esc
Printer-friendly Version
Interactive Discussion
Discussion
Paper
|D
iscussionP
aper|
Discussion
Paper
|D
iscussionP
aper|
3.3.2 Aerosol optical properties
Submicron single scattering albedos were similar between the background Arctic hazeand the BB plume cases, with 5th and 95th percentile values for the BB of 0.94 and0.98, respectively, and a median value of 0.97 (Fig. 6g). The calculated asymmetry pa-rameter (the cosine-weighted integral of the scattering phase function) was not highly5
variable, with 5th and 95th percentile values of 0.57 and 0.66, respectively, and a me-dian value of 0.62. The aerosol was moderately hygroscopic, with a geometric meanvalue of γ of 0.45. These values of γ are comparable to the higher end of those inoxidized airmasses measured downwind of Asia, India, and North America for similarlevels of organic mass fraction (Quinn et al., 2005), and suggest the organic matter was10
oxidized and not hydrophobic. This finding is consistent with analysis of AMS organicspectra (Zhang et al., 2005), which shows that >90% of the organic mass in the BBplumes was highly oxygenated (not shown). This finding is consistent with the largefraction of particles active as CCN. In sum the BB particles were organic rich (yet stillcontained enhanced sulfate) were aged, highly scattering, significantly hygroscopic,15
and effective as CCN.
3.3.3 Origins and transport
The FLEXPART model often simulated the transport of CO from BB sources with re-markable spatial fidelity and with modeled mixing ratio enhancements generally withina factor of two of the measurements (Fig. 2). The model did not predict the occurrence20
of some plumes, particularly above 4 km altitude; these misses may be at least partlyattributable to altitude displacement rather than gross errors in transport. The RAQMSmodel effectively simulated the general location of the transport of CO and aerosol par-ticles from BB sources to the Arctic, although the Eulerian RAQMS model tended tooverpredict CO mixing ratios and underpredict OC+BC concentrations.25
Two primary sources of smoke were identified based upon the FLEXPART andRAQMS simulations, which incorporate real-time emissions estimates from fires identi-
27382
ACPD10, 27361–27434, 2010
Characteristics,sources, and
transport of aerosols
C. A. Brock et al.
Title Page
Abstract Introduction
Conclusions References
Tables Figures
J I
J I
Back Close
Full Screen / Esc
Printer-friendly Version
Interactive Discussion
Discussion
Paper
|D
iscussionP
aper|
Discussion
Paper
|D
iscussionP
aper|
fied by MODIS satellite sensor imagery (Fig. 9). The first of these smoke sources wasa broad region located along the Russia/Kazakhstan border, but predominantly on theRussian side. The vegetation in this area is a mix of agricultural lands, steppe grass-lands and forest. Fires in this region probably originated with agricultural burning; someof these became wildfires. Fires in this region in springtime are an annual occurrence5
(Warneke et al., 2010). A second region of BB originated in Southeastern Siberia, be-tween Lake Baikal and the Pacific Ocean in the vicinity of the Chita and Amur Rivers.The vegetation in this region is a mix of grassland, shrubland, and coniferous forest.Images from the MODIS satellite sensors (NASA/University of Maryland, 2002) sug-gest that most of the fires occurred on forested land. Although there are no substantial10
vegetation differences across the Russia/China border, there were very strong gradi-ents in BB occurrence (Fig. 9; Warneke et al., 2010). This suggests that fire ignitionand/or control strategies differed across the political border. MODIS images indicatethat much of the land in this region was snow-covered in late March; fires began soonafter the snow at lower altitudes melted, suggesting deliberate ignition of moist fuels.15
MODIS images show merged plumes covering a broad region downwind of the manysmall fires.
Smoke from the two regions, henceforth referred to as Southern Russia and South-eastern Siberia, respectively, was episodically generated and transported to the Arcticbased on the fire occurrence and meteorologically driven transport events. Figure 1020
shows the FLEXPART-simulated emission and transport of these plumes over a 24-dayperiod (movies of these images and of FLEXPART simulated BB transport superim-posed on satellite cloud images are available in the online Supplementary Materials).Fires began east of Lake Baikal near the end of March and became widespread inmid-April. Transport from the midlatitudes to the Arctic occurred in 2 primary pulses25
(6–12 April and 16–25 April), each associated with midlatitude cyclones that advectedsmoke cyclonically upward and northward (Stohl et al., 2003). Within the Arctic, someof the smoke was sheared horizontally into filaments as it exited the cyclonic systemsinto the downstream anticyclones. Some of this sheared smoke became entrained into
27383
ACPD10, 27361–27434, 2010
Characteristics,sources, and
transport of aerosols
C. A. Brock et al.
Title Page
Abstract Introduction
Conclusions References
Tables Figures
J I
J I
Back Close
Full Screen / Esc
Printer-friendly Version
Interactive Discussion
Discussion
Paper
|D
iscussionP
aper|
Discussion
Paper
|D
iscussionP
aper|
Arctic cyclonic and anticyclonic systems, although the majority of emitted smoke re-mained in high midlatitudes. By late April smoke had penetrated deeply into the Arctic,reaching the North Pole and extensively covering the pan-Arctic region (Fig. 10; Sahaet al., 2010). The primary consequences of such smoke layers on the Arctic environ-ment are likely to be caused by direct and indirect radiative forcing and by in-cloud5
scavenging and wet deposition to the surface during transport. More long-term influ-ences may result if the smoke does not rapidly exit the Arctic and is mixed to the ABL,in which case dry deposition to the surface may occur. These issues are discussed inSect. 4.
3.4 Anthropogenic/fossil fuel plumes10
Plumes that were predominantly from fossil fuel sources were classified as “anthro-pogenic/fossil fuel”. These plumes, which were observed during only ∼1 h of total flighttime on 15 April 2008, were identified by CO mixing ratios >170 ppbv in the absenceof corresponding increases in acetonitrile. Furthermore, SO2 from the CIMS instru-ment was significantly elevated in these regions (mean mixing ratio 50 pptv) and was15
positively correlated with aerosol sulfate.
3.4.1 Aerosol composition and microphysical properties
The submicron aerosol composition in the anthropogenic/fossil fuel airmasses wasdominated by sulfate, ammonium, and organics. Organic matter comprised only33% of the non-refractory mass (Fig. 7, Table 3), in contrast to the organic-rich BB20
plumes (∼65% organic mass fraction). The geometric mean sulfate concentration was3.5 µg m−3. The mean ion balance between ammonium and measured anionic specieswas ∼0.5, indicating that the sulfate was not fully neutralized (Fig. 7). The geometricmean concentration of BC was 148 ng m−3. The fractions of particles in each compo-sition category was similar to those in background air. Both the number and volume25
size distributions were dominated by the accumulation mode, with a number geometric
27384
ACPD10, 27361–27434, 2010
Characteristics,sources, and
transport of aerosols
C. A. Brock et al.
Title Page
Abstract Introduction
Conclusions References
Tables Figures
J I
J I
Back Close
Full Screen / Esc
Printer-friendly Version
Interactive Discussion
Discussion
Paper
|D
iscussionP
aper|
Discussion
Paper
|D
iscussionP
aper|
mean diameter of 0.17 µm and a number concentration of 627 cm−3. Despite the highersulfate concentrations and the SO2 that was present, there were no modes of smallerparticles that would suggest recent new particle formation. At a supersaturation (SS)of 0.10(±0.04)%, 41(±7)% of the particles were active CCN. The fraction of activatedCCN increased to 87(±11)% for SS between 0.15 and 0.42%. The CCN activation5
fractions at either SS do not differ significantly from those for the background haze andbiomass/biofuel burning cases.
3.4.2 Aerosol optical properties
Median values of extinction, absorption, and submicron mass in the fossil fuel plumeswere all approximately 1/2 of the mean values for the BB plumes (Fig. 6b,e,f; Table 3).10
The anthropogenic aerosol was significantly more hygroscopic (γ=1.09) than was theBB aerosol (γ=0.45). This degree of hygroscopicity in the anthropogenic plumes ishigher than values reported in several aged fossil fuel influenced airmasses by Quinnet al. (2005) and Massoli et al. (2009) for similar organic mass fractions. The singlescattering albedo in the anthropogenic layers was 0.96±0.01, which was not signifi-15
cantly different from the BB value of 0.97±0.02. In sum, the aerosol was dominated byacidic sulfate, and was monomodal, hygroscopic, and highly scattering.
3.4.3 Origins and transport
FLEXPART and RAQMS simulations indicate that the primary source of sulfur specieswithin the anthropogenic layers encountered on 15 April 2008 was Eastern China,20
with some contribution from Eastern Europe. The sulfur-rich plumes were near otherplumes dominated by BB emissions. The sulfur species likely originated from anthro-pogenic sources as indicated by the models, and were transported by the same mid-latitude synoptic low pressure system that carried the BB plumes. Similar long-rangetransport of different types of pollution in adjacent layers without substantial mixing has25
been observed before (Clarke et al., 2001; Brock et al., 2004, 2008) and shows that
27385
ACPD10, 27361–27434, 2010
Characteristics,sources, and
transport of aerosols
C. A. Brock et al.
Title Page
Abstract Introduction
Conclusions References
Tables Figures
J I
J I
Back Close
Full Screen / Esc
Printer-friendly Version
Interactive Discussion
Discussion
Paper
|D
iscussionP
aper|
Discussion
Paper
|D
iscussionP
aper|
laminar transport of sheared filaments and layers from different sources over intercon-tinental distances is common.
3.5 Arctic sea-ice boundary layer (ABL)
In winter and spring, a persistent surface inversion of variable depth and strength oc-curs over the Arctic Ocean (e.g., Vowinckel, 1970; Tjernstrom and Graversen, 2009).5
The air within this inversion is at or very near ice saturation (Andreas et al., 2002). Dif-fuse low-level clouds and clear-air “diamond dust” precipitation are common (Ohtakeet al., 1982) because of heat and moisture fluxes from open and thinly ice-coveredleads. Static stability is high, and wind-generated mechanical turbulence very nearthe surface and sporadic convective turbulence from newly exposed open-water leads10
are the primary mechanisms for vertical transport (Andreas and Murphy, 1986; Struninet al., 1997; Pavelsky et al., 2010). The air within this layer is isolated from the air aloftdue to the high static stability and may have a different source and transport history(Stohl, 2006).
The WP-3D aircraft penetrated the sea-ice inversion layer on 16 occasions, briefly15
descending to altitudes of ∼70 m. An infrared sea-surface temperature (SST) sensorreported that open and thinly ice-covered leads (indicated by brief increases in SST3 K or more above the local mean SST) were present directly below the aircraft ∼10%of the time while in the ABL. Although the top of the inversion layer was often above1 km altitude, the moist ABL in which there was evidence of halogen chemistry was20
generally confined to altitudes <800 m. Several extended flight legs ∼200 m above thesurface were made (Fig. 2). In situ data were classified into the ABL category basedon the meteorological and gas-phase chemical criteria described previously. A total of5 h of flight time were spent within this airmass type.
27386
ACPD10, 27361–27434, 2010
Characteristics,sources, and
transport of aerosols
C. A. Brock et al.
Title Page
Abstract Introduction
Conclusions References
Tables Figures
J I
J I
Back Close
Full Screen / Esc
Printer-friendly Version
Interactive Discussion
Discussion
Paper
|D
iscussionP
aper|
Discussion
Paper
|D
iscussionP
aper|
3.5.1 Aerosol composition and microphysical properties
Within the moist ABL, the aerosol extensive properties, including mass concentration,extinction, absorption, and chemical species concentrations, were comparable to orless than values in the polluted background of the free troposphere (Fig. 6a–f; Table 3).Notably, BC and organic mass concentrations were lower than in the background air-5
mass, while sulfate concentrations were similar or higher (Fig. 7).The ABL submicron aerosol size distribution was similar to that of the background
free troposphere (Fig. 7), although number concentrations were lower within the ABL(Fig. 6a). The coarse mode volume concentration was significantly lower in the ABLcompared with the background air (Fig. 7, Table 3). Single particle composition in-10
formation from the PALMS mass spectrometer instrument shows a distinct change inparticle characteristics between the ABL and the free troposphere (Fig. 7). In the ABL,the coarse particle mode was composed mostly (79%) of sea-salt particles. Coarseparticles with dust and BB characteristics were infrequent in the inversion layer oversea-ice. About 22% of fine particles with diameters from 0.15 to 0.7 µm were com-15
posed of sea-salt; this is consistent with the findings that sea-salt contributes to ∼20%of fine aerosol mass measured at Barrow, Alaska (Quinn et al., 2002). The fractionof fine particles with a BB signature (31%) was significantly lower than in the otherairmass types, and was comparable to typical midlatitude tropospheric backgroundvalues (Hudson et al., 2004). At a supersaturation (SS) of 0.10(±0.04)%, 54(±11)% of20
the submicron particles were active CCN, a higher activated fraction than was foundin the other airmass categories (Table 3). The activated CCN fraction increased to88(±15)% for SS between 0.15 and 0.42%.
3.5.2 Aerosol optical properties
Submicron aerosol extinction and absorption were lower in the ABL than in the back-25
ground free troposphere, consistent with the decrease in particle mass and BC, re-spectively. As expected for the low BC fraction in the ABL, the single scattering albedo
27387
ACPD10, 27361–27434, 2010
Characteristics,sources, and
transport of aerosols
C. A. Brock et al.
Title Page
Abstract Introduction
Conclusions References
Tables Figures
J I
J I
Back Close
Full Screen / Esc
Printer-friendly Version
Interactive Discussion
Discussion
Paper
|D
iscussionP
aper|
Discussion
Paper
|D
iscussionP
aper|
in the ABL was higher, 0.97, than the background case, 0.96 (Fig. 6g, Table 3). TheABL aerosol was more hygroscopic (γ=0.97) than the background or BB cases, andwas similar to the anthropogenic/fossil fuel cases, in which the composition was alsodominated by acidic sulfate. In sum, compared to the free tropospheric Arctic back-ground haze, the ABL aerosol was reduced in quantity, enhanced in sulfate, deficient5
in organic matter and BC, more hygroscopic, and more highly scattering.
3.5.3 Origins and transport
Despite some statistical similarities in gas-phase properties between the backgroundand ABL airmasses, during individual vertical profiles there were often discretechanges in submicron aerosol characteristics as the aircraft penetrated the top of the10
ABL. In particular, particle number concentration, extinction, absorption, and BC con-centrations were frequently lower by a factor of ∼2 in the ABL relative to values inbackground air immediately above. These lower concentrations were associated withthe moist, halogen-active, O3-depleted portion of the sea-ice inversion layer that indi-cates chemical interaction with the surface. These observations suggest that dry or wet15
(ice) deposition may have been occurring within the ABL. Spackman et al. (2010) showevidence of dry deposition of BC in the vicinity of open leads where enhanced verticalmixing may accelerate the dry deposition process. However, differences in airmasshistories, and therefore aerosol sources, may also contribute to the observed verticalstructure.20
Twenty-day airmass histories calculated with the FLEXPART transport model andinitialized in the ABL most frequently remained within the Arctic. The modeled airparcels tended to circulate within the North American sector of the Arctic, particularly inthe vicinity of the Canadian Arctic archipelago (Fig. 11). In many cases the simulationsshowed several days of transport within the ABL, preceded by gradual descent from the25
free troposphere. This transport pattern is consistent with the expected climatologicalmean circulation of diabatic cooling and descent in the Arctic; as a result the ABLair over the North American Arctic has the longest residence time of any air in the
27388
ACPD10, 27361–27434, 2010
Characteristics,sources, and
transport of aerosols
C. A. Brock et al.
Title Page
Abstract Introduction
Conclusions References
Tables Figures
J I
J I
Back Close
Full Screen / Esc
Printer-friendly Version
Interactive Discussion
Discussion
Paper
|D
iscussionP
aper|
Discussion
Paper
|D
iscussionP
aper|
Arctic (Stohl, 2006). Mean mixing ratios of CO observed in the ABL did not differsignificantly from those found in the background free troposphere, indicating that mixingtimes between these two airmasses were short relative to the many-month timescalesof photochemical CO loss in high latitude winter/spring (Novelli et al., 1992). Thewide range of possible residence times of air parcels within the ABL – several days5
to perhaps a month (Stohl, 2006) – suggests that aerosol particles in the ABL couldbe subject to dry or wet deposition mechanisms over long time scales. Even slowor sporadic deposition processes, perhaps associated with turbulence and moisturefluxes over open leads, could become significant over such periods (Spackman et al.,2010).10
4 Discussion
4.1 “Background haze” measurements are consistent with surfaceclimatologies
Of the four airmass categories, the background haze and ABL groupings are mostconsistent with aerosol climatologies measured at surface sites. At Barrow, Alaska,15
long-term measurements of CO and submicron aerosol scattering, sulfate concentra-tion, and particle number measured during springtime may be compared with similarmeasurements aboard the WP-3D aircraft (Fig. 12). Extinction for the background andABL airmass categories lie at the 28th and 18th percentiles of the Barrow scatteringdata, respectively (scattering and extinction are equivalent to within a few percent),20
while the airborne sulfate measurements lie at the 73rd and 92nd percentiles of theBarrow measurements for these airmass categories. Although the aerosol measuredin background haze conditions was somewhat less light-scattering and had a highersulfate concentration than the typical surface haze measured at Barrow, these param-eters were within the interquartile range of the surface record. Particle number and CO25
for both the background and ABL groupings were also within the interquartile range
27389
ACPD10, 27361–27434, 2010
Characteristics,sources, and
transport of aerosols
C. A. Brock et al.
Title Page
Abstract Introduction
Conclusions References
Tables Figures
J I
J I
Back Close
Full Screen / Esc
Printer-friendly Version
Interactive Discussion
Discussion
Paper
|D
iscussionP
aper|
Discussion
Paper
|D
iscussionP
aper|
of the Barrow measurements. Measurements by the WP-3D in the ABL over the re-mote sea ice consistently showed the lowest concentrations of fine particle number,mass, extinction, and absorption and of CO and acetonitrile (Fig. 6a–f), yet climato-logical means measured at the Barrow Observatory were often more similar to thebackground haze category measured in the free troposphere (Fig. 12). It is possible5
that the ABL north of Barrow was more aged (Stohl, 2006), or the aerosol more de-pleted (Spackman et al., 2010), than surface-layer air typically sampled at the BarrowObservatory. In this case the ARCPAC measurements may be more representative ofthe remote ABL than are those made at Barrow.
Layers of enhanced aerosol extinction observed aloft during ARCPAC, whether orig-10
inating from biomass/biofuel or fossil fuel sources, were at the high end (>94th per-centile) of the probability distribution function for the Barrow surface observations. Thusthese layers were not representative of the typical springtime Arctic haze as measuredby surface sites. However, these aerosol layers were similar in terms of scatteringand aerosol composition to those measured during many previous airborne measure-15
ments in the Arctic (Shaw, 1975; Schnell, 1984; Radke et al., 1984; Rahn et al., 1977;Clarke et al., 1984; Ottar et al., 1986; Hansen and Novakov, 1989; Brock et al., 1990).Since the BB haze layers measured during ARCPAC and ARCTAS contained substan-tial quantities of sulfate, and since earlier airborne campaigns did not measure gas-phase tracers of combustion or organic aerosol mass with sufficient time response to20
characterize the discontinuous layers, an open question remains regarding how manyaerosol haze layers observed in past airborne campaigns were primarily of BB (ormixed BB and fossil fuel) origin.
4.2 Chronic pollution vs. episodic transport events: defining “Arctic haze”
In the ARCPAC airborne measurements, locally enhanced aerosol loadings were al-25
ways associated with mixing ratios of CO>170 ppbv. Mixing ratios of CO were rarely<140 ppbv in the absence of air with a stratospheric influence. The seasonal cycle ofCO at the Barrow surface observatory is pronounced and repeatable from year-to-year,
27390
ACPD10, 27361–27434, 2010
Characteristics,sources, and
transport of aerosols
C. A. Brock et al.
Title Page
Abstract Introduction
Conclusions References
Tables Figures
J I
J I
Back Close
Full Screen / Esc
Printer-friendly Version
Interactive Discussion
Discussion
Paper
|D
iscussionP
aper|
Discussion
Paper
|D
iscussionP
aper|
with little variability (5th and 95th percentile mixing ratios are 147 and 176 ppbv, respec-tively). There are only a few episodes of high CO measured at the surface of Barrow(values >195 ppbv exceed the 99th percentile), implying that the dense haze layers ofparticles and CO frequently found aloft are rarely seen at the surface (although suchevents have occurred (Stohl et al., 2006)). The limited variability in the springtime val-5
ues of CO and aerosol scattering measured at Barrow indicate that the frequency ofdense aerosol layers does not determine the climatological seasonal cycle. Insteadthe seasonal aerosol cycle observed at Barrow is better characterized as a gradualcycle in background conditions. The seasonality of these aerosol properties at Barrowand other surface stations in the Arctic (notably Alert, Canada) provide the canonical10
definition of “Arctic haze”. In contrast, much of the focus of airborne missions has beenon dense layers of enhanced aerosol and gas concentrations found aloft; these occur-rences have also been termed “Arctic haze” by investigators (e.g., Rahn et al., 1977;Garrett and Verzella, 2008).
Evaluating the ARCPAC data in the context of past surface and airborne measure-15
ments in the Arctic, it is apparent that the Arctic aerosol may best be described ashaving both chronic and episodic characteristics. The low-variance, seasonal cycle ofCO as measured at Arctic surface stations is associated with a similar low-variance,seasonal cycle in aerosol properties (Fig. 12). Multiple, independent lines of evidence,from atmospheric transport studies (e.g., Raatz and Shaw, 1984; Stohl, 2006) to global20
chemical transport modeling (e.g., Koch and Hansen, 2005; Fisher et al., 2010) tocompositional fingerprinting (e.g., Rahn, 1981), point to fossil fuel and biomass/biofuelcombustion sources in the northern midlatitudes – especially from Northeastern Eu-rope and Siberia – as the principal source of this chronic pollution near the surface ofthe Arctic. Arctic haze is best defined as the winter/spring maximum in this seasonal25
cycle in aerosol and trace gas concentrations. Episodic events are distinct from thisseasonal maximum, and are associated with direct, rapid transport from a variety ofmid- and northern-latitude sources. These transport events typically take the form ofdense aerosol layers found at altitudes from above the sea-ice inversion layer to the
27391
ACPD10, 27361–27434, 2010
Characteristics,sources, and
transport of aerosols
C. A. Brock et al.
Title Page
Abstract Introduction
Conclusions References
Tables Figures
J I
J I
Back Close
Full Screen / Esc
Printer-friendly Version
Interactive Discussion
Discussion
Paper
|D
iscussionP
aper|
Discussion
Paper
|D
iscussionP
aper|
upper troposphere (and occasionally at the surface (Stohl, et al., 2006; Stohl, et al.,2007)). Due to atmospheric mixing, some of these dense but thin haze layers aloftmay ultimately contribute to the chronic Arctic background haze, although Arctic res-idence times above the surface layer decrease with increasing altitude (Stohl, 2006).We note that long-range transport to the Arctic has been observed in summer as well5
as in winter and spring (e.g., Brock et al., 1989; Stohl et al., 2006; Paris et al., 2009).We suggest that the term “Arctic haze” not be used for episodic transport events,
despite its common use in the literature, since long-range, intercontinental transportof aerosol layers in the free troposphere is not unique to the Arctic (e.g., Stohl et al.,2002). The sources of the layers associated with episodic transport events in the Arc-10
tic appear to be diverse (Fisher et al., 2010). In 2008, unusually early and extensivebiomass burning in Southeastern Siberia contributed to aerosol layers found over theWestern Arctic (Warneke et al., 2010). Agricultural fires in Southern Russia, whichare a regular springtime occurrence (Warneke et al., 2010), also contributed to theaerosol layers observed in the Arctic. Aerosol layers originating from fossil fuel com-15
bustion, while infrequent in the ARCPAC dataset, were more common in the widergeographic region sampled by the ARCTAS research DC-8 and P-3B aircraft (Fisheret al., 2010, Jacob et al., 2010), and past airborne measurements have also reportedmany layers originating from such sources. Transport modeling (Koch and Hansen,2005; Stohl, 2006; Fisher et al., 2010) and some observations (Scheuer et al., 2003)20
suggest a seasonally varying transition from high latitude to midlatitude sources withincreasing altitude in the Arctic. However, our limited observations do not indicate sys-tematic changes in the characteristics of the background aerosol (chronic Arctic haze)as a function of altitude above the ABL.
4.3 Background and ABL aerosol contains a biomass or biofuel burning25
component
The background Arctic haze submicron non-refractory aerosol mass measured dur-ing ARCPAC was approximately 2/3 inorganic material and 1/3 organic compounds
27392
ACPD10, 27361–27434, 2010
Characteristics,sources, and
transport of aerosols
C. A. Brock et al.
Title Page
Abstract Introduction
Conclusions References
Tables Figures
J I
J I
Back Close
Full Screen / Esc
Printer-friendly Version
Interactive Discussion
Discussion
Paper
|D
iscussionP
aper|
Discussion
Paper
|D
iscussionP
aper|
(Fig. 7). The PALMS instrument reported that 64% by number of the fine mode parti-cles were classified as containing a biomass burning component based on potassiumand organic carbon marker ions, following the scheme of Hudson et al. (2004). Thisfraction is noticeably higher than typical levels of 20 to 40% that are consistently ob-served throughout the mid-latitude and tropical troposphere (Hudson et al., 2004; Froyd5
et al., 2009). The FLEXPART model predicts a small but detectable BB influence onArctic air from fires in Northern Asia and other mid-latitude regions prior to the ARCPACmeasurement period (Warneke et al., 2010). It is likely that these earlier plumes werepartially entrained into the background Arctic air, enhancing the BB aerosol fraction.Based on the observed coexistence on single particles of condensed material such as10
sulfate, ammonium, and lead with the BB marker species, BB particles in backgroundair were more aged than those within the intense BB aerosol layers, consistent withearlier emission from sources and longer atmospheric residence times. In the ABL theBB particle fraction (31%) was near typical mid-latitude free tropospheric values, butsignatures of particle aging were even stronger than in background air aloft. In par-15
ticular, the high sulfate content in the single particle mass spectra suggests extensiveaging (Hudson et al., 2004). The observed low concentrations of VOCs, as well as theFLEXPART transport simulations, indicate that ABL air was isolated to Arctic regionsfor the previous few weeks and had little recent influence from mid-latitude emissionsources. The source of BB aerosol material in the springtime background haze and20
in the ABL is presumably the same as the seasonally enhanced CO, i.e., winter andspring emissions from northern midlatitudes. In Northern Europe during the cold sea-son, wood burned for heating creates smoke that is co-emitted with anthropogenic pol-lution (Gelencser et al., 2007; Yttri et al., 2009). Both this cold-season biofuel sourceand mid-latitude springtime fires likely contribute to the seasonal background of BB25
aerosol material found in free tropospheric Arctic air.
27393
ACPD10, 27361–27434, 2010
Characteristics,sources, and
transport of aerosols
C. A. Brock et al.
Title Page
Abstract Introduction
Conclusions References
Tables Figures
J I
J I
Back Close
Full Screen / Esc
Printer-friendly Version
Interactive Discussion
Discussion
Paper
|D
iscussionP
aper|
Discussion
Paper
|D
iscussionP
aper|
4.4 No evidence of precipitation scavenging from layers aloft
Black carbon deposited on snow is a potentially significant climate forcing agent in theArctic (Hansen and Nazarenko, 2004; Jacobson, 2004, 2010; Flanner et al., 2007,2009; Shindell et al., 2008; Shindell and Faluvegi, 2009). It is important to understandthe origin of the BC that has been observed in snow at the surface of the Arctic if ef-5
fective mitigation strategies are to be developed (Quinn et al., 2008). Both airborneBC concentrations and precipitation rates are low in the Arctic, making direct measure-ments of depositional flux rare (Noone and Clarke, 1988; Doherty, et al., 2010). Recentanalysis based on compositional measurements of snow samples collected across theArctic in springtime indicate a dominant biomass and/or biofuel burning source over10
much of the Arctic (Hegg et al., 2009, 2010; Doherty et al., 2010).Since snow compositional measurements suggest a biomass/biofuel burning source,
one might expect to see evidence for wet deposition of particles from the BB layers ob-served aloft during ARCPAC. In 2004 measurements near the eastern coast of NorthAmerica, we found regions highly enhanced in gas-phase BB markers but relatively15
depleted with respect to aerosols and highly soluble gas-phase species, and have in-terpreted these observations as evidence for wet deposition (de Gouw et al., 2006). InARCPAC, CO mixing ratios and aerosol mass (estimated from volume) were highly cor-related in plumes that were enhanced in acetonitrile (Fig. 13). However, there were nocases during ARCPAC in which CO or acetonitrile were enhanced yet aerosol number20
and mass concentrations were not. Instead, the slope between aerosol mass and COstands at the high end of literature values for particle emissions from biomass burningsources (Fig. 13).
Dry deposition might occur if the smoke aerosol were mixed to near the sea-icesurface. However, the dense aerosol layers observed aloft during ARCPAC were de-25
coupled from the sea-ice ABL due to persistent strong inversions, and there was noindication of direct mixing of the BB aerosol plumes aloft to the sea-ice surface layerover the time scales of the ARCPAC measurements. On one occasion, BB smoke
27394
ACPD10, 27361–27434, 2010
Characteristics,sources, and
transport of aerosols
C. A. Brock et al.
Title Page
Abstract Introduction
Conclusions References
Tables Figures
J I
J I
Back Close
Full Screen / Esc
Printer-friendly Version
Interactive Discussion
Discussion
Paper
|D
iscussionP
aper|
Discussion
Paper
|D
iscussionP
aper|
measured on 19 April 2010 over the Barrow airport reached the lowest altitude, ∼70 m,sampled by the WP-3D aircraft. However, this measurement was over land rather thansea-ice, and occurred as a result of strong warm advection within a midlatitude airmassrather than mixing from aloft into the ABL. Smoke associated with this transport eventwas found aloft above the ABL over sea-ice north of Barrow (Lance et al., 2010b).5
Spackman et al. (2010) report evidence for dry deposition of BC and other aerosolconstituents within the ABL; this is the only evidence of loss of aerosol particles to thesurface found during ARCPAC. This deposition mechanism appeared to operate overthe lowest few hundred meters within the ABL over sea-ice, and thus did not directlyact upon the dense layers that were found only aloft, above the sea-ice inversion layer.10
4.5 Arctic aerosol produces net radiative heating
While there is no evidence that the BB particles in layers observed aloft during ARC-PAC deposited to the snow, the direct radiative forcing of the aerosol layers remains ofpotential significance. To evaluate this effect, aerosol direct radiative forcing was calcu-lated for the shortwave spectrum as the difference in flux with and without aerosol. The15
radiative transfer model used for the calculations was the Santa Barbara DISORT At-mospheric Radiative Transfer model (SBDART; Ricchiazzi et al. (1998)) implementedas described in McComiskey et al. (2008).
In this 1st-order modeling exercise, a solar zenith angle of 60 degrees, which repre-sents a maximum daily solar zenith angle (SZA) for ARCPAC latitudes, was assumed,20
as was a surface albedo of 0.85, which is the average April value from a 10 year cli-matology at Barrow (calculated from data collected by the Department of Energy ARMClimate Research Facility). A standard Arctic profile of absorbing gases (McClatcheyet al., 1972) was used. Holding all of these factors constant allows us to focus onthe maximum possible forcing caused by the aerosol alone under representative Arc-25
tic conditions. More complete radiative transfer modeling, including comparison withspectrally resolved radiance and irradiance measurements under varying surface albe-dos and SZA conditions, will be the subject of future work.
27395
ACPD10, 27361–27434, 2010
Characteristics,sources, and
transport of aerosols
C. A. Brock et al.
Title Page
Abstract Introduction
Conclusions References
Tables Figures
J I
J I
Back Close
Full Screen / Esc
Printer-friendly Version
Interactive Discussion
Discussion
Paper
|D
iscussionP
aper|
Discussion
Paper
|D
iscussionP
aper|
Ambient values of light extinction were calculated from ambient RH measurementsusing the mean γ values for each airmass category (Table 3). Single scattering albedowas recalculated using this ambient extinction value and the dry absorption measure-ment. A fixed asymmetry parameter of 0.65, lying between the values calculated fromthe dry size distributions (Table 3) and values reported for Barrow, Alaska, was used.5
McComiskey et al. (2008) show that radiative forcing sensitivity to varying asymmetryparameter in these Arctic conditions is negligible. From the entire ARCPAC campaign,ten representative profiles, including sampling in all four regimes (Fig. 14a), of ambientextinction and SSA derived from the observations were averaged into 150 meter binsfrom the surface to 8 km for the radiative transfer calculations (Fig. 14b,c).10
The results of the radiative transfer calculations for each of the 10 binned vertical pro-files are shown in Fig. 14d. Average heating rates of ∼0.1 K day−1 occurred between3 and 7 km, where most of the BB layers were observed, with a maximum value of theaverage profile of ∼0.2 K day−1. However, this maximum heating varied substantiallywith individual profiles depending on the properties of the aerosol layer, surface albedo,15
and height above the surface. Layers with maximum heating rates of ∼0.6 K day−1 werecalculated for individual profiles. The top-of-atmosphere radiative forcing for the aver-age profile was +3.3 W m−2, while surface forcing was −1.5 W m−2 and troposphericcolumn forcing +4.8 W m−2. Note that these values are for the instantaneous forcingscalculated at solar noon, which is the maximum possible. Diurnally averaged values20
would be lower. These values can be compared to surface in situ measurements atBarrow, Alaska for a representative case of Arctic haze (Quinn et al., 2007). For thiscase, calculations were made at solar noon on 15 April, similar solar geometry to ourcalculations, and with a surface albedo of 0.92, higher than our average value of 0.85.This case resulted in top-of-atmosphere forcing of +2.5 W m−2 and surface forcing of25
−0.93 W m−2, resulting in a tropospheric forcing of 3.43 W m−2. These calculationsshow that the short term effects of both the background haze and dense haze layersaloft are to cool the surface and heat the atmospheric column, while producing netenergy absorption by the earth-atmosphere system. Continued heating of the tropo-
27396
ACPD10, 27361–27434, 2010
Characteristics,sources, and
transport of aerosols
C. A. Brock et al.
Title Page
Abstract Introduction
Conclusions References
Tables Figures
J I
J I
Back Close
Full Screen / Esc
Printer-friendly Version
Interactive Discussion
Discussion
Paper
|D
iscussionP
aper|
Discussion
Paper
|D
iscussionP
aper|
sphere would ultimately result in an increase in the downward longwave radiative flux tothe surface, potentially resulting in a warming of the entire surface-atmosphere-aerosolcolumn (e.g., Pueschel and Kinne, 1995); this IR effect is not considered here.
To examine the relative radiative forcing potential of the four aerosol classifications,a column integrated radiative forcing efficiency (RFE), the radiative forcing per unit op-5
tical depth, was calculated (Table 4). For the same optical depth, the background, BB,and anthropogenic regimes have larger positive top-of-atmosphere and troposphericcolumn forcing and more negative surface forcing than does the ABL case. As dis-cussed in Sect. 4.1, observations at Barrow, Alaska capture well the seasonal cycleof the background aerosol and would thus accurately characterize the vertically inte-10
grated forcing associated with the background haze classification. However, when ABLair, with its depleted aerosol concentrations and high single scatter albedo, is present,in situ measurements at the surface will not accurately represent column radiative forc-ing.
5 Conclusions15
Airborne measurements from the NOAA WP-3 D aircraft in April 2008 in the AlaskanArctic could be placed into one of four categories based on trace gas mixing ratios:(1) air measured within the ABL that had been in chemical and physical contact withthe sea-ice surface; (2) air that was strongly influenced by BB originating primarilyfrom sources in Southern Russia and in Southeastern Siberia; (3) air that was affected20
primarily by anthropogenic fossil fuel combustion sources; and (4) air that was notinfluenced by any recent source, but that represented the aged, polluted backgroundof the springtime Arctic.
Aerosol layers associated with transport from the BB events were common in theAlaskan Arctic in spring 2008. The aerosol was often abundant and was highly scat-25
tering with single scattering albedos of ∼0.97. Radiative transfer calculations sug-gest that, on average, these haze layers cool the surface and heat the troposphere at
27397
ACPD10, 27361–27434, 2010
Characteristics,sources, and
transport of aerosols
C. A. Brock et al.
Title Page
Abstract Introduction
Conclusions References
Tables Figures
J I
J I
Back Close
Full Screen / Esc
Printer-friendly Version
Interactive Discussion
Discussion
Paper
|D
iscussionP
aper|
Discussion
Paper
|D
iscussionP
aper|
the altitude where they are found. Maximum noontime heating rates of ∼0.1 K day−1
were calculated for the average haze condition, although maximum heating rates of∼0.6 K day−1 were calculated for specific dense haze layers. Warneke et al. (2010) andFisher et al. (2010) show that, although the incidence of fires in the Russian/Siberianfire region was ∼3 times greater in 2008 compared to more typical years, significant5
fires occur somewhere within the region from Southern Russia to Southeastern Siberiaevery year. These fires are modest contributors to the Arctic budgets of most gas-phase species, including CO. However, because the springtime midlatitude fires areprodigious producers of particles (per CO molecule emitted, Fig. 13), and because thebackground Arctic haze aerosol is relatively diffuse, they have a very large impact on10
the Arctic aerosol budget compared to the background haze, contributing ∼30% of thetotal aerosol mass and ∼45% of the total BC mass poleward of 70◦ N in a typical fireyear (Warneke et al., 2010), not accounting for the presence of dense layers from fos-sil fuel sources. Furthermore, while the most dense smoke observed during ARCPACwas primarily confined to the Alaskan Arctic, transport modeling (Fig. 10, Supplemen-15
tary Material) and pan-Arctic sunphotometry and lidar observations (Saha et al., 2010)show significant smoke over much of the Arctic region poleward of 70◦ N by the endof April 2008. Thus springtime midlatitude Eurasian BB emissions represent a con-sequential source of aerosol to the entire Arctic region during the snowmelt season.The strongly differing burning patterns across political boundaries (Fig. 9) demonstrate20
that fire management policies can greatly affect emissions from BB during the Arcticsnowmelt season.
Our measurements in Arctic background air are consistent with previously reportedsurface observations suggesting that ∼25% of the non-sea-salt submicron mass dur-ing the Arctic haze season is organic (Quinn et al., 2002). Single particle compo-25
sition measurements in the background Arctic airmass suggest that biomass and/orbiofuel combustion contributes to this organic fraction, while fossil fuel emissions con-tribute most of sulfate in the background haze. Gas-phase and aerosol parametersmeasured in these background haze conditions are similar to median values reported
27398
ACPD10, 27361–27434, 2010
Characteristics,sources, and
transport of aerosols
C. A. Brock et al.
Title Page
Abstract Introduction
Conclusions References
Tables Figures
J I
J I
Back Close
Full Screen / Esc
Printer-friendly Version
Interactive Discussion
Discussion
Paper
|D
iscussionP
aper|
Discussion
Paper
|D
iscussionP
aper|
during the springtime Arctic haze maximum at the long-term surface site in Barrow,Alaska. These observations strongly suggest that a seasonal cycle in background tro-pospheric concentrations, rather than an increase in the frequency of intense pollutanttransport events, is responsible for the surface climatology. We suggest that the term“Arctic haze” be used to refer to this chronic, diffuse springtime pollution that is asso-5
ciated with seasonal increases in fossil fuel and biomass/biofuel emissions, reductionsin photochemical and depositional loss mechanisms, and enhanced transport fromsource regions in the midlatitudes. Spackman et al. (2010) provide evidence for lossof this background haze via transport through the ABL to the Arctic surface. In con-trast, episodic pollution events, resulting from rapid transport from heavily polluted but10
varied source types and regions, produce dense haze layers aloft that rarely directlyreach the surface monitoring sites; these phenomena are distinct from the seasonalcycle in background haze. These haze layers aloft are not unique to the Arctic, but areconsistent with observations throughout the midlatitudes of intercontinental transportof aerosols in the free troposphere. In the Arctic, it is likely that some fraction of these15
layers may ultimately mix and contribute to the polluted background, although Arcticlidar observations show distinct layering of even aged smoke (Saha et al., 2010). Ourobservations do not provide any direct evidence for deposition from these layers aloftto the snow surface.
Supplementary material related to this article is available online at:20
http://www.atmos-chem-phys-discuss.net/10/27361/2010/acpd-10-27361-2010-supplement.zip.
Acknowledgements. This work was supported by NOAA’s Climate Change and Air Quality Pro-grams. P. Pilewskie and S. Schmidt were supported by NOAA under award NA06OAR4310085.A. Nenes and R. Moore were supported by NOAA award NA04OAR4310088 and NASA award25
NNX08AQ99G. A. Nenes was also supported by a NSF Faculty Early Career Development(CAREER) Program award, and R. Moore by a DOE Global Change Education Program Grad-uate Research Fellowship. J. Cozic was supported by the Swiss National Science Foundation
27399
ACPD10, 27361–27434, 2010
Characteristics,sources, and
transport of aerosols
C. A. Brock et al.
Title Page
Abstract Introduction
Conclusions References
Tables Figures
J I
J I
Back Close
Full Screen / Esc
Printer-friendly Version
Interactive Discussion
Discussion
Paper
|D
iscussionP
aper|
Discussion
Paper
|D
iscussionP
aper|
under award PBBE22-119260. A. Stohl and H. Sodemann were supported by the ResearchCouncil of Norway in the framework of POLARCAT. MODIS hotspot data provided courtesy ofNASA and the University of Maryland. Many thanks to Jim Roberts and Andy Neuman, to thecollaborating ISDAC, ARCTAS, ICEALOT, and other POLARCAT participants, and to Everts Airin Fairbanks, Alaska for outstanding logistical support.5
References
Al-Saadi, J. A., Soja, A., Pierce, R. B., Szykman, J. J., Wiedinmyer, C., Emmons, L., Kondra-gunta, S., Zhang, X., Kittaka, C., Schaack, T., and Bowman, K.: Evaluation of near-real-timebiomass burning emissions estimates constrained by satellite active fire detections, J. Appl.Remote Sens., 2, 24 pp., 2008.10
Alterskjær, K., Hoose, C., and Kristjansson, J. E.: Do anthropogenic aerosols enhanceor suppress the surface cloud forcing in the Arctic?, J. Geophys. Res., in press,doi:10.1029/2010JD014015, 2010.
Andreae, M. O. and Merlet, P.: Emission of trace gases and aerosols from biomass burning,Global Biogeochem. Cy., 15, 955–966, 2001.15
Andreas, E. L. and Murphy, B.: Bulk transfer coefficients for heat and momentum over leadsand polynyas, J. Phys. Oceanogr., 16, 1875–1883, 1986.
Andreas, E. L., Guest, P. S., Persson, P. O. G., Fairall, C. W., Horst, T. W., Moritz, R. E., andSemmer, S. R.: Near-surface water vapor over polar sea-ice is always near ice saturation,J. Geophys. Res., 107, 8101, doi:10.1029/2000JC000411, 2002.20
Bahreini, R., Dunlea, E. J., Matthew, B. M., Simons, C., Docherty, K. S., DeCarlo, P. F.,Jimenez, J. L., Brock, C. A., and Middlebrook, A. M.: Design and operation of a pressure-controlled inlet for airborne sampling with an aerodynamic aerosol lens, Aerosol Sci. Tech.,42, 465–471, 2008.
Barrie, L. A.: Arctic air pollution: an overview of current knowledge, Atmos. Environ., 20, 643–25
663, 1986.Baumgardner, D., Jonsson, H., Dawson, W., O’Connor, D., and Newton, R.: The cloud, aerosol
and precipitation spectrometer: a new instrument for cloud investigations, Atmos. Res., 59–60, 251–264, doi:10.1016/S0169-8095(01)00119-3, 2001.
Baynard, T., Lovejoy, E. R., Pettersson, A., Brown, S. S., Lack, D., Osthoff, H., Massoli, P.,30
27400
ACPD10, 27361–27434, 2010
Characteristics,sources, and
transport of aerosols
C. A. Brock et al.
Title Page
Abstract Introduction
Conclusions References
Tables Figures
J I
J I
Back Close
Full Screen / Esc
Printer-friendly Version
Interactive Discussion
Discussion
Paper
|D
iscussionP
aper|
Discussion
Paper
|D
iscussionP
aper|
Ciciora, S., Dube, W. P., and Ravishankara, A. R.: Design and application of a pulsed cavityring-down aerosol extinction spectrometer for field measurements, Aerosol Sci. Tech., 41,447–462, 2007.
Bierwirth, E., Wendisch, M., Jakel, E., Ehrlich, A., Schmidt, K. S., Stark, H., Pilewskie, P., Es-selborn, M., Gobbi, G. P., Ferrare, R., Muller, T., and Clarke, A.: A new method to retrieve5
the aerosol layer absorption coefficient from airborne flux density and actinic radiation mea-surements, J. Geophys. Res., 115, D14211, doi:10.1029/2009JD013636, 2010.
Bodhaine, B. A.: Barrow surface aerosol: 1976–1986, Atmos. Environ., 23, 2357–2369, 1989.Bohren, C. F. and Huffman, D. R.: Absorption and Scattering of Light by Small Particles, J. Wiley
and Sons, New York, ISBN 0-471-05772-X, 1983.10
Bond, T. C., Anderson, T. L., and Campbell, D.: Calibration and intercomparison of filter-basedmeasurements of visible light absorption by aerosols, Aerosol Sci. Tech., 30, 582–600, 1999.
Bond, T. C., Streets, D. G., Yarber, K. F., Nelson, S. M., Woo, J.-H., and Klimont, Z.:A technology-based global inventory of black and organic carbon emissions from combus-tion, J. Geophys. Res., 109, D14203, doi:10.1029/2003JD003697, 2004.15
Bond, T. C. and Bergstrom, R. W.: Light absorption by carbonaceous particles: an investigativereview, Aerosol Sci. Tech., 40, 27–67, doi:10.1080/02786820500421521, 2006.
Brock, C. A., Radke, L. F., Lyons, J. H., and Hobbs, P. V.: Arctic hazes in summer over Green-land and the North American Arctic. I. Incidence and origins, J. Atmos. Chem., 9, 129–148,1989.20
Brock, C. A., Radke, L. F., and Hobbs, P. V.: Sulfur in particles in Arctic hazes derived fromairborne in situ and lidar measurements, J. Geophys. Res., 95, 22369–22387, 1990.
Brock, C. A., Schroder, F., Karcher, B., Petzold, A., Busen, R., and Fiebig, M.: Ultrafine particlesize distributions measured in aircraft exhaust plumes, J. Geophys. Res., 105, 26555–26567,2000.25
Brock, C. A., Hudson, P. K., Lovejoy, E. R., Sullivan, A., Nowak, J. B., Huey, L. G., Cooper, O. R.,Cziczo, D. J., de Gouw, J., Fehsenfeld, F. C., Holloway, J. S., Hubler, G., Lafleur, B. G., Mur-phy, D. M., Neuman, J. A., Nicks Jr., D. K., Orsini, D. A., Parrish, D. D., Ryerson, T. B.,Tanner, D. J., Warneke, C., Weber, R. J. and Wilson, J. C.: Particle characteristics follow-ing cloud-modified transport from Asia to North America, J. Geophys. Res., 109, D2336,30
doi:10.1029/2003JD004198, 2004.Brock, C. A., Sullivan, A. P., Peltier, R. E., Weber, R. J., Wollny, A., de Gouw, J. A., Mid-
dlebrook, A. M., Atlas, E. L., Stohl, A., Trainer, M. K., Cooper, O. R., Fehsenfeld, F. C.,
27401
ACPD10, 27361–27434, 2010
Characteristics,sources, and
transport of aerosols
C. A. Brock et al.
Title Page
Abstract Introduction
Conclusions References
Tables Figures
J I
J I
Back Close
Full Screen / Esc
Printer-friendly Version
Interactive Discussion
Discussion
Paper
|D
iscussionP
aper|
Discussion
Paper
|D
iscussionP
aper|
Frost, G. J., Holloway, J. S., Hubler, G., Neuman, J. A., Ryerson, T. B., Warneke, C., andWilson, J. C.: Sources of particulate matter in the Northeastern United States in sum-mer: 2. Evolution of chemical and microphysical properties, J. Geophys. Res., 113, D08302,doi:10.1029/2007JD009241, 2008.
Cai, Y., Montague, D. C., Mooiweer-Bryan, W., and Deshler, T.: Performance characteristics5
of the ultra high sensitivity aerosol spectrometer for particles between 55 and 800 nm: lab-oratory and field studies, J. Aerosol Sci., 39, 759–769, doi:10.1016/j.jaerosci.2008.04.007,2008.
Chapman, W. L. and Walsh, J. E.: Simulations of Arctic temperature and pressure by globalcoupled models, J. Climate, 20, 609–632, 2007.10
Clarke, A. D., Charlson, R. J., and Radke, L. F.: Airborne observations of Arctic aerosol,IV: Optical properties of Arctic haze, Geophys. Res. Lett., 11, 405–408, doi:10.1029/GL011i005p00405, 1984.
Chin, M., Ginoux, P., Lucchesi, R., Huebert, B., Weber, R., Anderson, T., Masonis, S.,Blomquist, B., Bandy, A., and Thornton, D.: A global aerosol model forecast for the ACE-15
Asia field experiment, J. Geophys. Res., 108, 8654, doi:10.1029/2003JD003642, 2003.Clarke, A., Collins, W., Rasch, P., Kapustin, V., Moore, K., Howell, S., and Fuelberg, H.: Dust
and pollution transport on global scales: aerosol measurements and model predictions,J. Geophys. Res., 106, 32555–32569, 2001.
Corbett, J. J., Lack, D. A., Winebrake, J. J., Harder, S., Silberman, J. A., and Gold, M.: Arctic20
shipping emissions inventories and future scenarios, Atmos. Chem. Phys., 10, 9689–9704,doi:10.5194/acp-10-9689-2010, 2010.
Cziczo, D. J., Murphy, D. M., Hudson, P. K., and Thomson, D. S.: Single particle measurementsof the chemical composition of cirrus ice residue during CRYSTAL-FACE, J. Geophys. Res.,109, D04201, doi:10.1029/2003JD004032, 2004.25
de Gouw, J. A., Warneke, C., Karl, T., Eerdekens, G., van der Veen, C., and Fall, R.: Sen-sitivity and specificity of atmospheric trace gas detection by proton-transfer-reaction massspectrometry, Int. J. Mass Spectrom., 223–224, 365–382, 2003a.
de Gouw, J. A., Warneke, C., Parrish, D. D., Holloway, J. S., Trainer, M., and Fehsenfeld, F. C.:Emission sources and ocean uptake of acetonitrile (CH3CN) in the atmosphere, J. Geophys.30
Res., 108, 4329, doi:10.1029/2002JD002897, 2003bde Gouw, J. A., Warneke, C., Stohl, A., Wollny, A. G., Brock, C. A., Cooper, O. R., Hol-
loway, J. S., Trainer, M., Fehsenfeld, F. C., Atlas, E. L., Donnelly, S. G., Stroud, V.,
27402
ACPD10, 27361–27434, 2010
Characteristics,sources, and
transport of aerosols
C. A. Brock et al.
Title Page
Abstract Introduction
Conclusions References
Tables Figures
J I
J I
Back Close
Full Screen / Esc
Printer-friendly Version
Interactive Discussion
Discussion
Paper
|D
iscussionP
aper|
Discussion
Paper
|D
iscussionP
aper|
and Lueb, R.: Volatile organic compounds composition of merged and aged for-est fire plumes from Alaska and Western Canada, J. Geophys. Res., 111, D10303,doi:10.1029/2005JD006175, 2006.
de Gouw, J. and Warneke, C.: Measurements of volatile organic compounds in the earth’satmosphere using proton-transfer-reaction mass spectrometry, Mass Spectrom. Rev., 26,5
223–257, doi:210.1002/mas.20119, 2007.Delene, D. J. and Ogren, J. A.: Variability of aerosol optical properties at four North American
surface monitoring sites, J. Atmos. Sci., 59, 1135–1150, 2002.Dick, W. D., Ziemann, P. J., and McMurry, P. H.: Multiangle light-scattering measurements
of refractive index of submicron atmospheric particles, Aerosol Sci. Tech., 41(5), 549–569,10
doi:10.1080/02786820701272012, 2007.Doherty, S. J., Quinn, P. K., Jefferson, A., Carrico, C. M., Anderson, T. L., and Hegg, D.: A com-
parison and summary of aerosol optical properties as observed in situ from aircraft, ship, andland during ACE-Asia, J. Geophys. Res., 110, D04201, doi:10.1029/2004JD004964, 2005.
Doherty, S. J., Warren, S. G., Grenfell, T. C., Clarke, A. D., and Brandt, R. E.: Light-15
absorbing impurities in Arctic snow, Atmos. Chem. Phys. Discuss., 10, 18807–18878,doi:10.5194/acpd-10-18807-2010, 2010.
Donahue, N., Robinson, A., and Pandis, N.: Atmospheric organic particulate mat-ter from smoke to secondary organic aerosol, Atmos. Environ., 43, 94–106,doi:10.1016/j.atmosenv.2008.09.055, 2009.20
Dunlea, E. J., DeCarlo, P. F., Aiken, A. C., Kimmel, J. R., Peltier, R. E., Weber, R. J., Tom-linson, J., Collins, D. R., Shinozuka, Y., McNaughton, C. S., Howell, S. G., Clarke, A. D.,Emmons, L. K., Apel, E. C., Pfister, G. G., van Donkelaar, A., Martin, R. V., Millet, D. B.,Heald, C. L., and Jimenez, J. L.: Evolution of Asian aerosols during transpacific transport inINTEX-B, Atmos. Chem. Phys., 9, 7257–7287, doi:10.5194/acp-9-7257-2009, 2009.25
Fisher, J. A., Jacob, D. J., Purdy, M. T., Kopacz, M., Le Sager, P., Carouge, C., Holmes, C. D.,Yantosca, R. M., Batchelor, R. L., Strong, K., Diskin, G. S., Fuelberg, H. E., Holloway, J. S.,Hyer, E. J., McMillan, W. W., Warner, J., Streets, D. G., Zhang, Q., Wang, Y., and Wu, S.:Source attribution and interannual variability of Arctic pollution in spring constrained by air-craft (ARCTAS, ARCPAC) and satellite (AIRS) observations of carbon monoxide, Atmos.30
Chem. Phys., 10, 977–996, doi:10.5194/acp-10-977-2010, 2010.Flanner, M. G., Zender, C. S., Randerson, J. T., and Rasch, P. J.: Present-day cli-
mate forcing and response from black carbon in snow, J. Geophys. Res., 112, D11202,
27403
ACPD10, 27361–27434, 2010
Characteristics,sources, and
transport of aerosols
C. A. Brock et al.
Title Page
Abstract Introduction
Conclusions References
Tables Figures
J I
J I
Back Close
Full Screen / Esc
Printer-friendly Version
Interactive Discussion
Discussion
Paper
|D
iscussionP
aper|
Discussion
Paper
|D
iscussionP
aper|
doi:10.1029/2006JD008003, 2007.Flanner, M. G., Zender, C. S., Hess, P. G., Mahowald, N. M., Painter, T. H., Ramanathan, V.,
and Rasch, P. J.: Springtime warming and reduced snow cover from carbonaceous particles,Atmos. Chem. Phys., 9, 2481–2497, doi:10.5194/acp-9-2481-2009, 2009.
Francis, J. A. and Hunter, E.: New insight into the disappearing Arctic sea-ice, EOS T. Am.5
Geophys. Un., 87, 46, 509–524, 2006.Frost, G. J., McKeen, S. A., Trainer, M., Ryerson, T. B., Neuman, J. A., Roberts, J. M., Swan-
son, A., Holloway, J. S., Sueper, D. T., Fortin, T., Parrish, D. D., Fehsenfeld, F. C., Flocke, F.,Peckham, S. E., Grell, G. A., Kowal, D., Cartwright, J., Auerbach, N., and Habermann, T.:Effects of changing power plant NOx emissions on ozone in the Eastern United States: proof10
of concept, J. Geophys. Res., 111, D12306, doi:10.1029/2005JD006354, 2006.Froyd, K. D., Murphy, D. M., Sanford, T. J., Thomson, D. S., Wilson, J. C., Pfister, L., and Lait, L.:
Aerosol composition of the tropical upper troposphere, Atmos. Chem. Phys., 9, 4363–4385,doi:10.5194/acp-9-4363-2009, 2009.
Fuelberg, H. E., Harrigan, D. L., and Sessions, W.: A meteorological overview of the ARCTAS15
2008 mission, Atmos. Chem. Phys., 10, 817–842, doi:10.5194/acp-10-817-2010, 2010.Garrett, T. J. and Verzella, L. L.: An evolving history of Arctic aerosols, B. Am. Meteorol. Soc.,
March, 299–302, doi:10.1175/BAMS-89-3-299, 2008.Garrett, T. J. and Zhao, C.: Increased Arctic cloud longwave emissivity associated with pollution
from mid-latitudes, Nature, 440, 787–789, doi:10.1038/nature04636, 2006.20
Gelencser, A., May, B., Simpson, D., Sanchez-Ochoa, A., Kasper-Giebl, A., Puxbaum, H., Ca-seiro, A., Pio, C., and Legrand, M.: Source apportionment of PM2.5 organic aerosol overEurope: primary/secondary, natural/anthropogenic, and fossil/biogenic origin, J. Geophys.Res., 112, D23S04, doi:10.1029/2006JD008094, 2007.
Hansen, A. D. A. and Novakov, T.: Aerosol black carbon measurements in the Arctic haze25
during AGASP-II, J. Atmos. Chem., 9, 347–361, doi:10.1007/BF00052842, 1989.Hansen, J. and Nazarenko, L.: Soot climate forcing via snow and ice albedos, P. Natl. Acad.
Sci. USA, 101, 423– 428, 2004.Hansen, J., Sato, M., Ruedy, R., Nazarenko, L., Lacis, A., Schmidt, G. A., Russell, G.,
Aleinov, I., Bauer, M., Bauer, S., Bell, N., Cairns, B., Canuto, V., Chandler, M., Cheng, Y., Del30
Genio, A., Faluvegi, G., Fleming, E., Friend, A., Hall, T., Jackman, C., Kelley, M., Kiang, N.,Koch, D., Lean, J., Lerner, J., Lo, K., Menon, S., Miller, R., Minnis, P., Novakov, T., Oinas, V.,Perlwitz, Ja., Perlwitz, Ju., Rind, D., Romanou, A., Shindell, D., Stone, P., Sun, S., Taus-
27404
ACPD10, 27361–27434, 2010
Characteristics,sources, and
transport of aerosols
C. A. Brock et al.
Title Page
Abstract Introduction
Conclusions References
Tables Figures
J I
J I
Back Close
Full Screen / Esc
Printer-friendly Version
Interactive Discussion
Discussion
Paper
|D
iscussionP
aper|
Discussion
Paper
|D
iscussionP
aper|
nev, N., Thresher, D., Wielicki, B., Wong, T., Yao, M., and Zhang, S.: Efficacy of climateforcings, J. Geophys. Res., D18104, doi:10.1029/2005JD005776, 2005.
Hansen, M., DeFries, R., Townshend, J. R. G., and Sohlberg, R.: Global land cover classifica-tion at 1 km resolution using a decision tree classifier, Int. J. Remote Sens., 21, 1331–1365,2000.5
Hegg, D. A., Radke, L. F., Hobbs, P. V., and Brock, C. A.: Nitrogen and sulfur emissions fromthe burning of forest products near large urban areas, J. Geophys. Res., 92, 14701–14709,1987.
Hegg, D. A., Warren, S. G., Grenfell, T. C., Doherty, S. J., Larson, T. V., and Clarke, A. D.:Source attribution of black carbon in Arctic snow, Environ. Sci. Technol., 43, 4016–4021,10
doi:10.1021/es803623f, 2009.Hegg, D. A., Warren, S. G., Grenfell, T. C., Doherty, S. J., and Clarke, A. D.: Sources of light-
absorbing aerosol in arctic snow and their seasonal variation, Atmos. Chem. Phys. Discuss.,10, 13755–13796, doi:10.5194/acpd-10-13755-2010, 2010.
Hirdman, D., Burkhart, J. F., Sodemann, H., Eckhardt, S., Jefferson, A., Quinn, P. K.,15
Sharma, S., Strom, J., and Stohl, A.: Long-term trends of black carbon and sulphate aerosolin the Arctic: changes in atmospheric transport and source region emissions, Atmos. Chem.Phys., 10, 9351–9368, doi:10.5194/acp-10-9351-2010, 2010.
Holland, M. M., Serreze, M. C., and Stroeve, J.: The sea-ice mass budget of the Arctic andits future change as simulated by coupled climate models, Clim. Dynam., 34, 185–200,20
doi:10.1007/s00382-008-0493-4, 2010.Holloway, J. S., Jakoubek, R. O., Parrish, D. D., Gerbig, C., Volz-Thomas, A., Schmitgen, S.,
Fried, A., Wert, B., Henry, B., and Drummond, J. R.: Airborne intercomparison of vacuumultraviolet fluorescence and tunable diode laser absorption measurements of troposphericcarbon monoxide, J. Geophys. Res., 105, 24251–24261, 2000.25
Hudson, P. K., Murphy, D. M., Cziczo, D. J., Thomson, D. S., de Gouw, J. A., Warneke, C.,Holloway, J., Jost, H.-J., and Hubler, G.: Biomass-burning particle measurements: charac-teristic composition and chemical processing, J. Geophys. Res., 109, D2337, doi:10.1029/2003JD004398, 2004.
Huey, L. G., Tanner, D. J., Slusher, D. L., Dibb, J. E., Arimoto, R., Chen, G., Davis, D.,30
Buhr, M. P., Nowak, J. B., Mauldin III, R. L., Eisele, F. L., and Kosciuch, E.: CIMS mea-surements of HNO3 and SO2 at the South Pole during ISCAT 2000, Atmos. Environ., 38,5411–5421 doi:10.1016/j.atmosenv.2004.04.037, 2004.
27405
ACPD10, 27361–27434, 2010
Characteristics,sources, and
transport of aerosols
C. A. Brock et al.
Title Page
Abstract Introduction
Conclusions References
Tables Figures
J I
J I
Back Close
Full Screen / Esc
Printer-friendly Version
Interactive Discussion
Discussion
Paper
|D
iscussionP
aper|
Discussion
Paper
|D
iscussionP
aper|
IPCC, Intergovernmental Panel on Climate Change: Climate Change 2007: The Physical Sci-ence Basis, Summary for Policymakers, IPCC Secretariat, Geneva, Switzerland, availableat: http://www.ipcc.ch, last access: 12 January 2008, 2007.
Intrieri, J. M., Shupe, M. D., Uttal, T., and McCarty, B. J.: An annual cycle of Arctic cloudcharacteristics observed by radar and lidar at SHEBA, J. Geophys. Res., 107, 8030, 15 pp.,5
2002.Jacob, D. J., Crawford, J. H., Maring, H., Clarke, A. D., Dibb, J. E., Emmons, L. K., Ferrare, R. A.,
Hostetler, C. A., Russell, P. B., Singh, H. B., Thompson, A. M., Shaw, G. E., McCauley, E.,Pederson, J. R., and Fisher, J. A.: The Arctic Research of the Composition of the Tropo-sphere from Aircraft and Satellites (ARCTAS) mission: design, execution, and first results,10
Atmos. Chem. Phys., 10, 5191–5212, doi:10.5194/acp-10-5191-2010, 2010.Jacobson, M. Z.: Climate response of fossil fuel and biofuel soot, accounting for soot’s
feedback to snow and sea-ice albedo and emissivity, J. Geophys. Res., 109, D21201,doi:10.1029/2004JD004945, 2004.
Jacobson, M. Z.: Short-term effects of controlling fossil-fuel soot, biofuel soot and gases, and15
methane on climate, Arctic ice, and air pollution health, J. Geophys. Res., 115, D14209,doi:10.1029/2009JD013795, 2010.
Janhall, S., Andreae, M. O., and Poschl, U.: Biomass burning aerosol emissions from vegeta-tion fires: particle number and mass emission factors and size distributions, Atmos. Chem.Phys., 10, 1427–1439, doi:10.5194/acp-10-1427-2010, 2010.20
Johannessen, O. M., Bengtsson, L., Miles, M. W., Kuzmina, S. I., Semenov, V. A., Aled-seev, G. V., Nagumyi, A. P., Zakharov, V. F., Bobylev, L. P., Pettersson, L. H., Hasselmann, K.,and Cattle, H. P.: Arctic climate change: observed and modeled temperature and sea-icevariability, Tellus, 56A, 328–341, 2004.
Jonsson, H. H., Wilson, J. C., Brock, C. A., Knollenberg, R. G., Newton, R., Dye, J. E., Baum-25
gardner, D., Borrmann, S., Ferry, G. V., Pueschel, R., Woods, D. C., and Pitts, M. C.: Per-formance of a focused cavity aerosol spectrometer for measurements in the stratosphere ofparticle size in the 0.06–2.0 µm diameter range, J. Atmos. Oceanic Technol., 12, 115–129,1995.
Kanakidou, M., Seinfeld, J. H., Pandis, S. N., Barnes, I., Dentener, F. J., Facchini, M. C., Van30
Dingenen, R., Ervens, B., Nenes, A., Nielsen, C. J., Swietlicki, E., Putaud, J. P., Balkan-ski, Y., Fuzzi, S., Horth, J., Moortgat, G. K., Winterhalter, R., Myhre, C. E. L., Tsigaridis, K.,Vignati, E., Stephanou, E. G., and Wilson, J.: Organic aerosol and global climate modelling:
27406
ACPD10, 27361–27434, 2010
Characteristics,sources, and
transport of aerosols
C. A. Brock et al.
Title Page
Abstract Introduction
Conclusions References
Tables Figures
J I
J I
Back Close
Full Screen / Esc
Printer-friendly Version
Interactive Discussion
Discussion
Paper
|D
iscussionP
aper|
Discussion
Paper
|D
iscussionP
aper|
a review, Atmos. Chem. Phys., 5, 1053–1123, doi:10.5194/acp-5-1053-2005, 2005.Kawamura, K., Kasukabe, H., and Barrie, L. A.: Source and reaction pathways of dicarboxylic
acids, ketoacids and dicarbonyls in Arctic aerosols: one year of observations, Atmos. Envi-ron., 20, 1709–1722, 1996.
King, W. D., Parkin, D. A., and Handsworth, R. J.: A hot-wire water device having fully calculable5
response characteristics, J. Appl. Meteorol., 17, 1809–1813, 1978.Koch, D. and Hansen, J.: Distant origins of Arctic black carbon: a Goddard Institute for Space
Studies ModelE experiment, J. Geophys. Res., 110, D04204, doi:10.1029/2004JD005296,2005.
Kopacz, M., Jacob, D. J., Fisher, J. A., Logan, J. A., Zhang, L., Megretskaia, I. A., Yan-10
tosca, R. M., Singh, K., Henze, D. K., Burrows, J. P., Buchwitz, M., Khlystova, I., McMil-lan, W. W., Gille, J. C., Edwards, D. P., Eldering, A., Thouret, V., and Nedelec, P.: Global es-timates of CO sources with high resolution by adjoint inversion of multiple satellite datasets(MOPITT, AIRS, SCIAMACHY, TES), Atmos. Chem. Phys., 10, 855–876, doi:10.5194/acp-10-855-2010, 2010.15
Lance, S., Medina, J., Smith, J. N., and Nenes, A.: Mapping the operation of the DMT continu-ous flow CCN counter, Aerosol Sci. Tech., 40, 242–254, 2006.
Lance, S., Brock, C. A., Rogers, D., and Gordon, J. A.: Water droplet calibration of a clouddroplet probe and in-flight performance in liquid, ice and mixed-phase clouds duringARCPAC, Atmos. Meas. Tech. Discuss., 3, 3133–3177, doi:10.5194/amtd-3-3133-2010,20
2010a.Lance, S., Shupe, M., Feingold, G., Brock, C. Cozic, J., Holloway, J. Ryerson, T., Peischl, J.,
Warneke, C., Schwarz, J., Spackman, R., Brioude, J., Cooper, O., Froyd, K., Moore, R., andNenes, A.: CCN as a modulator for ice processes in Arctic mixed-phase clouds, Atmos.Chem. Phys., in preparation, 2010b.25
Lavoue, D., Liousse, C., Cachier, H., Stocks, B., and Goldammer, J.: Modeling of carbonaceousparticles emitted by boreal and temperate wildfires at northern latitudes, J. Geophys. Res.,105, 26871–26890, 2000.
Law, K. S. and Stohl, A.: Arctic air pollution: origins and impacts, Science, 315, 1537,doi:10.1126/science.1137695, 2007.30
Lehrer, E., Honninger, G., and Platt, U.: A one dimensional model study of the mechanism ofhalogen liberation and vertical transport in the polar troposphere, Atmos. Chem. Phys., 4,2427–2440, doi:10.5194/acp-4-2427-2004, 2004.
27407
ACPD10, 27361–27434, 2010
Characteristics,sources, and
transport of aerosols
C. A. Brock et al.
Title Page
Abstract Introduction
Conclusions References
Tables Figures
J I
J I
Back Close
Full Screen / Esc
Printer-friendly Version
Interactive Discussion
Discussion
Paper
|D
iscussionP
aper|
Discussion
Paper
|D
iscussionP
aper|
Li, S. M. and Winchester, J. W.: Geochemistry of organic and inorganic ions of late winter Arcticaerosols, Atmos. Environ., 23, 2401–2415, 1989.
Lindsay, R. W., Zhang, J., Schweiger, A., Steele, M., and Stern, H.: Arctic sea-ice retreat in2007 follows thinning trend, J. Climate, 22, 165–176, 2009.
Lubin, D. and Vogelmann, A. M.: A climatologically significant aerosol longwave indirect effect5
in the Arctic, Nature, 439, 453–456, 2006.Massoli, P., Bates, T. S., Quinn, P. K., Lack, D. A., Baynard, T., Lerner, B. M., Tucker, S. C.,
Brioude, J., Stohl, A., and Williams, E. J.: Aerosol optical and hygroscopic properties duringTexAQS-GoMACCS 2006 and their impact on aerosol direct radiative forcing, J. Geophys.Res., 114, D00F07, doi:10.1029/2008JD011604, 2009.10
Matthew, B. M., Middlebrook, A. M., and Onasch, T. B.: Collection efficiencies in an Aerodyneaerosol mass spectrometer as a function of particle phase for laboratory generated aerosols,Aerosol Sci. Tech., 42, 884, doi:10.1080/02786820802356797, 2008.
McClatchey, R. A., Fenn, R. W., Selby, J. E. A., Volz, F. E., and Garing, J. S.: OpticalProperties of the Atmosphere, Air Force Cambridge Res. Lab., Hanscom A. F. B., Mass.,15
available at: http://oai.dtic.mil/oai/oai?verb=getRecord&metadataPrefix=html&identifier=AD0753075http://stinet.dtic.mil/oai/oai?verb=getRecord&metadataPrefix=html&identifier=AD0753075, last access: 18 March 2008, 1972.
McComiskey, A., Schwartz, S. E., Schmid, B., Guan, H., Lewis, E. R., Ricchiazzi, P., andOgren, J. A.: Direct aerosol forcing: calculation from observables and sensitivities to inputs,20
J. Geophys. Res., 113, D09202, doi:10.1029/2007JD009170, 2008.McConnell, J. R., Edwards, R., Kok, G. L., Flanner, M. G., Zender, C. S., Saltzman, E. S.,
Banta, J. R., Pasteris, D. R., Carter, M. M., and Kahl, J. D. W.: 20th-century industrial blackcarbon emissions altered Arctic climate forcing, Science, 317, 1381–1384, doi:10.1126/science.1144856, 2007.25
Mickley, L. J., Murti, P. P., Jacob, D. J., Logan, J. A., Rind, D., and Koch, D.: Radiative forc-ing from tropospheric ozone calculated with a unified chemistry-climate model, J. Geophys.Res., 104, 30153–30172, 1999.
Montzka, S. A., Aydin, M., Battle, M., Butler, J. H., Saltzman, E. S., Hall, B. D., Clarke, A. D.,Mondeel, D., and Elkins, J. W.: A 350-year atmospheric history for carbonyl sulfide in-30
ferred from Antarctic firn air and air trapped in ice, J. Geophys. Res., 109, D22302,doi:10.1029/2004JD004686, 2004.
Murphy, D. M., Cziczo, D. J., Froyd, K. D., Hudson, P. K., Matthew, B. M., Middle-
27408
ACPD10, 27361–27434, 2010
Characteristics,sources, and
transport of aerosols
C. A. Brock et al.
Title Page
Abstract Introduction
Conclusions References
Tables Figures
J I
J I
Back Close
Full Screen / Esc
Printer-friendly Version
Interactive Discussion
Discussion
Paper
|D
iscussionP
aper|
Discussion
Paper
|D
iscussionP
aper|
brook, A. M., Peltier, R. E., Sullivan, A., Thomson, D. S., and Weber, R. J.: Single-particlemass spectrometry of tropospheric aerosol particles, J. Geophys. Res., 111, D23S32,doi:10.1029/2006JD007340, 2006.
NASA/University of Maryland: MODIS Hotspot/Active Fire Detections, Data set, MODIS RapidResponse Project, NASA/GSFC (producer), University of Maryland, Fire Information for Re-5
source Management System (distributors), available at: http://maps.geog.umd.edu/firms/,2002.
Neuman, J. A., Nowak, J. B., Huey, L. G., Burkholder, J. B., Dibb, J. E., Holloway, J. S., Liao, J.,Peischl, J., Roberts, J. M., Ryerson, T. B., Scheuer, E., Stark, H., Stickel, R. E., Tanner, D. J.,and Weinheimer, A.: Bromine measurements in ozone depleted air over the Arctic Ocean,10
Atmos. Chem. Phys., 10, 6503–6514, doi:10.5194/acp-10-6503-2010, 2010.Noone, K. J. and Clarke, A. D.: Soot scavenging measurements in Arctic snowfall, Atmos.
Environ., 22, 2773–2778, 1988.Novelli, P. C., Steele, L. P., and Tans, P. P.: Mixing ratios of carbon monoxide in the troposphere,
J. Geophys. Res., 97, 20731–20750, doi:10.1029/92JD02010, 1992.15
Novelli, P. C., Masarie, K. A., and Lang, P. M.: Distributions and recent changes in troposphericcarbon monoxide, J. Geophys. Res., 103, 19015–19033, doi:10.1029/98JD01366, 1998.
Ohtake, T., Jayaweera, K., and Sakurai, K.-I.: Observation of ice crystal formation in lowerArctic atmosphere, J. Atmos. Sci., 39, 2898–2904, 1982.
Olivier, J. G. J. and Berdowski, J. J. M.: Global emissions sources and sinks, in: The Climate20
System, edited by: Berdowski, J., Guicherit, R. and Heij, B. J., A. A. Balkema/Swets andZeitlinger, Lisse, The Netherlands, ISBN 90 5809 255 0, 33–78, 2001.
Ottar, B., Pacyna, J. M., and Berg, T. C.: Aircraft measurements of air pollution in the NorwegianArctic, Atmos. Environ., 20, 87–100, 1986.
Paris, J.-D., Stohl, A., Nedelec, P., Arshinov, M. Yu., Panchenko, M. V., Shmargunov, V. P.,25
Law, K. S., Belan, B. D., and Ciais, P.: Wildfire smoke in the Siberian Arctic in summer:source characterization and plume evolution from airborne measurements, Atmos. Chem.Phys., 9, 9315–9327, doi:10.5194/acp-9-9315-2009, 2009.
Pavelsky, T. M., Boe, J., Hall, A., and Fetzer, E. J.: Atmospheric inversion strength over polaroceans in winter regulated by sea-ice, Clim. Dynam., 11 pp., doi:10.1007/s00382-010-0756-30
8, 2010.Peischl, J., Ryerson, T. B., Holloway, J. S., Parrish, D. D., Trainer, M., Frost, G. J., Aikin, K. C.,
Brown, S. S., Dube, W. P., Stark, H., and Fehsenfeld, F. C.: A top-down analysis of emissions
27409
ACPD10, 27361–27434, 2010
Characteristics,sources, and
transport of aerosols
C. A. Brock et al.
Title Page
Abstract Introduction
Conclusions References
Tables Figures
J I
J I
Back Close
Full Screen / Esc
Printer-friendly Version
Interactive Discussion
Discussion
Paper
|D
iscussionP
aper|
Discussion
Paper
|D
iscussionP
aper|
from selected Texas power plants during TexAQS 2000 and 2006, J. Geophys. Res., 115,D16303, doi:10.1029/2009JD013527, 2010.
Peltier, R. E., Hecobian, A. H., Weber, R. J., Stohl, A., Atlas, E. L., Riemer, D. D., Blake, D. R.,Apel, E., Campos, T., and Karl, T.: Investigating the sources and atmospheric processingof fine particles from Asia and the Northwestern United States measured during INTEX B,5
Atmos. Chem. Phys., 8, 1835–1853, doi:10.5194/acp-8-1835-2008, 2008.Petron, G., Granier, C., Khattatov, B., Lamarque, J.-F., Yudin, V., Muller, J.-F., and
Gille, J.: Inverse modeling of carbon monoxide surface emissions using Climate Moni-toring and Diagnostics Laboratory network observations, J. Geophys. Res., 107, 4761,doi:10.1029/2001JD001305, 2002.10
Pierce, R. B., Schaack, T. K., Al-Saadi, J., Fairlie, T. D., Kittaka, C., Lingenfelser, G., Natara-jan, M., Olson, J., Soja, A., Zapotocny, T. H., Lenzen, A., Stobie, J., Johnson, D. R., Av-ery, M., Sachse, G., Thompson, A., Cohen, R., Dibb, J., Crawford, J., Rault, D., Mar-tin, R., Szykman, J., and Fishman, J.: Chemical data assimilation estimates of continen-tal US ozone and nitrogen budgets during INTEX-A, J. Geophys. Res., 112, D12S21,15
doi:10.1029/2006JD007722, 2007.Pierce, R. B., Al-Saadi, J., Kittaka, C., Schaack, T., Lenzen, A., Bowman, K., Szykman, J.,
Soja, A., Ryerson, T. B., Thompson, A. M., Bhartia, P., and Morris, G. A.: Impacts of back-ground ozone production on Houston and Dallas, TX Air Quality during the TexAQS fieldmission, J. Geophys. Res., 114, D00F09, doi:10.1029/2008JD011337, 2009.20
Pilewskie, P., Pommier, J., Bergstrom, R., Gore, W., Howard, S., Rabbette, M., Schmid, B.,Hobbs, P. V., and Tsay, S. C.: Solar spectral radiative forcing during the Southern AfricanRegional Science Initiative, J. Geophys. Res., 108(D13), 8486, doi:10.1029/2002JD002411,2003.
Pueschel, R. and Kinne, S.: Physical and radiative properties of Arctic atmospheric aerosols,25
Sci. Total Environ., 160–161, 811-824, doi:10.1016/0048-9697(95)04414-V, 1995.Quinn, P. K., Miller, T. L., Bates, T. S., Ogren, J. A., Andrews, E., and Shaw, G. E.: A three-
year record of simultaneously measured aerosol chemical and optical properties at Barrow,Alaska, J. Geophys. Res., 107, doi:10.1029/2001JD001248, 2002.
Quinn, P. K., Bates, T. S., Baynard, T., Clarke, A. D., Onasch, T. B., Wang, W., Rood, M. J.,30
Andrews, E., Allan, J., Carrico, C. M., Coffman, D., and Worsnop, D.: Impact of particulateorganic matter on the relative humidity dependence of light scattering: a simplified parame-terization, Geophys. Res. Lett., 32, L22809, doi:10.1029/2005GL024322, 2005.
27410
ACPD10, 27361–27434, 2010
Characteristics,sources, and
transport of aerosols
C. A. Brock et al.
Title Page
Abstract Introduction
Conclusions References
Tables Figures
J I
J I
Back Close
Full Screen / Esc
Printer-friendly Version
Interactive Discussion
Discussion
Paper
|D
iscussionP
aper|
Discussion
Paper
|D
iscussionP
aper|
Quinn, P. K., Shaw, G., Andrews, E., Dutton, E. G., Ruoho-Airola, T., and Gong, S.: Arc-tic haze: current trends and knowledge gaps, Tellus, 59, 99–114, doi:10.1111/j.1600-0889.2006.00238.x, 2007.
Quinn, P. K., Bates, T. S., Baum, E., Doubleday, N., Fiore, A. M., Flanner, M., Fridlind, A.,Garrett, T. J., Koch, D., Menon, S., Shindell, D., Stohl, A., and Warren, S. G.: Short-lived5
pollutants in the Arctic: their climate impact and possible mitigation strategies, Atmos. Chem.Phys., 8, 1723–1735, doi:10.5194/acp-8-1723-2008, 2008.
Quinn, P. K., Bates, T. S., Schulz, K., and Shaw, G. E.: Decadal trends in aerosol chem-ical composition at Barrow, Alaska: 1976–2008, Atmos. Chem. Phys., 9, 8883–8888,doi:10.5194/acp-9-8883-2009, 2009.10
Raatz, W. E. and Shaw, G. E.: Long-range tropospheric transport of pollution aerosols into theAlaskan Arctic, J. Clim. Appl. Meteorol., 23, 1052–1064, 1984.
Radke, L. F., Lyons, J. H., Hegg, D. A., Hobbs, P. V., and Bailey, I. H.: Airborne observa-tions of Arctic aerosols. I: Characteristics of Arctic haze, Geophys. Res. Lett., 11, 393–396doi:10.1029/GL011i005p00393, 1984.15
Rahn, K. A.: Relative importances of North America and Eurasia as sources of Arctic aerosol,Atmos. Environ., 15, 1447–1455, 1981.
Rahn, K. A., Borys, R. D., and Shaw, G. E.: The Asian source of Arctic haze bands, Nature,268, 713–715, 1977.
Rahn, K. A. and McCaffery, R. J.: On the origin and transport of the winter Arctic aerosol,20
Ann. N. Y. Acad. Sci., 388, 486–503, 1980.Reda, I., Hickey, J. R., Stoffel, T., and Meyers, D.: Pyrgeometer calibration at the National
Renewable Energy Laboratory (NREL), J. Atmos. Terr. Phys., 64, 1623–1629, 2002.Ricchiazzi, P., Yang, S., Gautier, C., and Sowle, D.: SBDART: a research and teaching software
tool for plane-parallel radiative transfer in the Earth’s atmosphere, B. Am. Meteorol. Soc., 79,25
2101–2114, 1998.Ritter, C., Notholt, J., Fischer, J., and Rathke, C.: Direct thermal radiative forcing of tropospheric
aerosol in the Arctic measured by ground based infrared spectrometry, Geophys. Res. Lett.,32, L23816, doi:10.1029/2005GL024331, 2005.
Roberts, G. and Nenes, A.: A continuous-flow streamwise thermal-gradient CCN chamber for30
atmospheric measurements, Aerosol Sci. Tech., 39, 206–221, 2005.Ryerson, T. B., Buhr, M. P., Frost, G. J., Goldan, P. D., Holloway, J. S., Hubler, G., Jobson, B. T.,
Kuster, W. C., McKeen, S. A., Parrish, D. D., Roberts, J. M., Sueper, D. T., Trainer, M.,
27411
ACPD10, 27361–27434, 2010
Characteristics,sources, and
transport of aerosols
C. A. Brock et al.
Title Page
Abstract Introduction
Conclusions References
Tables Figures
J I
J I
Back Close
Full Screen / Esc
Printer-friendly Version
Interactive Discussion
Discussion
Paper
|D
iscussionP
aper|
Discussion
Paper
|D
iscussionP
aper|
Williams, J., and Fehsenfeld, F. C.: Emissions lifetimes and ozone formation in power plantplumes, J. Geophys. Res., 103, 22569–22583, 1998.
Ryerson, T. B., Williams, E. J., and Fehsenfeld, F. C.: An efficient photolysis system for fast-response NO2 measurements, J. Geophys. Res., 105, 26447–26461, 2000.
Saha, A., O’Neill, N. T., Eloranta, E., Stone, R. S., Eck, T. F., Zidane, S., Daou, D.,5
Lupu, A., Lesins, G., Shiobara, M., and McArthur, L. J. B.: Pan-Arctic sunphotometry dur-ing the ARCTAS-A campaign of April 2008, Geophys. Res. Lett., 37, L05803, doi:10.1029/2009GL041375, 2010.
Scheuer, E., Talbot, R. W., Dibb, J. E., Seid, G. K., DeBell, L., and Lefer, B.: Seasonal distribu-tions of fine aerosol sulfate in the North American Arctic Basin during TOPSE, J. Geophys.10
Res., 108, 8370, doi:10.1029/2001JD001364, 2003.Schnell, R. C.: Arctic haze and the Arctic Gas and Aerosol Sampling Program (AGASP), Geo-
phys. Res. Lett., 11, 361–364, 1984.Schwarz, J. P., Gao, R.-S., Fahey, D. W., Thomson, D. S., Watts, L. A., Wilson, J. C.,
Reeves, J. M., Darbehesti, M., Baumgardner, D. G., Kok, G. L., Chung, S. H., Schulz, M.,15
Hendricks, J., Lauer, A., Karcher, B., Slowik, J. G., Rosenlof, K. H., Thompson, R. L., Lang-ford, A. O., Loewenstein, M., and Aikin, K. C.: Single-particle measurements of midlatitudeblack carbon and light-scattering aerosols from the boundary layer to the lower stratosphere,J. Geophys. Res., 111, D16207, doi:10.1029/2006JD007076, 2006.
Serreze, M. and Francis, J. A.: The Arctic amplification debate, Climatic Change, 76, 241–264,20
2006.Sharma, S., Brook, J. R., Cachier, H., Chow, J., Gaudenzi, A., and Lu, G.: Light absorption and
thermal measurements of black carbon in different regions of Canada, J. Geophys. Res.,107, 4771, doi:10.1029/2002JD002496, 2002.
Sharma, S., Lavoue, D., Cachier, H., Barrie, L. A., and Gong, S. L.: Long-term trends of25
the black carbon concentrations in the Canadian Arctic, J. Geophys. Res., 109, D15203,doi:10.1029/2003JD004331, 2004.
Sharma, S., Andrews, E., Barrie, L. A., Ogren, J. A., and Lavoue, D.: Variations and sources ofthe equivalent black carbon in the high Arctic revealed by long-term observations at Alert andBarrow: 1989–2003, J. Geophys. Res., 111, D14208, doi:10.1029/2005JD006581, 2006.30
Shaw, G. E.: The vertical distribution of atmospheric aerosols at Barrow, Alaska, Tellus, 27,39–49, 1975.
Shaw, P. M., Russell, L. M., Jefferson, A., and Quinn, P. K.: Arctic organic aerosol measure-
27412
ACPD10, 27361–27434, 2010
Characteristics,sources, and
transport of aerosols
C. A. Brock et al.
Title Page
Abstract Introduction
Conclusions References
Tables Figures
J I
J I
Back Close
Full Screen / Esc
Printer-friendly Version
Interactive Discussion
Discussion
Paper
|D
iscussionP
aper|
Discussion
Paper
|D
iscussionP
aper|
ments show particles from mixed combustion in spring haze and from frost flowers in winter,Geophys. Res. Lett., 37, L10803, doi:10.1029/2010GL042831, 2010.
Shindell, D. and Faluvegi, G.: Climate response to regional radiative forcing during the twentiethcentury, Nat. Geosci., 2, doi:10.1038/NGEO473, 2009.
Shindell, D. T., Chin, M., Dentener, F., Doherty, R. M., Faluvegi, G., Fiore, A. M., Hess, P.,5
Koch, D. M., MacKenzie, I. A., Sanderson, M. G., Schultz, M. G., Schulz, M., Steven-son, D. S., Teich, H., Textor, C., Wild, O., Bergmann, D. J., Bey, I., Bian, H., Cuvelier, C., Dun-can, B. N., Folberth, G., Horowitz, L. W., Jonson, J., Kaminski, J. W., Marmer, E., Park, R.,Pringle, K. J., Schroeder, S., Szopa, S., Takemura, T., Zeng, G., Keating, T. J., and Zuber, A.:A multi-model assessment of pollution transport to the Arctic, Atmos. Chem. Phys., 8, 5353–10
5372, doi:10.5194/acp-8-5353-2008, 2008.Slusher, D. L., Huey, L. G., Tanner, D. J., Flocke, F. M., and Roberts, J. M.: A thermal
dissociation-chemical ionization mass spectrometry (TD-CIMS) technique for the simulta-neous measurement of peroxyacylnitrates and dinitrogen pentoxide, J. Geophys. Res., 109,D19315, doi:10.1029/2004JD004670, 2004.15
Spackman, J. R., Gao, R. S., Neff, W. D., Schwarz, J. P., Watts, L. A., Fahey, D. W., Hol-loway, J. S., Ryerson, T. B., Peischl, J., and Brock, C. A.: Aircraft observations of enhance-ment and depletion of black carbon mass in the springtime Arctic, Atmos. Chem. Phys., 10,9667–9680, doi:10.5194/acp-10-9667-2010, 2010.
Stark, H., Lerner, B. M., Schmitt, R., Jakoubek, R., Williams, E. J., Ryerson, T. B., Sueper, D. T.,20
Parrish, D. D., and Fehsenfeld, F. C.: Atmospheric in situ measurement of nitrate radical(NO3) and other photolysis rates using spectroradiometry and filter radiometry, J. Geophys.Res., 112, D10S04, doi:10.1029/2006JD007578, 2007.
Stohl, A., Eckhardt, S., Forster, C., James, P., and Spichtinger, N.: On the pathwaysand timescales of intercontinental air pollution transport, J. Geophys. Res., 107, 4684,25
doi:10.1029/2001JD001396, 2002.Stohl, A., Forster, C., Eckhardt, S., Spichtinger, N., Huntrieser, H., Heland, J., Schlager, H.,
Wilhelm, S., Arnold, F., and Cooper, O.: A backward modeling study of interconti-nental pollution transport using aircraft measurements, J. Geophys. Res., 108, 4370,doi:10.1029/2002JD002862, 2003.30
Stohl, A., Forster, C., Frank, A., Seibert, P., and Wotawa, G.: Technical note: The Lagrangianparticle dispersion model FLEXPART version 6.2, Atmos. Chem. Phys., 5, 2461–2474,doi:10.5194/acp-5-2461-2005, 2005.
27413
ACPD10, 27361–27434, 2010
Characteristics,sources, and
transport of aerosols
C. A. Brock et al.
Title Page
Abstract Introduction
Conclusions References
Tables Figures
J I
J I
Back Close
Full Screen / Esc
Printer-friendly Version
Interactive Discussion
Discussion
Paper
|D
iscussionP
aper|
Discussion
Paper
|D
iscussionP
aper|
Stohl, A.: Characteristics of atmospheric transport into the Arctic troposphere, J. Geophys.Res., 111, D11306, doi:10.1029/2005JD006888, 2006.
Stohl, A., Andrews, E., Burkhart, J. F., Forster, C., Herber, A., Hoch, S. W., Kowal, D., Lun-der, C., Mefford, T., Ogren, J. A., Sharma, S., Spichtinger, M., Stebel, K., Stone, R., Strom, J.,Tørseth, K., Wehrli, C., and Yttri, K. E.: Pan-Arctic enhancements of light absorbing aerosol5
concentrations due to North American boreal forest fires during summer 2004, J. Geophys.Res., 111, D22214, doi:10.1029/2006JD007216, 2006.
Stohl, A., Berg, T., Burkhart, J. F., Fjæraa, A. M., Forster, C., Herber, A., Hov, Ø., Lunder, C.,McMillan, W. W., Oltmans, S., Shiobara, M., Simpson, D., Solberg, S., Stebel, K., Strom, J.,Tørseth, K., Treffeisen, R., Virkkunen, K., and Yttri, K. E.: Arctic smoke – record high air10
pollution levels in the European Arctic due to agricultural fires in Eastern Europe in spring2006, Atmos. Chem. Phys., 7, 511–534, doi:10.5194/acp-7-511-2007, 2007.
Stroeve, J., Holland, M. M., Meier, W., Scambos, T., and Serreze, M. C.: Arctic sea-ice decline:faster than forecast, Geophys. Res. Lett., 34, L09501, doi:10.1029/2007GL029703, 2007.
Strunin, M. A., Postnov, A. A., and Mezrin, M. Y.: Meteorological potential for contamination of15
Arctic troposphere: boundary layer structure and turbulent diffusion characteristics, Atmos.Res., 44, 37–51, 1997.
Toon, O. B., Pollack, J. B., and Khare, B. N.: The optical constants of several atmosphericaerosol species: ammonium sulfate, aluminum oxide, and sodium chloride, J. Geophys.Res., 81, 5733–5748, 1976.20
Treffeisen, R., Tunved, P., Strom, J., Herber, A., Bareiss, J., Helbig, A., Stone, R. S., Hoyningen-Huene, W., Krejci, R., Stohl, A., and Neuber, R.: Arctic smoke – aerosol characteristicsduring a record smoke event in the European Arctic and its radiative impact, Atmos. Chem.Phys., 7, 3035–3053, doi:10.5194/acp-7-3035-2007, 2007.
Tjernstrom, M. and Graversen, R. G.: The vertical structure of the lower Arctic troposphere25
analysed from observations and the ERA-40 reanalysis, Q. J. Roy. Meteor. Soc., 135, 431–443, doi:10.1002/qj.308, 2009.
Turpin, B. J. and Lim, H.-J.: Species contributions to PM2.5 mass concentrations: revisit-ing common assumptions for estimating organic mass, Aerosol Sci. Tech., 35, 602–610,doi:10.1080/02786820119445, 2001.30
Vowinckel, E. and Orvig, S.: The climate of the North Polar Basin, in: World Survey of Clima-tology, vol. 14: Climates of the Polar Regions, Elsevier, New York, USA, 129–252, 1970.
Walsh, J. E., Kattsov, V. M., Chapman, W. L., Govorkova, V., and Pavlova, T.: Comparison of
27414
ACPD10, 27361–27434, 2010
Characteristics,sources, and
transport of aerosols
C. A. Brock et al.
Title Page
Abstract Introduction
Conclusions References
Tables Figures
J I
J I
Back Close
Full Screen / Esc
Printer-friendly Version
Interactive Discussion
Discussion
Paper
|D
iscussionP
aper|
Discussion
Paper
|D
iscussionP
aper|
Arctic climate simulations by uncoupled and coupled global models, J. Climate, 15, 1429–1446, 2002.
Wang, M., Overland, J. E., Kattsov, V., Walsh, J. E., Zhang, X., and Pavlova, T.: Intrinsic versusforced variation in coupled climate model simulations over the Arctic during the twentiethcentury, J. Climate, 20, 1093–1107, doi:10.1175/JCLI4043.1, 2007.5
Warneke, C., Bahreini, R., Brioude, J., Brock, C. A., de Gouw, J. A., Fahey, D. W., Froyd, K. D.,Holloway, J. S., Middlebrook, A., Miller, L., Montzka, S., Murphy, D. M., Peischl, J., Ryer-son, T. B., Schwarz, J. P., Spackman, J. R., and Veres, P.: Biomass burning in Siberia andKazakhstan as an important source for haze over the Alaskan Arctic in April 2008, Geophys.Res. Lett., 36, L02813, doi:10.1029/2008GL036194, 2009.10
Warneke, C., Froyd, K. D., Brioude, J., Bahreini, R., Brock, C. A., Cozic, J., de Gouw, J. A.,Fahey, D. W., Ferrare, R., Holloway, J. S., Middlebrook, A. M., Miller, L., Montzka, S.,Schwarz, J. P., Sodemann, H., Spackman, J. R., and Stohl, A.: An important contribution tospringtime Arctic aerosol from biomass burning in Russia, Geophys. Res. Lett., 37, L01801,doi:10.1029/ 2009GL041816, 2010.15
Wilson, J. C., Lafleur, B. G., Hilbert, H., Seebaugh, W. R., Fox, J., Gesler, D. W., Brock, C. A.,Huebert, B. J., and Mullen, J.: Function and performance of a low turbulence inlet for sam-pling super-micron particles from aircraft platforms, Aerosol Sci. Tech., 38, 790–802, 2004.
Winton, M.: Amplified Arctic climate change: what does surface albedo feedback have to dowith it?, Geophys. Res. Lett., 33, L03701, doi:10.1029/2005GL025244, 2006.20
Yttri, K. E., Dye, C., Braathen, O.-A., Simpson, D., and Steinnes, E.: Carbonaceous aerosols inNorwegian urban areas, Atmos. Chem. Phys., 9, 2007–2020, doi:10.5194/acp-9-2007-2009,2009.
Zhang, Q., Worsnop, D. R., Canagaratna, M. R., and Jimenez, J. L.: Hydrocarbon-like andoxygenated organic aerosols in Pittsburgh: insights into sources and processes of organic25
aerosols, Atmos. Chem. Phys., 5, 3289–3311, doi:10.5194/acp-5-3289-2005, 2005.
27415
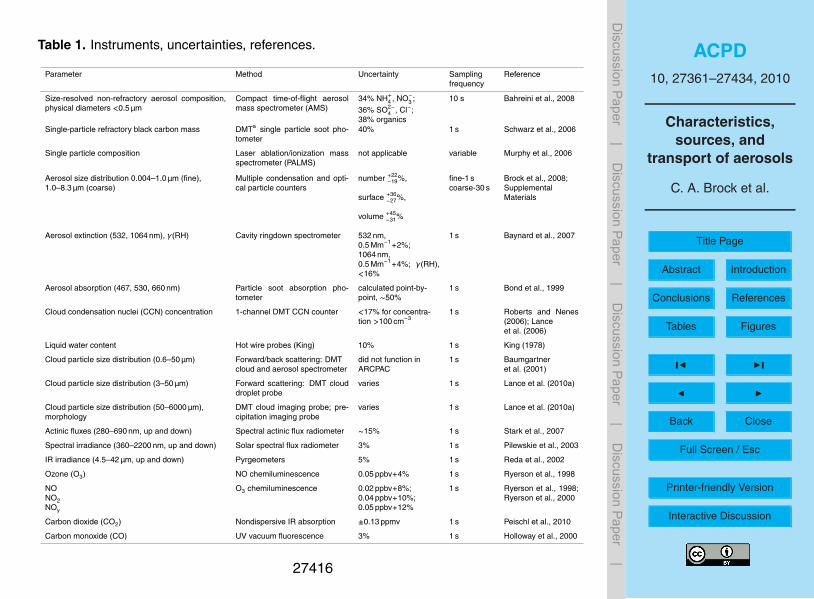
ACPD10, 27361–27434, 2010
Characteristics,sources, and
transport of aerosols
C. A. Brock et al.
Title Page
Abstract Introduction
Conclusions References
Tables Figures
J I
J I
Back Close
Full Screen / Esc
Printer-friendly Version
Interactive Discussion
Discussion
Paper
|D
iscussionP
aper|
Discussion
Paper
|D
iscussionP
aper|
Table 1. Instruments, uncertainties, references.
Parameter Method Uncertainty Samplingfrequency
Reference
Size-resolved non-refractory aerosol composition,physical diameters <0.5 µm
Compact time-of-flight aerosolmass spectrometer (AMS)
34% NH+4 , NO−
3 ;
36% SO2−4 , Cl−;
38% organics
10 s Bahreini et al., 2008
Single-particle refractory black carbon mass DMTa single particle soot pho-tometer
40% 1 s Schwarz et al., 2006
Single particle composition Laser ablation/ionization massspectrometer (PALMS)
not applicable variable Murphy et al., 2006
Aerosol size distribution 0.004–1.0 µm (fine),1.0–8.3 µm (coarse)
Multiple condensation and opti-cal particle counters
number +22−19%,
surface +36−27%,
volume +45−31%
fine-1 scoarse-30 s
Brock et al., 2008;SupplementalMaterials
Aerosol extinction (532, 1064 nm), γ(RH) Cavity ringdown spectrometer 532 nm,0.5 Mm−1+2%;1064 nm,0.5 Mm−1+4%; γ(RH),<16%
1 s Baynard et al., 2007
Aerosol absorption (467, 530, 660 nm) Particle soot absorption pho-tometer
calculated point-by-point, ∼50%
1 s Bond et al., 1999
Cloud condensation nuclei (CCN) concentration 1-channel DMT CCN counter <17% for concentra-tion >100 cm−3
1 s Roberts and Nenes(2006); Lanceet al. (2006)
Liquid water content Hot wire probes (King) 10% 1 s King (1978)
Cloud particle size distribution (0.6–50 µm) Forward/back scattering: DMTcloud and aerosol spectrometer
did not function inARCPAC
1 s Baumgartneret al. (2001)
Cloud particle size distribution (3–50 µm) Forward scattering: DMT clouddroplet probe
varies 1 s Lance et al. (2010a)
Cloud particle size distribution (50–6000 µm),morphology
DMT cloud imaging probe; pre-cipitation imaging probe
varies 1 s Lance et al. (2010a)
Actinic fluxes (280–690 nm, up and down) Spectral actinic flux radiometer ∼15% 1 s Stark et al., 2007
Spectral irradiance (360–2200 nm, up and down) Solar spectral flux radiometer 3% 1 s Pilewskie et al., 2003
IR irradiance (4.5–42 µm, up and down) Pyrgeometers 5% 1 s Reda et al., 2002
Ozone (O3) NO chemiluminescence 0.05 ppbv+4% 1 s Ryerson et al., 1998
NONO2NOy
O3 chemiluminescence 0.02 ppbv+8%;0.04 ppbv+10%;0.05 ppbv+12%
1 s Ryerson et al., 1998;Ryerson et al., 2000
Carbon dioxide (CO2) Nondispersive IR absorption ±0.13 ppmv 1 s Peischl et al., 2010
Carbon monoxide (CO) UV vacuum fluorescence 3% 1 s Holloway et al., 2000
27416
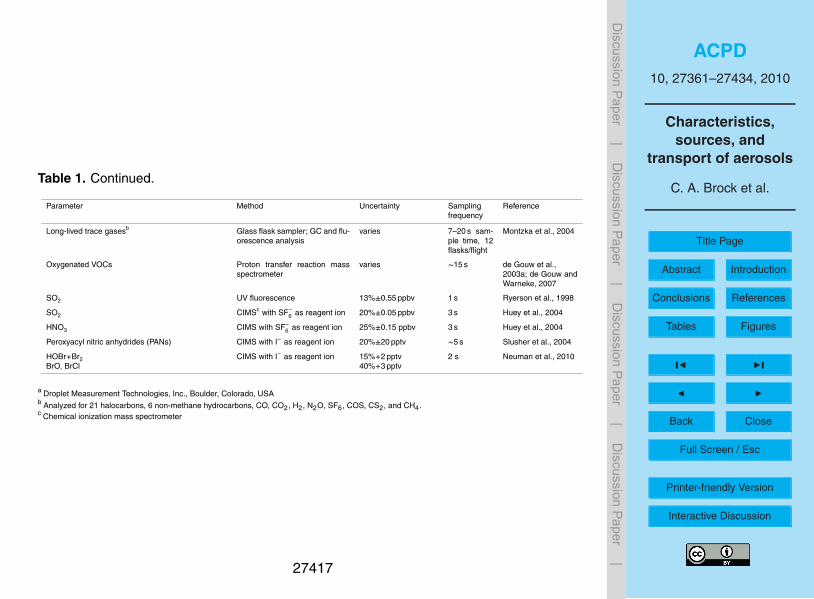
ACPD10, 27361–27434, 2010
Characteristics,sources, and
transport of aerosols
C. A. Brock et al.
Title Page
Abstract Introduction
Conclusions References
Tables Figures
J I
J I
Back Close
Full Screen / Esc
Printer-friendly Version
Interactive Discussion
Discussion
Paper
|D
iscussionP
aper|
Discussion
Paper
|D
iscussionP
aper|
Table 1. Continued.
Parameter Method Uncertainty Samplingfrequency
Reference
Long-lived trace gasesb Glass flask sampler; GC and flu-orescence analysis
varies 7–20 s sam-ple time, 12flasks/flight
Montzka et al., 2004
Oxygenated VOCs Proton transfer reaction massspectrometer
varies ∼15 s de Gouw et al.,2003a; de Gouw andWarneke, 2007
SO2 UV fluorescence 13%±0.55 ppbv 1 s Ryerson et al., 1998
SO2 CIMSc with SF−6 as reagent ion 20%±0.05 ppbv 3 s Huey et al., 2004
HNO3 CIMS with SF−6 as reagent ion 25%±0.15 ppbv 3 s Huey et al., 2004
Peroxyacyl nitric anhydrides (PANs) CIMS with I− as reagent ion 20%±20 pptv ∼5 s Slusher et al., 2004
HOBr+Br2BrO, BrCl
CIMS with I− as reagent ion 15%+2 pptv40%+3 pptv
2 s Neuman et al., 2010
a Droplet Measurement Technologies, Inc., Boulder, Colorado, USAb Analyzed for 21 halocarbons, 6 non-methane hydrocarbons, CO, CO2, H2, N2O, SF6 , COS, CS2, and CH4 .c Chemical ionization mass spectrometer
27417
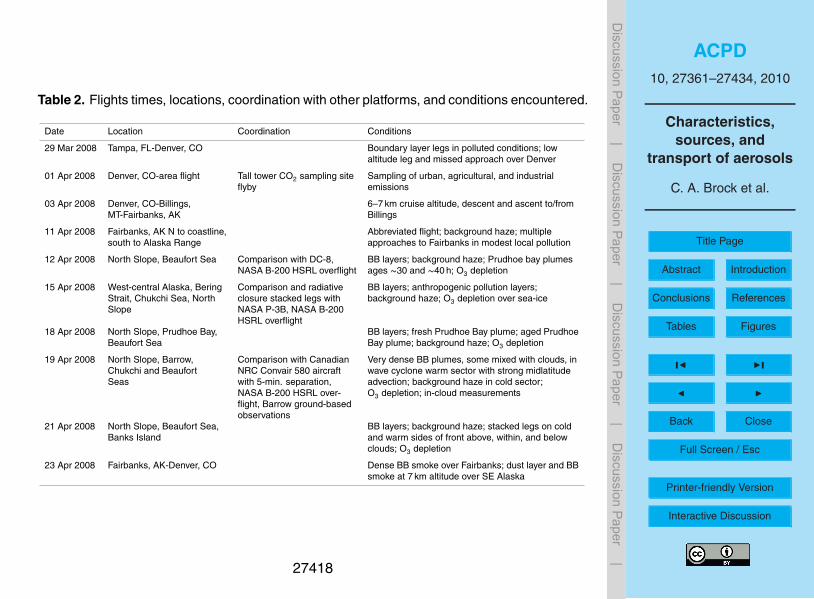
ACPD10, 27361–27434, 2010
Characteristics,sources, and
transport of aerosols
C. A. Brock et al.
Title Page
Abstract Introduction
Conclusions References
Tables Figures
J I
J I
Back Close
Full Screen / Esc
Printer-friendly Version
Interactive Discussion
Discussion
Paper
|D
iscussionP
aper|
Discussion
Paper
|D
iscussionP
aper|
Table 2. Flights times, locations, coordination with other platforms, and conditions encountered.
Date Location Coordination Conditions
29 Mar 2008 Tampa, FL-Denver, CO Boundary layer legs in polluted conditions; lowaltitude leg and missed approach over Denver
01 Apr 2008 Denver, CO-area flight Tall tower CO2 sampling siteflyby
Sampling of urban, agricultural, and industrialemissions
03 Apr 2008 Denver, CO-Billings,MT-Fairbanks, AK
6–7 km cruise altitude, descent and ascent to/fromBillings
11 Apr 2008 Fairbanks, AK N to coastline,south to Alaska Range
Abbreviated flight; background haze; multipleapproaches to Fairbanks in modest local pollution
12 Apr 2008 North Slope, Beaufort Sea Comparison with DC-8,NASA B-200 HSRL overflight
BB layers; background haze; Prudhoe bay plumesages ∼30 and ∼40 h; O3 depletion
15 Apr 2008 West-central Alaska, BeringStrait, Chukchi Sea, NorthSlope
Comparison and radiativeclosure stacked legs withNASA P-3B, NASA B-200HSRL overflight
BB layers; anthropogenic pollution layers;background haze; O3 depletion over sea-ice
18 Apr 2008 North Slope, Prudhoe Bay,Beaufort Sea
BB layers; fresh Prudhoe Bay plume; aged PrudhoeBay plume; background haze; O3 depletion
19 Apr 2008 North Slope, Barrow,Chukchi and BeaufortSeas
Comparison with CanadianNRC Convair 580 aircraftwith 5-min. separation,NASA B-200 HSRL over-flight, Barrow ground-basedobservations
Very dense BB plumes, some mixed with clouds, inwave cyclone warm sector with strong midlatitudeadvection; background haze in cold sector;O3 depletion; in-cloud measurements
21 Apr 2008 North Slope, Beaufort Sea,Banks Island
BB layers; background haze; stacked legs on coldand warm sides of front above, within, and belowclouds; O3 depletion
23 Apr 2008 Fairbanks, AK-Denver, CO Dense BB smoke over Fairbanks; dust layer and BBsmoke at 7 km altitude over SE Alaska
27418
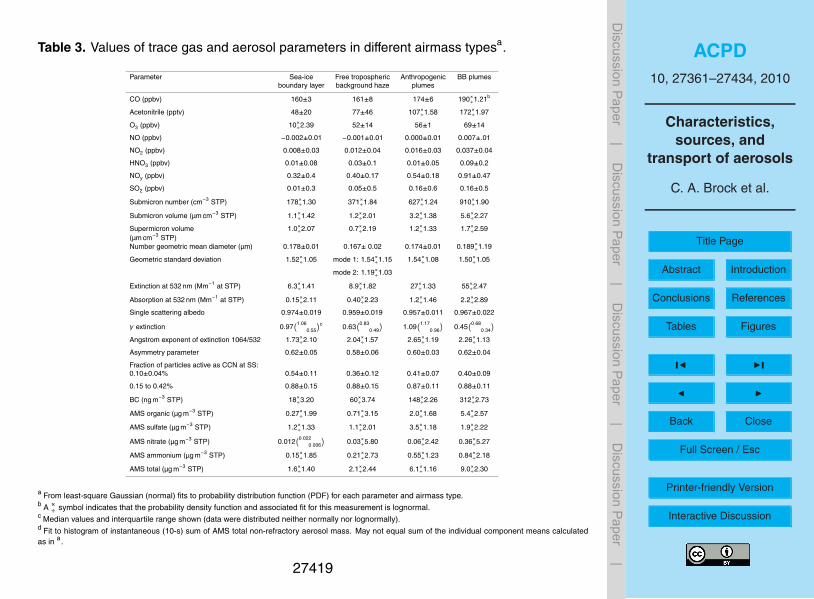
ACPD10, 27361–27434, 2010
Characteristics,sources, and
transport of aerosols
C. A. Brock et al.
Title Page
Abstract Introduction
Conclusions References
Tables Figures
J I
J I
Back Close
Full Screen / Esc
Printer-friendly Version
Interactive Discussion
Discussion
Paper
|D
iscussionP
aper|
Discussion
Paper
|D
iscussionP
aper|
Table 3. Values of trace gas and aerosol parameters in different airmass typesa.
Parameter Sea-ice Free tropospheric Anthropogenic BB plumesboundary layer background haze plumes
CO (ppbv) 160±3 161±8 174±6 190×÷1.21b
Acetonitrile (pptv) 48±20 77±46 107×÷1.58 172×
÷1.97
O3 (ppbv) 10×÷2.39 52±14 56±1 69±14
NO (ppbv) −0.002±0.01 −0.001±0.01 0.000±0.01 0.007±.01
NO2 (ppbv) 0.008±0.03 0.012±0.04 0.016±0.03 0.037±0.04
HNO3 (ppbv) 0.01±0.08 0.03±0.1 0.01±0.05 0.09±0.2
NOy (ppbv) 0.32±0.4 0.40±0.17 0.54±0.18 0.91±0.47
SO2 (ppbv) 0.01±0.3 0.05±0.5 0.16±0.6 0.16±0.5
Submicron number (cm−3 STP) 178×÷1.30 371×
÷1.84 627×÷1.24 910×
÷1.90
Submicron volume (µm cm−3 STP) 1.1×÷1.42 1.2×
÷2.01 3.2×÷1.38 5.6×
÷2.27
Supermicron volume(µm cm−3 STP)
1.0×÷2.07 0.7×
÷2.19 1.2×÷1.33 1.7×
÷2.59
Number geometric mean diameter (µm) 0.178±0.01 0.167± 0.02 0.174±0.01 0.189×÷1.19
Geometric standard deviation 1.52×÷1.05 mode 1: 1.54×
÷1.15 1.54×÷1.08 1.50×
÷1.05
mode 2: 1.19×÷1.03
Extinction at 532 nm (Mm−1 at STP) 6.3×÷1.41 8.9×
÷1.82 27×÷1.33 55×
÷2.47
Absorption at 532 nm (Mm−1 at STP) 0.15×÷2.11 0.40×
÷2.23 1.2×÷1.46 2.2×
÷2.89
Single scattering albedo 0.974±0.019 0.959±0.019 0.957±0.011 0.967±0.022
γ extinction 0.97(1.06
0.55
)c 0.63(0.83
0.49
)1.09
(1.170.96
)0.45
(0.680.34
)Angstrom exponent of extinction 1064/532 1.73×
÷2.10 2.04×÷1.57 2.65×
÷1.19 2.26×÷1.13
Asymmetry parameter 0.62±0.05 0.58±0.06 0.60±0.03 0.62±0.04
Fraction of particles active as CCN at SS:0.10±0.04% 0.54±0.11 0.36±0.12 0.41±0.07 0.40±0.09
0.15 to 0.42% 0.88±0.15 0.88±0.15 0.87±0.11 0.88±0.11
BC (ng m−3 STP) 18×÷3.20 60×
÷3.74 148×÷2.26 312×
÷2.73
AMS organic (µg m−3 STP) 0.27×÷1.99 0.71×
÷3.15 2.0×÷1.68 5.4×
÷2.57
AMS sulfate (µg m−3 STP) 1.2×÷1.33 1.1×
÷2.01 3.5×÷1.18 1.9×
÷2.22
AMS nitrate (µg m−3 STP) 0.012(0.022
0.006
)0.03×
÷5.80 0.06×÷2.42 0.36×
÷5.27
AMS ammonium (µg m−3 STP) 0.15×÷1.85 0.21×
÷2.73 0.55×÷1.23 0.84×
÷2.18
AMS total (µg m−3 STP) 1.6×÷1.40 2.1×
÷2.44 6.1×÷1.16 9.0×
÷2.30
a From least-square Gaussian (normal) fits to probability distribution function (PDF) for each parameter and airmass type.b A ×
÷ symbol indicates that the probability density function and associated fit for this measurement is lognormal.c Median values and interquartile range shown (data were distributed neither normally nor lognormally).d Fit to histogram of instantaneous (10-s) sum of AMS total non-refractory aerosol mass. May not equal sum of the individual component means calculatedas in a.
27419
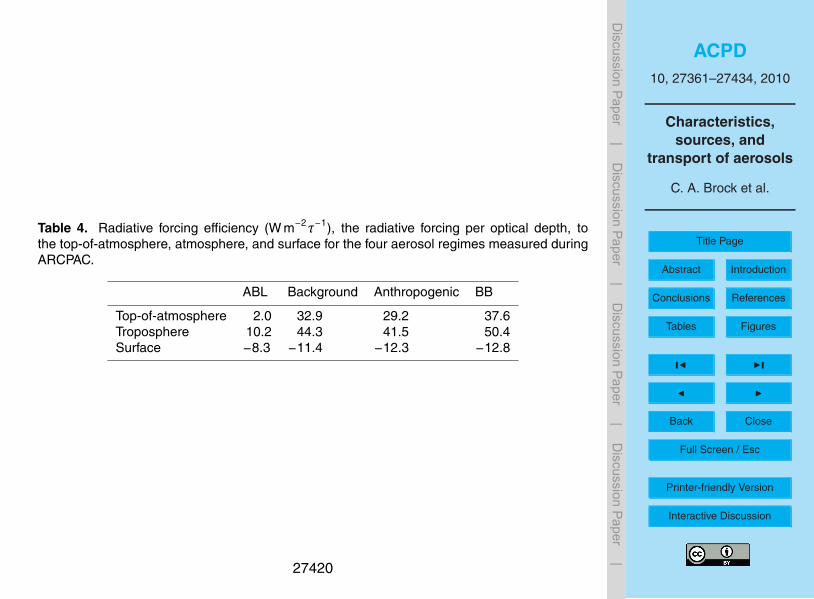
ACPD10, 27361–27434, 2010
Characteristics,sources, and
transport of aerosols
C. A. Brock et al.
Title Page
Abstract Introduction
Conclusions References
Tables Figures
J I
J I
Back Close
Full Screen / Esc
Printer-friendly Version
Interactive Discussion
Discussion
Paper
|D
iscussionP
aper|
Discussion
Paper
|D
iscussionP
aper|
Table 4. Radiative forcing efficiency (W m−2τ−1), the radiative forcing per optical depth, tothe top-of-atmosphere, atmosphere, and surface for the four aerosol regimes measured duringARCPAC.
ABL Background Anthropogenic BB
Top-of-atmosphere 2.0 32.9 29.2 37.6Troposphere 10.2 44.3 41.5 50.4Surface −8.3 −11.4 −12.3 −12.8
27420
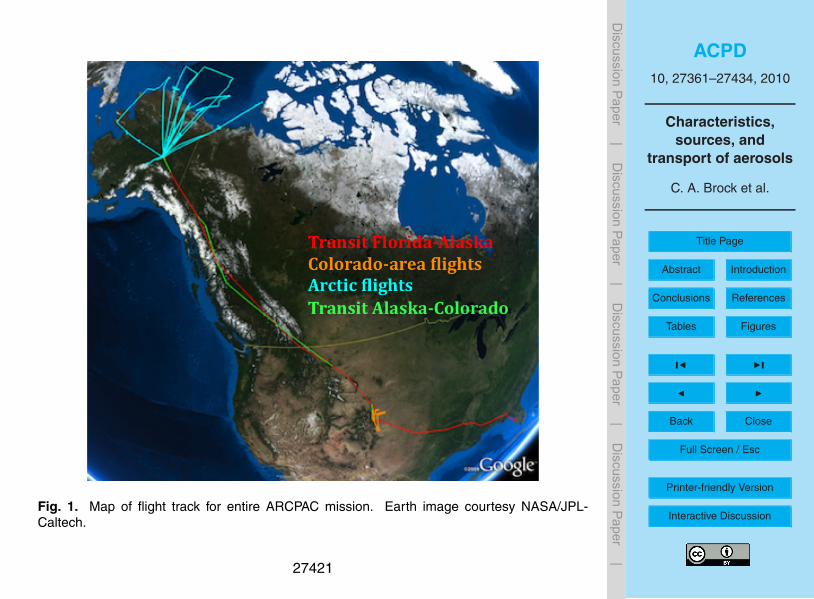
ACPD10, 27361–27434, 2010
Characteristics,sources, and
transport of aerosols
C. A. Brock et al.
Title Page
Abstract Introduction
Conclusions References
Tables Figures
J I
J I
Back Close
Full Screen / Esc
Printer-friendly Version
Interactive Discussion
Discussion
Paper
|D
iscussionP
aper|
Discussion
Paper
|D
iscussionP
aper|
Fig. 1. Map of flight track for entire ARCPAC mission. Earth image courtesy NASA/JPL-Caltech.
27421
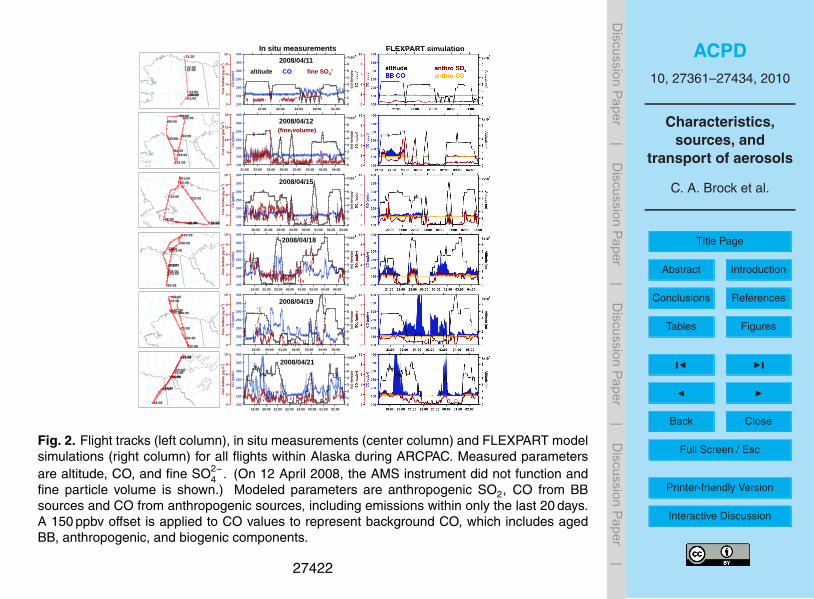
ACPD10, 27361–27434, 2010
Characteristics,sources, and
transport of aerosols
C. A. Brock et al.
Title Page
Abstract Introduction
Conclusions References
Tables Figures
J I
J I
Back Close
Full Screen / Esc
Printer-friendly Version
Interactive Discussion
Discussion
Paper
|D
iscussionP
aper|
Discussion
Paper
|D
iscussionP
aper|
400
350
300
250
200
150
100
CO
(ppb
v)
19:00 20:00 21:00 22:00 23:00 00:00 01:00 02:00
7x10³
6
5
4
3
2
1
0
Altitude (m
)
10
8
6
4
2
0
Fine
Sul
fate
(µg
m-3
)
400
350
300
250
200
150
100
CO
(ppb
v)
23:00 00:00 01:00 02:00 03:00 04:00 05:00
7x10³
6
5
4
3
2
1
0
Altitude (m
)
10
8
6
4
2
0
Fine
Sul
fate
(µg
m-3
)
400
350
300
250
200
150
100
CO
(ppb
v)
21:00 22:00 23:00 00:00 01:00 02:00 03:00 04:00
7x10³
6
5
4
3
2
1
0
Altitude (m
)
10
8
6
4
2
0
Fine
Sul
fate
(µg
m-3
)
400
350
300
250
200
150
100
CO
(ppb
v)20:00 21:00 22:00 23:00 00:00 01:00 02:00 03:00
7x10³
6
5
4
3
2
1
0
Altitude (m
)
10
8
6
4
2
0Fi
ne S
ulfa
te (µ
g m
-3)
400
350
300
250
200
150
100
CO
(ppb
v)
21:00 22:00 23:00 00:00 01:00 02:00 03:00 04:00
7x10³
6
5
4
3
2
1
0
Altitude (m
)
20
15
10
5
0
Fine
Vol
ume
(µm
3 m-3
)
400
350
300
250
200
150
100
CO
(ppb
v)
21:00 22:00 23:00 00:00 01:00
7x10³
6
5
4
3
2
1
0
Altitude (m
)
10
8
6
4
2
0
Fine
Sul
fate
(µg
m-3
)
21:00
22:00
23:00
00:0001:0002:00
03:00
04:00
19:0420:0021:0022:00
23:00
00:0001:00
02:00
03:00
20:06
21:00
22:00
23:00
00:00
01:00
02:00
03:0004:00
20:01
21:00
21:30
22:00
23:0000:00
01:00
2008/04/11
2008/04/12
2008/04/15
2008/04/18
2008/04/19
2008/04/21
In situ measurements FLEXPART simulation
altitude CO fine SO4= altitude anthro SO2
BB CO anthro CO
22:06
23:00
00:0001:00
02:0003:00
04:00
05:00
18:03
19:00
20:00
21:0022:00
23:0000:0001:00
02:00
(fine volume)
Fig. 2. Flight tracks (left column), in situ measurements (center column) and FLEXPART modelsimulations (right column) for all flights within Alaska during ARCPAC. Measured parametersare altitude, CO, and fine SO2−
4 . (On 12 April 2008, the AMS instrument did not function andfine particle volume is shown.) Modeled parameters are anthropogenic SO2, CO from BBsources and CO from anthropogenic sources, including emissions within only the last 20 days.A 150 ppbv offset is applied to CO values to represent background CO, which includes agedBB, anthropogenic, and biogenic components.
27422
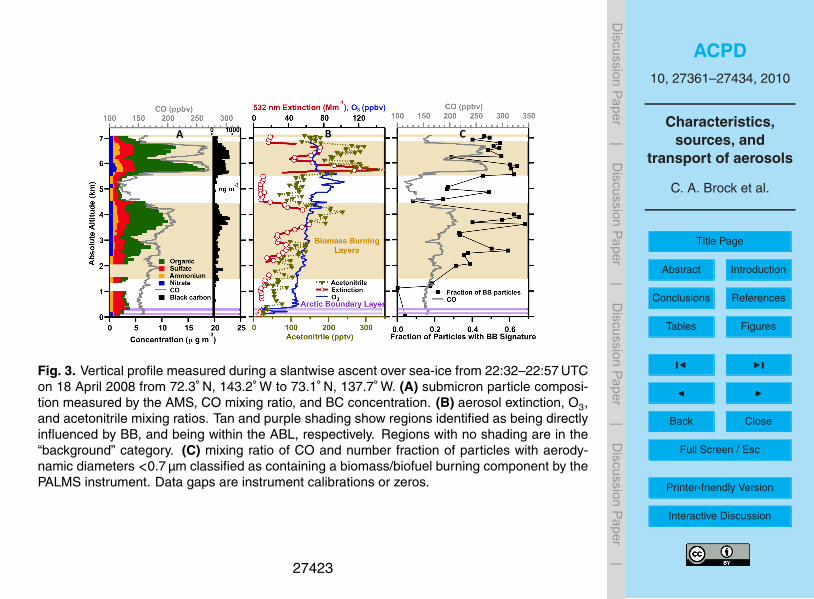
ACPD10, 27361–27434, 2010
Characteristics,sources, and
transport of aerosols
C. A. Brock et al.
Title Page
Abstract Introduction
Conclusions References
Tables Figures
J I
J I
Back Close
Full Screen / Esc
Printer-friendly Version
Interactive Discussion
Discussion
Paper
|D
iscussionP
aper|
Discussion
Paper
|D
iscussionP
aper|
Fig. 3. Vertical profile measured during a slantwise ascent over sea-ice from 22:32–22:57 UTCon 18 April 2008 from 72.3◦ N, 143.2◦ W to 73.1◦ N, 137.7◦ W. (A) submicron particle composi-tion measured by the AMS, CO mixing ratio, and BC concentration. (B) aerosol extinction, O3,and acetonitrile mixing ratios. Tan and purple shading show regions identified as being directlyinfluenced by BB, and being within the ABL, respectively. Regions with no shading are in the“background” category. (C) mixing ratio of CO and number fraction of particles with aerody-namic diameters <0.7 µm classified as containing a biomass/biofuel burning component by thePALMS instrument. Data gaps are instrument calibrations or zeros.
27423
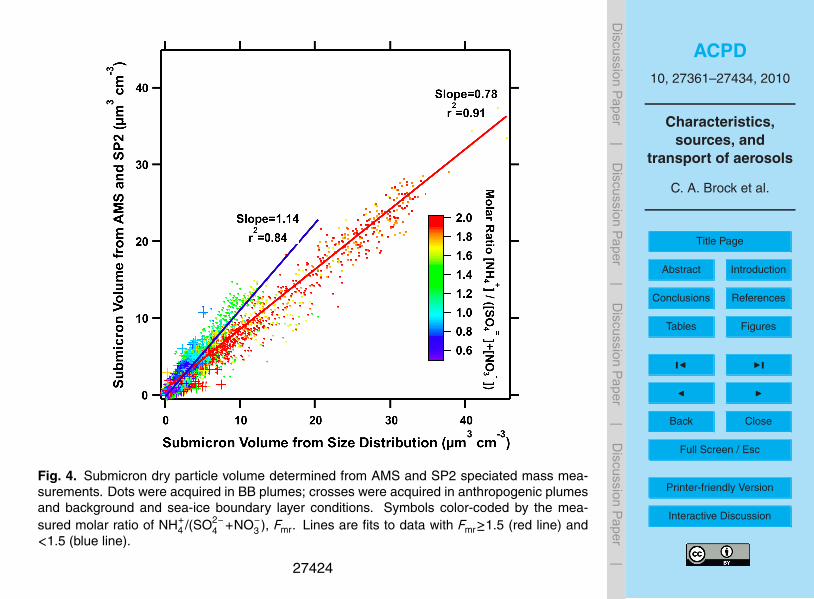
ACPD10, 27361–27434, 2010
Characteristics,sources, and
transport of aerosols
C. A. Brock et al.
Title Page
Abstract Introduction
Conclusions References
Tables Figures
J I
J I
Back Close
Full Screen / Esc
Printer-friendly Version
Interactive Discussion
Discussion
Paper
|D
iscussionP
aper|
Discussion
Paper
|D
iscussionP
aper|
Fig. 4. Submicron dry particle volume determined from AMS and SP2 speciated mass mea-surements. Dots were acquired in BB plumes; crosses were acquired in anthropogenic plumesand background and sea-ice boundary layer conditions. Symbols color-coded by the mea-sured molar ratio of NH+
4 /(SO2−4 +NO−
3 ), Fmr. Lines are fits to data with Fmr≥1.5 (red line) and<1.5 (blue line).
27424
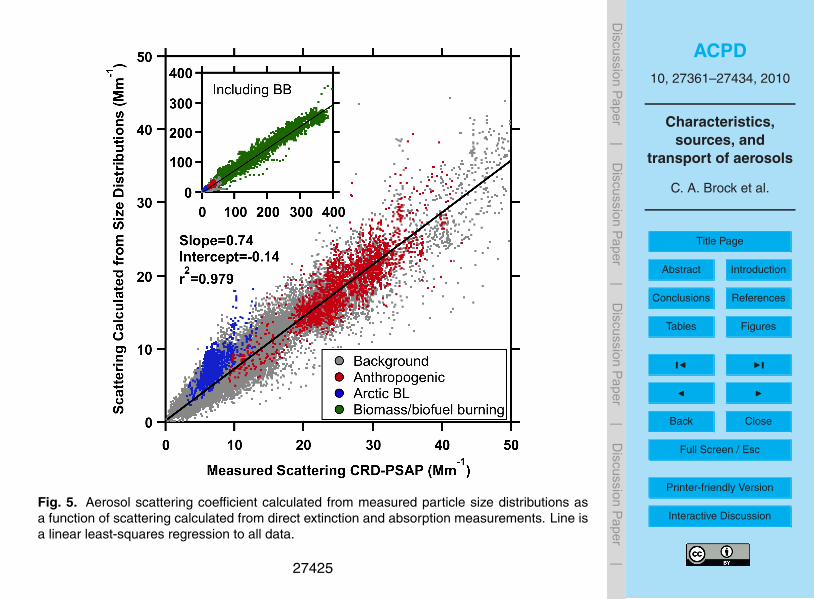
ACPD10, 27361–27434, 2010
Characteristics,sources, and
transport of aerosols
C. A. Brock et al.
Title Page
Abstract Introduction
Conclusions References
Tables Figures
J I
J I
Back Close
Full Screen / Esc
Printer-friendly Version
Interactive Discussion
Discussion
Paper
|D
iscussionP
aper|
Discussion
Paper
|D
iscussionP
aper|
Fig. 5. Aerosol scattering coefficient calculated from measured particle size distributions asa function of scattering calculated from direct extinction and absorption measurements. Line isa linear least-squares regression to all data.
27425
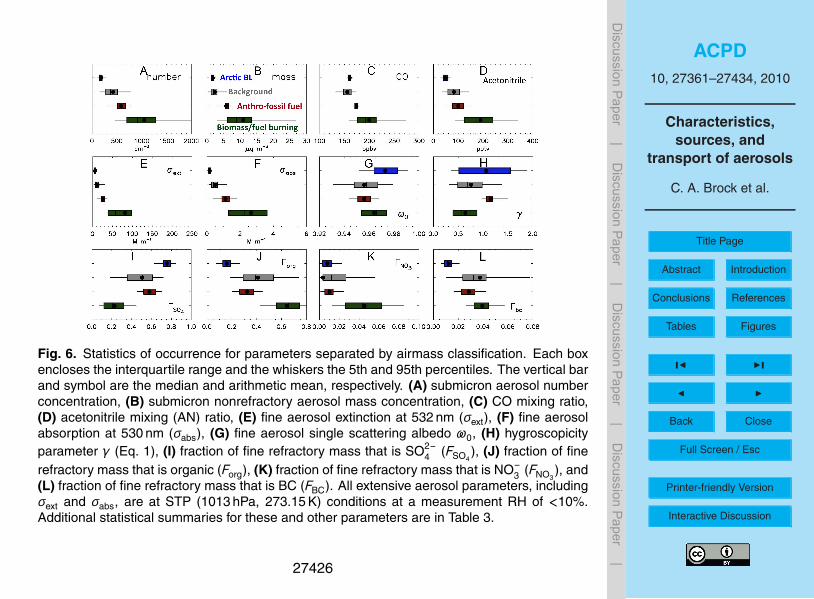
ACPD10, 27361–27434, 2010
Characteristics,sources, and
transport of aerosols
C. A. Brock et al.
Title Page
Abstract Introduction
Conclusions References
Tables Figures
J I
J I
Back Close
Full Screen / Esc
Printer-friendly Version
Interactive Discussion
Discussion
Paper
|D
iscussionP
aper|
Discussion
Paper
|D
iscussionP
aper|
Fig. 6. Statistics of occurrence for parameters separated by airmass classification. Each boxencloses the interquartile range and the whiskers the 5th and 95th percentiles. The vertical barand symbol are the median and arithmetic mean, respectively. (A) submicron aerosol numberconcentration, (B) submicron nonrefractory aerosol mass concentration, (C) CO mixing ratio,(D) acetonitrile mixing (AN) ratio, (E) fine aerosol extinction at 532 nm (σext), (F) fine aerosolabsorption at 530 nm (σabs), (G) fine aerosol single scattering albedo ω0, (H) hygroscopicityparameter γ (Eq. 1), (I) fraction of fine refractory mass that is SO2−
4 (FSO4), (J) fraction of fine
refractory mass that is organic (Forg), (K) fraction of fine refractory mass that is NO−3 (FNO3
), and(L) fraction of fine refractory mass that is BC (FBC). All extensive aerosol parameters, includingσext and σabs, are at STP (1013 hPa, 273.15 K) conditions at a measurement RH of <10%.Additional statistical summaries for these and other parameters are in Table 3.
27426
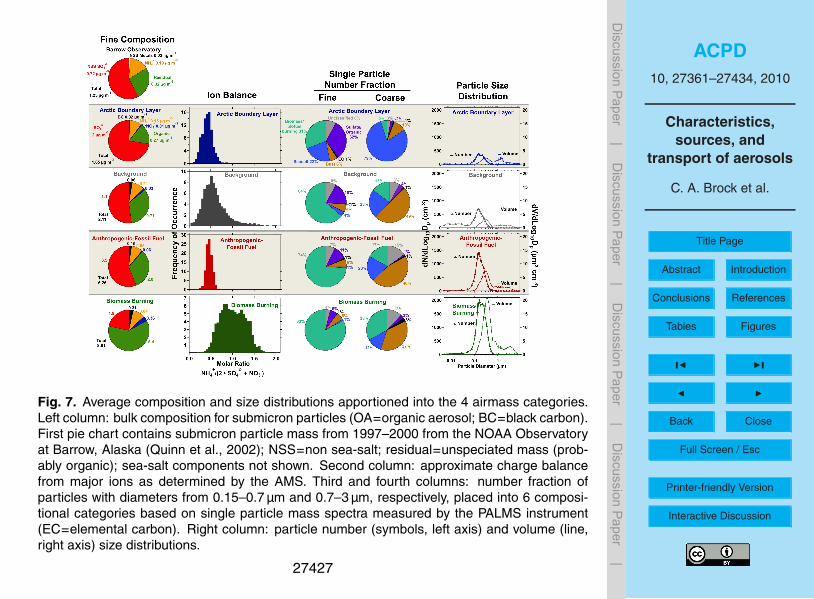
ACPD10, 27361–27434, 2010
Characteristics,sources, and
transport of aerosols
C. A. Brock et al.
Title Page
Abstract Introduction
Conclusions References
Tables Figures
J I
J I
Back Close
Full Screen / Esc
Printer-friendly Version
Interactive Discussion
Discussion
Paper
|D
iscussionP
aper|
Discussion
Paper
|D
iscussionP
aper|
Fig. 7. Average composition and size distributions apportioned into the 4 airmass categories.Left column: bulk composition for submicron particles (OA=organic aerosol; BC=black carbon).First pie chart contains submicron particle mass from 1997–2000 from the NOAA Observatoryat Barrow, Alaska (Quinn et al., 2002); NSS=non sea-salt; residual=unspeciated mass (prob-ably organic); sea-salt components not shown. Second column: approximate charge balancefrom major ions as determined by the AMS. Third and fourth columns: number fraction ofparticles with diameters from 0.15–0.7 µm and 0.7–3 µm, respectively, placed into 6 composi-tional categories based on single particle mass spectra measured by the PALMS instrument(EC=elemental carbon). Right column: particle number (symbols, left axis) and volume (line,right axis) size distributions.
27427
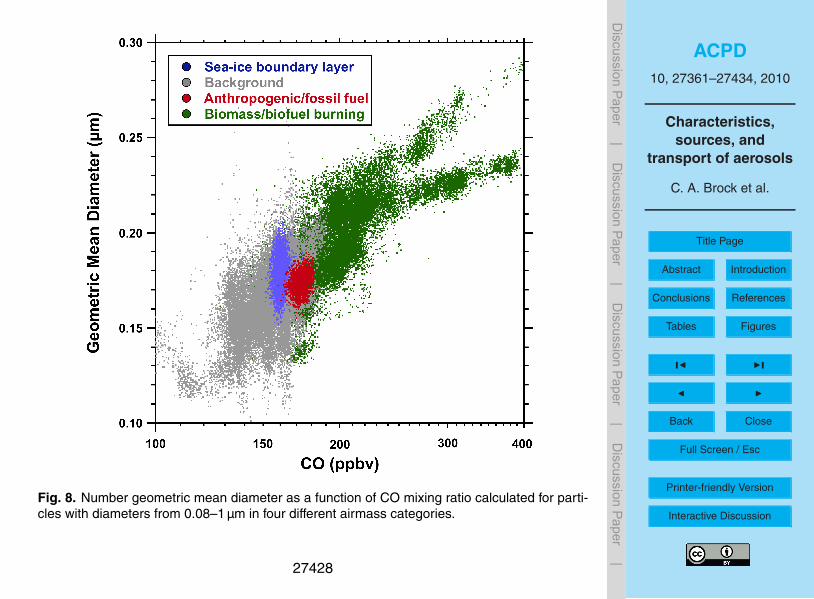
ACPD10, 27361–27434, 2010
Characteristics,sources, and
transport of aerosols
C. A. Brock et al.
Title Page
Abstract Introduction
Conclusions References
Tables Figures
J I
J I
Back Close
Full Screen / Esc
Printer-friendly Version
Interactive Discussion
Discussion
Paper
|D
iscussionP
aper|
Discussion
Paper
|D
iscussionP
aper|
Fig. 8. Number geometric mean diameter as a function of CO mixing ratio calculated for parti-cles with diameters from 0.08–1 µm in four different airmass categories.
27428
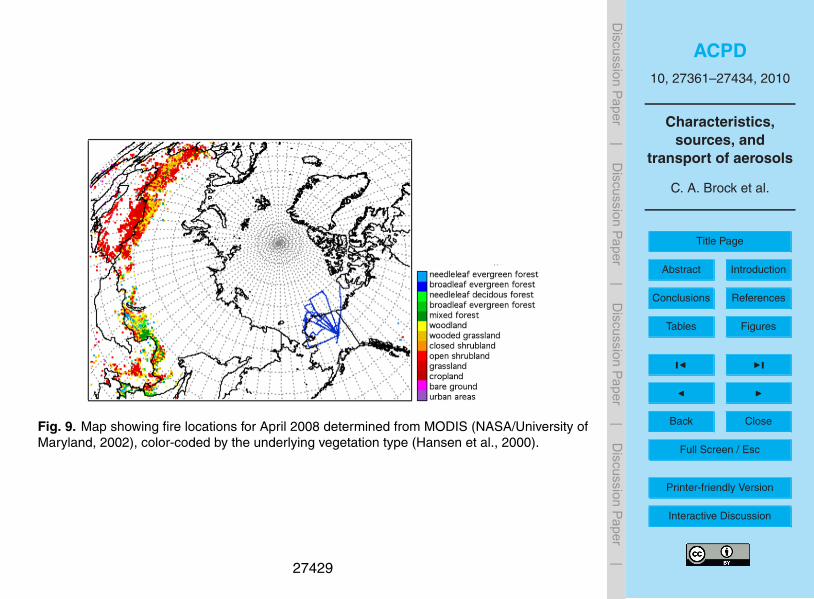
ACPD10, 27361–27434, 2010
Characteristics,sources, and
transport of aerosols
C. A. Brock et al.
Title Page
Abstract Introduction
Conclusions References
Tables Figures
J I
J I
Back Close
Full Screen / Esc
Printer-friendly Version
Interactive Discussion
Discussion
Paper
|D
iscussionP
aper|
Discussion
Paper
|D
iscussionP
aper|
Fig. 9. Map showing fire locations for April 2008 determined from MODIS (NASA/University ofMaryland, 2002), color-coded by the underlying vegetation type (Hansen et al., 2000).
27429
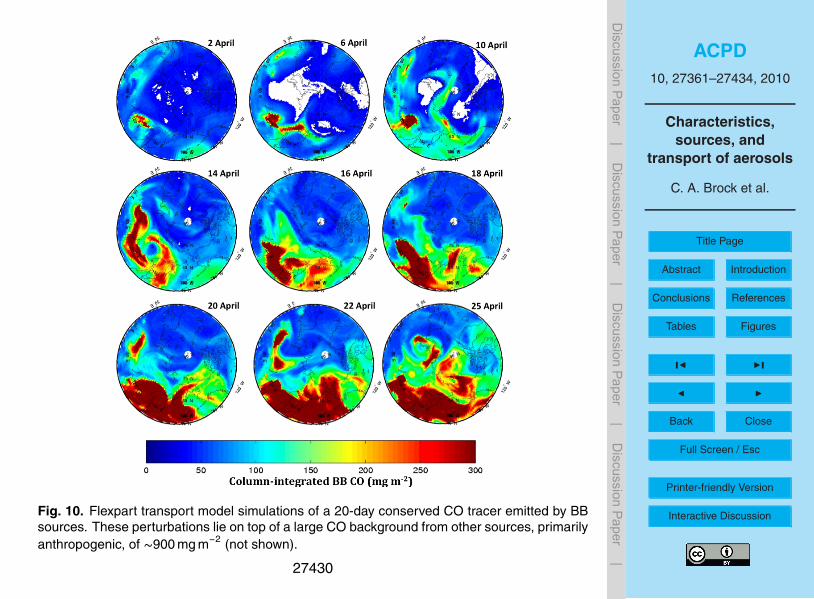
ACPD10, 27361–27434, 2010
Characteristics,sources, and
transport of aerosols
C. A. Brock et al.
Title Page
Abstract Introduction
Conclusions References
Tables Figures
J I
J I
Back Close
Full Screen / Esc
Printer-friendly Version
Interactive Discussion
Discussion
Paper
|D
iscussionP
aper|
Discussion
Paper
|D
iscussionP
aper|
Fig. 10. Flexpart transport model simulations of a 20-day conserved CO tracer emitted by BBsources. These perturbations lie on top of a large CO background from other sources, primarilyanthropogenic, of ∼900 mg m−2 (not shown).
27430
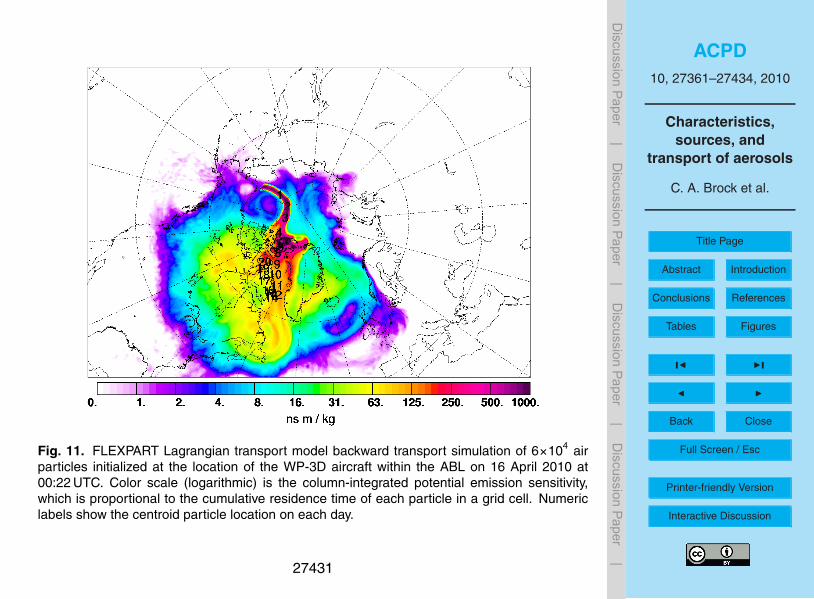
ACPD10, 27361–27434, 2010
Characteristics,sources, and
transport of aerosols
C. A. Brock et al.
Title Page
Abstract Introduction
Conclusions References
Tables Figures
J I
J I
Back Close
Full Screen / Esc
Printer-friendly Version
Interactive Discussion
Discussion
Paper
|D
iscussionP
aper|
Discussion
Paper
|D
iscussionP
aper|
Fig. 11. FLEXPART Lagrangian transport model backward transport simulation of 6×10⁴ airparticles initialized at the location of the WP-3D aircraft within the ABL on 16 April 2010 at00:22 UTC. Color scale (logarithmic) is the column-integrated potential emission sensitivity,which is proportional to the cumulative residence time of each particle in a grid cell. Numericlabels show the centroid particle location on each day.
27431
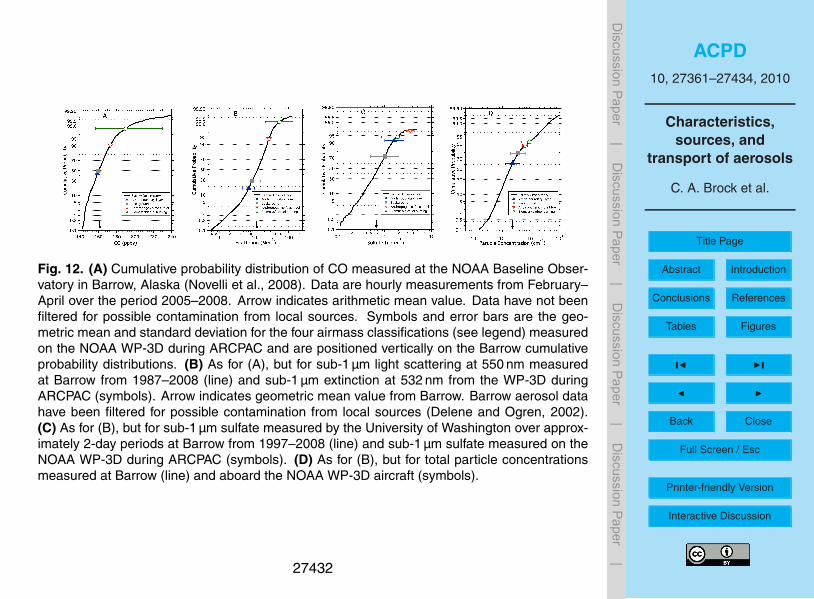
ACPD10, 27361–27434, 2010
Characteristics,sources, and
transport of aerosols
C. A. Brock et al.
Title Page
Abstract Introduction
Conclusions References
Tables Figures
J I
J I
Back Close
Full Screen / Esc
Printer-friendly Version
Interactive Discussion
Discussion
Paper
|D
iscussionP
aper|
Discussion
Paper
|D
iscussionP
aper|
Fig. 12. (A) Cumulative probability distribution of CO measured at the NOAA Baseline Obser-vatory in Barrow, Alaska (Novelli et al., 2008). Data are hourly measurements from February–April over the period 2005–2008. Arrow indicates arithmetic mean value. Data have not beenfiltered for possible contamination from local sources. Symbols and error bars are the geo-metric mean and standard deviation for the four airmass classifications (see legend) measuredon the NOAA WP-3D during ARCPAC and are positioned vertically on the Barrow cumulativeprobability distributions. (B) As for (A), but for sub-1 µm light scattering at 550 nm measuredat Barrow from 1987–2008 (line) and sub-1 µm extinction at 532 nm from the WP-3D duringARCPAC (symbols). Arrow indicates geometric mean value from Barrow. Barrow aerosol datahave been filtered for possible contamination from local sources (Delene and Ogren, 2002).(C) As for (B), but for sub-1 µm sulfate measured by the University of Washington over approx-imately 2-day periods at Barrow from 1997–2008 (line) and sub-1 µm sulfate measured on theNOAA WP-3D during ARCPAC (symbols). (D) As for (B), but for total particle concentrationsmeasured at Barrow (line) and aboard the NOAA WP-3D aircraft (symbols).
27432
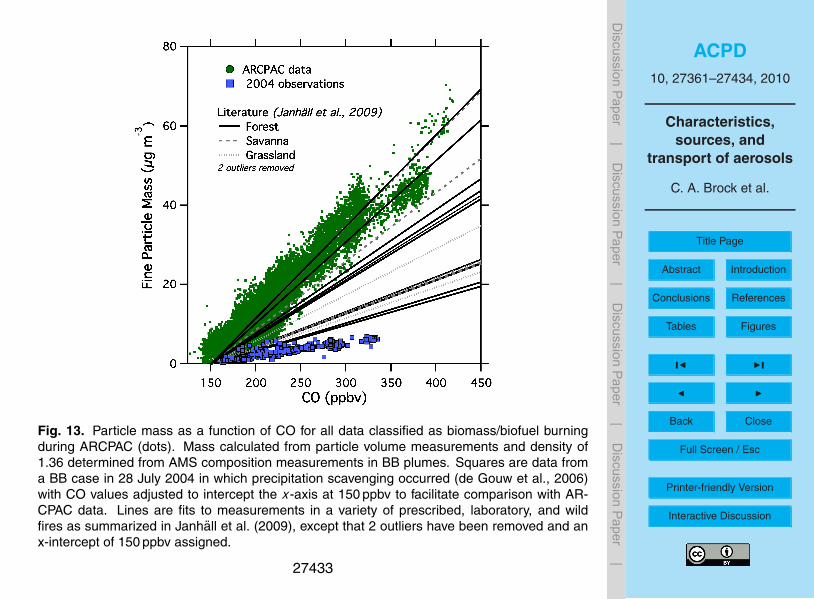
ACPD10, 27361–27434, 2010
Characteristics,sources, and
transport of aerosols
C. A. Brock et al.
Title Page
Abstract Introduction
Conclusions References
Tables Figures
J I
J I
Back Close
Full Screen / Esc
Printer-friendly Version
Interactive Discussion
Discussion
Paper
|D
iscussionP
aper|
Discussion
Paper
|D
iscussionP
aper|
Fig. 13. Particle mass as a function of CO for all data classified as biomass/biofuel burningduring ARCPAC (dots). Mass calculated from particle volume measurements and density of1.36 determined from AMS composition measurements in BB plumes. Squares are data froma BB case in 28 July 2004 in which precipitation scavenging occurred (de Gouw et al., 2006)with CO values adjusted to intercept the x-axis at 150 ppbv to facilitate comparison with AR-CPAC data. Lines are fits to measurements in a variety of prescribed, laboratory, and wildfires as summarized in Janhall et al. (2009), except that 2 outliers have been removed and anx-intercept of 150 ppbv assigned.
27433
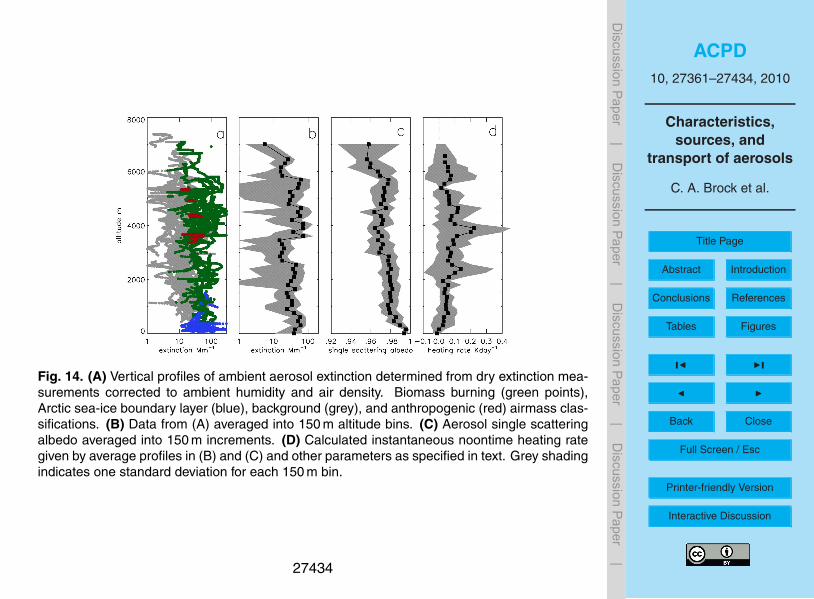
ACPD10, 27361–27434, 2010
Characteristics,sources, and
transport of aerosols
C. A. Brock et al.
Title Page
Abstract Introduction
Conclusions References
Tables Figures
J I
J I
Back Close
Full Screen / Esc
Printer-friendly Version
Interactive Discussion
Discussion
Paper
|D
iscussionP
aper|
Discussion
Paper
|D
iscussionP
aper|
Fig. 14. (A) Vertical profiles of ambient aerosol extinction determined from dry extinction mea-surements corrected to ambient humidity and air density. Biomass burning (green points),Arctic sea-ice boundary layer (blue), background (grey), and anthropogenic (red) airmass clas-sifications. (B) Data from (A) averaged into 150 m altitude bins. (C) Aerosol single scatteringalbedo averaged into 150 m increments. (D) Calculated instantaneous noontime heating rategiven by average profiles in (B) and (C) and other parameters as specified in text. Grey shadingindicates one standard deviation for each 150 m bin.
27434