long-term trends in the middle atmosphere dynamics - acp
TRANSCRIPT
ACPD10, 2633–2668, 2010
Long-term trends inthe middle
atmospheredynamics
J. Lastovicka et al.
Title Page
Abstract Introduction
Conclusions References
Tables Figures
J I
J I
Back Close
Full Screen / Esc
Printer-friendly Version
Interactive Discussion
Atmos. Chem. Phys. Discuss., 10, 2633–2668, 2010www.atmos-chem-phys-discuss.net/10/2633/2010/© Author(s) 2010. This work is distributed underthe Creative Commons Attribution 3.0 License.
AtmosphericChemistry
and PhysicsDiscussions
This discussion paper is/has been under review for the journal Atmospheric Chemistryand Physics (ACP). Please refer to the corresponding final paper in ACP if available.
Long-term trends in the middleatmosphere dynamics at northern middlelatitudes – one regime or two differentregimes?J. Lastovicka, P. Krizan, and M. Kozubek
Institute of Atmospheric Physics of ASCR, Bocni II, 14131 Prague, Czech Republic
Received: 11 September 2009 – Accepted: 17 January 2010 – Published: 3 February 2010
Correspondence to: J. Lastovicka ([email protected])
Published by Copernicus Publications on behalf of the European Geosciences Union.
2633
ACPD10, 2633–2668, 2010
Long-term trends inthe middle
atmospheredynamics
J. Lastovicka et al.
Title Page
Abstract Introduction
Conclusions References
Tables Figures
J I
J I
Back Close
Full Screen / Esc
Printer-friendly Version
Interactive Discussion
Abstract
Due to increasing atmospheric concentration of greenhouse gases and changingstratospheric ozone concentration, both of anthropogenic origin, various quantities inthe middle atmosphere reveal long-term changes and trends. Lastovicka and Krizan(2006) indicated possibility of change of trends in the dynamics in the northern midlati-5
tude middle atmosphere as a whole in the 1990s. To search for such change of trendswe use data on winds in the mesopause region, on total columnar ozone, on ozonelaminae, on winds in the middle and lower stratosphere, and on peak electron den-sity in the E region of the ionosphere. One group of quantities, the mesopause regionwind-like trends, changes their trends around 1990, the other one, the total ozone-like10
trends, in the mid-1990s. Altogether they create a skeleton of scenario of the changeof the middle atmosphere dynamics trends in the 1990s. Drivers of these changes ap-pear to be different for the first group and for the second group. Tropospheric processesseem to play a role in the changes of trends in middle atmospheric dynamics.
1 Introduction15
Human activities affect the atmosphere by pollution since the beginning of industrialrevolution. This man-made anthropogenic forcing influences the atmosphere not onlyin the troposphere, its influence is detectable even in the thermosphere, up to heightsof several hundred kilometres above surface, and changes climate in the whole atmo-sphere (e.g., Lastovicka et al., 2006). Life on Earth is more directly affected by climate20
change near the surface than in the middle and upper atmosphere, but as the story ofthe Earth’s ozone layer illustrates, changes at higher levels of the atmosphere may beimportant for life on Earth, as well.
In the middle atmosphere, the stratosphere, mesosphere and lower (and/or lower-most) thermosphere, the two main anthropogenic drivers of long-term changes and25
trends are greenhouse gases (mainly carbon dioxide) and ozone, and some role is
2634
ACPD10, 2633–2668, 2010
Long-term trends inthe middle
atmospheredynamics
J. Lastovicka et al.
Title Page
Abstract Introduction
Conclusions References
Tables Figures
J I
J I
Back Close
Full Screen / Esc
Printer-friendly Version
Interactive Discussion
also played by water vapour concentration changes. As concerns CO2, its increase inthe middle atmosphere results in cooling, not heating of the middle atmosphere. Thetransition region between the CO2 heating in the troposphere and cooling above isthe tropopause region and the lowermost stratosphere. In the middle atmosphere, theradiative effect of CO2 becomes more pronounced and produces a cooling. At these5
altitudes, CO2 is optically thin and is unable to contain sufficiently outgoing infraredradiation; thermal energy is transferred by collisions with ambient gas to the excitedstates of CO2 molecules and then lost to space via their infrared radiation. The ozonedepletion, developed mainly in the 1980s and 1990s, reduced ozone absorption ofsolar UV radiation and, thus, contributed significantly to cooling of the stratosphere.10
However, reduction of stratospheric ozone concentration affects also higher levels, in-cluding the ionosphere and neutral atmosphere at the ionospheric E-region maximumheights (∼110 km) (e.g., Akmaev et al., 2006; Bremer, 2008). Thus the whole middleatmosphere is directly or indirectly affected by stratospheric ozone depletion.
Cooling of the stratosphere was reviewed by Ramaswamy et al. (2001) and recently15
updated by Randel et al. (2009). They found some cooling in the whole stratosphere.Its main driver in the lower stratosphere is ozone depletion, whereas in the middle andupper stratosphere both ozone and greenhouse gases play an important role. Tem-perature trends in the mesosphere and mesopause region were reviewed by Beig etal. (2003). The mesosphere was found to be cooling by 2–3 K/decade, while in the20
mesopause region no significant temperature trend was observed, particularly in sum-mer. Such height dependence of temperature trends in the mesosphere-lower ther-mosphere (MLT) region has been qualitatively confirmed by model simulations (e.g.,Fomichev et al., 2007; Garcia et al., 2007).
A scenario of trends in the mesosphere, thermosphere and ionosphere was cre-25
ated by Lastovicka et al. (2006, 2008). This scenario provides a consistent pattern ofchange of the upper atmospheric climate in terms of long-term trends of selected up-per atmosphere-ionosphere system variables. Recent progress in this area has beenreviewed by Lastovicka (2009). Now it is right moment to investigate if (and how deep
2635
ACPD10, 2633–2668, 2010
Long-term trends inthe middle
atmospheredynamics
J. Lastovicka et al.
Title Page
Abstract Introduction
Conclusions References
Tables Figures
J I
J I
Back Close
Full Screen / Esc
Printer-friendly Version
Interactive Discussion
into) the stratosphere can “join” this scenario or it behaves in a separate manner as aconsequence of different relative role of long-term change drivers, particularly of ozone.The results of this study contribute to such a goal.
When atmospheric temperature and its height profile change, we can expectchanges in winds and activity of atmospheric waves. However, when Lastovicka et5
al. (2006, 2008) established the first scenario of trends in the mesosphere, thermo-sphere and ionosphere, they found three main areas of discrepancies, problems orunclear trends; one of them was the MLT region dynamics, where trends in winds atnorthern higher middle latitudes revealed a reversal near 1990. On the other hand, itis known that the total columnar ozone at northern middle latitudes changed its trend10
in the mid-1990s (e.g., Andersen et al., 2006; Harris et al., 2008; Krzyscin, 2006;Reinsel et al., 2005; Staehelin et al., 2001). Angell and Free (2009) claim based onUmkehr and ozone sonde data that the lower stratosphere (heights 10–19 km) con-tributes about half of the recent total ozone increase in northern moderate latitudes.The ozone trends in the lower stratosphere over Payerne (46.49◦ N, 6.57◦ E) at altitudes15
below 20 km were found to be caused, to a substantial extent, by dynamical changes(Weiss et al., 2001). Importance of dynamics in the turnaround of ozone trends in themid-1990s was stressed also by, e.g., Krzyscin (2006) and Reinsel et al. (2005). Thereare various possible dynamical contributors to the long-term trend in total ozone, asdiscussed, e.g., by Staehelin et al. (2001) and Hudson et al. (2003). Thus it is possible20
that the whole middle atmospheric dynamics changed trends around the first half ofthe 1990s, as it was first tentatively mentioned by Lastovicka and Krizan (2006).
The main aim of the paper is to answer the question if long-term changes in themiddle atmosphere (mesosphere and stratosphere) dynamics form one single regimeof change, or if the dynamics in the upper and lower parts of the middle atmosphere25
display long-term changes governed by two different regimes/dominant drivers. As weshow in the paper and as it is indicated by section titles/topics, there are rather twodifferent regimes but these are not strictly associated with/divided by altitude.
The primary open problem of the scenario of long-term changes and trends in the
2636
ACPD10, 2633–2668, 2010
Long-term trends inthe middle
atmospheredynamics
J. Lastovicka et al.
Title Page
Abstract Introduction
Conclusions References
Tables Figures
J I
J I
Back Close
Full Screen / Esc
Printer-friendly Version
Interactive Discussion
mesosphere-thermosphere-ionosphere system is the atmospheric dynamics and at-mospheric wave activity. The paper contributes to some extent also to this problem.
Section 2 describes the data and methods used. Section 3 treats ozone-like changesin other variables. Section 4 describes the MLT wind-like changes in trends in variousvariables. Section 5 contains brief discussion of observational results, and Sect. 6 is5
conclusions.
2 Data and methods
We deal with total columnar ozone, ozone laminae, stratospheric winds, MLT regionwinds and the maximum E region electron density represented by the critical frequencyfoE derived from ionosonde measurements. Information on trends in total columnar10
ozone are taken from literature, we do not analyze data. For other variables we dealwith data, applying only very simple methods to get trends like direct comparison ofdata, linear fit or piecewise linear trend determination approach. Studied trends aremostly strong enough and evident to allow such simple approach.
Ozone laminae are narrow layers of significantly enhanced (positive laminae) or sig-15
nificantly depressed (negative laminae) ozone concentration in ozone profiles. Thebest height resolution ozone profiles are provided by ozonesondes, therefore we useEuropean ozonesonde data. Long-term trends in the overall ozone content in laminaeper profile are quite similar in Europe, Canada and northern Japan (Krizan and Las-tovicka, 2005) therefore European data may be considered representative for northern20
higher middle latitudes. Trends based on positive laminae and on negative laminae arevery similar (Krizan and Lastovicka, 2005) and positive laminae provide better and lessnoisy data, therefore here we use only positive laminae.
Ozone laminae are defined and derived in various ways, which are in more detail dis-cussed, e.g., by Krizan and Lastovicka (2004, 2005, 2006). Here we use only positive25
laminae defined by enhancement of ozone concentration with respect to undisturbedozone profile expressed in ozone partial pressure (nbar). We do not use lamina defini-
2637
ACPD10, 2633–2668, 2010
Long-term trends inthe middle
atmospheredynamics
J. Lastovicka et al.
Title Page
Abstract Introduction
Conclusions References
Tables Figures
J I
J I
Back Close
Full Screen / Esc
Printer-friendly Version
Interactive Discussion
tion based on ozone mixing ratio. Two types of laminae are considered, large laminaewith peak values more than 40 nbar above the undisturbed values, and small laminaewith peak values between 10–20 nbar above the undisturbed values. Their predomi-nant origin is different.
Ozone laminae are derived from ozonesonde ozone profiles measured at Euro-5
pean stations Payerne (46.49◦ N, 6.57◦ E), Hoheinpeissenberg (47.8◦ N, 11.02◦ E), Lin-denberg (52.21◦ N, 14.12◦ E), Legionowo (52.4◦ N, 20.97◦ E), Prague-Libus (50.02◦ N,14.45◦ E), Uccle (50.8◦ N, 4.35◦ E). Station Prague-Libus made soundings only inJanuary–April, other stations did it throughout the year. Payerne, Hohenpeissenbergand Uccle data were taken from 1970, whereas continuous measurements at Linden-10
berg began in 1975 and at Legionowo and Prague-Libus in 1979. Ozonesonde datawere taken from Toronto database: http://www.msc-smc.ec.gc.ca/woudc.
Velocity and direction of stratospheric winds at pressure levels of 100, 50 and 10 hPawere taken from ERA-40 for the extra-tropical northern latitudes. Only selected resultsfor 100 and 10 hPa are presented in the paper.15
Mesopause region winds are used as measured at Collm (52◦ N, 15◦ E) by driftmethod, at Obninsk near Moscow (55◦ N, 37◦ E) by meteor radar (both with typicalheights 90–95 km), and partly at Juliusruh (54.6◦ N, 13.4◦ E) by MF radar; results aretaken from other papers.
Information on the behaviour of stratospheric planetary wave activity is taken from20
paper by Jacobi et al. (2009).Ionospheric parameters are used as measured at the two most reliable European
ionosonde stations Juliusruh (54.6◦ N, 13.4◦ E) and Slough/Chilton (51.6◦ N, 1.3◦ W).Data are taken from the Rutherford-Appleton Laboratory database: http://www.ukssdc.ac.uk/wdcc1/wdc menu.htm.25
2638
ACPD10, 2633–2668, 2010
Long-term trends inthe middle
atmospheredynamics
J. Lastovicka et al.
Title Page
Abstract Introduction
Conclusions References
Tables Figures
J I
J I
Back Close
Full Screen / Esc
Printer-friendly Version
Interactive Discussion
3 Total ozone-like changes in trends
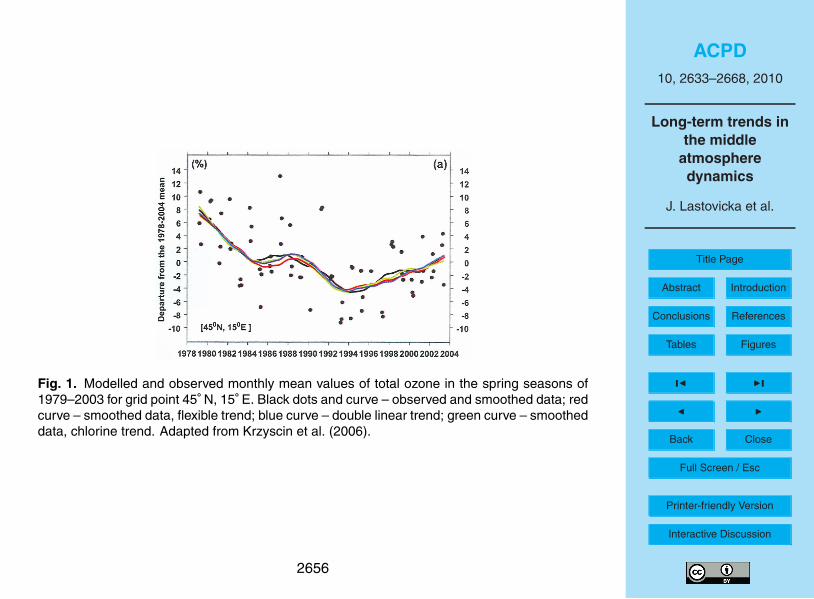
It is known that the total columnar ozone at northern middle latitudes reversed its trendin the mid-1990s (e.g., Andersen et al., 2006; Harris et al., 2008; Krzyscin, 2006;Reinsel et al., 2005; Staehelin et al., 2001). Figure 1 illustrates this change for gridpoint 45◦ N, 15◦ E based on Version 8 TOMS/SBUV total ozone satellite data. After5
a decrease since 1979 modulated by solar cycle responsible for the mini-peak near1989, the total ozone trend reversed to increase in 1994–1995. Thus turnaround oftotal ozone trends occurs in the mid-1990s. The ozone trends in the lower stratosphereover Payerne (46.49◦ N, 6.57◦ E) at altitudes below 20 km were found to be caused, to asubstantial extent, by dynamical changes, including the turnaround of trends in the mid-10
1990s (Weiss et al., 2001). The substantial role of dynamics in the trend turnaroundhas been supported also by results of other studies, e.g., Harris et al. (2008), Reinselet al. (2005). There are various possible dynamical contributors to the long-term trendin total ozone, as discussed, e.g., by Staehelin et al. (2001) and Hudson et al. (2003).
The mid-1990s are important also for the lower stratospheric temperature trends15
at middle latitudes. While over the period 1979–2007 there is a negative trend∼0.5 K/decade in global temperature, no noticeable cooling is observed since 1995(Randel et al., 2009). It may be caused by the change of trend in total ozone; since1995 the positive trend in ozone (heating) rather compensates the trend caused by in-creasing greenhouse gas concentration (cooling), whereas in 1979–1994(5) the ozone20
trend impact on temperature supported the greenhouse gas-induced cooling (ozonewas rather the main driver of cooling).
Since changes in dynamics seem to be rather decisive factor in turnaround of ozonetrends at northern middle latitudes in the mid-1990s, we turn attention to ozone lami-nae, a parameter which is more sensitive to changes in dynamics than the total ozone25
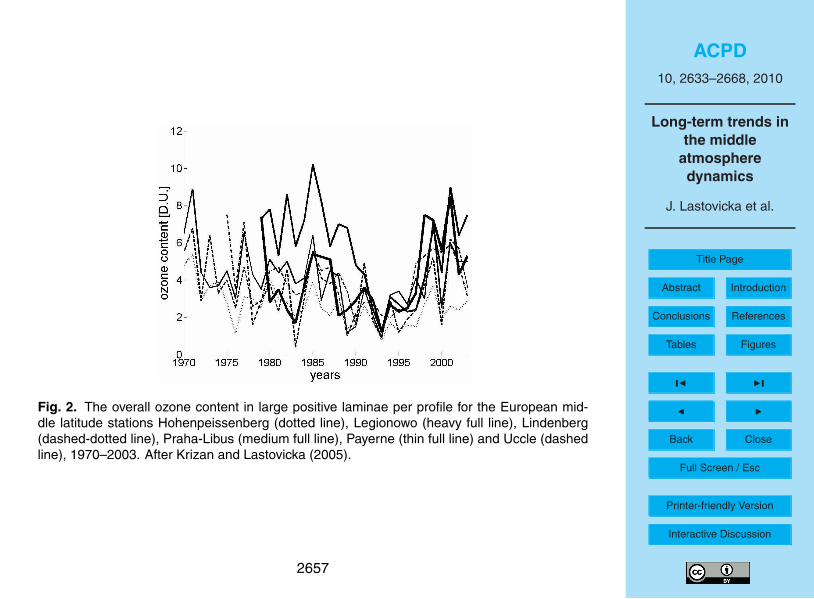
or the ozone content in various atmospheric layers. Laminae are defined in Sect. 2.Figure 2 is based on large positive laminae. Such ozone laminae display a verystrong seasonal variation, large majority of them occurring in January–May with peak
2639
ACPD10, 2633–2668, 2010
Long-term trends inthe middle
atmospheredynamics
J. Lastovicka et al.
Title Page
Abstract Introduction
Conclusions References
Tables Figures
J I
J I
Back Close
Full Screen / Esc
Printer-friendly Version
Interactive Discussion
in February-March. Long-term trends in ozone laminae are similar at latitudes of about35–75◦ N, and for Europe, Northern America and Japan (Krizan and Lastovicka, 2005).Trends are robust in the sense that they depend little on the definition and method ofdetermination of laminae, contrary to the overall ozone content in laminae or numberof laminae themselves (Krizan and Lastovicka, 2005, 2006).5
Figure 2 shows the long-term development of the overall ozone content in largelaminae per ozone profile for several European stations. Since 1970 the overall ozonecontent was rapidly decreasing towards the mid-1990s (depression in 1993 can beattributed to the Mt. Pinatubo volcanic eruption, as volcanic aerosols peaked aboveEurope in spring 2003 after measurements of Ansman et al., 1997). The overall ozone10
content in laminae per profile was reduced to less than a half of its 1970 value. Thenit turned to a rapid increase, in 2003 almost doubling its minimum level. In time thisturnaround of trends coincides with the trend turnaround in the total columnar ozone,both in the mid-1990s. A similar change of trend was observed also at other northernmiddle and higher latitude ozonesonde stations (Krizan and Lastovicka, 2005).15
The large positive laminae observed at analyzed European ozonesonde stationsseem to be very predominantly formed at or near the edge of polar vortex as filaments.They are transported from the vortex boundary by vertically differential meridional wind.Balloon-borne measurements confirm well-resolved laminations near the vortex edge(Orsolini et al., 1998). When the vortex is more stable, weaker laminae are produced20
than in the case of unstable vortex, and conditions for their meridional transport areworse due to stronger zonal wind. Arctic stratospheric winters 1964/1965–1971/1972were unusually warm (= less strong and stable vortex), followed by a period of “normal”winters and then by a period of very cold winters in the early and mid-1990s (Manney etal., 2005), which contributed to the negative trend in the overall ozone content in lami-25
nae. However, winters 1997/1998–2003/2004 were again unusually warm (Manney etal., 2005), which contributed to the observed positive trend in the overall ozone contentin laminae. Thus the Arctic polar vortex behaviour as indicator of behaviour of dynam-ics coincides with trend in the overall ozone content in laminae and its turnaround in the
2640
ACPD10, 2633–2668, 2010
Long-term trends inthe middle
atmospheredynamics
J. Lastovicka et al.
Title Page
Abstract Introduction
Conclusions References
Tables Figures
J I
J I
Back Close
Full Screen / Esc
Printer-friendly Version
Interactive Discussion
mid-1990s. First results also indicate relation of this turnaround of trends in total ozoneand laminae to the reversal of trend in the North Atlantic Oscillation (NAO) (Krizan andLastovicka, 2006).
How is it with trends in the number of laminae per profile, i.e. in the lamina occurrencefrequency? They display different trend behaviour and turnaround as discussed in5
Sect. 4.
4 MLT wind-like changes in trends
Routine wind measurements in the MLT region at heights of about 80–100 km havebeen carried out for several decades, particularly at several stations at northern highermiddle latitudes. The most prominent components of the mid-latitude MLT winds are10
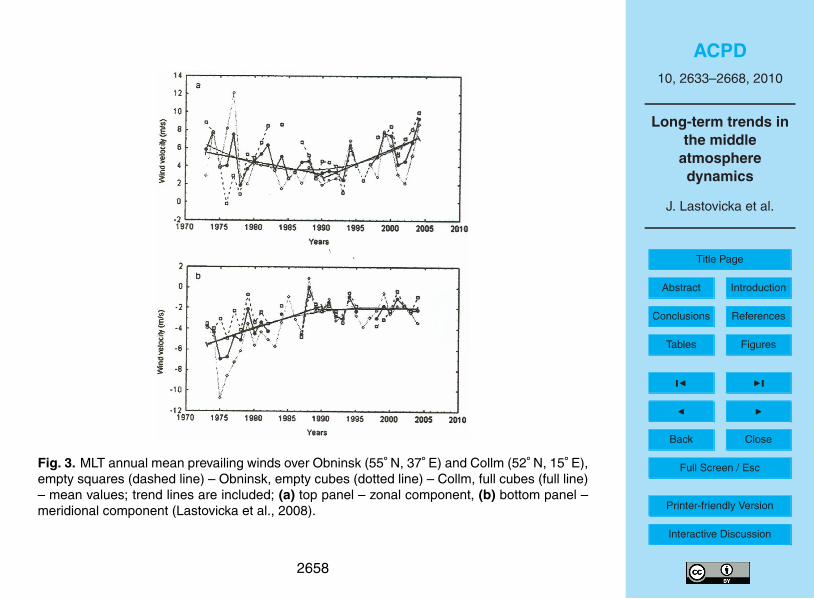
the prevailing (mean) winds and tidal winds, then planetary waves and gravity waves.Figure 3 shows how trends in the annual mean prevailing wind changed around 1990.Before 1990 both the annual prevailing zonal and meridional winds at Obninsk (55◦ N,37◦ E) and Collm (52◦ N, 15◦ E) weakened, whereas after 1990 zonal wind strengthenedand the negative trend in meridional wind levelled off. Shorter-period wind data series15
from Kazan (56◦ N, 49◦ E) and Saskatoon (52◦ N, 107◦ W) confirm this change of trend,(e.g., Jacobi et al., 2001), thus this change of trend in the MLT prevailing wind appearsto be characteristic for the whole northern higher middle latitude belt. On the otherhand Portnyagin et al. (2006) observed no increase of winter (December-February)mean zonal winds at Saskatoon (Canada) after 1985–1990 contrary to Collm. How-20
ever, Jacobi et al. (2009) claim that this difference in Saskatoon wind behaviour isexplainable by combined effect of different response to major stratospheric warmingand the stratospheric warming distribution with time.
Diurnal and semidiurnal tides are the most important tidal modes; in the MLT region itis particularly the semidiurnal tide. The negative trend in semidiurnal tidal winds seems25
to cease after the mid 1980s or rather near 1990 (e.g., Jacobi et al., 1997; Portnyaginet al., 2006), or may even reverse. Observations at Scott Base, Antarctica reveal a
2641
ACPD10, 2633–2668, 2010
Long-term trends inthe middle
atmospheredynamics
J. Lastovicka et al.
Title Page
Abstract Introduction
Conclusions References
Tables Figures
J I
J I
Back Close
Full Screen / Esc
Printer-friendly Version
Interactive Discussion
positive trend since the late 1980s (Baumgaertner et al., 2005). Thus tides behave ina similar way as prevailing wind. Again a reversal of trend is observed near 1990, eventhough maybe a little earlier than in prevailing wind.
These trends correspond to heights of about 90–95 km. Let us now go up, to about110 km. Wind data for trend studies are not available, but the worldwide ionosonde5
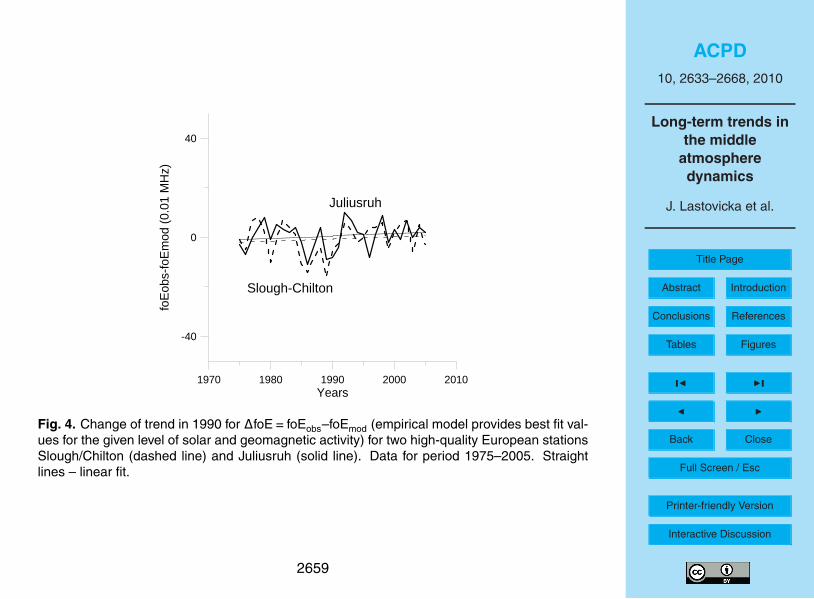
network provides long-time continuous measurements of foE, critical frequency of theionospheric E region, which represents its maximum electron density located near110 km. The overall long-term trend in foE is positive but weak (e.g., Bremer, 2008). Itis mainly a consequence of greenhouse cooling-evoked changes in chemistry of minorconstituents (e.g., Lastovicka et al., 2008). But how it looks in detail? Figure 4 shows10
the long-term development of foE for two high-quality data providing ionospheric sta-tions in Europe located in the same latitudinal band as MLT wind stations used in Fig. 3,Slough/Chilton (51.6◦ N, 1.3◦ W) and Juliusruh (54.6◦ N, 13.4◦ E). Both stations reveal aweak negative trend before 1990 and slightly stronger positive trend after, which resultsin the overall slight positive trend of rather low significance. Thus we again observe ten-15
dency to turnaround of trends near 1990. It is necessary to mention that if we dividethe data set used into two parts, 1975–1989 (negative trend) and 1990–2005 (positivetrend), only the Slough trend for 1975–1989 is statistically significant at the 95% level.However, it is not surprising due to short data series (15 and 16 data points, respec-tively). On the other hand, at much higher heights, in foF1 near 200 km, such change20
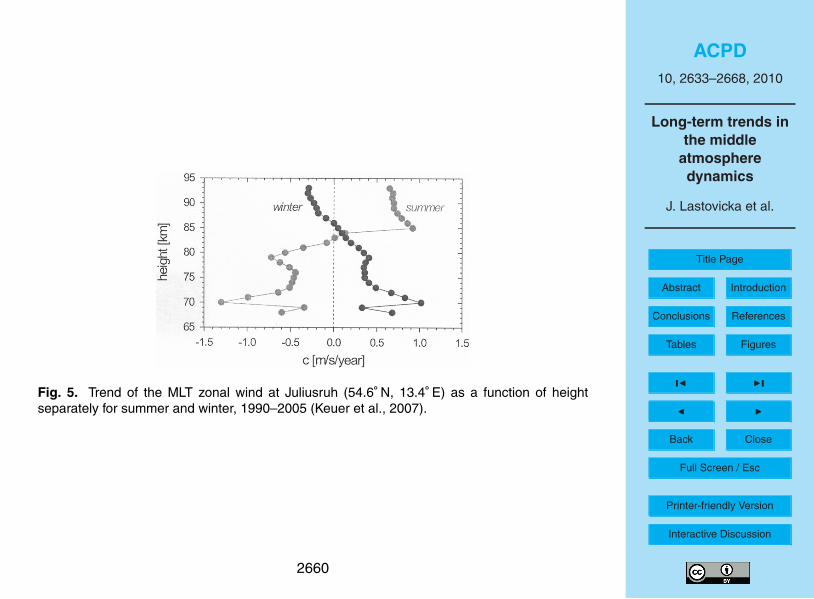
of trends has not been observed at all.Let us go from 90–95 km down into the mesosphere. As Fig. 5 shows, trends in
prevailing zonal winds change their signs and below 83–85 km are opposite to thoseabove, as found from partial reflection radar measurements at Juliusruh (54.6◦ N,13.4◦ E) at heights of 68–93 km (Keuer et al., 2007). Moreover, trends in winter are25
opposite to those in summer. The annual mean trend is dominated by stronger sum-mertime trends. Unfortunately, data on winds in the lower and middle mesospherebefore 1990, suitable for long-term trend studies, are not available. Therefore possibleturnaround of trends in mesospheric winds cannot be searched for.
2642
ACPD10, 2633–2668, 2010
Long-term trends inthe middle
atmospheredynamics
J. Lastovicka et al.
Title Page
Abstract Introduction
Conclusions References
Tables Figures
J I
J I
Back Close
Full Screen / Esc
Printer-friendly Version
Interactive Discussion
The next step is to go down to the stratosphere. ERA-40 and similar datasets al-low to study trends in winds in the middle and lower stratosphere. Here we presentthe results of the stratospheric wind data analysis based on ERA-40 wind data over1957–2002. Wind data from 30◦ N northward in ERA-40 grid points are used but onlythe results for 52.5◦ N latitudinal circle are analyzed here, because they coincide best5
with latitudes of the MLT region wind observations used in the paper. Another paperwill deal with results at other latitudes and also from other points of view, not onlylong-term trends. Most results will be presented for the 100 hPa level (heights ∼15–16 km) and a few for the 10 hPa level (heights around 30 km) will be added. Heightsaround 100 hPa are the main contributor to ozone laminae, and the sudden strato-10
spheric warming phenomenon is pronounced best at heights around 10 hPa, which arethe reasons (together with data availability) why these two heights have been selected.Larger laminae occur most frequently at heights around 14 km according to Reid andVaughan (1991), which is consistent with our result (Lastovicka, 2002) that more than40% of the overall ozone content in large laminae is located between 100–200 hPa.15
Other authors (e.g., Pierce and Grant, 1998; Orsolini et al., 2001) put the maximum oc-currence of laminae at potential temperatures of 375–400 K, i.e. again about 14–16 km.
Two parameters are studied, wind velocity and wind direction. Wind velocity trendschange to some extent with longitude, therefore the wind velocity data are separatedinto four different sectors: Europe and western Siberia (0◦–90◦ E), central and eastern20
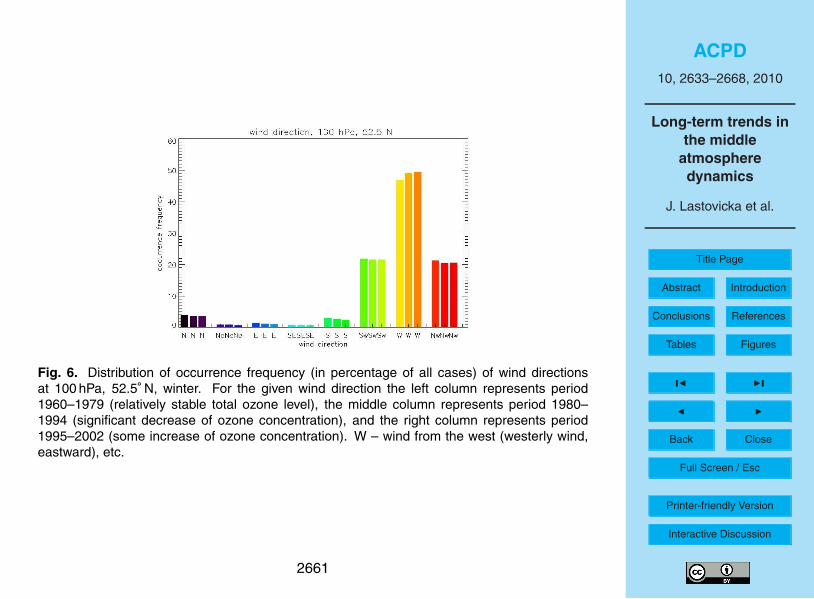
Siberia and western Pacific Ocean (90◦–190◦ E), eastern Pacific Ocean and NorthernAmerica (190◦–300◦ E), and Atlantic Ocean (300◦–360◦ E). On the other hand, winddirection does not change appreciably with longitude therefore only average data areshown. Only winter half of the year (October–March) results are presented hereafter.
When we began investigations, we expected stratospheric wind to follow the same25
trend pattern as ozone and, therefore, data were divided into three intervals accord-ing to the dates of change of trends in the northern midlatitude total ozone, i.e. before1980 (little trend in ozone), 1980–1995 (rapid decrease of total ozone), 1995 onwards(increasing total ozone). Figure 6 (left columns – before 1980; middle columns – 1980–
2643
ACPD10, 2633–2668, 2010
Long-term trends inthe middle
atmospheredynamics
J. Lastovicka et al.
Title Page
Abstract Introduction
Conclusions References
Tables Figures
J I
J I
Back Close
Full Screen / Esc
Printer-friendly Version
Interactive Discussion
1995; right columns – after 1995) shows that there is very little change, if any, in av-erage wind directions with interval and this is the case also in individual sectors (notshown here). Winds are very predominantly westerlies (marked W) – for more than90% of time wind blows in W, SW and NW sectors, i.e. with westerly (or eastward)zonal component. Meridional wind (N, S) occurs in 6–7 % of days, while winds with5
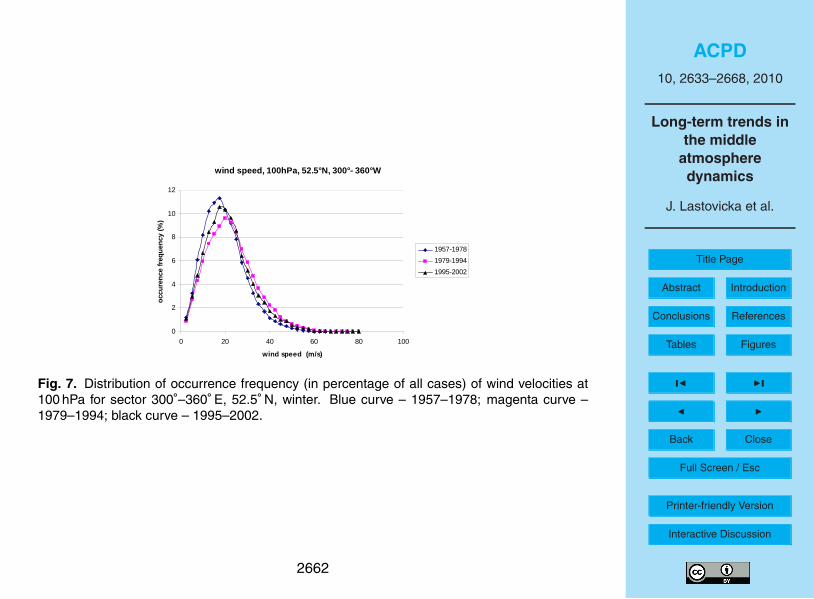
easterly zonal component are very rare.Then we divided in a similar way wind velocities. Figure 7 presents distribution of oc-
currence frequency of individual wind velocities for Atlantic Ocean sector (300◦–360◦ E)separately for the periods before 1980, 1980–1994, and the period since 1995. All foursectors provide similar pattern of change of wind velocity, but it is pronounced best in10
the Atlantic sector shown in Fig. 7. Slow winds dominate in the period before 1980. Inthe period of ozone recovery after 1995 there is a tendency to dominance in medium-speed winds. High-speed winds occur most often in the period of decreasing ozonecontent (1980–1994) (middle column). The difference between periods before 1980and 1980–1994 is not small, for example velocity of 40 m s−1 occurs twice as much for15
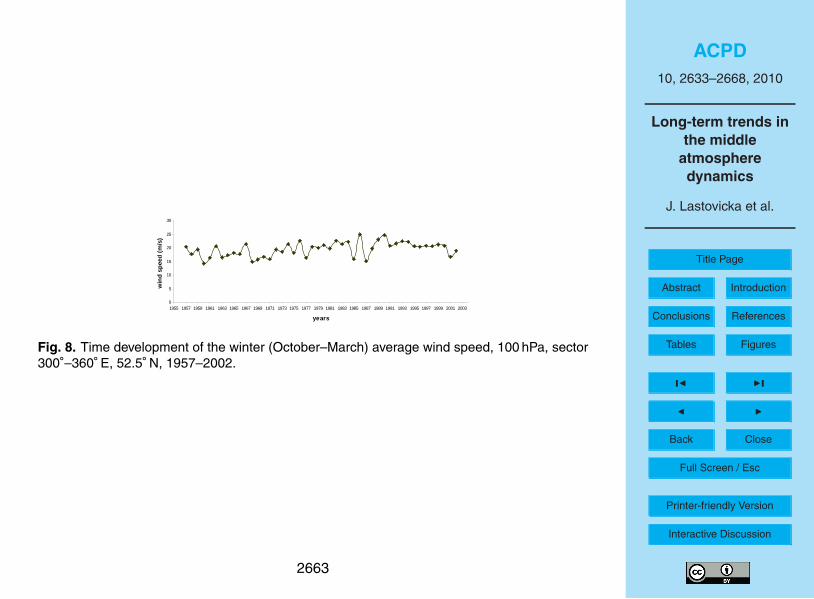
the latter period (Fig. 7).However, such result may be caused by two different effects. Either wind is stronger
in the middle period, because this period is the period of decreasing ozone concen-tration, or the trend turnaround point is near the centre of the middle period (as is thetrend turnaround point for MLT region winds) with positive trend before and negative20
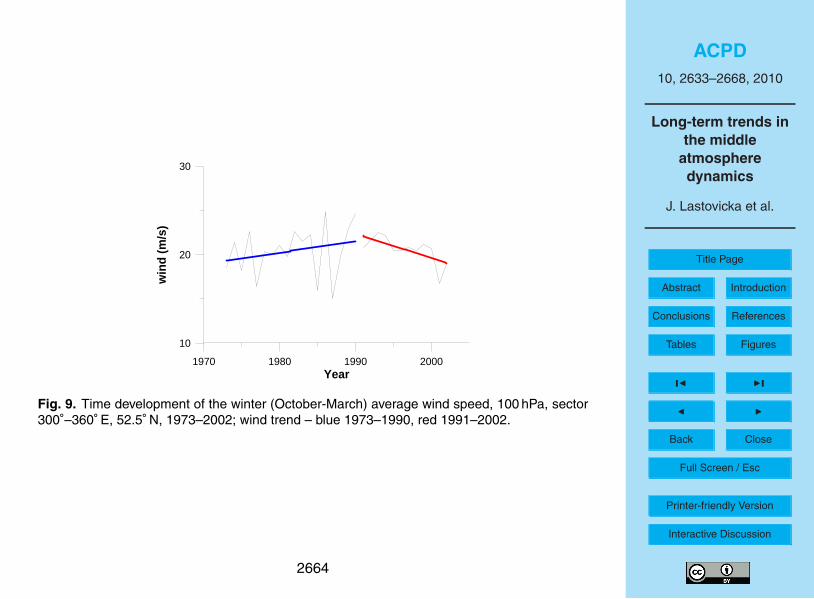
trend after the turnaround point. To resolve this question, Fig. 8 reveals time develop-ment of average wintertime wind velocities over the entire analyzed period. No changeof trend is indicated near the years 1980 and 1995; the change of trend is indicatednear 1990 or slightly before. That means that the trend in the 100 hPa wind velocitychanges not as trends in total ozone, it changes in the same time as the MLT region25
wind trends. Figure 9 presents the stratospheric wind data over the same period asMLT wind data in Fig. 3. Even though large year-to-year variability does not allow de-termine precisely the turnaround year of trends, it is quite evident that the turnaroundoccurred not in the years of turnarounds of trends in total ozone. It occurred near 1990
2644
ACPD10, 2633–2668, 2010
Long-term trends inthe middle
atmospheredynamics
J. Lastovicka et al.
Title Page
Abstract Introduction
Conclusions References
Tables Figures
J I
J I
Back Close
Full Screen / Esc
Printer-friendly Version
Interactive Discussion
in the years of turnaround of trends in the MLT winds shown in Fig. 3. We assumeturnaround year to be 1990 and divide data into two data sets as shown in Fig. 9,1973–1990 and 1991–2002. Then the positive trend in the former interval is statisti-cally insignificant at the 95% level due to very large oscillations of winds between years1985–1990, whereas the negative trend in the latter interval is statistically significant at5
the 95% level. However, small number of data points allows question sense/reliabilityof statistical significance estimates.
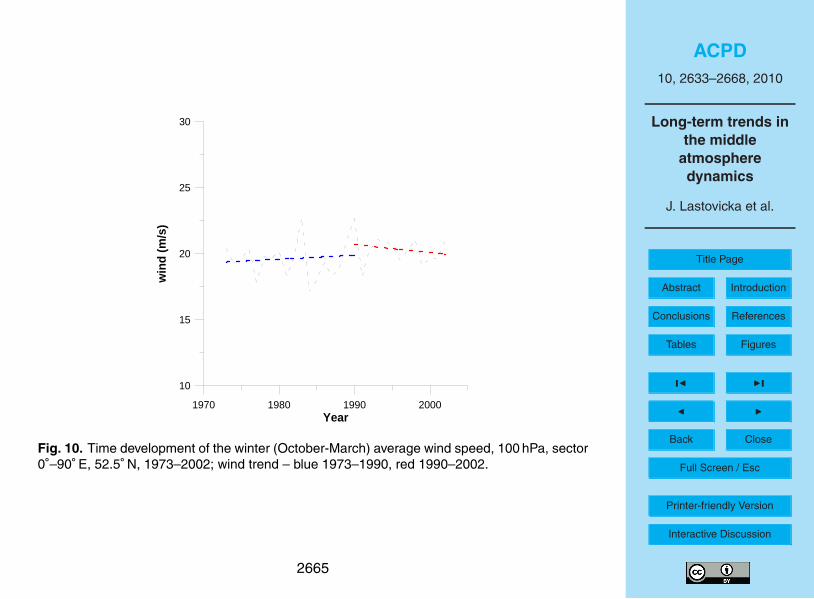
The above stratospheric wind velocity analyses have been made for the sector 300–360◦ E, while MLT wind measurements and ozone laminae observations are from thesector 0–90◦ E, even though except for Obninsk from the sub-sector 0–20◦ E, i.e. near10
the border between these two sectors. Therefore Fig. 10 shows the same as Fig. 9but for the sector 0–90◦ E. In this sector the trends are much weaker and insignificantbut of the same sign as in the sector 300–360◦ E. It is necessary to mention that out ofthe four sectors the trends and change of trends near 1990 are pronounced best in thesector 300–360◦ E and worst in the sector 0–90◦ E. Trends in 100 hPa winds are less15
pronounced than in the MLT winds (Fig. 3) or in the number of laminae (Fig. 12) butreveal the same turnaround of trends near 1990.
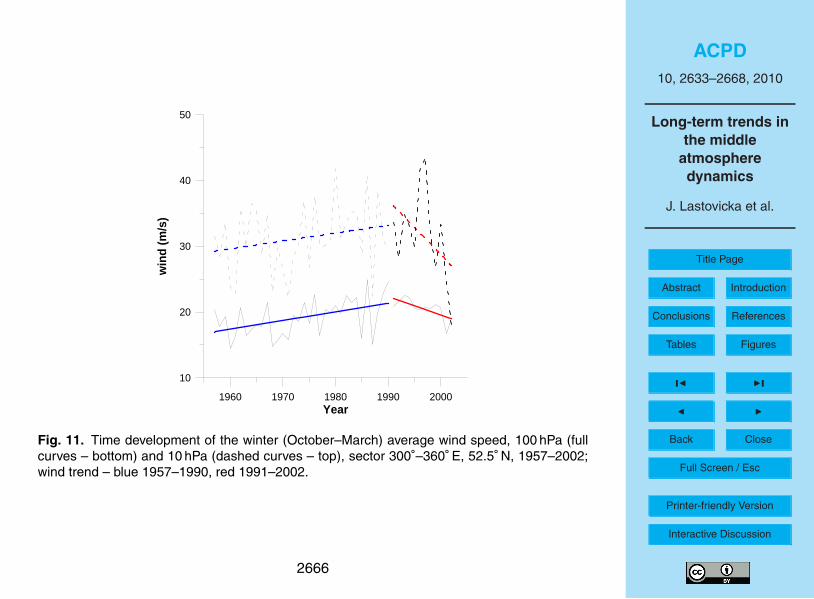
The 10 hPa wind pattern is shown in Fig. 11 together with the 100 hPa wind patternfor the sector 300–360◦ E. Winds at 10 hPa are stronger as expected. They strengthensince 1957 until the late 1980s in a similar way as winds at 100 hPa and year-to-year20
variations and extreme wind appearance at 10 hPa is mostly supported by similar be-haviour at 100 hPa. However, very extremes after 1990 in the years 1996 and 1997(positive), and 2002 (negative) are not supported by 100 hPa behaviour at all. Theylook like outliers with possibility to be caused by data problems. With these data twointerpretations of trend changes are possible – increase before 1990 and decrease25
after 1990, as indicated by trend lines in Fig. 11, or increase until 1980, then stagna-tion until 1997, and then decrease of wind velocity in a way more similar to ozone-likebehaviour of trends. Therefore we cannot conclude what is the behaviour of trends inwind velocity at 10 hPa. Reliability of some extremes in data needs to be checked. On
2645
ACPD10, 2633–2668, 2010
Long-term trends inthe middle
atmospheredynamics
J. Lastovicka et al.
Title Page
Abstract Introduction
Conclusions References
Tables Figures
J I
J I
Back Close
Full Screen / Esc
Printer-friendly Version
Interactive Discussion
the other hand, at 100 hPa both negative and positive trends are statistically significantat the 95% level due to the longer data series used compared to Fig. 9, where only thepositive trend is statistically significant at the 95% level.
All the above analyses of stratospheric wind trends were made for 52.5◦ N (50◦ Nprovides the same pattern), i.e. for higher middle latitudes. Now we turn attention to5
other latitudes and to 100 hPa, where trends are stronger and better pronounced andtheir changes more evident. Behaviour of stratospheric winds at other latitudes andgeneral analysis (not only trend analysis) of wind behaviour is topic of another paper.Therefore we shall only briefly mention results for the Atlantic sector (300◦–360◦ E) andfrom the point of view of trends. The trend pattern at 62.5◦ N is quite similar and at10
72.5◦ N is also fairly similar to that at 52.5◦ N. Towards lower latitudes, at 42.5◦ N thepattern is less similar, and at 32.5◦ N it is different. It is necessary to mention thatat 32.5◦ N, the 100 hPa wind velocity is to some extent influenced by the subtropicaltropopause jet, so its different behaviour is not surprising.
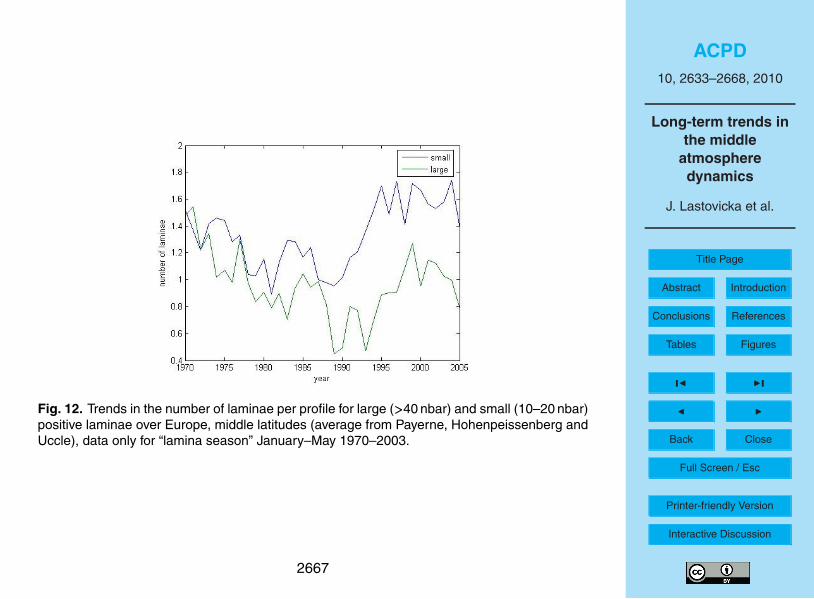
Another quantity, which responds to dynamical processes, is ozone laminae (e.g.,15
Krizan and Lastovicka, 2006). As it is clearly seen from Fig. 12, occurrence frequencyof both large and small laminae substantially and quite significantly decreased since1970 to 1989. This decrease was by a factor of 3 for large laminae and by a fac-tor of 1.5 for small laminae. Then the number of laminae turned to increase, whichcompensated for half of previous reduction for large laminae, but even overcompen-20
sated previous decrease for small laminae. However, it is necessary to mention thatin the early 1990s most sounding stations changed ozonesondes to EES sondes withhigher vertical resolution, which increased detection of narrower small laminae but lit-tle affected detection of broader large laminae. This explains much larger differencebetween small and large laminae in the 1990s compared to the 1980s. We cannot ex-25
clude that such an effect shifted minimum of small laminae slightly towards the 1980sbut this minimum occurred anyway well before 1995. The turnaround year 1989 iswithin accuracy of determination identical with year 1990, the turnaround year of MLTregion winds (Fig. 3), not like total ozone and the overall ozone amount in laminae per
2646
ACPD10, 2633–2668, 2010
Long-term trends inthe middle
atmospheredynamics
J. Lastovicka et al.
Title Page
Abstract Introduction
Conclusions References
Tables Figures
J I
J I
Back Close
Full Screen / Esc
Printer-friendly Version
Interactive Discussion
profile with trend turnaround in the mid-1990s (Sect. 3). It is necessary to mention thatdata including year-to-year variability of various origins allow estimate the turnaroundyear not better than ±1 year at best. On the other hand, an accurate determination ofthe year of turnaround is unnecessary for the purpose of the paper, we need only toknow if the turnaround year is close to 1990 or rather 1995. A smoothed behaviour of5
large laminae provides turnaround of trend slightly later, in the early 1990s, but againclose to 1990, not to 1995. For other regions (Canada, northern Japan) and largelaminae, the turnaround point occurs later, in the mid-1990s like in total ozone (Krizanand Lastovicka, 2005, their Fig. 11). Thus in the number of large laminae (not smalllaminae), the pattern in the European sector versus Japan and Canada is different and,10
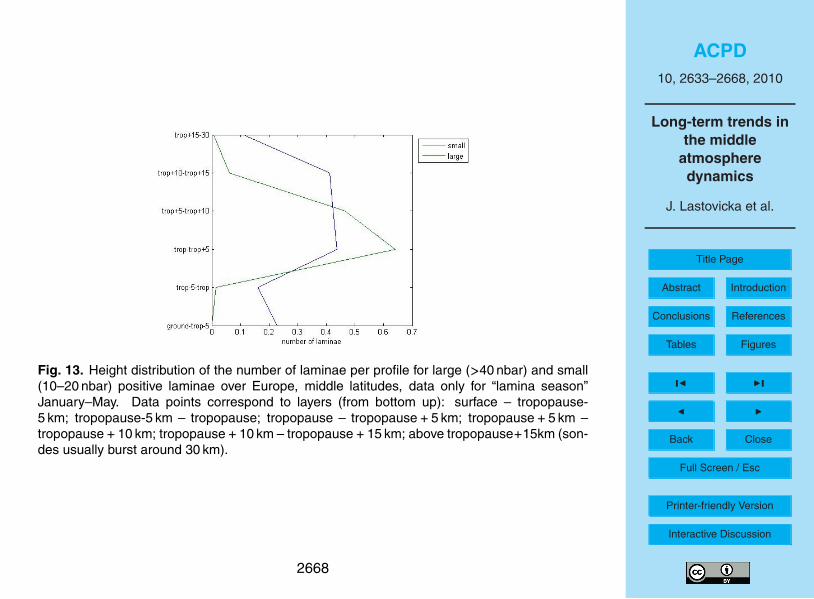
therefore, we will take them in further considerations with care.To be able to interpret the partly different behaviour of large and small laminae,
height distribution of laminae is presented in Fig. 13, which reveals substantial differ-ences in height distribution of large and small laminae. Almost all large laminae arelocated in two height regions, tropopause – tropopause+5km and tropopause+5 km15
– tropopause+10km, i.e. in the first 10 km above the tropopause. Distribution of smalllaminae is much broader, with a broad, flat peak in the first 15 km above the tropopauseand a significant tropospheric contribution, i.e. they occur more or less in the wholeheight range 0–30 km. This creates conditions for their different behaviour as observed,and indicates rather different origin of large and small laminae. Small laminae are prob-20
ably formed by several mechanisms including important role of upward propagatinggravity waves.
5 Discussion
Long-term trends in the middle atmosphere dynamics-related quantities appear togroup into two different clusters according to years of trend turnaround and related25
mechanisms responsible for change of trends. One group displays the total ozonetrend-like behaviour, the other group the MLT wind trend-like behaviour.
2647
ACPD10, 2633–2668, 2010
Long-term trends inthe middle
atmospheredynamics
J. Lastovicka et al.
Title Page
Abstract Introduction
Conclusions References
Tables Figures
J I
J I
Back Close
Full Screen / Esc
Printer-friendly Version
Interactive Discussion
As concerns the ozone-like trend pattern, it is observed in the total ozone and in theoverall ozone content in laminae per profile. As already discussed in Sect. 3, the Arcticpolar vortex behaviour as indicator of behaviour of dynamics, coincides with trend inthe overall ozone content in laminae and its turnaround in the mid-1990s. First resultsalso indicate some relation of this turnaround of trends in total ozone and laminae to5
reversal of trend in the North Atlantic Oscillation (NAO). This means that a substantialrole in driving trend changes might be played by phenomena of tropospheric origin; theNAO is tropospheric phenomenon, and trigger of changes in the stratospheric polarvortex, particularly of sudden stratospheric warming, is the planetary wave activity oftropospheric origin. Further investigations of the role of tropospheric phenomena are10
needed.The other group behaves like MLT winds. It consists of winds in the mesopause
region (90–95 km), maximum electron density in the E region (∼110 km), winds at100 hPa, and number of small ozone laminae. Trends in winds in the mesopauseregion and at 100 hPa have opposite direction, but it is not surprising as trends change15
their sign in 80–85 km (Fig. 5). The changes of trends observed around 1990 are veryprobably caused not directly by the increasing greenhouse concentration; e.g. they arenot observed in trends in mesospheric temperatures (Beig et al., 2003) or trends inthe height of maximum of the E region, hmE (Lastovicka et al., 2008), which both arecaused by increasing concentration of greenhouse gases. These changes of trends20
are probably of rather unclear dynamical origin. One possibility are long-term changesin the gravity wave source activity (predominantly in the troposphere) and gravity wavepenetration to the MLT region heights, because winds are sensitive to gravity waveforcing (particularly near the mesopause). The E-region ionosphere also responds tochanges in the gravity wave activity, and gravity waves contribute significantly to pro-25
duction of small laminae (e.g., Reid et al., 1994; Pierce and Grant, 1998). However,observational information on trends in the gravity wave activity in the MLT region isvery scarce, essentially missing (Lastovicka et al., 2008). As the main source of gravitywave activity is the troposphere, these trends may also be affected by the tropospheric
2648
ACPD10, 2633–2668, 2010
Long-term trends inthe middle
atmospheredynamics
J. Lastovicka et al.
Title Page
Abstract Introduction
Conclusions References
Tables Figures
J I
J I
Back Close
Full Screen / Esc
Printer-friendly Version
Interactive Discussion
dynamics but by its other features than the ozone-like trends. It is necessary to men-tion that changes of stratospheric (and mesospheric) filtering of gravity waves may alsoplay a role in changes of trends. To check the hypothesis on the role of gravity waves,more data and information about long-term behaviour of gravity wave activity at variousheights (it might be height-dependent) is required.5
Jacobi et al. (2009) derived from the NCEP/NCAR reanalyses the amplitudes ofthe stratospheric stationary planetary waves of zonal wavenumber 1 (SPW1) for 50◦ Nand 100, 30 and 10 hPa. The SPW1 amplitudes slightly decrease in 1973–1990 butincrease in 1991–2002 (Jacobi et al., 2009, their Fig. 7). In other words, they display theMLT wind-like type of change of trend. Moreover, European MLT region wind variations10
reveal similarity with the 100 hPa SPW1 variations before the early 1990s, whereas inmore recent years they are more strongly connected with the 30 hPa or 10 hPa SPW1variations (Jacobi et al., 2009).
The above turnarounds of trends concern dynamics of the middle atmosphere.Dates of changing/reversing trends in temperature-related parameters are different,15
if such reversals exist at all, because trends in the mesospheric temperatures (e.g.,Beig et al., 2003) do not reverse. Trends in the lower stratospheric temperature seemto cease after 1995 (Randel et al., 2009), but this change of trend is not of direct dy-namical origin, it is caused by reversal of trend in ozone concentration. Trends in theannual amplitude of temperature in the mesosphere over midlatitude Europe reversed20
in ∼2002 (Offermann et al., 2006). Trends in summer duration in the stratosphereand mesosphere at latitudes northward of ∼50◦ N reversed in ∼1980 (Offermann et al.,2005). However, as far as we know, no remarkable change in trends in mesospherictemperature-related parameters has been reported to occur near 1990 or 1995.
It is important to mention that changes in the tropospheric dynamics seem to play a25
role in the above discussed changes of trends in the middle atmosphere dynamics, i.e.that in situ sources may not be the primary drivers of these changes of trends. This isprobably the reason why these changes are not consistent with the upper atmospheretrend scenario described by Lastovicka et al. (2006, 2008).
2649
ACPD10, 2633–2668, 2010
Long-term trends inthe middle
atmospheredynamics
J. Lastovicka et al.
Title Page
Abstract Introduction
Conclusions References
Tables Figures
J I
J I
Back Close
Full Screen / Esc
Printer-friendly Version
Interactive Discussion
6 Conclusions
The main aim of the paper is to answer the question if long-term changes in the mid-dle atmosphere (mesosphere and stratosphere) dynamics form one single regime ofchange, or if the dynamics in the upper and lower parts of the middle atmosphere dis-play long-term changes governed by two different regimes and different drivers. We find5
two different regimes but these are not divided by an altitude, they are distinguished bydifferent turnaround year of trends and by different drivers of the turnaround of trends.
Observational results show “clustering” of dates of reversal of trends into two ba-sic groups, near 1990 and near 1995 (or mid-1990s), which means that two differentregimes (and related different drivers) are present in changes of trends in the dynam-10
ics of the middle atmosphere. The results, which form the observational “scenario” ofchange of trends in the dynamics in the middle atmosphere in or around the 1990s,may be summarized as follows:
1. Zonal as well as meridional prevailing and semidiurnal tidal winds in themesopause/MLT region (heights ∼90–95 km) at northern higher middle latitudes dis-15
play a reversal or levelling off of trends around 1990. A similar turnaround point intrends, ∼1990, is observed in the European sector at the same latitudes in the E-regionionosphere in foE (heights ∼110 km), in number of small ozone laminae (troposphereto middle stratosphere), and little bit later in number of large ozone laminae (lowerstratosphere) in the European sector (not in American and Japan sector). Winds in20
the lower stratosphere at 52.5◦ N change trends also near 1990. Similar change oftrends has been reported also for the stratospheric SPW1 at 50◦ N. These changesof trends are probably of rather unclear dynamical origin. One possibility is long-termchanges in the gravity wave source activity (mostly of tropospheric origin) and gravitywave penetration upwards up to the MLT region.25
2. At northern middle latitudes the total columnar ozone and the overall ozone con-tent in large laminae per profile reversed trends in the mid-1990, near 1995. Thereversal of trend in total ozone results in ceasing of trends in the lower stratospheric
2650
ACPD10, 2633–2668, 2010
Long-term trends inthe middle
atmospheredynamics
J. Lastovicka et al.
Title Page
Abstract Introduction
Conclusions References
Tables Figures
J I
J I
Back Close
Full Screen / Esc
Printer-friendly Version
Interactive Discussion
temperature after 1995 as a consequence of oppositely acting increase of the green-house gas concentration (cooling) and increase of ozone (warming). The Arctic po-lar vortex behaviour as indicator of behaviour of dynamics coincides with trend in theoverall ozone content in laminae per profile and its turnaround in the mid-1990s. Firstresults also indicate relation of this turnaround of trends in total ozone and laminae5
overall ozone content to reversal of trend in the North Atlantic Oscillation (NAO).The above results form a “skeleton” of scenario of change of trends in the dynamics
of the middle atmosphere in the 1990s. This “skeleton” needs to be completed by otherresults.
It is interesting that both groups reveal some role of tropospheric phenomena or10
phenomena of tropospheric origin in their trend reversals.Our results are based partly on latitudinal circle data, partly on the European sector
data only. Some data display the same trend behaviour in various longitudinal regions(e.g., the overall ozone content in laminae per profile) but at least the mesopauseregion winds (e.g., Jacobi et al., 2009) display different trend behaviour in the North15
America versus Europe (Saskatoon – Collm and Obninsk) and the number of largelaminae displays different trend change dating in Europe versus the Northern Americaand Japan, therefore our results are valid for European sector and in other sectorsmight be partly different (topic of future studies).
Here we discuss stratospheric winds only from the point of view of long-term trend20
behaviour. Analysis of other features of their behaviour is topic of MSc thesis andanother paper in preparation.
Data which we use here cover the upper part of the middle atmosphere above 90 kmand the lower part of the middle atmosphere below 10 hPa (∼30 km). In the lower andmiddle mesosphere the data suitable for wind trend studies are missing. The ERA-4025
data go up to 1 hPa, so in future we will analyze the ERA-40 and/or new ERA-Interimwind data at higher altitudes, taking however into account their possible reliability prob-lems near upper boundary. Wind data suitable for trend studies down to about 80–75 km appeared only during the 1990s, but we hope that careful checking of some
2651
ACPD10, 2633–2668, 2010
Long-term trends inthe middle
atmospheredynamics
J. Lastovicka et al.
Title Page
Abstract Introduction
Conclusions References
Tables Figures
J I
J I
Back Close
Full Screen / Esc
Printer-friendly Version
Interactive Discussion
older data allow go somewhat more backward to check trend changeover existenceand dating. These future observational studies will be accompanied by model simula-tions with LIM model of the University of Leipzig in collaboration in a joint DFG-GACRproject like in Jacobi et al. (2009).
Acknowledgements. This work has been supported by the Grant Agency of the Czech Repub-5
lic, grant 205/07/J052 (joint DFG – GA CR project).
References
Akmaev, R. A., Fomichev, V. I., and Zhu, X.: Impact of middle-atmospheric compositionchanges on greenhouse cooling in the upper atmosphere, J. Atmos. Solar-Terr. Phys., 68,1879–1889, 2006.10
Andersen, S. B., Weatherhead, E. C., Stevermer, A., Austin, J., Bruhl, C., Fleming, E .L., deGrandpre, J., Grewe, F., Isaksen, I., Pitari, G., Portman, R. W., Roguerud, B., Rosenfield,J. E., Smyshlaev, S., Nagashima, T., Velders, G. J. M., Weisenstein, D. K., and Xia, J.:Comparison of recent modelled and observed trends in total column ozone. J. Geophys.Res., 111, D02303, doi:10.1029/2005JD006091, 2006.15
Ansman, A., Mattis, I., Wandinger, U., Wagner, F., Reichardt, J., and Deshler, T.: Evolution ofthe Pinatubo aerosol: Raman lidar observations of particle optical depth, effective radius,and surface area over central Europe at 53.4◦ N, J. Atmos. Sci., 54, 2630–2641, 1997.
Angell, J.K., and Free, M.: Ground-based observations of the slowdown in ozone decline andonset of ozone increase. J. Geophys. Res., 114, D07303, doi: 10.1029/2008JD010860,20
2009.Baumgaertner, A. J. G., McDonald, A. J., Fraser, G. J., and Plank, G. E.: Long-term obser-
vations of mean winds and tides in the upper mesosphere and lower thermosphere aboveScott Base, Antarctica, J. Atmos. Solar-Terr. Phys., 67, 1480–1496, 2005.
Beig, G., Keckhut, P., Lowe, R. P., Roble, R. G., Mlynczak, M. G., Scheer, J., Fomichev, V.25
I., Offermann, D., French, W .J. R., Shepherd, M. G., Semenov, A. I., Remsberg, E. E.,She, C. Y., Lubken, F.-J., Bremer, J., Clemesha, B. R., Stegman, J., Sigernes, F., andFadnavis, S.: Review of mesospheric temperature trends, Rev. Geophys., 41(4), 1015,doi:10.1029/2002RG000121, 2003.
2652
ACPD10, 2633–2668, 2010
Long-term trends inthe middle
atmospheredynamics
J. Lastovicka et al.
Title Page
Abstract Introduction
Conclusions References
Tables Figures
J I
J I
Back Close
Full Screen / Esc
Printer-friendly Version
Interactive Discussion
Bremer, J.: Long-term trends in the ionospheric E and F1 regions. Ann. Geophys., 26, 1189–1197, 2008, http://www.ann-geophys.net/26/1189/2008/.
Fomichev, V. I., Jonsson, A. I., de Grandpre, J., Beagley, S. R., McLandress, C., Semeniuk, K.,and Shepherd, T. G.: Response of the middle atmosphere to CO2 doubling: Results fromthe Canadian Middle Atmosphere Model, J. Clim., 20(7), 1255–1264, 2007.5
Garcia, R. R., Marsh, D. R., Kinnison, D. E., Boville, B. A., and Sassi, F.: Simulation ofsecular trends in the middle atmosphere, 1950–2003, J. Geophys. Res., 112, D09301,doi:10.1029/2006JD007485, 2007.
Harris, N. R. P., Kyro, E., Staehelin, J., Brunner, D., Andersen, S.-B., Godin-Beekmann, S.,Dhomse, S., Hadjinicolaou, P., Hansen, G., Isaksen, I., Jrrar, A., Karpetchko, A., Kivi, R.,10
Knudsen, B., Krizan, P., Lastovicka, J., Maeder, J., Orsolini, Y., Pyle, J. A., Rex, M., Vanicek,K., Weber, M., Wohltmann, I., Zanis, P., Zerefos, C.: Ozone trends at northern mid- and highlatitudes – A European perspective, Ann. Geophys., 26(5), 1207–1220, 2008.
Hudson, R. D., Frolov, A. D., Andrade, M. F., and Follette, M. B.: The total ozone field separatedinto meteorological regimes. Part I. Defining the regimes, J. Atmos. Sci., 60, 1664–1677,15
2003.Jacobi, C., Hoffmann, P., Liu, R. Q., Krizan, P., Lastovicka, J., Merzlyakov, E. G.,
Solovjova, T. V., and Protnyagin, Yu. I.: Midlatitude mesopause region winds and wavesand comparison with stratospheric variability. J. Atmos. Sol.-Terr. Phys., 71, 1540–1546,doi:10.1016/j.jastp.2009.05.004, 2009.20
Jacobi, Ch., Lange, M., Kurschner, D., Manson A. H., and Meek, C. E.: A long-term comparisonof Saskatoon MF radar and Collm LF D1 mesosphere-lower thermosphere wind measure-ments, Phys. Chem. Earth, 26, 419–424, 2001.
Keuer, D., Hoffmann, P., Singer, W., and Bremer, J.: Long-term variations of the mesosphericwind field at mid-latitudes. Ann. Geophys., 25, 1779–1790, 2007,25
http://www.ann-geophys.net/25/1779/2007/.Krizan, P. and Lastovicka, J.: Definition and determination of ozone laminae in ozone profiles,
Studia Geoph. Geod., 48, 777–789, 2004.Krizan, P. and Lastovicka, J.: Trends in positive and negative ozone laminae in the Northern
Hemisphere. J. Geophys. Res., 110, D10107, doi:10.1029/2004JD005477, 2005.30
Krizan, P. and Lastovicka, J.: Ozone laminae: Comparison of the Southern and Northern Hemi-sphere, and tentative explanation of trends, J. Atmos. Solar-Terr. Phys., 68(17), 1962–1972,2006.
2653
ACPD10, 2633–2668, 2010
Long-term trends inthe middle
atmospheredynamics
J. Lastovicka et al.
Title Page
Abstract Introduction
Conclusions References
Tables Figures
J I
J I
Back Close
Full Screen / Esc
Printer-friendly Version
Interactive Discussion
Krzyscin, W. J.: Change in ozone depletion rates beginning in the mid 1990s: Trend analysesof the TOMS/ SBUV merged total ozone data, 1978–2003, Ann. Geophys., 24, 493–502,2006, http://www.ann-geophys.net/24/493/2006/.
Lastovicka, J.: Very strong negative trends in laminae in ozone profiles, Phys. Chem. Earth,27, 477–483, 2002.5
Lastovicka, J.: Global pattern of trends in the upper atmosphere and ionosphere: Re-cent progress. J. Atmos. Solar-Terr. Phys., 71, 1514–1528, doi:10.1016/j.jastp.2009.01.010,2009.
Lastovicka, J., Akmaev, R. A., Beig, G., Bremer, J., and Emmert, J. T.: Global change in theupper atmosphere, Science, 314 (5803), 1253–1254, 2006.10
Lastovicka, J., Akmaev, R. A., Beig, G., Bremer, J., Emmert, J. T., Jacobi, C., Jarvis, M. J.,Nedoluha, G., Portnyagin, Yu. I., and Ulich, T.: Emerging pattern of global change in theupper atmosphere and ionosphere, Ann. Geophys., 26(5), 1255–1268, 2008.
Lastovicka, J. and Krizan, P.: Trends in laminae in ozone profiles in relation to trends in someother middle atmospheric parameters, Phys. Chem. Earth, 31(1–3), 46–53, 2006.15
Manney, G. L., Kruger, K., Sabutis, J. L., Sena, S. A., and Rawson, S.: The remarkable 2003–2004 winter and other recent warm winters in the Arctic stratosphere since the late 1990s, J.Geophys. Res., 110, D04107, doi:10.1029/2004JD005367.
Offermann, D., Jarisch, M., Donner, M., Oberheide, J., Wohltmann, I., Garcia, R., Marsh, D.,Naujokat, B., and Winkler, P.: Middle atmosphere summer duration as an indicator of long-20
term circulation changes, Adv. Space Res., 35(8), 1416–1422, 2005.Offermann, D., Jarisch, M., Donner, M., Steinbrecht, W., and Semenov, A. I.: OH-temperature
re-analysis forced by recent variance increases, J. Atmos. Solar-Terr. Phys., 68(17), 1924–1933, 2006.
Orsolini, Y., Hansen, G., Manney, G.L., Livesey, N., and Hoppe, U.-P.: Lagrangian reconstruc-25
tion of ozone column and profile at the Arctic Lidar Observatory for Middle AtmosphericResearch (ALOMAR) throughout the in winter and spring of 1997–1998, J. Geophys. Res.,106, 10011–10021, 2001.
Orsolini, Y., Manney, G. L., Engel, A., Ovarlez, J., Claud, Ch., and Coy, L.: Layering in strato-spheric profiles of long-lived trace species: Balloon-borne observations and modeling, J.30
Geophys. Res., 103, 5815–5825, 1998.Pierce, R. B. and Grant, W. B.: Seasonal evolution of Rossby and gravity wave induced laminae
in ozone data obtained at Wallops Island, Virginia, Geophys. Res. Lett., 25, 1859–1862,
2654
ACPD10, 2633–2668, 2010
Long-term trends inthe middle
atmospheredynamics
J. Lastovicka et al.
Title Page
Abstract Introduction
Conclusions References
Tables Figures
J I
J I
Back Close
Full Screen / Esc
Printer-friendly Version
Interactive Discussion
1998.Portnyagin, Yu. I., Merzlyakov, E. G., Solovjova, T. V., Jacobi, Ch., Kurschner, D., Man-
son, A., and Meek, C.:. Long-term trends and year-to-year variability of mid-latitude meso-sphere/lower thermosphere winds. J. Atmos. Solar-Terr. Phys., 68, 1890–1901, 2006.
Ramaswamy, V., Chanin, M.-L., Angell, J., Barnett, J., Gaffen, D., Gelman, M., Keckhut, P.,5
Koshelkov, Y., Labitzke, K., Lin, J. J. R., O’Neil, A., Nash, J., Randel, W., Rood, R., Shiotani,M., Swinbank, R., and Shine, K.: Stratospheric temperature trends: observations and modelsimulations, Rev. Geophys., 39, 71–122, 2001.
Randel, W. J., Shine, K. P., Austin, J., Barnett, J., Claud, C., Gillett, N. P., Keckhut, P., Lange-matz, U., Lin, R., Long, C., Mears, C., Miller, A., Nash, J., Seidel, D. J., Thompson, D. W. J.,10
Wu, F., and Yoden, S.,: An update of observed stratospheric temperature trends. J. Geophys.Res., 114, DO2107, doi:10.1029/2008JD010421, 2009.
Reid, S. J. and Vaughan, G.: Lamination in ozone profiles in the lower stratosphere. Q. J. Roy.Meteor. Soc., 117, 825–844, 1991.
Reid, S. J., Vaughan, G., Mitchell, NJ., Prichard, I. T., Smith, H. J., Jorgensen, T. S., Varot-15
sos, C., and de Backer, H.: Distribution of ozone laminae during EASOE and the possibleinfluence of inertia-gravity waves. Geophys. Res. Lett., 21, 1479–1482, 1994.
Reinsel, G. C., Miller, A. J., Weatherhead, E. C., Flynn, L. E., Nagatani, R. M., Tiao, G. C., andWuebbles, D. J.: Trend analysis of total ozone data for turnaround and dynamical contribu-tions. J. Geophys. Res., 110, D16306, doi:10.1029/2004JD004662, 2005.20
Staehelin, J., Harris, N. R. P., Appenzeller, C., and J. Eberhard, J.: Ozone trends: a review,Rev. Geophys., 39, 231–290, 2001.
Weiss, A., Staehelin, J., Appenzeller, C., and Harris, N.R. P.: Chemical and dynamical contri-butions to ozone profile trends at the Payerne (Switzerland) balloon soundings, J. Geophys.Res., 106, 22685–22694, 2001.25
2655
ACPD10, 2633–2668, 2010
Long-term trends inthe middle
atmospheredynamics
J. Lastovicka et al.
Title Page
Abstract Introduction
Conclusions References
Tables Figures
J I
J I
Back Close
Full Screen / Esc
Printer-friendly Version
Interactive Discussion
Fig. 1. Modelled and observed monthly mean values of total ozone in the spring seasons of1979–2003 for grid point 45◦ N, 15◦ E. Black dots and curve – observed and smoothed data; redcurve – smoothed data, flexible trend; blue curve – double linear trend; green curve – smootheddata, chlorine trend. Adapted from Krzyscin et al. (2006).
2656
ACPD10, 2633–2668, 2010
Long-term trends inthe middle
atmospheredynamics
J. Lastovicka et al.
Title Page
Abstract Introduction
Conclusions References
Tables Figures
J I
J I
Back Close
Full Screen / Esc
Printer-friendly Version
Interactive Discussion
Fig. 2. The overall ozone content in large positive laminae per profile for the European mid-dle latitude stations Hohenpeissenberg (dotted line), Legionowo (heavy full line), Lindenberg(dashed-dotted line), Praha-Libus (medium full line), Payerne (thin full line) and Uccle (dashedline), 1970–2003. After Krizan and Lastovicka (2005).
2657
ACPD10, 2633–2668, 2010
Long-term trends inthe middle
atmospheredynamics
J. Lastovicka et al.
Title Page
Abstract Introduction
Conclusions References
Tables Figures
J I
J I
Back Close
Full Screen / Esc
Printer-friendly Version
Interactive Discussion
Fig. 3. MLT annual mean prevailing winds over Obninsk (55◦ N, 37◦ E) and Collm (52◦ N, 15◦ E),empty squares (dashed line) – Obninsk, empty cubes (dotted line) – Collm, full cubes (full line)– mean values; trend lines are included; (a) top panel – zonal component, (b) bottom panel –meridional component (Lastovicka et al., 2008).
2658
ACPD10, 2633–2668, 2010
Long-term trends inthe middle
atmospheredynamics
J. Lastovicka et al.
Title Page
Abstract Introduction
Conclusions References
Tables Figures
J I
J I
Back Close
Full Screen / Esc
Printer-friendly Version
Interactive Discussion
1970 1980 1990 2000 2010Years
-40
0
40
foE
obs-
foE
mod
(0.
01 M
Hz)
Juliusruh
Slough-Chilton
Fig. 4. Change of trend in 1990 for ∆foE= foEobs–foEmod (empirical model provides best fit val-ues for the given level of solar and geomagnetic activity) for two high-quality European stationsSlough/Chilton (dashed line) and Juliusruh (solid line). Data for period 1975–2005. Straightlines – linear fit.
2659
ACPD10, 2633–2668, 2010
Long-term trends inthe middle
atmospheredynamics
J. Lastovicka et al.
Title Page
Abstract Introduction
Conclusions References
Tables Figures
J I
J I
Back Close
Full Screen / Esc
Printer-friendly Version
Interactive Discussion
Fig. 5. Trend of the MLT zonal wind at Juliusruh (54.6◦ N, 13.4◦ E) as a function of heightseparately for summer and winter, 1990–2005 (Keuer et al., 2007).
2660
ACPD10, 2633–2668, 2010
Long-term trends inthe middle
atmospheredynamics
J. Lastovicka et al.
Title Page
Abstract Introduction
Conclusions References
Tables Figures
J I
J I
Back Close
Full Screen / Esc
Printer-friendly Version
Interactive Discussion
Fig. 6. Distribution of occurrence frequency (in percentage of all cases) of wind directionsat 100 hPa, 52.5◦ N, winter. For the given wind direction the left column represents period1960–1979 (relatively stable total ozone level), the middle column represents period 1980–1994 (significant decrease of ozone concentration), and the right column represents period1995–2002 (some increase of ozone concentration). W – wind from the west (westerly wind,eastward), etc.
2661
ACPD10, 2633–2668, 2010
Long-term trends inthe middle
atmospheredynamics
J. Lastovicka et al.
Title Page
Abstract Introduction
Conclusions References
Tables Figures
J I
J I
Back Close
Full Screen / Esc
Printer-friendly Version
Interactive Discussion
wind speed, 100hPa, 52.5°N, 300°- 360°W
0
2
4
6
8
10
12
0 20 40 60 80 100
wind speed (m/s)
occ
ure
nce
fre
qu
ency
(%
)
1957-1978
1979-1994
1995-2002
Fig. 7. Distribution of occurrence frequency (in percentage of all cases) of wind velocities at100 hPa for sector 300◦–360◦ E, 52.5◦ N, winter. Blue curve – 1957–1978; magenta curve –1979–1994; black curve – 1995–2002.
2662
ACPD10, 2633–2668, 2010
Long-term trends inthe middle
atmospheredynamics
J. Lastovicka et al.
Title Page
Abstract Introduction
Conclusions References
Tables Figures
J I
J I
Back Close
Full Screen / Esc
Printer-friendly Version
Interactive Discussion
0
5
10
15
20
25
30
1955 1957 1959 1961 1963 1965 1967 1969 1971 1973 1975 1977 1979 1981 1983 1985 1987 1989 1991 1993 1995 1997 1999 2001 2003
years
win
d s
pee
d (
m/s
)
Fig. 8. Time development of the winter (October–March) average wind speed, 100 hPa, sector300◦–360◦ E, 52.5◦ N, 1957–2002.
2663
ACPD10, 2633–2668, 2010
Long-term trends inthe middle
atmospheredynamics
J. Lastovicka et al.
Title Page
Abstract Introduction
Conclusions References
Tables Figures
J I
J I
Back Close
Full Screen / Esc
Printer-friendly Version
Interactive Discussion
1970 1980 1990 2000Year
10
20
30w
ind
(m
/s)
Fig. 9. Time development of the winter (October-March) average wind speed, 100 hPa, sector300◦–360◦ E, 52.5◦ N, 1973–2002; wind trend – blue 1973–1990, red 1991–2002.
2664
ACPD10, 2633–2668, 2010
Long-term trends inthe middle
atmospheredynamics
J. Lastovicka et al.
Title Page
Abstract Introduction
Conclusions References
Tables Figures
J I
J I
Back Close
Full Screen / Esc
Printer-friendly Version
Interactive Discussion
1970 1980 1990 2000Year
10
15
20
25
30
win
d (
m/s
)
Fig. 10. Time development of the winter (October-March) average wind speed, 100 hPa, sector0◦–90◦ E, 52.5◦ N, 1973–2002; wind trend – blue 1973–1990, red 1990–2002.
2665
ACPD10, 2633–2668, 2010
Long-term trends inthe middle
atmospheredynamics
J. Lastovicka et al.
Title Page
Abstract Introduction
Conclusions References
Tables Figures
J I
J I
Back Close
Full Screen / Esc
Printer-friendly Version
Interactive Discussion
1960 1970 1980 1990 2000Year
10
20
30
40
50
win
d (
m/s
)
Fig. 11. Time development of the winter (October–March) average wind speed, 100 hPa (fullcurves – bottom) and 10 hPa (dashed curves – top), sector 300◦–360◦ E, 52.5◦ N, 1957–2002;wind trend – blue 1957–1990, red 1991–2002.
2666
ACPD10, 2633–2668, 2010
Long-term trends inthe middle
atmospheredynamics
J. Lastovicka et al.
Title Page
Abstract Introduction
Conclusions References
Tables Figures
J I
J I
Back Close
Full Screen / Esc
Printer-friendly Version
Interactive Discussion
Fig. 12. Trends in the number of laminae per profile for large (>40 nbar) and small (10–20 nbar)positive laminae over Europe, middle latitudes (average from Payerne, Hohenpeissenberg andUccle), data only for “lamina season” January–May 1970–2003.
2667
ACPD10, 2633–2668, 2010
Long-term trends inthe middle
atmospheredynamics
J. Lastovicka et al.
Title Page
Abstract Introduction
Conclusions References
Tables Figures
J I
J I
Back Close
Full Screen / Esc
Printer-friendly Version
Interactive Discussion
Fig. 13. Height distribution of the number of laminae per profile for large (>40 nbar) and small(10–20 nbar) positive laminae over Europe, middle latitudes, data only for “lamina season”January–May. Data points correspond to layers (from bottom up): surface – tropopause-5 km; tropopause-5 km – tropopause; tropopause – tropopause+5 km; tropopause+5 km –tropopause+10 km; tropopause+10 km – tropopause+15 km; above tropopause+15km (son-des usually burst around 30 km).
2668