chapter 8 - atmosphere - environmental affairs
TRANSCRIPT
South Africa Environment Outlook
Chapter 8 Atmosphere
At a glanceThis chapter discusses three issues regarding our atmosphere that warrant attention: air quality, climate change,
and stratospheric ozone depletion. It describes the state of our atmosphere and highlights the fact that indoor
and outdoor air quality remains a concern, especially from a health perspective. Furthermore, our per capita
greenhouse gas emissions are above the global average and our dependence on coal for energy-generation
means that our emissions will increase in future. The chapter also outlines the consequences of climate change
and discusses our progress in addressing air quality, climate change, and ozone depletion.
8.1 INTRODUCTION 2028.2 AIR QUALITY 202 8.2.1 Indoor air quality 202 8.2.2 Ambient air quality and related health risks 203 8.2.3 Sources of atmospheric emissions 207 8.2.4 Persistent organic pollutants 211 8.2.5 Transboundary transportation of air pollutants 213 8.2.6 Acid deposition 213 8.2.7 Towards improving air quality 214 8.3 CLIMATE CHANGE 216 8.3.1 Concentrations of greenhouse gases 217 8.3.2 The latest temperature and rainfall projections 219 8.3.3 Greenhouse gas emissions 221 8.3.4 Effects of climate change 222 8.3.5 Our response to climate change 2258.4 STRATOSPHERIC OZONE DEPLETION 226 8.4.1 Consumption of ozone-depleting substances 227 8.4.2 Effects of stratospheric ozone depletion 228 8.4.3 Responses to stratospheric ozone depletion 2298.5 EMERGING ISSUES 2298.6 CONCLUSION 230 NOTES 232 REFERENCES 232
201
8.1 INTRODUCTIONThe atmosphere is a shared resource that is linked in many ways to ecosystems and human development. Its variable and unpredictable nature in South Africa directly affects food production, human health, and biodiversity. Consequently, the main issues of concern are indoor and ambient air pollution and the associated health impacts; climate change and variability and its implications for ecosystems and human well-being; and the depletion of stratospheric ozone.
The quality of air depends on the quantities of natural and human-caused emissions and the potential of the atmosphere and ecosystems to absorb and remove pollutants. Air pollutants vary in terms of how long they remain in the atmosphere and the impacts they cause. Gases such as carbon dioxide (CO2), methane (CH4), nitrous oxide (N2O, also known as ‘laughing gas’) and chlorofluorocarbons (CFCs) are long-lived and internationally important because of their implications for global warming and stratospheric ozone depletion. Pollutants such as nitrogen dioxide (NO2), sulphur dioxide (SO2), carbon monoxide (CO), and particulate matter (PM) are important locally in terms of human and ecological health.
South Africa is a water-stressed country with a well-developed agricultural sector, and it is sensitive to the effects of climate change – now recognized as a pressing environmental issue. These effects could lead to floods, droughts, rising sea levels, extreme weather events, increased tropical diseases, water scarcity, famines, decline in agricultural productivity, and shifts in migration and trade patterns.
Although stratospheric ozone depletion is a global concern, the impacts are also important locally. They include increased harmful ultraviolet-B (UV-B) radiation reaching ground level, with associated increases in skin cancer, cataract and immune system-related health risks. UV-B radiation also affects vegetation by damaging the photosynthetic pathways and genetic structure of plants.
8.2 AIR QUALITYIn discussions of air quality, a distinction is made between ambient (outdoor) air quality and indoor air pollution levels. Ambient air quality is of primary concern in proximity to industrial and mining activities and busy traffic routes, for example. In such instances, indoor pollutant concentrations are generally lower than are ambient air pollution levels. Within household-fuel-burning areas, indoor air pollutant concentrations in households burning coal, wood, or paraffin as fuel are of special concern, particularly in poorly ventilated dwellings. Here, people are exposed to very high indoor pollutant concentrations, as well as to elevated ambient pollutant concentrations out of doors.
Increasing emphasis is currently being placed on
ambient air quality management due to increasing concentrations of pollutants in the air, particularly in urban areas. New air quality legislation in the form of the National Environmental Management: Air Quality Act (No. 39 of 2004) (NEMAQA) reflects a shift in approach from the almost exclusive emphasis on source-based controls (aimed at limiting emissions) to a receiving-environment approach. It involves defining acceptable air quality levels and implementing interventions (for example, source-based controls, market incentives, voluntary initiatives) to achieve such levels as cost effectively as possible.
For people living in non-fuel-burning households, higher exposures to common combustion-related emissions (such as PM, SO2, NO2, and CO) generally occur outdoors. Poor ambient air quality and increased exposures in such cases come from pollutants emitted by neighbouring activities, for example vehicle activity along roadways, fuel-burning in residential areas, and industrial and mining operations.
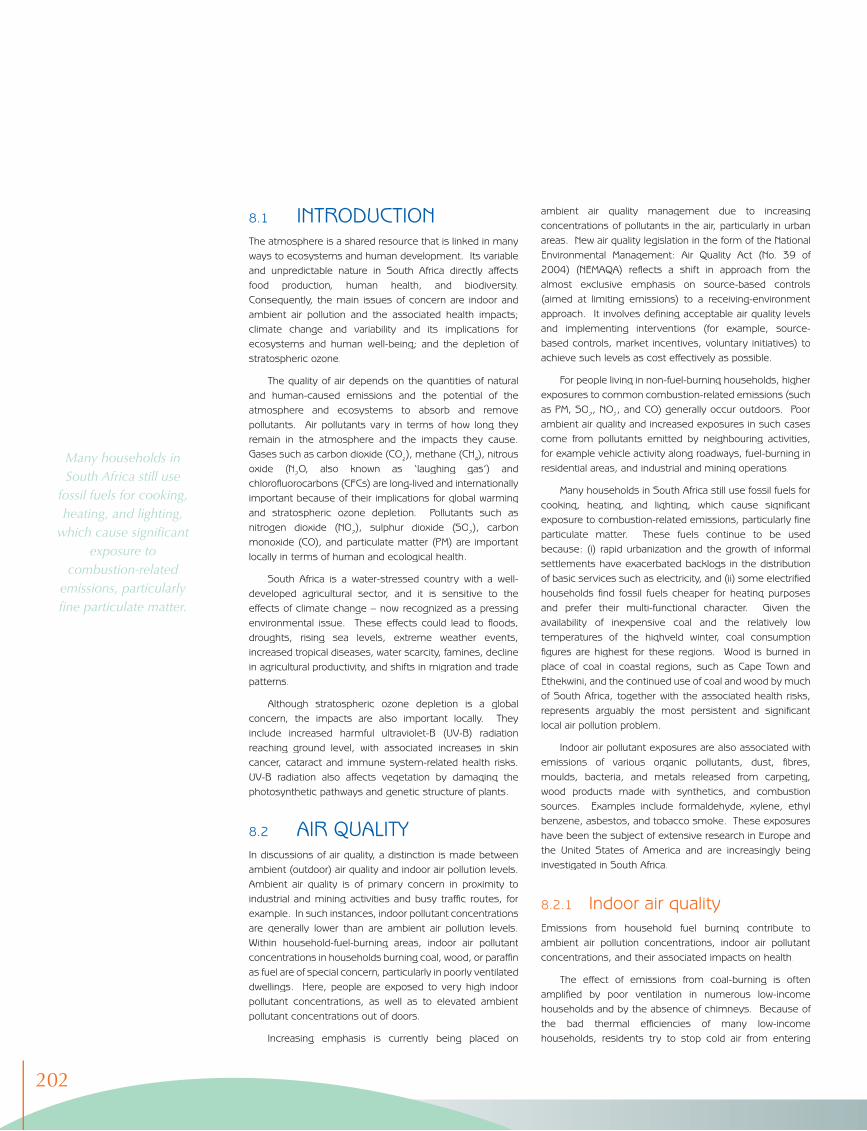
Many households in South Africa still use fossil fuels for cooking, heating, and lighting, which cause significant exposure to combustion-related emissions, particularly fine particulate matter. These fuels continue to be used because: (i) rapid urbanization and the growth of informal settlements have exacerbated backlogs in the distribution of basic services such as electricity, and (ii) some electrified households find fossil fuels cheaper for heating purposes and prefer their multi-functional character. Given the availability of inexpensive coal and the relatively low temperatures of the highveld winter, coal consumption figures are highest for these regions. Wood is burned in place of coal in coastal regions, such as Cape Town and Ethekwini, and the continued use of coal and wood by much of South Africa, together with the associated health risks, represents arguably the most persistent and significant local air pollution problem.
Indoor air pollutant exposures are also associated with emissions of various organic pollutants, dust, fibres, moulds, bacteria, and metals released from carpeting, wood products made with synthetics, and combustion sources. Examples include formaldehyde, xylene, ethyl benzene, asbestos, and tobacco smoke. These exposures have been the subject of extensive research in Europe and the United States of America and are increasingly being investigated in South Africa.
8.2.1 Indoor air qualityEmissions from household fuel burning contribute to ambient air pollution concentrations, indoor air pollutant concentrations, and their associated impacts on health.
The effect of emissions from coal-burning is often amplified by poor ventilation in numerous low-income households and by the absence of chimneys. Because of the bad thermal efficiencies of many low-income households, residents try to stop cold air from entering
Many households in South Africa still use
fossil fuels for cooking, heating, and lighting,
which cause signifi cant exposure to
combustion-related emissions, particularly fi ne particulate matter.
202
their homes. The restriction of air supply often prevents the complete oxidation of dangerous gases, such as CO, resulting in cases of carbon monoxide poisoning.
The concentrations of indoor air pollutants in fuel-burning households are much higher than recommended health limits1, 2, 3, 4, 5. Suspended particulate concentrations are orders of magnitude higher, while concentrations of fine particulate are even worse in wood-burning homes. Although outdoor SO2, CO, and NO2 concentrations within fuel-burning residential areas are generally below ambient air quality guidelines, notable violations of health standards occur because of indoor exposures to these pollutants.
The extent of indoor air pollutant concentrations and the associated health implications suggest the need for indoor air quality monitoring.
8.2.2 Ambient air quality and related health risksIn South Africa’s 1999 State of Environment Report, the characterization of baseline air quality was restricted
Asbestos mining started in South Africa around 1893 in the Northern Cape, Limpopo, and Mpumalanga. Three types of commercial asbestos were mined, namely chrysotile (white asbestos), crocidolite (blue asbestos), and amosite (brown asbestos).
All the blue and brown asbestos mines in South Africa have closed; the single remaining white asbestos mine no longer extracts raw fibre and only 20 people are employed in rehabilitating this mine. All asbestos mines in
South African stopped operating in 2000/2001, and subsequent exports were drawn from existing fibre stockpiles. These stockpiles were expected to be depleted by June 2003.
Up to the 1970s, around 3 000 products were made containing varying quantities of asbestos fibre of all types. Currently, 60 countries still use asbestos, but only the chrysotile variety and primarily in cement building materials such as roofing materials, cladding, and piping.
Exposure to asbestos causes diseases such as asbestosis and lung cancers, as well as other types of cancer. Inhalation of asbestos fibres is associated with a range of pulmonary diseases, primarily asbestosis (mesothelioma-type lung cancer). Despite asbestos mining having ceased, exposure to airborne asbestos fibres continues in South Africa.
Asbestos materials are still widely used in affordable housing, particularly in KwaZulu-Natal and the Eastern and Western Cape. Rural communities have used asbestos fibre as a building material, in which asbestos tailings (obtained from mine dumps) are mixed with mud to plaster the walls of traditional houses. According to the data from the Housing Monitor
Box 8.1 Asbestos remains a health risk
database, 24% of subsidized houses constructed since 1994 were constructed with asbestos-cement roof sheeting.
Inappropriate construction techniques in the building of new houses as well as in the maintenance of existing ones may result in occupational exposure to asbestos. In addition, unskilled and ill-equipped local labour is used extensively in the low income housing sector. This exacerbates the dangers, as limited financial resources often result in the inadequate provision – or even complete absence – of protective clothing and masks.
Furthermore, there is high risk to the environment and to local communities from abandoned, unrehabilitated and/or disturbed asbestos mines and dumps; absence of rehabilitation of asbestos processing plants; randomly discarded asbestos fibre dumps; and the use of asbestos-containing ores for road construction.
No current legislation in South Africa prohibits the use of asbestos-containing building material, but some local authorities in the Free State, Mpumalanga, Limpopo, and Western Cape provinces have nevertheless forbidden its use.
A safety cordon of more than 4 km was set up near Durban’s Bellair Road after
raw asbestos was spilled. Photography: IMAGES24.co.za / Beeld / Leon Botha
Smoke emissions from charcoal fi res. Photography: IMAGES24.co.za / Die Burger / Mouton van Zyl
Atmosphere 203
because of the limited data available. Since then, the number and sophistication of monitoring stationsa has grown substantially, and data sharing in industrial monitoring networks is increasing.
Tables 8.1–8.4 summarize the data from various ambient pollution-monitoring stations in domestic fuel-burning, industrial, traffic, and urban background areas. The following points highlight major potential health problems and present several air quality challenges for South Africa.
Elevated PM10 concentrations occur across the country, with levels exceeding South African National Standard (SANS)6, 7 air quality limits and international best practice standards (European Community limits) at all sites at which PM10 data are available.
Significantly high concentrations of fine particulates occur within fuel-burning residential areas (specifically where coal and wood are burned). Health safety limits are frequently exceeded (in the range 20–40% of days
•
•
in the year, with both daily and annual limits being exceeded).
Concentrations of SO2 in domestic coal-burning areas seldom exceed short-term (10-minute, hourly) air-quality limits, with annual averages comprising only 30% of the annual upper limit stipulated for the protection of human health. The SO2 concentrations within wood-burning residential areas (such as Khayelitsha) are within permissible limits.
Air qualty limits exceeded at road traffic-related sites: NO2 limits are exceeded only during short-term averaging periods. Increasing NO2 concentrations along busy traffic routes within metropolitan areas have been detected over the past decade8. The SANS annual limit for benzene (C6H6) is exceeded at all traffic-related sites except at the Johannesburg Buccleuch station, but this exception may be due to poor data availability. Although PM10 concentrations recorded at traffic sites exceed air quality limits, recent research indicates that only about 30% of these concentrations are related to vehicle
•
•
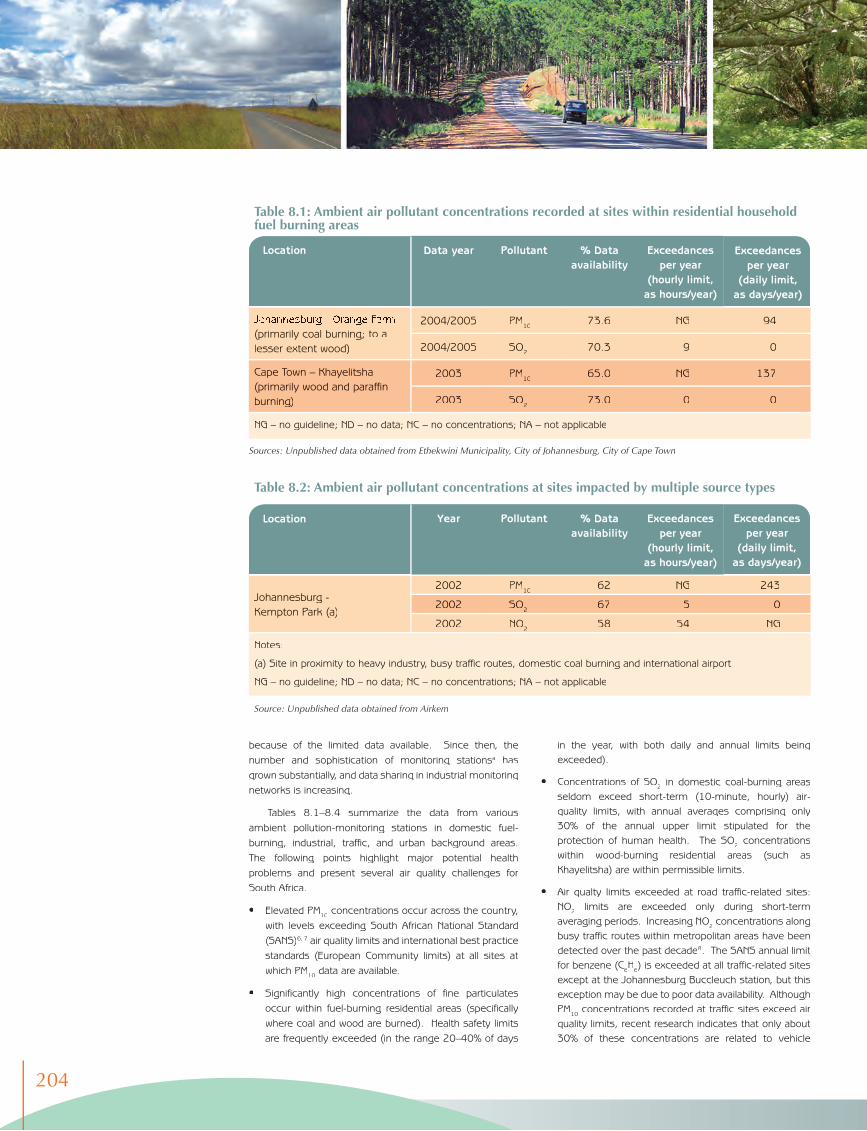
Table 8.2: Ambient air pollutant concentrations at sites impacted by multiple source types
Year Pollutant % Data availability
Exceedances per year
(hourly limit, as hours/year)
Johannesburg - Kempton Park (a)
2002 PM10 62 NG 243
2002 SO2 67 5 0
2002 NO2 58 54 NG
Notes:
(a) Site in proximity to heavy industry, busy traffic routes, domestic coal burning and international airport
NG – no guideline; ND – no data; NC – no concentrations; NA – not applicable
Source: Unpublished data obtained from Airkem
Exceedances per year
(daily limit, as days/year)
Location
Table 8.1: Ambient air pollutant concentrations recorded at sites within residential household fuel burning areas
Data year Pollutant % Data availability
Exceedances per year
(hourly limit, as hours/year)
Johannesburg - Orange Farm (primarily coal burning; to a lesser extent wood)
2004/2005 PM10 73.6 NG 94
2004/2005 SO2 70.3 9 0
Cape Town – Khayelitsha (primarily wood and paraffin burning)
2003 PM10 65.0 NG 137
2003 SO2 73.0 0 0
NG – no guideline; ND – no data; NC – no concentrations; NA – not applicable
Location Exceedances per year
(daily limit, as days/year)
Sources: Unpublished data obtained from Ethekwini Municipality, City of Johannesburg, City of Cape Town
204
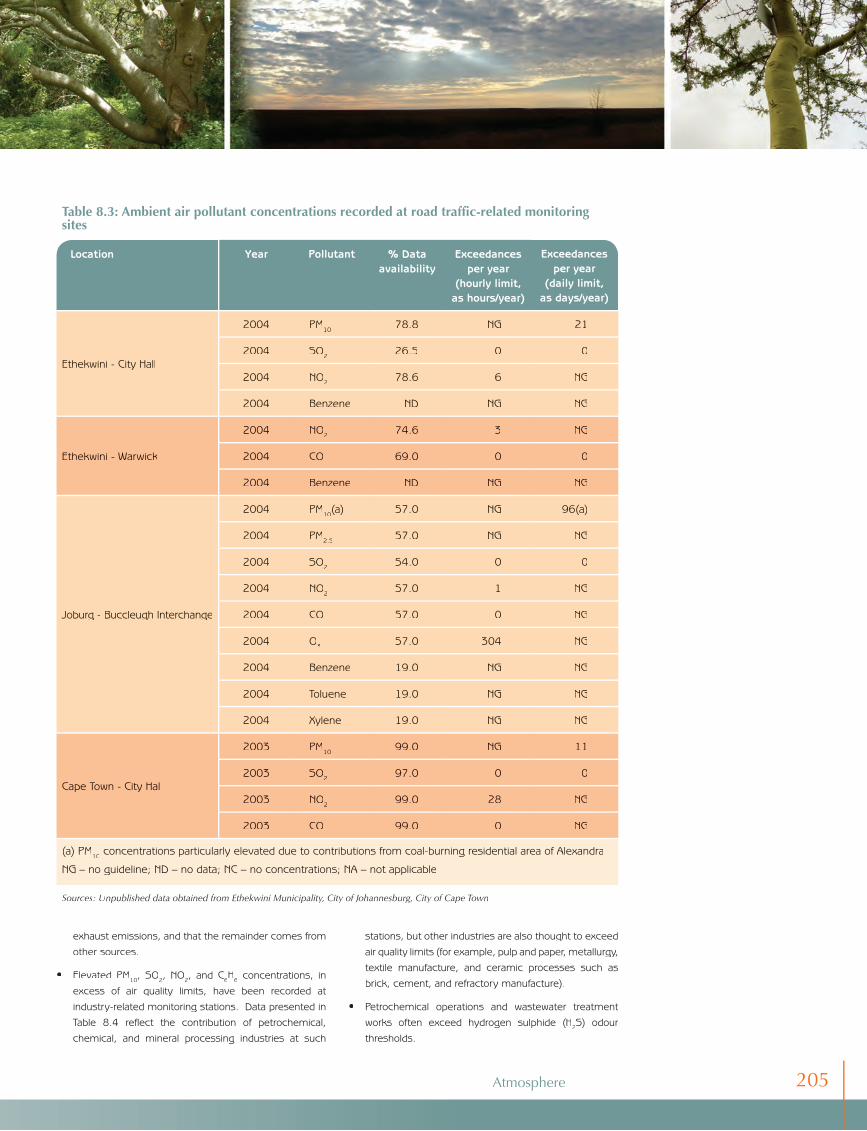
Table 8.3: Ambient air pollutant concentrations recorded at road traffic-related monitoring sites
Year Pollutant % Data availability
Exceedances per year
(hourly limit, as hours/year)
Ethekwini - City Hall
2004 PM10 78.8 NG 21
2004 SO2 26.5 0 0
2004 NO2 78.6 6 NG
2004 Benzene ND NG NG
Ethekwini - Warwick
2004 NO2 74.6 3 NG
2004 CO 69.0 0 0
2004 Benzene ND NG NG
Joburg - Buccleugh Interchange
2004 PM10(a) 57.0 NG 96(a)
2004 PM2.5 57.0 NG NG
2004 SO2 54.0 0 0
2004 NO2 57.0 1 NG
2004 CO 57.0 0 NG
2004 O3 57.0 304 NG
2004 Benzene 19.0 NG NG
2004 Toluene 19.0 NG NG
2004 Xylene 19.0 NG NG
Cape Town - City Hall
2003 PM10 99.0 NG 11
2003 SO2 97.0 0 0
2003 NO2 99.0 28 NG
2003 CO 99.0 0 NG
(a) PM10 concentrations particularly elevated due to contributions from coal-burning residential area of Alexandra
NG – no guideline; ND – no data; NC – no concentrations; NA – not applicable
Sources: Unpublished data obtained from Ethekwini Municipality, City of Johannesburg, City of Cape Town
Location Exceedances per year
(daily limit, as days/year)
exhaust emissions, and that the remainder comes from other sources.
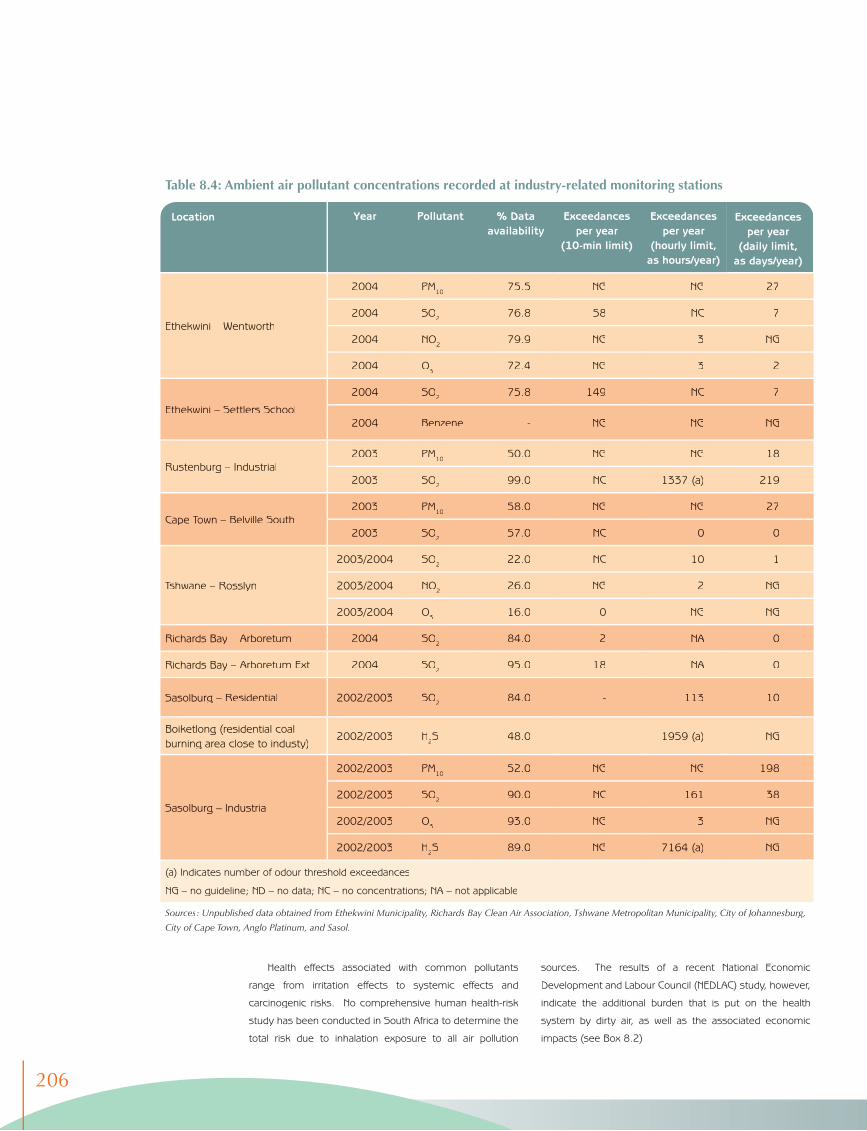
Elevated PM10, SO2, NO2, and C6H6 concentrations, in excess of air quality limits, have been recorded at industry-related monitoring stations. Data presented in Table 8.4 reflect the contribution of petrochemical, chemical, and mineral processing industries at such
•
stations, but other industries are also thought to exceed air quality limits (for example, pulp and paper, metallurgy, textile manufacture, and ceramic processes such as brick, cement, and refractory manufacture).
Petrochemical operations and wastewater treatment works often exceed hydrogen sulphide (H2S) odour thresholds.
•
Atmosphere 205
sources. The results of a recent National Economic
Development and Labour Council (NEDLAC) study, however,
indicate the additional burden that is put on the health
system by dirty air, as well as the associated economic
impacts (see Box 8.2).
Health effects associated with common pollutants
range from irritation effects to systemic effects and
carcinogenic risks. No comprehensive human health-risk
study has been conducted in South Africa to determine the
total risk due to inhalation exposure to all air pollution
Table 8.4: Ambient air pollutant concentrations recorded at industry-related monitoring stations
Year Pollutant % Data availability
Exceedances per year
(10-min limit)
Exceedances per year
(hourly limit, as hours/year)
Ethekwini – Wentworth
2004 PM10 75.5 NG NG 27
2004 SO2 76.8 58 NC 7
2004 NO2 79.9 NG 3 NG
2004 O3 72.4 NG 3 2
Ethekwini – Settlers School
2004 SO2 75.8 149 NC 7
2004 Benzene - NG NG NG
Rustenburg – Industrial2003 PM10 50.0 NG NG 18
2003 SO2 99.0 NC 1337 (a) 219
Cape Town – Belville South2003 PM10 58.0 NG NG 27
2003 SO2 57.0 NC 0 0
Tshwane – Rosslyn
2003/2004 SO2 22.0 NC 10 1
2003/2004 NO2 26.0 NG 2 NG
2003/2004 O3 16.0 0 NG NG
Richards Bay – Arboretum 2004 SO2 84.0 2 NA 0
Richards Bay – Arboretum Ext 2004 SO2 95.0 18 NA 0
Sasolburg – Residential 2002/2003 SO2 84.0 - 113 10
Boiketlong (residential coal burning area close to industy)
2002/2003 H2S 48.0 - 1959 (a) NG
Sasolburg – Industrial
2002/2003 PM10 52.0 NG NG 198
2002/2003 SO2 90.0 NC 161 38
2002/2003 O3 93.0 NG 3 NG
2002/2003 H2S 89.0 NG 7164 (a) NG
(a) Indicates number of odour threshold exceedances
NG – no guideline; ND – no data; NC – no concentrations; NA – not applicable
Sources: Unpublished data obtained from Ethekwini Municipality, Richards Bay Clean Air Association, Tshwane Metropolitan Municipality, City of Johannesburg,
City of Cape Town, Anglo Platinum, and Sasol. and Sasol. and
Location Exceedances per year
(daily limit, as days/year)
206
8.2.3 Sources of atmospheric emissionsThe most common sources of atmospheric emissions in South Africa include:
Electricity generation – power stations for the national grid
Industrial and commercial activities and non-domestic fuel-burning appliances operated by businesses, schools, and hospitals
Transport – petrol- and diesel-driven vehicle tailpipe Transport – petrol- and diesel-driven vehicle tailpipe Transportemissions, vehicle-entrained road dust, brake- and tyre-wear fugitivesb and rail- and aviation-related emissions
Waste treatment and disposal – waste incineration, landfills, and wastewater treatment works
Residential – household combustion of coal, paraffin, liquid petroleum gas, dung, and wood
Mining – fugitive dust releases and spontaneous combustion emissions
•
•
•
•
•
•
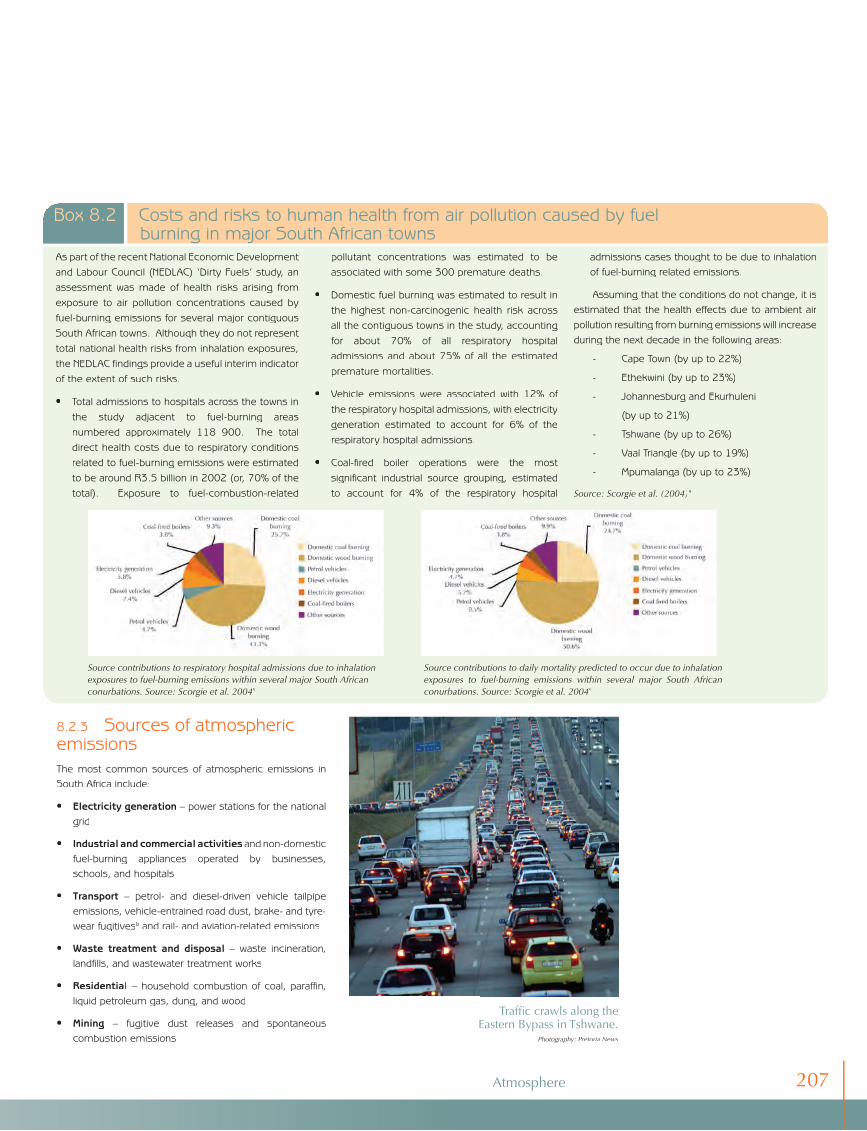
As part of the recent National Economic Development and Labour Council (NEDLAC) ‘Dirty Fuels’ study, an assessment was made of health risks arising from exposure to air pollution concentrations caused by fuel-burning emissions for several major contiguous South African towns. Although they do not represent total national health risks from inhalation exposures, the NEDLAC findings provide a useful interim indicator of the extent of such risks.
Total admissions to hospitals across the towns in the study adjacent to fuel-burning areas numbered approximately 118 900. The total direct health costs due to respiratory conditions related to fuel-burning emissions were estimated to be around R3.5 billion in 2002 (or, 70% of the total). Exposure to fuel-combustion-related
•
pollutant concentrations was estimated to be associated with some 300 premature deaths.
Domestic fuel burning was estimated to result in the highest non-carcinogenic health risk across all the contiguous towns in the study, accounting for about 70% of all respiratory hospital admissions and about 75% of all the estimated premature mortalities.
Vehicle emissions were associated with 12% of the respiratory hospital admissions, with electricity generation estimated to account for 6% of the respiratory hospital admissions.
Coal-fired boiler operations were the most significant industrial source grouping, estimated to account for 4% of the respiratory hospital
•
•
•
admissions cases thought to be due to inhalation of fuel-burning related emissions.
Assuming that the conditions do not change, it is estimated that the health effects due to ambient air pollution resulting from burning emissions will increase during the next decade in the following areas:
- Cape Town (by up to 22%)
- Ethekwini (by up to 23%)
- Johannesburg and Ekurhuleni
(by up to 21%)
- Tshwane (by up to 26%)
- Vaal Triangle (by up to 19%)
- Mpumalanga (by up to 23%)
Source: Scorgie et al. (2004)9
Box 8.2 Costs and risks to human health from air pollution caused by fuel burning in major South African towns
Traffi c crawls along the Eastern Bypass in Tshwane.
Photography: Pretoria News
Source contributions to respiratory hospital admissions due to inhalation exposures to fuel-burning emissions within several major South African conurbations. Source: Scorgie et al. 20049
Source contributions to daily mortality predicted to occur due to inhalation exposures to fuel-burning emissions within several major South African conurbations. Source: Scorgie et al. 20049
Atmosphere 207
Agricultural – crop residue burning, intestinal fermentation, and fertilizer and pesticide application
Tyre-burning, wildfires, and fugitive dust from open Tyre-burning, wildfires, and fugitive dust from open Tyre-burning, wildfires, and fugitive dust
areas.
There is no current comprehensive national emissions inventory for non-greenhouse gas emissions, so data from a 2003 NEDLAC emissions inventory9 have been used in this analysis. The NEDLAC inventory is restricted to fuel-burning activities within the electricity generation, industrial, commercial, residential, and agricultural sectors in the following areas: Tshwane, Johannesburg, Ekurhuleni, Mpumalanga Highveld, Vaal Triangle, Ethekwini, and Cape
•
•
Town. Given that fuel-burning is likely to be responsible for over 80% of emissions caused by human activity of the main gas pollutants (that is, of CO, CO2, SO2, NOX, and CH4) and that the regions covered include more than 40% of the South African population, this emissions inventory is a good indicator of the extent of the problem, pending the completion of a comprehensive and detailed national emissions inventory.
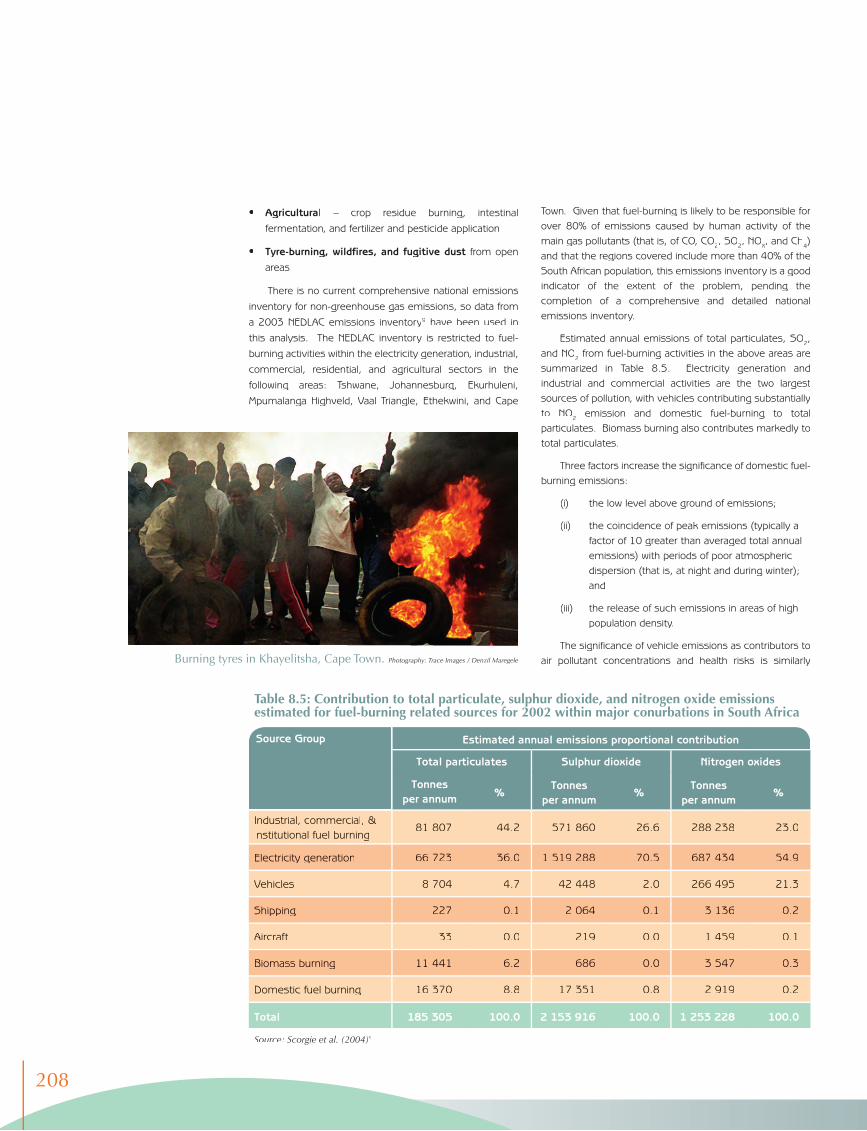
Estimated annual emissions of total particulates, SO2, and NO2 from fuel-burning activities in the above areas are summarized in Table 8.5. Electricity generation and industrial and commercial activities are the two largest sources of pollution, with vehicles contributing substantially to NO2 emission and domestic fuel-burning to total particulates. Biomass burning also contributes markedly to total particulates.
Three factors increase the significance of domestic fuel-burning emissions:
(i) the low level above ground of emissions;
(ii) the coincidence of peak emissions (typically a factor of 10 greater than averaged total annual emissions) with periods of poor atmospheric dispersion (that is, at night and during winter); and
(iii) the release of such emissions in areas of high population density.
The significance of vehicle emissions as contributors to air pollutant concentrations and health risks is similarly Burning tyres in Khayelitsha, Cape Town. Photography: Trace Images / Denzil Maregele
Table 8.5: Contribution to total particulate, sulphur dioxide, and nitrogen oxide emissions estimated for fuel-burning related sources for 2002 within major conurbations in South Africa
Total particulates Sulphur dioxide Nitrogen oxides
Tonnes per annum %
Tonnes per annum
%Tonnes
per annum%
Industrial, commercial, & institutional fuel burning
81 807 44.2 571 860 26.6 288 238 23.0
Electricity generation 66 723 36.0 1 519 288 70.5 687 434 54.9
Vehicles 8 704 4.7 42 448 2.0 266 495 21.3
Shipping 227 0.1 2 064 0.1 3 136 0.2
Aircraft 33 0.0 219 0.0 1 459 0.1
Biomass burning 11 441 6.2 686 0.0 3 547 0.3
Domestic fuel burning 16 370 8.8 17 351 0.8 2 919 0.2
Total 185 305 100.0 2 153 916 100.0 1 253 228 100.0
Source: Scorgie et al. (2004)9
Source Group Estimated annual emissions proportional contribution
208
increased by the low level above ground at which emissions occur and the proximity of such releases to high-exposure areas. Vehicle emissions, furthermore, tend to peak in the early morning and evening, when atmospheric dispersion is lower than at other times.
Biomass burning (wildfires) is a further significant, localized source of episodic emissions, due the low level of release and the fact that most emissions occur during the burn season (see Chapter 4, Box 4.2).
Given the amount of air pollution emitted overall, the contribution by industrial and power generation sources to air pollution concentrations and health risks is often lower than might be expected. This is because these sources are in general characterized by constant, high-level releases, and because their emissions are likely to be further away from residential settlements than those from household fuel-burning and vehicles. For example, the results of the Cape Town Brown Haze Study indicated that the major source of the brown haze is emissions from diesel vehicles. Due to the emissions from the Caltex Refinery and the Athlone power station being above the inversion layer, they do not form a significant portion of the industrial contribution during brown haze episodes in Cape Town10. The impact of industrial emissions has increased over the past decade, however, owing to the increase both in number and in area covered by residential settlements in locations previously designated as industrial buffer zones.
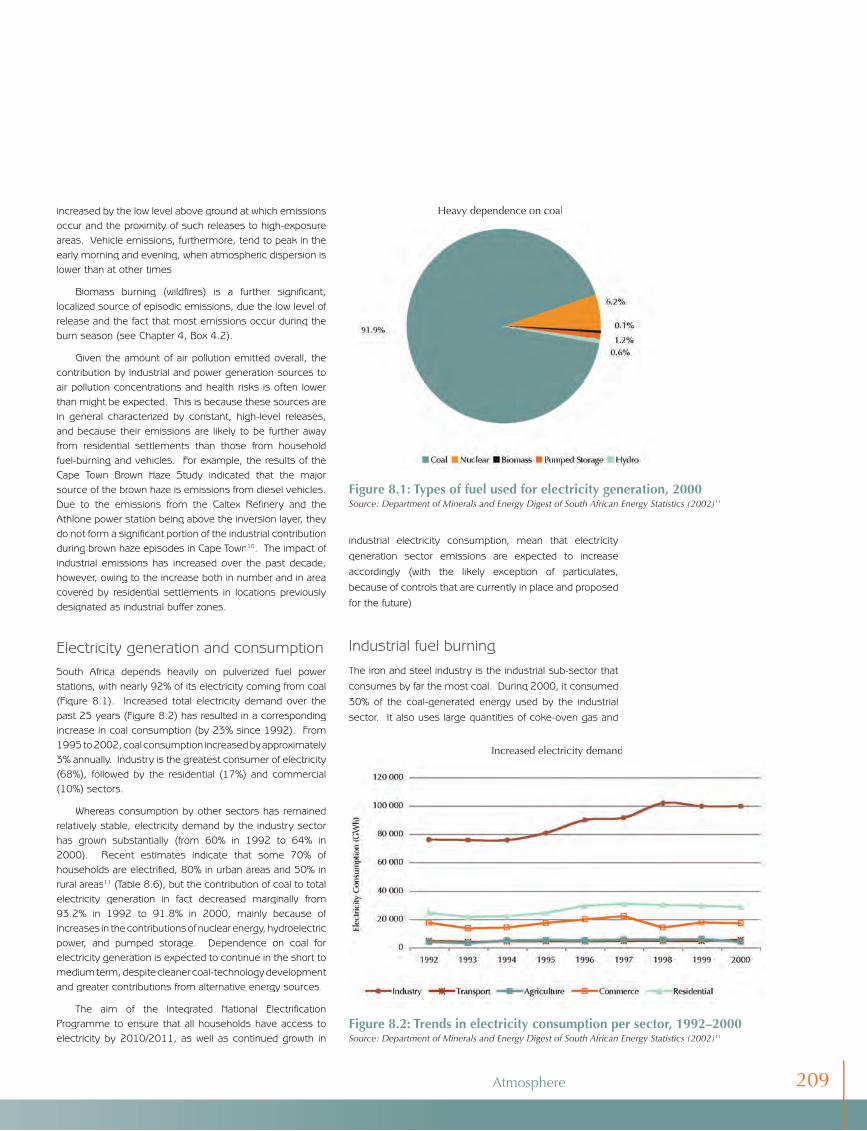
Electricity generation and consumptionSouth Africa depends heavily on pulverized fuel power stations, with nearly 92% of its electricity coming from coal (Figure 8.1). Increased total electricity demand over the past 25 years (Figure 8.2) has resulted in a corresponding increase in coal consumption (by 23% since 1992). From 1995 to 2002, coal consumption increased by approximately 3% annually. Industry is the greatest consumer of electricity (68%), followed by the residential (17%) and commercial (10%) sectors.
Whereas consumption by other sectors has remained relatively stable, electricity demand by the industry sector has grown substantially (from 60% in 1992 to 64% in 2000). Recent estimates indicate that some 70% of households are electrified, 80% in urban areas and 50% in rural areas11 (Table 8.6), but the contribution of coal to total electricity generation in fact decreased marginally from 93.2% in 1992 to 91.8% in 2000, mainly because of increases in the contributions of nuclear energy, hydroelectric power, and pumped storage. Dependence on coal for electricity generation is expected to continue in the short to medium term, despite cleaner coal-technology development and greater contributions from alternative energy sources.
The aim of the Integrated National Electrification Programme to ensure that all households have access to electricity by 2010/2011, as well as continued growth in
Figure 8.1: Types of fuel used for electricity generation, 2000Source: Department of Minerals and Energy Digest of South African Energy Statistics (2002)11
Figure 8.2: Trends in electricity consumption per sector, 1992–2000Source: Department of Minerals and Energy Digest of South African Energy Statistics (2002)11
industrial electricity consumption, mean that electricity generation sector emissions are expected to increase accordingly (with the likely exception of particulates, because of controls that are currently in place and proposed for the future).
Industrial fuel burningThe iron and steel industry is the industrial sub-sector that consumes by far the most coal. During 2000, it consumed 30% of the coal-generated energy used by the industrial sector. It also uses large quantities of coke-oven gas and
Heavy dependence on coal
Increased electricity demand
Atmosphere 209
coking coal and is the largest industrial consumer of fuel oil. Other industrial sub-sectors responsible for consuming significant quantities of coal include the chemical and petrochemical, food and tobacco, pulp and paper, and non-metallurgical sub-sectors.
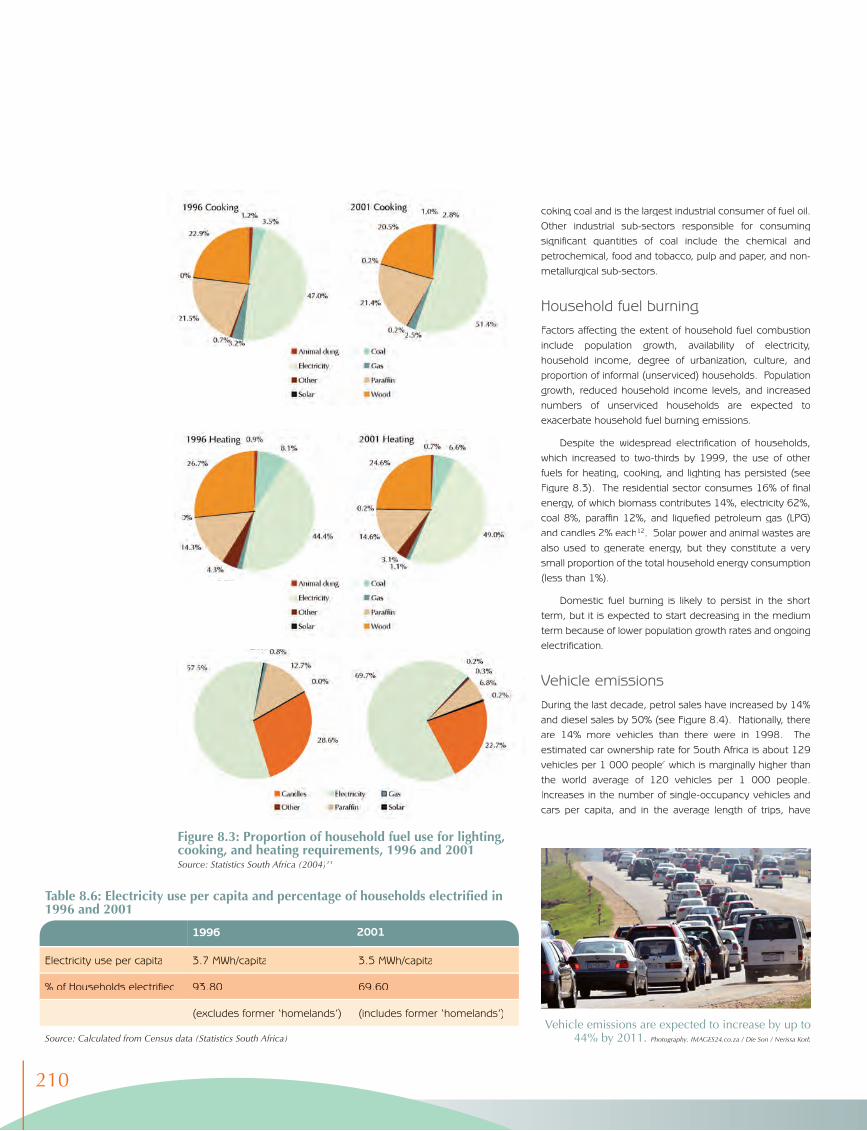
Household fuel burningFactors affecting the extent of household fuel combustion include population growth, availability of electricity, household income, degree of urbanization, culture, and proportion of informal (unserviced) households. Population growth, reduced household income levels, and increased numbers of unserviced households are expected to exacerbate household fuel burning emissions.
Despite the widespread electrification of households, which increased to two-thirds by 1999, the use of other fuels for heating, cooking, and lighting has persisted (see Figure 8.3). The residential sector consumes 16% of final energy, of which biomass contributes 14%, electricity 62%, coal 8%, paraffin 12%, and liquefied petroleum gas (LPG) and candles 2% each12. Solar power and animal wastes are also used to generate energy, but they constitute a very small proportion of the total household energy consumption (less than 1%).
Domestic fuel burning is likely to persist in the short term, but it is expected to start decreasing in the medium term because of lower population growth rates and ongoing electrification.
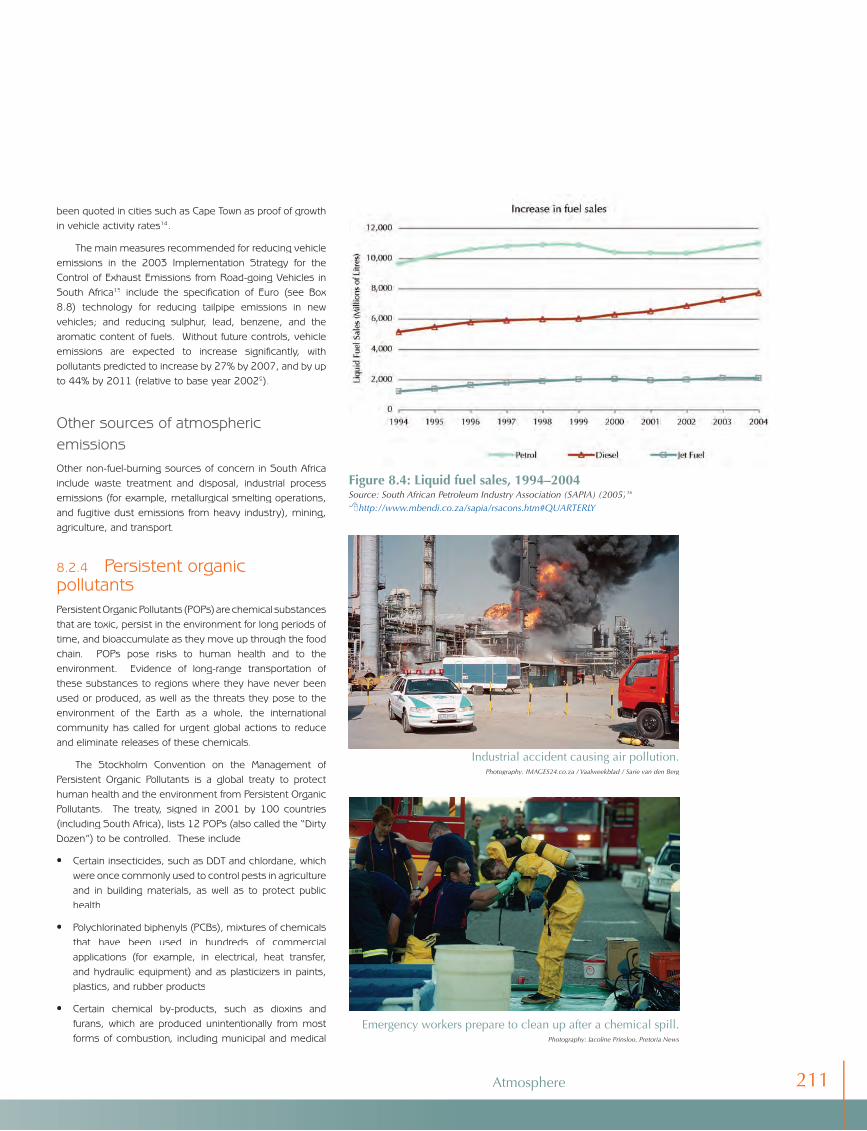
Vehicle emissionsDuring the last decade, petrol sales have increased by 14% and diesel sales by 50% (see Figure 8.4). Nationally, there are 14% more vehicles than there were in 1998. The estimated car ownership rate for South Africa is about 129 vehicles per 1 000 peoplec which is marginally higher than the world average of 120 vehicles per 1 000 people. Increases in the number of single-occupancy vehicles and cars per capita, and in the average length of trips, have
Vehicle emissions are expected to increase by up to 44% by 2011. Photography: IMAGES24.co.za / Die Son / Nerissa Korb
Figure 8.3: Proportion of household fuel use for lighting, cooking, and heating requirements, 1996 and 2001Source: Statistics South Africa (2004)13
Table 8.6: Electricity use per capita and percentage of households electrified in 1996 and 2001
1996
Electricity use per capita 3.7 MWh/capita 3.5 MWh/capita
% of Households electrified 93.80 69.60
(excludes former ‘homelands’) (includes former ‘homelands’)
Source: Calculated from Census data (Statistics South Africa)
2001
210
been quoted in cities such as Cape Town as proof of growth in vehicle activity rates14.
The main measures recommended for reducing vehicle emissions in the 2003 Implementation Strategy for the Control of Exhaust Emissions from Road-going Vehicles in South Africa15 include the specification of Euro (see Box 8.8) technology for reducing tailpipe emissions in new vehicles; and reducing sulphur, lead, benzene, and the aromatic content of fuels. Without future controls, vehicle emissions are expected to increase significantly, with pollutants predicted to increase by 27% by 2007, and by up to 44% by 2011 (relative to base year 20029).
Other sources of atmospheric emissionsOther non-fuel-burning sources of concern in South Africa include waste treatment and disposal, industrial process emissions (for example, metallurgical smelting operations, and fugitive dust emissions from heavy industry), mining, agriculture, and transport.
8.2.4 Persistent organic pollutantsPersistent Organic Pollutants (POPs) are chemical substances that are toxic, persist in the environment for long periods of time, and bioaccumulate as they move up through the food chain. POPs pose risks to human health and to the environment. Evidence of long-range transportation of these substances to regions where they have never been used or produced, as well as the threats they pose to the environment of the Earth as a whole, the international community has called for urgent global actions to reduce and eliminate releases of these chemicals.
The Stockholm Convention on the Management of Persistent Organic Pollutants is a global treaty to protect human health and the environment from Persistent Organic Pollutants. The treaty, signed in 2001 by 100 countries (including South Africa), lists 12 POPs (also called the “Dirty Dozen”) to be controlled. These include:
Certain insecticides, such as DDT and chlordane, which were once commonly used to control pests in agriculture and in building materials, as well as to protect public health
Polychlorinated biphenyls (PCBs), mixtures of chemicals that have been used in hundreds of commercial applications (for example, in electrical, heat transfer, and hydraulic equipment) and as plasticizers in paints, plastics, and rubber products
Certain chemical by-products, such as dioxins and furans, which are produced unintentionally from most forms of combustion, including municipal and medical
•
•
•
Figure 8.4: Liquid fuel sales, 1994–2004 Source: South African Petroleum Industry Association (SAPIA) (2005)16
8http://www.mbendi.co.za/sapia/rsacons.htm#QUARTERLY
Emergency workers prepare to clean up after a chemical spill. Photography: Jacoline Prinsloo, Pretoria News
Industrial accident causing air pollution. Photography: IMAGES24.co.za / Vaalweekblad / Sarie van den Berg
Atmosphere 211
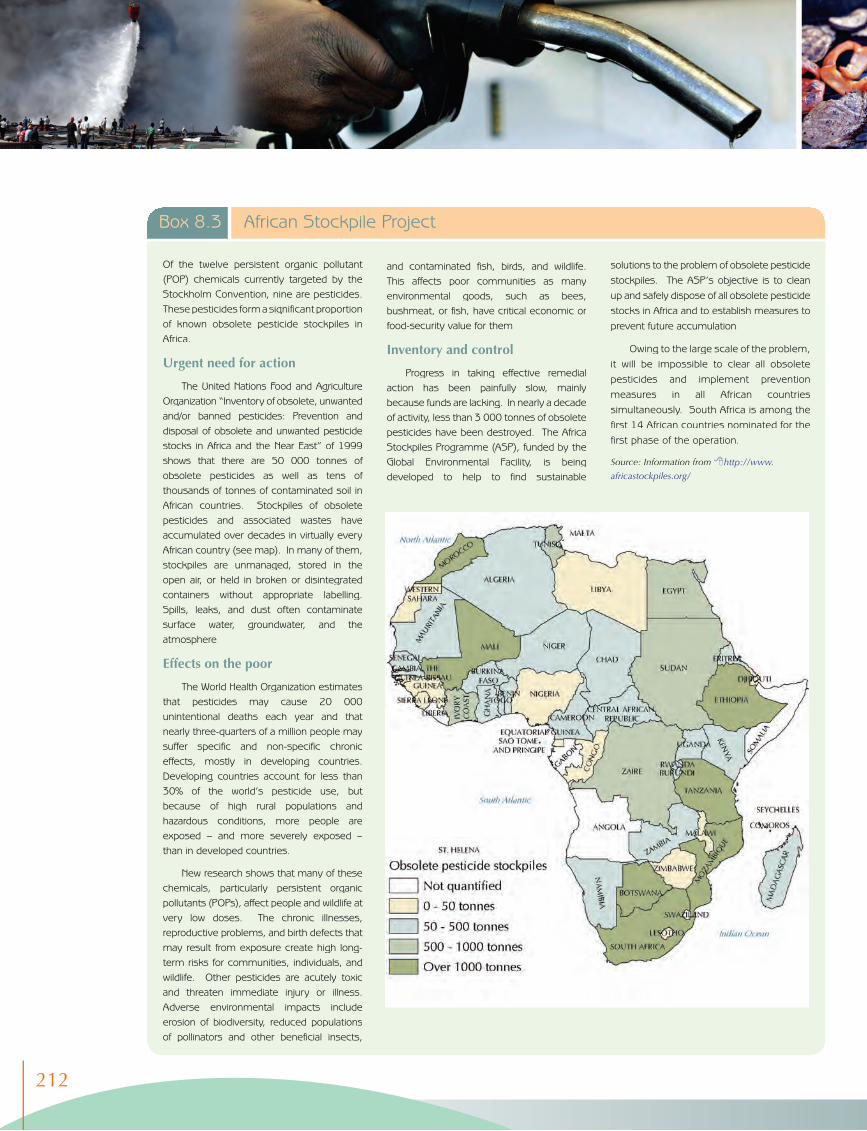
Of the twelve persistent organic pollutant (POP) chemicals currently targeted by the Stockholm Convention, nine are pesticides. These pesticides form a significant proportion of known obsolete pesticide stockpiles in Africa.
Urgent need for action
The United Nations Food and Agriculture Organization “Inventory of obsolete, unwanted and/or banned pesticides: Prevention and disposal of obsolete and unwanted pesticide stocks in Africa and the Near East” of 1999 shows that there are 50 000 tonnes of obsolete pesticides as well as tens of thousands of tonnes of contaminated soil in African countries. Stockpiles of obsolete pesticides and associated wastes have accumulated over decades in virtually every African country (see map). In many of them, stockpiles are unmanaged, stored in the open air, or held in broken or disintegrated containers without appropriate labelling. Spills, leaks, and dust often contaminate surface water, groundwater, and the atmosphere.
Effects on the poor
The World Health Organization estimates that pesticides may cause 20 000 unintentional deaths each year and that nearly three-quarters of a million people may suffer specific and non-specific chronic effects, mostly in developing countries. Developing countries account for less than 30% of the world’s pesticide use, but because of high rural populations and hazardous conditions, more people are exposed – and more severely exposed – than in developed countries.
New research shows that many of these chemicals, particularly persistent organic pollutants (POPs), affect people and wildlife at very low doses. The chronic illnesses, reproductive problems, and birth defects that may result from exposure create high long-term risks for communities, individuals, and wildlife. Other pesticides are acutely toxic and threaten immediate injury or illness. Adverse environmental impacts include erosion of biodiversity, reduced populations of pollinators and other beneficial insects,
and contaminated fish, birds, and wildlife. This affects poor communities as many environmental goods, such as bees, bushmeat, or fish, have critical economic or food-security value for them.
Inventory and control
Progress in taking effective remedial action has been painfully slow, mainly because funds are lacking. In nearly a decade of activity, less than 3 000 tonnes of obsolete pesticides have been destroyed. The Africa Stockpiles Programme (ASP), funded by the Global Environmental Facility, is being developed to help to find sustainable
Box 8.3 African Stockpile Project
solutions to the problem of obsolete pesticide stockpiles. The ASP’s objective is to clean up and safely dispose of all obsolete pesticide stocks in Africa and to establish measures to prevent future accumulation.
Owing to the large scale of the problem, it will be impossible to clear all obsolete pesticides and implement prevention measures in all African countries simultaneously. South Africa is among the first 14 African countries nominated for the first phase of the operation.
Source: Information from 8http://www.
africastockpiles.org/
212
waste incinerators, the open burning of trash, and industrial processes.
South Africa is one of 15 African countries participating in the African Stockpile Project (funded by the Global Environment Facility)d. The aim of this project is to clean up and safely dispose of all obsolete pesticide stocks (for details, see Box 8.3).
POPs emissions, which vary from point to diffuse sources, have not been quantified nationally. Ambient measurements of POPs are currently experimental and data are not readily available. Given the extensive national use of POPs and increasing international emphasis on their regulation, it would be beneficial to quantify POP emissions annually and to establish ambient concentrations of key POPs.
8.2.5 Transboundary transportation of air pollutantse
As the atmosphere over southern Africa and further afield is shared, pollutants come from and go to a variety of locations. Industrial emissions and biomass burning have the greatest potential for inducing environmental and climatic change and hence for affecting systems at a regional scale17, 18, 19.
Four major atmospheric transport pathways carry air towards the Highveld (see Map 8.1). Air masses from the south and central Atlantic Ocean are most likely to be free of industrial emissions, although indications are that biomass burning products, in particular CO, can be transported from South America to southern Africa along this pathway. Air masses from the Indian Ocean are also free of industrial pollutants. The African transport plume, however, may carry industrial pollutants from central southern Africa towards South Africa (with major sources being copper smelters in northern Zambia and Botswana, for example). Although production from Zambia’s Copper Belt has declined in recent years, it remains a significant source of aerosols20, 21. Intermittently (from August to October), the African transport plume also carries large quantities of biomass burning emissions into the South African atmosphere from wildfires in the Democratic Republic of Congo, Angola, and western Zambia.
There are five main pathways by which air masses are transported away from the Highveld, namely, the Indian Ocean plume, the recirculation plume, the Atlantic Ocean plume, the African plume, and the Southern Ocean plume (see Map 8.2). Of the five pathways, air flows most frequently along the Indian Ocean plume (that is, 48% of the time) by which material is transported from the Highveld to the Indian Ocean directly; or indirectly after having initially moved westward before recurving over Lesotho to exit over the southeast coast. The recirculation plume is the second most dominant (air flows along it 32% of the time). Together, the Indian Ocean and the recirculation plumes transport
80% of airborne pollutants off the southeastern continental margin towards Australasia.
Air pollutants carried in air masses that are either recirculated over the Highveld or imported from neighbouring regions contribute significantly to local atmospheric concentrations of fine particulates, particularly in Gauteng. Wildfire biomass burning (veld fires) and aged pollution-laden air (that is, air laden with pollution from faraway sources) were responsible for between 20% and 40% of inhalable particulates recorded in the Vaal Triangle and Johannesburg from 1990 to 1994. Local authorities responsible for air quality management clearly need to concern themselves not only with local sources but also with national and regional ones.
8.2.6 Acid depositionThere is disagreement as to whether or not the acid deposition occurring in South Africa is having detrimental effects on ecosystems. The 1999 National State of Environment Report gave it as a significant issue, but subsequent evidence suggests that this might not be the case.
The Mpumalanga Highveld region (where coal-fired electricity plants and petrochemical and metallurgical industries are concentrated) and the high-rainfall grasslands on the eastern Drakensberg escarpment are the main areas susceptible to acid deposition22. There is evidence23 that the critical rate of deposition is exceeded there, but there is no absolute proof at this early stage that it is directly related to changes in soil and water quality. Susceptible terrestrial and freshwater ecosystems are likely to show adverse effects of acid deposition only in a few decades’ time if the current emission rates of SO2 and nitric oxide (NO) are continued or increased. See Box 8.4 and 8.5 for more information.
Eskom has monitored wet deposition and rain chemistry continuously since 198524. Monitoring over 13 years shows that concentrations of non-sea-salt sulphate and nitrate at Amersfoort (which are indicative of environments affected by industrial emissions) were as high as those in northeastern United States of America and central Europe and typical of regions affected by acid-forming emissions. Most of the acidity in Amersfoort was found to be neutralized by base cations, however. At Makhado (characteristic of rural environments), concentrations were found to be similar to those of western African sites, which do not have high rates of deposition. Fossil fuel sources were the biggest contributors to precipitation acidity at Amersfoort, while at Makhado biomass (veld-burning) emissions predominated22.
An important area of uncertainty and insufficient knowledge relates to the capacity of ecosystems to absorb acid deposition from pollution. Air quality limits are defined only for their effects on the health of humans but not on that of ecosystems.
Given the extensive national use of
persistent organic pollutants (POPs) and increasing international
emphasis on their regulation, it would be benefi cial to quantify
POP emissions annually and to
establish ambient concentrations of key
POPs.
Atmosphere 213
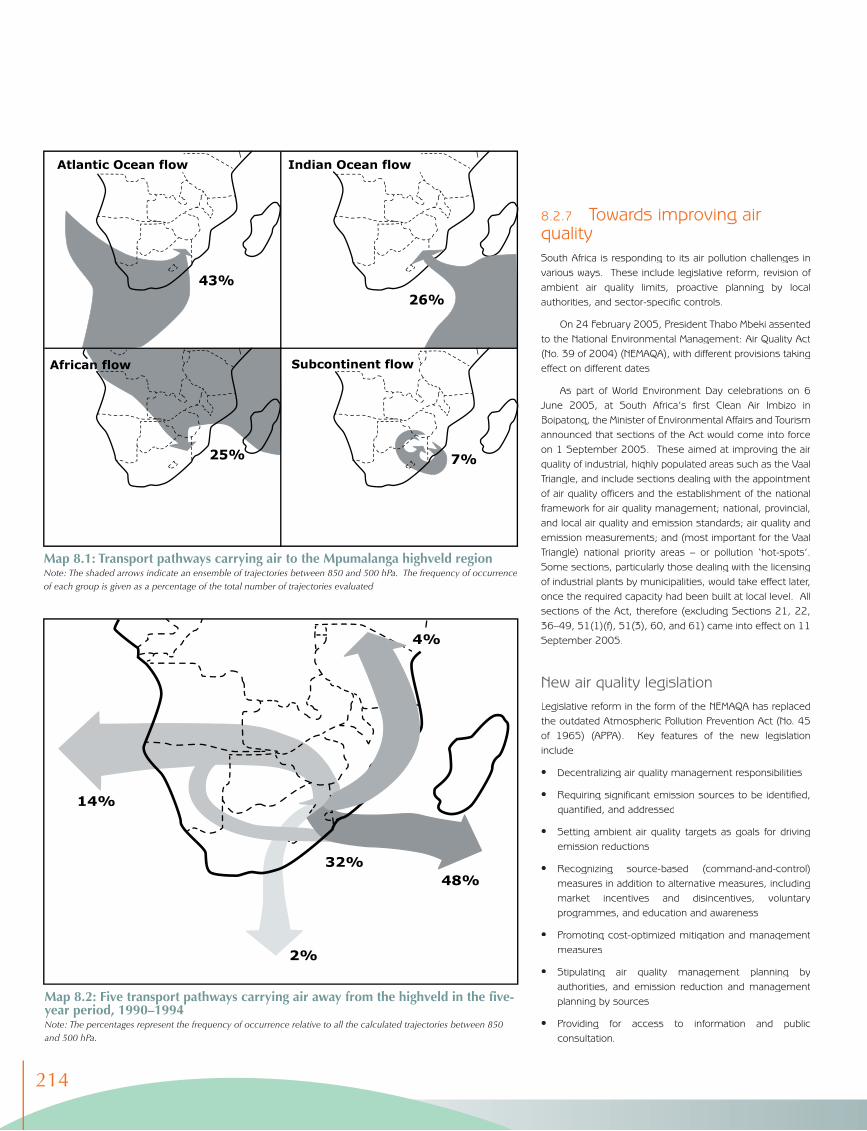
Map 8.2: Five transport pathways carrying air away from the highveld in the five-year period, 1990–1994Note: The percentages represent the frequency of occurrence relative to all the calculated trajectories between 850 and 500 hPa.
Map 8.1: Transport pathways carrying air to the Mpumalanga highveld region Note: The shaded arrows indicate an ensemble of trajectories between 850 and 500 hPa. The frequency of occurrence of each group is given as a percentage of the total number of trajectories evaluated.
8.2.7 Towards improving air qualitySouth Africa is responding to its air pollution challenges in various ways. These include legislative reform, revision of ambient air quality limits, proactive planning by local authorities, and sector-specific controls.
On 24 February 2005, President Thabo Mbeki assented to the National Environmental Management: Air Quality Act (No. 39 of 2004) (NEMAQA), with different provisions taking effect on different dates.
As part of World Environment Day celebrations on 6 June 2005, at South Africa’s first Clean Air Imbizo in Boipatong, the Minister of Environmental Affairs and Tourism announced that sections of the Act would come into force on 1 September 2005. These aimed at improving the air quality of industrial, highly populated areas such as the Vaal Triangle, and include sections dealing with the appointment of air quality officers and the establishment of the national framework for air quality management; national, provincial, and local air quality and emission standards; air quality and emission measurements; and (most important for the Vaal Triangle) national priority areas – or pollution ‘hot-spots’. Some sections, particularly those dealing with the licensing of industrial plants by municipalities, would take effect later, once the required capacity had been built at local level. All sections of the Act, therefore (excluding Sections 21, 22, 36–49, 51(1)(f), 51(3), 60, and 61) came into effect on 11 September 2005.
New air quality legislationLegislative reform in the form of the NEMAQA has replaced the outdated Atmospheric Pollution Prevention Act (No. 45 of 1965) (APPA). Key features of the new legislation include:
Decentralizing air quality management responsibilities
Requiring significant emission sources to be identified, quantified, and addressed
Setting ambient air quality targets as goals for driving emission reductions
Recognizing source-based (command-and-control) measures in addition to alternative measures, including market incentives and disincentives, voluntary programmes, and education and awareness
Promoting cost-optimized mitigation and management measures
Stipulating air quality management planning by authorities, and emission reduction and management planning by sources
Providing for access to information and public consultation.
••
•
•
•
•
•
214
Proactive air quality management planning by local authoritiesUnder the NEMAQA, local authorities take responsibility for monitoring air pollution and meeting nationally to set ambient air quality limits. To facilitate these activities, Air Quality Management Plans (AQMPs) are to be compiled, documenting sources of non-compliance and emission reduction strategies, which then become part of Integrated Development Plans. By October 2005, the City of Johannesburg, Ekurhuleni Metropolitan Municipality, and the City of Cape Town had already developed AQMPs.
Revision of air quality limitsThe NEMAQA also requires ambient air quality targets to be set, which will drive the reduction of emissions. Existing ambient air quality guidelines do not protect people’s health and well-being. With the exception of SO2, South Africa’s limits for particulates, NO2, ozone (O3), and lead (Pb) are more lenient than internationally accepted international health thresholds. Although updated air quality limits for common pollutants have been published by the South African Bureau of Standards (SABS) and the DEAT7, the Department has not yet adopted them. A supplementary standard was also published in 2004 to provide a framework for the (future) setting and implementation of the required national ambient air quality standards6.
Sector-specific air quality controlsSector-specific controls are being employed to reduce the impact of emissions from household fuel burning, electricity generation, energy, and vehicles. The Department of Minerals and Energy (DME) formulated an Integrated Clean Household Energy Strategy in 2003, which focuses on:
Refining combustion techniques and maintaining and replacing appliances
Replacing coal with electricity, low smoke fuels, alternative fuels such as gas, and renewable energy such as solar power
Reducing the energy requirements of dwellings through solar passive design (in new dwellings) and the insulation of existing homes.
Research is under way to develop a policy on integrating energy efficiency measures into housing developments.
Measures currently being implemented to reduce emissions from coal-fired power stations include the DME’s demand-side management programmes and renewable energy policy, as well as Eskom’s demand-side management programmes and improved pollution control technologies at operating power stations. Although cleaner coal technologies are being investigated (such as fluidized bed technology for implementation at the Komati Return-to-Service Station), cleaner production activities are gaining momentum and alternative fuels are being considered (notably gas). Nevertheless, coal-fired pulverized fuel power stations are expected to continue to supply most electricity for the foreseeable future.
•
•
•
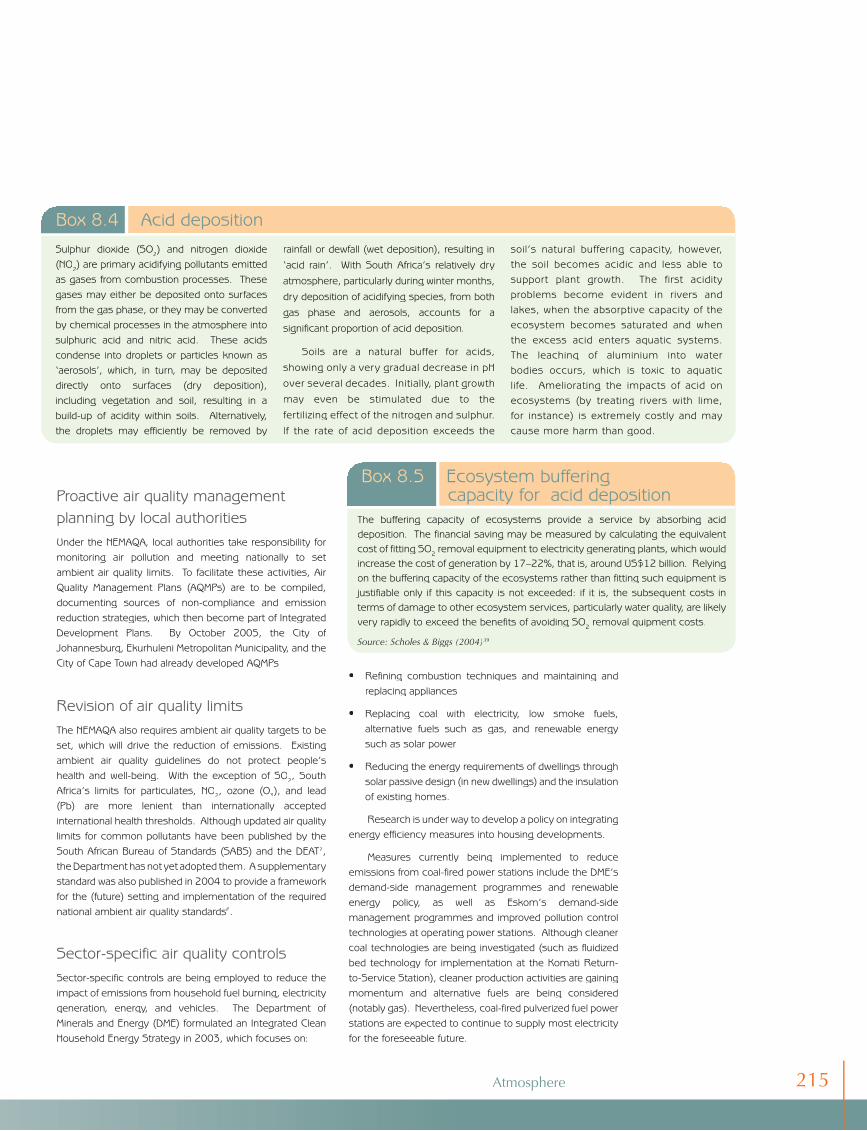
Sulphur dioxide (SO2) and nitrogen dioxide (NO2) are primary acidifying pollutants emitted as gases from combustion processes. These gases may either be deposited onto surfaces from the gas phase, or they may be converted by chemical processes in the atmosphere into sulphuric acid and nitric acid. These acids condense into droplets or particles known as ‘aerosols’, which, in turn, may be deposited directly onto surfaces (dry deposition), including vegetation and soil, resulting in a build-up of acidity within soils. Alternatively, the droplets may efficiently be removed by
rainfall or dewfall (wet deposition), resulting in ‘acid rain’. With South Africa’s relatively dry atmosphere, particularly during winter months, dry deposition of acidifying species, from both gas phase and aerosols, accounts for a significant proportion of acid deposition.
Soils are a natural buffer for acids, showing only a very gradual decrease in pH over several decades. Initially, plant growth may even be stimulated due to the fertilizing effect of the nitrogen and sulphur. If the rate of acid deposition exceeds the
soil’s natural buffering capacity, however, the soil becomes acidic and less able to support plant growth. The first acidity problems become evident in rivers and lakes, when the absorptive capacity of the ecosystem becomes saturated and when the excess acid enters aquatic systems. The leaching of aluminium into water bodies occurs, which is toxic to aquatic life. Ameliorating the impacts of acid on ecosystems (by treating rivers with lime, for instance) is extremely costly and may cause more harm than good.
Box 8.4 Acid deposition
The buffering capacity of ecosystems provide a service by absorbing acid deposition. The financial saving may be measured by calculating the equivalent cost of fitting SO2 removal equipment to electricity generating plants, which would increase the cost of generation by 17–22%, that is, around US$12 billion. Relying on the buffering capacity of the ecosystems rather than fitting such equipment is justifiable only if this capacity is not exceeded: if it is, the subsequent costs in terms of damage to other ecosystem services, particularly water quality, are likely very rapidly to exceed the benefits of avoiding SO2 removal quipment costs.
Source: Scholes & Biggs (2004)39
Box 8.5 Ecosystem buffering capacity for acid deposition
Atmosphere 215
Historically, emission permits for industry and energy generation issued under the APPA paid insufficient attention to the cumulative impacts of co-located industrial operations. The new NEMAQA now takes such cumulative impacts into account.
Vehicle emissionsVehicle emissions will be reduced through technology and fuel specifications stipulated by national policy and through the implementation by local authorities of traffic management measures. Since unleaded petrol was introduced in 1996, sales of vehicles equipped with catalytic converters had increased to about 47% of new
passenger vehicle sales by April 2003. Recent changes to fuel composition have included the reduction in the sulphur content of diesel from 5 000 parts per million (ppm) to 3 000 ppm. Further reductions to 500 ppm of sulphur in diesel and the total phasing-out of lead in petrol are intended as part of the proposed Implementation Strategy for the Control of Exhaust Emissions from Road-going Vehicles in South Africa. This strategy stipulates Euro technologies for new petrol- and diesel-driven vehicles, whilst also providing for future reductions in the sulphur, benzene, and aromatics content of fuels (see Box 8.8).
Implementing all these measures within the next ten-years is anticipated to bring about substantial changes in the nature and extent of vehicle emissions. In the absence of future controls, however, vehicle emissions are expected to increase substantially, with pollutants predicted to increase by 27% by 2007 and by up to 44% by 20119.
8.3 CLIMATE CHANGEThe main concern of climate change is global warming, which is based on a ‘greenhouse’ effect. The Earth has a natural temperature-control system in which certain atmospheric gases are critical. Water vapour, CO2, CH4, N2O, and ozone are known as greenhouse gases, because they trap some of the heat radiated by the Earth. They act like a blanket wrapped around the globe. On average, about one-third of the solar radiation that hits the Earth is reflected back to space. Of the remainder, the atmosphere absorbs some but the land and oceans absorb the most.
The Department of Environmental Affairs and Tourism initiated a two-year study to scrutinize the operations of more than 4 000 major industries so as to rank, review, and then rewrite their air pollution permits. This was necessary because some of the existing emission permits are so outdated that an industry can contravene health quality guidelines even as it complies with the legal emission limits specified in their permits. The intention of this study is to identify the 50 industries in South Africa that produce the largest and most poisonous volumes of air pollution.
Box 8.6 Exposing top air polluters
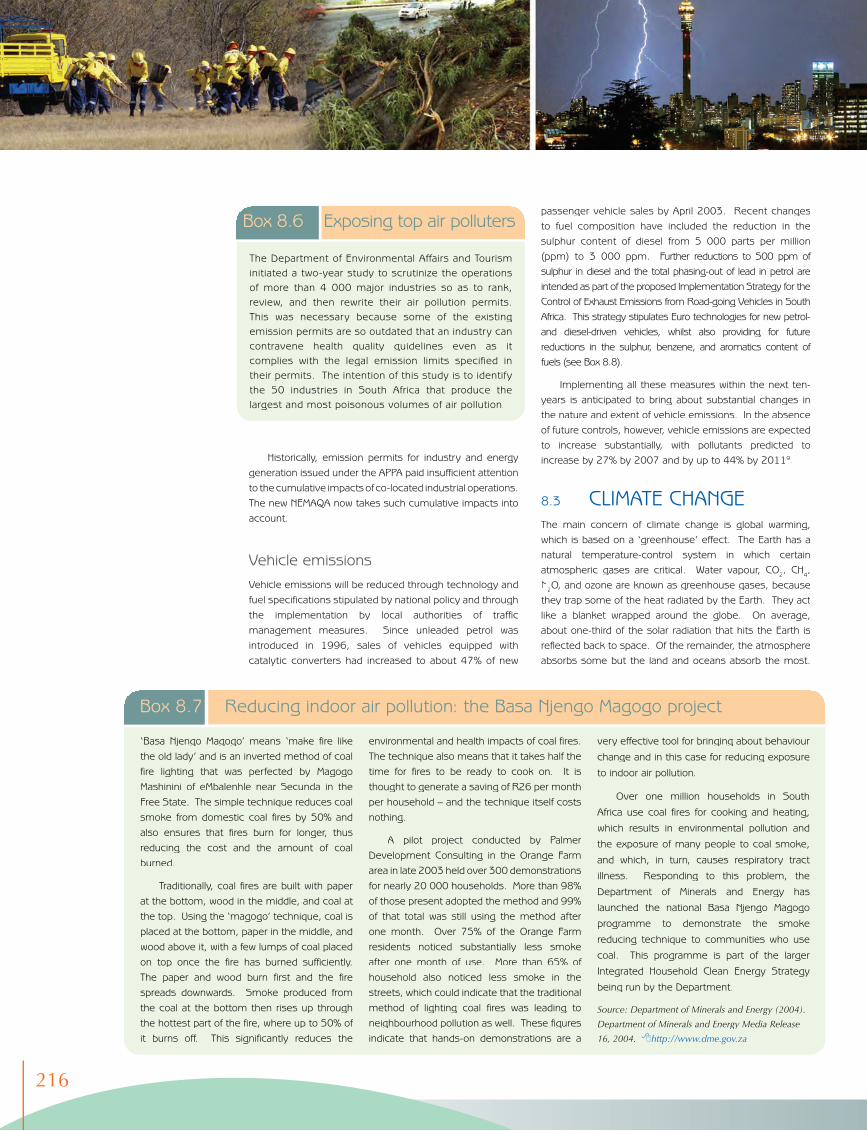
‘Basa Njengo Magogo’ means ‘make fire like the old lady’ and is an inverted method of coal fire lighting that was perfected by Magogo Mashinini of eMbalenhle near Secunda in the Free State. The simple technique reduces coal smoke from domestic coal fires by 50% and also ensures that fires burn for longer, thus reducing the cost and the amount of coal burned.
Traditionally, coal fires are built with paper at the bottom, wood in the middle, and coal at the top. Using the ‘magogo’ technique, coal is placed at the bottom, paper in the middle, and wood above it, with a few lumps of coal placed on top once the fire has burned sufficiently. The paper and wood burn first and the fire spreads downwards. Smoke produced from the coal at the bottom then rises up through the hottest part of the fire, where up to 50% of it burns off. This significantly reduces the
environmental and health impacts of coal fires. The technique also means that it takes half the time for fires to be ready to cook on. It is thought to generate a saving of R26 per month per household – and the technique itself costs nothing.
A pilot project conducted by Palmer Development Consulting in the Orange Farm area in late 2003 held over 300 demonstrations for nearly 20 000 households. More than 98% of those present adopted the method and 99% of that total was still using the method after one month. Over 75% of the Orange Farm residents noticed substantially less smoke after one month of use. More than 65% of household also noticed less smoke in the streets, which could indicate that the traditional method of lighting coal fires was leading to neighbourhood pollution as well. These figures indicate that hands-on demonstrations are a
very effective tool for bringing about behaviour change and in this case for reducing exposure to indoor air pollution.
Over one million households in South Africa use coal fires for cooking and heating, which results in environmental pollution and the exposure of many people to coal smoke, and which, in turn, causes respiratory tract illness. Responding to this problem, the Department of Minerals and Energy has launched the national Basa Njengo Magogo programme to demonstrate the smoke reducing technique to communities who use coal. This programme is part of the larger Integrated Household Clean Energy Strategy being run by the Department.
Source: Department of Minerals and Energy (2004).
Department of Minerals and Energy Media Release
16, 2004. 8http://www.dme.gov.za
Box 8.7 Reducing indoor air pollution: the Basa Njengo Magogo project
216
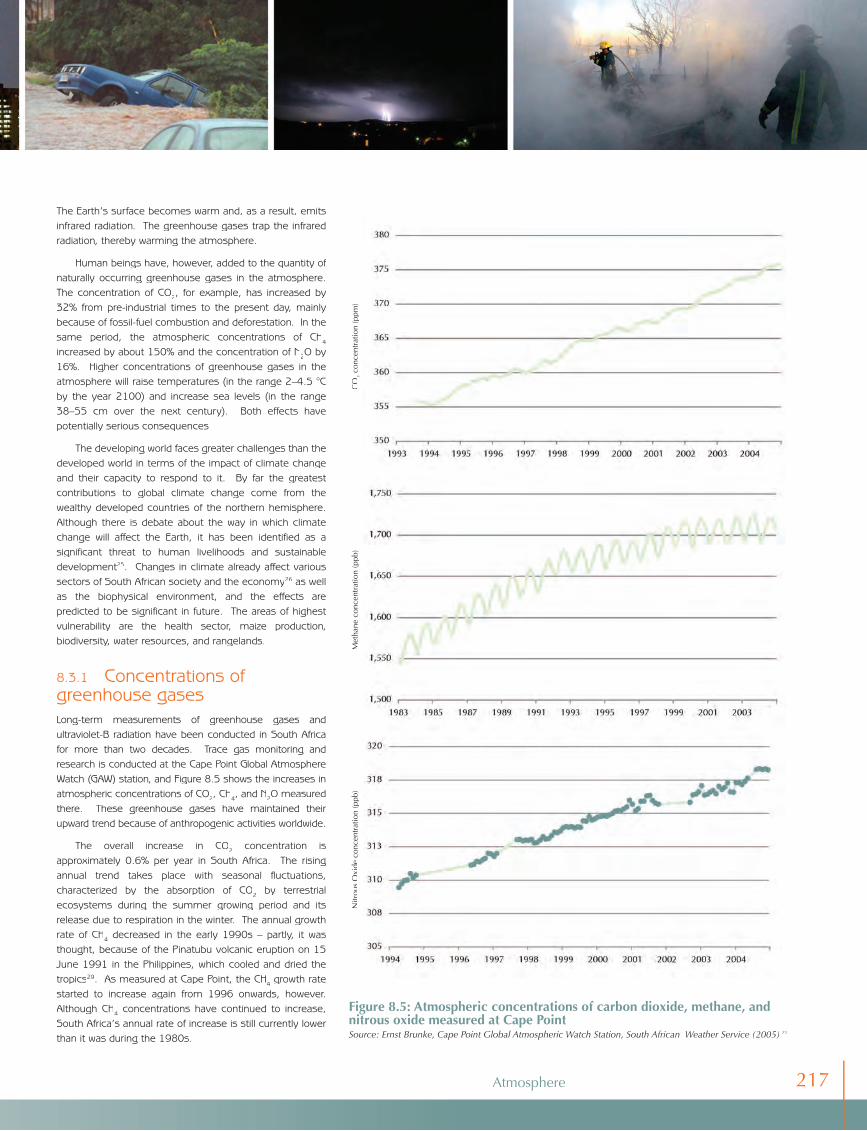
The Earth’s surface becomes warm and, as a result, emits infrared radiation. The greenhouse gases trap the infrared radiation, thereby warming the atmosphere.
Human beings have, however, added to the quantity of naturally occurring greenhouse gases in the atmosphere. The concentration of CO2, for example, has increased by 32% from pre-industrial times to the present day, mainly because of fossil-fuel combustion and deforestation. In the same period, the atmospheric concentrations of CH4
increased by about 150% and the concentration of N2O by 16%. Higher concentrations of greenhouse gases in the atmosphere will raise temperatures (in the range 2–4.5 °C by the year 2100) and increase sea levels (in the range 38–55 cm over the next century). Both effects have potentially serious consequences.
The developing world faces greater challenges than the developed world in terms of the impact of climate change and their capacity to respond to it. By far the greatest contributions to global climate change come from the wealthy developed countries of the northern hemisphere. Although there is debate about the way in which climate change will affect the Earth, it has been identified as a significant threat to human livelihoods and sustainable development25. Changes in climate already affect various sectors of South African society and the economy26 as well as the biophysical environment, and the effects are predicted to be significant in future. The areas of highest vulnerability are the health sector, maize production, biodiversity, water resources, and rangelands.
8.3.1 Concentrations of greenhouse gasesLong-term measurements of greenhouse gases and ultraviolet-B radiation have been conducted in South Africa for more than two decades. Trace gas monitoring and research is conducted at the Cape Point Global Atmosphere Watch (GAW) station, and Figure 8.5 shows the increases in atmospheric concentrations of CO2, CH4, and N2O measured there. These greenhouse gases have maintained their upward trend because of anthropogenic activities worldwide.
The overall increase in CO2 concentration is approximately 0.6% per year in South Africa. The rising annual trend takes place with seasonal fluctuations, characterized by the absorption of CO2 by terrestrial ecosystems during the summer growing period and its release due to respiration in the winter. The annual growth rate of CH4 decreased in the early 1990s – partly, it was thought, because of the Pinatubu volcanic eruption on 15 June 1991 in the Philippines, which cooled and dried the tropics29. As measured at Cape Point, the CH4 growth rate started to increase again from 1996 onwards, however. Although CH4 concentrations have continued to increase, South Africa’s annual rate of increase is still currently lower than it was during the 1980s.
Figure 8.5: Atmospheric concentrations of carbon dioxide, methane, and nitrous oxide measured at Cape PointSource: Ernst Brunke, Cape Point Global Atmospheric Watch Station, South African Weather Service (2005) 27
CO
2 co
ncen
trat
ion
(ppm
)M
etha
ne c
once
ntra
tion
(ppb
)N
itrou
s O
xide
con
cent
ratio
n (p
pb)
Atmosphere 217
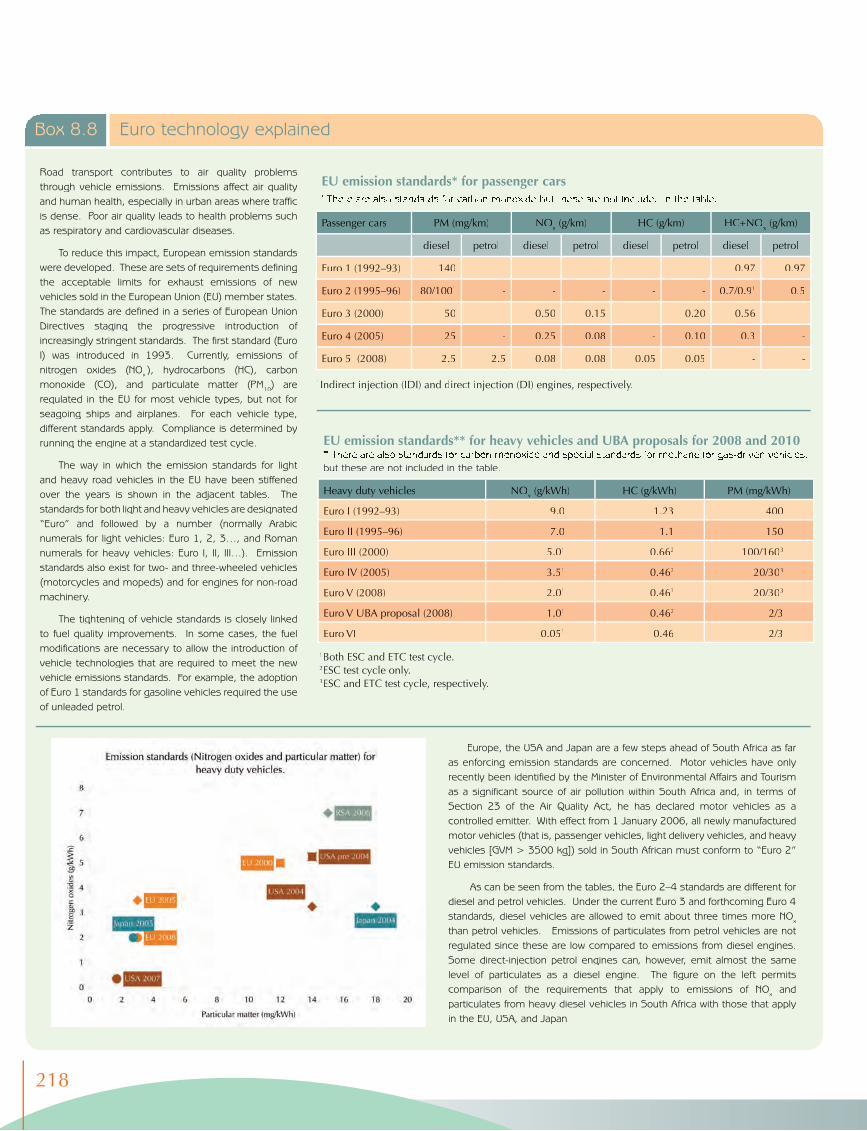
Box 8.8 Euro technology explained
EU emission standards* for passenger cars * There are also standards for carbon monoxide but these are not included in the table.
Passenger cars PM (mg/km) NOx (g/km) HC (g/km) HC+NOx (g/km)
diesel petrol diesel petrol diesel petrol diesel petrol
Euro 1 (1992–93) 140 - - - - - 0.97 0.97
Euro 2 (1995–96) 80/1001 - - - - - 0.7/0.91 0.5
Euro 3 (2000) 50 - 0.50 0.15 - 0.20 0.56 -
Euro 4 (2005) 25 - 0.25 0.08 - 0.10 0.3 -
Euro 5 (2008) 2.5 2.5 0.08 0.08 0.05 0.05 - -
1Indirect injection (IDI) and direct injection (DI) engines, respectively.
EU emission standards** for heavy vehicles and UBA proposals for 2008 and 2010** There are also standards for carbon monoxide and special standards for methane for gas-driven vehicles, but these are not included in the table.
Heavy duty vehicles NOx (g/kWh) HC (g/kWh) PM (mg/kWh)
Euro I (1992–93) 9.0 1.23 400
Euro II (1995–96) 7.0 1.1 150
Euro III (2000) 5.01 0.662 100/1603
Euro IV (2005) 3.51 0.462 20/303
Euro V (2008) 2.01 0.462 20/303
Euro V UBA proposal (2008) 1.01 0.462 2/3
Euro VI 0.051 0.46 2/3
1Both ESC and ETC test cycle. 2ESC test cycle only. 3ESC and ETC test cycle, respectively.
Road transport contributes to air quality problems through vehicle emissions. Emissions affect air quality and human health, especially in urban areas where traffic is dense. Poor air quality leads to health problems such as respiratory and cardiovascular diseases.
To reduce this impact, European emission standards were developed. These are sets of requirements defining the acceptable limits for exhaust emissions of new vehicles sold in the European Union (EU) member states. The standards are defined in a series of European Union Directives staging the progressive introduction of increasingly stringent standards. The first standard (Euro I) was introduced in 1993. Currently, emissions of nitrogen oxides (NOx ), hydrocarbons (HC), carbon monoxide (CO), and particulate matter (PM10) are regulated in the EU for most vehicle types, but not for seagoing ships and airplanes. For each vehicle type, different standards apply. Compliance is determined by running the engine at a standardized test cycle.
The way in which the emission standards for light and heavy road vehicles in the EU have been stiffened over the years is shown in the adjacent tables. The standards for both light and heavy vehicles are designated “Euro” and followed by a number (normally Arabic numerals for light vehicles: Euro 1, 2, 3…, and Roman numerals for heavy vehicles: Euro I, II, III…). Emission standards also exist for two- and three-wheeled vehicles (motorcycles and mopeds) and for engines for non-road machinery.
The tightening of vehicle standards is closely linked to fuel quality improvements. In some cases, the fuel modifications are necessary to allow the introduction of vehicle technologies that are required to meet the new vehicle emissions standards. For example, the adoption of Euro 1 standards for gasoline vehicles required the use of unleaded petrol.
Europe, the USA and Japan are a few steps ahead of South Africa as far as enforcing emission standards are concerned. Motor vehicles have only recently been identified by the Minister of Environmental Affairs and Tourism as a significant source of air pollution within South Africa and, in terms of Section 23 of the Air Quality Act, he has declared motor vehicles as a controlled emitter. With effect from 1 January 2006, all newly manufactured motor vehicles (that is, passenger vehicles, light delivery vehicles, and heavy vehicles [GVM > 3500 kg]) sold in South African must conform to “Euro 2” EU emission standards.
As can be seen from the tables, the Euro 2–4 standards are different for diesel and petrol vehicles. Under the current Euro 3 and forthcoming Euro 4 standards, diesel vehicles are allowed to emit about three times more NOx
than petrol vehicles. Emissions of particulates from petrol vehicles are not regulated since these are low compared to emissions from diesel engines. Some direct-injection petrol engines can, however, emit almost the same level of particulates as a diesel engine. The figure on the left permits comparison of the requirements that apply to emissions of NOx and particulates from heavy diesel vehicles in South Africa with those that apply in the EU, USA, and Japan.
218
The increases in concentration of N2O of about 0.2%
per year at Cape Point are due largely to the use of nitrogen
fertilizer in other parts of the world, but this is currently not
of concern in South Africa.
8.3.2 The latest temperature and rainfall projectionsA range of climate models has been developed from
computer simulations. If there is a doubling of CO2-
equivalent concentrations, a summary of the integrated
findings indicate the following potential climate changes for
South Africa28. (see Box 8.9)
Most of the models indicate a net drying on the western two-thirds of the subcontinent, south of about 10°S.
East coast regions, where topography plays a significant role in the formation of rainfall, are likely to become wetter. The extent to which this wetting will extend into the interior is uncertain.
The Western Cape is predicted to face a shorter rainfall season, with the eastern interior portions of the province likely to experience increased late summer rainfall.
Ambient air temperature is predicted to increase across the country, with the interior experiencing the greatest increases. Maximum warming for the interior is likely to be in the range 3–4 °C.
•
•
•
•
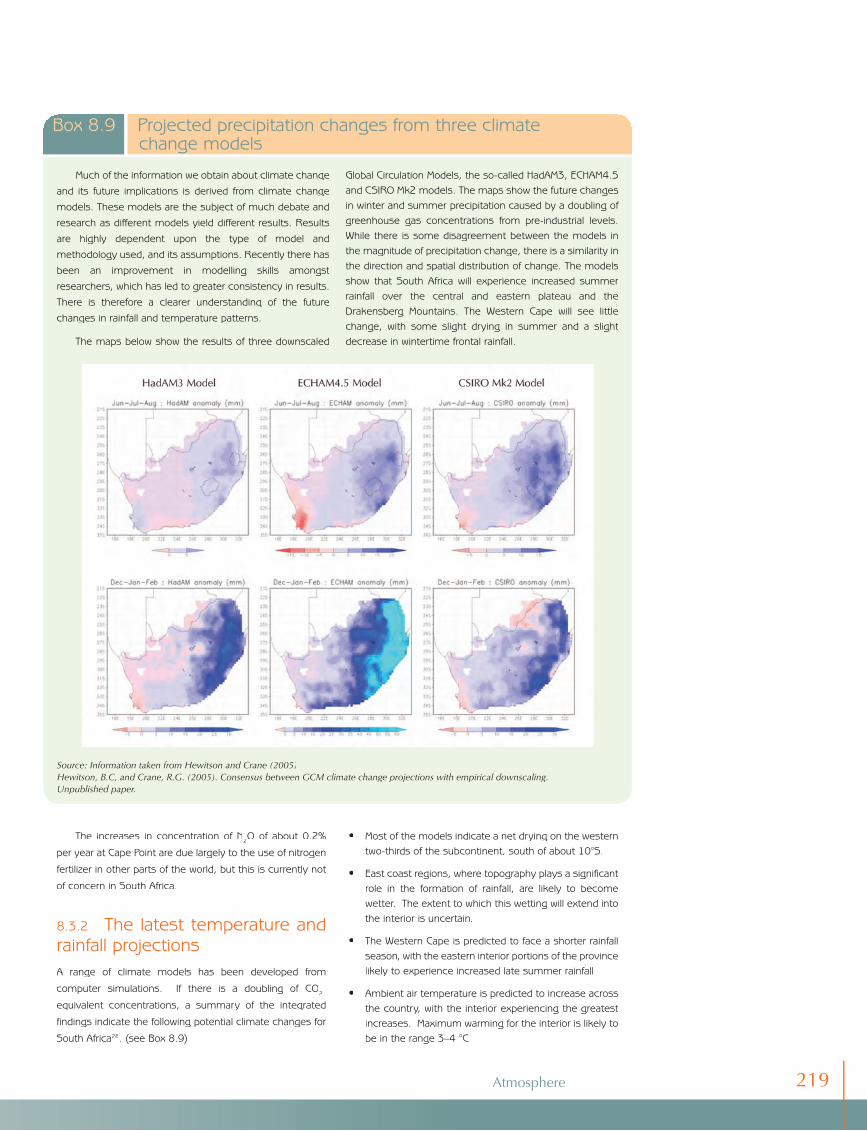
Much of the information we obtain about climate change and its future implications is derived from climate change models. These models are the subject of much debate and research as different models yield different results. Results are highly dependent upon the type of model and methodology used, and its assumptions. Recently there has been an improvement in modelling skills amongst researchers, which has led to greater consistency in results. There is therefore a clearer understanding of the future changes in rainfall and temperature patterns.
The maps below show the results of three downscaled
Global Circulation Models, the so-called HadAM3, ECHAM4.5 and CSIRO Mk2 models. The maps show the future changes in winter and summer precipitation caused by a doubling of greenhouse gas concentrations from pre-industrial levels. While there is some disagreement between the models in the magnitude of precipitation change, there is a similarity in the direction and spatial distribution of change. The models show that South Africa will experience increased summer rainfall over the central and eastern plateau and the Drakensberg Mountains. The Western Cape will see little change, with some slight drying in summer and a slight decrease in wintertime frontal rainfall.
Box 8.9 Projected precipitation changes from three climate change models
Source: Information taken from Hewitson and Crane (2005)Hewitson, B.C, and Crane, R.G. (2005). Consensus between GCM climate change projections with empirical downscaling. Unpublished paper.
Atmosphere 219
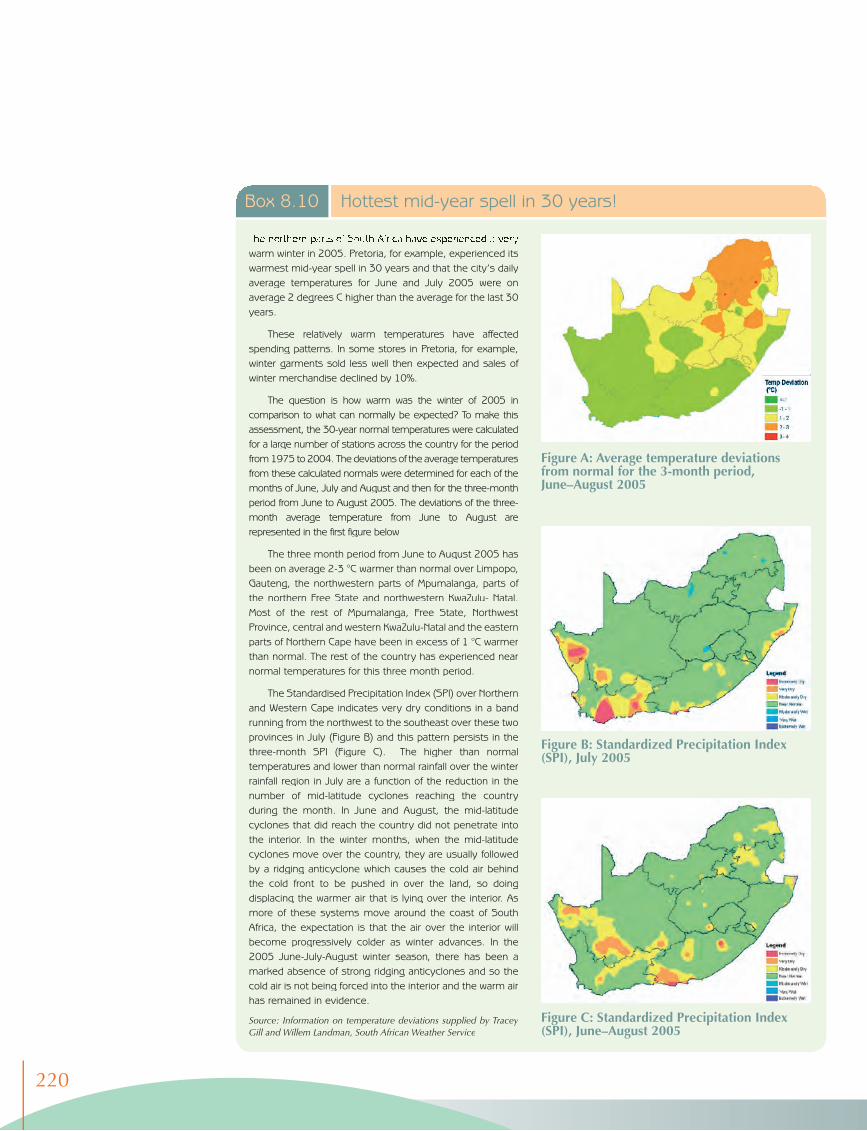
The northern parts of South Africa have experienced a very warm winter in 2005. Pretoria, for example, experienced its warmest mid-year spell in 30 years and that the city’s daily average temperatures for June and July 2005 were on average 2 degrees C higher than the average for the last 30 years.
These relatively warm temperatures have affected spending patterns. In some stores in Pretoria, for example, winter garments sold less well then expected and sales of winter merchandise declined by 10%.
The question is how warm was the winter of 2005 in comparison to what can normally be expected? To make this assessment, the 30-year normal temperatures were calculated for a large number of stations across the country for the period from 1975 to 2004. The deviations of the average temperatures from these calculated normals were determined for each of the months of June, July and August and then for the three-month period from June to August 2005. The deviations of the three-month average temperature from June to August are represented in the first figure below
The three month period from June to August 2005 has been on average 2-3 °C warmer than normal over Limpopo, Gauteng, the northwestern parts of Mpumalanga, parts of the northern Free State and northwestern KwaZulu- Natal. Most of the rest of Mpumalanga, Free State, Northwest Province, central and western KwaZulu-Natal and the eastern parts of Northern Cape have been in excess of 1 °C warmer than normal. The rest of the country has experienced near normal temperatures for this three month period.
The Standardised Precipitation Index (SPI) over Northern and Western Cape indicates very dry conditions in a band running from the northwest to the southeast over these two provinces in July (Figure B) and this pattern persists in the three-month SPI (Figure C). The higher than normal temperatures and lower than normal rainfall over the winter rainfall region in July are a function of the reduction in the number of mid-latitude cyclones reaching the country during the month. In June and August, the mid-latitude cyclones that did reach the country did not penetrate into the interior. In the winter months, when the mid-latitude cyclones move over the country, they are usually followed by a ridging anticyclone which causes the cold air behind the cold front to be pushed in over the land, so doing displacing the warmer air that is lying over the interior. As more of these systems move around the coast of South Africa, the expectation is that the air over the interior will become progressively colder as winter advances. In the 2005 June-July-August winter season, there has been a marked absence of strong ridging anticyclones and so the cold air is not being forced into the interior and the warm air has remained in evidence.
Source: Information on temperature deviations supplied by Tracey Gill and Willem Landman, South African Weather Service
Box 8.10 Hottest mid-year spell in 30 years!
Figure C: Standardized Precipitation Index (SPI), June–August 2005
Figure A: Average temperature deviations from normal for the 3-month period, June–August 2005
Figure B: Standardized Precipitation Index (SPI), July 2005
220
Other potential changes include more floods and droughts and stronger, more frequent temperature inversions, exacerbating air pollution problems.
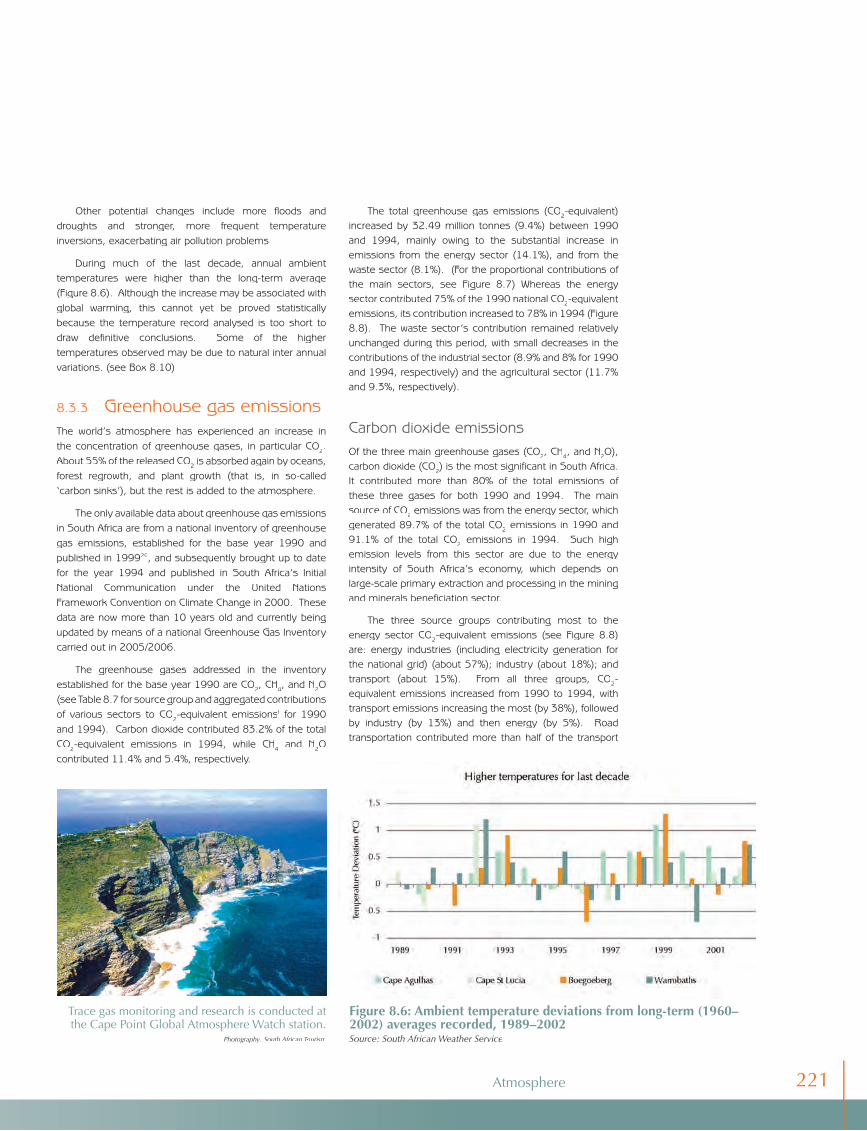
During much of the last decade, annual ambient temperatures were higher than the long-term average (Figure 8.6). Although the increase may be associated with global warming, this cannot yet be proved statistically because the temperature record analysed is too short to draw definitive conclusions. Some of the higher temperatures observed may be due to natural inter annual variations. (see Box 8.10)
8.3.3 Greenhouse gas emissionsThe world’s atmosphere has experienced an increase in the concentration of greenhouse gases, in particular CO2. About 55% of the released CO2 is absorbed again by oceans, forest regrowth, and plant growth (that is, in so-called ‘carbon sinks’), but the rest is added to the atmosphere.
The only available data about greenhouse gas emissions in South Africa are from a national inventory of greenhouse gas emissions, established for the base year 1990 and published in 199929, and subsequently brought up to date for the year 1994 and published in South Africa’s Initial National Communication under the United Nations Framework Convention on Climate Change in 2000. These data are now more than 10 years old and currently being updated by means of a national Greenhouse Gas Inventory carried out in 2005/2006.
The greenhouse gases addressed in the inventory established for the base year 1990 are CO2, CH4, and N2O (see Table 8.7 for source group and aggregated contributions of various sectors to CO2-equivalent emissionsf for 1990 f for 1990 f
and 1994). Carbon dioxide contributed 83.2% of the total CO2-equivalent emissions in 1994, while CH4 and N2O contributed 11.4% and 5.4%, respectively.
Figure 8.6: Ambient temperature deviations from long-term (1960–2002) averages recorded, 1989–2002 Source: South African Weather Service
The total greenhouse gas emissions (CO2-equivalent) increased by 32.49 million tonnes (9.4%) between 1990 and 1994, mainly owing to the substantial increase in emissions from the energy sector (14.1%), and from the waste sector (8.1%). (For the proportional contributions of the main sectors, see Figure 8.7) Whereas the energy sector contributed 75% of the 1990 national CO2-equivalent emissions, its contribution increased to 78% in 1994 (Figure 8.8). The waste sector’s contribution remained relatively unchanged during this period, with small decreases in the contributions of the industrial sector (8.9% and 8% for 1990 and 1994, respectively) and the agricultural sector (11.7% and 9.3%, respectively).
Carbon dioxide emissionsOf the three main greenhouse gases (CO2, CH4, and N2O), carbon dioxide (CO2) is the most significant in South Africa. It contributed more than 80% of the total emissions of these three gases for both 1990 and 1994. The main source of CO2 emissions was from the energy sector, which generated 89.7% of the total CO2 emissions in 1990 and 91.1% of the total CO2 emissions in 1994. Such high emission levels from this sector are due to the energy intensity of South Africa’s economy, which depends on large-scale primary extraction and processing in the mining and minerals beneficiation sector.
The three source groups contributing most to the energy sector CO2-equivalent emissions (see Figure 8.8) are: energy industries (including electricity generation for the national grid) (about 57%); industry (about 18%); and transport (about 15%). From all three groups, CO2-equivalent emissions increased from 1990 to 1994, with transport emissions increasing the most (by 38%), followed by industry (by 13%) and then energy (by 5%). Road transportation contributed more than half of the transport
Trace gas monitoring and research is conducted at the Cape Point Global Atmosphere Watch station.
Photography: South African To South African To South African T urism
Atmosphere 221
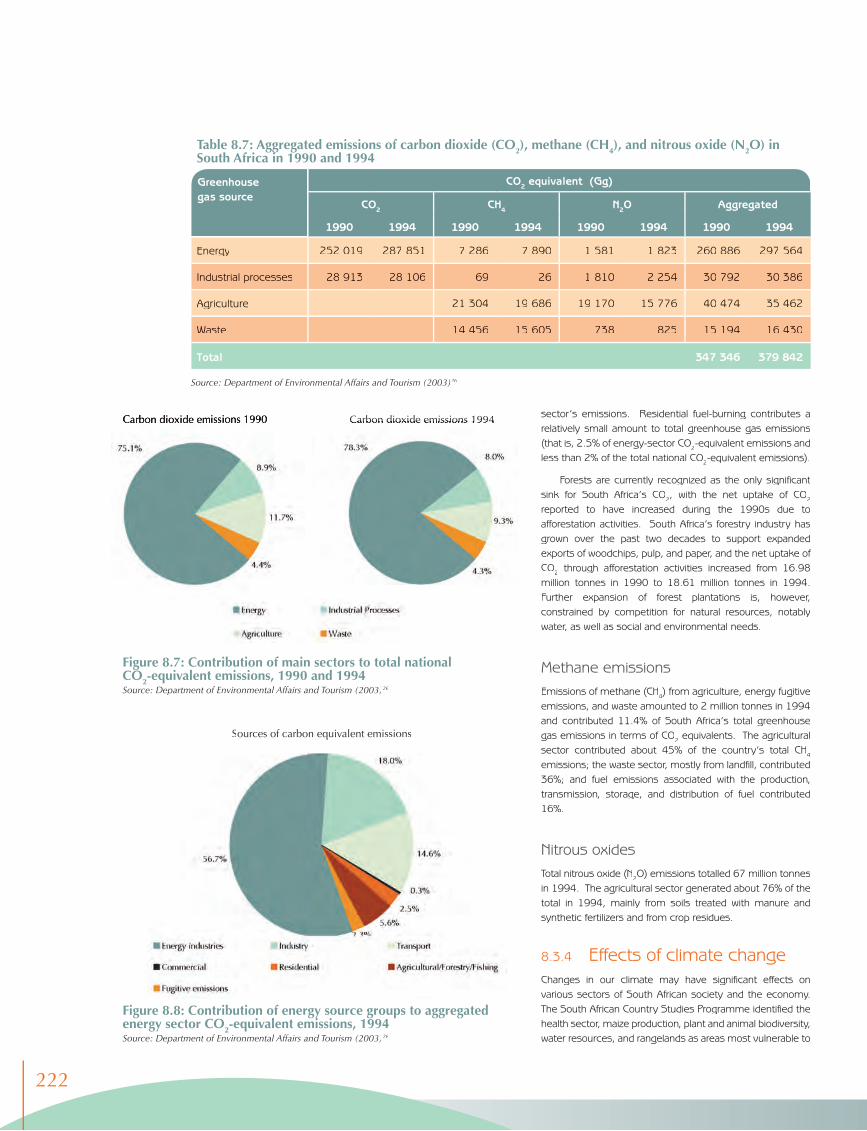
Table 8.7: Aggregated emissions of carbon dioxide (CO2), methane (CH4), and nitrous oxide (N2O) in South Africa in 1990 and 1994
CO2 equivalent (Gg)
CO2 CH4 N2O Aggregated
1990 1994 1990 1994 1990 1994 1990 1994
Energy 252 019 287 851 7 286 7 890 1 581 1 823 260 886 297 564
Industrial processes 28 913 28 106 69 26 1 810 2 254 30 792 30 386
Agriculture 21 304 19 686 19 170 15 776 40 474 35 462
Waste 14 456 15 605 738 825 15 194 16 430
Total 347 346 379 842
Greenhouse gas source
sector’s emissions. Residential fuel-burning contributes a relatively small amount to total greenhouse gas emissions (that is, 2.5% of energy-sector CO2-equivalent emissions and less than 2% of the total national CO2-equivalent emissions).
Forests are currently recognized as the only significant sink for South Africa’s CO2, with the net uptake of CO2
reported to have increased during the 1990s due to afforestation activities. South Africa’s forestry industry has grown over the past two decades to support expanded exports of woodchips, pulp, and paper, and the net uptake of CO2 through afforestation activities increased from 16.98 million tonnes in 1990 to 18.61 million tonnes in 1994. Further expansion of forest plantations is, however, constrained by competition for natural resources, notably water, as well as social and environmental needs.
Methane emissionsEmissions of methane (CH4) from agriculture, energy fugitive emissions, and waste amounted to 2 million tonnes in 1994 and contributed 11.4% of South Africa’s total greenhouse gas emissions in terms of CO2 equivalents. The agricultural sector contributed about 45% of the country’s total CH4
emissions; the waste sector, mostly from landfill, contributed 36%; and fuel emissions associated with the production, transmission, storage, and distribution of fuel contributed 16%.
Nitrous oxidesTotal nitrous oxide (N2O) emissions totalled 67 million tonnes in 1994. The agricultural sector generated about 76% of the total in 1994, mainly from soils treated with manure and synthetic fertilizers and from crop residues.
8.3.4 Effects of climate change Changes in our climate may have significant effects on various sectors of South African society and the economy. The South African Country Studies Programme identified the health sector, maize production, plant and animal biodiversity, water resources, and rangelands as areas most vulnerable to
Source: Department of Environmental Affairs and Tourism (2003)26
Figure 8.8: Contribution of energy source groups to aggregated energy sector CO2-equivalent emissions, 1994Source: Department of Environmental Affairs and Tourism (2003)26
Sources of carbon equivalent emissions
Figure 8.7: Contribution of main sectors to total national CO2-equivalent emissions, 1990 and 1994Source: Department of Environmental Affairs and Tourism (2003)26
Carbon dioxide emarbon dioxide emissions 1990 CCarbon dioxide emarbon dioxide emissions 199issions 19944
222
climate change26. More recent climate change models may lead to modifications of the anticipated effects, but the summaries below offer the latest available information on the impacts of climate change.
In addition, since the country’s economy depends so greatly on income generated from the production, processing, export and consumption of coal, it is also vulnerable to the possible response measure implemented by Annex 1 countriesg. Alternatively, exports could increase to non-Annex 1 countries.
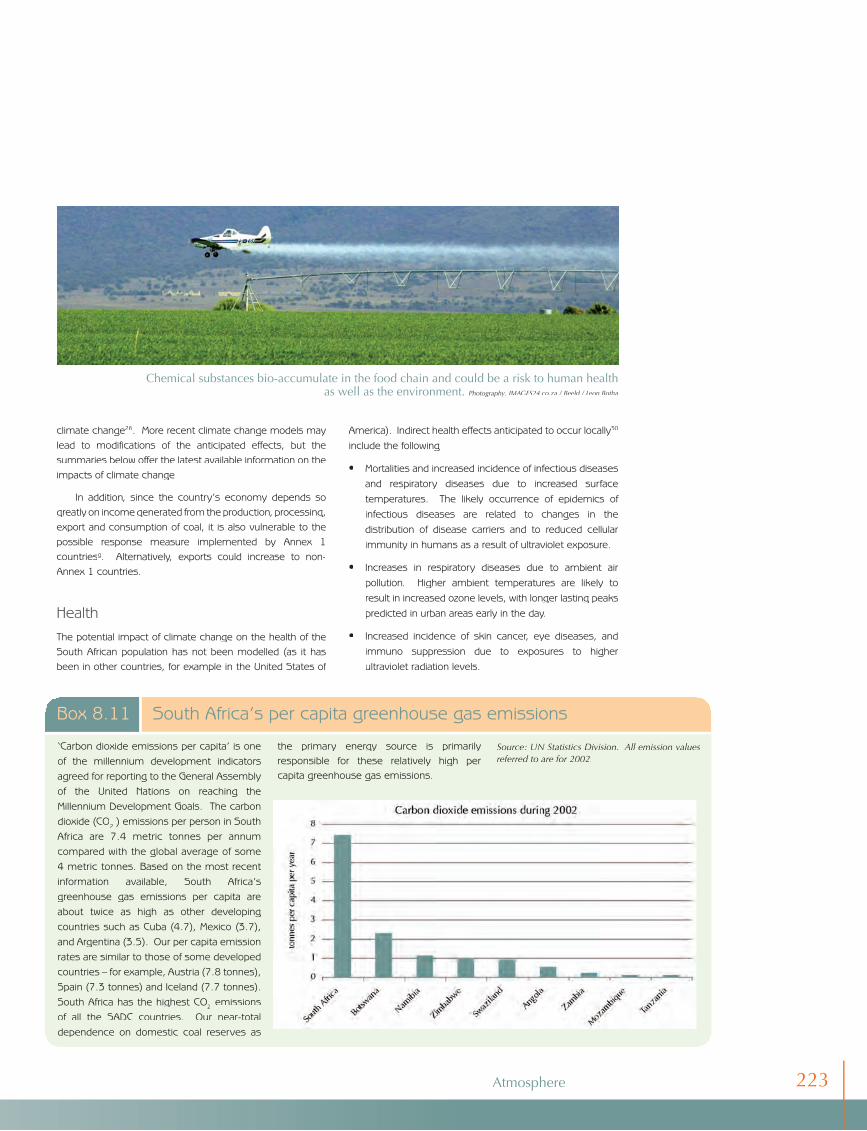
HealthThe potential impact of climate change on the health of the South African population has not been modelled (as it has been in other countries, for example in the United States of
‘Carbon dioxide emissions per capita’ is one of the millennium development indicators agreed for reporting to the General Assembly of the United Nations on reaching the Millennium Development Goals. The carbon dioxide (CO2 ) emissions per person in South Africa are 7.4 metric tonnes per annum compared with the global average of some 4 metric tonnes. Based on the most recent information available, South Africa’s greenhouse gas emissions per capita are about twice as high as other developing countries such as Cuba (4.7), Mexico (3.7), and Argentina (3.5). Our per capita emission rates are similar to those of some developed countries – for example, Austria (7.8 tonnes), Spain (7.3 tonnes) and Iceland (7.7 tonnes). South Africa has the highest CO2 emissions of all the SADC countries. Our near-total dependence on domestic coal reserves as
Box 8.11 South Africa’s per capita greenhouse gas emissions
the primary energy source is primarily responsible for these relatively high per capita greenhouse gas emissions.
Source: UN Statistics Division. All emission values referred to are for 2002.
America). Indirect health effects anticipated to occur locally30
include the following:
Mortalities and increased incidence of infectious diseases and respiratory diseases due to increased surface temperatures. The likely occurrence of epidemics of infectious diseases are related to changes in the distribution of disease carriers and to reduced cellular immunity in humans as a result of ultraviolet exposure.
Increases in respiratory diseases due to ambient air pollution. Higher ambient temperatures are likely to result in increased ozone levels, with longer lasting peaks predicted in urban areas early in the day.
Increased incidence of skin cancer, eye diseases, and immuno suppression due to exposures to higher ultraviolet radiation levels.
•
•
•
Chemical substances bio-accumulate in the food chain and could be a risk to human health as well as the environment. Photography: IMAGES24.co.za / Beeld / Leon Botha
Atmosphere 223
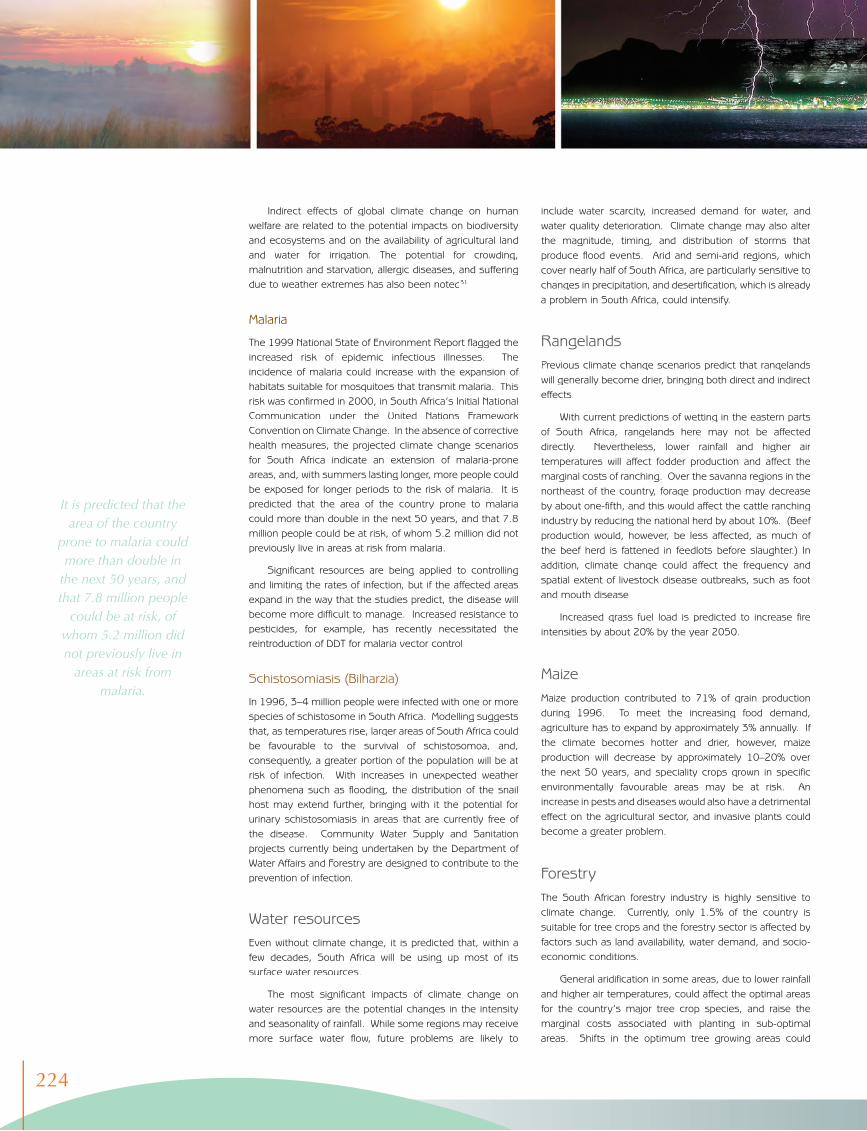
Indirect effects of global climate change on human welfare are related to the potential impacts on biodiversity and ecosystems and on the availability of agricultural land and water for irrigation. The potential for crowding, malnutrition and starvation, allergic diseases, and suffering due to weather extremes has also been noted31.
Malaria
The 1999 National State of Environment Report flagged the increased risk of epidemic infectious illnesses. The incidence of malaria could increase with the expansion of habitats suitable for mosquitoes that transmit malaria. This risk was confirmed in 2000, in South Africa’s Initial National Communication under the United Nations Framework Convention on Climate Change. In the absence of corrective health measures, the projected climate change scenarios for South Africa indicate an extension of malaria-prone areas, and, with summers lasting longer, more people could be exposed for longer periods to the risk of malaria. It is predicted that the area of the country prone to malaria could more than double in the next 50 years, and that 7.8 million people could be at risk, of whom 5.2 million did not previously live in areas at risk from malaria.
Significant resources are being applied to controlling and limiting the rates of infection, but if the affected areas expand in the way that the studies predict, the disease will become more difficult to manage. Increased resistance to pesticides, for example, has recently necessitated the reintroduction of DDT for malaria vector control.
Schistosomiasis (Bilharzia)
In 1996, 3–4 million people were infected with one or more species of schistosome in South Africa. Modelling suggests that, as temperatures rise, larger areas of South Africa could be favourable to the survival of schistosomoa, and, consequently, a greater portion of the population will be at risk of infection. With increases in unexpected weather phenomena such as flooding, the distribution of the snail host may extend further, bringing with it the potential for urinary schistosomiasis in areas that are currently free of the disease. Community Water Supply and Sanitation projects currently being undertaken by the Department of Water Affairs and Forestry are designed to contribute to the prevention of infection.
Water resourcesEven without climate change, it is predicted that, within a few decades, South Africa will be using up most of its surface water resources.
The most significant impacts of climate change on water resources are the potential changes in the intensity and seasonality of rainfall. While some regions may receive more surface water flow, future problems are likely to
include water scarcity, increased demand for water, and water quality deterioration. Climate change may also alter the magnitude, timing, and distribution of storms that produce flood events. Arid and semi-arid regions, which cover nearly half of South Africa, are particularly sensitive to changes in precipitation, and desertification, which is already a problem in South Africa, could intensify.
RangelandsPrevious climate change scenarios predict that rangelands will generally become drier, bringing both direct and indirect effects.
With current predictions of wetting in the eastern parts of South Africa, rangelands here may not be affected directly. Nevertheless, lower rainfall and higher air temperatures will affect fodder production and affect the marginal costs of ranching. Over the savanna regions in the northeast of the country, forage production may decrease by about one-fifth, and this would affect the cattle ranching industry by reducing the national herd by about 10%. (Beef production would, however, be less affected, as much of the beef herd is fattened in feedlots before slaughter.) In addition, climate change could affect the frequency and spatial extent of livestock disease outbreaks, such as foot and mouth disease.
Increased grass fuel load is predicted to increase fire intensities by about 20% by the year 2050.
MaizeMaize production contributed to 71% of grain production during 1996. To meet the increasing food demand, agriculture has to expand by approximately 3% annually. If the climate becomes hotter and drier, however, maize production will decrease by approximately 10–20% over the next 50 years, and speciality crops grown in specific environmentally favourable areas may be at risk. An increase in pests and diseases would also have a detrimental effect on the agricultural sector, and invasive plants could become a greater problem.
ForestryThe South African forestry industry is highly sensitive to climate change. Currently, only 1.5% of the country is suitable for tree crops and the forestry sector is affected by factors such as land availability, water demand, and socio-economic conditions.
General aridification in some areas, due to lower rainfall and higher air temperatures, could affect the optimal areas for the country’s major tree crop species, and raise the marginal costs associated with planting in sub-optimal areas. Shifts in the optimum tree growing areas could
It is predicted that the area of the country
prone to malaria could more than double in
the next 50 years, and that 7.8 million people
could be at risk, of whom 5.2 million did not previously live in
areas at risk from malaria.
224
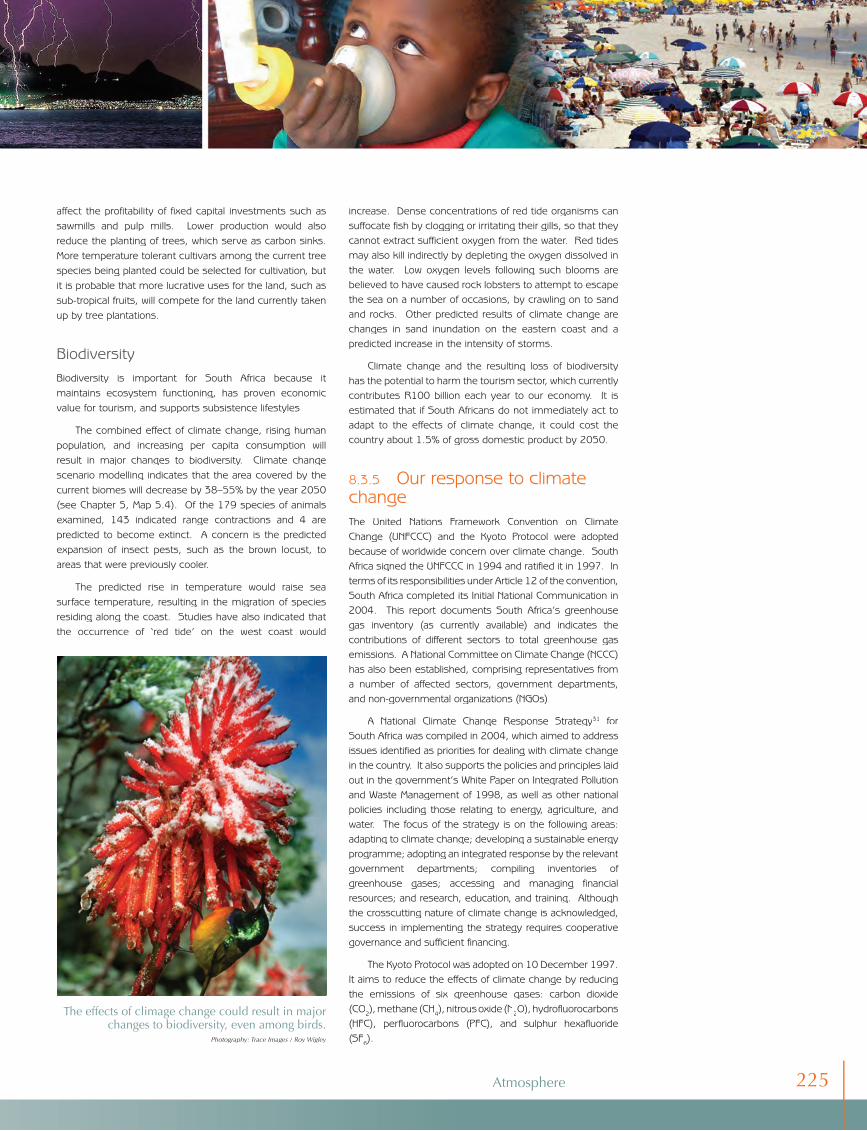
affect the profitability of fixed capital investments such as sawmills and pulp mills. Lower production would also reduce the planting of trees, which serve as carbon sinks. More temperature tolerant cultivars among the current tree species being planted could be selected for cultivation, but it is probable that more lucrative uses for the land, such as sub-tropical fruits, will compete for the land currently taken up by tree plantations.
BiodiversityBiodiversity is important for South Africa because it maintains ecosystem functioning, has proven economic value for tourism, and supports subsistence lifestyles.
The combined effect of climate change, rising human population, and increasing per capita consumption will result in major changes to biodiversity. Climate change scenario modelling indicates that the area covered by the current biomes will decrease by 38–55% by the year 2050 (see Chapter 5, Map 5.4). Of the 179 species of animals examined, 143 indicated range contractions and 4 are predicted to become extinct. A concern is the predicted expansion of insect pests, such as the brown locust, to areas that were previously cooler.
The predicted rise in temperature would raise sea surface temperature, resulting in the migration of species residing along the coast. Studies have also indicated that the occurrence of ‘red tide’ on the west coast would
increase. Dense concentrations of red tide organisms can suffocate fish by clogging or irritating their gills, so that they cannot extract sufficient oxygen from the water. Red tides may also kill indirectly by depleting the oxygen dissolved in the water. Low oxygen levels following such blooms are believed to have caused rock lobsters to attempt to escape the sea on a number of occasions, by crawling on to sand and rocks. Other predicted results of climate change are changes in sand inundation on the eastern coast and a predicted increase in the intensity of storms.
Climate change and the resulting loss of biodiversity has the potential to harm the tourism sector, which currently contributes R100 billion each year to our economy. It is estimated that if South Africans do not immediately act to adapt to the effects of climate change, it could cost the country about 1.5% of gross domestic product by 2050.
8.3.5 Our response to climate changeThe United Nations Framework Convention on Climate Change (UNFCCC) and the Kyoto Protocol were adopted because of worldwide concern over climate change. South Africa signed the UNFCCC in 1994 and ratified it in 1997. In terms of its responsibilities under Article 12 of the convention, South Africa completed its Initial National Communication in 2004. This report documents South Africa’s greenhouse gas inventory (as currently available) and indicates the contributions of different sectors to total greenhouse gas emissions. A National Committee on Climate Change (NCCC) has also been established, comprising representatives from a number of affected sectors, government departments, and non-governmental organizations (NGOs).
A National Climate Change Response Strategy31 for South Africa was compiled in 2004, which aimed to address issues identified as priorities for dealing with climate change in the country. It also supports the policies and principles laid out in the government’s White Paper on Integrated Pollution and Waste Management of 1998, as well as other national policies including those relating to energy, agriculture, and water. The focus of the strategy is on the following areas: adapting to climate change; developing a sustainable energy programme; adopting an integrated response by the relevant government departments; compiling inventories of greenhouse gases; accessing and managing financial resources; and research, education, and training. Although the crosscutting nature of climate change is acknowledged, success in implementing the strategy requires cooperative governance and sufficient financing.
The Kyoto Protocol was adopted on 10 December 1997. It aims to reduce the effects of climate change by reducing the emissions of six greenhouse gases: carbon dioxide (CO2), methane (CH4), nitrous oxide (N2O), hydrofluorocarbons (HFC), perfluorocarbons (PFC), and sulphur hexafluoride (SF6).
The effects of climage change could result in major changes to biodiversity, even among birds.
Photography: Trace Images / Roy Wigley
Atmosphere 225
This protocol is an international agreement among industrialized countries as well as countries in transition to a market economy (mainly in eastern Europe). Developed countries that are parties to the protocol are legally bound to reduce their collective emissions of greenhouse gases by at least 5% below 1990 levels during the treaty’s ‘first commitment period’ (2008–2012). South Africa acceded to the Kyoto Protocol in 2002 but, as a developing country, it is not currently required to reduce its greenhouse gas emissions. However, during the second commitment period, which begins in 2012, South Africa may need to make commitments to cut back.
The Kyoto Protocol also establishes an emissions trading regime and a “clean development mechanism” (CDM). Currently, responsibilities in terms of the UNFCCC are largely limited to the reporting of South Africa’s greenhouse gas emissions on a sectoral basis and the formulation of adaptation plans.
The Kyoto Protocol came into force on 16 February 2005. As of September 2005, a total of 157 countries (representing 67% of total global anthropogenic emissions) have ratified the agreement. Notable exceptions are Australia and the United States of America.
Various options for limiting emissions are available to nations and regions in the short and medium term. Policymakers can encourage energy efficiency and other climate-friendly trends in both the supply and consumption of energy. An economic and regulatory framework can be developed to promote cost-effective actions, the best of current and future technologies, and ‘no regrets’ solutions that make economic and environmental sense, irrespective of climate change. Taxes, regulatory standards, tradable
emissions permits, information programmes, voluntary programmes, and the phasing out of counterproductive subsidies are being considered. Changes in practices and lifestyle are also considered important – from better urban transport planning to improved personal habits, such as turning out lights when they are not needed.
It is clear that people and ecosystems will need to adapt to future climatic regimes. Past and current emissions have already committed the Earth to some degree of climate change in the 21st century, and adapting to these st century, and adapting to these st
effects will require a good understanding of socio-economic and natural systems, their sensitivity to climate change, and their inherent ability to adapt. Various countries are already developing strategies for dealing with the expected effects of climate change. Short- to medium-term measures applicable for development and implementation in South Africa include early warning systems and disaster relief programmes for droughts and floods.
8.4 STRATOSPHERIC OZONE DEPLETIONCertain chemicals can damage the Earth’s protective ozone layer. This is the atmospheric layer at 15–30 km altitude, in which ozone (O3) is concentrated at 1–10 ppm. It is found in the stratosphere (which extends from about 15 to 50 km above the Earth’s surface). Stratospheric ozone is a naturally occurring gas that filters the sun’s ultraviolet radiation. Consequently, any thinning of the ozone layer allows more radiation to reach the Earth’s surface. In terms of human health, overexposure to ultraviolet rays can lead to skin cancer, cataracts, and weakened immune
Box 8.12 Kuyasa Low-Income Housing Project, Cape Town
The Kuyasa low-cost urban housing upgrade is a small-scale Clean Development Mechanism (CDM) project that began in June 2003, located within a low-income housing area of Khayelitsha in the City of Cape Town municipality. The project aims to reduce fossil-fuel based energy consumption, and hence CO2 emissions, by means of three interventions in low-income housing units: the installation of solar water heaters; the retrofitting of compact fluorescent light bulbs; and the introduction of ceiling insulation. A total of 312 houses will benefit from full installation of the above three interventions, with a further 2 445
houses receiving subsidy for labour costs only.
Benefits of the project include:
Global and local benefits: a reduction in greenhouse gas emissions and resultant health cost benefits owing to fewer respiratory problems.
Social benefits: a saving in the cost of energy services for the households involved is expected to be about R626/household/year.
Economic benefits: temporary employment creation (107 temporary jobs created during the project implementation) and the
•
•
•
potential for permanent job creation
(12 jobs) through the local
manufacture and installation of
technologies and associated
infrastructure.
Political benefits: the project is an
example of sustainable energy
development in the Western Cape
and it contributes to the City of Cape
Town’s renewable energy and solar
water heater targets set at the Cities
Energy Strategy Conference in
2003.
Source. Palmer Development Group
(2004)32.
•
226
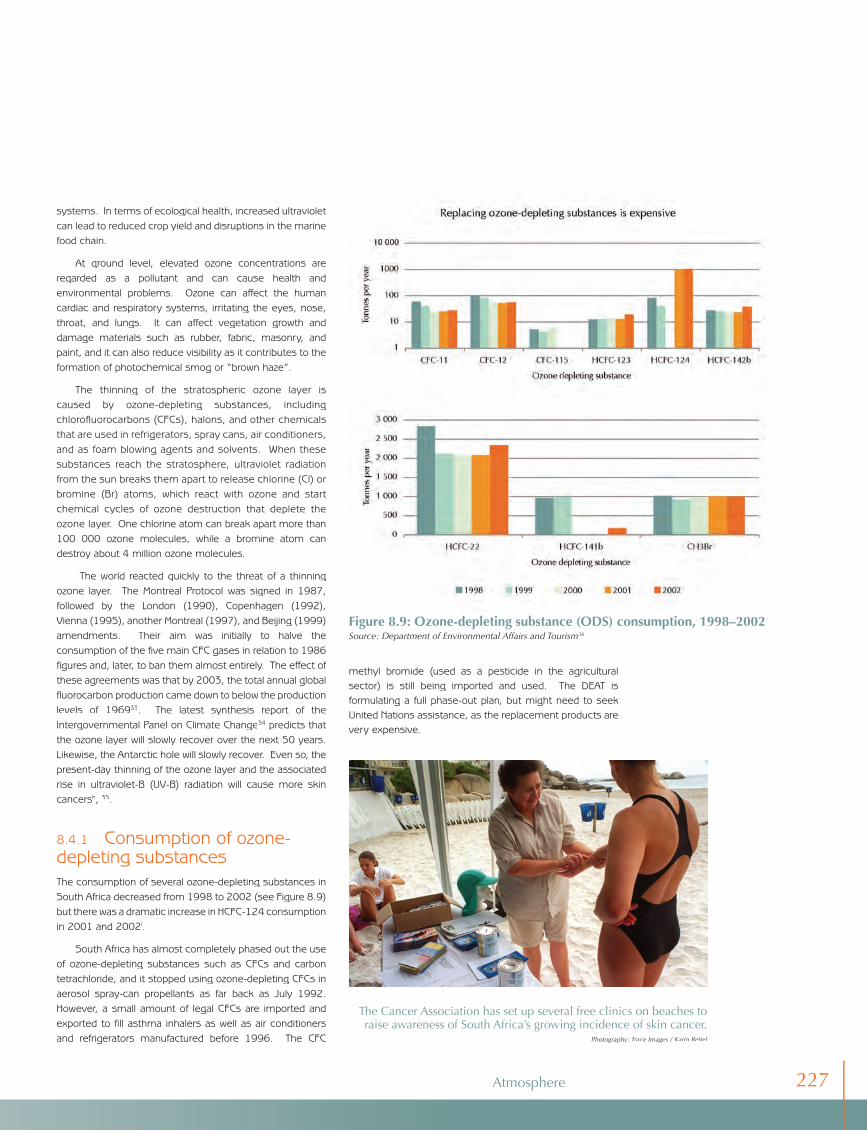
systems. In terms of ecological health, increased ultraviolet can lead to reduced crop yield and disruptions in the marine food chain.
At ground level, elevated ozone concentrations are regarded as a pollutant and can cause health and environmental problems. Ozone can affect the human cardiac and respiratory systems, irritating the eyes, nose, throat, and lungs. It can affect vegetation growth and damage materials such as rubber, fabric, masonry, and paint, and it can also reduce visibility as it contributes to the formation of photochemical smog or “brown haze”.
The thinning of the stratospheric ozone layer is caused by ozone-depleting substances, including chlorofluorocarbons (CFCs), halons, and other chemicals that are used in refrigerators, spray cans, air conditioners, and as foam blowing agents and solvents. When these substances reach the stratosphere, ultraviolet radiation from the sun breaks them apart to release chlorine (Cl) or bromine (Br) atoms, which react with ozone and start chemical cycles of ozone destruction that deplete the ozone layer. One chlorine atom can break apart more than 100 000 ozone molecules, while a bromine atom can destroy about 4 million ozone molecules.
The world reacted quickly to the threat of a thinning ozone layer. The Montreal Protocol was signed in 1987, followed by the London (1990), Copenhagen (1992), Vienna (1995), another Montreal (1997), and Beijing (1999) amendments. Their aim was initially to halve the consumption of the five main CFC gases in relation to 1986 figures and, later, to ban them almost entirely. The effect of these agreements was that by 2003, the total annual global fluorocarbon production came down to below the production levels of 196933. The latest synthesis report of the Intergovernmental Panel on Climate Change34 predicts that the ozone layer will slowly recover over the next 50 years. Likewise, the Antarctic hole will slowly recover. Even so, the present-day thinning of the ozone layer and the associated rise in ultraviolet-B (UV-B) radiation will cause more skin cancersh, 35.
8.4.1 Consumption of ozone-depleting substances The consumption of several ozone-depleting substances in South Africa decreased from 1998 to 2002 (see Figure 8.9) but there was a dramatic increase in HCFC-124 consumption in 2001 and 2002i.
South Africa has almost completely phased out the use of ozone-depleting substances such as CFCs and carbon tetrachloride, and it stopped using ozone-depleting CFCs in aerosol spray-can propellants as far back as July 1992. However, a small amount of legal CFCs are imported and exported to fill asthma inhalers as well as air conditioners and refrigerators manufactured before 1996. The CFC
methyl bromide (used as a pesticide in the agricultural sector) is still being imported and used. The DEAT is formulating a full phase-out plan, but might need to seek United Nations assistance, as the replacement products are very expensive.
Figure 8.9: Ozone-depleting substance (ODS) consumption, 1998–2002Source: Department of Environmental Affairs and Tourism36
The Cancer Association has set up several free clinics on beaches to raise awareness of South Africa’s growing incidence of skin cancer.
Photography: Trace Images / Karin Retief
Atmosphere 227
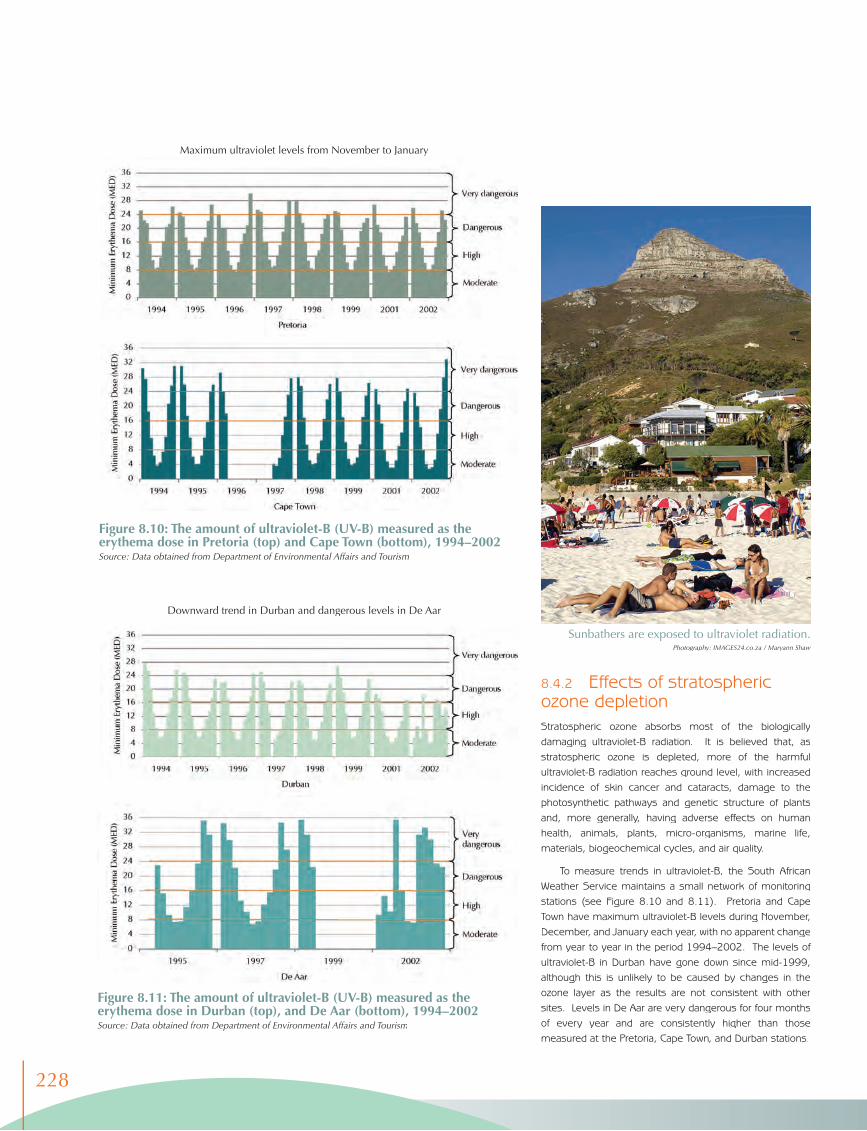
8.4.2 Effects of stratospheric ozone depletionStratospheric ozone absorbs most of the biologically damaging ultraviolet-B radiation. It is believed that, as stratospheric ozone is depleted, more of the harmful ultraviolet-B radiation reaches ground level, with increased incidence of skin cancer and cataracts, damage to the photosynthetic pathways and genetic structure of plants and, more generally, having adverse effects on human health, animals, plants, micro-organisms, marine life, materials, biogeochemical cycles, and air quality.
To measure trends in ultraviolet-B, the South African Weather Service maintains a small network of monitoring stations (see Figure 8.10 and 8.11). Pretoria and Cape Town have maximum ultraviolet-B levels during November, December, and January each year, with no apparent change from year to year in the period 1994–2002. The levels of ultraviolet-B in Durban have gone down since mid-1999, although this is unlikely to be caused by changes in the ozone layer as the results are not consistent with other sites. Levels in De Aar are very dangerous for four months of every year and are consistently higher than those measured at the Pretoria, Cape Town, and Durban stations.
Figure 8.10: The amount of ultraviolet-B (UV-B) measured as the erythema dose in Pretoria (top) and Cape Town (bottom), 1994–2002 Source: Data obtained from Department of Environmental Affairs and Tourism
Figure 8.11: The amount of ultraviolet-B (UV-B) measured as the erythema dose in Durban (top), and De Aar (bottom), 1994–2002Source: Data obtained from Department of Environmental Affairs and Tourism
Sunbathers are exposed to ultraviolet radiation. Photography: IMAGES24.co.za / Maryann Shaw
Maximum ultraviolet levels from November to January
Downward trend in Durban and dangerous levels in De Aar
228
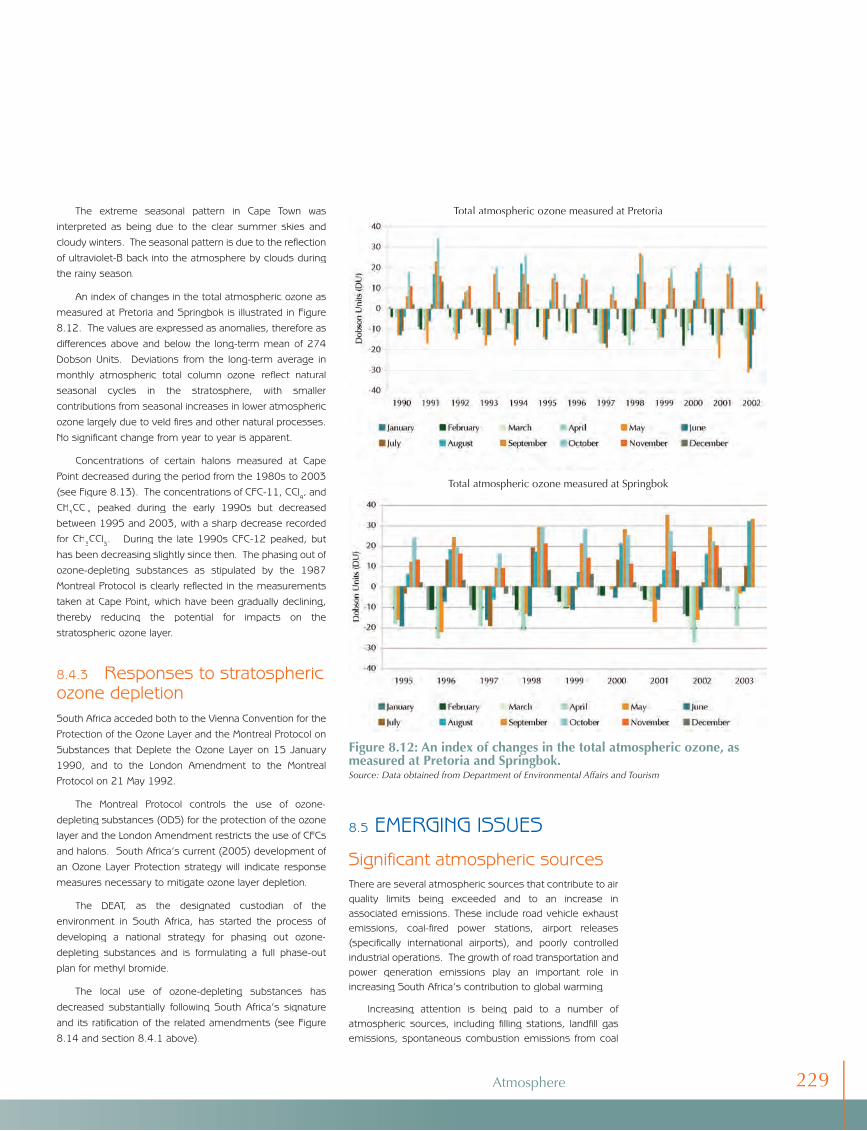
The extreme seasonal pattern in Cape Town was interpreted as being due to the clear summer skies and cloudy winters. The seasonal pattern is due to the reflection of ultraviolet-B back into the atmosphere by clouds during the rainy season.
An index of changes in the total atmospheric ozone as measured at Pretoria and Springbok is illustrated in Figure 8.12. The values are expressed as anomalies, therefore as differences above and below the long-term mean of 274 Dobson Units. Deviations from the long-term average in monthly atmospheric total column ozonejmonthly atmospheric total column ozonejmonthly atmospheric total column ozone reflect natural seasonal cycles in the stratosphere, with smaller contributions from seasonal increases in lower atmospheric ozone largely due to veld fires and other natural processes. No significant change from year to year is apparent.
Concentrations of certain halons measured at Cape Point decreased during the period from the 1980s to 2003 (see Figure 8.13). The concentrations of CFC-11, CCl4, and CH3CCl3 peaked during the early 1990s but decreased between 1995 and 2003, with a sharp decrease recorded for CH3CCl3. During the late 1990s CFC-12 peaked, but has been decreasing slightly since then. The phasing out of ozone-depleting substances as stipulated by the 1987 Montreal Protocol is clearly reflected in the measurements taken at Cape Point, which have been gradually declining, thereby reducing the potential for impacts on the stratospheric ozone layer.
8.4.3 Responses to stratospheric ozone depletionSouth Africa acceded both to the Vienna Convention for the Protection of the Ozone Layer and the Montreal Protocol on Substances that Deplete the Ozone Layer on 15 January 1990, and to the London Amendment to the Montreal Protocol on 21 May 1992.
The Montreal Protocol controls the use of ozone-depleting substances (ODS) for the protection of the ozone layer and the London Amendment restricts the use of CFCs and halons. South Africa’s current (2005) development of an Ozone Layer Protection strategy will indicate response measures necessary to mitigate ozone layer depletion.
The DEAT, as the designated custodian of the environment in South Africa, has started the process of developing a national strategy for phasing out ozone-depleting substances and is formulating a full phase-out plan for methyl bromide.
The local use of ozone-depleting substances has decreased substantially following South Africa’s signature and its ratification of the related amendments (see Figure 8.14 and section 8.4.1 above).
8.5 EMERGING ISSUES
Significant atmospheric sourcesThere are several atmospheric sources that contribute to air quality limits being exceeded and to an increase in associated emissions. These include road vehicle exhaust emissions, coal-fired power stations, airport releases (specifically international airports), and poorly controlled industrial operations. The growth of road transportation and power generation emissions play an important role in increasing South Africa’s contribution to global warming.
Increasing attention is being paid to a number of atmospheric sources, including filling stations, landfill gas emissions, spontaneous combustion emissions from coal
Figure 8.12: An index of changes in the total atmospheric ozone, as measured at Pretoria and Springbok.Source: Data obtained from Department of Environmental Affairs and Tourism
Total atmospheric ozone measured at Pretoria
Total atmospheric ozone measured at Springbok
Atmosphere 229
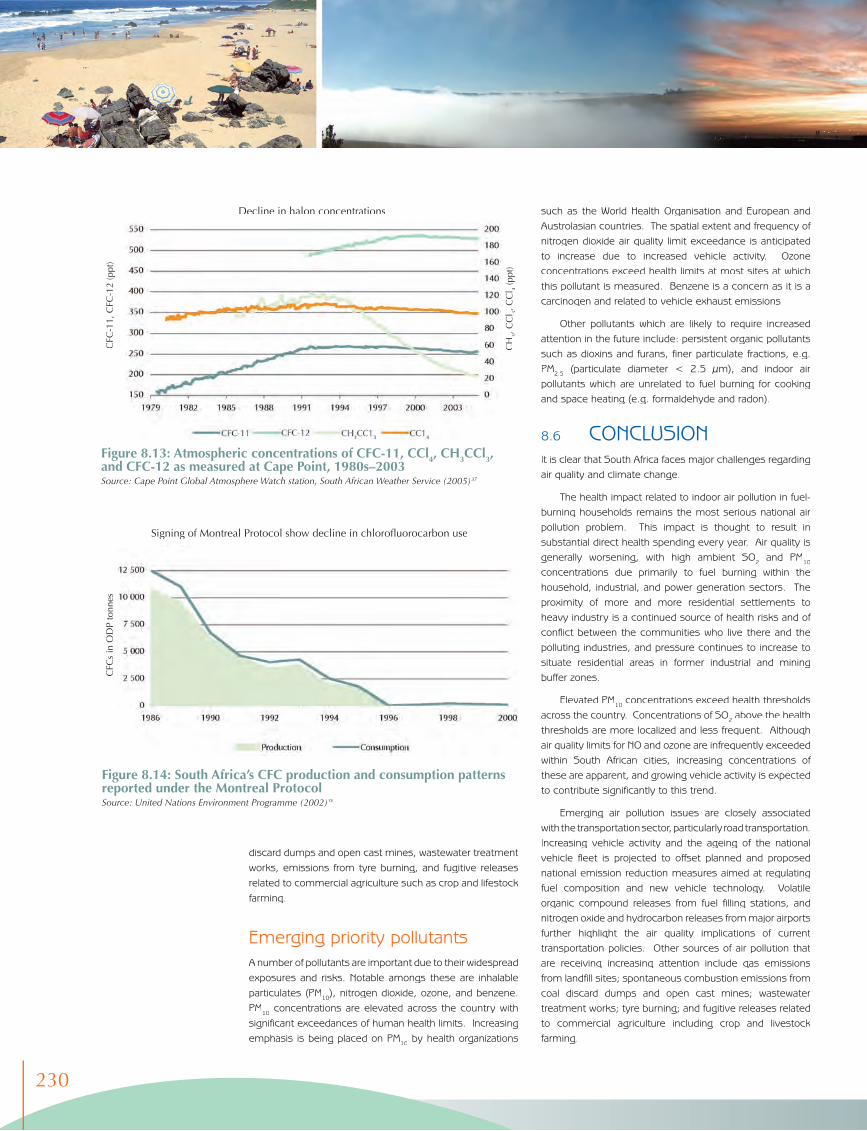
discard dumps and open cast mines, wastewater treatment works, emissions from tyre burning, and fugitive releases related to commercial agriculture such as crop and lifestock farming.
Emerging priority pollutantsA number of pollutants are important due to their widespread exposures and risks. Notable amongs these are inhalable particulates (PM10), nitrogen dioxide, ozone, and benzene. PM10 concentrations are elevated across the country with significant exceedances of human health limits. Increasing emphasis is being placed on PM10 by health organizations
such as the World Health Organisation and European and Austrolasian countries. The spatial extent and frequency of nitrogen dioxide air quality limit exceedance is anticipated to increase due to increased vehicle activity. Ozone concentrations exceed health limits at most sites at which this pollutant is measured. Benzene is a concern as it is a carcinogen and related to vehicle exhaust emissions.
Other pollutants which are likely to require increased attention in the future include: persistent organic pollutants such as dioxins and furans, finer particulate fractions, e.g. PM2.5 (particulate diameter < 2.5 µm), and indoor air pollutants which are unrelated to fuel burning for cooking and space heating (e.g. formaldehyde and radon).
8.6 CONCLUSIONIt is clear that South Africa faces major challenges regarding air quality and climate change.
The health impact related to indoor air pollution in fuel-burning households remains the most serious national air pollution problem. This impact is thought to result in substantial direct health spending every year. Air quality is generally worsening, with high ambient SO2 and PM10
concentrations due primarily to fuel burning within the household, industrial, and power generation sectors. The proximity of more and more residential settlements to heavy industry is a continued source of health risks and of conflict between the communities who live there and the polluting industries, and pressure continues to increase to situate residential areas in former industrial and mining buffer zones.
Elevated PM10 concentrations exceed health thresholds across the country. Concentrations of SO2 above the health thresholds are more localized and less frequent. Although air quality limits for NO and ozone are infrequently exceeded within South African cities, increasing concentrations of these are apparent, and growing vehicle activity is expected to contribute significantly to this trend.
Emerging air pollution issues are closely associated with the transportation sector, particularly road transportation. Increasing vehicle activity and the ageing of the national vehicle fleet is projected to offset planned and proposed national emission reduction measures aimed at regulating fuel composition and new vehicle technology. Volatile organic compound releases from fuel filling stations, and nitrogen oxide and hydrocarbon releases from major airports further highlight the air quality implications of current transportation policies. Other sources of air pollution that are receiving increasing attention include gas emissions from landfill sites; spontaneous combustion emissions from coal discard dumps and open cast mines; wastewater treatment works; tyre burning; and fugitive releases related to commercial agriculture including crop and livestock farming.
Figure 8.13: Atmospheric concentrations of CFC-11, CCl4, CH3CCl3, and CFC-12 as measured at Cape Point, 1980s–2003Source: Cape Point Global Atmosphere Watch station, South African Weather Service (2005)37
Decline in halon concentrations
CH
3, C
Cl 3,
CC
l 4 (p
pt)
CFC
-11,
CFC
-12
(ppt
)
Figure 8.14: South Africa’s CFC production and consumption patterns reported under the Montreal ProtocolSource: United Nations Environment Programme (2002)38
CFC
s in
OD
P to
nnes
Signing of Montreal Protocol show decline in chlorofl uorocarbon use
230
It is hoped that the new legislative framework (NEMAQA) and the development of air quality management tools, which focus on air pollutant concentrations and associated health risks rather than emissions, will ensure that sources posing the greatest risks to human health and the environment are prioritized. This will provide a basis for making mitigation and management measures as cost-effective as possible, and for health cost savings.
The NEMAQA also provides the framework for diverse and flexible measures to prevent air pollution. Given the need to address household fuel-burning and vehicle emissions as a priority, as well as a diverse range of industrial and mining operations, approaches other than command-and-control measures will need to be implemented. The Basa Njengo Magogo method of lighting fires, for example, requires intensive marketing, education, and awareness campaigns. Various market incentives and disincentives to restrict emissions (such as pollution rebates and taxes) are currently being investigated by the Department of Trade and Industry, and the outcome will significantly benefit future air quality management efforts.
Effective air quality management under the NEMAQA will however be dependent on the following conditions being met:
Timeous development and adoption of regulations, e.g. ambient air quality standards, emission limits, guidelines for air quality monitoring, modelling and management
Capacity building of local, provincial and national government personnel in terms of provision of adequate training, support and resources
Development and effective implementation of coherent air quality management systems comprising current and comprehensive emissions inventories, cost-effective and well run monitoring networks, and suitable air dispersion models
Standardization of monitoring methods, emissions inventories, modelling approaches and source, emissions, air quality and meteorological data reporting.
South Africa is sensitive to climate change, particularly since global warming is expected to result in increased frequency and intensity of droughts and floods. During the period 1990–1994, national CO2-equivalent emissions increased by 9.4%. This growth resulted mainly from the significant increases in greenhouse gas emissions from the energy sector. The three main source groups of energy-sector CO2-equivalent emissions are energy industries (includes electricity generation for the national grid), industry, and transport. From all three groups, CO2-equivalent emissions increased during the 1990–1994 period, with transport emissions increasing the most (by 38%). Road transportation contributes to more than half of the transport sector’s emissions. South Africa’s per capita
•
•
•
•
HCFC-124HCFC-124 is one of a series of fl uorocarbon
alternatives being studied by the Programme for
Alternative Fluorocarbon Toxicity
Testing (PAFT). HCFC-124 is considered
primarily as an alternative in
specialized refrigeration systems.
greenhouse gas emissions are above the global average – higher than most developing nations, and equivalent to some of the developed nations.
If South Africa’s CO2 levels double, it is expected that the western areas of the country will become dryer, that parts of the country will experience shorter rainfall seasons, and that air temperatures will rise, particularly in the interior. Other potential changes include increased incidents of flood and drought and stronger temperature inversions, exacerbating air pollution problems. These changes in climate could significantly affect a number of sectors of South Africa’s society and economy.
Atmosphere 231
NOTESBecause air quality monitoring is now required in terms of the new air quality legislation, many provincial and local authorities are currently establishing monitoring networks. Data from these networks, once established, will become the focus of a future national air quality reporting system. In the interim, data from private-sector monitoring stations has also been included.
‘Fugitives’ are small particles, such as dust, coming from brake-pad and tyre wear during braking. They remain airborne for short periods of time, settle to the ground, and are then disturbed again by traffi c. They could make up as much as 3% of PM10 and are increasing due to increasing traffi c densities.
Number of vehicles per capita are based on vehicle registration data from the National Transportation Information System (NaTIS) data base for the year 2001, and on the population statistics for the same year.
The groundwork for the African Stockpile Project began in the early 2000s, and implementation began in 2005 once funding was secured. The fi rst phase will take 3-4 years to complete. The main international partners with a direct role in project execution are the World Bank, Food and Agriculture Organization (FAO), and World Wide Fund for Nature (WWF). It involves 15 countries in total: Botswana, Cameroon, Cote d’Ivoire, Lesotho, Mali, Morocco, Mozambique, Namibia, Niger, Nigeria, South Africa, Swaziland, Tanzania, Tunisia, and Ethiopia.
Information on transboundary transportation of air pollutants contributed by Dr Stuart Piketh, Climatology Research Group, University of the Witwatersrand.
CH4 and N2O emissions are converted to CO2 equivalents using global warming potentials (GWP). GWPs are conversion factors that express the relative warming effects of the various greenhouse gases in terms of their CO2 equivalents. The values for a 100-year timeframe have been used, which are equivalent to 21 for CH4 and 310 for N2O, as recommended by the Intergovernmental Panel on Climate Change (IPCC).
‘Annex 1 countries’ are those listed in Annexure 1 of the Kyoto Protocol. They have agreed to reduce their CO2 emissions by 5% (compared to their 1990 levels) by the period 2008–2012. This means that they may in future decide not to import coal from South Africa in their efforts to reduce their emissions.
It is estimated that, under the Montreal Protocol scenario, there would be 440 000
a.
b.
c.
d.
e.
f.
g.
h.
more cases of skin cancer a year in the United States and 170 000 in northwest Europe by the year 2100. Under the Copenhagen Amendments scenario the estimates are 8 000 a year in the United States and 4 000 in northwest Europe.
Monochlorotetrafl uoroethane (HCFC-124) is used as an alternative to some of the CFCs that were used in refrigeration systems in the past. It can still cause damage to the ozone layer but it has an ozone depleting potential, or ODP (the capacity to destroy ozone molecules), of only 0.22, compared to CFC-11, which has a potential of 1.0, and Halon 2402, which has an ODP of 6.0. So Halon 2402 (which had to be phased out by 1994) is 6 times more detrimental to stratospheric ozone than CFC-11 (phased out by 1996) and about 30 times more detrimental than HCFC-124.
‘Atmospheric total column ozone’ is a technical term. The Weather Service measures the thickness of the ozone layer with an instrument called a Dobson spectrophotometer and relays that to the thickness of a column of air at 0 °C and 1 atm pressure. Normal thickness is 3 mm or 300 dobson units. Anything less indicates ozone depletion.
REFERENCES Terblanche, P., Nel, M.E., Opperman L., and Nyikos, H. (1993). Exposure to Air Pollution from Transitional Household Fuels in a South African Population. Journal of Exposure Analysis and Environmental Epidemiology 3, 15–22.
Terblanche, P. and Pols, A.S. (1994). Characterization of Risk Factors Associated with Household Fuel Usage in South Africa. Report compiled on behalf of the Department of Minerals and Energy. Report No. EO 9303. July. Pretoria.
Terblanche, P., Danford, I.R., and Pols, A.S. (1995). Comparative Evaluation of Human Exposures to Air Pollution from Low-Smoke and Conventional Household Coal Usage. Journal of Energy in Southern Africa, August, 131–136.
Van Niekerk, W.M.K. and van Niekerk, A.S. (2000). A needs-driven approach to the design process – a case study in combating pollution in low cost housing. Journal of Energy in Southern Africa, 11(1), 173–176.
Van Niekerk, A.S. and Swanepoel, P.A. (1999). Sasol Synthetic Fuels: eMbalenhle Air Quality Project, Phase Two, Indoor Air
i.
j.
1.
2.
3.
4.
5.
Quality and Desirability, Final Report. Report No. 98/14. 29 January 1999. Secunda.
South African National Standard 69 (2004). South African National Standard – Framework for setting & implementing national ambient air quality standards. Standards South Africa, South African Bureau of Standards, Pretoria.
South African National Standard 1929 (2004). South African National Standard – Ambient Air Quality – Limits for common pollutants. Standards South Africa, South African Bureau of Standards, Pretoria.
Scorgie, Y., Watson R. and Fischer, T. (2005). Background Information Document. Air Quality Baseline Assessment for the Ekurhuleni Metropolitan Municipality. Report compiled on behalf of Ekurhuleni Metropolitan Municipality. Report No. APP/04/EMM-01rev1.
Scorgie, Y., Burger L.W., and Annegarn, H.J. (2004). Socio-economic Impact of Air Pollution Reduction Measures – Task 2: Establishment of Source Inventories, and Task 3: Identifi cation and Prioritisation of Technology Options. Report compiled on behalf of NEDLAC, 25 June 2003. NEDLAC, Rosebank.
Wicking-Baird, M.C., de Villiers, M.G., and Dutkiewicz, R.K. (1997). Cape Town Brown Haze Study. Energy Research Institute, University of Cape Town. Cape Town.
Department of Minerals and Energy (2002). Digest of South African Energy Statistics. Department of Minerals and Energy, Pretoria.
Winkler, H. (2006). Energy policies for sustainable development in South Africa: Options for the future. Energy Research Centre, University of Cape Town, Rondebosch.
Statistics South Africa (2004). Primary Tables: South Africa Census ‘96 and 2001 compared. Report No. 03-02-04. Statistics South Africa, Pretoria.
City of Cape Town (2003). City of Cape Town State of Environment Report 2003. City of Cape Town, Cape Town.
South Africa (2003). Government Gazette No. 25741. Notice 3324 of 2003. Joint Implementation Strategy for the Control of Exhaust Emissions from Road-going Vehicles in the Republic of South Africa. Pretoria.
6.
7.
8.
9.
10.
11.
12.
13.
14.
15.
232
South African Petroleum Industry Association (2005). Fuel sales data. 8http://www.mbendi.co.za/sapia/rsacons.htm#QUARTERLY.
Charlson, R.J., Langer, J., and Rodhe, H. (1990). Sulphate aerosol and climate. Nature 326, 655–661.
Andreae, M.O. (1991). Biomass Burning: Its history, use and distributions and its impacts on environmental quality and global climate. In Levine, J.S. (ed.), Global biomass burning, atmospheric, climatic, and biospheric implications. MIT Press, Cambridge, 240–244.
Schimel, D., Alves, D., Enting, I., Heiman, M., Joos, F., Raynaud, D., Wigley, T., Prather, M., Derwent, R., Enhalt, D., Fraser, P., Sanhueza, E., Zhou, X., Jonas, P., Charlson, R., Rodhe H., Sadasivan, S., Shine, K.P., Fouquart, Y., Ramaswamy, V., Solomon, S., Srinivasan, J., Albritton, D., Derwent, R., Isaksen, I., Lal, M. Wuebbles, D. (1996). Radiative forcing of climate change. In J.T. Houghton, J.T., Meira Filho, L.G., Callander, B.A., Harris, N., Kattenberg, A., and Maskell, K. (eds.), Climate change 1995: The science of climate change. Cambridge University Press, Cambridge, 65–131.
Meter, S., Formenti, F., Piketh, S.J., Annegarn, H.J., and Kneen, M.A. (1999). PIXE investigation of aerosol composition over the Zambian copperbelt. Nuclear Instrument and Methods in Physics Section B 150, 433–438.
Meter, S.L. (1999). Sulphur emissions from Africa as a source of global aerosols. Unpublished MSc dissertation, University of the Witwatersrand, Johannesburg.
Mphepya, J.N., Pienaar, J.J., Galy-Lacaux, C., Held, G., and Turner, C.R. (2001). Precipitation chemistry at a rural and an industrial site in South Africa. National Association Clean Air Conference, 10–12 October, Port Elizabeth.
Kuylenstierna, J. and Hicks, K. (eds.) (1998). Climate Change 1995. The Science of Climate Change. Contribution of Working Group 1 to the Second Assessment Report of the Intergovernmental Panel on Climate Change.
Turner, C.R., Wells, R.B., and Olbrich, K.A. (1996). Deposition chemistry in South Africa. In Held, G., Gose, B.J., Surridge, A.D., Tosen, G.R., Turner, C.R., and Walmsley, R.D. (eds.), Air pollution and its impacts on the South African Highveld.
16.
17.
18.
19.
20.
21.
22.
23.
24.
Environmental Scientifi c Association, Cleveland, 80–85.
Midgley, G.F., Chapman, R.A., Hewitson, B., Johnston, P., de Wit, M. Ziervogel, G., Mukheibir, P., van Niekerk, L., Tadross, M., van Wilgen, B.W., Kgope, B., Morant, P.D., Theron, A., Scholes, R.J., Forsyth, G.G. 2 (2005). A Status Quo, Vulnerability and Adaptation Assessment of the Physical and Socio-economic Effects of Climate Change in the Western Cape. Report to the Western Cape Government, Cape Town, South Africa. CSIR Report No. ENV-S-C 2005-073. Stellenbosch.
Department of Environmental Affairs and Tourism (2003). South African Initial National Communication under the United Nations Framework Convention on Climate Change. Department of Environmental Affairs and Tourism, November, Pretoria.
South African Weather Service (2005). Meteorological and total atmospheric ozone data obtained from South African Weather Service, Pretoria.
Hewitson, B. (26 May 2005). Personal communication. University of Cape Town.
Scholes, R.J. and van der Merwe, M.R. (1999). Atmosphere and Climate. In the Department of Environmental Affairs and Tourism, National State of Environment Report 1999. Department of Environmental Affairs and Tourism, Pretoria.
Terblanche, P. (1994). The Potential Health Impact of Global Climate Change. NACA Clean Air Journal 9(2), 14–17.
Department of Environmental Affairs and Tourism (2004). National Climate Change Response Strategy. Department of Environmental Affairs and Tourism, Pretoria.
Palmer Development Gorup (2004). Kuyasa Low Income Housing (CDM) Project. Business Plan and Feasibility Study. Prepared for submission to the Department of Environmental Affairs and Tourism’s Poverty Relief Programme. Unpublished.
Alternative Flurocarbons Environmental Acceptability Study (AFEAS). AFEAS Research and Asssessment Program. Production and sales data through 2003. 8http://www.afeas.org
Intergovernmental Panel on Climate Change (2001). Climate Change 2001: Synthesis Report (2001). Edited by: Robert T. Watson and the Core Writing Team. Cambridge University Press. New York.
25.
26.
27.
28.
29.
30.
31.
32.
33.
34.
Van der Leun, J.C. (1997). Avoiding disaster. Our Planet 9(2), 9-10.
Department of Environmental Affairs and Tourism, National Environmental Indicators Database. 8http://www.environment.gov.za
Cape Point Global Atmosphere Watch Station, South African Weather Service (2005). Data obtained for atmospheric concentrations of CFC-11, CCl4, CH3 CCl3, and CFC-12 as measured at Cape Point from 1980s to 2003.
United Nations Environment Programme (2002). Ozone secretariat. 8http://www.unep.org/ozone
Scholes, R.J. and Biggs, R. (eds.) (2004). Ecosystem Services in Southern Africa: A Regional Assessment. Southern African Millennium Ecosystem Assessment (SAfMA). Council for Scientifi c and Industrial Research, Pretoria.
35.
36.
37.
38.
39.
Atmosphere 233