vacuum refining of copper
TRANSCRIPT

1 l-
i
! ,
'i , ,
c'
(>
, , --"---
,j
" \
VACUUM REFINING OF COPPER
by
Engin Ozberk
1
A ~hesi~ Submitted ta the Faculty of Graduate Studies 1
l ,
and Res~arch in Partial Fulfilment~of the Requirements for
the Degree of Master of Engineering in Metallurgical
Engineering, McGïll university, Montreal.
March 1980

\
,1
,1 ,
i , <!,
1
1 1
"
1 • t (
f
l, () j ~
,/
i
ABSTRACT
, /,1 An, experimental investigation of the .removal of'''impurities
1
(bismu~lead, arsenic and antimony) from baths of molten ~opper
. (blister, anode, and cathode type copper) under vacuum was carriep
out. A p~lot sc~le 150 kilogram vacuum induction melt~ng facility
was used for these tests. <f'
The effects of vacuum 1evels of 60-30~ ~Hg, me1t temper~ 1
tures of 11SO-13S0°C, melt.surface area te volume ra~ios of
6-10 m- I and the effect of ,water cooled condensers p~ac!d within
a ~woi cehtimeter,distance above the ~elt surfacé, wer~~studied.
, Kinetic data were, obtained for eva1uating the po n ia1 of
a full scale vacuum melting facility. A mathematic~l mo~l was
also developed for th,e proper ihterpret'ation of the experimental , .
results.
In the abeience of~"Q)cygen and ~ulphur ït was found that l
bismuth and l~aq cou1d be eliminat~d by up to 80% and 90% res-~ -
pective1y, whil~ remova1 of arsenic anp antimony was negligib1e.
The rate of removal of bismuth and 1ead increased as the
chamber p~essJre was lowered and the me{t' temperature· increased. ~
The melt ~urface area to volume ratio ~nd the distance of the
condenser to melt surface" did not have significant effed:s o~ ,
the rate cons~ants governi~g the rate of re~éval of impurities.
The rate, of eliminat..ion of bism-qth. and lead over the
range of 11SO-13S0°C and 300-60 ~~g, followed first order
kinetics. Rèmovaî rates were largely'controlled
port in the gas phase. /'
-"-~---
.Jo
... o

- - -- ---- '--"'--- - .-.-.. _~I -_. __ - -~_._-_.~. - - -- - _ .. - -
1 -'.
i 1
1
1
ii' 1
\ "'- 1
1 1 • r (1' A comparative study has shown ·that the rates of elj,mina- ,1 L
f 1
" !-tion of impurities in the present pilot plant scale equipment j f f>
1
were sigpifi~antly lower ~n previously published laboratory;, 1
scala tests.' 1 ,\
1 ' , 1 . , 1 : ~.
l Î
1 ! , ~ 1
L- I !
1 j ,. 1
" ! 1
! j , 1
f
1 1
~
CJ. 1 ,.
c
'0 1 " '/
t\ ~ , , l , .
1 1 .
" l
~ .
,', !
~
<Il,
1

c'
r , \
1,
1 i \ , 1
!
i
1 r,
RESUME
Une ,,~tude experirnentale de 1 '~limination des impurett€s
(bismuth, plDmb, arseniç et antimoine) des bains de cuivre fondu
sous vide {cuivre "Blister", cathode et anode en cuivre) a t€t~
rt€alisée. 'yne installation pilote de fusion par induction sous
vide, pouvant traiter une charge de 150 -kilogrammes a ~té utilist€e.
"' Les effets de, la quali tt€ du v,ide, ya1iant de 60 à 300 llHg,
de la température du bain, comprïse 'entre '1150 et 1350°C" du
rapport surfaée sur volume (de 6 à '10 ~~l) ain~i que l'effet de
~ondenseurs refroidis à l'eau et plac~s à une distance de deux
centimetres au-dessus du bain, ont été étudiés. , ! ,'l'
, \
Des données sur la cint€tique de rt€action ont t€tt€ obtenue~
dans le but d't€valuer les possibilit~s d'une installation sous
vide industrielle. Un mod~le mathématique a t€té développé afin'
d'interprt€ter les résultats expér~m~n~aux.
En l'abscence d'oxyg~ne et de soufre il a étt€ trouvé que " "
\, ,
l't€limination d~bismuth et du plomb peut atteindre respkct(vement
80 et 90% alors que celle de l'arsenic et ge l'antimoine est
négligeable.
La vitesse d.' él'iminati.on du bismuth et du plomb augmeI}te o
quanc~. la pression diminue, et la temperatur.e' du ,bain croit. Le
rapport surface sur volume et la distance condenseurs-bain n'ont
pas d'efJet significatif.
La viteFse d'éliminatiqn du/bismuth et du plomb suit une 1 0
,cinétique de premier' ordre dans le domaine 1150-1350°C et
. ' f <
-._- ---,--"_. ~~.-._-'-
\
'" J
j. ~ 1 i . !
'1 1
1 1
1 ! d ,

~ ), .
o
iv
300-60 lJHg. Elle est largement control~e par le transfert:,:dè
masse dans la phase g~seuse.
"" Une I!tude comparative ~ montrl! que les vitesses d'~limina-~-n dès impurêt~s dans l'installation pilote pr~sente étaient ta~ p' , not~m~nt plus basses ~e celles publi~es pr~c~demment et
prouvenant d J essais de, ,ab~ratoire.
!
"-tt,
, /"
t/
/
"

"
" (- '. (
1 • ,
-0
. ,
v J
li
ACKNOWLEDGEMENTS
, ' Every graduate student 0lies, a great deal to others and {
l am no exception.' l would like to acknowledge the 1ntellectual,'
patierlt and helpful guidan7e and s~pport l have received' from '1~ .
Professor R.I.L. Guthrie throughout my.three years at McGill
Uni versi ty . ' "
1
l would aIse like '"ta recognize aIl the membersof the
Metallurgical Engineering -Department'with whom l have collaborated
en the technical, academic, administrative and friendship level.
~he years at McGill University have been a very pleasant period
in my life.
. , l must also thank Karen Rivett for typing this somewhat
. lengthy text with a patient, understanding and cheerful attitude.
J,
If'
'---.-V"'
" 1

! 1
,1 1
"
l
toi
(,
()
/' 1
\ , ---". -~-~ - ... -- ..... ~~_\.
ABSTRACT
RESUME
TABLE OF CONTENTS
(
1
ACKNOWLEDGEMENTS
LIST OF TABLES ,
LIST OF FIGURES • NOMENCLATURE
CHAPTER I.
-/
INTRODUCTION (
I-1. MINOR ELEMENTS IN COPPER
I-1.A Production of Copper
I-1.B Behaviour of Mino~ Elements in
Production of Copper ,
I-l.C Difficulties Related to Irnpurity
Content of Copper and' Possible , '
ITechnica1 Solutions
1-2. VACUUM METALLURGY PROCESSES \
1-2.A Vacuum Induction Melting and
1t, r Refinin~,
1-3. PURPOSE OF PRESENT STUDY
CHAPTER II. REVIEW OF THE;ORY AND, PREVIOUS EXPERlMENTAl;J
WORK
} 11-1. INTRODUCTION TO VACUUM TECHNOLOGY .l'
II-2. HISTORY OF VACUUM METALLURGY
/
vi
i
ii
v
xi
xv
1
1
1
2
'6
9 , \
10
~ 11
12

(
C' ,1
1 1 --r',--
vii ,;
1
, ,
11-3. THEORY, OF MASS TRANSPORT IN'VAC~M 1
,II-3.A Thermodynamics in Relation to
Vacuum Metallurgy {,
1I-3.~ Rela~ive Volatility Coefficient • 1I-3.C Over~ll Mass Transport.Rate •
15
16
19
2l "1
1I-3.D Mass Transport in Liquid Metal 25
II-3..E ( 0
Mass Transport at Melt Surface-
Evaporation ~ '1 1
l' •
II-3.F Mass ~ransport in Gas Phase ~
II-4. PREVIOUS EX~
1
26
28
1I-4.A Treatment of Blister Copper ·31
1I-4.B Treatment of Anode and/or o
Cathode Type Copper
1I-4.C Treatment of Copper Matte
Patent Survey
1I-4.E S~ary ~f previous Experimental
Work
35
39
40
43
CHAPTER III. DEVELOPMENT O~ MATHEMATICAL MODEL AND A
_CRITICAL ANALYSIS OF PA~TERS USED 46 1
III ... 1. DEVELOPMENT OF MODEL / 46
~I~~ ~II-2. ANALYSIS OF PARAMETERS IN LIQUID PHASE
MASS TRANSPORT COEFFICIENT 50
III-3. ANAlYSIS OF GAS PHASE MASS TRANSPORT
COEFFICIENT 52
\
\
• 1
1 , J
1 •

! " , , ,
(-
(Î
_. _ ... __ ..... ----------
viii
. \
1II-4. VAPOUR MOLECULES CONTAINING MORE THAN
ONE ATOM (DIATOMI~/COMPOUND GAS SPECIES) 53
1II-5. VARIABLES AFFECTING OVERALL MASS TRANS-
PORT COEFFICIENT
111-6. COMPUTER PROGRAM
CHAPTER IV. EXPERIMENTAL WORI< ,
IV-l. EXPERIMENTAL P~OGRAM
+V-Z. APPARATUS
I·V':"Z.A Induction 'Furnace and Vacuum
Chamber --
IV-2.B pumping\ System
55
55
57
57
58
58
60
IV-2.C Pressure and.Temperatur? Control, 60
IV-2.D Cruéibles
IV-3. SAMPLING AND CHEMICAL ANALYSIS
IV-4. MATERIALS USED
IV-s. EXp'ERlMENTAL PROCEDURE
IV-6. CRITICAL ANALYSIS OF' THE 'EXPERIMENTAL'
TECHNIQUE AND AN ESTIMATE OF ERRORS
CHAPTER V. RESULTS
V-l. PRELIMINARY WORK 1.
66
66
68
70
72
175
75
V-2. 2-LEVEL FRACTIONAL FACTORIAL TEST DESIGN 76
V-3. PART l EXPERIMENTS - 80
V-4. PART N EXPERIMENTS 108
V-s. PART III EXPERtMENTS
V-6. PART \ IV EXPERlMENTS
.0
1
130
157

! . ;
f
! !
>
1)
V-7. CONDENSATE A~ALYSIS
V-B.
CHAPTER VI.
, VI-l.
VI-2.
1
STATISTICAL EVALUATION Of THE EXPERI-
MENTAL WORI<, ACCURACY
DISCUSSION
INTRODUCTION
REMOVAL OF BI SMUTH AND LEAD
'V,I-2.A Fractiona1 Factoria1 Test Design
Cv.~-2.B Effects of Pressure and
\ Temperature
VI-2.C Processing Time and
Reproducibili ty
VI - 3. REMOVAL OF ARSENIC AND ANTIMONY , J
\<-
VI-4. INFLUgNCE OF THE PRESENCE OF OXYGEN AND
SULPHUR IN THE SYSTEM
VI-5. AN~YSIS OF CONDENSATE AND COPPER LOSSES f) •
VI-6. KlNETIC S~UDIES
VI-7. COMPARISON OF RESULTS WITH- PREVIDUS WORK
CHAPTER VII. CONCLUSIONS
REFERENCES .
APPENDIX 1. THERMODYNAMIC DATA ,-
APPENDIX II. MEAN ~FRE:E PATH CALCULATIONq
APPENDIX III. ÈSTlMATION OF DIFFûStON AND MASS TRANS-
PORT COEFFICIENT IN LIQUID PHASE 1
APPENDIX IV. EVALUATIQN OF 2-LEVEL FRACTIONAL
FACTORIAL TEST DESIGN
, -----_.-.-.._-~---
ix
157 .
168
171
171
·17-1
171
176
184
184
185 \
190
193
215
220
223
236
240
·243
248
"
1 , .1
1 \
1 1
l ' -1 ' ,
,
1 1 \ . 1
i '.' ,
! J 1.
1

/.
" r , .. l 1
f ;
l \
r ~ ~ > ,
? 1
[ ;
f 1
t ~
" , 1~ _ .,I.n .... ~~ ~'" _...,. .. __ ~ ___ .... ,_ .. _ ............... M __
1 0
x
" ,
Co 1
APPENDIX V. ANALYSIS' OF .CONDENSATE AND COPPER LOSSES 1 258
Ci "0
o
~pÉNDlrlI.
A:PPE7, VII.
\
\
(
COMPUTER PROGRAM '
THERMOOYNAMIC CALCULATIONS WITH FACT
SYSTEM
(
è{fjit l , •
• . 1
262
266 / •
.,

(
\
(
1.
2.
3.
LIST OF TABLES ,
Representative Analysis, wt%
Relative Volati~ity Coefficient
Summary of'Result~ ~lable in
4~ Analysis of Vacuum Cast Copper o
1
values ,
Literature
5,-a. Chemi'cal Analysis of Tercod Crucibles, wU
5-b. Chemical Analysis of Hycor Alumina èrucibl~, wt% JI
6. Design of Four Factors in Eight Observations
7. ?xperimental Conditions and the Results for Part l
Experimen ts
xi
8. Summary of Results for Bismuth R7moval, Part l Experiments
9. Summary of Results for Lead Removal, Part l ExPeriments
10. Summary of Experimental Conditions and Results, Part II
Experiments .. ü. Summary of Experimen~~l Condi tions and Results, Part' III 1
Experiments
12. Summary of Kinetic Results for Bis~th Removal, Part III
13.
-Experiments 1 1
Summary of Kine~ic Results for Lead.Rernoval, Part III
lb." Experiments
14. Comparison of Duplicate Experiments
l5~ Surnmary of Experimerltal Conditions and Results, Bismuth
r and Lead Removal, Part IV ExperiInents'
16. °Elimination of Arsenic and Antimony 1
17. Analysis of Condensa te, w~%,
1 ,\
-"._--- -.-.. "_'.,.,.,-_._~. __ ._~---
• 1 ,
J , .\
1 ,
1 j î !

r-
~
r, ~ ~ , \
~r , (
1
1:
" \ ~
"
-(:
1 f
1
1
t 'C'!
xii
·1 18. Comparison of Re~ults, Showing the Effect of Condenser
Distance
19. Distribution Ratio of Inpurities Remov~d to Water Cooled
Condenser '\ 20. Summary of Kinetic Dat~ Showing the Effectlof Melt-
Temperature and Vacuum Pressure
2l-a. Estimated Equilibrium Tempe~atures at which Metal Oxides
would Form 1
21-b. Estimated Equilibrium Oxygen Pressures at which Metal 1
.'" Oxides would Form
"22. Predicted Mass Transfer Coefficients for Bismuth
2,3 • Predicted Mass Transfer Coefficients for, Le~d
24. Extrapolations ,of Overall Rate Constant for Bismuth-and
Lead
25. Comparison of Experimental Results with Predicted Overall
Rate Constants
26. Comparison of the Present Results with the Results Available
in Literature
, 1
"
tl
"
"
;
... , 1
-, i
' J
1
i 1 j • t
i
1

, t,
" " "
','
, ['
(
('~, ?
/'
/
\ 1
,q.ii
'LIST OF FIGURES
1. Combined process flow diagrams of extracting copp~r from
sulphide ores. 1
2. Degree of vacuum and pressure ranges of vacuum meta11urgy. l
3. Vapour pressure of sorne pure e1emènts p10tted as a function 1
of temperature.
4. Stages of rnass~transport in vacuum induction melting.
5. Overa11 view of the apparatus.
6. Various components.
7-a. Inside view of th~ vacuum ch~er (condenser on~the _side). " ~
7.-b. Inside view of the vacuum chamber (condenser in its
8. The pump~ng system.
9~ Graphite'sarnpling cup.
10-17. Rate of removal of bismuth and.1ead from corper,
. 1 1 8 Exper~ments F- to F- •
18-23. Rate of remova1 of bismuth and lead from copper,
Experiments A-1 to A-6.
24-30. Rate of removal of bismuth and-lead from copper,
Experilnents F-1-X, F-9-X, F-7, A-7-X, F-9, F-IO, A-'7.
31,32. Rate of remova1 of bismuth and lead f~m copper,
Experiments A-B, A-9.
33. Location of condensate samples. 1
34. Crucible surface mèta11ic accumulation,
a - Test A-l
b 'l'est A-7
r
position) •
,

"'\
~ ..
t f f • \' ~
(
(: ,
xiv
35. Overall rate constant vs. temperature for bismuth.
36. Overall rate constant vs. temperature,for lead. 1
37. Wt% elimination vs. tempe rature for bismuth and lead.
38. Overall rate constânt vs. pressure for bismuth and 'lead.
39. wt% elimination vs. pressure for bismuth and 1ead.
40-a. Mass transport coe,ffici~nts vs'. temperatu~f2J at pressures
of 100 and 60 llHg for Ibismuth ,~':
40-b. Mass transport coefficients vs. te~perature at pressures
of 100 and-60 llHg for lead.
41. Liquid phase mass tra~sport coefficient vs. temperature
for two levels of activation, energy, ÂE.
42. Evaporation mass transfer coefficient vs. tempe rature for 1 / ! bism~th and lead.
"-.~/-
/
43. Ku ys. ~emperature at different chamber pressures for bismuth.
44. Ku vs. temperatu;re at different chamber pressures for lead. ' h '
45.- Predicted gas pha~e mass transport coefficient vs. tempe rature
at different chàrnber pressures for bismuth.
46. Predicted gas phase mass,transport coefFicient vs. temperature /
at different chambe~ pressures for lead.
47.- Predicted overall ra te constant vs. temperature at different
chamber pressures for bismuth. 1 •
48. Predicted overall rate constant vs. temperàture at different
chamber'pressures for lead.
49. _ Extrapolated overall rate constant vs. tempe rature at
different chamber pressures for bismuth •
50. Extrapo1ated overa11 rate constant vs. temperaturecat
different chamber preps~res ~or lead.
~ \

le A
a
B
c~ ~
Ct' ~
Di
Do
.1.E 1J,-
',>'
i
K
~ K ' E~2 '
KG
KGo
Ke ; Ka ,
i L,l
l M,MO
1 Meu
Cl
"
NOMENCLATURE
melt surface area
activity
, bulk concentration of solute i
surface concentration of solute i
diffu~iv~ty of solute ,i
diffusion constant
J
activation energy for diffusion . -, ~ ~
sol ute (,or, i~puti ty) -
overal? rate constant ')
\ ,
evaporation mass transfer coefficient
evaporation mass transfer coefficient for
diatomic gases
gas phase mass transport coefficient
. gas, phase mass transpo~t coefficient
characteristic of the system
liquid phàse mass transport 'coefficient
term containing gas phase mass transport
ÇIOeffi,6ient
equilibrium coefficient 1
Boltzman constant, 1.38062 x ~0-2~\ liquid
'metal, metal oxide
molecular weight of copper
J \
, v
xv ,
1
)
g·,mole c~-3
gomole cm-3
2 -1 cm S . s
cal gtmole-l
cm s -1
cm s -J"
cm s -1
cm s-l
cm 6-1
jouleK-l
. -1 gomo1e
l,
, .
·1
, ,
" 1
l . ,
l
1

. ,
-1..
1
c·
g
•
" M. ~
. N'" i " ·
'---', ,
molecular weight of solute' r'
rate of elimination of solute i
N~' overall 'flux of solute i. 1. ~"":;:/
N~ maximum evaporative f[ux of solute i ~,ev
· Ni,gas' flux of solute i in gas phase
· Ni,11q flux of solute it in liquid phase
P
pl? ~
ambient pressure in chamber . ~
vapour pressure of solute i at'
condenser'surface ... '
, PI actual partial pressure of solute'i at
the inter~ace or in the gas phase
R
r
s
t
u. , 1.
v .Jo
wt%i
x
X'f ~
., '
o uva.p6~ pressure of pure solute i 1
equilibrium ~apour pr~ssure of solute i
gas'constant, 8.31432 x 10⁷
radius of cruc~ble
.' radius of solute molecule ". '
melt temperature
time
mean surface velocity of solute i 1 1
volume of melt'
weight percent of soiUte i
mdle ~racHon
m9le fraction of solute i at interface
.' 1 ~-- ~
xvi
g'mole-1
g'mole cm-3s-1
-2 -1 g·mole cm s
g'mole cm-2~-1
g.mole 'cm-2s-l
g'mole cm-2s-1
, pascal
pascal
pàsoal
pascal
pascal
J 2 -2 -1 gmole'g'c~ s K
K
,- ~." .. ~ ....... ,.~, .
;
1
J
1

',' 1 ,
r 1
"
(
( , ,t ",
. !
~----- -_ ...
a
y
e:
e. 1,
r
. ,
relative volatility coefficient
activity coefficient
molecular diameter
life time of volume solute i moving alonq
interf;tce
,Mean free path
li<~uid sOlv~nt viscosity
,densi ty of copper
i
/
- ---.-. -,---- 1 -------~--_.---
cm.
s-
cm
poise
g cm-3
1
xvii
1
1 1 1 /' J
1
i 1
\
! ;
1 -'
\
\

.. '
, .
J
1 1 !
1
(
GHAPTER l
INTRODUCTION ,
J l -1. MINOR.· ELEMENTS. IN COPPER
I~ Copper ores invariably contain sign+ficant quantitie's
of elements other than ,copper and sorne of these report with J
copper in the coppër cdncentrate. A number of these " 1
.impurities (e.g. àrsenic, antimpny, bismuth, lead, tin
é 1
and zinc) are considered deleterious in that they tend to
decrease the quality of the final product, copper-wire,
following electrolytic refining[l]. Converse~impurities
such as gold, sil,ver, selenium and telerium are classified
as being valuable and are readily recovered in the electrof<.? J .lytic refining stage ~ •
For such reasons, the behaviour· of minor ellements
commoniy present in copper concentra~e~ represepts an \ -,
impor"tant technical/,J as weIl as economic consideration in
any copper smelting operation.
I-I.A Production of Copper
, ..
Figure l surnrnarizes the current major processes used
in the pyrometallurqical productidn of'copper from copper l
sulphide ores. These or,es ~cço~r approximately 90% 'of
·the world' s p'rin\ary copper [3 J ( , • 1 /
Sulphide orea are generally treated by beneficiation
processes (comminution and tlotationl 50 as to prpduce
<\
"-'.~'" ---- -
-. 1 1

l'
,(
" é
1 •
'1 ,- .
, .'
,
2.
1
copper concentra tes «(~.])gure 1). Matte, (a mixture of- copper
and iron sulphides containing 30-55% Cu) is smelted ,from o ~
concentrate'eithe~ by conventional processes (blast1or b • , '
reverberatory orèlectric furnace) or by'new processes
(flash furnaces). Also, in recent years, ~e Noranda , "
Continuous Copper Making Reactor has 'been .employed to pro-
duce, very high grade mattes containing 60-7Q% CU. Both (
matte 'ana high grade mattes are then converted into blister
copper containing about 1% sulphur in Pierce-,Smi th converte1's.
Today, blister coppers (or rather a type of copper
simitar to conventional blister c~pper) ban be produèed
directly from côncentrates by the Mitsubishi and Noranda ,
continuous prcicesses: These molten blister coppers are then
fire-refined and cast into anodes. This latter step i5
followed by eleobro-refining, enabling 99.99+% copper to be
produced.
I-l.B Behaviour of Minor Elements in the Produption of Copper
While high quality copper results from the controlted
elimination of minor cÙements during the course of smelting
operations (Figure 1), studies of
rocésses'-' show {that very little, elimination of
fire-refining in the
latter operation any. slag remaining
fram the converters is ,first skimmed off. The copper is
then desulfurized, deoxidized and held for anode casting[S].
, . -'" \/ ?---:;-.
1
,"

)
\ ~ , , !
\
1 1
Î
(
" ; ,
1 1
\
+
Sulphide Ores (0.5-2% Cu)
\
Benefic~ation Processes
Concentlates (20-30% Cu)
~< Conventipnal Processes New Processes
,Figure 1.
.'"
Reve;beratory Blast Flash Furnace Furnac.e
Matte (30-55% Cu)
+
1 Blister Copper (98.5+% Cu)
+ Refining &
Casting
,Anode Copper (99.5+% Cu)
ElectroRefining
Cathode Copper "(~9. 99+% Cu)
Modified Confinuous Processes
High Grade Matte (50-75% Cu)
~.
o
..
, '
Comb:tned process fl~ diagrams for the extraétion of sulphide ores.
')
3.
-. Continuous , Proc.esses
, 1
l Blister Copper
(97+% Cu)
"

" '
h,
However, any high impurity contents of other elements in p
the blister copper eharged to the ano~e furnace, tend to
remain and proceed on through, to the eleetrolytic,refining ,
stage. This causes t~e following problems[3]:
1) Contaminatiçn,' of electrolyte, making e lectr91ytic
purification more difficult'and costly. . ,
• 0 2) Contamination of cathode 'copper, leading to ,
inferior electrical and mechanical properties of the fi~al
product, copper-wire-bar.
3) Contamination of anode slimes, leading to a more 1
. di,fficult and costly separation of valuable by-products. ~
It ïs clear that the ~em6val of aIl deleterious
impurities during matte smelting and 'converting stages and l ,
prior to the fire refining or electro-refining steps would
be ideal. Similarly, the concentratioh of aIl valuable
impurities i?,the blister copper and subsequently in the " .
4.
anode copper, would be 'ideal sincEl they are easily recovered
durlng the electrolytic refining stage.
Provided deleterious impurities in a matte are present '"
below cer.tain concentration levels, they can be eliminated
adequafely during the matt~ smelting and converti~g stages 1 ~
(Table 1). In these conventional processes, the elimination
oceurs by two mechanisms, slagging and volatilization, ~he
ov~rall elimination of each elernent being determined in an '-
,interplay of thermodynamic, kinetic and process factors. At 1
~
the s~e.time, conventional processes provlde h.igh recoveriesi
\
"
-\
1
1 li

as A4 ,u; ~ $>4"#45 iQq;:saA'4PJi(4iJi> ... ...,.~~t.. ------.... ~.~~ ~~""," :r"'lO~~"'''' -~ ... - ~ ~ ~ -,.. .. .,.-
~ --:4 ,,-,'
. ~
.. "-
-TABLE 1. Representative Analysisl
• , weight %. • , 0
,1
! l'
1
'1
--,
Cu Fe S
Matte 30-55 ' 30-45 20-25
Blister 98.5- 0.1 0.02-Copper 99.5 0.1
Anode 99:4- 0.002- 0.001-D C~pper 99.8 0.03 (J.003
Cathode 0.0002- 0.0004-Copper 99.99+ 0.0006 0.0007
1.. Conventional processes[3]
2. Not included in ftn@lysis
"
•
"1 'IMm -" * t' -:1:;">' --~--~I
0
2,-3
0.5-0.8·'
0.1-0.3
-i 2. n. ."
.-'
"
As Bi Pb Sb Zn Au
0-0.5 0-0.1 0-5 0-1 0-5 0- i5xlQ-4
0-0. J. 0-0.01 0-0.1 0-0.3 0.005 0-100xlO- 4
.;
0-0.3 0-0.01 0-0.1 0-0.3 o - 0.005
trace- m:-ace- trace- tr.ace-0.0001 0.0003 0.0005 0:.0002
0- 0.00001
Ç>
"
't"r g~},;
~ ~,
r
"
.~~
~_ ..... ~ ... ."._~ __ .",, __ ~;: __ L ____ .... ________ • ___ "" _________ _
\. ~.--..... -~;~ -/
~
. ; " Ag
0-0.1
0-0.1 "..
.. trace-\ 0.1
0.0005-0.001
~
~
VI
.c;:,
o

1;
( of valuable by-products such "as gold, silver, selenium and,
! telerium [6, 71..
Over the years, the composition of ores has not
rernained uniform, copper content~ tending to d~crease and
deleterious impur1ty elements tending to incrèase. As a ~ II \ •
6.
direct reflection, levels of impurity con~ents in the blister
copper have also generally risen[8]. Il
Opposed to these trends, the demand for higher~ur~ty \ 1
copper ha~"increased sub~tantially, in conjunction with
'" technical·advances achieved in the electronics industry.
Publicatio~s dealing with continuous pxocesses (i.e.
'"
Noranda and' Mi tsubishi} introduced in the last de cade' , indi-
cate that the processes ,tend to produce.blister coppecof
higher impurity content~ th~n that produced by conventional
proces'~es'[ 9-15 ] ~
I-I.C Difficulties Related to Impurity Content of Copper and Possible Technical Solutions ~ "
One çan summarize the present sibuation in copper
production with respect to impurit~,contents as follows:
1) The demand for nigher quality copper has increased.
2) The trend towards ftn increase in 'the impurity
contents of copper ores will' cqntinue.
'~) The recent continuous copper production processes
11\ result in blister copper of higher irnpurit le~els than produced using the mora conventional
/' ~' .
pyrometa~lurgical processes.
~ . -- --._- ------ .. --'"->
. '
1 i i
t 1 .\
..1 , 1. l'
1 ,
1

(
·'
(
• 1
t
1 l
7.
,<
4) Current electro-refining procasses are incapable
o,f dealing wi th high levels 'of deleterious elements-. , ."
5) The existing fire refiriing process is tot,ally
inadequate for eliminating delet~rious impurities.
A literat~re survey on research addre~sing itself to '
these difficulties of irnpurity rernoval from copper and
possibl~ solutions wa~ ca~ried out and is summarized below:
i) Clïlorination of Copper: The removal of various impuri ties 1
from liquid copper using c~lorides (e.g. sodium, calcium,
magnesium and ammonium chlorides) has been'investigated in , [16 ]
1aboratory sca1e experiments . It was concluded that
the proposed process would not be feasible.
ii) ~lux Additions and Oxidation of Copper: 'The idea of \ ~ 1
makin' flux additibns and oxidizing the impure copper has o
been in estigated extensivel~ in both laboratory and indus.ç ,
trial sc le expe~imen~[17-201. The process involves the
addition 0 various compositions and arnounts of fluxes to .
blister ~\ contained in anode type fumaces with the
simultaneous i~jection of air and/or o~gen enriched air 1
into the melt.
The removal of an impurity 'by oxidation can be exarnined
bn the basis of the following equiliJ:;>ri,urn relation [7] :
(11 l'
( 2)
, 1
/
, 1
1
\ , ,

1 1 J
, , '
M - impurity metal
MO = ,impurity,metal oxide
k =equilibrium coefficient e
a activity
l,s s liquid and solid
To determine ~. upper li:mi ts of' impuri ty removal,
d i. through Qxidation, ne ban cons~der the'molten copper to
be saturated with oxygen, in which case the equation for
,~ ke- reduces to:
ke
y
X
= =
activit~ coefficient ~
mole fraction <> •
where'YM is that in an infini~elY dilute solution.
, 8,.
..
For ~high impurity/removil, it is clearly desirable to
,have small values of YMO and ~O' and large values of YM and '" ,
k. The addition of fluxes t'o form iL slag, together wi th e o 1
slag skimming promotes the r~moval of impurities as metal
oxides', MO.
The experimental stud~es reported problems with high 1
copper los'ses to the slag an~ low levels of bismuth elimipa-
tion. , .
iii) Vacuum Refining of Copper: Vacuum refining is a
comparatively new process fqr the oopper pyrometallurgist l, ~
even though -it is weIl èstablisheçi in the production and,
refining 'of steel, zinc, mercury', etc. However, i t has
- _.~- ..... ..-.--....---.
J /
1
, 1 j
i l

i i
'j
1 ,
1
(
. '
potential with ~~o the elimination of the more
volatile impurit~es in liquid copper ~nd is the subject of
t~is thesis. In the following section, the techn91ogY'of
9.
'" vacuum metallurgy will be discussed b'riefly and then its'
(
1
/
--_.~--- ._"
pot~ntial application to copper refining will be considered.'
. 1-2. VACUUM METALLURGY PROCESSES
• ,Vacuum is rapidly becoming an essential feature in a
wide variety of metallurgical oper~tions. An overall réview ,
of the vacuum metallurgy processes and where they ar~'being - ,
1 " d" . b 1 [21-24] app ~e ~s g~ven e ow ~
i) Extractive Metallurgy
a.- The beneficiation of ~tes; Liltration,
briquetting 'I etc.
b - The reduction of compoundsi Mg and Ca'
production.
ii) Vacuum Mêlting Processes (for refining of crude
metal, alloy preparations, remelting, etc.)
a - Induction melting
Arc melting
,c - Electron beam techniques, "-
id - Cold crucible and levitation melting techniques
e - Zone,refining .
iii) Vacuum Degassing pf Liquid Steel
a - Stream degassing
b - Ladle degassing "
, 1
)

",
(
i
1 1
.....
c - Dortmund Horder (OH) degassing /
d - Rhein~_tahl (RH) degassing
iv) Casting of Various Shaped Pr,oducts
v) Heat Treatment
vi)'Testing of Me~als and Alloys
, vii) J oining
viii)" Surface Tre'atment
ix) Powder Metallurgy
x) Mechanical Working of Metals in Vacuum!
~ong these processes, vacuum inguction melting is
one possibility being considered f~~\the refining'of molten
copper.
I-2.A Vacuum Induction Melting and Refining
Vacuum ind~ction rnelting can provide c~?se control of
melt composition and ternperature while simultaneously
preventing unqesired contamination by reactive gases such
as oxygen[25]. Similarly through the, use of low pressures
(below 300 ~Hg = 40 pascals) and ïnductive stirring, the
rate of refining r~a~tions can be improved and purification J 1
10 .
processes which would not 'take place at atmospheric pressures
" can be carried out. '/ Vacu~ re,fining in ;i.nduction mel ting uni ts is achieved
through evaporation of volatile impurities into the gas
phase above the melt.
.,
-- .- .. , ... ," ... _ ...... ~l' .... "' ... ....., "'~-..... - ~
l "
(~
j
1 / 1
1 1 i

~\ (
0' •
(
J J I~
( Two important features necessary for the success of
p •
a vacuum refin~ng process are that 1) the rate of evapora-
tien from the melt surface must exceed its rate of cenden-
sation back onto the metal surface and that 2) the rate of
'~vaporation o~ impur~ ties -ahould be faster than that of the
base metal: Of these, the fi~st>teature depends on the
vacuum created above the mel,t surface while th1e second is .
fundamentally controlled .by the equilibrium pressure of
the impurity relative to that of the base metal . •
In 1963, Kameda ,and Yazawa [/26] in sÇ>me labora.tory 1 1
scale experiments confirmed that th~ refining of copper by
vacuum induction melting is possible. They also discussed 1
the evaporation'of impuriti~~from>a thermodynamic stand
point.
Since that time, numerous studies, aIl of laboratory
scale, have been carried out in Europe and Japan. ""'.
1-3. PURPOSE OF PRÉSENT STUDY
The present study was undertaken to investigate th~
general feasibility of impurity elimination from blister or
anode type of copper and 'ta de termine the main factors,
cont7olling the kinetics of vacuum induction melting at
the pilot scale level. , l'
Since,all data reported in the literature has been
obtained using laboratory scale equipment, the present study
aimed at determining the effects of scaling-up to pilot-
plant' leveI.
, 1 •
• 1
\
11.,
'.
1 i.

(
(
,: 12 ~
CHAPTER II
REVIEW OF THEORY AND PREVIOUS EXPERIMENTAL WORK
Ir-l. INTRODUCTION TO VACUUM TECHNOLOGY
Although the latin word vatcuum means "empty", it is 1
useful to !lote that at).IJthe lowest pressures which ,can be "
obtained by modern p~ping methods ther~ are Istill huqdreds of " '
Molecules in each cubic' centimeter of evacuated space[27].
According to the definition of the American Vacuum
Society (1958) the term "vacuum" refers to a given space .' c
filled with agas at pressures below'atmospheric, i.e. having 1 •
a density of moleèules less than about 2.5 x 10¹⁹ mole/cc.
The general term "vacuum" includes about 19 orders of
magnitude of pressure (or densities) below that corresponding
to the standard atmosphere. The lower limit of the range is
continuous~ decreasing, as vacuum te~hnology improves,its 1
pumping and measuring techniques.
Measuring a sy'stem' s absolute p~essure is the tradi-,
tional way to classify the degree of, vacuum: Thus, one can
speak of low, medium, high and ultra-high vacuum corresponding
to regions of lower and lower pressures as the levels indicated
in Figure 2.
The list of applications of Vacuum Technology includes 1
a large number of items which have become symbols of
'1 ,1
i 1
{' " .
1
j'
1 1
Il
l,'
'ô . l. , l

1
1 ! 1 !
1 -----
o "
--
c; ,..-,.
4 Arc Me1ting .. 4 Electron Beam .. J , l ' 1 1 Induction Melting 1 1 ,. ~I 1
, t 1 1
1 Degassing .. 14 1
1 1 1 t 1 • 1
'1 LOW V~C. : MEDIUM VAC·'I
HIGH VAc·'1
ULTRA-HIGH VAC. 4. .. '4 .. l1li .. '4 . ••
1 1 1 l , 1 1" , .
~ ~ ',~ -1 ~ , l 2
~essure (Pasca1. N/m )
. lé 102 -1 10-2 10-4 10-6 10-8 10-10 10-12 10-14 a -til-t 1 l , 1 1 1 1 1 1 1 l , , , 1 1 1 1 l' 1 ri 102 1 10-2 10-~ 10-6 _ 10-8 10-10 10-12 10-14 10-16
Pressure (mm Hg)
Figure 2. Degree of vacuum and pressure ranges of vacuum met~11urgy processes .
• <;' .....
?-..
~
1-' IN
.:
• .. ~~ - .... ~-....... .. l .... ""..-.. .. ~~~ ... ..:.-....... _--.., ...... --....................... )--,--~-_._~_ ... ~----'?I:. .......
/
,

(
"
..
.' technologie al progress. Its are a of application ranges ~. \
from vacuum ho'lding, vacuum lifting, 'vacuum c1eaning and
e'lectric lights to drying', distillatiàn and insulation.
In this large field of vacuum technology Vacuum
Metallurgy has gained an important place particulariy
during the, fast century with the introduction of several
different,types of processes.
II-2. HISTORY OF VACUUM METALLURGY
Il.
The effect of reduced. pressures on meta11urgica'r'
reactions was recognized towards the end of the 19th century
as being important .. In 1866 T. Graham carried out experi-
ments 'uhder reduced pressure to show that hydrogen cano
• [281 1 diffuse through the wa1.ls of a }?latinum tube . A United
States patent was gran;ted around 1867 for a vacuum furnace
complete wi th vacuum locks, and other patents were granted
in the 1890-' s for furnaces [25], as weIl as for a degassifi
cation techniqUe (Aitken, 1882) [28]. There is no record of \- ~
"
a praetical furnace unti1 that developed by Arsen in 1907,
which became the first usable too1 for studying metal1urgi-
cal reactions in the molten state under'vacuum. By.1921, .,
it was found that resistance heated furnaces were not. ~
satisfactory for large scale vacuum melting. Accordingly,
Heraeus G.m.b.H. built a 300 kilogram low frequency furnace in
1921 undef:. the di,rections of Rohn', The size and the' nprnber
of furnaces were incr~a~ed during th\e 1920' s aft~~ induction
1
\ 1 ~ ;
\ . \

; r , } [,
f i i
1
(
(
15.
melting was incorporated, and beginriing in 1939, 5 ton heats
were being produ~ed. Sinee pressures less than 2~7 pascals
(2 mm Hg) could not be maintained at that time, processes "
eould_.not be carried out at full efficieney.
Meanwhile, vacuum arc melting found application in the
Siemens works between 1903 and 1912 for the prodqction of high "\. ,- l ,
qua li ty tantalum for the eleetric 1amp industry. Then Moore, \
in 1923" and W. J. Krall in 1940 further improved the vacuum
arc mel t\i.ng applications [ 28 1.
The reall breakthrough for vacuum mel ting came towards the 1
1 1
end of the 19 'OlS with new improved industrial pumping systems.
The size of t e furRaces were concurrent1y enlarged. For ,
steel degassi and special alloy preparation purposes, ,
furnaces weIl above 50 ton capacity started being built. For
instance, in 1975 in Ja~an, twenty-nine uni ts wi th a maximum
capaeity of 34p tons were in operation yielding about 6 x lé
tons/year of vacuum refined slteel. This figure amounts to
10% of specialty steel products and 5% of common steel[29].
Vacuum melt~ng processes al50 started being applied to
zinc, cadmium, tin and titanium productions[30-32].
II-3. THEOR;l OF MASS TRANSPORT IN VACUUM
The investigation of evaporation phenomena began in
1873 by Stefan almost at the saroe time as vacuum t"echnology
began to be studied [33] . His first experirnents were carried
out with the eva~oration of m€!rcury into a vacuum. Oyer the 1"
1·
1 1
,1 !
. ,
l,
1
! 1
l

ï' (
(
~ l 1
.. years the potentiallY:. advantageous apP1ications that vacuum
metallurgical processes offered in the1production of high
quality metals, resulted in a large number of basic studies
,being carried out on the kinetics, of evaporation of metals
under vacuum. These investigations included the evaporation
of tungsten under vacuum [33 J, the vacuum refining of steel [33]
and the separation of zinJ and lead by dis1;:illa'tion [34-36] etc:
. However, the majori~y of recent theoretical information
available on the kinetics of vacuum refining i5 based on
experiments carried out with steel melts.
As mentioned earlier the application of vacuum
metallurgy to copper is relatively new: the earliest lite~-, ~
ature available dates back only to the' la te 1940' s [3 7 ] .'
Kinetic studies ·began 'during the last twenty years.
II-3.A Thermodynamics in Relation to Vacuum Metalluigy
As will be shawn in Chapter III r any understanding of
the kinetics of evaporation of impurities from la liquid metal
bath held under vacuum first requires information on the
thermodynamics of the system involved. Therefore in order ,
to analyze the kinetics of evaporation under vacuum consider-
ation' of the vapour pressure of the constituents above the 1
mel~ is a prerequisite. Unfortunately, very little data are
available with respect to the vapour pressure of elements
above their di lute solutions in liquid metals. However, \
'vapour pressures of pure elements are more or less precisely • 1
known and a plqt of th.ese versus temperature May be used as
l' r,
- :", :-;-"-1------.--..... - -1 -..... ,...
fi

- 1
..
(
. \
17.
~a rough guide for determining whi~h e1ements will exhibit , 1
preferential evaporation. In Figure 3, the change in vàpour .. o • pressure of the pure elements relevant to this study is
1
plotted against temperature[38J. I~ Appendix l, the-equations "-
for the vapour préssure of elements appropr~ate to this study
are incluQed. ,-Figure 13 shows these elements with highe! vapour 1
pressure th an copper that caA be evaporated.
If the vapoUr pressure of the pure element is known,
the equilibrium partial pressure of that element in a m~tallic
solution can be computed, provided" i ts activity coefficient
is known, using Henry's relation:
p~ .. p~ y:. x. ~ ~ J. ~
(4 )
where
P~ • equilibrium vapour pressure or solute i, pascal
, Pi .. vapeur pressure of 'pure solute ~t the known
temperature, pascal
Yi • Raoultian activity'coe~ficient of the solute i,
in an infinitely dilute solution
X. • mole fraction of solute i ~
. Hewever, since solute vapour pressures are potentially
dependent on the presence and amounts of other dissolved
camponents, vapour pressures based on binary solution data 1
does not i~ itself, guarantee the ease of a componentrs
separation from multi-component solutions[39J.
l'~

t"'\ ---./
1
1 ·1 !
, C
'"
,42#'1$ AkSi; ( "43 'l!!I.tI""-~'II-~"':":<""['('-~."~f1.'~"'-,
1 0.0
h ~~. 0' • o :As. 0 + 0
-1.01-
. :lE ~-2.0t-
~
f lit "'tIl-J.Ot-
,(nf • ~ O-,,"Ot-A. oC
~ 0 0-5.01--'
-
6DL -7.0 T3 ~ --L
12 11
'"
~
'\ .6
• o o o
/
.~
TlMPlaATual ~K
1 .. .. o o
!. ... o ct
• c: o o
• ;: o o
;: ... • ... r o • .... .. o ;,/i2;
,1>/' 0 0 0
" .- ~'.1. ~ ,6" ;;y Slty ,- ""4 ,0 "L>' ~/j- / " .~ O,,,..D
6' ~' /-" •. "" /-..;: 0'"
6' .// ,/
. .'.~O'" ~ /6
Il ",~,..,.. /,' -/ .a2~T /;/.0 / al ~" /1 li
/ ~
1 /
'Sb / /
--[
/ /,
ft
;1 ./e
./ ci C/
- , F. 1 1
1
• 1
L-- -'-- / ,/ - l. 1 ...L II
10 9 8 7 i
TlMPElATUal, k-'xl0-4
6 i 5
F~gure 3. -Vap~ur pressure of samé pure elements plotted as a function of tempe~ture. /
D ,
) fil' ----- --:- _~ . ~ _~r
,..-...
/
~
"
/
~ t

( '. r
, ()
. ! 1
" \,
\ . ~,
19.
1I-3.B Relative Volatility Coefficient (EVaporation Coefficient) !
The term relative volatility is used to compare the
vapour pr~ssure of one pure substance with another. Under
conditions of molecular evaporation, as defined by Langmuir,
the influence of the molecular weights of the cbmponents on . ~
the molar rate of evaporation must be considered [39-~,1']. Thus, "-
for evaporation from copper baths, the relative volatility /' , 1 !
coefficietft, a, as defined by Olette[39] i5:
where -1 Mcu • molecular weight of copper, g'mole ,
M. • molecular weight of solute, g'mole-1 ~
(5)
In a' dilute solution, copper (the solvent) will follow
Raoult's law and hence, Yeu is unity. Also, the impurity i \
(the solute) at sufficiently low concentrations will follow ,
Henry's law. Discounting solute-solute interactions, the o acti vit y coefficient Yi' can be taken equal to yi. Under
!
such' condd. tions , Ct. then becomes: 1
pc> W a • y ~ (~) Cu , ~ PCu Mi
'(6 )
By using the data given in "Appen1ix l values of Cl were
'calculated for bismuth~ lead, arsenic and antimony at three
different temperatures and these are given in Table 2.
• 1
;
j 1 l '
1
1 1

, , 1
'1 !
I-
I
(
( J,
()
TABLE 2. ,Relative Volatili ty Coefficient Valuesl. 1" ,
'.'
c CL Values l>
.' Temperature, K
Element 1423 1523 1623
1 Bi 15057 5715 2477 . Bi2
,9901 1
3454 1380
Pb 25387 8873 3579
A;T - 0
' 352 . "
32 . Sb - . '
Sb2 - 47 2 . J
0
1. Ca1culated from the data givenoin Appeôdix I.
2. At '1573 K
o
.\ 1, " -',
~
;;
l'
... '-----).
20.
1
1
1
1 l " ,
l 1.
- 1
-.,

(
'.
(
! , 1
1 /
r '
21.
If a is uni ty, no preferentiàl s,eparatipn is possible,
since the concentration of the two components in the' vapoJr
will be the same as in the condensed ph~se. Substances that
can be readily separated must show either large or small
yalues of a (Le. a should ,not approach unit y) • ,
II-3.C Overall Mass Trans}2ort Rate c'
ward[42.43] has studied the vaporization of impur i 'ties,
e.g. manganese, copper.and chromium, from irone Ten kilogram l'
melts were heated and stirred inductively, and the molten metal
$urface exposed to an inert gas phase. The pressure'ranged _",1" '. ' ~ 4 6 from 0.13 to 13.3 x 10 pascal (1-10 ~m). He showed that the
relation between the 10ss o~ evaporating solute.moleculés i
and the time'of vacuum melting followed first order kinetics. 1
As such the overall mass transport rate was given by:
or'
-4
which
yie1ds
. • • n N. ~
.. 'K ~ c~ v. ~
-d (wt%i) • dt K~
V (wt%i)
i11 ,integral form:
t t
)' d (wt%i) A )~ dt (wtU) • -K -V . '0 a
(wt%i l t 1
2.303 10g10 A -K -(wt%i) o. . V (t-tO)
'"
(7 )
(8) ,
(9 )
( 10)
/ !
1 f:
1
" j
1
,1

(
(
- L
1
" 1
1
·where
N!" l
C~ 1.
K
A
" V·
wt%i
t
..
22.
.. rate of elimination Qf the impurity element
(solute) i, g·mole cm-3s-1
bulk concentration of solute i, gO-mole cm-3
overall rate constant, cm s-l
• • i 1'{1.elt surface area, cm2 ..
volume of melt, cm3
weight percent of solute i
= itime, s
Eq~atioh 10 enables the overall rate constant K, to·be
l'
calculated from ~he siope of the curve resulting from a plot of
loglO wt%i versus time. . .
The mechanism of solute removal through evaporation oCGurs
in a series of steps'starting in the Iiquid metal and ending at
the condenser_
Ward[42] considered six steps for the transfer of impurity
'atoms from the bulk .liquid metai to a condenser surface. These
were:
(i) Solute transport in the ,bulk liquid rnetal to the
. / ,l, ne1ghbourhood of the rneit vacuum boundary,
(ii) Transport through the melt boundary to the meltl
vacuum interface,
(ii:i) Evaporation, J" , , " )
(:Lv) Transpor~ of the solute vapour through the gas phas'e
away from the clean melt/vacuum interface,
l . ,
i 1
1 • !
i , , 1
!
l' 1

1
1
('
(
(
23.
(v) Transport of the solute vapour through the bulk gas
phase towards the condenser,
(vi) Condensation ..
~hese steps would be more compl~cated and difficult to J
analyse when one considers (a) t?e possible existence of tpe
surface active elements at the interface, (b) reaction of the
vapour phase solute Metal at9ms with other gq§ molecules which
may be present in the vacuum, e.g. oxygene
A decade later, Ohno[44] considered the three limiting ....
transport steps as:
(i)' Transport of Molecules through the b'ulk liquid metal
to the metal/vacuum interfaoe,
(ii) Evaporat,ion, o
(iii) Transport 'of molecules thro?Çh the gas phase to
the condenser sUfface.
Figure 4 shows these steps in schematic forme Of these,
If
the mechanism of liquid phase mass transport rate and evaporation
can be reasonably weIl quantified on the basis df work by p~evious
researchers. However, mass transport mechanisms through the
vacuum space between the melt s~rfacesfand the chamber and
pumping systems are, as yet, less clearly defined and understood.
The various mass transport steps are discussed ,in the
following sections and the ~ffect of each step on the overall 1
mass 'transport coefficient is' considered.
j . '.
1 \ !

/
r .;'" 24.
l, 1
(
VACUUM
/ -------
1------------- KL -----__ -_--0._-
.'
..
(
Figure 4. Stages of mass transport in vacuum induction melting. t, .
(
, . , (

(
! 25.
'" II-3.D Mass Transport in Liquid Metal
The basis of solute mass transport through à liquid melt 1
typically involves the two precesses of diffusien and cenvectien.
~ Transpert precess theory can take both mechanisms i1nto
account[45]. Danckwert's surface renewal theory, Kraus's natural
convection model or Machlin's rigid flow model[46] can be used
to describe transport phenomena in inductively stirred melts
reasenably well[47]. rhe applicability ef the latter medel was
" . shown in a recent st'udy by Irons et al. [ 48] .
(
"
1
1 ~
Th~ Machlin medel supposes that flew across the surface
of an inductively stir~ed melt May be considered to be free
streamline slug flew with no.shearing ve10city gradients present "
within th~ ~ransferring surface layer. As 'such, the volatile 1 solute' is, supplied to the surface sele1y by diffusion from
1
wi~hin th~s' surface layer. The flux ef atdms to the surface is
then given ,by a modified forro ef the standard Penetration Theory
f ';rst d 1 d b RH· b· [49] • eve ope y • ~g ~e • 1
N" :a K (C~ - C ~ ) i,liq L"~ ~ (11)
where is given as,
(1'2)
taking
" . (13 )
then
WD. U . ~ ~ - .
lTr , . (14)
i 1
1 j. j

v. li'
C
1;.
I(\,
26.
Nil i,liq flux of solute i in liquid phase, g'mole cm-2s-l
'1 KL = liquid phase' mass transport coefficient, cm s-l .
1 è~ 1
l.
* C. l.
~ bulk concentration 'of solute i, g'mole cm- 3
, c~;J- -~., l " 3
c surface concentration of solute i, g'mole cm-t
D. :t.
diffusivity of solute i, cm2 s-l
a. l.
~ life time of volume solute i moving along
interface, s
r = radius of crucible, cm
U. l.
~ mean surface velocity of solute i, cm s-l
1I-3.E Mass Transport at Melt Surface-Evaporation'
l t Il . 1 f' ' . 1\ • t' n many me a urg~ca vacuum re l.nl.ng operatl.ons, par l.-
cularly those carried out under eonditions of high vacuum, the 1
rate of elimination may be limited by the rate of ev~pora~ion ,
of impuri ty atoms from the surface of the mel t. As a resul t, -----
equilibrium is not necessarily maintained bet~een liquid and gas
phase solute concentrations at the liquid/vapour interface,.
Under such conditions of hard vacuum Langmuir[50,51 J has derived
on the basis of the kinetic theory of gases; an expression for 1
the maximum rate of evaporation of a solute from a surface.
N~' l. ,ev -
+ Il P. l.
'1 21TRTM'. l.
(15)
1

c,
! 1
J 1
...
NI.' ~,ev
a po y M , i i Cu
Pc 121TRT M. u ~
• maxim~ evapo~atiV~Olute g ~mo1e 'cm -2 s-l
- evaporative coefficient (a=l)
27.
(16)
(17 )
(18 )
(19 )
(20)
. ,. ~,
p~ - equi1ibriurn vapour pressure of solute i at ~
P? ~
y. ~
'If 'X.
~
the interface, pascal 1
• vapour pressure of pure solute i, pascal
• Raou1tian activity coefficient of solute i
- mole fraction of solute i at interface
-1 • molecular weight of copper, g-mole
, Il .
1 _

(
(
j .
(
o \
28.
-3 Peu': density of copper, g cm
R
T
M. ~
= surface concentration of solute -3 i, g·mole cm
7 2 -2 -1 a gas constant, 8.31432 x lp g cm s K g·mole
z melt tempèrature, K !
~ mol~cular weight of solute i, g·mole cm- 3
-1 ' K = evaporation mass transfer coefficient, cm s -y
Equation 15 is only valid when a perfect vacuum is attained,
~nd aIl mole1ules evaporating are subsequently removed or condensed.
In the latter ca~e, the distance between the evaporating and ,
condensing surfaces must 'be less ,than the m1an free path of the
evaporating molecule or partial recondensation on the surface of
the liquid metal bath will occur (mean free path 'estimates for the i
impurity elements considered in this study are given in Appendix
II). When the partial pressure,of the i~purity element i is not
zero in the vacuum assembly, i ts rate of evap6ration is reà.uced~
according to the Lan,gmuir-Knudsen equati~n [40,52] •
N~' -~,ev
* P. • ~
n'ITRT M. ~ ..
(21 )
actual partial pressure of solute i (at the
interface or in the gas phase), pascal
1I-3.F Mass Transport in Gas Phase
In vacuum refining processes, the 'rate of elimination of
impurity elements ~ay also be affected by the rate of/transport
-.f ..
. j
1

.. "
.( '.
(
" 29.
of solute vapour away from the melt surface. This rate o,f transI
port is not as easy to predict as the other two rnass transport f
rates mentioned 'aoove. Factor~ which must be considered are:
(a) pr.essure gradient of vapour, (b) effective pressure 'of perma
nent gas in the~acuurn system, (c) hydrodynamic factors and
~hY$ical parameters of the system[40 1•
One can describe the rate of solute mass transport throrlgh
the gas away from the mel t surface wi th the following " equation [52 • 5 3 1 •
where,
l,
N~' ~,gas '" (22)
-2 -1 N~ a flux of solute i 'in gas phase, g·mole cm s ~,gas
- gas phase mass transport coefficient, cm , -1
P~ = vap~ur pressure oL solute i at condenser
surface (P~ a 0), pascal ~ 1
Based on the set of equations given above, both Richardson[52] . , [54 55]
anâ Ohno ' deve10ped rnathematical models tO'describe the • 1 1 -
kinetics of impur~ty e1irnlnation by vacuum inducti~n me1ting. An·
equivalent model has been used in the pres~nt work. A'critical
ana1ysis of the parameters chosen is included in Chapter III.
Salomon-de-Friedberg[56) also developed a model for the "
case of elimination of copper from steel melts. Mass transport 1
'rates in the liquid phase and evaporation rates at the interface
were described Or,l the basis of Machlin's and Langmuir's equations.
• 1
f

..
( ,
i' '
30.
Mass transport rates in the gas phase were postulated to be
" directly dependent on the pumping rate of gas from ~he vacuum . '
charnber.· An implicit assumption that vapourized molecules were ,
evacuated from the equipment in gaseous forrn was made ..
1I-4. PREVIOUS EXPERIMENTAL WORK
Numerous laboratory investigations into copper refining by
vacuum treatment have been carried out since the 1940's. "These
stU~d~ were perforrned both with the aim of eliminating deleterious
impuri ies ~own to marketable grades of copper and of decreasing -1
ingot porosity so as to improve the mechanical and electrical
properties. The effect of variables such as oxygen and/or sulphur
l~vels in the melt, melt temperature, vacuum level, melt surface 1 "
"
area to melt volume ratio, etc. were studied.
The information currently'available on vacuum refining has
been collected and reported in the follQwing sections. -, \ Based on\ ,
the type of copper treated, the information has been separated
, into threè groups dealing with blister copper, anode and/or
cathode copper and copper matte respectively.
In addition, a patent survey was carried out and th~s also
is reported in the last section of the chapter.
.. --- '~-' .. - _.~ - ~ -.... -_ ... ,.,~ ...... ..-. ~ ~ ,
,1
(
(
, 1
1 t
\ 1
, 31.
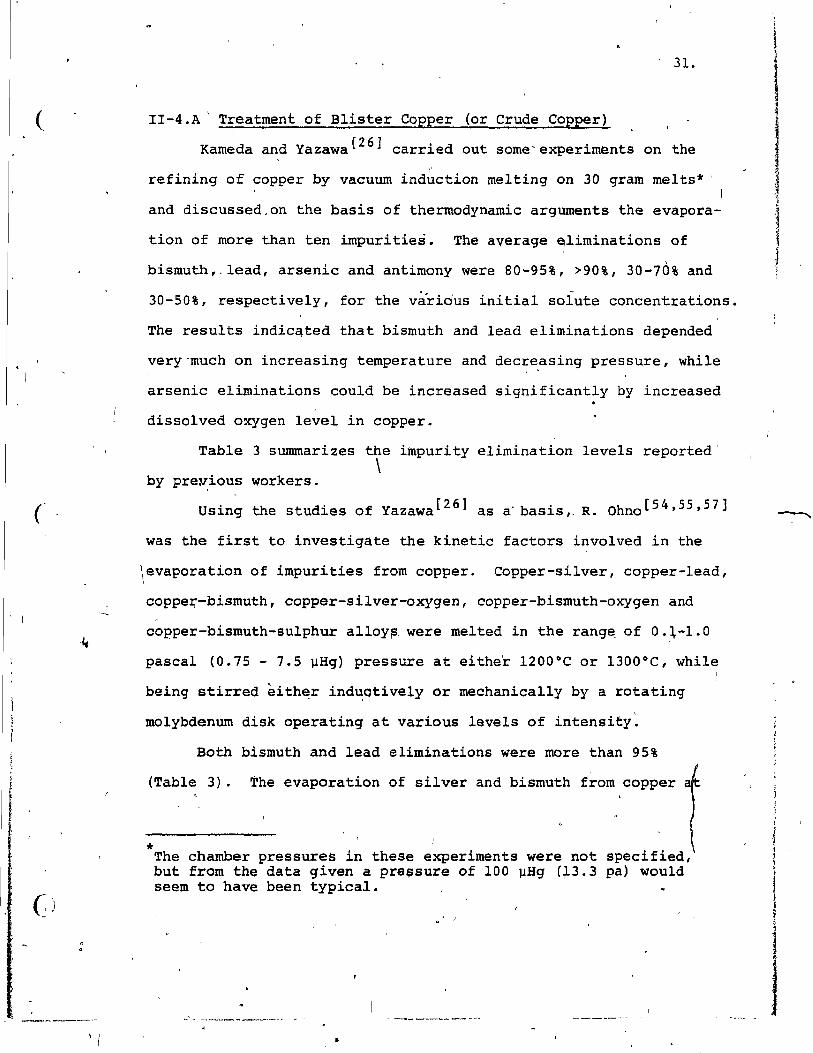
11-4.A " Treatment of Blister Copper (or Crude Copper)
Kameda and Yazawa[ 26 1 carried out some'experiments on the
" refining of copper by vacuum induction melting on 30 gram melts* '
and discussed,on the basis of therrnodynamic arguments the evapora
tion of more than ten impurities. The average ~liminations of
bismuth,.lead, arsenic and antirnony were 80-95%, >90%, 30-70% and
30-50%, respectively, for the varidus initial solute concentrations.
The results indicqted that bismuth and lead eliminations depended
very'much on increasing temperature and decre,asing pressure, while
arsenic eliminations could be increased significantly by increased
dissolved o~gen level in copper.
Table 3 surnrnarizes the itnpurity elimination levels reported' \
by previous workers.
using the studies of Yazawa ['2 6 ] as a' basis" R. Ohno[54.55,57]
was the first to investigate the kinetic factors involved in the
\evaporation of impurities from copper. Copper-silver, copper-Iead,
coppe~-bismuth, copper-silver-oxygen, copper-bismuth-oxygen and
copper-bismuth-sulphur alloyp, were melted in the rang~ of 0.~-1.0
pascal (0.75 - 7.5 llHg) pressure at eithe'r 1200°C or 1300°C, while 1
being stirred èith~r ind~otively or mechanically by a rotating
molybdenum disk operating at various levels of intensH:y ~
Both bismuth and lead elirninations we~e more than 95%
(Table 3). The evaporation of silver and bismuth from copper
* 1
The chamber pressures in these experiments were not specified, but from the data given a pre$sure of 100 llHg (+3.3 pa) would seem to have been typical.
•
< j l
1 l .
1
1
J

-~~-'7
"
;;fUI; 2U4t2 Q 4!Z 44 , t J Qg • $"4kq4!1..~ ............ __ 1.""""""""_ __~~ ... ~...-- ... "'~r,.,... "
,~! ........... ,.-..
TABLE 3. Summary of the Results Available in Literature
Copper !/V Elimination, wt% -3
Weight· Pres. Temp. Time K(lO cm/s) Ref. -1 •
Source kg II Hg oC Min m Bi Pb As Sb Bi Pb fi
Kameda 0.03 100 1100 60 50-80 +90 10-30 50-55 26
Kameda 0.03 100 1200 60 +90 /
+95 40-70 30-40 26
OhllO o.lb , 1-8 1200':'1300 5-20 60 +95 +95 - 8-30 10-30 54 ! -~
Bryan 0~02 80 1170 60 99 ~ 58
Bryan l. 4.~0 20-200 1200-1300 50-60 80-952 . 58 !
Komorova o.~b 10 1200 120 50-80 50-90 50-80 50-75 59
Golovko 100-500 1200 5-15 93 100 20 20 62 •
0
KiJD 75 30-50 40 60
Kametani 0.6-6,.0 1000-2000 1200 Vacuum Lift 10 60-80 10-20 Q 20 29 Refining
Taubenblat 25 <0.1 1150-1300 30 ;> 11'\50 V\50 Cathode Copper 89 /\
1. ' Overall rate constants were reported in different unit. -;;c
( t>-2. Estimated from the graphs. -,-
J w r-.l
, /
'iI' .. "t>~k!i .. "'~."- ... -....~ ................ ------ ..... --

, 1 "
(
, , 1
( j
· '
33.
both temperatures of 1200°C and l3-00°C in evacuated systems were
found to follow first order kinetics. However, lead proved to \
be anomalous 'in this respect. The presence of oxygen in the mel t
(0.OS-0.13%).dedreased the rates of evaporation of silver and
bismuth. Sulphur (0.11.0.12%) aiso decreased raJes of ~vaporation of bismuth, although to a 1esser extent than oxygen~ While the
rate of evaporation of these impurities seemed to be dependent on
the ,induction stirring rate of the melt; they seemed to be totally
insensitiv~ to the r&tationa1 speed of tne stirrer., It was aiso
concluded that for the experimental conditions studied1liguid
phase trins port wa~ not rate determining but that the gas phase
mass transport determined the overail mass transport rate.
Bryan et ,al.[SSJ studie~ the removal of only bismuth Drom
0.02 and 4.0 kilogram copper melts in a vacuum furnace over a
range of 5-1000 ~Hg pressures. They concluded that the\rate ,
determining step changed from gas phase transport at pressures '1
in excess of 200 llHg, and approached surface evaporation control '
at press~es of 10 ~Hg. It is not possible to ~ompare their 1
results wj,.th Ohno's results sinee they used the unit of "rate -2 -1 '
~onstant/cm sec, .. for mass transport without giving melt surface 1
area-or melt volUme. Sirnilarly percentage eliminations for 4
l' ,kilogram mel ts were not reported _ They found wi th 0.02 kilogram / J
melts at ,1170oC and 80 llHg p+essure that 99% bismuth e~imination
cduld be obtained wi thin 60 min,utes. They also found that' oxygen ,
and sulp~ur had a negligible effect on the transport rate in \
conflict wi th Ohno' s resul ts,_
---- - \- ,
1-
'\ ...
,)
ï î
1

(
•
( )
( Il
_1.------ '
p 34. \.
• 1
L. Komorova[59], using 20-30 gram samples, studied the 1 ~ behavtDur of arsenic, antimony, bismuth, lead, zinc and tin during-'
o ,
\ -2 the vacuum (10 mm Hg) refining of the blister éOpper at 1200°C.
It was concluded that· the elimination of metall1ic' vapours would 1
increase in the sequence Sn-As-Sb-Pb-Bi-Zn.~ It was also suggested
that arsenic and antimony wou1d be evaporated more easily in the . \
form of oxides.as these oxides are easily formed at l290°C. ~
"
Although tin wilL also forro oxideS' at these~temperatures, the d/gree
of tin elirnination was found to be low. The amounts ~f elimination
obtained are summarized in Table, 3. .. ,
Between 1960 and 1965, ,Russian investigators, on the basis
ofore~ults obtai~ed in laboratory scale experiments[~O-62], 1
~eported that the vacuum treatm~nt of copper held sign~fi~an~
promise. The behavi@ur of arsenic, antimony, bismuth, 1ead and
zinc'were studied and the improvement in the properties of copper' \ ,
as a result of h1gher purity was discussed. Th~ results of th~se
studies are included in Table 3. \ . \
H. Kametani and C. Yamauchi used a somewhat diffèrent , 1
experimenêal approach which they referred' to as the 'vacuum lift' 1
method of refi~ing blister copper'[63-65J. Experiments o~ the
'vacuum lift' refining of molten blister copper w~re carried out
under reduced pressures of 1-2 mm Hg at 120QoC using copper samp1es \ . ' of 0.6 and' 6 k1lograms. The fundam~ntals of the vacuum lift
refining process were studied, experiments being ca%ried out
using a obatchwise 'vacuum lift apparatus . .,., The vacuum vessel was
equipped with an oxygen concentration qell (of the lime stabilized
zirconia type), and a small crystal microphone for measuring 1
\,
1
! r ! !

(
,( JI
0' <> 1
..
35.
oxygen potential,s and detecting the evolution of 502 gas bubbles \
in the lift'ed mel t. Following vacuum lifts oË 4, '14 and 25 times, ,
the average eliminations were': o
oxygen (80%), sulphur(50-E!O%), arsenic «20%),
antirnony (20%), bismuth (10%), lead (60-80%) and
z.inc (30-50%).
• 0
1
The merit claimed for the vacuum lifting technique is that '1
by maintai,ning turbulent conditions in the melt" a large surface
.area is constantly exposed ta vacuum. Consequently outgasslng to
low concentrations can be achieved rapidly because gaseous products
are continually pumped away and steady-state equilibrium conditions
are nevèr atta'ined. ' The vacuum lift principle is also util~zed in ,
the stream degassing of steel 'and in the R-H (Ruhrstahl-Heraus) " 'QI
and D~H (Dortmunt-Hoerder) steel process~s. However, in the
studies of Kametan~ and Yamauchi[63-65] not much success could .'
be achieved in the rernoval of impurities ,other than sulphur and
oxygenas the above mention~d elimination pèrcentages indicate.
1I-4.B Treatment of Anode and/or Cathode Type Coppe~,
Vaquum refining of anode copper and especially cathode copper
'for the elimination of gaseous impurities (2,~) and metallic
impurities has been a prime concern tornany metallurgist~ over 1
the past 40 years. This interest has been prompted by the rapid
. advance in electrical technology requiring improved electrical
and mechanical prpperties. At the beginning of the 1960's, a
product called oxygen-free high conductivity copper (OFHC copper) •
of extrem~ly high purity (>99.99% Cu) was manu!aètured by the 1
., ,
- - ---.. ---; :.. _ ..
1 "1 1

1 ! f f
1
(
"
(:
(r
36 .
.. United State Metal Refining co.[66] It was found to be of higher
quality than other OFHC copper which had been commercially avail-
able since the beginning of the 1930'5. "
Generally OFHC copper is produced by melting selected ,
,copper cathodes in ,contact with carbon, in an elec~ric'furnace
under'a protective atmosphere of carbon monoxide and n~trogen, \
foll~wed by casting under the sarne. protectiv~ a~mosphere[67]. In
some OFHC coppe~ producing plants 1 deoxidant 1 met'als were also ~ "
used[68,69J. Since 'the advent in 1930'5 of the conventional OFHC
coppe~ process, al terna,ti ve vacuum processes have been con";:
sldered[66- 85 1. Trre common ~im in these studies has been-to
decrease the contents of the gaseous (oxygen, sulphur a~d hydrogen)
o~. metallic (arsenic, antimony, bismu~1 lead,
ties in copper thereby decreasing porosi~y and / "
~ce and increasing densi ty, ul timate t,ensile
tin, zihc) impuri-
electrical resis-
strength, reJative & 0
elongation and elec~rical conductivity. "In studying ways to
produce copper of superior quality to'OF~C copper, more than 20
'studies[66-85] have been carri~d out; temperatures ranging between o •
1180°C a'nd 1460°C, and vacuum pressures as high as 300 mm Hg and
as low as 10-5 mm Hg have been triè~ for hol~inq time of 10 minutes
to 7-8 hours.
Since these studies were very s'imilar only a few of the'
more salient features are mentioned below. 1
Thus, -in 1948, construction o~ a vacuum furnac~ to conduçt
tests on up to 180 kilogramOmelts of copper ~as repo.rted[68J.d"'A '" , .
series of experiments were carried out with cathoae~opper at
'., .. -_ .. _;..., --_._- __ o. __ o. -
/
'"',
..
1 ! 1
1"

, 1
f
\ t f f ~
(
(
(,1"
.,',,'
1
1
37. 1
" 120QoC - 1370°C under 5-10 jJHJ ~0.005 - 0.010 mm Hg)' pressure with
holding time qf 3 hours. promising results were obtained and
copper with iower impurity contents and better electrical and
meohanical properties cou!d be produc~d. The analyses ,of vacuum
cast copper in cemparison with OFHC copper preduced by conventional) "-
rnethods is given in Table 4.
[67] V. K. Gupta et al. claimed that refining 2-3 kilograrn
charges 'of cathode copper ,~t 1200°C. for 10 minutes at below ,10- 3 f
mm Hg vacuum was adequate for preducing certified grades of OFHe
depper[66,70]. Further, using higher temperatures and len~er :,'
holding times, co?per of superior quality could be prod~ced. " 1
This
copper had oxygen contents of <1 ppm, three times less th an that 1
for OFHC copper. The ~tu~ aIse claimed that it was possible to J ' <:
produce OFHC copper/directly from fire refined copper provided 1
the initial nickel content was low. '. Taubenblat et al. [85] studied the effects of time, pressure
, and melt temperature on the properties of cathode cèpper,.meltéd , .
and cast in 20-25 kilogram amounts, under a range of 0.1-1000 jJHg ,
pressures. . It wa's found tha t the concentrations of sulphur, le ad ,
bismu~h, tin and manganese could be decrea~ed. "Aaso, relative to
cdpper castùDder protective atmosphere conditions but not under
va~uum, better resistance to grain boundary èracking during
oxidation and h~gher elimination of porosity could be obtained.
In addition to these investigations on vacuum induction 1
, 1 melting of coppe~,lthe castability, of copper and copper alloys
in vacuum[86] have 'been studied as weIl as a continuous vacuum
pouring ladle[87]. Similarly, electron béam[78,80] and electric o
1 . _ .J
"
'II

(
(;
-_ .......... -,
,1
TABLE 4. Ana1ysi~ of Vacuum Cast copper[18]
% in . i E1ement % in OFHC Vacuum Copper
1 ... Hydrogen 0.00012 , 0.000008
Oxygen 0.00045 0.00004
Su1fur 0.0023 0.0001 *
Se1eniqm 0.0001<3 10.00005 ~
Te11urium 0.0001 0.00005 <
Lead 0.0005 0.0001
, 1
1
"
, \
..
~I
1 1
j
i 1 1
1 1
1 !

1 t 1 i
1
(
( 1
/ / 1
39.
arc[78,80,88] melting of copper were investigated. Even though
copper with comparable qualities to inducti6n melting could be
produced, it was concluded by F. N. Strel'tsov et al.[78,80] and
P. G. Clites[88] that electron beam ,and ~acuum arc melting as
methods of refining copper free af gas have no special advantages
over induction melting. Further, there are disadvantages awing to,
difficulties with melt temperature control and over-cooling of the
melt .,as a .result of excessive heat conduction through the sUf
rounding frozen scull of copper.
III-~.~atinent of Copper Matte
Very 1itt1e expe;imental work has been performed in this
area.
Bryan et al. [SB] FepQrted that bismuth removal from copper
sulphide was found ta be considerably slower than fram popper but , \
no quantitative results were given.
In a laboratory scale vacuum furnace and vacuum lift
apparatus (analogous to -the D-H process) H. ,KaIqetani, C. Yamauchi
et al.[89-93] investigated the removal of impurities from white
metal and mattes using samples of 100 gram and 4 kilogram for a ,.
vacuum furnace and a vacuum lift apparatus respectively, -under
reduced pressures of O.S-~.O mm Hg at 1200°C. Holding times af
one hour ~ere employed for vacuum furnace melting, whereas 20
vacuum lifts were applied in the vacuum lift apparatus. In vacuum ,
furnace mel'ting 1 the elimination of 'impuri ties frbm the sulphide
melt began to take place at pressures below about 10 mm Hg. The
evaporation of impurities was increased at a pressure pf ~0.5 mm Hg, 6 • 1

(
(
c
- /
40.
and nearly aIl the impurities in the mattes were reduced below
'0.1% after treatment periods of one hour. The range of elimina
tions were 65-90% arsenic, 50-95% antimony, 60-95% bismuth and
100% lead. In the vacuum lift refining of matte average elimina-
tions were in the range of 85% arsenic, 60% antimo~y, 80% bismuth,
90% 1ead and 50% zinc[91].
Experimental results for a series of studies on the vacuum
lift refining of matte and white metal were further discussed com-
'paring the O-'H process in steel rnaking and a tentative rnass trans
fer model was proposed by the same authors[92,93].
In more recent work, R. L. player[94] studied the kinetics
of removal of le~d and arsenic from copper matte in laboratory
(8-20 kilogram matte) and pilot pla~t (2 tonne matte) expe'rime'nts.
(!n laboratory experiments at pressures of 0.1 - 1.0 mm, Hg and
ll50°Craverage rate co~stant results varied in the range of
3-26 x 10-3 cm/s f01 le ad and 5-17 x 10-3 cm/s for arsenic.
Similarly, in the Pilot/Plant experiments at pressures of 0.3-
1.0 mm Hg and temperatures of 990-1070°C rate c9nstant results \
were in the range of 4-25 cm/s for lead and ~-216 cm/s for arsenic. , 1 1
Results obtained for'matte and white metal were more promis-, ".
ing than for blister copper.
II-4.0 Patent survey
In order to complete this investigati,on on tre, present
state of the art regarding vacuum treatment of copper, existing
patents have been studied:
,,-1

/"
"
i·
, r
1 1
j
1
(
41.
-An ,apparatus for (the vacuum treatment o,f eopp~r (or other
metals) 1 in whieh ~ eonveying gas is introduced into the recircu1a
ting me1t to improve the mixing of the melt\and therefore to
improve the vaporization of the impurities has been patente~[95].
Thr process is similar to the R-H process used for st~el refin
ing[96]. The apparatus contained a melting ehamber and two
concentrieally arranged, separately evacuab1e, degassing chambers
in whieh liquid metal is circulated by a differential pressure
and the action of a eonvèying gas. It was claimed that in 3 steps . -
using first oxidizing gas (air and/or pxygen) then redueing gas , -
(hydrogen, carbon monoxide, hydrocarbon cornpounds, or ch1orine'
compounds) and finally an inert gas,it would be possible to " ., "
eliminate arsenic, antimony, lead, selenium, telerium, su1phur " 1
and oxygen to arnounts less than one ppm. . A detai1ed exp1anation
of the apparatus is ineluded but experirnental data and the specifie
kind of copper used were not given.
Thomas G. Hart developed a glass (!) and graphite apparatus .
and from this a process for the treatment of electrolytic refined
copper (cathode eopper). This i5 eovered in 3 aeparate patents [97-
99] He claimed that the reIllOval of oxygen, sulphur, hydrogen,
1ead, te1erium and bismuth were tried by me1 ting the eopper in an
exc~ss of hydrogen and then exposing thin streams of the copper l '.'-
to vacuum, ~rior to casting. Several forms of suitable apparatus
both simple and complex are described in det~il ~ith diagrams.
No ehemical or quantitative data are disclosed as to the results
obtained with the described apparatus and. the process.

(
,
42.
A Japanese patent [100] specifies that treatment of tough
pi tch copper (cathode copper) in a vacuUm arc furna.ce could provide
" 1
decrease of oxygen content f,rom 10-30 to 8- ppm.
It was c1aimed in a Russian patent[lOl] that copper can be "
refined by melting and holding it at 10-),. mm Hg at 1400-1450°C 1
and then ho1di~g it at 10-3 mm Hg pressure. Similar to,this a
Czechos1ovakian patent[102] claimed that at 10-4 - 5 x 10⁻⁵ nun Hg 1
pre-ssure pass'ing hydroge~ or hydrogen and carbon monoxide mixture
under the surface of the copper mel t for 1-2 hours could eliminate 'tr
gasses from copper. No quantitative data is gi{,..en for these three
patents either.,
1 The International Nickél Company pate~ed a process fo~
refining of cement copper by a two-stage vacuum treatment[103].
Copper (containing 5% iron, 1.0% sulphur and 10% oxygen) precipi-
tated from solution is melted in an ipduction furnace in air ta
slag iron and to form a copper bath containing sulp,hur and oxygen.
The oxygen content is maintained at least in excess of the sulphur
content but not so much as to produce a separate cuprous oxide
phase. After removing the sl~g from the copper bath, --~itrogen oro
a mixture of nitrogen 'and hydrogen is passed through the mel~ at , '
0.76 tnm Hg pressure sa as ta lower the ,sulphur content ta less
than about 0.001% and the oxygen content ta about 0.1%. The
pressure is then decreased ta 0.075 - 0.15 mm Hg at 1200-1400°C.
After holding for 1-2 hours and deoxidizing, the melt i5 cast.
It is claimed that copper containing 0.1% arsenic, 0.1% bismuth,
0.1% lead, O.OH selenium, 0.01% telerium, 0.1% tin and 0.1% zinc 1
v
----,,-- ----~- --- - ~--" -,._-.. _~----- ..

i
1
1
(
(
1-
43.
can be treated by this process and the residual content of arsenic,
bismuth, lead, tin and zinc can be lowered to less than about
0.001% while selenium and telerium can be at least halved. The \
final copper contained < 1 ppm, sulphur and < 25 ppm oxygen.
In addition to these patents, processes for vacuum treatment
of copper-nickel scrap[104] and copper-chrome ,alloys [105] to
eliminate irnpurities such as 'lead, tin and zinc were also patented.
A process for v~cuurn trea:tment lof copper matte '(or white
, [106 J matte or speiss) has been patented by Japanese . In the
process, 100-300 grams of matte samp1es were treated at..1200-f 250°C
and pressures of 0.01-30 ItUTI Hg and ,eliminations were as follows: 1
Arsenic> 80%, antimony 50-80%, bismuth; 70-90%, 1ead ; 100%
and zinc; 75-99%.) 1 >
As mentioned abo~e, only two of the patents give detailed
. . d t [103,106] l h' d . l l l' . quant~ tat~ve a, a . A so t e 1.n ustrl.a sca e app l.catl.on l'
of the processes and specifica11y the treatment of copper prodl,lced
by contimious processes are nct mentioned in any of them'.
11-4.E Summary of Previous Experimental Work •
The results of this study on the state of art in.-t:he vacuum, r
treatment of copper c,an be summarizi!d as fo11ow~:
1. It ï:; shown' theoretically and experimentally that it is
possible to eliminate gaseous or metallic impurities from copper 1
by vacuum treatment at pressures of < 1 mm Hg and ternperatures
of llSO-1400°C. Better results with bismuth', lead and zinc cOl,lld
~--be~obtained compared to arsenic, antimony and tin under neutral
condi tians.
.. ' b· r
\

t
( , ~
1
-t-.
1
1
44.
2. Even though sorne doubt as to mechanisms exist, a kirtetic
model to eXflain the system of evaporation of impurities frpm
copper is available and it is shown that under vacuum, the 1
evaporation of metallic impurities are gas phase controlled.
Ohno [49,50] '~rd Bryan
do kinetic studies of
et al,. were the only ones who attempted Ito 1
the process both at laboratory scale. ,
3. ;mprovement in the, q,Uality o'!= copper producid by vacuum
treatment will depend :mainly on higher temperatures (up to l400 G e)
and lower pressures «-100 llHg).
4. It is poss~ble to improve mechanical and eiectrical
propert~es of copper by vacuum casting.
5. The possible effect .2!_Jl~~_~~er ,c~oled condenser
close to melt ~~ yet been studied.
6. Mos of the work carried out on vacuum refining' of
copper has 'bee laboratory scale, except for the two reports,
men tioned above [ 6 8 , 741 •
7. There re no known conunercial installations currently
in use for vacuum refining of copper.
8. Vacuum refining of copper produced by the continuous
processes '(such as the Noranda or Mitsubishi processes) have not
been studied and reported in the scientific li tebature, nor does
i t seem likely that any su'ch work is covered by patents, at the 1
present time. <"
9. Higher percentages of impurity evaporation are obtained
with copper mattes compared with copper melts. This indicates
that it May be wor,thwhile to carry out studies on the vacuum 1
treatment of' high grade matte.
I~
\
, !
"

( . "
()
1
1 ,. c
10'. Thel vacuum treatment of other metals such as steel
and lead is well established. 1
l'
, .-
f
,
...
45.
\
'-,
1
1 1 -
1
1
1 J
.. t.
î
1 1
,1
~ j
. i 1

, 1 ,
~ ! 1
(
J
...
46.
, ,
CHAPTER' III
DEVELOPMENT OF MATHEMATICAL MODEL AND A CRITlCAL "
ANALYSIS OF PARAMETERS,USED
III-l. DEVELOPMENT OF MODEL
As shown in the "'.previous chapter, the ~lwninati~n of
impurities in vacuum i~duction melting generallx follows ,first '-.
order'kinetics. As a result, the overall mass transport rat~
çan be described by an equation of the form: , ,
(wt%i) t 2.303 log' •
, \ (wt%i) 0 (10)
Bere, the overall mass transfer coefficient, K, will be
a function of ~he liquid phase mass transport coefficient, KL, " the evaporation mass transfer coefficient, ~, ,the gas phase
~ [ , ,
mass, transport coefficient, KG' as well as being potentially
depend~nt upon the presence of oxygen and/or sulphur and other " reactive elements either dissolved in melt or present in the
h :s [43,46,52] o gas p a e.
Liquid phase mass transport and'evaporation can be des
cribed with reason~ble accuracyon the basis of the Machlin[46]
. and Langmuir-Knudsen equations[50T, respect.ively. Mass transport ,~ .... J
of impuri t;i.es through the gaseous phase can be interpreted on-
the basis of the theory of molecular resistance to diffusion in
gas~s and related to the above mentioned rate equations.[40,52,53]
i i l
~

(
{.
"/
() 1 -
, :47.
When the partial vapour"pressure of the impprity element
is npt equal to zero at t~e iI).terface, its rate of evaporation
is less th an its limitinq maximum value, and is qiven by
Equation 21.
N:' -~/ev
. + * a {P. - P.) ~ 1. (21)
.. Similarly, the rate of, mass transport in the gas ppase
\
away from the mel t surface can be represented in terms of
Equation 22.
N~' ~,qas
KG * pb.) -2 -1 "\' RT (P i - ~ 9 • mo le cm s
\
(22)
Taking the vapour pressure of the impurity element at the
con~ehSing surface ~~y from the melt as zero, one 'rnay substitute
* 'the' value of P. into Equation 2i from Equation 21 f yielding 1. J
I2'ITRTM. N'.' (' l
1. a' (23)
The equil~briurn vapour pressure of the impurity eleme~t, + <
P., ia qiven by Equations J.6 and 17, i.e. l 1
- (24 )
so tha~,
1
Pcuv'21l'RTMi PCuRT * N:' ( + ) . C. (25)
). a' P ~ l 1
Y i MCu~ Pio Yi Meu KG (J 1.
J
b

, , ,
(
l,
(
.'
1 ,1
! , i -
._.------
48.
oThe molar flux\ of impurity i through the liquid to ·the
melt interface is given by
B . * N~ . • KL(el, - el') l.,l~q
\ '* CQmbininc;r'Equations 25 and Il to' eliminate ,co :
~
(
1: Pc I2'1rRTM, N~ + U l
l. Kt aP ~ 1 y. Me • 1. ~( U
- a P~ -y, MI_ l. l (;U
Peu 12 'IT R'l1Mi
and rearranging Equation 26, y~elds
, (1 1 PcuRT Nil
l.' TL + KE
+ Pl.°, ' M --r. Yi Cu
Simi1arly, defining RU as , \.
o
-Then
e~ 1.
- , 1
Which i8 equivalent to the mass t~nsport equation
•
-----.. 1
(11). f.
(26)
. (~O)
(27)
(28)
,(29)
(30)
/
1
l · l \
1 l,
l '
o

1 (
•
" ( ,
..
..
, . -- - --------
49.
Thus, the overall mass tr~sfer cOèfficient, K, is related
to the a~sumed three resistive steps, in the liquid, in~erface,
and,gas phases according to
For simplicity, the overall rate of mass transport can be
rearranged in terms of'weight percen~. Thus, for dilute solutions
V and
B Peu Ci "". 100 M. wUi
~
(32)
Consequently, for a weIl stirred, batch system of volume,
melt~urface area, A, one may write 'ôn the basis of the '>
continA1ty equation for species, i, that
-d(wt%iÏ.) • dt 1 .. A 'fi K (wt%i) (B)
In equation 8, K can' be obtained from experiments while
RL and RE can be ~imated fro~ the empirical equations provided
necessary thermodynamic and~kinetic data are available. Taking,
Then by di f ferenç.y from Equa tion 32, ,Ku can be det:ermined .J '
and .finally KG" can' be deduced.
f
_____ • ____ JI.
/
Il,
• 1
i i
1

>, r
, , .! 1
1.
c
I<j
50.
, , ' In the following sections, the terms forming IKt and KG
will be d~,scussed in more detail. RE is not included in this
discussion, sin~e ~ term~,in the equaiton are self-explanatory.
III-2. ANALYS~ PARAMETERS IN 11QUIO PHASE
," MASS TRANSPORT COEFFICIENT
1
Oiffusivity, D. : ~
A thorough 1iterature survey revealed the absence of )
published data relating to the diffusivity of the impurity -
element~ arsenic, antimony, bismuth, lead etc. in 1iquid copp~~[lb7-109.1 As a result, theories on the diffusivity of solute atoms
in di lute solutions had to be reviewed and adopted to'estimate the
diffusivity of these impurity elements in liquid c<?pper[47 ,52 ,109-
111]
1
Using equations of Walls and Upthegrove, Stokes and Einstein
and Sutherland[52], diffusivi~es of bismuth and l~ad rn liquid
copper were estimated (as shown in Appendix ~II~ Table/III-l) ~t temperatures of 1150'11250 and l3S0°C. The values obtained fell
, 5 2 / in the range of 1-3 x 10-. cm Is for bath elementso Since
experimentally, none of the" Jtheoretical equa tions are necessarily
" . fr~/t.G,,~e more accura~e', DBi ~r 0pb were somewhat arbitrarily
~aken as being 1 x 10~5 ~2/s at l150°C. Simiiarly using the • " 1
genera1 Arrhenius Equation* and choosing typical ~ctivation
energies of 15-30 Kcals/gomole, values of D1250 and 01350 were'
. [52] :"'~E/RT * Arrhenius Equation : D· Do
() 1 J
'>
.: i Î
1

c
(
.~
i f .• t
1
() - .
51. , estimated as 2.0I"x 10-5 crn2/s and 3.7 x 10⁻⁵ cm2/s, respectively.
Similar procedures were adopted for estimated diffusivities at
1423 and 1523 K, the ralues being included in Table "III-3 in
Appendix III. .
A summary of the ca1culations of diffusivity value~ and'
the formulas used are included in Appendix III. -,
-Mean Surface VelQcity of Me1t, u . -
On the basis of visual estirnates, for a variety of
'" induction rnelting furnaces,ranging from 0.1 kil.ogram to 908.0
kilogram, Machlin[46] found melt surface velocities ta be ~10 cm/s
(within an order of ~agnitude). These·estirnates were based on'
radial motion. of particles' floating across the top of the melts.' f
Using the same method, Irons et al.[48] obtained a value of about
20 cm/s in 55 ki1ogram' pig iron melts. t:
Similarly in rnuch .,bigger s'ize steel me1ts (cr. 3-45.0 tonnes)
Szekely and chang[112] measured the mean velocity as 15~40 cm/s.
Tarapore and Evans in mercury pools weighing up to 275 kilogram
obtained values of 2-8 cm/s[113,1141.
For the present vacuum induction system, a mean sur'face
ve10city of 10 cm/slwas taken as being a representative of the
mean surface velocity of the moltén copper bath.
Liquid phase mass transpqrt coefficients wer~ calculated
àt different temperatures following Equation 14 and the reasoning
outlined above. These are included, in .,Appendi?, III.
1.
. , l

(
\ ' \
(
52.
1II-3. ANALYSIS OF GAS PHASE MASS~TRANSPORT COEFFICIENT
1
i As mentioned'ear~ier, the gas phase mass transport
\
coefficient is not readily accessible to quannitative evaluation.
It is difficult to determine the partial pressure grad~ent of . /
impurity vapour as weIl as its bulk value in the vacuum'system.
It is also Known that the vapour pressure is dïfficul t to treat'
analytically in a gas stream whose molecules are moving pre-, .
dominantly in"one direction. Thermodynamic quantities are defined
for systems at equilibrium and cannot be used rigorously under
other d 't' [40] con ~ ~ons .
KG' the gas phase mass transport coefficient, is con- , l ,
sidered ~o be proportional ~o a power of the d~ffusion in the \
gas phase ranging from unit y to fractional values depending on
the convection curr'ent~ generated in the vacuum chamber.
, Based on> an early work by sherwoOd and c~oke[~3],
Richardîon[52] defined KG as being inversely proportional tb
vacuum pressure.
KG · Gas phase mass transport coeffiçient character
istic of the system,
P - Ambient pressure in chamber
This relation would also hold true for the overall mass
transfer coefficien~, Kt provided the gas phase re5ist~nce,
""
, l ,
r'
'[
j
1 -1

(
(
l ,
1
53.
1
l/KG
, dOminates[53 J , and this would tend to oçcur at higher
chamger pressures. Ward[42] mentioned that witp steel melts,
evaporation of impuri ty elements became independent of pressure _____ ·, \: '] below 10 pascals, ,but was ,pressure dependent above 10 pascals.
œhe pressure level for a given system'naturally depends -~'" t) / ,
on the pumping rates, melt composition and tèmperature. Si.milarly, oP
the gas phase mass transport coefficient càn be effected by the
presence of oxygen, or other active components in the gag
p~ase[115-118]. Heat transfer on the condenser surface may
also effect KG[~l~]. These effects have not been rnodelled in
the present analysis~
1 111-4. VAPOUR MOLECULES CONTA1N1NG MORE THAN ONE ATOM
(DIATOMIC/COMPOUND GAS SPECIES)
The mass transport equations given in the previous sections
referred aIl to monoatomic vapeur molecules. However, bismuth,
arsenic and antimony can forrn the following molecules:
l'
The equilibrium vapour pressure of theJimpurity element
(Equation 16) for molecules contalning more than one atom is: 1
( X*. ) x y. • 1. 1.
(34)
f J
, 1 i
î
1
J

( where
x = 2,3,4.
For the case of diatomic mo1ecules;
Or, since it is in dilute form:
-+ Meu * )2 P. .a P? (y. e. ~2 1 2 1 2 Peu 1 2
Rewriting Equation 15 taking the + new val ue of;l? ,
N~' ... 1,ev
Converting concentrations into weight percent,
The evaporation mass trans fer coefficient then takes 1 ! ing forro for diatomic gases: ! f ~
:2
1
po _ y2 Meu KE·
i'2_ 1 2 l' • 1 2 n'ITRTM. , PeU- 100 M.
1 2 1 2 J. ( --l' ---..
the
54.
fi
(35)
(36)
,( 37) { -
~38 )
follow- .
(39)
\,,-
1
1

( '\...
.'
55.
111-5. VARIABLES AFFECTING 'OVE L MASS TRANSPORT COEFFICIENT
( h l. 1.1 1. . dh h For ,t e exper~menta ~rog am, ~t was cons~dere t at t e
overall mass transfer co~fficie t for the removal of impurities
from blister and/or anode coppe
lowing p~rameter.s: ..
could be effected ~y the fol-
1 - Me~t temperature ,
2 Vacuum pressure
3 - Melt surface area/mel volume " "
r;;
4 Distance of condenser to melt surface
5 - Time span of vacuum t eatMent - processin9 time \
6 - Type of crucible 'h
ial used - reactibn with
refractories
7 - Oxygen content in
8 - Sulphur content in he melt 1
In this s~udy the firs six parameters were studied and
are discussed in detail in/the follpwin~ sections.
A
and,executed
The
sections.
app1yinq the
t
/ l
-6.f COMPUTER PROGRAM 1
.r--.i program was written in FORTRAN, and compiled
an IBM system 370 model 158 computer. ,
the equations given in the previous,
simplifying assumptions were necessary for
e and techniques of the model. The most
important ones were hat the melt surface was clean, that inter
actions between evaporatinq species were negliqible, and that . l '
pos~i~le chemical effects (i.e. oxidation) above the melt surface
i ! , , ,
1
î r !
j,
1
1

\ 56.
LI
( were either unimportant, or insensitive to changes in melt
temperature and degree of vacuum.
A copy of the computer program appears in Appendix VI.
For each experiment,-the program carried out the plotting of
the logarithm of the relative change in concentration pf the ... .
impurity element versus time, calculation of the slopes following '. '
regression analysis, calculation oft the corre ration coefficients 1
and determination of K, K:E.' KE, ~ and KG respectively. 0 __
. ,
.-. ..... r'"----- ---~~ ~---, . --------- --1-.i
l ' 1
! 1

c
( 1 ,
57.
CHAPTER IV
EXPERIMENTAL WORK
IV-I. EXPERIMENTAL PROGRAM
\ , The experimental program consisted of four parts involving
a total of 20 exPeriments. The first three sections dealt with
the removal of bismuth and lead from copper, while in Part IV 1
studies on the simul taneous rernoval of bismuth, lead, a1rsenic 1 ~
• • 1 and ant1mony were cons~dered.
l As mentioned in Section ,III-S, it was decided, in the present i
, ; study, to investigate the effects of six variables {vacuum pressure,
melt temperature, melt surface area to volume ratio, distance of
condenser from melt surface, type of crucible material and pro-
cessin~ time) on the overall rate constant, K, for the removal of
impuri ties from copper. Four of these, six variables (vacuum 1
pressure, melt temperature, melt surface area to volume ratio and 1
distance of condenser from melt surface) were chosen for study ,
in Part l and I~. (The remaining two were studied in Part III.)
In Part I, a 24- I -level fractional factorial test design
was utilized for the purpose of screening these four variables
sa as ta deterrnine those mast significantly affecting the rate
of removal of bismuth and lead from copper[120]. ,Altogeth~+ 1
eight experiments were carried out.
Once the results o,t Part l were kpown (vacuum pressure ~nd , 1
melt temperature were found ta,be th~ most effective variables),
Part II experirnents were planned. Six experimen~s were then
" /)
l'
i
1
1
1
!' 1
-)

1 ;
f } (
1 ~
(
(
58.
ft 1
carried out to obtain a relationship in between the overa11 rate
constant, K~ and vacuum pressure and melt temperature., J
.The effe1cts of different crucible matefial and processing \1
l'
time together with reproducibility of the experimental results 1 -
were investigated in four experiments'in Part III. 1\
In Pa~t IV, the removal of bismuth, lead, arsenic an.d -
antimony were studied in two experiments.
IV-2. APPARATUS
IV-2.A Induction Furnace and Vacuum Chamber
Experiments were carried out in a 150 kW, 3000 hertz Tocco* 1
induction furnace enclosed in a 2.25 cub1c meter vacuum chamb~r,
shown in Figure 5. The system was construeted by Deltec** Sy~tems
Inc. The chamber dimensio~s were 1'.5 meter in diameter and 1.8
Jeter in length. The induction furnace contained within the \ \
vacuum chamber was connected to four flexible insulated Ieads 1
which provided both power and cooling watér. These· flexible power
connections permitted furnace tilting for casting out the melt . • 1 1
The coil diameter was 35 centimeter and maximum steel
melting eap~city was 180 kilograrn. Power was supplied by a 1
3000 hertz, 150 kW, 800 V, I8BA Tocco Motor Gi~erator.***
\
* Mdnufactured by Inductotherm Inc., Rancocas, N.J.
** Oeitec S~stems Ine., Prirnrose, rA.
*** Manufactured by Reliance .,Eiectridal, Cleveland, Ohio.
.-!
l 1

59.
1
1
r
\ ' (
-,
"
1
Figure 5. Vacuum induction furnace and the control system.

(
·1
Ci
60.
Auxiliary equipment on the vacuum chamber (Figure 6) ,
included an.alloy addition chute, four view ports (one for an , 1
optical pyrometer), three sampling probes, one temperature measure-
ment probe ,(for dip tip 'thermocouple) and a water cooled condenser 1
designeà specifically for this study. The condenser, cylihdrical #
in shape, with the dimensions of 15 centimetêr diameter and 4
centimeter depth waS fabricated in steel. It was designed for
lateral and vertical movement (Figure 7-a and 7-b) .
IV-2.B Pumping System ,
The vacuum chamber was evacuated by means of a ~wo-stage , ,
pumping system consisting of a Stokes mechanical pump (nominal 1
1 3 -1 capacity • 0.142 m SI ) and a Roots' Blower (nominal c~pacity -
0.614 m3s-l). The blower was set to start automatically at
pressures below 2500 pascal (Figure 8). ,
IV-2.C Pressure and Temperature Control
In aIl experiments "pressure was measured using a standard
McLeod Gauge* which was accurate to within 10% at pressures below 1
300 pascal. At higher pressures two electrical resistance vacuum
gauges (one functioning below 2700 pascal and the other below
150 pascal) were als~ used. ,
1 Melt t~mperature in aIl experiments were measured with
Pt/Pt - 13% Rh thermocouple,contained in a pure alumina (>99.8%)
sheath. They remained continuously immersed in the bath durinq, 1
* Supplied by ~he Virtis Company, Gardiner, N.Y.
l 1
1 l 1
i
l l,
l'

-1.
\
Figure 6.
.. \.
6l.
Il
0 / ';..
" , , '
j \
1 •
Il Various components.
l'
l~ Viewing ports, 2. 3. Bridge breaker, 4. 5.' Melt lancing port.
Sampling and 9ip-tip thermocoupLe r~ds, Optical pyrometer port,
'" _ ~<;J. _________ _
\ . . '

l'
,1
1·
(
f
'1\ b
62.
" o.
.. "
Figure 7-a. Inside view of the"vacuum chamber". CCpnden$er on the side) ,
•
~ 1. Condenser, 2. -Induction furnace, 3. Filter ta the pymps,- 4. Chamber surface, 5. Pt-Pt 13% Rh thermocouple, 6. Dip-tip thermocouple, 7. Sampling rod and the graphite cup, 8. Viewin~ ports.
1 ~"
.Il 0
'." , ,-
, 1
" \

;
'" '. ,-", î .,
f. ~ 1
63.
'è .. ) .
,\ 1
1 ...
'Jf" 4 . " '\, f' .1'
. , ....,.
" , '< '. ~
~ '-
,""
0 é
\t
'"
'/ ." ~ ,\, ;
.. ) /
..
'. .,r., ; .. /
r' ./ r
~ J' (.
" ,.. ~ ,/' 1 'l't
"
" P '\ ,.. ""
-" ,l <1 ,
Figure' 7-p.: Inside view of the vacuum c;:~amber. (Condenser in . , 1 -~
\
'~ '"
, \ " .. .. ,(
II q J l,
'. r ,. J ,','
( " .. \ ' '\., , !
, . .
"-" ' , .;
\, 1t.
,1. / " ,/ ,

\ ", '
'. ,1
'1
Figure 8.
\ 1
...
J'he 1.
• 1
. f pump'ing system. Roots blower, 2.
:/ (,
Stokes mechanical pump,
JI .
3. Filter.
64.
l,
, '
"
, .

, , ,
1.
(
(
" .
(
65.
experimFts (±< 1.0% accuracy)'. As a second means o,f temperature o • • W 'l'
control, Pt/Pt - i3% Rh, D±p-Tip Type R* thermocouples mounted on a
the tempe rature measurement probe werê also used from time to
time during experiments: Both of these the:r:mocouples were con-
nected to a 0-200 mV range digital voltmeter.**
Pressure was controlled by injecting nitrogen into the
\ chamber while running the pumps at full capacity. The gas
injection point was located in the center of1the back ~ali of ~
the chamber.
At times{ minimization of' air inleakage into the vacuum
chamte~ could be difficult, especially at low operating pressures. 01 1
Due to the comp1ex structure of the chamber, the location and ,
repair of leaks proved difficu1t. This caused serio~s problems
, l' t d' . d . h th' '. t[121,122] h ln ear 1er s u les carrle out ·Wlt lS equlpme~ . • T e ,
chamber and pumping sys tem were regu1ar1y 1eak-checked using a
helium leak detector. Testing and subsequent repair of l~aks
lowered,the minimum operating pressure (that .is the pressure at
which the ·pumping capacity equa1s the rate of inlèakage) to
04-5 pas.cal[<122].
Melt temperature was'cont~olled manual1y by adjusting the
P?wer input to the furnace.
" 1
* ~upplied by Leeds and Nor~up, Elliport, PA. ~
** Supplied by "John Fl~e Mfg. Co. Inc., Mississau9a', Ontario.
" • 1

(
" !
..
66.
IV-2.p Crucibles
In aIL ,the experiments which were label1ed with "F" 1
Tercod* - carbon bonded silicon carbide and graphite crucible -
crucibles were used. Similarly, in the experiments w:hich were labeIIed "
with "A", Hycor Alumina** crucibles were utilized.
Two different dimensions of Tercod 1
crucibJ.es were used:
i) #30 Tercod, ID b 19.0 cm, H "" 25 cm , ,
ii) #50 Tercod, ID = 24.0 cm, H ". .25 cm
The dimensions of the Hycor Alumina crucibles were
ID ". 20 cm and H == 36 cm. tS
,'Chemical analysis of thèse crucibles are included in
Tables 5-a and 5-b.
IV- 3". SAMPLING AND CHEMICAL ANALYSES
• Samples of the melt were) taken1in aIL the experi~ents
1
using graphite cups at 30 minute intervals. A sampling probb , ,
with a graphite CUf atta~hed was lowered throu~ the sampling
por~. The cup was immersed into the melt a few times in order
to 'ensure complete' filling., This procedure had minimal effect
on vacuum levels, .sin~e double vacuum seals we~e incorporated in .
the furnace sampling fa~ility.' SimilarlY, power supply to the
o 'furnace remained uninte~rupted during sampling prqviding 'excellent
temperature st~bllity.
* Supplied by Ferro Electro, Bu~~alo, N.Y.
** Supplied by Engineering Ce~amics Co., Gilberts, Ill •
l '
J, 1
j , i l
j
"

'-- ,
, '1 '
t 1
, ,
, .'
,J '.
, t
..
,
(,1
,\--..--.-- -
-1
'TABLE 5-a. • Chemical
Compound
SiC rJ'
C
Si02
TABLE' 5-b. Chemical
Compound
A120 3
Si0 2 J Fe20 3
Na "20
67.
/
Analysis of Tercod Crucibles; wt%
wt% Compound wt%
44-52 A1 20 3 5.0
28-36 Fe20 3 0.7 1 , ,.
Il " g,laze 3.0
><il
A,nalys~s of Hycor "'lumina E::rucibles, wt%
wt~ Compound wt% Q ,
88.3 Ti02 0.10
11.2 K20 0.03 . ,
0.15 MgO • 0.03
0.12 _lt ... ! 0.02 CaO
c' •
---"i- ',--- --- --'--_.-

(
(
,(
\ \
, _u ,__ ____ __
" 1
68 •
• 1
The dimensions of the graphite cup (F,igure 9) were: ,
inside diameter "" 2 ,centimeter, height co 5 centime ter , wi th a
capacity of providing 20-30 gram copper samples.' ,
After selected experirnents, samples of condensate from
the condenser and other locations inside the chamber were collected
by scraping the powder from the surfaces. In addition, samples
of the metallic accumulations above the ~elt level on the inside
surface of the cruciblès wer~ taken for chemical analyslis. ,
s~mples taken by graphite cups were firs't separated from
the graphite by harnrnering and then cut into small chips. Two
to three. gram porti'ons o~ these chips would be dissolved in
ni tric acfd and anaIysed for bismuth, lead, arsenic or antimony
uSing,atomic abso~ption spectrometrie techniques.
Samples of condensate and metallic accumulations were 1
analysed similarly.
IV-4. MATE RIALS USED
The following materials were used in the experiments:
copper as the melt~ bismuth, lead, arsenic and antimony as Î
1 alloying elements; grap~i te for, sampl,ing cups and ni trogen to
~ provide an inert atmosphere. , \ Copper:
'[
1 .
Electrolytic tough pitch copper with the-trade name -
of F-llOO copper off-cuts.* Nominal composition was·+9~.9%'
copper by weight.
"
* Supplied by Noranda Metal Industries, Ltd., M~h~real, P.Q. 1
i t
,1
1
1 1 /.
1
1
1 1 l, i

(
(:
(
J ( '1
~,
, ,
,
- , \
/
Figuré 9. Graphite sampling cup.
-;::;:'--~'-' -- --~-_..- ~
69.
\

(
(
70.
Q Alloying Elements (bismuth, lead, arsenic, antimol).y)_: These
-werë aIl pure grade lumps with nominal compositions of 99.9% by 1 ~,
weight.*
Graphite: 'Commercial grad~ gr~phite rods, machined to , 1
specification.**
Nitrogen: 3 Commercial grade in cylinders ~ capaci tYt 7m ,
298 K, l atm. ***
IV-S. EXPERIMENTAL PROCEDURE
o J
The following procedures were {ollowed during the pre-j
paration and cpnduction of an experiment: <
1) The selected crucible was placed in the furnace. The
bath thermocouple was then assembled and inserted in one-end
closed ~lumina insulating tube and then placed inside the,
crucible. Thirty-four kilogram of copper and.a presel~cted
quantity of alloying elernents were then pl~ced in the crucible. 1
In sorne 'experiments, alloying elements wer~ aise 'added into the
liquid copper follewing completion of charge melt ,down. In aIl , 1
experiments, the alloying elements were wrappe~ in a copper foil
to enshre precise recoveries.
2) The vacuum chamber was cleaned, lubricated and closed.
After aIl the ports had been closed, the chamber was subjec~ed
, 1
* Supplied ,by American Chernicals Ltd. and Anachemia Chemica~s Ltd., Montreal, P.O.
*~I Supplieq by Union Carbide L.td., Lachine, P.O. 8,
\ ~
** * Supplied by We ldinq Products Ltd., Montreal, P. Q •
J
i , 1
i
"
1
1
l-
l

" "
- "
c
() 1
.o...-l
-,
.... r _ .. -~_ ... _.~--~-
71..
to vacuum, pumping 'being carried out at full capacity for
30-40 minutes. Provided the minimum operating pressure had \
been obtained and stabilized" the experiment proceeded. If not,
the e.xperiment was aborted, ~ ystem checked for leaks, and 1
any necessary maintenance
3) Once the desired been obtained, pumping , "
" stopped and nitrogen was injected into the chamber until the
pressure reached 4Cl, 000 pascal. ' The purpose of this back fi~ling
. operation wais to eliminate possible splashing during melt down , 1
and to provide b,etter control of the melt surface area to volume
ratio.
4) InQuction heating of the charge began toward the end
of nitrogen injection~ Heating up and melting usually required
somè two hours.
[0 .... 5) FO,llowing charge mel t down, purnping was aga in startedj
and continued until a minimum stable pressure had ,been attained. '"
After approximately 30 minutes for complete degassing, the ,
pressure was adjusted to the desired level by leaking nitrogen 1 " 1
into the chamber. )
6) Over this period, the melt temperature was adjusted
manually by changing the level ofl
power input to the fur~ace. \
7) In the case off the condenser being used, it would then
be relocated above the melt at this time. (Sam~nd ~em~erature measurements werepoBsible with the condenser in its
opera ting tos! tian. ) 1
, ..
1 :
,i
1
1
Il 1

(
( · ;
t
72.
8) The first sample was :taken once the experiment tempera-,
ture and pressure had stabilized and this was taken as the
starting point of the experiment (time = ta) .
9) Pressure and temper,ature were moni tored continuous1y
du ring the experiment and devi?ltions from set values minimized.
10) Sampl~s were .taken every 3p minutes. \
Il) On comp1etion of an experiment, the condenser 1 if
presen~, was removedi pumping was stopped and the vàlve opened
to allow air in to the chamber.
12) The door ~f the ~uum chamber was
cast into the was J.ron mo .
opened and the melt
13) Finally, aIl samples taken during the ,experiment as
well as the cast of copper, wer.b weighed. 1
14) After cQllecting the cqnden~a te samples, the chamber
was cleaned and p.r~d for the next experiment."
IV-6. CRITICAL ANALYSIS OF THE EXPERIMENTAL
TECHNIQUE AND AN ESTlMATE OF ERRORS
Generally, i t was possib,le in aIl 'the experiments, to
control variables wi thin close limi ts of the set' val ues wi thout
encountering "any difficul ties.
In the preliminary experiments, i t was observed that new
Tercod crucibl,es (sometimes) caused bubbling* during the course
of an experiment, making the mel t surface area to volume ratio J
,1
* It is possible that Qubbling occurred. due to reaction of a surface coating on the crucible ,with air leaking into the system.
'.
-......... """ -- ~-- -- ~ --- .~ -,
1
,
1 , . ,

, , , ,
,
(
----~ ---------
73.
value questionable.' After two to three melts using'the same
crucible the bubbling phenomenon ceased. As the same crucible
could be used for 8-10 melts, bubbling was avoided by using the
sarne crucible after,maki~g two to three dummy melts. This problem
did not occur with Hycor Alumina.crucibles.
During sampling and casting the melt, sorne sp1ashing'
oC9urred but this was not in excessive amounts (a~ways 1ess than o
, 200 gram copper) and was therefore treated as being negliglble
1
in terrns of melt charge weight.
Similarly, in aIl the experiments, the melt surface was
mirror like in appearance and apparently clean of any contamina-l ' •
ting surface films.
/ The minimum stable pressure which could b,e~ attained was
60 "Hg (8 pascal), the air 1eak rate into the system being in
the range of 5 -15 cm 3 s -l, .under standard C',ndi tions. [12 2]
Melt temperature, melt surface a~ea ~:-volum~ ratio, ".
the
distance of condenser from the melt surface, sampling time and
location and chemical analyses were aIl held in close control
during these experiments. -1
The reproducibility of the sampling, chemica1 analyses
and experiments themselves were investigated ùSing statistical
analyses. The numerical results obtained ~re included in the 1
following chapter.
For each expertment, correlation coefficients were calcu-, 1
lated, so as to de termine the significance of the-overall mass
transfer coefficient, K, used in the kinetic analysis.\
l'
1
'1

c
! l, 1 "
, 1
1 1 () " t -
1
Cl
74.
Estimate of Error: The following accuracy limits werel
estimated for the variables listed below:
Pressure: ±5%
Temperature: ±O.S%
A/V: ±l.O%
Distance,of Condenser: ±O.S cm
Chemical Analyses: ±lO%
i 1 ~
... --
1.
.[
J$
\~, ' 1
f
."-
Il .
1 1 ! 1
1
J f.
1 1 1 1 1
i
1 1 i
1 / 1
1
1 i i 1
l, ~. 1
-r-'-~. -, .----c, ~-'., ~,,' C,' ::-:-:.--- • ", .'

:.!~~ >', "
h .. ( l " " r :; .. , . . f'
~i d' J: '" " \:
~
l'
1
1 t
"
Il
() . - ~ " )
Jii t
'1 l'
1. 75.
CHAPTER V,
RESULTS
V-le PRELIMlNARY WORK
At the beginni}lg of the experimental work, three
preliminary experimehts were carried out to investigate 1
melting and casting procedures, melt attack and crucible
ehdurance, , techniques for controlling experimental Ivarliable~
and sampling.'
Preliminary studies indicated that the 'duration of
each vacuum teit should not be less than 120 minutes in
order to obserie the full effect of the conditions being
applied., This required that each e~eri entaI test take
about 4-5 hours. The selection of study,
~ in conjun~tion with these extended time periods and experi-, '
mental costs, necessitated that a statistical test design
be carried out, thereby redqcing the to~al pumber of experi~
men ts rf1!,quired. 4-i To this end, a 2 fractionalû factorial
test design was utilized[120]~ This design faoilitates
screening the most influential factor br fa~tors" effecting
the overall ra te consYtant, K, for bisrnhth an(l lead remov,al
from copper. ,\
a
\ , '
#
1
'(f~,f> '''1 -'~ ~ ~
. /" , l, ,: ) .... , ~I
i l'
"
El-
, t 1 l
1 1
1 ,
, , ,
- ~ ~ .. ~_ .... ---,..,. --..... ,-- ---.... -, \ ~ , ' .. _-~ !
" '

(
1 r
'~
1 ~ ...
\ • '1\
f 76.
V-2. 'l'WO-LEVEL FRACT70NAL FACTORIAL
T'EST DESIGN
The purpose of!- fractional ,factorial 'test desi~n
i8 to obtain information on the main factors and intera~tions \ '
\
using a smaller number of observations th an would bè required
bya complete factorial" test de~ign. , With the help of, this
'''test design, the best comblnation of exper,iInental. trea~ent ~ , .. '
condd. tions for maximum el.iminatioIil of solute i1np.uxities cano
be determined. Similarly,f the methods of evalua~iol'l{ ~an 1
allow one to estimate the influence bf those~interactio~ 't which are ,n~giectEfd, 'and,at the' sarne t1me -to ass~~s,an~-\j, potential (but unanticipated) importance they miqht have.
l '1 \ In this design, aIl four main effects' are clear of, , '
two-factor interactions, cbut two-factor interactions are )' ,
confujied, one wi th another: That', is, this \ method ,gi ves the,
main effects arid, a1: most-, -th~fi!e two:...f'actor interaètions, ~ '1
while aIl other interactions are asswned to' he zero 0t at ., ""
\least negligihle.
Fractional fac;:torial test' design involves fint ,
determining the number of variables' and levels required •. . , 1· '
A table of :variables and levels is then set', indicatinq the 1 0 :
required bonditions tQ be apPlied;.for eaçh s.bccessive 0
experi~ent (Table 6). \fter a~l be expe~ime~ts 'are carried , , , \ l, l '
out, the results' are tabulated (a,~ in Table 7).". From this, . \," , ni'" 1 -
table, ;by usinq" Yates 1 M~thOd\[l201]' ,val~es" for. the total
effect and sum of squares are cafCulat~d (Appendix· IV 1 . ',-
l, f . ' ·t
.. . , " " .
", 1('
.\
, '"
. l
. ;
1
1 ·1
1
]' 1 i
, 1
l,
, , . 1
1
J
"
, \
i 0 1
\
i
, 1
- .

/
"
/
-~
o (l '-'
-..1
\
TABLE 6. Design of Four Factors in Eight Observations
Factors and the Levels Selected for the Factors
·A B C Experiment Pressure Temp;y;ature A/v
Number lOO}l(-) 115 °C(_) " 6.7Om-l(_) 300}l(+) 1250°C(+) lO.2Om-l(+)
F-2
F-l +
F-3 +
F-4 + +
F-5 '\ + ....
F-6 + +
F~1 + +
F-8 + + +,\
1. A,B,C,D (D - +ABC) ~in effects. AB,~D.AC.BD,BC,AD interaction effects, ABC m ABP - BCD = ACD = 0 by assomption.
/
'"
D Condenser Dist.
<O.02m(-) >O.65m(+)
+
+
" +
( +
"
"'.
Treatment Combination
(1)
ad
/ bd
ab
cd·
ac
bC
abcd
Effects l Measuied, . Aliases
_A,BCD
B,ACD
AB ,CD
C~ABD
AC ,BD
BC,AD
ABC,D
I!t
"'
-...J -...J
-------------------- -----------------------------------------;: (
J /
1 l f' ~ .
1 ~

Q **. $&6 :s p tzIIi1L «AA, ~a JOU .... ______ .... ______ .... ~-~ __ ... ~_..._ __ ~_ - _ ....... ,_""~ .... ~~,...,...".... .... _,.~ ___ .. _",._ ... _"':' __ .,.....~ .... -~,.,~- M-.-._ ...... ______ __ ~r-_ .......................
/
'-
" . j
1 1 )
a " ~-
~
~ \
TABLE 7. Experimental Conditions1'and the Results for-Part 1 Experi~ents (24- 1 Fracti6na1 Factoria1 ~ .
Test Design)
Leve1 of Factors Responses
A B C - D -3 Experiment Pressure Temperature À/V Condenser Dist. E1im'n. wt.% K(lO cm/a)
Humber iOOl1 (-) 1150~C(-) 6.7Om-l(_) 0.02m(-) 30Op(+) 1250°C(+) 10. 2Om-1 (+) >0.65m(+) Bi Pb Bi Pb
F-2 46 61 1.127 1. 795
F-1 = + + 24 29 0.611 0.707 / "-
F-3 + + 49 66 1.337 2.215
F,,4 + + \ 46 54 1.108 1.432
F-5 + +- 38 58 0.652 1.116
F-6 + + 22 32 0.389 0.590 ..
F-7 + + 75 85 1.;94 ' 2.521
F-8 + + ,
+ + 53 71 0.991 1.656 • t ~
1. Copper weight ~ 34"kg. tfme a 120 min.
.....
"-
~ /
) , 1
.....t co
il'
-
"
! 1 -

79.
(, Tables ~V-l and IV-2). Then, by using the experimental
error variance and an F-test, the effects measured are
compar~d with each other and the significantly different 1
\
\1 one (or ones) is selected. Finally, the best combination
, \ i
r i i>-! 1 1 Cl
Ci
---------
of experimental conditions are defined.
As merltioned earlier, the four factors (variables)
chosen were vacuum pressure, melt temperature, ratio of
melt surface area to melt volume and the distance of condenser ô
from the melt surface.
The levels of factors were Sl,elected based on the
results of preliminary experiments and tneoretical stutlies.
These levels and the combination of conditions for each test
are tàbulated in Table 6. This table represents one half of \
a 24 ,factorial design and it is therefore a half replicate.
If-fractional factorial test design is used more than
once for a certain experimental study, using the sarne set of
variables and similar levels, experimental error variance
c~n be deterrnined directly ~rom a comparison of the replicate
set of tesil: ç1esigns. However, if the fractional factorial "
test desiqn is being applied for the first time to a certain
experimental study (as was the case in the present study), 1
then the experimental error variance can be estimated through
indirect methods. Thus, in the present study, two methode \
were used for deterrnining the variance in experimentai error:
a) using ari thmetic me.ans of the ,two-factor inter-
action 'mean squares;
: \
/

(
;'
('
<-l ,1
f
80.
b) usîng 'the variance obtained from the duplication
of a few ~anqomly selected ~xperi~ents from_the
test design ... -Details of these calculations and the procedure
followed for the evaluàtion of the results of 2 4- l -level 1
fractional factorial test design are included in Appendix IV. Il
A summary of the results obtained are included 'in the 1
following section. /'
V-3. PART l EXPERlMENTS
In the eight experiments carried'out for the fractional
factorial test design, the weight percent elimination and the
overall ma~s transfer coefficient values were obtained for
the removal of blismuth and lead from copper. These are
tabulàted in Table 7. 1
In these series of' experiments,_ the logarithrn of the , 1
relative change in solute content with time has been plotted \ , and thése ~e shown in 'Figures 10 to 17 inclusive. With ea~h
figure, data on the ,change of bi~muth or lead concentration
(in weight percent) with time are reported together with the 1
weight of tota~ copper losses. In Tables 8 and 9 the results •
of K, KL' KE' Ku' KGAS ' ,initial wtH, final wt%i and
(
elimination wt%i, together with computed correlation coeffi~ient, /
have been tabulated for bismuth and lead respectively. •
In aIl these experiments it was observed that Kpb
was,higher than KBi • It was confirmed that both bismuth and
1 <'i \ 1 1
1 l
j

Qi"' .,.'""*', '" - 'h _'1'0'. ~~_.-.... ~."-~---" _~ _, _ ,~-._ ...... ~<~ ... " >~"'-"'t-~~"'-"-" --.J __ .-.-.. ....... ..,-!;:""~ '_"'_"";'" ----r~ V·~ .... _ #~'_"'_
t1 - . -., ~ 1 ~
"-.-.

r.
. '\ .........;-_._,-,~_ ... "'~-~. --,"" •.. ~~ .. ~~~,. .. ~!~ .. 3~I~j~MR+ ... '~*.Q~k(.i~~~'~'.'~~~if~~~~~~ __ .kM ,t)W e :zc;a44gQ 1&
~
~,
o /
- .
.. 5"- \
(\ ,; .. ,., .. - ......
') ,--,
~\
TABLE 9. Summary of Results for Lead Removal, Part l Experimenta
j "' !
1
1
1 ! 1
..:
~
, . _.~~-_ ..... _---~- - --- .--_._ .. --"---"-----.. _-~~--
" .-'

-' (
/
)
()
. . ..... _--_ .....
--_ .... ~,.,.,--"."" ..... -~~ \
FIGURE 10
." , '
,-1
•
"
Rate ôf removal of bismuth and l.ead from copper, ) Test F-2. * 1
K( XIO-3 -1)' cm.S :
Elim'n, wt.%:
\t.i,me (min.)
o 30 60 90
120
Bi
wt.% Bi
0.090 0.063 0.060 0.054 0.049
Total copper 10ss** • 170 gr.
Pb
1. 795
.61
wt. % Pb
0.333 0.2-12 0.198 0.1621 0.130
*The order of appearance of the figures fo1lows the order in Table 7. ;
/ **Ihcludes the splashes aRd the amount evaporated.
\
83.
l 'r
"
. 11
1
1
1

,-...
1:: 1-:::J L en t-t
(Il
~ • ~' '-'
4 l,
t:)
0 ....J
(,J'
-- --
o.o~----~--~------~----~----~
-1. a
-1.5
-2.0 1
\
-2.5
-3.0
-3.5 0
-----_ .. -
•
30
/ ,
~
60 , 1
F:..2
"
90° 120 1
TIME (MI NUTESl ~
l' - --~_._>--- -
84.
'\ l' 1
~
1 1 .,
, , , 1
, j
!'
/ ,
1 1
l 1
\
1 '{
1

,\
-- --,---/
85.
( r

. 86 • ) e ,
C 1
i /
1 1 \ l,
\ FIGURE-ll "
from ~
Rate of removal of bismuth and lead copper, ~ , Test, F-l. 1 "-,. i <Bi Pb
,/
K(xIO- 3 -1 cm.s }: 0.611 0.707 1 , :t E lim ' n, wt. % : 24 29 , \
~ '/
-1.
~ 1 time. (min.) wt.% Bi wt. % Pb '. f f , 0 0.037 0.099 f
(} 1 30 0,.036 0.095\ r
f 60 0.034 0.088 f 90 0.030 o .082 " .'
! 120 o ~028 0.070 \ ,\
1
f Total copper 10ss -110 gr. ~ \ J
<;> \ , 7 \ \
!>
..l'
. '
.\
, , '
,..R.-•• _' .. it_. __ .... - --- ~- - ~

.' -, , ~ ~~~- --~~ "--, -_.- -- -- -....-----~--- -'--------.-. - -
\
b
'" 87. 1 /'
, 1 i
( 1 ~
" 1
'/ i : .
II(!I/IIII" , 1 .
1 0.0 , 1 1 1
1 / i 1 F_1.
, i /, l
f ,
-0.5 i - -i l
\ ] r
~ · . \ , l
i j
J
! l
-1. '0 - - 1 P
,.... l' ::c: /'
! · " ~
l, ,1- , i • ~ ::J ~ f ~ L: -t .. (
-1.5 ~ - , en ,
t - .. ' )
t-4 / Cf ID ' , , i , ~ ) ,
~ 1
~ -2.0 ~ ,-~ • ~ l-l 3: f ~
! ,/,'
(..') -2.5 ~ -0 ..:.J ,
1 1
-3.0 ~. - f 1
'1 f
q , j
-3.5' •• J • 1 i 0 30 60 90 120,
() TI~E (M 1 NUTESl ,.
• <.. - ----~- ,_.-.... '11. =;

, ,
c / .
/
0.0 1
t 1 J
-0.5 1-(
~ 1 , {.,
t II § ~ -1.0 1\ ~, -1
· c:f Œ lJj ...J -~. 5 1-
• ~ .
() ~ ~ l. • 1: .
l-\
1 ~ -2.0 r 1-, '-'
(.!)
~ ,,' ...J -2.5' 1-
-3.,0 1- .
\:;
~3.5 1
0 30
() TIME
\,
1 . 1
-- - .
.'
, ,
.,
1 J
60 1 90
(M 1 NUTESl
':) . ~------"""'\-- -/
88~
...
1
F_l " -
-~
1
- ( 4
i -
-
-
l,
1
120
/
, .
~ \
'\

r' i'
}, . r ~,
l", 1,
f (
; 1
." , \, "-..
i' f
, . i,
J ~
,
t " .-1· " " . l t ~ t. y ~ ~ ~
l ,
'. '- r ~~ .... 't""t~.M~W'~~""'~rw.,.,.!-': . ., ..... ~~.,'t\.~""-~ ...... ..".""'''''--- ~- . "
.)
!
« ~) "
1
FIGURE 12
Rate of 'removal of 'bismuth and lead from copper, Test F-3.
(')
;-
E1im' n, ,wt. % :
time .(min.)
o 30 60 90
120
,
Ç'J
~ota~ copper Joss
~.
~
"
{ ~ •
,
,.
"
_____ -_r ._. ___ --'_ -- ~ --~ -----~_"'~."'~~.T_'~ ...... "'--'
200
0
Bi
1. 337
lI.49_
w·t. % Bi
0.039 0.029 0.025 0.022 0.020
gr.
'II
Pb
2.215
66
J
wt. % Po
0.125 0.080 0.066 0.048 O. 04~
, . IJ
89.
\
1
'I .
r
1
"
" ,

~-- ---.
, , 90. , .
, ,
Le .. 1
Q" i
'f 0.0·
~ ! ,/\
"'- 1 "- 1 l
, ,
,1 i F_3 l <-
1
-0.,5 1- - 1 1
• 1 4/
1
1
\ >1 \ ' Il
! -1.0 l- r y - ! ,....
1 1 J: i
1 ' t-::J f ,
1 L -1.5
l...- l Cf) -• -, ! ' -.... ,
j ..... .. - 1
( ) ..
-.II " ' CD , '
~ -2.0, • 1- -
~ t- G .. 't. ~
/ "-'
t.:) -2~5 1- -0 _.JI
~
-3.0 1- -
,f' l .. l ,
1 1· 1 1 -3.5~--~-------~----~--~\-1~-2-0--~ \ o 30 60 90 ,\
1
T IME, (MINUTES) ~
\

~-.. --_ ... ~----_ ........ ...., ~~
r--\ ~ .. l
-f ! 1
1
-1
91. \ i
,(,1 t 1 !
.' Î
0.0'
f'_3 , .
-0.5 1 1
-' \ 1.
,
• f -1.0 1 1
l' r-. l ~
1 ~ 0
l a: w 1
, 1
< ,-. l,
1 Î' ...J -1 5 , }
.! , li
1 1. e) .\ x i f • ~ It-
3.: -2.0 '"-'
t:) " t EJ,
'---...J -2.5
1 J .',\ <.
'* !' •
-3.0 ~
./ 1 ( -3.5~----~----~----W-----~--~
o 30 60 90 120 . \
J, ,".
TIME (MINUTES)

,-"
. , "
~,
'I-l ,1 ~ t' ~ ~ i • " \ t' ;,
1'1 [; r 1
t
f i-
l 1 h
Î 1 , • !
.1
,
(\ j i
\ \
f1'
.
, r
FIGURE 13
'Rate of removal of bismuth and lead from copper, Test F-4.
-3 -1 K(xlO cm.s )~
Elim'n, wt.%:
time (1pin. ) J
0 30 60 90
120
copper 10"\-r
r
~
170 Total
J
Bi
1.\1-08
46
wt.% Bi
'0.060 0.045 0,042 0.039 0.033
gr.
/
1 ~
,"
Pb.
1. 432
54
wt. % Pb
0.215 0.138 0.136 o. ),.18 .... ' 0.098
, .
/
\ .'
,l'


, )
... -.'~ ~~-- .
Il
r
95 "'
( Il
1 r 1
, \
r t 1
FIGURÉ 14 i ~
Rate of removal of' bismuth and lead from coppe~ , Test F-5. "-
Bi Pb
K (xlO- 3 -1 cm. s ): 0.1552 .. 1.116
Elim 1 n', \olt. % : 38 58 /:
time (min. ) wt. % Bi wt.% Pb "
·c: 0 0.050 0.222 .30 0.049 0.167 60 0.048 0.156 90 0.039 ,0.122
120 0.031 0.093
) -> .
\ Total copper lqss • 130 gr •
.jl
/"
! 1 1 .. " , , 1
! " t
1
<il
.. j •
" 1 \ 1
<>, . 1 <;:>
1 ~
......r
/

1 \ " - -------- -
96 . .... • ","J~
( -'"
, / l' "-
0.0 l , 1 1 r
~,
F_'s 1 -
-'0.5' ~ ... ' .... j j 1
- .... .'
"-'
-1.0 ~ -,...... ::c 1- ... :J l - • L -U1 ' -1.5 ~ .. -......
(: co ~
~~ e,
IJ • -2.0 ~ -I ;
l-3:
t "'-' '!
j 1
1
f 1
-2.5 t- - ~
~ i
, 1 EJ
\ -.J ,
~ /\ i
l -3.0 ~ - • ,
j
\ \ /1 1
1 , , .- , Î J
1 1 1 1 1 ; ,-3.5
.. 0 ' 30 60 \90 120 l I!r r ,
1
(', ,~
TIME ,(MINUTES) "
"
-"'--_ ..... - ----~ -- ",- - - --- -/---- -",--.,.-<- -----~

- --" -- ........ _ ..... ---~~ ---,
0, 97.
1;
f ( r. ï 1 ,-, J: ,-,
, 0.0 1 l ; , F_5 ') 1 ,
. , ~' -0.5
"-,
-1.0 ~-Cl t
' . CI: W ....J -1.5 <11
, '
~ : 1
( \
• ,po , ,
,:- ! ~ -2.0 '-'
Î
(!) t S 1
f ....J -2.5
; v\ l \
-3.0 ...
\.
-3.5 . 30 60 90 ~20
~
(~J 1
TIME (M.I NUTESl 1
• 1 e
.'

~, l, 1
~ \
, ;'
'.
FIGURE 15
Rate of- rernoval of bismuth ~nd 1ead'from copper, Test F-6.
'.
K ( XIO-3' -1 cm.s ):
E1im'n, wt.%: )
time (min.) \
o ,,30
, 60 90
120
Bi'
0.389
22
wt. % Bi
0.032 0.031 ~--.029 0.025 0.025
Total copper 10S6' - 100 gr.
(
Fb
0.590
32
wt.% Pb
0.080 0.079 0.066 0.059 0,.054
98.
;'
i l,
1· 1 i

. -_ ... ---~--........... ~ U M~~ " - ~ -~ ~ -" ~
" -, .' y 1 1 " .
99. f j
\! 1 1
.Iî : , ( (JJ ! 1 1 1
1
'" 1
b • 0.0 1 1 1 1
F_6 , , -0.5 ~ , ., -
1 l' i ~ ~
; ! l·
1 , -1.0 , : 1 , - -, ,."lA /' ,
:c t-
/
::J
!~ L
-1.5 Cf) '" - -• '" ........ ~
'" ( 1 CD : .
~ , . -2.0 - .-
l, " t-~ 3: l' "-'
1 t.:) -2.5 - -f 0
" -) 1
~
U <ft'
/ 1 .c '.'
)
-3.0 -, (
i.
.' -3.5 1 1 ' 1 r-
D 30 60 90 120
() TIME (M l NUT ES)
---- ._" - ... '

, 1 ,-
- !
,1 (
: , 1 ,
\ ,
- ,(
.' " ,
i ï J
~ !
"
100.
O. 0 ...-----...--.---...--.---T-111 ,----,-....-..;../--,
1
, , ,-O. 5 ~
~-- ~------->, -
-1.0 r- -,--. • :0 CC - -- ~ . W .:..J ~1. 5 ~ -~
• ! t-~ -2.0 ~ -.......,
t.:) , . 0 " .....J -2.5 ... -
-3. 0 ~ -
" .l 1 1 -3.S------~--------------~,-------------o 30 60 90 120
lIME (M l NUT ES)
. J

, \
~ \ l 1 f • i "-t , ;
(
1
K( XI0-3 -1)" cn1.S :
E lim 1 n, wt. % :
. time (min.)
o 30
.60 90
120
l'
Bi
1. 794 \
wt. % Bi
0.044 0.037 0.023 0.022 0.011
Total copper 1088 - 290 gr •
",
Pb
2,,52]
~ 85
wt.% Pb
0.126 0.107 0.049 0.046 0.019
\ 1
,~
101.
. '

" 1
1 i 1
{ "
C " ! , ... f \ 1
o t 1 J
1
,0
~
::r: 'i-
l :::J r, :E en 1
~ 1 .. ...... , - ~ C'} (D , f 1
'l' ~ '1
: •
1 '" t-~ i: 3: i .....,
1 l:)
El e
~
()
!aWlU.t.. •
- --- - " l<\
(
o.o~----~-----~----~----~----~ 1/
-0.5 o
-1.0
1
-1.5
-2.0 •
, :)1-' ~
-2.5
'" , , "
-3.0 ..
-3.5~----~--~~----~--~~--~
_- 0 30 S\O 90 120
lIME (MINUTES)
, 1 1
,-- ~4 .1
102.
Q.
, .
D •
,
1 1
1
1 i l '
'? 1
; 1

1 q -.....,~)-. .. _-~~ , 1
1
-,
, , 1
! o.o------------~----~----~----~
l ' 1 .
\ ' . . i ' ,
-0.5 1 • }
-l.Q ,...... 0 te \
\
W ! -1
--l '-1.5
(l" ~
• 1 ~ i 3: -2.0 ~ è
; ....., ;
1 / " ' c c.;:)
EJ ..-l -2.5 1
j
!
J
'" ' .. f
1 -- ~ -
-3.0 'D
~
-3.5 J'
0 , 30 60 90- 120 0 /,
~..,.' . , "
.-,
() " Il .
TIME (MINUTES} \ .
\
'-. ~l·--,·- . ',1
'" ------- -.- .. - ... --_ .... ~ - ,~.
" "

\ ( 1 !' 1
i ! •
( 1
ï i , l
f t i 1
1 -1
1 1
! 1
! i l,
(
'\
" "
.'
, ,
FIGURE 17
Rate of remova~ of bismuth and le~d Test F-8.-
'l.o
Bi
K{><10- 3 -1 cm.s ): 0.991
1 E1im'n, wt.%: S3
time (min. ) wt.% Bi
a -0.017 30 0.012 60 / ~ 0.010 90 ,0 0.009
120 0.008
Tot'al
~ ~
copper 1055 - 240 gr.
l '
"
,"
1 \
from copper,
Pb
1. 656
71
wt.% Pb
0.035 0.021 O. 015 0.012 O. 010
:.
104.'
" '
1
i 1
1
~ p
1 1
1-6
, ,

1 l,
! \ 1 1
! J _'-'..1
t _ t. ~ C'
o
•
t:)
0 -1
\0
- --,-,---~'-----
1
, -
-,,\
. "
O~O~-------------r------~------r-~--~
-0.5
-1 . <û . \,.
-2.0
-2.5
:-3.0
i
-3.5 0 30 60 eO 120
T l M E (M l NU T E-S )
1
-~~ ........ ~-- ------- - -\ j
105. '
1
1 1
1
! II }
j 1
l
, 1 \ 1

~ ~_t.-,,_. _ ....... ~... ~... " .. ..1....- _ #
" c
J ! , l06~ l
l,
(}."O r----~--_r_--_r__~-~--..., "
-0.5 \ "
-1.0 , 1 l - 1
1 Cl a: l w {I ....J -1.5 J
1 , ;:-..: ~
Cl 1 , • j 1
f t-, >
~ -2.0 ~
1 (!)
D i ..:.J -2.5 , l i
1 i l
l \
1 -3.0 \ \'
71
1 1
1
-3.5 '0 30 60 90 '120
() TIME (M l NUTESl J "-
(:r) \
\.,~'" 1
J \ ),
" ,- Î /---,- ,-- -- -. .-_-1-_____
1

(
(
, .
() \
1
... l '
107 .
lead fo11owed first order kinetics very c10se1y, the cor
.relation c6~fficient never dropping below 0.916 for bismuth
or 0.943 for lead. 4-1 ' .
The results of the 2 'fractional factorial test ,p
\
design evaluation were as foriows:
Method (a): By estimating the mean square(error
variance) from two-factor interactions with one and three "
degrees of freedom (Appendix IV, Table IV-3-a)' and using \
5 and 10% levels of f-test, melt temperature and vacuum
pressure ~ere shown to be significantly effective on the , J\ -
overall mass transfer coefficierit of both bismuth and lead
'compared to the effects of mel t surface area to volume ratio \ ,1
~nd the distance of the condenser to ,melt surface (Appendix . \
IV, Table IV-3-b). 1
Method (b): In the second method, by est~mating the
error variance from the variance obtaïned from duplication
o'f ~o experiments (Appendix IV, Table IV- 4-a), similar
re~ults were ~btain~elt tempera~ure and vacuum pr~ssure
were highly significant at 1% level of f-test with one and 1
•. two d~grees of freedom for the error variance obtained from '.
\ . duplication of tests ~-l and f-3 (Appendix IV, Table IV-4-b) •
\ In addition, at 5 and 10% levels of f-tèst with one and two
degrees of freedom, i t was determined that the interaction'
effects of Be and AD (that is comb{ned )ffects of melt
., te'mperature and A/V and the combined ~f~ects of vacuum "" 1 •
• 1
pressure and the cohdenser distance to the melt surface) were
'r . ,
i , l
"
, .-{, 1 l'
1

(
(
C,·
108.
also significant for both lead (Appendix IV,
Table IV-4-b). . .
Further analys1s of the effects of inter-,
actions with a two-way table of total effects (Appendix IV, \
Table IV-S) showec1 véry little di.fference in between AD and
BC. As a consequence it was not possible to de termine which , \
set was the most significant. However, a 'tendency for the
overall mass transfer coefficient to increase with decreasing
levels of A and D (pre9sure and ~ondenser distance) or with \
increasing levels of Band C ( temperature and A/V) is
apparent.
Sœrumarizing, overall mass transfer coefficlents for
both bismuth and lead ~rease significantly with:
a - increasing melt temperature
/ b - decreasing vacuum pressure
They also increase slightly with ~e combin~d effects of:
c - ~ecreasing'vacuum pressure - decreasing distance
of condenser to melt surface
d - inc;easing melt temperature - increasing A/V.
V-4. PART II EXPERlMENTS
In order te obtain a quantitativ~ relat~onship between \
the overall "mass transfer coefficient K, and the variables .
~elt tempera~ure and vacuum pressure, further exper1mental
investigations were needed. Thus, the experiments in Part II \
were mainly concerned with the effect of vacuum pressure and
melt temperature on KBi and Kpb •

(
(
(
109.
A total of six ~xperirnents were carried out at
three different temperatures 11SOo-1250 o-r3S0°C and two~ • different pressures 100 - 60 ~Hg. The rnelt surface are a
~ " ta volume ratio was kept constant at 7.1 m- 1 and aga in the
treatrnent tirne was, 120 minutes in aH experiments. The
water cooled condenser was not used in these set of experi-
rnent's. A summary of aIl the results obtained, 'together with
the'experimental conditions involved, are provided in Table
10 for bismuth ând lea~. The logarithm of the relative,
impuri ty weig.ht change (in percent) wi th time was,~ plotted
in the'same ~ay as Part land these"are given in figures
l8-2~ inclusive.
\
Consistent with the previous results, it was observed ,\
that Kpb was always- higher than KBi . The rate of removal of
both bismuth and lead exhibited definite first order kinetics
(correlation coefficient was neve~ below 0.971 for bismuth
nor 0.965 for lead).
By increasing the temperature from IlSO°C to 1350°C
and decreasing the pressure from 100 ~Hg to 60 ~Hg, it was
possible to increase KB, , ~
'-3 -1 3.l~ x 10 cms and Kpb
4.70 x 10⁻³ ems-le
from 1. 05 x
from 1. 8;4 x
10 -3 cms -1 to
i 0 - 3 ~ms -1 ta'
The results of Part l and II experiments showed that
bismuth and lead can be rernoved from copper melts under
vacuum and that lower vacuum pressures and higher-melt ' 1 •
temperatures were the key factors in increasing their rate 1
, i ' i 1 , • ~
1 l

"' ..... àJ #t _ ... li$.a4# :; it«1'~~,IIi~'~;''''''-_.~ __ ''''''''''r.,......,.'''''
, i i t i 1
'1 t
/
:~ -<li' /-,
/
TABLE 10a. Summary of Experimental Conditions 1. and Results, Part II Experiments, Bismuth
~
BISMUTH ,.
'Tést Press. Temp. KLo.O-~ Corr. K(10-3 KE
{10-3 Ku (10-3 KG Initial
No l-IHg Oc cm/s) .. Coeff. cm/s) cm/s) cm/a) (cm/a) /' wt%
1
A-6 60 1150 5.09 0.986 1.32 28.44 1.89 631 0.030 /
A-3 60 1250 7.21 0.996 2. ]JJ 62.90 4.81 750 0.038
A-5 60 1350 9.78 0.990 3.15 125.40 4.84 391 0.030 0
A-l 100 1150 5.09 0.971 1.05. 2,8.44 1.38 460- 0.038
A-2 100 1250 .7.21 0.986 1.86 62.90 2.60 406 0.020
A-4- 100 1350 9.78 0.996 ' 2.33 125.40 3.13 252 0.020
1. , -1 -Copper weight = 34 kilogram, A/V = 7.1-m • Condenser Distance> 65 cm, tÉme = 120 minutes.
«
, c
/
.............,. .. ~~., __ ""-"....-.... _~ __ ...... u~
Final wt%-
0.015
0.010
0.006
0.022
0.008
0.006
~
Elim'n wt%
50
74
80
42
60
70
c -...... ...... 0-

i , 1 j
1 (
r-'l ( -'~ ~"~ "'-'
--------1 -
TABLE lOb. Summary of Experimental Conditions " and Results, Part II Experimenta, Lead
LEAD
Test Press. Temp. ~ (10-3 Corr. K(10-3 ~(10~3 Ku-(10-3 K Initial No I1Hg Oc cm/a) Coeff. cm/a) cm/a) cm/a) (cm7s) wt%
A-6 60 1150 5.09 0.965 2.00 47.,92 3.54 704 0.071
A-3 - 60 1250 7.21 0.979 4.04 97.53 10.13 1024 0.059 0
A-5 60 1350 9.78 0.993 4.70 180.99 9:'54 53~ 0.059 ,
A-1 100 1150 5.09 0.988 1.84 , 47.92 3.06 609 0.096
A-2 100 1250 7.21 0 0 .997 2.52 97.53 4.04 409 0.028
A-4 100 1350 9.78 0.994 3.93 180.99 6.81 383 0.027
1. Cop"pe1"welght - 34 kllogram, AN ~ )1 m-\ Condenser Distance~ > 65 cm, time = 120 minutes.
..
/
;-
"\
"
Final wt%
0.025
0.006
0.006
0.038
0.007
Q.004
~
Elim'n wt%
65
90
90
60
75
85
- "
'"
/
~
..... .....
.....
"
"

1
l-i
(
(
" "
/
1 1
· , 'i.'
FIGURE lB
112. 1
'la'te of remova1 of bismuth and 1ead from copper, Î Test A-6. *
K( XIO-3 -1 CII\.S ):
E1~m'n, wt.%:
tinte (min.)
o 30 60 90
120
Bi
1. 316
50
wt.% Bi
0.030 0.026 0.020 0.019 0.015
Total capper 1055 .. 200 gr.
Pb 1
2.000
65
wt. % Pb
0.071 0.060 0.055 0.037 0.025
*The arder of appearance of the fi~ures follows the order in Table 10.
'.
,I
1 1 1

113.
( ..
o.o~----~,~----~, ~I------~I-------~I--~I~
l
- " ; -o. 5 1- -/
- -1.0" ::c 1-::::> L . -1. 5 en h ---..... -- --. "-
Ci CD • .---.
~ -2.0 1- -•
t-3: ......,
(!) -2 .. 5 ~- ' -~ -.J
--~_.
-3.0 1- --~
-3.5 1 1 t 1 1
0 30 60 90 120 , i
i () t
, T I~E (M l NUT ES} { , ,
, ,
....

1 1
- . - --\--_.-
114. , ..
." ~~
'. tJ ~I;, ., ,. 0 r.
I~,
(
~ " , ~ o. 0 r· '.
t r,'
A_6' 1-'8l b
1 ,', , ,. -0.5 t il!.
t i
1" -1. a "
,..... Cl a: w "
-1 -1.5 •
( ~ •
f' t-- 0 , ~ -2.0 ....,
f
f (
t.:) ,
'! ID "
! ...J -2. 5 \ 1· .',,-r "-1 , 1
,/ -3.0 i
- 3 .. 5 L....-_---L...:..----:----J, __ --J-__ --I-__ --'
o 30 60 90 120
() TIME (MINUTES)

" Total copper loss - 280 gr.
\
/

\ ' , 1 , ,
1
, '0
O.O------r-----T-----~----~----ï
-0.5
-_ .. ----,--- --
116.
( 1
1
l l' i

" . 0
".~ ~~~l···l-V'"T'''' ..... ~,,.,,,.....,... ... -~ • _ ._ ~ __ __ • __ """" ......... M ...... __ -,,- ... -~ .. __ ... - -------;--- - ---,..... -
1 "
'V
117.
t t ...... ,.
t ---J. <v 0.0
----------- , ~ <' f 'A-3 , ~
l~ ,-."
l -0.5 " j!,
! l( r
i Cf
"i' t
~~j j ,. e 1 {> i ~,
-1. a c ! f f ~ ,--.. j ,1 O.
t CI: r W
1 f .....J -1.5 '.1 1
1 ~ t ,~ () 1 " 1
l • 1
i t- 1
t· ï ,3.: -2. a ,~
,/
f """" 1
{ ~ t:) ~ 0 f ' .....J -2.5 f . \' ~ "
1 •
\JP
~3.0 1 1
!' 1
\ .;1 • 1
#. -3.5 1
\
0 30 60 90 120 "
li) <l
0 {)
lIME (M r NUTESl
0
, Od F'

i !
'1
1 1 (
'.
(\
_L __ ~ __
,
-'.-
/
118.
FIGURE 20 . ~
Rate of removal of bismuth 1 and lead from copper, Test, A-5.
" Bi Pb
-3 -1 K Cx 10 cm. s ): 3.154 4.703
Elim'n, _wt.%: 80 90
" '" ()
time (min. ) wt. ~ Bi wt.% Pb
"' . ,0 0.030 0.059 30 9·020 0.038 60 0.011 0.021 90 0.009 0.009
·120 0.006 0.006
0
/
0
Total copper 10ss • 300 gr.
"
-
'r -------_ ... __ .-. - - ----------'r----.----'
j
l'
\ "
\ ' \

, , .- r ,-_. r -~ ~- "-- -- -- --~----""'-,.,. ....... _ ....... , - -- ------_.-- .
; .~.
1 , " 119.
1 1
i ( t /
1
~-!
~O. 0 1
A_5 -1
-0.5 ! ,
{ ( -. f
')
f -1.0 . - /
~ ::r:: t-:::)
i ~ \
t · en -1.5 , . t ...... r
~ Cj CD p
~ , , ;-...: , ! l , ; -2,.0 ~ • t r-
i 3: "'-'
· (!) -2.5 \
E)
:..J .. 1
", l '"1
)
-3.0 0
, • ",
-3.5 0 30 60 90 120
CO) TIME (MINUTES) \ ., \...
L #
J" ,
• ~
.... ---.... -r--~..I-- • "" 1--:' --_.~ -_._-....... -,.-. - -- ------_ .... --r:--- -'.- ---

120. ' i l ' ,
1
(
, : \ : 1
0.0
A_5
, l, [
-O~5
~ 1
r ;
-1. a / -- '"
0 " .. ,
CI: t W 1
t ....J -1.5 i t
l ' ~ Î () \ • c
! t-i ~ '-2'.0 1 ~
b ~
i (.!) • E)
1. y~ -2.5 .
-1 i 1 , !
\
1 -9.0 1
'1 1 'i
'\, 1 1
-3.~ 1
60 90 120 0 30 "
,C) ,
TIME (MINUTES) " -
"
,_ .. _----~- \~ _._------..... -

(
/
! ,
----~~----
Il
-. ,
FIGURE 21
Ratr of removal of bismuth and lead from copper, Test A-l.
'"
------------
\ , .' , 1 \
!--
1
.1
1 1 } ! 1
J c-
i J
1 1
\ 1
'.

(
(,
() ,',
..,po
\
-. J: t-::J 4: (f)
t-1
CO
~ •
t-3: .......
t.J El --'
~- ..... .--..-. ...... --~ ..... ~~ - -- -- ~- .. ~ ....... -
122.
\~ 1
/ , . ;-
1 1 1 1 O.O~----~----~-----r----~----~
A_l
-o. 5 ~ -
-1.0 ~ ,-
" . el
'-
-1.5 "-~ -... 1
j • --' -~~
-2.0 ~ -
-2.5 1- -\'
Il
-'3.0 1- -
-3.5 1 1 1 1
0 30 ' \ 60 90 120
lIME (M'I NUTESJ ('
- --·~""~_""''!'''"","""_K .. I1. ____ ''' ___ -- --
, l
\
1 i
l
l
1 î
1
l \,
1 1 , j
1
-J~ 1 --....~ \

(
0.0
" \ '
A_l
-0.5
-1 .0 ,....... 0 cr:: w ....J -1 .5 ~ Cl .. 1-~ -2.0 -.,
t:)
0 .. ~
--l -2.5
-3.0
~3. 5 à 30 60 ; 90 120
o \ TIME (MINUTES) ~
~
\ 123.
-,J
-----,
~ ,
1
\
\
\ i' 1
1 j
! \
!
1 1 , ! l-
l !

(
(
- 1- _ _ . ____ . ____ _
FIGURE\ 22 ,1
Rate of removal of bismuth and 1ead fram copper, Test ,A-2.
E1im'n, wt. %:
time (min.)
o 30
. 60 ~Ù
120
Bi
1. 856
60
wt.% Bi
0.020 0.015 0.011 0.009 0.Q08
, Total copper 10ss - 220 gr.
Pb
2.523
75
wt. % Pb
0.028 0.020 0.014 0.010 0.008
124.
• -----_\ ---------- - --
f
i !
1 1
, 1·
1 ~
, 1
1 1 1 . "

--- - -, .~ .. - -'"'--" .. " --- --~--
1 1
1 125. 1 { l
! (, t \
! ' ,
fP
0.0
A_2 t )
-0~5 f 1
1 i ! , : , L
- -1.0 t ::J: t-
" ::J \
L -1.5 en
t--t
() CD )
l 1
! ~ , -2.0 • >
{ ~ r
~
1 ~
t:) -2.5 t 0
\J --1 "-
.- \ .1 ,
-3.0
-3.5~----~----~----~----~----~ a 30 60 90 120
TIME (MINUTES)
, .

1 f i
126.
!
(
o.o~----------------~----~~----
-0.5
i -1.0 ~ i • ---r ---- 1 1 Cl l 1
• CI: 1
f w " j i
--1 1 : -1.5 1 , ~
i () ;:-...: 1
1 -r • " l
i- l 'i_~_.\
~ 3: -2.0 ~ " . '. -."
t:) '0 " --1 -2.5
, '
-3.0
-3.5~--~~----~----~----~----~
o 3Q 60 90 120
TI ME (M 1 NUTESl
1 "
----- ~I--

('f
---_ .... -.- ..
FIGURE 23
Rate of remova1 of bismuth and lead Test A-4.
) Bi
K(Xl0- 3 -1 CIn.S ): '112.325
E1im'n, wt. %: 70
time (min. ) wt. % Bi,
0 0.02Q 30 0.016 60 0.011 90 0.009
120 0.006
Total copper lOBS • ~50 gr. 1
, 1
, 1
"'. ------.---_. ----,-----
;
from copper,
Pb
3.928
85
wt.% Pb
0.027 0.020 0.010 0.006 0.004
.'
"
, 1 l .j
1
1
'" J
.' ,
i .. j
i i 1
,1
~" ,

128.
" (
.. ,
, ·o.o------------~--------------------
1 -0.5
" -1.0 j>
-. :c l-
.', ::::> L
-1.5 r en i 1 ......
(. (0 '4' ~ ~
'\ 0'
-2.0 ~ • t ,'--.-- l-
I ~~ ), '--
,'{
(.!) " -2.5 El -1
~ "-"-
":'3,,0
,-3.5~----~----~----~----~----~ '0 30 60 '90 120
() TIME . (MINUTES)
Il • _._--,-

(
-Cl a:"
, . 'w , ~ , l , 1 f
~ : () >
\ . 1-
t 3:
t "'-'
1 t:)
El ....J
1
' '
,,~ ..
(J,
\
o.o------~--~\~----~--~~~--~
-0.5
-1.0
-1.5
'-2. a
-2.5
-3'.0 •
, Î
• -3.'5
0 30, 60 90 120
~ TIME CMINUTES)
""'-..
--"--'
129.
i
1
1 j , 1 1
1 ,)
1
1
r 1
i
1 1 •
1 1

''', -"~
c
(:
l t
of removal. j Based on these resul ts, i t was decided to
carry on the research fur~er, so as to investigate any
ef~ects of longer process time, ',or different crucible
mater~als and to test the experimental reproducibility
of the results.
V-5. PART III EXPERlMENTS
\ '
Four experiments were carried out in Part III, the
aim being to maximize the amount of information possible
with a minimum nurnb~r of experiments.
130.
Test F-1-X was carried out strict1y for the purpose
of duplicating test F-1. In the remaining thrée exper~ents, . the refining time was d~ubled to 240 minutes. In experi-
e
ments F-9 and A-7, conditions ,ere seiected so ,that the
results of the firs~ 120 minutes could be used as dup1icates
of th~ randomly selected experiments carried out in Parts
l and:II. In the last experiment, F-lO, the resu1ts of ,
the first 120 ~inutes was reported as F-7 in Part 1. The o
on1y difference between F-9-x and F-3 are the A/V ratios. . ,
A summary of aIl the results atld experimental
c?nditions are reported in Tables IL, 12 and 13. As in the . previous parts, the logarithm of the change in werght
percent of impurity wtth time was plotted, and these are
shown in Figures 24-30 inclusive.
·1
• 1
j t 1 l ! , J
). '
, ! !

mu b.UUIII!Olii!#iOf4$Z41(11403'''''''-'I'IP>iI''''''"___ _. ___ .... ~ ... <., •• ,_, •.•••• ~.'.' '" -/~ r· .. ':;"-''/I·,.,·· .. " '·".,,-c,'''·,v. >,~
ç-
t~ ...-...,
O'
~ •
...... w ...... ,
"
Î 1 1 i ,
-1 1 1
~

• 1] li' .4.1 .. at.S,1lA t$Q$ • k)Atl QJt~$ ; &li Q.t. *'!i!P""!l'" "i' ........ ~'''''''-''''''~,~~.~'''.-, -. 1"'~'"' j • ,Jt
.. o ,........, e
~ -', 1-
c
': " ,; j ,
TABLE 12. • ' -'1
Summary'of Kinetic Resulta for Biamuth·Removal. Part III Experimenta'
,"
Test Corr. K(10-3 Kr. (10- 3 ~(10-3 Ku(10- 3 - K Initia1- ' Final - Elim 'n No. Coeff. cm/s) cm/s} cm/a) cm/s) (cm1si'o wt% wt% wt%
, 2. F-I-X - 0.969· 0.56 ... 5.l5 .28.44 0.56 187 0.043 0.034 21
F-9"-X2• 0.964 1.24 6.59 62.90 1.41 221 0.020 0".008 60
F_73. ,1
0.963 1. 79 6.59 62.90 2.57 400 0.044 0;011 75 ,(F-10) ,
.1.81 f - 2. 0.987 7.21 62.90 2.64 412 0.025 0.010 60 . A-7-X
F-9' ! 0.951 '0.75 6_59 62.90 0.86 134 0.020 0.006 70
F-IO 0.986 1.62 6.59 62.90 2.22 346 0.044 0.005 89 ~
"
A-7 0.,972 1.36 7.21 62.90 1.71 267 0.025 0.006 76
o " 1. Copper weight - 34. ki10gram
2. Dup lications: F-1 and F-I-X. F-J and F-9-X. A-2 and A~7-X. ,~ r .. -
,~ " 3. First 120 minut~ of test F-IO vas report~d as test F-7.
i 1
1 !-
•
~
~'----- - - -;: -~ ------,----~
~o
,
!/ J
C.
"
~
..... W l'V
...

_,2421-;::8 Li A4J.:A &W! z q Clac; 1If"'L4""' ... 'v .......... ~~_.J; ____ .. ·""""'~ ....... -."""r ...... _~_~',...\ '-_~'~_.-..r
1 ~ 1l
'-..-/
Il ~
1 1
\ ..
1
, 1. TABLE 13. Summary of Kinetic Resulta for Lead Removal. Part III Experimenta -
1
f \ 1
1
1 \ '
,1
. r " 1
·1 1 f }
if'
Test Corr. KÙO-3 ~ (10-3 -~(10-3 Ku ClO-3
NOr Coeff. cm/s) - cm/a) _ cm/a) cm/s)
F-I_X2 • 0.982 0.68 5.15 47.92 0.73
F-9_X2• 0.954 1.99 6.59 97.53 2.81
F_73• 0.965 2.52 6.59 97.53 4.2,6 --
(F-IOj
A-7-X2• " 0.927 2.51 7.21 97.53 4.0rr
F-9 0.982 1.63 6.59 97.53 2.22 ,
F-Io. 0.985 --: 2.84 6.59 97.53 5.27
1
A-7 0.985 2.45 7.21 ' 97.5-3 3.85
I.Copper weight - 34. kilogram
~ ..... t. ' .. 2.-DUp1ications -. F-l and F-1-X, F-3 and F-9-X. A-2 and A-7-X.
3. First 120 minutes of test F-10 was reported as test F-7.'
f'"
. ~m1' fœt1'~f'td r ,tt1r*i':we'-M.c'Nh,,;' " "t, dl """''''' .. $_""""",,,'''-- <- ~ ..... ~"'- '-~
J.CCj Initial Final (cm s)~t% - wt%
1~, 0.126 0.096 --..
284 0.048 0.011
431 0.126 -0.019
,404 0.047 0.012 r-
224 0.048 0.004 -
532 0.126 0.003
--' 389
, 0.047 0.003
"-
'" ~ ~__ ;.v- ............. ~--~
Elim'n wt%
24
77
85
75
92
98.
94
;< --~~~ ~........-_...,..~-
.........
'.1.
::c
<!
..... w w
". ---~- ----._--..... - .. ~-

/
1 ' , , t
Î>
, .
1,
! ~
(
(
Cf
---~-
1
Fl;iGURE 24
Rate of remova1 of bismuth and 1ead from copper 1
\ Test F-1-X.
K( X10-3 -1) ,cm. s :
Elim'n t wt.%:
time (min. )
0 1 30 60/ 90 ,
120
~
--
, , ..... ,._----
Bi
0.563
21
wt. % Bi
0.043 0.043 0.039. 0.037
,0.034 J
CO'
, i i
Pb
0.680
24
wt. % Pb
0.126 0.123 o .1~0 0,.099 0.096
tr
, J
0
,~~
134. ,",
( 1 \
1
\
\
l'
1 \
~ 1 i
1
1 ,
,

~
~
i ~, , \~ ~
fi ~
l' 2'
! r l. ,
y~
i "
" r
\ i
1 i. r· t. 1 t ! , (
~
1
.(
CI
(>
, '--'{-"
-J: l-=> ~ en ...... Œl . ,
;--..: •
1-~ '--'
Ç..!) 0 -.J
135.
1 ,
i 0.0 1 1 1 1
. \ ' .
i F_l_X 1 , , '
,0.5 1- -..-\
. '. \
-1 .' o· 1- -\ , ..
.. - '--f.S - -. -
1/ "
-2. 0 - -
"
-2.5 1- -r \
1 , ~'.
~
----~ i ---1
-----------3.0 -----------1- -------- -
~-
--------- 1 ---
-3.5~ .. ------~'~------~'--~---~'--------~r-'--------~ , 0 3Q 60 90 120 .
T IME (M l NUTESJ
____ ....... ,._ ... _1<._;. .... ' ... _------ ,----.......----

136.
(
\ ---
O.O-------~~-------"~I---------rl,-------TI----~
1 ! f.l_X
-0.5- -
. , .. '\ i -1.0 - - ----Cl 1
((
CI: : ;
I.LI l , ~ . --.J \ _il.S ~ .. 1 ~
( - ~
i } 1"
• "
.-,r 3: -2.0 ~ -, ! -; . ,
1 t!)
0 '-\.
! -1 -2.5 - -i
l , , ")
,.3.0 ... - i _L
r ,
-3.5 1 t t 1
90 0 30 60 120
() )
CM IN.UTES), TIM,E
"

} f,
1 1 1
\1 1 1
(
(
" Cl , '
~
.' Rate of remova-l of Test F-9-X r
K(XIO- 3 -1 cm. s ):
Elim 1 n, wt. %:,
time (min. )
0 30 60 90
120
\ '
\ .
FIGURE 25
bismuth and lead fram copper,
Bi Pb
1.242 1.992
60 77
'-,
wt. % Bi, wt. % Pb
0.020 0.048 0.013 0.026 0.011 0.015 Cl. 0 10 0.014 0.008 0.011
1 _
\
f Î
_ "_~"'~N

138.
1 1 . \ 1 , 1
0.0
1 - '- F_9 _X
" -0.5 i \ l
-3.5~----~----~----~------~--~ \ 0 30 60 90 120
TI ME (M l ~UTES) ,r
\
ir na -

(; \
. ;, t,
~ i ; l 1
. --'" '" ''';' -.- ,
139.
O.O------~-----T----~------~----~
-0.,5
-1.0 ,....... Cl cr: ?JJ
·W
---' -1.5 ~
• t-~~2.0
t:)
lD --'
"-,-.
-2.5
-3. 1 0
-3.5~----~----~----~----~------O' 30 6.0 90
TIME (MINUTES)
"' --,~',-------
"
120
' '

t \ r
(
--_.~_ ..... _.- - .-
'-• FIGURE 26
Rate of remova1 of bismuth and lead from copper 1
Tes1; F-7 (F-I0). *
K( X10-3 -1 cm. s ):
E1im'n, wt.%:
r time (min.)
o 30 60 ' 90
120
( ,.
Bi Pb
1. 794 2.521
75 85
wt.% Bi wt.% Pb
O.Q.44" 0.126 ~. 037- 0.107 0.023, 0.049 0.022 0.046 0.011 0.019
,"
..
'*First 120 min of test F-I0 was reported as test F-7.
\
, \
140.

\ ,Hl.
0.0 \ 1
1 F-1 / "
~ ,-0.5 , , ,.
l, 1-t t ,
• l -1.0 ) -- ~\ ::c
,1-=> ~
-1.5 l' U') .......
(1 (D
;--..! -2.0 •
• 1-'3: "--'
l t
-2.5 ---------;--- ---
t.:) E:) ,. .-1.
, -3.0 \ \
-3.5~/~/----L-----~~----L-----~--~~
o 30 60 90 120
o TIME (MINUTES) \
------.I>Oê-,. ,
\ . _--...J.. ___ "..,.._-F ~ "'---""~--'I~r-
\ '

, t
0.0 , " , .
\ .
1. F-7
-0.5
-1 .0' i
i .. \
~
Cl cr: W --l -1 .5
COI ~ 1 • r • r' l-i, 1
~ -2.0 i t ---r Î ~ t t:)
\ l E) i r
J 'J --l -2.5 r, 1
\ 1 '\
-......... :::,-....-
, 1
--3.0 • 1
1. , .. 1
-3 .. ~ a 30 60 90 12-0
J • ./ ..
'C> TIME (M l NUTES) ... (
-

143 .
. !
(
.. \ -•
\ '. . 1 FIGURE 27
"
~ Rate of remova1 of bismuth and 1ead from copper, Test A-7-X. "-,
Bi Pb .' .
-3 -1 K(~10 cm.s ): 1. 874 2.505
E1im "n, wt.%: 60 75

;. : . ,
, t ! 1 i
,C;
o -/
~( I! t-::::J L. en ....... CD
Il ' ~ •
t-~ -t:)
0 l' --'
"
, - 0- ---"'--'- .. _,._._~-
144.
0.0 A
."
A_7_X
-0.5
-1 . a ) \ \
-1 .5
-2~O
~2.5 -l, "
"
-~.O
.. -3.5~--~~----~----~------~----~
a 30' 60 90 120
T IME (MINUTES)
'.
1 1
f 1
1
l
L j j
1 j j . 1 1 , j
1 1 , , 1
1 l
b , 1

Î l , -_···----1- --
\.
O.O~~--~----~------~----~-----
a '
A-
• . '~. ....
1 ~ ___ _ -----""
l45.
, ,
\ j ! ) ;

-. ,\
" c
...
FIGURE 28
Ra-te of remova1 of bismuth and 1ead Test F-9.
, Bi \ . ' K (Xl0- 3 -1 0.753 cm. s ):
E1im'n, wt. %,: 70
time (minI· ) wt. % Bi \
( 0 \" 0.020 30 0.013 60 0,.011 90 0.010
120 0.008 150 '" Q.007
~ 180 0.007 210 0.OO6~
240 0.006 1
..
., Total, copper ioss • 340 gr. ~
J 1
'.
\ --
0, \ '
o ," ."
- -'-
from copper,
Pb
1. 631
92
wt.% Pb Wt
0.048 0.026 0.015 0.614 0.011 0.008 0.006 0-.004 0.004
146.
\
e
'1 1
~ .j
,1
~ ~
1
! 1
1 i 1 t
li,
\1,

/ 1.,,1>
,ç .~", ... '~-""'+~ , .... .;~- ~ ... ~-- --"~ .- . ~ -- --~.~. ,._----- ~ ~.~ .
i
1 r, 1
1
t , .. - ,'147.
1 !
G ,1
,~ j
, 1
f ... - 1 . ~. -.
f , ~ l r
t 1 1 r 1 ,r .. ,t 1
~, , . . ' 1t C ~ r ., · ::1' ~. N ( 0; ~ 1
~ 1 ~ "
t, LI..
1 ~.: · 0 .... Î C\I Î j 1
1 '.
,0 !
i 1 C
;
1"' 1 · CD
1
! .... 1 '.
., 1 lp C ,..., 1 .. • - ln -Cf") , . .... I.LJ 1
'" j
Cf 1-
\r ' ~ => , ,
0 Z \ ; - • - N I-t , .... l: , t / - ~ l ./.:'
;7 LLJ , 1
t ~) i .. l: 1
t J
• Î/ I-t ,
i ~ . ! l- l 1- '-.,> · Q
CD
Q •
:) 1- . Il · Q
'" \
1 1 • j • 1 .\ • .0 0 li) 0 \U) 0 1 II) Q ln • • • • • • • •
0 ·0 .... .... N N (1') ",.
1 1 1 1 1 1 , ' O' (HlnWS lB 7.,. lM) Del. 1
'"
1

~. \
\
148. , (
..---"------------\
\ 0 ::JI N
'b
0 -N
0 l \
CI:)
f -;\ 1
0 --i J
II) en - w \ f- I (Î ::::1
0 Z N' .-.. 1
, <t - l: ! • , \ ~ " -. t
\ t W. 1
0 1
r x: l
en !
1 "
.-.. 1
t f-
'l 0
t CD
0 (::) ln (:) Il) 0 1 ln 0 li)
1t • 1t • • • • • • (::). 0 - - N' N VJ ~
1 1 1 1 1
() (01:131· ï. -,LM) DQl
\' .

\
149.
c f
FIGURE 29
Rat~ ~f remova1 of bismuth and 1ead from'copper, Test F-10.
" \ Bi Pb '\
K(XIO- 3 -1 \. i \ cm. S ): 1.616 2.8141 !
1 E1im' n, wt.%: 89 ·98
ti~e (min. ) wt. % Bi wt~% Pb i
, 1
0 0.044 0.126 30 0.037 0.107 60 0.023 ' 0.049 90 0.022 0.046
120 0.011 0.019 '\ 150 0.010 0.015 180 O. Q.07 0.005 210 0.005 0.003
1 240, 0.005 0.003
f-I \ Total copper loss - 360 gr.
f
\~

150.
(: "

k ---- -_ .. _- ~---\" ",,---- ___ ''' __ -'0'-· _ ...
i~
t i
15l. l • \ (_.1
" ,-
\ r , >J ~. , -~:
\ 1 l "
"- J' 0 ~ ::1' ,
~~ N ,
~ )
"-~ l,
'.
J.
, ~ t
0 -N
. f
, Q CD ,
! -1 t t- 0 .&1 II) - I.LJ
1-
e'! :::J 0 Z
'" ..... - x: '-'
\ ! I.LJ 1
0 x: CJ) ..... 1- \.--- \ ;
0 1 CD !
~ 1 1
.r, 1 0 l ,
cr')
j 0
0 ln 0 ln 0 U1 -0 ln • • • • • • • •
0 0 - - N N 0'1 0'1 1 1 1 1 , ~ 1
() (Otf31 7. • LM) ~gl "
... ,-------'-.- -,

, "
• l • f r -
1
,
C ,
()
_. ___ ~ ......... _J _, ._ .......... -. ___ ~.
FIGURE 30
Rate of removal of bismuth anp lead from copper, Test A-7.
K( Xl0-3 , -1)' cm. s :
Elim'n, wt.%:
time '(min. )
0 30 60 90
120 150 180
- 210 240
Bi
1. 355
76
wt.% Bi
00.025
Ow019 0.014 0.011 0.010 0 •. 008 0.007 0.007 0.006
Total copper 10ss - 330 gr.
\
/
~
2.445
94 \
\\
wt. % Pb
0.047 0.023 0.015 0.014 0.012 0.007 0.,006 0.004 0.003
, -----_ .. - -~
152.
"
1 1
- 1
j
l i
-1 3 1 1 l

• 1
C)
• ::1' N
! " 1
<C 0 • -N
0 CI) -C) li) -
(; )'
C) N -
'" C) en
,
C) CD
" /
0 (1')
~ ____ ~ ______ ~ ______ ~~ __ ~ ______ ~ ______ ~ ____ ~ C)
C)
• • C) C)
1
c)
'-"" ..... r ... flw ... ~"" ........-.----
C)
• -1
ln • -1
• N 1
(HLnWS 1 8 7.. LM)
, 1
U)
• N
1
~gl
?
---~ - __ " __ "M'I1._F)<' ~b P ___ "'..,.~~~ ___ ---" -"
C) Ln • •
(1') (1) 1 1
/
1
153. /
"
-en w ..... ::l Z ...... ~ ......,
W ~ 1 ...... l' t-
::0

1
c c II) c II) 0 ln C 11)'
• • • • -' • • • • 0 0 .... .... N N ~ cr)
1 1 1 1 1 1 (,
() (01::131 i! • LM) ~gl'
- --~""'~~'_'_II __ ..... , ... a:_w_q.l..L ____ _

(
(J
.,I,lJ>ioo_.~."",-."""""" .. -,,,,,~ -
By applying vacuum for 240 minutes rather than r'
155.
120 minut~s_,_~t was possible to obtain residual concentra\
tion of bismuth and lead below 100 parts per million. , " That is, weight ''percent elimination of both bismuth and
lead at the end of 240 minut~s, were approximate1y 15%
higher compared to the eliminations obtained ~t the end
of 120 minutes. contrary, to this, KBi and Kpb ' wer~
general'ly 10wer for 240 minute treatmept times compared to
120 minute treatment,' .except :Eor test F-IO, where Kpb
increased from 2.52 x 10⁻³ cms-1 to 2.84 x 10- 3 cms-l . 1
Three randomly selected experiments, two from Part l
and one from Part II were repeat~d. Experiments with the
labels of t-I-X, F~9-X and A-7-X were replicates of ~he
exper'iments F-l, F-3, an,f A-2, respectively (Table 14).
The resu1ts showed that in,experiments F-I-X and F-9-X,
overa11 rnass transfer coefficient~ for both bismuth and
1ead varied in the range'of il. to ±IO.%, as compared to
those for experiments F-l and F-3. However, in experiment / :
A-7-X, identical resu1ts with those of experiment ~2 were , 1
achieved. This was a confirmation' of the reproducibi,li ty
of the results and the appropriateness 'of estimating
~erimental errors as being in the range of ±5 to ±10%.
~" ,No significant effect of changing from silicon
carbide-graphi te cruc~bles (Tercod) to high puri ty, a1wnina
crucibles (Hyco~ ~lumina) was observed on mass transport
rates of bismuth and lead from copper.
Il

"-~""'--"-~~_f"-__ ;",I"..-y-:ç;-l>- ....... " ... ; .... $,;; ~l'o~;:,j''\~;:I';.-r--..." ..... _"'''.l, •• 'r~~'"~!'"-~~---r''- .. O\''";-.., ~''''''-''1r, .. - ..... ~ "~ ,"-r l ' ;L!,. ..
~ r, .. ,~ -"
~
TABLE 14. Comparison Qf Duplicate Experiments
Bismuth
Test Press. Temp. K(lO=-3 Initial Final E1im t n KO-O- 3 , No. Il Hg Oc cm/s) vt% vt% vt% cm/a) -
F-1 300 1150 0.61 Q.037 Ô.028 24 0.71 _8%1. ,~" -12% _ -4% '~J
F-l-X 300 1150 0.56 0.043 0.034 22 J?..68 F-3 100 1250 1.34 0.039 0.020 -{ ) . 9 2.22
-7% +18% ;-10%
F-9-X 100 1250 1.24 0.020 0.008 60 1.99
A-2 100 1250 1.86 0.020 ' 0.008 r 60 2.52
+1% 0% 0%
A-7-X ,100 1250 1.87 0.025 0.010 60 2.51
1. Percent difference of dup1icates from the actual experiments. . ~ ~ ,
/
..
Lead
Initial Final wt% ~%
'. 0.099 0.070
0.126 0.096
0.125 0.043
0.048 0.011
0.028 0.007
0~047 0.012
------ -
ob ~\
-
El1m'n wt%
29
-177-24
66
+14%-
77
75
• 0%
.75
""t· .. -,r~""*<\'~~""tn
t-' (JI
C'I
/ /
---------------------.... -_ ........ ____ ...... "'.""'<'4I! . .r:u~ ~_'""'_" .. ,Hf' ~~ .... ..-__ • ___ ~'"'_""~_ ............. ~~+ ........... , ... __ .~ ,_ ... ~ _. __ ~~ ......... ::""--«-.oQ-,.. ... ~.....-...---------.'--'R_--_- __ ~_~

i ,-~; ~
l 1 !,
, "
,(.
~ .~ '> "
--_ ........... -_.- --
,157.
~6. PART IV EXPERIMENTS
In two experiments, the rernoval of arsenic and
antimony, in conjunction with bismuth and lead, were
investigated. No'elimination of arsenic and' antimony was
measured duriQg these tests" which were carried out at \,
1250'oC and 100 llHg (Table 16). For bismuth and lead,
ho~ever, very similar rates of removal were found to Ithose
reported earlier (Table 15). Plots of the change of
bism.u,~h and lead concentrations (log wt. %) with time are
given in ~igures 31 and;32.
V-7. CONDENSATE ANALYSIS . 1 1
A schematic diagram of the inside of the vacuum
furnace is given in Figure 33, showing the locations of J r,_ . .
the condensate samp1es. The'results of the condensa te
'analysis are swnmarized in Table 17.
The condensa te which collected-on the bottom surface "-
of the condenser itself formed a britt1e, wafer-like layer
which could be separated very easily tram tpe condenser.
It also contained meta1lic drop lets caused by splashing. /-
These drop lets would first -be,$eparated from the bulk 1 .' (l 'J
sample py' grinding ahd screening.
In experiment F~10, separate condensate samples were
taken fromthe\bottom (facing the melt) , the side and the
top of the condenser, ,to inv~stigate any variations in
composition. No variability was fo~d.
, . , ___ .. ____ P, ...... _.~J ... O''''_I. _._ ............ ,,~, _111'.--"-..----.<---- - . ~,,~, -"" ,-~ ----- ----
/
\ 1 1 , 1

.ifII1lfii$1!IW!A 4thJthW:'IIJl""";:1"1 Q iQAt4GCp:;; "forÇA;;"" .. ,*;,uo ~~~'''''''' ______ '''''''''''<' '_~~joI"_~.t',11~'''''''~'''~ l'''f
,--, '- t '\
... ':.'\. ~~
I~
., ./'
"-"\
1;
TABLE 15. Summary of Experimental Conditionsl • and Resu1ts, Bismuth,and Lead Removal, Part IV Experiments , .
1 l
! !
! 1.
1 1
\
Test No
A-8
A-9
Test No
A-8
A-9
1.
o.
Press. Temp. l). (10-3 Corr. pHg "C cm/a) Coeff.
100 1250 7.21 . 0.999
100 ' ' 1250 7.21 0.990
Press. Temp. I<L (10-3 Corr. ,plig Oc cm/s) Coeff.
100 1250 7.21 0.998
100 1250 7.21 0.997
. -1 Copper weight - 34 kilogram. A/V - 7.1 m
/
/' Oe
1_<_"1" '0 / -~--_._-~
,
..
BISMUTH
7 1
K{10-3 ~(10-3 1),(10-3 > K Initial Final Elim'n
cm/a) cm/a) cm/a) (c:,;s a) c wt% wt% wt~
2.20 62.90 3.33 520 0.025 0.008 68
1.51 62.90 1.98 308 0.045 0.021 53
LEAD ~
K(10-3 RE (10-3 Ku (10-3 K Initial Final- Elim'n cm/a) cm/a) cm/a) (cm7s)_ wt% wt% wt%
97.53 4.09 413 0.067 0.018 73
1. 78 97.53 2.43 246 0.110 0.044 -60
• Condenser Distance> 65, time a 120 minutes.
<\,
-_ ....... -......._~~ .... _-~~"""""-. ~- .. ~_., ......... ~ ~ ... ~ .. _'lê. .. ___ ...... ____ ••
1-' Ut CIl
l , . 1 ,
i
·-1 1 ! , J

t
1
,.,
( " J f " , !
i ,
,
! -f '\
l-l • 1
'-, " "
! I~ t, ,
l'. [
i , c, r t ~
• t· , k ri 1',. ..
1 t'
1 0
.c) _~ 0
" ~
'\
d
TABLE 16. Elimination of Arsenic and,Antimony l ,
Test No.
A-8
A-9
."
,...
As%
Initiai Final
?33 0.31
0.39 0.40 ~
~\ ~. ------~----~-------------------
Sbl
Initial
0.15
0.24
1-
. ,
159. 1
Finsl
0.15
0.25
f
.' 1 1
, il
,p, '-
" ~,~
r.'r ~~ ...
,t"'l°' -;
, ..
". 1
1
/ .
',;"
'~----.~~,------.-------------~
i
L , J
, l i
4 1""-. i ' 1
; l 1
1 , , , g
1 -]

+ < 7' "
.;,
; , ,. ,l-
I - ( lé
, i~ .
1
,~
,
" '. t~ ~ J , "
1
..
"
-
r JIk _. __ • __
, .
, "
." /
\
FIGURE 31
Rate of removal of bismuth ~nd lead from copper, . Test A-S.,
-3 . -1 K(xlO cm.s .. ,.) :
El'tm ' n, wt.' ~
r~'\._
\tl.m~ (min.) , .\
! 0 JO 60 90
120
..
1 {" "-
1 1
Bi -, 2.198
,68
wt.% Bi
0.025 .. 0.018 0.014 0.011, 0.008
l' r
Total copper Ip'ss' ·.210 gr,_
-. ~
"1
. 1
'ià
/\..- ...
'. .<
d.
\ '-
j'
~
,
~,
, i
ê
"
')0.
,
,\
, . 1
.\,
~ ·Pb -,-1
J. 2.541 ,~l
73 l,'
f
" wt. % Pb
fJ·067 ·10.045 '0.034 0.024'" 0.01j3
"" .-"f'
'" y
J
'1
" • .. ,. '"
t;!/ }j
.""
-'
~
. , _ ... -~_.,_,------"--,- ",
1(
..
) 1
( 1
,1
"
, '"'0
v'
<)

l, -.. ~ ,"
{ , il f (
" ~ ~ ".-
" i, "
.. '
. ,
, ..
- -~~,,~-_.~, --/ ,-
\
161.
-;
1
o.o~----~----------------~------
-
•
-0.5
-1 . 0
-1.5
-2.0 Q
c.:J 1-2. 5 o ...J
, ,/
" , , ' , , "-
, , {
-3'.0
01
\
J'
...
\
, r
f,
"
, ,
( ~O - 90-, '\
\
\ l
-T 1 ME \ ' (M 1 N'U T E 91 , ,,"/ J"'
- - .' --'-----
120
, ",
, .
"
"
, ,
!
~' l, 1
1
, .···1 1 l
l
1 } j
1
1
1 ;1
1 i 1
1 1

,0 162.
'",
~ (: ,~<I
4 ~, '"
r - --, 0.0 "
f ~ A_a " , 1
! -0.5 i t t ( .~ i ,
! j
1 l 't
f !
-1.,0 ," ~ -f C') 7,
t cr: f' lLJ
--' -1.5 \ \
() :....: •
l- f .-1 i - \ '3: ,
-2.0 ( , - l, .. c..:> \
0 --' \ '-2.5 <.,
. l' 1
,1 1 tl
,-3~O ~
"'" \~
, ."
\ "
-3.6 .. aO 0: 30 60 120 " J > , .. ' ,
oC) 1
lM i NUTES) 'T IME v,
it; •. '"
~-...
" ! )~ , ,- 0
_" _________ ~_~ ..... _ .• .1 ....... ~~ ,",><- ••

'i 1
r \
, t l () ; .
" " [, ~ 1
~
~ 1 r t 1 > ~
~ r , f ( \
1 f \ r
\t Î;
1 ,',C> ,
l'
(),
. , , , , ;
_.-----~-:---- "
, ~
•
Rate of removal of Test A-9.
K(XIO- 3 'ern.s- l ):
Elim' n, wt.%:
time (min. )
0 30 60 90
120
Total copper loss ..
\ \
\
~ \
~ - ---",.- '..-.... ~ ~ '--"~-'-"""'.' - ~ -,
FIGURE 32
bismuth and lead
Bi
1. 514
53
wt. %' Bi'
o ~O45 0.038 0.030 0.029 0.021
220 gr •
_. -- -~--~ --...,
163.
from copper,
Pb
1. 784
60
wt.% Pb)
0.110 0 .. 081 0.067 0.053 0.044 \
-.......... -?1' ,
i' 1
, 1
1 ~
l
1 . ' 1
:
, , \ i
, J
1 J J
1 \ 1 1 t

1
1 , J
Î \ t
(
f , 1
~ lt t ~ t t f -r :c j. 1-~ ::::> i
r L , -(1') , , .......
(- ) (Il • r, . t ~ ~I •
o '.
• t-~ -L:> 0 ...J
o \ .
, (
164.
l'
o.o------------------------~------\
-0.5
-1.0
-1.5
-2.0 \
-2.5 • 1
,
-3.0
-3.5~----~----~----~----~----~ . • 0"
T 1 M É\ (M 1 NU TES,) . \
• 1 - \
I--_---------~._-_. ,- --_ ... -------
\ '
1 \ 1
1 1 . 1
\ J
1
'. 1

-Cl . CI: lJ..{t.. ~
C, ~ •
t-• .~ ....,
(!)\ 0 -.J
()
\ ...
"
\ . -~~- "' .. _....",.-.... -"""" -.." - - __ , _. ,::.: .. o.. •
165. , \
o
o.o------~----~----,-----~----~ ! 1 . ,
-0,,5
-1.0
-1.5
-2.0
-2.5
Y -3.0,
\
\ \-3. S-
0 30 60 90
TI.ME (MINU·TESl
-...,.,-'-, ------_ ...... -:.------ -.-
A_'
120
\
1 \
! ' ;
1 t'
~
1 :
l 1 !
1 1 . ,
1
\
1 ! '
1
. 0 1
-..---- -\ - "-'''''--'--

"~"",,1 ......... _ ..... _~ ~, - ~~-- ~--
l,
1
1 166. l '" f
( \,
TABLE 11. Analysis of Conden$ate, wt%
~
Avera~e . 1.,2. 3. Distance to Powder·, , Droplets j,
Test I,ocation of Location Melt Surface li \
No. Sample No. cm Bi% Pb% J:u% Bi% Pb%: 1 ~
70.8 l
, F-2 Condenser 1 1.5-2. 14.5 5.3 16.7 72.0 1
} "
F-4 \ Condenser 1 1.5-2. 13.7 68.7 12.4 3.7' 12.7 -"
, Condenser 1 1.5-2. 10.7 42.9 12.4 4.5 13.1,
AroUnd Crucib1e 2 25 6.5 26.2 3Q.O
" 2.4' , F-6 Fil ter Pla te 3 80 7.3, 32.8 " f
Chamber 4 65 3.3 t 7.2 31.3 ; ,
Ooor 5 100 7.0 29.6 4.7 \ ,. " Condenser " (Average) 1 10~5 42.0 : \ , 1.5-2. 41.5 0.2 0.9 , , t. !
(:J Condenser a t . (Bottom) \ 1'1.1 40.6 5}.4 0.1 0.2 1
r ' :
~ F-lé' Condènser < (Side) 12.0 46.9 35.0 \ 0.3 1.4
1 1
Condenser ! (Top) 13.7 46.9 22.4 0.6 2.2 j
"
1 Fllter Plate 3 80 11.1 42.9 9.8 1
1 Chamber 'r 4 65 8.3 32.2, 21.5
\ Filter Plate 3 80 8.5 25.'2' 4.9
1 A-9 Chamber 4 65 5.2 16.2 2.7 " Door 5 100 2.0 Q 4~4 2.6 ~
1. Samples were ~round and separated by -lOO,me~h screen.
2.' The balance assumed to be oxygen.
3.The"bala~ce i8 not analyzed.
4. Time • 240 minutes, first 120 minutes was r~ported ~s F-7.
() ~
, /
,\
., ~ ,. --(. _ .. l, ' '
_ .. _-, ; - , ,

"II' q A A;P _ _ "'""~~_!"'"~ ____ " .... '- ~
1
1 ! ! 1
~
"
~
".
/
h4*s?N; .. ~IlW;"" ~ ....... __ ...... ~ ........ <~ ......
,Jo>
'r
~
01
.. : CIUC.IU
10 1 .. 1 0, ,.
oL __ --=-Jo .. ..
FUiNACE IOX
..-..,
LOCATION OF CONDENSATE
S~MPLES
"Figure B. Location 0 f C'ondcnsdte 'samples.
"
..
~
"
/
t.:-
- 1
--./
f-m -...J
""'"
"

t,-
f :1
r. ;,
!? ~ < ~
f \,
;"-
l' /
~, , '. If'
t >
l' ~ f
f 1 : \ ~, i ~ , \ •
, l 1
1
l'
\ 168.
Based on the detailed analysis of the condensate'
accumulat,ed on the condenser and weight percent eliminations,
the ratio of solute which remained on the condenser relative ,--------,---,---
to the total weight of sqlute evaporated from copper rnelts
" were calculated and included in Appendix V /
Sarnples, collected from other parts of the chamb~r 1
took the forro of a black powder of lead and bismuth oxides.
Chemical analysis showed that the bismuth content ranged
between 5 and 15%, ~ead between 25 and 50% and copper between
3 and 25% by weight. /
During experiments wi th hycor alumina crucibles, an
aècumulation of condensate occurred, which started just
above the rnelt level on the inside surface of the crucible. - - ,
"
It was found to comprise' 'rnainly metallic copper fo~ the
first 2-3 cm above the melt level. Abové this, the conden-. ,
sate changed into a wafer-like deposit. The material was
s'ectioned every 5 nnn and chemically analysed for two
experiments. The.repre~entative shape of the accumulation \
and' typical ehemical analyses are gi ven in Figure 34.
V-B. STATISTICAL EVALUATION OF THE
EXPERIMENTAL WORK, ACCURACY
In this study, a total of twenty experiments were . \
carried out and of th~se, three experiments were duplica~es
which confirm~d the reproducibility of the results obtained.
'------R-'----___ ._11 __________ 1.~_

.> , , ,
f , :
" .1
"
(ï C .' , 1 \
t ;,
~ ~ ~ i
} ~
, 1
l t ! \
(,
------.., ... ..,-
. _ .... ~"""~''''''~ T ~ M .... _~~
METAL
BU Pb% BU
---Z.-C
El 1.5 ~ C)
of ~ , f.:l
~ 1.0 ...:l j:Q ....
~ 0.5 t.J
Q ~ 0.0 t.J
0.497 3.86 .. , 5.51 '-'--- 0.016 o. 17 ----
o .016 ~ 0.068
'" ,
---0.008 0.038 - ci .006 0.009 -
........ -- -- - - _ .... ---- .... _---- .... _-------------..-- .... ------------_ .... TIIIiI'! COPPER ------ - - - - ..... - - - - -- - - - - - - ... - - --
Figure 34. Crucib1e surface met allie accumulation, a - Test A-l; (time .. 120 minutes).
~U:TAL
Bi% Pb%
2.5 0.011 0.248
2.0 e
~t L5 ~ 0.024
::. 0.007 ~ 1.0 lZl ,~
0.007 rr.. J:Q ~ 0.5 .... Q t.J
fi! 0.OÔ5 0.007 0.0 c.J
------- --------, '
._ .... --- ---- ----. --- .-.-- ...... ~ ...... --............ _ .. ---_ ... ~ --- -'COPpER --- --_ ....... --.- .... --
Figure
\ ~ ... ~-----'---,..~ ,-,<C ... ',
\ ' '. 34 b - Test A-7. t~me - ·240 ~Dute8) •
169.
POWDER , ;\ ,
Pb% eu%
13.22 70.89
1
~
1
1
, l
" Ci
1
, ""~'-----_""l.,'"' .• -.-.. -I:ItI-_--- - -----... "._~------'),
i
j
\ 1 1
1
î i \
1 1
'. ~

(
i .' ~ , ~ y &
? () ~ t. r !
;' ; ~ ~ ,
~:
1 !
170.
Overall, a total of 224 sarnples were analysedfor
two elements (bismuth and lèad) , i.e. 448 analyses were
obtained. Of these 224 samples, 36 of them'were randomly
selected (16% of the total) and analysed a secorid time for 1
the two elements (total of 72 values). Out of these 72
values only 6 (8% of the 72 values) vari~d by more than
±lO% cbmpared to the original values, and variations never ,
exceeded 20%. l 1
Twenty-one randomly selected samples were sent to
the Noranda Researc~ center\ to be analysed for bismuth,
lead and sorne of them also for copper, arsenic and antimony'.
The resu~ts obtained showed that only one 'valué varied by , ~, l ,,'
more than ±lOi compared to the origi,!lal values obtained in
our laboratories.
Analyses of arsenic, antimony and copper were not
inclUded in this evaluation study, since the se elements were
involved in'only a ~ew sarnples. ~'
The foregoing evaluati6n studies PtÔy'i~ confidence \
in th~ accuracy of the results obtained in the present study.
\
J (
- ------.--------------------~ \1
. . 1
i ~
~ j
j
l

(
(
o ~ )
-
, 171.
CHAPT ER VI
DISCUSSION
VI-l. INTRODUCTION
The main objectives undertaken at the begi~ing of
the experimental program were successfu11y achieved. It ~
was shown that bismuth and 1ead could be eliminated from !
copper melts under vacuum and that the main factors èon-
trolling the kinetics of this process could be defined
clearly. Similariy , a sufficient amount of accurate data
were obtained to enable comparisons with previous 1iterature
data avai1~ble on the,vacuum refining of copper. ---0
VI-2. REMOVAL OF BISMUTH AND LEAD
'IVI-2.A Fractional: Factorial Test Design
In the first part of the expe~imental ~ork, a t~o
level fractional factorial test design was used. With the .
supsequent eight,experiments, f~ur variables could be 1 •
screened. Two of these, vacuum pressure and mel t tempera-
ture were identified as being the most significant factors l ' 1
control1ing the overall rate constant for the removal of 1 bismùth and lead from copper melts.
One indication showing the satisfactory use of 1
fractional factorial test design is that the interactions
are small compared to the main effec1s. This can·be clearly
, 1 '-.-""--
" 1
1
! 1
1,'
l , 1
i ,
1 1 i,
l ,

/
f'
1
" 1 , '
" 1 'r . 1
,
/
() /
-----_. __ .
" observed in the re1atively low values for the effects of
AB,CD and AC,BD interactions for both bismuth and lead o
data I(Tables IV-1 and I~-2 in Appendix IV) •
The magnitude of an interaction depends upon thè /'
172.
ranges of the variables selected: as the ranges' a;-e decreased
the interactions become sma1ler cOIl\pared to the main éffects;
and when the reg~on ~to be examined i~ sufficient~y small,
the interactions with -few e~cePtio!1s become' negligib).~ [120] • , 1
As the, range becom~s narrower, the magnitudes of th~
effects becqme smaller, and the ~ore likely are they to be",
masked by experimentai error. The ranges chosen mdst be
such a~ to produce e(fects which are meas1,lrable but not so
large as-..to ,give:rise to appreciable .
! interac;Hons .
--tllis may be one of tlfe r~asons 1 1
why the factors melt
surface area to volume ratio and condenser distance to melt
sur~ace werer found to have linsignificant effect on the rate
of removal of bismuth and lead. The range between the. levels • , 1
seledted for mel t surface. area to volume ra,tio (6. 7 and
10.2 m- l ) were cl~arly not sufficiently different to 'cause o
any significant effects on K in th~ present experimental
equipmerit .. " '1
However, rhigh levels of mel t ,s~rface are a to volume
ratio are hard to achieve in equivalent industrial appli-
lations since melt surface area to volume ratio would be
. l ' , lways Hmi ted to e crucib,le and"1nduction coil d~~nsions.
r', igher mel t s ce area to volume ratios ·can be provideq
1 • 1
\ :
J '
.1

, "
,.
li f. ~
t fe' l, <) f· ,
1 ~ ...
, ,
. ,
(,\
~
•• ,
-_ .......... --...... -.- .' -~ ..
, 1
"
, through by rnixing the mel t wi th, inert gas bl;l.bbling or
through use of a va;cuwn lift refining type of process.
These were bpth considered to be beyond the s'cope of the 1 ,
present work. Hawever, as ment'ioned in Section 1I-4.A,'
Kametani and Yamauchi [29.63-65] cauld not obtain goad '"
impuri ty elimination resul ts wi th vacu\DII lift ,refining
, 173.
· , treatment of blister copper, in Which the melt surface area · "
e to volumè" ratio reaches ,rnuch highe'r values. 4... "i! ~
Similar ta the effect' of \variable m!'i~t: ,su;-face to 0' · the pres.ent s.elect,ian of 1 voltpne ratio~ne co~ld 'say that
\. v r;
the variable c denser distance from the melt surface ae{ , fi·
2 and 65·cm mayl not have been sufficiently di:ffer~nt to
obtain significant effects.
The purpbse of designing the water cooled condenser
and placing i t as clo~e to the melt surface a~r' possible
. ( 1. 5- 2. 0 cm) was to cr~ate a condensation s il1k for the 1
1
.~vaporating molecules, thereby overcoming the gas phase
resistancj! ,and prbviding enhanced .vapo~ization.' Maximum . .
or limi ting evaporation could have been achieved if the '"' i ' " '
condensation ~ink had been located Iwithin tJlé distance of "
Mean free path of. the evaporating atoms. , \
free, 'pa ths' fol," a11 the impuriti~S b~inl considèr~~ we~~ ";,. '
estimated aS
I bein\ Iees than one' centJ!iteter. over "the temper
ature and pressure ranges o~ the present experiments. '{ , "
(~anfree' path vaJ.ues are iriclude? i~ Appendix lI.) - . 1
. Unfortuna tely r there were pr,actical reasons. why the,
cooled condenser cOl,l1d ~ot "be placed w~Jin 1;11is 1 water
" .
1 ~'
-, ·...1...-,-0::--1001· ____ .--. - ---'--"r'"---;. -_ .. l ,.
.' -_. ~_ .. ~,.....-~-- -
'.
1 .
l'
• 1
-.-1.- ,,--
.. 1-1

1 -
1
(-: 1
. ,
~ }
l'} ~
t ! Ct ;,
! t
f ) ~
Il • , l , , ~
f f /'
r
1 r --_ . ....,..:....·--1-._ ... _-
1 1 1 1
, 1
"cri ti cal dis tance" of the m~lt surf aJ~. . Th us, ,sp lashes
from the melt and safety consi~erati9~s concernin~ the
possibility of melting the~ste~l jacket and causing a l, .
water-liquid metal explosion; rrevented closer juxta-
posi tioning. 1
• !
174.
Based on the pres7nt eXter~ments, one can conclude
that when a water cooled conde ser is placed at distances
of 2 cm or more from· the melt urface, it has little effect
on the rate of removal of impuli ties ~ver the range of 1
conditions studied in the pres~nt work.
One other interesting o~servation was .that the analysis i
of the condensat~ samples from:different locations of the 1
vacuum chamber, incl uding the w·ater cooled condenser, showed • 1
1\ .. 1
Ithat the condensate composition\was 'ndependènt of distance \ /
from the melt surface (Table 17). T is rnay be an indication ~
that the whole chamber acts as the c ndensing surface rather
than only those cold surfaces nearby1the melt. • 1 1
It should he clarified at this point that the results
of the fractional factorial test pesign shows that vacuum
pressure'an~ melt temperature hav~'much more effect than \
A/V and condenser distance, but that the latter' do play a
miner roie. \ \.
Actually, ~omparison of the\results of the expe~iments \ Il . ~
. F-7, .F-9'-X, A-2 and F,-lO, F-9 shows Il thEf favorable effects of
having thè condenser. distance rv 2.0 \cm (Table 18) compared
to ,..165 cm. In addition, further evidence was obtained from Co
. )
. ---________ • _r...-__ .. .,. __ . __ ~--' - ~ _......-_-".--------.... __ .~ ... ,

.
( , ~
1 ,
~ J
r ~
,1 ~. t' ,
l ·1 "-
f L , " \. 1
" ,
1 , (
'II!: .... t",,-\;~ • .,tf .,.""" ...... 11(~"""' ........ ,~A'tl. ..... , .. ....,.._._. ............. ""_. -~."" _ .. ~--.." - -_---... .. ~, _~ -J ____ .... __ ~~ ___
" 175.
1"
C. \
\
TABLE 18. Comparison of Results, Showing the Effect of Condenser Distance ~
'1OJ
Cond. 1
Elimination ,% -3 K(lO cm/s) '''Test Press. Temp. A/V Dist. Time
. No. II Hg Oc m-a. cm min. Bi Pb Bi Pb
F-7 -rOO 1250 10.2 2 120 75 85 1.79 , 2.52
F-9-X 100 1250 10.2 65 120 60 77 1.24 1.99
A-2 100 1250 7.1 65 '120 60 75 1.86 2.52 1 '" F-lO, 100 1250 10.2 2 240 89 98 1.62 2.84
F-9 100 1250 10.2 65 240 70 92 0.75 1.63
TABLE 19. Distribution Ratio of Impuri ty Removed ta Condenser
Amount of Distribution Ratio of 0 Test Press. Temp. Condensate Accumulated Impurity ta' Condenser!.
No. II Hg Oc On Condenser gram B1% Pb%
F-2 ,100 1150 53 "-~ 54 55
F-4 300 1250 t3 59 61
F-6 300 1150 34 83 74
F-l02• 100 1250 128 41 52 , '
1. Balance wa~ scattered to chambe'r. surface.
2. Time • 240 minutes.
-~,
1
,1
j 1 f . 1 , 1
1
\

, !
f i r , t
1 •• . '~
(
C) •
... ""-"'---_.--~-----
/
, :1
1 \ 176.
/
the analysis le the condensa te accumulated on the water
cooled condenser (Table 17). Using this data'and the tQtal
arnount oI bis~uth and lead evaporated from copper, distribu-
tian ratio of these'elements settling on the condenser
surface was calcu1ated. Details of these calculations are
included in Appendix V and a summary of the results provided
. in Table 19. / .
It is interesting to note that 40-80%.of the bismuth
or lead evaporated from copper accurnulated,on the water 1
coole,d conde~ser e~en though this did not reflect ~n any
',ignificant changes in ~he rate of mass transport.
The use of a fractional factorial trst design proved
most successful in the present work. Vacuum pressure and
melt temperature were found to be the most significant
factors in comparison to mi1t sUrface area to volume ratio
and conaenser distances.
The results obtalined in Pàrt II, confirmed that the
estimation of mean squar~ (error'variances) from two factor 1
interactions, as weIl as estimated experimental er\rors, had , \
been carried out correctly.
VI-2.B Effects of Pressure and Temperature
Analysing of the effect of pressure/ and ternperature
variations on impuri ty evaporation rates, one can observe, 1
similar changes: For instance, holding 'the pressure constant 1
at 60 llHg <?r ' at' 100 llHg and varying the tempera~e from
llS0°C to 1350°C', values of KB~ and' Kpb in6reased by two to 1
\.
1 •
'1 !
t
1
1
'f
1
1
l

(
,
(
)~ 177.
two and a half times (Figures 35 and 36 and Table 20). "
Sirnilar,ly, on holdi~g the me'l t temperature c~nstant at IISOoe,
1250°C and 1350°C respectively, and varying pressures from
300 ~Hg to 60 ~Hg, overal1 mass transfer coefficients, KBi
and Kpb' were ag~in ~ncreased by two to two and a half times
(Figure 38).
When one considers the effects of pressure and temper~ ,
ature in combination1much improved eliminations are possible.
, " Thus by increasing the melt temperature from IISOoe to 1350 0 e
'nd decreasing the vacuum chamber pressure from 300 ~Hg to
60 ~Hg, the overall mass transfer coeffibient could'be
increased by a ~actor of six for bismuth and eight times for
lead. ...
In"view of the close relationship of KL , KE and KG
with temperature and pressure (Section III-l) this behaviour
rt .' , Il .' , "
1 • 1 c~n be anticipated: Increasing t 7mperature causes ah increase
/
in solute vapour pressure, activity coefficient, diffusivfty
in the liquid and an increase in mean·free path distances in
the gas phase. Similarly, decreasing pressure dauses an
increase in mean free path values "resulting ,.in a decrease
in 'the gas phase's resistance to.evaporating solute molecules.
In Figures 37 and 39, the results for weight percenm
elimination of bismuth and lead at different temperatures
and pressures are pr~sented. The results show increased
eliminatio~s for ternperature changes between 1ISO~e and 1250 0 e • 1
while pressure decreases from 300 ~Hg to 100 ~Hg, than for
,\
, . ,
j i
1 l,

_.tIlZa,.JI JI lB JI .. "$4I&&$E&0;,.' f :'_ .~ ...,.. .. .,.,.."f$<f!M .. ~~ ....... ~..,~~ ........ """""~--._~ ....... 'l~~, ... """I"-~..,.,>"'~-~"'{'~""',..~- __ ~ .. __ ~ ...... __ .".... ___ ..... ~~..... '''_~ __ _
"
•
fi () --- -.......
.:,
TABLE 20. A Summary of Experimenta1,Kinetic Data, Showing the Effect of Me1t Temperature and Vacuum Pr~ssure
Bismuth Lead
Test Press. Temp. ~(lO-3 K(10-3 ~(10-3 ' Ku(10-3 K K(lO-3 ~(10"O"3 ~(10-3 No. l! Hg Oc cm/s) cm/a) cm/a) cm/a) (cm9s) cm/a) cml-a) cm/a)
A-6 60 1150 5;09 1.32 28.44 1.89 631 2.00 47.92 3.54 , ~
A-3 60 1250 7.21 2.76 62.90 4.81 750 4.04 -
97.53 10.i3 '\ ~ \
'>---.-
A-5 / 60 1350 9.78 3.15 125.40 ' 4.84= 391 4.-70 180.99 9.54
A-l 100 1150 5.09 1.05 28.44 1.38 460 1.84 47.92 3.06, \
A-2 100 1250 7.21 1.86 62.90 2.60 406 2.52 97.53 4.04 . A-4 100 1350 9.78 2.33 125.40 3.13 252 3.93 1&0.99 6.81
F-1 300 1150 5.15 0.61 2?44 0.7'1 237 0.71 47.92 0.83
F-8 300 1250 6.59 0.99 62.90 1.19 186 1.66 97.53 2.26
r,
-~---- ~----... ~-".. .... _~ .....-_-~--..-
K (cm1s)
704
1024
536
609
409
383
166
1229 1 ,
"
/
,r-...,
.,. ,
1-' ....., CXI
\
, 1
i

1- -- --- ---
~ ) , .
f - ,'jl~
~ , , . :
t , , t '.
1 r ~
, f , 1 t t \ () f,
• 1.
(
\ !
o
1 «
3.5 ~ E
3.0 u -,., 0 -~
... ~
, $ 2.0 IJ) z o u W ...... «,1.0 Cl::
--' --' <! Cl:: w
-0.5
--_. ----~-- -
BISMUTH
• A-2
~ 0. 0 _1423' 1523 TEMPERATURE, K
\
1623
Figur~ 35. Ove~all rate constant vs. temperature, for oismuth.
, (
f -.~ _ ~ .. ______ .-..1 .. - " ,~ .... -~
179.
\ i r !
1

, ,
1 . i 1
1
!
(l)
" 4.0 E
LEAD
60,ij/ 1
1 1
1 .
1 1 /
1 1 100)4,
1 1
1 A-61
2.0 â
41A-1
'- /
1 .0
1 1
1
,/ /-
Il.AL.3 1
" ,/
"
A.' ..- "","'" A-5
"'" ,/
4 'A-4 '
o.o~~------~------~~ 1423 1523 1623
TEMPERATUREJ
K . 1
Figure 36. Overall rate constant VS~ temperature, for lead •
. .
, - -~. r--..~ ........ ~ ____ -... . .-__ ._,,- .. ~, ..... ___ ..... ~ ____ .," ___ ~-::4'.
.180.
1

f
1 t (. '
,
" t
\ l' 0 , , ~
t , , " ,
t t 1
t , l r , • ( ) 1 i ~ f' t
, 1 I ! i
, '
o
1 1
" --
/
..c a..
... .-al
, ... Z 0 iI=
:.:. <t Z -~ --l W
~ 0 J-
~
100'
90
80
60
40
1
--- ----....--..----- 1 ~ , "
1,\. \ '\1 l' , , \
. 100)..l
Bi 6~f • Pbé.. 60,U.
/l,
1 1
/
------~.6.
Pbl /
1 /
AOPb
•
/
1 1
/
1 1
/ 1
1
1 /
/
,... ... • __ ... -gO.u o
'.
.. .J .. 0
•
1
30~~------~------~ 1423 1523 1623
TEMPERATURE",K
.. ,""of Figure 37. Wt% elimi'lation vs. tempe rature , for bismuth and lead.
1. ,
/ 181.

'0'
\ 1
\Pb , \ ,\t623K
\ , o
\ ........ •
D, Bi
~ c
..... .......... ......,:
t423K 1523K 1623K Bi 0 . ' •.
Pb  '... rO
!
j
- ......... !S23K 1 ....
, ......... . -.... .... ............ .......... -...
,
•
c
O.O'----'--~--------a-----'---' 100 200 3-00 '60
PRESS'URE, )AHg
Figure 38,' Overall rate 'constant vs. pressure, for biamuth and lead,
,,'

"""- .. __ .. _. --
183. ../
('1 G Il
100 1.443K 1523K 1623K
Bi c • • Pb J:::. ... 0 (
90 o.fb - ... , ~ f \\Pb~6023K · i' \ r , f'
.~-.. j' .0
f c.. • "' ... ----~__ 1523K .. . ~:23K -------__ . -
III ----- Â.\
.... , Z b. Pb 1 ~
"":- 0 , · .... ~
..... . ...... 'b. r « , ;~
i ..... ~ Z , · ....- , 1 () '- ,
~ ,
\.{ 50 c Bi ,
'" '" \-
~c .... ,1L.23K ; ....J ~ , • , lJJ .....
~ ..... ! , g
~ , ,
[ ..... 1
0 ..... ..... l- i' \ , t ~ , , ,
- t J> 30 ,
f ..... b.
[J
/ . 20 ./
60 100 200 300 PRESSURE J )JHg
Figure 39. Wt% elimination vs. pressure, for bismuth and lead. . 1
• ()

... "
(
!
, .
184.
temperafbre increases between 1250°C and l350°C and pre~sure
decreaaes bétween 100 ~Hg and 60 ~Hg.
VI-2.-C Processing Time and Reproducibiiity
By doubling'the time from 120 min. to 240 min. in
three experiments bismuth and 1ead concentrations could both
tle sïgnificant1y reduced below the 0.010%' level (Tables 12
and 1'3). • l ' It was observed in these exper~ments that the overall
mass transfer' coefficient for both bismuth a~d lead appeared .
to decrease somewhat during the second 120 minute time
interval. In Table Il, a comparison of the results for
experiments F-9-X to F-9, F-71o F-lO and A-7-X to A-7
clearly indicates such a behaviour. , . \
, (
This suggests that there may indeed be a so c'alled
"critical level of concentration of, impurities:' for optimum
rates bf removal. The level in the present study would' be
around 100 ppm.-
Duplication of three p8hdomly selected experiments "" ' confirmed the reproducibi1ity of the' results presented
\ (Table 1~).
VI-3. REMOVAL OF ARSENIC
In two experiments (A-8 ~
and 190'~Hg vacuum pressure, no elimination ei ther arsenic
or antimony was obtained followi~g 120 minut s of treatment
-(Table 16). _ The explanation for this probably lies in their .JI
1 1 ,
1
\ \
!
J
/
i l,

Cl
()
, ). extremely low activ:lty' coefficients in molten copper
-6 -2 ' (yo AS '" 10 and Y~b = 2.2 x 10 at 1573°C, Appendix I) •
.. , ConsequeThtly, even though theirvapour pressures are high,
(PO Sb '" 2.74 Imt). Hg, P"AS a 6 X '10 5 nnn Fig at 1573 K, T
Appendix I) their overall potential for evaporation 1s low.
From the data. ,provide? in Appendix l, evaporat1on
mass otransfer poefficients were estimated fo~ ars~nic and /
antimony by using Eqpations 20 and 39. The results were:
KE
.. 8 • 29 x 10- 4 cml s a t 1573 K As
KE
.. 6.53 x ,10- 5 cmls at 1573 K Sb
185.
1·
r 1· 1
ï ",,'
1
1
K .. 6.40 x 10- 8 cml s a t T5"'-7.:r3~K;r====-~~==-=-=-========r ESb
2 ~
The'se values are general1y more an 100 times 1ess
than K and K at similar temperatu es. ESi Epb
In t,he two experiments the rdtes
and lead remained very simi1ar to those
remova1 of bismuth
tained in earlier
experiments (Ta,.ble 15)., confirming that a y solu.te inter-
actions between bismuth, lead, arsenic ant~mony cou1d be ,
discounted over the typical industtial es studied.
VI-4. INFLUENCE OF THE PRESENCE XYGEN AND o
SULPHUR IN THE SYSTEM
i ~ 1
In the entire ,experimental work, oxYgen and sulphur
levels were Idwer than O. OÔl% in the coppet" prior to melUng
and the me1t surface, stayed perfjftlY clean and·clear during
v
1 , \

{ ~. 1
l
1
f' ' ~ ...... __ """'""" "", 'l"'- ... ~'~' ~
186.
(
()
the experiments.' Thus, ,the lowest vacuum p;-.es,sure optained \
was always in the range 40-1~0 llHg while runni~g the pumping
system ai~fù11 capacity .(as exp1ained in the previo?s , "'-,
sections, charniJer pressures of 6'0 ~ 100 and 300 ~Hg were
maintained by leaking nitrogen gas into the vacuum charnber).
Assuming that i t was all, ail," then ~ the partial presS'ûre of o '
oxygen in the system (21% oxygen in air) was only 11110 llHg
at aU times. 1
Thermodynarnic calculations were carried out in 'order . .
to estimate the stability of the common oxides of the elements
which are beihg considered, i.e. copper, bismuth,lead,
arsenic and antimony-,,_ The F.A.C.T. sy.stem taciHty of
McGi11 University [123] was. utilized for this purpose.
Tw~ different approaches were used in the calculations
for forming" 1iquid metal oxides from ei ther liquid or gaseous .
metal molecules wi th oxygen.
j:l) Assuming an extreme case of 500 llHg chamber pressure ,
(P 0 • 100 llHg) the equilibrium températures were" estimated °2
(Table 2l-a). , b) At three different temperOatures ,,(1423 K, 1523 K
and 1623 K) equilibrium pàrtial pressures ,of oxygen were ~
"1 estimated (Table 2l-b). /
" In bQth 'càses i t was ,assumeB tha t acti vi ty of copper
'. '. f b' (j th 0 001 d th ',.. was' 1.0, the act~vlty 0 ~smu was·., an e actlVl.t~es . of, lead', arsenic and antimony were 0.004 (again éxtl;'eine
cases were selected).
----------' .... il . ~ ---------»- ---
( 1
1 1 1 , ,
'0':

Q
l'
'.
Cl ,.
)
1· "
TABLE \ 21-a. 'Est1mat~d Equil1brium Temperatures at which Metal Orides would Forml .. 2.
Temperature, K
Element For Liquid Metal For Metal Vapour
oCu- 1139
B1 \ 938.8 1043.1 • , Pb 1000.1 1091.3
As ( 3.
1410.3
1
Sb 1339.1 1384.5
1. Activities of the elements were aaaumed to be:
a Cu - 1.0, aB! - 0.001, ~Pb" aAs '" a Sb ,"" 0.004
Chamber pressure - 500 llHg, P .. 100 llHg O2
2. ~ + t>2~ MnOm(l) or.nM(g) + ~(g)--'~Om(l) There,ia no data available for forming gaseous metal oxides.
3. There la no data avai1able.
-~
\
::"1"
..
187.

C \ ,
~; ~,
IL li , J 't 5. , ,', ~
~ ,: :t
li f, ~ t ,.
! ~, k
t >.
f, t ~ '1: ~
(l ~ ,>
f. t
i t !, "----
, .
!
'------
__ . ______ .. lJ
Il
'\
TABLE 2:l-b. Estimated Eqùilibrium Oxygen Pressures at which Metal Oxides would Forml.,2. (for certain melt temperatures)
Minimum chamber pressure for oxide formation. mm Hg r"
1 1423 K 1523 K 1623 K J
1 •
Element Liquid Metal Liquid Metal Liquid \ ~etal Metal Vapour Metal Vapour ~ Metal Vapour
,
Cu 0.018 - 0.073 - 0.249 --
Bi 36.7 17.3 187.7 64.0 775.2. 199.1
Pb 40.'4 14.0 302.5 5'3.6 1740.4 172.5 ,
,
As - 0.014 - 0.090 - 0.454 ,
Sb 0.001 0.023 0.007 0.137 \
1. Aetivities of the elements were assumed to be:
aCu • 1.0, aBi - 0.001, apb ~ aAs
= a Sb a 0.004.
1 m. m 1 2. ~+202")"MnOm(l) or nM(gr+20(g)~MnOm(1).
0.061 0.646
.
!pere 1 i9 no data available for the formation of gaseou9 metal oxldes \
3. There 19 no data available. , .
'. .. -9
J /
' . \
(f
----.--------------
188.
'.
\
1 , f
1 , , , !
1 !
1 1
! 1
1 ! 1 J

r
( - )
.)
"
189.
, ,
The first set of calculations indicate that at the
temperatures at which the experiments were carried out, it
was rot possible to forrn the metal oxides of any of the
e1ements being considered (Table ?l-a) before or during the
evaporhtion, of the element~being considered.
However, equilibrium temperatures for the forrna~ion
of oxides of both arsenic and antimony (1410 K for arsenic 1
and 1385 K for antimony) were much c1oserlto the lowest
melt temperatur~ (1423 K) maintained during the experiments 1 f,j
than bismuth (1043 ~), 1ead (1091 K) and copper (1139 K). , , \
Similarly, in} the second set of calc,ulations for;
bismuth a~d 1ead the estimated equilibrium oxygen pressures
weremuch higher than the oxygen partial pressures maimtained Il 1
'J t'~
'in the experiments, while for arsenic, antimony and copper ill
equi1ibrium oxygen pressures were closer ~o the oxygen , 1
pressures (Table 2l-b) maintained during the exper~ent:s.-
O~ the basis of these thermodynarnic studies one ,can
conc1ude that in the experiments concerning the elimination i
of bismuth and lead from copper there was no possibility of
metal oxide formation before or during the evaporation of
the elements. One can therefore conclude that there wals - - 1
effect of oxygen on the r:esul ts obtained. However, thi's
not be the case with arsenic ahd antimony. 1 •
no
may
. These results a}so show that métal oxides would ~orm
either after,evaporated metal rnolecules condense and dUring
·cooling do~n o~ the particles or after the experiment was l ,
1
completed and ,air was let into the vacuum chamber. 1
"
1 î ' j j
1
: \

,
'. 1 ~>
. ), r t,
(1
, t !
, 1
i t ,
t QI
(J
/' '
1
190. /
'" There was no possibili~y of sulphur contamination
" in the system.
Consequently, the effects of oxygen and sulphur
presence are considered to be neqligible in the present \'
work, except in their influence on the precipitation of
bismuth and lead oxide condensates adjacent ta' the cooler
sidewalls of the charnber\.
Computer print-outs of the c~culations are included
in Appendix VII.
VI-5. AN~YSIS OF CONDENSATE AND COPPER LOSSES
Condensate sarnples collected from the chamber surface
were in the farrn of a bllêk powdSr of bismuth and lead ,
oxides .. On the basis of thermodynamic calcu~ations de~ling
with the stability of these dxides, it was deduced that
these particles precipitated in the' gas phase, away from
the melt surface, at temperatures significahtly below the
tempera,ture of the copper malts (Tables 2l-a and 2l-b).
Furthermore, at the partial pressures of oxygen and at the , ~
melt ternperatures maintained during the experiments stable - Il t
oxide phases of these three elements could not exist in
either the liquid or gaseous forrn.
Analysis of the condensate showed that finè, micron
sized oxide particles of bismuth and lead were scattered ,
throughout 'the vacuum chamber (Figure 33 and Tables 17 and 19) , \
and on the crucible sidewall above the melt (Figure 34-a, 34-b).
, , /
1
, ! ) {
t

,
1 1 t j
, ,
!
f ' t
(-
C
.r;;
(1
-l"~.........----
/
_ ~,.. ~""_"""Ji"'f'_"'-)."_'''.' __ '''''''''' -~_ ... .,. ..........
191. '
These indicate that evaporated Molecules travel random distances
until on arriving at cold surfaces they begin to collect. This
May be an explanation again as to why, in small scale system, (
eliminations were found to be significantly higher than in
our large pilot sçale system. Thus, since metallic vapour
has to travel longer distances in larger scale systems, the
probability of recondensation of evaporat~d elements at the
melt surface is relatively higher than precipitation of
adjacent cold surfaces.
~he observation of high levels of bismuth and lead
(>1.0 wt.%) on the crucible surface présents a technological
problem. Thus, when one finishes refining,. and starts pouring
the melt into a ladle or mold, it will be possible to recon-\
taminate the copper with this accumulated condensate' on the ,,-v
crucible surface. ~.
" , Copper leyels in the condensate were generally low
(Table 17). This i9 consistent with the difference in weight
of oopper before and after the experiments which was always 1
less than 1% of the initial weight of coppèr. Less than 1%
copper loss included splashes which océurred during samplings 1
- and after the experiment was completed during casting the , "" , 1)1 '\
molten copper intb the molds. The weight of copper lost ,
to the condensate and percentages are reported in Apperidi:x: V,
-Table V-3.
Considerably lower vapour pressure of copper (Appendix l') , ,
within the \ tempera ture range of 1150-1350°C accounts for these
. \ ), ------~- ----~- -.--- " - - --- ----- ')
'l
1

1 r
, f 1
, . \ . t f ,
192.
low losses. , . Assum~ng a maximum rate of evaporation (Equation
. -1S), the weight of copper evaporàting in 120 minutes would be
" no more than 34-193 and 887 grams at temperatures of 11~0-1250
/
and 1350°C respectively. Thi~ represents 0.1, 0.6 and 2.6% '/
of the 34 kg initial charge of copper(. It also indicates .
that copper los ses should be comparatively' low for industria1 J
vacuum refininq proeesses. , <li
'Knowinq the maximum amount of copper that would be
transferred tp condensate within 120 minutes and hss~ing a
typical average of 70% by weight eliminat~on for bismuth and
1ead with the starting concentrations of 0.1% and 0.4%
respectively, the pe'rcent composition of the condensate can
be predicted as 'fo11ows:
" 'llSOoÇ J,250°C 13S0°C
\ , 1
Bi 16 8 2
Pb 62 30 9
Cu 22 62 -89
" Since.the maximpm rate of evapo~ation is assumed for
! 4.:-
copper thl<s wquld represen t the Most extreme case. AIso;
from 'the t~me OOpper charges were molten until the first ;
samp1e was taken there was usually a 30-60 minute time gap.
This was needed to adjus~ the melt temperature and chamber
pressure levelà -to the desired values. Naturally, evaporation
of the impurities and of copper took place, during this time
gap during which it was not possible to measure their rates.
Therefore, comparison,of predicted condensate compositions with
experimenta1 resu1ts is somewhat suspect.

(
) .
VI-6. KINETIC STUDIES
,1 &
As no elimination of arsenic and antimony'could be ' \
detected, kinetic studi~s cqncentr~ted only 9n bismuth and
(le~d impurities in copper.
Experimental result~ showed that the elimination of
193.
both bismuth and lead by vacuum induction me1ting followed
first order kinetics over the whoie range of conditions studied.
- For the linea~relatiônships ,fitted." the logarithms of the
relative changes in concentrations of bismuth and lead with
time, the lowest correlation coeffici~nts obtained wére 0.940
for bismuth and 0.927 for 1ead out of a total of 2d independent
experiments.
The conclusion is in. partial accord with the resultsj
obta-ined by Ohno[49.50] who~ at pressure below 10 UHg , found
that the removal of bismuth obeyed first order kinetics while
lead did not. The result~ of Bryan et al.[S3] indicated that
bismuth only obeyed first order kinetics at Pfessures above
200· UHg, while below that pressure, the rate of removal of
bismuth deviated from first order kinetics.
In aIl the present experiments, the overall rate constant
for lead was found to be higher th"tn that of bismuth. This
observation can be attributed to a two tirnes higher activity
coefficient of le~d as compared to bismuth in copper, together
with a vapour pressure of bismuth only'about 1.4 times that
of lead (Appendix I).
"
! .:
j
1 1
l

, .
( 1
t L
Cf
, .. ""j '"' .......
194.
,
The overall rate constant, together witp component
coefficients for the liquid, interface and gas'phase (K~,
~ and KG,KU l have been plotted versus temperature (OCl for
two different leveis ~f pressure (Figures 40-a and 40-bl .
The estimated values of the coefficients for both bismuth
and lead were always in the following order of magnitude: . \
K. < Ku < KL < 'KE < ~
This order shows that both bismuth and aead elimination
rates were generally controlled by the term, Ku" containing l '
th~ gas phase mass transfer coefficient. Figure 40 also shows i'
"-that there is a tendency towards mixed control (i.e. liquid
plus gas) as malt temperature was increased'and p~essure
decreased. This tendency was stronger for. lead than bismuth.
By using Equation 39, evaporation mass transfer
coefficients, RE. ~~
, were estimated for ,diatomic bismuth , m01ecu1es (Append~x l, Table I-l). They were always ,much
lower than evaporation mass transfer coeÎficients (~.) for . 1
monoatomic bismuth m01eéules (350 and 610 times 10wer at
1150~C and 1350°C(respective·ly). Therefore, it was decided
to ignore the ~vaporation of diatomi~ species and base
estirnati,ons only on ~,' for monoatomib bismûth meta1 vapour. ~
Due to lack of experimental data on the diffusivity of
bismuth, and lead in liquid copper, 1iquid phase mass transfer
coefficient Ri va~ues had ta be estirnated based on assumptions
concerning 0 and 6E (see Appendix III). In view of these
uncertainties, numerically equiva1ent values both
, bismuth and lead were ~ed in the analysis.
" ~ 1
-'

, 1
, 1
1 \ ( , '
, li'
, t ~
t ,
/ ?
~ f' 1 (,1 , \
~i
t li )
t l , 1 l i
. - ~ -------- ----~ -,
J ."
195. \ ,\,
... ...J ~
... W ~
1.0 --------------------~ooo 'BISMUTH ----~--~~
KG -- ...... , -------100,u ' .........
,0 / 1
o. 001 ----~-----"--------"'---' 1423 1523 1623
1EMPERÀTURE, K
1 100
10,
,.
Figure 40-a. Mass transport coefficients vs. temperature, at pressures of 100 and 60 UHg, for bismuth.
1 J __ ~ ___ _ _______ , ___ 0-
,
U1
E' U
'--' ::x:
,
, 1
"
"
, ,
1
1
'. "
, 1 1

~ > 1
i (,
•
f "
196.
7" (, / (. "
/ tO
----_.,,-----~ -J'
-~ -------

t
1 f (!' t '~
~
" ~ J ~ !
1 i r " 1 ~ f ~ f f
·f
In order to demonstrate the sensitivity of Ki to
cijanges in the activation energy .for diffusion, ~E was
decreased by 50% to 15,000 cal/mole and values of ,D and KL
197.
l l d h l . d' \. 41 h reca cu ate. T e resu ts are summar1ze 1n,F1gure , were
changes in the values of KL with temperature are shawn for
~E .. 15 and 30 Kca1s/mole respectively. . Comparison of the two sets of va~ues for, KL shows that
a 50% decrease in 6E co~ld result in a 50% decr~se in the ,
vaLue of KL at high melt temperatures of l650°C. With such
uncertainty, a distinction between the probability of gas and
liquid pha~es transport control becomes questionable. Over
the lower tempe rature ranges of the present experiments, such \ . .
uncertainties in 6E are considered less Qritical in considering
rate controlling steps and concluding that kinetics were , dominatedby, transfer through the gas phase.
Values for the evaporation mass transfer coeffièient,
KE, were also extrapolated up to l650°C using the data in
Appendix l. For bismuth and lead, the results are summarized c
in Figure 42.
As mentioned in Chapter III, section 1, values for ,Ku r
were deduced from Equation 31 and values for KG then determined «
by Equation 28.
By using the present data ob~ained for KU at 100 and ,
60 ~Hg.charnber presaures and 1150, 1250 and l350°C melt
temperatures (Table 20), a two variable linear equation was
determined through regression analysis for bath bismuth and j
'.

~ r !
{
C'
19'8.
t- Vl 22 0::,
20 ~E li) '<.J 18 . 'z_ -«('Il 16 1 cr; 0 1-- __
14 (J')-1
li) 12 « ..J ~~ 10 ... lJ.J t-_ lf)Z «W 8 ::r:-a..~ 6 OLL _LL. 4
o ::::> ~ 2 00 -u ...J 0
l, 1423 1523 1623 1723 11823 19~3 0
TEMPERATURE1 K /'
Figure 41. Liquid phase mass transport coefficient vs. temperature, for tWQ leve1s of activaqion energy, 6E
.~
,. ... ____ ----~--~-- __ r ___ •• _ _ ._ •• -.-........-,.".-___ _ - --- - --.-,---,---'-"------- -
,)
1 , t 1
j --
r i "1
1
/
- ---...

o
~'1
._--------" -
1
O.8~----------------~------
..... a: o a.. 0.6 lJ')U1 z, ~ E ~ u 0.5
w l.f),~
li) " ~ ~ 0.4
w z-~ ~ 0.3 t- LL « w -ê5002" a.. ~ . « > w, 0.1
0.0 1423 1523 1623 1723 ,1823 T EM P'ERATUR'E 1 K '
1923
199.
tiguTe 42. EvapoTation mass transfer coefficient vs. temperatuTe. for bismuth and lead. "
- '-
, .
G'.
/ 1
"-1
1
1
1 ~ 1
1
l
-----,_ .. _._ ... _ ... -. _.".-. _ .. ~q.--- ,------ ----_._-------

c
C ,J
•
200.
and 1ead. The equations are: {, 1
~_ = (-14.526 + Il.75 x lO-3T + 221 l/p) x 10-3 (40) -UBi
Corr. Coeff ... ,q.910
IL '. '(-30.50 +.24.38 x 10-3T + 466 l/p) x 10-3 -Upb ' . \
( 41)
Corr. Coeff. = 0.915 • COmbi~ing these KU equatio.ns with those fo+" ~ and ~,
the ov,erall. rate constant, K, could then,be "predicted" as à
function of chamber pressure and me1t.temperature. S~ilarly
extrapolating the above equations, ~ and .KG cou1d be , estimated for temperatures of 1450, 1550 and 165~oC and
pressures of 40 and 20 ~Hg. The results obt~ined are given
in Tables 22 and 23 an~ Figures 43-46.
For comp,arisen t F~ure's 43 and Ù' include
Ku at pressure 1eve1s of 300, 100 and
experimenta1
values of
resp,ecti vely .
. Using value~ for Ku (as calculated fram Equatjjons 40
and 41) , and those for ~ and Il:, values of the overàli rate
,constant K could be' predicted over the temperature range
lls·aoc to i650°C for both bismuth and 1ead at pressure. levels o ,.
of 300, 100, 60, 40 and 20 ~Hg. The resu1ts are listed in
Tables 22 and 23 and plotted against t~~perature in Figures\
47 and 48.
~xt~apolated.predictions suggest that at 11SO°C,
d~creasing the pressure fr~m' 100 ~Hg to 20 UHg cbuld increase'
\ ..
,
)'

.1..'
i
1 ! 1 i
'"
g7 SMt Si Ù5 UdU;. tCA6!4 .b.... ~--~ __ ·.,.~"~ ____ /~....-""·.,."......."'~-~ .. ~"-' ~---,-... <-r __
o ;/ ,..-...
~
c
"
./
"
TABLE 22. Pred'1cted Mass Trausfer Coefficients for Bisllluth o
300 IJ 100 IJ
....
' ...
/
60 \.1 40 jJ
0..
,.-,
20 jJ
IV o ....
i -1
t
, 1
! \ 1
J ;
~~ ....... --~""~~-_."<"> -''''''''' ~ ......... --... ...,. ~'~"'''''''IlPc_tii''''''''''';'''''''_'''''_-----------------

SU a~t; Z:;;:Q!~;::; 4,.q*.i'4t&,,;:wzn:-'~F4::;::Q!!R4JW4AU.~&fjqQ$Dt&41 Ib- ;o;a;:;.:;t;~JO""-"';~~~'"'f ~"""f'~~ ..... ~.,...:t • .,..~'- ~-t.~~ ... _~_--. ... """"" '"C'<!~~~"'~"""'''' __ ~''''~''''''_~''"f~_~'..::_ .. ", .• -... ",~"""p~",,-~. - - ~ ~""""'~~"'''''~--..-.. _~ .. _ ... ~_
\ - !
1 ,
\ 1 d , i 1 !/ ~ i 1 1
l ,
1 , l
J
i
i I-
I
1
j-,-
1
<
I~
tABLE 23. Predicted Mass Transfer Coefficients for Lead
---------
300 p 100 p
Teap ~(10-3 ~(10-3 !Cu (10-3 Kc K{10- 3 Ku (10- 3
Kc Oc cals) cals) cals) (cals) =/s) =/s) (cm/s) Q
Ü50 5.09 47.9 -0.91 :.. 2.2tf 437
1250 7.21 97.5 1.53 155 1.25 4.64 469 ~o -135.0 9.78 181.0 3.97 223 2.78 7.07 397
1450 12.80 31.1..6 6.40 216 4.21 9.51 320
1550 16.28 503.9 8.84 189 5.66 11.95 256
1650 20.19 769.1 11.28 163 7.17 14.39 207
~ ,
J~, ç!
o '
/
60 p
K{10-3 Ki!Cl.O- 3 Kc; K{10-3 Ku (10-3
cm/s) cm/s) (cm/s) cm/s) cm/s)
1.49 5.31 1055 2-:47 9.19
2.74 - 7.75 783 3.60 11.63
4.01 1{).18 572 4.85 14.06
5.36 12.62 425 6.23 16.50
6.80 15.06 322 7.70 .1g:-94
8.31 17.50 ;. 252 9.26 21. 38 -~
------J- -~---
40 p
Kc; K(10- 3 Ku (10-3
(cm/s) cm/s) cm/s) •
1826 ].07 20.84
1175 4.26 23.28
790 5.59 25.71
556- 7.05 28.15
405 8.61 30.59
308 10.25 3].0]
;;
'/
20 P
(c~s) 4141
235]
1444
948 "
655
476
~,
/""""'\,
- K(lo-3 cm/s)
3.77
5.21
6.82
8.56
10.41
U:33
IV o ....
- ---- .~,- ----'--

f l t, ~'
t j' e ~
, '
~ 1~
" t
"" , r "
,-'c, l' '\
b
( , , " f #
" i • , , ~ ! ~ r " r • ;
1 '.
•
~ N~ • ~ • _ ~ ~ ~ ~~ .... " ...... - ' -~ -
• 203.
.'
BISMUTH
- - - EXPERIMENTAL EMPIRICAL
1
1 "
\ " V)
........
E u
J --. ("')
0 --:::> ~
, 1
1
0.0 \ 1423 1523 . 162'3 1723 1823 -1923-
TEMPERATURç:, K 1
Figure .43. '~vs. temperature, ,at different chamber pressures, for
\\ bismuth.
, • • '1 . --~ -------~ .. _-
,
i 1 1 1 1 1 l f
" 1 1 r,
1 i ~
1 i ,
, ) 1 i
, i . , ! , 1 r
l 1
\,

, \ ,
1
1·
\ . ,
! '
1
! l ~ , t t
204.
( 36.0,.....-------:----------
LEAD
-- - EXPERIMENTAL --EMPIR'ICAl
"
u ,'--M
o --
• 1
1923
Figure 44. ~ vs. tempe1:'ature, at differentl' chamber preseures. for lead.
, /" ---~--- -- \. --\
\ . , "'-,
\ 1 • ~
j 1 f
1 1
j ~ î f 1 1 1 1
1.

\ 1
c
(
205.
'3600~----------~
1-0: o Q.V) Vl""zE <{U cr: l:> r- ~ . 2000 Vl ...
~~ ~~ UJ~ V)I.J... « lL.l :cw 0.:.0
u (J')
~
BISMUTH
\
o~----~--~--~--~----~ 1423 1523 1623 1723 1823 1923
TEM PERATURE, K
. ,
Figure 45. Predicted gas phase mass transport cbefficient vs. temperature, at different èhamber press~res, for bismuth.
1 /
-------~-/
1
1
: '

206.
4500------------------------
LEAD
" "
J-o:: 0 0-li) Z « , 0:: ..... Vl lJ) ..... '" <cZ ~W
('1 WU \1)-
«~ l wl 0..0 lf)u
« \.!:)
Ol~--------------~--------.-~ '1423 1523 1623 1723 -1'823 1923
l ' TEMPERATURE 1 K
, Fi'gure 46. Predicted gas phase mass transport coefficie~t vs. tempe rature , at different chamber pressures" for lead.
1-------1- •
'---"'-_'_" ,_J..It.oo-- __ 1.
i \
1 l '

"
... -\--207.
~ 10.0---I----oi-------E u -("') o
... ...... Z ~ V) Z o u
...J
...J « a:: w
\~
BISMUTH
0.0'---14-'-2-3 - 15...L-2-3 -, 1-,6"-2 3-1.....,j721--3- 18-""2-' 3-19 ..... 2-3.;;;..J/
TEM PERÀTURE, K
.. Figure 47. Predi~ted overall rate constant vs. temperature, at different
chamber pressures, for bismuth.
.( 1
l
l c ,
~ ! }
, l

(
-C"'1
0 ..- 10.0 -~
" ,a:-z <! t-V)
( z 0 u w
t \ ..... , <!
c:: ...J ...J «
1 0:: 1 w ! > • L 0
0_0
Cl Figure 48.
. .
208.
LEAD'
1423 1523 1623 1723 1823 1923 TEMPERATURE, K
, 1 ,
Predicted ove raIl rate constant vs. temperature, at different challlber pressures, for lead •
- ----,..--,-.----- ,~
1
\ 1 f 1 1
. , 1 -1
l f 1 1

1 i f, ; 1 l 1
(
209.
, KBi by 3.3 tiÎnes and ~b 2.5 times. By comparison 1 at 100 II Hg,
increasing t~e temperature from 1150 Oc to 16500l
C should increase
both REi and Kpb by 5.6 times, whi~e the increase is on1y 2.9
times fo~ ~i and 3.3 times for Kpb at 20 \.l Hg. By imcreasing
the temperature from 1150 to 1650 and decreasing the pressure
from 1~0 1l Hg to 20 \.l Hg 1 i t _is predicted that KBi and Kpb
should increase by 9.4 and 8.3 times respective1y. This would
'\ mean the level ~f weight percent elimin'7tioj tha~ cou1d be
'Iobtained for bismuth and lead at l150°C and 100 Il Hg in 120 ,
minutes ,should be obtained within 13-15 minutes at l650°C and
,20 II Hg.
Based on ~e experimenta1 resu1ts obtained at-lOO and
60 1l Hg chamber pressures and 1150, 1250 and 1350°C melt
temperatures for overall rate constant, K, (Table 20) a two
variab1e-temperature and pressure-linear equation was a1so
determined for both bismuth and 1ead through regression
analysis as follows:
KBi
- (-8.96'1 + 7.78 x lO~3 T + 99.5 l/p) x 10-3 (42)
Corto Coeff. • 0.958
Kpb - (-13,.43' + 11.98 .\ 10-3 T + 122.5 l/p) x 10-3 (43)
Corr'. Coeff. • O. 959-~
Wi th these equations i t is again possible to extra-
polate the values of K llP to l650°C and decre~sing the
pressure to 40 and 20 ,\.l ;Hg. The results are summarized in
'fable 24 and in F.igures 49" and 50 for bismuth and 1ead " ~
'. -respectively. In Figures 4"9 .and 50 experimenta1 K values
we,re alsQ plotted against tempèrature at 300, 100 and 60 Il Hg.
o
... _-..r __ Q.<t~_ .. ~ __ --- -.
1 ! 1 1
1

~
"
( ~,
l • f,
~ ,
i· i, ~
1 ~ i'l ., fi ~ ~ f
1
~, j
r
-, ,. ('. J
.' f
, ;
t
1
1
. ()
210.
(
TABLE 24. Extrapolation of Ove~all Elqlerimental ,Rate Constant for Bismuth and Lead 1 .
Bismuth Lead
K(10-3cm/s) K(10-3 cm/ s). Temp.
Oc 300l-! 10ÜlJ 60J,l 40l-! 20ll 30{}lJ lO{}lJ 6011 4011 2011
1150 0.31 q.98 1.64 2.47 4.96 0.76 1.57 2.39 3.41 .6.47
1250 l.O9- 1 1.75 2.42 /.25 5.73 1.95 2.77 3.59 4.61 7.67
1350 1.87 &53 3.19 4.02 6.51. 3.15 3.97 4.79 5.81 8.87
1450 .2.65 3.31 3.97 4.80 7.29 4.35 5.17 5.98 7.00 10.07
1550 . 3.42 4.09 4.75 5.58 8.07 5.55 6.36 7.18 8.20 11.26
1650 4.20 4.87 5.53 6.36 8.85 6.75 7.56 8.38 9.40' 12.41
Î
, 1
'. -~
1 .,
i \ ~ j ,
1 ; l
. \ i

,J - __ ~_ ............ -I"'''''''", • - ~ -......... ~-~- "
1 1 ,
21l. 1
1 1 ,
( 0 '
~~tl
9.0 BJSMBTH
1 / r
1· V) - - - EX PER 1 MENT AL ,
"'- E'XTRAPOLATE D E i u -1 ~ i
1 _ M j
0 1 --::::c ...
l- i z .\ <{ 1- . l- r U1 1 Z 1
j
0 ,1 l
U 1
( W 1-« ~
-1 -l, <{ a::: w > ,
0 ;, ~ ; 1
/ ,
1
" 1
0.0 1423" 1
" 1 , '
1523 1623 1723 18 3 ,
TEM PERATURE}
. . Figure 49. Extrapolated overall rate constant vs. temperat re,
different'chamber pressures, for bismuth.
/

!' .
(
.
,.-
,,'
(: '" r ' \
\' ~
r
1 f r-1
F ,~
t ! i
-- .--... """',... ... -........ _. __ ... "' .. "' ....... -
212.
/
Ul 14.0 "". ,
E LEAD u
--. -...,- EXPERIMENTAL M
"" 0 EXTRAPOLATED -"'-~ <;)
.. r--2 « 1-lf)
z 0 U
lLJ l-« c:t:
-.J -.J « c::~
lLJ > 0 0.0
1423 1523 1623 1723 182.3 1923 TEM PERATURE, K
\/ ,
-Figure 50. ~trapolated overall rate constant vs. temperature, at different
chamber pressures, for le ad .
~
,/
., - ~ ... ,----' ..... --. ~'fI/'l5I' .... "' ........ , .. ...,.-.~ ......... ---~--- l
,..
"
~
J 1 i
~ . F
î ~ 1 1 !
J i
" ,
. ,
, .' l-1

(
"'
, "
~-----
213.
Overall rate constants obtained from linear equations
(Equations 42 and 43) are in good,agreement with the values
p;t'edicted from Ki, -~ and ~ on the semi empirical basis 1
previouslr described for both bismuth and'lead. Both sets of
values are also in excellent agreement with the 'experimental
results, as shown i~ Table 25. 1
1
Of these two sets of correlations, it was decided to
select EqUatiohs 42 and 43 as most appropriate to the prese~t work since the~ were dinectly relat~d with the experimental
results.' \
As imPlie4 in the previous discussion, it was expected
and supposed lat tJ:le gas phase mass transport coef.ficient,
proportf.onal to chamber pres sure [ 47: 48 ] in
line with equiv leny-v~riations' in gas dllffusivities with
In pres~nt work this could not be demonstrated , 1
,clearly 'as ,the <rhamber presSure could not be reduced to the 1
l jlHg range. Similarly, insufficient knowledge of transport , '
0,
in the gas phase, 'and the raIe of trace amounts of oxygen
precluded, the qu~nti tative prediction of gas phase mass transfer 1
coefficients. 0 .. .". 0 1
1 ~
Other considerat!ons:
As { mention" in Ch~Pter III, in the present study, the
possible eff~cts If gases present in ~e gas phase, of surface
active elements w ich may be present at the interface, 0 heat " .J
transfer on the c ndenser, surface and finally rate were ,
1
1 , 1
1
! 1
t l i

f
, 1 j
! , 1
1
f,
o
o
~ b
Co
..... ~ ........... "...". '" "'--:;:r ~ ...... ..-~--. ~~~~",-~ __ -~_0, .. "~"'~"'''''~'''''' -'r~""
-. " .-.... '-/ "
-" ~- ~
TABLE 25. • -3 Compari,Ef,on of Experimenta1 Resu1t:s vith "Predicted" Ov~.!~_ Rate Constants, K(10 cm/s)
, -3 K(10 cm/s)
BISMUTH 'LEAn
"Predicted" "
"Predicted Press. _Temp. Experi~enta1 , trom Kz.. KE Best Experimental from \l~ Beat
}.lBg oC Results and K 1- F1tted2 • Resu1ts and • Fitted~' C il
" '-
60 1150 1.32 1.65 . 1.64 2.00 2.47 2.39
60 1250 2.76. 2 • .41 2.42 4.04 3.60 3.59
60 1350 3.15 ~
3.23 . 3.19 4.70 - 4.85 4.79
100 1150 l.OS 0.93 0.98 1.84 1.49 . 1.57, , (
100 1250 1.86 1.'13 1. 75 2.54 2.74 2.77
10'0 1350 2.33 2.55 2.53 3.93 4.01 3.97
1. As calculated trom' Equations 40 and 41.
2. As calcu1ated from Equ~tlons 4~ and 43.
'"
.,
----
"\
"
"f "
_ ?« $11 ~-- __ ~~_" __________ ''''''~_~_V ~~-- - ~ , ---~~~~ .... --- _ ..... _~~ ... _~~ .. _~ ~ .. ~.......--------
... .,/
"' .... ~ ;:,'
..--....,
to..l .... "'"
•
1 -j
l l
1 r-I 1 1. r, i

, .. i 1
d 1
, r
• , \
~ f '.
! ,
-f 1 1 1
(
i (\ " !
, "
215.
, not determined. These etfects, whether or not important, were
incorporated in the values of Ku' this being èalc~lated from
the differen<?"e of K and (KL 4- KE). ,During the cÇlurse of
experiments, it was obsefVed that the melt surface always
remained clean and shiny, -and there was no obvious oxide layer
presen't.
VI-7. COMPARISON OF RESULTS WITH PREVIOUS WORI<
" , A study of the kinetic data available in the literatur~
showed that in most cases information regardi~g'certain
variables were incomplete' (e.g. es~ecially melt surface area
to volume ratio), so that a thorough cbmp~rison of the results
,reported by varipus investigators and present results was not
possible. Consequently~ ?nly the range of results available
in the litera tl,lre could be compared wi th the range of the present
results.
A summary o( work up to this date by various scientists
(Table 3) is combined with the present results and included
in Table 26.
The comparison shows that the weight per,cent elim:Lnations'
obtained for bismuth and lead in the present study were
generally,lower than thos~' reporteq by previous ~esearchers. . '
This was the case e'iTen afte,r 240 minutes of treatment (Table Il). '. .
This discre~~ncy has been attributed to the higner p~essures ,
and lowe~A/V ratios applied in the pres~nt study relative to
other experimental. conditions. AIso, sinee the weight of the'
1 •
1 , j
{ ,
, 1
• ' n
1
.J , 1
l 1·

" §IF jQ; MM .cq:;:::z;;nsgt) aeSS% * Qi 'WiRQ- ... i!4i;<il* ..... hM;o ll@iQ'<iiJW!'f(lSI'lI'if • b "" ~o.;r-.~"""~-t'o""~"~-f' ,-•• ,}-.~ ,~~P'~ ,-' - "-V r~ ~ '"'~ ~ ~':+""'~~- ... -~, ,~,)-..". ·~~.a""i'" j ..... H .. ~:- ~.;- • .r,..::.y-~':~~-~ -a,..,,'ll.;"'''''~
l ;
i'\
1
1 l,
ri'
t
<> () " o ~
p
.. ~
. 0 l '
'"
~LE 26., CompariaOD of the Present Resulta Witb the Resulte Available in Literature
Copper Elimina~i.on. wt% 1::(10-3 cm/s) Weig!>!: Press. Temp. Tll11e A/v ReL
Source kg - Illlg ·c mn 1Il-1 Bi Pb ,As sb. IIi Pb , ., Prese.nt 34.0 60-100 1150-1350 120 6.7-10.2 40-80 50-90 0 0 1.0-3.0 1.5-4.5
Kameda 0.03 100 111)0 60 50-80 +90 10-30 50-55 ' 26 .. Kuoeda 0.03 1.00 1200 60 +90 +95 40-70 30-40 2.6
Olmo 0.15 1-8 1200-1300 5-20 60 +95 +95 8-30 10-30 54,55
Bryan - 0.02 80 1170 60 99 58 -;
Brysn!. - 4'00 2o-~00 1200-1300 50-60 8O::"9~' - 58
lCo.<ro~a .1).03 10 1200 120 50-80 50-90 50-80 50-75 59
Go10vlto 100-500 1200 5-15 93 100 20 20 62
Kil! 75 30-50 40 60
~tan1 < 0.6-6.0 l1 1000-2000 1200 Vacuum Lift 10 60-80 10-20 20 29 Refining
~ 'l'aubenblat 25 <0.1 1150-1300 30 50 50 Cat~ode Copper 85
l. Overe!l ràte couatauce vere reported in different uni~ and could not be comp~red vith the present values.
2. Ratimated fr~m. the graphe. ../
IV;. IV ..... en
, urlt li' 't th .pttnm' Ae>? IIiIN"kl » . oIliIftIlI:., ~ ... .--,...---- -- "- -- , .... >- -'~-'""'- .......... ~ • ....ot;""",",-"",aIf al .. n ... ---~--

c
, .
(
t [ 1
• \
1
1
--
217.
in the present pilot scale study was 200-1000 times larg~r than 1 1
those used by previous investigators, the~ is good reason to
suppose that the present results are more representative of
kirletic mechanisms one would expect to observe in large scale
systems.
Ohno[54,55] and Bryan et al. [58] w~re the only investigators , ,)
who carried out kinetic.studi7s and reported overall mass
trans.iie;r coefficient values. f They reported different rate
constants, Ohno using units of "kg m-2 s-l" while Bryan et al.
used "cm -2 s -ln. From the information given in Ohno' s data, l
1
it .is possibl.e to convert his data to allow comparison with thè
present work.
K(present study) la 1
x K (ohno) 10 o
Cu
This was not possible for' the data of Bryan et al., since neither . "
crucible radius,' melt density nor type of copQer melted was
repoz::ted.
It was founq~ that in the present study KBi was ~IO times
and Kpb wasr ~7 times lower than"the values reported by 'Ohno[54,55]
This was attributed to higher chamber pressure, lower-Ajv ratios,
and the larger scale experimedts in the present study. 1
Concurre~t work in the same equipment, work on vacuum
refining proc~sses in ste:~nd cast iron melts by Harris[122]
and Bernhurst and Gruzlesk,i ['1-"24] respectively have aiso
indicated that refifting processes can operate at very different / 1 \
rates ,in large (pilot scale) as compared te smali (laboratory \
~----------~~-----
1 i
1

(
(
~ 218.
........ ' J' (
scale) vacuum systems. I,t 'is therefor~ clear that special
care should,b~ directed towards understanding the causes for
such changes in mechanisms in any scale-up (or scale-down) • 1
studies. 1
In Table 25, the results of vacuum lift refininq studies
càrr~ed out by Kame'tani and Yamauchi as an alternative to
. d' l' [29] . Il d d vacu~ ~n uct~on me t~ng are ~nc u e . The I?ercentage
elirninations were genérally rnuch lower than these by vacuum
P induction rnelting. The results obtained by Taubenblat et al.!85] , \ 1
are\ also includ~d. in the sarne table as being , repiesentative of
theirecent wor,k Jn the refining of cathode (rather than anode
or blister) copplr. (These were mainly degassification experiments
and, .'as we would expect, starting levels of metallic: irnpurities ... \,
were much lower hqn the llilister or anode type copper being
considered in th present study. Goodldegassification, but
lowelimination f metallic irnpu~ities, were obtained.
i As 'shown 'inl Table 26, zero elirnination of either arsenic
or antimony ~n the present study contradicts the results of
Kameda and Yazawa[26]; Komerova[59] and Golovko[62]. Further
studies need to be carried out to investigate the mechanism of
their ra'te of rernoval in more detail, Le. the possible effects
of oxygen~nd/or sulphur concentrations in the melt. i
These comparisons reveal that the present study contains
by far the IOC>st detaiJ:,ed consideration into the kinetic
Imechanisms'of impurity elimination from copper 50 far reported.
,
i
1.
1
1
j 1

(
,)
\ 219.
In terms of cla~ms to oriqinality, the placement of a '",
water-cooled condenser as close as 1.5 - 2 cm to the melt
surface was nd~el and unique to this work. Smmilarly, the
conéentration~~ime data was significantly more extensive in
comparison with the three data point per experiment obtained
by Ohno[54,55J., Finally, a detailed analysis ,of condensa te
composition was again unique to this work.
,1
, '
. ' (
------.'t"-.. ---_AI __ -----.------, '
L
l
i ...

"
i i f
1 f
( ,
(
1 •
220.
CHAPTER VII
CONCLUSIONS
Based on the results and discussions presented in previous
chapters, the following conclusions can be drawn: /'
1
1. In the absence ofaxygen and sulphur, bismuth anù
1ead cou1d be eliminated by up to 80% and 90% respective1y
from copper by vacuum induction me1ting, while removal of
arsenic and antimony was negligib1~.
2. The rat~ of removal of bismuth and lead increased by 1
as lKe about 5 and 7 times respectively chamber pressure was '
lowered from 300 to 60 l,lHg and the melt tempe rature increased
from 1150 to l350°C.
3. The melt surface area to volume ratio and the distance
of the condenser to me1t surface did,not have significant effects
on the rate constants governing the rate of removal of impurities.
4. The rate of elimination of ~ismuth and le ad over the
,~ range 1150 1350°C and 300 - 60 UHg, fo1lowed first order . ' kinetics. "
5. Elimination rates were largely contro11ed by mass
transport in the gas phase. However, as melt temperature
increased above 1350°C and pressure decreased below 60 ~Hg,
kinetic -a~alysis ind~cated that the rate of eiiminati~ns were
controlled by a combination of both liquid and gas phase mass
transport.
~ -, ......... ,.>-., ... ,.. .. ~~-------
, "
. ,

, ,1
(
(
-221.
6. It is predicted that a, lowering of chamber pressure
to 20 ~Hg and a melt temperature of l650 Gc would generate
overaU .. rate constants of 9.xlO- 3 ans-l and l2.xlO- 3 aœ-1 for
bismuth and lead respectively.
7. Thé rate of elimination of impurities in ,the present
pilot plant scale equipment were significantly lower than \ .
laboratory scale results.
8. _< Total copper lasses to the condensate in vacuum ,
induction melting were founà ta he low. In the range of 1150-
l350 GC and 300 - 60 ~Hg it is not more.than 1-2%.
9. Vacuum ipduction melting would appear ta give better
results than vacuum lift refining. 1
10. 'There are no known' connnercial installations for the
vacuum refining of copper. r \
Claim to Originality: 1 •
,The following aspects, of the present work are considered
to be original:
a) A study of the vacuum refining of copper at a pilot
plant scale;
b) A study of the effects of a water cooled condenser
on the evaporation of impurities; )
c) A ~etailed analysis of condens~te samplesi
d) Detailed kinetic st~dies and calculations;
e~ The development of equipment and techniques for frequent
sampling during vacuum refining experiments.
\

(
Î
Suggestions for Future Work:
The possible effect of oxygen and sulphur concentration
levels on the rate of removal of impurities from copper should
be investigated since1the'vapour pressures of oxides and
sulphides are gen7rally much high~r than pure elements.
Similar1y, the simuluaneous presence of oxygen and
sulphur and possible nucleation of sulphur dioxide in the
copper should be investigated as this could possibly increase
melt surface area ta volume ratios to higher levels.
The conditions necessary for improving the elimination
of arsenic and antimony should be determined.
A feasibility study of vacuum induction refining and a
full comparison with the existing pyrometalluigical copper
refining processes should be preparëd.
l
l l 1
, 1
! 1
Il !
1

(
(
<>
REFERENCES
1. Hsu, Y.T. and O'Reilly, B., Impurity Effects in High-
Conductivity Copper, J. Metals, 21-24, (Dec. 1977).
2. Phillips, A.J., The Wor1ds Most Comp1ex Meta1lurgy - copper,
lead and zinc -, Trans. of the Meta1lurgical Society of : '
AIME, 224, 657-668, '(August 1962~.
3. Davenport, W.G. and Biswas, A.K., Extractive Metallurgy
of Copper, Pergamon Press, 1976.
4. Jeffes, J.H.E. and Jacob, K.T., The Physical Chemistry of
Fire Refining coppkr, N'PL 1971 Symposium, on Met,a1lurgica1
Chemistry, 513-525, (l972).
5.
6.
7.
McKerrow, G.C. and Pannel, D.G., Gaseous Deoxidat~on of
Anode Copper at the'Noranda Smelter, Cano MetL Quarter1y, 1
li (4), 629-633, (1972)., '-
Yazawa, A~, Thermodynamic Considerations of Copper Sme1ting, /
cano Met. Quarterly,' 13 (3), 443-453/W.974). '
Yazawp., A. and Azakami, ~., Thermo~namiCS of Removing
Impurities During Copper Sme1ting, Cano Met. Quarter1y, l ,
8 (3), 257-261, 1969. ..
8. Basagoitia, ~., Arsenic and Antimony Remova1 from Blister ! i
Copper by Fire Refining, The F~ture of Copper'Pyrom7tallurgy,
Proceedings of First Latin American Congress of Min. and
Ext. Met., Santiago, Chile: 219-~31, (August 1973).
__ ,.,._. __ ,..........._ ....... w~'" ~ M __ -
__ 0- ______ _
1
\ 1
,

(
, -1
1
224.
9. Nagamori, M., Mackey, P.J., and Tarassoff, P., Copper ,
~.
Equilibria of Pb, Bi, Sb and As Between Slag and Metal1ic
Copper, Meta11urgica1 Trans., 6B, 295-301, (June 1975).
10. Nagamori, M. ~nd ,Mackey, P .J~ ( Thermodynamics of Cop,per
Matte co~verting, Metaî1urgtca1 Trans. 9B , 567-579, (Dec. 1978). , '
11. Mackey, P.J., McKerrow, G.C. and Tarassoff, P., Minor Elements
in the Noranda Process, 104th AIME Annua1 Meeting, New York,
N.Y. i (Feb •. 1975). ;1 1
12. 'Mackey, P.J., The Noranda Proces~ - A Review of Metallurgy,
Pro+essiona1 Deve10prnent Seminars, Dept. Min. & Met. Eng.,
McGill Univ., (Jan. 1977) •
. 13. Mackey, p.d. and Bailey', J.W .B:, The Noranda Process,
( Pro'fessiona1 DeveloJment Seminars, Dept. Min. & Met. Eng.,
McGi1l Univ., (Jan.'1978).
, '> •
. \
14. Suzuki, T. and Shib'asaki, T., Behavior of Impurities in
Mitsubishi Cont. Copper Smelting and Converting Process,
104th AIME Annual Meeting, New York, N.t.; A75-40, (Feb. ~975)~
15. Mackey, P.J. and Balfour, G.C., Pyrorneta11urgy, J. Metals,
16.
17.
36-39, (April 1978).
Yazawa, A., Kubota, Y. and Vjiie, H. , Refining of Crude !
Copper by Addition of èhlorides, Bul. Research Lnst. of 1
Min. Dressing and Met., Tohoku Univ., 27 (1'2'-'11209-2116'
(Oct. 1971). ,
Miller, H.J., The Fi~e Refining of Copper, The ~efinin9
of Non-Ferfous ~etals - Proceedinqs, London, En~land , 145-
184, (July 1949).
r l , 1
1

\
( 18. Fritze, H.W., U.S. Patent 3,262,773.
19. De Bie, E' r Canadian Patent 922,902.
225. !
! 01 Î
1 ! 1 i
20.
21.
~el1, M.C.E. and Pargeter, K., U.S. Patent.3,767,383.
Bunshah, R.F., The Last Ten Years and the Nex, Five Years
in Vacuum MetaIIurgy, Trans. of the International V~c. '------------+-\ f
..
(
22.
. 23.
, \
Met. Conference 1967, 1-14, 1967. \
Barraclough, K.C., The Applications of Vacuum Techno1ogy to,
Steelmaking, vacuum~" ~2 (3)'1 9l-~02, 1972.
HOlden, C., Developments in the Pr~cessing of Liquid Steel,
Jour'. of the Iron and Steel Inst., 806-825, (June 1969). . . 24. Chesters, J~H., Refractories for Iron and Steeimaking, The
~ "'-Metals Society, London, 322-357, 1974 •
25. Darmara, F.N., Huntington, J.S. and MachIin, E.S., Vacuum -. Induction Melting, Jour}I':;~f the Iron.& Steel Inst., 266-275,
", ,.",
(March 195-9) •
26. Kameda,~. and Yazawa., A., Refining of Crude Copper by 1
Vacuum Melting, Tohoku Daigaku Senko Seiren Kenkyusho Iho,
19 (1), 57-68, 1963. ' ,
27. Roth, A., Vacuum Technology, North-Hol1and Pub1ishing Comp.,
1976.
28. Be1k, J.A., Vacuum Techniques ,in Metallurgt, Pergamon Press,
1963.
29. Kametani, H. and Yamauchi" C., Vacuum Lift Refining in
Copper Sme1ting, Trans. of NRI for Metals, 20 (1), 22-59,
1978.
30. Wink1er, O. and Bakish, R., Vacuum ~eta11urgy, Elsevier
~) Pub. Camp., 1914.
1 ~
1
l J ,
1
., 1 l

(
(
- , \ )
'. 226.
31. Servi, I~S.~ High-Vacuum Induction Melt~ng, Western Metal
Congress, Los Angeles, 103-11L, (March 1961) .
o
12. Nisbet, J.O., Pro~ress of Vacuum Meta11urgy in North America, \ \
33.
Trans. of'the International Vac' Met. Conference 1967, -, '\ J.5-36, 1967.
r ~-(
Knackè, O. land Stranski, LN., The Mechani,sm of Evaporation, \
progress in Metal Physics-6, edited by B. Cha1mers and ,
R. King, pergamon Press, 181-235, 1956.
34. Davey, T.R.A., Disti11ation,under
Vacuum, 12 (2), 83-95, 1962.
35. Davey, T.R.A., Discussion, Vacuum, 14, 227-230, 1964.
36. Davey, T.R.A., Vacuum Dezincing of Desi!verized Lead Bullion,
J. of .Metals, 991-997, (August 1953).
, 37. Stauffer, R.A., F9x, K. and DiPietro, D.W.," Vacuum Me1ting
and casting of Copper"Industria1 and Eng. Chem:, 40 (5), , ,
820-825, (1948).
38. Hu! tgren,. R., et. aL, ~elected Values of the Thermodynamiè
Properties of the Elements, ASM, 1973.
39. Olette', M., Vacuum Distil.lation of Min6r Elements from
Liquid Ferrous Alloys, Physica1 C~mist~ of Process 1
Met,allurgy, edited by G. St. Pierre, 8" (2), 1065-1087, 1961.
40. Pehlke, R.D., Unit Processes of Extractive Meta11urgy, ,
American Rlsevfef Pub. Camp., 130-141, 1973.
41. Ohno, R. and Ishida,'T., Rate of Evaporation 'of Mn, Cu, Sn,
Cr and S 'from Molten Iron under Vacuum, J. o~ the Iron & , ,
<.
Steel Inst., 904-908, (Sept. 1968). l ,
\ '
'- ,

227.
42. Ward, R.G., Evaporative Lasses During Vacuum Induction
44.
Melting of Steel, J. of the Iron & Steel Inst., 11-15,
r 1
T.D., Mechanism of Alloying Element
Evaporatlng During the Vacuum Induction Mel1ing of Steel,
J. of, the Iron & Steel cInst.,· 920-923" (Sept. 196"6).
Ohno, R., Kinetics of Evaporation of Mn,. Cu and S from Iron 1
A110ys in Vacuum Induction Me1ting, Trans. IStJ, 17, 732-741,
1977'. ' 1
45. \ Kinsman, G.J.M., Hazeldean, G.S.F. and' Davies, M.W.,
Physicochemlca1 Factors. Affecting the Vacuum Deoxidation of
Stee1s, J. of the Iron & Steel J;nst., 1463-1478, (Nov. 1969).
..
1. 46. Machlin, E.S., Kinetics of Vacuum Induction Refining Theory, /'
Trans. of Met. Society of AIME, 218, 314-326, (April 196Q)<:
47. Geiger, G.H. and poirier, D.R., Transport Phenomena in
\ . Metallurgy, Addisbn-Wes1ey pub. Camp., 547-571,1973.
48. Higbie, R., Trans. AICHEJ, 31, 365, (1935).
49. Irons, G .A., Chang, C.W., Guthrie, /R. I.L. and S,~eke1y, J., //
The Measurement and Prediction' of the Vaporization of j'
,i, Magnesium from an Inductively Stirred Melt, Met. Trans. B,
L'_~_'- ' 9a, l51-,~~~J.-Mafc; 1978. f ~
, ~-Braashaw, A. V. and R:Lchardson, F. D., Thermodynamic and
o
a.
Kinetic Aspects of Vacuum Degassing, Vacuum Degassing of
Steel, .Special Report 92, 'J'he Iron & Steèl ~nst., 1965.
51. Ohno, R., Kinetics/0f Evaporation of Various Elements from
Lig. Iron Alloys Under Vacuum, Liquid Metals - Chemistry &
- --~-----.~---.' .
/'
! " ;/ i

1 'l'
1~ rI '-..,.
1'"
228.
Physics, editid by S.Z. Beer, Marcel Dekher I~C., New York,
Chapter 2, 1972.
52. Richardson, F.D., ~hysica1 Chemistry of Melts in Meta11urgy,
"'{ol. 1 & 2, 'Academie Press, 48,3-493, 19'74,. - / ,
53. SherWood, T.K. and Cooke, N.E.~ Mass ~r~nsfer at'fow ---- -""', A.I.Ch.E. -Journal,. 3 (1), :p-42,' (March 19S7) • ' ~ ..... ,/"
54. Ohno, R., Rates of Evaporation of Ag, Pb and Bi -~ Copper ~- ~
Al10ys voin Va cU um Induction M,el tinEJ, Met. Trans. AIME, 7B,
647-653, (Dec. 1976).
55. Ohno, R.", Rates of Evaporation of ~g, Pb, Bi and S from
Mol ten Copper Alloys Stir/ed at Different Speeds under
'56.
"
57.
58 ~
Reduced Pressure, Tran. JIM, 18,.232-238, 1977. . ,
Salomon-de-Friedberg, H. and Davenport, W.G., Vacuum R~oval )
of Copper ~rom Me1ted Steel' Scrap, The Metallurgica1 Society
of CIM, Annual Vo;ume, 1977.
Ino ue , . M~, rashii, l'. and '"
R., Rates of Evaporation of .J~
..... ~-i
Ag fram Liquid Cu-Ag Alloys in High Freguency Vacuum Induction
-Merting, Jap. Inst. Metals J. 37 (9), 953 .. 963>, ,<T973).
Bryan; R., Pol1ard, D.M. and Willis, G.M., Removalof .
Bismuth from popper by,VacuUm ~fining, Ex~ractive ~tallurgy'
Symposium, The Univ. <rf .N.S. Wales, Australia, (Nov. 1977). :;
59. Komorova, L., Vacuum Refin~ng Technique for Remova1·of
Impuri ties from Copper, Hutnicke List Y , (Czech), 8, 57.7-582t, 1 .
,(1973). T»anslatio~ BISI 12425, The Metals Soc., London, U.K.
60. Kim,'G.V., Kvyatkovskii, A.N., et. al., Vacuum Processinq of •
Crude Copper, Tr. Altaisk Gorno-Met. Nauchn.-Iss1ed. Inst.,
Akad. Nauk Kaz. SSR, 14, 86-.89, (1963).
• a
J. l'
i i 1
.1 ~

(
~ ,1
1
;lv-
! f 1
1
"
, 1
, '
2'29. 1 • ,
61. NovoShi1iv, A.B." Vacuum Refining of Copper# Tr. Inst. Met.
Obogashch.~ Akaâ( NaukKaz. SSR, 31,23-'30,°(1968).
,62. Go10vko, V.V. and Isakova, R.A., Berno~a1 of Impurities from ,
Binary Al10ys and Crude Copp~r by a Vaçuum Method, Tr. Inst.
Met. i Obogashch., Akad. Nauk Kaz. SSR, 13, 32-37, (~965). ,
63. Kametani, H., and Yarnauchi, C., A Eundamenta1 Study on
Vacuum Lift Refining of Molten Copper, Trans. of Jap. Inst.
Meta1s, 13 (1), "13-20, (1972). ,)
64. Karnetani, H. and Yamauchi( C., Vacuum Lift Ref~ing of
~lten Copper Rernova1 of S arld 0, fi. Min. Metal!. Inst. Japan, ,
65.
66.
67.
68.
88, 347-352, (1972), \
Yamauchi, C.'and Kametani, H., Remova1 of S, 0 and Other \
Impurities by, Vacuum Lift Refining of Molten Blister Copper,
J. Min. Meta11. Inst. Japan, 89, 45-50~(1973) ~
Greatez: Puri ty for Oxygen-Free Copper," Metal progress, 124,
(Dec.1963):
~upta, V.K., Ma~av Rao, V.N. and Tarnhankar, R.V., Oxygen-,
Free High Conductivity Copper by Vacuum Ma1ting, Trans. ~
Indian Inst. Met~ls, 25 (2), 33-3'9, (19n). /
, ,
StaUffer, R.A., Fox, K. and DiPietro, O.W., Vacuum Melting
and Casting of Copper, IndustriaI' ,and Eng. Cham., 40 (5),
820-825, (194a).
69. Nik01aev, A.K., vodyanaya, T.A. and Revina/' N.!.', Vacuum
70.
. ,
Induction Me1ting of Copper, Tr., Gos. Nauch.-Iss1ed. Proekt.
Inst.' Sp1avov Obrab. Tsvet. MetaL, 32,41-411, (1969) •. 1
B1ank, H.A., ~abrièating OFHC Coppér, Metal Ind., 768-770,.
(June 1964) •
'1
\ .'
;
'" \

!
f 1 1 r
~ l
" '-
( 1
-1
( ,\
. ,
230. Î
71. Militsyn, K.N., Zolotoi, A.L., and Saramutin, V.I., Effect
of Vacuum-Melting on Gas Content and Porosity of Copper, Tr.
Mosk. Inst. Radiotekh. ,\ Electron. AvtoJl1.., 41, '209-213, (1973).
72. Wink1er, O., The Degassing p'rocess of Metallic Melts in V;acuo,
Vakuum Tech., 3 (5), 87-96, (1954).
73. 'Go1'onka, J. and Legowski, F., Physica1-Chemical Pheriomena in
the Production of Oxygeh-Free Copper Me1ted in Vacuo, Pro 1
Inst. Hutn. p'oland, 20 (4), 221-227, (1968). \
74 V ak t 1 Olf • Zyazetl, .L., Spev ,N.D., e . a ." Vacuum Treatment
Liquid Copper, Tsvetn. Metal'., 35 (7), 32-37, (1962).
75.A1e~sandrov, B.N. and Udovikov, B.I., Impurity Behavior
During Vacu~ Heating of Copper at High Temperatures, Fiz.
Kondens. Sostoyaniya, 16,114-121, (1971). "
76. Zelenov, A.N.,' Ivanova, N.T., et. al., Effect of Vacuum
77.
78.
79.
, , J Reme1ting on Gas Content of Copper, Tsvet. Metal., 39 (ll),
92-93, (1966). ,
Ze1enov, A.N., Ivanova~ N.T., ~t. al., Content of Gases in
Cast Copper Produced by Vacuum Me1tlng, Tsvetn. Metal., 40
(5), 84-85, (1967).
~tre1'tsov, F.N., Frid1yanskii, R.M. and Moldavskii, 0.0.,
~Ij~l\' \
Behaviour of Gases ~ Çopper and COpper Alloys During Vacuum
Furnace Me1ting, Tsvetn. Mètal., 44 (9), 81-85, (1971~. \ 1
Be1en'kii, L. Ya., Nam, B.P., et. al., Deoxidation of Copper
;uring ~~ Induction Melting, Tsvetn. Metal., (2), 67-68,
(1976) .
1 J
- - ~ ,
" ! , j ~ \
, , -

f' \
1 1
80.
231.
Strel ' tsov, r ~ N., et. al., Removal of !mpuri ties from /\
Copper During Vacuum Furnace Meltin'Ç" Tsvetn, Metal., (8),
40-43, (1973). \
Moldavskii, 0.0., Nonmetallic Inclusions in Copper\Alloys 1
Melted in Open and Vacuum Induction Furnaces, Tsvetn. Metal., v
(12),42-44, (1973). . '
82.' Aleksandrov, B.N., Study on the Behaviour of Impurities
During Vacuqm Distillation (or Initial Heating) a~d Zone
Me1ting of 9 Eâsily Fusible MataIs and Copper, Flz. Kondens.
Sostoyaniya~ 31, 92-104, (1974).
83. Clark Peres, A.E., Pite11a', C.F., et. al., Aspeots of Vacuum
Refining of Copper-Zinc A11oys, Portuguese Met. AME.; 25 -
(138), 351-36'0, (1969).
84. . " , (, 1 Dimitr1eva, /G.S., Osokin, N.G., et. al., Copper and Nlcke \ /
Loss Durfng Vacuum Melting, Tr. Nauch.-Iss1~d. Proekt. Inst.
Sp1avov,Obrab. Tsvet. Metal.', (35), 13-19, (1971). . ~
85.' Taubenb1at, P.W., Brockup, F .H., et. al., Vacuum Mel ting and
Casting of Copperi vacuum Meta11urgy, Edited by R.C. Krutenat,
Proceedings of 1977 Vacuum Met. Conference, Pittsburgh,
Penn.,' 543-568, (June 1977).
86. Mi1itsyn', K __ N., Zo1otoi, A.L. and Saramutin, V.l., qeter-1
mination 'Of the Castabili ty of Copper and Copper A110ys in ,.. \
Vaouo, Tr. Mosk. Inst. Radiotekh., Electron. Aveom., 41,
171-174, (1973).
87. Zyazev, V.L. and Tanutrov, IoN., Effect of Vàcuum Treatment
on the Properties of Copper in 'Ingots. Mekhan. ,Svoistva.
Litogo Metal., Akad. Nauk SSSR, Inet. Mashinoved u Tr.
, "
-- ~ ~ - ~....,..-., .......... "'~''''''''''~-'''''''''''~-: ... ~~ ---1
"

(
(
,
232.
Vosmogo Soveshch. Po. Teorii Liteinykh Protsessov, 297-302,
(1963) • 1
88. ciites, P.G., Vacuum Arc Melting and casting of Copper,
Bureau of Mines R.I. 6254, U.S. Dept. of Interior, Washington
D.C., (1963).
89. Kametani, H. Yamauchi, C., et. al., A Fundamenta1 Study on
the Vacuum Treatment of Molten Ma:tte and White ,Metal.,
Trans. Jap. Inst. Metals., 14 (3), 218-223, (1973).
\90. Yamauchi, C. and Kametani, H., EMF of ap Oxygen Concentration
Cell and Magnetite Measurements in Connection with the ) • JQ
Vacuum Treatment of Molten,Matte and White M~tal., Trans.
Jap. Inst. Metals. 14 (4) 261-266, (1973).
91. Yamauchi, C., Kame'tani, H., et. al., Removal of Impurities , /
in Molten Mattes and, White Metals by the Vacuum Lift Refining l '1 ~ V
J. Min. Metallo Inst. Japan, 89, 669-674, (1973).
92. Yamauchi, C., and Kametani, H., A Model on Vacuum Li ft
Refining of'Molten Matt~, J. Min. Metal!. "Inst. Japan, 89,
737-742, (1973). ,
93. Kametani, H., Yamauchi, C., et. al., Elimination of Impurities
in Molten Matte and White'Metal hy purge Gas Blowirig, J. Min. --/~
Metall. ;nst. Japan~.---9-0-i-Hf3-10B, (1974). ---~
94.\ Play~~- Removal of rmpurities from Copper Matte ~y ~ \
Vacuum Treat~nt,· Proceedinqs, 6th International VacuÙR\
Metallurqy Conference on Special' M~lting and Metal1urqical \1 ~
Coatings, San Diego, April 23-27, 1979.
95. De Bie, E. and Tougarinoff B., German ,patent 1,912,936
" (U.K. 1,248,556, Canadian 907,341).
"
1
1 ~. o

(
'"
(
o
, 1
233.
'" 96,. Sickbert, A., and Stick, W., U.S. Patent-3,367,396.
97. 1 Hart, T.G., Canadian Patent 874,351.
98.
99.
100.
10L
102.
103.
Hart, T.G. , U.S. patrnt 3,,575,399.:
Hart, T .G. , U.S. Patent 3,507,231.
Tsuda, N. , Japan Itokai,
'" 73-71,321.
Gutov, L.A. , Postnov, L.M. , et. al. ,
Miklossy, K., Czeck. ratent, 128(049.
(J.S.S.R. Patent 248, ~24. 1\
Bell, M.C.E., and Pargeter, J.K., U.S. Patent 3,767,383
'(Canadian 973,720) .
104. Von Der Crone, G., and Fricke, H., German Patent 2,024,302
(U.K. '1,289,265). • \ 'I~;. .. -
lOS. Suvorov, A.l., Sokolov. V.I., et. al., U.S.$.lt. Patent 3l\~2'69.
106. Shima, M., and Na~ao, S., Japan Patent' 112044/1910,
(Canadian 953~923).
107. Edwards: J.B., Huche, E.E. and Martin, -J.J., Diff~sion lin 't \
1 '
Binary Liquid-Meta1 Systems, Meta11urgical ,Reviews, Review ,
120, Part l, 13, 1968.
Edwards, J.B., Huche, E.E. and Martin, J.J., Diffusion in
Binary Liquid-Mètal Systems; Metall~F9ical Reviews, Review
120, Part II, 13, 1968.
Wa11s, H.A. and Upthegrove, W.R., Theory of Liquid Diffusion
Phenomena, Acta Metail~g~ca, 12, 461-47~J (May, ,1964) . ~
Solar, M. Y ., Kinetics of Hydrogen and Carbon Monoxi~e $, • 1
Absorption by Stagnant Molten Iron, Pb.D. Thesis, McGi11 • 1 1
Univ., 1971.
, .

(
o
Ill'.
112.
234.
Gourtsoyannis, L. Kinetics of Compound Qas Absorption' by l ' .
Liquid Iron and Nickel, Ph.D. Thesis, McGi1l uriiv., 1978.
Szekely, J. and Chang, C.W., Melt Ve1ocities, Temperature
Profiles, Tracer Dispersion Rates and Scrap Me1ting Kinetics
in Vacuum Induction Me1ting, Vacuum Metallurgy, Edited by 1
R.C. Krutenat" Proceedings of 1977 Vac. Met. Conference, 1
Pittsburgh, Penn., 15":-48, (June 1977). ,
113. Ta,rapore, E.D. and Evans, J.W., F1uid Ve10cities in Induction
l'',~~ ting Furnaces,: Part I. - ~. ,
, ,
Theory and Laboratory Experiments, (',
Metallurgica1 Trans. B., 7B, 343-351, (Sept. 1976).
114. Tarapore, E.D., Evans, J.W. and Langfeldt, J., Fluid Ve10cities
in Induction Me1ting Furnaces: Part rt. Large Scale
115.
Measurements ~nd Predictions, Mèta11urgical Trans., BB Y 179-
184, (March 1977).
Turkdogan, E.T., Grieveson, P. and Oarken, L.S., Enhancement ,
of Oiffusion-Limited Rates of Vaporization of ~eta1s, J. Phys.
Chem., 67, 1647-1654, (Aug. 1"963).
116. Distin, P.A. and Whiteway, S.G~, Kinetics of vapourization
and Oxidation of Liq. Iron Levitated in F10wing 'He1ium-Oxygen,
Cano Met. Quarter1y, 9 (2), 419-426, 197~.
117. Saito, T., Absorption and Evo1~tion of Gases by ~nd fro~
Molten Iron Alloys" Proqeedings of 4th Inter. Conf. in Vac. 1 ~
Met., 'TOkyo, Japan, 3-7, (.:J;une 1973). . 0 1
118. Parker, R.H~, An Introduction to Chemical ~eta11urgy, 1, '
pergamon P., Second Ed., 258-261, 1978.
, 1
. ,-- ___ ' --- ~I -
1
1 ,
1
l ' 1 l t 1
i

(
1 j .1
f 4 •
-~.
, 235.
119. Szekely, J. and PoveroIDO, J.J., Heat and Mass Transfer
Considerat~ons in Vapour Deposition, Proceedings of 4th
1 1
Inter. conf. on Vaè. Met., TOkyo, Japan, 204-208, (June 1973).
120. Davies, O.L., Editor, The Design and Analysi~ of Industrial
Experiments, Hafner Pub. Co., New York, Chapters '7 and 10,
1963 •. \'
121. Sa10mon-De-Friedberg, H., Residual '·Copper in Steel, Signifi-
canee, Vacuum Remova~; M. Eng. Thesis, McGi11 Univ., 1976.
122. Harris,' R., Vacuum Removal of Copper .from Liquid steel,
M. Eng. Thesis, McGill Univ., 1978.
123. BaIe, C.W., Pelton, A.D., Thompson, W.T., F.A;C.T. Userls
Guide, First Edit~on, McGill Univ. and Ecole polytechnique,
June 1970.
124. Barnhurst, R.J. and Gruzleski,' J.E., Vacu'l,llt\ Refinem~nt
of Cast Iron Melts, proceedings, 6th International Vacuum
Metallurgy ,Conference on Special Melting and Metallurgica1
Coatings, San Diego, April 23-27, 1979.
125. Kubaschewski, O., Evans, E.LL. and Alcock, C.B., Metallurgica1
Thermo9hemistry, pergamon P.,' Fourtp Edition, 1974.
126. Gomez, M., et. '-al., Densities of Molten Copper and Mol ten
Bismuth-Copper Alloys, Z. Meta11kde, 67, 131-134, 1976.
127. Iida, S'., Ohno, K., et. al., "Tables of Physical Constants Q •
\Butsuri Josu-hyo", Asakura, Tokyo, Japan, 1969.
li
r
j
.j , l
1

- .'----
236.
~ APPENDIX l
THERMODYNAMIC DATA
, , 1
1 1 ,
(
,1 r " 1 1
,1
o

1
1 1 1 l 1 (l
1 1 ; . ~
f " t l j
< \ r , 1 , ~
t l
I-1.! v~ Our Pressure of pu,re' E ements: 1
\ -1 1 Cu: tog po • -17520'1' - 1.21 log T + 13.21 mm ~g [125]
1
Bi: og po • -10400'1'-1 - 1.26 log T + ,12.35 mm Hg [125] . '
Bi2
:' og pO. -10730T-1 - 3.02 log T + 18.10 mm Hg [125]
o ... 1· Pb: 1 g P • -10130'1' - 0.985 log T + 11.16 mm Hg' (125]
Sb: P b - 2.74 1l1li Hg at 1573 K [38]
PSb - 66.12 DDII, Kg at 1573 K (38]
237.
As:, 2 • '5
PAs - P-As + PAs + PAs ~ 784 atm .. 6xlO, mm Hg at 1523 K [59J T 2 4
1
1-2. Activ1çy Coefficients: ) ~/
l~g r:i .' 1900T-1 - 0.885 : [9]
, U l '
log ra - 2587T-1 - 1.010 [9]_ Pb .
J'Sb ~ 2.2 x 10⁻² ~t 1573 ~ [9]
, '
yAs n 10-6 at 1513 K [9], ~
I-3. Density of Copper;
Pc - 7.936 - 7.862 x 10⁻⁴
(T-1356) g/cm3 [126] u" T • temperature, K' ""--./
Peu • 7 .88 8/Jm~, at 1423 K " 3
pCu ·"7.81 g cm at 1523 K
P~~ • 7,.73 g em3
at 1623 KI
1
3 \ Peu • 7.65 g/em. at 1723 K
Peu'· 7.57 gl cml
at 1823 K
, 1 3 Peu - 7.49 s/cm at 1~23 K
1 : 1
l' 1
, F j
. f 1 , 1
1
l •

1
! 1 , l' ~
I(
( i ! )
, r , l ~ , ~ t
1 ,
Cî
1
1-4. Molec:ular Weights:
M - 63.54 Cu
~i - 209.00
~i ,. 418.00 2 1
~b - 207.21
MSb ,. 121. 76
MAs - 74.91.
I-5. Crucible Dimensions :
#30 Crucible: l' • 9.6 cm
#50 Crucible: r • 11.8 cm
Alumina Crucible: r" 9.9 cm
I-6. Pressure Convertion:
/ l atm • 760 mm Hg - 1.01325
1.1 1 ~ '10 60
pascal 0.13 1.33 8.00
A/V • 0.067 -1 cm
A/v - 0.102 -1 cm
A/v - 0.071 -1 cm
x 105 pascal
100 300
13.33 40.00
'1000
1.33.32
1 /
, r
238.
l '
1 . \
, :
1
1 t r
~ \

(
,
Table 1-1. Values of Activitz Coefficient. Va20ur Pressure Transfer Coefficient
Y P, mm ..... Hg Temp'.
K Bi B12 Pb Bi B12 Pb
1423 2.82 2.82 6.43 17.71 10.89 8.62
1523 2.30, 2.30 A.8B 32.45 27.73 23.64
1623 1.93 78.91 62.18 57.06 ;
1723 1.65 1.65 3.10 172.30 12~8'
( 'I
1823 1.44 1.44 246.24
1923 '636.75 . 400.46 454.43
/
t
1 ;-
.. ~.- )
239.
and Eva~oration Mase
\ ,..
KE<J.0-3~m/s
Bi B1Z Pb
28.4 0.080 47.9
62.9 0.133 97.5
125.4 0.205 181.0
0.2,97 311.6
392.7 ~.411
616.0 0.542 769.1
, 1
...
\J
- ----- .. \
, . l ,
1
" 1 1 1
1
l'

) , i j
î \
, '
1 l ~
(
(
- ,
CS l,
, i
--_. __ ._~---'--
240.
.'
APPENDIX II
MEAN FREE PA~ CALCULATIONS
" ,
, 1 \
1 1
r
t "
1 l-
I
,

1 <>
(
1
i
.\ \ 1
"
,Cl
1 \
II-l. Mean Free Pa th Ca.1cu1ations:
À .. kT • Z.33 -20 T . [27 ] x 10 -2- cm
12 1T€~ € P
À - mean free path, cm
T .. temperature, K
€ .. molecular diameter. cm
P - ambient pressure, torr r k - Boltzman Constant
Temperatures: 1423 K, 1523 Kt 1623 K "
Pressures :' 60 J.lHg, 100 J.lRg, 300 J,JHg
80 pascal, 13.33 pascal; 40.0 pasc~l
Mo1ecular Diameter: (1 - 10-8 cm) [d'7 ]
Cu: 2.56 'lÇ A; Bi: 3.40 x A; Pb: 3:50 x A,
As: 2.78 x A; .Sb: 3.18 x A
, .
l,
241.
1
""----------
b

--- 1 ~ -..,~ ... _--~ ~
........ "_ ... __ .. ~ ._~--- - - ~ -------,
,-.,..J~'
o~ 242.
'~
( ..<.1.-
Table II-l. Predicted Mean Free Paths. ,~(cm)
" 1 i
Copper: Arsenic: u
0('
Pressure! t423 1523 1623 Pressure! 1
1423 1523 1623 Temperatu1re Temperature
8.0 ' 0.843 0")903 0.962 8.0 0.715 0.765 0.816
13.3 0.506 0.541- 0.577 13.3 0.429 0.459 0.489
,40.0 0.169 0.180. 0.192 40rO 0.143 0.153 0.163
0,-. '---------
Bismuth: Ant1monI: -,
Pressurel .,,~
Pressure! 1523 , 1 Te1j1Pera ture, 1423 1523 1623 Temp-erature 1423 1623
'''-'8. Q 0.478 0.5b 0.545 8.0 0.546 0.585 0.623 (
OJ07 13.3 0.287 0.327' 13.3 0.328 0.351 0.374
40.0 0.096 0.102 0.109 40.0 0.109 0.117 0.125
! V Lead:
1 t
1 PreSsurel Q 1423 15:i3 1623 Temperature
1
8.0 0.451 0.483 0.515 -.
13.3 0.271 0.290 0.309 '\
40.0 0.090 0.097 '0.103 ,
1,
()
D

1 J ,
1
1
( \
\
r \
t \
\
t ':
1 -k
1 .'
•
. -
•
-
.. , ,0
...
~
, '
.r ., ,
•
ESTIMATION OF DIFFUSION AND MASS TRANSP'ORT o ~
COEFFICIENTS IN LIQUID PHASE ,-
, ,
-• 0
\ .
/
f
• > r
243 •
1
1
1
'1 ' \ 1

le
(1
. ,
244. '
'III-l. ESTIMATION OF DIFFUSION IN LIQUID 'PHASE
III-l.l. Empirica1 Equations:
'" In order to estimate the diffusion in l1quid copper,empirica1 equations studied lire as follows: \
. "1 (i) ,Equation of Walls and Upthegrov~ for Henrian Solutions [52].
J '
(J,
(H) Equa\:ion of Sutherland \for rA tI r B [,?2]
D SI
AB
"(iii) Equation of Stokes-Einstein for rA > rB [52]
kBT .oD • ---..::::;.,-._
.' .AB 6~r AUB
(iv),Arrhenius Equation [52] - \
D "If Do -I::.E/RT
D, D A,B • 'diffusion (of s~lute ~ in soivent B), cm2s-
1
~ -23-1 k
B .. Bo1tzman constant, 1.38062 x 10 joule K
< J
T'· temperature, K
rA • radius 'of solute molecule, ! 10-8 cm '\
rB, • r~dius of solvent mole cule , ! 1
b • ratio of,rA to soivent interatomic spacing
~ - liqu~d solvent_v.t8cosity
Do '--diffusion coefficient, . , .. •
(pbise)
. 2 -1 cm s.
-1 -1 gal cm 8
(III-l. )
(III-2. )
(III-3. )
(III-4. )
1
p
, 1
1
1
1 , 1
j i 1 1
, , ,
1 1 ., 1
~t i 1

,
()
ÂE • activation energy for,diffusion
R - gas constant, 8.3143~ x 107
111-1.2. Data Available: ,1
, -1 cal gmole
\
245.
- -1 gm01e 2 -2 K-1 g cm s
Data used in the computations are listed below and the results are tab~ated in Table 111-1.
'\
(a) Radius of molecules: [127]
rCu '" 11.28 A, rBi " 1. 70 1, . r pb-'" .1. 75 1t
(b) ,In;eratomic spacing for copper: [127]
2,55 !
Cc) Viscosity of l~quid copper: [47]
}.leu - 3eP '" 3 x 10⁻⁹ joule·s.cm-3
1 (d) Activation energy for diffusion: ,[52] o ,
, -1 fl;,
ÂE - 30 kea1·mole
III-1.3. Estimation of Diffusion by Arrhenius Ecfuation:
It is assumed that D - 1. x 10-5 cm2/s lit l423K and ÂE ,!:l30 kcal/mole at all temperatures. Then by ratio of D 1423 to D 1523,'D at 1523 can also be dete;rmined:
1 1 D 1423 • e -ÂE/R ( 1423 - TIE) o 1523
By using the ratio method, diffusions are estimated up to 1923 K and ine1uded in Table 111-2. Sensitivity of diffusion ta decreasing ÂE to 15 kea1/mole is aIs a cheeked and ine1uded in Table 111-2.
\ . \
i
1
~ ;
: . ;
, l
1 î
t 1 \
i
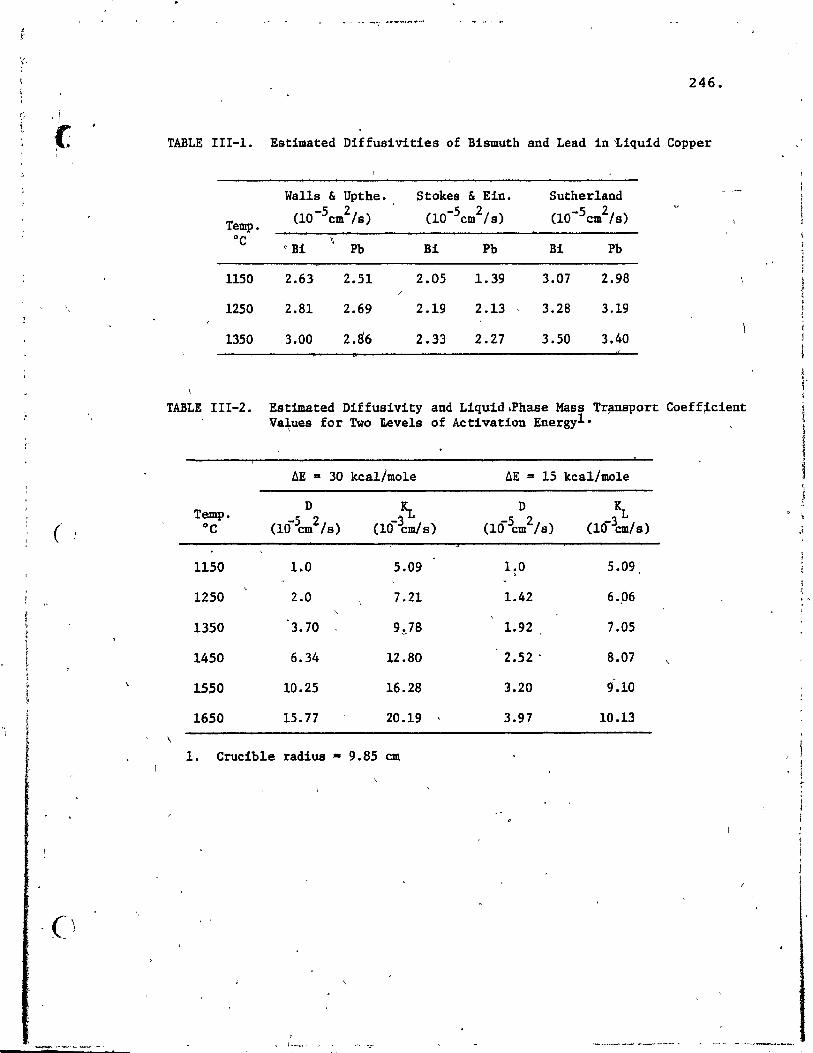
246.
1 , i
( TABLE 111-1. Estimated Diffusivit!es of Bismuth and Lead in ~iquid Copper
Wa1ls & Upthe. Stokes & Ein. Sutherland -S 2 -S 2 (1(j-Scm2/s) Temp. (10 cm /s) (10 cm /s)
Oc oBi
\ Pb Bi Pb Bi Pb
l1S0 2.63 2.S1 2.0S 1.39 3.07 2.98
12S0 2.81 2.69 2.19 2.13 3.28 3.19
13S0 3.00 2.86 2.33 2.27 3.S0 3.40
\
TABLE 1II-2. Estimated D1ffusivity and Liquid.Phaae Mass Tr~nsport Coeff~cient Values for Two 1.eve1a of Activation Energyl. ,
\
ilE :la 30 kca1/mo1e ilE ,. 15 kca1/mole
( Temp. D -3~ D KL -5 2 -5 2 -3 Oc (10 cm /a) (10 cm/a) (10 cm /s) (10 cm/s)
1150 1.0 5.09 1.0 5.09
1250 2.0 7.21 1.42 6.,06
1350 3.70 9~}8 1.92 1.05
1450 6.34 U.80 2.S2 " 8.07 ,
1550 10.25 16.28 3.20 9'.10
1650 15.77 20.19 , 3.97 10.13 '\
1. Crucible radius - 9.85 cm
1 ~
1
, 1
1 r l
. " ,
1 !
1 f

I-i i ; , r-I
\
t '>-t " \
1 ( 1 , t i l
t t \ ,
t
1
'\,
"-
C-)
,"
__ ' ____ l.
247.
III-l. ESTIMATION OF LIQUlD PRASE MASS TRANSPORT (!OE'FFICIENT
Based on the estimated diffusion values, liquid phase mass transport
coefficients, ~* were calculated at different temperatures and for the (
three d~fferent diameters of the 'crucibles used in the experiments. Thes~
values which were used in the kinetic studies are included in Table 111-3.
* Eq~tion for predicting ~ is given by Equation 14.
TABLE III-J.
\ -l' \
\
Estimated Liquid Phase Maas Transport Coefficient Values for Different Crucible Radius1•
-3 , ~ (10 cm/a) , ,
Crucible radius, cm Temp.
Oc 9.60 11.80 9.85
1150 5.15 4.65 5.09
1250 7.30 6.59 7.21
1350 9.91 8.94 9~78
\ 1.' àE • 30 kcal/mole
i ,
,
, "- ,~
,
1 Î l-
I 1
1
1

(
c)
o
- ....... -,_.,;.~_ ... _--~
APPENDIX IV
EVALUATION OF 2-LEVEL FRACTIONAL FACTORIAL TEST DESIGN
"
, 1
, "
(
1 •
/ /
'248.

· ,
(
l f
1
f ~
(
( 1
c)
IV-l. CALCULATION OF EFFECTS AND MEAN SQUARES
In arder ta analyse the effects of four factors on overall mass )
249.
transfer coefficient, K, the firat step was to calèulate the effects measured
and the Mean squares from the data obtained.[~20] Yates' Method[120] ,was - 1
used for this purpose and the results obtained including the stepwise , 1 calculation columns are tabulated in Tables IV-l and IV-2 for bismuth and
lead resp·ectively. This calcu~ation provides the seven effects (A, B 9 C,
D9 AB or CD, AC or BD, BC or AD) involving seven independent comparisons
between the eight responses. Thus, in this t'est design, aince every effect
1a based on one degree of freedom, the sums of squares also denote the mean~
squares. \
IV-2. INTERPRETATION OF RESULTS
In order to carry out a comparison of the effects measured using
statistical testing methods, the experimental error variance need to be
established. Since there was one set of experimental data, there was no (
direct astimate of the experimental error varianc~ by which the sign1ficance
of the effects might be judged. In non-replicated fractional fact'Ctrial
test designs such as this, thé interaction mean squares can be used to give
[120] J an estimate of the error variance. Or, as an alternative, the error 1
"varianée can be estimated from the variance obtained by duplicàting a
1
few randQm1y selec,ted experiments from the test design.
Method a. '
In Table IV-3-~ calculations fur the mean SUD!. of squares (estimate of'
error variance) from two faètor interadtiona for both bismuth and lead are
l-I {
i 1
1 1 J
1 !
1 ,1
1
, ..

( .. J
(
. '
(.!
()
'. 1 ~
1
250.
!.I
shown. Using t'hese, values, F"tes ts wère carried out for one and three
degrees of freedom to determine t~e significant effects (Table IV-3-b).
At 5 and 10% le~els of F-tests, mélt temperatu~e and vacuum nressure , ct ' t" .
were defined as the most Significant factors effecting mass tran~port
coefficient of bismuth and le~d.[120]
Method b.
In Table IV-4-a estimation of error varianée from duplicated experiments o
(Experiment F-l was auplicated tn experiment F-I-X and experiment F-) was
'duplicated in test F-~-X) is tabulated. Using these values, again F-tests
were carrled out ~or one and two degrees of freedom to de termine the
slgnificant 'effects (Table I~-4-b) for both bismuth and lead. Similar
results to "Method ail were obtained and sign1ficance levels were much higher.
Factors:- melt temperatute and vacuum pressure, were determined as signifi-
cantly effec,ting the overall mass transport coefficients of both bismuth
and·llead at, the 1% level of F-test. ~
Also at 5 and 10% levels of F-test the f~teraction effects of ,Be and
AD were found to be s~gnificant (Table IV-4-b). The effects of interactions , - [120]
were further analyzed by the two~ay ,tabl~ of total effects (Table IV-5).
The interaction effect of AD seems'to be sllghtly highe~ than BC, 1.461~
compared to 1.3g3 for Bi and 2.158 compàred to ~.089 for Pb. Since the
difference is....,so small lt is ~ifficult to separ~te tbe interaction effe~ts
of AD and BC from each other. Table IV-S indicates that combined effects
of decreasing vacuum pressure anidecrea~ing ~onden,er distance to mel~ surface thus again combined effeé s of increasing melt t~perature and
1 1 ~
increasing A/V can have positive effecta 'Ion ~i and Kpb·
l,
\
~=-\ -:-:_- ..
1
1
1
l·
1
,i
. "
1
! 1 i

, t .,
\
'\
" __ ... ___ ~~ •• _,~_' ___ ",,,,,ri_"""""<~ 0',"""'-""" ,--_ .... , "".' -<'~. -"' ... ,,- ... --~<..'" ~ ~ "-A ï' ~ "' ... - ~'-<'"'- - , _~ .... ~.,.~J" .... .",..., _~ ___
.. ,
n < --../
Experiment Number
F-2 ' F-1
F-3 \.
F-4 }i'-5
F-6
F-7
F-8
Total
,~
'\
"
"
TABLE IV~l. Calculation of Effects and Mean Squàres by Yates' ~et~od ~ Bismuth
Responaes -3 K{lO cm/a)
1.127
0.611
1'.337
1.108
0.652
0.389
1. 794
0.991
8.009
Cl)
1.738
2.445
1.041
2.785
-0.516
-0.229
-0 • .263
-0.803
(2) (3)
4.183... 8.009
3.826
-0.745'
-1.066
0.707
1. 744
0.287
-0.540
-1.8Ù·
2.451
-0.253
-0.357
-0.321
1.037
-0.827
M~an Eff~t
(Col. 3) /4
-0.453
0.613
-0.063
-0.089
-0.080
0.257
-0.207
Sum of Squares*
(Co1.3)2/8
0.410
0.751
0.008
0.016
~0.013
0.134
0.085
1.417 .
Effects Total Measured Effect
A
B
AB,Cn C 0
AC,BD
Bp,AD
n
-l.S1'1
2.451
-0.253
-0.357
-0.321
1.037
-0.827
~
Degrees of
Freedom
1
1
1
1
l
1
1
7
*Arithmetic Check: '\ 2 2 2' 2 2 2 2 2
Sum of Squares = (1.127) + (0.611) + (1.337) + (1.108) + (0.652) + (0.389) + (1.794) + (0.991)
" (8.~09)2 = 1.418' c'
" " /
------_._-_._-_. - ------_ .. _-_ ... " .. -'" ' - -~-~--~ --- ~ -,--- -- - ~--~ f:--
IV IJJ ....

1 ,
••• 1 .... 1(_ ; ! ) d t tUilg ,. NI.''''_ JQi -. '" ; ,_..............: ~-~ .. ~ .. ~~, ~ -,,,,._. -.' ,~P-,--~-- .~~-. r:'J .~
, ,-.
/
'\
9
~
/ /
1 \
TAB~,IV-2. Calculation of Effects and Mean Squares by Yates' Method - Lead
Sum of Responses Mean Efrect Squares* Experiment
-3 2 Effects Total Number K(10 cm/a) (1) (2) (3) (Co1.3)/4 (Col. 3) /8 Measured -Effect
F-2 1.795 2.502 6.149 12.032 '\ -. F-1- 0.707 3.647 5.883 -3.262 -0.861 1.336 A -3.262
. F-3 2.215 1. 706 --1.871 3.616 -0.904 1.634 B 3.616
F-4 4<- 1.432 4.117 -1. 391 / -0.034 -0.009 0.0002 AB;CD -0.034
F-5 1.116 -1.088 1.145 -0.266 ::-0.0~7 0.009 C -0.266
F-6 0.590 -0.783 2.4.71 b~480 0.120 0.029 AC ,BD 0.480
F-7 2.521 -0.526 0.305 1.326 0.332 0.220 BC,AD - 1.326 '\
0.052 F-8 1.656 -0~865 -0.339 -0.644 -0.161 D -0.644
Totai 12.032 3.274 l
*Aritbmetic Check:
--
Degrees of
Freedom
1
1
1
1
1 -,
1
1
'7-
"'l. ,
Sum of Squares - (1.795)2 + (0.707)2 + (2.215)2
~2 _ 3~Z74 + (1.432)2 + à.116)2 + (0.590)2 + (2.52~·)2r~K
\ ~
/
\ '1
N V1 ~ .
'f
"
;0
,/

i ; , ;
f (:
\
"
r t ,
!
\ (')
'j ~ .-
()
l
TABLE IV-3-a. Estimation af Mean Square from Twa Factor ~nteract1ons
Interactions Bi Pb 1
AB,CD 0.008 o.oook \
\ 1 i AC,BD 0.013 0.029
\ BC,AD 1
0.134 0.220
Total sum of squares 0.155 0.249
Number of sum of squares 3 3
" ~::~
Mean SUDl of squares 0.052· 0.083
t'i~,~ ..
';L~
~
r~ /) "
" 1 - ------~--- -~-"~ .. -----____ .... ',,_,. .. _II1II. ___ _
253.
\ 1 1 f'
1 1

(
---0--
(1
'If 1
- 1 254.
TABLE IV-3-b. Ana1ysis of Variance Based on Interactions (Determination of Significant Eff~cts. F-test for l, 3 degre~B of ffeedQmJL_
BismUth:
% Leve1 F-va1ue
10 5.54
5 10.10
2.5 17.40
1 34.10
'\ l.ead: ,
% Leve1 F-va1ue
10 5'.54
5 10.10
2.5 17.40
1 34.10
x
x
x
x
x
x
x
x
, ,
. Mean Squ.
0.052
0.052
().052
0.052
Mean Squ.
0.083
0.083
0.083
0.083
---
---
Significance Leve1
0.~88
0.525
0.905
1. n·3
Significance Leve 1
01.460
0.838
1.444
2.830
- -'- .. _---------_. __ ............. -------'
'"
Significant Effects
B,A
B
Signiflcant Effects
B,A
B,A
B
1 •
. '
'._--
l' 1 1 1
1
1
1

255.
, !
;TABLE IV-4-a. Estimation of Erl'cr Variance From Dupl1cated Experimttnts
Cî ",.
l
• 51! 'i '

(
, i f.
1.'
- ,
, t () :, r
1 ~
1 i
t t 1 1
/ /
C)' •
'>l J 7
~ ---~-- -- - -- - -_. -.--, 1 1
1
256. 1
r
0
----------
TABLE IV-4-b. Analysie of Variance BaB'ed on Estim:ated Erro}:' Variance, F-Test for 1" -2' Degrees of Freedom
Significance Significant % Level F-value Error Variance Level Effects
10.0 8.53 li: 3.l25xlO-3 • ,26.66xlO '::'3
B.A.BC-AD
5.0 18.50 3. 125xlO-3 . -3 B,A,BC-AD x 57.8IxlO
Bi <t
2.5 38.50 x ' 3Q.125xlO-3 - 120. 31xlO - 3
B.A ,
1.0 98.50 li: 3.125xlO-3 - 307.8WO-3 B.A
..... 10.0 \ 8.53 • x 13.45xlO-3 • 0.115 .1 B,A,BC-AD
5.0 18.50 -3 0.249 B,A li: 13. 45xlO • Pb
13.4SxlO-3 '~"I.:
2.5 38.50 0.518 B:A li: •
98.;J , ,
13.45xlO-3 ' '
';'-::'1.325:_"" '. 1.0 x • ._ B ...
~ .. ~f •
~ e.-,0 ....
,1
. ~l ... , ,
,.' .. a >
: " .. ' ~'- .
......... ~.;" : 1" l ,.
.. , . ~ . . , . "... ~ . .' .~
.- •
11.), ~
• / , ,
-!
'" il/ - ! ' ~I
• ! ~_"- _ t
-~------~---
1
1
.<>
li ;;..
-,,-.-.---,- --

,) , ! , \ ~
1 , \
f
1 > t
J' .~ i
f· f (
'f t ,-
ll50·e '(-)
l J l2S0 Ge
(~)
Laad
,\ ~ uso·e
, (-).
\ . 12S0·e t+)
,,(), \
'~ ,
\
.; , , "-..
•
, .
, '" o -.
~. TABLE IV-5,. ~ ,"" . ' \
Analysrs\of Interactions Be and AD , ,
, -1 , 6.70 m P , (-)
\
1.127 ~ 0. 869 1. 738
1.337 " b!Q! 1.223
2.445
..
-1 6.70 11 , . . (-)
1.795 odén \ 1.251
e 2.S02 ~ (.
2.21S 1 1.432 "1.824 - , 3.647
\ "
t
, .
, ~.
.-
"1
\
.
l
10.20 m -1
(+)
0.652 0.389' 0.521 --, 1,..041
1. 794 0.991 1.393 -2.785
-1 10.20 11
~+)
1.1U-t 0.853 \'0.5.90
-----:--. ' 1.706 ~
2.521 1.65~ 2.089 ........ 4.177
;'eo
l'
.~
,-
, "
<2 cm (-)
1.127 100lJHgJt 1.794 1.461 " (_) J """""""-
2.921 ,-" ,
,.....,300lJHg 1.108 " 0.389 0.749
(+) 1 1.497 1
1
"
? .;
'<2 cm
~ ,.. (-) '"")
1. 795 ...... "
b1ll.J 2',158 =-
4.316
1t432 ~
3OÜ1lHg ,0'10590 1.011 ('+)
2.022 , 1 ~
, ,
257.
..
....
>67 cm (+)
.337 0.652 0.995
1.989
0.611 Q.:lli 0.801
. 1.602
~,
>67 cm (
2,215 !.:.!l& \
'3.331 . '-0.i67 l:.ill. 1.182 .. 2.363
~ .
/ 'ï
J
( ,
'II
. ..
" lit
t
\ i r h ; j !


259. !
V-l.' ANALYSIS OF CONDENSATE
1
1 Water cooled condenser"was used in four experiments and this was held
\ within a distance of 1.5-2 cm abave the melt surface. After the experiments,
condensa te accumulated on tb;e éQndenser was, removed, weighed and ground. ~
Metailie draplets were separated from -100 mesh size powder by screening. l,
\
weighed again, and chemically analyzed separately. tlsing the chemieal \
analysis,. the amount cJ!IJ bismuth and lead in ~~ condensate were calculated.
Then from the initial and final contents' of bismuth a~d lead in the 'copper.
the total amount of element evaporated was determined. Finally. the ratio\
.L't \ of ,amount of element accumulated on the condenser ta the amount of e1ement
... ljj
. '
'\, evaporated was calculat,ed. The details of ca1culations are given in Tables
V-l and V-2.
V-2. COPPEl LOSSES·
The amount of capper charge used was weighed before and'after each
experiment and recorded. Then the ratio of the weight difference ,to initi.l
coppeT weight was determined and tabulated as appro:m;Lmate copper loss weight, % , , '
.in Table V-3. The -reasOn it was called approxima te was because ;t.t cpntained , ,
, the splashes and the amount of impurities evaporated. . , î
J 1
l , "
, . .,
:..

1 ,1
j , '~
i ï
rI
~
",. , , ~ i
1
~ 1
1
/
r'., --. 1
'-.....,/'
d> • /
/
TABLE'V-l. Analyses of Condensats Accumulated on Condenser
ÂIKlUDt of -100 Mesh Powder Condensa te Accomu1ated -100 Heah wt% veight. gram Ketallie
Test "Pre ••• Ta.p. On Conden.er Povder Bl/ Pb,
Droplets Ho. J,lBg ~C gr_ graa __ Bl Pb 1 II
gram
'-2 100 1150 ' 53 34 14.5 70.8 4.93 24.07 19
"-4 300 1250 73 27 13.7 68.6 3.70 18.52 46
1'-6 3(10 1150 34 7 10.7 42.9 0.75 3.00 27 P_101 • "100 1250 128 50 10.5 42.0 5.25 21.00 78
1. :tùe - 240 m1.n.
TABLI!: V-2. Distribution Ratio ta Condenser
BiBllUth "Lead
Eliainated -ETi1ll1na ted T~t Initial. Final, 'li8ight, gr_ Initial. " Final, veight. gram Hoo' we% vtt V "t% vt% VI
1'-2 0.090 0.046 14.96 0.333 0.130 69.02
F-4 0.060 0.033 <J.18 0.215 ',e;P98 39.78 "-6 0.032 0.025 2.38 0.080 0.054 8.84
Q. 1'-101. 0.044 0.005 13.26 0.126 0.0'03 41.82
l. Tbe • 240 ain.
"
f ________ -----------------------.............. --~-....... -------... 'L-,... ..... _ ~~ ____ """~
;.
Metal1ie Droplets
vt% veight, gram
Bi Pb, Bi Pb , 'lU IV
16.7 72.2 3.17 "13.72 3.7 12.7 1.70 5.84
4.5 13.1 1:22 3.54
0.2 0.9 0.i6 0.70
" /'
Distribution Ratio ta Condenaer, we%
Bi (I+III)/V
54
59 83
41
Pb (II+IV)/VI
55
61
74
52
s
.-
Total veight " gram
Bi Pb I+IlI II+IV
8.10 37.79 5.40 24.36
1.97 6.54 5.41 21.70
"
"'"
IV 0'1 o
"
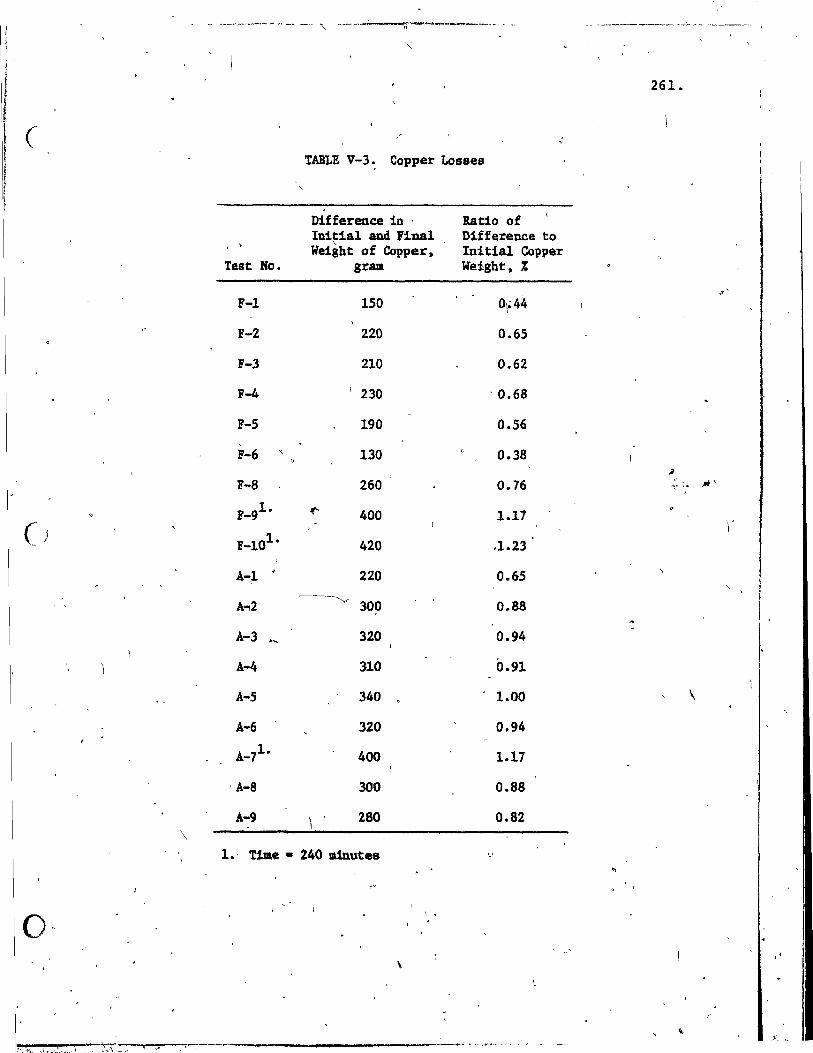
j'
i i C 1 ! r
()
261.
TABLE V-3. Copper Losses
\
,-'

:1 '
()
1
) .
~' : , ,
>'.
-_.---------
APPENDIX VI
COMPUTER PRDGRAM " '
\
" ,
\
1
, 1
: 1
Î
. , .
, \

(, ( f
1
c C C C
LISTING e, THE CGMPUTER pROGRA" W"ftS! TRANSFEft éOEFfICIEMTS· A-t BI '
O'I"ENSUJN )(1«20). Yi (20) _ 1
REAL ".KL.kE.PYRP.PYRP1."I"P.OR"R.HCU.KU.KOAS.K.RGRS.RAO. RCU CRLL PLOlON ~ , Olt 10 1-1.20
C. 0 g' RE~D THE DRTA ~, CHANGE ~ WEIGHT PERCENT 8' I"PUAITIES 8T,TIME
\ftERO (5 ... ' xun: Yi UJ IFen UJ .EQ.O.OIGO Te 15 CONTINUE la
c c pLGT LGG." C"AHGE 0" MEIG"T PrERCEHT tiF IftPURlTY al T litE c '
15 r-I-l
20
30
35
~l U+1) .0,0 Xl U+2) -SO.O
Yl u+u--s.S YI U"'21-0.5
CALL PLGT (1.0.2.0.-9) 1(-1.0 y-o. a
, D~ 20 H-l.S CRLL PLOT tx.O.0.2)
CRLL PLeTrx.o.l.2) , ,CRLL PLeT (X.O.O.3)
X.X"'1.0 CtlHllHUE
CRLL PUT (s. O. 0, O. 3) Y-l.0 x-s.o DO 2& H-l.7
CRLL PLOT (X. Y • 2) CALL PLOT (X-O, 1. Y • 2) CRLL PLOT (X ~ Y • 3)
Y-Y+l.0 CONTINUE
1 CALL PLOT (5.0.7,0.31
1 X-I&.O Y-7.0 .,.~
"----nI' 30 H-\.5 -a.LL PLOT (X. Y. 2)
" . CRLL PLOUX. Y-0.l.2J CRLL. PLtJHX. t. 31 X-X-l,O CONTINUE CRtL PLOT(0.0.7.0.SJ x-o.la ' Y-e.o
, DG 8& N-t.7 CRU PUT (X. Y.2J CALL PLOT(X<f'O.1.Y.2J
tALL PLOT(X.Y.S) Y-Y-l.O
CtlNlIHUE x-o.O
Y·-0.8 , ,..0.0
OG 110 H-l.5 IF fF.EQ. ao.O) x-x-o. 15
1 .
.
;
263.
1"1"
i
.1 • 1
i)
! 1
1 J
1
1 1 ,
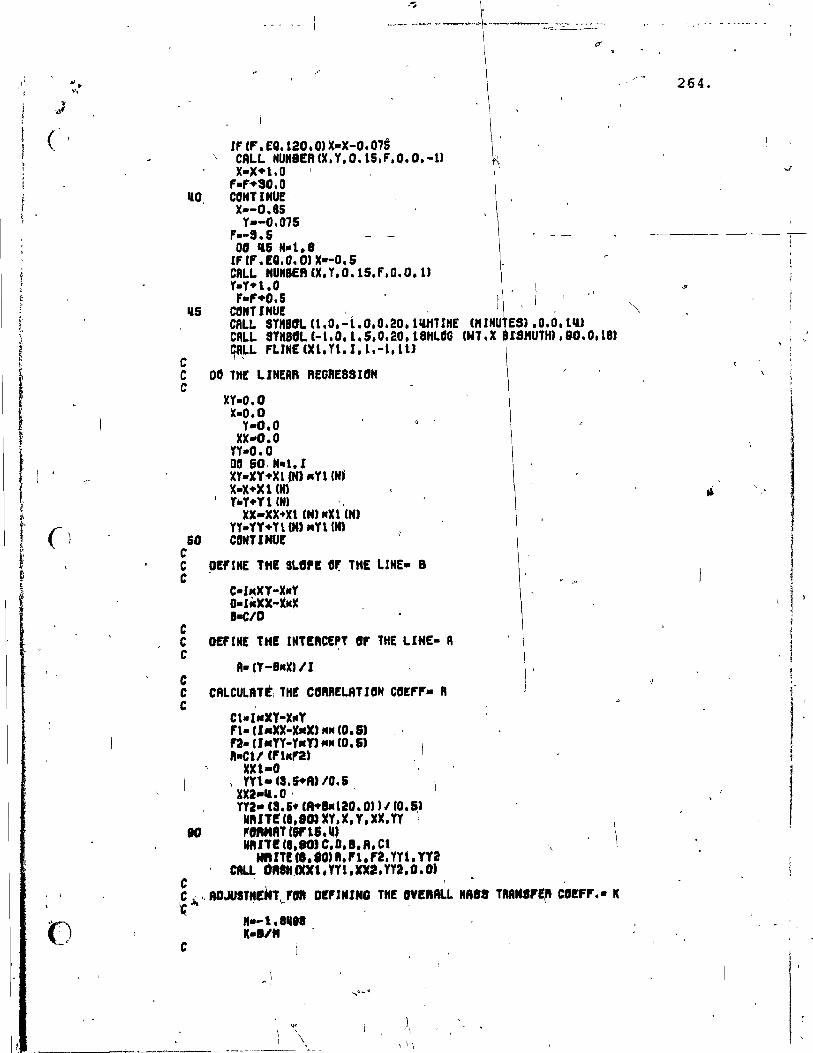
"
, ,
c c c
50 C C C
c c C
c C C
80
, -' " 1
IFlF.EQ.t20.0JX-X-0.075 CALL HU"8ER ex. Y. O. 15. F.O. o.-u X-)(·1.0
F-"·SO.O CONT 1 HUE X--0.85 Y--0.07S
F--S.S DO U H.l.8
IFlF.EQ.O.0)X--0.5 CAlL HUMBER lX. Y.O.1S.F.0.O. U Y-Y"1.0 FlllfI'·O.S
CeNTJHUE ' CAlL SYMBOL u.o.-LO.0.20.11&HTIHE ("IHU ES) .0.0.1IU CAlL SYMBOl. (-1. 0.1.5.0.20. 18HUG (14'. X 18"UTH). 90.0.18) ÇA!-L FLlMElXl.Yl.I.1.-1.1U
oc THE LINERR REGRESSI.,N
xr-O.O x-o.O
Y-O.O xx-o.O
n-o.o ot! 50, H-l.1 leY-XY"Xl lN) Rn CNi X-X+)(1 (Hl
\ Y.Y+YI (N) ,
XX-XX.Xl (M'RX1(H) n-'(Y.n (M' Rn (M) CeNTlHU!
.DE"NE THE SlaPE O~ THE LlNE- 8
C-hcXY-XMY Oa''')(X-XlClC a-CID
OEFItIE THE INTERCEPT ", THE LIHE- R
R- CY -S .. ,u Il CAlCULATtl THE caRRELAT UlM COErr- R
, Cl-r .. Xy-x"y Fl- U .. XX-,,,.X) .... (0.5) ,a-CJ .. YY-YRYJ_ICCO.SJ R-CtI (fl .. n)
XX1-0 , YYl- ct.S"A' 10.5 xxa-lI.o ' lY2- (3.&" (A.a.120.0l)' lO.51 NIUT! Il,SC>> xr.x. Y.XX. Y1 1
'eMA1 lS"15.14, NAn! (8.80) C.D.8.R. Ct
NftI1fCI.tG,R.fl.fa.YYt.Yr2 CALL DMIUXX1. 11'1. XX2. na. 0.0'
p ,.
,
\ \
C' • ~ .t. '. RDJUST~m 0--'. DE'JNIN~ THE IJVEIIRLL "AtS T"AM.!!'" COEF" •• Je
c " .... t.8" .. K·'/JI
~ \
) '1
-----.;.., .,~--------
264.
• .1
---- ----,-,
l "
! l ' 1 1
i

" 1 , r !
1 . i , 1
'1 1 f
, 1 , , ; f 1
f
i
! ( i , , i
f
, .
C CALCULA TE THE MASS TAAHSFER CCJEFF. IN LIQUID PHflSE- KL C
C
, RRo-8,85 kL-O. 0 le. ( Cl/AAD) "ICO. S) "CU-SS.SIA
TEJtP-U2S.
265.
----G-C----éCALGtlLATE THE DEHSJTY-8P'--6tJPPER-RCU C
-- ---------
ftCU.7. 938-0,,7882"0. 001" (1E"P-1358.) Cil C CALCULATE THE ACTIVITY CG!f'F. ct, IM'URITY. GAMA C
C
Tl- ueOO./TE"P) -0.885 GA"A-tO. O"MT t
C CALCULATE THE, VAPaUA PRESSURE G~ J"PURlTY. 'YAP C
c
PVAPl- (-101&00./TEMP) -1.28 .. ALGG10 nE"p) .12. SS PYAP. 10. O .... PYAP l
EX-l.O MIM,-208.0
C CALCULATE THE MASS TRAHSFER CGEf'f'. OF EYAPORAT laN- KE .,-C
Fl-(QA"A .. "CUl/RCU Fl-'t .... !X : .,,?
F2-(MI"'ICT[MP)"ICO.5 FS-0.OS8SIC'YAP/F2 KE-,S .. fl
g C,LCULATE THE MASS TRAHSfEACOrf'f'. IN THE CAS·' PHASE IFRG" K'rL.KE
1.K .. KLICKE u- (KL .. kE) -1( .. (KE1'KLl
kU-IIZt . IOAf"2S82.S8 la-ftCUI (GA"A .. MeU) lS-Z2 ... e:X
.' lIl·KUICU"'IIROAs .. n . KOAS-I,I'YAP 1
NAlTE Ut. LOO) B.ft,K. KL. KE,KU. KGAS.RAD, TE"P,ACU.PYAP. GA"A,9 _ LOO 'O"Al ('l' .111.10X. '8- ',ftS. 7 .1.10X. 'R-', FlS. 7,/, tOX, '1(.' .FlS. 'li
l 'C"ISEC ',I.lax. 'KL-',FIS. 7, 'CM/SEC'.I.l0X. 'KE-'.FtS. 7, 'CM/S[c '.1, HOX. 'KU-' .fts. 7. 'C"/SEC '.1, lOX. 'KORS.'. F13. 7, 'CH/SEC' .1.lOX'.
- ",'RAD-',"t3.'1. 'CM'.I.tOX. 'TEMP-'-,Fts. 7. 'IC'd,tOx. '''CU.'.fts. 7, 1 'GJl/CC',I.lme, 'PYAP.'.FlS. 7. 'M'.I.lOX, 'O,",A-'.F13. 7. 1I.10X. 'A-'.ns.?)
CALL EMorLT < STDP .
EHD
/
, .. ,_._"'""-----
, ---1-
1
) 1
1 1 l J ~
~
- 1

/ j
:
,
,fi
o
- ~_ .... _- ...... _ ................. ---,.-~ ... ~ . .
APPENDIX VII -------
( ;
THEBMOD~C CALcm.ATIONS WITa
l.A.C.T. SYSTEM
\
1
266.
''\
L'
1 1
! , i
i
1 i 1 1
.. 1
y
, " - ,

267 .
. . i
1 VII-l. ESTIMATION OF EQUILIBRIUM TEMPERATÙ:tmS •
AT WBICH METAL,OXIDES FORM
1
Vi t 1 (, /
Il '
f ..
, '

.~~~, 1< 4::;'''''~~'''4ijJO'I@id)'''N'~r~~~~ "'~lol_ ttÇ$'--.a~!!'~~r~-"'~"""""""''''~' -~,.,.......-.".,,,,.,.< ... -.....--.. --___ ..
1 1
l 1
-- - "-
f~
/ ---;,
- 1
xxxxxxxxxxxxxxxxxxxx~xxxxxxxxxxxxxxxxxxxxxxxxx~xxxxxxxXXXXXXXXXXXXXXXXXXXXXX~Xx - 1
1
=1 ,
o .502 2CU of CLJ:?D CT, .• 000658,l). (T,.000658,ûy.0001316) (Tp.000650yL)
CAlCUlATIONS ARE BASED ON THE INDICATED NUMBCR OF GRAM MOLES
*****~******************************************************************~<****** \ (T) 'DEL Té H DELTA G DELTA V - DELTA S [tCl fî, U 1 DEL Tt) ~î . (K) (CAœ, (CAL) (L) (CAL/K) CCnL) 1 (CAL)
*******************************************.~*~:****~:**~,*,l:~,:~******:l:************** l'
l'
-
* U39.1
/d
, * -32294.7
o 0.0 -O.7)10EI-05 :m.351 :3.11"s:!.8 1131.j-
xxxxxxxxxxxxxxxxxxxxxxxxxxxxxxxxxxxxxxxxxxxxxxxx;:x~xxXXXXXXXXXXXXXXXXXXXXXXXXXX
,
VOU DO (1) OR You DO NOT (2) WIS~I,TO EX~"INC PHASES AND rCNrCRA1URE RANGES ?
fif
~ L-__________ ~~ __ ~ __________________ ~ ______ ~ ________ ~ ________________ -, ______________________ ~ .
.J~_ ... """""_~ ~~""'''''''''''''''I ..... ,,,,_.....-~_ "-~~ .. ~ .... w~~~ ....... ,,.,.~ ..... ____ "'~_".""''''''''''_''' ....... .... """,-!O .... .......-•• -.... ___ 'H_, o ~
,,-,,-
/
l'V CI co
,

'"
l li t*.'i ~ x:%S~ "' __ ~--'_~""71'W'tC" ~"""," .. ~- ~"""~4"'>~~"~"""" ~ ~, .,.,... ... -........,. ';. - V''- ......... ~ ~~ -,.. .- "'-..... ,~. ~ " -~" .... ~.,.... " ............... ~ ..... -~ .... - ... -
'" " ~' ~ ~"---- ------
~: ,...,
xxxxxxxxxxxxx.xxxxxxxxxxxxxxxxxxxx.xXXXXXXXXXXX~{XXX?<XXXXXXXXXXXXX){XXXXX}~XXXXXXXXX
j
~BI t 1.q02 (T, .000658, l, .001> <T ~ .0006501 G·, .0001.316 >,'
DI~03 _. (T, .00065S,U
CAlCUlATIONS ARE BASED ON THE INDICATEb NUMDCR or OR~M MOLES
**************************************-***********************:1,***************** CT) DELTA'H' DELTA G DELTA V DELTA S DClTA U DELTA A (K) (CAU (CAL) (U (CAl/l\) ( CAL) " (CAL)
.*.*******************-*******************************~:*****:~.f.;t}/;;:~;:{*************.** l'
?
Id
* 933.8 *,
-111138.0 o -0.1 -0.176E~0& -118.37? -108339.3
\ 2798.5
xxxx~xxxxxxxxxxxxxxxxxxxxxxxxxxxxxxxxxx~xxxxxxxxxxxxxxxxxxxxxxxxxxxxxxxxxxxxxxx ,
YOU.DO (i> OR VOU DO NOT (2) WIS.' TO EXAMINE PHAses AND TfMPERATURf RANGES ?
~ '\\
l, ~>
'-------------------------"'-----------"---- -_. --- - ---- -~----
~~
--...
<Ill
\
\.
N 0'1 \D
t.
l)'
. .J; ~

6t:?'~ _ R je • a:;g ;t",~ "*::::::S; .......... ,;: ..... :& •• ,~,-....-<',.1' •••• 1'.~"
-.. '" /
--/ -
6>
-r
o'
-'
-,-------- - - --
-1
XXXXXXXX~XXXXXXXXXXXXXXXXXXXXXXXXXXXXXXXXXXXXXXX~XX~xXXXXXXXXXXXXXXXXXXXXXXXXX ~
#
2BI - f· (T~+0006~8.Gi.001)
"
Q , 1;502 ~
(T,.00065~.G,.0001316~
>
_ D1203 (T,.000658,L)
CALCULATIONS~ARÈ BASED ON THE INDICATED NU~~ER OF 'ORAM MOLES --
1:>
*~********************~************************************************~****~** (T~ DELTA H DELTA G DELTA V DELTA S DelTA U 0 DELTA A . otT (CAL) . -(CAL) - '(L) ~ (CAL/K) (CAL> (CAL)
********~************n*******.********~*****************:t..1:**~:******#********* or ;.
.. * . 1043.1
{, '-
/d
. * o -202820.2" 0.0 -0.455E-i06
"
-194.431
11'
'"
.-1
l . ..., ~ j
1 <;'~5,~ 'l. ~' 7255.t
XXXXXXXXXXX~~~XXXXXXXXXXXXXXXXXXXXXXXXXXXXXXXXXXXXXX~xxx~xxxxxxxxxxxxxxxxxxxxx ~ '. '. '-.. ." ç .'
y~U DO Ü)O OR .YOU rio NOT (2,) tJISU TD C~ù'~d'tIUE PHASES .~tm TCrH'[rMTUf~t RANGES ?, •
\ - ..... j •• .-;
.~
• • ~. " ,
(0
..... ________________ ...... ------________________ -'11--______ . ___________ - ______ -_ ---
c --------_ ..... - --- - ---- --- -_._-"'---_ ...... -_ ....... ' - /" ~
« ..... Q ......
~
v \
1 -
Ci
\.
~ • -,
1 1. f }
IV ,
....a 0

! 1. 1
i
.. 1
1 ,1
1
,JE '" ;:; ,JMC ~ ------~-.,~ .. -~ ~~ .. ~ .. --~' .. ~ '-"'-.................................
--.., ____ ___ J_ _ _ _
~-xxxxxxxxxxxxxxxxxx'XXXXXXXXXXXXXXXXXXX)~XXXXXXXXXXXXXXxxxxxxxx~xxxxxxxxxxxxxxxxxx
~PB + ... 50~ -::: f'BtO (T,.000658~L~.004) (T,.000658,G,.0001316) (T,.OOO-S5DyL)
"
= CAtCULATrONS ARE BASEII ON THE INDICATEIt NUMBEr~ or GF:AM l"10LES
****M~~******************************************************~*~*~***t********* <T) DELTA H DELTA G DELTA V nELT~ S DELTA U DELTA () (K) (CAL), (CAL) (L ) (Cril /~~) (CAL) (CAL)
***********************************i~t****~********J*~***t********************* ?
? * 1000.1
Id
* -45371.6 o
'0.0 -O.624E+05 -45~3t-.!> --H377 ~9 993.8
'-'
XXXXXXXX;<:<XXXXXXXXXXXXXXXXXXXXXXXXXXXXXXXXXXXXXXXXXY-XXXXXXXXXXXXXXX)~X;(XXXXXXX:-<X
'(ou DO -(1) OR YOU [10 NOT (~) WISH TO EXt'.MINE PHASES AI'ID TCl"lr·c::r\I~.lURC:: r,(iNOC::S ?
(
, <
._----- ----- - - -
œ nI., $ q w' v· ........ ,. ..-....~.......,..,.-....._~ -------
~ -
,
If
-"',
\
N .... ....

1
1
c 1_
1
1
1 \
, 1 1 1 1
_~-=-__ .. _ ..... ."...-~ .. p .,......-c""!'-, -.- ~_~~-.--.-....-~ ,... -'A<~"t""-;~""--_-"':-<-;o..-.. ~,.,-_ - ")-- - -~- ----~- --~_.~-----_.
'.
r~ ~
'~~----------------------------------------------------------------
xxxxxxxxxxxxxxxxxxxxxxxxxxxxxxxxxxxxxxx~xxxxxxxxxxxxxxxxxxxxxxxxxxxxxxxxxxxxxxx
PD + .502 (Tv.000658,GI.004) (TJ.000658.0,.OOOL316)
-::: r'n:to (Ty.000658,L)
i[
- \ . CALCULATIONS ARE BASED ON THE INDICATED NUMBER OF" GRAM MOLES
****~***********************************************.************************** cy) DELT~ H DELTA G DELTA V ~ -DELTA ~ DELTA LI DELTA.A (K) (CAL) (C~L) CL) (CAl/K) (CAL) (C~L)
**,***t*****************************************.*************************.**** 1·
1) * 1091.3
/d
* ·-88992.4 o 0.0 --0.204Ef06 --81 ~ 540 ·~73?2 3253.2
~
xxxxxxxxxxxxxxxxxxxxxxxxxxxxxxxxxxxxxxxxxxxxxxxxxxxxxxxxxxxxxxxxxxxxxxxxxxxxxxx
'"
YOU DO (1) OR YOU DO NOT (2) WISH Ta EXAMINE PHASES AIID TEMPeRATURE RANGeS ~ - ~
'\.
\....-
---- -- -- ---- --.. -~------- --_. --------, _'tt-
1 )
------ --- -~.~-~------
o "'---
J-_
...
N -...1 N
...

1 j
i -, i-
l
1 0: 1
1 1
i -
,~ ~'
--------------------------------------------------------------~------------
'" xxxx-xxxxxxxxxxxxxxxxxxxxxxxxxxxxxxxxxxxxxxx'XxxxxxxxxxY.X}~XXXXX)(>:xxXXX>(XXXXxxxxxx
~AS + 1.502 ~T,.000658,G,.004) (T,.000658,G't000131~)
AG203 (T,.000658,l)
CALCULATIONS ARE BASED ON TlIE" HWIEA fErr NUMfIEF..' OF ORllM HOLES
*****************************************:t********-******;t,:::**:/cf:;f'**-***:t*,~*.t******. (T)·, DELTA 1/ DELTA 0 DELTI~ V DELTA S DELTA U DELT~1 A (~~) (CAL)" (-CAU (U (CAL l't,) . (CAL) (CAL)
***************************~**********~f*****t********************************* ~?
'j'
* lHO.3
/.J
," '" -28072~.1
o 0.0 ··0. 61.jE: {06 -199.049 ~7001~.3 9009.7
XXXXXX}~XXXXxxxxxxxxxxxxxxxxxxxxxxxxxxxxxxxxxxxxxxxxxxxxxxxxxx~<xx'XxxxxxxxXxxxxxx
VOU DO (l)'OR YOU no NOT (2) WISH TO ExnMINE PHASES nND TEMF'rRATURE RANGES ?
) \
~ --- -------
"
~~-... .-l ....... "' .... -<~~ .... _~ ~ _-.J. ' ........................ __ .-...... ..- ...... \ ___ -~ ~
.;
,....-... ,
-----l'V -..J W
\.

~!
,............
(') ---------
'1
c
\
cd ~
xxxxxxxxxxxxxxxxxxxxxxxxxxxxxxxxxxxxxxxxxxxxxxxxxxxxxxxxxxxxxxxxxxxxxxxxxxxxxxx
~SB ~ (T,.00065B,L,.004)
- - -
l 1.50~ (T,.000658,G,.0001316)
l'
.
SB203 ( r y .000':",58 y L)
~ 'CALCULATIONS ARE BASED ON THE INDICAT~D N~MDER or GRAM MOLES
o
******************************************************************************* 5T) DELTA H DELTA G DELTA V DELTA ~ DELTA U DELTA A (K) (CALJ (CAG) CL) (CAL/K) (CAL) <tel)
***********************************************************~******************* 1
l' * 1339.1
/d
* -15717:?O o
0 .. 0 -0.250Ef-06
-{
-----Ù7.369 153180.0 3991.9
0)
{.
xxxxxxxxxxxxxxxxxxxxxxxxxxxxxxxxxxxxxxxxxxxxxxxxxxxxxxxxxxxxxxxxxxxxxxxxxxxxxxx
~
VOU DO (1) OR VOU DO NOT (2) WISH ro EXAMINe PHAGES AND TEMPERATURE RANGES 'i>
2
,-
i'
---_ .... ,.,~-----_._----';.
",: ,
/.
-.
.... ....
~,
~
\'
N -.J
"'"
\-
------

l !
it*9 ; t 'kR"" ''(!l'':pt ,p 4iAJt j.. (~ .. ni ....... -.,..,.,.,.--_,. __ ... c't--~-;...." .. ~~-. t~':,~-t:: -,...-.-,?t'~.~"'''~''''''é~:;''';;-- 1: ........... "~ .. ,i~~I .... !:{~~t"'I._ ..... - ..... .......".., .. r; .... -~~_~~"". ~ ~ _ .... ~~ .... __ ,., _<' ...
p
~ 0~----------~----- ~
~,
XXXXXXXXXXXXXXXXXXXXXXXXXXXXXXXXXXXXXXXXXXXXXXXXXXXXXXXXXXX;(::~xxxxxxxxxxxxxxxxx
~SB ~ 1.502 = SB203 (T~.000658,G,.004) (T~.000658,O,.OOOL316) (Tf.OOO~50~L)
CALCULATrONS I~RE BASED ON fliC INDICt-JTED NUtffJEf~ Glr Gr~I~M MOLES l . Q \ ,
**********************************************************=**~~**************** (T) 'D~LT~ H DELTA G DELTA V DELTt-J S ÙCLT~ U DELTA A (10 . (CAL) (CAU (U ( Cf\L'~, ) ( CtiU ( CAU
******.~ t*********~****·*****.t*********************************'1:***************** ~~
:t 1384.5
'j>
/d
* -269308.7 o ~ "
0.0 -O.604EtO~· -194.~23 ::!5?6";"'O. B 9629.8
xxxxxxxxxxxxxxxxxxxxxxxxxxxxxxxxxxxx~xxxxxxx~xxxxxxxxxXXXXXXXXXXXXXXXXXXXXXXXXX \
YOU [tO < 1 l OR YOll no NOT C:!) WISf~ TO C Xr"lMINC PHAGrS ,")ND TLi'lITRflTURE rMNOE'S 'P /
.6
. - - -__ - -- ---J--..----::--
•
..
1
.-
~
- ------ --;.~~.., ... ... --. __ r ....... ______ ... ""- ,~~ ... , ........ "" ....... ....vo: ............ - ~/II$;~~.-.. ... _--- .. - ......
'"-
IV -..J ln
/
/
. 1 , , 1
~~~!
\

l , \ i J f, 1
t
" 1
(
, . , ,
1
If
VII-_2. ESTIMATION OF EQUILIBRIUM OXYGEN PRESSUREa
AT warcH METAL OXIDES FORM
1 /
1 276.
"

""_~"""lIot_~ ....... r--,_., .. ..,~,#, ........... ~_,...,.,,"~,, ~",,!", __ """ .. "'-""'~."'<"""~'" _.-,. __ ,. ___ ~.~t~ --'l:-, • .."....-~~ .. \"""-" ... -:ro---=v-~ '" _><:""'~~_ ... ~ --.~~_""~_. ____ ;
;~ ~I
xxxxxxxxxxxxxx~xxxxxxxxxxxxxxxxxxxxxxxxxxxxxxxxxxxxxxxxxxxxxxxxxxxxxxxxxxxxxxxx
, ,
2CU n'F:,L)'
.'
~
+ .502 (T,P,G)
:::
---.
CU20 (TyP,L)
?
CALCULATIONS ARE BASED ON THE INDICATEn NUMRFR OF OR~M MOLES
,-
***********************-*****.***************#*********~'**;l';~**'t'l~*;{:***:i~*:t*:{,******* ' <T> CP) 'DELTA H DELTA G DELTA V DeLTA S DELTA U (10 - (ATM) (CAL> (CAL) (l) «('(Il/I\) (CAL.)
***************************~~************~:*~'*********.I::f:~'~: ::'f :I::f ,~:I'*l****;f'*********:1< .J ' ' '?
o 0.0
o 0.0
o
0.25-1[107
o • .s~3[ { 0,(,
0.0 - O+:-!03t-10~,
~
21.739 J ~9520.3
20.003 -20?51 + 7
1 e . 185 -28388.1
~
----,-xxxxxxxxxxx~xxxxxxxxxxxxxxxxxxx~xxxxxxxxxxxxxxx~xxxxx~XXXXYX':XXXXXXX~XXXXXXXXXX
YOU no (1) or~ YOIJ no NOT (2} W ISII TCl t"XntHNC f'IIAGtn ,"1f}D rUif'[F,'IHURE r~tlNGESw
r
__ • __ l
-~---_""'~ ___ ~._'.h __ ~"",,,, ___ ,,,,,,,,, __ ~_,,,,,,,,,,,,,,,._,,_,,,,~~ __ ---
~
/
I\.l ....,J ....,J
...
. .

J
1 , i
1
!~ 1 1
1
1·"
1 !.
. ___ ...... ~ .. 4_..-.. ___ ~,~ ........ ..,...,.. .. ~._~4 __ ~ .... ' r
~ ~-
- - - -- -_. -- -
-- . ~XXXXXXXXXXXXXXXXXXXXXXXXXXXXXXXXXXXXXXXXXXXXXXXXXXXXXXXXXXXXXXXXXXXXXXXXXXXXXX
::?BI (T,r-,l,.OOl)
"? 1 • -50::?
(T,P,O) .1::1203 ,'(T,.f'rL 1
CALCIJLATIONS ARE BASED ON THE INDlcnrCD NUMDCR DF GRAM MOLES . , ~
,~~ ~~
*********************M**************~*~t****************:*t**********~******,** CT) (P) ftELrA H DEll fI , 0 ftEL,TA V llE.LTn S DELTA U 0,) _ (ATM) (CAL) (CAL) <L) (CtiL/ld (CAL)
*******************************,**************************~**%***************** '[
1423 * * 0 1423.0 O.483E· 01 -105818.4 '·0. l 0.363E104 74 .• 363 -101576.4
l' )
1523 *' .
* 0 . 1523.0 0.247E-tOO -104760.5 0.1 -0.760E.t03 Ml .. -;'o.s --100220.1
l' 16::?3; * * 0
1.s23.0 O.102E-tOl -103717.9 0.0 -0.197E+03 ~3 .. ?O5 -9887(? <]
'j'
Id
:\XXXXXXXXXXXXXXXXXXXXXXXXXX;'::XXXXXXXXXXX-XXXXXXXXXXXXXXXXXXXXXj:X'(XXXXXXXXXXXXXXXX
YOU DO (1) OR YOU DO -NOT < 2) WISII rD [ÀM1INE PHASES tlNII TEllr'ERATURE r,.!\NGES l' r
, "
---y---- ---- ----------- ... .....- ....... ,--...... .--. ....... _~ - ~~~ - ----...... .......... ., ... ilrMb' .. t.' .. tirl.'I.' ....... ~~ .. lo-" .I< ... « ... ------~ ••• ~ ... ". __ .. ! .. , ~ ____ --
~
,
-=--::.~~J--
) l'V >-J
- (XI --
•
~
·1 ,
-:
"'"'1

." _______________ .... _ ..... _______ ..,.. ____________ .... ~~,.".....'t'l~ ...... ;'" ....... < .. _~~~ .. "" <- .-.. .,.... tI' .... =,' ... ..".~, - ... ~ ... ~ :> ~- ff"..r-~"'fI"''r -~..... --... -..~ç.;rr~~~~ .... ..".....,.I_ ...... ~J't .. ~I:tr _ _...,....,..~"""" - ... ".~"7t"'9"" __ ~..........-......... ___ _
j. 1
1 \.
f
-~ ~ ~
xxxxxxxxxxxxxxxxxxxxxxxxxxxxxxxxxxxxxxxx~xxxxxxxxxxxxxx~xx~xxxxxxxxxxxxxxxxxxxx ,
2BI + <T,P,G,.OO1)
1.502 / (T,F',G)
:::: B1203 (Tyr'vL)
..
CALCULATIONS ARE BASED, ON THE INDICA~TErr NlJMBE"R OF GRAM MOLES
***************~************~******************************t.t.***************~~~ (T> CP) DELTA H DELTA G DELTA V DelTA S DELTA U
• (~~) (tlTH) (CAL) (CAL) CL) <CAL/") (CAL~
********************************~***~****************************************** ?
1·123 * *' 0 • 0
1423.0 0.228E-01 -1'9.7496.9 0.0 ·0.179Ef 05 -138y7lJ9 -187598.9 ~?
1523 * * 0 1523.0' O.842E-Ol -196133.2 0.0 -0.520Et04 - 128.781, - 185539.7·
l' 1623 ~ - * * 0
1623.0 g,.. :!62E +00 -194785.6 0.0 -<f.170E f:04 120.016 -1831<76.9 ?
/d
. xxxxxxxxx-xxxxxxxxxxxxxxxxxxxxxxxxxxxxxxxxxxxxxxxxxxxxX;(xx~\;(~6o~0.xXXXXXXXX~XX)(XXx .
'yoU DO· (1) OR YOU DO NOT (2) ,WISH TO [XA.MH
.......... "0; 6 ... " .. ., .; J :;; (~ #$ ;:;;;se ..-; • ..,......, ...... J""'yta> , .. , ,lb """; ... _, • ...,~~''''-~----''V'''''> .......... ..." ... _~~~.'l"'- ~~~~::;1t,"',·"", /1(1)', _ .. ~,'-" ~~ - ~....,.. ~.z.,."'~~"" __ ","''''''''':r'''' ... ~~ 1'It'--'-~ ____ .,... ..... ____ ---...... p _ .. ___ ~
1 " !
.-"
\i
, , xxx~xxxxxxxxxxxxxxxxxxxxxxxxxxxxxxxxxx~xxxxxxxxxxxxxxx~xxxxxxxxxxxxxxxxxxxxxxxx
PB + (\T! F' , L, .004 )
.502 (T~P~O)
.." f'D:tO CT ,F'vU
CALCUL AT IONS ARE BASED O~,' THC- INDI etHED 2l1lMDcr~ ,or Or~tlM MOLCS
*******************************************~~***********t**$*********'********* (T) CP) DELTA H DELTA G DELTA V DCLTA C DCLTA LI (K) , (ATM) (CAL) (CAU (L) (C,"IL/t~) (CAL)
******t**~~**********************************************~*f****Jr************* 'i'
1423 * '"* 0 .J
14~3.0 0.53~E-Ol -43546.9 0.0 -0.110[1-04 30'(.I0~ • 4~13~.9 'f 1523 * -* o - ~
1523.0 Q.398E-'OO -431~_9_._0 -- - \~0.0 0.157C'03 ~[J v 315 4L1>10.0r< ? . 1623 * * 0 • 16~3.0 O. ~~9[f 01 -4~708.4 0.0 0.~?1r:fO~ ~':'.314 41096.2
J
Id
,-
XXXXXXXXXXXXxxxxxxxxxxxxxxxxxXXXXXXXX~XXXXXXXXXXXXXXXXxxxxx~~xxxxxxxxxxxxxxxxxx
" ~
YOU lIti 'U) cm YDU no NOl (2) WISH ru [X,"-l7HNC PII?ISI:.~; Mm rE'tlr'rI~rHUR[ r.:ANOCS "i' ,.
--""""'-
,"'''''1
'--
-"
t-.J 00 o
--=::::::

-t-, il
i
,1
1
tt ,. SA:A Z "PP' Il!1! ......... 'l.qçpf!&. '::l$' t •• ' , ~ ___ ~ ... ~""t"""",,""""""'~I"'0\"'~f""''''''''~. -.- ... ....,.,.,' ............ _< ... .".<--~-'1 ~ ..... ~.-'" - --""~ ........ ,..~--...... ~ ............. - .. - ,,~, .. <t.1!"_~VO_ ,:-.,...~ ~ ~ .... - - "--~. ,-"""'_" ___ "'~,. u_"""). ....... __ J .. ~""~"'t~ __ ~ ......
...
,~ ~,
r-"---< ------ -- - ---
---XXXXXXXXXXXXX'XXXXXXXXXXXXXXXXXXXXXXXXXXXXXXXXXXXXXXXXXXXX~;{X;<XXXXXXXXXXXX;<XXXXX
E'.S (TvP,G,.004)
+ .:JO~ (TvF',G)
f' !L1'(} (r~r'YL)
CALCULATIONS ARE BASED ON THE HUlICATED NUtWER or orüiM MOLes "
*******~********************~************************************************** (T) (P) DELTA H DFLrA 0 QELTA V DELT~ S DELTA U (~~) (ATli) (CI~U ~CAU ' (L) (CAL/I\) <CAL)
**;f:**** f*****,*-**********************:lC******************~~~~*~~~:*)I~~'::-i<************** .~
142,3 * * 0 1423.0 0.1041:-0J -86948.5 ('. v 0 O.951E-tOl -- 61. 102 02706.5
'i' \' l::- '-
-·1'-123, * * ()
15:23.0 0.705E--Ol -863~G.5 0.0 -0.:266E-f04 _ 5,s. 703 81813.4 l' 1623 * *\- 0
" :1623.0 o • :2:'7 Et 00 -85783.7\ 0.0 -0.801Ef03 I:"'"lï C\r_-C'" 00945.7 ..J ...... \J\J...J
'il
/rj
/
XXXXXX)'XXXXXXXXXXXXXXXXXXXXXXXXXXXXXXXXXXXXXXXXXX;~j~XX~,XX;{):)~;:X)\;:.XXXXXXXXXX-XXXXXX
"
'(OU DO (1) OR YOU DO NOJ (2) ,WISH TO eXr"rrHNE r'llAGCS IÎND rr:MPU<,ÎTlme r~ANOCS 'j>
~
~ ------
't
"
Il'
,~
"
IV co 1-'
---
" ~
, 1
-1 1
1 ! ! 1 i 1
1

... ________________________ ......... .-_.,......._ Fi~. Ilbt'lt;,'" ~~~~~~':. ......... ~-~U"_'l'J. ....... Jj''lI;: ... '"$..~~ ..... -.~~ """'--~"'.l''''~ ..... 't. ... ~,...:...f"'l,..,:;tlt~"" ~.~ .. 1'~~::.> ... ""I">'<""~' ... "1 ...... - ... ~~~ ___ ~_~ __ _
~ ~ 1
., -- --- -----~----- ~-- - -
xxxxxxxxxxxxxxxxxxxxxxxxxxxxxxxxxxxxx~xxxxxxxxxxxxxxxxXXXXXXX~XXXXXXXXXXXXXXXXX
2AS (T,P,G,.004)
+ 1.502 (T,P,O)
:;;: AS203 q;l
(Tyr",L)
CALCULATIONS ARE BASED ON THE INDICATED NUMBER or GRAM MOLES
•• • **~****************************************************************************
_ (T) (F') D~ TA H DeL TA G DEL TA V DEL TA S DEL TA U (K) - (ATM) (itAL) (CAL) (L) (CALI") (Ci>
****************************************************************~********. **** l' .
1423 * * 0 1423.0 0.184[-04 --280540.0
1'-1523 -1523.0 l' 1623 1623.0
1" Id
* -0.118E-03
* 0.597E--03
* -279183.8
* -277834.9
o
o
0.0 0.:!:!:!Ei08
- "
0.0 -0.370E}-07
0.0 -0.78H.-t06
l A.., 11::''") , ,~~ y ... J .....
1 fT+312
17t·1D6
'<;;..
~70650.0
2685S'0.2
2,!,t.545.7
, 1 1 XXXXXXXXXXX~XXXXXXXXXXXXXXXXXXXXXXXXXx"xXXXXXXXXXXX~XXXX;;1~ X,) XX},XXXXXXXXX)(XXXXX
",
~OU DO, (1) OR YOU DO NOT (2) WIGH TO EXAMJN~ rllAGES AND ~fMr[~ATURE RANGeS
~
~
~ "d ----------., -.. -------- -----~---~ .. __ .~-.r--I1-- 0' -
~
r
"
i.
IV 00 1'.)
i Î
, /
::;

J
1·
l 1 , :'
"
~ .
e
'1 et!S tn ~.lI_~& t;l'''I.'''''''<!-''''"''''---t~.'''''~---~~~~~''~~''''''--_~1.~~f_'''''''''''~~_--'-'t'''''''''''''''''''''_~_~~'''''1~''''''_--~~ ____ _
_ PI .. '~ , '/' .........
~ ~ - ~
r---I ~ - n - __ , _____ _
o .
XXXXXXXXXXXXXXXXXXXXXXXXXXXXXXXXXXXXXXXXXXXXXXXXXXXXXXXXXXXXX)-,)(XXXXXXXXXXXXXXXX
'" 2SB (T"P,L,.004)-
1.~Q2 (TvP,G) Il
~ SB~03 (T,PyL)
CALCULATIONS ARE BASEII ON THE INIIrCATED NLJMBER OF Gr~i?lM MOLES
, ~ -
***********************~******************************************************* ct) CP) DELTA H DC~TA G DELTA ~ DE~TA S,DELTA U ,(1\) 0 (ATM) (CAL) (CAt.) (U .. (C L/ld (CAL>,
*********************************************************;1:** ******************' l' 1423 1 1~3:0 0.877E-06
1" 15"3 . * ~ <\0- ,
1523.0 O.980E--Qg' l' 1623 , - * 1623.0 0.802E-O~ 'j'
Id'
* -156356.7
* -155398.9
* 0 -15445b.5
~
o .. 0.0, ~o. ~OOE+()9
o '0.0
o
O.l<;'lE-{on
0.0 --O.:!.49EI07
107l.878
'" j 0:21. 03~J
Il 95
1
1.167
• 0 Il
- 1'521 t 4.7-
150858.9
. 119.118.2
. '1 '
xxxxx ""XXXXXXXXxvXxvXXXXXXXxvvvXXxvxvvvv" vx"x"xxxx"vvv'" /J1, --" \<Vv vyvvVV" xxxxxxxx , r .. ./'\ " " " ... ,.......,... l'''''''' Ar, ... , .. " ... , .... , .r...A ... 'J ............ ,J ..... ."I''' .. '.r ............. '' ... ,\I' ............ , ... , .. ,'''...... "
VOU DO (1) OR" VOU DO-NOl 'i> , "
(2) WI81-1 TO EX~MINE F'1IÎ-1~:[·S I~ND TUW'U,ATLJRC r~('INGES
-\ ~ 'v---'..J
.., ,
o
./
N CO W
1
•• ... 1- - - ,--~-.- ----",- .. -- " -_ .. ,,-- -' -, --, .. - .~.--,---l ... __ ._cc ..• -. __ .. ...•. _-
! i-

( -=-
1
I~
... ~~ __ .,<-.,...",.",_ ......... _"...- _ .. ~l"_"'_~" ~,~~ .............. t • .,._ ..... '1!~.,......., ,,, -~ ....... ...,.,........._~_ ... ......,,.,,. _ .... _~ __ ,... ~_..,......--.._" ... ___ ._
f
• :-"\ --CO
/
XXXXXXXXX~XXXXXXXXXXXXXXXXXXXXXXXXXXXXXXXXX)~XXX~XXXXxXXXXXXXXXXXXXXXXXXXXXXXXXX
2SB (T,P,G,.004)
+
=
<T,P"lIG) 1.502 srC03
<TpP,L)
CAlCUlATIONS ARE BASED ON THC INDIC~TED NUMDER or GRAM-MOLES ,
******~************************************************************************ (T> (P) DELTA H . DelTA G DELTA V DELTA S DELTA U (10 (ATM) (CAU, (CAU <L ) (GAl/I-") (CAL)
******************************************************************************* l' . ~
1423 * * 0 1423.0 0.305[-04 -268744.1 0.0 - 0.134[:"'013 1013.057· -:~50046 .1
'1' 1523 * * 0
1523.0 0.180E-03 -267294.3 - 0.1 -0.243Cf07 -175.505 256-700.7 ? 1623 * * 0
1623.0 0;850E-03 1 - 265866.1- '-0.1 -0.548El-Oé, ,
16-3 .. ;;812 -254576.9 l'
/d
XXXXXXXXXXXXXXXXXXXXXXXXXXXXXXXXXXXXXXXXXXXXXXXXXXXXXXxxxxxxxy.xxxxxxxxxxxxxxxxx ... ~
/
'YOU DO t1) OR VOU DO NOT (2) WISH Ta-eXAMINE PHASES AND TEMrERATURE RANGES l'
~-------------------------------------------------------------------- --- --- - - ----.;...----- - -
\
"
~ -- _ ... -.... __ . -- ..... _------_ ..... J".-_.-----.-----ç---___ ----
." ,.-....,
~
IV co ~
.'.
i
1 ! ! 1
t ~ 1 1

-- ---_ .... _-~'- -.~,.-----"- - -- - -
ViI-3.. DATA
1"
.-.....
/
",
....
,".
- ..... ".,'" _,- - ~ r- --- -___ ~ ___ ~_ .. _ .!!~ ____ . --1 _-.: __ ••
~ ..
f8S.
1
1
1 1
Î • 1

~.Il 1 lU oz _ b 4 Ei' 1 lM] L!tS Q tA ua )j ... ~o\Iol'~"'''~.''~~''.'!:·,,'\I.''.!~~- .. ~""""'''.1'"l'' ~~~~~~~.l' ' .... ~~.(';'~-; ........ P"> ........... .F>~~~· ... i .. lO t ....... ", ~, .. "I.~ ~..."..t~ ""',.,. _", .... _~.>-__ ~~ ....... ____ ~ ___ ~ __ ~_
f -1
..
«
~ ':1 _ .... "",:-------...,..-------------_..:...._---------~----- ---- - --
FO~MULA: CU
NAME: COPPER
rORMULtI WEIGHT! "-
,
• 1 -PHASE' NAME
Sl SOLID LI LIQUID Gl GAS
, /
,
63.546
f~(\NGE (K)
:298.0 - 1357.0 1357.0 - 284é.o 2848.0 - 3400.0
Il H TRANG (1356.,s0 1\) -::: Il H TRANS (2048.00 1\)
y
~
~
3.170 (KCAL) ;':~. 743 (KCAU
CP = A i 1.0C-3*B*T(~) ~ 1.0C5*C*T(~)** 2 i l.ct ~*D*T(~)**2 ;<--"
******************************1**t***~*t************t***t*~ll~~~*************** PHASE D H298 5298 I1ENSITY ~ U C Il (KCAL" (CAL/K) (O/CM*~:3) (ClîL /1\ ) --
*************************************'********************************M***~**** 51 0.0 7.913 8.920 5.910 O.70~ 0.332 -0.0 LI 2.224 8.666 O+9~O 7.500 0;0 0.0 0.0 G1 79.200 37.954 IDEAL ~.C'O 0.0 0.0 0.0
/
REFERENCE: "THERMOCHCMICAL PROrERTJLU or INOROANIC SUDST~NC[n'f - 1. BAR.I N,O. KWiCIŒ, .""ND o. I\tfIlASCIIE.WSI\ t ~
SPR l NOUÎ -VEI:;:l AG ~ BEr,L T N y 1 <;',~ 7.
"
PRESS "RETURN" WH['N rŒAftY rem DtSr"LriY 1 'i'
~
/
-~----"'_"" _______ ~ ____ "' ___ ""'-",.J. ...................... ~ ------
/ "
'"
'",
r-.J (Xl
0\ 1
~
,t
j ) 1
i ,\ . 1
1 1
J ,

~*"i?"'hi;".:;;qOiJP!!FiJiCi 1&$ J4_ .. <tWiiP!ltllJlllf,iII_~",!SI(;'I!'''.~'''~-~~''~~'''_~ _ ... ~ _,.._ ......... .,-._<t"~,.,-~"'''' ...... .., .. ~.,., ... ,"""::'1;'> ....... ~~ .... ~~~ ....
--- "
/ ,---.,
FORMUU-\: DI
l'lAME: '!IIGMlITH /
FORMULA WEIGHT: ~Oü.98i
PHt\S[ NAM~ S1 SOLIn Li LHWID Li LIOUID 01 GAS Gl GAS G1 GAS Gi GAS
RANGE (K) {)
298~0 - 544.0 n" H TRANS ( 514.00 K) -544.0 - 1:.:!00.0
1200.0 - 1837.0 298.0 - 1200.0
1200.0 1-- 1500.0 1500.0 - 1837.0 1837.0 - 2000.0
/
2.700 (I\Cfll)
CP = A + 1.0E-3*D*T(K) • 1.0[5,C*T(Kl** 2 1~OE 6*D*T(K'**2 ~ , /'
..
*~**********************~*******************************************t********* PHASE D H:.:!98 8298 DENSITY ABC D
(KCAl ) (CAL/IO (G/CM**3) - - -- -- - - - (CAL /U - - - - -- --
*****************************************************t******:tt~**t******t**'** Sl~ 0.0 13.560 9.800 ~.D32 i.~D~ 0.981 0.0 L1 2.216 17.208 9.800 1.515 2.479 4.957 0.951 Ll-' 2.838 18.695 9.800 6.500 0.0 0.0 0.0 Gl 50.400 44.,s70 1 DCflL 4.968 _ 0.0 0.0 0.0 01 50.106 "44.601 IDEAL 1.952 0.013 0.0 0.0 Gl 50.137 44.734 IDEAL 4.886 0.057 0.0 0.0 Gl 50.508 44.84~ IDEAL 4.776 0.117 0.0 0.0
F:EFERENCE: • THErmod-lEMICtlL PROPERTIES or INORqflNIC ::;UDS1 ANCES· ~ 1. E:tif:IN, O. I\NACI\E, AND O. KUr:"'~SCIIEWSI\I y
•
SPRINGER VERLAO, BERLINy l~/l.
.,../"" -.
\
"'--" ", ('
•
/
- • --..... _~"-_L..-u....-~~ __ ,.~_..,~.oo<jO"O'-.. ~.,.. __ "'..."..,.-..-.......--- ~--"'----_._----
l '\ " ",1
,--
- .... " .. - ~ "'"'--- ~
--
\
IV C(X)
o.J
t
r

:1 i ~ .. l' l' 1
d :1
Il II Il r
'1
!
-
1
~
:
_F1
j'ORMULA: PB
~ (,ME t l.EAD
'ORMULA WEIGHT! 207.200
~,
PH/ISE NAME ~ANGE (f()
Sl SOLID 298.0 - - 600.0 Ll LIOU'ID 600.0 - 1200.0 L1 lrOUrD 1200.0 - 1400.0 Li lrOUID 1400.0 - 1700.0
""'"
\
, \
/'
D H TRANS ( 600.50 ~) = 1.141 _(f(CAU
Llo LIOÙID 1700.0 .. 202,s. 0 D H TRANS (2026.00 ~) - 42.530 (~CAL) Gl GAS 202() • 0 - 3000.0 ~
'i
CP =- A of 1.0E-·3*P*T<K) + 1.0E5-*é*T(~):I{){: 2' { 1.0r:: 6;~D:t:r (1\)**2
** ** ** *** * * * ** f* *' ~ * * ** * * ** ** ** * * ** * * * ~ ** .j::t: * * *JtilI: ** ,f: 1: *,:~ * f ~: * ,1,::. 'l, * ** ** 1.<* ** ** * * * * * *:!: PHASE D H298 0298 DENSITY n B C D (KCAU (CAL/U <G/CM:I' i(3) : (Cfll.'/'::) - - _. -. _.- ".
~******'******************'****~i******:*~*****************,**t******t********** Sl 0.0 15.184 11.344 5./09 2.00~-- ~.O 0.0 Ll 0,9~7 1/).053 11.34~ '7.765 0.730 ').0 0.0 Li 1.151 17.275. 11.314 7.1tO 0.195 0.0 0.0 L1 1.420 17.747 1:i.~44 ~.191 - 0.24,~ 0.0 ~ 0.0 Lt 1.618 10.0~2 11.344 ~.113 0~4~3 0.0 0.0 Gl 46.315 40.826 IDEAL 4.816 0.046 ~.945 0.6~6
?
REFERENCE: ·rl~ERMOCHE~icAl PROPERTIlG or INORGANIC OUBSTANCES· p
I. snRIN, O. KNACKE. AND O. ~uBntcl~WS~I, SrRING[R-VERLAO, nCRLIN,- ]"}7.
'y
PREss • RETURt.f" WHeN rŒ.ADY FClI~ DISf'LA-Y 'i>
-------- - -- - -- "~>I"""'''~~_-'':'~", 1"'- .",".I.~'1< ___ ~~;;O"",,~ ...... _;....---~.
~
~
~
~
~
N (Xl (Xl
\
CJ .. .

î) , ...........
,1
.. FORMULA: ()S ------ . 'NAME: ARSENIC' \
/ /
FORMULA WFIGHT: 14.92~
\
PH{~S[ NAME RANGE (1\)
51 SOLID ~
29â.o 800.0 61 GAS J' 290.0 - 1200.0 J' ..
/ , Co / " C-
,~
CP ~ A + 1.0E-3*B*TCK) ~ 1.0E5*C*TCK1**-2 • 1.OE b*D*T(I\)**2 ,. J-**********************************************************~************~***'~~* PHASE .[1 1-129D 8298 DENSITY A - [: r: D· ... '
(~~CAl ) - (CAL)'/\) (G/éM**~) -. . ( C/IL/~~) - - -, -- ,.
*** ****t************.tc****** i:************.~******~t. *******n.!:*'::*:::***i:*********** *.~ S1 . 0.0 8.534 5.727 5.501' 1.373 '0.0 0.0 G1 72.120 41.611 IDEAL ~.960 0.0 0.0 0.0
" /
REFERENCE: -THERMOCHEMICAl PROPCR1IFS or INORGANIC SUDSTANCC~-, I? BAItlN, o. I\NAC~~E p raND O. ~,UnASCIH:WS'" l, .~
SPRINGER VCRlAO, BERLIN, 1977.
\ )
PRESS • J1ETLJr~N· WHCN REAILY FOR D,[ SPLAY c c l' !)
/,
------~.-~---- --------"-~-" ....... ""-~_ t_ ... ct t'il ,G' ill.iI'l' .......... ..s...iIllIo.o.~_.rI;f~..,&oI''''' .... ~~..e. .... ,·-'·~------ .......... --_·_--......._---'
----------
,....-...
..
_ 1
I\J al \0

~- -~ -<----". -... ~-.
~~. """"""
FORMULA: SB ,f
NAME! Atn I-M O'N Y
rOm1U(f'l WEIGHT: 121. 7qO r-
PllflGE NAME RANGE CI() -= ~
51 SOlID 298.0 - 904.0 D 1·1 TRANS 90-1.00 K;(;" L1 lIQUID 904.0 - 1860.0
4.750 (I(CAl r-
Gl GAS 298.0 - 800.0 G1 GAS 800.0 "" 2000. 0
~
, ~
CP == A + 1. OE -~*B*T 00 il. OE5*C*T (1\) *'*".2 1 1. OC .s:r.D:H (~) **2
******************~******************************~****~***:******************** - PHASE fi H298 S298 DENUITY /' A Il C· P
'KCAL) (CAL/l, ) ( G/CM**3) . -" ". - - (Cf\l J'h )
********.f(**********************************-,'i:*******;~*****::.*~:***.-j:****:.'Ct.*I ... ******* 51 0.0 10.000 6 • .sB4 7.283 3.~;7 G.478 4.207
,L1 4.190 14,.988 6.<ill4 7.500 0.0 0.0 0.0 G1 63.230 43.053 IDEAL 4.?~O 0.0 0.0 0.0 Gl 62.973 42.407 IDeAL 4.~61 O.45~ 2.313 0.0
REFERENCE: • THERMOCHEHICAl PROPEraH S oc:- INOROANIC SUDSTAhICEU", I. BARIN, o. KNACKE, AND O. KUDASCHEWSKI, SPRINGEr~"·VERLAG, BERLIN, 1 CJ.;7.
\
J
" ..
PR~GS "RETURN" WHEN READY FOR DISPLAY 'i'
=
"
,
.. . --.. -. r:,.. -_ ..
..
t.
~
- ..
....
tv ~ o
/'
'"
"'"'
! d

; Qi g 4 $ $'4 'L $. !$IlS k ... ...- f'I!IP' tS JI.!\~1.,. Ilf '"'#" ~_,..,. .. _l,~_~ ... ~~ ........ ..--""" ,~_~-t -. ... ~ ___ ';;"'. r ........... , ... ~ ~ .. ':~~~ ..... "\ ... --~~- ... ~,..,,- ..... ~ ""~,~".~~,;.: .... ,,...~~~
,..
)
>Î!'
---. ~ ~ Î --- -, --,-'-,--------- -'---
FORMULA: 02 2 NAME: OXYGEN
FORMULA WEIGHT! 31.999
/
PilAS!:
Gl
NA ME
GAS
RANGE- (K)' - ,
298.0 - 3000,.0
~
CP = A + 1.0E-3*B*T(~) ~ 1.0E5*C*T(K)**-~ ç -'
1)
.(
1.0[·6*D,rC~)**~
****************************************************~*+*~***~*****~************ PHASE nOH298 8298 DEN8ITY' A ·El C Il
(KCAL> (CAL/r\) (G/CM**3) -"" " "- (CAL/t,)·· - - ~ ." -
***********************************~***~*~****************~***~~*~************* 81 0.0 49.005 UIEAL 7.160' 1.·000 -0.400- 0.0
J
REFEREtJCE! ·THERMOCHEMICAL PROf'trHICS -or INORGANIC SUBSUH~CCG~, 1. BARIN'f- a. l'\NACI\E, ~'Hm a. KUIIASCIICWS!',I, SPRINGER-VERLAO, DERLIN, 1977. .....
DO YOU WISH TO FIND (11 ~ARTICULAR COMPOUNDCS), OR (~) GROUP or COMPOUNDS? ?
f f /
.---.. _~_. __ ~. _____ "'ç'-~6-
~-
'"
IZJ
N \Q
1-'
. ,
"
1 1 \'
~

:> ïQ.i#; ""!fiii4 .... ;)~4ae~fb ,al L_(4<)é~ 44(4;; Pb 1*::;:;0;;;; .... ;; "'*lIt'+~ .... "t~Ji .... _-41<_ ... "--"'" ~~~~,::-, ,....~<
/
0-~---------------
rORMULA: CU20 _
"NtlME: CCtF'F'ER ( t) rt:nE
ror.nuu\ WE'ImlT: 143.091
f'/IfiCr
Sl L1
Nt)ME ~
CUPRITE I...HWID
RANG'E ("')
298 .. 0 - 1509.0 1509.0 - 2000.0
--,
•
D H TRANS (1509.~ h·'.-_.
CF' == A + 1. OE -3*B*T ('" il. OE5ll<C;f:T< K) **~2 t· 1.. OC '~)*D*T (K) **2 ~
***~*********~***********************************************~***************** 'BASE D H298 5298 lrENSITY A • B CIl'
....
(KCAL) (CAL/K~) (O/CM**3) .--- .. --- - -(Ci\L ~'t,- j -
********************************************************************-*********** ,
/
51 -40.700 22.210 6.000 0 13.520 7.000 1 0.0 ·.Q,Y-oo Li -32.151 21t-691 6.000 ~4.000 0.0 0.0 ,0~'9,
REFERENCE: ·THERMOCHEMICAL PRDPERTIES OF· TNORGANIC SUBSTANCES·~ 1. BARIN? O. KNAC~EY AND O. I.UDACCHEWUKI, SPRINOER-YERLAG, BCRLINy 1977.
PRESS • F:ETURN· WHCU READY ~ OR fIfSF'UW ?
/
•
fl
..
../
1. œ 91 R' e,? ..... ~---...:;--- ._,,+_ .... _~-- "-....:' --.-........... __ ..... ..,."..., ..... ~~~~""""~-~~~~ .... "'----~_..-._---,/
-r-
.-1
fi -, .
IV \Q c:v
~
'.

r
..
ilS""'" ,**",b<i!"""'~" ~ Z2W::e; C , ,,.. Il ".~ .... ~"".?~~'l"~'.;'!l'''~'''';,'>!~' ~ "r-Ff"N>.~" ~ "'l><"~~"'-"""'-"'-"'" .. _~ ...... .I"'''''''",,~ '!:.< .. ',.. ........... -'" .w' ,~.'-.. -"'-,,-.... ~ t_ ... --~ • .., ....
" ~~,,~
I~.L-___ ---------~--- ____ , __ _ ....-...... ~
" FORMULA!'BI20.!
l'lAME: BISMUTII TRIOXID[j ~ ~
) , o FORMULA WEIGHT: 465.959
'-c
PHASE NAME RANGE (K) .. 51 S2 Li
-SOL ID-A SOLIDLIQUI
97 El-. 04 D H TRANji ( 9-78.00 1\):::: 13: 600 (KCAL) - 1097.0 Il H TRANS 0097'.00 1\):::: 14.300 (I\CAL)' -. 1800.0
CP = A + 1.0E5*C*TCK>**-2 • 1.0E-6*D*T(K)**2 - . ***************************************~**~~********************************** PHASE D H298 - S298 DENS~TY ~ B C D
(KCAL> - (CML/K) (G/CMt*3) ---- ------ --- - (CAL/I~) ----------- ----
****************************************~************************************** S1 -136.400 36.200- S-.2Q9 --' -24.740 0.00,0 0.0 0.0 S2 ~126.305 43.357 8.550 36.QOO 0.0 0.0 0.0 Li -113.203 54.439 8.550 36.500 0.0 0.0 0.0
" )
REFERENCE: "THERMOCHEMICAL PRoprRTIES or INORGANIC SUBSTANCES", 1. BAR H~, Cl. KNACKE, AND o. tdJflASCHEWS/\ J, SPRINOER-VERLAO, BERLIN, 1977.
)
PRESS "RETURN" WHEN READY FOR DisrLAY ?
~
/
<3"
. ......... -- '-""""~ .... -"~ .... --
/'
--~ ...
1""""'\,
/""
~~Î
-tI
'"'
IIJ \0 W
,..-
~
"
.. '~
liV
) ~

________ .... ______ ~ __ .~ ••• "'. __ ..... _ .. ' .. _ .... ' ... e t .. n_ .. $( ....... , ___ ,_-..,.-..-_"l'I_,,...._,..l">'"_..,.~7'f("'.,..-. ... "<",, ' .. ~~ - ~
.,.. ,,~ ... ~_'"""_ ... "''''_'i)~ ,~~ __ ~ ..... '"""~ ...... -. 1 .. "'-~_ .....
J
~" j
FORMULA! PS*O
NAME: LE AD MONOXIDE
FOF:NUL.,"I !>JE l GHT:- 2~3. 199
PHM)E NAME
~ -----
..
RANGE. (K)
Si S2 Ll Gl
LITHARGE 298.0 - 762.0 Ir H TRANS ( 7,s2.00 1\) =. _ 0.394 (KCAL) MASSICOT 762.0 - 1158.0 Ir H TF~ANS (1150.00 K) ::. - 6.570 (KCAL) LIQUIII .-1158.0 - 1400.0 GAS 29"8.0 - 2000.0
./
CP = A t- 1.0E-3*B*T(K) + 1.0E:5*C~T(K)** -2 of 1.0E- 6:lŒ*T(I\> **2 - .
*************~***************************************************************** PHASE D H298 8298 DCNSITY ABC D
(KCAL) (CALI" ) (G/CM**3) - - ------. -- -'or - (CAL /,,) --- .-' .. , - ---- \
******************************************************************************* S1 -52.410 15.600 9.530 9.908 3.664 0.0 0.0 52 -52.458 15.232 8.000 10.712 3.946 0.0 0;0 l1 -47.439 17.954 8.000 15.308 0.0 0.0 0.0 Gl 11.480 57;346 IDEAL 0.lJ1 0.186 0.935 0.0
~
REFERENCE: ·THERMOCHEMICAL F'ROf'ERT LES ew [NOr~ûANIC SUBSTANCE"S·, I. BARTN, O. I\NACKE, AND O. I\llBASCIICWut,l, 5PRINGER-VERLAG, BERLIN, 1977.
,.J .. - it Q
'\
PRESS -RETURN" !>JHE~ READY FOR DISPLAY ?
....
----------- .. ~.., ,.,..._~ ... .--~ .. _--~-~""-~ ...... _- .... _--_ ... -..
-....... ~~h_·'"'_-........... ___ ~~_ ~
/'"""'\,.,
/
'" \D ~
~ ~
..

--.!b 1Mb ., Ma:U ta • lVW'. aliA 104 pp dt 49="""'" • .,..HIA N4LtPP f " ••• """~J;;:~.,..~"1"'''''--''''''''''.)I<1k~,,,,,,,,,~_&,,,,,,,,,,,~,,'''''~~''''''''''r<Io"'~~-'1'~'''~~~';',.I'~~P{.''''~-''~."""",#, .. - -...,.,... ,.-, ... ~
f\- ~ .--., ~J __________________________________________ __
Iiiaf(MULA t AS20::')
NAMEt ARSENIC rR[OXIDE
FORMULA WEIGHT: 197.841
) ..
"-
F'UABE NAME RANGE (f()
~
51 CLAUDET1TE 298.0 - 582.0 D H TRANS ( 582.00 f() ~ 4.400 (KCAL) Li LIOUII~ , 582.0 - 734.0 S2 ,ARSENOL 1 TE ~8.0 548.0
CP ~ A + 1.0E-3*B*T(K) + 1.0E~*C*T(K)** 2 1 l.OE 6'D*T(~)**2
********************************************'*~******~***4**~'**'***'**~******* PHASE D H298 S298 DENSITY _ ABC'· D
(KCAL> (CAL/t...> (G/CM**3) \ -- - - - - - _. (CAL/I\) --
*************************************.~*******\*********~~**********~*********** 51 -156.160 :2"9.330 . 4.150_ 14.300 42.000 0.0 0.0 L1 -152.815 33.963 4.150 36.500 0.0 6.0 0.0 82 -~157.000 :25.'980 3.86~ ,0.370 ,4B.üOO 0.0 0.0 , . \
) " ....
REFERENCE: -THERMOCHEMICAL PROPERTIES OF INORGANIC SUBSTANCLS" , 1. BARI~; q. KNACKE, AND O. kUDA3CH[WS~I, SF'R 1 NGER ··VERLAG, BCf.:L. IN, 'J <;' 77.
~
) ~
, ,
PRESS -RETURN" WHEN READY FOR DISPLAY ?
"-
M
~ -;--
M"S7 _ .. ~~~ -_ ..... .... ~~~ .... .&o.~.~~-:. .. ""-_~, .... w~t_ ... _~.
---~
'1
('"
..,
...
1\)
\0 U1
~
P>

iBU 2 C • j 14 lE .$>4.4 ..... $~, . 4 ...... ~ ___ ~~;Io.~~~,.,.... ........ "'l"~"'T~~.,.~ "11~"'~~~' ';:'>::,",'l::-r .. '~- 1,,'\.....~,. ...... "'..,...0(:;', •• " .... " .. ' ... , --;$1.. ........... ." ..... --'f'.~.
-.., ;:. ~
FORMULA: SD20J
NAME:. ~NTIMONY OXIDE
FOf~MUl(l WEIGHT: 291.498 <l'
Q
PHAS[ NAME RANGE (1\) ,
51 5ENARMO~TE 29B.O 845.0 ra H TRANS ( 845.00 ,,) ;:.. 1 • 600 ( "CAU 52 VALEN.ITE 845.0 ~ 929.0 n H TRANS ( 9'29.00 t,) .;:; 13. 1"50 -( KCAL ) L1 -LIQUID 929.0 - 1729.0
CP = A + 1. Ol-3*B*T (,,) l- 1. 0r::5*C* r (,,) *;1:-2 -{ 1. Or:: -6*'lI*T (K) **2 • J
******t********************************w****,**********************~*********** PHASE D H299 S298 DENSITY ABC D <KCAU (CAL/K) (G/CM~:*3) - ------- .-- -- (CAL/f'.,;)- ----- --_. __ -_ ,
***************~****************************************~***********~********** S1 -171.000 31.700 5.200 22.000 15.000 0.0 0.0 52 -169.400 33.593 5.670 2~.000 15.000 0.0 0.0 Li -159.912 40.100 5.670 37.S00 0.0 0.0 0.0
",
REFERENCES ·THERMOCHEMICAL PROPERTTES OF INORGANIC- SUBSTA~CES·, f. BAF<IN,' O.' KNACKE, .AND O. "'LJBASCHEWShl~ SPRINGER-VERLAG, BERLIN, 197} •
.. '"
DO VOU WI5H TU F IND (1) PAIï:TICULA-R COMPOLJNIJ (G), Of~ ('~) Of.:OUf' OF COMPOUNDG? fi ?
.0 "
~
L-________________________________________________________ ~ __ ~d~ ____________________ ~____________ _
, ~~ '"'""!" ...,... ......... t.,..,,~ ~~ ___ ... _ .... -, __ ............. ___ _
'"
t. '/;
"
'\
.;
~~ \
Q
'0
-,
~
~
IV ID 0\
'.
/
~
1
1 ~ 1
1 , 1
------~--~---- - ----,---- ' Or --
.'