development document for petroleum refining category - 1982
TRANSCRIPT


DEVELOPMENT DOCUMENT
for
EFFLUENT LIMITATIONS GUIDELINES NEW SOURCE PERFORMANCE STANDARDS
and
PRETREATMENT STANDARDS
for the
PETROLEUM REFINING POINT SOURCE CATEGORY
Anne M. Gorsuch Admi~istrator
Jeffery D. Denit Director, Effluent Guidelines Division
Dennis Ruddy Project Officer
October 1982
Effluent Guidelines Division Office of Water Regulations and Standards
U.S. Environmental Protection Agency Washington, D.C. 20460


SECTION
I.
II.
III.
TABLE OF CONTENTS
CONTENTS LIST OF TABLES LIST OF FIGURES
EXECUTIVE SUMMARY Summary and Conclusions
INTRODUCTION Prior EPA Regulations Overview of the Industry Summary of Methodology Approach
Industry Profile Waste Characterization Technology Evaluation Cost Development
DESCRIPTION OF INDUSTRY Introduction Industry Profile
General Description of the Industry
Refinery Distribution Anticipated Industry Growth
Unit Manufacturing Processes Overview of Refining Processes
Process Descriptions and Wastewater Characteristics
1. Crude Oil and Product Storage 2. Ballast Water Storage 3. Crude Desalting 4. Crude Oil Fractionation 5. Thermal Crackin~ 6. Catalytic Crack1ng 7. Hydrocracking 8. Polymerization 9. Alkylation
10. Isomerization 11. Reforming 12. Solvent Refining 13. Hydrotreating 14. Grease Manufacturing 15. Asphalt Production 16. Drying and Sweetening 17. Lube Oil Finishing 18. Blending and Packaging 19. Hydrogen Manufacture 20. Utilities Function
iii
PAGE
iii vii
xvii
1 1
15 15 15 17 18 18 18 19 20
21 21 21 21
22 23 23 23 23
24 25 25 26 27 28 29 29 29 30 30 31 32 33 34 34 35 35 36 36

SECTION
IV.
v.
VI.
VII.
TABLE OF CONTENTS (continued)
INDUSTRY SUBCATEGORIZATION Introduction Selected Subcategories Purpose and Basis of Selection
Flow Model for 1974 Regulation Flow Model Used for Proposed
1979 Regulations Refined Flow Model
WASTE CHARACTERIZATION Introduction Concentration of Toxic, Conventional
and Non-Conventional Pollutants 1977 Survey Short Term Sampling Program Long Term Sampling Program Survey of 1979 Effluent Monitoring
Data Industry Flow
Summary of Net Wastewater Flow Distribution of Flow by Subcategory Trends in Industry Water Usage
SELECTION OF POLLUTANTS TO BE REGULATED Introduction Selection of Regulated Pollutants for
Direct Dischargers Pollutants Selected for Regulation
in the Petroleum Refining Point Source Category (Direct Discharge Segment)
Pollutants Excluded from Regulation (Direct Discharge Segment)
Selection of Regulated Pollutants for Indirect Dischargers
Pollutants Selected for Regulation in the Petroleum Refining Point Source Category (Indirect Discharge Segment)
Pollutants Excluded from Regulation (Indirect Discharge Segment)
Environmental Significance of Selected Pollutants
Toxic Pollutants Conventional Pollutants Non-Conventional Pollutants
CONTROL AND TREATMENT TECHNOLOGY Introduction
iv
PAGE
61 61 61 62 63 65
67
69 69 70
71 73 74
75 75 75 76
121 121 121
122
122
123
124
124
124
124 126 127
149 149

SECTION
VII.
VIII.
IX.
x.
TABLE OF CONTENTS (continued)
CONTROL AND TREATMENT TECHNOLOGY (continued) In-Plant Source Control
In-Plant Treatment Options Chemical Substitution wastewater Reduction wastewater Reuse
End-of-Pipe Treatment Biological Treatment Filtration Granular Activated Carbon Powdered Activated Carbon Cyanide Removal Metals Removal RSKERL Carbon Studies Ultimate Disposal Methods
Existing Technology Effluent Concentration
BEST AVAILABLE TECHNOLOGY ECONOMICALLY ACHIEVABLE
Summary BAT Options Considered Identification of Best Available
Technology Economically Achievable
NEW SOURCE PERFORMANCE STANDARDS Summary NSPS Options Considered Identification of New Source Performance
Standards
PRETREATMENT STANDARDS FOR EXISTING AND NEW SOURCES
PAGE
149 149 151 152 153 155 156 157 158 158 160 160 161 162 164 165
223
223 224 234
237 237 238 240
243
Summary 243 Pretreatment Options Considered 244 Identification of Pretreatment Standards 249
for Existing and New Sources
XI. ACKNOWLEDGEMENTS
XII. REFERENCES
APPENDIX A COSTS OF TREATMENT AND CONTROL SYSTEMS Introduction Cost of Technologies Considered
Biological Treatment Filtration Powdered Activated Carbon Granular Activated Carbon In-Plant Control
v
251
253
A-1 A-1 A-2 A-2 A-2 A-3 A-3 A-4

TABLE OF CONTENTS (continued)
SECTION PAGE
APPENDIX A COSTS OF TREATMENT AND CONTROL SYSTEMS (continued)
Cost of Technology Selected as Basis A-6 for Limitations and Standards
BAT Options A-6 New Source Costs A-10 Pretreatment Options A-ll
APPENDIX B RAW PLANT DATA B-1
APPENDIX c GLOSSARY AND ABBREVIATIONS C-1
vi

TABLE
I-1
I-2
I-3
I-4
I-5
LIST OF TABLES
TITLE PAGE
Effluent Guidelines - Petroleum Refining Point 3 Source Category Best Available Technology Economically Achievable {BAT) Process Configuration -Process Breakdown
Effluent Guidelines - Petroleum Refining Point 4 Source Category Best Available Technology Economically Achievable {BAT) Size Factors by Sub-category
Effluent Guidelines - Petroleum Refining Point 5 Source Category Best Available Technology Economically Achievable {BAT) Process Factors by Subcategory
Effluent Guidelines - Petroleum Refining Point 6 Source Category New. Source Performance Standards {NSPS) Size Factors by Subcategory
Effluent Guidelines - Petroleum Refining Point 7 Source Category New Source Performance Standards {NSPS) Process Factors by Subcategory
I-6 Effluent Guidelines - Petroleum Refining Point Source Category Best Available Technology Achievable (BAT) Effluent Limitations by Subcategory
I-7
I-8
I-9
III-1
III-2
III-3
Effluent Guidelines - Petroleum Refining Point Source Category New Source Performance Standards (NSPS) Effluent Limitations by Subcategory
Effluent Guidelines - Petroleum Refining Point Source Category Ballast Water Standards for BAT and NSPS
Effluent Guidelines - Petroleum Refining Point Source Category Pretreatment Standards for Existing Sources (PSES) and New Sources (PSNS)
Intermediate and Finished Products Produced by Petroleum Refining Industry
Refining Capacity of Petroleum Refineries in the u.s. by State as of January 1, 1981
1980 Consumption of Petroleum Products
vii
9
10
11
41
42
43

TABLE
III-4
III-5
III-6
III-7
III-8
V-1
V-2
V-3
V-4
V-5
V-6
V-7
V-8
V-9
V-10
V-11
V-12
LIST OF TABLES (Continued)
TITLE
Sources of Supply for u.s. Petroleum Feedstocks
Characteristics of Crude Oils from Major Fields Around the World
Trend in Domestic Petroleum Refining from 1975 to 1981
List of Processes Identified from the 1977 Industry Survey by EPA Process Number
Qualitative Evaluation of Wastewater Flow and Characteristics by Fundamental Refinery Processes
Summary of Plant Characteristics for 17 Refineries Sampled in Screening Program
Comparison of Plant Characteristics - 17 Refineries Sampled vs. Overall Industry
Summary of Analytical Data Petroleum Refining Industry Screening Sampling Program - Facility
Summary of Analytical Data Petroleum Refining Industry Screening Sampling Program - Facility
Summary of Analytical Data Petroleum Refining Industry Screening Sampling Program - Facility
Summary of Analytical Data Petroleum Refining Industry Screening Sampling Program - Facility
Summary of Analytical Data Petroleum Refining Industry Screening Sampling Program - Facility
Summary of Analytical Data Petroleum Refining Industry Screening Sampling Program - Facility
Summary of Analytical Data Petroleum Refining Industry Screening Sampling Program - Facility
Summary of Analytical Data Petroleum Refining Industry Screening Sampling Program - Facility
Summary of Analytical Data Petroleum Refining Industry Screening Sampling Program - Facility
Summary of Analytical Data Petroleum Refining Industry Screening Sampling Program - Facility 157, Part 1
viii
1
20
50
59
64
80
84
126
153
PAGE
44
45
48
49
55
77
78
79
80
81
82
83
84
85
86
87
88

TABLE
V-13
V-14
V-15
V-16
V-17
V-18
V-19
V-20
V-21
V-22
V-23
V-24
V-25
V-26
V-27
V-28
LIST OF TABLES (Continued)
TITLE ~AGE
Summary of Analytical Data Petroleum Refining 89 Industry Screening Sampling Program - Facility 157, Part 2
Summary of Analytical Data Petroleum Refining 90 Industry Screening Sampling Program - Facility 167
Summary of Analytical Data Petroleum Refining 91 Industry Screening Sampling Program - Facility 169
Summary of Analytical Data Petroleum Refining 92 Industry Screening Sampling Program - Facility 186
Summary of Analytical Data Petroleum Refining 93 Industry Screening Sampling Program - Facility 194
Summary of Analytical Data Petroleum Refining 94 Industry Screening Sampling Program - Facility 205
Summary of Analytical Data Petroleum Refining 95 Industry Screening Sampling Program - Facility 235
Summary of Analytical Data Petroleum Refining 96 Industry Screening Sampling Program - Facility 241
Summary of Analytical Data Petroleum Refining 97 Industry POTW Sampling Program - Facility 13
Summary of Analytical Data Petroleum Refining 98 Industry POTW Sampling Program - Facility 16
Summary of Analytical Data Petroleum Refining 99 Industry POTW Sampling Program - Facility 21
Summary of Analytical Data Petroleum Refining 100 Industry POTW Sampling Program - Facility 25
Summary of Analytical Data Petroleum Refining 101 Industry POTW Sampling Program - Facility 43
Summary of Analytical Data Petroleum Refining 102 Industry POTW Sampling Program - Facility 45
Direct Discharge - Final Effluent Priority 103 Pollutants - Summary of EPA Screening Program Data
Indirect Discharge (To POTW) Priority Pollutants - 106 Summary of EPA Screening Program Data
ix

TABLE
V-29
V-30
V-31
V-32
V-33
V-34
VI-1
VI-2
VI-3
VI-4
VI-5
VI-6
VI-7
VI-8
LIST OF TABLES (Continued)
TITLE PAGE
Final Effluent Priority Pollutants - Summary of 109 EPA Regional Surveillance and Analysis Data
Most Frequently Occurring Priority Pollutants - 112 Plant 1
Most Frequently Occurring Priority Pollutants - 113 Plant 2
Potential Surrogates for Priority Pollutants - 114 Correlation Coefficients
Summary of 1976 Net Wastewater Flow - By Refinery 115 Size
Summary of 1976 Net Wastewater Flow - By Refinery 116 Subcategory
Flow - Weighted Concentrations and Loadings for 131 Direct Dischargers in the Petroleum Refining Industry - Conventional Pollutants -Nonconventional Pollutants
Flow - Weighted Concentrations and Loadings for 133 Direct Dischargers in the Petroleum Refining Industry - Toxic Pollutants - Total Phenols (4AAP Method)
Direct Discharge - Intake Water Priority Pollutant 134 Detection - Summary of EPA Screening Program Data
Direct Discharge - Separator Effluent Priority 137 Pollutant Detection - Summary of EPA Screening Program Data
Priority Pollutants Not Detected in Treated 140 Effluents Discharged Directly, and Excluded from Regulation
Priority Pollutants Detected in Treated Effluents 142 Discharged Directly, but Excluded from Regulation
Statistical Analysis Table for the Petroleum 143 Refining Industry - Direct Discharge - Current/BPT
Priority Pollutants Not Detected in Effluents 144 Discharged to POTW, and Excluded from Regulation
X

TABLE
VI-9
VI-10
VII-1
VII-2
VII-3
VII-4
VII-5
VII-6
VII-7
VII-8
VII-9
VII-10
VII-11
VII-12
VII-13
VIII-1
LIST OF TABLES (Continued)
TITLE PAGE
Priority Pollutants Detected in Effluents 145 Discharged to POTW, but Excluded from Regulation
Statistical Analysis Table for the Petroleum 147 Refining Industry - Indirect Discharge - Current
Sour Water Treatment in Petroleum Refineries 167
Effect of California Crudes on Reuse of Sour 171 Waters
Reuse of Sour Water - Industry Status 172
Cooling Tower Makeup Flow Rates in the Petroleum 174 Refining Industry
Summary of Flow Reduction Techniques Used 179 Identified by the 15 Refineries Studies During Wastewater Recycle Study
Summary of Data on Removal of Cyanides with Steam 183 Stripping and Biological Treatment in the Petroleum Refining Industry
Zero Discharge Refineries 184
Steam Electric Power Plants Using Vapor 188 Compression Evaporation as Part of Their waste-water Treatment System
Treatment Operations and Water Usage for 1973 189 and 1976
Summary of Treatment Technologies for 1973 and 215 1976
Refinery Flow vs. Final Effluent Concentrations 216 for 17 Screening Plants
Effluent Concentration from 50 Plant Study 217
Achievable Limitations Values 218
Diluted Effluent Concentrations from Direct Dis- 235 chargers in the Petroleum Refining Industry Com-pared to the EPA Ambient Water Quality Criteria for the Protection of Freshwater Aquatic Life
xi

TABLE
A-1
A-2
A-3
A-4
A-5
A-6
A-7
A-8
A-9
A-10
A-11
A-12
A-13
A-14
A-15
LIST OF TABLES (Continued)
TITLE
Raw Wastewater Equalization Systems Capital and Operating Costs
Rotating Biological Contactors (RBC's) as Roughing Systems Equipment Cost Basis and Energy Requirements
Rotating Biological Contactors (RBC's) as Roughing Filters Capital and Operating Costs
Filtration Equipment Cost Basis and Energy Requirements
Filtration Capital and Operating Costs
Powdered Activated Carbon Equipment Cost Basis and Energy Requirements, 80 mg/L Dosage Rate
Powdered Activated Carbon Capital Costs, 80 mg/L Dosage Rate
Powdered Activated Carbon Annual Operating Costs, 80 mg/L Dosage Rate
Powdered Activated Carbon Comparison of Operating Costs, Carbon Regeneration vs. Throw-Away
Powdered Activated Carbon Equipment Cost Basis and Energy Requirements Including Costs for Sludge Disposal, 80 rng/L Dosage Rate
Powdered Activated Carbon Capital Costs Including Costs for Sludge Disposal, 80 rng/L Dosage Rate
Powdered Activated Carbon Annual Operating Costs Including Credit for Sludge Disposal, 80 mg/L Dosage Rate
Powdered Activated Carbon Equipment Cost Basis and Energy Requirements, 150 rng/L Dosage Rate
Powdered Activated Carbon Capital Costs, 150 mg/L Dosage Rate
Powdered Activated Carbon Annual Operating Costs, 150 mg/L Dosage Rate
xii
PAGE
A-14
A-15
A-16
A-17
A-18
A-19
A-20
A-21
A-22
A-23
A-24
A-25
A-26
A-27
A-28

TABLE
A-16
A-17
A-18
A-19
A-20
A-21
A-22
A-23
A-24
A-25
A-26
A-27
A-28
A-29
A-30
A-31
LIST OF TABLES (Continued)
TITLE PAGE
PACT Comparison of Operating Costs, Carbon A-29 Regeneration vs. Throw-Away, 150 mg/L Dosage Rate
Powdered Activated Carbon Equipment Cost Basis A-30 and Ener~y Requirements Including Costs, for Sludge D1sposal, 150 mg/L Dosage Rate
Powdered Activated Carbon Capital Costs Including A-31 Costs for Sludge Disposal, 150 rng/L Dosage Rate
Powdered Activated Carbon Annual Operating Costs A-32 Including Credit for Sludge Disposal, 150 rng/L Dosage Rate
Granular Activated Carbon Equipment Cost Basis A-33 and Energy Requirements
Granular Activated Carbon Capital Costs A-34
Granular Activated Carbon Annual Operating Costs A-35
Supplemental Economic Cost Information Capital A-36 and Operating Costs for 10,000 Gallon per Day Treatment Systems
Cooling Tower Blowdown Rates Petroleum Refining A-37 Industry (Million Gallons per Day)
Chromium Removal Systems Equipment Cost Basis A-38 and Energy Requirements
Chromium Removal Systems Capital and Operating A-a9 Costs
Wastewater Recycle Capital and Operating Costs A-40
Water Softening of Recycled Wastewater Capital A-41 Costs
Capital and Operating Costs by Refinery Number A-42
Capital and Operating Costs, Indirect Discharge - A-47 Option 1
Capital and Operating Costs, Indirect Discharge - A-50 Option 2
xiii

TABLE
B-2
B-3
B-4
B-5
B-6
B-7
B-8
B-9
B-10
B-11
B-12
B-13
LIST OF TABLES (Continued)
TITLE
Analytical Results for Traditional Parameters for the RSKERL and B&R Sampling Program
Analytical Results for Priority Pollutants for the RSKERL and B&R Sampling Program - Volatile Organics
Analytical Results for Priority Pollutants for the RSKERL and B&R Sampling Program - Semivolatile Organics
Analytical Results for Priority Pollutants for the RSKERL and B&R Sampling Program - Pesticides
Analytical Results for Priority Pollutants for the RSKERL and B&R Sampling Program - Cyanides, Phenolics and Mercury
Analytical Results for Priority Pollutants for the RSKERL and B&R Sampling Program - Metals
Analytical Results for Traditional Parameters in the Pretreatment Sampling Program - Week 1
Analytical Results for Priority Pollutants for the Pretreatment Sampling Program- Week 1, Volatile Organics
Analytical Results for Priority Pollutants for the Pretreatment Sampling Program- Week 1, Semivolatile Organics
Analytical Results for Priority Pollutants for the Pretreatment Sampling Program- Week 1, Pesticides
Analytical Results for Priority Pollutants for the Pretreatment Sampling Program- Week 1, Metals
Analytical Results for Priority Pollutants for the Pretreatment Sampling Program - Week 2
Analytical Results for Priority Pollutants for the Pretreatment Sampling Program - Week 2, Volatile Organics
xiv
PAGE
B-2
B-9
B-12
B-17
B-20
B-30
B-36
B-37
B-38
B-40
B-41
B-42
B-43

TABLE
B-14
B-15
B-16
LIST OF TABLES {Continued)
TITLE
Analytical Results for Priority Pollutants for the Pretreatment Sampling Program - Week 2, Semivolatile Organics
Analytical Results for Priority Pollutants for the Pretreatment Sampling Program - Week 2, Pesticides
Analytical Results for Priority Pollutants for the Pretreatment Sampling Program - Week 2, Metals
XV
PAGE
B-45
B-48
B-49

FIGURE
I-1
III-1
III-2
III-3
III-4
V-1
V-2
V-3
VII-1
VII-2
VII-3
VII-4
LIST OF FIGURES
TITLE PAGE
Effluent Guidelines - Petroleum Refining Point 13 Source Category Best Available Technology Economically Achievable Sample Calculation -Proc~ss Factor
Geographical Distribution of Petroleum Refineries 56 in the United States, as of January 1, 1981
Crude Desalting {Electrostatic Desalting) 57
Crude Fractionation {Crude Distillation, Three 58 Stages)
Catalytic Cracking {Fluid Catalytic Cracking) 59
Histogram of Net Wastewater Flow by Size Class 117
Histogram of Net Wastewater Flow by Subcategory 118
Historical Trend of Total Industry Water Usage 119
Rotating Biological Contactors 219
Flow Diagram of a Granular Activated Carbon 220 System
Carbon Regeneration System 221
Flow Diagram of One Powdered Activated Carbon 222 Treatment Scheme
xvii

SECTION I
EXECUTIVE SUMMARY
SUMMARY a!Q CONCLUSIONS
This development document presents the technical data base developed by EPA to support effluent limitations and standards for the.Petroleum Refining Point Source Category. Technologies covered by this document to achieve these limitations and standards are defined as best available technology economically achievable (BAT), best available demonstrated technology (BADT, equal to new source performance standards NSPS), pretreatment standards for existing sources (PSES), and pretreatment standards for new sources (PSNS). Best conventional pollutant control technology (BCT) limitations are not addressed in this document because the Agency has reserved coverage of BCT for future rulemaking. Best practicable technology currently available (BPT) is not being revised and therefore will not be addressed in this document. The basis for BPT can be found in an earlier document (EPA~440/1-74-014a}. This document outlines the technology options considered and the rationale for selecting the technology levels on which pollutant limitations are based.
EPA is promulgating BAT effluent limitations guidelines equivalent to BPT, which were promulgated on May 9, 1974 (39 FR 16560) and amended May 20, 1975 (40 FR 21939).
EPA decided to retain the New Source Performance Standards (NSPS) that were promulgated May 9, 1974 (39 FR 16560).
Interim final pretreatment standards for existing sources (PSES) were promulgated on March 23, 1977 (42 FR 15684). Pretreatment standards for new sources (PSNS) were promulgated on May 9, 1974 (39 FR 16560). This document prese~ts the final PSES and PSNS promulgated, both of which are revision to the prior pretreatment standards for this industry. Pretreatment standards for both existing and new sources (PSES and PSNS) will limit ammonia and oil and grease at 100 mg/1, each. An alternate mass - based ammonia standard is also provided. In addition, PSNS contains a chromium mass limitation based upon the application of a 1 mg/1 standard to the cooling tower discharge portion of the total refinery flow to the POTW.
Stormwater runoff is not addressed in this document. The 1974 development document presented BPT, BAT, and NSPS for stormwater run off. These limitations were remanded for reconsideration by the u.s. Court of Appeals on August 11, 1976. These requirements were reserved by the Agency for future rulemaking.
Effluent limitations guidelines for conventional pollutants (BOD , 5 TSS, oil and grease, and pH) will be promulgated
1

separately as BCT limitations for existing direct dischargers in this category in future rulemaking.
The tables in this section summarize the final promulgated regulations.
Table I-1 lists the processes used in the determination of process categories and their associated weighting factors as used to determine process configurations. Tables I-2 and I-3 list the BAT size factors and process factors, respectively, while Tables I-4 and I-5 list the same factors as applied to NSPS. Tables I-6 and I-7 summarize effluent limitations by subcategory for BAT and NSPS. These effluent limitations are to be used in conjunction with the process factors and size factors determined in the preceeding tables to calculate actual mass limitations applicable to individual refineries. Table I-8 summarizes the ballast water allowance applicable to both BAT and NSPS. Table I-9 contains the general and specific pretreatment limitations applicable to PSES and PSNS for indirect dischargers.
A sample calculation of BAT effluent limitations is provided in Figure I-1. The reader should note that the BPT model uses only crude processes, cracking processes, lube processes, and asphalt processes for the calculation of the process factor (Table I-1). Moreover, the factors for process configuration and size shown in Tables I-2 through I-5 are discrete factors (do not permit interpolated, intermediate values) which apply to all refineries within a given range and subcategory.
Implementation of BAT, NSPS and PSES would incur no additional cost to the industry beyond existing requirements. A single new indirect discharging refinery of the type and size likely to be built in the 1980's and subject to PSNS would incur an additional capital cost of $0.39 million and an annual cost of $0.26 million (1979 dollars).
2

TABLE I·l
EFFLUENT GUIDELINES PETROLEUM REFINING POINT SOURCE CATEGORY
BEST AVAILABLE TECHNOLOGY ECONOMICALLY ACHIEVABLE (BAT) PROCESS CONFIGURATION • PROCESS BREAKDOWN
Process Category
Crude
Cracking and Coking
Lube
Asphalt
Processes Included Weighting Factor
desalting atmospheric distillation vacuum distillation
fluid catalytic cracking thermofor houdriflow gas-on cracking visbreakfng fluid coking delayed coking
1 ube hydrofi n 1 ng white oil manufacturing propane - dewaxing, deasphalting duo sol. solvent dewaxing lube vac. tower, wax fract. centrifuging and chilling MEK dewaxing deoiling (wax) naphtheni c 1 ubes S02 extraction wax pressing wax plant (with neutral separ.} furfural extraction clay contacting - percolation wax sweating acid treating phenol extraction
asphalt production asphalt oxidation asphalt emulsifying
3
6
13
12

Size Factors Bl Subcate9orl:
Topp!l\g: Cracking: Petrochemical: Lube: Integrated: 1,000 Barrels of Feedstock Size Size Size Size Size
Per Stream - Da~ Factor Factor Factor Factor Factor
Less than 24.9 1.02 0.91 0.73 0.71 0.73 25.0 to 49.9 1.06 0.95 0.76 0.71 0.73 50.0 to 74.9 1.16 1.04 0.83 0.74 0.73 75.0 to 99.9 1.26 1.13 0.91 0.81 0.73
100.0 to 124.9 1.38 1.23 0.99 0.88 o. 73 125.0 to 149.9 1.50 1.35 1.08 0.97 0.76 150.0 to 174.9 1.57 1.41 1 • 13 1.05 0.83 175.0 to 199.9 1. 57 1.41 1.13 1. 14 0.91 200.0 to 224.9 1.57 1.41 1 • 13 1 • 19 0.99 225.0 or greater 1.57 1.41 1.13 1.19 1.04
TABLE 1-2
EFFLUENT GUIDELINES
PETROLEUM REFINING POINT SOURCE CATEGORY
BEST AVAILABLE TECHNOLOGY ECONOMICALLY ACHIEVABLE (BAT)
~

Process Factors B~ Subcategor~:
TOf2J2ing: Cracking: Petrochemical: Lube: Integrated: Process Process Process Process Process Process
Configuration Factor Factor Factor Factor Factor
Less than 2.49 0.62 0.58 0.73 0.81 0.75 2.5 to 3.49 0.67 0.63 0.73 0.81 0.75 3.5 to 4~49 0.80 0.74 0.73 0.81 0.75 4.5 to 5.49 0.95 0.88 0.80 0.81 0.75 5.5 to 5.99 1.07 1.00 0.91 0.81 0.75 6.0 to 6.49 1. 17 1.09 Q.99 0.81 0.75 6.5 to 6.99 1. 27 1.19 1.08 0.88 0.82 7.0 to 7.49 1.39 1.29 1.17 0.88 0.82 7.5 to 7.99 1. 51 1.41 1. 28 1.00 0.92 8.0 to 8.49 1. 64 1.53 1. 39 1.09 1.00 8.5 to 8.99 1.79 1.67 1.51 1 • 19 1.10 9.0 to 9.49 1. 95 1.82 1.65 1. 29 1.20 9.5 to 9.99 2.12 1.89 1. 72 1. 41 1.30
10.0 to 10.49 2.31 1.89 l. 72 1.53 1.42 10.5 to 10.99 2.51 1.89 1.72 1.67 1.54 11.0 to 11.49 2.73 1.89 1. 72 1.82 1.68 11 • 5 to 11.99 2.98 1.89 1. 72 1. 98 1. 83 12.0 to 12.49 3.24 1.89 1. 72 2.15 1.99 12.5 to 12.99 3.53 1.89 1.72 2.34 2.17 13.0 to 13.49 3.84 1. 89 1. 72 2.44 2.26 13.5 to 13.99 4. 18 1.89 1. 72 2.44 2.26 14.0 or greater 4.36 1.89 1. 72 2.44 2.26
TABLE 1-3
EFFLUENT GUIDELINES
PETROLEUM REFINING POINT SOURCE CATEGORY
BEST AVAILABLE TECHNOLOGY ECONOMICALLY ACHIEVABLE (BAT)
01

1,000 Barrels of Feedstock
Per Streaa - Dai
Less than 24.9 25.0 to 49.9
en 50.0 to 74.9 75.0 to 99.9
100.0 to 124.9 125 .o to 149.9 150.0 to 174.9 175.0 to 199.9 200.0 to 224.9 225.0 or greater
Size Factors Bf Subcate9orx•
Topping a Cracking a Petrocheaicala
Size Size Size
Lube a
Size Factor Factor Factor ~or
1.02 0.91 0.73 0.71 1.06 0.95 0.76 0.71 1.16 1.04 0.83 0.74 1.26 1.13 0.91 0.81 1.38 1.23 0.99 0.88 1.50 1.35 1.08 0.97 1.57 1.41 1.13 1.05 1.57 1.41 1.13 1.14 1.57 1.41 1.13 1.19 1.57 1.41 1.13 1.19
Integrated a
Size Factor
0.73 o. n· 0.73 0.73 0.73 0.76 0.83 0.91 0.99 1.04
TABLE 1-4 BFFLUBRT GUIDBLINBS
PBTROLBUM REFINING POINT SOORCB CA~BGORY
NEW SOURCB PBRFORMANCB STANDARDS (NSPS)

Process Factors ax Subcat!!0£!1
'l'ol!J!ini• Crackln9a Petrocheatcala Lube a lnt!jrateda Process Process Process Process Process Process
Confi9uration Pactor Factor Pactor Pactor Pactor
Leas than 2.49 0.62 0.58 0.73 0.81 0.75 2.5 to 3.49 0.67 0.63 0.73 0.81 0.75 3.5 to 4.49 o.8o 0.7t 0.73 0.81 0.75 4.5 to 5.49 0.95 0.88 o.8o 0.81 0.75
........ s.s to 5.99 1.07 1.00 0.91 0.81 0.75 6.0 to 6.49 1.17 1.09 0.99 0.81 0.75 6.5 to 6.99 1.27 1.19 1.08 0.88 0.82 7.0 to 7.49 1.39 1.29 1.17 0.88 0.82 7.5 to 7.99 1.51 1.41 1.28 1.00 0.92 8.o to 8.49 1.64 1.53 1.39 1.09 1.00 8.5 to 8.99 1.79 1.67 1.51 1.19 1.10 9.0 to 9.49 1.95 1.82 1.65 1.29 1.20 9.5 to 9.99 2.12 1.89 1.72 1.41 1.30
10.0 to 10.49 2.31 1.89 1.72 1.53 1.U 10.5 to 10.99 2.51 1.89 1.72 1.67 1.54 11.0 to 11.49 2.73 1.89 1.72 1.82 1.68 11.5 to 11.99 2.98 1.89 1. 72 1.98 1.83 12.0 to 12.49 3.24 1.89 1.72 2.15 1.99 12.5 to 12.99 3.53 1.89 1.72 2.34 2.17 13.0 to 11.49 3.84 1.89 1. 72 2.44 2.26 13.5 to 13.99 4.18 1.89 1.72 2.44 2.26 14.0 or greater 4.36 1.89 1.72 2.44 2.26
TAa.E 1-5 BPP~ GUIDBLIHBS
PB'l'ROLBOII RBPIHIHG POIH'l' SOURCB CA'l"IGORY
HBW SOORCB PBRPOJUIAHCB S'lAHDARDS (HSPS)

00
T!!f!f!ingl Cr.Slnsu Peti'CIC:t.-tceh lubes Average of Dally Averege Of Daily Averege at Daily Averege of O.Uy
un .. nt ChariiCterleUce
Ned- Valuea far thlrt)l Mad- Vel ... for Thirty Hex~ Vel ... for Thirty Hex~ Veluea far Thirty llexi-for Any Coneecutlve Deya for An)l Canaecutlve DO)Ia far An)l Coneecutive D.,a for An)l Coneecutba O.,a for An)l
One Day Shall Not Exceed One Day lihall Not Exc~ One Dey Sluoll Not E!!!:Oed One Dey Sh~ll Not Excet!!l _ ~ Day
Metric Unital kil!!!lr- l!!r thau .. nd c&mlc Mtara of faedatock ~kgl1a000 •'1 cwm 117.0 "'·' 210.0 109.0 210.0 109.0 160.0 187.0 188.0 Phenolic C......,..nda 0.168 0.076 0.21 0.1 0.2S 0.12 0.18 0.184 0.4 ~ia•N 2.81 1.27 18.8 a.s 2J.4 10.6 2}.4 10.6 21.4 Sulfide 0.149 0.068 0.18 0.082 0.22 0.099 o.n 0.1S o.n Total Chrcaiua O.lU 0.2 o.u o.zs o.sz 0.) 0.77 0.4S 0.82 Hexavalent Chrcai• D.DZB o.ou O.OJS 0.016 0.046 0.02 0.068 o.o:s 0.068
E!!!Jllah Unltaa _,.. I!!" thouaand barnla or feedatock ~lb£1 1 000(bbl!
cw(1) 41.2 21.} 74.0 :sa.• 74.0 l8.4 127.0 66.0 116.0 Phenolic C......,..nda 0.06 0.027 0.074 0.016 0.088 o.04zs o.1n 0.06S 0.14 Allllonia • II 0.99 o.u 6.6 l.O 8.2s :s.8 8.J J.l 8.J Sulfide O.OSJ 0.024 0.06S 0.029 0.078 O.OJS 0.118 O.OSJ 0.124 Total Chrcai• 0.122 0.071 0.1S o.oa8 0.181 0.107 o.2n 0.16 0.29 Hexavalent Chrcaiua 0. 10 o.~ 0.012 O.OOS6 0.016 0.0072 0.024 0.011 o.ozs
lntqretecla Average of Daily Veluea tor Thirt)l ConeecuUva 0.,• Shall Not Exceed
1,..0 0.192
10.6 0.1S8 0.48 0.012
70.0 0.068 J.8 O.OS6 0.17 0.011
(1) To obtain actual Ualtlltiona ell veluea in thia hbla -t be ..,lUplled by a ..ec.tegory dependent varhble, fa ora f ia the product of the pr-.e factor and the aiza factor and the crude thr~ Un u.a.-.1 barrala par dey).
(2) Once-thr""'#l cooling water •r be diacharged with • total ol'lJ8Ric carbon (TOC) concentration nat to exceed S ag.tl. (J) In aR)I c ... in which the applicant can c~a ... trata that the dlloricla ion concentration in the arrtuant acaeda 1,000 -w'l (1,000 ppa), the ltagionel
Adeiniatrator My 8Ubatituta TOC • • paraaetar in Ueu at ClD. Errluant llaitetiona far TOC ahall be baaed an affl'*ll data frca the plant correlating TOC to Bll>s· If in the Judgeaent or the Ragionel Adelniatrator, adequate correlation data are not .. allable, the efrt'*ll Uaitetiona for TOC ahell be eatabliahad at a ratio or 2.2 to 1 to the applicable affluant llaltetiona on IIQ)s•
TABLE 1-6 urunn GUIIl£LU£S
PETROlEIIt REFINING POINT SOIIIC£ CATEGORY .-:sT AVAILABLE TECHNOlOGY ECONIIIICALLY ACIIIEYAIILE (BAT)
un .. nt lialhtlona By S...C.tegorya\1)(2)

\.0
11911
lopelna• Crecklnpt l'etroc:t-tc8la t!O!Jea lnt!l!!nbch Avef8!1e or Detlr Averege Or Oetlr Average or Oetlr Awrage or Deily Average of OeUr
Effl....t Nul- vet,_ ror thtrtr Nut.. Yet- ror lhtrtr Mllxt- ¥81- fol' Thil'tr Mllxt.. Vel- ror thtrtr llat- Yet- rol' thirty Chenctel'lettce ror Anr C..ecuthe 0.)'8 for Any Coneec:utlve 0.,.. for Any c...c:uthe O.,.e for Any c-.c:uthe O.,.e ror Any C..ecuttve D.ye
One Dey_ Shell Not_ Exc:eed _ One O.r Shell_l!l!t J:xc:eed ~ ~ ~ll_lfot [~ One ~ ShaU liCit £1!1!M4 ~ ~ Shall Not [JCCetld
Metric .._ttea lcll!!!Jr- l!!r thouen coetc: ..ten or ,_.toc:tc S!!ll£1 10011 a'
aoo, U.l 6.1 16.1 1.7 21.1 11.6 TSS .. , 4.9 11.1 1.2 14.9 9.5 coo<1> 61.0 )2,0 111.0 61.0 1JJ,O 69.0 Oil n Gre- '·' 1.9 4.1 2.6 6.6 1,5 Phenolic: C .......... 0.011 o.ou 0.119 0.051 o.1sa 0.077 "->le • N z.8 1,} 11.8 1.6 ZJ.4 10.7 Sulrtct. 0.071 0,0, o.1os 0.041 0.14 0.061 1ole1 Dlr•lun 0.18 o.1os 0.24 0.14 O.JZ 0.19 llexevelent Chr•lun 0.01} 0.111168 0,02 0.0018 o.ozs 0.012
[fl!llhh ... u •• _,._ Jl81' thoueend b~~~~ or feecletoc:lc ll!»/1_.000(bbl)
BOD5 •.2 2.2 5.1 1.1 7.7 4.1 TSS 1.0 1,9 4.0 z.s 5.2 '·' coo(}) 21.1 11.2 •1.5 21.0 47.0 24.0 Oil -.1 Gre- 1.1 0.7 1.7 0.91 2.• 1.1 Phenollc: CCIIIIpOIInde O.OJ1 0,016 0.042 0.02 0,056 0.021 "->1• • N 1.0 0,45 6.6 1.0 8.1 1.8 Sulflct. 0.027 0.012 0,0)7 0.011 0,05 O.OZ2 Total Chl'_.un 0.064 0.017 0.014 0.049 0.116 0.061 llexevelent ~lun 0.0052 0,0025 0,0072 O.OOJZ O.OOH 0,00'4
,.,6 ZJ.4
zu.o 10.5 0.25
n.4 o.zz 0.52 0.046
12.2 1.1
17.0 1.8 0.018 .. , 0.011 0.18 o.ozz
18.4 14.9
126.0 5.6 0.12
10.7 0,1 O,Jt o.ozt
6.~
5.1 45.0 2.0 0,04} 1.1 0.0}5 0.105 o.oon
41.6 Zl,t
29~.0
12.6 0,}
ZJ.4 0.26 0.64 o.osz
14.7
'·' 10 •• 0 •• 5 0.105 I.J 0,09) 0.22 0.019
22.1 17.9
1S2.0 6.7 0.14
10.7 0.12 0,}7
o.oz•
7.8 6.1
54.0 2 •• 0.51 1.8 0.042 o.u O.OIIIM
(1) To abhtn ectuel ll•ilettone ell wei- in thte tete ..t be .. tUpUed 11)1 • eubc:tltegory clopendenl vwtele, fl ....... r te the procNc:t or the proceee fec:tol' -.1 the elz• rector -.1 the c:I'Ude thrOIJ!hlul (in thowMd bernie per da)').
(2) llnc:ct-thr"""' coaling welel' .., be dtecherged with • tol8l organic c:el'bon (lOC) -..tretion not to __, 5 egll. (}) In any c:- ln 101\tc:h the ~ppllc:enl c:en ._.trete thel the dtlorlct. ion -ntretion in the effluent _..... 1,1100 llg/1 (1,0011 ppa), the Reglon8l
Act.lntetretol' .., eubetltute toe • • pel'..ter in lieu or coo. Effluent ltettetlone ror TIIC eh8ll be buecl on effluent ct.h fr• the plant c:orreletlng toe to aoo5• If in the Jucl!loo-enl or the Regton8l ~intetretor, edllquete c:orreletion ct.l• ere nat ev•Uele, the effl....t Uutetlone for TIIC eh811 be ••tellehed et • retlo or 2.2 to 1 to the ~ppllc:ele effl....t Uattettone an aoo,..
TAa£ 1-7
£FRI£Nl GUIOELJN£5 PETIIII.£111 ll[fiNING POINT 50IR:£ CAT[IiiiiY
NEW SWit£ I'EllriiiiiWO: STAIIMIDS (NSI'S~ £rn....t tillthtton.' a,. Wacat r,.,tn z>

TABLE, I-8
EFFLUENT GUIDELINES
PETROLEUM REFINING POINT SOURCE CATEGORY
BALLAST WATER TREATMENT STANDARDS FOR
BAT AND NSPS. FOR ALL SUBCATEGORIES
Po 11 utant or Maximum Pollutant For Any Property One Day
Metric Units (Kilograms per cubic meter of
coo-1 flow) 0.47
English Units (Pounds per
coo-1 1,000 gal of flow) 3.9
Average of Daily Values for 30
Consecutive Days
0.24
2.0
1- In any case in which the applicant can demonstrate that the chloride ion concentration in the effluent exceeds 1,000 mg/1 (1,000 ppm), the regional Administrator may substitute TOC as a parmeter in lieu of COD. Effluent limitations for TOC shall be based on effluent data from the plant correlating TOC to BOD5.
If in the judgement of the Regional Administrator, adequate correlation data are not available, the effluent limitations for TOC shall be established at a ratio of 2.2 to 1 to the applicable effluent limitations on BOD5.
10

1 of 2
TABLE I-9
EFFLUENT GUIDELINES
PETROLEUM REFINING POINT SOURCE CATEGORY PRETREATMENT STANDARDS FOR EXISTING SOURCES (PSES)
AND NEW SOURCES (PSNS)
A. General Prohibitions
Pollutants introduced into POTW by a non-domestic source shall not pass through the POTW or interfere with the operation or performance of the works. These general prohibitions and the specific prohibitions in paragraph B of this section apply to all non-domestic sources introducing pollutants into a POTW whether or not the source is subject to other National Pretreatment Standards or any national, state, or local pretreatment requirements.
B. Specific Prohibitions
In addition, the following pollutants shall not be introduced into a POTW:
1) Pollutants which create a fire or explosion hazard in the POTW;
2) Pollutants which will cause corrosive structural damage to the POTW, but in no case Discharges with pH lower than 5.0, unless the works are specifically designed to accommodate such Discharges;
3) Solid or viscous pollutants in amounts which will cause obstruction to the flow in the POTW resulting in interference;
4) Any pollutant, including oxygen demanding pollutants (BOD, etc.) released in a discharge at a flow rate and/or pollutant concentration which will cause interference with the POTW;
5) Heat in amounts which will inhibit biological activity in the POTW resulting in interference, but in no case heat in such quantities that the temperature at the POTW treatment plant exceeds 40°C (104°F) unless the approval authority, upon request of the POTW, approves alternate temperature limits.
11

2 of 2
TABLE I-9
EFFLUENT GUIDELINES
PETROLEUM REFINING POINT SOURCE CATEGORY PRETREATMENT STANDARDS FOR EXISTING SOURCES (PSES)
AND NEW SOURCES (PSNS) (continued)
c. Categorical Pretreatment Standards
1) Maximum Pollutant Concentrations for Any One Day (All Indirect Dischargers)
Pretreatment Standard for Existing and New Sources
Pollutant or Maximum for Any One Day Pollutant Property Milligrams per Liter (mg/L)
Oil and Grease 100 Ammonia 100 * * Where the discharge to the POTW consists solely of sour waters, the
owner or operator has the option of complying with this limit or the daily mass limitation set forth in the BAT or NSPS standards for existing or new sources, respectively.
2) Maximum Pollutant Concentration For Any One Day (new source indirect dischargers)
The following standard is applied to the cooling tower discharge part of the total refinery flow to the POTW by mutliplying: (1) the standards; (2) the total refinery flow to the POTW; and (3) the ratio of the cooling tower discharge flow to the total refinery flow.
Pretreatment Standard for New Sources Only
Pollutant or Maximum for Any One Day Pollutant Property Milligrams per Liter (mg/L)
Total Chromium 1
12

Capacity of Process Process process in weighting Process capacity relation to factor config-(1,000 refinery (from uration
Process bbl/day) throughput* Table I-1) factor
crude-ATM 125 1.0 vacuum 60 0.48 desalting 125 1.0
2.48 X 1 - 2.48
cracking-FCC 41 0.328 hydrocracking 20 0.160
0.488 X 6 - 2.93
lubes hydro- 5.3 0.042 fining
furfural extraction 4.0 0.032
phenol extraction 4.0 0.032
0.106 X 13 - 1.38
asphalt 4.0 0.032 X 12 - 0.38 Process configuration factor: 1.11
*Di'Y'ide process capacity by refinery throughput. In most cases, refinery throughput is equal to the crude capacity.
13
1 of 2
FIGURE I-1
EFFLUENT GUIDELINES PETROLEUM REFINING POINT SOURCE CATEGORY
BEST AVAILABLE TECHNOLOGY ECONOMICALLY ACHIEVABLE SAMPLE CALCULATION - PROCESS FACTOR
Step 1: Determine subcategory and size of the refinery (the example refinery is a lube facility with 125,000 bbl/day throughout).
Step 2: Obtain information on capacity of processes listed in Table I-1 from the refinery.
Step 3: Calculate process configuration factor as follows: (the processes and their associated capacities below are for the example refinery).

2 of 2
FIGURE I-1 (Cont'd)
Step 4: Determine process factor by looking at Table I-3 (for BAT). For process configuration of 7.17 in the lube subcategory, the process factor is 0.88.
Step 5: Determine size factor by looking at Table I-2 (for BAT). For a lube refinery with throughput of 125,000 bbl/day, the size factor is 0.97.
Step 6: Obtain unadjusted effluent limitations from Table I-6 for BA!. This example calculation computes the 30-day daily average COD (in units of lb/mbbl of feedstock). The COD value is 66 lb/mbbl (30-day).
Step 7: Calculate limitation for ODD by multiplying the process factor (from Step 4), the size factor (from Step 5), the effluent limit (from Step 6), and refinery throughput (Step 1).
0.88 (process factor) x 0.97 (size factor) x 66 lb/mbbl (unadjusted effluent limitation) x 125 mbbl • 7042 lb/day of COD (30-day daily average limit).
14

SECTION II
INTRODUCTION
This development document details the technical basis for the Agency's BAT, NSPS, PSES, and PSNS for the petroleum refining industry. These limitations and standards are promulgated under authority of Sections 301, 304, 306, 307, and 501 of the Clean Water Act (the Federal Water Pollution Control Act Amendments of 1972, 33 USC 1251 et seq., as amended by the Clean Water Act of 1977, P.L. 95-217T also called the "Act". The regulation was also promulgated in response to the Settlement Agreement in Natural Resources Defense Council, Inc. ~Train, 8 ERC 2120 (D.D.C. 1976), modified, 12 ERC 183~D.o.c. 1979) and in response to the decision of the United States Court of Appeals in American Petroleum Institute v. EPA, 540 F.2d 1023 {lOth Cir. 1976). - -
PRIOR ~ REGULATIONS
EPA promulgated BPT, BAT, NSPS and PSNS for the petroleum refining industry on May 9, 1974 (39 FR 16560, Subparts A-E). A development document was published in ~pril 1974 {EPA-440/1-74-014a). This document provided the bases for the 1974 regulation and is henceforth referred to as the 1974 Development Document. BPT and BAT limitations and NSPS were challenged in the U.S. Court of Appeals for the Tenth Circuit by the American Petroleum Institute and others. The court upheld both BPT limitations and NSPS, but remanded BAT limitations, in toto, for further consideration. Storm water regulations-under:BPT, BAT and RSPS were set aside by the court in the same action. Interim final PSES were promulgated on March 23, 1977 (42 FR 15684).
OVERVIEW Q! I§! INDUSTRY
The petroleum refining industry is defined by Bureau of the Census Standard Industrial Classification {SIC) 2911. The raw material of this industry is primarily petroleum material (generally, but not always, crude oil). Petroleum refineries process this raw material into a wide wariety of petroleum products, including gasoline, residual fuel oil, jet fuel, heating oils and gases, and petrochemicals. Refining includes a wide variety of physical separation and · chemical reaction processes. Because of the diversity and complexity of the processes used and the products produced, petroleum refineries are generally characterized by the quantity of raw material processed, rather than by the quantity and types of products produced.
EPA has identified 285 petroleum refineries in the United States and its possessions. The smallest refinery can refine fifty
15

barrels of oil per day (one barrel equals 42 gallons), while the largest can refine 665,000 barrels per day.
The u.s. refining industry has experienced a dramatic reversal of historical growth trends as a result of the reduction in consumption of petroleum products that has taken place since 1978. U.S. crude oil runs peaked at 14.7 million barrels per day in the calendar year 1978. Runs have decreased each year since then reaching 12.5 million barrels per day for the calendar year 1981. In early 1982 runs have dropped to below 11.5 million barrels per day representing percentage capacity utilizations in the low 60's. More than fifty plants have discontinued operations in the U.S. over the past year. It is expected that u.s. refinery activity will recover somewhat. The 1981 DOE Annual Report to Congress projects u.s. crude runs at 14.4 million barrels per day in 1985 and 13.4 million barrels per day in 1990 for their mid-oil price scenarios. The above forecasts of U.S. refinery activity indicate that very little, if any, new refinery facilities will be built at undeveloped sites over the next decade. However, it will be necessary for U.S. refineries to modernize and expand downstream facilities at existing refinery sites to allow increasingly heavier and higher sulfur crude oils to be processed into a product mix which emphasizes production of the lighter and higher quality products that will be demanded by the marketplace.
Since its inception, the u.s. refining industry has continued to build bigger and more efficient plants as new technology has developed over time. The average U.S. refinery capacity per plant increased from 43.3 thousand barrels per day to 55.6 thousand barrels per day from January 1, 1967, to January 1, 1973. This trend was halted in the late 1970's in response to the DOE "small refiner bias" provision of the crude oil entitlements program. This provision encouraged the construction of small, inefficient plants which offset the technological improvements created by expanding existing, larger refineries. 53 additional U.S. refineries were in operation on January 1, 1981 versus January 1, 1975. The number of plants in operation with capacity greater than 100 thousand barrels,per day increased by only seven (from 46 to 53) over this time period. Most of the new plants placed in operation were small. Average U.S. refinery capacity .increased only from 56.0 to 57.3 thousand barrels per day from January 1, 1975, to January 1, 198.1. Many of the small new plants built in this time period are among the fifty that have discontinued operations during the last year.
The four major sources of process wastewater are cooling water, water used to wash unwanted materials from a process stream, water used as part of a reaction process, and boiler blowdowns. Current treatment systems used by refineries for this process wastewater include (a) in-plant controls of water use; (b) inplant treatment of segregated wastestreams for ammonia and sulfide removal via steam stripping; and (c) end-of-pipe
16

treatment, consisting of oil/water separators, biological treatment and, in some cases, mixed media filtration. Although significant concentrations of toxic and other pollutants are found in untreated waste, data from an EPA sampling program of seventeen refineries show that application of BPT substantially reduces the concentrations of pollutants (See Sections V and VI for details of sampling programs). Toxic pollutants were reduced to near or below the concentrations that can be accurately measured using available measurement techniques.
SUMMARY Q[ METHODOLOGY
On December 27, 1977, the President signed into law the Clean Water Act of 1977. Although this law makes several important changes in the Federal water pollution control program, its most significant feature is the incorporation of several of the basic elements of the Settlement Agreement program for toxic pollution control. Sections 301(b)(2)(A) and 301(b)(2)(C) of the Act now require the achievement by July 1, 1984, of effluent limitations reflecting BAT for toxic pollutants, including the 65 pollutants and classes of pollutants which Congress declared toxic under Section 307(a). Likewise, the Agency's programs for new source performance standards and pretreatment standards are now aimed principally at toxic pollutant controls. Moreover, to strengthen the toxics control program, Section 304(e) of the Act now authorizes the Administrator to prescribe "best management practices" ("BMPs") to prevent the release of toxic and hazardous pollutants from plant site runoff, spillage or leaks, sludge or waste disposal, and drainage from raw material storage associated with, or ancillary to, the manufacturing or treatment process.
In keeping with its emphasis on toxic pollutants, the Clean Water Act of 1977 also revised the control program for non-toxic pollutants. Instead of BAT for "conventional" pollutants identified under Section 304(a)(4) (including biochemical oxygen demand, total suspended solids, fecal coliform, oil and grease and pH), the new Section 301(b)(2)(E) requires achievement by July 1, 1984, of "effluent limitations requiring the application of the best conventional pollutant control technology" ("BCT"). BCT is not an additional limitation but replaces BAT for the control of conventional pollutants. In addition to other factors specified in section 304(b)(4)(B), the Act requires the BCT limitations be assessed in light of a two part "costreasonableness" test. American Paper Institute v. ~' 660 F2d 954 (4th Cir. 1981). The first test compares the cost for private industry to reduce its conventional pollutants with the costs to publicly owned treatment works for similar levels of reduction in their discharge of these pollutants. The second test examines the cost-effectiveness of additional industrial treatment beyond BPT. EPA must find that limitations are "reasonable" under both tests before establishing them as BCT. In no case may BCT be less stringent than BPT. For non-toxic, nonconventional pollutants, Sections 301(b)(2)(A} and (b)(2)(F)
17

require achievement of BAT effluent limitations within three years after their establishment or by July 1, 1984, whichever is later, but not later than July 1, 1987.
APPROACH
The emphasis of this regulatory development effort differs from the one in 1974 because of legislative changes.
Despite the major revisions described above, the basic factors to be considered in developing effluent limitation guidelines and standards of performance remain unchanged. These include the total cost of applying a technology; effluent reduction benefits realized; the age of equipment and facilities; the process employed; the engineering aspects of applying various types of control techniques and process changes; nonwater-quality environmental related impacts (including energy requirements); and other factors as the Administrator deems appropriate.
Efforts to compile the necessary information to address the statutory factors mentioned above were divided into four segments: industry profile, waste characterization, technology assessment, and cost development. These efforts are briefly described below.
Industry Profile
To update the information needed to establish effluent guidelines for the petroleum refining category, EPA sent questionnaires to all refineries in the United States and its territorial possessions. The surveys were made under Section 308 of the Clean Water Act. The information obtained describes the petroleum refining industry wastewater treatment practices for the year 1976.
Information from these surveys was combined with existing information to develop an industry profile, including number of plants, their size, geographic location, manufacturing processes, wastewater generation, treatment, and discharge methods. Information on number, size, and geographical location of refineries was later updated with 1980 data from the U.S. Department of Energy (DOE). Questionnaire data aided in the final selection of plants for other aspects of this program. Flow data from the questionnaires was used to develop a flow model for the analysis of refinery wastewater production. Another objective of the survey was to obtain information identifying the use or generation of 123 toxic pollutants and determining the availability of plant data on the effectiveness of their removal. Since the initial questionnaire survey, the list of toxic pollutants has been revised from 123 to the present list of 126 specific substances.
Waste Characterization
18

Information on waste characterization of effluent is available from four sources described below.
petroleum refining which are briefly
The first effort in determining the potential presence of the toxics involved the identification of toxics manufactured and purchased by the industry. The 1977 survey requested such information from the industry.
The second effort was the sampling of 23 refineries and two POTW to determine the presence, absence and relative concentrations of toxic, conventional and non-conventional pollutants. The refineries were selected to be representative of the manufacturing processes, the prevalent mix of production among plants, and the current treatment technologies in the industry. The selected direct discharge refineries were meeting BPT limitations. Seventeen plants were direct dischargers (refineries that discharge effluents to U.S. waters) and six were indirect dischargers (refineries that direct effluents to publicly owned treatment works).
Subsequent to the 1979 proposal, EPA conducted a 60-day sampling program at two petroleum refineries. The program involved the sampling of raw and treated effluent every other day for a period of sixty days. Pollutants analyzed included toxics, but excluded asbestos and pesticides. The objectives of this program were to: (1) determine if there is a surrogate relationship between the priority pollutants and one or more of the traditional pollutant parameters (i.e. COD, TOC): and (2) confirm the presence or absence of specific priority' pollutants.
In a separate program, eight refineries were sampled by EPA regional surveillance and analysis field teams.
Technology Evaluation
Three major efforts were undertaken to identify and evaluate available control and treatment technologies. These include:
o A literature search that compiled available information on the status of and advances being made by the industry relative to wastewater handling and disposal.
o A review of the responses to the 1977 EPA Petroleum Refining Industry Survey which determined the status of the industry with regard to in-plant source control and end-of-pipe treatment.
o A program to assess the toxic removal effectiveness of carbon absorption treatment on a pilot scale. Granular activated carbon was tested at six plants and powdered activated carbon was tested in four of the same six refineries.
19

Subsequent to the 1979 proposal, the Agency conducted two additional studies. The objective of the first study was to determine the technical feasibility of recycle/reuse of wastewater at fifteen refineries. The second study involved the acquisition of effluent concentration data from fifty refineries that have biological treatment systems. Most of these refineries have below - industry average flows. The purposes were to determine if low - flow refineries discharge at higher pollutant concentrations and whether a long term average phenol concentration of 19 ppb is achievable.
The results of the above studies established a range of control and treatment technologies available to the petroleum refining industry. Section V discusses these studies in greater detail. Detailed discussion of BPT treatment technology is not presented in this document. It is presented in the 1974 Development Document.
~ Development
Information on costs, energy requirements and non-water quality environmental impacts associated with the control and treatment technologies was compiled at the time of the 1979 proposal. The preamble to the 1979 proposal presented estimates of the cost of recycle/reuse for comparison. The Agency confirmed these estimates of the cost of flow reduction via recycle/reuse during the 15 refinery study conducted after the 1979 proposal.
Results of these programs industry profile, Section VII on technology assessment systems.
are presented in Section III on V on waste characterization, Section and Appendix A on cost of treatment
20

INTRODUCTION
SECTION III
DESCRIPTION OF THE INDUSTRY
The purpose of this section is to provide a brief description of the petroleum refining industry~ This description is presented in two parts:
1} the overall industry profile: and
2} the unit manufacturing processes.
The industry profile includes a general description of the industry, a description of refinery distribution in the United States, and data related to the growth anticipated for this industry.
The information presented on unit manufacturing processes includes an overview of refining process operations. Also included is information on unit operations, and wastewater characteristics, related to some 20 individual processes.
INDUSTRY PROFILE
General Description 2t the Industry
This effluent guidelines study covers the petroleum refining industry in the United States, as defined by Standard Industrial Classification (SIC} Code 2911 of the U.S. Department of Commerce. SIC Code 2911 includes facilities primarily engaged in producing hydrocarbon materials through the distillation of crude petroleum and its fractionation products. There are numerous and varied intermediate and finished products which can be refined from crude petroleum. Table III-1 presents a listing of some of the major products of the petroleum refining industry.
It is important to note that the production of crude petroleum and natural gas, the production of natural gasoline and other natural liquid hydrocarbons, and operations associated with such production are not included in SIC 2911. These are covered by SIC Codes 1311 and 1312, respectively, and therefore, are not within the scope of this subject. This study also does not include distribution activities, such as gasoline service stations. Transportation of petroleum products is covered only to the extent that it affects a refinery's pollution control activities, such as the treatment of ballast water. Other activities outside the scope of the SIC Code 2911 were included in the development of raw waste load data and are listed as
21

auxiliary processes which are an integral part of refinery operations. Some of these include soap manufacture for the production of greases, steam generation, and hydrogen production.
Refinery Distribution
As of January 1, 1981, there were a total of 303 petroleum refineries operating in the United States, excluding Puerto Rico, the Virgin Islands, and Guam. These refineries are operating with a combined capacity of approximately 3.08 million cubic meters per stream-day (19.37 million barrels per stream-day) of crude oil processing. The individual capacities of the 303 refineries range from about 30 cubic meters per stream-day (190 barrels per stream-day) at the smallest plant to about 106,200 cubic meters per stream-day (668,000 barrels per stream-day) at the largest plant.
Since it's inception, the U.S. refining industry has continued to build bigger and more efficient plants as new technology has developed over time. The average U.S. refinery capacity per plant increased from 43.3 thousand barrels per day to 55.6 thousand barrels per day from January 1, 1967, to January 1, 1973. 53 additional U.S. refineries were in operation on January 1, 1981, versus January 1, 1975. The number of plants in operation with capacity greater than 100 thousand barrels per day increased by only seven (from 46 to 53) over this time period. Most of the new plants placed in operation were small. Average U.S. refinery capacity increased only from 56.0 to 57.3 thousand barrels per day from January 1, 1975, to January 1, 1981. Many of the small new plants built in this time period are among the fifty that have discontinued operations during the last year.
Additional information on industry profile is provided in: Table III-2 on refinery capacity; Table III-3 on 1980 consumption of petroleum products; Table III-4 on sources of supply for u.s. petroleum feedstocks; Table III-5 on characteristics of crude oil from major fields around the world; and Table III-6 on trend in domestic petroleum refining from 1975 to 1981.
Within the United States, most of the refining capacity is concentrated in two areas: major crude production areas, such as Texas, California, Louisiana, Oklahoma, and Kansas; and major population areas, such as Pennsylvania, Illinois, Ohio, New Jersey, and Indiana. Table III-2 lists the number of refineries, total crude ·refining capacity, and major process capacities in the United States by state. The geographical distribution of these refineries is displayed in Figure III-1.
22

Anticipated Industry Growth
The U.S. refining industry has experienced a dramatic reversal of historical growth trends as a result of the reduction in consumption of petroleum products that has taken place since 1978. U.S. crude oil runs peaked at 14.7 million barrels per day in the calendar year 1978. Runs have decreased each year since then reaching 12.5 million barrels per day for the calendar year 1981. In early 1982 runs have dropped to below 11.5 million barrels per day, representing percentage capacity utilizations in the low 60's. More than fifty plants have discontinued operations in the U.S. over the past year. It is expected that U.S. refinery activity will recover somewhat. The 1981 DOE Annual Report to Congress projects U.S. crude runs at 14.4 million barrels per day in 1985 and 13.4 million barrels per day in 1990 for their mid-oil price scenarios. The above forcasts of U.S. refinery activity indicate that very little, if any, new refinery facilities will be built at undeveloped sites over the next decade. · However, it will be necessary for U.S. refiners to modernize and expand downstream facilities at existing refinery sites to allow increasingly heavier and higher sulfur crude oils to be processed into a product mix which emphasizes production of the lighter and higher quality products that will be demanded by the marketplace.
Y!!! MANUFACTURING PROCESSES
Overview of Refining Processes
A petroleum refinery is a complex combination of interdependent operations engaged in separating crude molecular constituents, molecular cracking, molecular rebuilding, and solvent finishing to produce petroleum-derived products, such as those shown in Table III-1. There are a number of distinct processes that may be utilized by the industry for the refining of crude petroleum and its fractionation products. The EPA questionnaire survey of the petroleum refining industry, conducted during 1977, identified over 150 separate processes being used. These processes, along with the number of refineries employing each, are presented in Table III-7.
Although only about 150 separate processes were identified in the petroleum refining industry, there are many more process combinations that may be employed at an individual refinery, depending upon the type of crude being processed, the type of product being produced, and the characteristics of the particular refinery.
Process Descriptions and Wastewater Characteristics
The characteristics of the wastewater differ considerably for different processes. Considerable information is available that can be used to make meaningful qualitative interpretations of
23

pollutant loadings from refinery processes. The results of analysis of available information is presented in Table III-8 which shows the major sources of pollutants within a refinery. In order to characterize the wastes for each of the industry subcategories, it is essential to focus on the sources and contaminants within the individual production processes and auxiliary activities. Each process is itself a series of unit operations which causes chemical and/or physical changes in the feedstock or products. In the commercial synthesis of a single product from a single feedstock, there generally are sections of the process associated with the preparation of the feedstock, the chemical reaction, the separation of reaction products, and the final purification of the desired product. Each unit operation may have quite different water usages associated with it. The types and quantities of contact wastewater are, therefore, directly related to the nature of the various processes. This implies that the types and quantities of wastewater generated by each plant's total production mix are unique. Brief process descriptions and delineation of wastewater sources for the more important refining processes are presented below.
1. Crude Oil and Product Storage. Crude oil, intermediate, and finished products are stored in tanks of varying size to provide adequate supplies of crude oils for primary fractionation runs of economical duration, to equalize process flows and provide feedstocks for intermediate processing units, and to store final products prior to shipment in adjustment to market demands. Generally, operating schedules permit sufficient detention time for settling of water and suspended solids.
Wastewater pollutants associated with storage of crude oil and products are mainly in the form of free and emulsified oil and suspended solids. During storage, water and suspended solids in the crude oil separate. The water layer accumulates below the oil, forming a bottom sludge. When the water layer is drawn off, emulsified oil present at the oil-water interface is often lost to the sewers. This waste is high in COD levels and to a lesser extent, BODS. Bottom sludge is removed at infrequent intervals. Additional quantities of waste result from leaks, spills, salt "filters" (for product drying), and tank cleaning.
Intermediate storage is frequently the source of polysulfide bearing wastewaters and iron sulfide suspended solids. Finished product storage can produce high BODi, alkaline wastewaters, as well as tetraethyl lead. Tank cleaning can contribute large amounts of oil, COD, and suspended solids, and a minor amount of BOD~. Leaks, spills, and open or poorly ventilated tanks can also be a source of air pollution, through evaporation of hydrocarbons into the atmosphere.
24

2. Ballast Water Storage. Tankers which are used ·to ship Intermediate and final products generally discharge ballast (approximately 30 percent of the cargo capacity is generally required to maintain vessel stability}.
Ballast waters discharged by product tankers are contaminated with product materials which are the crude feedstock in use at the refinery, ranging from water soluble alcohol to residual fuels. In addition to the oil products contamination, brackish water and sediments are present, contributing high COD and dissolved solids loadings to the refinery wastewater. These wastewaters are generally discharged to either a ballast water tank or holding ponds at the refinery. In many cases, the ballast water is discharged directly to the wastewater treatment system, and potentially constitutes a "shock" load to the treatment system.
~ Crude Desalting. Common to all types of desalting are an emulsifier and settling tank. Salts can be separated from oil by either of two methods. In the first method, water wash desalting in the presence of chemicals (specific to the type of salts present and the nature of the crude oil) is followed by heating and gravity separation. In the second method, water wash desalting is followed by water/oil separation under the influence of a high voltage electrostatic field acting to agglomerate dispersed droplets. In either case, wastewater containing various removed impurities is discharged to the waste stream, while clean desalted crude oil flows from the upper portion of the holding tank. A process flow schematic of electrostatic desalting is shown in Figure III-2.
Much of the bottom sediment and water (BS&W) content in crude oil is caused by the "load-on-top" procedure used on many tankers. This procedure can result in one or more cargo tanks containing mixtures of sea waters and crude oil, which cannot be separated by decantation while at sea, and are consequently retained in the crude oil storage at the refinery. While much of the water and sediment are removed from the crude oil by settling during storage, a significant quantity remains to be removed by desalting prior to processing of the crude in the refinery.
The continuous wastewater stream from a desalter contains emulsified oil occasionally free oil, ammonia, phenol, sulfides, and suspended solids. These pollutants produce a relatively high BODS and COD. This wastewater also contains enough chlorides and other dissolved materials to contribute to the dissolved solids problem in the areas where the wastewater is discharged to fresh water bodies. There are also potential thermal pollution problems because the temperature of the desalting wastewater often exceeds gsoc (2QOOF).
25

~ Crude Oil Fractionation. Fractionation serves as the basic refining process for the separation of crude petroleum into intermediate fractions of specified boiling point ranges. The several alternative subprocesses include prefractionation and atmospheric fractionation, vacuum fractionation, and three-stage crude distillation.
Prefractionation Skimming}
and Atmospheric Distillation (Topping or
Prefractionation is an optional distillation process to separate economical quantities of very light distillates from the crude oil. Lower temperature and higher pressure conditions are used than would be required in atmospheric distillation. Some process water can be carried over to the prefractionation tower from the desalting process.
Atmospheric distillation breaks the heated crude oil as follows:
1. Light overhead products (CS and lighter} as in the case of prefractionation.
2. Sidestream distillate cuts of can be separated in a single towers, each tower yielding a stream.
3. Residual or reduced crude oil.
Vacuum Fractionation
kerosene, heating and gas oil tower or in a series of topping successively heavier product
The asphaltic residuum from atmospheric distillation amounts to roughly one-third (U.S. average) of the crude charged. This material is sent to vacuum stills, which recover additional heavy gas oil and deasphalting feedstock from the bottoms residue.
Three-Stage Crude Distillation
Three-stage crude distillation, representing only one of many possible combinations of equipment, is shown schematically in Figure III-3. The process consists of:
1. An atmospheric fractioning stage which produces lighter oils;
2. An initial vacuum stage which produces well~fractioned, lube oil base stocks plus residue for subsequent propane deasphalting; and
3. A second vacuum stage which fractionates surplus atmospheric bottoms not applicable for lube production, plus surplus initial vacuum stage residuum not required for deasphalting. This stage adds the capability of removing catalytic cracking stock from surplus bottoms to the distillation unit.
26

Crude oil is first heated in a simple heat exchanger, then in a direct-fired crude charqe heater. Combined liquid and vapor effluent flow from the heater to the atmospheric fractionating tower, where the vaporized distillate is fractionated into gasoline overhead product and as many as four liquid sidestream products: naphtha, kerosene, light and heavy diesel oil. Part of the reduced crude from the bottom of the atmospheric tower is pumped through a direct-fired heater to the vacuum lube fractionator. Bottoms are combined and charged to a third direct-fired heater. In the tower, the distillate is subsequently condensed and withdrawn as two sidestreams. The two sidestreams are combined to form catalytic cracking feedstocks, with an asphalt base stock withdrawn from the tower bottom.
Wastewater from crude oil fractionation generally comes from three sources. The first source is the water drawn off from overhead accumulators prior to recirculation or transfer of hydrocarbons to other fractionators. This waste is a major source of sulfides and ammonia, especially when sour crudes are being processed. It also contains significant amounts of oil, chlorides, mercaptans, and phenols.
A second waste source is discharge from oil sampling lines. This should be separable but may form emulsions in the sewer.
A third possible waste source is the very stable oil emulsions formed in the barometric condensers used to create the reduced pressures in the vacuum distillation units. However, when barometric condensers are replaced with surface condensers, oil vapors do not come in contact with water; consequently, e~ulsions do not develop.
~ Thermal Cracking. This fundamental process is defined in this study to include visbreaking and coking, as well as regular thermal cracking. In each of these operations, heavy gas oil fractions (from vacuum stills) are broken down into lower molecular weight fractions such as domestic heating oils, catalytic cracking stock, and other fractions by heating, but without the use of a catalyst. Typical thermal cracking conditions are 4800- 6030C, (~ooo- 110QOF) and 41.6- 69.1 atm (600-1000 psig). The high pressures result from the formation of light hydrocarbons in the cracking reaction (olefins, or unsaturated compounds, are always formed in this chemical conversion). There is also a certain amount of heavy fuel oil and coke formed by polymerization and condensation reactions.
The major source of wastewater in thermal cracking is the overhead accumulator on the fractionator, where water is separated from the hydrocarbon vapor and sent to the sewer system. This water usually contains various oils and fractions and may be high in BOD~, COD, ammonia, phenol, and sulfides, and may have a high alkalinity.
27

~ Catalytic Cracking. Catalytic cracking, like thermal cracking, breaks heavy fractions, principally gas oils, into lower molecular weight fractions. This is probably the key process in the production of large volumes of high-octane gasoline stocks; furnace oils and other useful middle molecular weight distillates are also produced. The use of catalyst permits operations at lower temperatures and pressures than with thermal cracking, and inhibits the formation of undesirable polymerized products. Fluidized catalytic processes, in which the finely powdered catalyst is handled as a fluid, have largely replaced the fixed bed and moving bed processes, which use a beaded or pelleted catalyst. A schematic flow diagram of fluid catalytic cracking is shown. in Figure III-4.
The process involves at least four types of reactions: 1) thermal decomposition; 2) primary catalytic reactions at the catalyst surface; 3) secondary catalytic reactions between the primary products; and 4) removal of polymerizable products from further reactions by absorption onto the surface of the catalyst as coke. This last reaction is the key to catalytic cracking because it permits decomposition reactions to move closer to completion than is possible in simple thermal cracking. Cracking catalysts include synthetic and/or natural silica-alumina, treated bentonite clay, Fuller's earth, aluminum hydrosilicates, and bauxite. These catalysts are in the form of beads, pellets, and powder, and are used in either a fixed, moving, or fluidized bed. The catalyst is usually heated and lifted into the reactor area by the incoming oil feed which, in turn, is immediately vaporized upon contact. Vapors from the reactors pass upward through a cyclone separator which removes most of the entrained catalyst. These vapors then enter the fractionator, where the desired products are removed and heavier fractions recycled to the reactor.
Catalytic cracking units are one of the largest sources of sour and phenolic wastewaters in a refinery. Pollutants from catalytic cracking generally come from the steam strippers and overhead accumulators on fractionators, used to recover and separate the various hydrocarbon fractions produced in the catalytic reactors.
The major pollutants resulting from catalytic cracking operations are oil, sulfides, phenols, cyanides, and ammonia. These pollutants produce an alkaline wastewater with high BODS and COD concentrations. Sulfide and phenol concentrations -in the wastewater vary with the type of crude oil being processed, but at times are significant. Regeneration of spent catalyst may produce enough carbon monoxide and catalyst fines to constitute an air pollution problem.
28

~ Hydrocracking. This process is basically catalytic cracking 1n the presence of hydrogen, with lower temperatures and higher pressures than fluid catalytic cracking. Hydrocracking temperatures range from 203o 4250C (4000 - SOOOF), while pressures range from 7.8- 137.0 atm (100 to 2000 psig). Actual conditions and hydrogen consumption depend upon the feedstock, and the degree of hydrogenation required. The molecular weight distribution of the products is similar to catalytic cracking, but with the reduced formation of olefins.
At least one wastewater stream from the process should be high in sulfides, since hydrocracking reduces the sulfur content of the material being cracked. Most of the sulfides are in the gas products which are sent to a treating unit for removal and/or recovery of sulfur and ammonia. However, in product separation and fractionation units following the hydrocracking reactor, some of the H2S will dissolve in the wastewater being collected. This water from the separator and fractionator will probably be high in sulfides, and possibly contain significant quantities of phenols and ammonia.
~ Polymerization. Polymerization units are used to convert olefin feedstocks (primarily propylene) into higher octane polymer units. These units generally consist of a feed treatment unit (remove H2S, mercaptans, nitrogen compounds), a catalytic reactor, an -acid removal section, and a gas stabilizer. The catalyst is usually phosphoric acid, although sulfuric acid is used in some older methods. The catalytic reaction occurs at 1470- 2240C (3000- 43SOF), and a pressure of 11.2- 137.0 atm (150 2000 psig). The temperature and pressure vary with the individual subprocess used.
Polymerization is a rather dirty process in terms of pounds of pollutants per barrel of charge, but because of the small polymerization capacity in most refineries, the total waste production from the process is small. Even though the process makes use of acid catalysts, the waste stream is alkaline, because the acid catalyst in most subprocesses is recycled, and any remaining acid is removed .by caustic washing. Most of the waste material comes from the pretreatment of feedstock to the reactor. The wastewater is high in sulfides, mercaptans, and ammonia. These materials are removed from the feedstock in caustic acid.
9. Alkylation. Alkylation is the reaction of an isoparaffin TUsually isobutane) and an olefin (propylene, butylene, amylenes) in the presence of a catalyst at carefully controlled temperatures and pressures to produce a high octane alkylate for use as a gasoline blending component. Propane and butane are also produced. Sulfuric acid is the most widely used catalyst, although hydrofluoric acid is also used. The reactor products are separated in a catalyst recovery unit, from which the
29

catalyst is recycled. The hydrocarbon stream is passed through a caustic and water wash before going to the fractionation section.
The major discharges from sulfuric acid alkylation are the spent caustics from the neutralization of hydrocarbon streams leaving the sulfuric acid alkylation reactor. These wastewaters contain dissolved and suspended solids, sulfides, oils, and other contaminants. Water drawn off from the overhead accumulators contains varying amounts of oil, sulfides, and other contaminants, but is not a major source of waste in this subprocess. Most refineries process the waste sulfuric acid stream from the reactor to recover clean acids, use it for neutralization of other waste streams, or sell it.
Hydrofluoric acid alkylation units have small acid rerun units to purify the acid for reuse. HF units do not have a spent acid or spent caustic waste stream. Any leaks or spills that involve loss of fluorides constitute a serious and difficult pollution problem. Formation of fluorosilicates has caused line plugging and similar problems. The major sources of waste material are the overhead accumulators on the fractionator.
~ Isomerization. Isomerization is a process technique for obtaining higher octane motor fuel by converting light gasoline stocks into their higher octane isomers. The greatest application has been, indirectly, in the conversion of isobutane from normal butane for use as feedstock for the alkylation process. In a typical subprocess, the desulfurized feedstock is first fractionated to separate isoparaffins from normal paraffins. The normal paraffins are then heated, compressed, and passed through the catalytic hydrogenation reactor which isomerizes the n-paraffin to its respective high octane isomer. After separation of hydrogen, the liquids are sent to a stabilizer, where motor fuel blending stock or synthetic isomers are removed as products.
Isomerization wastewaters present no major pollutant discharge problems. Sulfides and ammonia are not likely to be present in the effluent. Isomerization wastewaters should also be low in phenolics and oxygen demand.
~ Reforming. Reforming converts low octane naphtha, heavy gasoline, and napthene-rich stocks to high octane gasoline blending stock, .aromatics for petrochemical use, and isobutane. Hydrogen is a significant by-product of the process. Reforming is a mild decomposing process, since some reduction occurs in molecular size and boiling range of the feedstock. Feedstocks are usually hydrotreated for the removal of sulfur and nitrogen compounds prior to charging to the reformer, since the platinum catalysts widely used are readily poisoned.
The predominant reaction during reforming is the dehydrogenation of naphthenes. Important secondary reactions are the
30

isomerization and dehydrocyclization of paraffins. All three reactions result in high octane products.
One subprocess may be divided into three parts: the reactor heater section, in which the charge plus recycle gas is heated and passed over the catalyst in a series of reactions; the separator drum, in which the reactor-effluent is separated into gas and liquid streams, the gas being compressed for recycle; and the stabilizer section, in which the separated liquid is stabilized to the desired vapor pressure. There are many variations in subprocesses, but the essential and frequently the only difference is the composition of the catalyst involved.
Reforming is a relatively clean process. The volume of wastewater flow is small, and none of the wastewater streams have high concentrations of significant pollutants. The wastewater is alkaline, and the major pollutant is sulfide from the overhead accumulator on the stripping tower used to remove light hydrocarbon fractions from the reactor effluent. The overhead accumulator catches any water that may be contained in the hydrocarbon vapors. In addition to sulfides, the wastewater contains small amounts of ammonia, mercaptans, and oil.
~ Solvent Refining. Refineries employ a wide spectrum of contact solvent processes, which are dependent upon the differential solubilities of the desirable and undesirable feedstock components. The principal steps are: counter-current extraction, separation of solvent and product by heating and fractionation, and solvent recovery. Napthenics, aromatics, unsaturated hydrocarbons, sulfur and other inorganics are separated, with the solvent extract yielding high purity products. Many of the solvent processes may produce process wastewaters which contain small amounts of the solvents employed. However, these are usually minimized because of the economic incentives for reuse of the solvents.
Solvent Deasphalting
The primary purpose of solvent deasphalting is to recover lube or catalytic cracking feedstocks from asphaltic residuals, with asphalt as a by-product. Propane deasphalting is the predominant technique. The vacuum fractionation residual is mixed in a fixed proportion with a solvent in which asphalt is not soluble. The solvent is recovered from the oil via steam stripping and fractionation, and is reused. The asphalt produced by this method is normally blended into fuel oil or other asphaltic residuals.
Solvent Dewaxing
Solvent drawing removes wax from lubricating oil stocks by promoting crystallization of the wax. Solvents which are used include: furfural, phenol, cresylic acid propane (Duo-Sol},
31

liquid sulfur dioxide (El~leanu process), B-B- dichloroethyl ether, methyl ethyl ketone, nitrobenzene, and sulfur-benzene. The process yields deoiled waxes, wax-free lubricating oils, aromatics, and recovered solvents.
Lube Oil Solvent Refining
This process includes a collection of subprocesses for improving the quality of lubricating oil stock. The raffinate or refined lube oils obtain improved temperature, viscosity, color, and oxidation resistance characteristics. A particular solvent is selected to obtain the desired quality raffinate. The solvents include: furfural, phenol, sulfur dioxide, and propane.
Aromatic Extraction
Benzene, toluene, and xylene (BTX) are formed as by-products in the reforming process. The reformed products are fractionated to give a BTX concentrate cut, which, in turn, is extracted from the napthalene and the paraffinics with a glycol base solvent.
Butadiene Extraction
Approximately 15 percent of the u.s. supply of butadiene is extracted from the C4 cuts from the high temperature petroleum cracking processes. Furfural or cuprous ammonia acetate (CAA) is commonly used for the solvent extraction.
The major potential ROllutants from the various solvent refining subprocesses are tne solvents themselves. Many of the solvents, such as phenol, glycol, and amines, can produce a high BOOS. Under ideal conditions the solvents are continually recirculated with no losses to the sewer. Unfortunately, some solvent is always lost through pump seals, flange leaks, and other sources. The main source of wastewater is from the bottom of fractionation towers. Oil and solvent are the major wastewater constituents.
~ Hydrotreatinq. Hydrotreating processes are used to saturate olefins, and to remove sulfur and nitrogen compounds, odor, color and gum-forming materials, and others by catalytic action in the presence of hydrogen, from either straight-run or cracked petroleum fractions. In most subprocesses, the feedstock is mixed with hydrogen, heated, and charged to the catalytic reactor. The reactor products are cooled, and the hydrogen, impurities and high grade product separated. The principal difference between the many subprocesses is the catalyst; the process flow is similar for essentially all subprocesses.
Hydrotreating processes are used to reduce the sulfur content of product streams from sour crudes by approximately 90 percent or more. Nitrogen removal requires more severe operating conditions, but generally 80 - 90 percent, or better, reductions are accomplished.
32

The primary variables influencing hydrotreating are hydrogen partial pressure, process temperature, and contact time. An increase in hydrogen pressure gives a better removal of undesirable materials and a better rate of hydrogenation. Make-up hydrogen requirements are generally high enough to require a hydrogen production unit. Excessive temperatures increase the formation of coke, and the contact time is set to give adequate treatment without excessive hydrogen usage and/or undue coke formation. For the various hydrotreating processes, the pressures range from 7.8 - 205.1 atm (100 to 3000 psig). Temperatures range from less than 177oc (3SOOF) to as high as 4sooc (SSOOF), with most processing done in the range of 3140C (6000F) to 4270C (SOOOF). Hydrogen consumption is usually less than 5.67 Ml (200 scf) per barrel of charge.
Principal hydrotreating subprocesses are used as follows:
1. Pretreatment of catalytic reformer feedstock; 2. Naphtha desulfurization; 3. Lube oil polishing; 4. Pretreatment of catalytic cracking feedstock; s. Heavy gas-oil and residual desulfurization; and 6. Naphtha saturation.
The strength and quantity of wastewaters generated by hydrotreating depends upon the subprocess used and feedstock. Ammonia and sulfides are the primary contaminants, but phenols may also be present if the feedstock boiling range is sufficiently high.
14. Grease Manufacturing. Grease manufacturing processes require accurate weight or volumetric measurements of feed components, intimate mixing, rapid heating and cooling, together with milling, dehydration and polishing in batch reactions. The feed components include soap and petroleum oils with inorganic clays and other additives.
Grease is primarily a soap and lube oil mixture. The properties of grease are determined in large part by the properties of the soap component. For example, sodium metal base soaps are water soluble and would then not be suitable for water contact service. A calcium soap grease can be used in water service. The soap may be purchased as a raw material or may be manufactured on site as an auxiliary process.
Only very small volumes of wastewater are discharged from a grease manufacturing process. A small amount of oil is lost to the wastewater system through leaks in pumps. The largest waste loading occurs when the batch units are washed, resulting in soap and oil discharges to the sewer system.
33

15. Asphalt Production. Asphaltic feedstock (flux) is contacted with hot air at 2Q30C (4QQOF) to 28QOC (SSQOF) to obtain desirable asphalt product. Both batch and continuous processes are in operation at present, but the batch process is more prevalent because of its versatility. Nonrecoverable catalytic compounds include: copper sulfate, zinc chloride, ferric chloride, aluminum chloride, phosphorous pentoxide, and others. The catalyst will not normally contaminate the process water effluent.
Wastewaters from asphalt blowing contain high concentrations of oils and have high oxygen demand. Small quantities of phenols may also be present.
~ Drying and Sweetening: Drying and sweetening is a relatively broad process category pr1marily used to remove sulfur compounds, water and other impurities from gasoline, kerosene, jet fuels, domestic heating oils, and other middle distillate products. "Sweetening" pertains to the removal of hydrogen sulfide, mercaptans, and thiophenes, which impart a foul odor and decrease the tetra-ethyl lead susceptibility of gasoline. The major sweetening operations are oxidation of mercaptans or disulfides, removal of mercaptans, and destruction and removal of all sulfur compounds. Drying is accomplished by salt filters or absorptive clay beds. Electric fields are sometimes used to facilitate separation of the product.
The most common waste stream from drying and sweetening operations is spent caustic. The spent caustic is characterized as phenolic or sulfidic, depending on which is present in the largest concentration. Whether the spent caustic is actually phenolic or sulfidic is mainly determined by the product stream being treated. Phenolic spent caustics contain phenol, cresols, xylenols, sulfur compounds and ·neutral oils. Sulfidic spent caustics are rich in sulfides, but do not contain any phenols. These spent caustics have very high BOD~ and coo. The phenolic caustic streams are usually sold for the recovery of phenolic materials.
Other waste streams from the process result from water washing of the treated product and regeneration of the treating solution such as sodium plumbite Na 2 Pb02) in doctor sweetening. These waste streams will contain small amounts of oil and the treating material, such as sodium plumbite (or copper from copper chloride sweetening).
The treating of sour gases produces acid gas stream rich in hydrogen can be flared, burned as fuel, or elemental sulfur.
34
a purified gas stream, and an sulfide. The H2S rich stream processed for recovery of

~ Lube Oil Finishing. Solvent refined and dewaxed lube oil stocks can be further refined by clay or acid treatment to remove color-forming and other undesirable materials. Continuous contact filtration, in which an oil-clay slurry is heated and the oil removed by vacuum filtration, is the most widely used subprocess.
Acid treatment of lubricating oils produces acid bearing wastes occuring· as rinse waters, sludges, and discharges from sampling, leaks, and shutdowns. The waste streams are also high in dissolved and suspended solids, sulfates, sulfonates, and stable oil emulsions.
Handling of acid sludge can create additional problems. Some refineries burn the acid sludge as fuel. Burning the sludge produces large volumes of sulfur dioxide that can cause air pollution problems. Other refineries neutralize the sludge with alkaline wastes and discharge it to the sewer, resulting in both organic and inorganic pollution. The best method of disposal is probably processing to recover the sulfuric acid, but this also produces a wastewater stream containing acid, sulfur compounds, and emulsified oil.
Clay treatment results in only small quantities of wastewater being discharged to the sewer. Clay, free oil, and emulsified oil are the major waste constituents. However, the operation of clay recovery kilns involves potential air. pollution problems of hydrocarbon and particulate emissions. Spent clays usually are disposed of by landfill.
~ Blending and Packaging. Blending is the final step in producing finished petroleum products to meet quality specifications and market demands. The largest volume operation is the blending of various gasoline stocks (including alkylates and other high-octane components) and anti-knock (tetra-ethyl lead), anti-rust, anti-icing, and other additives. Diesel fuels, lube oils, and waxes involve blending of various components and/or additives. Packaging at refineries is generally highly automated and restricted to high volume, consumer oriented products such as motor oils.
These are relatively clean processes because care is taken to avoid loss of product through spillage. The primary source of waste material is from the washing of railroad tank cars or tankers prior to loading finished products. These wash waters are high in emulsified oil.
Tetra-ethyl lead is the major additive blended into gasolines and it must be carefully handled because of its nigh toxicity. Sludges from finished gasoline storage tanks can contain large amounts of lead and should not be washed into the wastewater system.
35

~ Hydrogen Manufacture. The rapid growth of hydrotreating and hydrocracking has increased the demand for hydrogen beyond the level of by-product hydrogen available from reforming and other refinery processes. The most widely used process for the manufacture of hydrogen in the refinery is steam reforming, which utilizes refinery gases as a charge stock. The charge is purified to remove sulfur compounds that would temporarily deactivate the catalysts.
The desulfurized feedstock is mixed with charged to the hydrogen furnace. hydrocarbons are converted to hydrogen, carbon dioxide. The furnace supplies the the reaction temperature.
superheated steam and On the catalyst, the
carbon monoxide, and heat needed to maintain
The gases from the furnace are cooled by the addition of condensate and steam, and then passed through a converter containing a high or low temperature shift catalyst depending on the degree of carbon monoxide conversion desired. Carbon dioxide and hydrogen are produced by the reaction of the monoxide with steam.
The gas mixture from the converter is cooled and passed to a hydrogen purifying system where carbon dioxide is absorbed into amine solutions and later driven off to the atmosphere by heating the rich amine solution in the reactivator.
Since some refining processes require a minimum of carbon oxides in the product gas, the oxides are reacted with hydrogen in a methanation step. This reaction takes place in the methanator over a nickel catalyst at elevated temperatures.
Hydrocarbon impurities in the product hydrogen usually detrimental to the processes where this hydrogen will Thus, a small amount of hydrocarbon is tolerable in the gas.
are not be used. effluent
Information concerning wastes from this process is not available. However, the process appears to be a relatively clean one. In the steam reforming subprocess a potential waste source is the desulfurization unit, which is required for feedstock that has not already been desulfurized. This waste stream would contain oil, sulfur compounds, and phenol. In the partial oxidation subprocess free carbon is removed by a water wash. Carbon dioxide is d~scharged to the atmosphere at several points in the subprocess.
20. Utilities Function. Utility functions such as the supply of steam and cooling water generally are set up to service several processes. Boiler feed water is prepared and steam is generated in a single boiler house. Non-contact steam used for surface heating is circulated through a closed loop, whereby varying quantities are made available for the specific requirements of
36

the different processes. recycled to the boiler discharged as blowdown.
The house,
condensate is nearly always where a certain portion is
The three major uses of steam generated within a refinery plant are:
1. For noncontact process heating. In this application, the steam is normally generated at pressures of 9.5 to 45.2 atm (125 to 650 psig);
2. For power generation such as in steam driven turbines, compressors, and pumps associated with the process. In this application, the steam is normally generated at pressures of 45.2 to 103 atm (650 to 1500 psig) and requires superheating; and
3. For use as a diluent, stripping medium, or source of vacuum through the use of steam jet ejectors. This steam actually contacts the hydrocarbons in the manufacturing processes and is a source of contact process wastewater when condensed. It is used at a substantially lower pressure than the foregoing and frequently is exhaust steam from one of the other uses.
Steam is supplied to the different users throughout the plant either by natural circulation, vapor phase systems, or by forced circulation liquid heat transfer systems. Both types of systems discharge some condensate as blowdown and require the addition of boiler makeup water. The main areas of consideration in boiler operation are normally boiler efficiency, internal deposits, corrosion, and the required steam quality.
Boiler efficiency is dependent on many factors. One is the elimination of boiler tube deposition that impedes heat transfer. The main contributors to boiler deposits are calcium, magnesium, silicon, iron, copper, and aluminum. Any of these can occur in natural waters, and some can result from condensate return line corrosion or even from makeup water pretreatment. Modern industrial boilers are designed with efficiencies on the order of 80 percent. A deposit of 0.32 em (1/8 inch) in depth will cause a 2-3 percent drop in this efficiency, depending on the type of deposit.
The quantity and quality of the blowdown from boilers and cooling towers depend on the design of the particular plant utility system. The heat content of these streams is purely a function of the heat recovery equipment associated with the utility system. The amounts of waste brine and sludge produced by ion exchange and water treatment systems depends on both the plant water use function and the intake source. None of these utility waste streams can be related directly to specific process units.
37

Quantitative limitations on parameters.such as dissolved solids, hardness; alkalinity, and temperature, therefore, cannot be allocated on a production basis. The limitations on such parameters associated with noncontact utility effluents should be established on the basis of the water quality criteria of the specific receiving water body or an EPA study of all industries, to define specific utility effluent limitations.
Noncontact cooling water also is normally supplied to several processes from the utilities area. The system is either a loop which utilizes one or more evaporative cooling towers, or a once-through system with direct discharge.
Cooling towers accomplish the cooling of water circulated over the tower by moving a predetermined flow of ambient air through the tower with large fans. The air water contact causes a small amount of the water to be evaporated by the air. Thus, through latent heat transfer, the remainder of the circulated water is cooled.
Approximately 252 kg cal (1,000 BTU) are removed from the total water circulation by the evaporation of 0.454 kg (1 lb) of water. Therefore, if 45.4 kg (100 lbs) of water are introduced at the tower inlet and 0.454 kg (1 lb) is evaporated to the moving air, the remaining 44.9 kg (99 lbs) of water are reduced in total heat content by 252 ·kg cal (1,000 BTU), of water leaving the tower have been cooled 3.240C/kg/kg cal (10F/lb/BTU) removed, and the exit temperature is reduced by about 5.5oc (100F). The common rule of thumb is 1 percent evaporation loss for each 5.5oc (lOOF) cooling.
Since cooling is primarily by transfer of latent heat, cooling tower selection is based on the total heat content or enthalpy of the entering air. At any one enthalpy condition, the wet bulb temperture is constant. Therefore, cooling towers are selected and guaranteed to cool a specific volume of water from a hot-water temperature to a cold water temperature while operating at a design wet bulb temperature. Design wet bulb temperatures vary from 15.6 oc (600F) to 35oc (850F) depending on the geographic area, and are usually equaled or exceeded only 2.5 percent to 5 percent of the total summer operating time.
Hot water temperature minus cold water temperature is termed cooling range, and the difference between cold water and wet bulb temperature is called approach.
A closed system is normally used when converting from once-through river cooling of plant processes. In the closed system, a cooling tower is used for cooling all the hot water from the processes. With the closed system, makeup water is required to replace evaporation loss at the tower.
38

Two other types of water losses also occur. The first is drift, which is droplet carryover in the air as contrasted to evaporate loss. The cooling tower industry has a standardized guarantee that drift loss will not exceed 0.2 percent of the water circulated. The second loss in the closed system is blowdown to sewer or river. Although blowdown is usually taken off the hot water line, it may be removed from the cold water stream in order to comply with any regulations that limit the temperature of water returned to the stream. Slowdown from a tower system will vary depending on the solids concentration in the makeup water, and on the occurrence of solids that may be harmful to equipment. Generally, blowdown will be about 0.3 percent per s.soc {lOOF) of cooling, in order to maintain a solids concentration in the recirculated water of three to four times that of the makeup water.
Internal boiler water treatment methods have 'advanced to such a stage that corrosion in the steam generation equipment can be virtually eliminated. The control of caustic embrittlement in boiler tubes and drums is accomplished through the addition of sodium nitrate in the correct ratio to boiler water alkalinity.
Caustic corrosion in high heat transfer boilers can also be controlled by the addition of chelating agents. This type of solubilizing internal boiler water treatment has been shown to be more effective than previous precipitation treatment using phosphate.
Other factors the amount concentration heat recovery
influencing boiler efficiency include reduction of of boiler blowdown by increasing cycles of
of the boiler feedwater, efficiency of the blowdown equipment, and the type of feed used.
Steam purity is of prime importance if:
1. The boilers are equipped with superheaters;
2. The boilers supply power generation equipment;
3. The steam is used directly in a process where contamination could affect product quality or destroy some material {such as a catalyst) essential to the manufacture of the product.
The minimum purity required for contact steam· (or contact process water) varies from process to ·process. Acceptable amounts of suspended solids, total solids, and alkalinity vary inversely with the steam pressure. The following tabulation summarizes boiler water concentration limits for a system providing a steam purity of 0.5- 1.0 ppm total solids, which is required for most noncontact steam uses. Boiler operation generally requires the use of antifoam agents and steam separation equipment.
39

Boiler Water Concentration Limits
Parameter Boiler Pressure, atm.
21.4 21.5-31.6 31.7-41.8 41.9-52.0
Total Solids (mg/L) 6,000 ·5, 000 4,000 2,500
Suspended Solids (mg/L) 1,000 200 100 50
Total Alkalinity (mg/L) 1,000 900 800 750
Water conditioning or pretreatment systems are normally part of the utilities section of most plants. From the previous discussions, it is obvious that the required treatment may be quite extensive. Ion exchange demineralization systems are very widely employed, not only for conditioning water for high pressure boilers, but also for conditioning various process waters. Clarification is also widely practiced and usually precedes the ion exchange operation.
40

TABLE III-1
INTERMEDIATE AND FINISHED PRODUCTS PRODUCED BY THE PETROLEUM REFINING INDUSTRY
Acid Oil Alkylates Aromatic Chemicals
SIC 2911
Asphalt and Asphaltic Materials (Semi-Solid and Solid) Benzene Benzol Butadiene Coke (Petroleum) Fuel Oils (Distillate and Residual) Gas (Refinery or Still Oil) Gases (LPG) Gasoline (except Natural Gasoline) Greases (Petroleum, Lubricative, Mineral Jelly, etc.) Jet Fuels Kerosene Mineral Oils (Natural} Mineral Waxes (Natural) Naphtha Naphthenic Acids Oils (Partly Refined) Paraffin Wax Petroleums (Nonmedicinal) Road Oils Solvents Tar or Residuum
41

~ N
It>. - ~rude Capac!\ y -state pl.,h • /ad b/ad
Alab•• Alaaka .\rlz:ona A.rk.,aea California Colorado Delaware Florida Georgie Hawaii llllnoia lnd!.-.a K.-.aaa Kentucky Loulal.-a ltarylond Nichigon Hinneaota Niaaiaaippi Miaaouri Jt»nt..-.a Nebr..SCa Nevada New Hatpehlre Melt Jeraey NewHedco New York
'*-rlh Carollna North Dakota llhlo
Okl"'-• Oregon Pemayl van! a lenneaaee Texas
utah Virginia W-inqton WBat Yirglnla Wisconsin Wyo!oing
1 4
4}
}
11
11 4
"
6
12
9
59 8
1J
24,0}9 21,526
1,0}} 10,675
404,JOJ 10,254 2),8116
1,016 5,087
19,955 202,544 10},20) n,090 40,219
411,lot4 4,886
21,9)1 )5,75)
62,827 17,646 25,75)
979 715
2,115 11l,l26
19,266 2),159 1,9)6
10,842 97,926 91,519
2,510 124,458
7,869 866,619 27,449 8,74)
65,157 ),672
7,440 l4,590
151,218 1l5,410
6,500 67,150
2,769,725 64,500
1:50,000 44,51) )2,000
125,526 1,274,104
649,200 484,9)) 2:5),000
2,587,555 JO,ll6
1J7,594 224,905 )95,214 111,000 162,000
6,160 4,500
1),684 711,878 121,190 145,684 12,495 68,200
616,000 588,281
15,789 782,900
49,500 5,,.51,461
172,668 55,000
409,867 2J,100 46,800
217,589
TOTI.l JOJ J,079,)}J 19,no,529
lllTES1
•' /ad - etblc 118tera per atre•-day b/ad - barrel• per Blre•-d•y
TABlE 111-2
REFINING CAPACITY Of PETROLEUM RUINERIES IN THE U.S. BT STATE AS or JANJART 1, 1981 ( 167)
Olerge capacity, b/ad Production capacity, b/ad --,V:-..,-.... ----:T::-he-.. -.71-----=cat.,.--c..:rack1ng - Cat Cat hydro- C.t hydro- Cat hydro- Alkyla- ArOtnatlce- --- Hydrogen
dhtlllotion OJl"Utiona Freeh_feed __ ~~ _____!llro~_ crecJ(!_ng rertnlnq tre~ __ _tion iaot~~erlzation Lwoa Asphalt Ott:rd)
J1,500
l,OOO 26,100
1,188,100 27,500 90,100
8,000
28,000 429,499 285,500 143,710 118,000 874,542
"·JOO 26,000
121,000 15B,JOO 40,000 51,100
2,400 l,OOO
)47,9~1
21,900 4J,OOO
208,500 194,76) 16,000
JJt,8ro 12,000
1,804,904 45,500 29,000
164,015 10,875 20,500 74,650
459,68} J,JOO
44,000
1}),600 2),000 50,000 4,000
215,6H
v.ooo 1,000
n,500 10,000
15,944 1,500
1,100 27,400 71,866
J94,588 8,500
15,000 )8,000
1J,444
6,996,&ro 1,600,058
15,000 549,000
7,000 62,000
22,000 449,110 212,000 117,550
70,000 876,617
4J,OOO 85,500 71,200 42,000 50,ioo
2,400
2)1,444 18,200 42,000
26,000 205,500 206,700
216,)00 JO,OOO
1,555,565 54,000 28,000 94,8))
9,700 77,417
5,531 .1~6
500 60,200
500 15,000
88,640 12,700 46,150 21,000 56,9BJ
6,100 7,900 6,860
12,000 14,700
500
46,,, 5,620
12,900
5,200 4),)00
)2,400
ZJ,JOO 11,000
27),899 11,660 5,000
28,999
1,000 19,2))
2J,500 10,000
10,000 578, 7}8
19,000 U,OOO
12,000 )19,671 12J,700 121,400 49,000
461,71}
)4,400 l4,600 95,400 16,000 44,200
750
79,944 25,750 2l,OOO
12,500 170,700 127,222
2JZ,900 9,}00
1,175,109 2J,200 9,500
112,722 6,400
10,000 )1,094
870,517 4,051,_,9
7,500
JJ1,722
20,000
66,500
),200
82,200
68,000
4,900
81,000 5,000
55,000
1}9,666 1,100
46,000
911,788
n,ooo
J69,000
JJ,OOO
44,500 40,000
216,500
12,500 69,000 56,000
14,000
110,000
20,000
l4,500 26,000
182,000
871,000 5,500
20,500
5,800 16,644
2,159,444
38,000 10,000
15,)00 8J4,866
20,200 110,000
15,500 582,75J 22),660 175,400 100,500 602,910
}9,700 78,800 5J,4SO 61,500 97,550
J25,04J )1,050 }9,SOO
n,500 112,500 158,277
H1,600 29,500
2,150,597 JJ,600 26,500
172,165 7,800
10,000 6J,J94
6,625,115
4,500 95,644
8,000
4,500 107,098
JO,OOO 50,400 11,000
162,188
7,500 14,400 14,400 5,000
10,200
11,1H 2,940 2,000
2,800
"·800 47,7H
4J,900 J,600
251,698 11,150
25,JH
1,700 7,950
979,567
10,500
J,595
1,500 7,)00
21,200 J,400
18,500 36,500
6,000
.,600
28,000
7,000
500 10,900 16,J05
9,900
254,220 J,750
2,900
1,500
"8,070
},950 21,570
5,600 8,900 5,400 5,000
30,600
6,500
7,500
2,100 9,800
27,700
91,522
6,600
1,8JO
240,512
26,500 6,000
8,250 82,100
J,JOO
17,500 1,JOO
51,000 55,400 21,000 JJ,500 56,100 11,300
0,650 1\9,000
10,400
11\,1\50
98,000 J,100
10,500
}1,800
211,600 11 ,soo 30,000
l,SOO 62,800 4,700
6,500
H,500 14,016
8J7 0 7
0.6 72.0
2.5 95.5
20.0 7J.O
14.0 109.0
16.7
72.0 10.0
48.5
n2.0
62.0 1.2
174,266 1,766.1
Coke
(t/d)
16,6}6 180
1,SOO
5,210 1,200 1,855
6,930
1,JOO J20 800
JIO
975
1,250 1,750
6,975 )50
875
2,910
125
51 ,4S1

TABLE III"'!3
1980 Consumption of Petroleum Products
Products 1980 Consumption 1 Million Cubic Meters Per Daz
Motor Gasoline (Million Barrels Per Daz)
1.05 (6.6)
Aviation Fuels 0.17 (1.1)
Distillate Fuel Oil 0.46 (2.9)
Residual Fuels 0.40 (2.5)
All Other Products 0.62 (3.9)
Total Consumption 2.70 (17.0)
Source - DOE Monthly Energy Review
43

TABLE III-4
Sources of Supply for u.s. Petroleum Feedstocks
Supply, Million Barrels Per Day Source 1980 1985 (Projected)
Domestic Crude Oil Production 8.6 7.9
Domestic Natural Gas Liquids 1.6 1.4
Crude OU Imports 5.2 5.1
Residual Fuel Imports .9 1.1
Other Imports .7
Exports (.5) (.1)
Micellaneous Sources! .5 .4 -Total Supply 17 .o 15.8
1 processing gain, stock change, etc.
Sources - 1980 - DOE Monthly Energy Review 1985 (Projected) - DOE Annual Report to Congress EIA/1980 - low price scenario
44

TABLE III-5 Page 1 of 3
Characteristics of Crude Oils from Major Fields Around the World
Country
Abu Dhabi Murban
Algeria Baasi Messaoud
canada
Alberta Bonnie Glen Golden Spike Judy Creek Pembina Swan Bills
Saakatchewan Midale Weyburn
Indonesia Minas
trag Basrah Light
Libya Brega
Mexico
lleforma Maya
Norway Ekofisk
Saudi Arabia
United States
Alaska Cook Inlet Prudhoe Bay
Arkansas Smackover
Gravity, APl
39.4
44.7
34 - 44 36 - 39 42 - 43 32 - 37 41
28 - 32 24 - 33
35.2
33.9
40.4
33.0 22.0
36.3
27 - 39
36 26 .a
22.2
45
Sulfur, Percent
0.74
0.13
0.25 0.23
0.42 o.ao 1.89 2.12
0.09
2.08
0.21
1 • .56 3.4
0.21
1.0 - 2.8
0.1 1.04
2.10
Nitrogen, Percent
0.080

TAiilE UI-5 Page 2 of 3
Country Gravl t;t 1 API Sulfur 1 Percent Nltro9en 1 Percent
California Elk Hi lis 22r5 0.68 0.472 Huntington Beach 22.6 1".57 0.048 Kern River 12.6 1.19 0.604 Hldway-Sunset 22.6 0.94 San Ardo 11. 1 2.25 o.gn Wilmington 22.1 1.44
Colorado Rangely 34.8 0.56 0.073
l<olnsas Bemis Shutts 34.6 0.57 0.162
Louisiana Bayou Sale 36.2 0.16 Caillou lsi. 35.4 0.23 0.040 Go I den Headaw 37.6 0.18 Grand Bay 35 0.31 Lake Barre 40.4 o. 14 0.02 Lake Washington 28.2 0.3·7 0.146 West Bay 32.1 0.27 0.071 Bay Harchand B1k. 2 20 • .2 0.46 Hain Pass Blk. 69 30.6 0.25 0.098 South Pass Blk. 24 32.3 0.26 0.068 South Pass Blk. 27 35.6 0..18 0.069 Tlmballer Bay 34.4 0.33 0.081 West Delta Blk. 30 27 0.33 0.09
Hlsslssippi Baxtervi lie 17.1 2 .. 71 0.111
New Hexico Vacuwa' 35 0.95 0.075
Oklahoma Golden Trend 42.1 0.11
Texas Anahuac 33.2 0.23 0.041 Conroe 37.6 0.15 Diamond H 45.'+ 0.20 Eut Texas 39.4 0.32 Hastings 31.0 0.15 0.02 Hawkins 26.8 2.19 0.076 Headlee 51.1 <o.1o 0.083 Ke II y Snyder 38.6 0.29 0.066 Lev~lland 31.1 2.12 0.136 Hldland Farms 39.6 0.13 0.080 Panhandle 40.4' 0.55 0.067 Seeliason 41.3 <O.IO 0.014
46

TABLE III-5 Page 3 of 3
Country Gravitz 1 APl Sulfur 1 Percent Nitrosen 1 Percent
tom O'Connor 31.1 0.16 0.03 Wasson 31.9 1.40 0.47 Webster 29.3 0.21 0.046 Yates 30.2 1.54 0.150
Utah Aneth 40.4 0.20 0.059
Venezuela
Boac an 10.3 5.53 tia Juana Medium 24.0 1.6 Lagomedio 32.6 1.23
47

~ CX>
TABLE 111-6
Trend in Domestic Petroleum Refining from 1975 to 1981 (Fifty States)
January 1, 197~ January 1, __ 1_981
Crude Capacity, bbl/CD 14,737,139 18,119,160
Total Companies 140 190
Total Refineries 263 316
Refineries with Capacity )100 Hbb1/CD 46 53
Refineries with Capacity <35 Hbbl/CD 144 181
Total Capacity of All )100 Hbb1/CD 8,762,400 11,043,400 Refineries
Average Refinery Capacity, bbl/CD 56,035 57,339
Sources: DOE Annual Survey, EIA - 0111 (81) DOl Bureau of Hines Annual Survey (1975)
Percent Change
+23
+36
+20
+15
+26
+26
+2

TABLE III- 7 Page 1 of 6
LIST OF PROCESSES IDENTIFIED FROM THE 1977 INDUSTRY SURVEY BY EPA PROCESS NUMBER
General Processes
1. 2. 3. 4. s. 6. 7. a. 9. 10. 11. 12. 13. 14. 15. 16. 17. 18. 19. 20.
Atmospheric Crude Distillation Crude Desalting Vacuum Crude Distillation Visbreaking Thermal Cracking Fluid Catalytic Cracking Moving Bed Cataly(iJ Cracking H2S04 AlkylatiGQ) a HF Alkylation \ Hydrocracking (b) Hydroprocessing (b) Catalytic Reforming Catalytic Polymerization Aromatic Petrocbemicals Production Delay Coking \C) Fluid Coking Isomerization Asphalt Production (d) Eliminated Eliminated
Lube Oil Processes
21. Hydrofining, Hydroffnishing, Lube Hydrofining (b)
MBD MBD MBD MBD MBD MBD MBD MBO MBD MBD MBO MBD MBD MBD MBD MBD MBD MBD MBD MBD
MBD
22. 23.
White Oil Manufacture MBD Propane Dewaxing, Propane Deasphalting MBD Propane Fractioning, Propane Deresining
24. Duo Sol, Solvent Treating, Solvent MBD Extraction, Duotreating, Solvent Dewaxing, Solvent Deasphalt
25. Lube Vac Twr, Oil Fractionation, Batch MBD Still (Naphtha Strip), Bright Stock Treating
26. Centrifuge & Chilling 27. MEK Dewaxing, Ketone Dewaxing,
MEK-Toluene Dewaxing Deoiling (Wax) Naphthenic Lube Production S02 Extraction See Other Processes See Other Processes See Other Processes Wax Pressing
28. 29. 30. 31. 32. 33. 34. 35. 36. 37. 38. 39. 40.
Wax Plant (with Neutral Separation) Furfural Extracting Clay Contacting - Percolation Wax Sweating Acid Treat Phenol Extraction
49
MBD MBD
MBD MBD MBD MBD MBO MBD MBD MBD MBD MBD MBD MBD MBD
Number of Refineries Using Process
246 191 163
11 18
118 20 59 65 38
122 166
36 37 45
6 19
104
19
6 25
10
26
4 24
11 10
3
2 2
16 19 5 6
11

TABLE II I - 7 Page 2 of 6
Treating and Finishing
41. Bender Treating MBD 33 42. Petreco Locap Gasoline Sweetening MBD 2 43. Asphalt Oxidizing (d) MBD 49 44. Caustic of KOH Treating, For ~xample: MBD 162
Caustic of KOH Treating for: H2S, Mercaptan, Cresylic Acid, Naphthenic Acid, PWS MEA for COS Removal, etc.
45. Water Wash MBD 99 46. Mercapfining, Pentane Mercapfining MBD 2 4 7. Merox Treating (i.e., Liquid-Liquid MBD 114
Extraction, Liquid-Liquid Sweetening, and Fixed Bed)
48. C3 & C4 Scrubbing, Girbitol Treating MBD 46
49. Linde Process (Charge) MBD 7 so. Doctor Treating MBD 17 51. Sulfuric Acid Treating MBD 10 52. Unisol Treating MBD 2 53. SO~ Treating MBD 3 54. Hy rotreating (b) MBD 62 55. Perco (Copper Chloride), Copper Slurry MBD 25 56. Inhibitor Sweeting MBD 44 57. KCr MBD 1 58. Clay Treating, Bauxite Treating MBD 93 59. Hypochlorite Sweetening MBD 4 60. Salt Brightening or Drying MBD 87 61. Sulfinol MBD 3 62. Unclassified Treating and Finishing
(Charge) MBD 9
Petrochemicals
63. Isobutane Production MBD 16 64. Carbon Black Feedstock Production MBD 4 65. Heptene Production MBD 2 66. Sulfolane Process (Charge) MBD 5 67. OxoAlcohol MBO 1 68. Naphthalene Production MBD 1 69. Butadiene MBD 3 70. Aliphatics MBD 8 71. Cumene (Charge) MBD 10 72. Paraxylene (Charge) MBD 7 73. Xylene Fractionation (Charge) MBD 11 74. Polypropene, Polyisobutylene, Poly
Feed Preparation, Trimer-Tetramer MBO 8
Production 75. ·Phenol, Oxonation Additives Mfg., MBD 4
Polystyrene Resin, Lube Oil Depressant Production
76. Eliminated MBD 71. Cresylic Acid MBD 2 78. Styrene Production MBD 2 79. Naphthenic Acid MBD 5 80. Alpha Olefins MLBD 1 81. Nitric Acid STD 1 82. Phtahalic Anhydride Production MBD 2
50

TABLE III -7 Page 3 of 6
83. Butyl Rubber MLSO 1 84. Polypropylene MBO 2 85. Cyclohexane Production MBO 8 86. Solvent Hydrotreater (b) MBD 7 87. Hexane-Heptane Unit MBO 1 88. Unclassified Petrochemicals MBD 7
Other Processes
31. Feed Preparation MBD 1 32. 200°F Softening Point Unfluxed Asphalt MBD 5
(d) 33. Compounding MBD 29 89. Asphalt Emulsifying (d) MBD 30 90. Sulfur Recovery, Sulfur Production {f) LTD 82 91. Hydrogen, Reformer Feed Prep, Steam MBO 37
Methane Reformer, Partial Oxidation (Liquid Units) (g)
92. Gas Plant (Liquid Units) (g) MBO 93. DEA Treating and Other Amine Treating MBD 37
Systems (Liquid Charge) (h) 59 94. C02 Recovery, C02 Production MLBO 7 95. Furfural MBO 0 96. Dubbs Pitch MBO 1 97. Solvent DecarbonizinJ MBO 7 98. Hydrodemethylation(b MBO 5 99. Catalyst Manufacture STD 3 100. Gasoline Additives Production MBO 2 101. Linear Paraffins MBO 1 102. Butadiene Concentration MBD 0 103. Nonene Production MBO 4 104. Ammonia Plants Production(e) MLBD 6 500. Light Ends Recovery MBD 7 501. Misc. Fractionation and Distillation MBD 10 502. Incineration MLBH 4 503. Sulfuric Acid Plant STD 5 504. Sodium Hydrosulfide MBO 1 505. Coke Calciner STD 0 506. Lube and Fuel-Additives MBO 5 508. Sulfonate Plant MBD 1 509. Marasol Splitter MBO 1 510. Aromatic Hydrogenation MBO 1 511. Aromatic Vacuum Unit MBO 1 512. Sour Concetrate Unifiner MBD 1 513. Naphtha Splitter MBO 4 514. Naphtha Unifining MBD 1 518. lsobutylene MLBO 2 519. NEJ< MBD 1 520. Secondary Butyl Alcohols MBO 1 521. Mesityl Oxide MBO 1 522. MIBK MBO 1 523. lsophorone MBD 1 524. SNG MBD 1 525. Petroleum Pitch MBO 1 526. Hydroa 1 ky 1 at ion of Aromatics MBO 1 528. Naphtha Rerun MBO 2 529. Wax Slabbing MBO 3 531. Rust Preventives MBD 1
51

TABLE II I - 7 Page 4 of 6
532. Petrolatum Oxidation MBO 1 533. Calcium Chloride Drying MBO 2 534. LPG MBO 6 535. Fuels Deasphalting MBO 1 536. Ethylene MLBO 2 537. Resin Former Stock MBD 1 539. Rerun Units MBO 4 540. Mineral Spirits MBO 3 541. Udex MLBO 4 542. Oiallylamine MLBO 1 544. Ethyl Amyl Ketone MLBO 1 545. Ionol Antioxidant MLBO 1 546. Tertiary Butyl Alcohol MLBO 1 547. Naphthenic Acids MLBO 1 548. Octyl Formal Alkylate MLBO 1 549. Octyl Formal Condensate MLBO 1 550. Perma 16 MLBD 1 551. Polyisobutylene Chloride MLBD 1 552. Automotive Spec Detergent MLBD 1 553. Pentoxone MLBD 1 554. Sodium Sulfonates MLBD 1 555. Tertiary Butyl Toluene MLBD 1 556. TBBA - Caustic Extraction MLBD 1 557. TBBA- Precipitation MLBD 1 558. Tergols MLBD 1 559. Dehydrating MBD 1 560. Desiccant Manufacture STD 1 562. Oxidate Manufacture MBD 1 563. Grease Mfg. v. Allied Products MBD 3 564. Tertiary Amylenes MBD 1 565. Scot Tail Gas t+1SCFD 2 566. Propylene MSD 6 567. Acetone MBO 3 568. Misc. Blending and Packaging MBO 4 569. Hydrogen, Reformer Feed Prep, Steam t+1SCFD 27
Methane Reformer, Partial Oxidation (Gas Units) {g)
570. Gas Plant (Gas Units) (g) ~SCFO 20
571. DEA and Other Amine Treating Systems ~SCFD 41 (Gas Charge) (h)
Number of plants responding to survey 262
52

TABLE I I I - 7 Page 5 of 6
!!lli!!. (a) Process Nos. 20 and 76 have been eliminated to avoid multiple account
ing of process rates. Capacities and rates previously assigned to these processes have been included wth Process Nos. 8 and 9, where applicable.
(b) Multiple accounting of process rates may have occurred in the original survey response for the following hydrogen processes:
10. Hydrocracking 11. Hydroprocessing 21. Hydrofining, Hydrofinishing
Lube Hydrofining
54. Hydrotreating 86. Solvent Hydrotreater 98. Hydrodemethylation
Revised values for Process Nos. 10 and 11 include only capacities and rates which cannot be included in the other four processes. Process No. 11 should include hydrotreating of upstream feedstocks (i.e., hydrodesulfurization of catalytic reformer feed}, while Process No. 54 should include hydrotreating of product.
(c) To obtain consistent units of 1000 barrels/day, reported charge rates to Process No. 15 have been converted as follows:
tons/day x 0.00667 • 1000 barrels/day
(d) To avoid multiple accounting of process rates, asphalt processes have been specifically revised to include the following:
18. Asphalt Production 32. 200°F Softening Point
Unfluxed Asphalt
43. Asphalt Oxidizing 89. Asphalt Emulsifying
Reported capacities and rates have been reassigned to the appropriate process.
(e) Multiple accounting of process rates occurred in the original response for Process Nos. 19 and 104. To resolve this problem, Process No. 19 has been eliminated and the capacities and rates previously included there have been ~assigned to Process No. 104.
(f) To obtain consistent units of long tons/day, reported values for Process No. 90 have been converted (using specific gravity of 1.803) as follows:
1000 barrels/day X 282 • long tons/day
(g) Rates for Process Nos. 91 and 92 are in liquid units, while rates in gaseous units for the same processes are included in Nos. 569 and 570.
(h) Liquid charge rates have been included in Process No. 93 for all amine treating (DEA, MEA, etc), while gas charge rates have been assigned to Process No. 571.
Unit Abbreviations:
MBD - thousand barrels per day MLBO - thousand pounds per day
53

TABLE Ill -7 Page 6 of 6
STD - short tons per day LTD - long tons per day MLBH - thousand pounds per hour MMSCFD - million standard cubic feet per day
54

'l'ABLB III - 8
Qualitative Bvaluation of wastewater Flow an4 Cbaracteriatica by runa ... ntal Refinerl Processes
Production Bllulsified Proce•••• ~ BOD COD J.lbenol ~ Oil Oil I!!! .!!!£· ~ia Chloride Aciditl Alkalinity Suap. Solids
Crud~ oil and Product Storage XX ll XXX X XXX XX 0 0 0 0 XX
Crude Desalting XX XX XX X XXX X XXX X XXX XX XXX 0 X XXX
Crude Distil-lation XXX ll X XX ll:XX XX XXX X XX XXX X 0 X X
• 'l'ber•al Cracking X X X X X X XX XX X X 0 XX X
Catalytic Cracking XXX XX XX XXX XXX X X XXX XX XXX X 0 XXX X
8ydrocracking X XX XX XX XX
PolY!Mr hatton X X X 0 X X 0 X X X X X 0 X
Alkylation XX X X 0 XX X 0 XX X X XX XX 0 XX
Iao.erhation X Ul Ul
Refor•ing X 0 0 X X X 0 0 X X 0 0 0 0
Solvent Refining X X X 0 ll X 0 0 X
Asphalt Blowing XXX XXX XXX X XXX
Devaxing X XXX XXX X 0 X 0
Bydrotreating X X X XX 0 XX XX 0 0 X 0
Drying and s-etening XXX XXX X XX 0 0 X XX 0 X 0 X X XX
XXX • Major Contribution, XX • Moderate Contribution, X • Minor Contribution, 0 • Insignificant Blank • No Data

01 C'l
Alaska - 4 Hawa11 - 2
3
0 3
3 11 1
7 12 4
FIGURl 111-1
GEOGRAPHICAL DISTRIBUTION OF PETROLEUM REFINERIES IN THE UNITED STATES. AS OF JANUARY 1. 1981

PROCESS WAiER ..._r "\
UNREFitJEO (J'1 CRUDE ........
~
ELECTRICAL .. , PO\IER I I I I I ALTERtiATEI r-- I , ,...., '-
I
HEATER EHUL 51 FIER
FIGURE III-2
CRUDE DESALTING (ELECTROSTATIC DESALTING)
DESALTED CRUDE
. EFFLUEtJT
WATER

(.TJ
co
Jublthsc
Stebllhd Gasoline
Crude Petrola&n
Gat
.ltMOtpherlc f roct lonator
Desalter
VacuUIII lubt fuct lonato[
Gas 011
FIGURE lii-3
To VacuUIII ,,,, ...
CRUDE FRACTIONATION lt"IUtnli! niS'I'IT·LATION- THREE STAGES\
Ught lube
Had. lub1
Hvy. lube
To Vacu&n Syu ...
~ f lather
Propane Deas~halter Feed
Asphalt --

Ul 1.0
PRESSURE REOUC lNG ORIFICE CHAHBER
FlUE GAS STEAH1
GENERATOR
RAW OIL CHARGE
CATAlYST STRIPPER
REGENERATOR
GAS AND GASOliNE TO GAS CONCENTRATION PlANT
HAIN COlUHN
liGHT CYClE GAS Oil
' LDHDU' I I RAW OIL I 1 SlURRY CHARGE
FIGURE 111-4
CATALYTIC CRAC~ING (FLUID CATALYTIC CRACKING)

SECTION IV
INDUSTRY SUBCATEGORIZATION
INTRODUCTION
The purpose of this section of the development document is to evaluate distinguishing refinery features which may require subclassification of the industry. Included here is a description of the selected subcategories, along with a discussion of the purpose and basis of this selection. The following items are addressed in the discussion of selection "purpose and basis":
the Flow Model for 1974 Regulation;
the Flow Model Used for Proposed 1979 Regulation; and
the Refined Flow Model.
SELECTED SUBCATEGORIES
Subcategorization of the petroleum refining industry was evaluated with respect to the traditional factors used to assess industries. However, the complexity of refining facilities (over 150 distinct processes are used in this industry} makes traditional subcategorization infeasible. Instead, the Agency used mathematical models that correlate achievable effluent flow with process variables as the basis for subcategorization. In the development of the 1974 regulations, the Agency found that the industry can be divided into five discrete subcategories:
o Topping Refineries o Cracking Refineries o Petrochemical Refineries o Lube Refineries o Integrated Refineries
The 1974 modeling effort developed five mathematical flow models which represented the best fit for those refineries within each subcategory. The models calculated discrete factors for refinery size, process configuration, and allowable wasteload which grouped the refineries within a subcategory in increments of production capacity and process configuration.
Data collected for the 1976 industry characterization work indicated that many refineries were making substantial improvements to their wastewater management systems. The 1976 data base sampled twice the number of refineries that contributed to the 1974 flow modeling effort.
61

In 1976 the u.s. Court of Appeals upheld the 1974 BPT and NSPS regulations, but remanded the more stringent BAT regulations {the 1974 BAT limitations were calculated using the 1974 flow model). Analysis of the expanded 1976 data base suggested that an alternative modeling approach which treated each refinery as an individual was possible to support a more stringent regulation. The flow model for the 1979 proposed regulation consisted of a single flow model capable of treating each refinery, essentially, as a separate subcategory. This model would calculate the industry average wastewater generation for any combination of processes. The petroleum refining industry found certain mathematical and conceptual discrepancies in the 1979 flow model which were reconciled with the "refined" flow model. This single model, in. its final revised form, could serve as the basis for developing more stringent limitations tailored to each refinery's wastewater management potential as compared to industry average performance. The refined flow model resulted in possible BAT effluent limitations only slightly less stringent than those calculated by the 1979 flow model.
Recent· analyses by the Agency of the actual performance of properly operated BPT technology treating refinery wastewaters has concluded that these refineries are providing adequate control of non-conventional and toxic priority pollutants. EPA is establishing the effluent limitations based upon BPT technology which was upheld in the U.S. Court of Appeals. The pollutant load factors calculated by using the 1974 model, achievable concentrations and variability factors insure adequate treatment.
PURPOSE ~ BASIS Q[ SELECTION
Section 304{b){2)(B) of the Act requires EPA to take the following factors into account in assessing best available technology: (a) age of equipment and facilities involved, (b) the process used, (c) the engineering aspects of applying various types of control technology, (d) process changes, {e) the cost of achieving such effluent reduction, (f) non-water-quality environmental impacts (including energy requirements), and (g) other factors that the Administrator deems appropriate. The assessment for best conventional pollutant control technology includes these factors plus an evaluation of " ... the reasonableness of the relationship between the costs of attaining a reduction in effluents and the effluent reduction benefits derived, and the comparison of the cost and level of reduction of such pollutants from the discharge from publicly owned treatment works to the cost and level of reduction of such pollutants from a class or category of industrial sources .•.. ".
The Agency . considered limitations for this differentiate groups
each factor in establishing effluent industry. Factors that significantly
of facilities generally serve as the basis
62

for industry subcategorization. Each subcategory then develops its own technologies representative of BAT, BCT, or BADT.
In developing BAT, the Agency analyzed each of the statutory factors to determine whether they significantly affect the ability of any group of refineries to meet uniform limitations. None of the factors were found to significantly affect the ability of refineries to meet effluent concentrations. The effluent flow, however, is significantly dependent on the processes used. Information compiled since the 1974 regulation supports this assessment. The long-term effluent study that is described in Section V of this report confirms that the BPT concentrations can be achieved by refineries regardless of age, process, and engineering aspects of applying various types of control technology. The revised flow model that is described in this section indicates that flow is dependent on the processes used.
In determining the flow to use in developing quantitative effluent guidelines, the Agency used mathematical models that correlate effluent flow with process variables. A brief description of each model is provided below:
!12! Model ~ 111! Regulation
Current BPT limitations for the refining industry are based on a linear model of industry effluent flows. This BPT model was developed using process and flow data from the 1972 EPA-API industry survey and appears as:
'l • A2+ A!X! + A2X2
With components,
'l • Log!Q (total flow/capacity)
A2 • Subcategory dependent constant
Al,A2 • Regression coefficient constants (1.51 and - - 0.0738, respectively)
X! • Refinery throughput
X~ • Sum of weighting factors for a particular refinery.
For the development of BPT regulations, the equation was mathematically transformed from the standard slope-intercept representation shown above to a form denoting deviation from a subcategory average value. The refinery process weighting factors are the normalized coefficients of the regression model:
" Z • Ao + L A.!,Xi \•1
63

where
Z = effluent flow
A2 = regression constant
Ai • regression constant (weighting factor) corresponding to the ith petroleum refining process.
Xi • throughput for process i.
BPT subcategorization was designed to give overall minimum variance to the system; i.e., variance within each subcategory was minimized and the differences between the subcategories were maximized. A more detailed discussion of this flow model is found in the 1974 development document (3).
The model adopted for the· 1974 regulation subcategorizes the industry into five groups: topping, cracking, petrochemical, lube, and integrated refineries. The model estimates the flow from each refinery in units of gallons of wastewater per thousand barrels of crude throughput. Refineries in the United States and its territorial possessions fall into one of the following five subcategories:
Subcategory
Topping
Cracking
Petrochemical
Lube
Basic Refinery Operations Included
Topping and catlytic reforming whether or not the facility includes any other process in addition to topping and catalytic reforming.
This subcategory is not applicable to facilities which include thermal processes (coking, visbreaking, etc.) or catalytic cracking.
Topping and cracking, whether or not the facility includes any processes in addition to topping and cracking, unless specified in one of the subcategories listed below.
Topping, cracking and petrochemical operations, whether or not the facility includes any process in addition to topping, cracking and petrochemical operations,* except lube oil manufacturing operations.
Topping, manufacturing
64
cracking processes,
and lube oil whether or not the

Integrated
facility includes any process in addition to topping, cracking and lube oil manufacturing processes, except petrochemical operations.*
Topping, cracking, lube oil manufacturing processes, and petrochemical operations, whether or not the facility includes any processes in addition to topping, cracking, lube oil manufacturing processes and petrochemical operations.*
*The term "petrochemical operations" shall mean the production of second generation petrochemicals (i.e., alcohols, ketones, cumene, styrene, etc) or first generation petrochemicals and isomerization products (i.e., BTX, olefins, cyclohexane, etc.) when 15\ or more of refinery production is as first generation petrochemicals and isomerization products.
;, t
In the recent toxics review program, the Agency reassessed the 1974 flow model in light of the more current data from the 1977 Survey for the purpose of determining achievable flow reduction.
~ Model ~ For Proposed li!! Regulation
The Agency analyzed the refining industry's discharge flow for the year 1976. Data Collected for the 1976 industry survey indicated that many refineries were making substantial improvements to their wastewater management systems. The expanded data bas~ (including approximately twice the number of refineries covered in the 1972 data base) was suitable for the development of an alternate modeling approach. In general, the industry reduced discharge flow significantly between 1972 (BPT data base) and 1976. A revised mathematical model was developed that more closely described the industry flow of 1976.
This model differed from the BPT flow models in that it is additive in form as opposed to the multiplicative form of the BPT model. Also, a single flow model includes all refineries compared to a separate model ~or each subcategory.
This model was used in the proposed regulation for the petroleum refining guidelines of December 1979 and it takes the following form:
FLOW • 0.004C + 0.046K + 0.048 (A+ L).
Flow is in units of million gallons per day. A,C,K,L are in units of thousands of barrels per day throughput. Constants are in units of million gallons per thousand barrels per day.
Where,
A • sum of asphalt processes
65

Asphalt Production Asphalt Oxidizer Asphalt Emulsifying
K • sum of cracking processes Hydrocracking Visbreaking Thermal Cracking Fluid Catalytic Cracking Moving Bed Catalytic Cracking
C • sum of crude processes Atmospheric Crude Distillation Crude Desalting Vacuum Crude Distillation
L • sum of lube processes Hydrofining, Hydrofinishing, Lube Hydrofining White Oil Manufacture Propane Dewaxing, Propane Deasphalting, Propane Fractioning,
Propane Deresining Duo Sol, Solvent Treating, Solvent Extraction, Duotreating, Solvent Dewaxing, Solvent Deasphalt
Lube Vac Twr, Oil Fractionation, Batch Still (Naphtha Strip), Bright Stock Treating
Centrifuge and Chilling MEK Dewaxing, Ketone Dewaxing, MEK-Toluene Dewaxing Deoiling (wax) , Naphthenic Lubes Production S02 Extraction wax Pressing Wax Plant (with Neutral Separation) Furfural Extracting Clay Contacting - Percolation Wax Sweating Acid Treat Phenol Extraction Lube and Fuel Additives Sulfonate Plant MIBK Wax Slabbing Rust Preventives Petrolatum Oxidation Grease Mgf. v. Allied Products Misc. Blending and Packaging
The model for the 1979 proposal does not classify refineries into discrete subcategories. Instead, it estimates the flow from each in-plant process. Regulation based on this model would provide allocation which would equal the summation of the loading calculated for each of the process throughputs.
66

Refined f!2! Model
Significant industry comments questioned the technical accuracy and statistical validity of the model as applied to all petroleum refineries in the industry. In response, the Agency refined the flow model for the 1979 proposal to consider those factors.
The resulting model is the following:
FLOW = 0.0021C + 0.0127A + 0.0236K + 0.0549L + 0.0212R
Where:
FLOW c A K L R and
• Net Process Wastewater in million gallons/day • Sum of Crude Process Rates in 1000 bbl/day • Sum of Asphalt Process· Rates in 1000 bbl/day • Sum of Cracking and Coking Process rates in 1000 • Sum of Lube Process Rates in 1000 bbl/day • Sum of Reforming and Alkylation Process Rates in
where: Crude Processes are defined as:
P1, P2, and P3
Asphalt Processes are defined as:
P18, P32, P43,and P89
Cracking and Coking Processes are defined as:
P4, PS, P6, P7, P10, P15, P16, and P54
Lube Processes are defined as:
P21, to P30 and P34 to P40
bbl/day
1000 bbl/day
Reforming and Alkylation Processes are defined as:
PB and P12
In accordance with the EPA process identification numbers for the following refinery processes:
1. Atmospheric Crude Distillation 2. Crude Desalting 3. Vacuum Crude Distillation 4. Visbreaking 5. Thermal Cracking 6. Fluid Catalytic Cracking 7. Moving Bed Catalytic Cracking 8. H2S04 Alkylation 10. Hydrocracking 12. Catalytic Reforming
67

15. Delayed Coking 16. Fluid Coking 18. Asphalt production 21. Hydrofining, Hydrofinishing, Lube Hydrofining 30. so2 Extraction 32. 200 OF Softening Point Unfluxed Asphalt 34. Wax Pressing 40. Phenol Extraction 43. Asphalt Oxidizing 54. Hydrotreating 89. Asphalt Emulsifying
Similar to the model for the 1979 proposal, the allocation for each refinery would be equal to the sum of the loading for each of the in-plant processes.
The methodology utilized complete evaluation of Burns and Roe report Refinements to 1979 Documentation" (164).
to develop this model as well as a model performance is contained in the
"Draft, ·Petroleum Refining Industry, Proposed Flow Model and Supplemental
This flow model is different and significantly better than the one used for the proposed regulations of December 1979. This model incorporates statistical improvements as well as updated information. It should be noted that the refined model provides allocation for Coking, Reforming and Alkylation processes. Allocation was not provided for these processes in the 1979 proposed flow model. Although Reforming and Alkylation are found to influence discharge flow in the refined model, these processes should not be considered in calculating BPT limitations because the model developed for BPT is different. This is because the wastewaters from these processes were· already considered in the 1974 BPT model, which generally predicts a higher flow rate than the refined model.
The model evaluation study reaffirms the finding of the BPT effort that the only refinery characteristics which should be considered in the development of effluent limitations and standards are the size and types of processes utilized at individual refineries.
68

INTRODUCTION
SECTION V
WASTE CHARACTERIZATION
The purpose of this section is to describe the waste characterization efforts undertaken and the results obtained by the Agency in the development of the limitations and standards which are addressed in this document. Refinery wastewater characterization efforts are described here in two parts:
a) the concentration of pollutants; and
b) the rate of flow.
The Agency conducted several studies to determine the flow and concentration of toxic, non-conventional, and conventional pollutants from the petroleum refining industry. These studies included extensive questionnaire surveys and sampling at refineries of treated and untreated wastewater.
The Agency defined the industry's discharge flow practices by distributing a questionnaire (1977) which requested information on the quantity of wastewater generated and discharged. The questionnaires were sent to all the refineries in the United States and its territorial possessions. Information representative of industry's production_and treatment practices during 1976 was req·1ested.
Several major programs were implemented to define the presence of toxics and other pollutants from the petroleum refining industry. As required under the Consent Decree Agreement between EPA and NRDC, the Agency was to determine whether control of the discharge of 65 classes of toxic pollutants would be needed. These 65 classes of toxic pollutants potentially included thousands of specific compounds. The Agency in 1977 selected 123 toxic pollutants for analyses. This list of 123 is now expanded to include 126 priority pollutants (PP). Most of the sampling was conducted in 1977-78. Sampling and analytical methodologies, including quality control and quality assurance procedures, were not fine-tuned at that time to quantify low level toxics. The results from these programs, however, were adequate to determine the presence, absence and relative concentrations of toxic pollutants.
Three major efforts were conducted. The first task was to request data from the industry on: (a) toxic pollutants purchased, manufactured, and analyzed in wastewater; and (b) treatability data on toxic pollutants. The second program was to sample 23 refineries and two POTW receiving refinery wastes for a
69

three day period. The third effort was to sample two refineries for a period of 60 days to determine long-term wastewater characteristics. The first two programs were conducted in 1977-1978 while the third program was conducted in 1980. In general, toxic pollutants were found in the untreated refinery wastes, but most were reduced to very low levels after BPT treatment systems. Details on each of these programs follow.
The Agency also compiled and analyzed one full year of selfmonitoring effluent data which was provided by 49 refineries for the calendar year 1979. This data gathering effort was referred to as "The Survey of 1979 Effluent Monitoring Data for the Petroleum Refining Point Source Category."
CONCENTRATIONS POLLUTANTS
Q[ TOXIC, CONVENTIONAL ~ HQ!-CONVENTIONAL
The Agency directed three major efforts toward the characterization of petroleum refinery wastewater quality: a detailed questionnaire survey of the industry (1977 Survey); and two wastewater sampling programs - one long-term and one shortterm. In addition, the Agency evaluated effluent monitoring data for the calendar year 1979 reported by the 49 refineries.
1212 Survey
A comprehensive questionnaire was sent to all refineries in the United States and its territorial possessions in 1977. The questionnaire requested the following information: (1) chemicals purchased or manufactured (final or intermediate) which contain the 123 toxic pollutants; and (2) NPDES limitations on toxics other than chromium. The list of 123 toxic pollutants was used in the 1977 mailing and the following compounds were subsequently added to form a list of 129 toxic pollutants:
o Di-n-octyl phthalate o PCB 1221 (Arochlor 1221) o PCB 1232 (Arochlor 1232) o PCB 1248 (Arochlor 1248) o PCB 1260 {Arochlor 1260) o PCB 1016 {Arochlor 1016)
Since that time, three of the compounds in the original listing have been removed from the list of priority pollutants leaving a total of 126 pollutant compounds designated by the Agency (FR 10723, 2/4/81 and FR 2266, 1/8/81). The survey responses indicated that 71 toxic pollutants were purchased as raw or intermediate materials; 19 of these are purchased by single refineries. At least 10 percent of all refineries purchase the following toxic pollutants:
o Benzene
70

o Carbon tetrachloride o 1,1,1-trichloroethane o Phenol o Toluene o Zinc and compounds o Chromium and compounds o Copper and compounds o Lead and compounds
Zinc and chromium are purchased by 28 percent of all refineries, while lead is purchased by nearly 48 percent of all plants.
Forty-five priority pollutants are manufactured as final or intermediate materials; 15 of these are manufactured at single refineries. Benzene, ethylbenzene, phenol, and toluene are manufactured by at least 10 percent of all refineries. Eight percent of all refineries manufacture cyanides; greater than 20 percent manufacture benzene/toluene.
Short I!rm Sampling program
Since the data obtained from the 1977 Survey was limited with respect to toxic pollutant data, the Robert s. Kerr Environmental Research Laboratory (RSKERL} (an EPA Laboratory} and Burns and Roe (an EPA contractor} conducted a three-day sampling program at each of 17 direct discharging refineries. Table V-1 is a summary of plant characteristics for these refineries. Table V-2 is a comparison of plant characteristics of the 17 refineries sampled versus the overall industry characteristics. The purpose of this sampling program was to obtain more complete i~formation on the occurrence of toxic pollutants in refinery waste streams. The results of this program are presented in Tables V-3 through V-20.
The effluents from 6 indirect discharging refineries, which discharge their wastewater to a POTW, were sampled by Burns and Roe in a supplemental sampling program. The results of this study are presented in Tables V-21 through V-26.
Samples were collected before and after the biological treatment systems. In some instances, samples were taken after polishing (i.e., polishing pond, sand filter}. The intake water was also sampled to determine the presence of toxic pollutants before contamination by refining processes.
Samples for conventional, nonconventional, and toxic pollutants {except for volatile organics, total phenols, and cyanide} were taken from 24-hour composite samples. The laboratory combined aliquots from these samples in equal portions to obtain the 72-hour composites for toxic pollutant analysis {acid and base-neutral extractible organics, pesticides, and metals). Grab samples were taken in specially prepared vials for volatile {purgeable) organics, total phenols and cyanide. Before plant visits, sample containers were carefully washed and prepared by
71

appropriate methods, depending on the type of sample. Samples were kept on ice for express shipment in insulated containers.
The analyses for toxic pollutants were performed according to groups of chemicals and associated analytical schemes. Organic toxic pollutants included volatile (purgeable), base-neutral and acid (extractable) pollutants, and pesticides. Inorganic toxic pollutants included heavy metals, cyanide, and asbestos.
The primary method used to screen and verify the volatiles, base-neutral, and acid organics was gas chromatography (GC) with confirmation and quantification of all priority pollutants by mass spectrometry (MS). Total phenols was analyzed by the 4-AAP method. GC was used to analyze pesticides with limited MS confirmation. Toxic heavy metals were analyzed by atomic absorption spectrophotometry (AAS), with flame or graphite .furnace atomization following appropriate digestion of the sample. Duplicate samples were analyzed using plasma emission spectrometry after appropriate digestion. Samples were analyzed for cyanides by a colorimetric method, with sulfide previously removed by distillation. Analysis for asbestos was accomplished by microscopy and fiber presence reported as chrysotile fiber count. Non-dispersive x-ray fluorescence was used for confirmation. Conventional pollutants (BOD~, TSS, pH, and oil and grease) and nonconventional pollutants (TOC and COD) were analyzed using "Methods for Chemical Analysis of Water and Wastes," (EPA 625/6-74-003) and amendments.
The most common pollutants found (detected in more than half the samples analyzed) include:
Percent of Samples BPT Fraction Pollutant Where Detected Limi-ted
Conventionals BOD 100 Yes Total Susp. Solids 100 Yes Oil & Grease 100 Yes
Non-Conventionals Ammonia Nitrogen 100 Yes COD 100 Yes TOC 100 Yes Sulfide 100 Yes Phenol (4AAP) 76 Yes
Volatiles Methylene Chloride 69 No
Metals Chromium 78 Yes Copper 54 No Mercury 74 No Selenium 68 No Zinc 80 No
72

Of the 126 toxic pollutants, 22 were detected and quantified more than once in all final effluent samples analyzed from direct discharges and 28 were detected and quantified more than once in all final effluent samples from indirect discharges. Table V-27 is a summary of the final effluent priority pollutant data from the 17 refineries' screening program. Table V-28 is a summary of the indirect discharge priority pollutant effluent data from the pretreatment program.
Samples were analyzed for asbestos at only four refineries. Asbestos was not detected in the intake or effluent from these refineries. One API separator effluent (prior to treatment) sample contained 3.4 million asbestiform mineral fibers per liter. However, the presence can be attributable to rain occurring during the sample collection period.
Additional toxic pollutant data was obtained from another eight direct discharging refineries by the EPA Regional Surveillance and Analysis teams during routine monitoring operations. The data extracted from single grab-samples taken at each of the refineries is summarized in Table V-29. The concentrations and pollutants detected are similar to those of the seventeen refinery program.
Long-!!£m Sampling Program
A long-term sampling program was conducted at two refineries for a period of sixty days.(l62) The purposes were: (1) to determine if there is a surrogate relationship between the priority pollutants and one or more of the traditional pollutant parameters; and (2) to confirm the presence or absence of specific priority pollutants. Samples of the untreated and treated wastewaters were collected every other day. Pollutant parameters analyzed include the BPT regulated pollutants and the toxics, excluding pesticides and asbestos. The sampling and analytical methods used are similar to those described in the short-term sampling program discussion. The results from this program are summarized in Tables V-30 and 31.
In general, the types of pollutants and the concentration ranges are similar to those found in the short term program. The . data also indicate that a strong correlation does not exist between the taxies and the traditional pollutant parameters.
The 30-day samples from the two plants were statistically analyzed to determine if surrogates for important pollutants could be found. Surrogates were sought for five pollutants: priority pollutant (PP) organics, total organics (PP organics plus Appendix C alkanes), extractables, PP metals, and total metals (PP metals plus a set of non-conventional metals). Seven potential surrogates were: BOD, COD, total phenol (4AAP), TOC, TSS, oil and grease, and chromium.
73

To be acceptable, a surrogate must demonstrate a statistically significant correlation with the pollutant and it must allow the level of the pollutant to be estimated with satisfactory accuracy.
Since the data samples were relatively small, the sensitivity of statistical analysis to the presence of apparent outliers was assessed by plotting surrogates against pollutants and by rerunning analyses with outliers removed. The findings of the study, however, were not influenced by these precautionary measures. Only two possible surrogates were identified, namely, total phenol (4AAP) for PP organics and for total organics, and chromium for PP metals and for total metals. However, as can be seen from Table V-32, statistical significance was obtained only in one plant. Because surrogate adequacy must be consistent across plants, the relationship was found to be invalid. In addition, the predictive adequacy, even for the single plant, is not sufficient to allow practical application of these two surrogates.
_sUR__.VE~Y Q[ 121! EFFLUENT MONITORING ~
The Agency also compiled and analyzed one full year of self monitoring data supplied by 49 refineries covering the 1979 calendar year. EPA selected 50 refineries (163) on the basis that each reported BPT technology in place in the 1976 survey. Moreover, 25 of the 50 were examples of refineries reporting process wastewater flows equal to or less than BAT Option 2 model flow. Another 15 of the 50 reported flows equal to or less than 1979 BAT Option 1 model flow. {See Section VIII for details of Options proposed for BAT in 1979).
This study was investigating the effects of BPT treatment where the total refinery wastewater is less than 1979 proposed model flows and therefore, 37 of the 50 refineries selected could be described as low flow refineries. Objectives of the study were to calculate variability factors, determine average effluent concentration for phenolic compounds {4AAP), examine TOC and cyan.ide as possible surrogate parameters, calculate refinery model flow for 1978 and verify the reported flow level.
Review of the data to determine those refineries that actually meet BPT performance levels appears in Preliminary Screening of the 1979 Effluent Monitorinq {BPT} DATA (160}. Statistical analysrs-of the same data set is reported in Petroleum Refining §!
INDUSTRY ~
Results of the Agency's efforts in the characterization of the rate of wastewater flow from the petroleum refinery industry are described below.
These results are in three parts: 1) summary data by refinery size; 2) data on distribution by refinery subcategory; and 3) water usage trends.
Summary 2t ~ Wastewater Flow
'igure V-1 presents a histogram of net flow for 243 refineries which provided the necessary data. Each point on the histogram represents a single refinery by its size class using the letters A through D which represent selected size ranges in 1000 bbl of crude processing capacity. The results of this histogram are summarized in Table V-33.
Although it can be seen that nearly 75 usage in the industry is attributable refineries, these refineries process a petroleum.
Distribution of ~ ~ Subcategory
percent of total water to about 20 percent of the large majority of crude
Figure V-2 presents a histogram of net flow for the same 243 refineries according to the subcategorization procedure described in Section IV. Similar to the previous figure, each point depicts a single refinery. Letter designations correspond to the five selected subcategories:
A - Topping
B - Cracking
C - Petrochemical
D - Lube
E - Integrated
This histogram is summarized in Table V-34.
This summary shows that, except for Topping Refineries, the fractional share of industry water usage is approximately equally distributed among the other four subcategories. However, the subcategory averages show wide disparity, ranging from 0.128 MGD for the topping subcategory to 9.327 MGD for the Integrated subcategory.
The histograms in consequence of the
Figures V-1 and V-2 reveal a striking skewed (non-symmetrical) distribution in
75

wastewater flow. This consequence is the between the industry average of 1.7 MGD and the (50-percentile) value of about 0.5 MGD.
Trends in Industry Water Usage
large difference industry median
Figure V-3 presents the historical trends in industry water usage from data contained in various surveys conducted by the Agency. The first survey data is the 1972 EPA/API Raw Waste Load Survey. This value is used as the baseline for further comparison. The 1977 Survey results provided the next value for calendar year 1976. Total flow in absolute units as well as a gallon/barrel value {adjusting for increased process capacity) was calculated for the same refineries surveyed in 1972. The results demonstrate that a significant reduction in water usage had· occurred during the previous four year period. On an absolute basis, total water usage was reduced to about 67 percent of the 1972 value. On a gallon/barrel basis, the reduction was even greater - up to 53 percent of the 1972 value.
The "Survey of 1979 Effluent Monitoring Data" (160) also provided information which was used to evaluate industry water usage. Since this survey was directed towards only 50 specific refineries, 37 of which had the lowest flow rates, particular care was taken to prevent the underestimation of industry flow. For this purpose, the sum of the flows of the 49 respondents to this questionnaire was compared to the sum of the 1976 flows from the same refineries. Although the flows of some individual refineries increased, the total flow in 1979 was found to be significantly lower than the 1976 flow on both an absolute and a gallon per barrel basis.
The two curves in Figure V-3 were extrapolated to the year 1984, the earliest year in which BAT limitations could take effect. It can be seen that the total water usage of the industry could potentially reach 42 percent of the year 1972 value {or 62.5 percent of the 1976 average} by 1984 if the current trend continues. On a gallon/barrel basis, water usage could potentially reach 29 percent of the 1972 value (40 percent of the 1976 average value}.
76

TABLE V-1
Summary of Plant Characteristics for 17 Refineries Sampled
in Screening Program
Refinery Location EPA 1000 bat"rels/ Sub-Number State Region Stream-day category
1 Alabama IV 30.0 A 20 California IX 100.0 B 50 Colorado VII 21.5 B 59 Illinois v 57.0 B 64 Illinois v 78.0 B 80 Kansas VII 52.0 B 84 Kansas VII 80.0 c
126 Montana VIII 46.0 B 153 Ohio v 125.0 c 157 Oklahoma VI 130.3 D 167 Pen11syl vania III 195.0 B 169 Pennsylvania III 188.0 B 186 Texas VI 185.0 c 194 Texas VI 405.0 E 205 Texas VI 103.4 c 235 Washington X 94.0 B 241 West Virginia III 12.0 A
77

TABLE V-2
Comparison of Plant Characteristics 17 Refineries Sampled vs. Overall Industry
EPA Region
I II
III IV v
VI VII
VIII IX
X
Subcategory A B c D E
Crude Capacity (1000 bbl/day)
0 - 49 so - 99
100 - 199 ~ - 200
Percent Distribution of Plants
Overall Industry
(Direct Discharge Segment)
5 0
9 9
17 35
5 8 7 5
TOO
27 45 12 1 1
5 100
49 22 18 11
TOO
78
0
17 Refineries Sampled
0
18 6
18 24 12 12
5 5
100
12 53 24
6 5
100
18 35 41
6 100

TABLE V-3
SUMMARY OF ANALYTICAL DATA PETROLEUM REFINING INDUSTRY SCREENING SAMPLING PROGRAM
FACILITY
AI' I SEPARATOR FINAL
FRACTION F'ARAMETER UNITS INTAKE EFFLUENT EFFLUENT --------- --------- ----- ------ --------- --CONVENTIONALS COlt HG/L 5 107 35
llOD HG/L 2 23 TOTAL SUSP, SOLIDS MG/L 3 380 .>9 PH UNIT 9 9 7
NON-CONVENTIONALS AMMONIA NITROGEN MG/L 4 12 12 TOC MG/L 2 29 11 SULFIDE UG/L 67 8133 267
VOLATILES llENZENE UG/L N-D G too N-D CHLOROFORH UG/L 70 L 5 L 5 1r2-TRANS-DICHLOROETHYLENE UG/L N-D 20 N-D ETHYLllENZENE UG/L N-D G 100 N-D METHYLENE CHLORIDE UG/L 0 100 0 100 G 100 TETRACHLOROETHYLENE UG/L N-D 0 50 L 10 TOLUENE UO/L N-D 0 100 N-D
ACill EXTRACT PHENOL UO/L N--D 13 N-D ........ 1.0 llASE-NEUTRALS ACENAPHTHENE UG/L N-D 37 N-ll
NAPHTHALENE UO/L N-D 48 N-D DJ-N-llUTYL PHTHALATE UO/L L 1 1 l DIETHYL PHTHALATE UO/L N-[1 12 N-[1 ACENAPHTHYLENE UG/L N-D ... N-[1 PllENANTHRENE UO/L N-D 5 N-l•
METALS ARSENIC UO/L L tO 12 L 10 CHROHIUH UG/L L 24 12 l COF'f'ER UG/L L :; 24 2 CYANIDE UG/L L 10 50 L 30 LEAD UO/L L 60 132 L 60 HERCURY UG/L L 1 L 1 L 1 NICI\EL UG/L L 50 5 L 50 ZINC UG/L 37 263 57
NON-CONV, METALS HEX-CHROHIUM UG/L L 20 57 13
MISC. PHENOLICS C4AAPOI UG/L L ll 97 3 A'
POLLUTANTS NOT LISTED WERE NEVER DETECTED L-LESS THANI N-D NOT DETECTED! E-ESTIMATED OR VALUE NOT QUANTIFIED OR CONFIRMED! G-GREATER THANI

TABLE V-4 SUMMARY OF ANALYTICAL DATA PETROLEUM REFINING INDUSTRY SCREENING SAMPLING PROGRAM
FACILITY 20
PIC TREATMENT FINAL
FRACTION PARAMETER UNITS INTAKE EFFLUENT EFFLUENT -------- --------- ----- ------ --------- --------CONVENTIONAL& COD MG/L 9 453 130
BOD MG/L 1 173 14 TOTAL SUSP, SOLIDS MG/L 11 42 22 OIL I GREASE MG/L 11 21 31 PH UNIT 8 9 7
NON-CONVENTIONAL& AMMONIA NITROGEN MO/L L 1 7 17 TOC MG/L 19 107 43 SULFIDE UG/L 267 933 533
VOLATILES CHLOROFORM UG/L L 10 11 L 10 METHYLENE CHLORIDE UO/L 22 30 N-D
ACID EXTRACT 2r4-DIMETHYLPHENOL UO/L N-D 10000 L 10
ltETALS CADMIUM UG/L I I 2 CHROMIUM UG/L 34 44 46 COPPER UG/L 22 7 L 6 CYANIDE UO/L L 20 43 L 20 LEAD UG/L 48 L 20 L 20
co NICKEL UG/L 9 L 15 L 15 0 SILVER UGIL I L 5 L 5
ZINC UO/L 36 6 5
NON-COHV, METALS HEX-CHROMIUM UO/L 7 33 L 20
MISC. PHENOLICS 14AAP0) UO/L L 10 29333 52
POLLUTANTS NOT LISTED WERE NEVER DETECTED L-LESS THAHI N-D NOT DETECTED! E-ESTIHATED OR VALUE HOT QUANTIFIED OR COHFIRHEDI G-GREATER THANI

TABLE V- 5
SUHHARY OF ANALYTICAL DATA PETROLEUH REFINING INDUSTRY
SCREENING SAHPLING PROGRAH
FACILITY 50
INTAKE DAF UNIT 810-TREATHENT FINAL FRACTION PARAHETER UNITS CWELLS) EFFLUENT EFFLUENT EFFLUENT -------- --------- ----- ------- -------- ------------- ---CONVENTIONALS COD HG/L 1 323 123 120
BOD HG/L l 117 J4 41 TOTAL SUSP, SOLIDS HO/L l 1 29 22 19 OIL I GREASE HG/L 7 93 11 JO PH UNIT 9 9 9 8
NON-CONVENTIONAL& AHHONIA NITROGEN HG/L l 1 38 6 10 TOC HO/L 8 71 41 38 SULFIDE UG/L 100 1367 67 467
VOLATILES BENZENE UG/L N-D 417 N-D N-Il 1r2-DICHLOROETHANE UG/l N-D 16 N-D N-D ETHYL BENZENE UG/l N-D 38 N-D N-ll HETHYLENE CHLORIDE UO/l 85 3 7 20
BASE-NEUTRALS NAPHTHALENE UG/l N-D 950 N-D N-ll BIS<2-ETHYLHEXYL) PHTHALATE UO/l 150 290 900 155 PHENANTHRENE UG/L N-D 19t' N-D N-D
HETALS ANTIHONY UG/L L 1 l 1 1 3 ARSENIC UG/l l 4 8 6 5 CACIHIUH UG/l l 20 l 20 7 l 20
co CHROHIUH UO/l L 1 718 547 99 ___, COPPER UG/l 11 179 118 26 CYANIDE UG/l l 20 323 105 50 lEAD UG/l 15 75 83 48 HERCURY UG/l 2 10 3 2 NICKEL UO/L L 1 L 50 10 5 SELENIUH UO/L 3 11 8 15 THALli Uti UO/L L 3 L 1 L 1 N-D ZINC UO/l 263 931 1142 632
NON-CONV, HETALS HEX-CHROHIUH UO/L, L 20 17 l 20 L 20
HISC, PHENOLICS <4AAP0l UO/L 5 4550 7 3
POLLUTANTS NOT LISTED WERE NEVER CIETECTED L-LESS THANI N-D NOT DETECTEDI E-ESTIHATED OR VALUE NOT GUANTIFIEll OR CONFIRHEDI G-GREATER Til AN I

TABLE V- 6
SUHHARY OF ANALYTICAL DATA PETROLEUH REFINING INDUSTRY
SCREENING SAHPLING PROGRAH
FACILITY 59
INTAKE DAF UNIT FINAL FRACTION PARAMETER UNITS !WELLS I EFFLUENT EFFLUENT
- --------- ----- ------- -------- ---CONVENTIONALS COD HG/L 9 630 660
BOD HG/L 6 84 100 TOTAL SUSP. SOLIDS HG/L 24 43 61 f'H UNIT 7 9 8
NON-CONVENTIONALS AHHONIA NITROGEN HG/L 1 35 39 TOC HG/L 8 183 220 SULFIDE UG/L L 1 16000 1200
VOLATILES BENZENE UG/L N-D G 100 N-D ETHYLBENZENE UG/L N-D G 100 N-D TOLUENE UG/L N-P G 100 N-D
BASE-NEUTRALS FLUORANTHENE UG/L N-P 3 N-P NAPHTHALENE UG/L 2 190 N-D BENZO IAIPYRENE UG/L N-P N-D 3 CHRYSENE UG/L N-P L 1 1 PHENANTHRENE UG/L N-P 140 N-D f'YRENE UG/L N-P 11 7
PESTICIOES PCB-1242 UG/L N-D 1 N-P
()) HETALS CHROHIUH UG/L L 240 726 1069 N
COf'f·ER UG/L L 40 6 L 5 CYANIDE UG/L L 20 50 20 HERCURY UG/L L 1 L 1 L 1 SILVER UG/L L 250 L 250 3 ZINC UG/L 7 275 433
HOH-CONV. HETALS HEX-CHROHIUH UG/L L 20 L 20 10
HISC. PHENOLICS (4AAPOI UG/l 230 5600 NOT RUN
POLLUTANTS NOT LISTED WERE NEVER OETECTED L-LESS THANI N-[1 NOT DETECTE[II E-ESTIHATED OR VALUE HOT QUANTIFIED OR CONFIRHEOI G--GREATER THANI

TABLE V-7
SUMMARY OF ANALYTICAL DATA PETROLEUM REFINING INDUSTRY SCREENING SAMPLING PROGRAM
FACILITY 64
SEPARATOR FINAL FRACTION PARAMETER UNITS INTAKE EFFLUENT EFFLUENT -------- --------- ----- ------ --------- ---CONVENTIONALS COD MG/L 47 157 59
BOD 11G/L 3 49 5 TOTAL SUSP, SOLIDS MG/L 20 15 14 PH UNIT 8 7 8
NON-CONVENTIONALS AHMONIA NITROGEN MG/L 6 13 20 TOC HG/L 15 43 10 SULFIDE UG/L L 1 1600 467
VOLATILES BENZENE UG/L N-D G 100 N-D ETHYLBENZENE UG/L N-D G 100 N-D METHYLENE CHLORIDE UG/L 50 10 10 TETRACHLOROETHYLENE UG/L so N-D N-D TOLUENE UG/L N-D G 100 N-D TRICHLOROETHYLENE UG/L 20 N-D N-D
ACID EXTRACT 2•4-DIMETHYLPHENOL UG/L N-D G 100 N-D PHENOL UG/L N-D G 100 N-Io
BASE-NEUTRALS ACENAPHTHENE UG/L 2 150 N-D co NAPHTHALENE UG/L N-D 106 N-I• w DI-N-BUTYL PHTHALATE UG/L L 1 N-D N-D
METALS CAI•MIUM UG/L L 1 L 20 L 20 CHROMIUM UG/L 39 71 43 COPPER UG/L 9 L 5 L 5 CYANIDE UG/L 10 L 30 L 30 LEAD UG/L 5 L 60 L 60 MERCURY UG/L N-D N-D L 1 NlCI\El UG/L 10 6 4 SELENIUM UG/L L 10 L 10 12 ZINC UG/L 122 25 52
MISC. PHENOLICS 14AAP0) UG/L 5 9067 8
POLLUTANTS NOT LISTED WERE NEVER DETECTED L-LESS THANI N-D NOT DETECTEDI £-ESTIMATED OR VALUE NOT QUANTIFIED OR CONFIRHEDI G- GREATEF: TIIANI

TABLE V-8
SUMMARY OF ANALYTICAL DATA PETROLEUM REFINING INDUSTRY SCREENING SAMPLING PROGRAM
FACILITY 80
COME<INED BIO-TREATMENT fiNAL
FRACTION PARAMETER UNITS INTAKE INFLUENT EFrLUENT ~----- --------- ----- ------ ------------- ---
CONVENTIONALS COD MG/L 343 287 263 BOD MG/L 43 G 73 23 TOTAL SUSP, SOLIDS HG/L 59 73 102 PH UNIT 8 7 9
NON-CONVENTIONALS AHHONIA NITROGEN HG/L 44 11 4
TOC HG/L 101 78 89 SULFIDE UG/L 1067 500 1000
VOL AT JLES CARBON TETRACHLORIDE UG/L G so N-D N-D 1r1r1-TRICHLOROETHANE UG/L G so N-D N-D METHYLENE CHLORIDE UO/L L 10 70 L 10
BASE-NEUTRALS fLUORANTHENE UG/L 29 N-D N-D
BENZO IAlPYRENE UG/L 33 10 1 CIIRYSENE UG/L 49 7 1 PIIENANTHRENE UG/L 160 2 N-ll
PYRE HE UG/L 140 10 H-D
00 PESTICIDES CHLORDANE UG/L 3 N-D H-D
-'=" liETA-BHC UG/L N-D 1 N-ll PCB-1221 UG/L N-D L 1 N-D
HETALS ARSENIC UG/L 27 41 31
CHROHJUM UG/L 38 58 37 COPPER UG/L 157 409 124
CYANIDE IJO/L L 30 727 70 HERCURY UG/L 1 L 1 L 1 NICKEL UG/L 35 93 67
SELENIUM IJO/L 12 L 10 L 10 ZINC UG/L 76 339 124
NON-CONV. HETALS IIEX-CHROHIUH UO/L 7 183 10
HlSC. PHENOLICS <4AAP0l UG/L 210 45 24
POLLUTANTS HOT LISTED WERE HEUER DETECTED L-LESS TIIANI N-D NOT DETECTEDI £-ESTIMATED OR VALUE NOT OUANTIFIED OR CONFIRHEDI G- GREAlER TllANI

TABLE V-9
SUMMARY OF ANALYTICAL DATA PETROLEUM REFINING INDUSTRY
SCREENING SAMPLING PROGRAM
FACILITY 84
SEPARATOR I•AF UNJT FINAL FRACTION PARAMETER UNITS INTAI\E EFFLUENT EFFLUENT EFFLUENT -----··-- ·--------- ----- ------- --------- ------------ ---------CONVENTIONALS COD MOIL 24 840 987 210
llOD MG/L 1 260 253 7 TOTAL SUSP, SOLIDS MG/L 11 139 131 59 OIL & GREASE HG/L 13 99 220 14 PH UNIT B 10 10 B
NON-CONVENTIONALS AMMONIA NITROGEN MG/L L 1 14 12 14 TOC HG/L 12 230 283 60 SULFIDE UG/L 300 27333 25333 1967
VOLATILES llENZENE UG/L L 1 409 2005 L HETHYLENE CHLORIDE UG/L 22 293 563 12 TOLUENE UG/L L 1 96 76405 L
ACID EXTRACT PHENOL UG/L 10 4900 2400
BASE-NEUTRALS FLUORANTHENE UG/L N-D 40 N-D N- Io NAPHTHALENE UG/L N-D 1100 700 N-D lliS<2-ETHYLHEXYL) PHTHALATE UG/L tlOO 700 1100 850 DIETHYL PHTHALATE UG/L N-I• N-D N-D N--D
00 CHRYSENE UG/L N-D 40 N-D N-Io (.J'1 PHENANTHRENE UG/L N-D tlOO 600 1
PESTICHoES ALPHA-ENDOSULFAN UG/L N-D N-D l 1 N- [o f·CB-1242 UG/L N-D 1 1 N-[o PCB-1232 UG/L N--D N-D 4 N-Il PCB-1016 UG/L N-Io 2 8 N-D
METALS ANTIMONY UG/L L 1 L 1 1 L 1 ARSENIC UG/L 5 5 L 4 5 CAI•HIUH UG/l l 20 l 20 5 l ::?0 CHROIUUM UG/l L 1 7.23 570 50 COPPER UG/L 1 19 2 1 CYANIDE UG/L L 20 tl25 1758 144 LEAD UG/L 36 245 204 40 MERCURY UG/L 1 1 1 NICI\EL UG/L 10 36 21 :?4 SELENIUit UG/L J 8 9 13 TIIALLIUit UG/L L 2 L 2 l 2 3 ZINC UG/L 27 106 83 45
NON-CONV. HETALS HEX-CHROHIUM UG/l l ::?0 13 7 L 20
MISC. PHENOLICS <4AAP0) UG/L 6 23750 23333 33
POLLUTANTS NOT LISTED WERE NEVER DETECT£~ L-LESS THANi N-D NOT DETECTEDI E-ESTIHATED OR VALUE NOT QUANTIFIED OR CONFIRHEDi 0-llREATER TIIANi

TABLE V-10
SUHHARY OF ANALYTICAL DATA PETROLEUH REFINING INDUSTRY SCREENING SAHPLINS rROGRAH
FACILITY 126
INTAKE SEPARATOR FINAL FRACTION PARAHETER UNITS <RIVER> EFFLUENT EFFLUENT -------- --------- ----- ------- --------- ---CONVEtiTIONALS COD HG/L 18 r9o 41
[IOD HG/L 1 37 1 TOTAL SUSP, SOLIDS HG/L 98 102 9 .0 I L & GREASE HG/L 17 52 18 f•H UNIT 8 8 8
NON-CONVENTIONALS AHHONIA NITROGEN HG/L L 1 7 5 TOC HG/L 12 54 20 SULFIDE UG/L 133 3100 167
VOLATILES BENZENE UG/L N-D N-D 12 CHLOROFORH UG/L L 10 55 66 HETHYLENE CHLORIDE UG/L N-D N-D 70
ACID EXTRACT 2r4-DICHLOROPHENOL UG/L N-D N-D 10 2r4-DIHETHYLPHENOL UG/L N-D 175 N-D PHENOL UG/L N-D 440 N-D
PESTICIDES 4r4'-DDE UG/L N-D 7 N-D
HETALS CADHIUH UG/L 2 L 2 4 co CHROHIUH UG/L 12 9 10 CTI
COPPER UG/L 5 23 7 CYANIDE UG/L L 20 103 17 LEAD UG/L L 20 L 20 28 SELENIUH UG/L L 20 L 20 20 ZINC UG/L 3 20 17
NON-CONV. HETALS HEX-CHROHIUH UG/L 13 20 L 20
HISC, PHENOLICS (4AAPOl UG/L 4 2133 7
POLLUTANTS NOT LISTED WERE NEVER DETECTED L-LESS TIIANI N-D NOT DETECTED; E-ESTIHATED OR VALUE NOT QUANTIFIED OR CONFIRHEDI G-- GkE A TER TllAN;

TABLE V- 11
SUHHARY OF ANALYTICAL DATA PETROLEUH REFINING INDUSTRY SCREENING SAHF·LING PROGRAH
FACILITY 153
IN TAl\£ SEPARATOR FINAL FRACTION f'ARAHETER UNITS !CITY> EFFLUENT EFFLUENT -------- --------- ------- --------- ---------CONVENTIONALS COP HG/L 5 257 79
BOP HG/L L 3 66 L 12 lOTAL SUSP, SOLIDS HG/L 1 39 8 OIL I GREASE HG/L 4 32 6 PH UNIT 8 8 7
NON-CONVENTIONALS AHHONIA NITROGEN HG/L L 1 4 L 1 TOC HG/L 5 81 31 SULFIDE UG/L 450 550 550
VOLATILES BENZENE UG/L NOT RUN 2434 2 ETHYLPENZENE UG/L NOT RUN 812 N-D HETHYLENE CHLORIDE UG/L NOT RUN 19 74 TOLUENE UG/L NOT RUN 11767 L 1
ACID EXTRACT PHENOL UG/L N-P 390 N-P
BASE-NEUTRALS NAPHTHALENE UG/L N-D 2-fo N-D BJS<2-ETHYLHEXYLI PHTHALATE UG/L 950 300 300
00 PI-N-BUTYL PHTHALATE UG/L 30 N-D 10 "'-1
HETALS ARSENIC UG/L L 4 5 L 4 CHROHIUH UG/L L 1 78 L 1 COPPER UG/L 10 127 45 CYANIDE UG/L L 5 8 L 5 LEAP UG/L 32 52 53 HERCURY UG/L 1 1 1 HinEL UG/L L 50 2 L 50 SELENIUH UG/L 2 3 21 ZINC UG/L 202 376 550
HISC, PHENOLICS (4AAPOI UG/L 1 5240 15
POLLUTANTS NOT LISTED WERE NEVER PETECTEP L-LESS THANI N-P NOT PETECTEDI E-ESTIH~TEP OR VALUE NOT DUANTIFIEP OR CONFIRHEDI G-GREATER THANI

TABLE V- 12 SUHHARY OF ANALYTICAL DATA PETROLEUH REFINING INDUSTRY SCREENING SAHPLING PROGRAH
FACILITY 157 PART 1
SEPARATOR SEPARATOR SEPARATOR EFFLUENT EFFLUENT EFFLUENT
FRACTION PARAHETER UNITS INTAKE !LUBE DILl !LIGHT DILl ITHERHALI -------- --------- ----- ------ ---------- ----------- ---------CONVENTIONALS COP HG/L 25 177 553 187
flOP HG/L 1 59 0 84 29 TOTAL SUSP. SOLIDS HG/L 5 53 123 45 OIL I GREASE HG/L 13 77 158 34 PH UNIT 8 8 8 7
NON-CGNVENTIONALS AHHONIA NITROGEN HG/L 1 2 10 5
TOC HG/L 14 51 162 53 SULF IliE UG/L 100 1433 10500 2867
ACID EXTRACT PHENOL UG/L N-P 420 160
BASE-NEUTRALS FLUORANTHENE UG/L N-P 30 N-P N-P NAPHTHALENE UG/L N-P N-P 350 1 BISI2-ETHYLHEXYLI PHTHALATE UG/L 110 180 300 50 CllRYSENE UG/L N-P 30 30 50 PHENANTHRENE UG/L N-P 30 90 1
00 PESTICIDES f'CB-1242 UG/L N-P N-P 1 1 00 PCB-1232 UG/L N-P N-P 1 1
PCB-1016 UG/L N-P N-P L 1
HETALS ARSENIC UG/L 3 3 5 3 CHROHIUH UG/L L 1 136 651 724 COPPER UG/L 4 286 59 15 CYANIDE UG/L 7 10 10 10 LEAD · UG/L L I 192 862 39 HERCURY UG/L 2 I 2 I NICKEL UG/L L I 154 26 36 SELENIUH UG/L 3 7 lJ 17 SILVER UG/L L 25 L 25 L 25 L N-P THALLIUH UG/L L 2 L 2 2 L 2 ZINC UG/L 61 306 872 229 .
NON-CONV, HETALS HEX-CHROHIUH UG/L 7 17 20 27
HISC, PHENOLICS 14AAPGI UG/L 11 733 1833 690
POLLUTANTS NOT LISTED WERE NEVER DETECTED L-LESS THANI N-D HOT PETECTEPI E-ESTIHATED OR VALUE NOT GUANTIFIED OR CONFIRHEDI G-GREATER THANI

TABLE V- U
SUMMARY OF ANALYTICAL DATA PETROLEUM REFINING INDUSTRY SCREENING SAMPLING PROGRAM
FACILITY 157 PART 2
SEPARATOR SEPARATOR EFFlUENT EFFlUENT BIO-TREATHENT FINAL
FRACTION PARAMETER UNITS I OTHER> IOTHER-2> EFFLUENT EFFLUENT -------- --------- ----- --------- --------- ------------- ---CON VENTI ONALS COD MG/L 337 83 553 89
llOD MG/L G 73 12 G 88 6 TOTAL SUSP. SOLIDS MG/L 52 30 19 12 OIL & GREASE MOIL 83 14 13 14 PH UNIT 8 8 8 7
NON-CONVENTIONALS AMMONIA NITROGEN MG/L 6 1 22 6 TOC MG/L 74 25 90 31 SULFIDE UG/L 7000 4333 22167 700
ACID EXTRACT 2o4-DIMETHYLPHENOL UG/L 650 N-D 750 N-D PENTACHLOROPHENOL UG/L 850 N-D N-D N-D PHENOL UG/L 16000 N-D G 12000 N-Il
llASE-NEUTRALS ACENAPHTHENE UG/L 50 N-D N-D N-D FLUORANTHENE UG/L 20 N-D N-[1 N-D lliSI2-ETHYLHEXYL) PHTHALATE UG/L 600 N-D 210 190
CX> DIETHYL PHTHALATE UG/L N-D N-D N-D 30 1.0 DIMETHYL PHTHALATE UG/L N-D N-D N-D 3
CHRYSENE UG/L 40 N-D N-D N-[1 FLUORENE UG/L 80 N-D N-[1 N-[1 PHENANHIRENE UG/L 230 N-D N-D N-[1
PESTICIDES PCB-1242 UG/L N-D N-D L ; N-[1
METALS ANTIMONY UG/L 1 L 1 L 1 L 11 ARSENIC UG/L 3 9 L 2 L 4 llERYLLIUM UG/L L 2 L 1 L 2 L 2 CAIIMIUM UG/L L 20 3 L 20 L 20 CHROMIUM UG/L 1451 2548 9 79 COPPER UG/L 38 75 13 9 CYANIDE UG/L 57 20 273 78 lEAO UG/L 32 53 15 18 MERCURY UG/L 2 1 3 2 NICKEL UG/L L 50 54 L 50 19 SELENIUM UG/L 16 20 18 19 SILVER UG/L L 1 6 L 25 L 25 THALLIUM UG/L L 2 3 L 2 L 2 ZINC UG/L 421 575 81 70
NON-CONV. METALS HEX-CilROMIUM UG/L 17 120 87 L 20
MISC. PHENOLICS 14AAPO> UG/L 4333 251 104333 11
POLLUTANTS NOT LISTED WERE NEVER DETECTED l-LESS THANI N-D NOT DETECTEDI E-ESTIMATED OR VALUE NOT QUANTIFIED O~CONFIRMEDI G-GREATER THANI

TABLE V-14
SUHHARY OF ANALYTICAL DATA PETROLEUH REFINING INDUSTRY
SCREENING SAHPLING PROGRAH
FACILITY 167
INTAKE DAF UNIT FINAL FRACTION PARAHETER UNITS <RIVER> EFFLUENT EFFLUENT -------- •w----w---- ------ -------- -------- ---------CONVENTIONALS COD HG/L 25 690 122
80[1 HG/L 3 118 7 TOTAL SUSf', SOLIDS HG/L 12 283 23 IHL & GREASE HG/L 10 293 19 PH UNIT 8 8 8
NON-CONVENTIONALS AHHONIA NITROGEN HG/L L 1 7 3 roc HG/L 11 237 41 SULF IIIE UG/L 367 1000 367
VOLATILES BENZENE UG/L N-[1 20 N-[1 CIILOROFORH UG/L L 10 100 L 10 HETHYLENE CHLORIPE UG/L N--[1 1100 L 10
ACID EXTRACT 2-CIILOROPHENOL UG/L N-[1 31:5 N-It 2r4-PIHETHYLPHENOL UG/L N-D 11:50 N-It 4-NITROPIIENOL UG/L N-[1 :5800 N-It 2r4-DINITROPHENOL UG/L N-It 11000 N-0 f'IIENOL UG/L N-D 10:5 N-D
I.D HETALS CADHIUH UG/L 1 1 L 1 C> CHROHIUH UG/L 13 1320 87
COPPER UG/L 9 276 28 LEAlt UG/L 46 96 L 20 NICKEL UG/L L 1:5 1:5 L 15 ZINC UG/L 89 1680 278
NON-CONV, HETALS IIEX-CHROHIUH UG/L L 20 20 L 20
HISC. PHENOLICS 14AAF'Ol UG/L L 10 700 29
I'OLLUTANTS NOT LISTEit WH'E NEVER DETEClEit L-LESS TIIANi N-D NOl VETECTEDi E-ESTIHATED OR VALUE NOl UUANTIFIEP OR CONFIRHEPi G-GREAlER TllANi

TABLE V-15 SUMMARY OF ANALYTICAL DATA PETROLEUM REFINING INDUSTRY SCREENING SAMPLING PROGRAM
FACILITY 169
SEF·ARATOf~
SEPARATOR EFFLUENT FINAL FRACTION PARAMETER UNITS INTAI<.E EFFLUENT <OTHER! EFFLUENT -------- ------ ---~- ----- ------ --------- ------------CONVENTIONALS COD MG/L 33 423 193 63
BOD HO/L 1 131 37 6 TOTAL SUSP, SOLIDS MG/L 210 123 42 28 PJ-i UNIT 7 8 7 7
NON-CONVENTIONALS AHMONIA NITROGEN MG/L L 1 12 11 2 TOC HG/L 10 120 50 16 SULFIOE UG/L 700 1200 1133 533
VOLATILES BENZENE UG/L N-D G 100 G 100 N-[1 CHLOROFORH UG/L N-D 10 10 N-£1 ETIIYLBENZENE UG/L N-D G 100 0 100 N-[1 HETHYLENE CHLORIDE UG/L 40 0 100 50 60 TOLUENE UG/L N-D 0 100 G 100 N··[l
ACID EXTRACT 2,4-DIHETHYLPHENOL UG/L N-D 0 100 0 100 N--D PHENOL UO/L N-D 0 100 G 100 N-[1
BASE-NEUTRALS ACENAPHTHENE UO/L 29 N-D 3000 6 FLUORANTHENE UG/L L 1 N-D 9 L 1
c.o NAPHTHALENE UO/L 1 500 280 L 1 ...... CHRYSENE UG/L N-D 20 2 L 1 ACENAPHTHYLENE UG/L L 1 N-D N-D N-D FLUORENE UG/L 1 270 300 N-[1 PfiENANTIIRENE UG/L 1 230 N-D N··D PYRE HE UG/l L 1 N-D 7 L I
PESTICHIES PCB-1242 UG/L l 1 :5 N-D N-[1
HETAl.S CHROHIUH UG/L 6 2:58 841 165 COPPER UG/L 8 110 44 27 CYANIDE UG/l l 60 377 150 80 LEAD UG/L 161 9 J L 60 HERCURY UG/l L 1 1 L 1 l. 1 NICl<EL UO/l 4 14 3 3 ZINC UG/l 211 360 323 161
HOH-COHV. HETALS HEX-CNROHIUH UG/l 100 23 17 40
HISC, PHENOLICS !4AAPO> UG/L L 10 54667 11000 3
POLLUTANTS NOT LISTED WERE NEVER DETECTED L-LESS THANI N-D NOT DETECTED! E-ESTIHATED OR VALUE NOT QUANTIFIED OR CONFIRHEDI G··GREATER THAtH

TABLE V-16
SUHHARY OF ANALYTICAL DATA PETROLEUH REFINING INDUSTRY
SCREENING SAHPLING PROGRAH
FACILITY 186
INT~KE OAF UNIT FINAL FRACTtON PARAIIETER UNITS <CITY I EFFLUENT EFFLUENT -------- ---------- ----- ------- -------- --------CONVENTIONALS COD IIG/L 9 233 84
BOD IIG/L L 6 40 L 12 TOTAL SUSP. SOLIDS IIG/L L 1 11 11 OIL I GREASE IIG/L 8 17 13 PH- UNIT 8 8 8
~ON-CONVENTIONALS AIIIIONIA NITROGEN IIG/L L 1 12 L 1 TOC IIG/L 7 67 16 SULFillE UG/L 233 500 367
VOLATILES BENZENE UG/L 14 12 11 CHLOROFORII UG/L 41 55 L 10 IIETHYLENE CHLORIDE UG/L 91 180 L 10
ACJ[o EXTRACT PARACHLOROIIETA CRESOL UG/L N-D N-D 10 2r4-DIIIET.HYLPHENOL UG/L N-D 18300 H-0 4-NITROf'HENOL UGIL N-D 1400 N-D 2r4-DINITROPHENOL UG/L N-Io 2660 N-D PHENOL UG/L L 10 33500 L 10
HETALS BERYLLIUH UG/L L 3 2 \0 CADHIUH UG/L L 2 L 2 1 N CJfROHIUII UG/L 16 113 81
COPPER UG/L 176 9 14 CYAN I DE UG/L L 20 20 L 20 LEA[I UG/L 65 L 20 16 NICI<.EL UG/L 2 L 15 6 SILVER UG/L L 5 L 5 2 ZINC UG/L 113 126 116
NON-CONV. HETALS HEX-CHROHIUII UG/L L 20 250 L 20
HISC. PHENOLICS C4AAPO> UG/L L 10 4400 L 10
POLLUTANTS NOT LISTED WERE NEVER DETECTED L-LESS THANI N-D NOT DETECTED; E-ESTIHATED OR VALUE NOT OUANTIFIED OR CONFIRHED; G-GREAHR TitAN;

TABLE V-11
SUHHARY OF ANALYTICAL DATA PETROLEUM REFINING INDUSTRY
SCREENING SAMPLING PROGRAM
FACILITY 194
UNTREATED I NT AilE SEPARATOR WASTEWATER FINAL
FRACTION PARAMETER UNITS <RIVER> EFFLUENT <OTHER> EFFLUENT -------- --------- ----- ------- --------- ---------- ---CONVENTIONALS COlt MO/L 28 410 463 133
BOD MG/L L 5 101 83 9 TOTAL SUSP, SOLIDS MG/L 22 85 35 45 Pit UNIT 9 9 7 8
NON-CONVENTIONALS AMMONIA NITROGEN MG/L L 1 13 1 5 TOC MG/L 11 103 134 34 SULFIDE UG/L 733 6733 833 900
VOLATILES ItENZENE UO/L N-D 0 100 90 6 CHLOROFORM UG/L N-D 15 10 N--D ETHYL BENZENE UO/L N-D G 100 20 N-It METIIYLENE CHLORIDE UG/L G 100 G 100 G 100 G 100 TOLUENE UG/L N-D G •oo 0 100 35
ACID EXTRACT PARACIILOROMETA CRESOL UG/L N-D N-D 10 N-It :? , 4-lJIHETHYLF'HENOl UG/l N-ll 71 0 100 N-lt PHENOL UO/L N-D
1.0 0 100 40 N--D
w ~:lASE-NEUTRAL'S ACENAf'IHifENE UG/L N-D 522 N-D N-[1
FLUORANTifENE UG/L N-D 8 N-It N-It NAF'IfTIIALENE UG/L N-D 302 27 N--It CHRYSENE UG/L N-D 6 l 1 N-It ACENAF'HTIIYLENE UO/L N-D 97 N-It N-D F'HENANTIIRENE UG/L N-It 140 1 N .. It PYRENE UG/L N-D 16 1 N-It
PESTICIDES HEPTACHLOR EPOXIDE UG/L N-D N-It 5 N .. D f'Cll-1221 UG/L N-D L 1 N-It N .. It PCB-1232 UG/L N-It 1 l 1 N-lt f'CB-1016 UG/L N-[1 2 1 N-D
METALS CIIROMIUM UG/L 601 1332 667 109 COF·PER UG/L L 40 16 6 2 CYANIDE UG/L l 60 13 l 60 l 60 LEA It UG/L L 600 4 l 60 l 60 MERCURY UG/L L 1 l 1 L 1 L 1 N I CI\EL UG/l 158 J l 50 l 50 ZINC UG/L 28 597 4990 64
NON-CONV. METALS HEX-CHROMIUM UG/L 53 L 20 L 20 l 20
MISC. F'lfENOLICS (4AAP0) UG/l l 11 5900 49 l 15
f'OllUTANTS NOT LISTEIJ WERE NEVER DETECTElt I -LESS TIIANI N-D NOT DETfCTEDI [-ESTIMATED OR VAlUE NOT OUANTlfiED OR CONFIRMEDI G- GREI\TfR TIII\NI

TABLE V- 18
SUHHARY OF ANALYTICAL DATA PETROLEUH ~EFINING INDUSTRY
SCREENING SAHPLING PROGRAH
FACILITY 205
INTAKE DAF UNIT FINAL FRACTION PARAMETER UNITS IWELLSI EFFLUENT EFFLUENT -------- --------- ----- ------- -------- ---CONVENTIONAL S COD HG/L 16 423 137
110[1 HG/L L 5 94 20 TOTAL SUSP. SOLIDS HG/L 11 32 25 PH UNIT 7 9 a
NON-CONVENTIONALS AMMONIA NITROGEN MG/L l 1 10 3 roc HG/L 19 137 47 SULF I [I[ UG/L 200 3633 500
VOLATILES CHLOROFORM UG/L 55 13 32 HETHYLENE CHLORIDE UG/L 130 N-D 44 TOLUENE UG/L L 10 16 N-D
ACHt EXTRACT 2o4-DIHETHYLPHENOL UG/L N-D 2000 N-D PHENOL UG/L N-D 1900 N-D
(lASE-NEUTRALS ACENAPHTHENE UG/L N-D 390 N-D ISOPHORONE UG/L N-D 2500 N-D NAPHTHALENE UG/L N-D 3750 N-D ACENAPHTHYLENE UG/L N-D 530 N-D
\0 ANTHRACENE UG/L N-Il 1750 N-D +=> FLUORENE UG/l N-D 495 N-It
PHENANTHRENE UG/L N-Il 1750 N-D
HETALS CHROHIUH UG/L 2 248 62 COPPER UG/L L 6 20 L 6 CYANIDE UG/L L 20 167 l 30 lEAD UO/L L 20 5 L 20 ZINC UO/L L 60 47 L 60
NON-CONV, HETALS HEX-CHROHIUH UO/L 13 L 20 7
HISC, PHENOLICS 14AAPOI UO/L L 10 10667 46
POLLUTANTS NOT LISTED WERE NEVER DETECTED L-LESS THANI N-D NOT DETECTED! E-ESTIHATED OR VALUE NOT OUANTIFIED OR CONFIRHEDI G-GREATER THANI

TABLE V-19
SUMMARY OF ANALYTICAL DATA PETROLEUM REFINING INDUSTRY SCREENING SAMPLING PROGRAM
FACILITY 235
INTAKE SEPARATOR FINAL FRACTION f'ARAMETER UNITS (CITYl EFFLUENT EFFLUENT . ------- --------- ----- -.------ --------- ---CONVENTIONALS COD MG/L 3 537 51
(IOD HG/L L 5 212 L 5 TOTAL SUSP, SOLIDS MOIL L 1 63 7 PH UNIT 7 10 8
NON-CONVENTIONALS AMMONIA NITROGEN MOIL L 1 15 2 roc MG/L 6 150 2'1 SULFIDE UG/L L 1 2'1333 300
VOLATILES fiENZENE UG/L L 10 1100 L 10 CHLOROFORM UG/L L 10 100 L 10 1r2-TRANS-PICHLOROETHYLENE UG/L 11 N-D N-D ETHYLfiENZENE UG/L N-D 28 N-Il METHYLENE CHLORIDE UG/L N-D 1600 41 TOLUENE UG/L L 10 655 N-Il
AC III EXTRACT 2-NITROPHENOL UG/L L 10 1350 N-D 4-NITROPHENOL UG/L L 10 20 N-D 2r4-PINITROPHENOL UG/L N-D 110 N-D
\0 4r6-DINITRO-O-CRESOL UG/L N-D 60 N-D Ul
fiASE-NEUTRALS ACENAPHTHENE UG/L N-D 315 N-D ISOPHORONE UG/L N-D 3550 N-D NAPHTHALENE UG/L N-D 3200 N-D ACENAPHTHYLENE UG/L N-D 665 N-[1 ANTHRACENE UG/L N-D 660 N-D PllENANTHRENE UG/L N-D 660 N-11
PESTICIDES ALDRIN UG/L N-D 12 N-D 8ElA-ENDOSULFAN UG/L N-D 13 N-D DELTA-BHC UG/L N-D 12 N-Il
METALS ANTIMONY UG/L L 25 360 370 CllROMIUM UG/L B '164 8 CYANIDE UG/L L 30 63 L 30 ZINC UG/L 12 11 9
NON-CONV, METALS HEX-CHROMIUM UG/L L 20 67 L 20
HISC, PHENOLICS ('IAAPOl UG/L L 10 67500 11
~OLLUTANTS NOT LISTEII WERE NEVER DETECTED L-LESS TllANI N-D NOT OETECTEDI E-ESTIMAlrD OR VALUE NOT OUANTJFIEO OR CONFJRMElll G-rmFATER THAlli

TABLE V- 20
SUMMARY OF ANALYTICAL [lATA PETROLEUM REFINING IN[IUSTRY SCREENING SAMPLING PROGRAH
FACILITY 241
INTAI\E SEPARATOR FINAL FRACTION PARAMETER UNITS (WELLS I EFFLUENT EFFLUENT -------- ---------- ----- ------- --------- ----CONVENTIONALS CO[I MG/L 11 320 247
llOD MG/L L 3 62 26 TOTAL SUSf', SOLI [IS MG/L 2 17 29 OIL I GREASE HG/L 9 50 42 PH UNIT 7 9 9
NON-CONVENTJONALS AMMONIA NITROGEN MG/L L 1 44 48 lOC MG/1. 9 80 66 SULFI[IE UG/L 333 5767 600
VOLATILES llENZENE UG/L L 1 894 N-Il CHLOROFORM UG/L N-D 6 N-1'1 METHYLENE CHLORIDE UG/L 6 4 3 [IICHLOROllROMOMETHANE UG/L N-Il 24 N-Il TOLUENE UG/L N-O 167 N-[1
ACI[I EXTRACT PHENOL UG/L 10 60 N-[1
(lASE-NEUTRALS liiS<2-ETHYLHEXYLI PHTHALATE UG/L 1100 320 2000 1..0 DIETHYL PHTHALATE UG/L 20 N-D 1 0'1
METALS ANTIMONY UG/L L 1 L 1 ARSENIC UG/L 21 438 734 CADMIUM UG/L L 20 L 20 1 CHROMIUM UG/L L 1 L 1 L 1 COPPER UG/L 85 98 90 CYAN I [IE UG/l 4 3 65 LEA [I UG/L 34 22 23 HERCURY UG/L 2 1 2 SELENIUM UG/L 6 8 16 ZINC UG/L 553 550 416
MISC. f'I{ENOLICS (.oiAAf'OI UG/L 5 112 16
POLLUTANTS NOT LISTE£1 WER[ NEVER DETECTED L-LESS THANi N-[1 NOT £oElECTE£oi E-fSliHATED OR VALUE NOT OUANTIFIED OR CONFIRMfDi G- GRE:ATER Tfi(IIH

TABLE V-21
SUHHARY OF ANALYTICAL DATA PETROLEUM REFlNINO INDUSTRY
POTW SAHPLINO PROORAH
FACILITY 13
FINAL EFFLUEhT-FRACTION PARAMETER UNITS TO POTW -------- --------- ----- ---------------CONVENTIONAL& COD HO/L 842
BOD HG/L 404 TOTAL SUSP, SOLIDS HG/L 75 OIL I GREASE HO/L 290 PH UNIT II
NON-CONVENTIONAL& AHHONIA NITROGEN HO/L 25 SUlFIDE UO/L 50
VOLATILES BENZENE UO/L 175 lrlri-TRICHLOROETHANE UO/L 7 CHLOROFORH UO/L 5 ETHYLBENZENE UO/L 205 TOLUENE UO/L 2300
ACID EXTRACT 2r4-PIHETHYLPH£NOL UO/L 2450 PHENOL UO/L 1650
BASE-NEUTRALS ACENAPHTHENE UO/L 9 JSOPHORONE UO/L 6
\0 NAPHTHALENE UO/L 92 ....... DIETHYL PHTHALATE UO/L 19 1r2-BENZANTHRACENE UO/L 6 CHRYSENE UO/L 6 ANTHRACENE UO/L ll FLUORENE UO/L 7 PHENANTHRENE UO/L ll
PESTICIDES 4r4'-PDT UO/L L 4r4'-PPE UO/L L ALPHA-BHC UO/L l
HETALS ARSENIC UO/L 14 CHROHIUH UO/L 1108 COPPER UO.IL II CYANIDE UO/L 203 LEAP UO/L 26 HERCURY UO/L L I SELENIUH UO/L 107 ZINC UO/L 120
HISC, PHENOLICS C4AAPOI UO/L 92150
POLLUTANTS NOT LISTED WERE NEVER DETECTED L-LESS THANI N-D NOT DETECTEDI E-ESTIHATED OR VALUE NOT OUANTIFIEP OR CONFJRHEDI

\0 (X)
FRACTION
CONVENTIONAL&
NOH-CONVENTIONAL&
VOLATILES
ACID EXTRACT
BASE-NEUTRALS
PESTICIDES
METALS
MISC.
TABLE V-22
SUMMARY OF ANAl.YTICAL DATA PETROLEUM REFINING INDUSTRY
POTU SAHPLINO PROORAH
PARAMETER
COD BOD
FACILITY 16
TOTAL SUSP, SOLIDS OIL I GREASE PH
AMMONIA NITROGEN
BENZENE ETHYLJENZENE TOLUENE
2•4-DIMETHYLPHENOL PHENOL
NAPHTHALENE
4•4'-DDT ALPHA-BHC
ARSENIC CHROMIUM COPPER CYANIDE LEAD SELENIUM ZINC
PHENOLICS C4AAP0)
POLLUTANTS NOT LISTED WERE NEVER DETECTED
FINAL EFFLUENT-UNITS TO POTU ----- ---------------MOIL 484 MOIL 120 HO/L 22 NOlL 37 UNIT 8
HG/L 2:5
UO/L 260 UO/L 277 UG/L 620
UO/L 318 UO/L :56:5
UO/L :53
UO/L 3 UO/L L I
U8/L 23 UO/L 1880 UO/L 14 UO/L 67 U8/l 20 UO/L 146 UO/L 333
UO/L 3700
L-LESS THANI N-D NOT DETECTEDI E-ESTINATED OR VALUE NOT QUANTIFIED OR CONFIRHEDI

TABLE V- iJ
SUHHARY OF ANALYTICAL DATA PETROLEUH REFINING INDUSTRY
POTW SAHPLING PROGRAH
FACILITY 21
FINAL EFFLUENT-FRACTION PARAHETER UNITS TO POTW
• -------- --------- ----- ---------------CONVENTIONAL& COD fiGIL 351
BOD HGIL 125 TOTAL SU&P. SOLIDS HGIL 23 OIL I GREASE HGIL 34 PH UNIT 9
NON-CONVENTIONAL& AHHONIA NITROGEN HGIL 4
VOLATILES BENZENE UGIL 466 1r2-DICHLOROETHANE UGIL 29 CHLOROFORH UOIL 19 ETHYLBENZENE UOIL 6073 TOLUENE UGIL 18500
ACID EXTRACT 2r4-DIHETHYLPHENOL UGIL 3'14 PHENOL UG/L 133
BASE-NEUTRALS NAPHTHALENE UGIL 162 BUTYL BENZYL PHTHALATE UG/L 5 DIETHYL PHTHALATE UGIL 6
1.0 1.0 PESTICIDES ALDRIN UGIL L
ALPHA-BHC UGIL L
KETAL& CHROHIUH UGIL '142 COPPER UG/L 15 CYANJDE UG/L 20 LEAD UGIL 3'1 SELENIUH UGIL 17 ZINC UG/L 172
HISC. PHENOLICS C4AAPOI UG/L 1467
POLLUTANTS NOT LISTED WERE NEVER DETECTED L-LESS THANI N-D NOT DETECTED! E-ESTIHATED OR VALUE NOT QUANTIFIED OR CONFIRHEDI

__, 0 0
fRACTION
CONVENTIONALS
NON-CONVENTIONALS
VOLATILES
ACIJI EXTRACT
BASE-NEUTRALS
PESTICIDES
NETALS
NOH-COHV. NETALS
NISC.
TABLE V-24
SUNNARY Of ANALYTICAL DATA PETROLEUN REFINING INDUSTRY
POTW SANPLINO PROORAN
PARAHETER
COP 80P
fACILITY 2:S
TOTAL SUSP. SOLIDS OIL I GREASE PH
ANHOHU NITROGEN
BENZENE CHLOROBEHZEHE CHLOROfORH ETHYL BENZENE TETRACHLOROETHYLENE TOLUENE
2•4-PINETHYLPHEHOL PENTACHLOROPHENOL PHENOL
NAPHTHALENE BUTYL BENZYL PHTHALATE PI-N-BUTYL PHTHALATE PIETHYL PHTHALATE ANTHRACENE flUORENE PHENANTHRENE PYRENE
BETA-BHC
ARSENIC CHRONJUN COPPER CYANJIIE LEAD SELENIUM ZINC
HEX-CHROHIUH
PHENOLICS (4AAPOl
POLLUTANTS NOT LISTED WERE NEVER DETECTED
UNITS -----NOll HO/L NOll HO/L UNIT
HO/L
UG/L UO/L UO/L UO/L UG/L UO/L
UO/L UO/L UG/L
UO/L UO/l UO/L UO/L UO/L UO/L UG/L UO/L
UO/L L
UO/L UO/L UG/L UO/L UO/L UO/L UO/L
UO/L
UO/L
fiNAL EffLUENTTO POTW
700 328 30 48 9
37
3867 16 tJ 6200 9 10200
644 41:5 14:50
330 a· 20 7 47 32 47 11
1:5 170:S 23 2800 28 261 148
320
103333
l-LESS THANI N-D NOT DETECTEDI E-ESTIHATED OR VALUE HOT QUANTifiED OR COHFIRHEPI

TABLE V-25
SUHMARY OF ANALYTICAL DATA PETROLEUH REFINING INDUSTRY
POTW SAHPLINO PROORAH
FACILITY 43
FINAL EFFl.UENT DIRECT FRACTION PARAIIETER UNITS TO POTII DISCHARGE -------- --------- ----- --------------- ---------CONVENTI ONALS COD MOIL 2510 130
DOD MOIL 531 311 TOTAL BUSP, SOLIDS MOIL 32 2!5 DJL I GREASE MOIL 134 4 PH UNIT 8 8
NON-CONVENTIONALS AMHONIA NITROGEN MOIL 43 3
VOt.ATILES BENZENE UO/L 24 N-D 1o2-DICHLOROETHANE UO/l N-D 14 1o1o1-TRICHLOROETHANE UO/l 8 N-D METHYLENE CHLORIDE UO/l 6 N-D
ACID EXTRACT 2o4-PIHETHYLPHENOL UO/l 49:50 8 PHENOL UO/l 7000 H-D
BASE-NEUTRALS 2•4-DINITROTOLUEHE UO/L H-D 10 1•2-DIPHEHYLHYDRAZIHE UO/L 12 N-D
__. N-NITROSODIPHENYLAHINE UO/l H-D 21 0
DI-N-BUTYL PHTHALATE UO/l H-D 7 __. DIETHYL PHTHALATE UO/L 6 N-D
PESTICIDES ALDRIN UO/L N-D L I 4•4'-DDT UO/L N-D L 1 HEPTACHLOR EPOXIDE UO/L N-D l 1 ALPHA-DHC UO/L L I L 1 DETA-BHC UO/L N-P L I
HETALS ARSENIC UO/L 6:5 H-D CHROMIUH UO/l 69 204 COPPER UG/l 47 5 CYANIDE UO/L 6667 30 LEAD UO/l N-D 18 NICKEL UO/L t4 H-D SELENIUH UO/L 481 N-D ZINC UO/L 47 137
NON-CONV, METALS HEX-CHROMIUM UO/L L 200 30
HISC, PHENOLICS 14AAPO> UO/L 140:500 103
POLLUTANTS NOT LISTED WERE NEVER DETECTED L-LESS THANI N-D NOT DETECTED! E-ESTIHATED OR VALUE NOT OUANTIFIED OR CONFIRMEDJ

TABLE V-26
SUHHARY OF ANALYTICAL DATA PETROLEUH REFINING INDUSTRY
POTU SAHPLING PROGRAH
FACILITY 45
FINAL EFFLUENT-FRACTION PARAHETER UNITS TO POTU -------- --------- ----- ---------------CONVENTIONAL& COD HG/L 429
BOP HG/L 153 TOTAL SUSP, SOLIDS HG/L 17 OJL I GREASE HG/L t5 PH UNIT 7
NON-CONVENTIONAL& AHHONIA NITROGEN HG/L 104
VOLATILES JENZENE UB/L 262 ETHYL BENZENE UG/L 10:1 TOLUENE UB/L 434
ACID EXTRACT 2r4-PIHETHYLPHENOL UG/L U60 PHENOL UG/L 2467
BASE-NEUTRALS ACENAPHTHENE UG/L 19 MAPKTKALEME UGJL 229 ANTHRACENE UO/L !18 PHENANTHRENE UQ/L :18 PYRENE UG/L 8
__, C) PESTICIDES ALDRIN UG/L L 1 N 4t4'-DDT UG/L L ' ALPHA-BHC UO/L L I
HETALS CHROHIUH UG/L 640 COPPER UO/l 22 CYANIDE UB/L 6000 LEAD UQ/L 17 HERCURY UG/L L I SELENIUH UB/L 143 ZINC UB/L 180
HISC, PHENOLICS C4AAPO) UO/L 16367
POLLUTANTS NOT LISTED WERE NEVER DETECTED L-LESS lHANf N-P NOT PETECTEPf E-ESTIHATEP OR VALUE NOT QUANTIFIED OR CONFIRHEPf

TABLE V-21 l>I~ECT LliSCHAitGE Pact l of 3
FINAL EFFLUENT PRIORITY POLLUTANTS SUMJ.IARY OF EPA SCREt:NING PROGRAM DATA
TOTAL TOTAL PAR, PLANTS f'l ANTS SAHF'LES TIHE'5 F'ER
fRACTION No. f'ARAHF.:TFR UNITS SAHF'LEO DETECTING ANALYZF.n nETECT£D CENT AVFRAGF HINIHUH HAXJHUH -------- ---- --------- ----- ------- --------- -------- --------VOL AT JL ES 2 ACROLEIN UG/l 16 0 16 0
~ ACRYLONITRILE UG/L 16 0 16 0 4 llFNZENE UG/L 16 4 16 4 25 2 L 1 12 6 CARilON TETRACHLORIDE IJG/L 16 0 16 0 7 CHLOROilENZENE UG/l 16 0 16 0
10 1o2-DICHLOROETHANE IJG/L 16 0 16 0 11 1•1•1-TRICHLOROETHANE UG/1 16 0 16 0 13 lo1-DICHLOROFTHANE UG/L 16 0 16 0 14 1•1•2-TRICHLOROETHANF. UG/l 16 0 16 0 15 1r1o2r2-TfTRACHLOROETHANE UG/L 16 0 16 0 16 CHI OIWfTHANE UG/L 16 0 16 0 17 BIS<CHLOROHETHYl> ETHER UG/L 16 0 16 0 19 2-CHLOROETHYL VINYL ETHER UG/L 16 0 16 0 23 CHLOROFORM UG/1 16 2 16 2 13 6 L 5 66 29 1•1-DICHLOROETHYLENE IJG/1. 16 0 16 0 30 1o2-TRANS-DICHLORO£THYLF.NE UG/L 16 0 16 0 32 lr2-DICHLOROf'ROPANE 110/L 16 0 16 0 33 1•3-DICHLOROF'ROPYLENE UG/l 16 0 16 0
__.. 38 ETHYLBFNZF.NE UO/L 16 0 16 0
0 44 HETHYLENF CHLORIDE UG/t 16 11 16 11 69 33 l 10 100 w 45 HfTHYl CHLORIDE UG/L 16 0 16 0
46 HETHYL ICROHID£ UG/L 16 0 16 0 47 llROHOFORH Ull/1. 16 0 16 0 48 DJCHLOROICROHOHF.THANf Ull/L 16 0 16 0 49 TRICHLOROFLUOROH[THANE llG/1. 16 0 16 0 50 DICHLORODIFLUOROHETHANf UG/L 16 0 16 0 51 CHtOROniBROHOHF.THANE IJil/L 16 0 16 0 85 TETRACHtOROETHYI ENE UG/L 16 0 16 0
86 TOLUENE UO/L 16 1 16 1 6 2 L 1 35 87 TRICHLOROETHYlENE UG/L 16 0 16 0 98 VINYl. CHLORIDE U0/1. 16 0 16 0
AC Jro EXTRACT 21 2•4•6-TRICHLOROPHfNOL UG/l. 17 0 22 0 22 PARACHI.OROHETA CRESOL UG/1. 17 1 22 1 '5 l I L 10 10 24 2-CHI.OROPHF.NOL UG/l 17 0 22 0 31 2r4-DICHLOROPHFNOL UG/l 17 1 22 1 5 l 1 N-[o 10 J4 2r4-DIHETHYlf'HENOI. UG/1 17 0 22 0 57 2-NITROf'HfNOL UG/L 17 0 22 0 59 4-NITROf'HENOL UG/l 17 0 22 0 59 2r4-DINITROf'HfNDL UG/l 17 0 22 0 60 4o6-DINITRO-O-CRFSOL UG/L 17 0 22 0 64 PENTACHI.OROf'HfNDL UG/L 17 0 22 0 65 f'HfHOL UG/l 17 0 22 0
BASE-NEUTRAtS 1 ACENAF'HTHENF. UG/l 17 1 22 1 5 L 1 N-lo 6 5 llfNZIDINE IJG/l 17 0 22 0 8 lr2•4-TRICHLOROBENZENf UG/L 17 0 22 0
Note: Laboratory analysis reported as less than a deduction
l-IESS THANI T-TRACFI N-D NOT I•ETECTE'III 0-GREATER THANI limit is considered not detected (value= O) for this table.

TABLE V-27 Dl~Cl DISCHARGE
FINAL EFFLUENT PRIORITY POLLUTANTS Page 'l of J
SUMMARY OF EPA SCREENING PROGRAM DATA
TOTAl. TOTAL PAR• PLANTS PlANTS SAHPI.ES TIHF.:S PER-
FRACTION HO. PARAHF.:TER UNITS SAHPLED DETECTING ANALYZED DETECTED CENT AVERAGE HINIKUH HAXIHUH -------- ---- --------- ----- ------- --------- -------- -------- ---- ------- -------BASE-NEUTRALS 9 HEXACHLOROBENZENE UG/L 17 0 22 0
12 HEXACHLOROETHANE UG/1. 17 0 22 0 18 ~~5(2-CHLOROETHYI.I ETHER UG/l 17 0 22 0 20 2-CHlORONAPHTHALENE IIG/L 17 0 22 0 25 1r2-DICHLOROBENZENE UG/L 17 0 22 0 26 1rJ-DICHLOROBENZENE UG/1. 17 0 22 0 27 lr~-DICHLOROBENZENE UQ/L 17 0 22 0 28 Jrl'-DICHlOROBfNZIDINE UG/L 17 0 22 0 35 2r~-DINITROTOLUENE UG/l. 17· 0 22 0 36 2r6-DJNJTROTOLUENE UG/L 17 0 22 0 37 1r2-DJPHENYLHYDRAZINE UG/l 17 0 22 0 39 FUJORANTHENE UG/L 17 0 22 0 ~0 ~-CHI.OROPHENYl PHENYL ETHER UG/l. 17 0 22 0 ~1 4-BROHOPHfNYL PHENYL ETHER UG/l 17 0 22 0 42 818(2-CH\OROISOPROPYl> ETHER UG/L 17 0 22 0 43 BJSC2-CHLOROETHYOXYI HETHANE UG/L 17 0 22 0 52 HfXACHlOROBUTADIENF.: UG/L 17 0 22 0 53 HfXACHLOROCYClOPfNTADIEHE IJG/L 17 0 22 0
__, 5~ I SOF'HORONE UG/L 17 0 22 0 0 55 NAPHTHALENE UG/L 17 1 22 1 5 L 1 N-Io L ~ 56 NITROBENZENE UG/L 17 0 22 0
61 N-NJTROSODJHETHYLAHINE UG/1. 17 0 22 0 62 N-NITROSODlPHENYLAHlNf UG/l 17 0 22 0 63 N-NlTROSODJ-N-PROPYlAHINE UG/l 17 0 22 0 66 815(2-ETHYLHEXYL) PHTHALATE UG/l 17 5 22 5 23 180 \ 10 2000
67 BUTYl BENZYl PHTHALATE UG/1. 17 0 22 0 68 DJ-N-BUTYl PHTHAI.ATE UG/L 17 2 22 2 9 1 N-D 10 69 OI-N-OCTYL PHTHALATE IJG/1. 17 0 22 0 70 DIETHYl PHTHAI.ATE UG/L J7 3 22 3 14 1 N-D 30 71 DIHETHYL PHTHAlATE UG/1. 17 1 22 1 5 L 1 N-D =~ 72 1r2-BENZANTHRACEN£ UG/l 17 0 22 0 73 BfNZO <A )f·YRENE UG/l 17 2 22 2 9 L 1 N-D 3 74 3r4-BfNZOFLUORANTHF.:NE UG/l 17 0 22 0 75 11r12-BEN70FLUORANTHEN£ UG/l 17 0 22 0 76 CHRYSENE UG/l 17 3 22 3 14 L 1 L 77 ACENAPHTHYLENE UG/l 17 0 22 0 78 ANTHRACENE IIG/L 17 0 22 0 79 1r12-B£NZOPERYLENE UG/L. 17 0 22 0 80 FlUORENE 110/1. 17 0 22 0 81 PHENANTHRF.:N£ UG/L 17 1 22 1 5 L 1 L 82 1r215r6-DIBENZANTHRACENE UG/L 17 0 22 0 83 INDENOC1r2r3-Crl\l PYR£NE UG/l 17 0 22 0 84 PYRENE UG/L 17 1 22 1 s L 1 l 1 7
f"ESTICH•ES 89 AI. DR IN UG/L 17 0 17 0 90 DIEUoRIN IIG/1. 17 0 17 0 91 CHLORToANf UG/L 17 0 17 0
Note: Laboratory analysts reported as less than a d~ductlon limit Is considered not detected (value= 0) for this table.
L-L£SS THANI T-TRACEI N-D NOT 1\ETECTED I B-GR£ATER THANI

TABLE V-27 DIRECT iHSCHAilliE Page 3 of 3
FINAL EFFLUENT PRIORITY POLLLTANTS SUMMARY OF EPA SCREENING PROGRAM DATA
TOTAl TOTAL PAR. PLANTS PLANTS SAHPLfS TJHES F'ER-
FRACTION NO. f>ARAHETER UNITS SAHF'LED DETECTING ANAl. YZED DETECTED CfNT AVfRAOE HI HI HUH HAXlHUH -------- ---- --------- ----- ------- --------- -------- -------- ---- -------PESTICHoES 92 4r4'-DDT UG/L 17 0 17 0
93 4r4'-DPE U0/1. 17 0 17 0 94 4r4'-DDD UG/L 17 0 17 0 95 ALPHA-ENDOSULFAN UO/L 17 0 17 0 96 BETA-EHDOSUIFAN UO/L 17 0 17 0 97 £NDOSULFAN SULFATE U0/1. 17 0 17 0 98 fNDRIH UO/L 17 0 17 0 99 ENDRIN AI.DEHYD£ UO/l 17 0 17 0
100 HEPTACHLOR UO/L 17 0 17 0 101 HEPTACHI.OR EPOXIDE UO/L 17 0 17 0 102 AIPHA-BHC UO/l 17 0 17 0 103 BETA-BHC UB/l 17 0 17 0 104 OAHHA-BHC U0/1. 17 0 17 0 105 DEL TA-BHC UO/l l7 0 17 0 106 f'CB-1242 110/L 17 0 17 0 107 PCB-1254 UG/1. 17 0 17 0 108 PCB-1221 UG/L 17 0 17 0 109 fCB-1232 UO/L 17 0 17 0 __, 110 f'CB-1248 110/L 17 0 17 0
0 111 PCB-1260 UO/L 17 0 17 0 U1 112 PCB-1016 liG/1. 17 0 17 0
113 TOXAPHENE UO/L 17 0 17 0 129 TCDD U0/1. 17 0 22 0
METALS 114 ANTIHONY U0/1. 17 3 17 3 18 22 l I 370 115 ARSENIC UG/L 17 4 21 8 38 177 l 4 900 117 BERYLLIUM UO/L 17 1 84 2 2 L 1 L I 2 118 CADHIUH UO/L 17 5 86 5 6 L 1 l 1 20 119 CHROHIUH UO/L 17 17 87 68 78 115 I. 5 1230 120 COPPER UO/L 17 12 85 46 54 23 L 4 JOO 121 CYANIDE UO/L 17 8 54 26 48 39 l 5 320 12' LEAD U0/1. 17 7 97 20 23 14 L 15 211 123 HERCURY UO/L 16 11 72 ~3 74 1 I 1 12 124 NICKEL UO/L 17 7 99 20 22 8 L 1 74 12~ SELEHIUH UG/L 17 7 31 21 68 11 L 10 32 126 SILVER U0/1_ 17 2 84 3 4 L 1 L I 15 127 THALLIUH UO/L 17 2 32 5 16 1 L 1 12 128 ZINC UO/L 17 16 92 74 80 203 L 10 ::>000
HON-CONV. HfTAIS 148 HEX-CHROHIUM UO/L 16 5 48 6 13 5 L 20 110
HISC, 167 PHFNOLICS 14AAP0l IJG/l 16 14 45 34 76 16 l 10 64
Note: Laboratory analysis reported as less than a deduction limit is considred ~-t-~etected (value= 0) for this table.
l-LESS THAHI T-TRACEI N-D NOT PET£CTEDI 0-GRfATER THANI

TABLE r-20 INDIRECT, DISCHARGE (TO POTW) Page 1 of 3
PRIORITY POLLUTANTS SUMMARY OF EPA
PRETREATMENT PROGRAM DATA
TOTAL TOTAL PAR. PLANTS Pl. ANTS SAHPLES TIHF.:S f•fR-
fRACTION NO, PARAHETER UNITS SAHPLfD DETECTING ANALYZED DfTf.CTED CENT AVERAGE HINIIUJH HAXJHUti -------- ---- --------- ----- ------- --------- -------- --------VOl.ATILES 2 ACROl.EIN UO/L " 0 18 0
3 ACRYI.ONITRILE UO/l " 0 18 0 4 BENZENE UO/l " " 18 12 67 817 N-1• 5800
" CARBON TETRACHLORIDE UO/L "'
0 HI 0 7 CHLOROBENZENE UG/L " 1 HI 1 7 2 N-D 31
10 1r2-DICHLOROETHANE UO/l 6 1 u 2 13 6 N-D 54 11 1r1r1-TRICHLOROETHANE UGit.. 6 2 Hi 2 13 2 N-D 15
13 1r1-DJCHLOROETHANE UOIL " 0 1S 0 14 1r1r2-TRICHLOROETHANE UG/l " 0 18 0 1S 1r1r2r2-TETRACHLOROETHANE UO/L "'
0 1S 0
16 CHLOROf.THANE UO/l " 0 18 0 17 ~JSCCHLOROHETHYLl ETHER U0/1. " b 18 0 19 2-CHI.OROETHYI. VINYl. ETHER UG/l " 0 18 0 23 CHl.OROfORH UOIL " 3 15 6 40 7 H-D 21
29 1r1-DICHLOROETHYLENE UO/L " 0 IS 0 JO lr2-TRANS-DICHlOROETHYLENE UO/l " 0 1S 0 32 lr2-DICHLOROPROPANE UO/l 6 0 18 0 33 lr3-DICHlOROPROPYLENE UO/L " 0 IS 0
_, 38 ETHYL BENZENE UOIL 6 s 1S 11 73 2540 N-Io tBOOO
0 44 Hf.THYLENE CHLORIDE UO/l. "' 1 1:5 1 7 I N-D 12 0'\ 4S HETHYL CHl.ORIPE UO/l " 0 18 0
46 HETHYL ~ROHI DE 1.10/l " 0 18 0 47 BROHOfORH UIJ/1. 6 0 18 0 48 DJCHLORO~ROHOHETHANE UO/L
"' 0 1:5 0
49 TRICHI.OROfl.UOROHETHANE UG/l " 0 18 0 50 DICHLORODifLUOROHETHANE UO/l " 0 18 0 51 CHI.ORODIBROHOHETHANE UG/1. 6 0 IS 0 8:5 TfTRACHLOROETHYl.ENE UG/1. " 1 1S I 7 l N-D 18
86 TOLUENE UG/L 6 s IS 11 73 6216 N-(1 41'1000
87 TR I CHl.OROE THYl.ENE UOIL 6 0 1:5 0 88 VINYL CHLORIDE UO/L 6 0 18 0
ACID EXTRACT 21 2r4rb-TRICHl.OROPH£NOL UG/l 6 0 18 0 22 PARACHLOROHETA CRESOL UG/l 6 0 15 0 24 2-CHLOROPHENOL UG/L 6 0 1'5 0 Jl 2r4-DICHLOROPHENOL UO/l " 0 18 0 34 ~r4-DIHETHYLPHENOL UG/L 6 6 IS 14 93 1509 N-Il 9300
57 2 -N ITROPHf.NOL U0/1. 6 0 18 0 58 4-NITROPHENOL UO/l 6 0 18 0 59 2r4-DJNITROPHf.NOL UG/L 6 0 18 0 60 4r6-DJNITRO-tl-CRfSOL UG/l 6 0 18 0 64 Pf.NTACHlOROPHfNOL UG/l. 6 I 16 I 6 52 ti-D 830 6:5 PHfNOL UG/l 6 6 15 12 80 194? N-D t4000
BASE-NEUTRALS 1 ACFNAPHTHENE IJG/l 6 2 1:5 3 20 5 N- [I 41 5 Bf.NZID1NE UG/L 6 0 18 0 8 1•2•4-TRICHLOROBfNZENE UB/L 6 0 15 0
Note: laboratory analysis reported as less thdn a JL;ccci&n 11n1t
L-l.f.SS THANI T-TRACEI N-fl NOT [lf.Tf.CTFfll is considered not detected (value= 0) for thi:;. taM~.

TABLE V-28 INDIRECT DISCHARGE (T~ POTW) Page 2 of 3 PRIORITY POLLUTA~TS
SUIU·IARY OF EPA PRETREATMENT PROGRAM DATA
TOTAL TOTAL PAR, PLANTS PLANTS SAMPI ES TIMES F"ff(-
FRACTION NO, PARAMETER UNITS SAMPLED DETECTINO ANALYZED DETECTED CENT AVFRAAE HIHIHIJH MAXI HUH -------- ---- --------- ----- ------- --------- -------- -------- ---- ------- ------- -------BASE-NEUTRALS 9 HEXACHLOROBFNZENE UG/L 6 0 19 0
12 HEXACHLOROETHANE UG/l 6 0 19 0 19 BISC2-CHLOROETHYll ETHER UG/L 6 0 19 0 20 2-CHLORONAPHTHALENE UG/L 6 0 19 0 25 1o2-DICHLOR08f.NZENE IJG/t. 6 0 15 0 26 1o3-DICHLOR09ENZENE UG/l 6 0 17 0 27 1o4-DICHLOROBEN7EHE UG/L 6 0 15 0 28 JoJ'-DICHL.OROBENZlDINE UG/L 6 0 18 0 35 2o4-DlNtTROTOLUENE UG/L 6 0 15 0 36 ~.6-DINJTROTOLUENE UG/L 6 0 18 0 37 1• 2-DIPHENYL HYDRAZIIIE UG/L 6 1 15 1 7 2 N-D 23 39 FLUDRANTHENE UG/L 6 0 15 0 40 4-CHLOROPHENYL PHENYL ETHER 110/L 6 0 18 0 41 4-BRDMDPHENYL PHENYL ETHER UG/L 6 0 18 0 42 BISC2-CHLDROISOPROPYLl ETHER 110/L 6 0 15 0 43 BJSC2-CHLOROETHYOXY> METHANE UG/l 6 0 15 0 52 HfXACHLOROBUTADIEHE IJG/1. 6 0 19 0 53 HEXACHLDRDCYCL.OPfHTADJENE UG/L 6 0 18 0
0 54 JSOPHORDNE IIG/L 6 1 15 1 7 1 N-Il 12 ........ 55 NAPHTHALENE UG/L 6 5 14 11 79 169 N-[1 620 56 NITR09FNZENE UG/L 6 0 18 0 61 N-NITRDSDDIHETHYLAHINE UG/1. I> 0 18 0 62 N-NITROSDDIPHfNYt.•HINE UG/t 6 0 15 0 63 N-NITRDSOOI-N-PROFfLAHINf UG/L 6 0 19 0 66 BISC2-ETHYLHFXYL> PHTHALATE UG/L 6 0 15 0 67 BUTYL BENZYL PHTHALATE UG/1 6 2 15 2 13 2 N-[1 16 6F.I DI-N-BUTYL PHTHALATE IIG/L 6 1 15· 1 7 3 N-[1 40 69 DI-N-dCTYL PHTHALATE UG/1 6 0 15 0 70 OIETHYL PHTHAt.ATE 116/1. 6 4 15 4 27 5 N- [I 38 71 DIHETHYL PHTHALATE UO/L 6 0 15 0 72 1o2-9FN7ANTHRACENE UO/L 6 1 15 1 7 1 N-D 12 73 BENlD CAlPYRfNE UG/L 6 0 18 0 74 lo4-9fNZOFLUORANTHfNE IIG/1. 6 0 19 0 75 11o12-BENZOFLUORANTHENE UG/L 6 ·o 18 0 76 CHRYSENE UG/L 6 1 15 1 7 1 11-[1 1 :~ 77 ACENAF"HTHYI FNE UG/L 6 0 15 0 78 ANTHRACENE 116/l 6 3 15 9 53 25 N- [I 81 79 1o12-BENZOPERYLENE UG/l 6 0 18 0 80 FLUORENE UO/L 6 2 15 J 20 7 N·-[1 63 81 f"HfNANTHRENE 110/l 6 3 15 8 53 ::!5 N-Il 81 82 ••~15o6-DI9fNZANTHRACfNF UG/l 6 0 18 0 83 tNnFNO(to2o3-Co[l) PYRfNE UG/1. 6 0 18 0 84 f"YRENE UG/L 6 2 15 2 13 2 N-[1 21
PESTJCJ[IES 89 ALDRIN UG/L 6 2 15 2 13 l 1 N··[l 90 [II[L[IRIN UG/L 6 0 15 0 91 CHI ORliANE UG/1. 6 0 18 0
Note: laboratory analysis reported as less than a ddtttion 1 ir.11t is considered not detected (value = O) for this table.
L-LFSS THANI T-TRACF; N-£1 NOT [1£TfCH[II

TABLE V-28 INDIRECT DISCHARGE (TO POTWI Page 3 of 3
PRIORITY POLLUTANTS SUW-IARY OF EPA
PRETREATMENT PROGRAM DATA
TOTAl IOTAL PAR, PlANTS PLANTS SAMPlES TIMES PER
FRACTION NO. F'ARAMETER UNITS SAMPLED DETECTING ANALYZED DETECTED CENT AVERA~E MJNJMIJM HAXIHIJM -------- ---- --------- ----- ------- --------- -------- -------- ---- ------- -------PESTif.IDES 92 4•4'-!lDT 116/l 6 3 15 4 27 l 1 N-[1 ~·
93 4,4'-D!lE UG/l 6 1 15 1 7 l 1 N-!1 l 94 4•4'-D!lD IIG/L 6 0 15 0 95 ALPHA-ENDOSULFAN UG/L 6 0 15 0 96 l!fTA-ENDOSIJlFAN llll/l 6 0 18 0 97 ENDOSULFAN SULFATE UG/L 6 0 18 0 98 FN!IRJN UG/L 6 0 18 0 99 ENIIR IN AU1EHYI1E UG/L 6 0 18 0
100 HEf'TAf.HLOR llll/L 6 0 15 0 101 HEPTACHlOR EPOXIDf UG/L 6 0 15 0 102 AIPHf\-I!HC llll/l 6 5 15 6 40 l 1 N-D 2 103 I!ETA-I!HC UG/L 6 1 15 2 13 I 1 N-[1 L 104 OAMMA-I!HC Ull/L 6 0 15 0 105 DF.LTA-I!HC UG/l 6 0 15 0 101.. f'CB-1242 llll/L 6 0 18 0 107 PCB-1254 UG/L 6 0 18 0 108 PCll-1221 llll/L 6 0 18 0 109 f'CB-1232 UG/L 6 0 18 0 110 PCll-1248 UO/L 6 0 18 0
0 111 PCll-1:;>60 UG/L 6 0 18 0 00 112 f'C:ll-1016 IIG/L 6 0 18 0
113 TOXAPHENE UG/L 6 0 18 0 129 TCDD Ull/L 6 0 18 0
METAI.S 114 ANTIMONY UG/L 6 0 18 0 115 ARSENIC UG/L 6 4 18 7 39 18 N-Il 69
117 BERYLLIUM UG/L 6 0 18 0 118 CADMIUH UG/l 6 0 19 0 119 CHROHIUM UG/L 6 6 18 19 100 1057 64 2196
120 C:OPPER UO/l 6 6 18 16 99 21 N-Il '57 121 CYANIDF UG/L 6 6 18 18 100 ?526 10 9000
122 LEAD llll/L 6 5 19 10 53 18 N-!1 43
123 MERCURY UG/l 6 2 18 5 28 L 1 N-!1 1 124 N I CI\El II GIL 6 1 19 1 6 2 N- [I 27
125 SELENIUM UG/l 6 6 18 16 89 192 N-Il 68:'
121.. SILVER IJG/l 6 0 18 0 127 THALLIUM UG/L 6 0 18 0 128 ZINC IJG/l 6 6 18 18 100 167 36 40~
NON-CONV. METAlS 148 HEX-CHROMILIM UG/L 6 1 18 3 17 53 I 20 480
MISC. 116 ASI!ESTOS IJG/L 6 0 18 0 167 PHENOLJCS ( 4AAF'O > 116/l 6 6 18 18 100 5690() 1100 1:01000
llote_: laboratory analysis reported as less than a dcccction limii. is considered not detected (value = 0) for this table.
L-LESS THANI T-TRACEI N-[1 NOT !lfTFCTFIII

TABLE V-29 Page 1 of 3 FINAL EFFLUENT PRIORITY POLLUTANTS
SUHI-IARY OF EPA REGIONAL SURVEILLANCE AND ANALYSIS DATA
TOTAL TOTAL PAR. PLIINTS PlliNTB BIIHPl.£8 TIHES PER-
FRACTION NO, PARAHETER UNITS SAHPLED DETECTING ANALYZED DETECTED CfNT AVERAGE HINIHUH HAXIHUH -------- ---- --------- ----- ------- --------- -------- --------VOI.ATILES 2 ACROI.EJN UO/L 7 0 8 0
3 ACRYlONITRIU: UO/L 7 0 8 0 4 lllfNZENE UO/L 7 0 8 0 6 CARillON TETRACHI.ORIDE UO/l. 7 0 8 0 7 CHl.OROIIIF.NZENE UO/L 7 0 8 0
10 1•2-PJCHLOROETHANE UO/l. 7 2 10 2 20 L 1 N-D 3 11 1•1•1-TRICHLOROF.TNANE UO/L 7 2 8 2 2S 1 N-D 3 u f,f-PICHLOROETHANE UO/l 7 0 8 0 14 1•1•2-TRICHLOROF.THANE UO/l 7 0 8 0 1S 1•1•2•2-TETRACHLOROETHANE UO/l 7 0 8 0 16 CHL.OROETHANE 110/L 7 0 8 0 17 IIIJSCCHLOROHETHYt.l ETHER UO/l 7 0 8 0 19 2-CHLOROETHYL VINYL ETHER 110/l 7 0 8 0 23 CHLOROFORH UO/L 7 2 10 2 20 l 1 L 10 29 1 't-DICHLOROETHYl.ENE UO/L 7 0 8 0
..... 30 1•2-TRANS-DJCHLOROF.THYI.EN£ UO/L 7 0 8 0 0 32 1•2-DICHlOROPROPANE 110/L 7 1 8 1 13 L 1 N-D 1.0 33 1,3-DICHLOROPROPYlENE UO/l 7 0 8 0
38 ETHYL. BENZENE UO/L 7 1 8 1 13 L 1 N-D L 1 44 HETHYl ENE CHI. ORI DE UO/L 7 3 9 3 33 2 l. 10 9 4S HETHYL CHLORIDE 110/1. 7 0 8 0 46 HETHYL IIIROHIDE UO/L 7 0 8 0 47 BROHOFORH 110/L. 7 1 8 1 ll L 1 l 10 48 PICHLOROIIIROHOHETHANE UO/l 7 0 8 0 49 TR I CHI.OROFLUOROitETHANE UO/L 7 0 8 0 50 PICHLOROPIFLliOROHETHANE UO/l 7 0 8 0 S1 CHLORODIBROHOHETHANE UO/L 7 2 9 2 22 2 L 10 13 85 TETRACNlOROETNYl.ENE UO/l 7 0 8 0 86 TOLUENE U0/1. 7 0 8 0 87 TRICHLOROETHYl.ENE UG/l. 7 i) 8 0 88 VINYL CHLORIDE UO/L 7 0 8 0
200 TRANS-1,3-DICHLOROPROPENE UO/L 7 0 8 0
ACID EXTRACT 21 2•4•6-TRJr.HI.OROPHENOL UO/l. 7 0 8 0 22 f'ARACHl.OROHETA CRESOL 110/l 7 0 8 0 24 2-CHLOROPHEHOL liB/L 7 0 8 0 31 2•4-DICHLOROPHENOL 110/L 7 0 8 0 34 2, 4-DIHETNYI.PHENOt. UO/l 7 0 8 0 57 2-NITROPHENOL 110/L 7 0 8 0 58 4-NITROPHENOL UO/L 7 0 8 0 S9 2•4-DINJTROPHEHOL UO/L 7 0 8 0 60 4•6-DINITR0-0-CRESOL UG/L 7 0 8 0 64 PENTACHLOROPHENOL UO/l 7 0 8 0 65 PHENOL UO/L 7 1 9 1 11 8 N-rr 76
BASE-NfiiTRALS 1 ACfNAPHTHEHE 110/l 7 0 8 0
L-LESS THANI T-TRACEI N-D NOT DETECTf.DI

TABLE V-2!} Page 2 of 3 FINAL EFFLUENT PRIORITY POLLUTANTS
SUMMARY OF EPA REGIONAL SURVEILLANCE AND ANALYSIS DATA
TOTAL TOTAL PAR, PLANTS PLANTS SAHPtES TlHES PER-
FRACTION Na. f'ARAHF.:Tf.R UNITS SAHPLF.D DETECTING ANALYlfD DETECTED CENT AVERAGE HINIHUH HAXIHIIH -------- ---- --------- ----- ------- --------- -------- -------- ---- -------IIAS£-Nf.UTRAI.S 5 BENZIDINE UO/L 7 0 0
B 1o2r4-TRICHLORDB£NZENE UG/L 7 0 0 9 HEXACHI.OR(IBf.NZEHE UO/l 7 0 0
12 HEXACHLOROETHANE 110/L 7 0 0 18 BIS<2-CHLOROETHYLI ETHER U0/1_ 7 0 0 20 2-CHlORONAPHTHAlEHE 110/L 7 0 0 25 1o2-DICHLOROIIENZENE UO/L 7 0 0 26 lo3-DICHlDROBFHZENE UG/l 7 0 0 27 lo4-DICHLOROII£NZFNE UG/L 7 0 0 28 3o3'-DICHLOROBENZIDINE UO/L 7 0 0 35 2o4-DINITROTOI.U£NE UG/L 7 0 0 36 2o6-DINITROTOLIIENE IJG/L 7 0 0 37 1o2-PIPHEHYLHYDRAZINE UO/L 7 0 0 39 Fl UORANTHENE UG/l 7 0 0 .o\0 4-CHLOROPHENYL PHENYL ETHER UO/L 7 0 0 41 4-BROHOPHFNYL PHENYL FTHER 110/L 7 0 0
0 42 BI9(2-CHLOROJ50PROPYLI ETHER UG/L 7 0 0 43 BI512-CHLOROETHYOXYI METHANE 110/l 7 0 0 52 HEXACHLORDBUTAPIENE UG/L 7 0 0 53 HFXACHLBROCYCLDPENTADIENE UG/L 7 0 0 54 150PHDRONE UG/L 7 1 1 13 34 N-D 270 55 NAPHTHAlENE UO/L 7 0 0 56 NITROBENZENE UG/L 7 0 0 61 H-NtTR050DIHETHYLAHINE UO/L 7 0 0 62 N-NITROSODIPHEHYLAHINF UG/L 7 0 0 63 H-NlTROSODI-H-PROPYI.AHINE UO/L 7 0 0 66 1115<2-ETHYLHEXYLI PHTHALATE UO/L 7 3 3 JB 16 L 10 75 67 BUTYL BFNZYL PHTHALATE UG/t 7 0 0 68 PI-N-BUTYL PHTHALATE U0/1. 7 1 l 13 1 L 10 9 69 01-N-OCTYL PHTHAlATE UO/L 7 0 0 70 DJETHYl PHTHALATE UG/l 7 ~ B 0 71 DIMETHYL PHTHAl.ATE UO/L 7 0 9 0 72 1o2-BENZANTHRACENE UG/L 7 0 9 0 73 BF.:NZO <AlPYRENE 116/l 7 0 B 0 74 3o4-B£NiOFLUORANTHFNE UG/l 7 0 B 0 75 11ot2-BFN70FLUORANTHENE UG/L 7 0 B 0 76 CHRYSENE UG/L 7 0 II 0 77 ACENAPHTHYlENE UG/L 7 1 8 1 13 l 1 N-D 78 ANTHRACENE UG/l 7 0 8 0 79 1o12-Bf.Nl0PF.:RYLENE UO/L 7 0 8 0 80 FLUORENE UG/L 7 0 B 0 81 PHENANTHRENE UIUL 7 0 8 0 82 1o215o6-DIB£NZANTHRACENf UG/l 7 0 8 0 83 INI'lfN0(1o2o3-Col'll PYRENE IJO/l 7 0 8 0 84 PYRENE UG/L 7 0 B 0
207 ANTHRACFNf/PHFNANTHRENE 116/1 7 1 8 1 13 9 N-D 80
l-LES5 THANI T-TRACEI N-D NOT l'lETECTEll I

TABLE V-29 Page 3 of 3 FINAL EFFLUENT PRIORITY POLLUTANTS
SUMHARY OF EPA REGIONAL SURVEILLANCE AND ANALYSIS DATA
TOTAL TOTAL PAR, PLANTS PLANTS SAHPLES TIHES PER-
FRACTION NO. f'ARAHF.:TFR UNITS SAHPLED DETECTING ANALYlED PET£CTED CFNT AVFRA6£ HINJHUH 11AXIHUH -------- ---- --------- ----- ------- --------- -- ----- -------- ---- ------- -------PESTICIDES 89 ALDRIN UG/1 7 0 0
90 DIFLDRJN UO/L 7 0 0 91 CHLORDANE UG/L 7 0 0 ?2 4•4'-DDT UG/1 7 0 0 93 4•4'-PDE UG/L 7 0 0 94 4•4'-DDD UG/L 7 0 0 95 ALPHA-EHPOSULFAN Utl/l- 7 0 0 911 BETA-fNDOSIJlFAN UG/L 7 0 0 97 ENDOSULFAN SULFATf UG/L 7 0 0 98 fNORIN Ull/L 7 0 0 99 fNDRJN AlDEHYDE UG/L 7 0 0
100 HfPTACHLOR UG/L 7 0 0 101 HEPTACHLOR EPOXIDE UG/l 7 0 0 102 AlPHA-BHC UG/L 7 0 0 103 llETA-IlHC UG/l 7 0 0 104 !lAHHA-BHC UG/L 7 0 8 0
--' 105 l1El TA-BHC UG/L 7 0 8 0 --' 106 PCB-1242 UG/1. 7 0 8 0 --' 107 PCB-1254 UG/L 7 0 8 0
108 PCB-1221 110/L 7 0 8 0 109 f'CB-1232 UG/L 7 0 8 0 110 PCB-1248 IIG/L 7 0 8 0 111 F'CB-1260 UG/L 7 0 8 0 1 I 2 PCB-1016 UG/L 7 0 8 0 113 TOXAPHENE UG/l 7 0 8 0 129 TCDD UO/L 7 0 8 0
HETALS 114 ANTIHONY UG/L 7 2 8 2 ~5 20 l 5 98 115 ARSFNIC UG/L 7 1 8 1 13 4 L 5 20 117 BERYLLIUH UG/L 6 2 7 2 29 7 l 25 40 118 CAflHIUH IJG/L 7 3 8 3 38 6 L 10 35 119 CHROHIUH UG/L 7 6 9 8 89 149 l 5 480 120 COPPER 110/l 7 6 9 7 78 11 L 10 20 121 CYANIDE UG/L 7 3 8 4 50 3 N-D 8 1 :>2 1 EAD UG/L. 7 5 9 5 56 33 N-[1 160 123 HERCURY UG/L 7 5 8 5 63 L 1 l 1 1 124 NICKEL UO/L. 7 3 8 3 38 13 l 5 39 125 SELENIUH UG/L 7 1 8 1 13 2 l 5 18 126 SILVER UO/L 7 1 8 1 13 l 1 l 5 2 127 THALLIUH UG/l 7 1 8 1 13 13 l 10 tOO 1211 ZINC U!l/l 7 7 10 9 90 258 l 10 620
NON-CONV, HF.:T ALS 148 HF.X-CHROHIUH UG/l 7 0 8 0
HISC, 116 AS!IF.STOS IJO/L 2 0 2 0 167. PHENOLICS 14AAP0) UG/l 8 7 9 8 !19 46 N-[o 125
l-lfSS THANI T-TRACEI N-ro NOT flfTEfTEI•I

TABLE V-30
MOST-FREQUENTLY OCCURRING PRIORITY POLLUTANTS* PLANT 1
Parameter
Influent
Volatiles - 30 samples analyzed Benzene Toluene
Times Detected
30 28
Extractable& - 30 samples analyzed 2 , 4 oimethyphenol 2 9 Phenol 30 Napthalene 30 Bis (2-ethylhexyl) Phthalate 28 Di-N-Butyl Phthalate 26 Anthracene/Phenanthracene 30 Fluorene 30 Pyrene 25
Metals - 30 samples analyzed ArsenJ.c Chromium Selenium Zinc
Effluent
26 30 29 30
Extractables - 29 samples analyzed Phenol 28 Di-N-Butyl Phthalate 28
Metals - 30 samples analyzed ArsenJ.c Chromium Selenium Zinc
Notes:
26 30 29 26
Average (uq/1)
27,083 6,877
256 769 253
26 8
38 20 23
10 320
28 350
12 9
8 103
31 69
Range (uq/1)
5800 - 75000 ND - 17000
ND - 800 180 - 1800
72 - 610 ND - 170 NO - 30
5 - 120 LS - 79 ND - 400
Ll - 24 120 - 920 Ll - 81 22 - 1900
NO - 55 NO - 27
Ll - 21 50 - 167 Ll - 72
9 - 411
*Pollutants occurring in 80 percent of samples taken from each point L - Less than NO - Not detected
112

TABLE V-31
MOST-FREQUENTLY OCCURRING PRIORITY POLLUTANTS* PLANT 2
Parameter
Influent
Volatiles - 30 samples analyzed Benzene Ethylbenzene Toluene
Times Detected
30 29 30
Extractable& - 29 samples analyzed 2, 4-oimethylphenol 29 Phenol 29 Naphthalene 29 Bis (2-ethylhexyl) Phthalate 26 Di-N-Butyl Phthalate 23 Chrysene/1, 2 Benzoanthracene 26 Anthracene/Phenanthracene 29 Fluorene 28 Pyrene 23
Metals - 30 samples analyzed Chromium Selenium Zinc
Effluent
30 27 30
Extractable& - 28 samples analyzed Phenol 26 Bis (2-ethylhexyl Phthalate) 23 Di-N-Butyl Phthalate 26
Metals - 30 samples analyzed Arsenic Chromium Selenium Zinc
Notes:
26 30 28 27
Average (ug/1)
18,747 1,890 8,573
272 3,007
289 21
5 32
195 77 23
1,324 18
516
8 17
6
7 160
21 60
Range ( ug/1)
3600 - 90000 NO - 3800
2300 - 20000
60 - 720 1200 - 6300
89 - 810 ND - 205 NO - 19 NO - 150 11 - 730 NO - 383 NO- 72
70 - 3420 Ll - 76
9 - 1840
NO - 51 NO - 260 NO - 12
Ll - 20 20 - 1250 Ll - 71 L9 - 339
*Pollutants occurring in 80 percent of samples taken from each point L - Less than ND - Not detected
113

Pollutant
PP Organics
PP Organics Appendix C Alkanes
PP Metals
Total Metals
TABLE V-32
POTENTIAL SURROGATES FOR PRIORITY POLLUTANTS CORRELATION COEFFICIENTS
Plant Plant
Plant Plant
Plant Plant
Plant Plant
(Statistics obtained by removing outliers shown in parentheses)
Total Phenol
1 0.681 (-0.013) 2 -0.011 ( 0.027)
1 0.545 2 -0.104
1 2
1 2
114
Chromium
0.39 0.844 (0.589)
0.571 -0.057 (0.108)

Size Class (1000 bbl crude
Capacity)
(A) LT so-l
(B) so - 100
(C) 100 - 200
(D) GT 200-2
Footnotes:
TABLE V-33
SUMMARY OF 1976 NET WASTEWATER FLOW BY REFINERY SIZE
(Million Gallons Per Day)
Number of Total for Average for Refineries Size Class Size Class
143 37.7S 0.264
so 72.2S 1.4SO
32 131.90 4.122
18 180.00 10.000
243 421.90 1.736
(1) LT m less than (2) GT • greater than
115
Fraction of Total
Industrz Flow
0.089S
0.1713
0.3126
0.4266
1.0000

Subcategory
(A) Topping
(B) Cracking
(C) Petrochemical
(D) Lube
(E) Integrated
All Subcategories
TABLE V-34
SUMMARY OF 1976 NET WASTEWATER FLOW BY REFINERY SUBCATEGORY
(Million Gallons Per Day)
Number of Total for Average for Refineries Subcategory Subcategory
85 10.880 0.128
103 135.857 1.319
24 84.816 3.534
20 88.080 4.404
11 102.597 9.327
243 422.230 1. 738
116
Fraction of Total
Industry Flow
0.0258
0.3218
0.2008
0.2086
0.240
1.0000

SYHBOL COUNT HEAN SToDEV, LT50 A 143 0.264 0.386 50-100 B :10 1.4:10 1.282 100-200 c 32 4.122 2.849
FLOW OT200 D 18 10.002 5.:14:1 (MGD) FREQUENCY PERCENTAGE
:5 10 u 20 2:5 30 3:5 40 4:1 50 55 60 65 70 7:5 80 INT. CUH, INT. CUH, +----+----t----t----t----t----t----t----+----+----t----t----t----t----t----t----t
t ,50000 tAAAAAAAAAAAAAAAAAAAAAAAAAAAAAAAAAAAAAAAAAAAAAAAAAAAAAAAAAAAAAAAAAAAAAAAAAAAAAAAAt 126 126 51.9 :11.9 t 1.0000 tAAAAAAAAAAAAAAAABBBBBBBBBBBBBBC 31 157 12.8 d4.6 t 1.5000 tAAAAAAABBBBBBBBBBBBC 20 177 8.2 72.8 t 2.0000 +BBBBBBCC 8 185 3.3 76.1 t 2oli000 tAA8888CCCCCCD 13 198 5.3 81.:1 t 3.0000 tBBBCCCCD 8 206 3.3 84.8 t 3.:1000 tBCCCCC 6 212 2.5 87.2 • 4.oooo tccc 3 2U 1.2 88.5 t 4.5000 tCD 2 217 o.8 89.3 t 5o0000 tBCCCDb 6 223 2.:1 91.8 * :s.:sooo t 0 223 o.o 91.8 • 6.0000 t 0 223 o.o 91o8 ~ t 6.5000 tCD 2 22:5 o.e 92.6 .... * 7.0000 t 0 22:5 o.o 92.6 0
G> • 7.:1000 tb 1 226 0.4 93.0 f t a.oooo no 2 228 o.8 93.8 t 8~:~ooo tc 1 229 0.4 94.2 <DO -c.,., .,., t 9.oooo tc 1 230 0.4 94.7 11>::: j;; t 9o:IOOO tD 1 231 0.4 95.1 ..... ,.., c:
• to.ooo tc 1 232 0.4 9:5.:1 ~;4 ~ __, * 1o.:soo tcoo 3 23:5 1.2 96.7 n~ < __, I
........ * u.ooo t 0 23:5 o.o 96.7 ~ ... * u.:soo tb 1 236 0.4 97.1 "'"' ... • 12.000 t 0 236 o.o 97.1 -1
m $ 12.:500 tCD 2 238 o.a 97.9 ~3
* u.ooo t 0 238 o.o 97.9 .., .... $ 13.:100 tD 1 239 0.4 98.4 0
::1:: * 14.000 t 0 239 o.o 98.4 • 14.:100 + 0 239 o.o 98.4 * 1:5.'000 t 0 239 o.o 98.4 t t:s.:soo t II 239 o.o 98o4 * u.ooo t 0 239 o.o 98.4 t UoliOO tb 1 240 0.4 98.8 * 17.000 tb 1 241 0.4 99.2 * 17.:500 t 0 241 o.o 99.2 • 18.000 + 0 241 o.o 99.2 * 18.:500 tb 1 242 0.4 99.6 • 19.000 t 0 242 o.o 99.6 * 19.:500 t 0 242 o.o 99.6 • 20.000 + 0 242 o.o• 99.6 * 20.:100 + 0 242 o.o 99.6 * 21.000 t 0 242 o.o 99.6 t 21.:500 tD 1 243 Oo4 100,0 * 22.000 t 0 243 o.o 100.0 * 22.500 + 0 243 o.o 1oo.o * 23.000 t 0 243 o.o 100.0 * 23.:500 + 0 243 o.o 10o.o t 24o000 + 0 243 o.o 100.0 * 24.:500 t 0 243 o.o 100.0 * 2:ii.ooo t 0 243 o.o 1oo.o
t----t----t----t----+----t----t----+----t----t----+----+----t----t----t----+----t li 10 u 20 25 30 ::1:5 40 45 50 5~ 60 6:5 70 7:5 80
NUMBER OF REFINERIES

SYHBOL COUNT HEAN SJ,DEV, A A 85 0.128 0.210 B B 103 1.319 1.682 c c 24 3.534 3.857 D D 20 4o404 5,508
FLOW E E 11 9.327 5.477 (MGD) FREQUENCY PERCENTAGE
s 10 15 20 25 30 35 40 45 so 55 60 65 70 75 80 INT. CUH, INT. CUH, t----t----t----t----t----t----t----t----t----t----t----t----+----t----+----+----t
* .50000 tAAAAAAAAAAAAAAAAAAAAAAAAAAAAAAAAAAAAAAAAAAAAAAAAAAAAAAAAAAAAAAAAAAAAAAAAAAAAAAAB* 126 126 51.9 51.9 * 1.0000 tAAAAABBBBBBBBBBBBBBBBBBCCCCDDDD 31 157 12.8 64.6
* 1.5000 tABBBBBBBBBBBBBCCCDDD 20 177 8.2 72.8
* 2.0000 tBBBBBBCC a 185 3.3 76.1 * 2.5000 tBBBBBCCCDDDDE 13 198 5.3 81.5
* 3.0000 tBBBBBBBC 8 206 3.3 84.8
* J,SOOO tBBBCCE 6 212 2.5 87.2
* 4.0000 tBBD 3 215 I, 2 88.5
* 4.5000 tCC 2 217 0.8 89.3
* 5.0000 tBBCDEE 6 223 2.5 91.8
* s.sooo t 0 223 o.o 91.8
* 6.0000 t 0 223 o.o 91.8
* 6.5000 tBE 2 225 0.8 92.6 :z: .....
* 7.0000 t 0 225 o.o 92.6 V> ....
* 7.5000 tB 1 226 0.4 93.0 0 en
* 8.oooo tcn 2 228 0.8 93.8 i * 8.5000 tB 1 229 0.4 94.2
IDO
* 9.0000 tB 1 230 0.4 94.7 -<..,
* 9.5000 tE 1 231 0.4 95.1 .,
f.n:i.. in __. * 10.000 tC 1 232 0.4 95.5 §~ c: __. * 10.500 tCDE J 235 1.2 96.7 ~r.
;;o
CX>
,.., * u.ooo t 0 235 o.o 96.7
-l ,.. <
"' V> * 11.500 tD I 236 0.4 97.1 cn-i I OI'T1 N
• 12.000 t 0 236 o.o 97.1 ~J; .... * 12.500 tDE 2 238 0.8 97.9 ,., • 13.000 t 0 238 o.o 97.9
~J
* 13.500 tE 1 23? 0.4 98.4 .., ,.... 0
* 14.000 t 0 239 o.o 98.4 "" * 14.500 t 0 239 o.o 98.4
• 1s.ooo t 0 239 o.o 98.4
* 15.500 t 0 239 o.o 98.4
• 16.000 t 0 239 o.o 98.4
• u.soo tc 1 240 0.4 98.8
• 17.000 tE 1 241 0.4 99.2 • 17.500 t 0 241 o.o 99.2
* 18.000 t 0 241 o.o 99.2
* 18.500 tE 1 242 0.4 99.6
* 19.000 t 0 242 o.o 99.6
* 19.500 t 0 242 o.o 99.6
* 20.000 t 0 242 o.o 99.6
* 20.500 t 0 242 o.o 99.6
* 21.000 t 0 242 o.o 99.6
* 21.500 tD 1 243 0.4 100.0
* 22.000 t 0 243 o.o 100.0
* 22.500 t 0 243 o.o 100.0
* 23.000 t 0 243 o.o 100.0
• 2:J.500 t 0 243 o.o 100.0
* 24.000 t 0 243 o.o 100.0
* 24.500 t 0 243 o.o 100.0 • 25.000 t 0 243 o.o 100.0
t----t----t----+----t----t----t----t----t----t----t----t----t----t----t----t----t 5 10 15 20 25 30 35 40 45 50 55 60 65 70 75 so
NUMBER OF REFINERIES

100
90
80 70. 60
!'IGOR!: v-3 HISTORICAL T1mND OF TOTAL INDUSTRY
WATER USAGE
~:iusted for Industry Expansion (gal./bbl)
BP'r Qw ..... 1"'"'"'•"
40 ~CProm 1977 Survey and BP'l' 1972 Calculated Fl~
~ , Average ~
Model Flow"
-!. 00
"" f-0.90
~0.80 ~ t__~ r-v· 70 10
l"'o r- en -0.60 ~ ---o. so
~ 0
~ ~ H.to ..... 2u iiiJ ~~~-- of Better Than Average Model H· 30 E
~~~~~~~llli:il!llll ~~~~~~l!'ll~~s~~~~~~~-20 ~ , E-o-10 .._o
1972 74 76 78 80 82 84
Date
ll 9

SECTION VI
SELECTION OF POLLUTANTS TO BE REGULATED
INTRODUCTION
The purpose of this section is to describe the selection of pollutants to be regulated. Included here is a description of the selection process (and results) for both the direct and indirect discharge segments of the petroleum refining point source category. Also presented here is a discussion of the environmental effects of certain pollutants.
EPA conducted an extensive sampling and analytical program to determine the presence of toxic, conventional and nonconventional pollutants in petroleum refinery wastewaters (see Section V for details). The program included the sampling of 17 direct dischargers, 6 indirect dischargers, and 2 POTW. Additional long-term wastewater sampling was conducted at two refineries to investigate the possible existence of surrogate relationships between toxic pollutants and other pollutant parameters. The results of these sampling efforts are presented in Section V.
Since results of the various sampling programs are quite similar, the data from the 17 direct and 6 indirect discharge refineries were used as the basis for estimating pollutant loadings and for selecting pollutants to be regulated.
The conventional and nonconventional pollutants analyzed were found frequently in effluent streams. Toxics were detected less frequently and at much lower concentrations. Pollutants from direct discharge refineries that have average concentrations greater than 10 ppb include total chromium, cyanide, zinc, toluene, methylene chloride, and bis (2-ethylhexyl) phthalate. The latter two compounds are contaminants from the analyses and their presence can not be solely attributable to the plants' operation. Cyanide, whose flow weighted concentration averages 45 ug/1, occurs at levels too low to be effectively reduced by feasible technology available to this industry. Zinc found at average concentrations of 105 ug/1 is neither causing nor likely to cause toxic effects. Toluene was removed to below measureable limits by all but one direct discharge refinery.
The estimated concentration and discharge loading of the conventional and non-conventional pollutants are summarized in Table VI-1. Similar information on toxics is included in Table VI-2.
Characteristics of wastewaters from indirect discharge refineries prior to their entry into POTW sewers are provided in Table V-28.
SELECTION OF REGULATED POLLUTANTS FOR DIRECT DISCHARGERS
121

The Act requires that effluent limitations be established for toxic pollutants referred to in Section 307(a)(1). The Settlement Agreement in Natural Resources Defense Council, Incorporated ~ Train, 8 ERC 2120 {D.D.C. 1976), modified, 12 ERC 1833 (D.D.C. 1979), provides for the exclusion of particular pollutants, categories and subcategories (Paragraph 8}, according to the criteria summarized below:
1. Equal or more stringent protection is already provided by EPA's guidelines and standards under the Act.
2. The pollutant is present in the effluent discharge solely as a result of its presence in the intake water taken from the same body of water into which it is discharged.
3. The pollutant is not detectable in the effluent within the category by approved analytical methods or methods representing the state-of-the-art capabilities. (Note: this includes cases in which the pollutant is present solely as a result of contamination during sampling and analysis by sources other than the wastewater.)
4. The pollutant is detected in only a small number of sources within the category and is uniquely related to only those sources.
5. The pollutant is present only in trace amounts and is neither causing nor likely to cause toxic effects.
6. The pollutant is present in amounts too small to be effectively reduced by known technologies.
7. The pollutant is .effectively controlled by the technologies upon which other effluent limitations and guidelines are based.
Pollutants Selected for Regulation in the Petroleum Refining Point Source Category (Direct Discharge Segment)
Specific effluent limitations are established for BOD~, TSS, COO, oil and grease, phenolic compounds (4AAP), ammonia, sulfide, total chromium, hexavalent chromium, and pH. These pollutants are limited under BPT, as well as BAT, and NSPS.
Tables VI-3 and VI-4 are summaries of priority detection results from the screening program for water, and separator effluent, respectively, at direct refineries.
pollutant the intake discharge
Pollutants Excluded frQm Regulation (Direct Discharge Segment)
All of the organic and inorganic priority pollutants {except chromium) are excluded from regulation.
122

Those priority pollutants which were not detected in the final effluent of direct discharqe refineries are listed in Table VI-S.
Priority pollutants which were detected in the final effluent of direct dischargers are listed in Table VI-6. Table VI-7 contains a statistical evaluation of the analytical data for these parameters. Average flow-weighted concentrations from Table VI-7 show low or trace concentrations for all priority pollutants except chromium (108 ppb). These pollutants are neither causing, nor likely to cause, toxic effects.
Two of the priority pollutants, methylene chloride and bis(2-ethylhexyl) phthalate, were detected in one or more of the treated effluent samples, however, their presence is believed to be the result of contamination in the field and laboratory. During sampling, polyvinyl chloride (Tygon) tubing was used. Phthalates are widely used as plasticizers to ensure that tubing (including tygon) remains soft and flexible. Methylene chloride was used as a solvent in the organic analytical procedure. The presence of these two pollutants, therefore, cannot be solely attributable to the refinery effluents.
SELECTION Qr REGULATED POLLUTANTS FOR INDIRECT DISCHARGERS
Section 307(b) of the Act requires EPA to promulgate pretreatment standards for both existing and new sources which discharge their wastes into publicly owned treatment works (POTW). These pretr.eatment standards are designed to prevent the discharge of pollutants which pass through, interfere with, or are otherwise incompatible with the operation of POTW. In addition, the Clean Water Act of 1977 adds a new dimension to these standards by requiring pretreatment of pollutants, such as metals, that limit POTW sludge management alternatives.
The Settlement Agreement in Natural Resources Defense Council, Incorporated~ Train, 8 ERC 2120 (D.D.C. 1976}, modified, 12 ERC 1833, D.D.C. 1979, provides for the exclusion of particular pollutants from pretreatment standards, categories and subcategories (Paragraph 8), according to the criteria summarized below:
(1) if 95 percent or more of all point sources in the point source category or subcategory introduce only pollutants to POTW that do not interfere with, do not pass through, or are not otherwise incompatible with the POTW; or
(2) the toxicity and amount of the incompatible pollutants (taken together) introduced by such point sources into POTW is so insignificant as not to justify development of pretreatment standards; or
(3} criteria (1, 3, 4, 5, and 6) set forth in the above direct discharge segment discussion.
123

Pollutants Selected for Regulation ill the Petroleum Refining Point Source Category (Indirect Discharge Segment)
Specific pretreatment standards are established chromium, ammonia, and oil and grease.
Pollutants Excluded f!Qm Regulation
for total
With the exception of chromium, all organic and inorganic priority pollutan·ts are excluded from regulation.
Those priority pollutants excluded because they were not detected are listed in Table VI-B.
Table VI-9 lists the priority pollutants which were detected in the effluents of indirect dischargers. Pollutants listed in Part I and Part II of Table VI-9 are excluded from national regulation in accordance with Paragraph B of the Settlement Agreement because either they were found to be susceptible to treatment by the POTW and do not interfere with, pass through, or are not otherwise incompatible with the POTW, or the toxicity and amount of incompatible pollutants are insignificant. Pollutants listed in Part III of Table VI-9 are excluded for several reasons. First, there is significant removal of several of these pollutants by the existing oil/water separation technology used to comply with the pretreatment standard for oil and grease. Second, there is significant removal of these pollutants by the POTW treatment processes by air stripping and biodegradation. Third, the amount and toxicity of these pollutants does not justify developing national pretreatment standards.
Table VI-10 contains a statistical evaluation of the occurrance and average flow weighted ·concentratio~s for those priority pollutants listed in Table VI-9.
ENVIRONMENTAL SIGNIFICANCE OF SELECTED POLLUTANTS
The environmental significance of the pollutants selected above is discussed here in the following groupings: a) toxic pollutants, b) conventional pollutants, and c) non-conventional pollutants.
Toxic Pollutants
The following "selected" pollutants are addressed here (under the grouping of toxics): lead, chromium, zinc, cyanide, and toluene.
Lead. Human exposure to lead has been shown to cause disturbances of blood chemistry, neurological damage, kidney damage, adverse reproductive effects, and adverse cardiovascular effects. Lead has also been shown to be carcinogenic and teratogenic in experimental animals.
124

The effects of lead on aquatic life have been extensively studied, particularly for freshwater species. As with other toxic metals, the toxicity of lead is strongly dependent on water hardness. LC50 values reported for freshwater fish in soft water are in the low mg/L range. Lead is chronically toxic in soft water at concentrations ranging from 19 to 174 ~g/L for six species of freshwater fish. Lead is bioconcentrated by fish, invertebrates, algae, and bacteria.
Chromium. Although chromium is an essential nutrient in trace amounts, it can be quite toxic to man at high concentrations. Damage to the skin, respiratory tract, liver, and kidneys has resulted from occupational exposure to high levels of chromium. Epidemiological studies suggest that long term inhalation of chromium produces lung cancer.
Concentrations of chromium lethal to aquatic organisms vary considerably depending upon the chemical form of chromium, the water hardness, and the species or organism exposed. LC50 values reported for 21 species of fish range from 3,300 ~g/L to 249,000 ~g/L. LC50 values reported for 33 invertebrates range from 67 ~g/L to 105,000 ~g/L.
Cyanides. Cyanides are a diverse group of compounds defined as organic or inorganic compounds which contain the -CN group. Cyanides are rapidly lethal to humans in low doses but apparently do not exert sublethal or chronic toxic effects. Cyanides are acutely toxic to fish at concentrations as low as 57 ~g/L and chronically toxic at concentrations as low as 7.8 ~g/L.
lin£. Zinc is an essential element required for normal human growth and development. Except at very high exposure levels, zinc is relatively non-toxic to humans. There is no evidence to suggest that zinc is carcinogenic, mutagenic, or teratogenic, although, based on tests with animals, there is one evidence that excessive amounts of zinc may promote tumor growth.
Although zinc is one of the most commonly occurring heavy metals in water, it can be toxic to aquatic life. Extensive toxicity testing with zinc has indicated a wide interspecific variation in zinc sensitivity. Acute 96-hour LC50 values reported for freshwater fish and invertebrates range from 0.040 mg/L to 103 mg/L.
Toluene. Neuromuscular deficiencies and menstrual disorders have been reported in women exposed chronically to toluene in the workplace. Acute exposure to high levels of toluene causes excessive central nervous system depression which can result in death.
Toluene has been shown to be acutely toxic to freshwater fish at concentrations ranging from 6.9 mg/L to 32.4 mg/L and to saltwater fish at concentrations ranging from 4.5 to 12 mg/L. A
125

single chronic value of 2.2 mg/L has been reported for saltwater fish.
Conventional Pollutants.
The environmental Significance of the conventional pollutants, biochemical oxygen demand, suspended solids, and oil and grease is discussed below.
Biochemical Oxygen Demand. Biochemical oxygen demand (BOD) is a measure of the oxygen consuming capabilities of organic matter. The BOD does not in itself cause direct harm to a water system, but it does exert an indirect effect by depressing the oxygen content of the water. Sewage and other organic effluents, during their processes of decomposition, exert a BOD, which can have a catastrophic effect on the ecosystem by depleting the oxygen supply. Conditions are reached frequently where all of the oxygen is used and the continuing decay process causes the production of noxious gases such as hydrogen sulfide and methane. Water with a high BOD indicates the presence of decomposing organic matter, and subsequent high bacterial counts that degrade its quality and potential uses.
Suspended Solids. Suspended solids include ,both organic and inorganic materials. The organic fraction includes such materials as grease, oil, tar, animal and vegetable fats, various fibers, sawdust, hair, and various materials from sewers. These solids may settle out rapidly, and bottom deposits are often a mixture of both organic and inorganic solids. They adversely affect fisheries by covering the bottom of the stream or lake with a blanket of material that destroys the fish-food, bottom fauna or the spawning ground of fish. Deposits containing organic materials may deplete bottom oxygen supplies and produce hydrogen sulfide, carbon dioxide, methane, and other noxious gases.
Solids may be suspended in water for a time, and then settle to the bed of the stream or lake. These settleable solids may be inert, slowly biodegradable materials, or rapidly decomposable substances. While in suspension, they increase the turbidity of the water, reduce light penetration, and impair the photosynthetic activity of aquatic plants.
Solids in suspension are aesthetically displeasing. When they settle to form sludge deposits on the stream or lake bed, they are often much more damaging to the life in water, and they retain the capacity to displease the senses. Solids, when transformed to sludge deposits, may do a variety of damaging things, including blanketing the stream or lake bed and thereby destroying the living spaces for those benthic organisms that would otherwise occupy the habitat. When of an organic and therefore decomposable nature, solids use a portion or all of the dissolved oxygen available in the area. Organic materials also
126

serve as a seemingly inexhaustible food source for sludgeworms and associated organisms.
Oil and Grease. In the petroleum refining industry, oils, greases, various other hydrocarbons and some inorganic compounds will be included in the freon extraction procedure. The majority of material removed by the procedure in a refinery wastewater will, in most instances, be of a hydrocarbon nature. These hydrocarbons, predominately oil and grease type compounds, contribute to COD, TOC, TOO, and usually BOD resulting in high test values. The oxygen demand potential of these freon extractables is only one of the detrimental effects exerted on water bodies by this class of compounds. Oil emulsions may adhere to the gills of fish or coat and destroy algae or other plankton. Deposition of oil in the bottom sediments can serve to inhibit normal benthic growths, thus interrupting the aquatic food chain. Soluble and emulsified materials ingested by fish may taint the flavor of the fish flesh. Water soluble components may exert toxic action on fish. The water insoluble hydrocarbons and free floating emulsified oils in a wastewater will affect stream ecology by interfering with oxygen transfer, by damaging the plumage and coats of water animals and fowls, and by contributing taste and toxicity problems. The effect of oil spills upon boats and shorelines and their production of oil slicks and iridescence upon the surface of waters is well known.
~-conventional Pollutants.
The environmental significance of the following non-conventional pollutants: chemical oxygen demand, sulfides, total organic carbon, phenolics (4AAP), and ammonia is discussed below.
Chemical Oxygen Demand. Chemical oxygen demand (COD) provides a measure of the equivalent oxygen required to oxidize the materials present in a wastewater sample, under acid conditions with the aid of a strong chemical oxidant, such as potassium dichromate, and a catalyst (silver sulfate). One major advantage of the COD test is that the results are available normally in less than three hours. Thus, the COD test is a faster test by which to estimate the maximum oxygen demand a waste can exert on a stream. However, one major disadvantage is that the COD test does not differentiate between biodegradable and nonbiodegradable organic material. In addition, the presence of inorganic reducing chemicals (sulfides, reducible metallic ions, etc.) and chlorides may interfere with the COD test.
Sulfides. In the petroleum refining industry, major sources of sulfide wastes are crude desalting, crude distillation and cracking processes. Sulfides cause corrosion, impair product quality and shorten the useful catalyst life. They are removed by caustic, diethanolamine (DEA), water or steam, or appear as sour condensate waters in these initial processing operations. Hydrotreating processes can be used to remove sulfides in the
127

feedstock. Most removed and recovered sulfide is burned to produce sulfuric acid or elemental sulfur.
When present in water, soluble sulfide salts can reduce pH, react with iron and other metals to cause black precipitates, cause odor problems, and can be toxic to aquatic life. The toxicity of solutions of sulfides to fish increases as the pH value is lowered. Sulfides also chemically react with dissolved oxygen present in water, thereby lowering dissolved oxygen levels.
Total Organic Carbon. Total organic carbon (TOC) is a measure of the amount of carbon in the organic material in a· wastewater sample. The TOC analyzer withdraws a small volume of sample and thermally oxidizes it at 150 degrees C. The water vapor and carbon dioxide from the combusion chamber (where the water vapor is removed) is condensed and sent to an infrared analyzer, where the carbon dioxide is monitored. This carbon dioxide value corresponds to the total inorganic value. Another portion of the same sample is thermally oxidized at 950 degrees C, which converts all the carbonaceous material to carbon dioxide; this carbon dioxide value corresponds to the total carbon value. TOC is determined by subtracting the inorganic carbon (carbonates and water vapor) from the total carbon value.
Phenolic Compounds (4AAP). Phenols and phenolic compounds are found in wastewaters of the petroleum refinery, chemical and wood distillation industries. Phenolic compounds include phenol (commonly referred to as carbolic acid) plus a number of other compounds that contain the hydroxy derivatives of benzene and its condensed nuclei. EPA has identified a number of toxic materials from this family of compounds, nine of which have been designated priority pollutants. ·
Phenol in concentrated solutions is quite toxic to bacteria, and it has been widely used as a germicide and disinfectant. Many phenolic compounds are more toxic than pure phenol; their toxicity varies with the chemical combination and general nature of the total wastes in which they occur. The toxic effects of combinations of different phenolic compounds is cumulative.
Biological treatment systems have been found able to effectively treat relatively high concentrations of phenolic compounds usin~ them as food without serious toxic effects. Experience has indicated that biological treatment systems may be acclimated to phenolic concentrations of 300 mg/L or more. However, protection of the biological treatment system against slug loads of phenol should be given careful consideration in the design. Slug loadings as low as 50 mg/L could be inhibitory to the biological population, especially if the biological system is not completely mixed.
Phenols in wastewater present the following two major problems:
128

1) At high concentrations, phenol acts as a bactericide.
2) At very low concentrations, when disinfected with chlorine, chlorophenols are formed, producing taste and odor problems.
Phenols and phenolic compounds are both acutely and chronically toxic to fish and other aquatic animals. Also, chlorophenols produce an unpleasant taste in fish flesh, destroying their recreational and commercial value.
It is necessary to control phenolic compounds in the raw water used to supply drinking water, as conventional treatment methods used by water supply facilities do not remove phenols. The ingestion of concentrated solutions of phenols will result in severe pain, renal irritation, shock, and possibly death.
The amino antipyrine method (4AAP) measures the presence of phenolic compounds in terms of the color effects caused when ~hese materials react in the presence of potassium ferricyanide at a pH of 10 to form a stable reddish-brown colored antipyrine dye. Color response of phenolic materials with 4-aminoantipyrine is not the same for all compounds. Because phenolic type wastes usually contain a variety of phenols, it is not possible to duplicate a mixture of phenols to be used as a standard. For this reason phenol itself has been selected as a standard and any color produced by the reaction of other phenolic compounds is reported as phenol. This value will represent the minimum concentration of phenolic compounds present in the sample. It is not possible to distinguish between different phenolic compounds using this analytical method.
Results of the sampling data for direct discharge refineries (Table V-27) illustrates the concentrations of total phenols (as measured by the 4AAP method) versus concentrations of the individual phenolic compounds identified as priority pollutants and present in refinery wastewaters. While phenolic compounds were found in the effluents of 14 of 16 refineries at an average concentration of 16 ug/L, only one of the priority pollutant phenols was detected at a concentration at or below measureable limits of the analytical equipment.
Ammonia. Ammonia is commonly found in overhead condensates from distillation and cracking and from desalting. It is usually found combined with sulfide as an ammonium su1fide salt. Ammonia is a common product of the decomposition of organic matter. Dead and decaying aminals and plants along with human and animal body wastes account for much of the ammonia entering the aquatic ecosystem. Ammonia exists in its non-ionized form only at higher pH levels and is the most toxic in this state. The lower the pH, the more ionized ammonia is formed and its toxicity decreases. Ammonia, in the presence of dissolved oxygen, is converted to nitrate (N0 3 ) by nitrifying bacteria. Nitrite (N02 ), which is an intermediate product between ammonia and nitrate, sometimes
129

occurs in quantity when depressed oxygen conditions permit. Ammonia can exist in several other chemical combinations including ammonium chloride and other salts.
Nitrates are considered to be among the poisonous ingredients of mineralized waters, with potassium nitrate being more poisonous than sodium nitrate. Excess nitrates cause irritation of the mucous linings of the gastrointestinal tract and the bladder; the symptoms are diarrhea and diuresis, and drinking one liter of water containing 500 mg/L of nitrate can cause such symptoms.
In most natural water the pH range is such that ammonium ions · (NH 4 +} predominate. In alkaline waters, however, high concentrations of un-ionized ammonia in undissociated ammonium hydroxide increase the toxicity of ammonia solutions. In streams polluted with sewage, up to -one half of the nitrogen in the sewage may be in the form of free ammonia, and sewage may carry up to 35 mg/L of total nitrogen. It has been shown that at a level of 1.0 mg/L un-ionized ammonia, the ability of hemoglobin to combine with oxygen is impaired and fish may suffocate. Evidence indicates that ammonia exerts a considerable toxic effect on all aquatic life within a range of less than 1.0 mg/L to 25 mg/L, depending on the pH and dissolved oxygen level present.
Ammonia can add to the problem of eutrophication by supplying nitrogen through its breakdown products. Some lakes in warmer climates, and others that are aging quickly are sometimes limited by the nitrogen available. Any increase will speed up the plant growth and decay process.
130

TABLE VI-1 (Ref. 168, page 22)
1 of 2
FLOW~EIGHTED CONCENTRATIONS! AND LOADINGS FOR DIRECT DISCHARGERS IN THE PETROLEUM
REFINING INDUSTRY
-Conventional Pollutants-
Pretreated Raw Currentj.BPT Cone. Load Cone. Load
Pollutant mg/L kkg/yr mg/L kkg_/_yr
BOD 133.2 57405.4 13.5 5833.0
TSS 92.1 39691.8 26.1 11252.1
Oil and Grease 150.6 64909.6 17.1 7389.2
.Total Loading 162006.8 24474.3
-Noneonventional Pollutants- 2
Pretreated Raw Current/BPT Cone. Load Cone. Load
Pollutant mg/L kkg/yr mg/L kkg/yr
COD 442.7 190836.3 114.6 49422.2
Ammonia 14.1 6070.1 6.8 2941.3
TOC 112.2 48348.8 33.3 14342.5
Sulfides 5.2 2257.1 0.6 274.1
Total Phenols 22.5 9719.1 0.018 7.6
Total Loading_ 257231.4 66987.7
131

Footnotes:
TABLE VI-1 (Ref. 168, page 22)
2 of 2
FLOW-wEIGHTED CONCENTRATIONS! AND LOADINGS FOR DIRECT DISCHARGERS IN THE PETROLEUM
REFINING INDUSTRY (continued)
1 Pretreated Raw and Current/BPT concentrations were supplied by EGD on a plant-by-plant basis. The industry-wide Pretreated Raw direct and the Current indirect discharge concentrations were obtained by flow-weighting the data for the seventeen direct and the four indirect dischargers studied in this analysis. The plant-by-plant Current/BPT direct discharge concentrations were flow-weighted to determine the industry-wide concentrations. The BAT industry-wide concentrations were calculated using the Current/BPT concentrations and flow-weighting on a plant-byplant basis, based on the adjusted BAT flows. The flow-weighted concentrations were derived by multiplying the average concentrations by the flow for each of the 17 refineries sampled. The sum of the products divided by the total flow of the refineries sampled results in a flowweighted average concentration.
2 Nonconventional pollutant loadings are not presented for BAT because the BAT removal effectiveness for these pollutant parameters is unknown.
132

.Pollutant
Total Toxic Loadings
Footnotes:
TABLE VI-2
FLOW-wEIGHTED CONCENTRATIONS 1 AND LOADINGS FOR DIRECT DISCHARGERS IN THE
PETROLEUM REFINING INDUSTRY
-Toxic Pollutants- 2
Pretreated Current/ BATJ Raw BPT Option 1 Option 2 Rev.Option Load Load Load Load Load
kkg/yr kkg/yr kkg/yr kkg/yr kkg/yr
3502.1 136.6 103.3 83.0 100.8
Rev.Option ~
Load kkg/yr
87.1
1 Pretreated Raw and Current/BPT concentrations were supplied by EGD on a plant-by-plant basis. The industry-wide Pretreated Raw direct and the Current indirect discharge concentrations were obtained by flow-weighting the data for the seventeen direct and the four indirect dischargers studied in this analysis. The plant-by-plant Current/BPT direct discharge concentrations were flow-weighted to determine the industry-wide concentrations. The BAT industry-wide concentrations were calculated using the Current/BPT concentrations and flow-weighting on a plant-byplant basis, based on the adjusted BAT flows. The flow-weighted concentrations were derived by multiplying the average concentrations by the flow for each of the 17 refineries sampled. The sum of the products divided by the total flow of the refineries sampled results in a flowweighted average concentration.
2 The individual toxic pollutant concentrations are listed in Section 2.3.
3 Some of the pollutants have an increased BAT concentration above Current/BPT because of the plant-by-plant flow-weighting procedure.
133

TABLE Vl-3 OlllECT DISCHMGE
INTAKE WATER PRIORITY POLLUTANTS' DETECTION PAGE 1 of 3 SUI-UIARY OF EPA SCREENING PROGRAfl DATA
TOTAL TOTAl PAR. PlANTS PLANTS SAHPLF.:'i TIHES
FRArTION NO. f'ARAHF.:TER UNITS SAHPLED DETECTING ANALY7Eil DfTfCTEn -------- ---- ----~---- ----- ------- --------- -------- --------VOLATILES 2 ACROLEIN UO/L 1:1 0 1:5 0
3 AC:RYl ONITRII-E 110/L 1:5 0 1:5 0 4 BENZENE UG/L IS 1 15 1 6 CARBON TF.:TRAC:HLOR JllE UG/L 15 1 1:5 1 7 CHLOROBfNZENE UG/L 15 0 15 0
10 lr2-DJCHLORO£THANE UO/L 15 0 15 0 11 1•1rt-TRICHLOROfTHANE UO/L 15 1 1:5 1 13 1•1-DICHLOROETHANE UO/L 15 0 1:5 0 14 1•1r2-TRICHLOROfTHANE UG/l 15 0 1:5 0 15 1•1•2•2-TETRACHLOROETHANE UG/1 15 0 1:5 0
16 CHI.OROETHANE IIG/L 1:5 0 15 0 17 BIS<CHLOROHETHYL) ETHER UO/l 15 0 1:5 0 19 2-CHI.OROETHYL VINYL ETHER UOVL 1:5 0 1:5 0 23 C:HLOROfORH UO/l 1:5 3 15 3 29 1•1-DICHLOROETHYLENE 110/L 15 0 1:5 0 30 lr2-TRANS-DICHLOROFTHYLENE UG/L 15 1 15 I
32 1r2-DICHLOROPROPANE 110/L 15 0 15 0 __, 33 lr3-DICHLOROPROPYLENf. UO/L 15 0 15 0 w 38 ETHYLBENZf.NE IIG/L 15 0 15 0 ~ 44 HETHYLENf CHLORIDE UO/L 15 10 15 10
45 HETHYL CHLORIDE UO/L 1:5 0 15 ()
46 HETHYL BROH I DE UG/L 15 () 15 0 47 llROH!lfORH UO/L 15 () 15 0 48 DICHLOROBROHOHf.THANf. UG/L 15 () 15 0 49 TRICHLOROFLUOROHETHANE 110/L 15 () 15 0
50 DICHLORODJFLUOROHETHANF. UO/L 15 () 15 0 51 CHLORODIBROHOHETHANE UG/L 15 0 15 0 85 TETRACHLOROETHYLENE UO/L 15 1 15 1 86 TOLUENE UO/L 15 0 15 0 87 TRICHLOROETHYLENf. UO/L 15 1 15 I 88 VINYL CHLORIDE UO/L 15 0 15 0
AC Uo EXTRACT 21 2•4•6-TRICHLOROPHENOI UO/L 17 0 17 0 22 PARACHLOROHETA C:Rf.SOL 110/t 17 0 17 0 24 2-CHLOROPHENOL UO/L 17 0 17 0 31 2•4-DICHLOROPHENOL UG/L 17 0 17 0 34 2•4-DlHETHYLPHf.NOL UO/L 17 0 17 0 57 2-NJTROPHfNOL UO/l 17 0 17 0 58 4-NITROPHENOL UO/l 17 0 17 0 59 2r4-DlNJTROPHENOL UO/L 17 0 17 0 60 4r6-DlNITRd-O-CRESOL UO/l 17 0 17 0 64 Pf.NTACHIOROPHf.NOL UG/L 17 0 17 0 65 PHENOL UG/l 17 2 17 2
BASE-NEUTRALS 1 AC:f.NAPHTHENE UG/L 17 2 17 2 5 BENZIDINE UO/t 17 0 17 0 8 1r2r4-TRICHLOROBfNZENE UG/L 17 0 17 0
Note: Laboratory analysis reported as less than a dctectiLn limit
is considered not detected (value= O) for this table. L-LESS THANI T-TRAC£1 N-D NOT D£TF.CTEDI

TABLE Vl-3 lliiiECT JIS€HI\R.iE P-'.:E 2 of 3
INTAKE WA'l'ER PRIORITY POLLUTANTS' DETECTION SUMMARY OF EPA SCREENING PROGRAM DATA
TOTAl. TOTAL PAR, PlANTS PlANTS SAHPLES TIHES
FRACTION NO. PARAHETfR UNITS SAHPLED PETECTINO ANAI.YZED PETECTFD -------- ---- --------- ----- ------- --------- -------- --------BASF-NEUTRAI.S 9 HEXACHI.OROIIENZENE UO/L 17 0 17 0
12 HfXACHI.OROETHANE 110/l 17 0 17 0 10 BISC2-CHLOROETHYL) ETHFR U0/1. 17 0 17 0 20 2-CHlORDNAPHrHAl.ENE UO/l 17 0 17 0 25 1r2-DICHI.OROBFNZENE UG/l 17 0 17 0 26 1o3-DICHI.OROBEN1ENE UG/l. 17 0 17 0 27 1o4-DICHI.OR09fNlENE UO/L 17 0 17 0 20 3o3'-DICHLDROBENZIDIN£ UO/l 17 0 17 0 35 2o4-DINITROTOLUENE UO/L 17 0 17 0 36 2o6-DlNITROTOlUENE UO/l 17 0 17 0 J7 1o2-DIPHENYLHYPRAZINE UO/l 17 0 17 0 39 FlliORANTHENE liO/l 17 2 17 2 40 4-CHl.ORDPHENYl PHENYL ETHER UO/l 17 0 17 0 41 4-BROHOPHf.NYl PHENYL ETHER UO/i. 17 0 17 0 42 BISC2-CHlOROISOPROPYL) ETHER U0/1. 17 0 17 0 4J BJSC2-CHLOROETHYOXY) HETHANE UO/l 17 0 17 0 52 HfXACHlOROBIITADJENE UG/L 17 0 17 0
__. 53 HEXACHLOROCYCLOPENTADIENE UG/L 17 0 17 0 w 54 J:40PHORONE UO/l 17 0 17 0 U1 55 NAPHTHALENE UO/l 17 2 17 2
56 NITROBFNZENE IJO/L 17 0 17 0 61 N-NITROSODIHETHYLAHINE UO/l 17 0 17 0 62 N-NITROSODIPHFNYLAHINE IJO/l 17 0 17 0 63 N-NITROSODJ-N-PROPYLAHINE UO/L 17 0 17 0 66 8JSC2-ETHYlHEXYl) PHTHAI.ATE UO/l 17 5 17 5 67 BUTYL BENZYL PHTHALATE UO/l 17 0 17 0 60 DI-N-BUTYl PHTHAI.AT£ UG/l 17 4 17 4 69 DI-N-OCTYL PHTHAlATE IJO/L 17 0 17 0 70 DJETHYL PHTHALATE UG/l. 17 0 17 0 71 DIHFTHYL PHTHAlATE 110/l 17 1 17 1 72 1o2-BENZANTHRACENE UO/l 17 0 17 0 73 llfN70 CA)PYRENE UO/L 17 1 17 74 Jo4-BENZOFLUDRANTHENE UO/l 17 0 17 0 75 11o12-BENZOFLUORANTHENE 110/L 17 0 17 0 76 CHRYSFNE UO/l 17 1 17 1 77 ACFNAPHTHYLENE 110/l 17 1 17 1 70 ANTHRACENE UO/l 17 0 17 0 79 1r12-BfNZOPFRYLENE 110/l 17 0 17 0 eo FlUORENE UG/l 17 1 17 1 81 PHENANTHRENE UR/l 17 2 17 2 82 lo215o6-DIBENZANTHRACENE UG/l 17 0 17 0 83 INnfNOCto2o1-CoD) PYRENE IJG/l 17 0 17 0 8'1 PYRE HE UG/l 17 2 17 2
PESTJCIOES 89 AU•RIN UG/L 17 0 17 0 90 DTFU•RIN IJG/l 17 0 17 0 91 CHLORDANE UG/l 17 l 17 l
Note: Laboratory analysis reported as less than a detection limit Is considered not detected
l-LESS THANI T-TRACfl N-D (value = 0) for this table.
NOT IIETfCTED I

TABLE Vl-3 Dl~ECT 1HSCIIARGE PAGE 3 of 3
INTAKE WATER PRIORITY POLLUTANTS' DETECTION SUMJ-IARY OF EPA SCREENING PROGRAM DATA
TOTAL TOTAL PAR, PLANTS PlANTS SAHPLES TJHES
FRACTION NO, f'ARAHETER UNITS SAHPLED OETECTJNG ANALYZED DETECTED -------- ---- --------- ----- ------- --------- -------- --------PESTJCJ[oES 92 4•4'-llDT UG/L 17 0 J7 0
93 4•4'-[l[lE UG/l 17 0 17 0 94 4•4'-DDO UG/L 17 0 17 0 9.5 ALPHA-ENDOSULFAN UG/1. 17 0 17 0 96 BEfA-ENllOSUIFAN UG/l 17 0 17 0 97 ENOOSULFAN SULFATE UG/l 17 0 17 0 9B fNDRJN UG/1 17 0 17 0 99 ENDRIN ALDEHYOE UG/L 17 0 17 0
100 HEPTACHLOR 110/l 17 0 17 0 101 HEPTACHLOR EPOXJDf UO/l 17 0 17 0 102 ALPHA-BHC UG/L 17 0 17 0 103 BETA-BHC UG/L 17 0 17 0 104 GAHHA-BHC UG/L 17 0 17 0 105 (lfl TA-BHC 116/L 17 0 17 0 106 f'CB-1242 UO/l 17 1 17 1 107 PCll-12!54 UG/L 17 () 17 0
__, 108 PCll-1221 UG/l l7 0 17 0 w 109 f'CB-1232 UG/L 17 0 17 0 0'1 110 PCB-1248 UG/l 17 0 17 0
1 t1 PCB-1260 UG/l 17 0 17 0 112 PCB-1016 UO/L 17 0 17 0 ltJ TOXAPHENE UG/l 17 0 17 0 129 TCDD UG/l 17 0 17 0
HETALS 114 ANTJHONY UG/l 17 0 17 0
115 ARSENIC UG/l 17 4 18 5 117 BERYL L ILIH UG/L 17 0 8!5 0
1111 CAOHIUH UG/l 17 4 85 4 119 CHROHJUH UG/1. 17 15 8!5 34 120 COPPER Ull/L 17 12 86 48 121 CYANIDE UG/L 17 3 52 4 122 LEA (I UG/L 17 10 88 26 123 HERCURY U0/1. 16 10 69 51 124 NICI<.El IJG/L 17 9 88 13 125 SELENJUH UG/l 17 6 23 10 126 Sll VER llG/l 17 1 85 2 127 THALLJUH UO/L 17 0 34 0 12R ZINC IJG/1 17 16 90 :;..,
NON-CONV, HETALS 148 HEX-CHROHIUH UG/l 16 7 48 10
HISC, 167 PHENOlICS 14AAPOI UO/L 17 9 48 17
Note: Laboratory analysis reported as less than a deduction limit Is considered not detect~~ (value z 0) for this table.
l-LESS THANI T-TRACEI N-D NOT OETECTEDI

TABLE Vl-4 DIRECT DISCHARGE Page 1 of 3
SEPARATOR EFFLUENT PRIORITY POLLUTANTS' i DETECT lOri SU~1ARY OF EPA SCREENING PROGRAM DATA
TOTAL TOTAL PAR. PlANTS PLANTS SAHf'lES TIHES
fRACTION NO. PARAMETER UNITS SAHf'lED DETECTING ANALYZED DETECTED -------- ---- --------- ----- ------- --------- --------VOLATILES 2 ACROlEIN UO/L 9 0 10 0
3 ACRYlONITRILE 110/L 9 0 10 0 4 BENZENE U0/1 9 8 10 9 6 CARBON TETRACHLORIDE UO/L 9 0 10 0 7 CHLOROBENZENE 110/1 9 0 10 0
10 1o2-DICHLOROETHANE UO/l 9 0 10 0 l1 lo1ol-TRICHLOROFTHANE IJB/L 9 0 10 0 13 1ol-DICHLOROETHANE UG/l. 9 0 10 0 14 lo1o2-TRICHLOROFTHANE IJG/L 9 0 10 0 15 1o1o2o2-TETRACHLORO£THANE UO/L 9 0 10 0 16 CHLOROETHANE UG/l 9 0 10 0 17 BIS<CHIOROHETHYL) ETHER UG/L 9 0 10 0 19 7-CHLOROFTHYL VINYL ETHER UO/L 9 0 10 0 23 CHUJROfORH UO/L 9 !I 10 6 29 1ol-DICHlORO£THYl.ENE UO/L 9 0 10 0 30 1o2-TRANS-DICHLOROETHYIENE UG/L 9 1 10 1 32 1o2-DICHLOROPROPANE UO/L 9 0 10 0 __. 33 lol-DICHLOROPROPYIENE UO/L 9 0 10 0
w 38 fTHYLBEN7ENE UO/l 9 6 10 7 -...J 44 HFTHYLFNE CHLORIDE 110/L 9 8 10 9
45 HETHYL CHI OR IDE UO/L 9 0 10 0 46 HfTHYL BROHI DE 110/L 9 0 10 0 47 llROHOfORH UO/L 9 0 10 0 48 DICHl.OROBROHOHETHANE UO/L 9 1 10 1 49 TRJCHLOROflUOROHETHANE UG/l 9 0 to 0 50 DICHLORODIFLUOROHETHANE UO/L 9 0 10 0 !11 CHIORODIBROHOHFTHANE 110/L 9 0 10 0 85 TETRACHlOROETHYLENE UG/L 9 1 10 1 86 TOLUENE UO/L 9 8 10 9 87 TRICHLOROETHYLENE UO/L 9 0 10 0 88 VINYL CHlORIDE UG/L 9 0 10 0
ACID EXTRACT 21 2o4o6-TRICHl.OROPHENOL UG/L 10 0 15 0 22 PARACHLOROHETA CRESOL UG/L 10 0 15 0 24 2-CHI.OROPHENOL UO/L 10 (l 15 0 31 2o4-DICHLOROPHENOL 110/L 10 0 15 0 34 2o4-DIH£THYLPHFNOL UO/L 10 5 15 6 57 2-N lTRUPHfNOL UO/L 10 1 15 1 58 4-NITROf'HENOL UG/L 10 1 15 1 59 2o4-DINITROPHFNOL UO/L 10 1 15 1 60 4o6-DINITRO-O-CRESOL UG/L 10 1 15 1 64 PENTACHlOROPHENOL U0/1 10 1 15 1 65 f'HfNOL UG/L 10 9 Hi 12
BASE-NEUTRALS t ACFNAf'HTHENE IJG/L 10 6 15 6 5 BF.:NZIDJNE UG/L 10 0 15 0 8 1o2o4-TRICHLOROBEN7ENE UO/L 10 0 15 0
Note: Laboratory analysis reported as less than a detection limit is considered not detected
L-LESS THANI T-TRACFI N-It NOT PETFCTfltl (value = 0) for this table.

TABLE Yl-4 UIRftT BISOHAR&E
SEPARATOR EFFLUENT PRIORITY POLLUTANT~ UETECTION Page 2 of 3
SUMMARY OF EPA SCREENING PROGI:Al4 DATA
TOTAL TOTAl. PAR. PLANTS PLANTS SAHPLES TJHES
fRACTION NO. PARAMETER UNITS SAHPLED DETECTING ANALYZED DETFCTED -------- ---- --------- ----- ------- --------- -------- --------BASE-NEUTRALS 9 HEXACHLOROBENZENE UG/L 10 0 IS 0
12 HEXACHLOROETHANE UG/L 10 0 15 0 18 BI8!2-CHLOROETHYLl ETHER UG/L to 0 t5 0 20 2-CHLORONAPHTHALENE UG/l. to 0 15 0 25 tr2-lliCHLOROIIENZENE UG/l. 10 0 t5 0 26 tr3-DICHLOR08ENZEHE UG/L to 0 t5 0 27 Jr4-DICHLOR08EN1ENE UG/L to 0 t5 0 28 3r3'-DICHLOROBEN11DINE UG/L 10 0 15 0 35 2r4-DINITROTOLUFNE UG/L 10 0 15 0 36 2r6-DINJTROTOLUENE UG/L 10 0 15 0 37 tr2-DIPHEHYI.HYDRAZINE UG/1. to 0 15 0 39 FLUORANTHENE UO/L 10 4 15 5 40 4-CHLOROPHEHYl. PHENYL ETHER UO/L 10 0 t5 0 4t 4-BROHOPHEHYL PHENYL ETHER U0/1. 10 0 IS 0 42 815!2-CHLOROJSOPROPYLl ETHER UG/l. 10 0 15 0 43 818!2-CHLORO£THYOXYl HFTHANE UG/L 10 0 1'5 0 52 HEXACHI.OROBUTADIENE UO/l to 0 t5 0 53 HEXACHLOROCYCI.OPENTADIENE UO/L 10 0 15 0
--' 54 ISOPHORONE UG/L 10 I 15 I w 55 NAPHTHALENE UG/l 10 8 15 9 CX> 56 NITROBENZENE UG/1. 10 0 1'5 0
61 N-NITROSODIHETHYLAHINE UG/l 10 0 1'5 0 62 N-NITROSODIPHFNYIAHINE UG/L 10 0 1'5 0 63 N-NITROSODl-N-PROPYLAKINE UO/l 10 0 1'5 0 66 BI8!2-ETHYLHEXYLl PHTHALATE UG/L 10 4 1'5 7 67 llUTYL BENZYL PHTHALATE UG/l 10 0 15 0 68 DI-N-BUTYl. PHTHAlATE UG/L 10 1 1'5 1 69 01-H-OCTYL PHTHALATE UO/l 10 0 15 0
70 DIETHYL PHTHALATE IJG/1. 10 1 1'5 1 71 DIHETHYL PHTHALATE U0/1. 10 0 15 0 72 lr2-BFH7ANTHRACENE UO/l. 10 0 15 0 73 BENZO !AlPYRENE UG/l 10 0 15 0 74 3r4-BfNZOFLIJORANTHENE UG/l. 10 0 15 0 75 t1r12-BENZOFLUORANTHENE UG/1. JO 0 1'5 0 76 CHRYSENE UG/L 10 4 1'5 8 77 ACENAPHTHYLEN£ UG/l 10 J 15 J 78 ANTHRACENE IJR/L 10 1 15 1 79 1r12-BENZOPERYLENF. UG/L 10 0 15 0 80 FlUORENE UO/L 10 2 15 3 81 f"HENANTHRF.NE UG/l JO 6 15 8 82 1o21'5r6-DI8fNZANTHRACENE UG/l. 10 0 15 0 83 INDEN0<1r2r3-CrDl f"YRENE UG/L 10 0 15 0 84 f"YRENE llG/l. 10 2 15 2
PESTJCIDES 89 ALDRIN UG/l. 10 1 15 1 90 DIELDRIN IJG/L 10 0 15 0 91 CHLORMNE uo/t 10 0 15 0
Note: laboratory analysis reported as less~~~ a detection limit is considered not detected
L-LESS THANI T-TRACEi N-D NOT [oFJECT[[II (value = 0) for this table.

TABLE Vl-4 OI:!ECT iliSCHAn!l£ Page 3 Of 3
SEPARATOR EFFLUENT PRIORITY POLLUTANTS' llETECTION SUI.U<!ARY OF EPA SCREENING PROGRAM DATA
TOTAL TOTAL PAR. PLANTS PLANTS SAHPLES TINES
FRACTION NO. PARAHETER UNITS SAHPLED DETECTING ANALYlfD DETECTfll -------- ---- --------- ----- ------- --------- -------- ---PESTICIDES 92 4•4'-DDT UO/L 10 0 15 0
93 4•4'-DDE UO/L 10 I IS 94 4•4'-DDD UO/L 10 0 1S 0 9S ALPHA-ENPOSULFAN UO/L 10 0 1S 0 96 BfTA-f.NPOSUI.FAN UO/L 10 1 1S 1 97 fNDOSULFAN SULFATE UO/L 10 0 IS 0 911 fNDRIN 110/L 10 0 IS 0 99 f.NDRIN AI.DEHYDE: U0/1 10 0 1S 0
100 HfPTACHLOR UO/L 10 0 IS 0 101 HEPTACHLOR EPOXIDf. UO/L JO 0 IS 0 102 AIPHA-BHC 110/L 10 0 IS 0 103 BE:TA-BHC UO/L 10 0 IS 0 104 OAI111A-8HC 110/L 10 0 IS 0 lOS llf.L TA-BHC UG/L 10 I IS I 106 PCB-1242 IIG/L 10 3 IS 3 107 f'CB-12S4 UO/L 10 0 IS 0 108 PCB-1221 110/L 10 I 15 109 PCB-1232 UO/L 10 2 15 2
--' 110 PCB-1248 IIG/1. 10 0 15 0 w 111 PCB-1260 UO/L 10 0 IS 0 \.0 112 PCB-1016 U0/1. 10 3 IS 3
11:1 TOXAF·HENE UG/L 10 0 15 0 129 TCDio 110/L 10 0 IS 0
11ETAL!i 114 ANTIHONY UG/L 10 2 IS 2 11S ARSf.NIC UO/L 10 5 19 IJ 117 BERYLLI,UH UG/L 10 1 75 1 liB CADIUUH UO/l J() I 78 4 119 CHROHIUI1 Ull/L 10 10 92 80 120 COPPER UO/L 10 8 79 61 121 CYANIIlf. UG/L 10 9 47 38 122 LEAD UIVL 10 7 81 39 123 Hf.RCURY UO/L 10 7 80 61 124 NICI<EL 110/L 10 7 78 17 125 SELE:NIUI1 Ull/L 10 4 39 29 126 SILVER 110/L 10 1 7S 3 127 THAI UUH UO/l 10 1 40 4 128 ZINC llll/1. 10 10 100 89
NON-CONV, HE:TAI.S 148 HEX-CHROHJUI1 UG/L 9 6 42 22
HISC, 167 PHFNOLJCS (4AAP0) IJG/L 10 10 48 46
Note: Laboratory analysis reported as less than a detection limit is considered not detected (value = 0) for this table.
L-LESS THANI T-TRACEI N-D NOT DfTE:CTEDI

1 of 2 TABLE VI-5
PRIORITY POLLUTANTS NOT DETECTED IN TREATED EFFLUENTS DISCHARGED DIRECTLY, AND EXCLUDED FROM REGULATION
Pursuant to Paragraph 8(a)(iii) of the Settlement Agreement, the following 98 priority pollutants are excluded from national regulation because they were not detected in effluents from BPT treatment systems by Section 304(h) analytical methods or other state-of-the-art methods:
EPA EPA No. Priority Pollutant No. Prioritl Pollutant
2 acrolein 52 hexachlorobutadiene 3 acrylonitrile 53 hexachlorocyclopentadiene 5 benzidine 54 isophorone 6 carbon tetrachloride 55 naphthalene 7 chlorobenzene 56 nitrobenzene 8 1,2,4-trichlorobenzene 57 2-nitrophenol 9 hexachlorobenzene 58 4-nitrophenol
10 1,2-dichloroethane 59 2,4-dinitrophenol 11 1,1,1-trichloroethane 60 4,6-dinitro-o-cresol 12 hexachloroethane 61 N-nitrosodimethylamine 13 1,1-dichloroethane 62 N-nitrosodiphenylamine 14 1,1,2-trichloroethane 63 N-nitrosodi-n-propylamine 15 1,1,2,2-tetrachloroethane 64 pentachlorophenol 16 chloroethane 65 phenol 18 bis(2-chloroethyl)ether 67 butyl benzyl phthalate 19 2-chloroethylvinyl ether 69 di-n-cetyl phthalate 20 2-chloronaphthalene 72 benzo(a)anthracene 21 2,4,6-trichlorophenol 74 3,4-benzofluoranthene 24 2-chlorophenol 75 benzo(k)fluoranthane 25 1,2-dichlorobenzene 77 acenaphthylene 26 1,3-dichlorobenzene 78 anthracene 27 1,4-dichlorobenzene 79 benzo(ghi)perylene 28 3,3'-dichlorobenzidine 80 fluorene 29 1,1-dichloroethylene 82 dibenzo(a,h)anthracene 30 1,2-trans-dichloroethylene 83 ideno(1,2,3-cd)pyrene 32 1,2-dichloropropane 85 tetrachloroethylene 33 1,3-dichloropropylene 87 trichloroethylene 34 2,4-dimethylphenol 88 vinyl chloride 35 2,4-dinitrotoluene 89 aldrin 36 2-6-dinitrotoluene 90 dieldrin 37 1,2-diphenylhydrazine 91 chlordane 38 ethyl benzene 92 4,4'-DDT 39 fluoranthene 93 4,4'-DDE 40 4-chlorophenyl phenyl ether 94 4,4'-DDD 41 4-bromophenyl phenyl ether 95 alpha-endosulfan 42 bis(2-chloroisopropyl) ether 96 beta-endosulfan 43 bis(2-chloroethoxy) methane 97 endosulfan sulfate 45 methyl chloride 98 endrin 46 methyl bromide 99 endrin aldehyde 47 bromoform 100 heptachlor 48 dichlorobromomethane 101 heptachlor epoxide 51 chlorodibromomethane 102 alpha-BHC
140

2 of 2 TABLE VI-S (Cont'd)
EPA EPA No. Prioritl Pollutant No. Prioritl Pollutant
103 beta-BHC 110 PCB-1248 104 gamma-BHC 111 PCB-1260 105 delta-BHC 112 PCB-1016 106 PCB-1242 113 toxaphene 107 PCB-1254 114 antimony (total) 108 PCB-1221 116 asbestos 109 PCB-1232 129 2,3,7,8-tetrachlorodibenzo-p-
dioxin (TCDD)
141

TABLE VI-6
PRIORITY POLLUTANTS DETECTED IN TREATED EFFLUENTS DISCHARGED DIRECTLY, BUT EXCLUDED FROM REGULATION
I. Pursuant to Paragraph 8(a)(iii) of the Settlement Agreement, the following 25 priority pollutants are excluded from national regulation because they are already effectively controlled by technologies upon which other effluent limitations and guidelines are based:
EPA EPA No. Priority Pollutant No. Priority Pollutant
1 acenaphthene 115 arsenic 4 benzene 117 beryllium
22 parachlorometacresol 118 cadmium 23 chloroform 120 copper 31 2,4-dichlorophenol 121 cyanide 68 di-n-butyl phthalate 122 lead 70 diethyl phthalate 123 mercury 71 dimethyl phthalate 124 nickel 73 benzo(a)pyrene 125 selenium 76 chrysene 126 silver 81 phenanthrene 127 thallium 84 pyrene 128 zinc 86 toluene
II. Pursuant to Paragraph 8(a)(iii) of the Settlement Agreement, the following two priority pollutants are excluded from national regulation because their detection is believed to be attributed to laboratory analysis and sample contamination:
EPA No. Priority Pollutant
44 methylene chloride 66 bis(2-ethylhexyl) phthalate
142

TABLE VI-7
S~attstlcal ~nalysls Table for ~he Petroleum Refining lndustry 1
Direct 01scharge - Current/BPT
Average Ma:diiiUII F I ow-Weighted Pollu~ent
Poll. Cone. Concentret ton Frequency Po II u1'an1' (UQ/f) (UQ/1) of De1'ect1on
Chlorotornt 3.1 66 2/17 Benzene 2.3 11 3/17 Toluene
3 10.1 35 1/17
2.4-Dfchlorophenol 0.2 10 1117 3
0.3 10 1/17 p-ehloro-m-eresol 3
0.1 3 1/17 Olme1'hyl phttlalate Dle~hyl ph1'halate 1.5 .30 1/17 DI-n-butyl phthalate 0.04 10 2/17 Ac:en8C)h~hene 1.1 6 1/17 Benzo(aJpyrene
3 0.1 3 2/17
Chyrsene o.o2 1 2/17 Phenanthrene 0.2 1 1/17 Pyrena 0.1 7 1/17 ~rsenfc
2 o.o1 31 3/17
Berylltum 0.04 2 2/51 Cadmium 3 0.25 20 3/53 Chromium <Trivalent) 107.8 1230 41/53 Chromium (Hexavalent) 7.7 110 8/48 ~per 9.8 199 26/50 Cyanide 45.5 320 26/39 Lead 5.2 113 10/54 Mercury 0.9 6 20/45 Nickel 3.4 74 "'" Selenium 17.2 32 17/20 Stiver 3 0.04 4 1/47 Thai llum 3
3.2 12 5/14 ZTne 104.6 620 43/59
FootnoTe:
'All 129 prTorTty pollutan1's were analyzed during the sampiTng of the Current/BPT wasTestreem. Thirteen organic polluTants and fourTeen Inorganic pollu1'an1"s were deTected. The Curren1"/BPT concentratTons were calculated by flow-welgh1"Tng the data avallabl& for the sevenTeen dTrect dTschargers sampled.
2Low values were not' Included, and were assumed to be no~ Quan1"1fTable. HTgh values were noT Tncluded because laboratory conTamlnaTTon was suspected; therefore, data were assumed to be r nva I I d.
3The Curren't/BPT polluTan't concenTration Is greater than In the Pretreated Raw wastestream because of the variability of the daTa during sampling.
143

TABLE VI-8
PRIORITY POLLUTANTS NOT DETECTED IN TREATED EFFLUENTS DISCHARGED TO POTW, AND EXCLUDED FROM REGULATION
Pursuant to Paragraph 8(a)(iii) of the Settlement Agreement, the following 75 priority pollutants are excluded from national regulation because they were not detected by Section 304(h) analytical methods or other-state-of-the-art methods in effluents discharged to POTW:
EPA EPA No. Prioritl Pollutant No. Prioritl Pollutant
3 acrylonitrile 62 N-nitrosodiphenylamine 5 benzidine 63 N-nitrosodi-n-propylamine 6 carbon tetrachloride 66 bis(2-ethylhexyl) phthalate 8 1,2,4-trichlorobenzene 69 d-n-octyl phthalate 9 hexachlorobenzene 71 dimethyl phthalate
12 hexachloroethane 74 3,4-benzofluoranthene 13 1,1-dich~oroethane 75 benzo(k)fluoranthane 14 1,1,2-trichloroethane 79 benzo(ghi)perylene 15 1,1,2,2-tetrachloroethane 82 dibenzo(a,h)anthracene 16 chloroethane 83 ideno(l,2,3-C,D)pyrene 18 bis(2-chloroethyl)ether 87 trichloroethylene 19 2-chloroethylvinyl ether 88 vinyl chloride 20 2-chloronaphthalene 90 dieldrin 21 2,4,6-trichlorophenol 91 chlordane 22 parachlorometa cresol 94 4,4'-DDD 25 1,2-dichlorobenzene 95 alpha-endosulfan 26 1,3-dichlorobenzene 97 endosulfan sulfate 27 1,4-dichlorobenzene 98 endrin 28 3,3'-dichlorobenzidine 99 endrin aldehyde 29 1,1-dichloroethylene 100 heptachlor 31 2,4-dichlorophenol 101 heptachlor epoxide 32 1,2-dichloropropane 102 alpha-BHC 33 1,3-dichloropropylene 103 beta-BHC 35 2,4-dinitrotoluene 104 gamma-BHC (lindane) 36 2-6-dinitrotoluene 106 PCB-1242 37 1,3-diphenylhydrazine 107 PCP-1254 41 4-bromophenyl phenyl ether 108 PCB-1221 42 bis(2-chloroisopropyl) ether 109 PCB-1232 43 bis(2-chloroethoxy) methane 110 PCB-1248 44 methylene chloride 111 PCB-1260 45 methyl chloride 112 PCB-1016 46 methyl bromide 113 toxaphene 47 bromoform 114 antimony (total) 51 chlorodibromomethane 116 asbestos 52 hexachlorobutadiene 126 silver (total) 53 hexachlorocyclopentadiene 127 thallium (total) 56 nitrobenzene 129 2,3,7,8-tetrachloro-dibenzo-p-61 N-nitrosodimethylamine dioxin (TCDD)
144

1 of 2
TABLE VI-9
PRIORITY POLLUTANTS DETECTED IN EFFLUENTS DISCHARGED TO POTW, BUT EXCLUDED FROM REGULATION
I. Pursuant to Paragraph 8(b)(i) of the Settlement Agreement, the following 5 priority pollutants are excluded from regulation because 95 percent or more of all point sources in the subcategory introduce into POTW only pollutants which are susceptible to treatment by the POTW and which do not interfere with, do not pass through, or are not otherwise incompatible with such treatment works:
EPA No. Priority Pollutant
24 2-chlorophenol 57 2-nitrophenol 77 acenaphthylene 80 fluorene
125 selenium
II. Pursuant to Paragraph 8(b)(ii) of the Settlement Agreement, the following 33 priority pollutants are excluded from regulation because the amount and toxicity of each pollutant do not justify developing national regulations:
EPA EPA No. Priority Pollutant No. Priority Pollutant
2 acrolein 85 tetrachloroethylene 7 chlorobenzene 89 aldrin
10 1,2-dichloroethane 92 4,4'-DDT 11 1,1,1-trichloroethane 93 4,4'-DDE 23 chloroform 96 beta endosulfan 30 1,2-trans-dichloroethylene 105 delta BHC 39 fluoranthene 115 arsenic 40 4-chlorophenyl phenyl ether 117 beryllium 48 dichlorobromomethane 118 cadmium 60 4,6 dinitro-o-cresol 120 copper 64 pentachlorophenol 121 cyanide 67 butyl benzyl phthalate 122 lead 68 di-n-butyl phthalate 123 mercury 70 diethyl phethalate 124 nickel 72 benzo(a)anthracene 128 zinc 73 benzo(a)pyrene 76 chrysene 84 pyrene
145

2 of 2
TABLE VI-9 (Cont'd)
III. Pursuant to Paragraphs 8(a)(iii), 8(a)(iv), and 8(b) of the Settlement Agreement, the following 12 priority pollutants are excluded from regulation for the following reasons. (1) There is significant removal of several of the pollutants by the technology upon which existing pretreatment standards for oil and grease are based. (2) There is significant removal of all these pollutants by the POTW treatment system. (3) The amount and toxicity of the pollutants do not justify developing national pretreatment standards.
EPA EPA No. Priority Pollutant No. Priority Pollutant
1 acenaphthene 58 4-nitrophenol 4 benzene 59 2,4-dinitrophenol
34 2,4-dimethylphenol 65 phenol 38 ethyl benzene 78 anthracene 54 isophorone 81 phenanthrene 55 naphthalene 86 toluene
146

TABLE VI-10
Stattsttcal Analysts Table for the Petroleum Reftntng lndustry1 lncUrec:t Dtscharge - Current
Awrage Max t 111U11
, low-wet ght.ci Pollutant ~~I. Cone. Conc:entratf on Fr"equency
Po II u1'an1' (UQ/1) (ua/1) of Detect 1 Otl
Acrolein 0.7 100 1129 ltldr"fn 0.6 12 3/22 1-BHC 0.6 12 2127 ODE 0.4 7 1/27 DOT 0.01 ' 1/28 ~ndoeultan 0.6 13 1/29 lsotlllof"Ofte 293 • .3 "~ 3/27 Dfchlorobr"o...thane o.t 24 1/28 CJtlorofot'll 24.6 tOO 17/28 1,2-Dfchloroethane 0.9 " 3/29 1,1,1•Tr"fchloro.thane 0.5 14 1/28 Tr-ans-1,2-Dtchlcroethene o.1 20 1/29 Tefradll oroethene 0.4 ~ 1/29 4-Ct lor-ophenypheny I
ether 1.4 30 21/27 Benzene 148.8 ~ 1/28 CJtlor-obenzene o.1 31 17127 Ethy I benzene 12.3.8 18000 20/27 Toluene 398.1 48000 20/27 ""enol 1368.7 33~ 1127 2-cb I or-opheno I 28.5
I 31, 1/27
Pen1'ach I or-opheno I 2.2 830 1127 2-NI'tr"ophenol 65.5 I 1.3~ 1129 4-N I 'tr"opheno I '61.4 I ,800 4/29 2,4-Dtnl'tr"ophenol 1068.4 I 11000 3/29 2,4-01-.thylphenol 1207.7
I 18.300. 17/27
4, 6-01 n I 1'r'o-o-cr..o I 2.9 60 1/29 0 I e1'hy I phthela~ 1.5 38 4/27 DI-n-butyl phthalate 0.1 40 1/27 Butyl benzyl phthalate 0.04 16 2127 Acenaphthene 188.9 ,22 6/27 Ac:enaphthylene 81.5 665 4/27 Anttracene 119.2 17,0 7127 Benzo(a)anthr"acene 0.4 12 1/27
147
1 of 2

TABLE VI-10 (Continued)
Statls~lcal Analysis Table tor the Petroleu• Refining lndusfryf lndlrec:t Dfscha~ge - Cw-f"en~
CCon't I nued )
Average Max(-F1~1gn1'ed Pollutan1' Poll. Cone. Concerrtr-a~ I on Frequency
2 of 2
Pollu'tan~ (UQ/1) (UQ/1) of Oetec:tfon
Benzo(a)p'l"ft• 0.03 to t/29 Cbrysene 5 • .3 30 4/TT Fluoranthene 6 • .3 812 4/27 Fluorene 50.5 495 4/TT NaphThalene 581.6 31~ 18/26 Ptlenan'ttrene 234.7 f750 15/TT Pyrene 4.6 f6 5127 Arsenlcl 0 • .3 4f 9129 Bery I II \Ill o.1 2 3/63 Cad•fu• 0.03 3 t/6.3 Chf"OIIfu. CTr Iva len~) 75f. f 2196 5ant Chr~fu• CHexavaleM) 115.8 410 23/60 Cec»IW' 80.6 510 52/66 Cyanide 195.2 3000 ""6 Lead 24.6 958 21/66 Mercury t.a 78 28/65 Nickel 14.6 771 6/66 SeleniUII 5f.2 322 f0/78 Zinc 429.4 3000 65na
Footnote:
1Atl 129 priority poll~an~s were analyzed during 1'tle .-,ling of the Cul"r-... .,...n-.... FOI'"Ty organIc pol I unn1's and twelve I norgan I c po 1 I unn'ts were de~ec:ted. The pollu1'an1' concentrrtlons were obtained fre~~ flow-welglt~fng the dan for se¥en1'..., Pr-..n-ee~ed Raw d I rec:t and the fOUl" Cw-rwrt I nd I rec:t d I sd'targers s~ud I ed In 1'ft Is analysIs. PSES I ftal~s for toxic poll~an~s ar• assumed to ,._In a~ Curr- levels. There Is no f I ow r-educ:t I on a~ PSES.
~ va I ues ..,.. not Inc I uded, and wet" a assumed to be not quan~ If I ab I e. HI gn val u•s were not Included because laboratory con1'•1na1'1on was suspected; therefor-e, dan were assu..-:1 to be Invalid.
148

SECTION VII
CONTROL AND TREATMENT TECHNOLOGY
INTRODUCTION
This section describes the control and treatment technologies that are determined to be feasible methods for the reduction of pollutants in petroleum refining wastewater. In identifying these technologies, the Agency assumed that each refinery had or would install the best practicable control technology currently available (BPCTCA) to comply with BPT limitations (3). The treatment technologies described below can further reduce the amount of pollutants discharged to navigable waters. They are divided into two broad classes: in-plant source control and end-of-pipe treatment. (A discussion of BPT technologies is also presented here for completeness). These two "classes" are discussed in the following paragraphs, along with a description of existing wastewater treatment and its effectiveness in the industry.
IN-PLANT SOURCE CONTROL
In-plant source control must be treated by eliminates a particular main wastewater stream.
reduces the overall pollutant load that an end-of-pipe system and reduces or pollutant before it is diluted in the
In developing an in-plant control scheme, the source of each particular pollutant must be identified and evaluated as to whether it can be eliminated or reduced. Sampling the wastewater at various points within the refinery sewer, beginning at the end-of-pipe treatment system and ending at the process units, produces a profile of the refinery sewer, which shows the origin and flow path of the pollutant in question.
Once the source of the particular pollutant is identified, the next step is to determine if the pollutant can be (a} removed with an in-plant treatment system; (b) eliminated by chemical substitution; or (c) reduced by recycling or reusing the particular wastewater stream. In-plant source control is further discussed below in terms of treatment options, chemical substitution, wastewater reduction, and wastewater reuse.
In-Plant Treatment Options
In all in-plant treatment options, the process waste streams under consideration must be segregated. If a particular pollutant (or pollutants) has more than one source, they all require segregation from the main wastewater sewer. However, similar sources can be combined for treatment in one system. Sour water, for example is produced at various locations within a
149

refinery complex but can be treated as a combined wastewater stream.
Sour water and cooling tower blowdown are the two waste streams for which in-plant treatment is now practiced or is available.
Sour Water. Sour water generally results from water brought into direct contact with a hydrocarbon stream. Direct contact results when steam is used as a stripping or mixing medium or when water is used as a washing medium, as in the crude desalting unit. Sour water contains sulfides, ammonia, and phenols.
The most common in-plant treatment schemes for sour waters involve sour water stripping, sour water oxidizing, or combinations of the two. These systems can greatly reduce sulfides and ammonia levels, and can also remove some phenols (24). Table VII-1 summarizes the extent of this technology in the refining industry. The operation of sour water strippers and sour water oxidizers is discussed at great length in numerous technical publications (3, 6, 18, 20, 24, 28, 48}. A sour water stripping study was undertaken in 1972 by the American Petroleum Institute (24). The results of this survey showed that 17 of 31 refluxed sour water strippers and 12 of 24 non-refluxed sour water strippers removed more than 99 percent of the sulfides. An additional nine refluxed and three non-refluxed units removed more than 99 percent of the sulfides and more than 95 percent of the ammonia. The data thus suggest that, overall, refluxed columns remove greater percentages of both pollutants. Note that of the five two-stage units studied, only one unit removed large percentages of both pollutants. Six of the seven strippers operating with flue or fuel gases removed over 99 percent of the sulfides. However, none of these units removed a high percentage of ammonia.
The average effluent concentration of all refluxed, non-refluxed, and flue gas units that removed more than 99 percent of the sulfide was 6.7 mg/L of sulfide. The average effluent from all units that removed more than 95 percent of the ammonia was 62.5 mg/L of ammonia. These averages are based upon a wide range of influent and effluent values.
Existing sour water stripper performance can increasing the number of trays, (b) increasing (c) increasing tower height, and/or (d) adding series (107). All these methods are now refining industry.
be improved by (a) the steam rate,
a second column· in available to the
Biological treatment to remove total phenols is also a demonstrated technology in this industry (48). Biological treatment of stripped sour waters may prove cost-effective in removing any biodegradable organic priority pollutants that may originate in this waste stream.
150

Phenols can also be removed from the the addition of oxidizing agents, peroxide (11), chlorine, chlorine permanganate (113).
sour water waste stream by such as ozone (51), hydrogen
dioxide, and potassium
A recent research project demonstrated that activated carbon also removes phenolic compounds. The experiment showed that activated carbon has a high affinity for phenolic compounds, requiring relatively short detention times. Activated carbon treatment in sour water streams may also remove any other organic priority pollutants present·. Refinery 237 uses activated carbon to treat the sour water waste stream, and the Agency has investigated this particular system further.
Cooling Tower Slowdown. Metals (such as chromium and zinc) and phosphate can be removed by precipitation and clarification at a relatively high pH (8 to 10). Hexavalent chromium, however, must be first reduced to the trivalent state before it can be precipitated and removed by clarification. Reduction is usually accomplished by adding sulfur dioxide, ferrous sulfate, or sodium bisulfite. The pH of the wastewater then rises with the addition of lime or caustic (lime is preferred if phosphates are to be precipitated), and the wastewater stream is clarified. Flocculants and flocculant aids, such as ferric chloride, alum, and polymers, can be added to increase removal efficiencies.
Japan's Mitsubishi Petrochemical Company has reported a new treatment technique for the removal of heavy metal ions (126). The system involves electrolytic coagulation in which electrical currents cause an iron electrode to dissolve. The iron combines with heavy metals and added hydroxide ion to form a sludge that can be precipitated rapidly from solution. Magnets aid the settling process. Mitsubishi reports that the new treatment system can reduce Cr+6 concentration to less than 0.05 ppm in 2900 gallons of metal plating wastewater. This system could be used to treat cooling tower blowdown streams at petroleum refineries.
Chemical Substitution
Chemicals are added to cooling tower recirculating water and boiler water to reduce corros1on, scaling, and biological growth. These chemicals usually include chromium, zinc, phosphates, and free chlorine.
Using organic chemicals to replace zinc and chromium solutions is also a viable alternative (53,54). Molybdates are also a practical alternative (55). (Molybdates are compounds containing the anion M
04-2 )
151

Wastewater Reduction
Reduction in water usage may sometimes be more cost-effective if the wastewater discharge is reduced, rather than reusing or recycling the existing amount of wastewater discharged. Good housekeeping is one inexpensive method of reducing wastewater and may include (a) shutting down pump gland cooling water lines on pumps that are out of service; (b) shutting down washdown hoses that are not in use, (c) eliminating leaks, (d) using dry cleaning methods, and (e) using vacuum trucks to clean up oil spills. Numerous other housekeeping procedures are commonly practiced throughout the industry.
Many new and modified refineries incorporate reduced water use and pollutant loading into their design. Some of these modifications include:
o Substitution of improved catalysts that require less regeneration.
0 Replacement of barometric condensers condensers or air fan coolers.
with surface
o Replacement of surface condensers with air fan coolers.
0 Use of hydrocracking and hydrotreating produce lower wastewater loadings processes.
processes that than existing
o Increased use of improved drying, sweetening, and finishing procedures to minimize spent caustics and acids, water washes, and filter solids requiring disposal.
o Recycle of wastewater at the process units to reduce the amount of wastewater leaving the process area.
A major process change that can reduce wastewater is the substitution of air cooling devices for water cooling systems. Many refineries have installed air cooling systems with their new process installations, thereby reducing the additional wastewater production associated with increased refinery complexity.
Of the 78 refineries for wh~ch comparative data are available between 1972 and 1976, the use of air cooling systems has increased at 39 refineries, has decreased at 26 refineries, and has remained the same at 13 refineries. Increased use of air cooling systems can reduce the quantity of cooling tower blowdown discharges that require treatment.
Another method of reducing wastewater is to eliminate cooling water from general purpose pumps (117). In certain instances the elimination of water can increase machinery reliability, reduce
152

capital expenditures for piping and water treatment facilities, and save operating costs. Guidelines are available for implementing a well-planned, step-by-step program of deleting cooling water from pumps and drivers. These procedures have been successfully implemented on a full-scale basis (117).
Wastewater Reuse
Many streams, such as treated sour waters, cooling tower blowdowns, and utility blowdowns, are suitable for use as wash water and fire system water. However, before reusing wastewater for these purposes, each plant must be investigated to determine the technical and economic feasibility.
Wastew~ ~rs emanating from end-of-pipe BPT facilities are generally of such quality that reuse can be quite attractive. Uses for treated refinery wastewaters include makeup water for cooling towers, pump gland cooling systems, washdown water, and fire water systems.
A number of articles in recent years describe actual reuse practices at one refinery (41, 57, 58). This plant reuses most of its treated wastewater as makeup to the cooling tower and fire water systems. In practice, the cooling towers act as biological treatment units, removing over 99 percent of the phenols present (41). The refinery reuses approximately 4.5 million gallons of process wastewater per day in the cooling towers; about 2.2 million gallons of cooling tower blowdown per day are sand filtered and discharged to the receiving stream. The difference, over 2 million gallons per day, is evaporated in the cooling towers or in an impounding basin (58). Wastewater reuse began at this refinery in 1954. Years of operating experience have confirmed that reuse water is a satisfactory makeup supply to cooling towers and does not require special water conditioning or treatment. Continued monitoring has confirmed that the system has no problems of corrosion, heat transfer, or cooling tower wood deterioration. Refinery management has concluded that cooling water reuse is an economically sound practice, paying significant dividends in terms of both pollution abatement and water conservation {57).
Finelt and Crump (128) report that refiners faced with increasing freshwater. costs may direct their water management policies toward the recirculation of treated water. Properly treated wastewater can be recycled as makeup to the cooling tower system. At new refineries, the recycle system could be justified economically over a non-recycle system for a number of reasons. There are a number of factors to be considered, most notably the cost. The cost of fresh water primarily determines the least costly system. At existing well-operated facilities, only at very high freshwater costs can the recycle system prove to be less costly than a non-recycle system. However, application of
153

recycle technology can reduce effluent discharge by up to 90 percent.
The use of sour waters as makeup to the desalter is a proven technology in this industry. This practice does remove some phenol because the phenolics are extracted from the sour water while the crude is washed. However, the removal efficiency varies greatly, depending on a number of factors, and this treatment scheme may not be a practical alt~rnative for some refineries (48). Certain crudes, particularly California crudes, may present problems in reusing sour waters in the desalter because they produce emulsions in the desalter effluent.
Table VII-2 identifies refineries with California crudes that recycle wastewater; the table also lists the percentage of California crudes that makeup crude capacity and the percentage of reused sour waters. These data show that refineries processing California crudes do not use large percentages of sour water in the desalter. In fact, refineries that use a large percentage of California crudes appear to reuse less sour water than refineries that process a small percentage of California crude. However, Table VII-3 shows that five of the six plants in this analysis do reuse sour water elsewhere in the refinery.
Sour water from stripper bottoms has other demonstrated uses in the petroleum refining industry (36). It can be reused as cooling tower makeup and as process wash water. In the biological environment in most cooling systems, 90 percent or more of the phenols present can be removed (36).
The 1977 Survey shows that 36 refineries reuse 100 percent of their treated sour waters in the desalter, while an additional 43 plants reuse at least some portion of their treated sour waters in the desalter. In addition, 32 refineries reuse treated sour waters in some other process. Of these plants, four reuse 100 percent of their treated sour waters as makeup to cooling towers. Table VII-3 summarizes the extent of industry reuse of treated sour waters.
The American Petroleum Institute published Water Reuse Studies in August 1977 (150). This document presents methods for achieving zero discharge, including:
o Recycle and reuse of treated effluent as well as other wastewaters
o Recovery and reuse of condensate streams
o Evaporation of wastewater with waste heat
0 Use of brine concentrators to eliminate high TDS streams.
154

The API report concludes that for most existing refineries, "(1). engineering concepts are available which indicate complete reuse of refinery water is technically possible and (2) the capital and operating costs appear favorable for complete recycle ."(150}.
The recycle of treated effluent as cooling tower makeup or for other uses is certainly a viable treatment alternative. Significant reductions in wastewater generation can decrease the quantities of pollutants discharged to navigable waters. When refineries improve the present wastewater management system by minimizing cooling tower blowdown, the treated effluent to be recycled may require softening before recirculation.
To determine an upper limit of how much treated wastewater can be reused as cooling tower makeup, the amount of cooling tower makeup required by each plant in the industry is summarized in Table VII-4. The percentage of cooling tower makeup water in the total wastewater discharged is also shown. This table has been derived from the 1977 survey data base. Approximately half the facilities have a cooling tower makeup water requirement that equals or exceeds the total refinery discharge flow.
In order to determine the degree of flow reduction that can be achieved on a national basis, EPA developed a flow model. The objective of the model was to estimate the average wastewater discharge flow from refineries which use similar processes. The model established which refineries are discharging less flow than other facilities. The higher flow refineries may be subject to flow reduction requirements.
In the proposed revisions of December 1979, an industry average flow reduction of 52% was required. This reduction level was determined by selecting the medium performance of refineries which are discharging less then the model predicts. The flow model upon which the proposal was based was found to be statistically deficient. A refined flow model was developed (see Section IV).The overall flow reduction as calculated from the refined flow model is 37.5%. For the purpose of confirming the achievability of this flow level, a detailed engineering study was conducted at 15 refineries located throughout the United States. The results of this study showed that the 37.5% reduction on an industry wide basis is technically achievable (159). A summary of the techniques identified for reusing wastewaters and reducing discharge flow rates at the refineries studied is presented in Table VII-S.
~-OF-~ TREATMENT
End-of-pipe treatment is defined here as all wastewater treatment systems that follow an API separator or a similar oil/water separation unit. The following end-of-pipe treatment techniques are available for the reduction of pollutants in petroleum
155

refining wastewater: a} biological treatment, b) filtration, c) granular activated carbon, d) powdered activated carbon, e) cyanide removal, and f) metals removal. These techniques are discussed below, along with the carbon studies conducted by the EPA Kerr Lab, and ultimate disposal methods.
Biological Treatment
Biological treatment is the basic process by refineries meet existing BPT guidelines. Very large oxygen-demanding compounds (as measured by the BOD1, test methods) are removed at many refineries application of well-designed and well-operated treatment systems (146).
which most amounts of
COD, and TOC through the
biological
Many options are available to plants which would upgrade their present biological systems. These include compartmentalized oxidation ponds to provide preliminary mechanical aeration, revamping of aerated lagoon systems into activated sludge systems, and converting of standard activated sludge systems to pure oxygen systems. Other modifications can improve the operating efficiency of particular biological treatment units, but each plant must be investigated to determine the feasibility of such modification.
Rotating Biological Contactors (RBC's) have attracted widespread attention in the United States since 1969. RBC's generally consist of rows of plastic disks mounted on horizontal shafts that turn slowly keeping the disk about 40 percent immersed in a shallow tank containing wastewater (see Figure VII-1). The RBC is a combination fixed film reactor and-mechanical aerator. The fixed film reactor is the disk upon which microorganisms attach themselves and grow. Mechanical aeration occurs during the portion of each rotation that a section of disk is above water level. Microorganisms produce a film on the surface of ~he disk which removes organic matter from the wastewater. Biodegradation of organic matter causes biomass to accumulate on the surface of each disk. Excess biomass is stripped and returned to the wastewater stream by the shearing action of water against rotating disks. Waste biomass is held in suspension by the mixing action of the disks, and carried out of the reactor for removal by a clarifier. Treatment efficiency can be improved by increasing the number of RBC's in series, and by temperature control, sludge recycle, and chemical addition.
RBC's have characteristics such as ability to sustain shock loads, modular expansion, and low power consumption which may be especially attractive for industrial application.
Full scale RBC installations treating refinery wastewaters have resulted in removal of oxygen demanding pollutants comparable to activated sludge and trickling filter systems (23, 172, 173). These refineries did not report removal effectiveness for
156

priority pollutants, however, they do report 4AAP phenol removals ranging from 42 percent to 97 percent. Data from the Regional Surveillance and Analysis program show one refinery using RBC's, Refinery 131, which achieved priority pollutant removals similar to the BPT systems studied in the 17 refinery B&R/RSKERL sampling program (158, Appendix B).
The sampling data presented in Section v indicate that biological treatment can remove organic priority pollutants to low levels (10-100 ug/L). These samples are from both industry and POTW and were collected and analyzed by EPA for this study.
Filtration
Filtration, utilized as a polishing step after biological treatment, is part of model BPT treatment (3). The survey results indicate that 27 of the 259 respondents use filtration as part of the existing treatment schem~, including plants that use filtration before biological treatment. Sixteen other refineries plan to install filtration systems in the near future. Table VII-6 lists those refineries that have, or are planning to install, rapid sand or dual media filtration systems. Filtration can improve effluent quality by removing suspended solids and associated BODi and COD and by removing carryover metals that have already been precipitated and flocculated. Filtration can also improve overall treatment plant performance (130, 132, 133).
Use of filtration techniques to remove solids reduces the effluent variability of biological treatment systems. One study (30) showed that the percentage of suspended solids removed does not deteriorate with high feed content; in fact, the amount of solids removed often increases with feed concentration. Concentration of suspended solids in the effluent rose during these situations, but not in proportion to the feed increase. Thus, one conclusion of the report is that granular media filters may be used to clarify refinery wastewaters, including occasional surges.
Another study (99) showed that filtration of refinery effluent can reduce suspended solids to less than 5 mg/L for "all feed concentrations" (8 to 91 mg/L of TSS), further supporting the fact that filters can reduce the effluent variability of biological treatment systems.
One petroleum refining company uses rapid sand filtration to treat its biological treatment plant influent (150). Biological treatment systems now remove both suspended and dissolved materials. However if filtration is used before biological treatment to remove the suspended material not removed in primary treatment, the biological system can remove more dissolved organics and generate fewer solids (50). Another advantage of prefiltration is that it allows the biological system to operate at increased sludge ages (20 to over 40 days). With high sludge
157

ages, treatment efficiencies are greater and less sludge is generated with fewer system upsets.
Granular Activated Carbon
Granular activated carbon has been used in the potable water industry for many years; recently industrial and municipal wastewater treatment plants have used it to remove dissolved organics (49). Activated carbon systems have functioned both as polishing units following a biological treatment system and as the major treatment process in a physical/chemical treatment system.
The granular activated carbon system considered here consists of one or more trains of carbon columns, each train having three columns operated in series. The columns operate by rotating their positions in the train. The newly regenerated carbon would be in the third vessel, whereas the vessel with the most spent carbon would be the first vessel. One possible piping and equipment arrangement showing this scheme is presented in Figure VII-2. Smaller refineries may require only one or two vessels operated manually without the sophisticated piping arrangement shown in Figure VII-2.
EPA expects that all but the smallest systems will require onsite regeneration of carbon. Figure VII-3 is a flow diagram of one possible carbon regeneration system. In some instances, filtration may be needed before carbon adsorption to remove suspended solids and prevent plugging of the carbon pores.
Refinery 168 treats all wastewater with activated carbon. This refinery uses granular activated carbon as the main treatment process; that is, it uses no biological treatment system for organic and BOD removal before adsorption. The refinery has experienced operating problems with the system (many of which have been mechanical in nature) and now plans to install a biological treatment facility to replace the carbon system.
Powdered Activated Carbon
A new technology developed over the past several years consists of adding powdered activated carbon to biological treatment systems. The adsorbant quality of carbon, which has been known for many years, aids in the removal of organic materials in the biological treatment unit (144}. This treatment technique also enhances color removal, clarification, and system stability, as well as BOD and COD removal (115, 116). Results of pilot testing (59, 60) indicate that this type of treatment, when used as a part of the activated sludge process, is a viable alternative to granular carbon systems.
One chemical manufacturing complex has installed a full-scale, 40 MGD powdered activated carbon system that started up during the
158

spring of 1977 {61). A simplified flow diagram is presented in Figure VII-4. The waste sludge, which contains powdered carbon, is removed from the activated sludge system and thickened in a gravity thickener. The sludge is then dewatered in a filter press before being fed to the regeneration furnace. The regenerated carbon is washed in an acid -solution to remove metals as well as other inorganic materials. Fresh carbon is added as makeup to replace the carbon lost in the overflow from the activated sludge process or in the regeneration system.
The powdered activated carbon system just described is a very comprehensive treatment system and includes operations that not all installations may require. The decision to use a filter press system or acid cleaning system in addition to a carbon regeneration furnace should be made individually, since some refineries may not require every treatment step. If the metals content is low and most of the solids are settleable, the filter press or acid cleaning systems may not be required even by refineries that regenerate carbon onsite.
Several tests in which powdered activated carbon was added to petroleum refinery activated sludge systems were conducted. Rizzo reported on a plant test in which carbon was added to an extended aeration treatment at the Sun Oil Refinery in Corpus Christi, Texas (150). In this test, three carbon dosages, 24 ppm, 19 ppm, and 9 ppm, were tried. Test results showed that even the very small carbon dosages significantly improved BOD, COD, and TSS removals, as well as producing uniform effluent quality, a clearer effluent and eliminating foam.
Grieves et al. {153) reported on a pilot plant study at the Amoco refinery in Texas City where activated carbon was added to the activated sludge process in 37.9- liter {10- gallon) pilot plant aerators. Significant amounts of soluble organic carbon (53 percent), soluble COD (60 percent), NH 3 -N (98 percent), and phenolics were removed after 50 mg/L of high surface area carbon was added. The amounts removed increased with increasing carbon dosage.
Exxon researchers tried adding activated carbon to bench scale activated sludge units with somewhat less success {154). They evaluated three carbon dosages, which produced aerator equilibrium carbon levels of 25 to 2,000 mg/L. At aerator carbon levels of 25 to 400 mg/L, the performance of the activated sludge process did· not improve. This low dosage is usually an inadequate amount of carbon, which gets lost or overwhelmed in the system.
At higher carbon dosages, aerator carbon levels of 1,000 mg/L or more, Exxon got positive results. In a field test (scale undisclosed), Thibault et al. significantly improved effluent quality and noted improvement in shock loading resistance leading
159

to process stability. An additional 10 percent of TOC and COD was removed.
Another powdered activated carbon scheme that uses very high sludge ages (60 days or more) has been studied (60, 145). The high sludge ages allow carbon to accumulate to high concentrations in the mixed-liquor, even though only small makeup amounts are added to the system. This approach may eliminate the costly regeneration scheme previously described because of the low carbon addition rates and spent carbon may be disposed of with the sludge. Considerable pilot work has been done with this concept, but no full-scale system is currently operating.
Pilot tests {62) have also shown that powdered activated carbon can be used successfully with rotating biological contactors {RBCs). Refinery 32 has constructed a full-scale system on the basis of pilot test results.
Cyanide Removal
Various treatment technologies are available for the removal of cyanides. Cyanide can be removed by treatment with ferrous sulfate. This precipitates the cyanide as a ferrocyanide, which can be removed in a subsequent sedimentation step. For the coil coating industry, a long-term effluent concentration of 0.07 mg/L was achieved via this technology {169).
Chlorine oxidation is a common technique of cyanide treatment. Chlorine is used primarily as an oxidizing agent in industrial waste treatment to destroy cyanide. Chlorine can be used in the elemental or hypochlorite form. The two step chemical reaction is:
Cl2 + NaCN + 2NaOH • NaCNO + 2 NaCl + H20 (2)
3Cl2 + 6NaOH + 2NaCNO • 2NaHC03 + N2 + 6 NaCl + 2820 (2)
The long-term concentrations achieved by the metal plating and inorganic chemical ·industry (hydrogen cyanide subcategory) are 0.18 mg/L (171) and 0.21 mg/L, (170) respectively.
Cyanide can also be removed by steam stripping and biological treatment. Both of these technologies are currently being used by the petroleum refining industry. Steam stripping removes approximately SO% (See Table VII-6) of the cyanide, and biological treatment removes approximately 75%. The long-term concentration of cyanide being discharged by the petroleum refining industry after steam stripping and biological treatment is 0.16 mg/L.
Metals Removal
160

Metals such as copper, zinc, lead, arsenic, and cadmium may originate from many sources within a refinery, and may, in specific cases, require end-of-pipe treatment. The development document published in March 1974 for the copper, nickel, chromium, and zinc segment of the electroplating industry (114) considered chemical precipitation and clarification to be the best practicable treatment in that category. The best plants in that industry obtained the following long-term average effluent concentrations for selected metals:
0 Copper (Cu) 0.2 mg/L 0 Nickel (Ni} 0.5 mg/L 0 Hexavalent Chromium (Cr+•} 0.055 mg/L 0 Trivalent Chromium (Cr(T)) 0.3 mg/L 0 Zinc (Zn) 0.3 mg/L 0 Cyanide (CN) 0.04 mg/L
The results of the RSKERL and Burns and Roe supplemental sampling programs (see Section V) show that BPT in the refining industry achieves metal discharges similar to or lower than the values shown; therefore, end-of~pipe chemical precipitation and clarification generally will not significantly improve the metals concentrations in petroleum refinery effluent over those achievable with existing BPT. Further reductions in the concentration of metals would require advanced wastewater treatment schemes, such as ion exchange, reverse osmosis, or activated carbon (147).
Since the chemical treatment scheme as an in-plant measure, the actual chromium may be lowered by dilution in the final effluent stream.
described earlier is applied discharge concentration of
of the cooling tower blowdown
A study was conducted to determine whether separate treatment of cooling tower blowdown prior to m1x1ng with other refinery process wastewaters would be practical. Site visits were made to fifteen refineries and engineering analyses were performed to determine: (1) the feasibility of separating cooling tower blowdown and (2) the advantage of separate treatment. The findings of the study are: (1) not all cooling tower blowdown streams are collectable (especially for older refineries where sources of leaks· cannot be found); and (2) some cooling tower blowdown is highly contaminated with oil. Therefore, cooling tower blowdown may still require biological treatment. The conclusion from the study is that a national regulation requiring separate treatment of cooling tower blowdown for existing refineries is not technically feasible.
RSKERL Carbon Studies
The Robert S. Kerr Environmental Research Laboratory (RSKERL) studied the implementation and effects of carbon treatment at six refineries as part of this study.
161

In the granular carbon tests, four columns were operated in parallel. Each column contained a different type of carbon so that differences in performance could be determined. One column contained previously exhausted and then regenerated carbon. The other three columns contained different types of virgin carbon. Using the isotherm testing method, the laboratory conducted field tests to determine which of the virgin carbons demonstrated the best .performance. The effluents from the "best" virgin carbon and the "regenerated" carbon were then tested to evaluate removal capabilities. The inlet wastewater to the carbon columns was treated using multi-media filtration.
RSKERL also tested a powdered activated carbon system at four of the six refineries. The test unit consisted of a small activated sludge pilot unit to which powdered carbon was added on a batch basis.
Because of the limited testing period, the low concentration of toxic pollutants in the influent to the PAC system, and lack of repeated carbon exhaustion and regeneration, the data from these pilot tests are insufficient to determine removal effectiveness.
Ultimate Disposal Methods
The use of flow reduction and the recycle methods previously described will reduce the quantity of water discharged or that needing end-of-pipe treatment. None qf the techniques discussed will eliminate the discharge of water. Zero discharge of water is technically achievable. 55 existing refineries have reported zero discharge. Table VII-7 presents information on the capacities and disposal methods used by these 55 refineries. Of the 55 plants, 32 use evaporation or percolation ponds, 10 use disposal wells, 5 use contract disposal, 2 use leaching beds, 1 uses surface spray, and 6 reported no wastewater generation at all.
To highlight the geographical and process distribution of the zero dischargers, the following breakdown is provided:
162

Distribution by EPA Region
Region
1 2 3 4 5 6 7 8 9
1 0 Total
Number of Refineries
1 0 0 1 1
20 2
14 14
2 55
Distribution by BPT Subcategory
Number of Subcategory Refineries
A B c D E
Not Classified Total
34 15
1 2 0 3
55
Percolation and evaporation ponds are attractive disposal methods when evaporation losses exceed rainfall. These ponds are sized according to the annual flow so that the inflow, plus the incidentally added water such as rainfall, equals percolation and evaporation losses. Many U.S. petroleum refineries now use this sizing technique.
The petroleum refining industry also practices deep-well injection. This method can be used only if extensive studies are conducted to ensure environmental protection.
Irrigation or other similar land disposal techniques is a viable end-of-pipe treatment alternative. This can eliminate discharge of all or a portion of process wastewaters to navigable streams. Refinery 26 already uses this or a similar technology.
Deep-well injection and irrigation or similar disposal methods are viable treatment alternatives. However, their application depends largely on the amount of rainfall, availability of a suitable deep-well, availability of land, and/or availability of land suitable for irrigation. Plants that are not located_in an area with these conditions can also achieve zero discharge. The zero discharge technology for these plants is based on forced (vapor compression} evaporation. (Table VII-S is a listing of steam electric power plants which use vapor compression evaporation as part of their wastewater treatment system). Heat is used to evaporate the water. The steam is condensed and reused as makeup water to the refinery while· the brine (slurry} stream is transformed into a solid state in a flash dryer. This zero discharge treatment scheme is described in detail in the 1977 American Petroleum Institute Report (150).
163

EXISTING TECHNOLOGY
Existing BPT guidelines are based on: (a) end-of-pipe treatment systems consisting of biological treatment followed by rapid sand or multi-media filtration or an equivalent polishing step, and (b) in-plant control practices widely used within the petroleum refining industry that include the following:
o Installation of sour water strippers to reduce the sulfide and ammonia concentrations entering the treatment plant.
o Elimination of once-through barometric condenser water by using surface condensers or recycle systems with oily-water cooling towers.
o Segregation of sewers so that unpolluted storm runoff and once-through cooling waters are not normally treated with the process and other polluted waters.
o Elimination of polluted once-through cooling water by monitoring and repairing surface condensers or by using wet and dry recycle systems.
The National Commission on Water Quality received a contractor's report prepared in 1975 on the petroleum refining industry. The report included a status of the treatment technology and water usage of most of the refineries in the United States (65). The data were obtained for 1973 and present a picture of the industry as it appeared at the time the BPT limitations were promulgated.
Data in the 1977 EPA Petroleum Refining Industry Survey (1977 Survey) reflect conditions during 1976. Table VII-9 presents a comparison of the industry's wastewater treatment practices for 1973 (National Commission Data) and 1976 (1977 survey). The following ~ist explains the abbreviated treatment processes in Table VII-9:
(Corr. Plat Sep.) (OAF) (OAF) (Chemical Floc.)
(Stab. Pond) (Aerated Lag.) (Act. Sludge) (Trick. Filter) (RBC) (Other Org. Rem.)
(Pol. Pond) (Act. Carbon) (Evap. or Perc. Pond)
164
Corrugated Plate Separator Dissolved Air Flotation Other Air Flotation Systems Chemical Flocculation Prefiltration Stabilization Pond Aerated Lagoon Activated Sludge Trickling Filter Rotating Biological Contactor Other Organics Removal Filtration Polishing Pond Activated Carbon Adsorption Evaporation or Percolation Pond

Table VII-10 summarizes the treatment systems listed in Table VII-9, showing the progress made by the industry in installing end-of-pipe treatment technology. The treatment units shown in these tables do not necessarily treat all of a particular refinery's wastewaters, and many treatment schemes may be pretreatment systems for discharge to a POTW.
The word "none" where indicated in Table VII-9 refers to refineries that do not have any of the treatment operations considered in this analysis. However, these plants may treat their wastewaters using gravity oil separation techniques.
A definitive list of refineries that have filtration or activated carbon operations is significant. Refineries that included filtration or activated carbon in their responses to the 1977 survey were screened to eliminate those systems that are treating only a minor portion of their wastewater, such as stormwater, runoff or boiler blowdown. This approach reduced the total number of refineries listed as having these types of treatment to just those plants that treat a significant portion of their wastewater using this technology.
Table VII-10 shows that in 1976 the number of refineries having BPT in place markedly increased from the number in 1973. The number of pretreatment operations, such as OAF, OAF and chemical flocculation also significantly increased, indicating the importance of these unit'operations in meeting BPT limitations.
Table VII-9 also presents data on water usage, including once-through cooling water, during the two 1-year periods surveyed. The comparison is based on water usage, rather than wastewater production, because data on wastewater production were not available for 1973. Those refineries for which data were available for both survey years, had reduced the overall flow by approximately 16 percent. This percentage would undoubtedly have been greater if market conditions had remained constant. However, many refineries expanded their operations or increased their complexity by adding additional process units between 1973 and 1976; these additions would minimize the effect of water reduction on a unit basis.
Effluent Concentration
The effluent concentration achievable by BPT treatment is discussed in the 1974 development document. The sampling results from the 17. screening plants agree with the original findings. The concentrations and variability factors used in the BPT limitations are given below:
165

Concentration Variability Factors mg/L daily monthly
Phenol 0. 1 3.5 1.7 Chromium {total) 0.25 2.9 1.7 Chromium (hexavalent) 0.02 3. 1 1 • 4 BODS 1 5. 0 3.2 1.7 TSS- 10.0 3.3 2. 1 O&G 5.0 3.0 1.6
The 1974 development document concluded that the influent concentrations do not affect the effluent quality of the BPT wastewater treatment system. Screening sampling results support this conclusion.
Table VII-1.1 presents a detailed summary of the discharge data from 17 sampled plants, including the percentage of actual discharge flow to BPT model flow and effluent concentrations for BOD, TSS, TOC, and oil and grease. The table also presents an analysis of the correlations among these factors. These data show that there is no significant correlation between percentages of actual flow to BPT flow and final effluent concentrations after BPT treatment.
A study was conducted to further examine the relationship between flow and concentration. Effluent flow and concentration data from fifty refineries were compiled. The data were analyzed to determine whether a statistically significant correlation exists between concentration and discharge flow {in relationship to the flow model prediction). The results of this study support the assessment that refineries with low discharge flow {in relation to the model prediction) do not have higher effluent concentrations than refineries with higher discharge flow. The data from the fifty refineries were also analyzed to determine the level of phenols (4AAP) achievable. The result indicated that the 19 ppb long-term average concentration (a value used in the proposed regulation of December 1979) is too low and that the BPT long-term concentration of 100 ppb is appropriate.
Effluent information was also evaluated to determine the appropriateness of the BPT concentrations for BODs, TSS, oil and grease, and chromium (total). The result indicates that the 30-day concentrations from the new data closely approximate that of BPT (See Table VII-12). The daily maximum concentrations, however, are higher than the BPT values for TSS, BODs, and phenols. It should be noted that most of the refineries in this study have flows that are significantly lower than the BPT model prediction. If significant flow reduction is required, the concentrations in Table VII-13 would probably be more appropriate than the BPT values. Long-term pollutant reduction would be achieved by flow reductions, but higher daily maximum concentrations should be permitted because of higher variability.
166

TABLE VII-1 Page 1 of 4
SOUR WATER TREATMENT IN PETROLEUM REFINERIES
REFINERY SINGLE STAGE TWO STAGE NUMBER STRIPPING STRIPPING OXIDIZING OTHER ------- ---------- --------- ---------
l X ::! X 3 X 8 X
10 X 13 X X 1:5 X 16 X 19 X ::?0 X ::!4 X :!~ X X :9 )( X X JO X 31 X 3::! X 33 X X 36 X 37 X 39 ')( X X 39 X 40 X X X 41 X X X 42 X 43 X :< 4:5 X 46 X X 49 X 50 X 51 X X 53 X 5:5 X 56 :< X 57 :< 59 X 60 X 6l X 62 X 63 X '(
64 X 65 X 67 X 68 X 70 '(
71 X -.~ X 73 X 74 '(
76 X 77 X 78 X 90 X 81 X 93 X X
167

TABLE VII - l Page 2 of 4
REFINERY SINGLE STAGE TWO STAGE NUMBER STRIPPING STRIPPING OXIDIZING OTHER -------- ------------ --------- ---------
84 X 8:5 X 86 X 87 X 88 X 94 X 96 X 98 X
102 X 103 X 104 X 10:5 X 106 X 107 X 108 X 109 X 111 X 112 X 113 X X 114 X X 115 X 116 X 117 X 121 X X X 1..,.., -· X 124 X 125 X 126 X 127 X 129 X X 130 X 131 X 132 X 133 X X 134 X 139 X 142 X 143 X X 144 X 147 X 149 X X 150 X 151 X 152 X 153 X 156 X 157 X 158 X 159 X 160 X 161 X 162 X 163 X t65 X
168

TABLE VI I - l Page 3 of 4
REFINERY SINGLE STAGE TWO STAGE NUMBER STRIPPING STRIPPING OXIDIZING OTHER -------- ------------ --------- ---------
166 X 167 X 168 X 169 X 174 X 175 X 176 X 179 X 190 X 19:::! X 193 X 194 X 195 X 196 X 197 X 199 X 190 X 194 X 195 X 196 X X 197 X :::!00 X :::!03 X :::!04 X :os X :::!08 X X :::!09 X :::!10 X :::!11 X :::!1:::! X :::!13 X :::!16 X X :::!:::!1 X ~~~ X ~~4 X :::!:::!5 X ::!~6 X ~~7 X :::!:::!9 X :::!30 X :::!3:::! X X :::!33 X :::!34 X :!35 X :::!37 X :::!39 X X X :::!41 ,(
:::!43 X :::!45 X :::!46 X :::!5:::! X :!55 X X X :so X :!:57 X
169

REFINERY NUI'tBER
:!59 :!59 ::!61 265 309
TABLE VII - 1
SINGLE STAGE T~O STAGE STRIPPING STRIPPING
X X X X X
170
Page 4 of 4
OXIDIZING OTHER

TABLE VII-2
EFFECT OF CALIFORNIA CRUDES ON REUSE OF SOUR WATERS
Percentage Percentage of Crude of Sour Water
Ref. No. State Crude Source Capacity to Desalter
13 CA L.A. Basin 17 26
32 CA California 49 12.5
37 CA San Joaquin Val, CA 39.6 17
Coalinga, CA 23.0
38 CA California 28.1 30
California 20.2
California 15.7
California 1.2
40 CA California 20 60
California 10
41 CA CA Midway Waxy 35 25
CA Mid Spec. 10
171

Page 1 of 2
TABLE VII-3
, Percentage of Percentage of Refinery Reuse in Desalter Other Reuse
::! 100.00 o.o 13 :!6.00 13.00 20 o.o 29.10 24 100.00 o.o ::!9 o.o 30.00 30 o.o UNKNOWN 32 12.~0 19.90 37 17.00 17.00 38 UNKNOWN o.o 40 60.00 ~~.oo 41 :!:S.OO 'J7 .oo 49 100.00 o.o ~1 10.00 20.00 :5::! UNKNOWN o.o 53 o.o 100.00 ~:5 100.00 o.o :57 o.o 29.:50 59 90.00 10.00 60 48.00 1~.00 61 :51.00 10.00 62 70.00 o.o 6~ :5:5.60 :!:S.40 61 100.00 o.o 68 74.00 :!6.00 71 100.00 o.o 7::! o.o 59.00 TJ o.o 100.00 76 100.00 •).0 80 o.o 100.00 81 97.00 o.o 83 100.00 o.o 8:5 :59.00 o.o 96 100.00 o.o 94 100.00 o.o 98 88.00 1::!.00
104 10.00 o.o 111 UNK.~OWN o.o 114 60.00 o.o 115 8:5.30 o.o 116 60.00 o.o 1::!1 o.o 9.00 l..,.., ~e.oo o.o 1.::!6 o.o 30.00 130 30.00 o.o 131 6.::!.00 :s.oo 132 o.o 6.00 142 100.00 o.o 143 100.00 o.o 144 100.00 o.o 14:5 o.o 100.00 147 100.00 o.o 149 100.00 o.o 150 100.00 o.o 151 9:5.00 o.o
172

TABLE VII-3 Page 2 of 2
Percentage of Percentage of Ref_i.n~v_ Reuse. in Desalter. Other Re.use
1~3 :o.oo so.oo 1S~ 3!5.00 o.o 1:56 50.00 50.00 1:57 o.o a.:o 1:59 :so.oo o.o 160 100.00 o.o 161 90.00 10.00 163 100.00 o.o 16:5 100.00 o.o 169 97.00 o.o 179 100.00 o.v 182 o.o 15.00 183 100.00 o.o 184 66.00 o.o 186 so.oo o.o 187 100.00 o.o 188 73.00 ::!7.00 194 so.oo o.o 196 40.00 o.o ::!00 100.00 o.o ::!03 40.00 o.o 204 100.00 o.o 20:5 100.00 o.o 209 100.00 o.o 211 100.00 o.o 216 1s.oo o.o 2~4 100.00 o.o 22:5 100.00 o.o ::!27 ?!5.00 :5.00 ::!28 100.00 o.o 230 100.00 o.o 23::! 60.00 40.00 ::!33 50.00 o.o 234 UNKNOWN o.o ::!41 a:s.oo ·o.o ::!43 99.99 o.o :!52 ao.oo o.o :!'.56 1oo.oo o.o :!'.57 100.00 o.o :!58 100.00 o.o ~59 100.00 o.o :!65 100.00 o.o 30'.5 :o.oo so.oo
173

TABLE SECTION VII-4 COOLING TOWER MAKEUP FLOW RATES
IN ·THE PETROLEUM REFINING INDUSTRY
Page 1 of 5
Refinery 1 2 3 .. 6 1 8
' 10 11 12 13 13 1, 16 17 18 19 20 21 22 23 24 2:5 26 29 30 31 32 33 3:5 36 37 38 39 40 41 42 43 4-4 45 46 48 49 so :51 52 53 :54 :55 so 57 sa :i9
Makeup Percentage Flow Divided Of Cooling
Makeup Flow By Total By BTU By {MGD} Effluent FlowCooling Tow~
0.0:59600 0.114800 o.o NOT APP. HOT APP. 0.107000 0.010000 0.025000 0.020000 2.909999 0.500000 7.303997 7.303997 0.08-4500 0.38.2100 0.018:500 0.108000 0.013000 1.450000 0.298000 0.094:500 NOT APP. 0.3:50000 0.867000 0.297000 3.419997 0.193000
> o.o 4.96999S O.o:SOOOO NOT APP, 0.030000 6.808996 3 • .290996 0.16:5000 6.614997 6.621992 0.030000 3.769996 o.o
> 4.348996 1.462999 0.140500 0.650000
> 0.23,000 NOT APP. HOT APP. o.o:;oooo 0.030000 NOT APP. 1.600000 9.69'1997 1.:514149 1.825500
174
0.313684 2.1.2592:5 o.o NOT APP. NOT APP. 0·64848:5 2.000000 0.69-4-4-44 0·400000 1·939999 0·723589 1·446336 1·4-46336 o.ss4099 1.1793.20 o.ss?229 0.473684 3.037382 0. 7':5910.2 4.3823:51 1.049999 NOT APP. 1.166666 1.791321 1.993288 0.914438 0.81-4277
> o.o OoS42:S7~ 1.633164 NOT APP. 1.090908 .2.88:5168 1.073734 1.092714 o.S48076 o.70S969 0.974126 1.314045 o.o
> 1.363321 1.116793 0.231848 UNKNOWN
> 1.:525973 NOT APP. NOT APP, 0.::!00000 1.764706 NOT Af'P, 1.2~:511:5 o.94t747 1.0~884:5 1.6:59:544
94.0000 100.0000 100.0000
o.o o.o
70.1000 30.0000 UNKNOWN UNKNOWN 94.0000 UNKNOWN 9'!5.0000 31.:5000
100.0000 72.0000 40.0000 UNKNOWN
100.0000 30.0000 UNKNOWN 73.0000 o.o
1s.oooo :58.0000 79.0000 7'!5.0000
100.0000 UNKNOWN 76.8000
100.0000 o.o
99.5000 43.0000 ao.oooo UNKNOWN 90.0000
.... sooo UNKNOWN 62.9000 9:5.0000 53.6000 :so.oooo 95 • .>000
6:5.0000 so.oooo o.o o.o
98.0000 100.0000
o.o 81.0000 89.0000 99.0000 47.8000

TABLE SECT.IO~ VII-4
COOLING Tm~ER ~4AKEUP FLOW i{ATES IN THE PETROLEUM REFINING INDUSTRY
Makeup Flow Refinery (MGD)
60 3.0~2498 61 4.~99999
62 5.659997 63 1.35~000 64 4.308998 6~ ~.484499 66 0.000050 67 9.829994 68 8.348999 70 o.o 71 0.359000 72 0.021000 73 0.468000 74 0.471500 76 1.933998 77 0.630000 78 0.075~00
79 o.o 80 ~.1:9998 81 0.776500 a2 o.~160oo 83 2.9~9999 84 ~.::!04995
85 5.394799 so o.440950 97 NOT APP, as o.735ooo 89 o.o 90 0.017000 91 o.oo~ooo
9: : 6.~52999 93 o.o 94 1.729000 95 o.o 96 19.014984 97 0.014040 98 4.::!89999 99 NOT APP.
100 NOT APP. to: o.o 103 ~ 0.025000 104 8.384995 105 NOT APP, !06 2.250000 107 0.045000 108 0.126000 109 o.:ooooo 110 NOT APP. 111 2.842497 11: 0.302500 113 0.529500 114 0.320000 115 1.983199 116 ~.964000
175
r~akeup Flow Divided
By Total Effluent Flow
1.568117 1.742423 1.179166 0.496337 0.897708 0.690139 UNKNOWN 0.416706 1.717900 o.o 1.486542 0.138158 o.60:5433 ::!.357499 0.848245 ~.292607 0.111029 UNKNOWN 9.::!60860 0.641735 0.375000 1.197873 1.304730 1.639756 1.::!74422 NOT APP. 3.:::3682 o.o 0.377778 0.416667 0.:587186 o.o 0.941176 o.o !.605995 UNKNOWN 1.656370 NOT APP. NOT APP. o.o
> 0.396825 1.128531 NOT APP, 1.069391 1.499999 :.863636 0.833333 NOT APP. 1.799048 1.490147 0.9'37505 t.::soooo o.7os:::ss 0.720000
Page 2 of 5 Percentage Of Cooling
By BTU B) Co.o 1i n a_ Towers
60.0000 47.0000 74.0000 91.4100 66.0000 40.0000
100.0000 65.6000 74.4000 UNKNOWN
100.0000 10.0000 75.0000 95.0000 86.~000 59.0000 90.0000 UNKNOWN 9~.4000
100.0000 100.0000 60.0000 75.0000 ao.oooo 97.0000 o.o
99.2000 2a.oooo 60.0000 UNKNOWN :56.0000 UNKNOWN 86.5000
100.0000 100.0000
UNKNOWN 3'9.4000 o.o o.o 0.9000
UNKNOWN 71.0000 o.o
30.0000 100.0000 99.0000
;'.6000 o.o
46.0000 35.0000 49.4000 78.0000 ss.aooo 40.0000

TABLE SECTION VII-4
COOLING TOWER MAKEUP FLOW RATES IN THE PETROLEUM REFINING INDUSTRY
Re.finerv 117 118 119 1::!0 1:1 12::! 1::!4 1~~ 126 1::!7 1::!8 129 130 131 13::! 133 134 135 136 137 138 139 140 141 14::! 143 144 145 146 147 148 149 150 151 1S:? 1:53 154 155 156 157 158 159 1~0
161 16::! 163 164 165 166 167 168 169 172 17'3
Makeup Flow Divided
Makeup Flow By Total ..--..· ..._jM_G-.DJ..__..-... Effluent Flow
1.4:50000 0.036!500 0.100500 0.17:5000 4.::!:50000 3.3::!3:500 0.97:5999 0.766000 0.400000 0.090000 ~lOT APP, 0.066600 NOT APP. 0.330000 1.599999 5.160996 o.o o.o 0.378000 o.o Oo46o000 0.071000 o.:::ooo o.o 0.50::!500 0.030000 0.7~9500 0.004500 0.300000 1.69!5000 0.1::!6500 0.740000 NOT APP. 4 .1'50000 3.070000 5.79:::!998 0.063000 0.391700 1.697997 4.111996 0.570800 0.199500 0.3::!8000 2.1149'97 2.115499 2.732998 0.030000 0.595400 o.osoooo 3.864999 1.240000 6.794998 0.772000 o.o
176
1.435642 1.0:)13887 0.670000 1.590908 0.944444 0.519297 2.05473!5 1.725224 0.061728 0.:520231 NOT APP, 0.66!5999 riOT APP. 0.114:583 0. 1:56648 0.6!50819 o.o UNKNOWN 1.321678 o.o 0.647222 :5.071427 2.018181 o.o 0.31723:5 0.02:5000 1.161314 UNKNOWN 3.22:5806 2.942707 0.790625 0.6276:50 NOT APP. 1.044288 ·:>.366348 1.489202 0.063000 2.::!6678::! 1.<.97997 2.049748 1.041605 0.720216 1.374285 3.253841 0.863469 2.635486 1.363636 2.053102 0.454545 0.7:57843 0.430:555 0.783737 0.339130 o.o
Pc.ge 3 of 5
Percentage Of Cooling
By BTU By Cool in<L Towers
99.0000 30.0000 28.0000 30.0000 65.0000 97.0000
100.0000 60.0000 ::!2.0000 99.0000 o.o
UNKNOWN o.o
20.0000 10.0000 95.0000 6::!.0000 UNKNOWN
100.0000 100.0000
1.0000 99.9000 70.0000
100.0000 66.5000
2.0000 100.0000
100.0000 UNKNOWN 39.0000
100.0000 77.0000 o.o
61.7000 35.0000 63.0000 UNKNOWN
100.0000 60.0000 88.9000 71.5000 60.0000
too.oooo 90.0000 UNKNOWN as.oooo
100.0000 49.3000 67.0000 70.0000
200.0000 90.0000 91.3000 UNKNOWN

TABLE SECTION VII-4
COOLING TOWER MAKEUP FLOW RATES IN THE PETROLEUM REFINING INDUSTRY Page 4 Of 5
Refinery Makeup Flow
(MGD)
Makeup Flow Divided
By Total Effluent Flow
Percer.tage Of Cocling
By BTU By Cooling Towers
------- ------- ---------------- -------------174 NOT APP· NOT APP. o.o 17:5 10.787498 0.864:521 UNKNOWN 176 0.086000 0.184986 33.0000 177 0.028000 0.036601 7:5.0000 179 0.632700 2.243616 82.0000 180 1.810998 0.676183 98.7500 181 20.876480 1.301:526 49.0000 182 6.599497 1.031171 70.0000 183 2.1696 ... 8 3.390075 59.7000 184 4.675991 3.438233 75.0000 185 1. 771:500 2.116487 95.0000 186 2.574697 1.418566 71.0000 187 3·.244994 4.203360 60.0000 188 > 4.653:500 ;- 1.911087 80.0000 189 o.o o.o UNKNOWN 190 o.o8:sooo 2.:560240 70.0000 191 2.:545:500 :5.606828 100.0000 192 0.028000 > 0.198:582 100.0000 193 o.o o.o UNKNOWN 194 11.303490 0.664911 79.0000 19:5 o.o o.o UNKNOWN 196 16 .4 ... :546:5 o.88894"" 91.3000 197 0.002000 0.2:50000 100.0000 199 0.017200 UNKNOWN UNKNOWN 200 1.694998 2.769604 70.0000 201 2.1:56999 2.270:524 69.0000 202 0.009:500 95.000000 100.0000 203 10.209991 0.789026 6:5.0000 204 :5.268191 1.:56020:5 7:5.0000 20:5 2.818796 1 • .!.:56192 90.6000 206 1::!.500000 13 .... 408600 100.0000 207 0.180000 2.:53:5211 90.0000 208 2.844998 0.:570140 47.:5000 209 0.413:500 1. 759:574 40.0000 ::!10 0.137000 3.:51::!819 79.9000 211 0.679049 0.834726 UNKNOWN ~1~ 1.763000 2.:50782::! 6:5.0000 ::!13 0.038880 0.7623:53 3:5.0000 :14 o.o o.o UNKNOWN ::!1:5 o.o o.o UNKNOWN ::!16 16.:502472 0.80894:5 78.0000 ::!18 7.800000 UNKNOWN 100.0000 ::!19 1,939999 1.616665 63.0000 ::!::!0, 0.0::!::!000 0.916667 100.0000 2~l: o.o o.o 99.5000 ~~:z 0.860000 ::!.4:57141 100.0000 ~:::!4 o.o o.o UNKNOWN 225 1.679999 1.411764 97.9000 ::!::!6 o.o o.o 29.8000 ::!::!7 1.483199 1.167972 ao.oooo 2::!8 0.364500 1.752403 100.0000 ~29 0.113:500 :5.456731 100.0000 ::!30 1.1:50000 1.642857 88.0000 :31 NOT APP. NOT APP. o.o
177

TABLE SECTION VII-4
COOLING TOWER i·~AKEUP FLOW RATES IN THE PETROLEUM REFINING INDUSTRY
Refinery
~4~ :!43 244 ~45
:!46 :!47 :!48 :!49 ~~0 :!51 ::!:5:! :!'53 :!'54 :!'55 :so :!57 :!58 :!59 :!60 :!61 :!64 ~65 :!66 278 :!91 :!9:2 :95 :296 :!98 30:2 303 305 307 308 309
Makeup Flow (MGD)
o.o :!.4:50000 o.o :! .149999 0.016000 0.016000 1.999999 0.0:5:5000 0.180000 0.324000 0.4:50000 0.:524000 0.61:!000 0.707000 0 .18:!'500 0.:5:58800 o.o 0.380000 o.o NOT APP, 0.009000 o.o o.o o.o 0.040000 NOT APP. 0.79:!000 NOT APP. NOT APP. 0.640000 o.o 1.:!96000 NOT APP. o.o 0.506000 NOT APP, 0.610600 NOT APP. o.o NOT APP. o.o 0.040000 o.o o.o 0.7::!0000
Makeup Flow Divided
By Total Effluent Flow
o.o :.4:50000 o.o 1.43333:::! 0.133333 0.:571428 1.044931 0.436:508 0.300000 0.490909 0.7031:!5 3.11904:5 0.334426 1.178332 0.32'3009 :.696910 o.o 0.4:56731 UNKNOWN NOT APP. 0.064748 o.o UNKNOWN o.o 0.109589 NOT APP. 0.792000 NOT APP. NOT APP. 1.361701 o.o 1.169674 NOT APP. UNKNOWN 3.563379 NOT APP. :2.361176 NOT APP. o.o NOT APP. UNI<.NOWN o.s63931 UNKNOWN UNKNOWN 0.743801
Page 5 of 5
Percentage of Cooling
By BTU by Cooling Towers
:.:sooo 45.0000 UNKNOWN 83.0000 UNKNOWN 90.0000 84.5000 47.0000 UNKNOWN
100.0000 95.0000 <>9.0000 99.0000 99.6000 UNI<.NOWN
100.0000 100.0000 so.oooo UNKNOWN o.o
90.0000 UNKNOWN UNKNOWH UNKNOWN
100.0000 o.o
40.0000 o.o o.o
90.0000 UNKNOWN UNI<.NOWN o.o
UNI<.NOWN 90', 0000 o.o
90.0000 o.o
100.0000 o.o
UNI<.NOWN 100.0000
UNI<.NOWN UNI\NOWN
100.0000
- DUE TO UNKNOWN MAKE-UP FLOWS FOR SOME COOLING TOWERS• fHE NUMBER IS GREATER THAN SHOWN
NOT APP. - NOT APPLICABLE BECAUSE OF 0.0 Z COOLING BY COOLING TOWERS
178

TABLI! VII-S Page 1 of 4
SUMMARY OF FLOW RBDUCTIOit TECHNIQUES USED IDENTIFIED DURING WASTEWATER RECYCLI! STUDY
Process Propoeed Wastewater BAT Potential Flow Reduction
Refinery Baee Discharge Dbcharge Technique• Identified to Additional Flow Reduction• Ro. Year Rata !MGOl Rate !MGOI Achieve BAT Dhcha.r!l• Rata Tachnlquee Identified
32 1979 2.43 3.53 Refinery hae achieved BAT In-Placer di~~eharga rata. Reuee of treated effluent for cooling water,
aervica water, coke eluicing operation, and coke pile duet control. Reuse of atripped eour water for desalter -keQP and washwatar. Recovery an4 reuse of condensate for boiler fae4watar. Potentialr ~ l!euee of etripped aour water an4 leocracker water for cooling tower ~aup. l!ecovary and rauea of condensate for cooling tower -kaup. Optialzation of cooling tower operation
50 1979 0.06 0.32 Refinery has achieved BAT In Placer dhcha.rge rata Reuse of treated affluent for cooling tower
.Uaup.
~ Potential a
-..J Reuae of eour water for desalter ~eup.
1.!> 57 1978 4.10 1.59 Raooverr an4 reuse of In-Place•
condensate for desaltar Reuee of treated effluent for fir-atar ayat-8ak&QP an4 boiler feed- l!ecovery an4 reuse of condensate for desalter water. ~aup an4 boiler fae4wetar Reduction of stea11 vent loaaaa. Control of cooling tower blow4own. Reduction of once-th.ru pu.p cooling water.
60 1979 1.12 2.46 Refinery has achiave4 BA'l' In-Placer dieoha.rge rata Reuee of treated affluent for utility water,
firewater, waa'l!fater, pmop cooling, and coking operation. Reuee of etrippe4 1100r water for desalter -keup an4 vashwater. Recovery an4 reuse of condensate. Recycle of desalter affluent
67 1979 10.0 8.26 Reuu of treated affluent In-Placer for cooling tower .Uaup Reuse of treated affluent for cooling tower .UaQP
an4 firewater eyet ... Potential a l!ecovery an4 raua of con4ansata for boiler feed-water. Reduction of steaa vent loaeee. Recycle of prooeee water.

1-' ro 0
Refinery Baaa ~.!!!!.
84 1978
96 1979
112 1978
125 1978
Page 2 of 4
'l'liBLit VII-5
SUMMAR! Of' P'Ullf REIXJCTIQII maiNigUBs URD lDRitrlPII!O DURING lfiiSTEWATBR RBC!CLB 8'1'11D! (Continued)
Proceaa PropoHd lfaatewatar IIA'I' Diacharga Dbchaqe .. ta IMGDI .. te h!GD)
1.33 1.12
8.o 10.1
0.17 o.u
2.36 1.13
Potential Flow Reduction !'eohnJ.quaa 14entiflad to
Acb!Da IIA'I' Dbohana .. te
Rauae of etdpped 110ur water for desalter .. teup an4 roc washwater. Reduction of boller blov&MI.
Raf lnery baa acbleve4 IIA'r 41acharge rate
RacoYery an4 reuse of con-4en.,.te for boller fee4-water. Re4uction of ateaa vent lospa. Recovery an4 reuse of oncetbru pw~p an4 CCIIIpl"eaaor cooling water for 4esalter ultaup.
Reuaa of traste4 affluent for cooling water at catalytic cracking unit. Replac-t of baro.etrlc COII4ansera with aurfaca con4anaera an4 reuaa of treate4 affluent for cooling. RacoYery ana reuse of con4ansate for boiler feaotvater. Control of cooling to.n~r blov4ovn. Ra4uotlon of once-thru Pdlp coolin9 water.
In-Place•
A441tlona1 Plow Ra4uctiona 'hobn!cruaa 14antifle4
Reuae of traate4 effluent for 4acoking operation. Potential• Recovery of steaa vent losses. Control of cooling tower blovcJovn.
In-Plaeeo Reuae of stripped .our water for 4eaalter .. teup. Recovery an4 reuse of con4enaate for desalter -.keup. Reduction of once-thru pw~p cooling water.
In-Placeo Reuse of traate4 effluent for bara.etric con-denaera and pu-p cooling water at crude unit. Recovery and reuse of condenaate for boiler fee4water. Potential• Reuse of treate4 effluent for utility water, puap and heat exchanger cooling water.

1-' 00 1-'
Refinery Mo.
157
168
180
196
Base tear
1979
1979
1978
1978
Page 3 of 4 TABLI!: VII-S
SUMMARY or FLOif RBDUCTIOR 'l'BCIIIIIQUES USED IDENTIFII!D DURING WI\STEWATER RECYCLI!: STUDY (Continued)
Proeese Proposed Wastewater BAT Discharge Discharge Rate !MGDI Rate !MGDI
2.17 2.31
3.25 2.75
1.81 1.66
26.7 7.6
Potential Flow Reduction Techniques Identified to
Achieve BAT Discharge Rate
Refinery has achieved BAT dbcharge rate.
Reduction of once-thru cooling water and service water. I110proved oil/wster separation for once-thru cooling water with increased segregation froM proceae waatewater for separate discharge.
Control of cooling tower blowdOWil.
Dieeolved air flotation and reuae of treated effluent for cooling tower Makeup, firewater, and service water. Segregation, diasolved air flotation and filtration of ballaat wster, and filtration of regenerant wastes for separate diecharge. EliMination of brackiah ~ater in firewater eysteM.
In-Place•
Additi~nal Flow Reductions Techniques Identified
Recovery and reuse of condensate for boiler feedwater and desalter makeup. Reduction of eteam requirements. Reuse of stripped sour wster for wash water. Reuse of treated effluent for desalter makeup. OptiMization of cooling tower operation. Recycle of desalter effluent and process water. Potential, Recovery and reuse of condensate for boiler feedwater. Reduction of steam vent losses. Reuse of treated effluent for cooling tower makeup. Reuse of once-thru cooling water for cooling tower makeup.
In-Place• Recovery and reuse of condensate for desalter Makeup. Potential! Reuse of stripped sour water for desalter makeup. Recovery and reuse of condensate for boiler feedwater. Reduction of steaM vent losses.
Potential• Reuse of stripped sour water for desalter makeup. Recovery and reuse of condensate for boiler feedwater and desalter Makeup. Reduction of atea• vent losses. Reuse of treated effluent for firewater system.
Potential• Reuse of stripped sour water for desalter makeup. Recovery and reuse of condensate for boiler firewater.

1--' CXl N
Refinery Ito.
205
238
Page 4 of 4
TliBLE VII -5
SUMMARY OF FLOif RBDUCTIOII 'l'BCHNIQUES USED IDENTIFIED DURING WASTEWATER RECYCLE STUDY (Continued)
Process Wastewater
Base Discharge Year Rate (IIGD)
1978 1.65
1979 2.14
Propoaecl BAT
Dhcharge Rate (IIGD)
1.34
1.03
Potential Flow Reduction Tachniquea Identified to
Achieve BAT Discharge Rata
Filtration and reuse of treated effluent for firewater ayatea.
Dissolved air flotation, filtration, and rauae of treated effluent for cooling tower aakeup and vastnrater. Segregation, d1aaolve4 air flotation and filtration of ballast -ter, and filtration of regenerant wastes for separate discharge.
In-Place a
Additional Flow Reductions Tacbnlquaa Identified
Reuse of stripped sour water for desalter makeup. Recovery and reuse of condenaate for cooling tower aakeup and boiler feedwater. Optt.ization of cooling tower operation.
In-Place a Recovery and reuse of condeneate for desalter aakeup and boiler feedvater. Potential• Control of cooling tower blovdown.

TABLE VII-6
Summary of Data on Removal of Cyanides with Steam Stripping and Biological Treatment in
the Petroleum Refining Industry
Percent Removal of Cyanides by Steam Stripping (ref. 48)
Biological Treatment (from Tables V-1 thru V-18)
Refluxed Non-Refluxed
0 91 73 59
0 22 57 50
.22.
Average for Both 53
183
Plant
Number
50 59 80 84
126 169 205 235 AVerage
Percent Removal
of Cyanides
85 60 90 90 83 70 82 52
77

TABLE VII -7
* zero Discharge Refineries
Capacity Refinery (1000 bbl/stream day)
C&H Refinery, Inc. I.usk, WY
S~uthwestarn Refining Co., Inc. LaBarge, WY
Onited Independent Oil Co. Tacoma, WA
Yetter Oil co. Colmer, IL
Dorchester Gas Producing Co. Alllar illo , TX
Mountaineer Refining Co., Inc. LaBarge, WY
Glenrock Refinery, Inc. Glenrock, WY
Thriftway, Inc. Graham, TX
Sage Creek Refining co. cowley, WY
Pioneer Rafin.nq, Ltd. Nixon, TX
Oxnard Refinery Oxnard, CA
car~bou Four Corners, Inc. Kirtland! NM
Kenco Refinery, Inc. Wolf Pol.nt, MT
Kentucky Oil and Refining Co. Betsy Layne, ~
.os
.5
.75
l.
l.
l.
l.
l.
2.2
2.5
2.5
3.
3.0
Page 1 of 4
Wastewater Disposition
Evap/perc pond
No wastewater generated
No wastewater generated
Evap/perc pond
Evap/perc pond
Evap/perc pond
Evap/perc pond
No wastewater gener~tad
No wastewater generated
E:vap/perc pond
Disposal well
No wastewater generated
Evap/perc pond
Illo wastewater generated
* This table includes all refineries whose production wastewater (excludinq stormwater, ballast water, once-thru non-contact cooling
water, and sanitary wastewater) is not discharged directly via an ~POES pe:mit nor is discharged to a E'O'l'W. This table also includes those refineries which do not generate production wastewater.
184

TABLE VII-7
Capacity Refinery (1000 bbl/stream day)
Sabre Refining, Inc. Bakersfield, CA
Mid-Tax Refinery Hearne, TX
Bayou State Oil Corp. Shreveport, LA
Thriftway Co. Farmington, &M
Southern Onion Refining co., Monument Refinery, Hobbs, ~
Ar~zona Fuels Corp. Fredonia, AZ
Tonkawa Refin~ng Co. Arnett, OK
!?lataau, Inc. Roosevelt. O't'
Texas Asphalt and Refining Co. El.lless. TX
Sunland Refining Corp. Bt.kersfield, CA
Plateau, Inc. Farmington, &M
Douglas• Oil Co. of CA Santa M.ar~a, CA
Gary Western Co. Fru.J.ta, co
E-Z Serve, Inc. Scott City, KS
3usky Oil Co. Cody, WY
3.5
3.5
4.
4.
4.5
5.
5.
5.6
6.0
7.
7.5
9.5
10.
10.
10.8
185
Page 2 of 4
Wastewater Disposition
Contract disposal
Recycle (7/l/77)
Disposal well, Evap/perc pond
Evap/perc poncl
Disposal well
Leaching bed Duposal well
Evap/perc pond
Evap/perc pond
Evap/perc poncl Contract cl.Uposal
Evap/perc poncl
Evap/perc pond
D~sposal well
Evap/perc pond Recycle
Evap/perc pond
Evap/perc pond (7/1/77)

TABLE VII-7
Refinery
Witco Chemical Corp. Oildale, CA
Newhall Refining Co., Inc. Newhall, CA
Atlantic Richfield Co. t'rudhoe Bay, AK
Atlantic Terminal Corp. Newington, NH
Kern County Refinery, Inc. Bakersfield, CA
San Joaquin Refining co. Bakersfield, CA
Texaco Inc. El Paso, TX
Shell Oil Co. Gallup, NM
Texaco, Inc. Amarillo, TX
Texaco,. Inc. Casper, WY
(1000
Mohawk Petroleum Corp., Inc. Bakersfield, CA
CRA, Inc. Phillipsburg, KS
Husky Oil Co. Cheyenne, WY
Southern Union Refining Co. LOvington Refinery, Ho.b.bs, NM
Little America Refining co. Evansville, WY
Chevron U.S.~. Inc. Bakersfield:, CA
Capacity b.bl/stream
ll.
12.
13.
15.
17.
17.
17.
19.
20.
21.
22.8
23.2
24.2
25.1
25.5
26.
186
da;tl
Page 3 of 4
Wastewater Disposition
Contract disposal
Contract disposal
Evaporation
Leaching bed
Surface spray
Evap/perc pond, recycle
Evap/perc pond, recycle
Evap/perc pond
Oisposal well, Evap/perc pond
Evap/perc pond, recycle
EVap/perc pond
Evap/perc pond
Evap/perc pond
Oisposal well
Evap/perc pond
Contract disposal, recycle

TABLE VII-7
Capacity Refinery (1000 bbl/stream day)
Navajo Refining co. 29.9 Artesia, NM
Champlin Petroleum co. 32. Wilmington, CA
Shell Oil Co. 35. Odessa, TX
Lion Oil co. 40. Bakersfield, CA
Amoco Oil co. 44.5 Casper, WY
Sinclair Oil Corp. 50.9 Sinclair, WY
Diamond Shamrock Corp. 53.5 sunray, TX
Cosden Oil and Chemical Co. 56. Big Spring, TX
Hawaiian Independent Refininery Ewa Beas:h, HI
Chevron U.S.A. Inc. El Paso, TX
60.3
75.
187
Page 4 of 4
Wastewater Disposition
Evap/pero pond
Disposal well
Evap/perc pond
Disposal well, Evap/perc pond
Evap/perc pond, recycle
Evap/perc pond
Disposal well
Evap/perc pond, recycle
Disposal well, Evap/perc pond
Evap/perc pond

TABLE VII-8
STEAM ELECTRIC POWER PLANTS USING VAPOR COMPRESSION EVAPORATION AS PART OF THEIR WASTEWATER TREATMENT SYSTEM
Station & Location
San Juan Station Farmington, NM
Huntington Station Huntington, UT
Navajo Station Page, AZ
Hayden Station Hayden, CO
Colstrip Station Colstrip, MT
Craig Station Craig, CO
R. D. Nixon Station
Four Corners Fruitland, NM
Pawnee Station Brush, CO
Big Stone Plant South Dakota
Capacity Owner/Operator (lbs/hr)
Public Service Co. 94,500 of New Mexico 189,000
Utah Power & Light 94,500
Salt River Project 94,500
Colorado-Ute Electric 123,000 Assoc. Inc.
Montana Power Co. 157,000
Colorado-Ute Electric 350,000 Assoc. Inc.
City of Colorado 175,000 Springs
Arizona Public Service 202,000
Public Service Co. 227,000 of Colorado
Otter Tail Power 300,000
188

Page 1 of 26 t'DJ.B YII-9
TUAt11111'1' OPIIA1'IOIIS AHD VATU USAGB 1913 AHD 1976
Vater Uaqe Ref. t'reataent Operation• HUlton Gal/Dal !...!!!:. llo. 1973 ill! ill.! .!!!! 001 DAI' Corr. Plata Sep. 0.61 1.87 -207
Act. Sludge DAI' Act. Sludge
002 Cbeaic:al Jloc. 0.291 0.186 36
003 DC 0.125
004 Ilona __. (X) 1.0 006 Stab. Pond DAI' 0.144 0.144 o.o
Aerated Lag.
007 DAr. DAI 0.243 -22 Stab. Pond Aerate4 Lag •. 0.200
008 Aerated Laa. -~.0
009 Aerated Laa. Aerated Laa. 0.26 o.ot 65 Pol. Poad
010 Stab. Pond Stab. Pond 0.44 0.14 68
011 Stab. Pond 2.92 3.52 -21
012 Stab. Pond Pre-Filtration 0.23 0.72 -213 Stab. Pond
013 DAI' Ch-ical Floc. 12.35 10.96 11 DAr
014 DAI' 0.062 0.155 -150

Page 2 of 26 TABLI YII-9
TIIATHEHT OPERATIONS AND WATU U~l 1973 ~ 1976 (continued)
Water Uaase &ef. Treabaent Operations Million Gal/Da~ ~ No. 1973 1976 1973 . 976
015 DAr Ch•ical Jloc. 0.270 filtration OAf
016 None None 0.56
' 017 Ch•ical floc. 0.06 lvap. or Perc. Pond
018 Hone Hone 0.60
019 None Hone \D 0
020 DAr Ch•ical floc. 4.79 4.51. 5.8 Act. Sludse DAr
Act. Sludse Pol. Pond
021 None Hone 0.22
022 DAP 0.18
023 filtration .475 lvap. or Perc. Pond
024 OAF DAP 0.35 0.54. -54 Aerated Las. Aerated Las.
Other Ora. Ilea.
025 oAr DAP 1.4 Other Ora. Ilea.
026 None Other Ora. Ilea. 0.35
027

Ref. Ho.
028
029
030
031
032
__. \.0 __.
033
034
035
036
037
038
039
040
TABLE VII-9
TREATMENT OPIIATIOHS AND WATER USAGE 1973 AND 1976 (continued)
Page 3 of 26
Water Dease Treataent Operation• Killion Gal/Dal
1973 1976 1973 1976
Hone OAl 6.5
Hone Evap. or Perc:. Pond 0.33
None DAl 0.10
DAI' DAl 18.80 16.2 Aerated Las. Aerated Las. Stab. Pond Stab. Pond
0.71
Hone 4.0
Evap. or Perc:. Pond Evap. or Perc:. Pond 0.12
DAI' DAl 7.6 7.6 Ac:i:. S1udse Aerated Las.
Pol. Pond
Corr. Plate Sep. Corr Plate Sep. 7.73 6.34 DAl DAl
Evap. or Perc:. Pond 0.35
Hone Ch-tc:al floc. 57.0 11.2 DAr
Act. Sludse Othera Ors .....
~
14
o.o
18
20

Page 4 of 26
TAILB VII-9
TIBA'niiiiT Ol'BIIATIOHS AND VATBil USAGB 1973 AIID 1976 (continued)
Vater Uaage lef. Treat .. nt Qeerationa Million Gal/Dal l led. !!!:_.. !ill. 1976 1973 .!!!!
041 Aerated Lag, Corr. l'late Sep. 126.2 Aerated Lag. Stab. l'ond l'ol. l'ond
042 Aerated Lag. Qaeaical Floc. 0.10 Bvap. or l'erc. l'ond Aerated Lag.
lvap. or Perc. l'ond
043 Hone DAr 4.96 Stab. l'ond
044 filtration 2.72 --'
lvap. or Perc. Pond 1.0 N 045 DAr Ch•ical noc. 29.71 28.9 2.7
-DAr OAr
046 DAr Ch•ical floc. 55.60 44. 21 DAr
047
048 Stab, Pond Bvap. or l'erc. Pond 1.27 0.85 ~3 lvap. or Perc. l'ond
049 Aerated Lag. Aerated Lag. Pol. Pond
1.53 0.71 50
050 Aerated Lag. DAr Aerated Lag.
0.40 0.47 -18
Stab. Pond Filtration

Page 5 of 26 TABLI VII-9
TREATKIHT OPERATIONS AND WATER USAGE 197]L_AHD 1976 (continued)
Water Usage l.ef. Treataent Operations Million Gal/Da~ I Red. No. 1973 1976 1973 976 -- --051 Act. Sludse Chemical floc. 321.
IW' Act. Slud1e Pol. Pond
052 Evap. or Perc. Pond Stab. Pond 0.34 Pol. Pond
053 None Filtration 1.25 0.11 Question-__, able 1.0
w Data
054 IW' 0.08 0.09 -13
055 None Corr. Plate Sep. 0.18 Stab. Pond Pol. Pond Bvap. or Perc. Pond
056 Aerated Las. DAr 5.82 -37 Aerated Las. 4.24 Pol. Pond Bvap. or Perc. Pond
057 Aerated LaB• Aeraged Lag. 11.63 Pol. Pond
058 None IW' 2.13
059 IW' IW' 51.27 2.4 Question-Aerated Laa. Act. Sludge able
Deta

Page 6 of 26 TAILI VII-9
TIIAntEHT OPEIATIOHS AND WATEil US~ 1973 ~ 1976 (continued)
Water U88ge aef. Treataent ~erattona HUlton Gal/Dal ~ ~ 1973 1976 1973 1976
060 DAr Cheat cal Jloc. 4.84 5.2 -7.4 Aerated Lag. DAr Act. Sludge Act. Sludse rntratioo rut ration
061 DAr Cb-1cal Floc. 12.09 Act. Sludse DAr
Act. Sludge Pol. Poad
__, 062 Trick Filter Trlc:k rntec 13.4 9.57 29
\0 ~ lvap. or Perc. road .Urated Las.
Pol. load
063 .Urated Las. .Urated Las. 7.97 8.79 -10 Stab. load Pol. load
064 DAr DAr 27.89 24.8 11 Act. Sluds• Act. &luds•
065 Act. Sluds• Act. Sludse 4.06 5.0 -23 Pol. load
066 lvap. or Perc. Pond 0.001
067 DAr Cb•lcal noc:. 13.49 144.3 -7 Aerated Las. DAr
.-rated Las.
068 Act. sluds• Act. Sludse 8.52 6.72 21
070 None 0.17

'UIU Yil-t Page 7•.of 26
!UATHIIIT OPIUTIOU .AJID VATU D8AGI 1973 .AJID 1976 (coatlMCI)
Watel' Uaqe Ref. Traat .. nt ~l'atlona IUllion Gal/Dal .!..!!!:. !2:..._ 197l 1976 ll1l 976
071 DU Cbeaical noc. 0.68 o.st 13 Stab. PoD4 DU
Aente4 Laa. Pol. road
072 Aant~ ,La,. a.-teal noc. 1.44 Stab. Poad Ael'ate4 Lq.
Pol. road
07l Aerated Laa. CIUialcal ftoc. 1.01 1.7t -77 --' Stab. Pond .Aerate4 La&· 1.0 Pol. PoD4 CJ"'
074 Aerated taa. Aentetl La&. 0.61 0.67 -o.3 Pol. Poad
075 Hone 1.27
076 Stab. Poud Qaealcal noc. 3.60 1.0 17 Auated La&. Pol. Poud
077 lvap. Ol' Pare. Pond Act. Siuda• 0.61 0.63 o.o Pol. PoDd lvap. or Pare. Pond
078 Hone Ch•lcal J'loc. O.Sl
079 Hone 0.16
080 Stab. Pond Stab. Pond 1.33 3.46 -160

Page 6 of 26 TABLI VII-9
TUATMENT OPBilATIONS AND WATEI. USAGI 1973 AND 1976 (continued).
Water Uaage Ref. Treataent O~rationa HllUon Gal/Dal ~ No. 1973 1976 1973 !.!1! 081 Chemical Floc. Aerated Lag. 2.50 1.58 37
Aerated Lag. Pol. PoPel Stab. Pond
082 None lvap. or Perc. PoPel
083 DAF DAF 4.63 4.86 -s.o
084 Aerated Lag. DAF 3.54 3.84 -8.5 _, Stab. Pond Act. Sludge 1.0
"' Pol. PoPel
085 None Chemical Floc. 11.0 10.43 5.2 OAF
Act. Sludge
086 DAF Chemical floc. 0.35 0.47 -34 DAr
087 None Bvap. or Perc. Pond 0.42 1.0 -138
088 OAF Stab. Pond 1.16
089 Bvap. or Perc. Pond lvap. or Perc. Pond 0.31 0.19 39
090 Aerated Lag. 0.031
091 None None 0.032 0.012 63
092 PAJ DAF 321.5 278.8 13 Other Org. Rem. Act. Sludge
Aerated Lag. Pol. Pond

Page 9 of 26 TABLE Vll-9
TREATMENT OPEilATIOHS AHD WATER USAG~ 1973 AHJ) 1976 (continued)
Water Uaage llef. Treataent Oeerationa Million Gal/Dal• !...!!!:. Ho. !ill !ill .1973 1976
093 Hone
094 Act. Sludge Corr. Plate Sep. 4.59 3.6 22 Aerated Lag. DAr
Act. Sludge Pol. Pond
095 Hone Stab. Pond 0.60 Pol. Pond __.
\.0 "-.J 096 Corr. Plate Sep. Corr. Plate Sep. 90.52 34.64 62
Aerated Las. Ch-i cal Floc. DAr
Act. Sludge
097 Hone 0.034
098 Aerated Las. OAF 31.27 26.56 15 DAr Aerated Lag. Stab. Pond
099 DAr 121. Aerated Lag. Pol. Pond
100 Filtration Filtration 0.19
101 Aerated Lag.
102 Aerated Las. Aerated Lag. 17.9 21.1 -18
103 Aerated LaJ. 0.27

TABLE Vll-9 Page 10 of 26
'l'IIATMKHT OPIU'fiOIIS AliD WATER USAGI 1973 AIID 1976 (coati oued)
Water Uaage Ref. Treat .. at 02!ratiooa Killioa Gal/DaJ I Reel. .!2:_ 197:J 1976 0 1973 976
104 Aerated Lag. Corr. Plata Sep. 24.88 21.34 14 Aerated Lag. Stab. Poad
105 Aerated Lag. Cbeaical Floc. 11.0 84. -18 OAF . Aerated Lag.
__, 106 Stab. Poad Aerated Lag. 5.76 4.59 20 \0 Pol. Poad CP
107 Hone Filtrttion 0.39 0.39 0.0
108 DAr OAF 0.31 0.34 -9.7
109 DAr Cbeaical Floc. 83.25 66.22 20 Act;. Slucl&e, DAr Trick. Filter Act. Sludge
Trick. Filter Pol. Pond
110 Stab. Poad 1.22 1.0 18
111 Cbealc:al noc:. 1.8 DAr
112 Filtration Aerated Lag. 0.75 0.51 32
113 Aerated Lag. Aerated Lag. 1.14 0.90 21 Pol. Pond
114 Act. Sludge Aerated Lag. 0.72 0.59 18 Pol. Pond

TABLB VII-9 Page 11 of 26
TUATMBHT OPIIlATIOIIS AIID WATIIl USAGI ltn ~ !976 (continued)
Water Uaage llef. Treat.ant 02erationa Million Gal/DaJ I led. Mo. 1973 1976 1973 976
115 Act. Sludge Pre-Filtration 5.05 3.92 22 Act. Sludge Pol. Pond
116 Aerated Lag. Stab. Pond 2.06 2.77 -34
117 DAr OAF 2.01 2.10 -4.5 Aerated Lag. Aerated Lag. Stab. Pond Pol. Pond
__. 118 None Aerated Lag. 0.13 0.94 -623 1.0 Filtration 1.0
119 Filtration Aerated Lag. 0.17 0.23 -35 Filtration
120 Hone Aerated Lag. 0.35 0.29 17 Filtration
121 Corr. Plate Sap. Corr. Plate Sap. 34.5 14.0 59 DAr DAP Aerated Lag. Aerated Lag. Stab. Pond Other Org. Ilea.
Pol. Pond
122 Aerated Lag. Aerated Lag. 12.08 35. Queation-able Data
124 Hone Cbeaical floc. 1.87 DAr
Stab. Pond

Page 12 of 26
TABLI VII-9
TUATHIUIT OPIIATIOHS AHD WATIR USAGI 1973 AHD 1976 (continued)
Ref. Treat88nt Operationa Water Uaa'e
Million Gal Dal I Red. ~ 1973 !!!! 1973 .!.!1! 125 Aerate4 Las. Aerated ~•I• 1.23 1.28 -4.1
Stab. Pond Otber Ors. lea. Pol. Pond
126 Aet:ated Las. !erated Las. 33.0 40.8 -24 Stab. Pond Pol. Pond
127 DU Oleaical noc. 0.31 0.25 19 Aerated Las· DU Stab. Pond Aerated Las.
N Pol. Pond 0 0
128 •vap. or Perc. Pond 0.01
129 Bvap. or Perc. Poad Aerated Las. 0.15 lvap.. or Perc. Pond Pol. Pond
130 Hone lone 3.13 2.67 u
131 Stab. Pond OAF 74.01 56.6 24 RIC -
132 Act. Sludse ou 174.5 181.5 -4.0 Aerated Las. Act. Sludse
Ill Stab. Pond DlJ' 35.28 19.3 45 .A~t. Sludse Trick. filtu filtration
134 Stab. Pond Act. Sludse 1.64 8.81 -2.0 filtration

N 0 ........
Ref. ~
135
136
137
138
139
140
141
142
143
144
145
146
147
148
Page 13 of 26
TdU YII-9
TIU'l'MUT OPIUTIOIIS Aim VATD US.AGI 1973 Aim 1976 (colltlauad)
Treat .. llt Operetlona Vater u .. ae
111llioll Gal/DaJ 1~73---~ -- ----.!!!! .ill! 1!!!
Hooe
Hone
Stab. Poad
Hone
OAF
OAF
Aerated Las.
Stab. Pond
DAr
DAr
Cou. Plate Sep.
lloDe
lvap. or Perc. PoQd
lvep. or Perc. Poad
lvap. or Perc. Poad
lvep. or Perc. Pond
Cbealcal floc. DAr
Ch-lcal floc. DAr
urated ..... Pol. Pond
Hone
Stab. Pond
Ch-i cal Floc. DAr
Act. Sludse
DAr·
18.35
28.85
45.02
0.32
1.40
0.6
0.06
1.03
0.168
0.5
0.03
21.67
33.7
1.17
0.014
0.3
1.94
0.47
!....!!!:.
-18
-17
Question-able Data
6.3
-39

TABLI VII-9 Page 14 of 26
TIEA'l'MBIIT OPIIATIOIIS AIID WATIIl USAGI 1973 AIID 1976 (continued)
Water Uaase lef. Treabaent Operation• Million GallO.~ ~ llo. 1973 .!ill. 1973 976
149 Aerated Las. Corr. Plate Sep. 1.78 4.92 -176 Aerated Las.
150 Aerated Las. Corr. Plate Sep. 84.44 60.14 29 Act. S~udse
151 DAF Cbeaical floc. 6.50 7.59 -17 Aerated Las. DAF
Aerated Las. N Pol. PoDd 0 N 152 DAF DAF 122.1 44.05 64
Aerated Las. Act. Sludse
153 Act. Sludse Other Orsanica lea. 5.43 4.7 13 Trick. Filter Filtration Aerated Las. Stab. Pond
154 Aerated Las. Stab. Pond 0.31 0.85 -174 Pol. Pond
155 Stab. Pond Stab. PoDd 0 •. 59 0.65 -10 Pol. Pond
156 Aerated Las. Chemical Floc. 2.47 2.37 4.0 DAr
Aerated Las. Pol. Pond
157 Other Organtca lea. Act. Sludge 7.65 7.33 4.2 Aerated Las. Other Organica lea.

Page 15 of 26 TABLI Vll-9
TUATMBHT OPIIATIOHS ~ WATII. US~~ 1971_ AJ1D 1976 (continued)
Water Uaa'e l.ef. rraataent 02erationa Million Gal Oaf !...!!!:. ~ 1973 !lli 1973976
1S8 Ac:t. Sludse Ac:t. Sluqe 1.40 1.49 -6.4 Stab. Pond Pol. Pond
1S9 None Stab. Pond 0.75 0.69 8.0 Pol. Pond
160 DAI' Chemical floc:. 0.53 0.65 -23 Ac:t. Sludse OAr
N filtration Act. Sluds• 0 Stab. Pond w
Pol •. Pond lvap. or Perc:. Pond
161 Aerated Las. Aerated Las. 1.'12 0.12 -81 Other Orsanic:a l.ea. Pol. Poad
162 DAI' DAr 5.84 6.3 -7.9 Aerated Las. Act. Sluilge
163 Aerated Lag. Aerated Las. 4.48 3.5 22 Pol. Pond
164 lvap. or Perc:. Pond
165 Stab. Poad Ch-i cal floc:. 0.73 o.8o -9.6 DAr
Stab. Pond Pol. Pond
166 None Hone 0.2

Page 16 of 26
TAILB VII-9
TIIATHIII'T OPIU.TIOiiS MID W.lTIR US.AGB 1971 MID 1976 (continued)
Water Uaa'e Ref. Treataeat Operatioaa Million Gal Dal U!!:. ~ 1973 .!lli ill! 1976
167 D.lF Cbeaical floc. 9.84 11.8 -20 Other OrJanlca lea. D.lF
.let. Sludge
168 PUt ration Pre-lllts:ation 81.4 123. -Sl .let. Carbon .let. Car boo
169 .let. Sludge .let. SludJe 51.2 49.23 3.8 N Trick. lUter Trick. filter 0 ~
170 Hone 7.84
172 Hone Hooe 1.58
173 liooe Hooe 5.43 1.07 43
174 Hone Aerated Lag. 28.8 8.08 72
175 liooe Corr. Plate Sep. 124.5 106.6 14
176 Hone Aerated Lag. 3.28 5.86 -79
177 Hone Hone 4.10 2.15 48
178 ~ o.8z
179 Aerated Lag. Cheaical Jloc. 0.98 0.98 o.o Aerated Lag. Stab. Pood Pol. Pond
180 Aerated LaJ. D.lF 4.18 1.91 11 lvap. or Perc. Pond .let. Sludse

Page 17 of 2~ TABLE YII-9
I'IUU'l'MBNT OPIIATIOIJS AND WATIR US.tGI lt7l AIID 1976 (continued)
Water Uea'e Ref. Treat .. ot Of!ratiooa Killion Gal Dal !...!!.!!.:. ~ 1973 .!!!! !!.!! .!!!! 181 Aerated Las. Pre-1'1ltrat1oo
Act. Sluclse 26.70 27.5 -3.0 1'1ltrat1oo
182 Aerated Laa. Act. Sluclse 16.56 14.53 12
183 DU Cbeaical l'loc. 1.40 Aerated Las. DU
N Aerated Las. 0 Pol. Pond c.n
184 Act. Sluclae a--teal l'loc. 6.32 6.86 -8.5 Act. Sludae
185 Bvap. or Perc. Poocl lvap. or Perc. Poocl 2.4
186 DU DAr 4.35 6.13 -18 Act. Sluclse Act. Sluclse
Stab. Poocl
187 Evap. or Perc. Poocl I'Utratioo 2.35 lvap. or Perc. Poocl
188 Hone Corr. Plate Sep. 6.22 5.23 16
189 Hone Aerated Las. 0.05 0.03 40 Pol. Poocl
190 OAF Aerated Las. 0.40 0.12 70 Aerated Las. Pol. Poocl
191 DAr 2.89

Page 18 of 26
TAILI VII-9
TBEATHBHT OPIRATIOHS AND WATEa USAGI 1973 AND 1976 (c:oatlnued)
Water Uaa'e aef. Treat.eot O~eratiooa Hillioo Gal DaJ l.!!!!. ~ 1973 I ill! !lli _ill
192 lvap. or Perc:. Pond 0.035
193 llooe 110114 0.039 0.053 -36
194 Aerated Lag. Aerated Lag. 44.25 32.7 26 Stab. Pond Pol. Pond
195 Hone Ilona 0.0011
196 DU Corr. Plate Sap. 130.0 46.38 64 N Act. Sludge Q\ealcal floc:. 0 Stab. Pond DU 0'\
Act. Sludge Stab. Poocl
197 Aerated Lag. 0.012 Pol. Pond
198 Hone
199 Pra-I'Utratioo 0.05 hratecl.La&. I'Utr~ttiOD
200 llooe llooe 2.00 1.43 29
201 DU Cheaical Ploc. 2.02 2.9 -44 .Aerated Laa. DAr
Act. Sludge PUt ration
202 0.004

TAi~ VII-9 Page 19 of 26
TUA'l'HEIIT OPUATIOHS AIID WATIR USAGI 1973 AIID 1976 (continued)
Water Uaase Ref. Treabaent ~erationa Million GallDef I Red. Ho. 1973 1976 1973 976
203 DAr Cbeaical rloc. 52.4 29.14 44 Act. Sludge OAF
204 Act. Sludge ctae.ical floc. 8.07 OAF
Act. Sludge Pol. Pond
205 DAI' OAF 12.66 9:05 29 Aerated Lag. Aerated Lag.
N Stab. Pond Pol. Pond 0 ........ 206 lvap. or Perc. Pond 0.05 0.14 -180
207 Hone Hone
208 Trick. filter Corr. Plate Sep. 15.25 23.2 -52 Act. Sludge Act. Sludge Stab. Pond Trick. filter
Stab. Pond
209 Evap. or Perc. Pond OAF 0.76 Stab. Pond Pol. Pond lvap. or Perc. Pond
210 Hone
211 DAI' Chemical floc. 1.25 1.98 -58 Aerated Lag. DAl
Act. Sludge Aerated Lag. filtration

TABU VU-9 Page 20 of 26
TIEA'l'HEH'f OPIBATIOHS AND WATIIl USA~I 1913 .~ 1976 ( cont lnued)
Water Usage llef. Trestaent Operations Million Gal/Dal ~ No. 1973 !ill. 1973 1976
212 DAP D.U 3.57 Act. Sludge Act. Sludge
213 OAF OAr 0.14 Aerated Lag. Stab. Pond Pol. Pond
214 lvap. or Perc. Pond lvap. or Perc. Pond
N 2U lvap. or Perc. Pond lvap. or Perc. Pond 0 00
216 Act. Sludge Cb-ical Floc. 672. 53.24 Question-Aerated Lag. Act. Sludge able
Aerated Lag. Data
218 Evap. or Perf• Pond 0.68
219 Aerated Lag. Aerated Lag. 3.45 Pol. Pond Filtration
220 Evap. or Perc. Pond 0.087
221 Act. Sludge Other Organics Rea. 14.33 8.15 43
222 Stab. Pond Aerated Lag. 0.89 Pol. Pond
223 None
224 DAF Cheaical Floc. 0.40 0.413 -3.3 DAr

N 0 \0
Ref. .!!!.!_..
225
226
227
228
229
230
231
232
233
234
TABLI VII-9 Page 21 of 26
TIU.DWIT OPIIlATIOIIS AIID VATIIl USAGI 1973 AIID 1976 (contioued)
Treat .. nt Operation• 1973 --1976
DAI'
Stab. Polld
Stab. Pollll lvap. or Perc. PoDd
lvap. or Perc. Polld
Hoae
Stab. Polld
Aerated Lal• rutratioa
DAI' Act. Sludse Stab. Polld
DAI' Act. Sludge
DAI' JiltrUion
Stab. Pollll Pol. Pollll
ou Aerated LaJ• llBC Pol. Pollll rutratioa
S~ab. Poncl Pol. Pollll
lvap. or Perc. Poncl
Stab. PoDd
a.-leal noc. Filtration
Act. Sluclfe Trick. Ji ter Pol. Poncl
DAr Act. Slucls• Trick. Filter lol. Poncl
Vater Uaase Killion GallDaf
1973 ~76
0.04
2.5~
0.48
1.80
72.22
5.59
2.30
2.52
0.084
2.59
0.55
0.15
1.5
63.65
3.75
ll!!:.
-110
-1.2
-15
17
12
33

UILI VII-9 Page 22 of 26
TIIATHIHT OPBIATIOHS AND WATER USAGE 1973 AHD 1976 (continued)
Water Usage Ref. Treabaent ~rations Hillion Gal/Da{ l Red. Ho. !lli 197, 1973 976
235 Trick. •nter Act. Sludge 4.40 3.66 17 Act. Sludge Trick. nlter
Pol. Pond
236 •ntration 0.13 o.u -15
237 Corr. Plate Sep. Corr. Plate Sep. 0.038 ou
Act. Carbon N
238 Trick. •tlter Act. Sludge 3.72 4.2 -13 __. 0 Act. Sludge Trick. •titer
Aerated Lag. Stab. Pond Pol. Pond
239 Filtration Corr. Plate Sep. 0.23 0.216 6.1 Stab. Pond DC
Pol. Pond
240 None 1.58 1.34 15
241 Other Organica Rea. Act. Sludge 2.47 0.96 61 Pol. Pond
242 None Hone 0.95 0.86 9.5
241 Aerated Lag. Aerated Lag. 0.86 0.71 10 Evap. or Perc. Pond Pol. P9nd
244 Bvap. or Perc. Pond 3.19

N __, __,
l.ef. No.
245
246
247
248
249
250
251
252
253
254
255
256
Page 23 of 26 · TABLB Vll-9
TiiATMIHT OPBIATIOHS AND WATEI. USAGE 1973 AND 1976 (continued)
Treataent Operation• 1973 1976
Stab. Pond
DAl Stab. Pond lvap. or Pare. Pond
Bvap. or Perc. Pond
DAP lvap. or Perc. Pond
Bvap. or Par~. Pond
Stab. Pond
Evap. or Perc. Pond
Corr. Plate Sep. Aerated Lag. Pol. Pond lvap. or Perc. Pond
Aerated Lag. lvap. or Perc. Pond Pol. Pond
lvap. or Perc. Pond
lvap. or Perc. Pond
DAP lvap. or Perc. Pond
Stab. Pond
Bvap. or Perc. Pond
Hone
Pre-Filtration Aerated Lag. Pol. Pond
Corr. Plate Sap. Stab. Pond
Water Uaage Million Gal/Day
1973 1976
2.16 2.84
0.84
0.24 0.32
1.0
0.13
0.04
I l.ed.
-31
-33

Ref. ~ ill! 257 DU
Aerated Lag.
258 Aerated Lag.
259
"' __,
"' 260 Hone
261
264
265
266 Hone
275
278
282
TABLB Vll-9 Page 24 of 26
Ti!ATHINT OPEIATIOHS AND WATER USAGE 1973 AND 1976 (continued)
Treataent Operation• 1976
Stab. Pond
DAr Act. Sludge Pol. Pond
OAF Act. Sludge
Aerated Las.
DU Trick. PUt.r
uc Evap. or Perc. rood
Corr. Plate Sep. DAr
Act. Sludse Stab. Pood Pol. Pond
Hone
Hone
Water Ueege Million Gal/Day
~---- 1W6
99.5
1.96
21.55
0.25 1.0
3.0
2.07
0.94 0.83
0.024
I Red.
-300
12

N __, w
lef. Ho.
283
284
287
288
289
290
291
292
293
294
295
296
297
298
Page 25 of 26 TABU YII-9
ftU.'niUT OPIIATIOIIS AIID V~TU. USAG& 1913 AIID 1976 (continued)
Treat .. nt Operationa 1973 m
Vater Uaase Million Gal/Day
ill! _m ~

llef.
~
299
300
301
N 302 --' .p. 303
3()4
305
306
307
308
309
TABLE VII-9 Page 26 of 26
TIIATHIUIT OPIIIATIOHS AND WATER USiGI 1973 AND 1976 (continued)
Treat.aut Operation• .!!1! !lli
lvap. or Perc. Pond
lvap. or Perc. Poad
Cheat cal l'loc. Act. Sludge Aeratecl Lag.
Water Uaqe Hil~io~ Gal/Day
!ill. --nn ~

TABLE VII-10
S!mna of Trg1;m,ID1j 'tJs!mologig for 1973 md 1976
=11tmerrt: iXI:!;IIIII N'Umb!Ui: Silf un
~teci Plate S•pantors 4
01.Ucal lloc:culation 1
Di .. olve Air Plotaticm 56
Othu: l'lotat.ion Sy•t- 1
PntUt::at.ion TJDlcnCiwn
Activated Sludqe 30
Tn.c:Jcl.i.nq l!'ilt-.r 7
unteci r.qoon 63
St:a.bil.i.zation i'rmd 44
Ratatinq Bioloqical Contac:tor 0
Other Orqanic::s a.K)YaJ. 4
l!'ilt:a~ 10
Pallshinq i'rmd8 T1DJCDowl1
Ac:ti.vateci <:arDon 1
!:lraporatian or Percal&t:Lcn Ponda 2&
BI':.UWII Uli
20
46
68
l.S
s<1l
so
10
73
35
5
10
23(1)
7!5
2
37
(1) Twa refineries have both pretiltrati.cm and po•t fi.lt..-ation. so that a total of only 27 refineries had filtration systiD 1976.
215

TABLE VII-11
IIEFDDY rtolf VS • rmAI. !2'!'I.D!:11'r ~011 roa l. 1 sCII!iEliDG Pr.AHTS
Pee~ of Avvaqe Avuaqe Avvaqe AYU"aqe Ratii!.MY ~Di~ BOD, TSS, 'rOC, Oil. all4 ~-.
Code n- to arr flaw !!Ll- :!!iLL- ~ !!J!l
A 40.8 c 4 • .5 37.0 u.o • a 17.8 ].8.5 zz.o 43.0 34.0 c 36.7 41.0 ].9.0 39.0 9.0 D 49.7 u.s.o 62.0 420.0 • t 1.43.3 <. 9.5 l.4.S lO.O • r • 96 :Z7.0 l.03.0 9Z.S • G Ul.7 <.12 • .5 56.0 60.0 ].6.5 II 72 • .5 4 4.5 9.0 ].9 • .5 zo.o I 69.4 <U.O a.o 31.5 6.0 .1 58.0 6.0 u.s 30.0 u.o It 89.4 4 a.s 14.0 40.5 u.s t. l.73.9 4 7.5 :Z7.S l.6 • .5 • II 35.0 <-U.o u.s l.6.0 u.o II 69.l 9.0 45.0 34.5 • 0 Ul.J 451.0 :zs.o 46.0 .. p • .: 5.0 6 • .5 43.5 • Q za.o :zs. 0 30.0 68.5 u.o
SJ.ove •. u •• lS •• Jl. - .u tAa=ept: 31.27 42.40 70.96 :Z6.03 (c:oznl,ad.oD) :z .03 .08 .08 .09
!Iota I • • 110 DAD
216

TABLE VII-12
Effluent Concentration From SO Plant Study
Pollutant Parameter Daily Maximum 30-day
Study BPT Study BPT N __, '-I BODl 62 48 20 25.5
TSS 58 31 24 21 0 & G 17 15 5.6 8.0 CRT 0.5 0.725 0.13 0.425 POL 1.2 0.35 o. 19 0. 17
NOTE: Concentrations are given in milligrams per liter (mg/L)

TABLE VII-13
ACHIEVABLE LIMITATIONS VALUES
Mean Daily Daily 30-Day 30-Day Pollutant Pollutant Variability Limitation Variability Limitation BPT Refineries Level Factor Value Factor Value
BOD 15.74 3.93 61.86 1.27 19.95
TSS 19.23 3.00 57.69 1.22 23.53
O&G 4.446 3.90 17.34 1.27 5.63
CRT 0.0928 5.48 0.5085 1.36 0.13
POL 0.1229 10.04 1.234 1.56 0.19
N __, co
Note: Concentrations are given in mi-lligrams per liter (mg/L)

~
lS = ..J en en -I --u en
>
-g
UJ
<.II
~
c::
z
~ ...
:;)
-<.II
en
~
... Q ~
< =
... ..J
~
en z = = ... -u.. ~
~
219

N N 0
FIGURE VII-2
fl~]iasra._of a Granular Activated Carbon Syste.
Backwash out -------...-
Influent
(]) (8)
CC.:U'\} ]'-:LJI~'r-- L • • Effluent [
.:._, o..(2 }--J; I · · ·
}
- Bact.wuh L@~"( --- ::!~ -- J~]~---4--- Water _ "----.JI l I -----··-·-
----- (~) --··- --- ~ -·--------..-. --·--·----~ To other carbon trains
P1f1llil.fjpl anatlon
!~ Main nffuentibedder (to 1st tank in series)
2 Main effluent header (frOIII 3rd tank 1n sertes) l Influent header to 2nd tank h1 series 4 Influent header to lrd tank 1n series 5 Effluent header fr001 1st tank in ser1e~ \
61 Effluent f~ 2nd tank 1n sertes 1 Connection between ll and 15 headers b tonnecUoo between t4 and f6 headers 9 Backwash in}et header 1 ) Backwash ou let header

N N
FIGURE VII-3
Carbon Regeneration System
M•-'•': I ~tJ u U: ~I ~ Regenerated
Carbon Holding lank
Spent Carbon Holding
Tarde
...__
Carboq Adsorption Tanks
~-------
...... ~
furnace

N N N
FIGURE VII-4
Flow Diagram of One Powdered Activated Carbon Treatment Treatment Scheme
Wcutewater lnf)uent .. l ____ l Treated Effluent
--------~-ll__________ ~ -~~
r-_., Powdered Activated Cubon Inlet
Carbon Ha~e-u~t ·-----a.
r Acttvated Sludge
Unth
( )-l I ( Sludge
Thtdener filter Presses Carbon
Regener;at1on furnace
_____ ] _. Acid Wuh
Systeaa

SECTION VIII
BEST AVAILABLE TECHNOLOGY ECONOMICALLY ACHIEVABLE
SUMMARY
Best Available Control Technology Economically Achievable (BAT) is equivalent to the existing Best Practicable Technology Currently Available (BPT) level of control. BAT technology, which is the same as BPT, includes in-plant control and end-ofpipe treatment. BPT in-plant technology consists of widely used control practices such as ammonia and sulfide control, elimination of once through barometric condenser water, segregation of sewers, and elimination of polluted once-through cooling water. BPT end-of-pipe treatment includes flow equalization, initial oil and solids removal {API separator or baffle plate separator), further oil and solids removal (clarifier or dissolved air flotation), biological treatment, and filtration or other final "polishing" steps. The effluent limitations for BAT are the same as those for SPT because the BAT flow model and subcategorization scheme are the same as those for BPT. BAT control technology, which is equivalent to BPT technology, is Option 9 of the nine options considered by the Agency.
BAT limitations, in general, represent the best economically achievable performance of direct dischargers included in an industrial category or subcategory. BAT limitations control the discharge of toxics (priority pollutants) and non-conventional pollutants (COD, phenolic compounds [4AAP], ammonia and sulfides) in the effluent of existing direct dischargers in the petroleum refining industry. BAT does not regulate conventional pollutants (TSS, oil and grease, BODS and pH) which are considered under Best Conventional Treatment Economically Available (BCT).
In assessing BAT, the Agency considers the age of the equipment and facilities involved, the processes employed, the engineering aspects of control technologies, process changes, the cost of achieving such effluent reduction, and non-water quality environmental impacts. The Admi'nistrator retains considerable discretion in assigning the weight to be accorded these factors. Where existing performance is uniformly inadequate, BAT may be transferred from a different subcategory or category.
EPA is required to consider costs, but does not have to balance costs against effluent reduction benefits. However, EPA has given substantial weight to the reasonableness of costs. The Agency has considered the volume and nature of discharges, the volume and nature of discharges expected after application of BAT, the general environmental effects of the pollutants, and the
223

costs and economic impacts of the required pollution control levels.
Effluent limitations for the petroleum refining industry are expressed as mass limitations, i.e., restrictions on the total quantity of pollutants that may be discharged. Since the total mass of pollutants in an effluent stream depends on both the total effluent flow and the concentration of pollutants in that flow, the nine options considered for BAT reflect both flow and concentration considerations.
~ OPTIONS CONSIDERED
EPA investigated nine control and treatment technology options for selection of BAT criteria. Options 1 through 6 were considered in formulating the proposed rule published in 1979. Model flow for options 1 through 5 refers to the flow model presented in the 1979 proposed regulation. Detailed explanation of these options is available in the 1979 draft development document. Option 7, a modification of Option 2, and Option 8, a modification of Option 1, were developed using the data base available at the time of the 1979 proposal, supplemented and modified by information collected by EPA after the proposed rule was published, as well as from public comments received on the proposed rule. Model flow for Options 7 and 8 refers to the refined flow model which reconciled discrepancies noted in the 1979 model, and more accurately depicted refinery wastewater flows (see Section IV).
Option 9, the BPT level of control, was reconsidered after publication of the proposed rule, as a result of public comments received. Model flow for Option 9 refers to the flow model presented in the 1974 development document.
Option 1 - Discharge flow reduction of 27 percent from model flow, achieved through greater reuse and recycle of wastewaters, in addition to BPT treatment.
Option 2 - Discharge flow reduction of 52 percent from model flow, achieved through greater reuse and recycle of wastewaters, in addition to BPT treatment. This was the control treatment option selected in the 1979 proposal.
Option 3 - Discharge flow reduction of 27 percent from model flow per Option 1, plus BPT treatment enhanced with powdered activated carbon to reduce residual toxic organic pollutants.
Option 4 - Discharge flow reduction of 52 percent from model flow per Option 2, in addition to BPT treatment plus segregation and separate treatment of cooling tower blowdown. Cooling tower blowdown treatment for metals removal includes reduction of hexavalent chromium to trivalent chromium, pH adjustment, precipitation, and settling or clarification.
224

Option 5 - Discharge flow reduction of 27 percent from model flow per Option 1, in addition to BPT treatment plus granular activated carbon treatment to reduce residual toxic organic pollutants.
Option 6 -A "no discharge of wastewater pollutants" (i.e., zero discharge) standard based upon reuse, recycle, evaporation, or reinjection of wastewaters.
Option 7 Discharge flow reduction of 37.5 percent from refined model flow achieved through greater reuse and recycle of wastewaters, in addition to BPT treatment.
Option 8 - Discharge percent from refined reuse and recycle of treatment.
flow reduction of approximately 20 model flow achieved through greater wastewaters, in addition to BPT
Option 9 - Flow equalization, initial oil and solids removal (API separator or baffle plant separator), additional oil/solids removal (clarifiers or dissolved air flotation), biological treatment, and filtration or other final "polishing" steps. This option is the basis of the existing regulations.
OTtion l· Reduce discharge flow to 27 percent below model flowflow model for 1979 proposal) in addition to BPT treatment. Establish a long term achievable concentration for phenolic compounds (4AAP) at 19 ug/1 as the base for computing pollutant load. Fifty percent of the petroleum refineries were already operating at this flow level (27 percent less than model flow) at the time of the 1979 proposal.
Flow reduction is a viable technology in the petroleum refining industry. Since 1972 the refining industry has reported decreasing wastewater discharge flows as refineries install water conservation, recycle and reuse technology in response to existing regulations, water supply costs, and water treatment costs. The following summary of industry discharge flows demonstrates this significant change in water management practices:
Specified Flow Type 1. Total 1976 Indirect Discharge Flow
(Supplemental Flow Questionnaire)
2. Total Calculated BPT Flow 1972
3. Total 1976 Direct Discharge Flow (Supplemental Flow Questionnaire)
4. Total 1976 Direct Discharge Flow
225
Total Flow, MGD
so 569
346

Minus Planned Flow Reductions (1977 Industry Survey and Supplemental Flow Questionnaire)
5. Total allowable BAT Flow Based on 1979 Proposed Flow Model
6. Total allowable BAT Flow Based on Refined Flow Model
7. S~e as (5), except actual individual flows from (4) are used if less than allowable individual BAT Flows
B. Same as (6), except actual individual flows from (4) are used if less than allowable individual BAT Flows
311
227
251
205
215
The methods of recycle/reuse are described in detail in Section VII. In order to verify that the 37.5 percent flow reduction was achievable, the Agency · conducted a 15 plant study ( 159). The study concluded that this level of flow reduction can be achieved by traditional recycle/reuse schemes.
Figure V-3 shows the results of projecting this trend toward reduced wastewater flow. The analysis predicts that the petroleum refining industry will achieve the Option 7 flow level (63 percent of revised model flow) within a few years. Reduction in pollutant loading occurs when BPT treatment systems achieve the same discharge pollutant concentrations at a reduced discharge flow level.
Tne Agency has concluded that removal of non-conventional pollutants would not change measureably from BPT treatment to BPT treatment plus 27 percent flow reduction. Ammonia and sulfide loadings depend primarily upon the process of stripping sour waters, an in-plant control technique, and will not be directly related to flow. No technologically feasible process changes or in-plant controls have been identified to further reduce ammonia and sulfides. Also, chemical oxygen demand (COD) does not vary directly with effluent flow. The Agency's attempts to quantify or predict changes in COD levels with the implementation of flow reduction/water reuse technologies were inconclusive.
Option 1 would limit total phenols at a mass limitation based upon an effluent concentration equivalent to 19 ug/L. The Agency received a number of comments on this issue stating that the proposal to limit total phenols at 19 ug/L was too stringent because technology is not available to consistently achieve such a level. Additional information on phenols was collected by EPA in the Petroleum Refining L(ng Term~ Analysis (161) and the "Surrogate Sampling Program" 162} subsequent to the December 1979 proposal. Information collected included effluent data from
226

49 refineries for calendar year 1979 plus 60 day sampling results at two refineries in 1980. Analysis of the data collected durinq these two studies concluded that 100 ug/L is appropriate to establish a mass limitation applicable on an industrywide basis in light of the variability due to fluctuations in treatment system performance.
Discharge of toxic priority pollutants would be less than BPT levels because the refineries would achieve former BPT concentrations at reduced discharge flows. Estimates of the pollutant reductions to be achieved by BPT treatment plus flow reduction assumed that the pollutant load for trivalent and hexavalent chromium after BPT treatment would be at or near the allowable level. Subsequent evaluation of BPT treatment since the original estimates indicates that BPT treatment achieves better removal of priority pollutants than originally thought, and that reduction in flow would achieve minimal further reductions. The Agency has estimated this further reduction in toxic pollutants over BPT treatment at 1 percent of the priority pollutants in raw refinery wastewater. This translates into an additional removal beyond BPT of approximately 1.3 pounds of toxic pollutants per day, per direct discharge refinery (168}.
The preamble to the proposed 1979 regulation (44 FR 75933) stated that $23.5 million additional investment would be required with an annual cost of $9.3 million (1979 dollars) to implement Option 1 for this industry. The capital costs, to a considerable extent, represent retrofit costs. These cost figures are the incremental costs beyond BPT to achieve Option 1 technology.
Option 1 effluent limitations are based upon the flow model for the 1979 proposal. Since the Agency has decided not to use this flow model for the regulation, Option 1 was rejected.
Option ~· Reduce discharge flow, 52 percent below model flow (flow model for 1979 proposal} in addition to BPT treatment. Establish a long term achievable concentration for phenolic compounds (4AAP) at 19 ug/1 as the base for computing pollutant load. Thirty-eight percent of the refineries were already operating at or below 52 percent of model flow at the time of the 1979 proposal.
Removal of non-conventional poll~tants (ammonia, sulfides and COD} is not directly dependent upon flow redu~tion. Like Option 1, the Agency has concluded that installation of flow reduction will not achieve measureable decrease in non-conventional pollutant loads over BPT treatment.
This option would also apply the 19 ug/L long term concentration to the 52 percent of model flow to calculate the allowable load by phenolic compounds (4AAP).
227

Again, many commenters questioned the ability of petroleum refineries to achieve this long term effluent concentration on an industrywide basis. Additional studies by the Agency concluded that 19 ug/L cannot be achieved consistently and that 100 ug/L is the appropriate concentration for regulating loadings of phenolic compounds (4AAP) for all direct dischargers in the petroleum refining industry.
Removal of priority pollutants would again be accomplished by the refineries achieving BPT level treatment at even greater reduced flows. The Agency's analysis of available data shows that implementation of Option 2 would remove an additional 1.5 percent of toxic pollutants from raw wastewaters beyond BPT treatment levels (168}. BPT removes 96 percent of the toxic pollutants from raw wastewaters discharged by the petroleum refining industry. This additional 1.5 percent translates into an additional removal beyond BPT of approximately two pounds of toxic pollutants per day, per direct discharge refinery.
The preamble to the 1979 proposal (44 FR 75938} stated that implementation of Option 2 would result in the removal of approximately 123,000 pounds of chromium per year. This 123,000 pounds of chromium per year represents the incremental removal from the BPT level to the BAT Option 2 level. However, based upon reevaluation of the effluent data base, the Agency has found this figure was overstated, because the observed chromium discharge of refineries with BPT level treatment was considerably less than that allowable by the BPT chromium limitations. The actual amount of chromium which would have been removed under this option is ·approximately 32,000 pounds per year (168).
Implementation of Option 2 would result in annual cost to the industry of $62 million with an initial capital investment of $138 million (1979 dollars). Initial investment includes, to a considerable extent, retrofit costs. These cost estimates represent the incremental cost beyond BPT treatment to achieve Option 2 technology.
BAT Option 2 was developed using the proposed 1979 flow model. However, based upon data submitted by commenters and the "Flow Model" study performed by EPA after the proposal {See Section IV), the proposed 1979 flow model was modified. The technical points raised by some of the commenters were of considerable assistance in the flow model refinement process. The main emphasis of the comments concerned the statistical deficiencies of the proposed model, the choice of model variables, and aspects of the resulting model fit. The structure of the model and the process variables to be included were reexamined and modified accordingly. This refinement process resulted in the refined flow model which was more representative of the current wastewater generation in the industry. Thus, Option 2 has been rejected because it was based on the proposed flow model that has been modified.
228

Option 3. Reduce discharge flow by 27 percent of model flow (flow model for 1979 proposal) per Option 1 plus enhanced BPT treatment with powdered activated carbon (PAC) to reduce residual toxic organic pollutants.
The two end-of-pipe treatment technologies that were used to establish Option 3 are rotating biological contactors (RBC) and powdered activated carbon (PAC) treatment. At the time of the Agency's data collection efforts in 1976-1979, there were seven facilities using these technologies. The Agency determined that, upon analysis of available data, there are significant operational (mechanical) problems with RBC technology. The Agency also found that full-scale experience with PAC technology was mixed, i.e., some facilities experienced consistently measurable pollutant reductions as intended, while others experienced inconsistent or no measurable effluent reductions. Because of these operational problems observed in full-scale facilities, there was limited performance information available.
The Agency's analysis of available data shows that implementation of Option 3 would remove an additional 1.5 percent of toxic pollutants from raw wastewaters beyond BPT tr·eatment levels. This translates into an additional removal beyond BPT of approximately two pounds of toxic pollutants per day, per direct discharge refinery (168).
Option 3, flow reduction plus PAC enhancement of a biological system may offer promise as a treatment technology to remove individual toxic pollutants under special circumstances, but this option is not a proven technology in the petroleum refining industry which can be applied in an industrywide regulation. Full scale experience with this technology did not produce consistent measurable results.
Given the limited additional effluent reduction benefits and the limited performance data available at this time, Option 3 is not warranted for this industry.
Option !· Reduce discharge flow by 52 percent of model flow (flow model for 1979 proposal) per Option 2 plus BPT treatment and separate treatment of cooling tower blowdown. This option could result in better removals than Option 2, since cooling tower biocides would not enter the biological treatment system and wastewater would not be diluted with cooling water before biological treatment.
Option 4 was predicated on industrywide ability to segregate, collect, and separately treat cooling tower blowdown, the major source of chromium for this industry. The wastewater recycle/reuse study (see Section VII), completed after the publication of the proposed regulation, concluded that, for existing sources, it is extremely difficult in many instances to segregate cooling tower blowdown for chromium treatment. Cooling
229

tower blowdown is typically effected at numerous locations throughout a refinery. Extensive collection systems would be necessary at many refineries to collect all blowdown streams for separate treatment. In addition, not all cooling tower blowdown streams are collectible. For instance, cooling water when used as makeup for refinery processing commingles with process water and cannot be traced or segregated, especially in older refineries. Therefore, the Agency has determined that it would not be proper to base BAT effluent limitations guidelines on this technology option.
Because this technology is not available to all direct discharge refineries on an industrywide basis, the Agency has rejected Option 4 as the basis for BAT regulation of existing refineries. However, refineries which will be built in the future can incorporate separate treatment of cooling tower blowdown into the plant design.
Option i· Reduce discharge flow to 27 percent below model flow (flow model for 1979 proposal) plus BPT treatment and granular activated carbon treatment to reduce residual toxic organic pollutants. Option 5 would provide treatment equivalent to Options 2 and 3.
BAT Option 5 is predicated on industrywide ability to install and operate granular activated carbon (GAC) treatment as an end-ofpipe technology. Although GAC technology is used in other industries, long term performance data of full scale systems treating refinery wastewaters would be required before this technology could be used as the basis for industrywide effluent limitations.
The Agency conducted six pilot plant treatability studies that used GAC to treat refinery wastes after BPT treatment (108). While toxic pollutant removal generally increases with the use of GAC, the levels of toxic pollutants after BPT treatment were so low that additional pollutant reduction across GAC treatment was minimal. Difficulties in quantifying pollutant reductions were experienced when the Agency tried to evaluate toxic pollutant removals in BPT treated water where concentrations approached the analytical limits of quantification.
Because of the difficulties experienced in Agency attempts to measure removal of tox~c pollutants, removal efficiencies have not been estimated for this option. Moreover, considering the marginal benefits and uncertain effectiveness of this technology in treating dilute concentrations of priority pollutants, the Agency decided to reject BAT Option 5.
Option i· Zero discharge of wastewater is a demonstrated technology. There are currently fifty-five refineries in the United States that do not discharge wastewater. However, the technology employed at these zero discharge refineries is very
230

site specific, e.g., 32 of the 55 use evaporation/percolation basins which rely upon special conditions of climate and geology. The zero discharge technologies considered by the Agency include those currently in use by the industry and those that are applicable from other industrial sources. The Agency realizes that some of the technologies in use by the refinery industry can not be applied in other geographical locations because of meteorological conditions, load availability, and other environmental constraints. Vapor compression distillation is i•dentif ied to be universally available and applicable. Although none of the refineries are using VCD, full scale use of such a system is being used successfully in the steam electric industry. However, the secondary impacts of VCD can be quite severe, and are prohibitive in the Agency's opinion. These secondary impacts include high energy consumption and solid waste generation.
Removal of toxic pollutants under this option would be 100% assuming that percolating or injected wastewater will not be transported to acquifers and streams. The 1979 development document (158) did not contain an estimate of the cost of retrofitting all existing direct discharge refineries to zero discharge. The technology would be different for each refinery and could be expected to incur higher capital and operating costs than a new refinery designed to achieve zero discharge.
The Agency rejected BAT Option 6, (1) because of its high capital and operating costs, including significant retrofit expenditures; and (2) because analysis of the zero discharge technologies revealed that significant non-water quality impacts would result from their use. These non-water quality impacts include generation of large amounts of solid waste and very high energy consumption.
Oltion 1· Reduce discharge flow to 37.5 percent below model flow refined flow model) plus BPT treatment. Option 7 is similar to Option 2, except that the revised mathematical model calculates a slightly different flow quantity. Also the flow reduction below model flow is less -than the 1979 proposal. Based upon the r~finements to the 1979 flow model described above, flow reduction was revised from an average 52 percent from the 1979 model flow to 37.5 percent from the refined model flow. This average 37.5 percent flow reduction was designated Option 7.
Option. 7 resulted from modeling efforts conducted after the 1979 proposed regulation. The methods of recycle/reuse are described in detail in Section VII. In order to verify that the 37.5 percent flow reduction was achievable, the Agency conducted a 15 plant study. The study concluded that this level of flow reduction can be achieved by traditional recycle/reuse schemes.
Removal of non-conventional pollutants beyond BPT treatment would be limited for the reasons discussed under Options 1 and 2.
231

The Agency's analysis of available data shows that implementation of Option 7 would have removed an additional 110,000 pounds of toxic pollutants annually beyond BPT treatment levels, equivalent to an additional 1.5 percent of toxic pollutants from raw wastewaters beyond BPT treatment levels. This translates into an additional removal beyond BPT of two pounds of toxic pollutants per day per direct discharge refinery.
The Agency estimated the costs to implement Option 7 recycle and reuse technologies. A capital cost of $112 million and $37 million (1979 dollars) in annual costs are associated with Option 7.
The Agency believes, that given the limited additional effluent reduction benefits and the costs involved, Option 7 is not warranted for this industry.
2Ttion !· Reduce discharge flow to 20 percent below model flow revised flow model} plus BPT treatment. BAT Option 8 is similar to Option 1. Based upon adqitional data submitted by commenters and the technical studies performed by EPA after the proposal (See Section IV), the flow model upon which Option 1 is based was reevaluated. The result of this reevaluation was a refinement in the 1979 flow model with use of more and better quality data. The amount of flow reduction via recycle and reuse technologies was determined to be an average 20 percent below refined model flow.
Removal of non-conventional pollutants beyond BPT would be limited for the reasons discussed under Option 1. The Agency's analysis of available data shows that implementation of Option 8 would remove an additional one percent of toxic pollutants from raw wastewaters beyond BPT treatment levels. This translates into an additional removal beyond BPT of 1.3 pounds of toxic pollutants per day, per refinery (168).
The cost of implementing Option 8 is estimated at a capital cost of $77 million and an annual cost of $25 million (1979 dollars}.
The Agency believes that, given all these factors and the costs involved, Option 8 is not warranted for this industry.
Option 9. A level of control equivalent to the BPT level of control consists of flow equalization, initial oil and solids removal (API separator, baffle plate separator), further oil and solids removal (clarifiers, dissolved air flotation), biological treatment, and filtration or other final "polishing" steps. This option is based upon the flow model developed for the BPT regulations promulgated by the Agency in 1974. Therefore, the effluent limitations are equivalent to the BPT effluent limitations.
232

Removal of non-conventional pollutants would remain at current BPT levels. Table VI-1 shows a total annual raw wastewater loading of non-conventional pollutants equal to 257,231 kkg/yr. BPT treatment would reduce this pollutant waste load to 66,988 kkg/yr for a net 74 percent removal of non-conventional pollutants by the petroleum refining industry. Table VI-1 contains removal efficiencies for total phenols as measured by the 4AAP method. BPT treatment reduces the total annual wasteload from 9719 kkg/yr to 7.6 kkg/yr.
Table V-27 contains a summary of the analytical results for concentrations of phenolic compounds (4AAP) and individual toxic phenolic compounds found in the effluent of direct dischargers. Parameter No. 167 (4AAP phenolic) shows an average 15 ug/L in 76 percent of the samples while individual toxic phenolic compounds identified as priority pollutants (parameters 21, 24, 31, 34, 57, 58, 59, 64 and 65) show a total of one detection occurrence at a concentration at or below·measurable limits. This data was the basis for the 19 ~g/L achievable concentration proposed in 1979.
EPA compiled additional data on the performance of refineries providing BPT treatment in the "Survey of 1979 Effluent Monitoring Data." This study examined the results of BPT treatment at refinery flows predominantly less than 1979 model flows. The analytical results are, therefore, representative of low-flow treatment systems (163). This study computed an average long term achievable concentration of 123 ~g/L for refineries with BPT treatment systems. This conclusion supports the long term achievable concentration of 0.100 mg/L initially set forth to calculate BPT pollutant loads at the BPT model flow rate. In addition, the Agency collected data on discharge of phenolic compounds from the Long Term Sampling Program (162) and the EPA Regional Surveillance and Analysis Teams (Table V-29) which confirm that the 19 ~g/L value is not representative of average long term performance and that the 100 ~g/L is appropriate.
Removal of toxic pollutants would remain at the levels achieved by BPT treatment. Table VI-2 shows a total annual raw wastewater loading equal to 3502 kkg/yr. BPT treatment can reduce the discharge of toxic pollutants to a total annual loading of 137 kkg/yr for a net removal efficiency of 96 percent. Ninety-six percent removal of toxic pollutants is calculated from the actual, measured performance of BPT treatment.
The concentration of pollutants in the final refinery effluents and their associated water quality criteria are presented in Section VI. Limited environmental benefit would be gained by requiring further control beyond BPT.
In summary, only the following pollutants were found at concentrations (average) in excess of 10 ppb: chromium (trivalent), cyanide, zinc, toluene, methylene chloride, and bis(2-ethyhexyl) phthalate. Of these, methylene chloride and
233

bis(2-ethylhexyl) phathalate are contaminants of the sampling and analytical methodology. Chromium is already· limited by BPT. Cyanide occurs in concentrations {flow-weighted average 45 -g/L) at the limits of effective removal by known technologies. Toluene is removed to below measurable limits by all but one refinery and is not characteristic of the industry. Zinc at an average concentration of 105 -g/L is not likely to cause toxic effects.
·The cost of implementing Option 9 is effectively zero, since the Act requires that all refineries achieve BPT treatment by 1977.
Considering the limited pollutant reduction benefits associated with Options 1 through 8, the inability to quantify nonconventional pollutant reduction via Options 1 through 8, the costs involved of going beyond the BPT level of control, and the 96 percent reduction in toxic pollutant loadings achieved by BPT, the Agency has determined that the BAT level of control should be equivalent to the BPT level of control for the petroleum refining industry.
IDENTIFICATION QE ~ AVAILABLE ACHIEVABLE
TECHNOLOGY ECONOMICALLY
~ Selection ~ Design Criteria - EPA selected Option 9. Effluent data from the EPA sampling survey show that present BPT treatment removes 96 percent of the toxic pollutants, 85 percent of the conventional pollutants (BOD, TSS, oil and grease}, and 44 percent of the nonconventional pollutants (COD, ammonia, TOC, sulfides, and phenolics (4AAP)). The levels of toxics from the final refinery effluents are extremely low (see Section VI for details).
A separate analysis of the Effluent Guidelines Division sampling and analytical data showed that there are no environmentally significant priority pollutants in direct discharges from petroleum refineries at BPT technology levels after application of the 50th percentile average and low flow dilutions. (See Table VIII-1). The basis for this determination of environmental significance is the comparison of diluted average plant effluent concentrations with ambient water quality criteria as determined by EPA Criteria and Standards Division (165). Selection of this option would result in no additional cost or secondary impacts beyond that associated with BPT compliance.
The bases for the BPT limitations can be found in the 1974 development document. The information upon which the numerical limitations are derived is presented in Table 50-52(3). These tables provide the concentrations, variability factors, and flows used. An example of how BPT should be applied is presented in Section I.
234

N w LT1
Pollutant
Arsenic Berylllu• ca•l• Chr01lu• Cfrl.l Qw-OMI• (Hex.l Copper Cyanide le11d Mercury Nickel Selanl• Sliver lhalll• line Clllorofona Ranzene ToJQ81le
-------·-----------
TABLE VIII-1 1 of 2
1.6 Diluted Effluent Concefttretlons fra. Direct Dischargers In the Petrol- Refining Industry
CurrentJaf>r 1 Diluted Concefttretlon I , EPA Allblent Vater Quality Crltarla
Diluted Concentretlon For the Protect lon of Frelhwatar f low-•1.-.tecl ual111 the 'otla percentile ualnt the 5otla percentile ~atlc Life
Avg. Cone. _...flow low t low Acute4 Qronlc ,-ua/1 ua/1 ua/1 ua/1 ua/1
0.01 0 0 440 filA 0.04 0 0 no• ,.1• 0.25 0 0 1.D 0.02'
107.79 o.o1 0.22 4100 ... 1.11· 0 o.oa 21 0.29 9.85 0 0.02 22 ,.6
.,.46 0 O.O!t '2 1.,
'·I' 0 0.01 170 1.8 0.88 0 0 4.1 0.2 1.)9 0 D.OI 1800 96
11.19 0 0.01 260 35
0.04 0 0 ••• o.u• 1.21 0 o.oa 1400• 40•
104.6 o.ot 0.21 120 41 I
1.1 0 0.01 28900• 1240• 2.1 0 0 ,)00. t«:A
10.1 0 0.02 17500• t«:A
---- -~

N w 0"1
TABLE VIll-i (Continued) 2 of 2
I .6 Diluted Effluent Concentntlona fro. Direct Dllchllf"gers In the Petrol- Reflnlno lndustr~ COIIpared to the EPA Allblent Water Quality Criteria for the Protection of fr81hwater Aquatic life
CContl-d)
CurrentiBPr 1 2 ' EPA Allblent Water Quality Q-lterla
Diluted Concentration Diluted Concentration for the Protection of freshwater f IOorWelghted uslnt the 5oth percentile using the 5oth percentile Aquatic life , _ Avg. Cone. •--eue flow low flow Acute' Chronic 5
Pollutant ug/1 ug/1 ug/1 ua/1 ug/1
2, 4-Dich lorophenol 0.22 0 0 2020• ]65• p-ch loro-.-Cresol 0.28 0 0 290• NCA Dl .. thyl phthalate 0.15 0 0 )]()()()• t«:A
Dlethyl phthalate 1.46 0 0 52100• t«:A DI-n-butyl phthalate 0.04 0 0 !140• t«:A
Acenaphthene 1.06 0 0 uoo• t«:A
Benzola)pyrene 0.05 0 0 t«:A t«:A Chyrsene 0.02 0 0 t«:A t«:A Phenanthrene 0.18 0 0 I«: A t«:A
Pyrene 0.12 0 0 t«:A t«:A
-">.1_
Footnotes:
IOertved by ..,ltlplylng the average concentration by the flow for each of the IJ reftiMif"l81 111111pledo "'- • .,.of the products dlvldad by the total flow of the refiiMif"les s...,led results In a flow-weighted •--•ue concentration.
2oerlved by dividing the flov-walghted averaga concentration by the 5oth percentile ._.. • .,. flow dilution factor. The 50th percentile CI512U corresponds to the ~~&dian average flow dilution factor. Flow elate ware available for U of the 164 refiiMif"les. Diluted concentration values less than 0.01 ug/1 are reported as zero,
3oerlved by dividing the flov-welghted averaga concentration by the 50th percentile low flow dilution factor. The 50th percentile 1496) corresponds to the •dian lov flow dilution factor. flow data were available for 32 of the 164 reftiMif"l81. Diluted concentration values less thon 0.01 ug/1 are reported as zero.
4Acute - The ~e~~lCI..,• concentration of a pollutant allowed at any tl• to protect freshwater organla ...
5Chronlc - The 24-hour average concentration of a pollutant to protect freshwater organlan•
•Lowest roportdd tolCic concentration to protect fr81hwater organlan. Reported when no other criteria ere available.
NCA - No criteria ovallabla.

SECTION IX
NEW SOURCE PERFORMANCE STANDARDS
SUMMARY
New source performance standards (NSPS) are equivalent to the existing NSPS promulgated on May 9, 1974 (39 FR 16560) which were upheld by the United States Court of Appeals in American Petroleum Institute v. ~' 540 F.2d 1023 (10th cir. 1976).
NSPS require a reduction in pollutant load based upon BPT inplant and end-of-pipe treatment plus a 25 to 50 percent wastewater flow reduction (depending upon subcategory). BPT inplant technology consists of widely used control practices such as ammonia and sulfide control, elimination of once-through barometric condenser water, segregation of sewers, and elimination of polluted once-through cooling water. BPT end-ofpipe technology consists of flow equalization, initial oil and solids separation (API separator or baffle plate separator), further oil and solids separation (clarifier or dissolved air flotation), biological treatment, and filtration or other "polishing" steps. NSPS use the flow model developed for the 1974 regulation to calculate pollutant loadings.
NSPS regulate the discharge of the following conventional, nonconventional and toxic pollutants from new refineries, which include BODS, TSS COD, oil and grease, total phenols (4AAP), ammonia(N),-sulfide, total chromium, hexavalent chromium, and pH.
A "new source" is a new refinery ("greenfield site") or a modification to an existing plant which is extensive enough to be "substantially independent" of an existing source. For example, as stated in the preamble to the proposed criteria for new source determinations, 45 FR 59343 (September 9, 1980) the addition of a structurally separate cracking unit at the site of an existing refinery that processes crude oil by the use of topping and catalytic reforming would be considered a modification of the existing source and not a new source, because the cracking unit would not be a substantially independent process.
New Source performance standards are equal to existing NSPS; this is Option 4 of the four options considered by EPA in this study.
Instructions for calculating effluent limitations and mass limitation factors for each subcategory are in Section I.
The basis for new source performance standards (NSPS) under Section 306 of the Act is the best available demonstrated technology (BACT). New plants have the opportunity to design the best and most efficient petroleum refining processes and wastewater treatment technologies; Congress therefore directed
237

EPA to consider the best demonstrated process changes, in-plant controls, and end-of-pipe treatment technologies capable of reducing pollution to the maximum extent feasible.
NSPS OPTIONS CONSIDERED
EPA considered four control and treatment options for the final new source performance standards. Options 1 and 2 were considered in formulating the proposed rule and were based upon the flow model for the proposed 1979 regulations. Option 4, the existing NSPS level of control, was reconsidered after publication of the proposed rule as a result of the public comments and is based upon the 1974 flow model.
Option 1 - Discharge flow reduction to 52 percent below model flow (flow model for 1979 proposal), achieved through greater reuse and recycle of wastewaters, in addition to BPT treatment. This Option is equivalent to BAT Option 2.
Option 2 - Discharge flow reduction to 27 percent below model flow (flow model for 1979 proposal), achieved through greater reuse and recycle of wastewaters in addition to BPT treatment, plus use of granular activated carbon to reduce residual organic toxic pollutants. This option is equivalent to BAT Option 5.
Option 3 - Zero discharge of wastewater pollutants.
Option 4 - Discharge flow reduction from 25 percent to SO percent below BPT model flow, depending upon subcategory, achieved through greater reuse and recycle of wastewaters in addition to BPT treatment. This option is the basis for the existing NSPS regulation, including the 1974 flow model upon which the existing NSPS is based.
NSPS Option 1 - Effluent flow reduction to 52 percent below model flow (flow model for 1979 proposal) plus BPT treatment is equivalent to BAT Option 2. The technology for this option is the same as that for the existing NSPS regulations - wastewater recycle and reuse technologies, in addition to BPT end-of-pipe treatment.
The Agency compared effluent reductions achievable by existing NSPS and this option. This comparison concluded that effluent reductions are comparable to the 1974 NSPS. The analysis was performed on a model greenfield new source refinery (190,000 bbl/day, cracking) which is classified as a "Subcategory B" refinery as defined by the existing regulation. This model refinery was configured to correspond with demand growth as published by the Department of Energy (see the Economic Analysis document). The costs to implement this option are comparable to the existing NSPS {see Appendix A). Nonwater quality environmental impacts and energy requirements are also similar to existing NSPS.
238

Since the costs, pollutant removals, energy and environmental effects are comparable there would be no significant benefit in adopting a regulation equivalent to BAT Option 2 (or BAT Option 7 which incorporates the refined flow model).
NSPS Option 2 - Effluent flow reduction to 27 percent below model flow (flow model for 1979 proposal) plus BPT technology and granular activated carbon (GAC) to remove residual organic toxic pollutants. NSPS Option 2 is equivalent to BAT Option 5, which is also based on GAC end-of-pipe technology.
A major proportion of the cost of GAC treatment is annual operating expense which will be similar for a new plant and for an existing plant. A new refinery will not incur the retrofit cost of flow reduction associated with BAT Option 5, however, the new refinery will sustain the capital costs of GAC technology plus annual operating costs. Estimates of these costs are shown in Appendix A.
For the reasons stated in the proceeding discussion on BAT Option 5, the Agency believes that GAC treatment is not demonstrated technology for this industry.
NSPS Option 3 - Zero discharge of pollutants is a demonstrated technology. However, the technology employed and the associated costs are very site-specific. This technology is now practiced by about 55 refineries in the United States where conditions of climate and geology make zero discharge attractive.
The Agency estimated the pollutant removal benefits which would accrue over and above existing NSPS for a typical 150,000 bbl/day refinery of the cracking subcategory. Daily pollutant removals would be 2.46 lb/day phenol, 3.9 lb/day hexavalent chromium, 6 lb/day total chromium, 308 lb/day TSS and 381 lb/day BOD.
Section VII and the discussion on BAT Option 6 describe technologies such as vapor compression distillation and deep well injection which are available, but which have other cost, energy and environmental affects that must be considered for an industry wide regulation. Unlike BAT Option 6, a newly constructed refinery can be designed to incorporate zero discharge during construction. However, annual operating costs remain high at sites which do not have favorable conditions.
The Agency reported a costing method for incorporating zero discharge into the construction of a typical new refinery as described by the American Petroleum Institute. The capital and annual costs for a typical petroleum refinery producing 150,000 barrels/day are estimated to be $11.6 million and $4.6 million (1979 dollars), respectively. The industry indicated ~n their comments that the energy consumed would cost $2,000,000 per year; they also stated that 7,300 tons per year of solid waste would be
239

generated. EPA believes that the energy and solid waste estimates from the industry are reasonable approximations.
While the Agency proposed zero discharge for NSPS in 1979, after careful re-examination of the combined effects associated with NSPS Option 3, EPA has rejected this proposal because:
1. it generates significant adverse non-water quality related impacts, including the production of large amounts of solid waste and high energy consumption;
2. the cost of achieving zero discharge is estimated to be extremely high, especially in geographical areas of low evapotranspiration which requires energy intensive forced evaporation techniques;
3. only marginal additional water pollution reduction benefits would be achieved beyond the existing NSPS.
4. the high costs of implementation could raise serious barriers to any decision invovling construction of a new source refinery.
NSPS Option 4 - Effluent flow reduction to 25 to SO percent below model flow ((low model for 1974 regulation) plus BPT technology is equivalent to the existing NSPS. Flow reduction of from 2S to SO percent of average BPT flow, depending upon subcategory, would be achieved by recycle and reuse technology.
Implementation of Option 4 would not cause the petroleum refining industry to incur any additional expense beyond the cost of meeting the current regulations for new direct discharge.
After careful consideration of the options proposed in 1979, together with the public comments received, the Agency finds no reason for revising current NSPS.
IDENTIFICATION QE NEW SOURCE PERFORMANCE STANDARDS
EPA is retaining the existing NSPS which are based on recycle and reuse technology resulting in pollutant reductions that range from 2S to 50 percent beyond BPT removals, depending upon the subcategory. Regulated pollutants for NSPS are BOD~, total suspended solids, chemical oxygen demand, oil and grease, .total phenols (4AAP), ammonia (N), sulfide, total chromium, hexavalent chromium, and pH.
New greenfield refineries are not expected to be built between now and 1990. Existing refineries~ however, may be modified to accommodate the heavier and higher sulfur crudes which are becoming increasingly prevalent in the current oil market. The change could cause certain refineries, or parts of refineries, to be considered new sources. However, it is unlikely that the
240

modification would be extensive enough so that the existing refinery would be reclassified as a new source.
241

SECTION X
PRETREATMENT STANDARDS FOR EXISTING AND NEW SOURCES
Summary
PSES - Pretreatment Standards for Existing Sources
Interm final PSES were promulgated by the Agency on March 23, 1977 (42 FR 15684) and are currently in effect. Regulated pollutants are oil and grease (100 mg/L) and ammonia (N) (100 mg/L) each on a daily maximum basis. EPA is retaining the existing PSES regulation, with one modification. An alternative mass limitation for ammonia (N} is provided for those indirect dischargers whose discharge to the POTW consists solely of sour waters. PSES is equivalent to Option 3 of the three technology options considered by the Agency for pretreatment standards.
~ - Pretreatment Standards for New Sources
PSNS were promulgated by the Agency on May 9, 1974 (39 FR 16560) and are currently in effect. Pretreatment standards for incompatible pollutants are equivalent to NSPS. Final PSNS are equivalent to pretreatment standards for existing sources (PSES), except that they also regulate total chromium at the equivalent of 1 mg/L for the cooling tower discharge part of the refinery flow to the POTW. An alternative mass limitation for ammonia (N) is also provided, as described above for PSES. PSNS is equivalent to Option 1 of the two technology options considered by the Agency for pretreatment standards for new sources.
A new indirect discharging refinery of the size and configuration likely to be built in the 1980's would incur additional capital costs of $0.37 million and an annual cost of $0.26 million (1979 dollars) beyond the cost of complying with existing PSNS.
Section 307(b) of the Act requires EPA to promulgate pretreatment standards for both existing sources (PSES) and new sources (PSNS) that discharge pollutants into publicly owned treatment works (POTW). PSES are designed to prevent the discharge of pollutants that pass through, interfere with, or are otherwise incompatible with the operation of the publicly owned treatment works (POTW). They must be achieved within three years of promulgation. The legislative history of the 1977 Act indicates that pretreatment standards are to be technology-based, analogous to the best available technology for removal of toxic pollutants. The general pretreatment regulations, which served as the framework for the categorical pretreatment regulations are found in 40 CFR Part 403 (43 FR 27736, June 26, 1978; 44 FR 9462, January 28, 1981) (also see Section I).
243

The Clean Water Act of 1977 requires pretreatment for toxic pollutants that pass through the POTW in amounts that would violate direct discharger effluent limitations or interfere with the POTW's treatment process or chosen sludge disposal method. EPA has generally determined that there is pass through of pollutants if the percent of pollutants removed by a welloperated POTW achieving secondary treatment is less than the percent removed by the BAT model treatment system.
Like PSES, PSNS are to prevent the discharge of pollutants which pass through, interfere with, or are otherwise incompatible with the operation of the POTW. PSNS are to be issued at the same time as NSPS. New indirect dischargers, like new direct dischargers, have the opportunity to incorporate the best available demonstrated technologies. The Agency considers the same factors in promulgating PSNS as it considers in promulgating PSES.
Pollutants ~ Regulated
The toxic pollutants listed in Table VI-9 were detected in petroleum refinery waste streams that are discharged to POTW. The Agency has decided not to establish PSES for these toxic pollutants in this industry for the following reasons:
The pollutants listed in Part I and Part II of Table VI-9 are excluded from national regulation in accordance with Paragraph 8 of the Settlement Agreement because they were either found to be susceptible to treatment by the POTW and do not interfere with, pass through, or are not otherwise incompatible with the POTW, or the toxicity and amount of incompatible pollutants were insignificant.
The pollutants listed in Part III of Table VI-9 are excluded from regulation for a combination of reasons. First, there is significant removal of some of these pollutants by the existing pretreatment standards for oil and grease. Second, there is significant removal of all these pollutants by the POTW treatment system. Third, the amount and toxicity of these pollutants does not justify developing national pretreatment standards.
The Agency did not propose requiring installation of BPT-type treatment on an industrywide basis for indirect dischargers.
PRETREATMENT OPTIONS CONSIDERED
EPA considered three control and treatment options for pretreatment standards for existing sources and two options for pretreatment standards for new sources. Options 1 and 2 were considered in formulating the proposed rule. As a result of public comments received, an alternative mass limitation for ammonia was added to Option 1 after proposal of the regulation. Option 3, the existing PSES level of control, was reconsidered
244

after publication of the proposed rule. Option 3 also contains an alternative mass limitation for ammonia (N).
Option 1 - Chromium reduction by pH adjustment, precipitation and clarification technologies applied to segregated cooling tower blowdown, plus control of oil and grease and ammonia at the existing PSES level of control.
Option 2 Establishment of two sets of pretreatment standards. The first would be Option 1 control for refineries discharging to POTW with existing or planned secondary treatment. The second would be Option 1 control plus treatment for total phenols by biological treatment for those refineries discharging to a POTW that· has been granted a waiver from secondary treatment requirements under Section 301(h} of the Act. EPA's proposed pretreatment standards for existing sources were based on this option. Further discussion is provided in the 1979 proposed petroleum refining regulation at 44 FR 75935.
Option 3 - Reduction of oil and greases and ammonia by oil/water separation and steam stripping technologies.
Evaluation 2f Pretreatment Options Considered
Option 1 - Reduce chromium in cooling tower blowdown to 1 mg/L by pH adjustment, precipitation, and clarification, and maintain control of oil and grease and ammonia {N) at existing {PSES) level of control (100 mg/L). Include alternative mass limitations for ammonia (N} for those refineries that discharge only sour waters to the POTW.
For the 1979 proposal, the Agency estimated the cost of retrofitting the affected indirect discharge refineries at an initial investment of $11.7 million and an annual cost of 16.8 million (1979 dollars). These estimates assume that cooling tower waste streams are readily identifiable and separable for all refineries (see Appendix A).
This option presumes the industrywide ability to segregate, collect, and separately treat cooling tower blowdown, the major source of chromium for this industry. The wastewater recycle/reuse study (see Section VII), completed after publication of the proposed regulation, concluded that, for existing sources, it is not technologically feasible, in many instances, to segregate cooling tower blowdown for chromium treatment. Cooling tower blowdown is typically effected at numerous locations throughout a refinery. Extensive collection systems would be necessary at many refineries to collect all blowdown streams for separate treatment. In addition, not all cooling tower blowdown streams are collectable. For instance, cooling water when used as makeup for refinery processing
245

commingles with process water and cannot be traced or segregated, especially in older refineries.
An alternative, treatment of the combined refinery waste stream for chromium removal, would require installation of most, if not all, of the BPT treatment train. Installation of BPT treatment for all existing indirect dischargers would cost an estimated $110 million in capital costs, and an annual cost of $42 million (1979 dollars}. This estimate represents the maximum cost estimated by assuming installation of .BPT treatment for all indirect dischargers {See Option 2}.
New refineries have the opportunity to design separation of cooling tower waste streams into the system and do not incur retrofit costs or the cost of treating combined waste streams. Separate treatment of cooling tower blowdown may be readily applied by new source indirect dischargers. The Agency estimated the incremental cost of incorporating Option 1 technology in a new source at an annual investment of $0.37.million and an annual cost of $0.26 million (1979 dollars} (see Appendix A}.
Option 2 Establish two sets of criteria; one for refineries that discharge to POTW with existing or planned secondary treatment, and one for refineries that discharge to POTW which have received a Section 301(h} waiver.
Under Section 30l(b}(l}(B} of the Act, most POTW should have installed secondary treatment by July 1, 1977. However, two groups of POTW have not yet met this requirement. One group remains subject to that obligation and contains POTW that are scheduled to install secondary treatment within the next few years. A second group of POTW is exempt from the requirement to install secondary treatment under Section 301(h} of the Act.
A determination of which pollutants may pass through or be incompatible with POTW operations, and thus be subject to pretreatment standards, depends on the level of treatment used by the POTW. Applicants for Section 301(h) waivers have treatment systems which vary from primary to primary plus partial secondary. In general, more pollutants pass through or interfere with a POTW using primary treatment (usually physical separation by settling}, as compared with one that has installed secondary treatment (settling plus biological stabilization} (see Section \r}.
Under Option 2, existing refineries that disharge to POTW which have or will provide secondary treatment would provide treatment equivalent to Option 1 (100 mg/L limit on oil and grease and ammonia (N} plus 1 mg/L on chromium applied to segregated cooling tower blowdown}. Refineries that discharge to POTW which have a section 301(h} waiver would be required to provide treatment for oil and grease, ammonia (N), and chromium plus treatment for
246

total phenols. Treatment for total phenols (4AAP) would require the addition of BPT end-of-pipe treatment.
Total cost of implementing Option 2 for existing indirect dischargers could not be calculated for the 1979 proposal, since no POTW had yet been granted a Section 301(h) waiver. The Agency did estimate the cost of installing biological treatment for each indirect discharge refinery. The Agency also estimated the cost of installing Option 1 treatment technology for each indirect discharging refinery. There was no determination of which of the refineries would ultimately discharge to POTW with secondary treatment versus those that would discharge to POTW with Section 301(h) waivers. However, if all indirect discharging refineries were required to install biological (BPT end-of-pipe) treatment systems, the maximum cost to the industry would be an initial capital investment of $110 million and an annual cost of $42 million (1979 dollars) (Appendix A).
Option 2 was proposed in the December 1979 regulation. The rationale was that a POTW with a primary treatment system will not adequately remove the toxics from the refinery. A POTW with primary treatment that receives waste from refineries was sampled. The results indicated that removal effectiveness is significantly less than that of a secondary system (see Appendix B- Raw Plant Data).
There are currently three POTW which recieve refinery wastes that can apply for Section 301(h) variances. In order to obtain a 301(h) variance, the POTW must be able to demonstrate that:
o The discharge will not interfere with the attainment or maintenance of water quality which assures the protection ·of public water supplies and the protection and propagation of a balanced, indigeneous population of shellfish, fish and wildlife and allows recreational activities, in and on the water, (Section 301(h)(2);
o The POTW has a monitoring system to measure, to the extent practicable, the impact of the discharge on a representative sample of aquatic biota, (Section 301(h)(3);
o The discharge will not impose additional requirements on any other point or nonpoint source, {Section 301(h)(4);
0 All applicable pretreatment standards are (Section 301(h)(S);
enforced,
o The POTW, to the extent possible, has established a schedule of activities designed to eliminate the entrance of toxic pollutants from non-industrial sources into the treatment works, (Section 301(h)(6));
247

o There will be no substantial increase in the volume of discharged pollutants to which the modification applies from the treatment works.
The degree of treatment required for a POTW obtaining a Section 301(h) waiver is determined after evaluating, among other things, the physical characteristics of the discharge and the nature of the receiving waters. Treatment levels vary for every POTW because of the importance of these site-specific factors; thus, the levels of toxic pollutants which pass through will also vary significantly in each case.
EPA now believes that it is not feasible and that it would be inappropriate to establish national pretreatment standards that take into account whether a discharger uses a POTW which has received a 301(h) waiver. Rather, the need for more rigorous pretreatment controls should be resolved on a case-by-case basis during the Section 301(h) waiver process, depending on the degree of the toxic pollutant problems in each instance.
Option 3 Reduce oil and grease and ammonia by oil/water separation and steam stripping technologies. This option is equivalent to existing PSES except that an alternate mass limitation for ammonia is provided for ammonia (N) for those refineries that discharge only sour waters to the POTW. Regulated pollutants are oil and grease and ammonia (N) (100 mg/L),. each on a daily maximum basis.
Option 3 does not limit the concentration of chromium in the effluent of indirect dischargers. At the time of proposal, the Agency believed such concentrations of chromium would limit a POTW's use or management alternatives of the sludge. Based upon review of existing information and analysis of public comments on the proposal, EPA has determined that this rationale is not valid on a nation wide basis. For this industry, chromium levels in sludge from POTW receiving petroleum refinery wastes generally do not impact sludge disposition or alternat1ves for use. There are no Section 405 sludge standards directed at concentrations of chromium in the sludge. Therefore, EPA has determined that the better approach is to permit the POTW to establish chromium pretreatment standards for existing sources if refinery waste would limit their sludge disposal alternatives. The general pretreatment regulations specifically provide the POTW with this authority. {See 40 CFR 403.5).
This option is the basis for the existing interim final PSES regulation. An alternative mass limitation for ammonia (N) is provided to those indirect dischargers whose discharge to the POTW consists solely of "sour waters. Sour waters generally result from water brought into direct contact with a hydrocarbon stream, and contains sulfides, ammonia and phenols. The Agency developed an alternative mass limitation for ammonia in response to public comments received on the proposed regulation. Several
248

commenters indicated that, when the refinery discharge to the POTW consists solely of sour waters, achievement of the 100 mg/L ammonia concentration limitation is often not possible. This is because steam stripping technology, the basis for the limitations, cannot consistently reduce ammonia in sour water streams to the 100 mg/L level. Thus, an equivalent mass limitation for ammonia was developed by the Agency.
IDENTIFICATION OF PRETREATMENT STANDARDS
PSES - EPA has selected Option 3, retention of the existing level of control, for final regulation of existing indirect discharge refineries. Option 1 was rejected because the Agency found it infeasible in many instances to segregate cooling tower blowdown for chromium treatment on an industrywide basis for existing refineries. Option 2 was rejected on the basis that it would be inappropriate to establish separate national pretreatment standards for those refineries that discharge to POTW which have a Section 30l(h) waiver because the conditions surrounding those installations are very site specific and can be better evaluated by the individual POTW. The general pretreatment regulations specifically provide POTW with authority to institute standards for pretreatment of industrial discharges which limit sludge disposal options.
PSNS - The Agency has selected Option 1 for the regulation of new sources. Segregation and separate treatment of cooling tower blowdown can be implemented with little additional expense in the design and construction of new refineries. Option 2 was rejected for the same reasons discussed under PSES.
249

SECTION XI
ACKNOWLEDGMENTS
Many individuals representing numerous organizations, corporations, and agencies have contributed material, time and energy to the technical studies conducted in developing these effluent limitations guidelines and standards, and to the production of this document.
This document was prepared under the direction of Mr. Dennis Ruddy and Mr. John Lum, Project Officers in the Energy and Mining Branch of EPA's Effluent Guidelines Division. Mr. William A. Telliard, Chief of the Energy and Mining Branch, also provided direction and assistance during the course of the program.
The Agency wishes to acknowledge the contributions to this project of Burns and Roe Industrial Services Corporation of Paramus, New Jersey under the direction of Mr. Arnold s. Vernick, Manager of Environmental Engineering, and Mr. Elwood c. Walker, Program Director.
The cooperation and assistance of the American Petroleum Institute and of the numerous company and refinery personnel who were involved in data gathering efforts, site studies, and wastewater sampling programs are greatly appreciated. The Agency's Robert s. Kerr Environmental Research Laboratory, all EPA regional offices, and the County Sanitation Districts of Los Angeles are specifically acknowledged for their efforts.
Appreciation is expressed to those at EPA Headquarters who contributed to the completion of this project, including Mr. Jeffery Denit of the Effluent Guidelines Division; Ms. Eleanor Zimmerman of the Monitoring and Data Support Division; Mr. Louis DuPuis, Mr. John Kukulka, and Mr. Henry Kahn of the Office of Analysis and Evaluation; and Ms. Susan Lepow and Mr. Mark Gordon of the Office of General Counsel.
251

SECTION XII
REFERENCES
1. American Petroleum Institute, "Petroleum Industry Raw Waste Load Survey," December 1972.
2. American Wastes DC, l969.
Petroleum Manual,
Institute, Disposal 2f Refinery Volume of Liquid Wastes, Washington,
3. Development Document for Effluent Limitations Guidelines and !!! Source PerfOrmance Standards for Petroleum Refining, EPA-440/l-74-014a, April l974,:Environmental Protection Agency, Washington, DC.
4. Bush, K. E., "Refinery Wastewater Treatment and Reuse," Chemical Engineering, April 12, 1976.
5. Wigren, A. A. and Burton, F. L., "Refinery Wastewater Control," Journal Water Pollution Control Federation, Vol. 44, No. 1, January 1972.
6. Armstrong, T. Water," The 1968. ---
A., Oil .........
"There's a Profit in Processing Foul ~ Gas Journal, pp. 96-98, June 17,
7. Easthagen, J.H. et al., "Development of Refinery Waste Water Control at Pascagoula, Mississippi," Journal Water Pollution Control Federation, Vol. 37, No. 12, December 1965.
8. Beychock, M. R., Aqueous Wastes from Petroleum and Petrochemical Plants, John Wiley & Soni; New York, 1967.
9. Klett, R. J., "Treat Sour Water for Profit," Hydrocarbon Processing, pp. 98-99, October, 1972.
10. Brunet, M. J. and Parsons, R. H., "Mobil Solves Fouling Problem Sour Water Stripper," !h! Q1! and~ Journal, pp. 62-64, November 20, 1972.
11. "Phenols in Refinery Waste Water Can· Be Oxidized With Hydrogen Peroxide," The Oil~ Gas Journal, pp. 84-86, January 20, 1975.
12. Short, T. E., Jr., et al., Refinery Waste Waters," The 119-124, November 25, 1974.
"Controlling Phenols in Oil ~ Gas Journal, pp.
13. Congram, G. E., "Refiners Zero In on Better Desalting," The Oil and Gas Journal, pp. 153-154, December 30, 1974.
253

14. Beychock, M. R., "Wastewater Treatment," Hydrocarbon Processing, pp. 109-112, December 1974.
15. Ewing, R. C., "Modern Waste-Treatment Plant on Stream in Texaco Refinery," The Oil and Gas Journal, pp. 66-69, September 28, 1970.
16. "New Ion-Exchange System Treats Sour Water," Ih! Oil and ~Journal, pp. 88-89, February 11, 1971.
17. Pollio, F. X. and Kunin, R., "Ion Exchange Resins Treat Sour Water," Ih! Q1l and §!! Journal, pp. 126-130, May 19, 1969.
18. Melin, G. A. et al., Strippers," Chemical No.6, June, 1975.
"Optimum Design of Sour Water Engineering Progress, Vol. 71,
19. Cantrell, A., "Annual Refining Survey," The Oil and ~ Journal, pp. 125-152, March 29, 1976.
20. Gantz, R. G., "API Sour Water Stripper Studies," Proceedings American Petroleum Institute, Section III Refining, Vol. 54, pp. 39-66, 1975.
21. Short, T.E. et al., "Petroleum Refining Phenolic Wastewaters," American Chemical Society, Div. of Fuel Chemistry, paper presented at !68th National Meeting, September 8-13, 1974.
22. Norwood, B. E., "Application of Biological Trickling Filter for Treatment of Effluent Water at Shell Oil Company's Houston Refinery," paper presented at the Petroleum and Petrochemicals Session of the National Pollution Control Exposition and Conference, April 4-5, 1968.
23. Congram, Treating 23, 1976.
G. E., "Biodisk Improves Effluent-WaterOperation," The Q1l and Gas Journal, February
24. 1972 Sour Water Stripping Survey Evaluation, Publication No. 927, prepared for American Petroleum Institute, Washington, DC, June 1972.
25. Annessen, R. J. and Gould, G. D., "Sour Water Processing Turns Problem Into Payout," Chemical Engineering, pp. 67-69, March 22, 1971.
26. Analysis 2f the 1972 API-EPA Raw Waste Load Survey Data, Brown & Root, Inc., API publication No. 4200, July T97i.
254

27. Diehl, D. s. et al., "Effluent Quality Control at a Large Oil Refinery," Journal Water Pollution Control Federation, Vol. 43, No. 11, p. 2254, November 1971.
28. Sour Water Stripping Project, Committee on Refinery Environmental Control, American Petroleum Institute, prepared by Environmental Services Department, Bechtel Corporation, API publication No. 946, June 1975.
29. Engineering Science, Inc., Petroleum Refining Industry, Technology and Costs of Wastewater Control, prepared by the National Commission on Water Quality, June 1975.
30. "Granular Media Filtration of Petroleum Refinery Effluent Waters," prepared by Envirotech Corporation, EIMCO BSP Division, for the American Petroleum Institute, API publication No. 947, October 1975.
31. Economics ~Refinery Waste Water Treatment, prepared by Brown & Root, Inc., prepared for the American Petroleum Institute, API publication No. 4199, August 1973.
32. Economic Refining for the 1976.
Impact of EPA's Regulations 2n ~ Petroleum Industry, prepared by Sobotka & Company, Inc,
u.s. Environmental Protection Agency, April
33. Mitchell, G. E., "Environmental Protection Benecia Refinery," prepared for the API 35th Midyear Meeting, Division of Refining, Houston, May 1970.
34. Ewing, R. C., "Shell Refinery Uses Pollution-Abatement Units," The Oil and Gas Journal, March 8, 1971.
35. Aalund, L. A., "Cherry Point Refinery- A Story of Air, Water, and Fuel," The Oil~ Gas Journal, January 24, 1972.
36. Maguire, W. F., "Reuse Sour Water Stripper Bottoms," Hydrocarbon Processing, pp. 151-152, September, 1975.
37. State and Local Pretreatment Programs Federal Guidelines, January 1977, u.s. Envi-ronmental Protection Agency, Washington, D.C.
38. Refinery Effluent Water Treatment Plant Using Activated Carbon, June 1975, U.S. Environmental Protection Agency, EPA-660/2-75-020.
39. Assessment of Hazardous Waste Practices in the Petroleum Refining IndUstry, prepared by Jacobs Engineering Co,
255

for the Environmental Protection Agency, June 1976, Contract No. 68-01-2288.
40. Report to Congress - Disposal of Hazardous Wastes, U.S.
41.
42.
Environmental Protection Agency, Publication No. SW-115, 1974.
Elkin, H. F., "Biological Oxidation and Refinery Wastewater for Pollution Control Conservation," Division of Refining, Vol. 36, p. 340, 1956.
Reuse of and Water No. I I I,
Elkin, H. F. et al., "Biological Refinery Wastes in Cooling Tower Industrial Wastes, Vol. 28, No. 12, 1956.
Oxidation of Oil Systems," Sewage~
p. 1475, December
43. Mohler, E. F., et al., "Experience with Reuse and Biooxidation of Refinery Wastewaters in Cooling Towers," Journal Water Pollution Control Federation, Vol. 36, No. 11, p. 1380, November 1964.
44. Wiley, M. A., "Chromium Analysis", API Proceedings, Holiday Inn, Arlington, VA, May 25 and June 11, 1973.
45. "Coastal Water Research Project," Southern California Coastal Water Research Project (SCCWRP), 1500 E. Imperial Highway, El Segundo, CA 90245, Annual Report, June 1975.
46.
47.
"Environmental Effect of Disposal of Wastewater in Open Coastal Waters," Southern Coastal Water Research Project (SCCWRP), Imperial Highway, El Segundo, CA 90245, August
Municipal California
1500 E. 1975.
Donaldson, W. T., Environmental Science April, 1977.
"Trace Organics and Technology,
in Water," Vo 1. 11 No. 4,
48. Interim Final Supplement for Pretreatment to the Development Document for---the Petroleum RefinrnQ Industry, Existing Pornt SOUrce Category, u.s. Environmental Protection Agency EPA 400/1-76/083a, March 1977.
49. Davis, J. C., "Activated Carbon: Prime Choice to Boost Secondary Treatment," Chemical Engineering, April 11, 1977, pp. 81-83.
SO. Grutsch, J. F. and Mallatt, R. C., "A New Perspective on the Role of the Activated Sludge Process and Ancillary Facilities," presented at the Open Forum on Management of Petroleum Refinery Wastewaters, January 26-29, 1976.
256

51. Gould, J. P. and Weber, w. J., "Oxidation of Phenols by Ozone," Journal Water Pollution Control Federation, Vol. 48, No. 1, January 1976.
52. Zagorski, J. S. and Faust, S.D., "Removing Phenols via Activated Carbon," Chemical Engineering Progress, pp. 65-66, May 1977.
53. Gesick, J. A., "A Comparative Study of Non-Chromate Cooling Water Corrosion Inhibitors," presented at the 35th Annual International Water Conference of the Engineers' Society of Western Pennsylvania, October 31, 1974.
54. Zecher, D. C., "Corrosion Inhibition by Surface- Active Chelants," presented at the International Corrosion Forum, Toronto, Canada, April 14-18, 1975.
55. Robitaille, D. R. and Bilek, J. G., "Molybdate CoolingWater Treatments," Chemical Engineering, December 20, 1976.
56. Bush, K. E., "Refinery Wastewater Treatment and Reuse," Chemical Engineering, April 12, 1976.
57. Mohler, E. F., Jr., and Clere, L. T., "Development of Extensive Water Reuse and Bio-Oxidation in a Large Oil Refinery," Complete Water Reuse, American Institute of Chemical Engineers, Library of Congress Catalog No. 73-87964, based on papers presented at the National Conference on Complete Water Reuse, April 23-27, 1973.
58. Mohler, E. F., Jr., and Clere, L. T., "Sun Oil Develops Water Reuse Program," The Oil and Gas Journal, September 10, 1973.
59. Crame, L. W., "Activated Sludge Enhancement: A Viable Alternative to Tertiary Carbon Adsorption," presented at the Open Forum on Management of Petroleum Refining Wastewater, June 6-9, 1977.
60. Grieves, C. G. et al., "Powdered Activated Carbon Enhancement of Activated Sludge for BATEA Refinery Wastewater Treatment," presented at ·the Open Forum on Management of Petroleum Refinery Wastewater, June 6-9, 1977.
61. Heath, H. W., Jr., "Combined Powdered Activated CarbonBiological ("PACT") Treatment of 40 MGD Industrial Waste," presented at Symposium on Industrial Waste Pollution Control at A.C.S. National Meeting, March 24, 1977.
257

62. Dehnert, J. F., "Case History The Use of Powdered Activated Carbon With a Biodisc-Filtration Process for Treatment of Refinery Wastes," presented at the Open Forum on Management of Petroleum Refinery Wastewater, June 6-9, 1977.
63.
64.
Zanitsch, R. H., and Lynch, R. Reactivation: State-of-the-Art," Forum on Management of Petroleum June 6-9, 1977.
Process Design Manual Environmental Protection October 1973.
for Agency
T., "Granular Carbon presented at the Open Refinery Wastewater,
Carbon Adsorption, Technology Transfer,
65. Ford, D.L. and Tischler, L. F., "Meeting BPT Standards for Refinery Wastewater Treatment," Industrial Wastes, July/August 1977.
66. Proceedings 2t the !il! National Conference on Control of Hazardous Materials Spills, University Of Houston, March 21-23, 1972.
67. Spill Prevention Techniques for Hazardous Pollution Substances, prepared by Arthur:o7 Little, Inc., for the U.S. Environmental Protection Agency, February 1971, Contract No. 14-12-927.
68. Industrial Process Profiles for Environmental Use, "Chapter 3 -Petroleum Refining Industry," prepared by Radian Corporation, for the U.S. Environmental Protection Agency, EPA-600/2-77-023c, January 1977.
69. Rizzo, J. L. and Shepa.rd, A. R., "Treating Industrial Wastewater with Activated Carbon," Chemical Engineering, January 3, 1977.
70. DeWall, F.B. et al., "Organic Matter Removal by Powdered Activated Carbon Added to Activated Sludge," Journal Water Pollution Control Federation, April 1977.
71. Thibault, G. T. et al., "PACT Performance Evaluated," Hydrocarbon Processing, May 1977.
72. Lanouette, K. H. and Paulson, E. G., "Treatment of Heavy Metals in Wastewater," Pollution Engineering, October 1976.
73. Petroleum Refineries in the United States and Puerto Rico, Mineral Industry-Bureau of Mines, January 1, 1977. Surveys, Washington, D.C., U.S. Department of the Interior,
258

74. Petroleum Refineries in the United States and Puerto Rico, Washington, D7C.;--National Petroleum--Refiners ASSOciation, July 22, 1977.
75. Sampling ~ Analysis Procedures for Screening Industrial Effluents f2£ Priority Pollutants, Environmental Protection Agency, Cincinnati, OH, 1977.
of u.~
April
76. Preliminary Industry Profile ~' prepared by Burns and Roe Industrial Services Corporation, for the U.S. Environmental Protection Agency, Effluent Guidelines Division, December 30, 1976.
77. "Worldwide Directory, Refining and Gas Processing, 1976-1977," Ih! Q!! ~ §!! ~Jo~u~r~n~a~l, 34th Edition, 1976.
78. S-1, Analysis 2t Self Reporting~ fr2m Refineries !2 Determine Compliance ~ July lL 1211 Effluent Limitations, prepared by Burns and Roe Industrial Services Corporation, for the u.s. Environmental Protection Agency, Effluent Guidelines Division, February 22, 1977.
79. S-2, Selection of Refineries ~ RSKERL Sampling Program, preparea-by Burns and Roe Industrial Services Corporation, for the u.s. Environmental Protection Agency, Effluent Guidelines Division, February 22, 1977.
80. Analytical Variability of fi!! Wastewater Parameters, Petroleum Refining Industry, prepared by Robert s. Kerr Environmental Research Laboratory, for the u.s. Environmental Protection Agency, EPA-600/2-76-234, September 1976.
81. Economic Analysis of Interim Final Pretreatment Standards ~ the Pitroleum Refining Industry, u.s. Environmental Protection Agency, EPA 440/1-77-002, April 1977.
82. Askins, W., and Wilcox, D. R., "Tertiary Treatment of an Organic Chemicals Plant Effluent," prepared for the Ninth Mid-Atlantic Industrial Waste Conference, August 8-9, 1977.
83. Talbot, R.S., "A New Redox Method for Complete Removal of Chromium from Wastewater," prepared for the Ninth Mid-Atlantic Industrial Waste Conference, August 8-9, 1977.
84. "Injections Pep Up Cat Crackers," Chemical 13, 1977.
259
Week, ............. April

85. Schwartz, R. D., and McCoy, C.J., "The Use of Catalytic Cracking Catalyst in Activated Wastewater Treatment," Journal Water Pollution Federation, Vol. 48, No. 2, February 1976.
Fluid Sludge
Control
86. Ford, D. L., "Putting Activated Carbon in Perspective to 1983 Guidelines," Industrial Water Engineering, May/June 1977.
87. Economic Analysis of Proposed Revised Effluent Standards ~Limitations for the Petroleum~ Refining Industry, u.s. Environmental Protection Agency, EPA-440/2-79-027, November 1979.
88. ~ Refinery Wastes to Pure Water, Corporation, New York, NY, undated.
Hydrotechnic
89. Siegal, B. A. and Harrel, R. C., "Community Metabolism in a Refinery Holding Pond," Journal Water Pollution Control Federation, Vol. 48, No. 10, October 1976.
90. Baird, R. et al., "Behavior of Benzidine and Other Aromatic Amines in Aerobic Wastewater Treatment," Journal Water Pollution Control Federation, July 1977.
91.
92.
Reed, J. L., "Outlook for Refinery Hydrocarbon Processing, June 1977.
Maclean, W. D., "Construction Site Selection Viewpoint," Hydrocarbon Processing, June 1977.
Capacity,"
A U.S.
93. Jenkins, D. M. and Sheppard, w. J., "What Refinery Pollution Abatement Costs," Hydrocarbon Processing, May 1977.
94. Hatch, L. F. and Matar, S., "From Hydrocarbons to Petrochemicals," Hydrocarbon Processing, June 1977.
95. Becker, K.P. and Wall, C.F., "Fluid Bed Incineration of Wastes," Chemical Engineering Progress, October 1976.
96. "Putting Powdered Carbon Environmental Science ~ September 1977.
in Wastewater Treatment," Technology, Vol. 11, No. 9,
97. Puckorius, P., "New Cooling-Water-Systems Treatment," ~ Qil and Gas Journal, July 5, 1971.
98. Nicholas, G.W., and Sopocy, D.M., "Evaluation of Cooling Tower Environmental Effects," Combustion, November 1974.
99. Kempling, J.C. and Eng, J., "Performance of Dual-Media Filters-2," Chemical Engineering Progress, April 1977.
260

100. Porter, J.W. et al., "Zero Discharge of Wastewater From Petroleum Refineries," prepared for the National Conference on Complete Water Reuse, April 23-27, 1973.
101. Lindsay, J.T. and Pratter, B.V., "Solving Petroleum Refinery Wastewater Problems," Journal Water Pollution Control Federation, August 1977.
102. Neff, B., "The Development of Petroleum Refinery Liquid Effluent Controls," prepared for members of the U.S. Environmental Protection Agency by Water Pollution Control Directorate, Environment Canada, March 3, 1977.
103. Status Report ~Abatement 2f Water Pollution From ~ Canadian Petroleum Refinery Industry-!21i, Water Pollution Control Directorate, Environment Canada, Report No. EPS-3-WP-76, December 1976.
104. Economic Analysis 2f Proposed Effluent Guidelines, Petroleum Refinery Industry, U.S. Environmental Protection Agency, EPA -230/1-73-020, September 1973.
105. Huber, L.J., "State and Development in Refinery Effluent Purification," prepared for the Ninth World Petroleum Congress, 1975.
106. Statistical Package for the Social Sciences, Second Edition, McGraw-Hill Book Company, 1970.
107. Beychok, Milton R., "State-of-the-Art in Sour Water Stripping," prepared for the Open Forum on Management of Petroleum Refinery Wastewater, June 6- 9, 1977.
108. Screening Survey for Priority Pollutants, Petroleum Refining Industry, Draft Report, prepared by the Robert S. Kerr Environmental Research Laboratory, for the u.s. Environmental Protection Agency, September 1977.
109. Watkins, J.P., "Controlling Sulfur Compounds in Wastewaters," Chemical Engineering, October 17, 1977.
110. Paulson, E.G., "How to Get Rid of Toxic Organics," Chemical Engineering, October 17, 1977.
111. Ford, D.L., and Elton, R.L., "Removal of Oil and Grease from Industrial Wastewaters," Chemical Engineering, October 17, 1977.
1 1 2.
11 3.
Lanouette, K.H., "Heavy Metals Engineering, October 17, 1977.
Removal,"
Lanouette, K.H., "Treatment of Phenolic Chemical Engineering, October 17, 1977.
261
Chemical
Wastes,"

114. Development Document~ Effluent Limitations Guidelines and~ Source Performance Standards for the. Copper, Nickel, Chromium, ~ Zinc Segment of the Electroplating Point Source Category, u.s. Environmental Protection Agency, EPA-440/1-74-003-a, March 1974.
115. Grulich, G. et al., "Treatment of Organic Chemicals Plant Wastewater With DuPont PACT Process," prepared for the AICHE Meeting, February 1972.
116. Hutton, D.G., and Robertaccio, F.L., 3,904,518, September 9, 1975.
u.s. Patent
117. Bloch, Heinz P., "Improve Safety and Reliability of Pumps and Drivers," Hydrocarbon Processing, pp. 97-100, January 1977.
118. Natural Resources Defense Council et al., ~ Train, 8 E.R.c. 2120 (D. D.c. 1976).
119. Thibodeaux, L.J., and Millican, J.D., "Quantity and Relative Desorption Rates of Air-Strippable Organics in Industrial Wastewater," Environmental Science and Technology, Vol. 11, No. 9, September 1977. ---
120. Knowlton, H.E., "Biodisks Work in Waste-Water Treating," Ih! Q1l ~~Journal, October 3, 1977.
121. Kunz, R.G. et al., "Cooling Water Chemical Engineering, August 1, 1977.
Calculations,"
122. Environmental Considerations of Selected Energy Conserving Manufacturing Process- Options: ~ ~ Petroleum Refining Industry Report, u.s. Environmental Protection Agency, EPA-600/7-76-034d, December 1976.
123. Dellinger, R. W., "Incorporation of the Priority Pollutants into Effluent Guidelines Division Documents," prepared for the Open Forum on Management of Petroleum Refinery Wastewater, Tulsa, Oklahoma, June 7, 1977.
124. §-!L Selection 2! Refineries ~ ~ ! R Supplemental Sampling Program, prepared by Burns and Roe Industrial Services Corporation, for the u. S. Environmental Prot~ction Agency, Effluent Guidelines Division, March 18, 1977, revised May 4, 1977.
125. Data Base for the Review ~ Effluent Limitations GUidelineS TBATEA-r7 !!! Source Performance Standards, and Pretreatment Standards for the Petroleum Refining POint Source Category, Paramus;- N.J., Burns and Roe Industrial Services Corporation, December 1977.
262

126. "Electrolytic Coagulation Cleans Waste Water," Chemical and Engineering ~, January 23, 1978.
127. Reed, D.T., Klen, E.F., and Johnson, D.A., "Use Stream Softening to Reduce Pollution," Hydrocarbon Processing, November 1977.
128. Finelt, s. and Crump, J.R., "Pick the Right Water Reuse System," Hydrocarbon Processing, October 1977.
129. Telliard, W. A., Rationale for the Development ~ BAT Priority Pollutant Parameters, May 24, 1977.
130. Grutsch, J.F. and Mallatt, R.C., "Optimizing Granular Media Filtration," Chemical Engineering Progress, April, 1977.
131. Lash, L., "Scale-up of Granular Media Filters," Chemical Engineering Progress, April 1977.
132. Brody, M.A. et al., "Performance of Dual-Media Filters," Chemical Engineering Progress, April 1977.
Upflow Filtration," Chemical Engineering Progress, April 1977.
134. Bardone, L. et al., Costs of Reducing SOs Emissions and Improving Effluent Water Quality from Refineriei; Concawe, Report NR., March 1977.
135. Heath, H.W., Jr., "Chambers Works Wastewater Plant Removal of Organic and Organo-Nitrogen From Wastewater," unpublished report .to Robert Environmental Research Laboratory, November April 1977.
Treatment Compounds
S. Kerr 1976 to
136. Hakansson, H. et al., Petroleum ~ Petrochemicals, Swedish Water and Air Pollution Research Laboratory, B346, Stockholm, January 1977.
137. Matthews, J.E. et al., Acute Toxic Effects 2t Petroleum Refinery Wastewaters 2n Redear Sunfish, Office of Research and Development, U.S. Environmental Protection Agency, EPA-600/2-76-241, October 1976.
138. Pendieton, H.E., Ph.D., "Petroleum and the Environment," Pollution Engineering, September 1977.
139. Dickerman, J.C. et al., Industrial Process Profiles for Environmental Use "Chapter 3-Petroleum Refining Industry," U.S. Eilvironmental Protection Agency, EPA-600/2-77-023C, January 1977.
263

140. "Industry's Challenge-on Benzene," Business Weeks August 22, 1977.
141. Gubrud, A.E., remarks at the Federal Water Quality Association Conference on Toxic Substances in the Water Environment, April 28, 1977.
142. Weiss, A.E., remarks at the Federal Water Quality Pollutants in the Aquatic Environment," prepared for the Open Forum on Management of Petroleum Refinery Wastewater, June 7, 1977.
143. Kuserk, F., "Texaco Has the Right Answer for Cleaner Refi~ery Effluents,"~ Jersey Effluents, October 1977.
144. DeWalle, F.B. et al., "Organic Matter Removal by Powdered Activated Carbon Added to Activated Sludge," Journal Water Pollution Control Federation, April 1977.
145. Grieves, C.G., "Powdered Carbon Improves Activated Sludge Treatment," Hydrocarbon Processing, October 1977.
146. Ford, D.L. et al., "Meeting BPT Standards for Intermediate and Secondary Refinery Wastewater Treatment," Industrial Wastes, September/October 1977.
147. Hannah, S.A. et al., "Removal of Uncommon Trace Metals by Physical and Chemical Treatment Processes," Journal Water Pollution Control Federation, November 1977.
148. Electron Microscopic Analysis 2£ Water Samples ~ Asbestos, Final Report, GCA Corporation, GCA/Technology Division, December 1971.
149. Analysis of Petroleum Refinery Priority Pollutants, Draft Research Institute, March 1978.
Effluents for Organic Final Report; Midwest
150. Water Reuse Studies, API Publication 949, American Petroleum Institute, August 1977.
151. Cost Manual for the Direct Discharge Segment 2[ the perroleum Retfnrng Industry, prepared by Burns and ROe Industrial Services Corporation, for the U.S. EnviQrnmental Protection Agency March 1979.
152. Rizzo, J.A., "Case History: Use of Powdered Activated Carbon in an Activated Sludge System," prepared for the First Open Forum on Petroleum Refinery Wastewaters, Tulsa, OK, January 1976.
153. Grieves, C.G. et al., "Effluent Quality Improvement by Powdered Activated Carbon in Refinery Activated Sludge
264

Processes," prepared for the API Refining Department, 42nd Midyear Meeting, Chicago, Illinois, May 11, 1977.
154. Thibault, G.T., Tracy, K.D., and Wilkinson, J.B., "Evaluation of Powdered Activated Carbon Treatment for Improving Activated Sludge Performance," prepared for the API Refining Department, 42nd Midyear Meeting, Chicago, IL, May 11, 1977.
155. Flynn, B.P., "Startup of 38 MGD Powdered Activated Carbon - Activated Sludge (PACT) Treatment System at DuPont's Chambers Works," prepared for the 50th Annual Water Pollution Control Federation conference, Philadelphia, PA, October 3, 1977.
156. Robertaccio, F.L., "Combined Powdered Activated CarbonBiological Treatment: Theory and Results," prepared for the Second Open Forum on Management of Petroleum Refinery Wastewaters, Tulsa, OK, June 8, 1977.
157. Spady, B. and Adams, A.D., "Improved Activated Sludge Treatment With Carbon," Deeds & Data, Water Pollution Control Federation, January 1976.-----
158. Development Document ~Effluent Limitations Guidelines and Standards for ~ Petroleum Refining Point Source Category. u.s. Environmental Protection Agency 440/1-79/014-b, December 1979.
159. Wastewater Recycle Study - Petroleum Refining Industry, prepared by Burns and Roe Industrial Services Corporation for the U.S.E.P.A. E.G.D., November 1980.
160. Preliminary Screening of the 1979 Effluent Monitoring (BPT) Data, preparea- by Burns and Roe Industrial Services Corporation for the u.s. Environmental Protection Agency, Effluent Guidelines Division, September 1982.
161. Petroleum Refining Self Monitoring Data Analysis, prepared by Sanford Research Institure--for the U.S. Environmental Protection Agency, Office of Analysis and Evaluation, September 1982.
162. Surrogate Sampling Program Petroleum Refining Industry, prepared by Burns and Roe Industrial Services Corporation Submittal to U.S. Environmental Protection Agency, Effluent Guidelines Division, September, 1982.
163. Summary gt the Record for the Development gt the Survey 2[ 1979 Effluent Monitoring Data ~ the Petroleum Refining Point Source Category, prepared by Burns and Roe Industrial Services Corporation for the U.S.
265

Environmental Protection Agency, Effluent Guidelines Division, June 1980.
164. Petroleum Refining Industry, Refinements to 1979 Proposed Flow Model inS Supplemental Documents,:Prepared by Burns and Roe Industrial Services Corporation for the U.S. Environmental Protection Agency, Effluent Guidelines Division, September 1982.
165. Ambient Water Quality Criteria, u.s. Environmental Protection Agency, Criteria and Standards Division, EPA 440/5-80-069, November 1980.
166. Petroleum Refining Industry, Flow Model Documentation Report, prepared by Burns and Roe Industrial Services Corporation for the u.s. Environmental Protection Agency, Effluent Guidelines Division, March 1980.
167. Cantrell, Ailleen, "Annual Refining Survey," Q1l inS~ Journal, March 30, 1981.
168. Environmental Data Summary ~ Analysis ~ the Petroleum Refining Industry, prepared by Versar, Inc. for the u.s. Environmental Protection Agency, Monitoring and Data Support Division, September 10, 1982.
169. Development Document for Effluent Limitations Guidelines and Standards for ~ Coil Coating Point Source Category, EPA 440/1-81/071b, January 1981.
170. Development Document ~Effluent Limitations Guidelines and Standards for Sh!· Inorganic Chemicals Manufacturing Point Source Category, Final, EPA 440/1-82/007, June 1982.
171. ~Compliance Costs for the Direct Discharge Segment of ~ Petroleum Refining Inaustry, prepared by Burns and Roe Industr~al Services Corporation for the u.S.EnvironProtection Agency, Effluent Guidelines Division,December 1980.
172. Hynek, R.J. and Chou, c.c., "Field Performance of Three RBC Aeration Modes Treating Industrial Wastes,"presented at. the 35th Annual Purdue Industrial Waste Conference, May 13-15, 1980.
173. Davies, B.T. and Vose, R.W. "Custom Designs cut Effluent Treating Costs Case Histories at Chevron U.S.A., Inc." Proceedings of the 32nd Purdue Industrial Waste Conference, May 10-12, 1977.
174. Grieves, C.G., Crame, L.W., Vernardos, D.G., Ying, W., "Powdered versus Granular Carbon For Oil Refinery Wastewater Treatment," Journal Water Pollution Control Federation, March 1980.
266

APPENDIX A
COSTS OF TREATMENT AND CONTROL SYSTEMS
INTRODUCTION
This section addresses the costs associated with the control and treatment technologies presented in Section VII. As such, the cost estimates represent the incremental expenditures required over and above the capital and operating costs associated with attainment of existing effluent limitations. These differential costs, therefore, relate to specific control and treatment alternatives that could be necessary to comply with BAT limitations.
The cost estimates presented do not include land costs; the cost of land is variable and site dependent and cannot be estimated on a national basis. However, the amount of land required is indicated for each of the major end-of-pipe treatment schemes. These land requirements are minimal compared with the land requirements for refinery process equipment and existing wastewater treatment facilities.
The cost data presented in this section are based on flow rates. The major capital cost items considered were equipment, installation, engineering, and contingencies, while operating costs included maintenance, labor, chemical, and power costs. The following unit costs in 1977 dollars were used for calculating the major capital and operating costs presented in this section:
Item
1. Tank Steel 2. Tank Lining 3. Carbon, granular (capital cost) 4. Garbon, granular (operating cost) 5. Carbon, powdered (operating cost) 6. Electricity 7. Manpower
Unit Cost
$1.40 - 2.00/po~nd $3.00 - 4300/ft $31.00/ft $0.61/lb $0.31/lb $0.04/kilowatt hr $10.00/hr
Capital costs for major equipment items such as clarifiers, filters, corbon regeneration furnaces, solids dewatering filters, activated carbon, and large pumps were obtained from equipment manufacturers. Other costs such as the unit cost of tank steel, piping, small pumps, etc. were derived from the contractor's (Burns and Roe) in-house experience and expertise in the design and construction of major facilities.

COST OF TECHNOLOGIES CONSIDERED
Biological Treatment
Cost analyses developed for BPT regulations are based on activated sludge or equivalent BPT systems (3). A very limited number of refineries may need to upgrade their existing biological treatment systems to comply with BAT limitations.
One method of upgrading a biological unit is to install a raw wastewater equalization system (143). Table A-1 presents capital and operating costs for this type of modification. These costs are based on 12 hours detention and include the necessary pumps and controls for equalization of flow and pollutant loading.
EPA assumes the tanks are manufactured by placing a steel shell on a concrete pad. Costs are included for pumping the wastewater either to or from the equalization tank. The Agency also assumes that either pumping is not required on both sides of the tank, or one set of pumps exists to supply the second pumping requirement.
Another method of improving the performance of a biological treatment system is to install a biological roughing unit. Rotating biological contactors (RBCs) are an applicable treatment alternative for use as a roughing system.
Tables A-2 and A-3 present equipment sizes and energy requirements and capital and operating costs for RBC units. It is assumed that this treatment alternative will be used if aerated lagoons or oxidation ponds comprise the basic biological treatment process. The use of aerated lagoons and oxidation ponds implies that the refinery has sufficient land to install this type of wastewater treatment system.
It is also assumed that the RBC units will precede the present biological system. Clarifiers or additional sludge handling capabilities will not be required, based on the assumption that the amount of solids carryover from the RBC units to the lagoons is approximately the same as that now entering the lagoons from the raw wastewater.
Filtration
BPT limitations are based, in part, on granular media filtration or polishing ponds (3). Many refineries do not include filtration or other polishing techniques in their present systems, even though that technology was included in model BPT. Certain refineries may have to install granular media filtration to comply with BAT limitations. Tables A-4 and A-5 include the associated cost data for filtration systems.
A-2

Powdered Activated Carbon
Refineries with activated sludge or trickling filter systems may inprove their effluent quality with powdered activated carbon treatment. Tables A-6 through A-8 present cost data for powdered activated carbon systems that do not include the cost ,of sludge handling in the analysis. However, when carbon regeneration is used in conjunction with powdered activated carbon treatment, the sludge produced in the biosystem is incinerated as the carbon is regenerated, thus eliminating the sludge disposal costs associated with this requirement. An analysis was undertaken to compare annual cost when sludge handling is included as a cost factor. This analysis is included in Table A-9. Tables A-10 through A-12 present cost data for powdered activated carbon systems based upon the inclusion of sludge handling costs.
Table A-ll includes the costs for purchase of solids dewatering systems, whereas Table A-12 includes operating costs with sludge disposal shown as a credit for the systems that include carbon regeneration.
The powdered activated carbon costs described above are based upon an 80 mg/L dosage rate. THis number is based upon one year of operating data at the DuPont Chambers works facility.
Powdered activated carbon treatment may also be used for the removal of organic toxic pollutants, but may require higher carbon dosages. Tables A-13 through A-15 present costs for powdered activated carbon systems based upon a carbon dosage of 150 mg/L. Tables A-16 through A-19 present the analyses and associated results when the costs for sludge hauling are recognized.
Granular Activated Carbon
Table A-20 presents the equipment sizes and energy requirements used to estimate the capital and operating costs for granular activated carbon systems. The sizes are based on the design concept described in Section VII, with the system consisting of tanks that can be shipped in one piece, thereby minimizing field construction. This sizing constraint results in an unusually large number of tanks for the larger systems. In reality, a more cost-effective approach (with cost savings approximately 5 to 15 percent) is for a given refinery to use field constructed steel tanks, concrete tanks, or other construction techniques, which have been determined for that refinery individually. The use of shop fabricated tanks with similar sizes allows for uniformity in cost estimating, especially in developing construction and design engineering estimates. This approach also results in a conservative (larger) estimate, and is considered preferable when considering general industry-wide costs.
A-3

'I'L!b le 1\.-21 presents the cL!pi tal costs for the systems l'";lJtlir,r..:rJ in Table A-20. Table A-22 provides the operating costs, excluding depreciation, for these granular activated carbon systems. The capital costs for carbon regeneration systems are based on an equipment manufacturer's quotations. Manpower requirements for the operation of the granular carbon adsorbers were obtained from the EPA Technology Transfer Series, Carbon Adsorption Manual ( 6 4) •
One equipment supplier leases carbon adsorption systems. Plants would pay a yearly operating cost with no initial investment other than a foundation for and piping to the equipment. This supplier has suggested the following rental cost estimates for the two smallest systems:
0
0
380M3/day (O.lxl0 6 gal/day) Foundation and hookup
3,800 M3/day (l.Oxl0 6 gal/day) Foundation and hookup
- $75,000 to $100,000/yr - $5,000
- $450,000/yr - $15,000
These estimates are based on a lease agreement for a minimum of three years and include the carbon adsorbe~s with installation, all granular carbon required, and carbon regeneration services. Manpower for the operation of the carbon columns is not included.
Low Flow Rate Systems
Table A-23 presents capital and operating costs for the systems discussed above at a design flow rate of 10,000 gal/day.
In-Plant Control
Chromium Removal - The treatment technology described in Section VII is the basis for estimating the costs of chromium removal. Refineries can also take advantage of the reduction capabilities of refinery sewers and the removal capabilities of secondary treatment systems.
Table A-24 presents cooling tower blowdown rates for the refineries that responded to the 1977 EPA Petroleum Refining Industry Survey. The flow rates have been used as the design basis for chromium treatment systems. Table A-25 presents equipment cost bases and energy requirements for selected flow rates from Table A-24; Table A-26 presents the capital and operating costs for these systems.
Flow Reduction - Section VII describes a number of in-plant control measures designed to reduce or eliminate wastewater flow. Many of these measures, however, require a plant-by-plant evaluation to determine their usefulness. In addition, the costs associated with their implementation are, for the most part, site dependent making an accurate estimation of representative costs on an industry-wide basis very difficult.
A-4

For the 1979 proposal, the Agency did select one in-plant flow reduction measure, however, that can be applied at most refineries and whose cost can be readily estimated on an industry-wide scale. This flow reduction scheme consists of recycling treated refinery wastewaters for process-related applications such as cooling tower makeup, pump gland cooling water, washdown water, and fire system water. This wastewater could be reused once and then returned to the refinery wastewater collection system for end-of-pipe treatment. The amount of wastewater that can be recycled in this manner depends on many factors, including the number of cooling towers in the plant and the salinity of the wastewater to be recycled. EPA chose this wastewater reduction technique to form an estimate, because it is both definable and representative of the costs that would be incurred by other, similarly effective in-plant control measures.
Table A-27 presents the capital and operating costs per mile used for the 1979 proposal for recycling various amounts of treated wastewater. In some cases, particularly for cooling tower makeup, the recycled wastewater may require treatment to remove calcium and magnesium hardness. The costing procedure for the 1979 proposal assumed the use of lime or lime-soda ash softening followed by filtration. Table A-28 presents the capital costs for softening systems that correspond to the flow rates in Table A-27. Operating costs cannot be readily determined on an industrywide basis because they depend largely on the site specific concentrations of calcium and magnesium in the recycled wastewater. Lime costs can be approximated at $0.025/1,0000 gal of treated water for an influent hardness of 100 mg/1 (as CaC0 3) , to $0.12/1,000 gal for an influent hardness of 500 mg/1 (as CaCO ) . These costs can vary, depending on the desired effluent quali~y and on the influent water quality, especially costs involving alkalinity.
In an effort to confirm its assessment of wastewater flow reduction costs, the Agency conducted a series of site investigations after proposal to identify feasible flow reduction techniques and to determine actual costs for specific refineries to install these technologies. This Wastewater Recycle Study involved fifteen refineries throughout the United States and focussed on methods of recycling and reusing wastewaters within a refinery in an effort to reduce the rate of final discharge. These methods included the recycling of treated wastewaters, the reuse of sour water, the recycling of pump and compressor cooling water, and the collection and reuse of steam condensate. Site investigations involved wastewater management practices that were found to be successful in reducing final effluent and that could be generally applicable to other refineries. The findings of the overall study, including discussions of the flow reduction schemes developed
A-5

for each refinery and estimates of the capital and annual operating cost requirements involved, were presented in a report (159). Results indicate that wastewater discharge reduction to the proposed BAT flow level is achievable at the refineries investigated. The study also revealed that the costing procedure used in developing the proposed regulations did produce conservative cost estimates.
COST OF TECHNOLOGY SELECTED AS BASIS FOR LIMITATIONS AND STANDARDS
EPA considered nine options in finalizing BAT regulations, four options for NSPS guidelines, and three options for PSES and PSNS controls. The following discussions describe the costing methodologies and results obtained for each.
BAT Options
As discussed in Section VIII, nine regulating options that included various combinations of flow reduction and wastewater treatment technology were considered for BAT. Options l through 6 were investigated in formulating the proposed rule. Option 7 (a modification of Option 2) and Option 8 (a modification of Option l) were developed on the basis of information that was available at the time of the 1979 proposal, but was then modified and supplemented as a result of information collected by EPA after the proposal. Option 9 requires no additional controls beyond existing BPT, and therefore, would incur no additional cost.
Cost estimates for Options l, direct discharging segment of basis for the 1979 proposal. and annual operating costs in Table A-29.
2, and 3 were developed for the the industry on a plant-by-plant These estimates of total capital 1977 dollars are presented in
It was realized that the most accurate method of determining compliance costs would be to conduct an engineering evaluation at each refinery that might be affected by proposed discharge regulations. However, in order to produce conservative compliance costs within a reasonable manhour expenditure, a cost estimating procedure was established. The procedure relied on flow reduction and end-of-pipe treatment alternatives that could be directly defined. The approach included flow reduction only (Option 1), and flow reduction plus enhanced biological treatment (Option 3) . The costs of the Option 3 wastewater management combination were used to represent the costs associated with meeting Option 2 requirements.
The procedure developed to estimate plant-by-plant compliance costs began with a review of each refinery's generated wastewaters, end-of-pipe treatment system, and modes of disposition. The volume of wastewater qenerated daily by each refinery was traced and categorized accordinq to treatment and disposal. Data were obtained from industry responses to EPA's 1977 Petroleum Refining Industry Survey and its subsequent submittals.
A-6

The next step in the costing procedure was to determine the type of biological enhancement to be added at each refinery and then assign costs. Although an individual refinery may choose to upgrade its biological treatment system in other ways, powdered activated carbon treatment and rotating biological contactors were considered in this procedure, and readily priced as add-on systems. Refineries that had, or were planning to have, aerated lagoons or oxidation ponds were given costs for RBC systems. Refineries that had, or were planning to have, activated sludge, trickling filters, or RBC systems were given costs for powdered activated carbon treatment. Capital and operating treatment costs were based on the influent rate to the end-of-pipe system, with a minimum of 10,000 gallons per day. Costs for these systems were expected to be conservatively high estimates.
Determining the amount of flow reduction required by each refinery was the third step in the procedure. The proposed flow model presented in Section IV was used to calculate model wastewater generation rates, based on process capacities, for each direct discharger. BAT discharge rates were then set at 73 percent of the calculated model flow (27 percent reduction). Each refinery's actual rate of direct discharge of production wastewaters was compared to its calculated BAT discharge rate to determine required reductions. Prior to this comparison, actual discharges were adjusted by planned reductions in the amount of wastewater generated, and reductions in flow to end-of-pipe treatment.
The following step in the procedure was to allocate flow reduction costs. The assumed reduction technique selected for the development of cost estimates was the recycling of treated wastewater for use in process related applications, such as cooling tower make-up, pump gland cooling water, wash down water, and fire system water. Based on recycle flow rate and a derived relationship between refinery size and required pumping distance, pumping and piping costs were calculated for each refinery that required flow reduction. The assumption was also made that softening would be necessary before treated wastewater could be reused. Costs were determined for softening 25 percent of the recycled wastewater with the lime-soda process and filtration.
The final step in the compliance costing procedure was to combine the treatment and flow reduction costs assigned to each refinery and to compute overall industry costs. Capital and operating costs for each refinery were generated by adding those model technologies that did not exist in 1976 and that were not planned for the ~uture. Since biological treatment is essential in meeting the BPT guidelines, this level of treatment was assumed to exist at all direct discharging refineries. Therefore, the cost estimates represent the incremental expenditures required over and above the costs associated with attainment of BPT effluent limitations.
A-7

More details on the costing procedure and refinery data used to estimate compliance costs can be found in the report on this effort entitled, "Cost Manual for the Direct Discharge Segment of the Petroleum Refining Industry" (151). The cost evaluation concluded that, for Option l, a total industry capital cost of $23.5 million in 1979 dollars would be required, with an annual operating cost of $3.4 million, to comply with proposed effluent limitations guidelines. Option 2 and Option 3 would require a total capital cost of $138 million and an annual operating cost of $27.1 million. These cost figures have been updated to 1979 dollars based upon the Nelson Refinery Construction and Operating Cost Indices.
An "annualized cost" combines capital cost and operating cost into a single value that represents average annual disbursements required to finance, operate, and amortize a facility. The basis for computing annualized compliance costs, as outlined in the Agency's economic analysis of proposed effluent standards and limitations (87), is the sum of annual operating costs (including labor, materials, chemicals, energy, insurance, and taxes), capital recovery, and return-on-investment. Computed on this basis, the estimated annualized cost that would be required for Option 1 is $9.3 million, while $62 million would be required for Options 2 and 3.
Option 4 required effluent limitations beyond BPT based upon wastewater flow reduction and the segregation and separate treatment of cooling tower blowdown. While the cost of chromium removal could be estimated, the cost of segregating cooling tower blowdown from other process streams was not available at the time of proposal. Therefore, EPA did not make a detailed cost analysis for this option.
One objective of the Agency's wastewater recycle/reuse study (159), conducted after the publication of the proposed regulation,
was to determine the waste management changes that would be required and the costs involved to segregate and collect these blowdown streams. Results of the study indicate that, for existing sources, it is extremely difficult, in many instances, to segregate cooling tower blowdown for chromium treatment. Cooling tower blowdown is typically effected at numerous locations throughout a refinery. Extensive collection systems would be necessary at many refineries to collect all blowdown streams for separate treatment. In addition, not all cooling tower blowdown streams are collectible. For instance, cooling water when used as makeup for refinery processes commingles with process water and cannot be traced or segregated, especially in older refineries. Therefore, the Agency has determined that it would not be proper to base BAT effluent limitations guidelines on this technology option. Complete cost estimates for this option have not been developed.
A-8

Option 5 was based upon wastewater flow reduction in addition to BPT treatment plus the addition of granular activated carbon treatment to control residual toxic organic pollutants. Cost estimates for this option were based upon compliance costs developed for Option 1 and the capital and operating costs for GAC treatment as shown in Tables A-21 and A-22. A total annual industry cost of an estimated $470 million in 1979 dollars would be required for this option.
Prohibiting the discharge of wastewater pollutants was proposed as Option 6, and was based upon reuse, recycle, evaporation, or reinjection of wastewaters. Total industry costs were not calculated for this option. While additional costs for building a new refinery to eliminate discharge have been determined, the costs of retrofitting an existing refinery are highly site specific. Costs for a zero discharge option, however, would be significantly higher than costs for applying any of the other options.
Options 7 and 8 are revisions to Options 1 and 2, and are based upon discharge flow reductions from the revised model flow. Results of the Agency's wastewater recycle study were used to revise the compliance costing procedures previously developed for Options 1 and 2.
Several methods were found at the refineries studied that could reduce the rates at which wastewaters were being discharged from boiler circuits, cooling tower circuits, and general process uses. The use of treated effluent as a replacement for raw water in these areas was also examined. However, not all methods are applicable at every refinery. Each refinery's flow scheme, intake water quality, and wastewater treatment system limit the flow reduction options available to it. But, a list of techniques has been identified from which a refinery can select one or more alternatives to reduce its discharge rate to the target BAT level.
Capital and operating cost data developed during the study represeni combinations of flow reduction techniques that could be used to meet the BAT level. A unit flow reduction cost resulted for each refinery based on the mix of reduction schemes proposed for that particular refinery. Annual flow reduction costs established for all of the refineries investigated fall within a specified range when expressed in terms of dollars per gallon reduced per day. These cost data were us~d to estimate flow reduction costs for the industry.
The previous compliance costing procedure began with a review of each refinery's generated wastewaters, end-of-pipe treatment system, and modes of disposition. The volume of wastewater generated daily by each refinery was traced and categorized according to treatment and disposal. The revised procedure continued with a determination of the amount of flow reduction
A-9

required by each refinery. Model flows were calculated based upon process crude capacities. BAT discharge rates were then set at 62.5 percent of the calculated model flows. Each refinery's existing process wastewater discharge rate is compared to its target BAT discharge rate to determine required reductions. Prior to this comparison, existing discharges were adjusted by flow reductions that were reportedly being planned for the near future. Flow reduction costs were then allocated for each refinery.
Plant-by-plant estimates of the costs that would be required for Option 7 were developed for the direct discharge segment of the industry. These estimates, along with refinery data used in the costing procedure, are presented in a report prepared for this effort entitled, "BAT Compliance Costs for the Direct Discharge Segment of the Petroleum Refining Industry" (171). Results of the revised procedure indicate that a total capital cost of $112 million and an annualized cost of $37 million in 1979 dollars would be required for this segment of the industry to comply with Option 7.
The Agency has not performed a detailed cost analysis of Option 8, but has estimated such costs based upon the costing procedure developed for Option 7. BAT discharge rates were set at 80 percent of the revised model flows. Flow reduction costs were allocated for each direct discharge refinery, generating plantby-plant estimates of compliance costs for Option 8. This effort concluded that a total capital cost of $77 million and an annualized cost of $25 million in 1979 dollars would be required for the industry to comply with Option 8.
New Source Costs
EPA considered four options for the final rulemaking. NSPS Options 1, 2, and 3 were included in the 1979 proposal. Option 4 was added subsequently and would set new source standards equal to the existing standards promulgated in 1974. NSPS Options 1, 2, and 3 utilize technology similar to BAT Options 2, 5, and 6, respectively. Unlike the similar BAT technology options, new sources have the opportunity to incorporate technological changes without incurring the retrofit costs included in modifications to existing refineries.
NSPS Option 1 - Discharge flow reduction to 52 percent below model flow, achieved through greater reuse and recycle of wastewater, in addition to BPT treatment, is equivalent to BAT Option 2.
A-10

The 1979 development document contains an estimate of cost to construct a new 150,000 barrel/day subcategory B refinery. Cost for NSPS Option 1 include:
Cost Component
Capital Costs Operating Costs
1979 Dollars
$ 0.75 million 0.37 million
NSPS Option 2 - Discharge flow reduction to 27 percent below BPT model flow, achieved through greater reuse and recycle of wastewaters in addition to BPT treatment, plus use of granular activated carbon (GAC) treatment to reduce residual organic toxic pollutants is equivalent to BAT Option 5. A new refinery will not incur the retrofit costs of flow reduction associated with BAT Option 5, however, it will incur the capital cost for GAC plus annual operating costs as shown in Tables A-21 and A-22.
NSPS Option 3 - Zero discharge of wastewater pollutants is similar to BAT Option 6 except that the new refinery will not incur retrofit costs.
EPA has not calculated the costs for eliminating wastewater discharge. However, the API publication Water Reuse Studies (150) has presented such costs for a 150,000 barrel per day refinery. Based upon estimates contained in this document, investment, over BPT, of 11.6 million would be required with an annual cost of 4.6 million, including interest and depreciation (1979 dollars).
NSPS Option 4 - Discharge flow reduction to from 25 percent to 50 percent below BPT model flow, depending upon subcategory, achieved through greater reuse and recycle of wastewater is equivalent t0 the existing new source performance standard promulgated in 1974. NSPS Option 4 is equal to the existing criteria for new sources, and therefore, a new refinery will incur no additional cost in complying with this technology option.
Pretreatment Options
The Agency evaluated three technology options for the selection of final standards for indirect dischargers. Options 1 and 2 are similar to Options 1 and 2 presented in the 1979 proposal. The third option was considered after the 1979 proposal and is similar to the existing standard for existing sources. EPA developed these costs by estimating the values for each plant requiring chromium removal and/or biological treatment. The costs presented in the tables were updated to January 1977.
Costs for end-of-pipe treatment includes the following processes:
Biological treatment, consisting of activated sludge units, thickeners, digesters, and dewatering facilities.
A-ll

Granular media filtration, consisting of filter systems and associated equipment.
These costs were also indexed to January 1977 values.
PS Option 1 - Chromium reduction by pH adjustment, precipitation and clarification technologies applied to cooling tower blowdown, plus control of oil and grease and ammonia at the existing level of control is similar to Option 1 in the 1979 proposal. Separation and treatment of cooling tower blowdown is the additional technology required beyond existing pretreatment standards.
Table A-30 presents the costs of modifying each indirect discharge refinery to meet Option 1 requirements. The analysis includes the cost of combining the effluents from multiple cooling tower installations. Estimates of necessary pumps and piping were obtained from the cost presented for recycle of treated effluents in Table A-27.
The Agency estimated the combined cost of retrofitting affected indirected dischargers at $11.7 million initial investment and an annual cost of $6.8 million (1979 dollars).
The Agency estimated the incremental cost of incorporating PS Option 1 technology into a subcategory B model new refinery (150,000 barrel per day topping and cracking) at an initial investment of 0.37 million and an annual cost of $0.26 million (1979 dollars) including interest and depreciation.
PS Option 2 - Establish two sets of pretreatment standards. Provide Option l control for refineries that discharge to POTW with existing or planned secondary treatment. Provide Option l controls plus biological treatment for refineries that discharge to POTW that have a Section 30l(h) waiver from secondary treatment. Tables A-30 and A-31 combined contain the costs to implement Option 2 (1977 dollars). Included in Table A-31 are costs for the installation of in-plant control measures for those plants whose wastewater flow exceeded the calculated BPT model flow. These costs were obtained from the National Commission on Water Quality (20).
Total cost of implementing Option 2 for existing refineries could not be calculated for the 1979 proposal since no POTW had been granted a Section 30l(h) waiver at the time the cost estimates were prepared. The Agency did estimate the cost of installing biological treatment for each indirect discharge refinery. These values are shown in Table A-31 for information purposes only. If all indirect discharge refineries were required to install biological treatment systems, the maximum cost to the industry (obtained by summing cost to each refinery in Table A-31 and indexing to a base year) would be an initial investment of $110 million and an annual cost of $42 million (1979 dollars) . All refineries discharging to POTW having secondary treatment were subject to the cost of providing Option l treatment shown in Table A-30.
A-12

PS Option 3 - Reduction of oil and grease and ammonia by oil/water separation and steam stripping technologies is equivalent to the existing pretreatment standard. Since indirect discharging refineries are already required to provide treatment equivalent to Option 3, implementation of Option 3 would incur no additional cost to existing refineries.
A-13

::t>' I
1-'
"""
TABLE A-1
RAW WASTEWATER EQUALIZATION SYSTEMS CAPITAL AND OPERATING COSTS
capital Cost, Dollars
3 3 3 3 3 Description 380 M /daX 3800 M /dgy 19,000 M ~day 38,000 M tgay 76,000 M ;gay
(0.1 X 10 ) (1.0 X 10 ) (5 X 10 ) (10 X 10 ) (20 X 10 ) gal/day gal/day gal/day gal/day gal/day
Detention tank, 12 hours detention, $ 30,000 $ 116,000 $ 346,000 $ 595,000 steel shell on concrete pad
Pumps, and associated controls, 8,000 30,000 87,000 149,000 installed
Subtotal $ 38,000 $ 146,000 $ 433,000 $ 744,000
Piping, installed (1~\) _______ !;,'lQQ _ 22,000 65,000 1~000
Total Installed Cost $ 43,700 $ 168,000 $ 498,000 $ 861,000
Engineering 6,650 26,000 75,000 129,500
Conting~ncy __ _6, 650 u 26,000 _ __Th, OOQ __ -~~].2~, 500 Total Capital Cost $ 57,000 $ 220,000 $ 648,000 $1,120,000
2 Land Requirements, Ft
Pumping $
585
140 $
5,780 28,200 57,600
Annual Operating Costs, Dollars
1,400 $ 7,000 $ 14,000
$1,020,000
255,000
$1,275,000
192,000 $1,467,000
221,500
221,500 $1,910,000
113,000
$ 28,000
Maintenance (3\ of Capital Cost) 1,700 6,600 19,500 33,600 57,300 Total Annual Cost $ 1,840 $ 8,000 $ 26,500 $ 47,600 $ 85,300
Notez The Depreciation factor has been omitted from this analysis due to the fact that it will be included separately in the Economic Impact Analysis Suppiement.

:J:> I
....... Lll
TABLE A-2
ROTATING BIOLOGICAL CONTACTORS (RBC 's) AS ROUGHING SYSTEMS
EQUIPMENT COST BASIS AND ENERGY REQUIREMENTS
Equipment Size
3 3 3 3 3 Description 380 M /da~ 3800 M /dgy 19,000 M ~day 38,000 M tgay 76,000 M tgay
(0.1 X 10 ) (1.0 X 10 ) (5 X 10 ) (10 X 10 ) (20 X 10 ) gal/day gal/day gal/day gal/day gal/day
Design Percent Removal 50 50 50 50 50 of BOD
Number of Units 1 6 24 48 96
Shaft Lengths, each 15 20 25 25 25
Total Square Feet of Surface Area 75,000 630,000 3,200,000 6,400,000 12,800,000
Annual Operating and Energy Requirements
Manpower Requirements, hours 500 750 1,000 1,500 2,000
Power Requirements, kwh/year 33,000 294,000 1,180,000 2,360,000 4,720,000

:t:' I
I-' 0"\
TABLE A-3
ROTATING BIOLOGICAL CONTACTORS (RBC's) AS ROUGHING FILTERS
CAPITAL AND OPERATING COS~S
Capital Cost, Dollars
3 3 3 3 3 Description 380 M /daM 3800 M /dgy 19,000 M 'day 38,000 M tgay 76 1 000 M /gay
(0.1 X 10 ) (1.0 X 10 ) (5 X 10 ) (10 X 10 ) (20 X 10 )
RBC Units, Steel Shell, Fiberglass Cover
gal/day gal/day gal/day gal/day gal/day
$ 46,000 $340,000 $1,590,000 $3,170,000 $6,340,000
Piping 5,000 35,000 160,000 317,000 634,000
Total Equipment Cost 51,000 375,000 1,750,000 3,487,000 6,974,000
Installation (50\) 2s,soo _ 187 .~oo Q7~ooo 1, 744,ooo 3,487 ,ooo
Total constructed Cost 76,500 562,500 2,625,000 5,231,000 10,461,000
Engineering 11,750 84,750 397,500 784,500 1,569,500
Contingency 11,750 84,750 397,500 784,500 1,569,500
Total Capital Cost
2 Land Requi:r:ed, Ft
Power
Labor
$100,000
420
$ 1,500
5,000
$732,000
2,800
$ 12,000
7,500
$3,420,000 $6,800,000 $13,600,000
13,500 27,000 54,000
Annual Operating costs•
$ 48,000 $ 95,000 $ 190,000
10,000 15,000 20,000
Maintenance (3\ of Total Capital Cost) 3,000 22,000 103,000 204,000 408,000
Total Annual Cost $ 9,500 $ 41,500 $ 161,000 $ 314,000 $ 798,000
Noter The depreciation factor has been omitted from this analysis due to the fact that it will be included separately in the Economic Impact Analysis Supplement.

::t:-1
I-' -.....]
Description
Filter Description (all units are auta~~atic and air scoured)
Bed depth, ft.
Operation type
Media type
Pu111ping, KWH/year
Labor, Manhours/year
'l'ABLB A-4
P.IL'l'MTIOH BgUIPMBift' COS7 BASIS AIID BNUGY MQUIRBIIBH'I'S
Bqui~t Coat Baals
3 3 3 3 3 380 M / day 3800 M /~Y _ __ ].9,()0() II /~y 3@,009 M /day __ 76,000 M /day
6 6 6 6 6 (0.1 X 10 gal/day) (1 X 10 gal/day) (5 X 10 gal/day) (10 X 10 gal/day (20 X 10 gal/day)
2 units 2 units 1 unit, 4-35'aquare 1 unlt,4-4l'aquare 5 1 di-. ,steel 111 di••· ,steel oells, concrete cella, concrete
4 4 4 4
Gravity Gravity Gravity Gravity
Dual .adia Dual 88Clla Dual lledla Dual lledla
Annual Oper~ttlpg ancJ Bn&rgy Jloquir-nts
3,440 34,400 172,000 344,000
400 500 600 700
2 units, 47 1 square cells, concrete
4
Gravity
Dual lledia
688,000
BOO

>' I
/-' co
TABLE A-5
FILTRATION CAPITAL AND OPERATING COSTS
Capital Cost, Dollars
3 3 3 3 3 Description 380 M /daX 3800 M /dgY 19,000 M 'day 38,000 M tgay 76,000 M /gay
(0.1 X 10 ) (1.0 X 10 ) (5 X 10 ) (10 X 10 ) (20 X 10 ) gal/day gal/day gal/day gal/day gal/day
Filtration Units Installed $ 25,000 $100,000 $250,000 $350,000 $600,000
Interconnecting Piping, Installed 3,000 10,000 25,000 35,000 60,000
Pumps, Installed 5,()00 15,000 ~2,90() 60,()00 100_,000 Total Installed Cost 33,000 125,000 317,000 451,000 770,000
Engineering 6,000 20,000 49,000 ~9,500 115,000
Contingency 6,000 20,000 49,000 69,500 115,000 Total Capital Cost $ 48,000 $165,000 $415,000 $590,000 $1,000,000
2 Land Requirement, Ft
Pumping
Labor
$
200
140
4,000
700 5,000 9,000
Annual Operating Cost, Dollars
$ 1,400 $ 7,000 $ 14,000
5,000 6,000 7,000
Maintenance (3\ of Capital Cost) 1,400 5t()OO __ _ 12,500 _ 18 1 000 Total Annual Cost $ 5,540 $ 11,400 $ 25,500 $ 39,000
18,000
$ 28,000
8,000
30,000 $ 66,000
Note; The Depreciation factor has been omitted from this analysis due to the fact that it will be included separately in the Economic Impact Analysis Supplement.

:;r:.. I
I-' \.0
TABLE A-6
POWD&ItED AC'I'IVATEO CARIIOH BQUIPHEtn' COST BASIS
AND ENERGY IUlQUIREHENTS 80 ..g/1 DOSAGE RATE
.!quis-ent 8i&e
3 3 3 l 3 Peacdption 380• /da¥ 3800• /dfi 191000 • (day 381000 a/gay 76 1000• tgay
(0.1 X 10 ) (1.0 X 10 ) (5 X 10 ) (10 X }0 ) (20 X 10 )
Powdered Carbon Feed Tanka (2 each) Capacity 1 gallon• (Baaed on teed concentration of one po\Uid carbon/gallon vater)
Feed Rate pounda/day
Manpower Requir-nta 1 boura
Nlacellaneoua Power Requlr-au, kWb/yr
9al/d gal/d gal/d 9al/d gal/d
700 71000 351000 701000 1401000
67 670 3,350 6,700 13,400
Annual Qperating and Energy Requlre .. nte
400 540 940 1,240 1,940
251000 50,000 125,000 200,000 l75,000

~ I
N 0
TABLE A-7
POIDBRED ACI'IVA'I'£0 CARBON CAPITAL COSTS
80 .g/1 DOSAGE RATS
capital C001ta, Dollars
3 3 3 3 3 Description 380 a /daX 3800 • /dgy 19,000 • 'day 38,000 • tgav 76,000 • tgav
(0.1 X 10) (1.0 X 10 ) (5 X 10) (10 X 10 ) (20 X 10 ) gal/d gal/d gal/d gal/d gal/d
Powdered carbon Feed Syatea $10,000 $30,000 $45,000 f60,000 $100,000
Piping 1,000 3,000 4,500 6,000 •10,000
Total Equipment Coat 11,000 33,000 49,500 66,000 110,000
Installation (50\) 6,000 16,500 24,1100 JJ,OOO 55,000
Total Constructed Cost 11,000 49,500 74,300 99,000 165,000
Engineering 9,000 10,000 11,350 15,!500 25,000
Contlnqencx 9,000 10,000 11,350 15,500 25,000
Total Capital coat
0 2 Land Requir ... nta, ft
us,ooo
100
f69,500
:zoo
$97,000 U30,000 $215,000
900 l,lOO 1,700

> I
1\.) ....
TABLE A-8
POIODED JC'J'IVA'I'IIO CARIIOH ANNUAL OPSMTING COSTS
80 119/1 DOSAGS RATS
Annual eo.t, Dollar•
l l .l l l ~•cdetton 380, t4•x 1aooa tegx lt,ooo• 'a.r 1a,ooo• JQax 76,ooo• tgax
(O.lxlO) (l.OxlO) (SxlO) (lOxlO) (20xl0) gal/4 CJal/d gal/d gal/d gal/d
CUboA Make-up • 7,400 $74,000 $310,000 $740,000 U,480,ooo
Miecellaneoua Power Requlc ... nte 1,000 2,000 s.ooo 8,000 1s,ooo
Labor ,,10/ .. nhOUll') 4,000 5,400 9,400 12,400 19,400
Maintenance (l' of total C!Pital Coat) 1,000 2,000 3,000 4.000 6,600
Total Annual coat $11,400 ,83,400 U81,400 f764,400 n,su,ooo
~
The depreciation factor baa been oaltted froa thia analyaia due to the fact that it will be included aeparately in the Sconoaic l~ct Analyaia Supplaaent.

!l:' I
N N
It-
TABLE A-9
I'CMDBMD ACI'IVA'l'ED CAIIIIOII
CDMPUISOII or Ol'BIIA'I'ING CXlS'l'S CAIUIOII IIEGENERATIOH VS. THROW-AWAY
80 119/1 DOSAGE IIA'I'B Reqeneratecl
380 ,;!/day 3800 a 3/dl!lf 19,000 a3/del'___lll_.f)OO ,..3/~ay_'l~.oo() a3t~ay
(0.1 X lOv)-11-:o X lOvJ --(5 X lOu) (10 X lOu) (20 X 10°) gal/d 9el/cl <Jel/d gal/d ga1/d
Capital Coat $735,000 fl,OOO,OOO $1,650,000 $2,300,000 $3,250,000
Carbon Make-Up $ 2,200 $ 22,000 $ 110,000 $ 220,000 $ 440,000 Furnace Power 5,000 19,000 44,000 76,000 132,000 Miscellaneous Power 1,000 2,000 5,000 8,000 · 15,000 Labor 91,600 93,000 97,000 100,000 108,000 Maintenance (3\) 1,000 2,000 3,000 4,000 6,600
(15\) 105,000 140,000 233,000 328,000 455,000 Depr,c1atJ.~ (~7\l _ 200,~-- ~7(),000~~-- _ ~~(;,000 ____ 6H,OOO _ 878,000
Total Annual Coat $405,800 $ 548,000 $ 938,000 $1,357,000 $2,034,600
Nol'o-Reqener a ted
Capital Coat $ 35,000 $ 39,500 $ 97,000 $ 130,000 $ 215,000
Carbon Make-Up $ 7,400 $ 74,000 $ 170,000 $ 740,000 $1,480,000 Labor 4,000 5,400 9,400 12,400 19,400 Maintenance (3\) 1,000 2,000 3,000 4,000 6,600 Miscellaneous Power 1,000 2,000 5,000 8,000 15,000 D•Pl'~tc!ationcnH _________ 9,~oo__ J7,60Q. 26,200 35,loo_ 58,ooo
Total Annual Coat $ 22,900 $ 101,000 $ 413,600 $ 799 1 500 $1,579,000
Cost for Sludye Dewatering Annual Coat with Sludge Dewatering
Coat for Land Disposal Annual Coat with Land Disposal
$ 20,000 $ 42,900
4,000 $ 46,900
$ 76,000 $ 177,000
40,000 $ 217,000
$ 1)7,000 $ 550,000
200,000 $ 750,000
$ 226,000 $1,025,000
400,000 $1,425,000
$ 335,000 $1,914,000
800,000 $2,714,000

;J::I I
N w
TABLE A-10
POWDERED ACTIVATED CARBON EQUIPMENT COST BASIS
AND ENERGY REQUIREMENTS INCLUDING COSTS FOR SLUDGE DISPOSAL
80 mg/1 DOSAGE RATE
Equipment Size
3 3 3 3 3 Description 380 M /daX 3800 M /dgy 19,000 M £day 38,000 M ;gay 76,000 M ;gay
(0.1 X 10 ) (1.0 X 10 ) (5 X 10 ) (10 X 10 ) (20 X 10 )
Powdered Carbon Feed Tanks (2 each) Capacity, gallons (Based on feed concentration of one pound carbon/gallon water)
Feed Rate pounds/day
Sludge handling and/or regeneration system, lbs/day dry solids
Carbon make-up lbs/day
Furnace power requirements Fuel, BTU/hr Connected hp
Manpower requirement, hours
gal/day gal/day gal/day gal/day gal/day
700 7,000 35,000 70,000 140,000
67 670 3,350 6,700 13,400
290 2,900 14,600 29,000 58,000
Annual Operating and Energy Requirements
67 670 3,350 2,000 4,000
N.A. N.A. N.A. 2,500,000 4,500,000 N.A. N.A. N.A. 100 140
400 540 940· 10,000 10,700

::t:" I
N ~
TABLE A-ll
l'OWOERED AC'I'IVATED CARBOII CAPITAL COSTS
IIICWOING COSTS FOR SWDGB DISPOSAL 80 119/l DOSAGB RAT£
Capital Coeta, Dollars
380 13/d 3800 r3
td 19,oog • 3/d 38,0~ •3/d 76,oog •
3/d
Description (O,lxlO gal/d) (l.OxlO gal/d) (5x10 gel/d) (lOxlO gal/d) (20xl0 gal/d)
Powdered carbon Feed Syac. uo,ooo $30,000 $45,000 $60,000 $100,000
Solids Dewatering syat .. -- -- -- 397,000 585,000
Regenerated Carbon Acid Walb Syat..,. -- -- -- 40,000 60,000 --- --- ---
Subtotal 10,000 30,000 45,000 497,000 745,000
Piping (10\) 1,000 3,000 4,500 ,49, 7op ___1!,.500
Total Equip.ent Coat 11,000 33,000 49,500 546,700 819,500
Inatallation (50\) 5,500 16,500 24,800 273,400 ~000
Total Constructed COat 16,500 49,500 74,300 820,100 1,229,500
Bngineedng 9,000 10,000 11,350 119,950 185,250
COntingency t,ooo l0 1 Q90 11,350 119,950 __1!!,_250
Subtotal 35,000 69,500 97,000 1,060,000 1,600,000
Activated Carbon Regeneration Syata. (InatalledJ -- -- -- 900,000 1,200,000 COntingenoy (For Utility Hook-up, etc.) -- -- -- 190,000 250,000 Bngineering for Carbon Regeneration Syete• -- -- uo,ooo ~000 - --- ---Total capital COat us,ooo f69,500 $97,000 f2,300,000 f],2SO,OOO
Land Requtr ... nta, tt2 100 200 900 3,000 4,500

!:I:>' I
N U1
TABLE A-12
POWDERED ACTIVA'l'ED CARBON ANNUAL OPERATING COSTS
IHCWDIHG CREDIT FOR SWDGE DISPOSAL 80 mg/1 DOSAGE RATE
Annual Cost, Dollars
3 3 3 3 3 Description 380 M /daX 3800 M /dgy 19,000 M 'day 38,000 M tgay 76,000 M tgay
(0.1 X 10 ) (1.0 X 10 ) (5 X 10 ) (10 X 10 ) (20 X 10 ) gal/day gal/day gal/day gal/day gal/day
Carbon Make-Up $7,400 $74,000 $370,000 $220,000 $440,000
Furnace Power 76,000 132,000
Miscellaneous Power Requirements 1,000 2,000 s,ooo 8,000 15,000
Labor ($10/manhour) 4,000 5,400 9,400 100,000 108,000
Sludge Disposal Credit (-)400,000 (-)800,000
Maintenance l,QOO ~,000 ~. _ ~1 QOO 3321 000 .. _ 46!.~.600
Total Annual Cost $13,400 $ 83,400 $387,000 $336,000 $ 356,000
Note a The depreciation factor has been omitted from this analysis due to the fact that it will be included separately in the Economic Impact Analysis Supplement.

::t:' I
N ~
TABLE A-13
P<lWDERED ACTIVATED CAIIBOH EQUJPHEH'f COS'J' BASES AND ENERGY R£0UlltBHEHTS
150 a:J/1 DOSAGE RATE
EQui(>!l!nt Sh.e
l80 t 3/d 3800 t 3
/d 19,~ • 1/d 38,0~ •
3;4 76,~ • 3/d
Description (O.lxlO gal/d) (l.OxlO gal/d) (SxlO gal/d) (lOxlO gal/d) (20xl0 gal/d)
Powdered Carbma reed 'fanks 1,000 (2 each) Capacity, gallons (Baaed on feed concentration of 1 1b carbon/gal water)
Feed Rate lb/d 125
Sludge Handling and/or Regeneration Syate•, 1b/d dry aoUda
llS
10,000 43,000
1,250 6,250
3,350 16,700
Annual !:!f!raUn!l and Ener!IX !!!guire-nte
Carbon Make-Up lb/d us 1,250 6,250 (25\ •ake-up)
Furnace Power Requireaenta Fuel, Btu/h M.A. II.A. H.A. Connected hp N.A. N.A. H.A.
Manpower Requireaenta, hours 400 540 940.
87,000 175,000
12,500 25,000
33,500 66,700
u,soo 8,150
H.A. <&,soo,ooo N.A. uo
1,240 10,700

>' I
N -...]
TABLE A-14
I'OWD&RED AC'l'IVATEO CAIIBON CAPITAL COSTS
150 1'9/1 DOSAGE RATE
Capital Coate, pollara
]80 1]/d l800 1]/d 19,~ •l/d l8,~ a 1/d 76,~ a 1td
Deacription fO.lxlO gal/dp (l.OxlO qal/dp (5xl0 qal/dp flOxlO tal/dQ (20xl0 tal/dp
Powder•~ ~arbon Feed Syatea us,ooo $45,000 $65,000 $90,000 n5o,ooo
Solids Dewater1ng Syatea -- -- -- -- 615,000
Regenerated Carbon Acid Wash Systea -- -- -- 60,000 - --- --- ---
Subtotal 15,000 45,000 65,000 90,000 825,000
Piping (10\) ~0 4,500 ~ 9,000 8],000
Total Equi~.ant Coat 16,500 49,500 71,500 99,000 908,000
Installation (50\) a1soo 24,500 l5 15oo 49,500 454,000
Total Conatructed Coat 25,000 74,000 107,000 148,500 1,]62,000
Engineering 9,000 u.ooo 16,500 22,250 207,500
Contingency '•000 u.ooo 16,500 22.250 207,500
Subtotal u,ooo 100,000 140,000 19],000 1, 771,000
Activated Carbon Regeneration -- -- -- -- l 1 l00,000 Systea (Installed) Contingency (For Utility -- -- -- -- 280,000 Hook-up, etc.) Engineering for Carbon -- -- -- -- 200,000 Regeneration Syatea
Total Capital Coat $ u,ooo ' 100,000 $140,000 $19],000 U,557,ooo
Land Requirements, tt2 100 800 2,000 l,OOO 4,500

::t>' I
N CX)
TABLE A-15
POWDERED ACTIVAtED CARBON ANNUAL OPERATING CDS'I'S
150 1119/l ~SAGE RA'l'E
Annual Coat, Oollan
110 e1t• J8oo 11;• 19,~ • 3,. )8,~ •
1,. 76,~ • 3,. Deacrtptlon (O.lxlO gal/d) (l.OxlO qal/dl (SxlO sal/dl (lOXlO sal/d) (20x10 gal/d)
CArbon Hake-Up
Furnace P-•r
IUacellanaoua P-.r Raquh·-nu
Labor ($10/aan-hour)
tlaintananca
Total Annual Coat
tlot••
Ul,900
1,000.
4,000
1,000
U9,900
Ul9,000
2,000
5,400
2,000
fl48,400
$694,000 U,J88,000 ' 825,000
1)2,000
5,000 8,000 15,000
9,400 12,400 108,000
),000 4,000 491,000
$711,400 $1,412,400 U,571,000
Tba Depraciation factor baa been oaJttad froa tbia analrata due to the faot that it will ba included .. paratalr in tha Econoaic ~~act AnalJill 8uppl ... at.

~ I
IV 1.0
TABLE A-16
PAC'!' COia>AJUSON OF OPERATING OOS'I'&
CAII80II ltEGINERATlON VS. 'l'IIIIOW-AWAY 150 119/l DOSAGE RATB
l!e!ener:eted
110 , 3td 1aoo r3
td .,,ooe • 3td 1a,~ a
3td
Oeecr:letlon (O.lxl~ gal/dl (l.OxlO gal/dl !5xl0 gal/dl !lOxlO gel/d) 76,ooe a
3t4
(20xl0 gel/41
S!Pltel Coat $743,000 $1,035,000 $1,743,000 f2,463,000 $3,557,000
Cer:bon Make-up 4,UO 41,300 207,000 4ll,OOO 825,000 Fur:nace Power: 5,000 19,000 44,000 76,000 132,000 Hlecelleneoue Power: 1,000 2,000 5,000 8,000 15,000 Labor: 91,600 93,000 97,000 100,000 108,000 Maintenance (l\1 1,000 2,000 3,000 4,000 6,000
(15\) 105,000 140,000 240,000 3U,000 485,000 Uepr:eciation (25\) 200,000 280,000 471,000 665,0Q!t 961,000
total Annual Cost 1407,730 $517,300 Sl,067,000 $1,609,000 U,5l2,000
Non-Regener:ated
Capital Cost f u,ooo !100,000 $140,000 $193,000 $322,000
Car:bon Hake-up U,900 139,000 694,000 1,388,000 2,175,000 Labor: 4,000 5,400 9,400 12,400 19,400 Maintenance (3\l 1,000 2,000 3,000 4,000 6,600 Miacelleneoua Power: 1,000 2,000 5,000 8,000 15,000 Dopr:ecietion !27\) 11,600 27,000 37,800 52,100 87,000
Total Annual Coat ' 11,500 $175,400 U49,200 $1,464,500 U,90l,OOO
Cost tor: Slud9e Deweter:ing 25,()QQ 95,000 171,000 282,000 419,000
Annual Cost with Sludge Dewatedng $ 56,500 $270,400 $920,200 $1,746,500 $3,122,000
Coat for: Lend Disposal s,ooo ~ 50,0Q() 25Q._gQQ 500,000 1,000,000
Annual Cost with Lancl Disposal $ 61,500 $320,400 $1,170,200 fl,246,500 $4,322,000

~ I w 0
TABLE A-17
POWOBRED ACliVATt:O CAIWON EQUIPHEH'l' COST BASt:S AND ENERt:Y tu:QUIREMENTS
INCLUDING COSTS FOR SWOG£ DISPOSAL 150 "4/1 DOSAGE RAT£
Equipaent Size
380 t 1/d l800 13/d 19,oog a
3/d l&.oog a
3/d 76,oog a3/d
Description (O.lx10 gal/d) (l.OxlO gal/d) (5xlP gal/d) (10xl0 gal/d) (20xl0 gal/d)
Powdered Carbon Feed Tanks 1,000 (2 eacl1) Capacity, gallons (Based on feed concentration of 1 lb carbon/gal water)
Feed Rate lb/d
Sludge handling and/or Regeneration System, lb/d dry solids
125
ll5
10,000 u,ooo
1,250 6,250
3,350 16,700
Annual 9!!rating and Enor!Zl Reguire .. nts
Carbon Hake-Up 1b/d (25\ make•up)
Furnace Power Requireaente Fuel, Btu/h Connected hp
otanpo-r Requiremente, hours
125
"·"· N.A.
400
J.,250 2,100
"·"· 1,300,000 II.A. 80
540 ,,700
87,000 175,000
12,500 25,000
Jl,500 66,700
418 8,350
2,500,009 4,500,000 100 140
10,000 10,700

~ I
w f-'
TABLE A-18
l'OWDEIIED ACTIVA'l'BD CAIUIOII CAPITAL CXlS'l'&
INCLUDING OOS'I'S FOR ILUilG& DISPOSAL 150 -.g/1 DOSAG8 M'IB
£!P1tal Costa, Doll&n
3ao ~3td 3aoo ~3td 19,ooe a3td ,a,ooe a
3td 76,~ •ltd
Description (O.lxlO gal/d) (l.OxlO gal/d) (5al0 gal/d) (lOxlO sal/d) (20x10 sal/d)
Powdered Carbon Feed Syat .. us,ooo • 45,000 • 65,000 • 90,000 U50,000
Sol1da Dewatering &ystea -- -- 250,000 415,000 615,000
Regenerated Carbon Acid Weab syate111 -- ----- 20,000 ~000 60,000
Subtotal 15,000 45,000 335,000 545,000 825,000
Piping (10\) ~ 4,5QO H,()OO 55,000 83,000
Total Equipment Coat 16,500 49,500 369,000 602,000 908,000
Installation (50) ~ :14,500 18S,OOQ 300,000 454,000
Total Constructed Coat 25,000 74,000 554,000 900,000 1,362,000
Engineedng 9,000 13,000 82,000 131,500 207,500
Contingency 91ooo u,ooo 82,000 ll1,500 ___!21, 500
Subtotal u,ooo 100,000 718,000 1,163,000 1, 777,000
Activated Carbon Regeneration Systum (Installed) -- -- 750,000 950,000 1,300,000 Contingency (For Utility Hook-up, etc.) -- -- 160,000 200,000 280,000 Engineering for Carbon Regeneration Syatea -- -- u~.ooo 150,000 200,000
Total Capital Coat $43,000 uoo.ooo U,7U,OOO U,463,ooo U,557,000
Land Requirements, tt2 100 800 2,000 3,000 4,500

::t::' I
w 1\.)
TABLE A-19
POWDUED AC'l'IVA'l'EO CAJI80II ANNUAL Ol'EIIATING COSTS
IIICUJDING CMDIT FOR SLUDGE DISPOSAL lSO 119/l DOSAGE RATE
Annual Coat, Dollars
]80 e3td 38oo e3
td 11,ooe a3td 3a,~ • 3;d 76,~ • 3;4
Pea9ription CO,lxlO qal/dl (l.OxlO gal/d) (5xl0 gal/d) llOxlO gal/d) (20xl0 gal/d)
Carboa Hake-up UJ,900 $139,000 U07,000 ·~13,000 $825,000
Furnace •-•r: -- -- 55,000 95,000 165,000
Hbcellaneoua Power Requir:e-nta 1,000 2,000 5,000 8,000 15,000
Labor (flOt-an-boQr:l ... ooo 5, .. 00 91,000 100,000 108,000
Sludge Diepoaal Cradlt -- -- (-)250,000 C-1500,000 C-)l,ooo,ooo
Maintenance ~ 2,000 zu,ooo 347,000 491,000
Total Annual Coat $19,900 1148,400 $357,000 $463,000 1604,000
~
The Depreciation factor baa b .. n oaitted f~ tbia analysis due to the fact that it will be included .. par:ately in tba Bconoalc I~act Analysis luppl ... nt

>' I
w w
Oescri pti on
Activated Carbon Units
Carbon, ft3 Total
Au toma t1 c Con t ro 1 s Included
Furnace size, lb/d of carbon
Carbon Make-up, lb/d (10% make-up)
furnace Power Requirements
fuel, Btu/hr Connected hp
Pumping Power Requirements kWh/yr
Manpower Requirements, hours
380 ml/day (O.lxl06 gal/d)
Three-4'diam. X 13' high
281
No
N.A.
125
N.A. N.A.
11,400
2,100
TABLE A-20
Granular Activated Carbon ~uipment Cost Basis
a Energy Requireuents
3800 ml/day (l.Oxlo6 gal/d)
Three-11' diarn. X 18' high
2800
Yes
1250
EquipAlent ¥,¥.. l9,~ 111 /day
(5x10 gal/d)
Nine-12' diam. X 25' high
14,000
Yes
6,250
38,~ aal/day (lOxlO gal/d)
76,000 ml/day (20xl06 gal/dl
flfteen-12' dtam. Thlrty-12' dlam. X 30' high X JQ' hfgh
28,000 56,000
Yes Yes
12,560 25,000
Annual Operating and Energy Requirements
12,5
500,000 40
114,000
9,800
625
800,000 50
570,000
10,500
1,250
1,500,000 60
1,140,000
11,500
2,500
2,800,000 80
2,280,000
12,500

!J::' I
w ,.!::.
TABLE A-21
GRANULAR ACTIVATED CARBON CAPITAL COSTS
~-- ~~-~~- Capita_! ~()l!tli_, Oollar:s
3 3 3 3 3 Description 380 IU /dgy 3800 II /gay 19 1 000 r /day 38 1 000 II &day 76 1000 II &day
(0.1 XlO I (1.0 XlO I (5 XlO I (10 XlO I (20 XlO I
Activated Carbon Units
Pumping ~ Misc. Equip. (10\)
gal/d
$50,000
5,000'
qal/d
$325,000
32,500
gal/d
$1,500,000
150,000
gal/d
$2,600,000
260,000
Pip!_l:lg (10\) S, O_QQ_ __ 321 SOO __ lSO,OQQ__ __ 260 1 000
Total Equipment Cost 60,000 390,000 1,800,000 3,120,000
Installation (SO\) lo,ooo 195,000 goo,ooo 1,560,000
Total Constructed Cost 90,000 585,000 2,700,000 4,680,000
Engineeri119 40,000 85,000 400,000 710,000
gal/d
$5,000,000
500,000
soo,ooo
6,000,000
3,000,000
9,000,00G
1,350,000
Contingency ;!0 1 000 80,000 ___ 400,0()0~- __ 710,()0Q 1, 350 1 000
Subtotal 150,000 750,000 3,500,000 6,100,000 11,700,000
Activated carbon Regeneration System (Installed) ----- 300,000 450,000 600,000 750,000
Contingency (For utility hook-up, etc.) ----- 60,000 100,000 120,000 150,000
Er.gineering for carbon Regeneration syste111 ____ __ ==------ _ 5o,(l(lo 5o,ooo_ eo,oo() 100,000
Total Capjtal Cost $150,000 $1,160,000 $4,100,000 $6,920,000 $12,700,000
Land Requirements, tt2 300 1,500 3,500 5,500 12,000

:J::' I w V1
TABLE A-22
GRANUlAR ACTIVATED CARBON ANNUAL OPERATING COSTS
Annual Costs, Dollars
Description 3
3600 111 3{_da~ l l 3 - 360 8 {_da~ 19 1000 111 {_da~ 36 1000 • /da~ 76 1000 • {_da~
(0.1 Xl06
) (1.0 Xl06 ) IS Xl06 l (10 uo6 ) (20 Xl0
6)
gal/day gal/day gal/day gal/day 9al/day
Carbon Make-up $26,000 $26,000 $137,000 $275,000 $550,000
Furnace Power --- 19,000 27,000 46,000 62,000
Puuopin9 500 5,000 25,000 50,000 100,000
• Labor ($10/~~anhour) 21,000 98,000 105,000 115,000 125,000
Maintenance (3\ of total Capita! CO!Ili_ __ ~~----~~-4._50_()___ ~00 _ _!2]_,0()()_ 206,000 ___ 381,000
Total Annual Cost $54,000 $165,000 $417,000 $694,000 $1,236,000
NOTE: The depreciation factor has been a.itted from this analysis due to the fact that it will be included separately in the Econo11ic Impact Analysis Supplement.
The 11anpower requireiiiSnts were obtained fra. the "Process Desi9n Manual for carbon Adsorption," Environmental Protection Al,jency Tochnoloqy Transfer Series, October 1973. l.abor includes operation, 11aintenance, and laboratory personnel requirements.

TABLE A-23
SUPPLEMEN'rAL ECONOMIC COST INFORMATION CAPITAL AND OPERATING COSTS
FOR 10,000 GALLON PER DAY TREATMENT SYSTEMS
Capital Cost, Annual Operating T:reatlnent System Dollars Dollars*
Equalization $ 12,000 $ 400
Rotating Bioloqical 50,000 6,100 Contactors
Filtration 35,000 3,000
Powdered Activated 35,000 4,300 C&rbon
Granular Carbon 60,000 10,000
A-36
Cost

TABLE: A-24
COOLING TOWEll BI.OWDOiiN RATES PETROLEUM REFINING INDUSTRY
(MILI.ICJI GALLONS PER DAY)
REFINERY REFINERY REFINERY NUMBER BLOWDOWN NOMBER BLOWDOWN NOMBER SLOWDOWN
l 0.008 96 6.01 188 1.01 2 O.Ol4 97 O.Ol 189 UnlcDown 3 UnlcDown 98 0.78 190 0.01 4 Not App. 99 Not App. l9l 0.485 6 Not App. lOO Not App. 192 0.01 7 0.03 102 UnlcDown 193 Ulllalown 8 Unlcnown 103 0.01 194 2.99 9 0.001 104 2.59 195 Ulllalown
lO 0.015 lOS Not App. 196 3.51 11 1.8 106 0.52 197 0.001 12 0.002 107 0.01 199 o.o1 13 1.015 108 UnJcnown 200 0.4 15 0.023 109 0.185 201 0.48 16 o'.o69 110 Not App. 202 UnlcDown 17 0.005 lll 1.11 203 2.035 18 0.021 112 Ulllalown 204 1.536 19 0.0015 113 0.109 205 0.6911 20 0.32 114 o.u8 206 2.5 21 0.0113 115 0.521 207 0.037 22 0.011 116 0.288 208 0.86 23 Not App. 117 0.50 209 0.095 24 0.065 118 0.012 2l0 o.ou 25 0.167 119 0.03l 211 0.279 26 0.0745 120 0.023 212 0.374 29 0.33 l2l 0.74 213 0.013 30 0.033 122 1.562 2l4 ODiczlown 31 o.o1 124 0.135 2l5 ~ 32 0.84 125 0.114 216 2.42 33 0.11 126 0.120 218 tJDkDowD 35 Not App. 127 0.025 219 0.565 36 0.0055 128 Not App. 220 0.012 37 1.83 129 0.066 221 tJDkDowD 38 0.702 130 Not App. 222 0.20 39 0.06 ll1 0.120 224 tJDkDowD 40 Ulllalown ll2 0.75 225 0.711 41 l.Ol ll3 1.831 .:Z26 Olllalown 42 0.012 ll4 OnJcnown 227 0.389 43 0.55 ll5 Olllalawn 228 0.122 44 Onlalown. ll6 Olllalown 229 0.009 45 0.817 13? ~ 230 0.37 46 0.145 l38 O.l53 231 Not App. 48 0.141 ll9 0.006 232 ~ 49 0.17 140 0.055 233 0.307 50 0.0255 141 Olllalawn 234 OllkDolm 51 Not App. 142 o.u 235 0.23 52 Not App. 143 0-- 236 o.oo 53 0.0355 144 0.144 237 o.oou 54 Olllalown 145 OnJcnown 238 0.325 55 Not App. 146 Onlalawn 239 OllkDolm 56 0.65 147 0.49 240 0.072 57 6.3 148 0.055 241 o.u 58 0.269 149 O.l5 242 0.305 59 0.237 150 Not App. 243 0.125 60 0.85 151 1.50 244 o.o3l5 61 1.4 152 1.78 245 0.153 62 1.025 153 3.806 246 0.0425 63 0.299 154 0.050 247 o.u&& 64 1.0 155 0.098 248 Olllalown 65 0.944 l56 0.564 249 0.015 66 Olllalown 157 0.925 250 Olllalown 67 3.23 lSB 0.067 251 Not App. 68 2.448 159 0.066 252 0.0015 70 Olllalawn 160 0.042 253 Olllalown 7l 0.095 161 1.129 254 ODkDown 72 0.022 162 0.356 255 Olllalown 73 0.138 163 0,;642 256 o.oooe 74 0.157 165 0.168 257 Not App. 76 0.826 166 0.025 258 0.634 77 0.198 16? 1.189 259 Not App. 79 ODkDown 168 0.62 260 Not App. 80 0.87 169 1.659 261 0.20 81 0.24 172 0.149 264 Olllalown 82 0.006 173 Olllalawn 265 0.259 83 l.OlS 174 Not App. 266 Not App. 84 Unknown 175 4.36 278 OnlcDDwn as 2.539 176 0.0026 291 0.00126 87 Not App. 177 0.014 292 Not App. 88 0.073 179 0.149 295 0.158 89 Unknown 180 0.386 296 Not App. 90 0.007 181 5.219 298 Unknown 91 0.0036 182 1.858 302 Not App. 92 2.024 183 0.341 303 Unlcnovn 93 0.021 184 0.521 305 0.010 94 0.432 185 0.322 307 Unknown 95 Unknown 186 0.516 308 Unknown
187 0.983 309 0.302 A- 37

TABLE A-25
Chr~aium Removal Systems Equlpn~nt Cost Basts and Energy Requirements
Description 3.83m3/day 38 v/tday 380 m3tday 38~ m3/daf 19,~0 m3/day 1.!.!1Q:__9!llil_ - {lxlO gal[d} ___1!!105_ gall d) (lxlO gal[d ·~{5x10 gal/d)
Detention Tank, gallons 32 320 3,200 32,000 160,000
Mixer, hp 0.25 0.25 1.5 15 80
Mixing Requirements, k~h/yr 1,650 1,650 9,900 99,000 526,000 ~ Solids Contact Clarifier, diam. 8 6 15 45 100 I w 00 S02 Feed Rate, lb/d 0.4 4 40 400 2,000
Acid Feed Rate, lb/d 0.2 2 20 200 1,000
Caustic Feed Rate, lb/d 2 20 200 2,000 10,000
Pumping Requi ren~nts, kWh/yr 23 230 2,300 23,000 115,000
Manpower Requiren~nts, t:/yr 520 520 520 1,040 2,060

:t>' I
w \0
TABLE A-26
Chr0111t11111 Re1110va I Sys tBIIS Capital and Operating Costs
Capital Costs, Dollars
Description 3.8 n13/day 38m3/day 380 111
3/day (lxl03 gal/day) (lx104 gal/~ (lxl05 ga~
38~ m3/day 19,~ m3/day
Uetentton Tank
Chemical Feed Systetns
Automatic Controls
Solids Contact Clarifier Pumps
$ 100
5,000
25,000
Total Equipment Cost 30,100 Installation (50%) 1~,000
Total Constructed Cost Engineering Contingency
Total Capital Cost
so Acid Caustic Mixing Pumping labor Maintenance (3:1. of Total Capital Cost)
Total Annual Cost
45,100 6,950 b,950
~59,000
~ 16 4
130 70
Negllgable !1,200 1,780
$ 7,200
~ 1,000
15,000
10,000
25,000
$ 5,000
30,000
10,000
35,000
{JxlO gal/day) (5x10 gal/day)
$20,000
40,000
10,000
80,000
$50,000
45,000
10,000
155,000
51,000 80,000 150,000 260,000 25,500 - 40,000___ 75,00Q 130,000
76,500 120,000 225,000 390,000 11 ,750 17,500 37,500 60,000 11,750 17,500 37,500 60,000
$100,000 $155,000 $300,000 $510,000
Annual Operating Costs, Dollars*
$ 160 $ 1,600 $ 16,000 $ 80,000 40 400 4,000 20,000
1,300 13,000 130,000 620,000 70 400 4,000 21,000 10 100 1,000 5,000
5,200 5,200 10,000 20,000 3,000 4,800 9,000 16,000
$ 9,780 $ 25,500 $174,000 $782,000
*Note: The depreciation factor has been omitted fr0111 this analysis due to the fact that 1t will be included separately in the Economic Impact Analysis Supplement.

TABLE A-27
Wastewater Recycle - Caeital and Oeerating Costs
Caeital Costs 1 Dollars- Per Mile
Description 2.3 m3/hr 16 m3/hr 80 m3/hr 160 m3/hr 320 m3/hr 800 m3/hr (10 gem) po geml {350 gem) poo gem) (1400 oeml (3500 gem)
Piping: Piping,installed,per mile $32,000 $53,000 $100,000 $135,000 $175,000 $243,000 Misc. Costs (15%) 51000 81000 15 1000 20 1000 26 1000 361000 Total Constructed cost,
per mile 37,000 61,000 115,000 155,000 201,000 279,000 Engineering (15%) 6,000 9,000 18,000 23,000 30,000 42,000 Contingency 71000 101000 17 1000 221000 29 1000 42 1000
Piping-total capital costs $50,000 $80,000 $150,000 $200,000 $260,000 $363,000 per mile
Pumps: Pumps and associated 5,000 8,000 15,000 20,000 26,000 37,000 equipment instalied (10% of eieing cost)
Total capital costs per mile $55,000 $88,000 $165,000 $220,000 $286,000 $400,000
(Minimum pumping costs 5,000 6,000 12,000 18,000 24,000 40,000 regardless of distance)
Annual Oeerating Costs, Dollars - Per rtil e
Pumping costs per mile, $100 $ 700 $2600 $4500 s 9200 $24,300 per year
Maintenance (1'.5% of capital 800 1300 2500 3300 4300 6,000 costs) eer milezeer ~ear
Total Annual operating cost $900 $2000 $5100 $7800 $13,500 $30,300
Note: The Depreciation factor has been omitted from this analysis due to the fact that it will be included separately in the Economic Input Analysis Supplement.
A-40

TABLE A-28
Water Softening of Rec~cled Wastewater Canit.al r.n~t.~
Capital Costs, Dollars
Description 2.3 m3/hr 16 m3/hr 80 m3/hr 160 m3/hr 320 m3/hr 800 m3/hr (10 gpm) (70 opm) {350 gpm) (700 gpm) (1400 gpm) (3500 gpm)
Solids Contact Clarifier $ 25,000 $ 30,000 $ 45,000 $ 65,000 $ 80,000 $125,000 (Diameter, ft) (8) ( 11) (23) (32) (45) (72}
Chemical Feed System(s) 5,000 7,000 10,000 15,000 25,000 50,000
Filter Unit 15,000 25,000 30,000 40,000 80,000 150,000 (Diameter, ft) (3) (8} ( 11) ( 15) ( t\~0-15 I (three-20'
units) units) Subtotal 45,000 62,000 85,000 120,000 185,000 325,000 Auxiliar~ Eguipment 51000 81000 10 1000 15 '000 20 1000 35,000
Total Capital Cost 50,000 70,000 95,000 135,000 205,000 360,000 Installation(50%l 25 1000 351000 50 1000 701000 100 1000 180 1000
Total Constructed Cost 75,000 105,000 145,000 205,000 305,000 540,000 Engineering 15,000 20,000 25,000 30,000 45,000 80,000 Contingenc~ 15 1000 201000 25 1000 30 1000 45,000 80 1000
Tota 1 Capita 1 Costs $105,000 $145,000 $195,000 $265,000 $395,000 $700,000
A-41

1 of 5 TABLE A-29
~P!'!'AL AND OP!:RAT!NG COSTS 9Y REFINERY WMBER ECONOMIC COSTS, DOLLARS
REFINER"/ OP'nON miMBER
l OPTION z. J.
~PI TAL ANNUAL OPERATING ~PI TAL ANNUAL OPERATING COST~ COSTS COSTS COSTS
1 131,000 8,600 181,000 30,100
2 76,000 5,900 126,000 14.900
3 50,000 4,700 85,000 9,700
6 86,000 6,700 171,000 14,700
7 70,000 5,600 140,000 12,600
9 1.5.000 3,200 67,000 9,400
10 70,000 5,600 140,000 12,600
ll 178,000 6,500 438,000 73,500
l2 145,000 5,200 586,000 32,200
13 No c:ost - c:onsiciered. presently indirect di.sc:ha:rg"er only.
19 No c:oat - insiqnific:ant flow.
20 200,000 15,000 275,0110 165,000
24 73,000 6,900 3l3,0CO 22,900
30 325,000 19,800 375,001) 43,800
32 750,000 29·,300 4,750,000 122,000
37 6lO,OOO 32,300 2,210,000 ll7 ,000
38 No c:oat - considered. presently indirect disc:ha:rqer only
40 935,000 47,300 1,060,000 558,000
41 550,000 37,500 6,950,000 328,000
43 300,000 17,500 2,400,000 120,000
46 338,000 17,500 398,000 90,500
49 llO,OOO 7,800 230,000 17,800
50 180,000 6,600 745,000 40,600
51 1,420,000 606,000 3,690,000 942,000
52 166,000 10,100 406,000 26,100
53 65,000 2,200 100,000 20,200
54 53,000 4,000 88,000 15,000
56 645,000 35,800 1.550,000 83,800
57 1,280,000 121,000 1,380,000 683,000
sg 385,000 19,100 460,000 104,000
60 0 0. 75,000 145,000
61 650,000 33,800 730,000 238,000
62 400,000 24,500 500,000 397,000
63 250,000 18,000 2,150,000 108,000
64 485,000 32,500 560,000 225,000
65 720,000 47,600 820,000 330,000
67 4,510,000 360,000 7,760,000 720,000
68 1,385,000 88,ooo 1,490,000 464,000
70 190,000 10,700 225.000 28.700
A-42

TABLE A-29 2 of 5
C.~Pim AND OP!:RATING COSTS SY RE!''nTERY ~ER ECCNOMIC COSTS I OCL:J\RS
REF :naRY OP'l'ICl\T 1 OP'l'Ial' 2,J ml'MBER
aPI'rAL ANNUAL OPERATING CAPIV.L ANNUAL OPERATING CO§~ CQ§'l'S CO§T:i CO§'l':i
7l 145,000 9,300 34c;,ooo 24,300
72 50,000 5,700 85,000 22,700
73 ~o cost - considered presently indirect disc:harqer only.
74 72,000 2,500 242,000 15,500
76 380,000 26,400 1,630,000 92,400
77 70,000 6,700 llO,OOO 34,700
so 91,000 6,800 lSl,OOO 15,800
Sl 270,000 21,100 1,150,000 69,100
a3 210,000 17,000 295,000 209,000
84 520,000 25,400 595,000 164,000
85 300,000 22,000 :!95,000 286,000
87 220,000 15,400 3l5,000 24,400
88 60,00() 6,200 2:.15,000 19,200
89 79,000 6,100 156,000 15,100
90 58,000 4, 700 118,000 11,700
91 45,000 3,400 80,000 7,400
92 1,680,000 78,100 4,010,000 415,000
93 51,000 4,000 86,000 10,000
94 428,000 27,400 503,000 172,000
96 600,000 44,300 3,080,000 387,000
97 85,000 6,500 120,000 17.500
98 650,000 30,800 2.250,000 111.000
99 45,000 5,000 128,000 13,000
100 30,000 1,100 65,000 10,600
102 230,000 13,600 305,000 32,600
103 48,000 6,100 157,000 14,100
104 500,000 28,000 4,600,000 208,000
lOS 305,000 22,200 380,000 203,000
106 200,000 13,000 1,300,000 73,000
107 No cost - will disc:harqe to PO'rW in tllture.
108 70,000 5,400 105,000 13,400
109 145,000 9,300 185,000 119,000
llO No cost - will discharge to POTW in tllture.
112 295,000 184,000 465,000 31,400
113 90,000 7,800 420,000 2s,aoo
114 No cost - will discharqe to POTW in tllture.
115 0 0 90,000 216,000
116 400,000 21,000 1,300,000 69,000
117 677,000 25,300 1,270,000 59,300
A-43

TABLE A-29 3 of 5 OP;J;I!J;. AND OPDATING COS!S SY !l.UIN:e::RY NUMBER
ZCONOMIC COSTS, DOLLAR~
RUDl!JlY OPTION l' OPTION 2,3 mnmg OPI'l'AL AI.'IWAL OPDATING CAPITAL AmruAI. OPDATING
COSD COSD COSTS COSTS
118 20,000 900 75,000 7,400
119 60,000 2,000 175,000 12,000
120 55,000 1,800 155,000 10,800
121 1,000,000 47,500 4,100,000 197' 500
122 1,320,000 115,000 5,720,000 319,000
124 220,000 12,400 !85,000 35,400
125 210,000 12,000 550,000 33,500
126 760,000 54,500 5,160,000 265,000
127 126,000 8,400 276,000 20,400
129 221,000 15,600 521,000 24,600
131 300,000 17,500 390,000 254,000
132 740,000 108,000 3,070,000 454,000
133 1,560,000 172,000 1,690,000 772,000
134 940,000 56,500 1,040,000 381,000
142 So ~oat - will 4iacharqe to PO'l'W in future.
143 So ~o•t - will 4iach&rq• to PO'l'W in future.
144 110,000 7,700 223,000 17,700
146 220,000 15,300 315,000 24,300
147 109,000 8,700 149,000 59,700
149 570,000 31,700 1,370,000 73,700
150 372,000 18,900 424,000 99,900
151 1,230,000 62,000 3,930,000 194,000
1!2 1,530,000 155,000 1,650,000 767,000
153 0 0 100,000 300,000
154 310,000 19,400 1,010,000 59,400
155 95,000 7,000 190,000 16,000
156 115,000 9,000 590,000 37,500
157 580,000 29,500 655,000 189,000
158 243,000 13,400 283,000 62,400
159 158,000 10,200 383,000 25,700
160 56,000 6,500 91,000 27,000
161 80,000 7, 200 355,000 25,200
162 220,000 17,000 295,000 215,000
163 165,000 11,400 865,000 ~3.400
165 162,000 10,000 396,000 26,000
167 1,680,000 111,000 1,780,000 507,000
168 0 0 80,000 228,000
169 2,220,000 172,000 2,34.0,000 840,000
172 320,000 24,000 370,000 89,000
173 255,000 17,700 295,000 60,700 A-44

TABLE A-29 4 of 5
s:l!PI'r.\!1 AND OP!l!A'l'!NG COSTS 3Y !tEF!NEl'I.Y m!MBER E90NOOC COSTS, OOI..I.AR§
llU'INEltY OPTIOIIl 1 OPTICN 2 ,J Nt!MBER CAPITAL .umt1AL OP!l!A'l'!NG CAPITAL ANNUAL OPDATING COST~ COST~ CO§~ CQ§~
174 244,000 16,900 674,000 42,900
175 No coat - will discharq• to PO'l'W in futur•.
176 185,000 ll,OOO 470,000 30,000
177 485,000 28, sao 535,000 93,500
179 158,000 9,800 383.000 25,600
180 565,000 46,100 640,000 263,000
181 980,000 106,000 3,540,000 448,000
183 106,000 8,500 526,000 33,400
184 150,000 12,000 225,000 112,000
186 580,000 26,500 655,000 171,500
189 50,000 3,700 103,000 9,900
190 38,000 3,800 60,000 6,400
194 2,870,000 154,000 12.200,000 650,000
196 2,230,000 255,000 5,330,000 6ll,OOO
197 35,000 3,000 85,000 9,000
199 155,000 9, 500 227,000 16,500
201 209,000 7,700 269,000 87,700
204 268,000 18,700 358,000 283,000
205 890,000 48,400 2,590,000 133,000
208 420,000 25,000 520,000 415,000
uo 35,000 3,200 70,000 8,200
2ll 0 0 60,000 69,000
:U:' 0 0 50,000 61,000
213 7l,OOO 5,700 144,000 12,700
2l6 1,000,000 66,800 4,250,000 424,000
219 0 0 a5a,oaa 48,000
221 600,000 423,000 690,000 301,000
222 235,000 17,000 510,000 35,000
226 63,000 5,000 128,000 12,000
227 0 0 60,000 96,000
230 125,000 9,400 645,000 40,400
231 No coat - will discharq• to l'O'l'W in futur•.
232 0 a 60,000 90,000
233 385,000 19,400 445,000 103,400
234 385,000 19,400 445,000 103,400
235 400,000 24,000 475,000 144,000
236 100,000 7,100 135,000 20,100
237 55,000 4,500 90,000 10.300
238 793,000 45,100 868,000 196,000
A-45

TABl·'E A-29 5 of 5 CAPI'rJ\L AND OP:a!,!!Y{Si CQ§I§ !Y RE!'I:Nli!I NO£mER
ECONOMIC COSTS. OQLI.ARS
RUim:RY OPTICIIT l. OPTICIII 2 ,3 NOMB!m CAPITAL ANNUAL OPDA'l'ING CAPITAL ANWAL OPDAT:WG
COSTS CQ§I§ COlD CQITI
239 uo.ooo 7,700 145.000 24,200
240 145,000 9,100 185,000 33,600
241 205,000 11.800 250,000 51,800
242 70.000 6.700 110,000 34,700
243 55.000 6.000 200,000 17,500
2.52 110.000 7,700 22!,000 17.700
%55 60,000 2,000 175,000 12,000
%56 80,000 7,300 365,000 26,300
%57 590,000 29,000 1,990,000 101,000
258 165,000 11,400 22!,000 95,400
259 590,000 29,300 665,000 198,000
260 58,000 4,400 ll6,000 10,700
%61 385,000 22,100 433,000 261,000
%65 248,000 13,700 296,000 64,700
%66 410,000 %3,200 470;000 81,200
292 JJo co•t - indgn.i.lic:an t flCJW.
295 315,000 20,100 355,000 45,100
309 42.5,000 !9,100 470,000 99,100
A-46

TABLE A-30 Page 1 of 3
CAPITAL AND OPERATING COSTS
INDIRECT DISCIIARGE - OPTION 1
Cooliu9 Reftnery Tuwer Chrooaiua Reoooval, $ Piping Co11t, ~ Total Co.,t, $
Code Slowdown Capital Annual Capital Annual Capita.t Annual No. ya1/day Cost vperating Coso: Cost Operatiny Cost t:ost Operating Cost
8 1,250** 63,000 7,JOO • • 63,000 7,30U
ll 1,020,000 100,000 17:..,000 320,000 11,000 620,000 186,000
~4 7,700 94,000 8,000 20,000 400 114,000 8,400
16 69,300 143,000 20,000 45,000 900 188,000 20,900
!)::! 18 21,500 115,000 12,500 30,000 400 145,000 12,900
I ~ 21 11,300 102,000 10,000 • • 102,000 10,000 --.,J
23 Does Not nave Cooling To,.er +
25 167,000 172,000 40,000 60,000 1,600 232,000 41,600
29 12~.000 207,000 70,000 150,000 4,200 357,000 74,200
3l 10,000 100,000 9,800 . . 10u,OOO 9,800
33 110,000 156,000 28,000 5u,OUO 1,10U 206,000 29,100
38 702,000 265,000 130,000 160,000 5,000 425,000 135,000
45 817,000 280,000 150,000 200,000 6,5UO 480,000 157,000
58 269,000 194,000 60,000 90,000 2,500 284,000 62,500
13 139,000 165,000 35,000 60,000 1,300 225,000 36,300

Page 2 of 3 TABLE A-30
Coul1n9 Refinery Towt::r Chr,>mlUIIl Removdl, ~ Piping Cost, ~ Total Cost, $
Code Slowdown Capital Annual Capital Anuudl Capital Annual No. gal/day Colit Operating CoH Cost Operating Cost Cost 01-erating Cost
76 15,000 106,000 10,000 35,000 500 143,000 10,500
79 No Cost - Unknown Flow
66 146,000 166,000 35,000 45,000 1,100 211,000 36,100
107 10,000 100,000 10,000 . • 100,000 10,000
110 No Cooling •rower +
~ 111 1,110,000 310,000 166,000 160,000 5,600 470,000 194,000
I 114 Non Chromilw Treatment ++
*"' CX> 126 No Cooling Tower +
}JO No Cooling Tower +
142 110,000 156,000 26,000 60,000 1,400 216,000 29,400
143 Non Chromiwa Treatment ++
145 1,000 .. 59,000 7,200 • • 59,000 7,200
1411 Non Ctu:oauiuRI 1'reat~nent i-+
166 25,000 116,000 12,000 • . 118,000 12,000
175 4,360,000 487,000 1>28,000 4115,000 l4,l00 972,000 662,000
182 1,860,000 370,000 2115,000 630,000 28,700 1,000,000 314,000
188 1,0lO,uOO 300,000 175,000 200,000 7,000 500,000 11l2,000

Refinery Code
No.
1!13
19!;
200
20J
206
207
220
224
225 :t::' I 228 ~ \0
229
231
264
291
lOS
TOTAL
NO'I"K:
A-30 Page 3 of 3
TABLE
Coolin<J 1•ower Chromium Re.aval, $ Pipin<J Cost, $ Total Cost, $
Slowdown Capital Annual Capital Annual Capital g"l/day Cost Operating Cost Cost Operating Cost Cost
130** !;9,000 7,200 * * !;9,000
No Cooling Tower +
39!;,000 220,000 80,000 65,000 2,000 285,000
2,040,000 382,000 3011,000 680,000 31,800 1,062,000
2,000 70,000 8,000 * * 70,000
36,500 126,000 15,000 40,000 700 166,000
Non Chr0111iwa Treatment ++
Non ChrOO&iu• Tre" tJaent ++
Non Chromiwa Treatlllent ++
!22,000 1&6,000 30,000 50,000 1,000 216,000
8,500 98;000 9,400 * • 98,000
No COU1ia19 Towers +
No Cooling Tower11 +
126,000 162,000 30,000 40,000 800 202,000
11,600•• 103,000 11,300 • • 103,000
5,916,000 2,633,000 3,675,000 150,000 9,591,000
• These Refineries have only one cooling tower and so pipincJ COiit ill excluded.
•• Actual Cooling Tower blowdown data were not available, the blowdown rate is ass&aed to be 25' of total wastewater generated.
+ These Refineries do not have any cooling towers.
++ These Refineries do not use Chromium in the cooli119 towers.
Annual Operating Cost
----
7,200
82,000
340,000
8,000
15,700
31,000
9,400
30,800
11,300
2,783,000

Refinery Code !fo.
8
13
14
16
18
21
23
25
29
31
33
38
45
58
73
78
79
86
107
llO
ll1
ll4
128
130
TABLE A-31
OPZ'rl\L AND OPERATING COS'l'S
INDIDC'l' OISC!AliGE - OP'l'l:ON 2
Capital COs1:s, S
Page 1 of 2
Allnu&l Opera1:inq Costs, S
No COs1: - Insiqni!icant Flow
5,800,000 626,000
315,000 51,400
826,000 136,000
495,000 58,000
373,000 62,500
315,000 60,200
375,000 54,500
4,650,000 S2l,OOO
247,000 54,700
1,090,000 152,000
4,350,000 455,000
3, 900,000 419,000
1,900,000 159,000
915,000 84,100
1,390,000 119,000
No Cos1: - Unknown Flow
800, JOO 104,000
255,000 57.900
250,000 56,700
2, 450,000 2ll,OOO
683,000 103,000
277,000 29,700
1,310,000 421,000
A-50

Page 2 of 2 TABLE A-31
Refinery Capital Annual Operatinq Code No. Costs, $ Costs, s
142 2,450,000 211,000
143 2,190,000 174,000
145 247,000 54,700
148 493,000 111,000
166 273,000 96,900
175 13,300,000 2,360,000
182 7,000,000 781,000
188 3,660,000 340,000
193 247' 000 54,700
195 247,000 54,700
200 1,150,000 106,000
203 13,800,000 1,510,000
206 437,000 95,800
207 375,000 92,500
220 258,000 56,700
224 655,000 112,1)00
225 2,220,000 177,000
228 710,000 112,000
229 242,000 25,400
231 1,110,000 378,000
264 250,000 55,500
291 250,000 51,200
305 277,000 29,700
A-51

APPENDIX B
RAW PLANT DATA
The purpose of this appendix is to present the raw analytical results for both the 17 refineries' screening program, and the pretreatment program. (It should be noted that the "screening program' is referred to in this appendix as the RSKERL and B&R sampling program). These results are presented in Tables B-1 through B-16, which follow.
Tables B-1 through B-6 contain the analytical results for the 17 direct discharge refineries.
Tables B-7 through B-11 include results from the first week of sampling for the pretreatment program. These tables report pollutant characteristics for wastewater leaving Refinery No. 25 and at various points in the treatment train of the first POTW.
Tables B-12 through B-16 contain the analytical results from the second week of the pretreatment'program. Included in these tables are effluent characteristics for Refinery Nos. 13, 16, 21, 43, and 45, as well as the wastewater pollutant characteristics at various stages in the treatment train of the second POTW.

tJj I
IV
TABLE B-1
-lxtf.cal .. wlte fo1: 'h:adiUonal Par-tara for the MCIIRL and BfoR 8!!!1'11"9 PJ"''1r-
------------------- -------~CGH!U~~!L__----------------------------s...u- DaY
lleflnery A Intake - 1 Intalr.e - :a Intake - l Separator effluent - 1 Separator effluent - 2 Separator effluent - 3 Plnel effluent - 1 Pinal effluent - 2 Pinal effluent - 3
lleflnery B
Intake - 1 Intake - 2 Intake - l Dill' effluent - 1 DAP effluent - 2 Dill' effluent - 3 Pinal effluent - 1 Pinal effluent - 2 Pinal effluent - l
lleflnerr c Intake - 1 lntalr.e - 2 Intake - l Separator effluent - 1 Separator effluent - 2 Separator effluent - 3 treated effluent - 1 treated effluent - 2 treated affluent - 3 Plnel effluent - 1 Pinal effluent - 2 Pinal effluent - 3
Note • L - r.e.. than G - Greater than
M=.l
L2 Ll
2 20 20 25-
L2 L2
]
Ll
Ll
2 130 110 270
15 9
30
2 Ll
2 150 1110
18 21 34 40 l1 40
45
l!ll:1
L2
Ll 4
24 18 lO
Ll Ll Ll
140 110 220
I!S!R:l
L2 L2
2
14
7 7
110 120 85
a
4 4
• 130
91 99 36 40 21
9 9 9
420 440 500 150 uo uo
1 1 2
380
370 220 llO 120 120 130 130 100
!!!<
1 2 2 ,, 2,
21 i1 11 11
u 25 11
100 110 110 47 39 4]
u 8
5 88 75 49
44
39 41 42 l1 ]6
BOD-1 lndicalaa analytical .. thod used seed fraa a aa.nstic sewage treatMent plant.
800-2 indicatea analytical .. thod used aaed fra. refinery final affluent.
BOD-3 ind1catea analytical .. thad where no aeed vaa -•d.
l!l!
5 4
Ll 490 390
260
•• 30 42
9
u 11 38 50 38 22 24
20
Ll Ll L1
22 311 21 20 18 28
20 2Z
16
!!!3
Ll.O 11
1.0 ll 11 11 111 11
9.0
L1.0
Ll.O Ll.O 8.4 7.3 6.7
18 111 18
Ll.O L1.0 Ll.O
52 50 ll
8.4 5.6 4.5 7.8
17 3.9
t6 ~
L.02 L.02 L.02
.09
.03
.05
.04 L.02
L.o2
L.02
.02 L.02 L.02
.10 L.02
L.02 L.02 L.02
L.02
L.02 L.02
.05 L.Ol L.02
L.Ol L.Ol L.02 L.02 L.02
L.02
!!-2
L.1 L.l
.2 9.0 6.9 8.5
.2
.2
.4
.2
.2
.4
.6 1.0 1.2 .5 .5 .6
L.S
L.5 .3
L.S
3.8 .3
L.S L.S
.2
.5
.s
.4
OfG
19 7 6
33 18
11 53 24 15
8 10
4 150 100
28 8
15 11
1 11
11
~
7.6 9.0 8.8 8.6 8.5 9.0
6.9 7.4 7.0
D.2 8.1 1.3 !o.2 tl.6
9.5 7.2
1.6 7.4
7.6
7.8
7.4
8.6 9.1 8.7
7.8
1.1 7.11 8.0 8.1
7.6
Page 1 of 7
Plow IMGD)
.433
.427
.432
3.91 3.86 4.12 1. 78 1.81
1.81
1.69
2.07 1.48
.0715
.0848
.1526
.1787
.1411
.2357

TABLE 8-1 Page 2 of 7
Analytical Result• for ~radltional Para.etere for the RSKERL and BSR Sa!fling Prograa
Concentrati,.. (118/1)
,s..,1a - o.v !J<b-1 !9!::1 lleflnely b
!!!!!::! em ~ !l!l! NIIJ ££'1> l!. -2
O&G 1!!!. Flow (lr.D}_
lntakc - 1 L5 20 20 10 24 Ll.O L.02 L.1 7.3
lntak<• - 2 1 4 4 5 12 2.2 L.02 L.l 7.4 Intake - l ] 6 4 a 16 2.0 L.02 L.l 7.3
DAP effluent - 1 160 L220 1000 300 60 ]6 L.02 15 8.9 .932•
DAP effluent - 2 140 500 150 16 29 L.02 18 8.5
OAF effluent - ] 120 Ll60 ]90 100 l2 40 L.02 15 8.6
rind effluent - 1 50 40 820 290 64 ]6 L.02 1.7 7. 7 .932•
Pinal effluent - 2 210 62 670 220 60 42 L.02 1.1 7.7
Pinal effluent - l 150 90 490 150 60 19 .03 .9 7.6
Refinery II Intake - 1 3 4 43 15 14 1.() L.02 L.l 1.1 18.00
Intake - 2 2 l 59 15 19 ?.IS L.02 L.l 7.6 16.56
Intake - l 2 l 19 15 28 7.1S L.02 L,l 7.5 18.00
OAF effluent - 1 54 56 160 48 17 11 L.02 1.8 7.3
DAr effluent - 2 52 41 160 42 1J l:l L.02 1.5 7.1
tll DAP effluent - l 45 44 150 39 16 15 L.02 1.5 7.2 I Pinal effluent - 1 18 18 47 10 9 15 L.02 .3 7.6 5.02
w Pinal effluent - 2 2 Ll 75 7 20 ll L.02 .5 7.5 4.59
rlnal effluent - ] L1 L1 55 ll 11 u L.02 .6 7.5 4.61
Refinery r Intake- 1 40 50 140 96 68 1.'7 L.02 1.6 9.2 1.5*
Intake - 2 40 52 350 liD 68 68 .02 .9 8.1
Intake - l 42 35 ]40 97 40 61 L.02 .1 8.0
coon..., tawe" blOOidcNn-1 25 42 210 62 64 ).9 ,05 7.3 0.17•
cooll119 t.-r blowdown-2 110 Gl60 )00 78 76 10 .09 1.0 8.1
Coo11119 tower blowd_,-1 47 36 ]50 95 80 19 .41 L.1 6.8
Plnal effluent - 1 18 18 260 liO 110 1.9 L.02 8.6 o.on• rlnal effluent - 2 ]6 " 270 75 96 2.8 L.02 2.0 8.5
Pinal effluent - J 20 18 260 82 100 3.9 .03 L.1 9.6
• Averaqe flow cJu"l"'' 72-hour •-11119 perloo.

l!!ll)la-J)!y
lleflner:r G
Intake - 1 Intake - 2 Intake - 3 Separator affl..,.nt - 1 Separator effl1101nt - 2 Separator effluent - 3 Dllr effluent - 1 Dllr effluent - 2 Dllr effluent - 3 Pinel effluent - 1 Pllllll efflaent - 2 Pi1111l effluent - 3
lleflnery H
Intake - 1 Intake - 2
tx:J Intake - 3 I Separat« effluent - 1 ~ Separator afflwnt - 2
llaparator affluent - 3 Plft8l effl-ftt - 1 Pl1111l afrl .. nt - 2 Pt...l ern ... - J
lllefinery 1 lat ... -1 latab - 2 Intel!• - , Sepnatar arn ... t - 1 Saparatar efr1 ... t - 2 Separatar affl .. nt - 3 Pinal effluent-1 P111111 afflaent-2 Final affluent-)
l!!l!!=!
.., .., .., 240 250 260 240 2110 220 15 10
6
L2 L2
2 60 20 ]0
L6 L6 , .., .., .., .. 76 55
L12 Ll2 L12
••ver_,e flow during tho r..-pllng period.
TABLE 8-1 -lytical Reeulte for 'rradltio1111l Par-tara for the RSJCERL and 115R S!Uif>lin<J Progr•
l!!!!::l
.., .., L:i
2110 240 298 270 2110 260
L2 L2
2 eo
LIS ]1
]2
66
t_
BOD-)
..,
260
250
12 Llo L14
L6 ... ]
77
Ll2 Ll2
Concentration (118/1.)
S!!
20 211 24
120
1160 160 900
1200 200 220 210
12
23
200 leD
• H 41
• 5
260 260 J50 .. 76 72
!!!!:
u 16 I
240
220
200 ]60 290 60 64 56
9
14
57 50 20 11 21
s •
119 110 75 ,. 29 29
'I'S~
Ll 18 16 54
252 JU
64 152 176 ]6
76 64
14 113 167 120
66 121
I
10 I
L1 L1
2
ll 46 32 6
I 10
NH1
Ll.O Ll.O Ll.O
20
1.0 14 12 10 15 15 12
Ll.O
Ll.O
7.3 6.2 6.2 5.0 5.0
Ll.O Ll.O
, .. 4.5 5.0
Ll.O Ll.O 1.7
~·6
L.02 L.02 L.OJ
.02
.02 L.OJ
.02 L.OJ L.02 L.02 L.OJ L.02
L.02
L.OJ .04
L.02 .02 .04
L.02 L.02 L.02
-2 ~
L.l
.6
.3 22 32 28
18 28 30
2.0 1.8 2.1
.)
L.l
.1 3.7 4.4 1.2
.2
.2
.1
.s ..
.5
.6
.7
..
O&G
23 7
8
130 56
110 190 250 220
24 9
10
31 13
8 80 51 24
37 13
)
2
• 5
30 25 42
5 , 9
Page 3 of 7
I!!!
7.6 7.6 7.7
10.2 10.3 10.6 9.9
10.2 10.4 8.3 8.0 8.0
8.2
8.5 7.9 7.3
8.6 ,.. 8.4 7.8
7.8 8.6 7.6 5.7 9.1 8.9 7.1 7.2 7.5
r1ow (MGOI
3.22 3.11 3.20
2.50 2.27 2.04
35 ••
5.04*
I. 2*
].53
3.53 3.53 2.99 3.26 3.29 2.75 2.27 2.44

TABLE B-1 Page 4 of 7
l\lla1rtica1 -1ta foe Yc..Uts..-1 Pu-tan foe tba --.Mill au ....,u.., P!!!!!!e-
eon-batlCIII (11!/1) 46 -2
!!!!:! ...!!!!:! IIID-3 !l!!! m J!! !!!, £! .!! ~ I!!! Flov_{!fm)
..,flMry .J
lhtake-1 LS 11 14 10 2.0 L.02 L.l 16 7.5 -t--2 2 .. It ] u.o .02 L.l 11 7.8 l .. take-3 ] 20 10 I Ll.O L.02 .] 11 7.3 S.parator 1 efflaa,.t-1 Sl , 210 .., ,. :11.0 .02 .7 74 8.9 s.paretar 1 efflaant-2 .,. 7e 110 ,, 82 1.0 L.02 1.8 120 8.2 S•parator 1 afflaant-J !10 110 55 22 1.7 .0] 1.8 H 7.9 S.parator 2 eff1aent-1 " .. JlO 57 64 8.4 L.02 5.5 .. 8.2 S.paretor 2 efflue•t-2 Q04 Q04 690 200 1M 14 ... 11 140 8.2 S.paretor 2 efflaent-J GM 610 no 108 8.4 .02 15 2!10 8.2 l•parator l effluent-1 15 sa 160 5I 62 J.O .02 1.8 25 7.4 .464 S.parator l efflaent-2 20 22 110 45 ]8 6.2 .02 5.1 n 7.] .122 sepaeator J efflae•t-J J2 220 6] , .. 4.5 ... 1.5 54 7.3 .572
~ separator .. efflue .. t-1 G80 100 no • H ] L.O:II 6.1 65 7.7 ~ Separator 4 effluent~! 70 55 270 sa H 7.] L.O:II 9.1 , .. 7.3
separator .. effluent-] 10 4]0 91 94 8.4 .OS s.t 1!10 7.1 separator 5 eff1aant-l 10 10 83 23 21 2.0 .14 L.l 7 8.1 Separator 5 effluent-2 u 10 75 22 16 1.0 .u 1.0 9 8.1 Separator 5 effluent-l 11 92 ll 48 Ll.O .09 12 25 7.1 8lo-pond lnfluent-1 " 610 so 24 22 ... 14 11 7.4 Blo-pond lnflaent-2 014 570 100 16 24 .10 .. , ' '·' Blo-pond lnfluent-1 014 ... 120 11 20 .oe 3.5 20 7.5 Flnel efl1•ott-l • ., 34 20 6.8 L.02 .2 20 7.0 2.70 Pinal effluent-2 6 87 H 7 s.o L.02 1.0 6 7.3 2.55 Fl11al effluent-] • 92 32 8 5.6 L.O:II .9 16 7.9 2. 71

OJ I
0"\
s..,Ie-oay
Refinery J:
Intake- I Intake-2 Intake-J Dill' effluent-! Dill' effluent-2 Dill' effluent-] Final afflue~t-1 Final effluent-2 Final effluent-]
Refinery L
lntake-1 Intake-2 Intake-) Separator 1 effluent-1 Separator J effluent-2 Separator 1 effluent-] Separator 2 effluent-} Separator 1 affluent-2 Separator 2 effluent-] Final effluent-! Final effluent-2 Final effluent-3
Refinery N
lntake-1 Intake-2 Intake-3 DIIF effluent-! Dill' effluent-2 OAF effluent-] Final effluent-1 Final effluent-2 Final effluent-]
1100-1
4 4
L6 LUO
220 Ll20
8 L6 ll
2
L2 100
180 32
40 3
11
L6
L6 L6 51 50 36
LU L6 L6
J.veragoJ flow i.arlnq 72-hour • ...,Ung period'.
TABLE B-1
Analytical llenlta for 'l'radltlOJWl Par-ter• for the RSURL and II'R 811!1Plill9~
!!m=l
Ll20 210
Ll20
J L5 LJ
130 100 \70 38 31 42
25 !12 40
!!!!!.:!
• 4
L6 80
200 Ll20
7 6
10
2 L3 L5
120 98
150 34 42 40
3 L4
8
u
u ]<I
40 34
LU L6 u
Concentration (118/1)
!l!ll!. ~ m
27 23 24
530 1000
540 96
uo 140
56 20 24
390 350 530 200 210 170
75 C4 71
10 9 II
260 220 220 92 86 73
11 10
180 350 180
39 42
13 10
6 110 110 140
49
56 46 19 15 14
6
10 4
72 62 66 18 16 14
12 14 10
260 380 :no
21 16 ]2
290 220 uo 140 110 120
36 48 34
21
L1
L1 L1 18
9 7 8
15 11
!!b
Ll.O Ll.O 1.0 6.7 &.7 6.2 2.2 3.4 3.9
Ll.O L1.0 Ll.O 6.2 10 20 7.8 15 9.0
Ll.O 3.4 3.0
Ll.O L1.0 L1.0 u 9.5 12
Ll.O L1.0 1.0
ra•6
L.02 L.02 L.02 L.02
.04
.02 L.02 L.02 L.02
.25 L.02
.05 L.02 L.02 .07 .05
L.02 L,02 L.02
.11
.01
L.02 L.02 L.02
.75 L.02 L,02 L.02 L.02 L.02
!-2
.4
.4
.3
.8 1.6
.6
.5
.3
.]
.1 1.0 1.0 .9
1.5 1.2
.8 1.7
.9 ...
.]
.9
.2
.2
.]
.6
.5
•• ... ... .3
~
9 6
14 590 190
98 ll 15 12
4
8 11 16 18 18 lJ 12 14
Page 5 of 7
J!!!
8.1
7.4 7.8
7.3 7.7
7.3
7.2 7.5 7.1 1.9 8.3 8.6 8.0 6.3 8.4 7.2 6.9 7.2
8.0 8.0 8.1 6.9 8.4 8.2
1.1 7.9 7.8
Flow IIIGDI
14.1•
5.4•
5.4•
].88 ].86
4.28 7.15 5.37 4.98
11.03 9.23 9.26
}.(;4
1.52
1.47

TABLE B-1 Page 6 of 7
Analytical Reeulta for Traditional Par•-ters for the RSKBRL lind Br.R S!!!J>l1!!9 Proqra•
Concentration (-s/1)
I!Oil-1, J!OI)-2 J!OI)-3 coo !QQ !ill! .!!!13 .£!: Ol!oG P!! rtow (lflD)
Refinery II lntal<e-1 Ll 40 12 18 Ll.O L.02 .l 8.4 24.69 lntal<e-2 LS 16 8 22 Ll.O .07 .a 7.7 26.84 lntal<a-l u 28 12 26 Ll.o .09 1.1 7.) 25.91 Separator effluent-1 83 360 88 68 12 L.cn 2.9 8.1 15.25
Separator effluent-2 100 430 uo 112 15 L.02 8.1 8.1 15.25 Separator effluent-) 120 440 100 76 ., L.cn 9.2 7.9 18.25 Che•. plant effluent-! 74 340 93 28 1.1 L.02 .1 6.8 0.8 Ole•. plant affluent-2 140 810 240 36 Ll.O L.02 .9 6.6 0.95 Che•. plant effluent-] 34 240 69 40 2.0 L,02 .9 1.7 0.9 rlnal effluent-1 10 140 ll 50 6.2 L.02 .6 8.6 14.75 Final effluent-2 8 120 ,, 40 6.7 L.02 .9 7.4 15.9 Final effluent-) 10 140 )6 44 J.O. L.02 .9 7.4 17.6 t:Jj
I Refinery 0 -....) lntal<e-1 L2 11 10 10 Ll.G L,cn .5 7.1
lntal<e-2 L5 LS 26 21 10 Ll.O .02 L.l 6.8 Intake-] Ll L2 12 25 14 Ll.O .en .1 7.0 OAF effluent-1 120 380 uo 21 5.3 L.02 3.9 8,4 2.88* OAF effluent-2 100 75 410 110 32 6.4 L.02 4.1 8.6 OAF effluent-] 85 88 480 180 42 111 L.02 2.9 8.8 Final affl,.nt-1 6 150 48 24 2.5 L.cn .6 7.9 2.88* Final affluent-2 LlO LlO 140 40 26 3.1 .02 .5 Pinal effluent-3 94 L8 120 52 24 2.5 L.02 .4 7.8
*Averaqe flow during 72-hour period.

TABLE B-1 Page 7 of 7
Analytical Re•ult• for Trad1Uonal Par-ten for the RSICBRL and 85R S!!!Plli!IJ Proqraa
Concentration (118/1)
S-la-O.Y a.:! 1!9!::1 1m:! !a& ~ l!!!. !!b £1.+6 !.-2 ~ 1!!!. Fl ... (l«lDI
Refinery P Intake-1 L2 4 3 Ll Ll.O L.02 L.l 7.0
IJitake-2 L5 L5 6 7 Ll Ll.O L.02 L.l 6.8
Intake-] L2 L2 L4 7 Ll Ll.O L.02 L.l 6.3 Separator affluant-1 320 600 170 68 11 L.Oa 25
Separator •ff1uent-2 210 220 540 140 78 16 .15 25 10.1 8eparator effluent-) 150 160 470 140 42 18 .05 23 9.9 Pinal affluent-1 L5 64 16 11 1.4 L.02 .3 Pinal effluent-2 L5 L5 49 :at 2 2.0 L.02 .6 7.7 Pinal effluent-] L3 L3 41 u 7 2.0 L.02 L.l 7.5
.. unery g Intake-1 L2 4 8 3 Ll.O L.OZ .4 5 7.1 Intake-2 L2 4 11 2 Ll.O L.02 .3 9 7.4 Intake-] L3 24 9 Ll Ll.O L.02 .) u 7.5 hparator effluent-! 80 50 370 91 28 45 L.02 9.3 62 9.2 Separator effluent-a 40 70 330 84 10 48 L.02 5.6 9.3
tl1 Se~rator effluent-] 66 64 260 65 12 ]9 L.02 2.4 38 9.8 I Pinal effluent-1 28 260 59 38 53 L.02 .7 45 8.8 .2783
00 Final effluent-2 20 250 78 22 49 L.02 .6 45 8.3 .3086 Final effluent-] )0 230 60 26 42 L.02 .5 37 8.7 .3186

TABLE B-2 ANAI.rf:ICAL RESULTS FOR PRIORI'l'Y POLLUTANTS
FOR 'rilE RSURL AND B&R SAMPLING PROGRAM
VOLATILE ORGANICS !CONCENTRATIONS, uq/l)
a Refinery A
Page 1 of 3
CO!!!pOunci Intake Water Separator Effluent Final Effluent
4 Benzene :Z3 Chloroform :Z9 l,:Z-trana-Dicbloroathylane 38 Ethylhenzene 44 .Methylene chloride 85 Tetracbloroethylane 86 Toluene
4 Benzene :Z3 Chloroform 44 Methylene cbloric!e
Intake Water
G(lOO)b D(L 5) 20 G(lOOlb G(lOOI G(SO! G(lOOl
Refinery B0
OM O:ffluant
NDb
l~ 30
Refinery c•
~(L Sib ND ND G(lOO)b O(L 101 NO
Pinal Effluent
O(L 10)~ ~ 101
Intake Water Separator Effluent Treated Effluent Final Effluent
4 Benzene 10 1,2-Dicbloroethane :Z3 Chlorotom 38 lthylben:&ene 44 Methylene chloride
4 Benzene 38 Ethylbenzene 86 'l'oluene
. 4 Benzene 38 Ethylhen:&ene 44 Methylene chloride 85 'l'etracbloroethylene 86 'l'oluene · 87 'l'richloroethylene
6 Carbon tetrachloride ll 1,1,1-Tricbloroethane 44 .Methylene chloride
4 Benzene 44 Methylene chloride 86 Toluene
4 Benzene 23 Chlorofom 44 Methylene chloride 86 Toluene
ND ND 0 (L]) b
~
4l7b ND ND 16 ND ND ND ND ND
~a ~ NOd 20
Refinery o•
Intake Water Seearator Effluent ¥inal Effluent
ND ND ND
Intake Water
ND ND sod 50 ND 20
G(lOO) G(lOOl G(lOOl
Refinery Ea
DA!' Effluent
G(lOO) G(lOOl 1od ND G(lOOl ND
Refinery r•
ND ND ND
!'inal Effluent
ND ND lOd ND ND ND
Intake Water Cooling Tower Slowdown Pinal Effluent
G(50l G(SO) O(L lOid
ND ND O(L lOid
Intake Water Separator Effluent OAI' Effluent Final Effluent
0(& 1) 409b 2,00Sb 0(~ l) 22 293 563 12 D(L l) 96 76,405 O(L l)
Refinery He
Intake Water Separator Zftluent Final Effluent
ND:b ND:b l2b D(L lO)d ssb 66b ND ND 70b ND ND O(L 10)
B-9

4 a-zue 23 Chlorofozm 38 !thylbeuue 44 Metbylue Cbloride 86 Toluene
4 lleAaeDe 10 1,2-<:ic:Al-tballe 15 1,1,2,2•Tecracblo=eCAalle 2 3 Chlorofozm 30 1.~-traaa•Oicbloroethylene 38 Etbylbellz-44 Methylue Cbloride 85 Tecrac:llloroethyleDe 86 T01ueDe
4 BeAzene ~3 Chlorofozm 31 Ethylbella-44 Methylue c:Aloride 86 Toluene
:lODZue 6 Carbon tetrachloride 23 Cblorofozm 44 Methylene c:llloride 86 Toluene
Intalce water
liD liD
~ Ill)
TABLE B-2
IntaJce Waterf
O(L 1)/D~L l)b 8/d(L 1)
~~ ND/111)
IntaJce Water lll)b
N'O
~L lO)d N'O :b liD Ill)
Refinery Ie
Separator Effluent
243.4b Ill)
lla tl7&T'
c: Re:tinert E
Separator EfflueDt
20: liD!) NOb 100
~ 1:go
~L 10)1:>
hfin•rt x.•
Page 2 of 3
!'iDal Effluent
Pinal !ftlueDt
ml' D(L D(L D(L D(L
~& D(L Ill)
10) 10) d 10) 10) 10)
101
Pinal separator 1 !ff!ueat SeJi!arator 2 !tfluent UflueDt
0(100) 10 0(l00)b 0(100) G(lOOI
Intalce Water
ub
~ 91 D(L 10)
Refinert Me
DAP !ft!.1ent
ud ~~i 10) liOd D(L 10)
RefineFY 1ta
0(100) liD 10 liD 0(&001 50 :b G(l00) liD
PiD&l Effluent
lld D(L 101 d D(L 10ld D(L 10) D(L 101
IntaJce Water Cbem.P!&Dt lfflueDt Separator !ff1ueat PiD&l !fflueDt
.4 lleAaeDe 23 Cblorofozm 38 lthyl..beu-44 MethyleDe cAloddlf 86 Tol-
4 llellaue 6 Ca%DCID tetrac:mloride 23 Cblorofozm 44 Methylene c:bloride 86 Toluene
4 a-zene 6 CazDoll tetrac:Aloride
liD Ill)
N'O G(lOO)b N'O
15 1,1,2.~-Tetraahloroethalle 2 3 Chloroform 30 1,2-trana-DicAloroetbylene 38 !thylbellzene 44 Metby1ene chloride 85 Tetrac:AloroetllyleDe 86 Toluene 87 Tric:Aloroetbylene
90 10 20 G(lOO)b G(lOOI
IntaJce Water
liD D(L lOJ 55 130 D(L 10)
0(100) •4 15 liD
G(100)b ~(l00)b G(lOOib "' G(1001 35
a.t&a•!% 2c
DAP !f!;!,ueDt !'&!!!:!. !tf;j.ueDt
DCL lO)b DCL 101: liD Dla 10) 13 324 liD ~b u
Refinery ,c Illtake Water Sepa£ator §ff!ueat Pinal Eff;!,u-t
D(L lOlb 1,l00b D(L 101: HI) Ill) D(t. 10) D(L 101 4 ?oob
D(t. lO)b D(L 101 D(L 101 11 ND ND N'O 28 liD ND l,&oob 4l D(L 10) liD N'O D(L 101 655 liD D(L 101 ND D(L 101
B-10

TABLE B-2 Page 3 of 3
Refinery g•
Intake Water Separator Effluent Pinal Effluent
4 BUieM 23 Chloroform 44 Methylene chloride 48 Dicblorobromameth&fte 86 'l'olueaa
D(L ll
:s ND ND
ND
~ ND ND
Volatile orqaaic compounds not liatad tor a refinery were not detected in samples taken at that refinery.
ND - Compound was not detected.
D(Lxl - Compound was detected at same concentration leas than x, but the concentration could not be qu&lltified.
G (xl - ccmpound vu detected at a level qreater than x.
a) Midwest Research Institute conducted the &DalY••• for volatile orqanic compounds in samples from RefiD,ries A, D, I, P, L, H. s .. Reference Ho. 149.
b) Compound was detected in sample blank.
c) NOS Corporation conducted the analyses for volatile orc;anic: compounds in samples from Refineries B, H, l, K, o, P.
d) Compound waa detected at a greater level in sample blank than in sample.
el Gulf SOuth Research Institute con4uctecl the ~yses for volatile orc;anic compounds in samples froa Refineries C, G, I, Q. 'rbese data re~resat results from one-time qrab samples collected durinq revisits to these refineries. Additional suaplinq wu necessary because the illitial volatile orqanic reaults h&ci bee conaiclerad invalid due to i.Dipro~r analytical techniques. Since the revisit to Refinery J was conducted by an UA r8CJional surveillance and analysis suaplinq tau, the results are not presented in this table •
• f) Concentrations presented are for QDPreserved/preservad samples.
B-11

TASLE 8-3 AHAL'lt'l'ICAL REStJI/l'S FOR PRIORI'l'Y POLLO'l'ANTS
FOR 'rilE RS:attt. ANti B5R SAMPLING PROGRAM
QM:rypt.A'liLE OBGAlfiCS !CQNCMM'fiONS. nq/1)
comeounci
Base • Neutral Extractable&
1 Acenaphthene 55 Naphthalene 77 Acenaphthy1ene 81 Phenanthrene/78 Anthracene0
68 Di•n•butyl phthalate 70 Oiethyl phthalate
Acid Extractable& 65 Phenol
Base-Neutral Extractable•
Acid &xtractab1es
22 Parachlor~ta cresol 34 2,4 - Oimethy1phenol 58 4- Nitrophenol 65 Phenol
Base-Neutral Extractable&
55 Napl\tha1ene 81 Phenanthren.e/78 Anthracene 66 Bis(2•ethyl.heXyll phthalate
Acid Extractable&
65 Phenol
Base-Neutral Extractable&
Acid Extractable&
Base-Neutral Extractable&
39 Fluoranthene 55 Napl\thalene 73 Sanzo (a) pyrene 76 Chrysene 81 Phenanthrene/78 Anthracene0
84 Pyrena
Acid Extractables
Intake Water
ND ND ND
O(LO.ll 0.2 ND
ND
Intake Water
ND
ND ND ND ND
Refir.orr A a
Separator Effluentb
37 68
4 5
1.3 12
lJ
Refinery ad
OAP Effluent
ND
ND 10,000
ND ND e
Refine;y C•1
Intalca !!U£...
Separator Effluent
'l'reated Effluent
ND ND
150
Final Effluent
ND
ND
Intake Water
ND 2
ND ND
D(LO.ll ND
NO
950 190 290
2200
B-12
ND ND
900
ND
Refinery o•
Separator Effluentg
3 190
ND O.l 140 ll
ND
Page 1 of 5
ND ND ND ND 0.7 ND
ND
Final Effluent
ND
0 (L 10) 0 (L 10) 0 (L 10) 0 (L 10)
Final Effluent
ND ND 310
ND
Final Effluent
NO NO
3 1.4
NO 7
ND

Base-Neutral Extractables
1 Acenaphthene 25 1,2-0ichlorobenzene 27 1,4-0ichlorobenzene 39 Fluoranthene 55 Naphthalene 76 Chrysene 80 Fluorene
Ant!u=acenec 81 Phenant!u:ene/78 84 Pyrena 68 Di-n-butyl phthalate
Acid Extractable&
34 2,4-Dimethylphenol 65 Phenol
Base-Neutral Extractablea
39 Fluoranthene 73 Benzo (a) pyrene 76 Chrysene
Anthracenec 9l Phenanthrene/7 8 84 Pyrena
Acid !xtractables
Base-Neutral Extractab~
39 Fluoranthene/~4 Pyrena 55 Naphthalene 76 Chrysene/72 Benzo (a)
Ant!u=acene 81 Phenanthrene/78 Anthracene 66 Bis (2-ethylhexyllphthalate
Acid Extracta.bles
65 Phenol
Base-Neutral Extracta.bles 70 Diethyl phthalate
Acid Extracta.bles
Base-Neutral Extracta.bles
66 Bis(2-ethylhexyllphthalate Acid Extractables
31 2,4-0ichlorophenol 34 2,4-0imethylphenol 65 !'henol
TABLE 8-3 Page 2 of 5
RefineD: !a
IntaJce Water OAF Effluentb Final Effluent Final Effluenth
1.8 150 NO NO O(I.O.S) NO NO NO 0 (I.O. 5) NO NO NO 0(I.0.2) NO NO NO
NJ) 106 NO NO ND 0.3 D(I.O.l) NO ND 110 NO ND ND so NO D(LO.l)
O(I.O.l) 5 O(LO.S) O(L0.5) 0.4 NO NO NO
ND G(100) NO NO NO G(lOO) NO NO
Ratineq ,a Intake Wateri Cooling Tower Blcx·tdownb Final Effluent
29 33 49
160 140
ND
Intake Water
NO NO NO
NO 1100
10
Final Effluent
1
NO
Intake Water
NO
NO NO NO
NO 10
7 2
10
ND
Retineq G-le
Se2arator Effluent OAF
40 1100
40
1100 700
4900
Refine£{: G-2f
Refineq Hd
Separator Effluent
B-13
NO 175 440
NO
NO 1.3 0.8 NO ND
ND
Effluent Final Effluent
NO NO 700 NO NO NO
600 NO 1100 850
2400
Final Effluent
D (L 10)
10 NO NO

TABLE B-3 Page 3 of 5
aaae-Neutral Extractable•
55 Naphthalene • 66 Bia(Z-athylhexyllphthalate 68 Di-n-butyl phthalate
Acid Extractablea
65 Phenol
Saae-Neutral Extractable
Acid Extractable
Base-Neutral Extractable•
l Acenaphthene 39 Pluoranthene/84 Pyrena 55 Napllthal•• 76 Chryseae/72 Benzo (a)
anthracene 8l Phenanthrene/78 Allthracene 80 Pluoreae 66 lia(Z-ethylhexyl)phthalate 70 Diethyl phthalate 71 DtD&thyl phthalate
Acid Extractable•
34 2,4-Dimethylphanol 64 Pentachlorophenol 65 Phenol
laae-Neutral Extractable•
1 Acenaphthene 39 Pluoranthene/84 Pyrena 55 Naphthalene
Intake Water
ND 950
30
ND
Final !:fluent
ND
MD
Intake water
ND MD ND ND
MD ND llO MD ND
ND ND ND
Separator 4 Effluent
so zo ND
76 Chrysene/72 Senzo(a)antbracena 40 8l Phenantbrene/78 Allthracene 80 Fluorene 66 lia(2-ethylhexyllphtbalate 70 Diethyl phthalate 71 Dimethyl phthalate
Acid Extractable•
34 2,4-Dtm.thylphenol 64 Pentachlorophenol 65 Phenol
Acid Extractable•
24 2-chlorophenol 34 2,4-Dimethylphenol 58 4-Nitrophenol 59 2, 4-Dini trophenol 65 Phenol
230 80
600 ND ND
6SO 850
16,000
Intake Water
ND
ND ND ND ND ND
B-14
Refinery I•le
Separator Effluent
290 300
ND
390
Final Effluent
NO 600 10
ND
Refin•!:I I-2f
Retin•!:I J-
Separator l Separator 2 Efnuet Eff~uent
MD ND 30 MD ND 350 30 30
30 90 ND ND
180 300 ND ND ND ND
ND ND ND ND
uo 160
Refill!£~!: J.
Separator 5 Bio-Pond Eff:J:uent I~luent
ND ND ND ND ND ND ND ND ND ND ND ND ND 210 ND ND ND ND
ND 750 ND ND ND G(l2,000)
Refinea ltd
Separator Effluent
ND
315 1,150 5,800
11,000 lOS
Separator 3 Effluent
MD ND ND so
ND ND 50 ND ND
ND ND ND
!continued)
Final Ef,luent
ND !fD ND ND ND ND 190
30 3
~D ND ND
!'inal Effluent
ND
ND ND !{D
NO ND

Baae-Neutral Extractable&
l Acenapbthene 39 l"luoranthene 55 Naphthalene 76 Chryaene 77 Acenaphthylene so Fluorene
Anthracene c 81 Phenanthrene/78 84 Pyrena
Acid Extractable•
34 2,4-Dtm.tbylphenol 65 Phenol
Base-Neutral !xtract&b1ea
Acid Extractable&
22 Parachlorometa creao1 34 2,4-Dimethylphenol 58 4•NitrOphenol 59 2,4-Dinitrophenol 65 Phenol
Baae-Neutral Extractable&
l Acenaphtbene 39 F1uorantbene 55 Naph~ene 76 Chryaene 77 Acenaphthylene 81 Phenanthrene/78 Anthracenec 84 Pyrena
Acid !xtractablea
22 Pa~chlorOBeta c~esol 34 2,4-Dimethylphenol 65 Phenol
aa .. -Neutral Ex~actablea
l Acenaphthene 39 Fluoranthene 54 Iaophorone 55 Naphthalene 68 Di-n-butyl phthalate 71 Dimetby~ phthalate 76 Chryaene 77 Acenaphthylene 78 Anthracene 80 Fluorene 81 Phenanthrene 84 Pyrena
Acid Extractable• 34 2,4-Dimethylphanol 65 Phenol
TABLE- B-3
Intake Separator ~ Effluent
29 Ntl 0.2 Ntl
l 500 Ntl 20 0.2 ND
l 270 l 230
0.3 ND
ND G(100) ND G(100)
19'
Refinery L4
Separator 29' !:!!fluent
3,000 9
280 2
ND 300
ND 7
G(l00) G(l00)
Page 4 of 5
Final Effluent
6 D(I.O.l)
O.l 0.3
ND NO
l D(I.O.l)
Ntl NO
Intake Water OAF Effluent
Ntl
Final Effluent
NO NO 10 ND 18,300 NO NO 1,400 NO NO 2,660 Ntl
D(L lO) 33,500 D(L 10)
Refinery N4
Intake CU.. Plallt Se{l&3:atorg Final !!!!£. Effluent !:I! :fluent Effluent
NO NO 522 NO liD liD 8 NO liD 27 302 Ntl liD D(I.O.ll 6 ND NO ND 87 NO !Q) l 140 NO NO l 16 !Q)
NO 10 ND ND NO G(lOOl 71 Ntl ND 40 G(1001 NO
Refinery od
rntaJce Water OAF Effluent Final Effluent
NO 390 NO NO NO NO NO 2,500 NO NO 3,750 NO m tm NO NO NO NO NO NO NO NO 530 NO Ntl 1,750 NO NO 495 NO NO 1,750 NO NO Ntl NO
tm 2,000 NO NO 1,900 NO
B-15

Base-Neutral Extractable•
1 Acenaphthene 54 I•ophorone 55 Naphthalene 77 Acenaphthy1ene 78 Anthracene 91 Phenanthrene
Acid Extractable&
57 2-Nitrophenol 58 4-Nitropnenol 59 2,4-0initrophenol 60 4,6-0initro-o-cresol
Base-Neutral Extracta.bles
66 Bis(2-ethylhexyl)phthalate 68 Di-n-butyl phthalate 71 Dimethyl phthalate
65 Phenol
Base-Neutral Extracta.bles
70 Diethyl phthalate
Acid Extractables
~·
TABLE B-3
I:nta.ke Water
NO NO NO NO NO NO
0 (L 10) 0 (t. 10)
ND NO
Intake Water
1,100 20 20
10
Final Effluent
l
NO
Refinery Pd
Separator Effluent
315 3,550 3,200
665 660 660
1,350 20
110 60
Refinery 0-18
Separtor Effluent
320 NO NO
60
t'.efinery 0-2f
Page 5 of 5
Final Effluent
NO NO NO ND ND ND
ND NO NO NO
Final !!!!fluent
2,000 NO NO
NO
Semivolatile organic compounds not listed for a refinery were not detected in samples taken at that refinery.
NO - Compdund waa not detected.
O(LXl - compound was detected at same concentration leas tban X, out the concentration could not be quantified.
G(X) - Compound was detected at a level greater than x.
(a) Midwest Research I:nstitute conducted the analyses for semivolatile organic compounds in samples from Refineries A,o,E,!',t.,N. s .. Refarence No. 149.
(b) Base-neutral extract was diluted 1:10 before analysis. (c) Concentration• represent SUIIIII for these two compounds which elute simultaneously and
have the same 111ajor ions for GC/MS.
(d) NOS Corporat~on conducted the analyses for s..tvolatile organic compounds in samples from Refiner~•• B, H, K, M, 0, P.
(e) Ryckman, Edgerley, Tomlinson ' Associates and Gulf South Research Institute conducted the analyses for semivolatile organic compounds 4ft samples fraa Refineries C,G,I,J,Q.
(f) Gulf South Research Institute conducted the analyses for semivolatile organic compounds in additional samples from Refineries C,G,I,Q. These data represent results from onetime qra.b samples collected during revisits to these refineries. Since the revisit to Refinery J was conducted by an EPA reqional surveillance and analysis sampling team, the results are not presented in this table.
(g) Both acidic and base-neutral extracts were diluted 1:10 before analysis.
(h) 'l'his sample was stored for 6 weeks prior to extraction for base-neutral and acidic organ~c compounds.
(i) Base-neutral extract was diluted 1:5 before analysis.
B-16

C911!1!0Upd.
109 PO-ll39
94 4,41
-DDD 9 7 ElldoeuJ.fan sUlfate
100 Heptacblor 103 b-BBC-Beta 104 r-BifC-G-106 P0-1242 107 PO-l254 108 PO-l22l 109 PO-l232 llO P0-1248 1ll PCB-ll&O ll2 P0-1011
Peetic:l.das
106 PC.I-1242 108 P0-1221
101 PCB-l242
9l Chlordane 103 b-asc-a.ta 108 Pds-1221
95 a-Endoaulfan-A1pba 106 P<:B-l242 109 PCB-l232 ll2 PCB-1016
89 A1d;in 93 4,4 -DDE
105 q-BHC-De1ta 106 P<:B-1242 107 PCB-l254 108 P<:B-1221 109 PCB-1232 110 P<:B-1248 lll PCB-l260 112 PCB-1016
TABLE 8-4
ANALlrl'ICAL RESUt.TS POR PRIORITY POLLU'l'AN"l'S
POR TBE RSKERI. AND B'R SAMPLING PROGRAM
PESTICIDES (CONCEN'rRATIONS, uq/1)
Refinery Aa
Intake Water Separator Effluent
ND 0.9
Int!Js! Water
NO NO NO ND ND ND ND ND NO NO ND ND
Refinery ab DAr Effluent
D(L 5) D(L 5) D(L 5) D(L 5) O(L 5) 0 (L 10) OIL lOl D(L 10) O(L 10) O(L 101 D(L 10) O(L 10)
Refinery ca
Separator Effluent
Treated Effluent
ND
Refinery oa
Intake Water Separator Effluent
NO ND
Intakt Water
1.1 NO
Refinery Ea
DAr Effluent
0.2
!!!finery r•
Page 1 of 3
Pinal Effluent
Pinal Effluent
ND NO
D(L 5) O(L Sl
ND O(L 10) O(L 101 O(t. 10) O(L 10) O(L 10) O(L 101 O(L 101
Final Effluent
Final Effluent
ND O(L 5)
Final Eftluent
Intake Water Coolin9 Tower Blowdown Pinal Effluent
IAtalce ~
ND ND ND ND
2.8 ND NO NO 0.7 NO NO 0.1 NO
Refinery G4
Separator !ff~
ND o.s
!11)
1.8
OAF Effluent
0.1 o.s 3,5 7.9
Refinery ab
Final !!fluent
ND NO NO ND
Intake Water Separator Effluent Final Effluent
B-17
liD ND !ll) !ll)
ND !ll)
NO NO NO NO
O(L 51 7
O(L 5) O(L 10) O(L 10) O(L 10) O(L 10) O(L 10) O(L 10) O(L 10)
!ll) !ll) !ll)
O(L 10) D(L 10) D(L 10) D(L 10) D(L 10) D(L 10) D (L 10)

Pesticides
1.06 V<:Z-ll~l 109 PCB-1232 l12 PCB-1016
106 PCB-1242 109 PCB-1232 ll2 PCB-1016
101 Heptachlor epoxide 106 PCB-1242 107 P<:B-1254 108 PCB-1221 109 P0-123-110 PCB-1248 111 PCB-1260 ll2 PCB-1016
1.06 PCB-1.242
106 PCB-1242 107 • PCB-1254 108 PCB-l22l. 109 PCB-1232 llO PCB-1249 111 PCB-1260 112 PCB-1016
101 Heptachlor apoxide 109 PC:S-1221 109 PCB-1232 112 PCB-1016
102 a-BHC-!Upha
99 Aldrin 96 b-Endosulfan-Beta
100 Heptachlor 103 b-BHC-Beta lOS q-BHC-Delta
TABLE B-4 Page 2 of 3
Refinery I 4
Intake Water Separator Effluent Final Effluent
ND ND
Intake- Separator 1 Separator 2 Separator 3 !!!!£
NI)
ND ND
Effluent Effluent Effluent
ND ND ND
o.s o.s 0.2
Refinery J 4 (continuedl
Separator 4 Separator S Bio-Pond Influent Ef:fluent
ND ND ND
Intake Water
0.2
ND ND ND ND
Effluent
ND ND ND
0.1 ND ND
Refinery 'I!'
Intake Water Separator Effluent
ND ND ND ND ND ND ND ND
D(L 5) D(L 10) D(L 10) D(L 10) D(L 10) D(L 10) D(L 10) D(L 10)
Refinery L4
Separator 1 Effluent
Separator 2 Effluent
Intake Water
ND ND ND NO ND ND ND
5.2 ND
Refinery Ill'
0117 Effluent
D(L 101 D(L 101 D(L 101 D(L lOl OIL lOI D(L 101 D(L 10)
Refinery N"
Chemical P 1ant Effluent
Separator Effluent
4.6 NO
O.l l.J
Intake Water
ND
Refinery o0
ND 0.1 0.5 1.9
OAF Effluent
D(L 10)
Refinery ~
Intake Water Separator Effluent
ND NO NO NO NO
B-18
12 D
D(L Sl D(L 5)
12
N1) N1) N1)
Final Effluent
ND NO N1)
!"inal Effluent
NO O(L 10) O(L 10) O(L 10) D(L 10) O(L 10) O(L 101 D(L 10)
Final Effluent
NO
Ftna1 Effluent
O(L 10) O(L 10) D(L 10) D(L 10) O(L 101 D(L 10) O(L lOl
Fina ... Effluent
NO NO NO tiD
Final Effluent
Final Effluent
NO NO NO NO NO

TABLE 8-4 Page 3 of 3
Retinerx 94
Intake Water Separator Effluent Final Effluent
ND ND
Pesticide compounds not listed for a refinery were not detected in samples taken at that refinery.
NO-compound was not detected.
D (Lx) -compound was detected at some concentration less than x, but the concentration could not be quantified.
ND
a) Ryckman, Ed9erley, Taalinaon and Aaaociates conducted the ana~yses for pesticide compounds in samples from Refineries A,C,D,E,P,G,I,J,L,N,Q. Since theM results h&ve not been verified by GC/MS, the reported identifications must be considered tentative.
b >NUS Corporation conducted the &nalysea tor pesticide compounds in samples tram Refineries B,S,X,M,O,P.
B-19

TABLE B-5 Page 1 of 10 AHALY"l''CAL RISOUS !'OR PRIORl'l'f POLt.ll'l'AN'l'S
FOR THE RS1CPI. AND B&R SAMP!.ING P'IIOGliAM crANIDE, PIIE!IOLICS, MUCURY coNCENTIWriONS , !!!ll/1 )
S!!!Ji!1e-Oai a
!:£ Cya!Uda Phenolics ~
Rafinuy A r..o11:1 InUke-1 2 r..010
InUke-l l .0001 InUke-2 2 r..01 r..010 InUke-2 1 .0001 InUke-3 2 r..01 r..o11 Intalte-3 l .0001 InUke-CCJIIIliOai ta 2 L.0005 Intak.-.::capoai ta 1 .0001 Separator attluent-1 2 .os r..52 Separator aff1uant-l l .0002 Separator affluant-2 2 .06 .l~
separator etfluent-2 1 .0002 separator effluent-3 2 .04 .lS Separator effluant-3 1 separator effluant•co.poaita 2 r..ooos Separator eff1uent-caapoaita 1 .0008 Final ettluant•l 2 L.03 L.02l Final effluant•l 1 .0002 !'iAal aU1uant-2 2 r..ol .010 Final etfluant-2 1 .0002 Final affluent-3 2 r..ol L.Oll Final eftluant-3 1 .0002 Final eftluant•CQIIPOSita 2 r..ooos Final etfluent-CCJIIIliOaita 1 .0003
.Refinery a Int:Jke-1 2 r..02 I..010 Intalca-2 2 t..02 r..oos InUke-3 2 r..02 r..oos In'!alte-CCJIIIliOai ta 2 L.OOOS OAI' affluant•l 2 .04 32. OAI' effluant-2 2 .OS 34. OAF effluent-3 2 • 04 22 • OAI' etfluant-CCJIIIliOSita 2 r..ooos Final ettluent-1 2 r..o:z .064 Final effluent-2 2 r..o:z .048 Final effl~W~~t-3 2 r..02 .045 Final atf1uent•cempoaita 2 r..ooos
B-20

TABLE B-5 Page 2 of 10
Sa!!!P1a-Daya ~ 9yanide Phenolics ~
Refinuy cc ID.talta-1 1 .0014 I.dtalta-1 l L.01 .004 .0010 ID.talta-2 1 .0016 Intalca-2 3 r..01 .006 .0060 Int&lca-3 1 .0013 Intalta-3 3 r..01 .004 .0010 Intalce-c:ompoai ta 1 .0013 Separator affluant-1 1 .oou Separator aftJ.uent-1 3 1.1 u. L.0010 Sapuator atflu.nt-2 1 .oou Saparato~ aff1ueat-2 3 .u 3.2 .0060 Separator etfluant-3 1 .0015 Saparato~ aff1u.nt-3 3 .07 1.6 .0020 Saparato~ effluent-3 3 .07 1.4 .0050 Separator affluant-3 3 .0780 Saparato~ aff1u.nt-coa;oaita 1 .0012 Treated eff1u.at-1 1 .0008 ~ated affluent-1 3 .u I..001 .0020 Treated etflueat-1 3 .0006 Traated effluent-2 l .0010 ~ted aff1uant-2 3 .11 .ou .0050 Treated aff1uaat-2 3 .016 Treated eff1uent-3 1 .0010 Treated eff1uaDt-3 3 .oa r..OOl. .0090 ~ated aff1ueat-3 3 .0060 ~reated efflu.at-campoaite 1 .0012 Final effluent-!. l .oou !'inll affluent-!. 3 .03 .002 .0010 !'inal effluent-2 1 .0014 Final effluent-2 3 .05 .006 .0010 !'in&l effluant-2 3 .04 !'in&l afUu.at-3 l .0013 Final efflu.nt-3 3 .06 .002 .0060 !'inal affluent-ccmpoaite 1 .0013 Intalca-4 3 L.02 L.0001 Separator effluent-4 3 r..o::z I..0004 Treated aff1uant-4 3 .05 I..0002 Final eff1uaat-4 3 .07 .0005
Refinery o Intalca-1 2 L.02 Intaka-l l .0001 ID.ealca-2 2 r..02 Ineake-2 1 .0002
B-21

TA8t.E B-S Page 3 of lO
S!!!!i!le-Dai a
~ C}ranida PhenoUc:• ~
aatinuy o (Cont. l Intake-3 ~ r..c~ 0.~3
:tntake-3 1 .0001 :tntake-compodte ~ r..aoos In~-saosit. l .coo~
Dlll' eftluent-1 2 .as 3.7 DAl" eftluent-1 1 .0002 Dlll' etfluent-2 2 .06 5.1 OAF effluent-2 1 .0001 OAF effluent-3 2 .04 a. a DAl" effluent-3 1 .aao2 OAF effluent-c:a.poe~te 2 r..ooos DAl" etfluent-campo•~te 1 t..OOOl l!'in&l etfluent-1 2 .03 l!'in&l effluent-1 1 .0002 Final efflu.at-2 2 .03 Final effluent-2 1 .0002 Final effluent-3 2 t..02 l!'inal effluent-3 1 .aoo2 Final efflueat-c:-sao•ite 2 r..aoos Final effluent~aite 1 .0002
aafineey E :tntake-1 2 .OJ t..au Intak-1 1 t..OOOl :tntake-2 2 t..Ol .015 Intake-2 1 1..0001 Intak-3 2 1..03 t..OlO :tntalle-3 1 1..0001 :tn~nte 2 r..aoos :tntake-CCIII(IOSi t. 1 t..0001 OAF effluent-1 2 t..Ol 6.8 DAl" etfluent-1 1 I..0001 DAl" etfluent-2 2 I.. OJ 9.9 DAl" etfluent-2 1 1..0001 Dlll' effluent-3 2 t..Ol u.o DAl" effluent-3 1 t..OOOl OAF etfluent-c:ompo•ite 2 t..ooos DAl" effluent-compo•~ta l t..0001 l!'inal effl.nent-1 2 t..Ol .au Final effluent-1 1 .0001 Final effluent-2 2 I..O.l .all Final effluent-2 1 t..OOOl Final ef.fluent-3 2 t..OJ t..OlO Final effluent-3 1 .COOl Final effluent-c:-saoute 2 t..ooos Final effluent-composite 1 .0001
B-22

TABLE s~s Page 4 of 10
s-o1e-Dax4 ~ cyani.de PhenoUca .!!!!S!!a
Refinery F Illtake-l 2 L.03 .21 Illtake-1 1 .0002 Illtake-2 2 L.Ol .21 Illtake-2 1 .0007 Illt.te-3 2 L.03 .21 Illtake-3 1 .0009 Illtaktt-<:OIIIWC8ite 2 L.ooos IJltMe-<IC11115108ite 1 .0006 Coolinq tower blowdawla-1 2 .52 .037 Coolinq tower bl.owdown-1 1 .0004 Coolinq tower b1owdawn-2 2 .83 .041 Coolinq tower bl.owdown-2 1 .0005 Coolinq tower blowdowD-3 2 .83 .057 Coolinq tCNU" blOM:Iawn-3 1 .0007 Coo.llllq tower blowdawn :a.;oaite 2 L.OOOS Coolinq tCNU" blcMiowft-compoaite 1 .ooos Final efUuant-1 2 .06 .022 FiA&l effluant-1 1 .OOOJ Final effluant-2 2 .07 .024 Final effluant-2 1 .OOOJ Final effluant-3 2 .08 .026 Final effluant-3 1 .OOOJ Final effluant~aite 2 L.OOOS Final effluent-co.poaite 1 .0004
Rafinery Gc Ill~l 1 .0013 IJltMe-l 3 L.Ol .010 .0005 Illt.te-2 1 .oou Illtake-2 3 L.01 L.001 .0004 tnt.te-3 1 .0023 IntMe-3 3 L.01 .oo8 L.OOOS tnteke-ocmpoaite 1 .ooo8 Sepazat~ effluent-1 1 .0017 separator effiuent-1 3 1.2 23. L.OOOl Sepazat~ effluant-1 3 1.2 24. Separator efflueDt-2 1 .0009 Separator etf1U&Bt-2 3 1.2 25. L.OOOl separator elfluant-3 1 .0018 separator etf1uent-3 3 1.5 23. .0002 separator effluent-oom;oaite 1 .0003 OAI' etfluent-l l .0011 OAF eftluent-1 3 1.9 22. L.0002 OAE etfluent-2 l .0011 OAF et:l!luent-2 3 2.0 26. .0005
B-23

TABLE- B-5 Page 5 of 10
S-le-Day4 !::!!!. cyuU.a PbeftoUcs ~
aafineey G (Cont. l OAF effluent~l 1 .0010 OAF etfluent•l 3 3.0 22. .0010 OAF etflueut-cc.poaite l .0003 Final effluant-1 l .0008 Final effluant-1 3 .09 .a.7 .0010 Final eff1uent•1 3 .0007 Final effluant-2 1 .0018 Final effluant-2 3 .07 .020 t..0002 Final effluant-2 l .09 Pinal effluant•l l .0008 Final eff1uant-l l .30 .032 .0005 Pinal efflueot-<:OIIIPO&i te l .0004 IAtake-4 3 t..02 Separator eff1uant~4 3 .60 OAF effluut•4 3 .ll Final effluant-4 3 .17
aafinary a IAtake-1 2 r..o2 .Oll In.take-2 2 r..o2 r..oo5 IAtake-3 2 t..02 r..oo5 I:ltakrccqiOtli te :z ,I..OOOS Separator effluant-1 2 .16 2.3 Separator effluent-2 2 .07 2.2 Separator effluant•l 2 .08 1..9 Separator eff1uant•oompo8ite 2 t..ooo5 Final effluant-1 2 .02 t..010 Final eff1u-t-2 2 .01 .010 Final effluant-3 2 .02 .012 Final effluant-ccaposite 2 t..ooo5
Mfineey I Intake-1 1 .OOl.l IAtake-1 3 L.005 L.OOl. .0007 In.take-2 l .oou Intake-2 3 L.OOS L.OOl .0005 Intake•3 1 .0014 Intake-3 3 L.005 .004 .0007 Separator affluent-!. 1 .0012 separator effluant-l 3 .010 6.0 t..0002 Separator effluant•l 3 5.6 t..0002 Separator effluent-2 1 .0028 Separator effluent-2 3 .015 4.4 .0008 Separator effluent~3 1 .oou Separator effluent~3 3 L.OOS s.o .0008
B-24

tABLE. B-5 Page 6 of 10
sele-o.y• f:!2. CVanide Phenolics ~
Refinery I (Cont.) Se~ator effluant•3 3 5.2 Final effluant-l l .0042 Final effluant-l 3 t..oos .018 I..0002 Final effluant-1 3 t..oos Final ef:fluant-2 1 .0012 Final effluant-2 3 r..oos .014 r..ooo2 Final effl1Wit•2 3 r..oos Final effluant-3 3 r..oos .012 .0010
Rafinuy J Intake-l l .0007 Intake-1 3 .01 .017 .0001 Intake-l 3 .0004 Intake-2 1 .0009 Intake-2 3 .01 .024 .0002 Intalce-3 l .0019 Intake-3 3 t..Ol .002 .0020 Intake-3 3 .0070 Intalce-3 3 .0070 In~dte l .ooos Sepuator-l efflueat-l l .0001 separator•l effluant-1 3 .01 1.0 .0030 S.puator-1 eflluant-2 l .0012 sepuator-1 effluant-2 3 .01 l.O t..OOOl S.puator•1 efllueat-2 3 .01 S.puator-l eflluant-3 l .0012 Sepuator-l effluant-3 3 .01 .2 .0010 S.puator-l eff1uant•compoaite l .coos S.puator-2 eflluant-l l .0028 Setarator-2 effluent-l 3 .01 l.O .0001 Separator-2 effluent-l 3 1.0 Sepuator-2 effluent-2 l .0016 Sepuator-2 elfluant-2 3 .01 2.0 .0050 Separator-2 effluent-3 l .0003 Sepuator-2 effluant-3 3 .Ol: 2.5 t..0010 Separator-2 eff1ueat-~aite 1 .0006 Separator-3 efflueat•l 1 .0002 Separator-3 effluant-1 3 .01 .690 t..0001 Separator-3 efflueat•l J .5 Se~arator•l eff1uent-2 1 .0006 Separator-3 et.tluent-2 3 .01 1.3 .0010 Separator-3 eff1uant-3 1 .0009 Separator-3 effluant-3 3 .01 .270 .0006 Separator-3 effluent-compos1te l .0010
B-25

lAW: B-5 Page 7 of 10
Seele-oax• ~ CX&Dl.cle Phenolics ~
RefiAezy J (CoDt.) Sep~ator-4 efflu.at-1 l .0002 Separator-4 effluent-1 3 .06 9.5 .0002 Separator-4 effluent-2 l .0013 Sepuator-4 effl-t-2 3 .OS 2.0 .ooso Separator-4 effluent•2 3 :z.o .0070 Sepantor-4 effluent•) 1 .0016 Se~tor-4 efflu.at•l 3 .06- 1.5 .0020 Separator-4 effl-t•l 3 1.5 Separator-4 efflueat--ccmpo.i te 1 .0004 Sepuato~-s effluent-1 1 .0003 Separator-S effluent-1 3 .02 .294 L.OOOl Separator-S effluent•Z l .0011 Sepantor-5 etfluent•2 3 .02 • .214 .0002 Separator-S etfluent-l 1 .0016 Separator-S effluent•] 3 .0:.1 .246 .0020 Sep~tor-5 efflunt-cc.poaite 1 .0005 Bio-pcad iDflQeftt•1 3 .22 120. .0020 Bio-pond iDflued-2 3 .34 uo. .0060 B1o-pan4 iDfluaat-3 3 .26 83. .0030 Final efflueat•1 1 .0008 Final effl-t-1 3 .01 .008 L.OOOl Final effluent-2 1 .0013 Final effluent•2 3 .08 .024 .0060 FiAal ettluent-3 1 .0009 Final effluent-3 3 .08 .002 .0040 Final eftluent•3 3 .08 Final efflu.at-cc.poeite 1 .0005
Ratinezy .!C Inealul-l 2 Inealui-:Z 2 r..o:z L.OlO tntake-3 2 Intalce-<:QIIPOaite 2 r..ooos DAI' efflueat-1 :z DAI' etflunt•:Z 2 r..02 .1 DU' effluent-3 2 DAI' effluent~aite 2 r..ooos FiAal efflu.at•l 2 FiAal efflunt•2 2 r..02 .029 FiDal efflueDt-3 2 E'iDal effluent-cc.poaite 2 r..ooos
B-26

TABLE B-5 Page 8 of 10
S!!IR1e-Oa.y a .!::!:2. Cyanide PhllnOlics ~
Rafineey L Intake-1 2 L.06 L.010 Intake-1 1 L.0001 Intake-2 2 L.06 t..010 Intake-2 1 .0002 Intake-3 2 L.06 L.010 Intaka-3 1 .0002 Intaka-=-POSi te 2 Intake-coapou te 1 .0002 Separator-1 ef!luent:-1 2 .l9 Sl. Separat:or-1 effluent:-]. 1 .0014 Separat:oc-l eff1uant:-2 2 • 36 52 • Separator-1 effluent:-2 1 .0014 Separato~-1 effluant-3 2 .58 61. Separat:o~-l effluent-3 1 .0008 Separat=-1 effluent-composite 2 Separato~-1 eff1uent:-camposite 1 .OOlS Separatc~-2 effluant-1 2 .16 Separat:oc-2 eff1uent-l l .0006 Separat:o~-2 effluent-2 2 .21 22. Separat~-2 eff1uent-2 1 .0004 Separato~-2 eff1uent-3 2 .08 L2.6 Separaeor-2 eff1uent-3 l .0004 Sep~ato~-2 effluant-~aita 2 Separato~-2 eff1uent-campoaita 1 .ooos l!'inal effluent-1 2 .08 L.OlO l!'inal effluent-1 l .0003 l!'inal effluent-2 2 .08 .010 !'inal effluent-2 l .0003 l!'inal effluent-3 2 .08 L.OlO l!'inal' eff1uent-3 l .0003 l!"inal eftluent-a.poaite 2 Final effluent-composite l .0003
Rafineey M Intake-1 2 I..02 L.010 Intake-2 2 I..02 L.OlO Intake-3 2 I..02 I..010 Intake-composite 2 DAF eftluent-1 2 .Ol 4.7 OAF effluent-2 2 .02 4.2 OAF effluent-3 2 .03 4.3 DAF effluant-coapos1te 2 Final effl11811t-l 2 I..02 L.OlO Final effluent-2 2 L.02 L.OlO Final effluent-3 2 I..02 I..OlO ?~al effluent-composite 2
B-27
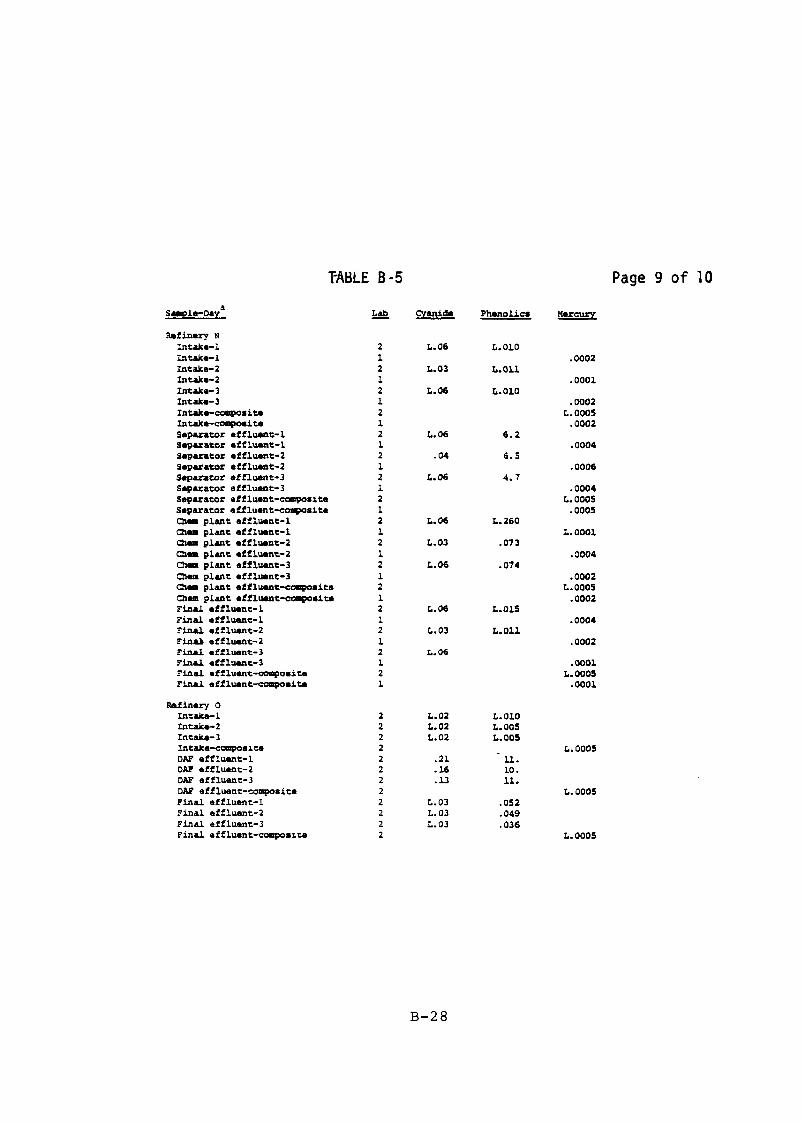
T--ABLE B-5 Page 9 of 10
S!!I!Ple-Day a
!:!2. cyanide Ph~olics ~
Refinery N Intalte-l 2 L.06 L.OlO Intalte-l l .0002 Intak.e-2 2 I.. OJ I..Oll Intak.e-2 l .0001 Intalte-3 2 L.06 L.OlO Inta.lte-3 l .0002 Intake-composite 2 L.OOOS Intake-composite l .0002 Separator ettluent-l 2 L.06 6.2 Separator effluant-l l .0004 Separator effluent-2 2 .04 6.5 separator etfluant-2 l .0006 s~aeor effluant-3 2 r..06 4.7 separator e:f!luent-3 l .0004 separator e!fluant-ccmpoaite 2 L.OOOS Separator efflu~t-composite l .ooos Cbea pl.nt effluent-l 2 L.06 L.260 Chem plant etfluent-l l L.OOOl Cbea plant et:fluant-2 2 L.Ol .073 Cbea pl.nt effluant-2 l .0004 Cbea plant etfluant-3 2 L.06 .074 Ch- plant etfluent-3 l .0002 Cham plant etfluant~aite 2 L.OOOS Ch- plant effluant-c.:.poaite l .0002 Final effluent-l 2 L.06 L.OlS Final effluant-l l .0004 Final etfluant-2 2 L.Ol L.Oll Finu affluent-2 l .0002 Final effluent-3 2 r..06 Final effl.uent-3 l .0001 Final eff1u~t-compoeite 2 L.OOOS Final effl.uant-campoeite l .0001
Refinery o In talta-l 2 L.02 L.Ol.O Intalte-2 2 L.02 I..OOS Inta.lte-3 2 L.02 t..oos Inta.lte-compoa:a.te 2 L.OOOS OAF effluent-l 2 .21. ll . OAF etfluent-2 2 • 16 lO. OAF etfluent-3 2 .lJ u. OAF effluent-composite 2 L.OOOS Final effl.uent-l 2 L.03 .052 Final effluent-2 2 L.03 .049 Final effluent-3 2 I.. OJ .036 Final affl.uent-compos:a.~e 2 L.OOOS
B-28

TABLE 8-5 Page 10 of 10
s!!!2Le-D&xa ~ CV&IU.de Phenolics !!!£SSX.
llaf~y p Intllke-1 2 I..03 I..OlO Intalte-2 2 t..o:z I..OOS Incalce-3 2 r..o:z r..oos Incalce-c:a.poaite 2 r..ooos Separator eff1uant-l 2 .09 106. Separator eff1lllellt•:Z 2 .06 Separator eff1ueDt-3 2 .04 29. Separator efflueDt-c:a.poaite . 2 r..ooos Fiftal eff1u.ot•1 2 I.. OJ .012 F1zl.al eU1-t•2 2 I..03 .ou rlAal. effluant•3 2 t..03 .010 F1zl.al eff1ueat-~aite 2 r..ooos
Mfiftuy o.c Incalce-1 1 .0021 Incalce-1 3 t..Ol t..OOl Incalce-2 1 .0012 Incalce-2 3 .o:z .004 .0010 Incalce-3 l .0034 Intaa-l 3 I..Ol .010 .0060 Separator eff1uent-1 l .0002 Separator efflQUt-1 3 t..Ol .102 .0060 Separator eUlueDt•1 3 .UJ laptrator effluut-2 1 .0003 Separator eff1ueDt-2 3 t..Ol. .U6 I..0002 Separator efflQ&ftt•3 1 .0003 'Sepuator afflu.nt-3 3 .OJ .ua r..0002 F1Dal effluect-1 l .0003 FinU effluant-1 3 r..Ol .016 .0060 Final eftl-t•1 3 t..Ol .0120 Pinal efflQUt•l 3 .0002 Final effl1lellt•2 1 .0003 Final eftllllellt•2 3 .32 .018 .0020 Final effl1lellt•2 3 .32 .018 L.0002 Pinal eftlQUt-3 1 .0008 Pinal effluant-3 3 .01 .014 I..0002 Intake-4 3 r..oz L.0001 Separator efflQUt•4 3 r..02 r..ooo:. Pinal eftllliellt•4 3 r..o2 L.OOOl
Notes: (&I If a value ,.. not listed for a ,ilarticul.ar sa.ple location anci tilDe, thu the indicated 1&Doratory dici not teat that •&IIPle for the spacifiaci ,i10llutant.
(b) r.- 1••• than. (C) Grab SU~Plea collecteci aurinq revisits to Rafuar:~.ea c, G, Q are
inc:licataci u Day 4.
Labs: 1· - E:PA Raqion v I.aboratory. 2 - Robert s. tt.rr !nviro11Mntal Raaeuc:h r.&Doratory, E:PA 3 - Ryclalan, Eciqerley, TOIIIl.inson anci Associates.
B-29

TABLE: B-6 Page 1 of 6
Concant:ration !!!!ll! !!!IJ.e-0aY a !=!l !i. !!. ~ s:. £! !!!. !!!. ~ !!. ~ !!. !! a.tiziUY A
I•l l r.a5 x.:z x.:zo X.:Z4 I.4 r.so L60 3l t-~ 1 x.:zs x.:z x.:zo X.:Z4 I.4 r.so L60 45 1•3 l x.:zs x.:z x.:zo X.:Z4 I.4 1:.50 L60 6a I•Ca.poa:l.te l x.:zs x.:z x.:zo X.:Z4 I.4 1:.50 L60 43 I•Ccllpoa:l.ta 2 I.S L3 rJ. I.S I.5 w rJ.5 1:.10 1:.10 t.:Z5 1:.10 r.a5 D-1 l X.:Z5 x.:z L:!O X.:Z4 26 r.so 147 253 SB-2 1 X.:Z5 x.:z x.:zo X.:Z4 23 r.so 109 239 SJ:•l 1 x.:zs x.:z X.:ZO l220 39 1:.50 224 329 DoC l x.:zs x.:z r.zo 30 23 1:.50 ll4 272 n-c 2 I.5 L3 t.l 32 17 23 64 220 l2 t.:Z5 1:.10 w R-1 1 X.:Z5 x.:z .t.20 t.24 I.4 I.SO 1.60 64 n:-2 1 X.:Z5 x.:z t.20 t.24 I.4 1:.50 1.60 65 n:-3 1 x.:zs x.:z X.:ZO X.:Z4 6 1:.50 L60 77 n-c 1 X.:Z5 x.:z x.:zo X.:Z4 5 I.50 L60 5l n:-c 2 I.S L3 rJ. 5 I.S rJ.5 rJ.5 30 1:.10 r.a5 1:.10 w
a.tiziUY. t•L 1 rJ. rJ. x.:z 30 30 6 60 t.60 t-2 1 rJ. I.l. x.:z 30 20 6 60 L60 1•3 1 2 I.l. 7 50 40 20 50 100 I..C 1 2 rJ. x.:z 60 30 20 70 100 I..C 2 I.S L3 rJ. I.S I.S w rJ.5 15 x.:zo t.:Z5 t.20 rJ.5 DAI' 1•1 1 rJ. I.l. x.:z 50 1.6 I.S x.:zo L60 DAI' 1•2 1 I.l. rJ. x.:z 50 g I.5 t.20 L60 DAI' !•l l rJ. rJ. 3 60 10 I.5 x.:zo L60 DAI' I..C 1 rJ. I.l. x.:z 60 10 I.S x.:zo L60 ou s-c 2 I.5 L3 rJ. I.5 7 w rJ.5 30 x.:zo t.:Z5 x.:zo w n:-1 1 rJ. rJ. 8 70 L6 I.S x.:zo !.60 n-2 1 rJ. rJ. r.z 70 1.6 I.S x.:zo 1.60 n-J 1 rJ. rJ. x.:z 40 1.6 I.S x.:zo 1:.50 n-c 1 rJ. rJ. x.:z 50 L6 I.S r.zo L60 n:-c 2 I.S L3 rJ. I.5 I.S w rJ.5 25 x.:zo x.:zs r.;o w
a.tiziUY C•l I•1 l X.:Z5 t.2 t.20 X.:Z4 l2 r.so 1.60 79 1•1 3 x.:z t.l 4 I.l. t-2 1 t.25 .t.2. x.:zo X.:Z4 9 r.so L60 44 1•2 l x.:z I.l. l3 I-~ l r.a5 x.:z x.:zo X.:Z4 ll t.50 L60 109 I•l 3 t.2 I.l. 4 rJ. t-c 1 X.:Z5 x.:z x.:zo X.:Z4 2l r.so ll9 1450 t-c 3. rJ. t.l I.l. 2 2 l 1 20 4 1 x.:z n-1 1 t:5 x.:z x.:zo 575 231 1:.50 71 607 sz-1 l 770 630 11 t.l sz-2 l r.zs r.z r.ao 518 151 r.so L60 517 n-2 3 820 670 a I.l. n-3 1 r.:s x.:z r.ao 669 140 r.so 64 614 S&-3 3 940 550 g t.l u-c 1 r.a5 t.2 x.:zo 574 182 r.so 227 3420 u-c 3 !.1 !.1 !.1 880 190 !.1 l2 ~90 8 !.1 15 T!•l 1 r.25 x.:z x.:zo 133 27 r.so L60 527 T!•l 3 u 940 lOO 9 930 10 t.l T!-2 1 us x.:z x.:zo l28 26 r.so 66 489 T!-2 9 470 190 6 440 L6 !.1 T!•3 1 X.:Z5 x.:z x.:zo 770 51 r.so !.60 au T!•3 3 l5 1100 260 44 930 a t-1 T!..C 1 :.zs x.:z x.:zo 342 59 t.SO 331 4780 T!..C 3 !.1 t.l 16 490 230 18 17 780 6 1 l5 n:-1 1 X.:Z5 x.:z r.ao ll2 19 r.so 1.60 478 l"t•l 7 26 590 13 n-2 :.zs x.:z r.ao 118 so r.so 113 565 n:-2 3 7 58 620 10 n:-3 1 r.as t.2 x.:zo 142 24 r.so L60 526 n:-3 3 7 26 590 19 !.1 n:-c 1 r.25 t.2 x.:zo 120 27 r.so ll2 1080 n:-c 3 !.1 !.1 t.l 3 10 15 so 700 19 :.z
RatiziUY c-f I t.l. !.1 SE 579 !.1 T! 519 !.1 !'! 543 t.l
B-30

TABLE B-G Page 2 of 6
ccmc.llt:&tiCII 19£11 s5 1.-o.1• !:!!?. !i. !!. !:!!. £!. £!!. !!!. ~ ~ ~ 9. .!!. !!. Refiu&y 0
I•l 1 1.250 r.ao 1.200 1.240 lAO I.SOO t.600 1.250 r-z 1 1.250 r.ao 1.200 1.240 IAO I.SOO t.600 1.250 1•3 1 1.250 r.ao 1.200 1.240 lAO I.SOO t.600 1.250 t-c 1 1.250 r.ao 1.200 1.240 IAO I.SOO t.600 1.250 t-c 2. I.5 1.3 I.1 1:.14 I.5 1:.15 1:.15 33 I.l.O 1.25 1:.10 1:.15 DAr 1-1 1 1.250 r.ao r.aoo 1020 lAO I.SOO t.600 410 DAr 1•2. 1 1.25 r.a r.ao 681 l5 r.so tAO 242 DAr 1-3 1 1.25 r.a r.ao 479 6 I.SO tAO 181 DAr 1-c 1 1.25 r.a %.20 719 7 I.SO t.60 262 DAr 1-c 2 I.5 1.3 I.1 730 I.5 1:.15 1:.15 2.80 1:.10 1.25 1:.10 1:.15 n-1 1 1.25 r.a %.20 1230 1.4 I.SO t.60 515 n-z 1 1.25 r.a r.ao UIO IA I.SO t.60 480 Pl-3 1 1.25 r.a r.ao 875 1.4 I.SO tAO 338 n-c 1 1.25 r.a r.ao 1080 l.4 I.SO tAO 430 n-c 2 l5 1.3 1:.1 1000 I.5 1:.15 1:.15 400 1:.10 1.25 1:.10 1:.15
Refiu&y E t-1 1 1.25 r.a r.ao 25 5 I.SO t.60 141 t-2 1 1.25 r.a %.20 5I a r.so t.60 102 %•3 1 1.25 r.a r.ao 35 l5 I.SO t.60 llO t-c 1 1.25 r.a %.20 42 10 r.so t.60 127 t-c 2 I.5 1.3 2 35 a 11 2l uo 1:.10 1.25 1:.10 1:.15 DAr 1-1 1 1.25 r.a r.ao 104 l.4 I.SO t.60 61 DAr 1-2 1 1.25 r.a 1.20 81 l.4 1.50 t.60 47 DAr 1•3 1 1.25 r.a %.20 89 l.4 1.50 t.60 54 DAr a:-c 1 1.25 r.a r.ao 89 l.4 t.So t.60 74 DAr E-c 2 I.5 1.3 '-1 76 I.5 za '-15 50 '-10 1.25 1:.10 1:.15 I'l-l 1 1.25 r.a r.ao 42 IA . 1.50 t.60 " n-2 1 1.25 r.a r.ao 52 IA 1.50 t.60 77 n-3 1 1.25 r.a r.ao 44 1.4 1.50 t.60 st n-c 1 1.25 r.a r.ao 42 1.4 I.SO t.60 44 n-c 2. I.5 1.3 1:.1 36 I.5 19 1:.15 30 t.lO 1.25 u 1:.15
Refiu&y p t-1 1 1.250 r.ao 1.200 1.240 50 I.SOO t.600 1.250 I•2 1 1.250 r.ao %.200 1.240 190 I.SOO t.600 1.250 I•l l 1.250 r.a r.ao 72 184 57 t.60 127 r-c 1 1.250 r.a r.ao 58 151 52 t.60 ll3 t-c 2 I.5 1.3 t.l 50 210 58 t.l5 uo 27 1.25 u t.lS r:r Il-l l 1.250 .r.a r.ao 50 278 64 t.60 229 C'1' 11-2 1 1.250 r.a r.ao 50 350 101 t.60 342 C'1' Il-l 1 1.25 .r.a r.ao 79 510 ll4 t.60 452 C'1' lt-c 1 1.25 .r.a r.ao 57 405 aa t.60 342 C'1' lt-c 2 I.5 1.3 I.l 44 500 77 t.l5 330 41 1.25 t.lO t.l5 Pl-1 1 1.25 r.a r.ao 73 199 68 t.60 us n:-2 1 • 1.25 .r.a r.ao ll 86 74 t.60 151 Fl-3 1 1.25 .r.a r.ao 29 84 71 t.60 lU n-c l .1.25 .r.a r.ao 45 l25 64 t.60 ll2 n-c 2 I.5 1.3 1:.1 7 l25 58 t.l5 100 31 1.25 1:.10 t.l5
llefiuzy G-1 t-1 l 1.25 r.a 1.20 1.24 l.4 1.50 78 52 I·l 3 I.l '-1 I·2 1 us r.a r.ao 1.24 l.4 52 102 72 I•2 3 1:.1 I.1 I•J l us .r.a r.ao 1.24 l.4 1.50 t.60 28 t-3 3 I.l I.1 t-c 1 us r.a r.ao 1.24 l.4 I.SO t.60 30 t-c 3 1:.1 I.l 1:.1 1 7 u 2 36 1:.1 r.a SZ•l l 1.25 .r.a r.ao 615 6 I.SO 181 us Sll•l 3 820 420 60 9 '-1 511•2 1 us L2 uo 676 53 as 308 U7 511•2 3 790 160 24 10 '-1 511•3 l us .r.a r.ao 73 IA 1.50 t.60 110 SII•J 3 1200 430 uo 6 '-1 s1-c 1 us u uo 6~ s 93 181 179 SE-c 3 t.l. '-1 t.l. 1000 7 u 278 65 u ~ u DU E•l 1 us L2 r.ao 526 l.4 r.so 1S9 93 DAr 1!:•1 3 7l0 270 44 '-1 OM !•2 1 us L2 r.ao 414 l.4 I.SO 115 94 DAr !•2 3 680 320 87 13 1.1 OAI' !•3 1 us L2 r.ao 73 IA r.so !..60 64 DU !•3 930 350 92 '-1 OAI' E-c us L2 24 425 104 144 139 DUE< t.l. Ll t.l. soo 1 260 53 I.4 9 u n:-1 us u r.ao 89 I.4 57 107 51 n-1 32 6
F!•2 l us L2 uo 86 IA 63 90 46 FE-2 3 9 12 F1•3 1 1:.25 u r.ao 73 IA r.so J..60 64 Fl•3 3 n-c l us t.2 uo 1:.24 IA r.so t.60 30 n:-c l Ll t.2 Ll 7 Ll 2 36 Ll u
B-31

-TABLE B-6 Page 3 of 6
Conc:antration (!!!lt::ll S!!li!1e-Ca.J' ~ .!!1 !!. g ~ ~ ~ ~ ~ !!. ~ !!. ll ~iAuy G-f
I 3 IJ. sa 3 t.l DAI' I 3 t.l n 3 t.l
llali.D.Uy B I-1 l t.l t.l t.2 20 L6 I.5 t.20 L60 I-2 1 t.l t.l t.2 10 , I.5 t.20 L60 I-3 1 t.l t.l s 20 10 I.5 t.20 L60 t-c 1 t.l t.l t.2 10 7 I.5 t.20 L60 t-c 2 I.5 I.3 t.l I.5 I.5 t.l5 t.l5 15 t.20 t.2S t.20 t.l.S a-l 1 t.l IJ. t.2 10 30 I.5 t.20 L60 a-2 1 IJ. IJ. t.2 7 20 I.5 t.20 L60 D-3 1 IJ. IJ. t.2 20 30 I.5 t.20 70 sa-c 1 IJ. IJ. t.2 10 30 I.5 t.20 L60 sa-c 2 I.5 t.3 IJ. I.5 7 t.l5 IJ.5 30 1:.20 w LZO IJ.5 n-1 1 IJ. IJ. LZ 20 10 I.5 so L60 PB-2 1 IJ. IJ. t.2 10 10 I.5 30 60 R-3 1 IJ. IJ. 20 10 9 I.5 1:.20 L60 n-c 1 IJ. IJ. 1:.2 10 7 I.5 30 L60 n-c 2 I.5 I.3 IJ. I.5 I.5 t.l5 IJ.5 25 1:.20 r.as 20 t.l5
lla.fiAuy I t-l 1 us u uo U4 IA I.50 L60 69 t-1 3 IJ. I-2 1 r.as 1:.2 uo U4 6 I.50 L60 52 t-2 3 IJ. t-3 1 w 1:.2 uo U4 20 I.50 79 336 t-3 3 IJ. t-c 1 w 1:.2 uo 1:.24 115 I.50 78 5315 t-c 3 IJ. IJ. IJ. 1 10 IJ. 2 25 IA I.l IJ. a-1 1 us u UD 98 U7 I.50 L60 172 sa-1 3 7 110 IA IJ. sa-2 1 w 1:.2 1:.20 91 167 I.50 L60 237 sa-z 3 u 100 1.4 I.l sa-3 1 w 1:.2 uo 102 1~ I.50 90 1070 sa-1 3 1:.2 100 I.l sa-c l r.as 1:.2 uo 98 U7 I.50 1158 ll20 n-c 3 IJ. IJ. IJ. 3 6 5 2 lOO 5 IJ. 4 LZ R-1 1 1:.25 u uo 1:.24 85 I.50 L60 6t n-1 3 25 I.l R-2 1 1:.25 LZ 1:.20 1:.24 22 I.50 L60 69 n-2 3 23 I.l FB-3 1 FB-3 3 n-c 1 1:.25 1:.2 1:.20 U4 71 I.50 211 2000 n-c 3 IJ. IJ. I.l 1 3 IJ. 2 60 1.4 IJ. 16 LZ
lla.f1J~By J I•1 1 LZ5 1:.2 1:.20 1:.24 5 I.SO L60 72 I•l 3 I.l t-2 1 us u LZD LZ4 10 I.50 L60 54 I-2 3 IJ. I•l 1 LZ5 LZ 1:.20 LZ4 r.4 I.50 L60 62 I•l 3 IJ. t-c l w 1:.2 uo 1:.24 4 I.50 L60 62 t-c 3 I.l t.l t.l 1 1 1 2 54 IJ. LZ 111-1 1 w LZ LZO 315 r.4 I.50 L60 uo 11 &-l 3 120 7 I.l 111-2 l w u LZO 620 U70 771 958 4H 11 1-2 3 100 2SO 16 IJ. 11 1-3 1 LZS LZ LZO 50 33 I.50 L60 432 11 1-3 3 115 420 I.4 I.l 11 E-<: 1 LZS u LZO 52 25 I.50 L60 257 Sl 1-c 3 t.l t.l t.l 76 2 t.l 4 320 I.l 1:.2 S2 1:-1 1 LZS LZ LZO 440 r.4 I.SO 190 316 S2 1:•1 3 450 l90 290 16 sa 1-'1 1 LZS LZ uo 10SO 231 69 2080 1400 12 E-2 3 1100 2000 2100 12 t.l Sl 1:•3 1 LZ5 LZ LZO 411 r.4 I.SO 876 790 12 1:-3 3 390 380 6a0 14 I.l sz s-c 1 LZS u uo 584 55 61 810 6S8 Sl 1-c 3 t.l I.l I.l 780 7 I.l 870 740 I.l a 13 1-1 1 r.as LZ LZO 547 14 118 123 194 13 &-l 3 830 uo 17 I.l S3 1•2 1 us u LZO 1010 16 I.SO L60 l45 13 1•2 3 1200 210 ll t.l S3 1•3 l LZS u LZO 350 16 I.SO L60 280 13 1•3 3 660 280 l1 IJ.
B-32

TABLE B-6 Page 4 of 6 Concantrat:l.on. (ug:t:ll
5!!!i!l-D4X a ~ !!l. ~ ~ £!. £!!. !!!. ~ ~ ~ ~ ~ !!.
a.tinuy J (Cont.) S3 B-e l us u uo 626 25 63 7l 215 53 s-c 3 l Ll Ll 570 2 Ll 2 260 Ll 6 u 54 B-1 1 us u uo 835 38 LSO 80 411 54 B-1 3 1500 340 25 Ll 54 B-2 l us u uo 1210 21 LSO r.&O 261 54 B-2 3 1300 290 24 Ll 54 !-3 1 us u uo 1860 77 LSO I.60 579 54 1-3 3 1700 620 Ll 54 E-c 1 us u uo 1300 42 LSO 69 304 54 e:-c 3 2 Ll Ll 1900 10 Ll 12 560 11 u 55 e:-1 1 ll. 2 uo 1580 Sl 189 164 464 5S B-1 3 4 2200 600 7 Ll S5 1-2 1 us u uo 2790 47 L50 r.&O 609 S5 B-2 3 5 4900 740 29 4 55 B-3 1 us u uo 1500 51 LSO r.&O 417 SS B-3 3 9 1800 520 19 6 55 s-c 1 us u uo 2010 45 79 101 491 S5 e:-c 3 Ll Ll 7 3600 182 l 2 760 9 Ll 23 u 11-P I-1 1 us u uo U4 41 LSO 72 148 11-P I-1 3 9 20 Ll 11-P I-2 1 us u uo us LSO I.60 54 .... I-2 3 5 10 Ll .... I-3 1 us u uo U4 1.4 L50 I.60 6S 11-P I-3 3 6 l8 Ll B-PI-<: 1 us u uo 29 17 LSO t.60 55 1-PI-<: 3 Ll Ll Ll 22 2 Ll 3 u Ll 22 u n-1 1 us u uo 96 9 53 82 uo ril-l 3 150 20 Ll n-z 1 us u uo 94 1.4 LSO t.60 51 n-2 J 27 7 27 Ll rll-3 1 us u uo 102 6 65 I.60 46 n-3 3 27 6 16 Ll n-c 1 us u uo 82 1.4 L50 t.60 62 B-e 3 Ll Ll Ll 54 32 3 9 62 1.4 Lll 12 u
a.tinuy II(
I-1 1 Ll Ll u 20 10 LS 70 200 I-2 1 Ll Ll u 10 10 L5 40 70 I-3 1 Ll Ll 3 10 10 LS 80 60 I-<: 1 Ll Ll u 20 10 L5 40 70 I-<: 2 L5 Ll Ll 5 6 Ll5 Ll5 4S uo us uo Ll5 OAI' B-1 1 Ll Ll u 1000 200 9 50 1000 DAr 1•2 l r.l Ll u 2000 400 20 200 3000 oar 1-3 1 Ll r.l u lOOO 200 L5 60 1000 oar B-e 1 Ll r.l u 1000 300 20 100 2000 OAI' B-<: 2 L5 Ll 3 1600 280 28 70 1400 uo us uo Ll5 n-1 l Ll Ll u 100 60 L5 uo 100 rll•2 1 Ll Ll u 60 10 L5 r.zo 70 rll-3 1 Ll Ll r.2 100 20 L5 r.zo 100 n-c 1 Ll Ll r.2 100 30 L5 r.zo 1000 n-c 2 •r.s Ll 1 73 l8 Ll5 Ll5 120 uo us uo Ll5
a.t:!Auy!. I-1 1 r.zso r.zo !.200 r.240 1.40 L500 !.600 810 I•2 1 usa uo r.zoo r.240 1.40 LSOO 700 uso I-3 1 us u r.zo U4 22 LSO 64 12S I-<: 1 uso uo r.zoo r.240 !.40 LSOO !.600 uso z-c 2 L5 Ll Ll 30 20 ll 40 120 uo us uo Ll5 S1 !-1 1 uso r.zo uoo 1000 170 !.500 !.600 490 Sl 1-2 1 uso r.zo !.200 r.240 !.40 LSOO r.&OO 290 51 11:-3 1 r.250 uo r.zoo r.240 100 !.500 I.600 290 Sll-c 1 uso r.zo !.200 !.240 100 !.500 I.600 360 51 1-c l L5 Ll Ll 290 180 70 4S 370 uo us uo LlS 52 11:-1 1 r.zs r.2 !.20 773 43 LSO t.60 382 52 11:-2 1 r.25 u r.zo 831 54 LSO r.&O 304 52 1-3 1 r.zs r.2 !.20 928 31 LSO r.&O 314 52 1-c 1 us r.2 r.zo 802 42 L50 I.60 32S 52 11:-<: l L5 Ll Ll 870 50 16 17 290 r.zo r.zs uo LlS n-1 1 us r.2 r.zo 20S 24 L50 r.&O 174 n-2 1 us r.2 !.20 119 19 L50 r.&O 157 n-1 1 r.25 u uo 165 31 LSO r.&O 161 n-c 1 r.zs r.2 r.zo 144 24 LSO I.60 174 n:-c 2 LS Ll Ll 190 39 15 !.15 140 r.zo r.25 r.zo r.l5
B-33

lAdLE B-6 Page 5 of 6 Concentrat:ian !U!i:,ll
S!!!!i!le-O&X a !:!!!. !:!1. !!. 9!. £:: Sl!. !!!:. ~ ~ ~ ~ ~ li
Rafinuy II I-1 1 I.l I.l !.2 30 300 10 200 200 I-2 1 t.1 t.1 !.2 10 100 I.5 !.20 90 I•3 1 t.1 t.1 !.2 20 100 I.5 40 100 I-c 1 t.1 t.1 !.2 20 200 t.S 60 100 I-c 2 t.S t.3 I.l t.S 180 I.l5 25 75 !.20 !.25 !.20 I.l5 DAI' e:-1 1 t.1 2 !.2 200 10 I.5 !.20 200 DAI' 1-2 1 t.1 2 !.2 100 10 t.S !.20 100 llAI' 1•3 1 t.1 2 !.2 90 g t.S !.20 90 llAI' 1-c 1 I.l 2 !.2 100 10 t.S !.20 100 llAI' 1-c 2 t.S t.3 t.1 73 6 I.l.S I.l5 140 !.20 !.25 !.20 I.l5 n:-1 1 t.1 2 3 90 10 t.S !.20 90 n:-2 1 I.l 2 !.2 100 10 t.S 50 100 n:-3 1 4 t.1 !.2 90 20 10 !.20 100 n:-c 1 4 t.1 !.2 100 20 20 30 200 n:-c 2 t.S t.3 t.1 24 8 I.l5 I.l5 90 !.20 !.25 !.20 I.l5
Rafin.ry II I•1 1 !.25 !.2 !.20 !.24 t.4 I.50 t.60 56 I•2 1 !.25 !.2 !.20 !.24 I.4 t.SO t.60 29 I•3 1 !.250 !.20 !.200 3000 I.40 790 t.IOO t.250 I-c 1 !.25 !.2 !.20 !.24 t.4 t.SO 1.60 36 I-c 2 I.5 t.3 I.l 7 I.5 I.l5 I.l5 19 !.20 !.25 !.20 t.l.S R•1 1 !.250 !.20 t.200 1000 I.40 I.SOO 1.600 480 R•2 1 !.250 !.20 t.200 2000 I.40 r.soo t.600 760 R•3 1 !.25 !.2 t.20 HO 7 r.so t.60 573 a:-c 1 !.25 !.2 !.20 uao l4 r.so I.60 603 n-c 2 ·I.! t.3 t.1 1400 61 16 18 570 !.20 !.25 !.20 I.l5 cn:-1 1 !.25 !.2 !.20 805 t.4 I.50 t.60 6Sl0 cn:-2 1 !.25 !.2 !.20 679 8 r.so t.60 4UO cn:-3 1 !.25 !.2 !.20 499 7 r.so t.60 4260 cn:-c 1 !.25 !.2 !.20 701 t.4 I.50 I.60 5210 cn:-c 2 I.5 t.3 t.1 650 13 I.l5 I.l5 4800 !.20 !.25 !.20 t.l.S n:-1 1 !.25 !.2 !.20 !.24 t.4 I.50 t.60 !.25 n:-2 1 !.25 !.2 !.20 159 I.4 r.so t.60 US n:-3 1 !.25 !.2 !.20 131 I.4 r.so I.60 6l n:-c 1 !.25 !.2 !.20 137 I.4 r.so t.60 104 n:-c 2 I.5 t.3 t.1 120 u I.l5 I.l5 35 !.20 !.25 !.20 I.l5
Rafinuy 0 I-1 1 t.1 t.1 !.2 I.5 I.6 I.5 !.20 I.60 %•2 1 t.1 t.1 !.2 I.5 I.6 I.5 t.20 t.60 I•3 1 t.1 t.1 !.2 I.5 I.6 I.5 t.20 1.60 I-c 1 t.1 t.1 !.2 I.5 I.6 I.5 !.20 1.60 I-c 2 I.5 t.3 t.1 8 I.5 I.l5 I.l5 t.l.O !.20 !.25 !.20 I.l5 llAI' 1-1 1 I.l t.1 !.2 200 30 I.5 t.20 1.60 DU' 1•2 1 t.1 t.1 !.2 300 10 I.5 !.20 t.60 DU' 1-3 1 I.l t.1 !.2 300 8 I.5 t.20 lOO DU' &-c L t.1 t.1 !.2 100 10 t.S t.20 60 DAI' a:-c 2 I.5 t.3 t.1 240 30 I.l5 27 14 !.20' I.25 !.20 I.l5 n:-1 1 t.1 t.1 !.2 50 I.6 I.5 !.20 1.60 !"1-2 1 t.1 t.1 !.2 50 I.6 t.S !.20 t.60 n:-3 1 t.1 t.1 !.2 50 I.6 I.5 t.20 I.60 n:-c 1 t.1 t.1 !.2 50 I.6 I.5 t.20 1.60 n:-c 2 I.5 t.3 t.1 uo t.S I.l5 I.l5 I.lO !.20 !.25 !.20 I.l5
Rafinuy p %•1 1 t.1 t.1 !.2 t.S 1.6 I.5 !.20 I.60 %•2 1 I.l t.1 !.2 I.5 1.6 t.S !.20 I.60 I•3 1 I.l I.l !.2 I.5 1.6 t.S !.20 I.60 I-c 1 I.l t.1 !.2 I.5 I.6 I.5 !.20 1.60 t-c 2 I.5 t.3 t.1 40 I.5 I.l5 t.15 61 !.20 !.25 !.20 t.l.S SE•1 1 I.l t.1 !.2 900 1.6 I.5 !.20 1.60 SE•2 1 t.1 t.1 !.2 so I.6 t.S !.20 I.60 R•3 1 t.1 t.1 !.2 700 I.6 t.S !.20 1.60 n-c 1 I.l t.1 !.2 600 1.6 I.5 !.20 1.60 SE-c 2 I.5 t.3 t.1 12 t.S I.l5 I.l5 55 !.20 360 !.20 I.lS n:-1 1 t.1 t.1 !.2 t.S I.6 t.S !.20 L60 n:-2 1 t.1 t.1 !.2 I.5 I.6 t.S !.20 I.60 n:-3 1 t.1 t.1 !.2 t.S I.6 I.5 !.20 1.60 n:-c 1 I.l t.1 !.2 I.5 L6 t.S !.20 1.60 n:-c 2 t.S t.3 t.1 40 I.5 I.l5 I.l5 43 !.20 370 !.20 t.15
B-34

TABL£ s .. 6 Page 6 of 6
CODceuatiOA !!!U1l !!!!11..0.J:. !e. !!1 !!. S! 9: sa !!!. ~ !!!. !!. a !!. llefiMzy Q-1
I•1 1 r.zs r.z r.zo LZ4 37 I.SO lAO 70 I•1 J lA I•2 1 LZ5 r.z r.zo LZ4 37 I.SO lAO 62 I•2 3 6 I•J 1 r.zs r.z r.zo r.24 20 I.SO lAO 329 I•J 3 10 I< 1 r.zs r.z r.zo LZ4 53 I.SO 167 2UO t-c 3 t.l t.l t.l 1 120 t.l 2 35 7 t.l .. n-1 1 LZ5 r.z r.zo LZ4 7 I.SO lAO 274 n-1 3 60 330 480 9 n-2 1 r.zs r.;z r.zo LZ4 IA I.SO lAO 444 Sl-2 3 140 470 4to 7 Sl-3 1 r.zs Q r.:zo LZ4 6 I.SO t.60 5U ft-3 3 60 640 460 6 SID-C 1 LZ5 r.z r.zo LZ4 1.5 I.SO 101 1460 SID-C J t.l t.l t.l 1 210 t.l 10 470 440 t.l 10 n-1 1 LZ5 r.z r.zo LZ4 u I.SO t.60 245 n-1 l 310 790 u n-z 1 r.zs r.;z r.zo LZ4 20 I.SO lAO 321 n-2 l t.l ltO 900 10 n-l 1 r.zs r.z r.zo LZ4 6 I.SO lAO 300 n-3 l t.l lSO 110 22 n-c 1 LZ5 r.z r.zo LZ4 23 t.50 102 U70 n-c l t.l t.l 5 2 110 t.l 15 340 800 1 20
llefiMzyQ-i' a 240 t.l 35 n 310 262 350 n: 300 167 500
!!otaa• al U a~ ia liOC ~ f~ a~ -l.e 1ocaUoD Ulll ~.- tM .I.DIUc:aUd l.aborataJCY 4U liOC ce.t tllac -lAo for tM -ifiaoi poUI&UDt.
1:11 - dac:a .:epee- -" t--~ qrab -a. cou...- cSazi.A9 ~ta co Roof1Ae:c1 .. C, G, Q •
.c. .C...a t11u I IAta'ca 111 - sapuacor afU.-t OAI' I - OAI' eft1..-t Til • fte&Ud atfl.llaDt n: • FiDal eff~t C'1' • - CoolJ.Dq Tower bl.looldaom 1-P I • Bio-poacl iAtl....,t en - ~ plaDt atu ..... c
~~ i. • UA Rllqioll V t.aboratCIJCY 2 -~ s. Ken I!Dn-attal a.aaucll lAIIorataJCY, UA l - Ryelllleft, Edqerlay, toii1JJiaon Ulll Aaaociataa
B-35
!!.
t.l
t.l
t.l
r.;z
t.l
t.l
t.l
r.z
t.l
t.l
t.l
r.z

TABLE B-7
AnalXtical Results for Traditional Para.etera in the Pretreat.ent S~lia~ Pr~raa - Week 1
Sampling ss Sulftde BO!Js coo Cit Phenol O&G Cr+6 Plt3-M location
Day pH 111911 1119/1 s 111!1/1 1119/1 111!1/1 lllg/1 111!111 111911 111911 " 1. Refinery Ito. 25 1 8.9 19 < 0.1 310 690 3.0 123 41.4 0.26 39.1
Effluent 2 8.7 45 < 0.1 320 710 2.6 88 42.3 0.48 36.1 3 8.68 25 <0.1 355 700 3.0 99 61.8 0.22 36.4
2. POnf No. 1 1 7.50 316 0.25 212 505 0.1 1.7 54.1 < 0.02 22.6
a. Raw Influent 2 7.50 290 0.20 240 580 • • 59.0 < 0.02 26.3 b:1 3 7.30 524 0.40 235 580 0.02 0.113 22.4 <.0.02 23.2 I w CT\ b. final Effluent 1 7.40 I <0.1 3 34 0.06 0.003 1.3 <. 0.02 8.8
2 7.55 2 <0.1 4 30 0.07 0.011 1.0 <0.02 12.0 3 7.80 2 <0.1 5 35 0.05 0.012 0.9 <.0.02 9.7
c. Primary Sludge I 5.9 21,200 35.0 >4,930 28,600 0.24 2.30 2,660 <0.02 74.2 2 8.5 39,160 110.0 8,920 39,700 • • 5,260 < 0.02 51.7 3 6.78 12,450 33.0 1,230 30,100 0.05 0.622 1,044 <0.02 3) .8
d. Secondary Sludge I 7.3 1,948 0.25 745 2,070 0.15 0.074 29.5 <0.02 10.4 2 7.45 3,536 0.80 1,460 42,300 • • 59.5 < 0.02 10.7 3 7.60 3,000 0.50 5,680 15,800 0.17 0.169 42.0 < 0.02 6.1
NOTE: Day 1 - 8/16/78; Day 2 - 8/17/78; Day 3 - 8/18/78
* tn trace, but below detection li•it
All samples were analyzed by the Water Quality labs associated with POTH 1~. 1.

TABLE B-8 ANALYTICAL RESULTS FOR PRIORITY P~LUTANTS FOR THE PRETREATMENT SAMPLING
PROGRAM-wEEK 1. vOLAtiLE RGARtc cORcENtRAttOAs. ug/1
Ref.No.X 25
POnf Pr1maryx Secondaryx Ffnalx XX XX Pol Eff.to Primary Secondary
Pollutant No. Day PO'IW In f. Ef'f. Eff. Ef'f. Sludge Sludge
Benz en• 4 1 4,200 23 17 9 2 5,800 Bl 64 13 3 1,600 "' 14
Ch 1 orobenzene 7 1 2 31 3
1 ,1, l·trfchloro-11 1 5 ethane 2 22 16
3 * 10 15 1,1-dfchloro- 13 1 16
ethane 2 3
Chloroform 23 1 2 21 10 "' "' 3 17 "' "' * "'
1,2-trans- 30 1 60 dfchloroethylene 2
3 * * so Ethyl benzene 38 1 9,000 25 38 * so
2 5,600 20 25 "' 20 3 4,000 * *
Methylene 44 1 * * * "' 30 10 chloride 2 * * * ( 11) .. 120
3 * * * 23 (ll) * 18(15) Tetrach 1 oro • B5 1 * 88 43 * * ethylene 2 117 160 16 10
3 18 19 24 * 23 Toluene 86 l 15,000 84 67 30
2 9,900 103 110 30 3 5,700 24 31 10
Tr1eh1oro- 87 1 38 21 * * 150 ethylene 2 57 78 * * 7
3 27 36 * * 20
NOTE: - Not detected. * In traces,but below detection limit. ) Sample bl.81lk. No vol&tile org&Ziica ietected in other sample blacks. X Analysis perfol'llll!d by west Coast Technical Service.
XX Analysis performed by Pomeroy, Johnston and Ba~ley. Of' the 30 volatile organics, only 11 were detected.
B-37

TABLE -8-9 Page 1 of 2
ANALYTICAL RESULTS FOR PRIORITY POL~UTANTS FOR THE PRETREA~ENT SAMPLING PROGRAM-!o!E£K 11 SEMIVOLATILE ORGANICS I COMCEKTRATIOHS 1 !!9ll)
Ref. NO. X 25
POrwX Primaryx SecondaryX Fina1x XX XX
Poll ** Eff. to Primary Secondary Pollutants No. Day PO'TW Inf. Eff. Eff. Eff. Sludge Sludge
Z,4..0flllltl!y1- 34 A£ 1 1,700 69 72 .. .. phenol 2 ..
3 233 25 34
Pentachloro- 64 AE. 1 .. phenol 2 * *
3 830
Phenol 65 AE 1 2,900 575 520 * .. 2 700 700 * .. 355 405 3 980 1,100 * .. 180 1,200
1,2 diel'lloro- 25 BME 1 • * .. 13 20 benzene 2 4 17 * 7 9
3 15 11 * * 10
1,3 d1ehloro- 25 BME 1 ... * 30 benzene 2 19 17 * 15 5
3 10 11 * .. 1 ,4 dfehloro- 27 BNE 1 zs- 23 ,.. .. 30 benzene 2 29 30 * 15 5
3 24 30 10 * 9
Isophorene 54 BNE 1 • z 23
3 * Naphtha 1 ene 55 BNE 1 620 113 93 * .. 440
2 121 156 * 30 3 370 20 35 *
Nitrobenzene 56 BNE 1 5 2 3
81s(2-ethyl- 66 BNE 1 124 94 * 75 hexy 1 ) phtha 1 ate 2 112 56 * * 130 180
3 130 150 240 140
Butyl benzyl 67 BNE 1 16 55 59 170 phthalate z 63 43 25
3 39 68 * * 14
B-38

TABLE B-9 Page 2 of 2
~~YTICAL RESULTS FOR PRIORITY POLLUTANTS FOR THE PRETREATMENT SAMPLING PROGRAM-WEEK l, SEMtVOL~TILE OR~~MICS (COMCEMT~~TIONS, us/1)
Ref.No.x 25 X X X X XX XX
Pollutants Poll - Eff. to PO Til Primary Secondary Final Primary Secondary No. !lay POTW Inf. Eff. Eff. Eff. Sludge Sludge
01-n-butyl 68 BNE 1 40 24 19 .. .. Phthalate z .. 28 21 ..
3 34 17 .. .. 01-n-oc'tyl 69 BNE 1 12 .. Phthalate 2 ..
3
Oiethyl 70 !3NE 1 27 .. 190 5 Phthalate 2 14 13 17 ..
3 .. .. 15 .. 11
Dimethyl 71 BNE 1 .. .. 9 Phthalate 2 ..
3 .. .. Acenapht hyl ene 77 BNE 1
2 3 ..
Anthracene .jo
78 BNE 1 60 .. .. 2 51 .. .. 3 30 .. .. ..
Fluorene 30 BNE 1 .. 2 63 .. .. 3 32 ..
Phenanthrene+ 81 SflE 1 60 .. .. 2 51 " ... 3 30 .. ,. ..
Pyrene 84 BNE 1 2 Zl 3
Of 59 semi-volatile organics, only 20 were detected. * in traces, but below Detection Limit. - ~~E • Acid extractable; BNE - Base/neutral extractlbles. .. Anthracene and Phenanthrene are unresolved . - 1lot detected. X Salllf'les were analyzed by West Coast Technical Services.
XX S~les were analyzed by Pomeroy, Johnston and Bailey.
B-39

TABLE.B-10 ANALYTICAL RESULTS FOR PRIORITY POLLUTANTS FOR THE PRETREATMENT
SAMPLING PROGRAM-WEEK 1. PEsftctb£s(CONCENTRAT10Ns. ug/11
Rafilluy" Poll. No.%.5 PO TWX PrimaryX SecondaryX Ffnalx Primar§X Secondar~x
No. W.to Pollutant Day PO'l'll
Inf. Eff. Eff. Eff. Sludge Sludge
4,4'-0DE 93 1 2 J 0.68 O.Jg
Heptachlor 100 1 2 J 0.12 0.13
b-8HC-8eta 103 1 0.18 2 3 0.10 0.55 0.49
r-8HC-Ganlna 104 1 1.1 2 6.3 1.2 3 0.14 0.13
NOTE: of" zs· pesticides only 4 were found; none of the four were confii"'IIIG by GCMS.
- Not detected.
x Sai!Pies were analyzed by west Coast Technical Service.
xx Sllll!lles were analyzed by Po•roy, Johnston and Bailey.
B-40

TABLE B-U .\Dal?tical IIHIIlb ts PrioriU: PoUuunu tor tile Pr-tllent s~illo --- WMk 1 1
*tal• !C611CeDtntioM 1 15.!11
_. .... 1
Effluent co 1'0tW &oa
tnMzy s--.r, Pillel Pn.&T s--.r, lafiMry No.
IIDUoataat IIDU. llo. oar llll~ unu-c un- Iff~ Sladqe ~~ 25
• .. X
-~ u• 1 1250 830 2 130 210 3 10 Z3
k..u w 1 27 86 73 30 .z .za 17' 76 3 26 " 10
IU)'U.t.aa U7 1 12 6 2 3 4 10
c:.IIWa Ul 1 61 37 1510 240 z 2!1 20 610 320 3 42 zo 180 310
~ Ul 1 llS 1t7 3!1 11 17100 4010 111M 2 357 lll 33 16 17100 5510 1473 3 241 140 31. 15 2170 5140 164!1
cow- 120 1 213 161 51 u 1100 2500 29 2 2a ll2 16 u.zoo 3300 26 3 202 106 16 32 3300 3000 15
tMd 122 1 251 1a 37 2!1 15700 1200 21 2 111 105 9000 1500 26 3 324 141 39 ll 2800 1600 ]0
~ 123 1 1.48 0.52 14 17 2 1.50 0.41 1.06 253 Zl 3 0.41 0.44 0.38 0.51 " 20
~ 124 1 204 110 90 11 l220 710 2 123 89 19 86 3400 850 3 92 73 61 " 700 750
.. J.wU .. 125 1 ll 30 193 2 38 41 6 6 322 3 32 30 35 9 267
l.l.lYV 121 1 80 50 2 u 80 60 3 u 60 10
'fii&Ui• L27 1 20 20 z 80 3 70 10
ZJJic 128 1 836 492 122 sa 40000 6100 155 z 9U 462 93 64 15800 8400 119 3 857 449 143 69 6340 8040 171
...... Not oecc-
X .\Dalysllll by DA •a.q:l.oD rt Lalloncocy .. Aa&Lysllll by ,._,., JobaROII - aa.uer
B-41

TABLE B-12
Analr:tica.l Results for 1'ta.ditioAAl Para.at.era for the Pretreat.aont S.
SaMipling llr.y {'II S:l ~'uU'ld.,. 110115 llllll. Cll l'benol or. a er•6 IH3-11 Location aa.s ... 1. l::ffluent t.:a PO'f\1 froUI Rt:fin~ry Nt.>.
a. Ro. 13 l lO.Bo 84 (0.1 It 50 '.112 0.13 !i1 nit (O,ai! 25.0 2 10.00 86 0.1 lto2 789 0.11t 6o.6 6],6 <o.ai! 27.1 3 11.1t2 56 (O.i .. 361 7611 O.J" 1o6 13.9 <O.ai! 21t.1
b. Ro. 21 1 6.75 20 (0.1 63 289 0,01 1.2 36 (0.00 2.1 2 6.56 26 <o.1 2ai! 4lt1 O,ai! 2.1 llt-5 (0.00 3.6 3 6.65 21. (0.1 .. 90 ]22 0.03 1.1 32.7 ~0.02 5.1
c! No. lt5 1 7.32 22 (0.1 1.69 5o6 lt.o 20 21.2 (O.ai! 161 2 6.90 24 <o.1•• 159 395 lt.o 1lt.3 11.7 (0.00 92.0 3 7-13 6 (0.1 •• 132 ]66 6.0 11t.6 10.9 <o.oo 57.5
d. Ito. It] Dirt~ct Dio 1 6.2lt 1lt <0.1 ~ 1lt9 0.03 0.21 lt.o o.o6 lt.O 2 7.6o 36 <o.1•• 57 130 0,01 O.olt 3.8 (0.00 2.9 3 7-29 36 (0.1 .. 12 w 0.05 o.o6 . 3.1 (0.00 2,0
No, 41 1 7.66 56 (0.1 5011 l,j(O 3.0 133 1" (0,00 ]2.0 2 7.84 30 (0,1 526 2,1t30 6.0 151 1lt2 <o.oo 111.0 3 7.52 6 (0.1 .. 556 3,330 9.0 lltB 117 (0.00 56.5
e. lio. 16 1 7.51 29 (0.1 89 396 o.oa 3.6 2lt.9 <O.OO 20.5 2 7.10 23 (0.1 .. 100 517 0.09 3.2 35.3 (0.00 30 ... 3 6.13 lit <o.t>• 166 537 0.03 lt.3 52.2 (0.00 22.7
tJj I 2. P01'W No. 2
,j:::. a. Innuent 1 7.50 390 1.0 311 791t o.o6 2.611 113 (0.00 35.6
N 2 7-57 324 l.lt 330 752 0.09 3.01 62 (0.00 40.5 3 7.51 552 0,6 324 6]1t 0.26 3.81 62 (0.00 35.1
b. Pr!Jilary Effluent 1 7.50 62 0.2 190 11]7 0.05 3.16 29.3 (0.02 36.9 2 7.56 112 0.2 196 420 o.u 3.11 32.3 <0.00 lio.o 3 7.51 92 0.1 l8o 1!50 o.41t lt.35 llt.7 (0,00 33.0
c. ~'lnal Ef:fluent 1 7.66 J.66 0.6 161 539 o.o6 2.79 36.7 <o.oo 39.1 2 7-77 184 o.lt 203 5ai! o.u 3.07 lt7.3 (0,00 43.9 3 7.55 232 o.lt 187 6o3 o.ltlt lt.1lt 52.0 <o.oo 37-5
d. UNOX Influent 1 7.51 76 0.1 1.66 ltlt7 0.07 2.99 26.0 <o.oo 32.1 2 7.71 62 0,2 195 lto6 0.16 lt.oo ]lt.o (0.02 37.9 3 7.20 791 0.6 276 1,26o 0.09 lt.29 29.0 (0.02 34.0
e. IJIOX IU'f1uent 1 6.91 7 (0.1 3 61 o.o6 (0.01 1.1 (0.02 35.9 2 6.96 16 (0.1 6 86 0.05 0.03 3.1 (O,ai! 34.9 3 7.00 9 (0.1 6 66 O.oll <o.o1 1.0 (0.00 29.1
t. Primary Sludge 1 6.]6 lt3,510 0.3 14,200 6o,500 2.2 2.67 3,100 <O.ai! 39.9 2 6.00 39,220 0.5 11!,950 41,500 1.9 3.91t 6,580 <o.oo 4o.l 3 • • • • • • • • • •
g. Digested Sludge 1 7.20 26,210 0.] 3,100 28,1too 2.6 1.27 2,420 (0.02 870 2 7.01 27,254 0.1 3,270 26,700 2.6 1.00 2,64o (0.00 4]6 3 • • • • t • • • • t
h. CenLrate 1 7.59 13,'.110 0.4 2,o6o 17,500 1.5 0,88 1,66o (0.00 414 2 7.56 13,940 o.t• 2,350 16,6oo 1.8 O.if 1,68o (0,00 420 3 • • • • • • • • • •
HO'fl<: !lay 1 - 8/23/'/8; Day 2 - 8/2'4/'18; Day 3 - 8/25/78. All a....,lu wet.,. llll&lyz..a by tbe llater Quality Laba aa•ociated wltb PO!II Ro. 2. Analyaea :for Cll, Phenola and 0 & G were delenuined on gt·ab samples. R-inlng COIIStituents were dtotel'lllir.ed 011 24 hour C""''JCCSlttoe.
• llot oampl...t .. Zinc Acetate l&ddec1 tu rewove intu1·fcrenctts

1 of 2 TABLE B-13
ANALYTICAL RESULTS OF PRIORITY POLLUTANTS FOR THE PRETREATMENT SAMPLING PROGRAM - WEEK 2 VOLATILE ORGANICS (Concentrations, ug/L)
POTW No. 2 Effluent to POTW from Refiner~ No. XX XX XX X X 43x
Poll. Day X Primar~ Unox X
Unox X Finalx XX Primary Digested Filter 13 21 45x Direct 43x l6x
Pollutant No. ** Inf. Eff. Inf. Eff. Eff. Centrate Sludge Sludge Cake
~---
Benzene 4 l 62 7l 79 - 40 17 6 1200 226 - * 380 2 57 67 77 * 62 * * 240 * 47 140 3 24 27 45 - 31 35 130 19 - 349 198 319
Carbon Tetra- 6 l - - - - 5 chloride 2 111
3 100 - . - - 184 - 6 Chlorobenzene 7 l - - - - - - - - - - *
2 3
1,2-dichloroethane 10 1 30 30 - - 7 12 5 - - * 2 - 19 - - 14 - 54 - 18
~ 1,1,1-trichloro-3 500 714 - * 621 11 - - - * 33 - 24
ll l 200 98 306
~ ethane 2 535 95 159 231 97 14 - - - 15 w 3 230 252 482 370 364 - 50 - - *
1,1-dichloroethane 13 l - - * 30 6 2 - - - * 3 - - * ll * 10 25 12
1,1,2,2-tetrachloro- 15 l ethane 2 - - - - 51
3 Chloroform 23 1 13 13 10 - 13 - - 18 .. * - *
2 ll 14 12 15 12 9 21 .. * 3 21 lll 14 14 19 - - - - .. 19 * *
1,1-dichloro- 29 l .. - * ethylene 2 30
3 - - 32 16 1,2-trans-dichloro- 30 l - - - - - 30
ethylene 2 3 - - - - - 25

2 of 2 TABLE B-13 (Continued)
ANALYTICAL RESULTS OF PRIORITY POLLUTANTS FOR THE PRETREATMENT SAMPLING PROGRAM - WEEK 2 VOLATILE ORGANICS (Concentrations, uq/L)
POTW No. 2 Effluent to POTW from Refiner~ No. XX XX XX X X 43x
Poll. Day Pr~ Unoxx Unox X Finalx Primary Digested Filter 13 21 45x Direct 43x 16x X XX
Pollutant No. ** Inf. Eff. Inf. Eff. Eff. Centrate Sludge Sludge Cake (1119/kg)
1,2-dichloro- 33 1 propylene 2 - - 3
3 Ethylbenzene 38 1 33 41 31 - 70 55 25 18000 108 - - 383
2 59 51 47 * 53 * * 130 - - 170 3 53 46 47 - 48 35 150 75 15 410 220 76
Methylene Chloride 44 1 24 44 67 (6)* (7)*450 - - * - - 12 2 221 15 11 - 44 3 37 14 - - 40 - 540 6 13
Dichlorobromo- 48 1 methane 2 - - - *
3 - - - * ttl Chlorodibromo- 51 1 I ,j::>. 111ethane 2 - - * ,j::>. 3
Tetrachloro- 85 1 73 70 85 - 9 ethylene 2 64 65 67 129
3 63 61 98 133 76 Toluene 86 1 161 197 202 140 60(6) 35 48000 426 - * 870
2 127 156 174 * - * * 420 - * 370 3 61 72 86 - 80 65 260 75 8 4600 7500 457
Trichloroethylene 87 1 12 15 29 - 250 2 14 21 26 22 3 12 12 24 * 15 - 380 10
Note: - not detected; * in traces but below detection limit; () sample blank. No volatile organics detected for other sample blanks; x - analysis performed by West Coast Technical Services; xx - analysis performed by Pomeroy, Johnston & Bailey; priority pollutants not listed were not detected; **Day 1, 2, & 3 are respectively August 23, 24, and 25 of 1978.

TABLE B-14
ANALYTicAL RESUI.TS OF PR.IOlliTY POLLUTANTS FOil. TUB PRETREATMENT SAMPLING PROGIWt - WEEK 2 ~EKIVOLATILE ORGANICS (CONCENTRATIONS, ug/1)
Pm'll Ro. 2 Filter
Effluent to POTW lroa fellnerl No.
Poll Pri.x Uno1tx Unoxx Final X XX Pri.XX Dig.xx Cake xx 43x Pollutant ** No. oaz lnf.x !ff. lnf. Eff. Eff. Centrate Sludse Sludse <!!!Its> 13X 21X 45X Direct 43x 16x
Parachloroaetacreaol A! 22 1 2 3 - - - - 96
2-Chlorophenol A! 24 1 - - - - - - - * 2 3
2,4-diaethylphenol A! 34 1 300 - 317 - - - - 202 459 - 599 385 2 220 230 210 - 180 1300 430 720 * 9300 250 3 720 750 470 - 740 - - - - 3600 550 2000 16
Pentachlorophenol A! 64 1 2 - - - - - - - - - - * 3
Phenol A! 65 1 700 840 620 7300 470 1900 - 218 4200 - - 944 tp 2 150 210 190 * 160 1100 63 1000 - 14,000 185 I 3 840 600 420 * 660 4600 - 1300 - 2200 119 2200
ol:::-lJJ Acenaphthene BNE 1 1 * * - - - - - - 17 * 2 - - - - - 18 - 41 *
3 * * - - - - - - - - - * * 1,2,4-trichloro B.NE 8 1 * 29
benzene 2 - - - * 3 20
1,2-dtchlorobenzene BNE 25 1 48 57 24 85 35 30 2 27 32 32 * 12 3 ll 14 14 - 22 170 135 245 45
1,3-dicblorobenzene IINj! 26 1 * * * 55 40 25 2 20 * * - * l 12 * * 21
1,4-dichlorobenzene BNE 27 1 17 17 12 55 40 25 2 20 16 17 * * 3 12 * * * 12 140 105 180 40
2,4-dinitrotoluene BNE 35 1 - - - - - - - - - 20 z 3
1,2-diphenylhydrazine BNE 37 1 - - - - - - - - - - 23 2 3

Pollutant ** l'luorathene BilE
bis(2-chloroiaopropy1) BNE ether
bia(Z-~hloxoethoxy) BNE aethane
lsophorone BNE
to I Naphthalene IIHE
>1:::-~
N-nitroso diphenyl BilE aaine
bis(2-ethylhexyl) IIHE phthalate
Butyl benzyl BNE phthalate
di-n-butyl phthalate BNE
dt-n-oetyl phthalate IIHE
TABLis B-14
AIW.YTICAL RESULTS 01' PlliOliTY POLLUTANTS POll Til& PIBTUAntEIIT SAHPLUIG Pli.OGllAH - WEEit 2 siMifotAtiLI oiidliilcs ( coNCtiitiAttoiiS, UJII)
Page 2 of 3
POiV No. 2 --Effluent toPON CrOai ReUnery No. Filter
Poll Pri." Unoxx Unoxx Final" xx Pri.xx Dig."" Cake xx 43x No. Day Inf.x Eff. Int. Eff. Eff. Centrate Sludge Sludge (!g/kg) llX 21X 45X Direct 43x 16x
39 1 2 * • 3
42 1 2 3 *
43 1 - -2 - -3 *
54 1 -2 12 -3 - - - - - - - - -
55 1 28 23 23 340 70 125 - 285 425 - - 88 2 * ~s 33 - - 140 91 - - 18 3 27 25 16 * 55 480 305 565 90 92 62 170
62 1 - - - - - -2 - - - -3 41
66 1 13 33 22 440 250 300 - - - * - • 2 30 29 17 * - * * * * • 3 43 23 23 14 61 810 - - 250 • • - •
67 1 28 16 - - - - - - * - • 2 21 13 10 • - - • - • • 3 • 14 16 13 27 - - - - • 10 - *
68 1 • 21 15 - - - - • • - • 2 • • • • - - • - 14 • 3 11 11 • • 22 - - - - - - - •
69 1 • 2 * • 3

TABLE B-14 Pa1e 3 of 3
AIIALniCAL USUL~_!)l PUOilln POU.UT.Aiml fOI. 1'81 PUTUA'IIIDIT S.lltPLIJIG I'I.OCUII - VUlt 2 SIIIIVOUTIU Oi.tWiiCS (WidiiiiA'fiCJa, VifiJ
I'01V 10. I ltfl-at to rOW !rca Lflaery Ro. fllter
Poll Pri.a UQOJlll UaoJlll liaalll D Pri.- Dia.- Cake J(J( 43& Pollutaat ** llo. Daz Iaf.a Bff. Iaf. Bff. Bff. Ceatrate ll!Y• ll!Y• <!ll!!l> 131: 21X 45X Direct 43& 16&
diethyl phthalate liNE 70 1 - 10 • 6 14 6 - - - • 11 1 * • • - - 38 11 3 * * * - • 10 15 6
di .. thylphthalate llliB 71 1 - * - - - - - - - - - * 1 - - • 3
benco(a)aathraceaett liNE 72 1 2 - - - - - • - • • • 3 - - - - - - - - - 12 - - *
ChryHaetf llliB 76 1 2 - - - - - * - * * * 3 - - - - - - - - - 12 - - •
tl:l Acenaphythyleae llliB 11 I I 2 ~ 3 - - * -...]
Anthracenet .... 78 I * * * - - - - • 81 * * * 2 * * * - - 36 * 39 3 * * * - • - - - - 29 • S4 *
Fluoreae .... 80 1 • 1 - • * - - 14 - - - - * 3 * - - - - - - - - *
Phenanthreaet BIIB 81 1 * * * - - - - • 81 * * * 2 * • * - - 36 * 39 3 * * * - * - - - - 29 * S4 *
Pyrene liNE 84 1 - * - - - - - - - • z - - - - - * - 16 * - * l - - - - - - - - - * - *
IIOTB: Of 59 aeaivolatilea, only 31 were detected .. * ia traces, but below 4etectioa liait
** AB - Acid Blltractable; BIIB - Baae/Beutral Batractable t Anthracene and Phenanthrene are unreaolved
tt Chryaene and leaco (a) anthraceoe are unresolved - llot detected X Saaplea analyced by Vest Coast Technical Servicea
XX Saaplea analyced by Po.eroy, Johnatoa • Bailey

TABLE B-15
AnalYtical !Wsult:s of Priority Pollutants for the Pretreatment Samplinq Progr-- Week 2 Pesticides !Concentrations.u
PmW No.2
" XX Digest~ XX Effluent to POrW frqm Refinerl No. Poll XX Priwary Unox" Uno><" FinillX XX Pri~~ary Filter 43x
Pollutdnt No. Day Int" Eff. Inf Eff Eff Centrate Sludge Sludge lJX 2lX 45X Direct 4lx 16X
. Aldrin 89 1
2 3 3.60 - 0.10 - - - - - - - 1.0 0.29 0.82
Dicldrln 90 1 2 - - - - 0.08 3
4,4'-DDT 92 1 - - - - - - - - - 0.30 - 4.90 2 - 0.17 - - - 0.08 - 0.09 3 O.ll - - - - - - - - 0.39 - - 0.83
4,4'-001> 93 1 - 0.09 0.35 2 0.19 - 0.11 - - 0.17 3 - - 0.66. - 0.17
4,4'-DDD 94 1 0.38 2 3
Arendosulfan-Alpha 95 1 2 l 0.12 - 0.52 - 0.22
Heptachlor 100 l 0.47 0.10 0.45 tJ1 2 - - - - l. 75 I 3 0.70 ~ Heptachlor 101 1 OJ el'Oxide 2
l - 2.10 - - - - - - - - - - 0.32 A-BHC-Alpha 102 1 - - 1.30 - - - - - - 0.52
2 - 0.24 - 1.5 1.62 - 0.17 0.27 o.36 2.21 0.41 3 0.88 - 1.20 1.40 0.76 - - - - 0.43 0.08
8-BHC-betii 101 1 - 0.16 o. 76 2 - - - - - - - - 0.32 3
R-BIIC-Gallllllii 104 1 - - 0.27 2 3
G-IIIIC-Delta 105 1 1.25 0.45 1.50 2 3 - - 0.27
NO'l'E; Of the 25 Pesticides, only 12 were found, however, none of theJD were conf{r.ed by GeMS not detected
X sampl"s analyzed by West Coast 'l'echnica1 Services XX samples analyzed by Pomeroy, Johnston and Bailey

TABLE B-16 Page 1 of 2
ANALYTICAL RESULTS FOR PRIORITY POLLUTANTS FOR THE PRETREATMENT SAMPLING PROGRAM - WEEK 2
METALS (CONCENTRATIONS, ug/1)
PO'lV No. 2 Effluent to POTW fro. Refinerz No. Poll. Primary lfriox Unox Final Priaary Digested Filter 43x
Pollutant No. Day Influent Effluent Influent Effluent Effluent Centrate Sludge Sludge Cake 13 21 45 Direct 43 16 X X X X X XX XX XX xx(~) X X X X X X
Antimony 114 1 - - - - - 58 1000 625 7 2 33 33 - - 35 1000 1000 625 13 3
Arsenic 115 1 40 - 26 - 29 162 324 285 3 27 - - - 60 2 37 - - - - 196 427 297 2 - - - - 67 35 3 66 - 49 - - - - - - 69 34
Beryllium 117 1 - - - - - 10 4 4 0.04 2 - - - - - 2 10 10 0.07 3
tJj CadmiUIII 118 1 28 12 13 - 20 580 2020 1050 16 I 2 27 20 14 - 25 1040 1200 1580 9
*"' 3 28 13 77 - 26 \0
Chromium 119 1 520 151 162 45 369 17100 57000 29600 461 1345 747 670 233 72 1644 2 427 154 177 45 334 27600 39600 42500 249 845 824 646 192 70 2196 3 573 164 1249 50 456 1133 1254 603 186 64 1800
Copper 120 1 376 141 251 24 390 6900 29000 13300 243 22 14 25 10 57 17 2 349 153 162 23 311 12300 31000 19200 173 - 17 19 - 47 12 3 529 176 1019 25 341 - 15 19 - 38 14
Lead 122 1 235 62 58 - 135 4200 18600 10800 214 43 42 33 35 - 39 2 220 62 50 - 126 7600 18200 15300 247 - 36 3 254 70 277 - 168 - 38 - - - 36
Mercury 123 1 0.25 1.69 1.82 2.46 0.49 94 124 232 1.6 0.79 - 0.67 2 0.37 0.25 0.43 - - 90 171 147 1.5 0.37 - 0.46 3 - 0.49 - - - 1.08
Nickel 124 1 399 208 220 206 290 3200 6650 6300 119 2 265 190 246 236 272 6500 6950 9810 67 - - - - 27 3 304 228 743 310 343

TOLE B-16 Page 2 of 2
AKALYTICAL USULTS FOR PIIOiliTY POLLUTAHTS FOil TB1 PUTUATIIIIIT SAIIPLIIIG PROGIWI - VUlt 2
IIITALS (COHCIIITIATIORS, y/1)
PO'lV llo. 2 Effluent to POTW fro• Refinerl No. Poll. Pri-ry Uaox Unox rinal PrJ, .. ry Digested rtlter 43x
Pollutant llo. Day Influent Effluent Influent Effluent Effluent Cent rate Slu .. ge Sludge Calte 13 21 45 Direct 43 16 X X X X X XX XX XX xx<!!lllka> X ll: X X ll: ll:
Selenlwa 125 1 - - 35 - 29 5 5 6 0.06 101 - 132 - 248 90 2 33 - 36 - 37 5 5 7 0.06 109 33 158 - 514 199 3 37 - 66 - - 110 - 140 - 682 149
Silver 126 1 15 - - - - 70 80 50 0.93 2 11 - - - 11 60 100 90 1 3 13 - 40 - 10
Thalli till 127 1 - - - - - 10 80 10 0.3 2 - - - - - 50 50 50 0.3 3
tJj Zinc 128 1 945 274 232 144 820 25600 69000 47000 771 190 153 183 115 57 196 I 2 952 375 452 178 810 43400 52600 70000 457 116 173 182 137 49 405
Ul 3 1593 385 2086 178 1027 55 189 174 158 36 398 0
Notes: - Not Detected. x Analyzed by EPA Region IV Laboratory
xx Analyzed by Poaeroy, Johnston and Bailey Centrate, priaary sludge, digested sludge and filter cake were not aaapled for on day l.

APPENDIX C
GLOSSARY AND ABBREVIATIONS
Act: The Federal October 18, 1972.
Water Pollution Control Act, P.L. 92-500, As amended by the Clean Water Act of 1977.
Administrator: Administrator of the U.S. Environmental Protection Agency whose duties are to administer the Act.
American Petroleum Institute et al. v. EPA, U.S. Court of Appeals -Tenth Circuit, August 11, 1976. API challenged the regulations promulgated in 1974. The Court upheld, BPT and NSPS, while remanding BAT and storm water effluent guidelines.
Appendix ~ Pollutants: Pollutants listed in Appendix A of the Settlement Agreement of June 7, 1976.
Best Available Technology Economically Achievable (BATEA Q£ BAT): Treatment required by July 1, 1983, for industrial discharge to surface waters as defined by Section 301 (b) (2) (A) of the Act.
Best Conventional Technology Economically Achievable (BCT): Treatment required by July 1, 1984 for industrial discharge as defined by Section 301 (b)(2)(E) of the Act.
Best Practicable Control Technology Currently Achievable (BPCTCA Q£ BPT): Treatment required by July 1, 1977, for industrial discharge to surface waters as defined by Section 301 (b) (1) (A) of the Act.
Best Available Demonstrated Technology (BADT): Treatment required for new sources as defined by Section 306 of the Act.
Catalyst: A substance that can change the rate of a chemical reaction but is not involved in the reaction.
Conventional Pollutants: Conventional pollutants are defined in Section 304(a)(4) including: biological demanding pollutants (BODS), total suspended solids (TSS), coliforming, and pH, and any additional pollutants defined Administrator as "conventional" (oil a~d grease).
those oxygen
fecal by the
Data Validation: An operation performed to ensure the accuracy and reliability of raw input information.
Dependent Variable: A variable whose value is a function of one or more independent variables.
Direct Discharger: A facility which discharges or may discharge pollutants into waters of the United States.
C-1

Economics Survey: Survey mailed by the Office of Analysis and Evaluation of EPA to the petroleum refining industry, pursuant to Section 308 of the Act requesting data on the economic status of petroleum refineries.
End-of-Pipe Treatment (Control): Wastewater treatment technologies that are used after gravity oil separation.
Flow Model: A mathematical model of the effluent wastewater flow.
Independent Variable: A variable whose value is not dependent on the value of any other variable.
Indirect Discharger: A facility which discharges or may discharge pollutants into a publicly owned treatment works.
In-plant Treatment Control: Treatment techniques that are used to reduce, reuse, recycle, or treat wastewater before end-of-pipe treatment.
Linear Regression: A method to fit a line through a set of points so that the sum of squared vertical deviations of the point values from the fitted line is a minimum; i.e., no other line, no matter how it is computed, will have a smaller sum of squared distances between the actual and predicted values of the dependent variable.
Mathematical Model: A quantitative equation or system of equations formulated so that the structure of a situation and the relationships among the relevant variables are reasonably depicted.
Mean Value: The statistical expected or average figure.
Multiple Linear Regression: A method to fit a plane through a set of points so that the sum of squared distances between the individual observations and the estimated plane is a minimum. This statistical technique is an extension of linear regression in that more than one independent variable is used in the least squares equation.
Portfolios ~ ~: The two sections that make up the 1977 U.S. EPA Petroleum Refining Industry Survey (see "1977 Survey").
Priority Pollutants: Pollutants included in Tables VI-5 and VI-6 of this document.
Process Configuration: A numerical measurement of a refinery's process complexity that was developed for use in calculating BPT limitations for this industry.
C-2

Process Factor: A factor that is based on process configuration and used in calculating BPT Limitations for a particular petroleum refinery.
Random Process: A procedure that varies according to some probability function.
Random Variable : A variable whose values occur according to the distribution of some probability function.
Regression Statistics: Values generated during a regression analysis that identify the significance, or reliability, of the regression-generated figures.
Regression Model~ equation, developed analysis.
A mathematical using a least
model, squares
usually ~ single linear regression
Residuals: The differences between the expected and actual values in a regression analysis.
Settlement Agreement of June 2L 1976: Agreement between the U.S. Environmental Protection Agency (EPA) and various environmental groups, as instituted by the United States District Court for the District of Columbia, directing the EPA to study and promulgate regulations for a list of chemical substances, referred to as Appendix A Pollutants.
Significance: A statistical measure of the validity, confidence, and reliability of a figure.
Size Factor: A factor that is based size and used in calculating limitations.
on a petroleum refinery's a petroleum refinery's BPT
Sour Waters: Wastewaters containing sulfur compounds, such as sulfides and mercaptans.
Statistical Stability: A condition repeated over time, differences occur random processes.
in which when a process is that are due solely to
Statistical Variance: The sum of the squared deviations about the mean value in proportion to the likelihood of occurrence. A measure used to identify the dispersion of a set of data.
The 1977 EPA Petroleum Refining Industry Survey (1977 Survey): A survey mailed pursuant to Section 308 of the Act to 274 refineries on February 11, 1977, and an additional 23 refineries on August 12, 1977. The survey was issued in two sections, Portfolio A and Portfolio B, requesting data on various aspects of process operations, wastewater production, and wastewater treatment.
C-3

Tolerance Limits: Numerical values identifying the acceptable range of some variable.
Traditional Pollutant Parameters: Pollutant parameters considered and used in the development of BPT limitations guidelines. These parameters include, but are not limited to BOD, COD, TOC, TSS, and ammonia.
C-4

ABBREVIATIONS
API: American Petroleum Institute
BATEA (BAT): Best Available Technology Economically Achievable
bbl: Barrel
BCTEA (BCT): Best Conventional Technology Economically Achievable Under Section 304(b)(4) of the Act.
BODS: Five Day Biochemical Oxygen Demand
BPCTCA (BPT): Best Practicable Control Technology Currently Available Under Section 304(b)(1) of the Act.
B & R: Burns and Roe
COD: Chemical Oxygen Demand
DMR: Discharge Monitoring Report
EPA: u.s. Environmental Protection Agency
GC: Gas Chromatography
Kg/m3: Kilograms Per Cubic Meter
lb/bbl: Pounds Per Barrel (One Barrel Equals 42 Gallons)
MS: Mass Spectrometry
MGD: Million Gallons Per Day
mg/L: Milligrams Per Liter
NPDES: National Pollutant Discharge Elimination System Permit Issued Under Section 402 of the Act.
NSPS: New Source Performance Standards Under Section 306 of the Act.
POTW: Publicly Owned Treatment Works
ppb: Parts Per Billion
PSES: Pretreatment Standards for New Sources of Indirect Discharges Under Section 307(b) of the Act.
PSNS: Pretreatment Standards for New Sources of Indirect Discharges Under Section 307(b) of the Act.
C-5

RCRA:
RSKERL:
S & A:
SPSS:
TOC:
TSS:
ug/L:
ABBREVIATIONS (Continued)
Resources Conservation and Recovery Act (P.L. 94-580) of 1978, Amendments to Solid Waste Disposal Act.
Robert s. Kerr Environmental Research Laboratory
Surveillance and Analysis
Statistical Package·for the Social Sciences
Total Organic Carbon
Total Suspended Solids
Micrograms Per Liter
*U.s. GOVERNMEIIT PRINTING OFFICE : 1982 0-381-085/4492 C-6