urbanization & landuse modeling in grape model
TRANSCRIPT
Urbanization & Landuse Modeling in GRAPE Model
Atsushi KUROSAWAThe Institute of Applied Energy (IAE), JAPAN
International Workshop on Urbanization, Development Pathways andCarbon ImplicationsTsukuba, Japan
March 28-30 2007
The views are solely those of the individual author and do not represent organizational views of IAE.
Outline
1.Urbanization and LanduseModeling
2.Carbon Management(*)(*) Collaboration WorkTakanobu Kosugi*1, Koji Tokimatsu*2, Norihiro Itsubo*2,3, Ryota Ii*4, Hiroshi Yagita*2,5, Masaji Sakagami*6*1 College of Policy Science, Ritsumeikan University*2 Research Center for Life Cycle Assessment, AIST*3 Musashi Institute of Technology*4 Pacific Consultants Co., Ltd.*5 Nippon Institute of Technology*6 Nihon Fukushi University
3.Summaries

Outline
1.Urbanization and LanduseModeling
2.Carbon Management
3.Summaries

Reg. Landuse & Food Bal.
FOREST
(FRS)
CROPLAND
(CRP)
GRASSLAND
(GRS)
URBAN
(URB)
OTHER AREA
(DSR)
CEREAL
GRASS
-FED
MEAT
GRASS
-FED
LIVESTOCK
CROP
-FED
LIVESTOCKHUMAN
BEING
OTHER
FOOD
PROTEIN
CALORIECROP
-FED
MEAT
LANDUSE LIVESTOCK & FOOD NUTRITION
TRADABLE
GOODS
function of
per capita GDP
function of
per capita GDP

# Modeling Urbanization
- Current Urbanization Area GLCC (Global Land Cover Characterization)USGS (U.S. Geological Survey)UNL (Univ. of Nebraska-Lincoln)JRC (EC Joint Research Center)Version 1 (1997)Satellite Data - Apr.1992 to March 1993Grid Data 1km x 1kmNew version (ver.2) available
Adjusted to base year (2000) using urban population information.
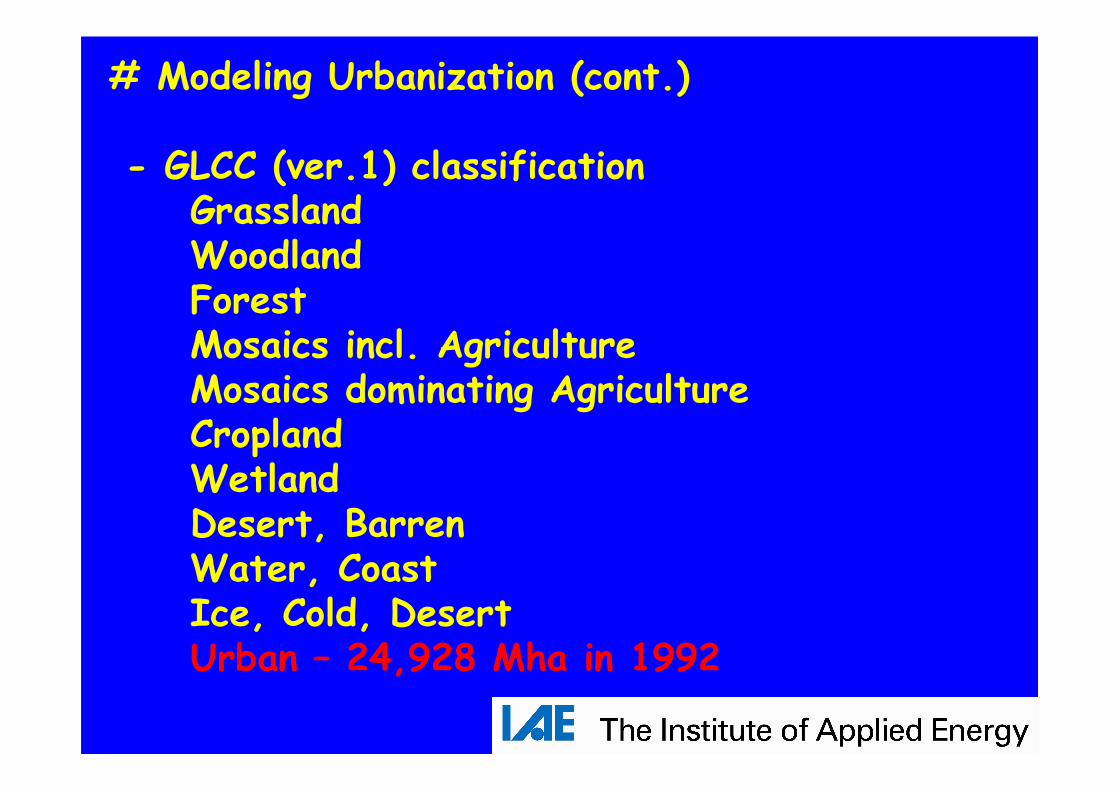
# Modeling Urbanization (cont.)
- GLCC (ver.1) classificationGrasslandWoodlandForestMosaics incl. AgricultureMosaics dominating AgricultureCroplandWetlandDesert, BarrenWater, CoastIce, Cold, DesertUrban – 24,928 Mha in 1992

# Modeling Urbanization (cont.)- Future Area Estimate
Urban Population Ratio Increase with Upper Bound (80%)
Same Population Density (base year)>>> Urban Area Required.
Urban Population Ratio
0%
10%
20%
30%
40%
50%
60%
70%
80%
90%
2000 2020 2040 2060 2080 2100
NAMR
WEUR
JAPN
OCEA
CPAS
SEAS
MENA
SSAF
LAMR
FSEE
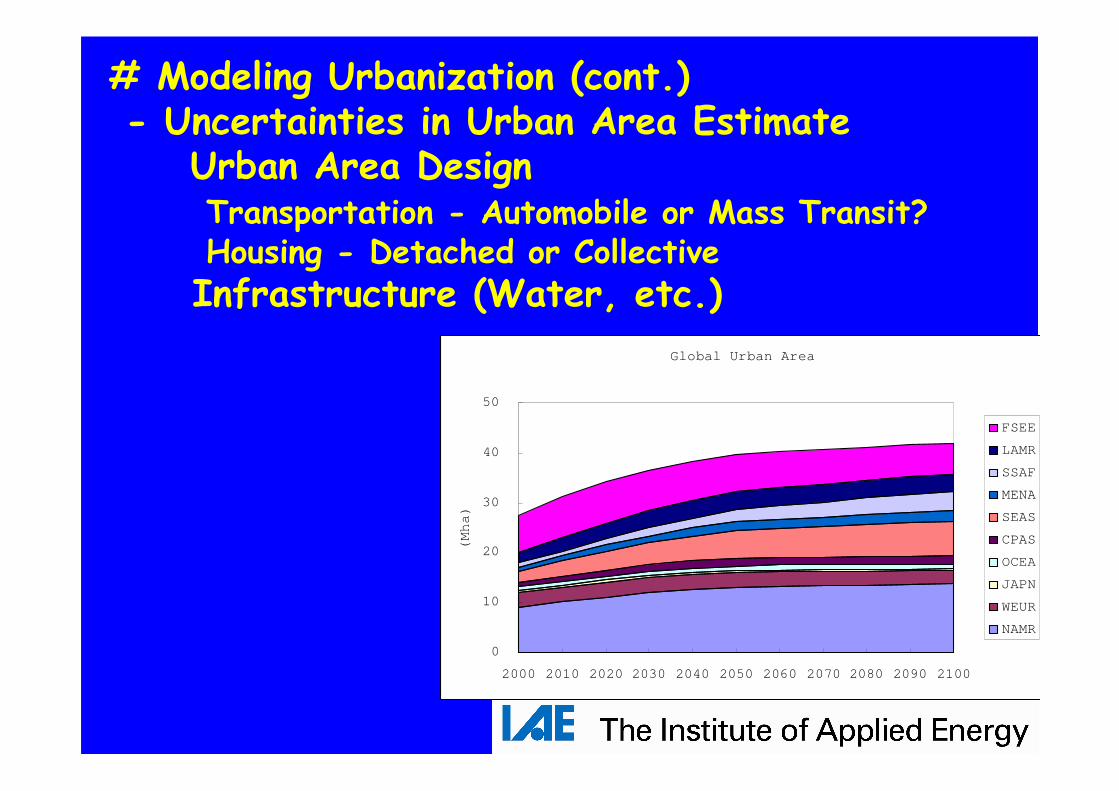
# Modeling Urbanization (cont.)- Uncertainties in Urban Area Estimate
Urban Area DesignTransportation - Automobile or Mass Transit?Housing - Detached or CollectiveInfrastructure (Water, etc.)
Global Urban Area
0
10
20
30
40
50
2000 2010 2020 2030 2040 2050 2060 2070 2080 2090 2100
(Mha)
FSEE
LAMR
SSAF
MENA
SEAS
CPAS
OCEA
JAPN
WEUR
NAMR
Outline
1.Urbanization and LanduseModeling
2.Carbon Management(*)(*) Collaboration WorkTakanobu Kosugi*1, Koji Tokimatsu*2, Norihiro Itsubo*2,3, Ryota Ii*4, Hiroshi Yagita*2,5, Masaji Sakagami*6*1 College of Policy Science, Ritsumeikan University*2 Research Center for Life Cycle Assessment, AIST*3 Musashi Institute of Technology*4 Pacific Consultants Co., Ltd.*5 Nippon Institute of Technology*6 Nihon Fukushi University
3.Summaries

# Coupling of IAM and LCIA: Motivation
* Existing Frameworks- Integrated assessment models (IAMs) to analyze climate change mitigation strategies.
- Life cycle impact assessment (LCIA) to make comprehensive analysis of environmental effects of product life cycle.
* Application to Adaptation StudyCoupling of IAM and LCIA can provide common and consistent framework basis for bottom-up and top-down integration in climate change impact assessment.
# LCIA tool LIME(*)
* Life cycle impact assessment (LCIA) tool for Japanese industrial production, marketing and environmental policy. Five years for development.(ref. Itsubo, et.al., Development of Weighting Factors for LCIA,
2003)
* Version 2 (LIME2) will be available soon.* Inventory – Impact – Category Endpoint
– Safegurd Subject – Single Index (i.e. Economic Valuation)

CO2
NOx
SOx
Land
Oil
Damage AssessmentFate Analysis Quality Analysis WeightingExposure Analysis
Inventory Concentration Impact Category Category Endpoint Safeguard
Subjects
Single Index
Single
index
Thermal/Cold Stress
Malaria
Skin Cancer
Cancer
Respiratory Disease
Cataract
Terrestrial
Aquatic
Plant
Benthos
Fishery
Crop
Energy
Materials
Global Warming
Acidification
Human toxicity (chemicals/metals)
Ecotoxicity
Ozone Depletion
Eutrophication
Oxidant
Creation
Land use
Benzene
NMVOC
TCDD
Lead
Total N
Total P
Waste
Copper ore
HCFCs
GHS in Air
Toxic. In Water
Toxic. In Soil
ODS in
Stratosphere
Toxic. In Air
Conc. Oxidant
Consumption of DO
Dep. of
Acidifying sub.
Resource Consumption
Cost
DALY
Primary
Productivity
Ecosystem
Biodiversity
Extinct Species
Dry weight
Human life
Waste
Dengue FavorHuman health
Social welfare
Air Pollution Disaster
Social assets
GHGs Conc.
# MWTP (Marginal Willingness to Pay)
* Approach - Conjoint AnalysisStep 1: Questionnaires to Japanese PublicStep 2: Conditional Logit Model
(Random Utility Theory)Step 3: Estimation of MWTP* Coupling of MWTP with InventoryExampleJPY/DALY – MWTP for Human HealthDALY (Disability Adjusted Life Year)(DALY/kgCO2) * (JPY/DALY) = (JPY/kgCO2)
# Extension of LIME to world and future* Base year and Region : Japan, 2000* Proxy Indexes for ExtensionHuman Health – Population DensitySocial Assets – GDP/capitaNet Primary Productivity – Potential NPP by Chikugo Model- GCM and Mesh DataBiodiversity– Vascular plant numbers in IUCN red listof threatened species (no changes infuture numbers, because of large uncertainty)
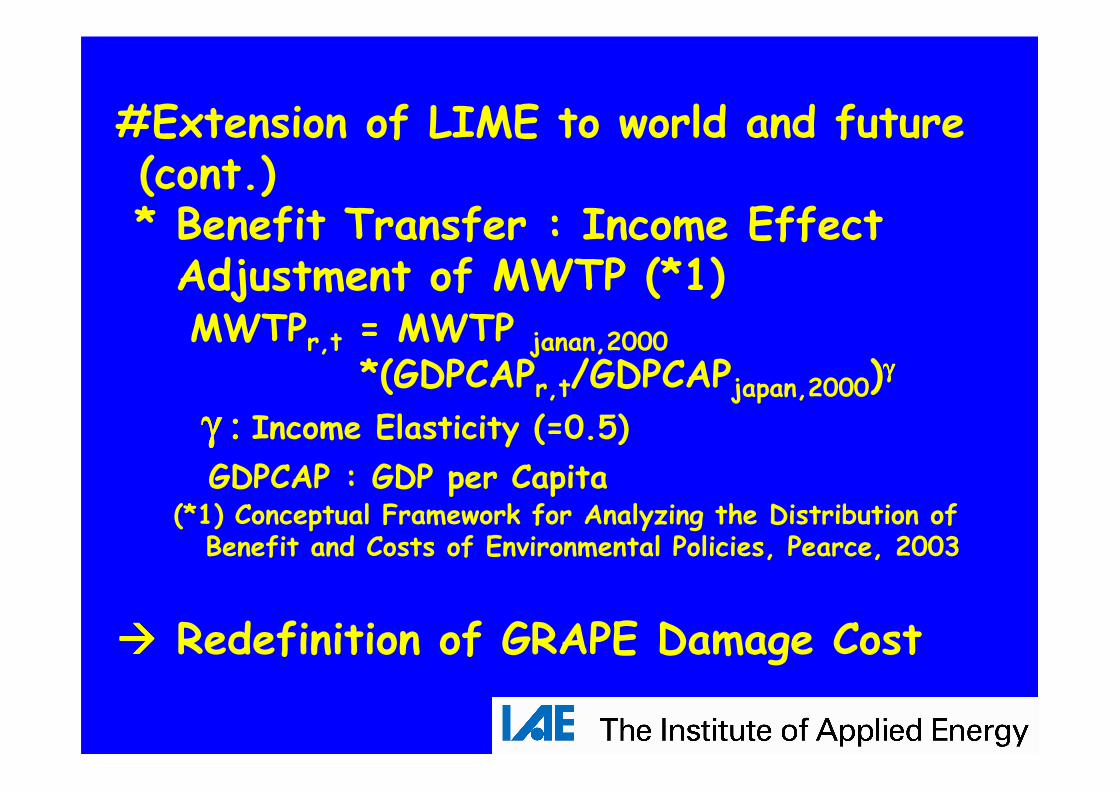
#Extension of LIME to world and future (cont.)* Benefit Transfer : Income Effect Adjustment of MWTP (*1)MWTPr,t = MWTP janan,2000
*(GDPCAPr,t/GDPCAPjapan,2000)γγγγ
γ : γ : γ : γ : Income Elasticity (=0.5)
GDPCAP : GDP per Capita (*1) Conceptual Framework for Analyzing the Distribution of
Benefit and Costs of Environmental Policies, Pearce, 2003
���� Redefinition of GRAPE Damage Cost
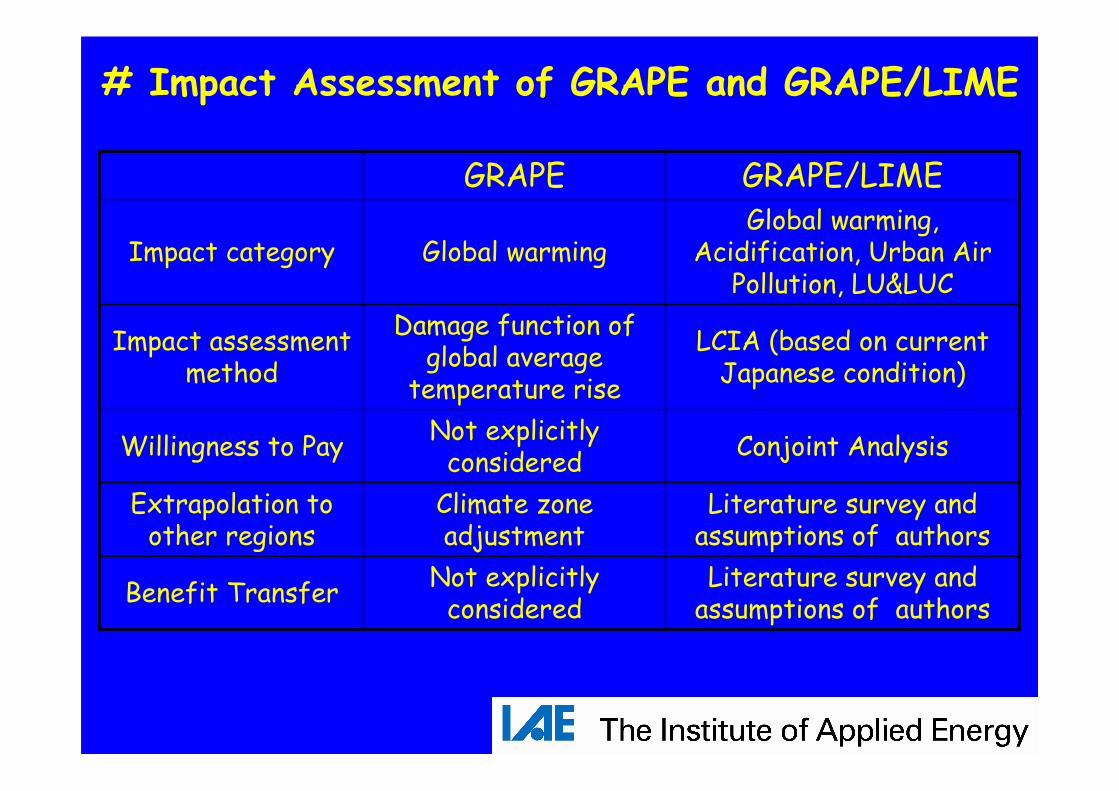
# Impact Assessment of GRAPE and GRAPE/LIME
Literature survey and assumptions of authors
Not explicitly considered
Benefit Transfer
Literature survey and assumptions of authors
Climate zone adjustment
Extrapolation to other regions
Conjoint AnalysisNot explicitly considered
Willingness to Pay
LCIA (based on current Japanese condition)
Damage function of global average
temperature rise
Impact assessment method
Global warming, Acidification, Urban Air
Pollution, LU&LUCGlobal warmingImpact category
GRAPE/LIMEGRAPE
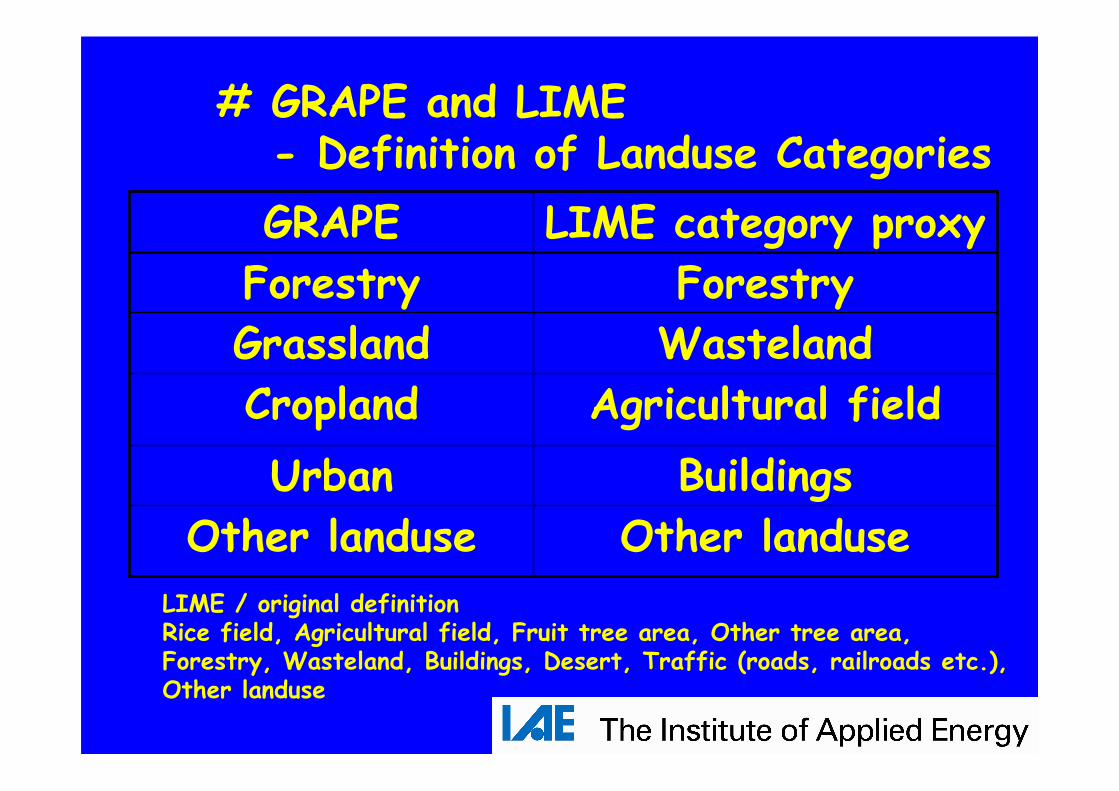
Other landuseOther landuse
BuildingsUrban
Agricultural fieldCropland
WastelandGrassland
ForestryForestry
LIME category proxyGRAPE
LIME / original definitionRice field, Agricultural field, Fruit tree area, Other tree area, Forestry, Wasteland, Buildings, Desert, Traffic (roads, railroads etc.), Other landuse
# GRAPE and LIME- Definition of Landuse Categories
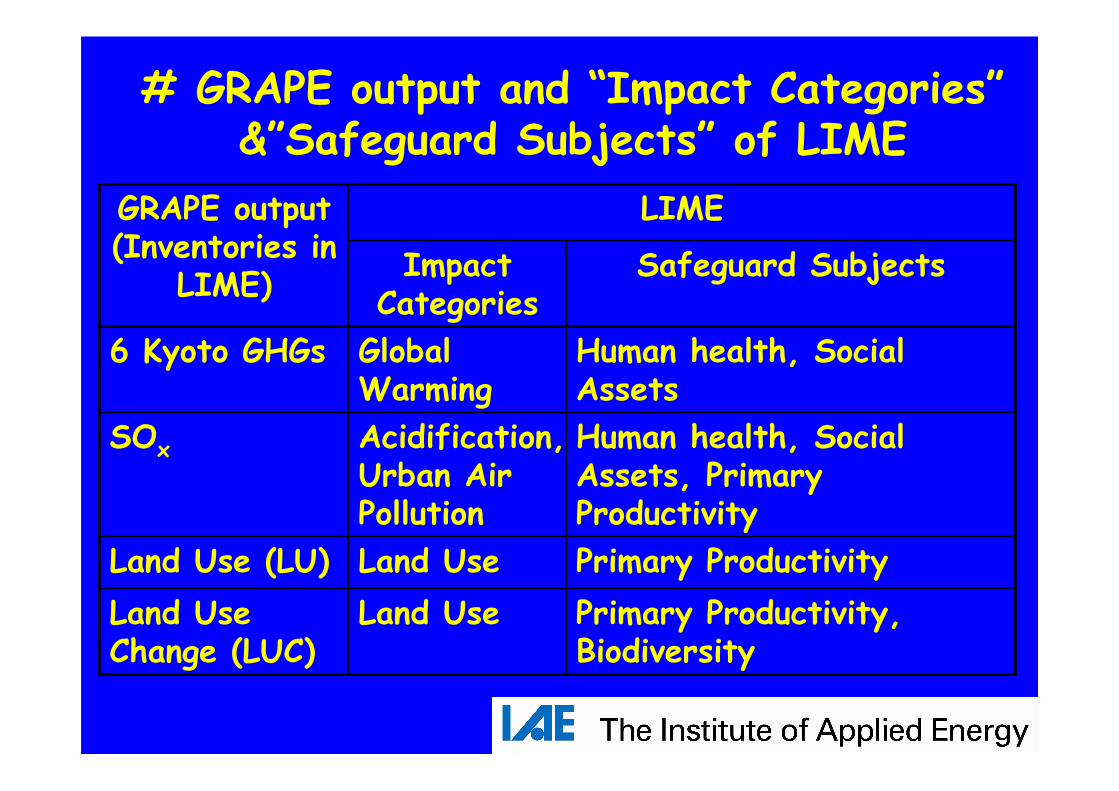
# GRAPE output and “Impact Categories”&”Safeguard Subjects” of LIME
Primary Productivity, Biodiversity
Land UseLand Use Change (LUC)
Primary ProductivityLand UseLand Use (LU)
Human health, Social Assets, Primary Productivity
Acidification,Urban Air Pollution
SOx
Human health, Social Assets
Global Warming
6 Kyoto GHGs
Safeguard SubjectsImpact Categories
LIMEGRAPE output(Inventories in
LIME)
0
2
4
6
8
10
12
14
2000 2020 2040 2060 2080 2100
year
Exte
rna
l costs
in p
erc
enta
ge
GD
P [
%]
0
2,000
4,000
6,000
8,000
10,000
12,000
14,000
Exte
rna
l C
osts
[B
illio
n $
/yr]
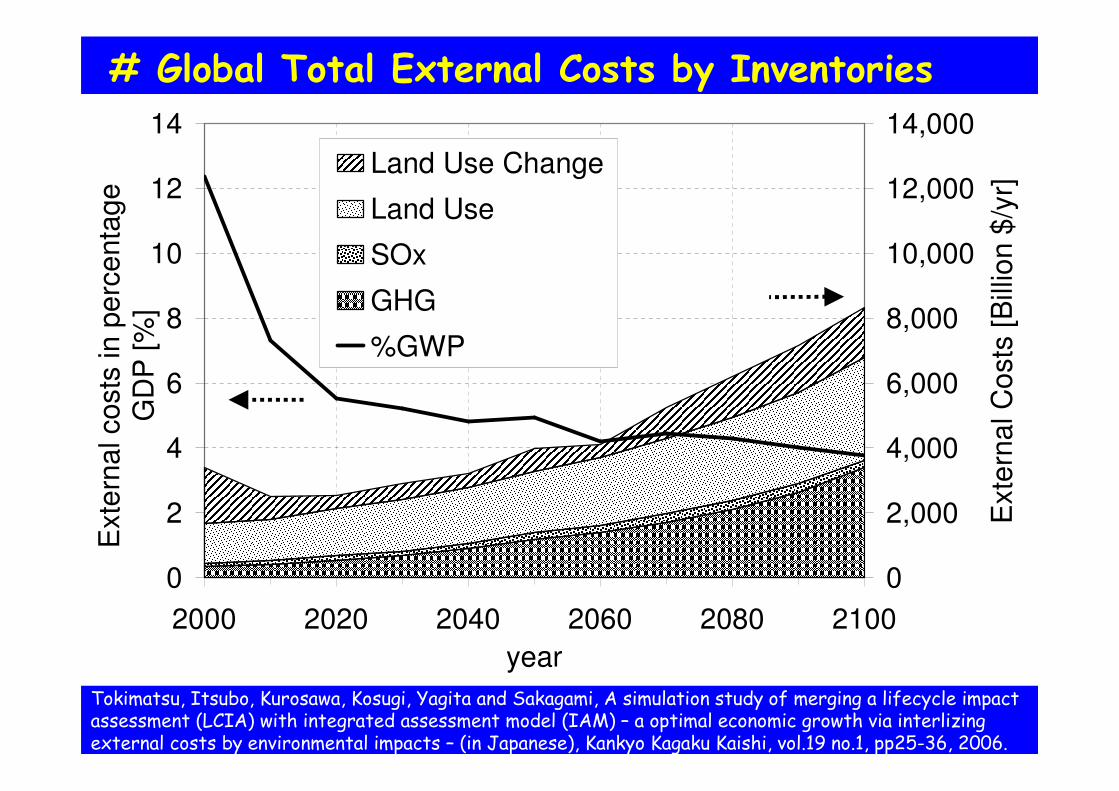
Land Use Change
Land Use
SOx
GHG
%GWP
# Global Total External Costs by Inventories
Tokimatsu, Itsubo, Kurosawa, Kosugi, Yagita and Sakagami, A simulation study of merging a lifecycle impact assessment (LCIA) with integrated assessment model (IAM) – a optimal economic growth via interlizingexternal costs by environmental impacts – (in Japanese), Kankyo Kagaku Kaishi, vol.19 no.1, pp25-36, 2006.
0
2
4
6
8
10
12
14
2000 2020 2040 2060 2080 2100
year
Exte
rna
l co
sts
in p
erc
en
tag
eG
DP
[%
]
0
2,000
4,000
6,000
8,000
10,000
12,000
14,000
Exte
rna
l C
osts
[B
illio
n $
/yr]
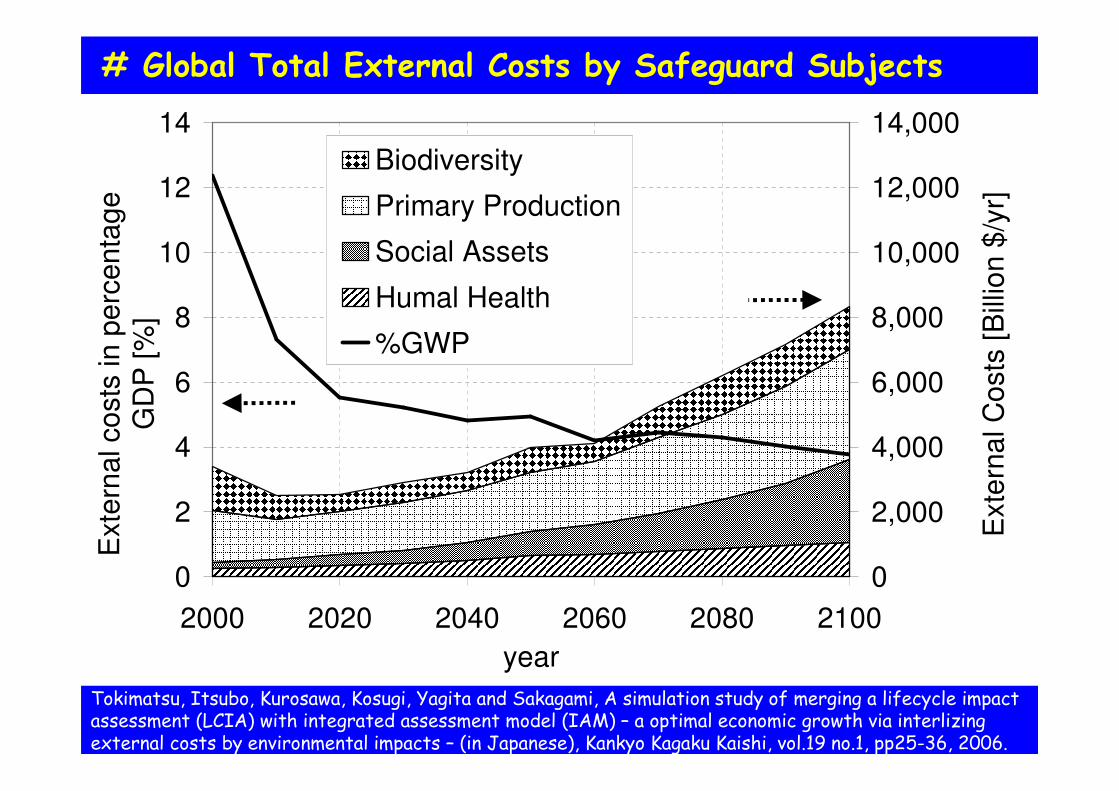
Biodiversity
Primary Production
Social Assets
Humal Health
%GWP
# Global Total External Costs by Safeguard Subjects
Tokimatsu, Itsubo, Kurosawa, Kosugi, Yagita and Sakagami, A simulation study of merging a lifecycle impact assessment (LCIA) with integrated assessment model (IAM) – a optimal economic growth via interlizingexternal costs by environmental impacts – (in Japanese), Kankyo Kagaku Kaishi, vol.19 no.1, pp25-36, 2006.
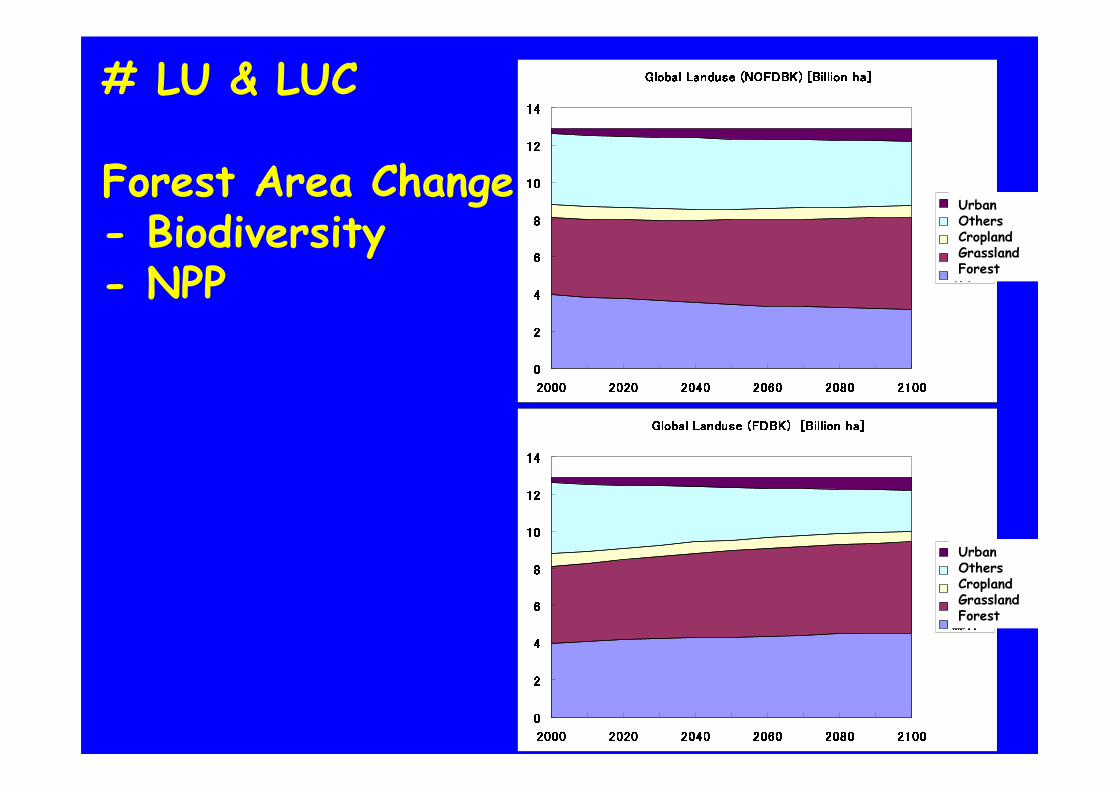
Global Landuse (NOFDBK) [Billion ha]Global Landuse (NOFDBK) [Billion ha]Global Landuse (NOFDBK) [Billion ha]Global Landuse (NOFDBK) [Billion ha]
00002222444466668888101010101212121214141414
2000200020002000 2020202020202020 2040204020402040 2060206020602060 2080208020802080 2100210021002100都市都市都市都市そのそのそのその他他他他耕地耕地耕地耕地草地草地草地草地森林森林森林森林
Global Landuse Global Landuse Global Landuse Global Landuse ((((FDBKFDBKFDBKFDBK)))) [[[[Billion haBillion haBillion haBillion ha]]]]
00002222444466668888101010101212121214141414
2000200020002000 2020202020202020 2040204020402040 2060206020602060 2080208020802080 2100210021002100都市都市都市都市そのそのそのその他他他他耕地耕地耕地耕地草地草地草地草地森林森林森林森林
UrbanOthersCroplandGrasslandForest
# LU & LUC
Forest Area Change- Biodiversity- NPP
UrbanOthersCroplandGrasslandForest
Global Sustainable Development Indices Global Sustainable Development Indices
for the Future:for the Future:
A Simulation Study Linked IAM with LCIA
Takanobu Kosugi*1, Koji Tokimatsu*2, Atsushi Kurosawa*3,
Norihiro Itsubo*2,4, Ryota Ii*5, Hiroshi Yagita*2,6, Masaji Sakagami*7
*1 College of Policy Science, Ritsumeikan University
*2 Research Center for Life Cycle Assessment,
National Institute of Advanced Industrial Science and Technology
*3 The Institute of Applied Energy
*4 Musashi Institute of Technology
*5 Pacific Consultants Co., Ltd.
*6 Nippon Institute of Technology
*7 Nihon Fukushi University
The 7th International Conference on EcoBalance
Nov. 14-16, 2006, at EPOCHAL TSUKUBA, Tsukuba, JAPAN

ObjectiveObjective
• Presenting
– a methodology to assess energy and materials systems from a
viewpoint of sustainable development in the future;
– preliminary results giving insights on energy and material-
related policies for sustainable development in 21st century.
• Core methodology: extension and application of
GRAPE/LIME model, which merges an IAM
GRAPE and a LCIA method LIME.
– GRAPE is extended to be coupled with a new submodel that
explicitly deals with the materials supply and demand systems
including mining, refining and recycling of iron and steel,
aluminum and copper.
Kosugi, Tokimatsu, Kurosawa, Itsubo, Ii, Yagita, Sakagami, Global Sustainable Development Indices for the Future:A simulation study of merging a lifecycle impact assessment (LCIA) with integrated assessment model (IAM), The 7th International Conference on EcoBalance, 2006, Tsukuba, JAPAN
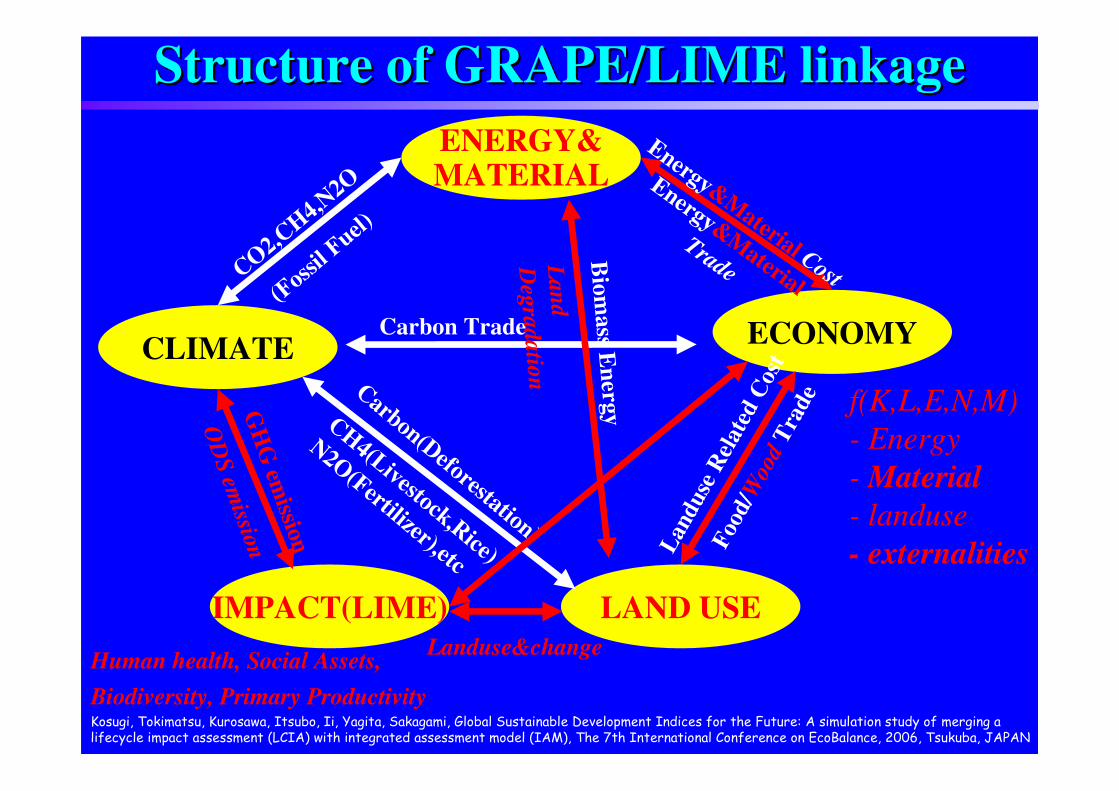
Human health, Social Assets,
Biodiversity, Primary Productivity
Carbon(D
eforestation)
CH
4(Livestock,Rice)
N2O
(Fertilizer),etc
ENERGY&MATERIAL
CLIMATE
IMPACT(LIME) LAND USE
ECONOMY
CO
2,CH
4,N2O
(Foss
il Fuel
)
Energy&M
aterial Cost
Energy&M
aterial
Trade
GH
G em
ission
OD
S em
ission L
anduse
Rel
ated
Cos
t
Foo
d/W
ood
Tra
de f(K,L,E,N,M)
- Energy
- Material
- landuse
- externalities
Carbon Trade
Bio
mass E
nerg
y
Lan
d
Deg
radatio
n
Landuse&change
Structure of GRAPE/LIME linkageStructure of GRAPE/LIME linkage
Kosugi, Tokimatsu, Kurosawa, Itsubo, Ii, Yagita, Sakagami, Global Sustainable Development Indices for the Future: A simulation study of merging a lifecycle impact assessment (LCIA) with integrated assessment model (IAM), The 7th International Conference on EcoBalance, 2006, Tsukuba, JAPAN
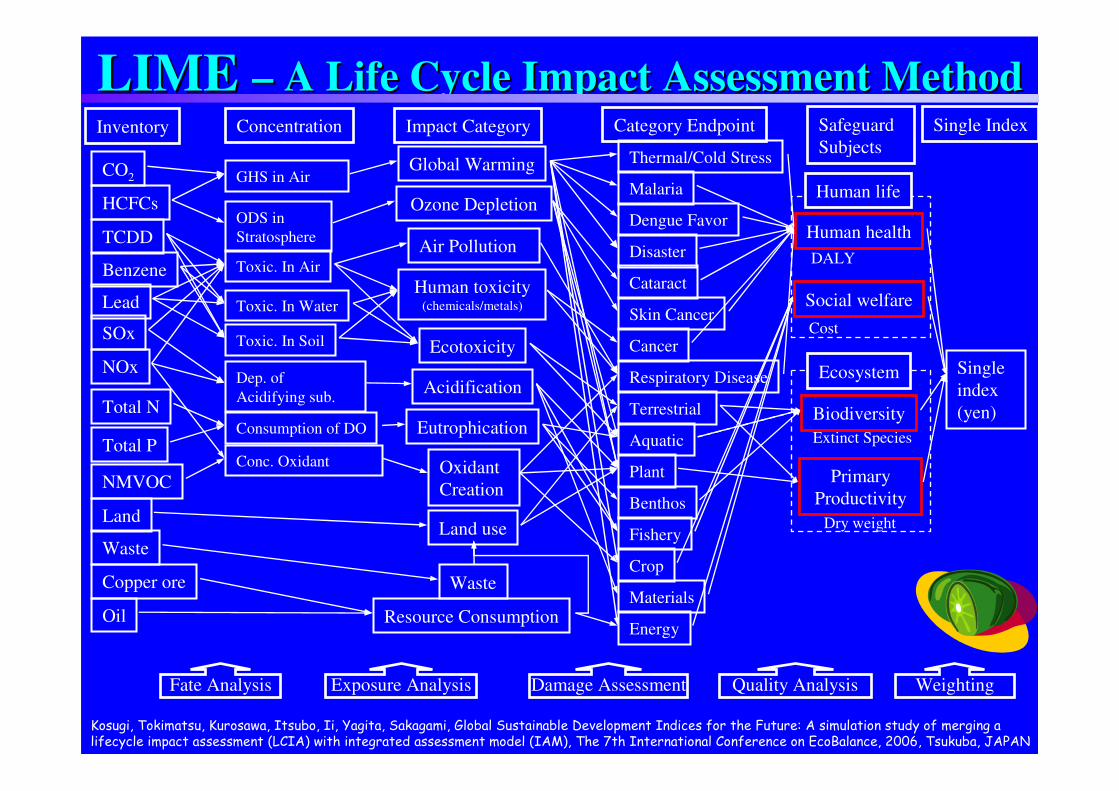
LIME LIME –– A Life Cycle Impact Assessment MethodA Life Cycle Impact Assessment Method
Damage AssessmentFate Analysis Quality Analysis WeightingExposure Analysis
Inventory Concentration Impact Category Category Endpoint Safeguard
Subjects
Single Index
Single
index
(yen)
Thermal/Cold Stress
Malaria
Skin Cancer
Cancer
Respiratory Disease
Cataract
Terrestrial
Aquatic
Plant
Benthos
Fishery
Crop
Energy
Materials
Global Warming
Acidification
Human toxicity (chemicals/metals)
Ecotoxicity
Ozone Depletion
Eutrophication
Oxidant
Creation
Land use
CO2
NOx
SOx
Benzene
NMVOC
TCDD
Lead
Total N
Total P
Oil
Waste
Copper ore
Land
HCFCs
GHS in Air
Toxic. In Water
Toxic. In Soil
ODS in
Stratosphere
Toxic. In Air
Conc. Oxidant
Consumption of DO
Dep. of
Acidifying sub.
Resource Consumption
Cost
DALY
Primary
Productivity
Ecosystem
Biodiversity
Extinct Species
Dry weight
Human life
Waste
Dengue FavorHuman health
Social welfare
Air Pollution Disaster
Kosugi, Tokimatsu, Kurosawa, Itsubo, Ii, Yagita, Sakagami, Global Sustainable Development Indices for the Future: A simulation study of merging a lifecycle impact assessment (LCIA) with integrated assessment model (IAM), The 7th International Conference on EcoBalance, 2006, Tsukuba, JAPAN
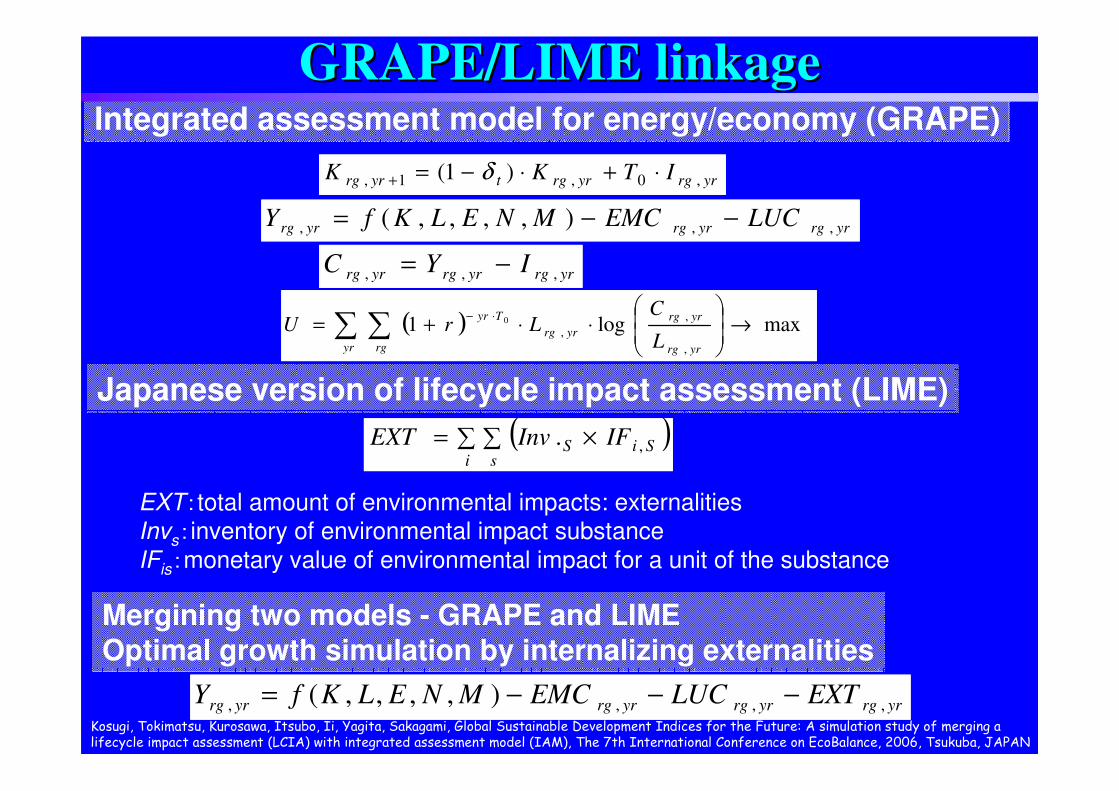
GRAPE/LIME linkageGRAPE/LIME linkageIntegrated assessment model for energy/economy (GRAPE)
Japanese version of lifecycle impact assessment (LIME)
Mergining two models - GRAPE and LIME
Optimal growth simulation by internalizing externalities
yrrgyrrgtyrrg ITKK ,0,1, )1( ⋅+⋅−=+ δ
yrrgyrrgyrrg LUCEMCMNELKfY ,,, ),,,,( −−=
yrrgyrrgyrrg IYC ,,, −=
( ) maxlog1,
,
,0 →
⋅⋅+= ∑ ∑ ⋅−
yr rg yrrg
yrrg
yrrg
Tyr
L
CLrU
yrrgyrrgyrrgyrrg EXTLUCEMCMNELKfY ,,,, ),,,,( −−−=
( )∑ ∑ ×=i s
SiS IFInvEXT ,.
EXT:total amount of environmental impacts: externalitiesInvs:inventory of environmental impact substanceIFis:monetary value of environmental impact for a unit of the substance
Kosugi, Tokimatsu, Kurosawa, Itsubo, Ii, Yagita, Sakagami, Global Sustainable Development Indices for the Future: A simulation study of merging a lifecycle impact assessment (LCIA) with integrated assessment model (IAM), The 7th International Conference on EcoBalance, 2006, Tsukuba, JAPAN
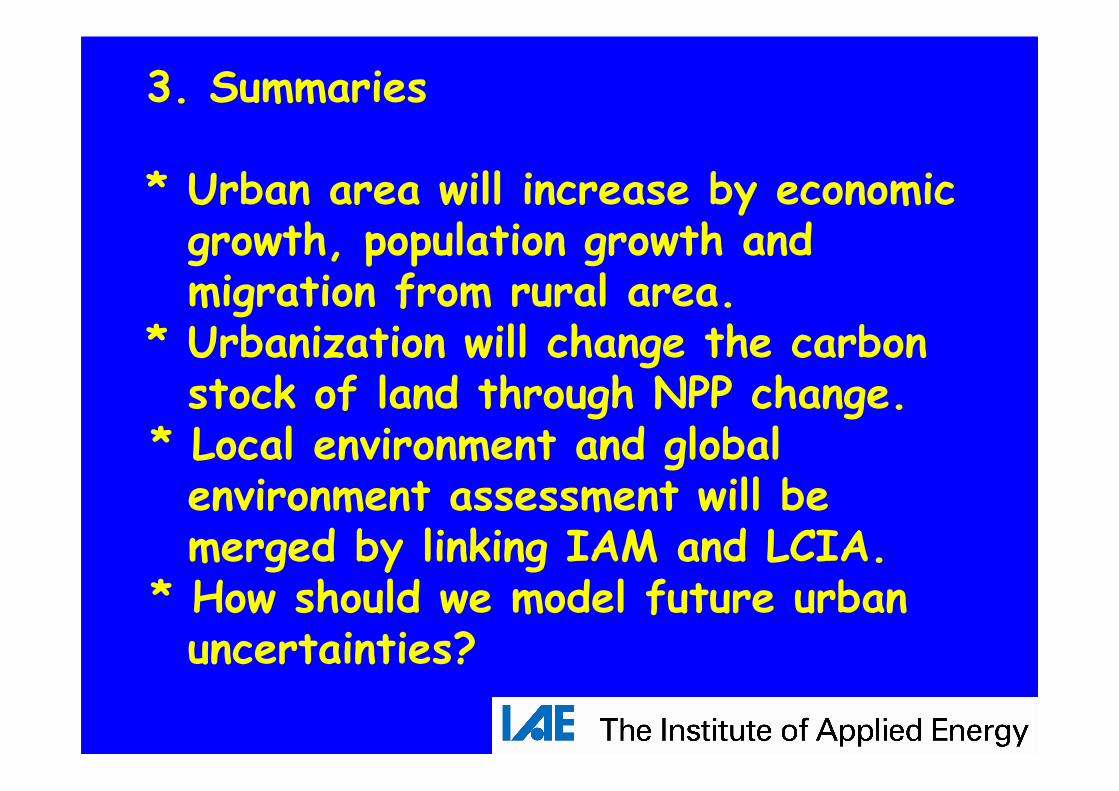
3. Summaries
* Urban area will increase by economic growth, population growth and migration from rural area.
* Urbanization will change the carbon stock of land through NPP change.
* Local environment and global environment assessment will be merged by linking IAM and LCIA.
* How should we model future urbanuncertainties?