urbanization and related environmental issues
TRANSCRIPT
79 | jacem, Vol. 3, 2017 Urbanization and Related Environmental Issues of Metro Manila
Journal of Advanced College of Engineering and Management, Vol. 3, 2017
URBANIZATION AND RELATED ENVIRONMENTAL ISSUES OF METRO MANILA
Ram Krishna Regmi
Environment and Resource Management Consultant, Kathmandu, Nepal
Email Address: [email protected]
__________________________________________________________________________________
Abstract
Due to rapid urbanization, Metro Manila is facing many environmental challenges with its continuous accelerating urban growth rate. According to 2010 census of population Metro Manila accounts about one-third of the total urban population and about 13% of the total national population of Philippines.The impact of urban growth of the Metro Manila to its urban environment relating on demography, solid wastes problem and problems in water bodies as well as air pollution and greenhouse gas emissionis emphasized here in this study.The flood prone areas within the Metro Manila is about 31%, most of the risk areas located along creeks, river banks or coastal areas.Metro Manila produces total garbage equivalent to 25% of the national waste generation in which about 17% is paper wastes and about 16% are plastics. In terms of water quality classification the upper reaches of the Marikina River is of Class A, but all remaining river systems are of Class C. Accordingly, the classification of Manila Bay is of Class SB. Similarly, the quality of ambient air of the Metro Manila is also poor. Using 2010 as base year, the major contributor to greenhouse gas is from vehicular emissions followed by the stationary sources. An urgent need is felt to incorporate environmental issues into planning its urban area to reduce the risks of further environmental degradation.
Keywords: Metro Manila; urbanization; environmental issues; solid wastes;water quality; air pollution
_________________________________________________________________________________
1. Introduction
Urbanization is a process by which cities are formed and became larger due to industrialization and economic development, and that encourages urban specific changes in specialization, labor division and human behaviors (Uttara et al., 2012). It is one of the most powerful and visible anthropogenic forces on Earth (Dawson et al., 2009). The rate of urbanization is very fast since the second half of the twentieth century, particularly in developing countries (Chadchan and Shankar, 2009). Almost all of the world’s population growth between 2000 and 2030 will be concentrated in urban areas in developing countries (United Nations, 2005). Worldwide urban populations are expected to grow by 1.4 billion by 2030, with accounting 60% of the total world population in city and town; and expected to reach 2.6 billion (USAID, 2013).
Urbanization is associated with the development and modernization of underdeveloped and developing countries. This includes the very rapid growth of many cities without the needed expansion in infrastructure and services and with a significant proportion of their population living in informal settlements or ‘slums’ lacking any infrastructure or services (Hardoy et al., 2001). It has long been common for urbanization to be blamed for a range of environmental problems, and over the last several decades scientists and policy makers have paid attention to cities and urbanization (Hope, 1986; Zhang and Song, 2003; Siciliano, 2012).
Urbanization has created numerous local to the global scale environmental problems (Kim and Baik, 2005; Zhao et al., 2006); such as highly reduction in natural vegetation production and carbon storage (Fang et al., 2003; Yuan, 2008), climate change and increase in energy demands (Zhou et al., 2004; Gonzalez et al., 2005), increase in air and water pollution and decrease in water supply (Liu and Diamond, 2005; Shao et al., 2006), and insufficient housing and sanitation facilities and traffic
80 | jacem, Vol. 3, 2017 Urbanization and Related Environmental Issues of Metro Manila
obstruction (Jago-on et al., 2009). Thus, recently many researchers (e.g., Foster, 2001; Chen, 2007; Li and Yao, 2009; Martinez-Zarzoso and Maruotti, 2011) have been conducted studies with the goal of better understanding the issues related to urbanization and its impacts on environments as a top priority. Most of the major environmental problems of the next century probably will result from the continuation and sharpening of existing problems that currently do not receive enough political attention (Uttara et al., 2012).
The population of Metro Manila is one of the largest in the Asia Pacific Region and in the world. Metro Manila is a megacity with the population exceeding 11.8 million people in 2010 spread over 17 local government units (NSO, 2012). According to the United Nations Centre for Human Settlements Study (UN-HABITAT, 2010), Metro Manila is considered one of the rapidly urbanizing megacities, ranking 14thamong 20 megacities around the world with a population projected to reach 14.8 million by 2025. As a highly urbanized area, Metro Manila experiences a lot of environmental problems associated with urbanization such as flooding, solid waste management problems, air and water pollution and climate change (Raflores and Regmi, 2015). The studies on urbanization of Metro Manila directly connected to its size, population, solid waste problem, water sector quality and air pollution and greenhouse gas emission have not been conducted yet. Therefore, this study aims to highlight the implications of urbanization for Metro Manila urban environment focusing on demography,solid wastes problem and problems in water sectorsas well asair pollution and greenhouse gas emission.
2. Location and key characteristics
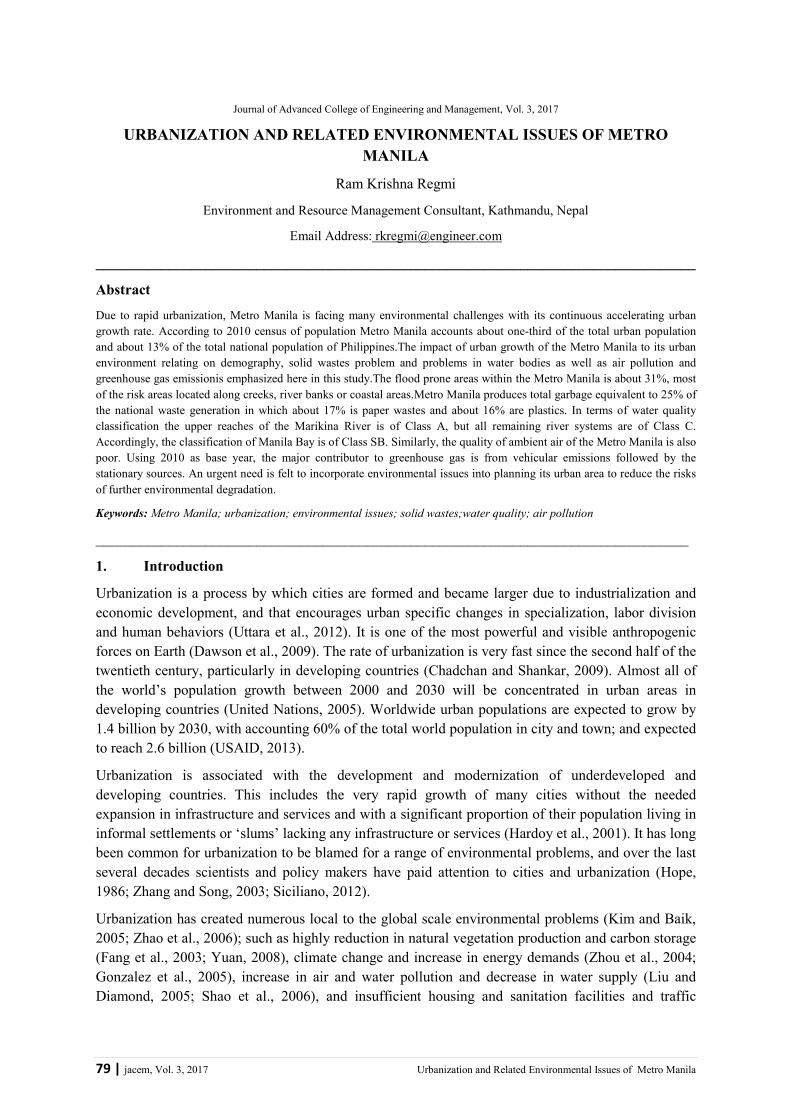
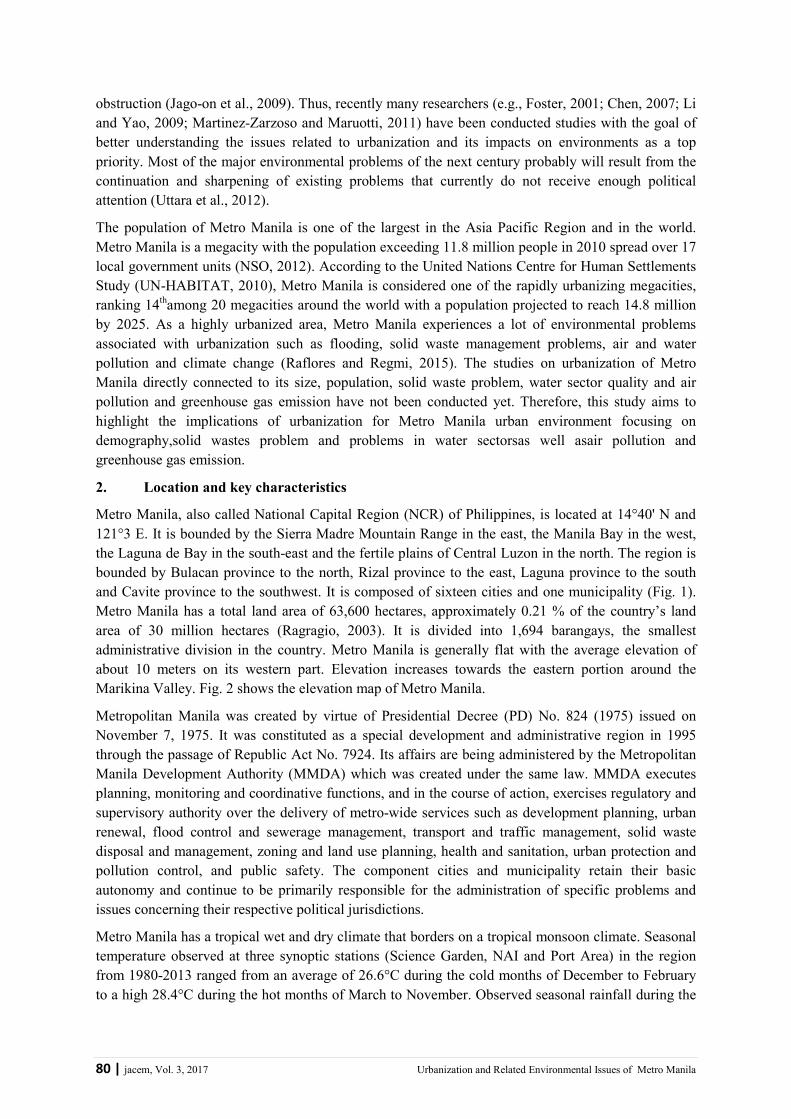
Metro Manila, also called National Capital Region (NCR) of Philippines, is located at 14°40' N and 121°3 E. It is bounded by the Sierra Madre Mountain Range in the east, the Manila Bay in the west, the Laguna de Bay in the south-east and the fertile plains of Central Luzon in the north. The region is bounded by Bulacan province to the north, Rizal province to the east, Laguna province to the south and Cavite province to the southwest. It is composed of sixteen cities and one municipality (Fig. 1). Metro Manila has a total land area of 63,600 hectares, approximately 0.21 % of the country’s land area of 30 million hectares (Ragragio, 2003). It is divided into 1,694 barangays, the smallest administrative division in the country. Metro Manila is generally flat with the average elevation of about 10 meters on its western part. Elevation increases towards the eastern portion around the Marikina Valley. Fig. 2 shows the elevation map of Metro Manila.
Metropolitan Manila was created by virtue of Presidential Decree (PD) No. 824 (1975) issued on November 7, 1975. It was constituted as a special development and administrative region in 1995 through the passage of Republic Act No. 7924. Its affairs are being administered by the Metropolitan Manila Development Authority (MMDA) which was created under the same law. MMDA executes planning, monitoring and coordinative functions, and in the course of action, exercises regulatory and supervisory authority over the delivery of metro-wide services such as development planning, urban renewal, flood control and sewerage management, transport and traffic management, solid waste disposal and management, zoning and land use planning, health and sanitation, urban protection and pollution control, and public safety. The component cities and municipality retain their basic autonomy and continue to be primarily responsible for the administration of specific problems and issues concerning their respective political jurisdictions.
Metro Manila has a tropical wet and dry climate that borders on a tropical monsoon climate. Seasonal temperature observed at three synoptic stations (Science Garden, NAI and Port Area) in the region from 1980-2013 ranged from an average of 26.6°C during the cold months of December to February to a high 28.4°C during the hot months of March to November. Observed seasonal rainfall during the
81 | jacem, Vol. 3, 2017 Urbanization and Related Environmental Issues of Metro Manila
same years reached as 297.4 mm during dry months of December to May and 2254.8 mm during rainy months Jun to November.
Fig 1 Administrative Boundary Map of Metro Manila
(Source: http://www.philgis.org/freegisdata.htm)
Fig 2 Elevation Map of Metro Manila (Source: http://www.philgis.org/freegisdata.htm)
82 | jacem, Vol. 3, 2017 Urbanization and Related Environmental Issues of Metro Manila
3. Urbanization and potential implications 3.1. Urban Expansion
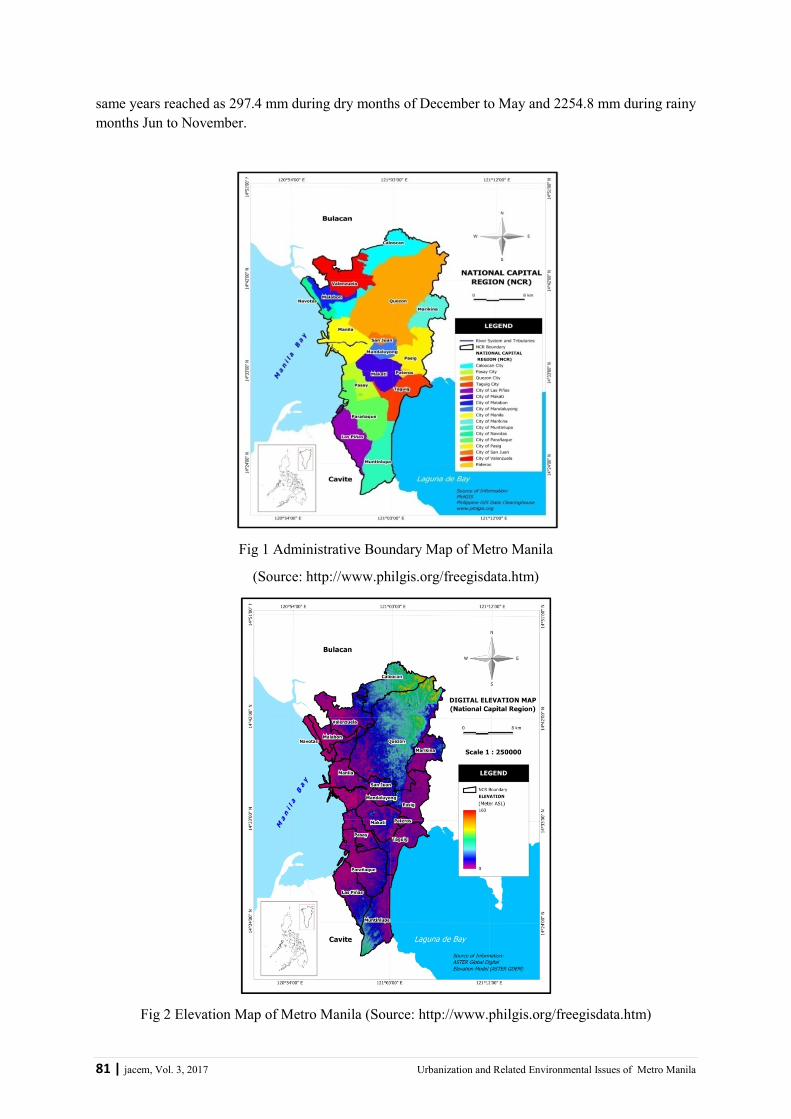
The increasing prices of land in the Metro Manila area and the associated environmental problems resulting from urbanization had directed to the growing movement of development in the surrounding regions of Metro Manila (Magno-Ballesteros, 2000). According to Singruand Lindfield (2014), the high level of urbanization of Regions III and IV-A, which is in close proximity to Metro Manila, is an indication of suburbanization and peri-urban development. A study conducted by World Bank Group (2015) also supports these findings. It showed that almost all the spatial growth in the Metro Manila area occurred in the neighbouring provinces of Cavite located south of Manila, Bulacan in the north and Laguna in the southeast. Fig. 3 shows the direction of the urban expansion from 2000-2010. The estimated day time population of Metro Manila is 14,500,000 persons or 22.3% higher than the actual census conducted in 2010 (Tolentino, 2013). This indicates that many people working in Metro Manila actually live in its neighbouring areas.
Fig 3 Map Showing the Direction of Expansion of Metro Manila (Source: World Bank Group, 2015)
Despite these movements, Metro Manila still experiences the various environmental problems associated with rapid and unplanned urbanization such as flooding, solid waste problems, a proliferation of informal settler families (ISFs), deterioration of air quality and increasing greenhouse gas emissions. With rapid urbanization of Metro Manila has resulted in the unregulated development of informal settlements usually on dangerous and risky areas such as those near seashore or flood zone (swampy areas), or on grounds prone to landslides (World Bank, 2010). Houses are also built near or above esteros and along rivers, which pose a danger to the lives of these ISFs during flooding events. The presence of informal settlers along the rivers and their tributaries also contributed to the constriction of the drainage areas of Metro Manila, have caused flooding during heavy rains. Moreover, these informal settlers add to the deterioration of the water quality of these water bodies due to indiscriminate disposal of wastes. Records from the concerned LGUs show that there are about 60,130 ISFs as of June 2012 in all the 17 cities and municipality of NCR.
83 | jacem, Vol. 3, 2017 Urbanization and Related Environmental Issues of Metro Manila
3.2. Land use change
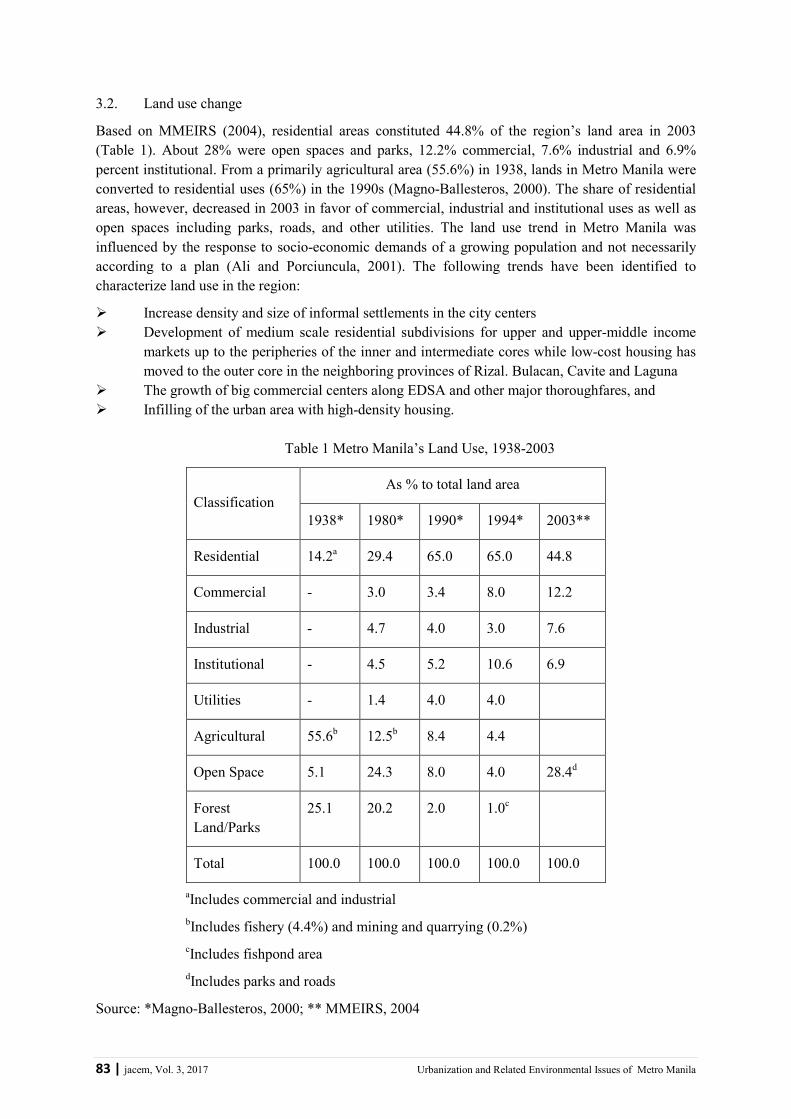
Based on MMEIRS (2004), residential areas constituted 44.8% of the region’s land area in 2003 (Table 1). About 28% were open spaces and parks, 12.2% commercial, 7.6% industrial and 6.9% percent institutional. From a primarily agricultural area (55.6%) in 1938, lands in Metro Manila were converted to residential uses (65%) in the 1990s (Magno-Ballesteros, 2000). The share of residential areas, however, decreased in 2003 in favor of commercial, industrial and institutional uses as well as open spaces including parks, roads, and other utilities. The land use trend in Metro Manila was influenced by the response to socio-economic demands of a growing population and not necessarily according to a plan (Ali and Porciuncula, 2001). The following trends have been identified to characterize land use in the region:
� Increase density and size of informal settlements in the city centers � Development of medium scale residential subdivisions for upper and upper-middle income
markets up to the peripheries of the inner and intermediate cores while low-cost housing has moved to the outer core in the neighboring provinces of Rizal. Bulacan, Cavite and Laguna
� The growth of big commercial centers along EDSA and other major thoroughfares, and � Infilling of the urban area with high-density housing.
Table 1 Metro Manila’s Land Use, 1938-2003
Classification As % to total land area
1938* 1980* 1990* 1994* 2003**
Residential 14.2a 29.4 65.0 65.0 44.8
Commercial - 3.0 3.4 8.0 12.2
Industrial - 4.7 4.0 3.0 7.6
Institutional - 4.5 5.2 10.6 6.9
Utilities - 1.4 4.0 4.0
Agricultural 55.6b 12.5b 8.4 4.4
Open Space 5.1 24.3 8.0 4.0 28.4d
Forest Land/Parks
25.1 20.2 2.0 1.0c
Total 100.0 100.0 100.0 100.0 100.0
aIncludes commercial and industrial bIncludes fishery (4.4%) and mining and quarrying (0.2%) cIncludes fishpond area dIncludes parks and roads
Source: *Magno-Ballesteros, 2000; ** MMEIRS, 2004
84 | jacem, Vol. 3, 2017 Urbanization and Related Environmental Issues of Metro Manila
3.3. Demography
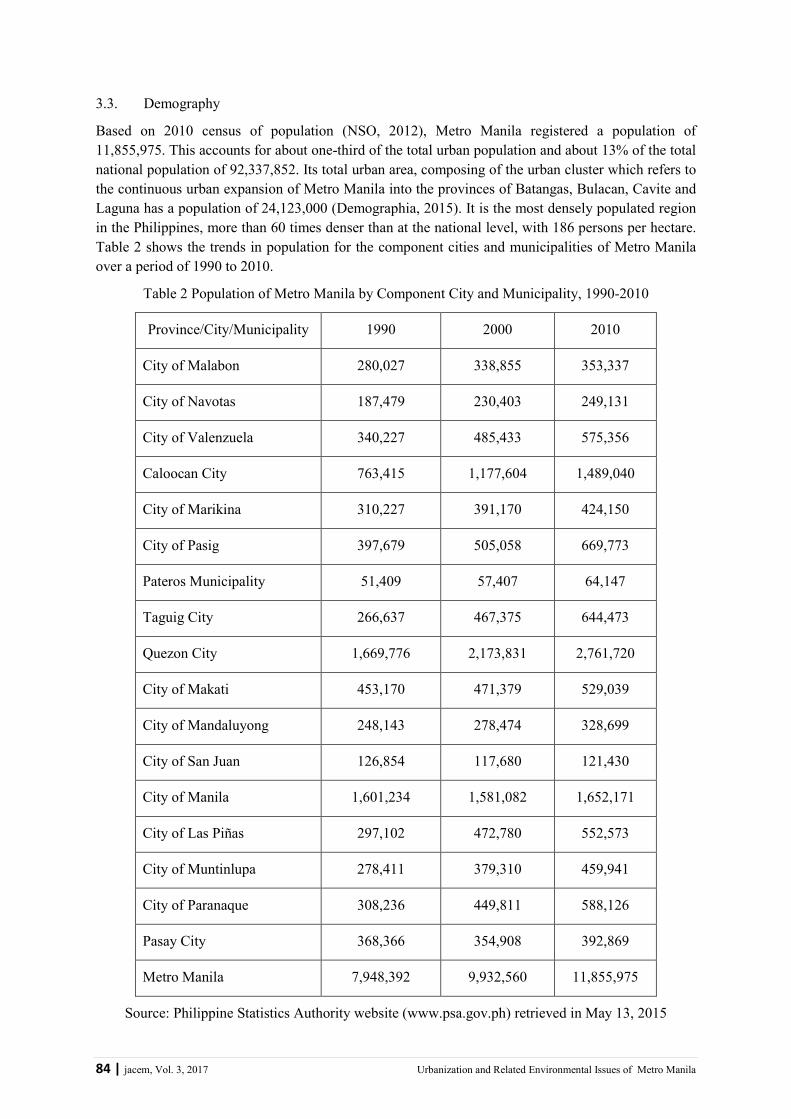
Based on 2010 census of population (NSO, 2012), Metro Manila registered a population of 11,855,975. This accounts for about one-third of the total urban population and about 13% of the total national population of 92,337,852. Its total urban area, composing of the urban cluster which refers to the continuous urban expansion of Metro Manila into the provinces of Batangas, Bulacan, Cavite and Laguna has a population of 24,123,000 (Demographia, 2015). It is the most densely populated region in the Philippines, more than 60 times denser than at the national level, with 186 persons per hectare. Table 2 shows the trends in population for the component cities and municipalities of Metro Manila over a period of 1990 to 2010.
Table 2 Population of Metro Manila by Component City and Municipality, 1990-2010
Province/City/Municipality 1990 2000 2010
City of Malabon 280,027 338,855 353,337
City of Navotas 187,479 230,403 249,131
City of Valenzuela 340,227 485,433 575,356
Caloocan City 763,415 1,177,604 1,489,040
City of Marikina 310,227 391,170 424,150
City of Pasig 397,679 505,058 669,773
Pateros Municipality 51,409 57,407 64,147
Taguig City 266,637 467,375 644,473
Quezon City 1,669,776 2,173,831 2,761,720
City of Makati 453,170 471,379 529,039
City of Mandaluyong 248,143 278,474 328,699
City of San Juan 126,854 117,680 121,430
City of Manila 1,601,234 1,581,082 1,652,171
City of Las Piñas 297,102 472,780 552,573
City of Muntinlupa 278,411 379,310 459,941
City of Paranaque 308,236 449,811 588,126
Pasay City 368,366 354,908 392,869
Metro Manila 7,948,392 9,932,560 11,855,975
Source: Philippine Statistics Authority website (www.psa.gov.ph) retrieved in May 13, 2015
85 | jacem, Vol. 3, 2017 Urbanization and Related Environmental Issues of Metro Manila
3.4. Flooding
Extreme flood events in Metro Manila are usually caused by heavy precipitation events lasting over 1 to 3 days generally resulting from typhoons and storm surges. Other causes of flooding are high tide combined with excess runoff from rivers, heavy rains, and sea level rise (WB, 2010). In addition to natural causes,WB (2010) said that extreme flood events are also caused by anthropogenic factors such as: a) reduction in river channel capacity resulting from encroachment of houses, siltation from deforestation, and garbage, b) disappearance of small river channels (esteros), c) reduced infiltration due to urbanization, d) loss of natural retention areas, and e) land subsidence resulting from over extraction of ground water. Drainage canals already clogged with rubbish is a major factor causing severe flooding in the metropolis (Singru and Lindfield, 2014).
About 31% of Metro Manila’s land area is prone to flooding (Magno-Ballesteros, 2000).Pornasdoro, et al. (2014) reported that the coastal cities of Valenzuela, Malabon, Caloocan, Navotas, Manila, Pasay, Parañaque and Las Piñas are considered the most flood prone areas in Metro Manila. Tidal movements in the Manila Bay and land subsidence particularly in Central Manila cause flooding in these cities. The extensive rainfall brought by Tropical Storm Ondoy (Ketsana) and Typhoon Pepeng (Parma) in 2009 had put most of the Metro Manila area under water. Even those areas that are not considered flood risks areas were severely affected.
The number of lives lost as a percentage of total population based on reports of the National Disaster Risk Reduction and Management Council (NDRRMC) has been steadily increasing from 0.003% in 2010 to 0.021% in 2011. Existing flood control structures in identified high risk areas are not enough to handle unexpected storm water (Singru and Lindfield, 2014).
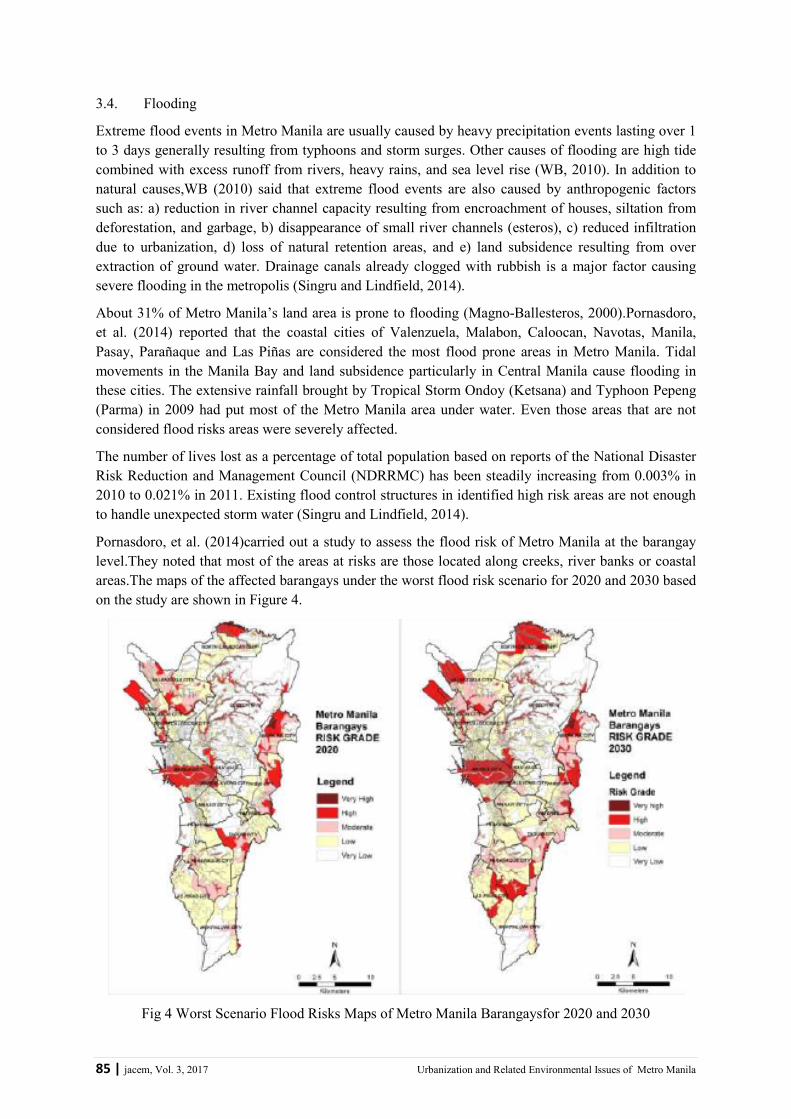
Pornasdoro, et al. (2014)carried out a study to assess the flood risk of Metro Manila at the barangay level.They noted that most of the areas at risks are those located along creeks, river banks or coastal areas.The maps of the affected barangays under the worst flood risk scenario for 2020 and 2030 based on the study are shown in Figure 4.
Fig 4 Worst Scenario Flood Risks Maps of Metro Manila Barangaysfor 2020 and 2030
86 | jacem, Vol. 3, 2017 Urbanization and Related Environmental Issues of Metro Manila
In order to address flooding issue in the metropolis, the government has initiated the Formulation and Implementation of a Flood Management Master Plan for Metro Manila. The Master Plan was formulated based on a Flood Risk Study conducted after Tropical Storm Ondoy and Typhoon Pepeng that hit Metro Manila. The study covers 435,400 hectares and includes the entire Metro Manila area as well as the provinces of Rizal, Laguna and parts of Bulacan.The Flood Management Master Plan that was formulated identified and short listed 11 long-term structural mitigation programs. These are independent programs but part of the integral measures for mitigating floods in Metro Manila and surrounding Areas.
3.5. Solid Wastes Problem
Metro Manila resident generates 0.69 kg of solid wastes per day in 2010 which is higher than the national average of 0.40 kg/capita/day (NSWMC, 2015). Total garbage produced by Metro Manila is estimated at 8,400 to 8,600 tons each day or equivalent to 25% of the national waste generation. About 17% of the daily total is paper wastes while 16% are plastics.
Wastes collected from NCR are disposed in the three disposal facilities, namely: the Rizal Provincial Sanitary Landfill (SLF) located in Rodriguez, Rizal; the Payatas SLF in Quezon City and the Tanza SLF in Navotas. These facilities service the 17 local government units of Metro Manila. They also serve as disposal sites for the garbage collected by MMDA from the different esteros and pumping stations in the region. The MMDA (2014) reported that more than 9.9 million cubic meters of garbage/wastes were disposed in these in 2014. This is 1.7 percent increase over 2013.It was estimated that only 70 % of the total garbage generated in Metro Manila are collected. The uncollected garbage goes into the river systems and esteros resulting in the clogging of waterways. This aggravates flooding in the metropolis.
3.6. Water Quality Problem
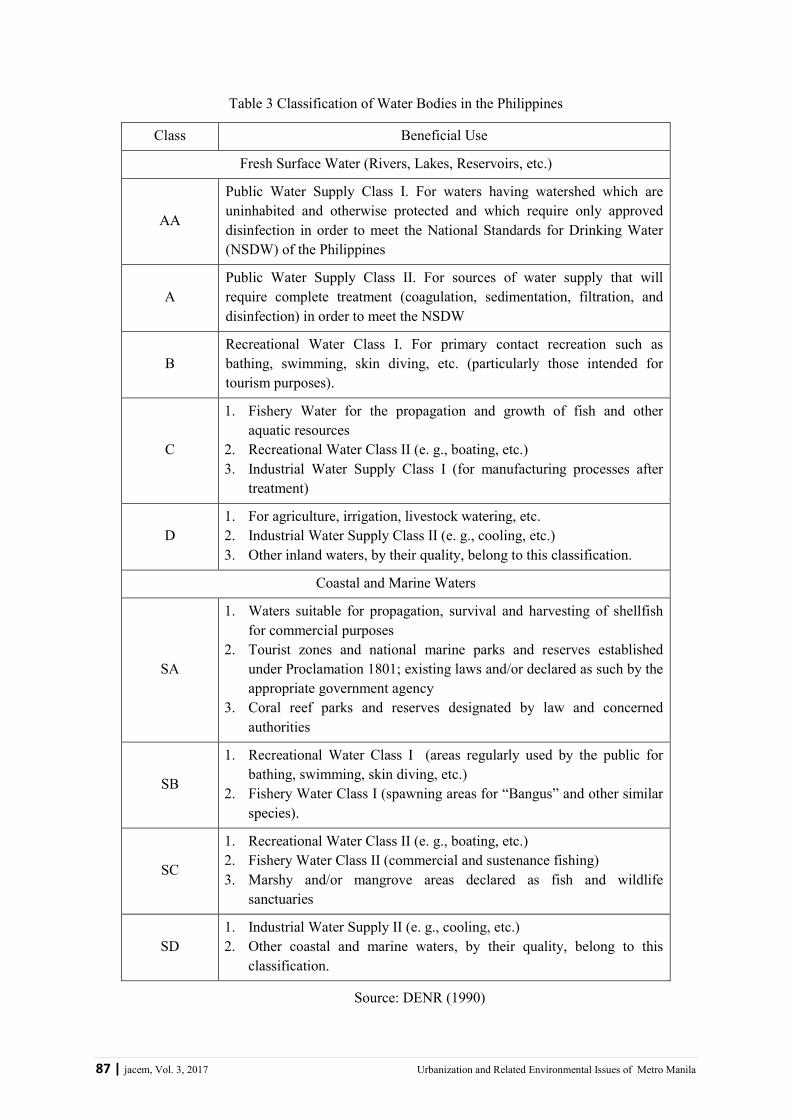
Water bodies in the Philippines, both inland surface waters and coastal and marine waters are classified according to their current most beneficial use or, in special cases, according to their intended or future beneficial use (DENR, 1990). Water classifications have been described according to the degree of protection required, with AA and SA classifications for inland surface waters and coastal and marine waters, respectively, corresponding to the most stringent levels of water quality (Table 3).
Five river systems traverse Metro Manila: the Marikina River, San Juan River, Parañaque River, Pasig River and Navotas-Malabon-Tullahan-Tenejeros River. Both the Marikina and San Juan rivers are major tributaries of the Pasig River. Except for the upper reaches of the Marikina River, which are classified as Class A, all five river systems were classified as Class C water bodies.Manila Bay was classified as Class SB, which means that the area is to be used for contact recreation such as bathing, swimming, skin diving, and similar activities and as spawning areas for milkfish and other similar species.
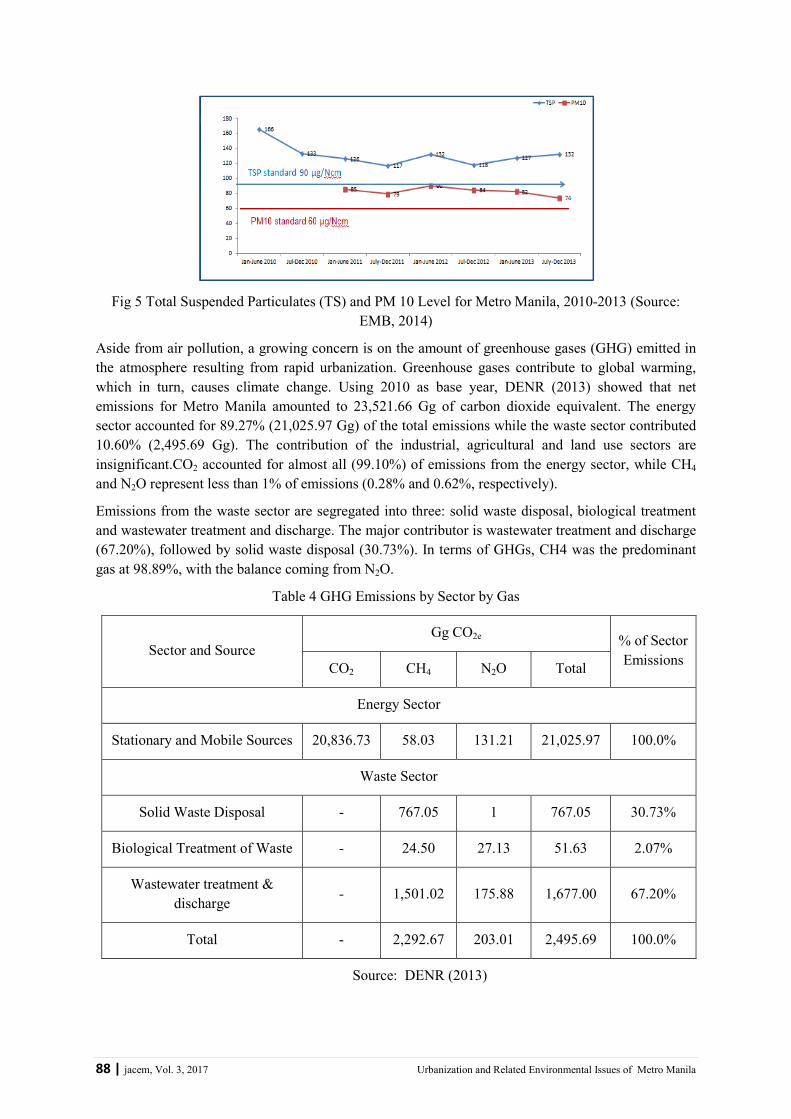
3.7. Air Pollution and Greenhouse Gas Emission
The increasing population in the metropolis and the rapid development in the area caused the poor quality of ambient air in the region. In 2013, total suspended particulates (TSP) or the amount of dust in the air in Metro Manila (132 µg/Ncm) exceeded the standard level of90 µg/Ncm by 47% (EMB, 2014). The amount of particulate matters PM10 was recorded as 74 µg/Ncm during the same year, exceeding the standard of 60 µg/Ncm by 23%. The high TSP and PM10 levels were due mainly from vehicular emissions (80%) while stationary sources contributed only 20%.
87 | jacem, Vol. 3, 2017 Urbanization and Related Environmental Issues of Metro Manila
Table 3 Classification of Water Bodies in the Philippines
Class Beneficial Use
Fresh Surface Water (Rivers, Lakes, Reservoirs, etc.)
AA
Public Water Supply Class I. For waters having watershed which are uninhabited and otherwise protected and which require only approved disinfection in order to meet the National Standards for Drinking Water (NSDW) of the Philippines
APublic Water Supply Class II. For sources of water supply that will require complete treatment (coagulation, sedimentation, filtration, and disinfection) in order to meet the NSDW
BRecreational Water Class I. For primary contact recreation such as bathing, swimming, skin diving, etc. (particularly those intended for tourism purposes).
C
1. Fishery Water for the propagation and growth of fish and other aquatic resources
2. Recreational Water Class II (e. g., boating, etc.) 3. Industrial Water Supply Class I (for manufacturing processes after
treatment)
D1. For agriculture, irrigation, livestock watering, etc. 2. Industrial Water Supply Class II (e. g., cooling, etc.) 3. Other inland waters, by their quality, belong to this classification.
Coastal and Marine Waters
SA
1. Waters suitable for propagation, survival and harvesting of shellfish for commercial purposes
2. Tourist zones and national marine parks and reserves established under Proclamation 1801; existing laws and/or declared as such by the appropriate government agency
3. Coral reef parks and reserves designated by law and concerned authorities
SB
1. Recreational Water Class I (areas regularly used by the public for bathing, swimming, skin diving, etc.)
2. Fishery Water Class I (spawning areas for “Bangus” and other similar species).
SC
1. Recreational Water Class II (e. g., boating, etc.) 2. Fishery Water Class II (commercial and sustenance fishing) 3. Marshy and/or mangrove areas declared as fish and wildlife
sanctuaries
SD 1. Industrial Water Supply II (e. g., cooling, etc.) 2. Other coastal and marine waters, by their quality, belong to this
classification.
Source: DENR (1990)
88 | jacem, Vol. 3, 2017 Urbanization and Related Environmental Issues of Metro Manila
Fig 5 Total Suspended Particulates (TS) and PM 10 Level for Metro Manila, 2010-2013 (Source: EMB, 2014)
Aside from air pollution, a growing concern is on the amount of greenhouse gases (GHG) emitted in the atmosphere resulting from rapid urbanization. Greenhouse gases contribute to global warming, which in turn, causes climate change. Using 2010 as base year, DENR (2013) showed that net emissions for Metro Manila amounted to 23,521.66 Gg of carbon dioxide equivalent. The energy sector accounted for 89.27% (21,025.97 Gg) of the total emissions while the waste sector contributed 10.60% (2,495.69 Gg). The contribution of the industrial, agricultural and land use sectors are insignificant.CO2 accounted for almost all (99.10%) of emissions from the energy sector, while CH4
and N2O represent less than 1% of emissions (0.28% and 0.62%, respectively).
Emissions from the waste sector are segregated into three: solid waste disposal, biological treatment and wastewater treatment and discharge. The major contributor is wastewater treatment and discharge (67.20%), followed by solid waste disposal (30.73%). In terms of GHGs, CH4 was the predominant gas at 98.89%, with the balance coming from N2O.
Table 4 GHG Emissions by Sector by Gas
Sector and Source Gg CO2e % of Sector
Emissions CO2 CH4 N2O Total
Energy Sector
Stationary and Mobile Sources 20,836.73 58.03 131.21 21,025.97 100.0%
Waste Sector
Solid Waste Disposal - 767.05 1 767.05 30.73%
Biological Treatment of Waste - 24.50 27.13 51.63 2.07%
Wastewater treatment & discharge - 1,501.02 175.88 1,677.00 67.20%
Total - 2,292.67 203.01 2,495.69 100.0%
Source: DENR (2013)
89 | jacem, Vol. 3, 2017 Urbanization and Related Environmental Issues of Metro Manila
4. Conclusion
Metro Manila is one of the rapidly urbanizing megacities in the word with a population projected to reach 14.8 million by 2025. Like other mega cities of the developing countries, it has also experienced a lot of environmental problems related to urbanization such as flooding, solid waste problems, a proliferation of informal settler families, deterioration of water quality, deterioration of air quality and increasing greenhouse gas emissions.
The land use trend in Metro Manila was the impact of socio-economic demands of theincrease in population.The informal settlers along the riversystemshave been partly responsible for the constriction of the drainage areas causing floods during heavy rains, and deterioration of the water quality of thewater bodies as well.Themost of the flood risk areas located along creeks, river banks or coastal areas those covering about 31% of the Metro Manila. At present the government has initiated the formulation and implementation of a Flood Management Master Plan for Metro Manilaand its surroundings that covers 435,400 hectares area.
Total garbage generated by Metro Manila is about 25% of the national waste generation in which only about 70% of the total generated garbage are collected and disposed in the disposal facilities. The uncollected garbage goes into the river systems and esteros thereby clogsthe entire waterways.Looking for the water quality of the water bodies of the Metro Manila, the upper reaches of the Marikina River is of Class A quality, and the remaining river systems are of Class C. The Manila Bay exhibits the water quality classification of Class SB.
The major contribution of deterioration of ambient air of the Metro Manila is from vehicular emissions and the stationary sources are the minor contributor. In terms of greenhouse gas emission the major contributor is the energy sector accounted for about 89.27% of the total emissions while the waste sector contributed about 10.60% as a minor contributor. The industrial, agricultural and land use sectors contribution to greenhouse gas emissionis insignificant.
References
1. Ali, M.,& Porciuncula, F. “Urban and peri-urban agriculture in Metro Manila: resources and opportunities for food production”. AVRDC Technical Bulletin No. 26, 45 pp(2001).
2. Chadchan, J., & Shankar, R. “Emerging urban development issues in the context of globalization”. Journal of Institute of Town Planners India, 6(2), 78-85 (2009).http://www.itpi.org.in/pdfs/apr6_09.pdf
3. Chen, J. “Rapid urbanization in China: a real challenge to soil protection and food security”.Catena, 69(1), 1-15. doi:10.1016/j.catena.2006.04.019(2007).
4. Dawson, R.J., Hall, J.W., Barr, S.L., Batty, M., Bristow, A.L., Carney, S., Dagoumas, A., Evans, S., Ford, A., Harwatt, H., Köhler, J., Tight, M.R., Walsh, C.L., Zanni,& A.M. “A blueprint for the integrated assessment of climate change in cities”. Tyndall Working Paper 129, pp. 26 (2009).
5. Demographia, “Demographia world urban areas”. 11thAnnual Edition(2015).
6. DENR. “Revised water usage and classification”. Water Quality Criteria Amending (Administrative Order No.34, Series of 1990). Philippines: Department of Environment and Natural Resources (1990).
7. 7DENR. “Top-down Metro Manila greenhouse gas (GHG) inventory”.Visayas Avenue, Diliman, 1100 Quezon City, Philippines: Department of Environment and Natural Resources(2013).
90 | jacem, Vol. 3, 2017 Urbanization and Related Environmental Issues of Metro Manila
8. EMB. “NCR emission inventory base year 2012”. Raw data for the publication of nationalstatus report 2015. Air Quality Management Bureau,DENR(2014).
9. Fang, J.Y., Piao, S.L., Field, C.B., Pan, Y.D., Guo, Q.H., &Zhou, L.M. “Increasing net primary production in China from 1982 to 1999”. Frontiers in Ecology and the Environment, 1(6), 293-297 (2003).doi/10.1890/1540-9295(2003)001%5B0294:INPPIC%5D2.0.CO;2
10. Foster, S.S.D. “The interdependence of groundwater and urbanisation in rapidly developing cities”.Urban Water, 3(3), 185-192(2001). doi.org/10.1016/S1462-0758(01)00043-7
11. Gonzalez, J.E., Luvall, J.C., Rickman, D., Comarazamy, D., Picon, A.J., Harmsen, E.W., Parsiani, H., Ramirez, N., Vasquez, R.E., Williams, R., Waide, R.B., & Tepley, C.A. “Urban heat islands developing in coastal tropical cities”. Eos Transactions American Geophysical Union, 86(42), 397-403(2005). doi.org/10.1029/2005EO420001
12. Hardoy, J.E., Mitlin, D., &Satterthwaite, D. “Environmental problems in an urbanizing world: Finding solutions for cities in Africa, Asia and Latin America”. London: Earthscan Publications, 448 pp(2001).
13. Hope, K.R. “Urbanization and economic development in the third world: an overview”.Cities, 3(1), 41-57(1986). doi:10.1016/0264-2751(86)90005-3
14. Jago-on, K. A., Kaneko, S., Fujikura, R., Fujiwara, A., Imai, T., Matsumoto, T., Zhang, J., Tanikawa, H., Tanaka, K., Lee, B., Taniguchi, M. “Urbanization and subsurface environmental issues: an attempt at DPSIR model application in Asian cities”. Science of the Total Environment, 407(9), 3089-3104(2009). doi:10.1016/j.scitotenv.2008.08.004
15. Kim, Y.H.,& Baik, J.J., “Spatial and temporal structure of the urban heat island in Seoul”.Journal of Applied Meteorology,. 44 (5), 591-605(2005). doi.org/10.1175/JAM2226.1
16. Li, B., & Yao, R. “Urbanisation and its impact on building energy consumption and efficiency in China”. Renewable Energy, 34(9) (2009)., 1994-1998. doi:10.1016/j.renene.2009.02.015
17. Liu, J.G., & Diamond, J. “China’s environment in a globalizing world”. Nature, 435 (7046), 1179-1186(2005). doi.org/10.1038/4351179a
18. Magno-Ballesteros, M. “Land use planning in Metro Manila and the urban fringe: implications on the land and real estate market”. Philippine Institute for Development Studies(Discussion Paper Series No. 2000-20) (2000).
19. Martinez-Zarzoso, I., & Maruotti, A. “The impact of urbanization on CO2 emissions: evidence from developing countries”. Ecological Economics, 70(7), 1344-1353(2011). doi:10.1016/j.ecolecon.2011.02.009
20. MMDA “MMDA highlights of accomplishments 2014” (2014).. http://www.mmda.gov.ph/images/pdf/Transparency/VII/Executive-Summary-CY-2014.pdf
21. MMEIRS. “Earthquake impact reduction study for Metropolitan Manila, Republic of the Philippines”, Final Report. Tokyo:Japan International Cooperation Agency(2004).
22. NSO. “The 2010 census of population and housing”. Republic of the Philippines: National Statistics Office, (2012).
91 | jacem, Vol. 3, 2017 Urbanization and Related Environmental Issues of Metro Manila
23. NSWMC. “National solid waste management status report (2008-2014)”. Republic of the Philippines: Department of Environment and Philippine Statics Authority Natural Resources, Environmental Management Bureau, National Solid Waste Management Commission (2015).
25. Pornasdoro,Karlo P., Silva, Liz C., Munarriz , Maria Lourdes T., Estepa, Beau A., Capaque, Curtis A. “Flood Risk of Metro Manila Barangays: A GIS Based Risk Assessment Using Multi-Criteria Techniques”. Journal of Urban and Regional Planning, 1(1), 51-72(2014).http://journals.upd.edu.ph/index.php/19May2014_surp/article/view/4207/3817
26. Presidential Decree (PD) No. 824, “Creating the Metropolitan Manila and the Metropolitan Manila commission and for other purposes”. Arellano Law Foundation (1975).http://www.lawphil.net/statutes/presdecs/pd1975/pd_824_1975.html
27. Raflores, L.SD., & Regmi, R.K. “Understanding the water and urban environment of a megacity: the case of Metro Manila, Philippines”. Water and Urban Initiative Working Paper Series 2(2015). United Nations University Institute for the Advanced Study of Sustainability.
28. Ragragio J.M. “Urban slums reports: the case of Manila, Philippines” (2003). http://www.ucl.ac.uk/dpu-projects/Global_Report/pdfs/Manila.pdf.
29. Shao, M., Tang, X.Y., Zhang, Y.H., & Li, W.J. “Environmental pollution of city clusters in China: current situation and challenges”. Frontiers in Ecology and the Environment, 4(7), 353-361(2006).doi: 10.1890/1540-9295(2006)004[0353:CCICAA]2.0
30. Singru, R.N.,& Lindfield, M. “Republic of the Philippines national urban assessment”.Mandaluyong City, Philippines: Asian Development Bank(2014).
31. Siciliano, G. “Urbanization strategies, rural development and land use changes in China: a multiple-level integrated assessment”. Land Use Policy 29 (1), 165-178(2012). doi:10.1016/j.landusepol.2011.06.003
32. Tolentino, F. “Land use and urban planning tools for disaster risk reduction in Metro Manila” (powerpoint presentation at Hanoi, Vietnam, November 18, 2013). http://www.anmc21.org/english/meeting/ 12_hanoi/pdf/1_6_manila.pdf.
33. UN-HABITAT. “The state of the world’s cities 2008–2009: harmonious cities”. Nairobi: United Nations Centre for Human Settlements (UNHABITAT) (2010).
34. United Nations. “World urbanization prospects (The 2005 Revision)”. New York: Department of Economic and Social Affairs, Population Division(2005).
35. USAID. “Sustainable service delivery in an increasingly urbanized world”. Washington, D.C. The United States Agency for International Development (2013).
36. Uttara, S., Bhuvandas, N., &Aggarwal, V. “Impacts of urbanization on environment”.International Journal of Research in Engineering and Applied sciences (IJRES),2(2), 1637-1645(2012). http://www.euroasiapub.org
37. World Bank. “Climate risks and adaptation in asian coastal megacities: a synthesis report”.Washington, DC: World Bank(2010).
38. World Bank Group, “East Asia's changing urban landscape: measuring a decade of spatial growth”. Urban Development, Washington, DC: World Bank(2015). https://openknowledge.worldbank.org/handle/10986/21159 License: CC BY 3.0 IGO.
92 | jacem, Vol. 3, 2017 Urbanization and Related Environmental Issues of Metro Manila
39. Yuan, F. “Land-cover change and environmental impact analysis in the Greater Mankato area of Minnesota using remote sensing and GIS modeling”. International Journal of Remote Sensing, 29(4), 1169-1184(2008). doi.org/10.1080/01431160701294703
40. Zhang, K.H., &Song, S. “Rural-urban migration and urbanization in China: evidence from time-series and cross-section analyses”. China Economic Review, 14(4), 386-400(2003). doi:10.1016/j.chieco.2003.09.018.
41. Zhao, S.Q., Da, L.J., Tang, Z.Y., Fang, H.J., Song, K., &Fang, J.Y. “Ecological consequences of rapid urban expansion: Shanghai, China”. Frontiers in Ecology and the Environment, 4(7), 341-346(2006). doi.org/10.1890/1540-9295 (2006) 004 [0341:ECORUE] 2.0.CO;2
42. Zhou L.M., Dickinson R.E., Tian Y.H., Fang J., Li Q., Kaufmann R.K., Tucker C.J., & Myneni R.B. “Evidence for a significant urbanization effect on climate in China”. PNAS, 101(26) (2004), 9540-9544. doi: 10.1073/pnas.0400357101