urban applications of persistent scatterer interferometry
TRANSCRIPT
1
Urban applications of Persistent Scatterer Interferometry Crosetto Michele, Monserrat Oriol
Institute of Geomatics, Av. Canal Olímpic s/n, 08860 Castelldefels (Barcelona), Spain Tel.: +34-93-5569280
Fax: +34-93-5569292
[email protected], [email protected]
Herrera Gerardo
Instituto Geológico y Minero de España (IGME), Rios Rosas 23, 28003 Madrid, Spain Tel.: +34913495785
Fax. + 34 913495834
Abstract This chapter reviews the applications of Persistent Scatterer Interferometry (PSI) in urban areas. PSI is a powerful satellite-based remote sensing technique used to measure and monitor surface deformation. The paper is mainly focused on C-band applications based on ERS and Envisat SAR data. It starts with a description of the main characteristics of PSI deformation monitoring. This is followed by a brief outline of the main PSI products, and a concise review of the principal PSI approaches proposed in the literature. The paper then discusses the major advantages and the open technical issues of PSI, which have to be considered in order to correctly assess the capabilities and limitations of this technique. A review of the most important PSI urban applications is then provided, which covers examples related to the analysis of metropolitan areas, subsidence and uplift phenomena, deformation caused by water, gas and oil extraction, seismic faults, landslides, and the monitoring of infrastructures and buildings. The last part of the paper discusses some of the most relevant results of PSI validation, a key aspect that drives the applicability and acceptability of this new technique. SAR, deformation, monitoring, validation.
1. Introduction This chapter reviews the urban applications of Persistent Scatterer Interferometry (PSI), the most advanced type of differential interferometric Synthetic Aperture Radar techniques (DInSAR) based on data acquired by spaceborne SAR sensors. The standard DInSAR techniques exploit the information contained in the radar phase of at least two complex SAR images acquired at different times over the same area generating interferograms or interferometric pairs. For a general review of SAR interferometry, see Rosen et al. (2000) and Crosetto et al. (2005). A large part of the DInSAR results obtained in the 1990s has been achieved by using the standard DInSAR configuration, which in some cases is the only one that can be implemented due to the limited SAR data availability.
A remarkable improvement in the quality of the DInSAR results is given by the advanced DInSAR methods that make use of large sets of SAR images acquired
2
over the same deformation phenomenon. These techniques represent an outstanding advance with respect to the standard ones, both in terms of deformation modelling capabilities and quality of the deformation estimation. Different DInSAR approaches based on large SAR datasets have been proposed, starting from the late 1990s. However, a fundamental step was the publication of the so-called Permanent Scatterers technique by Ferretti et al. (2000). As it is discussed later in this section, different new techniques have been proposed in the last years following this approach. They were initially named Permanent Scatterers techniques, while now all these techniques, including the original Permanent Scatterers technique, are called Persistent Scatterer Interferometry (PSI) techniques. Note that the term Permanent Scatterers is directly associated with the original technique patented by the Politecnico di Milano (Italy), and which is licensed to TRE (www.treuropa.com), a spin-off company of this university.
What is the key difference between DInSAR and PSI techniques? As already mentioned, the first difference is the redundant number of SAR images needed. A second substantial difference is that PSI techniques implement suitable data modelling procedures that make the estimation of different parameters possible. It is worth noting that the estimation is based on appropriate statistical treatments of the available redundant DInSAR observations. The estimated parameters are briefly discussed below. The first one is the time series of the deformation, which can provide information on the temporal evolution of the displacement. The deformation time series and the map of the average displacement rates are the two key products of a PSI analysis, as shown in Figure 1. Another parameter is the so-called residual topographic error, which is the difference between the true height of the scattering phase centre of a given point, and the height given by the employed digital elevation (DEM) model in this point, see Figure 2. This parameter plays an important role only for two specific goals: modelling purposes, i.e. proper estimation of the residual topographic component, separating it from the deformation component, and for geocoding purposes.
The standard geocoding methods simply employ the same DEM used in the DInSAR processing to geocode the DInSAR products, i.e. they use an approximate value of the true height of the scattering phase centre of a given pixel, which results in a location error in the geocoding. By using the residual topographic error this kind of error can be largely reduced, thus achieving a more precise geocoding: this may considerably help the interpretation and the exploitation of the results. An example of advanced geocoding is shown in Figure 3. An additional parameter is the atmospheric phase component of each image of the used SAR stack. The estimation of this component is fundamental to properly estimate the deformation contribution.
Fig. 1 Fig. 2 Fig. 3 As mentioned above, different PSI techniques have been proposed in the last years. Some of the most relevant works are briefly discussed below. The original Permanent Scatterers approach (Ferretti et al. 2000, 2001; Colesanti et al.
3
(2003a)) was followed by several other authors. The Small Baseline Subset (SBAS) technique is one of the most important and well documented PSI approaches (Berardino et al. 2002; Lanari et al. 2004; Pepe et al. 2005; 2007). A similar approach was proposed by Mora et al. (2003). Two companies that provide PSI services, Gamma Remote Sensing (www.gamma-rs.ch) and Altamira Information (www.altamira-information.com), described their approaches in Werner et al. (2003) and Arnaud et al. (2003), respectively. Hooper et al. (2004) described a procedure useful in geophysical applications. Crosetto et al. (2005) proposed a simplified approach based on stepwise linear functions for deformation and least squares adjustment. Crosetto et al. (2008) described a PSI chain, which includes an advanced phase unwrapping approach. Finally, further relevant contributions include Kampes and Hanssen (2004), which adapted the LAMBDA method used in GPS to the problem of PSI, and Van Leijen and Hanssen (2007), which described the use of adaptive deformation models in PSI.
This chapter is organized as follows. In section 2, the major advantages and the most important open technical issues related to PSI urban applications are discussed. Then, the most important PSI urban applications are reviewed. Finally the paper describes the results of the main validation activities carried out to prove the quality of the PSI-derived deformation estimates. Conclusions follow.
2. PSI advantages and open technical issues This section discusses the major advantages and the most important open technical issues of PSI urban applications. The advantages of PSI are manifold. PSI offers wide-area coverage associated with a relatively high spatial resolution. This allows us to study a whole metropolitan area, thus getting a global outlook of their deformation phenomena, keeping at the same time the capability to measure individual structures and buildings. Another important advantage of PSI is its sensitivity to small deformations, which are of the order of 1 mm/yr. Since it is based on spaceborne sensors, PSI exploits periodic and relatively low-cost data acquisitions. An unmatched capability is given by the ability to measure past deformation phenomena. This is possible by using the huge SAR image archives, which in case of ERS starts in 1991. This unique aspect of the technique means that it is possible to study ground motions that occurred in the past and for which no other survey data are available. Additionally, by using PSI analyses it is possible to get a potential reduction in the amount of ground-based observations, achieving simplified logistics operations and reducing personnel time and costs. The PSI technique provides two deformation measurement products. The first product, the average displacement rates, allows a user to quickly identify areas of motion that may be of interest. Once the user has identified areas of interest, a more in depth analysis can be carried out using the second type of product, i.e. the deformation time series. The time series allow a user to examine the motion history for a time period of interest. This is key information to identify potential causes of deformation, e.g. by analysing the time series with respect to the schedule of underground construction works, the lowering of a water table, etc.
Some of the most relevant PSI technical open problems are discussed below. Note that most of them concern all PSI applications, and not only the urban ones.
Spatial sampling. Even though the average density of Persistent Scatterers (PS), i.e. the points where PSI phase is good enough to get deformation measurements, is relatively high (e.g. 560 PS/km2 with ERS and 730 PS/km2 with Radarsat, see
4
www.treuropa.com/Portals/0/pdf/PSmeasures.pdf), it has to be considered that PSI is an opportunistic deformation measurement method, which is able to measure deformation only over the available PS, see Figure 4. PS density is usually low in vegetated and forested areas, over low-reflectivity areas, i.e. very smooth surfaces, and steep terrain. By contrast, the PS are usually abundant over buildings, monuments, antennas, poles, conducts, etc. In general the location of the PSs cannot be known a priori: this affects in particular the study of areas and objects of small spatial extent, e.g. specific buildings, which can be under-sampled or even not sampled at all. Note that this is particularly important for sensors like those of ERS, Envisat and Radarsat, while high-resolution SAR sensors, like TerraSAR-X, should considerably improve PS density (Adam et al., 2008). It is worth underlining a remarkable difference between PSI and ground-based geodetic and surveying techniques. The latter ones are based on strategically located points, i.e. they measure points chosen ad hoc on the objects of interest. By contrast, PSI performs a massive and opportunistic sampling, identifying PS that provide a strong and consistent radar reflectance over time. Usually PS can be located on the ground, on the side, or on the top of buildings or structures. But since some PS may show the deformation of a building and others of the ground, the direct comparison of PSI estimates with other data has to be carried out carefully.
Fig. 4
Temporal sampling. The capability of sampling deformation phenomena over time depends on the SAR data availability, which in turn depends on the revisiting time capabilities of the SAR satellites and on the data acquisition policies. For instance, Envisat has a revisiting time of 35 days but it carries several sensors, which cannot acquire data simultaneously. The SAR satellite revisiting time has a major impact on the temporal resolution of PSI deformation monitoring: PSI can typically monitor slow deformation phenomena, which evolve over several months or years. In addition to the temporal frequency of SAR images, PSI requires a large number of SAR scenes acquired over the same area. Typically more than 15-20 images are needed. Currently this amount of images is unavailable in several locations of the world.
Line-of-sight measurements. The PSI deformation measurements are made in the line-of-sight (LOS) of the SAR sensor, i.e. the line that connects the sensor and the target at hand. Given a generic 3D deformation in the area of interest, PSI provides the estimate of one component of this deformation, which is obtained by projecting the 3D deformation in the LOS direction. By using ascending and descending SAR data one can retrieve the vertical and east-to-west horizontal components of deformation. For this purpose it is required the independent processing of the ascending and descending datasets. With the orbits of the current SAR systems, PSI has a very low sensitivity to the north-to-south horizontal deformations.
Fast motion and linear deformation models. Due to the ambiguous nature of the PSI observations, i.e. the wrapped interferometric phases, PSI suffers severe limitations in the capability to measure “fast” deformation phenomena. Since PSI measures relative deformations, this limitation depends on the spatial pattern of
5
the deformation phenomenon at hand. As a rule of thumb, with the current revisiting times of the available C-band satellites, PSI has usually difficulties to measure deformation rates above 4-5 cm/year. An additional disadvantage is due to the fact that most of PSI approaches make use of a linear deformation model in their deformation estimation procedures. For instance, all PSI deformation products generated in the Terrafirma project (http://www.terrafirma.eu.com) are based on this model. This assumption, which is needed to unwrap the interferometric phases (one of the most important stages of any PSI technique), can have a negative impact on the PSI deformation estimates for all phenomena characterized by non-linear deformation behaviour, that is where the assumption is not valid. In areas where the deformation shows “significantly non-linear motion” and/or high motion rates the PSI products lack PSs. This lack of PSs represents an important limitation because it affects the areas where the interest to measure deformation is the highest.
Time series. The time series represent the most advanced PSI deformation product and also the most difficult one to be estimated. They are an ambitious product because they provide a deformation estimate to each of the acquisition dates of the used SAR images. The time series are particularly sensitive to phase noise. Their interpretation should take into account the above mentioned limitation related to the linear deformation model assumption. To the authors’ experience the real information content of the PSI deformation time series has not been fully understood so far. Even if excellent time series examples have been published in the literature, their limitations have been not clarified. It is worth noting that very few PSI time series validation results have been published in the literature.
Geocoding. PS geocoding has a direct impact on urban applications. According to the results of the Terrafirma Validation project (www.terrafirma.eu.com/Terrafirma_validation.htm), the east-to-west PS positioning precision (1 σ) is 2-4 m, and the PS height precision (1 σ) ranges between 1 and 2 m. In addition to these values it is also important to consider the uncertainty in the location of the PS within a resolution cell, e.g. 20 by 4 m in case of ERS SAR imagery. Even though the above values are certainly good if one considers that they are derived from satellite-based data, they limit the interpretation and exploitation possibilities of PSI results. This is particularly important for all applications related to the deformation of single buildings or structures.
Deformation tilts or trends. Tilts or trends in the PSI deformation velocity maps have to be considered with particular care. In fact they can occur due to uncompensated orbital errors and low frequency atmospheric effects. Therefore, a tilt in a given deformation velocity map could be due to the above error sources, or to a real geophysical signal. With a standard PSI processing it is not possible to estimate (subtle) low-frequency geophysical deformation signals. Two opposite situations may happen. First, one may get tilts in the PSI products that are interpreted as geophysical signals, while in fact they are simple residual processing errors. Second, we may get a product without any tilt, which is interpreted by a geophysicist as no signal, e.g. quiescence of a given phenomenon, while in fact the site may have undergone significant geophysical low-frequency deformations that have been removed during the PSI processing. If this is so, one should clearly communicate to the end user that the given PSI deformation products do not include the deformations characterized by low spatial frequencies.
6
3. Urban application review This section reviews the most important PSI urban applications. The references provided below are intended to be relevant examples and by no means form an exhaustive reference list. The majority of the examples are based on SAR data acquired by ERS-1/2 and Envisat, which represent the most important PSI data sources. In the forthcoming years it is expected to have an important increase of the urban applications based on high resolution TerraSAR data, e.g. see Strozzi et al. (2008). The increment will be mainly driven by the increased spatial resolution, which could open several applications related to the monitoring of single structures or buildings. Another important factor will be the shorter revisiting time capability of the new systems. On the other hand, one has to consider that data availability could be a limiting factor. In fact, from one side the current high resolution SAR system can only cover a fraction of the entire globe, and from the other the cost of the data could represent a limit to the development of some types of applications.
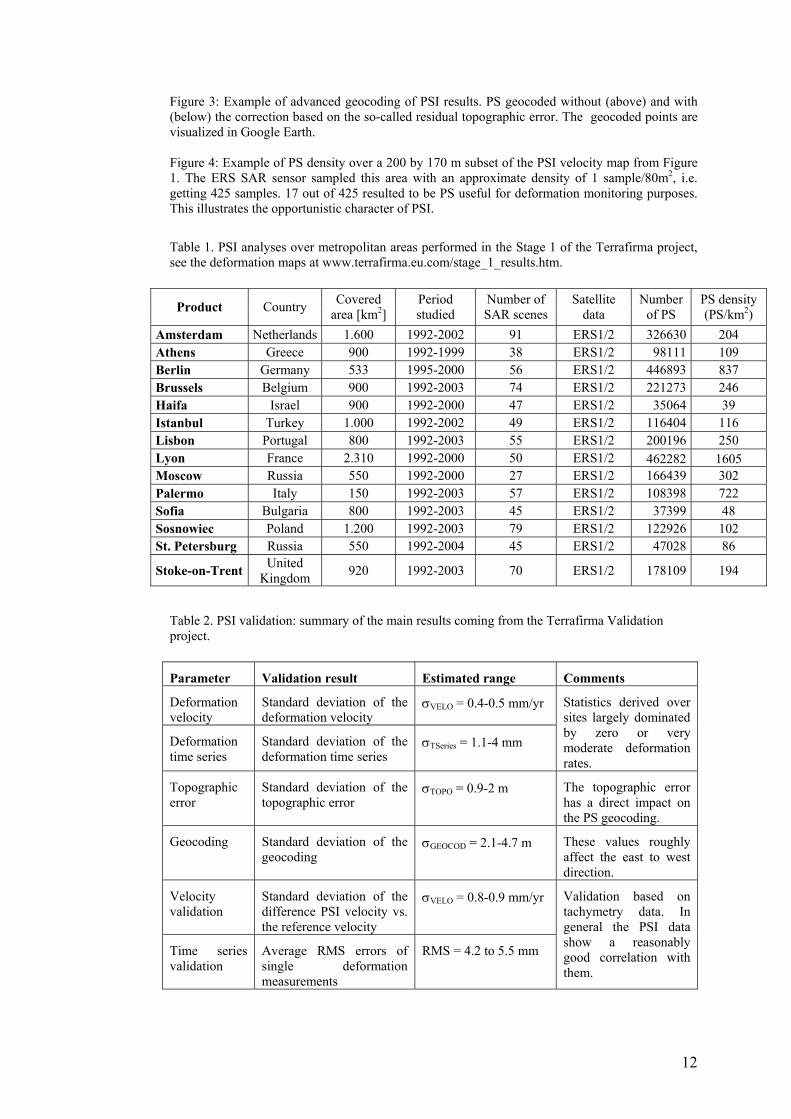
The deformation analysis over entire urban or metropolitan areas is one of the most powerful PSI urban applications. This type of analysis, which fully exploits the key advantages of PSI, i.e. wide-area coverage, measure of past deformation phenomena, and low cost, allows to get a global outlook of the deformation phenomena occurring in the area of interest. This type of analysis can be used to detect and measure deformation generated by different mechanisms, including unknown deformation phenomena. The best available collection of this type of analysis is given by the Terrafirma project, funded by the European Space Agency (ESA). Table 1 lists the cities analysed during the first stage of this project. Another rich set of European cities was analysed during its second stage. A wide collection of PSI results is available in the project webpage www.terrafirma.eu.com, following the link “Products/Stage 1/2 results”. In addition, this page offers comprehensive information on project partners, products and documentation.
Table 1 PSI is currently used to monitor subsidence and uplift phenomena in several cities around the world. A relevant example is described in Dixon et al. (2006), which show a PSI-derived subsidence map of New Orleans. This map reveals that parts of the city underwent rapid subsidence in the three years before the Hurricane Katrina disaster occurred in 2005. An interesting study of the natural and anthropogenic subsidence that affects the south-eastern Po Plain (Italy), which includes the city of Bologna, is described in Zerbini et al. (2007). The authors describe an analysis which combines different techniques to extract information on the spatial and temporal variability of the subsidence: GPS, gravity and PSI. Other interesting applications are described in Lanari et al. (2004), Ferretti et al. (2004), Herrera et al. (2007), Crosetto et al. (2008) and Vallone et al. (2008).
The monitoring of deformation caused by water, gas and oil extraction represents one of the most important PSI applications. Different private companies such as Telerilevamento Europa (www.treuropa.com), Altamira Information (www.altamira-information.com), Gamma Remote Sensing (www.gamma-rs.ch) and Fugro NPA Ltd (www.npagroup.com) offer monitoring services related to
7
them. Examples of PSI studies related to groundwater pumping are discussed in Tomás et al. (2005) and Bell et al. (2008). An interesting study of a gas extraction area, where four independent PSI analyses were carried out, is described in the Terrafirma Validation Project (www.terrafirma.eu.com/Terrafirma_validation.htm, follow the link “Product Validation Report”). Different interesting results can be found in webgis.irea.cnr.it, which publishes on-line the complete PSI results (velocity maps and time series) over different cities.
In some cases PSI has provided key information to study seismic faults in urban areas, e.g. see Bürgmann et al. (2006) and Funning et al. (2007). Both works concern the San Francisco Bay. The latter one is based on the joint analysis of PSI and GPS data. In addition, PSI has revealed important characteristics of the land deformation induced by volcanic activity in the area of Naples (Italy), e.g. see Lanari et al. (2003).
The study of landslide phenomena in urban areas is another important type of PSI application. Due to the deformation rate limitation discussed in the previous section, PSI is useful to study slow-moving deformation landslides. An example is provided by Hilley et al. (2004).
As already mentioned in the previous section, an advantage of PSI is the capability to measure whole metropolitan areas with a spatial resolution that, in some cases, allows us to measure individual structures and buildings. In this context it is important to recall the limitation of spatial sampling density mentioned in the previous section. An example of infrastructure monitoring is described in Crosetto et al. (2008), which concerns the main dike of the port of Barcelona (Spain). Another very interesting example of dike monitoring, which concerns the assessment of the safety of water defence systems, a crucial activity in low-lying countries such as the Netherlands, is described in Hanssen and van Leijen (2008). They show that, over the Netherlands, PSI can be used to obtain weekly updates on dike stability for a significant part of all dikes in the country. An example of study of buildings in the city of Rome (Italy) can be found in Manunta et al. (2008).
Finally it is worth mentioning an additional PSI application, which exploits the so-called residual topographic error. Using the topographic error, Perissin and Rocca (2006) assess the possibility to derive urban DEMs. An important limitation of this application is the relatively low PS density which can be achieved in urban area.
4. PSI urban applications: validation review This section reviews some of the most important PSI validation results, which concern in particular the monitoring of urban areas. Any new deformation measurement technique needs to demonstrate the quality of its measurements. This is fundamental to increase its acceptability and establish a long-term market. For this purpose, in the last years some important efforts have been made to study the quality of PSI results. The next section describes the outcomes of a major validation project founded by the ESA. Afterwards the most important validation results published in the literature are being discussed.
8
4.1 Results from a major validation experiment
The newest and most important PSI validation results come from the Validation Project in which is part of the Terrafirma project. It addressed key issues, like PSI quality assessment, assessment of performances, estimation of precision and accuracy and evaluation of the consistency of PSI results coming from different providers. This project was focused on the four Terrafirma PSI providers, i.e. Telerilevamento Europa, Altamira Information, Gamma Remote Sensing and Fugro NPA. It included two main parts: process validation and product validation. The process validation involved the inter-comparison of the different providers’ processed outputs and the analysis of their intermediate results. The product validation was based on PSI products generated over two test sites: Alkmaar and Amsterdam. The Alkmaar area, which includes a spatially correlated deformation field due to gas extraction, was studied using ERS-1/2 and Envisat data. Ground truth data on this site are available from levelling campaigns. The city of Amsterdam, which includes autonomous and mainly spatially uncorrelated movements, was studied using Envisat data and ground truth covering the area of the North-South metro line.
The inter-comparison activity generated useful global statistics, which concern large sets of PSs and provide information on the global inter-comparison behaviour of velocities, time series, topographic errors and PS geocoding. These values, which are summarized in Table 2, can be used to derive error bars to indicate the quality of the estimates derived by PSI. In addition to them, we briefly mention the validation results over the Amsterdam test site. Due to geocoding errors, it was not possible to make a perfect one-to-one comparison between PSs and ground truth. This affected negatively the validation results. A more in depth analysis can be found at www.terrafirma.eu.com/Terrafirma_validation.htm. It is worth noting that the statistics of Table 2 were derived over sites largely dominated by zero or very moderate deformation rates. Therefore they are representative of all PSI studies that concern areas with similar characteristics.
Table 2
4.2 PSI validation results
Assessing the PSI validation results published in the literature, one has to consider that PSI performances vary as a function of different factors, like SAR image availability, PS availability (spatial sampling), PS quality, temporal deformation behaviour, deformation rates and spatial extent of the analysed area. The evaluation of any validation result should always consider the characteristics of the validation experiment. Any extrapolation to different PSI conditions should be avoided. It is worth mentioning that most of the available validation results concern the PSI deformation velocity, while the other key product, i.e. deformation time series, is much less studied. Further research is needed to study the quality of the PSI time series.
This section concisely discusses some examples of PSI validation. Crosetto et al. (2008) describe the validation of PSI measurements over a dike of the port of
9
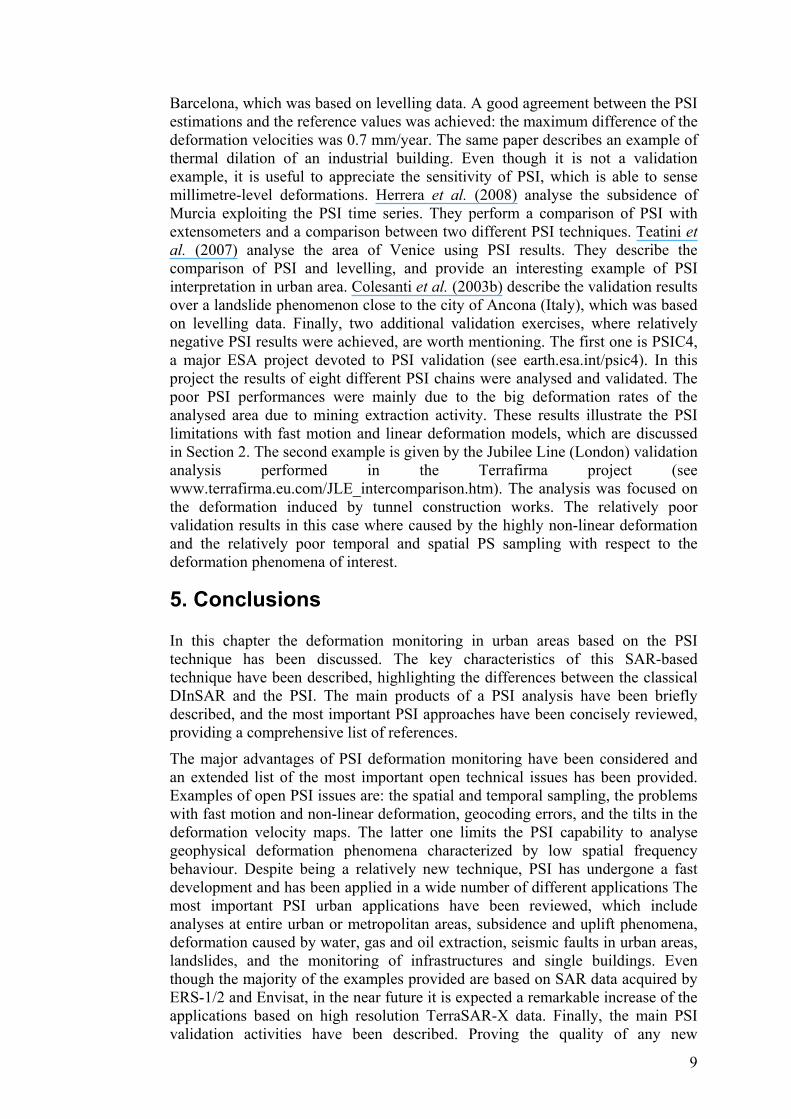
Barcelona, which was based on levelling data. A good agreement between the PSI estimations and the reference values was achieved: the maximum difference of the deformation velocities was 0.7 mm/year. The same paper describes an example of thermal dilation of an industrial building. Even though it is not a validation example, it is useful to appreciate the sensitivity of PSI, which is able to sense millimetre-level deformations. Herrera et al. (2008) analyse the subsidence of Murcia exploiting the PSI time series. They perform a comparison of PSI with extensometers and a comparison between two different PSI techniques. Teatini et al. (2007) analyse the area of Venice using PSI results. They describe the comparison of PSI and levelling, and provide an interesting example of PSI interpretation in urban area. Colesanti et al. (2003b) describe the validation results over a landslide phenomenon close to the city of Ancona (Italy), which was based on levelling data. Finally, two additional validation exercises, where relatively negative PSI results were achieved, are worth mentioning. The first one is PSIC4, a major ESA project devoted to PSI validation (see earth.esa.int/psic4). In this project the results of eight different PSI chains were analysed and validated. The poor PSI performances were mainly due to the big deformation rates of the analysed area due to mining extraction activity. These results illustrate the PSI limitations with fast motion and linear deformation models, which are discussed in Section 2. The second example is given by the Jubilee Line (London) validation analysis performed in the Terrafirma project (see www.terrafirma.eu.com/JLE_intercomparison.htm). The analysis was focused on the deformation induced by tunnel construction works. The relatively poor validation results in this case where caused by the highly non-linear deformation and the relatively poor temporal and spatial PS sampling with respect to the deformation phenomena of interest.
5. Conclusions
In this chapter the deformation monitoring in urban areas based on the PSI technique has been discussed. The key characteristics of this SAR-based technique have been described, highlighting the differences between the classical DInSAR and the PSI. The main products of a PSI analysis have been briefly described, and the most important PSI approaches have been concisely reviewed, providing a comprehensive list of references.
The major advantages of PSI deformation monitoring have been considered and an extended list of the most important open technical issues has been provided. Examples of open PSI issues are: the spatial and temporal sampling, the problems with fast motion and non-linear deformation, geocoding errors, and the tilts in the deformation velocity maps. The latter one limits the PSI capability to analyse geophysical deformation phenomena characterized by low spatial frequency behaviour. Despite being a relatively new technique, PSI has undergone a fast development and has been applied in a wide number of different applications The most important PSI urban applications have been reviewed, which include analyses at entire urban or metropolitan areas, subsidence and uplift phenomena, deformation caused by water, gas and oil extraction, seismic faults in urban areas, landslides, and the monitoring of infrastructures and single buildings. Even though the majority of the examples provided are based on SAR data acquired by ERS-1/2 and Envisat, in the near future it is expected a remarkable increase of the applications based on high resolution TerraSAR-X data. Finally, the main PSI validation activities have been described. Proving the quality of any new

10
technique is necessary for its acceptability and for establishing a long term market. In recent years major PSI validation projects have been funded by ESA. Their major outcomes have been discussed in this paper.
References Adam N, Eineder M, Yague-Martinez N, Bamler R (2008): High Resolution Interferometric
Stacking with TerraSAR-X. In: Proc. Int. Geosci. Remote Sensing Symp., IGARSS 2008, Boston, 2008.
Arnaud A, Adam N, Hanssen R, Inglada J, Duro J, Closa J, Eineder M (2003) ASAR ERS interferometric phase continuity. In: IGARSS 2003, 21-25 July 2003, Toulouse (France).
Bell JW, Amelung F, Ferretti A, Bianchi M, Novali F (2008) Permanent scatterer InSAR reveals seasonal and long-term aquifer-system response to groundwater pumping and artificial recharge, Water Resources Research, 44:1-18.
Bürgmann R, Hilley G, Ferretti A, Novali F (2006) Resolving vertical tectonics in the San Francisco Bay Area from Permanent Scatterer InSAR and GPS analysis. Geology 34(3):221-224.
Colesanti C, Ferretti A, Novali F, Prati C, Rocca F (2003a) SAR monitoring of progressive and seasonal ground deformation using the Permanent Scatterers Technique. IEEE Transactions on Geoscience and Remote Sensing 41(7):1685-1701.
Colesanti C, Ferretti A, Prati C, Rocca F (2003b) Monitoring landslides and tectonic motions with the Permanent Scatterers Technique. Engineering Geology 68:3-14.
Crosetto M, Crippa B, Biescas E, Monserrat O, Agudo M, Fernández P. (2005) Land deformation monitoring using SAR interferometry: state-of-the-art. Photogrammetrie Fernerkundung Geoinformation 6:497-510.
Crosetto M, Monserrat O, Muniganti P, Sawicka M, Rossi G, Calcagni L, Crippa B (2007) A 2+1D phase unwrapping for advanced DInSAR data processing. In: Proceedings of Fringe, 26–30 November 2007, Frascati (Italy).
Crosetto M, Biescas E, Duro J, Closa J, Arnaud A (2008) Quality assessment of advanced interferometric products based on time series of ERS and Envisat SAR data. Photogrammetric Engineering and Remote Sensing 74(4):443-450.
Dixon TH, Amelung F, Ferretti A, Novali F, Rocca F, Dokkas R, Sella G, Kim SW, Wdowinski S, Whitman D (2006) Subsidence and flooding in New Orleans. Nature 441:587-588.
Ferretti A, Prati C, Rocca F (2000) Nonlinear subsidence rate estimation using permanent scatterers in differential SAR interferometry. IEEE Transactions on Geoscience and Remote Sensing 38(5):2202-2212.
Ferretti A, Prati C, Rocca F (2001) Permanent scatterers in SAR interferometry. IEEE Transactions on Geoscience and Remote Sensing 39(1):8-20.
Ferretti A, Novali F, Bürgmann R, Hilley G, Prati C (2004) InSAR Permanent Scatterer Analysis Reveals Ups and Downs in San Francisco Bay Area. EOS 85(34):317-324.
Ferretti A, Savio G, Barzaghi R, Borghi A, Musazzi S, Novali F, Prati C, Rocca F (2007) Submillimeter Accuracy of InSAR Time Series: Experimental Validation. IEEE Transactions on Geoscience and Remote Sensing 45(5):1142-1153.
Funning GJ, Bürgmann R, Ferretti A, Novali F, Fumagalli (2007) Creep on the Rodgers Creek fault, northern San Francisco Bay area from a 10 year PS-InSAR dataset. Geophys. Res. Lett, 34, L19306, doi:10.1029/2007GL030836.
Hanssen RF, van Leijen FJ (2008) Monitoring water defense structures using radar interferometry, Radar Conference, 2008. In: Radar '08. IEEE, Rome (Italy), 26-30 May 2008.
Herrera G, Tomás R, López JM, Delgado J, Mallorquí JJ, Duque S, Mulas J (2007) Advanced DInSAR analysis on mining areas: La Union case study (Murcia, SE Spain). Engineering Geology 90:148-159.
Herrera G., Tomás R, Lopez-Sanchez JM, Delgado J, Vicente F, Mulas J, Cooksley G, Sanchez M, Duro J, Arnaud A, Blanco P, Duque S, Mallorqui JJ, De la Vega-Panizo R, Monserrat O (2008). Validation and comparison of Advanced Differential Interferometry Techniques: Murcia metropolitan area case study. ISPRS Journal of Photogrammetry and Remote Sensing doi:10.1016/j.isprsjprs.2008.09.008
Hilley GE, Bürgmann R, Ferretti A, Novali F, Rocca F (2004) Dynamics of Slow-Moving Landslides from Permanent Scatterer Analysis. Science 304(5679):1952-1955. doi: 10.1126/science.1098821.
11
Hooper A, Zebker H, Segall P, Kampes B (2004) A new method for measuring deformation on volcanoes and other natural terrains using InSAR Persistent Scatterers. Geophysical Research Letters, 31, L23611, doi: 10.1029/2004GL021737.
Kampes BM, Hanssen RF (2004) Ambiguity Resolution for Permanent Scatterer Interferometry. IEEE Transactions on Geoscience and Remote Sensing 42(11):2446-2453.
Lanari R, Berardino P, Borgström S, Gaudio CD, Martino PD, Fornaro G, Guarino S, Ricciardi GP, Sansosti E, Lundgren P (2003) The use of IFSAR and classical geodetic techniques for caldera unrest episodes: Application to the Campi Flegrei uplift event of 2000. Volcanol J. Geothermal Res 133:247–260.
Lanari R, Zeni G, Manunta M, Guarino S, Berardino P, Sansosti E (2004) An integrated SAR/GIS approach for investigating urban deformation phenomena: The city of Napoli (Italy) case study. Int. J. Remote Sens 25:2855–2862.
Manunta M, Marsella M, Zeni G, Sciotti M, Atzori S, Lanari R (2008) Two-scale surface deformation analysis using the SBAS-DInSAR technique: a case study of the city of Rome, Italy. International Journal of Remote Sensing, 29(6):1665–1684, doi: 10.1080/01431160701395278.
Mora O, Mallorquí JJ, Broquetas A (2003) Linear and nonlinear terrain deformation maps from a reduced set of interferometric SAR images. IEEE Transactions on Geoscience and Remote Sensing 41(10):2243-2253.
Pepe A, Sansosti E, Berardino P, Lanari R (2005) On the Generation of ERS/ENVISAT DInSAR Time-Series via the SBAS technique. IEEE Transactions on Geoscience and Remote Sensing Letters 2:265–269.
Pepe A, Manunta M, Mazzarella G, Lanari R (2007) A Space-Time Minimum Cost Flow Phase Unwrapping Algorithm for the Generation of Persistent Scatterers Deformation Time-Series. In: Proceedings of IGARSS 2007, 23–27 July 2007, Barcelona (Spain).
Perissin D, Rocca F (2006) High-Accuracy Urban DEM Using Permanent Scatterers, IEEE Transactions on Geoscience and Remote Sensing 44(11):3338-3347.
Rosen PA, Hensley S, Joughin (2000) Synthetic Aperture Radar Interferometry. Proc. of the IEEE, 88 (3):333-382.
Strozzi T, Tosi L, Teatini P, Wegmüller U (2008) Monitoring land subsidence in the Venice lagoon with TerraSAR-X, In: 3rd TerraSAR-X Science Team Meeting, Oberpfaffenhofen (Germany), 25-26 November 2008.
Teatini P, Strozzi T, Tosi L, Wegmüller U, Werner C, Carbognin L (2007) Assessing short- and long-time displacements in the Venice coastland by synthetic aperture radar interferometric point target analysis, J. Geophysical Research 112, F01012, doi:10.1029/2006JF000656.
Tomás R, Márquez Y, Lopez-Sanchez JM, Delgado J, Blanco P, Mallorquí JJ, Martinez M, Herrera G, Mulas J (2005) Mapping ground subsidence induced by aquifer overexploitation using advanced Differential SAR Interferometry: Vega Media of the Segura River (SE Spain) case study, Remote Sensing of the Environment 98 (2-3):269-283.
Vallone P, Crosetto M, Giammarinaro MS, Agudo M, Biescas E (2008) Integrated analysis of differential SAR interferometry and geological data to highlight ground deformations occurring in Caltanissetta city (Central Sicily, Italy). Engineering Geology 98:144–155.
Van Leijen F., Hanssen R.F. (2007) Persistent Scatterer Interferometry Using Adaptive Deformation Models. Proceedings of Envisat Symposium 2007, 23–27 April 2007, Montreux (Switzerland).
Werner C, Wegmüller U, Strozzi T, Wiesmann A (2003) Interferometric point target analysis for deformation mapping. In: Proceedings of IGARSS 2003, 21-25 July 2003, Toulouse (France).
Zerbini S, Richter B, Rocca F, van Dam T, Matonti F (2007) A Combination of Space and Terrestrial Geodetic Techniques to Monitor Land Subsidence:Case Study, the Southeastern Po Plain, Italy, J. Geophys. Res, 112, B05401, doi:10.1029/2006JB004338.
Figure 1: Example of PSI deformation velocity map over the city of Rome, which has been geocoded and imported in Google Earth (above). Below, on the left, it is shown a zoom of the velocity map over a deformation area. Below, on the right, are shown the deformation time series of a PS located in the zoom area and a PS belonging to a stable area. The white frame covers the area shown in Figure 4. Figure 2: 3D visualization with Google Earth of PS over a portion of Barcelona. The coloured circles represent the measured PS, which have been geocoded using the so-called residual topographic error. The colour of each PS represents its estimated residual topographic error.
12
Figure 3: Example of advanced geocoding of PSI results. PS geocoded without (above) and with (below) the correction based on the so-called residual topographic error. The geocoded points are visualized in Google Earth. Figure 4: Example of PS density over a 200 by 170 m subset of the PSI velocity map from Figure 1. The ERS SAR sensor sampled this area with an approximate density of 1 sample/80m2, i.e. getting 425 samples. 17 out of 425 resulted to be PS useful for deformation monitoring purposes. This illustrates the opportunistic character of PSI.
Table 1. PSI analyses over metropolitan areas performed in the Stage 1 of the Terrafirma project, see the deformation maps at www.terrafirma.eu.com/stage_1_results.htm.
Product Country Covered area [km2]
Period studied
Number of SAR scenes
Satellite data
Number of PS
PS density (PS/km2)
Amsterdam Netherlands 1.600 1992-2002 91 ERS1/2 326630 204 Athens Greece 900 1992-1999 38 ERS1/2 98111 109 Berlin Germany 533 1995-2000 56 ERS1/2 446893 837 Brussels Belgium 900 1992-2003 74 ERS1/2 221273 246 Haifa Israel 900 1992-2000 47 ERS1/2 35064 39 Istanbul Turkey 1.000 1992-2002 49 ERS1/2 116404 116 Lisbon Portugal 800 1992-2003 55 ERS1/2 200196 250 Lyon France 2.310 1992-2000 50 ERS1/2 462282 1605 Moscow Russia 550 1992-2000 27 ERS1/2 166439 302 Palermo Italy 150 1992-2003 57 ERS1/2 108398 722 Sofia Bulgaria 800 1992-2003 45 ERS1/2 37399 48 Sosnowiec Poland 1.200 1992-2003 79 ERS1/2 122926 102 St. Petersburg Russia 550 1992-2004 45 ERS1/2 47028 86
Stoke-on-Trent United Kingdom 920 1992-2003 70 ERS1/2 178109 194
Table 2. PSI validation: summary of the main results coming from the Terrafirma Validation project. Parameter Validation result Estimated range Comments
Deformation velocity
Standard deviation of the deformation velocity
σVELO = 0.4-0.5 mm/yr
Deformation time series
Standard deviation of the deformation time series
σTSeries = 1.1-4 mm
Statistics derived over sites largely dominated by zero or very moderate deformation rates.
Topographic error
Standard deviation of the topographic error
σTOPO = 0.9-2 m The topographic error has a direct impact on the PS geocoding.
Geocoding Standard deviation of the geocoding
σGEOCOD = 2.1-4.7 m These values roughly affect the east to west direction.
Velocity validation
Standard deviation of the difference PSI velocity vs. the reference velocity
σVELO = 0.8-0.9 mm/yr
Time series validation
Average RMS errors of single deformation measurements
RMS = 4.2 to 5.5 mm
Validation based on tachymetry data. In general the PSI data show a reasonably good correlation with them.