landslide activity maps generation by means of persistent scatterer interferometry
TRANSCRIPT
Remote Sens. 2013, 5, 6198-6222; doi:10.3390/rs5126198
Remote Sensing ISSN 2072-4292
www.mdpi.com/journal/remotesensing
Article
Landslide Activity Maps Generation by Means of Persistent Scatterer Interferometry
Silvia Bianchini 1,2,*, Gerardo Herrera 2, Rosa Maria Mateos 2,3, Davide Notti 2,4,
Inmaculada Garcia 2,5, Oscar Mora 6 and Sandro Moretti 1
1 Earth Sciences Department, University of Firenze, Via La Pira 4, I-50121 Firenze, Italy;
E-Mail: [email protected] 2 Geohazards InSAR laboratory and Modeling group (InSARlab), Geological Survey of Spain
(IGME), C/. Alenza 1, E-28003 Madrid, Spain; E-Mails: [email protected] (G.H.);
[email protected] (R.M.M.); [email protected] (I.G.) 3 Geological and Mining Institute of Spain, Urbanización Alcázar del Genil, 4. Edificio Zulema
bajos, E-18006 Granada, Spain 4 Earth and Environmental Science department, University of Pavia, Via Ferrata 1,
I-27100 Pavia, Italy; E-Mail: [email protected] 5 Geological and Mining Institute of Spain, Avenida Ciudad Querétaro s/n.,
E-07007 Palma de Majorca, Spain 6 Altamira Information, C/. Còrsega 381-387, E-08037 Barcelona, Spain;
E-Mail: [email protected]
* Author to whom correspondence should be addressed; E-Mail: [email protected];
Tel.: +39-055-275-7777; Fax: +39-055-275-7788.
Received: 18 September 2013; in revised form: 11 November 2013 / Accepted: 13 November 2013 /
Published: 25 November 2013
Abstract: In this paper a methodology is proposed to elaborate landslide activity maps
through the use of PS (Persistent Scatterer) data. This is illustrated through the case study
of Tramuntana Range in the island of Majorca (Spain), where ALOS (Advanced Land
Observing Satellite) images have been processed through a Persistent Scatterer
Interferometry (PSI) technique during the period of 2007–2010. The landslide activity map
provides, for every monitored landslide, an assessment of the PS visibility according to the
relief, land use, and satellite acquisition parameters. Landslide displacement measurements
are projected along the steepest slope, in order to compare landslide velocities with
different slope orientations. Additionally, a ground motion activity map is also generated,
based on active PS clusters not included within any known landslide phenomenon, but
OPEN ACCESS
Remote Sens. 2013, 5 6199
even moving, potentially referred to unmapped landslides or triggered by other kinds of
geomorphological processes. In the Tramuntana range, 42 landslides were identified as
active, four as being potential to produce moderate damage, intersecting the road Ma-10,
which represents the most important road of the island and, thus, the main element at risk.
In order to attest the reliability of measured displacements to represent landslide dynamics,
a confidence degree evaluation is proposed. In this test site, seven landslides exhibit a high
confidence degree, medium for 93 of them, and low for 51. A low confidence degree was
also attributed to 615 detected active clusters with a potential to cause moderate damage, as
their mechanism of the triggering cause is unknown. From this total amount, 18 of them
intersect the Ma-10, representing further potentially hazardous areas. The outcomes of this
work reveal the usefulness of landslide activity maps for environmental planning activities,
being exportable to other radar data and different geomorphological settings.
Keywords: SAR (Synthetic Aperture Radar); Persistent Scatterer Interferometry; landslides
1. Introduction
Differential SAR (Synthetic Aperture Radar) Interferometry techniques can offer great support to
natural hazard detection and monitoring since they provide ground displacement data characterized by
rapid and easily updatable measurements, millimetric and centimetric precision, high spatial
resolution, good temporal sampling, and wide area coverage, consequently, reducing efforts and costs.
In particular, multi-temporal interferometric techniques, i.e., Persistent Scatterer Interferometry (PSI),
have recently demonstrated to be a valuable and successful tool to detect slope instability and map
geomorphological processes, such as slow-moving landslides [1–12].
At present, the availability of large stacks of SAR data from both historical and new-generation
satellite sensors permits to spatially and temporally detect landslide displacements at regional and local
scale with improved resolution and precision [13–20], especially on wide areas that are too large or
inaccessible to be investigated through conventional monitoring techniques.
Nevertheless, PSI techniques hold some limitations, mainly due to the acquisition geometry of the
satellite systems. PSI-based displacement data are mono-dimensional along the satellite LOS (Line Of
Sight); consequently, they are dependent on the relationships between sensor acquisition geometry, the
local topography, and the real direction of movement. This is critical when dealing with landslides, as
only a fraction of slope movement component can be captured in the LOS. Additionally, the same
ground movement can be estimated with opposite sign and different module from ascending and
descending orbits, making the slope dynamics interpretation not immediately intelligible [6,8,21–23].
In this paper, a methodology to fully exploit PS data acquired in L-band by ALOS (Advanced Land
Observing Satellite) satellite equipped with PALSAR (Phased Array type L-band Synthetic Aperture
Radar) sensor is presented for detecting and representing landslide displacements in the Tramuntana
range in the island of Majorca (Spain), taking into account both satellite parameters and
geomorphological features. The main aim is assessing the ground velocity, the geometrical visibility,
Remote Sens. 2013, 5 6200
and radar detection suitability of the phenomena, and generating landslide activity maps, which can
represent alert maps of the study area.
The Tramuntana range is the main mountainous alignment of Majorca, where a wide range of slope
movements occurs, among which the most frequent ones are rockfalls, rotational, and complex
landslides [24]. The Tramuntana range is also characterized by a high exposure of elements at risk, due
to the presence of several tourist resorts and apartments, and the Ma-10 road that represents the main
road of the island and suffered several damages across time, due to both rockfalls and landslides.
After elaborating landslide and ground motion activity maps, an innovative confidence degree
evaluation is finally carried out, in order to attest the reliability of these provided products, resting
upon the availability of PS and further external data, i.e., damages inventory.
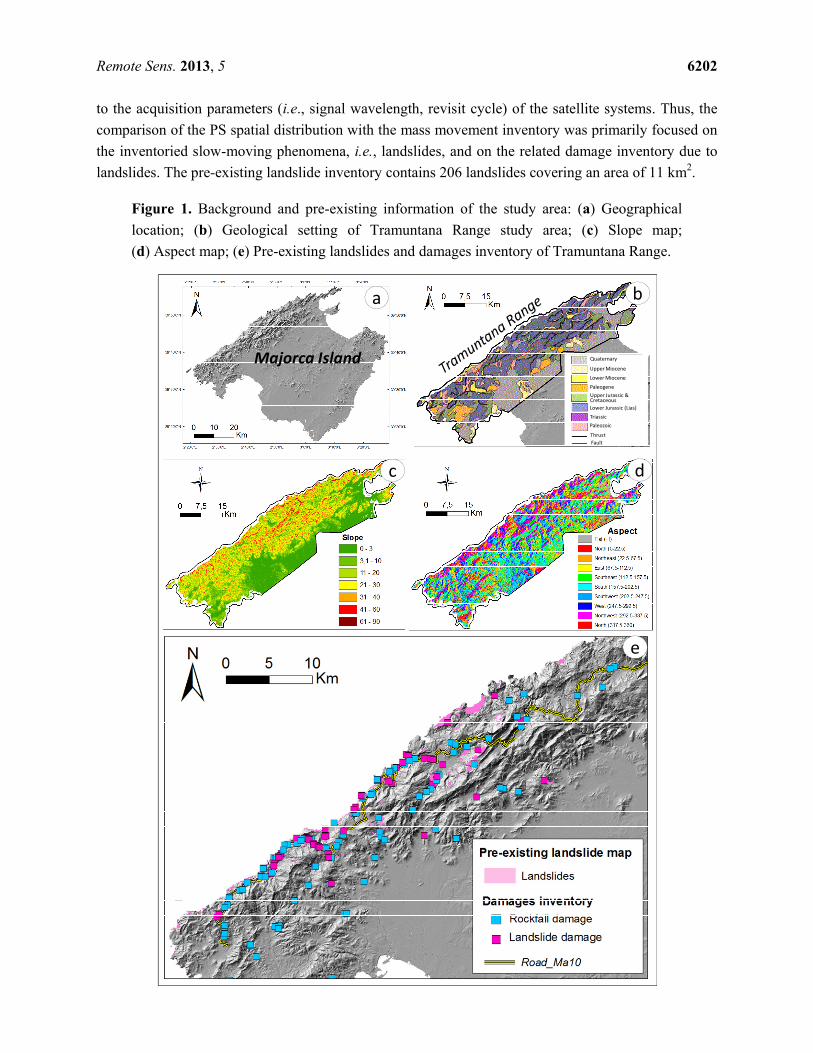
2. Study Area: The Tramuntana Range, Majorca (Spain)
The study area is the Tramuntana Range in Majorca (Spain), the main mountainous alignment of the
island, extended up 1,480 km2 in the northwestern part of Majorca [25] (Figure 1a). This Alpine range
spreads parallel to the north coast, being approximately 90 km maximum long and meanly 15 km wide.
The mountain line exceeds 600 m a.s.l. (above sea level) everywhere, and the central sector (Lluc area) is
the highest, with several peaks higher than 1,000 m, including Puig Major (1,445 m a.s.l.), which is the
highest peak on Majorca island [26]. The north coastal side of Tramuntana mountain range is the most
abrupt and rugged, with prevalent very high cliffs overlooking the sea and steep slopes with 30–40%
gradient percentage, while the southern side is smoother, characterized by a gentler gradient (Figure 1c).
Flat regions cover 4% of the total area. Slopes S-SE oriented are slightly frequent than the other
orientations, due to the structural outline of the range (Figure 1d).
The present geomorphologic setting is determined by the geological structure of the chain and was
formed during the Miocenic structuring linked to the Alpine fold, characterized by a series of NW
overlapping thrusts [27]. From the geological point of view, the main framework of the Tramuntana
range is constituted by Mesozoic carbonate rocks (limestones and dolostones) (Figure 1b). The lowest
units of the stratigraphic sequence of the Tramuntana range are composed of Triassic siliceous
sandstone (Buntsandstein, Lower Triassic), dolostones and marls (Rhaetian, Upper Triassic), and in
some places clay and gypsum (Keuper, Upper Triassic). Jurassic limestones and Lias dolostones
overlap the Triassic series. The upper units are conglomerate and marls (Paleogene-Miocene) and
recent colluvial sediments composed of Quaternary coarse debris, which cover most of the slopes with
several meters of thickness (Figure 1b).
From a structural point of view, the Tramuntana range is an NE-SW directed imbricated system of
overlapping thrusts [28]. The regional detachment level of the nappe thrusts is located in the Keuper
sediments (clays with gypsum and altered volcanic rocks) [27,29].
2.1. Landslide Movements on Tramuntana Range
The landslides of the Tramuntana range have been studied and described by Mateos [30] and
Mateos et al. [25,28]. The variety of lithologies cropping out in this mountain chain determines a wide
range of slope movements [24]. Therefore, the geological structure of the Tramuntana range conditions
the typology and the spatial distribution of the recent mass movements, as well as the presence of
Remote Sens. 2013, 5 6201
faults and discontinuities that often control the planes and the local failure surfaces of ground motions.
Shallow landslides are frequent phenomena: most of the movements are translational slides and earth
flows or complex movements, mostly involving the soft sediments from the Upper Triassic (clays with
gypsum), and the Paleogene-Neogene loam deposits that occasionally outcrop along the mountain
range. Movements, such as debris slides and debris flows, are also widespread as most of the slopes in
the Tramuntana range are covered with these coarse colluviums. Nevertheless, the most frequent slope
movements in the Tramuntana range are rockfalls due to the predominance of Jurassic rocky massifs
made of limestone and dolostones [30].
The steep topography of the chain, related to its geological and structural complexity, determines an
intense slope dynamics [25], quickened by the Mediterranean climate. The island of Majorca has a
typically Mediterranean climate, with mild winters and warm-dry summers. The maximum
precipitation takes place during the autumn months due to the arrival of the first cold air masses, which
contrast with the high temperature retained by the sea. This phenomenon is known as “gota fría”
(cold rain), in which heavy storms are accompanied by intense rainfall with episodes of up to 250 mm
in 24 h [25]. The orography of the island clearly controls the distribution of precipitation. The central
sector of the Tramuntana range registers an average annual precipitation of 1,200 mm, which gradually
drops towards the extreme SW of the range, where average annual precipitation is no more than
300 mm. Mateos et al. [25] reveals that recent rockfalls have also occurred after several freeze-thaw
cycles, being a determining and unusual factor in this warm region.
The economy of the Tramuntana range is based exclusively around tourism, which accounts for
95% of its income. In particular, the dwellings and the road network are of great importance in this
area as it welcomes 8.5 million visitors every year [25].
The occurrence of many shallow landslides cause huge damages on the island, e.g., the Estellencs
landslide (1971, 1979, 2010), the Fornalutx landslide (1924, 1974, 2002), and the Biniarroi landslide
(1721, 1813, 1943) that are the most important mass movements that occurred in the Balearic islands,
due to both their dimensions and caused damages [26].
A total of 918 events have been recorded in the Tramuntana range, being 65% rockfalls and 35%
landslides. From this amount, 19% of the events have produced damage to buildings, structures and
infrastructure. Recently, during the years 2008 to 2010, Majorca experienced one of the coldest and
wettest winters in living memory, leading to the occurrence of 34 mass movements that produced
damages to dwellings and road networks. Extensive damages occurred, especially on the Ma-10 Road,
which is the main road of the northern part of Tramuntana range with an intense vehicular traffic,
causing, therefore, significant economic losses, estimated at about 11M Euro [25].
The rockfall and landslide damage inventory dated up to 2011 is pointed out in Figure 1e: it was
elaborated at a 1:1,000 scale from different sources, and accounts 172 records (56 of them
corresponding to landslide occurrences and 116 to rockfalls).
The available pre-existing inventory of ground movements in Tramuntana range includes rockfalls
and landslides, covering the period 2008–2010 (Figure 1e). It was produced at a 1:5,000 scale by
means of orthophoto and field-work [25,30].
The PSI technique for mapping and monitoring mass movements can only be applied to
slow-moving landslide phenomena that are classified, according to Cruden and Varnes [31], as
extremely slow (velocity < 16 mm/yr) and very slow landslides (16 mm/yr < velocity < 1.6 m/yr), due
Remote Sens. 2013, 5 6202
to the acquisition parameters (i.e., signal wavelength, revisit cycle) of the satellite systems. Thus, the
comparison of the PS spatial distribution with the mass movement inventory was primarily focused on
the inventoried slow-moving phenomena, i.e., landslides, and on the related damage inventory due to
landslides. The pre-existing landslide inventory contains 206 landslides covering an area of 11 km2.
Figure 1. Background and pre-existing information of the study area: (a) Geographical
location; (b) Geological setting of Tramuntana Range study area; (c) Slope map;
(d) Aspect map; (e) Pre-existing landslides and damages inventory of Tramuntana Range.
Majorca Island
a b
c
dc
e
Quaternary
Upper Miocene
Lower MiocenePaleogeneUpper Jurassic & CretaceousLower Jurassic (Lias)TriassicPaleozoic
ThrustFault
Remote Sens. 2013, 5 6203
3. PSI Processing and Radar Data
Available radar data consist of 14 SAR images acquired by ALOS-PALSAR satellite in L-band
(24 cm wavelength), in the period of 2007–2010, in ascending orbit on the Tramuntana range and
processed using the Stable Point Network (SPN) technique [29,30]. The SPN is an advanced
differential interferometric processing technique that includes both the SB (Small Baseline) and the
PS (Persistent Scatterers) approaches [2]. In Table 1, the main acquisition characteristics of the SAR
dataset used in this work are shown.
Table 1. Main acquisition parameters of the Synthetic Aperture Radar (SAR) satellite
ALOS dataset in the Tramuntana range.
Sensor ALOS
Band L
Acquisition orbit Ascending
Temporal interval 01/01/2007–28/06/2010
Incidence angle (°) 39
Tracking angle (°) 346
Repeat cycle (days) 46
Number of images 14
Pixel resolution (m) 37×37
SPN technique allows detecting millimetric and centimetric displacements with high accuracy. This
advanced interferometric technique uses a stack of SAR images (typically 20–30) to measure ground
deformations with millimetric precision [32]. During the processing, the ground scatterers not affected
by temporal decorrelation are identified; these are called persistent scatterers or stable points. They are
natural objects over the ground surface, which give a very good reflection to the satellite throughout
the entire stack of images. These points present a reduced level of noise, which allows for very reliable
measurements. Furthermore, the atmospheric effects are estimated and compensated during the
processing to derive highly accurate elevation and displacement values for each stable point. The
highly precise error compensation allows for the generation of time series charts that provide a
visualization of the evolution of the displacement of each stable PS point. Urban, semi-urban or rural
areas can be studied in great detail, both in terms of high spatial resolution and the historical variation
of the displacement over long time periods.
In the study area, ALOS PS data show a high coherence, being 0.90 up to 1 for the 51% of the total
PS amount. Regarding the recorded motion rates, the velocity values measured along the LOS (VLOS)
range between about −30 mm/yr (away from the satellite direction) and +30 mm/yr (Table 2). Given
the widespread presence of rocks with sparse vegetation in the study area, ALOS-PALSAR is an
appropriate sensor as it is capable of measuring ground rates also in rural and natural zones, due to its
high penetration coefficient to the soil.
Remote Sens. 2013, 5 6204
Table 2. Amounts and velocity rates of Persistent Scatterer (PS) ALOS populations.
VLOS
PS number 722,331
PS density (PS/km2) 488
Velocity range(mm/yr) [min, max] [−28.1, +24.50]
Average Velocity (mm/yr) −0.2
IQR (0 ± σ) 0.0 ± 2.3
VSLOPE
PS number 326,604
PS density(PS/km2) 197
Velocity range(mm/yr) [min, max] [−64.7, 0.00]
Average Velocity(mm/yr) −3.9
Range within 68% PS from 0 0.0–−4.5
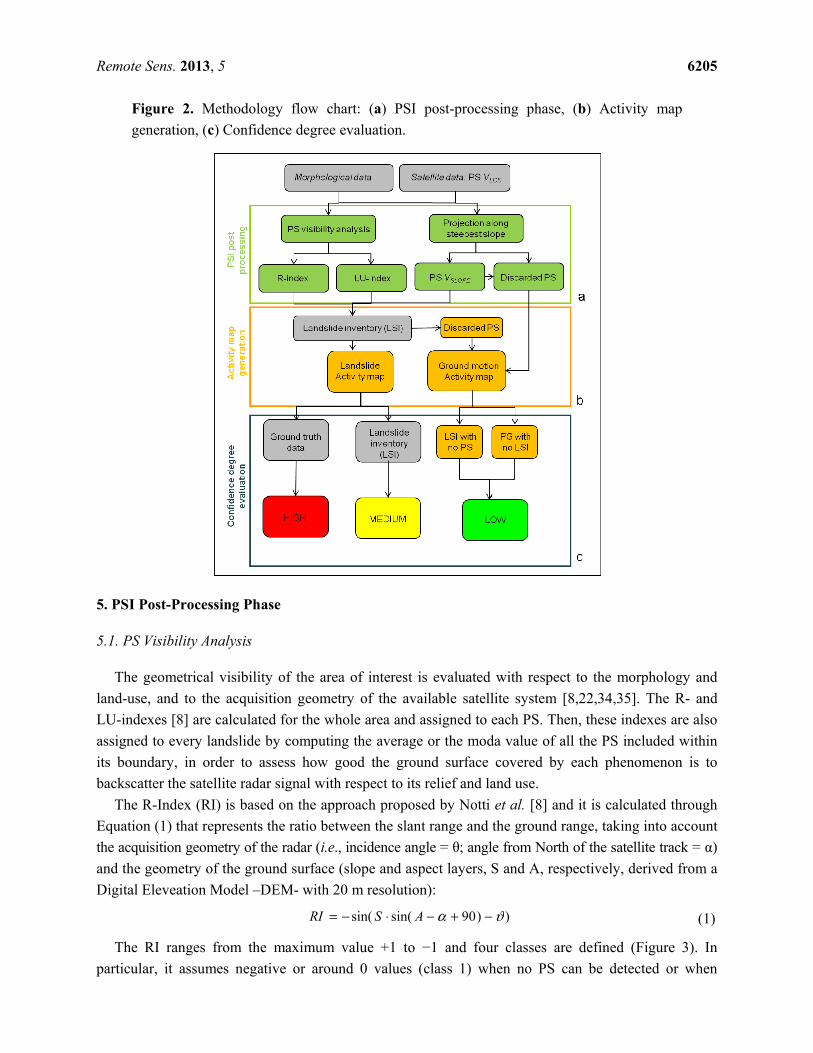
4. Methodology
The landslide activity map integrates the PSI data, the post-processing derived products and the
improved landslide inventory.
Input data (grey panels in Figure 2) include morphological and satellite PS data, the pre-existing
landslide inventory (LSI), as well as ground truth data, i.e., damage database and field survey of the
study area. Within the PSI post processing stage (Figure 2a), the visibility of the targeted study area is
assessed and the LOS PS displacements are projected downslope. The visibility assessment, calculated
through the computation of two indexes (R- and LU-index), is useful to identify slopes, PS targets, or
landslides with an adequate geometry for satellite measurements (i.e., slope direction parallel to the
satellite LOS direction), to be distinguished from those where geometrical distortions will be
introduced in the measurement. These geometrical distortions, characteristic of mountainous
environments, come out from the combination of the local topography with respect to the satellite
acquisition parameters [8,34] and can be reduced through the projection of satellite Line Of Sight
velocities (VLOS) along the local steepest slope (VSLOPE). In a second stage (Figure 2b), PSI data and
post-processing derived products are integrated with the landslide inventory to generate a “landslide
activity map”. Therefore, for every landslide phenomenon, both the landslide visibility assessments as
well as the displacement measurements are provided.
Separately, we also analyze PS benchmarks that were discarded through the downslope projection
and that are not referred to any landslide of LSI, but even moving, since they could deal with
unmapped landslides or other kinds of terrain motion processes. These clusters of moving PS are
considered for the generation of a “ground motion activity map”, being the target of further necessary
field investigations that could explain the mechanisms generating measured displacements. In the last
step (Figure 2c), the confidence degree of the activity maps is evaluated (high, medium, or low). This
evaluation aims at assessing how reliable the PSI measured displacement is to represent a landslide
movement. It is important to stress that the reliability on the PSI measurement itself is not evaluated,
but whether this measurement is related to landslide dynamic or not.
Remote Sens. 2013, 5 6205
Figure 2. Methodology flow chart: (a) PSI post-processing phase, (b) Activity map
generation, (c) Confidence degree evaluation.
5. PSI Post-Processing Phase
5.1. PS Visibility Analysis
The geometrical visibility of the area of interest is evaluated with respect to the morphology and
land-use, and to the acquisition geometry of the available satellite system [8,22,34,35]. The R- and
LU-indexes [8] are calculated for the whole area and assigned to each PS. Then, these indexes are also
assigned to every landslide by computing the average or the moda value of all the PS included within
its boundary, in order to assess how good the ground surface covered by each phenomenon is to
backscatter the satellite radar signal with respect to its relief and land use.
The R-Index (RI) is based on the approach proposed by Notti et al. [8] and it is calculated through
Equation (1) that represents the ratio between the slant range and the ground range, taking into account
the acquisition geometry of the radar (i.e., incidence angle = θ; angle from North of the satellite track = α)
and the geometry of the ground surface (slope and aspect layers, S and A, respectively, derived from a
Digital Eleveation Model –DEM- with 20 m resolution):
(1)
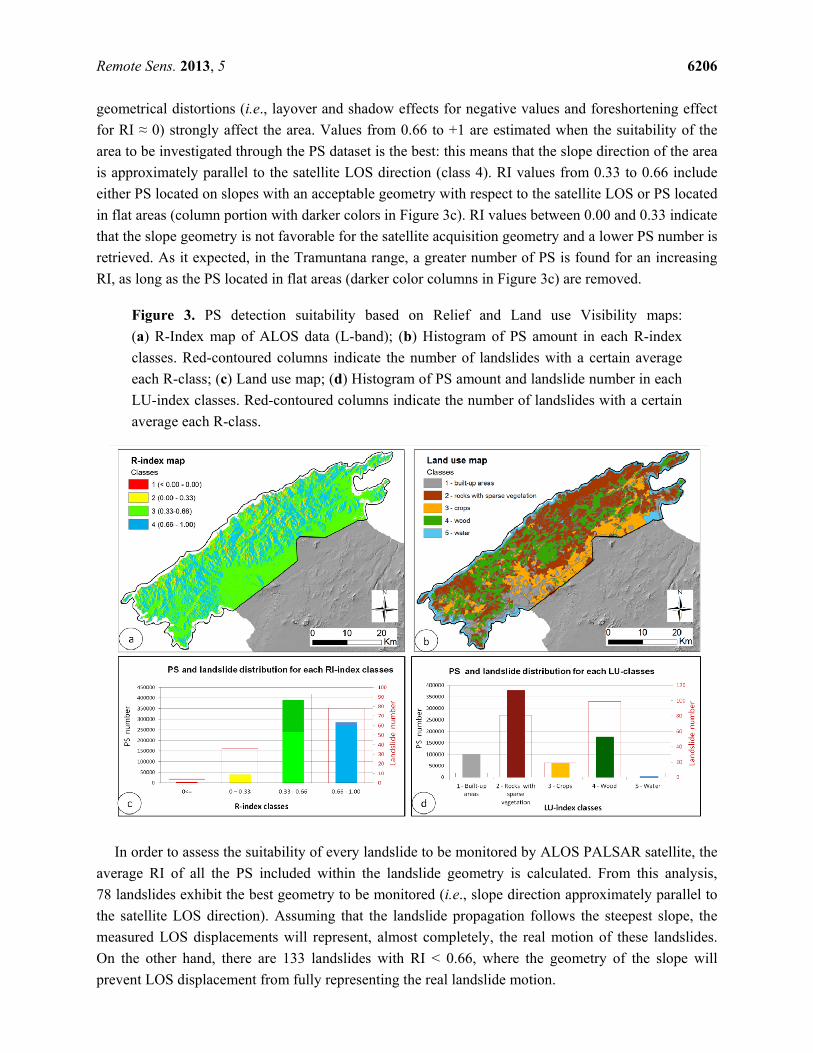
The RI ranges from the maximum value +1 to −1 and four classes are defined (Figure 3). In
particular, it assumes negative or around 0 values (class 1) when no PS can be detected or when
))90sin(sin( ϑα −+−⋅−= ASRI
Remote Sens. 2013, 5 6206
geometrical distortions (i.e., layover and shadow effects for negative values and foreshortening effect
for RI ≈ 0) strongly affect the area. Values from 0.66 to +1 are estimated when the suitability of the
area to be investigated through the PS dataset is the best: this means that the slope direction of the area
is approximately parallel to the satellite LOS direction (class 4). RI values from 0.33 to 0.66 include
either PS located on slopes with an acceptable geometry with respect to the satellite LOS or PS located
in flat areas (column portion with darker colors in Figure 3c). RI values between 0.00 and 0.33 indicate
that the slope geometry is not favorable for the satellite acquisition geometry and a lower PS number is
retrieved. As it expected, in the Tramuntana range, a greater number of PS is found for an increasing
RI, as long as the PS located in flat areas (darker color columns in Figure 3c) are removed.
Figure 3. PS detection suitability based on Relief and Land use Visibility maps:
(a) R-Index map of ALOS data (L-band); (b) Histogram of PS amount in each R-index
classes. Red-contoured columns indicate the number of landslides with a certain average
each R-class; (c) Land use map; (d) Histogram of PS amount and landslide number in each
LU-index classes. Red-contoured columns indicate the number of landslides with a certain
average each R-class.
In order to assess the suitability of every landslide to be monitored by ALOS PALSAR satellite, the
average RI of all the PS included within the landslide geometry is calculated. From this analysis,
78 landslides exhibit the best geometry to be monitored (i.e., slope direction approximately parallel to
the satellite LOS direction). Assuming that the landslide propagation follows the steepest slope, the
measured LOS displacements will represent, almost completely, the real motion of these landslides.
On the other hand, there are 133 landslides with RI < 0.66, where the geometry of the slope will
prevent LOS displacement from fully representing the real landslide motion.
Remote Sens. 2013, 5 6207
The Land Use Index (LU-index) calculation permits to analyze the effect of the land coverage on
PS detectability [8]. Five main categories of land use, based on the theoretical radar signal penetration
properties, are defined: (i) areas with buildings and structures; (ii) rocks, talus of wide dimensions,
rocky areas with sparse vegetation; (iii) cultivated fields; (iv) scrublands with bushes and woods; and
(v) water reservoirs. Land-use categories on Tramuntana range, extracted from the Corine Land Cover
of the Balearic Islands, are homogenized and reduced to the five classes (Figure 3b). In Figure 3d, the
PS number in each LU class is also shown. It can be seen that rocky outcrops with sparse vegetation
show the highest number of PS, followed by scrubland with bushes and woods. This is due to the
dominant presence of massive rock outcrops in vegetated areas all through the Tramuntana range. The
calculation of the LU moda value for all the PS detected within each landslide reveals that
180 landslides (85% of the total) are monitored in vegetated environments with a dominant presence of
massif rocks (classes 2 and 4) (Figure 3d).
5.2. LOS Displacement Projection along the Steepest Slope
PS displacement represents the one-dimensional projection in the satellite LOS direction of the real
movement that actually occurs in all three dimensions. In order to overcome the differences given by
ground geometry and satellite LOS, all the PS average yearly VLOS (mm/yr) are projected into the same
direction of the steepest slope, by means of Equation (2), obtaining VSLOPE (mm/yr) [22,23]. Thus, this
downslope projection is designed to compare landslide velocities with different slope orientations,
enriching VLOS information.
(2)
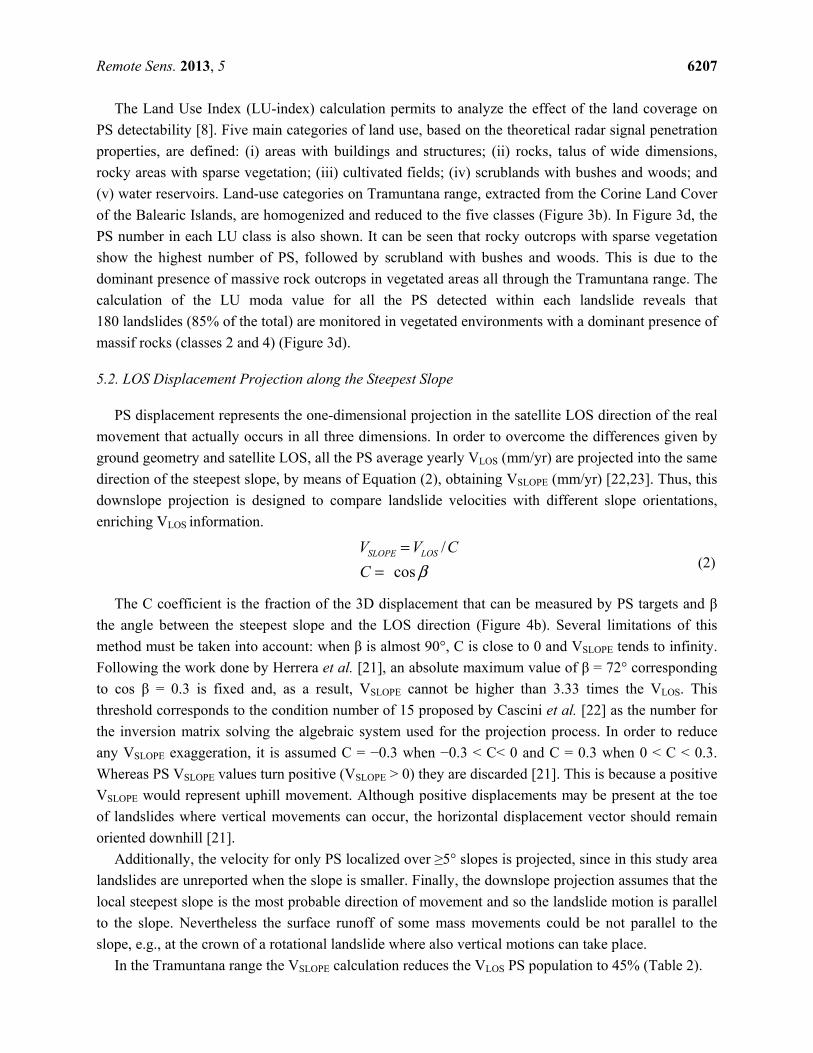
The C coefficient is the fraction of the 3D displacement that can be measured by PS targets and β
the angle between the steepest slope and the LOS direction (Figure 4b). Several limitations of this
method must be taken into account: when β is almost 90°, C is close to 0 and VSLOPE tends to infinity.
Following the work done by Herrera et al. [21], an absolute maximum value of β = 72° corresponding
to cos β = 0.3 is fixed and, as a result, VSLOPE cannot be higher than 3.33 times the VLOS. This
threshold corresponds to the condition number of 15 proposed by Cascini et al. [22] as the number for
the inversion matrix solving the algebraic system used for the projection process. In order to reduce
any VSLOPE exaggeration, it is assumed C = −0.3 when −0.3 < C< 0 and C = 0.3 when 0 < C < 0.3.
Whereas PS VSLOPE values turn positive (VSLOPE > 0) they are discarded [21]. This is because a positive
VSLOPE would represent uphill movement. Although positive displacements may be present at the toe
of landslides where vertical movements can occur, the horizontal displacement vector should remain
oriented downhill [21].
Additionally, the velocity for only PS localized over ≥5° slopes is projected, since in this study area
landslides are unreported when the slope is smaller. Finally, the downslope projection assumes that the
local steepest slope is the most probable direction of movement and so the landslide motion is parallel
to the slope. Nevertheless the surface runoff of some mass movements could be not parallel to the
slope, e.g., at the crown of a rotational landslide where also vertical motions can take place.
In the Tramuntana range the VSLOPE calculation reduces the VLOS PS population to 45% (Table 2).
β cos
/
==
C
CVV LOSSLOPE
Remote Sens. 2013, 5 6208
Even though the reduction of PS data is significant, this transformation improves their integration
with the landslides inventory. Exploiting the VLOS measurements, only 71 landslides (with almost
1 PS) show a negative displacement (i.e., downhill displacement or away from the satellite), whereas
95 of them exhibit a positive VLOS (i.e., uplift or towards the satellite). As it was explained in the
previous section, this is due to the distortion introduced by the satellite acquisition geometry with
respect to the slope relief. Once the VLOS is projected along the steepest slope, a total of 148 landslides
reveal a negative displacement, among which 77 landslides (with almost 1 PS) show an average
VSLOPE < −5 mm/yr (Table 3).
Table 3. Amounts and velocity rates of PS ALOS populations.
Landslides with PS Number ≥ 1 Landslides with PS Number > 4
N° Landslides PS VLOS 166 96
VLOS < −3 10 2
−3 < VLOS < +3 144 88
VLOS > +3 12 6
N° Landslides PS VSLOPE 148 77
VSLOPE < −5 77 42
−10 < VSLOPE < −5 64 38
VSLOPE < −10 13 7
Active Clusters with PS Out-Points Number > 4 PS
N° Active clusters
VLOS < −3 333
VLOS > +3 455
VSLOPE < −5 4189
VSLOPE < −10 615
5.3. Velocity Thresholds Determination
Velocity thresholds need to be established for distinguishing moving from not moving PS. Some
authors, such as Herrera et al. [21] and Righini et al. [9], consider 2 mm/yr as the VLOS stability
threshold for PSI C-band data. Other works [11] use a threshold of 5 mm/yr for VSLOPE obtained by a
calibration procedure. However, there are no previously published thresholds for PSI L-band data
results, due to the reduced number of applications.
Herein, authors use velocity threshold criteria based on the statistical analysis of PS velocity
distributions. As VLOS and VSLOPE PS populations show different velocity distribution patterns, being
the first approximately normal (Gaussian) and the second negatively skewed due to the PS reduction,
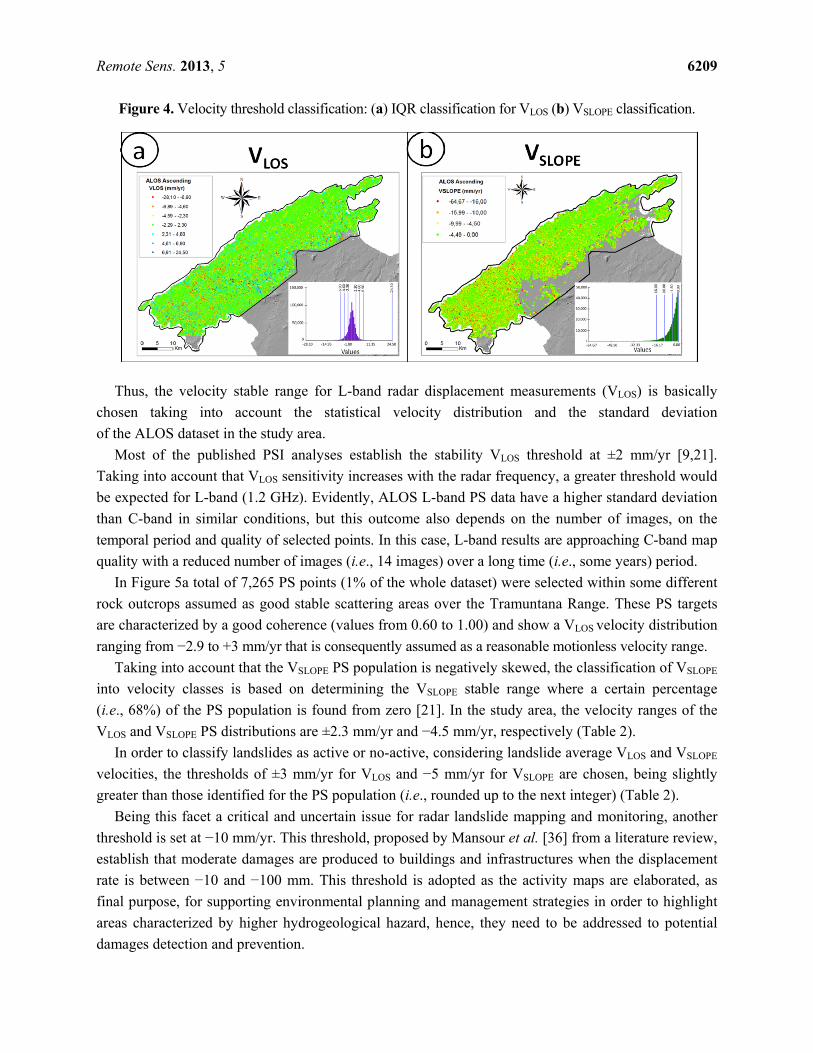
the two PS distributions are classified separately (Figure 4).
The classification of VLOS into velocity classes is based on the Inter-Quantile Range (IQR) around
zero (Figure 4a). The central position (Q2) is zero, while Q1 and Q3 are the upper and lower positions,
found by adding/detracting the standard deviation (σ) value to Q2 (0 ± σ). Thus, the IQR, which
represents the “dispersion” of data around zero, is considered the stable threshold range. The further
lower and upper velocity classes are derived using the σ value.
Remote Sens. 2013, 5 6209
Figure 4. Velocity threshold classification: (a) IQR classification for VLOS (b) VSLOPE classification.
Thus, the velocity stable range for L-band radar displacement measurements (VLOS) is basically
chosen taking into account the statistical velocity distribution and the standard deviation
of the ALOS dataset in the study area.
Most of the published PSI analyses establish the stability VLOS threshold at ±2 mm/yr [9,21].
Taking into account that VLOS sensitivity increases with the radar frequency, a greater threshold would
be expected for L-band (1.2 GHz). Evidently, ALOS L-band PS data have a higher standard deviation
than C-band in similar conditions, but this outcome also depends on the number of images, on the
temporal period and quality of selected points. In this case, L-band results are approaching C-band map
quality with a reduced number of images (i.e., 14 images) over a long time (i.e., some years) period.
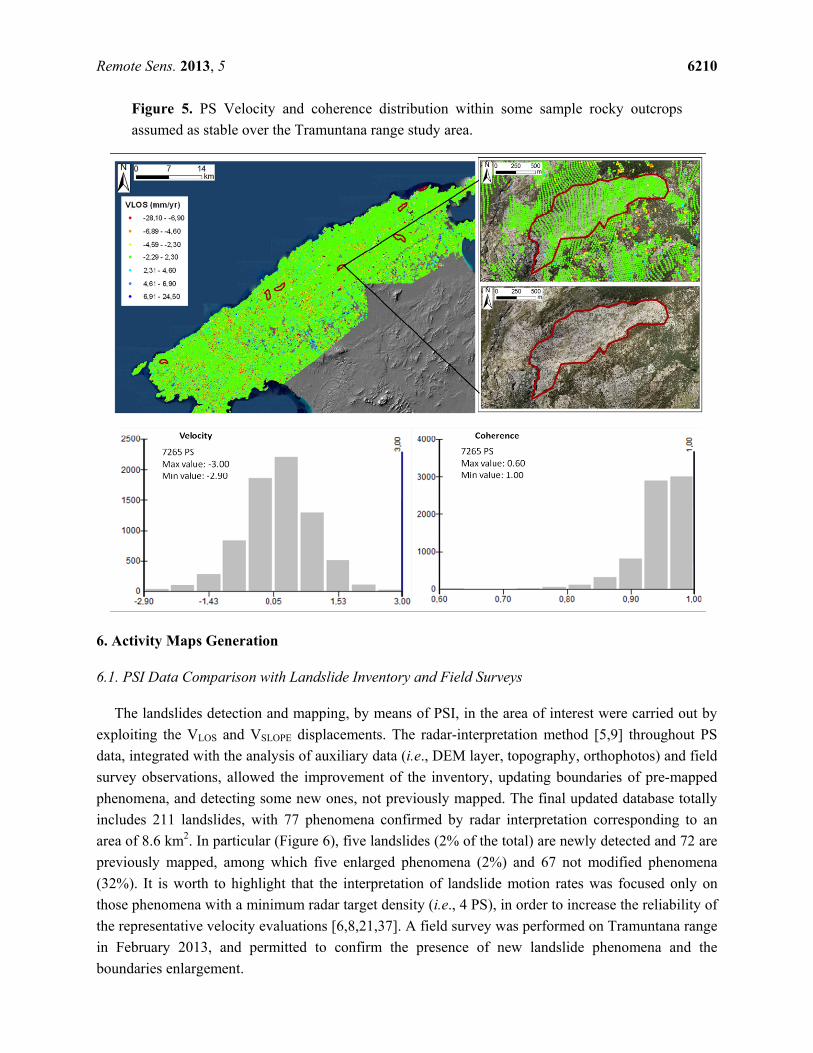
In Figure 5a total of 7,265 PS points (1% of the whole dataset) were selected within some different
rock outcrops assumed as good stable scattering areas over the Tramuntana Range. These PS targets
are characterized by a good coherence (values from 0.60 to 1.00) and show a VLOS velocity distribution
ranging from −2.9 to +3 mm/yr that is consequently assumed as a reasonable motionless velocity range.
Taking into account that the VSLOPE PS population is negatively skewed, the classification of VSLOPE
into velocity classes is based on determining the VSLOPE stable range where a certain percentage
(i.e., 68%) of the PS population is found from zero [21]. In the study area, the velocity ranges of the
VLOS and VSLOPE PS distributions are ±2.3 mm/yr and −4.5 mm/yr, respectively (Table 2).
In order to classify landslides as active or no-active, considering landslide average VLOS and VSLOPE
velocities, the thresholds of ±3 mm/yr for VLOS and −5 mm/yr for VSLOPE are chosen, being slightly
greater than those identified for the PS population (i.e., rounded up to the next integer) (Table 2).
Being this facet a critical and uncertain issue for radar landslide mapping and monitoring, another
threshold is set at −10 mm/yr. This threshold, proposed by Mansour et al. [36] from a literature review,
establish that moderate damages are produced to buildings and infrastructures when the displacement
rate is between −10 and −100 mm. This threshold is adopted as the activity maps are elaborated, as
final purpose, for supporting environmental planning and management strategies in order to highlight
areas characterized by higher hydrogeological hazard, hence, they need to be addressed to potential
damages detection and prevention.
Remote Sens. 2013, 5 6210
Figure 5. PS Velocity and coherence distribution within some sample rocky outcrops
assumed as stable over the Tramuntana range study area.
6. Activity Maps Generation
6.1. PSI Data Comparison with Landslide Inventory and Field Surveys
The landslides detection and mapping, by means of PSI, in the area of interest were carried out by
exploiting the VLOS and VSLOPE displacements. The radar-interpretation method [5,9] throughout PS
data, integrated with the analysis of auxiliary data (i.e., DEM layer, topography, orthophotos) and field
survey observations, allowed the improvement of the inventory, updating boundaries of pre-mapped
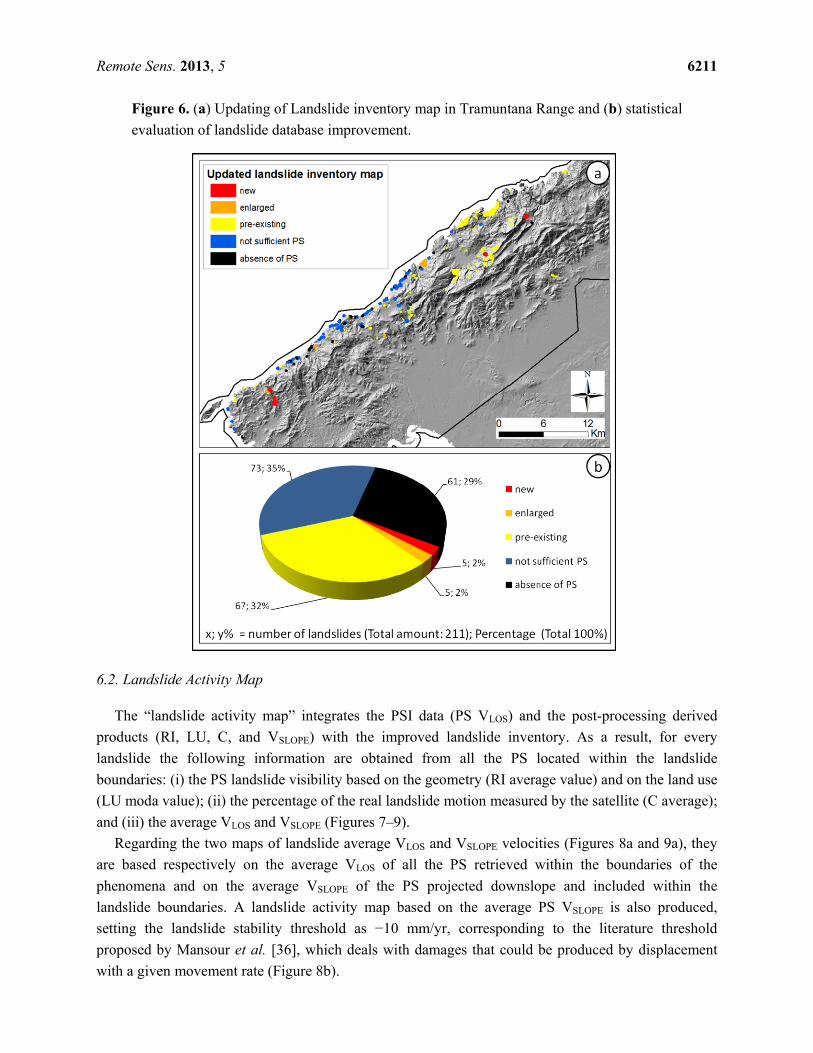
phenomena, and detecting some new ones, not previously mapped. The final updated database totally
includes 211 landslides, with 77 phenomena confirmed by radar interpretation corresponding to an
area of 8.6 km2. In particular (Figure 6), five landslides (2% of the total) are newly detected and 72 are
previously mapped, among which five enlarged phenomena (2%) and 67 not modified phenomena
(32%). It is worth to highlight that the interpretation of landslide motion rates was focused only on
those phenomena with a minimum radar target density (i.e., 4 PS), in order to increase the reliability of
the representative velocity evaluations [6,8,21,37]. A field survey was performed on Tramuntana range
in February 2013, and permitted to confirm the presence of new landslide phenomena and the
boundaries enlargement.
Remote Sens. 2013, 5 6211
Figure 6. (a) Updating of Landslide inventory map in Tramuntana Range and (b) statistical
evaluation of landslide database improvement.
6.2. Landslide Activity Map
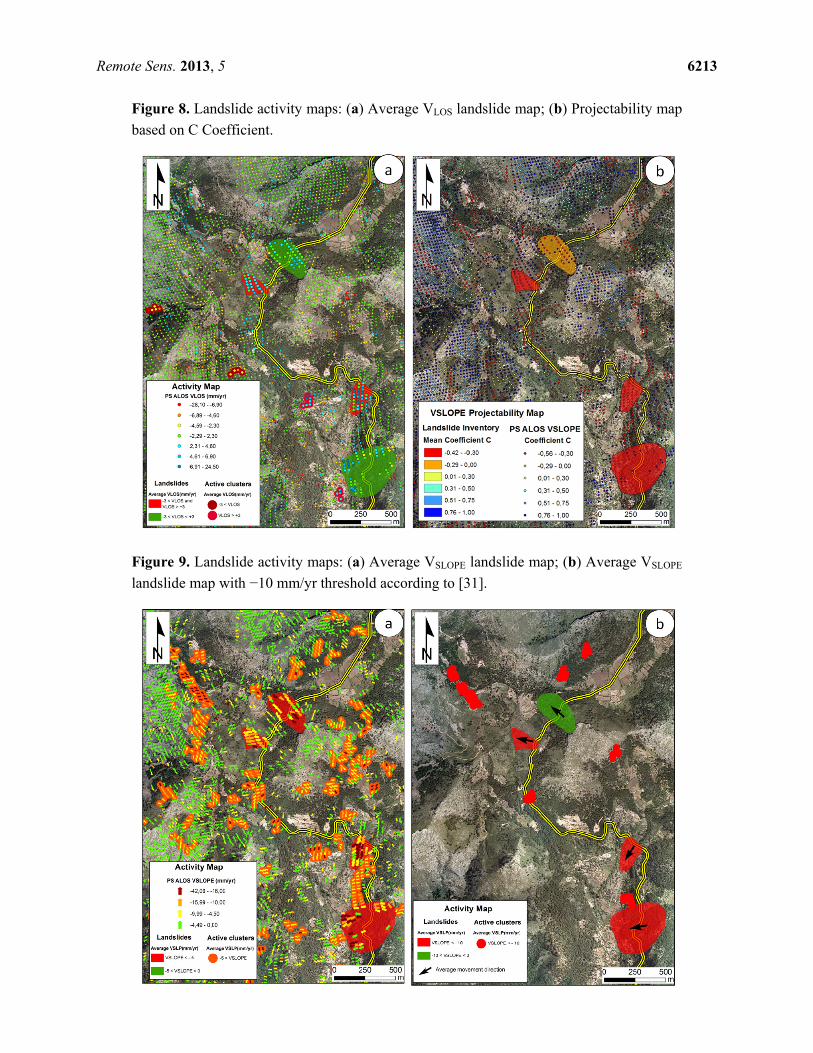
The “landslide activity map” integrates the PSI data (PS VLOS) and the post-processing derived
products (RI, LU, C, and VSLOPE) with the improved landslide inventory. As a result, for every
landslide the following information are obtained from all the PS located within the landslide
boundaries: (i) the PS landslide visibility based on the geometry (RI average value) and on the land use
(LU moda value); (ii) the percentage of the real landslide motion measured by the satellite (C average);
and (iii) the average VLOS and VSLOPE (Figures 7–9).
Regarding the two maps of landslide average VLOS and VSLOPE velocities (Figures 8a and 9a), they
are based respectively on the average VLOS of all the PS retrieved within the boundaries of the
phenomena and on the average VSLOPE of the PS projected downslope and included within the
landslide boundaries. A landslide activity map based on the average PS VSLOPE is also produced,
setting the landslide stability threshold as −10 mm/yr, corresponding to the literature threshold
proposed by Mansour et al. [36], which deals with damages that could be produced by displacement
with a given movement rate (Figure 8b).
Remote Sens. 2013, 5 6212
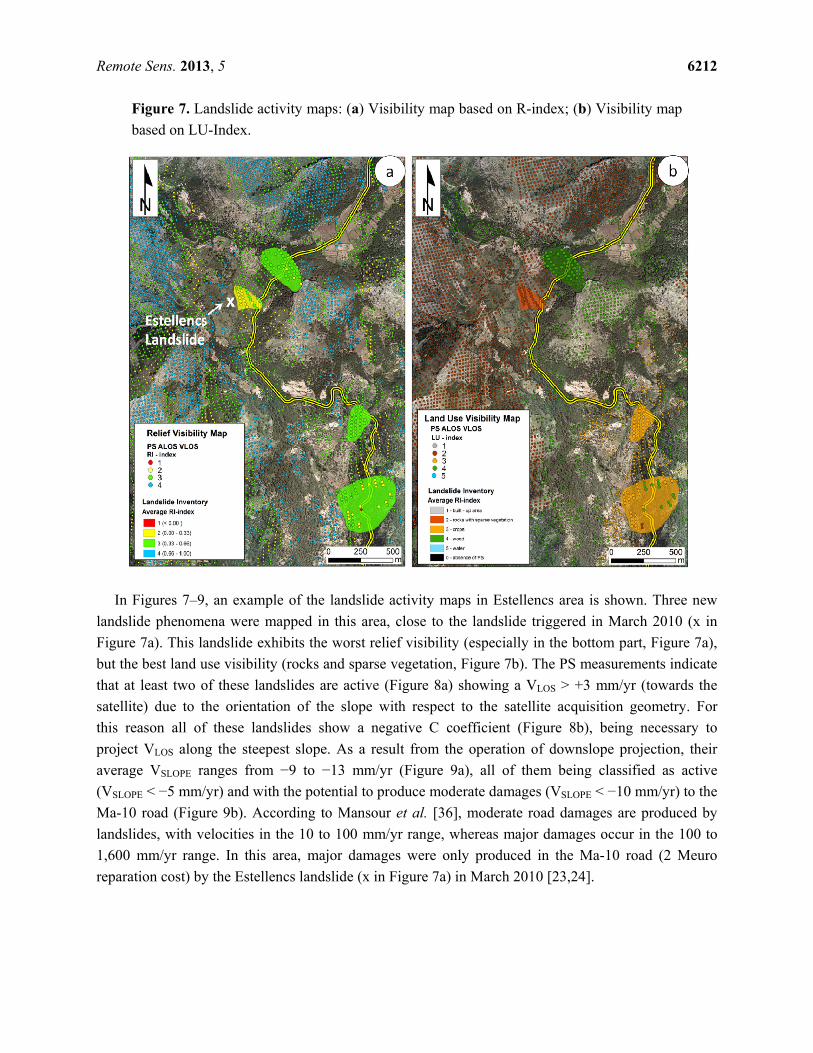
Figure 7. Landslide activity maps: (a) Visibility map based on R-index; (b) Visibility map
based on LU-Index.
In Figures 7–9, an example of the landslide activity maps in Estellencs area is shown. Three new
landslide phenomena were mapped in this area, close to the landslide triggered in March 2010 (x in
Figure 7a). This landslide exhibits the worst relief visibility (especially in the bottom part, Figure 7a),
but the best land use visibility (rocks and sparse vegetation, Figure 7b). The PS measurements indicate
that at least two of these landslides are active (Figure 8a) showing a VLOS > +3 mm/yr (towards the
satellite) due to the orientation of the slope with respect to the satellite acquisition geometry. For
this reason all of these landslides show a negative C coefficient (Figure 8b), being necessary to
project VLOS along the steepest slope. As a result from the operation of downslope projection, their
average VSLOPE ranges from −9 to −13 mm/yr (Figure 9a), all of them being classified as active
(VSLOPE < −5 mm/yr) and with the potential to produce moderate damages (VSLOPE < −10 mm/yr) to the
Ma-10 road (Figure 9b). According to Mansour et al. [36], moderate road damages are produced by
landslides, with velocities in the 10 to 100 mm/yr range, whereas major damages occur in the 100 to
1,600 mm/yr range. In this area, major damages were only produced in the Ma-10 road (2 Meuro
reparation cost) by the Estellencs landslide (x in Figure 7a) in March 2010 [23,24].
Remote Sens. 2013, 5 6213
Figure 8. Landslide activity maps: (a) Average VLOS landslide map; (b) Projectability map
based on C Coefficient.
Figure 9. Landslide activity maps: (a) Average VSLOPE landslide map; (b) Average VSLOPE
landslide map with −10 mm/yr threshold according to [31].
Remote Sens. 2013, 5 6214
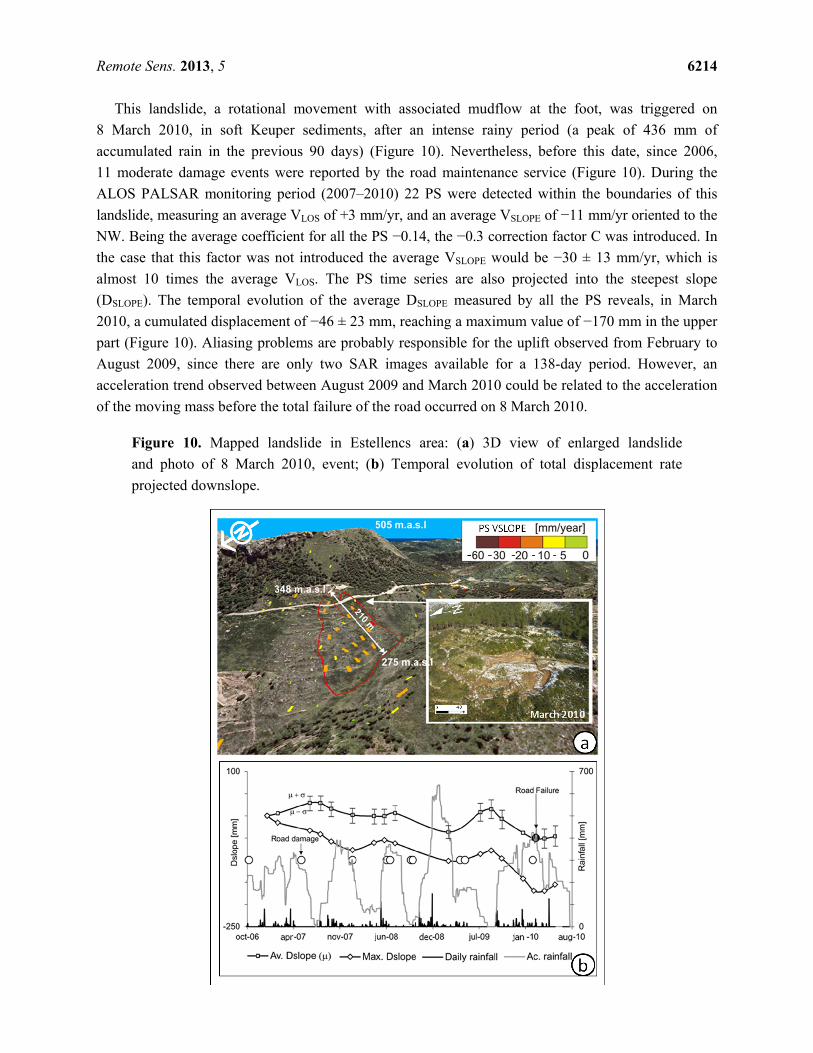
This landslide, a rotational movement with associated mudflow at the foot, was triggered on
8 March 2010, in soft Keuper sediments, after an intense rainy period (a peak of 436 mm of
accumulated rain in the previous 90 days) (Figure 10). Nevertheless, before this date, since 2006,
11 moderate damage events were reported by the road maintenance service (Figure 10). During the
ALOS PALSAR monitoring period (2007–2010) 22 PS were detected within the boundaries of this
landslide, measuring an average VLOS of +3 mm/yr, and an average VSLOPE of −11 mm/yr oriented to the
NW. Being the average coefficient for all the PS −0.14, the −0.3 correction factor C was introduced. In
the case that this factor was not introduced the average VSLOPE would be −30 ± 13 mm/yr, which is
almost 10 times the average VLOS. The PS time series are also projected into the steepest slope
(DSLOPE). The temporal evolution of the average DSLOPE measured by all the PS reveals, in March
2010, a cumulated displacement of −46 ± 23 mm, reaching a maximum value of −170 mm in the upper
part (Figure 10). Aliasing problems are probably responsible for the uplift observed from February to
August 2009, since there are only two SAR images available for a 138-day period. However, an
acceleration trend observed between August 2009 and March 2010 could be related to the acceleration
of the moving mass before the total failure of the road occurred on 8 March 2010.
Figure 10. Mapped landslide in Estellencs area: (a) 3D view of enlarged landslide
and photo of 8 March 2010, event; (b) Temporal evolution of total displacement rate
projected downslope.
Remote Sens. 2013, 5 6215
6.3. Ground Motion Activity Map
The “Ground motion activity map” is derived from the moving PS not included within landslide
boundaries (hereafter called “outpoints”). These outpoints can be related either to unknown landslides
or to other types of geomorphological processes, such as erosion or downhill creep, characteristic of
mountainous environments [7,38]. In order to identify unstable areas, the outpoints with VLOS < −3,
VLOS > +3 mm/yr, or VSLOPE < −5 mm/yr are clustered following the procedure proposed by
Meisina et al. [6]. These clusters derive from the 26 m radius of the circumscribed circle where the
multi-look PS area is inscribed. Clusters of at least 4 PS are selected and their average velocity is
computed, in order to identify potentially hazardous unmapped areas (the so-called “active clusters”).
In the Tramuntana range, 788 active clusters were identified considering VLOS, and 4189 considering
VSLOPE (Table 3). Taking into account the −10 mm/yr damage threshold proposed by Mansour et al. [36]
and commented above, the amount of active clusters is reduced to 615 (Table 3). From this amount,
18 of them intersect the Ma-10 Road, being the most hazardous ones and requiring additional field
surveys. Punctual field checks revealed that some of these active clusters are related to movements of
soil fillings (road embankments, tailing dams from quarries, or waste dams from construction works).
7. Confidence Degree Evaluation
The confidence degree of landslide and ground motion activity maps can be evaluated throughout
their comparison with external independent sources, such as damages inventories, in situ
measurements, field checks, etc. This evaluation aims at assessing if measured displacement represents
landslides dynamics. It is important to highlight that the reliability on the PSI measurement itself is not
evaluated, but whether this measurement is related to landslide activity or not. Three confidence
degree levels are established—low, medium, and high—depending upon ground truth data availability.
In the Tramuntana range, the confidence degree determination of the activity maps was performed
through the use of Ma-10 road damage database, which is the most relevant element at risk with high
exposure in the area of interest. Comparing LSI and damages to the road, it can be seen that 18
landslides intersect the Road M-10: five of them caused damages in 2007–2010, and 13 produced
damages before 2007 (Table 4).
ALOS PS data acquired in 2007–2010 monitored 11 landslides intersecting the Road, among which
two phenomena produced damages in this period and nine produced damages before 2007, classified
as “True” and “False” landslides, respectively (Table 4). The two landslide polygons that intersect the
road and produced damages in 2007–2010, detected by ALOS data, show an average VSLOPE of −8 and
−11 mm/yr. According to the 10 mm/yr landslide damage threshold adopted by Mansour et al. [36],
the former would be a “True Negative” (i.e., inactive landslide producing damages), whereas the latter
would be a “True Positive” (i.e., active landslide producing damages). Among the nine landslides
detected by ALOS that did not produce damages to the road, three of them are “False Positives”
(i.e., active landslides not producing damages), and six of them are “False Negatives” (i.e., inactive
landslides not producing damages).
Remote Sens. 2013, 5 6216
Table 4. Amounts and velocity rates of PS ALOS populations.
Reported Road
Ma-10 Damages
Reported Road Damages
Detected by ALOS PS
in 2007–2010
Average Velocity
True False Positive
(VSLOPE < −10 mm/yr)
Negative
(VSLOPE > −10 mm/yr)
5 landslides
(damages in 2007–2010) 2 1 1
13 landslides
(damages previous to 2007) 9 3 6
According to this analysis, our success rate is 63% over the 11 landslides that were monitored with
ALOS data in the period 2007–2010. Consequently, a high confidence degree is attributed to seven
landslides, specifically, one “True Positive” and six “False Negative” phenomena, as measured
displacements (active/inactive) can be correlated with reported damages (occurred/not occurred).
A medium confidence degree is assigned to the rest of detected landslides (93 phenomena) with
more than 4 PS or more than 50% of their spatial extension covered by PS pixel area. In these
landslides, it cannot be confirmed that measured displacement (active/inactive) is related to landslide
activity. However it is the most probable explanation since displacement measurements were gathered
within the landslide boundaries.
Figure 11. Confidence degree evaluation of Activity maps.
A low confidence degree is attributed to those landslides where neither sufficient number of PS data
(or no PS at all), nor ground information, provide evidence of terrain displacement. This confidence
Remote Sens. 2013, 5 6217
degree is also attributed to all the active clusters derived from moving PS out-points, since the
mechanism of the triggering cause is unknown. Thus, a low confidence degree is allocated to 51
detected landslides with less than 4 PS or less than 50% of their surface covered by PS pixel area, and
to all the 615 active clusters with an average VSLOPE < −10 mm/yr, 18 of which intersect the Ma-10
Road (Figure 11).
8. Discussion
Overall, the PSI analysis of ALOS PALSAR images in the Tramuntana Range reveals a good
performance for mapping and monitoring landslides in a rural environment, due to the high penetration
capacity of the L-band sensor and a sufficient sampling of SAR images for a three-year temporal span
(2007–2010). This time interval coincides with the most critical rainy and cold period of the study
area, when several landslide phenomena were triggered.
The reduced geometrical decorrelation combined with the long satellite revisiting time in L-band
(i.e., 46 days for ALOS system) leads to successful applications of L-band data especially for
conventional differential interferometry, e.g., [39–42]. However, the use of L-band PSI allows a
feasible investigation on natural areas such as Tramuntana range covered by rocky outcrops and
scrubland, due to its lower volumetric and temporal decorrelation in vegetated zones with respect to
C-band data, which are usually used in literature [6,9,37] for landslide detection and mapping.
Furthermore, L-band SAR data yields an intrinsic capability to detect faster ground movements with
respect to C-band, just due to the longer orbital repeat cycle and wavelength.
The PSI post-processing stage permits to evaluate how good is the area to backscatter the radar
signal, permitting to assess the suitability of the detected PS in terms of the satellite acquisition
geometry, the relief, and the land-use. In the Tramuntana range, 37% of the landslides exhibit the best
geometry to be monitored (i.e., average RI > 0.66; slope direction approximately parallel to the
satellite LOS direction), whereas for 63% a certain geometrical distortion will be introduced in the PS
measurement (average RI < 0.66). Concerning the land use, rocky outcrops with sparse vegetation and
scrubland with bushes or woods show the highest number of PS, because this land use class represents
the most widespread one in the Tramuntana range and because of the presence of many good stable
reflectors retrieved in L-band. In particular, 180 landslides (85% of the total) are successfully
monitored in a vegetated environment with a dominant presence of massif rocks (23 PS/landslide on
average), confirming the high penetration capacity on the ground of ALOS PALSAR sensor.
The projection of the VLOS along the steepest slope permits to homogenize landslide velocities with
different slope orientations. This procedure significantly reduces the PS population (45% in the
Tramuntana range), but enriches the VLOS interpretation. The number of landslides monitored with a
sufficient number of PS (> than 4 PS or more than 50% of the landslide area covered by PS) using the
VLOS dataset is 96, being reduced to 80% (77 landslides) when VSLOPE dataset is considered.
However, it is worth to highlight that the downslope projection of VLOS values is only valid when
the landslide movement is parallel to the slope. This requirement typically holds for planar slides with
slow-moving flow, but not for rotational landslides, which generally possess a vertical movement at
the crown and horizontal movement at the toe. In the Tramuntana range, the projection procedure turns
Remote Sens. 2013, 5 6218
out to be suitable since the most frequent phenomena, besides rockfalls, are translational slides, debris
slides, and earth/debris flows.
In order to classify landslides velocity from L-band radar displacement measurements, the
thresholds of ±3 mm/yr for landslide average VLOS and −5mm/yr for landslide average VSLOPE are
chosen. These values are slightly greater than those identified for the PS population (i.e., rounded up to
the next integer) (Table 2), and they account for 77% and 68%, respectively, of the PS population.
Most of the published landslide PSI analyses have been conducted on C-band (5.3 GHz) and establish
the stability VLOS threshold at ±2 mm/yr [9,21]. Taking into account that the VLOS sensitivity increases
with the radar frequency, a proportionally greater threshold would be expected for L-band (1.2 GHz),
i.e., higher by a factor of more than four. ALOS L-band data have a higher standard deviation than
C-band in similar conditions, but this feature also depends on the number of images, the temporal
period and the quality of selected points. In this case, in the Tramuntana range L-band results are close
to C-band map quality with a reduced number of images over a long acquisition time period.
Moreover, it is worth to underline that ALOS PS data in the study area show a high coherence and
hence a low standard deviation is achieved even within L-band dataset. Therefore, the chosen ±3 mm/yr
threshold that is only 50% greater than the commonly adopted C-band threshold is assumed as a
reasonable range for landslide movements based on L-band VLOS distribution.
By the way, being a critical issue for landslide monitoring, and the adopted threshold potentially
small, a −10 mm/yr threshold is set to identify active landslides. This threshold, proposed by
Mansour et al. [36] from a literature review, establishes that moderate damages are produced to
buildings and infrastructures when the displacement rate is between −10 and −100 mm/yr. The
adoption of this threshold for landslide activity maps elaboration is adequate, as the final purpose of
these maps is to highlight areas where potential damages could be produced, as a support to
environmental planning and management strategies.
The landslide activity map integrates the PSI data, the post-processing derived products (RI, LU, C,
and VSLOPE) with the landslide inventory (LSI), permitting to improve the interpretation of measured
displacements with respect to landslide dynamics. In the Tramuntana range, 35 landslides were identified
as inactive and 42 of them as active, from which seven of them overpass the −10 mm/yr threshold.
The “Ground motion activity map” consists of a set of active PS clusters that are not included
within the mapped landslide boundaries, and that can be related to either unknown landslides or to
other types of geomorphological processes. In the Tramuntana range 615 active clusters show a
velocity above the 10 mm/yr threshold (18 of them intersecting the Ma-10) representing potentially
hazardous areas.
The confidence degree of landslide and ground motion activity maps is evaluated throughout their
comparison with external independent sources, aiming to assess if measured displacement represents
the landslide dynamics or not. In the Tramuntana range, the confidence degree determination of the
activity maps was performed through the use of the damages database on Ma-10 road, which is the
most relevant element at risk with high exposure in the area of interest. A high confidence degree is
attributed to seven landslides as measured displacements (active/inactive) can be correlated with
reported damages (occurred/not occurred). Particular attention is paid to Estellencs landslide, where
the acceleration trend observed between August 2009 and March 2010 could be related to the
acceleration of the moving mass before the total failure of the road occurred on 8 March 2010.
Remote Sens. 2013, 5 6219
A medium confidence degree is assigned to 93 landslides as PSI measured displacement
(active/inactive) coincide with the landslide boundaries, but there are no external sources to confirm
landslide activity. A low confidence degree is attributed to 51 landslides where an insufficient number
of PS (or no PS at all) provides evidence of terrain displacement. This confidence degree is also
attributed to the 615 detected active clusters since their mechanism of the triggering cause is unknown.
Overall, the landslide database on the Tramuntana range (Figure 1e) has been enhanced by
detecting and analyzing landslide phenomena and further unstable areas (Figure 11) characterized by
higher motion rates. The reliability of the delivered maps has been assessed through the confidence
degree evaluation, making this “added value” interesting and useful for the policy decisions and
strategies concerning risk mitigation and urban-environmental design.
9. Conclusions
In this paper landslide and ground motion activity maps are elaborated through the use of PS
(Persistent Scatterers) ALOS data in L-band, over the Tramuntana Range in the island of Majorca
(Spain), extensively affected by mass movements across time, especially during the last years.
The landslide activity map provides, for every monitored landslide, an assessment of the PS
visibility according to the relief, land use and satellite acquisition parameters. The average VLOS and
VSLOPE velocities are also attributed to every landslide, providing an estimate of their state of activity
and their potential to cause damages. Additionally, a ground motion activity map is also generated,
based on active PS clusters not included within any mapped landslide phenomenon. Finally, a
confidence degree evaluation is carried out to attest the reliability of measured displacements to
represent landslide dynamics. In the Tramuntana range 42 landslides were identified as active (VSLOPE
< −5mm/yr) and seven of them with a potential to produce moderate damage (VSLOPE < −10mm/yr). A
high confidence degree was attributed to seven landslides, a medium one to 93, and a low confidence
degree to 51 landslide phenomena and to 615 active clusters, 18 of them intersecting the Ma-10 and
thus representing further potentially hazardous areas.
Overall, the outcomes of this work reveal the usefulness of landslide activity maps for environmental
planning activities, being exportable to other radar data and different geomorphological settings.
Acknowledgments
This work was carried out by Silvia Bianchini during a research internship in the Geohazards
InSAR laboratory (InSARlab), Geoscience Research Department of the Geological Survey of Spain
(IGME, Madrid), within the DORIS project (Ground Deformation Risk Scenarios: an Advanced
Assessment Service) funded by the EC-GMES-FP7 initiative (Grant Agreement n 242212).
The damage inventory was provided by the Civil Protection of Majorca Island. The pre-existing
available mass-movement inventory was carried out collecting various historical compilation of the
slope movements on Majorca island by Mateos et al. [23] and Mateos [27] and in situ information and
provided with the support from the Emergency and Road Maintenance Services of Balearic Islands.
Remote Sens. 2013, 5 6220
Conflicts of Interest
The authors declare no conflict of interest.
References
1. Mantovani, F.; Soeters, R.; Van Western, C.J. Remote Sensing techniques for landslide studies
and hazard zonation in Europe. Geomorphology 1996, 15, 213–225.
2. Ferretti, A.; Prati, C.; Rocca, F. Permanent Scatterers in SAR Interferometry. IEEE Trans. Geosci.
Remote Sens. 2001, 39, 8–20.
3. Hilley, G.E.; Burgmann, R.; Ferretti, A.; Novali, F.; Rocca, F. Dynamics of slow-moving
landslides from Permanent Scatterer analysis. Science 2004, 304, 1952–1955.
4. Farina, P.; Moretti, S.; Colombo, D.; Fumagalli, A.; Manunta, P. Landslide Risk Analysis by
Means of Remote Sensing Techniques: Results from the ESA/SLAM project. In Proceedings of
the International Geoscience and Remote Sensing Symposium (IGARSS), Anchorage, Alaska,
20–24 September 2004; pp. 62–65.
5. Farina, P.; Colombo, D.; Fumagalli, A.; Marks, F.; Moretti, S. Permanent Scatterers for landslide
investigations: outcomes from the ESA-SLAM project. Eng. Geol. 2006, 88, 200–217.
6. Meisina, C.; Zucca, F.; Notti, D.; Colombo, A.; Cucchi, G.; Giannico, C.; Bianchi, M. Geological
Interpretation of PSInSAR Data at Regional Scale. Sensors 2008, 8, 7469–7492.
7. Herrera, G.; Davalillo, J.C.; Mulas, J.; Cooksley, G.; Monserrat, O.; Pancioli, V. Mapping and
monitoring geomorphological processes in mountainous areas using PSI data: Central Pyrenees
case study. Nat. Hazards Earth Syst. Sci. 2009, 9, 1587–1598.
8. Notti, D.; Davalillo, J.C.; Herrera, G.; Mora, O. Assessment of the performance of X-band
satellite radar data for landslide mapping and monitoring: Upper Tena Valley case study.
Nat. Hazards Earth Syst. Sci. 2010, 10, 1865–1875.
9. Righini, G.; Pancioli, V.; Casagli, N. Updating landslide inventory maps using Persistent Scatterer
Interferometry (PSI). Int. J. Remote Sens. 2012, 33, 2068–2096.
10. Žibret, G.; Komac; M., Jemec, M. PSInSAR displacements related to soil creep and rainfall
intensities in the Alpine foreland of western Slovenia. Geomorphology 2012, 175–176, 107–114.
11. Cigna F.; Bianchini S.; Casagli N. How to assess landslide activity and intensity with Persistent
Scatterer Interferometry (PSI): The PSI-based matrix approach. Landslides 2013, 10, 267–283.
12. Liu, P.; Li, Z.; Hoey T.; Kincal, C.; Zhang, J.; Zeng, Q.; Muller, J. Using advanced InSAR time
series techniques to monitor landslide movements in Bading of the Three Gorges region, China.
Int. J. Appl. Earth Obs. Geoinf. 2013, 21, 253–264.
13. Crosetto, M.; Monserrat, O.; Iglesias, R.; Crippa, B. Persistent Scatterer Interferometry: potential,
limits and initial C- and X-band comparison. Photogramm. Eng. Remote Sens. 2010, 76, 1061–1069.
14. Lu, P.; Casagli, N.; Catani, F.; Tofani, V. Persistent Scatterers Interferometry Hotspot and Cluster
Analysis (PSI-HCA) for detection of extremely slow-moving landslides. Int. J. Remote. Sens.
2012, 33, 466–489.
Remote Sens. 2013, 5 6221
15. Lu, P.; Catani, F.; Tofani, V.; Casagli, N. Quantitative hazard and risk assessment for
slow-moving landslides from Persistent Scatterer Interferometry. Landslides 2013,
doi:10.1007/s10346–013–0432–2.
16. Herrera, G.; Notti, D.; García-Davalillo, J.C.; Mora, O.; Cooksley, G.; Sánchez, M.; Arnaud, A.;
Crosetto, M. Analysis with C- and X-band satellite SAR data of the Portalet landslide area.
Landslides 2011, 8, 195–206.
17. Bovenga, F.; Wasowski, J.; Nitti, D.O.; Nutricato, R.; Chiaradia, M.T. Using COSMO/SyMed
X-band and ENVISAT C-band SAR interferometry for landslides analysis. Remote Sens. Environ.
2012, 119, 272–285.
18. Tofani, V; Raspini F.; Catani, F; Casagli, N. Persistent Scatterer Interferometry (PSI) Technique
for landslide characterization and monitoring. Remote Sens. 2013, 5, 1045–1065.
19. Strozzi, T.; Ambrosi, C.; Raetzo H. Interpretation of aerial photographs and satellite SAR
Interferometry for the inventory of landslides. Remote Sens. 2013, 5, 2554–2570.
20. Del Ventisette, C.; Ciampalini, A; Manunta, M; Calò, F.; Paglia, L.; Ardizzone, F.;
Mondini, A.C.; Reichenbach, P.; Mateos, R.M.; Bianchini, S.; et al. Exploitation of large archives
of ERS and ENVISAT C-band SAR data to characterize ground deformations. Remote Sens.
2013, 5, 3896–3917.
21. Herrera, G.; Gutiérrez, F.; Garcí-Davalillo, J.C.; Guerrero, J.; Galve, J.P.; Fernández-Morodo, J.A.;
Cooksley, G. Multi-sensor advanced DInSAR monitoring of very slow landslides: the Tena valley
case study (central Spanish Pyrenees). Remote Sens. Environ. 2013, 128, 31–43.
22. Cascini, L.; Fornaro, G.; Peduto, D. Advanced low‐ and full‐resolution DInSAR map generation
for slow‐moving landslide analysis at different scales. Eng. Geol. 2010, 112, 29–42.
23. Colesanti, C.; Wasowski, J. Investigating landslides with space-borne Synthetic Aperture Radar
(SAR) Interferometry. Eng. Geol. 2006, 88, 173–199.
24. Mateos, R.M.; Azañon, J.M. Los movimientos de ladera en la Sierra de Tramuntana de la Isla de
Majorca: Tipos, características y factores condicionantes. Rev. Soc. Geol. España. 2005, 18, 89–99.
25. Mateos, R.M.; García-Moreno, I.; Herrera, G.; Mulas, J. Damage Caused by Recent
Mass-Movements in Majorca (Spain), a Region with a High Risk due to Tourism. In Proceedings
of The Second World Landslide Forum, Rome, Italy, 3–9 October 2011; p. 35.
26. Mateos, R.M.; García-Moreno, I.; Azañon, J.M. Freeze-thaw cycles and rainfall as triggering
factors of mass movements in a warm Mediterranean region: The case of the Tramuntana Range
(Majorca, Spain). Landslides 2012, 9, 417–432
27. Gelabert, B.; Sabat, F.; Rodriguez-Perea, A. A structural outline of the Serra de Tramuntana of
Majorca (Balearic Islands). Tectonophysics 1992, 203, 167–183.
28. Mateos, R.M.; Azañon, J.M.; Morales, R.; López-Chicano, M. Regional prediction of landslides
in the Tramuntana Range (Majorca) using probability analysis of intense rainfall. Geomorphology
2007, 51, 287–306.
29. Alvaro, M. La tectonica de cabalgamientos de la Sierra Norte de Majorca (Islas Baleares).
Bol. Geol. Min. 1987, 98, 34–41.
30. Mateos, R.M. Los Movimientos de Ladera en la Serra de Tramuntana (Majorca). Caracterización
Geomecánica y Análysis de Peligrosidad. Ph.D. Thesis, Colección Digital de Tesis de la
Universidad Complutense de Madrid, Madrid, Spain, 2006.
Remote Sens. 2013, 5 6222
31. Cruden, D.M.; Varnes, D.J. Landslide Types and Processes. In Landslides: Investigation and
Mitigation: Sp. Rep. 247; Turner, A.K., Schuster, R.L., Eds.; Transportation Research Board,
National research Council, National Academy Press: Washington, DC, USA, 1996; pp. 36–75.
32. Arnaud, A.; Adam, N.; Hanssen, R.; Inglada, J.; Duro, J.; Closa, J.; Eineder, M. ASAR ERS
Interferometric Phase Continuity. In Proceedings of the International Geoscience and Remote
Sensing Symposium (IGARSS), Toulouse, France, 21–25 July 2003.
33. Duro, J.; Closa, J; Biescas, E.; Crosetto, M.; Arnaud, A. High Resolution Differential
Interferometry Using Time Series of ERS and ENVISAT SAR Data. In Proceedings of 6th
Geomatic Week Conference, Barcelona, Spain, 8–11 February 2005.
34. Colombo, A.; Mallen, L.; Pispico, R.; Giannico, C.; Bianchi, M.; Savio, G. Mappatura regionale
delle aree monitorabili mediante l’uso della tecnica PS. In Proceedings of 10th National
Conference ASITA, Bolzano, Italy, 4–17 Novembre 2006.
35. Plank, S.; Singer, J.; Minet, C.; Thruro, K. Pre-survey suitability evaluation of the differential
synthetic aperture radar interferometry method for landslide monitoring. Int. J. Remote Sens.
2012, 33, 6623–6637.
36. Mansour, M.F.; Morgenstern, N.R.; Derek Martin, C. Expected damage from displacement of
slow-moving slides. Landslides 2011, 8, 117–131.
37. Bianchini, S.; Cigna, F.; Righini, G.; Proietti, C.; Casagli, N. Landslide HotSpot Mapping by
means of Persistent Scatterer Interferometry. Environ. Earth Sci. 2012, 67, 1155–1172.
38. Wasowski, J.; Refice, A.; Bovenga, F.; Nutricato, R.; Gostelow, P. On the applicability of SAR
Interferometry techniques to the detection of slope deformations. In Proceedings of 9th
International Association of Engineering Geologists (IAEG) Congress, Durban, South Africa,
16–20 September 2002.
39. Strozzi, T.; Farina, P.; Corsini, A.; Ambrosi, C.; Thüring, M.; Zilger, J.; Wiesmann, A.;
Wegmüller, U.; Werner C. Survey and monitoring of landslide displacements by means of L-band
satellite SAR interferometry. Landslides 2005, 2, 193–201.
40. Engelbrecht, J.; Inggs, M. Differential interferometry techniques on L-band data employed for the
monitoring of surface subsidence due to mining. South Afr. J. Geomatics 2013, 2, 82–93.
41. Zhou, L.; Zhang, D.; Wang, J.; Huang, Z.; Pan, D. Mapping land subsidence related to
underground coal fires in the Wuda Coalfield (Northern China) using a small stack of ALOS
PALSAR differential interferograms. Remote Sens. 2013, 5, 1152–1176.
42. García-Davalillo, J.; Herrera, G.; Notti, D.; Strozzi T.; Álvarez-Fernández, I. DInSAR analysis of
ALOS PALSAR images for the assessment of very slow landslides: The Tena Valley case study.
Landslides 2013, doi:10.1007/s10346–012–0379–8.
© 2013 by the authors; licensee MDPI, Basel, Switzerland. This article is an open access article
distributed under the terms and conditions of the Creative Commons Attribution license
(http://creativecommons.org/licenses/by/3.0/).