unveiling world's largest terry towel facility … - trident group
TRANSCRIPT
Performance Overview PresentationQ1 FY15
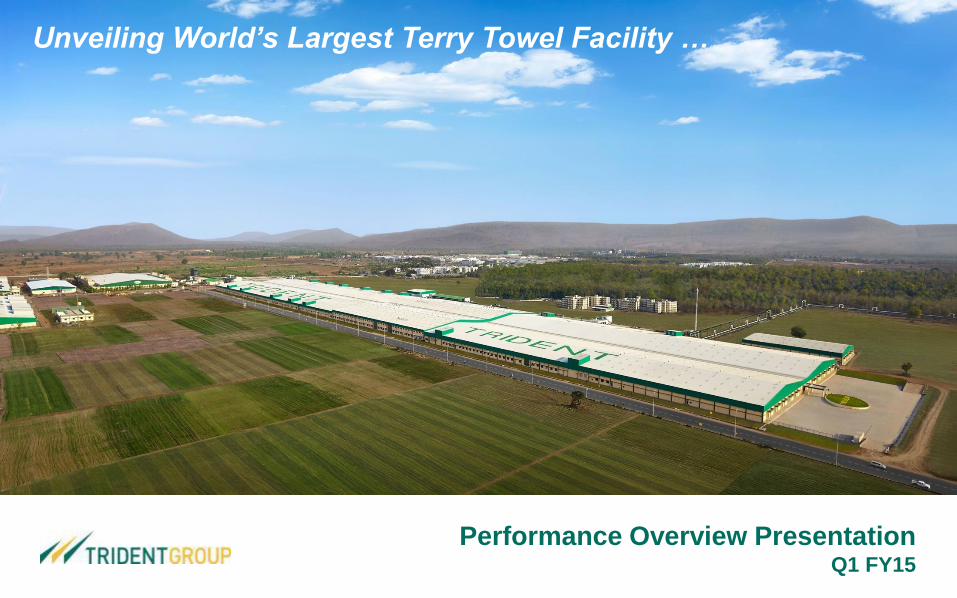
Unveiling World’s Largest Terry Towel Facility …
Safe HarborNo representation or warranty, express or implied, is made as to, and no reliance should be placed on, thefairness, accuracy, completeness or correctness of the information or opinions contained in this presentation.Such information and opinions are in all events not current after the date of this presentation. Certain statementsmade in this presentation may not be based on historical information or facts and may be "forward lookingstatements" based on the currently held beliefs and assumptions of the management of the Company, which areexpressed in good faith and in their opinion reasonable, including those relating to the Company's generalbusiness plans and strategy, its future financial condition and growth prospects and future developments in itsindustry and its competitive and regulatory environment.
Forward-looking statements involve known and unknown risks, uncertainties and other factors, which may causethe actual results, financial condition, performance or achievements of the Company or industry results to differmaterially from the results, financial condition, performance or achievements expressed or implied by suchforward-looking statements, including future changes or developments in the Company's business, itscompetitive environment and political, economic, legal and social conditions. Further, past performance is notnecessarily indicative of future results. Given these risks, uncertainties and other factors, viewers of thispresentation are cautioned not to place undue reliance on these forward-looking statements. The Companydisclaims any obligation to update these forward-looking statements to reflect future events or developments.
This presentation is for general information purposes only, without regard to any specific objectives, financialsituations or informational needs of any particular person. This presentation does not constitute an offer orinvitation to purchase or subscribe for any securities of the Company by any person in any jurisdiction, includingIndia and the United States. No part of it should form the basis of or be relied upon in connection with anyinvestment decision or any contract or commitment to purchase or subscribe for any securities. The Companymay alter, modify or otherwise change in any manner the content of this presentation, without obligation to notifyany person of such change or changes. This presentation may not be copied or disseminated in any manner.
Financial Highlights
Business Highlights
Strategy
About Us and Investor Contacts
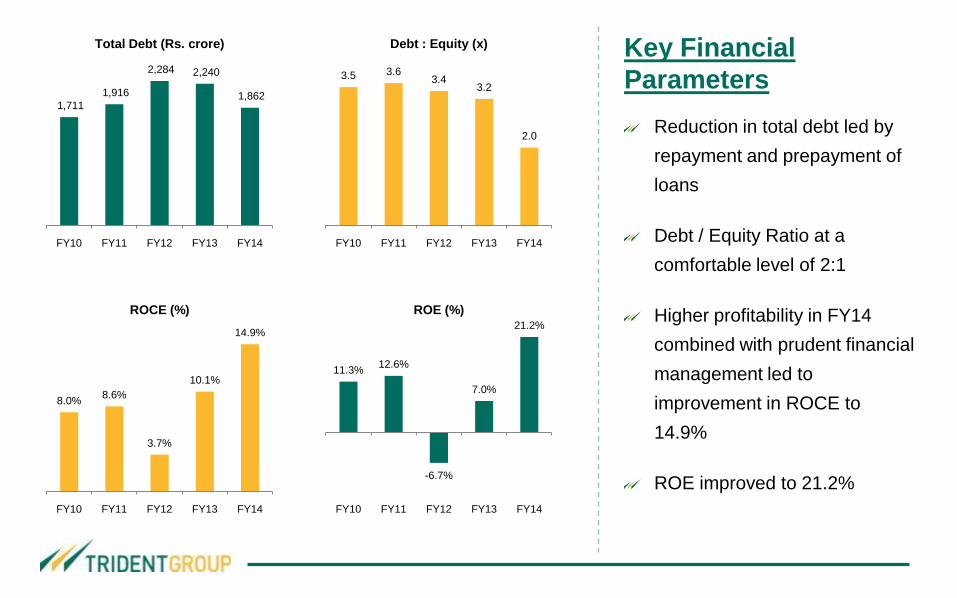
Key Financial
Parameters
Reduction in total debt led by
repayment and prepayment of
loans
Debt / Equity Ratio at a
comfortable level of 2:1
Higher profitability in FY14
combined with prudent financial
management led to
improvement in ROCE to
14.9%
ROE improved to 21.2%
1,711
1,916
2,284 2,240
1,862
FY10 FY11 FY12 FY13 FY14
Total Debt (Rs. crore)
8.0%8.6%
3.7%
10.1%
14.9%
FY10 FY11 FY12 FY13 FY14
ROCE (%)
11.3%12.6%
-6.7%
7.0%
21.2%
FY10 FY11 FY12 FY13 FY14
ROE (%)
3.5 3.63.4
3.2
2.0
FY10 FY11 FY12 FY13 FY14
Debt : Equity (x)
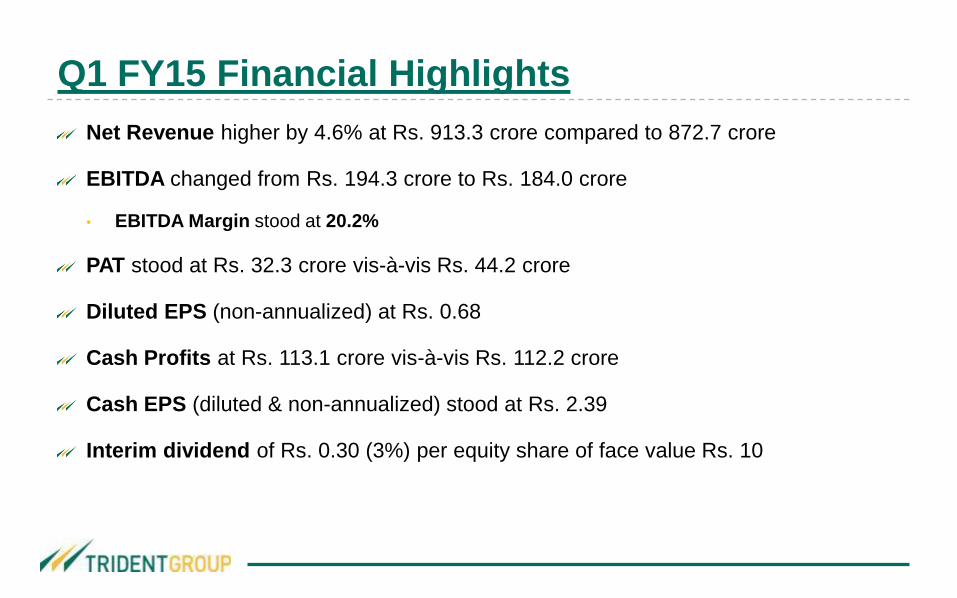
Q1 FY15 Financial Highlights
Net Revenue higher by 4.6% at Rs. 913.3 crore compared to 872.7 crore
EBITDA changed from Rs. 194.3 crore to Rs. 184.0 crore
• EBITDA Margin stood at 20.2%
PAT stood at Rs. 32.3 crore vis-à-vis Rs. 44.2 crore
Diluted EPS (non-annualized) at Rs. 0.68
Cash Profits at Rs. 113.1 crore vis-à-vis Rs. 112.2 crore
Cash EPS (diluted & non-annualized) stood at Rs. 2.39
Interim dividend of Rs. 0.30 (3%) per equity share of face value Rs. 10
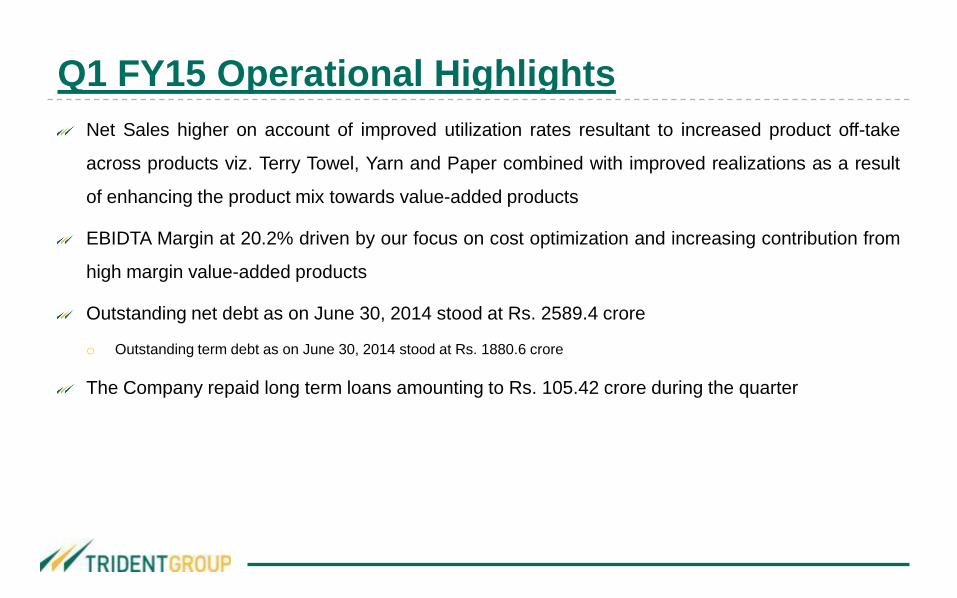
Q1 FY15 Operational Highlights
Net Sales higher on account of improved utilization rates resultant to increased product off-take
across products viz. Terry Towel, Yarn and Paper combined with improved realizations as a result
of enhancing the product mix towards value-added products
EBIDTA Margin at 20.2% driven by our focus on cost optimization and increasing contribution from
high margin value-added products
Outstanding net debt as on June 30, 2014 stood at Rs. 2589.4 crore
o Outstanding term debt as on June 30, 2014 stood at Rs. 1880.6 crore
The Company repaid long term loans amounting to Rs. 105.42 crore during the quarter
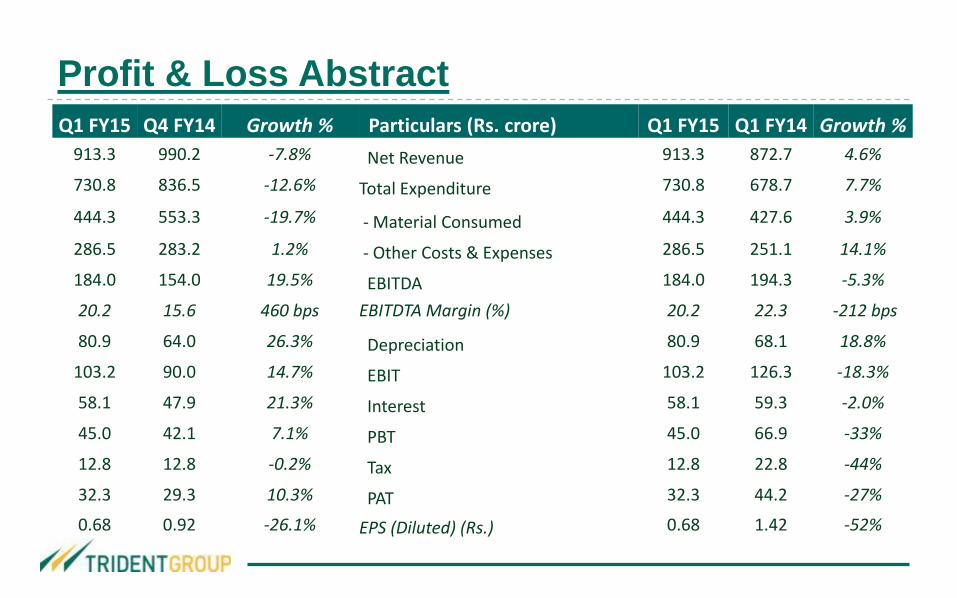
Profit & Loss Abstract
Q1 FY15 Q4 FY14 Growth % Particulars (Rs. crore) Q1 FY15 Q1 FY14 Growth %
913.3 990.2 -7.8% Net Revenue 913.3 872.7 4.6%
730.8 836.5 -12.6% Total Expenditure 730.8 678.7 7.7%
444.3 553.3 -19.7% - Material Consumed 444.3 427.6 3.9%
286.5 283.2 1.2% - Other Costs & Expenses 286.5 251.1 14.1%
184.0 154.0 19.5% EBITDA 184.0 194.3 -5.3%
20.2 15.6 460 bps EBITDTA Margin (%) 20.2 22.3 -212 bps
80.9 64.0 26.3% Depreciation 80.9 68.1 18.8%
103.2 90.0 14.7% EBIT 103.2 126.3 -18.3%
58.1 47.9 21.3% Interest 58.1 59.3 -2.0%
45.0 42.1 7.1% PBT 45.0 66.9 -33%
12.8 12.8 -0.2% Tax 12.8 22.8 -44%
32.3 29.3 10.3% PAT 32.3 44.2 -27%
0.68 0.92 -26.1% EPS (Diluted) (Rs.) 0.68 1.42 -52%
Management Comment
Commenting on the performance, Mr. Rajinder Gupta, Chairman at Trident
Group, said:
“The performance during the quarter is reflective of the progress on several strategic initiatives. The
commissioning of our new Terry Towel facility in Budni is under stabilization. However, it has started
adding to the overall efficiencies and is reflected in the improved margin profile of this business. The
full benefits of these capacities will be visible from FY16 onwards. In the paper business, our focus is
on improving productivity and operational efficiencies.
While we consolidate operations in the near term, we are confident of delivering sustained growth
through larger capacities and improved product offerings in the longer term. At the same
time, measures to strengthen our balance sheet will help us contain debt and financial costs relative
to the increasing size of our operation which will deliver enhanced value to our shareholders.”
Financial Highlights
Business Highlights
Strategy
About Us and Investor Contacts

Trident Textiles
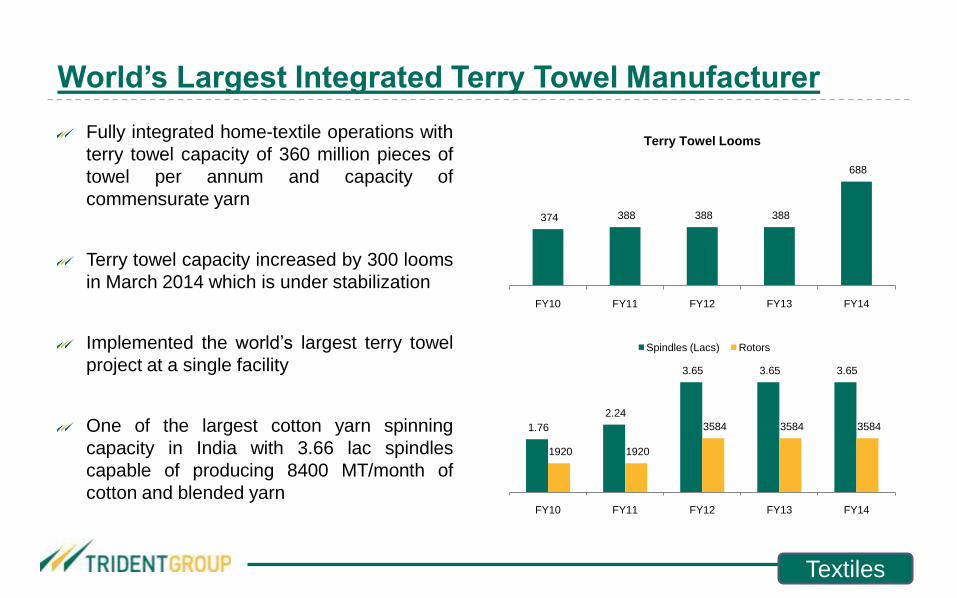
World’s Largest Integrated Terry Towel Manufacturer
Fully integrated home-textile operations with
terry towel capacity of 360 million pieces of
towel per annum and capacity of
commensurate yarn
Terry towel capacity increased by 300 looms
in March 2014 which is under stabilization
Implemented the world’s largest terry towel
project at a single facility
One of the largest cotton yarn spinning
capacity in India with 3.66 lac spindles
capable of producing 8400 MT/month of
cotton and blended yarn
374 388 388 388
688
FY10 FY11 FY12 FY13 FY14
Terry Towel Looms
Textiles
1.76
2.24
3.65 3.65 3.65
1920 1920
3584 3584 3584
FY10 FY11 FY12 FY13 FY14
Spindles (Lacs) Rotors
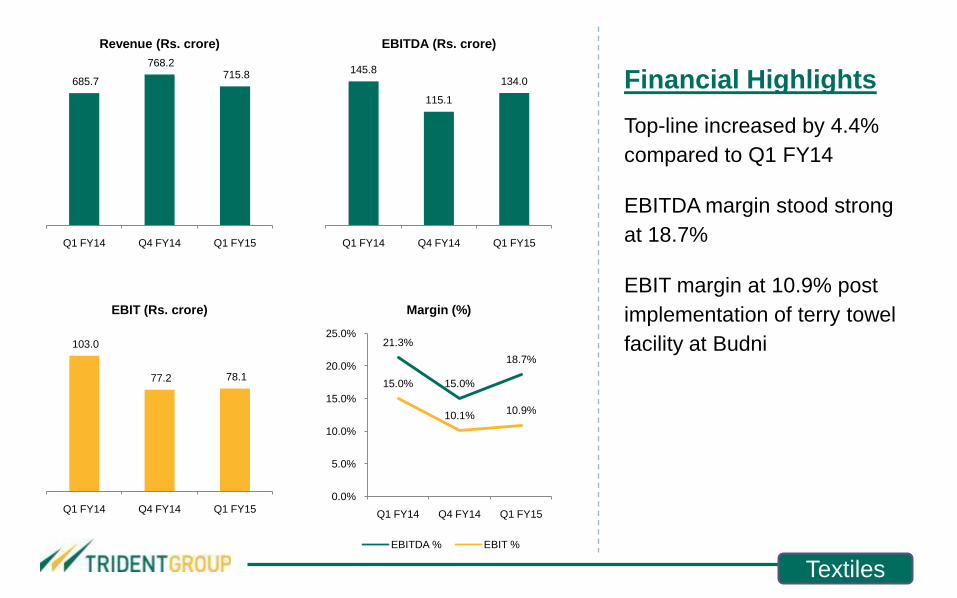
Financial Highlights
Top-line increased by 4.4%
compared to Q1 FY14
EBITDA margin stood strong
at 18.7%
EBIT margin at 10.9% post
implementation of terry towel
facility at Budni
685.7
768.2 715.8
Q1 FY14 Q4 FY14 Q1 FY15
Revenue (Rs. crore)
145.8
115.1
134.0
Q1 FY14 Q4 FY14 Q1 FY15
EBITDA (Rs. crore)
21.3%
15.0%
18.7%
15.0%
10.1%10.9%
0.0%
5.0%
10.0%
15.0%
20.0%
25.0%
Q1 FY14 Q4 FY14 Q1 FY15
Margin (%)
EBITDA % EBIT %
103.0
77.2 78.1
Q1 FY14 Q4 FY14 Q1 FY15
EBIT (Rs. crore)
Textiles
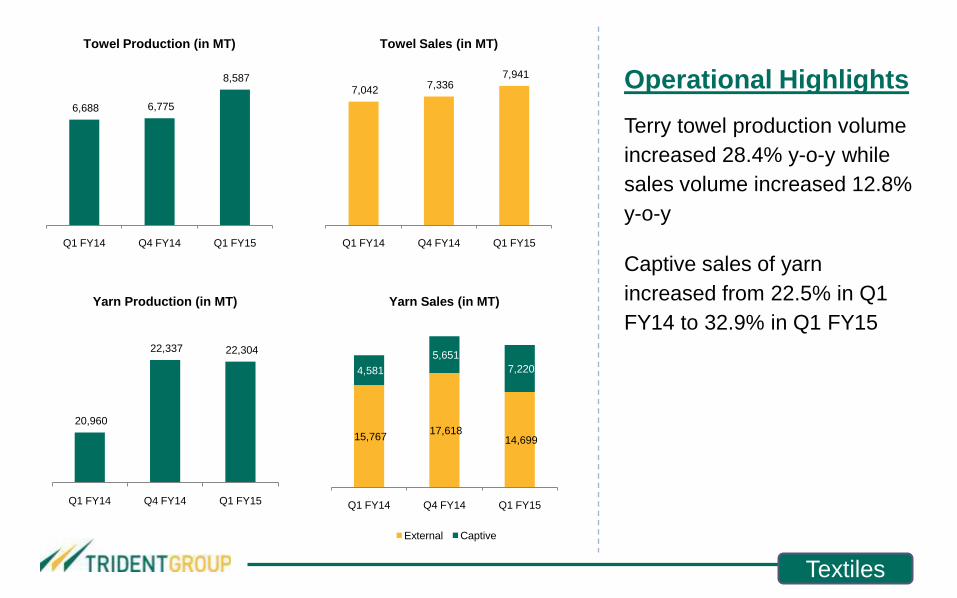
Operational Highlights
Terry towel production volume
increased 28.4% y-o-y while
sales volume increased 12.8%
y-o-y
Captive sales of yarn
increased from 22.5% in Q1
FY14 to 32.9% in Q1 FY15
6,688 6,775
8,587
Q1 FY14 Q4 FY14 Q1 FY15
Towel Production (in MT)
7,042 7,336
7,941
Q1 FY14 Q4 FY14 Q1 FY15
Towel Sales (in MT)
20,960
22,337 22,304
Q1 FY14 Q4 FY14 Q1 FY15
Yarn Production (in MT)
15,767 17,618
14,699
4,581
5,651
7,220
Q1 FY14 Q4 FY14 Q1 FY15
Yarn Sales (in MT)
External Captive
Textiles
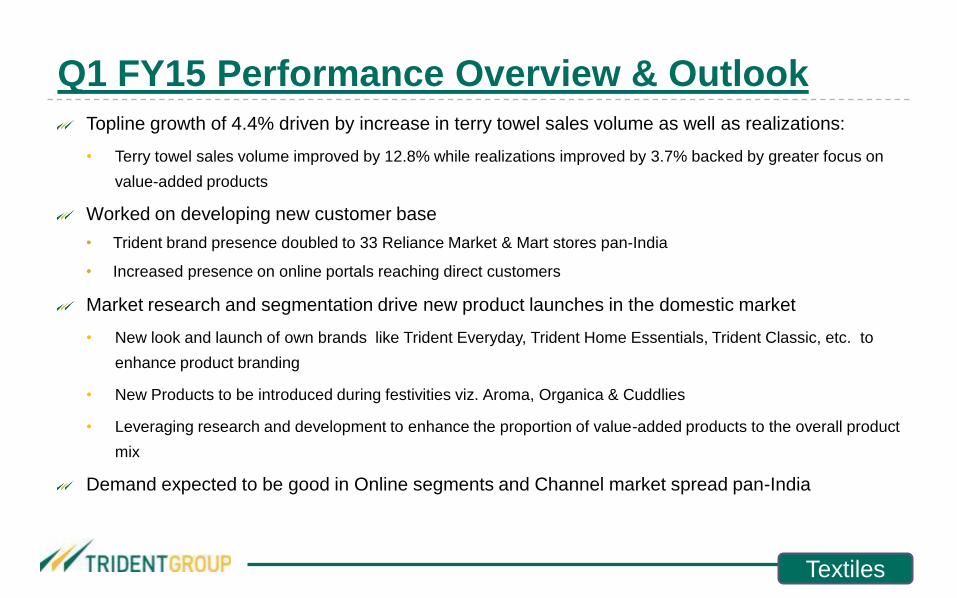
Q1 FY15 Performance Overview & Outlook
Topline growth of 4.4% driven by increase in terry towel sales volume as well as realizations:
• Terry towel sales volume improved by 12.8% while realizations improved by 3.7% backed by greater focus on
value-added products
Worked on developing new customer base
• Trident brand presence doubled to 33 Reliance Market & Mart stores pan-India
• Increased presence on online portals reaching direct customers
Market research and segmentation drive new product launches in the domestic market
• New look and launch of own brands like Trident Everyday, Trident Home Essentials, Trident Classic, etc. to
enhance product branding
• New Products to be introduced during festivities viz. Aroma, Organica & Cuddlies
• Leveraging research and development to enhance the proportion of value-added products to the overall product
mix
Demand expected to be good in Online segments and Channel market spread pan-India
Textiles
Trident Paper
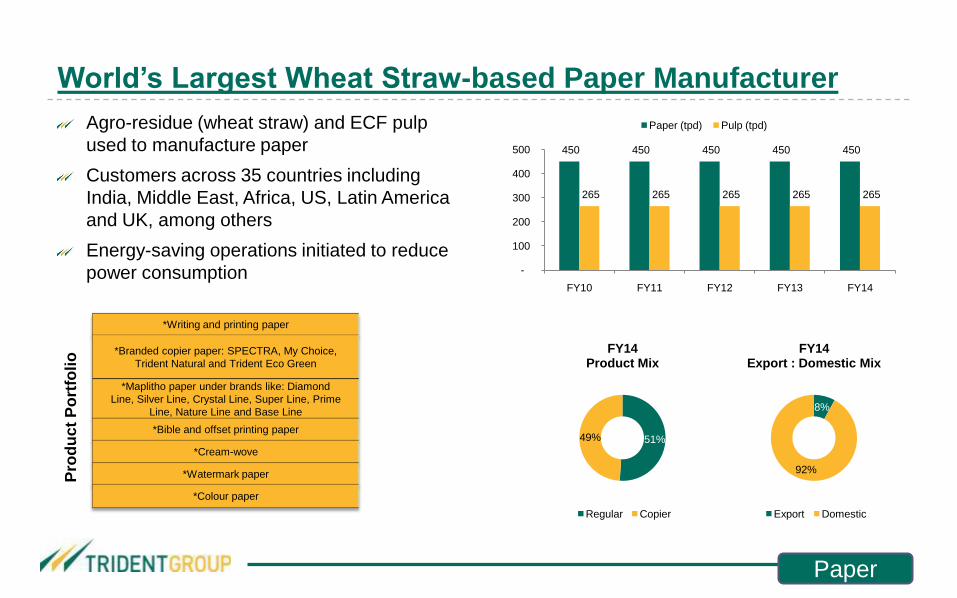
World’s Largest Wheat Straw-based Paper Manufacturer
Agro-residue (wheat straw) and ECF pulp
used to manufacture paper
Customers across 35 countries including
India, Middle East, Africa, US, Latin America
and UK, among others
Energy-saving operations initiated to reduce
power consumption
450 450 450 450 450
265 265 265 265 265
-
100
200
300
400
500
FY10 FY11 FY12 FY13 FY14
Paper (tpd) Pulp (tpd)
8%
92%
FY14Export : Domestic Mix
Export Domestic
51%49%
FY14Product Mix
Regular Copier
*Writing and printing paper
*Branded copier paper: SPECTRA, My Choice,
Trident Natural and Trident Eco Green
*Maplitho paper under brands like: Diamond
Line, Silver Line, Crystal Line, Super Line, Prime
Line, Nature Line and Base Line
*Bible and offset printing paper
*Cream-wove
*Watermark paper
*Colour paper
Pro
du
ct
Po
rtfo
lio
Paper
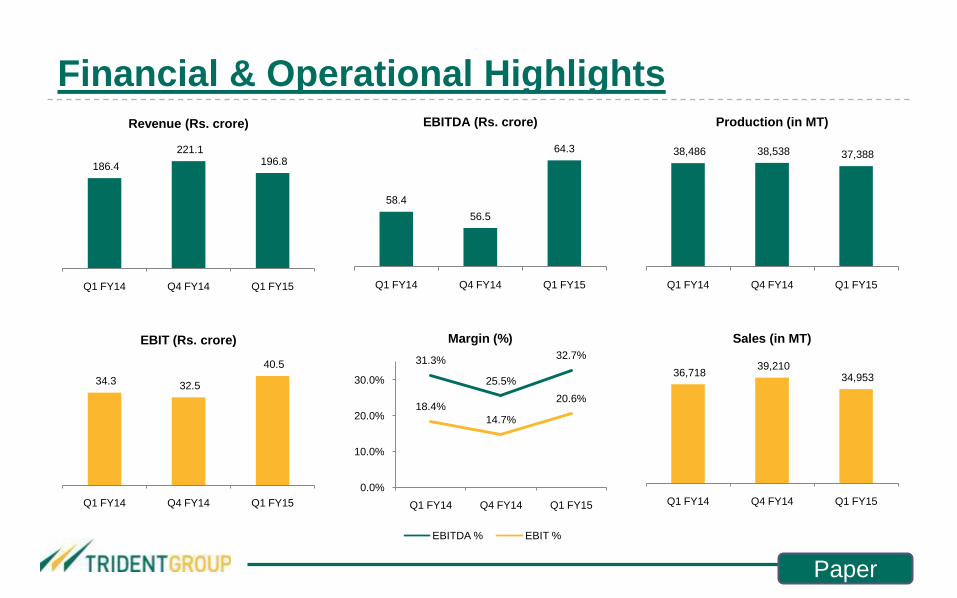
Financial & Operational Highlights
186.4
221.1 196.8
Q1 FY14 Q4 FY14 Q1 FY15
Revenue (Rs. crore)
58.4
56.5
64.3
Q1 FY14 Q4 FY14 Q1 FY15
EBITDA (Rs. crore)
34.3 32.5
40.5
Q1 FY14 Q4 FY14 Q1 FY15
EBIT (Rs. crore)
31.3%
25.5%
32.7%
18.4%
14.7%
20.6%
0.0%
10.0%
20.0%
30.0%
Q1 FY14 Q4 FY14 Q1 FY15
Margin (%)
EBITDA % EBIT %
38,486 38,538 37,388
Q1 FY14 Q4 FY14 Q1 FY15
Production (in MT)
36,718 39,210
34,953
Q1 FY14 Q4 FY14 Q1 FY15
Sales (in MT)
Paper
Q1 FY15 Performance Overview & Outlook
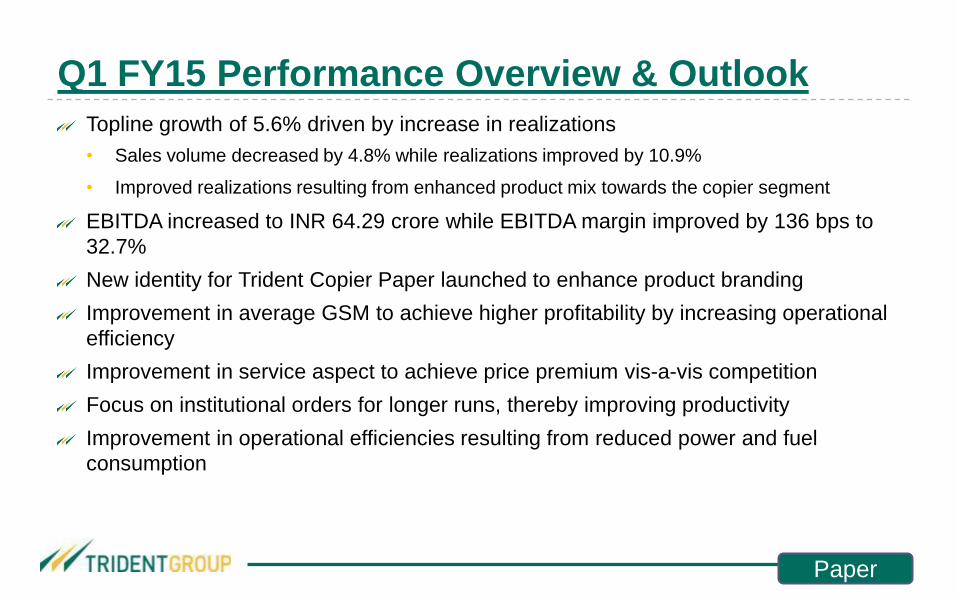
Topline growth of 5.6% driven by increase in realizations
• Sales volume decreased by 4.8% while realizations improved by 10.9%
• Improved realizations resulting from enhanced product mix towards the copier segment
EBITDA increased to INR 64.29 crore while EBITDA margin improved by 136 bps to
32.7%
New identity for Trident Copier Paper launched to enhance product branding
Improvement in average GSM to achieve higher profitability by increasing operational
efficiency
Improvement in service aspect to achieve price premium vis-a-vis competition
Focus on institutional orders for longer runs, thereby improving productivity
Improvement in operational efficiencies resulting from reduced power and fuel
consumption
Paper
Financial Highlights
Business Highlights
Strategy
About Us and Investor Contacts
Strategy20
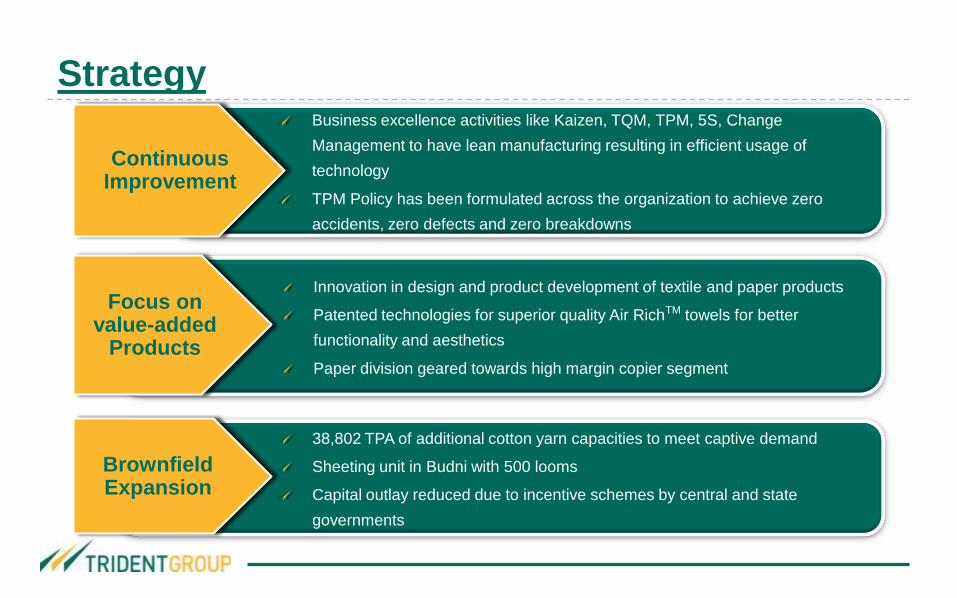
Business excellence activities like Kaizen, TQM, TPM, 5S, Change
Management to have lean manufacturing resulting in efficient usage of
technology
TPM Policy has been formulated across the organization to achieve zero
accidents, zero defects and zero breakdowns
Continuous Improvement
Innovation in design and product development of textile and paper products
Patented technologies for superior quality Air RichTM towels for better
functionality and aesthetics
Paper division geared towards high margin copier segment
Focus on value-added
Products
38,802 TPA of additional cotton yarn capacities to meet captive demand
Sheeting unit in Budni with 500 looms
Capital outlay reduced due to incentive schemes by central and state
governments
Brownfield Expansion
Strategy21
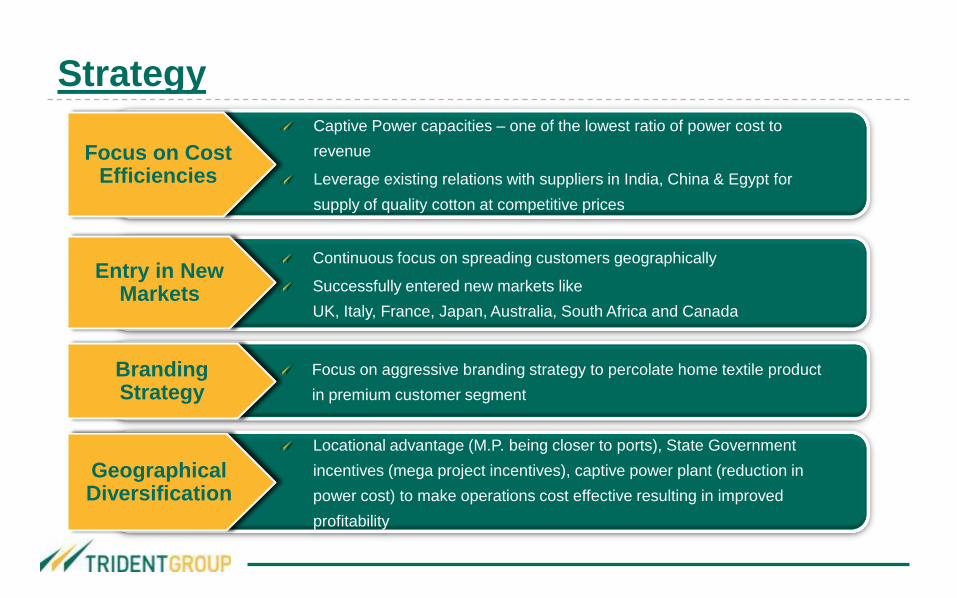
Captive Power capacities – one of the lowest ratio of power cost to
revenue
Leverage existing relations with suppliers in India, China & Egypt for
supply of quality cotton at competitive prices
Focus on Cost Efficiencies
Continuous focus on spreading customers geographically
Successfully entered new markets like
UK, Italy, France, Japan, Australia, South Africa and Canada
Entry in New Markets
Focus on aggressive branding strategy to percolate home textile product
in premium customer segment
Branding Strategy
Locational advantage (M.P. being closer to ports), State Government
incentives (mega project incentives), captive power plant (reduction in
power cost) to make operations cost effective resulting in improved
profitability
Geographical Diversification
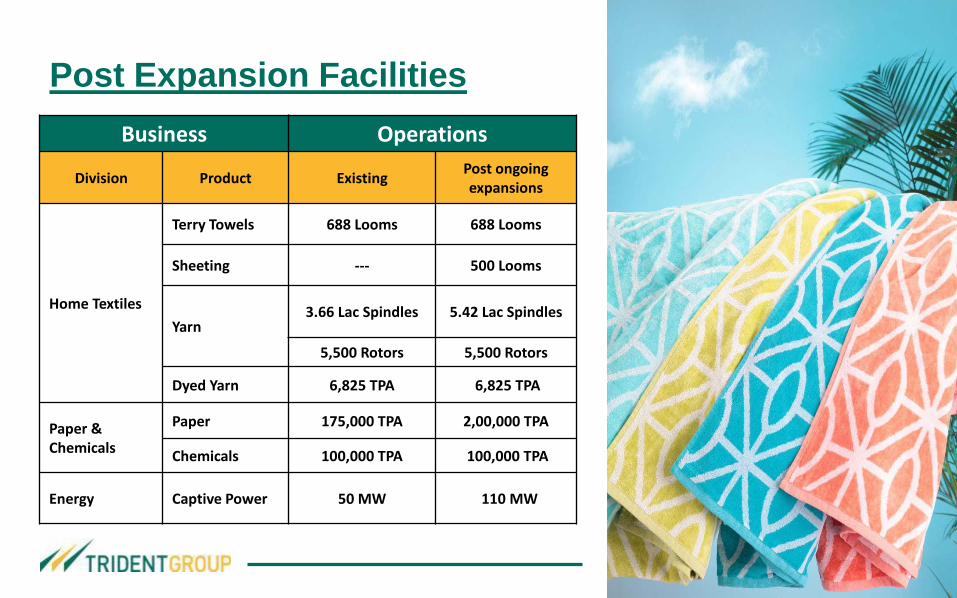
Post Expansion Facilities
Business Operations
Division Product ExistingPost ongoing expansions
Home Textiles
Terry Towels 688 Looms 688 Looms
Sheeting --- 500 Looms
Yarn3.66 Lac Spindles 5.42 Lac Spindles
5,500 Rotors 5,500 Rotors
Dyed Yarn 6,825 TPA 6,825 TPA
Paper & Chemicals
Paper 175,000 TPA 2,00,000 TPA
Chemicals 100,000 TPA 100,000 TPA
Energy Captive Power 50 MW 110 MW
Financial Highlights
Business Highlights
Strategy
About Us and Investor Contacts
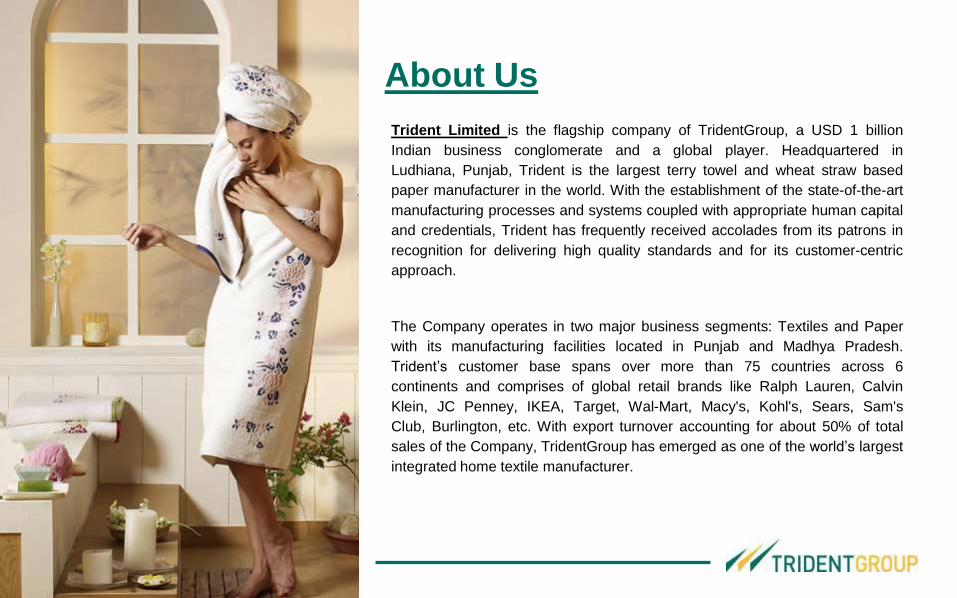
Trident Limited is the flagship company of TridentGroup, a USD 1 billion
Indian business conglomerate and a global player. Headquartered in
Ludhiana, Punjab, Trident is the largest terry towel and wheat straw based
paper manufacturer in the world. With the establishment of the state-of-the-art
manufacturing processes and systems coupled with appropriate human capital
and credentials, Trident has frequently received accolades from its patrons in
recognition for delivering high quality standards and for its customer-centric
approach.
The Company operates in two major business segments: Textiles and Paper
with its manufacturing facilities located in Punjab and Madhya Pradesh.
Trident’s customer base spans over more than 75 countries across 6
continents and comprises of global retail brands like Ralph Lauren, Calvin
Klein, JC Penney, IKEA, Target, Wal-Mart, Macy's, Kohl's, Sears, Sam's
Club, Burlington, etc. With export turnover accounting for about 50% of total
sales of the Company, TridentGroup has emerged as one of the world’s largest
integrated home textile manufacturer.
About Us
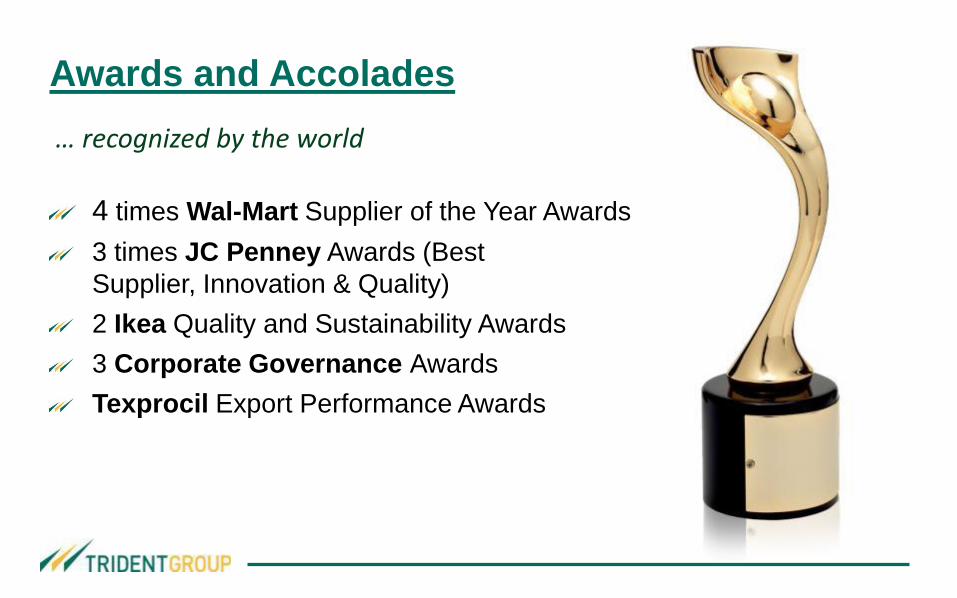
4 times Wal-Mart Supplier of the Year Awards
3 times JC Penney Awards (Best
Supplier, Innovation & Quality)
2 Ikea Quality and Sustainability Awards
3 Corporate Governance Awards
Texprocil Export Performance Awards
Awards and Accolades
… recognized by the world
Investor Contacts
Pawan Jain / Vaibhav Goel
Trident Limited
Tel: +91 161 5039 999
Fax: +91 161 5039 900
Email: [email protected]
Ishan Selarka / Nishid Solanki
CDR India
Tel: +91 22 6645 1232 / 1221
Fax: +91 22 6645 1213
Email: [email protected]
For more information about us, please visit www.tridentindia.com
OR
Contact: