towel sector - pacra
TRANSCRIPT
Towel SectorAn Overview
January 2021© The Pakistan Credit Rating Agency Limited.
TABLE OF CONTENTS
Contents Page No.
Introduction 1
Global Industry | Overview 3
Cotton Prices 5
Cotton Supply 6
Local Industry | Overview 7
Textile Exports 8
Towel Exports 9
Business Risk 11
Margins & Cost Structure 12
Regional Cost Comparison 13
Contents Page No.
Regulatory Environment 14
Working Capital Management 16
Financial Risk 17
Rating Curve 18
COVID-19 | Impact & Relief Measures 19
SWOT Analysis 20
Outlook & Future Prospects 21
Bibliography 22
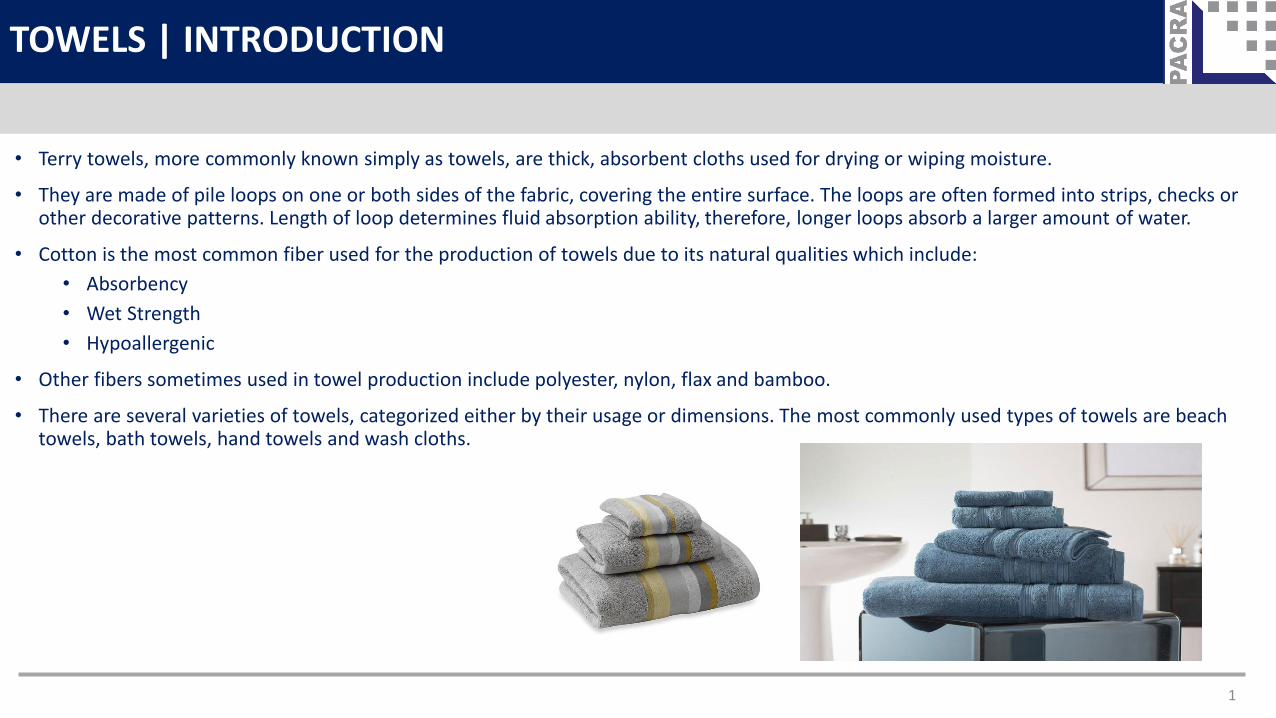
• Terry towels, more commonly known simply as towels, are thick, absorbent cloths used for drying or wiping moisture.
• They are made of pile loops on one or both sides of the fabric, covering the entire surface. The loops are often formed into strips, checks or other decorative patterns. Length of loop determines fluid absorption ability, therefore, longer loops absorb a larger amount of water.
• Cotton is the most common fiber used for the production of towels due to its natural qualities which include:
• Absorbency
• Wet Strength
• Hypoallergenic
• Other fibers sometimes used in towel production include polyester, nylon, flax and bamboo.
• There are several varieties of towels, categorized either by their usage or dimensions. The most commonly used types of towels are beach towels, bath towels, hand towels and wash cloths.
1
TOWELS | INTRODUCTION
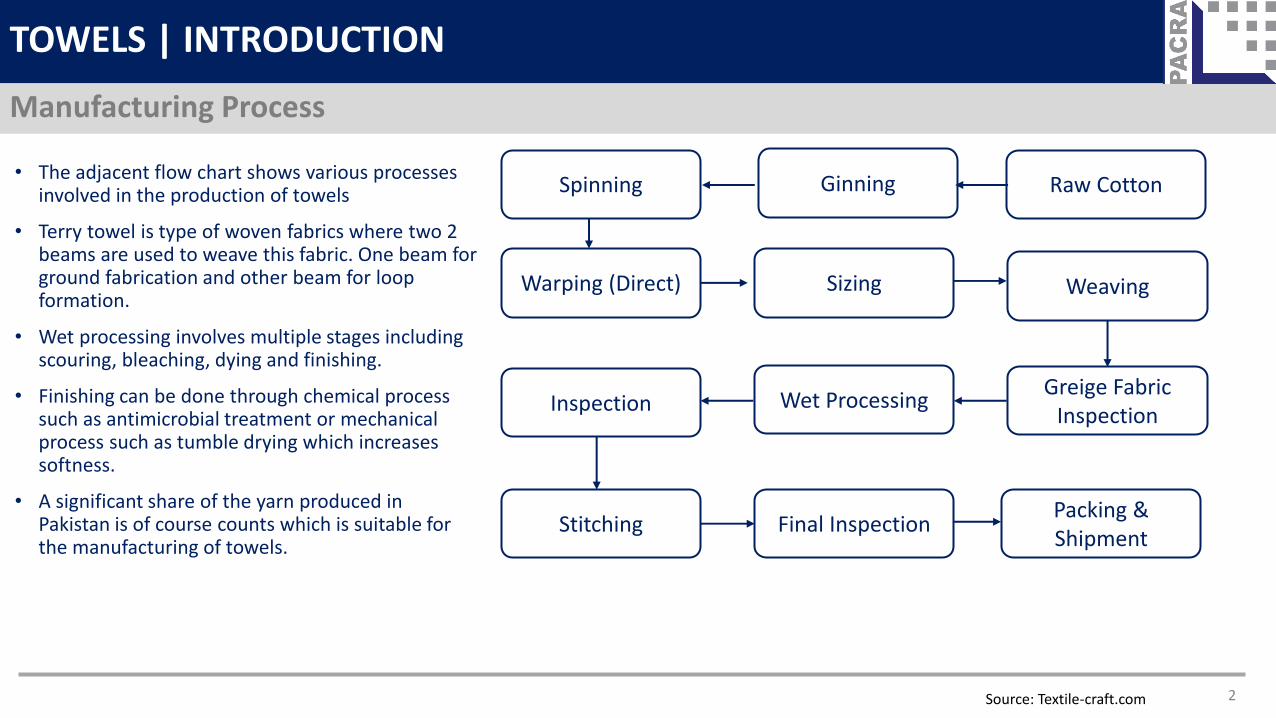
• The adjacent flow chart shows various processes involved in the production of towels
• Terry towel is type of woven fabrics where two 2 beams are used to weave this fabric. One beam for ground fabrication and other beam for loop formation.
• Wet processing involves multiple stages including scouring, bleaching, dying and finishing.
• Finishing can be done through chemical process such as antimicrobial treatment or mechanical process such as tumble drying which increases softness.
• A significant share of the yarn produced in Pakistan is of course counts which is suitable for the manufacturing of towels.
Source: Textile-craft.com 2
TOWELS | INTRODUCTION
Manufacturing Process
Warping (Direct) Sizing Weaving
Greige Fabric Inspection
Wet ProcessingInspection
Stitching Final InspectionPacking & Shipment
GinningSpinning Raw Cotton
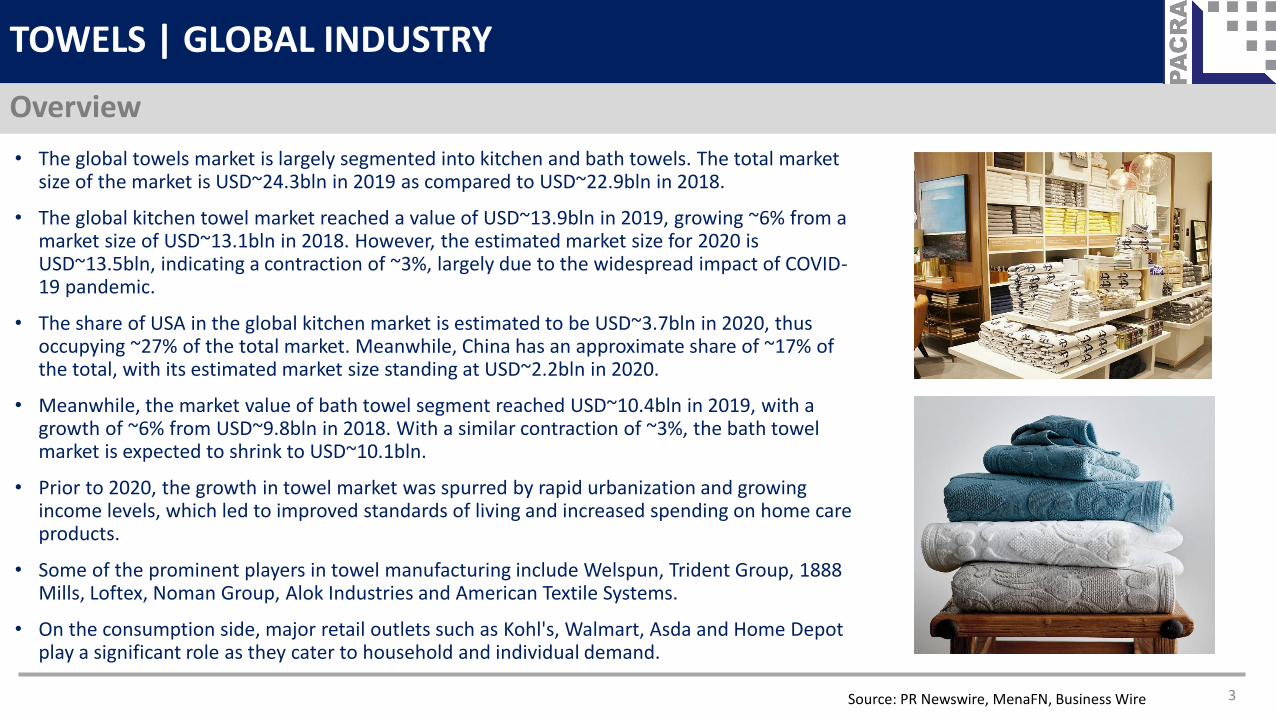
• The global towels market is largely segmented into kitchen and bath towels. The total market size of the market is USD~24.3bln in 2019 as compared to USD~22.9bln in 2018.
• The global kitchen towel market reached a value of USD~13.9bln in 2019, growing ~6% from a market size of USD~13.1bln in 2018. However, the estimated market size for 2020 is USD~13.5bln, indicating a contraction of ~3%, largely due to the widespread impact of COVID-19 pandemic.
• The share of USA in the global kitchen market is estimated to be USD~3.7bln in 2020, thus occupying ~27% of the total market. Meanwhile, China has an approximate share of ~17% of the total, with its estimated market size standing at USD~2.2bln in 2020.
• Meanwhile, the market value of bath towel segment reached USD~10.4bln in 2019, with a growth of ~6% from USD~9.8bln in 2018. With a similar contraction of ~3%, the bath towel market is expected to shrink to USD~10.1bln.
• Prior to 2020, the growth in towel market was spurred by rapid urbanization and growing income levels, which led to improved standards of living and increased spending on home care products.
• Some of the prominent players in towel manufacturing include Welspun, Trident Group, 1888 Mills, Loftex, Noman Group, Alok Industries and American Textile Systems.
• On the consumption side, major retail outlets such as Kohl's, Walmart, Asda and Home Depot play a significant role as they cater to household and individual demand.
Source: PR Newswire, MenaFN, Business Wire 3
TOWELS | GLOBAL INDUSTRY
Overview
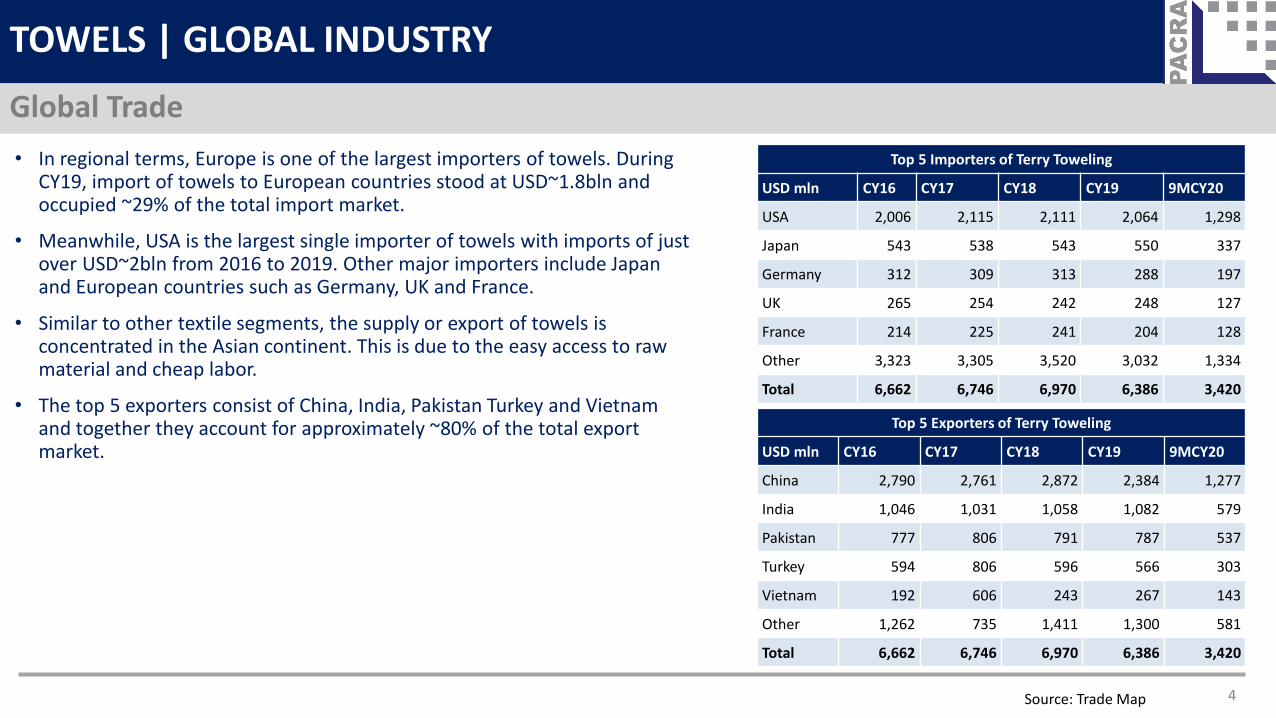
• In regional terms, Europe is one of the largest importers of towels. During CY19, import of towels to European countries stood at USD~1.8bln and occupied ~29% of the total import market.
• Meanwhile, USA is the largest single importer of towels with imports of just over USD~2bln from 2016 to 2019. Other major importers include Japan and European countries such as Germany, UK and France.
• Similar to other textile segments, the supply or export of towels is concentrated in the Asian continent. This is due to the easy access to raw material and cheap labor.
• The top 5 exporters consist of China, India, Pakistan Turkey and Vietnam and together they account for approximately ~80% of the total export market.
Source: Trade Map 4
TOWELS | GLOBAL INDUSTRY
Global Trade
Top 5 Importers of Terry Toweling
USD mln CY16 CY17 CY18 CY19 9MCY20
USA 2,006 2,115 2,111 2,064 1,298
Japan 543 538 543 550 337
Germany 312 309 313 288 197
UK 265 254 242 248 127
France 214 225 241 204 128
Other 3,323 3,305 3,520 3,032 1,334
Total 6,662 6,746 6,970 6,386 3,420
Top 5 Exporters of Terry Toweling
USD mln CY16 CY17 CY18 CY19 9MCY20
China 2,790 2,761 2,872 2,384 1,277
India 1,046 1,031 1,058 1,082 579
Pakistan 777 806 791 787 537
Turkey 594 806 596 566 303
Vietnam 192 606 243 267 143
Other 1,262 735 1,411 1,300 581
Total 6,662 6,746 6,970 6,386 3,420
Source: PCGA, PBS, TCO 5
TOWELS | LOCAL INDUSTRY
Cotton Supply
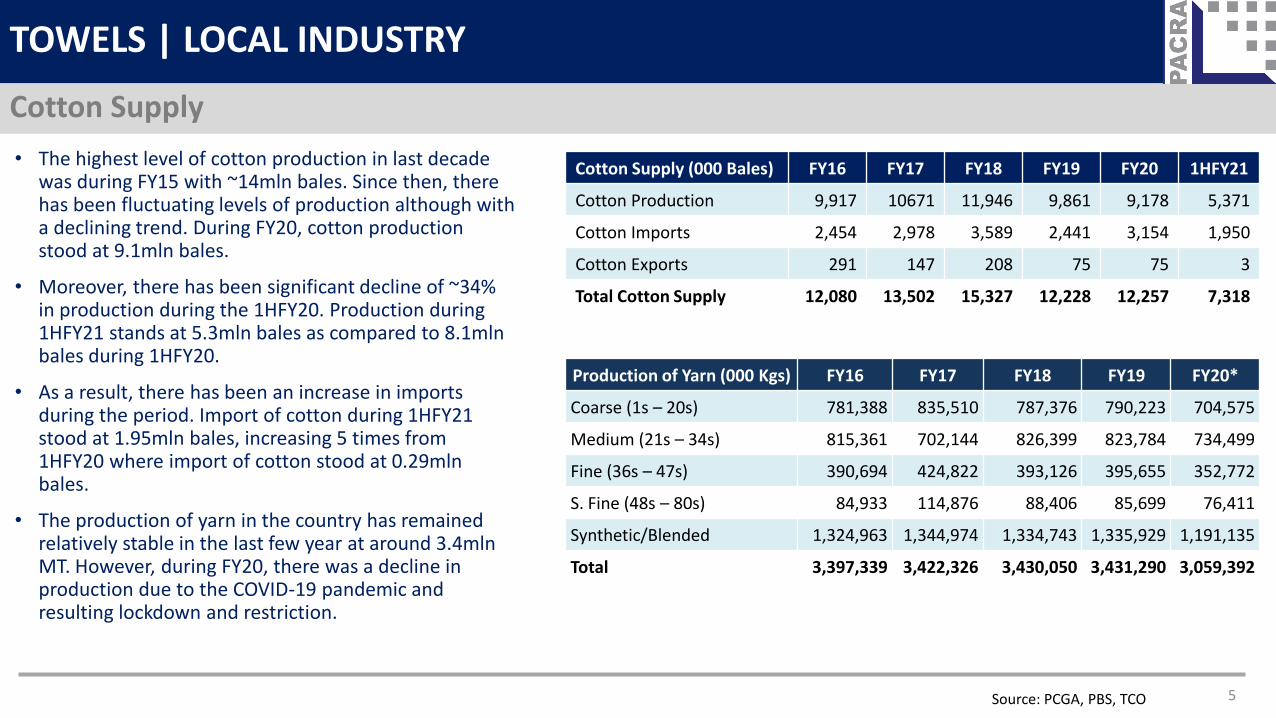
• The highest level of cotton production in last decade was during FY15 with ~14mln bales. Since then, there has been fluctuating levels of production although with a declining trend. During FY20, cotton production stood at 9.1mln bales.
• Moreover, there has been significant decline of ~34% in production during the 1HFY20. Production during 1HFY21 stands at 5.3mln bales as compared to 8.1mln bales during 1HFY20.
• As a result, there has been an increase in imports during the period. Import of cotton during 1HFY21 stood at 1.95mln bales, increasing 5 times from 1HFY20 where import of cotton stood at 0.29mln bales.
• The production of yarn in the country has remained relatively stable in the last few year at around 3.4mln MT. However, during FY20, there was a decline in production due to the COVID-19 pandemic and resulting lockdown and restriction.
Production of Yarn (000 Kgs) FY16 FY17 FY18 FY19 FY20*
Coarse (1s – 20s) 781,388 835,510 787,376 790,223 704,575
Medium (21s – 34s) 815,361 702,144 826,399 823,784 734,499
Fine (36s – 47s) 390,694 424,822 393,126 395,655 352,772
S. Fine (48s – 80s) 84,933 114,876 88,406 85,699 76,411
Synthetic/Blended 1,324,963 1,344,974 1,334,743 1,335,929 1,191,135
Total 3,397,339 3,422,326 3,430,050 3,431,290 3,059,392
Cotton Supply (000 Bales) FY16 FY17 FY18 FY19 FY20 1HFY21
Cotton Production 9,917 10671 11,946 9,861 9,178 5,371
Cotton Imports 2,454 2,978 3,589 2,441 3,154 1,950
Cotton Exports 291 147 208 75 75 3
Total Cotton Supply 12,080 13,502 15,327 12,228 12,257 7,318
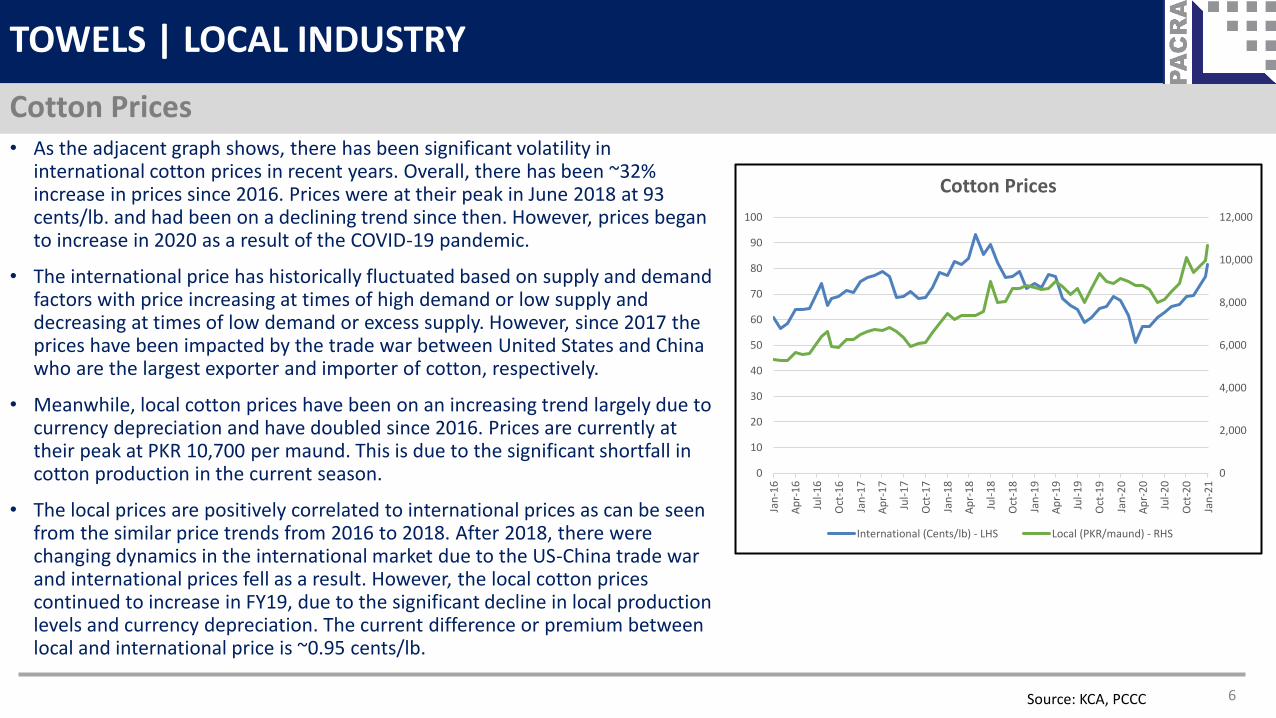
• As the adjacent graph shows, there has been significant volatility in international cotton prices in recent years. Overall, there has been ~32% increase in prices since 2016. Prices were at their peak in June 2018 at 93 cents/lb. and had been on a declining trend since then. However, prices began to increase in 2020 as a result of the COVID-19 pandemic.
• The international price has historically fluctuated based on supply and demand factors with price increasing at times of high demand or low supply and decreasing at times of low demand or excess supply. However, since 2017 the prices have been impacted by the trade war between United States and China who are the largest exporter and importer of cotton, respectively.
• Meanwhile, local cotton prices have been on an increasing trend largely due to currency depreciation and have doubled since 2016. Prices are currently at their peak at PKR 10,700 per maund. This is due to the significant shortfall in cotton production in the current season.
• The local prices are positively correlated to international prices as can be seen from the similar price trends from 2016 to 2018. After 2018, there were changing dynamics in the international market due to the US-China trade war and international prices fell as a result. However, the local cotton prices continued to increase in FY19, due to the significant decline in local production levels and currency depreciation. The current difference or premium between local and international price is ~0.95 cents/lb.
Source: KCA, PCCC 6
TOWELS | LOCAL INDUSTRY
Cotton Prices
0
2,000
4,000
6,000
8,000
10,000
12,000
0
10
20
30
40
50
60
70
80
90
100
Jan
-16
Ap
r-1
6
Jul-
16
Oct
-16
Jan
-17
Ap
r-1
7
Jul-
17
Oct
-17
Jan
-18
Ap
r-1
8
Jul-
18
Oct
-18
Jan
-19
Ap
r-1
9
Jul-
19
Oct
-19
Jan
-20
Ap
r-2
0
Jul-
20
Oct
-20
Jan
-21
Cotton Prices
International (Cents/lb) - LHS Local (PKR/maund) - RHS
Source: PBS, TMA 7
TOWELS | LOCAL INDUSTRY
Overview
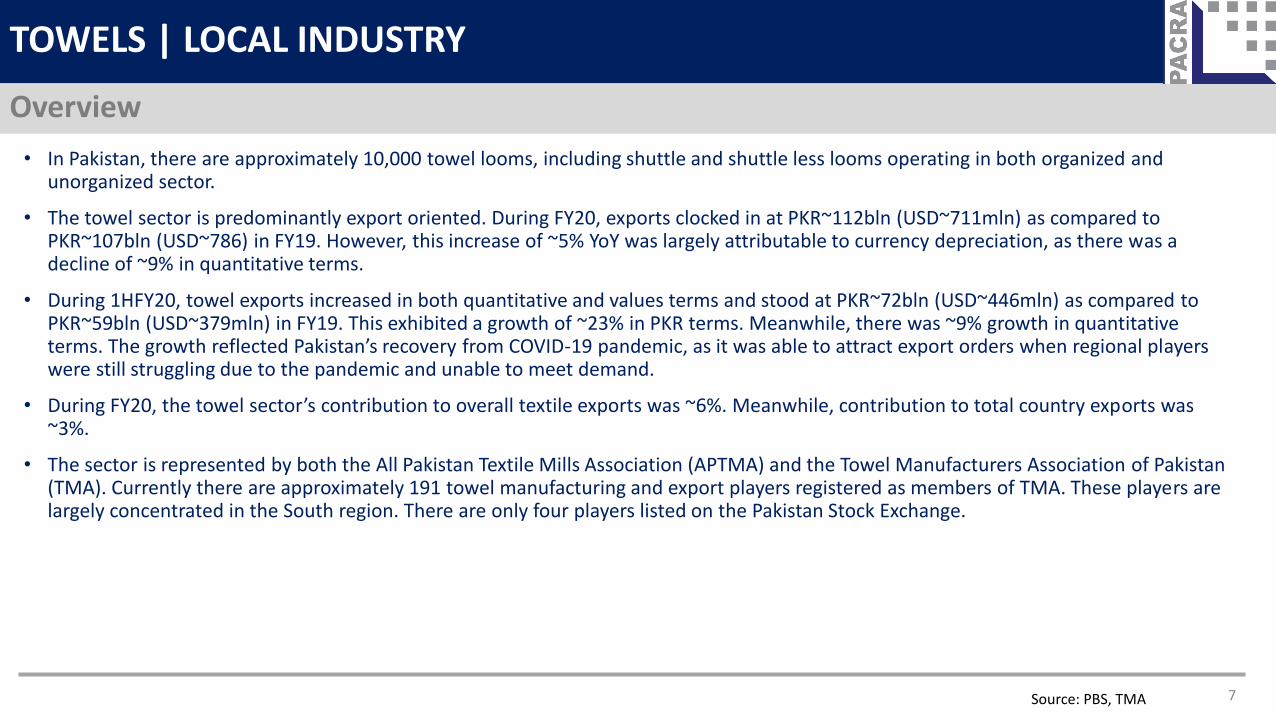
• In Pakistan, there are approximately 10,000 towel looms, including shuttle and shuttle less looms operating in both organized and unorganized sector.
• The towel sector is predominantly export oriented. During FY20, exports clocked in at PKR~112bln (USD~711mln) as compared to PKR~107bln (USD~786) in FY19. However, this increase of ~5% YoY was largely attributable to currency depreciation, as there was a decline of ~9% in quantitative terms.
• During 1HFY20, towel exports increased in both quantitative and values terms and stood at PKR~72bln (USD~446mln) as compared to PKR~59bln (USD~379mln) in FY19. This exhibited a growth of ~23% in PKR terms. Meanwhile, there was ~9% growth in quantitativeterms. The growth reflected Pakistan’s recovery from COVID-19 pandemic, as it was able to attract export orders when regional players were still struggling due to the pandemic and unable to meet demand.
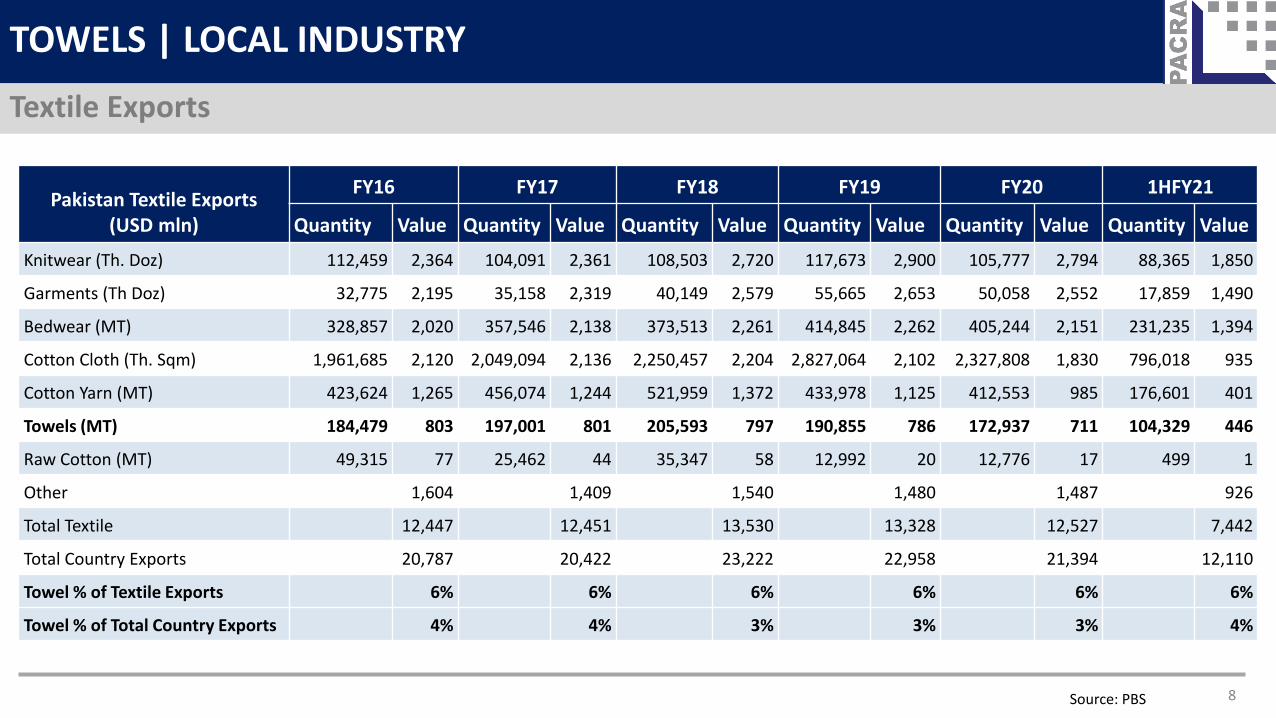
• During FY20, the towel sector’s contribution to overall textile exports was ~6%. Meanwhile, contribution to total country exports was ~3%.
• The sector is represented by both the All Pakistan Textile Mills Association (APTMA) and the Towel Manufacturers Association of Pakistan (TMA). Currently there are approximately 191 towel manufacturing and export players registered as members of TMA. These players are largely concentrated in the South region. There are only four players listed on the Pakistan Stock Exchange.
Pakistan Textile Exports (USD mln)
FY16 FY17 FY18 FY19 FY20 1HFY21
Quantity Value Quantity Value Quantity Value Quantity Value Quantity Value Quantity Value
Knitwear (Th. Doz) 112,459 2,364 104,091 2,361 108,503 2,720 117,673 2,900 105,777 2,794 88,365 1,850
Garments (Th Doz) 32,775 2,195 35,158 2,319 40,149 2,579 55,665 2,653 50,058 2,552 17,859 1,490
Bedwear (MT) 328,857 2,020 357,546 2,138 373,513 2,261 414,845 2,262 405,244 2,151 231,235 1,394
Cotton Cloth (Th. Sqm) 1,961,685 2,120 2,049,094 2,136 2,250,457 2,204 2,827,064 2,102 2,327,808 1,830 796,018 935
Cotton Yarn (MT) 423,624 1,265 456,074 1,244 521,959 1,372 433,978 1,125 412,553 985 176,601 401
Towels (MT) 184,479 803 197,001 801 205,593 797 190,855 786 172,937 711 104,329 446
Raw Cotton (MT) 49,315 77 25,462 44 35,347 58 12,992 20 12,776 17 499 1
Other 1,604 1,409 1,540 1,480 1,487 926
Total Textile 12,447 12,451 13,530 13,328 12,527 7,442
Total Country Exports 20,787 20,422 23,222 22,958 21,394 12,110
Towel % of Textile Exports 6% 6% 6% 6% 6% 6%
Towel % of Total Country Exports 4% 4% 3% 3% 3% 4%
Source: PBS 8
TOWELS | LOCAL INDUSTRY
Textile Exports
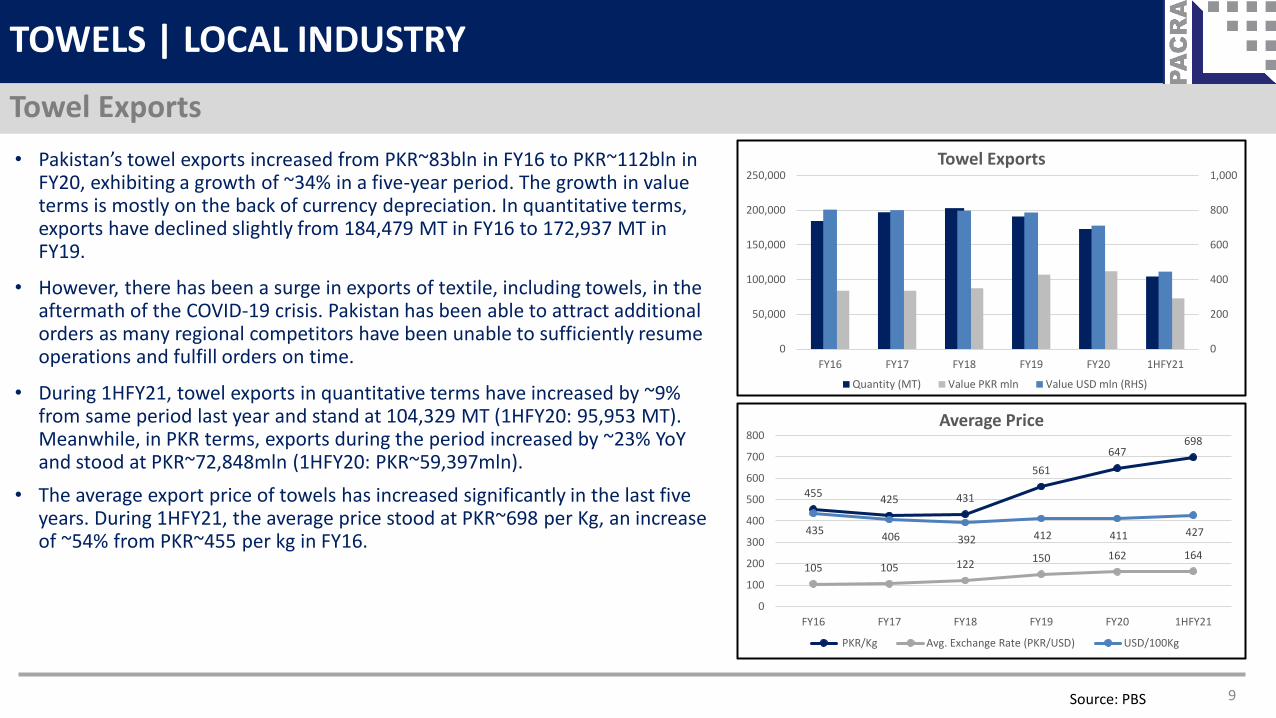
• Pakistan’s towel exports increased from PKR~83bln in FY16 to PKR~112bln in FY20, exhibiting a growth of ~34% in a five-year period. The growth in value terms is mostly on the back of currency depreciation. In quantitative terms, exports have declined slightly from 184,479 MT in FY16 to 172,937 MT in FY19.
• However, there has been a surge in exports of textile, including towels, in the aftermath of the COVID-19 crisis. Pakistan has been able to attract additional orders as many regional competitors have been unable to sufficiently resume operations and fulfill orders on time.
• During 1HFY21, towel exports in quantitative terms have increased by ~9% from same period last year and stand at 104,329 MT (1HFY20: 95,953 MT). Meanwhile, in PKR terms, exports during the period increased by ~23% YoY and stood at PKR~72,848mln (1HFY20: PKR~59,397mln).
Source: PBS 9
TOWELS | LOCAL INDUSTRY
Towel Exports
• The average export price of towels has increased significantly in the last five years. During 1HFY21, the average price stood at PKR~698 per Kg, an increase of ~54% from PKR~455 per kg in FY16.
0
200
400
600
800
1,000
0
50,000
100,000
150,000
200,000
250,000
FY16 FY17 FY18 FY19 FY20 1HFY21
Towel Exports
Quantity (MT) Value PKR mln Value USD mln (RHS)
455425 431
561
647698
105 105 122150 162 164
435 406 392 412 411 427
0
100
200
300
400
500
600
700
800
FY16 FY17 FY18 FY19 FY20 1HFY21
Average Price
PKR/Kg Avg. Exchange Rate (PKR/USD) USD/100Kg
Source: TDAP, PBS 10
TOWELS | LOCAL INDUSTRY
Towel Exports
0
5,000
10,000
15,000
20,000
25,000
Jul Aug Sep Oct Nov Dec Jan Feb Mar Apr May Jun Jul Aug Sep Oct Nov Dec Jan Feb Mar Apr May Jun Jul Aug Sep Oct Nov Dec
FY19 FY20 FY21
Qu
anti
ty (
MT)
Monthly Export Trend
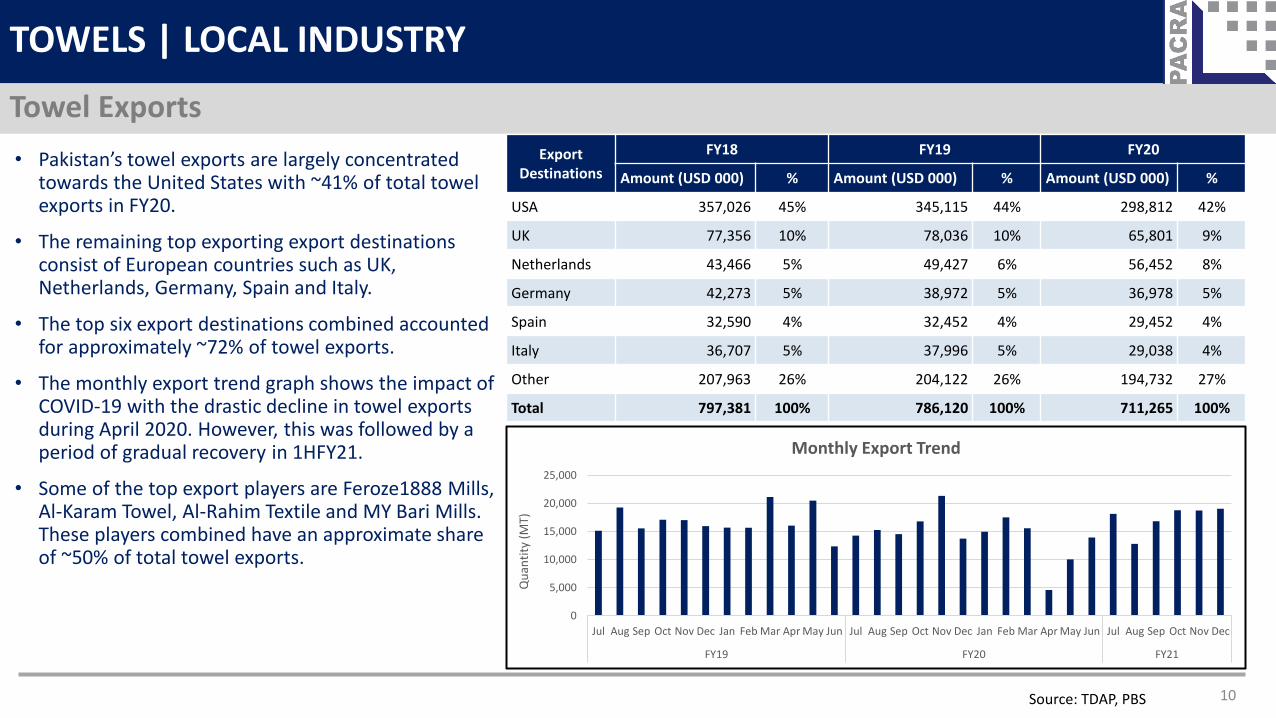
• Pakistan’s towel exports are largely concentrated towards the United States with ~41% of total towel exports in FY20.
• The remaining top exporting export destinations consist of European countries such as UK, Netherlands, Germany, Spain and Italy.
• The top six export destinations combined accounted for approximately ~72% of towel exports.
• The monthly export trend graph shows the impact of COVID-19 with the drastic decline in towel exports during April 2020. However, this was followed by a period of gradual recovery in 1HFY21.
• Some of the top export players are Feroze1888 Mills, Al-Karam Towel, Al-Rahim Textile and MY Bari Mills. These players combined have an approximate share of ~50% of total towel exports.
Export Destinations
FY18 FY19 FY20
Amount (USD 000) % Amount (USD 000) % Amount (USD 000) %
USA 357,026 45% 345,115 44% 298,812 42%
UK 77,356 10% 78,036 10% 65,801 9%
Netherlands 43,466 5% 49,427 6% 56,452 8%
Germany 42,273 5% 38,972 5% 36,978 5%
Spain 32,590 4% 32,452 4% 29,452 4%
Italy 36,707 5% 37,996 5% 29,038 4%
Other 207,963 26% 204,122 26% 194,732 27%
Total 797,381 100% 786,120 100% 711,265 100%
• The towel sector largely comprises of exports due to which demand trends from regions such as North America and Europe play an important role.
• Pakistan’s towel exports have a high level of concentration towards the United States which has a share of ~41% in total towel exports.
• The COVID-19 pandemic caused a decline in demand as export orders were cancelled or delayed as many export destinations went into strict lockdowns or restrictions. Moreover, manufacturing operations were also briefly suspended during the lockdown in the early stages of the pandemic.
• In recent months, the sector has significantly recovered with export orders increasing gradually. Pakistan was able to attract additional orders as regional competitors continued to struggle due to the pandemic and were unable to fulfil export orders. However, a second wave of the pandemic is ongoing and many regions have gone back into stricter restrictions. This could hamper the recovery as demand may remain low.
• Overall, textile sector exhibited a growth of ~2.4% on YoY basis during 5MFY21, according to the Large Scale Manufacturing Index.
• However, the sector faces some risk due to the significant decline in local cotton production. Latest figures for cotton arrivals stand at 5.49mln bales, a drastic decline of ~34% from 8.34mln bales during the same period last year. Greater level of cotton imports is expected, however, prices are rising in both local and international markets. This may have adverse consequences for the sector’s margins.
11
TOWELS | LOCAL INDUSTRY
Business Risk
Source: PBS, PCGA
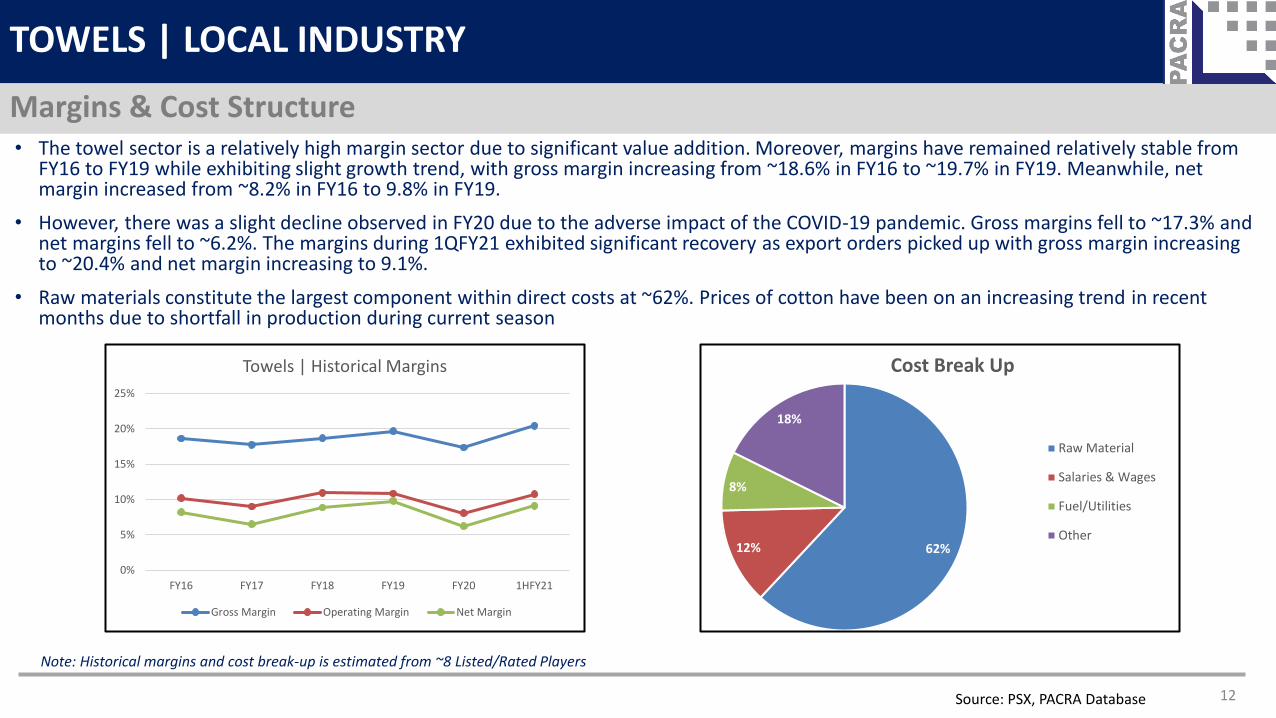
• The towel sector is a relatively high margin sector due to significant value addition. Moreover, margins have remained relatively stable from FY16 to FY19 while exhibiting slight growth trend, with gross margin increasing from ~18.6% in FY16 to ~19.7% in FY19. Meanwhile, net margin increased from ~8.2% in FY16 to 9.8% in FY19.
• However, there was a slight decline observed in FY20 due to the adverse impact of the COVID-19 pandemic. Gross margins fell to ~17.3% and net margins fell to ~6.2%. The margins during 1QFY21 exhibited significant recovery as export orders picked up with gross margin increasing to ~20.4% and net margin increasing to 9.1%.
• Raw materials constitute the largest component within direct costs at ~62%. Prices of cotton have been on an increasing trend in recent months due to shortfall in production during current season
Source: PSX, PACRA Database 12
TOWELS | LOCAL INDUSTRY
Margins & Cost Structure
Note: Historical margins and cost break-up is estimated from ~8 Listed/Rated Players
62%12%
8%
18%
Cost Break Up
Raw Material
Salaries & Wages
Fuel/Utilities
Other
0%
5%
10%
15%
20%
25%
FY16 FY17 FY18 FY19 FY20 1HFY21
Towels | Historical Margins
Gross Margin Operating Margin Net Margin
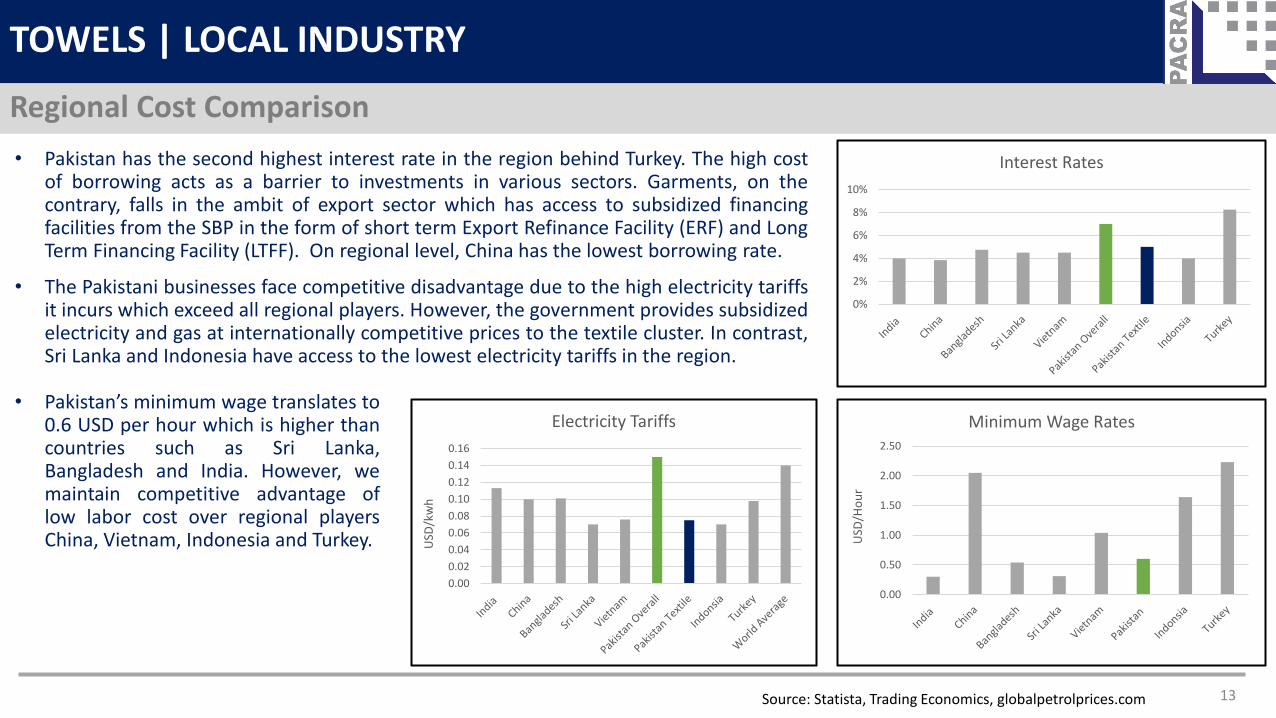
• Pakistan has the second highest interest rate in the region behind Turkey. The high costof borrowing acts as a barrier to investments in various sectors. Garments, on thecontrary, falls in the ambit of export sector which has access to subsidized financingfacilities from the SBP in the form of short term Export Refinance Facility (ERF) and LongTerm Financing Facility (LTFF). On regional level, China has the lowest borrowing rate.
• The Pakistani businesses face competitive disadvantage due to the high electricity tariffsit incurs which exceed all regional players. However, the government provides subsidizedelectricity and gas at internationally competitive prices to the textile cluster. In contrast,Sri Lanka and Indonesia have access to the lowest electricity tariffs in the region.
Source: Statista, Trading Economics, globalpetrolprices.com 13
TOWELS | LOCAL INDUSTRY
Regional Cost Comparison
0%
2%
4%
6%
8%
10%
Interest Rates
0.00
0.50
1.00
1.50
2.00
2.50
USD
/Ho
ur
Minimum Wage Rates
0.00
0.02
0.04
0.06
0.08
0.10
0.12
0.14
0.16
USD
/kw
hElectricity Tariffs
• Pakistan’s minimum wage translates to0.6 USD per hour which is higher thancountries such as Sri Lanka,Bangladesh and India. However, wemaintain competitive advantage oflow labor cost over regional playersChina, Vietnam, Indonesia and Turkey.
• With respect to Income Tax, the textile industry, including towel segment is under the Normal Tax Regime (NTR). Further, the sector is also subject to Minimum Tax @ 1.5% of turnover, if tax liability under NTR is lower than minimum tax. However, the additional tax paid under minimum tax is adjustable against future tax liabilities for the next 5 years.
• The duty structure implemented by the government provides protection to local towel manufacturers. In addition, sales tax of 17% is also applicable on the industry.
• The government recently removed regulatory duty of 5% on the import of yarn till 30th June 2021 through SRO 1352(I)/2020 issued by the Federal Board of Revenue.
• The sector receives subsidized financing from SBP under the following schemes;
• Long Term Financing Facility (LTFF) up to PKR 5bln for installation of new plant & machinery @ ~3-4%.
• The Government provides subsidized electricity at USD 7.5 cents/kwh and gas at USD 6.5/mmbtu in order to increase export competitiveness in international markets.
• The Government also provides Drawback of Local Taxes and Levies (DLTL) at the rate of 2% on eligible product line of processed fabric (2% additional drawback is also allowable for exports to non-traditional markets).
• The industry is represented by the All Pakistan Textile Mills Association (APTMA) as well as the Towel Manufacturers Association of Pakistan (TMA).
Source: FBR, SBP 14
TOWELS | LOCAL INDUSTRY
Regulatory Environment
Source: FBR 15
TOWELS | LOCAL INDUSTRY
Duty Structure
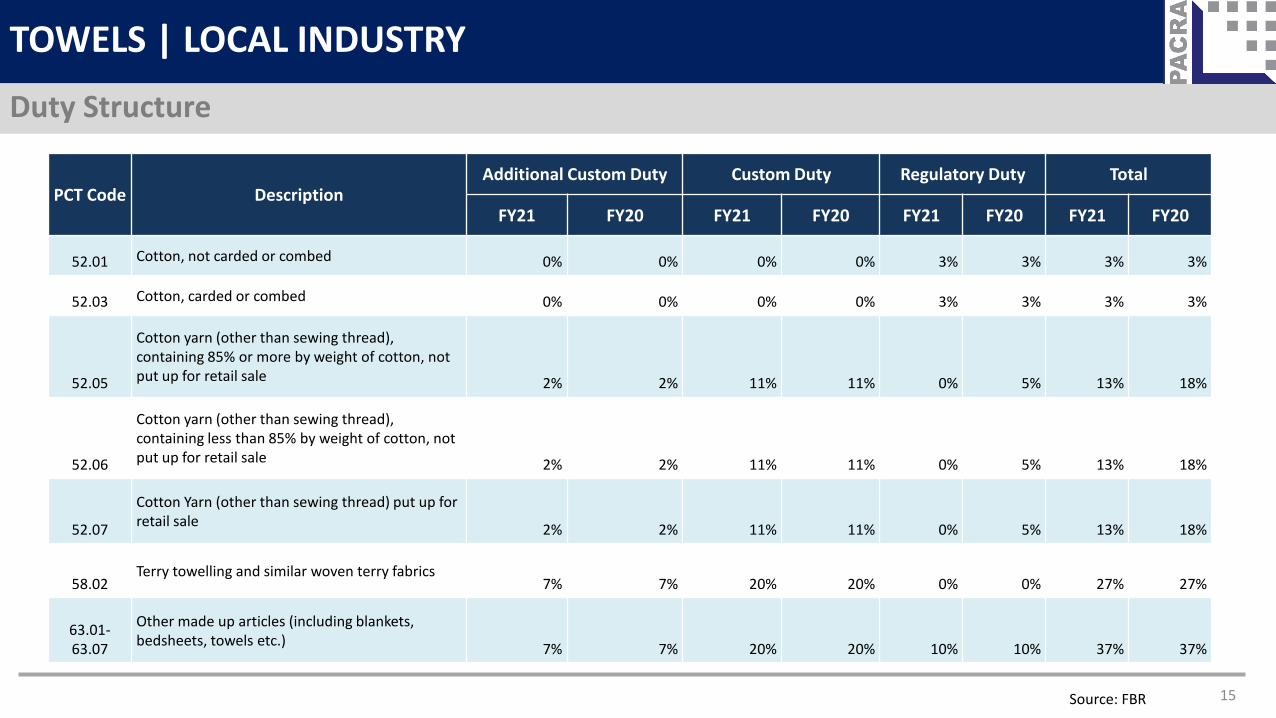
PCT Code DescriptionAdditional Custom Duty Custom Duty Regulatory Duty Total
FY21 FY20 FY21 FY20 FY21 FY20 FY21 FY20
52.01 Cotton, not carded or combed 0% 0% 0% 0% 3% 3% 3% 3%
52.03 Cotton, carded or combed 0% 0% 0% 0% 3% 3% 3% 3%
52.05
Cotton yarn (other than sewing thread), containing 85% or more by weight of cotton, not put up for retail sale 2% 2% 11% 11% 0% 5% 13% 18%
52.06
Cotton yarn (other than sewing thread), containing less than 85% by weight of cotton, not put up for retail sale 2% 2% 11% 11% 0% 5% 13% 18%
52.07
Cotton Yarn (other than sewing thread) put up for retail sale
2% 2% 11% 11% 0% 5% 13% 18%
58.02Terry towelling and similar woven terry fabrics
7% 7% 20% 20% 0% 0% 27% 27%
63.01-63.07
Other made up articles (including blankets, bedsheets, towels etc.)
7% 7% 20% 20% 10% 10% 37% 37%
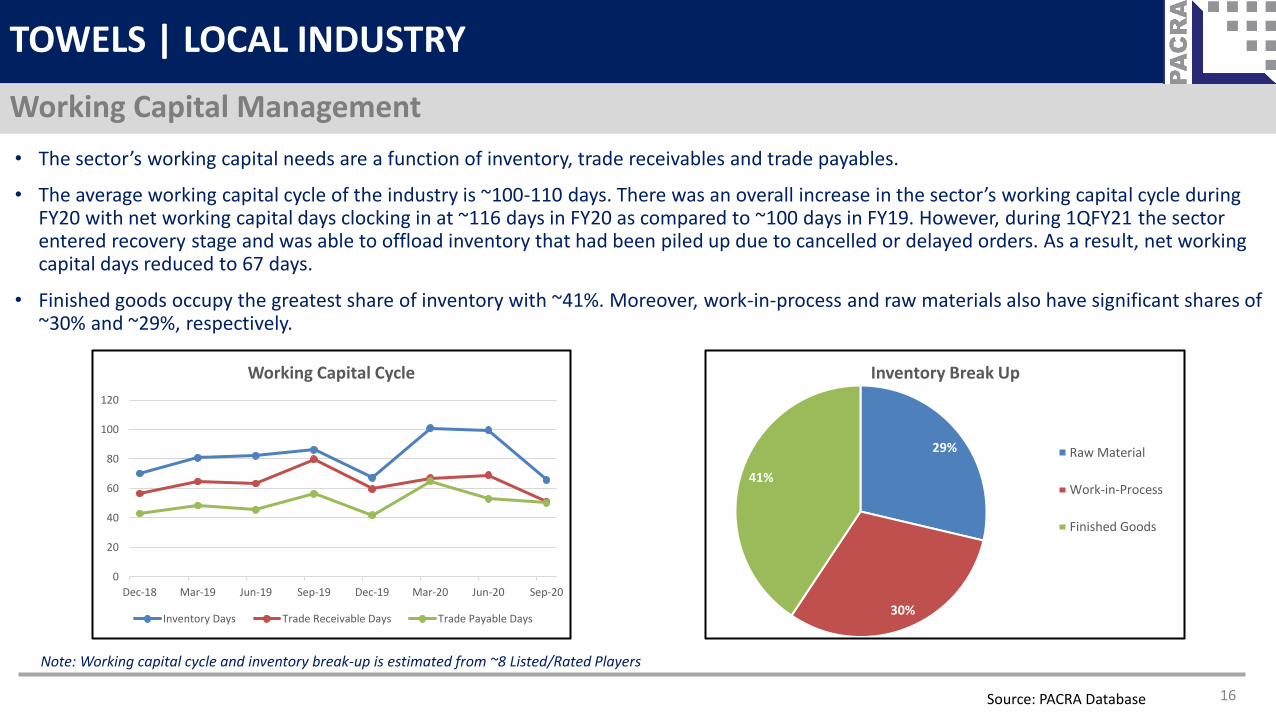
• The sector’s working capital needs are a function of inventory, trade receivables and trade payables.
• The average working capital cycle of the industry is ~100-110 days. There was an overall increase in the sector’s working capital cycle during FY20 with net working capital days clocking in at ~116 days in FY20 as compared to ~100 days in FY19. However, during 1QFY21 the sector entered recovery stage and was able to offload inventory that had been piled up due to cancelled or delayed orders. As a result, net working capital days reduced to 67 days.
• Finished goods occupy the greatest share of inventory with ~41%. Moreover, work-in-process and raw materials also have significant shares of ~30% and ~29%, respectively.
Source: PACRA Database 16
TOWELS | LOCAL INDUSTRY
Working Capital Management
Note: Working capital cycle and inventory break-up is estimated from ~8 Listed/Rated Players
0
20
40
60
80
100
120
Dec-18 Mar-19 Jun-19 Sep-19 Dec-19 Mar-20 Jun-20 Sep-20
Working Capital Cycle
Inventory Days Trade Receivable Days Trade Payable Days
29%
30%
41%
Inventory Break Up
Raw Material
Work-in-Process
Finished Goods
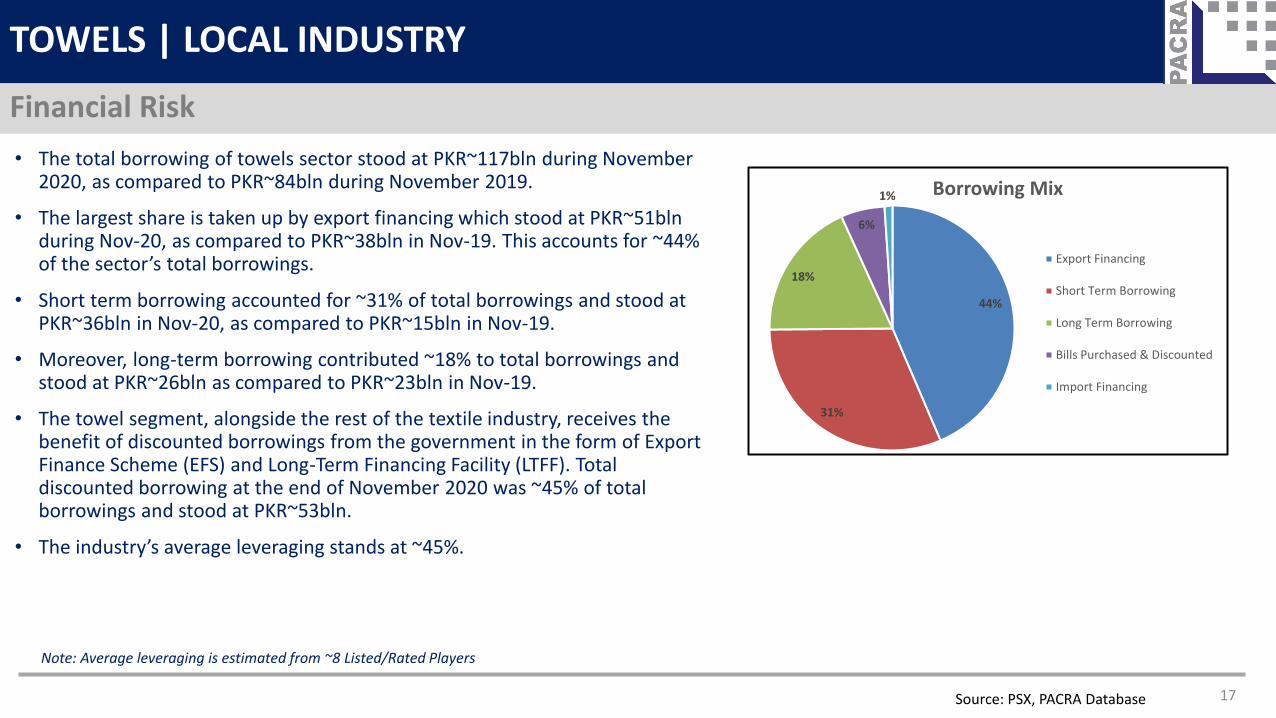
• The total borrowing of towels sector stood at PKR~117bln during November 2020, as compared to PKR~84bln during November 2019.
• The largest share is taken up by export financing which stood at PKR~51bln during Nov-20, as compared to PKR~38bln in Nov-19. This accounts for ~44% of the sector’s total borrowings.
• Short term borrowing accounted for ~31% of total borrowings and stood at PKR~36bln in Nov-20, as compared to PKR~15bln in Nov-19.
• Moreover, long-term borrowing contributed ~18% to total borrowings and stood at PKR~26bln as compared to PKR~23bln in Nov-19.
• The towel segment, alongside the rest of the textile industry, receives the benefit of discounted borrowings from the government in the form of Export Finance Scheme (EFS) and Long-Term Financing Facility (LTFF). Total discounted borrowing at the end of November 2020 was ~45% of total borrowings and stood at PKR~53bln.
• The industry’s average leveraging stands at ~45%.
Source: PSX, PACRA Database 17
TOWELS | LOCAL INDUSTRY
Financial Risk
Note: Average leveraging is estimated from ~8 Listed/Rated Players
44%
31%
18%
6%
1% Borrowing Mix
Export Financing
Short Term Borrowing
Long Term Borrowing
Bills Purchased & Discounted
Import Financing
Source: PACRA Database 18
TOWELS | LOCAL INDUSTRY
Rating Curve
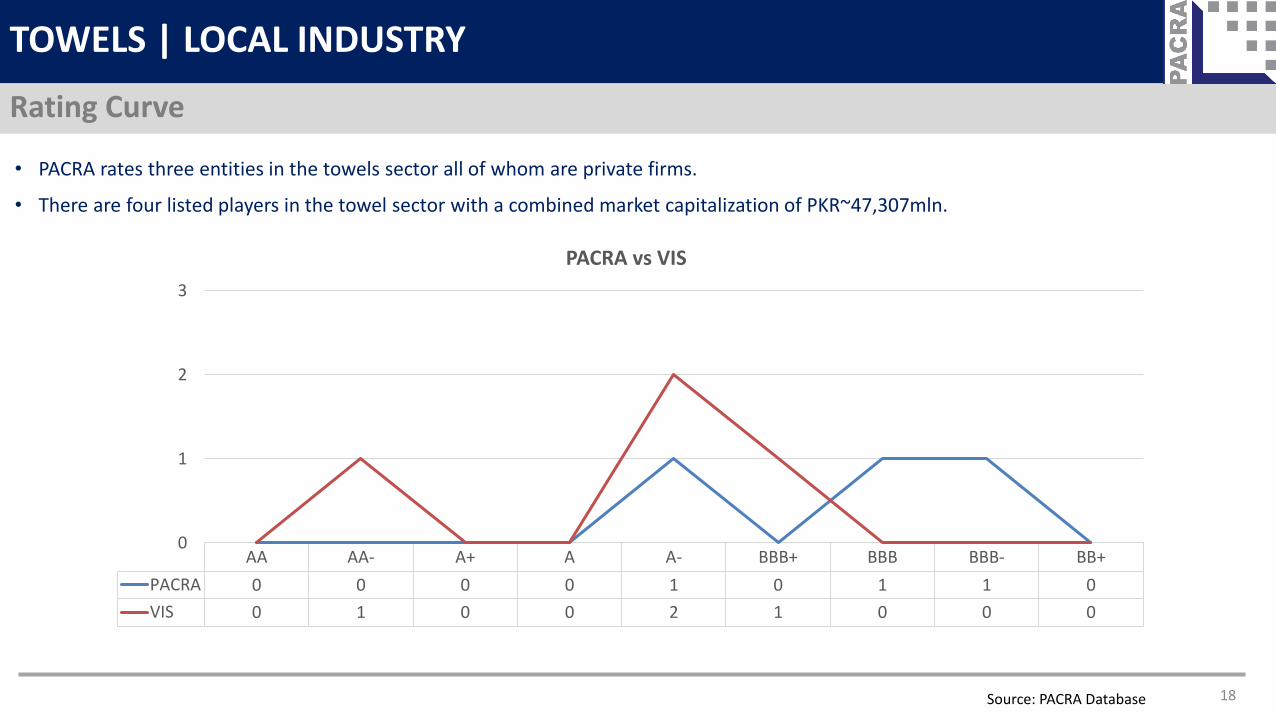
• PACRA rates three entities in the towels sector all of whom are private firms.
• There are four listed players in the towel sector with a combined market capitalization of PKR~47,307mln.
AA AA- A+ A A- BBB+ BBB BBB- BB+
PACRA 0 0 0 0 1 0 1 1 0
VIS 0 1 0 0 2 1 0 0 0
0
1
2
3
PACRA vs VIS
• The demand for exports is highly dependent on demand from European & North American markets. Since the spread of COVID-19 and subsequent impositions of countrywide lockdowns, major brands in USA and Europe had shut down retail operations resulting in orders on hold or cancellation.
• The towel manufacturers also had to suspend operations for some time during the early stages of the pandemic. Operations were resumed as the government moved towards ‘smart lockdown’ and implementation of SOPs in order to mitigate the negative economic impact.
• SBP allowed one year deferment of principal repayments to the corporate sector. In addition, restructuring of loans was allowed up to 30 June 2020. The SBP later extended the deadline to submit requests for deferment of principal repayments or restructuring/rescheduling up to 30th September 2020.
• The SBP also relaxed certain requirements of the Export Finance Scheme in order to provide relief to exporters. These relaxations included six month extension in shipping period for those availing EFS Part I loan and reduction of export performance requirement from 2 times to 1.5 times for those availing EFS Part II facility.
• Moreover, SBP also reduced the policy rate by 625bps to 7%. This is expected to reduce the sector’s finance costs by PKR~4,016mln.
Source: SBP, PACRA Database 19
TOWELS | LOCAL INDUSTRY
COVID-19: Impact & Relief Measures
20
TOWELS | LOCAL INDUSTRY
SWOT Analysis
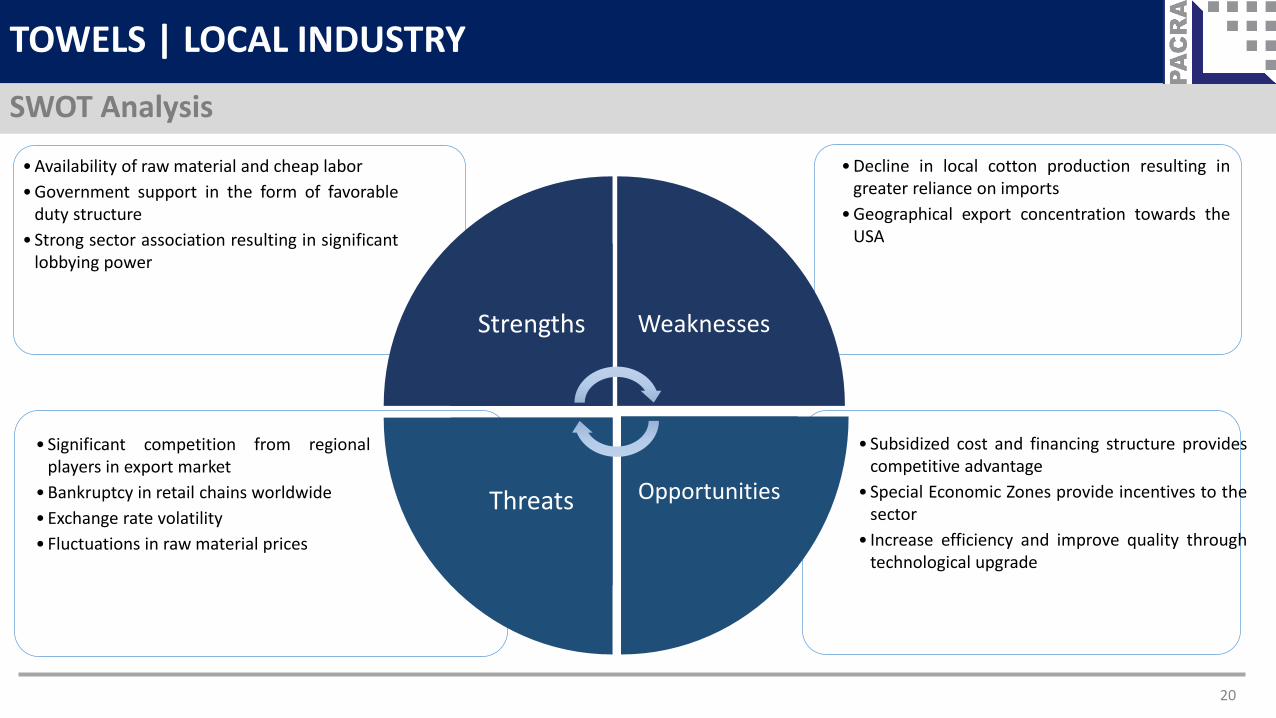
• Decline in local cotton production resulting ingreater reliance on imports
• Geographical export concentration towards theUSA
• Availability of raw material and cheap labor
• Government support in the form of favorableduty structure
• Strong sector association resulting in significantlobbying power
Strengths
Threats Opportunities
Weaknesses
• Subsidized cost and financing structure providescompetitive advantage
• Special Economic Zones provide incentives to thesector
• Increase efficiency and improve quality throughtechnological upgrade
• Significant competition from regionalplayers in export market
• Bankruptcy in retail chains worldwide
• Exchange rate volatility
• Fluctuations in raw material prices
• Despite challenges faced due to the COVID-19 pandemic the garment industry has been making a recovery in recent months as restrictions both in Pakistan and abroad have eased allowing the industry to resume operations and resulting in gradual increase in demand.
• Pakistan has also attracted additional export orders as regional competitors such as India and Bangladesh were unable to control COVID-19 crisis and thus not able to meet export orders in a timely manner. Overall textile imports from India and Bangladesh fell by ~41% and ~32%, respectively during the 2HFY20 as compared to the same period in previous year.
• As a result, towel exports during 1HFY21 grew by ~23% and clocked in at PKR~73bln (USD~446mln) as compared to PKR~59bln (USD~379mln) in 1HFY20. Moreover, in quantitative terms exports grew by ~9% from ~95,953 MT in 1HFY20 to ~104,329 MT in 1HFY21.
• The textile industry receives significant support from the government in the form of subsidized borrowing and energy prices due to its considerable contribution to the country’s GDP and exports.
• The decline in local cotton production has resulted in the increase of prices which may result in the reduction in margins for the sector. Moreover, greater reliance on imported raw material increases risk exposure due to exchange rate volatility. However, exchange rate is expected to remain stable in the near future.
• Moreover, the reduction in benchmark rate by 625bps should also reduce finance costs by PKR~4,016mln and alleviate some of the downward pressure on margins due to rising raw material costs.
Source: PBS, SBP. ILO 21
TOWELS | Outlook & Future Prospects
Outlook: Stable
• Pakistan Bureau of Statistics (PBS)
• Pakistan Stock Exchange (PSX)
• State Bank of Pakistan (SBP)
• Federal Board of Revenue (FBR)
• Towel Manufacturers Association of Pakistan (TMA)
• PACRA Database
• International Labor Organization (ILO)
• Pakistan Cotton Ginners Association (PCGA)
• Pakistan Central Cotton Committee (PCCC)
• Investing.com
• Statisa
• Trading Economics
• Business Recorder
• Trade Map
• MenaFN (https://menafn.com/1098203560/India-Bath-Towel-Market-2019-Global-Trends-Market-Share-Industry-Size-Growth-Opportunities-and-Forecast-to-2024?src=Rss)
• PR Newswire (https://www.prnewswire.com/news-releases/global-kitchen-towel-industry-2019-to-2027---market-trajectory--analytics-301087094.html)
TOWELS | BIBLIOGRAPHY
Research Team Saniya Tauseef
Asst. Manager
Insia Raza
Associate Analyst
Contact Number: +92 42 35869504
DISCLAIMERPACRA has used due care in preparation of this document. Our information has been
obtained from sources we consider to be reliable but its accuracy or completeness is not
guaranteed. The information in this document may be copied or otherwise reproduced, in
whole or in part, provided the source is duly acknowledged. The presentation should not be
relied upon as professional advice.
22