unpacking mathematical problem solving through a concept
TRANSCRIPT
Unpacking Mathematical Problem Solving through a Concept-Cognition-Metacognition Theoretical Lens
Dissertation
Presented in Partial Fulfillment of the Requirements for the Degree Doctor of Philosophy in the Graduate School of The Ohio State University
By
Pingping Zhang, B.A., B.S., M.A.
Graduate Program in Education: Teaching and Learning
The Ohio State University
2014
Dissertation Committee:
Azita Manouchehri, Advisor
Patti Brosnan
Michael Battista

Copyright by
Pingping Zhang
2014
ii
ABSTRACT
The purpose of this study was to unpack mathematical problem solving through a
concept-cognition-metacognition theoretical framework as a means to contribute to the
development of a theory of mathematical problem solving. The concept-cognition-
metacognition framework builds on Vygotsky’s (1962) concept formation theory and
Berger’s (2004) appropriation theory.
Mathematical problem solving and metacognitive behaviors of 5 middle school
children were studies using non-routine tasks that centered around the concept of area.
A cross analysis of five in-depth case studies involved 1) a problem by problem
analysis, 2) a stage by stage analysis, 3) an analysis of each type of metacognitive
behavior, and 4) an analysis of the relationship between stage and metacognition.
The results proposed: 1) 16 stages for the concept development of area along with
definitions, characteristics, and illustrative examples; 2) 6 types of metacognitive
behaviors along with their functions, consequences, and factors for effectiveness; and 3) a
global view of the problem solver’s behaviors under the influence of concept stages and
metacognitive behaviors and a micro view of the specific ways in which concept stages
impact each type of metacognitive behavior during the problem solver’s interaction with

iii
a task pertaining to the effectiveness of consequences generated by metacognitive
behaviors, the existence of effective metacognitive behaviors, and the restriction that
concept stages impose on the overall capacity of metacognition.

iv
DEDICATION
People I love and the mathematics education community

v
VITA
March 1985.......................................................Born in Beijing, P.R. China
2003...................................................................B.A., English, Beihang University
2003...................................................................B.S. Mathematics, Beihang University
2010...................................................................M.A. Mathematics Education, The Ohio
State University
PUBLICATIONS
Manouchehri, A., & Zhang, P. (2013). Forces hindering development of mathematical
problem solving among school children. Journal of Modern Education Review, 3(6), 427-434.
Manouchehri, A., Czocher, J., Somayajulu, R., Liu, Y., Zhang, P., & Tague, J. (2013). Fostering mathematical competence through technology-enhanced interactive environments. In D. Polly (Ed.), Common Core Mathematics Standards and Implementing Digital Technologies, 53-77.
Liu, Y., Zhang, P., Brosnan, P., & Erchick, D. (2012). Examining the geometry items of state standardized exams using the van Hiele model: Test content and student achievement. Research in Education, Assessment, and Learning, 3(1), 22-28.
FIELDS OF STUDY
Major field: .......................................................Education: Teaching and Learning
Specialization: ..................................................Mathematics Education
vi
ACKNOWLEDGEMENT
I am grateful to my advisor Dr. Azita Manouchehri for the intellectual shelter
during the past six years. I want to thank her by sheltering my own students as how she
has sheltered me, loving my academic family as she has been loving us, devoting my
efforts to endless challenges and mysteries in secondary mathematics education, and
being curious, passionate, and disciplined for the rest of my life. I especially want to
thank Dr. Jim Wilson, who has 45 years of commitment to advancing mathematical
problem solving in practice and theory, for sheltering my own advisor for nearly 20 years.
I am honored to have him as my intellectual grandfather; without him I would not exist.
I am grateful to my boss and committee member Dr. Patti Brosnan. She has
provided me tremendous help, encouragement, and invaluable experience in professional
development by including me in the Math Coaching Program family. Without listing
everything I am thankful for, I would like to let her know that I shall be a MCPeep
forever.
I am grateful to my committee member and teacher Dr. Mike Battista. He offered
me his unpublished Cognitive-Based Assessment book to help me conceptualize my
framework. His ideas and feedback were significantly inspiring and important for me to
relate my work to learning and learning progression.

vii
I greatly appreciate the opportunity to learn from three talented mathematics
educators who have distinct specialty areas (and personalities) for the past six years. I
could not have become a competent educator and researcher without them.
I want to thank my siblings and friends for endless help and mental support: Jenna
Tague, Jennifer Czocher, Manjula Joseph, Gilbert Kaburu, Ravi Somayajulu, Yating Liu,
Amanda Roble, Dinglei Huang, Ali Fleming, Monelle Gomez, and Joan Young. I owe
some of them a number of co-authorships.
I want to thank my parents for supporting me to pursue my degree. I know they
have missed me terribly but they only tell me they are proud.
Lastly, I want to thank my trainer Logan G. Kaverman for all the physical tortures
during the past two months. Without him I would not have been able to survive the
mental pressures from the final work.

viii
TABLE OF CONTENT ABSTRACT ....................................................................................................................... ii
DEDICATION.................................................................................................................. iv
VITA................................................................................................................................... v
ACKNOWLEDGEMENT ............................................................................................... vi
LIST OF FIGURES .......................................................................................................... x
LIST OF TABLES ......................................................................................................... xvi
CHAPTER 1 BACKGROUND ........................................................................................ 1 Metacognition ...................................................................................................................................... 2
Vygotsky’s Concept Formation Theory .................................................................................................. 4
Statement of the Problem .................................................................................................................... 5
Research Questions .............................................................................................................................. 6
Significance of the Study ....................................................................................................................... 7
CHAPTER 2 LITERATURE REVIEW AND THEORETICAL FRAMEWORK .... 8 Problem Solving and Mathematical Thinking ......................................................................................... 8
Problem Solving and Metacognition..................................................................................................... 16
Constructivism and Sociocultural Perspective ...................................................................................... 25
Concept Formation Theory .................................................................................................................. 34
Learning Progression and Cognition-Based Assessment ........................................................................ 44
Theoretical Framework ........................................................................................................................ 53
Significance of the Proposed Theoretical Framework ........................................................................... 55
Rationale for the Choice of the Target Concept .................................................................................... 59
CHAPTER 3 METHODOLOGY .................................................................................. 61 Research Design .................................................................................................................................. 62
Data Collection Procedures .................................................................................................................. 63
Instrument design................................................................................................................................ 67
Data Analysis ....................................................................................................................................... 74
Summary ............................................................................................................................................. 76
CHAPTER 4 RESULTS ................................................................................................. 77 The Case of Shana ................................................................................................................................ 78
The Case of Sandy .............................................................................................................................. 128
ix
The Case of Ivan ................................................................................................................................ 183
The Case of Andy ............................................................................................................................... 238
The Case of Allen ............................................................................................................................... 287
CHAPTER 5 DISCUSSION ........................................................................................ 336 Problem by Problem Analysis ............................................................................................................. 337
Stage by Stage Analysis ...................................................................................................................... 371
Analysis on Metacognition ................................................................................................................. 394
Analysis on Relationship between Stage and Metacognition .............................................................. 412
CHAPTER 6 CONCLUSION ...................................................................................... 421 Research Question #1 ........................................................................................................................ 421
Research Question #2 ........................................................................................................................ 430
Research Question #3 ........................................................................................................................ 435
Theoretical Contribution .................................................................................................................... 444
Implications for Research ................................................................................................................... 450
Implications for Practice .................................................................................................................... 466
Theoretical Limitation ........................................................................................................................ 466
In Closing ........................................................................................................................................... 468
REFERENCE ................................................................................................................ 472
APPENDIX A. CONCEPTUAL FRAMEWORK OF METACOGNITION
(TARRICONE, 2011) ................................................................................................... 479
APPENDIX B. QUESTIONS FOR BACKGROUND INTERVIEW ...................... 485
APPENDIX C. PRETEST INSTRUMENT ................................................................ 486
APPENDIX D. INTERVIEW INSTRUMENT .......................................................... 493
x
LIST OF FIGURES
x
Figure 4.13. Shana’s formula approach ........................................................................ 95
Figure 4.14. Shana’s concept stages and metacognitive behaviors in the Shaded
Triangle problem ............................................................................................................ 97
Figure 4.15. Shana’s attempt to visualizing a specific triangle ................................... 98
Figure 4.16. Shana’s attempt to replicate the shaded triangle ................................... 99
Figure 4.17. Shana’s complete drawing of 10 triangles ............................................... 99
Figure 4.18. Shana’s alternative drawing of triangles ............................................... 100
Figure 4.19. Shana’s second approach ........................................................................ 101
Figure 4.20. Shana’s concept stages and metacognitive behaviors in the Estimate
Region problem ............................................................................................................. 104
Figure 4.21. Shana’s Artificial Association Complex approach ............................... 104
Figure 4.22. Shana’s knowledge transfer from the rectangle area formula ............ 105
Figure 4.23. Shana’s modified Artificial Association Complex approach ............... 106
Figure 4.24. Shana’s concept stages and metacognitive behaviors in the Intersected
Area problem ................................................................................................................. 109
Figure 4.25. Shana’s division of the square ................................................................ 109
Figure 4.26. Shana’s specialization of simpler case ................................................... 110
Figure 4.27. Shana’s second drawing to illustrate the rotation ................................ 111
Figure 4.28. Shana’s balance of effectiveness between the metacognitive behaviors
and the challenges ......................................................................................................... 128
Figure 4.29. Sandy’s response to pretest item 1 ......................................................... 130
Figure 4.30. Sandy’s response to pretest item 2 ......................................................... 131
Figure 4.31. Sandy’s response to pretest item 3 ......................................................... 132
Figure 4.32. Sandy’s response to pretest item 4 ......................................................... 132
Figure 4.33. Sandy’s response to pretest item 5 ......................................................... 133
Figure 4.34. Sandy’s concept stages and metacognitive behaviors in the Compare
Areas problem ............................................................................................................... 136
Figure 4.35. Sandy’s formulaic approach to the Compare Areas problem ............. 139
Figure 4.36. Sandy’s concept stages and metacognitive behaviors in the Compare
Triangles problem ......................................................................................................... 143
Figure 4.37. Sandy’s comparison of sides ................................................................... 145
Figure 4.38. Sandy’s Surface Association Complex – Formula approach............... 145
Figure 4.39. Sandy’s measuring process ..................................................................... 146
xi
Figure 4.40. Sandy’s concept stages and metacognitive behaviors in the Shaded
Triangle problem .......................................................................................................... 151
Figure 4.41. Sandy’s air-trace ...................................................................................... 151
Figure 4.42. Sandy’s incorrect replication .................................................................. 152
Figure 4.43. Sandy’s first visual approach ................................................................. 154
Figure 4.44. Sandy’s formulaic approach ................................................................... 155
Figure 4.45. Sandy’s second visual approach ............................................................. 156
Figure 4.46. Sandy’s concept stages and metacognitive behaviors in the Estimate
Region problem ............................................................................................................. 159
Figure 4.47. Sandy’s initial approach to the Estimate Region problem .................. 159
Figure 4.48. Sandy’s revised approach to the Estimate Region problem ................ 160
Figure 4.49. Sandy’s concept stages and metacognitive behaviors in the Intersected
Area problem ................................................................................................................. 163
Figure 4.50. Sandy’s Surface Association Complex – Formula approach............... 164
Figure 4.51. Sandy’s Surface Association Complex – Formula approach (2) ......... 165
Figure 4.52. Sandy’s Potential Concept – Formula approach .................................. 166
Figure 4.53. Sandy’s demonstration of a special case ................................................ 167
Figure 4.54. Sandy’s Concept – Unit area approach ................................................. 168
Figure 4.55. Sandy’s balance of effectiveness between the metacognitive system and
the challenge .................................................................................................................. 183
Figure 4.56. Ivan’s response to item 1 ......................................................................... 184
Figure 4.57. Ivan’s response to item 2 ......................................................................... 185
Figure 4.58. Ivan’s response to item 3 ......................................................................... 186
Figure 4.59. Ivan’s response to item 4 ......................................................................... 186
Figure 4.60. Ivan’s response to item 5 ......................................................................... 187
Figure 4.61. Ivan’s concept stages and metacognitive behaviors in the Compare
Areas problem ............................................................................................................... 190
Figure 4.62. Ivan’s comparison between the areas of the circle and the triangle ... 192
Figure 4.63. Ivan’s equation approach to solve the variable .................................... 193
Figure 4.64. Ivan’s concept stages and metacognitive behaviors in the Compare
Triangles problem ......................................................................................................... 197
Figure 4.65. Ivan’s comparison between the measures of two sides ........................ 198
Figure 4.66. Ivan’s Artificial Association Complex transformation of the triangle 199
Figure 4.67. Ivan’s Pseudo-concept Complex – Non-measurement operation ........ 199
xii
xiii
Figure 4.96. Andy’s concept stages and metacognitive behaviors in the Estimate
Area problem ................................................................................................................. 263
Figure 4.97. Andy’s Concept – Unit area approach .................................................. 264
Figure 4.98. Andy’s concept stages and metacognitive behaviors in the Intersected
Area problem ................................................................................................................. 268
Figure 4.99. Andy’s Pseudo-concept Complex – Measurement approach .............. 269
Figure 4.100. Andy’s sense making of the range ........................................................ 269
Figure 4.101. Andy’s response to the interviewer’s prompt of a simpler case ....... 270
Figure 4.102. Andy’s balance of effectiveness between the metacognitive behaviors
and the challenges ......................................................................................................... 287
Figure 4.103. Allen’s response to item 1 ..................................................................... 289
Figure 4.104. Allen’s response to item 2 ..................................................................... 289
Figure 4.105. Allen’s response to item 3 ..................................................................... 290
Figure 4.106 Allen’s response to item 4 ...................................................................... 291
Figure 4.107. Allen’s response to item 5 ..................................................................... 291
Figure 4.108. Allen’s concept stages and metacognitive behaviors in the Compare
Areas problem ............................................................................................................... 294
Figure 4.109. Allen’s Chain Complex - Non-measurement approach ..................... 294
Figure 4.110. Allen’s comparison of the leftovers ...................................................... 295
Figure 4.111. Allen’s transformation of the triangle’s leftover ................................ 296
Figure 4.112. Allen’s enclosing of the leftovers .......................................................... 296
Figure 4.113. Allen’s concept stages and metacognitive behaviors in the Compare
Triangles problem ......................................................................................................... 300
Figure 4.114. Allen’s reasoning on the relation between triangle’s perimeter and
area ................................................................................................................................. 302
Figure 4.115. Allen’s concept stages and metacognitive behaviors in the Shaded
Triangle problem .......................................................................................................... 307
Figure 4.116. Allen’s drawing of the first triangle ..................................................... 308
Figure 4.117. Allen’s Concept – Unit area approach ................................................. 308
Figure 4.118. Allen’s alternative drawing ................................................................... 309
Figure 4.119. Allen’s Example-oriented Association Complex - Unit area reasoning
......................................................................................................................................... 310
Figure 4.120. Allen’s concept stages and metacognitive behaviors in the Estimate
Region problem ............................................................................................................. 312
xiv

xv
Figure 6.16. Generalization by the prompt ................................................................ 459
Figure 6.17. Surface Association Complex – Formula approach ............................. 460
Figure 6.18. Surface Association Complex – Formula approach (2) ....................... 460
Figure 6.19. Interviewer’s prompt of a simpler case ................................................. 461
Figure 6.20. Generalization by the prompt ................................................................ 461
Figure 6.21. Critical points that a task may impose on an individual...................... 464
xvi
LIST OF TABLES
Table 2.1. Change in trends in problem solving research from 1980 to 1992 (p. 670)
........................................................................................................................................... 15
Table 2.2. Levels of non-measurement reasoning about area in CBA (p. 112-113) .. 45
Table 2.3. Levels of measurement reasoning about area in CBA (p. 113-114) ......... 47
Table 3.1. Timeline for data collection .......................................................................... 63
Table 3.2. Dateline of interviews .................................................................................... 67
Table 3.3. Difference between conventional task and novel task ............................... 70
Table 3.4. Predicted concept stages potentially elicited by each problem ................. 72
Table 3.5. Samples of coded transcripts ........................................................................ 73
Table 4.1. Shana’s overall stages in pretest .................................................................. 78
Table 4.2. Breakdown of Shana’s key cognitive behaviors in the Compare Areas
problem ............................................................................................................................ 84
Table 4.3. Breakdown of Shana’s key cognitive behaviors in the Compare Triangles
problem ............................................................................................................................ 90
Table 4.4. Breakdown of Shana’s key cognitive behaviors in the Shaded Triangle
problem ............................................................................................................................ 96
Table 4.5. Breakdown of Shana’s key cognitive behaviors in the Estimate Region
problem .......................................................................................................................... 103
Table 4.6. Breakdown of Shana’s key cognitive behaviors in the Intersected Area
problem .......................................................................................................................... 108
Table 4.7. Shana’s overview of concept stages ........................................................... 114
Table 4.8. Shana’s self-initiated and interviewer-initiated shifts ............................. 115
Table 4.9. Shana’s types of metacognitive behaviors along with frequency revealed
under each stage for each problem .............................................................................. 120
Table 4.10. Shana’s functions and consequences of monitoring of strategies ......... 124
Table 4.11. Shana’s functions and consequences of regulation of strategy ............. 125
Table 4.12. Shana’s types of metacognitive behaviors with their frequency observed
on each stage .................................................................................................................. 126
xvii
Table 4.13. Sandy’s overall stages in pretest .............................................................. 129
Table 4.14. Breakdown of Sandy’s key cognitive behaviors in the Compare Areas
problem .......................................................................................................................... 135
Table 4.15. Breakdown of Sandy’s key cognitive behaviors in the Compare
Triangles problem ......................................................................................................... 141
Table 4.16. Breakdown of Sandy’s key cognitive behaviors in the Shaded Triangle
problem .......................................................................................................................... 150
Table 4.17. Breakdown of Sandy’s key cognitive behaviors in the Estimate Region
problem .......................................................................................................................... 158
Table 4.18. Breakdown of Sandy’s key cognitive behaviors in the Intersected Area
problem .......................................................................................................................... 162
Table 4.19. Overview of Sandy’s concept stages ........................................................ 169
Table 4.20. Sandy’s self-initiated and interviewer-initiated shifts ........................... 170
Table 4.21. Sandy’s types of metacognitive behaviors along with frequency of their
occurrence revealed under each stage for each problem .......................................... 174
Table 4.22. Sandy’s functions and consequences of intra-person monitoring and
control ............................................................................................................................ 177
Table 4.23. Sandy’s functions and consequences of monitoring of strategies ......... 178
Table 4.24. Sandy’s functions and consequences of regulation of strategy ............. 180
Table 4.25. Sandy’s types of metacognitive behaviors with their frequency observed
on each stage .................................................................................................................. 181
Table 4.26. Ivan’s overall stages in pretest ................................................................. 184
Table 4.27. Breakdown of Ivan’s key cognitive behaviors in the Compare Areas
problem .......................................................................................................................... 189
Table 4.28. Breakdown of Ivan’s key cognitive behaviors in the Compare Triangles
problem .......................................................................................................................... 195
Table 4.29. Breakdown of Ivan’s key cognitive behaviors in the Shaded Triangle
problem .......................................................................................................................... 203
Table 4.30. Breakdown of Ivan’s key cognitive behaviors in the Estimate Region
problem .......................................................................................................................... 208
Table 4.31. Breakdown of Ivan’s key cognitive behaviors in the Intersected Area
problem .......................................................................................................................... 212
Table 4.32. Ivan’s overview of concept stages ............................................................ 223
Table 4.33. Ivan’s self-initiated and interviewer-initiated shifts .............................. 225

xviii
xix
Table 4.54. Andy’s functions and consequences of regulation of strategy .............. 284
Table 4.55. Andy’s types of metacognitive behaviors with their frequency observed
on each stage .................................................................................................................. 285
Table 4.56. Allen’s overall stages in pretest ................................................................ 288
Table 4.57. Breakdown of Allen’s key cognitive behaviors in the Compare Areas
problem .......................................................................................................................... 293
Table 4.58. Interviewer’s prompts and Allen’s responses in the Compare Areas
problem .......................................................................................................................... 297
Table 4.59. Breakdown of Allen’s key cognitive behaviors in the Compare Triangles
problem .......................................................................................................................... 299
Table 4.60. Interviewer’s prompts and Allen’s responses in the Compare Triangles
problem .......................................................................................................................... 304
Table 4.61. Breakdown of Allen’s key cognitive behaviors in the Shaded Triangle
problem .......................................................................................................................... 306
Table 4.62. Breakdown of Allen’s key cognitive behaviors in the Estimate Region
problem .......................................................................................................................... 311
Table 4.63. Breakdown of Allen’s key cognitive behaviors in the Intersected Area
problem .......................................................................................................................... 315
Table 4.64. Allen’s overview of concept stages ........................................................... 321
Table 4.65. Allen’s self-initiated and interviewer-initiated shifts ............................. 323
Table 4.66. Allen’s types of metacognitive behaviors along with frequency of their
occurrence revealed under each stage for each problem .......................................... 327
Table 4.67. Allen’s functions and consequences of intra-person monitoring and
control ............................................................................................................................ 330
Table 4.68. Allen’s functions and consequences of monitoring of strategies ........... 331
Table 4.69. Allen’s functions and consequences of regulation of strategy ............... 332
Table 4.70. Allen’s types of metacognitive behaviors with their frequency observed
on each stage .................................................................................................................. 333
Table 5.1. Summarization of initial response/approach adopted by each participant
......................................................................................................................................... 338
Table 5.2. Approaches adopted by the participants solving the Compare Areas
problem. ......................................................................................................................... 340
Table 5.3. Concept stages of area and associated approach revealed by participants
......................................................................................................................................... 341
xx
Table 5.4. Metacognitive behaviors exhibited from the five participants ............... 342
Table 5.5. Task elements/objectives identified and initial approach adopted by each
participant ..................................................................................................................... 344
Table 5.6. Approaches adopted by the participants solving the Compare Triangles
problem .......................................................................................................................... 346
Table 5.7. Concept stages of area and associated approach revealed by participants
......................................................................................................................................... 348
Table 5.8. Metacognitive behaviors exhibited by participants ................................. 349
Table 5.9. Task elements/objectives identified and initial approach adopted by each
participant ..................................................................................................................... 351
Table 5.10. Approaches adopted by the participants when solving the shaded
triangles problem .......................................................................................................... 353
Table 5.11. Concept stages of area and associated approach revealed by participants
......................................................................................................................................... 354
Table 5.12. Metacognitive behaviors exhibited by participants ............................... 356
Continued....................................................................................................................... 358
Table 5.13. Task elements/objectives identified and initial approach adopted by each
participant ..................................................................................................................... 358
Table 5.14. Approaches adopted by the participants when solving the Estimate
Region problem ............................................................................................................. 361
Table 5.15. Concept stages of area and associated approach revealed by participants
......................................................................................................................................... 362
Table 5.16. Metacognitive behaviors exhibited by participants ............................... 363
Table 5.17. Task elements/objectives identified and initial approach adopted by each
participant ..................................................................................................................... 365
Table 5.18. Approaches adopted by the participants when solving the Intersected
area problem.................................................................................................................. 368
Table 5.19. Concept stages of area and associated approach revealed by participants
......................................................................................................................................... 370
Table 5.20. Metacognitive behaviors exhibited by participants ............................... 371
Table 5.21. Complete list of concept stages................................................................. 372
Table 5.22. Stages shifted to from Heap-NM ............................................................. 381
Table 5.23. Stages shifts to and from the Surface Association Complex – NM ....... 382
Table 5.24. Stages shifted to from the Surface Association Complex – UA ............ 382

xxi
Table 5.25. Stages shifted to from the Surface Association Complex – Formula ... 383
Table 5.26. Stages shifted to from the Artificial Association Complex .................... 384
Table 5.27. Stages shifted to from the Chain Complex – NM stage ......................... 385
Table 5.28. Stages shifted to from the Representation stage..................................... 386
Table 5.29. Stages shifted to from the Pseudo-concept Complex – NM................... 386
Table 5.30. Stages shifted to from the Pseudo-concept Complex – M ..................... 387
Table 5.31. Stages shifted to from the Pseudo-concept Complex – Formula .......... 388
Table 5.32. Stages shifted to from the Potential Concept – UA stage ...................... 389
Table 5.33. Stages shifted to from the Potential Concept – Formula ....................... 390
Table 5.34. Stages shifted to from the Potential Concept – Formula ....................... 391
Table 5.35. Stages shifted to from the Concept – Formula ....................................... 391
Table 5.36. Types of metacognitive behaviors and their coding criteria ................. 394
Table 5.37. Functions, frequencies, and consequences of intra-person monitoring
and control ..................................................................................................................... 396
Table 5.38. Functions, frequencies, and consequences of monitoring and control of
strategies ........................................................................................................................ 401
Table 5.39. Functions, frequencies, and consequences of regulation of strategy
applicability, regulation and transfer ......................................................................... 403
Table 6.1. Complete list of concept stages................................................................... 422
Table 6.2. Types of metacognitive behaviors and their coding criteria ................... 431
Table 6.3. Functions, consequences, and factors for effectiveness of intra-person
monitoring and control ................................................................................................. 432
Table 6.4. Functions, consequences, and factors for effectiveness of regulation of
task objectives................................................................................................................ 433
Table 6.5. Functions, consequences, and factors for effectiveness of monitoring and
control of strategies ....................................................................................................... 434
Table 6.6. Functions, consequences, and factors for effectiveness of regulation of
strategy applicability, regulation and transfer ........................................................... 435
Table 6.7. Concept stages as a factor for effectiveness of consequences of each type
of metacognitive ............................................................................................................ 439
Table 6.8. Concept stages as a factor for existence of effective metacognitive
behaviors ........................................................................................................................ 442
1
CHAPTER 1
BACKGROUND
Problem solving is a key aspect of learning mathematics. The goal of improving
children’s mathematical problem solving skills has been a prominent part of reform
efforts of the past century (Schoenfeld, 1992). In its recent report, the National Council of
Teachers of Mathematics (2006) indicated that increasing the percentage of the
population highly trained in mathematics is not enough if most people cannot deal with
the concepts and problem-solving skills required for active citizenship. Despite extended
calls for the need to improve children’s mathematical thinking and problem solving skills,
progress has been slow. Indeed, problem solving agenda has failed to found an effective
spot in the United States curriculum, and U.S. students’ problem solving performance
continues to be assessed as low by various international assessment programs
(Fleischman et al., 2010; Gonzales et al., 2008). Designing ways to improve students’
problem solving performance through instructional methods has been of great concern for
researchers. Lack of success of instructional approaches that build around an application
of Polya-style heuristic strategies has been explained to be due to community’s little
understanding of how individuals come to make decisions about when, where, why, and
how to use heuristics, strategies, and metacognitive actions (Schoenfeld, 1992). A
number of metacognitive instructional strategies have been found to be effective over the
2
past 25 years (Kramarski et al., 2002; Lester et al., 1989; Schoenfeld, 1987, 1992), but
the reasons behind such enhanced performance remain unknown.
Aside from the gap between research on problem solving and problem solving
instructional practice, a theory of problem solving is still missing (Schoenfeld, 2007).
The major challenge for problem solving researchers has shifted from characterizing
problem solving behaviors to providing theoretical explanations for them (Schoenfeld,
2007). Problem solving is a platform where mathematical thinking is studied. In order to
study this type of thinking, three kinds of components are generally distinguished:
mathematical knowledge, metacognition, and affective factors. Metacognition, which is
cognition about one’s cognition, has been identified as the key factor, as well as the key
obstacle, to furthering the genre of research on problem solving.
Metacognition
Metacognition consists of two categories of components: metacognitive
knowledge and metacognitive regulation (Tarricone, 2011). Metacognitive knowledge
includes declarative knowledge, procedural knowledge, and conditional knowledge,
while metacognitive regulation involves planning, monitoring, and evaluation. Schraw
and Moshman (1995) proposed three types of metacognitive theories which characterize
how individuals integrate their metacognitive knowledge and metacognitive regulation:
tacit theories, informal theories, and formal theories. Schraw and Moshman (1995)
distinguished between one’s statable metacognitive knowledge and one’s conscious
access to such information, and further highlighted the benefit and importance of the
latter.

3
Two major challenges persist when studying metacognition. The first one is the
inconsistency of metacognitive behaviors. One may exhibit rather sophisticated
metacognitive behaviors in some contexts while behave quite differently in others; this
phenomenon has been observed in many studies of problem solving (e.g. Zhang, 2010).
The second issue is the development of reliable methodologies to detect and represent
people’s metacognition. Aside from the complexity of the knowledge itself, two facts
have made its interpretation more problematic: (1) Metacognitive knowledge is not
necessarily statable. A number of studies have shown that children and adults constantly
use knowledge about cognition without being able to explicitly describe it (Montgomery,
1992; Bereiter & Scardamalia, 1993; Chi, Glaser, & Farr, 1988); (2) People may not be
conscious of their metacognition. If metacognition is knowledge about one’s cognition,
then meta-metacognition is knowledge about one’s metacognition. A number of existing
methods for studying metacognition rely on or promote individual’s meta-metacognition,
such as self-report instrument (Schraw & Sperling-Dennison, 1994), think-aloud protocol
and clinical interview (Zhang, 2010). However, Minsky (1988) argued that such
consciousness may be unnecessary or even disturbing for individuals who are involved in
the practice. Problem solving researchers have attempted to develop more reliable
methodologies. For instance the potential of Geometer’s Sketchpad for promoting adults’
problem-solving metacognition in dynamic geometry environment was recently explored
by Kuzle (2011), yet metacognitive phenomena embedded in other contexts and age
groups remain to be captured.
Since metacognitive behaviors have been proposed as concept-dependent, i.e. “the
meanings of specific metacognitive and higher order abilities are closely associated with
4
particular concepts and situations” (Lesh, Lester, & Hjalmarson, 2003, pp. 383), a
method to tackle individual’s conceptual development could be beneficial. Vygotsky’s
concept formation theory is selected to serve such purpose.
Vygotsky’s Concept Formation Theory
Vygotskian theory has been adopted extensively in mathematics education in
terms of its emphasis on social aspect of learning. However, Van der Veer and Valsiner
(1994) stated that the use of Vygotsky’s theory has been highly selective in the west, and
“the focus on the individual developing person which Vygotsky clearly had … has been
persistently overlooked” (p. 6).
Vygotsky’s concept formation theory outlines three stages associated with
individuals’ construction of any concept: heaps, complexes, and potential concepts
(Vygotsky, 1962). The development of attributes of a concept and individual’s operations
on them are explicitly described in the theory. The construction process is driven by the
mediation between personal development and social-accepted conventions. If we view
mathematics as a system of concepts/signs developed conventionally, Vygotsky’s
concept formation theory provides a fruitful framework to elaborate on the construction
of mathematical concepts. These concepts are the fundamental components identified by
the Models and Modeling perspective upon which cognition and metacognition act.
Berger (2004) studied the knowledge construction of mathematical concepts at
university level through Vygotsky’s concept formation theory in order to understand how
individuals bridge the gap between personal and social usage of mathematical signs and
definitions. She provides an interpretation of Vygotsky’s theory in mathematics domain,
5
along with indicators for each type of thinking. Berger focused on semiotics in her study
and suggested future research to look into the transformation across the stages.
Statement of the Problem
Acknowledging the important role of metacognition in problem solving, a better
lens to interpret and explain metacognitive phenomena is of great need. Previous studies
have proposed various models to understand metacognition, such as a cycle containing
metacognitive awareness, metacognitive evaluation, and metacognitive regulation
(Wilson & Clarke, 2004), taking into account four components including metacognitive
knowledge, metacognitive experience, goals, and actions (Flavell, 1979), and a model of
metacognitive failure consisting of metacognitive blindness, mirage, and vandalism
(Goos, 2002). However, these models and terms generally lack explanation as
metacognition does. Lack of effectiveness of existing models may have prevented
researchers from gaining a more meaningful understanding of metacognition.
The Vygotsky’s inspirational work Thought and Language (1962) offers a
different perspective to look at students’ thinking in problem solving activities, not only
to provide a different lens to interpret metacognitive phenomena, but also to potentially
bridge the gap between problem solving research and instructional practice. Yet, this
study was not meant to be separated from existing work on metacognition and problem
solving; instead, it incorporated established taxonomy and definitions of metacognitive
and problem-solving phenomena, and provided meaningful explanations for puzzling
findings and insightful answers to certain questions.
6
The proposed framework considered students’ conceptual knowledge involved in
problem solving activities through Vygotsky’s concept formation theory, identifying the
development of attributes of a concept and the individual’s operations on them. How
metacognition was intertwined with those developmental concepts was interpreted
through the indicators outlined by Tarricone (2011). In this framework, metacognition
was treated as concept-dependent, cognitive-dependent, developmental, and inconsistent.
Research Questions
This study aimed to investigate Vygotsky’s stages of concept formation exhibited
during students’ non-routine problem solving processes embedded in selected concepts.
Additionally, it aimed to identify possible patterns of metacognitive behaviors which
might intertwine with different stages of development of concepts’ attributes and
operations on them. This study was designed to understand metacognitive systems that
influence decision making within problem solving situations with an eye on: What types
of metacognitive behaviors do students utilize when solving non-routine problems? Are
there any patterns of such utilization for different problem solving phases or different
contexts? To what extent does the development of these behaviors relate to one’s
development of mathematical concepts? In order to systematically frame and develop this
framework, the following questions were used to guide the study:
1. What stages of mathematical concept development are exhibited in students’
problem solving activities in terms of Vygotsky’s theory?
2. What types of metacognitive behaviors are utilized by students when solving
non-routine problems?
7
3. What is the relationship between the metacognitive behaviors and the stages of
mathematical concept development as outlined by Vygotsky’s theory?
Significance of the Study
This study proposed a novel theoretical framework as a means to examine and
interpret metacognitive behaviors in mathematical problem solving processes. The
theoretical framework incorporates a learning theory (Vygotsky’s concept formation
theory) and the traditional cognition-metacognition framework into a three-layer model.
By using mathematical concept stages as a finer platform to unpack potential patterns of
metacognitive behaviors, this study fully aligns with Schoenfeld’s (2013) suggestion,
which was to trace typical developmental trajectories pertaining to students’ ability to
engage in problem solving in order to incorporate theories of learning and development
into a theory of decision making. He identified this issue as a key to theorize cognition
and problem solving.
8
CHAPTER 2
LITERATURE REVIEW AND THEORETICAL FRAMEWORK
This chapter provides an overview of existing literatures on 1) problem solving
and mathematical thinking, 2) problem solving and metacognition, 3) constructivism and
sociocultural perspective, and 4) concept formation theory. These literatures have
informed both the conceptualization of the concept-cognition-metacognition theoretical
framework and this specific study. The concept-cognition-metacognition framework is
described and elaborated in the theoretical framework section. The significance of the
framework is also discussed.
Problem Solving and Mathematical Thinking
Conceptualization
Over two decades ago Schoenfeld (1992) identified problem solving as one of the
most overworked but least understood subjects of that time. Framing problem solving as
a central component of mathematical thinking he argued for broadening the domain of
inquiry into learning of mathematical problem solving as a quest to better understanding
the functioning and nature of mathematical thinking.
9
What does it mean to think mathematically? According to Schoenfeld (1992),
mathematical thinking involves (1) a mathematical point of view, i.e. valuing the
processes of mathematization and abstraction and preferring to apply them, and (2)
competence with mathematical tools (such as abstraction, symbolic representation, and
symbolic manipulation) for the goal of understanding structure, i.e. mathematical sense-
making. I view this description to mean that, mathematical problem solving and
mathematical modeling involve mathematical thinking and that mathematical thinking
involves both.
Stanic and Kilpatrick (1989) summarized three historical themes surrounding
conceptualization of problem solving: problem solving as context, problem solving as
skill, and problem solving as art. In the first theme, problem solving as context, problem
solving serves as a vehicle for other curricular goals. In other words, problem solving is
not seen as a goal, but interpreted as working the given tasks so that some knowledge or
techniques can be learned. In the second theme, problem solving as skill, problem solving
is seen as a curriculum goal itself, but with a narrow definition: the ability to solve given
tasks. In the third theme, problem solving as art, problem solving is considered to be
“real” when the problems are challenging and complex, and as such real problem solving
sits at the heart of mathematics. Schoenfeld (1992) pointed out that most of the well-
accepted conceptions of problem solving were derived from the third theme. Without the
loss of generality, I interpret problem solving as a representation of an individual’s own
internal exploration towards an unknown path.
Aspects of Problem Solving Study
10
Schoenfeld (1992) summarized five different venues which were studied in the
genre pertaining to problem solving: knowledge base, problem solving strategies, self-
regulation, beliefs and affects, and practices. I will provide a brief review for each of the
five components in the following section.
Knowledge base.
There is consensus that six knowledge domains influence problem solving
performance including: informal and intuitive knowledge, mathematical facts and
definitions, algorithmic procedures, routine procedures, relevant competencies, and
knowledge about the rules of discourse (Schoenfeld, 1992). Informal knowledge refers to
personal perceptions which may enhance or impede better understanding towards formal
knowledge. One’s knowledge about mathematical facts and algorithmic procedures
could be correct or incorrect. Routine procedures and relevant competencies are different
from algorithmic procedures and other mathematical conventions; they are more
contextual rather than right or wrong. Knowledge about the rules of discourse may
influence one’s justification method and informal or empirical processes used in
confirming validity of results.
Existing studies have considered two issues regarding the status of knowledge
base in the problem solving process: whether an individual possesses certain knowledge
or not; and whether an individual manages to access existing knowledge in appropriate
context. The former case could be interpreted as missing a tool, while the latter may be a
matter of metacognition. Historically, one way to study interactions between knowledge
and problem solving was through the lens of information processing theory, where the
process of accessing resources was broken down into task environment, sensor buffer,
11
short-term memory, and long-term memory. Studies of short-term memory reported that
human could only keep seven chunks of information in short-term memory and operate
on them, where a chunk is any perceptual configuration (e.g. visual, auditory) that is
familiar and recognizable (Miller, 1956; Simon, 1980). Studies of long-term memory
focused on how people codified their experiences and ways in which those codifications
shaped what they saw and how they behaved in new situations. However, the information
processing perspective focused more on performance instead of the type of
understandings that supported it. Hence, its suggestion for teaching problem schemata as
a vehicle to improve mathematical problem solving was not well-received in the
mathematics education community. A more coherent theory has not yet been developed
(Schoenfeld, 2013) however, studies focused on understanding strategy usage while
problem solving have provided fruitful results as described below.
Problem solving strategies.
The study of problem solving strategies (or heuristics) commenced upon the
Polya’s work, How to Solve it (1945). The types of heuristics identified by Polya included:
analogy, auxiliary elements, decomposing and recombining, induction, specialization,
variation, and working backwards. During the 1960s and 1970s, a group of researchers,
such as Kilpatrick (1969) and Kantowski (1977), were motivated by Polya’s work and
began their study of heuristics used by students when solving problems (Schoenfeld,
2007). Although instruction on application of Polya-type heuristics has not been proven
to be successful due to the community’s little understanding of how individuals come to
make decisions about when, where, why, and how to use heuristics and metacognitive
12
actions (Schoenfeld, 1992), the concept provided valuable descriptive language for
problem solving researchers (Zawojewski & Lesh, 2003).
The need for understanding metacognitive actions (self-regulation) emerged
through the studies of problem solving strategies.
Self-regulation.
Self-regulation, one of the core concepts in metacognitive domain, involves
planning, organizing, self-instruction, self-monitoring, and self-evaluation (Baumeister &
Vohs, 2004; Ellis & Zimmerman, 2001). The following assertions regarding the
relationship between metacognition and self-regulation have been established (Tarricone,
2011, p. 169):
• Metacognition is an important sub-process of self-regulation but solely
insufficient for successful self-regulation.
• Metacognition and self-regulation’s main intersection is control, monitoring
and regulation of strategies to meet task demands and goals.
Hartman (2001) and Zimmerman (1995) indicate that knowledge domains and contexts
can affect self-regulation.
Lester, Garofalo, and Kroll (1989) designed a 12-week long instruction of
problem solving with both routine and non-routine problems, focusing on the
development of control of cognition. One of their main findings highlighted the dynamic
interaction between the mathematical concepts and metacognitive processes used to solve
problems with them. In other words, the control processes and awareness of cognitive
processes developed along with the understanding of mathematical concepts. Some
designed instructions on metacognition have been found to be effective (Kramarski et al.,
13
2002; Lester et al., 1989; Schoenfeld, 1987, 1992), but the reasons for why the students’
problem solving performance improved remain unknown.
A noticeable component that has been recognized as influential yet difficult to
generalize pertaining to individuals’ metacognitive actions is belief.
Beliefs and affects.
Belief means “an individual’s understandings and feelings that shape the ways
that the individual conceptualizes and engages in mathematical behavior” (Schoenfeld,
1992, p. 68). In his recent work How We Think (2010), Schoenfeld coined the term
orientation to encompass constructs like dispositions, beliefs, and preference. He
proposes that understanding an individual’s orientation is essential to interpreting and
predicting his/her decision making, in that one’s orientation shapes his/her goals and
could be used to explain his/her at-the-moment decisions when multiple choices are
present.
Lampert (1990) reported on an instructional project which was designed to alter
students’ perceptions of knowing and learning school mathematics. Seven types of
conventional beliefs about the nature of mathematics are described in her paper:
• There is one and only one answer to a problem.
• There is only one correct way to solve a problem.
• Students are not expected to understand mathematics, but memorize and
apply it.
• Mathematics is done by individuals in isolation.
14
• Students who are good at mathematics will be able to solve any problem in a
very short time.
• School mathematics has little to do with the real world.
• Formal proof has nothing to do with discovery or invention.
Research has established that individuals’ beliefs greatly influence their problem
solving behaviors. For example, a student who believes there is one and only one answer
to a problem may stop thinking after finding an answer to a problem with multiple
answers, or be overwhelmed by a problem with no answer. Zhang (2010) examined three
students’ problem solving behaviors along with their beliefs (orientations) about
mathematics and mathematical problem solving. Findings identified personal orientation
as a major influence on decision making process shaping the choice of strategy, switching
or staying with a strategy, and confirming an answer. Since beliefs are abstracted from
one’s experiences and cultures, a sociocultural perspective would be beneficial to account
for their development as well as analysis of their functioning.
The last venue is classroom practices that involves problem solving instruction
and development.
Practices.
Practice refers to the study of classroom environments that provoke mathematics
as an interactive discipline of sense-making, which serves as the media for producing
effective mathematical problem solvers. Assumptions have been made regarding the
possible impact of practices on learners’ cognition, yet empirical data supporting such
assumptions are not available.
What is yet to be known

15
Lester (1994) summarizes change in trends in problem solving research from
1980 to 1992 (Table 2.1).
Issues Lester’s view 1980
Schoenfeld’s view 1992
1. Need for greater clarity in meanings of terms
* *
2. Need for improved research methods * * 3. Importance of understanding interactions among aspects of problem-solving activity
* (implied)
*
4. Importance of understanding the role of control in problem solving
*
5. Importance of understanding the role of beliefs & affects in problem solving
*
6. Need for increased attention to issues related to instruction
* *
7. Need for better measures to assess problem-solving performance
*
8. Need for more attention to issues related to transfer of learning
*
Table 2.1. Change in trends in problem solving research from 1980 to 1992 (p. 670) Asterisk indicates that an issue is considered important.
Lester (1994) proposed four issues that remained to be considered by researchers
of mathematical problem solving: the need for clarity in the meaning of problem solving,
the need for more adequate research methods, the importance of understanding
interactions between domain knowledge and other aspects of problem-solving activity,
and the need to deal with problem-solving instruction. Since then three new issues have
emerged: the importance of understanding the role of control, the impact of beliefs on
problem solving performance, and the need for better problem solving performance
assessment tools. The transfer of learning was no longer a scope in 1992.
16
It has been twenty years since Lester’s status report has been published. Among
what he identified then, I believe the following issues continue to persist:
• Need for better research methods
• Understanding interactions between domain knowledge and other aspects of
problem-solving activity (e.g. strategy use, control, and beliefs)
• Understanding the role of metacognitive components on problem solving
behaviors
• Need for explanations and theories of effective problem solving
(metacognitive) instructions
• Need for better assessment of problem solving performance
• Understanding issues related to transfer of learning
In his most recent article on mathematical problem solving, Schoenfeld (2013)
reflected on the current state of mathematical problem solving both in theory and in
practice. He highlighted the importance and the challenge of building a theory of problem
solving to explain the goal-oriented decision making in complex problem solving settings.
A potential direction he foresaw is to trace typical developmental trajectories with
regards to individuals’ ability to engage in problem solving in order to theorize cognition
and problem solving.
Problem Solving and Metacognition
As previously described, metacognition has been recognized as the key to the
black box of understanding decision making in the problem solving process. It is also
17
agreed that development of a theory of mathematical problem solving is less likely to be
achieved without understanding metacognition and its functioning. Despite the prosperity
of the genre of work on metacognition as a discipline, problem solving researchers find it
difficult to unpack the mystery within their own contexts. Two reasons could attribute to
such difficulty. First, it is not clear whether mathematical metacognition might possess
unique features, which distinguish it from general theories of metacognition currently in
place. Second is the absence of accurate and adequate methods to capture this
phenomenon. Before elaborating on these two issues, I will provide a selective review of
existing metacognitive studies in both metacognition discipline and mathematical
problem solving field.
Metacognition as a Discipline
Tarricone (2011) outlined a summary of current conceptual work in the area of
metacognition as a discipline (see Appendix 1) and identified two core-components of
metacognition to include knowledge of cognition (or metacognitive knowledge) and
regulation of cognition (or metacognitive skills).
Knowledge of cognition contains three types of knowledge:
1. Declarative metacognitive knowledge –”knowing when and what you know
and do not know, including what you need to know, knowledge of strategy applicability,
and effective knowledge of what type of information is needed to meet task demands”
(ibid, pp. 157);
2. Procedural metacognitive knowledge – “knowledge and awareness of the
processes or how to meet task demands or task objectives” (ibid, pp. 160); and

18
3. Conditional metacognitive knowledge – “knowing when and why to use
declarative and procedural metacognitive knowledge” (ibid, pp. 165).
Tarricone (2011) claims existence of 2 to 3 levels of subcategories associated with
each of these categories taking into account person, task, and strategy variables.
Regulation of cognition contains two types of knowledge: regulation of cognition and
executive functioning, which further contains self-regulation and monitoring and control,
and metacognitive experience, which further contains metacognitive judgments and
metacognitive feelings. Under each of these two categories, there are 1 to 2 levels of
subcategories in terms of person, task, and strategy variables. Figure 2.1 illustrates the
Tarricone’s (2011) framework.
Figure 2.1. Tarricone’s (2011) conceptual framework of components of metacognition
19
Kluwe (1982) proposed two forms of declarative knowledge: domain knowledge
and cognitive knowledge. Domain knowledge refers to “individual’s stored information
about the domains of reality”, while cognitive knowledge implies “individual’s stored
assumptions, hypotheses, and beliefs about thinking” (p. 203). In particular, domain
knowledge was reported to be influential to conditional knowledge, which supports “the
adaptive application in unfamiliar, complex problems and contexts” (Tarricone, 2011, p.
165). If this is indeed the case, it is possible that an individual’s metacognition may
function differently upon the same problem depending on whether mathematical context
is hidden or evident.
Schraw and Moshman (1995) defined metacognitive theory as an individual’s
systemized cognitive framework which consolidates different kinds of metacognitive
knowledge and metacognitive skills. Metacognitive theories have two primary
characteristics. First, they integrate a wide range of metacognitive knowledge and
experience. If underdeveloped, metacognitive theories could lead to difficulties in
facilitating one’s cognition by metacognitive knowledge and skills. Second, they allow
individuals to explain and predict cognitive behaviors by coordinating beliefs. Schraw
and Moshman (1995) indicated that the degree of influence of these two properties may
vary from person to person and that the theories are developmental rather than static.
Three kinds of metacognitive theories were proposed by Schraw and Moshman: tacit
theories, explicit and informal theories, and explicit and formal theories (1995). Tacit
theories refer to theories acquired or constructed without explicit awareness that one
possesses a theory. It is tacit in that many individuals do not report having a theory of
intelligence even though they express beliefs which are consistent with such a theory.

20
Guzzetti et al. (1993) reported that tacit theories may be difficult to change even by
encouraging individuals to do so. Explicit and informal theories refer to theories where
the individuals are partially aware of some of their beliefs regarding a phenomenon, but
have not constructed a systemized framework that integrates and justifies these beliefs.
Emerging recognition and control of constructive processes are considered to be an
essential feature of this type of theories. Different from the tacit theories, informal
theories enable individuals to reflect purposefully and systematically on their behaviors
and modify their future behaviors based on the reflection (Kuhn et al., 1992). Another
distinct advantage of informal theories is that individuals are able to distinguish formal
aspects from informal, “where the formal aspect refers to the structure and contents of the
theory, and the empirical aspect refers to data that the theory attempts to explain”
(Schraw & Moshman, 1995, p. 360). Informal theory is a necessary step towards the
development of more sophisticated theories (Reich, Oster, & Valentin, 1994). Formal
theories refer to highly systemized theoretical structures. Existing studies reported that
formal theories are rare outside the field of one’s expertise (Kuhn, 1989; McCutcheon,
1992; Schon, 1987). Kuhn (1989) proposed two skills that are necessary for the formation
of a formal theory: the ability to distinguish and coordinate the formal and empirical
aspects of a theory, and the ability to evaluate and interpret the meaning of empirical
evidence separated from the formal aspect of the theory. Schraw and Moshman’s (1995)
framework relies on the degree of awareness (of one’s beliefs and of theorizing
constructions), but they fail to provide any measurement tool to assess it. They also point
out that it is unclear what may constitute a formal metacognitive theory. Although more
21
questions are raised by the authors, their proposed framework offers a global view to
understanding individual’s development of metacognitive behaviors as an overall system.
Study of Metacognition in Mathematical Problem Solving Studies
Many of the components presented in Figure 2.1 have been borrowed by problem
solving researchers since the late 1980s (Lester, 1994). Most recently, Kuzle (2011)
listed a number of instances where metacognition was investigated in problem solving
research: cognitive-metacognitive frameworks which reflected metacognitive processes
during students’ problem solving activities; the role of metacognition in problem solving;
the role of writing on metacognitive processes during problem solving activities; the role
of non-cognitive factors (such as affective states and beliefs); and the effects of
metacognitive instruction on problem solving. She concluded that “how and why
metacognitive behaviors emerged, to what extent students act metacognitively, and to
what degree metacognition influences problem-solving activity, in both desirable and
unproductive ways” were still unknown despite the extensive research on metacognition
in the problem solving field (p.46).
Existing research has attempted to tackle metacognition by looking through
problem solving behaviors/events (Schoenfeld, 1981; Lawson & Chinnappan, 1994),
investigating problem solving phases/stages/episodes (Lester et al., 1989; Anderson, Lee,
& Fincham, 2014), and developing new methodological techniques (Wilson & Clarke,
2004; Kuzle, 2011). A review of each is offered below.
Lawson and Chinnappan (1994) identified five categories of processing events in
a study of geometry problem solving: identification of given information, problem
control or management, generation of new information, self-assessment, and error. Based
22
on the comparison between the performance of high-achieving and low-achieving
students, they concluded that the ability to retrieve more knowledge and initiate more
processing events is crucial for success in problem solving performance.
Lester et al. (1989) studied the role of metacognition in seventh graders’ problem
solving behaviors. The researchers applied a framework that considered different actions
when working on a mathematical task: orientation (strategic behavior to assess and
understand a problem), organization (planning of behavior and choice of actions),
execution (regulation of behavior to conform to plans), and verification (evaluation of
decisions made and of outcomes of executed plans). The results indicate that the
orientation stage has the largest effect on students’ problem solving performance.
By using a combination of multivariate pattern analysis and hidden Markov
models, Anderson, Lee, and Fincham (2014) identified five major stages in solving a
class of problems: a Define Phase where individuals identified the problem to be solved,
an Encode Phase where individuals encoded the needed information, a Compute Phase
where individuals performed the necessary arithmetic calculations, a Transform Phase
where individuals performed any mathematical transformations, and a Respond Phase
where individuals entered an answer. They also reported characteristics of each stage,
potential factors that influenced the duration of these stages, and how these stages were
related to learning of a new mathematical competence. The results supported the
importance of reflection to successful learning. Anderson, Lee, and Fincham’s study did
not provide insight on metacognitive behaviors in mathematical problem solving yet their
work was a noticeable attempt to connect problem solving and learning.
23
Wilson and Clarke (2004) developed a multi-method technique to understand
individual’s metacognition. Three constructs of metacognition were examined:
metacognitive awareness, metacognitive evaluation, and metacognitive regulation.
Although they were able to interpret students’ metacognitive behaviors through
awareness-evaluation-regulation cycles, they failed to improve students’ problem solving
performance based on their findings.
Kuzle (2011) adopted dynamic geometry technology (Geometer’s Sketchpad) to
trace individuals’ metacognitive behaviors during geometrical problem solving, using
Wilson and Clarke’s (2004) three-category construct (as described above) and Artigue’s
(2002) student-tool interactional approach as her theoretical framework. She reported an
effective metacognitive behavior “taking a step back” in terms of promoting
metacognitive awareness and monitoring skills. She also pointed out negative effects of
metacognition and cautioned the unproductive aspects of metacognitive behaviors.
Holton and Clarke (2006) proposed a conception of scaffolding and claimed self-
scaffolding as essentially the same as metacognition. By self-scaffolding, they mean any
situations where an individual is able to provide scaffolding for himself when tackling a
problem or concept which is new to him. Instead of providing any detailed examination
of this self-scaffolding phenomenon in relation to problem solving behaviors, Holton and
Clarke (2006) identified two construction zones (Newman, Griffith, & Cole, 1989) of
self-scaffolding: conceptual scaffolding and heuristic scaffolding, each of which refers to
self-scaffolding on mathematical concept or procedure, and a more general approach to
problem solving, respectively.
Reasons for Difficulty
24
Despite the prosperous developments in metacognition discipline and the efforts
of problem solving researchers to better understand it, metacognition remains as a
mysterious construct as it pertains to its role in the decision making in problem solving. I
propose the following in support of my assertion.
First, since conditional knowledge is found to be influenced by domain
knowledge (Tarricone, 2011), it implies that metacognitive behaviors are not only
concept-dependent, but also domain-dependent. For example, if the same question is
given to an individual in a non-mathematical context (which the individual is not able to
recognize immediately) and a mathematical context, the individual may exhibit very
different metacognitive behaviors. As a result, metacognition frameworks might be
difficult or even inappropriate to be used in mathematical problem solving study. Just like
the suggestion on cautious application of research findings from schema theory
(Schoenfeld, 1992), knowledge transfer from metacognition discipline should also be
treated with great caution.
Second, better methods to unpack metacognition involved in problem solving are
in need. It seems that a favor towards metacognition may have limited the lens that
problem solving researchers have used to investigate problem solving behaviors.
Researchers have been focusing on finding new methodologies to study metacognition,
instead of developing more efficient ways to interpret and understand problem solving
processes including, “what one knows” and “how one constructs.” The former has been
acknowledged as one of the most important components, yet we lack an appropriate way
to interpret the domain due to the complex nature of non-routine problem solving. The
25
latter has been extensively studied and described, yet remains either too general to be
informative or too individually conditioned to be theorized.
Two learning perspectives greatly influenced my conceptualization of “what one
knows” and “how one constructs,” which serves as my epistemological foundation of the
proposed theoretical framework. The two perspectives, Constructivism and Sociocultural
perspective, are reviewed in the next section.
Constructivism and Sociocultural Perspective
The first premise is that human beings act towards things on the basis of
the meanings that the things have for them… The second premise is that
the meaning of such things is derived from, or arises out of, the social
interaction that one has with one’s fellows. The third premise is that these
meanings are handled in, and modified through, an interpretative process
used by the person in dealing with the things he encounters.
----Blumer (1969, p. 2)
Constructivism
Constructivism is a theory of learning based on the idea that knowledge is
constructed by the knower based on mental activity. Derived from the work of Jean
Piaget, constructivism entered the field of mathematics education about forty years ago
(Steffe & Gale, 1995). It has been a significant driving force guiding studies of teaching
and learning.
One of the most essential components of constructivism is prior knowledge.
Ausubel (1968) said, “If I had to reduce all educational psychology to just one principle, I
26
would say this: The most important single factor influencing learning is what the learner
already knows” (p. iv). Even in the investigations of discovery learning approaches,
where the students arrive at new knowledge on their own, have emphasized on the
importance of “previous knowledge” (e.g. Shulman & Keislar, 1966). In fact, from the
constructivist view, the results of “discovery learning” actually depend on the creative
manipulation of elements which are already available to the individual (Bauersfeld, 1995).
Constructivist theory influenced the cognitive science perspective: “First, learning is a
process of knowledge construction, not of knowledge recording or absorption. Second,
learning is knowledge-dependent; people use current knowledge to construct new
knowledge. Third, “learning is highly tuned to the situation in which it takes place”
(Resnick, 1989, p.1). The idea of context-specific construction upon prior knowledge
serves as the foundational premise in my study.
Another concept influenced by constructivism is the interpretation of knowledge.
Two interpretations of knowledge are generally raised (Goodman & Elgin, 1988). One is
knowledge as object, a truth which is an accurate and comprehensive description of the
real world at which humans seek to arrive. The second interpretation is knowledge as
action, where human constructs “something that works cognitively, that fits together and
handles new cases that may implement further inquiry and invention” (p. 163). The latter
interpretation, which is of constructivist perspective, is more helpful in the context of
problem solving.
While the theory forms the basis of many studies at the elementary level,
research at the secondary level, especially problem solving research, with the
constructivist perspective is in its infancy (Wilson, Fernandez, & Hadaway, 1993).
27
Wilson, Fernandez, and Hadaway (1993) point out that constructivism is aligned with
cognitive theories and mathematical views of problem solving, thus it is important to be
familiar with and evaluate such perspective in the problem solving field.
Sociocultural perspective
The important role of social and cultural experience towards individuals’
development has been established by existing studies. A popular and heavily cited quote
by Vygotsky indicates: “Any function in the child’s cultural development appears
twice… First it appears between people as an inter-psychological category, and then with
the child as an intra-psychological category” (Wertsch, 1985, p. 64). In particular, “any
higher mental function was external because it was social at some point before becoming
an internal, truly mental function” (Wertsch, 1985, p. 62).
Sfard (2008) interprets thinking as an individualized version of interpersonal
communication, which is essentially social. She proposed the concept of commugnitive, a
combination of cognitive and communicational, which means any discourse refers to
cognitive phenomena as well as to phenomena associated with interpersonal exchanges.
The process for the higher cognitive functions (including meaning, memory,
attention, thinking, and perception for Vygotsky) to move from the status of the
interpersonal to the intrapersonal is called internalization, which is “the process of
gaining control over external sign forms” (Wertsch, 1985, p. 65). Leont’ev, a student of
Vygotsky stated that the process of internalization is not the direct transferral of an
external sign to an internal plane, but the process of forming the plane (Wertsch, 1985). If
we consider learning as internalization of higher cognitive functions, then two challenges
pervail: 1. How to describe/model such process, and 2. How to assess the progress. Due
28
to the difference between memorizing/mimicking and internalizing, a more appropriate
way to assess the progress would be some context which does not reinforce the
assessment of a specific cognitive function. But then the assessed result may be heavily
influenced by many other factors such as personal belief and orientation, which may not
reflect the progress of the desired target.
Another key idea from Vygotsky’s theory is the claim that human mental
functioning is mediated by tools and signs (e.g. mathematical system and social
language). Sfard (2008) distinguishes the way that “language molds thinking (discourse)”
(p. 100), where people who speak different languages experience different discourses and
inner structures which further lead to different behaviors and interactions. Wertsch (1995)
states that key aspects of mental functioning cannot be understood without considering
the social contexts in which they are situated, yet most educational and psychological
theories fail to deal with this issue. Bauersfeld (1995) cautions against the interpretative
analysis of selective force of social practice in actual interaction, in that through a
relevant person’s (e.g. teacher or interviewer) emphasis on something, it may indicate a
change of the focus of attention, which is called the orienting function of language. He
also points out that nonexistent obstacles have little chance of being created out of itself.
This means that certain thoughtful interventions from a relevant person could be
beneficial, despite the change it might reinforce on the focus of attention.
An Integrated Theory
Confrey (1995) calls for the development of an integrated theory of learning,
arguing that each one, in isolation, is neither useful nor sufficient to account for learning.
She critiques that although social constructivism can be considered as an attempt to
29
integrate the two theories, it tends to neglect any forms of interaction other than social,
overlooking any form of expression other than linguistic. She argues that intracognitive
activity should be considered more carefully by social constructivists in examining
thinking and learning. Her characteristics of an ideal integrated theory include (p. 223-
224):
1. A rejection a simplistic view of an accessible reality. What is signified as
knowledge is that which is acknowledged by the participants as both personally
and socially viable.
2. Assuming knowledge as relative, both temporally and communally, in relation
to what one acknowledges as the appropriate grain size for evaluating it and in
relation to the evaluator.
3. Believing that educating involves knowledge about interactions with objects
and with others. These two kinds of interactions differ in fundamental ways.
4. The interactions among our interactions with objects, others (human), and
others (nonhuman) must be studied as a part of educating.
5. Recognizing the importance of children’s own actions in solving problems, and
their engagement with a variety of tools and materials in such problem solving
activity. The choice of tools and materials will exert a significant and varied
impact on the constructions the children make. These tools and their use represent
available cultural resources.
6. Acknowledging that from all forms of interaction, two complementary
outcomes occur. We develop a sense of separation and distinction, as well as a
sense of relation and connection.
30
7. Highlighting reflection as a method of transforming physical actions into
mental operations. It is through reflection that we develop as self-regulating
individuals.
8. Punctuating communication, communicating one’s ideas to others, as equally a
part of knowing as coming to know (von Foerster, 1982).
9. Finally, recognizing the presence of multiple cultures within any homogeny.
Developing a theory that supports a multicultural view of development, while
recognizing in our diversity a shared humanity is part of our challenge.
Notice that item 5 particularly highlights the importance of problem solving and decision
making which extends to the study of metacognition.
Models and Modeling perspective.
Aside from the social constructivism theory, the Models and Modeling (MM)
perspective presented in Beyond Constructivism (Lesh & Doerr, 2003) also integrates the
two theories and is mostly aligned with the characteristics listed above.
The MM perspective has four distinct characteristics (Lesh, Lester, & Hjalmarson,
2003). First, it assumes that metacognitive and higher order abilities are associated with
specific concepts and situation instead of content-independent processes. Second, both
cognitive abilities and metacognition are assumed to work in parallel and interactively.
Third, metacognitive and higher order abilities should be considered developmentally.
Fourth, the productivity of specific metacognitive functions may vary from one problem
to another and from one stage of problem solving to another. These characteristics clearly
raise the complexity and difficulty of the study, which could be considered as a step
forward compared to the “traditional perspectives” that were critiqued in the book, where
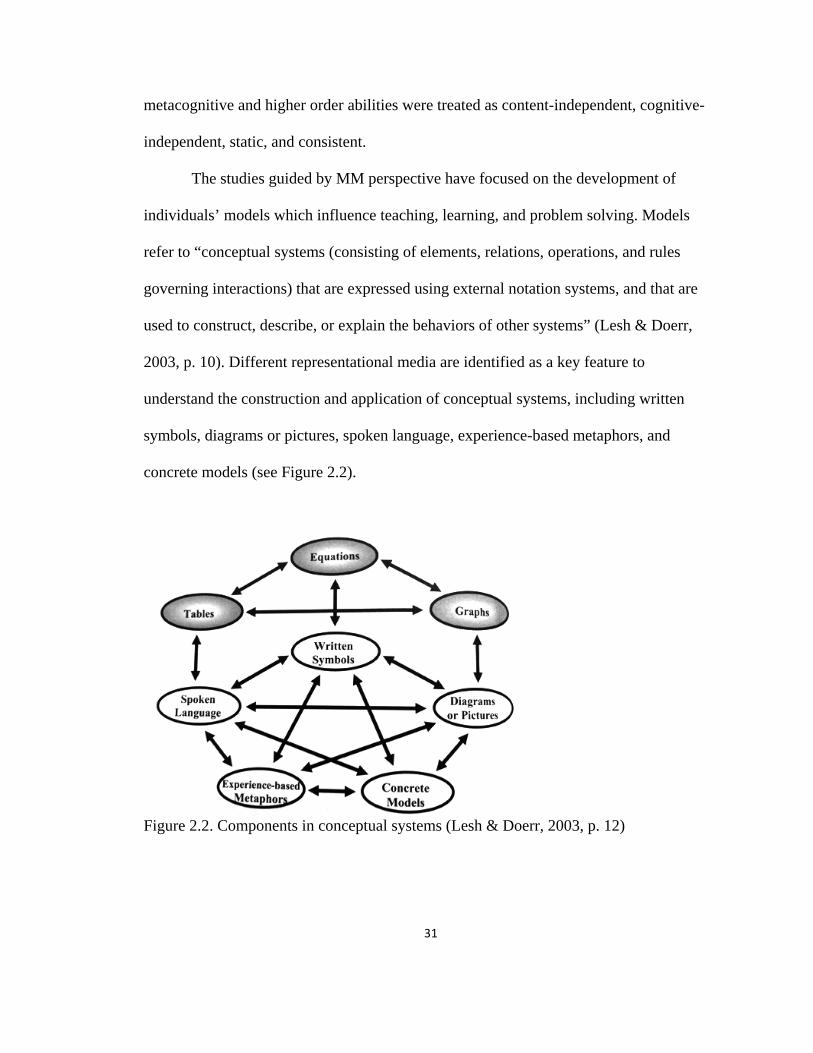
31
metacognitive and higher order abilities were treated as content-independent, cognitive-
independent, static, and consistent.
The studies guided by MM perspective have focused on the development of
individuals’ models which influence teaching, learning, and problem solving. Models
refer to “conceptual systems (consisting of elements, relations, operations, and rules
governing interactions) that are expressed using external notation systems, and that are
used to construct, describe, or explain the behaviors of other systems” (Lesh & Doerr,
2003, p. 10). Different representational media are identified as a key feature to
understand the construction and application of conceptual systems, including written
symbols, diagrams or pictures, spoken language, experience-based metaphors, and
concrete models (see Figure 2.2).
Figure 2.2. Components in conceptual systems (Lesh & Doerr, 2003, p. 12)
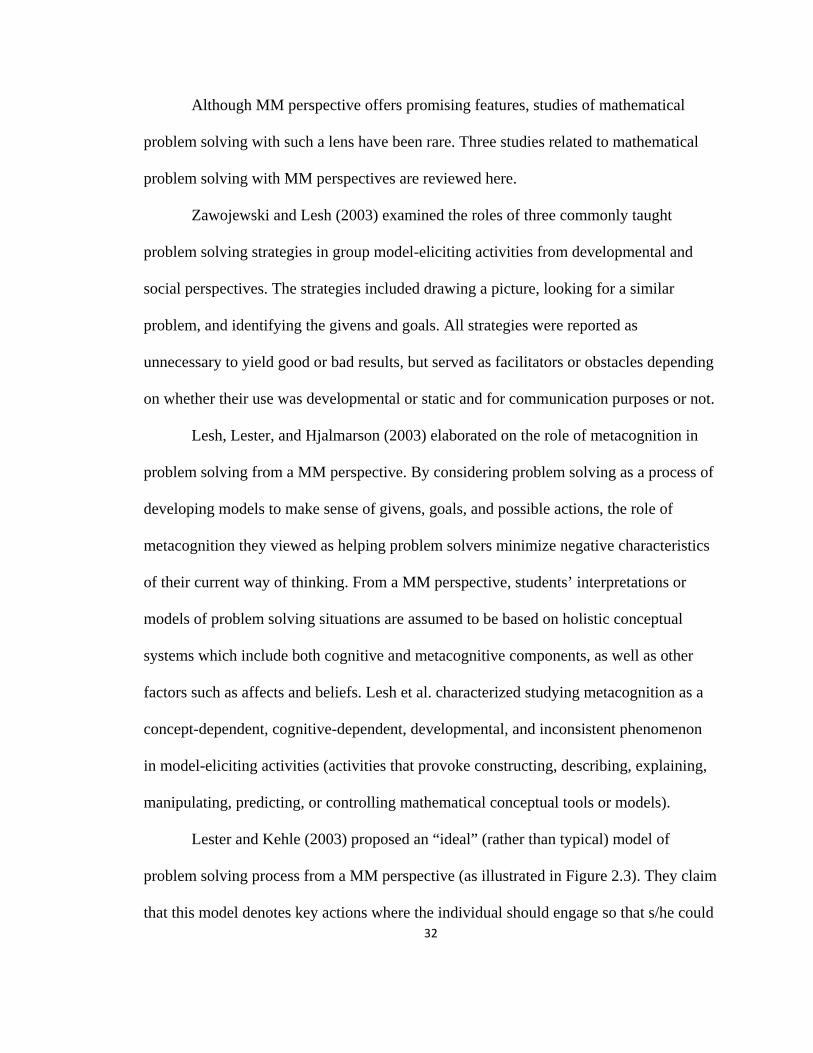
32
Although MM perspective offers promising features, studies of mathematical
problem solving with such a lens have been rare. Three studies related to mathematical
problem solving with MM perspectives are reviewed here.
Zawojewski and Lesh (2003) examined the roles of three commonly taught
problem solving strategies in group model-eliciting activities from developmental and
social perspectives. The strategies included drawing a picture, looking for a similar
problem, and identifying the givens and goals. All strategies were reported as
unnecessary to yield good or bad results, but served as facilitators or obstacles depending
on whether their use was developmental or static and for communication purposes or not.
Lesh, Lester, and Hjalmarson (2003) elaborated on the role of metacognition in
problem solving from a MM perspective. By considering problem solving as a process of
developing models to make sense of givens, goals, and possible actions, the role of
metacognition they viewed as helping problem solvers minimize negative characteristics
of their current way of thinking. From a MM perspective, students’ interpretations or
models of problem solving situations are assumed to be based on holistic conceptual
systems which include both cognitive and metacognitive components, as well as other
factors such as affects and beliefs. Lesh et al. characterized studying metacognition as a
concept-dependent, cognitive-dependent, developmental, and inconsistent phenomenon
in model-eliciting activities (activities that provoke constructing, describing, explaining,
manipulating, predicting, or controlling mathematical conceptual tools or models).
Lester and Kehle (2003) proposed an “ideal” (rather than typical) model of
problem solving process from a MM perspective (as illustrated in Figure 2.3). They claim
that this model denotes key actions where the individual should engage so that s/he could
33
obtain acceptable results. Dashed arrows in the figure denote “comparing” (i.e.
monitoring).
Figure 2.3. A model of problem solving process from a MM perspective
In this model, an individual starts from a complex realistic, imaginary, or
mathematical context, poses a specific problem and simplifies the complex context,
abstracts the problem into a well-defined mathematical problem by introducing
mathematical concepts and notions, then manipulates the abstract mathematical
representation to deduce some conclusions, and finally, compares the mathematical result
with the original context. A significant modification of this model is that it gives a
prominent role to metacognitive activity engaged in the problem solving process.
Although this model is more complex than other models aimed at describing problem
solving process, it fails to provide new insights on how to unpack/interpret metacognitive
behaviors in the problem solving process. In fact, this framework is heavily influenced by

34
the process of modeling (which is reasonable because the article is about viewing
problem solving from a modeling perspective). If we restrict the context in this model to
real world situation, it is almost identical to the modeling process. What’s more, the goal
of proposing such an “ideal” model of problem solving process is controversial. If they
aim to describe the process that the “most successful” problem solvers follow or actions
that produce the “best” problem solving result, problem solving research has already
looked into that. In fact, structural description (what affects success or failure in problem
solving) has been replaced by new theoretical challenges: theoretical descriptions and
explanations of how and why people make decisions during problem solving activities
(Schoenfeld, 2007). The MM perspective may be able to provide new insights for
problem solving research, but perhaps not as directly and explicitly as Lester et al.
proposed.
With the introduction of the constructs of conceptual system and its construction
and application, and the concept-dependent, cognitive-dependent, developmental, and
inconsistent nature of metacognition, the socially embedded MM perspective may
provide a fruitful lens to understand student thinking while engaged in problem solving.
Concept Formation Theory
Vygotsky’s theory has been utilized extensively in mathematics education
research in the past two decades. The theory places a sharp focus on sociocultural
perspective and the concept of zone of proximal development rather than the individual
developing person (Van der Veer & Valsiner, 1994). This model has been useful in
accounting for the role of interaction on development of individual cognition. Without
35
contradicting the fundamental premise of social relations and cultural influences on
learning, Vygotsky’s concept formation theory proposes a framework for individual’s
concept (word or sign) development within social environment.
Vygotsky’s Concept Formation Theory
To study the dynamics of the concept formation process, Vygotsky used a method
called “method of double simulation” (Vygotsky, 1962, p. 56), where two sets of stimuli
were presented to the individual, one as the objects of activity, the other as signs (non-
sense words) that were used to organize the activity. This method was considered as one
that combined the symbol and the perceptual material and thus could be used to
investigate the functional conditions of concept formation. The material used in his study
included 22 wooden blocks varying in color, shape, height, and size. Four meaningless
words were given to the subjects; each represented a specific meaning (tall, flat, tall and
small, flat and small). The subjects were given a sample block with a word and asked to
figure out what the word meant by grouping the blocks based on their characteristics, and
the examiner provided feedback after each guess by turning up the wrongly selected
blocks.
The result of study suggested that there were three basic phases for concept
formation: heap, complex, and concept. Each phase further contained multiple sub-phases,
as outlined in Figure 2.4.
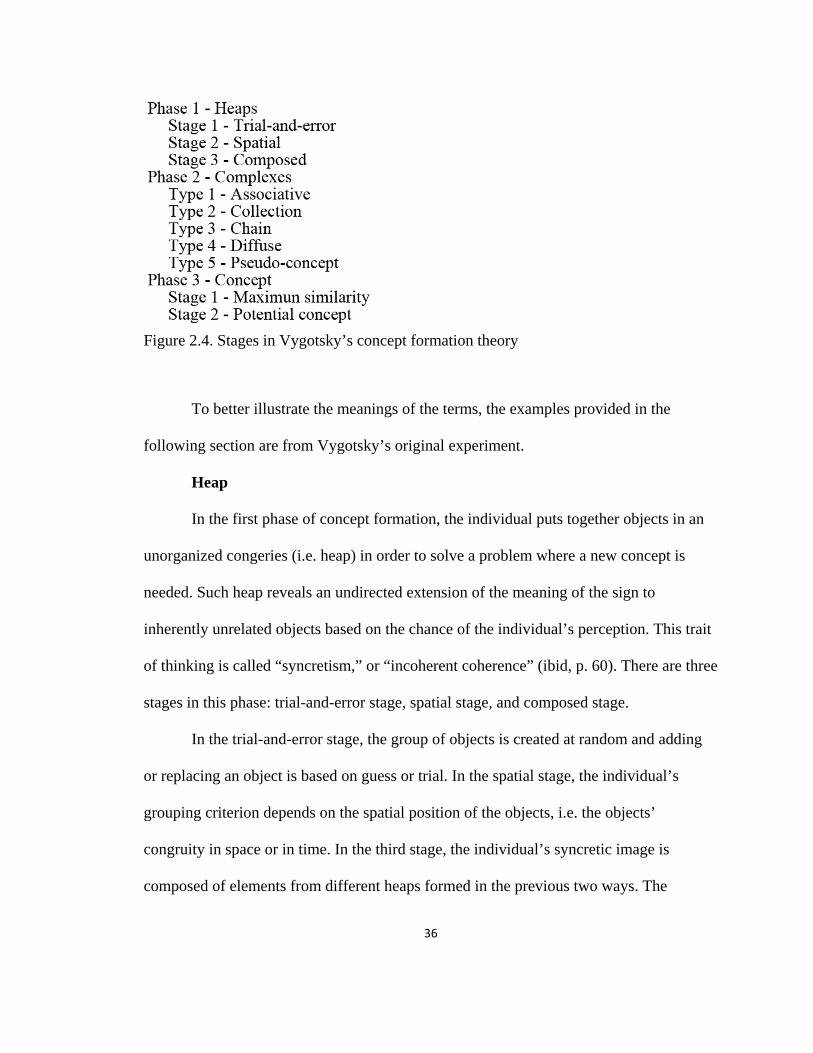
36
Figure 2.4. Stages in Vygotsky’s concept formation theory
To better illustrate the meanings of the terms, the examples provided in the
following section are from Vygotsky’s original experiment.
Heap
In the first phase of concept formation, the individual puts together objects in an
unorganized congeries (i.e. heap) in order to solve a problem where a new concept is
needed. Such heap reveals an undirected extension of the meaning of the sign to
inherently unrelated objects based on the chance of the individual’s perception. This trait
of thinking is called “syncretism,” or “incoherent coherence” (ibid, p. 60). There are three
stages in this phase: trial-and-error stage, spatial stage, and composed stage.
In the trial-and-error stage, the group of objects is created at random and adding
or replacing an object is based on guess or trial. In the spatial stage, the individual’s
grouping criterion depends on the spatial position of the objects, i.e. the objects’
congruity in space or in time. In the third stage, the individual’s syncretic image is
composed of elements from different heaps formed in the previous two ways. The
37
difference is that the individual now goes through a two-step operation to give meaning
to a new word, yet the operation remains syncretic and leads to simple assembling of
heaps.
Complex
At the complex level of concept formation, objects are united in an individual’s
mind not only by his impressions, but also by existing bonds between them. The
distinction between connections among things and connections among subjective
impressions represents a step away from syncretism. However, the bonds between objects
are concrete and factual instead of abstract and logical. Such factual bonds are discovered
through direct experience and lack logical unity. The main difference between a complex
and a concept is that any factually presented connection could result in the inclusion of an
element into a complex. There are five basic types of complexes which succeed one
another during this stage: associative, collection, chain, diffuse, and pseudo-concept.
The associative type of complexes is based on any bond between the sample
block and other blocks. When building an associative complex, the individual may add
one block to the group because it has the same color, and another because it has the same
shape. Any bond suffices an inclusion to the group; the nonsense word serves as a
“family name” of the group.
For the second type of complexes, the individual resembles collections based on
some trait where the objects differ and complement one another. In Vygotsky’s
experiment, the child picks out objects differing from the sample, not at random, but to
form a complemented collection of one attribute (e.g. a group of blocks with different
38
colors). A mixed collection is also possible; the child may select a collection of both
colors and shapes.
The chain complex could be considered as the “purest form of thinking in
complexes” (ibid, p. 64). It is a dynamic, consecutive joining of individual links into a
chain, where meaning is carried over from each link to another. The decisive attribute
keeps changing and after each time an object is included because of an attribute, it carries
all its attributes into the complex. For example, if the sample block is a yellow triangle,
the child may choose a few triangular blocks until his attention is caught by the blue
triangular block, and then he may start choosing blue blocks of any shape. The
hierarchical organization is missing in complexes; all attributes function equally.
The next type of complexes is diffuse complex. The diffuse complex possesses a
fluid attribute that unites its single elements. For example, if the sample block is a yellow
triangle, a child may pick trapezoids besides triangles because trapezoids are like
triangles without a top. Then trapezoids could lead to squares and other shapes. Similarly,
green could be picked after yellow, and then blue. Vygotsky indicates that children’s
amazing capability of transitions between bonds enables them to do limitless diffuse
constructions of complexes based on specific attributes. However, the concrete bonds
within the attribute are dim, unreal, and unstable.
The last type of complexes in his phase is pseudo-concept. In this stage, the
generalization formed in the individual’s mind is phenotypically similar to concept but
psychologically different from it. For example, if a sample block is a yellow triangle, a
child may pick all the triangles in the material. It may seem that the action is guided by
the concept of triangle, but Vygotsky’s experiment shows that the child is actually guided
39
by the concrete likeness and forms an associative complex limited to one perceptual bond.
Pseudo-concepts serve as a bridge between complexes and concepts, and the individual
begins to practice conceptual thinking before he is clearly aware of the nature of the
operations. Since the development of a complex is predetermined by the meaning that a
given word has in the social language, pseudo-concepts predominate over all other
complexes.
Concepts
The principle function of complex thinking is to establish connections, yet to form
a concept also requires abstraction and analysis. Abstraction ripens in the third phase,
although it begins way back into earlier periods. This phase contains two stages:
maximum similarity and potential concepts.
In the first stage, the individual groups together maximally similar objects. For
example, small and round, red and flat. In Vygotsky’s experiment, since none of the
blocks were identical, the child had to choose some traits over the other, i.e. abstracts
from the non-preferential attributes. Thus, an object’s attributes are globally divided into
two parts.
For potential concepts, the grouping of objects is based on a single attribute
instead of maximum similarity. This type of concepts already plays a part in complex
thinking, like associative complexes based on one attribute. Yet in complex thinking, the
abstracted attribute is unstable and has no privileged position, while in potential concepts,
an abstracted trait is not easily lost among other traits. Only with the mastery of
abstraction and advanced complex thinking, an individual could progress to the formation
of genuine concepts.

40
Vygotsky’s concept formation theory provides a framework to investigate the
concept development stages by examining individual’s operations on objects’ attributes,
which enables us to tackle the notions of “prior knowledge” and “conceptual systems”
mentioned in previous sections. However, since Vygotsky’s study focused on the
interrelation of thought and language, application of the theory in mathematics education
should be made cautiously.
Berger’s (2004) appropriation frame, which derives from Vygotsky’s concept
formation theory, proposes an interpretation of Vygotsky’s theory in mathematics domain
along with indicators for each type of thinking. This theory will be reviewed in the next
section.
Berger’s Appropriation Theory
Berger developed the appropriation theory to examine how an undergraduate
mathematics student appropriated a mathematical object (i.e. constructs a mathematical
concept). The theory is illustrated in Figure 2.5. Stages in bold are those described by
Vygotsky. Stages in Italic are signifier-oriented and underlining stages are signified-
oriented. Signifier-oriented refers to the situation where the student’s primary focus in on
the symbol. Signified-oriented refers to the situation where the student’s primary focus is
on an idea conjured up by the symbol.

41
Figure 2.5. Stages in Berger’s appropriation theory
Berger’s theory addresses several specific issues of interest in mathematics
education, such as prevalent activities when dealing with abstract mathematical objects
with concrete representations signifiers (i.e. symbol or words) and construction of a
mathematical concept based on abstraction of attributes of the mathematical sign.
Berger’s elaboration for each term is described as following.
In the Heap stage, learner associates a sign with another because of physical
context or circumstance (such as layout on the page) instead of any inherent or
mathematical property of the signs.
For Association complex, the learner uses one mathematical sign as a nucleus and
associates other signs with some common attributes based on objective and factual
justification. There are three subtypes under this category: surface association, example-
centered association, and artificial association. Surface association focuses on a signifier
rather than its meaning; it’s indicated by student’s focus on a set of symbols and
42
overlooking other significant signifiers in the mathematical expression. Example-
centered association refers to the situation where an example is the core around which the
new concept is built. This type of association is indicated by a student’s use of an
example of a concept in a sense that every property of the example is a property of the
concept. Artificial association means an unfamiliar object is artificially associated with a
familiar object although the connection between the two might be irrelevant. An indicator
is when students associate a new object to a familiar object so that the new object could
be reminded of in some way.
For chain complex, the student associate one mathematical sign with another
based on some kind of recognized similarity (such as a shared word or property) and then
link the new sign to another sign relying on a different attribute to form a chain. The
indicator for this complex is the association between two signs through multiple links,
otherwise the complex is considered as associative complex.
Berger states that collection complex does not directly transfer into the
mathematics arena, and she changes the notion into the grouping of mathematical
processes or objects where one undoes what the other does such as plus and minus,
multiplication and division, and differentiation and integration.
Representation complex is specific in mathematics. With this form of complex,
the learner identifies the visual or numerical representation of a mathematical object as
the object itself. Properties abstracted from such representation are considered as the
properties of the object.
Template-orientation complex is signifier-oriented like the surface association,
but the similarity is limited to the templates of signifiers. For example, the matrix

43
multiplication statement “AB=C” has a similar template as the real number multiplication
statement “ab=c.” Then students may associate the two based on the template and transfer
the commutative property of real numbers to matrices.
Berger acknowledges that Pseudo-concept is ubiquitous like Vygotsky claimed.
Students with a pseudo-concept could use and communicate the mathematical notion as if
they fully understand it, although their understanding may be based on contractions and
connections instead of logic. A way to distinguish pseudo-concept suggested by Berger is
to examine the integrity of a student’s prior or post activity.
Concept is defined as a mathematical idea with consistent and logical internal
links (links between different properties and attributes of the concept) and external links
(links of the concept to other concepts). For a conceptual learner, the signified (the idea
of mathematical object) is the primary focus of attention instead of the signifier.
Diffuse complexes and potential concepts are excluded from the appropriation
theory. Berger explained that diffuse complex is the same as artificial association in
mathematical domain, and potential concepts are impossible to be distinguished from
mathematical complexes because abstraction of attributes is intertwined with the
formation of complexes. However, since the appropriation theory is developed based on
first year undergraduate students’ performance in calculus and linear algebra, it is
possible that the framework would be different for secondary students in other subjects.
Aside from the two concept formation theories, knowledge in the field of learning
progression greatly contributed to the development of my concept developmental
framework as well. I will review the key contributor, Battista’s (2012) Cognition-Based
Assessment, in the next section.

44
Learning Progression and Cognition-Based Assessment
Learning progression plays an important role in mathematics education (Smith,
Wiser, Anderson, & Krajcik, 2006). It is defined as “descriptions of the successively
more sophisticated ways of thinking about a topic that can follow one another as children
learn about and investigate a topic” (National Research Council, 2007, p. 214). Learning
progression suggests how conceptual understanding can develop by organizing
conceptual knowledge around core ideas (NRC, 2007). Individuals may follow different
learning progresses across the developmental levels rather than a linear/inevitable
progress (Smith et al., 2006). Learning progression identifies students’ change of levels
of understanding towards a topic (e.g. shape, measurement, and ratio) in an instructional
setting, and suggests instructional methods which are claimed to help students move from
one level to another. It has provided powerful tools for teaching, such as informing
formative and summative assessment and guiding instructional decision making in
curriculum development and classroom teaching (Battista, 2011).
Cognition-Based Assessment
Contrary to van Hiele levels which related progression through the levels of
geometric thinking to phases of instruction, Battista uses constructivist constructs (e.g.
levels of abstraction) to describe students’ progression through the van Hiele levels
(Battista, 2011). Building on this work, he developed Cognition-Based Assessment and
Teaching of Fractions, Place Value, Addition and Subtraction, Multiplication and
Division, Geometric Shapes, and Geometric measurement (Battista, 2012). I will review
the piece which was extensively referred to during the development of the conceptual
framework of area in this study: CBA levels for Area in Geometric Measurement.
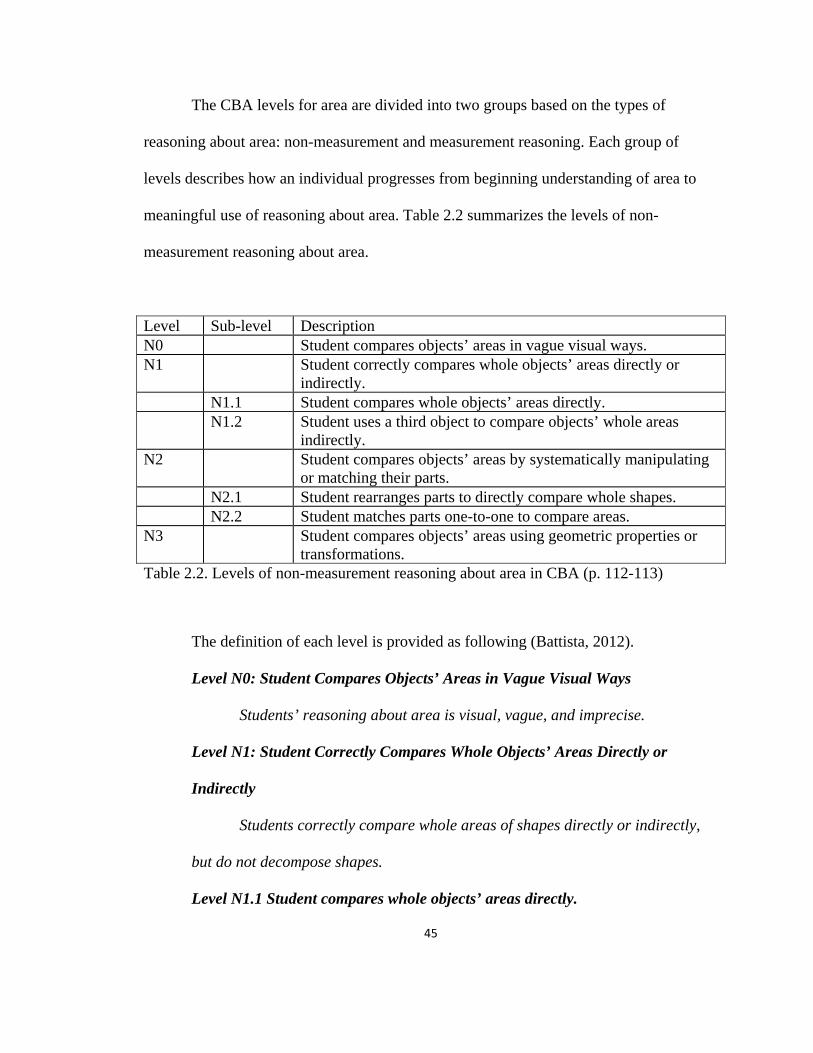
45
The CBA levels for area are divided into two groups based on the types of
reasoning about area: non-measurement and measurement reasoning. Each group of
levels describes how an individual progresses from beginning understanding of area to
meaningful use of reasoning about area. Table 2.2 summarizes the levels of non-
measurement reasoning about area.
Level Sub-level Description N0 Student compares objects’ areas in vague visual ways. N1 Student correctly compares whole objects’ areas directly or
indirectly. N1.1 Student compares whole objects’ areas directly. N1.2 Student uses a third object to compare objects’ whole areas
indirectly. N2 Student compares objects’ areas by systematically manipulating
or matching their parts. N2.1 Student rearranges parts to directly compare whole shapes. N2.2 Student matches parts one-to-one to compare areas. N3 Student compares objects’ areas using geometric properties or
transformations. Table 2.2. Levels of non-measurement reasoning about area in CBA (p. 112-113)
The definition of each level is provided as following (Battista, 2012).
Level N0: Student Compares Objects’ Areas in Vague Visual Ways
Students’ reasoning about area is visual, vague, and imprecise.
Level N1: Student Correctly Compares Whole Objects’ Areas Directly or
Indirectly
Students correctly compare whole areas of shapes directly or indirectly,
but do not decompose shapes.
Level N1.1 Student compares whole objects’ areas directly.

46
In direct comparison, students compare the areas of two shapes by placing
them next to or on top of each other.
Level N1.2 Student uses a third object to compare objects’ whole areas
indirectly.
With indirect comparison, a third area region is used to “record” a copy
of one of the two original regions, then this “record” is directly compared to the
other original region.
Level N2: Student Compares Objects’ Areas by Systematically Manipulating or
Matching Their Parts
To compare the areas of shapes, students systematically manipulate or
compare the parts of the shapes.
Level N2.1. Student rearranges parts to directly compare whole shapes.
To compare the areas of shapes, students systematically and deliberately
decompose and recompose the interiors of the shapes either physically or
mentally, then visually compare the recomposed regions.
Level N2.2. Student matches parts one-to-one to compare areas.
Students compare the areas of two shapes by matching, one-by-one, pairs
of pieces that they think are the same area—they do not transform one shape into
another.
Level N3: Student Compares Objects’ Areas Using Geometric Properties or
Transformations

47
Students compare the areas of shapes by explicitly using slides, turns, or
flips of shape parts in ways that allow them to infer, based on shape or motion
properties, that one transformed shape is congruent or non-congruent to another.
Table 2.3 summarizes the levels of measurement reasoning about area.
Level Sub-level Description M0 Student uses numbers in ways unconnected to appropriate area-
unit iteration. M1 Student incorrectly iterates area-units. M1.1 Student iterates single area units incorrectly. M1.2 Student decomposes shapes into parts incorrectly. M1.3 Student iterates area-units incorrectly, but eliminates double-
counting errors. M2 Student correctly iterates all area units one by one. M2.1 Student correctly iterates whole units, but not fractional units. M2.2 Student correctly iterates whole units and simple fractional units. M3 Student correctly operates on composites of visible area-units. M4 Student correctly and meaningfully operates on area using only
numbers (no visible units or iteration). M5 Student fully understands procedures and formulas for
determining areas of rectangles. M6 Student generalizes understanding of area measurement to non-
squares and to area unit conversions. M6.1 Student understands enumeration procedures for arrays of non-
squares. M6.2 Student understands and makes area unit conversions. M7 Student uses geometric properties and variables to understand and
solve problems involving area formulas for non-rectangular shapes.
Table 2.3. Levels of measurement reasoning about area in CBA (p. 113-114)
The definition of each level is provided as following (Battista, 2012).
Level M0: Student Uses Numbers in Ways Unconnected to Appropriate Area-
Unit Iteration

48
Students use numbers to describe areas; however, there is no evidence
that their numbers represent iterations of area-units.
Level M1: Student Incorrectly Iterates Area-Units
Students make definite progress over Level M0 reasoning because they
explicitly attempt to iterate area units. However, students incorrectly iterate area-
units because (a) they do not fully understand what an area unit is; (b) they do not
properly coordinate area units with each other so their iterations contain gaps,
overlaps, or different sizes; or (c) they do not possess a proper spatial structuring
or organization of the area units needed to cover the interior of a shape; or (d)
they incorrectly decompose a shape into parts because they do not understand the
geometric structure of the shape.
Level M1.1 Student iterates single area units incorrectly.
Students’ area-unit iterations have gaps, overlaps, or different
sized/shaped units. Students do not see how area-units must be organized or
structured to cover the interior of shapes.
Level M1.2 Student decomposes shapes into parts incorrectly.
Students incorrectly decompose shapes into parts, causing their unit
iterations to be incorrect.
Level M1.3 Student iterates area-units incorrectly, but eliminates double-
counting errors.
A major breakthrough in thinking occurs when students can coordinate
their decompositions so that they can structure their counting in a way that
49
eliminates double counting of squares. Students at this level still, however, have
difficulty imagining the locations of interior squares.
Level M2. Student Correctly Iterates All Area-Units One by One
Students correctly iterate all visible, student-drawn, or visualized area-
units needed to completely cover the interior of a shape.
Level M2.1 Student correctly iterates whole units, but not fractional units.
Level M2.2 Student correctly iterates whole units and simple fractional units.
During iteration, students correctly count whole and, in simple situations,
fractional area-units.
Level M3: Student Correctly Operates on Composites of Visible Area-Units
A composite unit (or composite for short) is a set of more basic units that
is treated as a single thing or entity, while simultaneously recognizing the basic
units within it.
Level M4: Student Correctly and Meaningfully Operates on Area Using only
Numbers (No Visible Area-Units or Unit Iteration)
Students determine areas of shapes when no area units are visible in the
shapes. They do this by meaningfully operating on appropriate measurement
numbers.
Level M5. Student Fully Understands Procedures/Formulas for Determining
Areas of Rectangles
Students know what is meant by the formula for the area of a rectangle—A
= l × w. They can clearly explain why the procedure of multiplying the length and
width of a rectangle gives the rectangle’s area.
50
Level M6: Student Generalizes Understanding of Area Measurement to
Enumerating Non-Squares and to Area Unit Conversions
A critical mental process required for both enumerating non-squares and
converting measures made in one area-unit to measures in another area-unit is
spatially structuring composites of area-units and properly linking that spatial
structuring to arithmetic operations. While students gradually develop elements of
this spatial structuring ability in earlier levels, the capability does not become
mature, abstract, and general until Level M6.
Level M6.1 Student understands enumeration procedures for arrays of non-
squares.
Students’ mental models incorporate structuring that is abstract and
general enough to apply to situations in which the basic units are not cubes.
Level M6.2 Student understands and makes area unit conversions.
Given any unit-length conversion equivalence (1 yard = 3 feet), students can
make corresponding area-unit conversions using arithmetic operations, and they
can explain and justify their procedures using pictures or models.
Level M7: Student Uses Geometric Properties and Variables to Understand
Derivations and Problems Involving Area of Non-Rectangular Shapes
Students’ understanding of area measurement is abstract and general enough for
them to develop, use, and justify procedures and formulas to find the areas of
triangles, parallelograms, and trapezoids.
The examples provided under each level of reasoning were interpreted through
Vygotsky’s concept formation theory and used as a reference to guide the identification
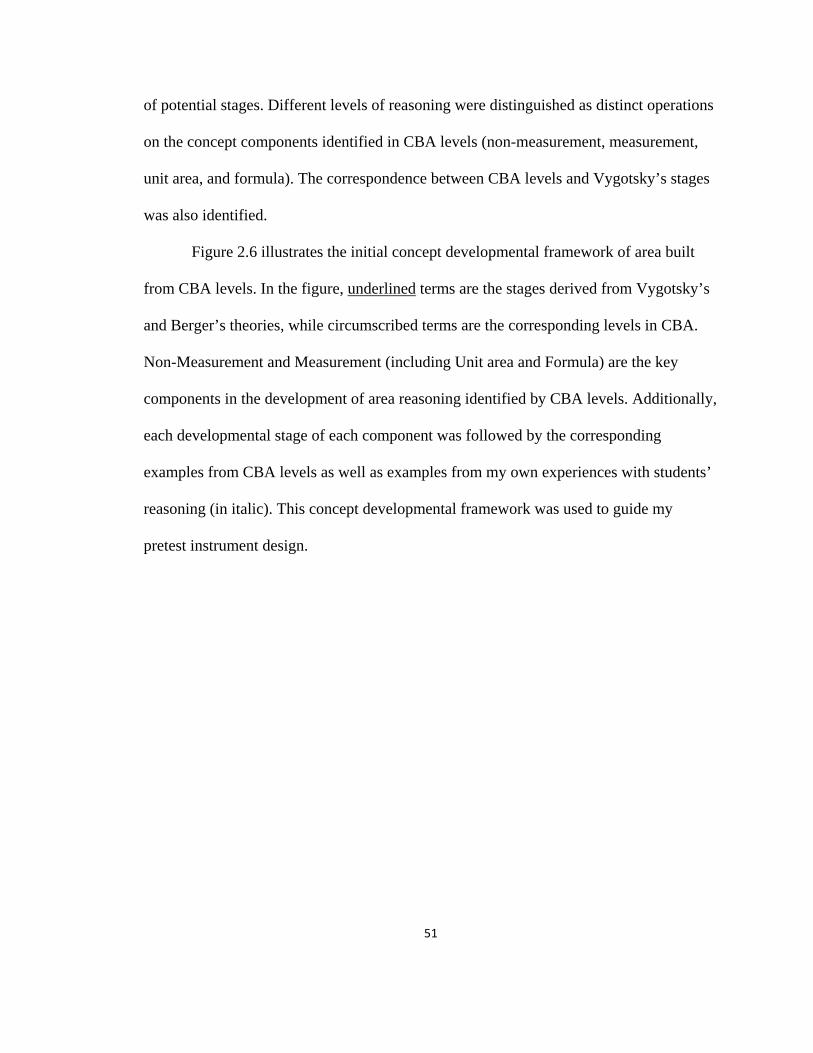
51
of potential stages. Different levels of reasoning were distinguished as distinct operations
on the concept components identified in CBA levels (non-measurement, measurement,
unit area, and formula). The correspondence between CBA levels and Vygotsky’s stages
was also identified.
Figure 2.6 illustrates the initial concept developmental framework of area built
from CBA levels. In the figure, underlined terms are the stages derived from Vygotsky’s
and Berger’s theories, while circumscribed terms are the corresponding levels in CBA.
Non-Measurement and Measurement (including Unit area and Formula) are the key
components in the development of area reasoning identified by CBA levels. Additionally,
each developmental stage of each component was followed by the corresponding
examples from CBA levels as well as examples from my own experiences with students’
reasoning (in italic). This concept developmental framework was used to guide my
pretest instrument design.
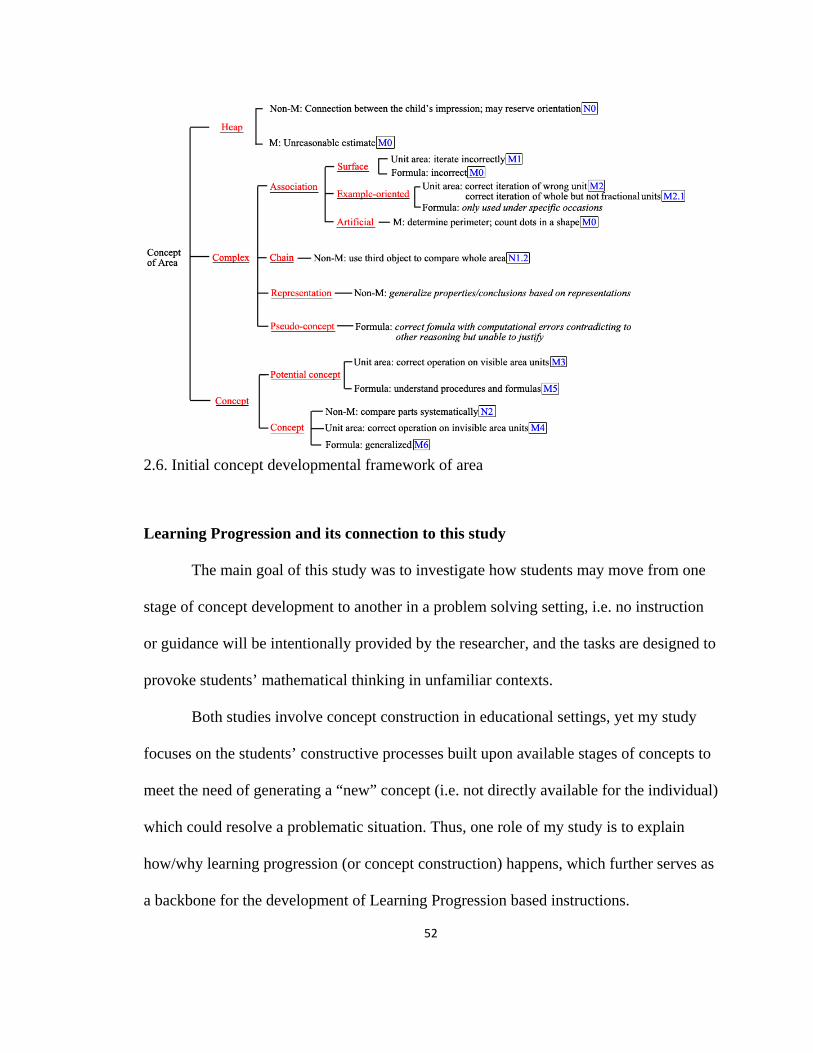
52
2.6. Initial concept developmental framework of area
Learning Progression and its connection to this study
The main goal of this study was to investigate how students may move from one
stage of concept development to another in a problem solving setting, i.e. no instruction
or guidance will be intentionally provided by the researcher, and the tasks are designed to
provoke students’ mathematical thinking in unfamiliar contexts.
Both studies involve concept construction in educational settings, yet my study
focuses on the students’ constructive processes built upon available stages of concepts to
meet the need of generating a “new” concept (i.e. not directly available for the individual)
which could resolve a problematic situation. Thus, one role of my study is to explain
how/why learning progression (or concept construction) happens, which further serves as
a backbone for the development of Learning Progression based instructions.
53
What’s more, existing studies have reported that many learners do not know how
to “use” what they’ve learned when the knowledge is needed under a new situation. I
suggest that maybe the way we determine “what they’ve learned” is questionable. For
example, the difference between a developed concept and a developing pseudo-concept
(which dominates and exists throughout all concept formation stages) may greatly
influence how an individual uses the concept in new contexts, although they may look the
same based on standard assessments. The stages of a developing concept are mainly
determined by how one operates on them in concept formation theory. In other words,
“what an individual learns” is mainly determined by “how s/he uses them,” not the other
way around.
Theoretical Framework
The theoretical framework shaping this study is grounded in and concerned with
three layers of conceptual domains: mathematical concepts, cognitive behaviors, and
metacognitive behaviors as illustrated in Figure 2.7. Each fold will be elaborated in this
section.
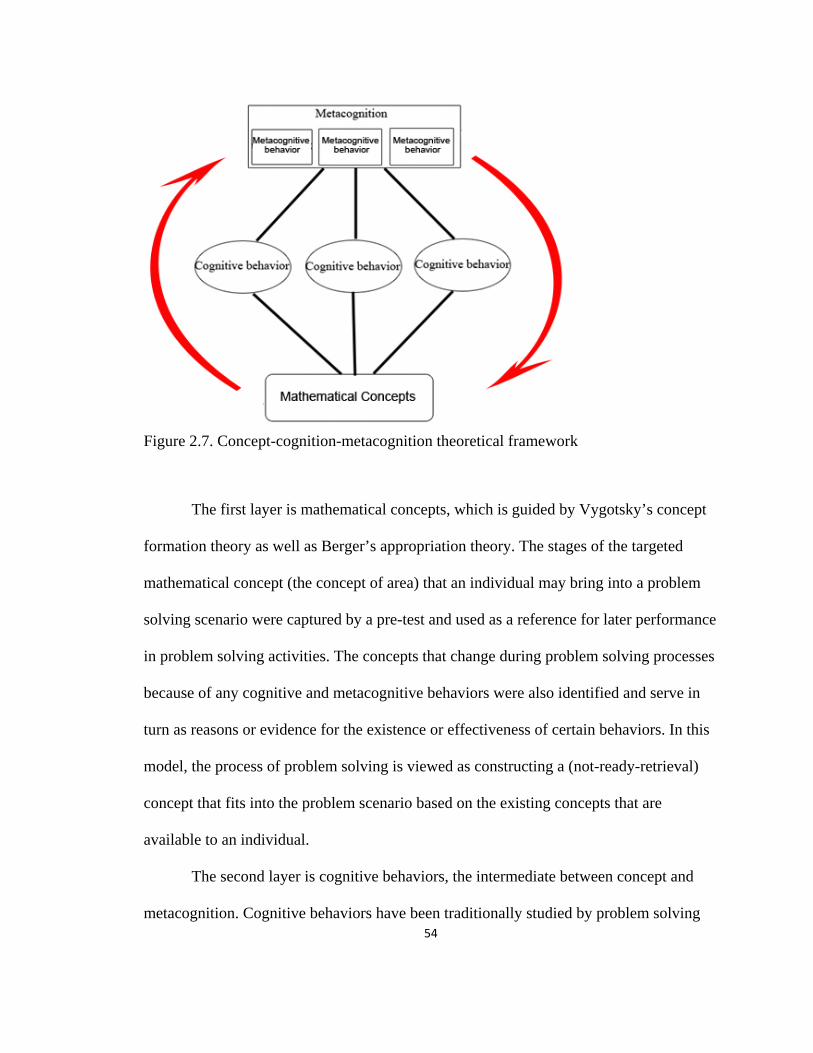
54
Figure 2.7. Concept-cognition-metacognition theoretical framework
The first layer is mathematical concepts, which is guided by Vygotsky’s concept
formation theory as well as Berger’s appropriation theory. The stages of the targeted
mathematical concept (the concept of area) that an individual may bring into a problem
solving scenario were captured by a pre-test and used as a reference for later performance
in problem solving activities. The concepts that change during problem solving processes
because of any cognitive and metacognitive behaviors were also identified and serve in
turn as reasons or evidence for the existence or effectiveness of certain behaviors. In this
model, the process of problem solving is viewed as constructing a (not-ready-retrieval)
concept that fits into the problem scenario based on the existing concepts that are
available to an individual.
The second layer is cognitive behaviors, the intermediate between concept and
metacognition. Cognitive behaviors have been traditionally studied by problem solving

55
researchers, and the MM perspective suggests that metacognitive behaviors are
cognition-dependent. In this model, cognitive behaviors are identified and examined in
relation to both concepts that they act upon and metacognition that guides them.
The third layer is metacognitive behaviors that relate to cognition and concept.
The detected metacognitive behaviors in the study were coded relying on criteria outlined
by Tarricone (2011). Existing studies (e.g. Kuzle, 2011) reported productive/positive and
non-productive/negative metacognitive behaviors without providing an explanation for
how they were identified or characterized. I propose that only looking at the relations
between cognition and metacognition may be insufficient to understand the phenomena;
the (dynamic) concepts that they act upon may play a very important role.
This model provides an integrated dynamic picture of how an individual may
construct a concept (solve a problem) in a given context. Other factors which would
influence the actual in-the-moment choice of each individual, such as culture, personal
orientation, and previous experience, are not the primary foci of study in the current
investigation.
Significance of the Proposed Theoretical Framework
The major difference between the proposed theoretical lens and existing
frameworks (i.e. cognitive-metacognitive perspectives) in problem solving area is the
integration of the “developing concepts” layer, which is grounded in Vygotsky’s concept
formation theory.
The significance of the framework is elaborated by responding to three questions:
1) Why is Vygotsky’s concept formation theory alone insufficient to study
problem solving?
56
2) Why is it important to incorporate the concept formation theory in the existing
cognitive-metacognitive framework?
3) What may the proposed theoretical lens allow us to see which we haven’t seen
before? How could that help us better understand problem solving?
Why is Vygotsky’s concept formation theory alone insufficient to study problem solving?
Although problem solving is interpreted as a process of concept construction
based on my theoretical lens, which is essentially learning, the context (i.e. problem
solving situations) makes it different from a pure concept formation study, which focuses
on concept acquisition. A concept construction for the sake of resolving an unfamiliar
problem and a concept construction for the sake of concept acquisition may involve very
different cognitive and metacognitive functions, despite the similar result of constructing
a new concept. Also, I propose that without an examination of cognitive and
metacognitive behaviors in a setting that provokes mathematical thinking, a mathematical
concept formation theory may be limited in providing a description of “what it may look
like at each stage” to an explanation of “how/why the transitions may happen cognitively.”
Since my study investigates problem solving behaviors, the concept formation theory
alone would not be sufficient.
Why is it important to incorporate the concept formation theory in the existing
cognitive-metacognitive framework?
There are two reasons for this. First is the established dilemma that metacognition
in problem solving is cognition-dependent, developmental, and inconsistent. We have
come to the point where the two-layer framework, cognition-metacognition, is
insufficient to further understanding the phenomena and advancing the field towards
57
developing a theory of mathematical problem solving. Many constructs have been
introduced to resolve this dilemma (i.e. beliefs, goals, experiences, etc.) yet these factors
have been found to be so personalized and diverse that limits impact on our theorizing
capacity regarding the development of mathematical problem solving skills. What has
been identified as the most important component in all theories and studies related to
“knowledge constructions” is prior knowledge, which leads to the second reason.
Past literature has highlighted the importance of existing knowledge on problem
solving performance and yet it is not quite clear HOW it may influence the process of
concept construction. What’s more, metacognitive behaviors have been proposed as
concept-dependent. These issues urged me to find a way to tackle individual’s concept
development while engaged in problem solving and associate the two types of dependent
behaviors with it. Vygotsky’s concept formation theory is chosen to help me tackle this
notion. Do cognitive and metacognitive behaviors have any patterns for each concept? Or
do they suggest any pattern for each stage of any concept? The concept formation theory
provides us a potential tool to investigate “dependence” and “inconsistency” of both
types of behaviors, especially those that concern metacognitive actions.
What may the proposed theoretical lens allow us to see which we haven’t seen before?
How could that help us better understand problem solving?
An elaborated model of a problem solving process based on my theoretical lens is
illustrated in Figure 2.8.
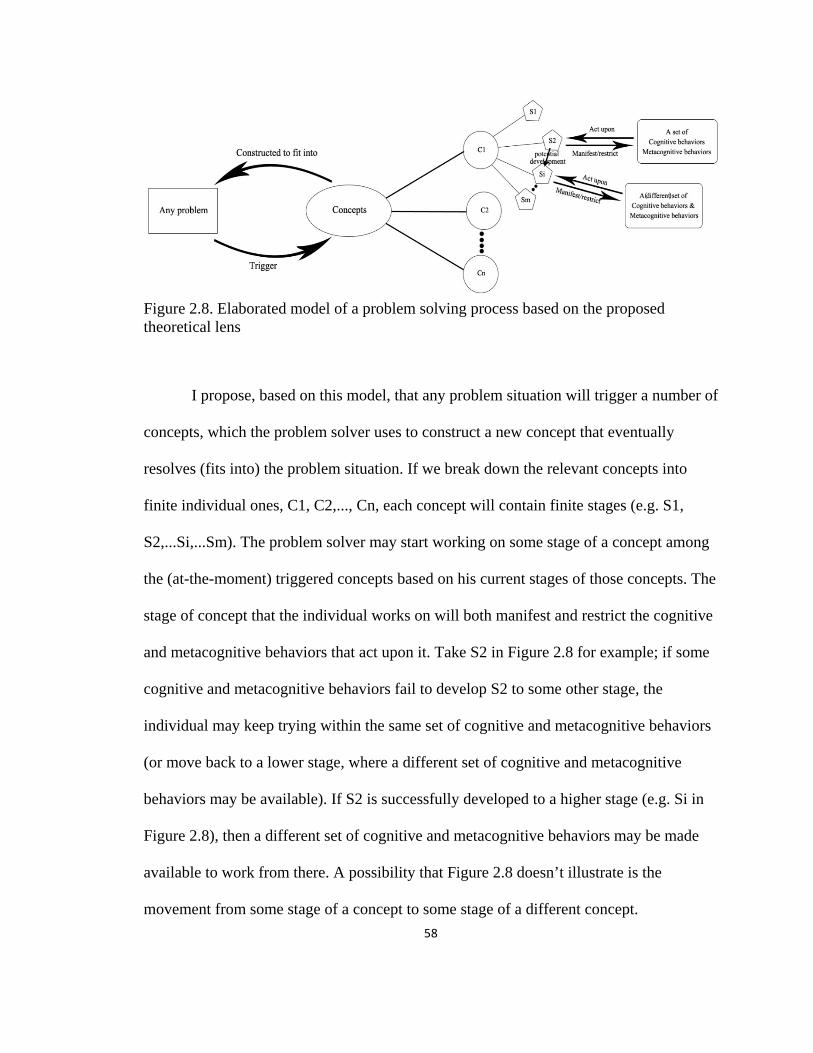
58
Figure 2.8. Elaborated model of a problem solving process based on the proposed theoretical lens
I propose, based on this model, that any problem situation will trigger a number of
concepts, which the problem solver uses to construct a new concept that eventually
resolves (fits into) the problem situation. If we break down the relevant concepts into
finite individual ones, C1, C2,..., Cn, each concept will contain finite stages (e.g. S1,
S2,...Si,...Sm). The problem solver may start working on some stage of a concept among
the (at-the-moment) triggered concepts based on his current stages of those concepts. The
stage of concept that the individual works on will both manifest and restrict the cognitive
and metacognitive behaviors that act upon it. Take S2 in Figure 2.8 for example; if some
cognitive and metacognitive behaviors fail to develop S2 to some other stage, the
individual may keep trying within the same set of cognitive and metacognitive behaviors
(or move back to a lower stage, where a different set of cognitive and metacognitive
behaviors may be available). If S2 is successfully developed to a higher stage (e.g. Si in
Figure 2.8), then a different set of cognitive and metacognitive behaviors may be made
available to work from there. A possibility that Figure 2.8 doesn’t illustrate is the
movement from some stage of a concept to some stage of a different concept.

59
The community has been curious to learn what happens when a problem solver
manages to reach a different stage (and the answer “metacognition happens” is not good
enough). What is the key connection between the two stages? What cognitive and
metacognitive behaviors directly contribute to constructing such a connection? In
particular, what cognitive and metacognitive behaviors may be effective for constructing
some connections between certain stages but ineffective or even negative for constructing
some other connections between certain stages? These questions are all crucial to better
understand problem solving, and I conjecture that the proposed theoretical lens can
potentially provide a means to answer them.
Rationale for the Choice of the Target Concept
I chose area as the target concept in my study for four reasons.
First, the concept of area involves non-measurement and measurement reasoning,
which are likely to promote intuitions/insights when a problem solver is stuck. This also
allows me to design interview problems which allow possible starting points and
movements among a relatively wider range of stages.
Second, the concept of area can restrict relevant concepts that are involved in
solving a problem. Since my goal was to examine possible relationship between concept
stages and metacognitive behaviors, having a manageable number of concepts involved
in the problem solving processes was beneficial. I do acknowledge it is possible that a
problem solver may choose to work on some concept which I may have failed to consider
when designing problems.

60
Third, the concept developmental framework of area relates to various concepts in
algebra, calculus, and probability. It can potentially bridge different mathematical areas
traditionally assumed and treated as disconnected so that the students can consider when
thinking about concepts that are conventionally presented in an abstract, symbolic way
(Manouchehri, in press). For example, the concept of area can be used to present the
algebraic formula, distance=speed*time, geometrically, as well as interpreting the
concept of definite integrals of a function.
Last but not least, my examination of 662 sets of students’ responses to 5
problems from grade 5 to 8 identified the concept of area as a consistent problem for
children in all grade levels. These non-routine problems were designed to trace the
development of selected concepts from five topics: measurement and geometry (area),
probability and data analysis, numbers and fractions, patterns, and functions. They were
distributed among students in over 30 schools in Ohio and contained pre- and post-sets in
order to capture the one-year growth of each student.
61
CHAPTER 3
METHODOLOGY
The purpose of this study was to investigate the stages of concept formation
exhibited during students’ non-routine problem solving embedded in selected concepts,
and to identify possible metacognitive patterns which are assumed to be intertwined with
different stages of development of concepts. The study was designed to understand
individuals’ metacognitive systems utilized when navigating decision making in problem
solving situations. The following research questions were used to guide this study:
1. What stages of mathematical concept development are exhibited in students’
problem solving activities in terms of Vygotsky’s theory?
2. What types of metacognitive behaviors are utilized by students when solving
non-routine problems?
3. What is the relationship between those metacognitive behaviors and the stages
of mathematical concept development?
This chapter provides a description of the research design, participant selection
process, data collection procedures, rationale for the choice of the target concept,
instrument design, and data analysis procedures.
62
Research Design
The study involved case studies with multiple subjects, using both pre-assessment
and mathematical non-routine problem solving interviews with think-aloud protocols.
Multiple subjects were selected in order to capture possible patterns of metacognitive
behaviors associated with different concept developmental status. Case study and think-
aloud protocols have been used to study problem solving phenomena since the 1980s
(Lester, 1994). Case study allows researchers to study “how” and “why” of a certain
phenomenon (Merriam, 1998), and think-aloud protocols provide opportunities to
understand reasons behind observable behaviors.
Along with think-aloud protocols, deliberate concurrent probing questions were
asked in order to understand puzzling or interesting behaviors observed during the
interviews. Even without the intention to guide or hint the subjects towards any direction,
studies of discourse and metacognition caution that social interactions inevitably alter
people’s thoughts/attentions to some degree. In order to better elicit and describe students’
thinking, these interactions could be necessary (Goos & Galbraith, 1996) and are possibly
more reliable than retrospective probing (Patton, 2002). To compensate for the potential
alteration, the influence of such interactions was taken into consideration when
interpreting and analyzing students’ behaviors (distinguished as participant-initiated and
interviewer-initiated shifts/behaviors), recording both the nature of intervention as well as
the type of behaviors resulted from them.
Aside from the probing questions, I provided deliberate prompts when a
participant seemed to have exhausted his/her attempts or became stuck. These prompts
aimed to test how far the participants would be able to proceed (in terms of concept
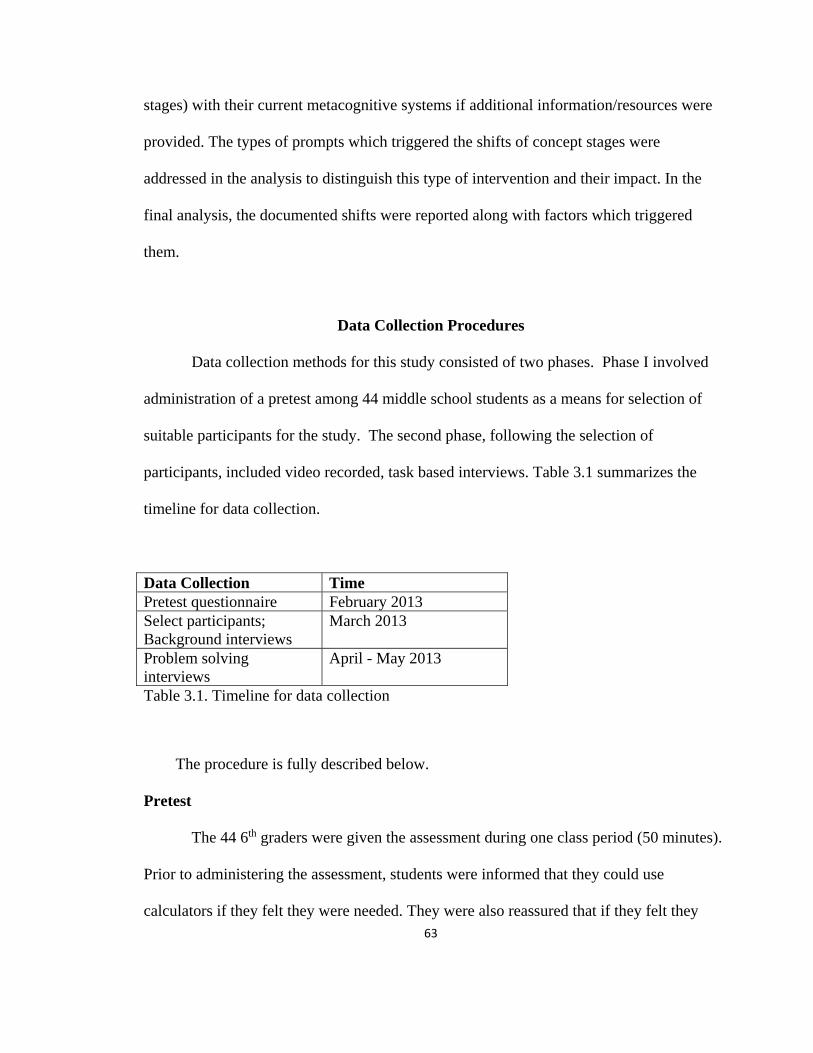
63
stages) with their current metacognitive systems if additional information/resources were
provided. The types of prompts which triggered the shifts of concept stages were
addressed in the analysis to distinguish this type of intervention and their impact. In the
final analysis, the documented shifts were reported along with factors which triggered
them.
Data Collection Procedures
Data collection methods for this study consisted of two phases. Phase I involved
administration of a pretest among 44 middle school students as a means for selection of
suitable participants for the study. The second phase, following the selection of
participants, included video recorded, task based interviews. Table 3.1 summarizes the
timeline for data collection.
Data Collection Time Pretest questionnaire February 2013 Select participants; Background interviews
March 2013
Problem solving interviews
April - May 2013
Table 3.1. Timeline for data collection
The procedure is fully described below.
Pretest
The 44 6th graders were given the assessment during one class period (50 minutes).
Prior to administering the assessment, students were informed that they could use
calculators if they felt they were needed. They were also reassured that if they felt they
64
needed help with reading the problems, the researcher would provide assistance
accordingly. Lastly, they were asked not to erase their work even if they considered it
wrong.
All 44 responses were collected and examined. Each individual’s developmental
status revealed in the responses was categorized as “overall low” (all responses were
rated as Heap and non-Pseudo-concept Complex stages), “varied” (responses were rated
across Heap to Concept stages), and “overall high” (Reponses were rated as Pseudo-
concept Complex and Concept stages). Representative students were selected from each
category based on the characteristics described in the participant selection section.
Participant Selection
Five (5) students from a population of forty four (44) 6th graders at a local middle
school were selected to participate in this study. The larger group of 44 were from three
distinct class periods of an algebra course taught by the same teacher at the time of data
collection. They had been observed by the researcher for 6 months prior to data collection.
In the course of observing class sessions it became evident that they exhibited a range of
different types and levels of understanding of the concept of area.
All 44 students completed the pre-test designed to capture the students’ current
developmental stages of the target concept (concept of area). Based on the students’
responses to the pre-test items four criteria were considered when selecting participants
for the focused, in-depth study: : 1) the participants were willing to be involved in the
study and had signed the consent forms; 2) the participants represented a range of
different developmental status of the target concept; one participant exhibited a low status,
one participant exhibited a high status, and three participants exhibited varied status; 3)
65
the participants were comfortable with the think-aloud protocol; 4) the participants
possessed different problem solving behaviors/orientations based on my classroom
observations.
The selected five participants are briefly introduced in the following sections.
More detailed information will be presented in the detailed account of each case study.
Shana.
Shana’s responses to the pretest items exhibited a low level of concept
development yet a relatively high problem solving ability. What’s more, she was more
articulate in terms of describing her approaches/thoughts than other students who also
exhibited low level of concept development. These served as my main rationale to further
study her problem solving behaviors.
Sandy.
Sandy exhibited various stages of conceptual understanding on the pretest items,
as well as an exceptionally mature communicational orientation in how she presented her
responses. It was assumed that this tendency/orientation may enable the interviewer to
elicit more metacognitive information on a wider range of stages. This served as my main
rationale for inclusion of Sandy as a candidate for further study.
Ivan.
Ivan’s responses to the pretest items exhibited various stages of conceptual
understanding as well as particular patterns of thinking that were not visible in other
students’ work. These included ignoring fractional parts taking into account only whole
unit areas, and using informal measuring tools to solve problems where measurement was
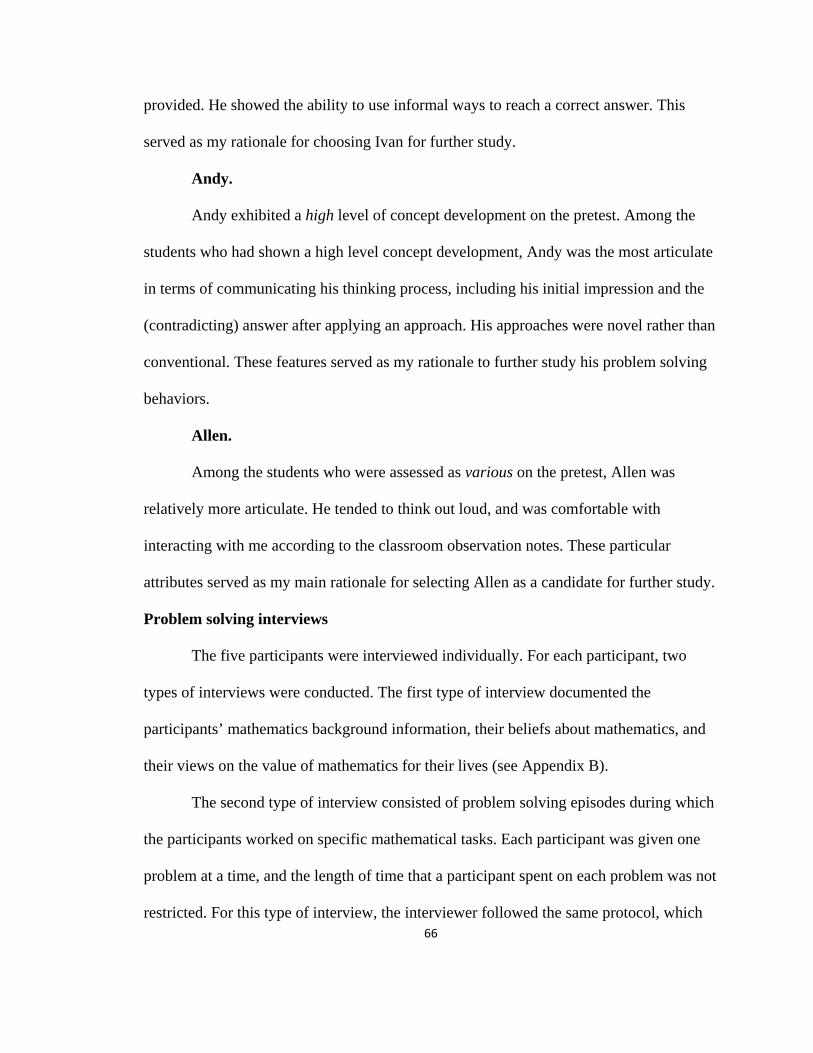
66
provided. He showed the ability to use informal ways to reach a correct answer. This
served as my rationale for choosing Ivan for further study.
Andy.
Andy exhibited a high level of concept development on the pretest. Among the
students who had shown a high level concept development, Andy was the most articulate
in terms of communicating his thinking process, including his initial impression and the
(contradicting) answer after applying an approach. His approaches were novel rather than
conventional. These features served as my rationale to further study his problem solving
behaviors.
Allen.
Among the students who were assessed as various on the pretest, Allen was
relatively more articulate. He tended to think out loud, and was comfortable with
interacting with me according to the classroom observation notes. These particular
attributes served as my main rationale for selecting Allen as a candidate for further study.
Problem solving interviews
The five participants were interviewed individually. For each participant, two
types of interviews were conducted. The first type of interview documented the
participants’ mathematics background information, their beliefs about mathematics, and
their views on the value of mathematics for their lives (see Appendix B).
The second type of interview consisted of problem solving episodes during which
the participants worked on specific mathematical tasks. Each participant was given one
problem at a time, and the length of time that a participant spent on each problem was not
restricted. For this type of interview, the interviewer followed the same protocol, which

67
suggested the least interruption from the interviewer during students’ problem solving
work. The protocol also suggested that interventions be made only when a clear
understanding what children were doing is not evident, when questions existed about the
choice of strategies they used when solving problems, and if reasoning and justification
was not shared by the participants. Table 3.2 outlines the dateline of interviews.
Participant Date and time of problem solving interview for Problems 1 and 2
Date and time of problem solving interview for Problems 3, 4, and 5
Shana April 10th, 2013. 1 hour. April 12th, 2013. 1 hour. Sandy April 17th, 2013. 1 hour. April 19th, 2013. 1 hour. Ivan April 24th, 2013. 1 hour. April 26th, 2013. 1 hour. Andy May 1st, 2013. 1 hour. May 3rd, 2013. 1 hour. Allen May 8th, 2013. 1 hour. May 10th, 2013. 1 hour. Table 3.2. Dateline of interviews
Instrument design
Two sets of instruments were designed for this study: pre-test and non-routine
interview tasks. Figure 3.1 illustrates the major references for the design of each
instrument.
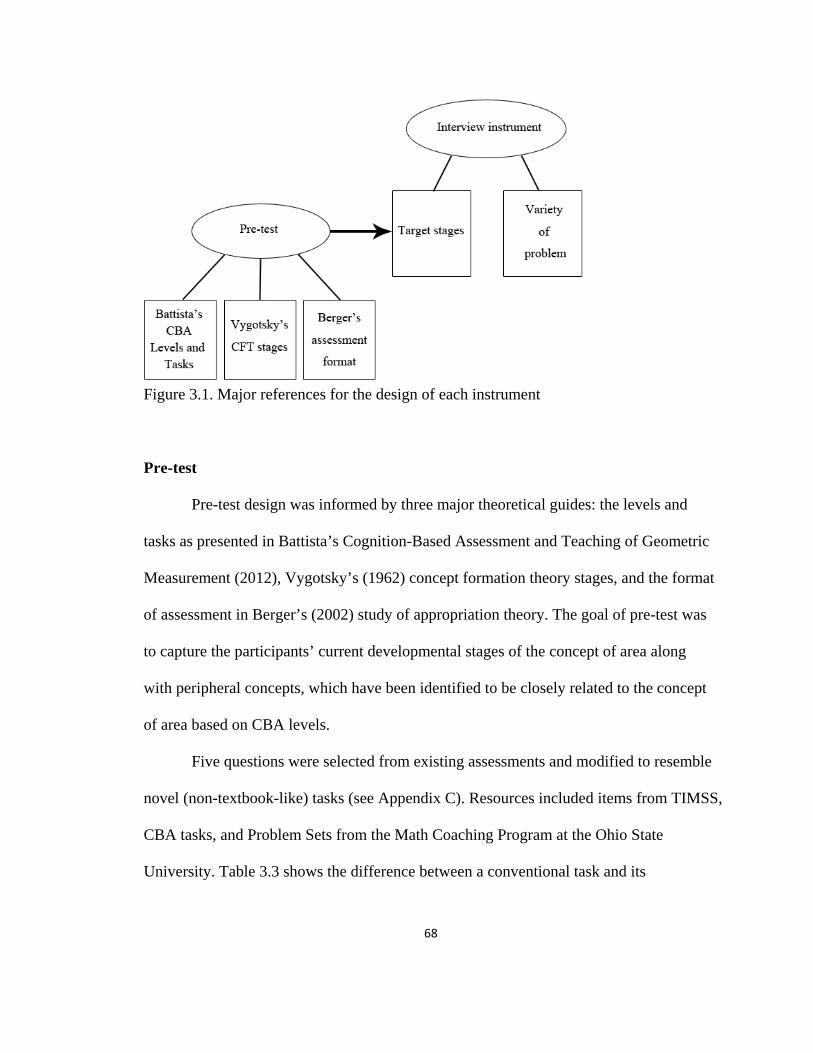
68
Figure 3.1. Major references for the design of each instrument Pre-test
Pre-test design was informed by three major theoretical guides: the levels and
tasks as presented in Battista’s Cognition-Based Assessment and Teaching of Geometric
Measurement (2012), Vygotsky’s (1962) concept formation theory stages, and the format
of assessment in Berger’s (2002) study of appropriation theory. The goal of pre-test was
to capture the participants’ current developmental stages of the concept of area along
with peripheral concepts, which have been identified to be closely related to the concept
of area based on CBA levels.
Five questions were selected from existing assessments and modified to resemble
novel (non-textbook-like) tasks (see Appendix C). Resources included items from TIMSS,
CBA tasks, and Problem Sets from the Math Coaching Program at the Ohio State
University. Table 3.3 shows the difference between a conventional task and its
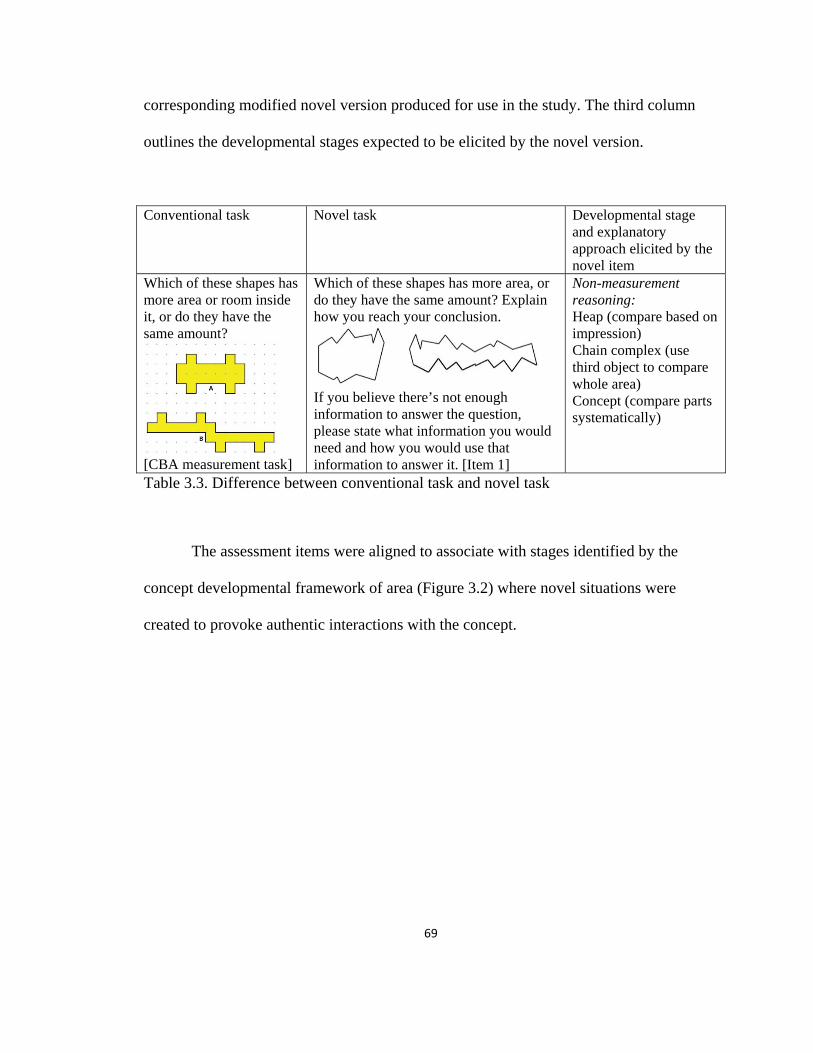
69
corresponding modified novel version produced for use in the study. The third column
outlines the developmental stages expected to be elicited by the novel version.
Conventional task Novel task Developmental stage and explanatory approach elicited by the novel item
Which of these shapes has more area or room inside it, or do they have the same amount?
[CBA measurement task]
Which of these shapes has more area, or do they have the same amount? Explain how you reach your conclusion.
If you believe there’s not enough information to answer the question, please state what information you would need and how you would use that information to answer it. [Item 1]
Non-measurement reasoning: Heap (compare based on impression) Chain complex (use third object to compare whole area) Concept (compare parts systematically)
Table 3.3. Difference between conventional task and novel task
The assessment items were aligned to associate with stages identified by the
concept developmental framework of area (Figure 3.2) where novel situations were
created to provoke authentic interactions with the concept.
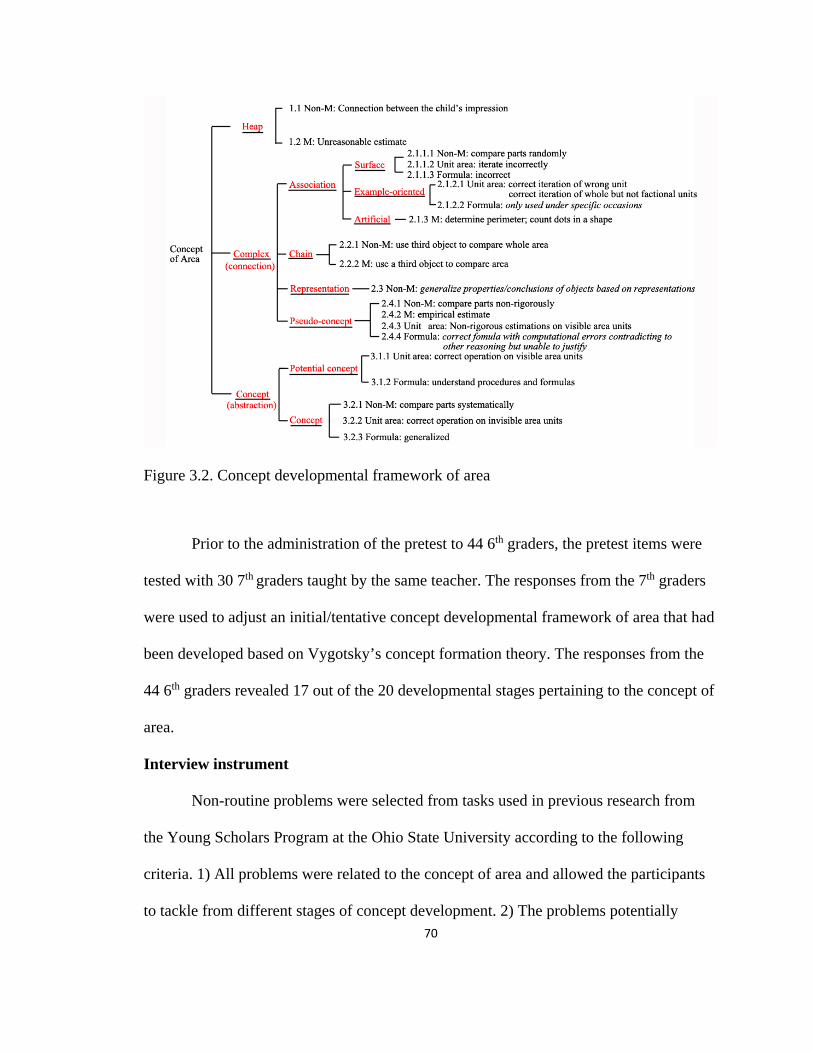
70
Figure 3.2. Concept developmental framework of area
Prior to the administration of the pretest to 44 6th graders, the pretest items were
tested with 30 7th graders taught by the same teacher. The responses from the 7th graders
were used to adjust an initial/tentative concept developmental framework of area that had
been developed based on Vygotsky’s concept formation theory. The responses from the
44 6th graders revealed 17 out of the 20 developmental stages pertaining to the concept of
area.
Interview instrument
Non-routine problems were selected from tasks used in previous research from
the Young Scholars Program at the Ohio State University according to the following
criteria. 1) All problems were related to the concept of area and allowed the participants
to tackle from different stages of concept development. 2) The problems potentially

71
covered a wide range of concept stages. 3) Peripheral concepts were integrated in several
problems in order to enable some degree of interactions between different concepts. Each
peripheral concept played a crucial role when a participant tackled the problem. Some
task elements were deliberately designed to deviate/test the participants’ reactions, such
as the missing measures in Problem 3 and the absence of scale in Problem 4.
In the task selection process, I predicted concept stages that could be potentially
elicited by each problem, which was considered as the capacity of the problem. The
predicted stages pertaining to each problem are outlined in Table 3.4.
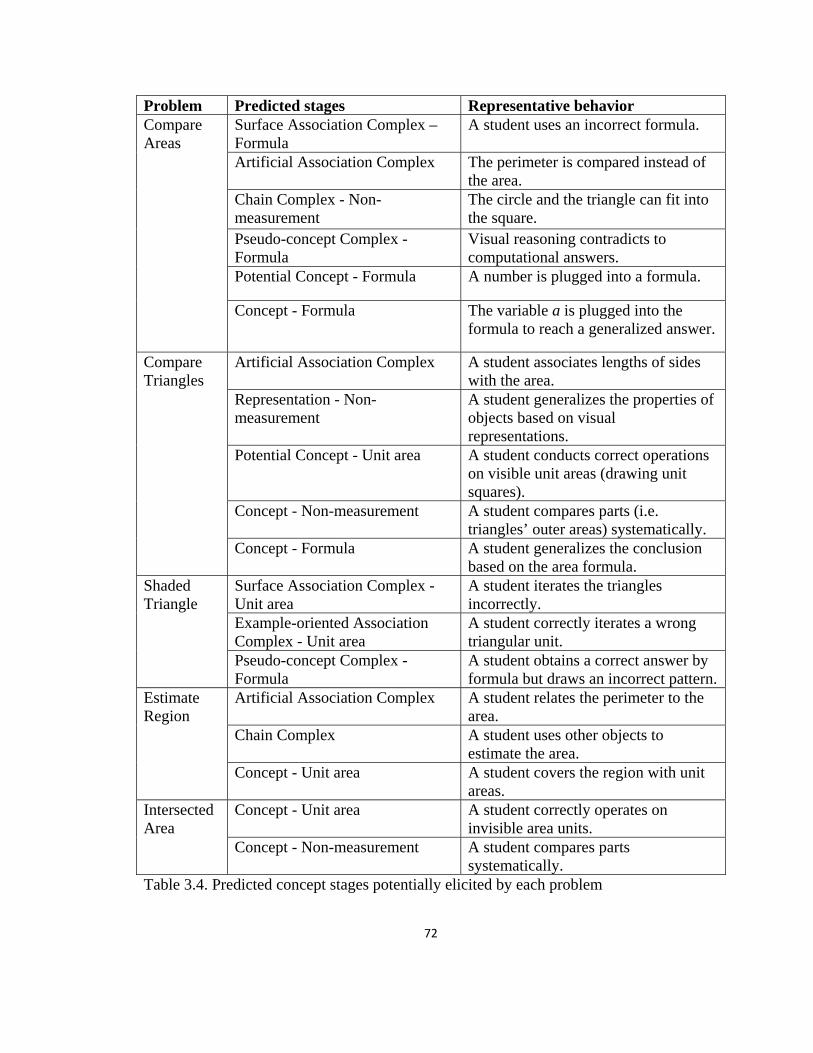
72
Problem Predicted stages Representative behavior Compare Areas
Surface Association Complex – Formula
A student uses an incorrect formula.
Artificial Association Complex The perimeter is compared instead of the area.
Chain Complex - Non-measurement
The circle and the triangle can fit into the square.
Pseudo-concept Complex - Formula
Visual reasoning contradicts to computational answers.
Potential Concept - Formula A number is plugged into a formula.
Concept - Formula The variable a is plugged into the formula to reach a generalized answer.
Compare Triangles
Artificial Association Complex A student associates lengths of sides with the area.
Representation - Non-measurement
A student generalizes the properties of objects based on visual representations.
Potential Concept - Unit area A student conducts correct operations on visible unit areas (drawing unit squares).
Concept - Non-measurement A student compares parts (i.e. triangles’ outer areas) systematically.
Concept - Formula A student generalizes the conclusion based on the area formula.
Shaded Triangle
Surface Association Complex - Unit area
A student iterates the triangles incorrectly.
Example-oriented Association Complex - Unit area
A student correctly iterates a wrong triangular unit.
Pseudo-concept Complex - Formula
A student obtains a correct answer by formula but draws an incorrect pattern.
Estimate Region
Artificial Association Complex A student relates the perimeter to the area.
Chain Complex A student uses other objects to estimate the area.
Concept - Unit area A student covers the region with unit areas.
Intersected Area
Concept - Unit area A student correctly operates on invisible area units.
Concept - Non-measurement A student compares parts systematically.
Table 3.4. Predicted concept stages potentially elicited by each problem
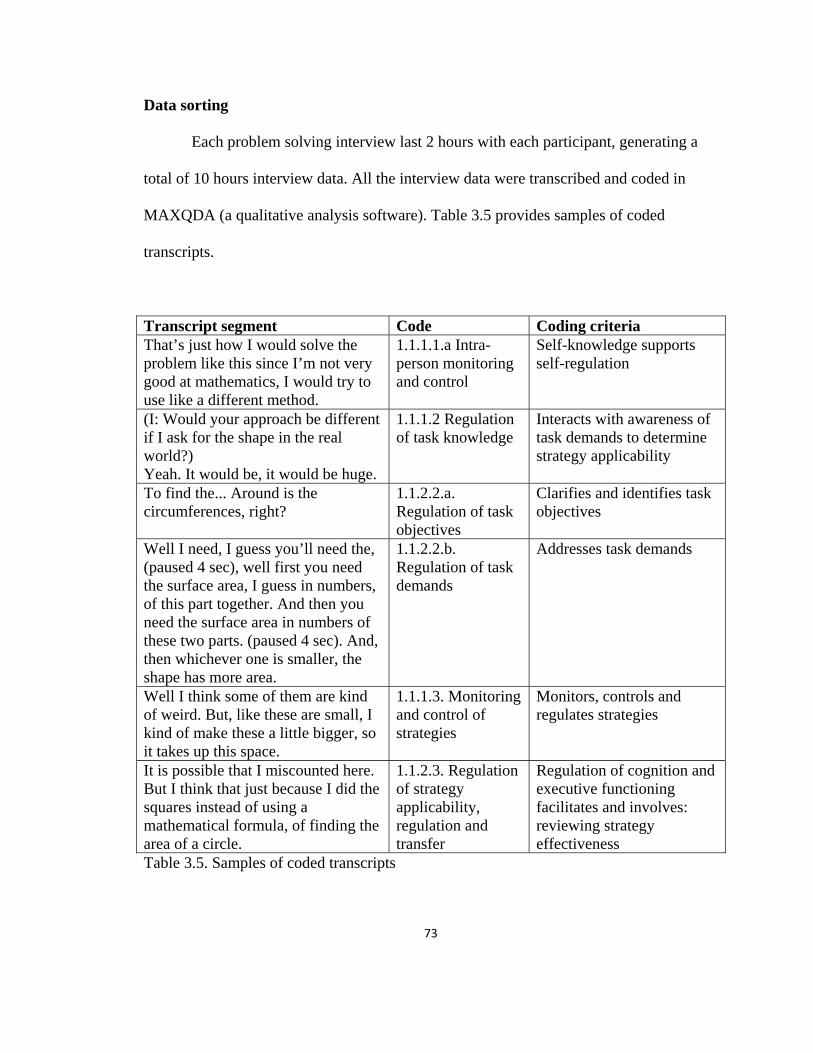
73
Data sorting
Each problem solving interview last 2 hours with each participant, generating a
total of 10 hours interview data. All the interview data were transcribed and coded in
MAXQDA (a qualitative analysis software). Table 3.5 provides samples of coded
transcripts.
Transcript segment Code Coding criteria That’s just how I would solve the problem like this since I’m not very good at mathematics, I would try to use like a different method.
1.1.1.1.a Intra-person monitoring and control
Self-knowledge supports self-regulation
(I: Would your approach be different if I ask for the shape in the real world?) Yeah. It would be, it would be huge.
1.1.1.2 Regulation of task knowledge
Interacts with awareness of task demands to determine strategy applicability
To find the... Around is the circumferences, right?
1.1.2.2.a. Regulation of task objectives
Clarifies and identifies task objectives
Well I need, I guess you’ll need the, (paused 4 sec), well first you need the surface area, I guess in numbers, of this part together. And then you need the surface area in numbers of these two parts. (paused 4 sec). And, then whichever one is smaller, the shape has more area.
1.1.2.2.b. Regulation of task demands
Addresses task demands
Well I think some of them are kind of weird. But, like these are small, I kind of make these a little bigger, so it takes up this space.
1.1.1.3. Monitoring and control of strategies
Monitors, controls and regulates strategies
It is possible that I miscounted here. But I think that just because I did the squares instead of using a mathematical formula, of finding the area of a circle.
1.1.2.3. Regulation of strategy applicability, regulation and transfer
Regulation of cognition and executive functioning facilitates and involves: reviewing strategy effectiveness
Table 3.5. Samples of coded transcripts
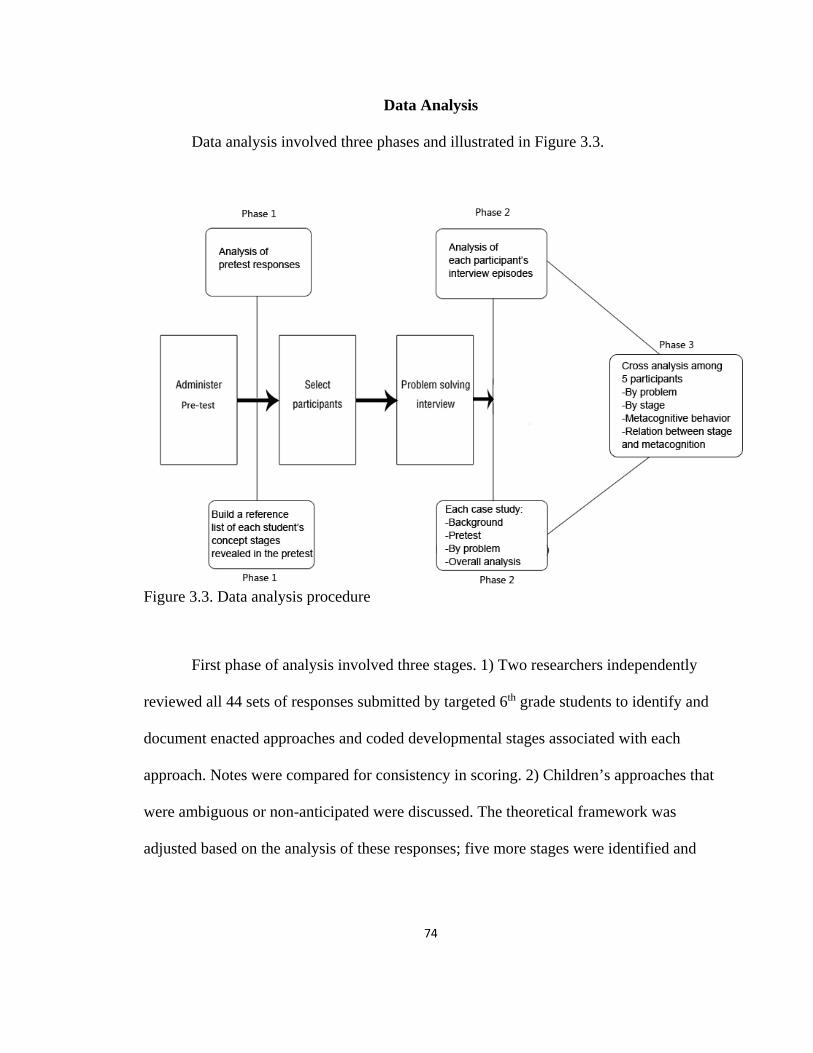
74
Data Analysis
Data analysis involved three phases and illustrated in Figure 3.3.
Figure 3.3. Data analysis procedure
First phase of analysis involved three stages. 1) Two researchers independently
reviewed all 44 sets of responses submitted by targeted 6th grade students to identify and
document enacted approaches and coded developmental stages associated with each
approach. Notes were compared for consistency in scoring. 2) Children’s approaches that
were ambiguous or non-anticipated were discussed. The theoretical framework was
adjusted based on the analysis of these responses; five more stages were identified and
75
added to the original framework. 3) Based on the analysis I built a reference list of
detected stages for each student to inform participant selection.
In the second phase, each individual case study was analyzed according to four
considerations: 1) The participant’s background interview was examined and recorded
pertaining to his/her general mathematical backgrounds and beliefs as a reference for
later analysis. 2) The individual’s pretest result was summarized along with a brief
analysis of the response to each item. 3) An elaborative discussion of the participant’s
mathematical practices on each of the five interview problems was conducted along three
dimensions: (a) a breakdown of the individual’s key cognitive behaviors during each
problem solving episode, (b) a summary of observed concept stages and metacognitive
behaviors detected during the episode, and (c) a detailed analysis of the individual’s
problem solving behaviors through the proposed concept-cognition-metacognition
theoretical lens. 4) An overall analysis of each case was organized as responses to the
three research questions guiding the study.
The last level of analysis, cross case analysis, encompassed four dimensions: 1) a
problem by problem analysis, which compared and contrasted the five participants’
performance on each problem; 2) a stage by stage analysis, which compared and
contrasted the five participants’ conceptual behaviors on each stage; 3) an analysis of
each type of metacognitive behavior, which compared and contrasted the five participants’
metacognitive behaviors; 4) an analysis of the relationship between stage and
metacognition, which built on the previous three sections and abstracts potential
attributions of metacognitive behaviors pertaining to each concept stage.

76
Summary
This chapter summarized the research design, data collection procedures
(including pretest, participant selection process, and problem solving interviews),
instrument design (including pretest, interview instrument, and data sorting/coding
samples), and data analysis procedures (including three phases). The collected and coded
data were elaborately analyzed and reported in the five case studies in the next chapter.
77
CHAPTER 4
RESULTS
This chapter provides a detailed description of the five study participants
presented in the form of individual cases. Each case consists of four sections. The first
section of each case provides background information on the subject elicited during the
initial interview. The second section summarizes the individual’s pretest result along with
a brief analysis of the response to each item. The third section offers detailed discussion
of the participant’s mathematical practices on each of the five interview problems.
Analysis of the performance is offered along three dimensions: 1) a breakdown of the
individual’s key cognitive behaviors during each problem solving episode, 2) a summary
of observed concept stages and metacognitive behaviors detected during the episode, and
3) a detailed analysis of the individual’s problem solving behaviors through the proposed
concept-cognition-metacognition theoretical lens. The fourth portion of each case study
presents an overall analysis of each case organized around responses to the three research
questions guiding the study.
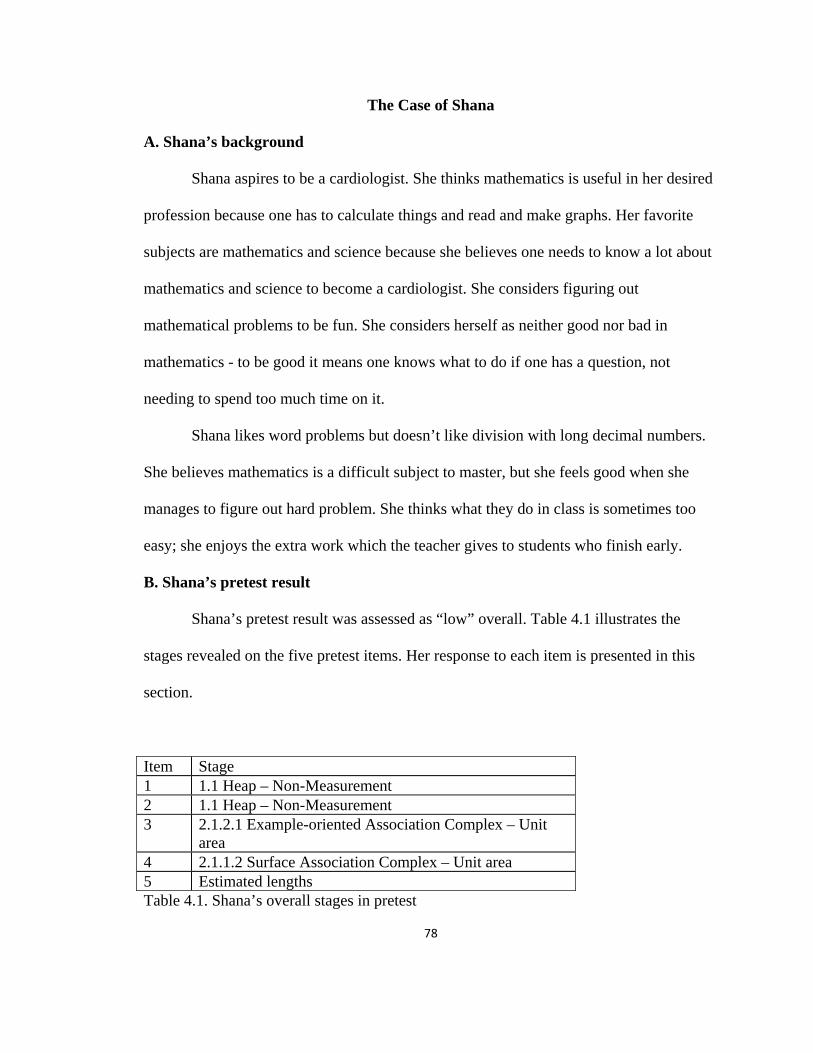
78
The Case of Shana
A. Shana’s background
Shana aspires to be a cardiologist. She thinks mathematics is useful in her desired
profession because one has to calculate things and read and make graphs. Her favorite
subjects are mathematics and science because she believes one needs to know a lot about
mathematics and science to become a cardiologist. She considers figuring out
mathematical problems to be fun. She considers herself as neither good nor bad in
mathematics - to be good it means one knows what to do if one has a question, not
needing to spend too much time on it.
Shana likes word problems but doesn’t like division with long decimal numbers.
She believes mathematics is a difficult subject to master, but she feels good when she
manages to figure out hard problem. She thinks what they do in class is sometimes too
easy; she enjoys the extra work which the teacher gives to students who finish early.
B. Shana’s pretest result
Shana’s pretest result was assessed as “low” overall. Table 4.1 illustrates the
stages revealed on the five pretest items. Her response to each item is presented in this
section.
Item Stage 1 1.1 Heap – Non-Measurement 2 1.1 Heap – Non-Measurement 3 2.1.2.1 Example-oriented Association Complex – Unit
area 4 2.1.1.2 Surface Association Complex – Unit area 5 Estimated lengths Table 4.1. Shana’s overall stages in pretest
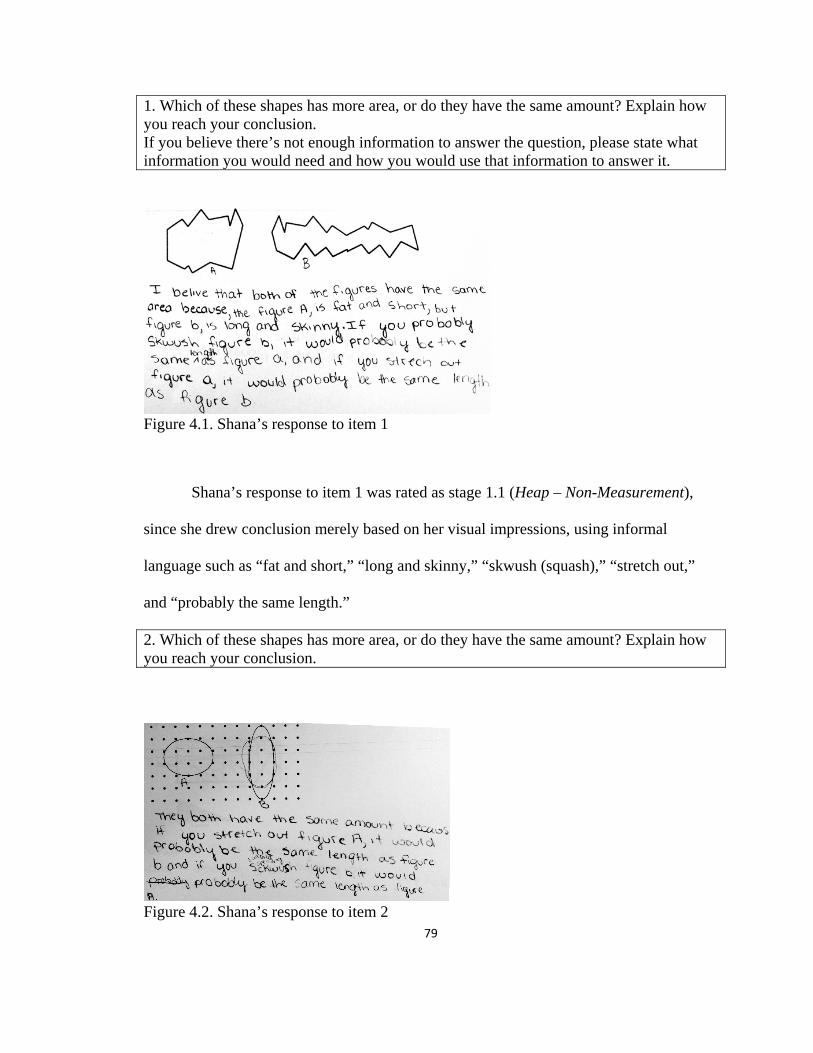
79
1. Which of these shapes has more area, or do they have the same amount? Explain how you reach your conclusion. If you believe there’s not enough information to answer the question, please state what information you would need and how you would use that information to answer it.
Figure 4.1. Shana’s response to item 1
Shana’s response to item 1 was rated as stage 1.1 (Heap – Non-Measurement),
since she drew conclusion merely based on her visual impressions, using informal
language such as “fat and short,” “long and skinny,” “skwush (squash),” “stretch out,”
and “probably the same length.”
2. Which of these shapes has more area, or do they have the same amount? Explain how you reach your conclusion.
Figure 4.2. Shana’s response to item 2
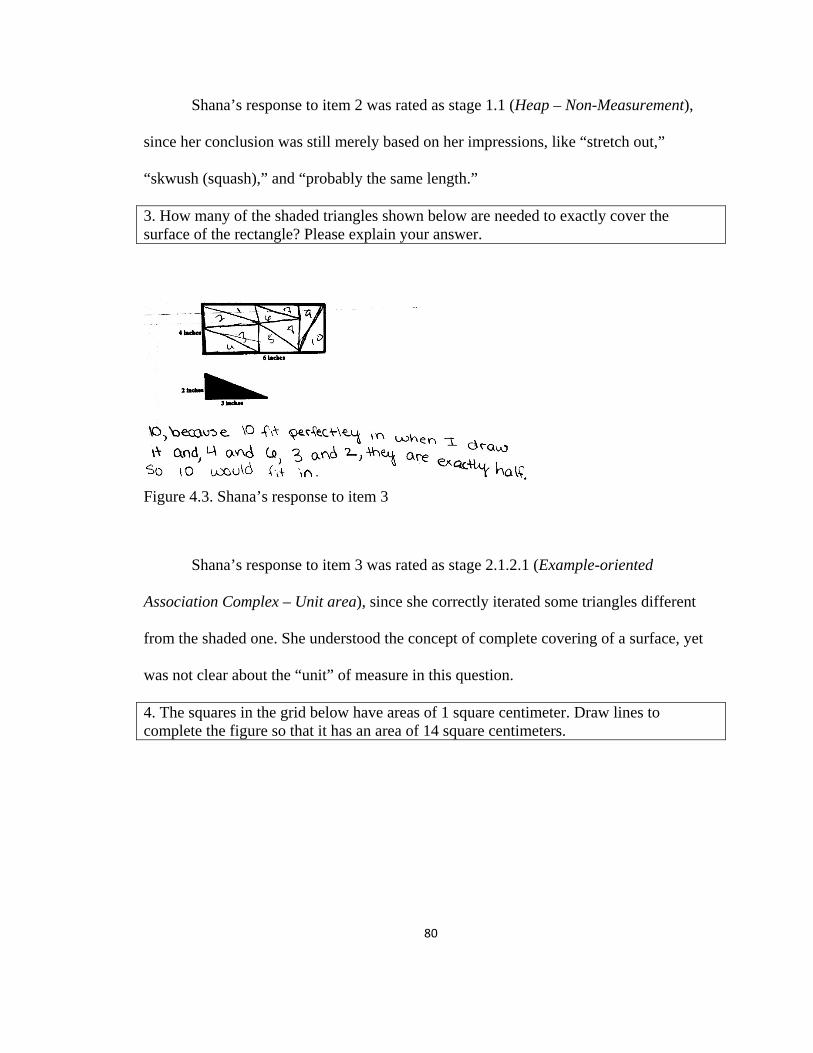
80
Shana’s response to item 2 was rated as stage 1.1 (Heap – Non-Measurement),
since her conclusion was still merely based on her impressions, like “stretch out,”
“skwush (squash),” and “probably the same length.”
3. How many of the shaded triangles shown below are needed to exactly cover the surface of the rectangle? Please explain your answer.
Figure 4.3. Shana’s response to item 3
Shana’s response to item 3 was rated as stage 2.1.2.1 (Example-oriented
Association Complex – Unit area), since she correctly iterated some triangles different
from the shaded one. She understood the concept of complete covering of a surface, yet
was not clear about the “unit” of measure in this question.
4. The squares in the grid below have areas of 1 square centimeter. Draw lines to complete the figure so that it has an area of 14 square centimeters.
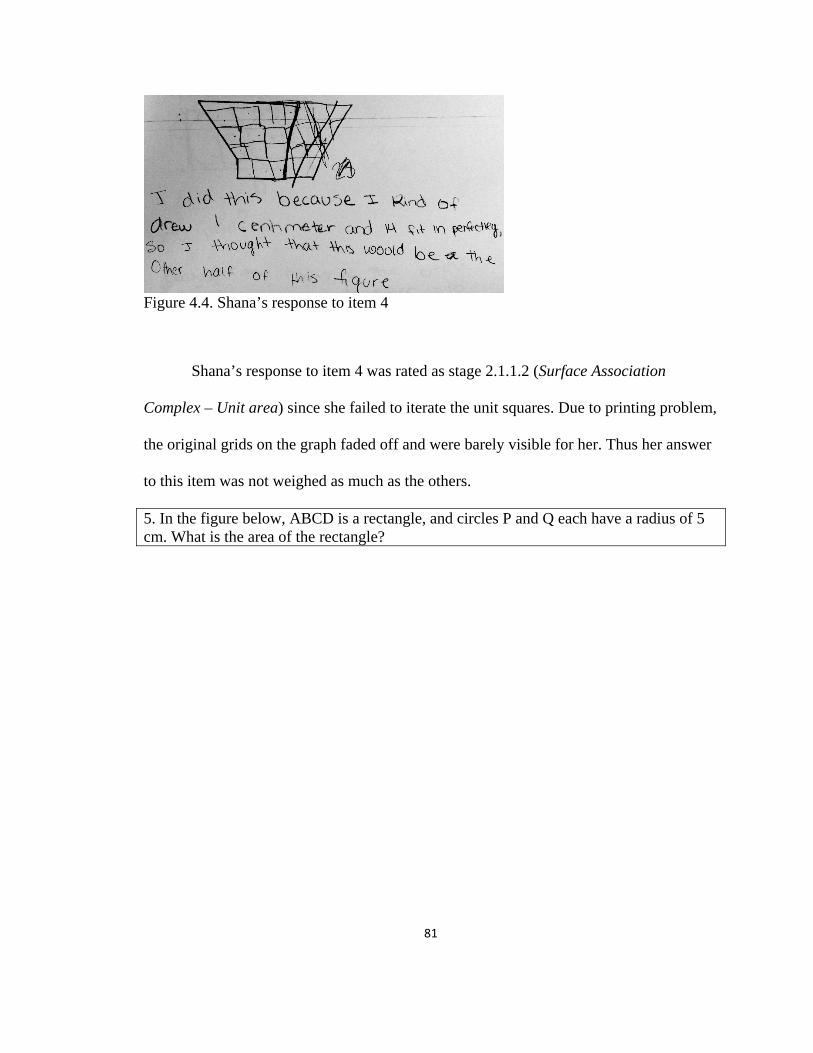
81
Figure 4.4. Shana’s response to item 4
Shana’s response to item 4 was rated as stage 2.1.1.2 (Surface Association
Complex – Unit area) since she failed to iterate the unit squares. Due to printing problem,
the original grids on the graph faded off and were barely visible for her. Thus her answer
to this item was not weighed as much as the others.
5. In the figure below, ABCD is a rectangle, and circles P and Q each have a radius of 5 cm. What is the area of the rectangle?

82
Figure 4.5. Shana’s response to item 5
Although Shana’s performance on the previous items was assessed as low, she
successfully estimated the two sides of the rectangle and found the area in item 5. Notice
that she found the longer side by stating “the bigger sides are like half of the smaller
sides.” It is unclear whether she related the bigger sides to the radius or estimated only
based on the smaller sides. In this item, she showed potential problem solving ability
despite of lower stages of concept development.
Shana’s responses to the pretest items exhibited a low level of concept
development yet a relatively high problem solving ability. What’s more, she was more
articulate in terms of describing her approaches/thoughts than other students who also
exhibited low level of concept development. These served as the researcher’s main
rationale to further study her problem solving behaviors.
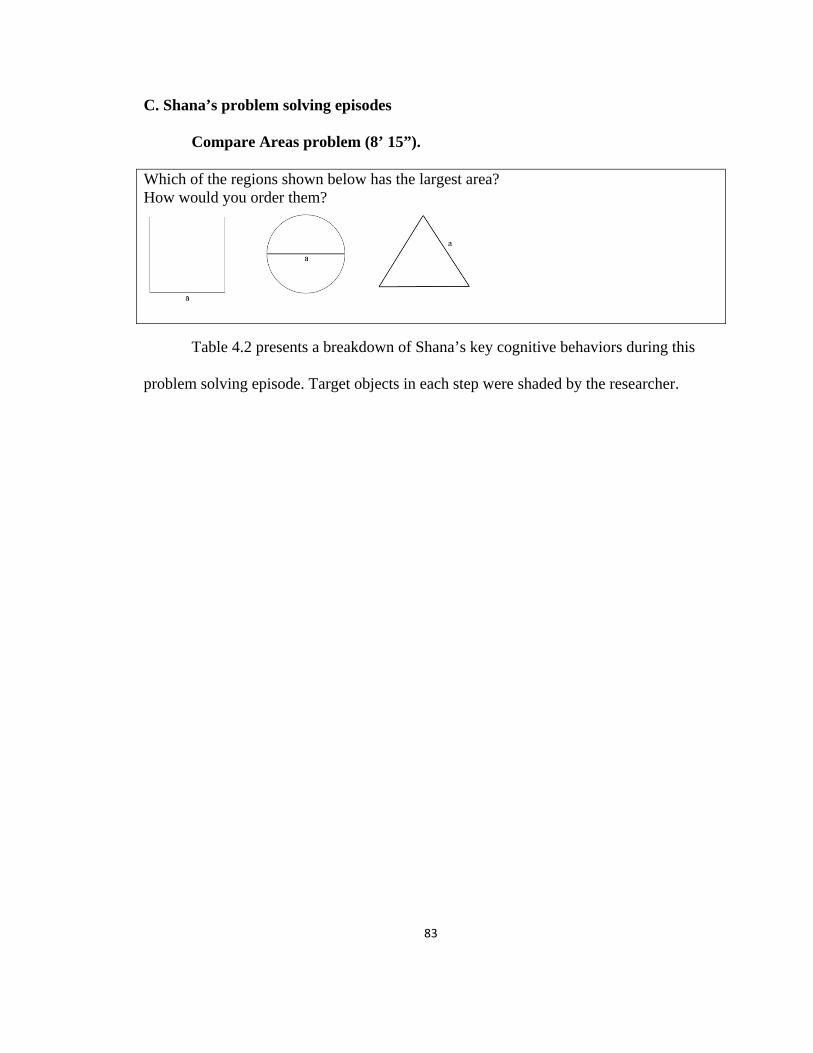
83
C. Shana’s problem solving episodes
Compare Areas problem (8’ 15”).
Which of the regions shown below has the largest area? How would you order them?
Table 4.2 presents a breakdown of Shana’s key cognitive behaviors during this
problem solving episode. Target objects in each step were shaded by the researcher.
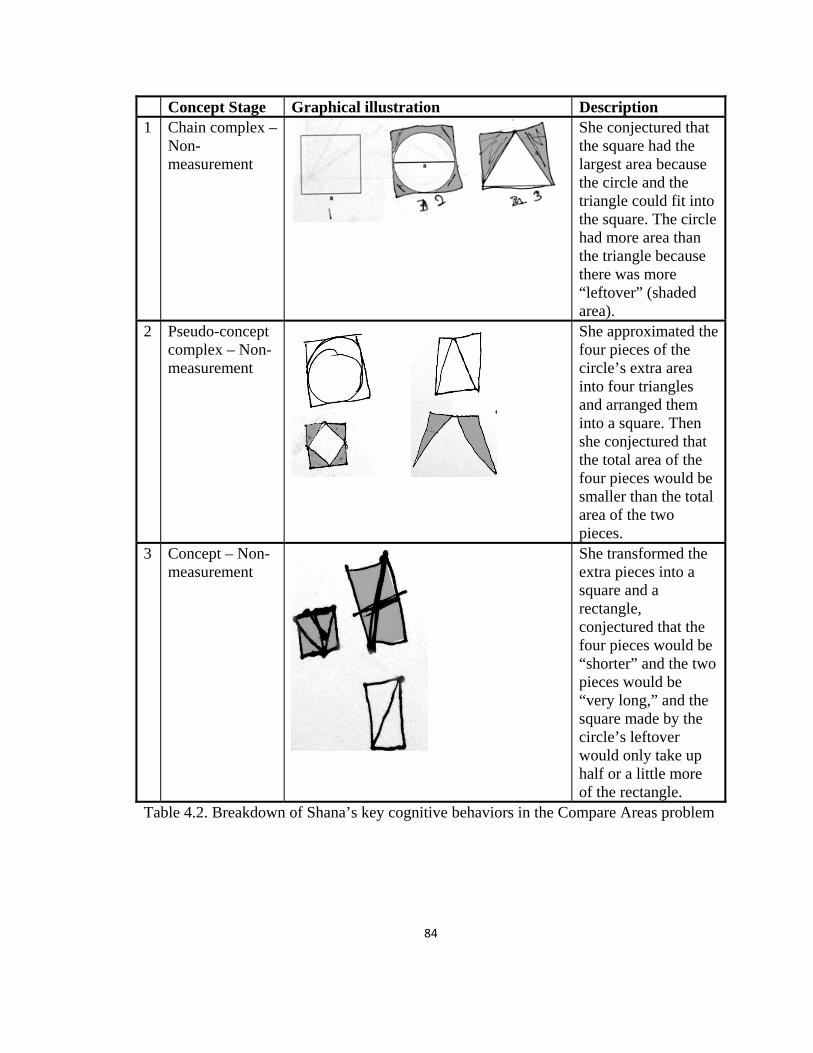
84
Concept Stage Graphical illustration Description 1 Chain complex –
Non-measurement
She conjectured that the square had the largest area because the circle and the triangle could fit into the square. The circle had more area than the triangle because there was more “leftover” (shaded area).
2 Pseudo-concept complex – Non-measurement
She approximated the four pieces of the circle’s extra area into four triangles and arranged them into a square. Then she conjectured that the total area of the four pieces would be smaller than the total area of the two pieces.
3 Concept – Non-measurement
She transformed the extra pieces into a square and a rectangle, conjectured that the four pieces would be “shorter” and the two pieces would be “very long,” and the square made by the circle’s leftover would only take up half or a little more of the rectangle.
Table 4.2. Breakdown of Shana’s key cognitive behaviors in the Compare Areas problem
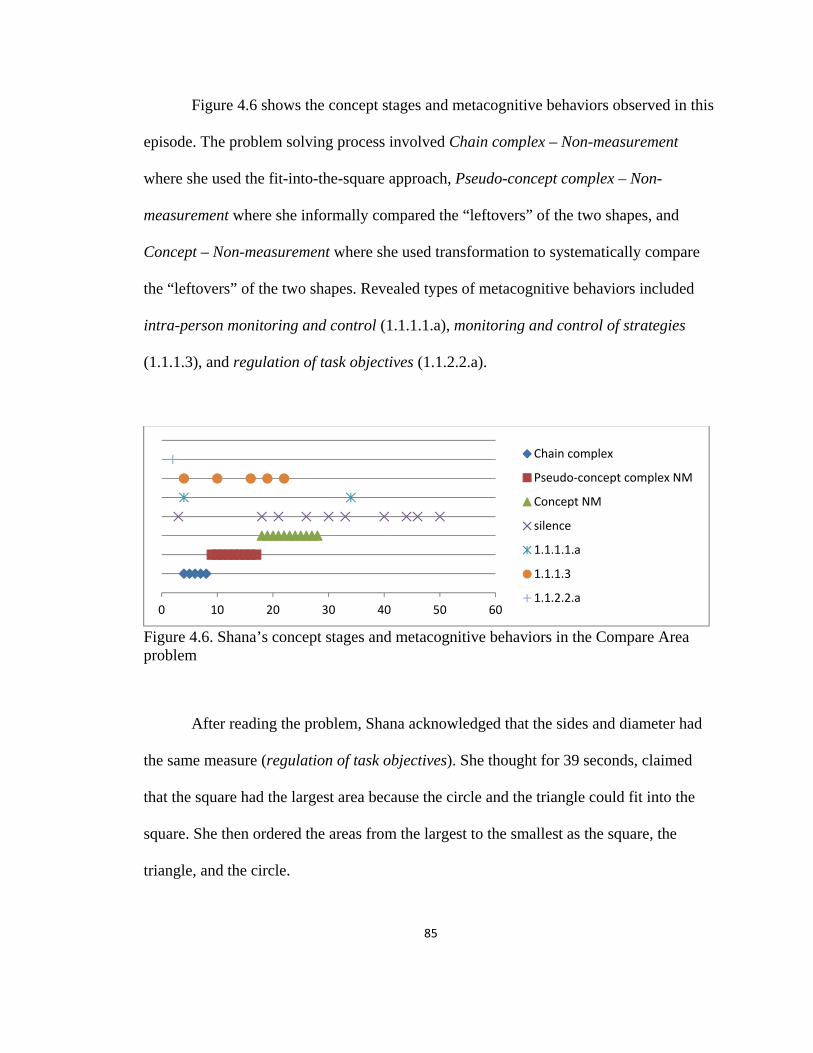
85
Figure 4.6 shows the concept stages and metacognitive behaviors observed in this
episode. The problem solving process involved Chain complex – Non-measurement
where she used the fit-into-the-square approach, Pseudo-concept complex – Non-
measurement where she informally compared the “leftovers” of the two shapes, and
Concept – Non-measurement where she used transformation to systematically compare
the “leftovers” of the two shapes. Revealed types of metacognitive behaviors included
intra-person monitoring and control (1.1.1.1.a), monitoring and control of strategies
(1.1.1.3), and regulation of task objectives (1.1.2.2.a).
Figure 4.6. Shana’s concept stages and metacognitive behaviors in the Compare Area problem
After reading the problem, Shana acknowledged that the sides and diameter had
the same measure (regulation of task objectives). She thought for 39 seconds, claimed
that the square had the largest area because the circle and the triangle could fit into the
square. She then ordered the areas from the largest to the smallest as the square, the
triangle, and the circle.
0 10 20 30 40 50 60
Chain complex
Pseudo-concept complex NM
Concept NM
silence
1.1.1.1.a
1.1.1.3
1.1.2.2.a
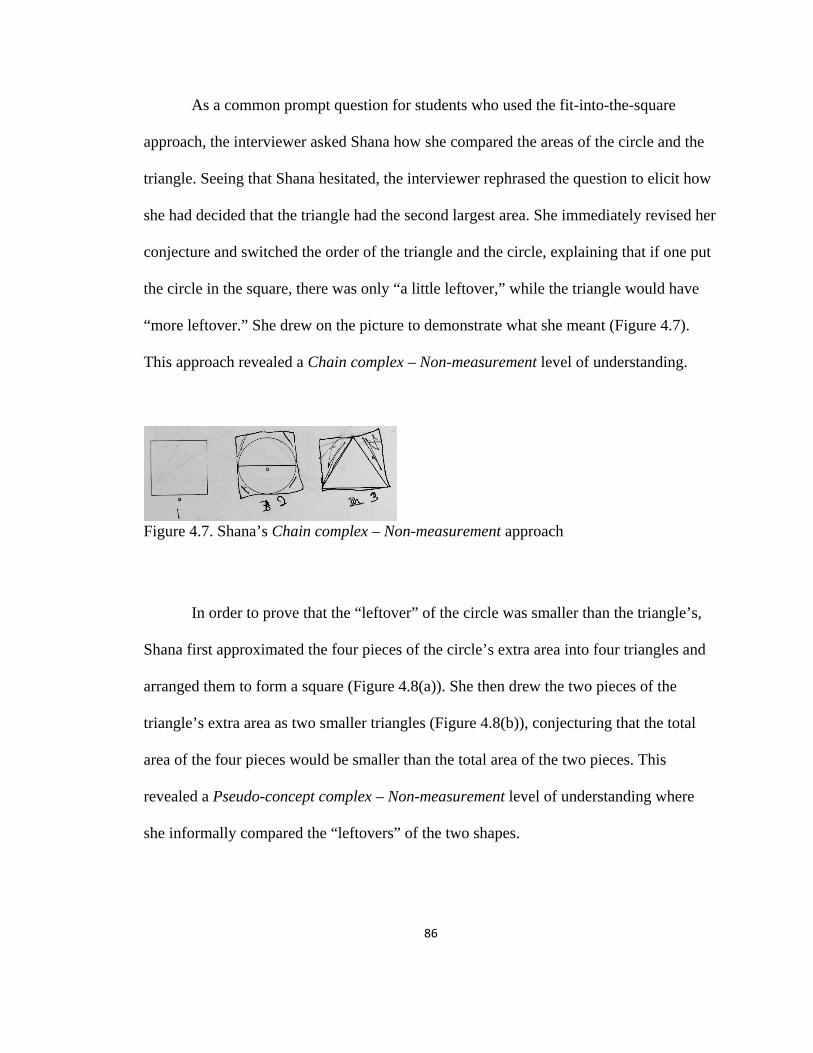
86
As a common prompt question for students who used the fit-into-the-square
approach, the interviewer asked Shana how she compared the areas of the circle and the
triangle. Seeing that Shana hesitated, the interviewer rephrased the question to elicit how
she had decided that the triangle had the second largest area. She immediately revised her
conjecture and switched the order of the triangle and the circle, explaining that if one put
the circle in the square, there was only “a little leftover,” while the triangle would have
“more leftover.” She drew on the picture to demonstrate what she meant (Figure 4.7).
This approach revealed a Chain complex – Non-measurement level of understanding.
Figure 4.7. Shana’s Chain complex – Non-measurement approach
In order to prove that the “leftover” of the circle was smaller than the triangle’s,
Shana first approximated the four pieces of the circle’s extra area into four triangles and
arranged them to form a square (Figure 4.8(a)). She then drew the two pieces of the
triangle’s extra area as two smaller triangles (Figure 4.8(b)), conjecturing that the total
area of the four pieces would be smaller than the total area of the two pieces. This
revealed a Pseudo-concept complex – Non-measurement level of understanding where
she informally compared the “leftovers” of the two shapes.

87
(a)
(b) Figure 4.8. Shana’s drawing of the leftover of the triangle
The interviewer asked her how she had reached the conjecture. Shana produced
Figure 9 and explained that the four pieces would be “shorter” and the two pieces would
be “very long,” so the square made by the circle’s leftover took up only a half of the
rectangle (made by the triangle’s leftover). This approach revealed a Concept – Non-
measurement level of understanding where she used transformation to systematically
compare the “leftovers” of the two shapes.
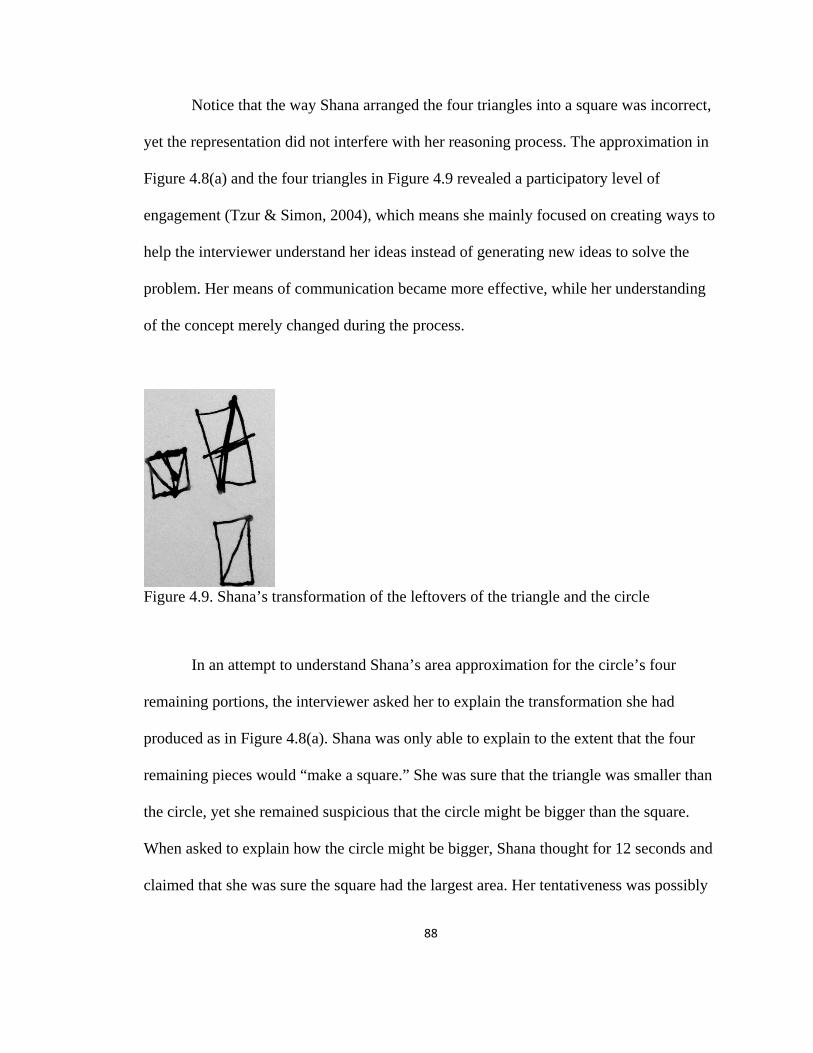
88
Notice that the way Shana arranged the four triangles into a square was incorrect,
yet the representation did not interfere with her reasoning process. The approximation in
Figure 4.8(a) and the four triangles in Figure 4.9 revealed a participatory level of
engagement (Tzur & Simon, 2004), which means she mainly focused on creating ways to
help the interviewer understand her ideas instead of generating new ideas to solve the
problem. Her means of communication became more effective, while her understanding
of the concept merely changed during the process.
Figure 4.9. Shana’s transformation of the leftovers of the triangle and the circle
In an attempt to understand Shana’s area approximation for the circle’s four
remaining portions, the interviewer asked her to explain the transformation she had
produced as in Figure 4.8(a). Shana was only able to explain to the extent that the four
remaining pieces would “make a square.” She was sure that the triangle was smaller than
the circle, yet she remained suspicious that the circle might be bigger than the square.
When asked to explain how the circle might be bigger, Shana thought for 12 seconds and
claimed that she was sure the square had the largest area. Her tentativeness was possibly
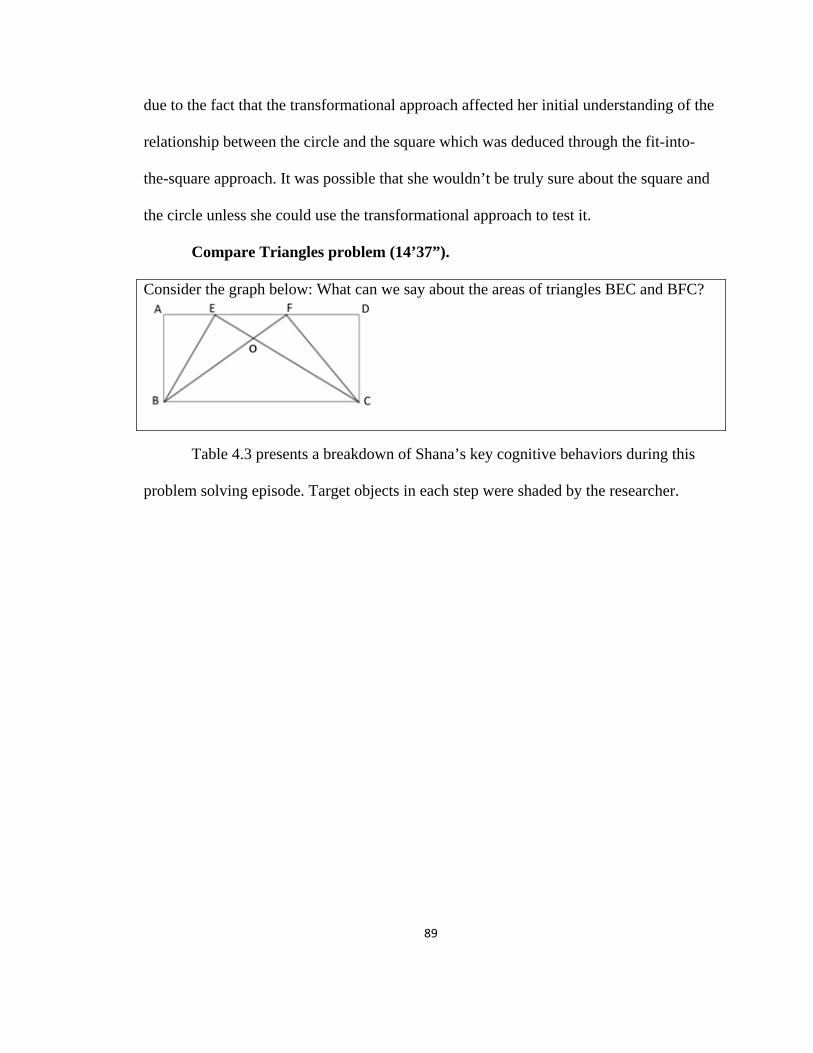
89
due to the fact that the transformational approach affected her initial understanding of the
relationship between the circle and the square which was deduced through the fit-into-
the-square approach. It was possible that she wouldn’t be truly sure about the square and
the circle unless she could use the transformational approach to test it.
Compare Triangles problem (14’37”).
Consider the graph below: What can we say about the areas of triangles BEC and BFC?
Table 4.3 presents a breakdown of Shana’s key cognitive behaviors during this
problem solving episode. Target objects in each step were shaded by the researcher.
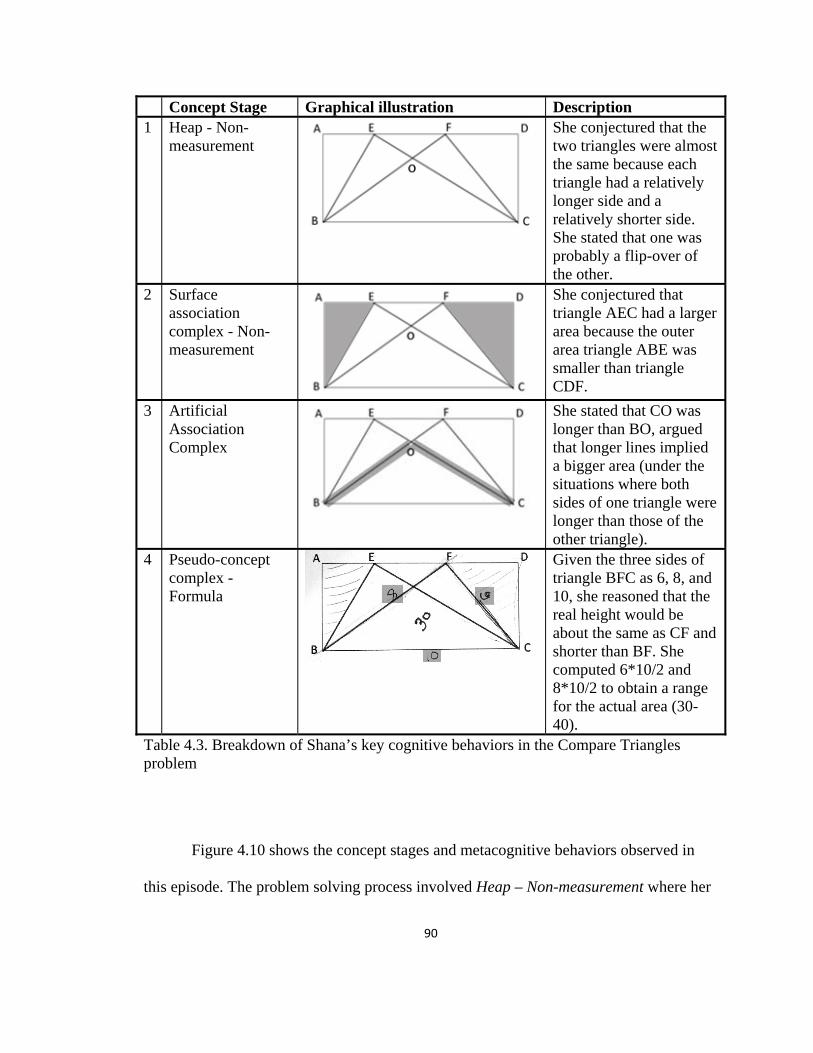
90
Concept Stage Graphical illustration Description 1 Heap - Non-
measurement
She conjectured that the two triangles were almost the same because each triangle had a relatively longer side and a relatively shorter side. She stated that one was probably a flip-over of the other.
2 Surface association complex - Non-measurement
She conjectured that triangle AEC had a larger area because the outer area triangle ABE was smaller than triangle CDF.
3 Artificial Association Complex
She stated that CO was longer than BO, argued that longer lines implied a bigger area (under the situations where both sides of one triangle were longer than those of the other triangle).
4 Pseudo-concept complex - Formula
Given the three sides of triangle BFC as 6, 8, and 10, she reasoned that the real height would be about the same as CF and shorter than BF. She computed 6*10/2 and 8*10/2 to obtain a range for the actual area (30-40).
Table 4.3. Breakdown of Shana’s key cognitive behaviors in the Compare Triangles problem
Figure 4.10 shows the concept stages and metacognitive behaviors observed in
this episode. The problem solving process involved Heap – Non-measurement where her
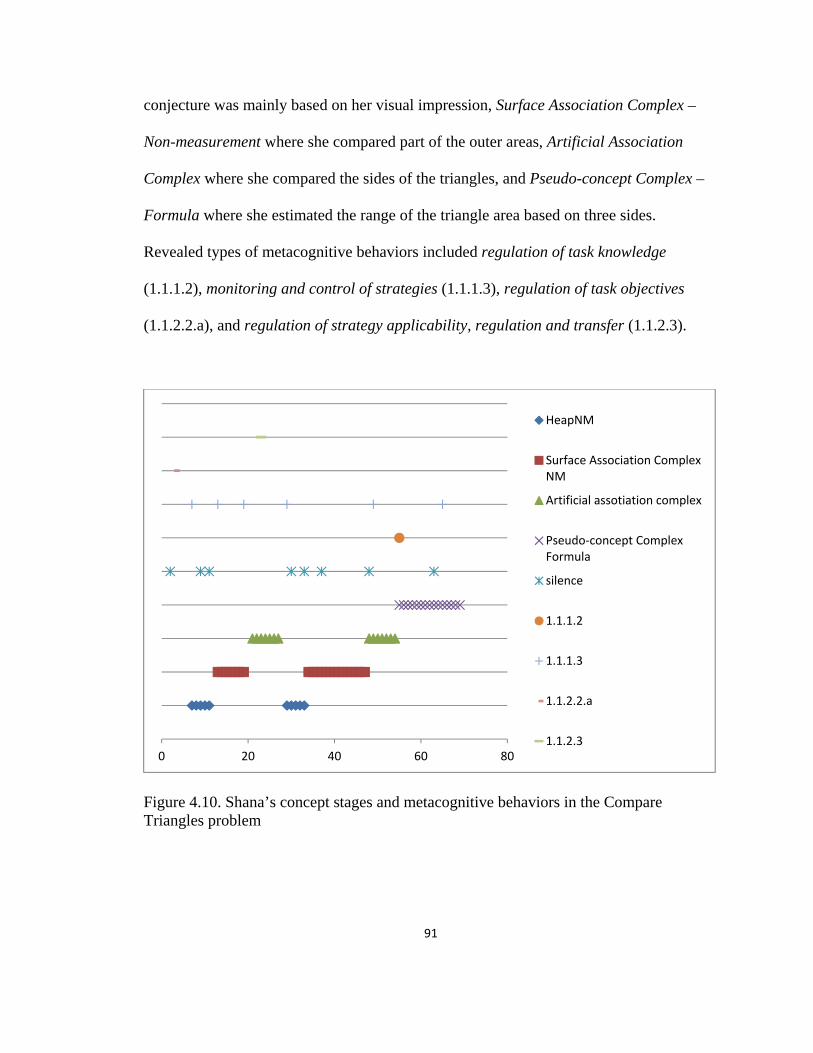
91
conjecture was mainly based on her visual impression, Surface Association Complex –
Non-measurement where she compared part of the outer areas, Artificial Association
Complex where she compared the sides of the triangles, and Pseudo-concept Complex –
Formula where she estimated the range of the triangle area based on three sides.
Revealed types of metacognitive behaviors included regulation of task knowledge
(1.1.1.2), monitoring and control of strategies (1.1.1.3), regulation of task objectives
(1.1.2.2.a), and regulation of strategy applicability, regulation and transfer (1.1.2.3).
Figure 4.10. Shana’s concept stages and metacognitive behaviors in the Compare Triangles problem
0 20 40 60 80
HeapNM
Surface Association ComplexNM
Artificial assotiation complex
Pseudo-concept ComplexFormula
silence
1.1.1.2
1.1.1.3
1.1.2.2.a
1.1.2.3
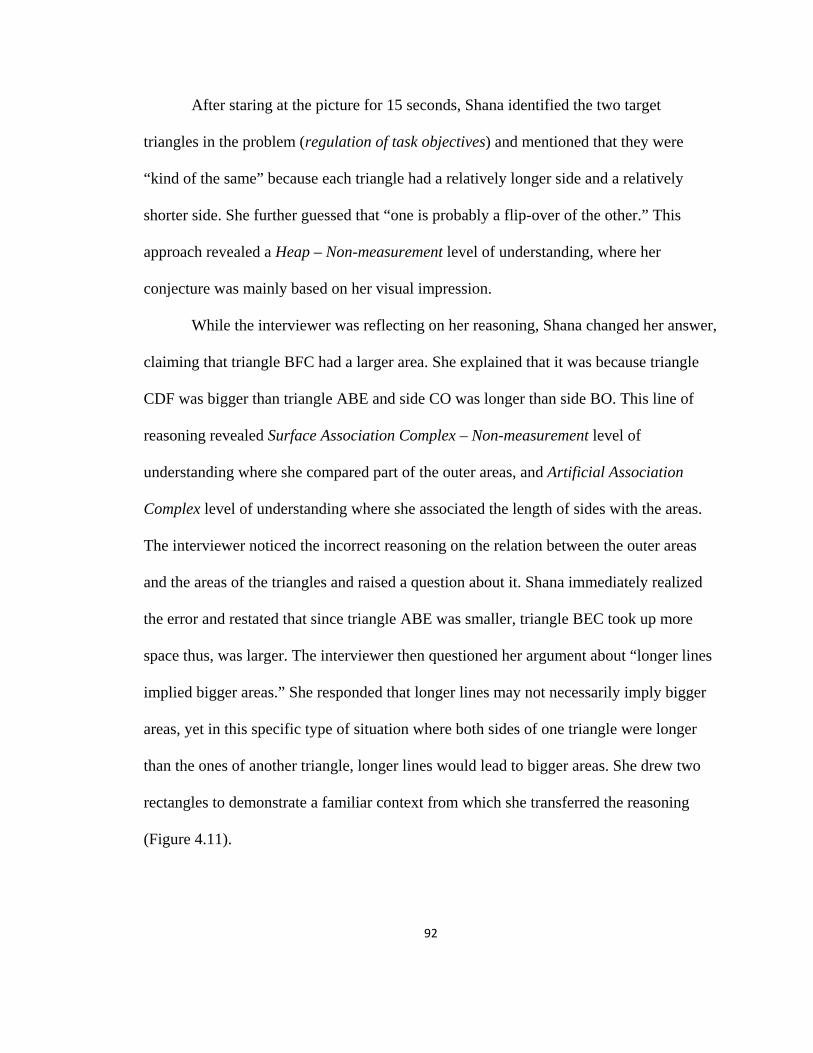
92
After staring at the picture for 15 seconds, Shana identified the two target
triangles in the problem (regulation of task objectives) and mentioned that they were
“kind of the same” because each triangle had a relatively longer side and a relatively
shorter side. She further guessed that “one is probably a flip-over of the other.” This
approach revealed a Heap – Non-measurement level of understanding, where her
conjecture was mainly based on her visual impression.
While the interviewer was reflecting on her reasoning, Shana changed her answer,
claiming that triangle BFC had a larger area. She explained that it was because triangle
CDF was bigger than triangle ABE and side CO was longer than side BO. This line of
reasoning revealed Surface Association Complex – Non-measurement level of
understanding where she compared part of the outer areas, and Artificial Association
Complex level of understanding where she associated the length of sides with the areas.
The interviewer noticed the incorrect reasoning on the relation between the outer areas
and the areas of the triangles and raised a question about it. Shana immediately realized
the error and restated that since triangle ABE was smaller, triangle BEC took up more
space thus, was larger. The interviewer then questioned her argument about “longer lines
implied bigger areas.” She responded that longer lines may not necessarily imply bigger
areas, yet in this specific type of situation where both sides of one triangle were longer
than the ones of another triangle, longer lines would lead to bigger areas. She drew two
rectangles to demonstrate a familiar context from which she transferred the reasoning
(Figure 4.11).
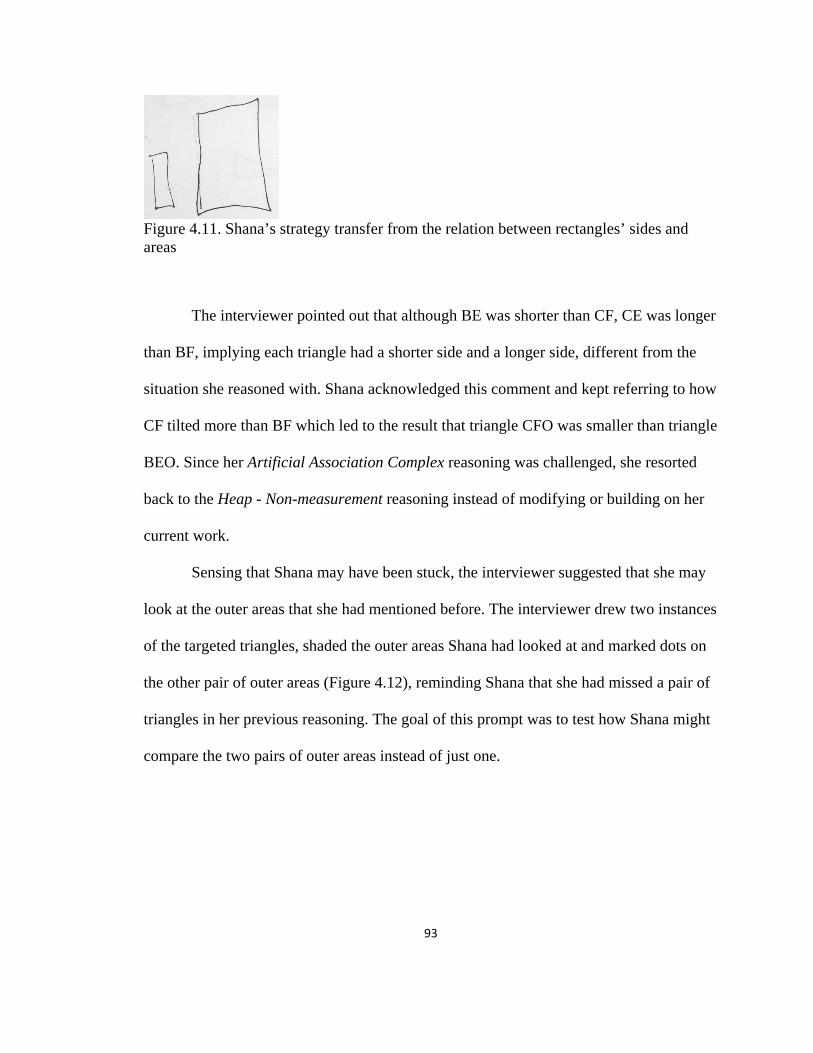
93
Figure 4.11. Shana’s strategy transfer from the relation between rectangles’ sides and areas
The interviewer pointed out that although BE was shorter than CF, CE was longer
than BF, implying each triangle had a shorter side and a longer side, different from the
situation she reasoned with. Shana acknowledged this comment and kept referring to how
CF tilted more than BF which led to the result that triangle CFO was smaller than triangle
BEO. Since her Artificial Association Complex reasoning was challenged, she resorted
back to the Heap - Non-measurement reasoning instead of modifying or building on her
current work.
Sensing that Shana may have been stuck, the interviewer suggested that she may
look at the outer areas that she had mentioned before. The interviewer drew two instances
of the targeted triangles, shaded the outer areas Shana had looked at and marked dots on
the other pair of outer areas (Figure 4.12), reminding Shana that she had missed a pair of
triangles in her previous reasoning. The goal of this prompt was to test how Shana might
compare the two pairs of outer areas instead of just one.
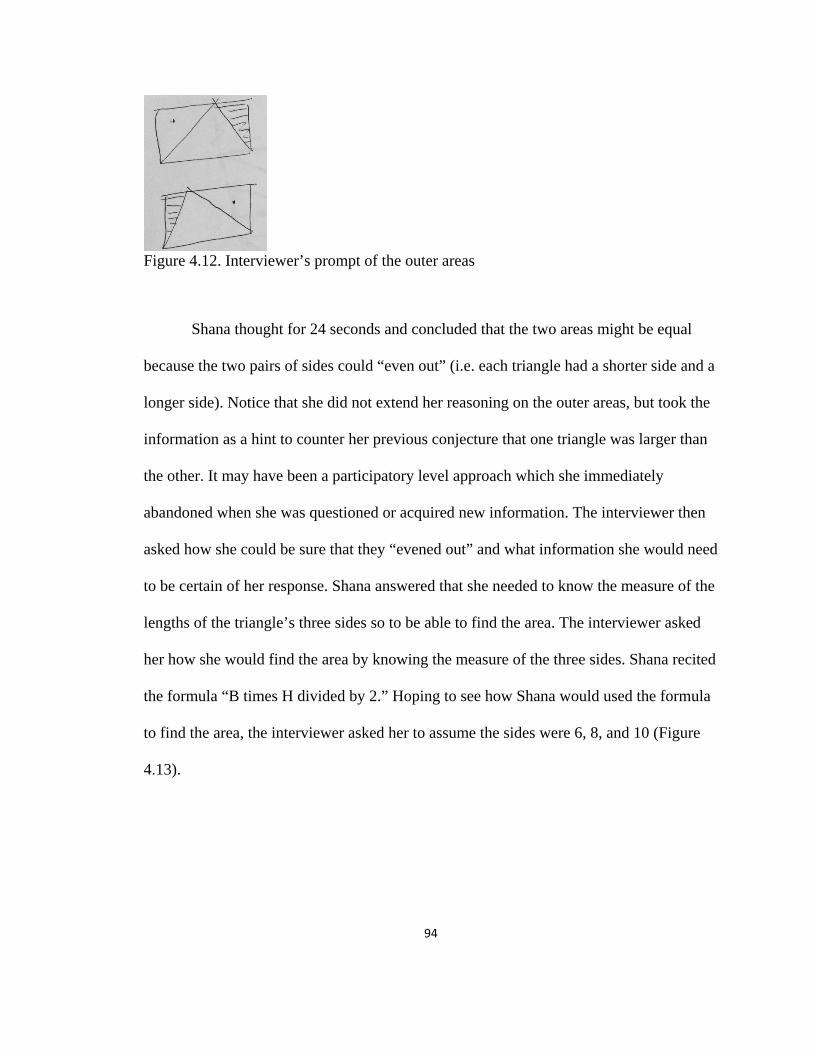
94
Figure 4.12. Interviewer’s prompt of the outer areas
Shana thought for 24 seconds and concluded that the two areas might be equal
because the two pairs of sides could “even out” (i.e. each triangle had a shorter side and a
longer side). Notice that she did not extend her reasoning on the outer areas, but took the
information as a hint to counter her previous conjecture that one triangle was larger than
the other. It may have been a participatory level approach which she immediately
abandoned when she was questioned or acquired new information. The interviewer then
asked how she could be sure that they “evened out” and what information she would need
to be certain of her response. Shana answered that she needed to know the measure of the
lengths of the triangle’s three sides so to be able to find the area. The interviewer asked
her how she would find the area by knowing the measure of the three sides. Shana recited
the formula “B times H divided by 2.” Hoping to see how Shana would used the formula
to find the area, the interviewer asked her to assume the sides were 6, 8, and 10 (Figure
4.13).
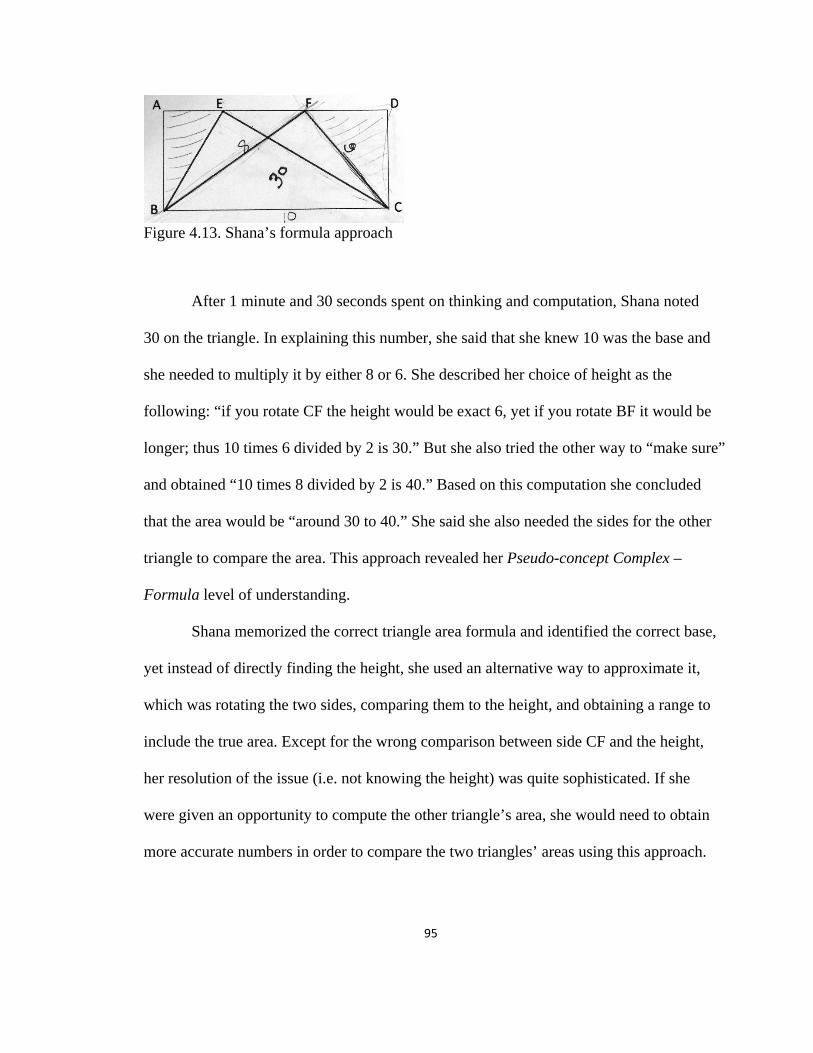
95
Figure 4.13. Shana’s formula approach
After 1 minute and 30 seconds spent on thinking and computation, Shana noted
30 on the triangle. In explaining this number, she said that she knew 10 was the base and
she needed to multiply it by either 8 or 6. She described her choice of height as the
following: “if you rotate CF the height would be exact 6, yet if you rotate BF it would be
longer; thus 10 times 6 divided by 2 is 30.” But she also tried the other way to “make sure”
and obtained “10 times 8 divided by 2 is 40.” Based on this computation she concluded
that the area would be “around 30 to 40.” She said she also needed the sides for the other
triangle to compare the area. This approach revealed her Pseudo-concept Complex –
Formula level of understanding.
Shana memorized the correct triangle area formula and identified the correct base,
yet instead of directly finding the height, she used an alternative way to approximate it,
which was rotating the two sides, comparing them to the height, and obtaining a range to
include the true area. Except for the wrong comparison between side CF and the height,
her resolution of the issue (i.e. not knowing the height) was quite sophisticated. If she
were given an opportunity to compute the other triangle’s area, she would need to obtain
more accurate numbers in order to compare the two triangles’ areas using this approach.
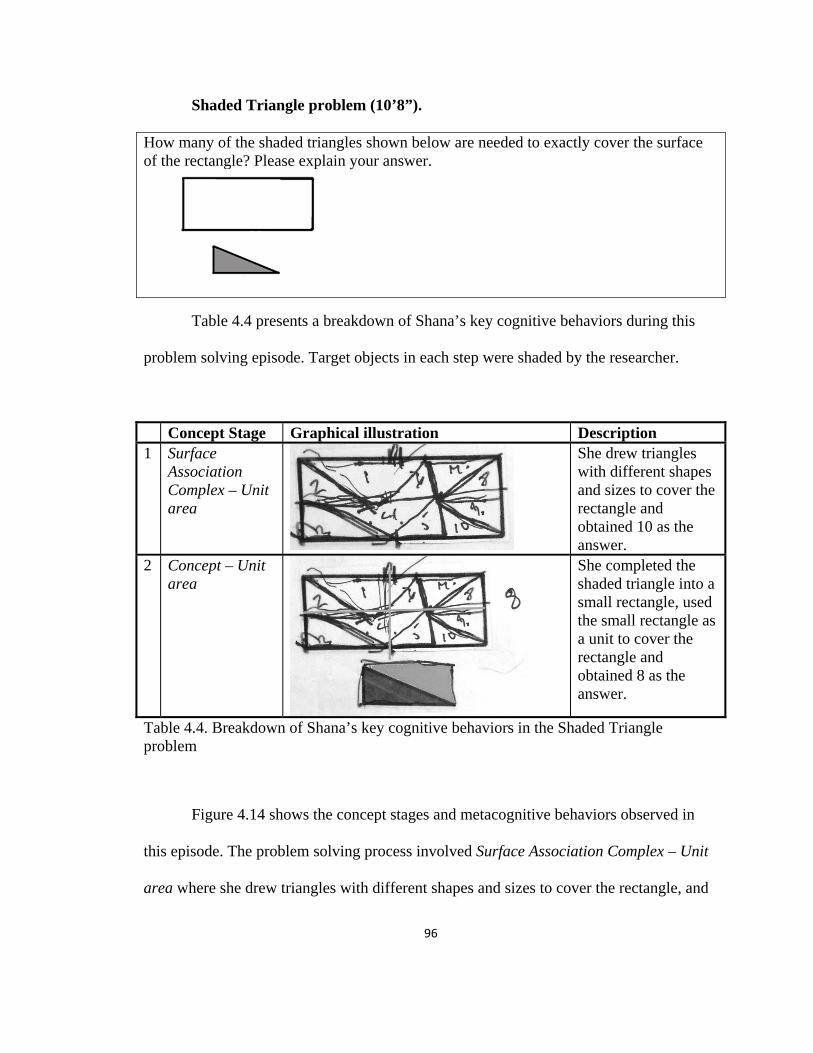
96
Shaded Triangle problem (10’8”).
How many of the shaded triangles shown below are needed to exactly cover the surface of the rectangle? Please explain your answer.
Table 4.4 presents a breakdown of Shana’s key cognitive behaviors during this
problem solving episode. Target objects in each step were shaded by the researcher.
Concept Stage Graphical illustration Description 1 Surface
Association Complex – Unit area
She drew triangles with different shapes and sizes to cover the rectangle and obtained 10 as the answer.
2 Concept – Unit area
She completed the shaded triangle into a small rectangle, used the small rectangle as a unit to cover the rectangle and obtained 8 as the answer.
Table 4.4. Breakdown of Shana’s key cognitive behaviors in the Shaded Triangle problem
Figure 4.14 shows the concept stages and metacognitive behaviors observed in
this episode. The problem solving process involved Surface Association Complex – Unit
area where she drew triangles with different shapes and sizes to cover the rectangle, and

97
Concept – Unit area where she used a small rectangle as the unit area to correctly cover
the rectangle. Revealed types of metacognitive behaviors included intra-person
monitoring and control (1.1.1.1.a), monitoring and control of strategies (1.1.1.3), and
regulation of strategy applicability, regulation and transfer (1.1.2.3).
Figure 4.14. Shana’s concept stages and metacognitive behaviors in the Shaded Triangle problem
Shana read the problem and thought for 16 seconds, announced that she would
draw triangles in the rectangle. She spent 4 minutes and 42 seconds completing the
drawing and concluded the answer as “10ish.” While drawing, she paused at the point as
shown in Figure 4.15(a), and produced two images on the side (Figure 4.15(b)). She
seemed to have difficulty visualizing the shape of the triangle at the upper left corner
within the rectangle.
0 10 20 30 40
Surface Association Complex UA
Concept UA
silence
1.1.1.1.a
1.1.1.3
1.1.2.3

98
(a)
(b) Figure 4.15. Shana’s attempt to visualizing a specific triangle
Shana began using measurement after she finished the drawing. She first
measured the height of the shaded triangle with the tip of her pen, then measured the
width of the rectangle. She measured the width twice, indicating that it was twice as long
as the triangle’s height. Then she tried to measure the length of the rectangle’s length in
the same way, but stopped measuring after moving the pen twice. She may have used the
height of the triangle as a unit of measure, and determined how many times the unit
would go into the width and length of the rectangle. This strategy would work well on the
width yet was not helpful on the length, which was possibly why Shana stopped after
measuring twice.
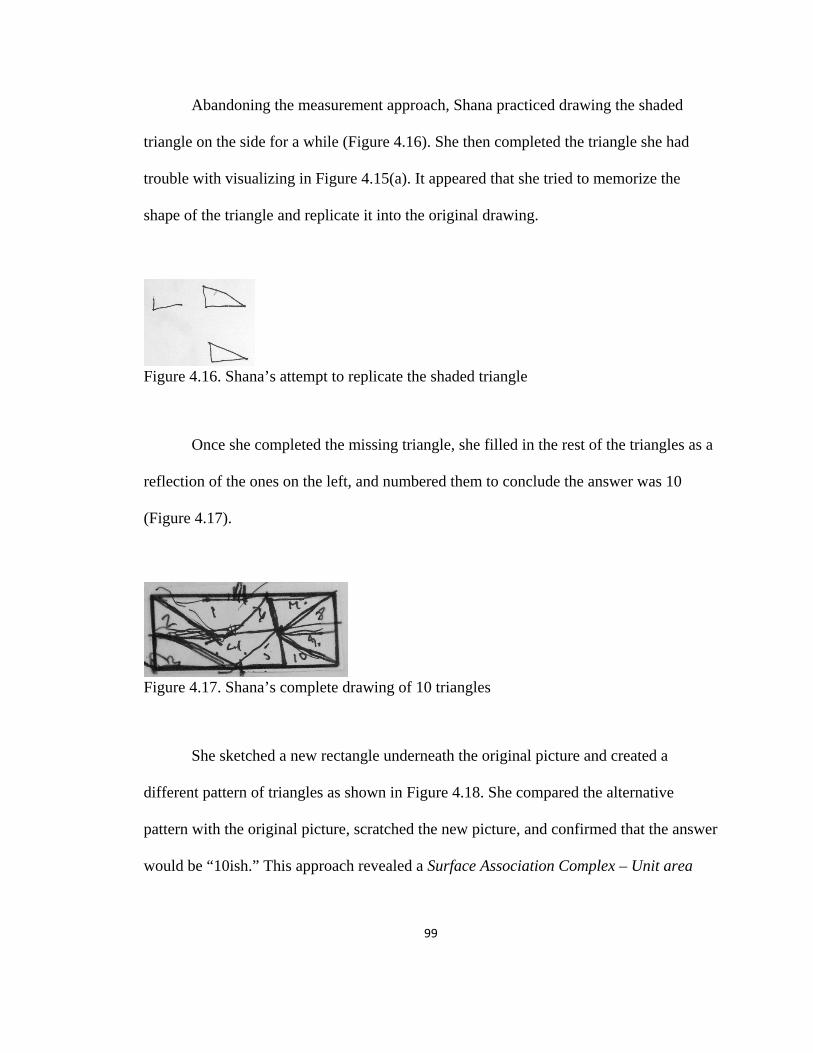
99
Abandoning the measurement approach, Shana practiced drawing the shaded
triangle on the side for a while (Figure 4.16). She then completed the triangle she had
trouble with visualizing in Figure 4.15(a). It appeared that she tried to memorize the
shape of the triangle and replicate it into the original drawing.
Figure 4.16. Shana’s attempt to replicate the shaded triangle
Once she completed the missing triangle, she filled in the rest of the triangles as a
reflection of the ones on the left, and numbered them to conclude the answer was 10
(Figure 4.17).
Figure 4.17. Shana’s complete drawing of 10 triangles
She sketched a new rectangle underneath the original picture and created a
different pattern of triangles as shown in Figure 4.18. She compared the alternative
pattern with the original picture, scratched the new picture, and confirmed that the answer
would be “10ish.” This approach revealed a Surface Association Complex – Unit area
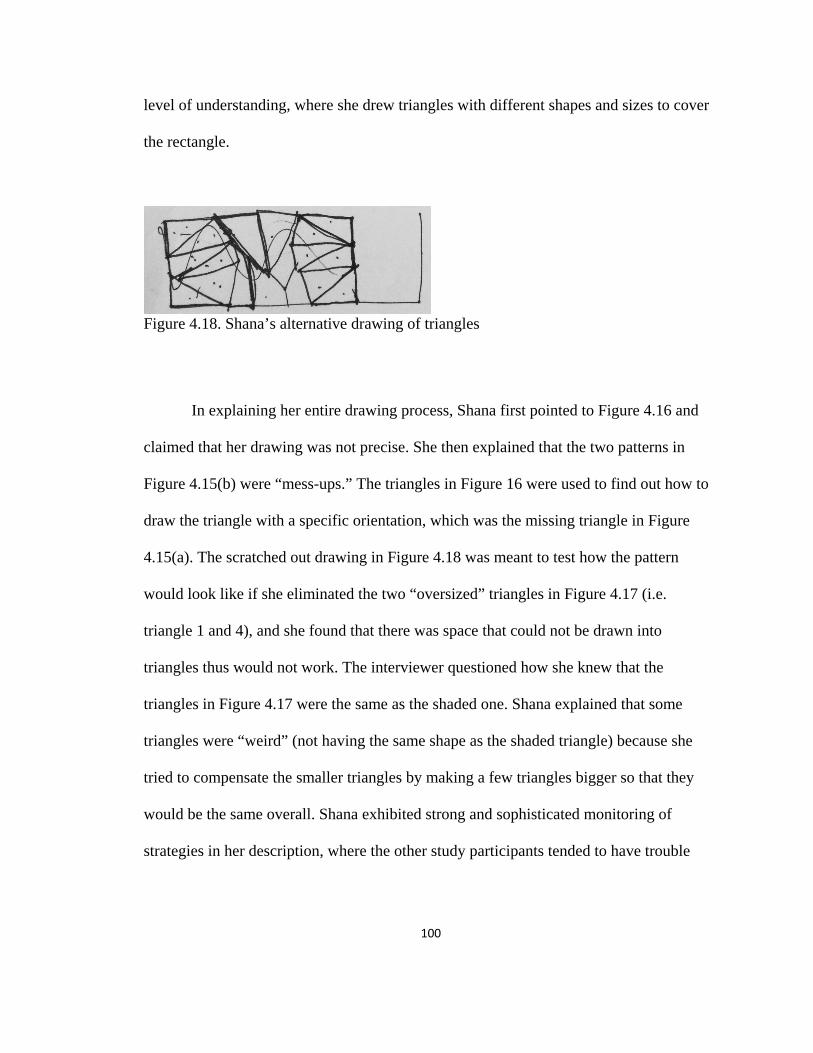
100
level of understanding, where she drew triangles with different shapes and sizes to cover
the rectangle.
Figure 4.18. Shana’s alternative drawing of triangles
In explaining her entire drawing process, Shana first pointed to Figure 4.16 and
claimed that her drawing was not precise. She then explained that the two patterns in
Figure 4.15(b) were “mess-ups.” The triangles in Figure 16 were used to find out how to
draw the triangle with a specific orientation, which was the missing triangle in Figure
4.15(a). The scratched out drawing in Figure 4.18 was meant to test how the pattern
would look like if she eliminated the two “oversized” triangles in Figure 4.17 (i.e.
triangle 1 and 4), and she found that there was space that could not be drawn into
triangles thus would not work. The interviewer questioned how she knew that the
triangles in Figure 4.17 were the same as the shaded one. Shana explained that some
triangles were “weird” (not having the same shape as the shaded triangle) because she
tried to compensate the smaller triangles by making a few triangles bigger so that they
would be the same overall. Shana exhibited strong and sophisticated monitoring of
strategies in her description, where the other study participants tended to have trouble

101
with explaining their actions after they had finished solving the task (retrospective
reports).
Shana was asked to use a different way to solve the problem. She thought for 23
seconds and said two shaded triangles could make up a small rectangle. She measured the
small rectangle’s length and used it as a unit to measure the rectangle’s top side, drawing
a vertical line in the middle (Figure 4.19). She further sketched the small rectangle at the
top-left corner of the rectangle and counted four triangles on its left half. Then she
repeated the process and counted eight triangles in total, concluding that the answer was
8.
Figure 4.19. Shana’s second approach
The interviewer pointed out to Shana that her current answer was different from
the previous one. explained that the second approach was “realer” (the rectangle provided
more “real size” than the “big and small” triangles she had drawn in Figure 4.17) thus it
was closer to the answer. She was sure that she had measured it right the second time and
the answer should be correct. This approach revealed her Concept – Unit area level of
102
understanding where she used a small rectangle as the unit area to correctly cover the
rectangle.
When assessing the validity of the two approaches, Shana chose the one that was
more similar to the original picture. Given the same type of metacognitive behaviors, the
level of her operations on units of triangles and units of rectangles determined her success.
Her shift of stages in this episode was indeed a shift from Complex level understanding
of units of triangle to Concept level understanding of units of rectangle.
Estimate Region problem (5’39”).
Estimate the area of the region shown below.
Table 4.5 presents a breakdown of Shana’s key cognitive behaviors during this
problem solving episode. Target objects in each step were shaded by the researcher.
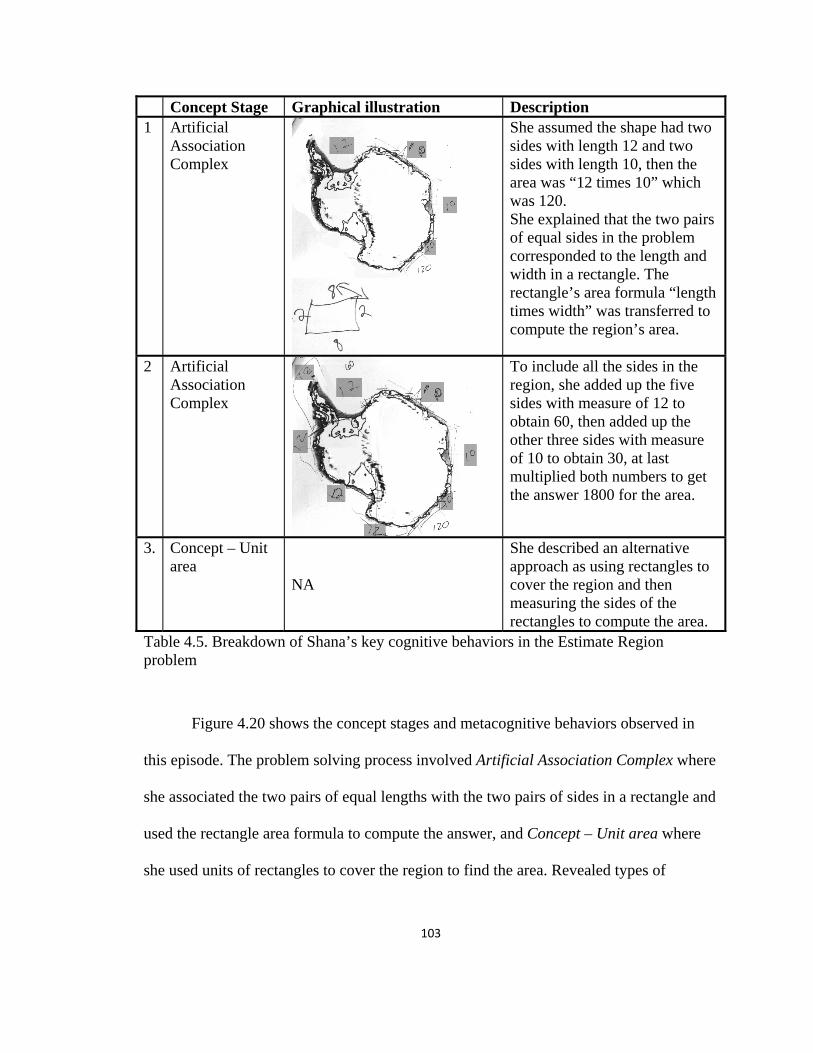
103
Concept Stage Graphical illustration Description 1 Artificial
Association Complex
She assumed the shape had two sides with length 12 and two sides with length 10, then the area was “12 times 10” which was 120. She explained that the two pairs of equal sides in the problem corresponded to the length and width in a rectangle. The rectangle’s area formula “length times width” was transferred to compute the region’s area.
2 Artificial Association Complex
To include all the sides in the region, she added up the five sides with measure of 12 to obtain 60, then added up the other three sides with measure of 10 to obtain 30, at last multiplied both numbers to get the answer 1800 for the area.
3. Concept – Unit area
NA
She described an alternative approach as using rectangles to cover the region and then measuring the sides of the rectangles to compute the area.
Table 4.5. Breakdown of Shana’s key cognitive behaviors in the Estimate Region problem
Figure 4.20 shows the concept stages and metacognitive behaviors observed in
this episode. The problem solving process involved Artificial Association Complex where
she associated the two pairs of equal lengths with the two pairs of sides in a rectangle and
used the rectangle area formula to compute the answer, and Concept – Unit area where
she used units of rectangles to cover the region to find the area. Revealed types of
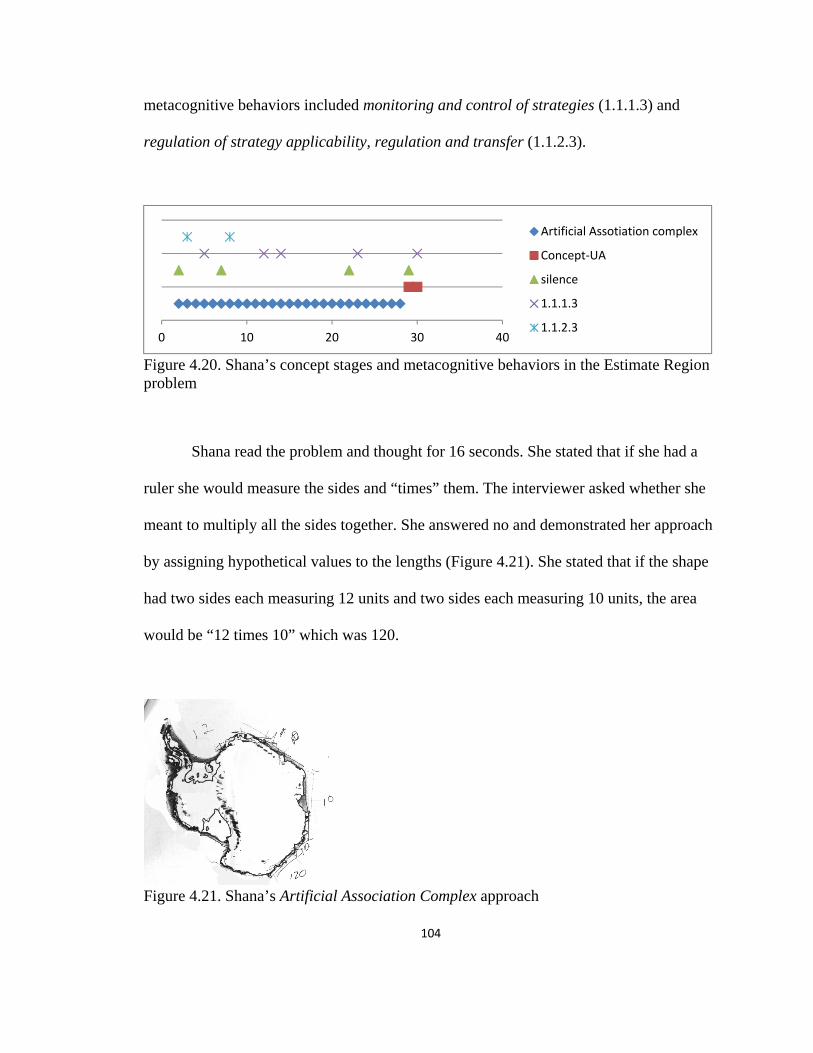
104
metacognitive behaviors included monitoring and control of strategies (1.1.1.3) and
regulation of strategy applicability, regulation and transfer (1.1.2.3).
Figure 4.20. Shana’s concept stages and metacognitive behaviors in the Estimate Region problem
Shana read the problem and thought for 16 seconds. She stated that if she had a
ruler she would measure the sides and “times” them. The interviewer asked whether she
meant to multiply all the sides together. She answered no and demonstrated her approach
by assigning hypothetical values to the lengths (Figure 4.21). She stated that if the shape
had two sides each measuring 12 units and two sides each measuring 10 units, the area
would be “12 times 10” which was 120.
Figure 4.21. Shana’s Artificial Association Complex approach
0 10 20 30 40
Artificial Assotiation complex
Concept-UA
silence
1.1.1.3
1.1.2.3
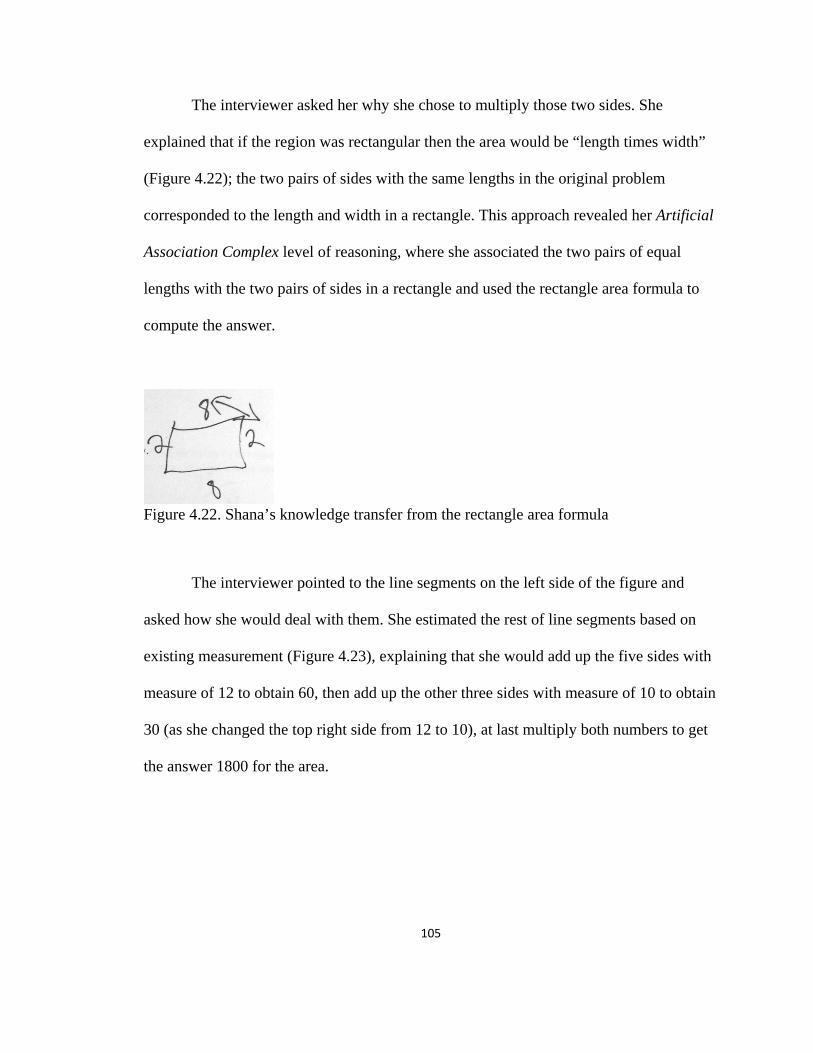
105
The interviewer asked her why she chose to multiply those two sides. She
explained that if the region was rectangular then the area would be “length times width”
(Figure 4.22); the two pairs of sides with the same lengths in the original problem
corresponded to the length and width in a rectangle. This approach revealed her Artificial
Association Complex level of reasoning, where she associated the two pairs of equal
lengths with the two pairs of sides in a rectangle and used the rectangle area formula to
compute the answer.
Figure 4.22. Shana’s knowledge transfer from the rectangle area formula
The interviewer pointed to the line segments on the left side of the figure and
asked how she would deal with them. She estimated the rest of line segments based on
existing measurement (Figure 4.23), explaining that she would add up the five sides with
measure of 12 to obtain 60, then add up the other three sides with measure of 10 to obtain
30 (as she changed the top right side from 12 to 10), at last multiply both numbers to get
the answer 1800 for the area.
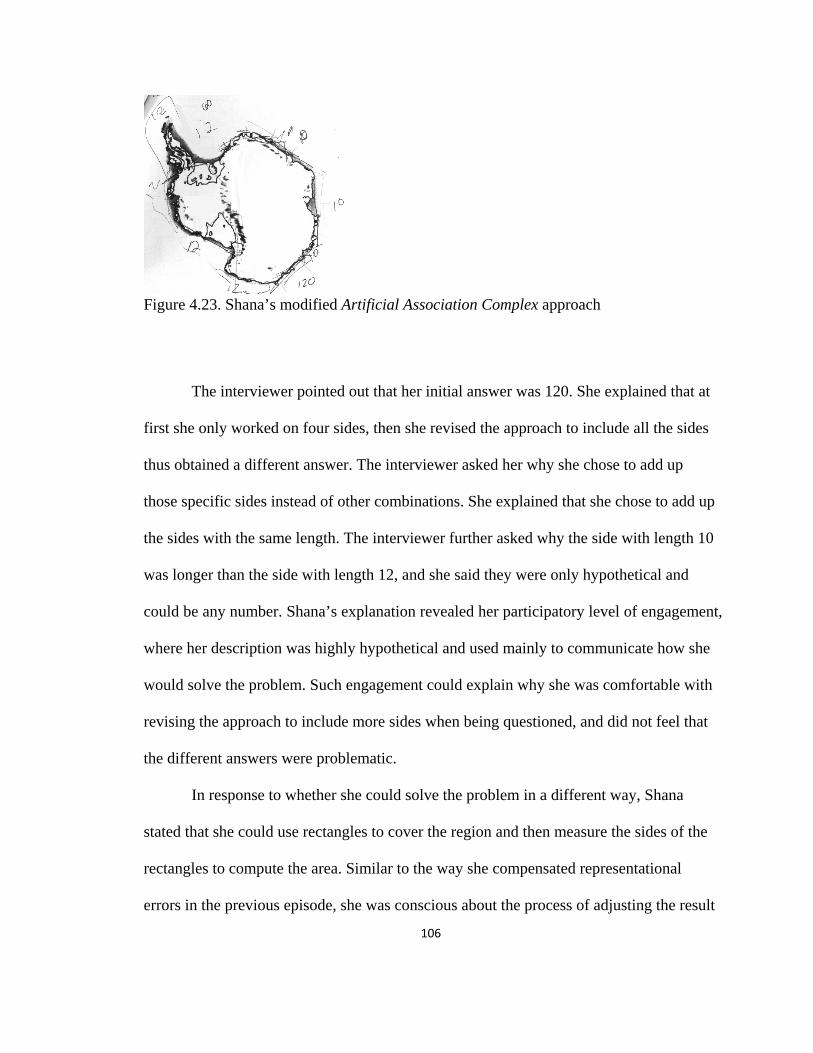
106
Figure 4.23. Shana’s modified Artificial Association Complex approach
The interviewer pointed out that her initial answer was 120. She explained that at
first she only worked on four sides, then she revised the approach to include all the sides
thus obtained a different answer. The interviewer asked her why she chose to add up
those specific sides instead of other combinations. She explained that she chose to add up
the sides with the same length. The interviewer further asked why the side with length 10
was longer than the side with length 12, and she said they were only hypothetical and
could be any number. Shana’s explanation revealed her participatory level of engagement,
where her description was highly hypothetical and used mainly to communicate how she
would solve the problem. Such engagement could explain why she was comfortable with
revising the approach to include more sides when being questioned, and did not feel that
the different answers were problematic.
In response to whether she could solve the problem in a different way, Shana
stated that she could use rectangles to cover the region and then measure the sides of the
rectangles to compute the area. Similar to the way she compensated representational
errors in the previous episode, she was conscious about the process of adjusting the result
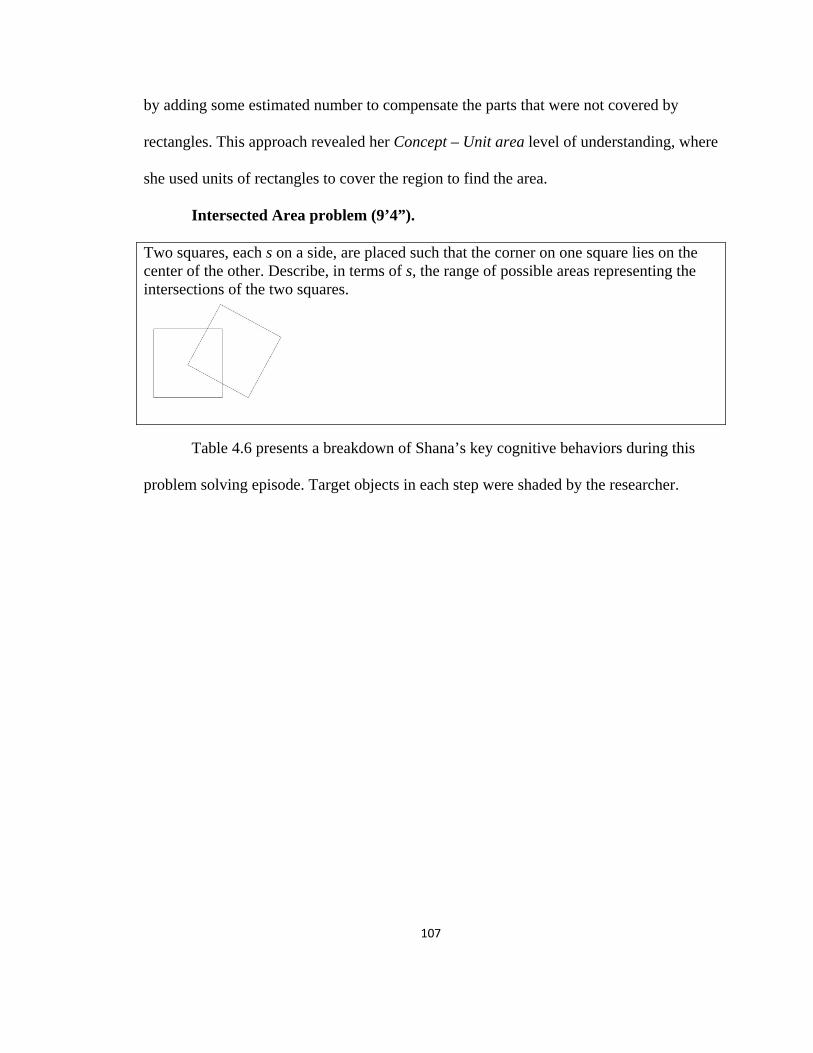
107
by adding some estimated number to compensate the parts that were not covered by
rectangles. This approach revealed her Concept – Unit area level of understanding, where
she used units of rectangles to cover the region to find the area.
Intersected Area problem (9’4”).
Two squares, each s on a side, are placed such that the corner on one square lies on the center of the other. Describe, in terms of s, the range of possible areas representing the intersections of the two squares.
Table 4.6 presents a breakdown of Shana’s key cognitive behaviors during this
problem solving episode. Target objects in each step were shaded by the researcher.

108
Concept Stage Graphical illustration Description 1 Potential
Concept – Formula Pseudo-concept Complex – Non-measurement
She assumed the square’s side was 8, then its area was 64. She estimated the intersected area based on its relation with the quarter square. Since the intersected area had an extra piece of area as well as a piece of area missing from the quarter square, the range of was between 32 and 16.
2 Pseudo-concept Complex – Non-measurement
She drew a special case and observed that the intersected area was exactly one fourth.
3. Pseudo-concept Complex – Non-measurement
She claimed that as the square moving around the center, the area remained one fourth. Yet she was not sure, thus chose a safer answer as “between one half and one fourth.”
Table 4.6. Breakdown of Shana’s key cognitive behaviors in the Intersected Area problem
Figure 4.24 shows the concept stages and metacognitive behaviors observed in
this episode. The problem solving process involved a combination of Potential Concept –
Formula with the rectangle area formula and Pseudo-concept Complex – Non-
measurement where she informally compared a quarter square with the intersected area.
Revealed types of metacognitive behaviors included intra-person monitoring and control
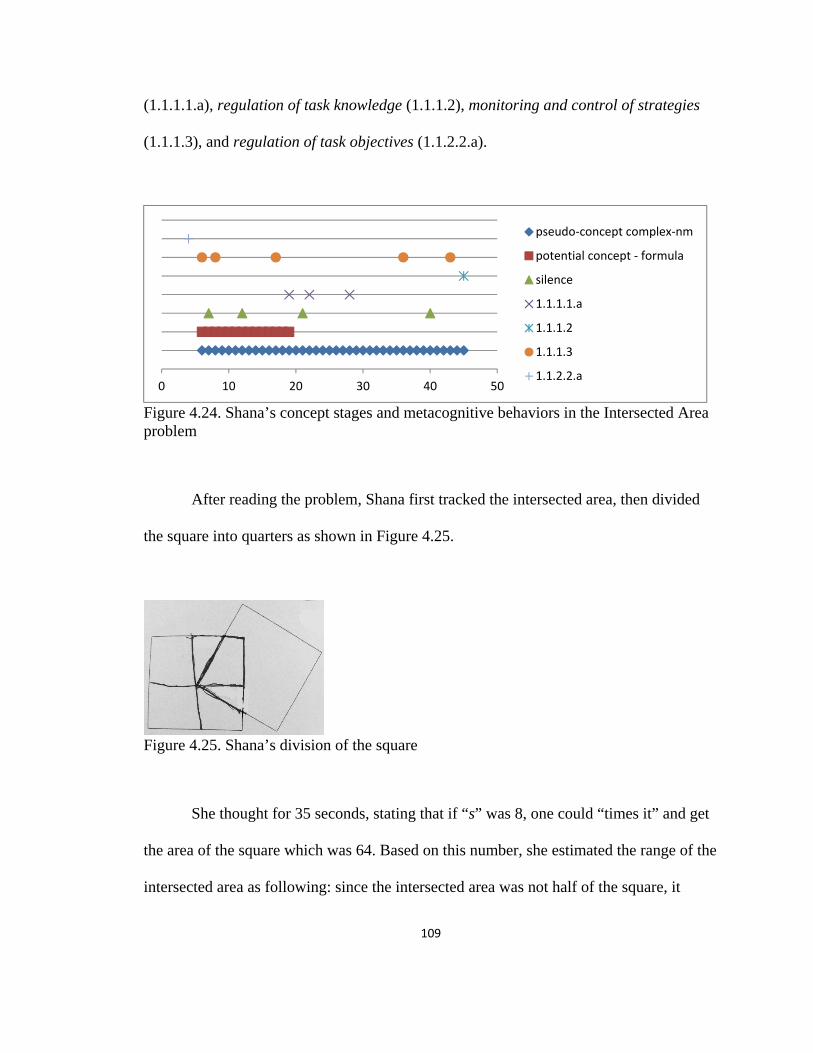
109
(1.1.1.1.a), regulation of task knowledge (1.1.1.2), monitoring and control of strategies
(1.1.1.3), and regulation of task objectives (1.1.2.2.a).
Figure 4.24. Shana’s concept stages and metacognitive behaviors in the Intersected Area problem
After reading the problem, Shana first tracked the intersected area, then divided
the square into quarters as shown in Figure 4.25.
Figure 4.25. Shana’s division of the square
She thought for 35 seconds, stating that if “s” was 8, one could “times it” and get
the area of the square which was 64. Based on this number, she estimated the range of the
intersected area as following: since the intersected area was not half of the square, it
0 10 20 30 40 50
pseudo-concept complex-nm
potential concept - formula
silence
1.1.1.1.a
1.1.1.2
1.1.1.3
1.1.2.2.a

110
should be less than 32; the intersected area did not take up a whole quarter square, yet
comparing to the quarter square, the intersected area had an extra piece of area as well as
a piece of area missing from it; thus the intersected area would “actually be one fourth.”
She commented that since she was not sure whether it was exactly one fourth, she
concluded the range of area as “between 32 and 16.” This approach revealed a
combination of Potential Concept – Formula level of reasoning with the rectangle area
formula and Pseudo-concept Complex – Non-measurement level of reasoning where she
informally compared a quarter square with the intersected area. The advanced
measurement reasoning enabled her to specialize the case and make sense of the problem,
while the less-advanced non-measurement reasoning allowed her to reach the conclusion
of “close to one fourth.”
The interviewer asked Shana to draw a situation that was different from the given
one. She thought for a second and drew Figure 4.26, explaining that this was a situation
where the intersection was exactly one fourth.
Figure 4.26. Shana’s specialization of simpler case
The interviewer asked her whether the area would become larger if the position of
the square changed. She answered that “I’m pretty sure it will be the same, because from
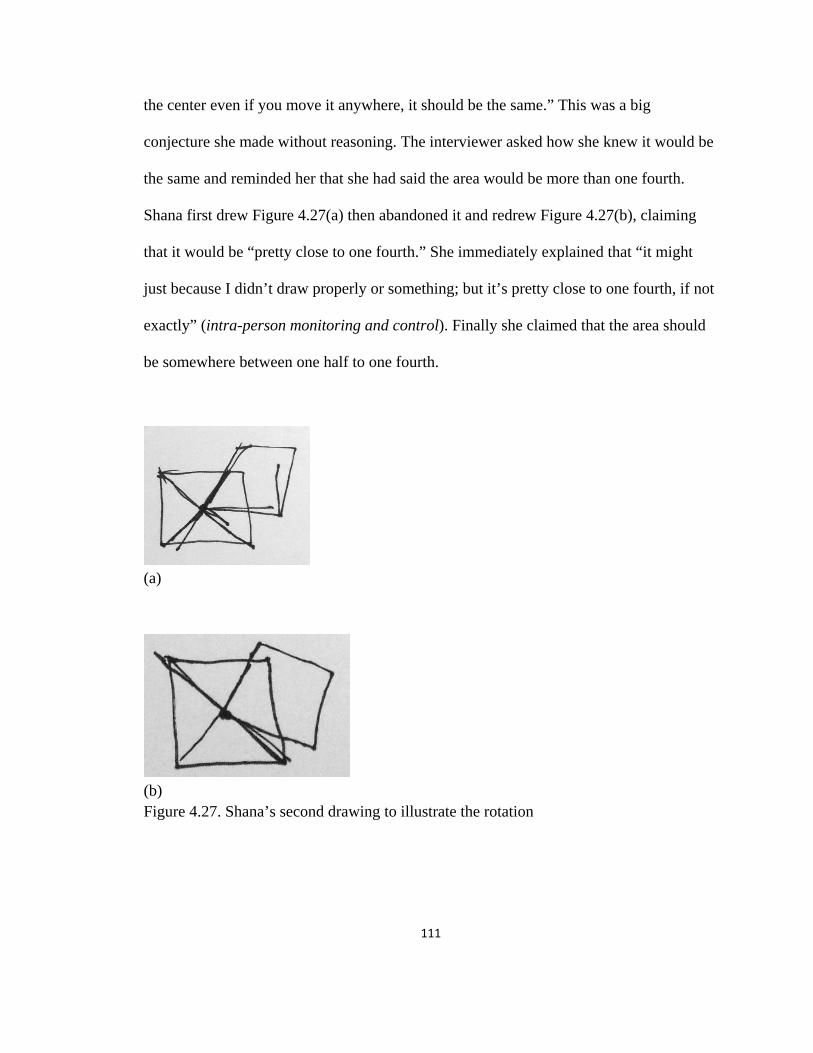
111
the center even if you move it anywhere, it should be the same.” This was a big
conjecture she made without reasoning. The interviewer asked how she knew it would be
the same and reminded her that she had said the area would be more than one fourth.
Shana first drew Figure 4.27(a) then abandoned it and redrew Figure 4.27(b), claiming
that it would be “pretty close to one fourth.” She immediately explained that “it might
just because I didn’t draw properly or something; but it’s pretty close to one fourth, if not
exactly” (intra-person monitoring and control). Finally she claimed that the area should
be somewhere between one half to one fourth.
(a)
(b) Figure 4.27. Shana’s second drawing to illustrate the rotation
112
The interviewer pointed out the two conjectures that Shana had produced then: 1)
the area would be between a half and a fourth and 2) the area would always be one fourth.
Shana explained that she wasn’t sure whether she drew it correctly, thus she chose the
first conjecture as the answer in order to “be sure.” She only had a “feeling” that it would
be one fourth but she was not sure.
At this point, the interviewer decided to ask Shana to elaborate on her statement
“from the center even if you move it anywhere, it should be the same.” In response,
Shana restated that she was not sure because she couldn’t draw perfectly, but “it should
be close to one fourth of the actual area.” Being pushed to provide a reason for that
conjecture, Shana mumbled for 10 seconds and finally said “I don’t know how to say it.”
Realizing 7that she may not be able to communicate the idea, the interviewer offered her
assessment of Shana’s thinking.
“Would you say that if you move it around the center, you have some extra area
here (pointing to the triangle at the bottom of the intersection), and you will
always lose the same area on the other side (pointing to the triangle to the left of
the intersection)?” (Intersected Area Problem, 8’23”)
Shana immediately acknowledged the reasoning about the compensation of areas
under rotation. She further claimed that the two triangles were “almost” the same. The
interviewer asked her how she could determine whether the two triangles were indeed the
same or “almost” the same. Shana rephrased the question as “whether the intersection
would be exactly one fourth,” stating that she was not sure. She specified that if the
position was the same as the one in Figure 22 then she was sure the area was one fourth;
yet if it was “tilted,” then she was not sure. Despite of the reasoning about “moving the
113
square around the center,” Shana chose the conjecture of “between one half and one
fourth” as the answer since she was not sure whether it was exactly one fourth and she
was allowed to choose a “range.”
Shana abandoned the measurement reasoning after she became familiar with the
problem and continued using the non-measurement reasoning, yet the latter prevented her
from finding a precise relationship between the intersected area and the square. Even
after the interviewer provided her with the language to describe the movement around the
center, she stayed at the same stage and was not able to reach a more precise answer.
Some of the study participants could rely on measurement reasoning to discover
the relationship between the two triangles (congruent). For Shana, who appeared to only
have a Pseudo-concept Complex level understanding of triangle formula (revealed in
Problem 2), this path may not be an option for her. A Concept level non-measurement
reasoning would require a more rigorous drawing so that the congruency could be
possibly discovered by a systematical comparison. Since Shana was fully aware of her
inaccurate drawing, she discarded her feeling about “exactly one fourth” and chose a
safer answer under her current stage of reasoning.
Although Shana’s reasoning and answers were not influenced by her inaccurate
drawing in Problems 1 and 3, the inaccurate drawing served as a major rationale for her
choice of answer in this episode. A likely reason for this difference is that she was
visualizing rectangles in Problems 1 and 3, while in Problem 5 she was comparing
triangles. The intra-person monitoring and control was only revealed when she was
deciding conclusions on a non-concept level of understanding (triangle in this case).
D. Overall Analysis
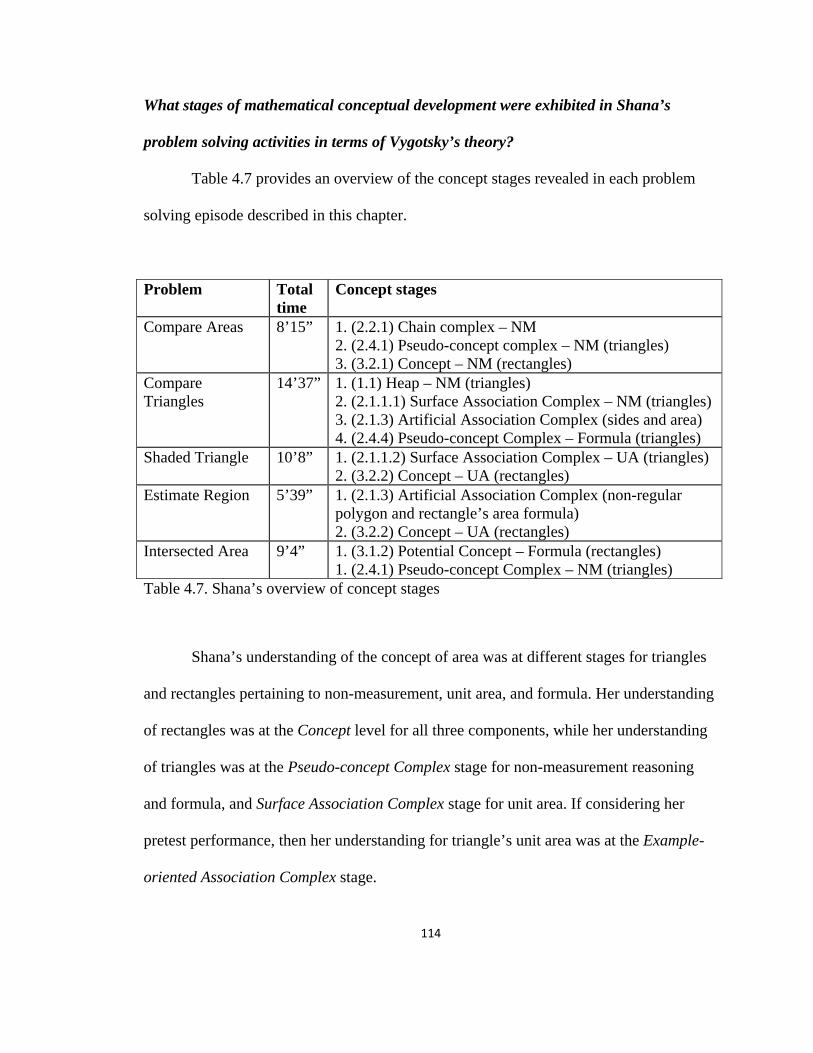
114
What stages of mathematical conceptual development were exhibited in Shana’s
problem solving activities in terms of Vygotsky’s theory?
Table 4.7 provides an overview of the concept stages revealed in each problem
solving episode described in this chapter.
Problem Total time
Concept stages
Compare Areas 8’15” 1. (2.2.1) Chain complex – NM 2. (2.4.1) Pseudo-concept complex – NM (triangles) 3. (3.2.1) Concept – NM (rectangles)
Compare Triangles
14’37” 1. (1.1) Heap – NM (triangles) 2. (2.1.1.1) Surface Association Complex – NM (triangles) 3. (2.1.3) Artificial Association Complex (sides and area) 4. (2.4.4) Pseudo-concept Complex – Formula (triangles)
Shaded Triangle 10’8” 1. (2.1.1.2) Surface Association Complex – UA (triangles) 2. (3.2.2) Concept – UA (rectangles)
Estimate Region 5’39” 1. (2.1.3) Artificial Association Complex (non-regular polygon and rectangle’s area formula) 2. (3.2.2) Concept – UA (rectangles)
Intersected Area 9’4” 1. (3.1.2) Potential Concept – Formula (rectangles) 1. (2.4.1) Pseudo-concept Complex – NM (triangles)
Table 4.7. Shana’s overview of concept stages
Shana’s understanding of the concept of area was at different stages for triangles
and rectangles pertaining to non-measurement, unit area, and formula. Her understanding
of rectangles was at the Concept level for all three components, while her understanding
of triangles was at the Pseudo-concept Complex stage for non-measurement reasoning
and formula, and Surface Association Complex stage for unit area. If considering her
pretest performance, then her understanding for triangle’s unit area was at the Example-
oriented Association Complex stage.
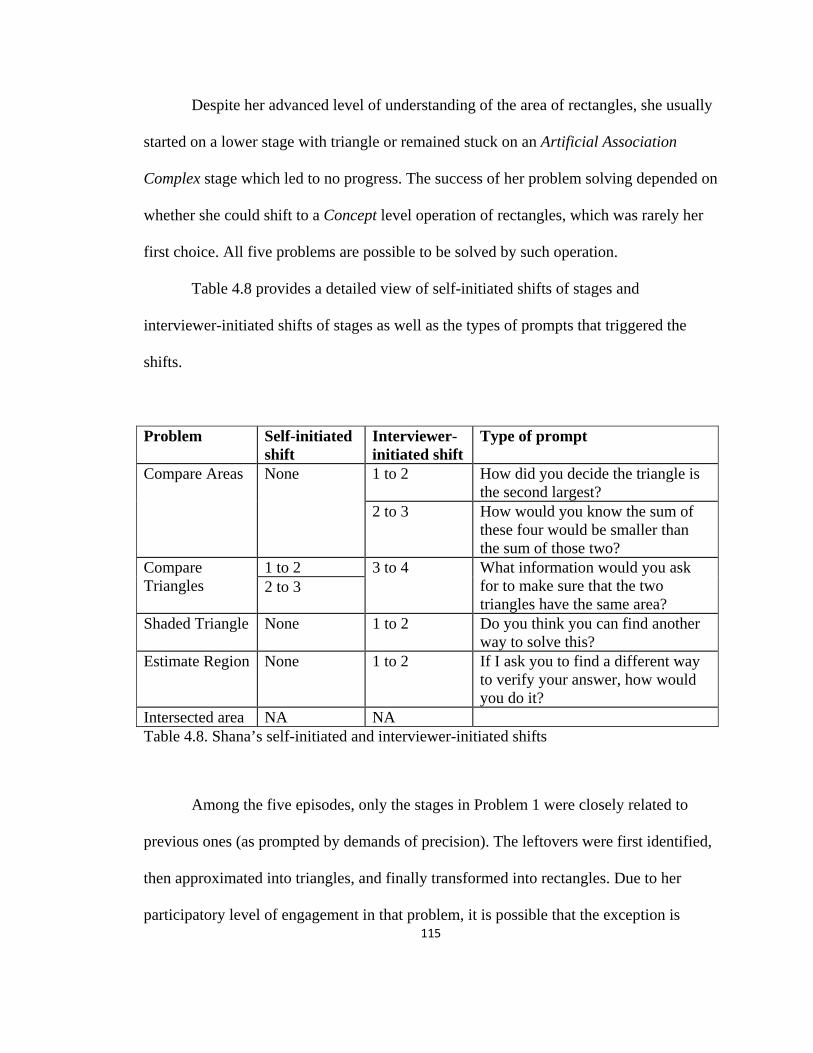
115
Despite her advanced level of understanding of the area of rectangles, she usually
started on a lower stage with triangle or remained stuck on an Artificial Association
Complex stage which led to no progress. The success of her problem solving depended on
whether she could shift to a Concept level operation of rectangles, which was rarely her
first choice. All five problems are possible to be solved by such operation.
Table 4.8 provides a detailed view of self-initiated shifts of stages and
interviewer-initiated shifts of stages as well as the types of prompts that triggered the
shifts.
Problem Self-initiated shift
Interviewer-initiated shift
Type of prompt
Compare Areas None 1 to 2 How did you decide the triangle is the second largest?
2 to 3 How would you know the sum of these four would be smaller than the sum of those two?
Compare Triangles
1 to 2 3 to 4 What information would you ask for to make sure that the two triangles have the same area?
2 to 3
Shaded Triangle None 1 to 2 Do you think you can find another way to solve this?
Estimate Region None 1 to 2 If I ask you to find a different way to verify your answer, how would you do it?
Intersected area NA NA Table 4.8. Shana’s self-initiated and interviewer-initiated shifts
Among the five episodes, only the stages in Problem 1 were closely related to
previous ones (as prompted by demands of precision). The leftovers were first identified,
then approximated into triangles, and finally transformed into rectangles. Due to her
participatory level of engagement in that problem, it is possible that the exception is
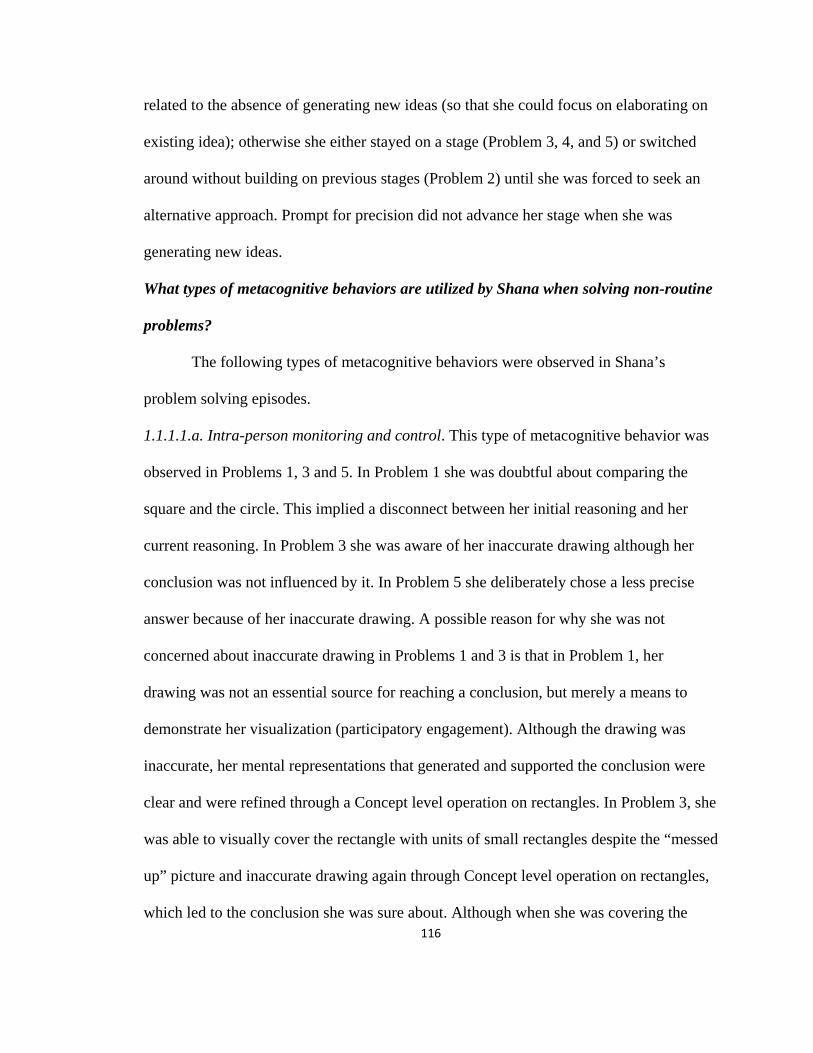
116
related to the absence of generating new ideas (so that she could focus on elaborating on
existing idea); otherwise she either stayed on a stage (Problem 3, 4, and 5) or switched
around without building on previous stages (Problem 2) until she was forced to seek an
alternative approach. Prompt for precision did not advance her stage when she was
generating new ideas.
What types of metacognitive behaviors are utilized by Shana when solving non-routine
problems?
The following types of metacognitive behaviors were observed in Shana’s
problem solving episodes.
1.1.1.1.a. Intra-person monitoring and control. This type of metacognitive behavior was
observed in Problems 1, 3 and 5. In Problem 1 she was doubtful about comparing the
square and the circle. This implied a disconnect between her initial reasoning and her
current reasoning. In Problem 3 she was aware of her inaccurate drawing although her
conclusion was not influenced by it. In Problem 5 she deliberately chose a less precise
answer because of her inaccurate drawing. A possible reason for why she was not
concerned about inaccurate drawing in Problems 1 and 3 is that in Problem 1, her
drawing was not an essential source for reaching a conclusion, but merely a means to
demonstrate her visualization (participatory engagement). Although the drawing was
inaccurate, her mental representations that generated and supported the conclusion were
clear and were refined through a Concept level operation on rectangles. In Problem 3, she
was able to visually cover the rectangle with units of small rectangles despite the “messed
up” picture and inaccurate drawing again through Concept level operation on rectangles,
which led to the conclusion she was sure about. Although when she was covering the
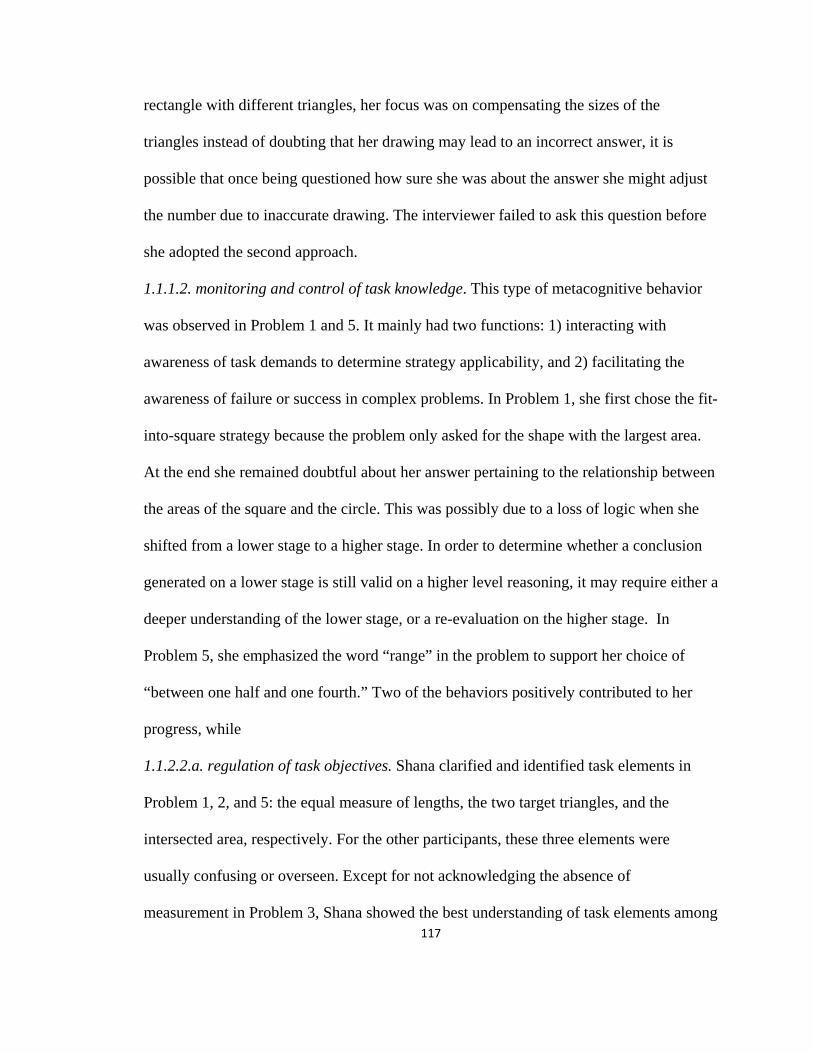
117
rectangle with different triangles, her focus was on compensating the sizes of the
triangles instead of doubting that her drawing may lead to an incorrect answer, it is
possible that once being questioned how sure she was about the answer she might adjust
the number due to inaccurate drawing. The interviewer failed to ask this question before
she adopted the second approach.
1.1.1.2. monitoring and control of task knowledge. This type of metacognitive behavior
was observed in Problem 1 and 5. It mainly had two functions: 1) interacting with
awareness of task demands to determine strategy applicability, and 2) facilitating the
awareness of failure or success in complex problems. In Problem 1, she first chose the fit-
into-square strategy because the problem only asked for the shape with the largest area.
At the end she remained doubtful about her answer pertaining to the relationship between
the areas of the square and the circle. This was possibly due to a loss of logic when she
shifted from a lower stage to a higher stage. In order to determine whether a conclusion
generated on a lower stage is still valid on a higher level reasoning, it may require either a
deeper understanding of the lower stage, or a re-evaluation on the higher stage. In
Problem 5, she emphasized the word “range” in the problem to support her choice of
“between one half and one fourth.” Two of the behaviors positively contributed to her
progress, while
1.1.2.2.a. regulation of task objectives. Shana clarified and identified task elements in
Problem 1, 2, and 5: the equal measure of lengths, the two target triangles, and the
intersected area, respectively. For the other participants, these three elements were
usually confusing or overseen. Except for not acknowledging the absence of
measurement in Problem 3, Shana showed the best understanding of task elements among
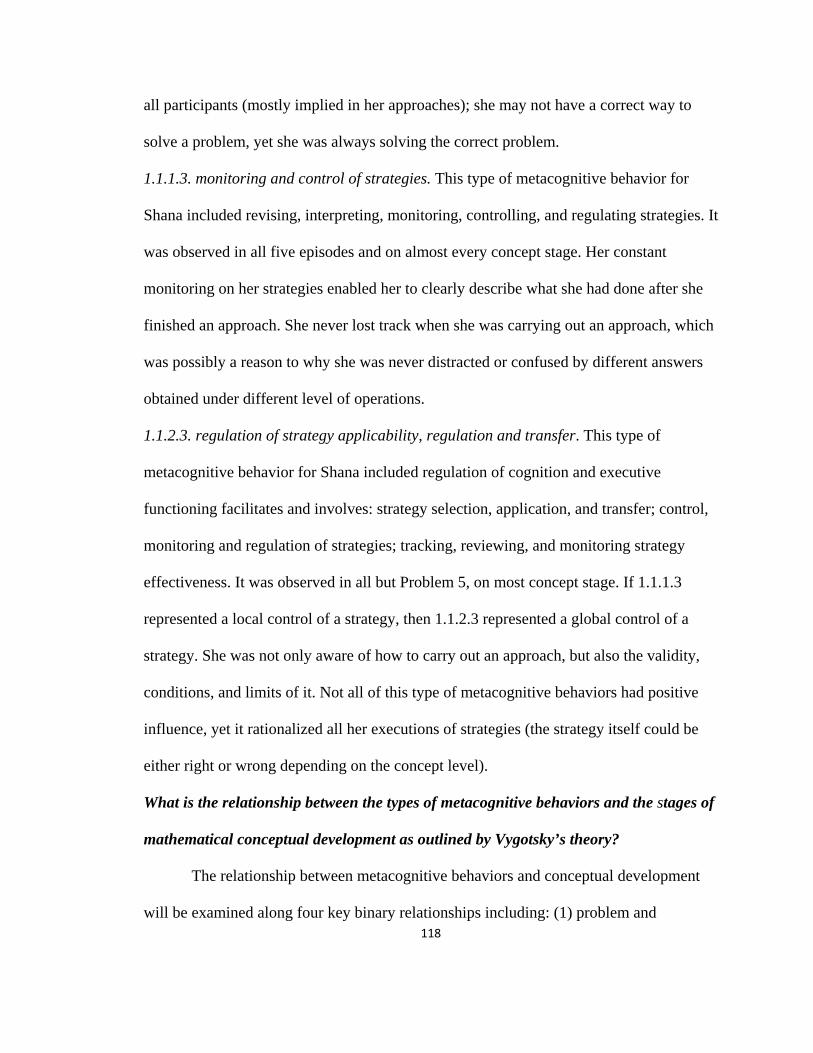
118
all participants (mostly implied in her approaches); she may not have a correct way to
solve a problem, yet she was always solving the correct problem.
1.1.1.3. monitoring and control of strategies. This type of metacognitive behavior for
Shana included revising, interpreting, monitoring, controlling, and regulating strategies. It
was observed in all five episodes and on almost every concept stage. Her constant
monitoring on her strategies enabled her to clearly describe what she had done after she
finished an approach. She never lost track when she was carrying out an approach, which
was possibly a reason to why she was never distracted or confused by different answers
obtained under different level of operations.
1.1.2.3. regulation of strategy applicability, regulation and transfer. This type of
metacognitive behavior for Shana included regulation of cognition and executive
functioning facilitates and involves: strategy selection, application, and transfer; control,
monitoring and regulation of strategies; tracking, reviewing, and monitoring strategy
effectiveness. It was observed in all but Problem 5, on most concept stage. If 1.1.1.3
represented a local control of a strategy, then 1.1.2.3 represented a global control of a
strategy. She was not only aware of how to carry out an approach, but also the validity,
conditions, and limits of it. Not all of this type of metacognitive behaviors had positive
influence, yet it rationalized all her executions of strategies (the strategy itself could be
either right or wrong depending on the concept level).
What is the relationship between the types of metacognitive behaviors and the stages of
mathematical conceptual development as outlined by Vygotsky’s theory?
The relationship between metacognitive behaviors and conceptual development
will be examined along four key binary relationships including: (1) problem and

119
metacognition, (2) participant and metacognition, (3) metacognition and effectiveness,
and (4) concept and metacognition.
Problem and metacognition.
A specific problem may tend to provoke certain types of metacognitive behaviors
for each participant. Table 4.9 illustrates the types of metacognitive behaviors along with
frequency revealed under each stage for each problem.
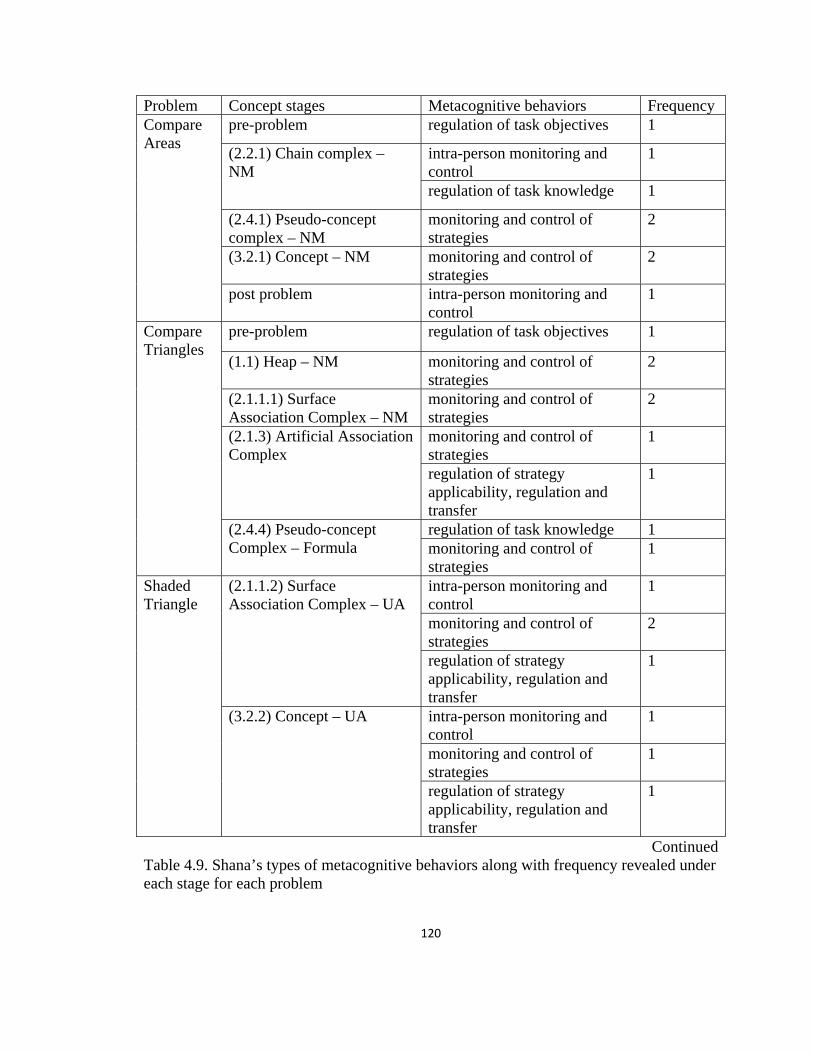
120
Problem Concept stages Metacognitive behaviors Frequency Compare Areas
pre-problem regulation of task objectives 1
(2.2.1) Chain complex – NM
intra-person monitoring and control
1
regulation of task knowledge 1
(2.4.1) Pseudo-concept complex – NM
monitoring and control of strategies
2
(3.2.1) Concept – NM monitoring and control of strategies
2
post problem intra-person monitoring and control
1
Compare Triangles
pre-problem regulation of task objectives 1
(1.1) Heap – NM monitoring and control of strategies
2
(2.1.1.1) Surface Association Complex – NM
monitoring and control of strategies
2
(2.1.3) Artificial Association Complex
monitoring and control of strategies
1
regulation of strategy applicability, regulation and transfer
1
(2.4.4) Pseudo-concept Complex – Formula
regulation of task knowledge 1 monitoring and control of strategies
1
Shaded Triangle
(2.1.1.2) Surface Association Complex – UA
intra-person monitoring and control
1
monitoring and control of strategies
2
regulation of strategy applicability, regulation and transfer
1
(3.2.2) Concept – UA intra-person monitoring and control
1
monitoring and control of strategies
1
regulation of strategy applicability, regulation and transfer
1
ContinuedTable 4.9. Shana’s types of metacognitive behaviors along with frequency revealed under each stage for each problem
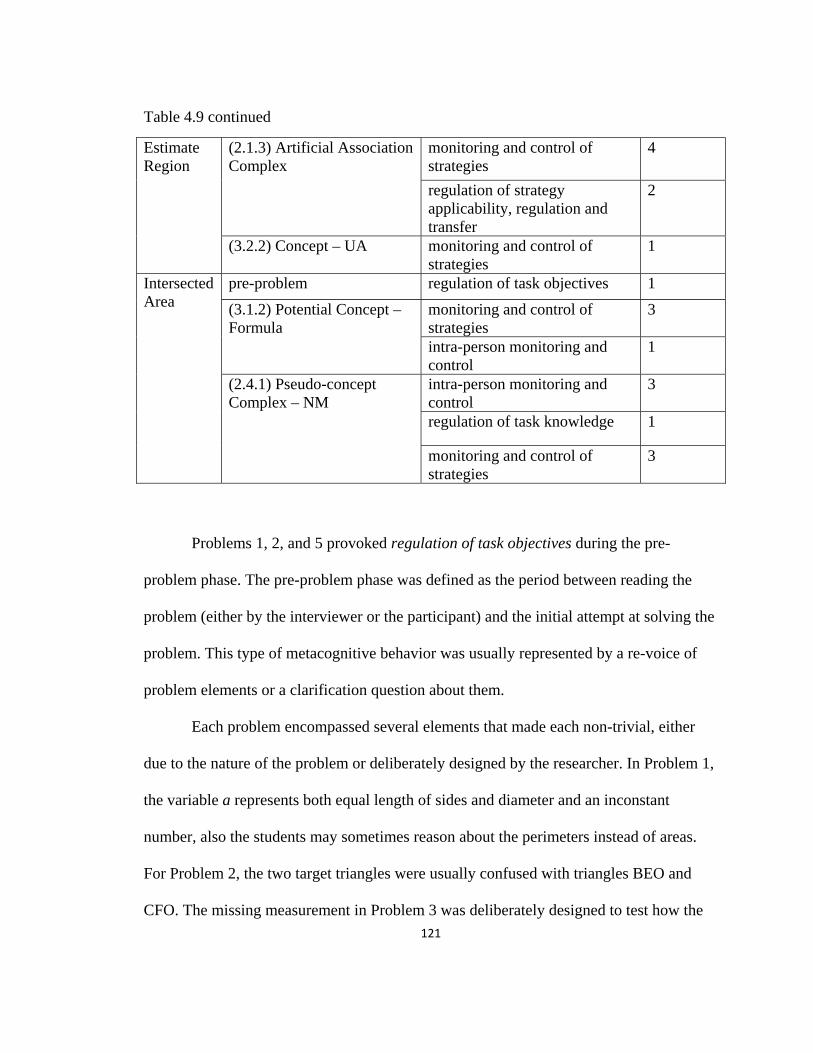
121
Table 4.9 continued
Estimate Region
(2.1.3) Artificial Association Complex
monitoring and control of strategies
4
regulation of strategy applicability, regulation and transfer
2
(3.2.2) Concept – UA monitoring and control of strategies
1
Intersected Area
pre-problem regulation of task objectives 1
(3.1.2) Potential Concept – Formula
monitoring and control of strategies
3
intra-person monitoring and control
1
(2.4.1) Pseudo-concept Complex – NM
intra-person monitoring and control
3
regulation of task knowledge 1
monitoring and control of strategies
3
Problems 1, 2, and 5 provoked regulation of task objectives during the pre-
problem phase. The pre-problem phase was defined as the period between reading the
problem (either by the interviewer or the participant) and the initial attempt at solving the
problem. This type of metacognitive behavior was usually represented by a re-voice of
problem elements or a clarification question about them.
Each problem encompassed several elements that made each non-trivial, either
due to the nature of the problem or deliberately designed by the researcher. In Problem 1,
the variable a represents both equal length of sides and diameter and an inconstant
number, also the students may sometimes reason about the perimeters instead of areas.
For Problem 2, the two target triangles were usually confused with triangles BEO and
CFO. The missing measurement in Problem 3 was deliberately designed to test how the
122
participants may solve the problem under such condition. Problem 4 did not include a
measurement either and was a real-life situation, which could provoke different
understandings and behaviors depending on the participants’ awareness of these features.
The wording of Problem 5 was the most complex one, and the range of possible areas
may seem confusing for the students before they start specializing.
Shana’s regulation of task objectives enabled her to notice many of the above
elements. A possible pattern of this type of metacognitive behavior for her is that she was
more likely to regulate the task objectives when the elements were given (Problems 1, 2,
and 5); she was not aware of missing elements that were important to solve the problems
at any stage of the problem solving process (Problems 3 and 4).
Both Problems 1 and 5 revealed the most number of types (4) of metacognitive
behaviors for Shana; Problem 2 revealed three; and Problems 3 and 4 revealed two.
Possible relationships between the number of types and frequency and each problem will
be analyzed in the cross analysis section.
Participant and metacognition.
Shana displayed much more monitoring and control of strategies and regulation
of strategy application, regulation and transfer than other types of metacognitive
behaviors. The effectiveness of these two types of behaviors depended on the concept
stages, which will be elaborated in the next section.
Her intra-person monitoring and control (awareness of her inaccurate drawing)
was conditioned under the reliance on visualization (when her conclusion was fully
deduced from her drawing). When she had a mental representation that she could operate

123
on, she was able to ignore the inaccurate drawing and deduce a correct conclusion; the
(inaccurate) drawing was merely a means to communicate with the interviewer.
As assessed in pretest, she exhibited relatively high problem solving ability (item
5) while tended to start with low level concept stages (in items 1 to 4). Such performance
corresponded with her concept level operations on unit area of rectangles and inability to
self-initiate a shift from a low level concept stage to a higher one.
Metacognition and effectiveness.
Shana’s metacognitive behaviors of monitoring and control of strategies
(monitoring of strategies for short) and regulation of strategy application, regulation and
transfer (regulation of strategy for short) were commonly observed and not associated
with any particular stages. Yet their effectiveness (e.g. whether they advanced her
thinking process) may not be the same.
There were 23 occasions of monitoring of strategies and 5 occasions of regulation
of strategy. The formal locally controlled the strategies, while the latter globally. Table
4.10 summarizes the functions and consequences of the 23 occasions of monitoring of
strategies.

124
Number of times Function Consequence 15 Interpreted a strategy Kept track of reasoning; led to a
conjecture. 2 Monitored a strategy Locally aware of the
effectiveness of a strategy 1 Controlling strategy elements Distinguished hypothetical
elements. 2 Revised an error Recognized an error and
corrected it. 1 Revised a strategy Modified a strategy based on
information provided by the interviewer.
3 Reviewed a strategy Generalized a strategy by reviewing it.
Table 4.10. Shana’s functions and consequences of monitoring of strategies
One of the occasions contained two functions, which caused the total number of
functions to be 24 instead of 23. Shana tended to work silently and explained her
approaches after she finished. The first three functions were mostly reported afterwards,
while the latter three were reported immediately. Among the 15 occasions of interpreting
a strategy, she was able to strictly carry out a strategy and generate a conjecture despite
the fact that the strategy itself may not have been correct. She was not confused while
carrying out any strategy and rarely abandoned or switched a strategy while working on it.
Due to her participatory level of engagement in several problems, the type of
effectiveness of metacognitive behaviors tended to be different from the other
participants, since the main purpose was to communicate her existing ideas instead of
advancing them. She communicated her thinking effectively, yet success in advancing
her ideas seemed to depend on whether she chose to use a Unit area approach to solve a
problem.

125
Table 4.11 summarizes the functions and consequences of the 5 occasions of
regulation of strategy.
Number of times Function Consequence 1 Strategy selection Selected a strategy associated
with a specific condition. 2 Strategy transfer Simulate a strategy from a
familiar context. 2 Monitoring strategy effectiveness Applied an alternative method
to verify the strategy validity. 1 Reviewing strategy effectiveness Reviewed different strategies
to compare the validity. Table 4.11. Shana’s functions and consequences of regulation of strategy
All functions listed above advanced her thinking process in different degree. The
first two functions rationalized the execution of a strategy, while the latter two increased
the validity of a strategy.
The local and global control of strategies collectively affected her problem
solving process, leading to the result that she tended to stick to an approach and was able
to generate a conjecture and justify it. She usually had confidence in her answers because
of her strong control over the strategies. She needed relatively simple prompts (i.e.
precision and alternative approach) to shift to a higher stage.
The other types of metacognitive behaviors, which are relatively rare, had positive
effect on her problem solving process. Overall, high effectiveness of metacognitive
behaviors enabled Shana to perform better (if not similar) than the other participants who
were assessed as having higher levels of concept development.
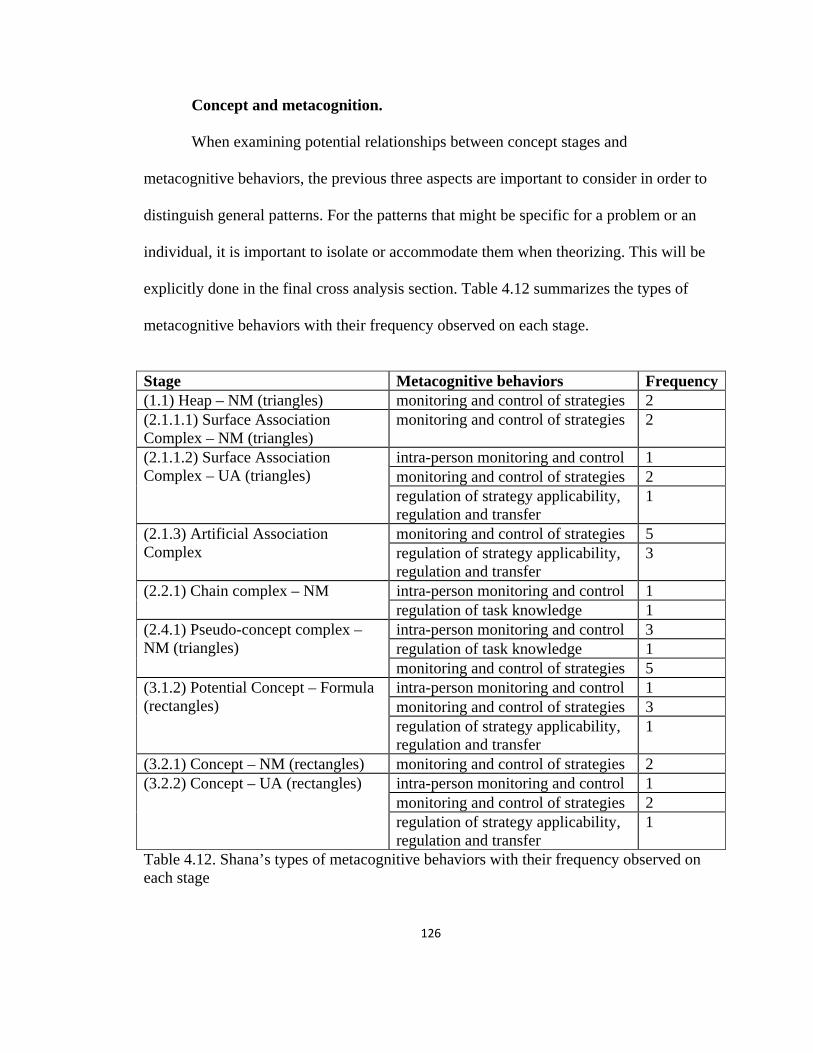
126
Concept and metacognition.
When examining potential relationships between concept stages and
metacognitive behaviors, the previous three aspects are important to consider in order to
distinguish general patterns. For the patterns that might be specific for a problem or an
individual, it is important to isolate or accommodate them when theorizing. This will be
explicitly done in the final cross analysis section. Table 4.12 summarizes the types of
metacognitive behaviors with their frequency observed on each stage.
Stage Metacognitive behaviors Frequency(1.1) Heap – NM (triangles) monitoring and control of strategies 2 (2.1.1.1) Surface Association Complex – NM (triangles)
monitoring and control of strategies 2
(2.1.1.2) Surface Association Complex – UA (triangles)
intra-person monitoring and control 1 monitoring and control of strategies 2 regulation of strategy applicability, regulation and transfer
1
(2.1.3) Artificial Association Complex
monitoring and control of strategies 5 regulation of strategy applicability, regulation and transfer
3
(2.2.1) Chain complex – NM intra-person monitoring and control 1 regulation of task knowledge 1
(2.4.1) Pseudo-concept complex – NM (triangles)
intra-person monitoring and control 3 regulation of task knowledge 1 monitoring and control of strategies 5
(3.1.2) Potential Concept – Formula (rectangles)
intra-person monitoring and control 1 monitoring and control of strategies 3 regulation of strategy applicability, regulation and transfer
1
(3.2.1) Concept – NM (rectangles) monitoring and control of strategies 2 (3.2.2) Concept – UA (rectangles) intra-person monitoring and control 1
monitoring and control of strategies 2 regulation of strategy applicability, regulation and transfer
1
Table 4.12. Shana’s types of metacognitive behaviors with their frequency observed on each stage
127
Shana’s metacognitive behaviors were sophisticated and advanced, yet they were
at times restricted by her participatory level of engagement. She was able to flexibly
resolve most issues that were either brought up by the interviewer or occurred during the
execution of an approach. Her concept development mainly determined whether the
conjecture she reached was valid (in that she could always find a way to reach a
conjecture). Although she worked better with rectangle, she chose the initial stages based
on how she understood the problem rather than what she could work with well.
Shana is an example of the types of individuals who shows relatively more
effective metacognitive behaviors with relatively low concept development. She may
neither have confidence in her problem solving ability nor perform well on tests, yet she
could always perform well on the stage she was working on and was able to move to
higher stages with certain prompts. The unbalanced frequency of each type of
metacognitive behaviors was another personal feature. It revealed how an individual
could behave if her control of strategies was more developed than the control of person
knowledge and task.
Her major challenge in the problem solving processes included: 1) low concept
stages with triangles, which neutralized her advanced monitoring ability; and 2)
participatory level of engagement, where she focused on communication instead of
advancing her ideas. Figure 4.28 illustrates the balance of effectiveness between the
metacognitive behaviors and the challenges.

128
Figure 4.28. Shana’s balance of effectiveness between the metacognitive behaviors and the challenges
The Case of Sandy
A. Sandy’s background
Sandy plans to be an artist and hoping to sell her own artwork. She believes
mathematics to be useful in every profession, “in art you need mathematics to make three
dimensional stuff.” Her favorite subjects include English and science because she loves
writing. She also expressed that she learns about new things every day in science classes.
Although she likes mathematics she does not favor it as much as science or English. Her
view of self as a mathematician is restricted; she does not consider herself as particularly
good at mathematics – she could do basic operations but not as good as she wishes to be.
She believes that in order to be good at mathematics one should be able to do things
easily and quickly “without sitting down and thinking about it forever.”
challenges metacognitive behaviors
advanced monitoring and control of strategies and regulation of
strategy
intra-person monitoring and control (control
drawing deficiency)
low concept stages (triangles)
participatory level of engagement

129
She likes word problems and multiplication and doesn’t like division with long
decimal numbers. She feels mathematics is a very useful subject to know but she doesn’t
spend a lot of time on it. She likes the topics they explore in class but hopes the teacher
could explain better since sometimes she doesn’t understand what he is teaching.
B. Sandy’s pretest result
Sandy’s pretest result was assessed as “various” overall. Table 4.13 illustrates the
stages revealed on the five pretest items. Her response to each item is presented in this
section.
Item Stage 1 2.1.1.3 Surface Association Complex – Formula 2 2.1.1.3 Surface Association Complex – Formula 3 2.1.1.2 Surface Association Complex – Unit area 4 3.1.1 Potential Concept – Unit area 5 Property of radius Table 4.13. Sandy’s overall stages in pretest
1. Which of these shapes has more area, or do they have the same amount? Explain how you reach your conclusion. If you believe there’s not enough information to answer the question, please state what information you would need and how you would use that information to answer it.
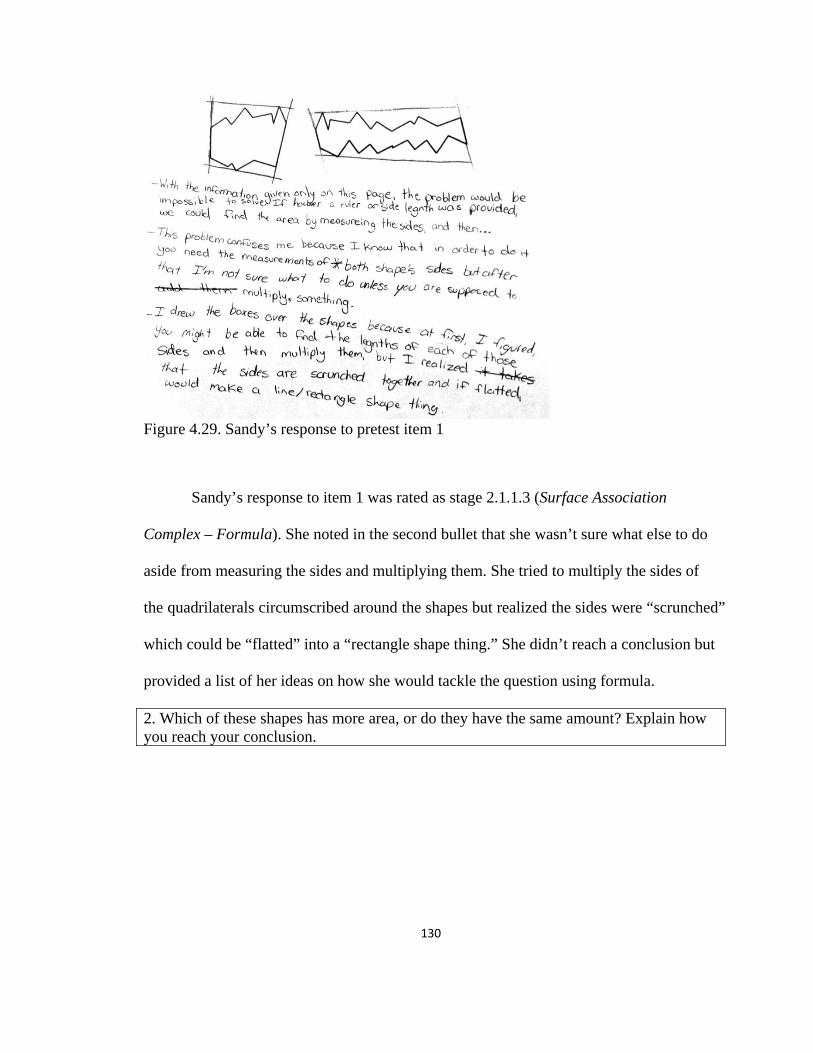
130
Figure 4.29. Sandy’s response to pretest item 1
Sandy’s response to item 1 was rated as stage 2.1.1.3 (Surface Association
Complex – Formula). She noted in the second bullet that she wasn’t sure what else to do
aside from measuring the sides and multiplying them. She tried to multiply the sides of
the quadrilaterals circumscribed around the shapes but realized the sides were “scrunched”
which could be “flatted” into a “rectangle shape thing.” She didn’t reach a conclusion but
provided a list of her ideas on how she would tackle the question using formula.
2. Which of these shapes has more area, or do they have the same amount? Explain how you reach your conclusion.
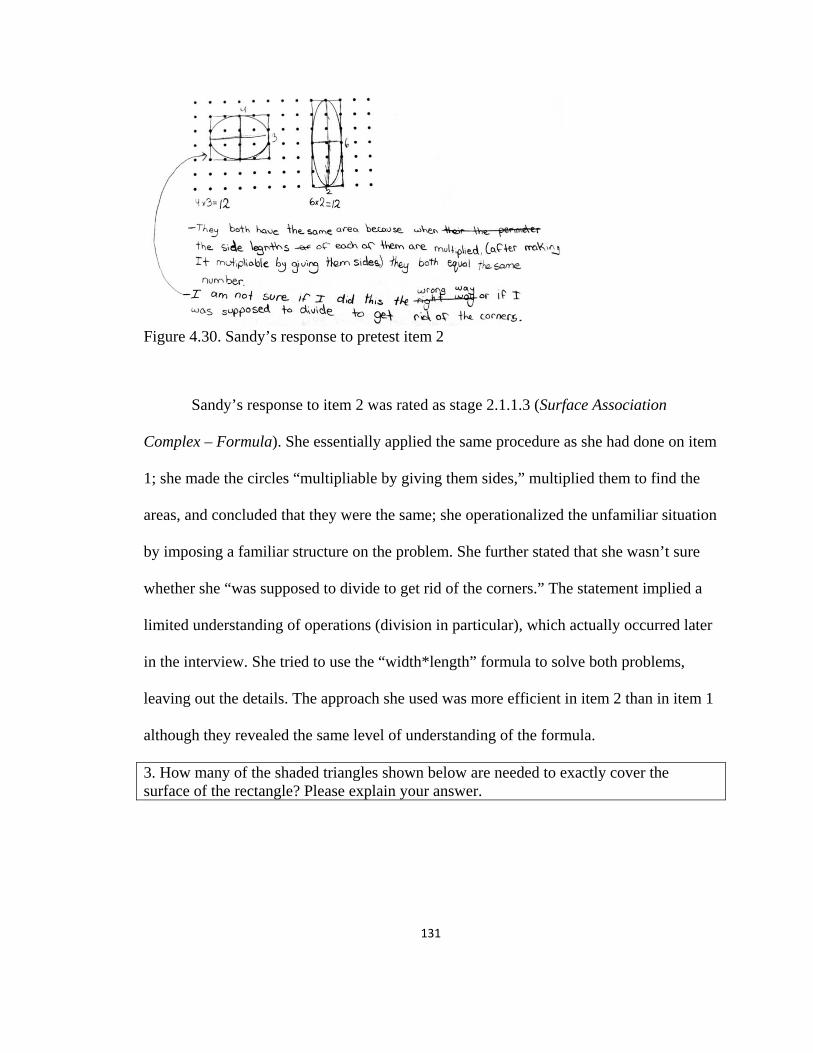
131
Figure 4.30. Sandy’s response to pretest item 2
Sandy’s response to item 2 was rated as stage 2.1.1.3 (Surface Association
Complex – Formula). She essentially applied the same procedure as she had done on item
1; she made the circles “multipliable by giving them sides,” multiplied them to find the
areas, and concluded that they were the same; she operationalized the unfamiliar situation
by imposing a familiar structure on the problem. She further stated that she wasn’t sure
whether she “was supposed to divide to get rid of the corners.” The statement implied a
limited understanding of operations (division in particular), which actually occurred later
in the interview. She tried to use the “width*length” formula to solve both problems,
leaving out the details. The approach she used was more efficient in item 2 than in item 1
although they revealed the same level of understanding of the formula.
3. How many of the shaded triangles shown below are needed to exactly cover the surface of the rectangle? Please explain your answer.
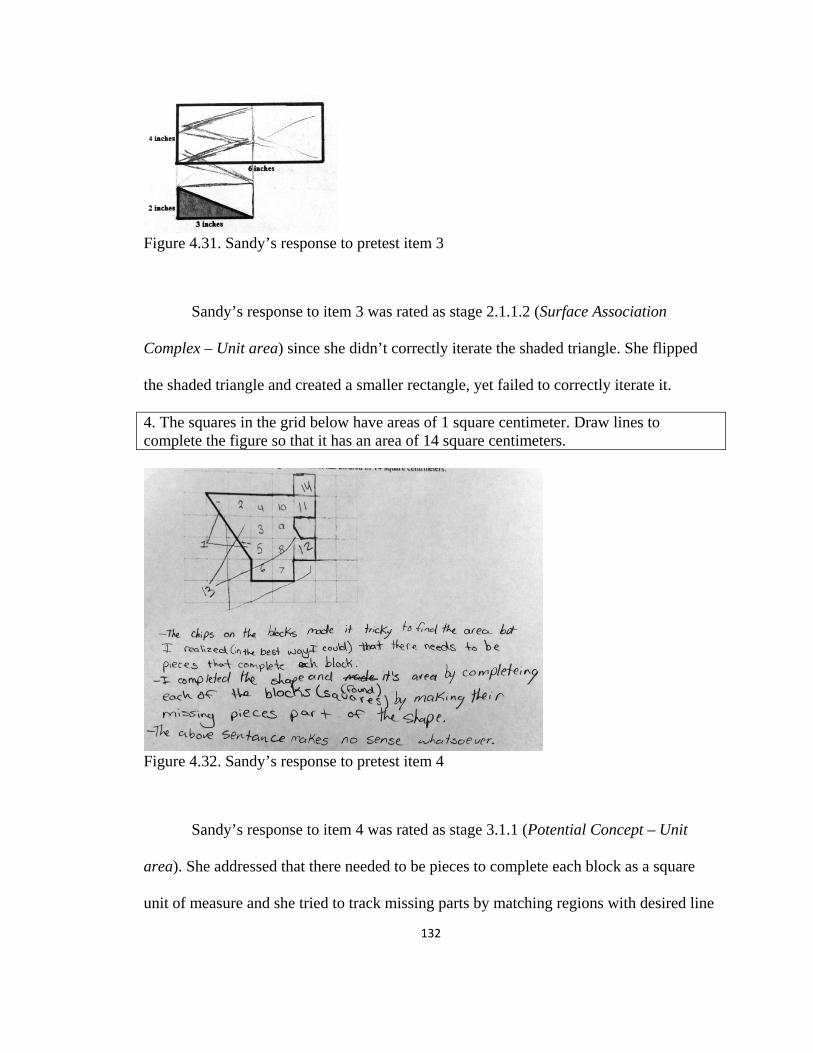
132
Figure 4.31. Sandy’s response to pretest item 3
Sandy’s response to item 3 was rated as stage 2.1.1.2 (Surface Association
Complex – Unit area) since she didn’t correctly iterate the shaded triangle. She flipped
the shaded triangle and created a smaller rectangle, yet failed to correctly iterate it.
4. The squares in the grid below have areas of 1 square centimeter. Draw lines to complete the figure so that it has an area of 14 square centimeters.
Figure 4.32. Sandy’s response to pretest item 4
Sandy’s response to item 4 was rated as stage 3.1.1 (Potential Concept – Unit
area). She addressed that there needed to be pieces to complete each block as a square
unit of measure and she tried to track missing parts by matching regions with desired line

133
segments. She clearly stated that she made missing pieces part of the shape, where one of
the pieces was miscounted. Her approach was effective despite of the mistake and her
description was quite clear, although she commented that she it didn’t make any sense to
her.
5. In the figure below, ABCD is a rectangle, and circles P and Q each have a radius of 5 cm. What is the area of the rectangle?
Figure 4.33. Sandy’s response to pretest item 5
Sandy used the radius of the inscribed circles to find the width of the rectangle
and computed the correct area. She stated that the problem was easy and explicitly
described the process she had used to obtain the width of the rectangle. Her statement
“based on the data we can safely assume that the length of DC and AB is 20 cm each” is
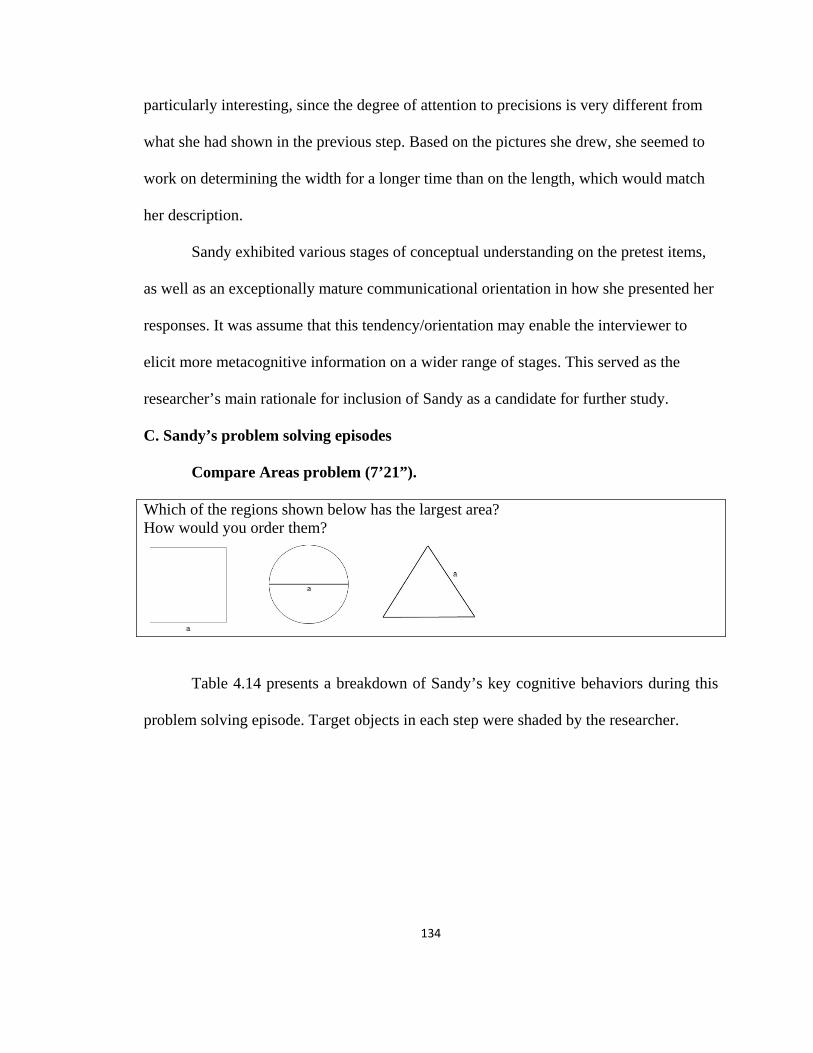
134
particularly interesting, since the degree of attention to precisions is very different from
what she had shown in the previous step. Based on the pictures she drew, she seemed to
work on determining the width for a longer time than on the length, which would match
her description.
Sandy exhibited various stages of conceptual understanding on the pretest items,
as well as an exceptionally mature communicational orientation in how she presented her
responses. It was assume that this tendency/orientation may enable the interviewer to
elicit more metacognitive information on a wider range of stages. This served as the
researcher’s main rationale for inclusion of Sandy as a candidate for further study.
C. Sandy’s problem solving episodes
Compare Areas problem (7’21”).
Which of the regions shown below has the largest area? How would you order them?
Table 4.14 presents a breakdown of Sandy’s key cognitive behaviors during this
problem solving episode. Target objects in each step were shaded by the researcher.
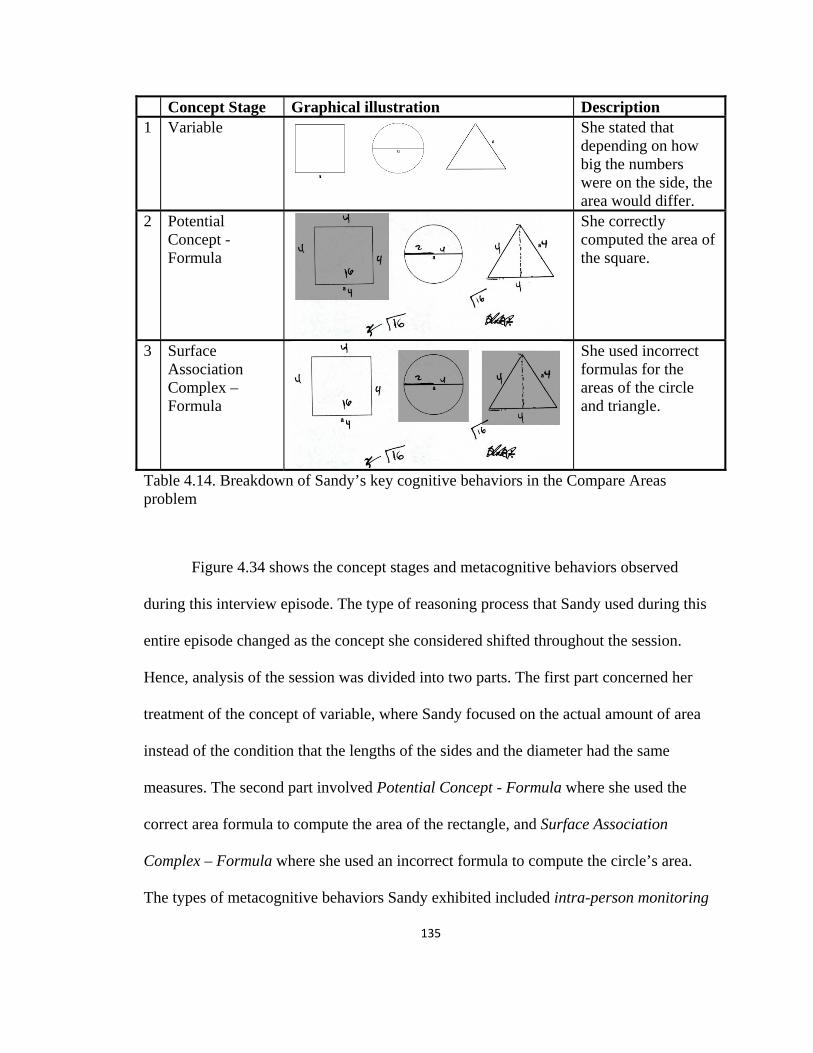
135
Concept Stage Graphical illustration Description 1 Variable
She stated that depending on how big the numbers were on the side, the area would differ.
2 Potential Concept - Formula
She correctly computed the area of the square.
3 Surface Association Complex – Formula
She used incorrect formulas for the areas of the circle and triangle.
Table 4.14. Breakdown of Sandy’s key cognitive behaviors in the Compare Areas problem
Figure 4.34 shows the concept stages and metacognitive behaviors observed
during this interview episode. The type of reasoning process that Sandy used during this
entire episode changed as the concept she considered shifted throughout the session.
Hence, analysis of the session was divided into two parts. The first part concerned her
treatment of the concept of variable, where Sandy focused on the actual amount of area
instead of the condition that the lengths of the sides and the diameter had the same
measures. The second part involved Potential Concept - Formula where she used the
correct area formula to compute the area of the rectangle, and Surface Association
Complex – Formula where she used an incorrect formula to compute the circle’s area.
The types of metacognitive behaviors Sandy exhibited included intra-person monitoring
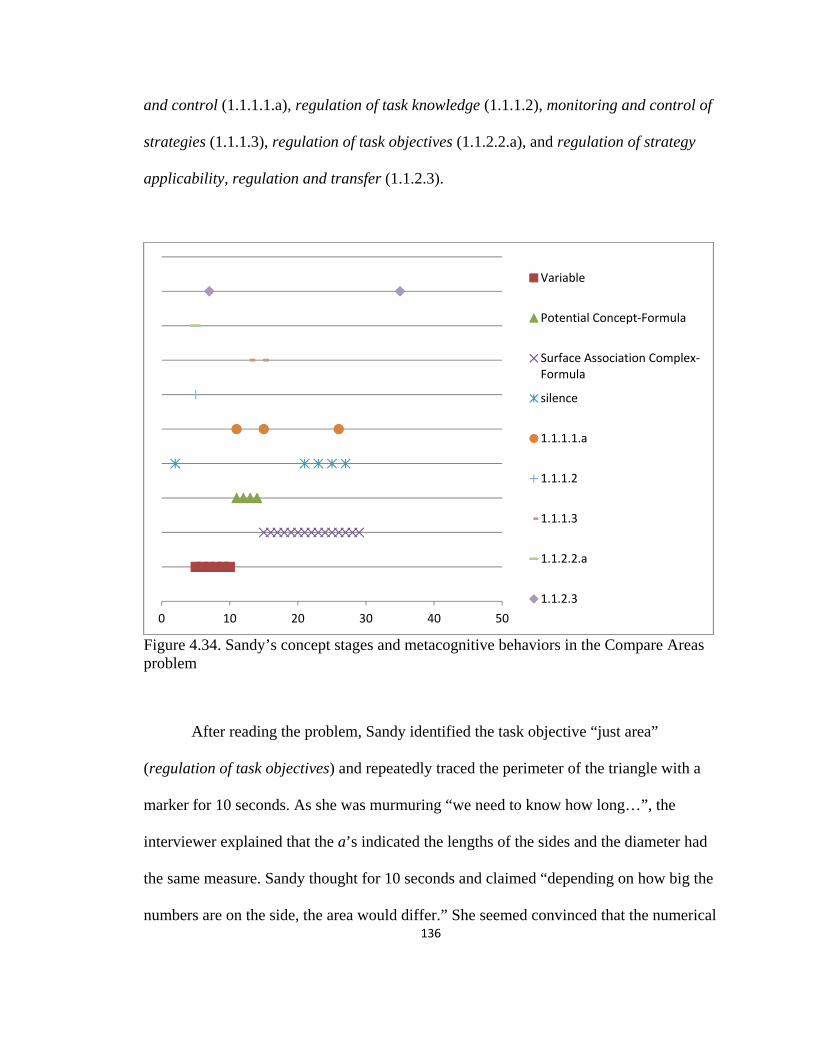
136
and control (1.1.1.1.a), regulation of task knowledge (1.1.1.2), monitoring and control of
strategies (1.1.1.3), regulation of task objectives (1.1.2.2.a), and regulation of strategy
applicability, regulation and transfer (1.1.2.3).
Figure 4.34. Sandy’s concept stages and metacognitive behaviors in the Compare Areas problem
After reading the problem, Sandy identified the task objective “just area”
(regulation of task objectives) and repeatedly traced the perimeter of the triangle with a
marker for 10 seconds. As she was murmuring “we need to know how long…”, the
interviewer explained that the a’s indicated the lengths of the sides and the diameter had
the same measure. Sandy thought for 10 seconds and claimed “depending on how big the
numbers are on the side, the area would differ.” She seemed convinced that the numerical
0 10 20 30 40 50
Variable
Potential Concept-Formula
Surface Association Complex-Formula
silence
1.1.1.1.a
1.1.1.2
1.1.1.3
1.1.2.2.a
1.1.2.3

137
value of the variable would affect the result of computation (regulation of strategy
applicability, regulation and transfer), which made her reluctant to randomly choose a
number and finally claimed she wasn’t sure how to solve the problem.
In Sandy’s initial approach to solving the problem, she focused on the actual
amount of area instead of the condition that the lengths of the sides and the diameter had
the same measure. Different from the other study participants who seemed comfortable
with picking either a number or using visual evidence as a source for forming an initial
strategy, she seemed to be stuck due to her awareness of the limitation of those strategies;
she did not have any readily accessible approaches and was too cautious to try any
technique in which she did not trust. Sandy was careful about generalizing based on
visual clues, which was revealed at the end of the episode. Her understanding of variable
greatly influenced her initial mathematical behaviors. She was fully aware that a could
represent any value and that for different values of a the results would be different. Such
understanding prevented her from specializing (picking a number and testing it). She was
also aware of the Representation stage (as she elaborated by the end of the interview),
where generalized properties based on visual representations were not always correct (e.g.
an object which looked larger on paper may not necessarily have larger measures). This
awareness stopped her from using visual approach.
The interviewer asked Sandy whether she needed any information to solve the
problem. Sandy responded that she needed a number because she was not sure “how to
do this real quick” (intra-person monitoring and control). This corresponded with what
she had stated in the background interview regarding her perception that being good at
mathematics meant “doing things quickly without thinking about it forever.” The
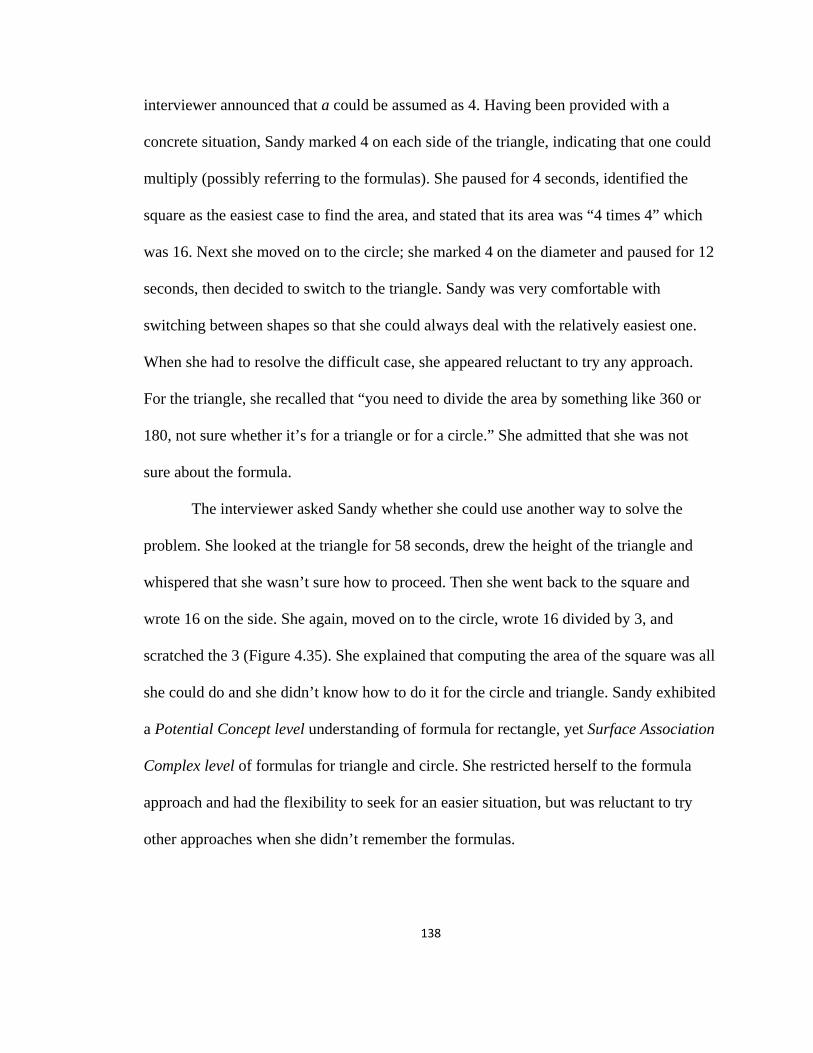
138
interviewer announced that a could be assumed as 4. Having been provided with a
concrete situation, Sandy marked 4 on each side of the triangle, indicating that one could
multiply (possibly referring to the formulas). She paused for 4 seconds, identified the
square as the easiest case to find the area, and stated that its area was “4 times 4” which
was 16. Next she moved on to the circle; she marked 4 on the diameter and paused for 12
seconds, then decided to switch to the triangle. Sandy was very comfortable with
switching between shapes so that she could always deal with the relatively easiest one.
When she had to resolve the difficult case, she appeared reluctant to try any approach.
For the triangle, she recalled that “you need to divide the area by something like 360 or
180, not sure whether it’s for a triangle or for a circle.” She admitted that she was not
sure about the formula.
The interviewer asked Sandy whether she could use another way to solve the
problem. She looked at the triangle for 58 seconds, drew the height of the triangle and
whispered that she wasn’t sure how to proceed. Then she went back to the square and
wrote 16 on the side. She again, moved on to the circle, wrote 16 divided by 3, and
scratched the 3 (Figure 4.35). She explained that computing the area of the square was all
she could do and she didn’t know how to do it for the circle and triangle. Sandy exhibited
a Potential Concept level understanding of formula for rectangle, yet Surface Association
Complex level of formulas for triangle and circle. She restricted herself to the formula
approach and had the flexibility to seek for an easier situation, but was reluctant to try
other approaches when she didn’t remember the formulas.
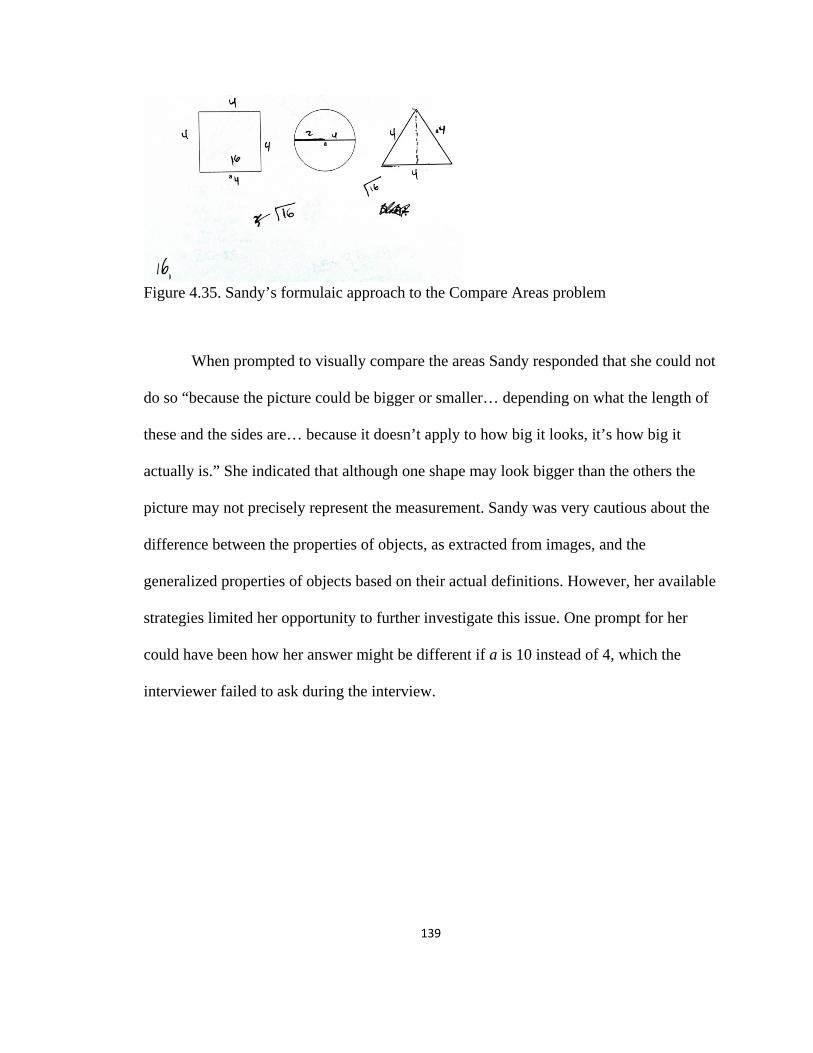
139
Figure 4.35. Sandy’s formulaic approach to the Compare Areas problem
When prompted to visually compare the areas Sandy responded that she could not
do so “because the picture could be bigger or smaller… depending on what the length of
these and the sides are… because it doesn’t apply to how big it looks, it’s how big it
actually is.” She indicated that although one shape may look bigger than the others the
picture may not precisely represent the measurement. Sandy was very cautious about the
difference between the properties of objects, as extracted from images, and the
generalized properties of objects based on their actual definitions. However, her available
strategies limited her opportunity to further investigate this issue. One prompt for her
could have been how her answer might be different if a is 10 instead of 4, which the
interviewer failed to ask during the interview.
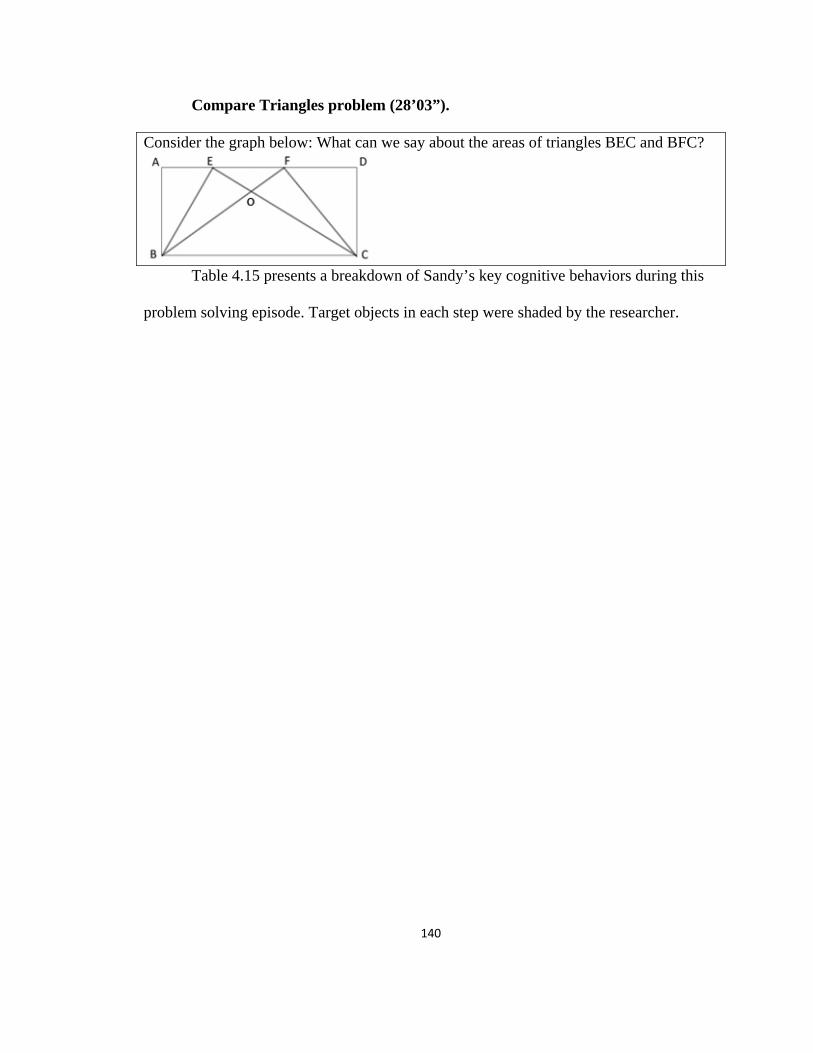
140
Compare Triangles problem (28’03”).
Consider the graph below: What can we say about the areas of triangles BEC and BFC?
Table 4.15 presents a breakdown of Sandy’s key cognitive behaviors during this
problem solving episode. Target objects in each step were shaded by the researcher.
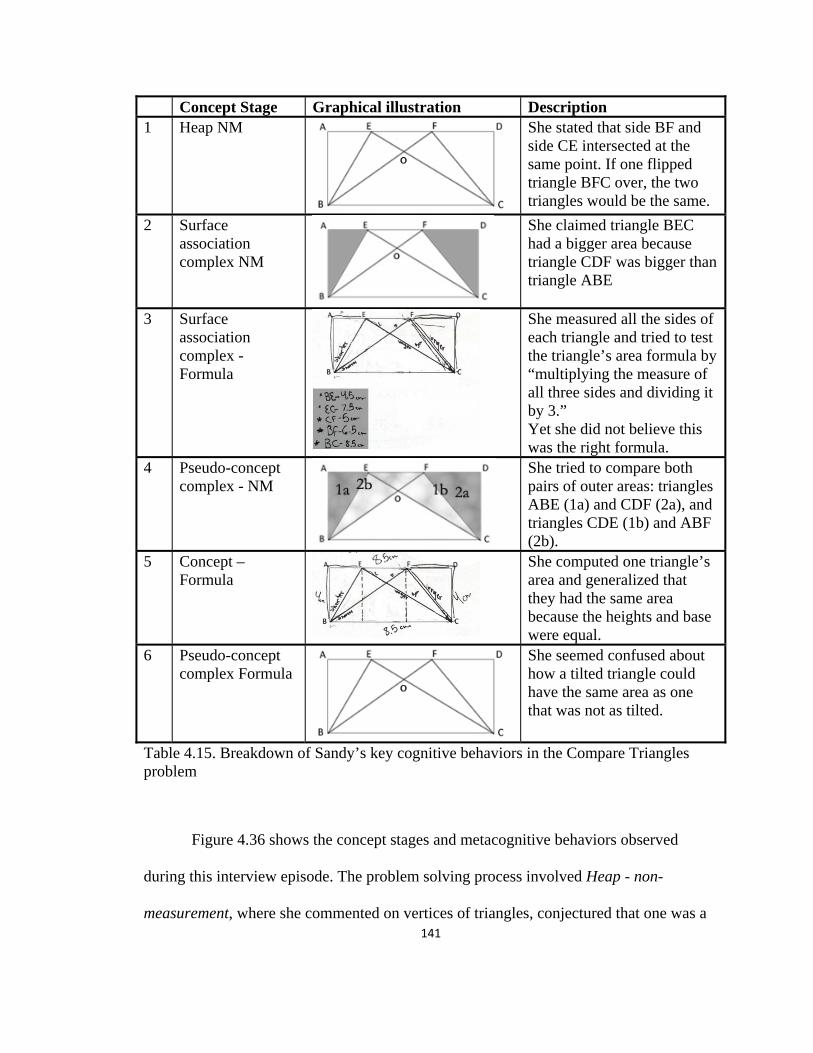
141
Concept Stage Graphical illustration Description 1 Heap NM She stated that side BF and
side CE intersected at the same point. If one flipped triangle BFC over, the two triangles would be the same.
2 Surface association complex NM
She claimed triangle BEC had a bigger area because triangle CDF was bigger than triangle ABE
3 Surface association complex - Formula
She measured all the sides of each triangle and tried to test the triangle’s area formula by “multiplying the measure of all three sides and dividing it by 3.” Yet she did not believe this was the right formula.
4 Pseudo-concept complex - NM
She tried to compare both pairs of outer areas: triangles ABE (1a) and CDF (2a), and triangles CDE (1b) and ABF (2b).
5 Concept –Formula
She computed one triangle’s area and generalized that they had the same area because the heights and base were equal.
6 Pseudo-concept complex Formula
She seemed confused about how a tilted triangle could have the same area as one that was not as tilted.
Table 4.15. Breakdown of Sandy’s key cognitive behaviors in the Compare Triangles problem
Figure 4.36 shows the concept stages and metacognitive behaviors observed
during this interview episode. The problem solving process involved Heap - non-
measurement, where she commented on vertices of triangles, conjectured that one was a
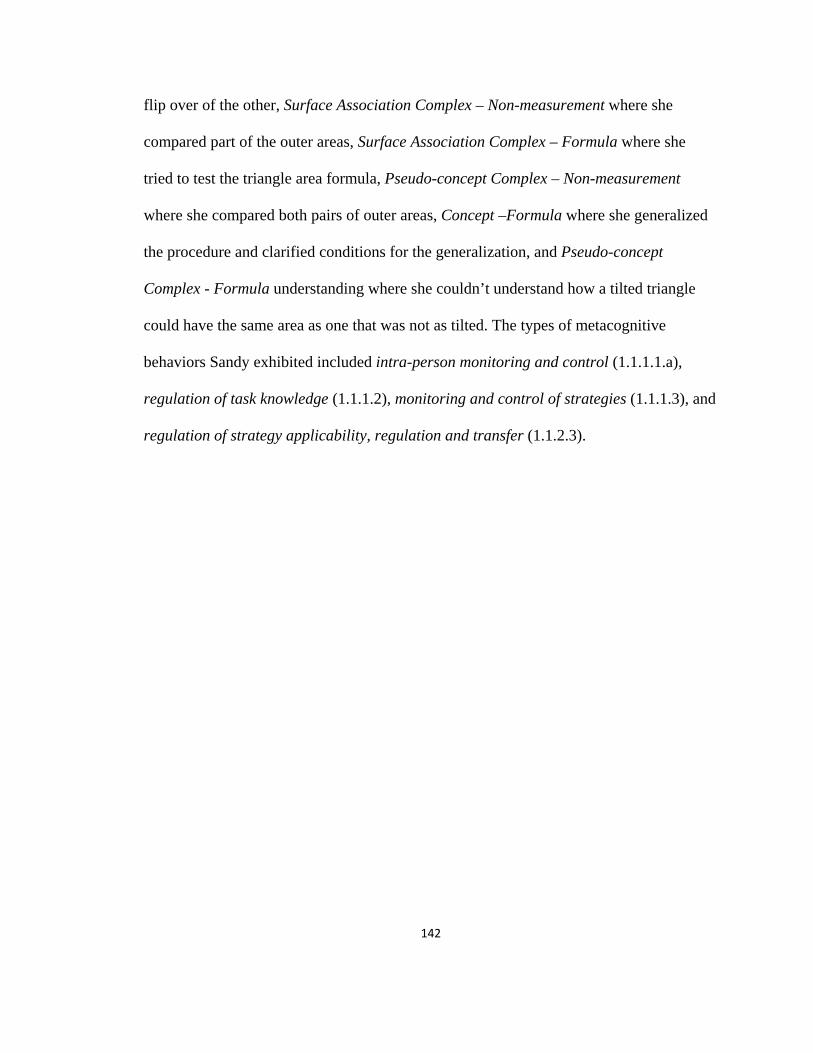
142
flip over of the other, Surface Association Complex – Non-measurement where she
compared part of the outer areas, Surface Association Complex – Formula where she
tried to test the triangle area formula, Pseudo-concept Complex – Non-measurement
where she compared both pairs of outer areas, Concept –Formula where she generalized
the procedure and clarified conditions for the generalization, and Pseudo-concept
Complex - Formula understanding where she couldn’t understand how a tilted triangle
could have the same area as one that was not as tilted. The types of metacognitive
behaviors Sandy exhibited included intra-person monitoring and control (1.1.1.1.a),
regulation of task knowledge (1.1.1.2), monitoring and control of strategies (1.1.1.3), and
regulation of strategy applicability, regulation and transfer (1.1.2.3).
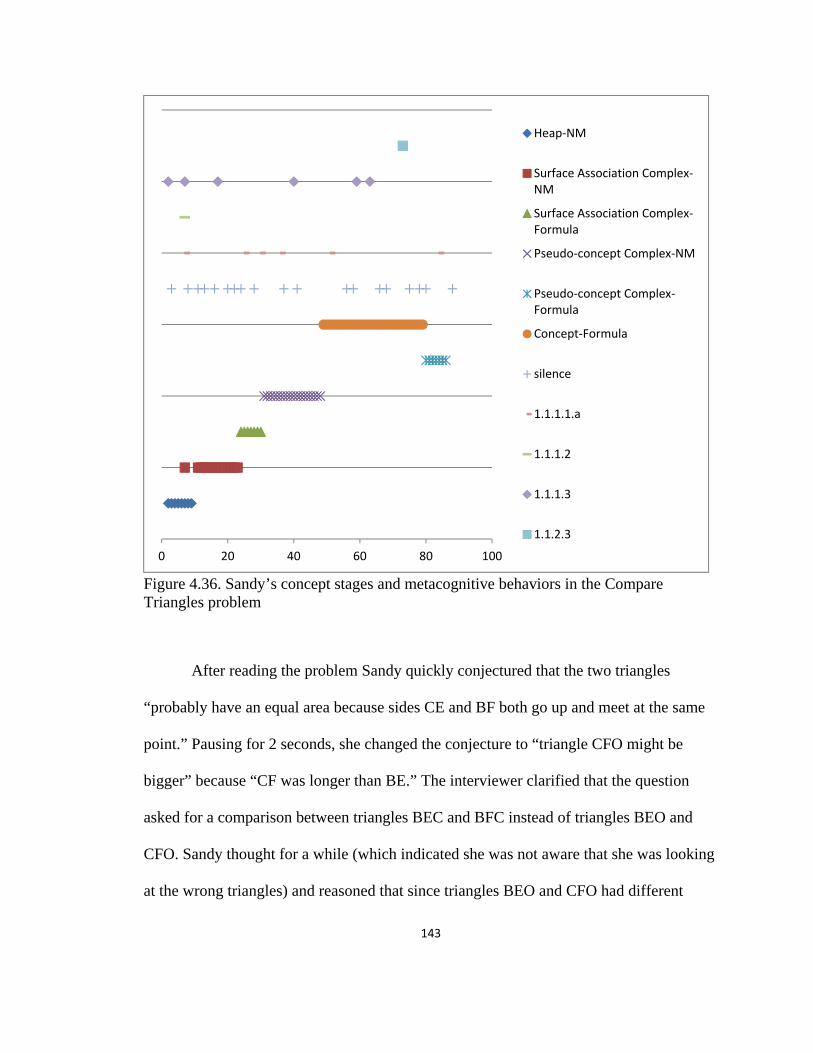
143
Figure 4.36. Sandy’s concept stages and metacognitive behaviors in the Compare Triangles problem
After reading the problem Sandy quickly conjectured that the two triangles
“probably have an equal area because sides CE and BF both go up and meet at the same
point.” Pausing for 2 seconds, she changed the conjecture to “triangle CFO might be
bigger” because “CF was longer than BE.” The interviewer clarified that the question
asked for a comparison between triangles BEC and BFC instead of triangles BEO and
CFO. Sandy thought for a while (which indicated she was not aware that she was looking
at the wrong triangles) and reasoned that since triangles BEO and CFO had different
0 20 40 60 80 100
Heap-NM
Surface Association Complex-NM
Surface Association Complex-Formula
Pseudo-concept Complex-NM
Pseudo-concept Complex-Formula
Concept-Formula
silence
1.1.1.1.a
1.1.1.2
1.1.1.3
1.1.2.3
144
areas, triangles BEC and BFC would have different areas as well. Although she did not
look at the correct triangles initially, she made a connection between what she had looked
at and what the problem asked for (having a common area triangle BOC) and drew
inference instead of re-examining the problem like what the other participants did under
the same situation.
She paused for another 3 seconds and reverted to her previous conjecture “the two
triangles have an equal area” because side BF and side CE intersected at the same point
and “if you flip triangle BFC over, it would be lined up,” which was a transformation she
could not decipher quickly. This revealed a Heap - Non-measurement level of reasoning.
Sandy explained that if one could measure the lengths of the sides, one would be able to
tell whether the two triangles had the same area (regulation of task knowledge). Since a
ruler was not available, Sandy measured the sides with her marker and claimed that sides
BF and CE had “about the same” measure. Instead of making any conjectures based on
the two sides, she switched to comparing the outer areas triangles DFC and ABE. She
claimed that triangle BEC had a bigger area because triangle CDF was bigger than
triangle ABE. Although she did not provide any reasoning or rationale, this switch could
be interpreted as to avoid “hard” situations when “easier” situations were available;
comparing similar measure of lengths with inaccurate measurement is considerable
harder than comparing outer areas which are visually different. This revealed a Surface
Association Complex – Non-measurement reasoning, where she compared part of the
outer areas. However she could not continue reasoning with this approach and remained
silent. The interviewer decided to provide her a ruler to see how she would reason with
measurement.

145
Sandy marked the two pairs of sides as “shorter” and “longer” (Figure 4.37).
Either triangle had a side shorter and a side longer, which made the situation non-trivial
again.
Figure 4.37. Sandy’s comparison of sides
After she received a ruler, Sandy spent 1 minutes and 51 seconds measuring the
lengths of all sides for both triangles (Figure 4.38).
Figure 4.38. Sandy’s Surface Association Complex – Formula approach
Stating that she did not remember the formula, Sandy drew two dotted lines to
mark the heights of the two triangles. She did not do anything about the heights until she
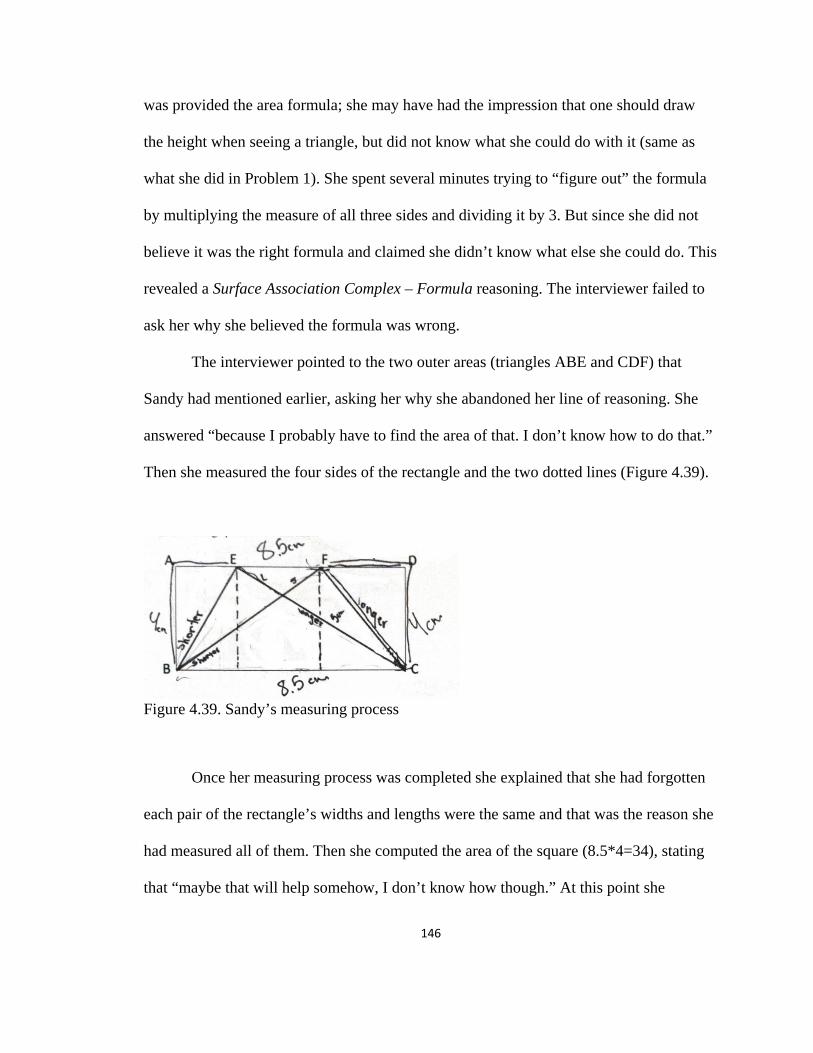
146
was provided the area formula; she may have had the impression that one should draw
the height when seeing a triangle, but did not know what she could do with it (same as
what she did in Problem 1). She spent several minutes trying to “figure out” the formula
by multiplying the measure of all three sides and dividing it by 3. But since she did not
believe it was the right formula and claimed she didn’t know what else she could do. This
revealed a Surface Association Complex – Formula reasoning. The interviewer failed to
ask her why she believed the formula was wrong.
The interviewer pointed to the two outer areas (triangles ABE and CDF) that
Sandy had mentioned earlier, asking her why she abandoned her line of reasoning. She
answered “because I probably have to find the area of that. I don’t know how to do that.”
Then she measured the four sides of the rectangle and the two dotted lines (Figure 4.39).
Figure 4.39. Sandy’s measuring process
Once her measuring process was completed she explained that she had forgotten
each pair of the rectangle’s widths and lengths were the same and that was the reason she
had measured all of them. Then she computed the area of the square (8.5*4=34), stating
that “maybe that will help somehow, I don’t know how though.” At this point she

147
decided to measure triangles ABE and CDF, but only measured side DF (3.3 cm) and
claimed triangle CDE had a larger area than triangle ABF. In explaining why she decided
to look at triangles ABE and CDF, she said because the target triangles’ areas depended
on them; if she could find both outer areas, she might be able to determine the areas of
the target triangles. This revealed a Pseudo-concept Complex – Non-measurement
reasoning, where she tried to compare both pairs of outer areas.
The interviewer asked Sandy whether she believed she needed the triangle’s area
formula to solve the problem. She explained that she thought there might be other ways
to solve the task but she couldn’t think of any. The interviewer decided to provide her
with the formula to see whether she could solve the problem and generalize the answer.
Sandy measured the two dotted lines and was surprised to discover that they were the
same (3.5 cm). The heights she measured were different from the sides of the rectangle (4
cm); she did not realize this contradiction even after she generalized the relationship
based on the heights of the triangles. She checked her computation and wrote down the
area of triangle BFC. When she moved on to triangle BEC, she stared at the picture for 8
seconds and announced “I didn’t actually need to know any of those,” “they have the
same area because the heights and base are equal.” She was very sure about this
conclusion. This revealed a Concept –Formula reasoning, where she was able to
generalize the procedure and clarify conditions for the generalization (base and top vertex
should be on both sides of the rectangle).
The interviewer drew a different triangle on the picture she had produced and
asked her whether the shape of the triangles mattered. Sandy first reasoned that the base
would be the same, then carefully drew the height of the new triangle, and commented
148
that the height would also be the same which meant the area would be the same. The
interviewer asked her whether her conjecture would be true for any triangles inside the
rectangle. Sandy generalized that any triangles would have the same area as long as their
base was BC and had a top on AD. She drew a triangle with a different base and height as
a counter-example. In explaining why all the areas would be the same, she reasoned that
because all the heights and base were the same.
Sandy was convinced of the accuracy of the answer since the numbers were the
same. But she was still confused about how a “tilted” triangle could have the same area
as one that was not. The disconnect between her abstract observation on base and height
and concrete observation on slanted was not revealed until this moment, which showed a
Pseudo-concept Complex - Formula understanding. Berger (2004) indicated that Pseudo-
concept Complex level understanding could appear very similar to Concept level
understanding, and the only way to potentially distinguish them is to ask more questions
to test the nature of operation (factual or logical). One possible reason for the disconnect
could be that her understanding of the area formula is limited – the visual connection
between a triangle and the corresponding rectangle which could explain how the triangle
area formula is deduced is absent. Although Sandy was able to make correct observations
and even seemed to generalize based on the formula, the conclusion was not meaningful
for her.
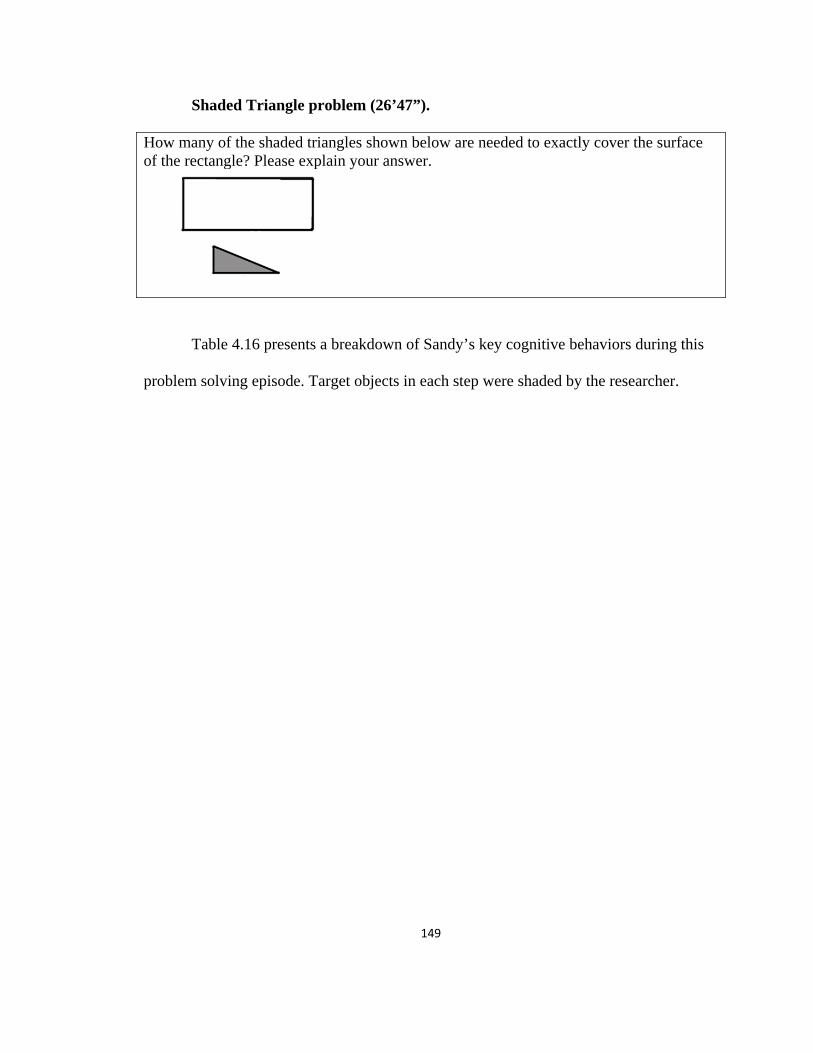
149
Shaded Triangle problem (26’47”).
How many of the shaded triangles shown below are needed to exactly cover the surface of the rectangle? Please explain your answer.
Table 4.16 presents a breakdown of Sandy’s key cognitive behaviors during this
problem solving episode. Target objects in each step were shaded by the researcher.
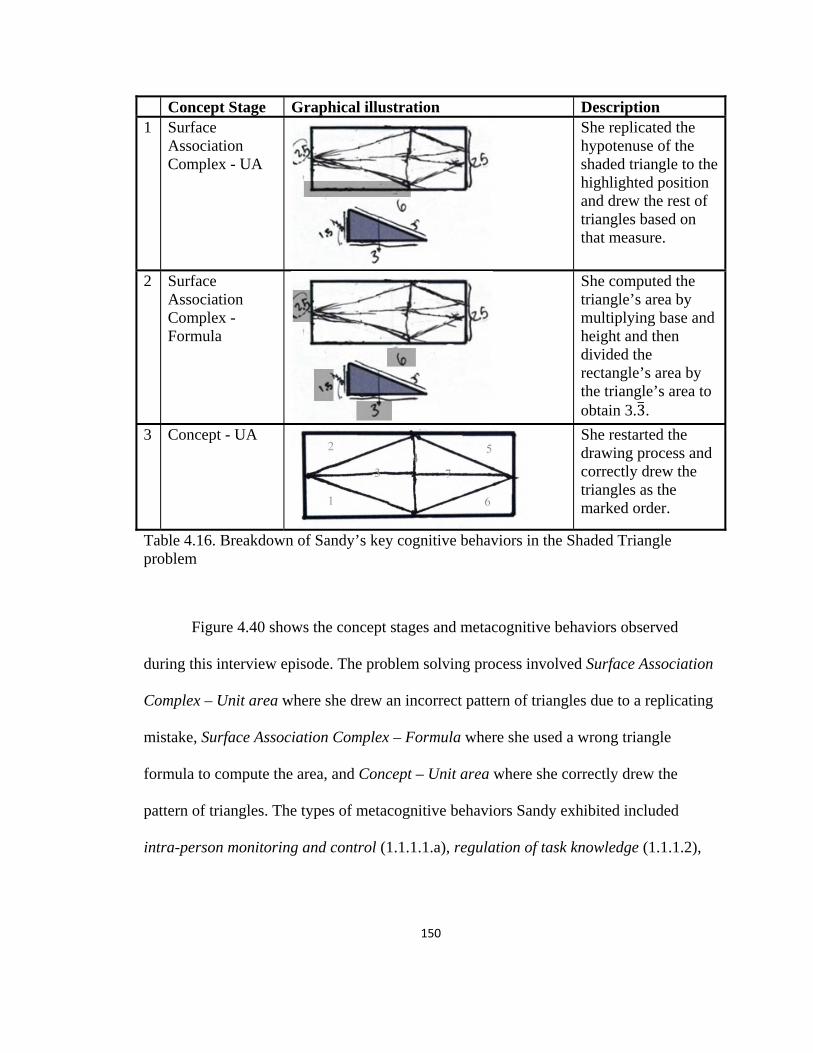
150
Concept Stage Graphical illustration Description 1 Surface
Association Complex - UA
She replicated the hypotenuse of the shaded triangle to the highlighted position and drew the rest of triangles based on that measure.
2 Surface Association Complex - Formula
She computed the triangle’s area by multiplying base and height and then divided the rectangle’s area by the triangle’s area to obtain 3.3.
3 Concept - UA She restarted the drawing process and correctly drew the triangles as the marked order.
Table 4.16. Breakdown of Sandy’s key cognitive behaviors in the Shaded Triangle problem
Figure 4.40 shows the concept stages and metacognitive behaviors observed
during this interview episode. The problem solving process involved Surface Association
Complex – Unit area where she drew an incorrect pattern of triangles due to a replicating
mistake, Surface Association Complex – Formula where she used a wrong triangle
formula to compute the area, and Concept – Unit area where she correctly drew the
pattern of triangles. The types of metacognitive behaviors Sandy exhibited included
intra-person monitoring and control (1.1.1.1.a), regulation of task knowledge (1.1.1.2),
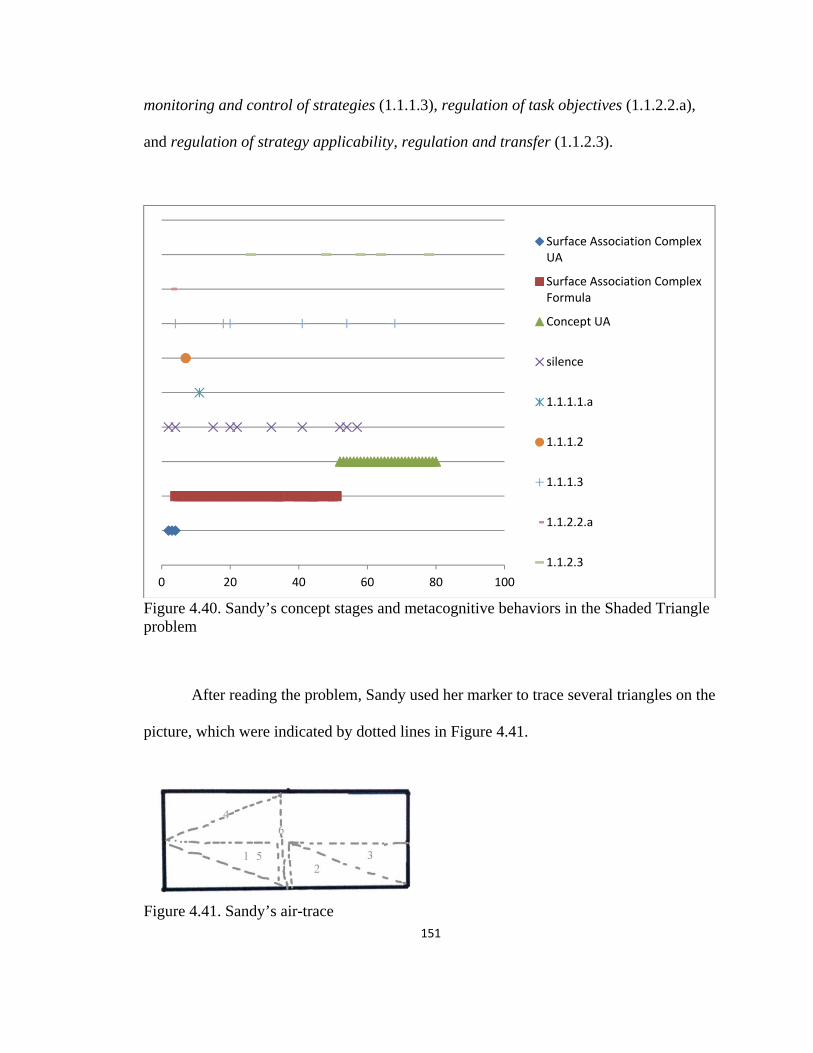
151
monitoring and control of strategies (1.1.1.3), regulation of task objectives (1.1.2.2.a),
and regulation of strategy applicability, regulation and transfer (1.1.2.3).
Figure 4.40. Sandy’s concept stages and metacognitive behaviors in the Shaded Triangle problem
After reading the problem, Sandy used her marker to trace several triangles on the
picture, which were indicated by dotted lines in Figure 4.41.
Figure 4.41. Sandy’s air-trace
0 20 40 60 80 100
Surface Association ComplexUA
Surface Association ComplexFormula
Concept UA
silence
1.1.1.1.a
1.1.1.2
1.1.1.3
1.1.2.2.a
1.1.2.3
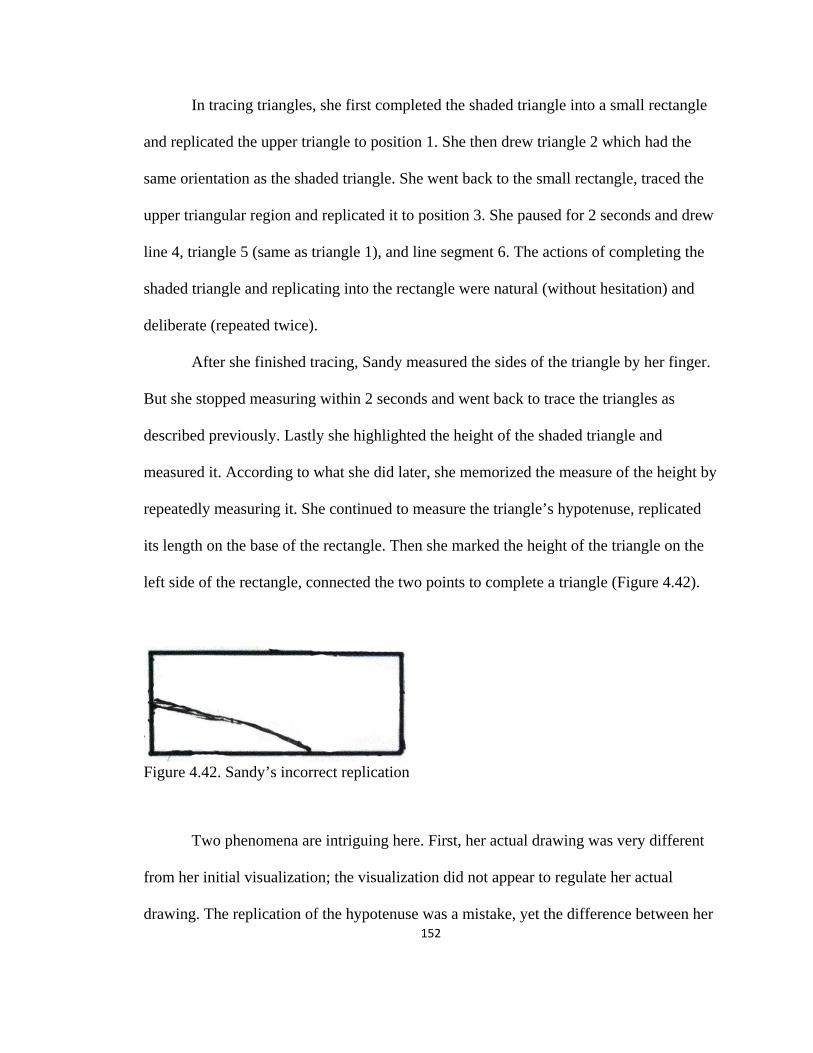
152
In tracing triangles, she first completed the shaded triangle into a small rectangle
and replicated the upper triangle to position 1. She then drew triangle 2 which had the
same orientation as the shaded triangle. She went back to the small rectangle, traced the
upper triangular region and replicated it to position 3. She paused for 2 seconds and drew
line 4, triangle 5 (same as triangle 1), and line segment 6. The actions of completing the
shaded triangle and replicating into the rectangle were natural (without hesitation) and
deliberate (repeated twice).
After she finished tracing, Sandy measured the sides of the triangle by her finger.
But she stopped measuring within 2 seconds and went back to trace the triangles as
described previously. Lastly she highlighted the height of the shaded triangle and
measured it. According to what she did later, she memorized the measure of the height by
repeatedly measuring it. She continued to measure the triangle’s hypotenuse, replicated
its length on the base of the rectangle. Then she marked the height of the triangle on the
left side of the rectangle, connected the two points to complete a triangle (Figure 4.42).
Figure 4.42. Sandy’s incorrect replication
Two phenomena are intriguing here. First, her actual drawing was very different
from her initial visualization; the visualization did not appear to regulate her actual
drawing. The replication of the hypotenuse was a mistake, yet the difference between her
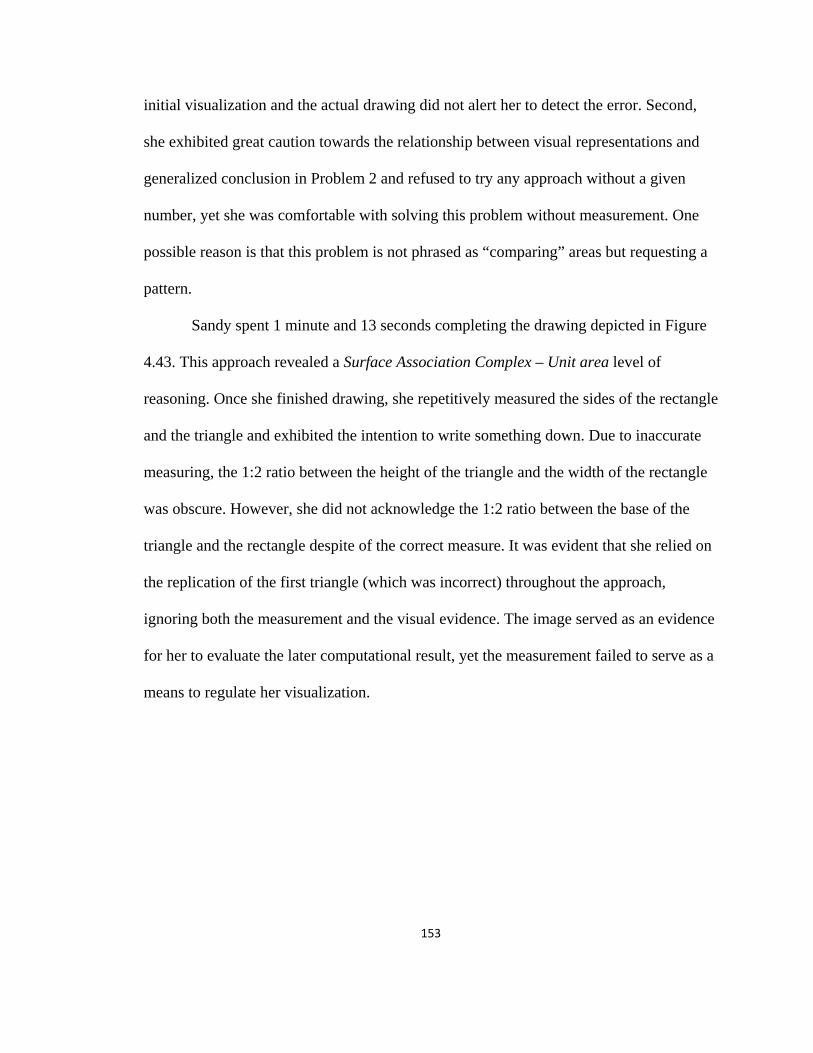
153
initial visualization and the actual drawing did not alert her to detect the error. Second,
she exhibited great caution towards the relationship between visual representations and
generalized conclusion in Problem 2 and refused to try any approach without a given
number, yet she was comfortable with solving this problem without measurement. One
possible reason is that this problem is not phrased as “comparing” areas but requesting a
pattern.
Sandy spent 1 minute and 13 seconds completing the drawing depicted in Figure
4.43. This approach revealed a Surface Association Complex – Unit area level of
reasoning. Once she finished drawing, she repetitively measured the sides of the rectangle
and the triangle and exhibited the intention to write something down. Due to inaccurate
measuring, the 1:2 ratio between the height of the triangle and the width of the rectangle
was obscure. However, she did not acknowledge the 1:2 ratio between the base of the
triangle and the rectangle despite of the correct measure. It was evident that she relied on
the replication of the first triangle (which was incorrect) throughout the approach,
ignoring both the measurement and the visual evidence. The image served as an evidence
for her to evaluate the later computational result, yet the measurement failed to serve as a
means to regulate her visualization.
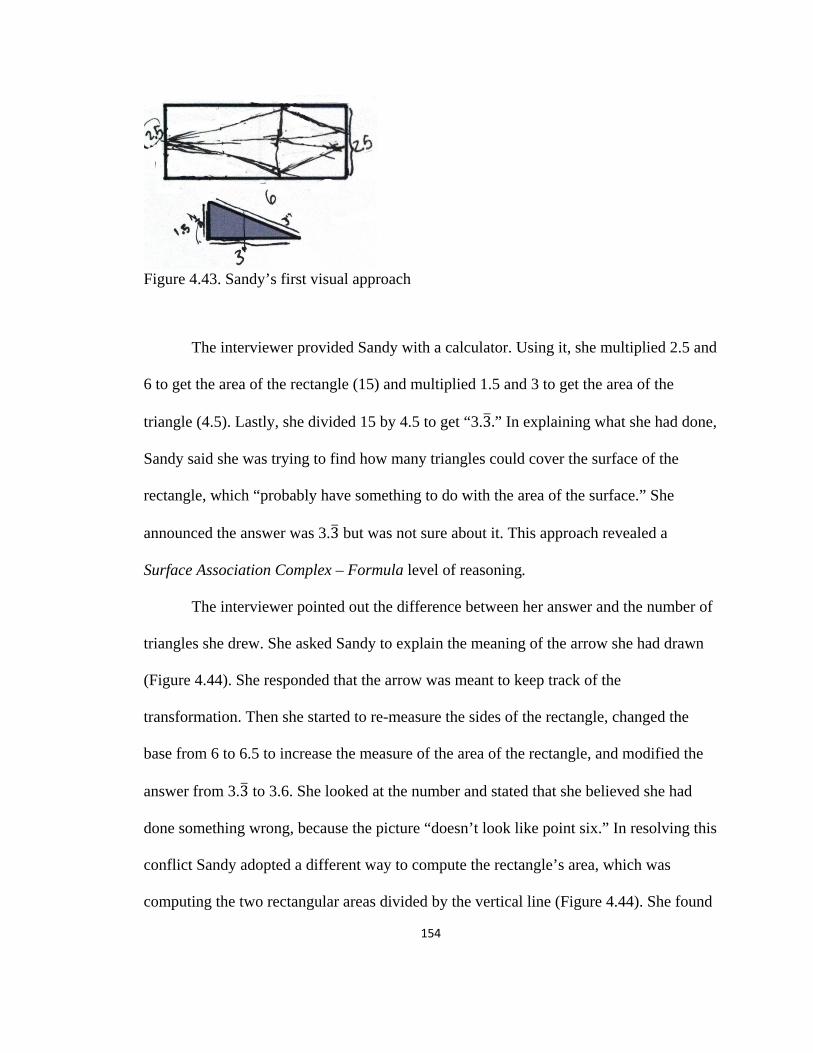
154
Figure 4.43. Sandy’s first visual approach
The interviewer provided Sandy with a calculator. Using it, she multiplied 2.5 and
6 to get the area of the rectangle (15) and multiplied 1.5 and 3 to get the area of the
triangle (4.5). Lastly, she divided 15 by 4.5 to get “3.3.” In explaining what she had done,
Sandy said she was trying to find how many triangles could cover the surface of the
rectangle, which “probably have something to do with the area of the surface.” She
announced the answer was 3.3 but was not sure about it. This approach revealed a
Surface Association Complex – Formula level of reasoning.
The interviewer pointed out the difference between her answer and the number of
triangles she drew. She asked Sandy to explain the meaning of the arrow she had drawn
(Figure 4.44). She responded that the arrow was meant to keep track of the
transformation. Then she started to re-measure the sides of the rectangle, changed the
base from 6 to 6.5 to increase the measure of the area of the rectangle, and modified the
answer from 3.3 to 3.6. She looked at the number and stated that she believed she had
done something wrong, because the picture “doesn’t look like point six.” In resolving this
conflict Sandy adopted a different way to compute the rectangle’s area, which was
computing the two rectangular areas divided by the vertical line (Figure 4.44). She found
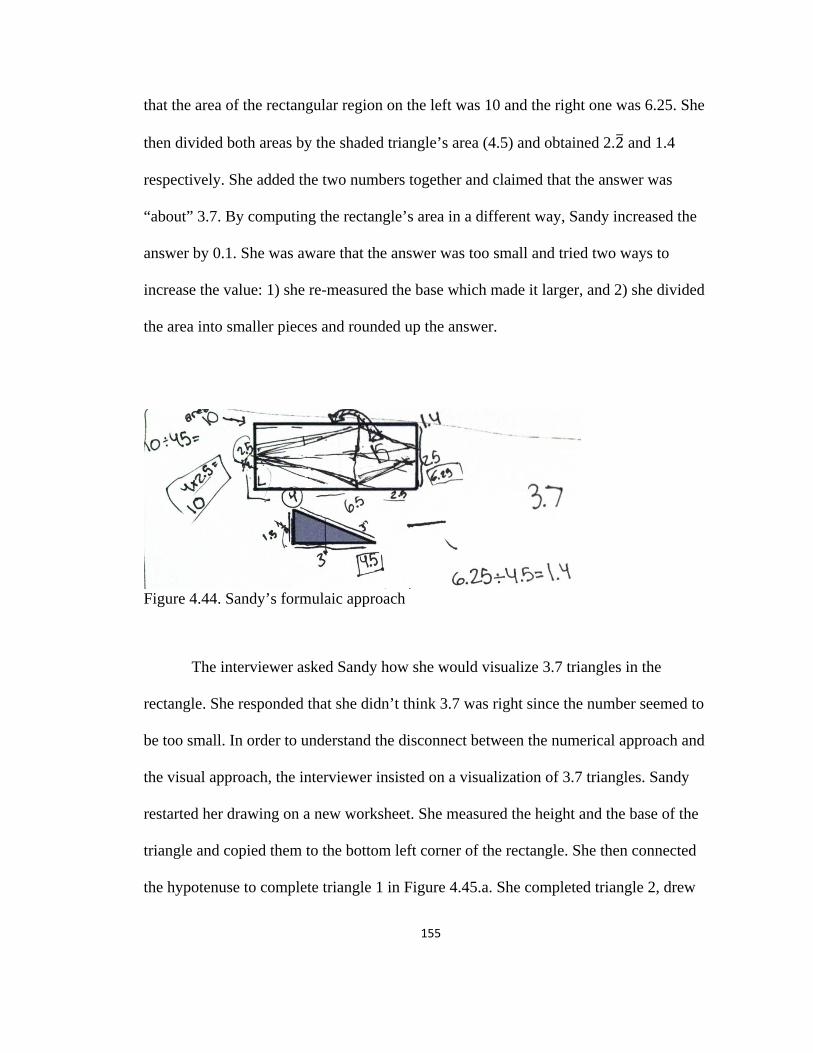
155
that the area of the rectangular region on the left was 10 and the right one was 6.25. She
then divided both areas by the shaded triangle’s area (4.5) and obtained 2.2 and 1.4
respectively. She added the two numbers together and claimed that the answer was
“about” 3.7. By computing the rectangle’s area in a different way, Sandy increased the
answer by 0.1. She was aware that the answer was too small and tried two ways to
increase the value: 1) she re-measured the base which made it larger, and 2) she divided
the area into smaller pieces and rounded up the answer.
Figure 4.44. Sandy’s formulaic approach
The interviewer asked Sandy how she would visualize 3.7 triangles in the
rectangle. She responded that she didn’t think 3.7 was right since the number seemed to
be too small. In order to understand the disconnect between the numerical approach and
the visual approach, the interviewer insisted on a visualization of 3.7 triangles. Sandy
restarted her drawing on a new worksheet. She measured the height and the base of the
triangle and copied them to the bottom left corner of the rectangle. She then connected
the hypotenuse to complete triangle 1 in Figure 4.45.a. She completed triangle 2, drew

156
line segments 3 and 4 to finish the four triangles on the left part of the rectangle.
Following a brief pause she continued to complete drawing triangle 5, triangle 6, and line
segment 7 as shown in Figure 4.45.b. This approach revealed a Concept – Unit area level
of reasoning.
(a)
(b) Figure 4.45. Sandy’s second visual approach
Sandy crossed out her previous work and concluded the answer as 8. In response
to why she didn’t draw 3.7 triangles, Sandy could only state that she “underestimated it.”
Sensing that Sandy may not have the language to explain her own thinking process, the
interviewer provided a guess of Sandy’s thoughts: Sandy had doubts in the number thus
chose to restart the drawing process, measuring and replicating as what she did at the
beginning of the interview. In addition to this guess, Sandy explained that she had

157
visualized the 3.7 triangles as 3 “fat” triangles with a “fractional” triangle and she knew it
wouldn’t work. This statement explained Sandy’s decision making for not drawing 3.7
triangles upon requests, which she could not articulate until the interviewer provided the
guess.
In explaining why she drew the triangles differently the first time, Sandy stated
that she was mostly estimating the line segments instead of precise measuring, thus the
triangles looked different from the shaded triangle. Contrary to her explanation, the key
mistake for the inaccurate drawing was to replicate the triangle’s hypotenuse as the base.
This is an example of when retrospective reflections may not match the true situations.
Sandy believed in the drawing instead of the computed answer because the second
visualization made sense and was convincing to her. At the end the interviewer told her
the correct triangle area formula and she realized why the number was “way off.”
Estimate Region problem (7’26”).
Estimate the area of the region shown below.
Table 4.17 presents a breakdown of Sandy’s key cognitive behaviors during this
problem solving episode. Target objects in each step were shaded by the researcher.

158
Concept Stage Graphical illustration Description 1 Concept – Unit
area She drew a rectangle to enclose the region and then computed the rectangle’s area as the estimated answer.
2 Concept – Unit area
She drew 4 triangles to approximate the empty space, then subtracted the triangles’ areas from the rectangle’s area to obtain a more accurate estimation.
3 Concept – Unit area
She stated that one could keep drawing triangles to obtain more precise estimation. She drew the shaded triangle to demonstrate this general approach.
Table 4.17. Breakdown of Sandy’s key cognitive behaviors in the Estimate Region problem
Figure 4.46 shows the concept stages and metacognitive behaviors observed
during this interview episode. The problem solving process involved Concept – Unit area,
where she used rectangle and triangles to approximate the region. The types of
metacognitive behaviors Sandy exhibited included intra-person monitoring and control
(1.1.1.1.a), regulation of task knowledge (1.1.1.2), and monitoring and control of
strategies (1.1.1.3).

159
Figure 4.46. Sandy’s concept stages and metacognitive behaviors in the Estimate Region problem
After reading the problem, Sandy asked whether she was allowed to “estimate” by
measuring. No other participant in the study had made such a request prior to measuring.
She exhibited an awareness of task demands, which was directly related to her selection
of strategy. She used a pencil to draw four lines to enclose the region and then shaded the
four sides with a marker to form a closed figure. She measured the lengths for both sides
of the rectangle (5.5 and 5 respectively) (Figure 4.47). She interpreted the problem as
approximating a given shape without relating it to a real region or stating the possibility
of a different measure as the other participants did.
Figure 4.47. Sandy’s initial approach to the Estimate Region problem
0 5 10 15 20 25 30 35
Concept UA
silence
1.1.1.1.a
1.1.1.2
1.1.1.3
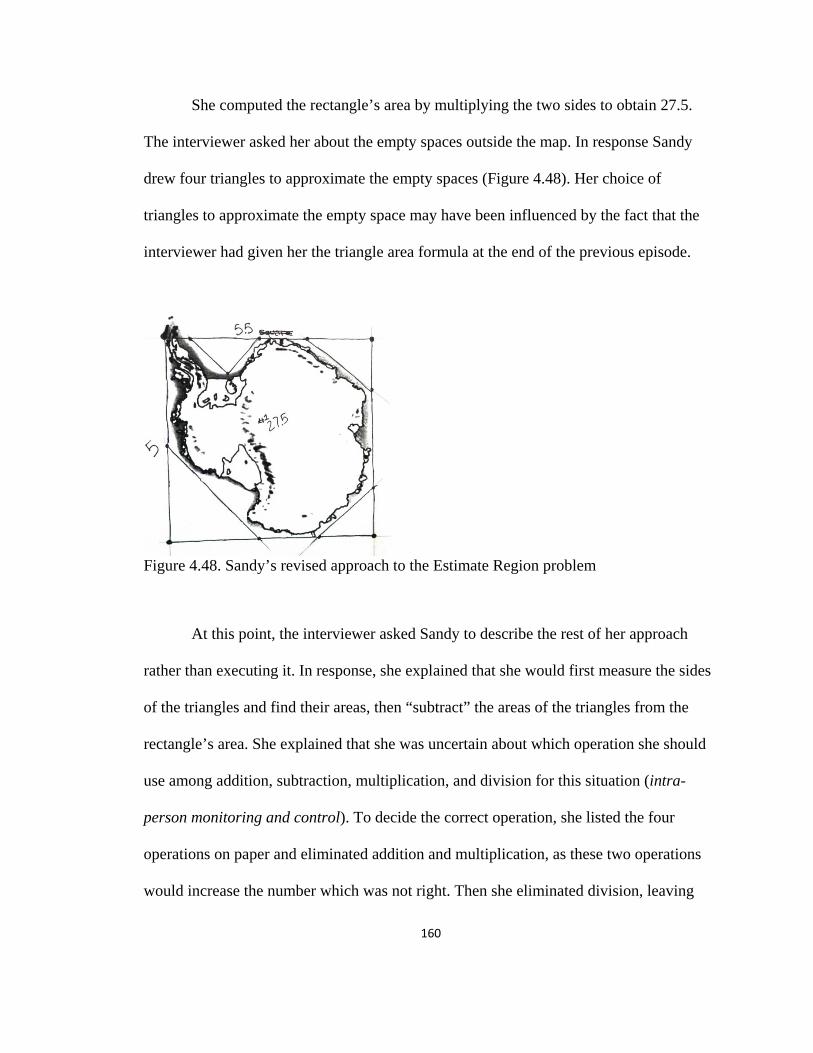
160
She computed the rectangle’s area by multiplying the two sides to obtain 27.5.
The interviewer asked her about the empty spaces outside the map. In response Sandy
drew four triangles to approximate the empty spaces (Figure 4.48). Her choice of
triangles to approximate the empty space may have been influenced by the fact that the
interviewer had given her the triangle area formula at the end of the previous episode.
Figure 4.48. Sandy’s revised approach to the Estimate Region problem
At this point, the interviewer asked Sandy to describe the rest of her approach
rather than executing it. In response, she explained that she would first measure the sides
of the triangles and find their areas, then “subtract” the areas of the triangles from the
rectangle’s area. She explained that she was uncertain about which operation she should
use among addition, subtraction, multiplication, and division for this situation (intra-
person monitoring and control). To decide the correct operation, she listed the four
operations on paper and eliminated addition and multiplication, as these two operations
would increase the number which was not right. Then she eliminated division, leaving
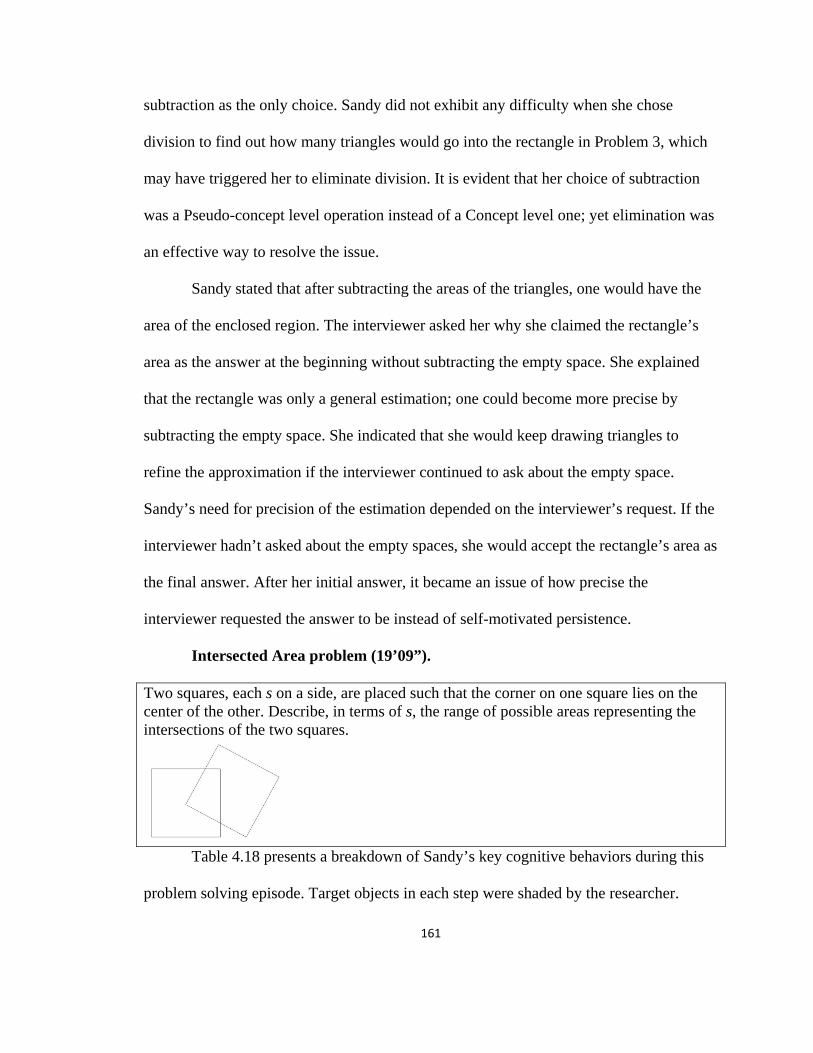
161
subtraction as the only choice. Sandy did not exhibit any difficulty when she chose
division to find out how many triangles would go into the rectangle in Problem 3, which
may have triggered her to eliminate division. It is evident that her choice of subtraction
was a Pseudo-concept level operation instead of a Concept level one; yet elimination was
an effective way to resolve the issue.
Sandy stated that after subtracting the areas of the triangles, one would have the
area of the enclosed region. The interviewer asked her why she claimed the rectangle’s
area as the answer at the beginning without subtracting the empty space. She explained
that the rectangle was only a general estimation; one could become more precise by
subtracting the empty space. She indicated that she would keep drawing triangles to
refine the approximation if the interviewer continued to ask about the empty space.
Sandy’s need for precision of the estimation depended on the interviewer’s request. If the
interviewer hadn’t asked about the empty spaces, she would accept the rectangle’s area as
the final answer. After her initial answer, it became an issue of how precise the
interviewer requested the answer to be instead of self-motivated persistence.
Intersected Area problem (19’09”).
Two squares, each s on a side, are placed such that the corner on one square lies on the center of the other. Describe, in terms of s, the range of possible areas representing the intersections of the two squares.
Table 4.18 presents a breakdown of Sandy’s key cognitive behaviors during this
problem solving episode. Target objects in each step were shaded by the researcher.
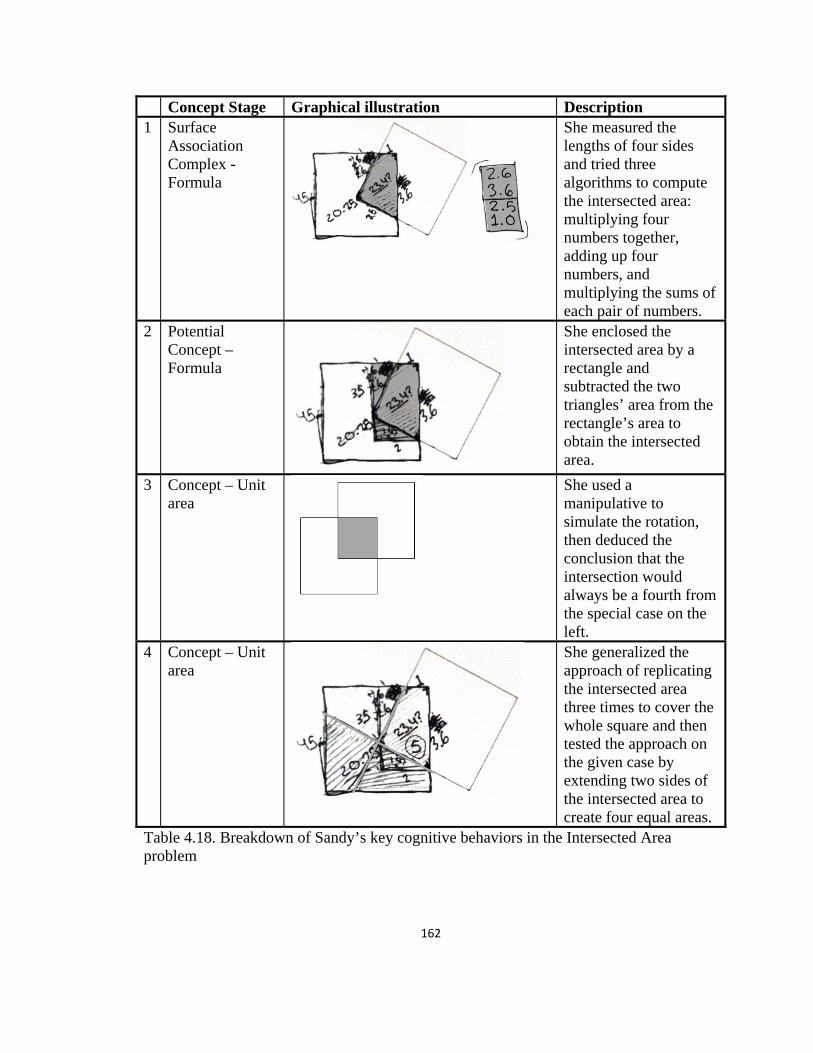
162
Concept Stage Graphical illustration Description 1 Surface
Association Complex - Formula
She measured the lengths of four sides and tried three algorithms to compute the intersected area: multiplying four numbers together, adding up four numbers, and multiplying the sums of each pair of numbers.
2 Potential Concept – Formula
She enclosed the intersected area by a rectangle and subtracted the two triangles’ area from the rectangle’s area to obtain the intersected area.
3 Concept – Unit area
She used a manipulative to simulate the rotation, then deduced the conclusion that the intersection would always be a fourth from the special case on the left.
4 Concept – Unit area
She generalized the approach of replicating the intersected area three times to cover the whole square and then tested the approach on the given case by extending two sides of the intersected area to create four equal areas.
Table 4.18. Breakdown of Sandy’s key cognitive behaviors in the Intersected Area problem
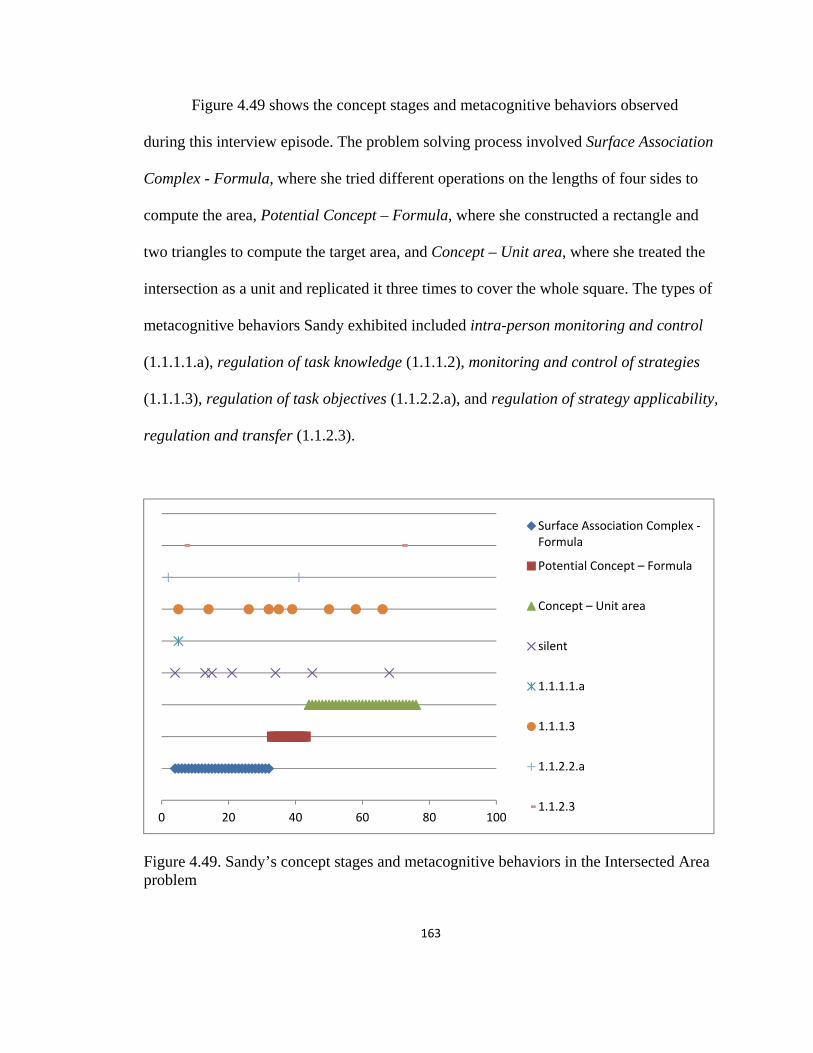
163
Figure 4.49 shows the concept stages and metacognitive behaviors observed
during this interview episode. The problem solving process involved Surface Association
Complex - Formula, where she tried different operations on the lengths of four sides to
compute the area, Potential Concept – Formula, where she constructed a rectangle and
two triangles to compute the target area, and Concept – Unit area, where she treated the
intersection as a unit and replicated it three times to cover the whole square. The types of
metacognitive behaviors Sandy exhibited included intra-person monitoring and control
(1.1.1.1.a), regulation of task knowledge (1.1.1.2), monitoring and control of strategies
(1.1.1.3), regulation of task objectives (1.1.2.2.a), and regulation of strategy applicability,
regulation and transfer (1.1.2.3).
Figure 4.49. Sandy’s concept stages and metacognitive behaviors in the Intersected Area problem
0 20 40 60 80 100
Surface Association Complex -Formula
Potential Concept – Formula
Concept – Unit area
silent
1.1.1.1.a
1.1.1.3
1.1.2.2.a
1.1.2.3
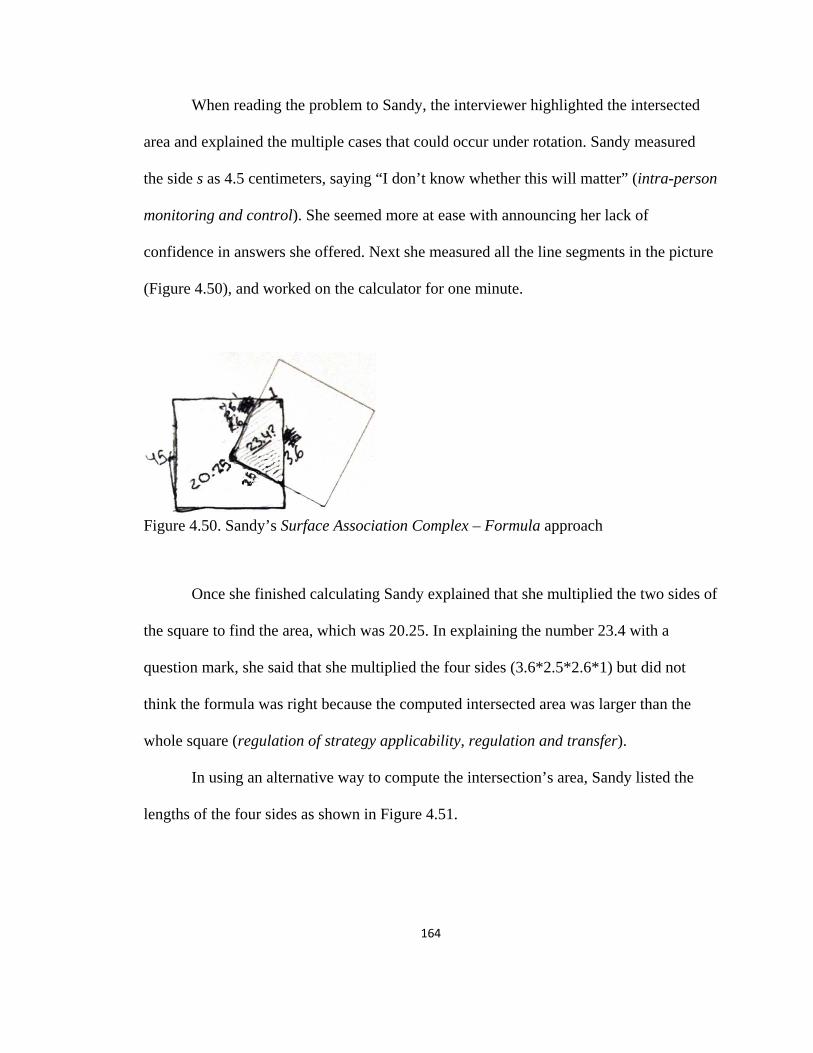
164
When reading the problem to Sandy, the interviewer highlighted the intersected
area and explained the multiple cases that could occur under rotation. Sandy measured
the side s as 4.5 centimeters, saying “I don’t know whether this will matter” (intra-person
monitoring and control). She seemed more at ease with announcing her lack of
confidence in answers she offered. Next she measured all the line segments in the picture
(Figure 4.50), and worked on the calculator for one minute.
Figure 4.50. Sandy’s Surface Association Complex – Formula approach
Once she finished calculating Sandy explained that she multiplied the two sides of
the square to find the area, which was 20.25. In explaining the number 23.4 with a
question mark, she said that she multiplied the four sides (3.6*2.5*2.6*1) but did not
think the formula was right because the computed intersected area was larger than the
whole square (regulation of strategy applicability, regulation and transfer).
In using an alternative way to compute the intersection’s area, Sandy listed the
lengths of the four sides as shown in Figure 4.51.
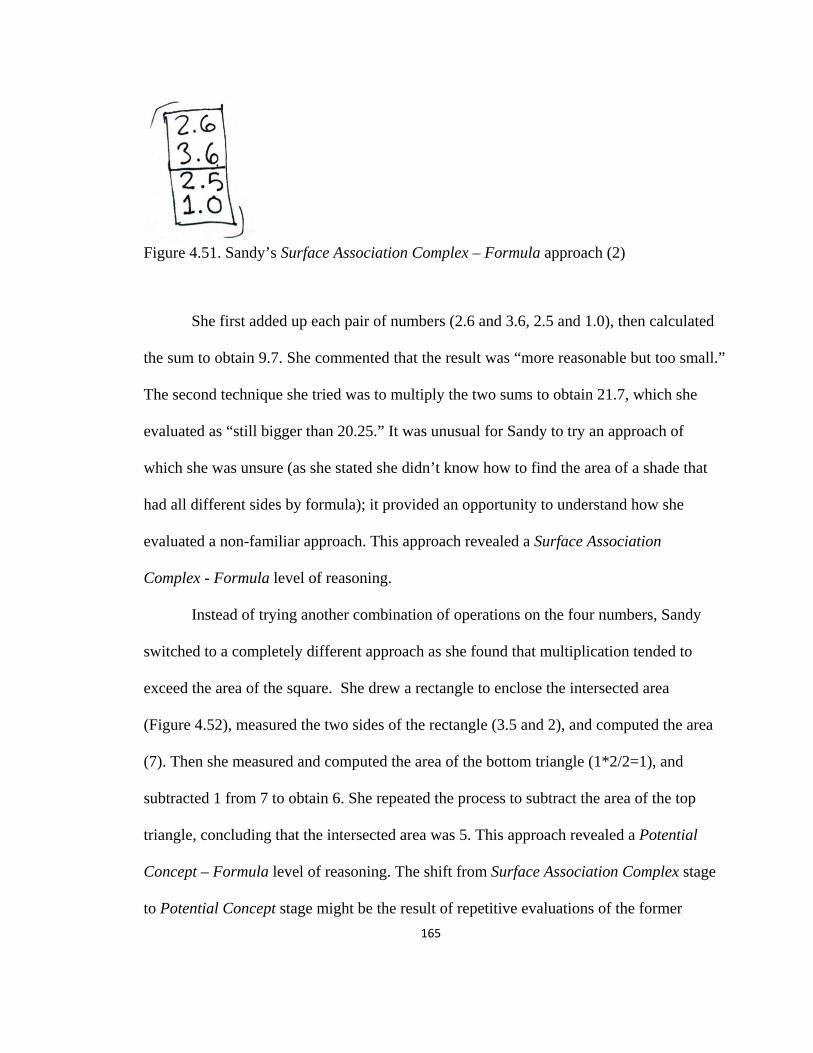
165
Figure 4.51. Sandy’s Surface Association Complex – Formula approach (2)
She first added up each pair of numbers (2.6 and 3.6, 2.5 and 1.0), then calculated
the sum to obtain 9.7. She commented that the result was “more reasonable but too small.”
The second technique she tried was to multiply the two sums to obtain 21.7, which she
evaluated as “still bigger than 20.25.” It was unusual for Sandy to try an approach of
which she was unsure (as she stated she didn’t know how to find the area of a shade that
had all different sides by formula); it provided an opportunity to understand how she
evaluated a non-familiar approach. This approach revealed a Surface Association
Complex - Formula level of reasoning.
Instead of trying another combination of operations on the four numbers, Sandy
switched to a completely different approach as she found that multiplication tended to
exceed the area of the square. She drew a rectangle to enclose the intersected area
(Figure 4.52), measured the two sides of the rectangle (3.5 and 2), and computed the area
(7). Then she measured and computed the area of the bottom triangle (1*2/2=1), and
subtracted 1 from 7 to obtain 6. She repeated the process to subtract the area of the top
triangle, concluding that the intersected area was 5. This approach revealed a Potential
Concept – Formula level of reasoning. The shift from Surface Association Complex stage
to Potential Concept stage might be the result of repetitive evaluations of the former
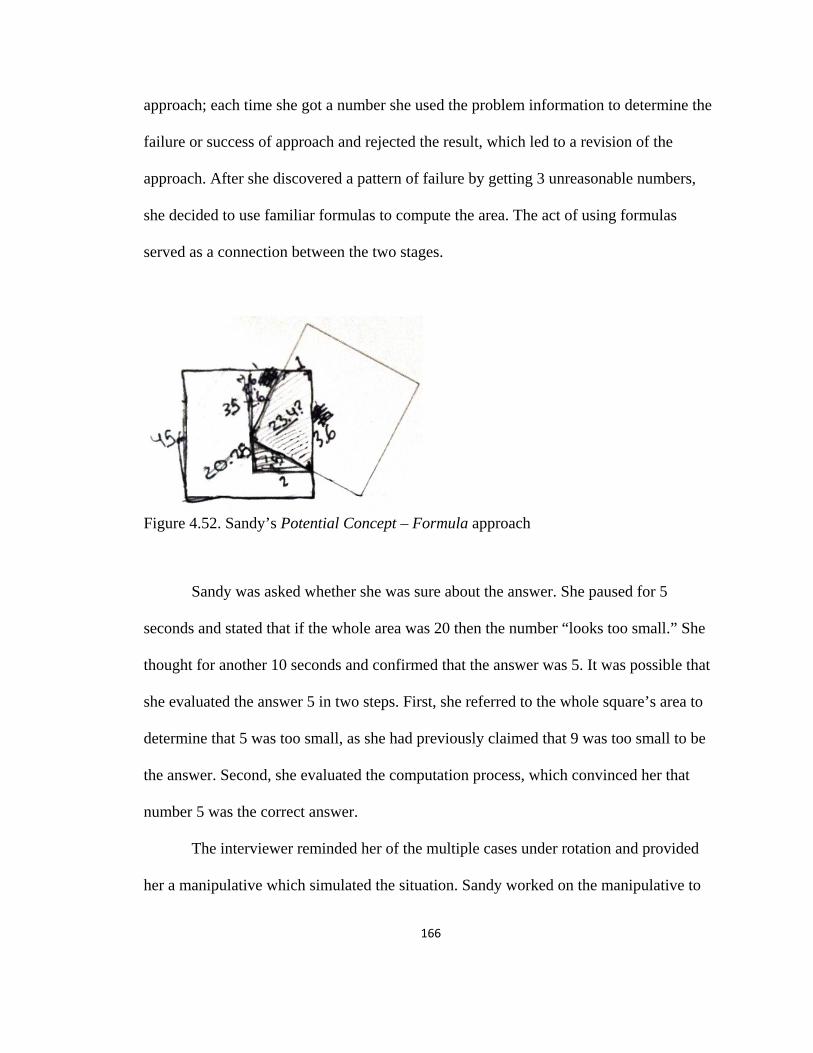
166
approach; each time she got a number she used the problem information to determine the
failure or success of approach and rejected the result, which led to a revision of the
approach. After she discovered a pattern of failure by getting 3 unreasonable numbers,
she decided to use familiar formulas to compute the area. The act of using formulas
served as a connection between the two stages.
Figure 4.52. Sandy’s Potential Concept – Formula approach
Sandy was asked whether she was sure about the answer. She paused for 5
seconds and stated that if the whole area was 20 then the number “looks too small.” She
thought for another 10 seconds and confirmed that the answer was 5. It was possible that
she evaluated the answer 5 in two steps. First, she referred to the whole square’s area to
determine that 5 was too small, as she had previously claimed that 9 was too small to be
the answer. Second, she evaluated the computation process, which convinced her that
number 5 was the correct answer.
The interviewer reminded her of the multiple cases under rotation and provided
her a manipulative which simulated the situation. Sandy worked on the manipulative to

167
simulate the movement for a while, wrote 0.25 on the paper, then crossed it out and wrote
, confirming that was the answer. She explained that if one rotated the square into the
position in Figure 4.53, it would take four copies of the intersected area to make the full
square.
Figure 4.53. Sandy’s demonstration of a special case
The transition from number 5 to is intriguing for the following reasons. First, the
whole square area was 20.25, which was not an exact 4:1 ratio. Second, her conclusion
was generalized from the special case in Figure 26, while she had been very careful with
such generalization in previous episodes.
The interviewer asked Sandy how she knew the ratio was for other cases. She
responded that “I guess there’s a way to put it four ways.” After examining the
manipulative, she suggested that one “might have to move pieces around,” which implied
to replicate the intersected area onto the whole square. In attempting to try this approach
on the original case, she extended the two sides to divide the square into four parts
(Figure 4.54). She confirmed that the four parts were congruent by measuring
corresponding sides’ lengths. This approach revealed a Concept – Unit area level of
reasoning.
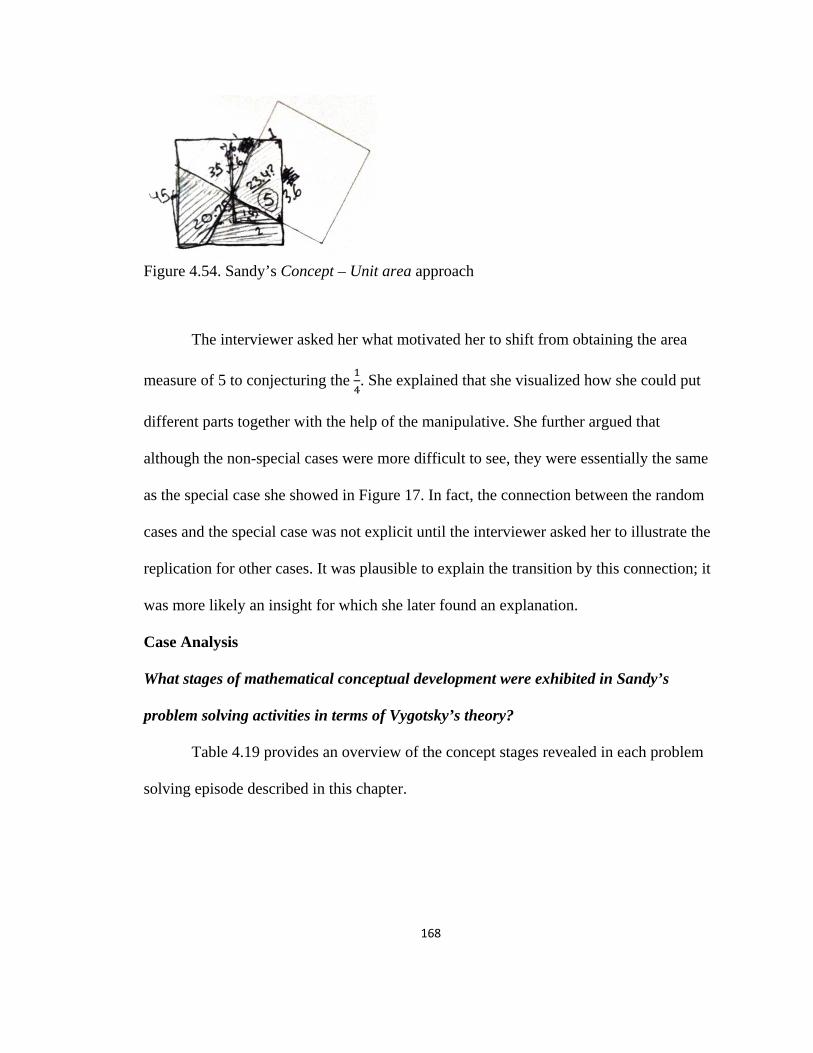
168
Figure 4.54. Sandy’s Concept – Unit area approach
The interviewer asked her what motivated her to shift from obtaining the area
measure of 5 to conjecturing the . She explained that she visualized how she could put
different parts together with the help of the manipulative. She further argued that
although the non-special cases were more difficult to see, they were essentially the same
as the special case she showed in Figure 17. In fact, the connection between the random
cases and the special case was not explicit until the interviewer asked her to illustrate the
replication for other cases. It was plausible to explain the transition by this connection; it
was more likely an insight for which she later found an explanation.
Case Analysis
What stages of mathematical conceptual development were exhibited in Sandy’s
problem solving activities in terms of Vygotsky’s theory?
Table 4.19 provides an overview of the concept stages revealed in each problem
solving episode described in this chapter.

169
Problem Total time Concept stages Compare Areas 7’21” (3.1.2) Potential Concept – Formula (rectangle)
(2.1.1.3) Surface Association Complex – Formula (triangle, circle)
Compare Triangles
28’03” 1. (1.1) Heap – NM 2. (2.1.1.1) Surface Association Complex – NM 3. (2.1.1.3) Surface Association Complex – Formula (triangle) 4. (2.4.1) Pseudo-concept Complex - NM 5. (3.2.3) Concept –Formula (triangle) 6. (2.4.4) Pseudo-concept Complex – Formula (triangle)
Shaded Triangle 26’47” 1. (2.1.1.2) Surface Association Complex – UA (triangle) 2. (2.1.1.3) Surface Association Complex – Formula (triangle) 3. (3.2.2) Concept – UA (triangle)
Estimate Region 7’26” 1. (3.2.2) Concept – UA (rectangle, triangle) Intersected Area 19’09” 1. (2.1.1.3) Surface Association Complex – Formula
2. (3.1.2) Potential Concept – Formula (rectangle, triangle) 3. (3.2.2) Concept – UA
Table 4.19. Overview of Sandy’s concept stages
Sandy exhibited Concept level understanding for unit area and a relatively lower
level of understanding for non-measurement and formula. Different from Shana who only
had Concept level understanding for rectangles, Sandy had a Concept level understanding
of unit area for rectangles, triangles, and irregular shapes. When she operated with unit
areas, she could effectively solve the problem unless she made a procedural mistake (i.e.
in Problem 3).
Sandy’s understanding of triangle area formula changed from Surface Association
to Pseudo-concept Complex after the interviewer provided her the formula at the end of
the second problem solving episode (Problem 2). She was able to perform concept-like
generalization with the formula, but was unable to connect concrete and abstract
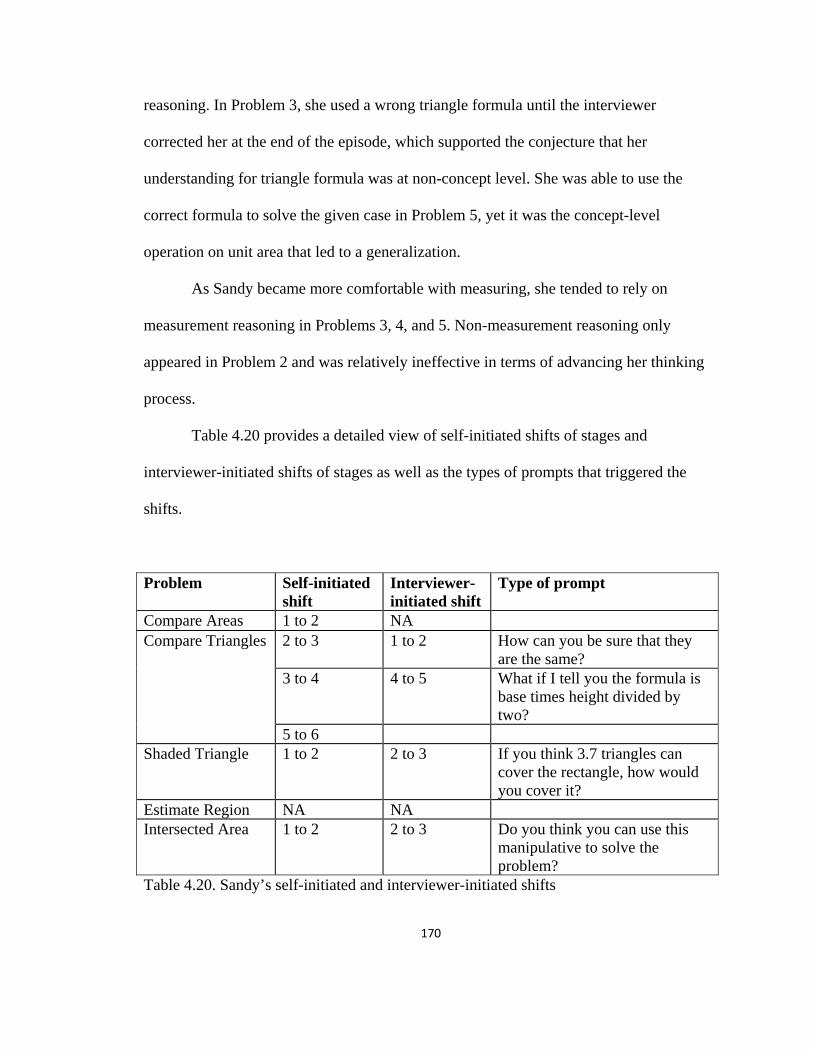
170
reasoning. In Problem 3, she used a wrong triangle formula until the interviewer
corrected her at the end of the episode, which supported the conjecture that her
understanding for triangle formula was at non-concept level. She was able to use the
correct formula to solve the given case in Problem 5, yet it was the concept-level
operation on unit area that led to a generalization.
As Sandy became more comfortable with measuring, she tended to rely on
measurement reasoning in Problems 3, 4, and 5. Non-measurement reasoning only
appeared in Problem 2 and was relatively ineffective in terms of advancing her thinking
process.
Table 4.20 provides a detailed view of self-initiated shifts of stages and
interviewer-initiated shifts of stages as well as the types of prompts that triggered the
shifts.
Problem Self-initiated
shift Interviewer-initiated shift
Type of prompt
Compare Areas 1 to 2 NA Compare Triangles 2 to 3 1 to 2 How can you be sure that they
are the same? 3 to 4 4 to 5 What if I tell you the formula is
base times height divided by two?
5 to 6 Shaded Triangle 1 to 2 2 to 3 If you think 3.7 triangles can
cover the rectangle, how would you cover it?
Estimate Region NA NA Intersected Area 1 to 2 2 to 3 Do you think you can use this
manipulative to solve the problem?
Table 4.20. Sandy’s self-initiated and interviewer-initiated shifts
171
Sandy had relatively more self-initiated shifts in her interview episodes. She had
advanced monitoring and control of strategies behaviors to evaluate the effectiveness of
an approach and tried to improve it when she could. She tended to self-initiate a shift to a
formula stage when she could not proceed with, or needed to test the current approach.
The only occasion she shifted from a formula stage to a non-measurement stage was
when she was aware that she was working with a wrong area formula (Surface
Association Complex - Formula) in Problem 3. With the exception of Problem 1 where
she was restricted by the formula approach, she exhibited a high level of intra-strategy
flexibility and tended to switch between stages pertaining to different components (non-
measurement, unit area, and formula).
The types of prompts the researcher used in Sandy’s case were, for the most part,
different from the ones used in case of other participants because she tended to regularly
monitor precision and alternative approaches herself. Two of the prompts introduced new
information which triggered Concept level operations that were not built on her previous
work. The prompt in Problem 3 indirectly led to her Concept level operation, since she
went through a visualization and chose to not respond to the prompt but restart an
approach.
What types of metacognitive behaviors are utilized by Sandy when solving non-routine
problems?
The following types of metacognitive behaviors were observed in Sandy’s
problem solving episodes.
1.1.1.1.a. intra-person monitoring and control. Sandy was reluctant to try an approach or
to show her work when she had doubts regarding their accuracy. She usually addressed

172
that she was “not sure,” did not know “how to do,” or “could only do it this way;” the
self-assessment was mostly accurate yet tended to be conservative. Her intra-person
monitoring and control was the strongest in Problem 1, where she was cautious about
generalizing based on visual clues, or using any approach what she recognized as limited.
In later episodes, as she became more comfortable with executing tentative approaches
and was less influenced by her desire to “solve a problem real quick.” She exhibited
sophisticated monitoring and control of strategies behaviors to modify and switch
between approaches. Both mistakes and insights were observed when her intra-person
monitoring and control was less dominant.
1.1.1.2. regulation of task knowledge. Sandy exhibited regulation of task knowledge in
Problems 1, 2, 3, and 4. In Problems 1 and 4, she clarified with the demands on
measurement prior to determining strategy applicability. In Problems 2 and 3, she
explained explicitly her choice of approaches by stating the task demands. Although she
addressed the task demands in an uncertain way, this orientation might be due to her style
of intra-person monitoring and control.
1.1.2.2.a. regulation of task objectives. Sandy tended to not address task objectives out
loud. Her regulation of task elements were mostly reflected in her approaches. She was
able to capture most of the task objectives except the 2:1 ratio or missing measurement in
Problem 3 and the “range of possible areas” in Problem 5.
1.1.1.3. monitoring and control of strategies. Three features characterized Sandy’s
monitoring and control of strategies. First she exhibited flexibility within an approach
where she tended to work on an “easier” situation, skipping the situations that she
considered as more difficult. Indeed, she avoided complex situations unless she was
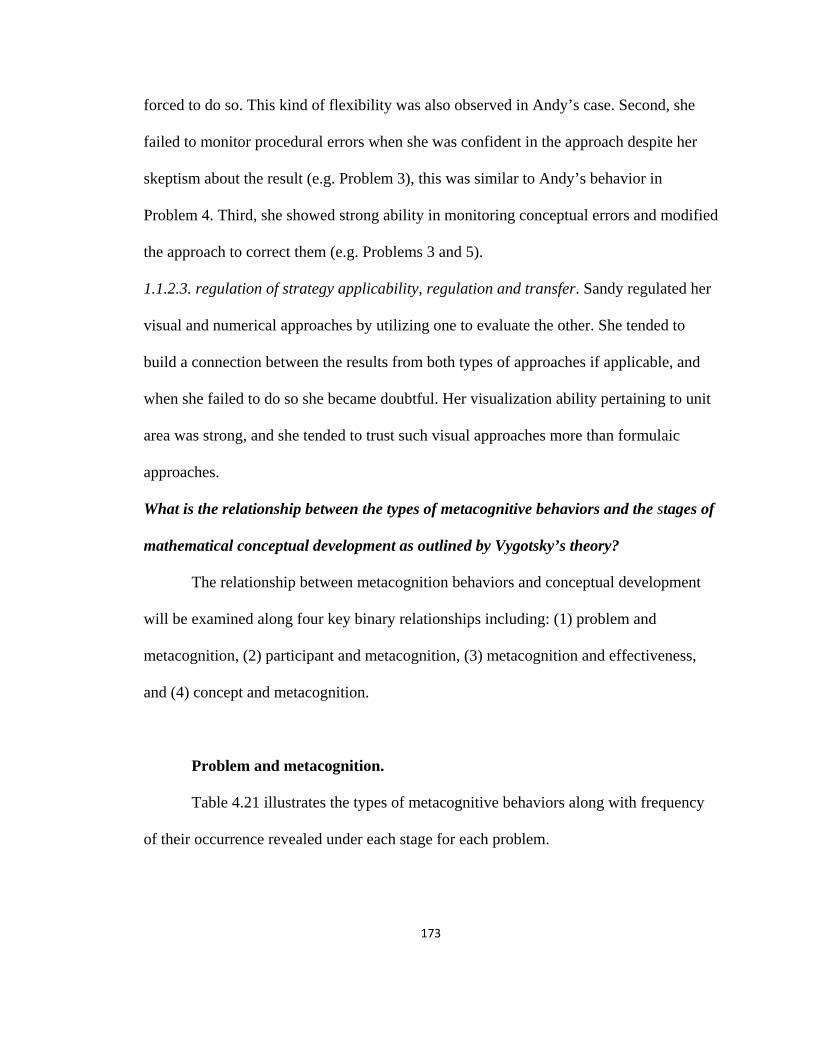
173
forced to do so. This kind of flexibility was also observed in Andy’s case. Second, she
failed to monitor procedural errors when she was confident in the approach despite her
skeptism about the result (e.g. Problem 3), this was similar to Andy’s behavior in
Problem 4. Third, she showed strong ability in monitoring conceptual errors and modified
the approach to correct them (e.g. Problems 3 and 5).
1.1.2.3. regulation of strategy applicability, regulation and transfer. Sandy regulated her
visual and numerical approaches by utilizing one to evaluate the other. She tended to
build a connection between the results from both types of approaches if applicable, and
when she failed to do so she became doubtful. Her visualization ability pertaining to unit
area was strong, and she tended to trust such visual approaches more than formulaic
approaches.
What is the relationship between the types of metacognitive behaviors and the stages of
mathematical conceptual development as outlined by Vygotsky’s theory?
The relationship between metacognition behaviors and conceptual development
will be examined along four key binary relationships including: (1) problem and
metacognition, (2) participant and metacognition, (3) metacognition and effectiveness,
and (4) concept and metacognition.
Problem and metacognition.
Table 4.21 illustrates the types of metacognitive behaviors along with frequency
of their occurrence revealed under each stage for each problem.

174
Problem Concept stages Metacognitive behaviors Frequency Compare Areas
pre-problem regulation of task knowledge 1 regulation of task objectives 1 regulation of strategy applicability, regulation and transfer
1
(3.1.2) Potential Concept – Formula
intra-person monitoring and control
1
regulation of task knowledge 1
(2.1.1.3) Surface Association Complex – Formula
intra-person monitoring and control
2
monitoring and control of strategies
1
Compare Triangles
(1.1) Heap – NM intra-person monitoring and control
1
monitoring and control of strategies
2
(2.1.1.1) Surface Association Complex – NM
regulation of task knowledge 1 monitoring and control of strategies
1
(2.1.1.3) Surface Association Complex – Formula
intra-person monitoring and control
2
(2.4.1) Pseudo-concept Complex - NM
intra-person monitoring and control
1
monitoring and control of strategies
1
(3.2.3) Concept –Formula intra-person monitoring and control
1
monitoring and control of strategies
1
regulation of strategy applicability, regulation and transfer
1
(2.4.4) Pseudo-concept Complex – Formula
intra-person monitoring and control
1
Continued
Table 4.21. Sandy’s types of metacognitive behaviors along with frequency of their occurrence revealed under each stage for each problem
175
Table 4.21 continued Shaded Triangle
(2.1.1.2) Surface Association Complex – UA
regulation of task objectives 1 monitoring and control of strategies
2
(2.1.1.3) Surface Association Complex – Formula
intra-person monitoring and control
1
regulation of task knowledge 1 monitoring and control of strategies
4
regulation of strategy applicability, regulation and transfer
2
(3.2.2) Concept – UA monitoring and control of strategies
2
regulation of strategy applicability, regulation and transfer
3
Estimate Region
pre-problem regulation of task knowledge 1 (3.2.2) Concept – UA intra-person monitoring and
control 1
monitoring and control of strategies
6
Intersected Area
pre-problem regulation of task objectives 1 (2.1.1.3) Surface Association Complex – Formula
intra-person monitoring and control
1
monitoring and control of strategies
4
regulation of strategy applicability, regulation and transfer
1
(3.1.2) Potential Concept – Formula
regulation of task objectives 1 monitoring and control of strategies
2
(3.2.2) Concept – UA monitoring and control of strategies
3
regulation of strategy applicability, regulation and transfer
1
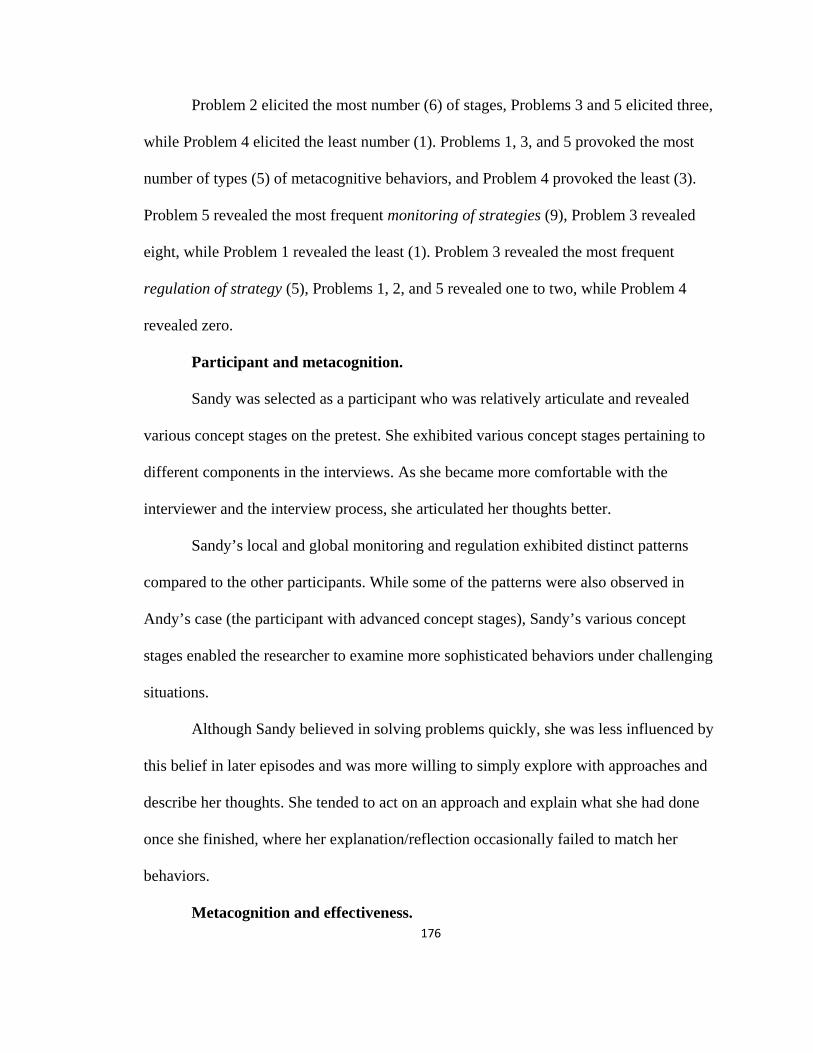
176
Problem 2 elicited the most number (6) of stages, Problems 3 and 5 elicited three,
while Problem 4 elicited the least number (1). Problems 1, 3, and 5 provoked the most
number of types (5) of metacognitive behaviors, and Problem 4 provoked the least (3).
Problem 5 revealed the most frequent monitoring of strategies (9), Problem 3 revealed
eight, while Problem 1 revealed the least (1). Problem 3 revealed the most frequent
regulation of strategy (5), Problems 1, 2, and 5 revealed one to two, while Problem 4
revealed zero.
Participant and metacognition.
Sandy was selected as a participant who was relatively articulate and revealed
various concept stages on the pretest. She exhibited various concept stages pertaining to
different components in the interviews. As she became more comfortable with the
interviewer and the interview process, she articulated her thoughts better.
Sandy’s local and global monitoring and regulation exhibited distinct patterns
compared to the other participants. While some of the patterns were also observed in
Andy’s case (the participant with advanced concept stages), Sandy’s various concept
stages enabled the researcher to examine more sophisticated behaviors under challenging
situations.
Although Sandy believed in solving problems quickly, she was less influenced by
this belief in later episodes and was more willing to simply explore with approaches and
describe her thoughts. She tended to act on an approach and explain what she had done
once she finished, where her explanation/reflection occasionally failed to match her
behaviors.
Metacognition and effectiveness.
177
The effectiveness of Sandy’s five types of metacognitive behaviors will be
analyzed in this section.
Table 4.22 summarizes the functions and consequences of the 12 occasions of
intra-person monitoring and control.
Number of times Function Consequence 6 Self-knowledge supports self-
regulation Monitored what she knew or didn’t know.
4 Self-awareness supports self-regulation
Monitored what she wasn’t sure about.
1 Self-monitoring Reported whether being convinced.
1 Regulation influenced by attributional beliefs
Self-monitoring influenced by belief of quick problem solving
Table 4.22. Sandy’s functions and consequences of intra-person monitoring and control
The first two types of functions made sure that she only implemented approaches
that she was sure of and were effective in terms of monitoring her confidence in the
approaches. These two functions were mostly observed in the first two episodes (seven
out of ten), where she was overly-cautious about making mistakes. As a result of this
effect, her monitoring of strategies and regulation of strategy were suppressed in the first
two episodes and mostly observed in the latter three. The occasion of the self-monitoring
function enabled the interviewer to differentiate her Pseudo-concept Complex - Formula
understanding in Problem 2, without which it would have been highly difficult to detect
the disconnect between her concrete and abstract reasoning provided the generalization
she conducted. The last function was only observed in Problem 1, which enabled her to
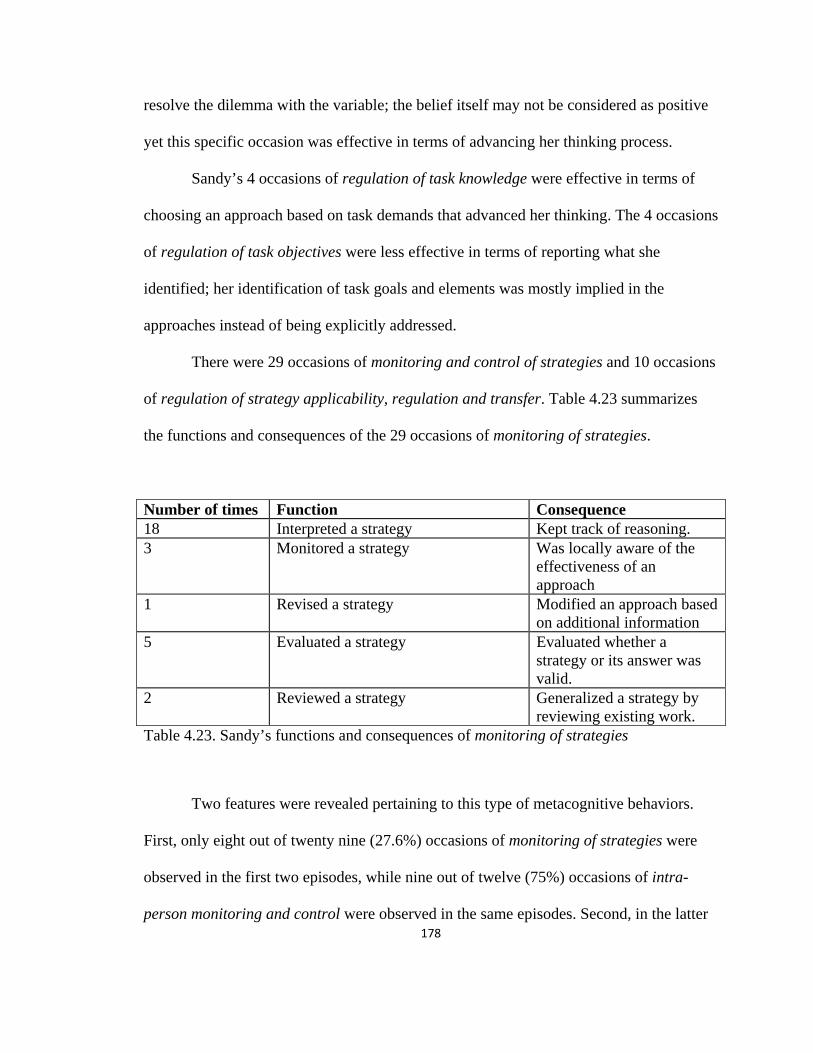
178
resolve the dilemma with the variable; the belief itself may not be considered as positive
yet this specific occasion was effective in terms of advancing her thinking process.
Sandy’s 4 occasions of regulation of task knowledge were effective in terms of
choosing an approach based on task demands that advanced her thinking. The 4 occasions
of regulation of task objectives were less effective in terms of reporting what she
identified; her identification of task goals and elements was mostly implied in the
approaches instead of being explicitly addressed.
There were 29 occasions of monitoring and control of strategies and 10 occasions
of regulation of strategy applicability, regulation and transfer. Table 4.23 summarizes
the functions and consequences of the 29 occasions of monitoring of strategies.
Number of times Function Consequence 18 Interpreted a strategy Kept track of reasoning. 3 Monitored a strategy Was locally aware of the
effectiveness of an approach
1 Revised a strategy Modified an approach based on additional information
5 Evaluated a strategy Evaluated whether a strategy or its answer was valid.
2 Reviewed a strategy Generalized a strategy by reviewing existing work.
Table 4.23. Sandy’s functions and consequences of monitoring of strategies
Two features were revealed pertaining to this type of metacognitive behaviors.
First, only eight out of twenty nine (27.6%) occasions of monitoring of strategies were
observed in the first two episodes, while nine out of twelve (75%) occasions of intra-
person monitoring and control were observed in the same episodes. Second, in the latter
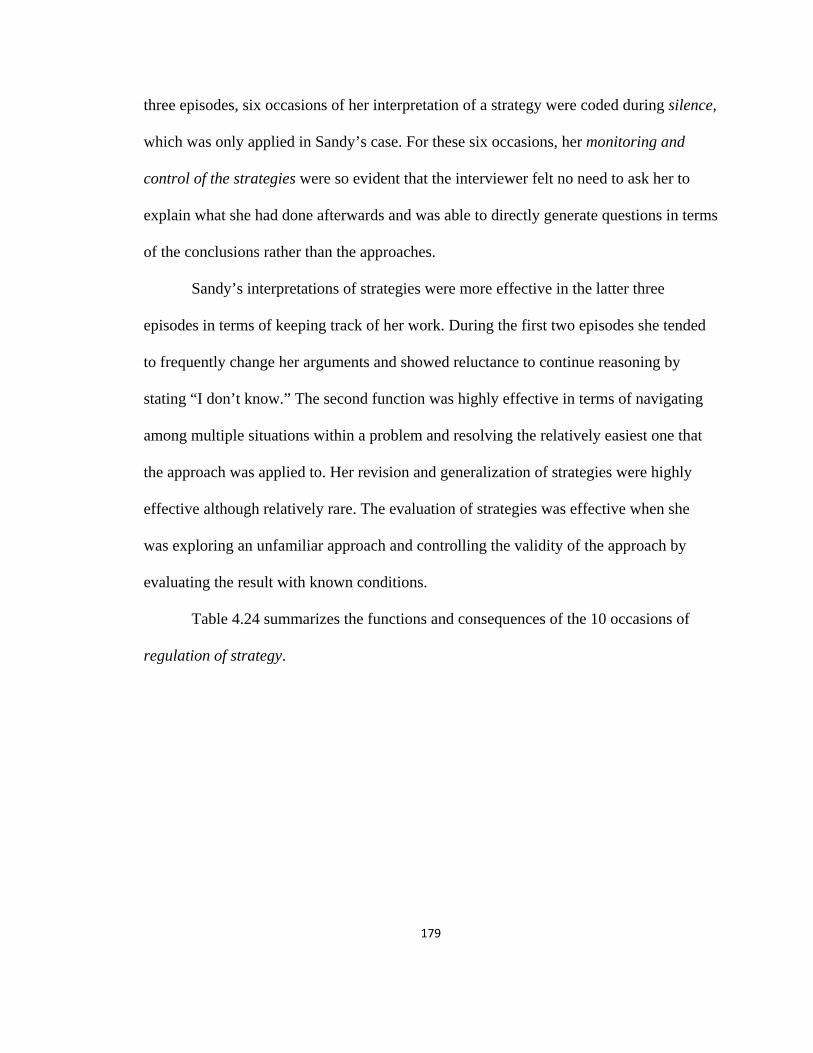
179
three episodes, six occasions of her interpretation of a strategy were coded during silence,
which was only applied in Sandy’s case. For these six occasions, her monitoring and
control of the strategies were so evident that the interviewer felt no need to ask her to
explain what she had done afterwards and was able to directly generate questions in terms
of the conclusions rather than the approaches.
Sandy’s interpretations of strategies were more effective in the latter three
episodes in terms of keeping track of her work. During the first two episodes she tended
to frequently change her arguments and showed reluctance to continue reasoning by
stating “I don’t know.” The second function was highly effective in terms of navigating
among multiple situations within a problem and resolving the relatively easiest one that
the approach was applied to. Her revision and generalization of strategies were highly
effective although relatively rare. The evaluation of strategies was effective when she
was exploring an unfamiliar approach and controlling the validity of the approach by
evaluating the result with known conditions.
Table 4.24 summarizes the functions and consequences of the 10 occasions of
regulation of strategy.
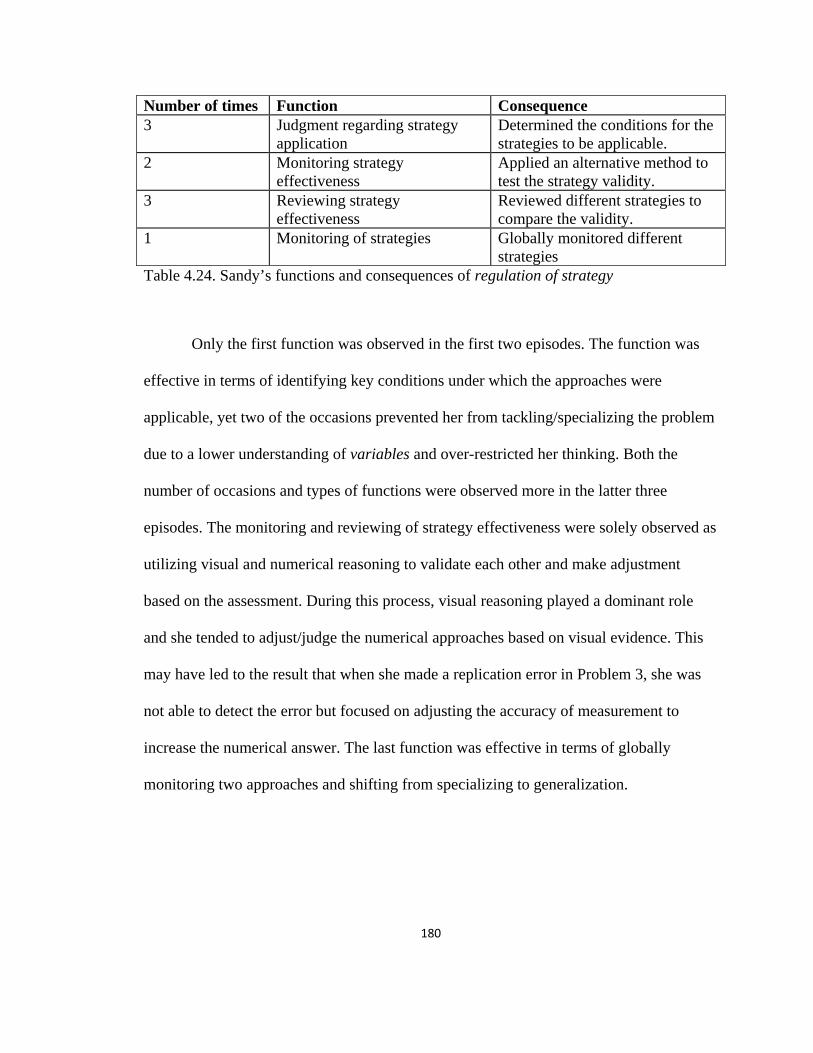
180
Number of times Function Consequence 3 Judgment regarding strategy
application Determined the conditions for the strategies to be applicable.
2 Monitoring strategy effectiveness
Applied an alternative method to test the strategy validity.
3 Reviewing strategy effectiveness
Reviewed different strategies to compare the validity.
1 Monitoring of strategies Globally monitored different strategies
Table 4.24. Sandy’s functions and consequences of regulation of strategy
Only the first function was observed in the first two episodes. The function was
effective in terms of identifying key conditions under which the approaches were
applicable, yet two of the occasions prevented her from tackling/specializing the problem
due to a lower understanding of variables and over-restricted her thinking. Both the
number of occasions and types of functions were observed more in the latter three
episodes. The monitoring and reviewing of strategy effectiveness were solely observed as
utilizing visual and numerical reasoning to validate each other and make adjustment
based on the assessment. During this process, visual reasoning played a dominant role
and she tended to adjust/judge the numerical approaches based on visual evidence. This
may have led to the result that when she made a replication error in Problem 3, she was
not able to detect the error but focused on adjusting the accuracy of measurement to
increase the numerical answer. The last function was effective in terms of globally
monitoring two approaches and shifting from specializing to generalization.
181
Concept and metacognition.
In this section, the relationship between concept stages and metacognitive
behaviors along with their frequency will be analyzed. Table 4.25 summarizes the types
of metacognitive behaviors with their frequency observed on each stage.
Stage Metacognitive behaviors Frequency(1.1) Heap – NM intra-person monitoring and control 1
monitoring and control of strategies 2 (2.1.1.1) Surface Association Complex – NM
regulation of task knowledge 1 monitoring and control of strategies 1
(2.1.1.2) Surface Association Complex – UA
regulation of task objectives 1 monitoring and control of strategies 2
(2.1.1.3) Surface Association Complex – Formula
intra-person monitoring and control 6 regulation of task knowledge 1 monitoring and control of strategies 9 regulation of strategy applicability, regulation and transfer
3
(2.4.1) Pseudo-concept complex – NM
intra-person monitoring and control 2 monitoring and control of task knowledge
1
monitoring and control of strategies 3 (2.4.4) Pseudo-concept Complex – Formula
intra-person monitoring and control 1 monitoring and control of strategies 1
(3.1.2) Potential Concept – Formula intra-person monitoring and control 1 regulation of task objectives 1 monitoring and control of task knowledge
3
(3.2.2) Concept – UA intra-person monitoring and control 1 monitoring and control of strategies 11 regulation of strategy applicability, regulation and transfer
4
(3.2.3) Concept –Formula intra-person monitoring and control 1 monitoring and control of strategies 1 regulation of strategy applicability, regulation and transfer
1
Table 4.25. Sandy’s types of metacognitive behaviors with their frequency observed on each stage
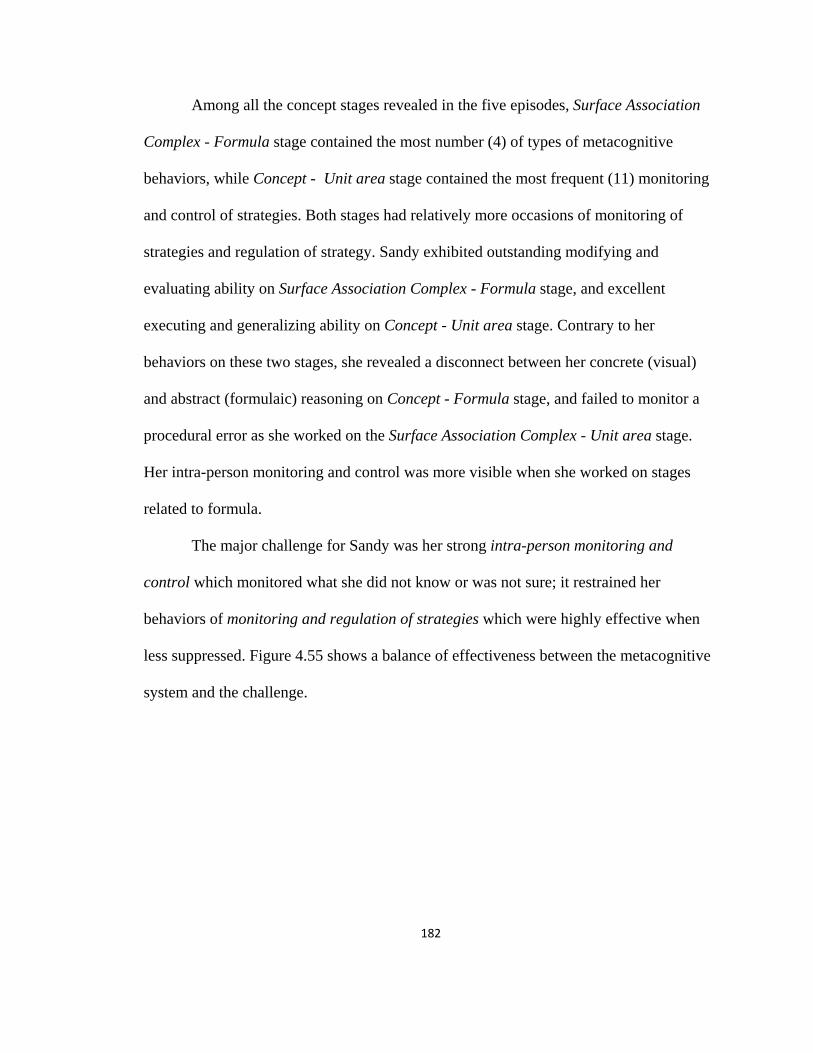
182
Among all the concept stages revealed in the five episodes, Surface Association
Complex - Formula stage contained the most number (4) of types of metacognitive
behaviors, while Concept - Unit area stage contained the most frequent (11) monitoring
and control of strategies. Both stages had relatively more occasions of monitoring of
strategies and regulation of strategy. Sandy exhibited outstanding modifying and
evaluating ability on Surface Association Complex - Formula stage, and excellent
executing and generalizing ability on Concept - Unit area stage. Contrary to her
behaviors on these two stages, she revealed a disconnect between her concrete (visual)
and abstract (formulaic) reasoning on Concept - Formula stage, and failed to monitor a
procedural error as she worked on the Surface Association Complex - Unit area stage.
Her intra-person monitoring and control was more visible when she worked on stages
related to formula.
The major challenge for Sandy was her strong intra-person monitoring and
control which monitored what she did not know or was not sure; it restrained her
behaviors of monitoring and regulation of strategies which were highly effective when
less suppressed. Figure 4.55 shows a balance of effectiveness between the metacognitive
system and the challenge.
183
Figure 4.55. Sandy’s balance of effectiveness between the metacognitive system and the challenge
The Case of Ivan
A. Ivan’s background
Ivan’s career goal is to pursue either game design or engineering. He thinks
mathematics is useful in both professions. His favorite subjects are social studies and
science. He likes learning about history and enjoys mixing chemicals. Mathematics is not
his favorite subject but he doesn’t hate it. He considers himself not as good as his friends
in mathematics since they are enrolled in advanced mathematics classes. He associated
being good at mathematics to the ability to do programming or to study calculus.
He likes algebraic equations and enjoys doing familiar problems. He feels
mathematics could be hard or easy, or mildly challenging. He enjoys what he does in
class, although sometimes things are a little difficult for him to understand.
challenge metacognitive system
intra-person monitoring and control which
monitored what she did not know or was not sure
Advanced monitoring and
control of strategies and regulation of
strategy: modifying, evaluating,
executing, and generalizing
strategies
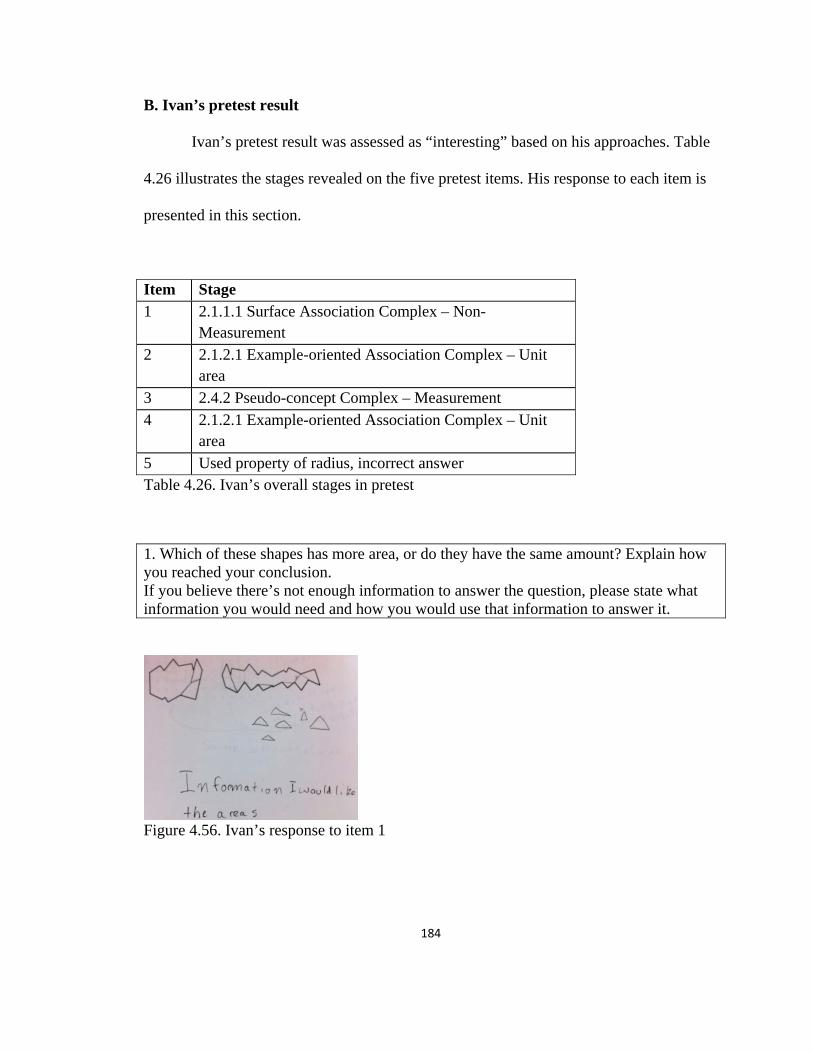
184
B. Ivan’s pretest result
Ivan’s pretest result was assessed as “interesting” based on his approaches. Table
4.26 illustrates the stages revealed on the five pretest items. His response to each item is
presented in this section.
Item Stage 1 2.1.1.1 Surface Association Complex – Non-
Measurement
2 2.1.2.1 Example-oriented Association Complex – Unit area
3 2.4.2 Pseudo-concept Complex – Measurement
4 2.1.2.1 Example-oriented Association Complex – Unit area
5 Used property of radius, incorrect answer Table 4.26. Ivan’s overall stages in pretest
1. Which of these shapes has more area, or do they have the same amount? Explain how you reached your conclusion. If you believe there’s not enough information to answer the question, please state what information you would need and how you would use that information to answer it.
Figure 4.56. Ivan’s response to item 1
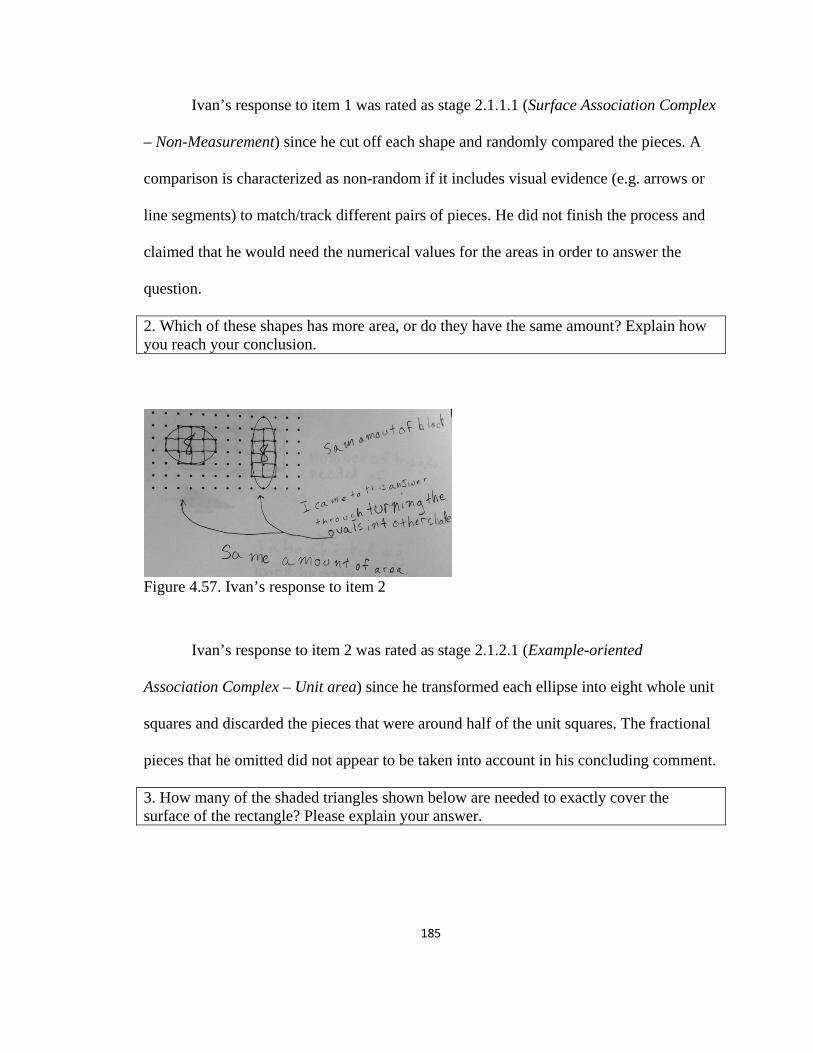
185
Ivan’s response to item 1 was rated as stage 2.1.1.1 (Surface Association Complex
– Non-Measurement) since he cut off each shape and randomly compared the pieces. A
comparison is characterized as non-random if it includes visual evidence (e.g. arrows or
line segments) to match/track different pairs of pieces. He did not finish the process and
claimed that he would need the numerical values for the areas in order to answer the
question.
2. Which of these shapes has more area, or do they have the same amount? Explain how you reach your conclusion.
Figure 4.57. Ivan’s response to item 2
Ivan’s response to item 2 was rated as stage 2.1.2.1 (Example-oriented
Association Complex – Unit area) since he transformed each ellipse into eight whole unit
squares and discarded the pieces that were around half of the unit squares. The fractional
pieces that he omitted did not appear to be taken into account in his concluding comment.
3. How many of the shaded triangles shown below are needed to exactly cover the surface of the rectangle? Please explain your answer.
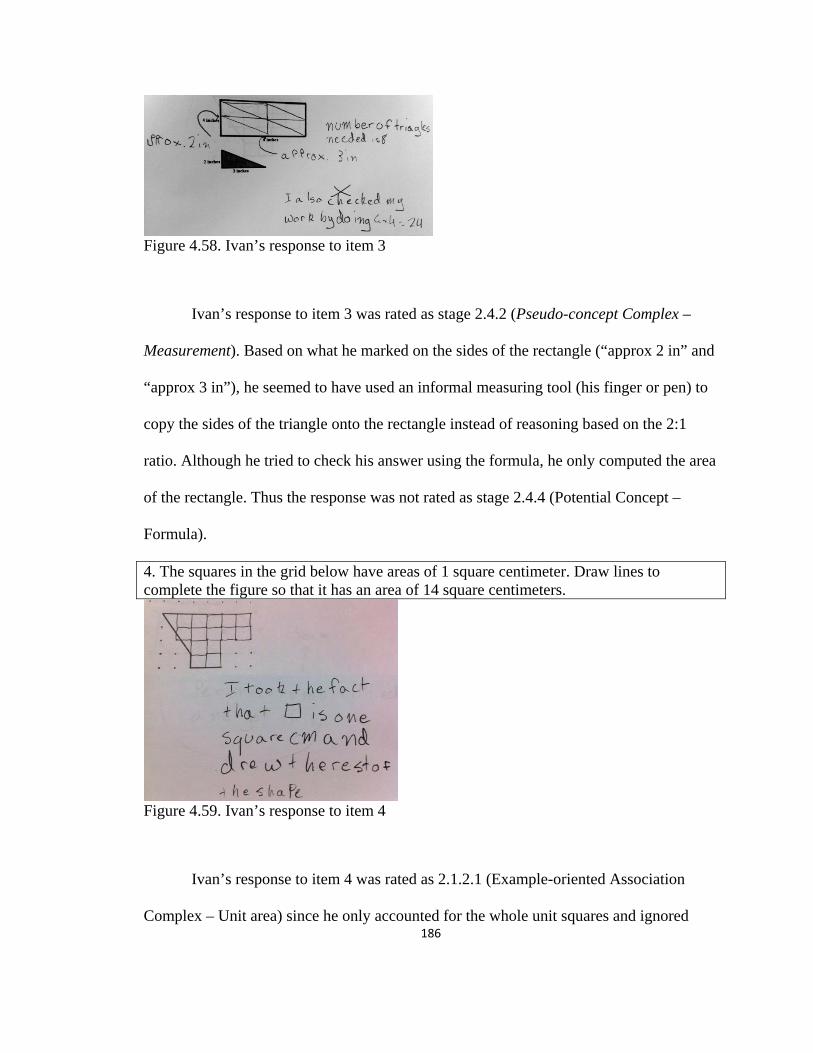
186
Figure 4.58. Ivan’s response to item 3
Ivan’s response to item 3 was rated as stage 2.4.2 (Pseudo-concept Complex –
Measurement). Based on what he marked on the sides of the rectangle (“approx 2 in” and
“approx 3 in”), he seemed to have used an informal measuring tool (his finger or pen) to
copy the sides of the triangle onto the rectangle instead of reasoning based on the 2:1
ratio. Although he tried to check his answer using the formula, he only computed the area
of the rectangle. Thus the response was not rated as stage 2.4.4 (Potential Concept –
Formula).
4. The squares in the grid below have areas of 1 square centimeter. Draw lines to complete the figure so that it has an area of 14 square centimeters.
Figure 4.59. Ivan’s response to item 4
Ivan’s response to item 4 was rated as 2.1.2.1 (Example-oriented Association
Complex – Unit area) since he only accounted for the whole unit squares and ignored
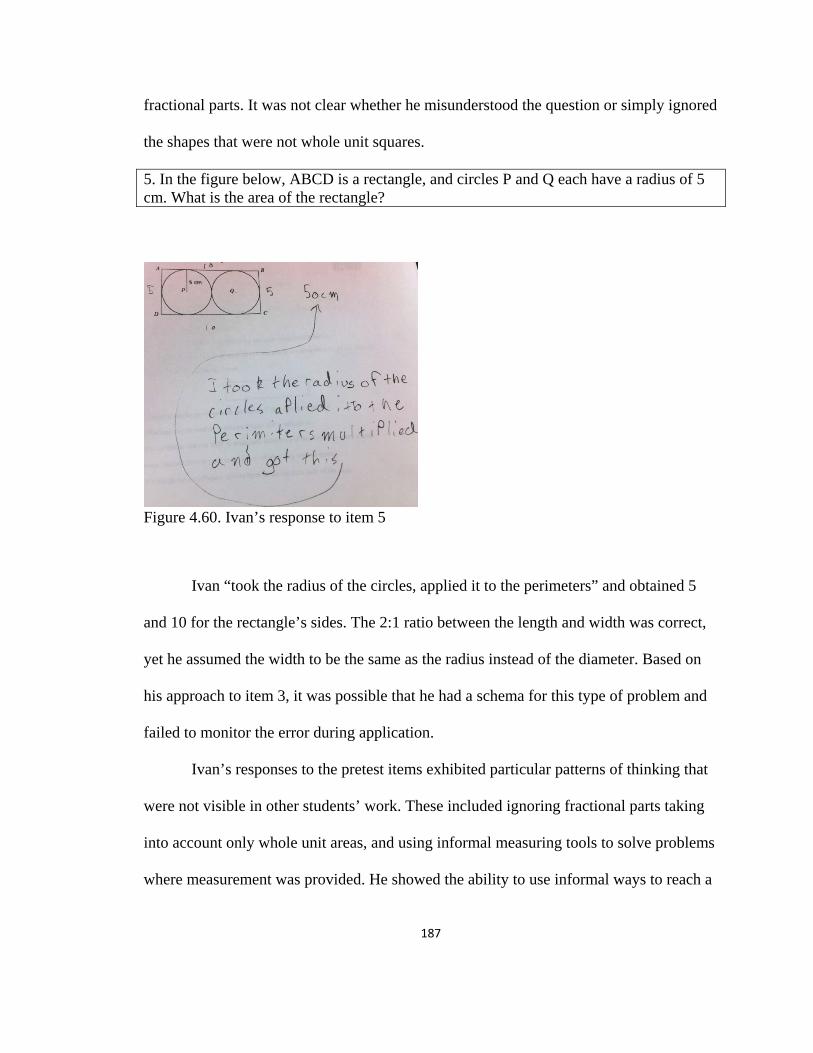
187
fractional parts. It was not clear whether he misunderstood the question or simply ignored
the shapes that were not whole unit squares.
5. In the figure below, ABCD is a rectangle, and circles P and Q each have a radius of 5 cm. What is the area of the rectangle?
Figure 4.60. Ivan’s response to item 5
Ivan “took the radius of the circles, applied it to the perimeters” and obtained 5
and 10 for the rectangle’s sides. The 2:1 ratio between the length and width was correct,
yet he assumed the width to be the same as the radius instead of the diameter. Based on
his approach to item 3, it was possible that he had a schema for this type of problem and
failed to monitor the error during application.
Ivan’s responses to the pretest items exhibited particular patterns of thinking that
were not visible in other students’ work. These included ignoring fractional parts taking
into account only whole unit areas, and using informal measuring tools to solve problems
where measurement was provided. He showed the ability to use informal ways to reach a
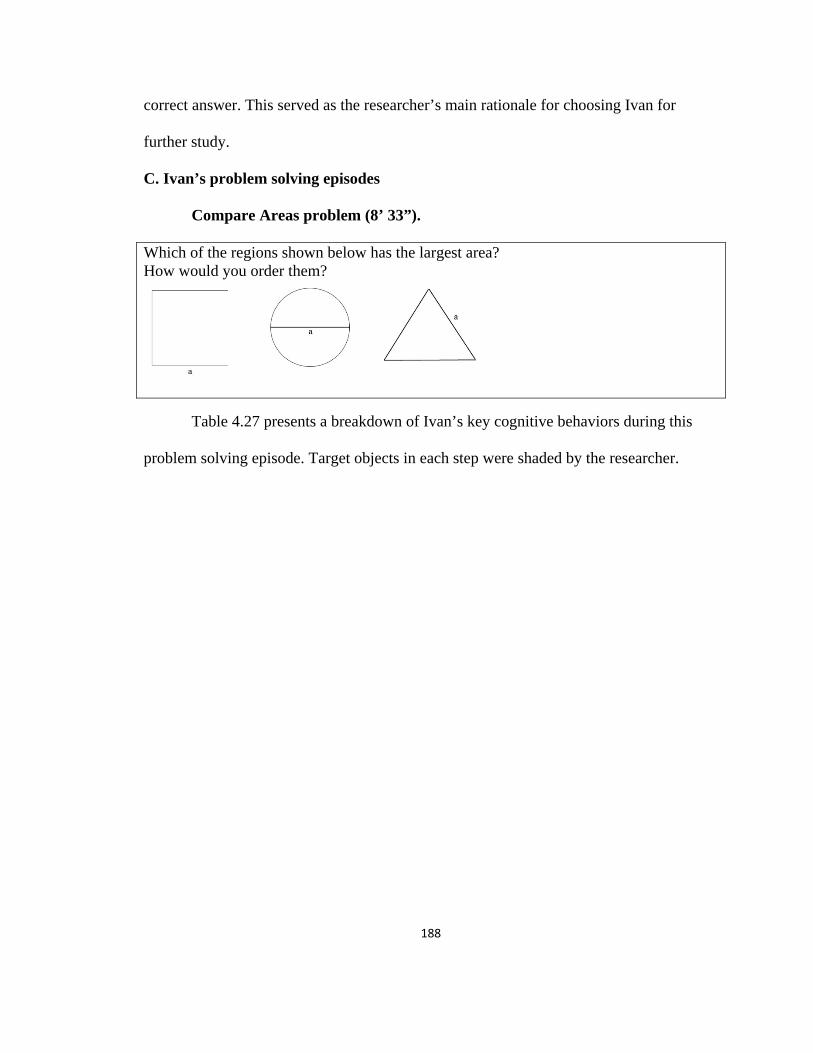
188
correct answer. This served as the researcher’s main rationale for choosing Ivan for
further study.
C. Ivan’s problem solving episodes
Compare Areas problem (8’ 33”).
Which of the regions shown below has the largest area? How would you order them?
Table 4.27 presents a breakdown of Ivan’s key cognitive behaviors during this
problem solving episode. Target objects in each step were shaded by the researcher.

189
Concept Stage Graphical illustration Description 1 Chain Complex
– Non-measurement
The circle could fit into the square.
2 Surface Association Complex – Non-measurement
The shaded area of the triangle made it almost the same as the circle’s area. Thus the square had the largest area, and the triangle and the circle had the same area.
3 Variables and equations
Set up the equation a=x. Found the value of a by solving the equation, which was measuring the sides and diameter in the picture with his thumb. The answer was a=5.
Table 4.27. Breakdown of Ivan’s key cognitive behaviors in the Compare Areas problem
Figure 4.61 shows the concept stages and metacognitive behaviors observed
during this interview episode. The type of reasoning process that Ivan used during this
entire episode changed as his interpretation of problem shifted. Hence, analysis of the
session was divided into two parts. The first part involved Chain Complex – Non-
measurement and Surface Association Complex – Non-measurement reasoning aiming to
compare the areas of the three shapes. The second part focused on finding the value of a,
which involved setting up an equation. The types of metacognitive behaviors Ivan
exhibited included intra-person monitoring and control (1.1.1.1.a), monitoring and
control of strategies (1.1.1.3), regulation of task objectives (1.1.2.2.a), regulation of task
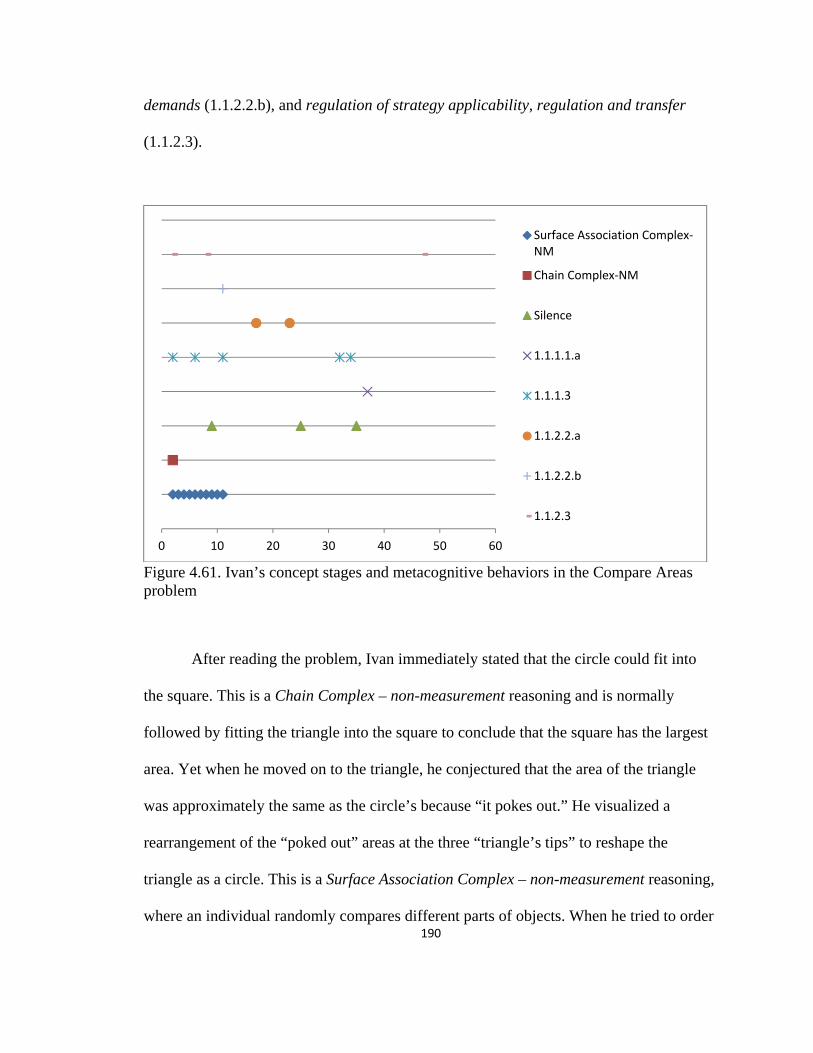
190
demands (1.1.2.2.b), and regulation of strategy applicability, regulation and transfer
(1.1.2.3).
Figure 4.61. Ivan’s concept stages and metacognitive behaviors in the Compare Areas problem
After reading the problem, Ivan immediately stated that the circle could fit into
the square. This is a Chain Complex – non-measurement reasoning and is normally
followed by fitting the triangle into the square to conclude that the square has the largest
area. Yet when he moved on to the triangle, he conjectured that the area of the triangle
was approximately the same as the circle’s because “it pokes out.” He visualized a
rearrangement of the “poked out” areas at the three “triangle’s tips” to reshape the
triangle as a circle. This is a Surface Association Complex – non-measurement reasoning,
where an individual randomly compares different parts of objects. When he tried to order
0 10 20 30 40 50 60
Surface Association Complex-NM
Chain Complex-NM
Silence
1.1.1.1.a
1.1.1.3
1.1.2.2.a
1.1.2.2.b
1.1.2.3
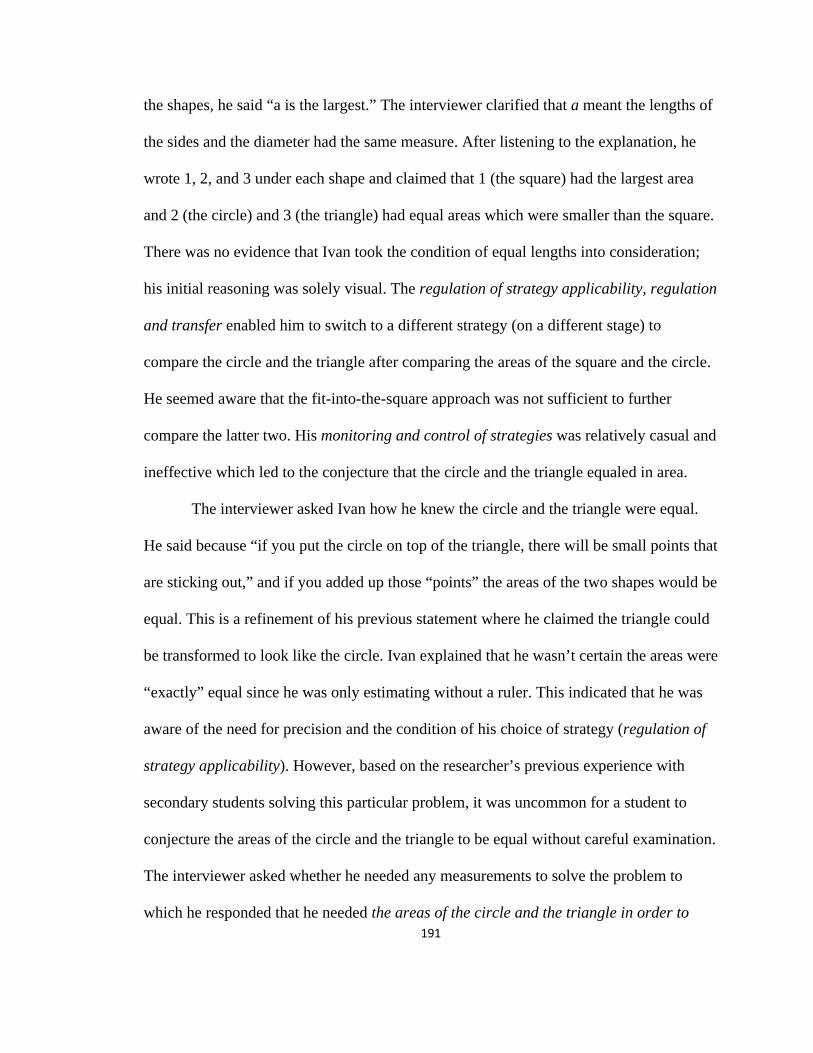
191
the shapes, he said “a is the largest.” The interviewer clarified that a meant the lengths of
the sides and the diameter had the same measure. After listening to the explanation, he
wrote 1, 2, and 3 under each shape and claimed that 1 (the square) had the largest area
and 2 (the circle) and 3 (the triangle) had equal areas which were smaller than the square.
There was no evidence that Ivan took the condition of equal lengths into consideration;
his initial reasoning was solely visual. The regulation of strategy applicability, regulation
and transfer enabled him to switch to a different strategy (on a different stage) to
compare the circle and the triangle after comparing the areas of the square and the circle.
He seemed aware that the fit-into-the-square approach was not sufficient to further
compare the latter two. His monitoring and control of strategies was relatively casual and
ineffective which led to the conjecture that the circle and the triangle equaled in area.
The interviewer asked Ivan how he knew the circle and the triangle were equal.
He said because “if you put the circle on top of the triangle, there will be small points that
are sticking out,” and if you added up those “points” the areas of the two shapes would be
equal. This is a refinement of his previous statement where he claimed the triangle could
be transformed to look like the circle. Ivan explained that he wasn’t certain the areas were
“exactly” equal since he was only estimating without a ruler. This indicated that he was
aware of the need for precision and the condition of his choice of strategy (regulation of
strategy applicability). However, based on the researcher’s previous experience with
secondary students solving this particular problem, it was uncommon for a student to
conjecture the areas of the circle and the triangle to be equal without careful examination.
The interviewer asked whether he needed any measurements to solve the problem to
which he responded that he needed the areas of the circle and the triangle in order to
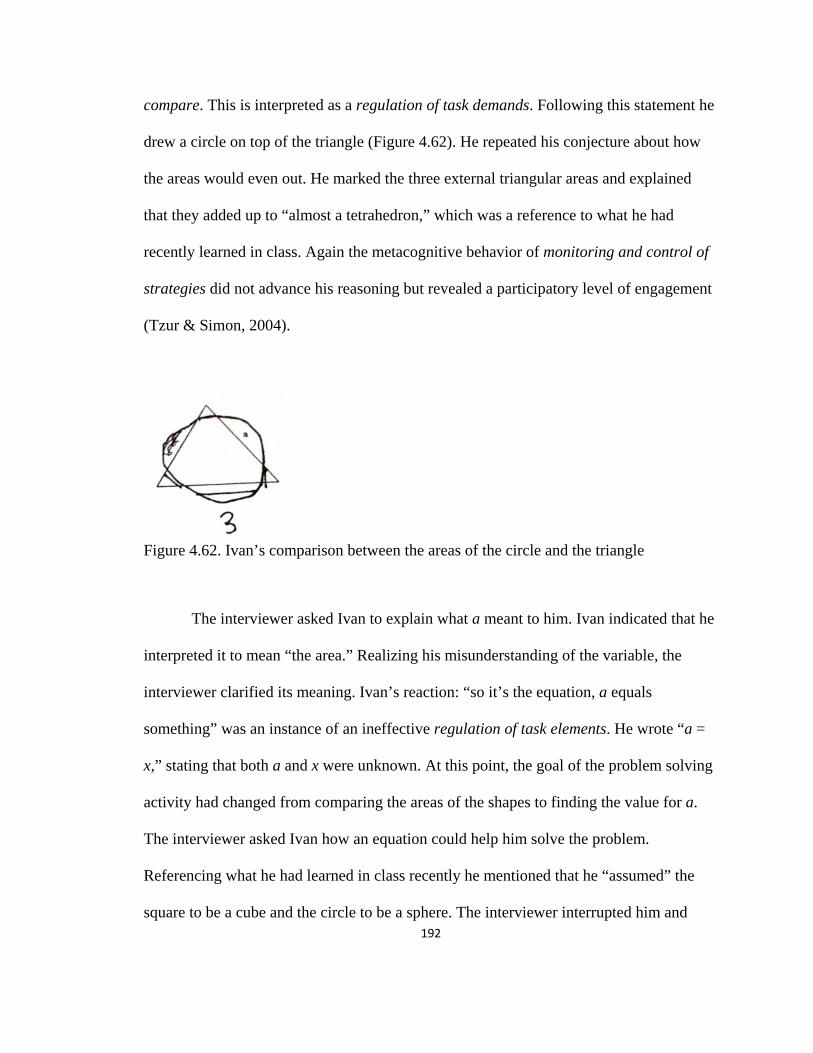
192
compare. This is interpreted as a regulation of task demands. Following this statement he
drew a circle on top of the triangle (Figure 4.62). He repeated his conjecture about how
the areas would even out. He marked the three external triangular areas and explained
that they added up to “almost a tetrahedron,” which was a reference to what he had
recently learned in class. Again the metacognitive behavior of monitoring and control of
strategies did not advance his reasoning but revealed a participatory level of engagement
(Tzur & Simon, 2004).
Figure 4.62. Ivan’s comparison between the areas of the circle and the triangle
The interviewer asked Ivan to explain what a meant to him. Ivan indicated that he
interpreted it to mean “the area.” Realizing his misunderstanding of the variable, the
interviewer clarified its meaning. Ivan’s reaction: “so it’s the equation, a equals
something” was an instance of an ineffective regulation of task elements. He wrote “a =
x,” stating that both a and x were unknown. At this point, the goal of the problem solving
activity had changed from comparing the areas of the shapes to finding the value for a.
The interviewer asked Ivan how an equation could help him solve the problem.
Referencing what he had learned in class recently he mentioned that he “assumed” the
square to be a cube and the circle to be a sphere. The interviewer interrupted him and

193
clarified that the figures were two dimensional. Then he explained that he was only
taught how to find the areas of three dimensional figures. It seemed that Ivan failed to
keep track of the goal of the problem after his attention was redirected to the meaning of
a’s.
Following this interaction, he decided to measure the sides using his thumb, and
concluded that it was “about an inch.” When he measured the circle, he said he
remembered the area formula involved the circumference and π but didn’t recall much
beyond that. After he measured the triangle’s side, he stated that the sides looked the
same. At this time he was completely unaware that the equality of lengths of the sides
and the diameter was a given condition. He wrote “a = 5” as his answer to the equation.
After he went back to the circle and computed the radius, he claimed that he finished the
problem, since he had determined the value of a (Figure 4.63).
Figure 4.63. Ivan’s equation approach to solve the variable
The interviewer asked whether he could determine the area for the triangle. He
answered that he could only compute the area of the square unless it was a three
dimensional figure (intra-person monitoring). He explained that by using Google Sketch
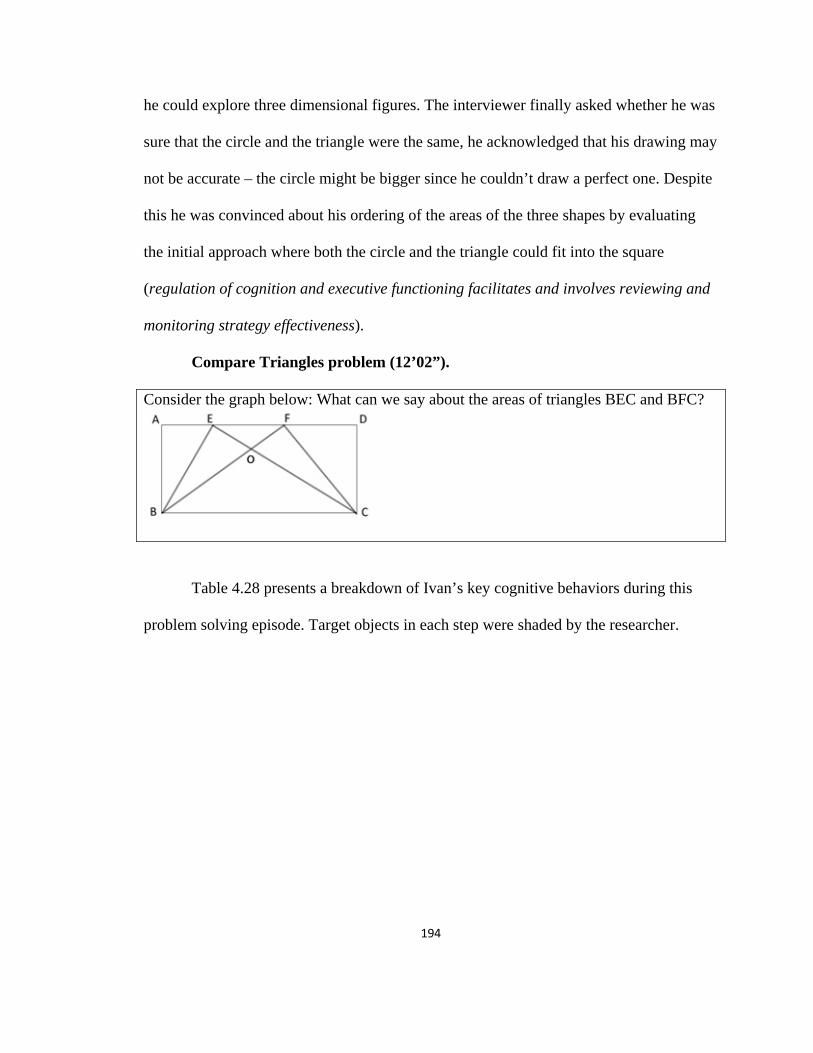
194
he could explore three dimensional figures. The interviewer finally asked whether he was
sure that the circle and the triangle were the same, he acknowledged that his drawing may
not be accurate – the circle might be bigger since he couldn’t draw a perfect one. Despite
this he was convinced about his ordering of the areas of the three shapes by evaluating
the initial approach where both the circle and the triangle could fit into the square
(regulation of cognition and executive functioning facilitates and involves reviewing and
monitoring strategy effectiveness).
Compare Triangles problem (12’02”).
Consider the graph below: What can we say about the areas of triangles BEC and BFC?
Table 4.28 presents a breakdown of Ivan’s key cognitive behaviors during this
problem solving episode. Target objects in each step were shaded by the researcher.
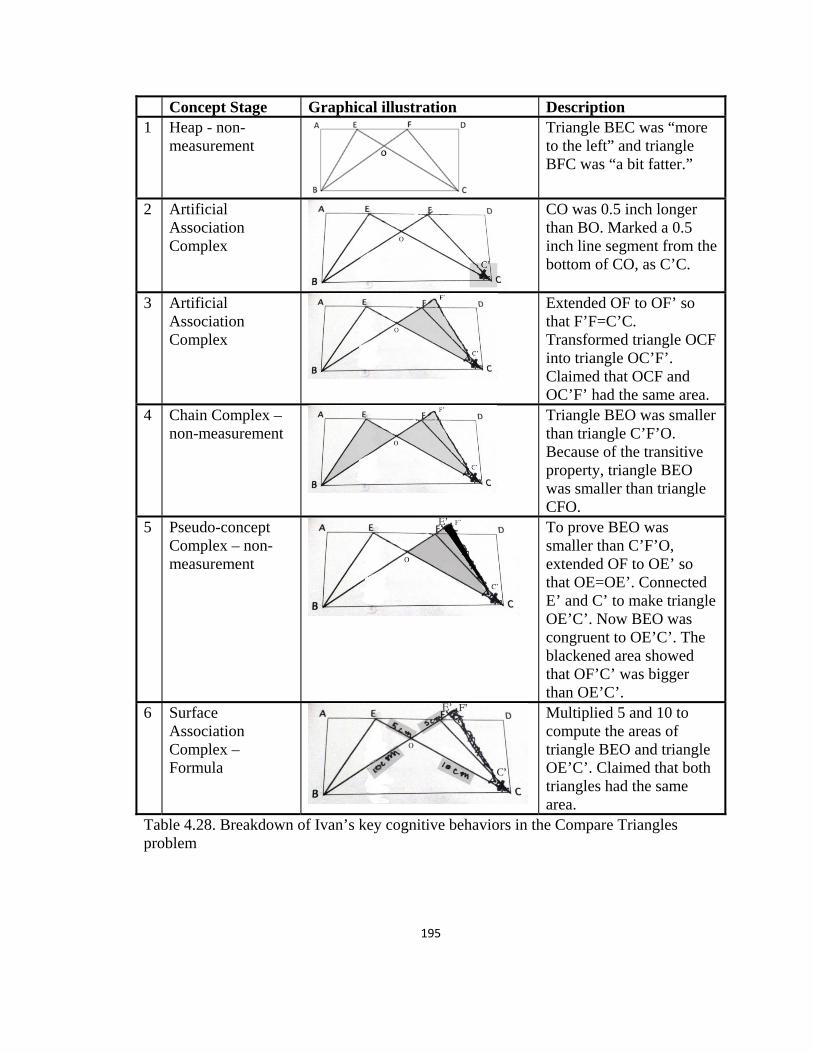
195
Concept Stage Graphical illustration Description 1 Heap - non-
measurement Triangle BEC was “more to the left” and triangle BFC was “a bit fatter.”
2 Artificial Association Complex
CO was 0.5 inch longer than BO. Marked a 0.5 inch line segment from the bottom of CO, as C’C.
3 Artificial Association Complex
Extended OF to OF’ so that F’F=C’C. Transformed triangle OCF into triangle OC’F’. Claimed that OCF and OC’F’ had the same area.
4 Chain Complex – non-measurement
Triangle BEO was smaller than triangle C’F’O. Because of the transitive property, triangle BEO was smaller than triangle CFO.
5 Pseudo-concept Complex – non-measurement
To prove BEO was smaller than C’F’O, extended OF to OE’ so that OE=OE’. Connected E’ and C’ to make triangle OE’C’. Now BEO was congruent to OE’C’. The blackened area showed that OF’C’ was bigger than OE’C’.
6 Surface Association Complex – Formula
Multiplied 5 and 10 to compute the areas of triangle BEO and triangle OE’C’. Claimed that both triangles had the same area.
Table 4.28. Breakdown of Ivan’s key cognitive behaviors in the Compare Triangles problem

196
Figure 4.64 shows the concept stages and metacognitive behaviors observed
during this interview episode. The problem solving process involved Heap - non-
measurement, where Ivan described the area by visual impression, Artificial Association
Complex, where he assumed that the area of a triangle would remain the same if the
length of one side was increased by the same amount as another was reduced, Chain
Complex – non-measurement, where he constructed a third object to compare the two
target shapes, Pseudo-concept Complex – non-measurement, where he compared two
triangles by constructing a congruent triangle without justifying the congruence, and
Surface Association Complex – Formula, where he computed the triangle area with a
wrong formula and using incorrect measurements. The types of metacognitive behaviors
Ivan exhibited included intra-person monitoring and control (1.1.1.1.a), monitoring and
control of strategies (1.1.1.3), regulation of task objectives (1.1.2.2.a), and regulation of
strategy applicability, regulation and transfer (1.1.2.3).
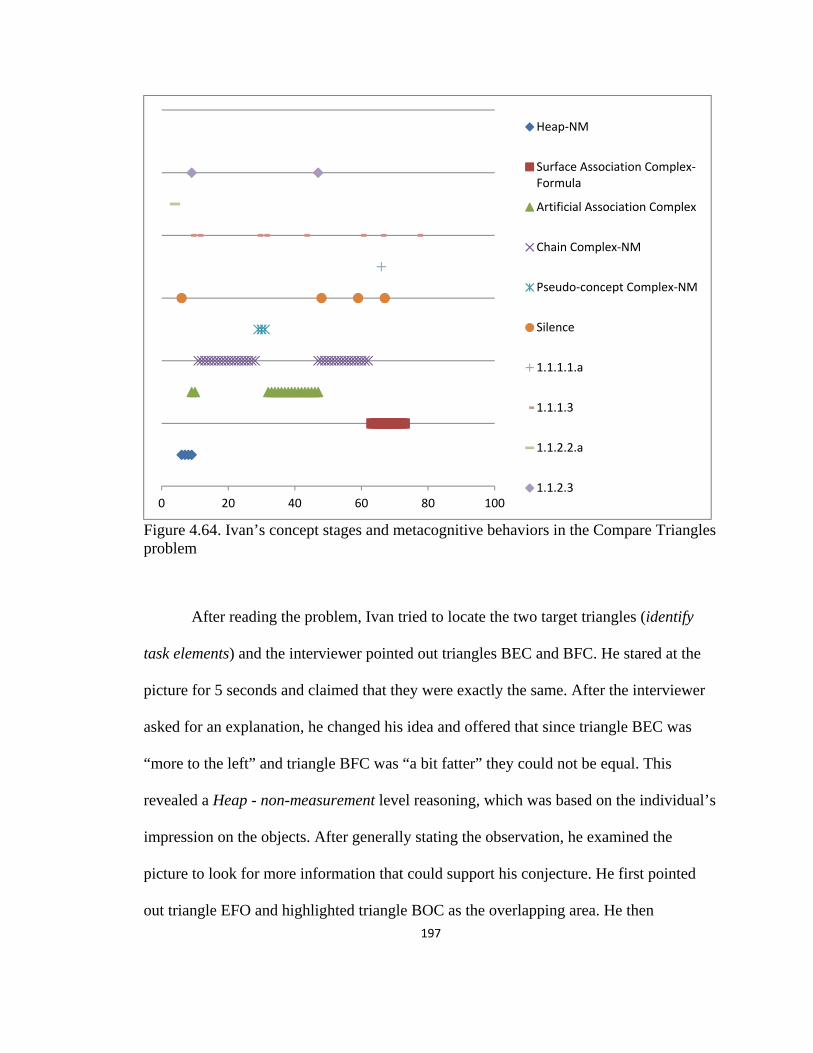
197
Figure 4.64. Ivan’s concept stages and metacognitive behaviors in the Compare Triangles problem
After reading the problem, Ivan tried to locate the two target triangles (identify
task elements) and the interviewer pointed out triangles BEC and BFC. He stared at the
picture for 5 seconds and claimed that they were exactly the same. After the interviewer
asked for an explanation, he changed his idea and offered that since triangle BEC was
“more to the left” and triangle BFC was “a bit fatter” they could not be equal. This
revealed a Heap - non-measurement level reasoning, which was based on the individual’s
impression on the objects. After generally stating the observation, he examined the
picture to look for more information that could support his conjecture. He first pointed
out triangle EFO and highlighted triangle BOC as the overlapping area. He then
0 20 40 60 80 100
Heap-NM
Surface Association Complex-Formula
Artificial Association Complex
Chain Complex-NM
Pseudo-concept Complex-NM
Silence
1.1.1.1.a
1.1.1.3
1.1.2.2.a
1.1.2.3
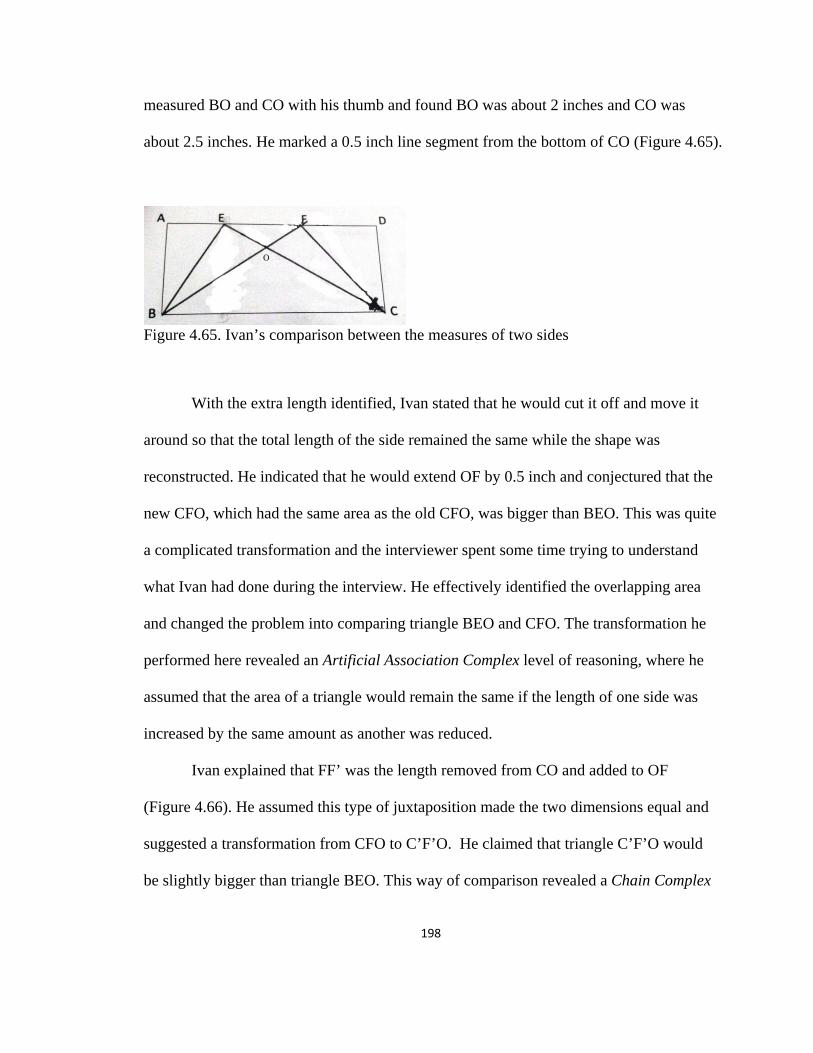
198
measured BO and CO with his thumb and found BO was about 2 inches and CO was
about 2.5 inches. He marked a 0.5 inch line segment from the bottom of CO (Figure 4.65).
Figure 4.65. Ivan’s comparison between the measures of two sides
With the extra length identified, Ivan stated that he would cut it off and move it
around so that the total length of the side remained the same while the shape was
reconstructed. He indicated that he would extend OF by 0.5 inch and conjectured that the
new CFO, which had the same area as the old CFO, was bigger than BEO. This was quite
a complicated transformation and the interviewer spent some time trying to understand
what Ivan had done during the interview. He effectively identified the overlapping area
and changed the problem into comparing triangle BEO and CFO. The transformation he
performed here revealed an Artificial Association Complex level of reasoning, where he
assumed that the area of a triangle would remain the same if the length of one side was
increased by the same amount as another was reduced.
Ivan explained that FF’ was the length removed from CO and added to OF
(Figure 4.66). He assumed this type of juxtaposition made the two dimensions equal and
suggested a transformation from CFO to C’F’O. He claimed that triangle C’F’O would
be slightly bigger than triangle BEO. This way of comparison revealed a Chain Complex
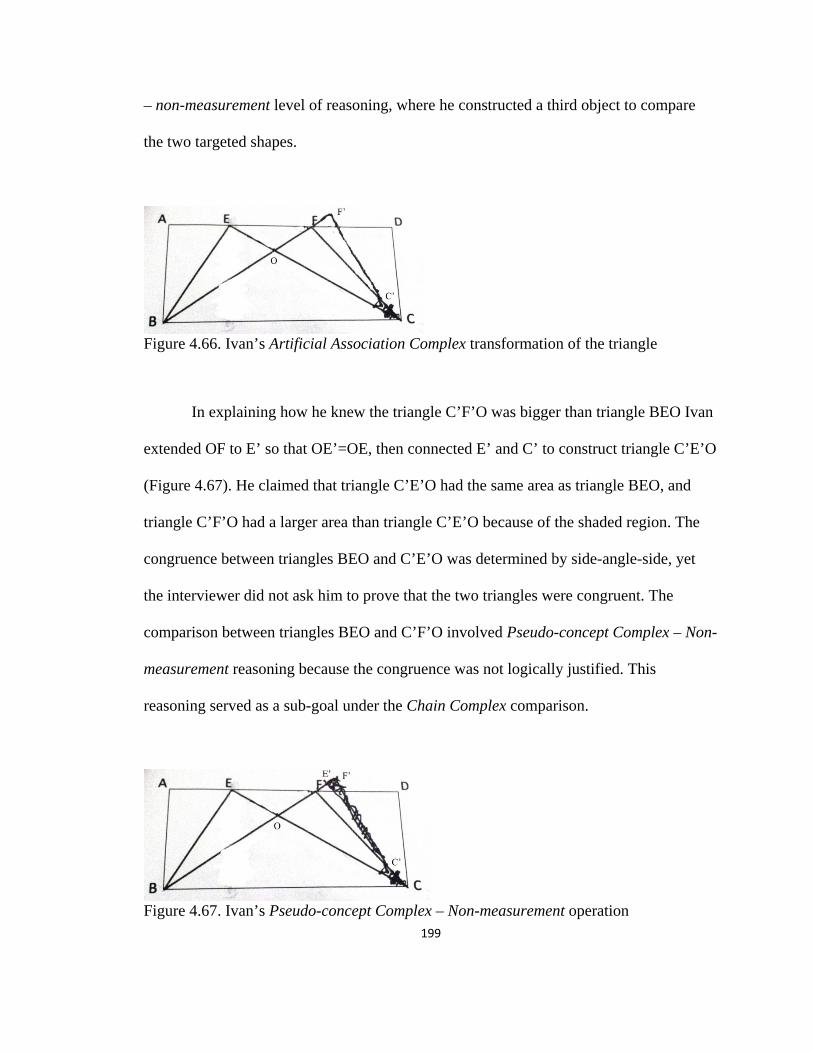
199
– non-measurement level of reasoning, where he constructed a third object to compare
the two targeted shapes.
Figure 4.66. Ivan’s Artificial Association Complex transformation of the triangle
In explaining how he knew the triangle C’F’O was bigger than triangle BEO Ivan
extended OF to E’ so that OE’=OE, then connected E’ and C’ to construct triangle C’E’O
(Figure 4.67). He claimed that triangle C’E’O had the same area as triangle BEO, and
triangle C’F’O had a larger area than triangle C’E’O because of the shaded region. The
congruence between triangles BEO and C’E’O was determined by side-angle-side, yet
the interviewer did not ask him to prove that the two triangles were congruent. The
comparison between triangles BEO and C’F’O involved Pseudo-concept Complex – Non-
measurement reasoning because the congruence was not logically justified. This
reasoning served as a sub-goal under the Chain Complex comparison.
Figure 4.67. Ivan’s Pseudo-concept Complex – Non-measurement operation

200
The interviewer asked Ivan how he could reassure if triangles CFO and C’F’O
were equal (Artificial Association Complex level of reasoning). Ivan answered that since
he cut off a line segment and put it back, the length and the area remained the same
although triangle C’F’O looked “fatter” while triangle CFO looked “longer.” Ivan was
then asked whether he believed the area of the triangle would remain the same if the
length of a side remained the same, He responded that as long as the two triangles had the
same length and the same “wideness” the area would remain the same. The interviewer
attempted to challenge Ivan by pointing out that by cutting off 0.5 inch from CO, a small
triangular area was eliminated, yet by adding 0.5 inch to OF, a large area was created.
Ivan acknowledged the limitation of his approach and explained that he had tried to make
triangle BF’C’ to be roughly the same as triangle BEC so that he could directly compare
them. He was fully aware of his goal of constructing triangle C’F’O (regulation of
cognition and executive functioning facilitates and involves: strategy selection and
application) – to simplify the comparison between two triangles by creating a pair of
sides with the same length (a part of the Chain Complex level of reasoning). A plausible
reason for his assumption was that he had been working on triangles BEO and C’F’O
while taking triangle BOC as the overlapping area, yet the new triangle BF’C’ no longer
contained triangle BOC which he did not realize. Ivan also indicated that his drawing was
messy and it became harder to tell what he had done (intra-person monitoring and
control). Despite this he refused to restart on a new worksheet, which probably led to his
confusion in the next phase.
When Ivan was asked to validate his Artificial Association Complex reasoning, he
eventually referred to his Chain Complex reasoning as the ultimate goal for creating
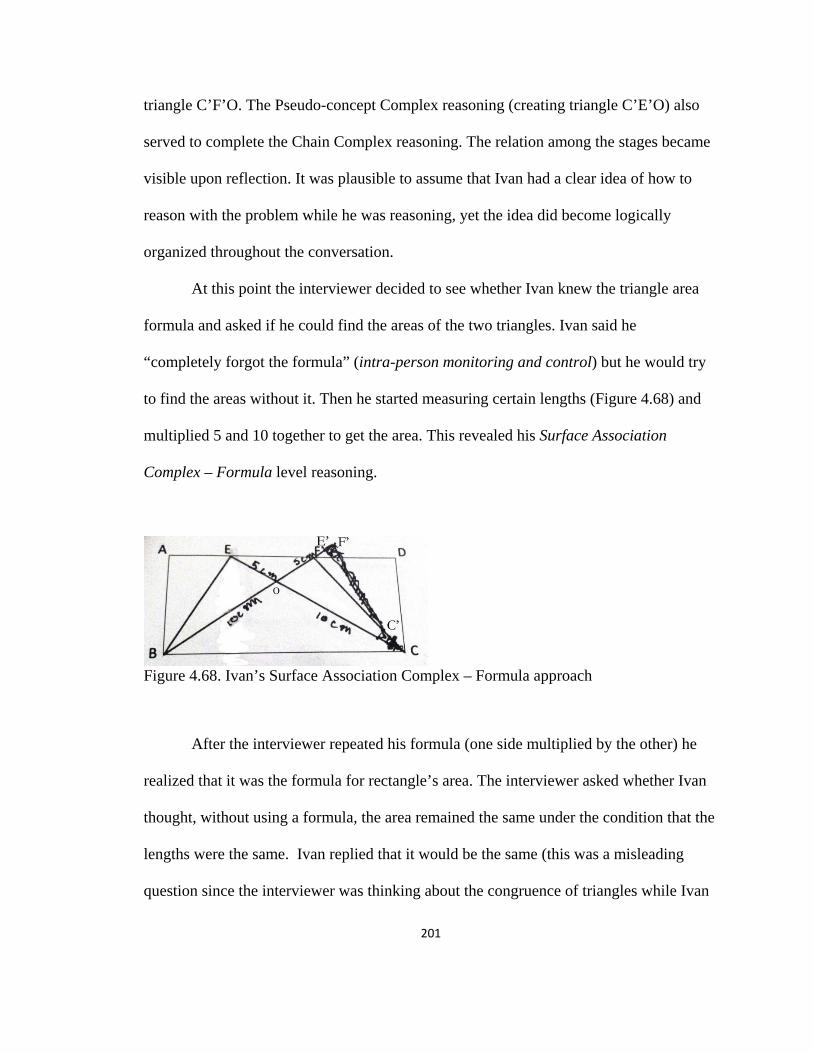
201
triangle C’F’O. The Pseudo-concept Complex reasoning (creating triangle C’E’O) also
served to complete the Chain Complex reasoning. The relation among the stages became
visible upon reflection. It was plausible to assume that Ivan had a clear idea of how to
reason with the problem while he was reasoning, yet the idea did become logically
organized throughout the conversation.
At this point the interviewer decided to see whether Ivan knew the triangle area
formula and asked if he could find the areas of the two triangles. Ivan said he
“completely forgot the formula” (intra-person monitoring and control) but he would try
to find the areas without it. Then he started measuring certain lengths (Figure 4.68) and
multiplied 5 and 10 together to get the area. This revealed his Surface Association
Complex – Formula level reasoning.
Figure 4.68. Ivan’s Surface Association Complex – Formula approach
After the interviewer repeated his formula (one side multiplied by the other) he
realized that it was the formula for rectangle’s area. The interviewer asked whether Ivan
thought, without using a formula, the area remained the same under the condition that the
lengths were the same. Ivan replied that it would be the same (this was a misleading
question since the interviewer was thinking about the congruence of triangles while Ivan

202
possibly was not). To confirm his response he re-measured the lengths of BO, C’O, EO,
and E’O. Previously Ivan had claimed triangle BEO was smaller than triangle BF’C’, yet
here he lost track of his drawing and focused on BEO and the non-shaded triangle, which
was the one he constructed to prove BEO was smaller than C’F’O.
The key concept shifts in this problem included the transition from Artificial
Association Complex to Chain Complex – NM to Pseudo-concept Complex – NM. When
Ivan was segmenting a side and moving it around to transform a new triangle operating
on the Artificial Association Complex stage, the only evident goal was that he wanted to
force a pair of sides to be equal. The assumption that the transformation did not change
the total area (same perimeter indicated same area) was not valid; he acknowledged this
issue later but explained that he tried to not change the area too much. As the researcher
questioned his approach, he explicitly performed on Chain Complex comparison among
the three triangles, where the transformed triangle served as a middle element in the
transitive relation. The Pseudo-concept Complex – NM approach occurred when Ivan was
pressured by the interviewer to be more explicit when comparing the transformed triangle
and the other triangle. As the three stages were adopted, Ivan chose the Chain Complex
approach to justify the other two approaches when he reflected on his behaviors. This
reflection revealed his advanced regulation of strategy.
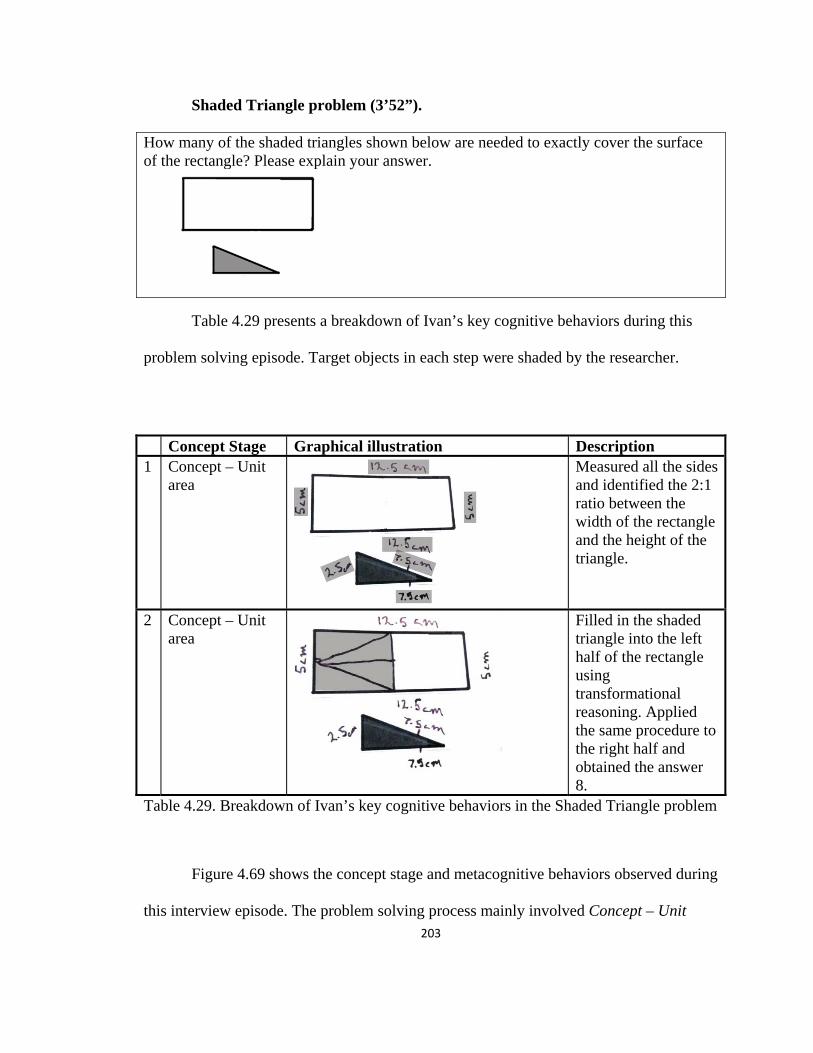
203
Shaded Triangle problem (3’52”).
How many of the shaded triangles shown below are needed to exactly cover the surface of the rectangle? Please explain your answer.
Table 4.29 presents a breakdown of Ivan’s key cognitive behaviors during this
problem solving episode. Target objects in each step were shaded by the researcher.
Concept Stage Graphical illustration Description 1 Concept – Unit
area Measured all the sides and identified the 2:1 ratio between the width of the rectangle and the height of the triangle.
2 Concept – Unit area
Filled in the shaded triangle into the left half of the rectangle using transformational reasoning. Applied the same procedure to the right half and obtained the answer 8.
Table 4.29. Breakdown of Ivan’s key cognitive behaviors in the Shaded Triangle problem
Figure 4.69 shows the concept stage and metacognitive behaviors observed during
this interview episode. The problem solving process mainly involved Concept – Unit
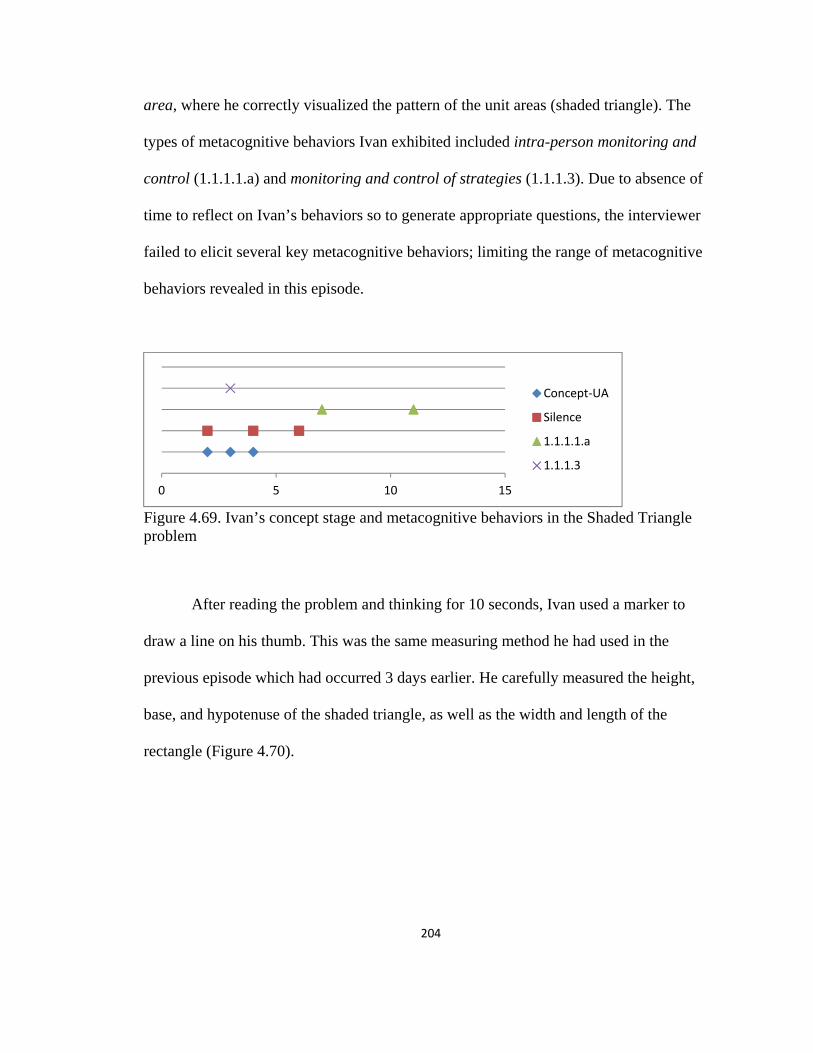
204
area, where he correctly visualized the pattern of the unit areas (shaded triangle). The
types of metacognitive behaviors Ivan exhibited included intra-person monitoring and
control (1.1.1.1.a) and monitoring and control of strategies (1.1.1.3). Due to absence of
time to reflect on Ivan’s behaviors so to generate appropriate questions, the interviewer
failed to elicit several key metacognitive behaviors; limiting the range of metacognitive
behaviors revealed in this episode.
Figure 4.69. Ivan’s concept stage and metacognitive behaviors in the Shaded Triangle problem
After reading the problem and thinking for 10 seconds, Ivan used a marker to
draw a line on his thumb. This was the same measuring method he had used in the
previous episode which had occurred 3 days earlier. He carefully measured the height,
base, and hypotenuse of the shaded triangle, as well as the width and length of the
rectangle (Figure 4.70).
0 5 10 15
Concept-UA
Silence
1.1.1.1.a
1.1.1.3
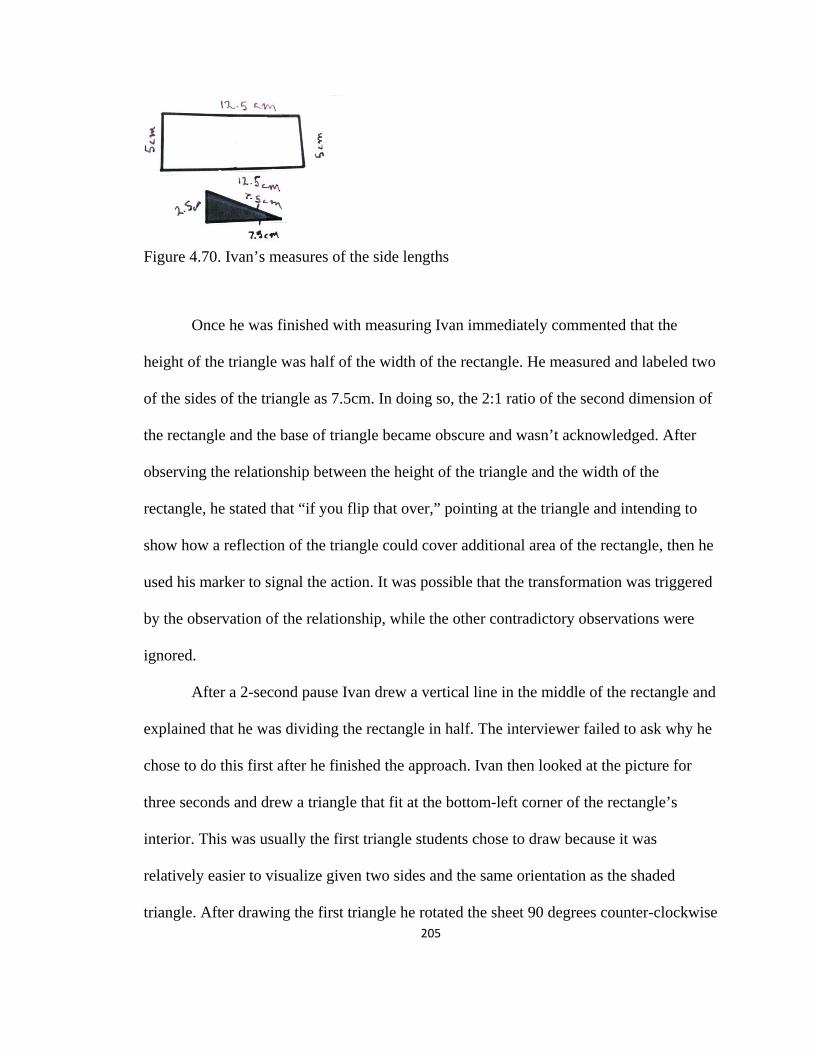
205
Figure 4.70. Ivan’s measures of the side lengths
Once he was finished with measuring Ivan immediately commented that the
height of the triangle was half of the width of the rectangle. He measured and labeled two
of the sides of the triangle as 7.5cm. In doing so, the 2:1 ratio of the second dimension of
the rectangle and the base of triangle became obscure and wasn’t acknowledged. After
observing the relationship between the height of the triangle and the width of the
rectangle, he stated that “if you flip that over,” pointing at the triangle and intending to
show how a reflection of the triangle could cover additional area of the rectangle, then he
used his marker to signal the action. It was possible that the transformation was triggered
by the observation of the relationship, while the other contradictory observations were
ignored.
After a 2-second pause Ivan drew a vertical line in the middle of the rectangle and
explained that he was dividing the rectangle in half. The interviewer failed to ask why he
chose to do this first after he finished the approach. Ivan then looked at the picture for
three seconds and drew a triangle that fit at the bottom-left corner of the rectangle’s
interior. This was usually the first triangle students chose to draw because it was
relatively easier to visualize given two sides and the same orientation as the shaded
triangle. After drawing the first triangle he rotated the sheet 90 degrees counter-clockwise
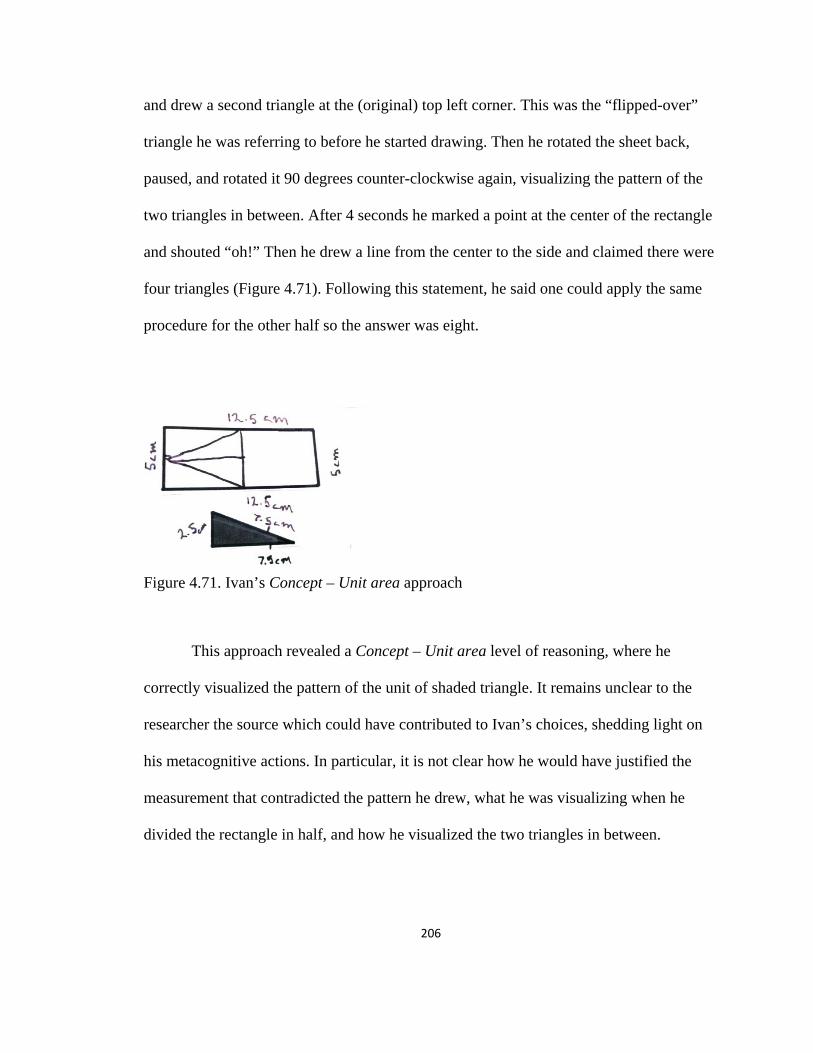
206
and drew a second triangle at the (original) top left corner. This was the “flipped-over”
triangle he was referring to before he started drawing. Then he rotated the sheet back,
paused, and rotated it 90 degrees counter-clockwise again, visualizing the pattern of the
two triangles in between. After 4 seconds he marked a point at the center of the rectangle
and shouted “oh!” Then he drew a line from the center to the side and claimed there were
four triangles (Figure 4.71). Following this statement, he said one could apply the same
procedure for the other half so the answer was eight.
Figure 4.71. Ivan’s Concept – Unit area approach
This approach revealed a Concept – Unit area level of reasoning, where he
correctly visualized the pattern of the unit of shaded triangle. It remains unclear to the
researcher the source which could have contributed to Ivan’s choices, shedding light on
his metacognitive actions. In particular, it is not clear how he would have justified the
measurement that contradicted the pattern he drew, what he was visualizing when he
divided the rectangle in half, and how he visualized the two triangles in between.
207
The interviewer asked whether Ivan thought there was another way to solve the
problem. He suggested that he could compute the area, but he didn’t know the triangle
area formula (intra-person monitoring and control).
Estimate Region problem (7’18”).
Estimate the area of the region shown below.
Table 4.30 presents a breakdown of Ivan’s key cognitive behaviors during this
problem solving episode. Target objects in each step were shaded by the researcher.
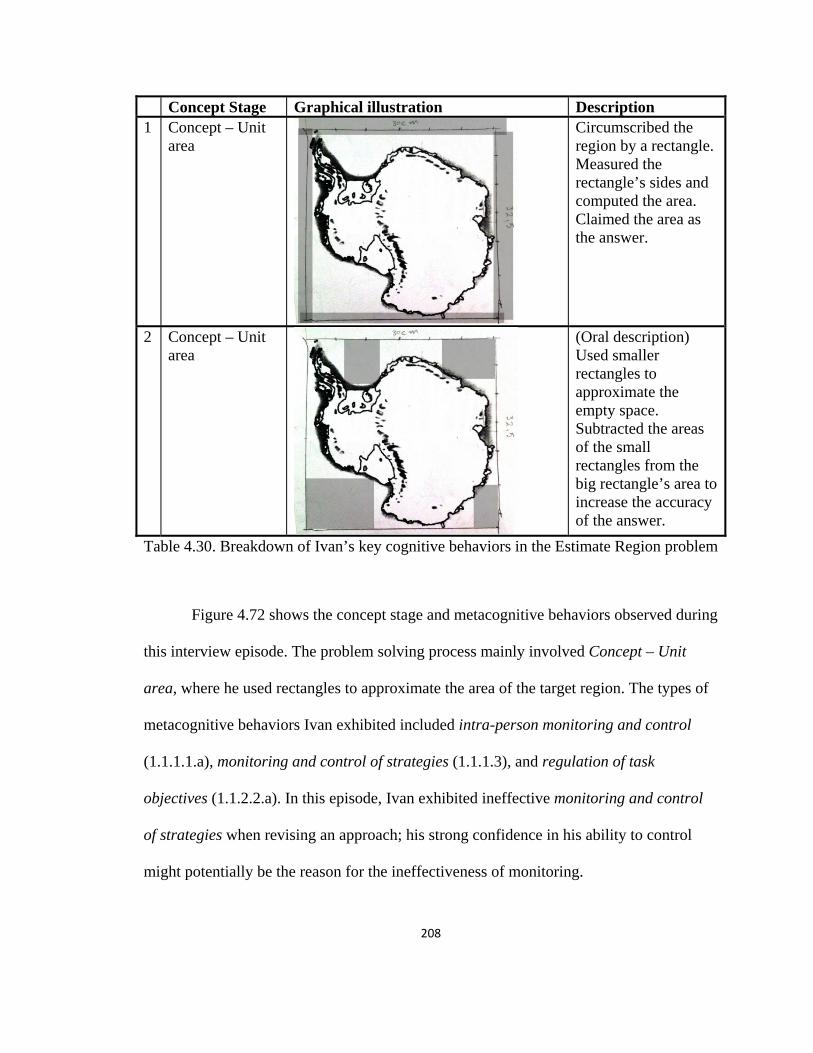
208
Concept Stage Graphical illustration Description 1 Concept – Unit
area Circumscribed the region by a rectangle. Measured the rectangle’s sides and computed the area. Claimed the area as the answer.
2 Concept – Unit area
(Oral description) Used smaller rectangles to approximate the empty space. Subtracted the areas of the small rectangles from the big rectangle’s area to increase the accuracy of the answer.
Table 4.30. Breakdown of Ivan’s key cognitive behaviors in the Estimate Region problem
Figure 4.72 shows the concept stage and metacognitive behaviors observed during
this interview episode. The problem solving process mainly involved Concept – Unit
area, where he used rectangles to approximate the area of the target region. The types of
metacognitive behaviors Ivan exhibited included intra-person monitoring and control
(1.1.1.1.a), monitoring and control of strategies (1.1.1.3), and regulation of task
objectives (1.1.2.2.a). In this episode, Ivan exhibited ineffective monitoring and control
of strategies when revising an approach; his strong confidence in his ability to control
might potentially be the reason for the ineffectiveness of monitoring.
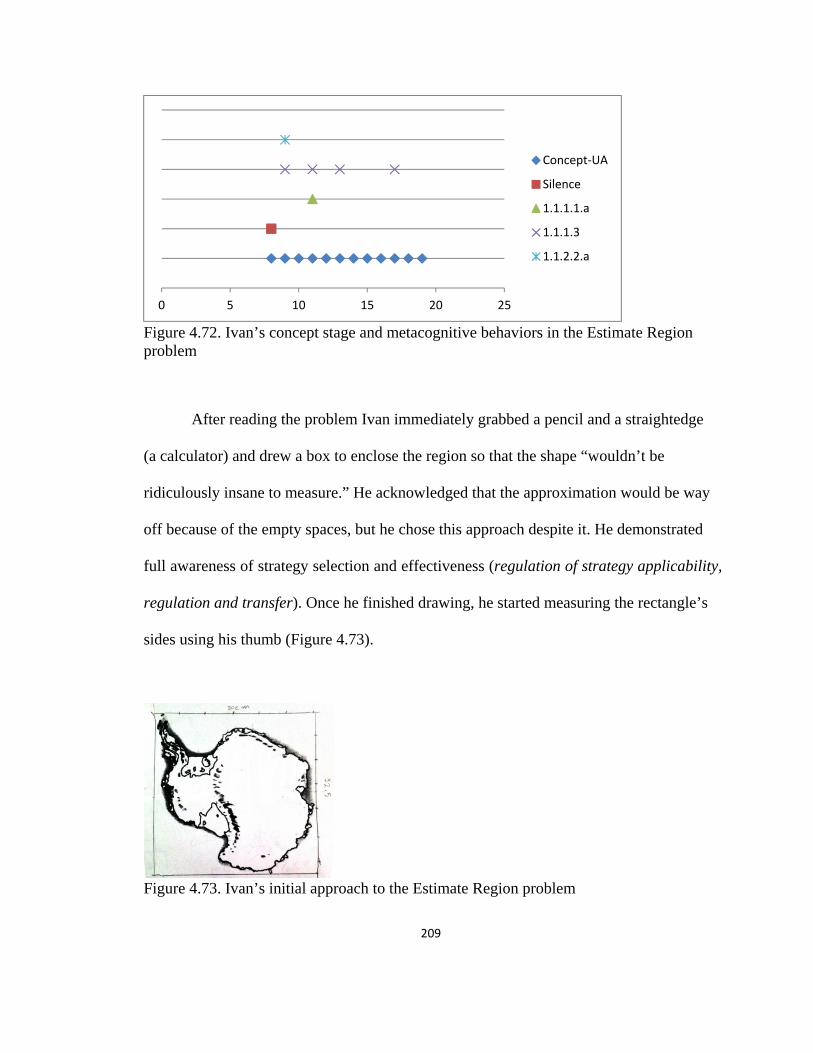
209
Figure 4.72. Ivan’s concept stage and metacognitive behaviors in the Estimate Region problem
After reading the problem Ivan immediately grabbed a pencil and a straightedge
(a calculator) and drew a box to enclose the region so that the shape “wouldn’t be
ridiculously insane to measure.” He acknowledged that the approximation would be way
off because of the empty spaces, but he chose this approach despite it. He demonstrated
full awareness of strategy selection and effectiveness (regulation of strategy applicability,
regulation and transfer). Once he finished drawing, he started measuring the rectangle’s
sides using his thumb (Figure 4.73).
Figure 4.73. Ivan’s initial approach to the Estimate Region problem
0 5 10 15 20 25
Concept-UA
Silence
1.1.1.1.a
1.1.1.3
1.1.2.2.a
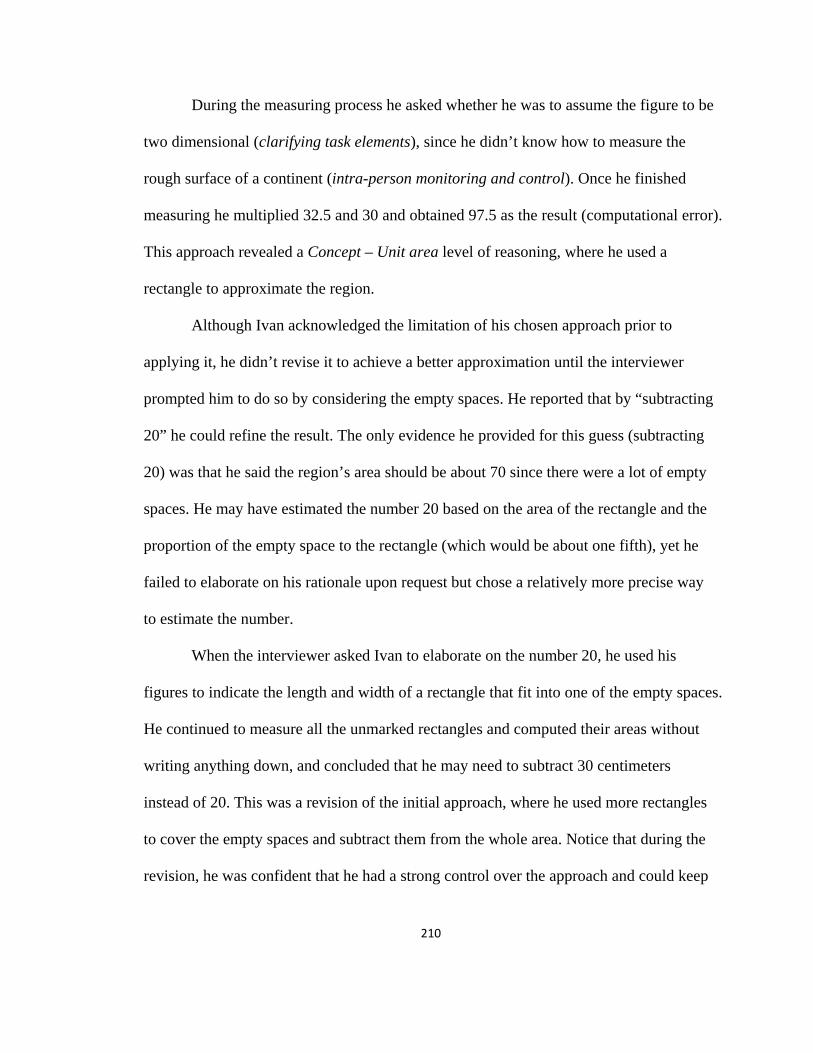
210
During the measuring process he asked whether he was to assume the figure to be
two dimensional (clarifying task elements), since he didn’t know how to measure the
rough surface of a continent (intra-person monitoring and control). Once he finished
measuring he multiplied 32.5 and 30 and obtained 97.5 as the result (computational error).
This approach revealed a Concept – Unit area level of reasoning, where he used a
rectangle to approximate the region.
Although Ivan acknowledged the limitation of his chosen approach prior to
applying it, he didn’t revise it to achieve a better approximation until the interviewer
prompted him to do so by considering the empty spaces. He reported that by “subtracting
20” he could refine the result. The only evidence he provided for this guess (subtracting
20) was that he said the region’s area should be about 70 since there were a lot of empty
spaces. He may have estimated the number 20 based on the area of the rectangle and the
proportion of the empty space to the rectangle (which would be about one fifth), yet he
failed to elaborate on his rationale upon request but chose a relatively more precise way
to estimate the number.
When the interviewer asked Ivan to elaborate on the number 20, he used his
figures to indicate the length and width of a rectangle that fit into one of the empty spaces.
He continued to measure all the unmarked rectangles and computed their areas without
writing anything down, and concluded that he may need to subtract 30 centimeters
instead of 20. This was a revision of the initial approach, where he used more rectangles
to cover the empty spaces and subtract them from the whole area. Notice that during the
revision, he was confident that he had a strong control over the approach and could keep
211
track of the process without writing things down. In fact, he failed to keep track of the
numbers and missed the opportunity to detect the computational error.
Intersected area problem (20’36”).
Two squares, each s on a side, are placed such that the corner on one square lies on the center of the other. Describe, in terms of s, the range of possible areas representing the intersections of the two squares.
Table 4.31 presents a breakdown of Ivan’s key cognitive behaviors during this
problem solving episode. Target objects in each step were shaded by the researcher.
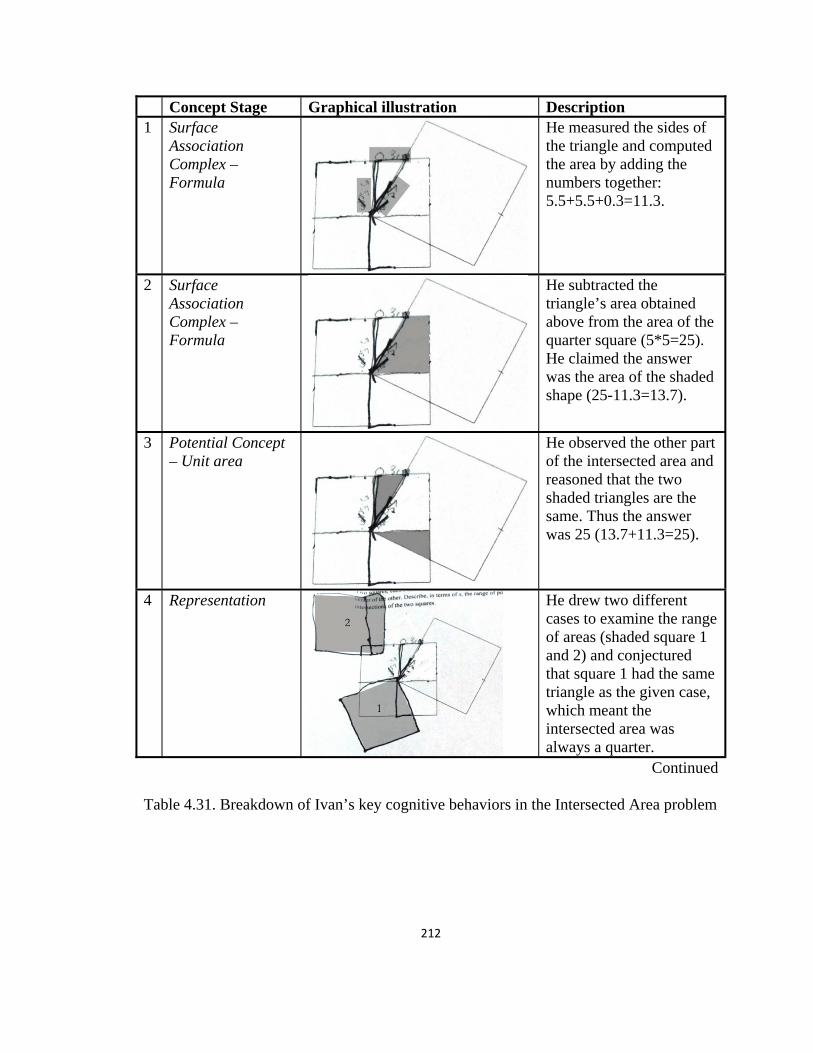
212
Concept Stage Graphical illustration Description 1 Surface
Association Complex – Formula
He measured the sides of the triangle and computed the area by adding the numbers together: 5.5+5.5+0.3=11.3.
2 Surface Association Complex – Formula
He subtracted the triangle’s area obtained above from the area of the quarter square (5*5=25). He claimed the answer was the area of the shaded shape (25-11.3=13.7).
3 Potential Concept – Unit area
He observed the other part of the intersected area and reasoned that the two shaded triangles are the same. Thus the answer was 25 (13.7+11.3=25).
4 Representation He drew two different cases to examine the range of areas (shaded square 1 and 2) and conjectured that square 1 had the same triangle as the given case, which meant the intersected area was always a quarter.
Continued
Table 4.31. Breakdown of Ivan’s key cognitive behaviors in the Intersected Area problem
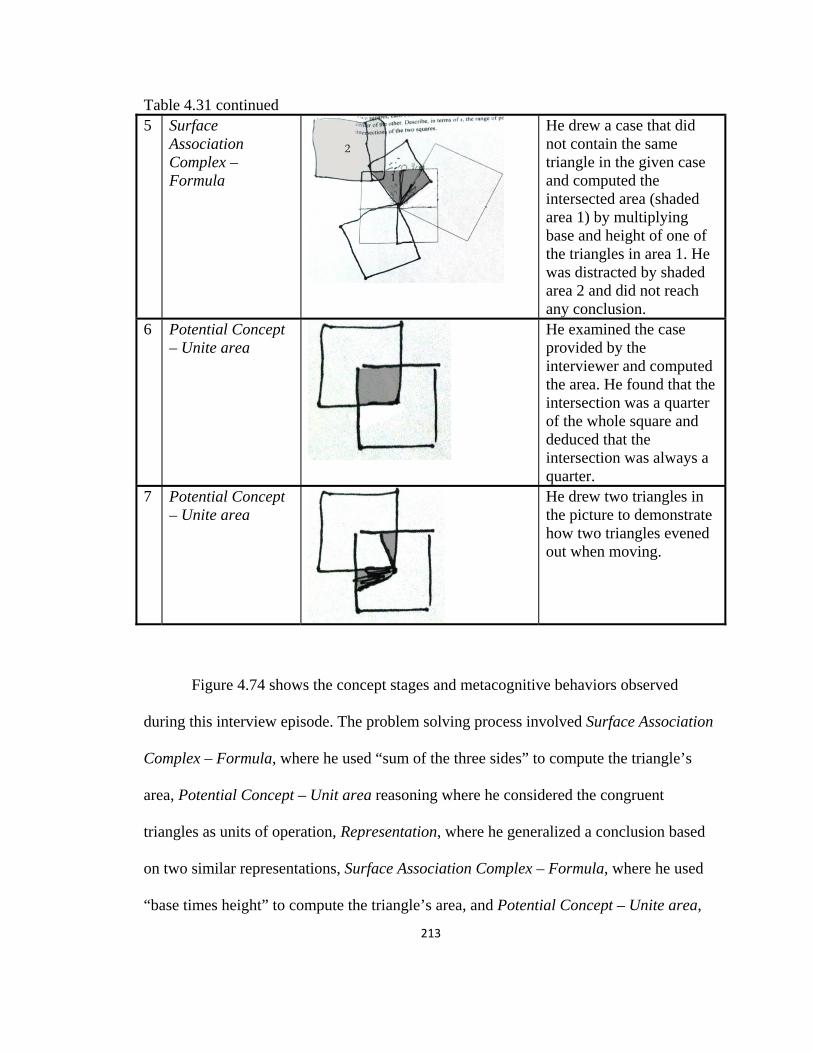
213
Table 4.31 continued 5 Surface
Association Complex – Formula
He drew a case that did not contain the same triangle in the given case and computed the intersected area (shaded area 1) by multiplying base and height of one of the triangles in area 1. He was distracted by shaded area 2 and did not reach any conclusion.
6 Potential Concept – Unite area
He examined the case provided by the interviewer and computed the area. He found that the intersection was a quarter of the whole square and deduced that the intersection was always a quarter.
7 Potential Concept – Unite area
He drew two triangles in the picture to demonstrate how two triangles evened out when moving.
Figure 4.74 shows the concept stages and metacognitive behaviors observed
during this interview episode. The problem solving process involved Surface Association
Complex – Formula, where he used “sum of the three sides” to compute the triangle’s
area, Potential Concept – Unit area reasoning where he considered the congruent
triangles as units of operation, Representation, where he generalized a conclusion based
on two similar representations, Surface Association Complex – Formula, where he used
“base times height” to compute the triangle’s area, and Potential Concept – Unite area,
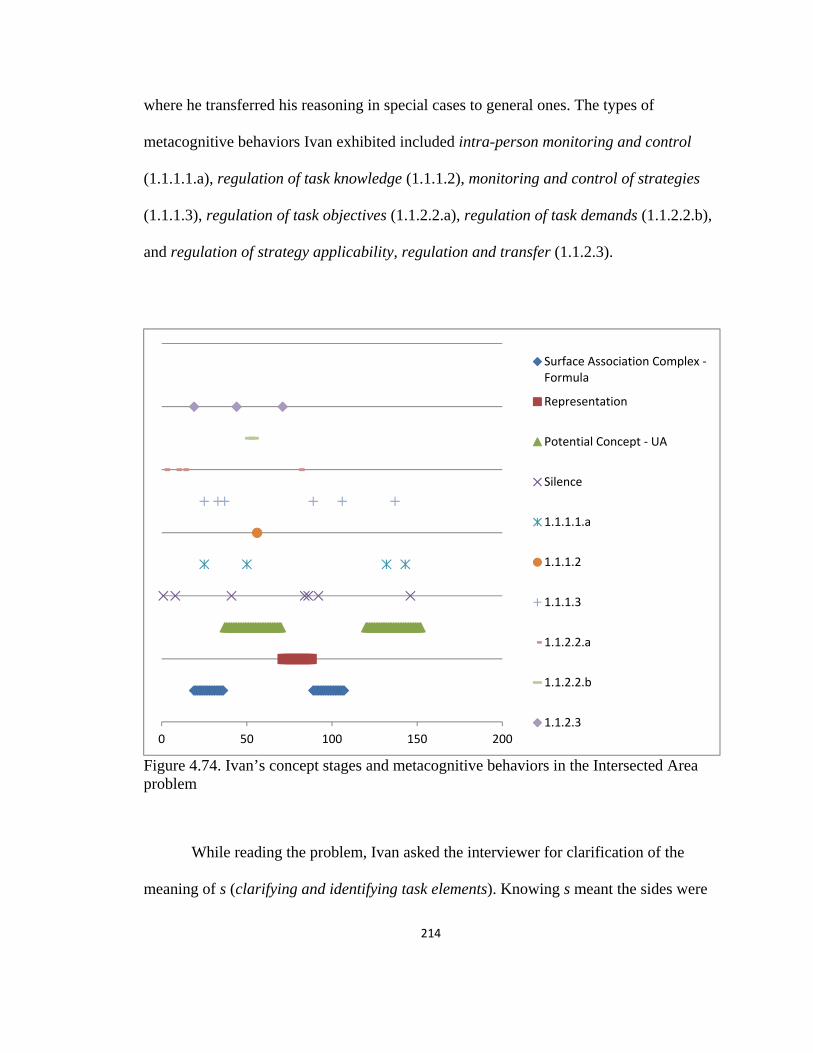
214
where he transferred his reasoning in special cases to general ones. The types of
metacognitive behaviors Ivan exhibited included intra-person monitoring and control
(1.1.1.1.a), regulation of task knowledge (1.1.1.2), monitoring and control of strategies
(1.1.1.3), regulation of task objectives (1.1.2.2.a), regulation of task demands (1.1.2.2.b),
and regulation of strategy applicability, regulation and transfer (1.1.2.3).
Figure 4.74. Ivan’s concept stages and metacognitive behaviors in the Intersected Area problem
While reading the problem, Ivan asked the interviewer for clarification of the
meaning of s (clarifying and identifying task elements). Knowing s meant the sides were
0 50 100 150 200
Surface Association Complex -Formula
Representation
Potential Concept - UA
Silence
1.1.1.1.a
1.1.1.2
1.1.1.3
1.1.2.2.a
1.1.2.2.b
1.1.2.3

215
all equal, he immediately measured the sides with his thumb which were 2 inches. Then
the interviewer reminded him that one of the square’s vertices was placed at the center of
the other. Ivan echoed the information (based on his later behaviors, he did not
understand this condition), stared at the picture for 7 seconds, and questioned about “the
intersection” (clarifying and identifying task elements). The interviewer highlighted the
intersected area on the picture and he acknowledged it. Ivan was comfortable enough to
show the process of understanding the problem, and it was evident what he noticed and
tried to clarify in terms of task elements. At this point, the only task element that he had
not acknowledged was the “range of areas” which indicated other possible cases besides
the given one.
When the interviewer tried to explain what “the range of areas” meant in this
problem, Ivan interrupted her and started drawing the “radius” of the fixed square (which
might mean the radius of the inscribed circle). Once he finished drawing, he commented
that the triangle (shaded in Figure 4.75) looked very similar to the shaded triangle in the
third interview problem, and claimed he was going to assume it was like that; according
to his later behavior, he was assuming the base and the hypotenuse of the triangle were
the same, which was exactly what he had done in problem 3.
Figure 4.75. Ivan’s knowledge transfer between two problems
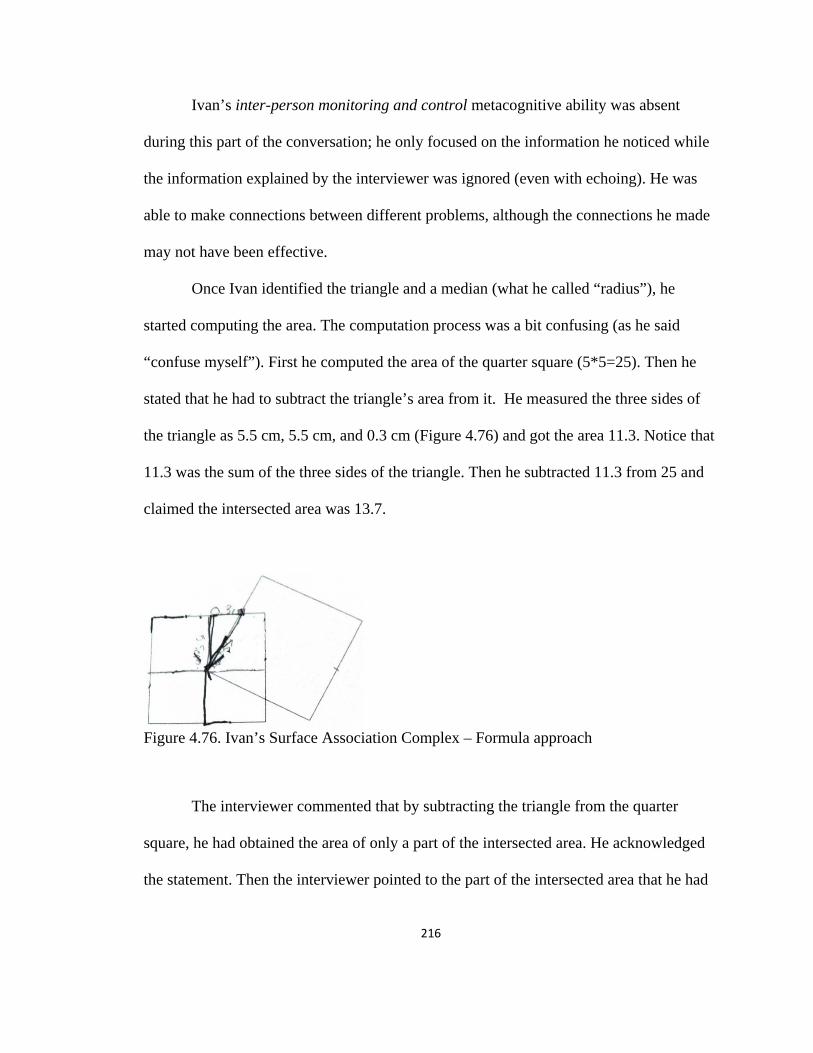
216
Ivan’s inter-person monitoring and control metacognitive ability was absent
during this part of the conversation; he only focused on the information he noticed while
the information explained by the interviewer was ignored (even with echoing). He was
able to make connections between different problems, although the connections he made
may not have been effective.
Once Ivan identified the triangle and a median (what he called “radius”), he
started computing the area. The computation process was a bit confusing (as he said
“confuse myself”). First he computed the area of the quarter square (5*5=25). Then he
stated that he had to subtract the triangle’s area from it. He measured the three sides of
the triangle as 5.5 cm, 5.5 cm, and 0.3 cm (Figure 4.76) and got the area 11.3. Notice that
11.3 was the sum of the three sides of the triangle. Then he subtracted 11.3 from 25 and
claimed the intersected area was 13.7.
Figure 4.76. Ivan’s Surface Association Complex – Formula approach
The interviewer commented that by subtracting the triangle from the quarter
square, he had obtained the area of only a part of the intersected area. He acknowledged
the statement. Then the interviewer pointed to the part of the intersected area that he had
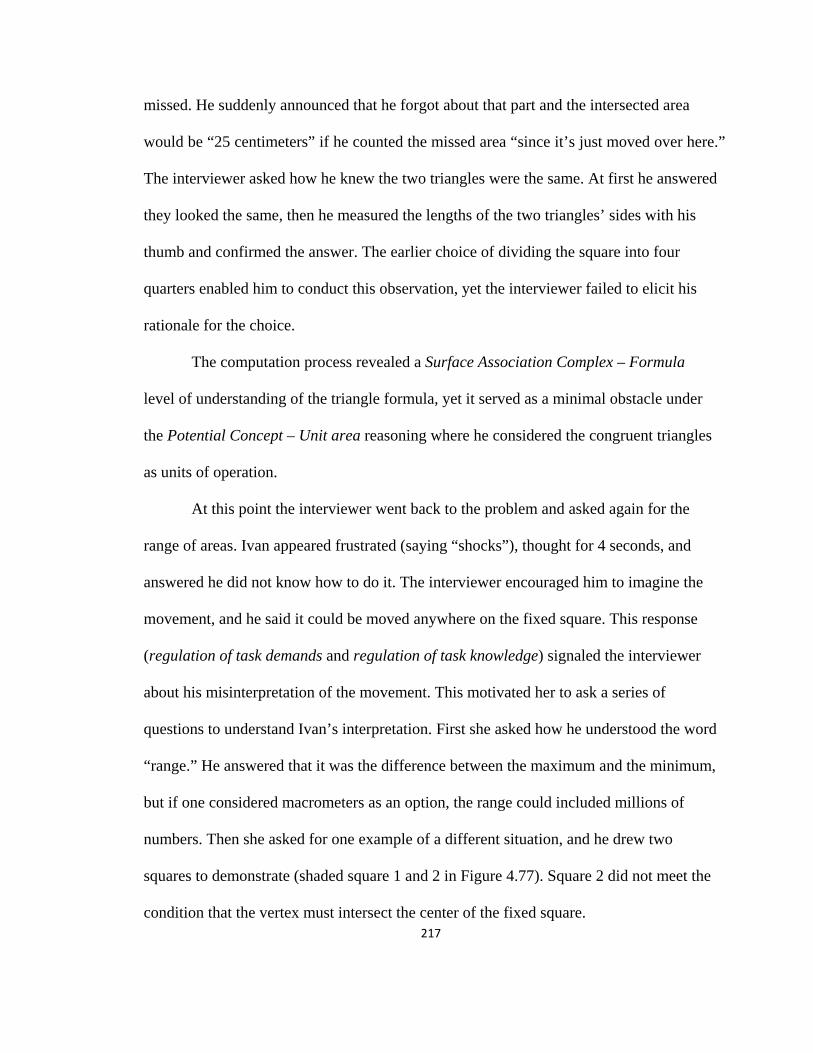
217
missed. He suddenly announced that he forgot about that part and the intersected area
would be “25 centimeters” if he counted the missed area “since it’s just moved over here.”
The interviewer asked how he knew the two triangles were the same. At first he answered
they looked the same, then he measured the lengths of the two triangles’ sides with his
thumb and confirmed the answer. The earlier choice of dividing the square into four
quarters enabled him to conduct this observation, yet the interviewer failed to elicit his
rationale for the choice.
The computation process revealed a Surface Association Complex – Formula
level of understanding of the triangle formula, yet it served as a minimal obstacle under
the Potential Concept – Unit area reasoning where he considered the congruent triangles
as units of operation.
At this point the interviewer went back to the problem and asked again for the
range of areas. Ivan appeared frustrated (saying “shocks”), thought for 4 seconds, and
answered he did not know how to do it. The interviewer encouraged him to imagine the
movement, and he said it could be moved anywhere on the fixed square. This response
(regulation of task demands and regulation of task knowledge) signaled the interviewer
about his misinterpretation of the movement. This motivated her to ask a series of
questions to understand Ivan’s interpretation. First she asked how he understood the word
“range.” He answered that it was the difference between the maximum and the minimum,
but if one considered macrometers as an option, the range could included millions of
numbers. Then she asked for one example of a different situation, and he drew two
squares to demonstrate (shaded square 1 and 2 in Figure 4.77). Square 2 did not meet the
condition that the vertex must intersect the center of the fixed square.
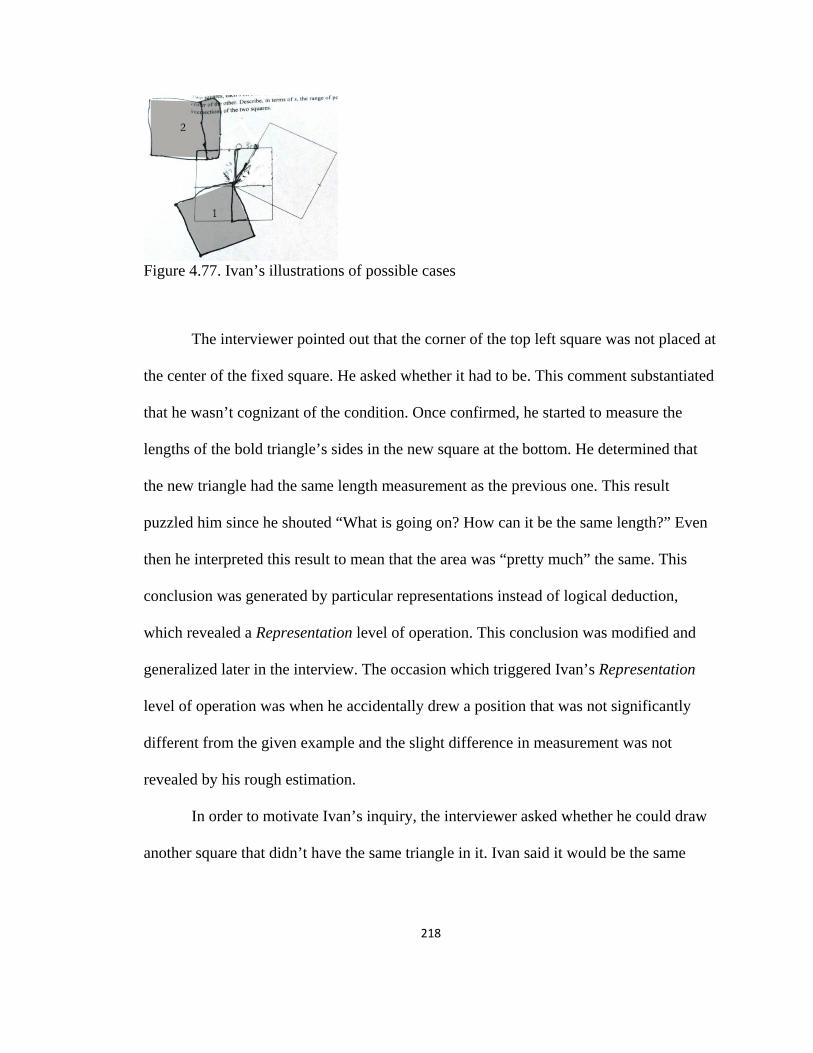
218
Figure 4.77. Ivan’s illustrations of possible cases
The interviewer pointed out that the corner of the top left square was not placed at
the center of the fixed square. He asked whether it had to be. This comment substantiated
that he wasn’t cognizant of the condition. Once confirmed, he started to measure the
lengths of the bold triangle’s sides in the new square at the bottom. He determined that
the new triangle had the same length measurement as the previous one. This result
puzzled him since he shouted “What is going on? How can it be the same length?” Even
then he interpreted this result to mean that the area was “pretty much” the same. This
conclusion was generated by particular representations instead of logical deduction,
which revealed a Representation level of operation. This conclusion was modified and
generalized later in the interview. The occasion which triggered Ivan’s Representation
level of operation was when he accidentally drew a position that was not significantly
different from the given example and the slight difference in measurement was not
revealed by his rough estimation.
In order to motivate Ivan’s inquiry, the interviewer asked whether he could draw
another square that didn’t have the same triangle in it. Ivan said it would be the same
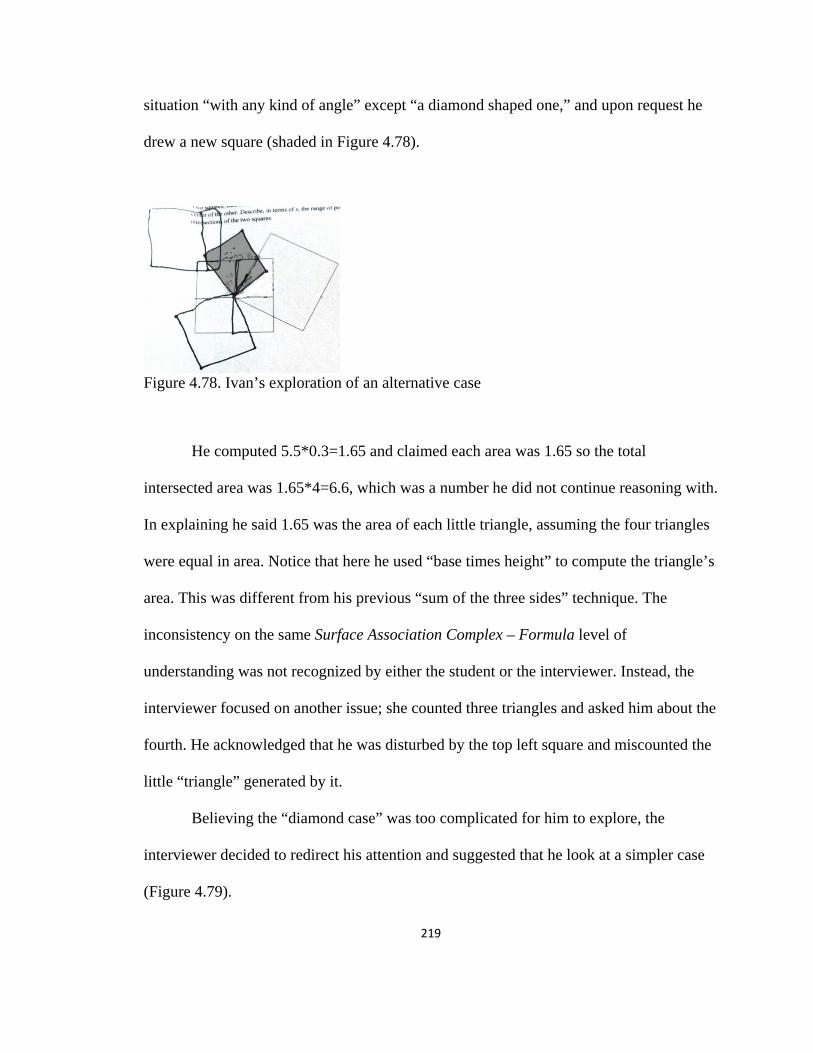
219
situation “with any kind of angle” except “a diamond shaped one,” and upon request he
drew a new square (shaded in Figure 4.78).
Figure 4.78. Ivan’s exploration of an alternative case
He computed 5.5*0.3=1.65 and claimed each area was 1.65 so the total
intersected area was 1.65*4=6.6, which was a number he did not continue reasoning with.
In explaining he said 1.65 was the area of each little triangle, assuming the four triangles
were equal in area. Notice that here he used “base times height” to compute the triangle’s
area. This was different from his previous “sum of the three sides” technique. The
inconsistency on the same Surface Association Complex – Formula level of
understanding was not recognized by either the student or the interviewer. Instead, the
interviewer focused on another issue; she counted three triangles and asked him about the
fourth. He acknowledged that he was disturbed by the top left square and miscounted the
little “triangle” generated by it.
Believing the “diamond case” was too complicated for him to explore, the
interviewer decided to redirect his attention and suggested that he look at a simpler case
(Figure 4.79).
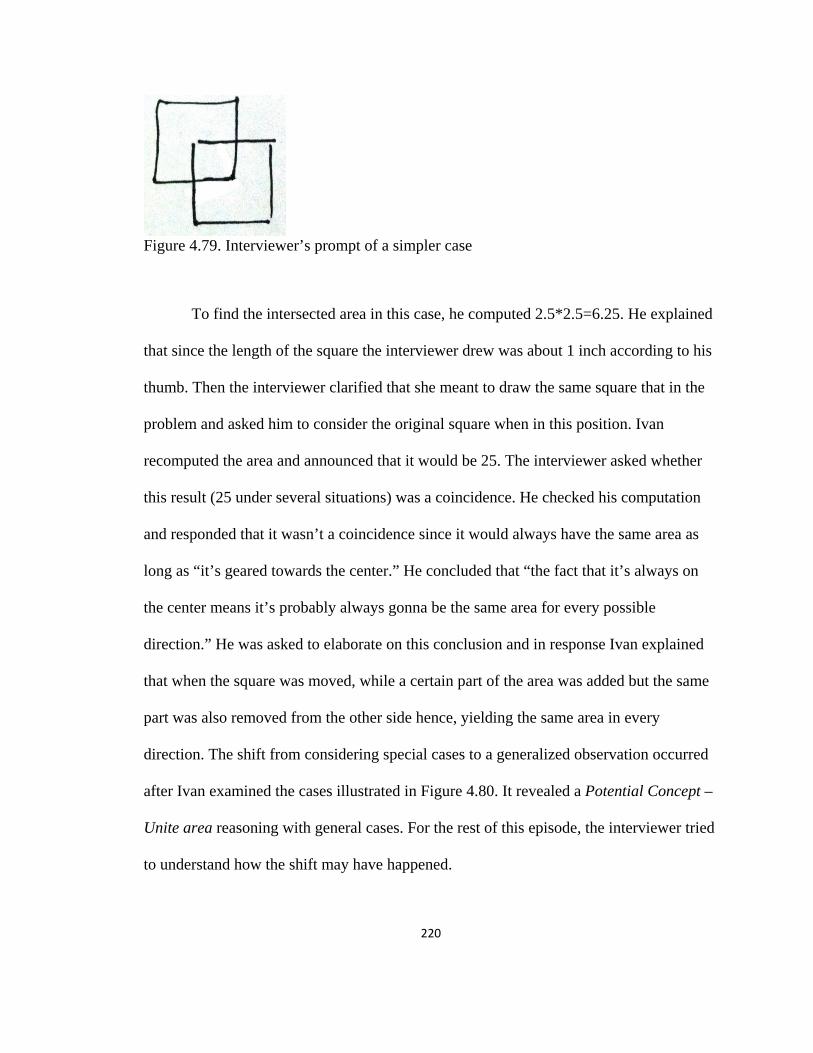
220
Figure 4.79. Interviewer’s prompt of a simpler case
To find the intersected area in this case, he computed 2.5*2.5=6.25. He explained
that since the length of the square the interviewer drew was about 1 inch according to his
thumb. Then the interviewer clarified that she meant to draw the same square that in the
problem and asked him to consider the original square when in this position. Ivan
recomputed the area and announced that it would be 25. The interviewer asked whether
this result (25 under several situations) was a coincidence. He checked his computation
and responded that it wasn’t a coincidence since it would always have the same area as
long as “it’s geared towards the center.” He concluded that “the fact that it’s always on
the center means it’s probably always gonna be the same area for every possible
direction.” He was asked to elaborate on this conclusion and in response Ivan explained
that when the square was moved, while a certain part of the area was added but the same
part was also removed from the other side hence, yielding the same area in every
direction. The shift from considering special cases to a generalized observation occurred
after Ivan examined the cases illustrated in Figure 4.80. It revealed a Potential Concept –
Unite area reasoning with general cases. For the rest of this episode, the interviewer tried
to understand how the shift may have happened.
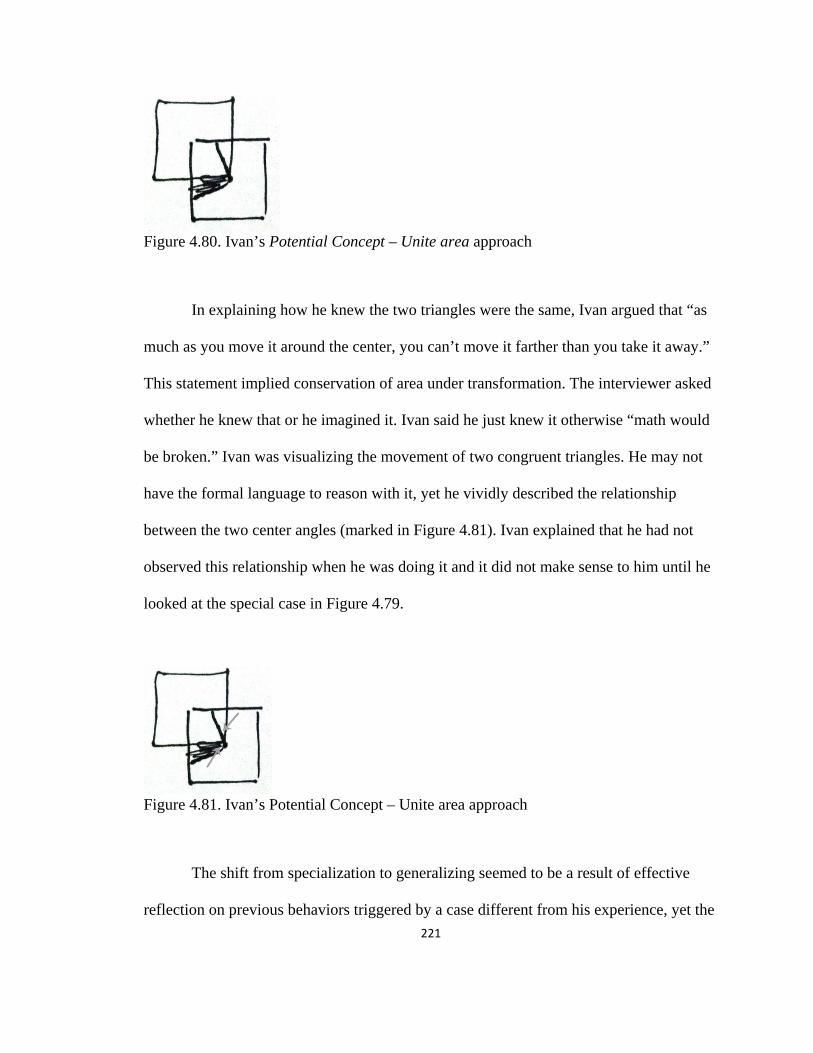
221
Figure 4.80. Ivan’s Potential Concept – Unite area approach
In explaining how he knew the two triangles were the same, Ivan argued that “as
much as you move it around the center, you can’t move it farther than you take it away.”
This statement implied conservation of area under transformation. The interviewer asked
whether he knew that or he imagined it. Ivan said he just knew it otherwise “math would
be broken.” Ivan was visualizing the movement of two congruent triangles. He may not
have the formal language to reason with it, yet he vividly described the relationship
between the two center angles (marked in Figure 4.81). Ivan explained that he had not
observed this relationship when he was doing it and it did not make sense to him until he
looked at the special case in Figure 4.79.
Figure 4.81. Ivan’s Potential Concept – Unite area approach
The shift from specialization to generalizing seemed to be a result of effective
reflection on previous behaviors triggered by a case different from his experience, yet the
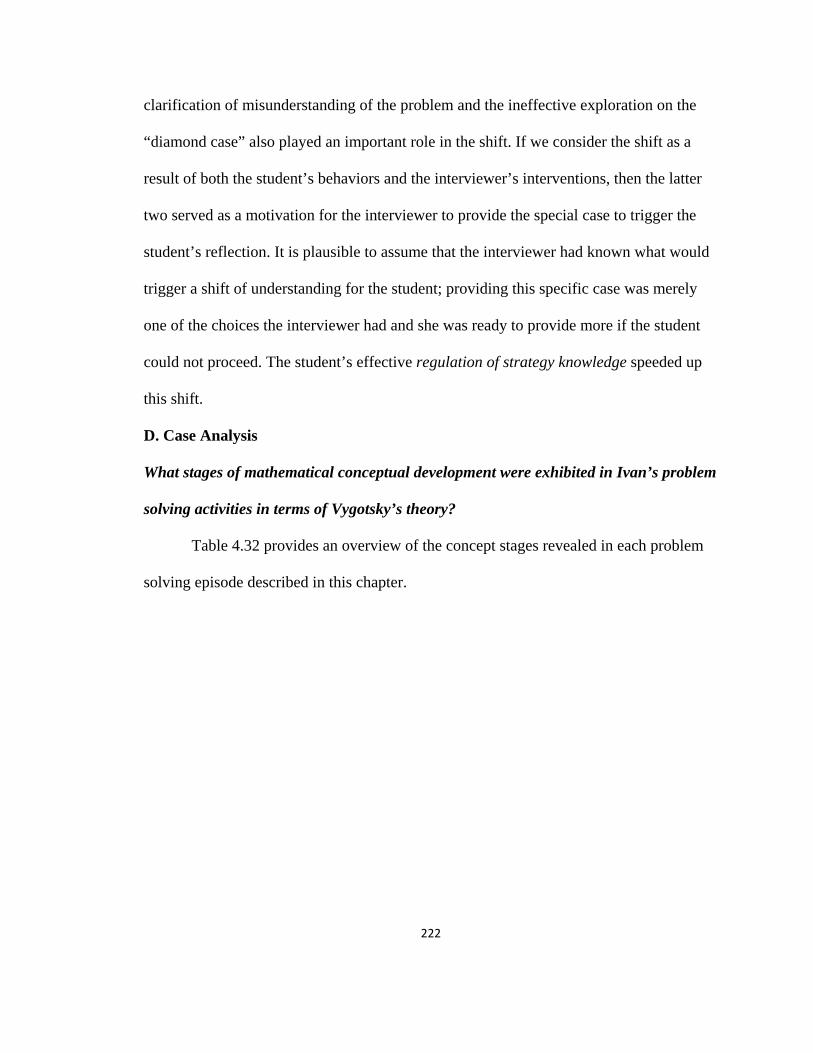
222
clarification of misunderstanding of the problem and the ineffective exploration on the
“diamond case” also played an important role in the shift. If we consider the shift as a
result of both the student’s behaviors and the interviewer’s interventions, then the latter
two served as a motivation for the interviewer to provide the special case to trigger the
student’s reflection. It is plausible to assume that the interviewer had known what would
trigger a shift of understanding for the student; providing this specific case was merely
one of the choices the interviewer had and she was ready to provide more if the student
could not proceed. The student’s effective regulation of strategy knowledge speeded up
this shift.
D. Case Analysis
What stages of mathematical conceptual development were exhibited in Ivan’s problem
solving activities in terms of Vygotsky’s theory?
Table 4.32 provides an overview of the concept stages revealed in each problem
solving episode described in this chapter.

223
Problem Total time
Concept stages
Compare Areas
8’33” 1. (2.2.1) Chain Complex – NM 2. (2.1.1.1) Surface Association Complex – NM
Compare Triangles
12’02” 1. (1.1) Heap – NM (triangles) 2. (2.1.3) Artificial Association Complex (sides and area) 3. (2.2.1) Chain Complex – NM (triangles) 4. (2.4.1) Pseudo-concept Complex – NM (triangles) 5. (2.1.1.3) Surface Association Complex – Formula (triangles)
Shaded Triangle
3’52” 1. (3.2.2) Concept – UA (triangles)
Estimate Region
7’18” 1. (3.2.2) Concept – UA (rectangles)
Intersected Area
20’36” 1. (2.1.1.3) Surface Association Complex – Formula (triangles) 2. (3.1.1) Potential Concept – UA (triangle) 3. (2.3) Representation 4. (2.1.1.3) Surface Association Complex – Formula (triangles) 5. (3.1.1) Potential Concept – UA (triangles)
Table 4.32. Ivan’s overview of concept stages
Ivan tended to work on concept stages of triangles (both confidently and
effectively) although his stage of concept development pertaining to rectangles appeared
to be higher (concept level reasoning for unit area and formula). His concept
development of triangles was at Surface Association Complex level for formula and
concept level for unit area. His non-measurement reasoning was generally on the
complex level and only revealed in the first two problems; he tended to use measurement
reasoning as he became more comfortable with the interview (in Problems 3 to 5).
He showed Surface Association Complex level of understanding for triangle’s
area formula which appeared three times in Problems 2 and 5, but the wrong formula was
hardly an obstacle to his thinking/reasoning process. He used two different ways to

224
compute triangle’s area: multiplying the legs of the triangle and adding up three sides of
the triangle. Despite the lack of consistency for the formula, he managed to reach a
meaningful observation most of the time.
He went through five stages in Problems 2 and 5 and adopted two unique
approaches that were not observed from the other participants. In Problem 2 he revealed
an Artificial Association Complex level of reasoning, segmenting a side of one triangle
and transforming it into a new triangle in order to compare with the other one. In Problem
5 he exhibited a Representation level of reasoning where he generalized a conclusion
based on the pattern he observed in his drawing.
For problems 3 and 4 where only one concept stage was exhibited, fewer
metacognitive processes were elaborated due to the lack of time for the interviewer to
reflect on his behaviors.
Table 4.33 provides a detailed view of self-initiated shifts of stages and
interviewer-initiated shifts of stages as well as the types of prompts that triggered the
shifts.
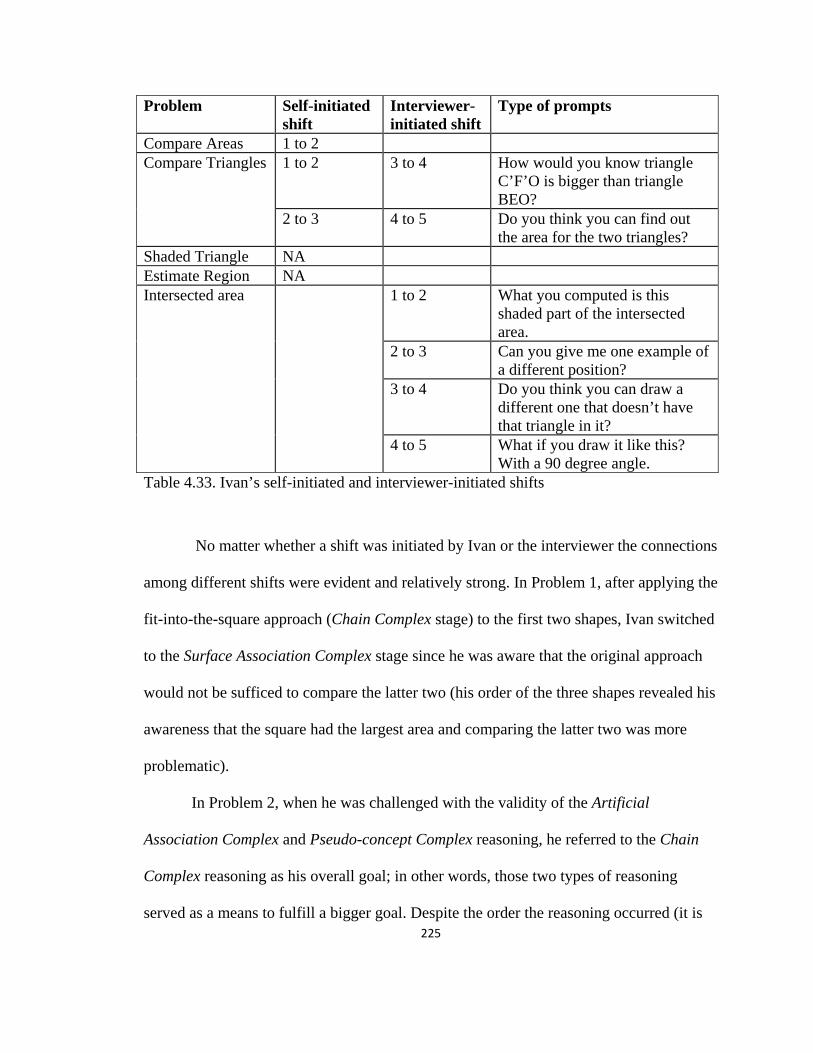
225
Problem Self-initiated shift
Interviewer-initiated shift
Type of prompts
Compare Areas 1 to 2 Compare Triangles 1 to 2 3 to 4 How would you know triangle
C’F’O is bigger than triangle BEO?
2 to 3 4 to 5 Do you think you can find out the area for the two triangles?
Shaded Triangle NA Estimate Region NA Intersected area 1 to 2 What you computed is this
shaded part of the intersected area.
2 to 3 Can you give me one example of a different position?
3 to 4 Do you think you can draw a different one that doesn’t have that triangle in it?
4 to 5 What if you draw it like this? With a 90 degree angle.
Table 4.33. Ivan’s self-initiated and interviewer-initiated shifts
No matter whether a shift was initiated by Ivan or the interviewer the connections
among different shifts were evident and relatively strong. In Problem 1, after applying the
fit-into-the-square approach (Chain Complex stage) to the first two shapes, Ivan switched
to the Surface Association Complex stage since he was aware that the original approach
would not be sufficed to compare the latter two (his order of the three shapes revealed his
awareness that the square had the largest area and comparing the latter two was more
problematic).
In Problem 2, when he was challenged with the validity of the Artificial
Association Complex and Pseudo-concept Complex reasoning, he referred to the Chain
Complex reasoning as his overall goal; in other words, those two types of reasoning
served as a means to fulfill a bigger goal. Despite the order the reasoning occurred (it is
226
plausible to assume he had known what to do at the beginning), the connection became
clearer as he proceeded.
In Problem 5, he generated a Representation level conclusion based on
observations of the Potential Concept – Unit area stage, and then went through another
round of Potential Concept – Unit area level of reasoning to generalize and make sense
of previous observations. He was the only participant who went through a cycle of stages
of reasoning (Surface Association Complex – Formula to Potential Concept – Unit area
to Representation to Surface Association Complex – Formula to Potential Concept – Unit
area) to complete the shift from specialization to generalization.
What types of metacognitive behaviors are utilized by Ivan when solving non-routine
problems?
The following types of metacognitive behaviors were observed in Ivan’s problem
solving episodes.
1.1.1.1.a. Intra-person monitoring and control. Ivan was relatively expressive in
terms of monitoring what he knew or did not know. In Problem 1, he stated that he knew
how to solve the problem with three dimensional figures but not planar models. In
Problems 2 and 3, he admitted that he could not recall the triangle’s area formula. In
Problem 4, he said he didn’t know how to measure the depth of a continent which was
why he wanted to make sure it was a two dimensional graph. In Problem 5, he reported to
the interviewer when he confused himself or could not proceed, and argued that he knew
the relationship as a fact otherwise he was breaking mathematics. Many of these
behaviors served as clues for the interviewer to generate prompt questions to study his
decision making rationale or understanding to the problem. Interestingly, although he
227
stated that he forgot the triangle’s area formula in Problem 3, he was comfortable with
using two different (incorrect) formulas to compute the triangle’s area in Problem 5.
1.1.1.2. monitoring and control of task knowledge. This type of metacognitive
behavior was observed once in Problem 5, where Ivan described that the task demands
made it impossible to exhaust the answers thus no strategy would be applicable to solve
the problem. It enabled the interviewer to diagnose his interpretation of the task demands.
1.1.2.2.a. regulation of task objectives. He tended to have trouble to either keep
track of task objectives or correctly interpret them. This type of metacognitive behaviors
mostly revealed these tendencies. He clarified and identified task objectives not only at
the beginning of each episode, but also after he had worked on a problem for a while,
usually when the interviewer asked him a prompt question about his approach which
caused him to suddenly lose track or re-identify task objectives.
1.1.2.2.b. regulation of task demands. He addressed task demands in Problems 1
and 5. In Problem 1 when he was asked what he would need to precisely compare the
circle and the triangle, he answered that he needed the measure to compute the areas.
Although he could not compute the areas after he found the measurement because he
didn’t know the formulas, he was fully aware of the need for doing so. In problem 5, he
described how to find the range of areas as well as why it would be difficult to do so.
1.1.1.3. monitoring and control of strategies. He exhibited an informal but
relatively strong monitoring and control of strategies, particularly when he was
interpreting strategies. His control did not appear rigorous in that he seldom wrote
numbers/notes when he was executing an approach and the process was always fast. Yet
most of the time he was able to keep track of the numbers/relationships until he finished
228
the approach. The informality of his monitoring of strategies only had a negative effect in
Problem 4, where he was subtracting units of rectangles to improve the approximation for
the area of the region. The biggest influence of the informal monitoring was that the
interviewer tended to have less time or concrete evidences to understand or reflect on his
thinking.
1.1.2.3. regulation of strategy applicability, regulation and transfer. The
regulation of strategy was much less frequent than monitoring of strategies yet played an
important role in the problem solving processes. It was possible that his global regulation
of strategy may be too strong and deeply internalized that it became harder to be isolated
from the other behaviors.
What is the relationship between the types of metacognitive behaviors and the stages of
mathematical conceptual development as outlined by Vygotsky’s theory?
The relationship between metacognitive behaviors and conceptual development
will be examined along four key binary relationships including: (1) problem and
metacognition, (2) participant and metacognition, (3) metacognition and effectiveness,
and (4) concept and metacognition.
Problem and metacognition.
Table 4.34 illustrates the types of metacognitive behaviors along with frequency
of their occurrence revealed under each stage for each problem.
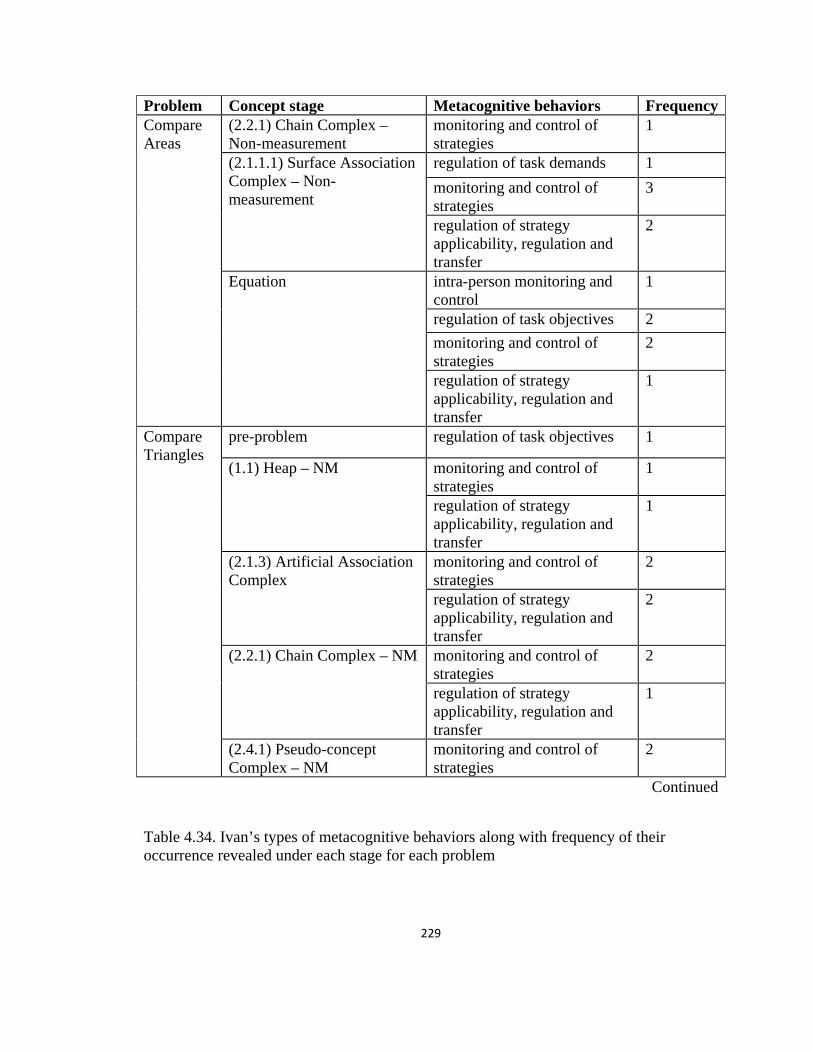
229
Problem Concept stage Metacognitive behaviors FrequencyCompare Areas
(2.2.1) Chain Complex – Non-measurement
monitoring and control of strategies
1
(2.1.1.1) Surface Association Complex – Non-measurement
regulation of task demands 1
monitoring and control of strategies
3
regulation of strategy applicability, regulation and transfer
2
Equation intra-person monitoring and control
1
regulation of task objectives 2
monitoring and control of strategies
2
regulation of strategy applicability, regulation and transfer
1
Compare Triangles
pre-problem regulation of task objectives 1
(1.1) Heap – NM monitoring and control of strategies
1
regulation of strategy applicability, regulation and transfer
1
(2.1.3) Artificial Association Complex
monitoring and control of strategies
2
regulation of strategy applicability, regulation and transfer
2
(2.2.1) Chain Complex – NM monitoring and control of strategies
2
regulation of strategy applicability, regulation and transfer
1
(2.4.1) Pseudo-concept Complex – NM
monitoring and control of strategies
2
Continued
Table 4.34. Ivan’s types of metacognitive behaviors along with frequency of their occurrence revealed under each stage for each problem
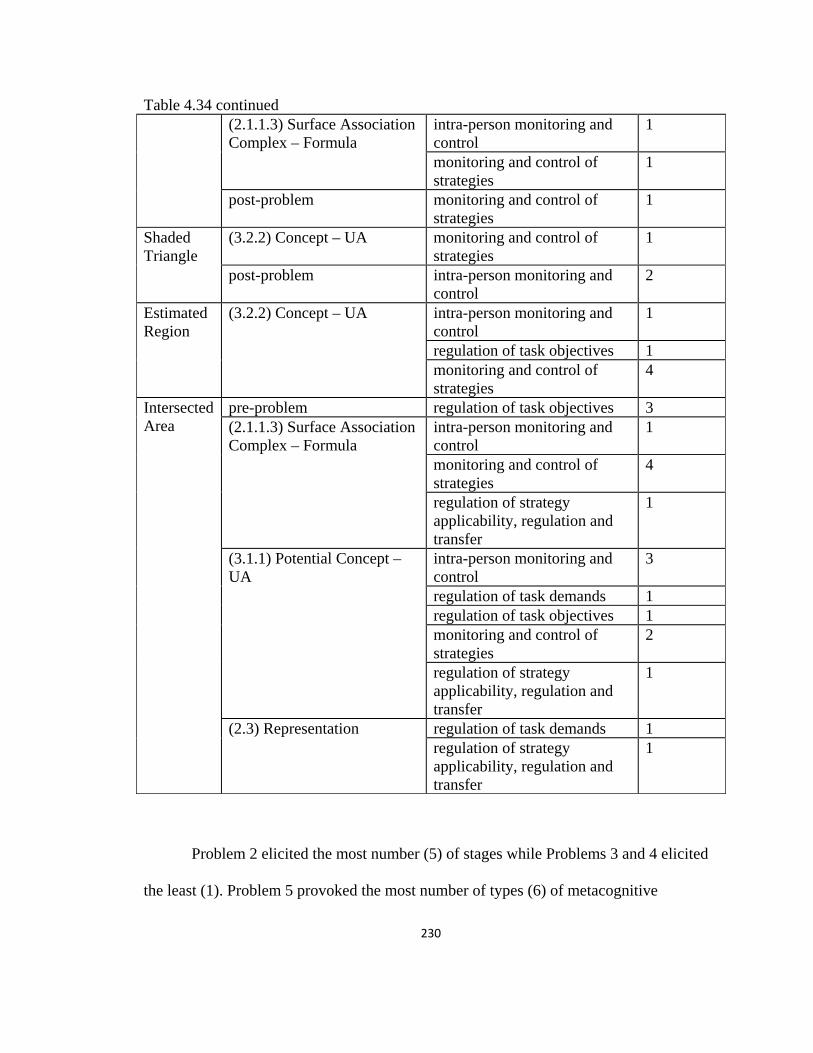
230
Table 4.34 continued (2.1.1.3) Surface Association
Complex – Formula intra-person monitoring and control
1
monitoring and control of strategies
1
post-problem monitoring and control of strategies
1
Shaded Triangle
(3.2.2) Concept – UA monitoring and control of strategies
1
post-problem intra-person monitoring and control
2
Estimated Region
(3.2.2) Concept – UA intra-person monitoring and control
1
regulation of task objectives 1 monitoring and control of strategies
4
Intersected Area
pre-problem regulation of task objectives 3 (2.1.1.3) Surface Association Complex – Formula
intra-person monitoring and control
1
monitoring and control of strategies
4
regulation of strategy applicability, regulation and transfer
1
(3.1.1) Potential Concept – UA
intra-person monitoring and control
3
regulation of task demands 1 regulation of task objectives 1 monitoring and control of strategies
2
regulation of strategy applicability, regulation and transfer
1
(2.3) Representation regulation of task demands 1 regulation of strategy applicability, regulation and transfer
1
Problem 2 elicited the most number (5) of stages while Problems 3 and 4 elicited
the least (1). Problem 5 provoked the most number of types (6) of metacognitive
231
behaviors, and Problem 3 provoked the least (2). Problem 2 revealed the most frequent
monitoring of strategies (9) and regulation of strategy (4), while Problems 3 and 4 did not
reveal any regulation of strategy. Both Problems 1 and 5 revealed the same numbers of
monitoring of strategies (6) and regulation of strategy (4). Considering the second part of
Problem 1 episode (working on an equation stage), Problems 2 and 5 provided the most
information in terms of metacognitive phenomena.
Participant and metacognition.
Ivan was selected as a participant who had shown interesting approaches on
various concept stages on the pretest. He exhibited the same characteristics during the
interviews which enabled the researcher to further examine his analytical dispositions.
Ivan displayed many unique behaviors that were not observed among other
participants, including concerns about whether a shape was three-dimensional or two-
dimensional, constructing a triangle by segmenting a side and moving it around, using a
wrong measurement or formula while conducting an effective observation, and
accidentally visualizing similar representations which led to an emotional breakout.
Although Ivan’s verbal monitoring of strategies hindered the development of a
deeper understanding of his thinking processes in Problems 3 and 4, his extensive
elaborations in Problems 2 and 5 enabled the researcher to examine the relationship
between specific concept stages and metacognitive behaviors that were only observed in
Ivan’s case.
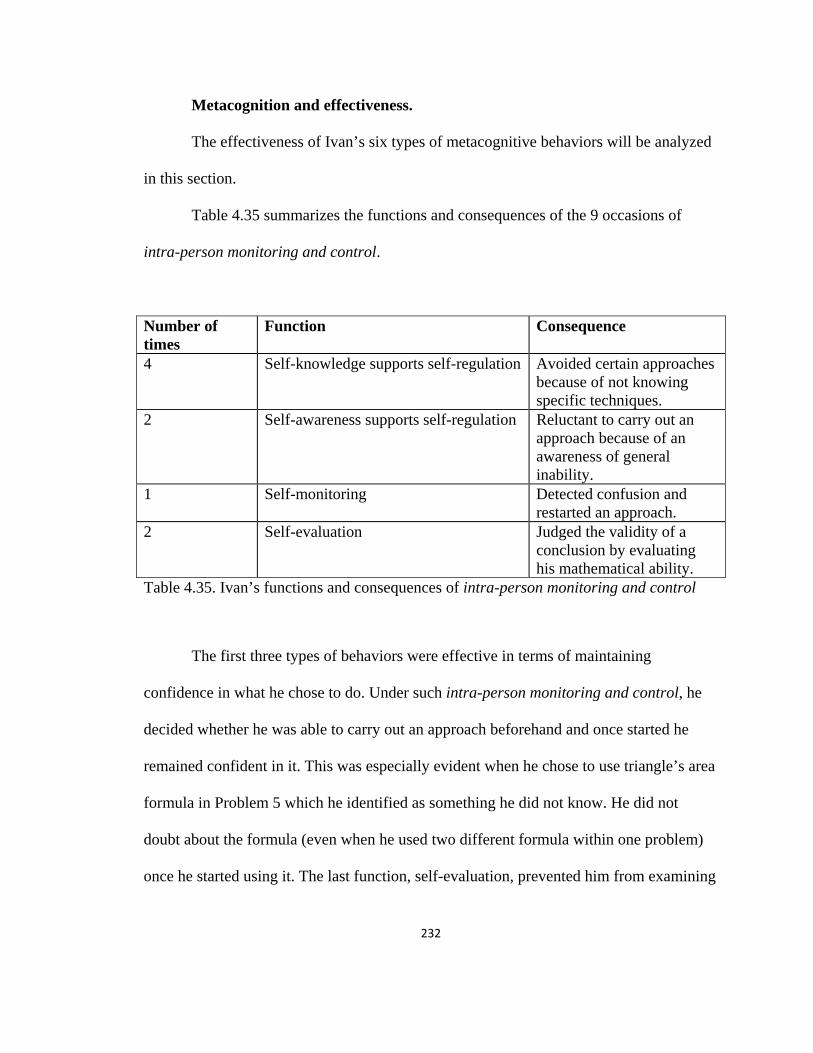
232
Metacognition and effectiveness.
The effectiveness of Ivan’s six types of metacognitive behaviors will be analyzed
in this section.
Table 4.35 summarizes the functions and consequences of the 9 occasions of
intra-person monitoring and control.
Number of times
Function Consequence
4 Self-knowledge supports self-regulation Avoided certain approaches because of not knowing specific techniques.
2 Self-awareness supports self-regulation Reluctant to carry out an approach because of an awareness of general inability.
1 Self-monitoring Detected confusion and restarted an approach.
2 Self-evaluation Judged the validity of a conclusion by evaluating his mathematical ability.
Table 4.35. Ivan’s functions and consequences of intra-person monitoring and control
The first three types of behaviors were effective in terms of maintaining
confidence in what he chose to do. Under such intra-person monitoring and control, he
decided whether he was able to carry out an approach beforehand and once started he
remained confident in it. This was especially evident when he chose to use triangle’s area
formula in Problem 5 which he identified as something he did not know. He did not
doubt about the formula (even when he used two different formula within one problem)
once he started using it. The last function, self-evaluation, prevented him from examining

233
the mathematical reasoning behind the conclusion, although they appeared to be correct
“insights” in the contexts.
Among the 8 occasions of regulation of task objectives, 6 of them were effective
in terms of clarifying and identifying task elements and prevented him from
misinterpreting the information (provided that the interviewer confirmed the correct
interpretations when he asked for clarification). The two ineffective behaviors were both
re-identification of task elements followed with certain prompts or limited observations.
When there was no interference from prompts or observations, Ivan’s regulation of task
objectives was mostly challenged by misinterpretations and poor inter-person monitoring
and control (where he tended to ignore task clarifications from the interviewer).
Ivan’s occasions of regulation of task demands (2) were both effective. Although
he only addressed task demands twice (because of prompt questions), it was evident that
he always determined and understood task demands when he was solving a problem.
This type of metacognitive behaviors closely collaborated with intra-person monitoring
and regulation of strategy, which minimized the negative effects from lower concept
stage operations.
There were 24 occasions of monitoring and control of strategies and 9 occasions
of regulation of strategy applicability, regulation and transfer. Table 4.36 summarizes
the functions and consequences of the 24 occasions of monitoring of strategies.
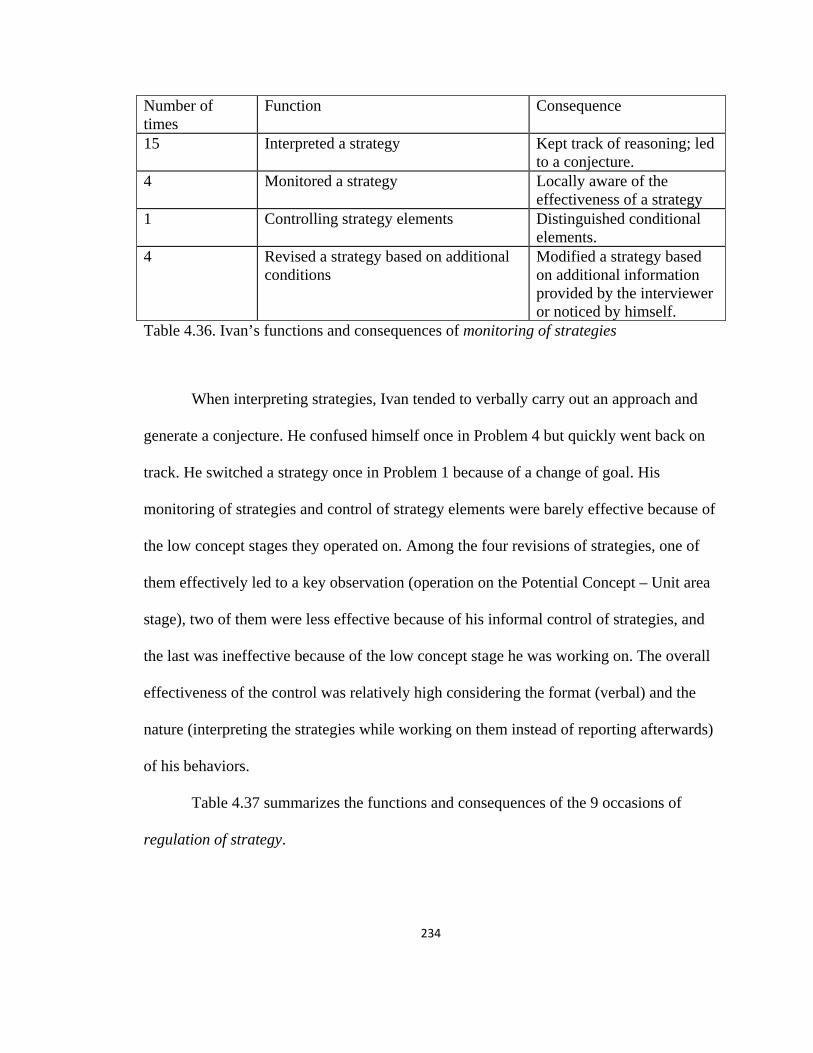
234
Number of times
Function Consequence
15 Interpreted a strategy Kept track of reasoning; led to a conjecture.
4 Monitored a strategy Locally aware of the effectiveness of a strategy
1 Controlling strategy elements Distinguished conditional elements.
4 Revised a strategy based on additional conditions
Modified a strategy based on additional information provided by the interviewer or noticed by himself.
Table 4.36. Ivan’s functions and consequences of monitoring of strategies
When interpreting strategies, Ivan tended to verbally carry out an approach and
generate a conjecture. He confused himself once in Problem 4 but quickly went back on
track. He switched a strategy once in Problem 1 because of a change of goal. His
monitoring of strategies and control of strategy elements were barely effective because of
the low concept stages they operated on. Among the four revisions of strategies, one of
them effectively led to a key observation (operation on the Potential Concept – Unit area
stage), two of them were less effective because of his informal control of strategies, and
the last was ineffective because of the low concept stage he was working on. The overall
effectiveness of the control was relatively high considering the format (verbal) and the
nature (interpreting the strategies while working on them instead of reporting afterwards)
of his behaviors.
Table 4.37 summarizes the functions and consequences of the 9 occasions of
regulation of strategy.
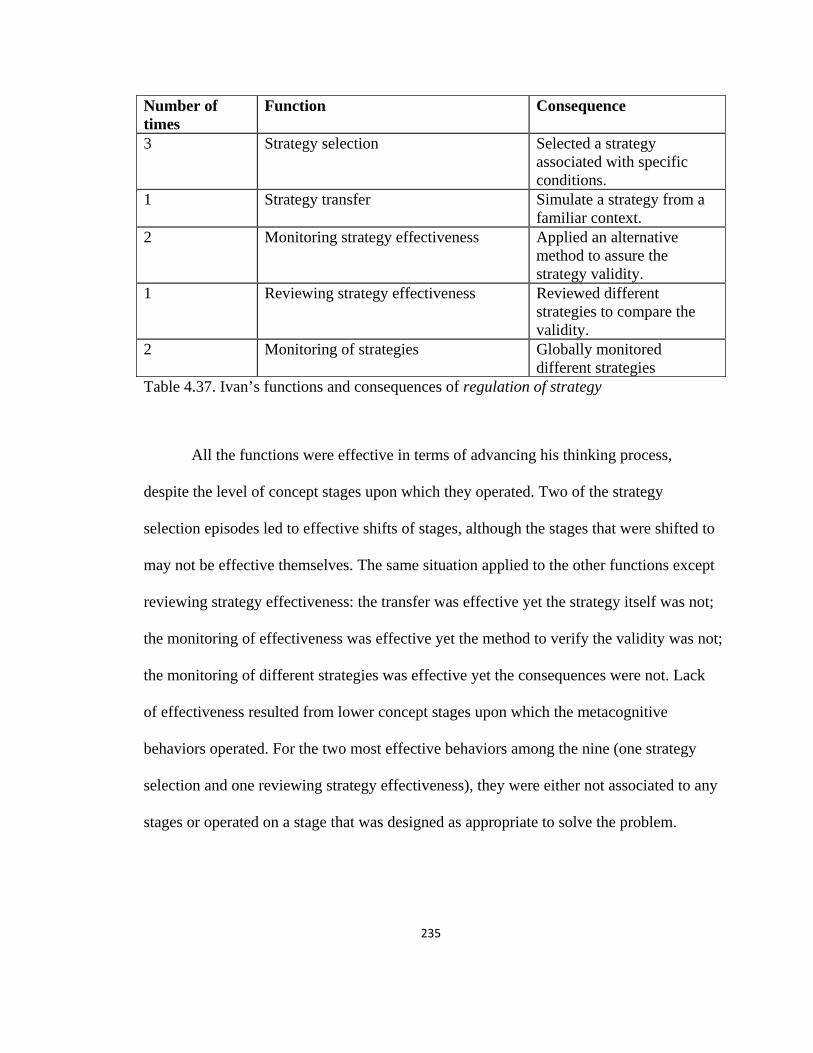
235
Number of times
Function Consequence
3 Strategy selection Selected a strategy associated with specific conditions.
1 Strategy transfer Simulate a strategy from a familiar context.
2 Monitoring strategy effectiveness Applied an alternative method to assure the strategy validity.
1 Reviewing strategy effectiveness Reviewed different strategies to compare the validity.
2 Monitoring of strategies Globally monitored different strategies
Table 4.37. Ivan’s functions and consequences of regulation of strategy
All the functions were effective in terms of advancing his thinking process,
despite the level of concept stages upon which they operated. Two of the strategy
selection episodes led to effective shifts of stages, although the stages that were shifted to
may not be effective themselves. The same situation applied to the other functions except
reviewing strategy effectiveness: the transfer was effective yet the strategy itself was not;
the monitoring of effectiveness was effective yet the method to verify the validity was not;
the monitoring of different strategies was effective yet the consequences were not. Lack
of effectiveness resulted from lower concept stages upon which the metacognitive
behaviors operated. For the two most effective behaviors among the nine (one strategy
selection and one reviewing strategy effectiveness), they were either not associated to any
stages or operated on a stage that was designed as appropriate to solve the problem.

236
Concept and metacognition.
In this section, the relationship between concept stages and metacognitive
behaviors along with their frequency will be analyzed. Table 4.38 summarizes the types
of metacognitive behaviors with their frequency observed on each stage.
Stage Metacognitive behaviors Frequency(1.1) Heap – NM monitoring and control of strategies 1
regulation of strategy applicability, regulation and transfer
1
(2.1.1.1) Surface Association Complex – NM
regulation of task demands 1 monitoring and control of strategies 3 regulation of strategy applicability, regulation and transfer
2
(2.1.1.3) Surface Association Complex – Formula
intra-person monitoring and control 2 monitoring and control of strategies 5 regulation of strategy applicability, regulation and transfer
1
(2.1.3) Artificial Association Complex
monitoring and control of strategies 2 regulation of strategy applicability, regulation and transfer
2
(2.2.1) Chain complex – NM monitoring and control of strategies 3 regulation of strategy applicability, regulation and transfer
1
(2.3) Representation regulation of task demands 1 regulation of strategy applicability, regulation and transfer
1
(2.4.1) Pseudo-concept complex – NM
monitoring and control of strategies 2
(3.1.1) Potential Concept – UA intra-person monitoring and control 3 regulation of task demands 1 regulation of task objectives 1 monitoring and control of strategies 2 regulation of strategy applicability, regulation and transfer
1
(3.2.2) Concept – UA intra-person monitoring and control 1 regulation of task objectives 1 monitoring and control of strategies 1
Table 4.38. Ivan’s types of metacognitive behaviors with their frequency observed on each stage

237
Ivan exhibited a complex system of metacognitive behaviors to maintain
effectiveness when working on lower concept stages. His intra-person monitoring and
control enabled him to be confident in his approaches and avoid approaches that he knew
he was not able to carry out. His advanced regulation of task demands and regulation of
strategy allowed him to identify the most effective approach among available stages, and
approaches that were less effective became a means to support the most effective one.
These two types of metacognitive behaviors tended to be less referenced but exerted
strong influence on his general performance. The major challenges for Ivan included
some ineffective intra-person monitoring and control (e.g. false confidence on a lower
stage), poor inter-person monitoring and control (leading to ineffective collaboration),
ineffective regulation of task objectives (which served as an important resource for
regulation of task demands), and informal monitoring and control of strategies (which
was more likely to be ineffective on lower concept stages). Figure 4.82 shows a balance
of effectiveness between the complex system and the challenges. In the five problem
solving episodes, his overall effectiveness was relatively high.
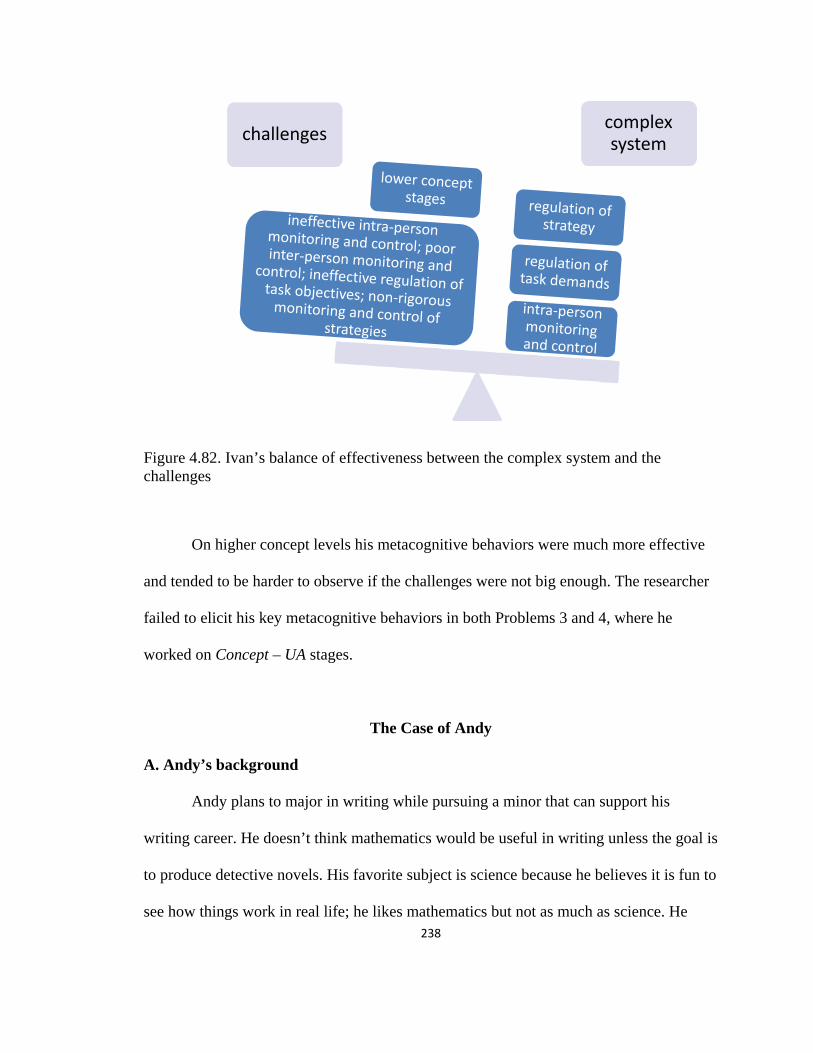
238
Figure 4.82. Ivan’s balance of effectiveness between the complex system and the challenges
On higher concept levels his metacognitive behaviors were much more effective
and tended to be harder to observe if the challenges were not big enough. The researcher
failed to elicit his key metacognitive behaviors in both Problems 3 and 4, where he
worked on Concept – UA stages.
The Case of Andy
A. Andy’s background
Andy plans to major in writing while pursuing a minor that can support his
writing career. He doesn’t think mathematics would be useful in writing unless the goal is
to produce detective novels. His favorite subject is science because he believes it is fun to
see how things work in real life; he likes mathematics but not as much as science. He
challenges complex system
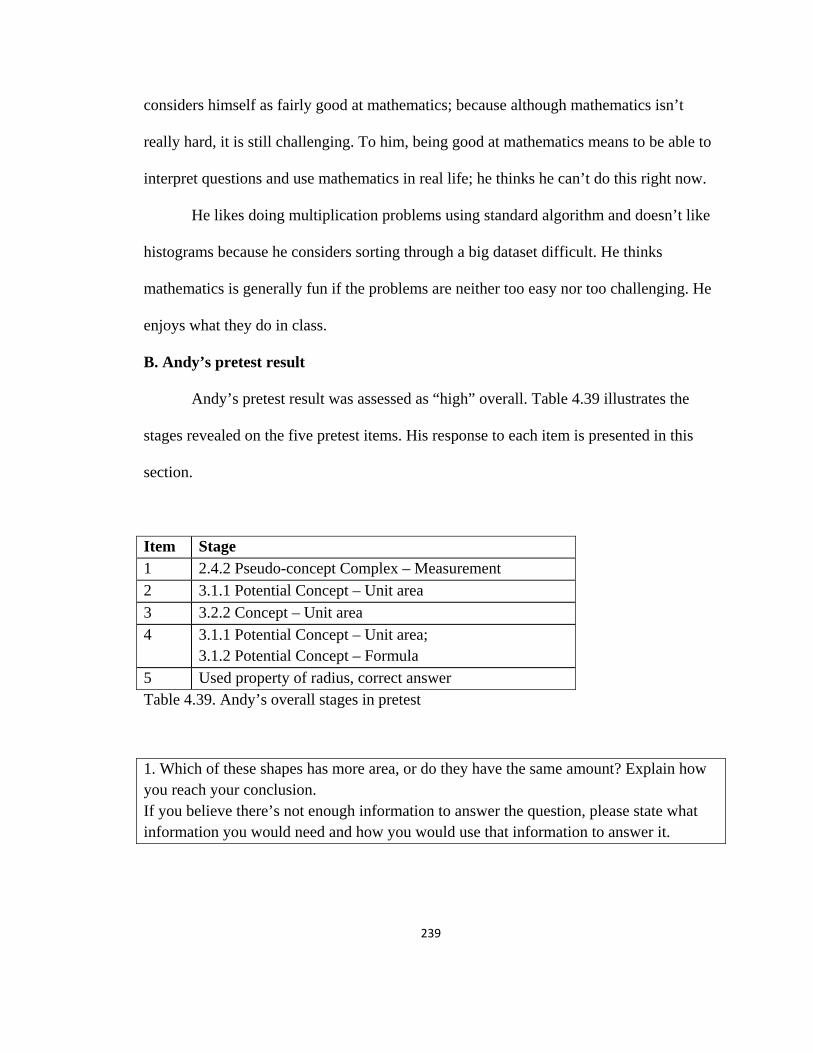
239
considers himself as fairly good at mathematics; because although mathematics isn’t
really hard, it is still challenging. To him, being good at mathematics means to be able to
interpret questions and use mathematics in real life; he thinks he can’t do this right now.
He likes doing multiplication problems using standard algorithm and doesn’t like
histograms because he considers sorting through a big dataset difficult. He thinks
mathematics is generally fun if the problems are neither too easy nor too challenging. He
enjoys what they do in class.
B. Andy’s pretest result
Andy’s pretest result was assessed as “high” overall. Table 4.39 illustrates the
stages revealed on the five pretest items. His response to each item is presented in this
section.
Item Stage 1 2.4.2 Pseudo-concept Complex – Measurement
2 3.1.1 Potential Concept – Unit area
3 3.2.2 Concept – Unit area
4 3.1.1 Potential Concept – Unit area; 3.1.2 Potential Concept – Formula
5 Used property of radius, correct answer Table 4.39. Andy’s overall stages in pretest
1. Which of these shapes has more area, or do they have the same amount? Explain how you reach your conclusion. If you believe there’s not enough information to answer the question, please state what information you would need and how you would use that information to answer it.
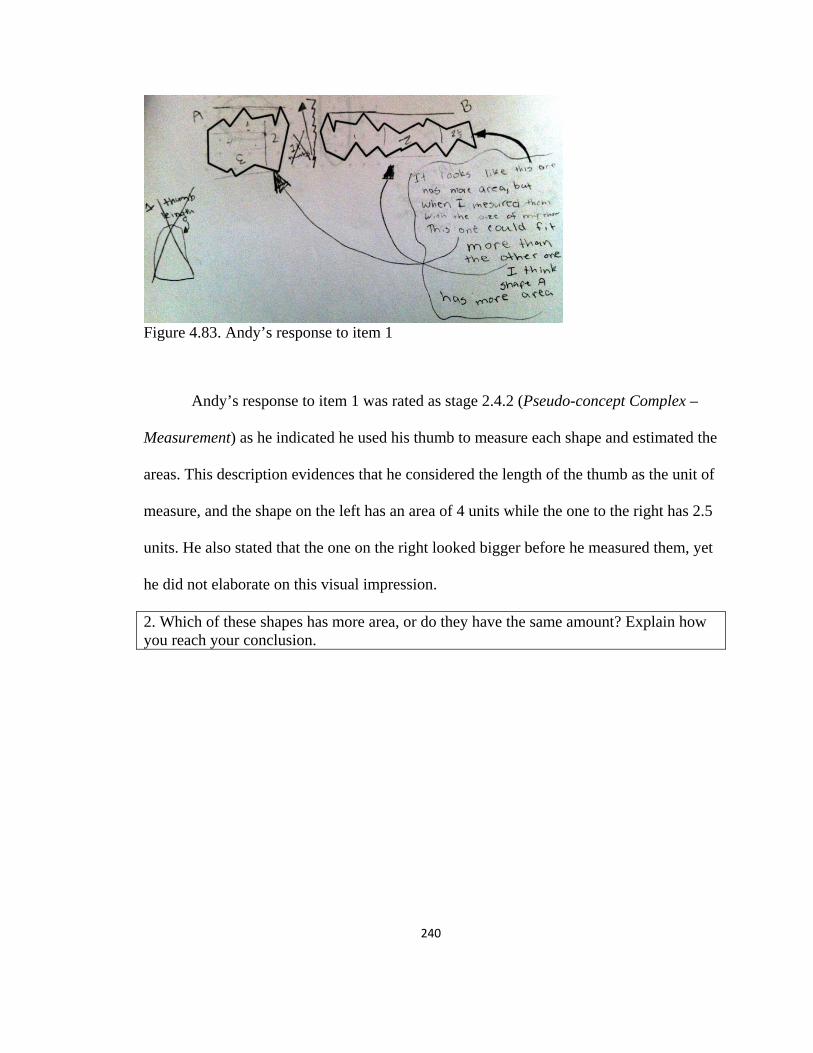
240
Figure 4.83. Andy’s response to item 1
Andy’s response to item 1 was rated as stage 2.4.2 (Pseudo-concept Complex –
Measurement) as he indicated he used his thumb to measure each shape and estimated the
areas. This description evidences that he considered the length of the thumb as the unit of
measure, and the shape on the left has an area of 4 units while the one to the right has 2.5
units. He also stated that the one on the right looked bigger before he measured them, yet
he did not elaborate on this visual impression.
2. Which of these shapes has more area, or do they have the same amount? Explain how you reach your conclusion.
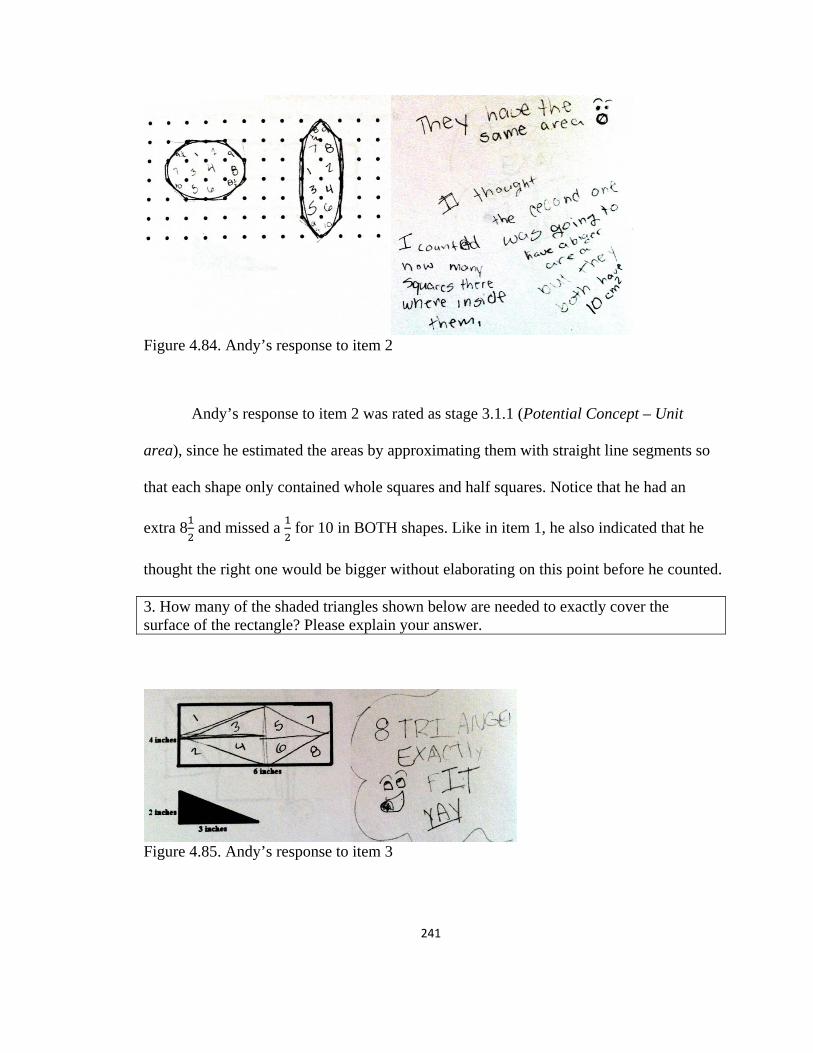
241
Figure 4.84. Andy’s response to item 2
Andy’s response to item 2 was rated as stage 3.1.1 (Potential Concept – Unit
area), since he estimated the areas by approximating them with straight line segments so
that each shape only contained whole squares and half squares. Notice that he had an
extra 8 and missed a for 10 in BOTH shapes. Like in item 1, he also indicated that he
thought the right one would be bigger without elaborating on this point before he counted.
3. How many of the shaded triangles shown below are needed to exactly cover the surface of the rectangle? Please explain your answer.
Figure 4.85. Andy’s response to item 3

242
Andy’s response to item 3 was rated as stage 3.2.2 (Concept – Unit area), since
he correctly iterated the triangles in the rectangle.
4. The squares in the grid below have areas of 1 square centimeter. Draw lines to complete the figure so that it has an area of 14 square centimeters.
Figure 4.86. Andy’s response to item 4
Andy’s response to item 4 was rated as stage 3.1.1 (Potential Concept – Unit area)
and 3.1.2 (Potential Concept – Formula). He computed the triangular area by the triangle
area formula and completed the shape by dividing the four square units into four columns
and taking three of them. Based on his computation on the right side, it seems that he first
tested the number which when multiplied by four would come close to the desired
rectangular area (4, 3.5, and 3) then how many sets of 4s there were in an eleven (2.75).
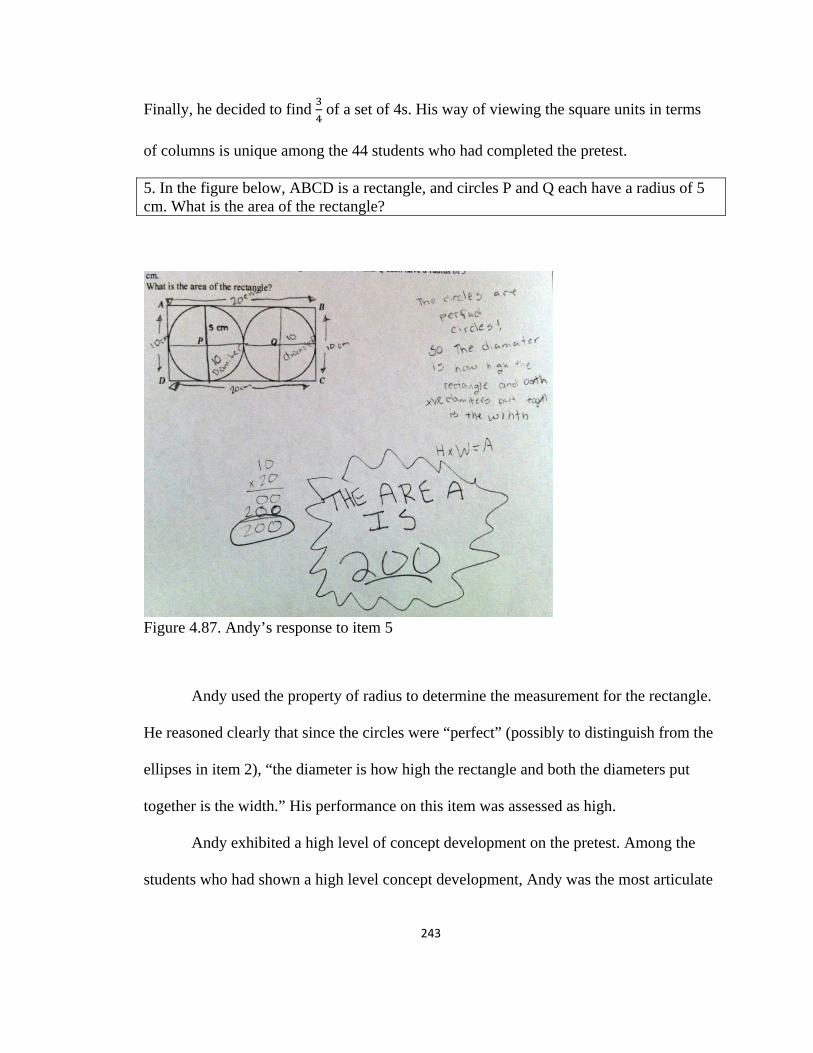
243
Finally, he decided to find of a set of 4s. His way of viewing the square units in terms
of columns is unique among the 44 students who had completed the pretest.
5. In the figure below, ABCD is a rectangle, and circles P and Q each have a radius of 5 cm. What is the area of the rectangle?
Figure 4.87. Andy’s response to item 5
Andy used the property of radius to determine the measurement for the rectangle.
He reasoned clearly that since the circles were “perfect” (possibly to distinguish from the
ellipses in item 2), “the diameter is how high the rectangle and both the diameters put
together is the width.” His performance on this item was assessed as high.
Andy exhibited a high level of concept development on the pretest. Among the
students who had shown a high level concept development, Andy was the most articulate

244
in terms of communicating his thinking process, including his initial impression and the
(contradicting) answer after applying an approach. His approaches were novel rather than
conventional. These features served as the rationale for the interviewer to further study
his problem solving behaviors.
C. Andy’s problem solving episodes
Compare Areas problem (9’07”).
Which of the regions shown below has the largest area? How would you order them?
Table 4.40 presents a breakdown of Andy’s key cognitive behaviors during this
problem solving episode.
Concept Stage Graphical illustration Description 1 Potential concept
– Formula
He assigned a=4, computed the area of the square and the triangle by formula. He stated the height of the triangle was the same as its side. The square had an area of 16, the triangle had 8.
2 Potential concept – Unit area
He drew unit squares and counted them to find the area of the circle. Every 2 larger partial squares were counted as 1 whole square; every 4 smaller partial squares were counted as 1 whole square. The answer was 15.5 unit squares.
Table 4.40. Breakdown of Andy’s key cognitive behaviors in the Compare Areas problem

245
Figure 4.88 shows the concept stages and metacognitive behaviors observed in
this episode. The problem solving process involved Potential concept – Formula where
he substituted a number to compute the area with the area formulas, and Potential
concept – Unit area where he drew unit squares to find the area of the circle. Revealed
types of metacognitive behaviors included intra-person monitoring and control
(1.1.1.1.a), monitoring and control of strategies (1.1.1.3), regulation of task objectives
(1.1.2.2.a), and regulation of strategy applicability, regulation and transfer (1.1.2.3).
Figure 4.88. Ivan’s concept stages and metacognitive behaviors in the Compare Areas problem
After reading the problem, Andy confirmed with the interviewer that “around is
the circumference,” and then recited the correct formula for calculating the circumference
of circles. Once he wrote down the formula, the interviewer explained what the a’s meant.
He acknowledged the information, recited the area formula for squares as “a times a,”
assigned a value (four) to a, and computed the area for the square (4*4=16). According to
his later reflection on the rationale of reciting the circle’s circumference formula, he
naturally turned to the distance instead of the area because the former was immediately
0 10 20 30 40 50
Potential Concept - UA
Potential concept – Formula
silence
1.1.1.1.a
1.1.1.3
1.1.2.2.a
1.1.2.3
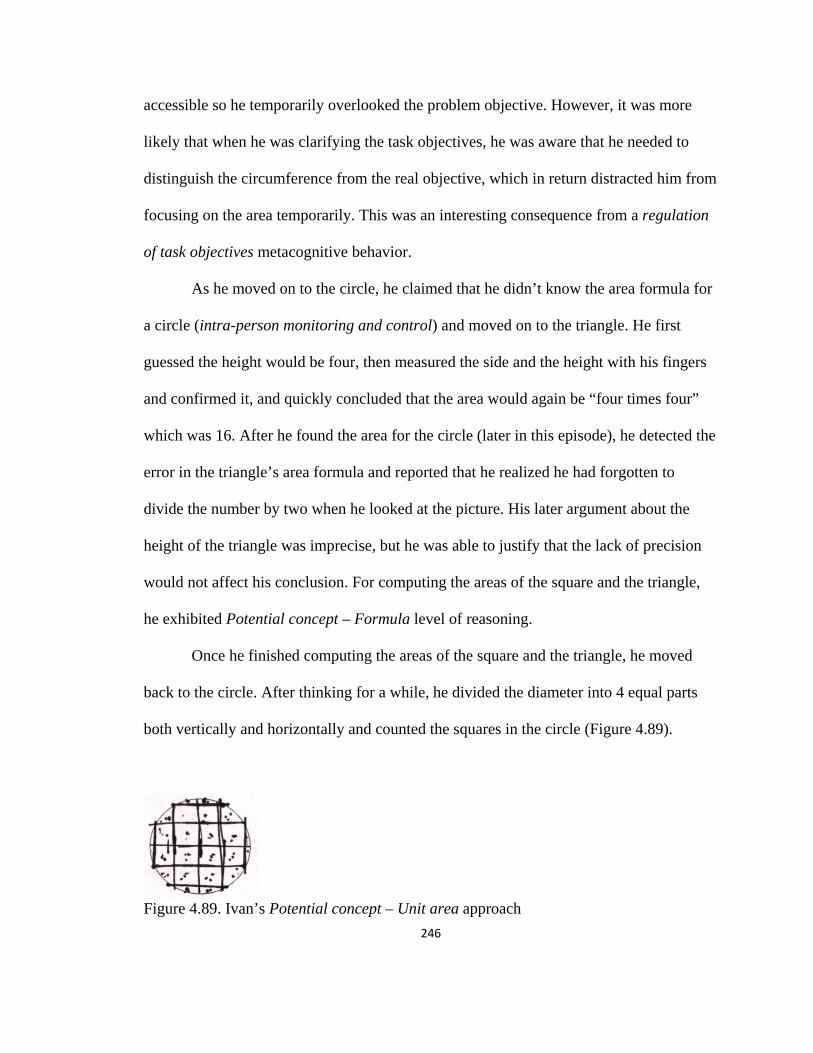
246
accessible so he temporarily overlooked the problem objective. However, it was more
likely that when he was clarifying the task objectives, he was aware that he needed to
distinguish the circumference from the real objective, which in return distracted him from
focusing on the area temporarily. This was an interesting consequence from a regulation
of task objectives metacognitive behavior.
As he moved on to the circle, he claimed that he didn’t know the area formula for
a circle (intra-person monitoring and control) and moved on to the triangle. He first
guessed the height would be four, then measured the side and the height with his fingers
and confirmed it, and quickly concluded that the area would again be “four times four”
which was 16. After he found the area for the circle (later in this episode), he detected the
error in the triangle’s area formula and reported that he realized he had forgotten to
divide the number by two when he looked at the picture. His later argument about the
height of the triangle was imprecise, but he was able to justify that the lack of precision
would not affect his conclusion. For computing the areas of the square and the triangle,
he exhibited Potential concept – Formula level of reasoning.
Once he finished computing the areas of the square and the triangle, he moved
back to the circle. After thinking for a while, he divided the diameter into 4 equal parts
both vertically and horizontally and counted the squares in the circle (Figure 4.89).
Figure 4.89. Ivan’s Potential concept – Unit area approach

247
He counted 17 squares in the circle (without showing the counting process), then
concluded that the circle would have the largest area. The interviewer asked him to
explain what he had done with the circle. He answered that since he didn’t know how to
find the area using a formula, he divided the horizontal diameter into four parts because
he assumed the length was four. Then he divided the vertical diameter in the same
manner. He counted twelve whole unit squares within the circle and estimated that the
“larger partial squares” could form two whole squares. At this point he paused for 4
seconds and recounted the unit squares, and claimed that there were 15.5 unit squares in
the circle. Andy’s refined counting mechanism for the partial squares was evident – every
two larger partial squares were counted as one whole square (there were four of them),
every four smaller partial squares were counted as one whole square (there were six of
them). The approach to find the area of the circle revealed a Potential concept – Unit
area level of reasoning.
When Andy finished counting he looked at the numbers at hand (16, 15.5, and 16)
and paused for 2 seconds. He then went back to the triangle and claimed the triangle’s
area should be 8 instead of 16. It is possible that the representation provided some visual
clue to the error, or the close numbers made him aware that something might be wrong.
After he corrected the triangle’s formula, he ordered the three shapes from the biggest to
the smallest – square, circle, and triangle.
At this point, the interviewer asked several questions on actions he had taken,
which are illustrated in Table 4.41.

248
Question from the interviewer Response from Andy What made you go back to the triangle and modify the formula?
I’m pretty sure the triangle area formula is base times height divided by 2. I completely forgot to do it at the beginning.
How sure are you about the height of the triangle?
Since it’s an equilateral triangle, all the sides are the same and the height is the same too. Roughly the same.
As you said they are roughly the same, how important it would be to be precise in this case?
In this case, I don’t think it would make that much of difference if it’s 0.5 off, because my answer would still be roughly the same. This would be still smaller than the other two.
Why did you look at the circumference at the beginning?
I don’t know actually. I thought I forgot that it was the area, not the distance around.
Table 4.41. Interviewer’s prompts and Ivan’s responses in the Compare Areas problem
Lastly, the interviewer pointed out that the area of the square (16) and the area of
the circle (15.5) were very close and asked him whether he was convinced of his
conclusion. Andy said it was possible that he miscounted the unit squares in the circle,
and he was not totally convinced of the answer because he had not computed the values
using a formula. When he was asked whether he could use another way to solve the
problem, Andy said he could think about it but he didn’t want to do so.
Andy showed stronger trust in “pure mathematical” methods (i.e. formulas) than
informal methods (e.g. visual estimations). He tended to consider the importance of
precision based on a global view of the results (across different approaches); when the
area was much smaller it was less important to be precise (the triangle), but when the area
was close to another he would leave some room for a reconsideration of plausibility of
the answer.
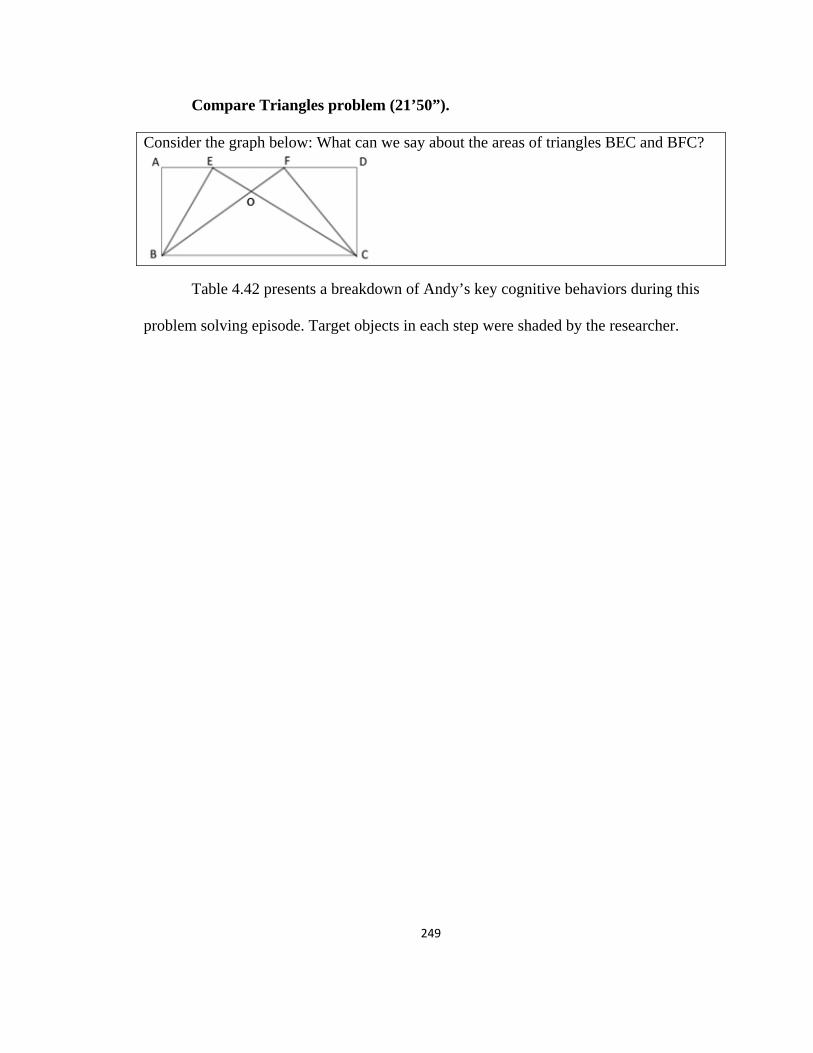
249
Compare Triangles problem (21’50”).
Consider the graph below: What can we say about the areas of triangles BEC and BFC?
Table 4.42 presents a breakdown of Andy’s key cognitive behaviors during this
problem solving episode. Target objects in each step were shaded by the researcher.
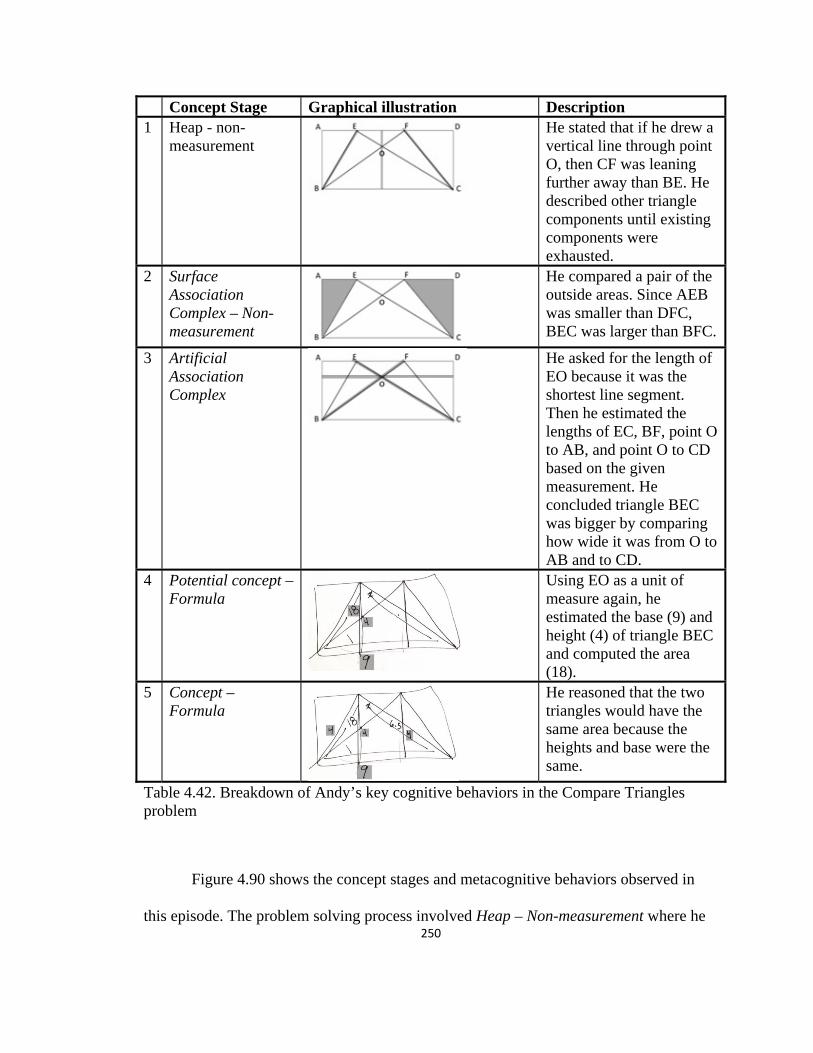
250
Concept Stage Graphical illustration Description 1 Heap - non-
measurement
He stated that if he drew a vertical line through point O, then CF was leaning further away than BE. He described other triangle components until existing components were exhausted.
2 Surface Association Complex – Non-measurement
He compared a pair of the outside areas. Since AEB was smaller than DFC, BEC was larger than BFC.
3 Artificial Association Complex
He asked for the length of EO because it was the shortest line segment. Then he estimated the lengths of EC, BF, point O to AB, and point O to CD based on the given measurement. He concluded triangle BEC was bigger by comparing how wide it was from O to AB and to CD.
4 Potential concept – Formula
Using EO as a unit of measure again, he estimated the base (9) and height (4) of triangle BEC and computed the area (18).
5 Concept – Formula
He reasoned that the two triangles would have the same area because the heights and base were the same.
Table 4.42. Breakdown of Andy’s key cognitive behaviors in the Compare Triangles problem
Figure 4.90 shows the concept stages and metacognitive behaviors observed in
this episode. The problem solving process involved Heap – Non-measurement where he
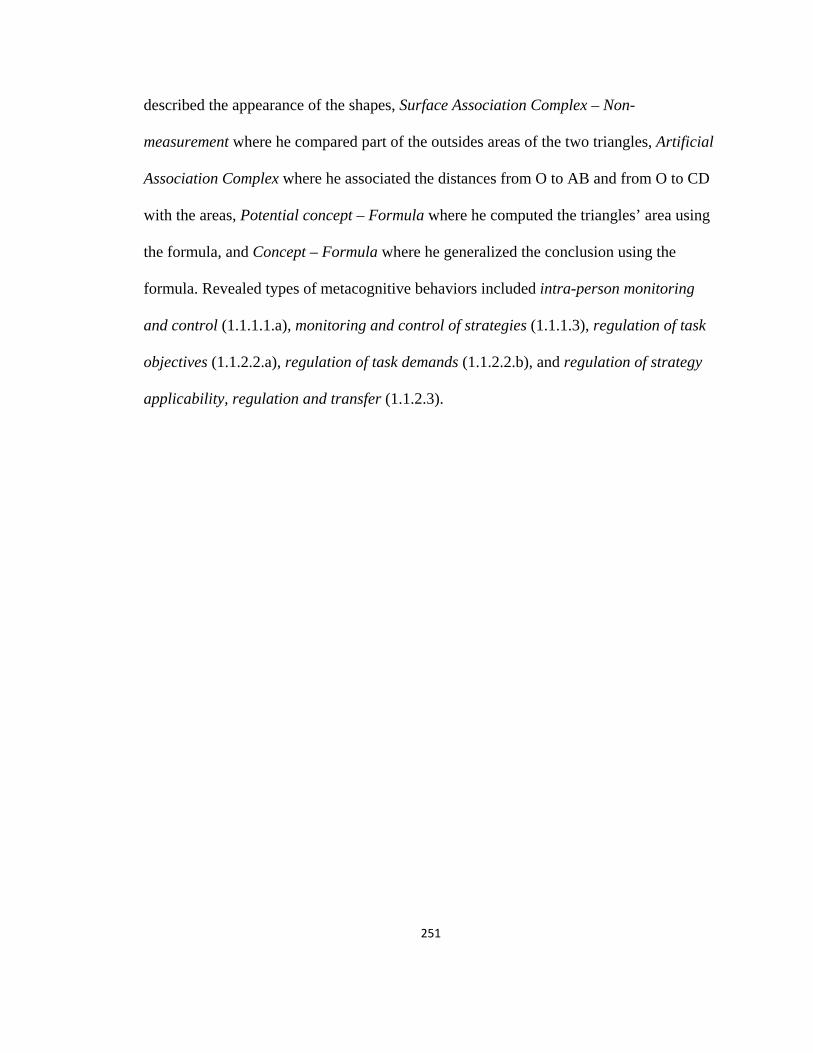
251
described the appearance of the shapes, Surface Association Complex – Non-
measurement where he compared part of the outsides areas of the two triangles, Artificial
Association Complex where he associated the distances from O to AB and from O to CD
with the areas, Potential concept – Formula where he computed the triangles’ area using
the formula, and Concept – Formula where he generalized the conclusion using the
formula. Revealed types of metacognitive behaviors included intra-person monitoring
and control (1.1.1.1.a), monitoring and control of strategies (1.1.1.3), regulation of task
objectives (1.1.2.2.a), regulation of task demands (1.1.2.2.b), and regulation of strategy
applicability, regulation and transfer (1.1.2.3).
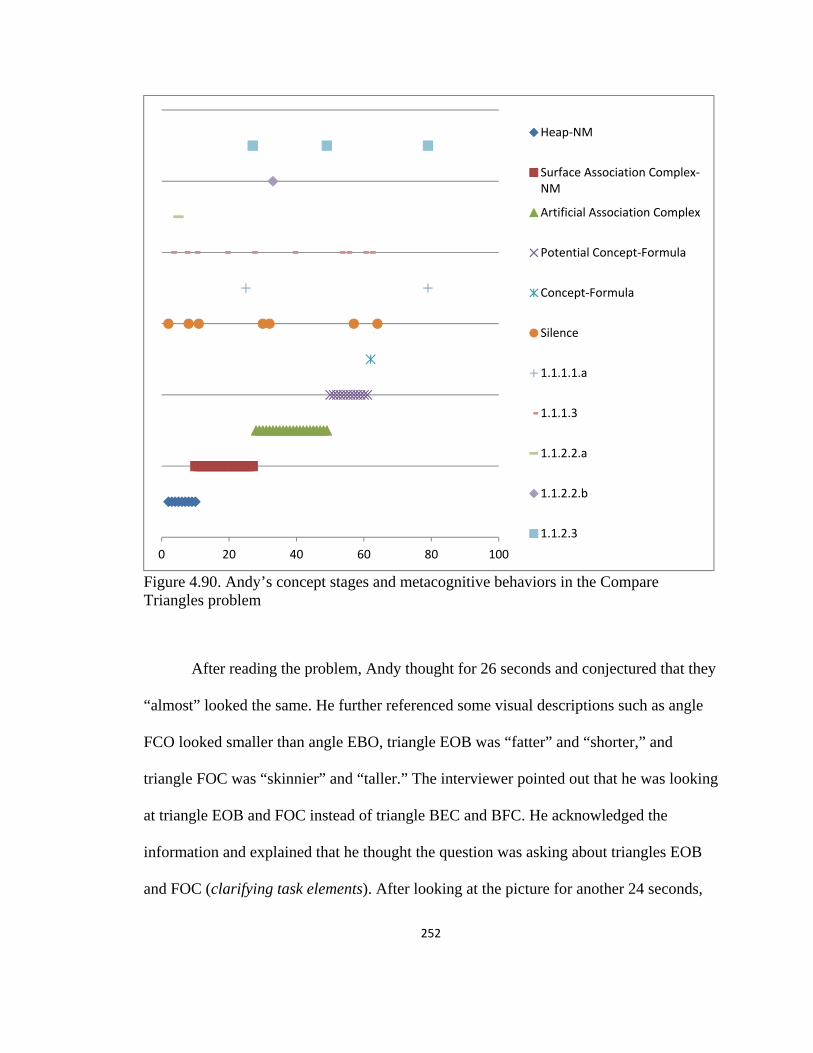
252
Figure 4.90. Andy’s concept stages and metacognitive behaviors in the Compare Triangles problem
After reading the problem, Andy thought for 26 seconds and conjectured that they
“almost” looked the same. He further referenced some visual descriptions such as angle
FCO looked smaller than angle EBO, triangle EOB was “fatter” and “shorter,” and
triangle FOC was “skinnier” and “taller.” The interviewer pointed out that he was looking
at triangle EOB and FOC instead of triangle BEC and BFC. He acknowledged the
information and explained that he thought the question was asking about triangles EOB
and FOC (clarifying task elements). After looking at the picture for another 24 seconds,
0 20 40 60 80 100
Heap-NM
Surface Association Complex-NM
Artificial Association Complex
Potential Concept-Formula
Concept-Formula
Silence
1.1.1.1.a
1.1.1.3
1.1.2.2.a
1.1.2.2.b
1.1.2.3
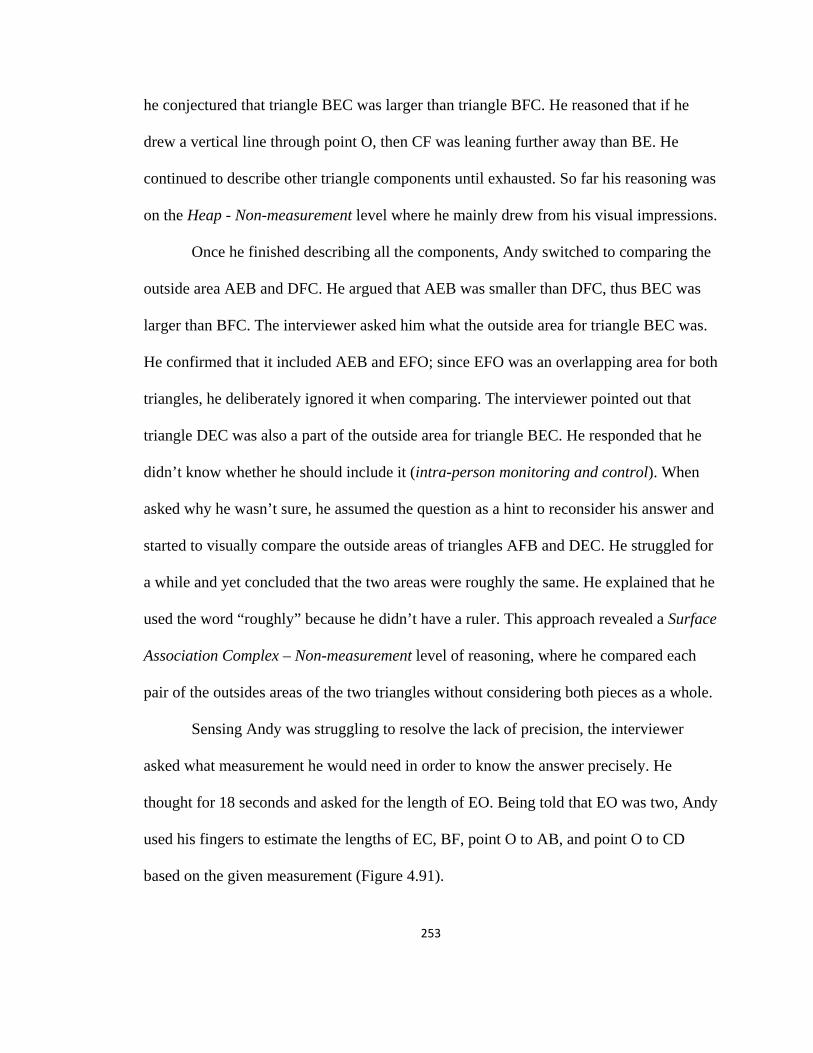
253
he conjectured that triangle BEC was larger than triangle BFC. He reasoned that if he
drew a vertical line through point O, then CF was leaning further away than BE. He
continued to describe other triangle components until exhausted. So far his reasoning was
on the Heap - Non-measurement level where he mainly drew from his visual impressions.
Once he finished describing all the components, Andy switched to comparing the
outside area AEB and DFC. He argued that AEB was smaller than DFC, thus BEC was
larger than BFC. The interviewer asked him what the outside area for triangle BEC was.
He confirmed that it included AEB and EFO; since EFO was an overlapping area for both
triangles, he deliberately ignored it when comparing. The interviewer pointed out that
triangle DEC was also a part of the outside area for triangle BEC. He responded that he
didn’t know whether he should include it (intra-person monitoring and control). When
asked why he wasn’t sure, he assumed the question as a hint to reconsider his answer and
started to visually compare the outside areas of triangles AFB and DEC. He struggled for
a while and yet concluded that the two areas were roughly the same. He explained that he
used the word “roughly” because he didn’t have a ruler. This approach revealed a Surface
Association Complex – Non-measurement level of reasoning, where he compared each
pair of the outsides areas of the two triangles without considering both pieces as a whole.
Sensing Andy was struggling to resolve the lack of precision, the interviewer
asked what measurement he would need in order to know the answer precisely. He
thought for 18 seconds and asked for the length of EO. Being told that EO was two, Andy
used his fingers to estimate the lengths of EC, BF, point O to AB, and point O to CD
based on the given measurement (Figure 4.91).

254
Figure 4.91. Andy’s Artificial Association Complex approach
After measuring the above lengths he stated that triangle BEC was bigger and
explained that he used EO as a unit to measure all other sides because it was the shortest
line segment. Since EC was almost the same as BF, he drew the conclusion based on the
distance from O to AB and to CD (4 and 4.5 respectively). He further reasoned that he
chose to look at the distances from point O because it was the “longest point.” The
interviewer asked whether his decision was based on the length instead of the area. He
responded that he was comparing the outside areas which would be easier than finding
the areas of the target triangles (regulation of strategy applicability, regulation and
transfer). He may have looked at triangle ABF and CDE, yet it was not clear how he
drew the conclusion based on the two distances. This approach was considered as an
Artificial Association Complex level of reasoning, where he associated the distances from
O to AB and from O to CD with the areas.
At this point the interviewer asked Andy whether he could find the area of the
triangles. Using EO as a unit again, he estimated the base (9) and height (4) of triangle
BEC and computed 18 as the area. This showed a Potential Concept – Formula level of
reasoning, where he correctly measured the base and height and computed the triangle’s
area using the formula. Then he moved on to triangle BFC and claimed that the base was
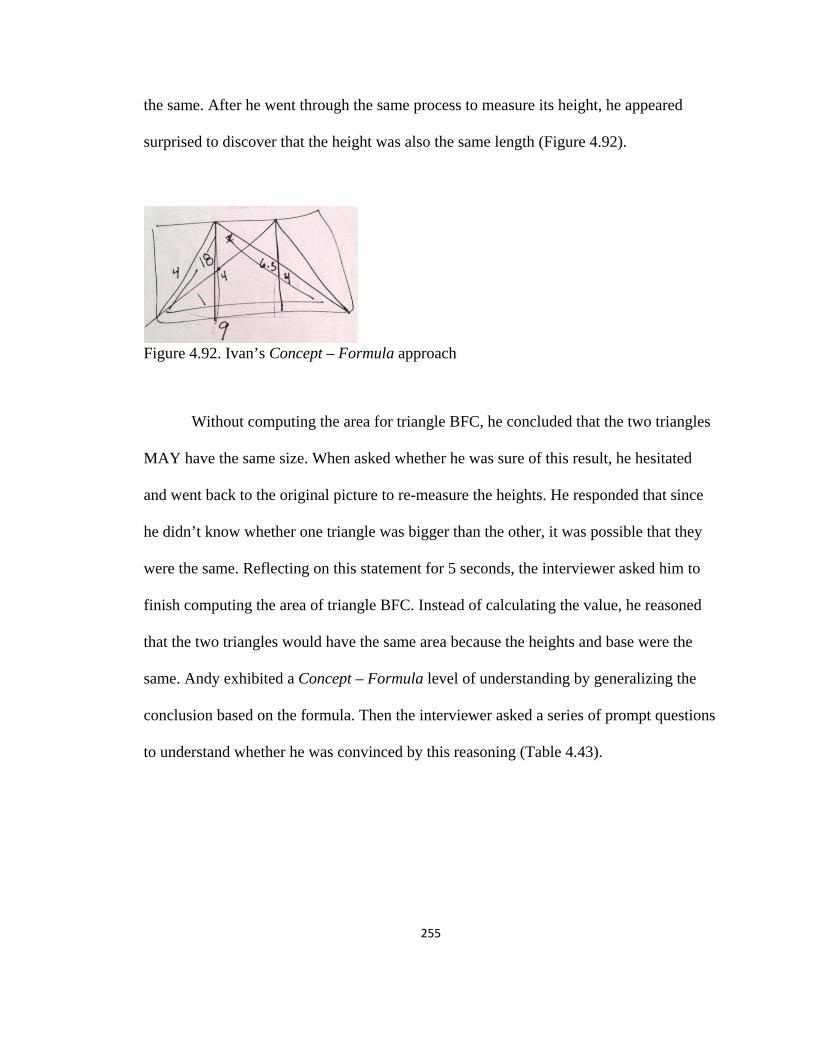
255
the same. After he went through the same process to measure its height, he appeared
surprised to discover that the height was also the same length (Figure 4.92).
Figure 4.92. Ivan’s Concept – Formula approach
Without computing the area for triangle BFC, he concluded that the two triangles
MAY have the same size. When asked whether he was sure of this result, he hesitated
and went back to the original picture to re-measure the heights. He responded that since
he didn’t know whether one triangle was bigger than the other, it was possible that they
were the same. Reflecting on this statement for 5 seconds, the interviewer asked him to
finish computing the area of triangle BFC. Instead of calculating the value, he reasoned
that the two triangles would have the same area because the heights and base were the
same. Andy exhibited a Concept – Formula level of understanding by generalizing the
conclusion based on the formula. Then the interviewer asked a series of prompt questions
to understand whether he was convinced by this reasoning (Table 4.43).

256
Question from the interviewer Response from Andy Are you still not sure about the area? I’m not entirely sure about the numbers,
but I’m 98% sure that these two have the same area.
What’s that 2%? The possibility that they could have different areas.
Even when you say they have the same base and same height?
There’s 2% of my mind is still thinking that these two could have different areas.
Do you think there’s never a 100% possibility for something in mathematics?
(No response)
In Problem 1, would you say you are 100% sure when you ordered the three shapes?
This is not a mathematical way of doing it, so that’s not 100% sure. But I’m 99% sure.
You have 1% doubt because you didn’t use the area formula to compute the circle?
Yes. So in this case (Problem 2), I should be 100% sure because same height same base. I’m 100% sure they have the same area.
Table 4.43. Interviewer’s prompts and Andy’s responses in the Compare Triangles problem
Andy was not fully convinced by his own logic when he generated the conclusion
using the formula. It was evident that he reasoned inductively; he was aware that he could
not test all cases, thus he remained doubtful of accuracy of his answers. Andy
distinguished the trustworthiness of “non-mathematical” (informal) approaches and
“mathematical” (formal) approaches and concluded that he should have trusted the
validity of formal approaches. The conversation revealed his inductive reasoning
(empirical reasoning) and authoritarian reasoning (external conviction reasoning) in
Harel and Sowder’s (1998) terminology.
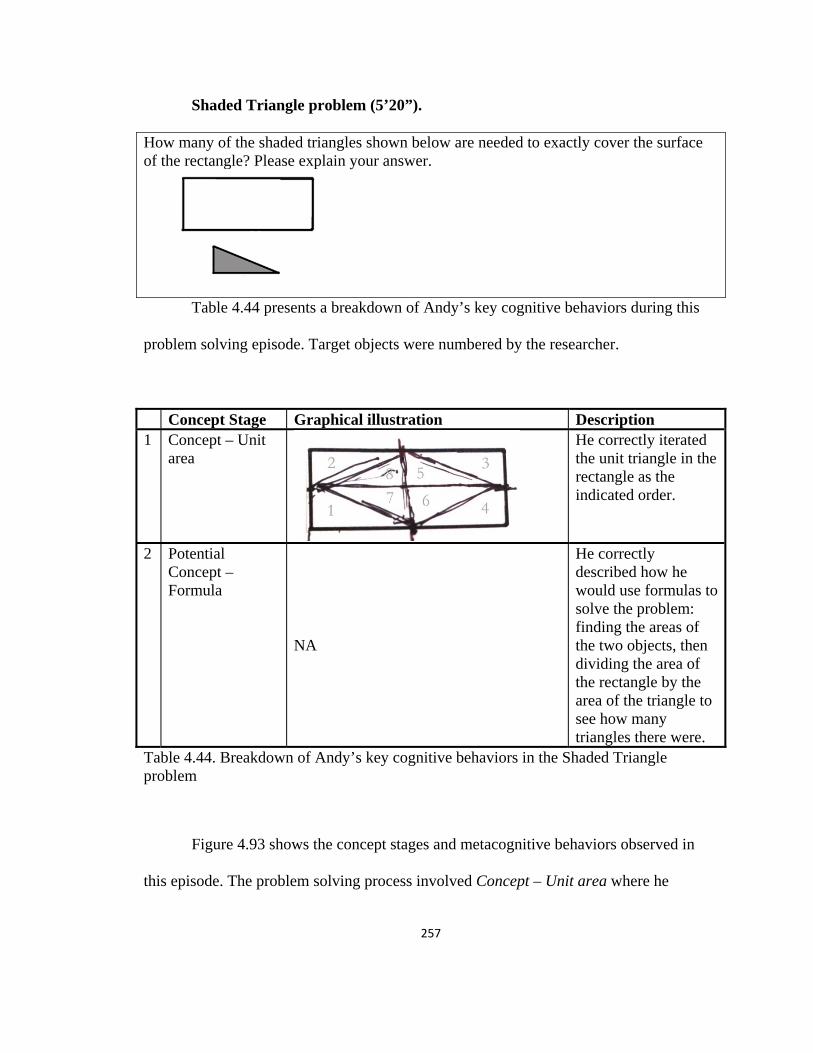
257
Shaded Triangle problem (5’20”).
How many of the shaded triangles shown below are needed to exactly cover the surface of the rectangle? Please explain your answer.
Table 4.44 presents a breakdown of Andy’s key cognitive behaviors during this
problem solving episode. Target objects were numbered by the researcher.
Concept Stage Graphical illustration Description 1 Concept – Unit
area He correctly iterated the unit triangle in the rectangle as the indicated order.
2 Potential Concept – Formula
NA
He correctly described how he would use formulas to solve the problem: finding the areas of the two objects, then dividing the area of the rectangle by the area of the triangle to see how many triangles there were.
Table 4.44. Breakdown of Andy’s key cognitive behaviors in the Shaded Triangle problem
Figure 4.93 shows the concept stages and metacognitive behaviors observed in
this episode. The problem solving process involved Concept – Unit area where he
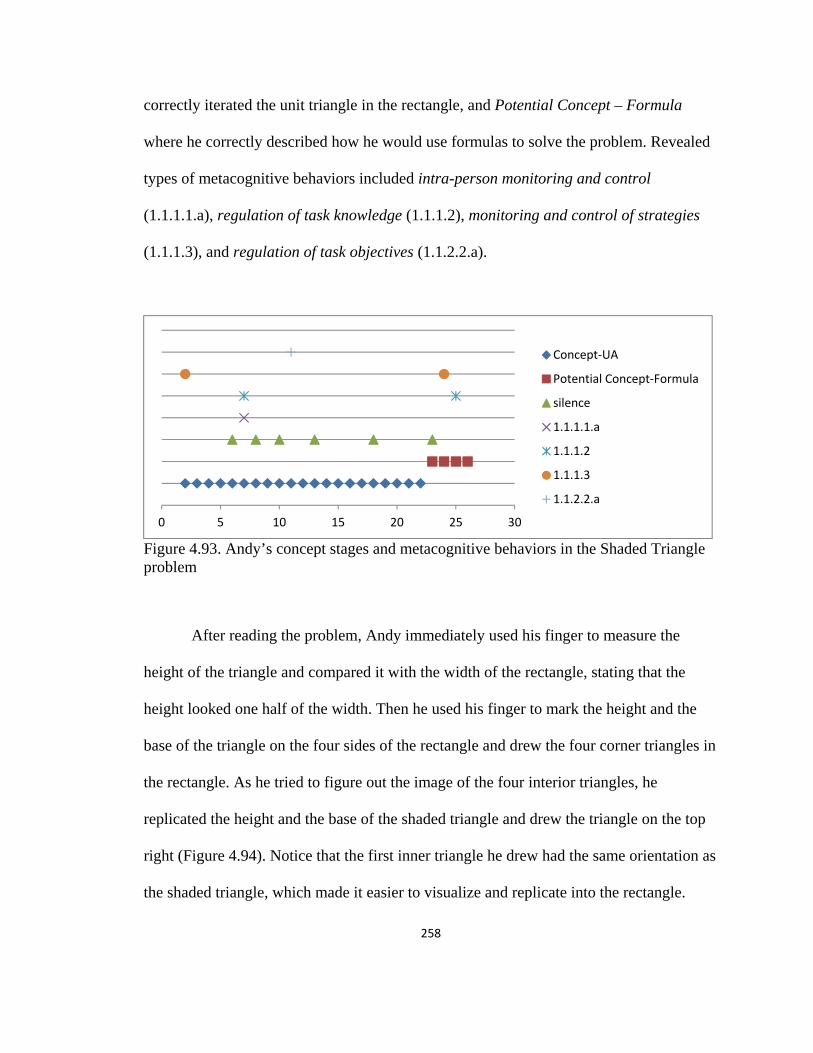
258
correctly iterated the unit triangle in the rectangle, and Potential Concept – Formula
where he correctly described how he would use formulas to solve the problem. Revealed
types of metacognitive behaviors included intra-person monitoring and control
(1.1.1.1.a), regulation of task knowledge (1.1.1.2), monitoring and control of strategies
(1.1.1.3), and regulation of task objectives (1.1.2.2.a).
Figure 4.93. Andy’s concept stages and metacognitive behaviors in the Shaded Triangle problem
After reading the problem, Andy immediately used his finger to measure the
height of the triangle and compared it with the width of the rectangle, stating that the
height looked one half of the width. Then he used his finger to mark the height and the
base of the triangle on the four sides of the rectangle and drew the four corner triangles in
the rectangle. As he tried to figure out the image of the four interior triangles, he
replicated the height and the base of the shaded triangle and drew the triangle on the top
right (Figure 4.94). Notice that the first inner triangle he drew had the same orientation as
the shaded triangle, which made it easier to visualize and replicate into the rectangle.
0 5 10 15 20 25 30
Concept-UA
Potential Concept-Formula
silence
1.1.1.1.a
1.1.1.2
1.1.1.3
1.1.2.2.a
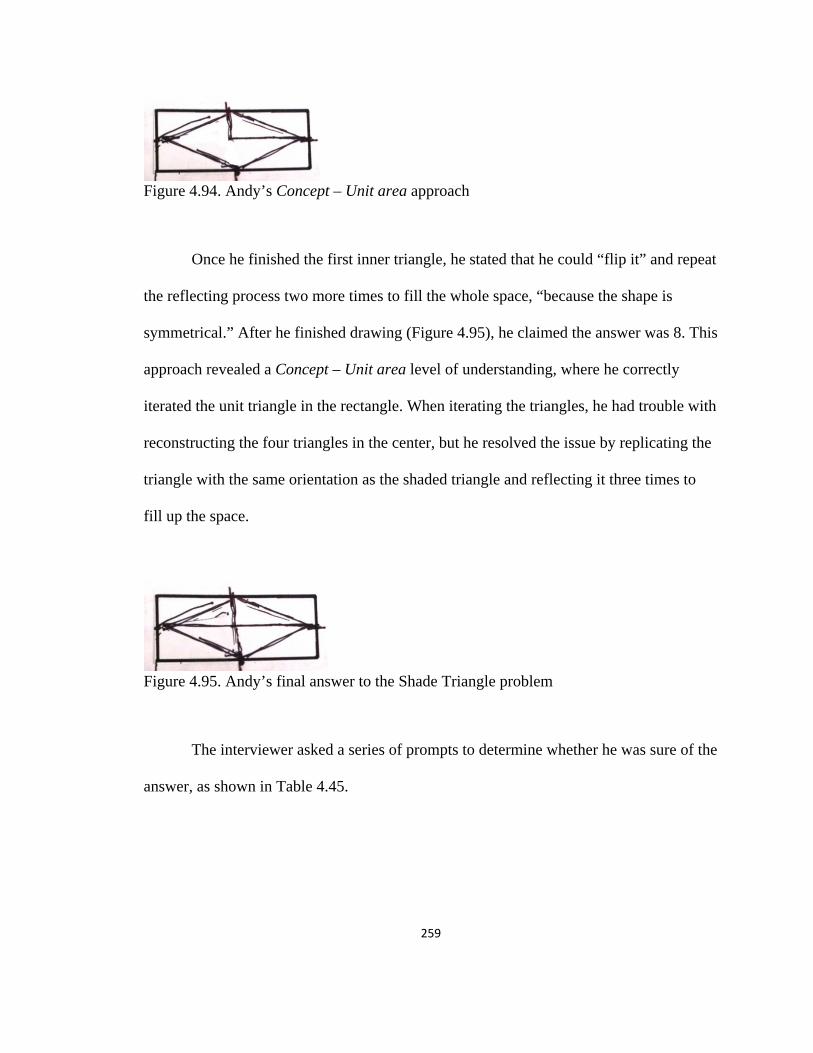
259
Figure 4.94. Andy’s Concept – Unit area approach
Once he finished the first inner triangle, he stated that he could “flip it” and repeat
the reflecting process two more times to fill the whole space, “because the shape is
symmetrical.” After he finished drawing (Figure 4.95), he claimed the answer was 8. This
approach revealed a Concept – Unit area level of understanding, where he correctly
iterated the unit triangle in the rectangle. When iterating the triangles, he had trouble with
reconstructing the four triangles in the center, but he resolved the issue by replicating the
triangle with the same orientation as the shaded triangle and reflecting it three times to
fill up the space.
Figure 4.95. Andy’s final answer to the Shade Triangle problem
The interviewer asked a series of prompts to determine whether he was sure of the
answer, as shown in Table 4.45.

260
Question from the interviewer Response from Andy Are you 100% sure about the answer? In theory it works. But I’m not the best at
drawing things that are exactly the same. Which part are you not sure of? I’m not sure about the size. I know these
(triangle’s two legs) are half of these (rectangle’s width and length). In theory it works, so I’m pretty sure.
When you say in theory, what theory is that?
If the triangle’s two legs are half of the rectangle’s width and length, then it works. If not, it doesn’t.
What information would you ask for to make sure?
How big the height of the triangle and the width of the rectangle are. If it’s really half, then it would work.
Table 4.45. Interviewer’s prompts and Andy’s responses in the Shaded Triangle problem
Andy exhibited three types of metacognitive behaviors in this conversation. The
first type was intra-person monitoring and control, where he was aware that he may have
drawn the shapes inaccurately. The second type was regulation of task knowledge, where
the regulation facilitated the awareness of failure or success in solving complex problems
(“in theory it works”). The third type was regulation of task objectives, where he
identified and clarified task elements and was fully aware of the missing measurement
which was important when solving the problem. Andy was the only study participant who
exhibited an awareness of the missing information in this problem. The regulation of task
knowledge was closely related to the regulation of task objectives instead of the intra-
person monitoring and control (for Shana, her regulation of task knowledge was solely
related to the intra-person monitoring and control in this problem).
At the end of the episode, the interviewer asked whether Andy could use another
way to solve the problem. He answered that if he could find the areas of the two objects
he would divide the area of the rectangle by the area of the triangle to see how many
261
triangles would cover the space; yet he felt he needed the measurement to execute this
approach (regulation of task knowledge). This revealed a Potential Concept – Formula
level of understanding.
Estimate Region problem (23’51”).
Estimate the area of the region shown below.
Table 4.46 presents a breakdown of Andy’s key cognitive behaviors during this
problem solving episode. Target objects in each step were shaded by the researcher.
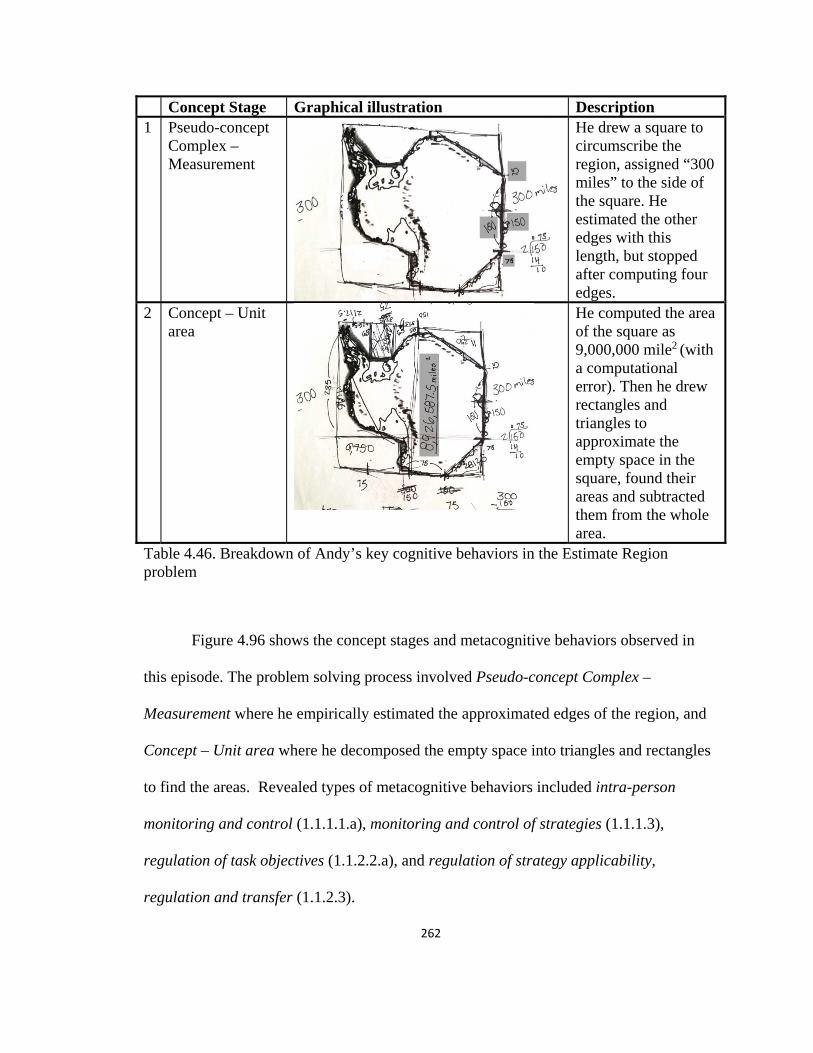
262
Concept Stage Graphical illustration Description 1 Pseudo-concept
Complex – Measurement
He drew a square to circumscribe the region, assigned “300 miles” to the side of the square. He estimated the other edges with this length, but stopped after computing four edges.
2 Concept – Unit area
He computed the area of the square as 9,000,000 mile2 (with a computational error). Then he drew rectangles and triangles to approximate the empty space in the square, found their areas and subtracted them from the whole area.
Table 4.46. Breakdown of Andy’s key cognitive behaviors in the Estimate Region problem
Figure 4.96 shows the concept stages and metacognitive behaviors observed in
this episode. The problem solving process involved Pseudo-concept Complex –
Measurement where he empirically estimated the approximated edges of the region, and
Concept – Unit area where he decomposed the empty space into triangles and rectangles
to find the areas. Revealed types of metacognitive behaviors included intra-person
monitoring and control (1.1.1.1.a), monitoring and control of strategies (1.1.1.3),
regulation of task objectives (1.1.2.2.a), and regulation of strategy applicability,
regulation and transfer (1.1.2.3).
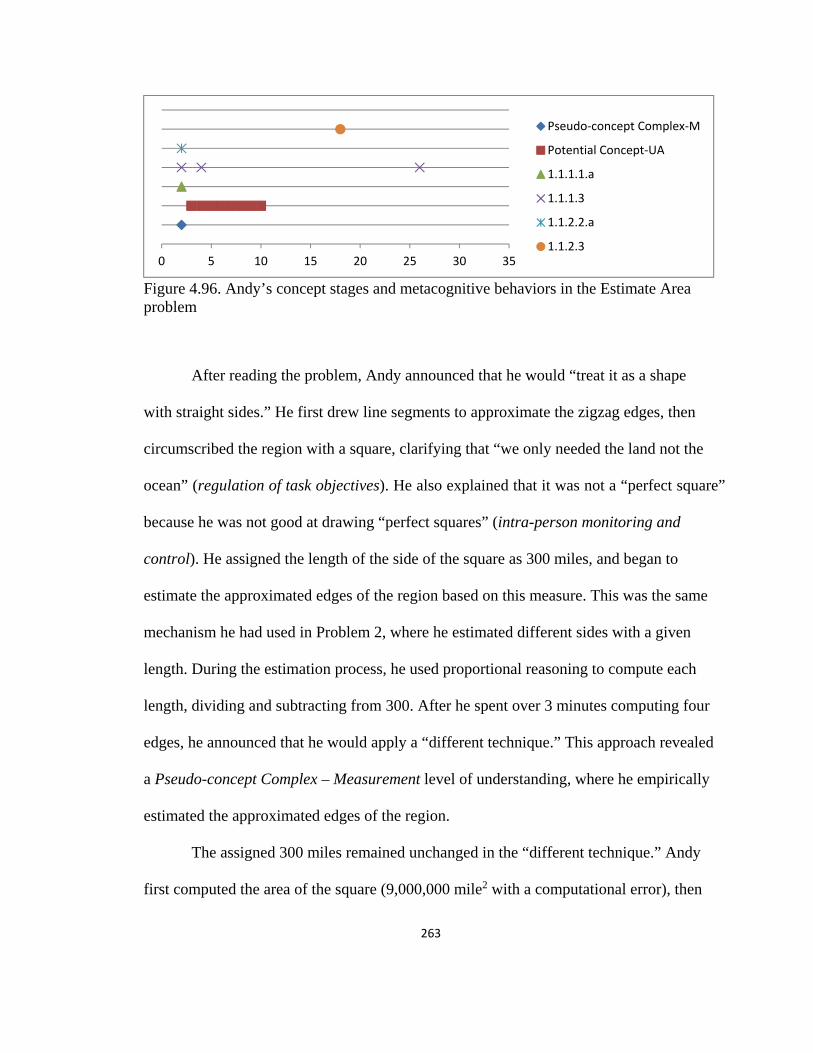
263
Figure 4.96. Andy’s concept stages and metacognitive behaviors in the Estimate Area problem
After reading the problem, Andy announced that he would “treat it as a shape
with straight sides.” He first drew line segments to approximate the zigzag edges, then
circumscribed the region with a square, clarifying that “we only needed the land not the
ocean” (regulation of task objectives). He also explained that it was not a “perfect square”
because he was not good at drawing “perfect squares” (intra-person monitoring and
control). He assigned the length of the side of the square as 300 miles, and began to
estimate the approximated edges of the region based on this measure. This was the same
mechanism he had used in Problem 2, where he estimated different sides with a given
length. During the estimation process, he used proportional reasoning to compute each
length, dividing and subtracting from 300. After he spent over 3 minutes computing four
edges, he announced that he would apply a “different technique.” This approach revealed
a Pseudo-concept Complex – Measurement level of understanding, where he empirically
estimated the approximated edges of the region.
The assigned 300 miles remained unchanged in the “different technique.” Andy
first computed the area of the square (9,000,000 mile2 with a computational error), then
0 5 10 15 20 25 30 35
Pseudo-concept Complex-M
Potential Concept-UA
1.1.1.1.a
1.1.1.3
1.1.2.2.a
1.1.2.3
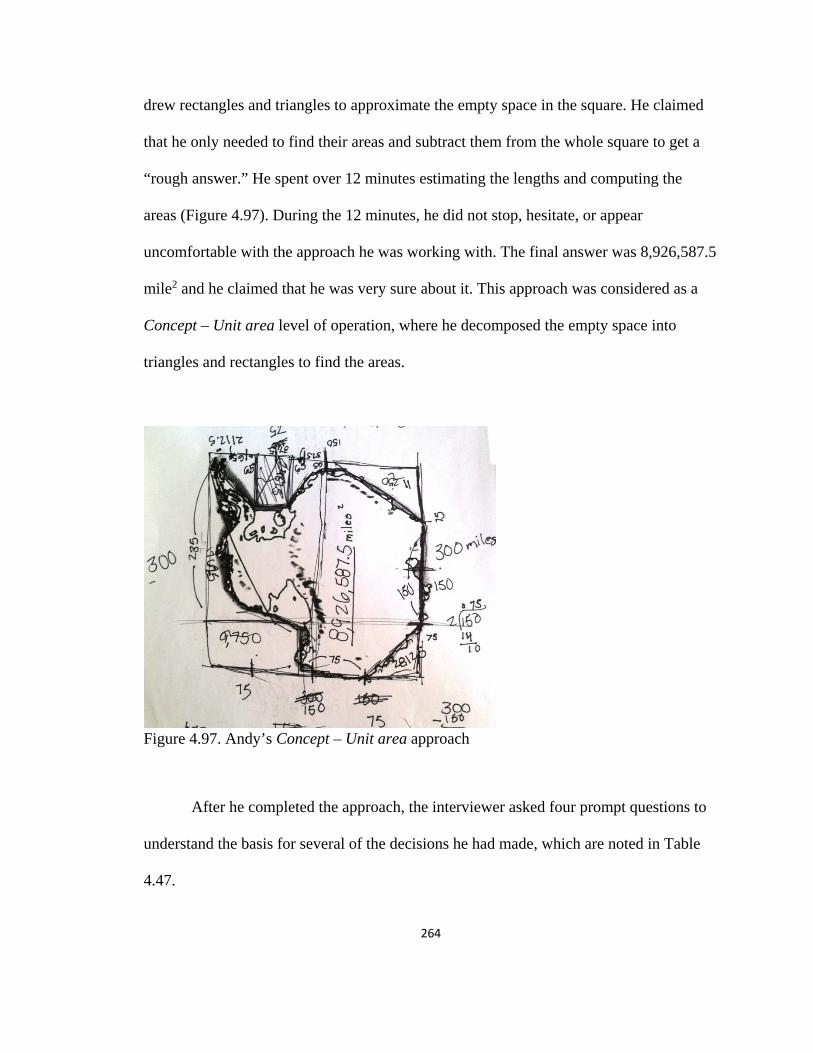
264
drew rectangles and triangles to approximate the empty space in the square. He claimed
that he only needed to find their areas and subtract them from the whole square to get a
“rough answer.” He spent over 12 minutes estimating the lengths and computing the
areas (Figure 4.97). During the 12 minutes, he did not stop, hesitate, or appear
uncomfortable with the approach he was working with. The final answer was 8,926,587.5
mile2 and he claimed that he was very sure about it. This approach was considered as a
Concept – Unit area level of operation, where he decomposed the empty space into
triangles and rectangles to find the areas.
Figure 4.97. Andy’s Concept – Unit area approach
After he completed the approach, the interviewer asked four prompt questions to
understand the basis for several of the decisions he had made, which are noted in Table
4.47.
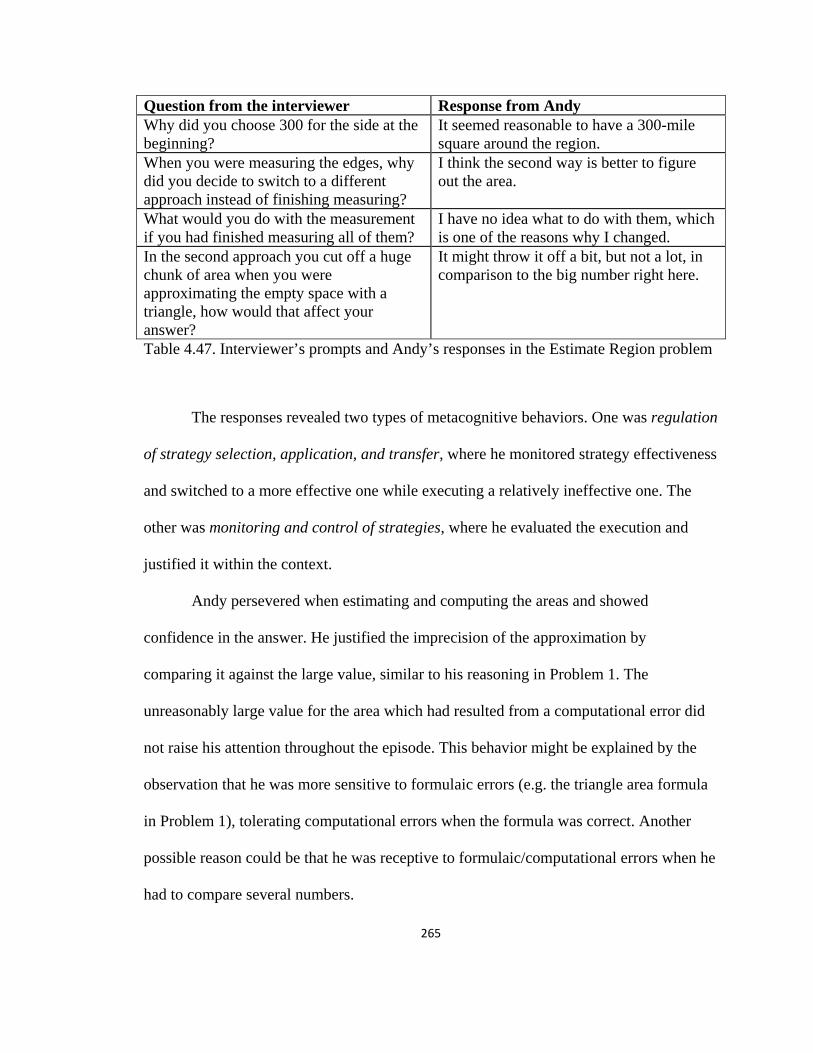
265
Question from the interviewer Response from Andy Why did you choose 300 for the side at the beginning?
It seemed reasonable to have a 300-mile square around the region.
When you were measuring the edges, why did you decide to switch to a different approach instead of finishing measuring?
I think the second way is better to figure out the area.
What would you do with the measurement if you had finished measuring all of them?
I have no idea what to do with them, which is one of the reasons why I changed.
In the second approach you cut off a huge chunk of area when you were approximating the empty space with a triangle, how would that affect your answer?
It might throw it off a bit, but not a lot, in comparison to the big number right here.
Table 4.47. Interviewer’s prompts and Andy’s responses in the Estimate Region problem
The responses revealed two types of metacognitive behaviors. One was regulation
of strategy selection, application, and transfer, where he monitored strategy effectiveness
and switched to a more effective one while executing a relatively ineffective one. The
other was monitoring and control of strategies, where he evaluated the execution and
justified it within the context.
Andy persevered when estimating and computing the areas and showed
confidence in the answer. He justified the imprecision of the approximation by
comparing it against the large value, similar to his reasoning in Problem 1. The
unreasonably large value for the area which had resulted from a computational error did
not raise his attention throughout the episode. This behavior might be explained by the
observation that he was more sensitive to formulaic errors (e.g. the triangle area formula
in Problem 1), tolerating computational errors when the formula was correct. Another
possible reason could be that he was receptive to formulaic/computational errors when he
had to compare several numbers.

266
Intersected Area problem (13’22”).
Two squares, each s on a side, are placed such that the corner on one square lies on the center of the other. Describe, in terms of s, the range of possible areas representing the intersections of the two squares.
Table 4.48 presents a breakdown of Andy’s key cognitive behaviors during this
problem solving episode. Target objects in each step were shaded by the researcher.
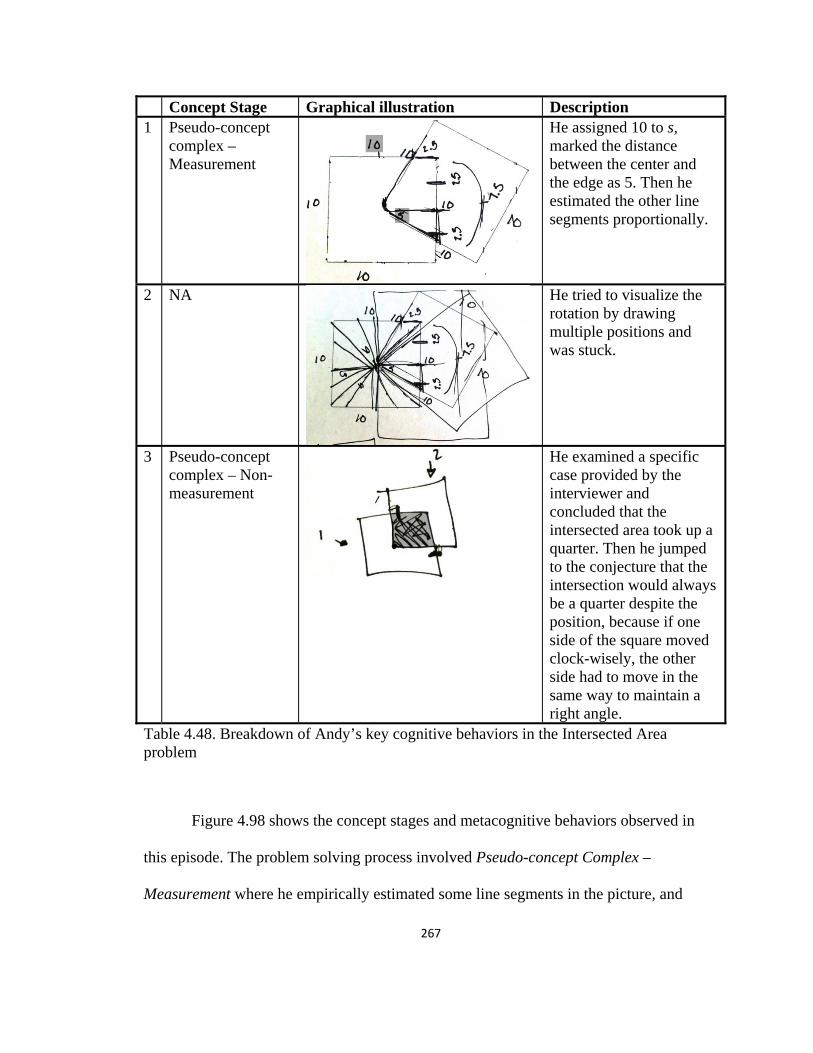
267
Concept Stage Graphical illustration Description 1 Pseudo-concept
complex – Measurement
He assigned 10 to s, marked the distance between the center and the edge as 5. Then he estimated the other line segments proportionally.
2 NA He tried to visualize the rotation by drawing multiple positions and was stuck.
3 Pseudo-concept complex – Non-measurement
He examined a specific case provided by the interviewer and concluded that the intersected area took up a quarter. Then he jumped to the conjecture that the intersection would always be a quarter despite the position, because if one side of the square moved clock-wisely, the other side had to move in the same way to maintain a right angle.
Table 4.48. Breakdown of Andy’s key cognitive behaviors in the Intersected Area problem
Figure 4.98 shows the concept stages and metacognitive behaviors observed in
this episode. The problem solving process involved Pseudo-concept Complex –
Measurement where he empirically estimated some line segments in the picture, and
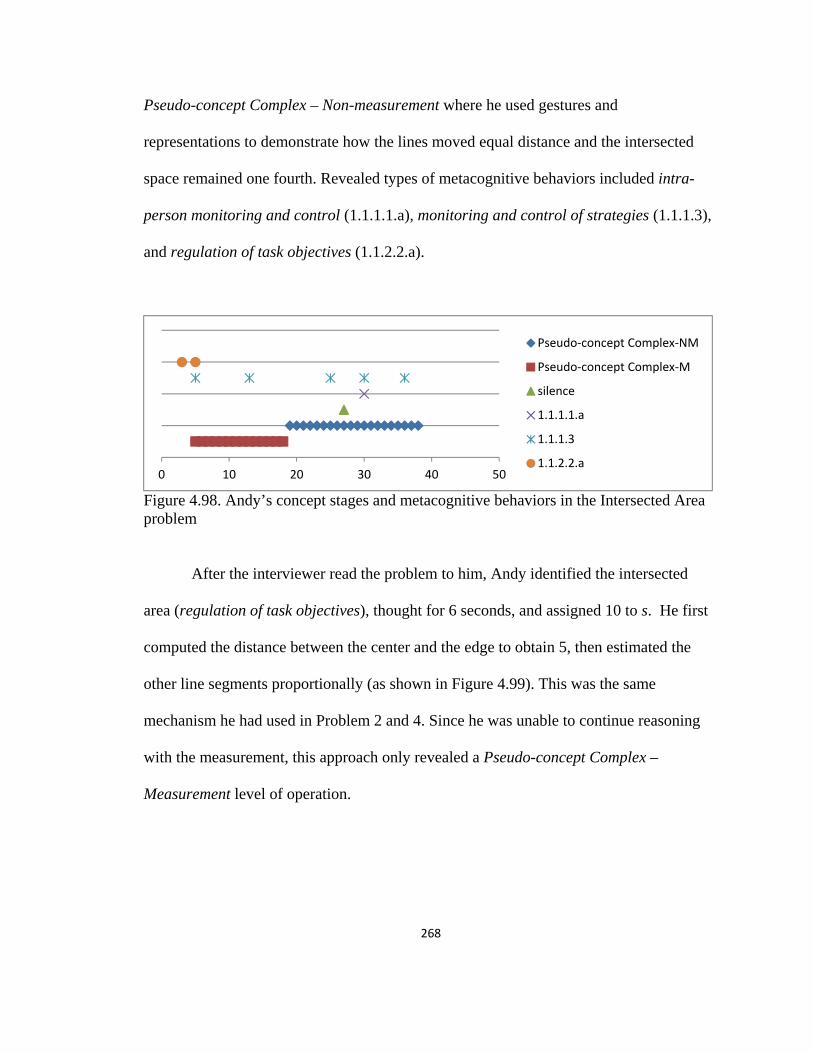
268
Pseudo-concept Complex – Non-measurement where he used gestures and
representations to demonstrate how the lines moved equal distance and the intersected
space remained one fourth. Revealed types of metacognitive behaviors included intra-
person monitoring and control (1.1.1.1.a), monitoring and control of strategies (1.1.1.3),
and regulation of task objectives (1.1.2.2.a).
Figure 4.98. Andy’s concept stages and metacognitive behaviors in the Intersected Area problem
After the interviewer read the problem to him, Andy identified the intersected
area (regulation of task objectives), thought for 6 seconds, and assigned 10 to s. He first
computed the distance between the center and the edge to obtain 5, then estimated the
other line segments proportionally (as shown in Figure 4.99). This was the same
mechanism he had used in Problem 2 and 4. Since he was unable to continue reasoning
with the measurement, this approach only revealed a Pseudo-concept Complex –
Measurement level of operation.
0 10 20 30 40 50
Pseudo-concept Complex-NM
Pseudo-concept Complex-M
silence
1.1.1.1.a
1.1.1.3
1.1.2.2.a
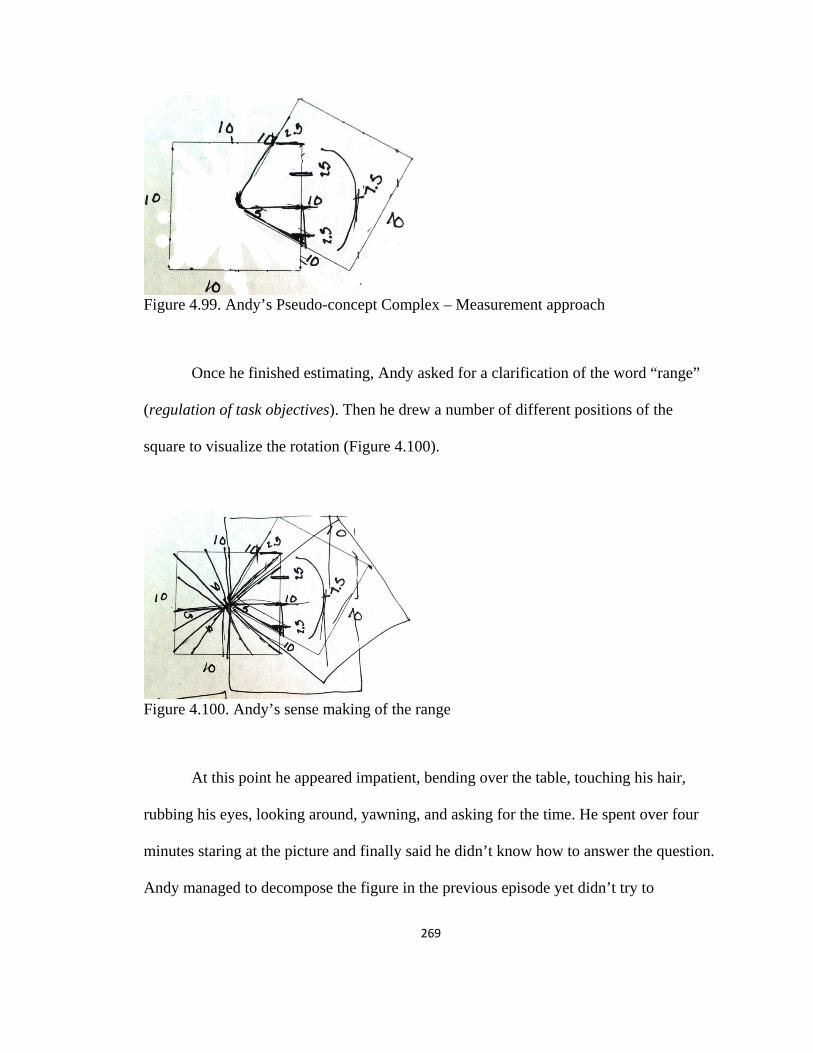
269
Figure 4.99. Andy’s Pseudo-concept Complex – Measurement approach
Once he finished estimating, Andy asked for a clarification of the word “range”
(regulation of task objectives). Then he drew a number of different positions of the
square to visualize the rotation (Figure 4.100).
Figure 4.100. Andy’s sense making of the range
At this point he appeared impatient, bending over the table, touching his hair,
rubbing his eyes, looking around, yawning, and asking for the time. He spent over four
minutes staring at the picture and finally said he didn’t know how to answer the question.
Andy managed to decompose the figure in the previous episode yet didn’t try to

270
decompose here. One possible reason was that he started to consider the rotation before
he resolved the given case and was overwhelmed by the information (the other four
participants managed to analyze the given picture first and then asked for an explanation
of “range”).
Sensing that Andy was frustrated and tired, the interviewer suggested that he may
want to examine the situation where the intersected area was a smaller square. He drew
the picture and claimed that the intersection took up a quarter of the square (Figure 4.101).
Figure 4.101. Andy’s response to the interviewer’s prompt of a simpler case
Following this observation, he conjectured that if he rotated the square, the
intersected area would remain a quarter. He reasoned that as one side of the intersected
area moved, the other side would move the same amount of space; thus although the
shape of the shaded area changed, it would always be one fourth of the area. In order to
understand Andy’s transition from specialization to generalization, the interviewer asked
how he moved from the observation he had made earlier (shown in Figure 18) to the new
conjecture that the area was always one fourth. Andy first stated that he had a sense that
the intersected area would remain the same but wasn’t sure previously (intra-person
monitoring and control). Then he explained that after he examined the case in Figure 18,
271
he thought if one side of the square moved clock-wise, the other side had to follow the
same type of movement in order for the right angle to be preserved. He demonstrated his
reasoning in Figure 4.100 and showed how both sides of the rotating square moved up
and down by the same distance.
Andy described an insight which was triggered by the picture in Figure 4.101. At
this point the interviewer did not have enough time to attempt to rationalize his insights
or see how far he could go in terms of concept stages. Since Andy only reasoned with
“equal distance” and “right angle” without examining the congruent triangular areas, his
understanding was at a Pseudo-concept Complex – Non-measurement level.
D. Case Analysis
What stages of mathematical conceptual development were exhibited in Andy’s
problem solving activities in terms of Vygotsky’s theory?
Table 4.49 provides an overview of the concept stages revealed in each problem
solving episode described in this chapter.

272
Problem Total time
Concept stages
Compare Areas 9’07” 1. (3.1.2) Potential Concept – Formula 2. (3.1.1) Potential Concept – Unit area
Compare Triangles
21’50” 1. (1.1) Heap – Non-measurement 2. (2.1.1.1) Surface Association Complex – Non-measurement 3. (2.1.3) Artificial Association Complex 4. (3.1.2) Potential Concept – Formula 5. (3.2.3) Concept – Formula
Shaded Triangle 5’20” 1. (3.2.2) Concept – Unit area 2. (3.1.2) Potential Concept – Formula
Estimate Region 23’51” 1. (2.4.2) Pseudo-concept complex – Measurement 2. (3.2.2) Concept – Unit area
Intersected Area 13’22” 1. (2.4.2) Pseudo-concept complex – Measurement 2. (2.4.1) Pseudo-concept complex – Non-measurement
Table 4.49. Andy’s overview of concept stages
Andy exhibited concept level understanding of unit area and formula for both
rectangles and triangles. He did not know/remember the area formula for circles but he
was able to utilize his existing knowledge (Potential Concept level understanding of unit
area) to resolve the problem. Among these advanced concept development stages, he
showed a strong preference for formulaic approaches. When he was not working with
formulas, he was not confident in the result (e.g. the circle’s area in Problem 2 and the
absence of measurement in Problem 3).
His non-measurement reasoning was at a lower level and was less visible in the
interview: a Heap stage and a Surface Association Complex stage in Problem 2, and a
Pseudo-concept Complex stage in Problem 5. He was concerned about the impreciseness
of non-measurement reasoning in Problem 2, where he demanded measurement to be
sure. Yet in Problem 5 he was comfortable with the absence of measurement in his
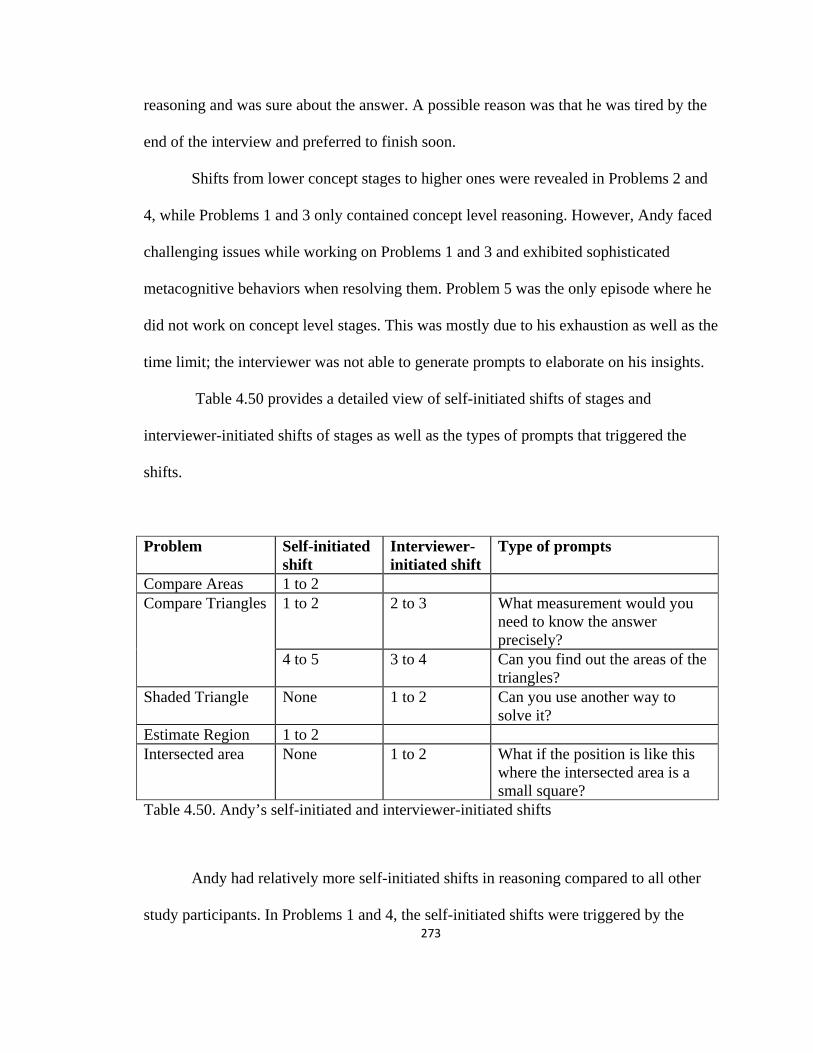
273
reasoning and was sure about the answer. A possible reason was that he was tired by the
end of the interview and preferred to finish soon.
Shifts from lower concept stages to higher ones were revealed in Problems 2 and
4, while Problems 1 and 3 only contained concept level reasoning. However, Andy faced
challenging issues while working on Problems 1 and 3 and exhibited sophisticated
metacognitive behaviors when resolving them. Problem 5 was the only episode where he
did not work on concept level stages. This was mostly due to his exhaustion as well as the
time limit; the interviewer was not able to generate prompts to elaborate on his insights.
Table 4.50 provides a detailed view of self-initiated shifts of stages and
interviewer-initiated shifts of stages as well as the types of prompts that triggered the
shifts.
Problem Self-initiated shift
Interviewer-initiated shift
Type of prompts
Compare Areas 1 to 2 Compare Triangles 1 to 2 2 to 3 What measurement would you
need to know the answer precisely?
4 to 5 3 to 4 Can you find out the areas of the triangles?
Shaded Triangle None 1 to 2 Can you use another way to solve it?
Estimate Region 1 to 2 Intersected area None 1 to 2 What if the position is like this
where the intersected area is a small square?
Table 4.50. Andy’s self-initiated and interviewer-initiated shifts
Andy had relatively more self-initiated shifts in reasoning compared to all other
study participants. In Problems 1 and 4, the self-initiated shifts were triggered by the
274
awareness of ineffectiveness of the current approaches he was using. In Problem 1 he was
aware that he didn’t know the area formula for circles, while in Problem 4 he was aware
that he didn’t know how to find the region’s area after finding all the measurement for the
edges.
The two self-initiated shifts in Problem 2 were more complicated. Considering his
lower concept development for non-measurement reasoning, the shift from Heap - Non-
measurement to Surface Association Complex - Non-measurement was exactly the same
as the participant whose concept development was assessed as “low” in the pretest. The
shift from Potential Concept - Formula to Concept - Formula was intuitive and inductive,
aligned with his advanced concept development for formula.
In terms of interviewer-initiated shifts, the introduction of measurement in
Problem 2 merely changed his non-measurement reasoning into an Artificial Association
Complex one, where he used measurement to compare the partial areas which he
identified earlier in an artificial way. The redirection of focus to formula in the same
problem, which was completely unrelated to his previous work, was a choice of the
interviewer to test whether and how he could use a formula to solve the problem. The
shift in Problem 5 was triggered by a prompt of special case; the consequence of the shift
was again intuitive, which the interviewer did not have enough time to pursue.
What types of metacognitive behaviors are utilized by Andy when solving non-routine
problems?
The following types of metacognitive behaviors were observed in Andy’s
problem solving episodes.
275
1.1.1.1.a. Intra-person monitoring and control. This type of behavior was
observed in every episode. Aside from monitoring what he knew and didn’t know,
Andy’s strong trust in formulaic approach was a chief motivation for activating his self-
regulation process. In Problem 2, he reviewed the approach in Problem 1 and concluded
that he wasn’t sure about the answer because he hadn’t computed the circle’s area using a
formula, whereas the result in Problem 2 was generated by formula thus he was confident
in its accuracy. In Problem 4 he failed to detect the computational error which was
possibly due to his confidence in the correct formula; he was more likely to detect an
error when he was not confident in whether he was referencing the correct formula (the
triangle’s formula in Problem 1). Such belief may have also influenced his regulation of
task objectives. His awareness of the absence of measurement in Problem 3 was possibly
due to his lack of confidence in the non-formulaic approach (unit-area approach).
1.1.1.2. regulation of task knowledge. This type of behavior was observed twice
in Problem 3, where the regulation raised his sensitivity of failure or success in complex
problems (“in theory it works”) and he interacted with awareness of task elements to
determine strategy applicability (to use the formulaic approach he would need
measurement). Both behaviors monitored the missing information that was essential for
the approaches to be valid.
1.1.2.2.a. regulation of task objectives. Andy’s clarification of task elements
usually appeared after he started using an approach. This indicated that he tended to act
on a problem before fully understanding it. He was comfortable with increasing his
understanding of a problem while working on it. Most of his identification of task
elements positively influenced his problem solving process, with one exception in
276
Problem 1 where his distinction between circumference and area misled him to find the
circumference of a circle.
1.1.2.2.b. regulation of task demands. This type of behavior was observed once in
Problem 2, where he addressed the need of the smallest unit of measurement that he
would use to determine other lengths in order to compare the area. Such regulation was
revealed (but not directly addressed) by the same mechanism in Problems 4 and 5.
Regulation of task demands was hardly observable when he operated on concept level
stages.
1.1.1.3. monitoring and control of strategies. Andy was comfortable with
describing/explaining the approaches while executing them. He monitored the approaches
rigorously by writing down what he was talking or thinking about. The format of his
monitoring and control of strategies enabled the interviewer to observe and understand
most of his thinking process, which led to the fact that the prompt questions and their
responses were the most organized and rationalized among all the participants.
1.1.2.3. regulation of strategy applicability, regulation and transfer. This type of
behavior was mostly observed when he was working on a non-formulaic approach and
needed an alternative way to either justify or improve its effectiveness. The functions
were relatively limited comparing to other participants. This point will be further
discussed in the next section.
What is the relationship between the types of metacognitive behaviors and the stages of
mathematical conceptual development as outlined by Vygotsky’s theory?
The relationship between metacognitive behaviors and conceptual development
will be examined along four key binary relationships including: (1) problem and

277
metacognition, (2) participant and metacognition, (3) metacognition and effectiveness,
and (4) concept and metacognition.
Problem and metacognition.
Table 4.51 illustrates the types of metacognitive behaviors along with frequency
revealed under each stage for each problem.
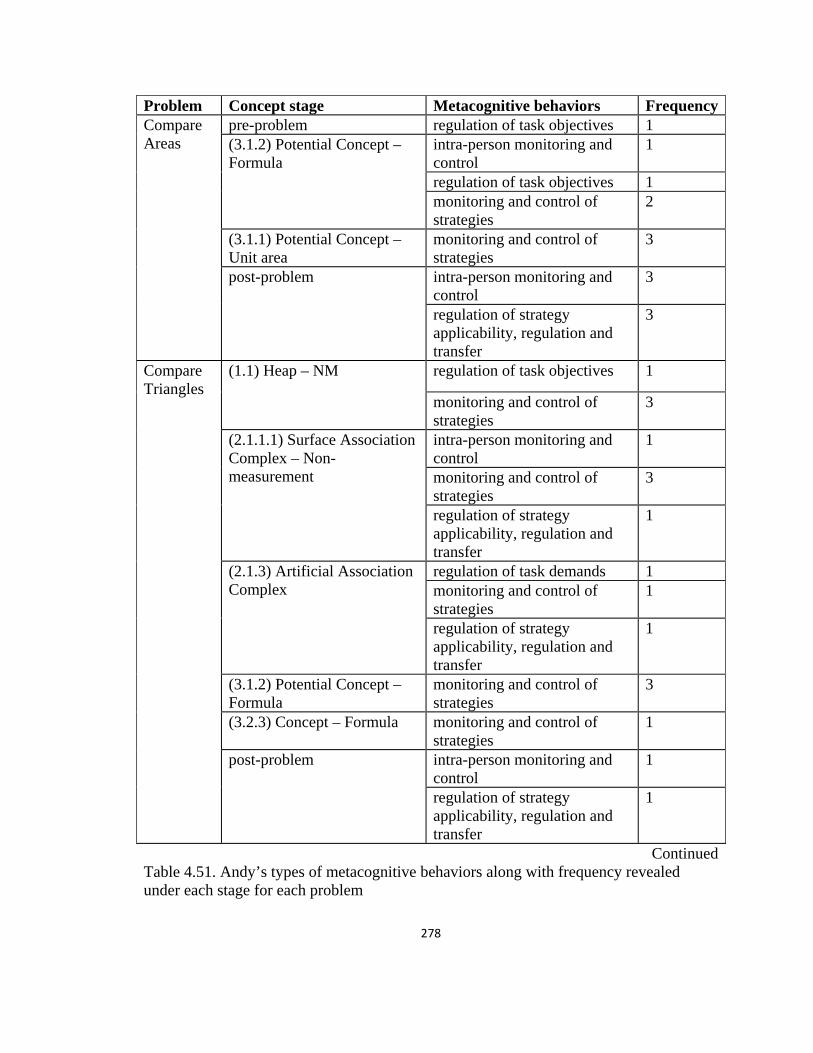
278
Problem Concept stage Metacognitive behaviors FrequencyCompare Areas
pre-problem regulation of task objectives 1 (3.1.2) Potential Concept – Formula
intra-person monitoring and control
1
regulation of task objectives 1 monitoring and control of strategies
2
(3.1.1) Potential Concept – Unit area
monitoring and control of strategies
3
post-problem intra-person monitoring and control
3
regulation of strategy applicability, regulation and transfer
3
Compare Triangles
(1.1) Heap – NM regulation of task objectives 1
monitoring and control of strategies
3
(2.1.1.1) Surface Association Complex – Non-measurement
intra-person monitoring and control
1
monitoring and control of strategies
3
regulation of strategy applicability, regulation and transfer
1
(2.1.3) Artificial Association Complex
regulation of task demands 1 monitoring and control of strategies
1
regulation of strategy applicability, regulation and transfer
1
(3.1.2) Potential Concept – Formula
monitoring and control of strategies
3
(3.2.3) Concept – Formula monitoring and control of strategies
1
post-problem intra-person monitoring and control
1
regulation of strategy applicability, regulation and transfer
1
ContinuedTable 4.51. Andy’s types of metacognitive behaviors along with frequency revealed under each stage for each problem

279
Table 4.51 continued Shaded Triangle
(3.2.2) Concept – UA intra-person monitoring and control
1
regulation of task knowledge 1 regulation of task objectives 1 monitoring and control of strategies
1
(3.1.2) Potential Concept – Formula
regulation of task knowledge 1
monitoring and control of strategies
1
Estimated Region
(2.4.2) Pseudo-concept complex – Measurement
intra-person monitoring and control
1
regulation of task objectives 1 monitoring and control of strategies
1
(3.2.2) Concept – Unit area monitoring and control of strategies
1
post-problem monitoring and control of strategies
1
regulation of strategy applicability, regulation and transfer
1
Intersected Area
pre-problem regulation of task objectives 1 (2.4.2) Pseudo-concept complex – Measurement
regulation of task objectives 1 monitoring and control of strategies
2
(2.4.1) Pseudo-concept complex – Non-measurement
intra-person monitoring and control
1
monitoring and control of strategies
3
Problem 2 elicited the most number (5) of stages while the other problems elicited
two. Problem 2 provoked the most number of types (5) of metacognitive behaviors,
Problems 1, 3, and 4 provoked four, and Problem 5 the least (3). Problem 2 revealed the
most frequent monitoring of strategies (11), both Problems 1 and 5 revealed five, and
Problems 3 and 4 revealed relatively fewer (2 and 3 respectively). Problems 1 and 2
280
revealed the most frequent regulation of strategy (3), while Problems 3 and 5 revealed
none.
Andy was evidently tired while working on Problem 5. He showed little
perseverance and seemed tolerant of imprecision; not the pattern of behavior he had
exhibited during previous four sessions. The interviewer also did not have enough time to
test the stage he may have been able to reach. Due to these two reasons, the pattern of
behaviors and level of performance in Problem 5 were significantly different from the
general pattern of behaviors and level of performance he had shown when working on the
other problems.
Participant and metacognition.
Andy was selected as a participant who had shown a high level concept
development for measurement reasoning in the pretest (as he did not use any non-
measurement reasoning in the pretest). In the interview, he exhibited concept level
understanding for unit area and formula which aligned with the pretest result, while a
lower level concept development for non-measurement reasoning.
Compared to the other study participants, Andy was more comfortable and
competent at communicating his in-the-moment thinking process. Most of the decision
making moments were either reported immediately or elaborated on afterwards. What’s
more, different cognitive loads of the interview problems successfully created various
challenging levels for Andy (slightly challenging, moderately challenging, and too
challenging), which enabled the interviewer to examine his pattern of metacognitive
behaviors in a broader context.
Metacognition and effectiveness.
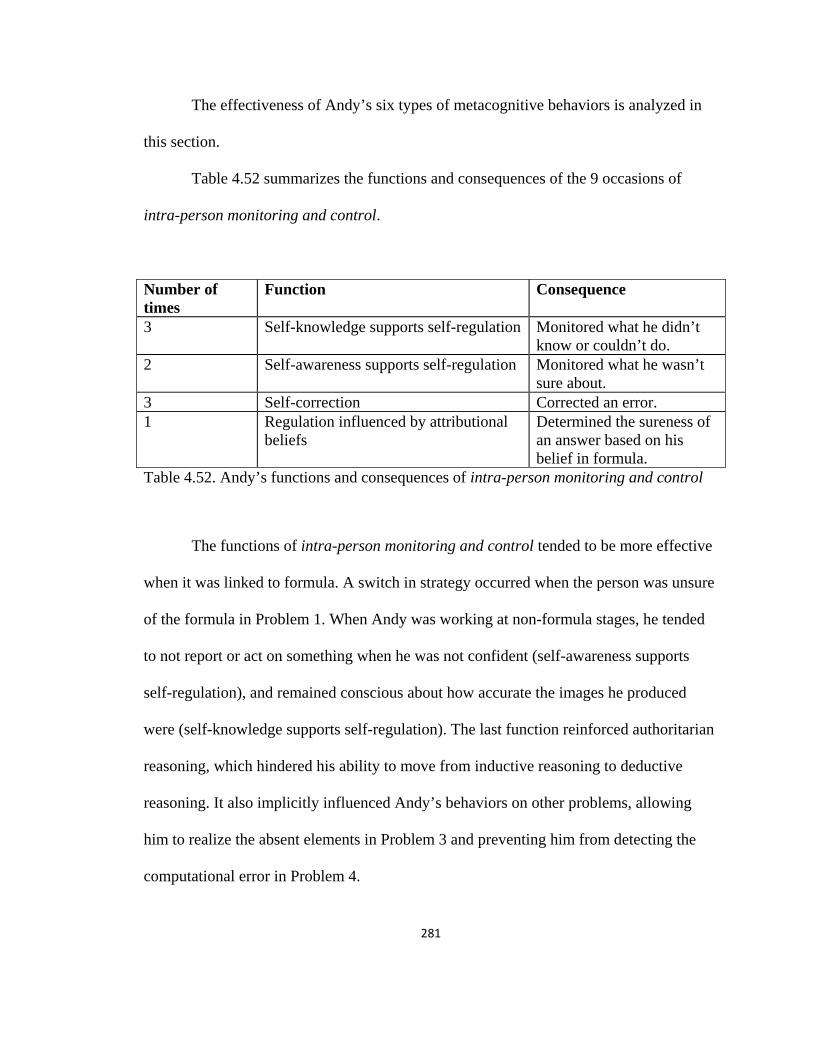
281
The effectiveness of Andy’s six types of metacognitive behaviors is analyzed in
this section.
Table 4.52 summarizes the functions and consequences of the 9 occasions of
intra-person monitoring and control.
Number of times
Function Consequence
3 Self-knowledge supports self-regulation Monitored what he didn’t know or couldn’t do.
2 Self-awareness supports self-regulation Monitored what he wasn’t sure about.
3 Self-correction Corrected an error. 1 Regulation influenced by attributional
beliefs Determined the sureness of an answer based on his belief in formula.
Table 4.52. Andy’s functions and consequences of intra-person monitoring and control
The functions of intra-person monitoring and control tended to be more effective
when it was linked to formula. A switch in strategy occurred when the person was unsure
of the formula in Problem 1. When Andy was working at non-formula stages, he tended
to not report or act on something when he was not confident (self-awareness supports
self-regulation), and remained conscious about how accurate the images he produced
were (self-knowledge supports self-regulation). The last function reinforced authoritarian
reasoning, which hindered his ability to move from inductive reasoning to deductive
reasoning. It also implicitly influenced Andy’s behaviors on other problems, allowing
him to realize the absent elements in Problem 3 and preventing him from detecting the
computational error in Problem 4.
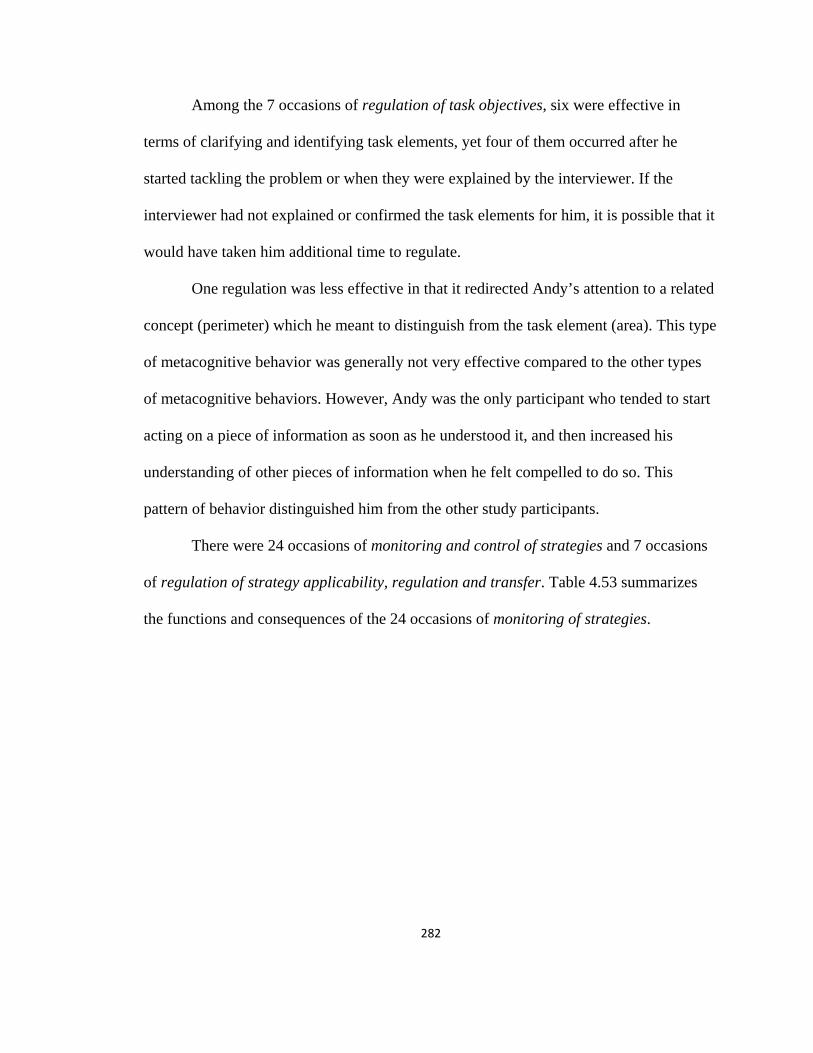
282
Among the 7 occasions of regulation of task objectives, six were effective in
terms of clarifying and identifying task elements, yet four of them occurred after he
started tackling the problem or when they were explained by the interviewer. If the
interviewer had not explained or confirmed the task elements for him, it is possible that it
would have taken him additional time to regulate.
One regulation was less effective in that it redirected Andy’s attention to a related
concept (perimeter) which he meant to distinguish from the task element (area). This type
of metacognitive behavior was generally not very effective compared to the other types
of metacognitive behaviors. However, Andy was the only participant who tended to start
acting on a piece of information as soon as he understood it, and then increased his
understanding of other pieces of information when he felt compelled to do so. This
pattern of behavior distinguished him from the other study participants.
There were 24 occasions of monitoring and control of strategies and 7 occasions
of regulation of strategy applicability, regulation and transfer. Table 4.53 summarizes
the functions and consequences of the 24 occasions of monitoring of strategies.
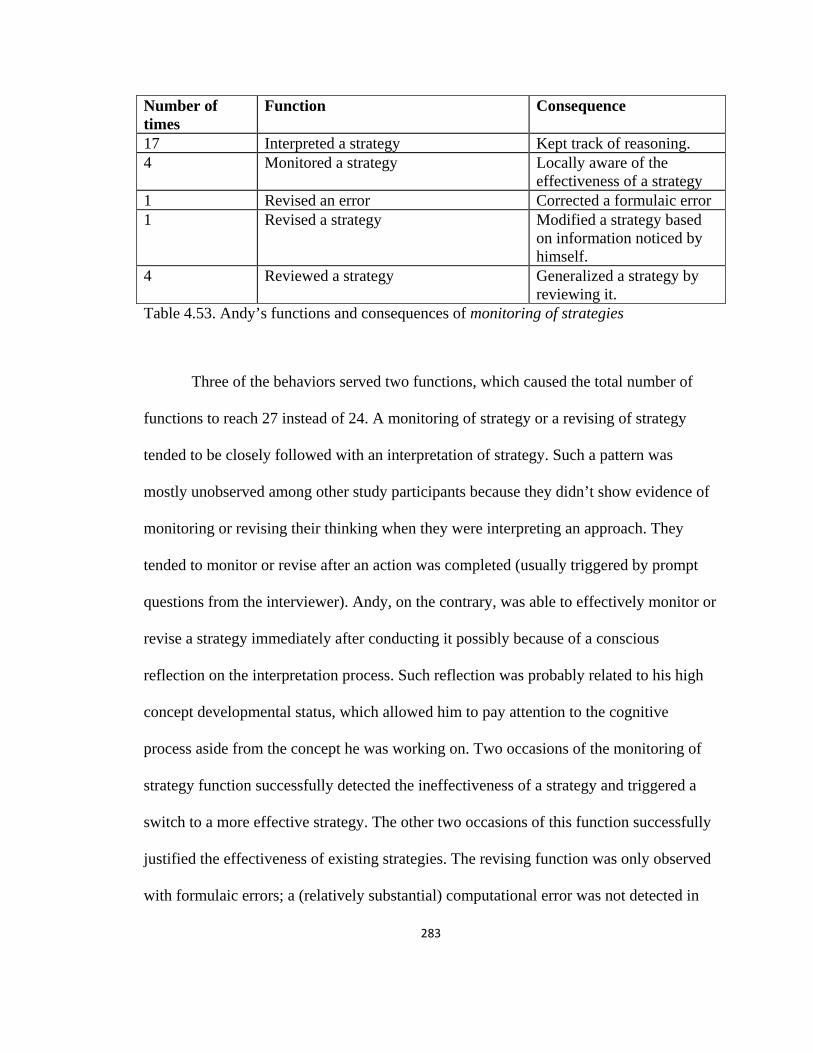
283
Number of times
Function Consequence
17 Interpreted a strategy Kept track of reasoning. 4 Monitored a strategy Locally aware of the
effectiveness of a strategy 1 Revised an error Corrected a formulaic error 1 Revised a strategy Modified a strategy based
on information noticed by himself.
4 Reviewed a strategy Generalized a strategy by reviewing it.
Table 4.53. Andy’s functions and consequences of monitoring of strategies
Three of the behaviors served two functions, which caused the total number of
functions to reach 27 instead of 24. A monitoring of strategy or a revising of strategy
tended to be closely followed with an interpretation of strategy. Such a pattern was
mostly unobserved among other study participants because they didn’t show evidence of
monitoring or revising their thinking when they were interpreting an approach. They
tended to monitor or revise after an action was completed (usually triggered by prompt
questions from the interviewer). Andy, on the contrary, was able to effectively monitor or
revise a strategy immediately after conducting it possibly because of a conscious
reflection on the interpretation process. Such reflection was probably related to his high
concept developmental status, which allowed him to pay attention to the cognitive
process aside from the concept he was working on. Two occasions of the monitoring of
strategy function successfully detected the ineffectiveness of a strategy and triggered a
switch to a more effective strategy. The other two occasions of this function successfully
justified the effectiveness of existing strategies. The revising function was only observed
with formulaic errors; a (relatively substantial) computational error was not detected in
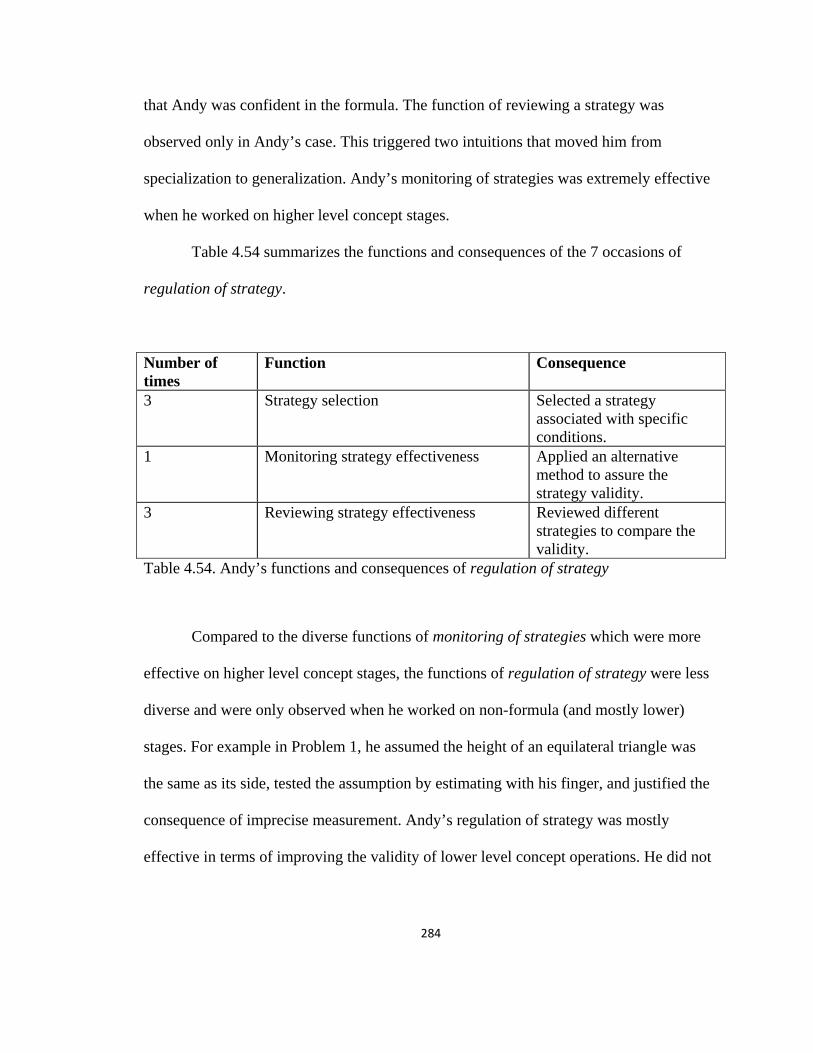
284
that Andy was confident in the formula. The function of reviewing a strategy was
observed only in Andy’s case. This triggered two intuitions that moved him from
specialization to generalization. Andy’s monitoring of strategies was extremely effective
when he worked on higher level concept stages.
Table 4.54 summarizes the functions and consequences of the 7 occasions of
regulation of strategy.
Number of times
Function Consequence
3 Strategy selection Selected a strategy associated with specific conditions.
1 Monitoring strategy effectiveness Applied an alternative method to assure the strategy validity.
3 Reviewing strategy effectiveness Reviewed different strategies to compare the validity.
Table 4.54. Andy’s functions and consequences of regulation of strategy
Compared to the diverse functions of monitoring of strategies which were more
effective on higher level concept stages, the functions of regulation of strategy were less
diverse and were only observed when he worked on non-formula (and mostly lower)
stages. For example in Problem 1, he assumed the height of an equilateral triangle was
the same as its side, tested the assumption by estimating with his finger, and justified the
consequence of imprecise measurement. Andy’s regulation of strategy was mostly
effective in terms of improving the validity of lower level concept operations. He did not

285
exhibit such regulation on higher level concept stages in that the validity was locally
controlled by his monitoring of strategies.
Concept and metacognition.
In this section, the relationship between concept stages and metacognitive
behaviors along with their frequency is analyzed. Table 4.55 summarizes the types of
metacognitive behaviors with their frequency observed on each stage.
Stage Metacognitive behaviors Frequency(1.1) Heap – NM regulation of task objectives 1
monitoring and control of strategies 3 (2.1.1.1) Surface Association Complex – NM
intra-person monitoring and control 1 monitoring and control of strategies 3 regulation of strategy applicability, regulation and transfer
1
(2.1.3) Artificial Association Complex
regulation of task demands 1 monitoring and control of strategies 1 regulation of strategy applicability, regulation and transfer
1
(2.4.1) Pseudo-concept Complex – NM
intra-person monitoring and control 1 monitoring and control of strategies 3
(2.4.2) Pseudo-concept Complex - M intra-person monitoring and control 1 regulation of task objectives 2 monitoring and control of strategies 3
(3.1.1) Potential Concept – UA monitoring and control of strategies 3 (3.1.2) Potential Concept - Formula intra-person monitoring and control 1
regulation of task knowledge 1 regulation of task objectives 1 monitoring and control of strategies 6
(3.2.2) Concept – UA intra-person monitoring and control 1 regulation of task knowledge 1 regulation of task objectives 1 monitoring and control of strategies 2
(3.2.3) Concept - Formula monitoring and control of strategies 1 Table 4.55. Andy’s types of metacognitive behaviors with their frequency observed on each stage

286
On higher level of concept stages, Andy’s monitoring and control of strategies
was highly effective (always led to an answer) and rigorous (key steps were clearly
written down). He was fully aware of his decision making process, which enabled him to
report them either during or after he solved the problems. He also exhibited the ability to
use related (yet not necessarily high level) concepts to resolve emerging issues when he
was executing a high level operation, such as the approximation of triangle’s height in
Problem 1 and the transformational reasoning in Problem 3.
On non-formula (mostly lower) levels Andy relied mainly on regulation of
strategy to control the effectiveness of approaches, along with some regulation of task
knowledge and regulation of task demands. In Problem 2 where the problem was too
challenging for him, he was able to self-initiate a shift from Heap - NM to Surface
Association Complex - NM, address the task demands, and create an Artificial Association
Complex approach to solve the problem. He went through exactly same three stages as
Shana, who was assessed as having low concept development, yet he exhibited much
more metacognitive behaviors and used a more plausible artificial approach. In Problem
5, he exhibited limited metacognitive behaviors possibly because he was tired and
overwhelmed by visualizing the rotation before he had a chance to tackle the given
situation. Thus his behaviors in Problem 5 were not considered as a part of his general
patterns.
His major challenges included, 1) the pattern of regulation of task objectives --
acting on a piece of information as soon as he understood it, and then gaining the
understanding of the rest pieces of information when he had to -- which led to lower

287
effectiveness for such regulation; and 2) strong belief in formula, which led to
authoritarian reasoning and insensitive monitoring on computational errors.
Figure 4.102 illustrates the balance of effectiveness between the metacognitive
behaviors and the challenges. In the five problem solving episodes, Andy’s overall
effectiveness was considered as high.
Figure 4.102. Andy’s balance of effectiveness between the metacognitive behaviors and the challenges
The Case of Allen
A. Allen’s background
Allen’s career goal is to be an attorney. He sees mathematics as a useful tool in
every profession and unsure of how it might help him in his aspired career. His favorite
subjects are language arts and French. He enjoys learning new vocabulary, reading, and
challenges metacognitive behaviors
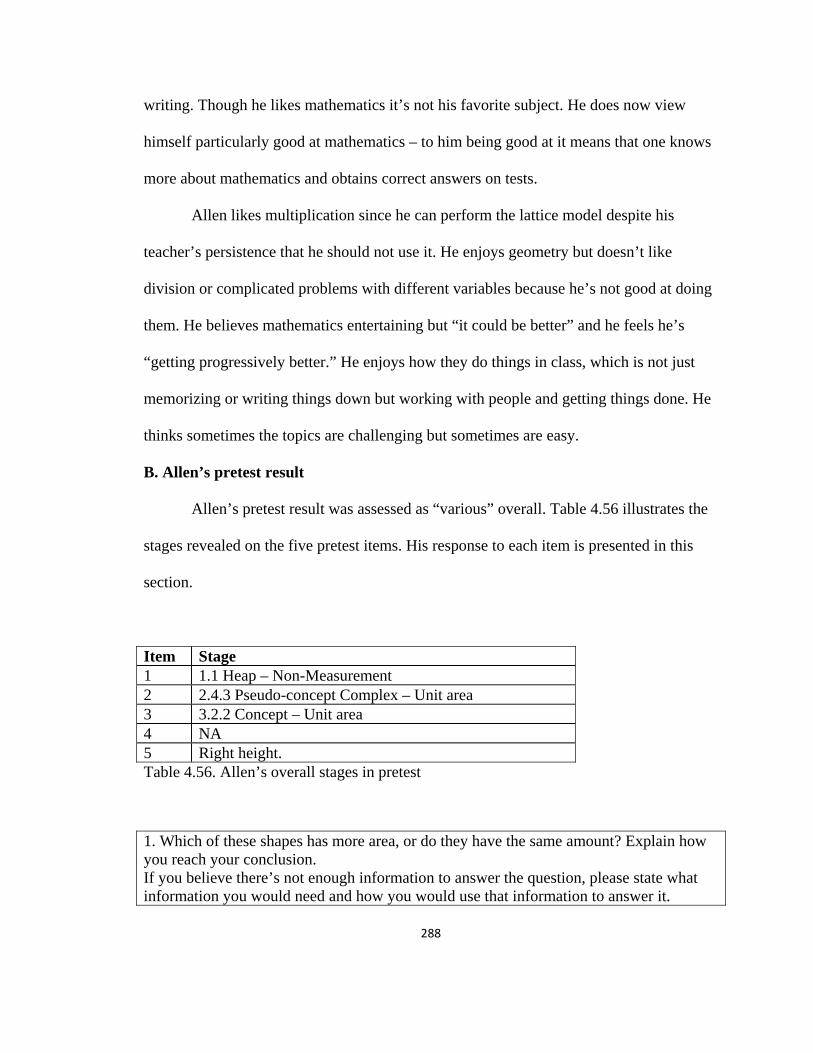
288
writing. Though he likes mathematics it’s not his favorite subject. He does now view
himself particularly good at mathematics – to him being good at it means that one knows
more about mathematics and obtains correct answers on tests.
Allen likes multiplication since he can perform the lattice model despite his
teacher’s persistence that he should not use it. He enjoys geometry but doesn’t like
division or complicated problems with different variables because he’s not good at doing
them. He believes mathematics entertaining but “it could be better” and he feels he’s
“getting progressively better.” He enjoys how they do things in class, which is not just
memorizing or writing things down but working with people and getting things done. He
thinks sometimes the topics are challenging but sometimes are easy.
B. Allen’s pretest result
Allen’s pretest result was assessed as “various” overall. Table 4.56 illustrates the
stages revealed on the five pretest items. His response to each item is presented in this
section.
Item Stage 1 1.1 Heap – Non-Measurement 2 2.4.3 Pseudo-concept Complex – Unit area 3 3.2.2 Concept – Unit area 4 NA 5 Right height. Table 4.56. Allen’s overall stages in pretest
1. Which of these shapes has more area, or do they have the same amount? Explain how you reach your conclusion. If you believe there’s not enough information to answer the question, please state what information you would need and how you would use that information to answer it.
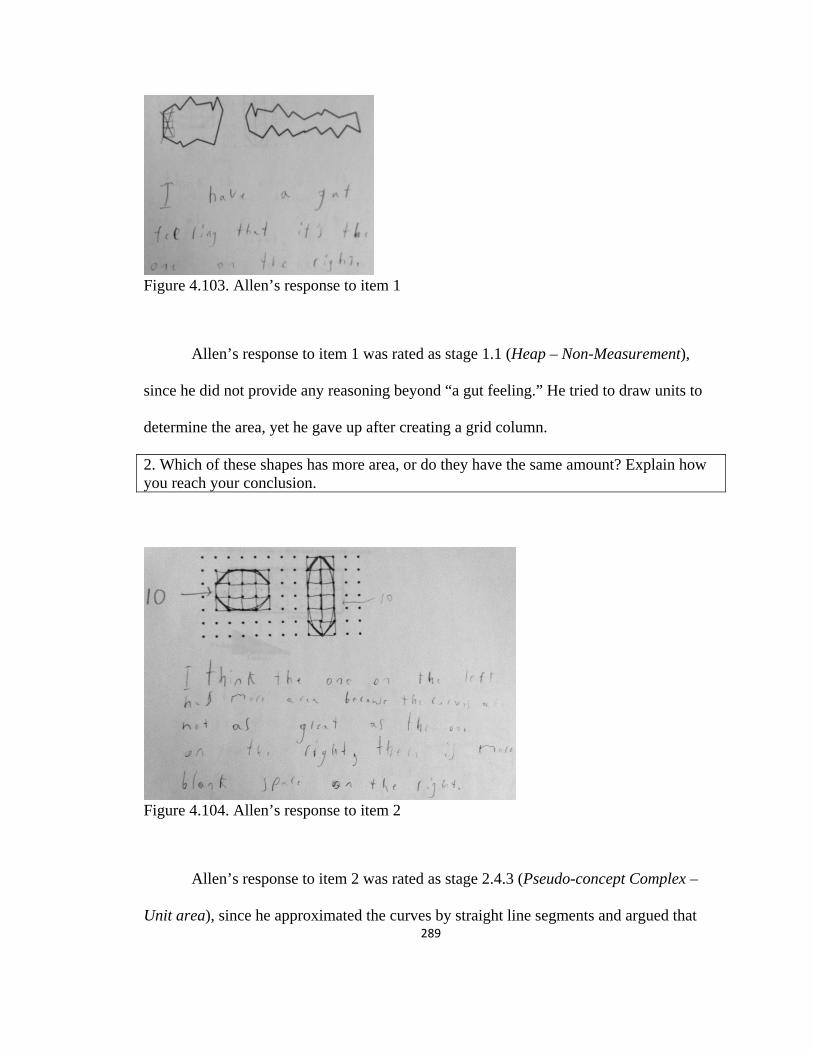
289
Figure 4.103. Allen’s response to item 1
Allen’s response to item 1 was rated as stage 1.1 (Heap – Non-Measurement),
since he did not provide any reasoning beyond “a gut feeling.” He tried to draw units to
determine the area, yet he gave up after creating a grid column.
2. Which of these shapes has more area, or do they have the same amount? Explain how you reach your conclusion.
Figure 4.104. Allen’s response to item 2
Allen’s response to item 2 was rated as stage 2.4.3 (Pseudo-concept Complex –
Unit area), since he approximated the curves by straight line segments and argued that
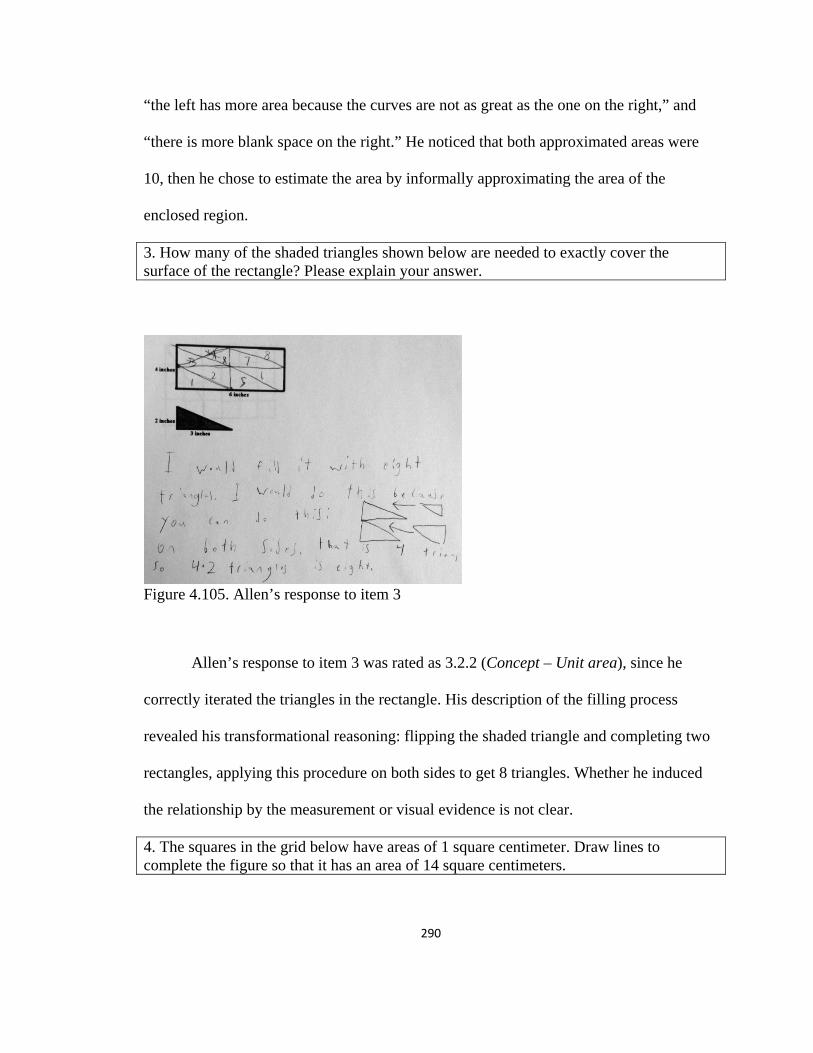
290
“the left has more area because the curves are not as great as the one on the right,” and
“there is more blank space on the right.” He noticed that both approximated areas were
10, then he chose to estimate the area by informally approximating the area of the
enclosed region.
3. How many of the shaded triangles shown below are needed to exactly cover the surface of the rectangle? Please explain your answer.
Figure 4.105. Allen’s response to item 3
Allen’s response to item 3 was rated as 3.2.2 (Concept – Unit area), since he
correctly iterated the triangles in the rectangle. His description of the filling process
revealed his transformational reasoning: flipping the shaded triangle and completing two
rectangles, applying this procedure on both sides to get 8 triangles. Whether he induced
the relationship by the measurement or visual evidence is not clear.
4. The squares in the grid below have areas of 1 square centimeter. Draw lines to complete the figure so that it has an area of 14 square centimeters.
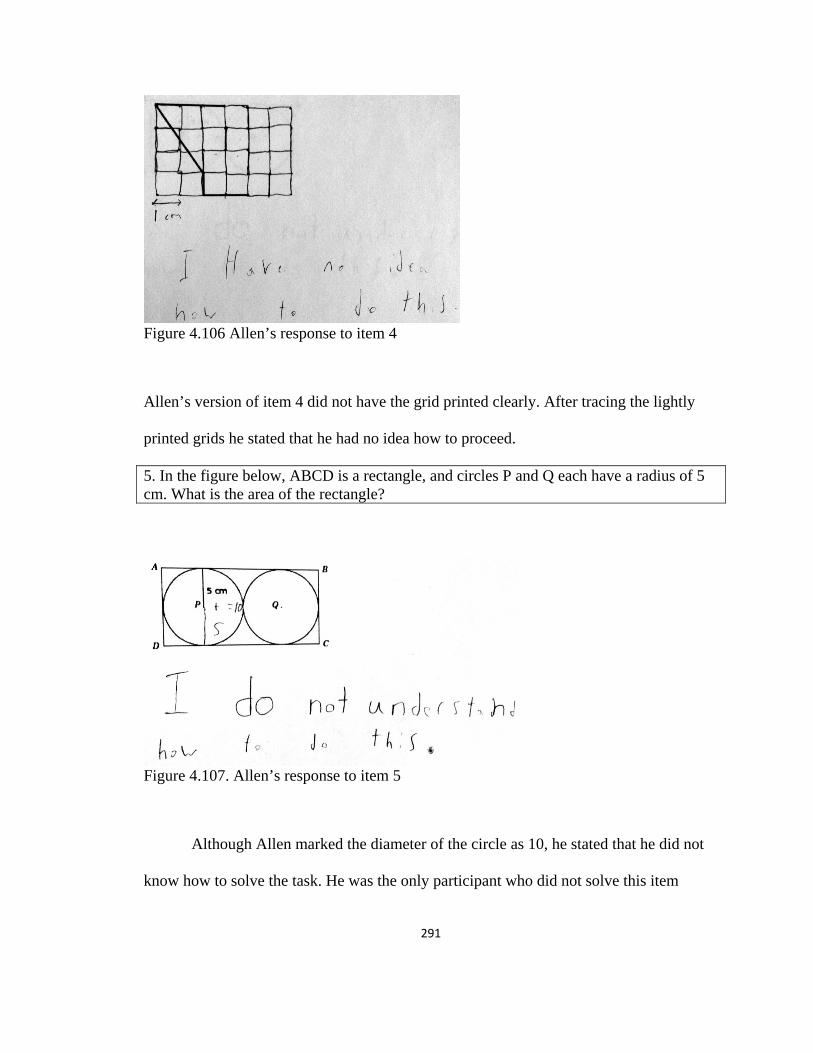
291
Figure 4.106 Allen’s response to item 4
Allen’s version of item 4 did not have the grid printed clearly. After tracing the lightly
printed grids he stated that he had no idea how to proceed.
5. In the figure below, ABCD is a rectangle, and circles P and Q each have a radius of 5 cm. What is the area of the rectangle?
Figure 4.107. Allen’s response to item 5
Although Allen marked the diameter of the circle as 10, he stated that he did not
know how to solve the task. He was the only participant who did not solve this item
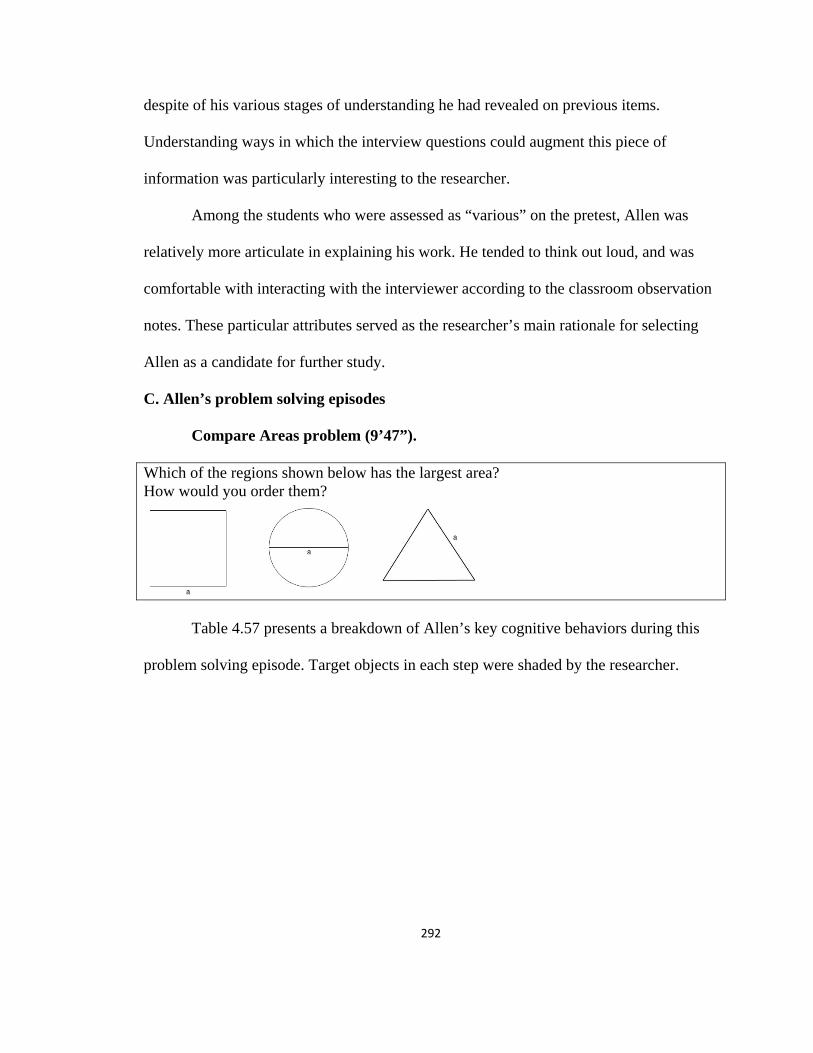
292
despite of his various stages of understanding he had revealed on previous items.
Understanding ways in which the interview questions could augment this piece of
information was particularly interesting to the researcher.
Among the students who were assessed as “various” on the pretest, Allen was
relatively more articulate in explaining his work. He tended to think out loud, and was
comfortable with interacting with the interviewer according to the classroom observation
notes. These particular attributes served as the researcher’s main rationale for selecting
Allen as a candidate for further study.
C. Allen’s problem solving episodes
Compare Areas problem (9’47”).
Which of the regions shown below has the largest area? How would you order them?
Table 4.57 presents a breakdown of Allen’s key cognitive behaviors during this
problem solving episode. Target objects in each step were shaded by the researcher.
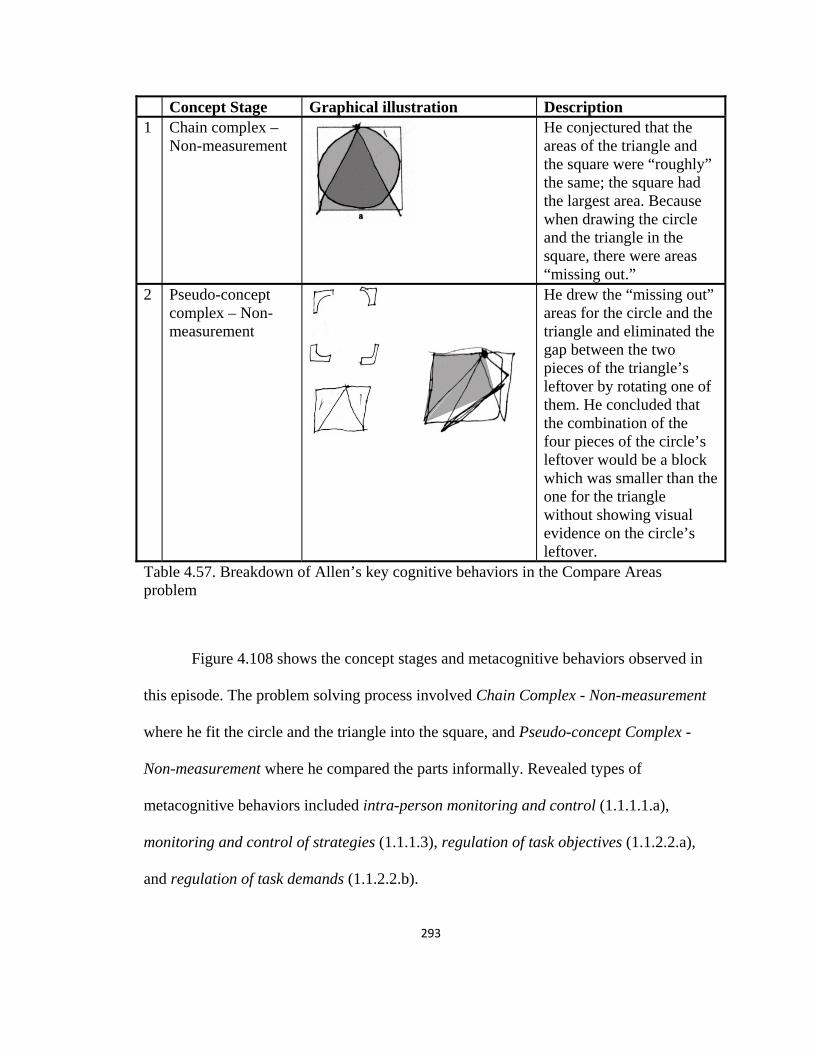
293
Concept Stage Graphical illustration Description 1 Chain complex –
Non-measurement
He conjectured that the areas of the triangle and the square were “roughly” the same; the square had the largest area. Because when drawing the circle and the triangle in the square, there were areas “missing out.”
2 Pseudo-concept complex – Non-measurement
He drew the “missing out” areas for the circle and the triangle and eliminated the gap between the two pieces of the triangle’s leftover by rotating one of them. He concluded that the combination of the four pieces of the circle’s leftover would be a block which was smaller than the one for the triangle without showing visual evidence on the circle’s leftover.
Table 4.57. Breakdown of Allen’s key cognitive behaviors in the Compare Areas problem
Figure 4.108 shows the concept stages and metacognitive behaviors observed in
this episode. The problem solving process involved Chain Complex - Non-measurement
where he fit the circle and the triangle into the square, and Pseudo-concept Complex -
Non-measurement where he compared the parts informally. Revealed types of
metacognitive behaviors included intra-person monitoring and control (1.1.1.1.a),
monitoring and control of strategies (1.1.1.3), regulation of task objectives (1.1.2.2.a),
and regulation of task demands (1.1.2.2.b).
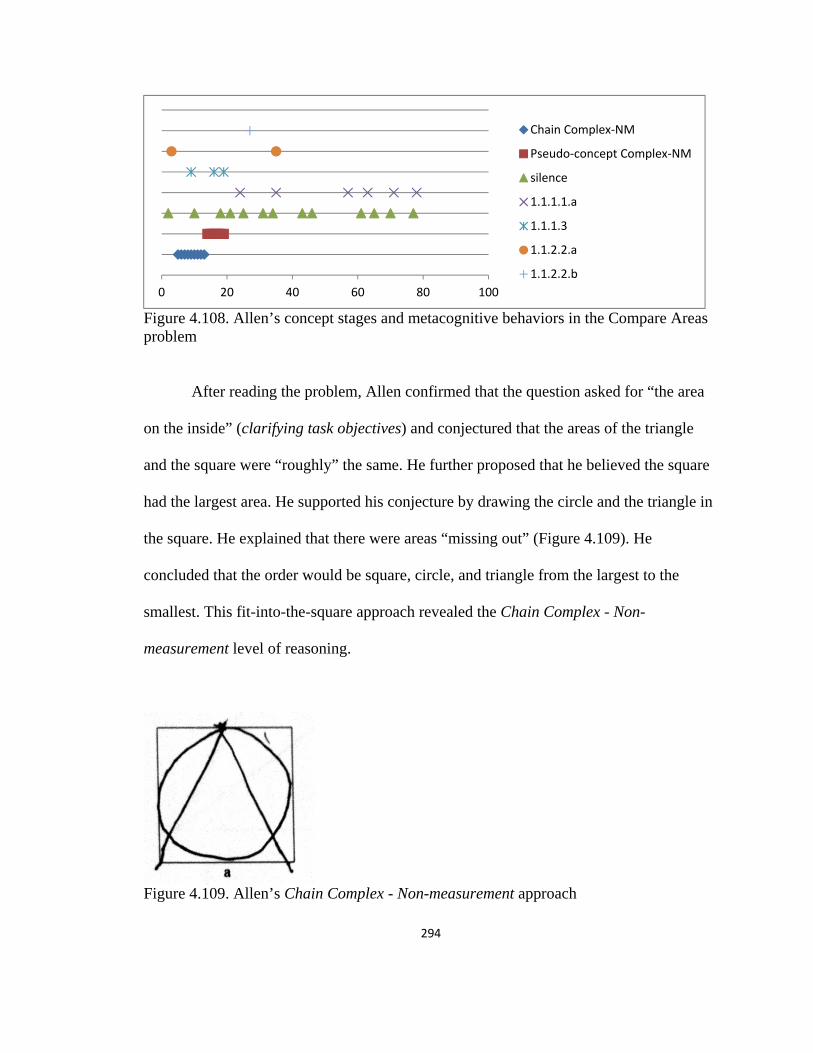
294
Figure 4.108. Allen’s concept stages and metacognitive behaviors in the Compare Areas problem
After reading the problem, Allen confirmed that the question asked for “the area
on the inside” (clarifying task objectives) and conjectured that the areas of the triangle
and the square were “roughly” the same. He further proposed that he believed the square
had the largest area. He supported his conjecture by drawing the circle and the triangle in
the square. He explained that there were areas “missing out” (Figure 4.109). He
concluded that the order would be square, circle, and triangle from the largest to the
smallest. This fit-into-the-square approach revealed the Chain Complex - Non-
measurement level of reasoning.
Figure 4.109. Allen’s Chain Complex - Non-measurement approach
0 20 40 60 80 100
Chain Complex-NM
Pseudo-concept Complex-NM
silence
1.1.1.1.a
1.1.1.3
1.1.2.2.a
1.1.2.2.b
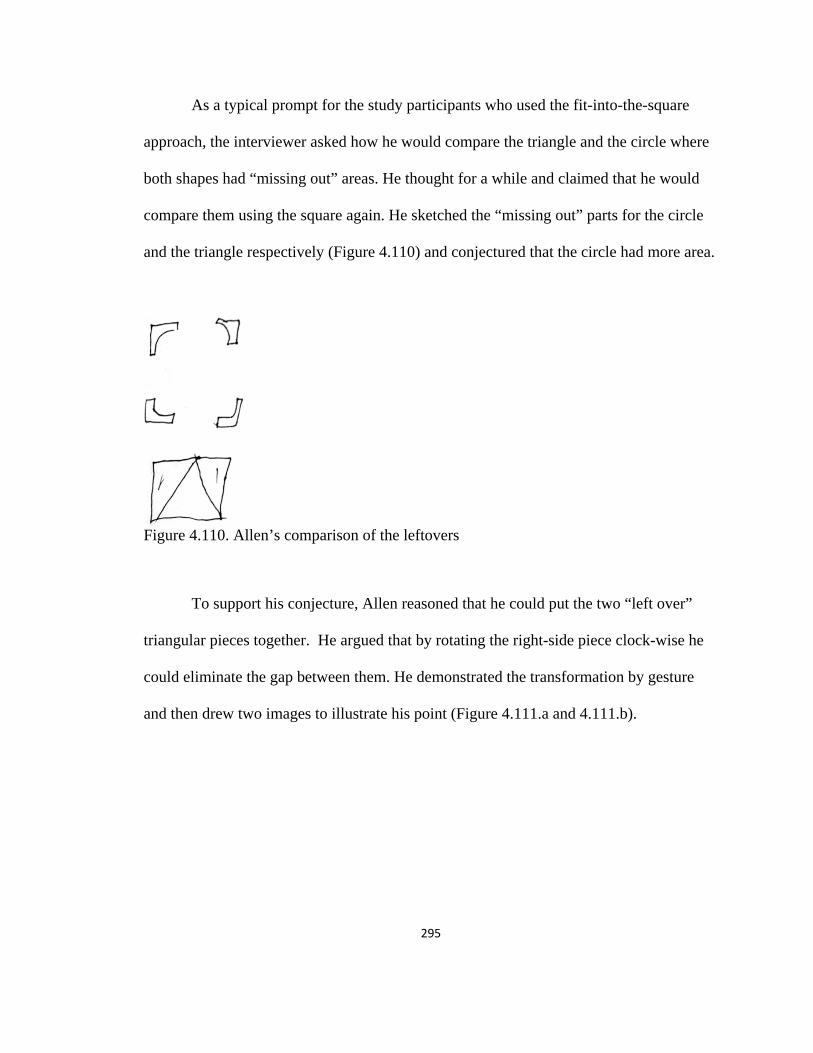
295
As a typical prompt for the study participants who used the fit-into-the-square
approach, the interviewer asked how he would compare the triangle and the circle where
both shapes had “missing out” areas. He thought for a while and claimed that he would
compare them using the square again. He sketched the “missing out” parts for the circle
and the triangle respectively (Figure 4.110) and conjectured that the circle had more area.
Figure 4.110. Allen’s comparison of the leftovers
To support his conjecture, Allen reasoned that he could put the two “left over”
triangular pieces together. He argued that by rotating the right-side piece clock-wise he
could eliminate the gap between them. He demonstrated the transformation by gesture
and then drew two images to illustrate his point (Figure 4.111.a and 4.111.b).
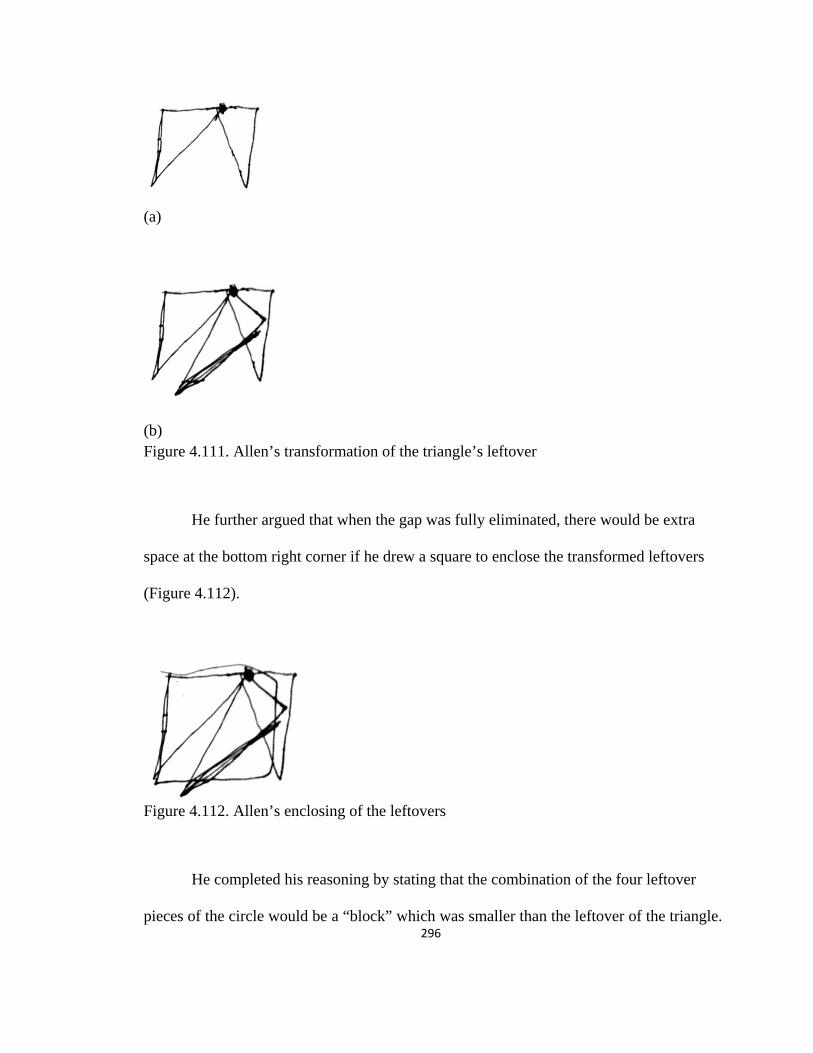
296
(a)
(b) Figure 4.111. Allen’s transformation of the triangle’s leftover
He further argued that when the gap was fully eliminated, there would be extra
space at the bottom right corner if he drew a square to enclose the transformed leftovers
(Figure 4.112).
Figure 4.112. Allen’s enclosing of the leftovers
He completed his reasoning by stating that the combination of the four leftover
pieces of the circle would be a “block” which was smaller than the leftover of the triangle.
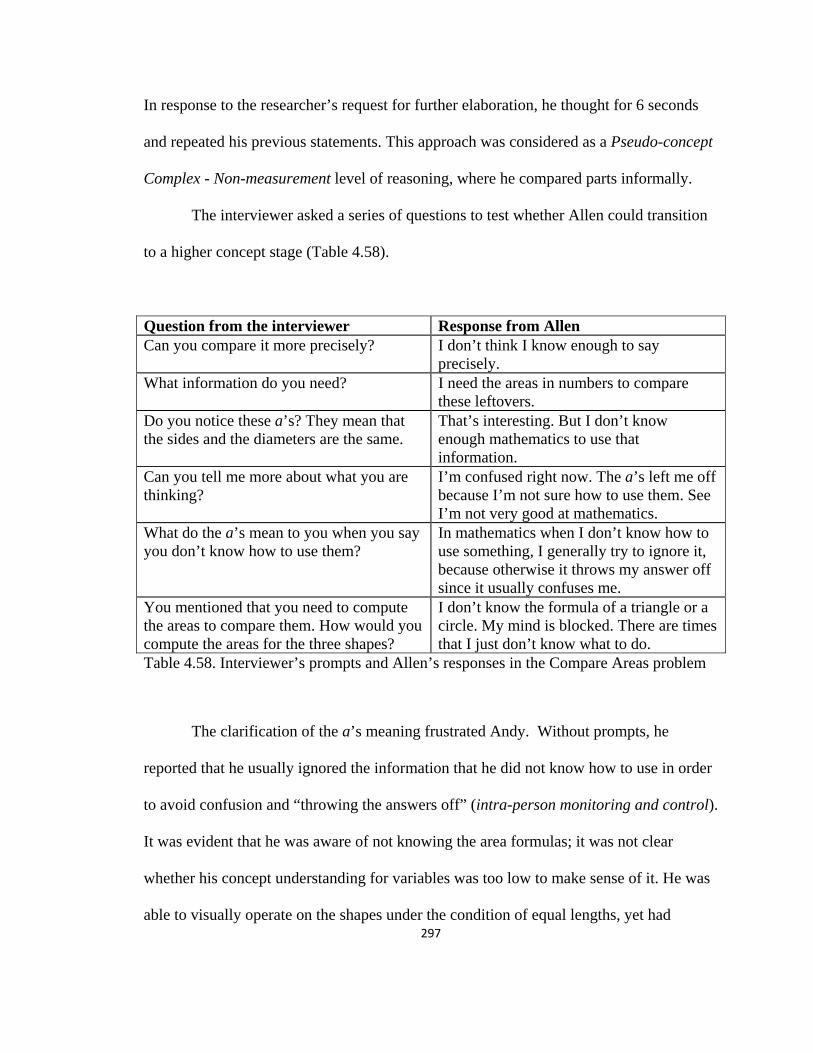
297
In response to the researcher’s request for further elaboration, he thought for 6 seconds
and repeated his previous statements. This approach was considered as a Pseudo-concept
Complex - Non-measurement level of reasoning, where he compared parts informally.
The interviewer asked a series of questions to test whether Allen could transition
to a higher concept stage (Table 4.58).
Question from the interviewer Response from Allen Can you compare it more precisely? I don’t think I know enough to say
precisely. What information do you need? I need the areas in numbers to compare
these leftovers. Do you notice these a’s? They mean that the sides and the diameters are the same.
That’s interesting. But I don’t know enough mathematics to use that information.
Can you tell me more about what you are thinking?
I’m confused right now. The a’s left me off because I’m not sure how to use them. See I’m not very good at mathematics.
What do the a’s mean to you when you say you don’t know how to use them?
In mathematics when I don’t know how to use something, I generally try to ignore it, because otherwise it throws my answer off since it usually confuses me.
You mentioned that you need to compute the areas to compare them. How would you compute the areas for the three shapes?
I don’t know the formula of a triangle or a circle. My mind is blocked. There are times that I just don’t know what to do.
Table 4.58. Interviewer’s prompts and Allen’s responses in the Compare Areas problem
The clarification of the a’s meaning frustrated Andy. Without prompts, he
reported that he usually ignored the information that he did not know how to use in order
to avoid confusion and “throwing the answers off” (intra-person monitoring and control).
It was evident that he was aware of not knowing the area formulas; it was not clear
whether his concept understanding for variables was too low to make sense of it. He was
able to visually operate on the shapes under the condition of equal lengths, yet had
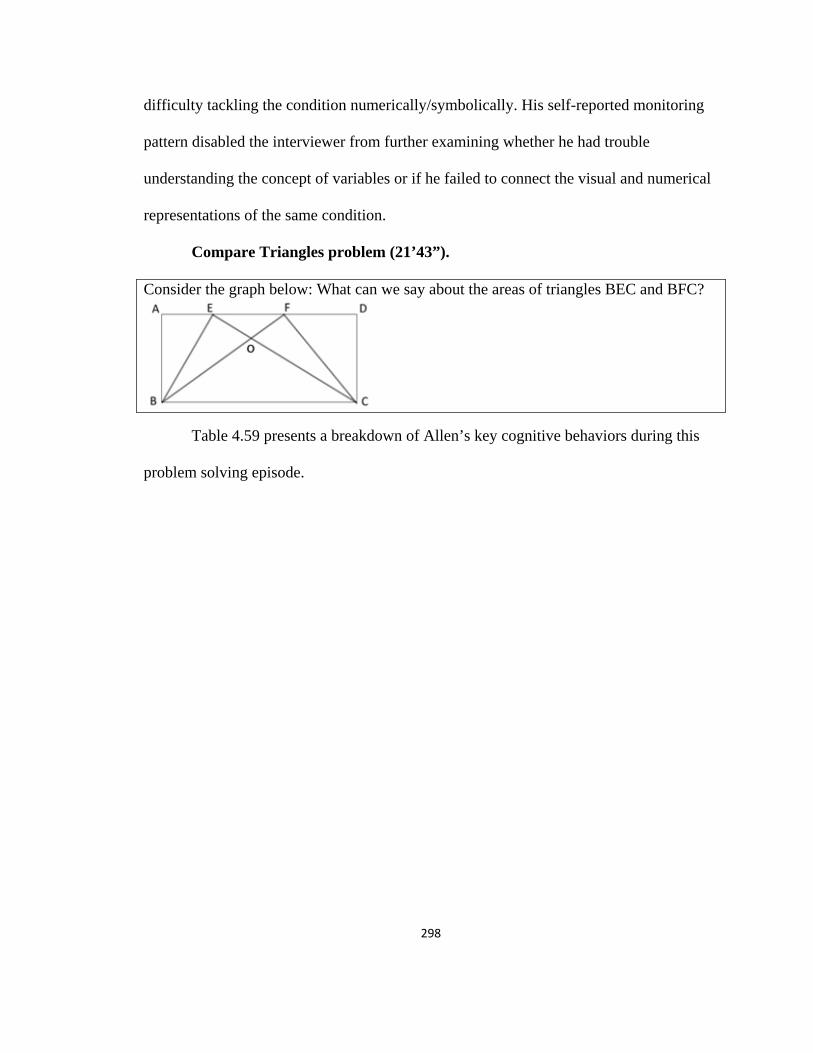
298
difficulty tackling the condition numerically/symbolically. His self-reported monitoring
pattern disabled the interviewer from further examining whether he had trouble
understanding the concept of variables or if he failed to connect the visual and numerical
representations of the same condition.
Compare Triangles problem (21’43”).
Consider the graph below: What can we say about the areas of triangles BEC and BFC?
Table 4.59 presents a breakdown of Allen’s key cognitive behaviors during this
problem solving episode.

299
Concept Stage Graphical illustration Description 1 Heap - Non-
measurement
He stated that if moving E and F to the midpoint of AD, then the two triangles had the same area. When moving the two points back to their original position, one triangle became “shorter but thicker” and the other became “longer and skinnier.”
2 Artificial Association Complex
He reasoned that during the movement described in stage 1, each triangle’s side lengths compensated (i.e. the perimeter remained the same) thus the gain and loss of its area evened out.
3 Pseudo-concept Complex - Formula
Given the triangle’s area formula, he computed both triangles’ areas and concluded they had the same area. He used stage 2 to explain this conclusion.
Table 4.59. Breakdown of Allen’s key cognitive behaviors in the Compare Triangles problem
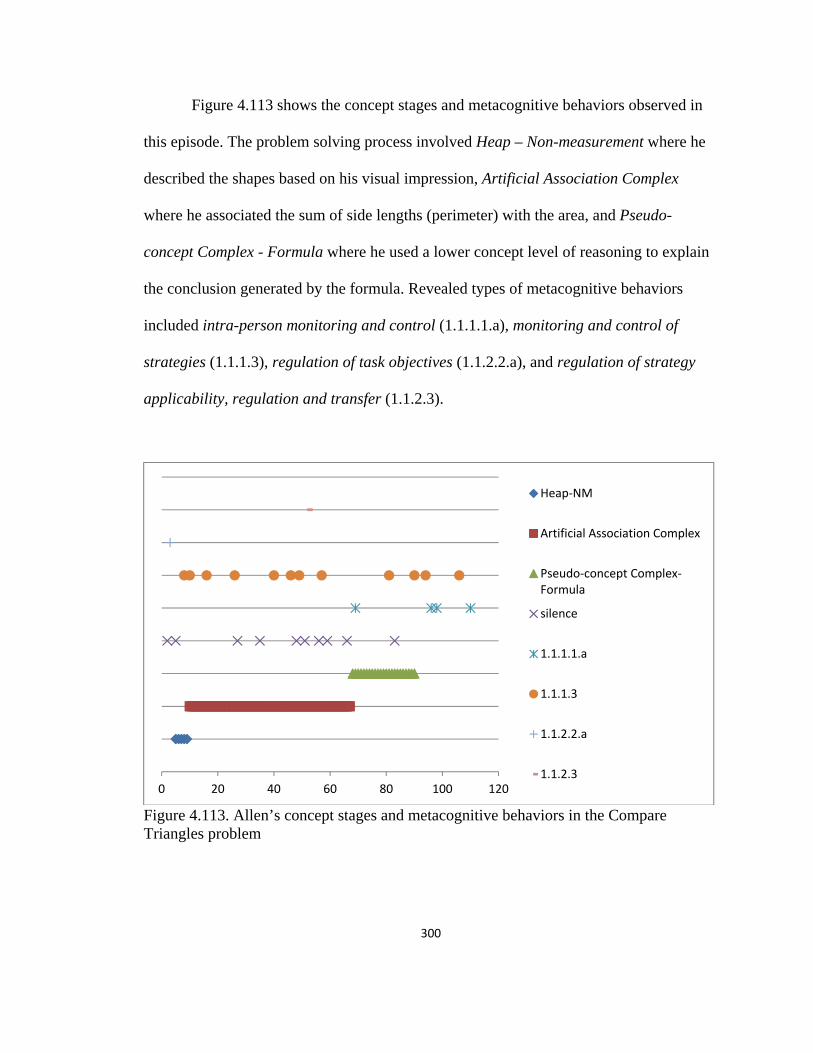
300
Figure 4.113 shows the concept stages and metacognitive behaviors observed in
this episode. The problem solving process involved Heap – Non-measurement where he
described the shapes based on his visual impression, Artificial Association Complex
where he associated the sum of side lengths (perimeter) with the area, and Pseudo-
concept Complex - Formula where he used a lower concept level of reasoning to explain
the conclusion generated by the formula. Revealed types of metacognitive behaviors
included intra-person monitoring and control (1.1.1.1.a), monitoring and control of
strategies (1.1.1.3), regulation of task objectives (1.1.2.2.a), and regulation of strategy
applicability, regulation and transfer (1.1.2.3).
Figure 4.113. Allen’s concept stages and metacognitive behaviors in the Compare Triangles problem
0 20 40 60 80 100 120
Heap-NM
Artificial Association Complex
Pseudo-concept Complex-Formula
silence
1.1.1.1.a
1.1.1.3
1.1.2.2.a
1.1.2.3
301
After reading the problem, Allen thought for 6 seconds and confirmed that the
problem asked for the area (regulation of task objectives). Then he claimed that the two
triangles had equal areas, explaining that if he moved E and F to the midpoint of AD the
two triangles equaled in areas. He further reasoned that if he then moved the two vertices
back to their original positions, one triangle would become “shorter but thicker” and the
other one would become “longer and skinnier.” He used transformational reasoning to
conjecture the relationship between the two triangles, yet the approach only revealed a
Heap – Non-measurement level of understanding which was visually built on his
impression.
The interviewer asked him whether he meant the areas evened out in the
transformational process. In response he measured OF and OE with a ruler and stated
that he could have been wrong. He went back to describing how the lengths of the sides
of the triangles changed during the transformational process and concluded that they were
equal. The interviewer commented that he was reasoning with the lengths of the sides and
asked him how he would reason about the areas as the shapes of the triangles changed
during the movement. He responded that although the shapes changed, the areas were
compensated for because “it loses one centimeter here but will gain it back there.”
Although he conjectured that the gain and loss of the area compensated while changing,
his reasoning was about compensation of lengths of the sides, which implied that the
triangle’s perimeter remained unchanged. This reasoning was considered as an Artificial
Association Complex level of operation.
To challenge his reasoning about the compensation of side lengths, the
interviewer conjectured that the sum of BE and EC should be the same as the sum of BF
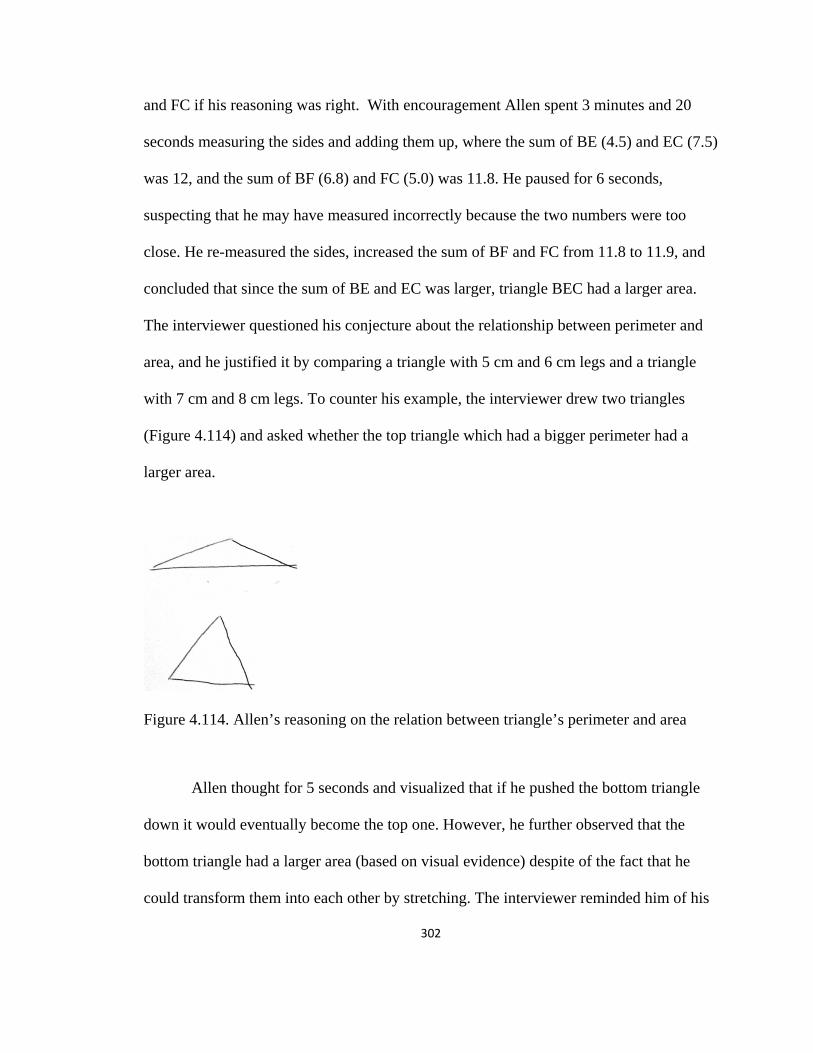
302
and FC if his reasoning was right. With encouragement Allen spent 3 minutes and 20
seconds measuring the sides and adding them up, where the sum of BE (4.5) and EC (7.5)
was 12, and the sum of BF (6.8) and FC (5.0) was 11.8. He paused for 6 seconds,
suspecting that he may have measured incorrectly because the two numbers were too
close. He re-measured the sides, increased the sum of BF and FC from 11.8 to 11.9, and
concluded that since the sum of BE and EC was larger, triangle BEC had a larger area.
The interviewer questioned his conjecture about the relationship between perimeter and
area, and he justified it by comparing a triangle with 5 cm and 6 cm legs and a triangle
with 7 cm and 8 cm legs. To counter his example, the interviewer drew two triangles
(Figure 4.114) and asked whether the top triangle which had a bigger perimeter had a
larger area.
Figure 4.114. Allen’s reasoning on the relation between triangle’s perimeter and area
Allen thought for 5 seconds and visualized that if he pushed the bottom triangle
down it would eventually become the top one. However, he further observed that the
bottom triangle had a larger area (based on visual evidence) despite of the fact that he
could transform them into each other by stretching. The interviewer reminded him of his
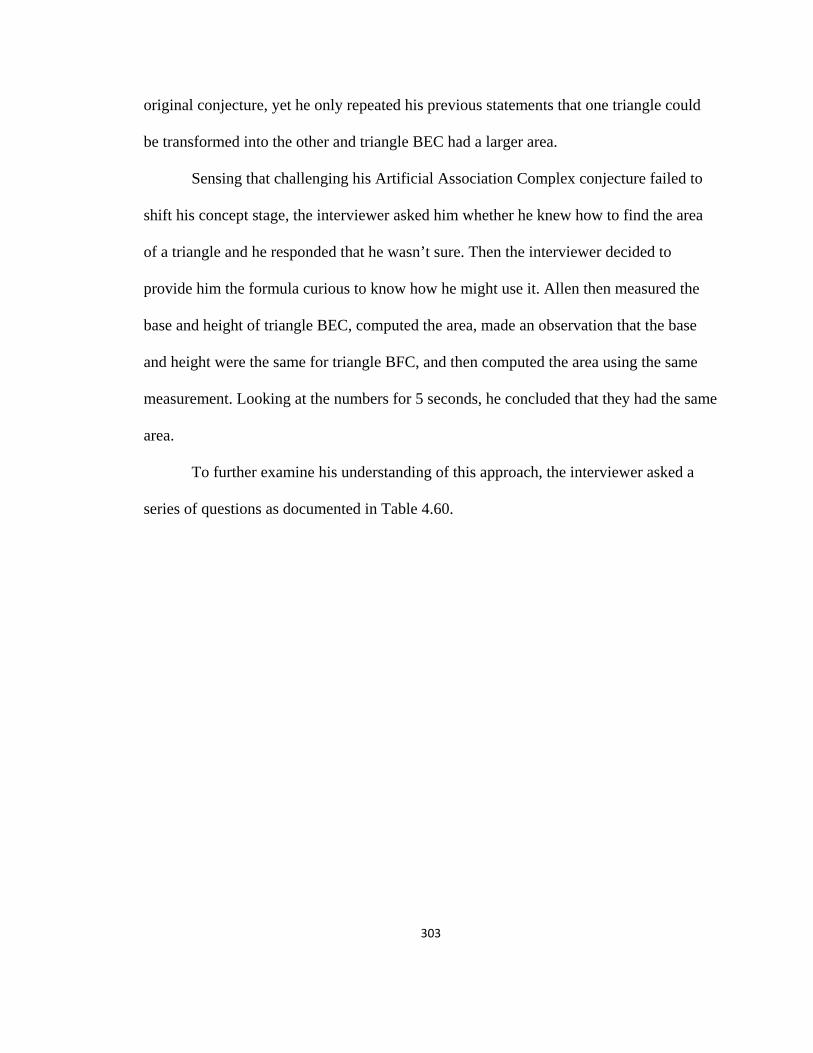
303
original conjecture, yet he only repeated his previous statements that one triangle could
be transformed into the other and triangle BEC had a larger area.
Sensing that challenging his Artificial Association Complex conjecture failed to
shift his concept stage, the interviewer asked him whether he knew how to find the area
of a triangle and he responded that he wasn’t sure. Then the interviewer decided to
provide him the formula curious to know how he might use it. Allen then measured the
base and height of triangle BEC, computed the area, made an observation that the base
and height were the same for triangle BFC, and then computed the area using the same
measurement. Looking at the numbers for 5 seconds, he concluded that they had the same
area.
To further examine his understanding of this approach, the interviewer asked a
series of questions as documented in Table 4.60.
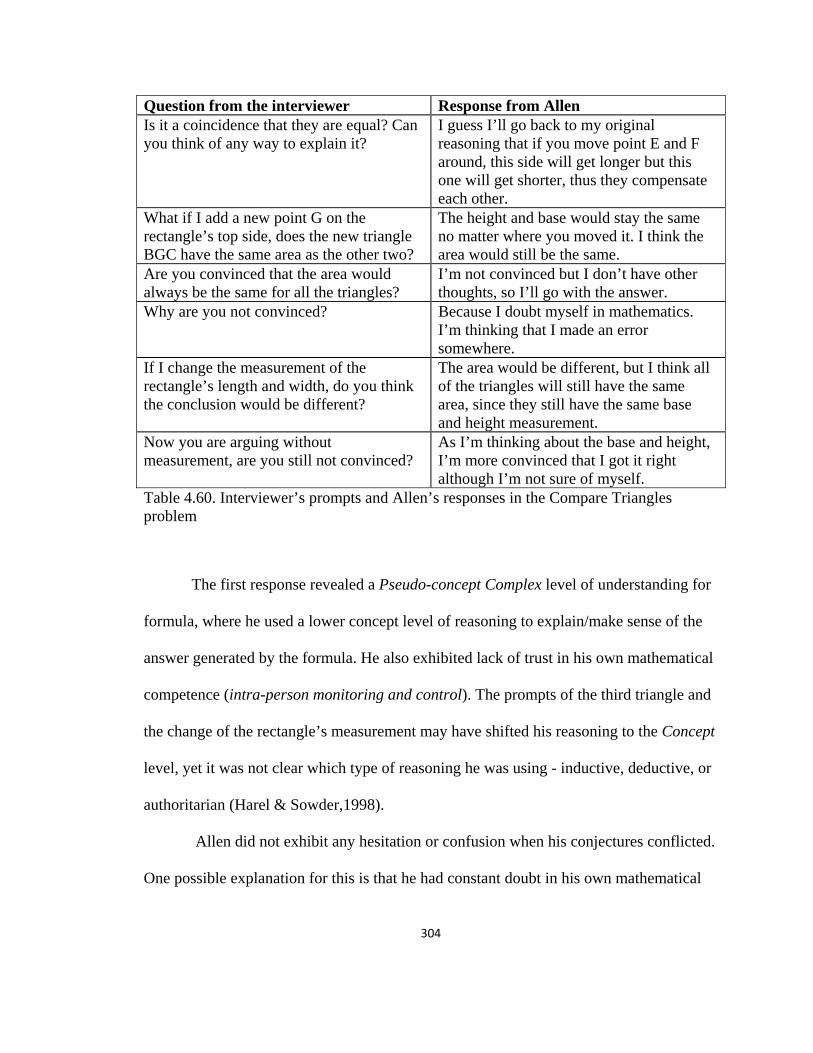
304
Question from the interviewer Response from Allen Is it a coincidence that they are equal? Can you think of any way to explain it?
I guess I’ll go back to my original reasoning that if you move point E and F around, this side will get longer but this one will get shorter, thus they compensate each other.
What if I add a new point G on the rectangle’s top side, does the new triangle BGC have the same area as the other two?
The height and base would stay the same no matter where you moved it. I think the area would still be the same.
Are you convinced that the area would always be the same for all the triangles?
I’m not convinced but I don’t have other thoughts, so I’ll go with the answer.
Why are you not convinced? Because I doubt myself in mathematics. I’m thinking that I made an error somewhere.
If I change the measurement of the rectangle’s length and width, do you think the conclusion would be different?
The area would be different, but I think all of the triangles will still have the same area, since they still have the same base and height measurement.
Now you are arguing without measurement, are you still not convinced?
As I’m thinking about the base and height, I’m more convinced that I got it right although I’m not sure of myself.
Table 4.60. Interviewer’s prompts and Allen’s responses in the Compare Triangles problem
The first response revealed a Pseudo-concept Complex level of understanding for
formula, where he used a lower concept level of reasoning to explain/make sense of the
answer generated by the formula. He also exhibited lack of trust in his own mathematical
competence (intra-person monitoring and control). The prompts of the third triangle and
the change of the rectangle’s measurement may have shifted his reasoning to the Concept
level, yet it was not clear which type of reasoning he was using - inductive, deductive, or
authoritarian (Harel & Sowder,1998).
Allen did not exhibit any hesitation or confusion when his conjectures conflicted.
One possible explanation for this is that he had constant doubt in his own mathematical

305
ability, thus any conjecture he made was plausible by default and he was comfortable
with accepting the most current one.
Shaded Triangle problem (9’17”).
How many of the shaded triangles shown below are needed to exactly cover the surface of the rectangle? Please explain your answer.
Table 4.61 presents a breakdown of Allen’s key cognitive behaviors during this
problem solving episode. Target objects were shaded by the researcher.

306
Concept Stage Graphical illustration Description 1 Concept – Unit
area He correctly iterated the triangles into the rectangle.
2 Pseudo-concept Complex - Formula
NA
He measured and computed the areas for the triangle and the rectangle, then divided the rectangle’s area by the triangle’s area to obtain 7.57. He claimed that the number was not accurate because 8 triangles could fit exactly.
3 Example-oriented Association Complex - Unit area
He drew a second pattern to demonstrate that although 8 was the only answer there could be two different patterns.
Table 4.61. Breakdown of Allen’s key cognitive behaviors in the Shaded Triangle problem
Figure 4.115 shows the concept stages and metacognitive behaviors observed in
this episode. The problem solving process involved Concept – Unit area where he
correctly visualized the pattern of shaded triangles, Pseudo-concept Complex - Formula
where he computed the answer using the area formulas which was different from the
answer he generated previously, and Example-oriented Association Complex - Unit area
where he correctly iterated a different triangular unit. Revealed types of metacognitive
behaviors included intra-person monitoring and control (1.1.1.1.a), monitoring and

307
control of strategies (1.1.1.3), regulation of task objectives (1.1.2.2.a), and regulation of
strategy applicability, regulation and transfer (1.1.2.3).
Figure 4.115. Allen’s concept stages and metacognitive behaviors in the Shaded Triangle problem
After reading the problem, Allen identified the task objective and paused for 4
seconds. He then conjectured that the answer was 8. To solve the problem formally, he
first measured the triangle’s three sides as 3.2, 1.3, and 3.3, then copied and marked the
two legs of the triangle on the left and bottom side of the rectangle, at last connected the
two points to complete the triangle (Figure 4.116). The first triangle had the same
orientation as the shaded triangle, which was the one most study participants chose to
draw.
0 10 20 30 40 50
Example-oriented AssociationComplex-UA
Pseudo-concept Complex-Formula
Concept-UA
silence
1.1.1.1.a
1.1.1.3
1.1.2.2.a
1.1.2.3
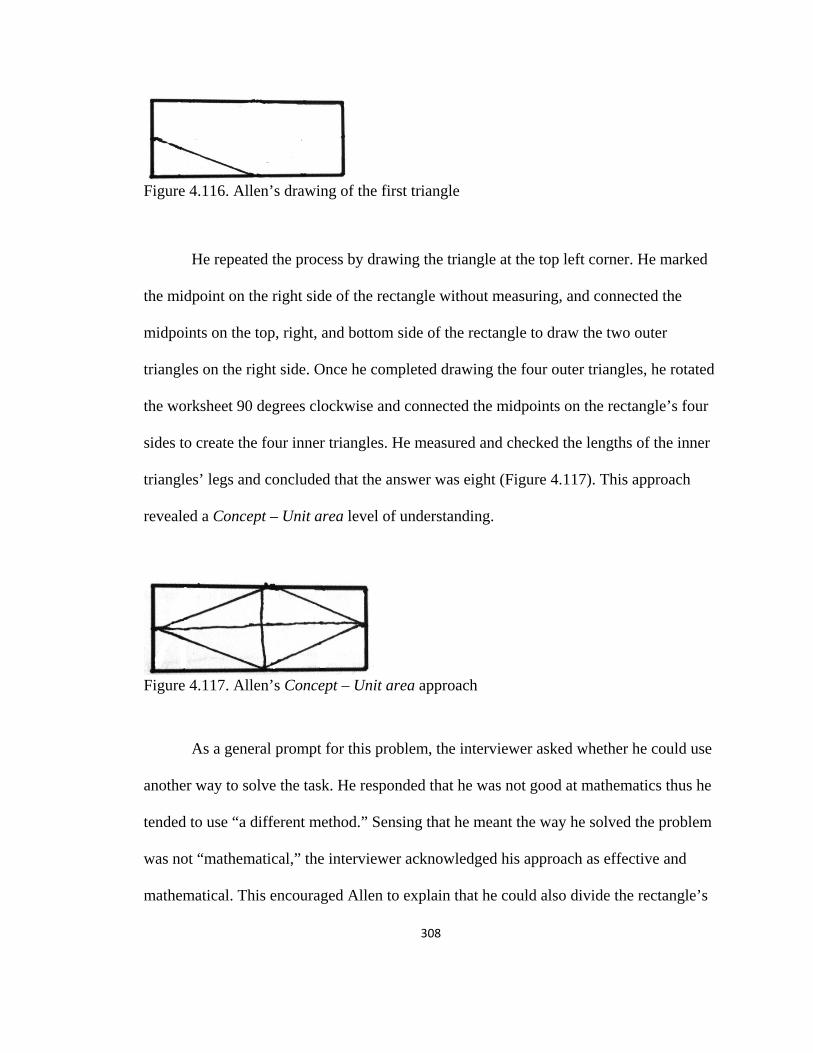
308
Figure 4.116. Allen’s drawing of the first triangle
He repeated the process by drawing the triangle at the top left corner. He marked
the midpoint on the right side of the rectangle without measuring, and connected the
midpoints on the top, right, and bottom side of the rectangle to draw the two outer
triangles on the right side. Once he completed drawing the four outer triangles, he rotated
the worksheet 90 degrees clockwise and connected the midpoints on the rectangle’s four
sides to create the four inner triangles. He measured and checked the lengths of the inner
triangles’ legs and concluded that the answer was eight (Figure 4.117). This approach
revealed a Concept – Unit area level of understanding.
Figure 4.117. Allen’s Concept – Unit area approach
As a general prompt for this problem, the interviewer asked whether he could use
another way to solve the task. He responded that he was not good at mathematics thus he
tended to use “a different method.” Sensing that he meant the way he solved the problem
was not “mathematical,” the interviewer acknowledged his approach as effective and
mathematical. This encouraged Allen to explain that he could also divide the rectangle’s

309
area by the triangle’s area, though unsure of how to make sense of what he may obtain
from this procedure. He did decide to try out his method and computed the triangle’s area
(2.08) and the rectangle’s area (15.75), divided the latter by the former, and rounded the
result to 7.57. Once he obtained the number, he immediately commented that it was not
as “accurate” because he believed 8 triangles could fit in the rectangle exactly. The
formulaic approach was evidently what he perceived as the “mathematical way” to solve
the problem. Despite of the correct reproduction of the procedure, he was less confident
in this approach and his answer was not influenced by the computational result. This
approach revealed his Pseudo-concept Complex - Formula level of understanding.
Contradictory to the theoretically dominating role of Pseudo-concept Complex
stages (Berger, 2004), Allen’s Pseudo-concept Complex - Formula approach gave way to
the Concept - Unit area approach. His self-perceived low mathematical competence may
have played an important role in this phenomenon.
To further understand his evaluation of the two approaches, the interviewer asked
Allen whether there could be two answers to this question to which he responded
positively. In explaining what he meant by two answers, he drew a pattern different from
the original one as a “second answer” (Figure 4.118).
Figure 4.118. Allen’s alternative drawing

310
In complying with my request to complete the drawing, he copied the short leg of
the triangle on the top side of the rectangle and drew four triangles on the right half of the
rectangle (Figure 4.119). He concluded that the answer would still be eight since the
pattern would be the same for the other half. He again expressed distrust on the computed
answer (“may have measured wrong”) because he knew there could fit eight by looking
at the picture at the beginning.
Figure 4.119. Allen’s Example-oriented Association Complex - Unit area reasoning
The pattern he drew (Figure 4.119) revealed an Example-oriented Association
Complex - Unit area level of reasoning, where he correctly iterated a wrong unit triangle.
In the previous problem, he changed his answer because of a 0.1 difference between two
numbers. Yet here he believed he made a measuring error (without re-measuring to test it
as in the previous problem) when the computed number didn’t match his drawing. His
confidence in the visual approach was possibly the main reason for the completely
different behaviors in this context, despite of the low level concept stage for unit area
which was revealed at the end.
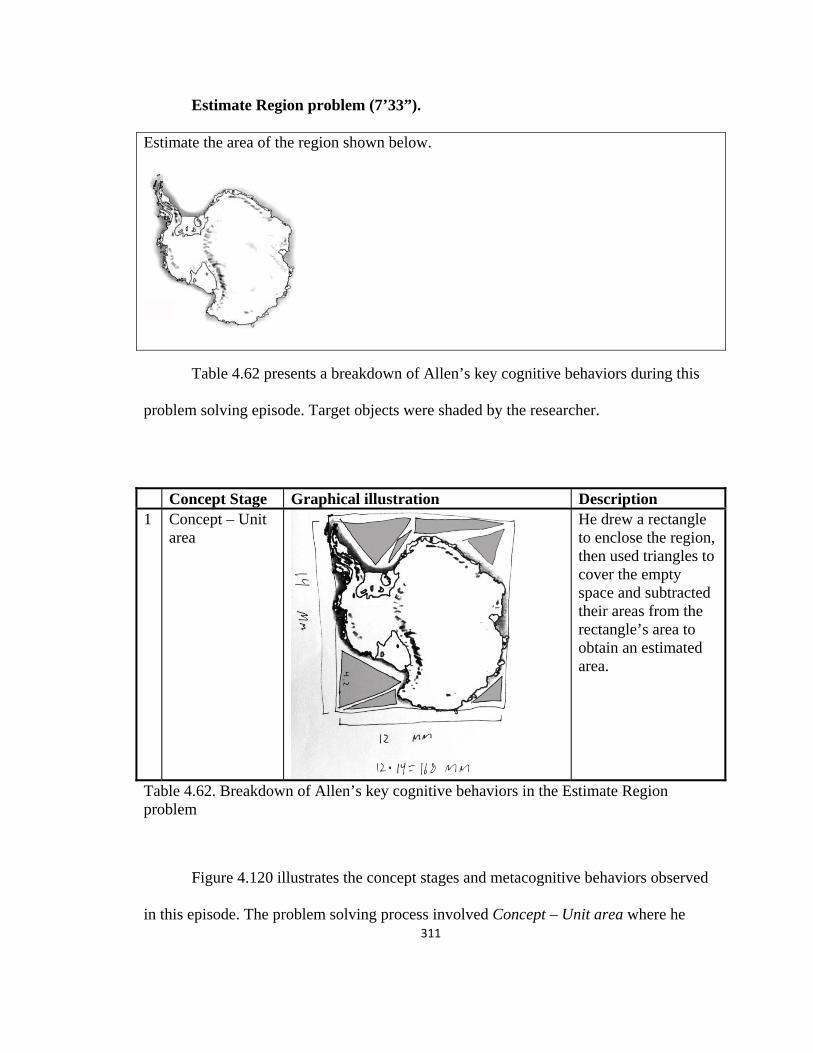
311
Estimate Region problem (7’33”).
Estimate the area of the region shown below.
Table 4.62 presents a breakdown of Allen’s key cognitive behaviors during this
problem solving episode. Target objects were shaded by the researcher.
Concept Stage Graphical illustration Description 1 Concept – Unit
area He drew a rectangle to enclose the region, then used triangles to cover the empty space and subtracted their areas from the rectangle’s area to obtain an estimated area.
Table 4.62. Breakdown of Allen’s key cognitive behaviors in the Estimate Region problem
Figure 4.120 illustrates the concept stages and metacognitive behaviors observed
in this episode. The problem solving process involved Concept – Unit area where he
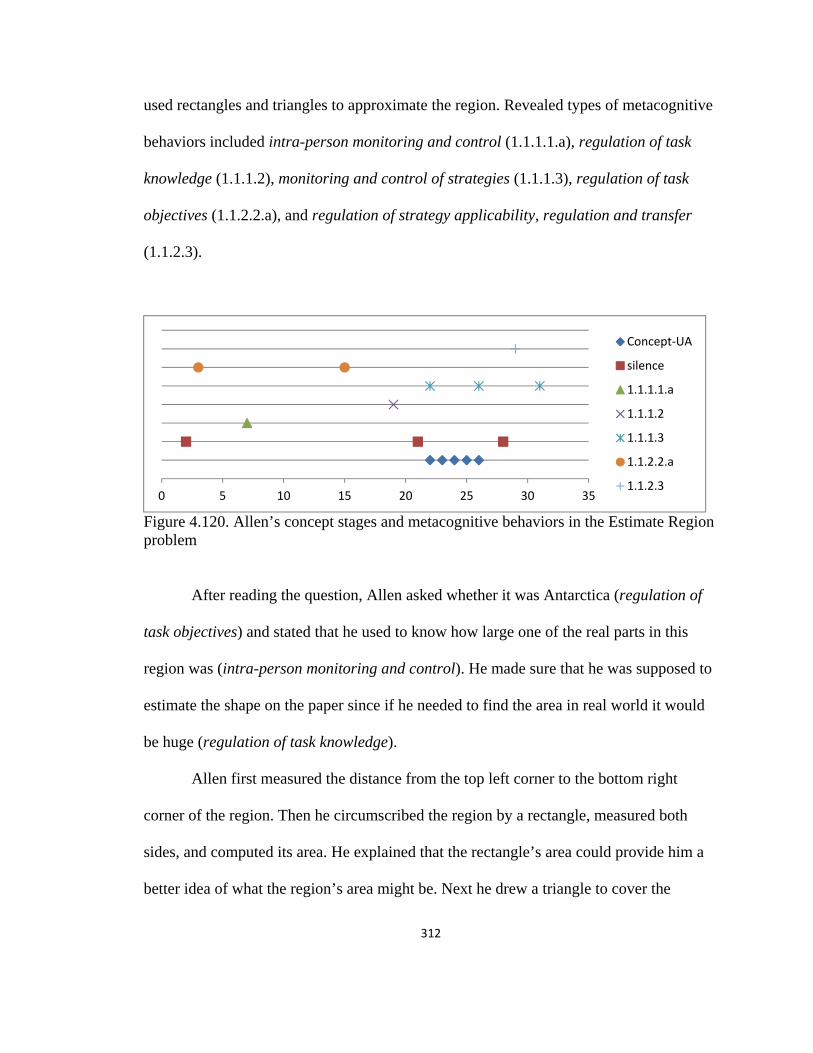
312
used rectangles and triangles to approximate the region. Revealed types of metacognitive
behaviors included intra-person monitoring and control (1.1.1.1.a), regulation of task
knowledge (1.1.1.2), monitoring and control of strategies (1.1.1.3), regulation of task
objectives (1.1.2.2.a), and regulation of strategy applicability, regulation and transfer
(1.1.2.3).
Figure 4.120. Allen’s concept stages and metacognitive behaviors in the Estimate Region problem
After reading the question, Allen asked whether it was Antarctica (regulation of
task objectives) and stated that he used to know how large one of the real parts in this
region was (intra-person monitoring and control). He made sure that he was supposed to
estimate the shape on the paper since if he needed to find the area in real world it would
be huge (regulation of task knowledge).
Allen first measured the distance from the top left corner to the bottom right
corner of the region. Then he circumscribed the region by a rectangle, measured both
sides, and computed its area. He explained that the rectangle’s area could provide him a
better idea of what the region’s area might be. Next he drew a triangle to cover the
0 5 10 15 20 25 30 35
Concept-UA
silence
1.1.1.1.a
1.1.1.2
1.1.1.3
1.1.2.2.a
1.1.2.3
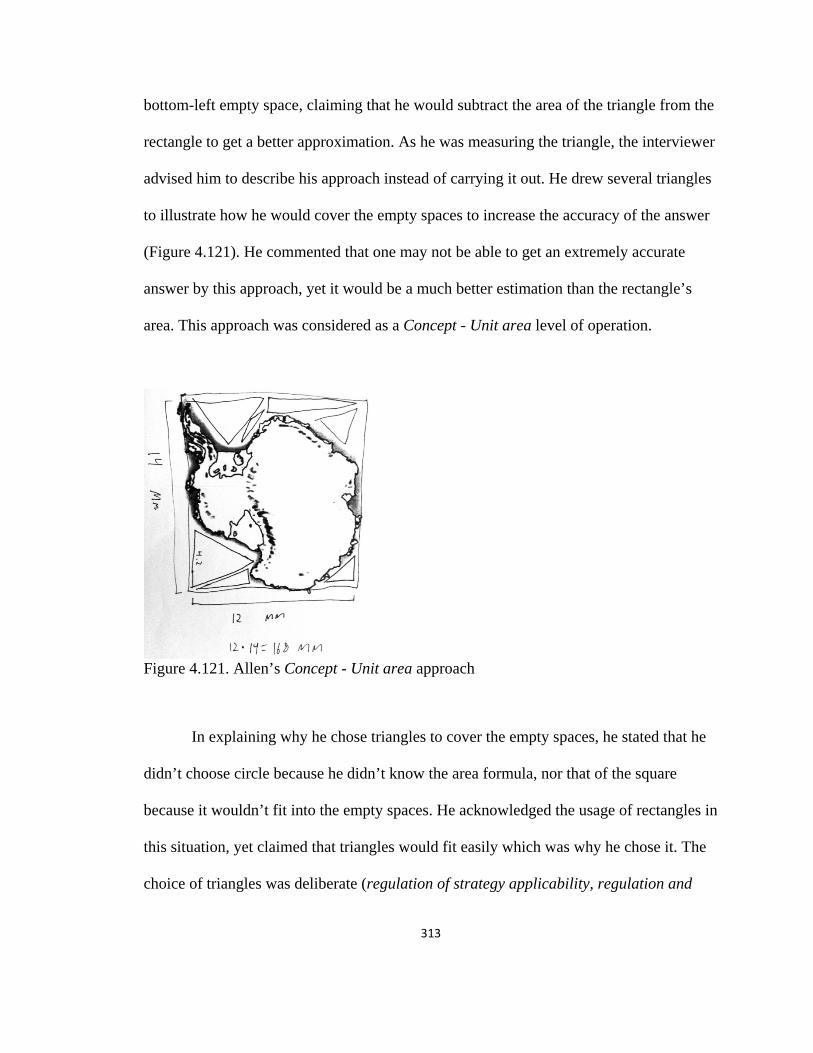
313
bottom-left empty space, claiming that he would subtract the area of the triangle from the
rectangle to get a better approximation. As he was measuring the triangle, the interviewer
advised him to describe his approach instead of carrying it out. He drew several triangles
to illustrate how he would cover the empty spaces to increase the accuracy of the answer
(Figure 4.121). He commented that one may not be able to get an extremely accurate
answer by this approach, yet it would be a much better estimation than the rectangle’s
area. This approach was considered as a Concept - Unit area level of operation.
Figure 4.121. Allen’s Concept - Unit area approach
In explaining why he chose triangles to cover the empty spaces, he stated that he
didn’t choose circle because he didn’t know the area formula, nor that of the square
because it wouldn’t fit into the empty spaces. He acknowledged the usage of rectangles in
this situation, yet claimed that triangles would fit easily which was why he chose it. The
choice of triangles was deliberate (regulation of strategy applicability, regulation and

314
transfer), yet the interviewer didn’t ask why he believed he could only use one type of
shape instead of a mixture of different types. At the end the interviewer asked whether it
would be difficult to find out all the triangles drawn in the picture. Allen evaluated the
approach as easy but tedious.
Intersected Area problem (21’44”).
Two squares, each s on a side, are placed such that the corner on one square lies on the center of the other. Describe, in terms of s, the range of possible areas representing the intersections of the two squares.
Table 4.63 presents a breakdown of Allen’s key cognitive behaviors during this
problem solving episode. Target objects were shaded by the researcher.
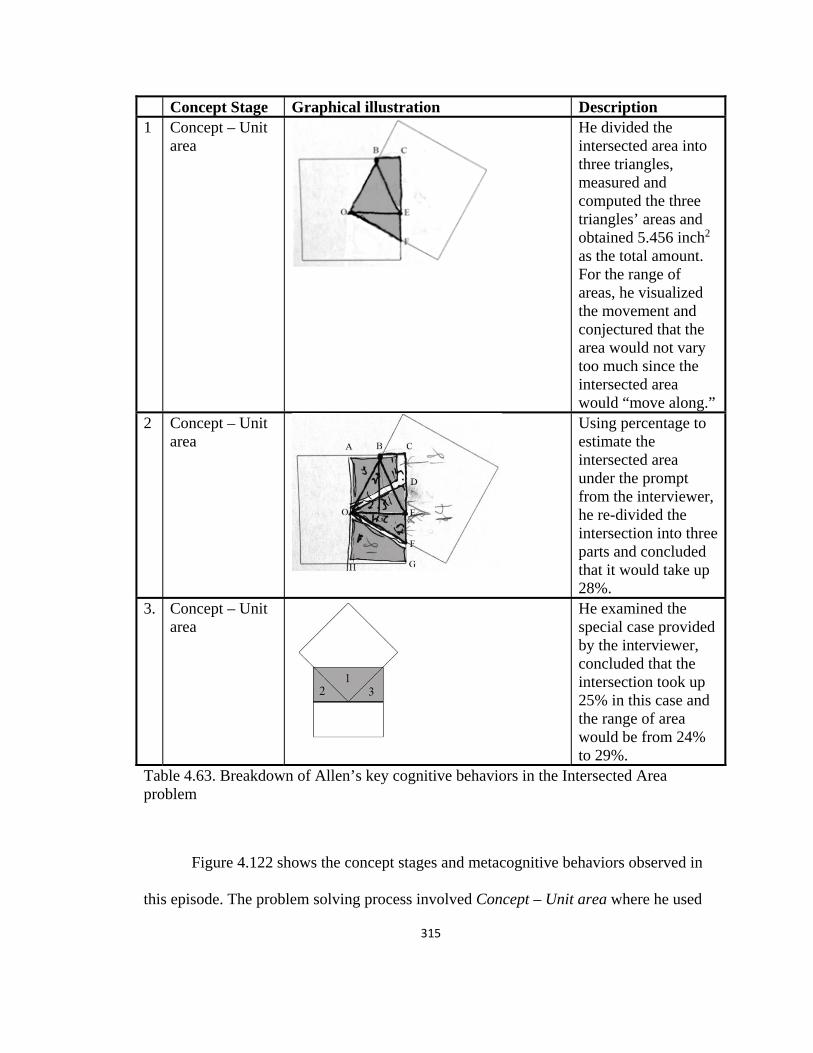
315
Concept Stage Graphical illustration Description 1 Concept – Unit
area
He divided the intersected area into three triangles, measured and computed the three triangles’ areas and obtained 5.456 inch2 as the total amount. For the range of areas, he visualized the movement and conjectured that the area would not vary too much since the intersected area would “move along.”
2 Concept – Unit area
Using percentage to estimate the intersected area under the prompt from the interviewer, he re-divided the intersection into three parts and concluded that it would take up 28%.
3. Concept – Unit area
He examined the special case provided by the interviewer, concluded that the intersection took up 25% in this case and the range of area would be from 24% to 29%.
Table 4.63. Breakdown of Allen’s key cognitive behaviors in the Intersected Area problem
Figure 4.122 shows the concept stages and metacognitive behaviors observed in
this episode. The problem solving process involved Concept – Unit area where he used
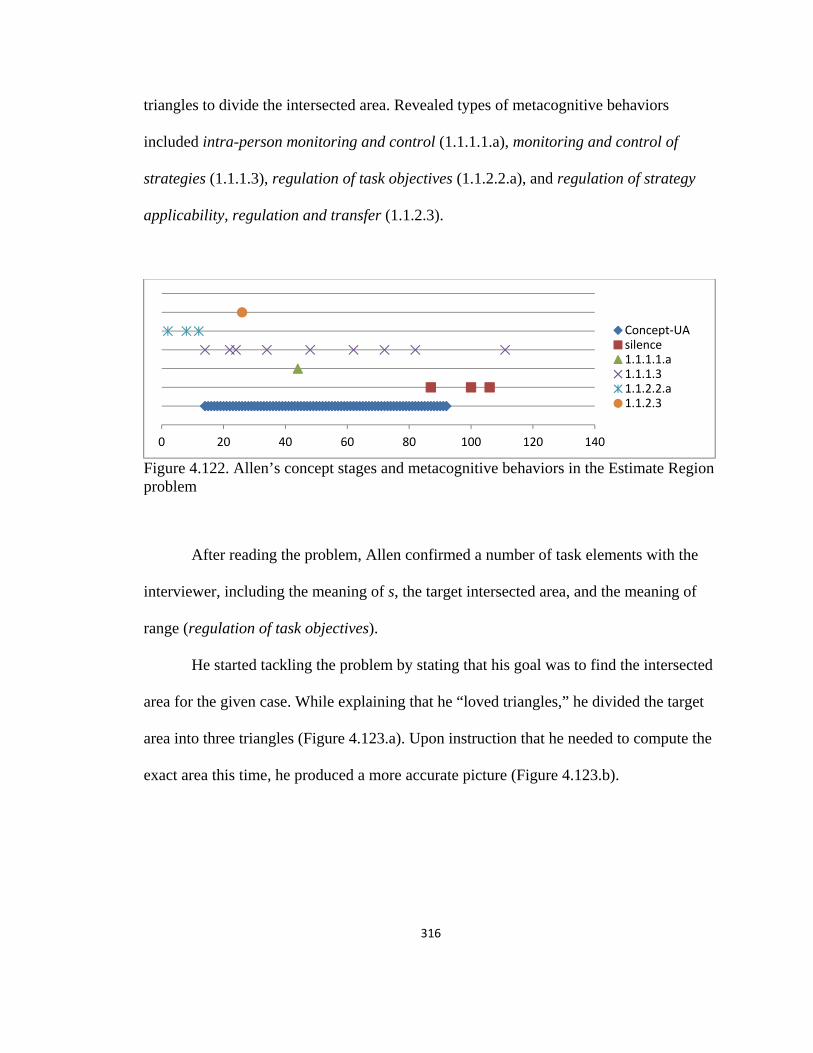
316
triangles to divide the intersected area. Revealed types of metacognitive behaviors
included intra-person monitoring and control (1.1.1.1.a), monitoring and control of
strategies (1.1.1.3), regulation of task objectives (1.1.2.2.a), and regulation of strategy
applicability, regulation and transfer (1.1.2.3).
Figure 4.122. Allen’s concept stages and metacognitive behaviors in the Estimate Region problem
After reading the problem, Allen confirmed a number of task elements with the
interviewer, including the meaning of s, the target intersected area, and the meaning of
range (regulation of task objectives).
He started tackling the problem by stating that his goal was to find the intersected
area for the given case. While explaining that he “loved triangles,” he divided the target
area into three triangles (Figure 4.123.a). Upon instruction that he needed to compute the
exact area this time, he produced a more accurate picture (Figure 4.123.b).
0 20 40 60 80 100 120 140
Concept-UAsilence1.1.1.1.a1.1.1.31.1.2.2.a1.1.2.3
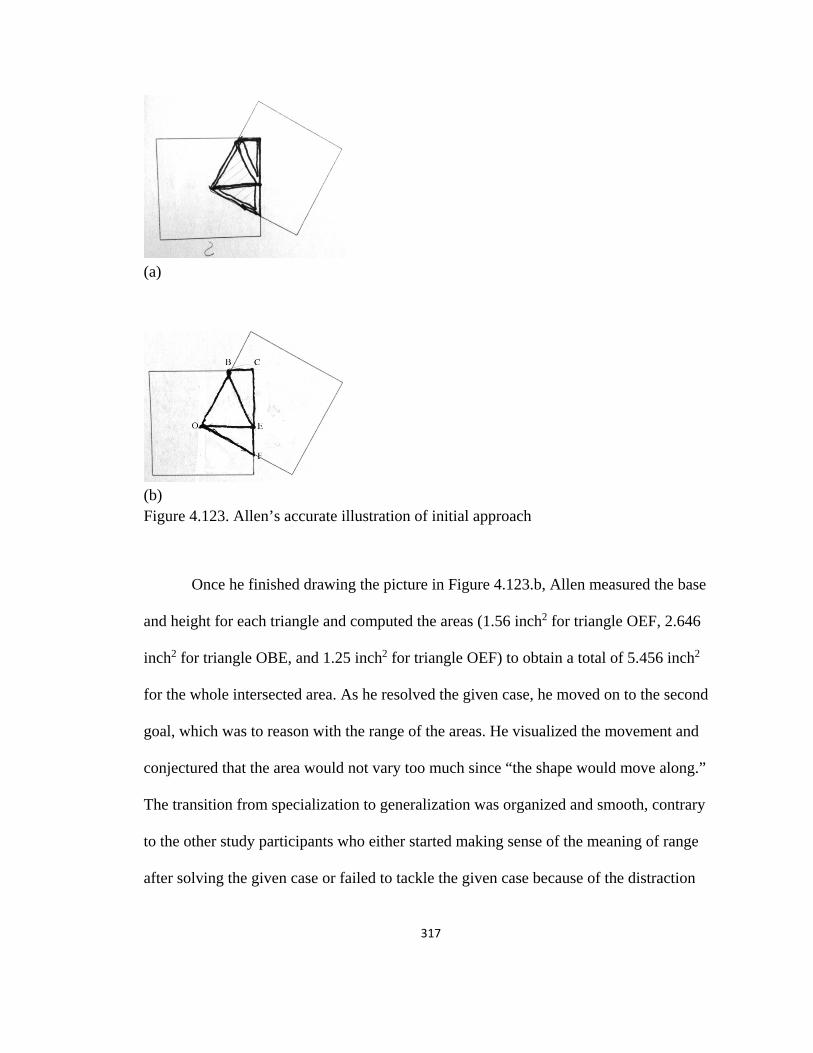
317
(a)
(b) Figure 4.123. Allen’s accurate illustration of initial approach
Once he finished drawing the picture in Figure 4.123.b, Allen measured the base
and height for each triangle and computed the areas (1.56 inch2 for triangle OEF, 2.646
inch2 for triangle OBE, and 1.25 inch2 for triangle OEF) to obtain a total of 5.456 inch2
for the whole intersected area. As he resolved the given case, he moved on to the second
goal, which was to reason with the range of the areas. He visualized the movement and
conjectured that the area would not vary too much since “the shape would move along.”
The transition from specialization to generalization was organized and smooth, contrary
to the other study participants who either started making sense of the meaning of range
after solving the given case or failed to tackle the given case because of the distraction
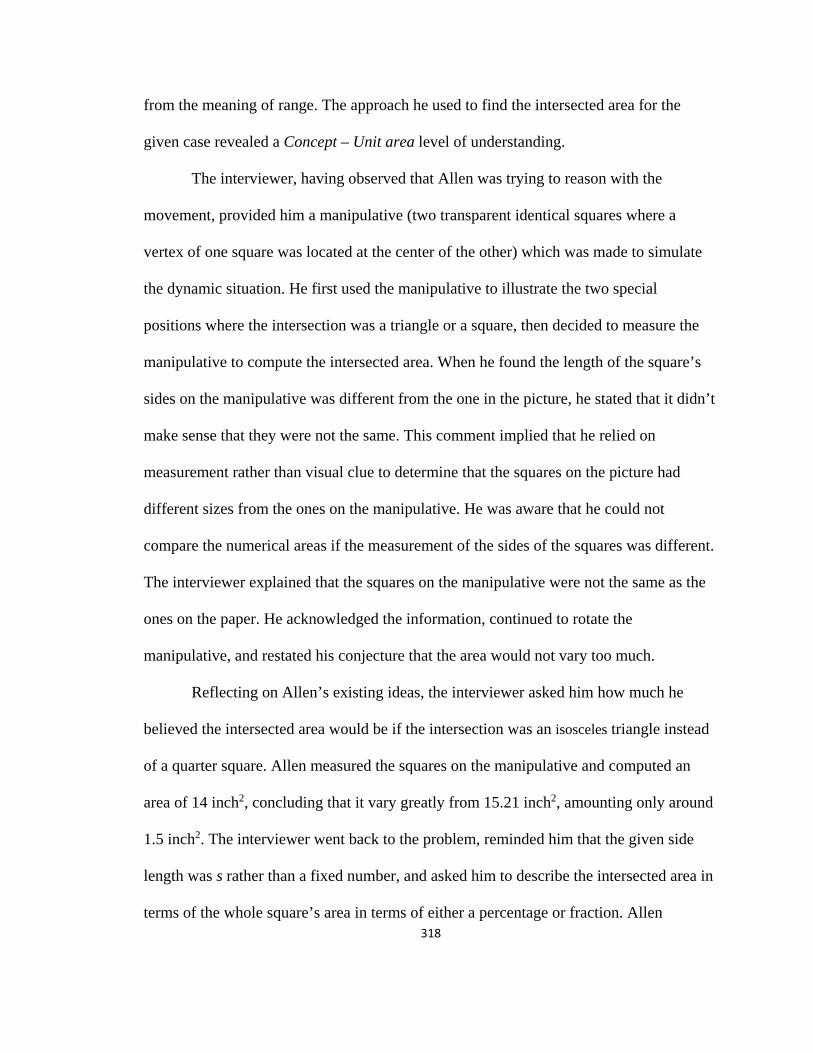
318
from the meaning of range. The approach he used to find the intersected area for the
given case revealed a Concept – Unit area level of understanding.
The interviewer, having observed that Allen was trying to reason with the
movement, provided him a manipulative (two transparent identical squares where a
vertex of one square was located at the center of the other) which was made to simulate
the dynamic situation. He first used the manipulative to illustrate the two special
positions where the intersection was a triangle or a square, then decided to measure the
manipulative to compute the intersected area. When he found the length of the square’s
sides on the manipulative was different from the one in the picture, he stated that it didn’t
make sense that they were not the same. This comment implied that he relied on
measurement rather than visual clue to determine that the squares on the picture had
different sizes from the ones on the manipulative. He was aware that he could not
compare the numerical areas if the measurement of the sides of the squares was different.
The interviewer explained that the squares on the manipulative were not the same as the
ones on the paper. He acknowledged the information, continued to rotate the
manipulative, and restated his conjecture that the area would not vary too much.
Reflecting on Allen’s existing ideas, the interviewer asked him how much he
believed the intersected area would be if the intersection was an isosceles triangle instead
of a quarter square. Allen measured the squares on the manipulative and computed an
area of 14 inch2, concluding that it vary greatly from 15.21 inch2, amounting only around
1.5 inch2. The interviewer went back to the problem, reminded him that the given side
length was s rather than a fixed number, and asked him to describe the intersected area in
terms of the whole square’s area in terms of either a percentage or fraction. Allen
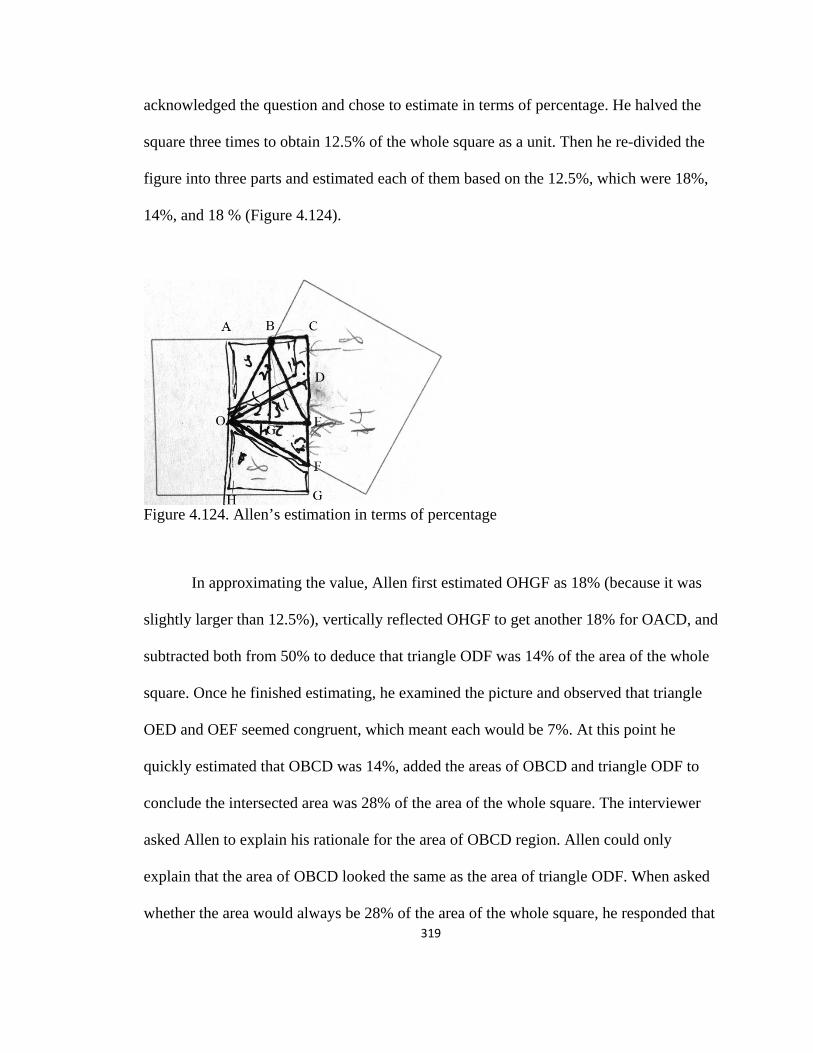
319
acknowledged the question and chose to estimate in terms of percentage. He halved the
square three times to obtain 12.5% of the whole square as a unit. Then he re-divided the
figure into three parts and estimated each of them based on the 12.5%, which were 18%,
14%, and 18 % (Figure 4.124).
Figure 4.124. Allen’s estimation in terms of percentage
In approximating the value, Allen first estimated OHGF as 18% (because it was
slightly larger than 12.5%), vertically reflected OHGF to get another 18% for OACD, and
subtracted both from 50% to deduce that triangle ODF was 14% of the area of the whole
square. Once he finished estimating, he examined the picture and observed that triangle
OED and OEF seemed congruent, which meant each would be 7%. At this point he
quickly estimated that OBCD was 14%, added the areas of OBCD and triangle ODF to
conclude the intersected area was 28% of the area of the whole square. The interviewer
asked Allen to explain his rationale for the area of OBCD region. Allen could only
explain that the area of OBCD looked the same as the area of triangle ODF. When asked
whether the area would always be 28% of the area of the whole square, he responded that
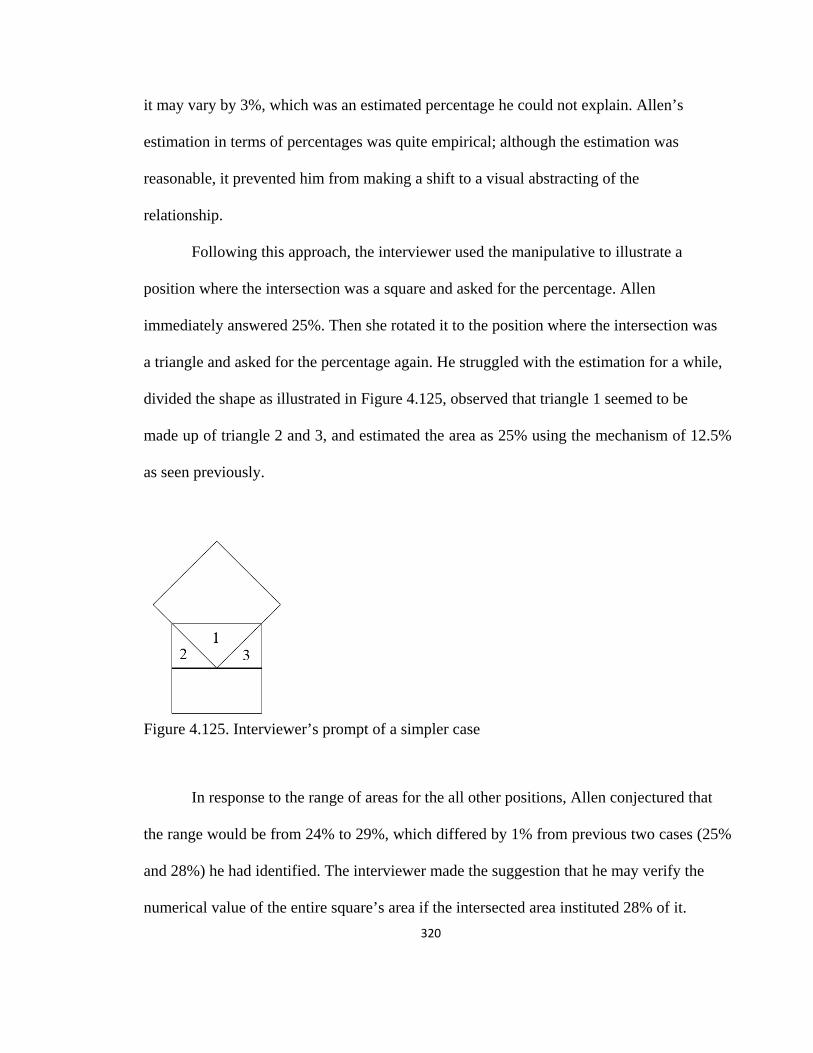
320
it may vary by 3%, which was an estimated percentage he could not explain. Allen’s
estimation in terms of percentages was quite empirical; although the estimation was
reasonable, it prevented him from making a shift to a visual abstracting of the
relationship.
Following this approach, the interviewer used the manipulative to illustrate a
position where the intersection was a square and asked for the percentage. Allen
immediately answered 25%. Then she rotated it to the position where the intersection was
a triangle and asked for the percentage again. He struggled with the estimation for a while,
divided the shape as illustrated in Figure 4.125, observed that triangle 1 seemed to be
made up of triangle 2 and 3, and estimated the area as 25% using the mechanism of 12.5%
as seen previously.
Figure 4.125. Interviewer’s prompt of a simpler case
In response to the range of areas for the all other positions, Allen conjectured that
the range would be from 24% to 29%, which differed by 1% from previous two cases (25%
and 28%) he had identified. The interviewer made the suggestion that he may verify the
numerical value of the entire square’s area if the intersected area instituted 28% of it.
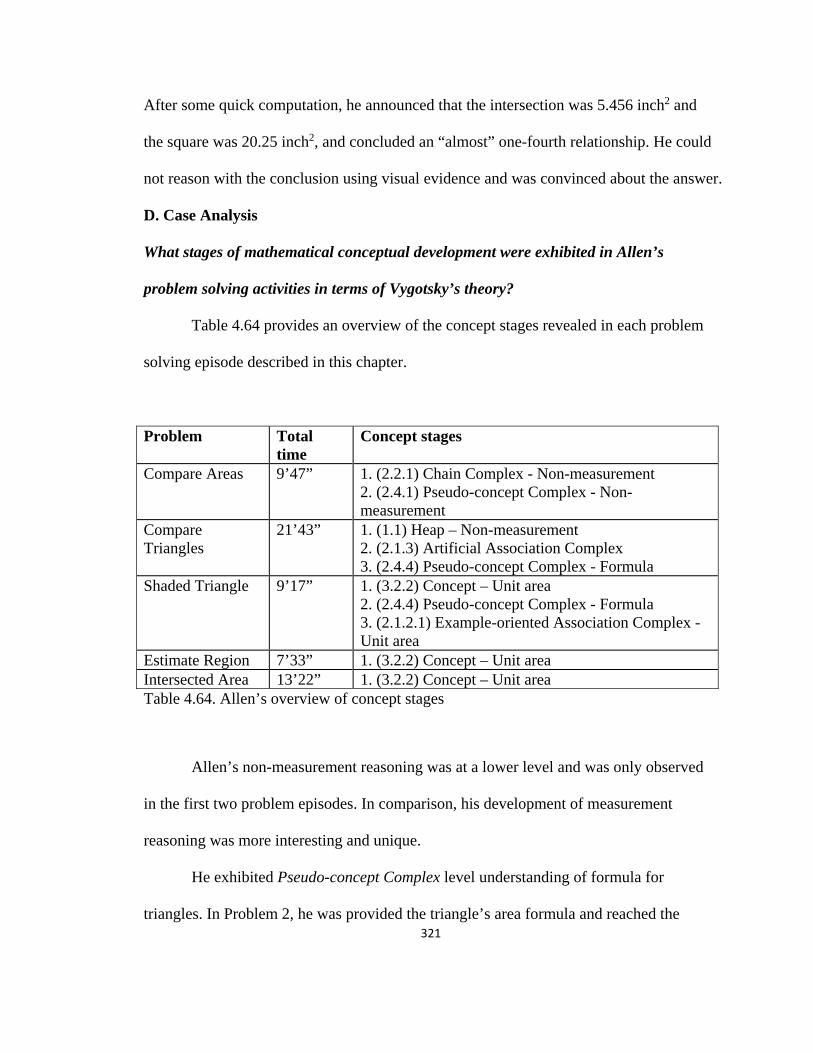
321
After some quick computation, he announced that the intersection was 5.456 inch2 and
the square was 20.25 inch2, and concluded an “almost” one-fourth relationship. He could
not reason with the conclusion using visual evidence and was convinced about the answer.
D. Case Analysis
What stages of mathematical conceptual development were exhibited in Allen’s
problem solving activities in terms of Vygotsky’s theory?
Table 4.64 provides an overview of the concept stages revealed in each problem
solving episode described in this chapter.
Problem Total time
Concept stages
Compare Areas 9’47” 1. (2.2.1) Chain Complex - Non-measurement 2. (2.4.1) Pseudo-concept Complex - Non-measurement
Compare Triangles
21’43” 1. (1.1) Heap – Non-measurement 2. (2.1.3) Artificial Association Complex 3. (2.4.4) Pseudo-concept Complex - Formula
Shaded Triangle 9’17” 1. (3.2.2) Concept – Unit area 2. (2.4.4) Pseudo-concept Complex - Formula 3. (2.1.2.1) Example-oriented Association Complex - Unit area
Estimate Region 7’33” 1. (3.2.2) Concept – Unit area Intersected Area 13’22” 1. (3.2.2) Concept – Unit area Table 4.64. Allen’s overview of concept stages
Allen’s non-measurement reasoning was at a lower level and was only observed
in the first two problem episodes. In comparison, his development of measurement
reasoning was more interesting and unique.
He exhibited Pseudo-concept Complex level understanding of formula for
triangles. In Problem 2, he was provided the triangle’s area formula and reached the
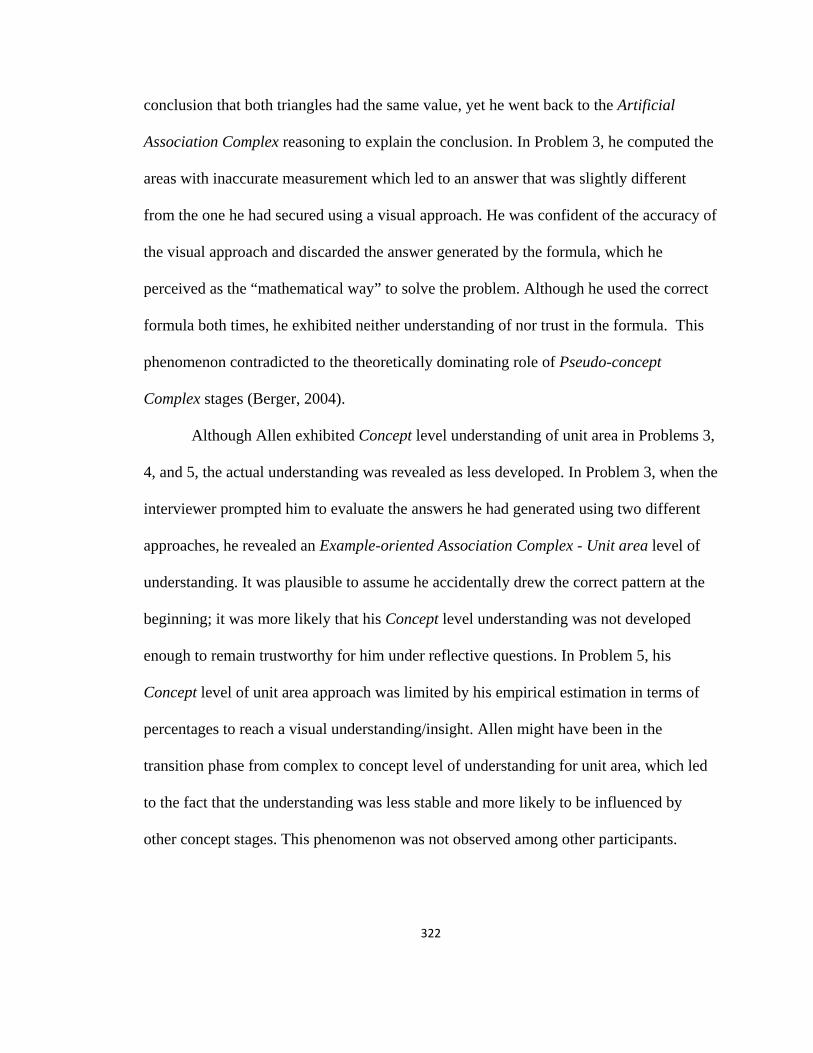
322
conclusion that both triangles had the same value, yet he went back to the Artificial
Association Complex reasoning to explain the conclusion. In Problem 3, he computed the
areas with inaccurate measurement which led to an answer that was slightly different
from the one he had secured using a visual approach. He was confident of the accuracy of
the visual approach and discarded the answer generated by the formula, which he
perceived as the “mathematical way” to solve the problem. Although he used the correct
formula both times, he exhibited neither understanding of nor trust in the formula. This
phenomenon contradicted to the theoretically dominating role of Pseudo-concept
Complex stages (Berger, 2004).
Although Allen exhibited Concept level understanding of unit area in Problems 3,
4, and 5, the actual understanding was revealed as less developed. In Problem 3, when the
interviewer prompted him to evaluate the answers he had generated using two different
approaches, he revealed an Example-oriented Association Complex - Unit area level of
understanding. It was plausible to assume he accidentally drew the correct pattern at the
beginning; it was more likely that his Concept level understanding was not developed
enough to remain trustworthy for him under reflective questions. In Problem 5, his
Concept level of unit area approach was limited by his empirical estimation in terms of
percentages to reach a visual understanding/insight. Allen might have been in the
transition phase from complex to concept level of understanding for unit area, which led
to the fact that the understanding was less stable and more likely to be influenced by
other concept stages. This phenomenon was not observed among other participants.
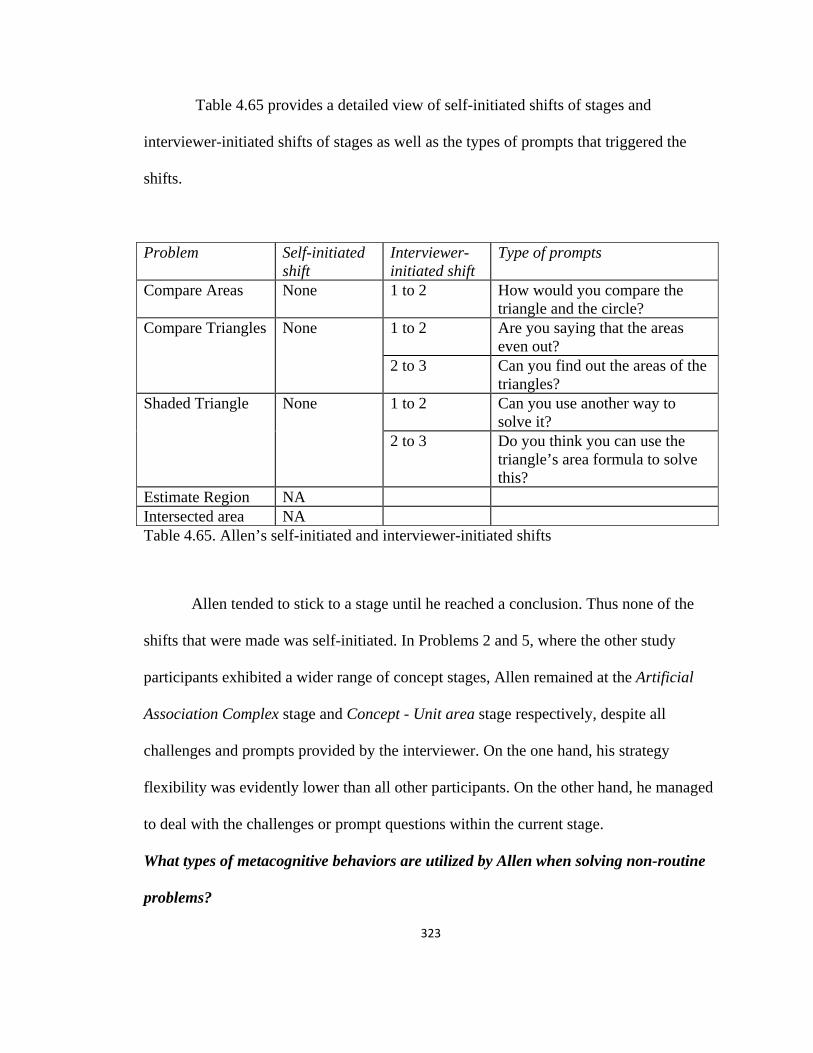
323
Table 4.65 provides a detailed view of self-initiated shifts of stages and
interviewer-initiated shifts of stages as well as the types of prompts that triggered the
shifts.
Problem Self-initiated shift
Interviewer-initiated shift
Type of prompts
Compare Areas None 1 to 2 How would you compare the triangle and the circle?
Compare Triangles None 1 to 2 Are you saying that the areas even out?
2 to 3 Can you find out the areas of the triangles?
Shaded Triangle None 1 to 2 Can you use another way to solve it?
2 to 3 Do you think you can use the triangle’s area formula to solve this?
Estimate Region NA Intersected area NA Table 4.65. Allen’s self-initiated and interviewer-initiated shifts
Allen tended to stick to a stage until he reached a conclusion. Thus none of the
shifts that were made was self-initiated. In Problems 2 and 5, where the other study
participants exhibited a wider range of concept stages, Allen remained at the Artificial
Association Complex stage and Concept - Unit area stage respectively, despite all
challenges and prompts provided by the interviewer. On the one hand, his strategy
flexibility was evidently lower than all other participants. On the other hand, he managed
to deal with the challenges or prompt questions within the current stage.
What types of metacognitive behaviors are utilized by Allen when solving non-routine
problems?
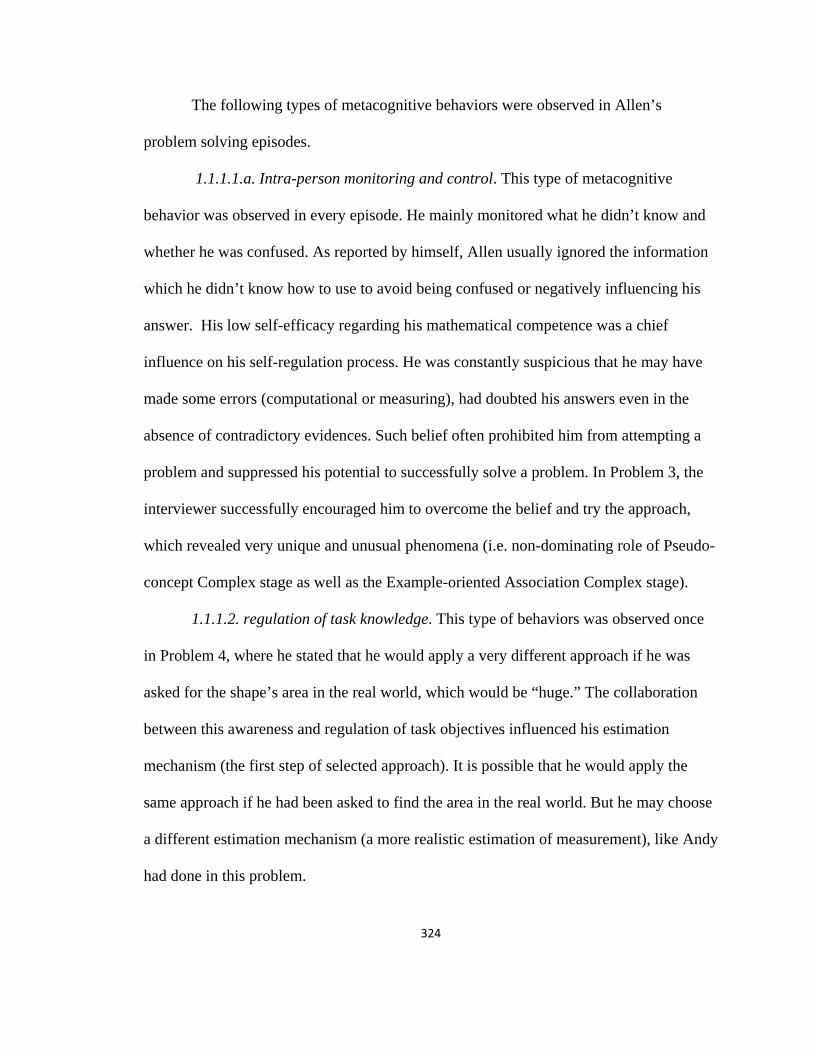
324
The following types of metacognitive behaviors were observed in Allen’s
problem solving episodes.
1.1.1.1.a. Intra-person monitoring and control. This type of metacognitive
behavior was observed in every episode. He mainly monitored what he didn’t know and
whether he was confused. As reported by himself, Allen usually ignored the information
which he didn’t know how to use to avoid being confused or negatively influencing his
answer. His low self-efficacy regarding his mathematical competence was a chief
influence on his self-regulation process. He was constantly suspicious that he may have
made some errors (computational or measuring), had doubted his answers even in the
absence of contradictory evidences. Such belief often prohibited him from attempting a
problem and suppressed his potential to successfully solve a problem. In Problem 3, the
interviewer successfully encouraged him to overcome the belief and try the approach,
which revealed very unique and unusual phenomena (i.e. non-dominating role of Pseudo-
concept Complex stage as well as the Example-oriented Association Complex stage).
1.1.1.2. regulation of task knowledge. This type of behaviors was observed once
in Problem 4, where he stated that he would apply a very different approach if he was
asked for the shape’s area in the real world, which would be “huge.” The collaboration
between this awareness and regulation of task objectives influenced his estimation
mechanism (the first step of selected approach). It is possible that he would apply the
same approach if he had been asked to find the area in the real world. But he may choose
a different estimation mechanism (a more realistic estimation of measurement), like Andy
had done in this problem.
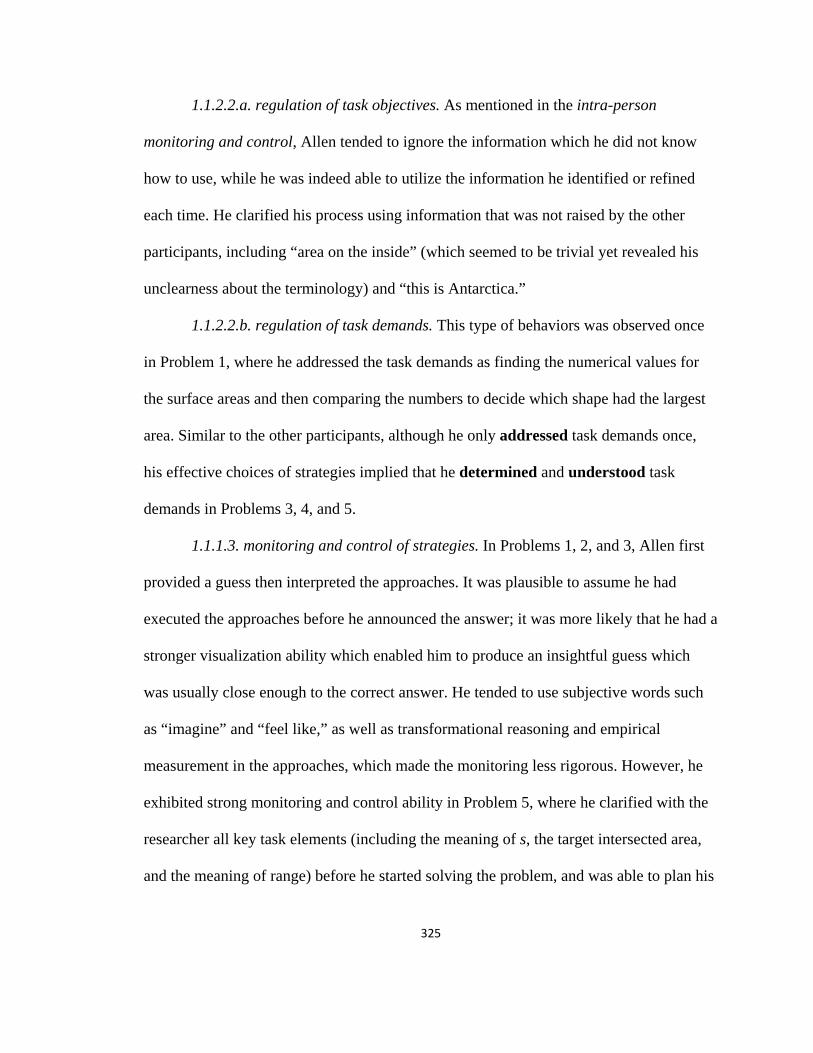
325
1.1.2.2.a. regulation of task objectives. As mentioned in the intra-person
monitoring and control, Allen tended to ignore the information which he did not know
how to use, while he was indeed able to utilize the information he identified or refined
each time. He clarified his process using information that was not raised by the other
participants, including “area on the inside” (which seemed to be trivial yet revealed his
unclearness about the terminology) and “this is Antarctica.”
1.1.2.2.b. regulation of task demands. This type of behaviors was observed once
in Problem 1, where he addressed the task demands as finding the numerical values for
the surface areas and then comparing the numbers to decide which shape had the largest
area. Similar to the other participants, although he only addressed task demands once,
his effective choices of strategies implied that he determined and understood task
demands in Problems 3, 4, and 5.
1.1.1.3. monitoring and control of strategies. In Problems 1, 2, and 3, Allen first
provided a guess then interpreted the approaches. It was plausible to assume he had
executed the approaches before he announced the answer; it was more likely that he had a
stronger visualization ability which enabled him to produce an insightful guess which
was usually close enough to the correct answer. He tended to use subjective words such
as “imagine” and “feel like,” as well as transformational reasoning and empirical
measurement in the approaches, which made the monitoring less rigorous. However, he
exhibited strong monitoring and control ability in Problem 5, where he clarified with the
researcher all key task elements (including the meaning of s, the target intersected area,
and the meaning of range) before he started solving the problem, and was able to plan his
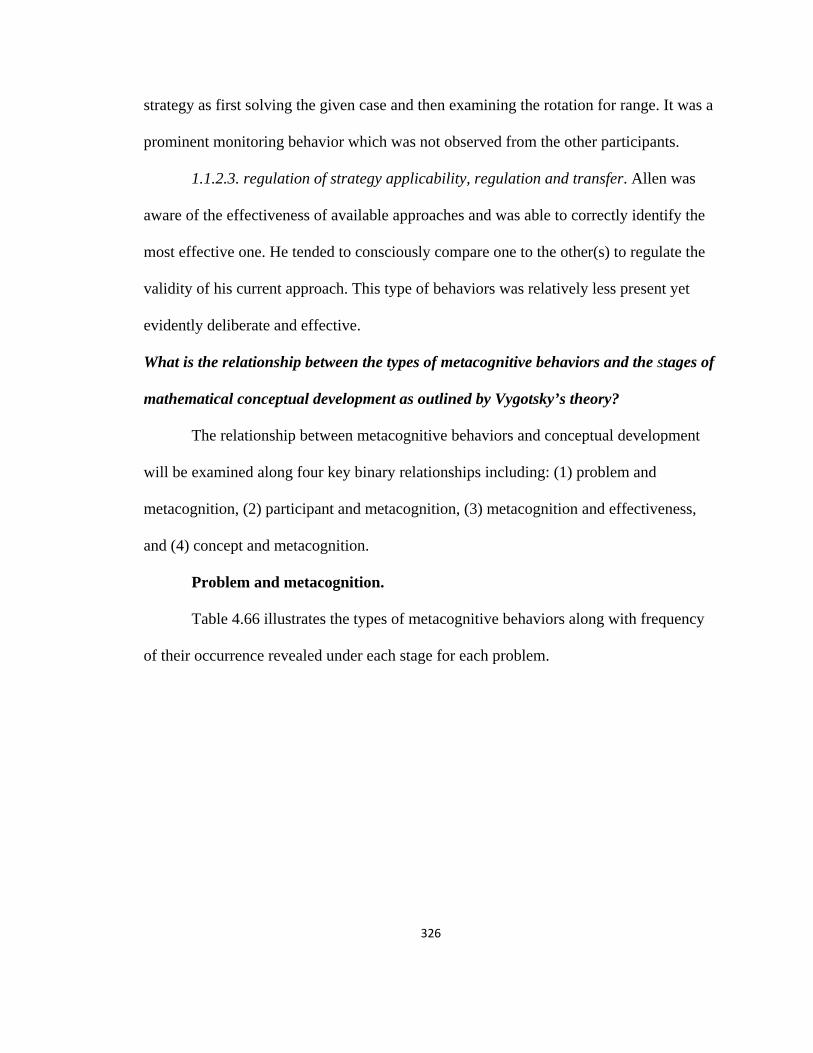
326
strategy as first solving the given case and then examining the rotation for range. It was a
prominent monitoring behavior which was not observed from the other participants.
1.1.2.3. regulation of strategy applicability, regulation and transfer. Allen was
aware of the effectiveness of available approaches and was able to correctly identify the
most effective one. He tended to consciously compare one to the other(s) to regulate the
validity of his current approach. This type of behaviors was relatively less present yet
evidently deliberate and effective.
What is the relationship between the types of metacognitive behaviors and the stages of
mathematical conceptual development as outlined by Vygotsky’s theory?
The relationship between metacognitive behaviors and conceptual development
will be examined along four key binary relationships including: (1) problem and
metacognition, (2) participant and metacognition, (3) metacognition and effectiveness,
and (4) concept and metacognition.
Problem and metacognition.
Table 4.66 illustrates the types of metacognitive behaviors along with frequency
of their occurrence revealed under each stage for each problem.
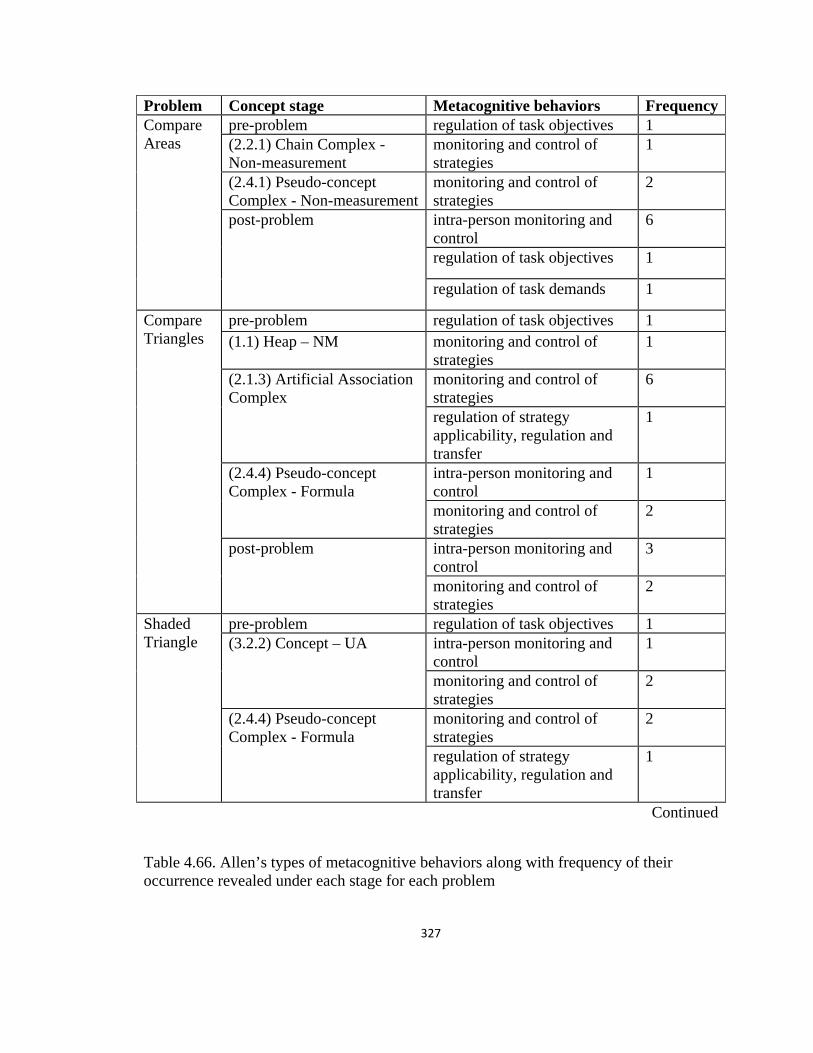
327
Problem Concept stage Metacognitive behaviors FrequencyCompare Areas
pre-problem regulation of task objectives 1 (2.2.1) Chain Complex - Non-measurement
monitoring and control of strategies
1
(2.4.1) Pseudo-concept Complex - Non-measurement
monitoring and control of strategies
2
post-problem intra-person monitoring and control
6
regulation of task objectives 1
regulation of task demands 1
Compare Triangles
pre-problem regulation of task objectives 1 (1.1) Heap – NM monitoring and control of
strategies 1
(2.1.3) Artificial Association Complex
monitoring and control of strategies
6
regulation of strategy applicability, regulation and transfer
1
(2.4.4) Pseudo-concept Complex - Formula
intra-person monitoring and control
1
monitoring and control of strategies
2
post-problem intra-person monitoring and control
3
monitoring and control of strategies
2
Shaded Triangle
pre-problem regulation of task objectives 1 (3.2.2) Concept – UA intra-person monitoring and
control 1
monitoring and control of strategies
2
(2.4.4) Pseudo-concept Complex - Formula
monitoring and control of strategies
2
regulation of strategy applicability, regulation and transfer
1
Continued
Table 4.66. Allen’s types of metacognitive behaviors along with frequency of their occurrence revealed under each stage for each problem
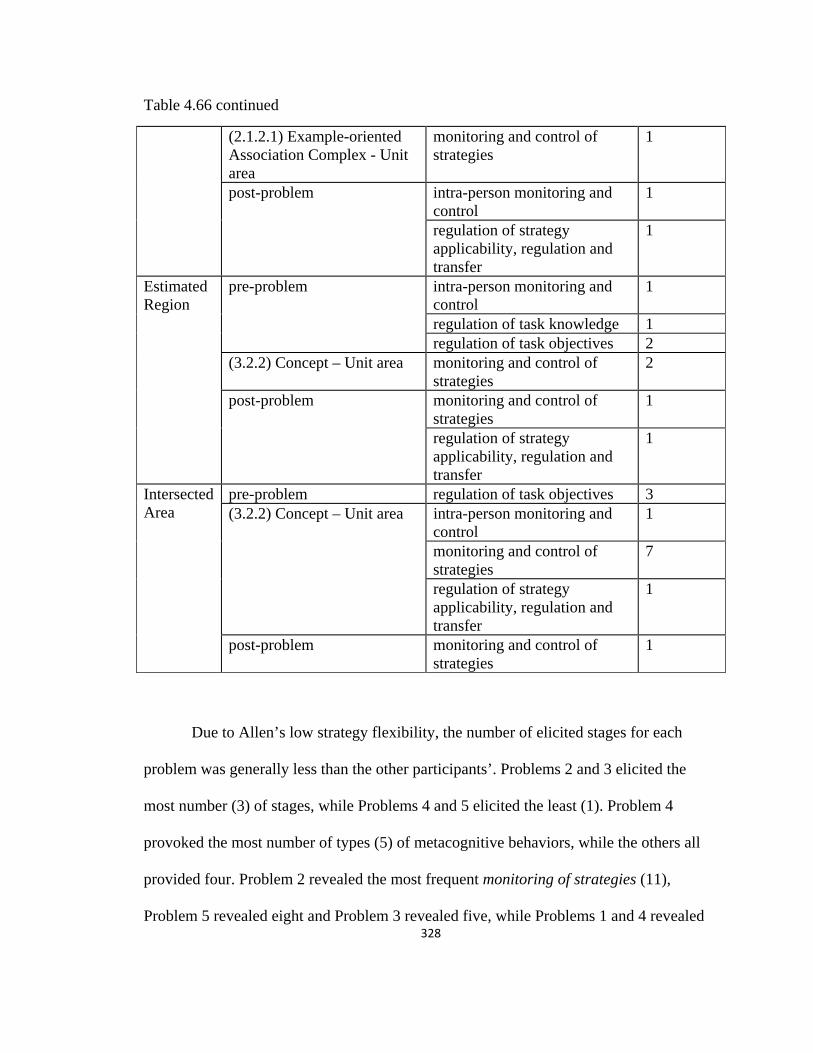
328
Table 4.66 continued
(2.1.2.1) Example-oriented Association Complex - Unit area
monitoring and control of strategies
1
post-problem intra-person monitoring and control
1
regulation of strategy applicability, regulation and transfer
1
Estimated Region
pre-problem intra-person monitoring and control
1
regulation of task knowledge 1 regulation of task objectives 2
(3.2.2) Concept – Unit area monitoring and control of strategies
2
post-problem monitoring and control of strategies
1
regulation of strategy applicability, regulation and transfer
1
Intersected Area
pre-problem regulation of task objectives 3 (3.2.2) Concept – Unit area intra-person monitoring and
control 1
monitoring and control of strategies
7
regulation of strategy applicability, regulation and transfer
1
post-problem monitoring and control of strategies
1
Due to Allen’s low strategy flexibility, the number of elicited stages for each
problem was generally less than the other participants’. Problems 2 and 3 elicited the
most number (3) of stages, while Problems 4 and 5 elicited the least (1). Problem 4
provoked the most number of types (5) of metacognitive behaviors, while the others all
provided four. Problem 2 revealed the most frequent monitoring of strategies (11),
Problem 5 revealed eight and Problem 3 revealed five, while Problems 1 and 4 revealed
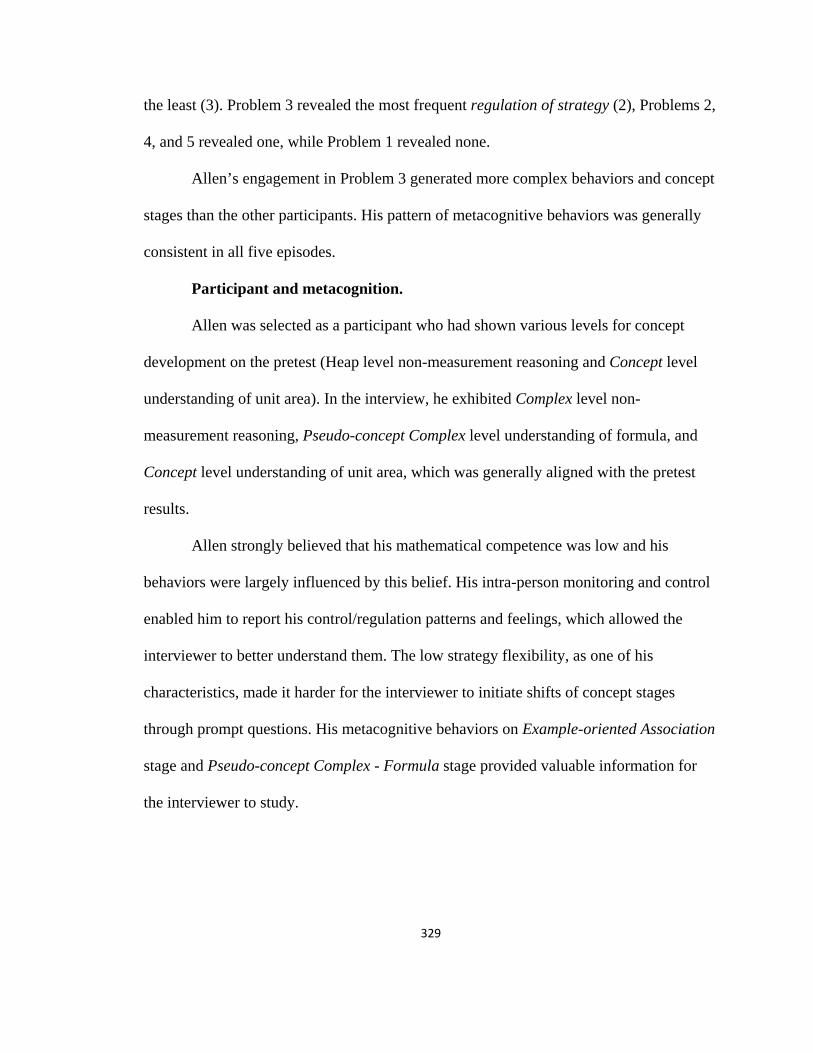
329
the least (3). Problem 3 revealed the most frequent regulation of strategy (2), Problems 2,
4, and 5 revealed one, while Problem 1 revealed none.
Allen’s engagement in Problem 3 generated more complex behaviors and concept
stages than the other participants. His pattern of metacognitive behaviors was generally
consistent in all five episodes.
Participant and metacognition.
Allen was selected as a participant who had shown various levels for concept
development on the pretest (Heap level non-measurement reasoning and Concept level
understanding of unit area). In the interview, he exhibited Complex level non-
measurement reasoning, Pseudo-concept Complex level understanding of formula, and
Concept level understanding of unit area, which was generally aligned with the pretest
results.
Allen strongly believed that his mathematical competence was low and his
behaviors were largely influenced by this belief. His intra-person monitoring and control
enabled him to report his control/regulation patterns and feelings, which allowed the
interviewer to better understand them. The low strategy flexibility, as one of his
characteristics, made it harder for the interviewer to initiate shifts of concept stages
through prompt questions. His metacognitive behaviors on Example-oriented Association
stage and Pseudo-concept Complex - Formula stage provided valuable information for
the interviewer to study.
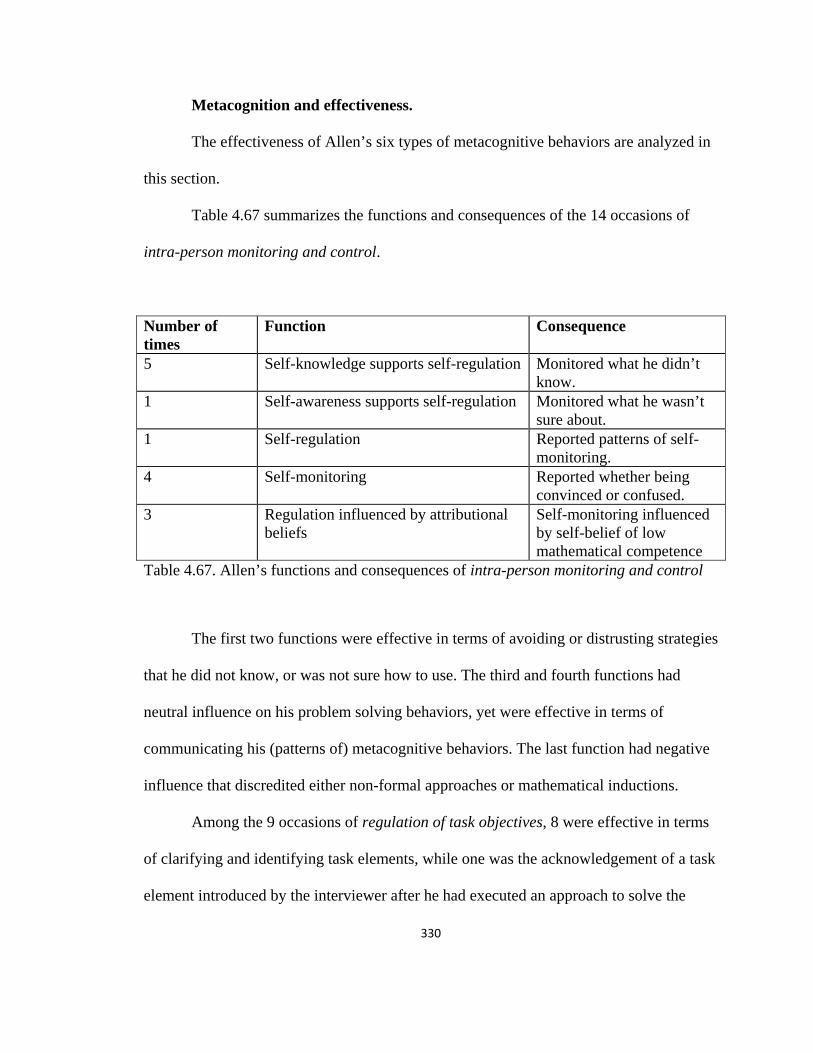
330
Metacognition and effectiveness.
The effectiveness of Allen’s six types of metacognitive behaviors are analyzed in
this section.
Table 4.67 summarizes the functions and consequences of the 14 occasions of
intra-person monitoring and control.
Number of times
Function Consequence
5 Self-knowledge supports self-regulation Monitored what he didn’t know.
1 Self-awareness supports self-regulation Monitored what he wasn’t sure about.
1 Self-regulation Reported patterns of self-monitoring.
4 Self-monitoring Reported whether being convinced or confused.
3 Regulation influenced by attributional beliefs
Self-monitoring influenced by self-belief of low mathematical competence
Table 4.67. Allen’s functions and consequences of intra-person monitoring and control
The first two functions were effective in terms of avoiding or distrusting strategies
that he did not know, or was not sure how to use. The third and fourth functions had
neutral influence on his problem solving behaviors, yet were effective in terms of
communicating his (patterns of) metacognitive behaviors. The last function had negative
influence that discredited either non-formal approaches or mathematical inductions.
Among the 9 occasions of regulation of task objectives, 8 were effective in terms
of clarifying and identifying task elements, while one was the acknowledgement of a task
element introduced by the interviewer after he had executed an approach to solve the
331
problem. As he reported in Problem 1, the introduced task element which was not used in
his existing approaches interfered with his thinking process and confused him.
Considering his understanding of the variable s in Problem 5, it was likely that he was
intimidated by not knowing the area formulas of triangles and circles instead of the
meaning of variable a as he claimed.
There were 31 occasions of monitoring and control of strategies and 5 occasions
of regulation of strategy applicability, regulation and transfer. Table 4.68 summarizes
the functions and consequences of the 31 occasions of monitoring of strategies.
Number of times
Function Consequence
23 Interpreted a strategy Kept track of reasoning. 1 Monitored a strategy Locally aware of the effectiveness of
a strategy. 2 Evaluated a strategy Evaluated whether a strategy was
valid or difficult to execute. 6 Reviewed a strategy Generalized a strategy by reviewing
existing work. Table 4.68. Allen’s functions and consequences of monitoring of strategies
Allen was able to effectively keep track of his reasoning when interpreting a
strategy, despite of his reliance on visual impressions and inaccurate
measurement/estimation which restricted the effectiveness of the strategy itself. The
combination of effective strategy execution and heavy reliance on visual impressions and
inaccurate measurement/estimation was considered as a factor to his low strategy
flexibility. The second function (monitored a strategy) was only observed when an
approach failed to support his previous conjecture and he attempted to improve the

332
validity before he unjustified the conjecture. When the answer of an approach
contradicted to the conjecture he already had support with, he used global regulation of
strategy to determine the validity of both approaches. The third function (evaluated a
strategy) was observed when the interviewer challenged his reasoning, where he
effectively evaluated the approach to either defend or modify the logic. Allen’s
generalization on existing reasoning was less effective due to his visual impressions and
inaccurate measurement/estimation. Yet this function was more frequently observed on
Allen than the other participants; he tended to review existing reasoning to abstract a
general approach/result.
Table 4.69 summarizes the functions and consequences of the 5 occasions of
regulation of strategy.
Number of times
Function Consequence
1 Strategy transfer Simulate a strategy from a familiar context.
1 Monitoring strategy effectiveness Applied an alternative method to assure the strategy validity.
3 Reviewing strategy effectiveness Reviewed different strategies to compare the validity.
Table 4.69. Allen’s functions and consequences of regulation of strategy
The first function occurred on the Artificial Association Complex stage of
understanding, which was ineffective in terms of advancing his thinking yet enabled the
interviewer to identify the resource and challenge his original reasoning. The latter two
functions were effective in terms of controlling or determining the validity of existing

333
approaches. In fact, he regulated the factors which influenced the execution of an
approach instead of the approach itself (which was indeed valid), such as inaccurate
measurement and inaccurate understanding.
Concept and metacognition.
In this section, the relationship between concept stages and metacognitive
behaviors along with their frequency is analyzed. Table 4.70 summarizes the types of
metacognitive behaviors with their frequency observed on each stage.
Stage Metacognitive behaviors Frequency(1.1) Heap – NM monitoring and control of strategies 1 (2.1.2.1) Example-oriented Association Complex - Unit area
monitoring and control of strategies 1
(2.1.3) Artificial Association Complex
monitoring and control of strategies 7 regulation of strategy applicability, regulation and transfer
1
(2.2.1) Chain Complex - Non-measurement
monitoring and control of strategies 1
(2.4.1) Pseudo-concept Complex – NM
monitoring and control of strategies 2
(2.4.4) Pseudo-concept Complex - Formula
intra-person monitoring and control 1 monitoring and control of strategies 4 regulation of strategy applicability, regulation and transfer
1
(3.2.2) Concept – UA intra-person monitoring and control 2 monitoring and control of strategies 11 regulation of strategy applicability, regulation and transfer
1
Table 4.70. Allen’s types of metacognitive behaviors with their frequency observed on each stage
Allen’s regulation of task knowledge, regulation of task objectives, and regulation
of task demands were absent in Table 4.67; they occurred during either the pre-problem

334
phase or post-problem phase. A possible reason for this phenomenon was the pattern of
task regulation he reported in Problem 1. Among the fourteen occasions of intra-person
monitoring and control, only three occurred on (relatively higher) concept stages.
Comparing to the other participants, less concept stages were revealed from Allen
because of his low strategy flexibility.
The relationship between concept stages and metacognitive behaviors in Table 10
consists of the following pattern: monitoring and control of strategies was the dominating
type of metacognitive behaviors observed on all stages (especially lower stages), which
meant he was not/less influenced by other types of metacognitive behaviors once he
started working on a stage. Different types of metacognitive behaviors were less
collaborative or simultaneous.
The main challenges Allen faced in the problem solving processes include 1) self-
belief of low mathematical competence, 2) reliance on visual impression (despite of his
strong visualization ability) and inaccurate measurement/estimation, and 3) pattern of
regulation of task objectives. Figure 4.126 illustrates the balance of effectiveness between
the metacognitive behaviors and the challenges.
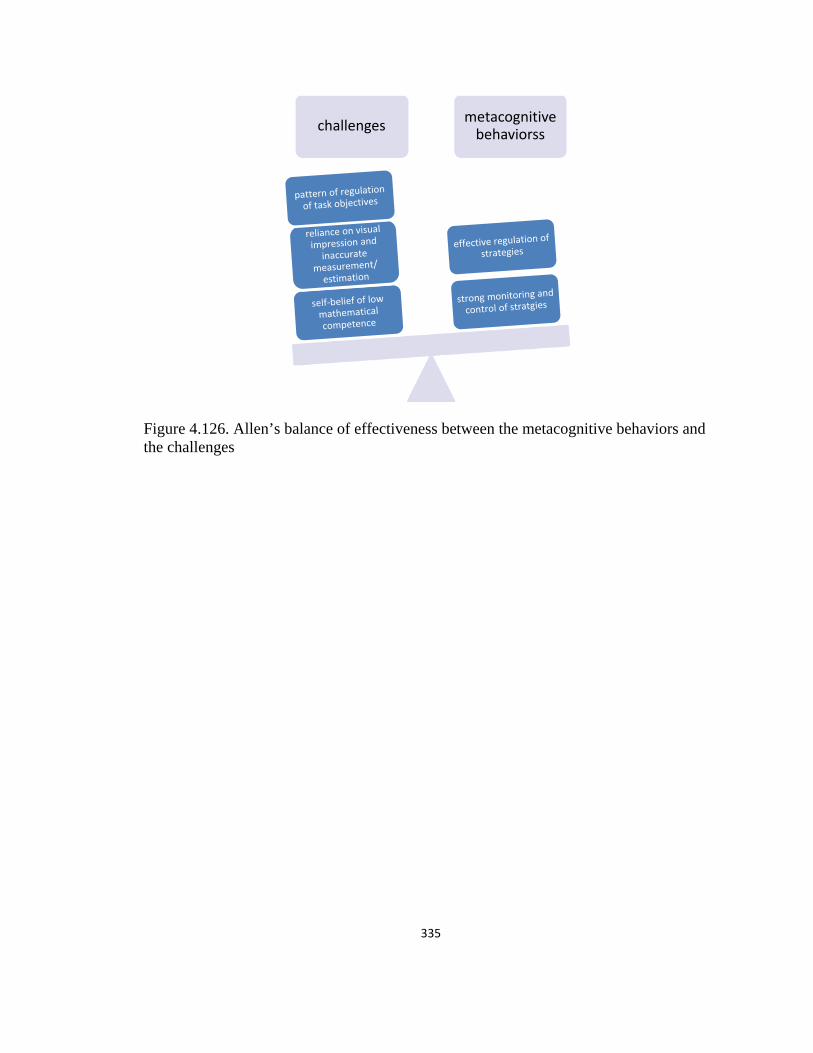
335
Figure 4.126. Allen’s balance of effectiveness between the metacognitive behaviors and the challenges
challenges metacognitive behaviorss
336
CHAPTER 5
DISCUSSION
This chapter provides a cross analysis of the results represented in the previous
chapter. The analysis consists of four sections. The first section is a problem by problem
analysis, which compares and contrasts the five participants’ performance on each
problem. This analysis further includes four dimensions of the participants’ work: point
of entry, documented approaches, revealed concept stages, and revealed metacognitive
behaviors. The second section is a stage by stage analysis, which compares and contrasts
the five participants’ conceptual behaviors on each stage. This analysis involves three
dimensions: variation of approaches on each stage, documented shifts, and related
concepts embedded on each stage. The third section is an analysis of each type of
metacognitive behavior, and compares and contrast the five participants’ metacognitive
behaviors. This analysis examines two issues: factors for effectiveness and the
participants’ systems of metacognitive behaviors. The last section is an analysis of the
relationship between stage and metacognition. This analysis builds on the previous three
sections and abstracts the following attributes of metacognitive behaviors pertaining to
each concept stage: effectiveness, existence, and restriction.

337
Problem by Problem Analysis
In this section the analysis will include: 1) each participant’s point of entry,
including identified task elements/objectives and his/her initial approach, 2) types of
approaches the study participants used, 3) participants’ concept stages revealed when
working on the problem, and 4) metacognitive behaviors revealed from the participants
during the problem solving episode.
Each of the interview problems elicited a wide range of concept stages and varied
types of concept stages (i.e. Non-measurement, Measurement, Unit area, and Formula).
Problem 2 elicited the most number of concept stages among all problems, while Problem
5 elicited the most varied types of concept stages. The different levels of cognitive
demands significantly influenced the frequencies of metacognitive behaviors observed in
each problem by each of the participants.
Compare Areas Problem
Which of the regions shown below has the largest area? How would you order them?
Point of entry.
One task element and one task objective are essential to solving this problem: the
variable a that represents the equal length of sides and diameter, and the comparison of
the areas.
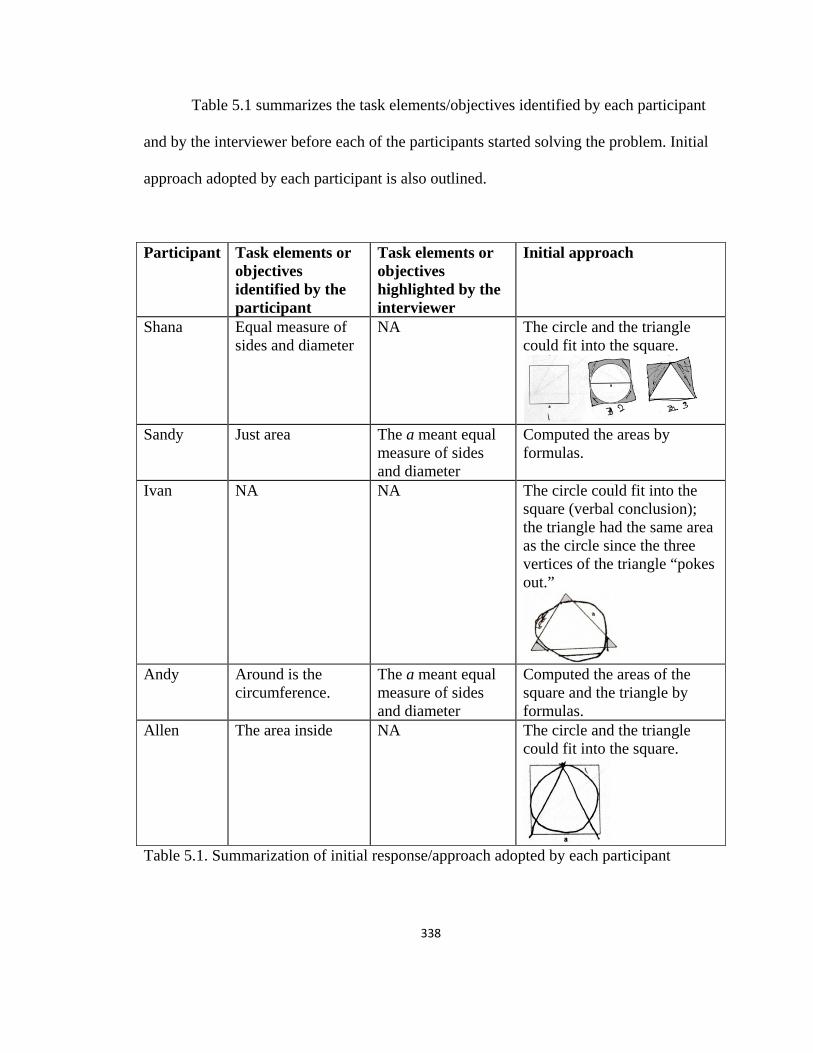
338
Table 5.1 summarizes the task elements/objectives identified by each participant
and by the interviewer before each of the participants started solving the problem. Initial
approach adopted by each participant is also outlined.
Participant Task elements or
objectives identified by the participant
Task elements or objectives highlighted by the interviewer
Initial approach
Shana Equal measure of sides and diameter
NA The circle and the triangle could fit into the square.
Sandy Just area The a meant equal measure of sides and diameter
Computed the areas by formulas.
Ivan NA NA The circle could fit into the square (verbal conclusion); the triangle had the same area as the circle since the three vertices of the triangle “pokes out.”
Andy Around is the
circumference. The a meant equal measure of sides and diameter
Computed the areas of the square and the triangle by formulas.
Allen The area inside NA The circle and the triangle could fit into the square.
Table 5.1. Summarization of initial response/approach adopted by each participant
339
Among the five participants, Sandy’s understanding of variable greatly influenced
her initial behaviors. She focused on the actual amount of area instead of the condition
that the lengths of the sides and the diameter had the same measures. This prevented her
from adopting either a visual or a numerical approach to start tackling the problem. Allen,
whose understanding of variable was restricted, chose to ignore it so to avoid confusion.
Ivan overlooked the variable; his later behaviors were influenced by this element rather
than at the beginning. Interestingly, Shana (who was assessed as low concept
development) was the only participant who explicitly identified the task element of equal
measure, whereas the others were either confused by the information, overlooking it, or
needed to be reminded by the interviewer.
Documented approaches.
Table 5.2 illustrates the approaches that the participants used when solving the
Compare Areas problem.
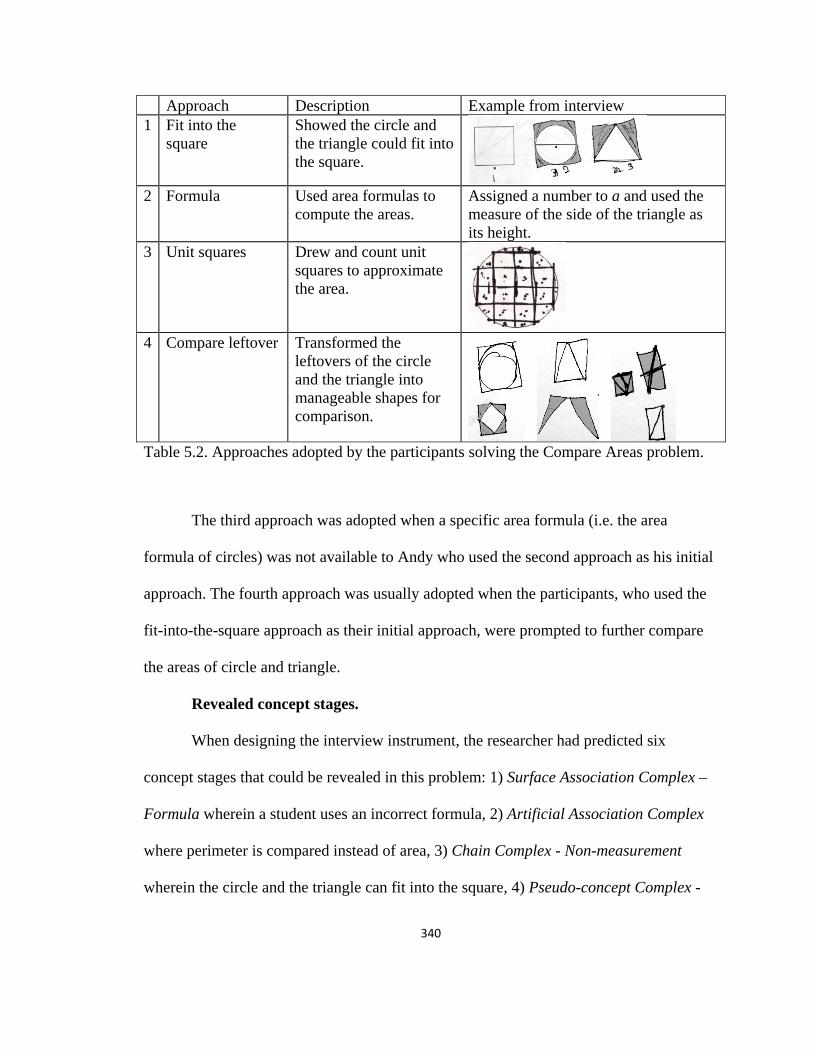
340
Approach Description Example from interview 1 Fit into the
square Showed the circle and the triangle could fit into the square.
2 Formula Used area formulas to
compute the areas. Assigned a number to a and used the measure of the side of the triangle as its height.
3 Unit squares Drew and count unit squares to approximate the area.
4 Compare leftover Transformed the leftovers of the circle and the triangle into manageable shapes for comparison.
Table 5.2. Approaches adopted by the participants solving the Compare Areas problem.
The third approach was adopted when a specific area formula (i.e. the area
formula of circles) was not available to Andy who used the second approach as his initial
approach. The fourth approach was usually adopted when the participants, who used the
fit-into-the-square approach as their initial approach, were prompted to further compare
the areas of circle and triangle.
Revealed concept stages.
When designing the interview instrument, the researcher had predicted six
concept stages that could be revealed in this problem: 1) Surface Association Complex –
Formula wherein a student uses an incorrect formula, 2) Artificial Association Complex
where perimeter is compared instead of area, 3) Chain Complex - Non-measurement
wherein the circle and the triangle can fit into the square, 4) Pseudo-concept Complex -
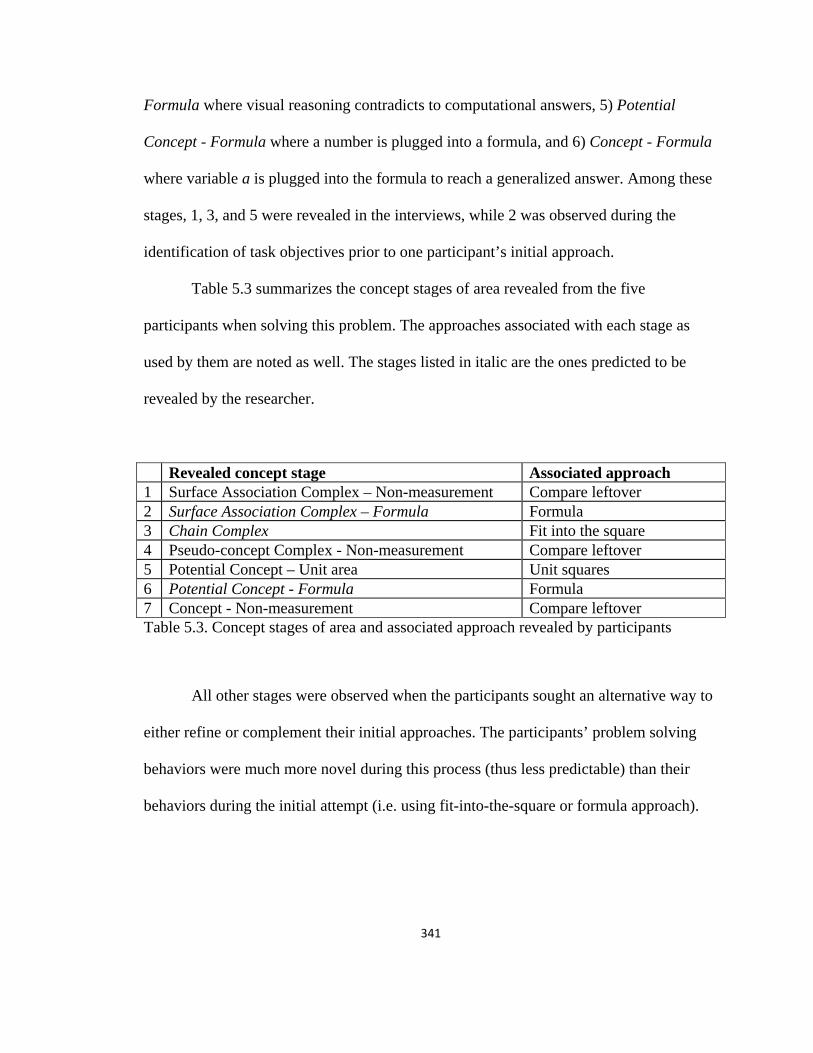
341
Formula where visual reasoning contradicts to computational answers, 5) Potential
Concept - Formula where a number is plugged into a formula, and 6) Concept - Formula
where variable a is plugged into the formula to reach a generalized answer. Among these
stages, 1, 3, and 5 were revealed in the interviews, while 2 was observed during the
identification of task objectives prior to one participant’s initial approach.
Table 5.3 summarizes the concept stages of area revealed from the five
participants when solving this problem. The approaches associated with each stage as
used by them are noted as well. The stages listed in italic are the ones predicted to be
revealed by the researcher.
Revealed concept stage Associated approach 1 Surface Association Complex – Non-measurement Compare leftover 2 Surface Association Complex – Formula Formula 3 Chain Complex Fit into the square 4 Pseudo-concept Complex - Non-measurement Compare leftover 5 Potential Concept – Unit area Unit squares 6 Potential Concept - Formula Formula 7 Concept - Non-measurement Compare leftover Table 5.3. Concept stages of area and associated approach revealed by participants
All other stages were observed when the participants sought an alternative way to
either refine or complement their initial approaches. The participants’ problem solving
behaviors were much more novel during this process (thus less predictable) than their
behaviors during the initial attempt (i.e. using fit-into-the-square or formula approach).
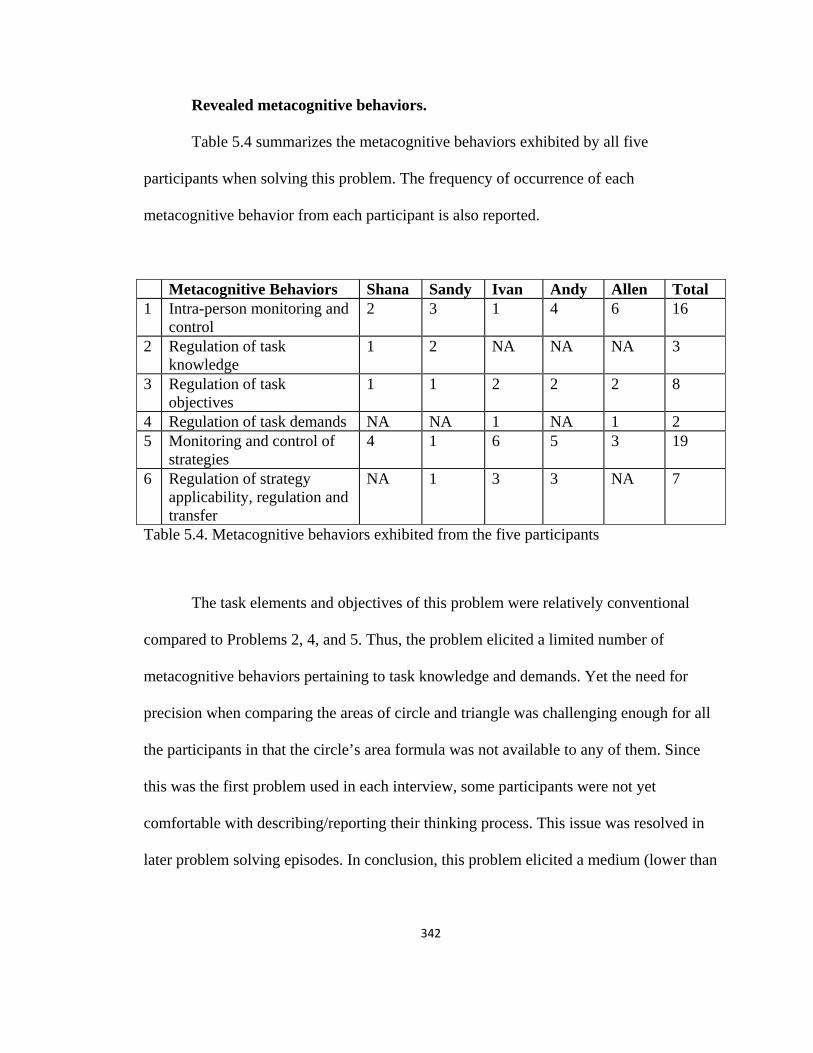
342
Revealed metacognitive behaviors.
Table 5.4 summarizes the metacognitive behaviors exhibited by all five
participants when solving this problem. The frequency of occurrence of each
metacognitive behavior from each participant is also reported.
Metacognitive Behaviors Shana Sandy Ivan Andy Allen Total 1 Intra-person monitoring and
control 2 3 1 4 6 16
2 Regulation of task knowledge
1 2 NA NA NA 3
3 Regulation of task objectives
1 1 2 2 2 8
4 Regulation of task demands NA NA 1 NA 1 2 5 Monitoring and control of
strategies 4 1 6 5 3 19
6 Regulation of strategy applicability, regulation and transfer
NA 1 3 3 NA 7
Table 5.4. Metacognitive behaviors exhibited from the five participants
The task elements and objectives of this problem were relatively conventional
compared to Problems 2, 4, and 5. Thus, the problem elicited a limited number of
metacognitive behaviors pertaining to task knowledge and demands. Yet the need for
precision when comparing the areas of circle and triangle was challenging enough for all
the participants in that the circle’s area formula was not available to any of them. Since
this was the first problem used in each interview, some participants were not yet
comfortable with describing/reporting their thinking process. This issue was resolved in
later problem solving episodes. In conclusion, this problem elicited a medium (lower than

343
Problems 2 and 5 while higher than Problems 3 and 4) number of metacognitive
behaviors both in frequency and types.
Compare Triangles problem
Consider the graph below: What can we say about the areas of triangles BEC and BFC?
Point of entry.
There is one task element that could be confusing based on the researcher’s
previous experience with school children solving this problem: the two target triangles
were sometimes mistaken with triangles BEO and CFO. This substitution would be valid
if the overlapping area BOC is acknowledged; yet children tend not to realize this when
they compare triangles BEO and CFO.
Table 5.5 summarizes the task elements/objectives identified by each participant
and by the interviewer before each of the participants started solving the problem. Initial
approach adopted by each participant is also outlined.
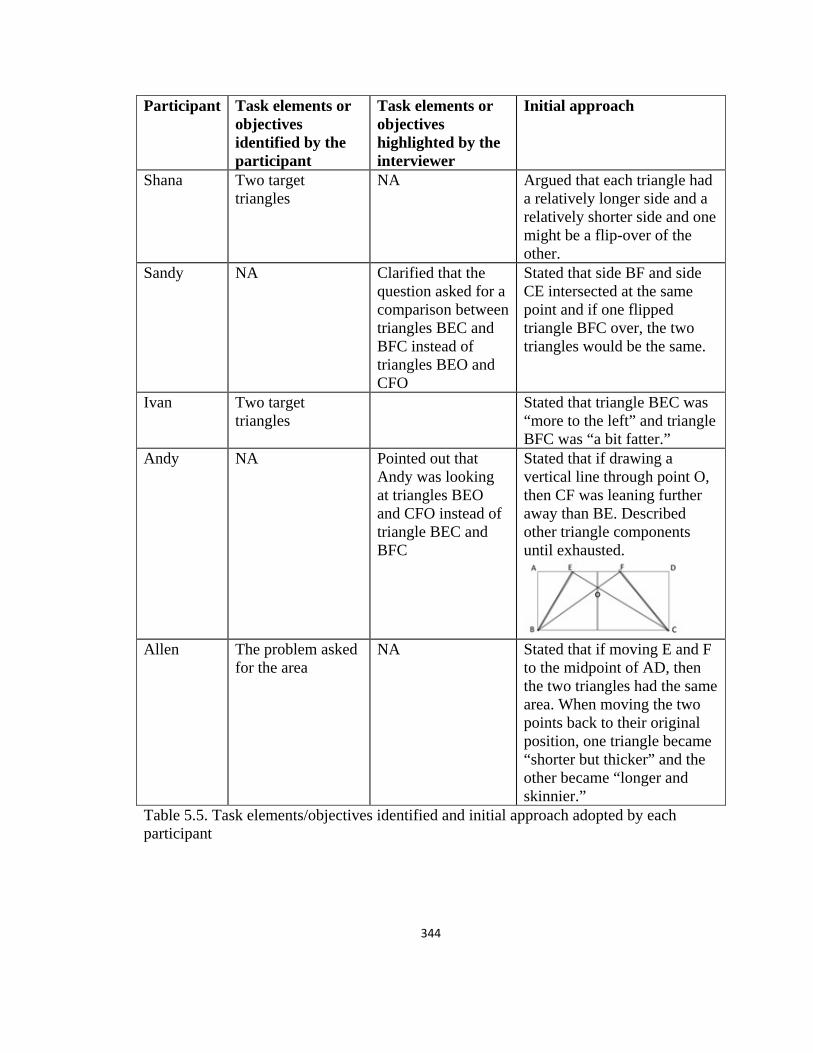
344
Participant Task elements or objectives identified by the participant
Task elements or objectives highlighted by the interviewer
Initial approach
Shana Two target triangles
NA Argued that each triangle had a relatively longer side and a relatively shorter side and one might be a flip-over of the other.
Sandy NA Clarified that the question asked for a comparison between triangles BEC and BFC instead of triangles BEO and CFO
Stated that side BF and side CE intersected at the same point and if one flipped triangle BFC over, the two triangles would be the same.
Ivan Two target triangles
Stated that triangle BEC was “more to the left” and triangle BFC was “a bit fatter.”
Andy NA Pointed out that Andy was looking at triangles BEO and CFO instead of triangle BEC and BFC
Stated that if drawing a vertical line through point O, then CF was leaning further away than BE. Described other triangle components until exhausted.
Allen The problem asked for the area
NA Stated that if moving E and F to the midpoint of AD, then the two triangles had the same area. When moving the two points back to their original position, one triangle became “shorter but thicker” and the other became “longer and skinnier.”
Table 5.5. Task elements/objectives identified and initial approach adopted by each participant
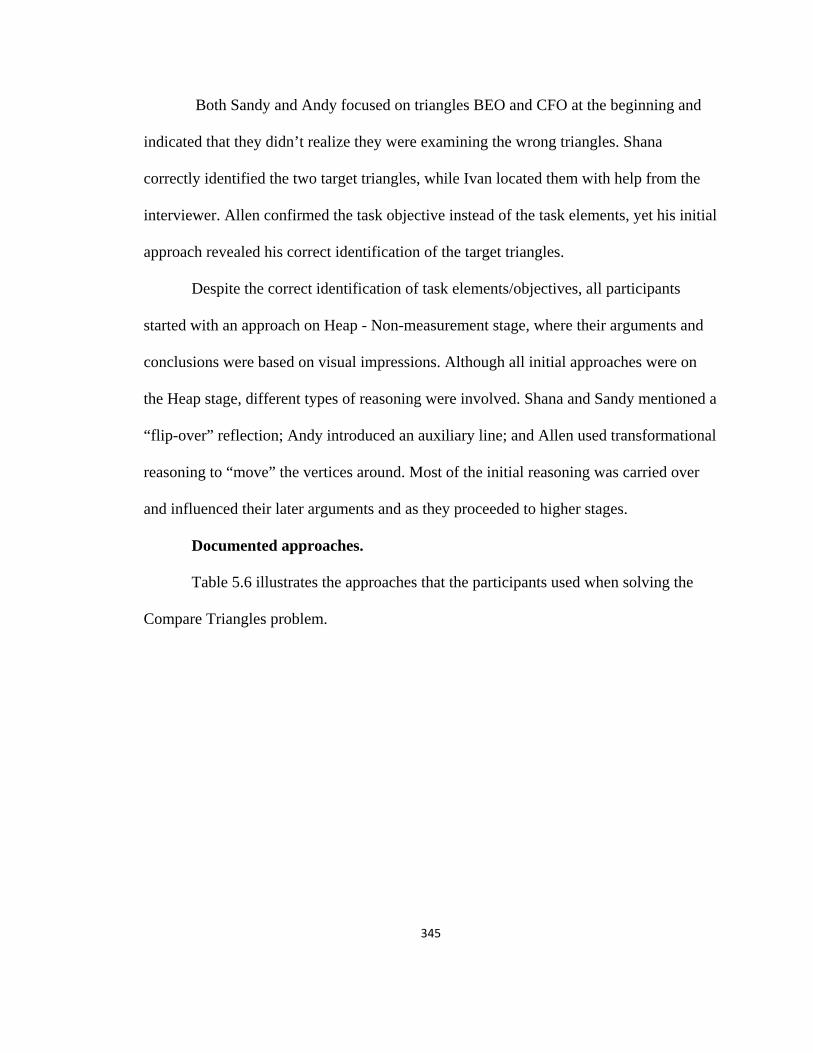
345
Both Sandy and Andy focused on triangles BEO and CFO at the beginning and
indicated that they didn’t realize they were examining the wrong triangles. Shana
correctly identified the two target triangles, while Ivan located them with help from the
interviewer. Allen confirmed the task objective instead of the task elements, yet his initial
approach revealed his correct identification of the target triangles.
Despite the correct identification of task elements/objectives, all participants
started with an approach on Heap - Non-measurement stage, where their arguments and
conclusions were based on visual impressions. Although all initial approaches were on
the Heap stage, different types of reasoning were involved. Shana and Sandy mentioned a
“flip-over” reflection; Andy introduced an auxiliary line; and Allen used transformational
reasoning to “move” the vertices around. Most of the initial reasoning was carried over
and influenced their later arguments and as they proceeded to higher stages.
Documented approaches.
Table 5.6 illustrates the approaches that the participants used when solving the
Compare Triangles problem.
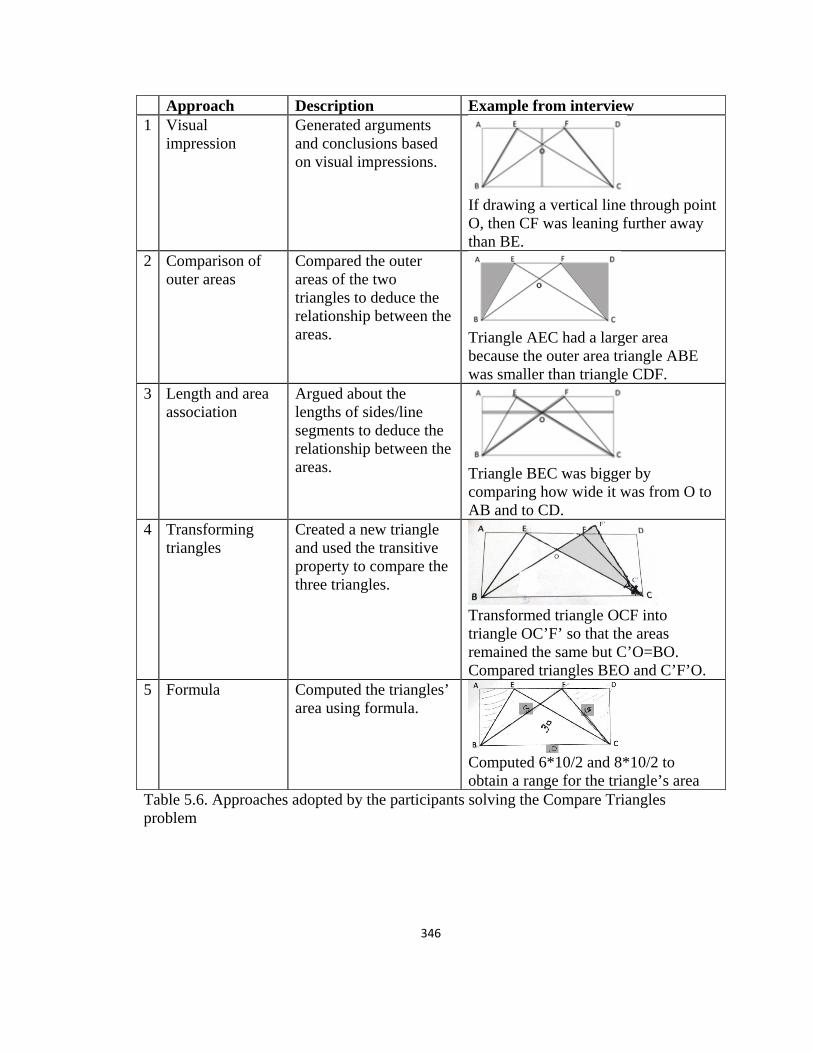
346
Approach Description Example from interview 1 Visual
impression Generated arguments and conclusions based on visual impressions.
If drawing a vertical line through point O, then CF was leaning further away than BE.
2 Comparison of outer areas
Compared the outer areas of the two triangles to deduce the relationship between the areas.
Triangle AEC had a larger area because the outer area triangle ABE was smaller than triangle CDF.
3 Length and area association
Argued about the lengths of sides/line segments to deduce the relationship between the areas.
Triangle BEC was bigger by comparing how wide it was from O to AB and to CD.
4 Transforming triangles
Created a new triangle and used the transitive property to compare the three triangles.
Transformed triangle OCF into triangle OC’F’ so that the areas remained the same but C’O=BO. Compared triangles BEO and C’F’O.
5 Formula Computed the triangles’ area using formula.
Computed 6*10/2 and 8*10/2 to obtain a range for the triangle’s area
Table 5.6. Approaches adopted by the participants solving the Compare Triangles problem
347
The participants who used the comparison of outer areas approach considered
only one pair of the outer areas at the beginning. Once they were prompted that there
were two pairs of outer areas, they either had trouble comparing both pairs (e.g. arguing
they “even out” without showing evidence) or abandoned the approach. The fourth
approach (transforming triangles) was only observed from Ivan, which involved three
different concept stages and was considered as novel, thoughtful, and sophisticated by the
researcher. The fifth approach (formula) was solely the result of the interviewer’s prompt,
where she requested the participants to solve the problem using a formula and provided
the formula if it was not available to them. This approach revealed the participants’
understanding of the triangle’s area formula as well as whether and how they could
generalize the conclusion based on it.
Revealed concept stages.
When designing the interview instrument, the researcher had predicted five
concept stages that could be revealed in this problem: 1) Artificial Association Complex
where a student associates lengths of sides with the area, 2) Representation - Non-
measurement wherein a student generalizes the properties of objects based on visual
representations, 3) Potential Concept - Unit area where a student conducts correct
operations on visible unit areas (drawing unit squares), 4) Concept - Non-measurement
wherein a student compares parts (i.e. triangles’ outer areas) systematically, and 5)
Concept - Formula where a student generalizes the conclusion based on the area formula.
Among these stages, 1 and 5 were revealed in the interviews.
Table 5.7 summarizes the concept stages of area that the five participants revealed
when solving this problem. The approaches associated with each stage as used by them
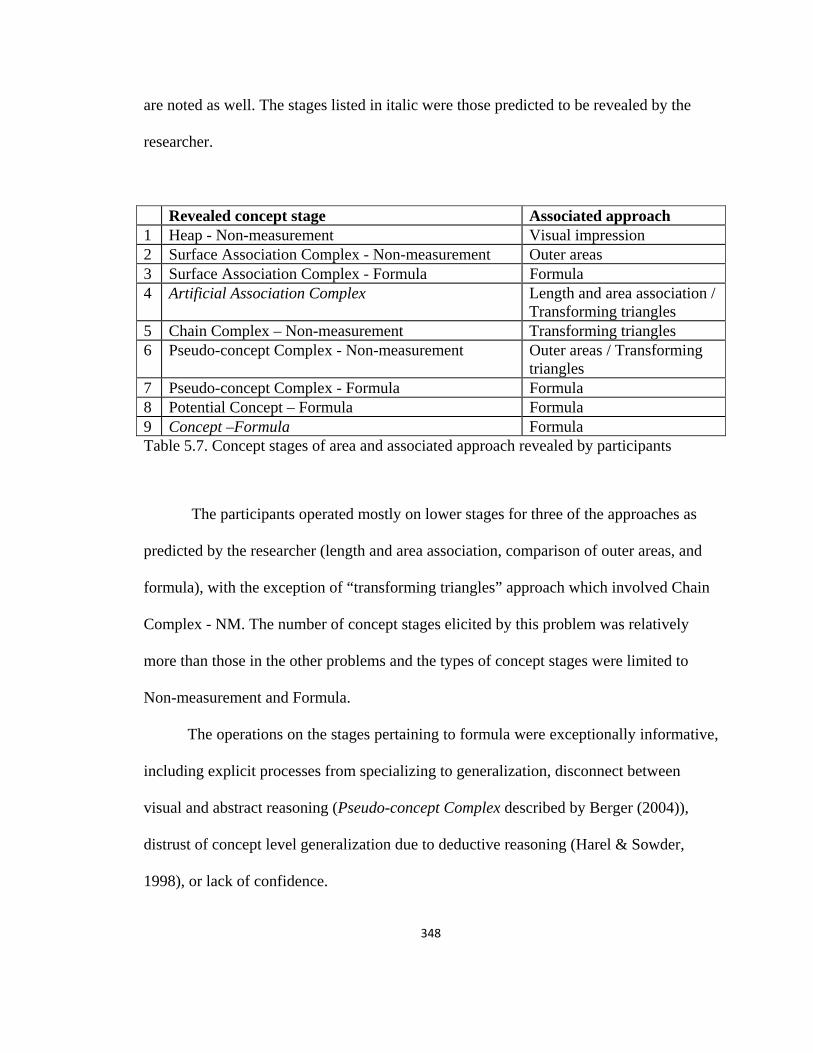
348
are noted as well. The stages listed in italic were those predicted to be revealed by the
researcher.
Revealed concept stage Associated approach 1 Heap - Non-measurement Visual impression 2 Surface Association Complex - Non-measurement Outer areas 3 Surface Association Complex - Formula Formula 4 Artificial Association Complex Length and area association /
Transforming triangles 5 Chain Complex – Non-measurement Transforming triangles 6 Pseudo-concept Complex - Non-measurement Outer areas / Transforming
triangles 7 Pseudo-concept Complex - Formula Formula 8 Potential Concept – Formula Formula 9 Concept –Formula Formula Table 5.7. Concept stages of area and associated approach revealed by participants
The participants operated mostly on lower stages for three of the approaches as
predicted by the researcher (length and area association, comparison of outer areas, and
formula), with the exception of “transforming triangles” approach which involved Chain
Complex - NM. The number of concept stages elicited by this problem was relatively
more than those in the other problems and the types of concept stages were limited to
Non-measurement and Formula.
The operations on the stages pertaining to formula were exceptionally informative,
including explicit processes from specializing to generalization, disconnect between
visual and abstract reasoning (Pseudo-concept Complex described by Berger (2004)),
distrust of concept level generalization due to deductive reasoning (Harel & Sowder,
1998), or lack of confidence.
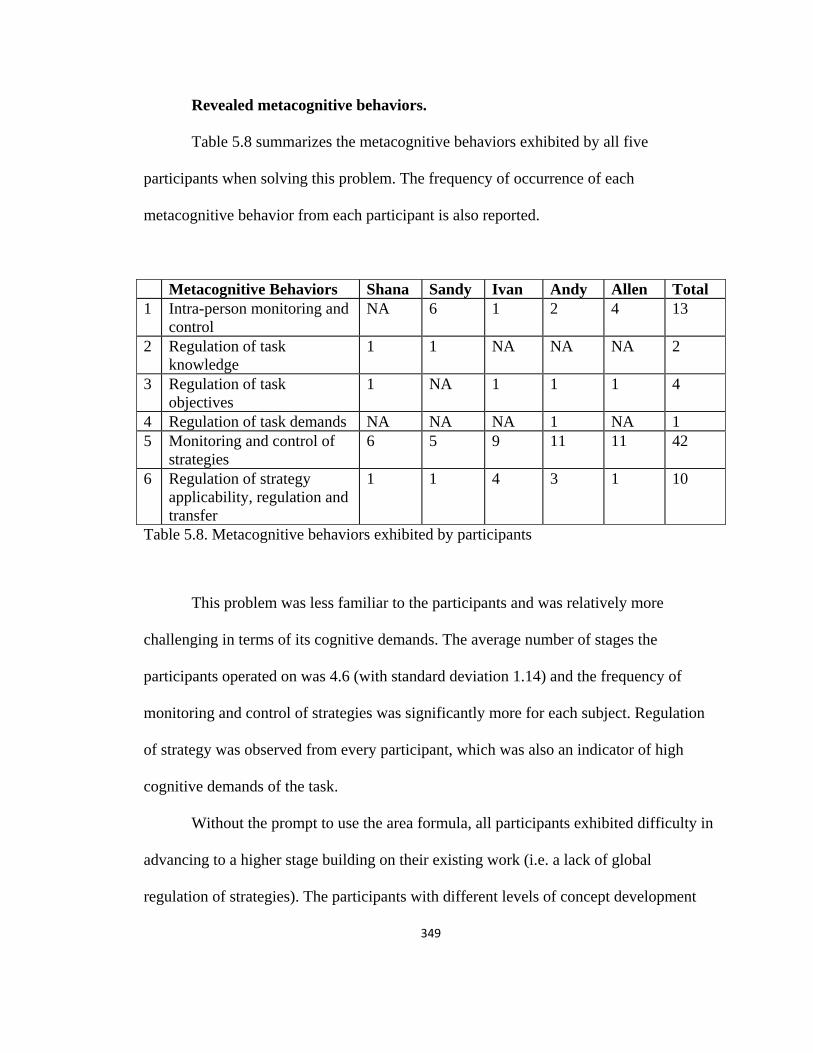
349
Revealed metacognitive behaviors.
Table 5.8 summarizes the metacognitive behaviors exhibited by all five
participants when solving this problem. The frequency of occurrence of each
metacognitive behavior from each participant is also reported.
Metacognitive Behaviors Shana Sandy Ivan Andy Allen Total 1 Intra-person monitoring and
control NA 6 1 2 4 13
2 Regulation of task knowledge
1 1 NA NA NA 2
3 Regulation of task objectives
1 NA 1 1 1 4
4 Regulation of task demands NA NA NA 1 NA 1 5 Monitoring and control of
strategies 6 5 9 11 11 42
6 Regulation of strategy applicability, regulation and transfer
1 1 4 3 1 10
Table 5.8. Metacognitive behaviors exhibited by participants
This problem was less familiar to the participants and was relatively more
challenging in terms of its cognitive demands. The average number of stages the
participants operated on was 4.6 (with standard deviation 1.14) and the frequency of
monitoring and control of strategies was significantly more for each subject. Regulation
of strategy was observed from every participant, which was also an indicator of high
cognitive demands of the task.
Without the prompt to use the area formula, all participants exhibited difficulty in
advancing to a higher stage building on their existing work (i.e. a lack of global
regulation of strategies). The participants with different levels of concept development
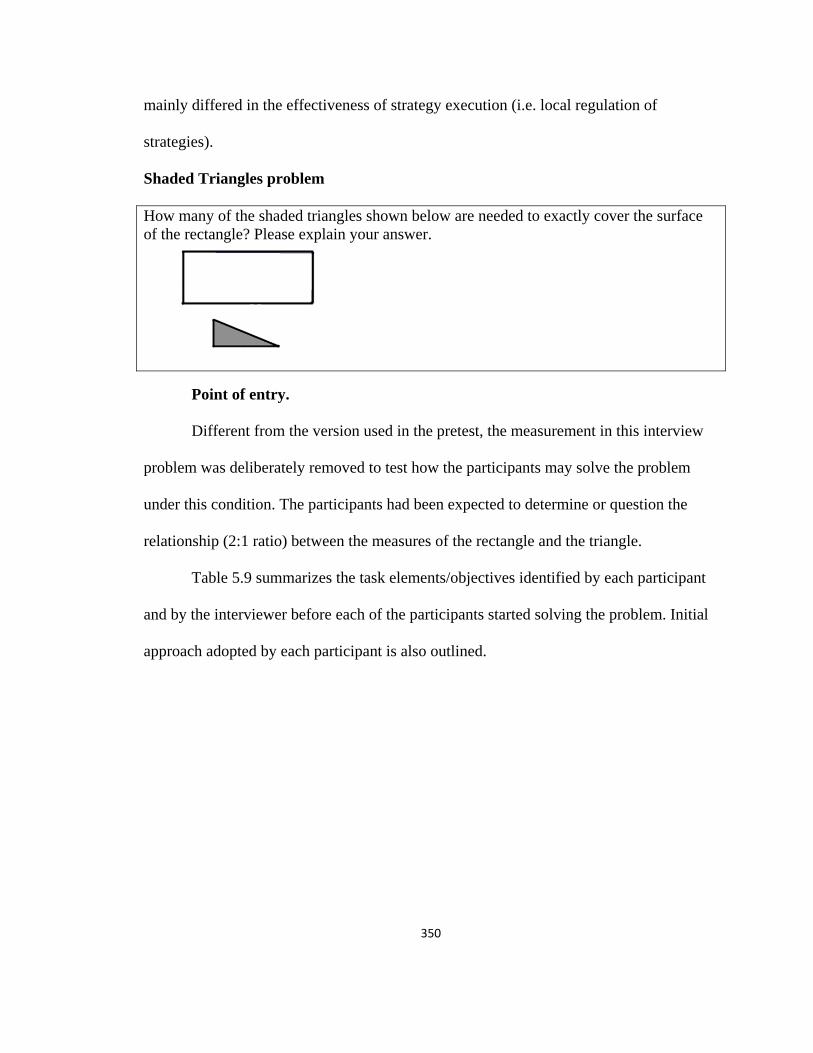
350
mainly differed in the effectiveness of strategy execution (i.e. local regulation of
strategies).
Shaded Triangles problem
How many of the shaded triangles shown below are needed to exactly cover the surface of the rectangle? Please explain your answer.
Point of entry.
Different from the version used in the pretest, the measurement in this interview
problem was deliberately removed to test how the participants may solve the problem
under this condition. The participants had been expected to determine or question the
relationship (2:1 ratio) between the measures of the rectangle and the triangle.
Table 5.9 summarizes the task elements/objectives identified by each participant
and by the interviewer before each of the participants started solving the problem. Initial
approach adopted by each participant is also outlined.

351
Participant Task elements or objectives identified by the participant
Task elements or objectives highlighted by the interviewer
Initial approach
Shana NA NA
Drew triangles in the rectangle.
Sandy NA NA
Replicated the hypotenuse of the shaded triangle to the highlighted position and drew the rest of triangles based on that measure.
Ivan The height of the triangle was half of the width of the rectangle
NA
Measured the sides and drew the triangles using transformation reasoning.
Andy The height looked one half of the width
NA
Iterated the triangle in the rectangle as the indicated order
Allen How many of the triangles
NA
Iterated the triangles in the rectangle.
Table 5.9. Task elements/objectives identified and initial approach adopted by each participant
352
Among the three participants who correctly mapped the triangles into the
rectangle, two of them explicitly identified the 1:2 ratio between the height of the triangle
and the width of the rectangle, while one identified the task objective. Only Andy showed
an awareness of the impact of the missing measurement on the validity of his approach at
the end of the interview.
Ivan’s iteration was not influenced by either the incorrect measure of the
hypotenuse of the triangle or the obscure ratio of the sides of the triangle and the
rectangle. In Sandy’s case, on the contrary, the obtained measures revealed the 1:2 ratio
of the base of the triangle and the length of the rectangle while the ratio of the other pair
remained obscure. Her incorrect iteration was mainly due to the replication of the
triangle’s hypotenuse; the absence of task element identification may have contributed to
the fact that she failed to detect the replication mistake throughout the episode. In
Shana’s case, she mainly exhibited difficulty in visualizing/operating with triangles,
which corresponded to her performance in the pretest where measurement was provided.
Documented approaches.
Table 5.10 illustrates the approaches that the participants used when solving the
Shaded Triangles problem.

353
Approach Description Example from interview 1 Draw unit
triangles Iterated the shaded triangle into the rectangle
2 Draw unit rectangles
Used the shaded triangle to form a small rectangle as a unit. Iterated the unit rectangle into the rectangle.
3 Formula Used area formulas to find how many of the triangles would be needed to cover the rectangle.
Computed the triangle’s area by multiplying base and height and then divided the rectangle’s area by the triangle’s area to obtain 3.3.
Table 5.10. Approaches adopted by the participants when solving the shaded triangles problem
Once the participants solved the problem using the “draw the unit triangles”
approach, the interviewer prompted them to use an alternative method to solve the task.
The “draw unit rectangles” approach was the alternative approach Shana adopted, while
the rest of them chose to use “formula.”
Ivan stated the option of using a formula yet did not execute it since he did not
remember the triangle’s area formula. Among the three participants who actually used the
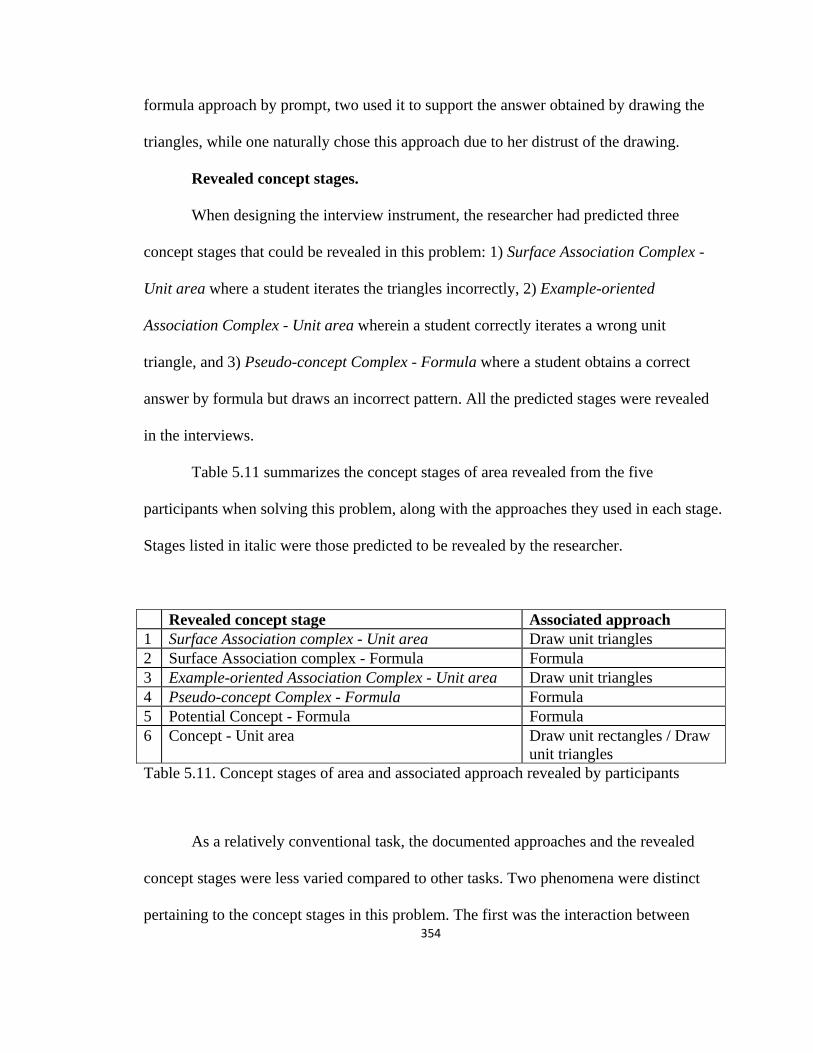
354
formula approach by prompt, two used it to support the answer obtained by drawing the
triangles, while one naturally chose this approach due to her distrust of the drawing.
Revealed concept stages.
When designing the interview instrument, the researcher had predicted three
concept stages that could be revealed in this problem: 1) Surface Association Complex -
Unit area where a student iterates the triangles incorrectly, 2) Example-oriented
Association Complex - Unit area wherein a student correctly iterates a wrong unit
triangle, and 3) Pseudo-concept Complex - Formula where a student obtains a correct
answer by formula but draws an incorrect pattern. All the predicted stages were revealed
in the interviews.
Table 5.11 summarizes the concept stages of area revealed from the five
participants when solving this problem, along with the approaches they used in each stage.
Stages listed in italic were those predicted to be revealed by the researcher.
Revealed concept stage Associated approach 1 Surface Association complex - Unit area Draw unit triangles 2 Surface Association complex - Formula Formula 3 Example-oriented Association Complex - Unit area Draw unit triangles 4 Pseudo-concept Complex - Formula Formula 5 Potential Concept - Formula Formula 6 Concept - Unit area Draw unit rectangles / Draw
unit triangles Table 5.11. Concept stages of area and associated approach revealed by participants
As a relatively conventional task, the documented approaches and the revealed
concept stages were less varied compared to other tasks. Two phenomena were distinct
pertaining to the concept stages in this problem. The first was the interaction between
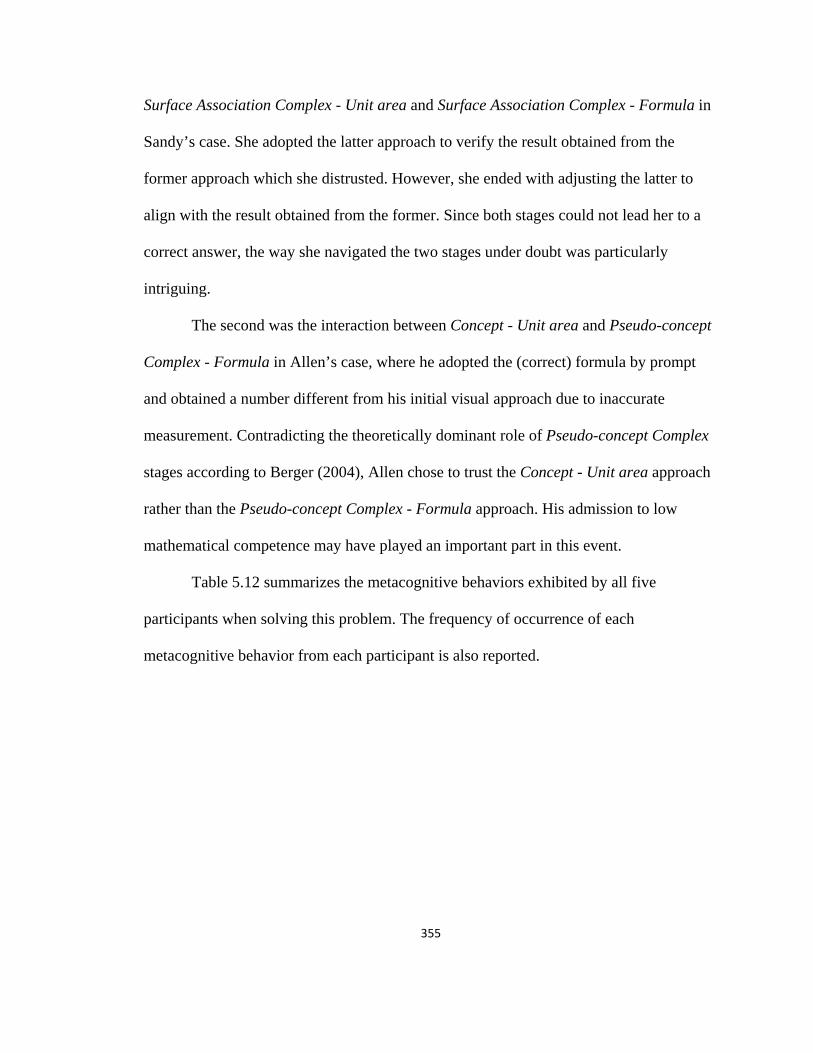
355
Surface Association Complex - Unit area and Surface Association Complex - Formula in
Sandy’s case. She adopted the latter approach to verify the result obtained from the
former approach which she distrusted. However, she ended with adjusting the latter to
align with the result obtained from the former. Since both stages could not lead her to a
correct answer, the way she navigated the two stages under doubt was particularly
intriguing.
The second was the interaction between Concept - Unit area and Pseudo-concept
Complex - Formula in Allen’s case, where he adopted the (correct) formula by prompt
and obtained a number different from his initial visual approach due to inaccurate
measurement. Contradicting the theoretically dominant role of Pseudo-concept Complex
stages according to Berger (2004), Allen chose to trust the Concept - Unit area approach
rather than the Pseudo-concept Complex - Formula approach. His admission to low
mathematical competence may have played an important part in this event.
Table 5.12 summarizes the metacognitive behaviors exhibited by all five
participants when solving this problem. The frequency of occurrence of each
metacognitive behavior from each participant is also reported.
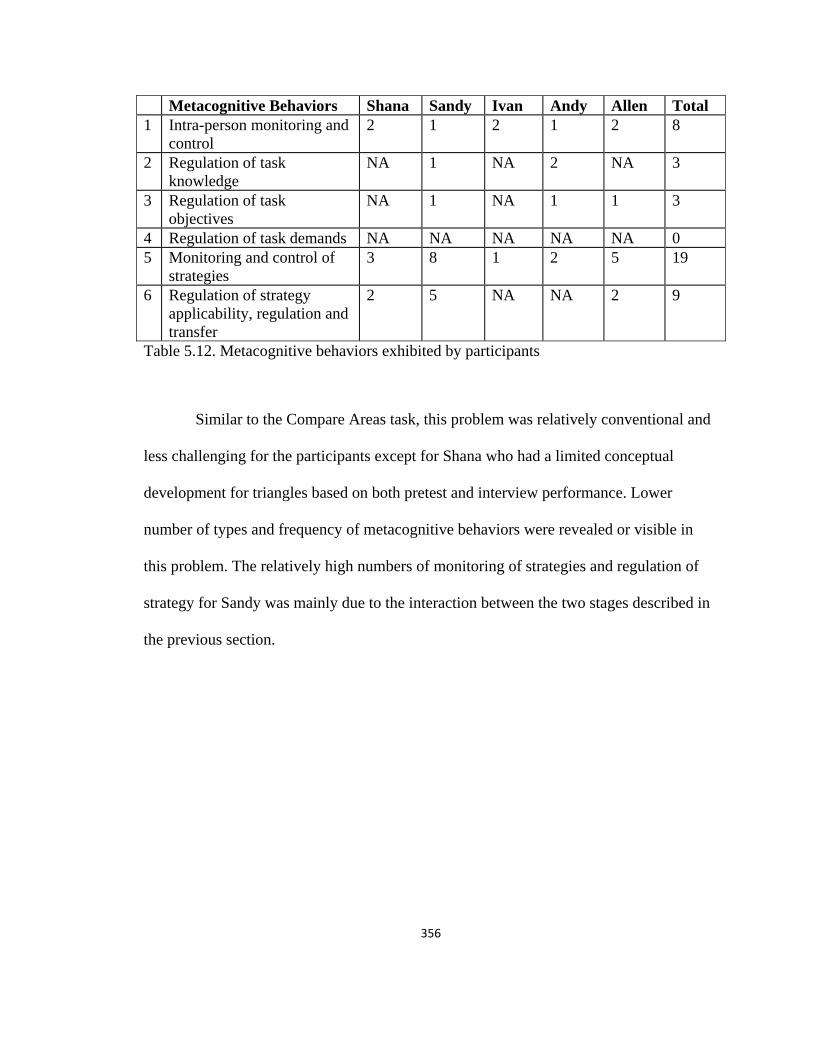
356
Metacognitive Behaviors Shana Sandy Ivan Andy Allen Total 1 Intra-person monitoring and
control 2 1 2 1 2 8
2 Regulation of task knowledge
NA 1 NA 2 NA 3
3 Regulation of task objectives
NA 1 NA 1 1 3
4 Regulation of task demands NA NA NA NA NA 0 5 Monitoring and control of
strategies 3 8 1 2 5 19
6 Regulation of strategy applicability, regulation and transfer
2 5 NA NA 2 9
Table 5.12. Metacognitive behaviors exhibited by participants
Similar to the Compare Areas task, this problem was relatively conventional and
less challenging for the participants except for Shana who had a limited conceptual
development for triangles based on both pretest and interview performance. Lower
number of types and frequency of metacognitive behaviors were revealed or visible in
this problem. The relatively high numbers of monitoring of strategies and regulation of
strategy for Sandy was mainly due to the interaction between the two stages described in
the previous section.
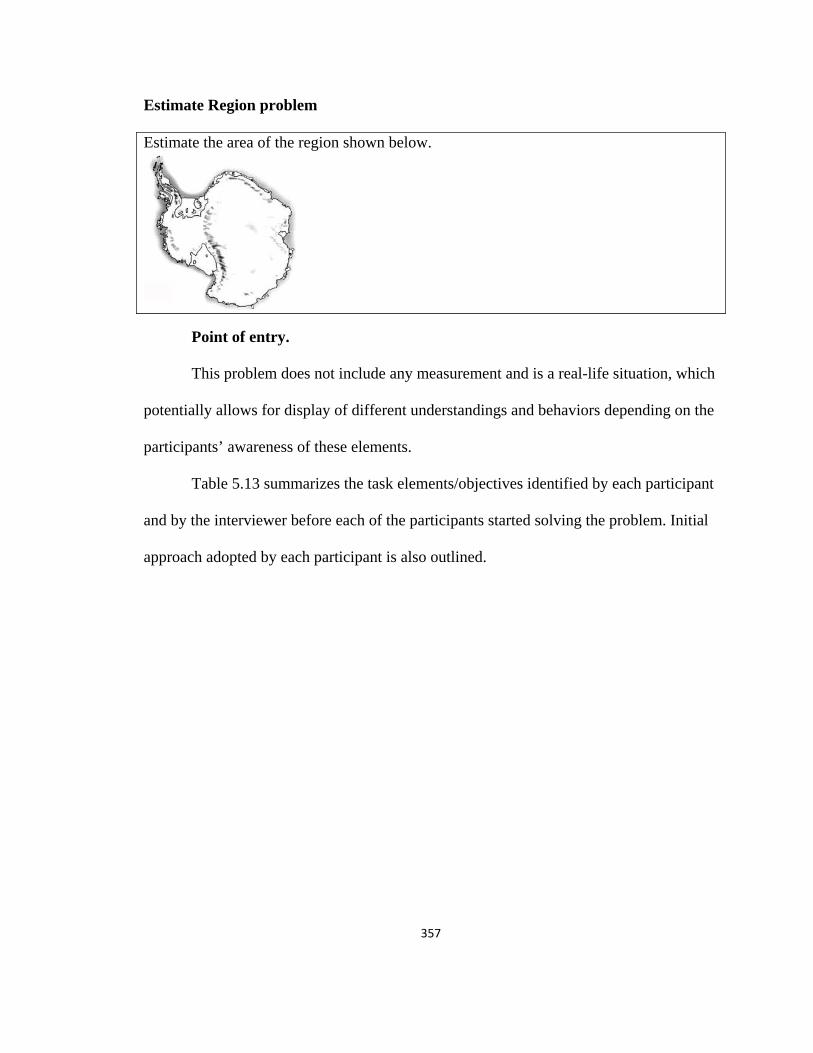
357
Estimate Region problem
Estimate the area of the region shown below.
Point of entry.
This problem does not include any measurement and is a real-life situation, which
potentially allows for display of different understandings and behaviors depending on the
participants’ awareness of these elements.
Table 5.13 summarizes the task elements/objectives identified by each participant
and by the interviewer before each of the participants started solving the problem. Initial
approach adopted by each participant is also outlined.
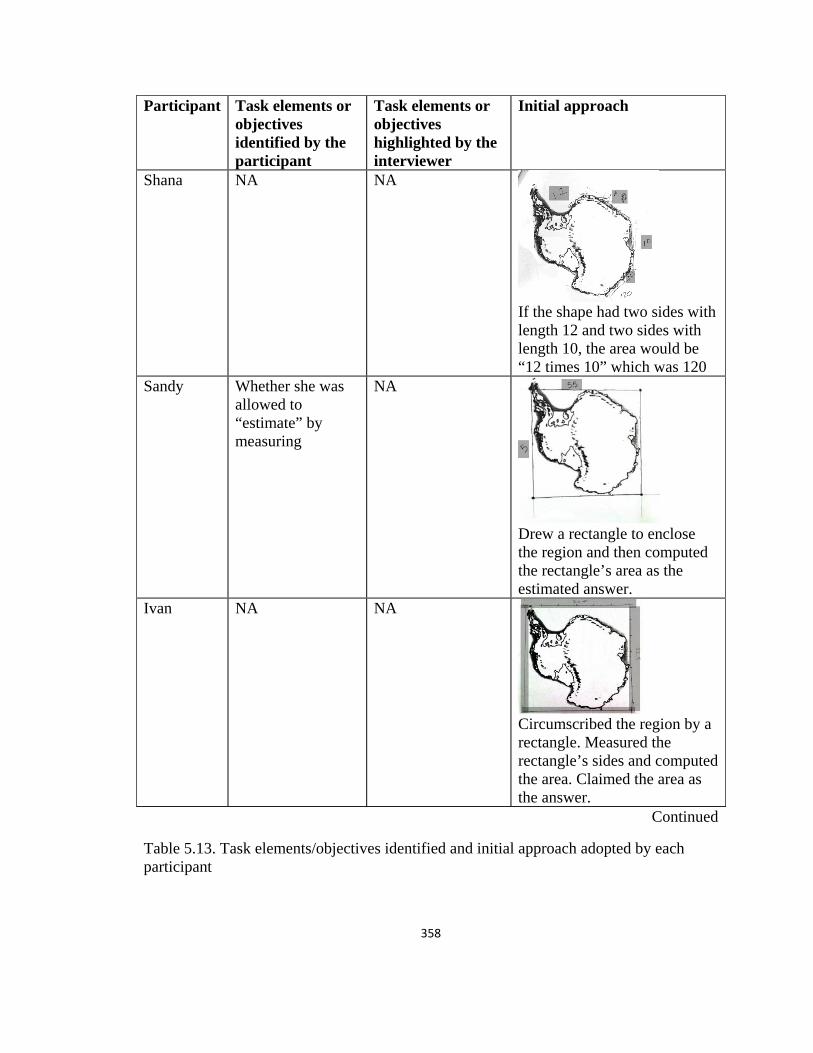
358
Participant Task elements or objectives identified by the participant
Task elements or objectives highlighted by the interviewer
Initial approach
Shana NA NA
If the shape had two sides with length 12 and two sides with length 10, the area would be “12 times 10” which was 120
Sandy Whether she was allowed to “estimate” by measuring
NA
Drew a rectangle to enclose the region and then computed the rectangle’s area as the estimated answer.
Ivan NA NA
Circumscribed the region by a rectangle. Measured the rectangle’s sides and computed the area. Claimed the area as the answer.
Continued
Table 5.13. Task elements/objectives identified and initial approach adopted by each participant
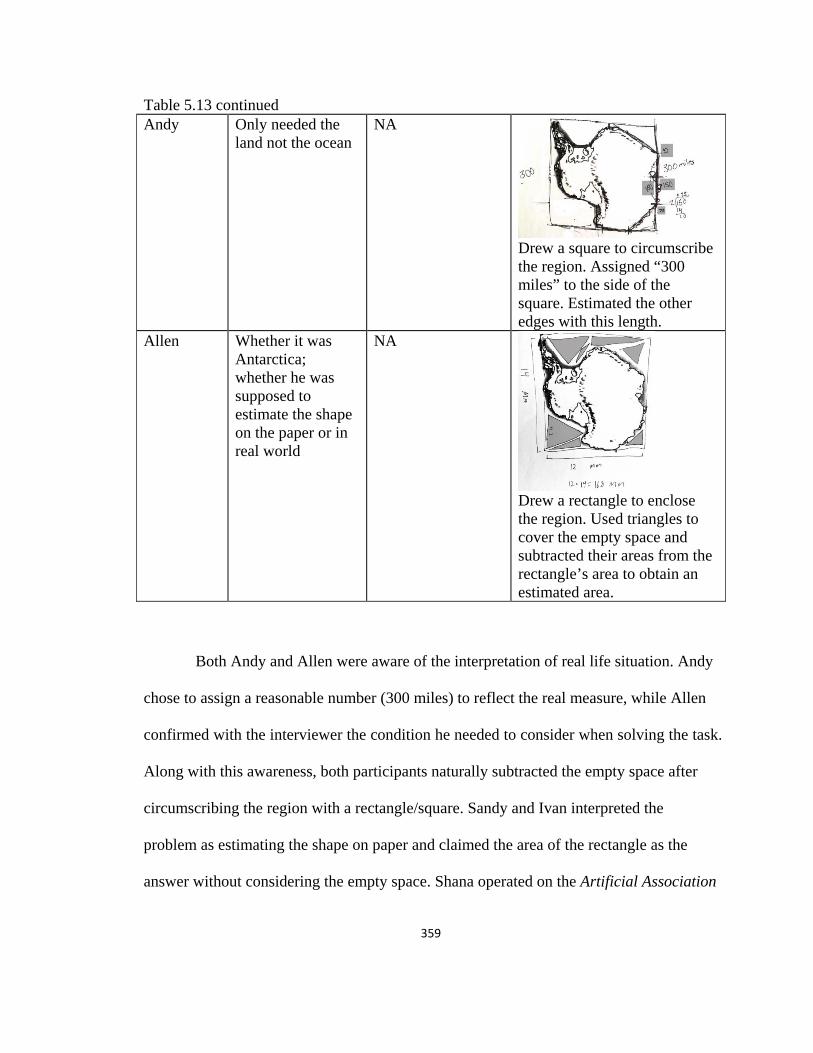
359
Table 5.13 continued Andy Only needed the
land not the ocean NA
Drew a square to circumscribe the region. Assigned “300 miles” to the side of the square. Estimated the other edges with this length.
Allen Whether it was Antarctica; whether he was supposed to estimate the shape on the paper or in real world
NA
Drew a rectangle to enclose the region. Used triangles to cover the empty space and subtracted their areas from the rectangle’s area to obtain an estimated area.
Both Andy and Allen were aware of the interpretation of real life situation. Andy
chose to assign a reasonable number (300 miles) to reflect the real measure, while Allen
confirmed with the interviewer the condition he needed to consider when solving the task.
Along with this awareness, both participants naturally subtracted the empty space after
circumscribing the region with a rectangle/square. Sandy and Ivan interpreted the
problem as estimating the shape on paper and claimed the area of the rectangle as the
answer without considering the empty space. Shana operated on the Artificial Association

360
Complex stage where she imitated the rectangle’s area formula to compute an irregular
shape’s area, which was the only low stage revealed in this problem.
Documented approaches.
Table 5.14 illustrates the approaches that the participants used when solving the
Estimate Region problem.
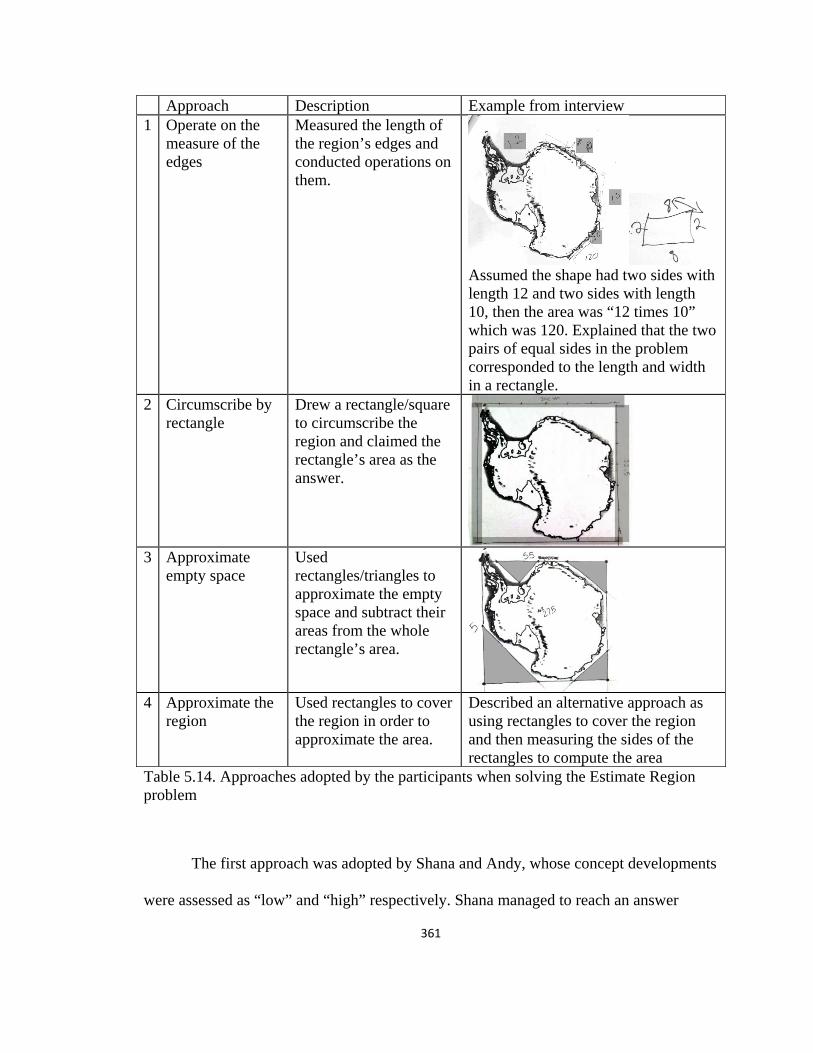
361
Approach Description Example from interview 1 Operate on the
measure of the edges
Measured the length of the region’s edges and conducted operations on them.
Assumed the shape had two sides with length 12 and two sides with length 10, then the area was “12 times 10” which was 120. Explained that the two pairs of equal sides in the problem corresponded to the length and width in a rectangle.
2 Circumscribe by rectangle
Drew a rectangle/square to circumscribe the region and claimed the rectangle’s area as the answer.
3 Approximate
empty space Used rectangles/triangles to approximate the empty space and subtract their areas from the whole rectangle’s area.
4 Approximate the
region Used rectangles to cover the region in order to approximate the area.
Described an alternative approach as using rectangles to cover the region and then measuring the sides of the rectangles to compute the area
Table 5.14. Approaches adopted by the participants when solving the Estimate Region problem
The first approach was adopted by Shana and Andy, whose concept developments
were assessed as “low” and “high” respectively. Shana managed to reach an answer
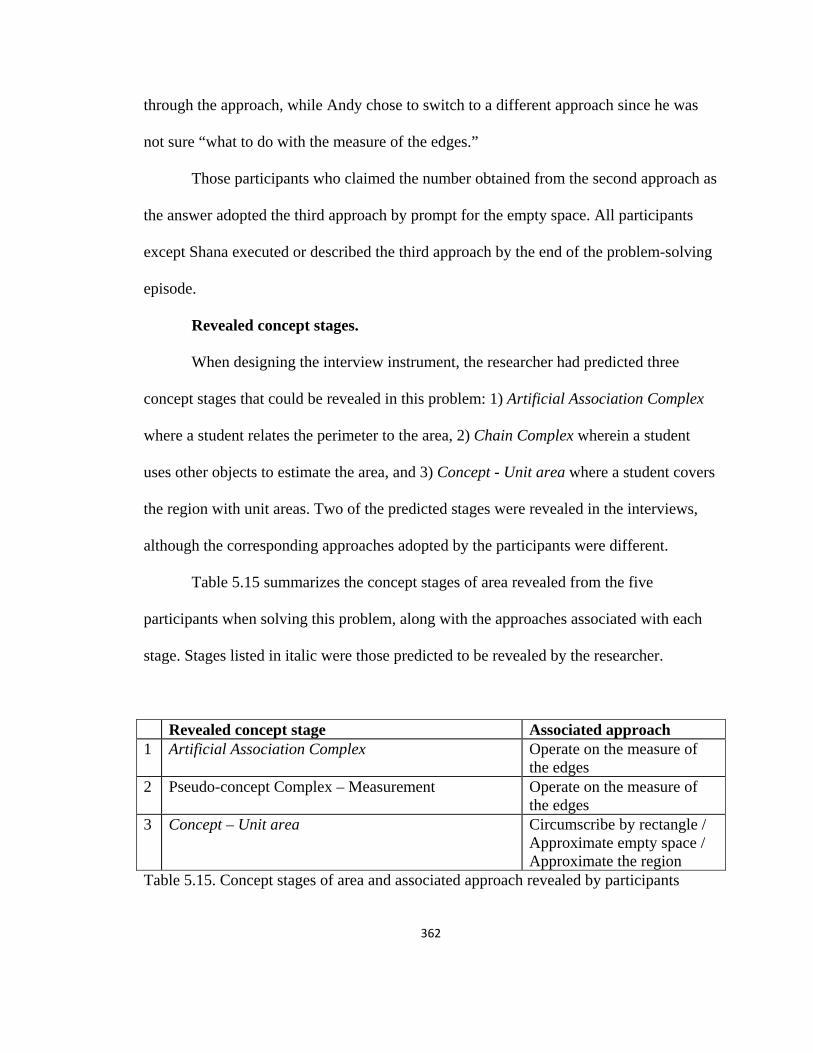
362
through the approach, while Andy chose to switch to a different approach since he was
not sure “what to do with the measure of the edges.”
Those participants who claimed the number obtained from the second approach as
the answer adopted the third approach by prompt for the empty space. All participants
except Shana executed or described the third approach by the end of the problem-solving
episode.
Revealed concept stages.
When designing the interview instrument, the researcher had predicted three
concept stages that could be revealed in this problem: 1) Artificial Association Complex
where a student relates the perimeter to the area, 2) Chain Complex wherein a student
uses other objects to estimate the area, and 3) Concept - Unit area where a student covers
the region with unit areas. Two of the predicted stages were revealed in the interviews,
although the corresponding approaches adopted by the participants were different.
Table 5.15 summarizes the concept stages of area revealed from the five
participants when solving this problem, along with the approaches associated with each
stage. Stages listed in italic were those predicted to be revealed by the researcher.
Revealed concept stage Associated approach 1 Artificial Association Complex Operate on the measure of
the edges 2 Pseudo-concept Complex – Measurement Operate on the measure of
the edges 3 Concept – Unit area Circumscribe by rectangle /
Approximate empty space / Approximate the region
Table 5.15. Concept stages of area and associated approach revealed by participants

363
This problem revealed the least number of concept stages among all problems
used in the study. Multiple approaches were observed on Concept - Unit area stage and
there was a degree of variation among the approaches under the same category. Thus, this
problem served as an example of how cognitive/metacognitive behaviors may vary under
the same stage. Whether and how these variations should be included in the proposed
theory remain as a question.
Revealed metacognitive behaviors.
Table 5.16 summarizes the metacognitive behaviors exhibited by all five
participants when solving this problem. The frequency of occurrence of each
metacognitive behavior from each participant is also reported.
Metacognitive Behaviors Shana Sandy Ivan Andy Allen Total 1 Intra-person monitoring and
control NA 1 1 1 1 4
2 Regulation of task knowledge
NA 1 NA NA 1 2
3 Regulation of task objectives
NA NA 1 1 2 4
4 Regulation of task demands NA NA NA NA NA 0 5 Monitoring and control of
strategies 5 6 4 3 3 21
6 Regulation of strategy applicability, regulation and transfer
2 NA NA 1 1 4
Table 5.16. Metacognitive behaviors exhibited by participants
Although the participants may not have been familiar with this type of problem,
the challenge it posted was limited due to two reasons. First, the participants had become
comfortable with the format of interviews after three problem solving episodes thus, were
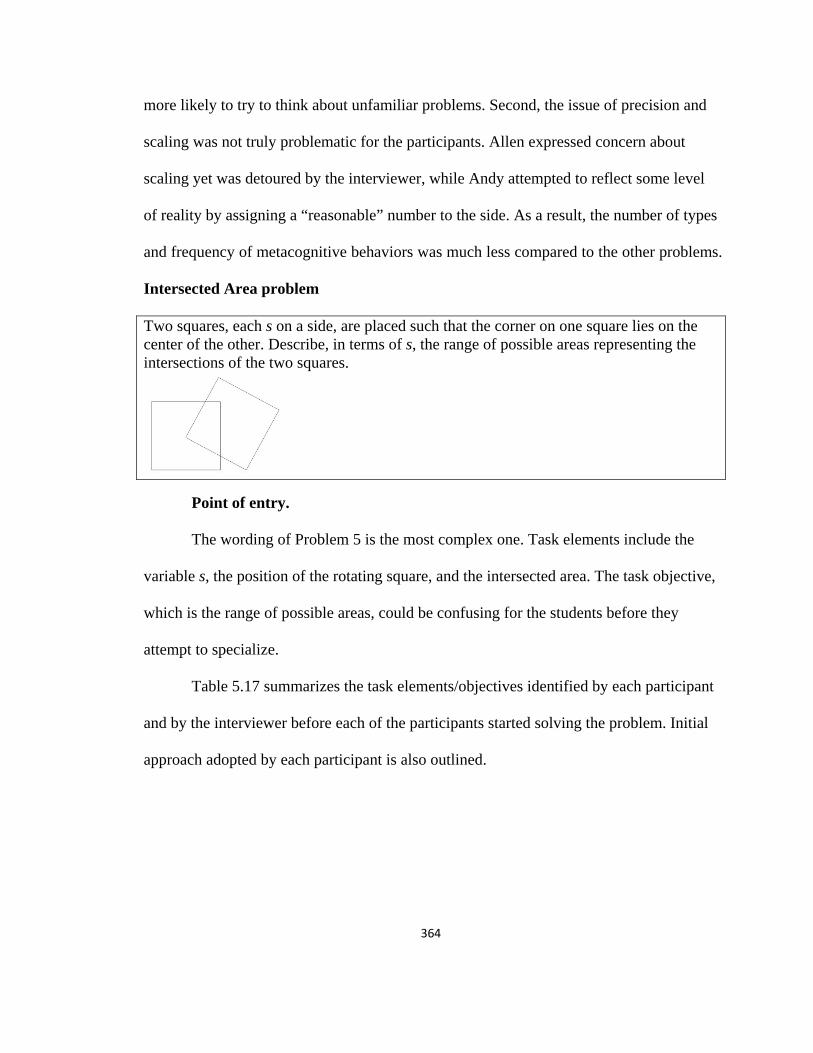
364
more likely to try to think about unfamiliar problems. Second, the issue of precision and
scaling was not truly problematic for the participants. Allen expressed concern about
scaling yet was detoured by the interviewer, while Andy attempted to reflect some level
of reality by assigning a “reasonable” number to the side. As a result, the number of types
and frequency of metacognitive behaviors was much less compared to the other problems.
Intersected Area problem
Two squares, each s on a side, are placed such that the corner on one square lies on the center of the other. Describe, in terms of s, the range of possible areas representing the intersections of the two squares.
Point of entry.
The wording of Problem 5 is the most complex one. Task elements include the
variable s, the position of the rotating square, and the intersected area. The task objective,
which is the range of possible areas, could be confusing for the students before they
attempt to specialize.
Table 5.17 summarizes the task elements/objectives identified by each participant
and by the interviewer before each of the participants started solving the problem. Initial
approach adopted by each participant is also outlined.
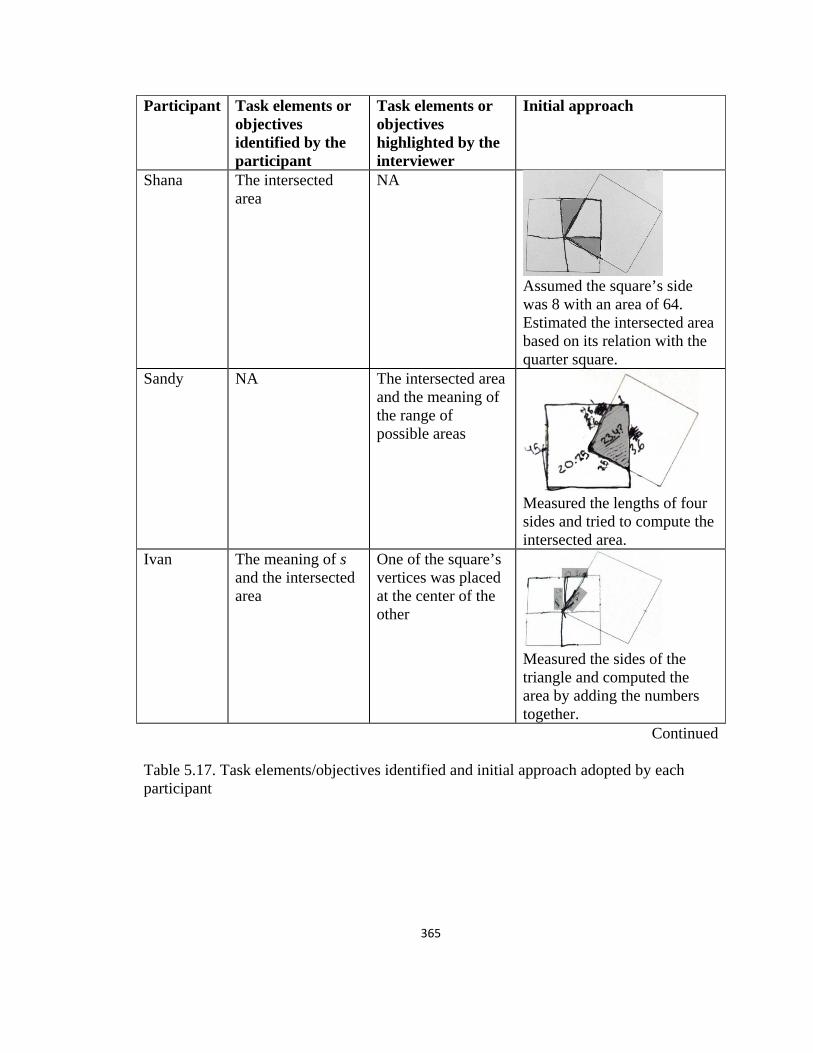
365
Participant Task elements or objectives identified by the participant
Task elements or objectives highlighted by the interviewer
Initial approach
Shana The intersected area
NA
Assumed the square’s side was 8 with an area of 64. Estimated the intersected area based on its relation with the quarter square.
Sandy NA The intersected area and the meaning of the range of possible areas
Measured the lengths of four sides and tried to compute the intersected area.
Ivan The meaning of s and the intersected area
One of the square’s vertices was placed at the center of the other
Measured the sides of the triangle and computed the area by adding the numbers together.
Continued Table 5.17. Task elements/objectives identified and initial approach adopted by each participant

366
Table 5.17 continued Andy The intersected
area NA
Assigned 10 to s marked the distance between the center and the edge as 5. Estimated the other line segments proportionally.
Allen The meaning of s, the intersected area, and the meaning of range
NA
Divided the intersected area into three triangles, measured and computed the three triangles’ areas. Estimated the range accordingly.
As the last interview problem, the participants had become accustomed to
assigning a number to the variable s or directly measuring the lengths at the initial
attempt. For the three task elements, only Ivan overlooked the intersected area (although
he identified it at the beginning) and the position of the rotating square, while the other
participants showed correct understanding of all three elements.
The task objective (i.e. range of possible areas) was either confusing or ignored at
the specializing phase (i.e. when the student was examining the given situation) with the
exception of Allen’s case. Allen correctly understood all the task elements and objective
before attempting the problem, and was able to organize and monitor his goal as “first
resolving the given case and then examining the rotation.” Based on the behaviors of the

367
other four participants, it seemed that if an individual was not capable of globally
monitoring such a process, it might be more effective to ignore the rotation during the
specializing phase to avoid being confused as in Andy’s case.
Documented approaches.
Table 5.18 illustrates the approaches that the participants used when solving the
Intersected area problem.
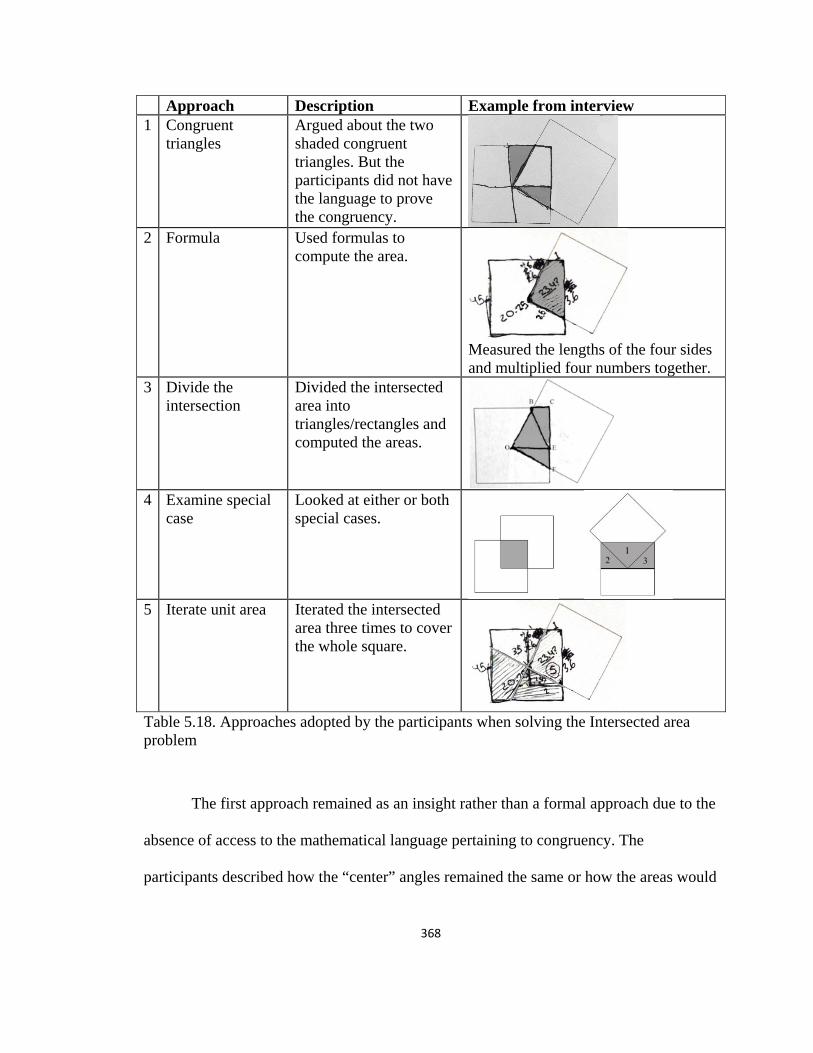
368
Approach Description Example from interview 1 Congruent
triangles Argued about the two shaded congruent triangles. But the participants did not have the language to prove the congruency.
2 Formula Used formulas to compute the area.
Measured the lengths of the four sides and multiplied four numbers together.
3 Divide the intersection
Divided the intersected area into triangles/rectangles and computed the areas.
4 Examine special
case Looked at either or both special cases.
5 Iterate unit area Iterated the intersected
area three times to cover the whole square.
Table 5.18. Approaches adopted by the participants when solving the Intersected area problem
The first approach remained as an insight rather than a formal approach due to the
absence of access to the mathematical language pertaining to congruency. The
participants described how the “center” angles remained the same or how the areas would

369
“even out” as the square rotated but could not formally prove that the two triangles were
congruent under rotation.
The special case in the fourth approach was prompted by the interviewer when
she sensed the participants might be stuck. It usually triggered the insight of “the
intersected area is always one fourth of the whole area” once the participants examined
the picture. Then the participants tended to use the first approach to support the shift from
specializing to generalization, yet as described above the reasoning remained informal.
The fifth approach was adopted by Sandy. She used the manipulative that
simulated the rotation to examine the special cases in the fourth approach and generalized
the approach as an iteration of the intersected area. Without the language for congruency,
this approach is considered as more effective than the first approach in terms of
generalization.
Revealed concept stages.
When designing the interview instrument, the researcher had predicted two
concept stages that could be revealed in this problem: 1) Concept - Unit area where a
student correctly operates on invisible area units, and 2) Concept - Non-measurement
wherein a student compares parts systematically. The first predicted stage was revealed in
the interviews, while only the approach associated with the second predicted stage was
revealed due to the participants’ lack of language for congruency.
Table 5.19 summarizes the concept stages of area revealed from the five
participants when solving this problem, along with the approaches associated with each
stage. Stages listed in italic were those predicted to be revealed by the researcher.
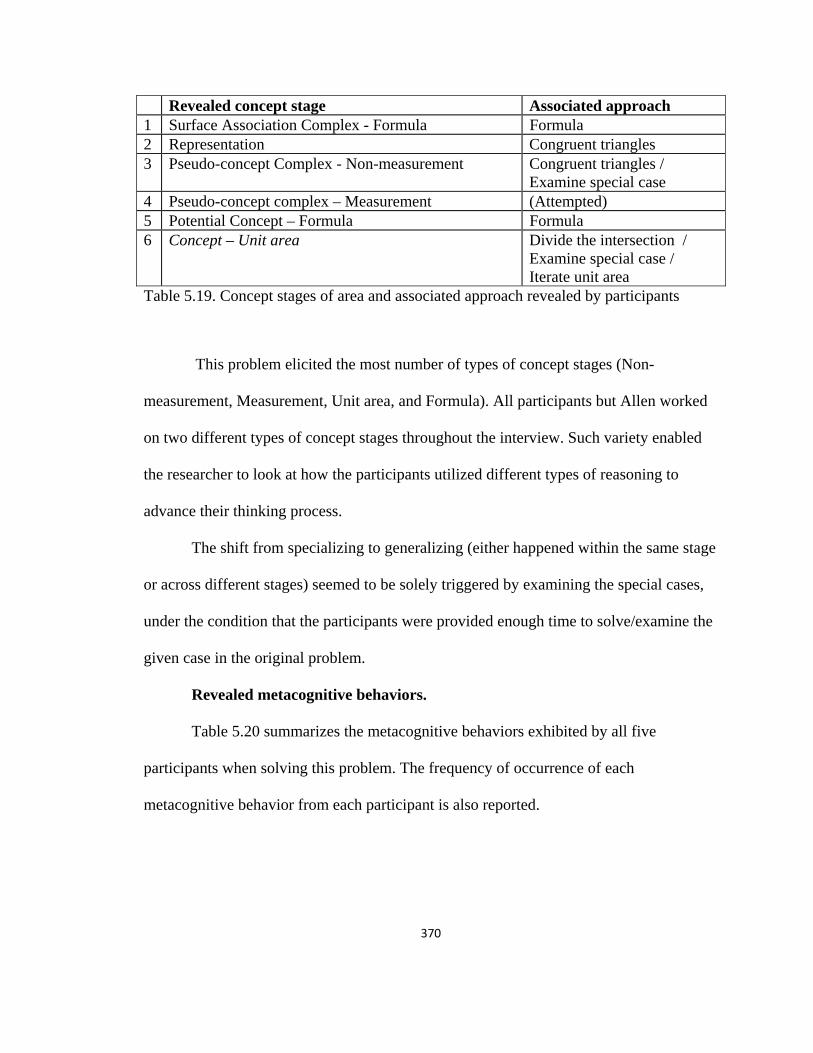
370
Revealed concept stage Associated approach 1 Surface Association Complex - Formula Formula 2 Representation Congruent triangles 3 Pseudo-concept Complex - Non-measurement Congruent triangles /
Examine special case 4 Pseudo-concept complex – Measurement (Attempted) 5 Potential Concept – Formula Formula 6 Concept – Unit area Divide the intersection /
Examine special case / Iterate unit area
Table 5.19. Concept stages of area and associated approach revealed by participants
This problem elicited the most number of types of concept stages (Non-
measurement, Measurement, Unit area, and Formula). All participants but Allen worked
on two different types of concept stages throughout the interview. Such variety enabled
the researcher to look at how the participants utilized different types of reasoning to
advance their thinking process.
The shift from specializing to generalizing (either happened within the same stage
or across different stages) seemed to be solely triggered by examining the special cases,
under the condition that the participants were provided enough time to solve/examine the
given case in the original problem.
Revealed metacognitive behaviors.
Table 5.20 summarizes the metacognitive behaviors exhibited by all five
participants when solving this problem. The frequency of occurrence of each
metacognitive behavior from each participant is also reported.
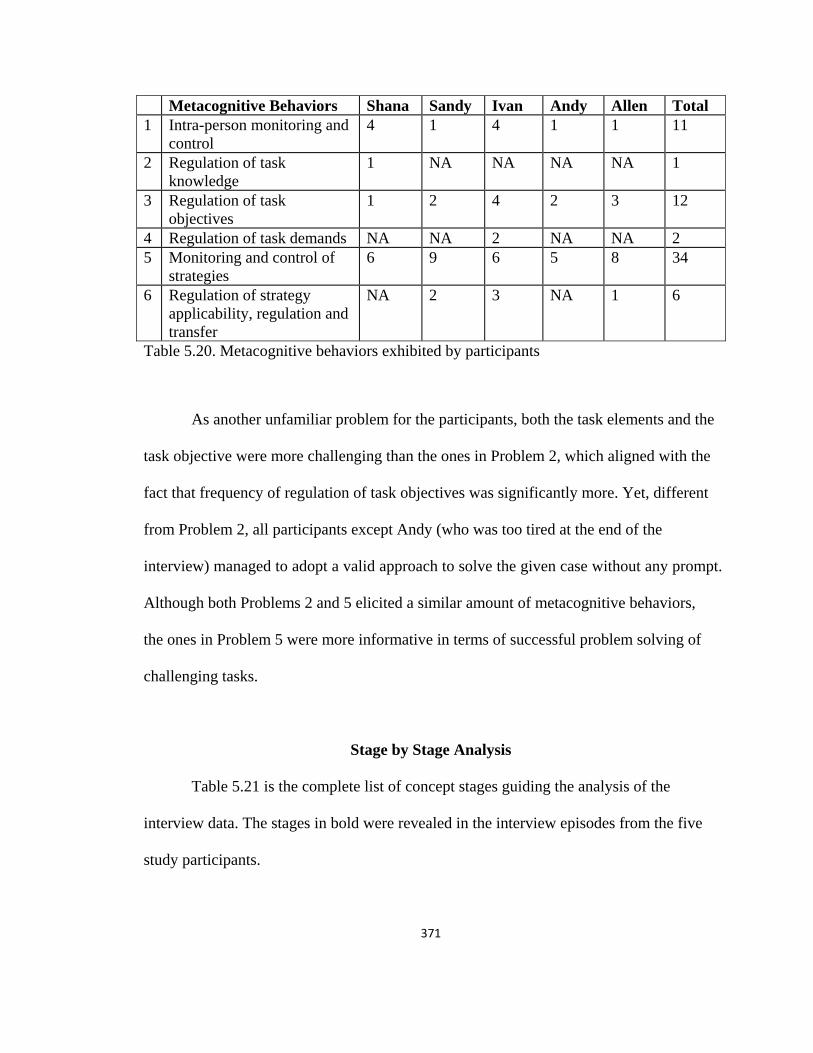
371
Metacognitive Behaviors Shana Sandy Ivan Andy Allen Total 1 Intra-person monitoring and
control 4 1 4 1 1 11
2 Regulation of task knowledge
1 NA NA NA NA 1
3 Regulation of task objectives
1 2 4 2 3 12
4 Regulation of task demands NA NA 2 NA NA 2 5 Monitoring and control of
strategies 6 9 6 5 8 34
6 Regulation of strategy applicability, regulation and transfer
NA 2 3 NA 1 6
Table 5.20. Metacognitive behaviors exhibited by participants
As another unfamiliar problem for the participants, both the task elements and the
task objective were more challenging than the ones in Problem 2, which aligned with the
fact that frequency of regulation of task objectives was significantly more. Yet, different
from Problem 2, all participants except Andy (who was too tired at the end of the
interview) managed to adopt a valid approach to solve the given case without any prompt.
Although both Problems 2 and 5 elicited a similar amount of metacognitive behaviors,
the ones in Problem 5 were more informative in terms of successful problem solving of
challenging tasks.
Stage by Stage Analysis
Table 5.21 is the complete list of concept stages guiding the analysis of the
interview data. The stages in bold were revealed in the interview episodes from the five
study participants.
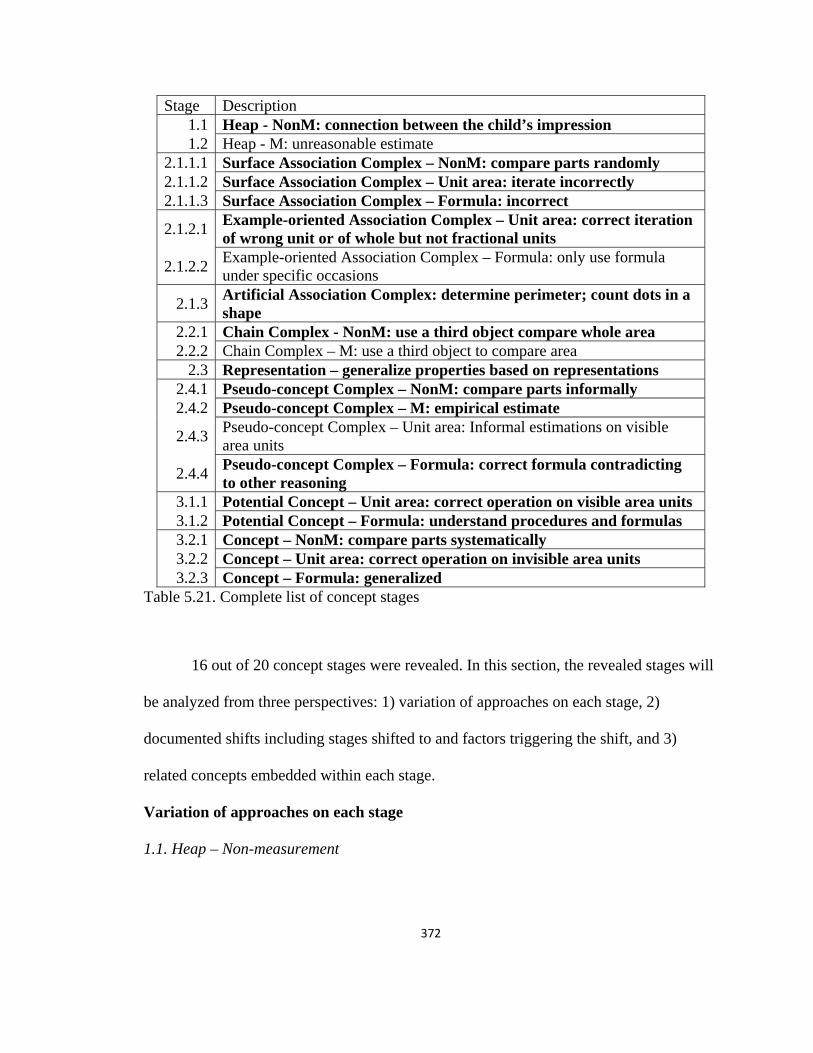
372
Stage Description 1.1 Heap - NonM: connection between the child’s impression 1.2 Heap - M: unreasonable estimate
2.1.1.1 Surface Association Complex – NonM: compare parts randomly 2.1.1.2 Surface Association Complex – Unit area: iterate incorrectly 2.1.1.3 Surface Association Complex – Formula: incorrect
2.1.2.1 Example-oriented Association Complex – Unit area: correct iteration of wrong unit or of whole but not fractional units
2.1.2.2 Example-oriented Association Complex – Formula: only use formula under specific occasions
2.1.3 Artificial Association Complex: determine perimeter; count dots in a shape
2.2.1 Chain Complex - NonM: use a third object compare whole area 2.2.2 Chain Complex – M: use a third object to compare area
2.3 Representation – generalize properties based on representations 2.4.1 Pseudo-concept Complex – NonM: compare parts informally 2.4.2 Pseudo-concept Complex – M: empirical estimate
2.4.3 Pseudo-concept Complex – Unit area: Informal estimations on visible area units
2.4.4 Pseudo-concept Complex – Formula: correct formula contradicting to other reasoning
3.1.1 Potential Concept – Unit area: correct operation on visible area units 3.1.2 Potential Concept – Formula: understand procedures and formulas 3.2.1 Concept – NonM: compare parts systematically 3.2.2 Concept – Unit area: correct operation on invisible area units 3.2.3 Concept – Formula: generalized
Table 5.21. Complete list of concept stages
16 out of 20 concept stages were revealed. In this section, the revealed stages will
be analyzed from three perspectives: 1) variation of approaches on each stage, 2)
documented shifts including stages shifted to and factors triggering the shift, and 3)
related concepts embedded within each stage.
Variation of approaches on each stage
1.1. Heap – Non-measurement
373
In this stage, connections between objects were mainly made based on the
individuals’ impressions.
This stage was only revealed in Problem 2 and associated with the “visual
impression” approach. The approach varied from descriptions of angles/vertices/lengths
of sides to visual impressions on the appearance of the triangles (tilted, fat, short, etc.).
The participants mainly described what they saw and drew conclusions based on the
observations that they were not able to justify.
2.1.1.1. Surface Association Complex – Non-measurement
An individual compared parts of different objects randomly (without evidence of
keeping track of the comparison) in this stage.
This stage was revealed in Problem 1 and Problem 2, under the “compare leftover”
and the “outer area” approaches respectively. The participants visually compared either a
portion of the area that they were supposed to look at (e.g. only one pair of the outer areas)
or all parts of the area (e.g. the “poked out” area of the triangle) in an inexplicit way. The
individuals visually identified a valid relation between objects, yet did not have an
effective tool at hand to further analyze the relation.
2.1.1.2. Surface Association Complex – Unit area
An individual iterated non-identical units in this stage.
This stage was only revealed in Problem 3, where one participant drew triangles
of different shapes and sizes within the rectangle. The rectangle was fully covered, and
the participant exhibited the awareness to compensate smaller triangles by drawing larger
triangles so that they “evened out” overall. The individual exhibited an understanding of
covering and iteration of unit areas, yet was not able to visualize the shape as a unit.

374
The result showed that an individual could have different spatial visualization
abilities (e.g. congruency, similarity, reflection, etc.) for different shapes. She may not be
able to visualize a triangle as a unit, yet was able to correctly and efficiently visualize a
rectangle as the unit. The different angles in a triangle (compared to only right angles in a
rectangle) may have caused the difficulty for visualization/replication.
2.1.1.3. Surface Association Complex – Formula
An individual utilized an incorrect formula to compute the area in this stage.
This stage was revealed in Problems 1, 2, 3, and 5. The approach only involved
using an incorrect formula of a regular shape (e.g. triangle formula). Documented
incorrect formula of regular shapes included “multiplying two legs of a (non-right)
triangle and divided by 2,” “multiplying base and height of a triangle,” and “multiplying
three sides of a triangle.” The individual was aware of the need for using a formula and
had a basic impression of the format of formulas without an understanding of the
conceptualization of the formula.
2.1.2.1. Example-oriented Association Complex – Unit area
An individual correctly iterated a wrong unit in this stage.
This stage was only revealed in Problem 3, where the participant demonstrated an
iteration of a unit triangle that was different from the given unit triangle. The
visualization of the unit area and the deduced numerical answer were factually associated
instead of logically associated. This factual association led to the result that a participant
who had correctly iterated a given unit area concluded that one could iterate a different
unit area as long as the number of units remained the same. An individual exhibited
375
advanced iteration abilities, yet was only aware of the unit area being numerically
identical with a lack of the unit specificity.
2.1.3. Artificial Association Complex
An individual associated the concept of area with other different concepts by an
artificial relation which was neither factual nor logical.
This stage was revealed in Problems 2 and 4. Three approaches were associated
with this stage, including “length and area association,” “transforming triangles,” and
“operate on the measure of the edges.” The first two approaches were built on an invalid
relation between length and area (e.g. longer length means larger area). This association
could be related to a logical relation between length and area (e.g. Heron’s formula) as
opposed to being treated as a “wrong” association. The third approach was an invalid
imitation of the rectangle’s area formula for a non-regular shape. Such imitation revealed
a basic knowledge of the structure of area formulas without an understanding of how the
formulas were constructed.
2.2.1. Chain Complex – Non-measurement
An individual used a third object to compare two whole areas.
This stage was revealed in Problems 1 and 2 and associated with the approaches
“fit into the square” and “transforming triangles” respectively. In the former approach,
the third object was a part of the task elements (a given object) and the participants chose
it as an object of reference to compare the other two shapes. In the latter approach, the
participant transformed a triangle into a third object to assist the comparison. The
creation of a third object involved more complex thinking processes than using an
existing object, such as adopting two other stages during the transformation and setting
376
up a deliberate goal of applying the transitive property. An individual was aware of the
potential difficulty in directly comparing two whole areas and sought a third object to
either form a common platform for comparison or a medium that could provide a factual
or logical connection.
2.3. Representation
An individual generalized properties of the objects based on their visual
representation in this stage.
This stage was revealed in Problem 5 under the approach “congruent triangles.”
The participant observed a pattern of congruent triangles based on the two cases he drew
and generalized it as a pattern for all cases. The property was a result of his (unconscious)
identical drawing rather than a logical deduction. A generalization from limited visual
clues was considered as the nature of this stage. If an individual failed to establish an
accountable connection between the objects and their representations (such as the equal
length condition and the actual pictures in Problem 1), the generalized properties based
on the visual representation were considered a product of the Representation stage.
2.4.1. Pseudo-concept Complex – Non-measurement
An individual compared parts of different objects in an informal way in this stage.
By informal it means that the comparison was organized (not random) yet not explicit
enough (not systematic) to produce a valid result. It is an intermediate stage between
Surface Association Complex – NM and Concept – NM.
This stage was revealed in Problems 1, 2, and 5. The approaches involved
“compare leftover,” “outer areas,” “congruent triangles,” and “examining special case.”
The participants generated a “vague” argument which was plausible based on the visual
377
evidence. The argument was considered as “vague” because of the following reasons: 1)
the argument was based on factual connections yet had the potential to be interpreted as
logical (from the adult’s point of view); 2) the argument appeared to be an insight which
the participants were not able to justify possibly due to a lack of mathematical tools or
language; 3) the argument was sound but too implicit for the listener to make sense of the
reasoning process.
2.4.2. Pseudo-concept Complex – Measurement
An individual empirically estimated the measures of an object in this stage.
This stage was revealed in Problems 4 and 5 under the approach “operate on the
measure of the edges” and an unfinished attempt respectively. Both approaches involved
estimating a given shape’s edges/sides using proportions without relying on exact
measurement to find the area. An individual was aware of the need for measurement and
had a method to find it, yet the connection between such measurement and the target goal
(finding the area) was unclear. To achieve a valid connection between the two, the
individual had to rely on either the unit area component or the formula component, thus
there did not exist any Potential concept or Concept stage for Measurement.
2.4.4. Pseudo-concept Complex – Formula
An individual applied a correct formula yet his/her formulaic reasoning
contradicted other types of reasoning (e.g. visual) in this stage.
This stage was revealed in Problems 2 and 3. When the answer obtained from a
correct formula contradicted the participants’ visual reasoning. There, they either
remained (slightly) doubtful towards the answer or chose to trust the answer obtained
using visual reasoning.
378
When an individual had a Pseudo-concept Complex understanding of formula,
there was usually a disconnect between his/her formulaic reasoning and his/her visual
reasoning. When the two kinds of reasoning led to contradictory results, the individual
chose one based on one of two factors: 1) how advanced each reasoning was, and 2) how
much trust s/he had on each reasoning. In the interview episodes, one participant chose
the Pseudo-concept Complex – Formula reasoning over the Heap – Non-measurement
reasoning but showed confusion over the disconnect. The other participant chose the
Concept - Unit area reasoning over the Pseudo-concept Complex – Formula reasoning
with confidence. This serves as an example of the first factor. Yet it is possible that one’s
stronger trust in a particular reasoning is not associated with a more advanced
developmental level of it, but merely a preference due to other factors.
3.1.1. Potential Concept – Unit area
An individual correctly operated on visible area units in this stage.
This stage was only revealed in Problem 1 associated with the “unit squares”
approach, where the participant drew unit areas on a circle and counted them to find the
circle’s area. He had a mechanism for operating on the partial squares, which was to
group partial squares according to their proportional sizes and then convert them into
equivalent whole squares. An individual reasonably assigned explicit or implicit
proportional relations to partial squares in a consistent way during the operation. With the
reliance on a visible unit grid, the processes of decomposing (e.g. identifying
proportional relation) and reconstructing (e.g. converting to whole squares) did not
require the individual to (flexibly) define the units prior to the operation.
3.1.2. Potential Concept – Formula
379
An individual understood the procedures to apply formulas in this stage.
This stage was revealed in Problems 2 and 5. The participants correctly identified
the base and height of each pair of the triangle and used the formula to compute the area.
It is possible that if an individual fails to recognize a contradiction or an opportunity to
generate such contradiction is never provided, this stage may be difficult to distinguish
from Pseudo-concept Complex – Formula stage. This difficulty was acknowledged by
Berger (2004) and she suggested to examining the integrity of an individual’s prior or
post activity as a way of distinguishing between the two. For the concept of area, an
effective way to differentiate them might be to examine whether and how an individual
could use another type of reasoning (e.g. visual) to explain/justify/support the conclusion
obtained by a correct formula.
3.2.1. Concept – Non-measurement
An individual systematically compared different parts of objects in this stage.
This stage was only revealed in Problem 1 under the approach “compare leftover,”
where the leftovers were rearranged into a square and a rectangle to compare the two
areas. An individual adopted an explicit mechanism to construct a connection between
different parts so that the objects became visually comparable and the result was
justifiable.
3.2.2. Concept – Unit area
An individual correctly operated on invisible area units in this stage.
This stage was revealed in Problems 3, 4, and 5 associated with the approaches
“draw unit rectangles,” “draw unit triangles,” “circumscribe by a rectangle,”
“approximate empty space,” “approximate the region,” “divide the intersection,”
380
“examine special case,” and “iterate unit area.” Among all the approaches, the
participants defined a unit or different units prior to or during the processes of
decomposing (dividing the shape into manageable units) and/or reconstructing (covering
a target shape with self-defined units). An individual took full control over the area units
in terms of their shapes, sizes, orientations, and other properties during the restructuring.
How one defined the units involved a more complex metacognitive process which will be
elaborated on in the fourth section.
3.2.3 Concept – Formula
An individual generalized a conclusion with formula in this stage.
This stage was only revealed in Problem 2, where the participants generalized that
the areas of the two triangles were equal if their heights and bases were equal. They
either measured and computed both triangles’ areas and then went back to generalize the
conditions based on this result, or measured and computed one triangle’s area and
generalized based on the observation of that heights and bases were the same. Despite
variation in the amount of evidence they needed to generalize, the shift from specializing
to generalizing was associated with the abstraction of measurement. Without such
abstraction, the participant was only able to produce tentative conclusion with a doubt
about whether s/he had exhausted possible cases. An individual deduced a conclusion
that did not involve specific numbers or measurement and was able to justify the
conclusion using formulas (and other types of reasoning).
Documented shifts
1.1. Heap – Non-measurement
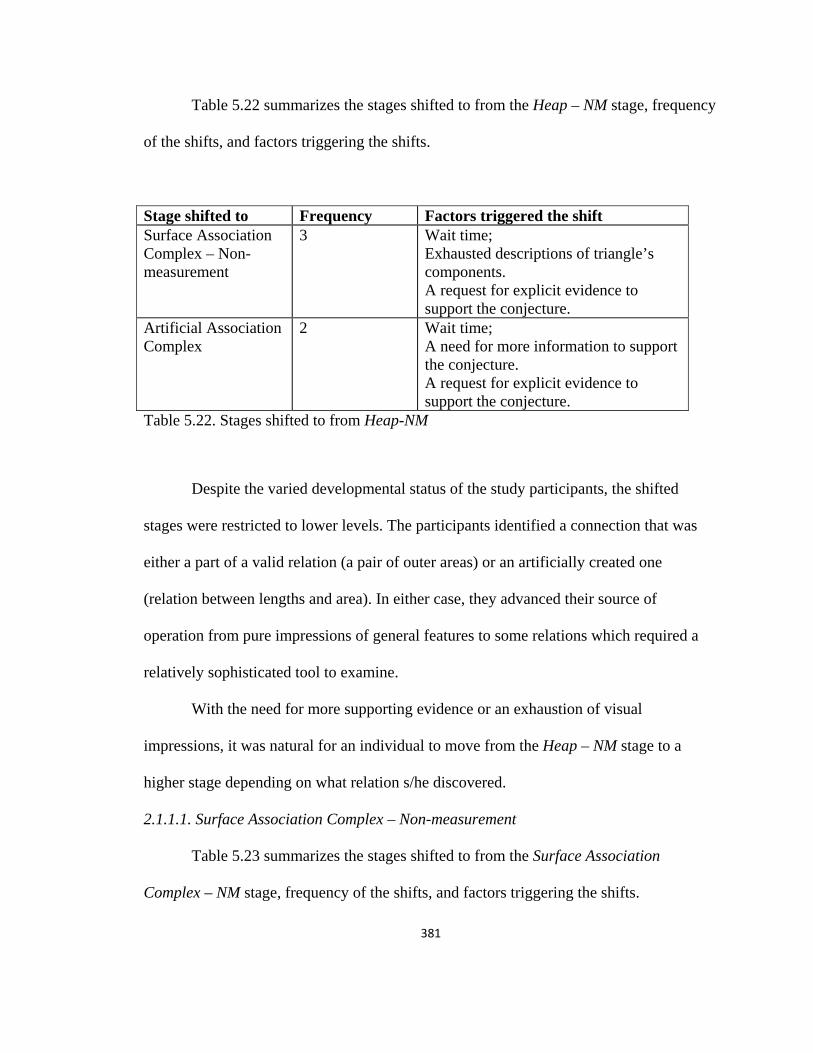
381
Table 5.22 summarizes the stages shifted to from the Heap – NM stage, frequency
of the shifts, and factors triggering the shifts.
Stage shifted to Frequency Factors triggered the shift Surface Association Complex – Non-measurement
3 Wait time; Exhausted descriptions of triangle’s components. A request for explicit evidence to support the conjecture.
Artificial Association Complex
2 Wait time; A need for more information to support the conjecture. A request for explicit evidence to support the conjecture.
Table 5.22. Stages shifted to from Heap-NM
Despite the varied developmental status of the study participants, the shifted
stages were restricted to lower levels. The participants identified a connection that was
either a part of a valid relation (a pair of outer areas) or an artificially created one
(relation between lengths and area). In either case, they advanced their source of
operation from pure impressions of general features to some relations which required a
relatively sophisticated tool to examine.
With the need for more supporting evidence or an exhaustion of visual
impressions, it was natural for an individual to move from the Heap – NM stage to a
higher stage depending on what relation s/he discovered.
2.1.1.1. Surface Association Complex – Non-measurement
Table 5.23 summarizes the stages shifted to from the Surface Association
Complex – NM stage, frequency of the shifts, and factors triggering the shifts.
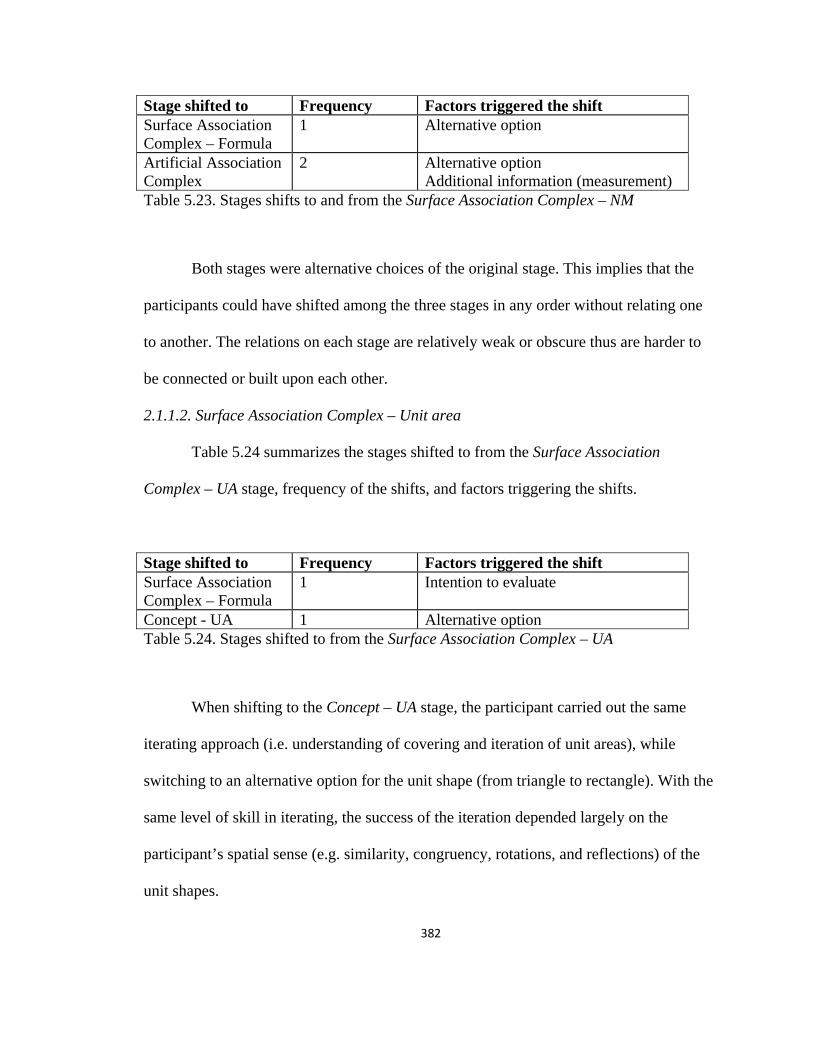
382
Stage shifted to Frequency Factors triggered the shift Surface Association Complex – Formula
1 Alternative option
Artificial Association Complex
2 Alternative option Additional information (measurement)
Table 5.23. Stages shifts to and from the Surface Association Complex – NM
Both stages were alternative choices of the original stage. This implies that the
participants could have shifted among the three stages in any order without relating one
to another. The relations on each stage are relatively weak or obscure thus are harder to
be connected or built upon each other.
2.1.1.2. Surface Association Complex – Unit area
Table 5.24 summarizes the stages shifted to from the Surface Association
Complex – UA stage, frequency of the shifts, and factors triggering the shifts.
Stage shifted to Frequency Factors triggered the shift Surface Association Complex – Formula
1 Intention to evaluate
Concept - UA 1 Alternative option Table 5.24. Stages shifted to from the Surface Association Complex – UA
When shifting to the Concept – UA stage, the participant carried out the same
iterating approach (i.e. understanding of covering and iteration of unit areas), while
switching to an alternative option for the unit shape (from triangle to rectangle). With the
same level of skill in iterating, the success of the iteration depended largely on the
participant’s spatial sense (e.g. similarity, congruency, rotations, and reflections) of the
unit shapes.
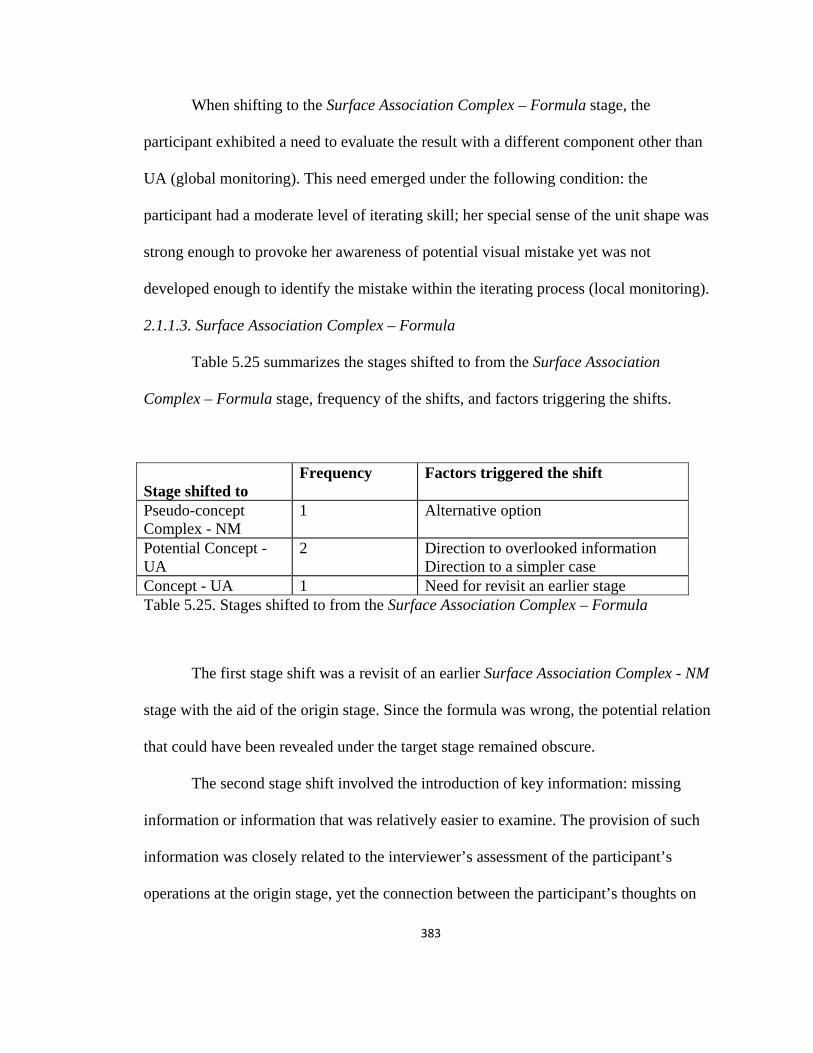
383
When shifting to the Surface Association Complex – Formula stage, the
participant exhibited a need to evaluate the result with a different component other than
UA (global monitoring). This need emerged under the following condition: the
participant had a moderate level of iterating skill; her special sense of the unit shape was
strong enough to provoke her awareness of potential visual mistake yet was not
developed enough to identify the mistake within the iterating process (local monitoring).
2.1.1.3. Surface Association Complex – Formula
Table 5.25 summarizes the stages shifted to from the Surface Association
Complex – Formula stage, frequency of the shifts, and factors triggering the shifts.
Stage shifted to
Frequency Factors triggered the shift
Pseudo-concept Complex - NM
1 Alternative option
Potential Concept - UA
2 Direction to overlooked information Direction to a simpler case
Concept - UA 1 Need for revisit an earlier stage Table 5.25. Stages shifted to from the Surface Association Complex – Formula
The first stage shift was a revisit of an earlier Surface Association Complex - NM
stage with the aid of the origin stage. Since the formula was wrong, the potential relation
that could have been revealed under the target stage remained obscure.
The second stage shift involved the introduction of key information: missing
information or information that was relatively easier to examine. The provision of such
information was closely related to the interviewer’s assessment of the participant’s
operations at the origin stage, yet the connection between the participant’s thoughts on
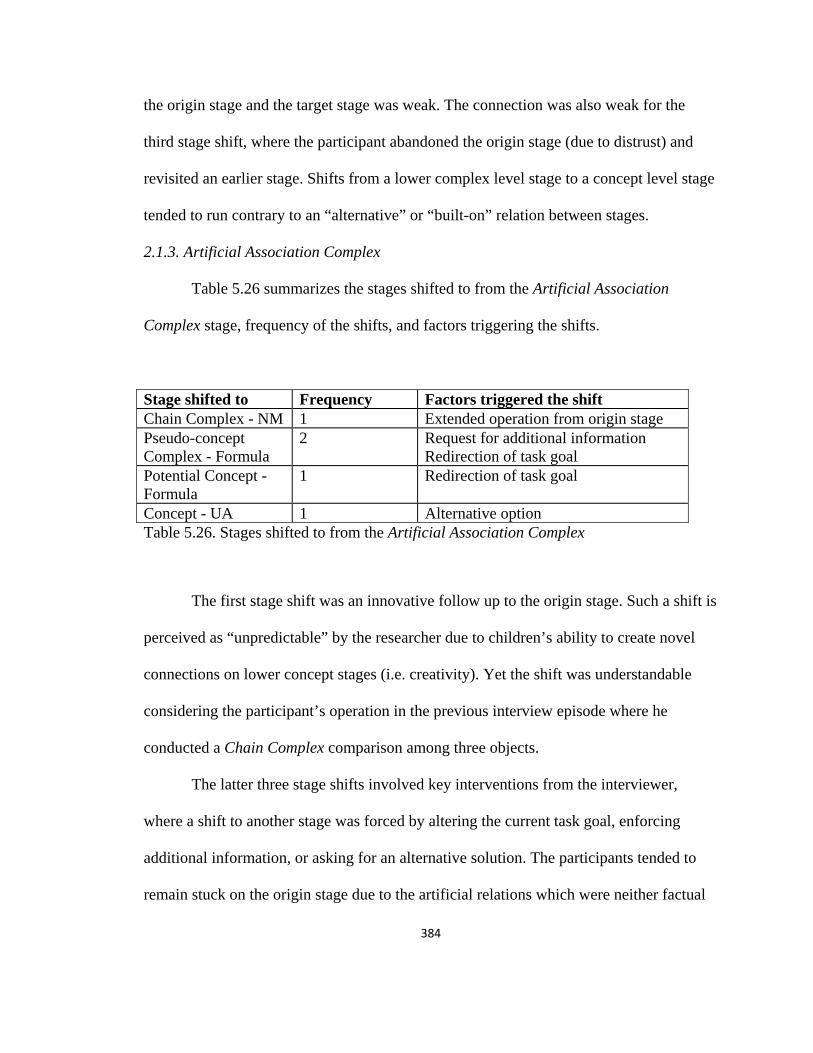
384
the origin stage and the target stage was weak. The connection was also weak for the
third stage shift, where the participant abandoned the origin stage (due to distrust) and
revisited an earlier stage. Shifts from a lower complex level stage to a concept level stage
tended to run contrary to an “alternative” or “built-on” relation between stages.
2.1.3. Artificial Association Complex
Table 5.26 summarizes the stages shifted to from the Artificial Association
Complex stage, frequency of the shifts, and factors triggering the shifts.
Stage shifted to Frequency Factors triggered the shift Chain Complex - NM 1 Extended operation from origin stage Pseudo-concept Complex - Formula
2 Request for additional information Redirection of task goal
Potential Concept - Formula
1 Redirection of task goal
Concept - UA 1 Alternative option Table 5.26. Stages shifted to from the Artificial Association Complex
The first stage shift was an innovative follow up to the origin stage. Such a shift is
perceived as “unpredictable” by the researcher due to children’s ability to create novel
connections on lower concept stages (i.e. creativity). Yet the shift was understandable
considering the participant’s operation in the previous interview episode where he
conducted a Chain Complex comparison among three objects.
The latter three stage shifts involved key interventions from the interviewer,
where a shift to another stage was forced by altering the current task goal, enforcing
additional information, or asking for an alternative solution. The participants tended to
remain stuck on the origin stage due to the artificial relations which were neither factual
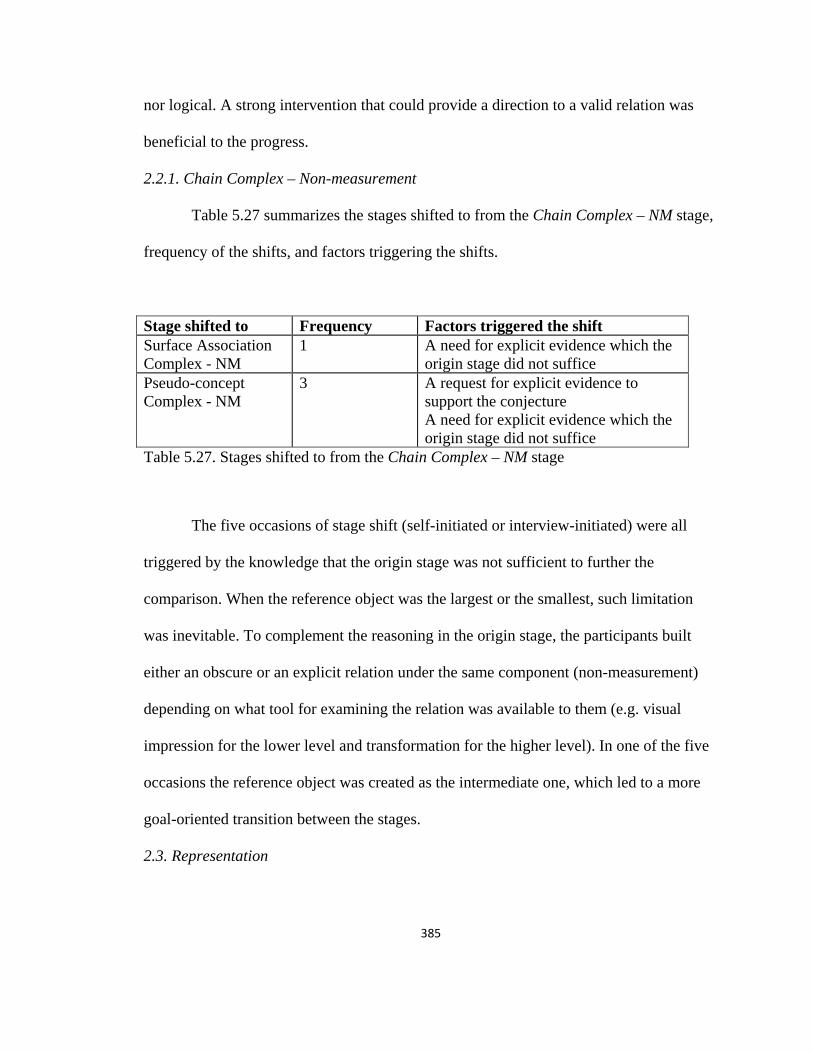
385
nor logical. A strong intervention that could provide a direction to a valid relation was
beneficial to the progress.
2.2.1. Chain Complex – Non-measurement
Table 5.27 summarizes the stages shifted to from the Chain Complex – NM stage,
frequency of the shifts, and factors triggering the shifts.
Stage shifted to Frequency Factors triggered the shift Surface Association Complex - NM
1 A need for explicit evidence which the origin stage did not suffice
Pseudo-concept Complex - NM
3 A request for explicit evidence to support the conjecture A need for explicit evidence which the origin stage did not suffice
Table 5.27. Stages shifted to from the Chain Complex – NM stage
The five occasions of stage shift (self-initiated or interview-initiated) were all
triggered by the knowledge that the origin stage was not sufficient to further the
comparison. When the reference object was the largest or the smallest, such limitation
was inevitable. To complement the reasoning in the origin stage, the participants built
either an obscure or an explicit relation under the same component (non-measurement)
depending on what tool for examining the relation was available to them (e.g. visual
impression for the lower level and transformation for the higher level). In one of the five
occasions the reference object was created as the intermediate one, which led to a more
goal-oriented transition between the stages.
2.3. Representation
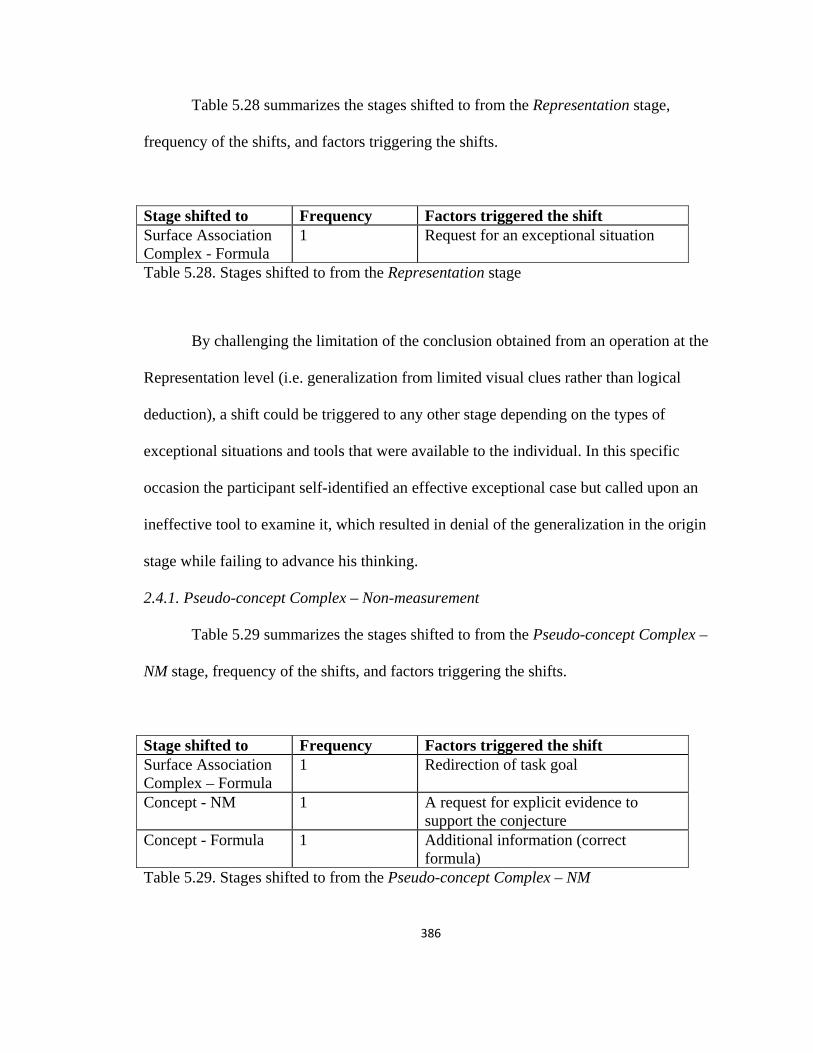
386
Table 5.28 summarizes the stages shifted to from the Representation stage,
frequency of the shifts, and factors triggering the shifts.
Stage shifted to Frequency Factors triggered the shift Surface Association Complex - Formula
1 Request for an exceptional situation
Table 5.28. Stages shifted to from the Representation stage
By challenging the limitation of the conclusion obtained from an operation at the
Representation level (i.e. generalization from limited visual clues rather than logical
deduction), a shift could be triggered to any other stage depending on the types of
exceptional situations and tools that were available to the individual. In this specific
occasion the participant self-identified an effective exceptional case but called upon an
ineffective tool to examine it, which resulted in denial of the generalization in the origin
stage while failing to advance his thinking.
2.4.1. Pseudo-concept Complex – Non-measurement
Table 5.29 summarizes the stages shifted to from the Pseudo-concept Complex –
NM stage, frequency of the shifts, and factors triggering the shifts.
Stage shifted to Frequency Factors triggered the shift Surface Association Complex – Formula
1 Redirection of task goal
Concept - NM 1 A request for explicit evidence to support the conjecture
Concept - Formula 1 Additional information (correct formula)
Table 5.29. Stages shifted to from the Pseudo-concept Complex – NM
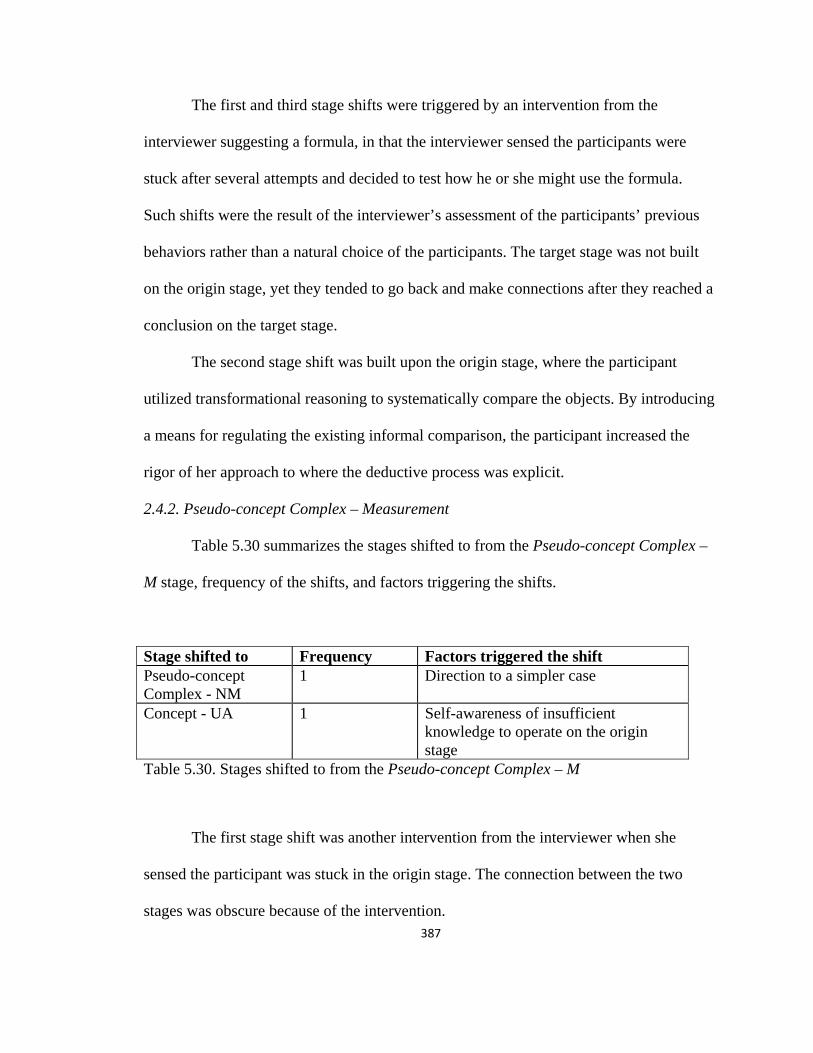
387
The first and third stage shifts were triggered by an intervention from the
interviewer suggesting a formula, in that the interviewer sensed the participants were
stuck after several attempts and decided to test how he or she might use the formula.
Such shifts were the result of the interviewer’s assessment of the participants’ previous
behaviors rather than a natural choice of the participants. The target stage was not built
on the origin stage, yet they tended to go back and make connections after they reached a
conclusion on the target stage.
The second stage shift was built upon the origin stage, where the participant
utilized transformational reasoning to systematically compare the objects. By introducing
a means for regulating the existing informal comparison, the participant increased the
rigor of her approach to where the deductive process was explicit.
2.4.2. Pseudo-concept Complex – Measurement
Table 5.30 summarizes the stages shifted to from the Pseudo-concept Complex –
M stage, frequency of the shifts, and factors triggering the shifts.
Stage shifted to Frequency Factors triggered the shift Pseudo-concept Complex - NM
1 Direction to a simpler case
Concept - UA 1 Self-awareness of insufficient knowledge to operate on the origin stage
Table 5.30. Stages shifted to from the Pseudo-concept Complex – M
The first stage shift was another intervention from the interviewer when she
sensed the participant was stuck in the origin stage. The connection between the two
stages was obscure because of the intervention.

388
The second stage shift was a result of the participant’s self-knowledge of
available tools for operation within the origin stage. The absence of the needed tool drove
him to seek an alternative approach where a tool was available. Two components were
considered as important in this type of shift. First, the participant had a preference for
using familiar tools rather than inventing a tool on the spot (e.g. imitating an unknown
formula based on a familiar formula). Second, the participant had an accurate knowledge
of what he did or did not know and constantly used this knowledge as a source of
regulating his behaviors. Among all the study participants, different degrees of such
knowledge were revealed. These included: not knowing what s/he didn’t know, to having
a general sense of what may not be correct, and robust knowledge of what s/he knew or
did not know.
2.4.4. Pseudo-concept Complex – Formula
Table 5.31 summarizes the stages shifted to from the Pseudo-concept Complex –
Formula stage, frequency of the shifts, and factors triggering the shifts.
Stage shifted to Frequency Factors triggered the shift Example-oriented Association Complex - UA
1 Can there be two answers to a problem?
Table 5.31. Stages shifted to from the Pseudo-concept Complex – Formula
The stage shift was triggered by a prompt and revealed unexpected information.
The original intention of the prompt was to ask the participant to evaluate the two
different answers obtained from two types of approaches on Concept - Unit area stage
and Pseudo-concept Complex - Formula stage to see which approach he trusted more (i.e.
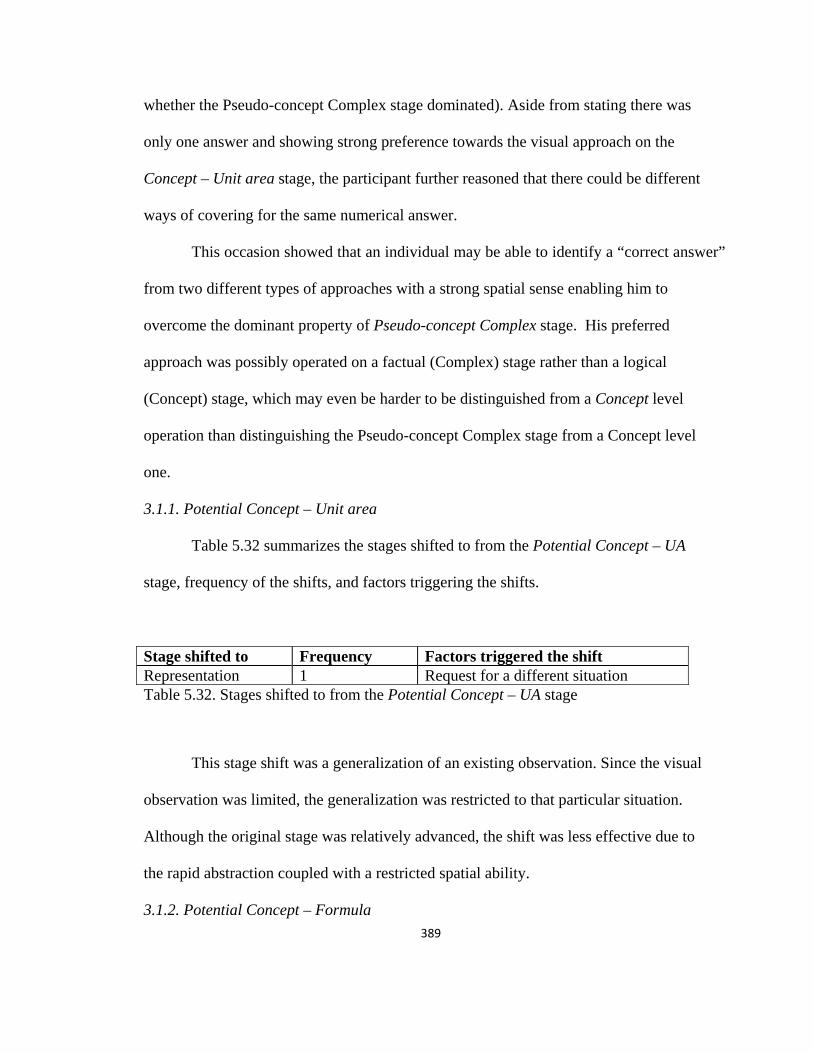
389
whether the Pseudo-concept Complex stage dominated). Aside from stating there was
only one answer and showing strong preference towards the visual approach on the
Concept – Unit area stage, the participant further reasoned that there could be different
ways of covering for the same numerical answer.
This occasion showed that an individual may be able to identify a “correct answer”
from two different types of approaches with a strong spatial sense enabling him to
overcome the dominant property of Pseudo-concept Complex stage. His preferred
approach was possibly operated on a factual (Complex) stage rather than a logical
(Concept) stage, which may even be harder to be distinguished from a Concept level
operation than distinguishing the Pseudo-concept Complex stage from a Concept level
one.
3.1.1. Potential Concept – Unit area
Table 5.32 summarizes the stages shifted to from the Potential Concept – UA
stage, frequency of the shifts, and factors triggering the shifts.
Stage shifted to Frequency Factors triggered the shift Representation 1 Request for a different situation Table 5.32. Stages shifted to from the Potential Concept – UA stage
This stage shift was a generalization of an existing observation. Since the visual
observation was limited, the generalization was restricted to that particular situation.
Although the original stage was relatively advanced, the shift was less effective due to
the rapid abstraction coupled with a restricted spatial ability.
3.1.2. Potential Concept – Formula
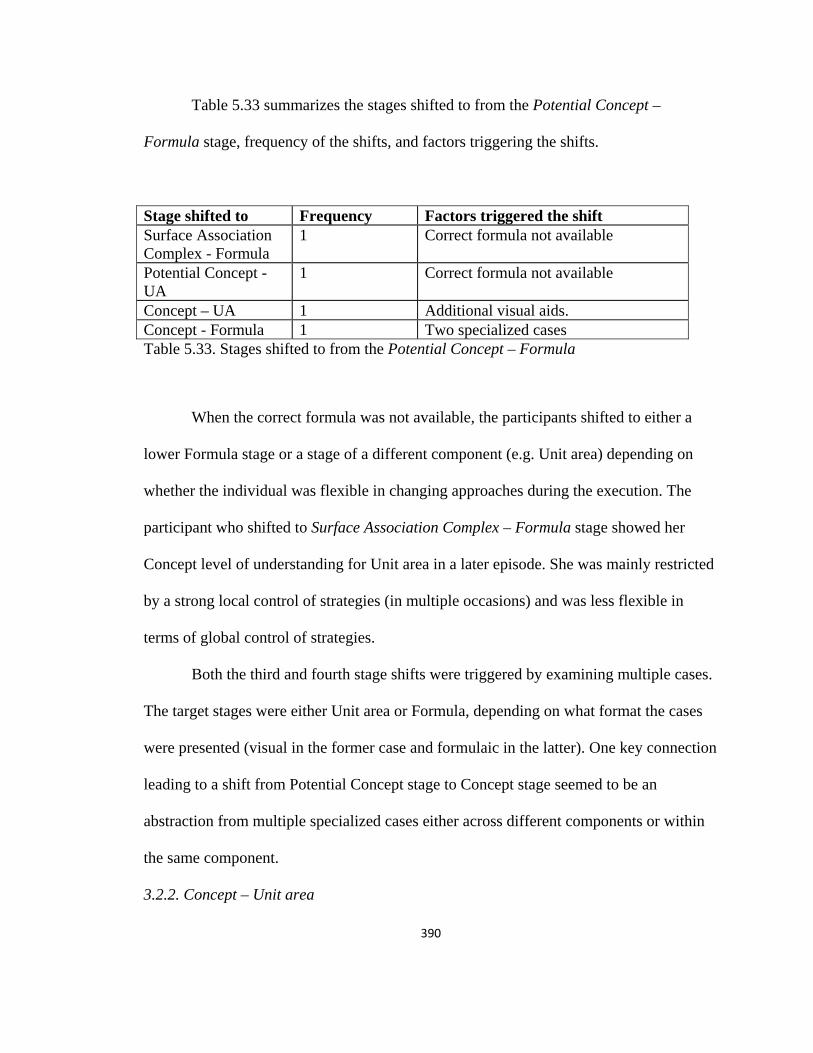
390
Table 5.33 summarizes the stages shifted to from the Potential Concept –
Formula stage, frequency of the shifts, and factors triggering the shifts.
Stage shifted to Frequency Factors triggered the shift Surface Association Complex - Formula
1 Correct formula not available
Potential Concept - UA
1 Correct formula not available
Concept – UA 1 Additional visual aids. Concept - Formula 1 Two specialized cases Table 5.33. Stages shifted to from the Potential Concept – Formula
When the correct formula was not available, the participants shifted to either a
lower Formula stage or a stage of a different component (e.g. Unit area) depending on
whether the individual was flexible in changing approaches during the execution. The
participant who shifted to Surface Association Complex – Formula stage showed her
Concept level of understanding for Unit area in a later episode. She was mainly restricted
by a strong local control of strategies (in multiple occasions) and was less flexible in
terms of global control of strategies.
Both the third and fourth stage shifts were triggered by examining multiple cases.
The target stages were either Unit area or Formula, depending on what format the cases
were presented (visual in the former case and formulaic in the latter). One key connection
leading to a shift from Potential Concept stage to Concept stage seemed to be an
abstraction from multiple specialized cases either across different components or within
the same component.
3.2.2. Concept – Unit area
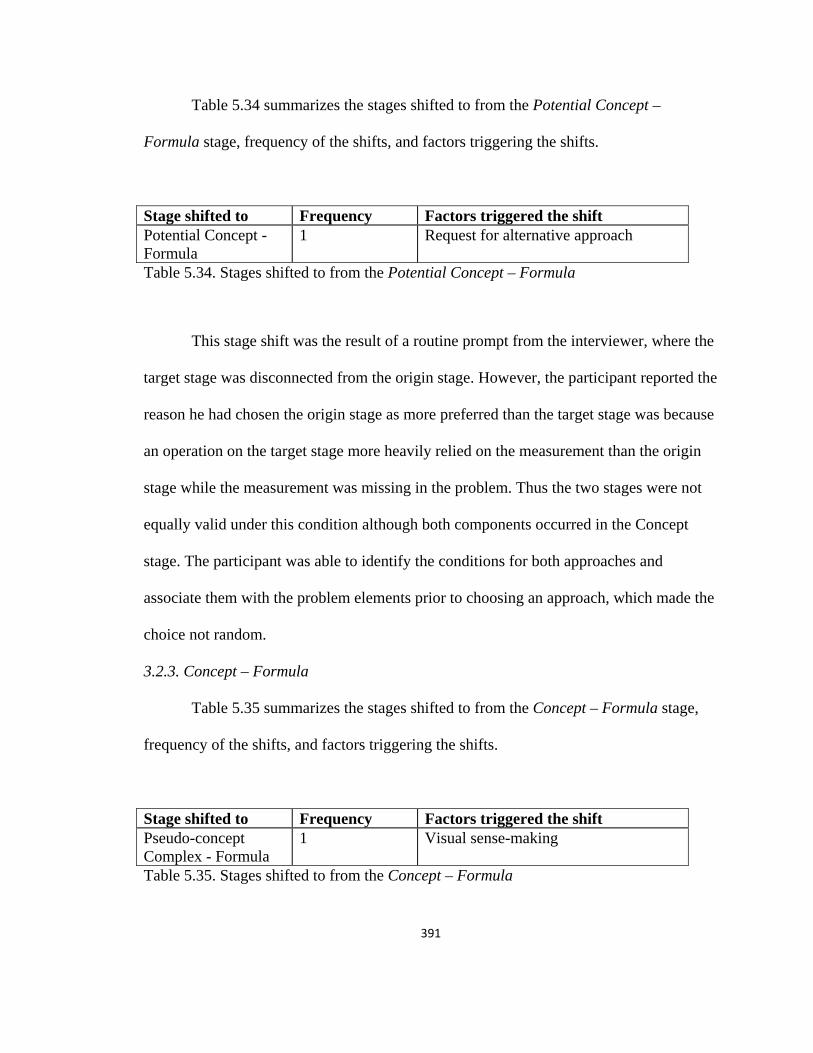
391
Table 5.34 summarizes the stages shifted to from the Potential Concept –
Formula stage, frequency of the shifts, and factors triggering the shifts.
Stage shifted to Frequency Factors triggered the shift Potential Concept - Formula
1 Request for alternative approach
Table 5.34. Stages shifted to from the Potential Concept – Formula
This stage shift was the result of a routine prompt from the interviewer, where the
target stage was disconnected from the origin stage. However, the participant reported the
reason he had chosen the origin stage as more preferred than the target stage was because
an operation on the target stage more heavily relied on the measurement than the origin
stage while the measurement was missing in the problem. Thus the two stages were not
equally valid under this condition although both components occurred in the Concept
stage. The participant was able to identify the conditions for both approaches and
associate them with the problem elements prior to choosing an approach, which made the
choice not random.
3.2.3. Concept – Formula
Table 5.35 summarizes the stages shifted to from the Concept – Formula stage,
frequency of the shifts, and factors triggering the shifts.
Stage shifted to Frequency Factors triggered the shift Pseudo-concept Complex - Formula
1 Visual sense-making
Table 5.35. Stages shifted to from the Concept – Formula
392
This stage shift was triggered by the participant’s desire to engage in visual sense
making. This attempt revealed a disconnect between her abstract formulaic reasoning and
concrete visual reasoning. Without advanced non-measurement reasoning, the participant
was only able to perform a concept level operation with formula without an
understanding of why it worked. The formulaic deduction was not enough to achieve
such an understanding.
Related concepts
Two concepts played an important role in the participants’ problem solving
processes: the concept of variable and transformational reasoning.
Variable.
The concept of variable was involved in the task elements in Problems 1 and 5,
where a variable was used to represent the condition of “equal measure.”
In Problem 1 the shapes were different and thus the participants were required to
take this condition into consideration either implicitly or explicitly. Individuals with low
level of concept stage of variable tended to deliberately ignore the variable (to avoid
being confused) or unintentionally neglect it (and solely rely on visual evidence). If the
individual had a relatively developed concept stage for non-measurement reasoning, such
behaviors were effective. However, if one was pushed to consider the variable and his/her
thinking process became distracted, such behaviors were unproductive.
Individuals with medium level of concept stage of variable tended to naturally
substitute a number and examine a specific situation. Whether s/he was aware that
different numbers would lead to the same conclusion was not a part of the regular prompt
from the interviewer.
393
Individuals with relatively high level of concept stages of variable should have
been able to justify that the conclusion remains the same with different numbers or
directly operate with the variable. If the individual was aware of the inconstant property
of variable yet failed to relate the variable to the condition of “equal measure,” such
awareness could prevent her/him from tackling the problem with any specific number,
which was a drawback rather than an effective metacognitive control.
In Problem 5 the condition of “equal measure” was less difficult for the
participants to understand in that the objects were two identical squares. They should
have been able to visually identify and understand the condition despite their stage of
concept development of variable. This is considered as one of the reasons why the
participants performed better in Problem 5 than in Problem 2 whereas the cognitive
demands in the former were relatively higher.
Transformational reasoning.
The concept of transformational reasoning was revealed in Problems 1, 2, 3, and 5.
If the concept of variable played an important role in the strategy selection process, then
the concept of transformation reasoning played an assisting role in the strategy execution
process. Thus its effectiveness was more dependent on the developmental stages of the
concept of area.
If a participant was operating at a low concept stage of area, the transformational
reasoning appeared as an unsupported “insight.” The relations embedded within the area
concept stage were too disconnected and limited that the individual was not able to justify
such an insight even if the insight might be effective and promising.
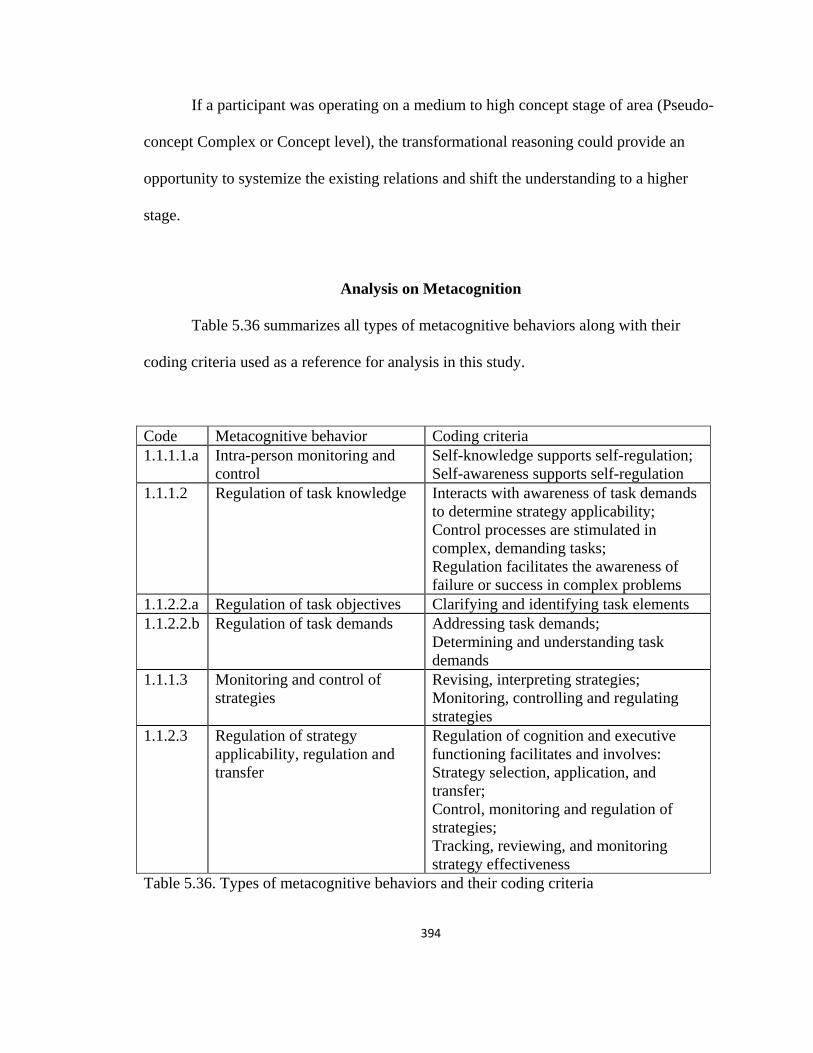
394
If a participant was operating on a medium to high concept stage of area (Pseudo-
concept Complex or Concept level), the transformational reasoning could provide an
opportunity to systemize the existing relations and shift the understanding to a higher
stage.
Analysis on Metacognition
Table 5.36 summarizes all types of metacognitive behaviors along with their
coding criteria used as a reference for analysis in this study.
Code Metacognitive behavior Coding criteria 1.1.1.1.a Intra-person monitoring and
control Self-knowledge supports self-regulation; Self-awareness supports self-regulation
1.1.1.2 Regulation of task knowledge Interacts with awareness of task demands to determine strategy applicability; Control processes are stimulated in complex, demanding tasks; Regulation facilitates the awareness of failure or success in complex problems
1.1.2.2.a Regulation of task objectives Clarifying and identifying task elements 1.1.2.2.b Regulation of task demands Addressing task demands;
Determining and understanding task demands
1.1.1.3 Monitoring and control of strategies
Revising, interpreting strategies; Monitoring, controlling and regulating strategies
1.1.2.3 Regulation of strategy applicability, regulation and transfer
Regulation of cognition and executive functioning facilitates and involves: Strategy selection, application, and transfer; Control, monitoring and regulation of strategies; Tracking, reviewing, and monitoring strategy effectiveness
Table 5.36. Types of metacognitive behaviors and their coding criteria
395
In the first part of this section, each type of metacognitive behavior will be
analyzed pertaining to the functions they served and the factors that made them effective.
In the second part of the section, the study participants’ systems of metacognitive
behaviors will be reviewed.
Factors for effectiveness
1.1.1.1.a. Intra-person monitoring and control
Table 5.37 summarizes the functions, frequencies, and consequences of all
occasions for intra-person monitoring and control detected from the study participants.
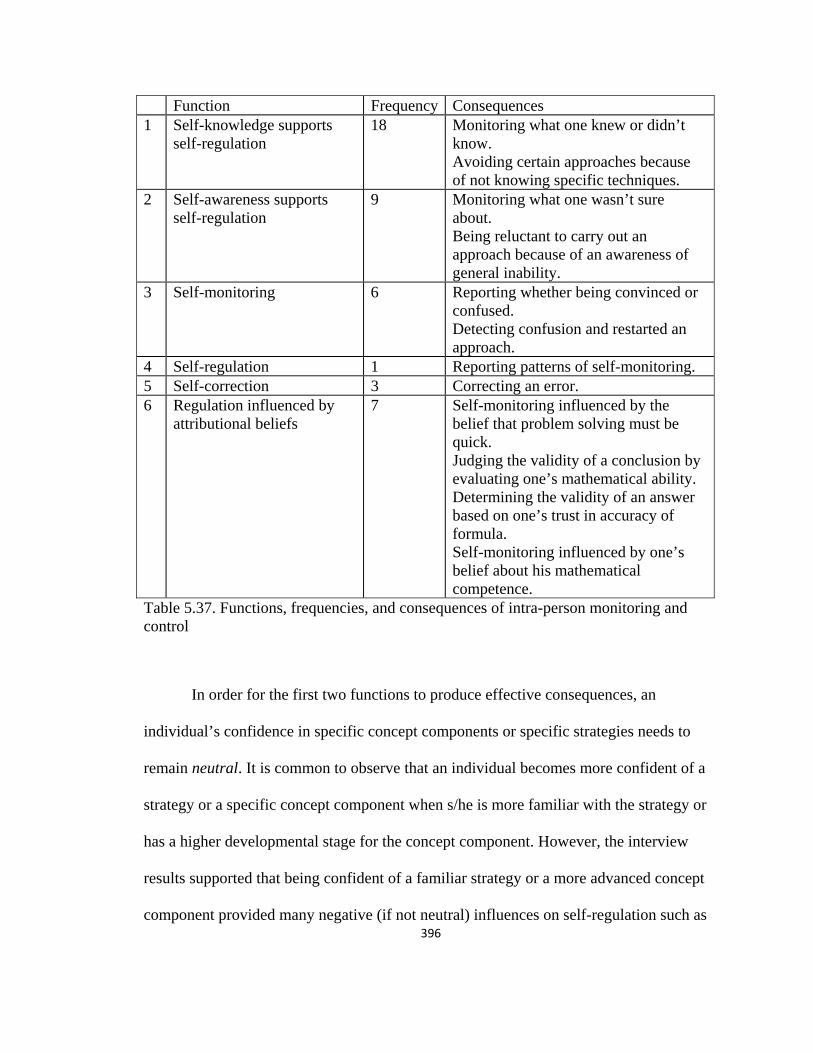
396
Function Frequency Consequences 1 Self-knowledge supports
self-regulation 18 Monitoring what one knew or didn’t
know. Avoiding certain approaches because of not knowing specific techniques.
2 Self-awareness supports self-regulation
9 Monitoring what one wasn’t sure about. Being reluctant to carry out an approach because of an awareness of general inability.
3 Self-monitoring 6 Reporting whether being convinced or confused. Detecting confusion and restarted an approach.
4 Self-regulation 1 Reporting patterns of self-monitoring. 5 Self-correction 3 Correcting an error. 6 Regulation influenced by
attributional beliefs 7 Self-monitoring influenced by the
belief that problem solving must be quick. Judging the validity of a conclusion by evaluating one’s mathematical ability. Determining the validity of an answer based on one’s trust in accuracy of formula. Self-monitoring influenced by one’s belief about his mathematical competence.
Table 5.37. Functions, frequencies, and consequences of intra-person monitoring and control
In order for the first two functions to produce effective consequences, an
individual’s confidence in specific concept components or specific strategies needs to
remain neutral. It is common to observe that an individual becomes more confident of a
strategy or a specific concept component when s/he is more familiar with the strategy or
has a higher developmental stage for the concept component. However, the interview
results supported that being confident of a familiar strategy or a more advanced concept
component provided many negative (if not neutral) influences on self-regulation such as
397
overlooking errors and lower strategy flexibility. Low confidence negatively influenced
self-regulation as well, where it mostly prevented an individual from trying an approach
that may or may not work.
Among the five study participants, the only individual who exhibited neutral
confidence/preference on all concept components and strategies (despite her advanced
operations on all components for rectangles which were mostly her alternative choices)
was Shana. She chose a concept stage or a strategy to work on primarily based on her
understanding of the problem and did not exhibit preference towards a specific
component/strategy. She performed exceptionally well compared to the other participants
who were assessed as having higher concept developmental stages than she. She was also
the one who displayed the least number of occasions of intra-person monitoring and
control.
For the third, fourth, and fifth functions to produce effective consequences, an
individual needs to be sensitive to doubts towards the problems, the approaches, or the
answers. To maintain such sensitivity, the individual should not rely on authority or
schemata during problem solving processes. A non-Heap stage is required for doubts to
both exist and be manageable.
The effectiveness of the consequences of the last function largely varied. The
same belief (despite whether the belief itself seemed positive, neutral, or negative)
generated positive or negative influences on self-regulation under different contexts. A
general pattern was that when a participant was less influenced by attributional beliefs,
his/her problem solving performance tended to be more stable (and better in this study).
1.1.1.2. Regulation of task knowledge
398
This type of metacognitive behavior was less observed in the interviews. The
function was less diverse while the consequences were mostly distinct. It is the most
complex and situated one since it incorporates other types of metacognitive behaviors
(mostly monitoring and control of task objectives/demands and monitoring of strategies)
which have their own complex factors for effectiveness. The occasions from the
participants were not enough to conjecture any pattern or factor for this type of
metacognitive behavior.
1.1.2.2.a. Regulation of task objectives
This type of metacognitive behavior had less diverse functions and fewer
consequences despite its moderate frequency of appearance in the interviews. For some
participants task objectives tended to be reflected in their choices of strategies rather than
explicitly addressed; such phenomenon did not interfere with the identification of factors
for effectiveness. Two factors were distinguished from the data.
The first factor was when the regulation of task elements/objectives happened.
Four of the participants tended to go through task elements/objectives and identify as
many task elements and objectives as they could before attempting to solve a problem,
while one participant always started acting on a piece of information as soon as he
understood it and then increased his understanding of other pieces when he had to.
Although the effectiveness of the former pattern (thorough regulation of task objectives)
varied based on how many elements/objectives an individual was able to identify, the
latter pattern (cumulative regulation of task objectives) was generally less effective as
described below.

399
First, when a problem involved relatively complex elements and/or objectives, the
pattern of cumulative regulation of task objectives tended to hinder the participant from
initiating an effective attempt (provided that this participant had an advanced concept
developmental status and the lack of sufficient task elements became the major obstacle
for his choice of strategy). For the individual who had the pattern of cumulative
regulation, the only occasion where he identified all task elements and objectives before
he attempted the problem, he was not able to handle the complexity of information and
was too frustrated/confused to proceed in problem solving. Having been assessed as
having an advanced concept developmental status, the individual’s performance was at a
lower level compared to other participants. Another aspect was that without a relatively
thorough understanding of task elements, it was more likely to be distracted by “non-task
elements” that were identified by the individual for the purpose of distinguishing from
the real task elements and lead to the phenomenon of “correctly solving the wrong
problem.”
The second factor was whether an individual deliberately/strategically ignored
certain task elements/objectives. One participant self-reported his pattern of regulation of
task elements, where he deliberately ignored task elements that he did not know how to
use in order to avoid being confused and “throwing his answers off.” If the participants
were forced to consider the overlooked task elements (either deliberately ignored or due
to low regulation ability), their thinking process tended to become less effective. This
deliberate processing of task elements is especially effective if an individual has a limited
concept developmental status for relevant concepts but a more advanced status for the
400
primary concept involved in the problem, where the latter can be used to complement the
missing information from the former.
1.1.2.2.b. Regulation of task demands
Similar to the regulation of task knowledge, this type of metacognitive behavior
was less frequently observed and not even detected from the two female participants. It
integrated with intra-person monitoring and regulation of strategy and was highly situated.
Most of regulation of task demands were considered as being “determined and
understood” through strategy selection instead of being “addressed” explicitly. To obtain
more information on this type of metacognitive behavior to conjecture a pattern or factor,
it requires the use of more challenging problems (such as Problems 2 and 5) and
deliberate prompt (for example “what would you need to know to solve the problem”)
from the interviewer.
1.1.1.3. Monitoring and control of strategies
Table 5.38 summarizes the functions, frequencies, and consequences of all
occasions for monitoring and control of strategies detected from the study participants.
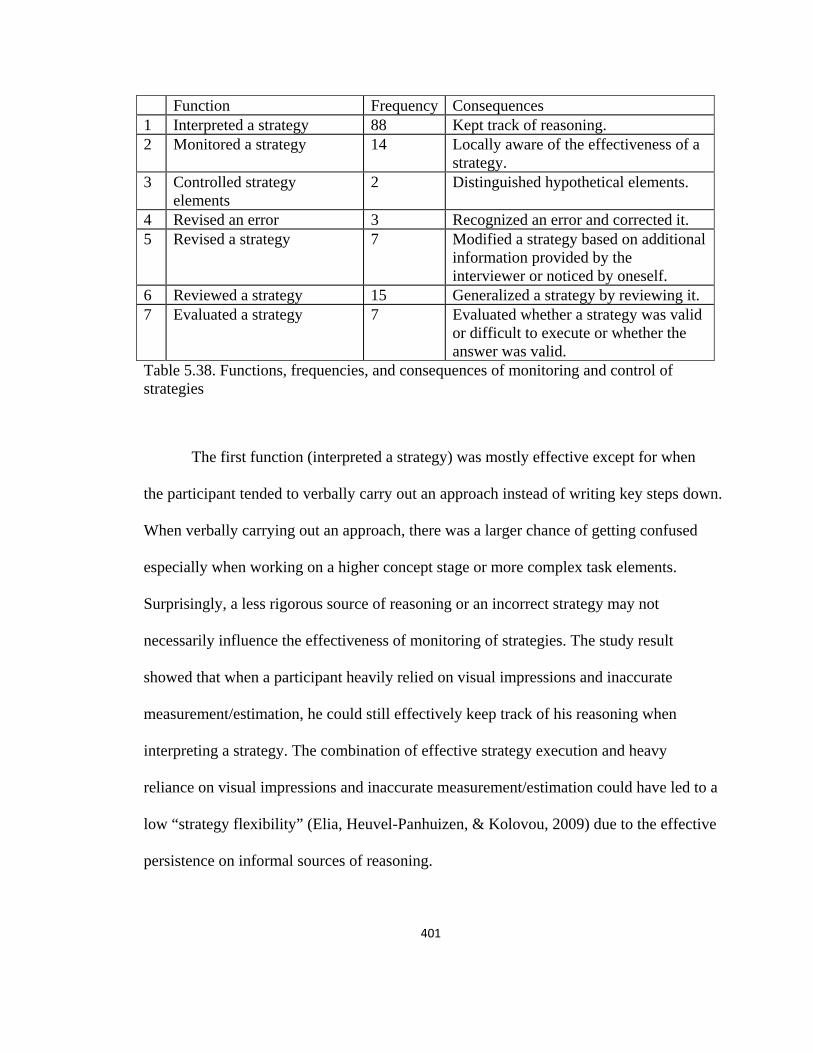
401
Function Frequency Consequences 1 Interpreted a strategy 88 Kept track of reasoning. 2 Monitored a strategy 14 Locally aware of the effectiveness of a
strategy. 3 Controlled strategy
elements 2 Distinguished hypothetical elements.
4 Revised an error 3 Recognized an error and corrected it. 5 Revised a strategy 7 Modified a strategy based on additional
information provided by the interviewer or noticed by oneself.
6 Reviewed a strategy 15 Generalized a strategy by reviewing it. 7 Evaluated a strategy 7 Evaluated whether a strategy was valid
or difficult to execute or whether the answer was valid.
Table 5.38. Functions, frequencies, and consequences of monitoring and control of strategies
The first function (interpreted a strategy) was mostly effective except for when
the participant tended to verbally carry out an approach instead of writing key steps down.
When verbally carrying out an approach, there was a larger chance of getting confused
especially when working on a higher concept stage or more complex task elements.
Surprisingly, a less rigorous source of reasoning or an incorrect strategy may not
necessarily influence the effectiveness of monitoring of strategies. The study result
showed that when a participant heavily relied on visual impressions and inaccurate
measurement/estimation, he could still effectively keep track of his reasoning when
interpreting a strategy. The combination of effective strategy execution and heavy
reliance on visual impressions and inaccurate measurement/estimation could have led to a
low “strategy flexibility” (Elia, Heuvel-Panhuizen, & Kolovou, 2009) due to the effective
persistence on informal sources of reasoning.
402
Due to the local nature of the second function (monitored a strategy), the
effectiveness of consequences mainly depended on whether the individual was operating
on relatively higher concept stages. Without this prerequisite, the use of this function
might be effective (such as navigating among multiple situations within a problem and
solving the easiest one that the approach was applied to or improving the validity of an
approach to support previous conjecture), yet the act may not lead to an effective
consequence due to the restriction of low concept stages.
The occasions of the third and fourth functions (controlled strategy elements and
revised an error) were not sufficient to identify potential factors to the effectiveness of
consequences. Yet two comments can be made. 1) For the third function, an individual
did not have to work on a correct strategy or a higher level concept stage to be able to
distinguish hypothetical elements for the approach. It seemed to be a conscious reflection
on the first function (which was also not necessarily influenced by an incorrect strategy).
2) The fourth function required a relatively high sensitivity to the validity of the approach
(e.g. being suspicious about the approach). If the individual had strong trust/confidence in
the approach, s/he was less likely to detect an error.
The last three functions (revised a strategy, reviewed a strategy, and evaluated a
strategy) always generated effective consequences. It seemed that a self-initiated
occasion of the functions may guarantee the effectiveness. The acts of modification,
generalization, and evaluation required a broader control (but not as broad as the global
control) of the strategies than the previous four functions. The research study documented
typical components that could potentially trigger these acts, such as introduction of
contradicting/missing information (revision), examination of multiple varied cases
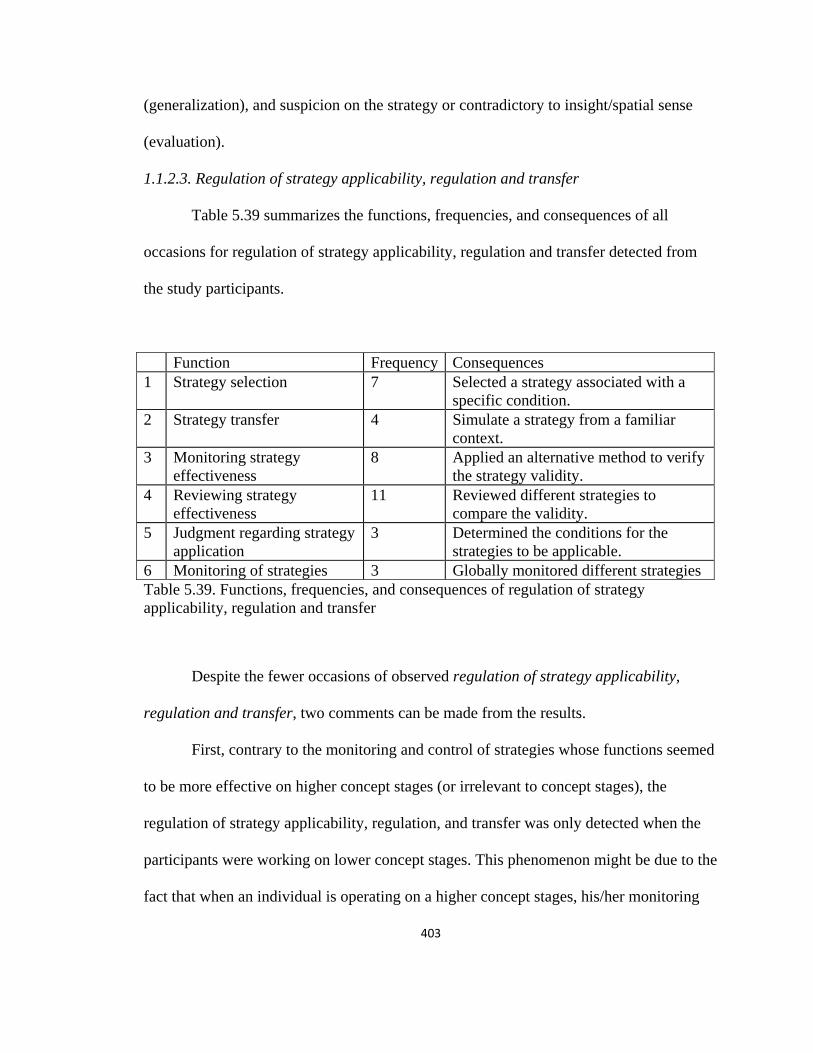
403
(generalization), and suspicion on the strategy or contradictory to insight/spatial sense
(evaluation).
1.1.2.3. Regulation of strategy applicability, regulation and transfer
Table 5.39 summarizes the functions, frequencies, and consequences of all
occasions for regulation of strategy applicability, regulation and transfer detected from
the study participants.
Function Frequency Consequences 1 Strategy selection 7 Selected a strategy associated with a
specific condition. 2 Strategy transfer 4 Simulate a strategy from a familiar
context. 3 Monitoring strategy
effectiveness 8 Applied an alternative method to verify
the strategy validity. 4 Reviewing strategy
effectiveness 11 Reviewed different strategies to
compare the validity. 5 Judgment regarding strategy
application 3 Determined the conditions for the
strategies to be applicable. 6 Monitoring of strategies 3 Globally monitored different strategies Table 5.39. Functions, frequencies, and consequences of regulation of strategy applicability, regulation and transfer
Despite the fewer occasions of observed regulation of strategy applicability,
regulation and transfer, two comments can be made from the results.
First, contrary to the monitoring and control of strategies whose functions seemed
to be more effective on higher concept stages (or irrelevant to concept stages), the
regulation of strategy applicability, regulation, and transfer was only detected when the
participants were working on lower concept stages. This phenomenon might be due to the
fact that when an individual is operating on a higher concept stages, his/her monitoring

404
and control of strategies is more effective and s/he tends to stay with the approach and
trust the result due to the strong local control. But when an individual is operating on a
lower concept stages, his/her local monitoring and control of strategies may become less
effective and thus s/he may feel the need of a global control to ensure the validity and
rationale of strategy execution.
However, this explanation requires an individual to have a sense of whether
his/her local control is effective or not in order to initiate a global control to complement.
Based on the study results, possible sources for this to happen included an advanced
spatial sense, a moderate distrust of strategies (strong distrust would hinder the strategy
execution), and a need to communicate one’s reasoning process. All the participants
tended to report global control on task when any of these sources were evident even when
they operated on a lower concept stage.
Second, all the functions of this type of metacognitive behaviors were effective in
terms of advancing one’s thinking process, increasing the validity of an approach,
rationalizing the execution of a strategy, or improving the efficiency of communication
despite the concept stages upon which they operated. However, due to the nature of lower
concept stages, these effective actions may not necessarily lead to effective results. The
strategy selection may lead to effective shifts of stages, yet the stages to which they were
shifted may not be effective. The strategy transfer may be effective but the transferred
strategy may not be. The monitoring of effectiveness may be effective but the method to
verify the validity may not be. The monitoring of different strategies may be effective but
the conclusion may not be. If a global control was not associated with any specific stages
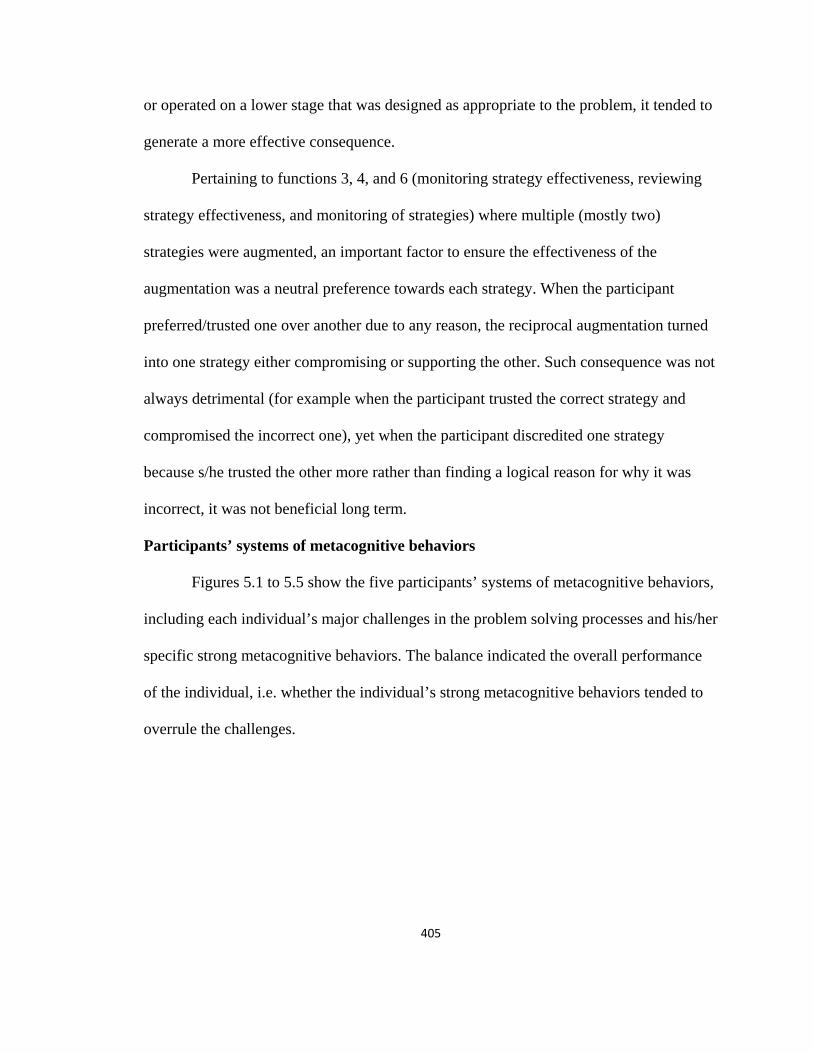
405
or operated on a lower stage that was designed as appropriate to the problem, it tended to
generate a more effective consequence.
Pertaining to functions 3, 4, and 6 (monitoring strategy effectiveness, reviewing
strategy effectiveness, and monitoring of strategies) where multiple (mostly two)
strategies were augmented, an important factor to ensure the effectiveness of the
augmentation was a neutral preference towards each strategy. When the participant
preferred/trusted one over another due to any reason, the reciprocal augmentation turned
into one strategy either compromising or supporting the other. Such consequence was not
always detrimental (for example when the participant trusted the correct strategy and
compromised the incorrect one), yet when the participant discredited one strategy
because s/he trusted the other more rather than finding a logical reason for why it was
incorrect, it was not beneficial long term.
Participants’ systems of metacognitive behaviors
Figures 5.1 to 5.5 show the five participants’ systems of metacognitive behaviors,
including each individual’s major challenges in the problem solving processes and his/her
specific strong metacognitive behaviors. The balance indicated the overall performance
of the individual, i.e. whether the individual’s strong metacognitive behaviors tended to
overrule the challenges.
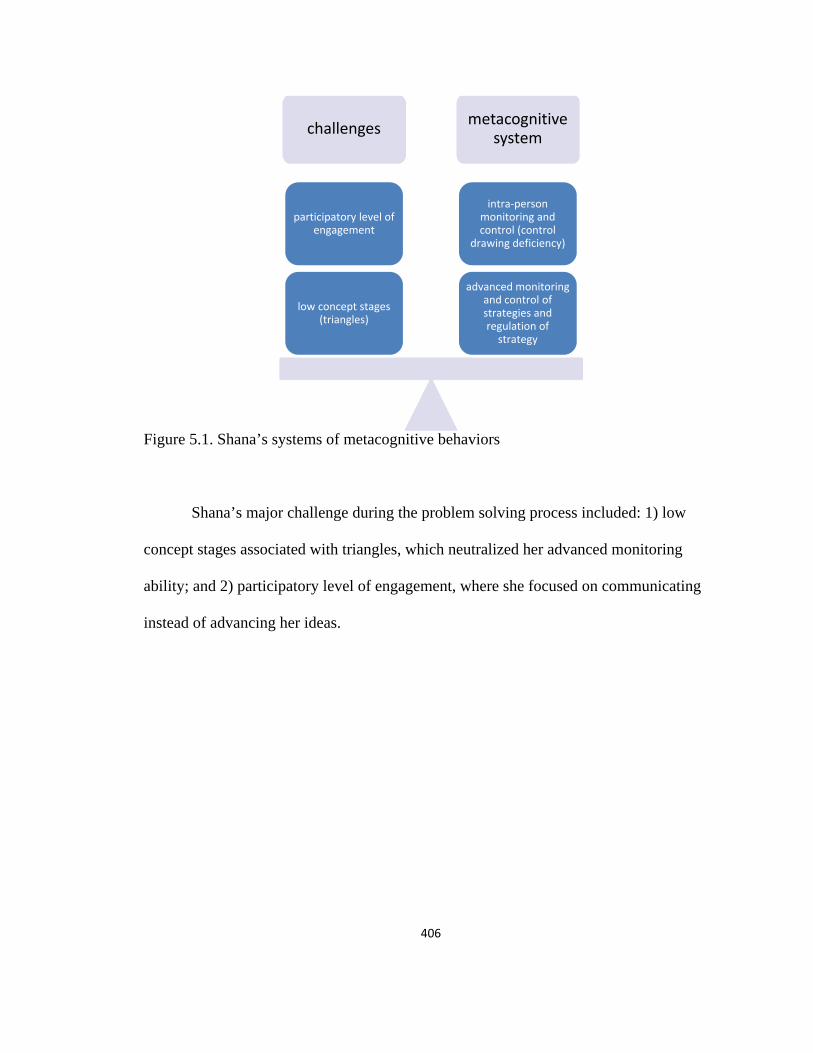
406
Figure 5.1. Shana’s systems of metacognitive behaviors
Shana’s major challenge during the problem solving process included: 1) low
concept stages associated with triangles, which neutralized her advanced monitoring
ability; and 2) participatory level of engagement, where she focused on communicating
instead of advancing her ideas.
challenges metacognitive system
advanced monitoring and control of strategies and regulation of
strategy
intra-person monitoring and control (control
drawing deficiency)
low concept stages (triangles)
participatory level of engagement

407
Figure 5.2. Sandy’s systems of metacognitive behaviors
The major challenge for Sandy was her strong intra-person monitoring and
control which could make her aware of what she did not know or was not sure; it
restrained her behaviors of monitoring and regulation of strategies which were highly
effective when less suppressed.
challenge metacognitive system
intra-person monitoring and control which
monitored what she did not know or was not sure
Advanced monitoring and
control of strategies and regulation of
strategy: modifying, evaluating,
executing, and generalizing
strategies
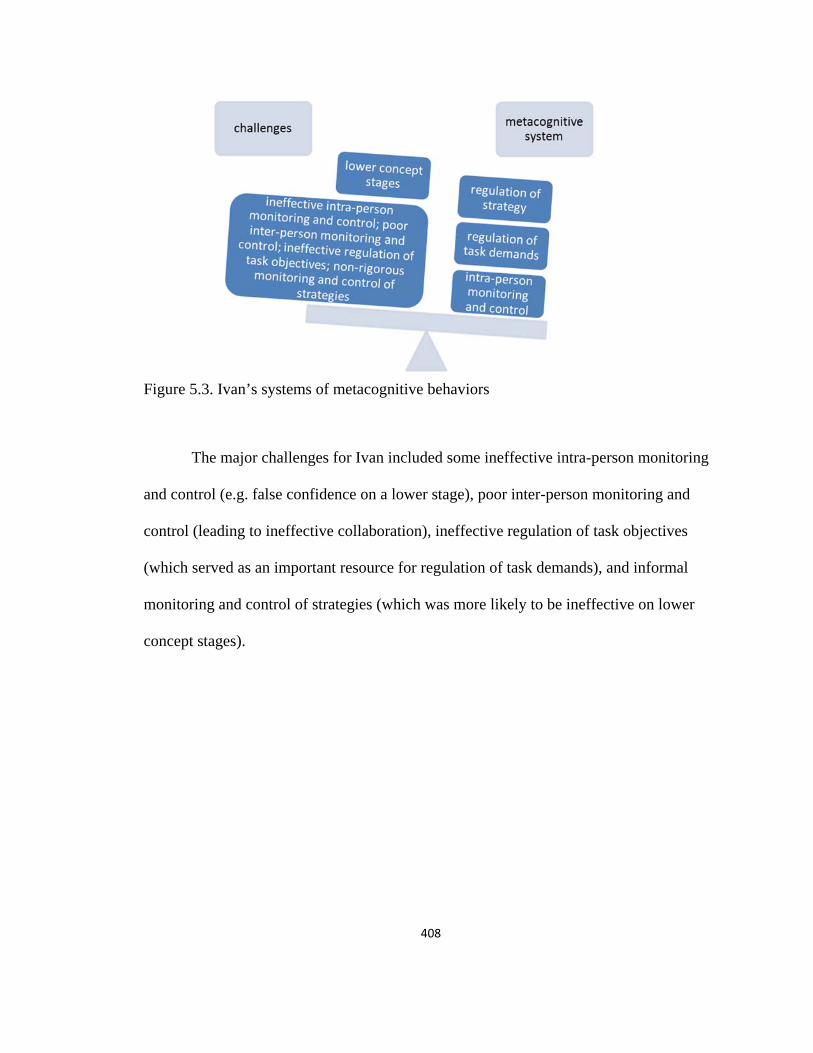
408
Figure 5.3. Ivan’s systems of metacognitive behaviors
The major challenges for Ivan included some ineffective intra-person monitoring
and control (e.g. false confidence on a lower stage), poor inter-person monitoring and
control (leading to ineffective collaboration), ineffective regulation of task objectives
(which served as an important resource for regulation of task demands), and informal
monitoring and control of strategies (which was more likely to be ineffective on lower
concept stages).
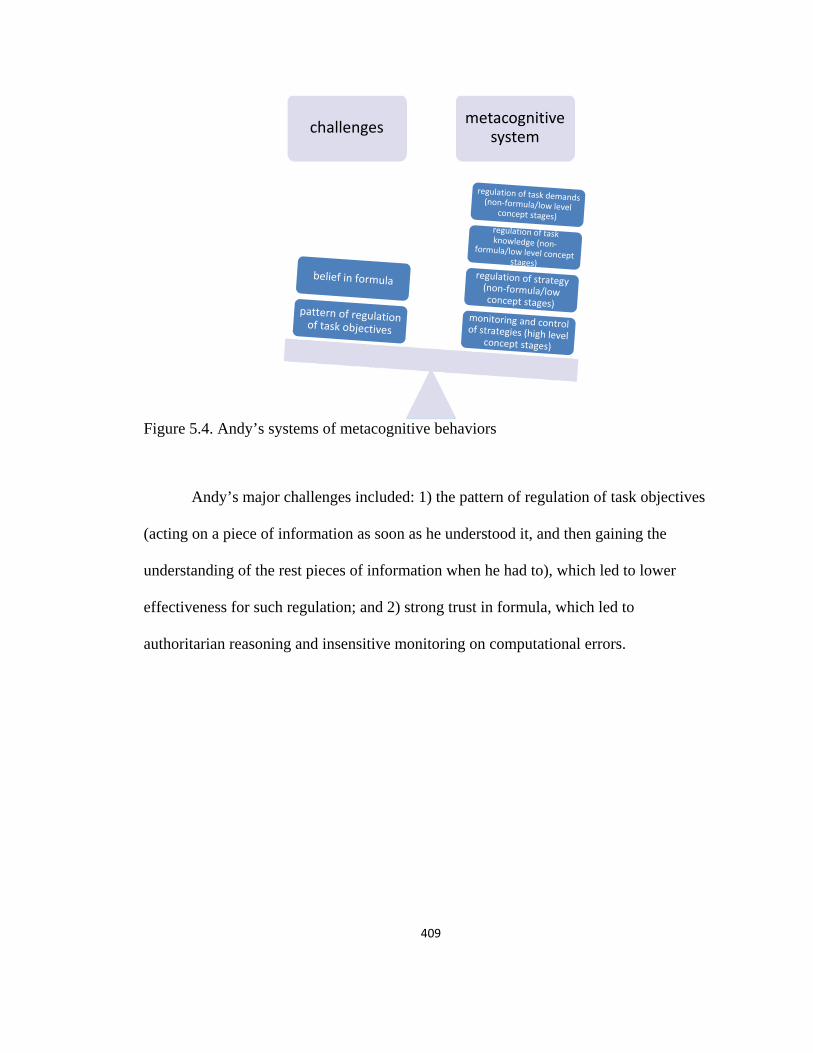
409
Figure 5.4. Andy’s systems of metacognitive behaviors
Andy’s major challenges included: 1) the pattern of regulation of task objectives
(acting on a piece of information as soon as he understood it, and then gaining the
understanding of the rest pieces of information when he had to), which led to lower
effectiveness for such regulation; and 2) strong trust in formula, which led to
authoritarian reasoning and insensitive monitoring on computational errors.
challenges metacognitive system
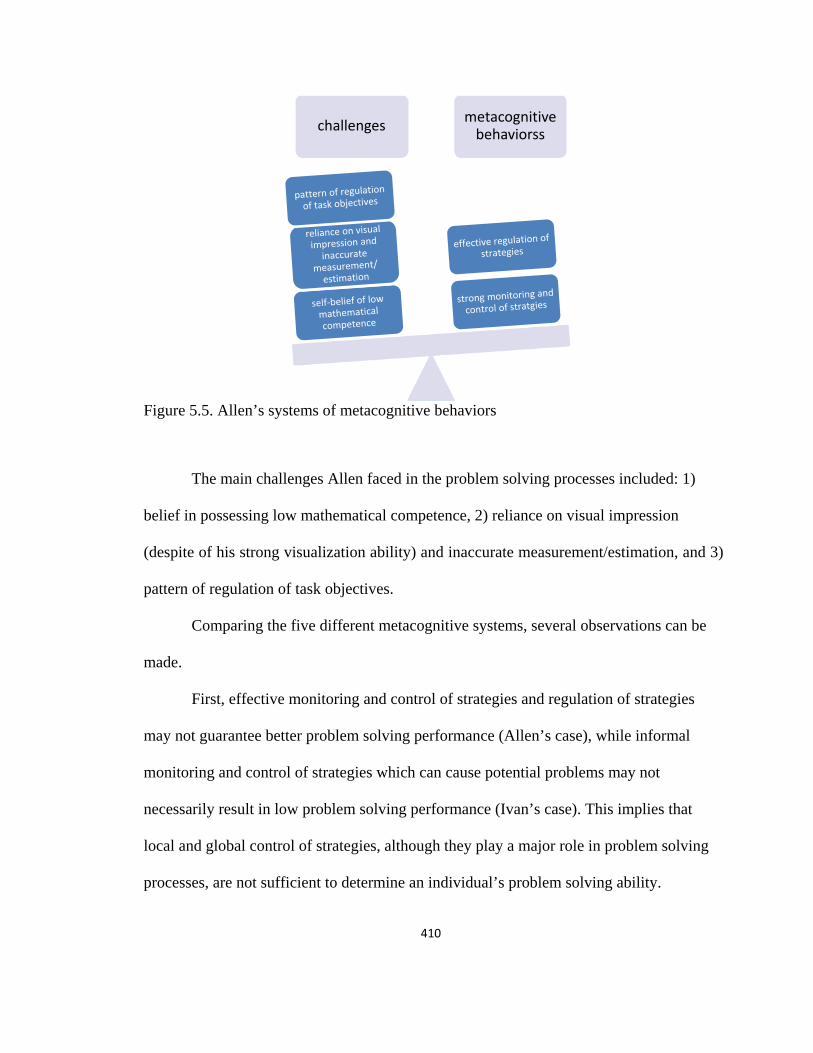
410
Figure 5.5. Allen’s systems of metacognitive behaviors
The main challenges Allen faced in the problem solving processes included: 1)
belief in possessing low mathematical competence, 2) reliance on visual impression
(despite of his strong visualization ability) and inaccurate measurement/estimation, and 3)
pattern of regulation of task objectives.
Comparing the five different metacognitive systems, several observations can be
made.
First, effective monitoring and control of strategies and regulation of strategies
may not guarantee better problem solving performance (Allen’s case), while informal
monitoring and control of strategies which can cause potential problems may not
necessarily result in low problem solving performance (Ivan’s case). This implies that
local and global control of strategies, although they play a major role in problem solving
processes, are not sufficient to determine an individual’s problem solving ability.
challenges metacognitive behaviorss
411
Second, regulations of task demands and objectives play a more influential
compared to the other types of metacognitive behaviors on problem solving performance.
Between the two, regulation of task demands seems to have a larger influence than
regulation of task elements on mathematical problem solving performance. In other
words, if one is able to effectively determine the task demands, s/he may have a better
problem solving performance even with a less effective pattern of identification of task
elements (e.g. cumulative regulation of task objectives). This implies that having a sense
of what might be needed to solve the problem (but may not necessarily have the tool or
information at hand) is more beneficial than being able to effectively identify task
elements prior to solving the problem.
Third, personal beliefs or preference for specific components can be challenging
(if not neutral) for the participants. For specific situations, being doubtful of self-
competence may raise an individual’s skeptism of correction of what s/he does and force
sensitivity to potential mistakes, yet it could also hinder him/her from trying something
s/he believes s/he cannot do. One type of intervention provided by the interviewer was to
help the participants overcome their negative self-image as mathematicians, which
generated rich information about what they were able to produce if the intervention was
successful. Personal preference had the same effect, which had both negative and positive
influence on the participants’ problem solving behaviors. Yet, it was less altered by the
interviewer.
Last but not the least, for the participants in this study, low concept
developmental stages did not seem to be a key challenge in problem solving process. The
participant who was assessed as having a low concept development had a balanced
412
overall performance, while another participant, who was assessed as having a varied
concept development, had a negative overall performance (the other two participants with
varied development had a balanced and a positive overall performance). Aside from the
possibility of inaccurate measure of pre-test items, I argue that concept stages play a far
more complex role in the problem solving processes as analyzed in the previous section.
The potential relationship between concept stages and metacognitive behaviors will be
discussed in the next session.
Analysis on Relationship between Stage and Metacognition
Building on the analyses in the previous three sections, this section will abstract
and elaborate on the relationship between the metacognitive behaviors and the concept
stages at two levels: macro level and micro level.
Macro level
Figure 5.6 outlines the macro relationship between concepts and metacognition
within a problem solving process. Arrows indicate the influence from one element to
another.
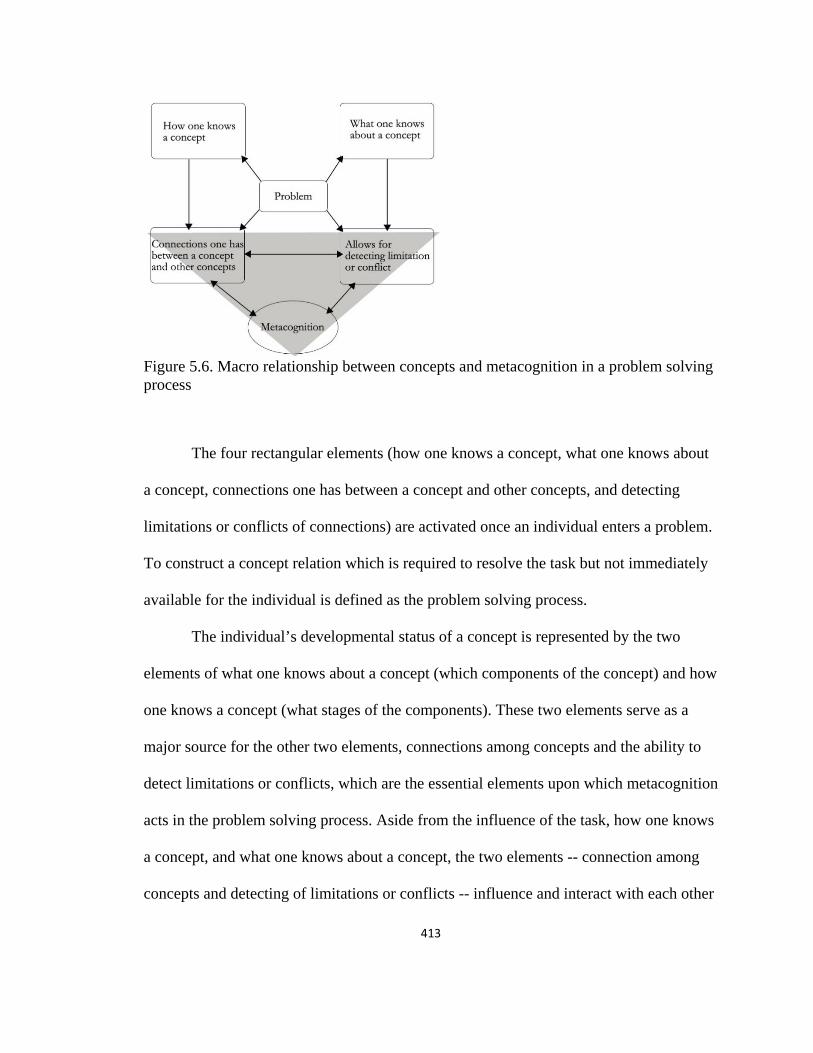
413
Figure 5.6. Macro relationship between concepts and metacognition in a problem solving process
The four rectangular elements (how one knows a concept, what one knows about
a concept, connections one has between a concept and other concepts, and detecting
limitations or conflicts of connections) are activated once an individual enters a problem.
To construct a concept relation which is required to resolve the task but not immediately
available for the individual is defined as the problem solving process.
The individual’s developmental status of a concept is represented by the two
elements of what one knows about a concept (which components of the concept) and how
one knows a concept (what stages of the components). These two elements serve as a
major source for the other two elements, connections among concepts and the ability to
detect limitations or conflicts, which are the essential elements upon which metacognition
acts in the problem solving process. Aside from the influence of the task, how one knows
a concept, and what one knows about a concept, the two elements -- connection among
concepts and detecting of limitations or conflicts -- influence and interact with each other
414
so to construct reliable connections in search for the desired relation to answer the
problem. Metacognition kicks in during this interaction. The interactions among the three
form a cycle which is the shaded region (the Action Zone) in Figure 3.
During the constructing process, metacognitive behaviors facilitate both the
retrieval of connections among concepts and the detection of limitations or conflicts
among connections. Meanwhile, the connections among concepts that are available to the
individual and his/her capacity to detect limitations and conflicts influence the
effectiveness of consequences of the metacognitive behaviors. A successful problem
solving activity is defined as the construction of a desired relation through the
interactions among the three components in the Action Zone.
Due to the nature of the problem solving setting, how and what one knows about a
concept mainly serve as sources in such processes. They determine the starting point of
activity and how far an individual may proceed by operating in the Action Zone with
one’s existing sources. The potential change of these two is a natural product of complex
operations on existing stages rather than a goal of the individual.
For example, suppose the problem involves the concept of area of triangles. “How
one knows a concept” can involve one’s knowledge of what the formula means (b, h,
etc.); “what one knows about a concept” is whether the individual is familiar with the
image and/or the formula; “connections one has between a concept and other concepts”
could be the area of rectangles, the height of triangles, or other related concepts
embedded in the problem. The latter two influence an individual’s ability to detect
limitation or conflict of sources available for him/her to solve the problem, and the
415
detected limitation or conflict informs the individual to revise or seek for alternative
connections.
Going back to the observation where low concept development stages did not
seem to be a key challenge in problem solving processes, this flowchart could provide
two reasons for the phenomenon. First what/how one knows about a concept mainly
determines the starting point and how far an individual could proceed by operating within
the Action Zone (i.e. central interactions between concept and metacognition during a
problem solving process) with his/her existing sources. During the interviews, the
researcher provided prompts and information (in order to learn how far each participant
could go with his/her current metacognitive ability) which allowed the individual to
operate on sources beyond what s/he essentially knew. Thus the observation of “low
concept development stages not being a key challenge” could only imply that an
individual with a lower concept developmental status may have the potential to achieve
outstanding problem solving performance (i.e. sophisticated and successful operations in
the Action Zone) if appropriate resources/scaffolding are provided by a more
knowledgeable peer. Some participants were indeed less sensitive to the interviewer’s
prompts and were more restricted by what/how s/he knew about a concept.
The second reason is that the “low concept development stages” were assessed
pertaining to the general concept of area (pretest design). During the interviews, the
participants exhibited more complex developmental status across related concepts such as
triangle, rectangle, height, irregular polygon, etc. An individual with a low concept
developmental status of area for triangles could have a high concept developmental status
of area for rectangles (e.g. Shana); or s/he could have varied developmental stages for
416
different components of each shape. Such complexity is mainly due to the
epistemological difference between the related concepts (e.g. geometric shapes) and is
beyond the scope of this study. The pretest was designed to capture different
developmental stages for three area components (non-measurement, unit area, and
formula), which was an initial/limited attempt to test the proposed theoretical framework.
The flowchart could be used to demonstrate why merely knowing a concept is not
sufficient to effectively problem solve (missing the shaded triangular region) and why
effective metacognitive skills alone are not sufficient either (absence of the two sources
on top). Compared to concept stages, other factors such as belief, prior experience, and
preference are too personalized and could have their own merit for effective influences
on certain problem solving behaviors despite their negative impact on general
performance. What’s more, these factors might be temporarily overcome by providing
appropriate pieces of concept information or altered by reaching higher concept
developmental status. They mainly serve the purpose of forming a long-term self-learning
habit for an individual. Thus, I consider concepts as the primary factor to conduct
effective operations in the shaded triangular region while the others are secondary.
Micro level
The micro relationship between concept stages and metacognitive behaviors will
be abstracted from the previous analyses in terms of effectiveness, existence, and
restriction.
417
Effectiveness.
The effectiveness of intra-person monitoring and control might be negatively
influenced if an individual is more confident of a higher concept stage for a specific
concept component (e.g. non-measurement, unit area, and formula), such as overlooking
errors and lower strategy flexibility. A varied concept developmental status along with
advanced metacognitive behaviors could produce effective problem solving performance
if the individual has neutral confidence/preference for each component.
The effectiveness of regulation of task knowledge mostly depends on monitoring
and control of task objectives/demands and monitoring of strategies. The study result
does not provide enough information to abstract any pattern or factors for this type of
complex metacognitive behavior.
Regulation of task objectives is less influenced by varied concept developmental
status. A limited concept development status for relevant concepts combined with a more
advanced development of primary concept may be overcome by strategically ignoring
certain task elements/objectives. The major factor for the effectiveness of this type of
metacognitive behavior is when it happens (before or in the process of problem solving)
rather than whether an individual has a higher concept developmental status.
Regulation of task demands closely incorporates with intra-person monitoring and
regulation of strategy and is highly situated. The study result does not provide enough
information to abstract any pattern or factors for this type of complex metacognitive
behavior.
For monitoring and control of strategies (local control), if an individual relies on
verbal rather than written control, the effectiveness of tracking one’s reasoning tends to
418
be unstable on higher concept stages. A less rigorous source of reasoning or an incorrect
strategy may not necessarily influence the effectiveness of tracking. Due to the local
nature of monitoring of strategy effectiveness, the effectiveness of consequences mainly
depends on whether the individual is operating on relatively higher concept stages.
Without this prerequisite, the attempt to use this function might be effective, yet the act
may not lead to an effective consequence due to the restriction of low concept stages. An
individual does not have to work on a higher level concept stage to be able to distinguish
hypothetical element for an approach; it seems to be a conscious reflection on the
“tracking a strategy” process. For relatively broader control functions (i.e. revising a
strategy, reviewing a strategy, and evaluating a strategy), their effectiveness are less
directly related to concept stages.
For regulation of strategy applicability, regulation and transfer (global control),
all the functions of this type of metacognitive behavior are effective in terms of
advancing one’s thinking process, increasing the validity of an approach, rationalizing the
execution of a strategy, or improving the efficiency of communication despite the
concept stages upon which they operate. However, due to the nature of lower concept
stages, the effective actions may not necessarily lead to effective results. If a global
control was not associated with any of specific stages or operated on a lower stage that
was what considered as appropriate to the problem, it tended to generate a more effective
consequence.
Existence.
While the existence of regulation of task knowledge/demands is more related to
non-concept-stage components (challenging task, deliberate prompts, etc.), the existence

419
of two types of metacognitive behaviors is related to concept stages pertaining to specific
functions.
To allow the self-monitoring, self-regulation, and self-correction functions under
intra-person monitoring and control to be effective, non-Heap stages are required for
doubts to both exist and be manageable, which further enables an individual to be
sensitive to effective self-monitoring, self-regulation, and self-correction.
Regulation of strategy application, regulation, and transfer is more likely to be
detected when the individuals are working on lower concept stages. The reason for this
could be that when an individual is operating on a higher concept stage, his/her
monitoring and control of strategies is more effective and s/he tends to stay with the
approach and trust the result due to the strong local control. But when an individual is
operating on a lower concept stages, his/her local monitoring and control of strategies
may become less effective and thus s/he may feel the need of a global control to ensure
the validity and rationale of strategy execution.
Restriction.
The restriction of concept stages on metacognitive behaviors mainly comes from
the relations embedded on each stage. Each concept stage is essentially defined by what
kind of relations it consists of (which further determines what type of operations is
allowed/limited to).
For lower concept stages, the embedded relations are concrete and factual. Such
relations can be valid, yet they usually require more sophisticated tools (mathematical
and/or cognitive) to effectively unpack/operate on the relations. Even when the
metacognitive behavior is effective and sophisticated (e.g. regulation of strategy
420
application, regulation, and transfer), such a requirement is hard to achieve on one’s own.
The lower the concept stage is, the more obscure the relations are.
To help with building meaningful connections among these relations, scaffolding
could include: 1) identifying the concrete relations that the child has observed; 2)
mapping as many potential connections between the discrete relations as one can; 3)
understanding what is missing/essential to build each connection; 4) pointing out each
missing/essential part and see whether the individual is able to build any connection; 5)
providing essential information to aid the process if the individual is not able to do so
under the hint. This procedure is harder as the concept stage is lower, in that the relations
might be too discrete to be made sense of, build connections, or provide appropriate
indirect instruction. Thus a problem-based or ZPD instruction may work better if the
learner has at least a higher complex level understanding for a certain concept.
421
CHAPTER 6
CONCLUSION
The purpose of this study was to unpack mathematical problem solving through a
novel concept-cognition-metacognition theoretical framework. In this chapter I address
the research questions, theoretical contribution drawing from the results, implication to
research, implication to practice, and limitations of work.
The research questions guiding data collection and analysis were:
1. What stages of mathematical concept development are exhibited in students’
problem solving activities in terms of Vygotsky’s theory?
2. What types of metacognitive behaviors are utilized by students when solving
non-routine problems?
3. What is the relationship between the metacognitive behaviors and the stages of
mathematical concept development as outlined by Vygotsky’s theory?
Research Question #1
What stages of mathematical concept development are exhibited in students’ problem
solving activities in terms of Vygotsky’s theory?
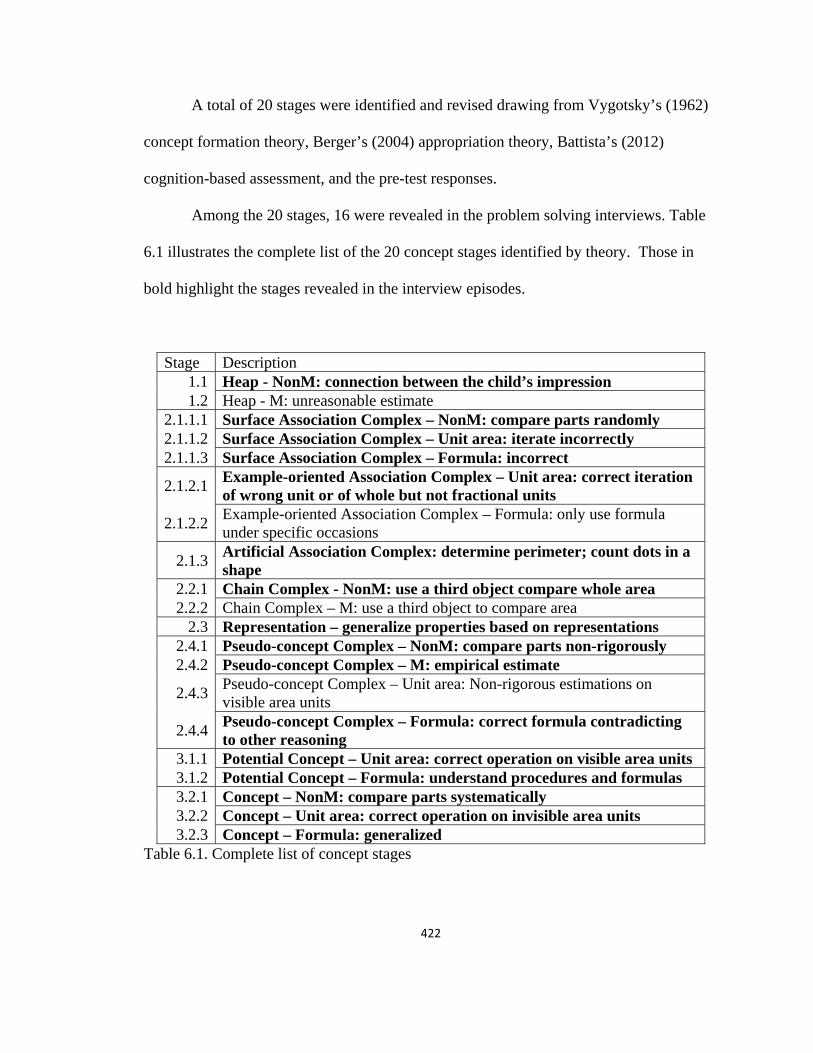
422
A total of 20 stages were identified and revised drawing from Vygotsky’s (1962)
concept formation theory, Berger’s (2004) appropriation theory, Battista’s (2012)
cognition-based assessment, and the pre-test responses.
Among the 20 stages, 16 were revealed in the problem solving interviews. Table
6.1 illustrates the complete list of the 20 concept stages identified by theory. Those in
bold highlight the stages revealed in the interview episodes.
Stage Description 1.1 Heap - NonM: connection between the child’s impression 1.2 Heap - M: unreasonable estimate
2.1.1.1 Surface Association Complex – NonM: compare parts randomly 2.1.1.2 Surface Association Complex – Unit area: iterate incorrectly 2.1.1.3 Surface Association Complex – Formula: incorrect
2.1.2.1 Example-oriented Association Complex – Unit area: correct iteration of wrong unit or of whole but not fractional units
2.1.2.2 Example-oriented Association Complex – Formula: only use formula under specific occasions
2.1.3 Artificial Association Complex: determine perimeter; count dots in a shape
2.2.1 Chain Complex - NonM: use a third object compare whole area 2.2.2 Chain Complex – M: use a third object to compare area
2.3 Representation – generalize properties based on representations 2.4.1 Pseudo-concept Complex – NonM: compare parts non-rigorously 2.4.2 Pseudo-concept Complex – M: empirical estimate
2.4.3 Pseudo-concept Complex – Unit area: Non-rigorous estimations on visible area units
2.4.4 Pseudo-concept Complex – Formula: correct formula contradicting to other reasoning
3.1.1 Potential Concept – Unit area: correct operation on visible area units 3.1.2 Potential Concept – Formula: understand procedures and formulas 3.2.1 Concept – NonM: compare parts systematically 3.2.2 Concept – Unit area: correct operation on invisible area units 3.2.3 Concept – Formula: generalized
Table 6.1. Complete list of concept stages
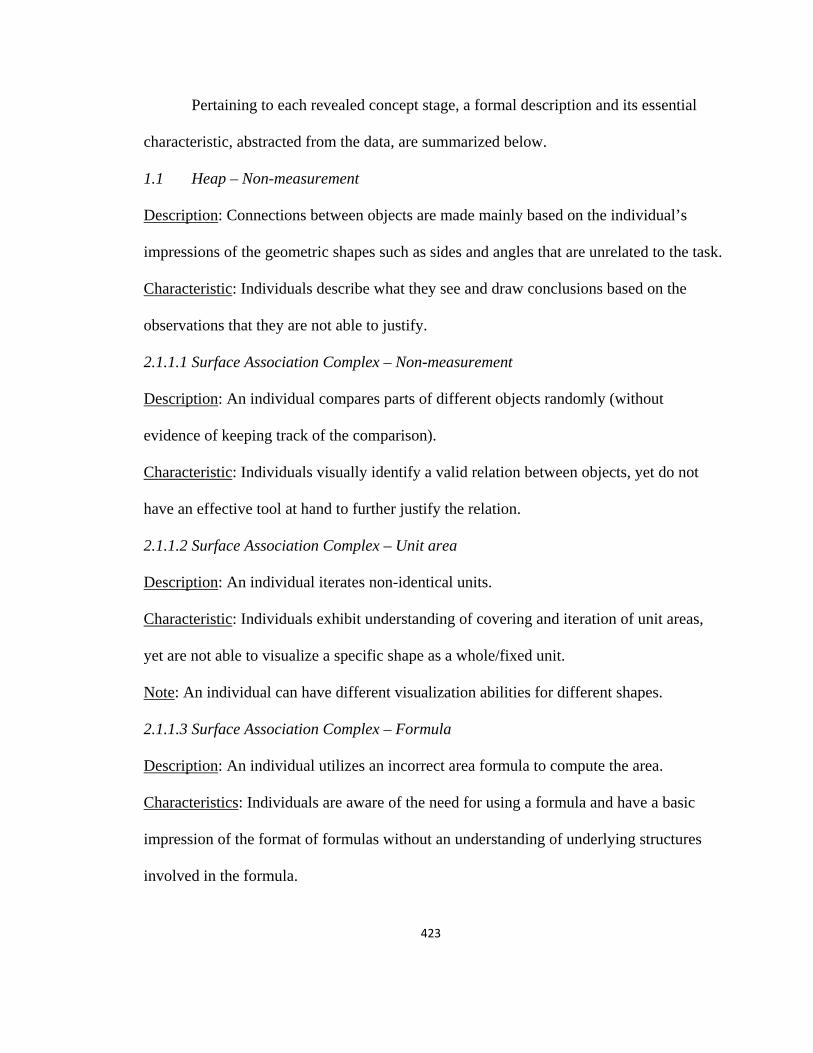
423
Pertaining to each revealed concept stage, a formal description and its essential
characteristic, abstracted from the data, are summarized below.
1.1 Heap – Non-measurement
Description: Connections between objects are made mainly based on the individual’s
impressions of the geometric shapes such as sides and angles that are unrelated to the task.
Characteristic: Individuals describe what they see and draw conclusions based on the
observations that they are not able to justify.
2.1.1.1 Surface Association Complex – Non-measurement
Description: An individual compares parts of different objects randomly (without
evidence of keeping track of the comparison).
Characteristic: Individuals visually identify a valid relation between objects, yet do not
have an effective tool at hand to further justify the relation.
2.1.1.2 Surface Association Complex – Unit area
Description: An individual iterates non-identical units.
Characteristic: Individuals exhibit understanding of covering and iteration of unit areas,
yet are not able to visualize a specific shape as a whole/fixed unit.
Note: An individual can have different visualization abilities for different shapes.
2.1.1.3 Surface Association Complex – Formula
Description: An individual utilizes an incorrect area formula to compute the area.
Characteristics: Individuals are aware of the need for using a formula and have a basic
impression of the format of formulas without an understanding of underlying structures
involved in the formula.
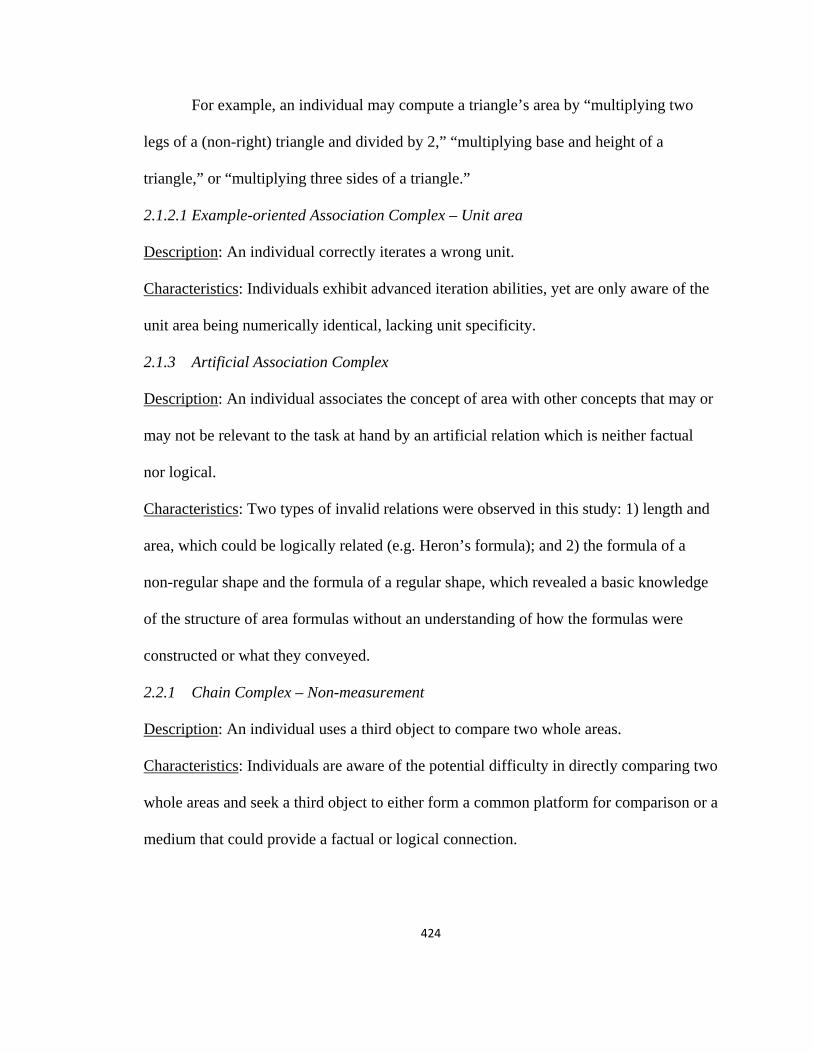
424
For example, an individual may compute a triangle’s area by “multiplying two
legs of a (non-right) triangle and divided by 2,” “multiplying base and height of a
triangle,” or “multiplying three sides of a triangle.”
2.1.2.1 Example-oriented Association Complex – Unit area
Description: An individual correctly iterates a wrong unit.
Characteristics: Individuals exhibit advanced iteration abilities, yet are only aware of the
unit area being numerically identical, lacking unit specificity.
2.1.3 Artificial Association Complex
Description: An individual associates the concept of area with other concepts that may or
may not be relevant to the task at hand by an artificial relation which is neither factual
nor logical.
Characteristics: Two types of invalid relations were observed in this study: 1) length and
area, which could be logically related (e.g. Heron’s formula); and 2) the formula of a
non-regular shape and the formula of a regular shape, which revealed a basic knowledge
of the structure of area formulas without an understanding of how the formulas were
constructed or what they conveyed.
2.2.1 Chain Complex – Non-measurement
Description: An individual uses a third object to compare two whole areas.
Characteristics: Individuals are aware of the potential difficulty in directly comparing two
whole areas and seek a third object to either form a common platform for comparison or a
medium that could provide a factual or logical connection.
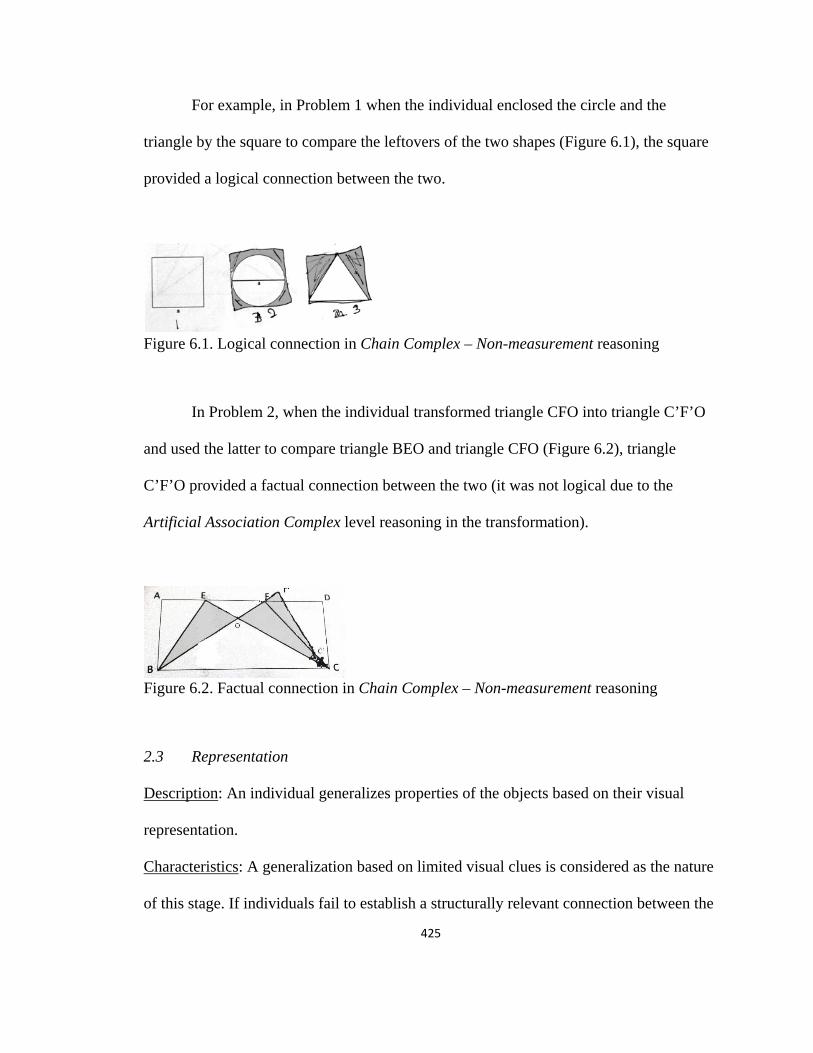
425
For example, in Problem 1 when the individual enclosed the circle and the
triangle by the square to compare the leftovers of the two shapes (Figure 6.1), the square
provided a logical connection between the two.
Figure 6.1. Logical connection in Chain Complex – Non-measurement reasoning
In Problem 2, when the individual transformed triangle CFO into triangle C’F’O
and used the latter to compare triangle BEO and triangle CFO (Figure 6.2), triangle
C’F’O provided a factual connection between the two (it was not logical due to the
Artificial Association Complex level reasoning in the transformation).
Figure 6.2. Factual connection in Chain Complex – Non-measurement reasoning
2.3 Representation
Description: An individual generalizes properties of the objects based on their visual
representation.
Characteristics: A generalization based on limited visual clues is considered as the nature
of this stage. If individuals fail to establish a structurally relevant connection between the
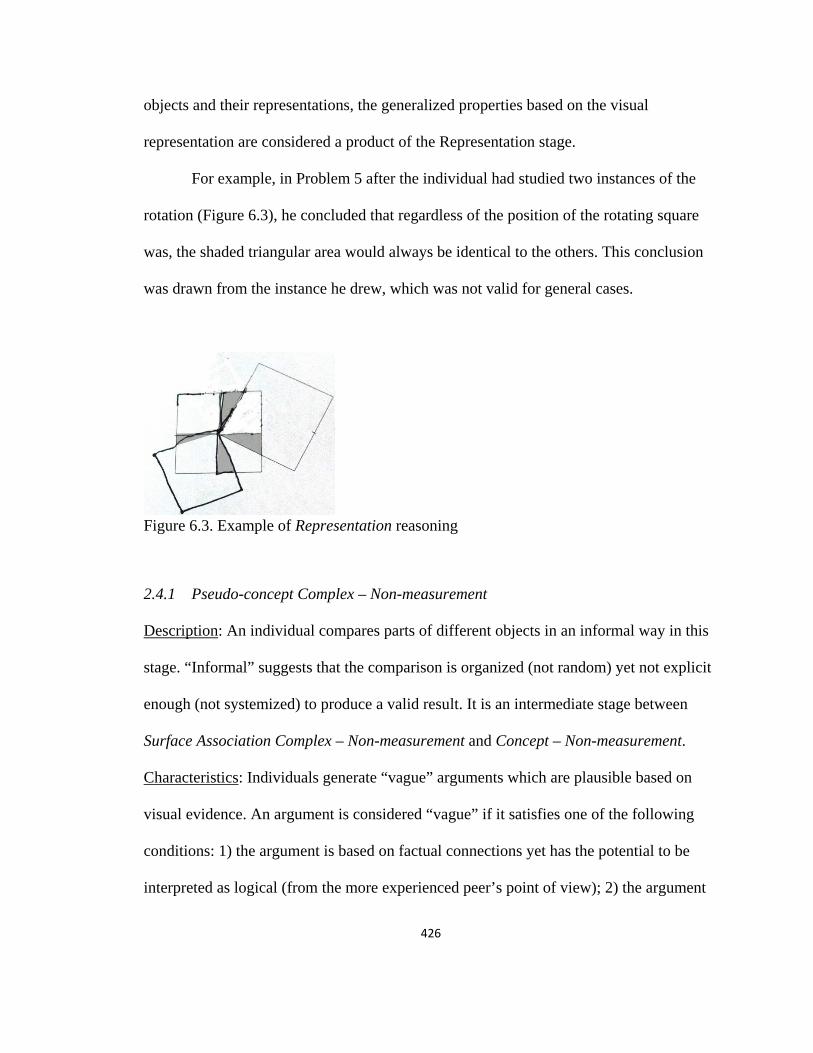
426
objects and their representations, the generalized properties based on the visual
representation are considered a product of the Representation stage.
For example, in Problem 5 after the individual had studied two instances of the
rotation (Figure 6.3), he concluded that regardless of the position of the rotating square
was, the shaded triangular area would always be identical to the others. This conclusion
was drawn from the instance he drew, which was not valid for general cases.
Figure 6.3. Example of Representation reasoning
2.4.1 Pseudo-concept Complex – Non-measurement
Description: An individual compares parts of different objects in an informal way in this
stage. “Informal” suggests that the comparison is organized (not random) yet not explicit
enough (not systemized) to produce a valid result. It is an intermediate stage between
Surface Association Complex – Non-measurement and Concept – Non-measurement.
Characteristics: Individuals generate “vague” arguments which are plausible based on
visual evidence. An argument is considered “vague” if it satisfies one of the following
conditions: 1) the argument is based on factual connections yet has the potential to be
interpreted as logical (from the more experienced peer’s point of view); 2) the argument
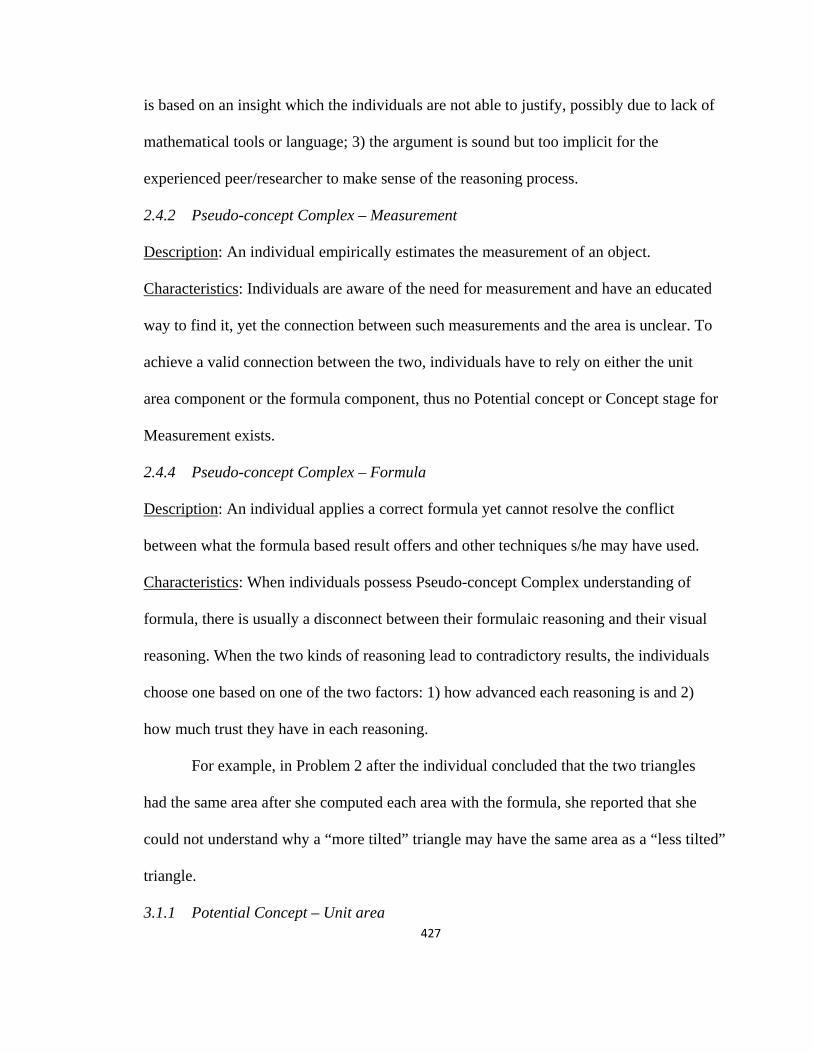
427
is based on an insight which the individuals are not able to justify, possibly due to lack of
mathematical tools or language; 3) the argument is sound but too implicit for the
experienced peer/researcher to make sense of the reasoning process.
2.4.2 Pseudo-concept Complex – Measurement
Description: An individual empirically estimates the measurement of an object.
Characteristics: Individuals are aware of the need for measurement and have an educated
way to find it, yet the connection between such measurements and the area is unclear. To
achieve a valid connection between the two, individuals have to rely on either the unit
area component or the formula component, thus no Potential concept or Concept stage for
Measurement exists.
2.4.4 Pseudo-concept Complex – Formula
Description: An individual applies a correct formula yet cannot resolve the conflict
between what the formula based result offers and other techniques s/he may have used.
Characteristics: When individuals possess Pseudo-concept Complex understanding of
formula, there is usually a disconnect between their formulaic reasoning and their visual
reasoning. When the two kinds of reasoning lead to contradictory results, the individuals
choose one based on one of the two factors: 1) how advanced each reasoning is and 2)
how much trust they have in each reasoning.
For example, in Problem 2 after the individual concluded that the two triangles
had the same area after she computed each area with the formula, she reported that she
could not understand why a “more tilted” triangle may have the same area as a “less tilted”
triangle.
3.1.1 Potential Concept – Unit area
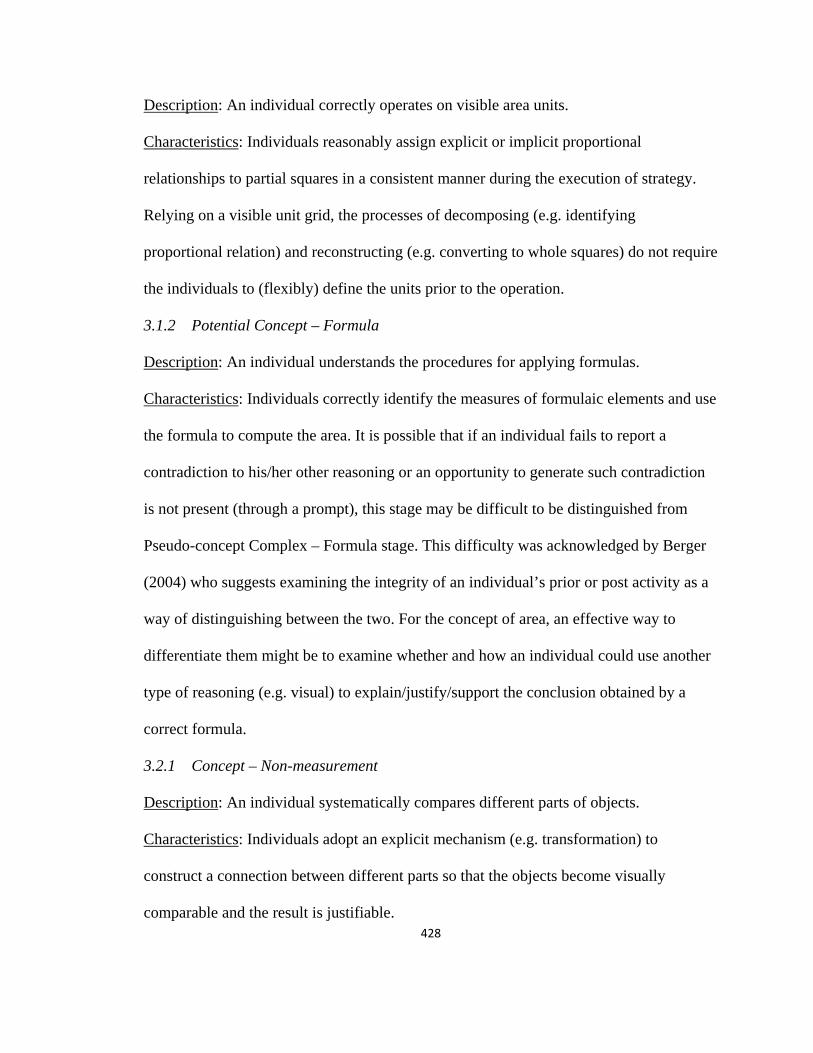
428
Description: An individual correctly operates on visible area units.
Characteristics: Individuals reasonably assign explicit or implicit proportional
relationships to partial squares in a consistent manner during the execution of strategy.
Relying on a visible unit grid, the processes of decomposing (e.g. identifying
proportional relation) and reconstructing (e.g. converting to whole squares) do not require
the individuals to (flexibly) define the units prior to the operation.
3.1.2 Potential Concept – Formula
Description: An individual understands the procedures for applying formulas.
Characteristics: Individuals correctly identify the measures of formulaic elements and use
the formula to compute the area. It is possible that if an individual fails to report a
contradiction to his/her other reasoning or an opportunity to generate such contradiction
is not present (through a prompt), this stage may be difficult to be distinguished from
Pseudo-concept Complex – Formula stage. This difficulty was acknowledged by Berger
(2004) who suggests examining the integrity of an individual’s prior or post activity as a
way of distinguishing between the two. For the concept of area, an effective way to
differentiate them might be to examine whether and how an individual could use another
type of reasoning (e.g. visual) to explain/justify/support the conclusion obtained by a
correct formula.
3.2.1 Concept – Non-measurement
Description: An individual systematically compares different parts of objects.
Characteristics: Individuals adopt an explicit mechanism (e.g. transformation) to
construct a connection between different parts so that the objects become visually
comparable and the result is justifiable.
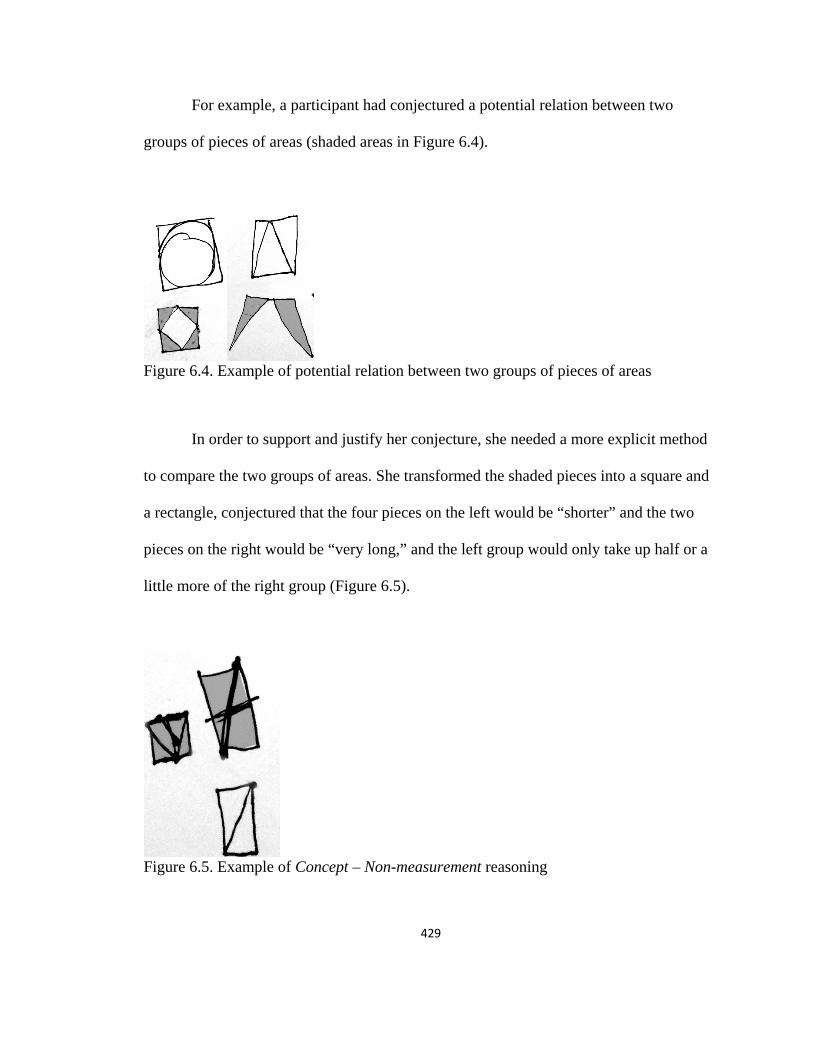
429
For example, a participant had conjectured a potential relation between two
groups of pieces of areas (shaded areas in Figure 6.4).
Figure 6.4. Example of potential relation between two groups of pieces of areas
In order to support and justify her conjecture, she needed a more explicit method
to compare the two groups of areas. She transformed the shaded pieces into a square and
a rectangle, conjectured that the four pieces on the left would be “shorter” and the two
pieces on the right would be “very long,” and the left group would only take up half or a
little more of the right group (Figure 6.5).
Figure 6.5. Example of Concept – Non-measurement reasoning
430
3.2.2 Concept – Unit Area
Description: An individual correctly operates on invisible area units.
Characteristics: Individuals take full control over the area units in terms of their shapes,
sizes, orientations, and other properties during the restructuring.
3.2.3 Concept – Formula
Description: An individual generalizes a conclusion using formulas.
Characteristics: Individuals deduce a conclusion that does not involve specific numbers
or measurement and are able to justify the conclusion using formulas (and other types of
reasoning).
Research Question #2
What types of metacognitive behaviors are utilized by students when solving non-
routine problems?
Table 6.2 summarizes all types of metacognitive behaviors along with their
coding criteria detected in the study.
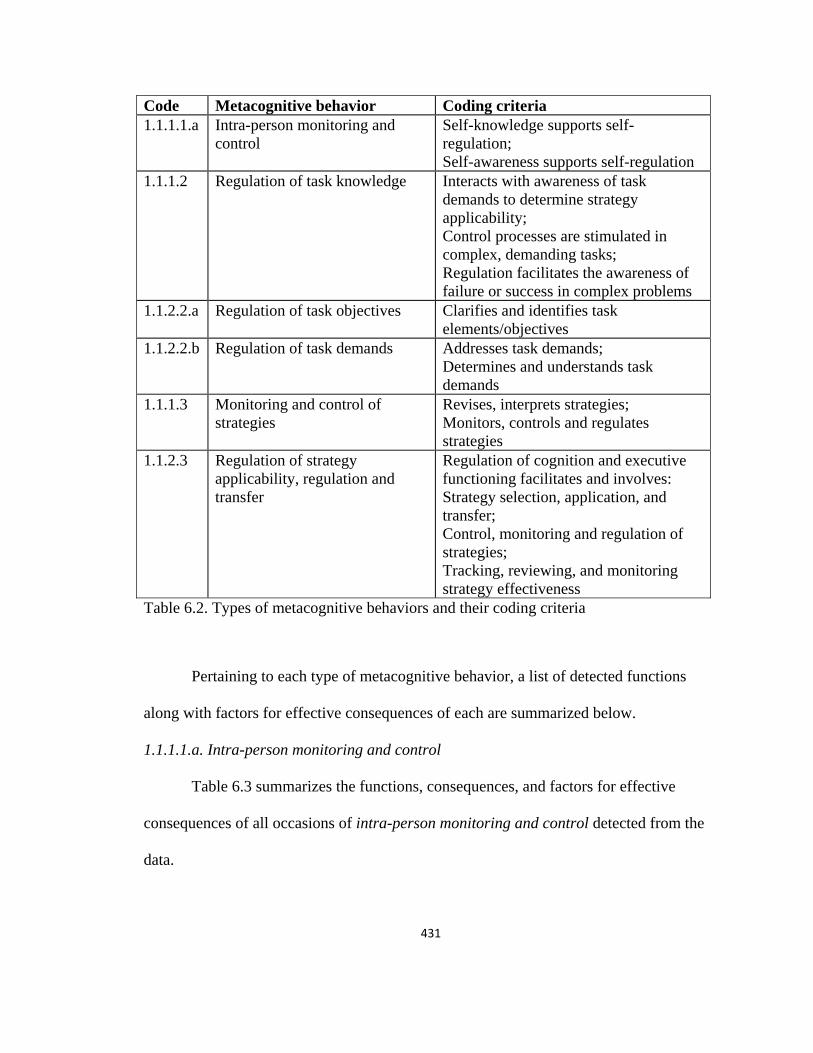
431
Code Metacognitive behavior Coding criteria 1.1.1.1.a Intra-person monitoring and
control Self-knowledge supports self-regulation; Self-awareness supports self-regulation
1.1.1.2 Regulation of task knowledge Interacts with awareness of task demands to determine strategy applicability; Control processes are stimulated in complex, demanding tasks; Regulation facilitates the awareness of failure or success in complex problems
1.1.2.2.a Regulation of task objectives Clarifies and identifies task elements/objectives
1.1.2.2.b Regulation of task demands Addresses task demands; Determines and understands task demands
1.1.1.3 Monitoring and control of strategies
Revises, interprets strategies; Monitors, controls and regulates strategies
1.1.2.3 Regulation of strategy applicability, regulation and transfer
Regulation of cognition and executive functioning facilitates and involves: Strategy selection, application, and transfer; Control, monitoring and regulation of strategies; Tracking, reviewing, and monitoring strategy effectiveness
Table 6.2. Types of metacognitive behaviors and their coding criteria
Pertaining to each type of metacognitive behavior, a list of detected functions
along with factors for effective consequences of each are summarized below.
1.1.1.1.a. Intra-person monitoring and control
Table 6.3 summarizes the functions, consequences, and factors for effective
consequences of all occasions of intra-person monitoring and control detected from the
data.

432
Function Consequences Factors for effectiveness 1 Self-
knowledge supports self-regulation
Monitored what one knew or didn’t know. Avoided certain approaches because of not knowing specific techniques.
Neutral confidence/preference in specific concept components or specific strategies.
2 Self-awareness supports self-regulation
Monitored what one wasn’t sure about. Reluctant to carry out an approach because of an awareness of general inability.
Neutral confidence/preference in specific concept components or specific strategies.
3 Self-monitoring
Reported whether being convinced or confused. Detected confusion and initiated a different approach.
Sensitive to doubts towards the problems, the approaches, or the answers.
4 Self-regulation
Reported patterns of self-monitoring.
Sensitive to doubts towards the problems, the approaches, or the answers.
5 Self-correction
Corrected an error. Sensitive to doubts towards the problems, the approaches, or the answers.
6 Regulation influenced by attributional beliefs
Self-monitoring influenced by belief of quick problem solving. Judged the validity of a conclusion by evaluating one’s mathematical ability. Determined the accuracy of an answer based on one’s belief in formula. Self-monitoring influenced by self-belief of low mathematical competence
When an individual is less influenced by related beliefs, his/her problem solving performance tends to be more stable.
Table 6.3. Functions, consequences, and factors for effectiveness of intra-person monitoring and control
1.1.1.2. Regulation of task knowledge
The functions of this type of metacognitive behavior were less diverse while the
consequences were mostly distinct. Other types of metacognitive behaviors (mostly
monitoring and control of task objectives/demands and monitoring of strategies), which
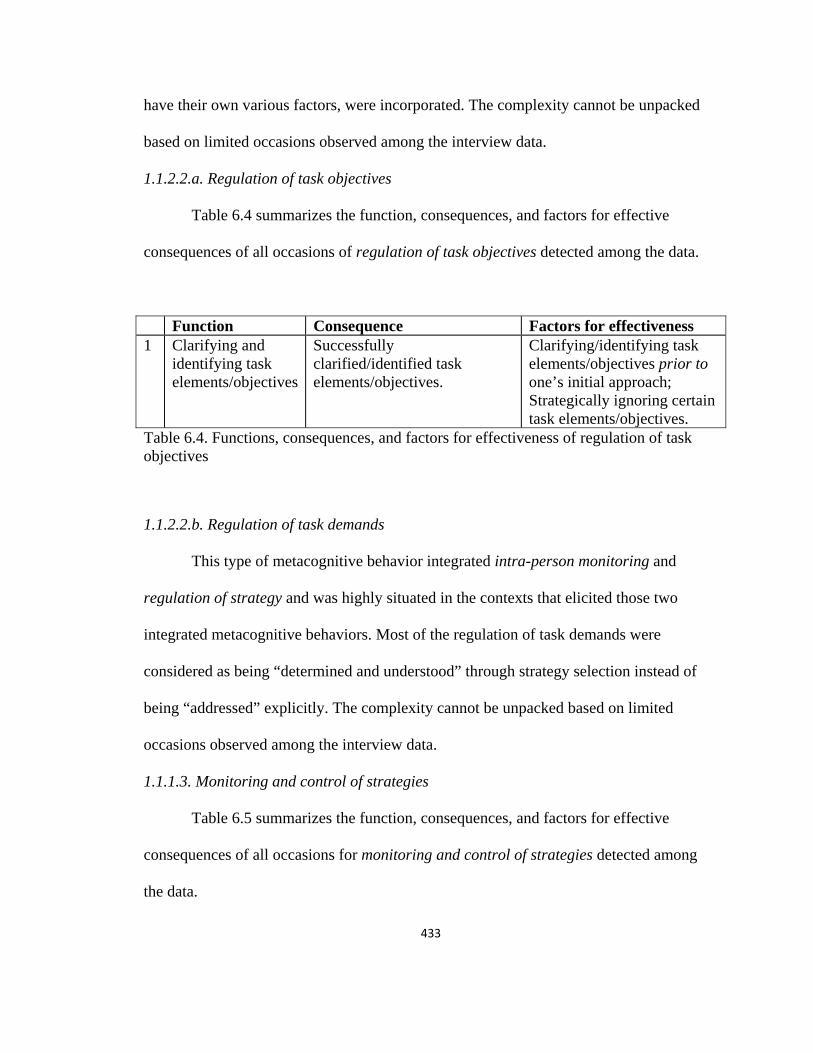
433
have their own various factors, were incorporated. The complexity cannot be unpacked
based on limited occasions observed among the interview data.
1.1.2.2.a. Regulation of task objectives
Table 6.4 summarizes the function, consequences, and factors for effective
consequences of all occasions of regulation of task objectives detected among the data.
Function Consequence Factors for effectiveness 1 Clarifying and
identifying task elements/objectives
Successfully clarified/identified task elements/objectives.
Clarifying/identifying task elements/objectives prior to one’s initial approach; Strategically ignoring certain task elements/objectives.
Table 6.4. Functions, consequences, and factors for effectiveness of regulation of task objectives
1.1.2.2.b. Regulation of task demands
This type of metacognitive behavior integrated intra-person monitoring and
regulation of strategy and was highly situated in the contexts that elicited those two
integrated metacognitive behaviors. Most of the regulation of task demands were
considered as being “determined and understood” through strategy selection instead of
being “addressed” explicitly. The complexity cannot be unpacked based on limited
occasions observed among the interview data.
1.1.1.3. Monitoring and control of strategies
Table 6.5 summarizes the function, consequences, and factors for effective
consequences of all occasions for monitoring and control of strategies detected among
the data.

434
Function Consequences Factors for effectiveness 1 Interpreted a
strategy Kept track of reasoning. Writing key steps down instead of
verbally carrying out an approach.
2 Monitored a strategy
Locally aware of the effectiveness of a strategy.
Operating on relatively higher concept stages.
3 Controlled strategy elements
Distinguished hypothetical elements.
(Not enough information to conjecture) (Non-factors: correct strategies or higher level concept stages)
4 Revised an error
Recognized an error and corrected it.
(Not enough information to conjecture) (Potential factor: high sensitivity to the validity of the approach, e.g. absence of trust/confidence in the approach)
5 Revised a strategy
Modified a strategy based on additional information provided by the interviewer or noticed by oneself.
Existence of the function guarantees effectiveness of consequence. (Potential trigger: introduction of contradicting/missing information)
6 Reviewed a strategy
Generalized a strategy by reviewing it.
Existence of the function guarantees effectiveness of consequence. (Potential trigger: examination of multiple varied cases)
7 Evaluated a strategy
Evaluated whether a strategy was valid or difficult to execute or whether the answer was valid.
Existence of the function guarantees effectiveness of consequence. (Potential trigger: suspicion on the strategy or contradictory to insight/spatial sense)
Table 6.5. Functions, consequences, and factors for effectiveness of monitoring and control of strategies

435
1.1.2.3. Regulation of strategy applicability, regulation and transfer
Table 6.6 summarizes the function, consequences, and factors for effective
consequences of all occasions of regulation of strategy applicability, regulation and
transfer detected among the data.
Function Consequences Factors for effectiveness 1 Strategy
selection Selected a strategy associated with a specific condition.
Not associated with any specific stages or operated on a lower stage that is designed as appropriate to the problem
2 Strategy transfer
Simulated a strategy from a familiar context.
3 Monitoring strategy effectiveness
Applied an alternative method to verify the strategy validity.
Neutral preference towards each strategy
4 Reviewing strategy effectiveness
Reviewed different strategies to compare the validity.
Neutral preference towards each strategy
5 Judgment regarding strategy application
Determined the conditions for the strategies to be applicable.
6 Monitoring of strategies
Globally monitored different strategies
Neutral preference towards each strategy
Table 6.6. Functions, consequences, and factors for effectiveness of regulation of strategy applicability, regulation and transfer
Research Question #3
What is the relationship between the metacognitive behaviors and the stages of
mathematical concept development as outlined by Vygotsky’s theory?
Macro and Micro level analysis of the relationship between the metacognitive
behaviors and the concept stages is elaborated in the following two sections.

436
Macro level
The macro analysis provides a global view of the problem solver’s behaviors
under the influence of concept stages and metacognitive behaviors. Figure 6.6 outlines
the relationship between concepts and metacognition within a problem solving process.
Arrows indicate the influence from one element to another.
Figure 6.6. Relationship between concepts and metacognition in a problem solving process
The four rectangular elements (how one knows a concept, what one knows about
a concept, connections one has between a concept and other concepts, and detecting
limitations or conflicts of connections) are activated once an individual enters a problem.
To construct a concept relation which is required to resolve the task but not immediately
available to the individual is defined as the problem solving process.
The individual’s developmental status of a concept is represented by the two
elements of what one knows about a concept (which components of the concept) and how
437
one knows a concept (what stages of the components). These two elements serve as a
major source for the other two elements, connections among concepts and the ability to
detect limitations or conflicts, which are the essential elements upon which metacognition
acts in the problem solving process. Aside from the influence of the task, how one knows
a concept, and what one knows about a concept, the two elements -- connection among
concepts and detecting of limitations or conflicts -- influence and interact with each other
so to construct reliable connections in search for the desired relation to answer the
problem. Metacognition kicks in during this interaction. The interactions among the three
form a cycle which is the shaded region (the Action Zone) in Figure 6.6.
During the constructing process, metacognitive behaviors facilitate both the
retrieval of connections among concepts and the detection of limitations or conflicts
among connections. Meanwhile, the connections among concepts that are available to the
individual and his/her capacity to detect limitations and conflicts influence the
effectiveness of consequences of the metacognitive behaviors. A successful problem
solving activity is defined as the construction of a desired relation through the
interactions among the three components in the Action Zone.
Due to the nature of the problem solving setting, how and what one knows about a
concept mainly serve as sources in such processes. They determine the starting point of
activity and how far an individual may proceed by operating in the Action Zone with
one’s existing sources. The potential change of these two is a natural product of complex
operations on existing stages rather than a goal of the individual.
Micro level
438
The relationship between concept stages and metacognitive behaviors analyzed at
the micro level highlights the specific ways in which concept stages impact each type of
metacognitive behavior during the problem solver’s interaction with a task.
Connections are analyzed according to effectiveness of consequences generated
by metacognitive behaviors, the existence of effective metacognitive behaviors, and the
restriction that concept stages impose on the overall capacity of metacognition.
Effectiveness
Table 6.7 summarizes how concept stages may influence the effectiveness of
consequences of each type of metacognitive behavior.
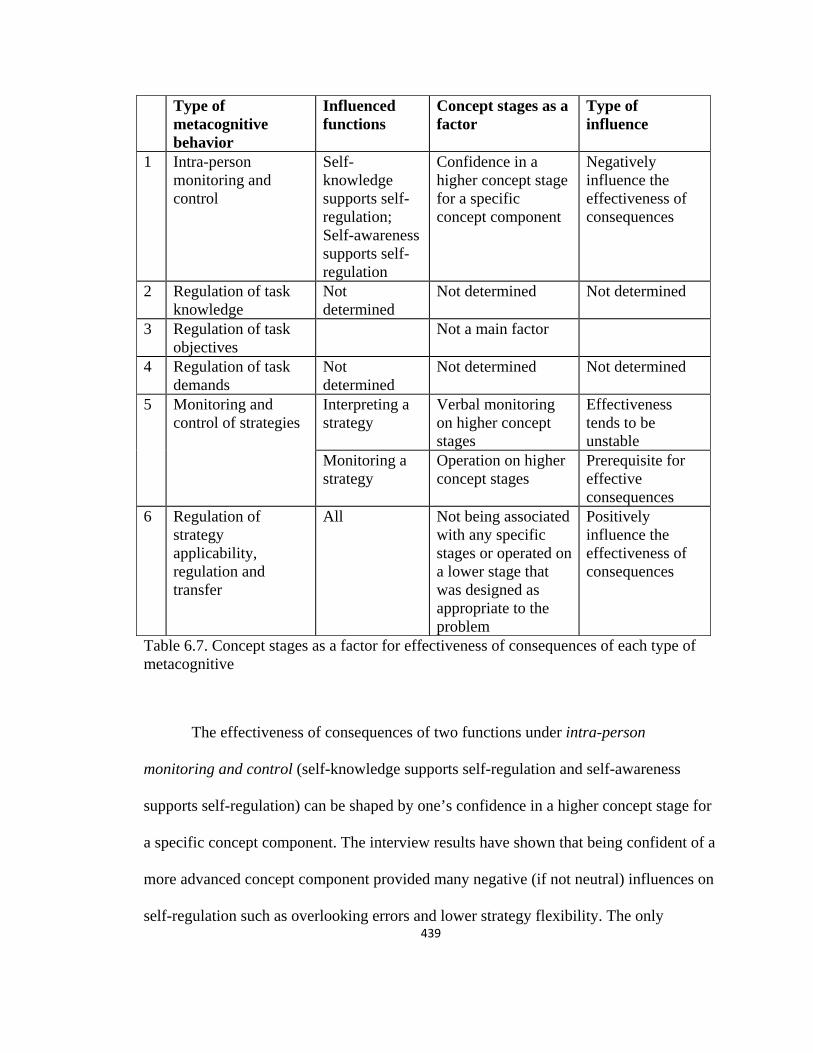
439
Type of metacognitive behavior
Influenced functions
Concept stages as a factor
Type of influence
1 Intra-person monitoring and control
Self-knowledge supports self-regulation; Self-awareness supports self-regulation
Confidence in a higher concept stage for a specific concept component
Negatively influence the effectiveness of consequences
2 Regulation of task knowledge
Not determined
Not determined Not determined
3 Regulation of task objectives
Not a main factor
4 Regulation of task demands
Not determined
Not determined Not determined
5 Monitoring and control of strategies
Interpreting a strategy
Verbal monitoring on higher concept stages
Effectiveness tends to be unstable
Monitoring a strategy
Operation on higher concept stages
Prerequisite for effective consequences
6 Regulation of strategy applicability, regulation and transfer
All Not being associated with any specific stages or operated on a lower stage that was designed as appropriate to the problem
Positively influence the effectiveness of consequences
Table 6.7. Concept stages as a factor for effectiveness of consequences of each type of metacognitive
The effectiveness of consequences of two functions under intra-person
monitoring and control (self-knowledge supports self-regulation and self-awareness
supports self-regulation) can be shaped by one’s confidence in a higher concept stage for
a specific concept component. The interview results have shown that being confident of a
more advanced concept component provided many negative (if not neutral) influences on
self-regulation such as overlooking errors and lower strategy flexibility. The only
440
participant who exhibited neutral confidence about all concept components (despite her
advanced operations on all components for rectangles) chose a concept stage to work on
primarily based on her understanding of the problem and did not show any preference for
a specific component. She performed exceptionally well compared to the other
participants who were assessed as having higher concept developmental stages than she.
The effectiveness of consequences of “interpreting a strategy” function under
monitoring and control of strategies could be influenced by one’s verbal monitoring of
approaches (i.e. verbally executing an approach rather than writing key steps down) on
higher concept stages. When verbally carrying out an approach, there was a bigger
chance to get confused especially when working on a higher concept stage.
The effectiveness of consequences of “monitoring a strategy” function under
monitoring and control of strategies mainly depended on whether the individual was
operating on relatively higher concept stages. Without this prerequisite, the attempt of
this function might be effective (such as navigating among multiple situations within a
problem and solving the easiest one that the approach was applied to or improving the
validity of an approach to support previous conjecture), yet the act could not lead to an
effective consequence due to the restriction of low concept stages (which will be
discussed more in the restriction section).
The effectiveness of consequences of all functions under regulation of strategy
applicability, regulation and transfer seemed to be influenced by whether the regulation
involved a preference for a specific stage (e.g. a neutral regulation on multiple stages) or
whether the regulation was operated on a stage that was designed to generate the answer
to the problem. In this study, when this type of metacognitive behavior was used by

441
students, it was only detected when the participants were working on lower concept
stages. Although all functions of this type of metacognitive behaviors were effective in
terms of advancing one’s thinking process, increasing the validity of an approach,
rationalizing the execution of a strategy, or improving the efficiency of communication
despite the concept stages upon which they operated, the effective actions did not
necessarily lead to effective consequences due to the nature of lower concept stages. If a
global control was not associated with any specific stages or operated on a lower stage
that was designed as appropriate to the problem, it tended to generate a more effective
consequence.
Existence
Table 6.8 summarizes the existence of effective metacognitive behaviors that was
directly related to concept stages.

442
Type of metacognitive behavior
Influenced functions
Concept stages as a factor
Type of influence
1 Intra-person monitoring and control
Self-monitoring; Self-regulation; Self-correction
Non-Heap stages Non-Heap stages are required for doubts to both exist and be manageable.
2 Regulation of task knowledge
Not a main factor
3 Regulation of task objectives
Not a main factor
4 Regulation of task demands
Not a main factor
5 Monitoring and control of strategies
Not a main factor
6 Regulation of strategy applicability, regulation and transfer
All Lower concept stages
More likely to be detected on lower concept stages due to less effective local control.
Table 6.8. Concept stages as a factor for existence of effective metacognitive behaviors
To allow self-monitoring, self-regulation, and self-correction functions under
intra-person monitoring and control to be effective, non-Heap stages were required for
doubt to both exist and be manageable, which further enabled an individual to be
sensitive to doubts for effective self-monitoring, self-regulation, and self-correction.
Regulation of strategy application, regulation, and transfer was more likely to be
detected when the individuals were working on lower concept stages. The reason for this
could be that when an individual was operating on a higher concept stage, his/her
monitoring and control of strategies was more effective and s/he tended to stay with the
approach and trust the result due to the strong local control. But when an individual was
operating on a lower concept stages, his/her local monitoring and control of strategies
443
may become less effective and thus s/he may feel the need of a global control to ensure
the validity and rationale of strategy execution.
Restriction
The following list summarizes the restriction that concept stages impose on the
overall metacognitive activities, as revealed in the study.
• The restriction of concept stages on the overall capacity of metacognitive
behaviors mainly comes from the relations embedded in each stage, which
essentially defines each stage and determines what type of operation it
permeates (allows or limits).
• For lower concept stages, the embedded relations are concrete and factual.
The relations might be valid, yet require more sophisticated mathematical
and/or cognitive tools to effectively unpack/operate on them. On Heap
stages, the embedded relations are the most obscure.
• Effective metacognitive systems may not allow an individual who
operated on a lower concept stage to make the connections s/he needs to
solve a task, in that the metacognitive behaviors are not sufficient for
him/her to construct desired relations out of the obscure relations
embedded on lower stages.
For example, if an individual who has a Surface Association Complex of formula
understanding needs at least a Potential Concept understanding of formula to solve a
problem. With the awareness of the need for using a formula along with a basic
impression of the format of formulas without an understanding of the defining structured
involved in the formula (characteristic of Surface Association Complex – Formula stage),
444
the individual needs to construct a means to identify the measures of formulaic elements
and use the formula to compute the area (characteristic of Potential Concept – Formula
stage). Such construction can be extremely challenging for an individual even with a
sophisticated metacognitive system (effective intra-person monitoring and control,
monitoring and control of strategies, and regulation of strategy). An effective
metacognitive system may be able to facilitate the shift from a Pseudo-concept Complex
– Formula stage to a higher formulaic stage, or from a Surface Association Complex –
Formula stage to a higher one with the aid of an advanced unit area/non-measurement
stage. Its capacity is generally limited on lower stages.
Theoretical Contribution
The proposed concept-cognition-metacognition theoretical lens contributes to the
development of both a new analytical framework and a new methodology for studying
and theorizing mathematical problem solving.
Decades of research has established the importance of mathematical problem
solving to disciplinary learning (NCTM, 2006). Challenges associated with improving
students’ problem solving performance have been reported (Schoenfeld, 1992). Absence
of theoretical explanations that would allow characterization of problem solving
behaviors for guiding instruction has also been noted (Schoenfeld, 2007).
In 1994 Lester’s (1994) summarized key issues in need of attention in order for
research on mathematical problem solving to make progress. The list included, among
many:
• Need for better research methods
445
• Understanding interactions between domain knowledge and other aspects
of problem-solving activity (e.g. strategy use, control, and beliefs)
• Understanding the role of metacognitive components on problem solving
behaviors
• Need for explanations and theories of effective problem solving
(metacognitive) instructions
• Need for better assessment of problem solving performance
• Understanding issues related to transfer of learning.
Many of the concerns and recommendations Lester raised then persist 20 years
later. The field continues to lack theorizing power, as Schoenfeld stated (2007), a theory
of mathematical problem solving. The key obstacle to progress has been associated with
capturing and explaining the functioning of metacognition, a construct too
difficult/complex to unpack and yet central to the study of mathematical problem solving
(Lesh, Lester, & Hjalmarson, 2003). Two reasons have been offered to account for the
challenge.
First, there has been no accurate or adequate method to capture metacognitive
phenomena. We may need to wait for a breakthrough from the neuroscientists. Yet I
perceive that attitude too passive, restricting progress. The current study attempted a
different route to approach the issue, using a complex yet manageable platform (i.e.
mathematical concepts) for interpreting/systemizing metacognitive behaviors (under
currently available methods to elicit them such as think-aloud protocol, probing questions,
and dynamic software) instead of a new method to assess/elicit metacognition.
446
Second, problem solving researchers have been tackling metacognitive
phenomena using methods such as categorizing problem solving events (Schoenfeld,
1981; Lawson & Chinnappan, 1994), framing problem solving phases/stages/episodes
(Lester et al., 1989; Anderson, Lee, & Fincham, 2014), and developing new
methodologies such as a multi-method technique to interpret metacognitive behaviors
through awareness-evaluation-regulation cycles (Wilson & Clarke, 2004) and dynamic
geometry technology to provoke and detect metacognitive behaviors during geometrical
problem solving (Kuzle, 2011). Researchers have reached the conclusion that
metacognitive behaviors are concept-dependent, cognitive-dependent, developmental,
and inconsistent. The list implies that there are too many variables involved and thus the
problem is almost unsolvable. The perception that the only way to solve a specific
equation is to identify and fix all the variables, does not yield an effective way to
generalize a solution that could yield answers (see how Schoenfeld (2010)
explained/predicted individual’s decision making moments). Problem solving researchers
have come to the point where the key variables are extensively identified/described and
they need a new tool (other than the cognition-metacognition framework) to tackle the
phenomena of mathematical problem solving.
For example, Elia, Heuvel-Panhuizen, and Kolovou (2009) discussed two
methods for studying strategy flexibility usage: inter-task flexibility (changing strategies
across problems) and intra-task flexibility (changing strategies within problems). The
findings included that higher inter-task strategy flexibility was displayed by more
successful problem solvers, while intra-task strategy flexibility did not support the
problem solvers in reaching a correct answer. A related study showed that understanding

447
of the problem influenced the correctness of the answer, instead of the flexibility in the
use of strategies. The results of my previous study (Zhang, 2010), which used the
cognition-metacognition framework, supported the findings that intra-task strategy
flexibility did not imply success at reaching correct answers to tasks. There I posited that
the level of intra-task strategy flexibility might depend largely on the individual’s
confidence and preference for the use of certain strategies. These constructs may not
ensure that correct answers across different subject areas and heuristics be reached.
Instead, they may prevent the individuals from moving forward in securing an enhanced
level of understanding of the problem. The results of that study revealed that high intra-
task strategy flexibility was associated with personal preference for efficient strategies,
lack of confidence on a currently utilized strategy, and significant change in level of
understanding of the problem. In contrast, low intra-task strategy flexibility could be
associated with confidence in the strategy currently used and an insufficient change of
understanding.
The current study has identified more explicit factors pertaining to the
phenomenon of intra-task strategy flexibility. First, a high intra-task strategy flexibility
where an individual tended to switch between stages associated with different area
components (non-measurement, unit area, and formula) may be the result of advanced
monitoring and control of strategies behaviors to evaluate the effectiveness of an
approach, which required at least a Pseudo-concept Complex stage of understanding to
allow the effectiveness to be evaluated. For example, a participant tended to self-initiate a
shift to a formula stage when she could not proceed with, or was not successful with
testing the current approach. The only occasion where she shifted from a formula stage to

448
a non-measurement stage was when she was aware that she was working with a wrong
area formula (Surface Association Complex - Formula). Second, a low intra-task
strategy flexibility where an individual tended to stay on a stage until s/he reached a
conclusion may be the result of advanced monitoring and control of strategies behaviors
to execute an approach with a lower concept developmental status or a heavy reliance
on visual impressions/inaccurate measurement. The condition of concept stages (low) or
level of visual impressions (inaccurate measurement) restricted an individual’s ability to
evaluate the effectiveness of an approach, which was a key factor for high intra-task
strategy flexibility. Meanwhile, the advanced metacognitive behavior to execute an
approach ensured that the individual could reach a conclusion despite the ineffectiveness
of an approach (so that s/he would not switch an approach due to being not able to carry
it out). The outcome of these two types of intra-task strategy flexibility depended on the
stage the individual chose to work on rather than the level of flexibility. A high intra-task
strategy flexibility may not necessarily guarantee an individual to reach the desired stage
for solving a problem; it may only drive the individual to abandon an ineffective
(perceived by the problem solver) approach. A low intra-task strategy flexibility may
generate a correct answer if the lower level concept stage (e.g. Chain Complex – NM in
Problem 1) on which the individual was working was a desired stage to solve the problem.
This might be why intra-task flexibility did not support the problem solvers in reaching a
correct answer.
Two obvious benefits of examining problem solving behaviors through concept
stages are that: 1) The analysis can go beyond “approaches/strategies,” since on the same
concept stage there could be different approaches (due to different contexts) with a
449
common characteristic, i.e. operating on the essential relations embedded in that stage; 2)
The process of problem solving is no longer interpreted as a “time-line” (Schoenfeld,
1985) or “swirling” (Mason, Burton, & Stacey, 1985), but constructing/finding/operating
on relations and shifting to a different stage when specific relations are created. On this
level of analysis, an individual may switch between stages without making connections to
existing work (just trying an alternative approach when one approach doesn’t work), or
the shift of stage can be a result of an operation on existing relations. The former can
explain why an individual may behave differently under the same context; the order of
choices is not linear, but parallel (an act-out order can depend on the personalized factors
which are more situated and less generalizable). The latter represents a genuine problem
solving moment that has been puzzling: what may have triggered the shift? What
relations are created during the shift? What is the operation that creates the new relations?
The proposed theoretical lens trims out the personalized factors which could
greatly influence the act-out orders mentioned in the previous paragraph; it focuses on the
relations along with the metacognitive behaviors acting on them. A mature
developmental framework of a concept under this theoretical lens should be able to
illustrate to which stages are able/more likely to be shifted from the stages that are
currently available for an individual under a list of potential (cognitive/metacognitive)
factors that may trigger the shifts. The framework will not be able to predict which factor
would guarantee a shift from a specific stage to another (this can vary from individual to
individual because of personalized factors). This type of prediction, as the study results
indicated, may not be essential to theorizing. This analytical lens does not provide a new
method to assess/elicit metacognition - which is what the researchers have been hoping to
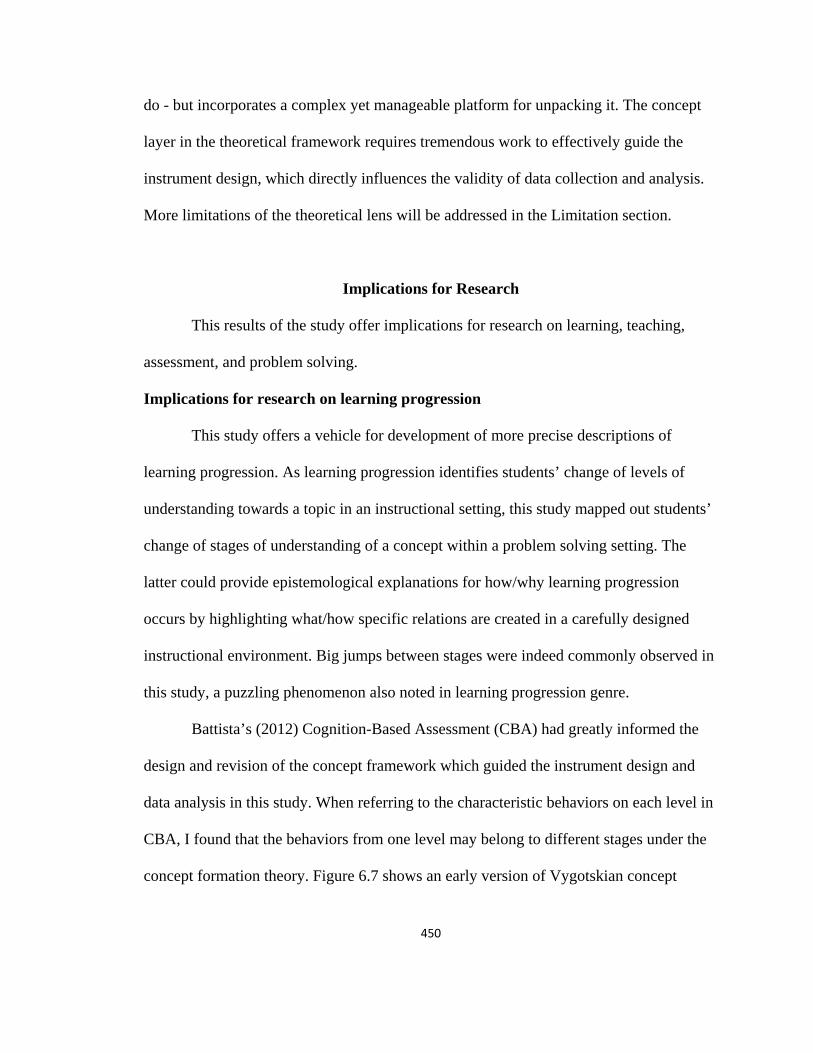
450
do - but incorporates a complex yet manageable platform for unpacking it. The concept
layer in the theoretical framework requires tremendous work to effectively guide the
instrument design, which directly influences the validity of data collection and analysis.
More limitations of the theoretical lens will be addressed in the Limitation section.
Implications for Research
This results of the study offer implications for research on learning, teaching,
assessment, and problem solving.
Implications for research on learning progression
This study offers a vehicle for development of more precise descriptions of
learning progression. As learning progression identifies students’ change of levels of
understanding towards a topic in an instructional setting, this study mapped out students’
change of stages of understanding of a concept within a problem solving setting. The
latter could provide epistemological explanations for how/why learning progression
occurs by highlighting what/how specific relations are created in a carefully designed
instructional environment. Big jumps between stages were indeed commonly observed in
this study, a puzzling phenomenon also noted in learning progression genre.
Battista’s (2012) Cognition-Based Assessment (CBA) had greatly informed the
design and revision of the concept framework which guided the instrument design and
data analysis in this study. When referring to the characteristic behaviors on each level in
CBA, I found that the behaviors from one level may belong to different stages under the
concept formation theory. Figure 6.7 shows an early version of Vygotskian concept
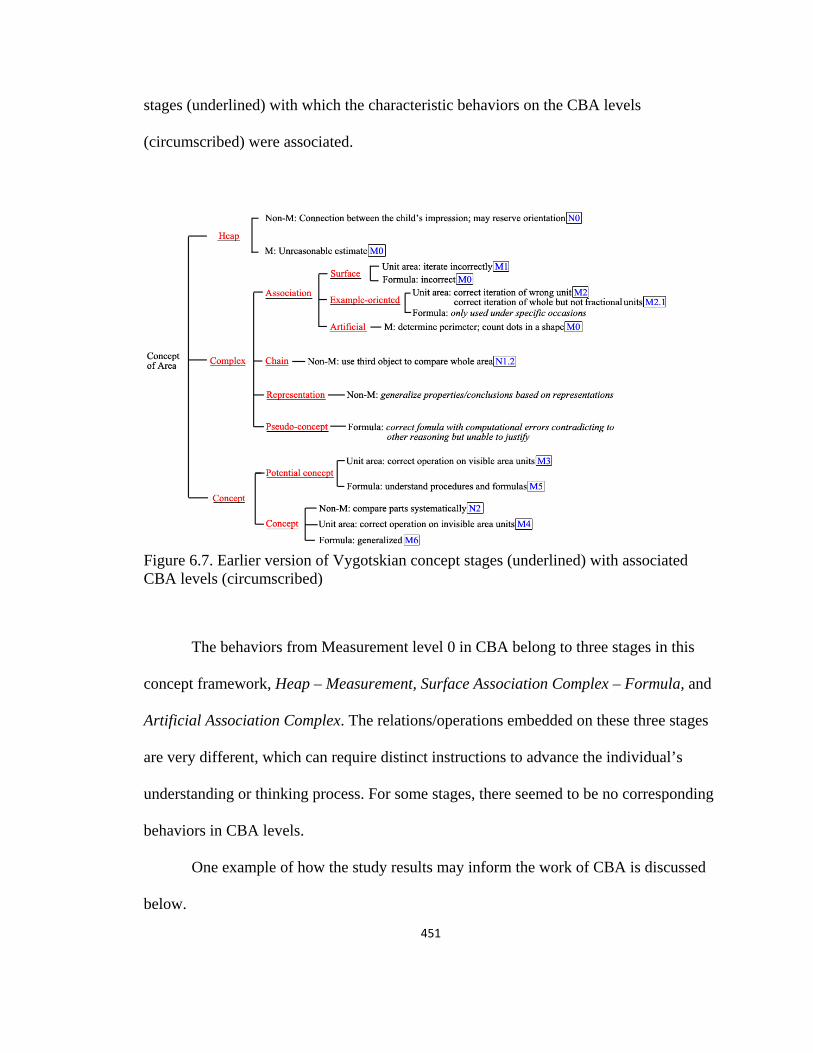
451
stages (underlined) with which the characteristic behaviors on the CBA levels
(circumscribed) were associated.
Figure 6.7. Earlier version of Vygotskian concept stages (underlined) with associated CBA levels (circumscribed)
The behaviors from Measurement level 0 in CBA belong to three stages in this
concept framework, Heap – Measurement, Surface Association Complex – Formula, and
Artificial Association Complex. The relations/operations embedded on these three stages
are very different, which can require distinct instructions to advance the individual’s
understanding or thinking process. For some stages, there seemed to be no corresponding
behaviors in CBA levels.
One example of how the study results may inform the work of CBA is discussed
below.
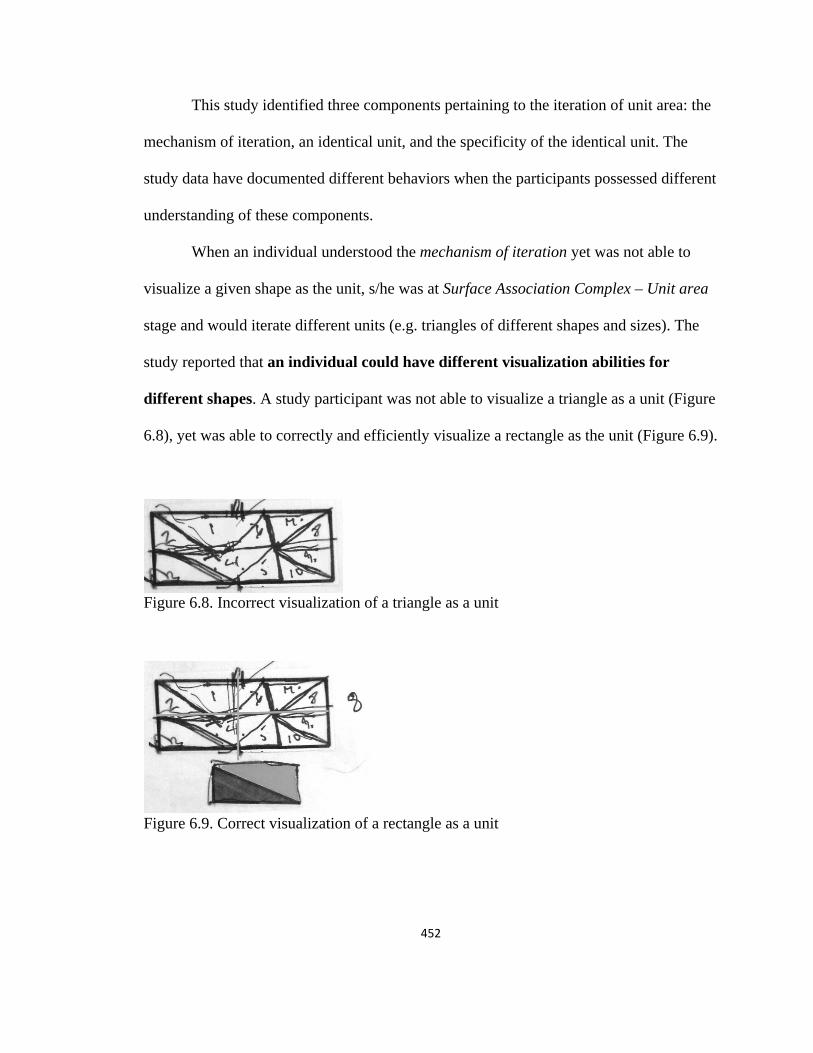
452
This study identified three components pertaining to the iteration of unit area: the
mechanism of iteration, an identical unit, and the specificity of the identical unit. The
study data have documented different behaviors when the participants possessed different
understanding of these components.
When an individual understood the mechanism of iteration yet was not able to
visualize a given shape as the unit, s/he was at Surface Association Complex – Unit area
stage and would iterate different units (e.g. triangles of different shapes and sizes). The
study reported that an individual could have different visualization abilities for
different shapes. A study participant was not able to visualize a triangle as a unit (Figure
6.8), yet was able to correctly and efficiently visualize a rectangle as the unit (Figure 6.9).
Figure 6.8. Incorrect visualization of a triangle as a unit
Figure 6.9. Correct visualization of a rectangle as a unit
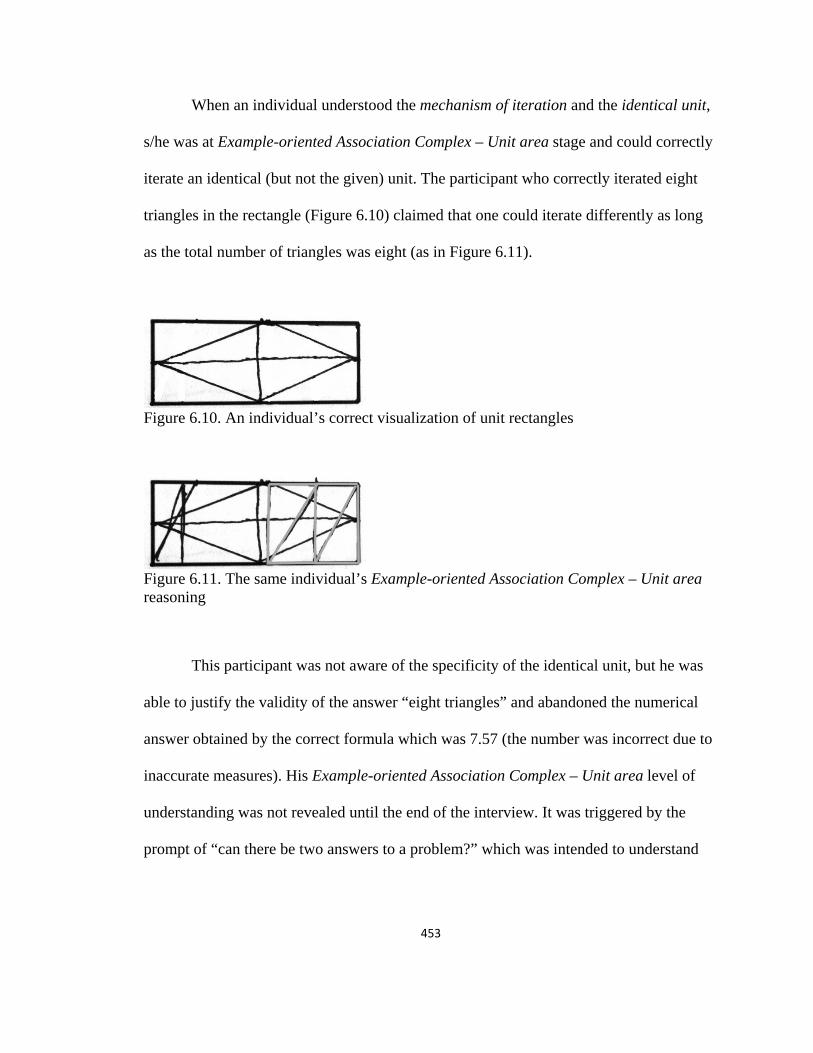
453
When an individual understood the mechanism of iteration and the identical unit,
s/he was at Example-oriented Association Complex – Unit area stage and could correctly
iterate an identical (but not the given) unit. The participant who correctly iterated eight
triangles in the rectangle (Figure 6.10) claimed that one could iterate differently as long
as the total number of triangles was eight (as in Figure 6.11).
Figure 6.10. An individual’s correct visualization of unit rectangles
Figure 6.11. The same individual’s Example-oriented Association Complex – Unit area reasoning
This participant was not aware of the specificity of the identical unit, but he was
able to justify the validity of the answer “eight triangles” and abandoned the numerical
answer obtained by the correct formula which was 7.57 (the number was incorrect due to
inaccurate measures). His Example-oriented Association Complex – Unit area level of
understanding was not revealed until the end of the interview. It was triggered by the
prompt of “can there be two answers to a problem?” which was intended to understand
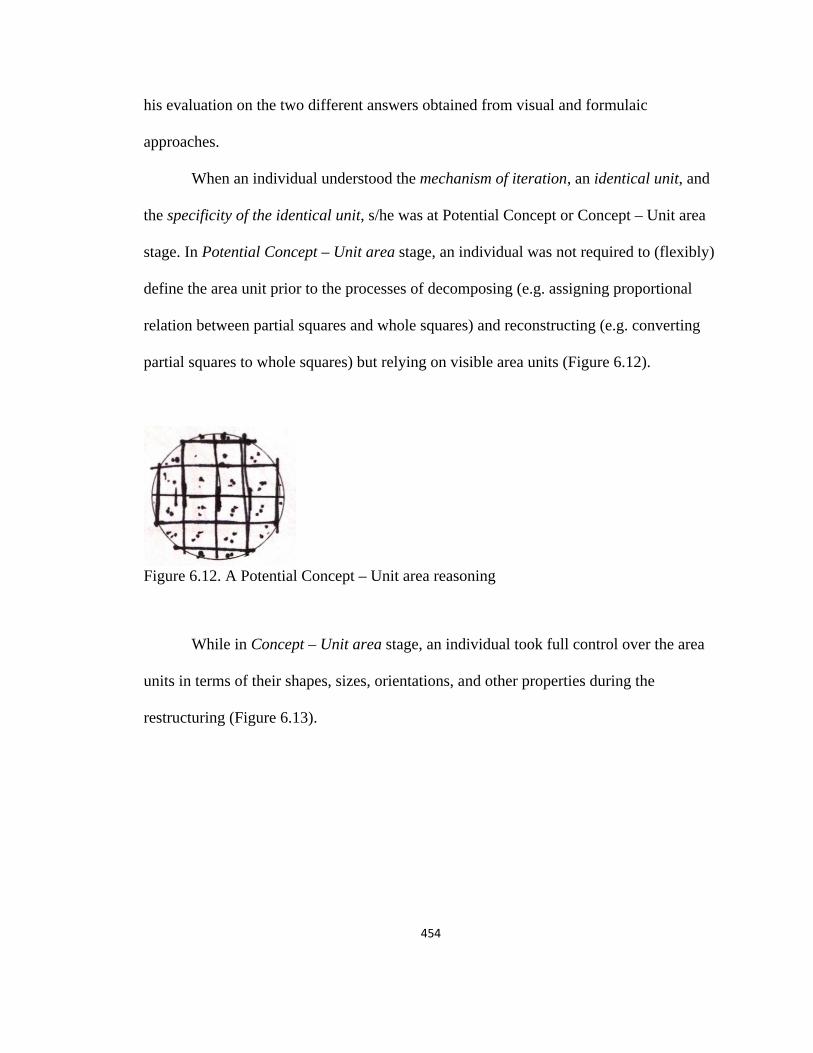
454
his evaluation on the two different answers obtained from visual and formulaic
approaches.
When an individual understood the mechanism of iteration, an identical unit, and
the specificity of the identical unit, s/he was at Potential Concept or Concept – Unit area
stage. In Potential Concept – Unit area stage, an individual was not required to (flexibly)
define the area unit prior to the processes of decomposing (e.g. assigning proportional
relation between partial squares and whole squares) and reconstructing (e.g. converting
partial squares to whole squares) but relying on visible area units (Figure 6.12).
Figure 6.12. A Potential Concept – Unit area reasoning
While in Concept – Unit area stage, an individual took full control over the area
units in terms of their shapes, sizes, orientations, and other properties during the
restructuring (Figure 6.13).
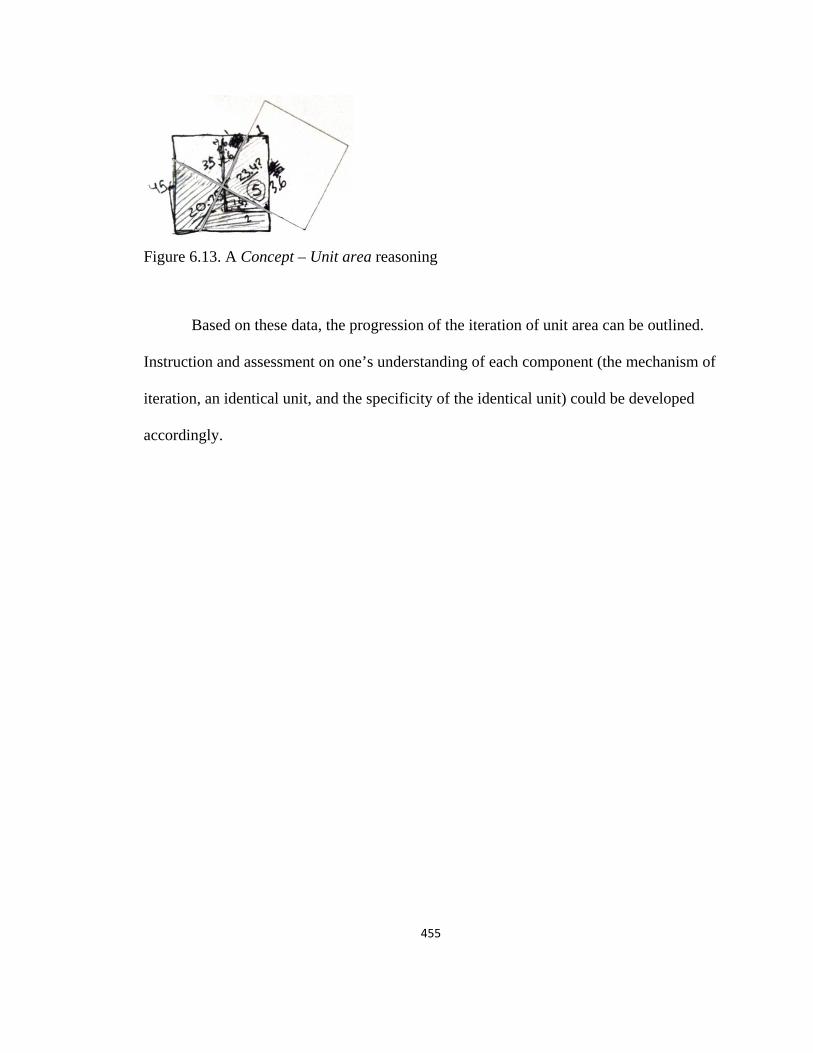
455
Figure 6.13. A Concept – Unit area reasoning
Based on these data, the progression of the iteration of unit area can be outlined.
Instruction and assessment on one’s understanding of each component (the mechanism of
iteration, an identical unit, and the specificity of the identical unit) could be developed
accordingly.
456
Implications for research on teaching
This study can contribute to the conceptualization of Vygotsky’s (1987) zone of
proximal development, offering guides for instruction and research on teaching.
The zone of proximal development (ZPD) is defined as “the distance between the
actual developmental level as determined by independent problem solving and the level
of potential development as determined through problem solving under adult guidance, or
in collaboration with more capable peers” (Vygotsky, 1987, p86). Silver (2011) proposed
the following guideline for classroom ZPD instruction:
1. Assess the learner’s current knowledge and experience for the academic
content.
2. Relate content to what students already understand or can do.
3. Break a task into small, more manageable tasks with opportunities for
intermittent feedback.
4. Use verbal cues and prompts to assist students.
This guideline provides the general steps/strategies for the instruction process, yet
may not be informative/feasible enough for a practitioner to follow without a deep
understanding of the related concepts.
By identifying the relations embedded on each stage as well as the corresponding
cognitive/metacognitive factors that may help to build connections among them, this
study can serve as a resource to inform/organize the epistemological knowledge that is
required to execute the strategies described in the above guideline. To re-phrase the ZPD
instruction process in terms of the language used in this study, the scaffolder needs to:

457
1) Identify the relations (stages) that the child has
noticed/acquired/established.
2) Map out as many potential connections between the isolated relations as
possible.
3) Understand what is missing/essential to build each connection.
4) Point to each missing/essential part and see whether the student is able to
build potential connection.
5) Provide essential information to aid the process if the student is not able to
do so under the hint.
When providing prompts and testing how far each participant could proceed after
s/he exhausted his/her attempts or got stuck in the interviews, I generally attempted to
follow the above process, except that my goal was not to guide the students towards
finding the correct answer. My knowledge of the relations and potential factors came
from extensive experience with secondary students’ work on the same problems. On
several occasions where a participant’s work was too novel or the relations were too
discrete, I found it difficult to go beyond step 1 or 2.
Two examples from my interventions in the interviews are provided below.
When the participants were solving the Intersected Area problem, most of them
were not able to proceed after they solved the original case despite what approaches they
used to specialize. One participant had found the area of the intersected region by
subtracting the areas of two triangles from a constructed rectangle, as shown in Figure
6.14 (the approach revealed a Potential Concept – Formula level of operation).
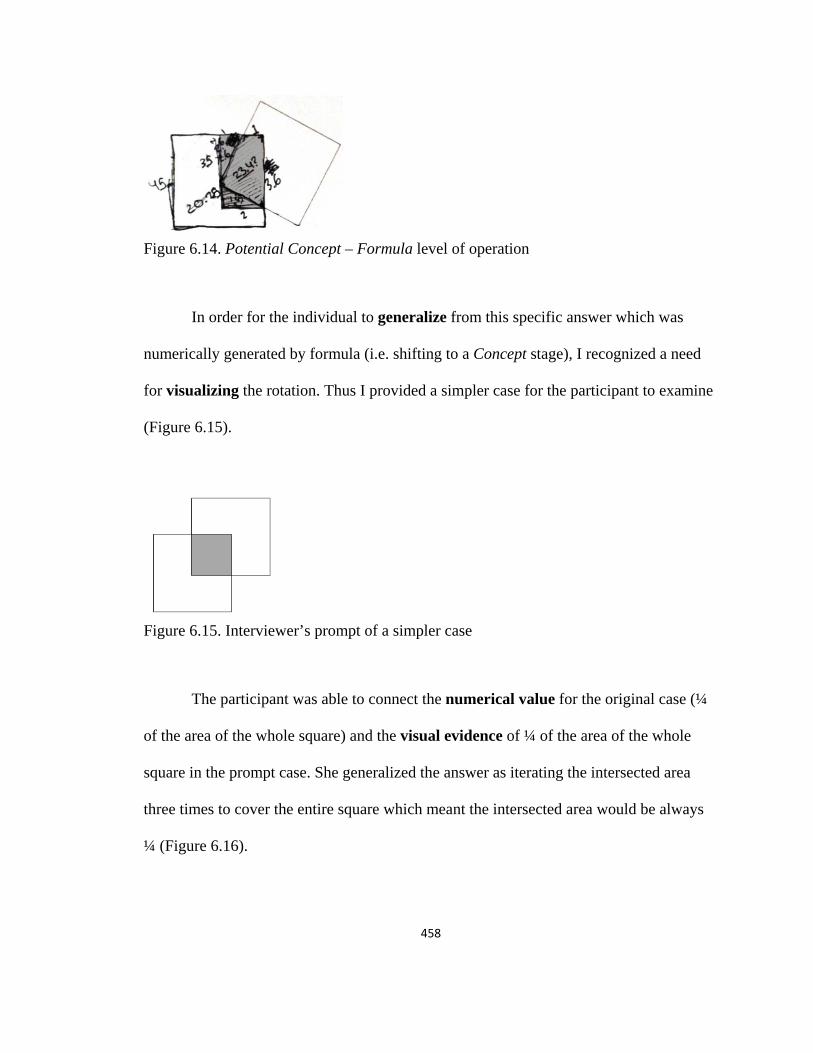
458
Figure 6.14. Potential Concept – Formula level of operation
In order for the individual to generalize from this specific answer which was
numerically generated by formula (i.e. shifting to a Concept stage), I recognized a need
for visualizing the rotation. Thus I provided a simpler case for the participant to examine
(Figure 6.15).
Figure 6.15. Interviewer’s prompt of a simpler case
The participant was able to connect the numerical value for the original case (¼
of the area of the whole square) and the visual evidence of ¼ of the area of the whole
square in the prompt case. She generalized the answer as iterating the intersected area
three times to cover the entire square which meant the intersected area would be always
¼ (Figure 6.16).
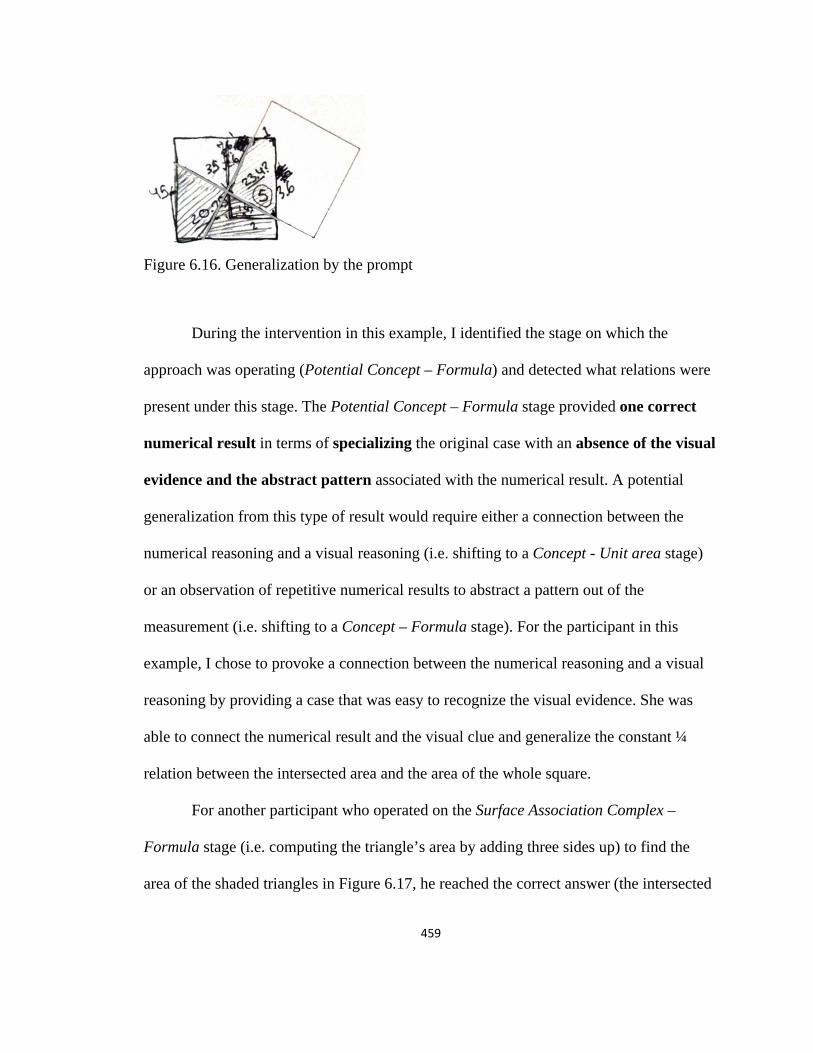
459
Figure 6.16. Generalization by the prompt
During the intervention in this example, I identified the stage on which the
approach was operating (Potential Concept – Formula) and detected what relations were
present under this stage. The Potential Concept – Formula stage provided one correct
numerical result in terms of specializing the original case with an absence of the visual
evidence and the abstract pattern associated with the numerical result. A potential
generalization from this type of result would require either a connection between the
numerical reasoning and a visual reasoning (i.e. shifting to a Concept - Unit area stage)
or an observation of repetitive numerical results to abstract a pattern out of the
measurement (i.e. shifting to a Concept – Formula stage). For the participant in this
example, I chose to provoke a connection between the numerical reasoning and a visual
reasoning by providing a case that was easy to recognize the visual evidence. She was
able to connect the numerical result and the visual clue and generalize the constant ¼
relation between the intersected area and the area of the whole square.
For another participant who operated on the Surface Association Complex –
Formula stage (i.e. computing the triangle’s area by adding three sides up) to find the
area of the shaded triangles in Figure 6.17, he reached the correct answer (the intersected
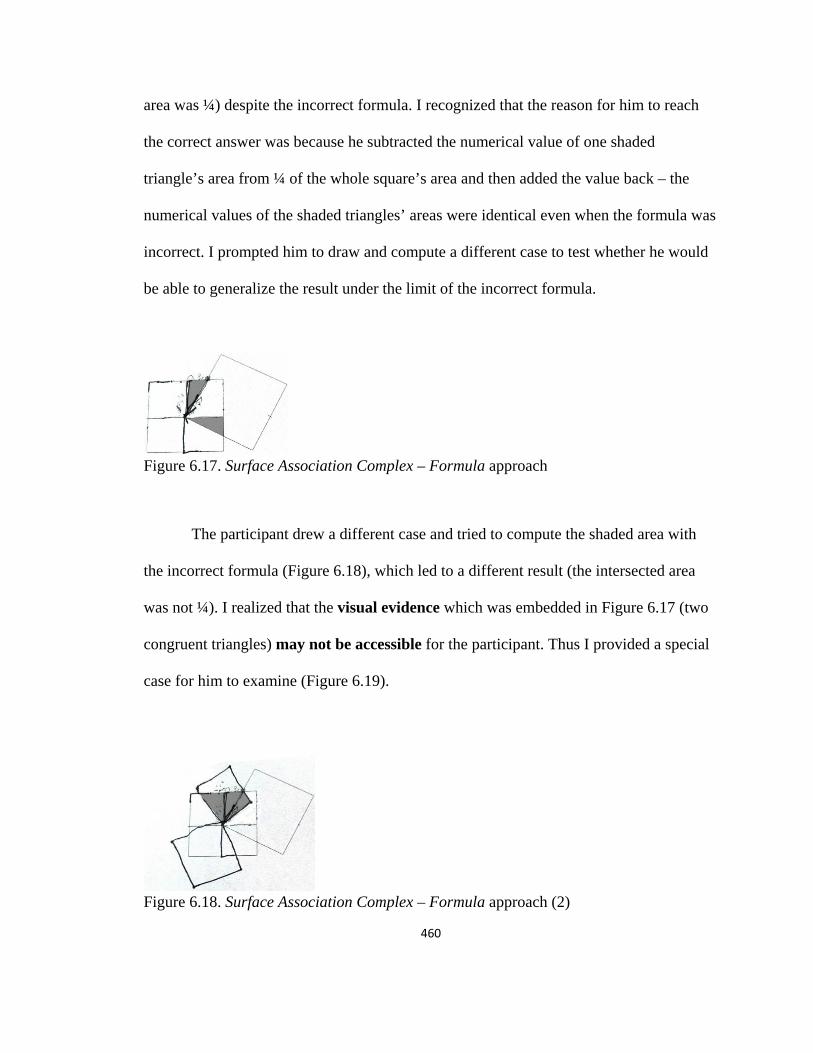
460
area was ¼) despite the incorrect formula. I recognized that the reason for him to reach
the correct answer was because he subtracted the numerical value of one shaded
triangle’s area from ¼ of the whole square’s area and then added the value back – the
numerical values of the shaded triangles’ areas were identical even when the formula was
incorrect. I prompted him to draw and compute a different case to test whether he would
be able to generalize the result under the limit of the incorrect formula.
Figure 6.17. Surface Association Complex – Formula approach
The participant drew a different case and tried to compute the shaded area with
the incorrect formula (Figure 6.18), which led to a different result (the intersected area
was not ¼). I realized that the visual evidence which was embedded in Figure 6.17 (two
congruent triangles) may not be accessible for the participant. Thus I provided a special
case for him to examine (Figure 6.19).
Figure 6.18. Surface Association Complex – Formula approach (2)
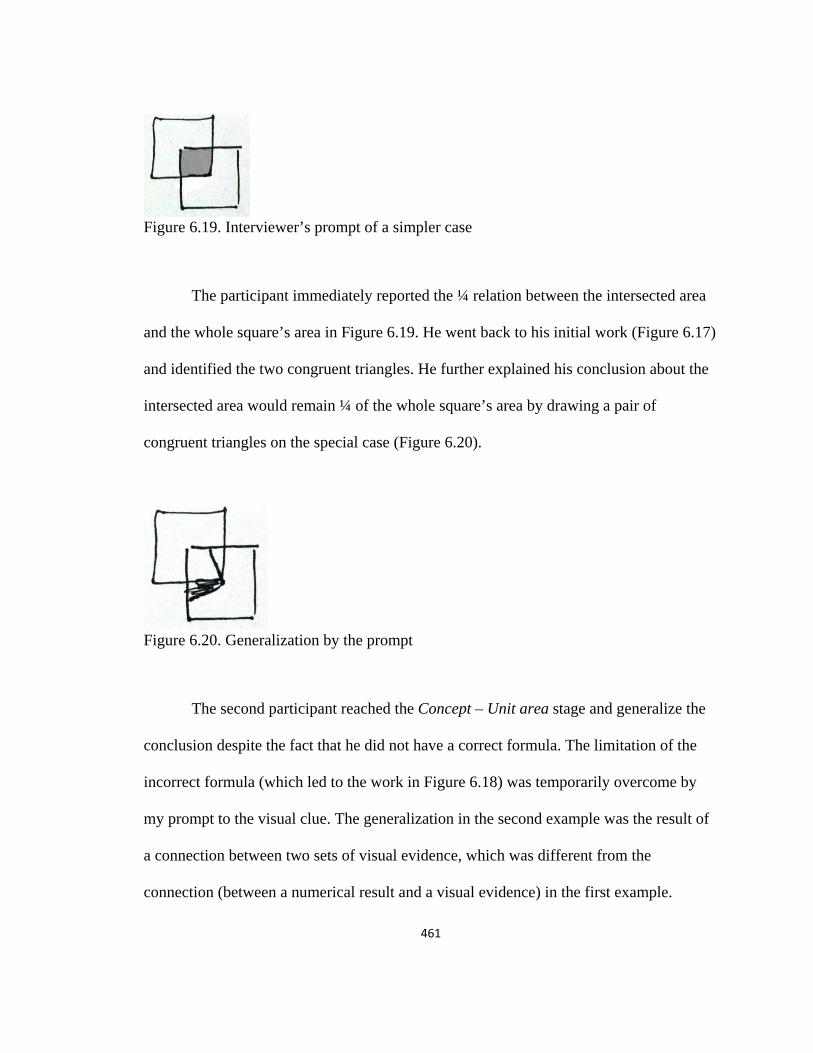
461
Figure 6.19. Interviewer’s prompt of a simpler case
The participant immediately reported the ¼ relation between the intersected area
and the whole square’s area in Figure 6.19. He went back to his initial work (Figure 6.17)
and identified the two congruent triangles. He further explained his conclusion about the
intersected area would remain ¼ of the whole square’s area by drawing a pair of
congruent triangles on the special case (Figure 6.20).
Figure 6.20. Generalization by the prompt
The second participant reached the Concept – Unit area stage and generalize the
conclusion despite the fact that he did not have a correct formula. The limitation of the
incorrect formula (which led to the work in Figure 6.18) was temporarily overcome by
my prompt to the visual clue. The generalization in the second example was the result of
a connection between two sets of visual evidence, which was different from the
connection (between a numerical result and a visual evidence) in the first example.
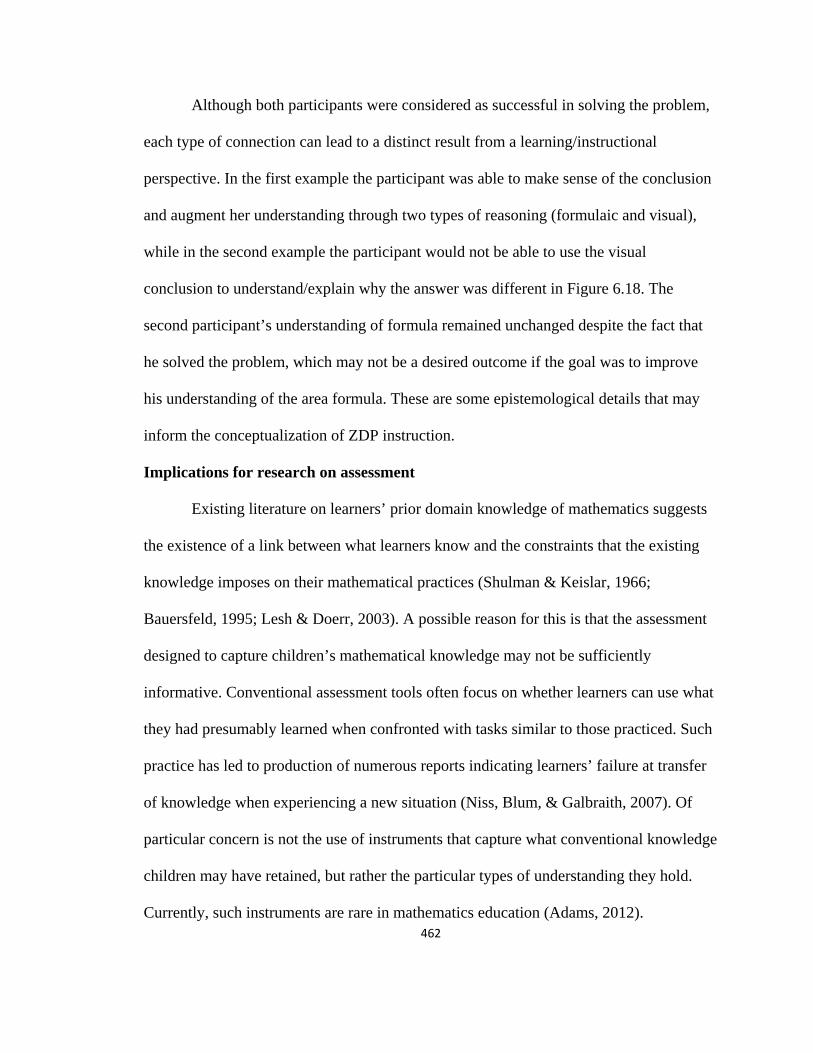
462
Although both participants were considered as successful in solving the problem,
each type of connection can lead to a distinct result from a learning/instructional
perspective. In the first example the participant was able to make sense of the conclusion
and augment her understanding through two types of reasoning (formulaic and visual),
while in the second example the participant would not be able to use the visual
conclusion to understand/explain why the answer was different in Figure 6.18. The
second participant’s understanding of formula remained unchanged despite the fact that
he solved the problem, which may not be a desired outcome if the goal was to improve
his understanding of the area formula. These are some epistemological details that may
inform the conceptualization of ZDP instruction.
Implications for research on assessment
Existing literature on learners’ prior domain knowledge of mathematics suggests
the existence of a link between what learners know and the constraints that the existing
knowledge imposes on their mathematical practices (Shulman & Keislar, 1966;
Bauersfeld, 1995; Lesh & Doerr, 2003). A possible reason for this is that the assessment
designed to capture children’s mathematical knowledge may not be sufficiently
informative. Conventional assessment tools often focus on whether learners can use what
they had presumably learned when confronted with tasks similar to those practiced. Such
practice has led to production of numerous reports indicating learners’ failure at transfer
of knowledge when experiencing a new situation (Niss, Blum, & Galbraith, 2007). Of
particular concern is not the use of instruments that capture what conventional knowledge
children may have retained, but rather the particular types of understanding they hold.
Currently, such instruments are rare in mathematics education (Adams, 2012).
463
The concept layer in the proposed theoretical lens can guide the design of
research-based assessments. Because of how stages are defined in Vygotsky’s concept
formation theory (relations and operations on relations), what an individual understands
is determined by how s/he operates and not the other way around. A key considering
when designing tasks to be used in this study was that each item was deliberately
designed to allow entries from multiple levels of concept stages, and in total, they
covered most of the stages in the framework. Students’ responses were not categorized as
right or wrong but assigned to different stages. The participants who were selected based
on the pretest responses indeed exhibited similar characteristics (both concept
development status and problem solving ability) in the problem solving interviews. A
more detailed report on the pretest result has been published elsewhere (Zhang,
Manouchehri, & Tague, 2013).
Implications for research on problem solving
Aside from the theoretical contribution addressed in the previous section, this
study provides explicit implications for task design/selection when studying problem
solving.
Two types of metacognitive behaviors (regulation of task knowledge and
regulation of task demands) were not able to be unpacked based on limited data.
Regulation of task knowledge seemed to involve less diverse functions yet generate more
distinct consequences. It integrated regulation of task objectives/demands and monitoring
of strategies. Regulation of task demands integrated intra-person monitoring and
regulation of strategy. This type of metacognitive behavior tended to be determined and
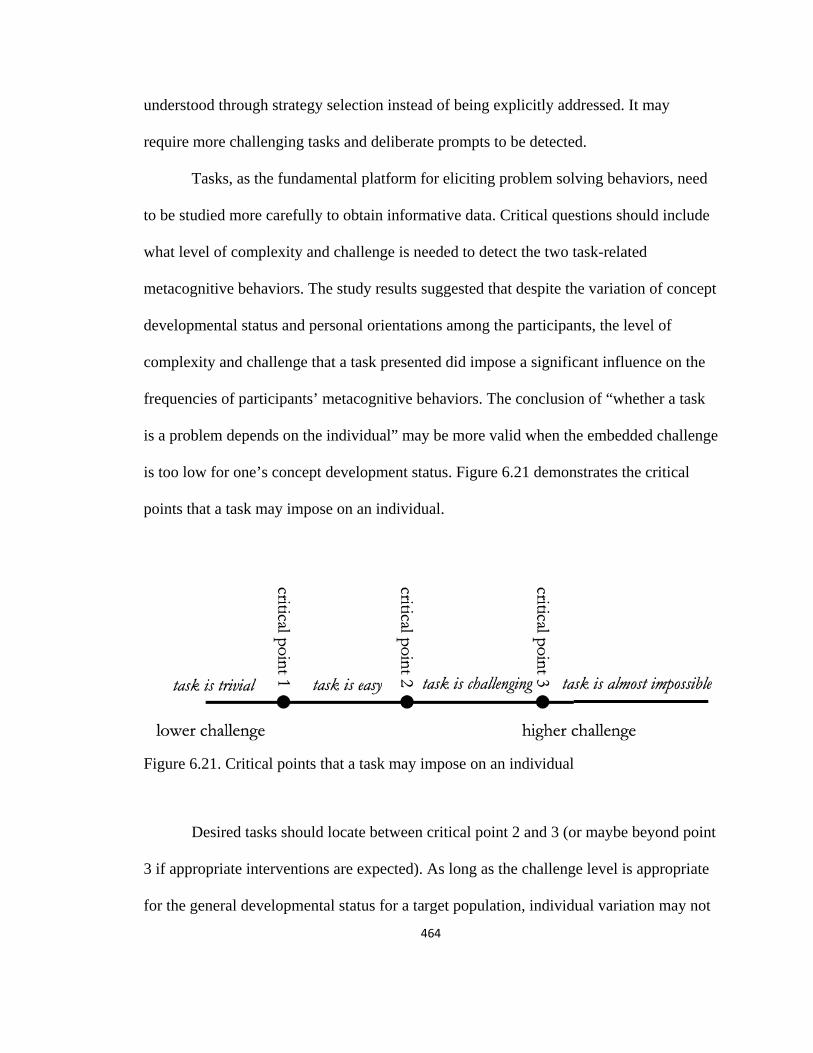
464
understood through strategy selection instead of being explicitly addressed. It may
require more challenging tasks and deliberate prompts to be detected.
Tasks, as the fundamental platform for eliciting problem solving behaviors, need
to be studied more carefully to obtain informative data. Critical questions should include
what level of complexity and challenge is needed to detect the two task-related
metacognitive behaviors. The study results suggested that despite the variation of concept
developmental status and personal orientations among the participants, the level of
complexity and challenge that a task presented did impose a significant influence on the
frequencies of participants’ metacognitive behaviors. The conclusion of “whether a task
is a problem depends on the individual” may be more valid when the embedded challenge
is too low for one’s concept development status. Figure 6.21 demonstrates the critical
points that a task may impose on an individual.
Figure 6.21. Critical points that a task may impose on an individual
Desired tasks should locate between critical point 2 and 3 (or maybe beyond point
3 if appropriate interventions are expected). As long as the challenge level is appropriate
for the general developmental status for a target population, individual variation may not

465
be a significant concern for studying metacognitive behaviors. Existing literature does not
provide a guide that can inform systemized task design/selection.
Future research on task design/selection may need to outline: 1) task elements and
objectives that are essential to understanding the problem, 2) specific concept stages as
entry points granted by the tasks, 3) desired concept stages on which the solutions are
embedded, and 4) potential shifts/paths between the stages in (2) and (3).
Item 1 is needed to identify whether a task is appropriate for a target population to
understand. If a task involves an essential element that an individual has not learned, s/he
would not be able to solve the “correct problem” unless it is properly explained.
Item 2 determines whether the task allows individuals with different concept
developmental stages to tackle the problem. More entry points would enable the task to
be used on a population that contains more varied concept developmental status.
Item 3 determines whether the task might be too challenging/impossible to solve
given a specific concept developmental stage as well as whether the task allows different
approaches to solve.
Item 4 provides an aid for the interviewers/researchers who plan to adopt the task
to prepare for potential prompts/probing questions when observing an individual to solve
the problem.
These four items mainly determine the capacity of a task. If a task allows only one
entry point and one desired stage for the solution, it mostly assesses whether an
individual knows the procedure or not.
466
Implications for Practice
The map of concept stages generated in this study is detailed and descriptive. It is
relatively easy to understand and refer to as an assessment guideline. Teachers who are
interested in using the map along with the designed instrument to assess their students’
knowledge on the concept of area should be able to do so without
misinterpretations/ambiguity or digging into related theory or literature.
For teachers who are interested in learning about metacognition and promoting
students’ metacognitive skills, the consequences for each function of each type of
metacognitive behavior are descriptive and helpful in conceptualizing the idea and
detecting students’ behaviors.
The interview problems have detailed reports on observed entries and approaches,
nature of tasks, and related concept stages. These can be used as lesson plan resources for
instruction or assessment purposes.
One goal of my line of study is to generate information/resources that are
accessible to teachers. As more concepts are studied, a collection of research-based
assessment should be the most direct contribution to practice.
Theoretical Limitation
Three theoretical limitations were experienced in this study.
First, mathematical concepts are closely interrelated. It is inevitable (and
necessary) to involve concepts other than the target concept in a problem solving setting.
It requires scrupulous design to control the number of related concepts in the instrument,
not to mention unexpected concepts brought in by the study participants. Considering the
467
ultimate goal of the theoretical lens, which is to abstract potential patterns among
different concepts and theorize mathematical problem solving, it can be difficult to
identify patterns in presence of relationships among concepts (e.g. the concept of
triangles/rectangles/heights and the concept of area). A potential solution to this might be
grouping concepts by their epistemological characteristics and developing different
theories accordingly.
The second limitation concerns the extent to which the theoretical framework of a
concept should be detailed. The study results revealed potential sub-stages/sub-
components under some stages/components, such as the three sub-components of unit
area (iteration, identical unit, and specificity of identical unit) and the distinct sub-stages
under Artificial Association Complex stage (depending on what concept was associated
with). The theoretical framework pertaining to the development of the concept of area
which was used in this study contained only the most basic stages. This could certainly
have been a limitation. Yet it is important to include essential stages and components
while maintaining the framework as manageable, in that a more complex framework will
significantly increase the level of difficulty/complexity in later work, including
instrument design, participant selection, data analysis, and generalization of potential
patterns from collected data.
Third, the instrument design under this theoretical lens plays an overwhelmingly
important role. Two of the interview problems elicited very limited information since
they did not seem challenging enough for the participants. Two types of task-related
metacognitive behaviors were minimally detected in this study, and it is not clear what
type of problems might provide the capacity to detect them. The role of instrument design
468
becomes a limitation of the theoretical lens because it greatly limits the number of
researchers who may adopt it as a theoretical framework for their study.
In Closing
In his most recent article on mathematical problem solving, Schoenfeld (2013),
considered ways in which theories of learning and development might be incorporated
into a theory of decision making proposed, “… if we can trace typical developmental
trajectories with regard to students’ (properly supported) ability to engage in problem
solving, this might help shape curriculum development. More generally, if our goal is to
theorize cognition and problem solving, such issues need to be addressed” (p.21). The
theoretical lens developed and used in the current study fully aligns with this idea.
Going back to the issues identified by Lester (1994), this investigation focused on
the interactions between domain knowledge and a key element of problem solving
activity, i.e. control (metacognitive components). In light of the results several key
questions emerge:
1. How does the epistemological characteristics of a mathematical concept
hinder/provoke specific functions of metacognitive behaviors?
As the target concept in this study, the concept of area mainly contains three
components: non-measurement reasoning, unit area, and formula according to Battista’s
(2012) CBA levels. The study results revealed that an individual’s understanding for each
component could be at a different stage (e.g. a lower stage for non-measurement but a
higher stage for unit area) or even at different stages for different related concepts (e.g.
lower stages for area of triangles but higher stages for area of rectangles). One participant
469
failed to visualize a triangle as a unit, yet was able to correctly and efficiently visualize a
rectangle as the unit. I conjectured that the reason why an individual had different
visualization abilities for different shapes was possibly because of the different angles in
a triangle (compared to only right angles in a rectangle) which may have caused the
difficulty for visualization/replication. If this was the case, different epistemological
characteristics of mathematical concepts could have distinct impacts on specific
functions/consequences of metacognitive behaviors as the findings suggested that
concept stages have served as a key factor for many functions/consequences of
metacognitive behaviors.
2. How can we systemize/theorize the task design/selection rationales
pertaining to a concept and metacognitive behaviors that are under study?
This study failed to collect enough data for two task-related metacognitive
behaviors (regulation of task knowledge and regulation of task demands). I identified
potential metacognitive behaviors that those two tended to closely integrate. I also raised
the issue about what type of tasks would be more appropriate to promote those two types
of task-related metacognitive behaviors. Given the crucial role of task design/selection in
problem solving study, such systemization merits great attention. Based on the study
results, I suggested four potential aspects for systemizing task design/selection in the
Implications for research on problem solving section, yet I believe they were far from
explicit.
3. How to effectively abstract/interpret information in (observable) cognitive
behaviors to better inform researchers’ understanding of one’s (dynamic)
concept developmental status and (unobservable) metacognitive behaviors?

470
Is it possible to develop a guideline/framework to regulate such
interpretation?
In this study, individuals’ cognitive behaviors were interpreted in terms of
concept stages and metacognitive behaviors. For example, each approach an individual
utilized informed the concept stage s/he was operating on and his/her potential strategy-
related metacognitive behaviors; each switch of approaches were interpreted as a shift of
concept stages and potential metacognitive behaviors triggering the shifts. As the
interpreting process went on, I developed a mental guideline to maintain the consistency
and efficiency of interpretation. This guideline, although informal at this time, had been
important to regulate/control the quality of data interpretation. If problem solving
researchers could reflect on and report such mental guidelines, it may help to improve the
effectiveness of data interpretation.
4. Given the knowledge of potential factors for effective consequences of
metacognitive behaviors, can those factors be controlled? Can effective
consequences be promoted or facilitated?
Aside from concept stages, the study proposed a number of potential factors for
effective consequences of metacognitive behaviors, such as neutral preference towards
specific concept components or specific strategies, when (thorough or cumulative) the
regulation of task elements/objectives happened, and written or verbal monitoring of
strategies. Can we control/influence/impact these factors during instruction?
The study distinguished the difference between effective metacognitive behaviors
and effective consequences of metacognitive behaviors. This distinction was especially
clear for regulation of strategy applicability, regulation, and transfer (global regulation).
471
What does it mean to improve problem solving ability/performance? Which one(s) might
be teachable?
5. How does different models/frameworks of metacognitive studies in the
field of mathematical problem solving provide information that may
augment/confirm/challenge each other?
Problem solving researchers have been developing models, frameworks, and
techniques to study this phenomena, such as problem solving events (Schoenfeld, 1981;
Lawson & Chinnappan, 1994), problem solving phases/stages/episodes (Lester et al.,
1989; Anderson, Lee, & Fincham, 2014), a multi-method technique to interpret through
awareness-evaluation-regulation cycles (Wilson & Clarke, 2004), and dynamic geometry
technology (Kuzle, 2011). Each lens determines and restricts what a researcher can obtain
from a piece of data. Comparing the conclusions/interpretations offered by different
lenses on the same piece of data may provide a finer image of the data. As pointed out by
both Schoenfeld (1992) and Lester (1994), problem solving had been the most
overworked but least understood subject. Excessive data may need to be replaced by finer
analyses.
Despite the potential theoretical limitations, the lens used in current study
provides a promising perspective for studying mathematical problem solving and merits
further attention. Future studies are needed to both revise/improve the findings on the
concept of area and extend to other mathematical concepts in order to accumulate
findings for generalizing/theorizing mathematical problem solving.
472
REFERENCE
Adams, W. K. (2012). Problem solving assessment. The Journal of the Acoustical Society of America, 132(3), 1923.
Anderson, J. R., Lee, H. S., & Fincham, J. M. (2014). Discovering the structure of mathematical problem solving. Neuro Image, 97, 163-177.
Artigue, M. (2002). Learning mathematics in CAS environment: The genesis of a reflection about instrumentation and the dialects between technical and conceptual work. International Journal of Computers for Mathematical Learning, 7(3), 245–274.
Ausubel, D. P. (1968). Educational psychology: A cognitive view. New York: Holt, Rinehart & Winston.
Battista, M. (2011). Conceptualizations and issues related to learning progressions, learning trajectories, and levels of sophistication. The Mathematics Enthusiast, 8(3), 507-570.
Battista, M. (2012). Cognition-based assessment and teaching of geometric measurement: Building on students’ reasoning. Portsmouth, NH: Heinemann.
Bauersfeld, H. (1995). The structuring of the structures: Development and function of mathematizing as a social practice. In L. P. Steffe, & J. Gale (Eds.), Constructivism in education, 137-158. Hillsdale, NJ & Hove, UK: Lawrence Erlbaum Associates Publishers.
Baumeister, R. F., & Vohs, K. D. (2004). Handbook of self-regulation: Research, theory, and applications. New York and London: Guilford Press.
Bereiter, C., & Scardamalia, M. (1993). Surpassing ourselves: An inquiry into the nature and implications of expertise. Chicago, IL: Open Court.
Berger, M. (2002). The appropriation of mathematical objects by undergraduate mathematics students: a study, unpublished doctoral dissertation. Johannesburg, Republic South Africa, School of Mathematics, University of the Witwatersrand.
Berger, M. (2004). Heaps, complexes and concepts. For the Learning of Mathematics, 24(2), 2-6.
Blumer, H. (1969). Symbolic interactionism. Englewood Cliffs, NJ: Prentice-Hall.

473
Chi, M. T. H., Glaser, R., & Farr, M. J. (Eds.). (1988). The nature of expertise. Hillsdale, NJ: Erlbaum.
Confrey, J. (1995). Towards a framework for constructivist instruction. In L. Steefland (Ed.), Proceedings of the ninth international conference for the psychology of
mathematics education Noordwijkerhout, 477-483. Utrecht, The Netherlands: State University of Utrecht.
Elia, I., van den Heuvel-Panhuizen, M., & Kolovou, A. (2009). Exploring strategy use and strategy flexibility in non-routine problem solving by primary school high achievers in mathematics. ZDM, 41(5), 605-618.
Ellis, D., & Zimmerman, B. J. (2001). Enhancing self-monitoring during self-regulated learning of speech. In H. J. Hartman (Ed.), Metacognition in learning an instruction: Theory, research, and practice, 205-228. Dordrecht, Netherlands: Kluwer Academic Publishers.
Flavell, J. H. (1979). Metacognition and cognitive monitoring: A new area of cognitive developmental inquiry. American Psychologist, 34(10), 906–911.
Fleischman, H. L., Hopstock, P. J., Pelczar, M. P., & Shelley, B. E. (2010). Highlights from PISA 2009: performance of U.S. 15-year old students in reading, mathematics, and science literacy in an international context (NCES 2011-004). U.S. Department of Education, National Center for Education Statistics. Washington, DC: U.S. Government Printing Office.
Gonzales, P., Williams, T., Jocelyn, L., Roey, S., Kastberg, D., & Brenwald, S. (2008). Highlights from TIMSS 2007: mathematics and science achievement of U.S. fourth- and eighth-grade students in an international context (NCES 2009–001 Revised). National Center for Education Statistics, Institute of Education Sciences, U.S. Department of Education. Washington, DC.
Goodman, N., & Elgin, C. Z. (1988). Reconceptions in philosophy and other arts and science. Indianapolis: Hackett.
Goos, M. (2002). Understanding metacognitive failure. Journal of Mathematical Behavior, 21(3), 283–302.
Goos, M., & Galbraith, P. (1996). Do it this way! Metacognitive strategies in collaborative mathematical problem solving. Educational Studies in Mathematics, 30(3), 229–260.
Guzzetti, B. J., Snyder, T. E., Glass, G. V., & Gamas, W. S. (1993). Promoting conceptual change in science: A comparative meta-analysis of instructional interventions from reading education and science education. Reading Research Quarterly, 28, 116-161.
Harel, G., & Sowder, L. (1998). Students’ proof schemes: Results from exploratory studies. Research in collegiate mathematics education III, 7, 234-282.
474
Hartman, H. J. (2001). Developing students’ metacognitive knowledge and skills. In H. J. Hartman (Ed.), Metacognition in learning and instruction: Theory, research, and practice, 33-68. Dordrecht, Netherlands: Kluwer Academic Publishers
Holton, D., & Clarke, D. (2006). Scaffolding and metacognition. International Journal of Mathematical Education in Science and Technology, 17(2), 127-143.
Kantowski, M. G. (1977). Processes involved in mathematical problem solving. Journal for Research in Mathematics Education, 8(2), 163-180.
Kilpatrick, J. (1969). Problem solving and creative behavior in mathematics. In J. W. Wilson & L. R. Carey (Eds.), Review of recent research in mathematics education studies in mathematics series. Studies in Mathematics Series (Vol. 19, pp. 153–187). Stanford, CA: School Mathematics Study Group.
Kluwe, R. H. (1982). Cognitive knowledge and executive control: Metacognition. In D. R. Griffin (Ed.), Animal mind – Human mind, 201-224. New York: Springer - Verlag.
Kramarski, B., Mevarech, Z. R., & Arami, M. (2002). The effects of metacognitive instruction on solving mathematical authentic tasks. Educational Studies in Mathematics, 48, 225-250.
Kuhn, D. (1989). Children and adults as intuitive scientists. Psychological Review, 96, 674-689.
Kuhn, D., Schauble, L., & Garcia-Mila, M. (1992). Cross-domain development of scientific reasoning. Cognitive Instruction, 9, 285-327.
Kuzle, A. (2011). Preservice teachers’ patterns of metacognitive behavior during mathematics problem solving in a dynamic geometry environment. Athens, Georgia: University of Georgia.
Lampert, M. (1990). When the problem is not the question and the solution is not the answer: Mathematical knowing and teaching. American Educational Research Journal, 27, 29-63.
Lawson, M. J., & Chinnappan, M. (1994). Generating activity during geometry problem solving: Comparison of the performance of high-achieving and low-achieving high school students. Cognition and Instruction, 12(1), 61–93.
Lesh, R. & Doerr, H. M. (Eds.). (2003). Beyond constructivism: Models and modeling perspectives on mathematics problem solving, learning, and teaching. Mahwah and London: Lawrence Erlbaum Associates Publishers.
Lesh, R., & Doerr, H. M. (2003). Foundation of a models and modeling perspective on mathematics teaching, learning, and problem solving. In R. Lesh, & H. M. Doerr (Eds.), Beyond constructivism: Models and modeling perspectives on mathematics problem solving, learning, and teaching, 3-34. Mahwah and London: Lawrence Erlbaum Associates Publishers.
475
Lesh, R., Lester, F. K., & Hjalmarson, M. (2003). A models and modeling perspective on metacognitive functioning in everyday situations where problem solvers develop mathematical constructs. In R. Lesh, & H. M. Doerr (Eds.), Beyond constructivism: Models and modeling perspectives on mathematics problem solving, learning, and teaching, 383-404. Mahwah and London: Lawrence Erlbaum Associates Publishers.
Lester, F. K. (1994). Musings about mathematical problem-solving research: 1970-1994. Journal for Research in Mathematics Education, 25(6), 660-675.
Lester, F. K., Garofalo, J., & Kroll, D. L. (1989). The role of metacognition in mathematical problem solving: A study of two grade seven classes. Final report. Indiana University, Bloomington. (ERIC Documentation Reproduction Service ED314255).
Lester, F. K., & Kehle, P. E. (2003). From problem solving to modeling: The evolution of thinking about research on complex mathematical activity. In R. Lesh, & H. M. Doerr (Eds.), Beyond constructivism: Models and modeling perspectives on mathematics problem solving, learning, and teaching, 501-518. Mahwah and London: Lawrence Erlbaum Associates Publishers.
Manouchehri, A. (in press). Manuscripts for methods in teaching STEM secondary mathematics - Geometry.
Mason, J., Burton, L. & Stacey, K. (1985). Thinking mathematically. London, Addison-Wesley.
McCutcheon, G. (1992). Facilitating teacher personal theorizing. In E. W. Ross, J. W. Cornett, & G. McCutcheon (Eds.), Teacher personal theorizing: Connecting curriculum practice, theory, and research. Albany, NY: State University of New York Press.
Merriam, S. B. (1998). Qualitative research and case study applications in education (2nd ed.). San Francisco: Jossey-Bass.
Miller, G. A. (1956). The magical number seven, plus or minus two: Some limits on our capacity for processing information. Psychological Review, 63, 81-97.
Minsky, M. (1988). The society of mind. London: William Heinemann Ltd.
Montgomery, D. E. (1992). Young children’s theory of knowing: The development of a folk epistemology. Development Review, 12, 410-430.
National Council of Teachers of Mathematics. (2006). Curriculum focal points for kindergarten through grade 8 mathematics. Reston, VA: Author.
National Research Council. (2007). Taking science to school: learning and teaching science in grades k-8. Committee on science learning, kindergarten through eighth grade. R. A. Duschl, H. A. Schweingruber, and A. W. Shouse, Editors. Board on
476
Science Education, Center for Education. Division of behavioral and social sciences and education. Washington, DC: The National Academies Press.
Newman, D., Griffin, P., & Cole, M. (1989). The construction zone: Working for cognitive change in school. Cambridge: Cambridge University Press.
Niss, M., Blum, W. & Galbraith, P. (2007). Introduction. In Blum, W., Galbraith, P. L., Henn, H.-W. & Niss, M. (Eds.), Modelling and applications in mathematics education. The 14th ICMI Study, 3-32. New-York: Springer.
Patton, M. Q. (2002). Qualitative research and evaluation methods. Thousand Oaks, CA: Sage.
Pólya, G. (1945). How to solve it: A new aspect of mathematical method. Princeton, NJ: Princeton University Press.
Reich, K. H., Oster, F. K., & Valentin, P. (1994). Knowing why I now know better: Children’s and youth’s explanations of their worldview changes. Journal of Research on Adolescence, 4, 151-173.
Resnick, L. B. (Ed.). (1989). Knowing, learning, and instruction. Essay in honor of Robert Glaser. Hillsdale, NJ: Lawrence Erlbaum Associates.
Schoenfeld, A. H. (1981). Episodes and executive decisions in mathematical problem solving. Paper presented at the Annual meeting of the American Educational Research Association, Los Angeles, CA. (ERIC Documentation Reproduction Service No. ED201505)
Schoenfeld, A. H. (1987). What’s all the fuss about metacognition? In A. H. Schoenfeld (Ed.), Cognitive science and mathematics education, 189-215. Hillsdale, NJ: Erlbaum.
Schoenfeld, A. H. (1992). Learning to think mathematically: Problem solving, metacognition, and sense making in mathematics. In D. A. Grouws (Ed.), Handbook of research on mathematics teaching and learning, 334-370. New York: Macmillan.
Schoenfeld, A. H. (2007). Problem solving in the United States, 1970–2008: research and theory, practice and politics. ZDM Mathematics Education, 39, 537-551.
Schoenfeld, A. H. (2010). How we think: A theory of goal-oriented decision making and its educational applications. New York, NY: Routledge.
Schoenfeld, A. H. (2013). Reflections on problem solving theory and practice. The Mathematics Enthusiast, 10(1&2), 9-34.
Schon, D. (1987). Educating the reflective practitioner. San Francisco, CA: Jossey-Bass Publishers.
477
Schraw, G., & Sperling-Dennison, R. (1994). Assessing metacognitive awareness. Contemporary Educational Psychology, 19, 460-475.
Schraw, G., & Moshman, D. (1995). Metacognitive theories. Educational Psychology Review, 7(4), 351-371.
Sfard, A. (2008). Thinking as communicating: Human development, the growth of discourses, and mathematizing. New York, NY: Cambridge University Press.
Shulman, L. S., & Keislar, E. R. (1966). Learning by discovery. Chicago: Rand McNally.
Silver, D. (2011). Using the ‘zone’ help reach every learner. Kappa Delta Pi Record, 47(sup1), 28-31.
Simon, H. (1980). Problem solving and education. In D. Tuma & F. Reif (Eds.), Problem solving and education: Issues in teaching and research, 81-96. Hillsdale, NJ: Erlbaum.
Smith, C. L., Wiser, M., Anderson, C. W., & Krajcik, J. (2006). Implications of research on children’s learning for standards and assessment: A proposed learning progression for matter and the atomic-molecular theory. Measurement, 14(1&2), 1-98.
Stanic, G., & Kilpatrick, J. (1989). Historical perspectives on problem solving in mathematics curriculum. In R. I. Charles & E. A. Silver (Eds.), The teaching and assessing of mathematical problem solving, 1–31. Reston, VA: National Council of Teachers of Mathematics.
Steffe, L. P., & Gale, J. E. (Eds.). (1995). Constructivism in education. Hillsdale, NJ: Lawrence Erlbaum.
Tarricone, P. (2011). The taxonomy of metacognition. New York: Psychology Press.
Tzur, R., & Simon, M. (2004). Distinguishing two stages of mathematics conceptual learning. International Journal of Science and Mathematics Education, 2(2), 287-304.
Van der Veer, R., & Valsiner, J. (1994). Reading Vygotsky: From fascination to construction. In R. van der Veer & J. Valsiner (Eds. and Trans.), The Vygotsky Reader, 1−9. Oxford: Blackwell Publishers.
von Foerster, H. (1982). A constructivist epistemology. Cahiers de la Fondation Archives Jean Piaget, 3, 191-213.
Vygotsky, L. S. (1962). Thought and language. E. Hanfmann, & G. Vakar (Eds. and Trans.). Cambridge, MA: MIT Press.
Vygotsky, L. S. (1987). Zone of proximal development. Mind in society: The development of higher psychological processes, 52-91. Wertsch, J. V. (1985). Vygotsky and the social formation of mind. Cambridge, MA: Harvard University
478
Press.
Wertsch, J. V. (1985). Vygotsky and the social formation of mind. Harvard University Press.
Wilson, J., & Clarke, D. (2004). Towards the modeling of mathematical metacognition. Mathematics Education Research Journal, 16(2), 25–48.
Wilson, J., Fernandez, M. L., & Hadaway, N. (1993). Mathematical problem solving. In P. S. Wilson (Ed.). Research ideas for the classroom: High school mathematics, chapter 4. New York: MacMillan.
Zawojewski, J. S., & Lesh, R. (2003). A models and modeling perspective on problem solving. In R. Lesh, & H. M. Doerr (Eds.), Beyond constructivism: Models and modeling perspectives on mathematics problem solving, learning, and teaching, 317-336. Mahwah and London: Lawrence Erlbaum Associates Publishers.
Zhang, P. (2010). Inference on students’ problem solving performances through three case studies. Columbus, Ohio: Ohio State University.
Zhang, P., Manouchehri, A., & Tague, J. (2013). Capturing middle school students’ understanding of the concept of area using Vygotsky’s concept formation theory. Proceedings of the 35th annual conference of the Psychology of Mathematics Education – North American. Chicago, IL.
Zimmerman, B. J. (1995). Self-regulation involves more than metacognition: A social cognitive perspective. Educational Psychologist, 30(4), 217-221.
479
APPENDIX A. CONCEPTUAL FRAMEWORK OF METACOGNITION
(TARRICONE, 2011)

480
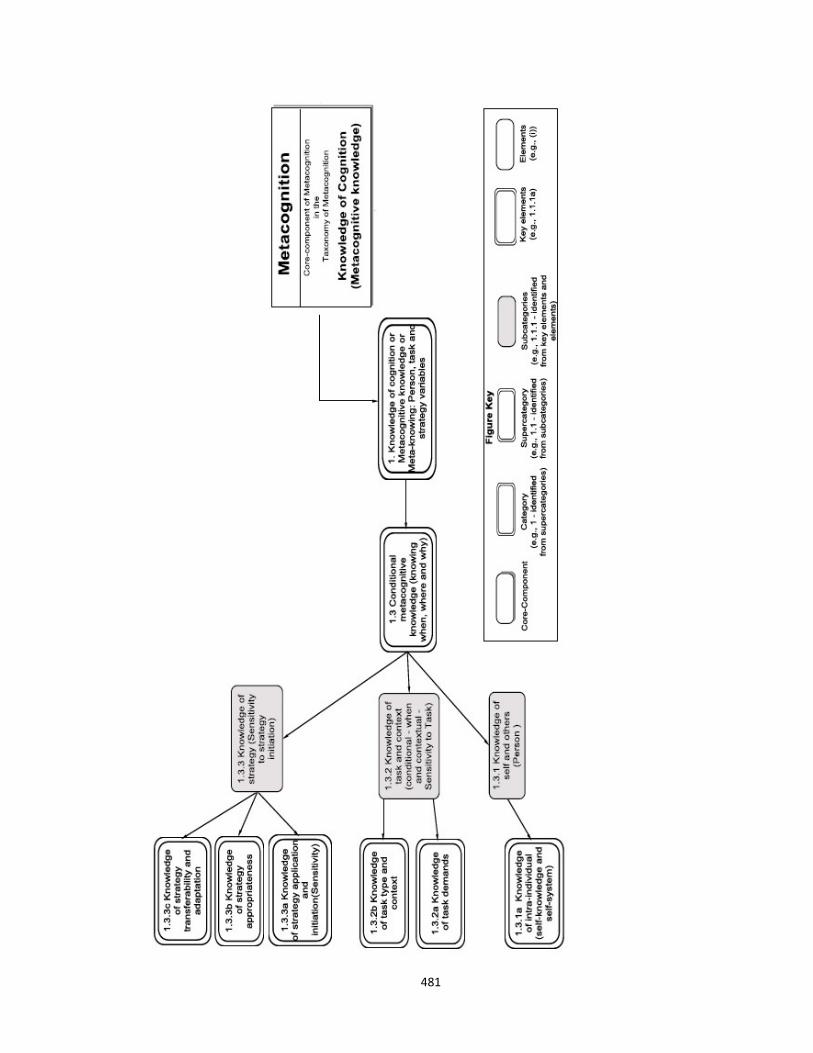
481
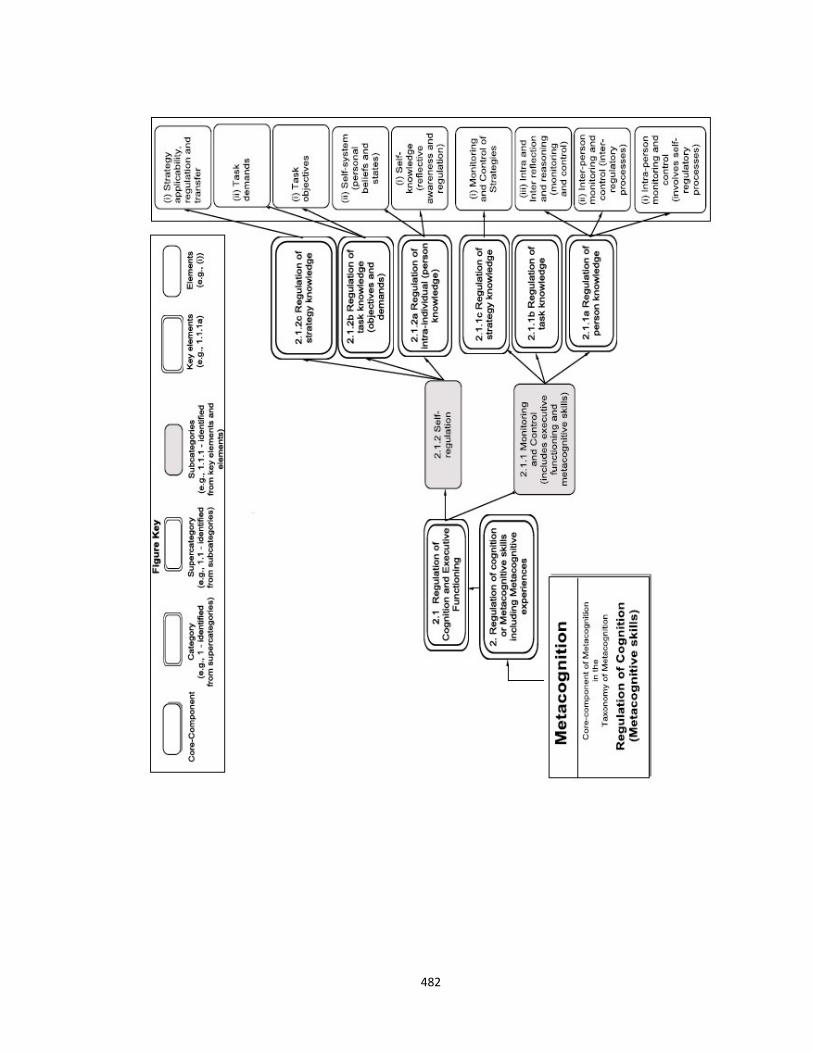
482
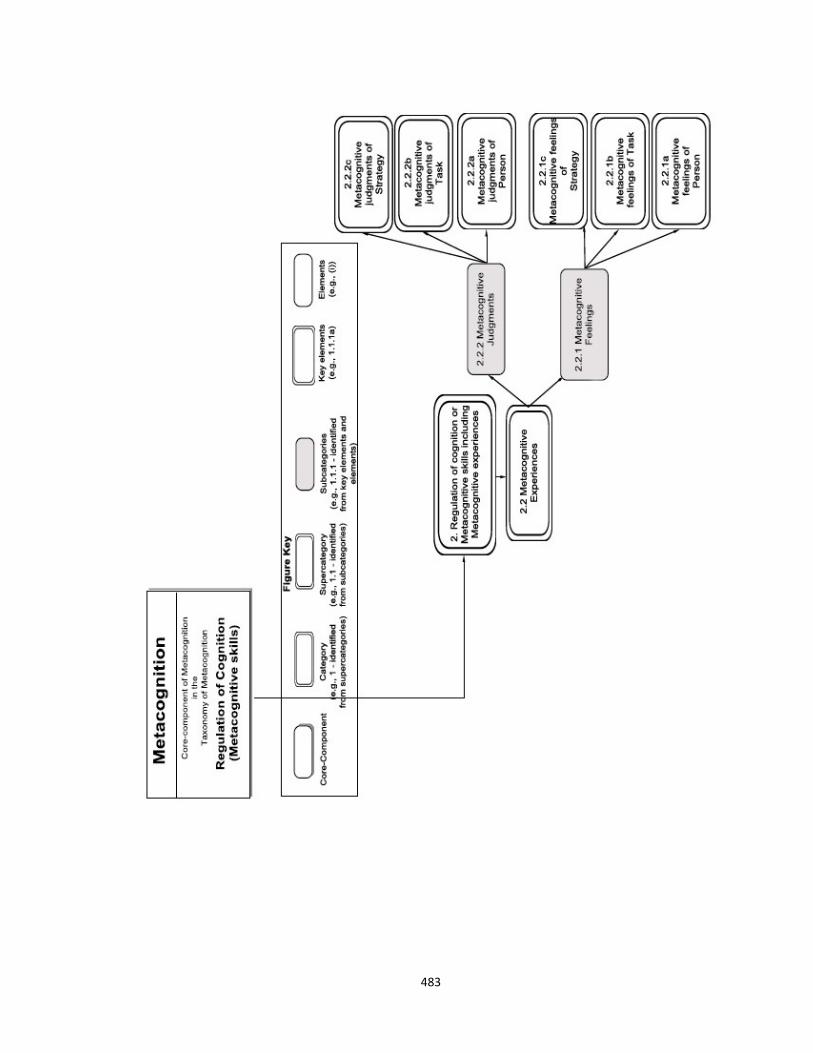
483
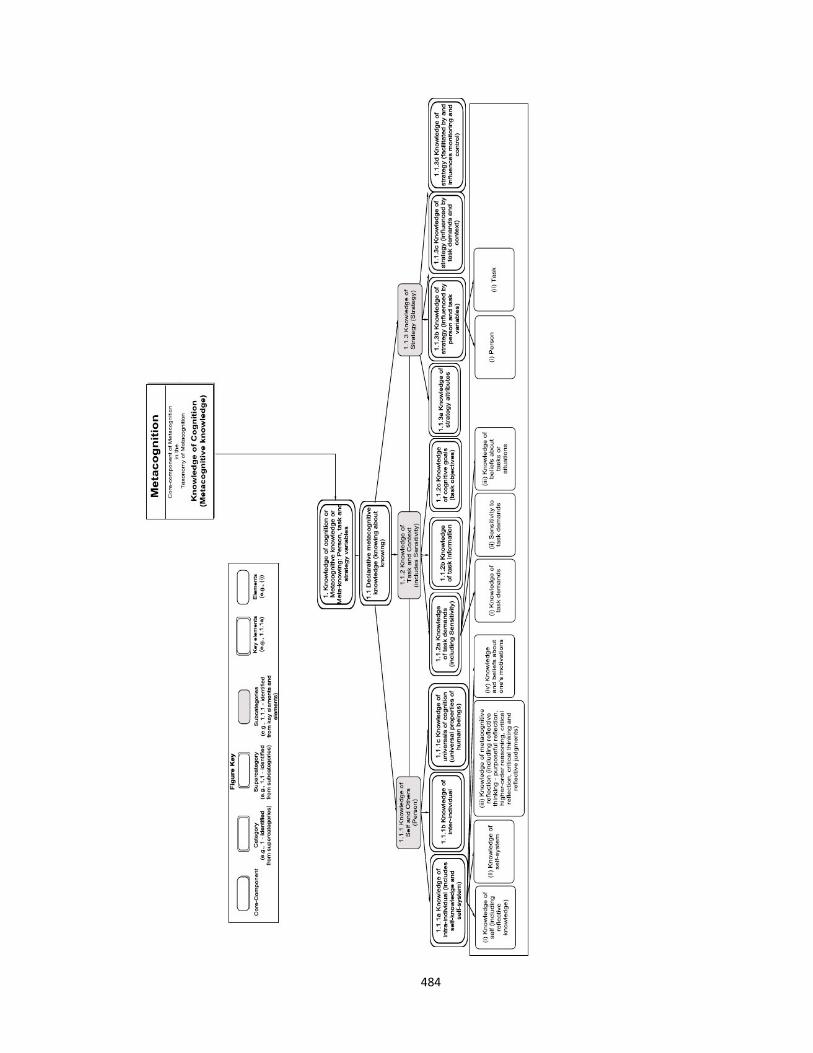
484

485
APPENDIX B. QUESTIONS FOR BACKGROUND INTERVIEW
a. What course are you taking at school?
b. What do you want to be when you grow up? Do you think mathematics is useful in that
profession?
c. What is your favorite subject? Why is it your favorite subject?
d. Do you consider yourself good at math? If yes, why? If no, what does it mean to be
good in math?
e. Give me an example of the kind of a problem you are doing at school?
f. Give me an example of the kind of mathematics problem you like to do?
g. Give me an example of the kind of mathematics problem you don’t like to do?
h. Generally, how do you feel about math?
i. What do you typically do in class? Do you like how you do things?

486
APPENDIX C. PRETEST INSTRUMENT

487
PRE-TEST
The Ohio State University
Name: ________________________________ Class: ____________________
Instruction for test administrators:
1. Pre-Test should be administered during one class session (50 minutes).
2. If students are provided with more than 50 minutes to complete the test, please indicate
the amount of time in the box below.
3. Students may be provided with calculators if they feel them needed.
4. Students may be read the problems if their IEP’s indicate so.
5. Please advise students NOT to erase their work even if they consider them wrong.
Instead, instruct them to put a cross on top of what they wish to erase.
6. If students run out of space, advise them to use the back side of the page.
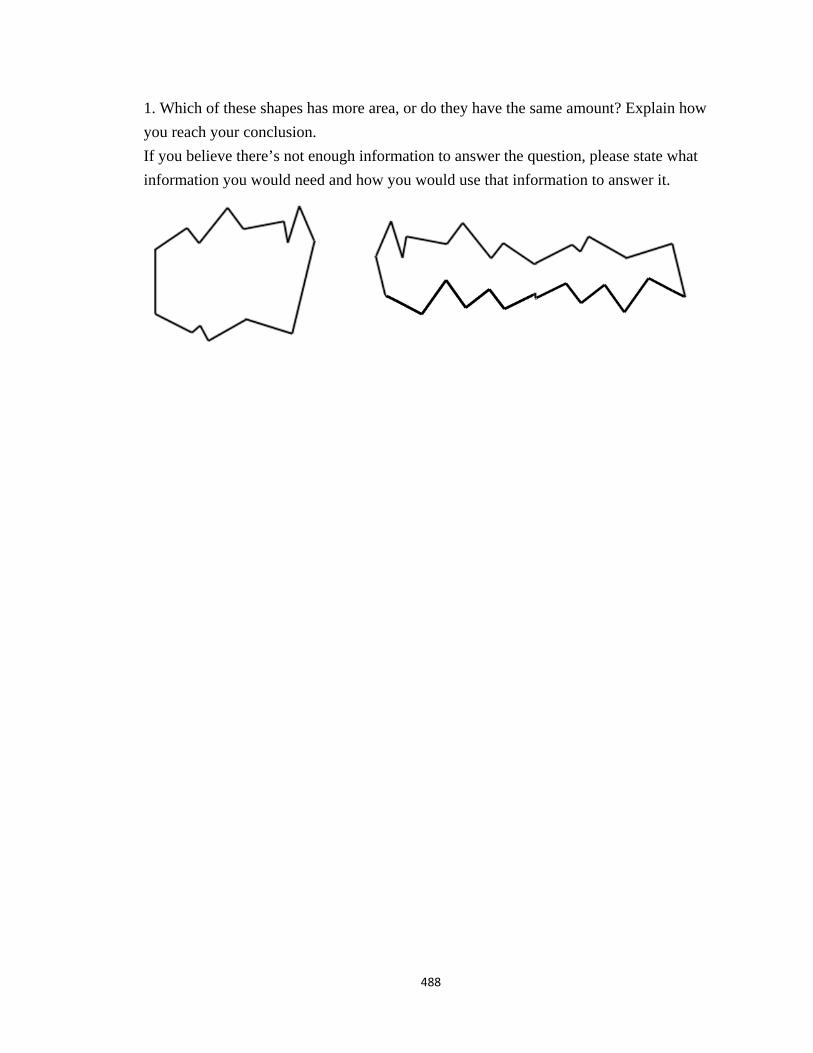
488
1. Which of these shapes has more area, or do they have the same amount? Explain how
you reach your conclusion.
If you believe there’s not enough information to answer the question, please state what
information you would need and how you would use that information to answer it.
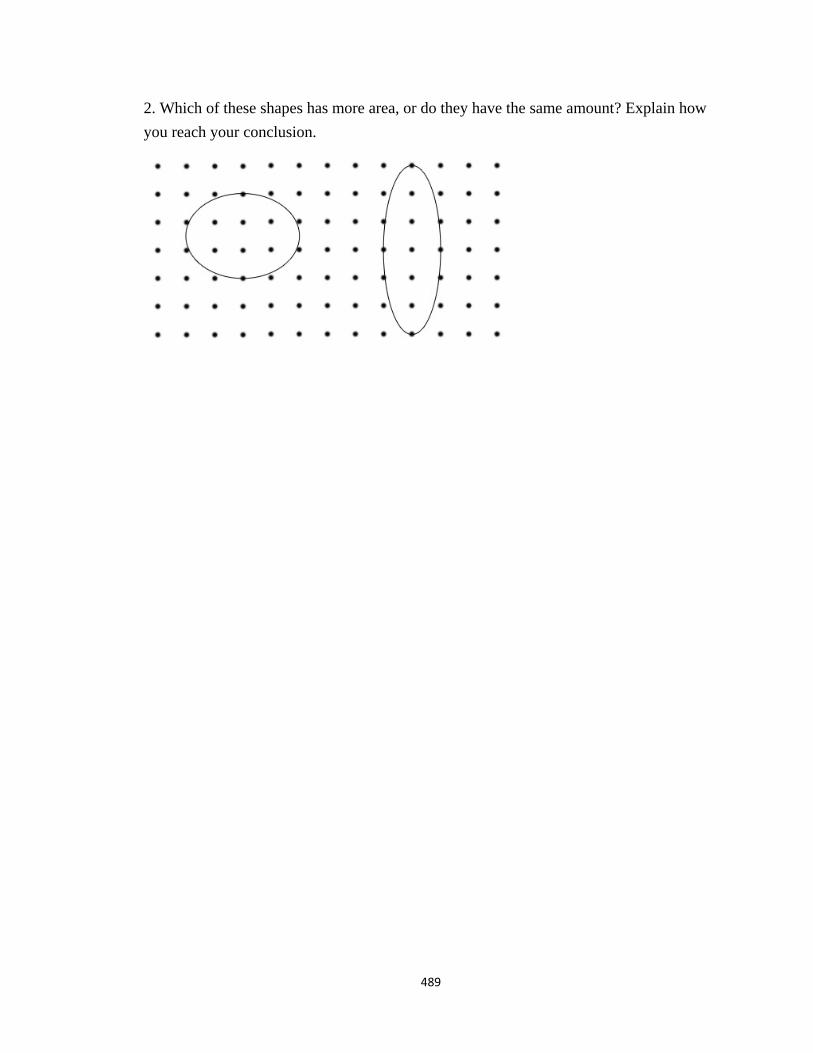
489
2. Which of these shapes has more area, or do they have the same amount? Explain how
you reach your conclusion.
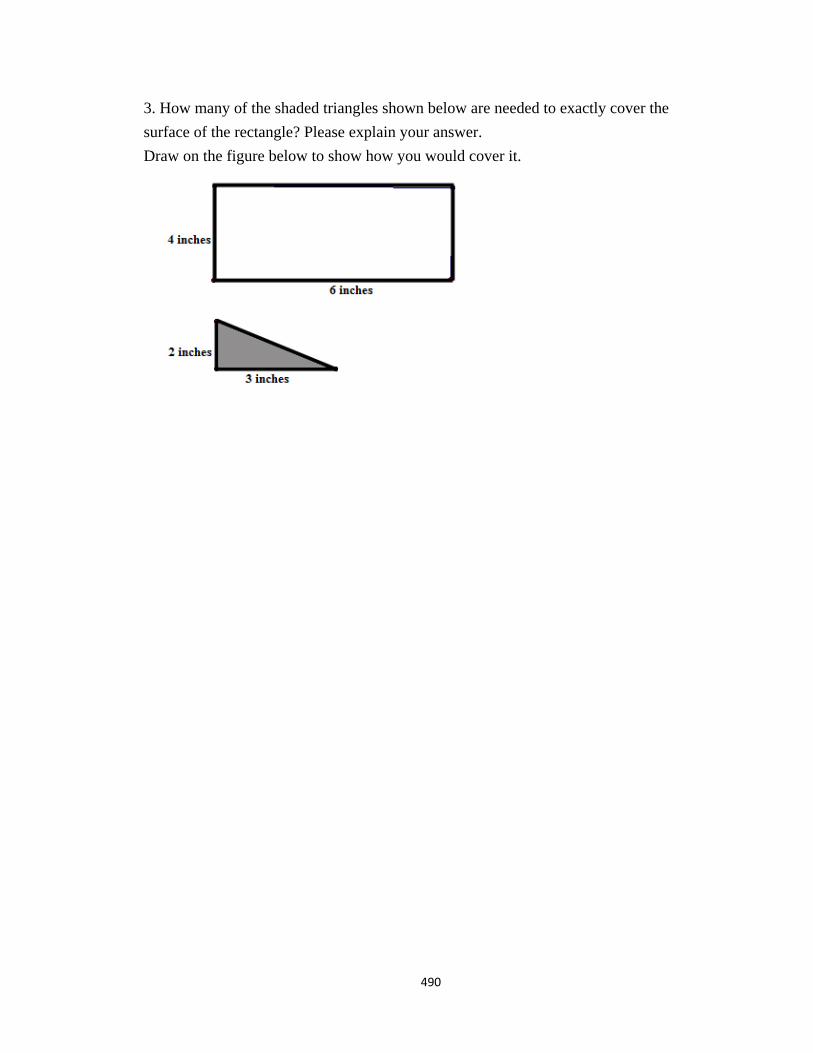
490
3. How many of the shaded triangles shown below are needed to exactly cover the
surface of the rectangle? Please explain your answer.
Draw on the figure below to show how you would cover it.

491
4. The squares in the grid below have areas of 1 square centimeter.
Draw lines to complete the figure so that it has an area of 14 square centimeters.
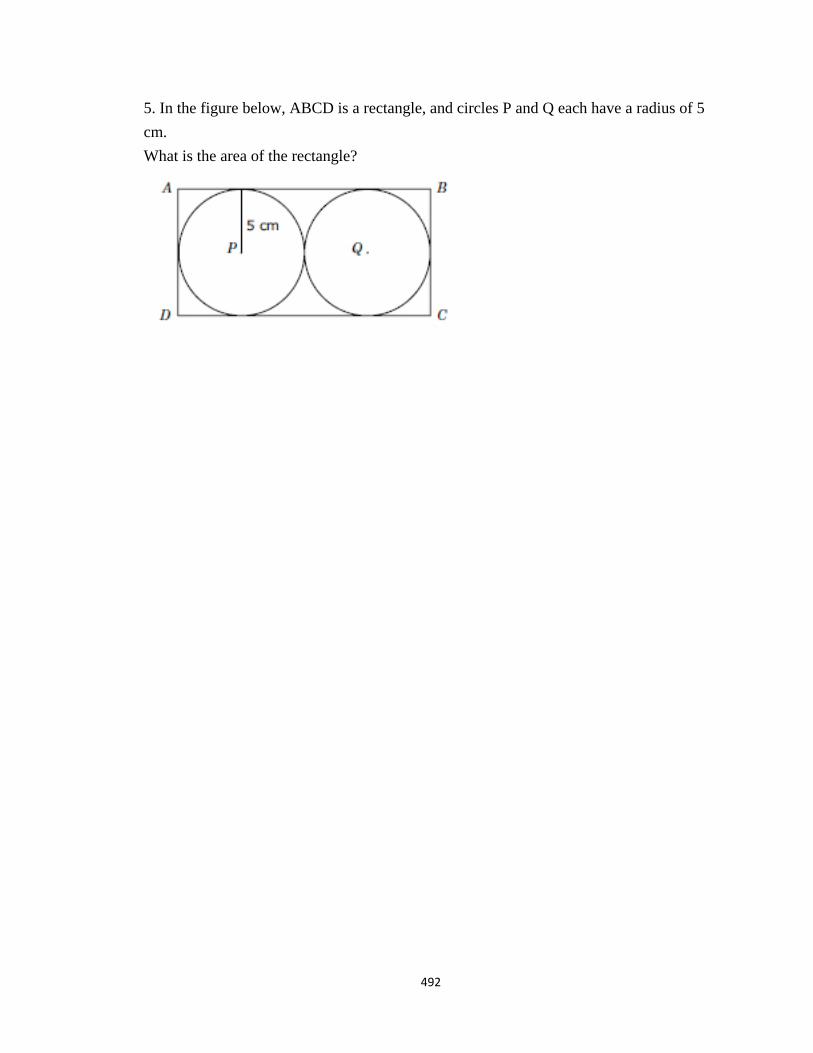
492
5. In the figure below, ABCD is a rectangle, and circles P and Q each have a radius of 5
cm.
What is the area of the rectangle?

493
APPENDIX D. INTERVIEW INSTRUMENT
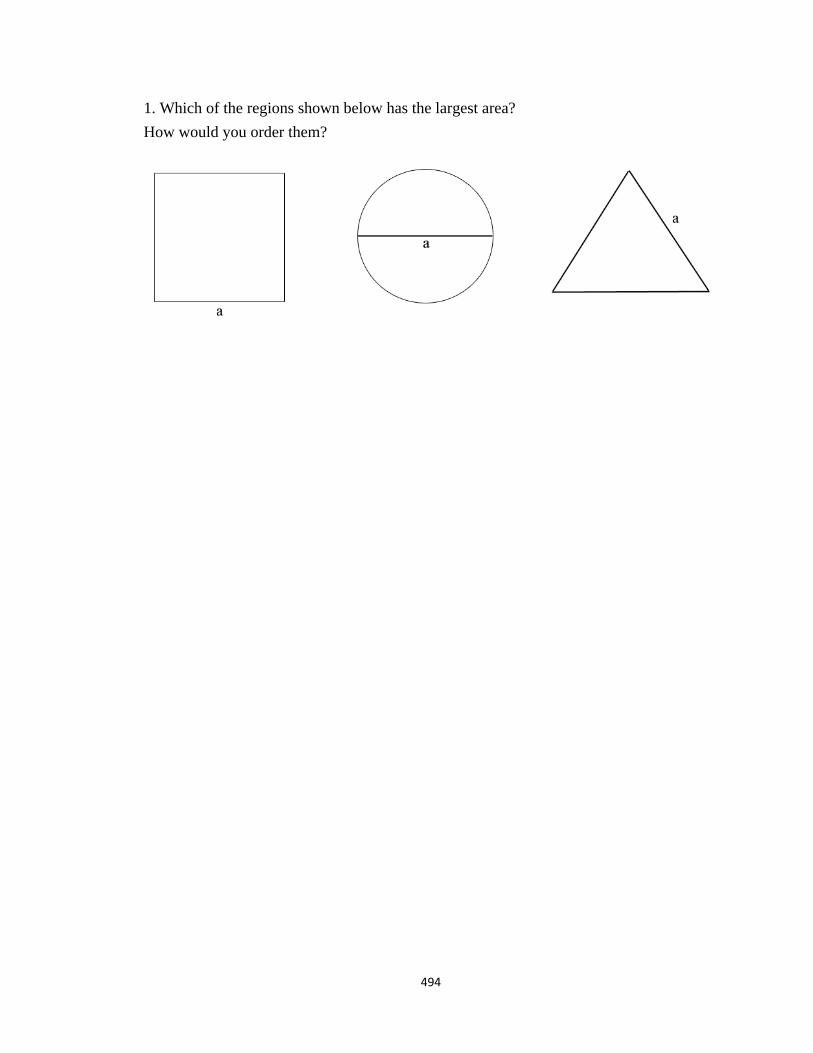
494
1. Which of the regions shown below has the largest area?
How would you order them?
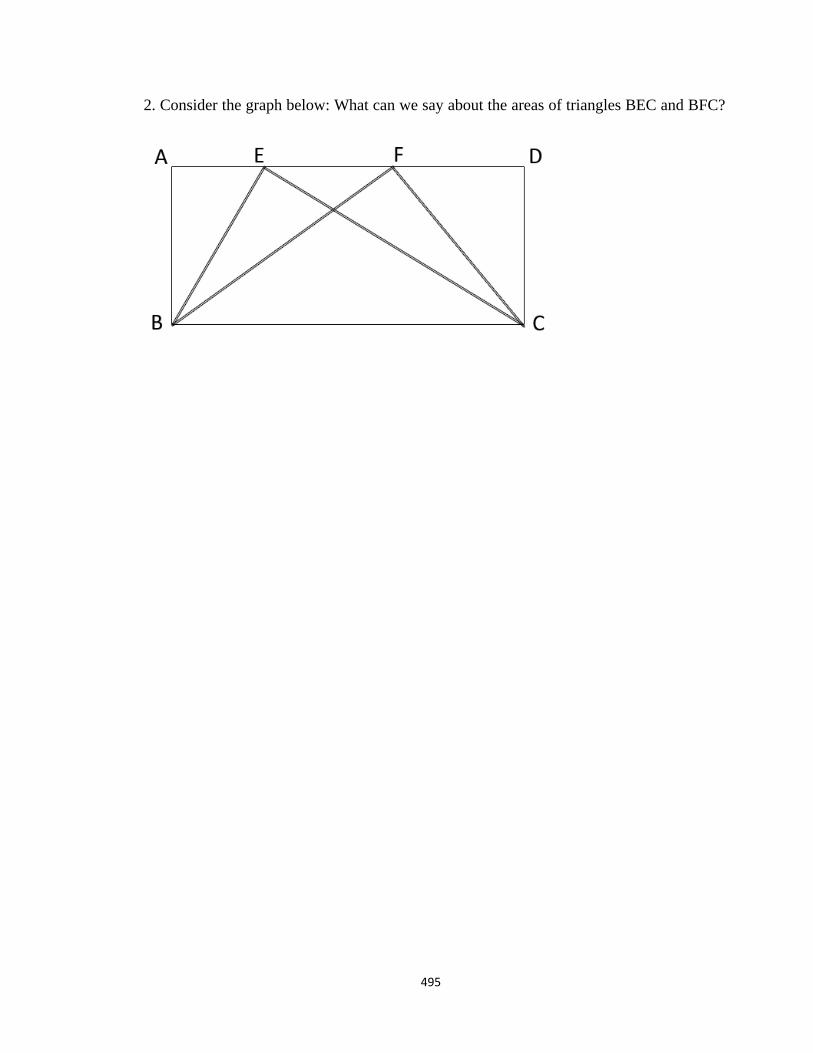
495
2. Consider the graph below: What can we say about the areas of triangles BEC and BFC?
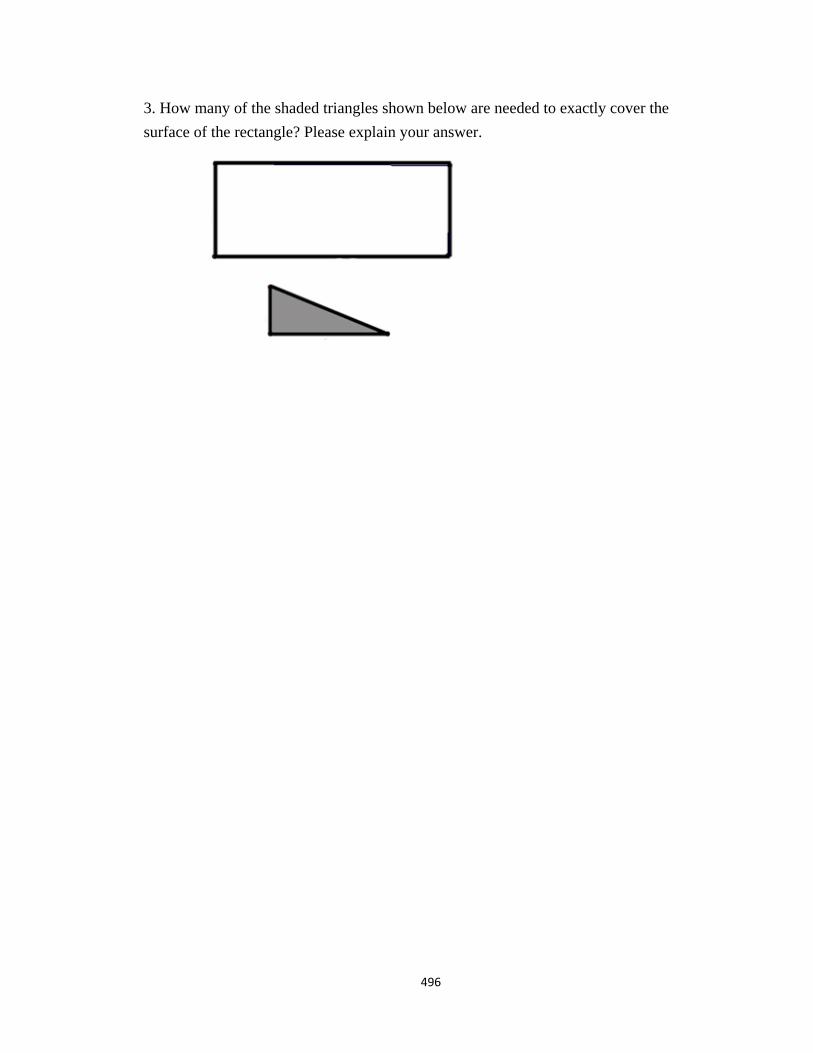
496
3. How many of the shaded triangles shown below are needed to exactly cover the
surface of the rectangle? Please explain your answer.

497
4. Estimate the area of the region shown below.
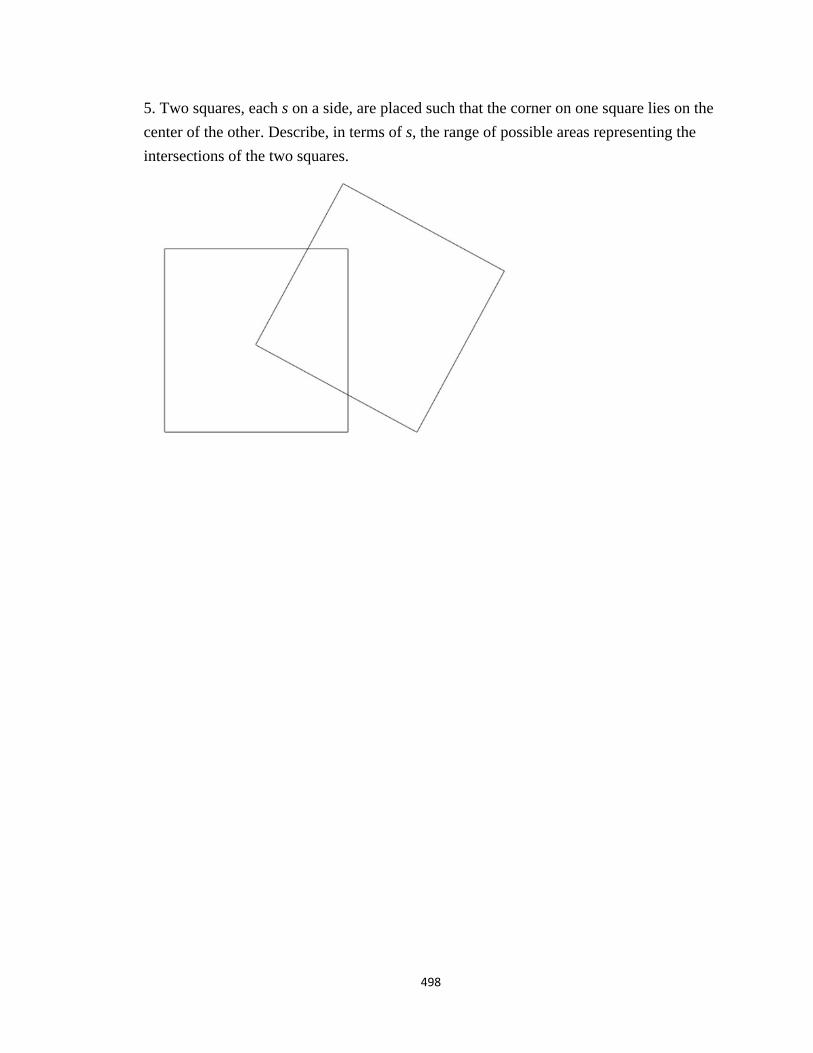
498
5. Two squares, each s on a side, are placed such that the corner on one square lies on the
center of the other. Describe, in terms of s, the range of possible areas representing the
intersections of the two squares.