universities and industrially relevant science: towards measurement models and indicators of...
TRANSCRIPT
A
tTowpa
arEic©
Kc
1
ia(opcaT
0
Research Policy 35 (2006) 1569–1585
Universities and industrially relevant science: Towards measurementmodels and indicators of entrepreneurial orientation
Robert J.W. TijssenCentre for Science and Technology Studies (CWTS), Leiden University, PO Box 9555, 2300 RB Leiden, Netherlands
Available online 7 November 2006
bstract
Which university departments engaged in industrially relevant science are likely candidates to become entrepreneurial? At present,here are neither measurement models nor leading indicators that can answer such questions at an international comparative level.his paper introduces concepts, theory, and a measurement model for identifying (the early stages of) a university’s enterpreneurialrientation within a quantitative analytical framework. This approach focuses specifically on university–industry interactions, inhich the connectivity between academic science and industrial research is captured and measured empirically in terms of (1)ublic–private co-authored research articles, and (2) references (‘citations’) within corporate research articles to university researchrticles.
The paper examines a range of country-level and institutional determinants of industrially relevant science, across 18 researchreas of significant industrial interest, and at two different levels of analysis: research systems of OECD countries, and large sets ofesearch universities within those countries. The results of these large-scale analyses, along with those of a case study dealing with
uropean universities active in the field of immunology research, suggest that many structural factors determine university–industrynteractions and (the potential for) entrepreneurial orientation. The two connectivity indicators appear to be of minor significanceompared to a university’s country of location and the magnitude of its research activities in industrially relevant fields of science.
2006 Elsevier B.V. All rights reserved.
ledge
tion related to the production of codified research-basedknowledge and its dissemination to science-dependent
eywords: University entrepreneurial orientation; Stage model; Knowators
. Introduction
This paper introduces a novel conceptual and analyt-cal framework to conduct comprehensive and in-depthnalyses of university’s ‘industrially relevant research’IRR) in relation to the science-based entrepreneurialrientation (SEO) of university units. The scope of thisaper is restricted to research-related activities, out-
omes and impacts (thus excluding teaching, training,nd consultancy activities with a commercial value).he earliest stages of SEO can be examined by look-E-mail address: [email protected].
048-7333/$ – see front matter © 2006 Elsevier B.V. All rights reserved.doi:10.1016/j.respol.2006.09.025
spillovers; University–industry linkages; Research performance indi-
ing at structural characteristics and abstract functionsrelated to academic research activities, which are oper-ationalised in terms of their research output, and theirlinkages and interactions with private-sector users oftheir research-based knowledge. The approach taken inthis study focuses specifically on quantifiable informa-
industrial R&D.1
1 There are many kinds of knowledge-intensive spillovers (e.g. inten-tional transfers as well as unintended spillovers), each of which mayflow through various dissemination and communication channels, andmay take different routes to transform and materialise into shapes and
h Polic
external financing, to conduct contract research that isoutsourced by the corporate sector, and to participatein collaborative public–private research partnerships.4
with relatively low quantities of research papers in international peer-reviewed journals, as well as ‘research intensive’ universities that pro-duce many research papers. University research activities may span theentire spectrum from curiosity-driven academic ‘discovery’ researchto problem-driven to highly focused ‘applied’ research for specific(end) users, as well as intermediate forms of research such as generic,mission-oriented ‘strategic’ research or ‘engineering research’ dealingwith general purpose technologies.
3
1570 R.J.W. Tijssen / Researc
The phenomenon of entrepreneurial universities hasnow become widespread within the advanced industri-alised countries as well as developing countries, andhas attracted increasing policy attention. So far, mostof the policy debate and empirical analysis focused oneconomic outputs and impacts of entrepreneurial uni-versities (such as patents, licenses and start-up firms), ortheir technology transfer mechanisms and facilities. Thepervasive diffusion of this entrepreneurial orientationjustifies larger-scale and more in-depth empirical stud-ies focusing on enterpreneurial potential. The analyticalframework introduced in this paper enables a systematicinvestigation of early ‘upstream’ knowledge-generatingstages of entrepreneurial science and university/industryinteractions, both within and across and fields of science,as well as across countries.
The remainder of paper is organised as follows:Section 2 presents a brief review of theoretical con-cepts, empirical studies and policy issues related toentrepreneurial science that may guide the developmentof an indicator-based comparative framework. Section 3introduces the two key indicators of IRR, and describesthe methodology and data sets that are applied in thestatistical analyses. Section 4 presents the results ofthe analyses dealing with the aggregate levels of coun-tries and research fields. In addition, the statistical rela-tionships between IRR indicators and university-ownedpatents are investigated for a sample of European uni-versities active within the field of immunology research.Finally, Section 5 summarises the main findings, obser-vations and interpretations leading to tentative conclu-sions as to the limitations and relevance of this newapproach.
2. Theoretical and empirical background
2.1. University–industry interactions andentrepreneurial orientation
Clark (1998, 2004) introduces, from a higher edu-
cation system perspective, five necessary conditions forthe creation of an ‘entrepreneurial university’. Three ofthese are particularly relevant in the case of research-oriented entrepreneurial universities2 in the advancedadded values that are deemed useful for intermediate users or end usersof those inputs. These informational properties of science constitute apowerful analytical tool for studying the spillovers impacts and pay-offs of publicly funded basic science (Dasgupta and David, 1994). Thisapplies especially to codified research-based information.
2 The term ‘research-oriented university’ (or ‘research university’)is used in a broad sense, i.e. including ‘research active’ universities
y 35 (2006) 1569–1585
industrialised countries: ‘expanded developmentalperiphery’, ‘stimulated academic heartland’, and ‘inte-grated entrepreneurial culture’. Entrepreneurial researchuniversities are viewed as those that embrace the spiritof enterprise and innovation, promote an entrepreneurialculture, reach across the traditional academic-industryboundaries to form mutually beneficial relationships,and create a variety of functions to accommodate thetransfer of knowledge and technologies across theseboundaries, while integrating new managerial andmarket-related practices.3 Many of these research uni-versities with science and technology departments arenow in this process of transition, in which an increasingnumber of units ‘at the developmental periphery’take the form of interdisciplinary or transdisciplinaryresearch centres focusing on societal problems andpursuing enterpreneurial science to meets the needs ofbusiness sectors. They have the stock of knowledge andexpertise, the knowledge-generating capabilities, andthe research facilities to engage in science-based enter-preneurial activities. As a result, many find themselvesin an advantageous position to participate in the growthof the science-dependent industries and are tempted tocash in on their contributions.
Parallel to the internal push towards application-oriented university science, many research-oriented uni-versities nowadays also experience an external pull forc-ing them to engage (more) actively in programmes of
A university’s industrially relevant research activities and itsentrepreneurial orientation are likely to depend very significantly ona range of cultural determinants. More specifically, these include the‘managerial culture’ at research universities (e.g. incentive systems),and the ‘governance culture’ of the research and higher education sec-tor at the regional or national level (e.g. legislative and regulatoryframeworks, business-promoting measures), as well as the overarch-ing socio-economic culture of a country (e.g. risk-aversion attitudes inwelfare states).
4 Such measures gave a significant boost to the adoption or furtherprofessionalisation of IPR-related procedures and policies, while con-tract research conducted at universities is increasingly viewed as aninherent part of the routine activities of today’s universities (Etzkowitz,1998; Branscomb et al., 1999; Van Looy et al., 2003).
h Policy
Tkprdspr
ntsiaTaccstuatai
cgovaiUois
fvairt
iaopinoBe
R.J.W. Tijssen / Researc
he implicit assumption here is that universities possessnowledge-based assets that are economically underex-loited. Driven by this demand for access to universityesearch and transferring research-based knowledge toomains of application, research universities have startedhifting their knowledge production bases more towardsroblem-oriented research and the commercialisation ofesults.5
Most entrepreneurial universities have adoptedew organisational structures and incentive policieso raise awareness among students and staff (such aspecialised professorships, entrepreneurship courses,ncorporating entrepreneurs into university curricula,nd supporting graduates in their start-up activities).hose policies are often aimed at promoting managerialnd attitudinal changes among academics toward theommercialisation of research findings and towardollaborative projects with business enterprises. Along-ide the adoption of systematic practices with respecto technology development and IPR, universities mayndertake an ever-larger variety of transfer-orientedrrangements, including industrial liaison offices,echnology transfer offices, business incubator facilities,cademic spin-off firms, science parks, or joint venturesn which universities start acting as a shareholder.6
For these truly entrepreneurial universities, commer-ialising research outputs and science-based technolo-ies has increasingly become one of the (secondary)bjectives of research universities—alongside their con-entional mission and traditional drive to achievend maintain international scientific leadership withinndustrially relevant fields of science and engineering.niversity–industry interactions are often the seedbed
r catalyst of these commercialisation processes. Lead-ng research universities in industrial-relevant fields ofcience are often actively involved in contract research,5 The shift toward commercialisation, and the possible implicationsor basic academic research, has spurred heated debate and contro-ersy with the academic world and amongst science policy makers,nd within the press (e.g. Nature editorial, 2001). Recent case studiesndicate that these shifts are not necessarily detrimental to the basicesearch done at universities, but, on the contrary, tend to create posi-ive effects (e.g., Van Looy et al., 2004).
6 Increasing attention is being devoted to activities within sciencenstitutions for promoting linkages between universities and industrynd for fostering the creation of university spin-offs. Empirical studiesn the human and financial resources that universities devote to this pur-ose, and on the managerial and organisational structure of the transfernstitutions and mechanisms they use (industrial liaison offices, tech-ology transfer offices) are still scarce. Most of the research literaturen this topic refers to institutions in the USA and UK (e.g., Lee, 1996;ercovitz et al., 2001; Feldman et al., 2002; Link et al., 2003; Siegelt al., 2003; Lockett et al., 2005).
35 (2006) 1569–1585 1571
consultation, and other R&D linkages with industry inorder to generate additional funding for research, aswell as obtaining and consolidating strategic positionswithin the knowledge markets and innovation networks.Several of these ‘third income stream’ activities are rel-atively easy to quantify and monitor in terms of indi-cators capturing financial flows, as are the outputs ofentrepreneurial science in terms of patents, spin-off com-panies, and amounts of revenues and new jobs generated(e.g. Molas-Gallart et al., 2002). Measuring the (interme-diate) research outputs and associated knowledge flowsduring the ‘upstream’ early stages of SEO is a muchmore complex undertaking.
2.2. Towards a conceptual framework andmeasurement model
At present there is neither a convincing explanatorytheory of fledging SEO, nor generally accepted conceptsor compelling definitions of its salient characteristics,that offer guidance for the design of comparative metricsand quantitative indicators. Fortunately, a growing lit-erature exists on university–industry research linkagesand relationships (see e.g. Polt, 2001; OECD, 2002),as well as wide variety of recent case studies dealingwith various organisational, psychological, cultural andeconomic issues related to academic entrepreneurship,‘third stream’ research funding, technology transfer,and spin-off companies.7 Building upon results of theabove studies, the following general description of thepotential for SEO is adopted in this paper: “the latent oremerging capability within a university organisation tocreate new resources and/or to utilise existing resourcesand facilities in such a way that results of intra-muralresearch and development activities are exploited andcommercialised as assets (services, products, or relatedprocesses) that can be traded on the open market withina competitive business setting through a new or existingenterprise”. The nascent ability and motivation ofuniversity professors, researchers or students to pursueentrepreneurial activities will mostly entail a slowly
evolving interplay between internal (endogenous)developments related to scientific and technologicalcapabilities and activities, and external (exogenous)business-oriented and market-driven forces. One may7 Recent articles include: Klofsten and Jones-Evans (2000), Chiesaand Piccaluga (2000), Etzkowitz (2002), Molas-Gallart et al. (2002),Mowery and Ziedonis (2002), Ndonzuau et al. (2002), Etzkowitz(2003), Glassman et al. (2003), Goldfarb and Henrekson (2003),Meyer (2003), Powers (2004), Clarysse and Moray (2004), Lehrer andAsakawa (2004) and Powers and McDougall (2005).
1572 R.J.W. Tijssen / Research Policy 35 (2006) 1569–1585
cience-
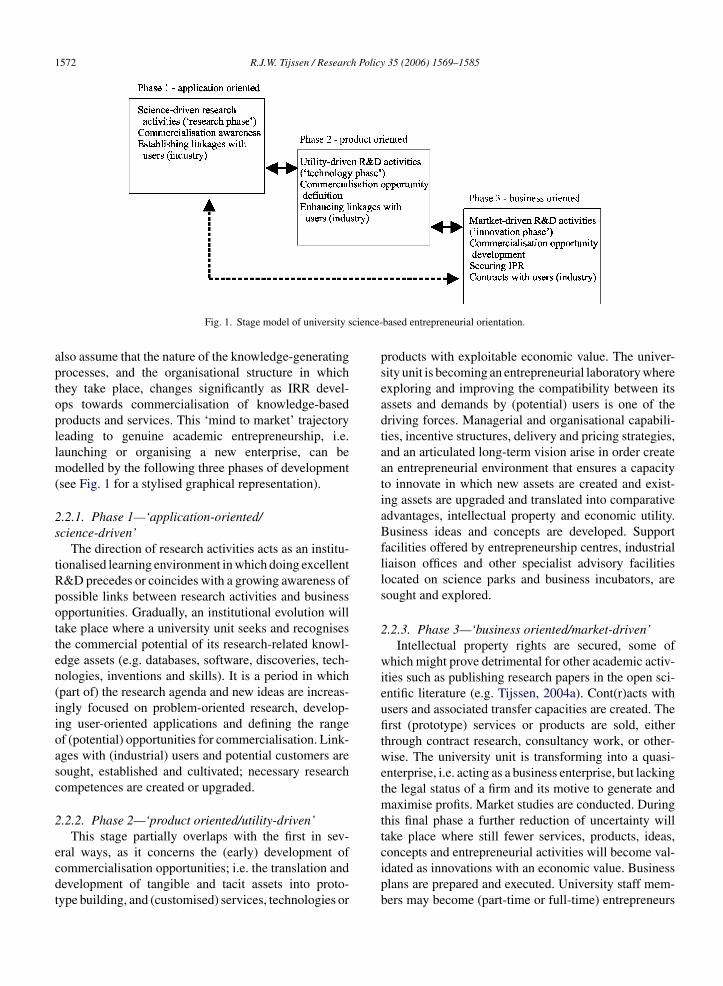
Fig. 1. Stage model of university salso assume that the nature of the knowledge-generatingprocesses, and the organisational structure in whichthey take place, changes significantly as IRR devel-ops towards commercialisation of knowledge-basedproducts and services. This ‘mind to market’ trajectoryleading to genuine academic entrepreneurship, i.e.launching or organising a new enterprise, can bemodelled by the following three phases of development(see Fig. 1 for a stylised graphical representation).
2.2.1. Phase 1—‘application-oriented/science-driven’
The direction of research activities acts as an institu-tionalised learning environment in which doing excellentR&D precedes or coincides with a growing awareness ofpossible links between research activities and businessopportunities. Gradually, an institutional evolution willtake place where a university unit seeks and recognisesthe commercial potential of its research-related knowl-edge assets (e.g. databases, software, discoveries, tech-nologies, inventions and skills). It is a period in which(part of) the research agenda and new ideas are increas-ingly focused on problem-oriented research, develop-ing user-oriented applications and defining the rangeof (potential) opportunities for commercialisation. Link-ages with (industrial) users and potential customers aresought, established and cultivated; necessary researchcompetences are created or upgraded.
2.2.2. Phase 2—‘product oriented/utility-driven’This stage partially overlaps with the first in sev-
eral ways, as it concerns the (early) development ofcommercialisation opportunities; i.e. the translation anddevelopment of tangible and tacit assets into proto-type building, and (customised) services, technologies or
based entrepreneurial orientation.
products with exploitable economic value. The univer-sity unit is becoming an entrepreneurial laboratory whereexploring and improving the compatibility between itsassets and demands by (potential) users is one of thedriving forces. Managerial and organisational capabili-ties, incentive structures, delivery and pricing strategies,and an articulated long-term vision arise in order createan entrepreneurial environment that ensures a capacityto innovate in which new assets are created and exist-ing assets are upgraded and translated into comparativeadvantages, intellectual property and economic utility.Business ideas and concepts are developed. Supportfacilities offered by entrepreneurship centres, industrialliaison offices and other specialist advisory facilitieslocated on science parks and business incubators, aresought and explored.
2.2.3. Phase 3—‘business oriented/market-driven’Intellectual property rights are secured, some of
which might prove detrimental for other academic activ-ities such as publishing research papers in the open sci-entific literature (e.g. Tijssen, 2004a). Cont(r)acts withusers and associated transfer capacities are created. Thefirst (prototype) services or products are sold, eitherthrough contract research, consultancy work, or other-wise. The university unit is transforming into a quasi-enterprise, i.e. acting as a business enterprise, but lackingthe legal status of a firm and its motive to generate andmaximise profits. Market studies are conducted. Duringthis final phase a further reduction of uncertainty willtake place where still fewer services, products, ideas,
concepts and entrepreneurial activities will become val-idated as innovations with an economic value. Businessplans are prepared and executed. University staff mem-bers may become (part-time or full-time) entrepreneurs
h Policy
aei
swbvidesdt,nicttasioowl
3i
aap1wutr
mtpcapifawe
R.J.W. Tijssen / Researc
nd establish a company, within or outside the universitynvironment, in order to sell their products and servicesn the marketplace.
Note that this stage model of SEO suggests a linearequential view of pathways towards entrepreneurship,hich is obviously an oversimplification. It is proba-ly the case that researchers work simultaneously onarious forms of R&D, with diverse modes of fund-ng and different objectives. Although empirical evi-ence is lacking, we may assume that progress towardsntrepreneurial science is driven by iterative, organic andelf-reinforcing processes characterised by many (time-elayed) feedback loops and idiosyncratic trajectorieshat are context-dependent and contingent upon country-field-, market- and institute-specific factors, and last butot least by the unique capacities of highly motivatedndividuals. At some points during this development pro-ess, decisions are made, and subsequent actions taken,hat are critical to phase transitions.8 Moreover, whenraversing from one phase to the other, new functions aredded to university research units rather than being sub-tituted; basic science in phase 1 is not being abandonedn favour of applied research or prototype developmentf phase 2; similarly the shift to entrepreneurial functionsf phase 3 does not necessarily imply that all professorsill become full-time entrepreneurs, nor that units are
ikely to abandon applied or basic research altogether.
. Methodology: information sources andndicators
A valid empirical analysis of SEO must take intoccount as many as possible of inputs, throughputsnd outputs that shape and drive SEO-activities withinhases 1, 2 and 3 of the entrepreneurial process. Phase
factors may relate to entrepreneurial awareness
ithin the university unit, or industry’s awareness ofniversity research and researchers; phase 2 relateso university–industry interactions, such as contractesearch and joint research; phase 3 may include patents8 Obviously a wide variety of interrelated factors are likely to deter-ine whether or not research units move on to the next phase (and
he success or failure of these phase transitions). The outcome of theserocesses will be affected by a mix of socio-economic, physical, psy-hological, managerial, legislative and financial considerations. Suchdynamic, complex decision-making environment defies any com-
rehensive theoretical modeling. Central to these decision processess the degree of alignment between a unit’s past achievements anduture potential, and the unit’s drive to meet knowledge exploitationspirations and goals, within an organisational and regulatory frame-ork that fosters further development towards commercialisation and
ntrepreneurship.
35 (2006) 1569–1585 1573
and licences, and other related indicators of commer-cialisation efforts. A statistically robust indicator-basedmodel of R&D-driven SEO should cover those factorswhich are manifest in identifiable activities and tangibleresults and that can be categorised and quantified with astatistically sound metrics. However, comparative datathat may give rise to measurements and indicators forcomparisons across organisational, geographical andcognitive boundaries are still scarce, a problem impedingthe progress towards theories and indicators of science-based innovation (Tijssen, 2004b). Although some SEOcharacteristics are obviously amenable to measurement(such as patents), the current lack of generally acceptableand statistically sound metrics and information sourcesof quantitative data prevent the development to robustdata for comparative measurements and indicators(see Table A1 in Appendix A for a non-exhaustive listof possible indicators characterised by their currentfeasibility for international comparisons of universities).
We therefore turn our attention to those very fewmeasurable characteristics dealing with phases 1 and2 that do enable an exploratory indicator-based assess-ment within an internationally comparative framework.This approach focuses on how universities contributeto the production of knowledge for the business sec-tor and engage in cooperative research projects withbusiness enterprises. The quantitative data are derivedfrom the research publications that are (co) produced byacademics and published in the scientific and engineer-ing journal literature.9 These publications arise from an‘open science’ mechanism that produces a huge poolof knowledge, resulting mostly from basic scientificresearch that can be used freely by the international sci-entific community. Corporate researchers also draw fromthis source, sometimes quite heavily in case of science-based areas of technology (Jaffe, 1989).
Researchers and engineers employed by R&D per-forming companies also add to this source by publishingtheir own research findings in these journals. Althoughthe quantities of corporate research publications appearto declining in recent years, industrial researchersstill produce some 40 000 publications annually, the
majority of which are co-authored with academics(Tijssen, 2004a). Often, these co-authored publicationscan be seen as tangible outcomes of a process in which9 These publications represent one of most important internationalchannels of knowledge transfer within the natural sciences, medicalsciences and life sciences. In the other broad fields of science, partic-ularly in the engineering sciences and computer sciences, conferenceproceedings and reports series are often used as highly valued vehiclesfor disseminating university research-based knowledge.
h Polic
1574 R.J.W. Tijssen / Researcresearchers are likely to have shared and exchangedtacit knowledge and skills (e.g., Rosenberg, 1990).The dissemination of these co-authored papers into thepublic domain therefore reflect direct spillovers of infor-mation, knowledge and technologies that are not easilycaptured by the information perspective of science.These co-publications also signal a more deliberate ori-entation of a university towards engaging in cooperativeresearch with the private sector and (potential) industrialapplications for academic research. It seems reasonableto assume that those universities that make attractiveresearch partners or sources of industrial-relevant sci-entific knowledge for the business sector, are probablyalso more inclined to embrace or promote a morebusiness-oriented research culture themselves, and mayeventually pursue their own entrepreneurial activities.
In the process of publishing the research findings,the authors not only mention details about their researchpartners (i.e. the co-authors and their affiliations),but they usually also cite other research papers in thefootnotes or reference lists of their journal articles. Indoing so, they also leave a paper trial of other externalinformation sources and associated knowledge flows.10
The many millions of citations within research articlespublished each year in the international journal literatureprovides a rich source of empirical information fortapping into knowledge spillovers patterns worldwideand systemically analysing structural characteristicsof those patterns. References within research papersby industrial researchers that cite research articles(co) produced by universities reflect indirect spilloversof knowledge produced by academic science and itsabsorption by industry.11 Hence, citation-based knowl-edge spillovers between curiosity-driven academicresearch and strategy-driven corporate research indicatean awareness of new academic knowledge amongstindustrial researchers and its utilisation during thecourse of their own corporate research (Tijssen and
Van Leeuwen, 2006). Those university researchers thatproduce knowledge that is cited by industrial researchersare very likely to be active in research topics with a10 Naturally, researchers will only tend to cite those printed sourcesthat were of significant relevance to them—either to describe back-ground information or introduce their research objectives, or, morespecifically, to cite those sources that are directly related to the activi-ties, achievements and outcomes reported in their research papers.11 The strong interpretation of citations is that they reflect a causal
relationship between producer and user, revealing sources of academicscience applied in industrial research. The weaker interpretation isthat reasons for these citations are multivaried and ambiguous, thusemphasising a more casual relationship between cited sources and cit-ing users.
y 35 (2006) 1569–1585
potential for industrial applications and commercialvalue in the long run. These cross-sectoral citations mayalso provide an early warning indicator of a universityunit’s industrial relevance.
The publication and citation data used in this studywere extracted from the CWTS Bibliometric Database,which includes the Thomson Scientific’s Citation Indexes(such as the Science Citation Index®) representing aunique source of bibliographic information on jour-nal articles and the citation linkages between thesearticles.12 The university sector contributes the vastmajority of the millions of bibliographic records ofresearch publications stored in this multidisciplinaryinternational database; about 5% of the papers list anauthor affiliation in the business sector.
The publication records were retrieved from the CD-ROM issues of these bibliographic databases. Eachrecord contains the full list of author affiliate addresses,which allowed us to identify the contributing universi-ties and business enterprises. The data collection and dataanalysis is restricted to research articles, review articlesand letters, since these document types are by far themost frequently used for reporting substantial and origi-nal research results. Using the bibliographic informationfrom this database, two size-independent IRR indicatorswere designed for each university and field of science:
• University–industry research cooperation intensity(RCI): the quantity of public–private co-authoredresearch publications relative to total output ofresearch publications produced by a university withinthe same time-interval.
• Industry-to-university corporate citations intensity(CCI): the quantity of references (‘citations’) withincorporate research papers to a university’s researchoutput relative to the university’s total output of‘citable’ publications.
Framed within this stage model of SEO, these indi-cators most likely to relate to phase 1.13 The next sec-tions will examine the statistical relationships between
12 The CWTS/Thomson-Scientific database is owned and operated byCWTS under licence agreement with Thomson Scientific, a company ofThomson International. The database covers some 7 000 fully coveredpeer-reviewed journals out of a total of some 15 000 ‘sources’ (i.e.journals or conference series).13 University research units traversing from phases 1 and 2 to phase
3 may produce significantly less ‘citable’ research articles (this beingpredominantly a product of phase 1). However, it is more likely thatthese units will increase staff numbers to accommodate for additionalfunctions, while continuing to pursue basic (and applied) science andpublishing research articles in peer-reviewed journals.
h Policy
Rwse
4r
4
aeitdimccatciiaR
attgake
Fp
R.J.W. Tijssen / Researc
CI, CCI and other determinants of SEO in more detailithin the broader analytical context of domestic R&D
ystems, fields of science, and indicators of universityntrepreneurial activities.
. Findings: determinants of university–industryesearch interactions
.1. Comparison of OECD countries
The science-based entrepreneurial activities ofcademics, and the likelihood of possible futurentrepreneurial activities, tends to be driven by a match-ng of personal ambitions and perceived business oppor-unities, the ultimate realisation of which is heavilyependent on enabling factors and limitations at both thenstitutional or sectoral level. These meso-level deter-
inants are in turn driven and affected by regional orountry-specific regulatory frameworks and economiconditions. A proper appreciation of IRR indicators,nd statistical modelling of its key determinants, shouldherefore begin by taking note of differences betweenountries with regard to their R&D systems and theirnnovation systems. This section is dedicated to explor-ng macro-level determinants within OECD countriess a function of relevant general characteristics of their&D systems.
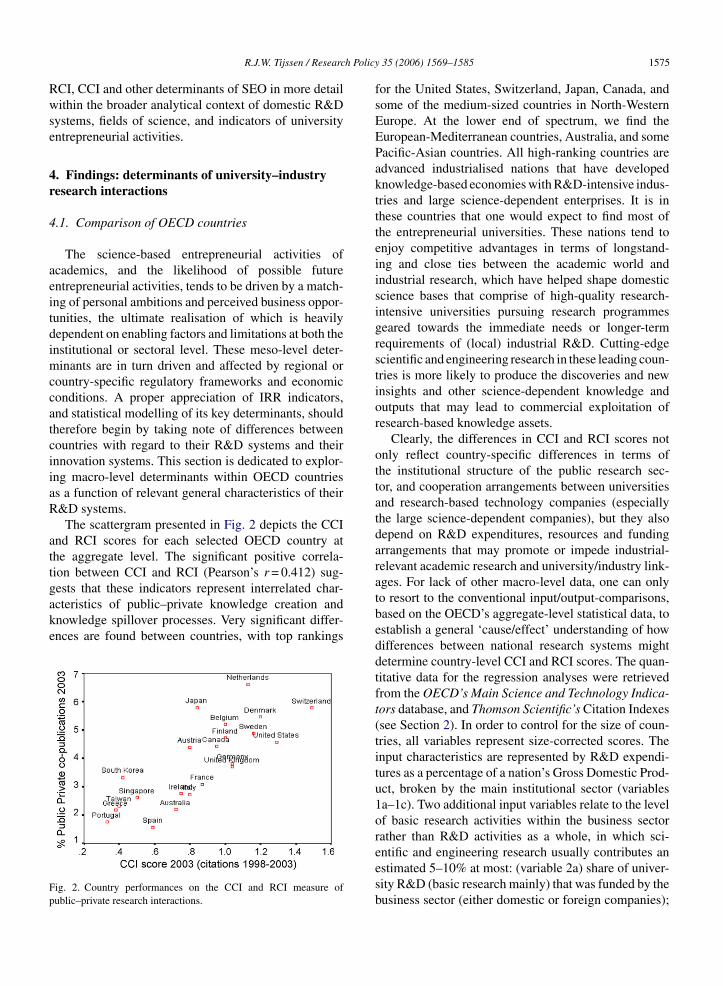
The scattergram presented in Fig. 2 depicts the CCInd RCI scores for each selected OECD country athe aggregate level. The significant positive correla-ion between CCI and RCI (Pearson’s r = 0.412) sug-
ests that these indicators represent interrelated char-cteristics of public–private knowledge creation andnowledge spillover processes. Very significant differ-nces are found between countries, with top rankingsig. 2. Country performances on the CCI and RCI measure ofublic–private research interactions.
35 (2006) 1569–1585 1575
for the United States, Switzerland, Japan, Canada, andsome of the medium-sized countries in North-WesternEurope. At the lower end of spectrum, we find theEuropean-Mediterranean countries, Australia, and somePacific-Asian countries. All high-ranking countries areadvanced industrialised nations that have developedknowledge-based economies with R&D-intensive indus-tries and large science-dependent enterprises. It is inthese countries that one would expect to find most ofthe entrepreneurial universities. These nations tend toenjoy competitive advantages in terms of longstand-ing and close ties between the academic world andindustrial research, which have helped shape domesticscience bases that comprise of high-quality research-intensive universities pursuing research programmesgeared towards the immediate needs or longer-termrequirements of (local) industrial R&D. Cutting-edgescientific and engineering research in these leading coun-tries is more likely to produce the discoveries and newinsights and other science-dependent knowledge andoutputs that may lead to commercial exploitation ofresearch-based knowledge assets.
Clearly, the differences in CCI and RCI scores notonly reflect country-specific differences in terms ofthe institutional structure of the public research sec-tor, and cooperation arrangements between universitiesand research-based technology companies (especiallythe large science-dependent companies), but they alsodepend on R&D expenditures, resources and fundingarrangements that may promote or impede industrial-relevant academic research and university/industry link-ages. For lack of other macro-level data, one can onlyto resort to the conventional input/output-comparisons,based on the OECD’s aggregate-level statistical data, toestablish a general ‘cause/effect’ understanding of howdifferences between national research systems mightdetermine country-level CCI and RCI scores. The quan-titative data for the regression analyses were retrievedfrom the OECD’s Main Science and Technology Indica-tors database, and Thomson Scientific’s Citation Indexes(see Section 2). In order to control for the size of coun-tries, all variables represent size-corrected scores. Theinput characteristics are represented by R&D expendi-tures as a percentage of a nation’s Gross Domestic Prod-uct, broken by the main institutional sector (variables1a–1c). Two additional input variables relate to the levelof basic research activities within the business sectorrather than R&D activities as a whole, in which sci-
entific and engineering research usually contributes anestimated 5–10% at most: (variable 2a) share of univer-sity R&D (basic research mainly) that was funded by thebusiness sector (either domestic or foreign companies);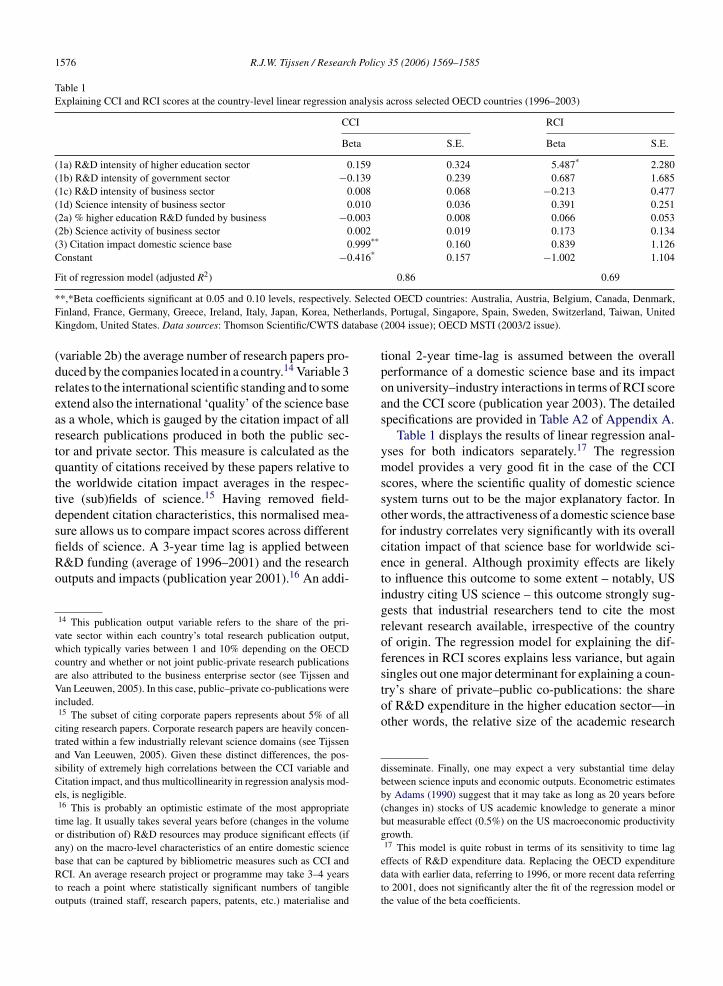
1576 R.J.W. Tijssen / Research Policy 35 (2006) 1569–1585
Table 1Explaining CCI and RCI scores at the country-level linear regression analysis across selected OECD countries (1996–2003)
CCI RCI
Beta S.E. Beta S.E.
(1a) R&D intensity of higher education sector 0.159 0.324 5.487* 2.280(1b) R&D intensity of government sector −0.139 0.239 0.687 1.685(1c) R&D intensity of business sector 0.008 0.068 −0.213 0.477(1d) Science intensity of business sector 0.010 0.036 0.391 0.251(2a) % higher education R&D funded by business −0.003 0.008 0.066 0.053(2b) Science activity of business sector 0.002 0.019 0.173 0.134(3) Citation impact domestic science base 0.999** 0.160 0.839 1.126Constant −0.416* 0.157 −1.002 1.104
Fit of regression model (adjusted R2) 0.86 0.69
. Selecterlandstabase
**,*Beta coefficients significant at 0.05 and 0.10 levels, respectivelyFinland, France, Germany, Greece, Ireland, Italy, Japan, Korea, NethKingdom, United States. Data sources: Thomson Scientific/CWTS da
(variable 2b) the average number of research papers pro-duced by the companies located in a country.14 Variable 3relates to the international scientific standing and to someextend also the international ‘quality’ of the science baseas a whole, which is gauged by the citation impact of allresearch publications produced in both the public sec-tor and private sector. This measure is calculated as thequantity of citations received by these papers relative tothe worldwide citation impact averages in the respec-tive (sub)fields of science.15 Having removed field-dependent citation characteristics, this normalised mea-sure allows us to compare impact scores across different
fields of science. A 3-year time lag is applied betweenR&D funding (average of 1996–2001) and the researchoutputs and impacts (publication year 2001).16 An addi-14 This publication output variable refers to the share of the pri-vate sector within each country’s total research publication output,which typically varies between 1 and 10% depending on the OECDcountry and whether or not joint public-private research publicationsare also attributed to the business enterprise sector (see Tijssen andVan Leeuwen, 2005). In this case, public–private co-publications wereincluded.15 The subset of citing corporate papers represents about 5% of all
citing research papers. Corporate research papers are heavily concen-trated within a few industrially relevant science domains (see Tijssenand Van Leeuwen, 2005). Given these distinct differences, the pos-sibility of extremely high correlations between the CCI variable andCitation impact, and thus multicollinearity in regression analysis mod-els, is negligible.16 This is probably an optimistic estimate of the most appropriate
time lag. It usually takes several years before (changes in the volumeor distribution of) R&D resources may produce significant effects (ifany) on the macro-level characteristics of an entire domestic sciencebase that can be captured by bibliometric measures such as CCI andRCI. An average research project or programme may take 3–4 yearsto reach a point where statistically significant numbers of tangibleoutputs (trained staff, research papers, patents, etc.) materialise and
ed OECD countries: Australia, Austria, Belgium, Canada, Denmark,, Portugal, Singapore, Spain, Sweden, Switzerland, Taiwan, United
(2004 issue); OECD MSTI (2003/2 issue).
tional 2-year time-lag is assumed between the overallperformance of a domestic science base and its impacton university–industry interactions in terms of RCI scoreand the CCI score (publication year 2003). The detailedspecifications are provided in Table A2 of Appendix A.
Table 1 displays the results of linear regression anal-yses for both indicators separately.17 The regressionmodel provides a very good fit in the case of the CCIscores, where the scientific quality of domestic sciencesystem turns out to be the major explanatory factor. Inother words, the attractiveness of a domestic science basefor industry correlates very significantly with its overallcitation impact of that science base for worldwide sci-ence in general. Although proximity effects are likelyto influence this outcome to some extent – notably, USindustry citing US science – this outcome strongly sug-gests that industrial researchers tend to cite the mostrelevant research available, irrespective of the countryof origin. The regression model for explaining the dif-ferences in RCI scores explains less variance, but againsingles out one major determinant for explaining a coun-
try’s share of private–public co-publications: the shareof R&D expenditure in the higher education sector—inother words, the relative size of the academic researchdisseminate. Finally, one may expect a very substantial time delaybetween science inputs and economic outputs. Econometric estimatesby Adams (1990) suggest that it may take as long as 20 years before(changes in) stocks of US academic knowledge to generate a minorbut measurable effect (0.5%) on the US macroeconomic productivitygrowth.17 This model is quite robust in terms of its sensitivity to time lag
effects of R&D expenditure data. Replacing the OECD expendituredata with earlier data, referring to 1996, or more recent data referringto 2001, does not significantly alter the fit of the regression model orthe value of the beta coefficients.
h Policy
budasqhadHwmvd
4
sisrictsifbttr
sJc(lrm
ptStoTdoorld
R.J.W. Tijssen / Researc
ase within a national science system. A relatively largeniversity research system is more likely to provide aiverse and high-quality pool of research-related sourcesnd activities that are relevant for (local or foreign)cience-dependent industry. Returning to the researchuestion underlying this regression analysis, we nowave convincing empirical evidence that a country’s RCInd CCI scores are in large part determined by distinctlyifferent structural properties of domestic science bases.ence, the analytical distinction between RCI and CCIill be retained during the next step of our statisticalodelling, which deals with the meso-level of the uni-
ersity sectors in the selected OECD countries brokenown by field of science.
.2. The university sector and fields of science
The meso-level analysis and modelling relates to aet of 18 pre-selected research fields of acknowledgedndustrial relevance, i.e. fields of science where private-ector organisations accounted for a substantial share ofesearch papers published worldwide.18 The geograph-cal coverage is expanded to 25 OECD member states,overing a total of 6366 higher education sector institu-ions (research universities mainly) across these fields ofcience.19 Framing the university–industry interactionsn terms of knowledge flows also opens up the possibilityor introduction of another interesting type of citation-
ased explanatory variable: the references in patentso the research literature published in scientific andechnical journals. Similarly to citations from corporateesearch papers, these patent citations may also reflect18 These 18 fields of science were selected from a comprehensiveet of 279 fields (i.e. sets of journals grouped under the heading ofournal Categories) that comprise the Thomson Scientific/CWTS fieldlassification system. The 18 fields met the following selection criteria:1) a minimum of 500 corporate papers worldwide in 2001; (2) ateast one EU15 country with 50 or more papers authored by corporateesearchers in 1996–2001; (3) at least one EU15 country with 25 orore public/private co-authored papers in 1996–2001.
19 The three additional OECD countries are: Israel, Norway, and Peo-les Republic of China. The total selection of 25 countries covers morehan 95% of the worldwide publication output in the CWTS/Thomsoncientific database. The selection of universities was extracted from the
op-1000 most highly cited public research organisations (at the mainrganisational level) within each field during the years 1996–2001 (seeijssen and Van Looy, 2005). The total number of universities includesouble counts owing to the fact that many universities publish in severalf the selected fields. Each field-dependent set of universities includesnly those cases that: (a) produced a minimum of six (co-authored)esearch articles published in 1996–2001, and (b) received a total of ateast six citations from corporate research papers that were publisheduring the same 6-year time-interval.
35 (2006) 1569–1585 1577
the spillover and utilisation of scientific knowledge inbusiness sector applications. The list of these ‘non-patentreferences’ (NPRs) often include one or more researcharticles published in peer-reviewed international jour-nals. These NPRs have a direct or indirect bearingon the knowledge claims stated in the application, orprovide relevant background information of knowledgedomains described in the patent. As such, NPR-baseddata may provide information on science-technologylinkages and public–private knowledge flows within andacross national boundaries (e.g., Tijssen, 2001).
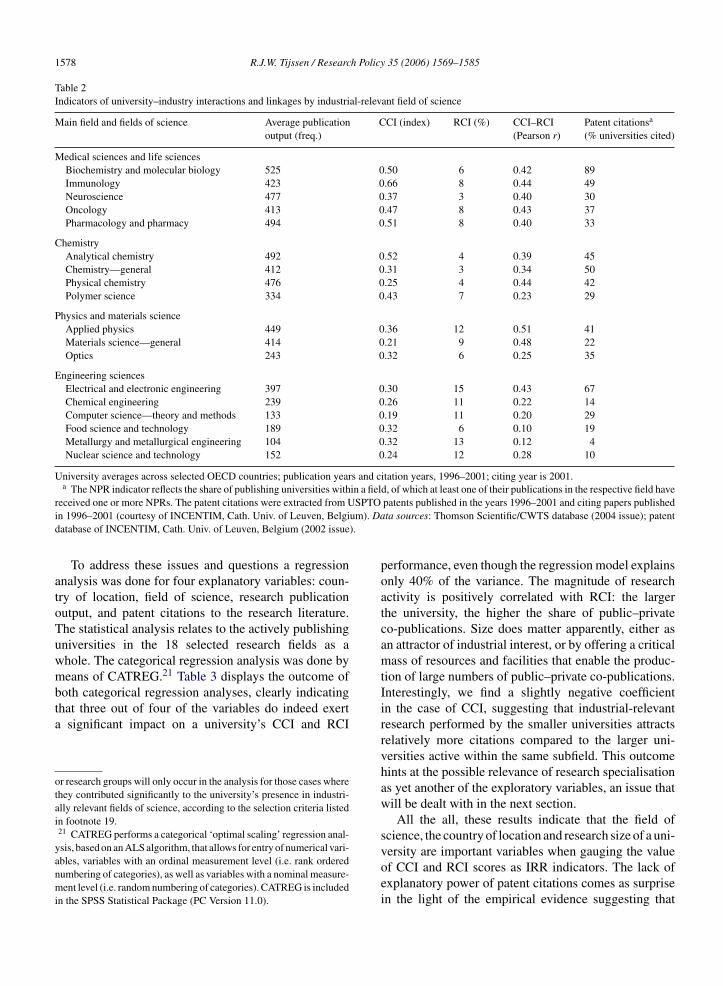
Table 2 exhibits the summary statistics of universityperformance within those 18 fields, grouped by broadfield of science. The first noticeable feature of these keycharacteristics is the large variety across fields. Each fielddefines its own distinctive profile. The statistical rela-tionship between CCI and RCI scores varies significantlybetween fields, where some fields within the EngineeringSciences exhibit quite low CCI–RCI correlation coef-ficients. The main conclusion to be drawn from thesefindings is that both CCI scores and RCI scores arefield-specific and, therefore, statistical modelling needsto incorporate field-dependent parameters when focus-ing on the performance of individual universities.
The large research universities located in theadvanced industrialised countries are more than likely tobenefit from a competitive edge over their counterpartsin other countries in terms of economies of scale andscope. These ‘academic powerhouses’ sustain a rangeof relevant research activities, equipment and infrastruc-ture needed to assemble the critical mass of researchtalent and resources that enable the kind of cutting-edge basic research that (1) gets noticed and cited incorporate research papers and patents, and (2) attractsresearch partners from industry which may lead to jointresearch articles. Given the unfortunate lack of interna-tionally comparative data for universities as to the sizeof their (human, financial and infrastructural) resources,such detailed like-by-like comparisons are beyond thescope of the current study. By way of crude estimate, thecross-university comparisons in this paper correct for thesize of individual universities in terms of their publica-tion output, i.e. the output in each of the respective fieldsrelative to the output of the other universities within that
same field. In other words, the powerhouse research uni-versities are those that produce the largest quantities ofresearch papers.2020 The analysis accounts for disciplinary-based differences within thebroad (engineering) universities, but only with respect to their degreeof IRR (rather than SEO). The publications of university departments
1578 R.J.W. Tijssen / Research Policy 35 (2006) 1569–1585
Table 2Indicators of university–industry interactions and linkages by industrial-relevant field of science
Main field and fields of science Average publicationoutput (freq.)
CCI (index) RCI (%) CCI–RCI(Pearson r)
Patent citationsa
(% universities cited)
Medical sciences and life sciencesBiochemistry and molecular biology 525 0.50 6 0.42 89Immunology 423 0.66 8 0.44 49Neuroscience 477 0.37 3 0.40 30Oncology 413 0.47 8 0.43 37Pharmacology and pharmacy 494 0.51 8 0.40 33
ChemistryAnalytical chemistry 492 0.52 4 0.39 45Chemistry—general 412 0.31 3 0.34 50Physical chemistry 476 0.25 4 0.44 42Polymer science 334 0.43 7 0.23 29
Physics and materials scienceApplied physics 449 0.36 12 0.51 41Materials science—general 414 0.21 9 0.48 22Optics 243 0.32 6 0.25 35
Engineering sciencesElectrical and electronic engineering 397 0.30 15 0.43 67Chemical engineering 239 0.26 11 0.22 14Computer science—theory and methods 133 0.19 11 0.20 29Food science and technology 189 0.32 6 0.10 19Metallurgy and metallurgical engineering 104 0.32 13 0.12 4Nuclear science and technology 152 0.24 12 0.28 10
University averages across selected OECD countries; publication years and citation years, 1996–2001; citing year is 2001.a The NPR indicator reflects the share of publishing universities within a field, of which at least one of their publications in the respective field have
SPTOum). Da).
received one or more NPRs. The patent citations were extracted from Uin 1996–2001 (courtesy of INCENTIM, Cath. Univ. of Leuven, Belgidatabase of INCENTIM, Cath. Univ. of Leuven, Belgium (2002 issue
To address these issues and questions a regressionanalysis was done for four explanatory variables: coun-try of location, field of science, research publicationoutput, and patent citations to the research literature.The statistical analysis relates to the actively publishinguniversities in the 18 selected research fields as awhole. The categorical regression analysis was done bymeans of CATREG.21 Table 3 displays the outcome of
both categorical regression analyses, clearly indicatingthat three out of four of the variables do indeed exerta significant impact on a university’s CCI and RCIor research groups will only occur in the analysis for those cases wherethey contributed significantly to the university’s presence in industri-ally relevant fields of science, according to the selection criteria listedin footnote 19.21 CATREG performs a categorical ‘optimal scaling’ regression anal-
ysis, based on an ALS algorithm, that allows for entry of numerical vari-ables, variables with an ordinal measurement level (i.e. rank orderednumbering of categories), as well as variables with a nominal measure-ment level (i.e. random numbering of categories). CATREG is includedin the SPSS Statistical Package (PC Version 11.0).
patents published in the years 1996–2001 and citing papers publishedta sources: Thomson Scientific/CWTS database (2004 issue); patent
performance, even though the regression model explainsonly 40% of the variance. The magnitude of researchactivity is positively correlated with RCI: the largerthe university, the higher the share of public–privateco-publications. Size does matter apparently, either asan attractor of industrial interest, or by offering a criticalmass of resources and facilities that enable the produc-tion of large numbers of public–private co-publications.Interestingly, we find a slightly negative coefficientin the case of CCI, suggesting that industrial-relevantresearch performed by the smaller universities attractsrelatively more citations compared to the larger uni-versities active within the same subfield. This outcomehints at the possible relevance of research specialisationas yet another of the exploratory variables, an issue thatwill be dealt with in the next section.
All the all, these results indicate that the field ofscience, the country of location and research size of a uni-
versity are important variables when gauging the valueof CCI and RCI scores as IRR indicators. The lack ofexplanatory power of patent citations comes as surprisein the light of the empirical evidence suggesting that
R.J.W. Tijssen / Research Policy 35 (2006) 1569–1585 1579
Table 3Explaining the CCI and RCI scores of individual research universities located in OECD countries (standardized beta coefficients and standard error);n = 6366 cases
CCI RCI
Beta S.E. Beta S.E.
Field of science 0.459a 0.010 0.256a 0.010Country of location 0.375a 0.010 0.308a 0.010Publication output −0.135a 0.009 0.487a 0.010Patent citations to research papers 0.081 0.011 0.026 0.010
F 0.37
rce: Th
tl1so
4i
vptfuw(pttetaitecIop
urorpfido
it of model (adjusted R2)
a Beta coefficients are statistically significant at 0.01 level. Data sou
hese citations reflect the strength of science-technologyinkages at macro- and meso-levels (e.g. Narin et al.,997; Tijssen et al., 2000). The next section is devoted tocrutinising and testing the statistical relevance of somef those variables in more detail.
.3. Validation study: European universities activen immunology research
The key notion underlying of this article is that uni-ersity entrepreneurial activities will at some point startroducing patents or other IP protecting measures prioro launching commercial activities or firms. Applyingor patents constitutes a first step towards formalisedniversity entrepreneurship.22 Typically, IPR measuresill emerge at phase 3 of the developmental process
see Section 2.2.3), which means that the production ofatents can be used as a proxy of the transformationo university entrepreneurial activity. Hence, universi-ies that apply for patents are more likely to exhibitntrepreneurial activities (at a later stage) as comparedo those universities without patents. Obviously, thisssumption holds only for those fields of science andndustrial sectors where patents reflect university-basedechnological development, and for those national sci-nce systems where universities protect their IPR andommercialise those technologies by way of patenting.
n effect, this restricts the scope of our validation studyf science-related or science-dependent sectors whereatents are prime vehicles for protecting and trading IPR:22 In some countries academics may also file for patents as individ-als. Alternatively, academics have opted for transferring the patentights to firms and take out (exclusive) licenses. Note that the quantitiesf university patents tend to be low thus compromising the statisticalobustness of the model. Moreover some fields of science are morerone to R&D activities resulting in (USPTO) patent filings than otherelds. Hence, the validity of patent intensity as a proxy of SEO is field-ependent. The NPR shares listed in Table 5 are most likely indicativef these differences in patenting propensities.
0.41
omson Scientific/CWTS database (2004).
pharmaceuticals, biotechnology, chemicals, electronics,and computers. These high-tech R&D-intensive indus-tries account for the majority of the patents, as well asthe majority of research articles in international scien-tific and technical journals produced by business sectorenterprises (e.g., Godin, 1996).
A recent empirical study conducted by Noyons et al.(2003) produced patent data for universities in WesternEuropean countries that were actively publishing in thefields of immunology and neuroscience.23 The sourceconsists of patents filed in the period 1995–2000 (priorityyears) at the European Patent Office (EPO). Immunol-ogy is selected as an illustrative representative for anin-depth study of CCI and RCI at the level of the 187universities across 16 countries in Western Europe. Thedata in Table 2 indicate that immunology research is oneof the major sources of information for R&D in the lifesciences industries.
One of the key hypotheses following from this SEOmodel is that CCI and/or RCI scores should be positivelycorrelated with university patenting activity, especiallyuniversity-owned patents, either in terms of absolutequantities of patents or the quantities relative to theresearch magnitude of the university. With regard tothe latter indicator, the patent intensity (PI) was cal-culated as the patent output of each university rela-tive to its publication output in 1996–2001 related to
immunology research.24 The correlations presented inTable 4 indeed reveal low, but nonetheless significant,coefficients.23 The set of countries comprises all EU-15 member states (minusLuxembourg), Switzerland and Norway. Further methodological infor-mation about this study, and detailed results, can be viewed and down-loaded at the project website www.cwts/ec-coe.24 The patent intensity value is equal to the ‰ share of patent out-
put relative to the publication output. These fractions were recodedinto seven categories with the frequencies following a normal Gaus-sian distribution (default option in the categorical regression packageCATREG).
1580 R.J.W. Tijssen / Research Polic
Table 4Relationships between CCI and RCI scores and university patentingin immunology-related R&D
CCI RCI PI
Corporate citation intensity (CCI)Research cooperation intensity
(RCI)0.436a
Patent intensity (PI) 0.213a −0.022Patents (P) 0.246a 0.260a 0.274a
Pearson correlation coefficients (n = 187 universities).a Correlations are significant at the 0.01 level (two-tailed). Time-
(
intervals: RCI and CCI scores (1996–2001); P and PI scores(1995–2000). Data source: Thomson Scientific/CWTS database (2004issue).
Using patents as a partial indicator of phase 3 activi-ties and outputs opens up the possibility for a more exten-sive validation study of SEO with additional explanatoryvariables. Expanding on the model described in Table 1,the following four variables are added relating to a uni-versity’s research size or to its specialisation rate: (a)the total number of research articles published; (b) thetotal number of public–private co-authored articles; (c)the share of the research articles within the field; (d) theshare of public–private co-authored articles within thefield. The following hypotheses of university patentingbehaviour can now be tested:
(a) the regression model will produce a better fit of uni-versity patenting in terms of the absolute numbers
of patents, rather than using the relative numbers ofpatents;b) the model which includes the country of loca-tion included will produce a better fit (in view
Table 5Regression analyses models of university patenting activity in immunology re
Independent variable
Patent output, beta coeffi
Incl. ‘Country’a
Country 0.25 (0.04)**
Total publication output all fields 0.41 (0.15)**
Public–private cooperation output all fields 0.39 (0.16)‘
Share total public output in field 0.18 (0.04)**
Share public–private output in field 0.16 (0.08)**
Corporate citation intensity (CCI) 0.09 (0.04)**
Public–private cooperation intensity (RCI) −0.21 (0.08)**
Patent citations to research papers 0.16 (0.04)Fit of model (adjusted R2) 0.77
**,*Standardized beta coefficients are statistically significant at 0.05 and 0.10 l(2004); patent database of INCENTIM.
a Regressor variables.
y 35 (2006) 1569–1585
of the different patenting regimes across Europeancountries);
(c) given their low correlation with patent intensity (seeTable 3), neither CCI nor RCI will be major explana-tory variables of patenting output.
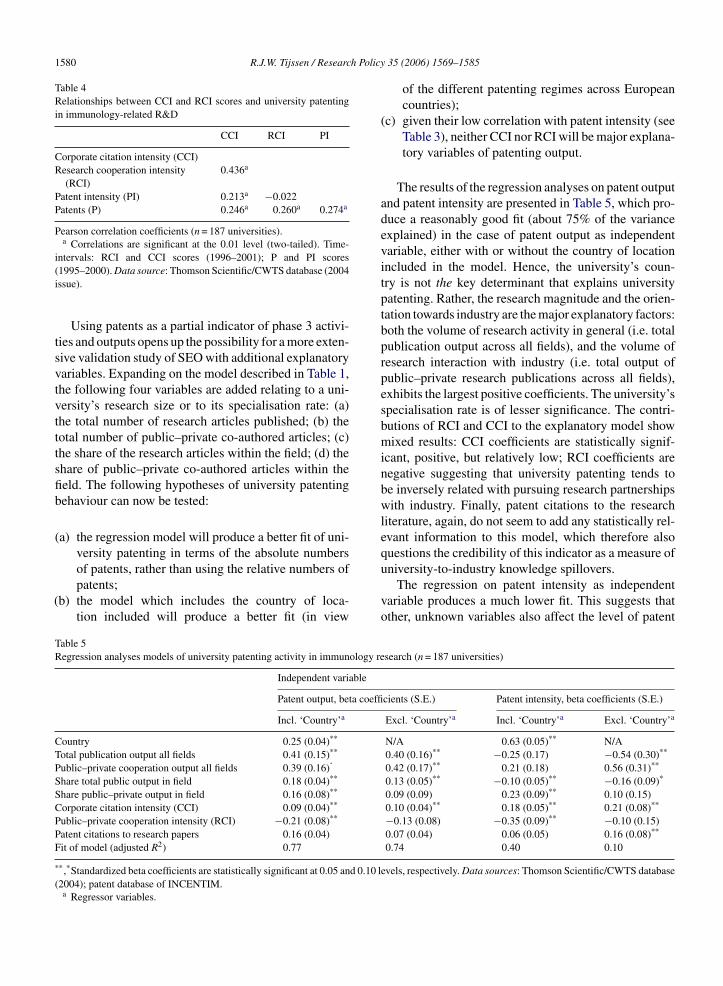
The results of the regression analyses on patent outputand patent intensity are presented in Table 5, which pro-duce a reasonably good fit (about 75% of the varianceexplained) in the case of patent output as independentvariable, either with or without the country of locationincluded in the model. Hence, the university’s coun-try is not the key determinant that explains universitypatenting. Rather, the research magnitude and the orien-tation towards industry are the major explanatory factors:both the volume of research activity in general (i.e. totalpublication output across all fields), and the volume ofresearch interaction with industry (i.e. total output ofpublic–private research publications across all fields),exhibits the largest positive coefficients. The university’sspecialisation rate is of lesser significance. The contri-butions of RCI and CCI to the explanatory model showmixed results: CCI coefficients are statistically signif-icant, positive, but relatively low; RCI coefficients arenegative suggesting that university patenting tends tobe inversely related with pursuing research partnershipswith industry. Finally, patent citations to the researchliterature, again, do not seem to add any statistically rel-evant information to this model, which therefore alsoquestions the credibility of this indicator as a measure of
university-to-industry knowledge spillovers.The regression on patent intensity as independentvariable produces a much lower fit. This suggests thatother, unknown variables also affect the level of patent
search (n = 187 universities)
cients (S.E.) Patent intensity, beta coefficients (S.E.)
Excl. ‘Country’a Incl. ‘Country’a Excl. ‘Country’a
N/A 0.63 (0.05)** N/A0.40 (0.16)** −0.25 (0.17) −0.54 (0.30)**
0.42 (0.17)** 0.21 (0.18) 0.56 (0.31)**
0.13 (0.05)** −0.10 (0.05)** −0.16 (0.09)*
0.09 (0.09) 0.23 (0.09)** 0.10 (0.15)0.10 (0.04)** 0.18 (0.05)** 0.21 (0.08)**
−0.13 (0.08) −0.35 (0.09)** −0.10 (0.15)0.07 (0.04) 0.06 (0.05) 0.16 (0.08)**
0.74 0.40 0.10
evels, respectively. Data sources: Thomson Scientific/CWTS database
R.J.W. Tijssen / Research Policy 35 (2006) 1569–1585 1581
Table 6European universities in immunology research with relatively high CCI scores and/or RCI scores, but lacking university-owned EPO-patentsa
Total publicationoutputb
Public–privateco-publication output
CCI (index) RCI (%) EPO-patents TTIc
Univ. Brescia 214 32 2.33 15 0 NoUniv. Verona 159 6 0.86 4 0 NoUniv. Catania 65 6 0.65 9 0 NoUniv. Cagliari 51 0 0.31 0 0 NoUniv. Linkoping 214 11 0.19 5 0 YesUniv. Athens 121 6 0.19 5 0 YesUniv. Granada 63 0 0.38 0 0 Yes
a universT (1995–2
of 50 pu, accor
ioeoiafptrvtbdgbriro
tesiasdsooFabp
t
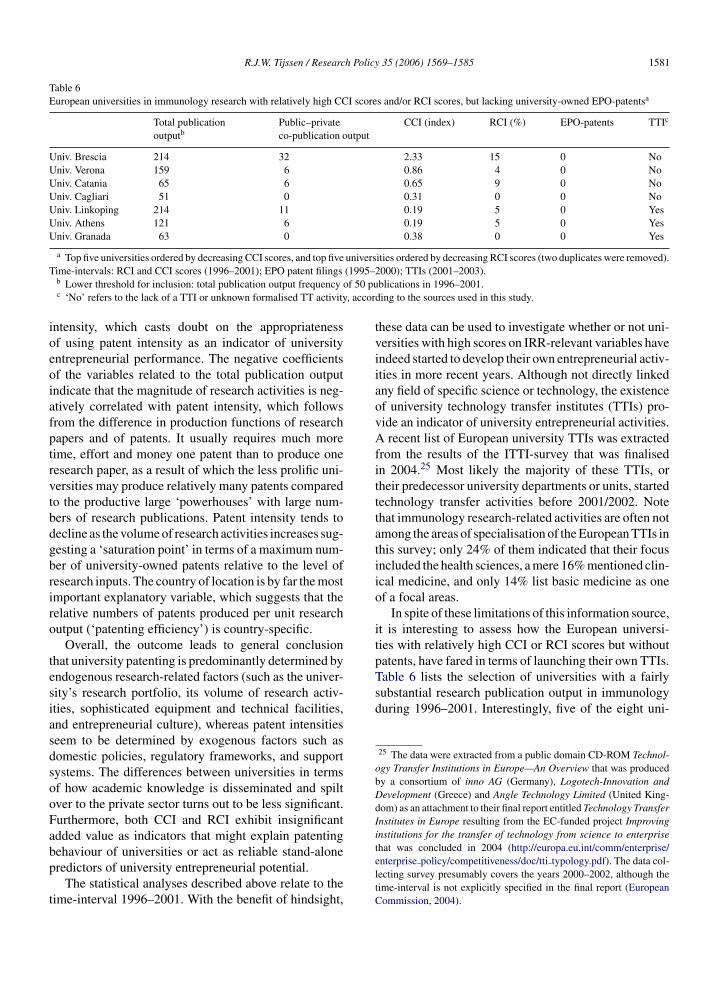
Table 6 lists the selection of universities with a fairlysubstantial research publication output in immunologyduring 1996–2001. Interestingly, five of the eight uni-
25 The data were extracted from a public domain CD-ROM Technol-ogy Transfer Institutions in Europe—An Overview that was producedby a consortium of inno AG (Germany), Logotech-Innovation andDevelopment (Greece) and Angle Technology Limited (United King-dom) as an attachment to their final report entitled Technology TransferInstitutes in Europe resulting from the EC-funded project Improvinginstitutions for the transfer of technology from science to enterprise
Top five universities ordered by decreasing CCI scores, and top fiveime-intervals: RCI and CCI scores (1996–2001); EPO patent filingsb Lower threshold for inclusion: total publication output frequencyc ‘No’ refers to the lack of a TTI or unknown formalised TT activity
ntensity, which casts doubt on the appropriatenessf using patent intensity as an indicator of universityntrepreneurial performance. The negative coefficientsf the variables related to the total publication outputndicate that the magnitude of research activities is neg-tively correlated with patent intensity, which followsrom the difference in production functions of researchapers and of patents. It usually requires much moreime, effort and money one patent than to produce oneesearch paper, as a result of which the less prolific uni-ersities may produce relatively many patents comparedo the productive large ‘powerhouses’ with large num-ers of research publications. Patent intensity tends toecline as the volume of research activities increases sug-esting a ‘saturation point’ in terms of a maximum num-er of university-owned patents relative to the level ofesearch inputs. The country of location is by far the mostmportant explanatory variable, which suggests that theelative numbers of patents produced per unit researchutput (‘patenting efficiency’) is country-specific.
Overall, the outcome leads to general conclusionhat university patenting is predominantly determined byndogenous research-related factors (such as the univer-ity’s research portfolio, its volume of research activ-ties, sophisticated equipment and technical facilities,nd entrepreneurial culture), whereas patent intensitieseem to be determined by exogenous factors such asomestic policies, regulatory frameworks, and supportystems. The differences between universities in termsf how academic knowledge is disseminated and spiltver to the private sector turns out to be less significant.urthermore, both CCI and RCI exhibit insignificantdded value as indicators that might explain patenting
ehaviour of universities or act as reliable stand-aloneredictors of university entrepreneurial potential.The statistical analyses described above relate to theime-interval 1996–2001. With the benefit of hindsight,
ities ordered by decreasing RCI scores (two duplicates were removed).000); TTIs (2001–2003).blications in 1996–2001.
ding to the sources used in this study.
these data can be used to investigate whether or not uni-versities with high scores on IRR-relevant variables haveindeed started to develop their own entrepreneurial activ-ities in more recent years. Although not directly linkedany field of specific science or technology, the existenceof university technology transfer institutes (TTIs) pro-vide an indicator of university entrepreneurial activities.A recent list of European university TTIs was extractedfrom the results of the ITTI-survey that was finalisedin 2004.25 Most likely the majority of these TTIs, ortheir predecessor university departments or units, startedtechnology transfer activities before 2001/2002. Notethat immunology research-related activities are often notamong the areas of specialisation of the European TTIs inthis survey; only 24% of them indicated that their focusincluded the health sciences, a mere 16% mentioned clin-ical medicine, and only 14% list basic medicine as oneof a focal areas.
In spite of these limitations of this information source,it is interesting to assess how the European universi-ties with relatively high CCI or RCI scores but withoutpatents, have fared in terms of launching their own TTIs.
that was concluded in 2004 (http://europa.eu.int/comm/enterprise/enterprise policy/competitiveness/doc/tti typology.pdf). The data col-lecting survey presumably covers the years 2000–2002, although thetime-interval is not explicitly specified in the final report (EuropeanCommission, 2004).
h Polic
1582 R.J.W. Tijssen / Researcversities on this list are Italian ones, which suggest thatthis country in particular seems to have been laggingbehind other Western European countries in terms oftranslating their research findings into formalised uni-versity entrepreneurial activities. This apparent failingwas corrected in October 2001 when Italy passed innova-tive legislation (Law 383) by which patent ownership isassigned to the university inventor(s), while the inventorshares the proceeds from industrial exploitation by theuniversity that employs the inventor.26 As a result, TTIshave become more important in the university system,and many Italian universities (including Brescia, Cagliariand Verona) have joined the Italian inter-university coop-erative Network per la Valorizzazione della Ricerca Uni-versitaria, which was founded in 2002 and is devotedto promoting technology transfer activities, universitypatenting and spin-off companies (e.g. Cesaroni et al.,2005).
5. Discussion and cautionary remarks
The underlying notion and guiding principle of thisstudy is the process view of a research university, i.e. auniversity that is becoming more entrepreneurial throughtime, during which it will engage in university–industryresearch cooperation and contract research. Some fea-tures of the process towards university entrepreneurialscience, and possibly also the potential for academicentrepreneurship, are amenable to comparative mea-surement and can be captured by the two connectivityindicators introduced in this study: the research cooper-ation intensity (RCI) and the corporate citation intensity(CCI). The results indicate that both indicators are, atbest, partial proxies of a university’s entrepreneurialorientation. The industrial relevance of academic sci-ence, and the associated entrepreneurial potential ofuniversities, is more likely to be affected by the coun-try of location and the sheer magnitude of a univer-sity’s research activities. Although they are still ratherspeculative indicators in need of further validation, CCIand RCI have nonetheless proven to be of significantinstrumental relevance for investigating the structural
characteristics of university–industry interactions, espe-cially at the macro-level. Even so, it is important tokeep in mind that the tentative conclusions drawn from26 Under the new law universities have a right to claim at least 30% inthe event that no internal regulations are established and up to a maxi-mum of 50% if internal regulations are established. Some universitiesallow scientists to offer their IP rights to the employer and, if the offeris accepted, the university agrees to cover patent costs in exchange fora higher percentage of the proceeds from industrial exploitation.
y 35 (2006) 1569–1585
these observations are valid only within the context ofthe analytical framework applied in this study, one thatrelies heavily on a conceptualisation of SEO in termsof university–industry interactions and connections, andhinging critically on comparative information derivedfrom research articles in international scientific litera-ture, patents, and citation flows. The scope of inferenceis therefore restricted to those fields of academic scienceand those research-based industries that produce signif-icant numbers of research papers and patents. In manycases universities simply produce too few patents to war-rant any definitive conclusions, irrespective of the fieldof science.
Owing to the rather narrow analytical focus adoptedin this approach, one may easily overlook or neglectthe possible contributions of education and training,transfer activities, and other research-related activi-ties that may ultimately prove to be more importantdrivers and effective channels for universities to gen-erate (complementary) economic returns. Given thefact that a host of country-, field- and organisation-specific factors are likely to impact on different phasesof these processes, it is unreasonable to assume thatthis daunting complexity can be easily reduced to asingle convincing measurement model that may giverise to reliable leading indicators. This inherent con-straint is exacerbated by the dynamics of modern-dayscience and its manifold interactions with economicdevelopment; the world of university entrepreneurialscience will have moved on, and may have altered sig-nificantly, before a plausible general theory, compre-hensive models, and appropriate indicators have beendeveloped.
Acknowledgements
This paper is partially based on results of a researchproject that was conducted in cooperation with INCEN-TIM (Cath. Univ. Leuven, Belgium) and funded bythe European Commission/DG Research (contract no.HPV2-CT2001-00012). An extended version of thispaper was presented at the Conference “The Role of Uni-versities in Innovation Systems”, hosted by the EuropeanUniversity Institute, Florence (Fiesole), Italy, 17–18June 2005. I am greatly indebted to Thed van Leeuwenand Ed Noyons (CWTS), and Hugo Hollanders (UNU-MERIT, Netherlands) for contributing R&D statisticsof OECD countries and background data on the R&D
performance of universities. Stefano Breschi (Univ. Boc-coni, Italy) and Fabrizio Cesaroni (Univ. Lecce, Italy)kindly supplied additional information on technologytransfer offices affiliated to Italian universities. Bart van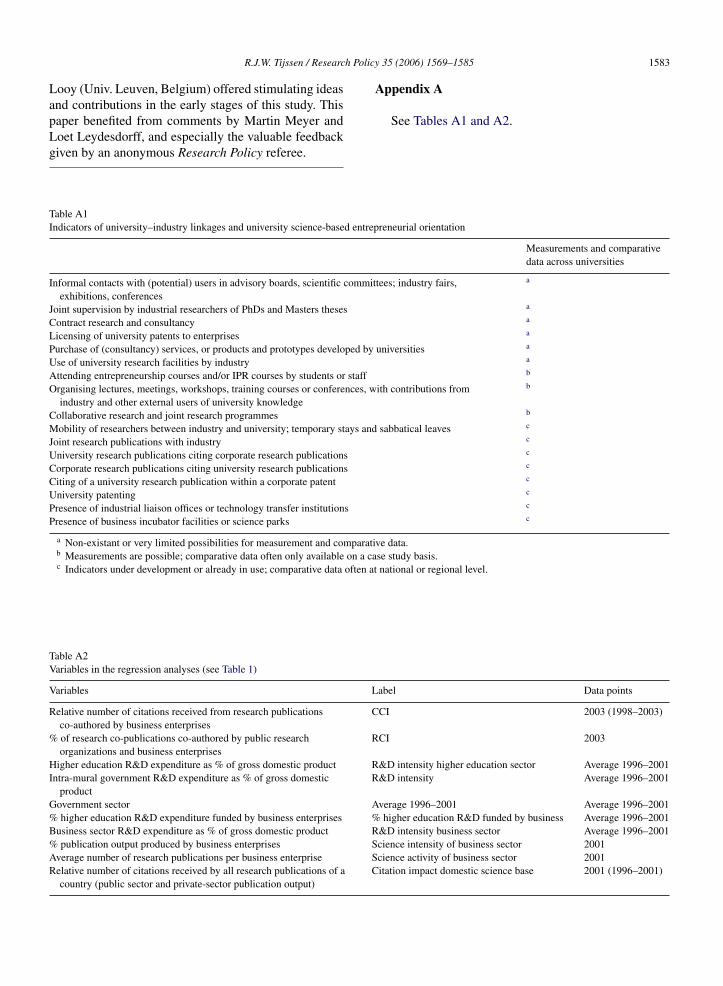
h Policy 35 (2006) 1569–1585 1583
LapLg
Appendix A
See Tables A1 and A2.
TI
I
JCLPUAO
CMJUCCUPP
TV
V
R
%
HI
G%B%AR
R.J.W. Tijssen / Researc
ooy (Univ. Leuven, Belgium) offered stimulating ideasnd contributions in the early stages of this study. Thisaper benefited from comments by Martin Meyer and
oet Leydesdorff, and especially the valuable feedbackiven by an anonymous Research Policy referee.able A1ndicators of university–industry linkages and university science-based entrep
nformal contacts with (potential) users in advisory boards, scientific commitexhibitions, conferences
oint supervision by industrial researchers of PhDs and Masters thesesontract research and consultancyicensing of university patents to enterprisesurchase of (consultancy) services, or products and prototypes developed byse of university research facilities by industryttending entrepreneurship courses and/or IPR courses by students or staffrganising lectures, meetings, workshops, training courses or conferences, windustry and other external users of university knowledge
ollaborative research and joint research programmesobility of researchers between industry and university; temporary stays and
oint research publications with industryniversity research publications citing corporate research publicationsorporate research publications citing university research publicationsiting of a university research publication within a corporate patentniversity patentingresence of industrial liaison offices or technology transfer institutionsresence of business incubator facilities or science parks
a Non-existant or very limited possibilities for measurement and comparatib Measurements are possible; comparative data often only available on a cac Indicators under development or already in use; comparative data often at
able A2ariables in the regression analyses (see Table 1)
ariables L
elative number of citations received from research publicationsco-authored by business enterprises
C
of research co-publications co-authored by public researchorganizations and business enterprises
R
igher education R&D expenditure as % of gross domestic product Rntra-mural government R&D expenditure as % of gross domestic
productR
overnment sector Ahigher education R&D expenditure funded by business enterprises %
usiness sector R&D expenditure as % of gross domestic product Rpublication output produced by business enterprises S
verage number of research publications per business enterprise Selative number of citations received by all research publications of acountry (public sector and private-sector publication output)
C
reneurial orientation
Measurements and comparativedata across universities
tees; industry fairs, a
a
a
a
universities a
a
b
ith contributions from b
b
sabbatical leaves c
c
c
c
c
c
c
c
ve data.se study basis.national or regional level.
abel Data points
CI 2003 (1998–2003)
CI 2003
&D intensity higher education sector Average 1996–2001&D intensity Average 1996–2001
verage 1996–2001 Average 1996–2001higher education R&D funded by business Average 1996–2001
&D intensity business sector Average 1996–2001cience intensity of business sector 2001cience activity of business sector 2001itation impact domestic science base 2001 (1996–2001)
Polic
Small Business Economics 14, 299–309.Lee, Y.S., 1996. Technology transfer and the research university: a
search for the boundaries of the university–industry collaboration.Research Policy 25, 843–863.
y 35 (2006) 1569–1585
Lehrer, M., Asakawa, K., 2004. Pushing scientists into the market-place: promoting science entrepreneurship. California Manage-ment Review 46, 55–76.
Link, A., Scott, J., Siegel, D., 2003. The economics of intellectual prop-erty at universities. International Journal of Industrial Organization21, 1217–1225.
Lockett, A., Siegel, D., Wright, M., Ensley, M., 2005. The creation ofspin-off firms at public research institutions: managerial and policyimplications. Research Policy 34, 981–993.
Meyer, M., 2003. Academic entrepreneurs or entrepreneurial aca-demics? Research-based ventures and public support mechanism.R&D Management 33, 107–115.
Molas-Gallart, J., Salter, A., Patel, P., Scott, A., Duran, X., 2002. Mea-suring Third Stream activities. SPRU report to the Russell Groupof Universities, University of Sussex.
Mowery, D., Ziedonis, A., 2002. Academic patent quality and quantitybefore and after the Bayh–Dole act in the United States. ResearchPolicy 31 (3), 399–419.
Narin, F., Hamilton, K.S., Olivastro, D., 1997. The increasing linkagebetween US technology and public science. Research Policy 26,317–330.
Nature (editorial), 2001. Is the university–industrial complex out ofcontrol? Nature 409, 119.
Ndonzuau, F.N., Pirnay, F., Surlemont, B., 2002. A stage model ofacademic spin-off creation. Technovation 22, 281–289.
Noyons, E.C.M., Buter, R.K., Van Raan, A.F.J., Schmoch, U., Heinze,T., Hinze, S., Rangnow, R., 2003. Mapping excellence in sci-ence and technology across Europe-Life Science: Nanoscience andnanotechnology. CWTS/FhG-ISI reports for the European Com-mission/DG Research.
OECD, 2002. Benchmarking Industry–Science Relationships. Organ-isation for Economic Cooperation and Development, Paris.
Polt, W., Benchmarking industry science relations: the role of frame-work conditions. Final report prepared for EC/DG Enterprise.
Powers, J.B., 2004. R&D funding sources and university tech-nology transfer: what is stimulating universities to be moreentrepreneurial? Research in Higher Education 45, 1–23.
Powers, J.B., McDougall, P.P., 2005. University start-up formation andtechnology licensing with firms that go public: a resource-basedview of academic entrepreneurship. Journal of Business Venturing20, 291–311.
Rosenberg, N., 1990. Why do firms do basic research with their ownmoney? Research Policy 19, 165–174.
Siegel, D., Waldman, D., Link, A., 2003. Assessing the impact oforganizational practices on the productivity of university tech-nology transfer offices: an exploratory study. Research Policy 32,27–48.
Tijssen, R.J.W., Buter, R.K., Van Leeuwen, Th.N., 2000. Technologi-cal relevance of science: validation and analysis of citation linkagesbetween patents and research papers. Scientometrics 47, 389–412.
Tijssen, R.J.W., 2001. Global and domestic utilization of industrialrelevant science: patent citation analysis of science/technologyinteractions and knowledge spill-overs. Research Policy 30, 35–54.
Tijssen, R.J.W., 2004a. Is the commercialisation of scientific researchaffecting the production of public knowledge? Global trends inthe output of corporate research articles. Research Policy 33, 709–
733.1584 R.J.W. Tijssen / Research
References
Adams, J.D., 1990. Fundamental stocks of knowledge and pro-ductivity growth. Journal of Political Economy 98, 673–702.
Bercovitz, J.M., Feldman, I.F., Burton, R., 1990. Organizational struc-ture as determinants of academic patent and licensing behavior: anexploratory study of Duke John Hopkins and Penn State Universi-ties. The Journal of Technology Transfer 26, 21–35.
Branscomb, L.M., Kodama, F., Florida, R., 1999. IndustrializingKnowledge: University–Industry Linkages in Japan and the UnitedStates. MIT Press, London, UK.
Cesaroni, F., Conti, G., Piccalunga, A., Moscara, P., 2005. TechnologyTransfer Offices (TTO) in Italian universities: what do they doand how they do it. In: Paper presented at the Fifth Triple HelixConference, Turin, Italy, pp. 18–21.
Chiesa, V., Piccaluga, A., 2000. Exploitation and diffusion of publicresearch: the case of academic spin-off companies in Italy. R&DManagement 30, 329–339.
Clark, B.R., 1998. Creating Entrepreneurial Universities: Organisa-tional Pathways of Transformation. Pergamon/Elsevier Science,Oxford.
Clark, B.R., 2004. Sustaining Change in Universities: Continuities inCase Studies and Concepts. Open University Press, Berkshire, Eng-land.
Clarysse, B., Moray, N., 2004. A process study of entrepreneurial teamformation: the case of a research-based spin-off. Journal of Busi-ness Venturing 19, 55–79.
Dasgupta, P., David, P., 1994. Toward a new economics of science.Research Policy 23, 487–521.
Etzkowitz, H., 1998. The norms of entrepreneurial science: cognitiveeffects of the new university–industry linkage. Research Policy 27,823–833.
Etzkowitz, H., 2002. MIT and the Rise of Entrepreneurial Science.Routledge Press, London, UK.
Etzkowitz, H., 2003. Research groups as ‘quasi-firms’: the inven-tion of the entrepreneurial university. Research Policy 32, 109–121.
European Commission, 2004. Technology Transfer Institutions inEurope: An Overview 2004. Report by inno AG, Logotech-Innovation and Development and Angle Technology Limited forEC/DG Enterprise.
Feldman, M., Feller, I., Bercovitz, J., Burton, R., 2002. Equity and thetechnology transfer strategies of American research universities.Management Science 48, 105–121.
Glassman, A.M., Moore, R.W., Rossy, G.L., Neupert, K., Napier, N.K.,Jones, D.E., Harvey, M., 2003. Academic entrepreneurship—viewson balancing the Acropolis and the Agora. Journal of ManagementInquiry 12, 353–374.
Godin, B., 1996. Research and the practice of publication in industries.Research Policy 25, 587–606.
Goldfarb, B., Henrekson, M., 2003. Bottom-up versus top-down poli-cies towards the commercialization of university intellectual prop-erty. Research Policy 32, 639–658.
Jaffe, A., 1989. Real effects of academic research. American EconomicReview 79, 957–970.
Klofsten, M., Jones-Evans, D., 2000. Comparing academicentrepreneurship in Europe—the case of Sweden and Ireland.
Tijssen, R.J.W., 2004b. Measuring and evaluating science-technologyinteractions: towards international statistics. In: Moed, H., Glanzel,W., Schmoch, U. (Eds.), Handbook of Quantitative Science andTechnology Research: The Use of Publication and Patent Statistics
h Policy
T
T Transfer 28, 53–61.
R.J.W. Tijssen / Researc
in Studies on S&T Systems. Kluwer Academic Publishers, Dor-drecht, pp. 695–716.
ijssen, R.J.W., Van Leeuwen, T.N., 2006. Measuring impacts of aca-demic science on industrial research: a citation-based approach.Scientometrics 66, 55–69.
ijssen, R.J.W., Van Looy, B., 2005. European science in industrial
relevant research areas: development of an indicator-based bib-liometric methodology for performance analyses of countries andresearch organizations. Summary report for the European Com-mission (DG Research) produced by the Centre for Science andTechnology Studies, Leiden (CWTS) and International Centre for35 (2006) 1569–1585 1585
Studies in Entrepreneurship and Innovation Management, Leuven(INCENTIM).
Van Looy, B., Callaert, J., Debackere, K., Verbeek, A., 2003. Patentrelated indicators for assessing knowledge-generation institutions:towards a contextualised approach. The Journal of Technology
Van Looy, B., Ranga, M., Callaert, J., Debackere, K., Zimmermann,E., 2004. Combining entrepreneurial and scientific performance inacademia: towards a compounded and reciprocal Matthew-effect.Research Policy 33, 425–441.