understanding the impacts of a combination of service improvement strategies on bus running time and...
TRANSCRIPT
Transportation Research Part A 46 (2012) 614–625
Contents lists available at SciVerse ScienceDirect
Transportation Research Part A
journal homepage: www.elsevier .com/locate / t ra
Understanding the impacts of a combination of service improvementstrategies on bus running time and passenger’s perception
Ehab I. Diab 1, Ahmed M. El-Geneidy ⇑School of Urban Planning, McGill University, Suite 400, 815 Sherbrooke St. W., Montréal, Québec, Canada H3A 2K6
a r t i c l e i n f o a b s t r a c t
Article history:Received 30 July 2011Received in revised form 16 November 2011Accepted 29 November 2011
Keywords:Running timeLimited-stop bus serviceArticulated busesReserved laneSmart card fare collectionTransit signal priority (TSP)
0965-8564/$ - see front matter � 2011 Elsevier Ltddoi:10.1016/j.tra.2011.11.013
⇑ Corresponding author. Tel.: +1 514 398 8741; faE-mail addresses: [email protected] (E.I.
1 Tel.: +1 514 549 0093; fax: +1 514 398 8376.
Transit agencies implement many strategies in order to provide an attractive transportationservice. This article aims to evaluate the impacts of implementing a combination of strate-gies, designed to improve the bus transit service, on running time and passengersatisfaction. These strategies include using smart card fare collection, introducing limited-stop bus service, implementing reserved bus lanes, using articulated buses, and implement-ing transit signal priority (TSP). This study uses stop-level data collected from the Société detransport de Montréal (STM)’s automatic vehicle location (AVL) and automatic passengercount (APC) systems, in Montréal, Canada. The combination of these strategies has lead toa 10.5% decline in running time along the limited stop service compared to the regular ser-vice. The regular route running time has increased by 1% on average compared to the initialtime period. The study also shows that riders are generally satisfied with the serviceimprovements. They tend to overestimate the savings associated with the implementationof this combination of strategies by 3.5–6.0 min and by 2.5–4.1 min for both the regular routeand the limited stop service, respectively. This study helps transit planners and policy makersto better understand the effects of implementing a combination of strategies to improverunning time and passenger’s perception of these changes in service.
� 2011 Elsevier Ltd. All rights reserved.
1. Introduction
Boulevard Saint-Michel is a heavily used bus corridor located to the east of Montréal’s central business district, in theprovince of Québec, Canada. According to official estimations this corridor serves around 43,000 passengers per day. Thisservice is operated by the Société de transport de Montréal (STM), the transit provider on the island of Montréal, and movesmore than 1.2 million rides per weekday on its 4 metro lines and 202 bus routes. In an attempt to improve transit service onthe island, STM has implemented a series of measures. These measures included implementation of a smart card systemcalled ‘OPUS’ on April, 2008, to provide passengers with the attractiveness and advantages of automated fare collection(Société de transport de Montréal, 2010). At the same time, the STM made the decision to implement a limited-stop bus ser-vice (Route 467) running parallel to the regular bus service (Route 67) along the boulevard Saint-Michel corridor. On March30th, 2009, the STM implemented this new service. The new route serves only 40% of the stops along Route 67, with an aver-age stop spacing of 615 m. Route 467 runs on weekdays from 6:00 AM to 7:00 PM with an average headway of 10 min and7 min during peak hours. Starting August 3rd, 2009, the STM began to operate a reserved bus lane during peak hours in orderto improve the service. On February 1st, 2010, the STM continued its series of improvements along the corridor by assigninga number of articulated buses to serve Route 467. Finally, on September 1st, 2010, the STM equipped a few of these buses
. All rights reserved.
x: +1 514 398 8376.Diab), [email protected] (A.M. El-Geneidy).
E.I. Diab, A.M. El-Geneidy / Transportation Research Part A 46 (2012) 614–625 615
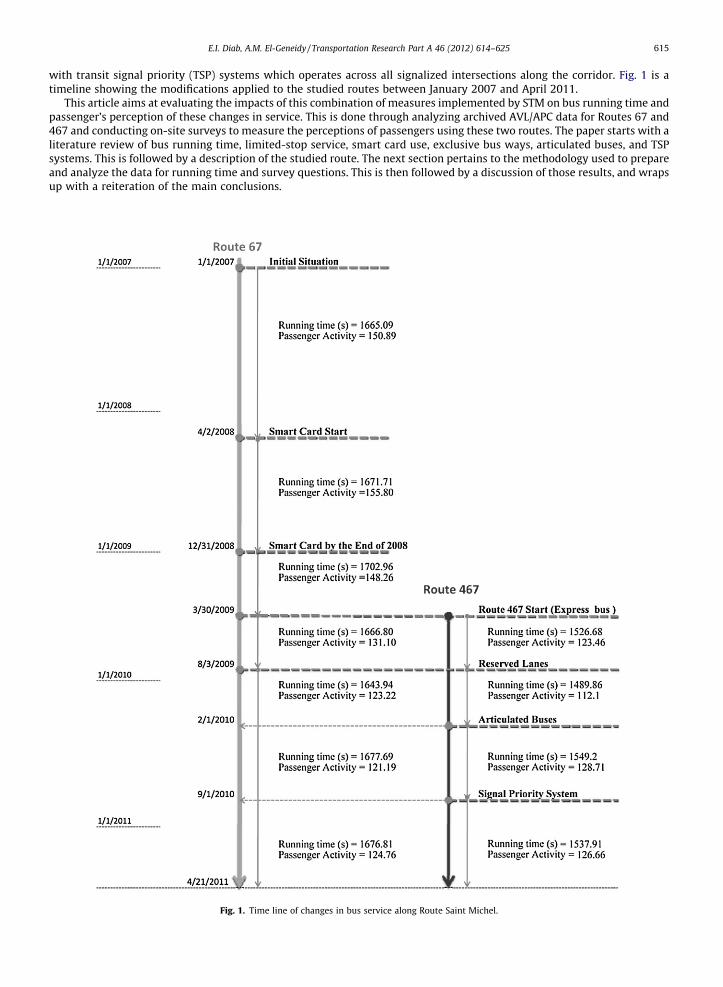
with transit signal priority (TSP) systems which operates across all signalized intersections along the corridor. Fig. 1 is atimeline showing the modifications applied to the studied routes between January 2007 and April 2011.
This article aims at evaluating the impacts of this combination of measures implemented by STM on bus running time andpassenger’s perception of these changes in service. This is done through analyzing archived AVL/APC data for Routes 67 and467 and conducting on-site surveys to measure the perceptions of passengers using these two routes. The paper starts with aliterature review of bus running time, limited-stop service, smart card use, exclusive bus ways, articulated buses, and TSPsystems. This is followed by a description of the studied route. The next section pertains to the methodology used to prepareand analyze the data for running time and survey questions. This is then followed by a discussion of those results, and wrapsup with a reiteration of the main conclusions.
Fig. 1. Time line of changes in bus service along Route Saint Michel.
616 E.I. Diab, A.M. El-Geneidy / Transportation Research Part A 46 (2012) 614–625
2. Literature review
Transit users consider the service reliable when their in-vehicle time (i.e. running time), access and egress time (Hensheret al., 2003; Murray and Wu, 2003), and their waiting time at stops are minimized. Reduction in running time is expected toincrease ridership and rider satisfaction (Hensher et al., 2003). Running time is the time that takes a bus to move betweentwo defined points during a trip along a specific route. The review of previous studies in transit literature identified severalcommon factors that influence running time. These factors include passenger activity, load, distance, delay at the beginningof the trip, period of the day, number of actual stops made, weather and traffic conditions (Abkowitz and Engelstein, 1983;Levinson, 1983; Strathman et al., 2000). Transit agencies generally try to reduce the effect of these factors and enhance thequality of service by adopting different strategies. These strategies are determined according to the project location, fundingand required improvements. Strategies may include smart card fare collection systems, reserved bus lanes, limited bus stopservice, articulated buses, and TSP systems. Nevertheless, a direct method to evaluate the success of these strategies is togenerate running time models, using before and after data while isolating the impacts of each strategy through the use ofdummy variables. Synergies can also be measured through a single dummy variable comparing the before to the after timeperiod. Running time models that use archived AVL/APC data are well known in the transit literature, and have been used byseveral researchers (El-Geneidy et al., 2006; Kimpel, 2001; Kimpel et al., 2005).
To a great extent, the majority of literature covering transit agencies improvement strategies has been done by investi-gating the effects of one or two strategies meant to improve the service. Several studies agreed that limited-stop bus service,reserved bus lane, and TSP decrease running time (Kimpel et al., 2005; Surprenant-Legault and El-Geneidy, 2011; Tétreaultand El-Geneidy, 2010), while articulated buses and smart card systems increase running time (El-Geneidy andSurprenant-Legault, 2010; El-Geneidy and Vijayakumar, 2011; Surprenant-Legault and El-Geneidy, 2011). While the follow-ing section will review the literature covering these strategies and their expected impacts, none of these studies provide acomprehensive analysis that measure the impacts of implementing these set of measures on bus running time for twoparallel high-frequency routes (less than 10 min) sharing the same corridor.
Limited stop (express) service is considered one of the most effective strategies for decreasing running time (Ercolano,1984; Furth and Day, 1985). Limited stop buses serve only a few stops along a route, while a parallel regular route servesall stops including the limited and intermediate stops. A few studies were published estimating or reporting the savingsdue to the implementation of this service (Diaz and Hinebaugh, 2009; El-Geneidy and Surprenant-Legault, 2010; Tétreaultand El-Geneidy, 2010). The savings vary depending on the number of stops included in the express service as well as thedemand for this new service. Also a small number of studies concentrated on riders satisfaction and perception of timesavings after the implementation of service (Conlon et al., 2001; Furth and Day, 1985). The majority of research investigatingthe effects of reserved bus lanes on running time used simulation or has been derived from descriptive statistics (Shalaby,1999; Tanaboriboon and Toonim, 1983; Thamizh Arasan and Vedagiri, 2010). One recent study provides more accurateestimations using before and after AVL/APC data to isolate the effect of reserved lane. This study estimated that the timesavings due to the implementation of reserved lane ranged between 1.2% and 2.3% of total running time (Surprenant-Legaultand El-Geneidy, 2011). Moreover, smart cards are used by transit operators to minimize fare fraud and pilfering (Corinne,2008), to reduce operating and maintenance costs associated with magnetic strip card readers (Attoh-Okine and Shen,1995), and to increase passenger satisfaction (Multisystems et al., 2003; Société de transport de Montréal, 2009). The mostcommon smart card used in public transit is the contactless card, which is equipped with a microprocessor and operated by areader through a radio frequency (Holcombe, 2005; Multisystems et al., 2003). According to previous research, the use ofsmart card have had a general negative effect increasing running time compared to using flash passes (El-Geneidy andSurprenant-Legault, 2010; Kittelson and Associates et al., 2003; Surprenant-Legault and El-Geneidy, 2011).
Articulated buses can be found on heavily used routes (Jarzab et al., 2002; Levinson et al., 2002) as they can carry more pas-sengers than regular buses during one trip and have higher loading (boarding and alighting passengers) speeds (Kaneko et al.,2006). Nevertheless, many transit agencies found that the maintenance cost and fuel consumption of articulated buses washigher compared to regular buses, while acceleration and performance were much lower (Hemily and King, 2008). The useof articulated buses along a transit corridor is expected to have a mixed effect on running time. The first is a negative effectincreasing running time due to the acceleration, deceleration and maneuvering time. The second is a positive effect decreasingrunning time due to the decline in the time associated to passenger activity (El-Geneidy and Vijayakumar, 2011). In addition,TSP is a complex element, which involves traffic signal systems, transit vehicle detection systems and communication technol-ogies. Evaluation of TSP is often done using simulation techniques (Balke et al., 2000; Dion et al., 2004; Shalaby et al., 2003;Smith et al., 2005) as well. Although the majority of TSP studies show improvements in running time, service reliability and effi-ciency the practice shows that significant differences are the exception rather than the rule (King County Department of Trans-portation, 2002). This is confirmed by a study developed in 2005 using archived AVL/APC data collected before and after TSPimplementation (Kimpel et al., 2005). The study confirmed that TSP benefits are not consistent across routes and time periods.
3. Methodology
The data used in this study comes from STM’s archived AVL/APC systems. The archived AVL/APC data is widely recognizedin transit research as a rich source of information for planning and operational improvements (Dueker et al., 2004; El-Geneidy
E.I. Diab, A.M. El-Geneidy / Transportation Research Part A 46 (2012) 614–625 617
et al., 2006). However, only 18% of STM’s buses (306 out of 1680 buses) are outfitted with AVL/APC. STM assigns these buses todifferent routes in order to obtain a sample of the network operational information. The obtained data for Routes 67 and 467led to a sample of 62,000 trip level observations (around 2,270,000 stop level observations) for both routes. The data wascollected between January 1st, 2007 and April 21st, 2011. This trip level data were cleaned by removing incomplete trips,holidays, weekend trips, system recording errors, trips with insufficient passenger activity (less than 6 boarding or alightingpassengers), and trips during construction periods, deleting around 1027 trips. After this data cleaning process, two datasetswere constructed. The first include records from January to April 2007 and 2011, which contains 6478 trips. The second data-set contains 60,973 complete trips between January 1st, 2007 and April 21st, 2011.
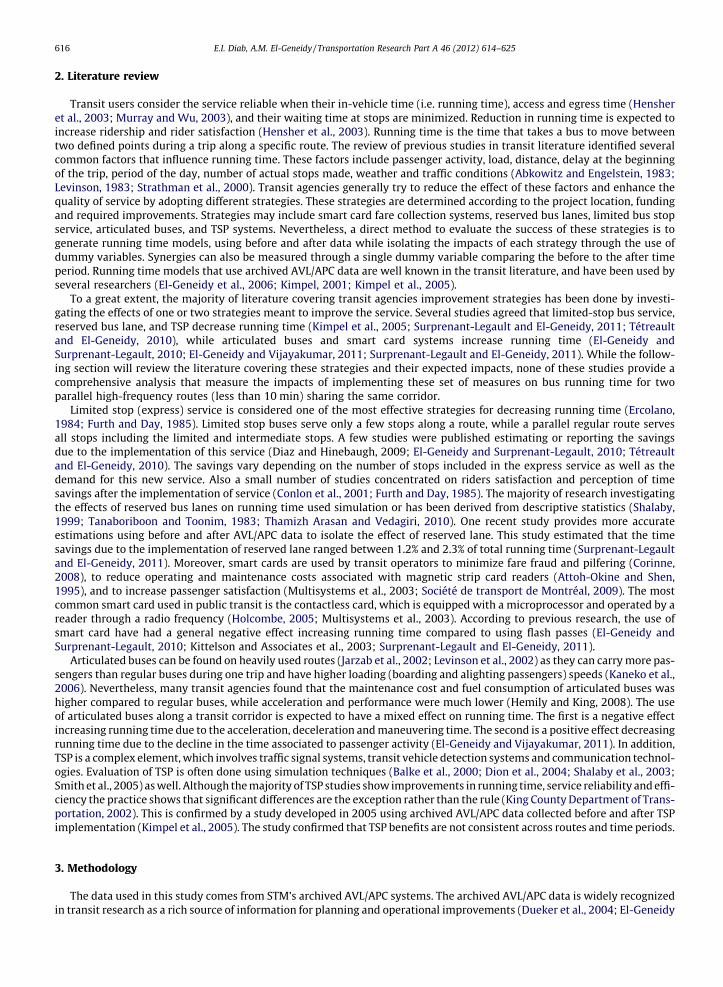
Fig. 2 shows Route 467 and 67 as well as the analyzed segment along the routes. They run north–south (about 9.4 km, 5.8mile) from boulevard Henri–Bourassa in the north to Rue Hochelaga in the south along boulevard Saint-Michel, crossingthrough five boroughs of the City of Montréal. Both Routes 67 and 467 share the same space and connect two metro stations,Joliette metro station, at the end of the southern direction, and Saint-Michel station, at its midway point. The route’s maincorridor (boulevard Saint-Michel) consists of three lanes in each direction with no median island for the majority of the cor-ridor. Route 67 average stop spacing is 241 and 255 m southbound and northbound direction, respectively, while Route 467is 611 and 623 m southbound and northbound direction, respectively. As seen in Fig. 1, the segment analyzed in this paperstretches between boulevard Saint-Joseph in the south and rue Fleury in the north (6.82 km; 4.24 mile). This segment waschosen primarily because it did not experience any changes in term of number of assigned stops or locations along boulevardSaint-Michel during the study period (2007–2011). A total of 28 signalized intersections are functioning along the analyzedsegment. All traffic signals are equipped with TSP functionality. The TSP system operates when a bus that is equipped withthis technology is detected by the traffic signal while approaching an intersection, either the green lights is extended or apriority is activated, giving the bus a head start over motorists (Société de transport de Montréal, 2011). Only 2957 trips weremade by buses equipped with TSP during the study period. Routes 467 are served by both articulated buses and regular lowfloor buses. Around 9864 of the total trips were made by articulated buses.
In this research we will be concentrating on two statistical models to capture and isolate the effects of the improvementstrategies made by STM during the study period. Table 2 includes a list of variables to be incorporated in the statistical anal-ysis. According to previous studies, the factors affecting running time include passenger activity, passenger activity associ-ated with articulated buses, number of stops made, time of the day, delays at the beginning of a trip, bus type and weatherconditions.
The first running time model is a general model that captures the overall impact of all changes made by STM during thestudy period. AVL/APC data from January 2007 to April 2007 is included as well as data from January 2011 to April 2011. Thekey variable in this model is Y2011, a dummy variable that will distinguish between the two. This variable will capture theimpacts of all the changes made on Route 67. A positive value will indicate an increase in the overall running time, whereas anegative one indicates a decline and improvements in running time along Route 67. Since Route 467 did not exist during the2007 period, the Y2011 variable need to be combined with the 467 dummy to understand the level of improvements thatRoute 467 brought to this corridor. The model specification is:
1. Running time = f(Maximum passenger load, Actual stops made, Total passenger activity (boardings and alightings), Preciprain (mm), Snow on the ground (cm), Route 467, Northbound trip, Delay at the start of the trip, AM Peak trip, PM Peaktrip, Night trip, Midnight and early morning trip, Y2011).
The second running time model contains dummy variables to control for the implementation of a smart card system, re-served lanes, limited-stop service, articulated buses and TSP. A dummy, Smart Card Start, distinguishes the trips made afterthe introduction of a new smart card payment system. According to STM, by the end of 2008, about a half million smart cardswere in circulation (Société de transport de Montréal, 2009), therefore the study includes another variable called ‘smart cardby the end 2008’ to distinguish the trips made after this date, in order to demonstrate the real effect of the implementation ofsmart card system. A second dummy variable, Reserved Lane, included distinguishing trips made after the reserved lane’simplementation. Reserved lanes are operated on weekdays between 6:30 AM and 9:00 AM southbound and between2:30 PM and 6:30 PM northbound. A third dummy variable, Articulated buses, characterizes articulated buses in operationalong Route 467. A dummy variable to distinguish all the trips made after this date called ‘After articulated buses date’ is in-cluded. This dummy will help in showing the effect of articulated buses on other buses running time along the corridor. Adummy variable called ‘TSP’ is used to distinguish TSP equipped buses from others. It is important to note that all TSPequipped buses are articulated and operating on Route 467. Finally, a dummy variable called ‘After TSP date’distinguishsall trips made after the implementation of TSP to measure the impact of TSP on unequipped buses. The model specificationis:2. Running time = f(Maximum passenger load, Actual stops made, Total passenger activity (boardings and alightings), Artic-
ulated passenger activity (boarding and alighting on an articulated bus), Rain (mm), Snow on the ground (cm), Route 467,Northbound trip, Delay at the start of the trip, AM Peak trip, PM Peak trip, Night trip, Midnight and early morning trip,Smart card start, Smart card by the end of 2008, Reserved bus lane in operation, After articulated buses operation date,Articulated buses, After TSP implementation date, TSP equipped buses).The explanations of each variable used in both models are presented in Table 1.
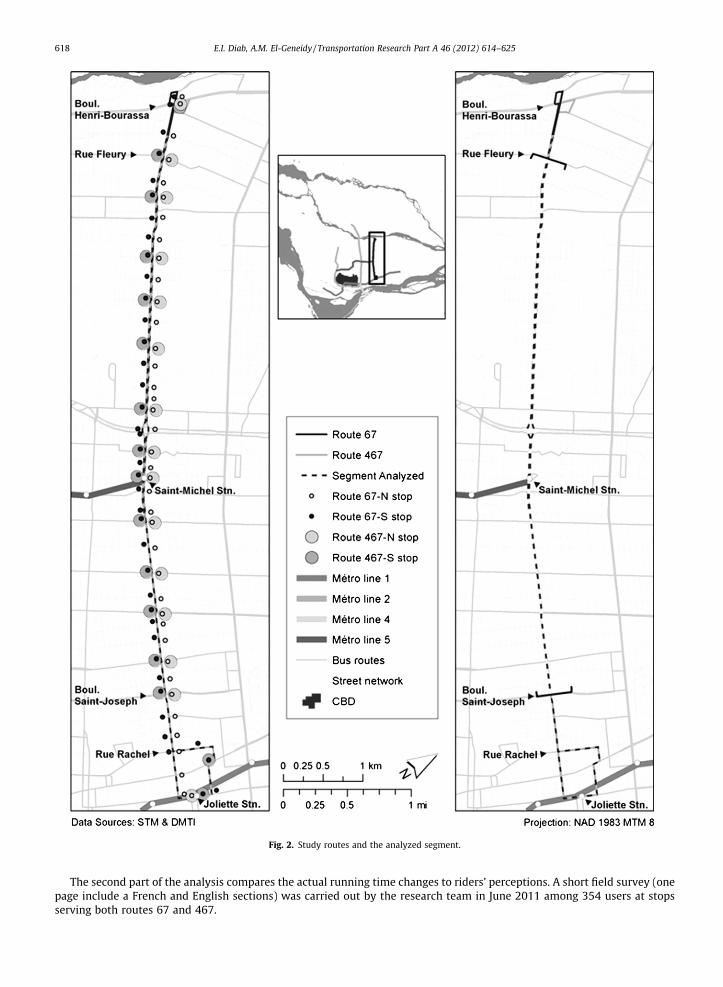
Fig. 2. Study routes and the analyzed segment.
618 E.I. Diab, A.M. El-Geneidy / Transportation Research Part A 46 (2012) 614–625
The second part of the analysis compares the actual running time changes to riders’ perceptions. A short field survey (onepage include a French and English sections) was carried out by the research team in June 2011 among 354 users at stopsserving both routes 67 and 467.
E.I. Diab, A.M. El-Geneidy / Transportation Research Part A 46 (2012) 614–625 619
Passengers were asked which route (Route 67 or 467) do they used most often and how often they used this route. Theywere also asked to evaluate their travel and waiting time and compare it to the period when they started using either Route67 and 467. The survey requests the riders to report their boarding and alight stations. The survey also asked the riders toreport the dates when they started using either route.
4. Analysis
4.1. Descriptive statistics
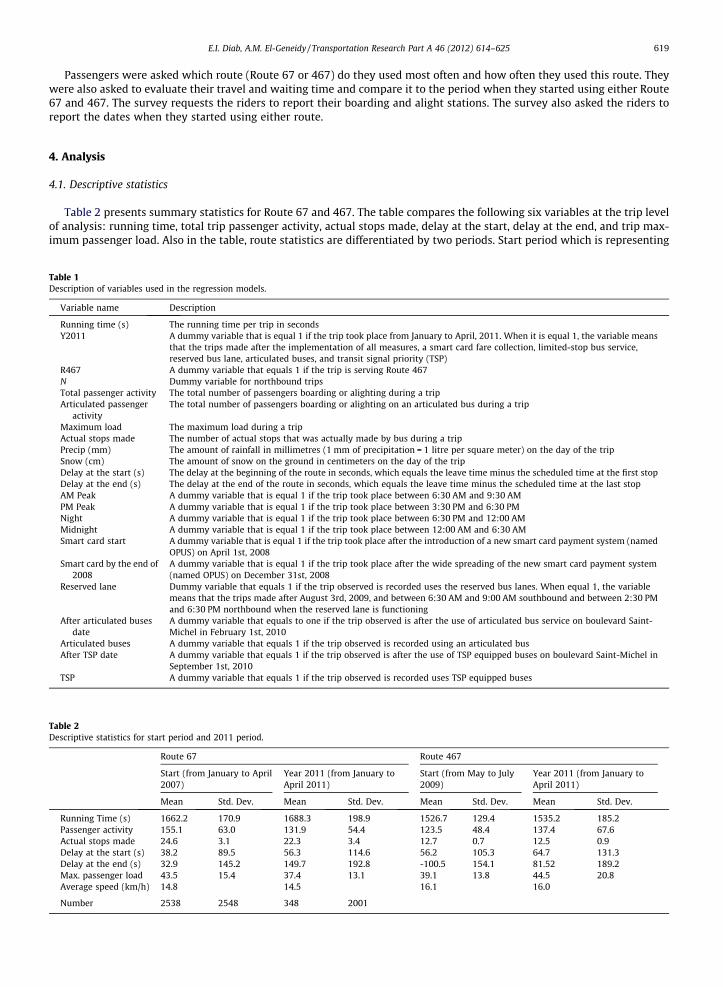
Table 2 presents summary statistics for Route 67 and 467. The table compares the following six variables at the trip levelof analysis: running time, total trip passenger activity, actual stops made, delay at the start, delay at the end, and trip max-imum passenger load. Also in the table, route statistics are differentiated by two periods. Start period which is representing
Table 2Descriptive statistics for start period and 2011 period.
Route 67 Route 467
Start (from January to April2007)
Year 2011 (from January toApril 2011)
Start (from May to July2009)
Year 2011 (from January toApril 2011)
Mean Std. Dev. Mean Std. Dev. Mean Std. Dev. Mean Std. Dev.
Running Time (s) 1662.2 170.9 1688.3 198.9 1526.7 129.4 1535.2 185.2Passenger activity 155.1 63.0 131.9 54.4 123.5 48.4 137.4 67.6Actual stops made 24.6 3.1 22.3 3.4 12.7 0.7 12.5 0.9Delay at the start (s) 38.2 89.5 56.3 114.6 56.2 105.3 64.7 131.3Delay at the end (s) 32.9 145.2 149.7 192.8 -100.5 154.1 81.52 189.2Max. passenger load 43.5 15.4 37.4 13.1 39.1 13.8 44.5 20.8Average speed (km/h) 14.8 14.5 16.1 16.0
Number 2538 2548 348 2001
Table 1Description of variables used in the regression models.
Variable name Description
Running time (s) The running time per trip in secondsY2011 A dummy variable that is equal 1 if the trip took place from January to April, 2011. When it is equal 1, the variable means
that the trips made after the implementation of all measures, a smart card fare collection, limited-stop bus service,reserved bus lane, articulated buses, and transit signal priority (TSP)
R467 A dummy variable that equals 1 if the trip is serving Route 467N Dummy variable for northbound tripsTotal passenger activity The total number of passengers boarding or alighting during a tripArticulated passenger
activityThe total number of passengers boarding or alighting on an articulated bus during a trip
Maximum load The maximum load during a tripActual stops made The number of actual stops that was actually made by bus during a tripPrecip (mm) The amount of rainfall in millimetres (1 mm of precipitation = 1 litre per square meter) on the day of the tripSnow (cm) The amount of snow on the ground in centimeters on the day of the tripDelay at the start (s) The delay at the beginning of the route in seconds, which equals the leave time minus the scheduled time at the first stopDelay at the end (s) The delay at the end of the route in seconds, which equals the leave time minus the scheduled time at the last stopAM Peak A dummy variable that is equal 1 if the trip took place between 6:30 AM and 9:30 AMPM Peak A dummy variable that is equal 1 if the trip took place between 3:30 PM and 6:30 PMNight A dummy variable that is equal 1 if the trip took place between 6:30 PM and 12:00 AMMidnight A dummy variable that is equal 1 if the trip took place between 12:00 AM and 6:30 AMSmart card start A dummy variable that is equal 1 if the trip took place after the introduction of a new smart card payment system (named
OPUS) on April 1st, 2008Smart card by the end of
2008A dummy variable that is equal 1 if the trip took place after the wide spreading of the new smart card payment system(named OPUS) on December 31st, 2008
Reserved lane Dummy variable that equals 1 if the trip observed is recorded uses the reserved bus lanes. When equal 1, the variablemeans that the trips made after August 3rd, 2009, and between 6:30 AM and 9:00 AM southbound and between 2:30 PMand 6:30 PM northbound when the reserved lane is functioning
After articulated busesdate
A dummy variable that equals to one if the trip observed is after the use of articulated bus service on boulevard Saint-Michel in February 1st, 2010
Articulated buses A dummy variable that equals 1 if the trip observed is recorded using an articulated busAfter TSP date A dummy variable that equals 1 if the trip observed is after the use of TSP equipped buses on boulevard Saint-Michel in
September 1st, 2010TSP A dummy variable that equals 1 if the trip observed is recorded uses TSP equipped buses
620 E.I. Diab, A.M. El-Geneidy / Transportation Research Part A 46 (2012) 614–625
the situation before implementation any measures, from January to April of 2007 for Route 67, and from May to July of 2009for Route 467. The year 2011 period, from January to April of 2011, represents the route situation after the implementation ofstudied measures along the routes. Furthermore, Fig. 1 presented the averages of bus running time and passenger activity inrelation to each strategy that was implemented along Routes 67 and 467.
4.2. Running time models
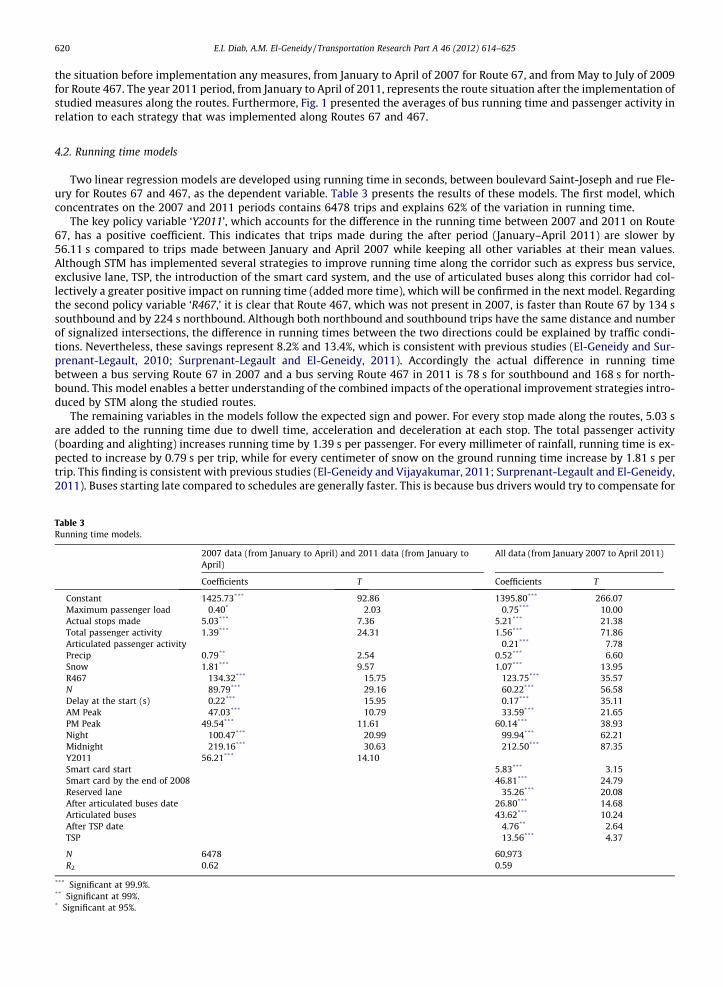
Two linear regression models are developed using running time in seconds, between boulevard Saint-Joseph and rue Fle-ury for Routes 67 and 467, as the dependent variable. Table 3 presents the results of these models. The first model, whichconcentrates on the 2007 and 2011 periods contains 6478 trips and explains 62% of the variation in running time.
The key policy variable ‘Y2011’, which accounts for the difference in the running time between 2007 and 2011 on Route67, has a positive coefficient. This indicates that trips made during the after period (January–April 2011) are slower by56.11 s compared to trips made between January and April 2007 while keeping all other variables at their mean values.Although STM has implemented several strategies to improve running time along the corridor such as express bus service,exclusive lane, TSP, the introduction of the smart card system, and the use of articulated buses along this corridor had col-lectively a greater positive impact on running time (added more time), which will be confirmed in the next model. Regardingthe second policy variable ‘R467,’ it is clear that Route 467, which was not present in 2007, is faster than Route 67 by 134 ssouthbound and by 224 s northbound. Although both northbound and southbound trips have the same distance and numberof signalized intersections, the difference in running times between the two directions could be explained by traffic condi-tions. Nevertheless, these savings represent 8.2% and 13.4%, which is consistent with previous studies (El-Geneidy and Sur-prenant-Legault, 2010; Surprenant-Legault and El-Geneidy, 2011). Accordingly the actual difference in running timebetween a bus serving Route 67 in 2007 and a bus serving Route 467 in 2011 is 78 s for southbound and 168 s for north-bound. This model enables a better understanding of the combined impacts of the operational improvement strategies intro-duced by STM along the studied routes.
The remaining variables in the models follow the expected sign and power. For every stop made along the routes, 5.03 sare added to the running time due to dwell time, acceleration and deceleration at each stop. The total passenger activity(boarding and alighting) increases running time by 1.39 s per passenger. For every millimeter of rainfall, running time is ex-pected to increase by 0.79 s per trip, while for every centimeter of snow on the ground running time increase by 1.81 s pertrip. This finding is consistent with previous studies (El-Geneidy and Vijayakumar, 2011; Surprenant-Legault and El-Geneidy,2011). Buses starting late compared to schedules are generally faster. This is because bus drivers would try to compensate for
Table 3Running time models.
2007 data (from January to April) and 2011 data (from January toApril)
All data (from January 2007 to April 2011)
Coefficients T Coefficients T
Constant 1425.73*** 92.86 1395.80*** 266.07Maximum passenger load �0.40* �2.03 �0.75*** �10.00Actual stops made 5.03*** 7.36 5.21*** 21.38Total passenger activity 1.39*** 24.31 1.56*** 71.86Articulated passenger activity �0.21*** �7.78Precip 0.79** 2.54 0.52*** 6.60Snow 1.81*** 9.57 1.07*** 13.95R467 �134.32*** �15.75 �123.75*** �35.57N �89.79*** �29.16 �60.22*** �56.58Delay at the start (s) �0.22*** �15.95 �0.17*** �35.11AM Peak �47.03*** �10.79 �33.59*** �21.65PM Peak 49.54*** 11.61 60.14*** 38.93Night �100.47*** �20.99 �99.94*** �62.21Midnight �219.16*** �30.63 �212.50*** �87.35Y2011 56.21*** 14.10Smart card start 5.83*** 3.15Smart card by the end of 2008 46.81*** 24.79Reserved lane �35.26*** �20.08After articulated buses date 26.80*** 14.68Articulated buses 43.62*** 10.24After TSP date �4.76** �2.64TSP �13.56*** �4.37
N 6478 60,973R2 0.62 0.59
*** Significant at 99.9%.** Significant at 99%.* Significant at 95%.
E.I. Diab, A.M. El-Geneidy / Transportation Research Part A 46 (2012) 614–625 621
the delay that they have at start. Running time decreases by 0.22 s for every second of delay at the beginning of the route.Trips during PM peak are much longer (49.5 s) than midday trips, which is expected due to congestion and the increase indemand. Trips made during AM peak, night, and midnight are faster, by 47.03, 100.47, and 219.16 s respectively, comparedto midday trips, which is also consistent with previous studies (Tétreault and El-Geneidy, 2010).
Regarding the second detailed running time model, it is clear that the model follows the same signs and magnitude as theprevious model. The introduction of the smart card (OPUS) fare collection system on buses on April 1st, 2008 increased thetrips running time on Route 67 by 5.83 s. By the end of 2008, this value increased by 46.8 s to reach 52.61 s. This increase isrelated to the growth in the number of smart card users compared to using traditional flash passes, a finding that is consis-tent with previous work (El-Geneidy and Surprenant-Legault, 2010). As would be expected, the implementation of the re-served bus lanes along boulevard Saint-Michel decreased running time by 35.26 s on average. This saving in running timedue to the use of reserved lanes is considered small. One explanation for this is the effect of cars waiting in this lane to turnright at a traffic light, as cars cannot turn right on red lights on the island of Montréal (Surprenant-Legault and El-Geneidy,2011).
The introduction of articulated buses along the corridor increased the running time by 26.80 s along the corridor.Although articulated buses run only on Route 467, this increase is due to the high-frequency of service along the two routes.As in many cases buses are directly behind each other, since the average headway for Route 467 and Route 67 is only 7 minduring the peak hours. The use of an articulated bus adds 70.4 s along Route 467, which is the combined effect of the 43.62 sassociated with the use of an articulated bus and 26.80 s associated to the time period of implementing this service. How-ever, this value does not explain the true effect of an articulated bus on the running time. Operation of an articulated bus hasa mixed effect on running time, increasing time associated with acceleration, deceleration and merging with traffic, anddecreasing time associated with passenger activity. Hence, the model includes a ‘articulated passenger activity’ variable whichcaptures the savings in dwell time by 0.2 s per passenger (and the average trip passenger activity is 126 passengers), indi-cating a savings of 26.3 s in dwell time. Accordingly, operating an articulated bus adds 44.1 s on running time, which is con-sistent with previous studies (El-Geneidy and Vijayakumar, 2011). Furthermore, since the majority of operated buses alongRoute 467 are articulated, the difference on Route 467 saving between the two regression models can be also explained.
Around 50 operated articulated buses along Route 467 are outfitted with a TSP system (Société de transport de Montréal,2011). After the introduction of these buses on September 1st, 2010, the total travel time decreased by 4.76 s (0.3%) for allbuses serving the corridor, even if they were not equipped with TSP. For TSP-equipped buses, the total running time savingsreached 18.32 s (1.2%). According to previous work in transit literature, TSP benefits are not consistent across routes andtime periods. Nevertheless, it is possible that the benefits of the TSP system are mitigated because of the corridor’s physicalfactors and system design (e.g., AVL and signal controller logic), and operational factors, such as excess traffic congestion anddelay-causing events. Therefore, a more detailed study concerning TSP operation along the corridor is required in order tomaximize the benefits.
Using the second running time model coefficients, it is possible to estimate the changes in running time by conducting asensitivity analysis that predicts the changes on average running time for each route while keeping all variables constant attheir mean values. This sensitivity analysis enables a better understanding of the synergies impacts of each change in theoperational environment. Table 4 presents the estimated running times and the percentage of change compared to Route67 initial situation. As seen in this table, the introduction of OPUS increased running time along Route 67 by 3% on averagecompared to Route 67 initial situation. Running time in general declined by 0.3% along Route 67 after the implementation ofthe limited-stop service (Route 467), mainly due to a decline in the number of passengers using Route 67. For Route 467, therunning time saving was around 11% on average compared to Route 67 initial situation, this drop in running time is relatedto the decline in the number of stops and to the number of passengers using the route per trip. Hence, the reserved bus lanesoperated only on northbound PM peak and southbound AM peak, the savings along Route 67 and 467 trips using these laneswere 1.7% and 13% compared to Route 67 initial situation, respectively. On the contrary, trips running on northbound AMpeak and southbound PM peak had not benefits from the reserved lanes as they are implemented on the other side of thecorridor.
After using articulated buses along Route 467 running times have declined by 10.2% and 10.5% for those buses using thereserve lanes, and by 8.2% and 8.7% for other trips not benefiting from the reserved lanes. The operation of articulated busesalong Route 467 affected Route 67 performance, increasing running time by 0.2% and 0.4% on average for those trips usingthe reserved lanes and by 2.2% and 2.4% for other trips. The installation of a TSP system on articulated buses decreased run-ning time by 11.3% and 11.5% on average compared to Route 67 initial situation for buses using reserved lanes, and by 9.3%and 9.8% for other buses not using the reserved lanes. Also for Route 67, the running time decreased by 0.1% for buses usingreserved lanes, and by 2% for other buses. Finally, it is clear that collectively after the implementation of all measures, Route467 is faster by 10.2% on average, while Route 67 is slower by 1% on average, compared to Route 67 in the initial situation.
To summarize, the various measures used by STM can divided into two groups. The first group of implemented measuresdecreases running time along the analyzed corridor. These measures include limited-stop bus service (10.8%), reserved buslane (2.2%), and operation of TSP (1.2%). Meanwhile, the second group increases running time. These measures includeimplementation of a smart card system (3%) and operation of articulated buses (2.8%). It is also important to note that a spill-over effect is present when it comes to using TSP and articulated buses, where non-articulated buses experience a decline inrunning time when operating parallel to articulated buses. In addition, non-TSP equipped buses experience savings by run-ning parallel to TSP equipped buses.
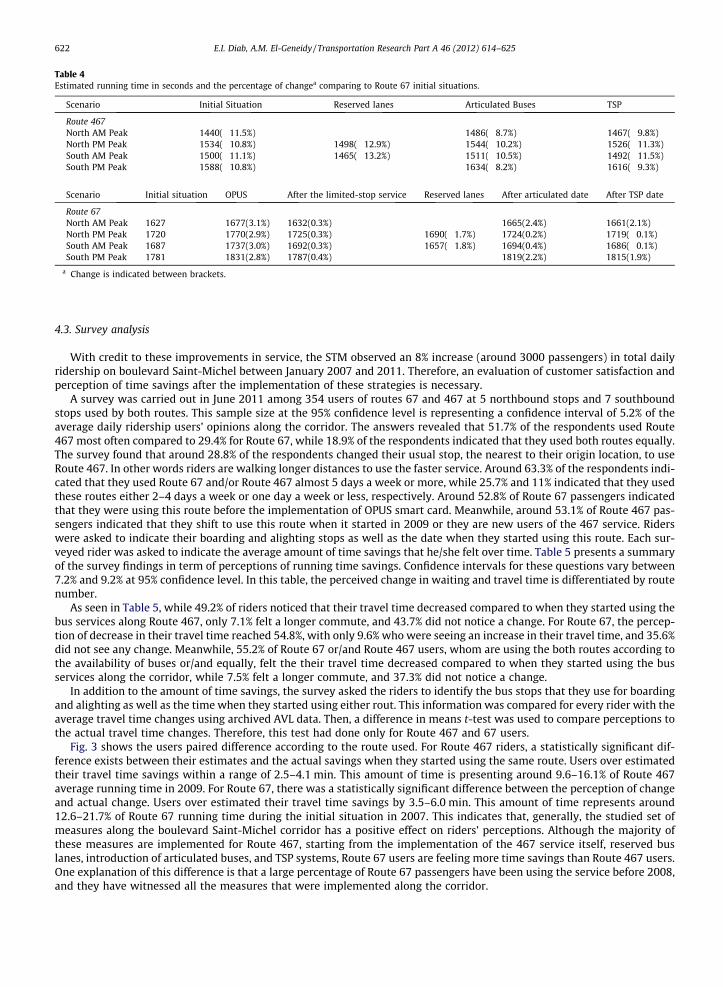
Table 4Estimated running time in seconds and the percentage of changea comparing to Route 67 initial situations.
Scenario Initial Situation Reserved lanes Articulated Buses TSP
Route 467North AM Peak 1440(�11.5%) 1486(�8.7%) 1467(�9.8%)North PM Peak 1534(�10.8%) 1498(�12.9%) 1544(�10.2%) 1526(�11.3%)South AM Peak 1500(�11.1%) 1465(�13.2%) 1511(�10.5%) 1492(�11.5%)South PM Peak 1588(�10.8%) 1634(�8.2%) 1616(�9.3%)
Scenario Initial situation OPUS After the limited-stop service Reserved lanes After articulated date After TSP date
Route 67North AM Peak 1627 1677(3.1%) 1632(0.3%) 1665(2.4%) 1661(2.1%)North PM Peak 1720 1770(2.9%) 1725(0.3%) 1690(�1.7%) 1724(0.2%) 1719(�0.1%)South AM Peak 1687 1737(3.0%) 1692(0.3%) 1657(�1.8%) 1694(0.4%) 1686(�0.1%)South PM Peak 1781 1831(2.8%) 1787(0.4%) 1819(2.2%) 1815(1.9%)
a Change is indicated between brackets.
622 E.I. Diab, A.M. El-Geneidy / Transportation Research Part A 46 (2012) 614–625
4.3. Survey analysis
With credit to these improvements in service, the STM observed an 8% increase (around 3000 passengers) in total dailyridership on boulevard Saint-Michel between January 2007 and 2011. Therefore, an evaluation of customer satisfaction andperception of time savings after the implementation of these strategies is necessary.
A survey was carried out in June 2011 among 354 users of routes 67 and 467 at 5 northbound stops and 7 southboundstops used by both routes. This sample size at the 95% confidence level is representing a confidence interval of 5.2% of theaverage daily ridership users’ opinions along the corridor. The answers revealed that 51.7% of the respondents used Route467 most often compared to 29.4% for Route 67, while 18.9% of the respondents indicated that they used both routes equally.The survey found that around 28.8% of the respondents changed their usual stop, the nearest to their origin location, to useRoute 467. In other words riders are walking longer distances to use the faster service. Around 63.3% of the respondents indi-cated that they used Route 67 and/or Route 467 almost 5 days a week or more, while 25.7% and 11% indicated that they usedthese routes either 2–4 days a week or one day a week or less, respectively. Around 52.8% of Route 67 passengers indicatedthat they were using this route before the implementation of OPUS smart card. Meanwhile, around 53.1% of Route 467 pas-sengers indicated that they shift to use this route when it started in 2009 or they are new users of the 467 service. Riderswere asked to indicate their boarding and alighting stops as well as the date when they started using this route. Each sur-veyed rider was asked to indicate the average amount of time savings that he/she felt over time. Table 5 presents a summaryof the survey findings in term of perceptions of running time savings. Confidence intervals for these questions vary between7.2% and 9.2% at 95% confidence level. In this table, the perceived change in waiting and travel time is differentiated by routenumber.
As seen in Table 5, while 49.2% of riders noticed that their travel time decreased compared to when they started using thebus services along Route 467, only 7.1% felt a longer commute, and 43.7% did not notice a change. For Route 67, the percep-tion of decrease in their travel time reached 54.8%, with only 9.6% who were seeing an increase in their travel time, and 35.6%did not see any change. Meanwhile, 55.2% of Route 67 or/and Route 467 users, whom are using the both routes according tothe availability of buses or/and equally, felt the their travel time decreased compared to when they started using the busservices along the corridor, while 7.5% felt a longer commute, and 37.3% did not notice a change.
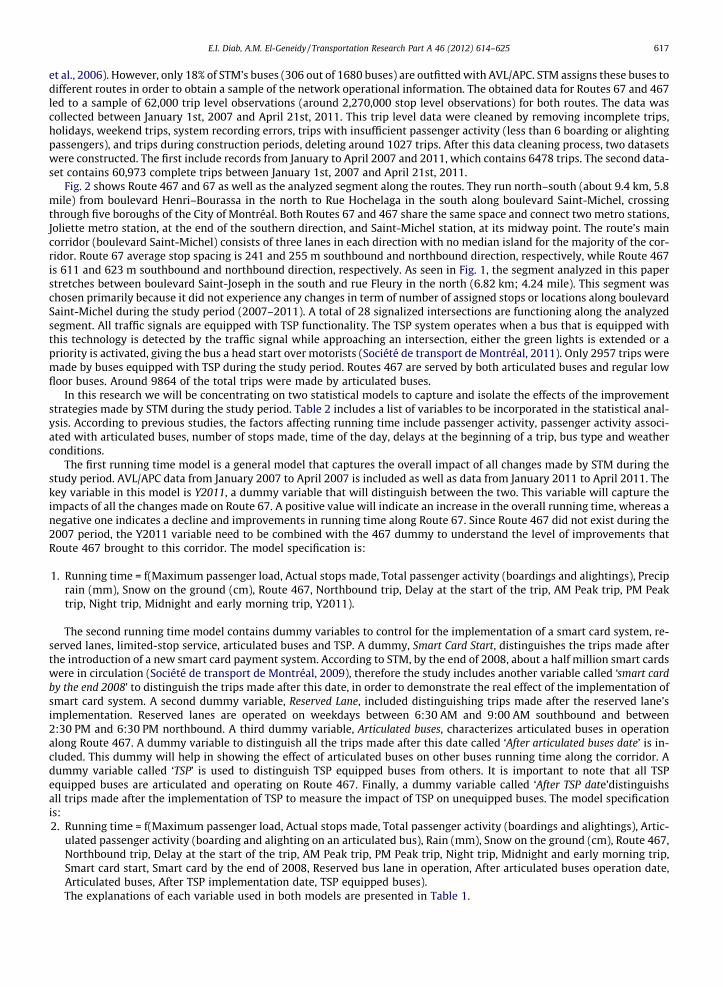
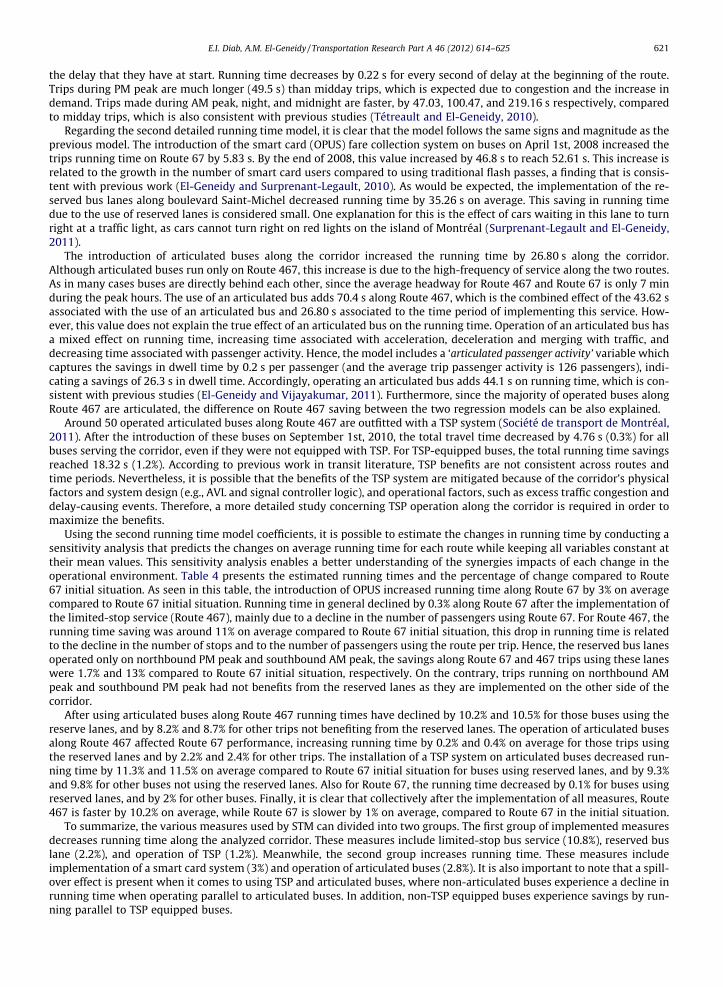
In addition to the amount of time savings, the survey asked the riders to identify the bus stops that they use for boardingand alighting as well as the time when they started using either rout. This information was compared for every rider with theaverage travel time changes using archived AVL data. Then, a difference in means t-test was used to compare perceptions tothe actual travel time changes. Therefore, this test had done only for Route 467 and 67 users.
Fig. 3 shows the users paired difference according to the route used. For Route 467 riders, a statistically significant dif-ference exists between their estimates and the actual savings when they started using the same route. Users over estimatedtheir travel time savings within a range of 2.5–4.1 min. This amount of time is presenting around 9.6–16.1% of Route 467average running time in 2009. For Route 67, there was a statistically significant difference between the perception of changeand actual change. Users over estimated their travel time savings by 3.5–6.0 min. This amount of time represents around12.6–21.7% of Route 67 running time during the initial situation in 2007. This indicates that, generally, the studied set ofmeasures along the boulevard Saint-Michel corridor has a positive effect on riders’ perceptions. Although the majority ofthese measures are implemented for Route 467, starting from the implementation of the 467 service itself, reserved buslanes, introduction of articulated buses, and TSP systems, Route 67 users are feeling more time savings than Route 467 users.One explanation of this difference is that a large percentage of Route 67 passengers have been using the service before 2008,and they have witnessed all the measures that were implemented along the corridor.
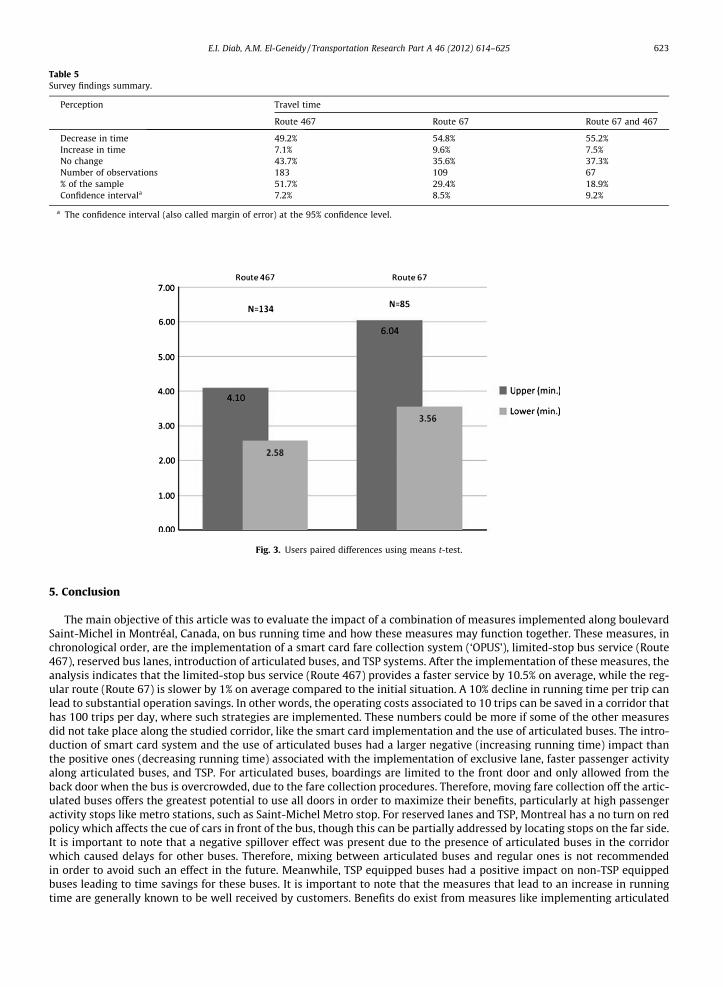
Table 5Survey findings summary.
Perception Travel time
Route 467 Route 67 Route 67 and 467
Decrease in time 49.2% 54.8% 55.2%Increase in time 7.1% 9.6% 7.5%No change 43.7% 35.6% 37.3%Number of observations 183 109 67% of the sample 51.7% 29.4% 18.9%Confidence intervala 7.2% 8.5% 9.2%
a The confidence interval (also called margin of error) at the 95% confidence level.
Fig. 3. Users paired differences using means t-test.
E.I. Diab, A.M. El-Geneidy / Transportation Research Part A 46 (2012) 614–625 623
5. Conclusion
The main objective of this article was to evaluate the impact of a combination of measures implemented along boulevardSaint-Michel in Montréal, Canada, on bus running time and how these measures may function together. These measures, inchronological order, are the implementation of a smart card fare collection system (‘OPUS’), limited-stop bus service (Route467), reserved bus lanes, introduction of articulated buses, and TSP systems. After the implementation of these measures, theanalysis indicates that the limited-stop bus service (Route 467) provides a faster service by 10.5% on average, while the reg-ular route (Route 67) is slower by 1% on average compared to the initial situation. A 10% decline in running time per trip canlead to substantial operation savings. In other words, the operating costs associated to 10 trips can be saved in a corridor thathas 100 trips per day, where such strategies are implemented. These numbers could be more if some of the other measuresdid not take place along the studied corridor, like the smart card implementation and the use of articulated buses. The intro-duction of smart card system and the use of articulated buses had a larger negative (increasing running time) impact thanthe positive ones (decreasing running time) associated with the implementation of exclusive lane, faster passenger activityalong articulated buses, and TSP. For articulated buses, boardings are limited to the front door and only allowed from theback door when the bus is overcrowded, due to the fare collection procedures. Therefore, moving fare collection off the artic-ulated buses offers the greatest potential to use all doors in order to maximize their benefits, particularly at high passengeractivity stops like metro stations, such as Saint-Michel Metro stop. For reserved lanes and TSP, Montreal has a no turn on redpolicy which affects the cue of cars in front of the bus, though this can be partially addressed by locating stops on the far side.It is important to note that a negative spillover effect was present due to the presence of articulated buses in the corridorwhich caused delays for other buses. Therefore, mixing between articulated buses and regular ones is not recommendedin order to avoid such an effect in the future. Meanwhile, TSP equipped buses had a positive impact on non-TSP equippedbuses leading to time savings for these buses. It is important to note that the measures that lead to an increase in runningtime are generally known to be well received by customers. Benefits do exist from measures like implementing articulated
624 E.I. Diab, A.M. El-Geneidy / Transportation Research Part A 46 (2012) 614–625
buses, since they do lead to less crowdness along buses. Meanwhile smart card systems are known for their benefits to theagencies in reducing fraud.
The second objective of this article was to quantify to what extent users have perceived STM’s implemented strategiesand their effects on their travel time. Generally, users perceived a decrease in their travel time. While there was no actualsaving in buses running time, users over estimated their travel time savings within a range of 2.5–6.0 min. This generallyindicates that passengers have a positive attitude towards the improvements in service and over estimate them.
Finally, this article studied the effects of a combination of measures on the buses running time for two high frequencyroutes sharing the same corridor. Therefore, it is recommended to expand this study and investigate the effects of these mea-sures on the variability of service and actual headway changes. Since not all STM buses are equipped with APC and AVL sys-tems, it is not possible to do that with the current data used in this study. Also, due to the small effects of TSP system on therunning time along the corridor, a more detailed study concerning the factor affecting TSP operation and programming alongthe corridor is required in order to maximize the benefits of the system.
Acknowledgements
We would like to acknowledge the Société de transport de Montréal (STM) for partially funding this research and for pro-viding the data used in the project. Special thanks to Michel Tremblay, Jocelyn Grondines and Sébastien Gagné for their feed-back and support during this project. The authors would like to thank Vincent Chakour and Anais Mathez for their help inproof reading the article. This research was funded in part by Natural Sciences and Engineering Research Council of Canada-collaborative research and development (NSERC-CRD) program.
References
Abkowitz, M., Engelstein, I., 1983. Factors affecting running time on transit routes. Transportation Research Part A 17, 107–113.Attoh-Okine, N., Shen, L., 1995. Security issues of emerging smart cards fare collection application in mass transit. In: Proceedings of Vehicle Navigation and
Information Systems Conference, 1995. Proceedings. In Conjunction with the Pacific Rim TransTech Conference. 6th International VNIS. ‘A Ride into theFuture’, pp. 523–526.
Balke, K., Dudek, C., Urbanik, T., 2000. Development and evaluation of intelligent bus priority concept. Transportation Research Record 1727, 12–19.Conlon, M., Foote, P., O’Malley, K., Stuart, D., 2001. Successful arterial street limited-stop express bus service in Chicago. Transportation Research Record
1760, 74–80.Corinne, S., 2008. Smart transit cards come to Montreal, Quebec. CBC News, Montreal. Characteristics of bus rapid transit for decision-making. Washington,
DC, USA.Diaz, R., Hinebaugh, D., 2009. Characteristics of bus rapid transit for decision-making.Dion, F., Rakha, H., Zhang, Y., 2004. Evaluation of potential transit signal priority benefits along a fixed-time signalized arterial. Journal of Transportation
Engineering 130 (3), 294–303.Dueker, K.J., Kimpel, T.J., Strathman, J.G., Callas, S., 2004. Determinants of bus dwell time. Journal of Public Transportation 7, 21–40.El-Geneidy, A., Surprenant-Legault, J., 2010. Limited-stop bus service: an evaluation of an implementation strategy. Public Transport: Planning and
Operation 2, 291–306.El-Geneidy, A., Vijayakumar, N., 2011. The effects of articulated buses on dwell and running times. Journal of Public Transportation 14, 63–86.El-Geneidy, A., Strathman, J., Kimpel, T., Crout, D., 2006. The effects of bus stop consolidation on passenger activity and transit operations. Transportation
Research Record 1971, 32–41.Ercolano, J.M., 1984. Limited-stop bus operations: an evaluation. Transportation Research Record 994, 24–29.Furth, P., Day, B., 1985. Transit routing and scheduling strategies for heavy demand corridors. Transportation Research Record 1011, 23–26.Hemily, B., King, R., 2008. TCRP Synthesis 75: Uses of higher capacity buses in transit service.Hensher, D.A., Stopher, P., Bullock, P., 2003. Service quality-developing a service quality index in the provision of commercial bus contracts. Transportation
Research Part A 37, 499–517.Holcombe, B., 2005. Government smart card handbook. US General Services Administration, Washington.Jarzab, J., Lightbody, J., Maeda, E., 2002. Characteristics of bus rapid transit projects: an overview. Journal of Public Transportation 5, 31–46.Kaneko, T., Iiuzuka, H., Kageyama, I., 2006. Steering control for advanced guideway bus system with all-wheel steering system. Vehicle System Dynamics 44,
741–749.Kimpel, T., 2001. Time point-level analysis of transit service reliability and passenger demand. Doctor of Philosophy in Urban Studies, Portland State
University.Kimpel, T., Strathman, J., Bertini, R., Bender, P., Callas, S., 2005. Analysis of transit signal priority using archived TriMet bus dispatch system data.
Transportation Research Record, 156–166.King County Department of Transportation, 2002. An evaluation of transit signal priority in Aurora Avenue North, transit speed and reliability program.
Seattle, WA.Kittelson & Associates, KFH Group, Parsons Brinckerhoff Quade & Douglass, & Hunter-Zaworsk, K., 2003. Transit Capacity and Quality of Service Manual.Levinson, H., 1983. Analyzing transit travel time performance. Transportation Research Record 915, 1–6.Levinson, H., Zimmerman, S., Clinger, J., 2002. Bus rapid transit: an overview. Journal of Public Transportation 5, 1–29.Multisystems, Mundle and Associates, & Simon &Simon Research and Associates., 2003. Fare policies, structures and technologies: Update.Murray, A., Wu, X., 2003. Accessibility tradeoffs in public transit planning. Journal of Geographical Systems 5, 93–107.Shalaby, A., 1999. Simulating performance impacts of bus lanes and supporting measures. Journal of Transportation Engineering 125, 390–397.Shalaby, A., Abdulhai, B., Lee, J., 2003. Assessment of streetcar transit signal priority options using microsimulation modeling. Canadian Journal of Civil
Engineering 30 (6), 1000–1009.Smith, H., Hemily, B., Ivanovic, M., 2005. Transit signal priority (TSP): A planning and implementation handbook.Société de transport de Montréal, 2009. The STM in 2008 activity report Montreal, Québec.Société de transport de Montréal, 2010. On the move 2009 activity report Montreal, Québec.Société de transport de Montréal, 2011. The 467 express, a taste of tomorrow’s transit. Montréal.Strathman, J.G., Dueker, K.J., Kimpel, T.J., Gerhart, R.L., Turner, K., Taylor, P., Callas, S., Griffin, D., 2000. Service reliability impacts of computer-aided
dispatching and automatic location technology: a Tri-Met case study. Transportation Quarterly 54, 85–102.Surprenant-Legault, J., El-Geneidy, A., 2011. Introduction of a reserved bus lane: impact on bus running time and on-time performance. Transportation
Research Record, 10–18.
E.I. Diab, A.M. El-Geneidy / Transportation Research Part A 46 (2012) 614–625 625
Tanaboriboon, Y., Toonim, S., 1983. Impact study of bus lanes in Bangkok. Journal of Transportation Engineering 109, 247–255.Tétreault, P., El-Geneidy, A., 2010. Estimating bus run times for new limited-stop service using archived AVL and APC data. Transportation Research Part A
44, 390–402.Thamizh Arasan, V., Vedagiri, P., 2010. Microsimulation study of the effect of exclusive bus lanes on heterogeneous traffic flow. Journal of Urban Planning
and Development 136, 50–58.