uncertainty based analysis of the impact of watershed phosphorus load on reservoir phosphorus...
TRANSCRIPT

Journal of Hydrology 521 (2015) 533–542
Contents lists available at ScienceDirect
Journal of Hydrology
journal homepage: www.elsevier .com/ locate / jhydrol
Uncertainty based analysis of the impact of watershed phosphorus loadon reservoir phosphorus concentration
http://dx.doi.org/10.1016/j.jhydrol.2014.12.0280022-1694/� 2014 Elsevier B.V. All rights reserved.
⇑ Corresponding author. Tel.: +98 21 6111 2237.E-mail addresses: [email protected] (M. Karamouz), [email protected] (M.
Taheriyoun), [email protected] (M. Seyedabadi), [email protected] (S. Nazif).1 Tel.: +98 21 6111 2237.2 Tel.: +98 3113913822.
Mohammad Karamouz a,1, Masoud Taheriyoun b,2, Mohammadreza Seyedabadi a,1, Sara Nazif a,⇑a School of Civil Engineering, College of Engineering, University of Tehran, Tehran, Iranb Department of Civil Engineering, Isfahan University of Technology, Isfahan, Iran
a r t i c l e i n f o s u m m a r y
Article history:Received 22 February 2014Received in revised form 6 September 2014Accepted 13 December 2014Available online 20 December 2014This manuscript was handled by LaurentCharlet, Editor-in-Chief, with the assistanceof Prosun Bhattacharya, Associate Editor
Keywords:Phosphorus loadUncertaintySWAT modelGLUECopulaBMPs
In many regions of the world that depend on surface reservoirs as a source of water supply, eutrophication isa major water quality problem. Developing simulation models to evaluate the impact of watershed nutrientloads on the reservoir’s water quality is an essential step in eutrophication management. In this regard,analysis of model uncertainty gives an opportunity to assess the reliability and the margin of safety ofthe model predictions for Total Maximum Daily Load (TMDL) from the watershed nutrient load. In thisstudy, a computational procedure has been proposed for the analysis of the model uncertainties in simula-tion of watershed phosphorous load and reservoir phosphorous concentration. Data from the Aharchaiwatershed which is located upstream of the Satarkhan reservoir in the northwestern part of Iran, is usedas the study area to test the effectiveness of the proposed methodology. The Soil and Water AssessmentTools (SWAT) is utilized for assessment of watershed phosphorus load as the main agent resulting in thereservoir eutrophication in the region. The most effective parameters in model performance are identifiedby a global sensitivity analysis technique named modified Fourier Amplitude Sensitivity Test (FAST) whichcan incorporate parameter interdependencies. The Generalized Likelihood Uncertainty Estimation (GLUE)technique is also applied to set up behavioral ranges of the parameters that are relevant to the actual obser-vations. Finally, the cumulative weighted-likelihood distribution functions (CWLDF) are derived for out-puts of the SWAT. They are used jointly for estimation of results uncertainty limits using the Copulamethod. To assess the effectiveness of applying Best Management Practices (BMPs) in the watershed,two scenarios of with and without BMPs application are tested. The results showed the effectiveness ofthe proposed model in uncertainty estimation of watershed phosphorus load and reservoir phosphorusconcentration as well as the effectiveness of BMPs in reducing P loads from the watershed.
� 2014 Elsevier B.V. All rights reserved.
1. Introduction
High concentration of nutrients (phosphorous, nitrogen, etc.)may result in eutrophication which is a major water quality prob-lem in many lakes and reservoirs. This phenomenon is caused bythe excessive agricultural and industrial activities in the watershedupstream of a reservoir. Thus control and reduction of watershednutrient loads is a key issue in successful management of reservoireutrophication. The choice of effective watershed managementpractices with the aim of nutrient load reduction depends on thecharacteristics of watershed and the nutrients concentrations levelin the reservoir.
Best Management Practices (BMPs) in a watershed are effectivemeasures for the reduction of pollutants before they enter thereceiving water body. Watershed simulation models have beenused as effective tools in assessing the suitability of BMPs in reduc-tion of nutrient load to the receiving waters (Santhi et al., 2003;Arabi et al., 2007). Regarding the capabilities of the Soil and WaterAssessment Tools (SWAT) model, it can also be used to designBMPs for reducing runoff nutrient loads at the watershed-scale.
Due to limitations in data and model capabilities, there is agreat deal of uncertainty in estimating the values of parametersneeded for the design of BMPs. Therefore, if realistic bounds ofinput parameters variability are determined then BMPs can bedesigned more effectively in a watershed planning scheme.
Sohrabi et al. (2003) selected probability distributions for sensi-tive parameters of SWAT. These parameters have been determinedin pervious investigations in this study area. They showed the com-bined effect of such variability on model output in the terms of

534 M. Karamouz et al. / Journal of Hydrology 521 (2015) 533–542
cumulative probability distribution functions. Their investigationsshow that by considering the input parameters’ uncertainty, themean stream flow and sediment loading estimations will changeby �64% and +8.2%, respectively in comparison with the resultsobtained using mean value of input parameters. In another study,Shirmohammadi et al. (2006) reviewed sources and methods ofuncertainty analysis including Monte Carlo simulation (MCS), Latinhypercube sampling (LHS), and GLUE. They concluded that uncer-tainty in TMDL models should be taken into consideration duringboth the assessment and implementation phases.
Gallagher and Doherty (2007) investigated the use of threemethods for uncertainty analysis of the Hydrological SimulationProgram-Fortran (HSPF) model in a large watershed. These meth-ods include first-order analysis, Markov Chain Monte Carlo(MCMC) methods and nonlinear calibration-constrained optimiza-tion. They compared the performances of the three methods. Theyconcluded that the first-order uncertainty analysis has the advan-tage to be implemented with virtually no computational burdenbut its use in analyzing predictive uncertainty is often limited.MCMC methods are far more robust, and can produce reliable esti-mates of parameter and predictive uncertainty. Nonlinear calibra-tion-constrained optimization can also provide good estimates ofparameter and predictive uncertainty. However, they do not pro-vide the same amount of qualitative information on the probabilitystructure of parameter space as do MCMC methods.
Refsgaard et al. (2007) reviewed different methods of uncer-tainty analysis. They evaluated the performance of the methodsin their application, modeling stage, and source and nature ofuncertainties. They proposed a terminology for uncertainty consid-eration in modeling issues of water resources management. Theyprovided an interpretation of uncertainty with focus on the degreeof confidence that a decision maker has about results and corre-sponding probabilities. In another study, Warmink et al. (2010)developed an algorithm for classification of uncertainties in envi-ronmental models. Their proposed algorithm can be used in com-paring uncertainty analyses in different studies and selection ofthe best method based on the considered model.
Arabi et al. (2007) proposed a framework for investigation ofthe uncertainties in the performance of watershed managementpractices. They generated cumulative likelihood of SWAT outputsusing the GLUE method. Their uncertainty analysis was focusedon the range of parameters that need site-specific adjustmentsbased on the available data and the uncertainties associated withthe BMPs characteristics. Vogel et al. (2008) also utilized the GLUEmethodology in a rainfall–runoff model calibration process andconcluded that choice of a likelihood function using a statisticallyvalid function can provide reliable domains for model prediction.
Pohlert et al. (2007) used a regression-based global sensitivityanalysis to evaluate the impact of the new parameters and outputssensitivity in an extended version of SWAT model. GLUE methodwas also used by Karamouz et al. (2009) to evaluate the uncer-tainty of the SWAT model in simulation of watershed phosphorusload, using quintile analysis of the generated cumulative likelihoodand yielding the uncertainty limits.
Previous studies in uncertainty analysis, mainly have focusedon uncertainty of watershed load predictions and did not considerits impact on reservoir water quality. Inflow to the reservoir waterquality is usually measured, however it is done often at a distancefrom the reservoir. But in the absence of water quality sampling forthe water in the reservoir that supplies demand, providing an esti-mation of water quality in the reservoir is of high value. In thisstudy, this need has been realized. Furthermore, there has not beena prior specific procedure for assessing uncertainty limits in deter-mining the effectiveness of BMPs in reservoirs’ eutrophicationmanagement. There are a number of parameters in river and reser-voir water quality modeling which there are interactions among
them. Ignoring these interactions in different steps of analysiswould provide unreliable results. As an example, in the applicationof the GLUE method for uncertainty estimation, joint probability ofoccurrence of the uncertain model parameters are not considered.In this study these shortcoming is realized and a scheme is pro-posed to include parameters interactions in the uncertainty analy-sis by developing a new joint probability based weightingapproach that utilizes the Copula method.
To summarize, integration of modeling and application toolsincluding GLUE, Copula, SWAT and FAST (Fourier Amplitude Sensi-tivity Test) is done in this study to improve the body of knowledgein uncertainty and sensitivity analyses, river and reservoir waterquality modeling, and BMP studies for a watershed water qualitymanagement. In this integrated analysis, the effect of uncertaintieson the watershed parameters and BMPs, on Phosphorous (P) loadfrom the watershed and reservoir P concentration, are determined.
2. The study area
The study area of this paper is Aharchai river watershed whichis located upstream of the Satarkhan reservoir in northwesternpart of Iran. The watershed is located between 38� 240 and 38�410N and 46� 200 and 46� 550E. Fig. 1 shows the location of thewatershed and reservoir.
The area of the watershed is about 93,000 ha which is composedof 36.5% dry farming, 1.4% irrigated farming, 5.3% combination ofirrigated farming and orchard land use, 12% open space, 16.6% com-bination of dry farming and range, 27.3% range, 0.5% urban area, and0.4% water bodies. The average flow at the outlet of the basin is2.9 m3/s, which varies between 0 and 21 m3/s through the year.
The Satarkhan dam is used to supply water for various regionalpurposes such as municipal, irrigation, mining and industry. There-fore, the issue of water quality is of great importance. However,uncontrolled entrance of nutrient loads from agricultural fields tothe reservoir has resulted in eutrophication and deterioration ofthe reservoir water quality during recent years. Therefore, the needto utilize water quality management practices has been emerged.
The monthly river water quality and flow data are gathered bythe East Azerbaijan Regional Water Company (EARWC). These dataare measured at Orang station located at the upstream of the res-ervoir (Fig. 1) from August 2002 to December 2005 for a period of41 months. These data are used for development of watershed sim-ulation model.
In the reservoir, one station near dam axis is considered formonthly sampling of nitrogen and phosphorus concentration atabout 0.5 m below the water surface. The data are used in calibra-tion and validation of the reservoir water quality model. Moredetailed information on the data used in this study is provided inKaramouz et al. (2010).
The samples taken from both the river and reservoir were ana-lyzed in the water quality lab of EARWC. The analysis methodswere based on EPA method 365.2 for phosphorus and EPA Method351.3 and 353.2 for nitrogen.
The average TN:TP ratio in the reservoir water based on themeasured data from January 2003 to August 2007 is 62. The aver-age ratios in spring, summer, autumn and winter are 101, 66, 37and 43, respectively. According to USEPA (1990), ratios greaterthan 10 are indicatives of phosphorus limitation. Therefore phos-phorous is the main agent in eutrophication control of the Satark-han reservoir.
3. Methods
To analyze the uncertainty of the SWAT model parametersincluding both watershed and reservoir models, a methodology is
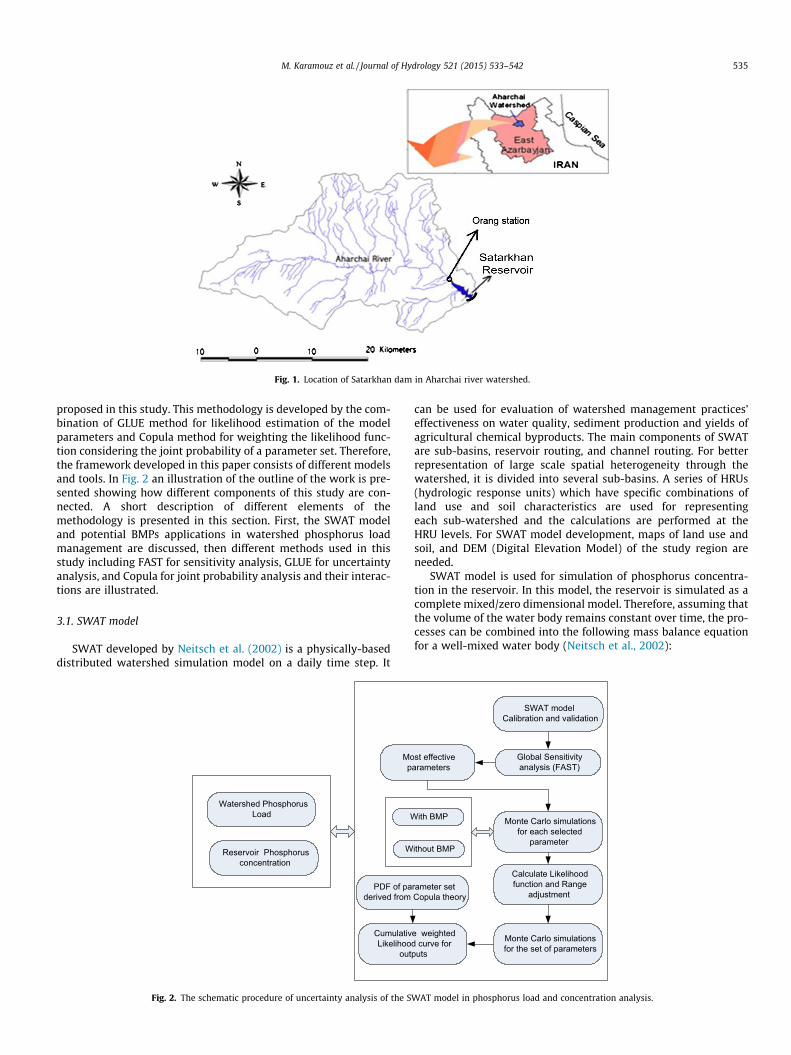
Fig. 1. Location of Satarkhan dam in Aharchai river watershed.
M. Karamouz et al. / Journal of Hydrology 521 (2015) 533–542 535
proposed in this study. This methodology is developed by the com-bination of GLUE method for likelihood estimation of the modelparameters and Copula method for weighting the likelihood func-tion considering the joint probability of a parameter set. Therefore,the framework developed in this paper consists of different modelsand tools. In Fig. 2 an illustration of the outline of the work is pre-sented showing how different components of this study are con-nected. A short description of different elements of themethodology is presented in this section. First, the SWAT modeland potential BMPs applications in watershed phosphorus loadmanagement are discussed, then different methods used in thisstudy including FAST for sensitivity analysis, GLUE for uncertaintyanalysis, and Copula for joint probability analysis and their interac-tions are illustrated.
3.1. SWAT model
SWAT developed by Neitsch et al. (2002) is a physically-baseddistributed watershed simulation model on a daily time step. It
Mop
CumulativLikelihoo
out
Watershed Phosphorus Load
Reservoir Phosphorus concentration
W
W
PDF of paderived from
Fig. 2. The schematic procedure of uncertainty analysis of the S
can be used for evaluation of watershed management practices’effectiveness on water quality, sediment production and yields ofagricultural chemical byproducts. The main components of SWATare sub-basins, reservoir routing, and channel routing. For betterrepresentation of large scale spatial heterogeneity through thewatershed, it is divided into several sub-basins. A series of HRUs(hydrologic response units) which have specific combinations ofland use and soil characteristics are used for representingeach sub-watershed and the calculations are performed at theHRU levels. For SWAT model development, maps of land use andsoil, and DEM (Digital Elevation Model) of the study region areneeded.
SWAT model is used for simulation of phosphorus concentra-tion in the reservoir. In this model, the reservoir is simulated as acomplete mixed/zero dimensional model. Therefore, assuming thatthe volume of the water body remains constant over time, the pro-cesses can be combined into the following mass balance equationfor a well-mixed water body (Neitsch et al., 2002):
st effective arameters
Monte Carlo simulations for each selected
parameter
Global Sensitivity analysis (FAST)
Calculate Likelihood function and Range
adjustment
Monte Carlo simulations for the set of parameters
e weighted d curve for puts
SWAT modelCalibration and validation
ith BMP
ithout BMP
rameter set Copula theory
WAT model in phosphorus load and concentration analysis.

536 M. Karamouz et al. / Journal of Hydrology 521 (2015) 533–542
V � dcdt¼WðtÞ � Q � c � m � As ð1Þ
where V is the volume of the reservoir (m3), c is the concentration ofphosphorus (kg/m3), t is time, W(t) is the phosphorus load enteringthe reservoir (kg/day), Q is the rate of water flow exiting the waterbody (m3/day), m is the apparent settling velocity (m/day), and As isthe area of the sediment–water interface (m2).
3.2. BMP representation in SWAT
The structural BMPs that are used in this study for non-pointsource control include filter strips (FS), parallel traces (PT), gradestabilization structures (GSS) and detention ponds (DP).
A filter strip is a graded and vegetated band along the edge of achannel segment in a sub-basin to trap the pollutant loads from thedrained area into the channel segment. A filter strip is representedby its width (FILTERW) which is utilized in HRUs and channel seg-ment which is drained to it (Arabi et al., 2008). The trapping effi-ciency, trapef_sed, is calculated as follows (Neitsch et al., 2002):
trapef sed ¼ 0:367� FILTERW0:2967 ð2Þ
Parallel terraces are placed in a HRU by embankments or chan-nels constructed across-the-slope. These facilities decrease surfacerunoff volume, peak runoff rate, sheet and rill erosion, erosivepower of runoff, and also prevent from rills and gullies formation.To incorporate parallel terraces in a SWAT model, it is necessary tohave some modifications on the SCS curve number, USLE (Univer-sal Soil Loss Equation) support practice factor (USLE_P) and aver-age slope length (SLSUBBSN). The calibrated value of curvenumber (CN) value is decreased (i.e. 6 units) for considering theparallel terraces impact on surface runoff volume (Arabi et al.,2008). Slope length (SLSUBBSN) is modified as follows:
SLSUBBSN ¼ ðx� Sþ yÞ � 100=S ð3Þ
where S is the average slope of the considered HRU and x and y aredimensionless constants. x depends on location of the watershedbased on ASAE (2003). The y value depends on the soil erodibility,cropping system and its management; and varies between 0.3 and1.2 (ASAE, 2003). The lower values of y show the more erodiblesoils.
Grade stabilization structures (GSSs) are designed to reduce thechannel grade in a water course. These structures reduce the ero-sion potential, decrease the peak flow rate/flow velocity and alsoreduce the gully erosion in the channel segment. To incorporatethese structures in the watershed model, it is necessary to adjust
Table 1BMP type and decision variables used in the SWAT (Karamouz et al., 2010).
BMP type Parameter SWAT inputfile
Parameter description
Filter strip (FS) FILTERW .hru Filter width (m)
Parallel terraces (PT) SLSUBBSN .hru Average slope lengthUSLE_P .mgt USLE equation supportCN2 .mgt SCS runoff curve numb
Grade stabilization structure(GSS)
CH_S2 .rte Channel Slope SteepneCH_EROD .rte Channel erodibility fac
Detention pond (DP) pnd_pvol .pnd Volume of water storespillway (m3)
Pnd_fr .pnd Fraction of HRU drainiPnd_psa .pnd Surface area of ponds w
A: Eq. (3).B: Eq. (4).
* For graded channels sod outlets with the average watershed slope of 13–16% (Arab** Non-erodible.
the slope of the channel segment (CH_S2) and channel erodibilityfactor (CH_EROD). CH_S2pre is modified as follows:
CH S2 ¼ CH S2pre �h
CH L2ð4Þ
where CH_S2 and CH_L2 (m) are the slope and the length of theupstream channel after GSS implementation, respectively, h (m)reflects the GSS height. Also channel erodibility factor should beadjusted to show the non-erodible surface (set as 0.001 indicatingnon-erodible surface).
Detention ponds are permanent pools within HRU that attenuatestorm peaks, reduce the load of suspended sediments, metals anddissolved nutrients in the HRU outflow through sedimentationand biological/biochemical processes. In this study, the conven-tional type of detention pond is used which has a bottom perme-ability of zero. The main parameters of the detention pond to bedetermined are pond area and volume for the maximum and emer-gency spillway levels, and fraction of the HRU runoff that drains tothe pond. A list of BMPs used in this study and their representativeparameters are provided in Table 1.
3.3. Uncertainty analysis
To assess the effectiveness of watershed BMPs in reducing thephosphorus concentration in the reservoir, the uncertainty analysison model results is done with and without BMPs implementation.A global sensitivity analysis (GSA) is done using the modified FASTmethod to determine the most effective parameters on model out-put variations regarding the parameters interdependency. Thenthe Monte Carlo simulation under uniform distribution and timeextent of calibration-validation data is performed. Likelihood func-tion is calculated for each set of simulation and behavioral range isadjusted according to the likelihood function. GLUE-likelihoodweights (derived from Copula method) are computed for the setof parameters simulated by Monte Carlo method. Further detailsof sensitivity analysis as well as Glue and Copula theory are givenin Sections 3.4–3.6, respectively.
3.4. Sensitivity analysis
The sensitivity analysis is used to identify the most sensitiveinput parameters in the SWAT model. Since the use of Copula mod-eling is designed to examine joint probability of parameters, themost sensitive parameters should be chosen for analysis consider-ing their interdependency. This can be achieved by application ofan appropriate global sensitivity analysis method.
Default value withoutBMP
WithBMP
0 20
15.2 Apractice factor 0.5 0.14*
er 35–95 (CN2)-6
ss 0.07 Btor 0.05 0.001**
d in ponds when filled to the principal 0 20,000
ng to pond 0 0.9hen filled to principal spillway (ha) 0 30
i et al., 2008).

M. Karamouz et al. / Journal of Hydrology 521 (2015) 533–542 537
FAST is a popular global sensitivity analysis technique (Xu andGertner, 2008). The modified FAST method proposed by Xu andGertner (2008) is used in this study. This method considers the cor-relation of variables in the sensitivity analysis. This is an importantissue because the method can consider the joint significance ofparameters in system performance as one may be a catalyst for theother. In some cases, the changes in individual variables may notbe so effective in model response; however the simultaneouschanges of these variables due to correlation between them, mayresult in considerable change in system output, which is consideredin modified FAST method. Due to considerable correlation betweenmodel variables used in this study, modified FAST method is usedfor sensitivity analysis. In this study, the calibrated–validated modelis considered as the initial condition in sensitivity analysis runs.
3.5. Generalized Likelihood Uncertainty Estimation (GLUE)
GLUE is a methodology used to evaluate the predictive uncer-tainty within an environmental model (Beven and Binley, 1992).The likelihood function used in GLUE, is defined as follows (Arabiet al., 2007):
Lða yÞ ¼j max 1� r2e
r2o
� �; 0
� �; ð5Þ
where a refers to the parameter set, y is the observed data andL(a|y) is the likelihood of parameter set (a) for the observed data(y); r2
e is the variance error between model simulations andobserved data, r2
o is the variance of the observed data. Results withgoodness of fit/likelihood values less than zero are termed as ‘non-behavioral’ and are discarded. The rest of parameter sets that arecalled ‘behavioral’, are assigned with the standardized likelihoodweights summing up to 1.0.
To calculate the likelihood function in BMP applications, it isassumed that the outputs of calibrated model without BMP canbe used as the observed data in the likelihood function calculationsdue to lack of observed data. Although it is not real observed data,it is a practical way to make it possible to calculate the likelihoodfunction.
In uncertainty analysis using GLUE method, the model perfor-mance is evaluated for different sets of parameters developed justconsidering the possible range of each variable, without consider-ing the possibility of these sets of parameters happening simulta-neously. To overcome this disadvantage of GLUE method, the
Fig. 3. Aharchai watershed delineation with 81 sub-basins an
likelihood value obtained from GLUE method is weighted basedon the joint probability of that set of model parameters as follows:
Lw ¼ Lða yÞ � f aj ð6Þ
where Lw is weighted likelihood and fa is joint probability densityfunction of parameter set of a obtained using Gaussian Copula aswill be explained in the Section 3.6.
3.5.1. Behavioral range adjustmentThe ranges of input parameters are adjusted in the sensitivity
analysis in order to make the GLUE analysis time efficient. This isan essential step before quantifying the uncertainty of model out-puts. To adjust the sensitivity range of the parameters for eachindividual parameter, 100 random values assuming a uniformdistribution are generated and for each run the phosphorus loador concentration with the related likelihood measure is calculated.
3.6. Copula theory
To present a more practical configuration of the system perfor-mance, the joint probability of the selected model parametersshould be considered in simulation of phosphorus load and reser-voir phosphorus concentration. For this purpose the Copula theoryhas been used. Copula is a stochastic and probability based modelwhich has had rapid growth in water resources engineering appli-cation in recent years (Karamouz et al., 2011).
In this study, the Gaussian copula is used among different fam-ilies of Copula distributions. The Gaussian copula for the d inde-pendent variables is as follows:
CGauss Fx1 ðx1Þ; Fx2 ðx2Þ; . . . ; FxdðxdÞ
� �¼ U U�1 Fx1 ðx1Þ
� þU�1 Fx2 ðx2Þ
� þ � � � þU�1 Fxd
ðxdÞ� �
ð7Þ
where U is the joint cumulative distribution function of a multivar-iate normal distribution with mean zero and covariance matrixequal to the correlation matrix of the considered variables andU�1 is the inverse cumulative distribution function of a standardnormal distribution. Fxi
ðxiÞ is the marginal probability distribution.Then, joint density can be expressed as
f a ¼ c Fx1 ðx1Þ; Fx2 ðx2Þ; . . . ; FxdðxdÞ
� �Yd
i¼1
f xiðxiÞ ð8Þ
where f xiðxiÞ is the density function of variable xi and c is copula
density. As mentioned before, fa is considered as the weight inthe likelihood function of Eq. (6).
Satarkhan Reservoir
d 258 HRU in the SWAT model (Karamouz et al., 2010).

0
0.05
0.1
0.15
0.2
Phos
phor
ous
conc
entra
tion
(mg/
L)
model
observed
calibra�on valida�on
Fig. 5. Model calibration and validation results for monthly phosphorous concentration in the reservoir from October 2003 to August 2006.
Table 2List of 15 SWAT parameters for watershed phosphorous load and reservoir phosphorous concentration used in sensitivity analysis.
Variable Symbol (in this paper) Definition Symbol (in SWAT model)
Phosphorus load CN Initial SCS runoff curve number for moisture condition II CN2.mgtOP Initial organic P concentration in soil layer (mg/kg) SOL_ORGP.chmSP Initial soluble P concentration in soil layer (mg/kg) SOL_LABP.chmSL Average slope steepness (m/m) SLOPE.hruSE Soil evaporation compensation factor ESCO.hruUP USLE equation support practice factor USLE_PCA Ratio of chlorophyll-a to algal biomass (lg-chla/mg algae) AI0.wwq
Phosphorus concentration PI Phosphorus availability index PSP.bsnSD Threshold depth of snow, above which there is 100% cover SNOCOVMX.bsnST Snow temperature lag factor TIMP.bsnRL Surface runoff lag coefficient SURLAG.bsnPU Phosphorus uptake distribution parameter UBP.bsnMF Melt factor for snow SMFMX.bsnAP Fraction of algal biomass that is phosphorus AI2.wwqNA Nonlinear algal self-shading coefficient LAMBDA2.wwq
0.9370.902 0.880 0.873
0.751 0.730
0.648
0.60.650.70.750.80.850.90.951
CN OP SP SL SE UP CA
S
Parameter
Fig. 6. Sensitivity analysis of input phosphorus load to the reservoir.
0.956 0.922 0.904 0.8720.753 0.672 0.605
0.395
0.000
0.200
0.400
0.600
0.800
1.000
1.200
PI SD ST RL PU MF AP NA
S
Parameter
Fig. 7. Sensitivity analysis of phosphorus concentration in the reservoir.
Fig. 4. Model calibration and validation results for monthly phosphorous load data at the reservoir inlet from January 2003 to December 2005 (Karamouz et al., 2010).
538 M. Karamouz et al. / Journal of Hydrology 521 (2015) 533–542

M. Karamouz et al. / Journal of Hydrology 521 (2015) 533–542 539
4. Results and discussion
In this study the watershed of Aharchai river is subdivided into81 sub-basins and 258 HRUs. The sub-basins are shown in Fig. 3. Incalibration and validation of the SWAT model, the flow data and Pconcentration at the sampling stations, explained in Section 2 (thestudy area), are used. The SWAT model is manually calibrated andvalidated for the flow, sediment and phosphorus load at the outlet
Fig. 8. Graphs for the top eight sensitive SWAT input paramete
of watershed draining to the Satarkhan reservoir (Orang station,Fig. 1). P load data are calculated by multiplying the dischargeand P concentration data at Orang station located at the upstreamof the reservoir which are available from January 2003 to Decem-ber 2005. Two years of data are used for calibration and one yearfor validation. For the reservoir model, the available measurementsfor P concentration in the reservoir are from October 2003 toAugust 2006. The first three years are used for model calibration
rs related to average phosphorous load and concentration.

540 M. Karamouz et al. / Journal of Hydrology 521 (2015) 533–542
and the rest are used for model validation. The difference betweenduration of available data for P load and concentration does notaffect the proposed procedure since watershed and reservoir sim-ulation models are developed and run separately.
The calibrated values of SWAT model parameters with no BMPand no point source control strategy are given in Table 1. Figs. 4and 5 show the calibration and validation results for phosphorousload to the reservoir and phosphorus concentration in the reser-voir. The figures show a close match between simulated and theobserved data in both periods. As it can be noticed, the periodsof comparisons in two figures are different due to the availabilityof the observed data. The specified parameter values during thecalibration are considered as the base case values in uncertaintyanalysis.
Typical parameters and coefficients in the SWAT model consid-ered in the sensitivity analysis are listed in Table 2. Seven param-eters for phosphorous load and 8 parameters for phosphorusconcentration have been selected primarily as the most effectiveparameters on the SWAT model outputs.
Figs. 6 and 7 show the sensitivity index obtained for selectedparameters in the calculation of phosphorous input load and con-centration in the reservoir. Based on these results, the parametersgiven in Table 2 have been sorted and the top four parameters ofhigher sensitivity index in each group of variables are selected asthe most effective parameters for the Monte Carlo simulation.
4.1. Behavioral range adjustment
In Fig. 8 the calculated values for all 8 sensitive parametersselected in this study are shown. The behavioral range of eachparameter is identified according to the positive value of the like-lihood function (Eq. (5)) as depicted in Fig. 8.
The initial state values of the input parameters are the same asthe values in the calibrated–validated model. Table 3 shows theadjusted ranges derived from the plots in Fig. 8. The range adjust-ment is done for the model without BMP implementation.
Table 3Behavioral parameter ranges for the studied watershed.
Symbol (inthis paper)
Parameter Defaultrange
Adjustedrange
CN CN2.mgt 38–98 38–76OP SOL_ORGP.chm 0–4000 0–35SP SOL_LABP.chm 1–100 1–20SL SLOPE.hru 0–0.6 0–0.075PI PSP.bsn 0.03–0.7 0.04–0.26SD SNOCOVMX.bsn 0–500 0–1.2ST TIMP.bsn 0–1 0.02–0.04, 0.27–0.39, 0.7–1RL SURLAG.bsn 1–24 1–18
0
0.2
0.4
0.6
0.8
1
0 200
400
600
800
1000
1200
1400
1600
1800
2000
cum
ulat
ive
likel
ihoo
d
Phosphorus load input to the reservoir (kg /month)
0.05
0.95
Without BMPWith BMP
Fig. 9. Cumulative likelihood for phos
Adjusted parameters’ ranges (Table 3) are used to probabilisticallydetermine the margin of safety in the load and concentration esti-mation. For this purpose, 5000 simulations using Monte Carlomethod based on the uniform distribution are performed usingthe input variables for the years 2003–2005. Eight sensitive modelparameters (selected from the sensitivity analysis) are included inthe analysis using the behavioral range (Table 3). For each realiza-tion in the parameter space, the weighted likelihood values are cal-culated according to Eq. (6).
In the next step, the BMPs are applied in the watershed. The val-ues of BMPs representative parameters are shown in Table 1. Thencumulative distribution curves for phosphorous load and reservoirconcentration are plotted for both scenarios, with and withoutBMPs implementation, as it is shown in Fig. 9. In this figure, the5 and 95 percent confidence interval are plotted. The 5 and 95 per-centiles are considered as the margin of safety for calculating theTMDL.
The graphs show the effectiveness of BMP implementations onreduction of watershed phosphorus load and reservoir phosphorusconcentration. The results are summarized in Table 4. In this table,lower and upper bounds attributing to 5 and 95 percentiles of thecumulative likelihood plots, the median (representing the 50thpercentile) and standard deviation (SD) and coefficient of variation(CV) of concentrations are shown. The columns named ‘‘difference’’show the difference of upper and lower bounds of the confidenceintervals. A comparison between the results of two scenariosshows that a smaller difference is obtained after implementationof BMPs, likewise, the cumulative likelihood plots in Fig. 9, suggestless variability and uncertainty after implementing BMPs.
Furthermore, for P load the calculated SD and CV in Table 4,which can be considered as a measure of uncertainty, are reducedsignificantly after application of BMPs. Therefore, it can be con-cluded that applying BMPs to a watershed reduces the uncertain-ties in predicting the P load.
For phosphorus load, the marginal difference decreases from980 kg/month to 205 kg/month or about 79% and also the SDdecreases from 247 to 26 or about 89%, while the CV shows lessreduction from 25% to 12% (about 48% decrease). Overall, it isinferred that applying the BMPs can reduce the model uncertaintyin estimation of watershed P load.
As for reservoir P concentration, the difference and SD are0.075 mg/l and 0.0175 respectively before BMP implementationwhich are reduced to 0.045 mg/l and 0.011 after BMP implementa-tion (about 37% reductions). But CV is increased from 9% to 24%.Considering CV as a measure of uncertainty, it is concluded thatapplication of BMPs unlike for watershed P load, does not reducethe uncertainty of the model in prediction of reservoir Pconcentration.
0
0.2
0.4
0.6
0.8
1
0.02
0.04
0.06
0.08
0 .1
0 .12
0.14
0 .16
0.18
0.2
0 . 22
0. 24
0.26
0.28
0 .3
cum
ulat
ive
likel
ihoo
d
Phosphorus concentration in the reservoir (mg /lit)
0.05
0.95
Without BMP
With BMP
phorous load and concentration.

Tabl
e4
Sum
mar
yof
cum
ulat
ive
likel
ihoo
dan
alys
isst
atis
tics
.
Ou
tpu
tpa
ram
eter
Wit
hou
tB
MP
Wit
hB
MP
Perc
ent
ofre
duct
ion
95%
con
fide
nce
lim
itM
edia
nSt
anda
rdde
viat
ion
(SD
)C
oeffi
cien
tof
vari
atio
n(C
V)
(%)
95%
con
fide
nce
lim
itM
edia
nSt
anda
rdde
viat
ion
(SD
)C
oeffi
cien
tof
vari
atio
n(C
V)
(%)
95%
con
fide
nce
lim
it
Med
ian
(%)
Stan
dard
devi
atio
n(S
D)
(%)
Low
erU
pper
Dif
fere
nce
Low
erU
pper
Dif
fere
nce
Low
er(%
)U
pper
(%)
Phos
phor
us
load
(kg/
mon
th)
460
1520
1060
980
247
2515
026
026
205
2613
6783
7989
Phos
phor
us
con
cen
trat
ion
inre
serv
oir
(mg/
l)0.
167
0.24
20.
075
0.2
0.01
759
0.03
0.07
80.
011
0.04
50.
011
2482
6878
37
M. Karamouz et al. / Journal of Hydrology 521 (2015) 533–542 541
The above statistics show the efficiency of BMPs application inremoval of phosphorus load and concentration in the watershed.As shown in Table 4, the reduction percent in median of phospho-rus load is calculated as 79% and the reduction percent in medianof phosphorus reservoir concentration is 78%. It is obvious thatincoming phosphorous load to the reservoir is the main factor inreservoir phosphorous concentration which is considered as themain agent in the occurrence of algae bloom and eutrophicationin the reservoir. Therefore, application of BMPs in the watershedupstream of the Satarkhan reservoir is an effective way in the con-trol and management of reservoir eutrophication.
5. Conclusions
In this study, a methodology has been proposed for the uncer-tainty analysis of parameters used in the SWAT model. In the pro-posed approach, the impact of watershed P load on the Pconcentration in the reservoir is inspected through the cumulativedistribution curves of watershed P load and reservoir P concentra-tion. To assess the effectiveness of BMP implementation onwatershed P load and the reservoir P concentration, the uncer-tainty analysis is done for two scenarios of with and without BMPsimplementation.
Comparing the confidence intervals resulted from the cumula-tive likelihood curves showed that BMP implementation in awatershed results in less uncertainty in watershed P load simula-tion. The difference between upper and lower bounds showed thatthe uncertainty reduction in estimation of watershed phosphorusload with BMP application is more than the uncertainty reductionin the reservoir concentration. It implies that using BMP reduceshigh variability in watershed P load. But the findings are not con-sistent on the impact of BMPs on the model uncertainty estimationof reservoir P concentration. The application of BMPs showedalmost the same reduction percent in median of watershed P loadand reservoir P concentration. Therefore BMPs can be used as aneffective measure in control of eutrophication in the Satarkhan res-ervoir. The results based on Coefficient of Variation (CV), as theuncertainty measure, showed that the application of BMPseffectively reduces the uncertainty of the model in prediction ofwatershed P load but there is not any significant change in reser-voir P concentration. The results also show that uncertaintybounds obtained through the computational procedure in thisstudy are effective means of coping with the margin of safety(MOS) in the TMDL estimation. The provided uncertainty boundfor watershed P load estimation can be used as an effective toolin assessing the parameter variability in watershed managementwith the objective of reducing watershed phosphorus load andfor the purpose of reservoir eutrophication management.
Acknowledgements
This study was partially supported by a contract entitled ‘‘Studyof revisiting supply and demand and drought management inAharchai Watershed’’ sponsored by the University of Tehran andthe East Azerbaijan Water Authority. Part of this paper was pre-sented at the 2009 ASCE-EWRI congress in Kansas City, Missouri.
References
Arabi, M., Frankenberger, J.R., Engel, B.A., Arnold, J.G., 2008. Representation ofagricultural conservation practices with SWAT. Hydrol. Process. 22, 3042–3055.
Arabi, M., Govindaraju, R., Hantush, M., 2007. A probabilistic approach for analysisof uncertainty in the evaluation of watershed management practices. J. Hydrol.333, 459–471.
ASAE, 2003. Design, Layout, Construction and Maintenance of Terrace Systems.ASAE Standards S268.4 FEB03, ASAE, St Joseph, MI.
Beven, K.J., Binley, A.M., 1992. The future of distributed models: model calibrationand uncertainty prediction. Hydrol. Process. 6, 279–298.

542 M. Karamouz et al. / Journal of Hydrology 521 (2015) 533–542
Gallagher, M., Doherty, J., 2007. Parameter estimation and uncertainty analysis for awatershed model. Environ. Model. Softw. 22 (7), 1000–1020.
Karamouz, M., Taheriyoun, M. Seyedabadi, M., Behboodian, S., 2009. Evaluation ofuncertainties in the simulation of watershed nutrient load: a case study. WorldEnvironmental and Water Resources Congress – ASCE 2009, Kansas CityMissori.
Karamouz, M., Taheriyoun, M., Baghvand, A., Tavakolifar, H., Emami, F., 2010.Optimization of watershed control strategies for reservoir eutrophicationmanagement. J. Irrig. Drain. 136 (12), 847–861.
Karamouz, M., Nazif, A., Hosseinpour, S., 2011. Improvement of urban drainagesystem performance under climate change impact: case study. J. Hydrol. Eng. 16(5), 395–412.
Neitsch, S.L., Arnold, J.G., Kiniry, J.R., Williams, J.R., King, K.W., 2002. Soil and WaterAssessment Tool Theoretical Documentation, version 2000. Grassland. Soil andWater Research Laboratory, Agricultural Research Service, Temple, TX.
Pohlert, T., Huisman, J.A., Frede, L., Breuer, H.G., 2007. Integration of adetailed biogeochemical model into SWAT for improved nitrogenpredictions—model development, sensitivity, and GLUE analysis. Ecol. Model.203, 215–228.
Refsgaard, J.C., Sluijs, J.P., Vanrolleghem, A.L., Hojberg, P.A., 2007. Uncertainty in theenvironmental modelling process – a framework and guidance. Environ. Model.Softw. 22 (11), 1543–1556.
Santhi, C., Srinivasan, R. Arnold, J.G., Williams, J.R., 2003. A modeling approach toevaluate the impacts of water quality management plans implemented in theBig Cypress Creek Watershed. In: Proceedings of Second Conference onWatershed Management to Meet Emerging TMDL Environmental Regulations,Albuquerque, NM, pp. 384–394.
Shirmohammadi, A., Chaubey, I., Harmel, R., Bosch, D., Muñoz-Carpena, R.,Dharmasri, D., Sexton, A., Arabi, M., Wolfe, M., Frankenberger, J., Graff, C.,Sohrabi, T., 2006. Uncertainty in TMDL Models. Am. Soc. Agric. Biol. Eng. 49 (4),1033–1049.
Sohrabi, T.M., Shirmohammadi, A., Chu, T.W., Montas, H., Nejadhashemi, A.P., 2003.Uncertainty analysis of hydrologic and water quality predictions for smallwatershed using SWAT2000. Environ. Forensics 4, 229–238.
U.S. EPA, 1990. The Lake and Reservoir Restoration and Guidance Manual. EPA/440/4-90/006. Office of Water, Washington, DC.
Vogel, R.M., Stedinger, J.R., Batchelder, R., SeungUk, L., 2008. Appraisal of theGeneralized Likelihood Uncertainty Estimation (GLUE) Method, WorldEnvironmental and Water Resources Congress – ASCE 2008. Ahupua’a, Hawaii.
Warmink, J.J., Janssen, J.A.E.B., Krol, M.J., Booij, M.S., 2010. Identification andclassification of uncertainties in the application of environmental models.Environ. Model. Softw. 25 (12), 1518–1527.
Xu, C., Gertner, G.Z., 2008. A general first-order global sensitivity analysis method.Rel. Eng. Syst. Safe. 93, 1060–1071.