maximizing available phosphorus in calcareous soils by addition compost and inorganic phosphorus...
TRANSCRIPT

International Journal of ChemTech Research CODEN (USA): IJCRGG ISSN: 0974-4290
Vol.8, No.4, pp 1563-1572, 2015
Maximizing Available Phosphorus in Calcareous Soils by Addition Compost and Inorganic Phosphorus Forms
KadriaM. ElAzab, A.Kh. AMER, M. M. HAMAD and E. G. ABOU- ELELA
Soils, Water and Environment Res. Institute, Agric. Res. Centre, Giza, Egypt
Abstract: In calcareous soils, phosphorus (P) retention and immobilization take place due to
precipitation and adsorption. Also, addition of organic manure could improve the soil
physical and chemical conditions besides it might increase the efficiency of added P fertilizer
and provide additional source of nutrients. Information on the availability of P following
inorganic fertilizer and compost addition to calcareous soil may help in better management of
P fertilization. The objective of this studied was to study the combination effect of organic
fertilizers addition (compost) and different forms of inorganic phosphorus fertilizers on the
improvement of phosphorus use efficiency by maximizing its availability in calcareous soil
and accumulation in biological yield of wheat(cv Giza168). The treatments includedthree
inorganic-P forms (i.e. calcium super phosphate15 % P2O5 (P1), triple super phosphate 42%
P2O5 (P2) and phosphoric acid72.4% P2O5 (P3) and control (without P) which combined with
three rates of compost (0, 10 and 20 m3.fed.
-1).The change in the amount of available P in soil
was measured during wheat growth at three periods (i.e. tillering, spike development and
maturity stages) in a field experiment on a calcareous soil.
The amount of availableP in soil was determined by Olsen and analyzed statistically.On the
other hand, the wheat plant parameters (i.e. biological yield, grains quality and plant
nutritional status) were measured and analyzed. Results indicated that mean values of
available P in soil were significantly increased with increasing the rates of compost combined
with inorganic P particularly at 10 m3.Fed.
-1 with either triple super phosphate (P2)or
phosphoric acid (P3),while the obtained increases of available P content with increasing the
rats of compost addition up to 20 m3.fed
-1 were low compared to the rate 10 m
3.Fed.
-1. These
decreasing may be attributed to the stimulatory effects of higher rate from compost in
presence of these two forms (P2, P3)to enhance the precipitation and adsorption conditions or
formation of less soluble complexes with Ca2+
cations, then showed significantly decreasing
along with age of plant. Also, this increase reflected significantly increasing in most studied
parameters of plants.
Finally, the data obtained for either percentage increase yield or phosphorous forms use
efficiency (PFUE) appearedparallel trends. So,the highest percentage increases were at used
the rate (10 m3.Fed.
-1) combined with inorganic P2and P3,and then significantly decreased
with increasing the rats of compost addition up to 20 m3.Fed.
-1, this decreasing were highest
at used P3compared P2.It is difficult to understand the difference between the role effect of P2
andP3 with compost.For these reason,it needs number of specific experimental for explain
these process.
Key wards:Calcareous Soil, Compost amendment and Inorganic P forms.
Introduction:
Wheat (TriticumstivumL.) is the most important cereal crop in the world. InEgypt, increasing
importance of wheat is due to the large increase in the gap between production and consumption, a huge
increment of population and the low level of national income. Therefore, Egypt is considered the biggest

KadriaM. ElAzab et al /Int.J. ChemTech Res. 2015,8(4),pp 1563-1572. 1564
importer of wheat in the world. Extensive efforts are continuously paid for increasing its productivity by means
of vertical and/or horizontal planting. Increases of wheat production to contribute in solving food problem.In
general, under such unfavorable conditions ( in new reclaimed sandy calcareous soils ) and in soil characterized
as low fertile, low organic matter content and high leaching rate let the production of most crops not economic
and farmers have to apply high rates of chemical fertilizers to maintain satisfactory yield1. There are several
ways for increasing wheat production especially in the newly reclaimed areas; one of them is the appropriate
application of integrated plant nutrient supply system following balanced fertilization needs to be developed for
resource, poor farmers to sustain the potential productivity.
Phosphorus as one of the important nutritional elements in metabolic processes i.e., plant growth, total
and early fruits yield has a vital role as a main constituent of energy compounds, nucleic acids, phospholipids
and co-enzymes. Many literatures such as2, 3
and 4who reported that, phosphorus fertilizer had a significant
effect on plant growth and its yield. As well as the different forms of phosphorus affected the physical and
chemical properties of vegetable fruits, 5
. In spite of, most literatures reported that, the effect of phosphorus
varied according to its source. Whereas, the application of chemically treated source like calcium super-
phosphate results in better plant growth, higher fruits yield compared to the addition natural phosphorus like
rock phosphate6. Also, several studies
7 and
8suggest that organic sources of P are more effective for plant
absorption than inorganic ones.
Application of phosphorus fertilizers in agricultural calcareous soils has introduced some problems
mainly due to P fixation, low recovery and accumulation in soil. Decrease in availability of P is suggested to be
a complex function of several factors such as: soil chemical composition, amount and reactivity of silicate
clays, CaCO3, Fe oxides, P addition rates and time,9. In general, in calcareous soils major factor in decreasing
phosphorus sorption capacity is phosphorus precipitation in form of calcium phosphate. Organic and biologic
fertilizers increased uptake due to the increased solubility and decreased precipitation, 10
. Generally,manure
application had an appreciable and different impact on the chemical fractions of P in calcareous soils as P from
manure gradually turned into available forms over the time,11
.
Organic sources of P are known to increase P availability more than inorganic P fertilizers and enhance
efficient use of applied P fertilizer,12
. The synergistic effect of manure application along with P fertilizer on
increasing soil test P concentration has been reported by13
,14
,15
and16
. Moreover,17
reported that organic
amendments consisting of a mixture of humic and fulvic acids increased recovery of applied P by bicarbonate
(Olsen-P).This was due to decreases in the precipitation rate of poorly soluble Ca phosphate by organic
amendments. Finally,18
reported that application of organic and compost to the newly reclaimed lands maintain
ecologicalbalance and develops biological processes to their optimum. In addition to preservation of soil
structure, earthworm and microorganisms, addition of composts improve soil chemical propertiesincluding
decrease soil pH, increase cation exchange capacity (CEC) and enhance the availability of the most nutrient
important for plant growth and agricultural production. It increases the water holding capacity and improves the
soil structure and aggregates.The intensive use of compost for increasing agricultural production, maintaining
and enhancing soil fertility and decreasing pollution hazards is of vital importance especially in the newly
reclaimed soil.
So, this work aims to evaluate direct application of compost and inorganic phosphorus forms on the
changes of availability of phosphorus in calcareous soil and his accumulation in biological yield of wheat. In
addition to evaluate the phosphorus forms use efficiency and also to detect the availability of phosphorus
following organic and /or inorganic phosphorus forms addition to soil may help to a better management of P
fertilization of the crop in respect to plant growthin the newly reclaimed soil.
Materials and methods:
Filed experiment was conducted at Nubaria Agriculture Research Station, Behera Governorate, Egypt.,
during winter seasons 2012/2013 to study the response of wheat to the application different forms of
phosphorus fertilizer individually or combined with compos tunder calcareous soil conditions. Wheat grains
(TriticumAestivum L.) cv Giza 168 were sown. Soil samples were collected, air-dried and analyzed, texture was
determined by the hydrometer method, soil organic C was analyzed using Walkley and Black method. Soil pH
was determined in 1:2.5 soil/water suspension after 0.5 h.ECe was determined in a soil paste extract, cation
exchange capacity was measured by 1MNaOAc buffered at pH 8.2 and total CaCO3 was determined using the
calcimeter method, according to19
. Available Pwas determined by the Olsen method 20
.The Murphy-Riley (MR)
colorimetric method was widely used for environmental P determination, which uses ammonium molybdate,

KadriaM. ElAzab et al /Int.J. ChemTech Res. 2015,8(4),pp 1563-1572. 1565
ascorbic acid, and antimony potassium tartrate to develop a blue color with P (absorption at 880 nm),21
.The
chemical characteristics of the experimental soil are presented in Table (1) and compost analysis is shown in
Table (2).
Table No.1: Some characteristics of the investigated soil at Nubaria Agriculture Research Station.
N Sand Silt Clay
0-20 0.41 23.72 12.7 56.64 23.13 20.23 Sandy Loam
20- 40 0.28 25.16 10.1 51.42 19.66 28.92 Sandy Clay Loam
Na+
K+
Ca++
Mg++ HCO3
=Cl
- SO4=
0-20 8.22 2.23 9.73 5.43 5.13 2.01 3.78 11.20 7.82
20- 40 8.29 2.49 10.62 3.80 7.18 3.30 3.85 12.43 8.62
Depth
(Cm)
O.M
(%)
CaCO3
(%)
Available Macro-nutrients
(mg.kg-1
Soil)Particle size Distribution (%)
Texture
P
2.14
1.46
Depth
(Cm)
pH
(1:2.5)
EC
(dS/m)
Soluble Ions (m.e/L)
Cations Anions
The design of the experiment area was arranged in a split plot with three replicates. The main plots
were three rates of compost (0, 10 and 20 m3.fed.
-1.), the sub plots werefour treatments, 3 plots treated by the
same recommended doses (45 kg P2O5 fed-1
) of phosphorus and each with one form of inorganicP fertilizer;
P1calcium super phosphate 15 % P2O5, P2 triple super phosphate 46 % P2O5 and P3 phosphoric acid 72.4 % P2O5
and The fourth was without phosphorus (ControlP0). The P additions were broadcasting and incorporated with
soil after compost addition before planting. Each treatment was replicated three times. Nitrogen and Potassium
fertilizers were added in the form of ammonium nitrate 33.5% N and potassium sulfate (48 % K2O),at
recommended doses (100 kg Nfed-1
and 24 kg Kfed.-1
respectively)and the other usual agricultural practices
were conducted as recommended by Ministry of Agriculture.
Table No.2:Some characteristics of the compost added to soil experiment.
N P K
33.1 19 19 100 3.3 2180 22.23 6450 79
Na+
K+
Ca++
Mg++
HCO3=
Cl -
SO4=
7.2 24 9.73 8 9.9 2.8 2.75 20 14.5
O.C (%)O.M (%)
Available Macro-nutrients
(mg.kg-1
Compost)
CEC
meq.100 g
Compost-1
CaCO3 (%)C:N ratio SP (%)
pH (1:2.5) EC (dS/m)
Soluble Ions (meq.100g Compost-1
)
Cations Anions
Soil samples (0-20 cm) were collected from each treatment at tillering, spike development and maturity,
air dried, crushed and passed through a 2-mm sieve for estimating available P by the Olsen method 20
.Phosphorus concentration in extracts was determined by the colorimetric method of 22.
Wheat plant samples
were taken from each treatment at the studied growth periodswhich separated to shoots and roots at tillering
stageand separated at maturity to grains and straw.Plant sample were dried at 70 C0 and digested for chemical
determinations according to 23
.Nitrogen, P and K content in the digests straw and grains were determined
according to the methods described by 24
and 25
.
At harvesting time, the wheat plants were harvested from each plot.Grain andstraw were weighed andrelated to
kg.fed.-1
. The following data of someparameters were recorded: such as plant height(cm), spike length
(cm),1000grains weight (g)and biological yield(kg.fed.-1
). The percent increase in yield was calculated by using
formula:
Plant analysis and dry matter data were utilized to calculate plant nutrient uptake, P forms use efficiency
(PFUE) which was calculated by using formula:
PFUE = [(Pf - Pc) / P] × 100.

KadriaM. ElAzab et al /Int.J. ChemTech Res. 2015,8(4),pp 1563-1572. 1566
Where Pf and Pc are total P uptake from fertilizer)inorganic Phosphorus)and control plots (without or
with compost) respectively, and P is the applied forms of phosphorus in kg.Fed.-1
. Phosphorus uptake calculated
from total P measured in plants (straw + grain) was multiplied by total yield in kg.fed-1
and then divided by
100,26
.
Statistical analysis:
All data analysis of variance normally was assessingby using Minitab computer program and least
significant difference(L.S.D) was calculated at level of 5% 27
.
Results and Discussion:
Amount of available P in soil at different stages:
Data in Table (3) declared that increasing the rates of compost addition, caused increasing in
availability of P in soil which was raised significantly from 8.74 mg.kg-1
at control to 12.40 and 12.42 mg.kg-1
with addition of 10 or 20 m3compost.fed.
-1 respectively, without significant difference among them.On the other
hand, the inorganic P-forms treatments appeared significant effect on increasing available P in soil compared to
the control to 130.7%, 166.9% and 172.8% with P1, P2 and P3, respectively.Those significant increasesmay be
attributed to their compacting for precipitation and adsorption conditions in calcareous soil. These results are in
agreement with those obtained by28
who found that acidic P fertilizer (phosphoric acid) could result in low P
adsorption compared to alkaline one. Although there is limited information available comparing the effect of
acidic and alkaline P source on its adsorption/precipitation in soil.
Table No.3:Mean values and statistical analysis of studied individually and interactions treatments on the
availability of P in soil (mg.kg-1
).
Growth
Stage
Compost
m3.fed
-1 P0 P1 P2 P3mean available
P (mg.kg-1
)
0 2.90 19.20 19.63 19.90 15.41
10 7.40 22.00 21.90 22.77 18.52
20 10.93 24.07 23.63 24.23 20.72
mean 7.08 21.76 21.72 22.30 18.22
0 2.17 5.57 9.13 9.73 6.65
10 5.73 10.17 14.83 14.87 11.40
20 8.20 10.97 12.27 11.23 10.67
mean 5.37 8.90 12.08 11.94 9.56
0 2.02 3.20 5.59 5.80 4.15
10 3.43 6.23 9.42 10.10 7.30
20 3.43 5.37 7.11 7.59 5.87
mean 2.96 4.93 7.37 7.83 5.77
0 2.36 9.32 11.45 11.81 8.74
10 5.52 12.80 15.38 15.91 12.40
20 7.52 13.47 14.34 14.35 12.42
mean 5.13 11.86 13.72 14.02 11.19
Tillering
Spike
development
Harvesting
Compost
mean
Compost ( C )
Posph. (P )
Stages ( S )
-------------
C : 0.21
P : 0.24
S : 0. 21
CP : 0.42
CS : 0.42
PS : 0.36
CPS : 0.72
LSD at 0.05
level
Inorganic P-formsTreatments
P0 = Control (without phosphorus).
P1 = (Calcium super phosphate)
P2= ( Triple super phosphate)
P3 = (Phosphoric acid)
The data of P concentration (mg.kg-1
soil) in soil which taken at different growth period presented in
table (3) showed that strongly decreasing and highly significantly with the time, which the maximum
concentration of available P was at the first stage (tilleringstage) and then decline with 47.4% at the spike
development stageand 68.3% at maturitystage, from 18.21 to 9.57 then 5.77 mg. kg-1
respectively. thisdecrease
may be attributed to increasing the consumption of P element with increasing plant growth, also increasing the
role of Ca2+
which is dominant ion in soil solution of calcareous soils and it is possible to formless soluble
complexes with weak acid anions like orthophosphate is due to unavoidable dominance of this ion. The
dynamics of P is managed by calcite, which strongly holds P and consequently maintains low P concentration in

KadriaM. ElAzab et al /Int.J. ChemTech Res. 2015,8(4),pp 1563-1572. 1567
soil solution. These notes were in agreement with those obtained by 29
who found that mineral P fertilization
help increase the amount of available P in the soil in the first stage and then decreases as time of incubation
goes on.
Data illustrated in table (3) indicated a clear response to studied treatment interactions on the
availability of P.The increase in availability of P was greatly in case of compost addition.In this
concern,13
showed that the combined addition of poultry manure and fertilizer P had a synergistic effect and
increased Olsen extractable P compared with fertilizer P alone. These finding are consistent with 30
who reported
that application of manure combined with fertilizer P increased P recovery as Olsen-P compared with separate
application of fertilizer. On the other hand, it‟s appear the same trend of inorganic P-forms , while the obtained
increases of available P content with increasing the rates of compost addition up to 20 m3.fed
-1 were slight
compared to the rate 10 m3.fed
-1 particularly at used both triple super phosphate (P2)or phosphoric acid
(P3).This decrease may be attributed to the stimulatory effects of higher rate from compost in presence these
forms (P2, P3)to enhance the precipitation and adsorption conditions or formation of less soluble complexes
with Ca2+
cations, also these results may be attributed to character of compost addition, which the largely
amount of phytate in higher rates of compost showed negatively effect on P solubility. These results were in
agreements with 31
who showed that in the short term, manures with large phytate contents can demonstrate
lower phosphorus solubility on calcareous soil.
0
y = -7.0215x + 25.495
R² = 0.9244
y = -6.24x + 27.864
R² = 0.9942
y = -8.2635x + 30.862
R² = 0.9551
0
5
10
15
20
25
Tillering Stage (T) Spike developmentStage (S)
Harvesting Stage(H)
Av
ail
ab
le P
in
so
il m
g.k
g-1
With triple super phosphate (P2)
0 m3.fed-1
10 m3.fed-1
20 m3.fed-1
Linear (0 m3.fed-1)
Linear (10 m3.fed-1)
Linear (20 m3.fed-1)
y = -7.0525x + 25.914
R² = 0.939
y = -6.335x + 28.58
R² = 0.9801
y = -8.323x + 30.997
R² = 0.9048
0
5
10
15
20
25
Tillering Stage (T) Spike developmentStage (S)
Harvesting Stage(H)
Av
ail
ab
le P
in
so
il m
g-k
g-1
With phopshoric acid (P3)
0 m3.fed-1
10 m3.fed-1
20 m3.fed-1
Linear (0 m3.fed-1)
Linear (10 m3.fed-1)
Linear (20 m3.fed-1)
y = -8x + 25.322
R² = 0.8582
y = -7.8835x + 28.567
R² = 0.9228
y = -9.35x + 32.167
R² = 0.9491
0
5
10
15
20
25
Tillering Stage (T) Spike developmentStage (S)
Harvesting Stage(H)
Av
ail
ab
le P
in
so
il m
g.k
g-1
With calcium super phosphate (P1)
0 m3.fed-1
10 m3.fed-1
20 m3.fed-1
Linear (0 m3.fed-1)
Linear (10 m3.fed-1)
Linear (20 m3.fed-1)
y = -0.4395x + 3.2417
R² = 0.8706 y = -1.9835x + 9.489
R² = 0.9916
y = -3.75x + 15.022
R² = 0.9761
0
5
10
15
20
25
Tillering Stage (T) Spike developmentStage (S)
Harvesting Stage(H)
Av
ail
ab
le P
in
so
il m
g.k
g-1
without inorganic -P (P0)
0 m3.fed-1
10 m3.fed-1
20 m3.fed-1
Linear (0 m3.fed-1)
Linear (10 m3.fed-1)
Linear (20 m3.fed-1)
Figure No.1:Effect of applied treatments on the change of phosphorous availability in calcareous soil.
On the other hand, the means value of available P in soil which presented in table (3) and figure (1) as a
results to the interactions between P- forms addition and age of plant growth or between rates of compost and
growth period showed significant decrease with increasing age of plant (time). The high available P content in
soil at the first growth stage of wheat began accelerate decreasing up to harvest. It is noteworthy to mention that
increasing the available P in soil with increasing the rate of compost this increasing were gradually decreasing
with the age of plant especially at high rate (20 m3. fed.
-1) P availabilities were decreased to 48.5% , 71.67% at
20 m3.fed.
-1, 38.44% and 60.58% at 10 m
3.fed.
-1and 56.84%, 73.07% at 0 m
3.fed.
-1for spike development
stageand maturity stage compared with tillering stage respectively, these results indicated that the recommended
rate of compost is 10 m3.fed.
-1 for calcareous soil, which plant have been supplied by their requirements
regularly through different growth period that have positive effect on plant productions. In the other hand, the
progressively decreasing up to 73.07 % from P available until harvest at control (without compost) may be
attributed to P deficiency and the quantity of P available isn‟t sufficient for plant growth, as soon as decreasing
the use inorganic P efficiency under condition of calcareous soil. Also, the progressively decreasing up to 71.67
% from available P until harvest at high rates addition of compost (20 m3. fed.
-1) may be attributed to the

KadriaM. ElAzab et al /Int.J. ChemTech Res. 2015,8(4),pp 1563-1572. 1568
association of plant consumption and process of precipitation and adsorption for P element in present highly
concentration of compost in calcareous soil.
Due to the interaction effect of inorganic P formsand different growth periodon the availability of P,
there are decreasing down to 44.38%, 46.45% and 59.09% as a results to useP2, P3 and P1forms respectivelyup
to the spike development stage.On the other hand, there was another arrangement for these forms corresponding
to their different effect on the availability of P in the period from spike development till harvest namely
phosphoric acid (P3), triple super phosphate (P2) then calcium super phosphate (P1) in the order; 64.88%,
66.06% and 77.34% respectively. These results indicated that the form (P2) or (P3) was superior to the (P1).
Data in table (3) showed an obvious response for available P content in calcareous soil by application of
(P2) or (P3) in presence the lowest addition rate of compost (10 m3. fed.
-1), as best treatments. These peaks were
regularly decreased with advancing plant age without limiting effect on plant growth. On the other hand, the
highest values of available P content at the first age of plant when applied the same inorganic P forms with the
highest rates of compost (20m3.fed.
-1)which had negative effect on plant growth.
Vegetative growth parameters:
Table No.3:Effect of applied treatments on growth parameter and yield components:
Compost
m3.fed
-1 P0 P1 P2 P3 mean
0 87.3 88.1 84.8 86.1 86.6
10 87.4 93.3 95.2 89.7 91.4
20 94.4 93.2 97.3 91.0 94.0
mean 89.7 91.5 92.4 88.9 90.7
0 9.2 9.7 9.5 9.5 9.5
10 9.1 9.3 9.8 9.8 9.5
20 10.5 8.8 10.9 10.7 10.2
mean 9.6 9.3 10.1 10.0 9.7
0 2055.2 2828.0 3100.7 3012.8 2749.2
10 2284.8 3096.8 3382.4 3371.2 3033.8
20 2340.8 2940.0 2940.0 2475.2 2674.0
mean 2226.9 2954.9 3141.0 2953.1 2819.0
0 3287.2 3948.0 4224.1 4071.2 3882.6
10 3315.2 4093.6 4821.6 6092.8 4580.8
20 3752.0 4205.6 4424.0 4356.8 4184.6
mean 3451.5 4082.4 4489.9 4840.3 4216.0
0 5342.4 6776.0 7324.8 7084.0 6631.8
10 5600.0 7190.4 8204.0 9464.0 7614.6
20 6092.8 7145.6 7364.0 6832.0 6858.6
mean 5678.4 7037.3 7630.9 7793.3 7035.0
0 44.5 45.7 45.5 45.3 45.3
10 44.9 45.1 45.5 44.5 45.0
20 45.5 48.3 44.9 45.6 46.1
mean 45.0 46.4 45.3 45.1 45.5
0 18.2 15.8 18.4 15.9 17.1
10 16.1 16.6 16.5 16.8 16.5
20 16.4 18.3 18.1 15.3 17.0
mean 16.9 16.9 17.7 16.0 16.9
0 38.5 42.0 42.3 42.6 41.4
10 41.0 42.8 41.1 35.6 40.1
20 38.4 41.2 40.1 36.3 39.0
mean 39.3 42.0 41.2 38.2 40.2
C : ns
P : ns
CP : ns
C : ns
P : ns
CP : ns
C : 1.8
P : 2.1
CP :3.9
Harvest Index %
Inorganic P-formsLSD at 0.05
level
Treatments
Items Studied
C : 3.4
P : ns
CP : ns
C : ns
P : ns
CP : ns
C : 224.7
P : 259.5
CP : ns
C : 338.8
P : 391.2
CP :731.2
C : 500.7
P : 578.1
CP :1053.0
Wh
eat
gra
in q
uality
para
met
r
Pla
nt
hei
gh
t
(cm
)
Gra
ins
kg.f
ed-1
Sp
ike
len
gth
(cm
)
Str
aw
kg.f
ed-1
Tota
l d
ray
w. k
g.f
ed-1
1000-g
rain
wei
gh
t (g
)
Cro
ud
pro
tin
e %
Para
met
ers
of
wh
eat
gro
wth
Bio
logic
al yie
ld (
kg.f
ed-1
)
The statistically analysis data presented in Table (4) and figure (2) showed the effect of applied
inorganic -P forms and rates of compost (individually or combined) on some vegetative growth parameters i.e.,
plant height (cm), spike length (cm) of wheat plants and grains, straw, total yield, 1000 grain weight, crude
protein and harvest index.
KadriaM. ElAzab et al /Int.J. ChemTech Res. 2015,8(4),pp 1563-1572. 1569
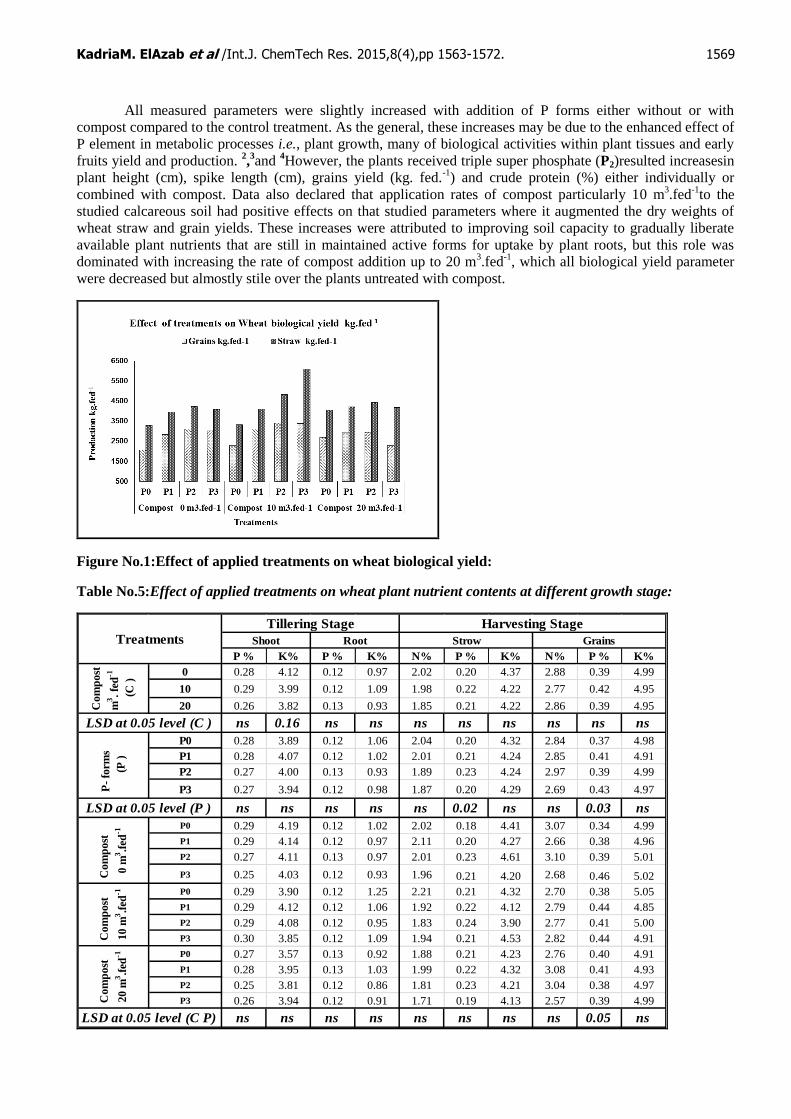
All measured parameters were slightly increased with addition of P forms either without or with
compost compared to the control treatment. As the general, these increases may be due to the enhanced effect of
P element in metabolic processes i.e., plant growth, many of biological activities within plant tissues and early
fruits yield and production. 2,3and
4However, the plants received triple super phosphate (P2)resulted increasesin
plant height (cm), spike length (cm), grains yield (kg. fed.-1
) and crude protein (%) either individually or
combined with compost. Data also declared that application rates of compost particularly 10 m3.fed
-1to the
studied calcareous soil had positive effects on that studied parameters where it augmented the dry weights of
wheat straw and grain yields. These increases were attributed to improving soil capacity to gradually liberate
available plant nutrients that are still in maintained active forms for uptake by plant roots, but this role was
dominated with increasing the rate of compost addition up to 20 m3.fed
-1, which all biological yield parameter
were decreased but almostly stile over the plants untreated with compost.
Figure No.1:Effect of applied treatments on wheat biological yield:
Table No.5:Effect of applied treatments on wheat plant nutrient contents at different growth stage:
P % K% P % K% N% P % K% N% P % K%
0 0.28 4.12 0.12 0.97 2.02 0.20 4.37 2.88 0.39 4.99
10 0.29 3.99 0.12 1.09 1.98 0.22 4.22 2.77 0.42 4.95
20 0.26 3.82 0.13 0.93 1.85 0.21 4.22 2.86 0.39 4.95
ns 0.16 ns ns ns ns ns ns ns ns
P0 0.28 3.89 0.12 1.06 2.04 0.20 4.32 2.84 0.37 4.98
P1 0.28 4.07 0.12 1.02 2.01 0.21 4.24 2.85 0.41 4.91
P2 0.27 4.00 0.13 0.93 1.89 0.23 4.24 2.97 0.39 4.99
P3 0.27 3.94 0.12 0.98 1.87 0.20 4.29 2.69 0.43 4.97
ns ns ns ns ns 0.02 ns ns 0.03 ns
P0 0.29 4.19 0.12 1.02 2.02 0.18 4.41 3.07 0.34 4.99
P1 0.29 4.14 0.12 0.97 2.11 0.20 4.27 2.66 0.38 4.96
P2 0.27 4.11 0.13 0.97 2.01 0.23 4.61 3.10 0.39 5.01
P3 0.25 4.03 0.12 0.93 1.96 0.21 4.20 2.68 0.46 5.02
P0 0.29 3.90 0.12 1.25 2.21 0.21 4.32 2.70 0.38 5.05
P1 0.29 4.12 0.12 1.06 1.92 0.22 4.12 2.79 0.44 4.85
P2 0.29 4.08 0.12 0.95 1.83 0.24 3.90 2.77 0.41 5.00
P3 0.30 3.85 0.12 1.09 1.94 0.21 4.53 2.82 0.44 4.91
P0 0.27 3.57 0.13 0.92 1.88 0.21 4.23 2.76 0.40 4.91
P1 0.28 3.95 0.13 1.03 1.99 0.22 4.32 3.08 0.41 4.93
P2 0.25 3.81 0.12 0.86 1.81 0.23 4.21 3.04 0.38 4.97
P3 0.26 3.94 0.12 0.91 1.71 0.19 4.13 2.57 0.39 4.99
ns ns ns ns ns ns ns ns 0.05 ns
Co
mp
ost
20 m
3.f
ed-1
LSD at 0.05 level (C P)
Co
mp
ost
m3.
fed
-1
(C )
LSD at 0.05 level (C )
P-
form
s
(P )
LSD at 0.05 level (P )
Co
mp
ost
0 m
3.f
ed-1
Co
mp
ost
10 m
3.f
ed-1
Treatments
Tillering Stage Harvesting Stage
Shoot Root Strow Grains

KadriaM. ElAzab et al /Int.J. ChemTech Res. 2015,8(4),pp 1563-1572. 1570
The significant response of biological yield to the applied inorganic -P forms in combination with
compost may be due to the positive effect of both of them.All observations emphasized the beneficial effect on
plant growth by enhancing the availability of nutrients in soil as a result of this combination. On the other hand,
compost application had an appreciable and different impact on the chemical fractions of P in calcareous soils
which increased P availability and enhanced efficient use of applied P fertilizer. This phenomena was limited
with increasing compost addition, where the obtained increases in biological yield due tothe treatment of 10
m3.fed.
-1 were higher than those of 20 m
3.fed.
-1 particularly with P forms (P2 or P3) compared with control
(without P and compost). These increases were (64.5, 46.7 %) and (64,85.3% ) for grains and straw at addition
of P2 and P3combined with 10 m3. compostfed
-1and the harvest index for these treatments was 41.1% and
35.6%, respectively.
The data presented in Table (5) showed insignificantly effect due to applied inorganic P forms and rates
of compost (individually or combined) on macronutrients studied at most of plant stages, except addition either
P2 or P3forms individually on P content in plant, while it had significant effect on P content in straw and grains
respectively.
Table No.6:Statistical analysis of macronutrients uptake by straw and grains of wheat as affected by
studied treatments:
N kg.fed-1 P kg.fed-1 K kg.fed-1 N kg.fed-1 P kg.fed-1 K kg.fed-1 N kg.fed-1 P kg.fed-1 K kg.fed-1
0 78.2 8.0 169.9 78.9 10.9 137.3 157.1 18.9 307.2
10 90.0 10.0 194.3 84.4 12.7 150.1 174.4 22.7 344.4
20 76.9 8.9 176.5 77.2 10.5 132.4 154.2 19.4 308.9
9.5 1.0 19.9 ns 0.9 11.9 ns 1.3 27.6
P0 70.0 7.0 148.9 63.2 8.3 110.9 133.2 15.3 259.8
P1 82.0 8.7 173.8 84.7 12.1 145.0 166.7 20.7 318.8
P2 84.3 10.5 189.5 93.0 12.3 157.1 177.3 22.8 346.6
P3 90.6 9.8 208.7 79.8 12.7 146.7 170.4 22.5 355.4
11.0 1.2 23.0 15.1 1.1 13.7 23.2 1.5 31.9
P0 66.1 6.0 144.6 63.0 7.1 102.5 129.1 13.1 247.1
P1 82.5 7.7 169.6 75.5 10.7 140.3 158.1 18.5 309.9
P2 85.1 9.7 194.6 96.1 12.0 155.2 181.2 21.7 349.9
P3 79.3 8.4 170.8 80.9 13.8 151.3 160.2 22.2 322.0
P0 73.2 6.8 143.2 61.5 8.6 115.3 134.7 15.4 258.5
P1 80.2 8.9 170.2 87.6 13.5 149.8 167.8 22.4 320.0
P2 88.4 11.7 187.9 93.3 14.0 169.9 181.7 25.7 357.8
P3 118.2 12.6 276.0 95.1 14.9 165.4 213.3 27.5 441.4
P0 70.7 8.0 158.8 65.2 9.4 114.9 135.9 17.4 273.8
P1 83.4 9.4 181.6 90.9 11.9 145.0 174.3 21.3 326.7
P2 79.3 10.1 186.0 89.5 11.1 146.2 168.8 21.2 332.1
P3 74.4 8.3 179.5 63.3 9.6 123.4 137.7 17.8 302.9
19.0 2.0 39.8 ns 1.9 ns ns 2.5 55.2
TreatmentsStraw Grains Total uptak by wheat plant
Co
mp
ost
m3.
fed
-1
(C )
LSD at 0.05 level (C )
P-
form
s
(P )
LSD at 0.05 level (P )
Co
mp
ost
0 m
3.f
ed-1
Co
mp
ost
10 m
3.f
ed-1
Co
mp
ost
20 m
3.f
ed-1
LSD at 0.05 level (C P)
Table No.7:Effect of studied treatments on relative increase in wheat yield and (PFUE):
P0 P1 P2 P3 P0 P1 P2 P3
0 Control 37.60 50.87 46.59 - 12.01 19.12 20.24
10 11.17 50.68 64.58 64.03 - 15.42 22.73 26.67
20 13.90 43.05 43.05 20.44 - 8.83 8.49 1.02Co
mp
ost
m3.f
ed-1
(C
)
% increase in yield P forms use efficiency (PFUE) %Treatments
Concerning the applied of different P forms individually, data in table(7) indicated that the increase in
yield obtained from using P2> P3> P1 compared to the control, these values were greatly increased with10 m-3
.
fed.-1
addition rate which appeared the same trend (P2> P3> P1), while increasing rate of compost up to 20 m-

KadriaM. ElAzab et al /Int.J. ChemTech Res. 2015,8(4),pp 1563-1572. 1571
3.fed.
-1decreased these percentage particularly at using P3form. Also the values of PFUE were highest due to
application P3 when compared with both P2 and P1 respectively without compost addition. The same trend was
detected when P application at different forms combined with compost at rate of 10 m-3
. fed.-1
but the values
were highest in case ofadditions individually. It worth to mention that the application of compost at rate of 20
m-3
.fed.-1
combined with different P forms in this work caused a decreased in PFUE up to minimum values
particularly at used form acid fertilizer (P3). These results were attributed to number of reasons: ie, addition of
this rate of compost will increase the total surface area for calcareous soil, 32
found that the reactivity of
CaCO3in soils depends upon the specific surface area of the carbonate and on its total surface area. It has been
demonstrated that Ca2+
is dominant ion in soil solution of calcareous soils and it is possible that formation of less
soluble complexes with weak acid anions like orthophosphate is due to unavoidable dominance of this ion. The
dynamics of P is managed by calcite, which strongly holds P and consequently maintains low P concentration
insoil solution,33
. Also, addition of highest rate of compost may be contain large amount of phytatewhich
showed negative effect on P solubility.
Conclusion:
Application of compost combined chemical phosphorus fertilizer increased Olsen P valueand enhanced
the efficiency of added phosphorus as compared to separate P forms application.These values were decreased
differently at used rate of 20 m-3
. fed.-1
combined with different P forms.Therefore, it may be concluded that
interaction with treatment application in this work had an appreciable and different impact on the availability of
P in calcareous soils.These phenomena complexes need to laboratory quantitative and qualitative specific
studies using 32
P to identify whether plant consumption or process of precipitation and adsorptionhas the
positive effect in Pstatus in soil solution and plant tissues.
References:
1. Zeidan E.M.,Abd El-HameedI.M.,BassiounyA.H. and WalyA.A.,Effect of irrigation intervals, nitrogen
and organic fertilization on yield, yield attributes and crude protein content of some wheat cultivars
under newly reclaimed saline soil condition.4th Conference on Recent Technologies in
Agriculture,2009.
2. MahmoudH.A.F. and AmaraM.A.T., Response of tomato to biological and mineral fertilizers under
calcareous soil conditions. Cairo, Egypt. Bulletin of Faculty of Agric. Cairo Univ.2000, 51, (2), 151-
174.
3. Anil-More S.A.,HiremathB.M.,Chittapur and ChimmadV.P., Effect of green manuring and forms of
phosphorus on the productivity of chillit cotton intercropping system. Krnataka Journal of Agric.
Sciences, 2005, 18, (2), 297-301.
4. Choudhuy, M.R.,TalukdarN.C. and SaikiaA., Effect of integrated nutrient management on growth and
productivity of brinjal. India Crops, 2005, 6, (3), 551-554.
5. Aliyu, L.S., SingA.,MagajiM.D. and UmarM.S., Variety and phosphate effects on yield and yield
components of cowpea. Journal of Plant Sciences, 2007, 2, (6), 583-591.
6. Hafez, Magda M. and Asmaa R. Mahmoud, Effect of the Natural and Chemical Phosphorus
Fertilization as Individually And/or Mixed on the Productivity of Eggplant. Res. J. Agric. & Biol. Sci.,
2009,5, (4), 344 - 348.
7. Courtney R.G. and MullenG.J., Soil quality and barley growth as influenced by the land application of
two compost types. Biores. Technol., j.biortech.2007.06.034
8. Gil M.V.,CarballoM.T. and CalvoL.F., Fertilization of maize with compost from cattle manure
supplemented with additional mineral nutrients. Waste Manag., doi:10.1016/j.wasman.2007.05.009
9. Afif, E.,MatarA.and Torrent J.,Availability of phosphate applied to calcareous soils of west Asia and
North Africa. Soil Sci. Soc. Am. J. 1993,57, 756–760.
10. VahidSarvi, Mohammad Feizian, AzadeMikhak, ArezoMahdavi Effect of biologic fertilizers on
different forms of phosphorus and corn yield in Moghan region. 9th international soil Science Congress
on the Soul of Soil and Civilization"14-16 October, Side, Antalya/ Turkey 2014.
11. Halajnia, A.,HaghniaG.H.,FotovatA.,KhorasaniR., Phosphorus fractions in calcareous soils amended
with P fertilizer and cattle manure. Geoderma2009, 150, 209–213.
12. Mohanty, S.,PaikarayN.K.,RajanA.R., Availability and uptake phosphorus from organic manures in
groundnut (Arachis hypogea L.) and corn (Zea Mays L.) sequence using radio tracer technique.
Geoderma2006,133, 225–230.
KadriaM. ElAzab et al /Int.J. ChemTech Res. 2015,8(4),pp 1563-1572. 1572
13. Toor, G.S. and BahlG.S., Effect of solitary and integrated use of poultry manure and fertilizer
phosphorus on the dynamics of P availability in different soils. Bioresour. Technol.,1997,62, 25-28.
14. Reddy, D.D.,SubbaRaoA.,Sammi Reddy K. and TakkarP.N., Yield sustainability and phosphorus
utilization in soybean–wheat system on Vertisols in response to integrated use of manure and fertilizer
phosphorus. Field Crops Res. 1999, 62, 181–190.
15. Mkhabela, M.S. and WarmanP.R., The influence of municipal solid waste compost on yield, soil
phosphorus availability and uptake by two vegetable crops grown in a Pugwashsandy loam soil in Neva
Scotia. Agric. Ecosyst. Environ. 2005, 106, 57–67.
16. Garg, S. and BahlG.S., Phosphorus availability to maize as influenced by organic manures and fertilizer
P associated phosphatase activity in soils. Bioresour. Technol. 2008,99, 5773–5777.
17. Delgado, A., Madrid A.,KassemS.,AndreuL., and CampilloM.C., Phosphorus fertilizer recovery from
calcareous soils amended with humic and fulvic acids. Plant Soil 2002, 245, 277–286.
18. Kandil, Hala, El- KherbawyM.I., IbrahimS.,Abd-ElfattahA.,Abd El-MoezM.R. and BadawyS.H.,Effect
of Different Sources and Rates of Some Organic Manure on Content of Some Heavy Metals in
Different Soils and Plants Grown Therein: II. Effect on Corn Plants. Soil Forming Factors and
Processes from the Temperate Zone,2012,11, 19-32.
19. Nelson, R.E., Carbonate and gypsum. In: Page, MillerA.L., KeeneyR.H.,, D.R. (Eds.),Methods of Soil
Analysis. Part 2: Chemical and Microbiological Properties, 2nd editionAmerican Society of Agronomy,
Madison, Wisconsin, USA, 1982, 181–198.
20. Olsen, S. R., Cole C. V., Watanabe F. S. and DeanL. A., Estimation of Available Phosphorus in Soils
By Extraction with Sodium Bicarbonate,1954, 939, U.S. Department of Agriculture, Washington, DC,
USA.
21. Drummond L. and MaherW., Determination of phosphorus in aqueous solution via formation of the
phosphoantimonylmolybdenum blue comples re-examination of optimum conditions for the analysis of
phosphate.AnalyticaChimicaActa 1990, 302:69-74.
22. Murphy J.and RileyJ P., A modified single solution method for the determination of phosphates in
natural waters. Anal. Chem. Acta, 1962,27, 31-36.
23. Ryan, J.,GarabetS.,HarmsenK. and RashidA., A soil and plant Analysis Manual Adapted for the west
Asia and North Africa Region. ICARDA, Aleppo, Syria, 140 pp.1996
24. Cottenie, A.,VerlooM.,KikensL.,VelgheG. and CamerlynckR., Analytics Problems and Methods in
Chemical Plant and Soil Analysis. Handbook, Ed. A. Cottenie, Gent, Belgium.1982
25. Page, A. L.,Miller R. H. and KeeneyD.R.,"Methods of Soil Analysis". II. Chemical and
Microbiological Properties 2nd Ed. Madison, Wisconsin, U.S.A.1982
26. Panhwar Q. A., RajputA.,NaherU. A., and JusopS., Assessment of phosphorus use efficiency and
various phosphorus applicationmethods on wheat in calcarious soil. Journal of Food, Agriculture &
Environment,2014,12, 2, 1 3 1 8 - 1 3 2 2.
27. Barbara, F.R. and BrainL.J., „‟Minitab Hand book‟‟. Duxbury press. AnImprint of Wad Sworth Publish.
Comp. Belonont California, U.S.A.1994
28. Naeem, A.,AkhtarM. and WaqarA., Optimizing Available Phosphorus in Calcareous Soils Fertilized
with Diammonium Phosphate and Phosphoric Acid Using Freundlich Adsorption Isotherm. Hindawi
Publishing Corporation The Scientific World Journal 2013,, 5 pages
http://dx.doi.org/10.1155/2013/680257.
29. Al-Rohily, K.M.,GhoneimA.M.,ModaihshA.S.andMahjoubM.O., Phosphorus availability in calcareous
soil amend with chemical phosphorus fertilizer, cattle manure compost and sludge manure.
International Journal of Soil Science,2013,8 ,1, 17-24.
30. Turner, B.L., Cade-MenunB.J. andWestermannD.T., Organic phosphorus composition and potential
bioavailability in semi-arid arable soils the Western United States. Soil Sci. Soc. Am. J. 2003,67, 1168–
1179.
31. Leytem, A.B., SmithD.R., Applegate T.J.and ThackerP.A., The influence of manure phytic acid on
phosphorus solubility in calcareous soils.Soil Sci. Soc. Am. J. 2006,70, 1629-1638.
32. Rashid, A. and RowellD. L., “Phosphate sorption and release: 1. Isotopically exchangeable and non-
exchangeable adsorbed phosphate in relation to soil properties,” Pakistan Journal of Soil Science,
1988,3, 1-2, 17–20.
33. Bertrand, I.,HinsingerP.,JaillardB. and ArvieuJ.C.,“Dynamics of phosphorus in the rhizosphere of
maize and rape grown on synthetic, phosphated calcite and goethite,” Plant and Soil, 1999, 211, 1,
111–119.